Parks & Recreation Services Municipal Service Review and ...
370
Final Report Parks & Recreation Services Municipal Service Review and Sphere of Influence Updates Prepared for: Contra Costa Local Agency Formation Commission Prepared by: Economic & Planning Systems, Inc. (EPS) In association with: Berkson Associates (BA) June 2021
-
Upload
khangminh22 -
Category
Documents
-
view
1 -
download
0
Transcript of Parks & Recreation Services Municipal Service Review and ...
Final Report
Parks & Recreation Services Municipal Service Review and Sphere of Influence Updates Prepared for: Contra Costa Local Agency Formation Commission Prepared by: Economic & Planning Systems, Inc. (EPS) In association with: Berkson Associates (BA) June 2021

Table of Contents
1. INTRODUCTION .................................................................................................... 1
Legal Context & LAFCO Policies ................................................................................. 1
Overview of Jurisdictions .......................................................................................... 2
MSR Methodology ................................................................................................... 4
Best Practices ......................................................................................................... 8
Impact of the COVID-19 Global Pandemic ................................................................... 9
Organization of the MSR .......................................................................................... 9
Acknowledgements ............................................................................................... 10
2. MUNICIPAL SERVICE REVIEW AND SOI SUMMARY .......................................................... 11
Municipal Service Review Determinations ................................................................. 11
Sphere of Influence Recommendations ..................................................................... 16
3. AMBROSE RECREATION & PARK DISTRICT ................................................................... 23
Agency Boundaries ................................................................................................ 23
Impact of COVID-19 .............................................................................................. 25
Growth and Population Projections .......................................................................... 25
Adequacy of Park and Recreation Facilities and Services ............................................. 26
Financial Ability to Provide Services ......................................................................... 29
Management & Accountability ................................................................................. 30
Ambrose Recreation and Park District MSR Determinations ......................................... 32
Sphere of Influence Update .................................................................................... 34
4. GREEN VALLEY RECREATION & PARK DISTRICT ............................................................. 36
Agency Boundaries ................................................................................................ 36
Impact of COVID-19 .............................................................................................. 38
Growth and Population Projections .......................................................................... 38
Adequacy of Park and Recreation Facilities and Services ............................................. 39
Financial Ability to Provide Services ......................................................................... 42
Management & Accountability ................................................................................. 43
Green Valley Recreation and Park District MSR Determinations .................................... 44
Sphere of Influence Update .................................................................................... 46
5. PLEASANT HILL RECREATION & PARK DISTRICT ............................................................ 48
Agency Boundaries ................................................................................................ 48
Impact of COVID-19 .............................................................................................. 48

Growth and Population Projections .......................................................................... 50
Adequacy of Park and Recreation Facilities and Services ............................................. 51
Financial Ability to Provide Services ......................................................................... 55
Management & Accountability ................................................................................. 57
MSR Determinations .............................................................................................. 58
Sphere of Influence Update .................................................................................... 60
6. EAST BAY REGIONAL PARK DISTRICT ........................................................................ 63
Agency Boundaries ................................................................................................ 63
Impact of COVID-19 .............................................................................................. 65
Growth and Population Projections .......................................................................... 65
Adequacy of Park and Recreation Facilities and Services ............................................. 66
Financial Ability to Provide Services ......................................................................... 69
Management & Accountability ................................................................................. 72
MSR Determinations .............................................................................................. 73
7. CITY PARKS & RECREATION & SERVICES .................................................................... 75
Overview of Agencies ............................................................................................ 75
Growth and Population Projections .......................................................................... 75
Disadvantaged Communities ................................................................................... 76
Adequacy of Park and Recreation Facilities and Services ............................................. 77
Financial Ability to Provide Services ......................................................................... 82
Shared Facilities and Cooperation ............................................................................ 84
Accountability for Community Service Needs ............................................................. 85
Impact of COVID-19 .............................................................................................. 85
City Recreation Services MSR Determinations ........................................................... 86
8. COMMUNITY SERVICES DISTRICTS ........................................................................... 125
Overview of Districts ............................................................................................ 125
Impact of COVID-19 ............................................................................................. 126
Growth and Population Projections ......................................................................... 126
Present and Planned Capacity of Facilities and Adequacy of Public Services .................. 128
Financial Ability to Provide Services ........................................................................ 133
Management & Accountability ................................................................................ 134
Crockett Community Services District MSR Determinations ........................................ 138
Diablo Community Services District MSR Determinations ........................................... 140
Town of Discovery Bay Community Services District MSR Determinations ..................... 141
Kensington Police Protection and Community Services District MSR Determinations ....... 142

9. COUNTY SERVICE AREAS ...................................................................................... 145
Overview of Districts ............................................................................................ 145
Impact of COVID-19 ............................................................................................. 145
Growth and Population Projections ......................................................................... 145
Present and Planned Capacity of Facilities and Adequacy of Public Services .................. 147
Financial Ability to Provide Services ........................................................................ 147
Management & Accountability ................................................................................ 151
CSA M-16 MSR and SOI Determinations .................................................................. 153
CSA M-17 MSR and SOI Determinations .................................................................. 156
CSA M-29 MSR and SOI Determinations .................................................................. 158
CSA M-30 MSR and SOI Determinations .................................................................. 160
CSA R-4 MSR and SOI Determinations .................................................................... 163
CSA R-7 MSR and SOI Determinations .................................................................... 166
CSA R-9 MSR and SOI Determinations .................................................................... 169
CSA R-10 MSR and SOI Determinations .................................................................. 172
List of Tables
1. Introduction
Table 1 Contra Costa LAFCO Commission Members ......................................................... 2
Table 2 Summary of Agencies Reviewed ........................................................................ 3
2. Municipal Service Review and SOI Summary
Table 3 Sphere of Influence Recommendations ............................................................. 17
3. Ambrose Recreation & Park District
Table 4 Ambrose RPD Growth and Population Projections ............................................... 26
Table 5 Ambrose RPD Summary of Inventory of Parkland and Recreation Facilities ............. 27
Table 6 Ambrose RPD Programs, Events, and Facility Rentals .......................................... 28
Table 7 Ambrose RPD Annual Operating Budget ............................................................ 30
Table 8 Ambrose RPD Capital Planning and Funding ...................................................... 30

Table 9 Ambrose RPD Governance and Contact Information ............................................ 31
Table 10 Ambrose RPD Summary of Staffing .................................................................. 31
4. Green Valley Recreation & Park District
Table 11 Green Valley RPD Growth and Population Projections .......................................... 39
Table 12 Green Valley RPD Summary of Inventory of Parkland and Recreation Facilities ....... 40
Table 13 Green Valley RPD Programs, Events, and Facility Rentals .................................... 41
Table 14 Green Valley RPD Annual Operating Budget....................................................... 42
Table 15 Green Valley RPD Governance and Contact Information ...................................... 43
Table 16 Green Valley RPD Summary of Staffing Table .................................................... 44
5. Pleasant Hill Recreation & Park District
Table 17 Pleasant Hill RPD Growth and Population Projections .......................................... 50
Table 18 Pleasant Hill RPD Summary of Inventory of Parkland and Recreation Facilities ........ 52
Table 19 Pleasant Hill RPD Programs, Events, and Facility Rentals ..................................... 54
Table 20 Pleasant Hill RPD Annual Operating Budget ....................................................... 56
Table 21 Pleasant Hill RPD Capital Planning and Funding .................................................. 56
Table 22 Pleasant Hill RPD Governing Body and Contact Information ................................. 57
Table 23 Pleasant Hill RPD Summary of Staffing ............................................................. 58
6. East Bay Regional Park District
Table 24 East Bay RPD Growth and Population Projections ............................................... 65
Table 25 East Bay RPD Summary of Inventory of Parkland and Recreation Facilities ............. 68
Table 26 East Bay RPD Annual Operating Budget ............................................................ 70
Table 27 East Bay RPD Capital Planning and Funding ....................................................... 71
Table 28 East Bay RPD Governance and Contact Information ............................................ 72
Table 29 East Bay RPD Summary of Staffing .................................................................. 73

7. City Parks & Recreation & Services
Table 30 Summary of Non-City Owned Park and Open Space Amenities by City .................. 79
8. Community Services Districts
Table 31 Crockett CSD Boundary History ......................................................................125
Table 32 Crockett CSD Park and Recreation Facilities .....................................................130
Table 33 Diablo CSD Park and Recreation Facilities ........................................................130
Table 34 Discovery Bay CSD Park and Recreation Facilities..............................................131
Table 35 Kensington CSD Park and Recreation Facilities ..................................................132
Table 36 Crockett CSD Governing Body and Contact Information .....................................135
Table 37 Diablo CSD Governance and Contact Information ..............................................136
Table 38 Town of Discovery Bay CSD Governing Body and Contact Information ..................137
Table 39 Kensington CSD Governance and Contact Information .......................................137
Table 40 Summary of CSD Staffing ..............................................................................138
9. County Service Areas
Table 41 CSAs Growth and Population Projections ..........................................................146
Table 42 Summary of Inventory of Parkland and Recreation Facilities for County-Administered CSAs ............................................................................148
Table 43 CSAs Governance and Contact Information ......................................................152
List of Maps
1. Introduction
Map 1 Map of City Boundaries and Spheres of Influence in Contra Costa County ................ 5
Map 2 Map of Recreation & Park Districts, Community Service Districts, and County Service Areas in Contra Costa County ...................................................... 6
Map 3 Map of Disadvantaged Communities and Disadvantaged Unincorporated Communities in Contra Costa County ................................................................. 7
3. Ambrose Recreation & Park District
Map 4 Map of Ambrose RPD ..................................................................................... 24
4. Green Valley Recreation & Park District
Map 5 Map of Green Valley RPD ................................................................................ 37
5. Pleasant Hill Recreation & Park District
Map 6 Map of Pleasant Hill RPD ................................................................................. 49
6. East Bay Regional Park District
Map 7 Map of East Bay RPD ..................................................................................... 64
List of Figures
7. City Parks & Recreation & Services
Figure 1 Cities’ Growth and Population Projections .......................................................... 76
Figure 2 Cities’ Neighborhood and Community Park Acreage Levels of Service .................... 78
Figure 3 Cities’ Park and Open Space Acreage ............................................................... 80
Figure 4 Condition of Existing Park and Recreation Facilities ............................................. 81
Figure 5 Budgeted FY19-20 Parks and Recreation-Related Expenditures per Capita ............. 83
Figure 6 FY19-20 Budgeted Parks and Recreation Cost Recovery Percentage ...................... 84
8. Community Services Districts
Figure 7 Comparison CSDs’ Growth and Population Projections tables ..............................127
Figure 8 CSD Park Acreage Levels of Service ................................................................128
Figure 9 Condition of Existing CSD Park and Recreation Facilities .....................................129
Figure 10 CSDs’ FY19-20 Revenues and Expenditures Per Capita .......................................134

9. County Service Areas
Figure 11 CSA’s Fiscal Year 2020/21 Revenue Composition ..............................................149
Figure 12 CSA’s Fiscal Year 2020/21 Expenditure Composition ..........................................150
Appendices
Appendix A: City Data (Support Tables)
Appendix B: Boundary History Tables
Appendix C: Maps of Cities’ Boundaries and Spheres of Influence in Contra Costa County
Appendix D: Maps of CSDs’ Boundaries and Spheres of Influence in Contra Costa County
Appendix E: Maps of CSAs’ Boundaries and Spheres of Influence in Contra Costa County
Appendix F: LAFCO & MSR History
Appendix G: Acronyms and Glossary of Terms

Economic & Planning Systems, Inc. Z:\Shared\Projects\Oakland\191000s\191105_ContraCostaLAFCO_Parks&RecMSR\Report\191105 CC LAFCO Parks and Rec MSR-SOI Final 2021June14.docx
1. INTRODUCTION
State law requires that Local Agency Formation Commissions (LAFCOs) conduct regional analysis of municipal services (Municipal Service Reviews, or MSRs) every five years or “as necessary” to support reviews of city, district and jurisdictional spheres of influence (SOIs).1 The Commission may assess options for improving effective infrastructure and service delivery within and contiguous to the agencies’ SOIs including, but not limited to, the consolidation or dissolution of agencies.
MSRs provide a tool for LAFCOs to evaluate the adequacy of public service and providers, and to improve the organization and provision of services. MSRs support LAFCOs’ mission to plan and shape “the logical and orderly development and coordination of local governmental agencies.”2
Contra Costa LAFCO retained Economic & Planning Systems, Inc. (EPS) and Berkson Associates (BA) to conduct the second round Parks and Recreation MSR for all jurisdictions providing park maintenance and/or recreation services in Contra Costa County.
Lega l Contex t & LAFCO P o l i c i es
Contra Costa LAFCO (CC LAFCO) is required to prepare this MSR and SOI Update by the Cortese-Knox-Hertzberg Local Government Reorganization Act of 2000 (Government Code §56000, et seq.), which took effect on January 1, 2001. Pursuant to this legislation, CC LAFCO is required to conduct a comprehensive review of municipal service delivery and update the spheres of influence of all agencies under LAFCO’s jurisdiction. The MSR reviews services provided by public agencies—cities and special districts—whose boundaries and governance are subject to LAFCO.
LAFCO Overview
LAFCO regulates, through approval, denial, conditions and modification, boundary changes proposed by public agencies or individuals. It also regulates the extension of public services by cities and special districts outside their boundaries. LAFCO is empowered to initiate updates to the SOIs and proposals involving the dissolution or consolidation of special districts, mergers, establishment of subsidiary districts, formation of a new district or districts, and any reorganization including such actions. Otherwise, LAFCO actions must originate as petitions or resolutions from affected voters, landowners, or local agencies (i.e., counties, cities or districts).
CC LAFCO was formed by the State legislature as a countywide agency to discourage urban sprawl and encourage the orderly formation and development of local government agencies. CC LAFCO consists of seven regular members: two members from the Contra Costa County Board of Supervisors, two City Council members appointed by the city selection committee, two independent special district members appointed by the independent special district selection committee, and one public member who is appointed by the other members of the Commission.
1 Government Code Section 56425 directs LAFCOs to review and update agencies’ SOIs, as necessary, every five years, and Section 56430 requires MSRs to be conducted before or in conjunction with the sphere updates. 2 Government Code Section 56425.

Contra Costa LAFCO Parks & Recreation MSR/SOI Update June 2021 1. Introduction Page 2
Economic & Planning Systems, Inc. Z:\Shared\Projects\Oakland\191000s\191105_ContraCostaLAFCO_Parks&RecMSR\Report\191105 CC LAFCO Parks and Rec MSR-SOI Final 2021June14.docx
There is also an alternate member in each category. All Commissioners are appointed to four-year terms. Current Commission members are shown in Table 1.
Table 1 Contra Costa LAFCO Commission Members
Overv iew o f Ju r i sd i c t i ons
The first-round parks and recreation MSR, prepared in 2010, reviewed the Recreation and Park Districts and the County Services Areas (CSAs) but not the cities or the Community Service Districts (CSDs). In addition, parks and recreation service providers in the County were evaluated in three Sub-Regional MSRs of jurisdictions in East, West, and Central Contra Costa County in 2008 and 2009 as well as in the MSR of city services in 2019.3
This comprehensive assessment of parks and recreation service providers in the County provides an evaluation of each recreation and park district, each city park and recreation department, and each CSA and CSD in Contra Costa County under LAFCO jurisdiction that provide recreation services, as shown in Table 2.
3 Contra Costa LAFCO, Contra Costa Local Agency Formation Commission Municipal Service Review Update, June 12, 2019.
Member Name Title Jurisdictional Representation Term Expiration
Igor Skaredoff Chair Special District Member 2022Rob Schroder Vice Chair City Member 2023Candace Andersen Commissioner County Member 2022Donald Blubaugh Commissioner Public Member 2024Tom Butt Commissioner City Member 2024Federal Glover Commissioner County Member 2022Michael McGill Commissioner Special District Member 2024Edi Birsan Alternate City Member 2023Diane Burgis Alternate County Member 2024Stanley Caldwell Alternate Special District Member 2022Charles R. Lewis, IV Alternate Public Member 2024
Source: Contra Costa LAFCO, as of February 2021.

Contra Costa LAFCO Parks & Recreation MSR/SOI Update June 2021 1. Introduction Page 3
Economic & Planning Systems, Inc. Z:\Shared\Projects\Oakland\191000s\191105_ContraCostaLAFCO_Parks&RecMSR\Report\191105 CC LAFCO Parks and Rec MSR-SOI Final 2021June14.docx
Table 2 Summary of Agencies Reviewed
BoundaryType of Jurisdiction/Name 2020 2020-2040 Annual
Growth RateOverlap
(if applicable)Type of Update
Recreation and Park DistrictAmbrose Recreation and Park District
28,240 1.19% City of Pittsburg MSR and SOI
East Bay Regional Park District 2,840,120 1.02%Contra Costa and Alameda Counties
MSR Only
Green Valley Recreation and Park District
1,205 0.17% Town of Danville MSR and SOI
Pleasant Hill Recreation and Park District
41,552 0.30%City of Pleasant HillCity of Lafayette
MSR and SOI
CityAntioch 112,520 1.09% MSR OnlyBrentwood 65,118 2.00% MSR OnlyClayton 11,337 0.27% MSR OnlyConcord 130,143 1.67% MSR OnlyDanville 43,876 0.30% GVRPD MSR OnlyEl Cerrito 24,953 0.43% MSR OnlyHercules 25,530 0.66% MSR OnlyLafayette 25,604 0.37% PHRPD MSR OnlyMartinez 37,106 0.44% MSR OnlyMoraga 16,946 0.43% CSA R-4 MSR OnlyOakley 42,461 1.87% MSR OnlyOrinda 19,009 0.20% MSR OnlyPinole 19,505 0.44% MSR OnlyPittsburg 74,321 1.12% ARPD MSR OnlyPleasant Hill 34,267 0.33% PHRPD See PHRPDRichmond 111,217 1.47% MSR OnlySan Pablo 31,413 0.39% MSR OnlySan Ramon 83,118 0.44% CSA M-29 MSR OnlyWalnut Creek 70,860 0.80% MSR Only
County Service AreaM-16 (Clyde) 733 0.11% MSR and SOIM-17 (Tara Hills/Montalvin Manor) 9,757 0.15% MSR and SOIM-29 (City of San Ramon) 33,057 0.17% City of San Ramon MSR and SOIM-30 (Alamo Springs) 140 0.18% CSA R-7 MSR and SOIR-4 (Town of Moraga) 17,916 0.15% Town of Moraga MSR and SOIR-7 (Alamo) 15,587 0.17% CSA M-30 MSR and SOIR-9 (El Sobrante) 14,546 0.55% MSR and SOIR-10 (Rodeo) 9,141 0.14% MSR and SOI
Community Services DistrictCrockett 3,309 0.23% MSR OnlyDiablo 808 0.16% MSR OnlyTown of Discovery Bay 15,215 0.17% MSR OnlyKensington 5,270 0.17% MSR Only
Contra Costa County 1,153,561 0.72%
Source: Contra Costa LAFCO.
Resident Population
Note: Comprehensive MSR and SOI updates were last completed for the cities and CSDs in 2019; for the CSAs in 2013; and for the Recreation and Park Districts in 2010.
Contra Costa LAFCO Parks & Recreation MSR/SOI Update June 2021 1. Introduction Page 4
Economic & Planning Systems, Inc. Z:\Shared\Projects\Oakland\191000s\191105_ContraCostaLAFCO_Parks&RecMSR\Report\191105 CC LAFCO Parks and Rec MSR-SOI Final 2021June14.docx
MSR M ethodo logy
Each park and recreation service provider was contacted and requested to provide information in a series of formatted tables that the consulting team pre-populated with data from websites and available supporting documents such as master plans, capital improvement programs, and budgets. EPS assembled the information into a Public Review Draft MSR with MSR determinations for each agency.
In addition to a service review of all jurisdictions, this report also recommends updates to the spheres of influence of the Ambrose, Green Valley, and Pleasant Hill RPDs as well as the CSAs. The SOI for the cities and CSDs were updated in 2019 in conjunction with the “City Services” MSR. Map 1 shows the boundaries of all cities within the county and Map 2 depicts the boundaries of all RPDs, CSDs, and CSAs. Map 3 indicates the location of Disadvantaged Communities (DACs) and Disadvantaged Unincorporated Communities (DUCs).
Chapters were reviewed by each respective agency for technical accuracy and by LAFCO staff in advance of public distribution. Following revisions, LAFCO circulated a Draft MSR for public review and comment. This MSR was prepared following LAFCO public hearings, public comment, and direction from LAFCO.
Note on Population and Growth Projections
The population and growth projections of all cities as well as the East Bay Regional Park District, which encompasses both Alameda and Contra Costa Counties, were derived from CA Department of Finance data for 2020 and Plan Bay Area forecasts. Plan Bay Area, is coordinated by the nine-county San Francisco Bay Area’s regional planning organizations, Association of Bay Area Governments (ABAG) and Metropolitan Transportation Commission (MTC). The Plan Bay Area initiative is a detailed, long-range plan charting the course for the future of the region. The County overall anticipates population growth of 0.72% per year between 2020 and 2040.
The 2020 and 2040 population for the CSDs, CSAs and the three other RPDs in this report were derived with input from Contra Costa County GIS specialists, based on a combination of data sources, including the CC LAFCO Directory, ESRI Business Analyst, and MTC’s Transportation Analysis Zones (TAZs). TAZs are used by MTC to forecast population growth, economic growth, and transportation/transit capacity and responsiveness and then distribute those results throughout the region. The methodology and sources used to derive each special district’s current population and future growth estimates are described in greater detail in each respective chapter.
As with all growth projections, it should be noted that these estimates are based on the best-known information at the time. Moreover, the COVID-19 pandemic is likely to impact future growth, however, the exact nature and scope of this impact remains uncertain.
In addition to uncertainties regarding future growth, it should also be noted that the 2020 population estimates for the CSDs, CSAs, ARPD, GVRPD, and PHRPD are themselves based on 2010 Census figures. Given that the 2020 Census is currently underway, new benchmarks for actual 2020 population estimates will be released in the coming months, and there could be substantial shifts in population counts when the 2020 data is released.

Contra Costa LAFCO Parks & Recreation MSR/SOI Update June 2021 1. Introduction Page 5
Economic & Planning Systems, Inc. Z:\Shared\Projects\Oakland\191000s\191105_ContraCostaLAFCO_Parks&RecMSR\Report\191105 CC LAFCO Parks and Rec MSR-SOI Final 2021June14.docx
Map 1 Map of City Boundaries and Spheres of Influence in Contra Costa County

Contra Costa LAFCO Parks & Recreation MSR/SOI Update June 2021 1. Introduction Page 6
Economic & Planning Systems, Inc. Z:\Shared\Projects\Oakland\191000s\191105_ContraCostaLAFCO_Parks&RecMSR\Report\191105 CC LAFCO Parks and Rec MSR-SOI Final 2021June14.docx
Map 2 Map of Recreation & Park Districts, Community Service Districts, and County Service Areas in Contra Costa County
NOTE: The East Bay Regional Park District is not depicted because its jurisdictional sphere of influence spans the entirety of Alameda and Contra Costa Counties.

Contra Costa LAFCO Parks & Recreation MSR/SOI Update June 2021 1. Introduction Page 7
Economic & Planning Systems, Inc. Z:\Shared\Projects\Oakland\191000s\191105_ContraCostaLAFCO_Parks&RecMSR\Report\191105 CC LAFCO Parks and Rec MSR-SOI Final 2021June14.docx
Map 3 Map of Disadvantaged Communities and Disadvantaged Unincorporated Communities in Contra Costa County

Contra Costa LAFCO Parks & Recreation MSR/SOI Update June 2021 1. Introduction Page 8
Economic & Planning Systems, Inc. Z:\Shared\Projects\Oakland\191000s\191105_ContraCostaLAFCO_Parks&RecMSR\Report\191105 CC LAFCO Parks and Rec MSR-SOI Final 2021June14.docx
Bes t P rac t i ces
Achieving transparency and public accountability standards dictates that cities and districts provide easily accessible and clear documentation of their activities, including planning and financial information. The Government Finance Officers Association (GFOA) publishes a list of best practices and lists key documents that public agencies should be publishing regularly (see https://www.gfoa.org/best-practices).
Transparency
Websites - State law requires all agencies have a website (unless the agency makes findings of financial inability).4 Websites are increasingly the first place to go to find information about an agency or a district. Websites should provide information about the governance structure including the names and terms of Board members or commissioners, services provided, staff, and contact information. Websites should provide meeting schedules, agendas, and minutes.5 Copies of current and past budgets, financial statements and supplemental reports, and audits should be available as well.
Planning
Master Plans – Park and Recreation Master Plans are important tools to help communities’ vision and plan for the future, while engaging residents and stakeholders. Park and recreation districts and departments should periodically prepare and update their Master Plans to help guide future investment.
Accounting and Financial Reporting
Annual Budget – Budgets should provide a comprehensive and detailed view of the budget, including comparisons to recent years. Budget documents should include a “Fiscal Health Report” with an explanation of trends and conclusions regarding fiscal health.
Financial Policies – Budgets should summarize policies for the establishment, maintenance and use of various General Fund and CIP reserves.
Annual Audited Financial Statements – Financial statements should be prepared in a timely manner and provide a clear and comprehensive picture of agency financials consistent with Generally Accepted Accounting Principles (GAAP).
Capital Improvement Program – A capital improvement program (CIP) with identified improvements, costs, and timeframe should be prepared, with some discussion of funding
4 On September 14, 2018, the Governor signed SB 929 which added Government Code Section 6270.6 and 53087.8 which required that every independent special district in California maintain a website by January 1, 2020. Exceptions can be made by districts facing hardship, as adopted by majority vote of those districts’ governing boards. The intent of the bill is to provide the public easily accessible and accurate information about the district. 5 AB 2257, approved on September 9, 2016, requires district and governmental websites to include Board meeting agendas for all meetings occurring on or after January 1, 2019.

Contra Costa LAFCO Parks & Recreation MSR/SOI Update June 2021 1. Introduction Page 9
Economic & Planning Systems, Inc. Z:\Shared\Projects\Oakland\191000s\191105_ContraCostaLAFCO_Parks&RecMSR\Report\191105 CC LAFCO Parks and Rec MSR-SOI Final 2021June14.docx
sources and funding priorities. The CIP can be a stand-alone report or it can be included in the budget documents.
Cost of Service/Rate Studies –Fees and charges (e.g., facility rental rates and charges for recreation programs and classes) should be reviewed regularly and adjusted as needed.
Impact o f the COV ID-19 G loba l P andemic
EPS prepared this report as the nation and world seek to address the coronavirus pandemic, an unprecedented public health crisis that spreads through community contact, particularly in indoor settings. Park and recreation facilities and services have been unevenly affected. On one hand, guidance to shelter in place is taking its toll and people are eager to get outside and explore and enjoy the regions parks. On the other hand, recreational programming is unadvised, and most programming has been cancelled entirely or severely curtailed.
The data collection and analysis for this report commenced in January 2020, in the weeks preceding the severity of the crisis becoming apparent globally, but continued throughout the Spring, Summer, and Fall – and continues today. By Summer 2020, given that the economic fallout was both significant and abrupt, it was clear that agencies would need additional time to respond to requests for data and information, and extensions were granted. Even with extensions, the length and severity of the coronavirus pandemic continues to be unknown, and the fiscal and service implications will depend fundamentally on how the crisis unfolds in the coming months and years.
LAFCOs conducted planning and meetings virtually during the statewide shelter-in-place orders beginning in March 2020 and continue to work through issues of how LAFCO will resolve the legal mandate for meetings, quorums, etc. In addition, the LAFCO commissions around the state are discussing methods to address anticipated future funding shortfalls resulting from the pandemic. As of mid-2020, LAFCO commissions around the state have focused on the evolving role of LAFCO commissions as a result of this pandemic. LAFCOs are prepared to assist with mergers and dissolutions of jurisdictions that may no longer remain fiscally solvent or are unable to meet the service/program needs of their constituents. LAFCOs are also looking to expand their role as a resource and clearinghouse for public agencies as they deal with fiscal shortfalls, facility closures, social distancing measures and other restrictions to limit the spread of coronavirus.
In general, in the first six months of the pandemic, as signs of economic distress ripple through many sectors, it is clear that public agencies will experience reduced revenues in the near term. The full implications and scope of fiscal shortfalls are unknown at this time. To the extent possible, the programmatic and fiscal implications of the pandemic for the subject jurisdictions of this MSR are further detailed within each jurisdiction’s chapter.
Organ i za t ion o f the MSR
This Introduction lays out the basic MSR framework, methodology, and report structure. To promote improved agency efficiency, service efficacy, and operational transparency, this chapter contains a discussion of “best practices” that highlight districts’ improvements and achievements since the 2010 MSR which noted several challenges. This chapter contains a discussion of the

Contra Costa LAFCO Parks & Recreation MSR/SOI Update June 2021 1. Introduction Page 10
Economic & Planning Systems, Inc. Z:\Shared\Projects\Oakland\191000s\191105_ContraCostaLAFCO_Parks&RecMSR\Report\191105 CC LAFCO Parks and Rec MSR-SOI Final 2021June14.docx
impact of COVID-19 on the functions and fiscal health of the jurisdictions evaluated in this report.
Chapter 2 summarizes the MSR and SOI findings/determinations, highlighting key findings of LAFCO concern regarding the parks and recreation services provided in the County.
Chapters 3, 4, 5, and 6 focus on the four recreation and park districts.
Chapter 7 provides a summary of park and recreation services in each of the incorporated cities in Contra Costa County.
Chapter 8 addresses the four CSDs that provide park and recreation services.
Chapter 9 provides a summary of the eight CSAs that provide enhanced funding for park and recreation services.
Appendix A provides a range of support tables that summarize the data provided by each of the cities and that are the basis of the MSR determinations. Appendix B includes boundary history tables. Appendices C, D, and E are the maps of the agencies or districts included in the MSR. Appendix F provides a history of LAFCO and MSRs. Appendix G to support provides a list of the key acronyms and a glossary of terms used in this report.
Ackn owledgements
Contra Costa LAFCO Executive Officer, Lou Ann Texeira, provided project direction and review. Credit for archival review and organization undertaking belongs to Lou Ann Texeira and her team, including former LAFCO clerk Kate Sibley and current LAFCO clerk Sherrie Weis, County GIS staff Kristine Solseng and Chris Howard, and consultant Richard Berkson. Chris Howard and Kristine Solseng of the Contra Costa County Information Technology Department prepared maps and helped conduct GIS analysis.
This report was prepared by Economic & Planning Systems, Inc. (EPS). Ashleigh Kanat served as principal author. Anisha Gade and Luke Foelsch provided research and assisted with drafting of the report. Richard Berkson of Berkson & Associates (BA) served as Senior Project Advisor to the consulting team providing fiscal and financial expertise. Photos taken by Ashleigh Kanat at various points during the study.
The authors extend their appreciation to those individuals at the many agencies that provided planning and financial information and documents referenced and used in this report.

Economic & Planning Systems, Inc. Z:\Shared\Projects\Oakland\191000s\191105_ContraCostaLAFCO_Parks&RecMSR\Report\191105 CC LAFCO Parks and Rec MSR-SOI Final 2021June14.docx
2. MUNICIPAL SERVICE REVIEW AND SOI SUMMARY
Munic ipa l Se rv i ce Rev iew Dete rminat ions
The MSR analysis provides the basis for making determinations about the adequacy of facilities and services, governance structures and efficiencies, and opportunities for greater coordination and cooperation between park services/maintenance and recreation providers. The MSR determinations are prerequisites to sphere of influence (SOI) determinations and may lead to subsequent LAFCO and agency actions.
Since preparation and LAFCO adoption of the 2010 MSR, most agencies have worked to address concerns and improve services and facilities as noted in the 2010 MSR. Notable exceptions, largely the result of growing populations, service demands, and lack of resources, are summarized here and more fully described in subsequent chapters containing agency-specific detail and determinations.
1. Growth and Population Projections This determination evaluates future growth and demand and whether agencies can adequately serve increased populations. a) Demand for park and recreation facilities and services is affected primarily by population
growth. Overall, population in Contra Costa County is forecast to increase an average of 0.72% annually, with expected growth of approximately 15%, or 178,600 people, between 2020 and 2040, for a total population in 2040 of approximately 1.33 million people. This growth is primarily expected to occur in the incorporated cities, with population in the unincorporated portions of the County expected to decrease.
b) Demand is also affected by growth among population segments with higher park visitation rates or programming needs such as younger and higher-income people, or seniors who avail themselves of recreation programming. Technical work completed as part of the County’s General Plan Update indicates that the share of residents under age 18 is declining, while the share of those 55 and older is increasing, influencing demand for programming and services focused on seniors. On average, unincorporated Contra Costa County households have higher incomes than the County overall or the Bay Area. The highest median household incomes in the County are found in the Lamorinda and San Ramon Valley subareas (Central County) and affect ability to pay for and fund recreation services and programs and community events.6
c) Many of the incorporated cities in the County are expected to be slower growth areas, with 12 of the 19 cities projected to have a lower compound annual population growth rate than the County-wide compound annual growth rate of 0.72% between 2020 and 2040. The bulk of the projected population increases over the next two decades are anticipated to occur within just a handful of cities, with 81% of the total projected population growth across all 19 Contra Costa cities attributable to just six cities (in order: Concord, Richmond, Brentwood, Antioch, Oakley, and Pittsburg).
6 Contra Costa County General Plan Update, Existing Conditions Technical Report: Market Overview, June 2018.

Contra Costa LAFCO Parks & Recreation MSR/SOI Update June 2021 2. Municipal Service Review and SOI Summary Page 12
Economic & Planning Systems, Inc. Z:\Shared\Projects\Oakland\191000s\191105_ContraCostaLAFCO_Parks&RecMSR\Report\191105 CC LAFCO Parks and Rec MSR-SOI Final 2021June14.docx
d) Localized demand changes will primarily depend on specific development applications. For example, CSA-29 was formed specifically to address new growth in the Dougherty Valley Specific Plan Area and provide financing for park and recreation facility maintenance in the City of San Ramon. Also, in the next 20 years, the populations of Concord, Oakley and Brentwood are expected to increase by 39%, 45%, and 49%, respectively.
e) Service population increases in each of the CSAs is expected to range from 0.12% per year to 0.57% per year. Service population increases in each of the CSDs is expected to range from 0.16% per year to 0.23% per year. In all cases, growth in the CSAs and CSDs is expected to be lower than the Countywide average of 0.72% per year.
2. The location and characteristics of any disadvantaged unincorporated communities (DUCs) within or contiguous to the sphere of influence Identifying disadvantaged communities or disadvantaged unincorporated communities allows public agencies, cities and counties to address municipal service and infrastructure deficiencies—specifically, access to parks and recreational facilities, programs and services—that are known to exist in some disadvantaged communities.
DUCs are inhabited communities containing 12 or more registered voters that constitutes all or a portion of a “disadvantaged community.” A disadvantaged community is defined as a community in which the median household income is 80% or less than the statewide median household income.7 This determination assesses the prospect of including neighboring DUC(s) when an agency’s SOI is updated or expanded. In 2011 SB 244 began requiring cities and counties to address the infrastructure needs of unincorporated disadvantaged communities in city and county general plans, MSRs, and annexation decisions. Therefore, this MSR Update identified disadvantaged communities within relevant jurisdictions’ SOI. Map 3 shows the location of all disadvantaged communities in Contra Costa County.
a) There is a total of 16 disadvantaged communities in Contra Costa County. There are three cities or Census Designated Places (CDP) that meet the disadvantaged definition as a whole: San Pablo, Bethel Island, and North Richmond. The 13 remaining DUCs reflect census tracts and block groups that do not align with city or CDP boundaries.
b) While a number of agencies reviewed serve disadvantaged unincorporated communities, these communities appear to have reasonable access to parkland and recreational facilities. However, property tax revenue and the agencies’ ability to recover costs through user fees from DUCs present additional challenges.
3. Present and Planned Capacity of Public Facilities and Adequacy of Public Services, Including Infrastructure Needs and Deficiencies This determination refers to the adequacy of existing and planned public facilities in relation to how public services are, and will be, provided to residents. Infrastructure can be evaluated in terms of capacity, condition, availability and quality, and plans for future improvement and/or expansion. Both active and passive parkland are evaluated in this MSR. Active parkland is defined as developed parkland with active recreation programming and sports
7 Government Code Section 56033.5 defines a "disadvantaged unincorporated community" as inhabited territory, as defined by Section 56046, or as determined by commission policy, that constitutes all or a portion of a "disadvantaged community" as defined by Section 79505.5 of the Water Code.

Contra Costa LAFCO Parks & Recreation MSR/SOI Update June 2021 2. Municipal Service Review and SOI Summary Page 13
Economic & Planning Systems, Inc. Z:\Shared\Projects\Oakland\191000s\191105_ContraCostaLAFCO_Parks&RecMSR\Report\191105 CC LAFCO Parks and Rec MSR-SOI Final 2021June14.docx
facilities. Passive parkland is defined as developed or undeveloped parkland containing trails, walkways, cultural/scenic resources, picnic tables, and shade structures. In cases where a district has not established its own service standard, the Contra Costa County standard is used. The County has a park and recreation facilities goal of four acres per 1,000 residents.8 a) Consistent with the 2010 MSR, additional park acres continue to be needed within all
districts except the PHRPD to meet County General Plan goals of 4.0 acres per 1,000 residents. The need for additional acres is most acute in the high-growth, incorporated areas of north and east County (e.g., Concord, Oakley, Brentwood).
b) Across the County there exists a wide range in the current level of service provision of cities’ developed park acreage per 1,000 residents. The cities’ levels of service range from a low of 0.88 acres per 1,000 residents to a high of 12.95, with an average of 3.70.
c) In addition to the neighborhood and community parkland that each city or district maintains and operates, there are park and open space areas that are either within the jurisdictions’ boundaries or in close proximity, granting residents access to additional parkland and open space. These additional park and open space areas, most of which are owned/operated by EBRPD or East Bay Municipal Utility District (EBMUD), effectively increase the parkland acreage per resident for each jurisdiction.
d) Consistent with the 2010 MSR (and excluding the cities and the city-administered CSAs), every agency has existing and future park acreage needs relative to the Countywide General Plan goal of 4.0 acres per 1,000 residents. Green Valley RPD, Ambrose RPD and all of the County-managed CSAs have significant existing and future acreage needs.
e) PHRPD adopted a Master Plan in May 2020 to guide future park planning and investment in the coming decades, and ARPD adopted a Master Plan in 2016. EBRPD’s most recent Master Plan is from 2013. GVRPD does not have a Master Plan.
f) Resident participation in recreation programming and community activities is often indicative of agency outreach efforts, and appear exceptionally strong within the Pleasant Hill Recreation and Park District and appear to be improving within the Ambrose Recreation and Park District. For the County administered CSAs, outreach to residents occurs primarily through the offices of the elected County Supervisors and/or direct mail in some cases. In CSA R-7, the Alamo MAC promotes events in the community.
g) The 2010 MSR recommended that the County and Alamo MAC collaborate to jointly plan future capital improvements at CSA R-7 parks. This remains an appropriate recommendation.
h) At the time of the 2010 MSR, all of the park and recreation facilities within CSA M-29 were constructed and had opened between 2000 and 2009 with no major capital needs or maintenance deficiencies to report. However, since 2010, the facilities have been aging. The City of San Ramon, which partially encompasses CSA M-29, has begun maintenance and renovation planning to address capital needs, and the City of San Ramon reports that park and recreation facilities remain in very good condition generally.
8 Page 9-24 of Envision 2040, the County General Plan’s Open Space Element.

Contra Costa LAFCO Parks & Recreation MSR/SOI Update June 2021 2. Municipal Service Review and SOI Summary Page 14
Economic & Planning Systems, Inc. Z:\Shared\Projects\Oakland\191000s\191105_ContraCostaLAFCO_Parks&RecMSR\Report\191105 CC LAFCO Parks and Rec MSR-SOI Final 2021June14.docx
4. Financial Ability of Agencies to Provide Services This determination evaluates whether the agency has the financial ability to provide adequate services now and in the future, particularly when considering SOI changes and potential annexations to the agency. a) Property taxes, assessments,9 and charges for services (user/registration fees) are the
primary revenue sources for park and recreation services in the County. b) Of the 34 agencies reviewed in this MSR, only CSAs R-9 and R-10 do not receive any
funding from property taxes or assessments. CSA R-9 is unfunded and CSA R-10 revenue is limited to facility rentals, resulting in challenges maintaining facilities and providing services.
c) The parks and recreation-related expenditures of the cities included in this report average $157 per resident, from a low of $16 to a high of $589. While every City reported that current levels of financing are adequate for current park and recreation service provision, the COVID-19 pandemic and its related restrictions on gatherings has significantly altered the service provision of city Parks and Recreation Departments.
d) Of the park and recreation districts evaluated, GVRPD has the highest recreation expenditures per capita, spending approximately $1,200 per district resident; however, this ratio is skewed by the very small service population within the District’s boundaries. The PHRPD spends approximately $220 per capita; EBRPD spends approximately $95 per capita; and ARPD spends approximately $49 per capita.
e) CSAs that pass through their funds to cities within or adjacent to their bounds (i.e., CSAs M-29, M-30 and R-4) generally have higher service levels, because CSA funds are augmenting existing city funds for parks and recreation services. The cities receiving CSA funding reported that financing, while constrained, is generally sufficient to provide park and recreation services.
f) The financial ability of PHRPD to improve its facilities was greatly enhanced by Bond Measure E that was approved by district residents in August 2009. The $28 million bond funded various new facilities and upgrades within the District. A more recent bond measure, Measure A, for $63.5 million, did not pass in March 2020 and may affect the District’s ability to fully implement its recent Master Plan.
g) Except for the city-administered CSAs, all districts charge fees for services. It is recommended that fees be reviewed/updated regularly.
h) If districts charge an assessment, and do not utilize a CPI adjustment, it is recommended that they do so. If not already reflected in the engineer’s report, incorporating a CPI adjustment would require voter approval.
9 This MSR/SOI Update uses the term “assessment” broadly, to encompass benefit assessments, special taxes, special assessments, and/or parcel taxes. In some cases, the formation documents are vague, referring to a “benefit assessment or service charge” while the annual property tax bills refer to “special taxes and assessments.” A Benefit Assessment requires a professional engineer’s report that describes the benefit, proposed costs, and presents a benefit formula that is used to determine each property’s share of the cost. A majority vote is required to approve a rate increase. A Special Tax, on the other hand, is imposed for a specific purpose and must be approved by a 2/3 majority of the qualified voters in the service area. A Special Tax is not necessarily limited to the relative benefit it provides to the property owners or taxpayers.

Contra Costa LAFCO Parks & Recreation MSR/SOI Update June 2021 2. Municipal Service Review and SOI Summary Page 15
Economic & Planning Systems, Inc. Z:\Shared\Projects\Oakland\191000s\191105_ContraCostaLAFCO_Parks&RecMSR\Report\191105 CC LAFCO Parks and Rec MSR-SOI Final 2021June14.docx
i) The County prepares annual budgets for the County’s Special Districts and presents the information in a transparent manner; however, it would improve transparency if the County included a brief description of the purpose of each CSA and provided more detail about what each CSA funds within the Special Districts Budget each year.
5. Status of, and Opportunities for, Shared Facilities This determination reviews current sharing arrangements with other agencies, if any, and whether opportunities exist to improve the efficiency and effectiveness of services through sharing, collaboration or functional consolidation.
a) Park and recreation service providers share facilities extensively in Contra Costa County. Most commonly, agencies collaborate with school districts to provide additional recreational areas and facilities to residents after school hours, which is the case for PHRPD, the Crockett CSD, and CSAs R-7 and R-10. For example, the Crockett CSD, which serves the unincorporated communities of Crockett and Port Costa, makes its swimming pool available to the high school swim team.
b) The majority of cities (15 out of 18) indicated that they are taking advantage of shared facilities through joint-use agreements or other methods. Local school districts are the most common organization type with which cities are sharing facilities.
c) Opportunities for future facility sharing are generally limited to establishing or increasing collaboration with the local school district.
6. Accountability for Community Service Needs, Including Governmental Structure and Operational Efficiencies This determination reviews whether an agency follows "best practices" to a) facilitate cost effective and efficient delivery of services; and b) enable review and input by residents, LAFCO and other agencies and stakeholders, including adequate and transparent reporting documents, and website access. This determination can also consider governance options (e.g., consolidation) to improve efficiencies and accountability. a) Accountability is best ensured when there is sufficient constituent interest to maintain full
governing boards or advisory committees, constituent outreach is conducted to promote accountability and ensure that constituents are informed and not disenfranchised, and public agency operations and management are transparent to the public.
b) The vast majority of cities in the County have either a Parks and Recreation Commission established or a commission that performs similar activities by which the municipalities exhibit adequate accountability to community service needs.
c) Generally, when there is a lack of constituent interest in an agency’s activities, governing bodies are challenged to fill board and advisory committee positions. In the case of the park and recreation service providers, there currently are no vacancies on district boards, but a number of advisory committees appear to have weakened or lack an advisory committee altogether, including CSAs R-9 and R-10.
d) Accountability to constituents is constrained in CSAs M-29 and R-4, where the residents in the unincorporated areas being served by the cities are not eligible to sit on the city park commissions.
e) All agencies prepare and post meeting agendas and make minutes available as required; however Green Valley RPD’s agendas and meeting minutes are not current as of January 2021.

Contra Costa LAFCO Parks & Recreation MSR/SOI Update June 2021 2. Municipal Service Review and SOI Summary Page 16
Economic & Planning Systems, Inc. Z:\Shared\Projects\Oakland\191000s\191105_ContraCostaLAFCO_Parks&RecMSR\Report\191105 CC LAFCO Parks and Rec MSR-SOI Final 2021June14.docx
f) Websites with contact information are a recommended practice for all local agencies, and except for the CSAs, all agencies are meeting this standard.
g) There is generally a lack of web presence promoting recreation programming within the CSAs, to the extent programming is available. It is recommended that the County improve access to information about all available classes and locations to promote the use of these services.
h) All of the agencies reviewed demonstrated accountability in disclosure of information and cooperation with LAFCO during the MSR process.
i) All of the districts prepare annual budgets, maintain current financial records, and adopt long-term CIPs. This is managed by the County for the County-administered CSAs and by the benefitting cities for the city-administered CSAs. Additionally, accountability would be improved if the County included a brief description of what each CSA funds within the Special Districts Budget each year.
j) It is recommended that all districts (specifically, Green Valley RPD) whose board members serve as staff consult with their legal counsel regarding the statutory authority for such dual service, and ask legal counsel to evaluate whether any prohibited or perceived conflicts of interest, incompatible activities or other legal problems might arise from this arrangement.
7. Any Other Matter Related to Efficient Service Delivery, As Required by Commission Policy This determination is an opportunity to highlight other concerns that may be relevant. In this MSR, issues related to the implications of COVID-19 are noted. a) The length, severity and long-term impacts of the coronavirus pandemic continue to be
uncertain, and the fiscal and service implications will depend fundamentally on how the crisis unfolds in the coming months and years. To date, the least affected agencies are those CSAs whose revenues come from property taxes and assessments (i.e., not charges for services or user fees) and that pass those revenues along to the primary service providers. Cities tend to be more affected since their revenues are more dependent on a broader range of revenues more affected by the pandemic (e.g., sales and hotel tax revenues). Additional information about specific agency impacts is noted in their respective chapters.
Sphere o f In f luence Recommendat ions
An SOI is a LAFCO-approved plan that designates an agency’s probable future boundary and service area. The SOI essentially defines where and what types of government reorganizations, such as annexation, detachment, dissolution or consolidation, may be initiated. The governing bodies of local agencies and voters may initiate reorganizations so long as they are consistent with the SOIs. An SOI change neither initiates nor approves a government reorganization. If and when a government reorganization is initiated, there are procedural steps required by law, including a protest hearing and/or election, by which voters may choose to approve or disapprove a reorganization.

Contra Costa LAFCO Parks & Recreation MSR/SOI Update June 2021 2. Municipal Service Review and SOI Summary Page 17
Economic & Planning Systems, Inc. Z:\Shared\Projects\Oakland\191000s\191105_ContraCostaLAFCO_Parks&RecMSR\Report\191105 CC LAFCO Parks and Rec MSR-SOI Final 2021June14.docx
Consistent with Government Code Section 56425, in determining the sphere of influence of each local agency, the commission shall consider and prepare a written statement of its determinations with respect to each of the following:
(1) The present and planned land uses in the area, including agricultural and open-space lands.
(2) The present and probable need for public facilities and services in the area. (3) The present capacity of public facilities and adequacy of public services that the agency
provides or is authorized to provide. (4) The existence of any social or economic communities of interest in the area if the
commission determines that they are relevant to the agency. (5) The nature, location, and extent of any functions or classes of services provided by
existing districts. (For Special Districts only.)
This report identifies options and preliminary recommendations for LAFCO to consider as it reviews and updates the SOIs of three RPDs and eight CSAs. The consultants’ SOI recommendations are summarized in Table 3 and the RPD and CSA chapters include additional detail.
Table 3 Sphere of Influence Recommendations
Ambrose RPD
SOI Options
1) Reduce SOI to match existing and future service area 2) Reduce SOI to remove some overlaps with the City of Pittsburg 3) Retain existing coterminous SOI
Name Recommendation
Ambrose RPD Retain existing coterminous SOIGreen Valley RPD Retain existing coterminous SOI on a provisional basisPleasant Hill RPD Defer, pending subcommittee recommendationCSA M-16 Retain existing coterminous SOICSA M-17 Retain existing coterminous SOICSA M-29 Retain existing coterminous SOICSA M-30 Retain existing coterminous SOICSA R-4 Retain existing coterminous SOICSA R-7 Retain existing coterminous SOICSA R-9 Adopt a zero SOICSA R-10 Adopt a zero SOI
Sources: Economic & Planning Systems, Inc.; Berkson Associates.

Contra Costa LAFCO Parks & Recreation MSR/SOI Update June 2021 2. Municipal Service Review and SOI Summary Page 18
Economic & Planning Systems, Inc. Z:\Shared\Projects\Oakland\191000s\191105_ContraCostaLAFCO_Parks&RecMSR\Report\191105 CC LAFCO Parks and Rec MSR-SOI Final 2021June14.docx
Current Recommendation
Retain existing coterminous SOI. The SOI recommendation for ARPD in 2010 was to reduce the District’s SOI, given its limited capacity to provide adequate public services and the likelihood that the neighboring cities of Concord and/or Pittsburg would annex portions of the ARPD service area. In May 2010, the Commission passed a resolution to retain ARPD’s coterminous SOI. The 2020 update finds the District in a more sustainable and accountable condition. Therefore, the SOI option and recommendation for the District in this update is to retain the existing coterminous SOI until such time that the City of Concord or the City of Pittsburg annex portions of the unincorporated County. At that point, it may be more evident how and in what way the ARPD boundary might be reduced to eliminate boundary overlaps and better serve the ARPD service population.
Green Valley RPD
SOI Options
1) Adopt a zero SOI 2) Retain existing coterminous SOI 3) Retain existing coterminous SOI on a provisional basis
Current Recommendation
Retain existing coterminous SOI on a provisional basis. In October 2009, the Commission passed a resolution to reduce the SOI for the GVRPD by approximately 131 acres, further encouraging the District to continue to make operational improvements and pursue other governance options and specifying that LAFCO would review the GVRPD in two years. Subsequently, the 2010 MSR included governance options including 1) dissolving GVRPD and expanding the SOI and annexing the area to CSA R-7 SOI to include the GVRPD; or 2) dissolving GVPRD and naming the Town of Danville as the successor agency as GVPRD is fully within the Town’s boundary.
While governance and governance procedures of the GVRPD have improved since the 2010 MSR, the District is not operating in a fully transparent a manner compared with best practices and other RPDs in the County. For example, agendas are not posted and meeting minutes do not appear current. Budget information, while provided upon request, is not available on the District’s website. Further, the District’s assets are limited to a small swimming pool and surrounding lawn area located in a residential neighborhood. The District averages approximately 100 member families each year (ranging from 95 to 115). The District sponsors community events but events are limited.
In acknowledging the challenges of the COVID-19 pandemic, the current recommendation is to retain the existing coterminous SOI on a provisional basis, with the expectation that the District report back to LAFCO within two years to demonstrate full transparency with respect to governance, capital improvement planning, increased membership, and fiscal solvency.
Pleasant Hill RPD
SOI Options
1) Defer, pending subcommittee recommendation 2) Retain existing SOI

Contra Costa LAFCO Parks & Recreation MSR/SOI Update June 2021 2. Municipal Service Review and SOI Summary Page 19
Economic & Planning Systems, Inc. Z:\Shared\Projects\Oakland\191000s\191105_ContraCostaLAFCO_Parks&RecMSR\Report\191105 CC LAFCO Parks and Rec MSR-SOI Final 2021June14.docx
Current Recommendation
Defer, pending subcommittee recommendation. The 2010 SOI recommendation was to expand the SOI to include all areas within the City of Pleasant Hill’s SOI (an expansion of approximately 16 acres), expand the SOI to include all areas within the City of Pleasant Hill’s corporate limits, and reduce the SOI to exclude city of Lafayette and Walnut Creek areas with the exception of Lafayette immediately adjacent to Brookwood Park. The rationale was that PHRPD primarily was providing recreation and park services to the City of Pleasant Hill and therefore, a more logical boundary for PHRPD would be an SOI that matches the City boundaries. Moreover, there was service duplication in certain parts of the PHRPD where the cities of Lafayette and Walnut Creek were also providing similar recreation and park services to local residents. In May 2010, the Commission passed a resolution to adjust PHRPD’s SOI as described above. In this update, and through conversations with the District, there have been no changes since 2010 that suggest further adjustments are appropriate.
In a letter submitted to LAFCO dated March 29, 2019 during the City MSR and re-submitted to LAFCO on February 8, 2021, 40 residents of the Reliez Valley area expressed a desire to detach from PHRPD, indicating that they pay taxes to PHRPD but do not use PHRPD services, instead, receiving park and recreation services from the City of Lafayette. At its meeting on April 14, 2021, LAFCO directed staff to appoint a subcommittee to facilitate discussions between the residents and the District regarding the issues raised by the residents. A recommendation on the PHRPD SOI should be deferred until the subcommittee has been able review the facts and make a recommendation to LAFCO.
CSA M-16
SOI Options
1) Retain existing coterminous SOI
Current Recommendation
Retain the existing coterminous SOI. Based on the research and determinations in the MSR, there have not been any changes since 2010 that would alter this recommendation, and the current recommendation is to retain the existing coterminous SOI until such time that the City of Concord annexes the area. The district is contiguous to the City of Concord and with Concord’s SOI.
CSA M-17
SOI Options
1) Retain existing coterminous SOI
Current Recommendation
Retain the existing coterminous SOI. Based on the research and determinations in the MSR, there have not been any changes since 2010 that would alter this recommendation, and the current recommendation is to retain the existing coterminous SOI. The district is contiguous to the cities of Pinole and Richmond.
CSA M-29
SOI Options
1) Retain existing coterminous SOI

Contra Costa LAFCO Parks & Recreation MSR/SOI Update June 2021 2. Municipal Service Review and SOI Summary Page 20
Economic & Planning Systems, Inc. Z:\Shared\Projects\Oakland\191000s\191105_ContraCostaLAFCO_Parks&RecMSR\Report\191105 CC LAFCO Parks and Rec MSR-SOI Final 2021June14.docx
Current Recommendation
Retain the existing coterminous SOI. Based on the research and determinations in the MSR, there have not been any changes since 2010 that would alter this recommendation, and the current recommendation is to retain the existing coterminous SOI. CSA M-29 has a steady revenue source through the City, and is integral to ensuring continued service in the future for the DVSP development. The City recently completed its final Dougherty Valley annexation. Once the area has been built-out and the territory within CSA M-29 has been entirely annexed by the City, it is recommended that the City and County collaborate to find a more efficient manner for the City to continue to receive financing for these services. One possibility may be the establishment of a subsidiary assessment district within the City of San Ramon.
CSA M-30
SOI Options
1) Retain existing coterminous SOI 2) Adopt a zero SOI (to signal future dissolution or consolidation with another local agency)
Current Recommendation
Retain existing coterminous SOI. CSA R-7 encompasses the bounds of CSA M-30. Residents of M-30 pay an assessment to the County, which is transferred to the Town for enhanced parks and recreation, law enforcement, street maintenance, landscaping, and street lighting. Residents of M-30 also pay property taxes to CSA R-7 for park and recreation services. As noted in the 2010 MSR report, a governance option is to remove the M-30 territory from CSA R-7 to eliminate duplication of services. Another option is to consolidate the two CSAs into a single CSA, and create a zone for the area formerly within CSA M-30 to maintain the financing mechanism for enhanced services by the Town of Danville per the agreement between the Town and the County. Given the duplication in service, it was recommended that the Commission adopt a zero SOI for CSA M-30. The Commission directed LAFCO staff to work with the County to combine R-7 and M-30 to address the service overlap and report back to the Commission within 12 months. However, each CSA was formed based on unique objectives, with CSA M-30 providing services beyond those provided by CSA R-7. At this time, the recommendation is to retain the existing coterminous SOI, which will leave the funding mechanism in place.
CSA R-4
SOI Options
1) Retain existing coterminous SOI 2) Adjust SOI to remove vacant unincorporated areas and expand to include entire Moraga
bounds 3) Adjust SOI to exclude incorporated Town of Moraga 4) Adopt a zero SOI
Current Recommendation
Retain existing coterminous SOI. CSA R-4 was formed prior to the incorporation of Moraga, which occurred in 1974. Pursuant to the CKH Act and CSA law (Government Code Section 25210 et seq.), whenever territory is incorporated into a new city or annexed to a city, it is typically detached from county service areas. As noted above, CSA R-4 contains most of the Town of Moraga and surrounding unincorporated areas, most of which are vacant lands. This raises questions regarding the need for, level of, and possible duplication of parks and recreation

Contra Costa LAFCO Parks & Recreation MSR/SOI Update June 2021 2. Municipal Service Review and SOI Summary Page 21
Economic & Planning Systems, Inc. Z:\Shared\Projects\Oakland\191000s\191105_ContraCostaLAFCO_Parks&RecMSR\Report\191105 CC LAFCO Parks and Rec MSR-SOI Final 2021June14.docx
services provided through the CSA. In 2010, it was recommended that the Commission defer the SOI update for CSA R-4; and direct LAFCO staff to further discuss with the County and Town of Moraga governance and boundary options and report back to the Commission within 12 months. In 2013, LAFCO retained the existing SOI for CSA R-4. This action followed discussions with County and Town of Moraga staff. It was determined that the existing government structure is appropriate and enables the Town to continue to include this unincorporated area in its long-term planning for parks and recreation services.
CSA R-7
SOI Options
1) Retain existing coterminous SOI 2) Reduce the SOI to exclude the CSA M-30 territory 3) Consolidate R-7 and M-30 4) Expand the SOI to include the Green Valley Recreation & Park District (GVRPD) to signal
a future consolidation of these districts
Current Recommendation
Retain existing coterminous SOI. CSA R-7 encompasses the bounds of CSA M-30. Further discussion with the County is needed to address any potential service duplication and boundary issues. Previously the LAFCO Commission directed LAFCO staff to work with County and Town of Danville staff to combine R-7 and M-30 to address service overlap. However, each CSA was formed based on unique objectives, with CSA M-30 providing services beyond those provided by CSA R-7. The Alamo MAC is opposed to a governance option that would reduce the territory of CSA R-7 to exclude the area of overlap with CSA M-30. Consolidation of GVPRD and CSA R-7 could enhance the operation and maintenance of the Green Valley pool; however, in 2010, County Public Works was opposed to the option, noting that there are inadequate financial resources to cover costs for maintenance and capital improvements to the pool. Also, members of the Alamo community, the Alamo MAC and District III County Supervisor expressed opposition to such a consolidation.
At this time, the recommendation is to retain the existing coterminous SOI, which will leave the funding mechanism in place.
CSA R-9
SOI Options
1) Retain the existing coterminous SOI 2) Adopt a zero SOI to signal future dissolution of the District
Current Recommendation
Adopt a zero SOI. CSA R-9 has no regular source of financing to maintain the Children’s Reading Garden at the County library in El Sobrante and depends on volunteers for periodic upkeep. The recommendation is to dissolve CSA R-9 and shift the park maintenance duties to the Landscape and Lighting District.
CSA R-10
SOI Options
1) Adopt a zero SOI to signal future dissolution of the District

Contra Costa LAFCO Parks & Recreation MSR/SOI Update June 2021 2. Municipal Service Review and SOI Summary Page 22
Economic & Planning Systems, Inc. Z:\Shared\Projects\Oakland\191000s\191105_ContraCostaLAFCO_Parks&RecMSR\Report\191105 CC LAFCO Parks and Rec MSR-SOI Final 2021June14.docx
2) Retain the existing coterminous SOI
Current Recommendation
Adopt a zero SOI. The CSA’s only sources of revenue are from facility rentals and program fees, both of which have been severely challenged by COVID. While the lasting effects of COVID remain unknown, the current recommendation is to adopt a zero SOI to signal future dissolution of the District, in which case the County is the successor agency. County staff anticipates that maintenance of the outdoor/field areas could be provided by Landscape and Lighting District (LLD) Zone 38 without causing an undue burden. In the longer term, because the Lefty Gomez Community Center and the adjacent ballfields are located on a parcel owned by the John Swett Unified School District, the parcels may be returned to the School District.

Economic & Planning Systems, Inc. Z:\Shared\Projects\Oakland\191000s\191105_ContraCostaLAFCO_Parks&RecMSR\Report\191105 CC LAFCO Parks and Rec MSR-SOI Final 2021June14.docx
3. AMBROSE RECREATION & PARK DISTRICT
The Ambrose Recreation and Park District (ARPD) was formed in 1946, and provides recreation and park services to 28,240 residents, living in the unincorporated community of Bay Point and a portion of the western area of the City of Pittsburg. The District operates nearly 29 acres of parks and coordinates a number of recreational programs, including several aquatic programs, exercise and fitness classes, and youth camps, and hosts special seasonal events.
Agency Boundar ies
Map 4 depicts the ARPD boundary, which encompasses approximately 9.3 square miles, or approximately 5,950 acres. The District’s boundary is located entirely within Contra Costa County, extending south from the Contra Costa-Solano county line to the northeastern city limits of the City of Concord, including a portion of the City of Pittsburg (528 acres) and the unincorporated community of Bay Point. Contra Costa is the principal county and Contra Costa LAFCO has jurisdiction.
While the boundary and SOI of the ARPD has been modified since its formation, as shown in Appendix B, Table B-1, there have been no changes since 2002. Based on LAFCO staff reports, LAFCO staff assume that the existing SOI is coterminous with ARPD bounds based on previous SOI amendments. In 2010, LAFCO affirmed the existing coterminous SOI.

Contra Costa LAFCO Parks & Recreation MSR/SOI Update June 2021 3. Ambrose Recreation & Park District Page 24
Economic & Planning Systems, Inc. Z:\Shared\Projects\Oakland\191000s\191105_ContraCostaLAFCO_Parks&RecMSR\Report\191105 CC LAFCO Parks and Rec MSR-SOI Final 2021June14.docx
Map 4 Map of Ambrose RPD

Contra Costa LAFCO Parks & Recreation MSR/SOI Update June 2021 3. Ambrose Recreation & Park District Page 25
Economic & Planning Systems, Inc. Z:\Shared\Projects\Oakland\191000s\191105_ContraCostaLAFCO_Parks&RecMSR\Report\191105 CC LAFCO Parks and Rec MSR-SOI Final 2021June14.docx
Impact o f COVID-19
As a result of the global pandemic and statewide shelter-in-place public health directives, ARPD cancelled recreational programming and closed their facilities. In addition, the District’s Board adopted Resolution #19/20-03 Emergency Administrative Leave Program for District Employees as a response to the spread of the Coronavirus (COVID-19). The District reports that throughout the pandemic, District staff has been working diligently to ensure that residents are safe and engaged with ARPD parks and programs in compliance with state and local guidelines. The Board meetings have been conducted via teleconference and phone; some connectivity issues occurred, and the District switched platforms to minimize disruptions. As conditions evolve, the District is working to identify options for reopening.
The District reported a loss of approximately $30,000 in revenue, as of May 2020. Even though the initial loss of revenue was not judged to be significant, given the uncertainty of the situation, the longer-term consequences for the District’s fiscal solvency remain to be seen. Nonetheless, the District has put two capital projects on hold and decided to adjust the timeline of one of these projects.
In the spirit of improving ARPD’s long-range planning efforts, the District conducts public visioning workshops that recur every five to ten years. The intention is to perform a SWOT analysis, which is a strategic planning exercise to identify Strengths, Weaknesses, Opportunities, and Threats. The first such workshop was held in 2015. The second workshop was set to take place in April 2020 but was postponed because of the COVID-19 pandemic.
Growth and Popu la t ion P ro jec t ions
The District considers its service population, or customer base, to be the property owners and residents living within the boundaries of the District. There are 28,240 people in the District, according to 2020 Contra Costa County GIS estimates, as shown in Table 4. The County forecasts that estimated average annual growth of 1.2% will add approximately 7,100 residents for a total population of 35,400 by 2040 a total increase of about 25%. As a point of comparison, the County overall anticipates population growth of 0.72% per year between 2020 and 2040.10
10 The 2020 population estimate was derived by taking the 2019 ESRI Business Analyst population estimate and applying the long-term growth rate of the relevant MTC Transportation Analysis Zone (TAZ). The 2019 ESRI Business Analyst figure was judged to be more accurate than the ARPD population that was published in the 2019 LAFCO Directory. Furthermore, it should be noted that because even the 2019 population estimates are derivations based on 2010 Census figures, the 2020 Census is likely to re-establish the current population benchmark.
As with all growth projections, it should also be noted that these are approximations based on the best-known information at the time. Given that the COVID-19 pandemic is an unprecedented public health crisis, its impacts on future growth in the District are uncertain. Therefore, the projections listed in Table 4 may vary from actual future growth.

Contra Costa LAFCO Parks & Recreation MSR/SOI Update June 2021 3. Ambrose Recreation & Park District Page 26
Economic & Planning Systems, Inc. Z:\Shared\Projects\Oakland\191000s\191105_ContraCostaLAFCO_Parks&RecMSR\Report\191105 CC LAFCO Parks and Rec MSR-SOI Final 2021June14.docx
Table 4 Ambrose RPD Growth and Population Projections
Service Duplication and Boundary Overlap
There are three areas that cumulatively represent a 528-acre area of overlap between the ARPD boundary and the City of Pittsburg (e.g., along Bailey Road and West Leland Road, south of SR 4), and residents in these areas of overlap are served by both jurisdictions.
Shared Facilities and Cooperation
The District does not share its facilities with other agencies; however, it does cooperate with other agencies to provide efficient services. For example, the District reports that it benefits from cooperative relationships with nearby agencies such as the City of Pittsburg, Contra Costa County, and the Mount Diablo Unified School District. The City of Pittsburg Police Department ensures safety at Ambrose Memorial Park, the largest park. Recently FEMA used the Community Center to administer vaccinations, and the District offered to house community members who were displaced by a fire. The Community Center is a cooling center during “normal hours” or normal operation but was closed during the pandemic. In addition, the County’s Human Resources Department rents space within ARPD facilities, and the non-profit Meals on Wheels provides a seniors’ lunch at the Ambrose Community Center’s dining hall, which had been put on hold and is expected to resume during the summer of 2021.
Disadvantaged Communities
The unincorporated community of Bay Point is classified as a Disadvantaged Community and represents most of the District’s population. Several of the District’s smaller parks are located in this community, and residents also have access to the Bay Point Regional Shoreline.
As reported by District staff, the District has made a concerted effort since the 2010 MSR to expand and improve its recreation program offerings, and the District is intentionally keeping its program fees affordable to all residents in acknowledgement of Bay Point’s classification as a Disadvantaged Community.
Adequ acy o f Park a nd Rec rea t ion Fac i l i t i es a nd Serv i c es
Since the prior 2010 MSR, four pocket/neighborhood parks previously owned and maintained by the County were transferred to the ARPD. In total, the ARPD operates nearly 29 acres of parks,
Item 2020 2040Absolute
ChangeAnnual Rate
of Growth
Total Residents 28,240 35,377 7,137 1.2%
Sources: ESRI Business Analyst; ABAG/MTC Population Projections; Economic & Planning Systems, Inc.

Contra Costa LAFCO Parks & Recreation MSR/SOI Update June 2021 3. Ambrose Recreation & Park District Page 27
Economic & Planning Systems, Inc. Z:\Shared\Projects\Oakland\191000s\191105_ContraCostaLAFCO_Parks&RecMSR\Report\191105 CC LAFCO Parks and Rec MSR-SOI Final 2021June14.docx
as listed in Table 5. which equals 1.0 acre per 1,000 residents within the District, well below the County General Plan standard of 4.0 acres of parkland per 1,000 residents.11
Many of the District’s facilities are in moderate condition (i.e., currently in need of some upgrades or renovations). However, according to District staff, the Ambrose Community Center and Park is in poor condition and in need of major infrastructure upgrades and may need to be rebuilt entirely. A new restroom project is underway at Ambrose Park, which is being funded through Park Impact Fees and District funds.
Table 5 Ambrose RPD Summary of Inventory of Parkland and Recreation Facilities
ARPD coordinates a number of recreational programs, exercise and fitness classes, and youth camps, as seen in Table 6. The District’s swimming pool had been inactive for several years but reopened as the Ambrose Park Aquatics Center in June 2017, creating the opportunity for new aquatic programs. The District charges user fees and reviews these fees each year as part of the normal budget process, however the Board has not increased fees to keep pace with inflation.12
11 While the City of Pittsburg has a park acreage standard of 5.0 acres per 1,000 residents, the County’s standard is 4.0 acres per 1,000 residents. As most of the District’s population resides in the unincorporated County, the Countywide standard is most applicable to the District. In any case, the District’s level of service of 1.0 acres per 1,000 residents is inadequate. 12 Interview with Doug Long, March 17, 2020.
Name Address/Location AcresParkType Facilities Condition
Alves Lane Mini Park 93 Alves Lane, Bay Point 0.9 Passive Picnic and BBQ ModerateAmbrose Community Center and Park
3105 Willow Pass Road, Bay Point 7.5 Active Community Center, baseball fields, playground, outdoor basketball
Poor
Ambrose Park 125 Memorial Way, Bay Point 11.5 Active Playground, picnic, BBQ, restrooms and sports fields, swimming pool, tennis and basketball courts
Moderate
Anuta Park 2485 Willow Pass Road, Bay Point 2.9 Active Playground, gazebo, drop-in soccer fields
Moderate
Lynbrook Park Virgil St. & Lynbrook St. 4.1 Active Basketball court, BBQ, baseball/soccer field, playground, walking path
Moderate
Tradeswind Park Tradeswind Ct. & Driftwood Dr. 0.7 Passive Picnic bench, pathway Moderate
Boeger Park Caskey Street 0.5 Active Playground, picnic benches, turf area
Moderate
Hickory Meadows Park Summerfield & Winterbrook Dr. 0.3 Active Playground Moderate
Viewpointe Park Seacliff Place 0.3 Active Playground Moderate
Total 28.7
Acreage per 1,000 Residents 1.0
Source: Ambrose Recreation and Park District.

Contra Costa LAFCO Parks & Recreation MSR/SOI Update June 2021 3. Ambrose Recreation & Park District Page 28
Economic & Planning Systems, Inc. Z:\Shared\Projects\Oakland\191000s\191105_ContraCostaLAFCO_Parks&RecMSR\Report\191105 CC LAFCO Parks and Rec MSR-SOI Final 2021June14.docx
Table 6 Ambrose RPD Programs, Events, and Facility Rentals
Item / Event DescriptionUser
Fees/RatesAnnual
Attendance2019 Annual
Revenues
Activities / ProgramsRecreation classes Karate $45 - $60 month 400 $20,000
Fitness $60 month 12 $720Aerobics $5 per class 3,800 $12,000Youth dance $44 per session 61 $2,700Folklorico $40 month 96 $5,000Gym $5 month 46 $230Youth Camps $10 per session 110 $1,100Aquatic Recreation Swim Adults $6.00 daily admission 1,368 $8,200Aquatic Recreation Swim Youth/Seniors $3.00 daily admission 3,729 $12,000Aquatic Season Pass $20 - $28 season membership 195 $4,500Aquatic Lessons $56 per session 250 $14,000Aquatic Camps $20 16 $320
Total 10,083 $80,770
Facility RentalsAmbrose Community Center Rented to County $82,716Private Rentals Rental of Community Center $75,000Total $157,716
Other Events / Annual Festivals / Memberships, Etc.Haunted House Halloween event n/a n/a $0Breakfast with Santa Christmas/Holiday event n/a n/a $0Eggstravaganza Easter event n/a n/a $0Membership Aquatic Season Passes n/a n/a $6,500Total $6,500
Source: Ambrose Recreation and Park District.

Contra Costa LAFCO Parks & Recreation MSR/SOI Update June 2021 3. Ambrose Recreation & Park District Page 29
Economic & Planning Systems, Inc. Z:\Shared\Projects\Oakland\191000s\191105_ContraCostaLAFCO_Parks&RecMSR\Report\191105 CC LAFCO Parks and Rec MSR-SOI Final 2021June14.docx
Fee increases could decrease accessibility to recreation programs by disadvantaged communities within ARPD’s boundary. In addition to recreational programs, the District hosts seasonal special events for Halloween, Christmas and Easter.
F inanc ia l Ab i l i t y to P rov ide Serv i ces
The annual operating budget of ARPD is approximately $1.3 million, or $1.0 million, excluding grant revenue but including reserves. The most recent operating budget (FY19/20) indicates that 70% of the District’s revenues are from taxes and assessments. Typically, charges for recreational programs and events and facility rentals generate represent important sources of revenue for ARPD, but COVID has affected the District’s ability to generate this revenue, as reflected in the FY19/20 budget.
Since the 2010 MSR, the District made a concerted effort to reduce costs and has managed to hold labor/salaries and maintenance expenditures steady. Expenditures in FY19/20 were approximately $49 dollars per capita (residents in the District’s boundaries) and did require limited use of reserves.
The budget documents on the District’s website go back as far as FY17/18, with these two fiscal years shown in greater detail in Table 7. Note that costs that appear constant or steady in nominal dollars are decreasing after considering inflation.
The District’s 2016 Facility Assessment Review estimates roughly $12 million of needed capital improvements. The District’s capital projects, as shown for FY 2019/20 in Table 8, are funded with park impact fees and with property tax revenue. The former accounts for approximately two-thirds of ARPD’s roughly $600,000 in capital revenues while the latter accounts for the remaining one-third. Expenditures, which totaled about $550,000, included the construction of new restrooms at Ambrose Park and tree care. The District has not reviewed its impact fees in the past six years, and the Board will be discussing this at an upcoming visioning workshop. The District also relies on grant opportunities to fund capital improvements, and the Board will be considering additional/alternative funding opportunities at an upcoming visioning workshop.
District staff reports that most of ARPD’s parks and facilities are in “moderate” condition and in need of upgrades and improvements. Because ARPD is largely composed of a disadvantaged community, the District finds it difficult to raise the revenues necessary to support all of the identified improvements at all relevant facilities.

Contra Costa LAFCO Parks & Recreation MSR/SOI Update June 2021 3. Ambrose Recreation & Park District Page 30
Economic & Planning Systems, Inc. Z:\Shared\Projects\Oakland\191000s\191105_ContraCostaLAFCO_Parks&RecMSR\Report\191105 CC LAFCO Parks and Rec MSR-SOI Final 2021June14.docx
Table 7 Ambrose RPD Annual Operating Budget
Table 8 Ambrose RPD Capital Planning and Funding
Management & Accountab i l i t y
The District is governed by a five-member board, as shown in Table 9. The District demonstrated full accountability in its disclosure of information and cooperation with LAFCO. The agency responded to LAFCO’s written questionnaires and cooperated with LAFCO interview and document requests.
Type Revised FY 17-18 Approved FY 19-20
Annual Operating BudgetRevenue
Charges for Services $198,700 $66,300Taxes and Assessments $821,400 $971,400Grant Revenues $176,300 $125,000Money/Reserves/Property $0 $207,400Total Revenues $1,196,400 $1,370,100
ExpendituresLabor/Salaries $518,800 $535,100Maintenance Costs $639,100 $629,500Capital Outlays $38,500 $205,500Total Expenditures $1,196,400 $1,370,100
Expenditures per Acre $47,672Expenditures per Capita $49
Source: Ambrose Recreation and Park District.
Item FY 19-20
Annual Capital ExpendituresNew restroom at Ambrose Park $510,000Tree removal/pruning $36,333Total Capital Expenditures $546,333
Source: Ambrose Recreation and Park District.

Contra Costa LAFCO Parks & Recreation MSR/SOI Update June 2021 3. Ambrose Recreation & Park District Page 31
Economic & Planning Systems, Inc. Z:\Shared\Projects\Oakland\191000s\191105_ContraCostaLAFCO_Parks&RecMSR\Report\191105 CC LAFCO Parks and Rec MSR-SOI Final 2021June14.docx
Table 9 Ambrose RPD Governance and Contact Information
ARPD employs a staff of 11 full-time equivalents (FTEs), as reported by District staff and as shown in Table 10.13 Given the District population and acres of parkland, this amounts to roughly 0.4 FTEs per 1,000 residents and 0.4 FTEs per acre.
Table 10 Ambrose RPD Summary of Staffing
13 Based on a 2,080-hour work year, 9 part-time/seasonal employees average 18 hours/week = 8,424 hours; divided by 2,080 = 4 FTE + 7 full time = 11FTE.
Item
Governing Board Members
Manner of Selection
Length of Term
Meetings
Agenda Distribution
Minutes Distribution
Contact
Mailing Address
Email / Website
Doug Long (General Manager)
3105 Willow Pass Road, Bay Point, CA 94565
http://www.ambroserec.org
Source: Ambrose Recreation and Park District.
5 Board Members (names/terms available at www.ambroserec.org/board-members)
Information
Elections at-Large
Four Years
Second Thursday at 6:30pm
Posted online and at district office
Posted online and by request at district office
Type of Staff Annual Average
Full-Time (Paid) 7Part-Time (Paid) 7Seasonal (Paid) 2Full Time Equivalents (FTE) 11
Volunteer (Unpaid) 0
Staff (FTE) per 1,000 Residents 0.4Staff (FTE) per Acre 0.4
Source: Ambrose RPD

Contra Costa LAFCO Parks & Recreation MSR/SOI Update June 2021 3. Ambrose Recreation & Park District Page 32
Economic & Planning Systems, Inc. Z:\Shared\Projects\Oakland\191000s\191105_ContraCostaLAFCO_Parks&RecMSR\Report\191105 CC LAFCO Parks and Rec MSR-SOI Final 2021June14.docx
Ambrose Rec rea t ion an d Park D i s t r i c t MSR Dete rminat ions
1. Growth and Population Projections
a) The residential population served by the District is projected to increase at an average of 1.2% annually, with expected growth of approximately 25%, or 7,137 people, between 2020 and 2040, for a total population in 2040 of approximately 35,377 people.
b) The District’s population is projected to grow at a faster rate than the County’s population overall, which is expected to grow at an average of 0.72% per year.
2. The location and characteristics of any disadvantaged unincorporated communities within or contiguous to the sphere of influence
a) The northern portion of the area served by the Ambrose Recreation and Park District, the unincorporated community of Bay Point, qualifies as a disadvantaged community.
b) At 1.0 acre per 1,000 residents, the amount of parkland in the Bay Point community and the District overall is below the County’s General Plan standards and below the City of Pittsburg’s park acreage goals and inadequate.
c) The District has made a concerted effort since the 2010 MSR to expand and improve its program offerings, which it has achieved through contracts with providers. The District now offers a broader array of recreation programs for all ages and provides more aquatic programming. The District is intentional in its efforts to keep the cost of recreational programming accessible to all residents, including residents of the Bay Point community.
3. Present and Planned Capacity of Public Facilities and Adequacy of Public Services, Including Infrastructure Needs and Deficiencies
a) The District owns and maintains nine (9) parks in the District’s service area for a total of nearly 29 acres, including one community center. The parks feature sports fields, tennis courts, BBQ areas, picnic tables, playgrounds, and restrooms. There is a swimming pool at Ambrose Park.
b) The District provides approximately 1.0 acre of parkland per 1,000 residents, which is well below typical levels of service in the County even with the transfer of four pocket/neighborhood parks to ARPD from the County. Generally, there is a lack of neighborhood park space within the District.
c) There are an additional 17.5 acres of parkland in or adjacent to the ARPD that are owned and maintained by the City of Pittsburg which provide additional parkland to the ARPD’s service population and brings the effective level of service to 1.6 acres of parkland per 1,000 residents.
d) In a significant turnaround from the prior MSR in 2010, the District now offers recreational programming, including a robust aquatics program, to meet the needs of all residents, although programming has been and continues to be significantly affected by COVID-19. Access to the gym at the Community Center is available for a nominal fee. Classes and programs are described online and registration occurs online as well.
e) The District planned to embark on public visioning workshops that would recur every five to ten years. The first such workshop was set to take place in April, 2020 but the pandemic lockdown forced ARPD to cancel the workshop.

Contra Costa LAFCO Parks & Recreation MSR/SOI Update June 2021 3. Ambrose Recreation & Park District Page 33
Economic & Planning Systems, Inc. Z:\Shared\Projects\Oakland\191000s\191105_ContraCostaLAFCO_Parks&RecMSR\Report\191105 CC LAFCO Parks and Rec MSR-SOI Final 2021June14.docx
f) The District’s annual budget includes a CIP list and District staff indicated that approximately $12 million of outstanding capital improvements are identified. At an upcoming visioning workshop, the Board will consider additional/alternative funding opportunities.
g) The majority of the District’s parks and recreation facilities are in moderate condition as reported by the District, although the District reports that Ambrose Community Center and Park are in poor condition. Concerns regarding the quality of facilities at Ambrose Park and the Community Center were identified in the 2010 MSR as well.
4. Financial Ability of Agencies to Provide Services
a) In FY 19/20, approximately 70% of the District’s revenues came from taxes and assessments with additional revenue coming from user/registration fees and facility rentals, and periodic grants. User/registration fees and facility rentals are being negatively affected by COVID, and limited use of reserves was needed in FY 19/20.
b) Compared with FY 17/18, taxes and assessments increased by 18%, while user/registration fees are down 66%.
c) The District indicated that because it serves a disadvantaged community, it is unable to raise the revenues necessary to fund needed capital improvements.
5. Status of, and Opportunities for, Shared Facilities
a) While the District does not share any facilities, the District rents its Community Center to the County’s Employment & Human Services Department and benefits from cooperative relationships with the Mount Diablo Unified School District and the Pittsburg Police Department, which reliably administers and ensures safety at the largest parks.
6. Accountability for Community Service Needs, Including Governmental Structure and Operational Efficiencies
a) The District is accountable to its service population and provides transparent governance and operations information. The District’s website provides access to the agendas and minutes for the Board meetings, as well as annual budgets and audits.
b) The District responded to LAFCO’s requests for information in a timely manner. c) The 2010 MSR indicated that in the long term, the City of Pittsburg may want to annex
the community of Bay Point. As the entire ARPD boundary is within the City’s SOI, upon annexation of Bay Point, LAFCO may wish to establish ARPD as a subsidiary district of the City of Pittsburg. This remains an appropriate governance option for future consideration. Since the prior MSR, there have not been any discussions regarding annexation.
7. Any Other Matter Related to Efficient Service Delivery, As Required by Commission Policy
a) COVID-19 has affected the District’s ability to offer recreation classes, programs, and activities. To date, the District is not holding virtual programs or hosting online activities. The District’s fiscal situation has not changed significantly; however, the longer the pandemic precludes the District from offering recreational programming, the more likely the District is to experience negative fiscal effects. To date, the District has not altered any capital plans.

Contra Costa LAFCO Parks & Recreation MSR/SOI Update June 2021 3. Ambrose Recreation & Park District Page 34
Economic & Planning Systems, Inc. Z:\Shared\Projects\Oakland\191000s\191105_ContraCostaLAFCO_Parks&RecMSR\Report\191105 CC LAFCO Parks and Rec MSR-SOI Final 2021June14.docx
Sphere o f In f luence Update
SOI Options
1) Reduce SOI to match existing and future service area 2) Reduce SOI to remove some overlaps with the City of Pittsburg 3) Retain existing coterminous SOI
Current Recommendation
Retain existing coterminous SOI. The SOI recommendation for ARPD in 2010 was to reduce the District’s SOI, given its limited capacity to provide adequate public services and the likelihood that the neighboring cities of Concord and/or Pittsburg would annex portions of the ARPD service area. In May 2010, the Commission passed a resolution to retain ARPD’s coterminous SOI. The 2020 update finds the District in a more sustainable and accountable condition. Therefore, the SOI option and recommendation for the District in this update is to retain the existing coterminous SOI until such time that the City of Concord or the City of Pittsburg annex portions of the unincorporated County. At that point, it may be more evident how and in what way the ARPD boundary might be reduced to eliminate boundary overlaps and better serve the ARPD service population.
SOI Determinations
1. Present and planned land uses in the area, including agricultural and open-space lands.
The District boundaries encompass residential uses, limited commercial and industrial areas, park and open space areas, and the Pittsburg/Bay Point BART Station. ARPD has no land use authority; County and city plans include land uses and population growth that may impact the District’s service population and ability to provide services. No changes in present and planned land uses will result from this SOI update.
2. Present and probable need for public facilities and services in the area.
There is a present and probable future need for park and recreation services in the community of Bay Point and surrounding areas. Population within ARPD is expected to increase at an annual rate of approximately 1.2%. No changes in public facilities or services provided by ARPD will result from this SOI update.
3. Present capacity of public facilities and adequacy of public services that the agency provides or is authorized to provide.
ARPD generally provides adequate park maintenance services and is improving its recreation programming. There are nearly 29 acres of parkland owned and maintained by ARPD, which translates into 1.0 acres of parkland per 1,000 district residents, short of the County’s General Plan goal of 4.0 acres of parkland per 1,000 residents. The SOI update will not impact the present capacity of public facilities and adequacy of public services that ARPD provides or is authorized to provide.

Contra Costa LAFCO Parks & Recreation MSR/SOI Update June 2021 3. Ambrose Recreation & Park District Page 35
Economic & Planning Systems, Inc. Z:\Shared\Projects\Oakland\191000s\191105_ContraCostaLAFCO_Parks&RecMSR\Report\191105 CC LAFCO Parks and Rec MSR-SOI Final 2021June14.docx
4. Existence of any social or economic communities of interest in the area if the commission determines that they are relevant to the agency.
ARPD serves the unincorporated community of Bay Point, which qualifies as a disadvantaged unincorporated community. Several of the District’s smaller parks are located in this community, and residents also have access to the Bay Point Regional Shoreline. As reported by District staff, the District has made a concerted effort since the 2010 MSR to expand and improve its recreation program offerings, and the District is intentionally keeping its program fees affordable to all residents in acknowledgement of Bay Point’s classification as a Disadvantaged Community. The SOI update will not affect the existence of any social or economic communities of interest.
5. Nature, location, and extent of any functions or classes of services provided by existing districts. (For Special Districts only.)
ARPD provides park maintenance and recreation programming. Park and recreation facilities maintained by ARPD are located in the unincorporated community of Bay Point. The District is bounded by the City of Concord to the south and west, the City of Pittsburg to the east, and the Contra Costa-Solano county line to the north.

Economic & Planning Systems, Inc. Z:\Shared\Projects\Oakland\191000s\191105_ContraCostaLAFCO_Parks&RecMSR\Report\191105 CC LAFCO Parks and Rec MSR-SOI Final 2021June14.docx
4. GREEN VALLEY RECREATION & PARK DISTRICT
With a service population of approximately 1,200 residents, Green Valley Recreation and Park District (GVRPD) owns and operates a swimming pool and surrounding lawn area for the Cameo Acres neighborhood and serves the surrounding areas of Danville and Alamo. GVRPD also offers activities commonly provided at community pools, including swim lessons, a non-competitive swim team, lifeguard training, community and social events.
Agency Boundar ies
The District’s boundary is located entirely within Contra Costa County, located in the northeastern portion of the Town of Danville east of Green Valley Road, as shown in Map 5. The boundaries encompass approximately 165 acres, or approximately 0.25 square miles. Contra Costa is the principal county and Contra Costa LAFCO has jurisdiction. The District’s SOI is coterminous with its boundary. The formation and boundary history of the District are detailed in Appendix B, Table B-2.

Contra Costa LAFCO Parks & Recreation MSR/SOI Update June 2021 4. Green Valley Recreation & Park District Page 37
Economic & Planning Systems, Inc. Z:\Shared\Projects\Oakland\191000s\191105_ContraCostaLAFCO_Parks&RecMSR\Report\191105 CC LAFCO Parks and Rec MSR-SOI Final 2021June14.docx
Map 5 Map of Green Valley RPD

Contra Costa LAFCO Parks & Recreation MSR/SOI Update June 2021 4. Green Valley Recreation & Park District Page 38
Economic & Planning Systems, Inc. Z:\Shared\Projects\Oakland\191000s\191105_ContraCostaLAFCO_Parks&RecMSR\Report\191105 CC LAFCO Parks and Rec MSR-SOI Final 2021June14.docx
Impact o f COVID-19
The global pandemic and statewide shelter-in-place public health directives during March and April 2020 caused GVRPD to cancel the original opening date of the Green Valley pool in late Spring and the District did not hire seasonal staff as is customary. The District anticipates a decrease in the number of memberships as the lockdown eases and public pools are allowed to reopen. The decrease in memberships and a shorter swim season would also result in a decrease in the number of seasonal staff hired.
While GVRPD had originally reported that it intended to increase membership fees, since the arrival of the global pandemic, the District is now contemplating the need to adjust membership prices to reflect a shortened season. But, with decreased membership the District acknowledges it will also have decreased staffing costs. However, since the District does not anticipate any change to its property tax revenue, there should not be a big impact financially.
In terms of capital improvements, the District does not have any plans for large capital projects this year and therefore does not anticipate a significant impact to its capital budget.
Growth and Popu la t ion P ro jec t ions
GVRPD serves roughly 1,200 residents as of 2020, as shown in Table 11. By 2040, this number is expected to increase by about 40 residents, or an average annual growth of approximately 0.17%. This rate of growth is comparatively slow; as a point of comparison, the County overall anticipates population growth of 0.72% per year between 2020 and 2040.14
14 The 2020 population estimate was arrived at by taking the 2019 ESRI Business Analyst population estimate and applying the long-term growth rate of the relevant MTC Transportation Analysis Zone (TAZ). The 2019 ESRI Business Analyst figure was judged to be more accurate than the GVRPD population that was published in the 2019 LAFCO Directory. Furthermore, it should be noted that because even the 2019 population estimates are derivations based on 2010 Census figures, the 2020 Census is likely to re-establish the current population benchmark.
As with all growth projections, it should also be noted that these are rough estimates based on the best known information at the time. Given that the COVID-19 pandemic is an unprecedented public health crisis, its impacts on future growth in the District cannot be known at this time. Therefore, the projections listed in Table 11 may vary from actual future growth.

Contra Costa LAFCO Parks & Recreation MSR/SOI Update June 2021 4. Green Valley Recreation & Park District Page 39
Economic & Planning Systems, Inc. Z:\Shared\Projects\Oakland\191000s\191105_ContraCostaLAFCO_Parks&RecMSR\Report\191105 CC LAFCO Parks and Rec MSR-SOI Final 2021June14.docx
Table 11 Green Valley RPD Growth and Population Projections
Service Duplication and Boundary Overlap
The GVRPD is located within the Town of Danville, and the GVRPD service population is also served in part by the Town of Danville.
Shared Facilities and Cooperation
There are no shared facilities in the District.
Disadvantaged Communities
No disadvantaged communities were identified within or contiguous to the District’s sphere of influence.
Adequ acy o f Park a nd Rec rea t ion Fac i l i t i es a nd Serv i c es
The District maintains only one facility; a 70-year-old public pool and its surrounding lawn that are roughly 1.2 acres in size, as detailed in Table 12. GVRPD reported that the pool is not ADA compliant. The District also reported that they do not experience any significant security concerns such as dumping/garbage, graffiti or after-hours trespassers.
Despite the pool’s age, regular small-scale capital improvements in recent years mean that the pool is in good condition. While it is fully functional and there are no usage or liability concerns, there are a few, minor infrastructure upgrades such as ongoing maintenance of addressing cracks along the pool’s surface, etc. The lawn area is in very good condition, meaning that it does not need any upgrades at the present time.
Item 2020 2040Absolute
ChangeAnnual Rate
of Growth
Total Residents 1,205 1,244 39 0.17%
Sources: Economic & Planning Systems, Inc., ESRI Business Analyst, ABAG/MTC Population Projections

Contra Costa LAFCO Parks & Recreation MSR/SOI Update June 2021 4. Green Valley Recreation & Park District Page 40
Economic & Planning Systems, Inc. Z:\Shared\Projects\Oakland\191000s\191105_ContraCostaLAFCO_Parks&RecMSR\Report\191105 CC LAFCO Parks and Rec MSR-SOI Final 2021June14.docx
Table 12 Green Valley RPD Summary of Inventory of Parkland and Recreation Facilities
The pool is not drained in the off-season; the District puts on seasonal special events regularly to make use of the facility year-round. As detailed in Table 13, GVRPD staff arrange movie nights, swim parties, BBQs, contests and games. While many of these events are open and free for members, non-members are allowed to participate in the annual “Cornhole League” in the Fall.
In addition, the District generates a small amount of revenue by renting the lawn and picnic area for private parties. On average, GVRPD generates a few hundred dollars annually. The larger boost to District revenues in the form of user-generated fees comes in the form of memberships, which generates roughly $50,000 annually.
The District averages approximately 100 members each year, ranging from 95 to 115. Three types of annual pool memberships are available. Rates are $500 for a Family Membership in the Cameo area and $550 outside the Cameo Area. A Senior Membership (for two seniors) is $175. Memberships are renewed on an annual basis. Guests are allowed for a fee but must be accompanied by a member.
Name Address/Location AcresParkType Facilities Condition
Green Valley Swmimming Pool
1515 Green Valley Road, Danville
1.2 Active Swimming poolLawn/picnic area
Pool is in good conditionLawn/picnic area are in very good condition
Total 1.2Acreage per 1,000 residents 1.0
Sources: 2010 Parks and Recreation & Cemetery Services MSR; Green Valley RPD; Google Earth

CC LAFCO Parks & Recreation MSR/SOI Updates June 2021 4. Green Valley Recreation & Park District Page 41
Economic & Planning Systems, Inc. Z:\Shared\Projects\Oakland\191000s\191105_ContraCostaLAFCO_Parks&RecMSR\Report\191105 CC LAFCO Parks and Rec MSR-SOI Final 2021June14.docx
Table 13 Green Valley RPD Programs, Events, and Facility Rentals
Item / Event Description
UserFees/Rates
(if applicable)
Average AnnualAttendance
(if applicable)
Average AnnualRevenues
(if applicable)
Activities / ProgramsMovie Nights 1-2/x summer, movie on the lawn free for members 120 n/aTGIF BBQ and Swim parties BBQ free for members 500 n/aPolar Plunge Pancake breakfast/jump in pool free for members 75 n/aCornhole League Adult cornhole league in October free for anyone 75 n/aChili Cookoff Chili Competition free for members 75 n/a
Facility RentalLawn/picnic area Rental of picnic tables, BBQ, and pool $150 per 25 guests 100 $450 - $750Total
Other Events / Annual Festivals / Memberships, Etc.Household Membership $450 per season $21,600Non-Resident Seasonal Membership $500 per season $27,500Seniors $150 per season $2,400Total $51,500
Source: Green Valley RPD.
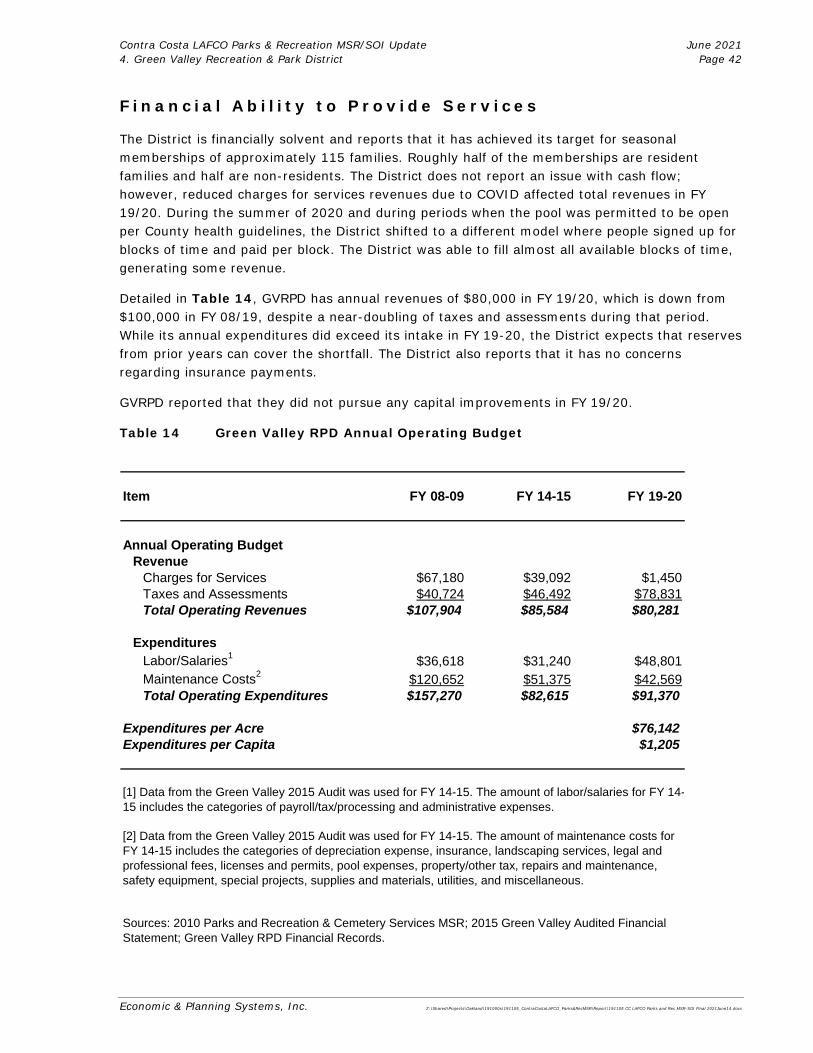
Contra Costa LAFCO Parks & Recreation MSR/SOI Update June 2021 4. Green Valley Recreation & Park District Page 42
Economic & Planning Systems, Inc. Z:\Shared\Projects\Oakland\191000s\191105_ContraCostaLAFCO_Parks&RecMSR\Report\191105 CC LAFCO Parks and Rec MSR-SOI Final 2021June14.docx
F inanc ia l Ab i l i t y to P rov ide Serv i ces
The District is financially solvent and reports that it has achieved its target for seasonal memberships of approximately 115 families. Roughly half of the memberships are resident families and half are non-residents. The District does not report an issue with cash flow; however, reduced charges for services revenues due to COVID affected total revenues in FY 19/20. During the summer of 2020 and during periods when the pool was permitted to be open per County health guidelines, the District shifted to a different model where people signed up for blocks of time and paid per block. The District was able to fill almost all available blocks of time, generating some revenue.
Detailed in Table 14, GVRPD has annual revenues of $80,000 in FY 19/20, which is down from $100,000 in FY 08/19, despite a near-doubling of taxes and assessments during that period. While its annual expenditures did exceed its intake in FY 19-20, the District expects that reserves from prior years can cover the shortfall. The District also reports that it has no concerns regarding insurance payments.
GVRPD reported that they did not pursue any capital improvements in FY 19/20.
Table 14 Green Valley RPD Annual Operating Budget
Item FY 08-09 FY 14-15 FY 19-20
Annual Operating BudgetRevenue
Charges for Services $67,180 $39,092 $1,450Taxes and Assessments $40,724 $46,492 $78,831Total Operating Revenues $107,904 $85,584 $80,281
ExpendituresLabor/Salaries1 $36,618 $31,240 $48,801Maintenance Costs2 $120,652 $51,375 $42,569Total Operating Expenditures $157,270 $82,615 $91,370
Expenditures per Acre $76,142Expenditures per Capita $1,205
[1] Data from the Green Valley 2015 Audit was used for FY 14-15. The amount of labor/salaries for FY 14-15 includes the categories of payroll/tax/processing and administrative expenses.
[2] Data from the Green Valley 2015 Audit was used for FY 14-15. The amount of maintenance costs for FY 14-15 includes the categories of depreciation expense, insurance, landscaping services, legal and professional fees, licenses and permits, pool expenses, property/other tax, repairs and maintenance, safety equipment, special projects, supplies and materials, utilities, and miscellaneous.
Sources: 2010 Parks and Recreation & Cemetery Services MSR; 2015 Green Valley Audited Financial Statement; Green Valley RPD Financial Records.

Contra Costa LAFCO Parks & Recreation MSR/SOI Update June 2021 4. Green Valley Recreation & Park District Page 43
Economic & Planning Systems, Inc. Z:\Shared\Projects\Oakland\191000s\191105_ContraCostaLAFCO_Parks&RecMSR\Report\191105 CC LAFCO Parks and Rec MSR-SOI Final 2021June14.docx
Management & Accountab i l i t y
The District operates with a full board and has started publishing its meeting minutes online. The Board meeting agendas are not published because the District reported that meetings are rather informal. This is largely due to the fact that GVRPD does not have any formal, full-time staff. A small group of dedicated resident members volunteer their time to function as Board Members and perform administrative, legal and accounting functions to maintain the ongoing operations of the District. The key personnel, contact information, address and website are listed in Table 15. While the names and terms of elected Board Members are not available on the District’s website, they are available on the LAFCO website.
Table 15 Green Valley RPD Governance and Contact Information
The only staff that are officially hired by GVRPD are seasonal staff that take care of the day-to-day operations of the Green Valley Pool during the open season (usually in the summer). GVRPD normally hires about two-dozen lifeguards and pool operators, as shown in Table 16. This constitutes a full time equivalent (FTE) count of 3.67 and results in an FTE to 1,000 residents ratio of 3.0. In terms of FTE per acre, the ratio is approximately 3.1 FTE per acre.
Item Information
Governing Board Members 5 Board Members (names/terms not available online)
Manner of Selection Elections at-largeLength of Term Four YearsMeetings Second Tuesday of each month in the eveningAgenda Distribution Not DistributedMinutes Distribution Posted onlineContact Gina GlimmeMailing Address Post Office Box 112, Diablo, CA 94528Email / Website www.thegreenvalleypool.com
Source: Contra Costa LAFCO Directory (August 2019); Green Valley RPD.

Contra Costa LAFCO Parks & Recreation MSR/SOI Update June 2021 4. Green Valley Recreation & Park District Page 44
Economic & Planning Systems, Inc. Z:\Shared\Projects\Oakland\191000s\191105_ContraCostaLAFCO_Parks&RecMSR\Report\191105 CC LAFCO Parks and Rec MSR-SOI Final 2021June14.docx
Table 16 Green Valley RPD Summary of Staffing Table
Since the prior MSRs in 2008 and 2010, the District has made efforts to address some of the challenges previously identified and now prepares annual budgets, conducts annual financial audits, maintains a basic website, posts meeting minutes, etc. Transparency could be improved by posting a regular board meeting schedule and meeting agendas and by providing more detailed meeting minutes.
Green Va l l ey Rec rea t ion an d Park D is t r i c t MSR Dete rminat ions
1. Growth and Population Projections
a) The territory within the District boundary is built-out, and as such, only minimal population growth is expected.
b) The residential population served by the District is projected to remain relatively stable, with expected growth of approximately 0.17% per year, or 3% (39 people) between 2020 and 2040, for a total population in 2040 of approximately 1,244 people.
c) The District’s population is projected to grow at a slower rate than the County’s population overall, which is expected to grow at an average of 0.72% per year.
2. The location and characteristics of any disadvantaged unincorporated communities within or contiguous to the sphere of influence
a) No disadvantaged communities were identified within or contiguous to the District’s sphere of influence.
3. Present and Planned Capacity of Public Facilities and Adequacy of Public Services, Including Infrastructure Needs and Deficiencies
a) The District’s only facility is a 70-year old swimming pool that is not-ADA-compliant, restrooms and changing areas, and the surrounding lawn area. The lawn area includes picnic tables.
Type of Staff Annual Average
Full-Time (Paid) 0Part-Time (Paid) 0Seasonal (Paid) 24Full Time Equivalents (FTE) 3.67
Volunteer (Unpaid) 5Other (Please Define) 0
Staff (FTE) per 1,000 Residents 3.0Staff (FTE) per Acre 3.1
Source: Green Valley RPD.

Contra Costa LAFCO Parks & Recreation MSR/SOI Update June 2021 4. Green Valley Recreation & Park District Page 45
Economic & Planning Systems, Inc. Z:\Shared\Projects\Oakland\191000s\191105_ContraCostaLAFCO_Parks&RecMSR\Report\191105 CC LAFCO Parks and Rec MSR-SOI Final 2021June14.docx
b) The District performs small but regular capital improvements that help maintain the pool in good condition.
c) In the prior MSR in 2010, the District described a desire to replace the pool with a new, much larger pool to better serve nearby residents. No further planning has occurred and the District does not have the sufficient capital reserves or surplus cash flow to fund such a major renovation.
d) The District sponsors community events each year (e.g., the Polar Plunge and the Chili Cookoff) and provides regular programming, such as movie nights and TGIF BBQ and Swim parties. All events are free for members.
4. Financial Ability of Agencies to Provide Services
a) COVID-19 has affected the District’s ability to fully open the pool which has significantly affected membership revenue. In FY 2019/20 nearly all of the District’s revenue came from taxes and assessments compared with five years ago, when charges for services (membership dues) comprised 45% of the District’s revenues.
b) Since the prior MSR in 2010, the District has been successful at expanding and improving event programming.
c) The District provides adequate pool and lawn maintenance services but is not able to fund significant capital improvements or even consider a full renovation.
5. Status of, and Opportunities for, Shared Facilities
a) The District does not share any facilities.
6. Accountability for Community Service Needs, Including Governmental Structure and Operational Efficiencies
a) The District is not fully accountable to its service population in that it does not provide fully transparent governance and financial information on its website. Since the prior MSRs in 2008 and 2010, the District made efforts to address some of the challenges previously identified and now prepares annual budgets, conducts annual financial audits, posts meeting minutes, etc. However, the website could provide more content with respect to the District’s governance. Budgets and audits are not posted, and transparency could be improved by posting a regular board meeting schedule and meeting agendas and by providing more timely and more detailed meeting minutes.
b) The District responded to LAFCO’s requests for information in a timely manner. c) The governance alternatives identified in the 2008 and 2010 MSRs remain options:
consolidate with the Town of Danville; consolidate with EBRPD; consolidate with the San Ramon Valley School District; consolidate with CSA R-7; pursue private options including forming a nonprofit entity, forming a
homeowners association or joining with another private pool association (e.g., Del Amigo Pool Association)
d) LAFCO opined in the 2008 MSR, and it remains the case, that an independent special district is not an appropriate governance option and would never be formed today.

Contra Costa LAFCO Parks & Recreation MSR/SOI Update June 2021 4. Green Valley Recreation & Park District Page 46
Economic & Planning Systems, Inc. Z:\Shared\Projects\Oakland\191000s\191105_ContraCostaLAFCO_Parks&RecMSR\Report\191105 CC LAFCO Parks and Rec MSR-SOI Final 2021June14.docx
7. Any Other Matter Related to Efficient Service Delivery, As Required by Commission Policy
a) COVID-19 had a significant effect on the District’s ability to open the pool, and membership revenue was severely affected. Operating expenses were also reduced in the sense that the District did not need to hire seasonal employees.
Sphere o f In f luence Update
SOI Options
1) Adopt a zero SOI 2) Retain existing coterminous SOI 3) Retain existing coterminous SOI on a provisional basis
Current Recommendation
Retain existing coterminous SOI on a provisional basis. In October 2009, the Commission passed a resolution to reduce the SOI for the GVRPD by approximately 131 acres, further encouraging the District to continue to make operational improvements and pursue other governance options and specifying that LAFCO would review the GVRPD in two years. Subsequently, the 2010 MSR included governance options including 1) dissolving GVRPD and expanding the SOI and annexing the area to CSA R-7 SOI to include the GVRPD; or 2) dissolving GVPRD and naming the Town of Danville as the successor agency as GVPRD is fully within the Town’s boundary.
While governance and governance procedures of the GVRPD have improved since the 2010 MSR, the District is not operating in a fully transparent a manner compared with best practices and other RPDs in the County. For example, agendas are not posted and meeting minutes do not appear current. Budget information, while provided upon request, is not available on the District’s website. Further, the District’s assets are limited to a small swimming pool and surrounding lawn area located in a residential neighborhood. The District averages approximately 100 member families each year (ranging from 95 to 115). The District sponsors community events but events are limited.
The current recommendation is to retain the existing coterminous SOI on a provisional basis, with the expectation that the District report back to LAFCO within two years to demonstrate full transparency with respect to governance, capital improvement planning, increased membership, and fiscal solvency.
SOI Determinations
1. Present and planned land uses in the area, including agricultural and open-space lands.
The District boundaries primarily encompass residential uses. GVRPD has no land use authority; County and city plans include land uses and population growth that may impact the District’s service population and ability to provide services. No changes in present and planned land uses will result from this SOI update.

Contra Costa LAFCO Parks & Recreation MSR/SOI Update June 2021 4. Green Valley Recreation & Park District Page 47
Economic & Planning Systems, Inc. Z:\Shared\Projects\Oakland\191000s\191105_ContraCostaLAFCO_Parks&RecMSR\Report\191105 CC LAFCO Parks and Rec MSR-SOI Final 2021June14.docx
2. Present and probable need for public facilities and services in the area.
Population within the District is expected to increase by less than 0.2% annually. While there will be a continued need for adequate park and recreational services, no changes in public facilities or services provided by the District will result from this SOI update at this time.
3. Present capacity of public facilities and adequacy of public services that the agency provides or is authorized to provide.
GVRPD owns and operates a community swimming pool and coordinates related aquatic programs and activities for both members and non-members. The pool facilities are approximately 70 years old, and they are not ADA-compliant. The District has limited resources. Retaining the existing SOI as proposed will not affect the present capacity of public facilities and adequacy of services provided by GVRPD.
4. Existence of any social or economic communities of interest in the area if the commission determines that they are relevant to the agency.
The SOI update will not affect the existence of any social or economic communities of interest in the area that are relevant to GVRPD.
5. Nature, location, and extent of any functions or classes of services provided by existing districts. (For Special Districts only.)
GVRPD owns and operates a swimming pool and coordinates related aquatic services and programs. The District serves Cameo Acres and surrounding Danville and Alamo neighborhoods.
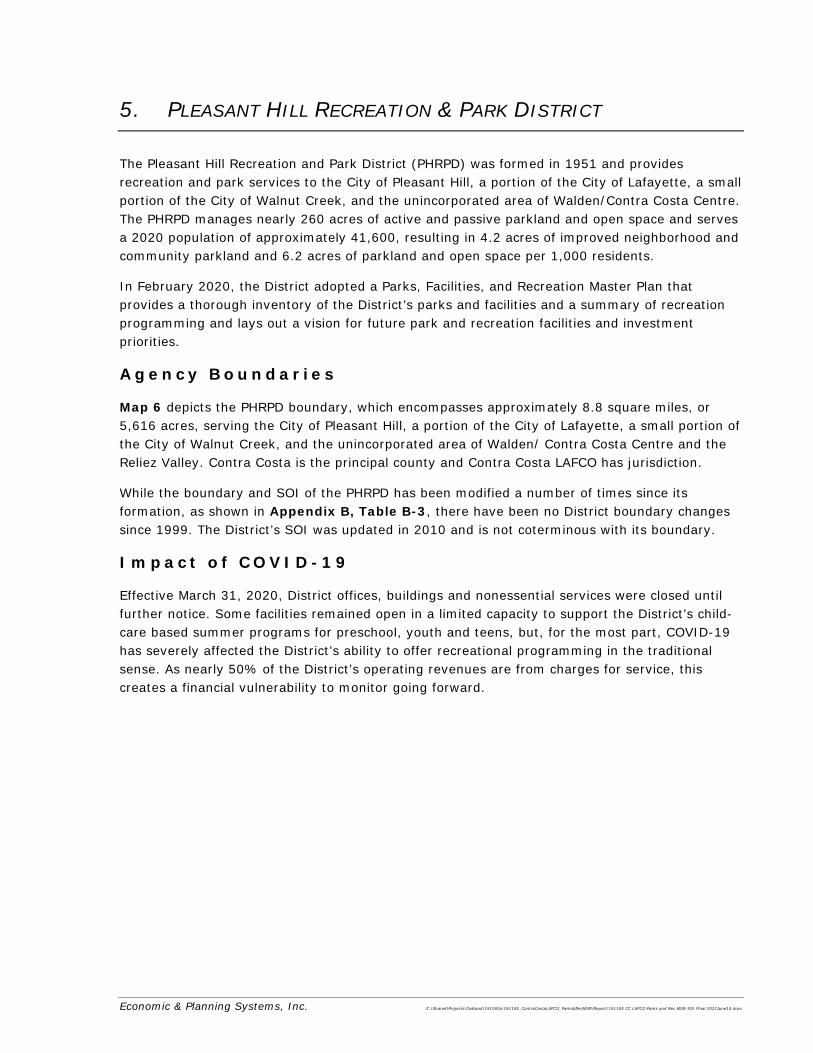
Economic & Planning Systems, Inc. Z:\Shared\Projects\Oakland\191000s\191105_ContraCostaLAFCO_Parks&RecMSR\Report\191105 CC LAFCO Parks and Rec MSR-SOI Final 2021June14.docx
5. PLEASANT HILL RECREATION & PARK DISTRICT
The Pleasant Hill Recreation and Park District (PHRPD) was formed in 1951 and provides recreation and park services to the City of Pleasant Hill, a portion of the City of Lafayette, a small portion of the City of Walnut Creek, and the unincorporated area of Walden/Contra Costa Centre. The PHRPD manages nearly 260 acres of active and passive parkland and open space and serves a 2020 population of approximately 41,600, resulting in 4.2 acres of improved neighborhood and community parkland and 6.2 acres of parkland and open space per 1,000 residents.
In February 2020, the District adopted a Parks, Facilities, and Recreation Master Plan that provides a thorough inventory of the District’s parks and facilities and a summary of recreation programming and lays out a vision for future park and recreation facilities and investment priorities.
Agency Boundar ies
Map 6 depicts the PHRPD boundary, which encompasses approximately 8.8 square miles, or 5,616 acres, serving the City of Pleasant Hill, a portion of the City of Lafayette, a small portion of the City of Walnut Creek, and the unincorporated area of Walden/ Contra Costa Centre and the Reliez Valley. Contra Costa is the principal county and Contra Costa LAFCO has jurisdiction.
While the boundary and SOI of the PHRPD has been modified a number of times since its formation, as shown in Appendix B, Table B-3, there have been no District boundary changes since 1999. The District’s SOI was updated in 2010 and is not coterminous with its boundary.
Impact o f COVID-19
Effective March 31, 2020, District offices, buildings and nonessential services were closed until further notice. Some facilities remained open in a limited capacity to support the District’s child-care based summer programs for preschool, youth and teens, but, for the most part, COVID-19 has severely affected the District’s ability to offer recreational programming in the traditional sense. As nearly 50% of the District’s operating revenues are from charges for service, this creates a financial vulnerability to monitor going forward.
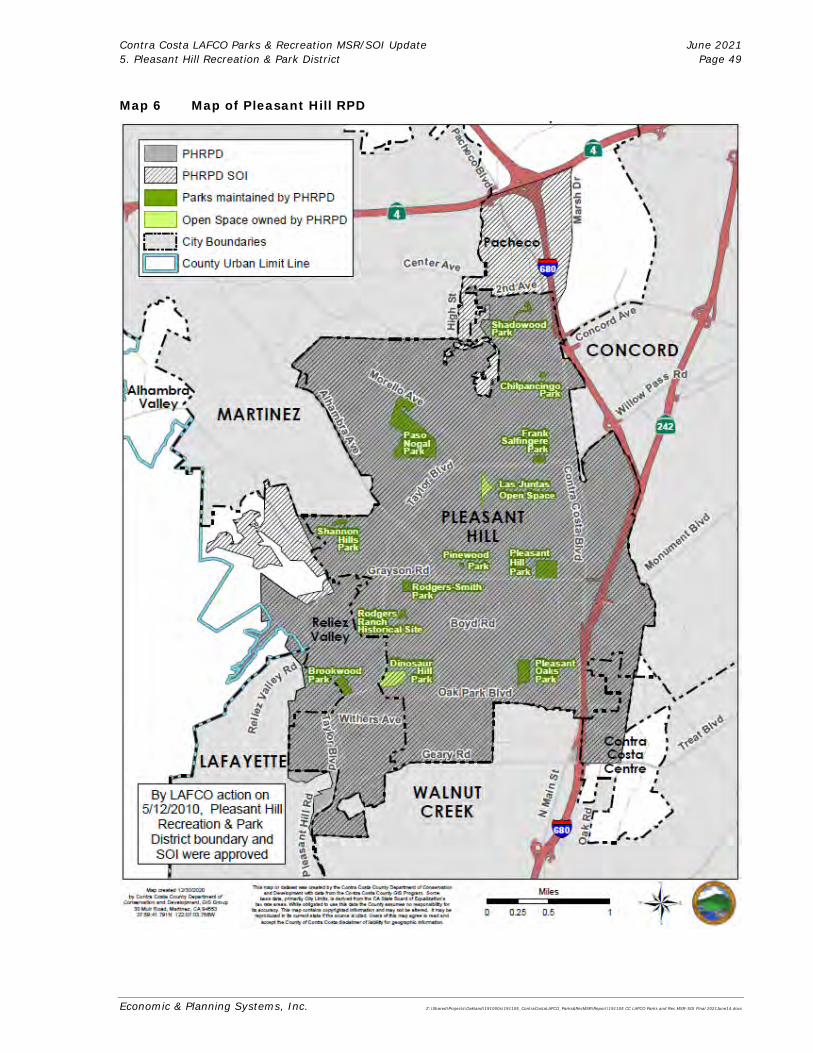
Contra Costa LAFCO Parks & Recreation MSR/SOI Update June 2021 5. Pleasant Hill Recreation & Park District Page 49
Economic & Planning Systems, Inc. Z:\Shared\Projects\Oakland\191000s\191105_ContraCostaLAFCO_Parks&RecMSR\Report\191105 CC LAFCO Parks and Rec MSR-SOI Final 2021June14.docx
Map 6 Map of Pleasant Hill RPD

Contra Costa LAFCO Parks & Recreation MSR/SOI Update June 2021 5. Pleasant Hill Recreation & Park District Page 50
Economic & Planning Systems, Inc. Z:\Shared\Projects\Oakland\191000s\191105_ContraCostaLAFCO_Parks&RecMSR\Report\191105 CC LAFCO Parks and Rec MSR-SOI Final 2021June14.docx
Growth and Popu la t ion P ro jec t ions
PHRPD is a slow growth area with a population of nearly 41,600 as of 2020. By 2040, the population is expected to grow by about 2,400 residents, or at an annual average rate of 0.30%, as shown in Table 17. As a point of comparison, the County overall anticipates population growth of 0.72% per year between 2020 and 2040.15
Table 17 Pleasant Hill RPD Growth and Population Projections
Service Duplication and Boundary Overlap
The District’s boundary does reflect some overlap. The District includes the entirety of the City of Pleasant Hill, in addition to a portion of the City of Lafayette (in the southwest of the District), and a small portion of the City of Walnut Creek, as well as the unincorporated community of Walden/Contra Costa Centre (in the southeast of the District) and the Reliez Valley.
Residents in the portions of the City of Lafayette and the City of Walnut Creek that are served by the Pleasant Hill RPD can access recreational programming through the District or their city’s Park and Recreation department. Residents in the northern portion of Lafayette that are within the District are in close proximity to Brookwood Park, that is in the unincorporated Reliez Valley adjacent to the City of Lafayette boundary; the 2010 MSR recommended that the boundary overlap be retained because “residents of the City of Lafayette use this park facility.”16
15 The 2020 population estimate was arrived at by taking the 2019 ESRI Business Analyst population estimate and applying the long-term growth rate of the relevant MTC Transportation Analysis Zone (TAZ). The 2019 ESRI Business Analyst figure was judged to be more accurate than the PHRPD population that was published in the 2019 LAFCO Directory. Furthermore, it should be noted that because even the 2019 population estimates are derivations based on 2010 Census figures, the 2020 Census is likely to re-establish the current population benchmark.
As with all growth projections, it should also be noted that these are rough estimates based on the best-known information at the time. Given that the COVID-19 pandemic is an unprecedented public health crisis, its impacts on future growth in the District cannot be known at this time. Therefore, the projections listed in Table 17 may vary from actual future growth. 16 2010 Parks, Recreation and Cemetery Services MSR, page 108.
Item 2020 2040Absolute
ChangeAnnual Rate
of Growth
Total Residents 41,552 43,975 2,423 0.30%
Sources: ESRI Business Analyst; ABAG/MTC Population Projections; Economic & Planning Systems, Inc.

Contra Costa LAFCO Parks & Recreation MSR/SOI Update June 2021 5. Pleasant Hill Recreation & Park District Page 51
Economic & Planning Systems, Inc. Z:\Shared\Projects\Oakland\191000s\191105_ContraCostaLAFCO_Parks&RecMSR\Report\191105 CC LAFCO Parks and Rec MSR-SOI Final 2021June14.docx
Shared Facilities and Cooperation
District staff reported that the PHRPD shares some facilities with the Mount Diablo Unified School District, including softball fields at the middle and high schools, and the maintenance yard. Prior to September 2020, the District also shared a swimming pool with the high school; however, the agreement was terminated due to significant upgrades needed to the pool and lack of access. Going forward, the District will rent the pool at an hourly rate as needed.
Disadvantaged Communities
There is a disadvantaged community located within the District’s sphere of influence in the southern portion of the City of Pleasant Hill, adjacent to the City of Walnut Creek. The community appears to have good access to the District’s parks, including the 11-acre Pleasant Oaks Park which has benefitted from recent investment and is in very good condition according to District staff.
Adequ acy o f Park a nd Rec rea t ion Fac i l i t i es a nd Serv i c es
The District prepared a Parks and Recreation Master Plan that was finalized in May 2020 which provides a thorough inventory of the District’s parks and facilities and a summary of recreation programming. The Pleasant Hill Recreation and Park District consists of 13 parks encompassing 126 acres as well as developed and undeveloped open space encompassing 115 acres.
In June 2020, the District purchased 5 acres of land from the County. The land is part of a 15-acre project (5 acres for a City Library and 5 acres for a housing project). The District does not have funds to develop the land at this time, but has plans for two baseball fields, with an overlapping soccer field, playground, bocce courts, walking paths, and restrooms.
The District owns two additional properties that house the Winslow Center and the Old School House. The District also has a joint use agreement with the school district to use the ballfields at College Park High
School and Valley View Middle School. In total, the PHRPD manages nearly 260 acres of active and passive parkland and open space, as shown on Table 18.

Contra Costa LAFCO Parks & Recreation MSR/SOI Update June 2021 5. Pleasant Hill Recreation & Park District Page 52
Economic & Planning Systems, Inc. Z:\Shared\Projects\Oakland\191000s\191105_ContraCostaLAFCO_Parks&RecMSR\Report\191105 CC LAFCO Parks and Rec MSR-SOI Final 2021June14.docx
Table 18 Pleasant Hill RPD Summary of Inventory of Parkland and Recreation Facilities
Name Address/Location AcresParkType Facilities Condition
Pleasant Hill CommunityCenter
320 Civic Drive 2.3 Active Large banquet room, 3 meeting rooms, and 3 preschool rooms
Very Good
Pleasant Hill Senior Center
233 Gregory Lane NA Active 25,000 sq. foot building with banquet room and 7 additional meeting rooms
Very Good
Winslow Center 2590 Pleasant Hill Rd. 3.1 Active Single large hall with stage and two additional meeting rooms
Poor
Plesant Hill Park 147 Gregory Lane 16.5 Active 2 Baseball/softball diamond, volleyball, basketball, 2 playgrounds, picnicareas, bocce courts
Very Good
Rodgers-Smith Park Grayson Road 4.5 Active Picnic and BBQ area, sports field, volleyball,basketball, bocce
Moderate
Pleasant Hill Aquatic Park
147 Gregory Lane NA Active 2 pools, sprayground, picnicareas
Moderate
Paso Nogal Park Paso Nogal Road 63.0 Passive Turfed meadow, open space, trails, off-leash dog park
Very Good
Pleasant Oaks Park Near Pleasant Hill Adult Cente 11.0 Active 5 Sports fields, 2 playground/tot lots, picnic areas and BBQ
Very Good
Brookwood Park Taylor Blvd. and Withers Ave. 6.3 Passive Picnic and BBQ area, labryinth, basketballand tot lot
Good
Frank Salfingere Park Taylor Blvd. and Ruth Drive 1.5 Passive Turf area Very GoodPinewood Park Near Strandwood Elementary School 0.3 Passive Tot lot ModerateChilpancingo Park Golf Club Road 2.5 Passive Turf area PoorShadowood Park Spart Ct. off Camelback Road 2.6 Passive Turf, picnic/BBQ area, tot lot, basketball hoop ModerateShannon Hills Park Devon Ave. 2.5 Passive Turf, tot lot, natural creek ModerateRodgers Ranch 315 Corstsen Rd. 2.1 Passive Historical Site and Farm Very GoodSchool House 2050 Oak Park Blvd. 1.9 Passive Theatre, Meeting Rooms PoorDinosaur Hill Park Off Taylor Blvd. 13.0 Passive Open space, trails Very GoodRidgeview Open Space Area
Paso Nogal Rd. 56.0 Passive Hiking trails Very Good
Las Juntas West of Lucille Ave. 7.0 Passive Open space Very GoodValley High II Falls Ct., Parkhaven Dr., Cliffside Dr. 12.1 Passive Primarily open space, some turf Very GoodValley High IV Verbana Ct. and Elderwood Dr. 11.0 Passive Open space Very GoodValley High V Valley High Drive & Marello Drive 4.6 Passive Open space Very GoodWoodside Hills I Heritage Hill Drive 22.0 Passive Open space Very GoodWoodside Hills III Grayson Rd., Heritage Meadows Rd.,
Woodside Meadows Rd.12.3 Passive Open space Very Good
Total 258.1Total Acreage per 1,000 Residents 6.2
(Excluding Open Space) 4.2
Source: Pleasant Hill RPD 2020 Master Plan.
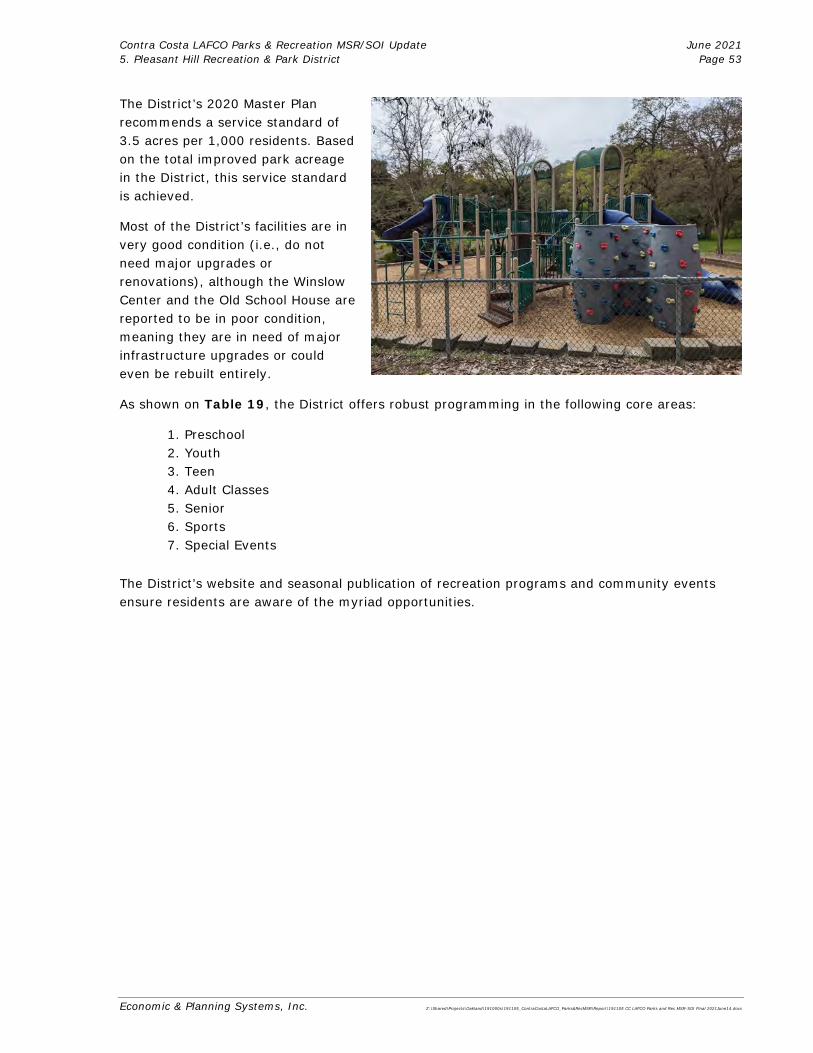
Contra Costa LAFCO Parks & Recreation MSR/SOI Update June 2021 5. Pleasant Hill Recreation & Park District Page 53
Economic & Planning Systems, Inc. Z:\Shared\Projects\Oakland\191000s\191105_ContraCostaLAFCO_Parks&RecMSR\Report\191105 CC LAFCO Parks and Rec MSR-SOI Final 2021June14.docx
The District’s 2020 Master Plan recommends a service standard of 3.5 acres per 1,000 residents. Based on the total improved park acreage in the District, this service standard is achieved.
Most of the District’s facilities are in very good condition (i.e., do not need major upgrades or renovations), although the Winslow Center and the Old School House are reported to be in poor condition, meaning they are in need of major infrastructure upgrades or could even be rebuilt entirely.
As shown on Table 19, the District offers robust programming in the following core areas:
1. Preschool 2. Youth 3. Teen 4. Adult Classes 5. Senior 6. Sports 7. Special Events
The District’s website and seasonal publication of recreation programs and community events ensure residents are aware of the myriad opportunities.

Contra Costa LAFCO Parks & Recreation MSR/SOI Update June 2021 5. Pleasant Hill Recreation & Park District Page 54
Economic & Planning Systems, Inc. Z:\Shared\Projects\Oakland\191000s\191105_ContraCostaLAFCO_Parks&RecMSR\Report\191105 CC LAFCO Parks and Rec MSR-SOI Final 2021June14.docx
Table 19 Pleasant Hill RPD Programs, Events, and Facility Rentals
Item / Event DescriptionAverage Annual
AttendanceAverage Annual
Revenues
Activities / ProgramsAdult Classes Enrichment Classes, Fitness Classes 16,948 $190,000Adult Sports Basketball, Volleyball, Bocce, Tennis 48,857 $302,000Aquatics Lessons, Swim Team, Lap Swim,
Recreational Swim, Events49,272
$311,400Pre-School Priority Preschool, Holiday Camp 698,608 $370,000Co-Sponsored Groups 265,195Senior Programs Classes, Trips, Events, Nutrition Program,
Fitness200,675 $498,000
Teen Programs Afterschool Program, classes, Teen Council, events, camps $463,000
Youth Classes and Events 51,600 $560,000Youth Sports Youth & Teen Sports Clinics, Camps, Skill
Development and Team Sports6,216 $241,000
Total 1,337,371 $2,935,400
Facility RentalsCommunity, Senior, and Teen Centers
57,762 $1,297,500
Other Events / Annual Festivals / Memberships, etc. approx. $100,000 [1]Eggstravaganza Special Event- Egg Hunt, GamesBlues & BrewsTinkers & ThinkersTrunk or TreatSenior Center Membership 2,000
[1] Average annual revenue for PHRPD's special events is about $100,000 pre-pandemic.
Source: Pleasant Hill Recreation and Park District.

Contra Costa LAFCO Parks & Recreation MSR/SOI Update June 2021 5. Pleasant Hill Recreation & Park District Page 55
Economic & Planning Systems, Inc. Z:\Shared\Projects\Oakland\191000s\191105_ContraCostaLAFCO_Parks&RecMSR\Report\191105 CC LAFCO Parks and Rec MSR-SOI Final 2021June14.docx
F inanc ia l Ab i l i t y to P rov ide Serv i ces
The District has an annual operating budget of more than $9 million per year (as of FY 2018-19), which is approximately 40% higher than it was five years prior, as detailed in Table 20. Revenues primarily come from taxes and assessments and charges for services, with a modest amount of additional revenue from grants and money/reserves/property. Publicly available budget documents indicate that the District is adequately resourced and has the financial ability to provide robust services. However, COVID-19 has severely affected the District’s ability to offer recreational programming in the traditional sense. As nearly 50% of the District’s operating revenues are from charges for service, this creates a financial vulnerability to monitor going forward. In addition, the District’s parcel tax of $47 per parcel does not include a cost inflator; as such, the value of the annual parcel tax erodes over time.
Since the 2010 MSR was prepared, the passage of Measure E, a $28 million general obligation bond, resulted in a number of improvements throughout the District’s service area, including a new senior center, a new teen center, a new community center, and upgrades to Pleasant Oaks Park. Bathroom facilities and/or upgrades at Rodgers-Smith Park, Pleasant Hill Park, and Brookwood Park are included in the 2020 Master Plan for future development.
Looking forward, PHRPD publishes a five-year Capital Improvement Program Plan each year that supports implementation of the 2020 Master Plan priorities. For the period from FY 2021 through FY 2024, nearly $1.5 million of capital improvements is identified, with the most extensive improvements planned for Pleasant Hill Park and the Rodgers Smith Park (see Table 21). The City of Pleasant Hill passes all of the parkland in-lieu fee revenue it collects from new development to PHRPD for parkland acquisition and park improvements. However, a recent bond measure, Measure A, for $63.5 million, did not pass in March 2020 and may affect the District’s ability to fully implement its recent Master Plan.

Contra Costa LAFCO Parks & Recreation MSR/SOI Update June 2021 5. Pleasant Hill Recreation & Park District Page 56
Economic & Planning Systems, Inc. Z:\Shared\Projects\Oakland\191000s\191105_ContraCostaLAFCO_Parks&RecMSR\Report\191105 CC LAFCO Parks and Rec MSR-SOI Final 2021June14.docx
Table 20 Pleasant Hill RPD Annual Operating Budget
Table 21 Pleasant Hill RPD Capital Planning and Funding
Type FY 08-09 FY 13-14 FY 18-19
Annual Operating BudgetRevenue
Charges for Services $2,500,000 $2,746,000 $4,595,000Taxes and Assessments $3,300,000 $3,531,000 $4,546,000Grant Revenues $200,000 $24,000 $35,000Money/Reserves/Property $150,000 $288,200 $68,000Other $0Total Revenue $6,150,000 $6,589,200 $9,244,000
ExpendituresLabor/Salaries 2872000 2947000 $4,233,000Capital Outlays 548000 737200 $230,000Maintenance Costs 175200 245000 $215,000Other 2324300 2603000 $4,456,000Total Expenditures $5,919,500 $6,532,200 $9,134,000
Expenditures per Acre $33,880Expenditures per Capita $220
Source: Pleasant Hill Recreation and Park District; Economic & Planning Systems, Inc.
Site Project Description FY 20/21 FY 21/22 FY 22/23 FY 23/24
Community Center 2 Metro Warmers $11,000Community Center Audio Visual Equipment $10,000 $7,500Community Center Carpet Replacement $150,000Community Center Painting/Repairs/Reupholstery 30000 50000Community Center Pavilion Room Shades 26000Oak Park 1700 Oak Park - Design/Pre-Dev. 153000Operations Vehicle Purchase and Replacements $30,000 $30,000Pleasant Hill Park Resurface Parking Lot $250,000Pleasant Oaks Park Group Picnic Shade Structure $50,000Rodgers Smith Park Refurbish Restroom $250,000Senior Center 2 Metro Warmers $11,000Senior Center Audio Visual Equipment $6,000 $11,500Senior Center Building HVAC Design Options $28,100Senior Center Carpet Replacement $35,000Senior Center Extend Front Reception Area $50,000Senior Center Installation of Shade in Bocce Courts $30,000Senior Center Kitchen HVAC Design $14,000Senior Center Planning for Sound Issues $15,000Senior Center Computer Lab Equipment Replacement $20,000Teen Center 2 Door Reach-in Refrigerator $3,500Teen Center Carpet Replacement $20,000Various Park Sites Park Monument Signs $38,000Total $373,600 $91,000 $585,000 $280,000
Source: Pleasant Hill RPD

Contra Costa LAFCO Parks & Recreation MSR/SOI Update June 2021 5. Pleasant Hill Recreation & Park District Page 57
Economic & Planning Systems, Inc. Z:\Shared\Projects\Oakland\191000s\191105_ContraCostaLAFCO_Parks&RecMSR\Report\191105 CC LAFCO Parks and Rec MSR-SOI Final 2021June14.docx
Management & Accountab i l i t y
The District is governed by a five-member board, as shown in Table 22. The District demonstrated full accountability in its disclosure of information and cooperation with LAFCO. The agency responded to LAFCO’s written questionnaires and cooperated with LAFCO interview and document requests.
In addition to the District’s well-maintained and easy-to-navigate website, regular outreach activities conducted by the District include an email newsletter and a catalog of available classes, activities and community events called The Spotlight, which is a print publication sent out three times a year to 68,000 - 72,000 homes in Contra Costa County. Print copies are also available at all PHRPD facilities and other places in the community (e.g., local library, doctor’s offices, schools where allowed). Also, each month the District sends an email news bulletin with current information about the District.
Table 22 Pleasant Hill RPD Governing Body and Contact Information
Item
Governing Board Members
Manner of Selection Elections at-largeLength of Term Four YearsMeetings
Agenda Distribution Posted online and at district facilitiesMinutes Distribution Posted online and by request from district officeContact Michelle Lacy (General Manager)Mailing Address 147 Gregory Lane, Pleasant Hill, CA 94523Email / Website [email protected]
http://www.pleasanthillrec.com/
Source: Contra Costa LAFCO Directory (August 2019).
Information
5 Board Members (names/terms available at https://www.pleasanthillrec.com/151/District-Board)
2nd and 4th Thursdays of each month at 7:00 PM(except for November and December when meetings are the 1st and 3rd Thursdays)

Contra Costa LAFCO Parks & Recreation MSR/SOI Update June 2021 5. Pleasant Hill Recreation & Park District Page 58
Economic & Planning Systems, Inc. Z:\Shared\Projects\Oakland\191000s\191105_ContraCostaLAFCO_Parks&RecMSR\Report\191105 CC LAFCO Parks and Rec MSR-SOI Final 2021June14.docx
The District employs approximately 30 full-time staff, 32 part-time staff, and seasonal staff as well, for a total of 71 full-time equivalents, as shown on Table 23.
Table 23 Pleasant Hill RPD Summary of Staffing
MSR Determinat ion s
1. Growth and Population Projections
a) The residential population served by the District is projected to remain relatively stable, growing approximately 6% (2,423 people), between 2020 and 2040, for a total population in 2040 of approximately 43,975 people.
b) With expected growth of 0.3% per year, the District’s population is projected to grow more slowly than the County’s population overall, which is expected to grow at an average of 0.72% per year.
2. The location and characteristics of any disadvantaged unincorporated communities within or contiguous to the sphere of influence
a) There is a disadvantaged community located within the District’s sphere of influence in the southern portion of the City of Pleasant Hill, adjacent to the City of Walnut Creek. The community appears to have good access to the District’s parks, including the 11-acre Pleasant Oaks Park which has benefitted from recent investment and is in very good condition according to District staff.
3. Present and Planned Capacity of Public Facilities and Adequacy of Public Services, Including Infrastructure Needs and Deficiencies
a) The District offers nearly 260 acres of parkland, representing approximately 6.2 acres per 1,000 residents which exceeds the District’s stated goals and is substantially greater than most other park and recreation providers in the County.
b) The District’s active parks are well-amenitized with picnic and BBQ areas, tot lots, basketball courts, bocce courts, and restrooms. There are special feature parks as well, such as the Pleasant Hill Aquatic Park.
Type of Staff Annual Average
Full-Time (Paid) 30Part-Time (Paid) 32Seasonal (Paid) 159Full Time Equivalents (FTE) 71
Volunteer (Unpaid) 32
Staff (FTE) per 1,000 Residents 0.8Staff (FTE) per Acre 0.3
Source: Pleasant Hill RPD

Contra Costa LAFCO Parks & Recreation MSR/SOI Update June 2021 5. Pleasant Hill Recreation & Park District Page 59
Economic & Planning Systems, Inc. Z:\Shared\Projects\Oakland\191000s\191105_ContraCostaLAFCO_Parks&RecMSR\Report\191105 CC LAFCO Parks and Rec MSR-SOI Final 2021June14.docx
c) The District has a current Master Plan that was adopted in February 2020 to guide park planning and investment.
d) The District performs regular capital improvements that help maintain the District’s parks and facilities in mostly very good condition. There are some exceptions, and District staff has identified that the Winslow Center, the School House, and the Chilpancingo Park are in poor condition and in need of significant upgrades.
e) Pre-COVID, the District offers robust recreational programming for all segments of the resident population and sponsors a range of community events each year.
4. Financial Ability of Agencies to Provide Services
a) The District has an annual operating budget of more than $9 million per year, with revenues primarily coming from taxes and assessments and charges for services, with a modest amount of additional revenue from grants and money/reserves/property. Publicly available budget documents indicate that the District is adequately funded and has the financial ability to provide robust services.
b) PHRPD publishes a five-year Capital Improvement Program Plan each year that supports implementation of the 2020 Master Plan priorities. For the period from FY 2021 through FY 2024, nearly $1.5 million of capital improvements is identified.
c) COVID-19 has severely affected the District’s ability to offer recreational programming, creating a financial vulnerability to monitor going forward.
d) The District’s parcel tax of $47 per parcel does not include a cost inflator; as such, the value of the annual parcel tax erodes over time.
5. Status of, and Opportunities for, Shared Facilities
a) District staff reported that the PHRPD shares some facilities with the Mount Diablo Unified School District, including softball fields at the middle and high schools, and the maintenance yard.
6. Accountability for Community Service Needs, Including Governmental Structure and Operational Efficiencies
a) The District is accountable to its service population and provides transparent governance and operations information. The District’s website provides access to the agendas and minutes for the Board meetings and its various committees, as well as annual budgets and audits. The four standing committees include Budget and Finance, Land and Facilities, Program, and Personnel. There is also a Senior Club Board.
b) The District fully responded to LAFCO’s requests for information in a timely manner. c) The District makes efforts to reach out to the community through its catalog of available
classes, activities and community events called The Spotlight, which is a print publication sent out three times a year to 68,000 - 72,000 homes in Contra Costa County. Also, the District sends an email news bulletin with current information about the District each month, as well as a monthly Senior Newsletter for the District’s Senior Center members.
d) The 2010 MSR found that while the District meets the legal requirement for establishment of a subsidiary district (of the City of Pleasant Hill) based on land area and registered voters, the District has functioned as an independent agency since 1951 and continues to provide adequate services to taxpayers. While some boundary clean-up may be appropriate, no changes to the District’s governance are recommended.

Contra Costa LAFCO Parks & Recreation MSR/SOI Update June 2021 5. Pleasant Hill Recreation & Park District Page 60
Economic & Planning Systems, Inc. Z:\Shared\Projects\Oakland\191000s\191105_ContraCostaLAFCO_Parks&RecMSR\Report\191105 CC LAFCO Parks and Rec MSR-SOI Final 2021June14.docx
7. Any Other Matter Related to Efficient Service Delivery, As Required by Commission Policy
a) COVID-19 is having a significant effect on the District’s ability to offer recreational programs and sponsor community events. While this has negatively affected the District’s revenues, there have been operational savings that have partially off-set the loss in revenue.
Sphere o f In f luence Update
SOI Options
1) Defer, pending subcommittee recommendation 2) Retain existing SOI
Current Recommendation
Retain existing SOI. The 2010 SOI recommendation was to expand the SOI to include all areas within the City of Pleasant Hill’s SOI (an expansion of approximately 16 acres), expand the SOI to include all areas within the City of Pleasant Hill’s corporate limits, and reduce the SOI to exclude city of Lafayette and Walnut Creek areas with the exception of Lafayette immediately adjacent to Brookwood Park. The rationale was that PHRPD primarily was providing recreation and park services to the City of Pleasant Hill and therefore, a more logical boundary for PHRPD would be an SOI that matches the City boundaries. Moreover, there was service duplication in certain parts of the PHRPD where the cities of Lafayette and Walnut Creek were also providing similar recreation and park services to local residents. In May 2010, the Commission passed a resolution to adjust PHRPD’s SOI as described above. In this update, and through conversations with the District, there have been no changes since 2010 that suggest further adjustments are appropriate.
In a letter submitted to LAFCO dated March 29, 2019 during the City MSR study process and re-submitted to LAFCO on February 8, 2021, 40 residents of the Reliez Valley area expressed a desire to detach from PHRPD due to 1) the community’s identification with and receipt of services from Lafayette and its parks and recreation department, and attendance at school districts serving Lafayette and the area; and 2) absence of benefit from PHRPD facilities and services despite contributing to PHRPD bond payments and property taxes; and 3) perception of PHRPD disinvestment in Brookwood Park, the single nearby park serving the community.
The residents signing the letter indicate that Brookwood Park receives inadequate maintenance, its basketball court is unusable, playground equipment is deteriorated, and it lacks a bathroom. The District reports recent basketball rim replacements and states that the park is in good condition but needs planned upgrades including court resurfacing and new playground equipment; however, improvements are on hold due to pandemic revenue reductions and the failure of Measure A.
As noted above, LAFCO modified the District’s SOI as a result of the 2010 MSR recommendations to encompass areas consistent with Pleasant Hill’s SOI, which includes the Reliez Valley area that was unchanged by the 2019 City MSR.

Contra Costa LAFCO Parks & Recreation MSR/SOI Update June 2021 5. Pleasant Hill Recreation & Park District Page 61
Economic & Planning Systems, Inc. Z:\Shared\Projects\Oakland\191000s\191105_ContraCostaLAFCO_Parks&RecMSR\Report\191105 CC LAFCO Parks and Rec MSR-SOI Final 2021June14.docx
Residents of Lafayette who reside within the City and District boundaries, and unincorporated Reliez Valley residents could work with LAFCO staff to facilitate an application to LAFCO if residents wish to detach from PHRPD. The detachment would create an adverse fiscal impact upon the District due to the reduction in revenues, and potentially shift their debt burden to other PHRPD residents. The status and disposition of ownership and maintenance responsibility for the Brookwood Park would need to be determined if it no longer fell within PHRPD boundaries and remained outside the City of Lafayette boundaries.
At its meeting on April 14, 2021, LAFCO directed staff to appoint a subcommittee to facilitate discussions between the residents and the District regarding the issues raised by the residents. A recommendation on the PHRPD SOI should be deferred until the subcommittee has been able review the facts and make a recommendation to LAFCO.Determinations
1. Present and planned land uses in the area, including agricultural and open-space lands.
The District boundaries encompass the City of Pleasant Hill, a portion of the City of Lafayette (single family residential), small portions of the City of Walnut Creek (commercial), a portion of the unincorporated community of Walden/Contra Costa Centre (commercial and multi-family residential), and the Reliez Valley (residential). Land uses within the District are primarily residential, with some light industrial and commercial areas. Land uses in the City of Pleasant Hill SOI area to the north of the City (along Pacheco Boulevard) are residential and light industrial. PHRPD has no land use authority; County and city plans include land uses and population growth that may impact the District’s service population. The recommendation to retain the existing SOI will not result in any changes in present and planned land uses.
2. Present and probable need for public facilities and services in the area.
Population within the District is expected to increase by approximately 0.3% annually. While there will be a continued need for adequate park and recreational services in the District, the recommendation to retain the existing SOI will not result in any changes in public facilities or services provided by the District at this time.
3. Present capacity of public facilities and adequacy of public services that the agency provides or is authorized to provide.
The District offers nearly 260 acres of parkland, representing approximately 6.5 acres per 1,000 residents which exceeds the District’s stated goals and is substantially greater than most other park and recreation providers in the County. In addition, the District offers robust recreational programming for all segments of the resident population and sponsors a range of community events each year. Retaining the existing SOI as proposed will not affect the present capacity of public facilities and adequacy of services provided by PHRPD.
4. Existence of any social or economic communities of interest in the area if the commission determines that they are relevant to the agency.
There is a disadvantaged community located within the District’s sphere of influence in the southern portion of the City of Pleasant Hill, adjacent to the City of Walnut Creek. The

Contra Costa LAFCO Parks & Recreation MSR/SOI Update June 2021 5. Pleasant Hill Recreation & Park District Page 62
Economic & Planning Systems, Inc. Z:\Shared\Projects\Oakland\191000s\191105_ContraCostaLAFCO_Parks&RecMSR\Report\191105 CC LAFCO Parks and Rec MSR-SOI Final 2021June14.docx
recommendation to retain the existing SOI will not affect the existence of any social or economic communities of interest in the area that are relevant to PHRPD.
As discussed above in the current SOI recommendation, 40 residents have indicated that they represent a community of interest that is more closely aligned with the City of Lafayette due to their proximity to Lafayette, participation in Lafayette schools and community, and minimal use of PHRPD services and facilities, despite the location of Brookwood Park. While this potential community of interest does not materially change the current SOI recommendation, it is a basis for considering an application for detachment from PHRPD if the residents choose to proceed with this course of action.
At the April 14, 2021 LAFCO hearing, the Commission directed staff to facilitate discussions between unincorporated and City residents that reside within the District, and District representatives, to discuss boundary, service and facility issues.
5. Nature, location, and extent of any functions or classes of services provided by existing districts. (For Special Districts only.)
PHRPD directly provides park maintenance and recreation programming throughout District boundaries.

Economic & Planning Systems, Inc. Z:\Shared\Projects\Oakland\191000s\191105_ContraCostaLAFCO_Parks&RecMSR\Report\191105 CC LAFCO Parks and Rec MSR-SOI Final 2021June14.docx
6. EAST BAY REGIONAL PARK DISTRICT
The East Bay Regional Park District (EBRPD) is the largest regional park system in the United States, providing park and recreation services in Alameda and Contra Costa counties.17 The system comprises nearly 125,000 acres in 73 parks and receives more than 25 million visits each year. In Contra Costa County, the boundary land area of EBRPD is 720 square miles.
The District offers diverse and robust activities and programs, including archery, biking, boating/kayaking/sailing, camping, day camps, resources for dogs, field trips, fishing, geocaching, golfing, hiking, horseback riding, movie nights, naturalist programs, outdoor recreation programs, and more.
The District has an annual operating budget of nearly $260 million per year, with revenues primarily coming from taxes and assessments and charges for services. COVID-19 is having a significant effect on the District’s ability to offer recreational programs and activities and, in turn, on the District’s user fee revenues; however, the EBRPD is in a better financial position than most local governments, because property taxes are its primary revenue source.
Agency Boundar ies
The District’s SOI is coterminous with its boundary, and the boundary of the District is coterminous with both Contra Costa and Alameda counties, as shown in Map 7.
The service area for EBRPD includes District regional parklands, East Bay Municipal Utility District (EBMUD) owned lands, the San Francisco Water Department Watershed, the East Shore State Park (owned by the State of California, but operated by EBRPD), and the Middle Harbor and Port View Parks operated by the Port of Oakland. The EBRPD boundary encompasses a total of 1,457.6 square miles of land in both Contra Costa and Alameda counties, according to the most recent MSR prepared for Alameda LAFCO. In Contra Costa County, the boundary land area of EBRPD is 720 square miles.
17 Alameda County is the principal county and Alameda LAFCO has jurisdiction; however, because EBRPD’s service area encompasses all of Contra Costa County, a profile of the District is included in this MSR update.

CC LAFCO Parks & Recreation MSR/SOI Updates June 2021 6. East Bay Regional Park District Page 64
Economic & Planning Systems, Inc. Z:\Shared\Projects\Oakland\191000s\191105_ContraCostaLAFCO_Parks&RecMSR\Report\191105 CC LAFCO Parks and Rec MSR-SOI Final 2021June14.docx
Map 7 Map of East Bay RPD

Contra Costa LAFCO Parks & Recreation MSR/SOI Update June 2021 6. East Bay Regional Park District Page 65
Economic & Planning Systems, Inc. Z:\Shared\Projects\Oakland\191000s\191105_ContraCostaLAFCO_Parks&RecMSR\Report\191105 CC LAFCO Parks and Rec MSR-SOI Final 2021June14.docx
Impact o f COVID-19
Between the COVID-19 pandemic and the region’s extreme wildfire activity during the Summer and Fall of 2020, the EBRPD had to close or limit activity at many of its parks/facilities, and according to the District’s FY 2021 Budget, the next fiscal year will provide challenges. However, the EBRPD is in a better financial position than most local governments, because property taxes are its primary revenue source. According to an August 2020 Beacon Economics projection, assessed value will increase by between 2.4% to 5.5% (low and high forecasts) in the coming year. However, the second most important source of Park District revenues will be significantly negatively impacted by the pandemic. Fees and Charges for Services, which experienced a $7.2 million loss in 2020, will be affected again in 2021.
Growth and Popu la t ion P ro jec t ions
Given that EBRPD spans both Alameda and Contra Costa Counties, the population of both counties was added to arrive at the total affected residents, as shown in Table 24. The counties are expected to grow from about 2.84 million residents in 2020 to nearly 3.48 million by 2040, an increase of about 640,000. This rate of growth is slightly higher than 1.0% and represents a moderate level of growth over the long term. As a point of comparison, the Contra Costa County anticipates population growth of 0.72% per year between 2020 and 2040.
Table 24 East Bay RPD Growth and Population Projections
Service Duplication and Boundary Overlap
As a regional park district, the EBRPD boundaries completely overlap the geo-political boundaries of Alameda and Contra Costa counties.
AbsoluteChange
AnnualGrowth
Rate
Alameda County 1,670,834 2,131,734 460,900 1.23%Contra Costa County 1,153,561 1,332,206 178,645 0.72%Total Residents 2,840,120 3,479,665 639,545 1.02%
Sources: CA Department of Finance; ABAG/MTC Plan Bay Area.
Note: Given that EBRPD spans both Alameda and Contra Costa Counties, data represent combined 2020 population estimates and 2040 growth projections for both counties.
Item 2020 2040
(2020 - 2040)

Contra Costa LAFCO Parks & Recreation MSR/SOI Update June 2021 6. East Bay Regional Park District Page 66
Economic & Planning Systems, Inc. Z:\Shared\Projects\Oakland\191000s\191105_ContraCostaLAFCO_Parks&RecMSR\Report\191105 CC LAFCO Parks and Rec MSR-SOI Final 2021June14.docx
Shared Facilities and Cooperation
EBRPD has a number of shared facilities within the District, including:
The Ardenwood Historic Farm, which is jointly operated with the City of Fremont. EBRPD is responsible for the maintenance and operation of parks, open space and trails
in the Murray Township area, which is in the Livermore Area Recreation and Park District (LARPD) boundary, but is more efficiently serviced by EBRPD. EBRPD receives a portion of the property tax from Murray Township directly via the County under the previously approved redistribution of property tax revenue.
Mission Peak is owned by the City of Fremont and managed by EBRPD. The Hayward Regional Shoreline is managed in coordination with the Hayward Area
Recreation and Park District (HARD), the City of Hayward, and the Alameda County Flood Control District.
EBRPD manages several properties for the State of California including the McLaughlin Eastshore State Park, Del Valle, and Crown Beach.
EBRPD shares management of some watershed/park land with local water agencies (EBMUD, Contra Costa and San Francisco) and with LARPD.
Disadvantaged Communities
There are a number of disadvantaged communities located within the District’s sphere of influence. In all cases, the communities appear to have good access to the District’s parks and facilities.
Adequ acy o f Park a nd Rec rea t ion Fac i l i t i es a nd Serv i c es
The East Bay Regional Park District is the largest regional park system in the United States, receiving more than 25 million visits each year. Since its founding, the District has grown consistently in terms of acres of parkland, open space, and miles of trails; partnerships with local, regional, State, and federal initiatives; and investments in recreation, health, education, and habitat preservation. The system comprises nearly 125,000 acres with 73 parks. Park District facilities include:
Over 1,330 miles of trails within the parklands 8 freshwater lakes 3 swim lagoons 3 State Parks 2 San Francisco Bayshore beaches 3 swimming pools 40 lake fishing docks 3 Bay fishing piers 235 family campsites 5 cabins 42 youth camping areas 24 backpacking camps 7 equestrian centers 2 golf courses

Contra Costa LAFCO Parks & Recreation MSR/SOI Update June 2021 6. East Bay Regional Park District Page 67
Economic & Planning Systems, Inc. Z:\Shared\Projects\Oakland\191000s\191105_ContraCostaLAFCO_Parks&RecMSR\Report\191105 CC LAFCO Parks and Rec MSR-SOI Final 2021June14.docx
1 disc-golf course 137 group picnic sites subject to reservation 10 interpretive and education centers 18 children’s playgrounds 2 mobile education centers 16 wedding, meeting, and banquet facilities
EBRPD maintains its natural areas, park areas, trees, landscaping, buildings, and other structures at the District’s park sites and facilities. Table 25 provides a summary of EBRPD facilities organized by city (limited to those cities in Contra Costa County).
Given EBRPD’s role in the region as a provider and steward of natural, open space parks, there is not really an appropriate service standard by which to evaluate the District’s assets. The National Recreation and Park Association (NRPA) recommends that a municipal park system include at least 6.25 to 10.5 acres of developed open space per 1,000 residents. While this standard is directed at municipal park systems, which implies developed parks, and not regional open space parks, the total park acreage per 1,000 residents for the municipal park system in EBRPD is 44, which greatly exceeds the above-mentioned service standards. The District has not adopted its own standards with regard to a minimum park acreage per capita to be maintained.
The District proactively plans to serve its current and future service populations. A Land Use Plan is a long-range planning document that recommends programs for managing and conserving park resources and offers proposals for future recreational use. The District is currently developing Habitat Conservation Plans and Preserve Management Plans, as well as Land Use Plans or Land Use Plan Amendments for the following facilities in Contra Costa County:
Concord Hills Regional Park Land Use Plan Southern Las Trampas Wilderness Land Use Plan Amendment Roddy Ranch Habitat Restoration and Public Access Plans
The District also practices capital improvement planning and there are currently approximately 500 active projects in various stages. All projects and budget estimates are available on the District’s website. The adjacent chart shows how the District funds capital improvements. District Revenue Sources includes Measure FF. The voters within 11 cities and unincorporated areas of western Alameda and Contra Costa Counties passed Measure FF in 2018, as an extension of Measure CC. Measure FF is designated to fund specific projects, and to provide ongoing staffing at specific parks in the Measure FF area. Annually this funding source generates over $3.3 million and will remain in place for 20 years.

Contra Costa LAFCO Parks & Recreation MSR/SOI Update June 2021 6. East Bay Regional Park District Page 68
Economic & Planning Systems, Inc. Z:\Shared\Projects\Oakland\191000s\191105_ContraCostaLAFCO_Parks&RecMSR\Report\191105 CC LAFCO Parks and Rec MSR-SOI Final 2021June14.docx
Table 25 East Bay RPD Summary of Inventory of Parkland and Recreation Facilities
The District offers diverse and robust activities and programs, all of which are described online on the District’s website. Activities include archery, biking, boating/kayaking/sailing, camping, day camps, resources for dogs, field trips, fishing, geocaching, golfing, hiking, horseback riding, movie nights, naturalist programs, outdoor recreation programs, and more.
User/reservation fees apply to camping, boating, picnic areas, naturalist and aquatics programs, and field trips; and permit fees apply for select activities and special events. All fee and permit
City Name
Acres (unless otherwise
indicated) Facilities
Antioch, Brentwood, Oakley Antioch/Oakley Regional Shoreline 7.5 Picnic areas, fishing pierAntioch, Brentwood, Oakley Big Break Regional Shoreline 1,648.0 Multi-use trails, picnic areas, play area (sand), fishing
pier, canoe and kayak launch (beach), amphitheater, visitor center
Antioch, Brentwood, Pittsburg Black Diamond Mines Regional Preserve 8,349.0 Multi-use trails, picnic areas, camping areas, visitors centers
Antioch, Brentwood, Oakley, Pittsburg
Contra Loma Regional Park 779.0 Multi-use trails, picnic areas, swim lagoon, fishing docks, boat launch, concession stand
Antioch Morgan Territory Regional Preserve 5,061.0 Multi-use trails, picnic areas, camping areaBay Point Bay Point Regional Shoreline 150.0 Multi-use trails, picnic areasBrentwood Round Valley Regional Preserve 2,191.0 Multi-use trails, picnic areas, camping areaBrentwood Vasco Caves Regional Preserve 1,644.0 Guided tours onlyConcord Concord Hills Regional Park 2,687.0 Multi-use trails, visitor centerConcord, Alamo, Walnut Creek Diablo Foothills Regional Park / Castle Rock
Recreation Area1,060.0 Multi-use trails, picnic areas, swimming pool, softball
field, basketball courts, horseshoe pits, volleyball court
Concord, Danville, Alamo, San Ramon
Iron Horse Regional Trail 32 mi. Multi-use trail
Crockett, Martinez Carquinez Straight Regional Shoreline 1,568.0 Multi-use trailsCrockett, Hercules Crockett Hills Regional Park 2,124.0 Multi-use trails, picnic areasDanville, Alamo, Lafayette, San Ramon, Walnut Creek
Las Trampas Regional Wilderness 5,593.0 Multi-use trails, picnic areas, camping areas, stables, event space (Little Hills Ranch)
Danville Sycamore Valley Open Space Regional Preser 695.0 Multi-use trailsEl Cerrito, El Sobrante, Orinda Kennedy Grove Regional Recreation Area 221.0 Multi-use trails, picnic areas, volleyball court, horseshoe
pit, amphitheater, event space (Fern Cottage)
El Cerrito, Richmond Point Isabel Regional Shoreline 23.0 Multi-use trails, picnic areas, boating (beach), fishing (beach)
El Sobrante, Pinole, Richmond Sobrante Ridge Botanic Regional Preserve 277.0 Multi-use trails, picnic areasLafayette, Martinez, Pleasant Hill Briones Regional Park 6,256.0 Multi-use trails, picnic areas, camping areas, archery
rangeLafayette Lafayette-Moraga Regional Trail 7.65 mi. Multi-use trailMartinez Radke Martinez Regional Shoreline 343.0 Multi-use trails, picnic areas, horse arena, fishing pier,
marina, softball fields, soccer field, bocce ball courts
Martinez Waterbird Regional Preserve 198.0 Multi-use trailsOrinda Reinhardt Redwood Regional Park 1,833.0 Multi-use trails, picnic areas, camping areas, swimming
pool, play area, archery range, amphitheater
Orinda Sibley Volcanic Regional Preserve 928.0 Multi-use trails, camping area, visitor centerOrinda Tilden Regional Park - Botanic Garden 10.0 Botanic gardenPinole, Richmond, San Pablo Point Pinole Regional Shoreline 2,432.0 Multi-use trails, picnic areas, camping area, play area,
fishing pier, volleyball court, horseshoe pitPittsburg, Richmond Brooks Island Regional Preserve 373.0 Guided tours onlyRichmond, San Pablo Miller/Knox Regional Shoreline 307.0 Multi-use trails, picnic areas, play area, fishing pier,
beach, volleyball court, horseshoe pitRichmond Wildcat Canyon Regional Park 2,789.0 Multi-use trails, picnic areas, play area, horseshoe pitSan Ramon Bishop Ranch Regional Open Space 806.0 Multi-use trails
Total Acreage in Contra Costa County Cities 50,352.5Acreage per 1,000 Residents 17.7
Source: East Bay Regional Park District.

Contra Costa LAFCO Parks & Recreation MSR/SOI Update June 2021 6. East Bay Regional Park District Page 69
Economic & Planning Systems, Inc. Z:\Shared\Projects\Oakland\191000s\191105_ContraCostaLAFCO_Parks&RecMSR\Report\191105 CC LAFCO Parks and Rec MSR-SOI Final 2021June14.docx
costs are available on the District’s website in a Consolidated Fee Schedule, which was updated in 2021.
F inanc ia l Ab i l i t y to P rov ide Serv i ces
As shown on Table 26, total revenues received by EBRPD in FY 2018/19 were $230 million and are budgeted to be $211 million in FY 2020/21, with projected declines attributable to the effects of COVID. Of this total FY 2021 amount, 84% is from property taxes and special assessments, 13% is charges for services, and 3% is other revenue, such as lease revenue. EBRPD levies a special parcel tax for public safety and park maintenance services.
According to the District’s FY 2021 Budget, the next fiscal year will provide challenges. However, the EBRPD is in a better financial position than most local governments, because property taxes are its primary revenue source. According to an August 2020 Beacon Economics projection, assessed value will increase by between 2.4% to 5.5% (low and high forecasts) in the coming year. However, the second most important source of Park District revenues will be significantly negatively impacted by the pandemic. Fees and Charges for Services, which experienced a $7.2 million loss in 2020, will be affected again in 2021.
The District continues to pursue the capital objectives of the Measure WW $500 million voter-approved debt authorization, and $80 million of new Measure WW bonds are planned to be issued in 2021, a portion of which will be designated as Green Bonds, for environmentally beneficial projects.
Total expenditures in FY 2018/19 for EBRPD were $269 million and are budgeted to be $232 million in FY 2020/21. Of this total FY 2021 amount, 60% is budgeted to be spent on personnel costs, 20% is attributed to supplies and services, 12% is for intra-District and inter-agency obligations, nearly 6% goes to debt service, and nearly 2 % is allocated to capital outlay. Revenues are forecast to exceed expenditures in FY 2020/21 in the amount of $21 million.

Contra Costa LAFCO Parks & Recreation MSR/SOI Update June 2021 6. East Bay Regional Park District Page 70
Economic & Planning Systems, Inc. Z:\Shared\Projects\Oakland\191000s\191105_ContraCostaLAFCO_Parks&RecMSR\Report\191105 CC LAFCO Parks and Rec MSR-SOI Final 2021June14.docx
Table 26 East Bay RPD Annual Operating Budget
Item 2009 2014 2019
Annual Operating BudgetRevenueGeneral Fund $111,063,678 $111,053,800 $144,492,550Special Revenue Funds $8,256,281 $25,370,100 $19,553,570Debt Service Funds $29,950,600 $26,048,800 $30,560,400Internal Service Funds $3,798,091 $17,686,210 $15,370,720Permanent Funds $0 $27,400 $0Project Funds $3,195,000 $12,935,310 $20,265,030Total Revenue $156,263,650 $193,121,620 $230,242,270
ExpendituresPersonnel Costs $87,951,974 $94,735,560 $127,689,250Supplies and Services $28,938,835 $31,799,830 $41,329,750Intra-District $900,656 $6,132,760 $6,985,790Inter-agency Agreements 300000 $17,132,000 $13,332,000Capital Outlays 11,086,614 $9,135,290 $10,360,680Debt Service 32,933,150 $32,868,950 $30,544,800Transfers Out $0 $0 $38,632,940Total Expenditures $162,111,229 $191,804,390 $268,875,210
Total Expenditures per Capita $94.67
Sources: East Bay RPD 2020 Adopted Operating Budget; East Bay RPD 2019 Adopted Operating Project and Program Budget with Five Year Expenditure Plan; 2009 Adopted Operating Budget.

Contra Costa LAFCO Parks & Recreation MSR/SOI Update June 2021 6. East Bay Regional Park District Page 71
Economic & Planning Systems, Inc. Z:\Shared\Projects\Oakland\191000s\191105_ContraCostaLAFCO_Parks&RecMSR\Report\191105 CC LAFCO Parks and Rec MSR-SOI Final 2021June14.docx
Table 27 East Bay RPD Capital Planning and Funding
Item FY 19-20 Funding Source
Annual Capital Budget - Parks and Recreation ProjectsExpenditures
Ardenwood Historic Farm Regional Preserve - Electrical System Upgrade $725,000 Funded
Bay Area Ridge Regional Trail $900,000 Partially Funded
Bay Point Regional Shoreline - Access and Habitat Restoration $5,100,000 Partially Funded
Big Break Regional Shoreline - Visitor Center $125,000 Funded
Big Break Regional Shoreline - Storage Shed $150,000 Funded
Black Diamond Regional Preserve - Coal Mine Exhibit $1,142,200 Funded
Black Diamond Regional Preserve - Barn Roof Replacement $120,000 Funded
Camp Arroyo Regional Recreation Area - Housing Replacement $150,000 Funded
Camp Arroyo Regional Recreation Area - Residence Cabin Replacement $210,000 Funded
Claremont Canyon Regional Preserve Site Prep/Restoration $364,808 Funded
Coyote Hills Regional Park Visitor Center Replacement $150,000 Funded
Coyote Hills Regional Park - DQ Campground $3,050,168 Funded
Coyote Hills Regional Park - Access and Habitat $7,000,000 Funded
Coyote Hills Regional Park - Replace Well $250,000 Funded
Deer Valley Regional Preserve - Horse Valley Wetland Restoration $750,820 Funded
Deer Valley Regional Preserve - Star Residence Repair $570,000 Funded
Del Valle Regional Park - Trail $5,339,876 Funded
Dry Creek Pioneer Regional Park - Five Bridges Replacement $700,000 Funded
Garin Regional Park - Stonebrae Trail Implementation $129,000 Funded
Garin Regional Park - Walpert Ridge Improvement $475,000 Funded
Hayward Regional Shoreline - Dredge Ponds and Levees Repair $12,467,073 Partially Funded
Hayward Regional Shoreline - Trailside-Calpine Improvement $300,000 Funded
Hayward Regional Shoreline - Cogswell Bridges Repair $175,000 Funded
Iron Horse Regional Trail $350,000 Partially Funded
Kennedy Grove Regional Recreation Area - Playground Equipment Replacement $299,991 Funded
Lake Chabot Regional Park Trails $450,000 Funded
Lake Chabot Regional Park Roads $260,000 Funded
Las Trampas Wilderness Regional Preserve - Water Tank Replacement $1,500,000 Funded
Las Trampas Wilderness Regional Preserve - Buildings Demolition $1,055,000 Funded
Little Hills Regional Recreation Area - Restroom Reconstruction $272,000 Funded
Marsh Creek Regional Trail $275,000 Funded
Martin Luther King Jr. Regional Shoreline $6,575,000 Partially Funded
McLaughlin Eastshore State Park Regional Shoreline - Golden Gate Fields Trail $9,819,636 Funded
Miller/Knox Regional Shoreline - Shoreline Access $3,749,489 Partially Funded
Mission Peak Regional Preserve - Expand Staging Area $1,595,748 Funded
Oyster Bay Regional Shoreline - Picnic Area and Access $6,394,968 Partially Funded
Pleasanton Ridge Regional Park - Garms Staging Area Development $6,964,000 Partially Funded
Pleasanton Ridge Regional Park - Tyler Staging Area Development $2,129,000 Partially Funded
Pleasanton Ridge Regional Park - Land Use Plan Implementation $210,000 Partially Funded
Point Molate Regional Shoreline - Bay Trail Extension $8,170,260 Partially Funded
Point Pinole Regional Shoreline - Visitor Center $18,311,412 Partially Funded
Point Pinole Regional Shoreline - Dotson Marsh Restoration $14,120,875 Funded
Radke Martinez Regional Shoreline - Trail Construction $150,900 Funded
Radke Martinez Regional Shoreline - Trail Replacement $240,000 Funded
Redwood Regional Park - Piedmont Stables Restoration $300,000 Funded
Robert W. Crown Memorial State Beach Regional Shoreline - McKay Bldgs $1,107,968 Funded
San Francisco Bay Regional Trail - Lone Tree Trail $2,931,090 Funded
San Francisco Bay Regional Trail - Martinez Bay Trail $285,000 Funded
San Pablo Bay Regional Shoreline - Pinole Shores Construction $13,493,298 Funded
Shadow Cliffs Regional Recreation Area - Lake Water Supply $130,191 Funded
Shadow Cliffs Regional Recreation Area - Solar Panels $7,498,357 Funded
Shadow Cliffs Regional Recreation Area - Interpretive Pavilion $950,000 Partially Funded
Shadow Cliffs Regional Recreation Area - Lake Trail Repair $200,000 Funded
Shadow Cliffs Regional Recreation Area - Boat Concession Bldg Replacement $965,000 Partially Funded
Sibley Volcanic Regional Preserve - McCosker Creek Restoration $9,601,000 Partially Funded
Sibley Volcanic Regional Preserve - Trails $454,272 Funded
Sunol Wilderness Regional Preserve - Visitor Center $615,537 Partially Funded
Tassajara Creek Regional Trail - Trail Develoment $1,000,000 Partially Funded
Tilden Botanic Garden - Visitor Center $225,000 Partially Funded
Tilden Botanic Garden - Replace Structures $168,880 Partially Funded
Tilden Botanic Garden - Replace Chemical Toilet $199,800 Funded
Tilden Botanic Garden - Pave Three Roads $410,000 Funded
Tilden Botanic Garden - Install Oxygen Storage $392,950 Funded
Tilden Botanic Garden - Remove Crossing at Brook Road $275,000 Funded
Tilden Botanic Garden - Renovate Enivronmental Education Center $135,000 Funded
Vasco Caves Regional Preserve - Residence Replacement $210,000 Funded
Wildcat Canyon Regional Park - Waterline and Restroom $416,030 Funded
Total Capital Expenditures $165,201,597
Source: East Bay RPD 2019 Adopted Operating Project and Program Budget with Five Year Expenditure Plan (https://www.ebparks.org/civicax/filebank/blobdload.aspx?blobid=32030)

Contra Costa LAFCO Parks & Recreation MSR/SOI Update June 2021 6. East Bay Regional Park District Page 72
Economic & Planning Systems, Inc. Z:\Shared\Projects\Oakland\191000s\191105_ContraCostaLAFCO_Parks&RecMSR\Report\191105 CC LAFCO Parks and Rec MSR-SOI Final 2021June14.docx
Management & Accountab i l i t y
EBRPD has a seven-member governing body. Board members are elected by geographic district to four-year terms (details are provided in Table 28). EBRPD also has a Park Advisory Committee made up of 21 citizen-members, appointed by the EBRPD Board of Directors. Advisory Committee members are appointed for two-year terms and may serve a total of four consecutive terms, or eight years.
The Board meets twice a month on the first and third Tuesdays at 1:00 pm, typically at the district headquarters in Oakland. During COVID, Board meetings are held via telephone and video conference. Board meeting agendas and minutes are posted in multiple locations. In addition to the required agendas and minutes, EBRPD updates constituents with a bimonthly newsletter and through community outreach programs. EBRPD also posts public documents on its website.
Financial planning documents include an annually adopted budget and annually audited financial statement. EBRPD conducts capital improvement planning in the annual budget, and maintains an outlook of up to five years. Capital improvement plans are updated annually.
Table 28 East Bay RPD Governance and Contact Information
Item Information
Governing Board Members 7 Board Members (names/terms available at www.ebparks.org/about/board)
Manner of Selection Elected; each Director represents a specific geographic area of the District known as a Ward
Length of Term Four YearsMeetings 1st and 3rd Tuesdays of the month at 1:00pmAgenda Distribution https://www.ebparks.org/about/meetingsMinutes Distribution https://www.ebparks.org/about/meetingsContact Sabrina Landreth, General ManagerMailing Address 2950 Peralta Oaks Court, Oakland, CA 94605Email / Website https://www.ebparks.org/about/board/default.htm
Source: East Bay Regional Park District.

Contra Costa LAFCO Parks & Recreation MSR/SOI Update June 2021 6. East Bay Regional Park District Page 73
Economic & Planning Systems, Inc. Z:\Shared\Projects\Oakland\191000s\191105_ContraCostaLAFCO_Parks&RecMSR\Report\191105 CC LAFCO Parks and Rec MSR-SOI Final 2021June14.docx
Table 29 East Bay RPD Summary of Staffing
MSR Determinat ion s
1. Growth and Population Projections
a) The residential population served by the District is projected to expand significantly at an average annual rate of 1.02%, equivalent to expected growth of approximately 22%, or 639,545 people, between 2020 and 2040, for a total population in 2040 of approximately 3,479,665 people.
b) The District’s population is projected to grow at a faster rate than the County’s population overall, which is expected to grow at an average of 0.72% per year, as growth in Alameda County is expected to outpace growth in Contra Costa County.
2. The location and characteristics of any disadvantaged unincorporated communities within or contiguous to the sphere of influence
a) There are a number of disadvantaged communities located within the District’s sphere of influence. In all cases, the communities appear to have good access to the District’s parks and facilities.
3. Present and Planned Capacity of Public Facilities and Adequacy of Public Services, Including Infrastructure Needs and Deficiencies
a) The District offers approximately 125,000 acres of parkland and open space, representing approximately 44 acres per 1,000 residents. Most of the active parks are well-amenitized with picnic and BBQ areas, other recreation features, and restrooms.
b) The District performs regular capital improvements that help maintain the District’s parks and facilities in mostly very good condition.
c) Pre-COVID, the District offered very robust recreational programming and activities for all segments of the resident population. During this COVID period, the District is identifying and developing virtual experiences and other programming to support distance learning.
Type of StaffAnnual Average
(2021)
Permanent Staff 788Seasonal/Temporary Staff 98Full Time Equivalents (FTE) 886
Staff (FTE) per 1,000 Residents 0.31Staff (FTE) per Acre 0.01
Source: EBRPD 2021 Proposed Budget.

Contra Costa LAFCO Parks & Recreation MSR/SOI Update June 2021 6. East Bay Regional Park District Page 74
Economic & Planning Systems, Inc. Z:\Shared\Projects\Oakland\191000s\191105_ContraCostaLAFCO_Parks&RecMSR\Report\191105 CC LAFCO Parks and Rec MSR-SOI Final 2021June14.docx
4. Financial Ability of Agencies to Provide Services
a) The District has an annual operating budget of approximately $230 million per year, with revenues primarily coming from taxes and assessments and charges for services. Publicly available budget documents indicate that the District is adequately resourced; however, this is being challenged during COVID and expenditures are expected to exceed revenues in FY 20/21.
b) EBRPD publishes a Project and Program Budget and Five-Year Expenditure Plan each year that supports implementation of capital priorities. For the five-year period from FY 2020 through FY 2024, nearly $390 million of capital improvements are identified. The District has identified funding consisting primarily of District Revenue Sources and District Bonds.
5. Status of, and Opportunities for, Shared Facilities
a) The District shares facilities and management responsibilities with other agencies where it is efficient to do so. For example, the District manages several properties for the State of California including the McLaughlin Eastshore State Park, Del Valle, and Crown Beach, and also shares management of some watershed/park land with local water agencies (EBMUD, Contra Costa and San Francisco) and with LARPD. The Ardenwood Historic Farm is jointly operated with the City of Fremont, and Mission Peak is owned by the City of Fremont and managed by EBRPD. The Hayward Regional Shoreline is jointly managed with the Hayward Area Recreation and Park District, the City of Hayward, and Alameda County Flood Control. In addition, the EBRPD is responsible for the maintenance and operation of parks, open space and trails in the Murray Township area, which is in the LARPD boundary.
b) No additional opportunities for shared facilities were identified as part of this MSR update.
6. Accountability for Community Service Needs, Including Governmental Structure and Operational Efficiencies
a) The District is accountable to its service population and provides transparent governance and operations information. The District’s website provides access to the agendas and minutes for the Board of Directors meetings and the Park Advisory Committee meetings. The website also provides access to annual budgets and capital improvement plans.
b) The District makes efforts to reach out to the community through its monthly e-newsletter and its website which is easy to navigate.
c) No changes to the District’s governmental structure appear warranted.
7. Any Other Matter Related to Efficient Service Delivery, As Required by Commission Policy
a) COVID-19 had a significant effect on the District’s ability to offer recreational programs and activities and, in turn, on the District’s user fee revenues. While this has negatively affected the District’s revenues, there have been some operational savings that have partially off-set the loss in revenue.

Economic & Planning Systems, Inc. Z:\Shared\Projects\Oakland\191000s\191105_ContraCostaLAFCO_Parks&RecMSR\Report\191105 CC LAFCO Parks and Rec MSR-SOI Final 2021June14.docx
7. CITY PARKS & RECREATION & SERVICES
In 2019, Contra Costa LAFCO adopted a second-round “City Services” MSR and SOI Study. This chapter builds on that effort and provides a more detailed overview of the park and recreation services provided by the 19 incorporated towns and cities in Contra Costa County.
Overall, most city populations are projected to grow at a slower rate than the Countywide average, while Brentwood and Oakley are expected to far outpace the county average growth by 2040. Developed parkland acreage provision within cities varies considerably, ranging from just under 1 acre per 1,000 residents to almost 13 acres per 1,000 residents. The cities provide equitable access to a broad range of recreation services for all residents, and, overall, facilities are in moderate to good condition.
All cities follow best practices for websites, reporting, and planning. While COVID-19 has affected every city to varying degrees, all cities report that they anticipate the ability to continue providing adequate parks and recreation services despite the budgetary setbacks realized due to the pandemic and its effects.
Detailed maps of all cities’ boundaries, SOIs, and urban growth boundaries are included in Appendix B.
Overv iew o f Agenc ies
There are 19 incorporated towns and cities in Contra Costa County. All towns and cities in the County are the primary providers of Parks and Recreation services within their jurisdiction and are addressed within this chapter with the exception of the City of Pleasant Hill. Parks and Recreation services for the City of Pleasant Hill are provided through the Pleasant Hill Recreation & Park District which is addressed within Chapter 5. This chapter primarily focuses on the 18 Contra Costa County cities that provide Parks and Recreation services within their jurisdictions.
Growth and Popu la t ion P ro jec t ions
Many of the incorporated cities in the County are expected to be slower growth areas, with 12 of the 19 cities projected to have a lower compound annual population growth rate than the countywide compound annual growth rate of 0.72% between 2020 and 2040. Five cities, Antioch, Concord, Oakley, Pittsburg, and Richmond, are expected to grow between 1 and 2% in that time. One city, Brentwood, is expected to grow at a relatively fast pace of 2%. Walnut Creek is expected to grow at a compound annual rate of 0.80%.
In absolute terms, population growth projections between 2020 and 2040 range from a gain of a few hundred residents (such as in Clayton and Orinda) to a gain of over 50,000 residents (as in the case of Concord). The majority of cities in the county are expected to gain less than 10,000 residents by 2040. Oakley, Pittsburg, and Walnut Creek are projected to add between 10,000 and 20,000 residents while Antioch, Brentwood and Richmond are expected to add anywhere from 27,000 to 37,000 residents each. Meanwhile, the unincorporated areas of the county are expected to decline in population, losing roughly 50,000 residents during the same time period.

Contra Costa LAFCO Parks & Recreation MSR/SOI Update June 2021 7. City Parks & Recreation & Services Page 76
Economic & Planning Systems, Inc. Z:\Shared\Projects\Oakland\191000s\191105_ContraCostaLAFCO_Parks&RecMSR\Report\191105 CC LAFCO Parks and Rec MSR-SOI Final 2021June14.docx
With regard to methodology for all cities, the 2020 population estimates are from Table E-1 of the California Department of Finance January 2019 estimates and the projected population growth between 2020 and 2040 shown in Figure 1 are from the regional planning agency (ABAG/MTC) Plan Bay Area. The resulting 2040 population projections are therefore a combination of Department of Finance and ABAG/MTC estimates.
As with all growth projections, it should be noted that these are estimates based on the best available information at the time. Given that the COVID-19 pandemic is an unprecedented public health crisis, its impacts on future growth in the County are uncertain, and the projections shown in Figure 1 may vary from actual future growth.
Figure 1 Cities’ Growth and Population Projections
Disadvantaged C ommun i t i es
Of the 18 cities, 11 have Disadvantaged Communities (DACs) within their jurisdiction or SOI. All 11 cities report that residents of the Disadvantaged Communities have the same park and recreation access as the other members of their communities. Many cities indicated that they provide financial scholarships and funding opportunities for economically disadvantaged members of their community to help defray the costs of recreational program participation. Ten cities indicated that they provide scholarships or financial aid for recreational program enrollment.

Contra Costa LAFCO Parks & Recreation MSR/SOI Update June 2021 7. City Parks & Recreation & Services Page 77
Economic & Planning Systems, Inc. Z:\Shared\Projects\Oakland\191000s\191105_ContraCostaLAFCO_Parks&RecMSR\Report\191105 CC LAFCO Parks and Rec MSR-SOI Final 2021June14.docx
Adequ acy o f Park a nd Rec rea t ion Fac i l i t i es a nd Serv i c es
The primary metric used in assessing a city’s adequacy of parks and recreation service provision is the amount of park acreage provided. This section focuses on developed neighborhood and community parkland only, with open space acreage addressed separately within each city’s individual determinations. Topography, urbanization, city size, and other factors can work to constrain the amount of park acreage a city is able to provide. Figure 2 shows the existing developed neighborhood and community park acreage per 1,000 residents for each city.
The Quimby Act allows California cities and counties to require land dedication or enact fees as a condition of the approval of a parcel subdivision map. The Act enables jurisdictions to set a Level of Service (LOS) standard of between three and five park acres per 1,000 residents with which to determine the proportional amount of land to be dedicated or fees to be paid by developers when seeking parcel subdivision approval.
Figure 2 displays both the current neighborhood and community park acreage per 1,000 residents for each of the 18 cities addressed in this Chapter in conjunction with each city’s adopted LOS standard. It is important to emphasize that Figure 2 excludes any undeveloped parkland or open space acreage that may exist in each city, instead focusing on developed neighborhood and community parkland in order to enhance comparability between cities. Each city’s adopted LOS standard displayed is representative of what cities reported during the data gathering for this report or what is stated within their municipal codes. The exact criteria by which cities measure their LOS standards can vary, and may include open space or other types of park acreage in their calculations that are not included within their LOS presented in Figure 2. The LOS values presented herein may differ from a city’s own internal calculation for purposes of determining whether they are meeting their own LOS standards. Note that Pinole is omitted as an outlier in order to enhance readability as the city provides a particularly high park acreage per 1,000 residents. Pinole’s current park acreage LOS is denoted within the text box included in Figure 2. As a point of comparison, the County’s General Plan goal is 4.0 acres of parkland per 1,000 residents.
Across the County, most (13 out of 15) cities do not have a developed neighborhood and community parkland LOS that meets their adopted LOS standard, with an average deficiency of 1.9 acres per 1,000 residents. Of the 15 cities with an adopted LOS standard, 10 have an LOS standard of 5 acres per 1,000 residents. Concord, Danville, and San Ramon have LOS standards above 6 acres per 1,000 residents and Clayton18 and Richmond have standards below 5 acres of developed parkland per 1,000 residents. El Cerrito also has an adopted LOS standard of 5 acres per 1,000 residents, however its adopted LOS standard includes recreation and open space acreage, not just developed neighborhood and community parkland acreage, and as such, their LOS standard is omitted from Figure 2.
While having an adopted LOS standard is considered best practice, two municipalities, Moraga and San Pablo, do not have adopted park acreage LOS standards. While Moraga is currently
18 The City of Clayton has an LOS standard of 10 acres per 1,000 residents, however three of those acres are to be developed parkland with the remaining seven being devoted to open space.

Contra Costa LAFCO Parks & Recreation MSR/SOI Update June 2021 7. City Parks & Recreation & Services Page 78
Economic & Planning Systems, Inc. Z:\Shared\Projects\Oakland\191000s\191105_ContraCostaLAFCO_Parks&RecMSR\Report\191105 CC LAFCO Parks and Rec MSR-SOI Final 2021June14.docx
ninth in the County in terms of park acreage provision per capita, San Pablo has the lowest in the County. Adopting a Quimby In-Lieu fee can aid cities in procuring funds to increase park acreage provision for their residents. There are two cities, Martinez and Pinole, whose current park acreage LOS exceeds their adopted LOS standard. It is pertinent to reiterate these findings relate only to developed neighborhood and community park acreage and omit the existing levels of open space acreage within each city.
Figure 2 Cities’ Neighborhood and Community Park Acreage Levels of Service
In addition to the neighborhood and community parkland that each city maintains and operates, there are park and open space areas that are either within cities’ boundaries or in close proximity, granting residents access to additional parkland beyond what is captured in Figure 2. These additional park and open space areas effectively increase the parkland acreage per resident for each city. Table 30 lists the park and open space areas in or near each city that are owned, maintained, or operated by other agencies or jurisdictions. Figure 3 is an extension of Figure 2 and includes the park and open space areas that are in or adjacent to each city in addition to each city’s neighborhood and community parkland, demonstrating how parks and open space owned and maintained by other jurisdictions improve park and recreation access for the County’s residents. The majority of facilities listed below are maintained by the East Bay

Contra Costa LAFCO Parks & Recreation MSR/SOI Update June 2021 7. City Parks & Recreation & Services Page 79
Economic & Planning Systems, Inc. Z:\Shared\Projects\Oakland\191000s\191105_ContraCostaLAFCO_Parks&RecMSR\Report\191105 CC LAFCO Parks and Rec MSR-SOI Final 2021June14.docx
Regional Park District or East Bay Municipal Utility District (EBMUD). EBMUD also operates an additional trail network along the western portion of the County.
Table 30 Summary of Non-City Owned Park and Open Space Amenities by City
As shown in Figure 3, residents in Contra Costa County cities have ample access to park and open space acreage when acreage beyond that which is owned and/or operated by the cities is included.
City Additional Facilities*
AntiochAntioch/Oakley Regional Shoreline, Big Break Regional Shoreline, Black Diamond Mines Regional Preserve, Contra Loma Regional Park, Morgan Territory Regional Preserve
BrentwoodAntioch/Oakley Regional Shoreline, Big Break Regional Shoreline, Black Diamond Mines Regional Preserve, Contra Loma Regional Park, Round Valley Regional Preserve, Vasco Caves Regional Preserve
Clayton N / AConcord Concord Hills Regional Park, Diablo Foothills Regional Park, Iron Horse Regional Trail
DanvilleIron Horse Regional Trail, Las Trampas Regional Wilderness, Diablo Foothills, Sycamore Valley Regional Open Space Preserve
El CerritoMiller/Knox Regional Shoreline, Point Isabel Regional Shoreline, Kennedy Grove Regional Recreation Area, Wildcat Canyon Regional Park
Hercules Crockett Hills Regional Park
LafayetteBriones Regional Park, Lafayette-Moraga Regional Trail, Las Trampas Regional Wilderness, Lafayette Reservoir
MartinezBriones Regional Park, Carquinez Strait Regional Shoreline, Radke Martinez Regional Shoreline, Waterbird Regional Preserve, John Muir National Historic Site
Moraga N / A
Oakley Antioch/Oakley Regional Shoreline, Big Break Regional Shoreline, Contra Loma Regional Park
OrindaKennedy Grove Regional Recreation Area, Reinhardt Regional Park, Sibley Volcanic Regional Preserve, Tilden Regional Park - Botanic Garden
Pinole Point Pinole Regional Shoreline, Sobrante Ridge Botanic Regional Preserve
PittsburgBlack Diamond Mines Regional Preserve, Brooks Island Regional Preserve, Contra Loma Regional Park
Pleasant Hill Briones Regional Park
RichmondBrooks Island Regional Preserve, Miller-Knox Regional Shoreline, Point Isabel Regional Shoreline, Point Pinole Regional Shoreline, Sobrante Ridge Botanic Regional Preserve, Wildcat Canyon Regional Park
San Pablo Miller-Knox Regional Shoreline, Point Pinole Regional Shoreline
San RamonBishop Ranch Regional Open Space, Iron Horse Regional Trail, Las Trampas Regional Wilderness, Little Hills Picnic Ranch
Walnut CreekCastle Rock Regional Recreation Area, Diablo Foothills Regional Park, Las Trampas Regional Wilderness
Sources: East Bay Regional Park District, East Bay Municipal Utility District, Contra Costa County.
*In addition to the facilities listed here, the East Bay Municipal Utility District operates an extensive trail system along the western portion of the County.

Contra Costa LAFCO Parks & Recreation MSR/SOI Update June 2021 7. City Parks & Recreation & Services Page 80
Economic & Planning Systems, Inc. Z:\Shared\Projects\Oakland\191000s\191105_ContraCostaLAFCO_Parks&RecMSR\Report\191105 CC LAFCO Parks and Rec MSR-SOI Final 2021June14.docx
Figure 3 Cities’ Park and Open Space Acreage
Cities reported on the existing conditions of their park and recreation facilities. Figure 4 shows the self-reported states of repair of each city’s park and recreation facilities, presented as percentages of facilities that are indicated to be in poor, moderate, or good condition.

Contra Costa LAFCO Parks & Recreation MSR/SOI Update June 2021 7. City Parks & Recreation & Services Page 81
Economic & Planning Systems, Inc. Z:\Shared\Projects\Oakland\191000s\191105_ContraCostaLAFCO_Parks&RecMSR\Report\191105 CC LAFCO Parks and Rec MSR-SOI Final 2021June14.docx
Figure 4 Condition of Existing Park and Recreation Facilities
Overall, most cities in Contra Costa County reported that the majority of their park and recreation facilities are in good condition. The City of Pinole was the only city to indicate that no facilities are in “good” condition, and that all are in “moderate” condition. The cities of Lafayette, Pittsburg, San Pablo, San Ramon, and Walnut Creek indicated that at least one of their facilities is in poor condition, with Pittsburg reporting the highest percentage of facilities in poor condition. Brentwood, Concord, Danville, Moraga, and Oakley all reported that 100% of their facilities are in good condition. The City of Antioch did not provide data relating to the current levels of facility upkeep.
A Capital Improvement Plan (CIP) is a short-range plan produced by cities used to identify necessary infrastructure projects and funding options. These are generally higher cost projects that require a longer timeline in order to budget accordingly, and most cities produce CIPs on multiyear interims. Cities will typically include a CIP category specific to Parks and Recreation, which may include projects such as playground equipment improvements, park landscaping, and recreation facility construction or upkeep.
All 18 cities have current adopted CIPs. Ten of the 18 cities indicate that 100% of their current Parks and Recreation-related CIP projects have fully identified funding sources. The cities of Concord and Walnut Creek did not provide information related to the portion of their current CIP projects that have identified funding, and the cities of Martinez and San Pablo did not provide funding source information related to their future CIP projects. Seven cities indicated that a

Contra Costa LAFCO Parks & Recreation MSR/SOI Update June 2021 7. City Parks & Recreation & Services Page 82
Economic & Planning Systems, Inc. Z:\Shared\Projects\Oakland\191000s\191105_ContraCostaLAFCO_Parks&RecMSR\Report\191105 CC LAFCO Parks and Rec MSR-SOI Final 2021June14.docx
portion of their future Parks and Recreation-related CIP projects have funding identified, and five cities did not indicate the presence of any future parks-related CIP projects. Three cities, Pinole, Richmond, and Walnut Creek indicated that 100% of all future Parks and Recreation-related CIP projects have funding sources fully identified.
The cities and towns in Contra Costa County offer a myriad of recreation programming, including classes, sports leagues, and events for all age groups. Nearly all of the cities (14 out of 18) indicate that they offer some form of classes to their residents. Fourteen of the cities indicate that they offer either sports leagues or sports-related summer camps for youths. Community events hosted by the Parks and Recreation Department, such as concert or movie series, holiday-themed community events, or parades are offered by 13 of the cities according to information received for this MSR process.
F inanc ia l Ab i l i t y to P rov ide Serv i ces
Every city reported that current levels of financing are adequate for current park and recreation service provision. It is important to note that this MSR effort attempted to assess the state of parks and recreation services under normal circumstances. COVID-19 has had significant impacts on the fiscal status of municipal governments and most cities indicate that their parks and recreation departments have been adversely affected. The magnitude of the negative financial impacts is typically correlated with the amount that the department relies on recreation user fee revenue to fund operations. COVID-19 health order restrictions have severely limited the number and scale of allowable programming and facility rentals since March of 2020, and those cities that rely heavily on these revenues have felt the brunt of the impact.
Figure 5 demonstrates the Fiscal Year 2019-20 budgeted Parks and Recreation-related expenditures for each city presented on a per capita basis. Due to the various sizes and populations of each city, it is necessary to normalize the expenditures by population size in order to allow for a reasonable comparison between each city. On average, cities in Contra Costa County are spending $157 per resident on parks and recreation expenditures each year. Ten cities are below this average and eight cities are above. The City of Clayton spends the least per capita, at $16, although it is pertinent to note that Clayton has the smallest population and does not offer recreational programming. The City of Walnut Creek, at $589 per capita, reported the highest annual parks and recreation-related expenditures. Walnut Creek has a substantial amount of open space acreage to maintain which contributes to their significantly higher reported expenditures.

Contra Costa LAFCO Parks & Recreation MSR/SOI Update June 2021 7. City Parks & Recreation & Services Page 83
Economic & Planning Systems, Inc. Z:\Shared\Projects\Oakland\191000s\191105_ContraCostaLAFCO_Parks&RecMSR\Report\191105 CC LAFCO Parks and Rec MSR-SOI Final 2021June14.docx
Figure 5 Budgeted FY19-20 Parks and Recreation-Related Expenditures per Capita
Cities generally attempt to collect cost recovery revenues for certain types of services provided. User fees, rental fees, and recreational programming enrollment fees are the primary types of revenues used by cities to offset Parks and Recreation expenditures. Typically, any expenditures not offset by user fee revenues are funded through a city’s General Fund, although some cities may have specialized funds that contribute to Parks and Recreation Departments. While funding structures and overall financial health vary between cities, in general a higher cost recovery proportion may indicate the fiscal strength of a Parks and Recreation Department as their activities are more able to pay for themselves and do not rely on General Fund revenues. In light of current health order restrictions due to the COVID-19 pandemic, cities that rely heavily on cost recovery revenues to fund their Parks and Recreation functions are more at risk for funding issues as county-mandated shutdowns of large in-person gatherings severely limit a city’s ability to provide programming. Cities that do not rely heavily on cost recovery revenues are perhaps better-positioned to withstand the negative fiscal impacts due to the pandemic without having to make drastic changes to staffing levels and service provision.
Figure 6 displays each city’s cost recovery revenues as a proportion of their total Parks and Recreation-related expenditures for Fiscal Year 2019-20.19
19 The City of Lafayette provided Fiscal Year 2018-19 values.
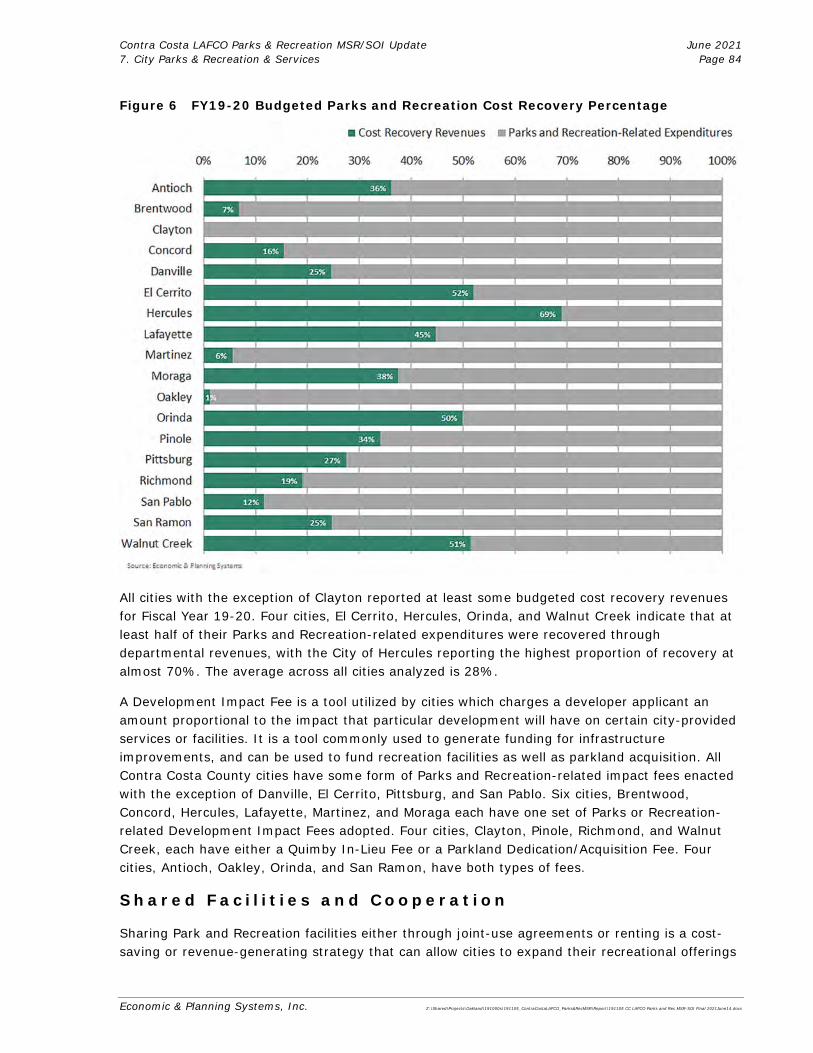
Contra Costa LAFCO Parks & Recreation MSR/SOI Update June 2021 7. City Parks & Recreation & Services Page 84
Economic & Planning Systems, Inc. Z:\Shared\Projects\Oakland\191000s\191105_ContraCostaLAFCO_Parks&RecMSR\Report\191105 CC LAFCO Parks and Rec MSR-SOI Final 2021June14.docx
Figure 6 FY19-20 Budgeted Parks and Recreation Cost Recovery Percentage
All cities with the exception of Clayton reported at least some budgeted cost recovery revenues for Fiscal Year 19-20. Four cities, El Cerrito, Hercules, Orinda, and Walnut Creek indicate that at least half of their Parks and Recreation-related expenditures were recovered through departmental revenues, with the City of Hercules reporting the highest proportion of recovery at almost 70%. The average across all cities analyzed is 28%.
A Development Impact Fee is a tool utilized by cities which charges a developer applicant an amount proportional to the impact that particular development will have on certain city-provided services or facilities. It is a tool commonly used to generate funding for infrastructure improvements, and can be used to fund recreation facilities as well as parkland acquisition. All Contra Costa County cities have some form of Parks and Recreation-related impact fees enacted with the exception of Danville, El Cerrito, Pittsburg, and San Pablo. Six cities, Brentwood, Concord, Hercules, Lafayette, Martinez, and Moraga each have one set of Parks or Recreation-related Development Impact Fees adopted. Four cities, Clayton, Pinole, Richmond, and Walnut Creek, each have either a Quimby In-Lieu Fee or a Parkland Dedication/Acquisition Fee. Four cities, Antioch, Oakley, Orinda, and San Ramon, have both types of fees.
Shared Fac i l i t i e s an d Coopera t ion
Sharing Park and Recreation facilities either through joint-use agreements or renting is a cost-saving or revenue-generating strategy that can allow cities to expand their recreational offerings

Contra Costa LAFCO Parks & Recreation MSR/SOI Update June 2021 7. City Parks & Recreation & Services Page 85
Economic & Planning Systems, Inc. Z:\Shared\Projects\Oakland\191000s\191105_ContraCostaLAFCO_Parks&RecMSR\Report\191105 CC LAFCO Parks and Rec MSR-SOI Final 2021June14.docx
without necessitating the large capital expenditures related to new facility construction. Fifteen of the 18 cities examined in this chapter indicate that they share facilities with at least one other district or organization. The cities of Hercules and Martinez both indicate that they do not currently share any facilities, and the City of Clayton did not indicate its status of shared facilities. There are a number of cities that are either adjacent to or overlapping with county agencies such as County Services Areas (CSAs), Community Services Districts (CSDs), and Recreation and Park Districts (RPDs). Proximity to or overlap with these jurisdictional boundaries may indicate potential opportunities for shared facilities. Thirteen of the 18 cities are either adjacent to or overlapping with these special districts. Only the cities of Antioch, Brentwood, Clayton, Oakley, and Richmond are not overlapping or abutting to any CSAs, CSDs, or RPDs.
Accoun tab i l i t y f o r Communi ty Serv i ce Needs
All cities indicate adequate accountability in regard to Community Service Needs. Each city provides access to agendas and minutes for Council and Commission meetings on their website as well as public notices for time and place of meetings. Every city demonstrated accountability and transparency by disclosing financial and service-related information in response to LAFCO requests.
Fifteen out of the 18 cities have some form of a Parks and Recreation Commission established. Most of these are specifically related to Parks and Recreation, with the exception of Clayton which has a Trails and Landscape Committee, Hercules, which has a Community and Library Services Commission, and San Pablo, which has a Community Services Standing Committee. Three cities - Oakley, Pinole, and Pittsburg - do not currently have a Parks and Recreation Commission or similar equivalent established.
Impact o f COVID-19
The fiscal and economic impacts of the COVID-19 pandemic have been significant and widespread across almost all levels of government and private-sector organizations. Parks and Recreation Departments in particular have felt significant negative impacts of mandated social distancing requirements and the ensuing cancellation of recreational programming such as classes, sports, and summer camps, which for many departments are primary sources of revenue. Depending on the structure of each department’s budget, the severity of this impact can vary significantly.
No city included in this MSR indicated that the fiscal impacts of COVID-19 is so severe as to necessitate the closure or dissolution of their Parks and Recreation Department. All cities reported that they anticipate the ability to continue providing adequate parks and recreation services despite the budgetary setbacks realized due to the pandemic and its effects.
Many cities reported that they are taking steps to mitigate the current and expected fiscal setbacks caused by COVID-19. The most commonly reported efforts include the reduction in expenditures, deferment of capital investments, and the siphoning of reserve funds to compensate for the significant reductions in anticipated program revenues.
Every city reported that some or all recreation programming was cancelled following the March 2020 Health Orders issued by the County and State. All cities indicated that modified programming, either via virtual means or socially distant in-person activities, have already been

Contra Costa LAFCO Parks & Recreation MSR/SOI Update June 2021 7. City Parks & Recreation & Services Page 86
Economic & Planning Systems, Inc. Z:\Shared\Projects\Oakland\191000s\191105_ContraCostaLAFCO_Parks&RecMSR\Report\191105 CC LAFCO Parks and Rec MSR-SOI Final 2021June14.docx
implemented or are being explored. The City of Clayton did not provide information related to the effects of COVID-19 on City operations.
C i ty Rec rea t ion Serv i ces MSR Dete rm ina t ions
The data utilized for the following determinations have been compiled primarily from sources published prior to COVID-19 and its effects on agency operations. These data are used to reflect typical operations under normal circumstances, with the assumptions that operations will return to their typical states within the next few years. Information regarding the effects COVID-19 has had on operations relevant to this MSR is included to the extent possible.
City of Antioch Parks and Recreation Services MSR Determinations
1. Growth and Population Projections
a) The California Department of Finance estimates the City of Antioch’s 2020 population to be 112,520. The Association of Bay Area Governments projects Antioch’s population to increase by 27,130 residents between 2020 and 2040, to a total of 139,650. This represents a compound annual growth rate of 1.09%.
2. The location and characteristics of any disadvantaged unincorporated communities within or contiguous to the sphere of influence
a) Disadvantaged communities have been identified within the City’s SOI. The residents of the City’s disadvantaged communities have equivalent access to park facilities as other members of the community.
3. Present and Planned Capacity of Public Facilities and Adequacy of Public Services, Including Infrastructure Needs and Deficiencies
a) There are currently 322.4 acres of developed neighborhood and community parkland20 and 24.9 miles of recreational trails within the City of Antioch. Recreation facilities include two community centers and a water park. Additional facilities that Antioch residents have access to include Antioch/Oakley Regional Shoreline, Big Break Regional Shoreline, Black Diamond Mines Regional Preserve, Contra Loma Regional Park, and Morgan Territory Regional Preserve.
b) The City currently has 2.87 acres of developed parkland per 1,000 residents. c) The City of Antioch has a level of service standard of 5 acres per 1,000 residents.
Relative to this standard, the City is underproviding park acreage. The current LOS is short of this standard by 2.13 acres per 1,000 residents. The City, therefore, needs 240 more acres to meet the standard for the current population. In order to meet the LOS for the projected 2040 city population, the City will need 376 additional acres of parkland.
d) There is adequate recreational programming offered within the City to meet the needs of youths and adults. Estimated FY 18/19 annual attendance for water park guests and recreation program participants totaled 38,466.
e) The City indicates that residents of disadvantaged communities have the same access to recreation facilities and programs as other residents. The City charges no facility entry
20 Including 189.4 acres of neighborhood parkland and 133 acres of community parkland.

Contra Costa LAFCO Parks & Recreation MSR/SOI Update June 2021 7. City Parks & Recreation & Services Page 87
Economic & Planning Systems, Inc. Z:\Shared\Projects\Oakland\191000s\191105_ContraCostaLAFCO_Parks&RecMSR\Report\191105 CC LAFCO Parks and Rec MSR-SOI Final 2021June14.docx
fees for general use, provides scholarship funding for youth to apply to program fees and specialized facility entry, and the department collaborates with community organizations to ensure widespread dissemination of information and resources.
f) CIP planning has been conducted through the City of Antioch 5 Year Capital Improvement Plan 2019-2024.
g) The City of Antioch does not currently have a Parks and Recreation Master Plan adopted. The City has a section within their 2003 General Plan that lists Parks and Recreation Objectives and Policies.
h) The City states their intention to acquire future parkland through the use of Park In-Lieu Fees on future development but gave no indication regarding the identification of areas where future parkland will be created.
i) Funding sources have been identified for 100% ($2.6M) of the City’s current planned parks-related capital expenditures through 2024. The majority of the identified funding will be addressed through the Park In-Lieu Fund, with the Delta Fair Fund also identified as a funding source.
j) Funding sources have been identified for 33% ($28.3M) of the City’s future planned parks-related capital expenditures ($85.4M). Development Impact Fees are the only funding source currently identified.
k) The City did not disclose the condition of their park facilities.
4. Financial Ability of Agencies to Provide Services
a) The City of Antioch reported that the current level of financing is adequate for parks and recreation service provision and they anticipate the ability to accommodate future anticipated growth.
b) The City has Park In-Lieu Fees and Development Impact Fees established and a Park and Recreation User Fee schedule which is approved annually and includes an escalation factor connected to the Consumer Price Index.
c) The majority of the City’s Recreation Services Fund revenue comes from General Fund transfers (52%) and Service Charges (44%). Parks and Recreation Administration Support is funded entirely by a 1% sales tax. Parks Maintenance is funding is split between Street Light & Landscape Maintenance District and Other.
5. Status of, and Opportunities for, Shared Facilities
a) The City shares a park with the Antioch Unified School District and the Antioch Senior Center. The City has identified additional opportunities for shared facilities with community organizations.
6. Accountability for Community Service Needs, Including Governmental Structure and Operational Efficiencies
a) The City of Antioch website provides access to the agendas and minutes for the City Council and its various boards and commissions, including the Park and Recreation Commission; the City’s budgets; and the City’s CAFRs. The City adequately provides accountability with regard to governance and municipal operations.
b) The City of Antioch website provides access to public notices, including the time and place at which City residents may provide input, as well as other opportunities for public

Contra Costa LAFCO Parks & Recreation MSR/SOI Update June 2021 7. City Parks & Recreation & Services Page 88
Economic & Planning Systems, Inc. Z:\Shared\Projects\Oakland\191000s\191105_ContraCostaLAFCO_Parks&RecMSR\Report\191105 CC LAFCO Parks and Rec MSR-SOI Final 2021June14.docx
involvement in the City decision-making process. Meeting agendas and minutes are posted in a timely manner. The City adequately provides accountability with regard to citizen participation.
c) The City of Antioch demonstrated accountability and transparency by disclosing financial and service-related information in response to LAFCO requests.
d) The City of Antioch performs additional outreach activities through the following outlets: meetings and civic events in neighborhood parks and community centers, and through the Antioch Council of Teens, a forum for the City’s youth to provide input for city recreation programming.
7. Any other matter related to efficient service delivery, as required by commission policy
a) COVID-19 is having significant effects on the City’s General Fund revenues and the City’s ability to fund Park and Recreation services. In response to COVID-19, the City has increased information and outreach for residents through virtual opportunities and put indoor facilities, playgrounds, and programs on hiatus while continuing to offer outdoor activities as allowable. The City has indicated that revenues have declined due to COVID-related cancellations but expenditures for program development and seasonal and part-time staff have also decreased.
City of Brentwood Parks and Recreation Services MSR Determinations
1. Growth and Population Projections
a) The California Department of Finance estimates the City of Brentwood’s 2020 population to be 65,118. The Association of Bay Area Governments projects Brentwood’s population to increase by 31,715 residents between 2020 and 2040, to a total of 96,833. This represents a compound annual growth rate of 2.00%.
2. The location and characteristics of any disadvantaged unincorporated communities within or contiguous to the sphere of influence
a) A disadvantaged community has been identified within the City’s SOI. The residents of the City’s disadvantaged community have equivalent access to park facilities as other members of the community.
3. Present and Planned Capacity of Public Facilities and Adequacy of Public Services, Including Infrastructure Needs and Deficiencies
a) There are currently 237.05 acres of developed neighborhood and community parkland21 and 19.22 miles of recreational trails within the City of Brentwood. Recreation facilities include an aquatic complex, a senior activity center, and a skate/BMX park. Additional facilities that Brentwood residents have access to include Antioch/Oakley Regional Shoreline, Big Break Regional Shoreline, Black Diamond Mines Regional Preserve, Contra
21 Including 3.27 acres of pocket parks, 110.39 acres of neighborhood parks, and 123.39 acres of community park facilities.

Contra Costa LAFCO Parks & Recreation MSR/SOI Update June 2021 7. City Parks & Recreation & Services Page 89
Economic & Planning Systems, Inc. Z:\Shared\Projects\Oakland\191000s\191105_ContraCostaLAFCO_Parks&RecMSR\Report\191105 CC LAFCO Parks and Rec MSR-SOI Final 2021June14.docx
Loma Regional Park, Round Valley Regional Preserve, and Vasco Caves Regional Preserve.
b) The City currently has 3.64 acres of developed parkland per 1,000 residents. c) The City of Brentwood has a level of service standard of 5 acres per 1,000 residents.
Relative to this standard, the City is underproviding park acreage. The current LOS is short of this standard by 1.36 acres per 1,000 residents. The City, therefore, needs 88.5 additional acres to meet the standard for the current population. In order to meet the LOS for the projected 2040 city population, the City will need 247.1 additional acres of parkland.
d) The City offers a limited variety of sports activities and classes for all ages due primarily to a lack of facilities and limited staff. Estimated annual attendance for recreation program participants of all ages totals 53,189.
e) The City indicates that the residents of disadvantaged communities have the same access to recreation facilities and programs as other residents. The City offers many free activities that are accessible and open to the general public and offers scholarships that can be applied to any of its Parks and Recreation programming.
f) CIP planning is conducted through the City of Brentwood 5 Year Capital Improvement Plan 2019-2024.
g) The City of Brentwood has a Parks and Recreation Master Plan that was updated in February 2019. The City recognizes some deficiencies in facility provision and plans to acquire new parkland through its Development Fee Program.
h) The City states their intention to acquire future parkland through the use of land dedication or in-lieu payments from new development. The City has policies in place guiding the locations of these future park facilities.
i) Funding sources have been identified for 100% ($3.6M) of the City’s planned parks-related capital expenditures through 2024. The entirety of the identified funding will be addressed through Replacement funds.
j) The City indicated that all 90 of their park facilities are in good condition.
4. Financial Ability of Agencies to Provide Services
a) The City of Brentwood reported that the current level of financing is adequate for parks and recreation service provision and they anticipate the ability to accommodate future anticipated growth.
b) The City has Development Impact Fees established and a User Fee schedule which is updated annually.
c) The majority of the City’s Parks and Recreation Department revenue comes from the Landscape Lighting Assessment Districts (LLAD) Replacement Fund (71%) and General Fund transfers (20%).
5. Status of, and Opportunities for, Shared Facilities
a) The City has Joint Use Agreements with the Brentwood Unified School District and Liberty Unified High School District. The City also shares facilities with the Senior Club, the County, the Chamber of Commerce, and a non-profit.
b) The City has no currently pending opportunities for new shared facilities but indicates the possibility of future partnership opportunities with its new future tech center.

Contra Costa LAFCO Parks & Recreation MSR/SOI Update June 2021 7. City Parks & Recreation & Services Page 90
Economic & Planning Systems, Inc. Z:\Shared\Projects\Oakland\191000s\191105_ContraCostaLAFCO_Parks&RecMSR\Report\191105 CC LAFCO Parks and Rec MSR-SOI Final 2021June14.docx
6. Accountability for Community Service Needs, Including Governmental Structure and Operational Efficiencies
a) The City of Brentwood website provides access to the agendas and minutes for the City Council and its various boards and commissions, including the Park and Recreation Commission; the City’s budgets; and the City’s CAFRs. The City adequately provides accountability with regard to governance and municipal operations.
b) The City of Brentwood website provides access to public notices, including the time and place at which City residents may provide input, as well as other opportunities for public involvement in the City decision-making process. Meeting agendas and minutes are posted in a timely manner. The City adequately provides accountability with regard to citizen participation.
c) The City of Brentwood demonstrated accountability and transparency by disclosing financial and service-related information in response to LAFCO requests.
d) The City of Brentwood performs additional outreach activities through the following monthly meetings by various City commissions and through widely publicizing opportunities for community input for various projects such as master plans and strategic plans.
7. Any other matter related to efficient service delivery, as required by commission policy
a) COVID-19 is having significant effects on the City’s General Fund revenues and the City’s ability to fund Park and Recreation services. In response to COVID-19, the City began offering courses virtually and through socially-distanced measures. Strategic initiatives have been put on hold until funding can be identified as current funding has been diverted due to the pandemic response. The City has also utilized its Senior Activity Center as a COVID_19 testing facility for the County and State.
City of Clayton Parks and Recreation Services MSR Determinations
1. Growth and Population Projections
a) The California Department of Finance estimates the City of Clayton’s 2020 population to be 11,337. The Association of Bay Area Governments projects Clayton’s population to increase by 625 residents between 2020 and 2040, to a total of 11,962. This represents a compound annual growth rate of 0.27%.
2. The location and characteristics of any disadvantaged unincorporated communities within or contiguous to the sphere of influence
a) There are no disadvantaged communities that have been identified within the City’s SOI.

Contra Costa LAFCO Parks & Recreation MSR/SOI Update June 2021 7. City Parks & Recreation & Services Page 91
Economic & Planning Systems, Inc. Z:\Shared\Projects\Oakland\191000s\191105_ContraCostaLAFCO_Parks&RecMSR\Report\191105 CC LAFCO Parks and Rec MSR-SOI Final 2021June14.docx
3. Present and Planned Capacity of Public Facilities and Adequacy of Public Services, Including Infrastructure Needs and Deficiencies
a) There are currently 17.52 acres of developed neighborhood and community parkland22 and 27 miles of recreational trails within the City of Clayton. Recreation facilities include baseball and soccer fields.
b) The City currently has 1.55 acres of developed parkland per 1,000 residents. c) The City of Clayton has a level of service standard of 10 acres per 1,000 residents. This
includes 3 acres of developed parkland and 7 acres of active open space. Relative to this standard, the City is underproviding park acreage. The current LOS is short of this standard by 1.45 acres of developed parkland per 1,000 residents. The City, therefore, needs 17.0 additional acres of developed parkland to meet the standard for the current population. In order to meet the LOS for the projected 2040 city population, the City will need 18.8 additional acres of parkland.
d) The City does not offer recreational programming. e) CIP planning has been conducted through the City of Clayton 5 Year Capital Improvement
Plan 2019-2024. f) The City of Clayton does not have a standalone Parks and Recreation Master Plan, but
Section VI of their 2000 General Plan covers Open Space and Conservation planning. g) The City did not indicate any plans for acquiring further parkland in the future. h) The City has one current CIP project. Funding for the project has been partially identified
and will come from the Garbage Franchise Community Enhancement Fee. i) The City has four future CIP projects, of which funding has been identified for one. The
Funding source identified is the CIP Construction Fund. j) Of the City’s eight Park and Recreation facilities, seven are indicated to be in very good
condition and one is indicated to be in moderate condition.
4. Financial Ability of Agencies to Provide Services
a) The City of Clayton reported that the current level of financing is adequate for park service provision and did not indicate that they anticipate the inability to accommodate future anticipated growth.
b) The City has Parkland Dedication Fee established and a Master Fee Schedule which is updated annually. On average, fees increase by about two% annually.
c) The entirety of the City’s Community Park budget is funded through the General Fund according to the information provided.
5. Status of, and Opportunities for, Shared Facilities
a) The City did not indicate that they have any Joint-Use Agreements. b) The City did not indicate if they are currently pursuing opportunities for new shared
facilities.
22 Including an 8.9-acre community park and 8.6 acres of other parkland.

Contra Costa LAFCO Parks & Recreation MSR/SOI Update June 2021 7. City Parks & Recreation & Services Page 92
Economic & Planning Systems, Inc. Z:\Shared\Projects\Oakland\191000s\191105_ContraCostaLAFCO_Parks&RecMSR\Report\191105 CC LAFCO Parks and Rec MSR-SOI Final 2021June14.docx
6. Accountability for Community Service Needs, Including Governmental Structure and Operational Efficiencies
a) The City of Clayton website provides access to the agendas and minutes for the City Council and its various boards and commissions, including the Trails and Landscape Committee; the City’s budgets; and the City’s CAFRs. The City adequately provides accountability with regard to governance and municipal operations.
b) The City of Clayton website provides access to public notices, including the time and place at which City residents may provide input, as well as other opportunities for public involvement in the City decision-making process. City Council meeting agendas and minutes are posted in a timely manner. The City adequately provides accountability with regard to citizen participation.
c) The City of Clayton demonstrated accountability and transparency by disclosing financial and service-related information in response to LAFCO requests.
d) The City of Clayton performs additional outreach activities through monthly meetings by various City commissions and through publicizing opportunities for community input for various projects such as master plans and strategic plans.
7. Any other matter related to efficient service delivery, as required by commission policy
a) At this time the City of Clayton has not indicated the extent to which COVID-19 is affecting the City’s ability to provide Parks and Recreation services.
City of Concord Parks and Recreation Services MSR Determinations
1. Growth and Population Projections
a) The California Department of Finance estimates the City of Concord’s 2020 population to be 130,143. The Association of Bay Area Governments projects Concord’s population to increase by 51,245 residents between 2020 and 2040, to a total of 181,388. This represents a compound annual growth rate of 1.67%.
2. The location and characteristics of any disadvantaged unincorporated communities within or contiguous to the sphere of influence
a) Disadvantaged communities have been identified within the City’s SOI. The residents of the City’s disadvantaged community have equivalent access to park facilities as other members of the community.
3. Present and Planned Capacity of Public Facilities and Adequacy of Public Services, Including Infrastructure Needs and Deficiencies
a) There are currently 365.7 acres of developed neighborhood and community parkland,23 175 acres of open space, a 160-acre golf course, and 10.3 miles of recreational trails
23 Including 13.86 acres of neighborhood parks, 317 acres of community park facilities, and 34.8 acres of other parkland facilities.

Contra Costa LAFCO Parks & Recreation MSR/SOI Update June 2021 7. City Parks & Recreation & Services Page 93
Economic & Planning Systems, Inc. Z:\Shared\Projects\Oakland\191000s\191105_ContraCostaLAFCO_Parks&RecMSR\Report\191105 CC LAFCO Parks and Rec MSR-SOI Final 2021June14.docx
within the City of Concord. Additional recreation facilities include three sports complexes and a skate park. Additional facilities that Concord residents have access to include Concord Hills Regional Park, Diablo Foothills Regional Park, and Iron Horse Regional Trail.
b) The City currently has 2.8 acres of developed parkland per 1,000 residents. c) The City of Concord has a level of service standard of 6 acres per 1,000 residents.
Relative to this standard, the City is underproviding park acreage. The current LOS is short of this standard by 2.11 acres per 1,000 residents. The City, therefore, needs 275 more acres to meet the standard for the current population. In order to meet the LOS for the projected 2040 city population, the City will need 582 additional acres of parkland.
d) The City offers a robust variety of sports activities and classes for all ages. Estimated annual attendance for recreation program participants of all ages totals 42,960.
e) The City indicates that the residents of disadvantaged communities have the same access to recreation facilities and programs as other residents. The City offers access to parks and recreational use of courts and playgrounds free of charge, and additionally offers affordable youth classes at parks located within disadvantaged communities.
f) CIP planning has been conducted through the City of Concord Capital Budgets for 2018-2020 and 2020-2022.
g) The City of Concord does not have a standalone Parks and Recreation Master Plan but has an Open Space and Conservation Element within the Concord 2030 General Plan.
h) The City states their intention to acquire future parkland through its plan to develop 800 acres of future parks and open space through the redevelopment of the former Concord Naval Weapon Station which will allow the city to meet the park provision needs of its anticipated future population.
i) The City did not indicate the portion of specific CIP projects that have funding sources identified. The City specified a number of funds that are generally used for CIP expenditures, such as bond proceeds, Capital Projects funds, and General Fund revenues.
j) Park and Recreation facilities within the City of Concord were indicated to be in good condition.
4. Financial Ability of Agencies to Provide Services
a) The City of Concord reported that the current level of financing is adequate for parks and recreation service provision and they anticipate the ability to accommodate future anticipated growth.
b) The City has Development Impact Fees established and a User Fee schedule which is evaluated periodically, typically priced to maximize participation levels.
c) The majority of the City’s Parks and Recreation Department revenue comes from Non-Major Governmental Funds (35%), User Fees/Charges (27%), and Enterprise Fund Revenue (24%).
5. Status of, and Opportunities for, Shared Facilities
a) The City has Joint Use Agreements with Mt. Diablo Unified School District, California State University, and community-based non-profits.
b) The City indicates they are open to exploring partnerships that enhance the community’s parks and recreation opportunities. They are currently exploring the opportunity to develop a bicycle playground in partnership with the Contra Costa Transportation Authority.

Contra Costa LAFCO Parks & Recreation MSR/SOI Update June 2021 7. City Parks & Recreation & Services Page 94
Economic & Planning Systems, Inc. Z:\Shared\Projects\Oakland\191000s\191105_ContraCostaLAFCO_Parks&RecMSR\Report\191105 CC LAFCO Parks and Rec MSR-SOI Final 2021June14.docx
c) The City of Concord is adjacent to the Pleasant Hill and the Ambrose Recreation and Park District, and County Service Area M-16.
6. Accountability for Community Service Needs, Including Governmental Structure and Operational Efficiencies
a) The City of Concord website provides access to the agendas and minutes for the City Council and its various boards and commissions, including the Parks, Recreation, and Open Space Commission; the City’s budgets; and the City’s CAFRs. The City adequately provides accountability with regard to governance and municipal operations.
b) The City of Concord website provides access to public notices, including the time and place at which City residents may provide input, as well as other opportunities for public involvement in the City decision-making process. Meeting agendas and minutes are posted in a timely manner. The City adequately provides accountability with regard to citizen participation.
c) The City of Concord demonstrated accountability and transparency by disclosing financial and service-related information in response to LAFCO requests.
d) The City of Concord performs additional outreach activities through monthly meetings by various City commissions and publicizes these meetings according to City requirements.
7. Any other matter related to efficient service delivery, as required by commission policy
a) COVID-19 is having significant effects on the City’s General Fund revenues. In response to COVID-19, the City has adapted programs for virtual or online participation where possible as COVID-19 health order restrictions have limited the traditional program offerings.
Town of Danville Parks and Recreation Services MSR Determinations
1. Growth and Population Projections
a) The California Department of Finance estimates the Town of Danville’s 2020 population to be 43,876. The Association of Bay Area Governments projects Danville’s population to increase by 2,725 residents between 2020 and 2040, to a total of 46,601. This represents a compound annual growth rate of 0.30%.
2. The location and characteristics of any disadvantaged unincorporated communities within or contiguous to the sphere of influence
a) No disadvantaged communities were identified within the Town’s SOI.

Contra Costa LAFCO Parks & Recreation MSR/SOI Update June 2021 7. City Parks & Recreation & Services Page 95
Economic & Planning Systems, Inc. Z:\Shared\Projects\Oakland\191000s\191105_ContraCostaLAFCO_Parks&RecMSR\Report\191105 CC LAFCO Parks and Rec MSR-SOI Final 2021June14.docx
3. Present and Planned Capacity of Public Facilities and Adequacy of Public Services, Including Infrastructure Needs and Deficiencies
a) There are currently 169.3 acres of developed neighborhood and community parkland24 and 6.88 miles of recreational trails within the Town of Danville. Recreation facilities include sports fields and a gymnasium that is under a joint-use agreement with the San Ramon Valley Unified School District. Additional facilities that Danville residents have access to include Iron Horse Regional Trail, Las Trampas Regional Wilderness, Diablo Foothills, and Sycamore Valley Regional Open Space Preserve.
b) The Town currently has 3.9 acres of developed parkland per 1,000 residents. c) The Town of Danville has a level of service standard of 6.6 acres per 1,000 residents.
Relative to this standard, the Town is underproviding park acreage. The current LOS is short of this standard by 2.7 acres per 1,000 residents. The Town, therefore, needs 120.3 more acres to meet the standard for the current population. In order to meet the LOS for the projected 2040 Town population, the Town will need 138.2 more acres of parkland.
d) The Town offers a variety of recreation programming for all ages. Attendance for recreation program participants of all ages totaled 20,233 in Fiscal Year 2019.
e) CIP planning is conducted through the Town of Danville’s 2019/20 CIP. f) The Town of Danville has a Parks, Recreation and Arts Strategic Plan that was adopted in
2006 and updated in 2017. g) The Town indicates there are no current plans to acquire additional parkland. The Town
indicates that availability of large-scale community park acreage is limited, so the Town intends to focus on enhancing and expanding the existing public trail system.
h) The Town indicates that $24.0 million (97%) of the total $24.7 million in current and future CIP projects have funding sourced identified. The majority of projects will be funded through their Park Facilities fund (49%) and through the Park Dedication Impact Fund (16%).
i) The Town reported that all park and recreation facilities are in very good condition.
4. Financial Ability of Agencies to Provide Services
a) The Town of Danville reported that the current level of financing is adequate for parks and recreation service provision and they anticipate the ability to accommodate future anticipated growth.
b) CSA M-30 provides financing for extended facilities and services in the unincorporated community of Alamo Springs through the Town of Danville. Among the services funded, the Town uses CSA funds to provide park and recreation services within Town limits – there are no park facilities within the CSA boundary.
c) The Town has a User Fee schedule which is updated annually. d) The majority of the Town’s Parks and Recreation-related revenues come from Gas Tax &
LLAZ-Zone D (41.7%), General Fund transfers (35.9T), and User Fees / Charges (22.3%). This financial information includes both the Recreation, Arts & Community Services Department and Maintenance related to Recreation services.
24 Including 164.6 acres of community parkland, 1.4 acres of neighborhood parkland, 3 acres of a special use site, and a 0.36-acre pocket park.

Contra Costa LAFCO Parks & Recreation MSR/SOI Update June 2021 7. City Parks & Recreation & Services Page 96
Economic & Planning Systems, Inc. Z:\Shared\Projects\Oakland\191000s\191105_ContraCostaLAFCO_Parks&RecMSR\Report\191105 CC LAFCO Parks and Rec MSR-SOI Final 2021June14.docx
5. Status of, and Opportunities for, Shared Facilities
a) The Town has shared-use agreements with the San Ramon Valley Unified School District, EBMUD, ERBPD, and Contra Costa County (Hap Magee Ranch Park and the Iron Horse Trail).
b) The Town indicated they are not pursuing additional opportunities to share facilities with other entities.
c) The Town of Danville is adjacent to County Service Areas M-30 and R-7, the Diablo Community Services District, and also has overlapping boundaries with the Green Valley Recreation and Park District.
6. Accountability for Community Service Needs, Including Governmental Structure and Operational Efficiencies
a) The Town of Danville website provides access to the agendas and minutes for the Town Council and its various boards and commissions, including the Parks, Recreation, and Arts Commission; the Town’s budgets; and the Town’s CAFRs. The Town adequately provides accountability with regard to governance and municipal operations.
b) The Town of Danville website provides access to public notices, including the time and place at which Town residents may provide input, as well as other opportunities for public involvement in the Town decision-making process. Meeting agendas and minutes are posted in a timely manner. The Town adequately provides accountability with regard to citizen participation.
c) The Town of Danville demonstrated accountability and transparency by disclosing financial and service-related information in response to LAFCO requests.
7. Any other matter related to efficient service delivery, as required by commission policy
a) COVID-19 is having significant effects on the Town’s Parks and Recreation activities and programming. In response to COVID-19, the Town postponed or cancelled programs beginning in mid-March 2020. Losses in anticipated revenues due to cancellations and refunds have been mitigated by postponing certain CIP projects and offering online classes and virtual activities.
City of El Cerrito Parks and Recreation Services MSR Determinations
1. Growth and Population Projections
a) The California Department of Finance estimates the City of El Cerrito’s 2020 population to be 24,953. The Association of Bay Area Governments projects El Cerrito’s population to increase by 2,230 residents between 2020 and 2040, to a total of 27,183. This represents a compound annual growth rate of 0.43%.

Contra Costa LAFCO Parks & Recreation MSR/SOI Update June 2021 7. City Parks & Recreation & Services Page 97
Economic & Planning Systems, Inc. Z:\Shared\Projects\Oakland\191000s\191105_ContraCostaLAFCO_Parks&RecMSR\Report\191105 CC LAFCO Parks and Rec MSR-SOI Final 2021June14.docx
2. The location and characteristics of any disadvantaged unincorporated communities within or contiguous to the sphere of influence
a) A disadvantaged community has been identified within the City’s SOI in an area along State Highway 123 and Petrero Avenue. The residents of the City’s disadvantaged community have equivalent access to park facilities as other members of the community.
3. Present and Planned Capacity of Public Facilities and Adequacy of Public Services, Including Infrastructure Needs and Deficiencies
a) There are currently 45.3 acres of developed neighborhood and community parkland,25 102 acres of open space, 1.6 acres of undeveloped parkland, and 3.6 miles of recreational trails within the City of El Cerrito. Recreation facilities include a swim center, community center, ten clubhouses, and a senior center. Additional facilities that El Cerrito residents have access to include Miller/Knox Regional Shoreline, Point Isabel Regional Shoreline, and Kennedy Grove Regional Recreation Area.
b) The City currently has 1.82 acres of developed neighborhood and community parkland per 1,000 residents.
c) The City of El Cerrito has a level of service standard of 5 acres of recreation and open space land per 1,000 residents. Relative to their adopted standard, the City is meeting their park acreage standard. Note that this is a different criterion than what is used throughout this report. When El Cerrito’s city-owned and city-maintained park and open space acreage is included, the City is providing seven acres per 1,000 residents, exceeding their standard by two acres.
d) The City offers a variety of sports activities and classes for all ages. Fiscal year 2019 enrollment for recreation program participants of all ages totaled 23,068.
e) The City indicates that residents of disadvantaged communities have the same access to recreation facilities and programs as other residents. The City offers scholarships to members of disadvantaged communities and reduced fees for childcare and preschool.
f) CIP planning is conducted through the El Cerrito 10-Year CIP for 2018-19 through 2027-28.
g) The City of El Cerrito has a Parks and Recreation Facilities Master Plan that was approved in April 2019.
h) The City states there are few options for parkland acquisition left in the City. The Parks and Recreation Facilities Master Plan identifies two small parcels that could be acquired to expand the Baxter Creek Gateway Park.
i) The City indicates that three out of seven current CIP projects have funding sources identified. The City further identified the Capital Improvement Program Fund, Measure A, and the general fund as funding sources. None of the three future CIP projects have specific funding sources identified.
j) Of the 16 developed park facilities in the City of El Cerrito, one was reported to be in very good condition, ten were reported to be in good condition, and five were reported to be in fair condition.
25 Including 42.2 acres of City parkland, a 0.3-acre city dog park, a 2.8-acre community center and swim center, and a 0.1-acre city playground.

Contra Costa LAFCO Parks & Recreation MSR/SOI Update June 2021 7. City Parks & Recreation & Services Page 98
Economic & Planning Systems, Inc. Z:\Shared\Projects\Oakland\191000s\191105_ContraCostaLAFCO_Parks&RecMSR\Report\191105 CC LAFCO Parks and Rec MSR-SOI Final 2021June14.docx
4. Financial Ability of Agencies to Provide Services
a) The City of El Cerrito reported that the current level of financing is adequate for parks and recreation service provision and the department relies mainly on user fees to provide services, with about 50%cost recovery in FY 2019-20. The City indicates that there are some recreation programming areas that are not meeting demand due to space limitations.
b) The 2019 City Services MSR indicated that the City’s CIP is not sufficient to maintain and expand facilities and infrastructure consistent with projected needs. To the extent the City is unable to identify other sources of revenue to fund park and recreation facility improvements, the City may struggle to maintain its service levels and may be forced to defer needed maintenance and upkeep.
c) The City does not have Parks and Recreation-related Development Impact Fees adopted, but has approved Measure H, an annual parcel tax on residential properties that funds park and recreation facility maintenance and enhancements. The City also has developer related fees for open space and park development in the San Pablo Specific Plan Area. User Fees are generally increased each year in accordance with the Consumer Price Index.
d) The majority of the City’s Parks and Recreation Department revenue comes from User Fees and Charges. The City indicated that the Recreation Department has 75%cost recovery through user fees and charges, and that percentage drops to 52 when parks-related Public Works expenditures are included.
5. Status of, and Opportunities for, Shared Facilities
a) The City has Joint Use Agreements with the five schools within the West Contra Costa Unified School District, and jointly owns Central Park with the City of Richmond.
b) The City indicates they are not pursuing any additional opportunities for shared facilities. c) The City of El Cerrito is adjacent to the Kensington Community Services District.
6. Accountability for Community Service Needs, Including Governmental Structure and Operational Efficiencies
a) The City of El Cerrito website provides access to the agendas and minutes for the City Council and its various boards and commissions, including the Park and Recreation Commission; the City’s budgets; and the City’s CAFRs. The City adequately provides accountability with regard to governance and municipal operations.
b) The City of El Cerrito website provides access to public notices, including the time and place at which City residents may provide input, as well as other opportunities for public involvement in the City decision-making process. Meeting agendas and minutes are posted in a timely manner. The City adequately provides accountability with regard to citizen participation.
c) The City of El Cerrito demonstrated accountability and transparency by disclosing financial and service-related information in response to LAFCO requests.
d) The City of El Cerrito performs additional outreach activities through its additional organizations and committees, such as the El Cerrito Trail Trekkers, the Urban Forest Committee, the Environmental Quality Committee, and the Arts and Culture Committee.

Contra Costa LAFCO Parks & Recreation MSR/SOI Update June 2021 7. City Parks & Recreation & Services Page 99
Economic & Planning Systems, Inc. Z:\Shared\Projects\Oakland\191000s\191105_ContraCostaLAFCO_Parks&RecMSR\Report\191105 CC LAFCO Parks and Rec MSR-SOI Final 2021June14.docx
7. Any other matter related to efficient service delivery, as required by commission policy
a) COVID-19 is having significant effects on the City’s General Fund revenues, particularly as the City has no reserves. In response to COVID-19, the City has adapted programs for virtual participation and has offered in-person programming in accordance with the County Health Order.
City of Hercules Parks and Recreation Services MSR Determinations
1. Growth and Population Projections
a) The California Department of Finance estimates the City of Hercules’s 2020 population to be 25,530. The Association of Bay Area Governments projects Hercules’s population to increase by 3,565 residents between 2020 and 2040, to a total of 29,095. This represents a compound annual growth rate of 0.66%.
2. The location and characteristics of any disadvantaged unincorporated communities within or contiguous to the sphere of influence
a) No disadvantaged communities were identified within the City’s SOI.
3. Present and Planned Capacity of Public Facilities and Adequacy of Public Services, Including Infrastructure Needs and Deficiencies
a) There are currently 31.3 acres of developed neighborhood and community parkland26 and 6 miles of recreational trails within the City of Hercules. Recreation facilities include five recreation centers, sports fields, two pools, and a gymnasium. Additional facilities that residents of Hercules have access to include Crockett Hills Regional Park.
b) The City currently has 1.2 acres of parks and open space per 1,000 residents. c) The City of Hercules has a level of service standard of 5 acres per 1,000 residents.27
Relative to this standard, the City is underproviding park acreage. The current LOS is short of this standard by 3.80 acres per resident. The City, therefore, needs an additional 96.4 acres to meet the standard for the current population. In order to meet the LOS for the projected 2040 city population, the City will need 114.2 additional acres of parkland.
d) There is adequate recreational programming offered within the City to meet the needs of youths and adults. Estimated annual attendance figures for activities / programs were not provided for this MSR effort. The City indicated that annual attendance for other events and annual festivals averages 1,975.
e) CIP planning is conducted through the City of Hercules FY2020-21 Annual Budget. f) The City of Hercules does not currently have a standalone Parks and Recreation Master
Plan adopted. The City has an Open Space/Conservation Element within its 1998 General Plan.
26 Includes 1.8 acres of Neighborhood parkland and 29.5 acres of Community parkland. 27 The LOS standard of 5 acres per 1,000 residents consists of 3.25 acres of community parks and 1.75 acres of neighborhood parks.

Contra Costa LAFCO Parks & Recreation MSR/SOI Update June 2021 7. City Parks & Recreation & Services Page 100
Economic & Planning Systems, Inc. Z:\Shared\Projects\Oakland\191000s\191105_ContraCostaLAFCO_Parks&RecMSR\Report\191105 CC LAFCO Parks and Rec MSR-SOI Final 2021June14.docx
g) The City states there are currently no plans to acquire future parkland. h) Funding sources are identified for both of the City’s current parks and open space-related
CIP projects. The identified funding will be addressed through General Fund and LLAD funds.
i) Of the City’s 13 existing park facilities, eight are reported to be in good condition, one is reported to be in fair condition, two are listed as new, and two did not have information provided regarding their condition.
4. Financial Ability of Agencies to Provide Services
a) The City of Hercules reported that the current level of financing is adequate for parks and recreation service provision and they anticipate the ability to accommodate future anticipated growth.
b) The 2019 City Services MSR indicated the City may experience funding obstacles to maintaining existing service levels or meeting overall infrastructure needs when accounting for projected population increases over the next five years. Based on the City-provided financial information for FY2019-20 it does not appear that park and recreation services are currently experiencing inordinate negative fiscal impacts beyond COVID-related revenue reductions.
c) The City has Park and Recreation Development Impact Fees and a Master Fee schedule which is approved annually through the City Council and increases 3% annually on average.
d) The City provided information regarding User Fees / Charges revenue for the City’s Parks and Recreation Department. These revenues accounted for 69% of the departmental expenditures in FY2019-20.
5. Status of, and Opportunities for, Shared Facilities
a) The City indicates that it does not share any facilities with other entities. b) The City is not currently pursuing any opportunities to share facilities. c) The City is adjacent to County Service Area R-10.
6. Accountability for Community Service Needs, Including Governmental Structure and Operational Efficiencies
a) The City of Hercules website provides access to the agendas and minutes for the City Council and its various boards and commissions, including the Community and Library Services Commission; the City’s budgets; and the City’s CAFRs. The City adequately provides accountability with regard to governance and municipal operations.
b) The City of Hercules website provides access to public notices, including the time and place at which City residents may provide input, as well as other opportunities for public involvement in the City decision-making process. Meeting agendas and minutes are posted in a timely manner. The City adequately provides accountability with regard to citizen participation.
c) The City of Hercules demonstrated accountability and transparency by disclosing financial and service-related information in response to LAFCO requests.
d) The City Hercules performs additional outreach activities through annual events held by the Parks and Recreation Department and through the Community and Library Services Commission.

Contra Costa LAFCO Parks & Recreation MSR/SOI Update June 2021 7. City Parks & Recreation & Services Page 101
Economic & Planning Systems, Inc. Z:\Shared\Projects\Oakland\191000s\191105_ContraCostaLAFCO_Parks&RecMSR\Report\191105 CC LAFCO Parks and Rec MSR-SOI Final 2021June14.docx
7. Any other matter related to efficient service delivery, as required by commission policy
a) COVID-19 is having significant effects on the City’s fiscal situation and the City’s ability to fund Park and Recreation services. In response to COVID-19, the City made significant cuts to staffing as revenues have drastically changed from years past. The City has attempted to offer virtual programming and altered capital plans due to budgetary concerns.
City of Lafayette Parks and Recreation Services MSR Determinations
1. Growth and Population Projections
a) The California Department of Finance estimates the City of Lafayette’s 2020 population to be 25,604. The Association of Bay Area Governments projects Lafayette’s population to increase by 1,950 residents between 2020 and 2040, to a total of 27,554. This represents a compound annual growth rate of 0.37%.
2. The location and characteristics of any disadvantaged unincorporated communities within or contiguous to the sphere of influence
a) A disadvantaged community has been identified within the City’s SOI. The residents of the City’s disadvantaged community have equivalent access to park facilities as other members of the community.
3. Present and Planned Capacity of Public Facilities and Adequacy of Public Services, Including Infrastructure Needs and Deficiencies
a) There are currently 91.3 acres of developed neighborhood and community parkland,28 a 19.8-acre undeveloped nature park, and 9 miles of recreational trails within the City of Lafayette. Recreation facilities include a community center, a multi-sport rink, and sports fields. Additional facilities that residents of Lafayette have access to include Briones Regional Park, Lafayette-Moraga Regional Trail, Las Trampas Regional Wilderness, and the Lafayette Reservoir.
b) The City currently has 3.6 acres of developed parkland per 1,000 residents. c) The City of Lafayette has a level of service standard of 5 acres per 1,000 residents.
Relative to this standard, the City is underproviding park acreage. The current LOS is short of this standard by 1.4 acres per resident. The City, therefore, needs 36.7 more acres to meet the standard for the current population. In order to meet the LOS for the projected 2040 city population, the City will need 46.5 more acres of parkland.
d) The City offers a variety of sports activities and classes for all ages, and indicates that the amount of available field space is an ongoing concern. Enrollment in 2019 for recreation program participants of all ages totaled 9,581.
28 Including 68 acres of community parkland, 1.4 acres of neighborhood parkland, 2.2 acres of trail area, 11.5 acres of sports fields, and an 8.2-acre community center.

Contra Costa LAFCO Parks & Recreation MSR/SOI Update June 2021 7. City Parks & Recreation & Services Page 102
Economic & Planning Systems, Inc. Z:\Shared\Projects\Oakland\191000s\191105_ContraCostaLAFCO_Parks&RecMSR\Report\191105 CC LAFCO Parks and Rec MSR-SOI Final 2021June14.docx
e) The City indicates that residents of disadvantaged communities have the same access to recreation facilities and programs as other residents. The City is not currently making specific efforts to provide facilities and programming for the disadvantaged communities, but is developing a Parkland Acquisition and Development Plan that will aim to establish walkable neighborhood parks for all areas of Lafayette.
f) CIP planning has been conducted through the City of Lafayette Five-Year CIP 2019-2023. g) The City of Lafayette has a Parks, Recreation, and Open Space Master Plan that was
completed in 2012 and updated in 2019. h) The City states there are few options for parkland acquisition left in the City. The
forthcoming Parkland Acquisition and Development Plan will track potential future sites. i) The City did not indicate the portion of specific CIP projects that have funding sources
identified. The City indicates that the annual capital budget for parks projects is funded through Development Fees.
j) Of the eight developed park facilities owned by the City of Lafayette, three were reported to be in very good condition, four were reported to be in moderate condition, and one was reported to be in poor condition.
4. Financial Ability of Agencies to Provide Services
a) The City of Lafayette did not indicate whether the current level of financing is adequate for parks and recreation service provision. The City is projecting a one-third loss in revenues in 2020 due to COVID-necessitated contraction of programming.
b) The City has a Parkland Development Fee and a Park Facility Development Fee adopted. These development fees are adjusted annually based on policies tied to their respective nexus studies. The city indicated that there is no average annual increase to user fees.
c) The majority of the City’s Parks and Recreation Department revenue comes from User Fees (56% in FY18-19) with Development Fees (35% in FY18-19) and General Fund funding (20% in FY18-19) representing the other major funding sources.
5. Status of, and Opportunities for, Shared Facilities
a) The City has License Agreements with the East Bay Municipal Utility District (EBMUD) for certain trail sections and the City rents classroom space from the Lafayette School District.
b) The City indicates they are not pursuing additional opportunities for shared facilities; however, field partnerships have been discussed at the Commission level.
c) The City of Lafayette is adjacent to County Service Area R-4 and has overlapping boundaries with the Pleasant Hill Recreation and Park District.
6. Accountability for Community Service Needs, Including Governmental Structure and Operational Efficiencies
a) The City of Lafayette website provides access to the agendas and minutes for the City Council and its various boards and commissions, including the Park and Recreation Commission; the City’s budgets; and the City’s CAFRs. The City adequately provides accountability with regard to governance and municipal operations.
b) The City of Lafayette website provides access to public notices, including the time and place at which City residents may provide input, as well as other opportunities for public involvement in the City decision-making process. Meeting agendas and minutes are
Contra Costa LAFCO Parks & Recreation MSR/SOI Update June 2021 7. City Parks & Recreation & Services Page 103
Economic & Planning Systems, Inc. Z:\Shared\Projects\Oakland\191000s\191105_ContraCostaLAFCO_Parks&RecMSR\Report\191105 CC LAFCO Parks and Rec MSR-SOI Final 2021June14.docx
posted in a timely manner. The City adequately provides accountability with regard to citizen participation.
c) The City of Lafayette demonstrated accountability and transparency by disclosing financial and service-related information in response to LAFCO requests.
d) The City of Lafayette did not indicate any additional outreach activities performed.
7. Any other matter related to efficient service delivery, as required by commission policy
a) COVID-19 is having significant effects on the City’s Parks, Trails & Recreation Department. In response to COVID-19, the City has adapted programs for virtual participation, decreased summer camp cohort sizes, halted most contract class offerings, stopped offering special events and facility rentals, and delayed General Fund capital maintenance for the Community Center.
City of Martinez Parks and Recreation Services MSR Determinations
1. Growth and Population Projections
a) The California Department of Finance estimates the City of Martinez’s 2020 population to be 37,106. The Association of Bay Area Governments projects Martinez’s population to increase by 3,375 residents between 2020 and 2040, to a total of 40,481. This represents a compound annual growth rate of 0.44%.
2. The location and characteristics of any disadvantaged unincorporated communities within or contiguous to the sphere of influence
a) A disadvantaged community has been identified within the City’s SOI in the northwest area. The residents of the City’s disadvantaged community have equivalent access to park facilities as other members of the community.
3. Present and Planned Capacity of Public Facilities and Adequacy of Public Services, Including Infrastructure Needs and Deficiencies
a) There are currently 271.55 acres of developed neighborhood and community parkland29 and 3 miles of recreational trails within the City of Martinez. Recreation facilities include an aquatic center, a senior center, and ball fields. Additional facilities that residents of Martinez have access to include Briones Regional Park, Carquinez Strait Regional Shoreline, Radke Martinez Regional Shoreline, Waterbird Regional Preserve, and the John Muir National Historic Site.
b) The City currently has 7.3 acres of developed parkland per 1,000 residents. c) The City of Martinez has a level of service standard of 5 acres per 1,000 residents. The
City is meeting and exceeding this standard. The current LOS is greater than this standard by 2.32 acres per resident. At the current level of park acreage in the City, the LOS will be met for the projected 2040 City population.
29 Including 107.25 acres of neighborhood parks, a 150-acre ballfield/event complex, a 1-acre dog park, 5.8 acres of passive parkland, a 1-acre plaza, and 6.5 acres of neighborhood/school parkland.

Contra Costa LAFCO Parks & Recreation MSR/SOI Update June 2021 7. City Parks & Recreation & Services Page 104
Economic & Planning Systems, Inc. Z:\Shared\Projects\Oakland\191000s\191105_ContraCostaLAFCO_Parks&RecMSR\Report\191105 CC LAFCO Parks and Rec MSR-SOI Final 2021June14.docx
d) The City offers a robust variety of sports activities and classes for all ages. FY19-20 attendance for all activity and program participants of all ages totaled 27,080, but the City indicated this number is lower than would be typical as it reflects COVID-related closings and restrictions beginning in Spring 2020.
e) The City indicates that the residents of disadvantaged communities have the same access to recreation facilities and programs as other residents. The City has a scholarship program to assist low-income families in recreation program enrollment.
f) CIP planning conducted through the City of Martinez Five-Year Capital Improvement Program for Fiscal Years 2019-20 to 2024-25.
g) The City of Martinez does not have a standalone Parks and Recreation Master Plan but has an Open Space & Conservation as well as a Parks and Community Facilities & Utilities Element within the City of Martinez 2035 General Plan Update.
h) The City states their intention to acquire future parkland in three general areas of the City: Alhambra Hills, Pacheco Corridor, and Downtown.
i) The City reports that all five of the current CIP projects related to Parks and Recreation, those listed under Measure H Park Bond Projects, are fully funded. Four of the five projects are fully funded through Measure H funds, and one project is funded through a combination of Measure H, Park in-Lieu, Park and Recreation, and Gas Tax funding. The City has one future parks-related CIP project for which a funding source has not been identified.
j) Of the 17 park facilities in the City of Martinez, ten are reported to be in very good condition, five are reported to be in moderate condition, and two are currently under construction as of the writing of this report.
4. Financial Ability of Agencies to Provide Services
a) The City of Martinez reported that the current level of financing is adequate for parks and recreation service provision and they anticipate the ability to accommodate future anticipated growth.
b) The City has Development Impact Fees established and a User Fee schedule which is evaluated every two years or when a facility is renovated and reopened.
c) The majority of the City’s reported Parks and Recreation Department FY19-20 revenue comes from User Fees / Charges (61%), with the remaining being collected from Measure H Funding (39%). These User Fee revenues are significantly lower than average years due to COVID.
5. Status of, and Opportunities for, Shared Facilities
a) The City does not currently share any facilities with other entities. b) The City indicates that there are no additional opportunities for shared facilities currently
being pursued. c) The City of Martinez is adjacent to and has small portions of boundary overlap with the
Pleasant Hill Recreation and Park District.
6. Accountability for Community Service Needs, Including Governmental Structure and Operational Efficiencies
a) The City of Martinez website provides access to the agendas and minutes for the City Council and its various boards and commissions, including the Parks, Recreation, and

Contra Costa LAFCO Parks & Recreation MSR/SOI Update June 2021 7. City Parks & Recreation & Services Page 105
Economic & Planning Systems, Inc. Z:\Shared\Projects\Oakland\191000s\191105_ContraCostaLAFCO_Parks&RecMSR\Report\191105 CC LAFCO Parks and Rec MSR-SOI Final 2021June14.docx
Open Space Commission; the City’s budgets; and the City’s CAFRs. The City therefore adequately provides accountability with regard to governance and municipal operations.
b) The City of Martinez website provides access to public notices, including the time and place at which City residents may provide input, as well as other opportunities for public involvement in the City decision-making process. Meeting agendas and minutes are posted in a timely manner. The City adequately provides accountability with regard to citizen participation.
c) The City of Martinez demonstrated accountability and transparency by disclosing financial and service-related information in response to LAFCO requests.
d) The City of Martinez performs additional outreach activities through monthly meetings by various City commissions and publicizes these meetings in accordance with the Brown Act.
7. Any other matter related to efficient service delivery, as required by commission policy
a) COVID-19 is having effects on the City’s General Fund revenues. In response to COVID-19, the City has cancelled traditional programming but offers modified programming where possible. Fiscally, the Department anticipates a significant decrease in revenue but a large savings in expenditures.
Town of Moraga Parks and Recreation Services MSR Determinations
1. Growth and Population Projections
a) The California Department of Finance estimates the Town of Moraga’s 2020 population to be 16,946. The Association of Bay Area Governments projects Moraga’s population to increase by 1,520 residents between 2020 and 2040, to a total of 18,466. This represents a compound annual growth rate of 0.43%.
2. The location and characteristics of any disadvantaged unincorporated communities within or contiguous to the sphere of influence
a) No disadvantaged communities were identified within the Town’s SOI.
3. Present and Planned Capacity of Public Facilities and Adequacy of Public Services, Including Infrastructure Needs and Deficiencies
a) There are currently 57.5 acres of developed neighborhood and community parkland,30 250 acres of open space, and 20.5 miles of recreational trails (5.2 of which are provided and maintained by the Town) within the Town of Moraga. Recreation facilities include a community center and a skate park.
b) The Town currently has 3.4 acres of developed parkland per 1,000 residents. c) The Town of Moraga does not have an adopted park acreage standard per 1,000
residents.
30 Including 8.4 acres of passive parkland, 40.2 acres of active parkland, and 8.9 acres of active/passive parkland.

Contra Costa LAFCO Parks & Recreation MSR/SOI Update June 2021 7. City Parks & Recreation & Services Page 106
Economic & Planning Systems, Inc. Z:\Shared\Projects\Oakland\191000s\191105_ContraCostaLAFCO_Parks&RecMSR\Report\191105 CC LAFCO Parks and Rec MSR-SOI Final 2021June14.docx
d) The Town offers parks and recreation classes. Annual attendance for classes, facility rentals, and other events/festivals totals 30,511.
e) CIP planning is conducted through the Town of Moraga Five-Year Capital Improvement Program 2019-2024.
f) The Town of Moraga has a Parks and Recreation Master Plan that was adopted in 2007. g) The Town plans to acquire eight additional acres of passive park space adjacent to the
existing Moraga Commons Park. h) The Town reports that all five of the current CIP projects related to Parks and Recreation
are fully funded, and two out of five future CIP projects are either fully or partially funded. These projects are primarily funded through grants, with additional funding coming from developer fees, asset replacement, and donations.
i) Of the four existing park facilities in the Town of Moraga, one is reported to be in excellent condition and three are reported to be in good condition.
4. Financial Ability of Agencies to Provide Services
a) The Town of Moraga reported that the current level of financing is adequate for parks and recreation service provision and they anticipate the ability to accommodate future anticipated growth, and also indicated there is a shortage of community field space.
b) The Town has Development Impact Fees established and a User Fee schedule which is adopted and approve by the Town Council annually.
c) The Town’s Park and Recreation Department is funded through the General Fund, user fees, grant funds for special projects, and is dependent upon donations to sustain operations.
5. Status of, and Opportunities for, Shared Facilities
a) The Town has joint-use agreements in place with the Moraga School District and Saint Mary’s College.
b) The Town indicates that there are no additional opportunities for shared facilities currently being pursued, although the existing joint-use agreements are currently being renewed.
c) The Town of Moraga’s boundaries overlap almost entirely with the boundaries of County Service Area R-4.
6. Accountability for Community Service Needs, Including Governmental Structure and Operational Efficiencies
a) The Town of Moraga website provides access to the agendas and minutes for the Town Council and its various boards and commissions, including the Parks, Recreation, and Open Space Commission; the Town’s budgets; and the Town’s CAFRs. The Town adequately provides accountability with regard to governance and municipal operations.
b) The Town of Moraga website provides access to public notices, including the time and place at which Town residents may provide input, as well as other opportunities for public involvement in the Town decision-making process. Meeting agendas and minutes are posted in a timely manner. The Town adequately provides accountability with regard to citizen participation.
c) The Town of Moraga demonstrated accountability and transparency by disclosing financial and service-related information in response to LAFCO requests.

Contra Costa LAFCO Parks & Recreation MSR/SOI Update June 2021 7. City Parks & Recreation & Services Page 107
Economic & Planning Systems, Inc. Z:\Shared\Projects\Oakland\191000s\191105_ContraCostaLAFCO_Parks&RecMSR\Report\191105 CC LAFCO Parks and Rec MSR-SOI Final 2021June14.docx
7. Any other matter related to efficient service delivery, as required by commission policy
a) The Town reports that the effects that COVID-19 has on the Town of Moraga’s fiscal situation have been minimal due primarily to the Town’s minimal number of revenue streams and the Town not collecting or relying on tax revenues that would be depressed due to the pandemic. The largest budget impact has been loss in Parks and Recreation revenues due to cancelled programs. The lost revenues have been compensated with expense reductions.
b) In response to COVID-19, the Town has offered virtual programs, COVID-compliant in-person day camp, and a distance-learning lab.
City of Oakley Parks and Recreation Services MSR Determinations
1. Growth and Population Projections
a) The California Department of Finance estimates the City of Oakley’s 2020 population to be 42,461. The Association of Bay Area Governments projects Oakley’s population to increase by 19,075 residents between 2020 and 2040, to a total of 61,536. This represents a compound annual growth rate of 1.87%.
2. The location and characteristics of any disadvantaged unincorporated communities within or contiguous to the sphere of influence
a) A portion of a disadvantaged community has been identified within the City’s SOI in northwest Oakley. The residents of the City’s disadvantaged community have equivalent access to park facilities as other members of the community.
3. Present and Planned Capacity of Public Facilities and Adequacy of Public Services, Including Infrastructure Needs and Deficiencies
a) There are currently 168 acres of developed neighborhood and community parkland31 within the City of Oakley, and most recreation trails are provided and maintained by the East Bay Regional Park District. Recreation facilities include a recreation center and multipurpose fields. Additional facilities that residents of Oakley have access to include Antioch/Oakley Regional Shoreline, Big Break Regional Shoreline, and Contra Loma Regional Park.
b) The City currently has 4.0 acres of developed parkland per 1,000 residents. c) The City of Oakley has a level of service standard of 5 acres per 1,000 residents. Relative
to this standard, the City is underproviding park acreage. The current LOS is short of this standard by 1.0 acres per resident. The City, therefore, needs 44.3 more acres to meet the standard for the current population. In order to meet the LOS for the projected 2040 city population, the City will need 139.7 more acres of parkland.
31 Including 94.39 acres of neighborhood parkland, 43.4 acres of community parkland, and 30.2 acres of school parkland/playground areas under joint use agreement with the local school district.

Contra Costa LAFCO Parks & Recreation MSR/SOI Update June 2021 7. City Parks & Recreation & Services Page 108
Economic & Planning Systems, Inc. Z:\Shared\Projects\Oakland\191000s\191105_ContraCostaLAFCO_Parks&RecMSR\Report\191105 CC LAFCO Parks and Rec MSR-SOI Final 2021June14.docx
d) The City offers a variety of sports activities and classes for all ages. Annual attendance / participants for recreation programming, facility rentals, and other events totals approximately 37,000.
e) The City indicates that the residents of disadvantaged communities have the same access to recreation facilities and programs as other residents. The City offers youth scholarships for Oakley residents under the age of 18 who meet the HUD very low-income requirements.
f) CIP planning is conducted through the City of Oakley Five-Year Capital Improvement Program 2018/19-2022/23.
g) As indicated in the 2019 City Services MSR, the City is considering obtaining a computerized asset management program which would help the City track park and recreation infrastructure and maintenance needs.
h) The City of Oakley has a Parks, Trails, and Recreation Master Plan that was approved in 2020.
i) The City has plans to establish a 55-acre park on Dutch Slough Road as part of the larger Dutch Slough Tidal Marsh Restoration project of approximately 1,200 acres.
j) The City indicates that all five of the current CIP projects have funding identified. Funding comes primarily from the General Capital Fund, the 2016 Lease Revenue Bond, and the Park Impact Fee.
k) The City provided no information regarding future CIP projects. l) The City indicated that all 36 of their park facilities (excluding the school facilities) are in
good condition.
4. Financial Ability of Agencies to Provide Services
a) The City of Oakley reports that the current level of financing is adequate for parks and recreation service provision and the department relies mainly on general purpose revenues. The City indicates they will likely need additional indoor facilities to meet future demand.
b) The City has adopted a Park Improvement Development Impact Fee and a Park Acquisition Fee. The City has not established a policy for recreation services user fees.
c) The majority of the City’s Parks and Recreation Department funding comes from LLAD funding (61% in FY19/20).
5. Status of, and Opportunities for, Shared Facilities
a) The City has Joint Use Agreements with the Oakley Union Elementary School District, the Liberty Union High School District, and a lease agreement with the Oakley Seniors Club and Oakley Community Garden.
b) The City indicates they are not pursuing any additional opportunities for shared facilities, but is currently looking to update the Memorandum of Understanding with the Oakley Union Elementary School District and Liberty Union High School District.
6. Accountability for Community Service Needs, Including Governmental Structure and Operational Efficiencies
a) The City of Oakley website provides access to the agendas and minutes for the City Council; the City’s budgets; and the City’s CAFRs. The City adequately provides accountability with regard to governance and municipal operations.

Contra Costa LAFCO Parks & Recreation MSR/SOI Update June 2021 7. City Parks & Recreation & Services Page 109
Economic & Planning Systems, Inc. Z:\Shared\Projects\Oakland\191000s\191105_ContraCostaLAFCO_Parks&RecMSR\Report\191105 CC LAFCO Parks and Rec MSR-SOI Final 2021June14.docx
b) The City of Oakley website provides access to public notices, including the time and place at which City residents may provide input, as well as other opportunities for public involvement in the City decision-making process. Meeting agendas and minutes are posted in a timely manner. The City adequately provides accountability with regard to citizen participation.
c) The City of Oakley demonstrated accountability and transparency by disclosing financial and service-related information in response to LAFCO requests.
d) The City of Oakley does not have a Parks and Recreation Commission but provides additional outreach through its Oakley Youth Advisory Council and the Engage in Oakley Platform for online community engagement on park and recreation projects.
7. Any other matter related to efficient service delivery, as required by commission policy
a) COVID-19 is having effects on the City’s General Fund revenues, and the City believes the primary impact will be felt in Fiscal Year 2020-2021. In response to COVID-19, the City postponed large group events, offered virtual activities where possible, and is planning alternate options for events that will be socially distant or virtual.
City of Orinda Parks and Recreation Services MSR Determinations
1. Growth and Population Projections
a) The California Department of Finance estimates the City of Orinda’s 2020 population to be 19,009. The Association of Bay Area Governments projects Orinda’s population to increase by 785 residents between 2020 and 2040, to a total of 19,794. This represents a compound annual growth rate of 0.20%.
2. The location and characteristics of any disadvantaged unincorporated communities within or contiguous to the sphere of influence
a) No disadvantaged communities were identified within the City’s SOI.
3. Present and Planned Capacity of Public Facilities and Adequacy of Public Services, Including Infrastructure Needs and Deficiencies
a) There are currently 50.8 acres of developed neighborhood and community parkland,32 111 acres of open space, and 12 miles of recreational trails within the City of Orinda. Recreation facilities include two community centers, tennis courts, and sports fields. Additional facilities that residents of Orinda have access to include Kennedy Grove Regional Recreation Area, Reinhardt Regional Park, Sibley Volcanic Regional Preserve, and Tilden Regional Park - Botanic Garden.
b) The City currently has 2.7 acres of developed parkland per 1,000 residents. c) The City of Orinda has a level of service standard of 5 acres per 1,000 residents. Relative
to this standard, the City is underproviding park acreage. The current LOS is short of this
32 Including 9 acres of neighborhood parkland, 41.5 acres of community parkland, and 0.3 acres of other non-categorized developed parkland.

Contra Costa LAFCO Parks & Recreation MSR/SOI Update June 2021 7. City Parks & Recreation & Services Page 110
Economic & Planning Systems, Inc. Z:\Shared\Projects\Oakland\191000s\191105_ContraCostaLAFCO_Parks&RecMSR\Report\191105 CC LAFCO Parks and Rec MSR-SOI Final 2021June14.docx
standard by 2.3 acres per resident. The City, therefore, needs 95.4 more acres to meet the standard for the current population. In order to meet the LOS for the projected 2040 city population, the City will need 99.0 more acres of parkland.
d) The City offers a variety of sports activities and classes for both youth and adults. Average annual attendance for classes, summer camps, and youth sports is estimated at 14,568. Annual facility rentals are estimated at 13,800, and attendance at annual festivals/events is estimated at 2,250.
e) CIP planning is conducted through the City of Orinda Capital Improvement Plan 2019-2023.
f) The City of Orinda has a Parks and Recreation Master Plan which was created in 1989. g) The City states that current facilities have sufficient capacity to meet existing and future
needs and there are no plans to acquire future parkland currently. h) The City indicates that all three current CIP projects have funding sources identified, and
five of the 12 future CIP projects have funding sources identified. Main funding sources are the Park Dedication Fee and grants.
i) Of the seven park facilities in the City of Orinda, five were reported to be in very good condition and two were reported to be in moderate condition.
4. Financial Ability of Agencies to Provide Services
a) The City of Orinda indicates that the current level of financing is adequate for parks and recreation service provision. The City’s parks and recreation user fees typically cover about 75% of total department costs in cost recovery revenue. In FY19-20, user fee revenues recovered about 50% of total parks and recreation-related expenditures, which includes park maintenance expenditures.
b) The City has an adopted Park Dedication Fee and Impact Fee, which annually adjust based on the price of real property in the City. The City has also recently approved two facility “add-on” fees designed to generate funds for the repair / replacement of City athletic facilities or at the Orinda Community Center.
c) The City indicates that user fees are typically adjusted annually based on the Consumer Price Index.
d) The majority of the City’s Parks and Recreation Department revenue comes from User Fees (75% in FY19-20) with the remaining revenue collected through an assortment of grants, district assessments, and interest revenues.
5. Status of, and Opportunities for, Shared Facilities
a) The City has a joint-use agreement with the Orinda Union School District and the City is responsible for the maintenance and operating costs of the Orinda Library / Community Auditorium facility, which is leased from the “Friends of the Orinda Library,” who own the facility, and the costs are partially paid from a voter approved parcel tax for Library services.
b) The City indicates they are not pursuing any additional opportunities for shared facilities. c) The City of Orinda is adjacent to County Service Area R-4.

Contra Costa LAFCO Parks & Recreation MSR/SOI Update June 2021 7. City Parks & Recreation & Services Page 111
Economic & Planning Systems, Inc. Z:\Shared\Projects\Oakland\191000s\191105_ContraCostaLAFCO_Parks&RecMSR\Report\191105 CC LAFCO Parks and Rec MSR-SOI Final 2021June14.docx
6. Accountability for Community Service Needs, Including Governmental Structure and Operational Efficiencies
a) The City of Orinda website provides access to the agendas and minutes for the City Council and its various boards and commissions, including the Parks and Recreation Commission; the City’s budgets; and the City’s CAFRs. The City adequately provides accountability with regard to governance and municipal operations.
b) The City of Orinda website provides access to public notices, including the time and place at which City residents may provide input, as well as other opportunities for public involvement in the City decision-making process. Meeting agendas and minutes are posted in a timely manner. The City adequately provides accountability with regard to citizen participation.
c) The City of Orinda demonstrated accountability and transparency by disclosing financial and service-related information in response to LAFCO requests.
d) The City of Orinda did not indicate any additional outreach activities performed.
7. Any other matter related to efficient service delivery, as required by commission policy
a) COVID-19 is having significant effects on the City’s Parks and Recreation Department, as the majority of the Department’s costs have historically been recovered through user fee revenues. In response to COVID-19, the City has been forced to both considerably reduce staffing as well as reduce its offerings, has begun offering virtual programs where possible, and offers modified summer camp programs and distance learning support programs when school began.
City of Pinole Parks and Recreation Services MSR Determinations
1. Growth and Population Projections
a) The California Department of Finance estimates the City of Pinole’s 2020 population to be 19,505. The Association of Bay Area Governments projects Pinole’s population to increase by 1,775 residents between 2020 and 2040, to a total of 21,280. This represents a compound annual growth rate of 0.44%.
2. The location and characteristics of any disadvantaged unincorporated communities within or contiguous to the sphere of influence
a) No disadvantaged communities were identified within the City’s SOI.
3. Present and Planned Capacity of Public Facilities and Adequacy of Public Services, Including Infrastructure Needs and Deficiencies
a) There are currently 252.5 acres of developed neighborhood and community parkland,33 12 acres of open space, and 3.5 miles of recreational trails within the City of Pinole.
33 Including 13.5 acres of neighborhood parkland, 237 acres of community parkland, and 2 acres of regional park/bay trail space.

Contra Costa LAFCO Parks & Recreation MSR/SOI Update June 2021 7. City Parks & Recreation & Services Page 112
Economic & Planning Systems, Inc. Z:\Shared\Projects\Oakland\191000s\191105_ContraCostaLAFCO_Parks&RecMSR\Report\191105 CC LAFCO Parks and Rec MSR-SOI Final 2021June14.docx
Recreation facilities include a youth center, senior center, tiny tot center, community playhouse, swim center, and courts and ball fields. Additional facilities that residents of Pinole have access to include Point Pinole Regional Shoreline and Sobrante Ridge Botanic Regional Preserve.
b) The City currently has 12.9 acres of developed parkland per 1,000 residents. c) The City of Pinole has a level of service standard of 3 acres per 1,000 residents. The City
is meeting and exceeding this standard. The current LOS is greater than this standard by 9.9 acres per resident. At the current level of park acreage in the City, the LOS will be met for the projected 2040 City population.
d) The City offers a variety of sports activities and classes for all ages. Fiscal year 2019 enrollment for activities and programs totaled 10,413, with 435 facility rentals and 940 attendees at festivals/events.
e) CIP planning is conducted through the City of Pinole Five-Year Capital Improvement Plan: FY 2020-21 through FY 2024-25.
f) The City of Pinole does not have a standalone Parks and Recreation Master Plan. The City does have a Parks, Trails, and Recreational Facilities section within their General Plan that was adopted in 2010.
g) The City did not indicate plans to acquire future parkland. h) Nine of the ten current parks-related CIP projects have funding identified. The majority of
projects are being funded through Park grants. i) The City indicates all park facilities are in moderate condition.
4. Financial Ability of Agencies to Provide Services
a) The City of Pinole reported that the current level of financing is adequate for parks and recreation service provision. The City is not aware of any significant new development that will affect its level of services.
b) The 2019 City Services MSR indicated the City was experiencing some fiscal challenges that could affect the City’s ability to provide services. Based on the City-provided financial information for FY2019-20 it does not appear that park and recreation services are currently experiencing negative impacts due to budgeted fiscal challenges.
c) The City adopted a Park Dedication Impact Fee. The City did not indicate whether it has any policies in place regarding user fee cost escalation.
d) About half of the City’s Park and Recreation-related funding comes from service/user fees, with most of the other half coming from the General Fund. All of the City’s Public Works funding related to parks maintenance comes from the General Fund.
5. Status of, and Opportunities for, Shared Facilities
a) The City shares their facilities with the Pinole Community Players, Pinole Seals, and the East Bay Regional Park District. Stewart Elementary School and St. Joseph school has allowed the City to use their facilities for youth programming.
b) The City expressed interest in expanding their youth programs to offer them at all West Contra Costa Unified School District schools in Pinole.
c) The City of Pinole is adjacent to County Service Area M-17 and County Service Area R-9.

Contra Costa LAFCO Parks & Recreation MSR/SOI Update June 2021 7. City Parks & Recreation & Services Page 113
Economic & Planning Systems, Inc. Z:\Shared\Projects\Oakland\191000s\191105_ContraCostaLAFCO_Parks&RecMSR\Report\191105 CC LAFCO Parks and Rec MSR-SOI Final 2021June14.docx
6. Accountability for Community Service Needs, Including Governmental Structure and Operational Efficiencies
a) The City of Pinole website provides access to the agendas and minutes for the City Council; the City’s budgets; and the City’s CAFRs. The City adequately provides accountability with regard to governance and municipal operations.
b) The City of Pinole website provides access to public notices, including the time and place at which City residents may provide input, as well as other opportunities for public involvement in the City decision-making process. Meeting agendas and minutes are posted in a timely manner. The City adequately provides accountability with regard to citizen participation.
c) The City of Pinole demonstrated accountability and transparency by disclosing financial and service-related information in response to LAFCO requests.
d) The City of Pinole does not have a Parks and Recreation Commission but its Community Services Commission oversees matters including recreation and parks activities.
7. Any other matter related to efficient service delivery, as required by commission policy
a) COVID-19 is having effects on the City’s Parks and Recreation revenues and believes this will continue into FY 2021 if mandated closures persist. In response to COVID-19, the City cancelled all recreation programs, events, field, park, and facility rentals. The City is offering a range of virtual classes and programming, including cooking classes, video game design, and coding lessons.
City of Pittsburg Parks and Recreation Services MSR Determinations
1. Growth and Population Projections
a) The California Department of Finance estimates the City of Pittsburg’s 2020 population to be 74,321. The Association of Bay Area Governments projects Pittsburg’s population to increase by 18,560 residents between 2020 and 2040, to a total of 92,881. This represents a compound annual growth rate of 1.12%.
2. The location and characteristics of any disadvantaged unincorporated communities within or contiguous to the sphere of influence
a) Disadvantaged communities have been identified within the City’s SOI. The residents of the City’s disadvantaged community have equivalent access to park facilities as other members of the community.

Contra Costa LAFCO Parks & Recreation MSR/SOI Update June 2021 7. City Parks & Recreation & Services Page 114
Economic & Planning Systems, Inc. Z:\Shared\Projects\Oakland\191000s\191105_ContraCostaLAFCO_Parks&RecMSR\Report\191105 CC LAFCO Parks and Rec MSR-SOI Final 2021June14.docx
3. Present and Planned Capacity of Public Facilities and Adequacy of Public Services, Including Infrastructure Needs and Deficiencies
a) There are currently 322 acres of developed neighborhood and community parkland34 and 26.37 miles of recreational trails within the City of Pittsburg. Recreation facilities include a swim center and a senior center. Additional facilities that residents of Pittsburg have access to include Black Diamond Mines Regional Preserve, Brooks Island Regional Preserve, and Contra Loma Regional Park.
b) The City currently has 4.3 acres of parks and open space per 1,000 residents. c) The City of Pittsburg has a level of service standard of 5 acres per 1,000 residents.
Relative to this standard, the City is underproviding park acreage. The current LOS is short of this standard by 0.7 acres per resident. The City, therefore, needs 49.6 more acres to meet the standard for the current population. In order to meet the LOS for the projected 2040 city population, the City will need 142.4 more acres of parkland. The City indicated that according to its General Plan, there should be adequate land available to meet this need.
d) The City offers a variety of sports activities and classes for all ages. The City stated that it does not track attendance data for these programs.
e) The residents of the City’s disadvantaged communities have the same access to recreation facilities and programs as other residents. It is unclear whether the City offers scholarship programs for its recreation programming, but they do offer a number of programs that are free of charge.
f) CIP planning is conducted through the City of Pittsburg Five-Year Capital Improvement Program 2019/20 Through 2023/24.
g) The City of Pittsburg does not have a standalone Parks and Recreation Master Plan. Their current General Plan, adopted in 2001, includes an element regarding Open Space, Youth, and Recreation.
h) The City indicates that future subdivision approvals might result in open space/parkland dedication. The City also indicates they are in the early stages of considering the conversion of approximately 70-acre golf course into a public recreation facility. The City states that these projects are speculative at this stage and do not yet have City Council approval.
i) The City indicates 11 of the 18 current CIP projects have funding identified. Revenues from Parkland Dedication Fees are identified as the source of funding.
j) The City indicated that of their 26 parks, five are in good condition, 12 are in moderate condition, and nine are in poor condition. The City stated that the community is lacking sufficient facilities to meet the organized sports needs of its growing community.
4. Financial Ability of Agencies to Provide Services
a) The City of Pittsburg reported that the current level of financing is adequate for current parks and recreation service provision and the department relies entirely on General Fund revenues.
34 Including 11.7 acres of linear parkland, 30.2 acres of neighborhood parkland, and 280.1 acres of community parkland.

Contra Costa LAFCO Parks & Recreation MSR/SOI Update June 2021 7. City Parks & Recreation & Services Page 115
Economic & Planning Systems, Inc. Z:\Shared\Projects\Oakland\191000s\191105_ContraCostaLAFCO_Parks&RecMSR\Report\191105 CC LAFCO Parks and Rec MSR-SOI Final 2021June14.docx
b) The 2019 City Services MSR indicated the City identified funding obstacles that could affect the City’s ability to provide services for the projected increased population. Based on the City-provided financial information for FY2019-20 it does not appear that park and recreation services are currently experiencing negative impacts due to budgeted fiscal challenges; however, the City states that their current facilities are insufficient to meet the organized sports needs of their community and that they do not have a community center to host classroom and sport activities.
c) The City did not indicate whether there are currently any Park Impact Fees adopted or if there are policies in place for user fee cost escalations.
d) The City indicates that most of the City’s Parks and Recreation Department funding comes from the City’s General Fund (73% in FY19-20) with the remainder coming from Service/User Fees (27% in FY19-20).
5. Status of, and Opportunities for, Shared Facilities
a) The City shares fields and a gymnasium with the Pittsburg Unified School District. b) The City indicates there are no additional opportunities for shared facilities that are
currently being pursued. c) The Ambrose Recreation and Park District overlaps the City of Pittsburg’s boundary.
6. Accountability for Community Service Needs, Including Governmental Structure and Operational Efficiencies
a) The City of Pittsburg website provides access to the agendas and minutes for the City Council; the City’s budgets; and the City’s CAFRs. The City adequately provides accountability with regard to governance and municipal operations.
b) The City of Pittsburg website provides access to public notices, including the time and place at which City residents may provide input, as well as other opportunities for public involvement in the City decision-making process. Meeting agendas and minutes are posted in a timely manner. The City adequately provides accountability with regard to citizen participation.
c) The City of Pittsburg demonstrated accountability and transparency by disclosing financial and service-related information in response to LAFCO requests.
d) The City of Pittsburg does not have a Parks and Recreation Commission.
7. Any other matter related to efficient service delivery, as required by commission policy
a) COVID-19 is having effects on the City’s General Fund revenues. In response to COVID-19, the City began hosting all public meetings in a virtual format, is making necessary budget cuts to reflect expected revenue losses due to the effects of COVID, and is exploring virtual programming opportunities.

Contra Costa LAFCO Parks & Recreation MSR/SOI Update June 2021 7. City Parks & Recreation & Services Page 116
Economic & Planning Systems, Inc. Z:\Shared\Projects\Oakland\191000s\191105_ContraCostaLAFCO_Parks&RecMSR\Report\191105 CC LAFCO Parks and Rec MSR-SOI Final 2021June14.docx
City of Richmond Parks and Recreation Services MSR Determinations
1. Growth and Population Projections
a) The California Department of Finance estimates the City of Richmond’s 2020 population to be 111,217. The Association of Bay Area Governments projects Richmond’s population to increase by 37,835 residents between 2020 and 2040, to a total of 149,052. This represents a compound annual growth rate of 1.47%.
2. The location and characteristics of any disadvantaged unincorporated communities within or contiguous to the sphere of influence
a) Disadvantaged communities have been identified within the City’s SOI. The residents of the City’s disadvantaged community have equivalent access to park facilities as other members of the community.
3. Present and Planned Capacity of Public Facilities and Adequacy of Public Services, Including Infrastructure Needs and Deficiencies
a) There are currently 271.61 acres of developed neighborhood and community parkland35 and 35 miles of recreational trails within the City of Richmond. Recreation facilities include three community centers, two aquatics centers, and a fieldhouse. Additional facilities that residents of Richmond have access to include Brooks Island Regional Preserve, Miller-Knox Regional Shoreline, Point Isabel Regional Shoreline, Point Pinole Regional Shoreline, Sobrante Ridge Botanic Regional Preserve, and Wildcat Canyon Regional Park.
b) The City currently has 2.4 acres of developed parkland per 1,000 residents. c) The City of Richmond has a level of service standard of 3 acres per 1,000 residents.
Relative to this standard, the City is underproviding park acreage. The current LOS is short of this standard by 0.6 acres per resident. The City, therefore, needs 62 additional acres to meet the standard for the current population. In order to meet the LOS for the projected 2040 city population, the City will need 175.5 additional acres of parkland.
d) The City offers a variety of sports activities and classes for all ages. In FY19-20 the City had attendance of almost 4,000 in its activities and programs.
e) The residents of the City’s disadvantaged communities have the same access to recreation facilities and programs as other residents. The City has scholarships available for after school programs.
f) CIP planning was conducted for capital improvement projects approved for FY 2020-2021.
g) The City of Richmond has a Parks Master Plan that was approved in 2010. h) The City did not provide information regarding additional parkland acquisition plans. i) The City indicates all six current CIP projects have at least partial funding identified.
Revenues from grants and impact fees are the main sources of funding. j) The City indicates that 38 of their 76 parks are in very good condition while the
remaining 38 are in moderate condition. The City also indicates that budgetary
35 Including 221.9 acres of parkland, 29 acres of park/trails, 4.17 acres of pathway/other, and 16.54 acres of plaza area.

Contra Costa LAFCO Parks & Recreation MSR/SOI Update June 2021 7. City Parks & Recreation & Services Page 117
Economic & Planning Systems, Inc. Z:\Shared\Projects\Oakland\191000s\191105_ContraCostaLAFCO_Parks&RecMSR\Report\191105 CC LAFCO Parks and Rec MSR-SOI Final 2021June14.docx
constraints make staffing and programming challenging for the Community Services Department – Recreation Division.
4. Financial Ability of Agencies to Provide Services
a) The City of Richmond reports that the current level of financing is adequate for current parks and recreation service provision and the department’s revenues are mainly comprised of service/user fees.
b) The 2019 City Services MSR indicated that the City was experiencing fiscal challenges that could affect the City’s ability to provide services, particularly in the event of unexpected funding needs. Based on the City-provided financial information for FY2019-20 it does not appear that park and recreation services are currently experiencing inordinate negative fiscal impacts beyond COVID-related budget reductions.
c) The City has Park Dedication Impact Fees adopted. The City also has a policy in place to increase user fees annually according to the Consumer Price Index.
d) The City indicated that the Recreation Division of its Community Services Department is funded primarily through the General Fund.
5. Status of, and Opportunities for, Shared Facilities
a) The City shares Central Park with the City of El Cerrito and has lease agreements with the Washington Field House and the YWCA.
b) The City indicates there are no additional opportunities for shared facilities that are currently being pursued.
6. Accountability for Community Service Needs, Including Governmental Structure and Operational Efficiencies
a) The City of Richmond website provides access to the agendas and minutes for the City Council and the Recreation and Parks Commission; the City’s budgets; and the City’s CAFRs. The City adequately provides accountability with regard to governance and municipal operations.
b) The City of Richmond website provides access to public notices, including the time and place at which City residents may provide input, as well as other opportunities for public involvement in the City decision-making process. Meeting agendas and minutes are posted in a timely manner. The City adequately provides accountability with regard to citizen participation.
c) The City of Richmond demonstrated accountability and transparency by disclosing financial and service-related information in response to LAFCO requests.
d) The City of Richmond does not have a Parks and Recreation Commission but the Community Services Department – Recreation Division provides outreach through social media, the City website, Activity Guides, a bi-monthly newsletter, flyers, and a virtual launch pad/vlog site.

Contra Costa LAFCO Parks & Recreation MSR/SOI Update June 2021 7. City Parks & Recreation & Services Page 118
Economic & Planning Systems, Inc. Z:\Shared\Projects\Oakland\191000s\191105_ContraCostaLAFCO_Parks&RecMSR\Report\191105 CC LAFCO Parks and Rec MSR-SOI Final 2021June14.docx
7. Any other matter related to efficient service delivery, as required by commission policy
a) COVID-19 is having effects on Richmond’s Community Services Department – Recreation Division budget. In response to COVID-19, the City has offered virtual summer camps, one in-person summer camp, and a variety of virtual programs for all ages.
City of San Pablo Parks and Recreation Services MSR Determinations
1. Growth and Population Projections
a) The California Department of Finance estimates the City of San Pablo’s 2020 population to be 31,413. The Association of Bay Area Governments projects San Pablo’s population to increase by 2,535 residents between 2020 and 2040, to a total of 33,948. This represents a compound annual growth rate of 0.39%.
2. The location and characteristics of any disadvantaged unincorporated communities within or contiguous to the sphere of influence
a) Disadvantaged communities have been identified within the City’s SOI. The residents of the City’s disadvantaged community have equivalent access to park facilities as other members of the community.
3. Present and Planned Capacity of Public Facilities and Adequacy of Public Services, Including Infrastructure Needs and Deficiencies
a) There are currently 27.6 acres of developed neighborhood and community parkland and 0.55 miles of recreational trails within the City of San Pablo. Recreation facilities include a community center, two senior centers, a sports complex, and multiple sports fields. Additional facilities that residents of San Pablo have access to include the Miller-Knox Regional Shoreline and Point Pinole Regional Shoreline.
b) The City currently has 0.9 acres of developed parkland per 1,000 residents. c) The City of San Pablo does not have an adopted park acreage standard per 1,000
residents. d) The City offers a variety of sports activities and classes for all ages. The City reported
annual attendance at parks and recreation classes to be 3,500. e) Residents of the City’s disadvantaged communities have the same access to recreation
facilities and programs as other residents. The City has scholarships available for senior center programming.
f) CIP planning is conducted for capital improvement projects for FY 2017-2021. g) The City of San Pablo does not have a standalone Parks and Recreation Master Plan but
has a chapter in their adopted General Plan which focuses on Parks, Schools, Community Facilities, and Utilities.
h) The City indicates there are no current plans to acquire more parkland. i) The City indicates that its one current parks-related CIP project is fully funded and did
not indicate the funding status of the one future parks-related CIP project. j) The City indicates that of its 14 park and recreation facilities, four are in very good
condition, eight are in moderate condition, and two are in poor condition.

Contra Costa LAFCO Parks & Recreation MSR/SOI Update June 2021 7. City Parks & Recreation & Services Page 119
Economic & Planning Systems, Inc. Z:\Shared\Projects\Oakland\191000s\191105_ContraCostaLAFCO_Parks&RecMSR\Report\191105 CC LAFCO Parks and Rec MSR-SOI Final 2021June14.docx
4. Financial Ability of Agencies to Provide Services
a) The City of San Pablo reports that the current level of financing is adequate for current parks and recreation service provision and the department recovered about 12% of their Parks and Recreation expenditures in FY2019-20.
b) The City does not have adopted Park-related Impact Fees. The City does not have an adopted policy for user fee price escalation but has recently increased some of the user fees for the Community Services Department.
c) The City’s Community Services Department is funded primarily through the General Fund.
5. Status of, and Opportunities for, Shared Facilities
a) The City has a Joint-Use Agreement with the West Contra Costa Unified School District to share resources for some after-school youth programs.
b) The City indicates they are researching future partnerships with Contra Costa County for certain programs.
c) The City of San Pablo is adjacent to County Service Area R-9.
6. Accountability for Community Service Needs, Including Governmental Structure and Operational Efficiencies
a) The City of San Pablo website provides access to the agendas and minutes for the City Council; the City’s budgets; and the City’s CAFRs. The City adequately provides accountability with regard to governance and municipal operations.
b) The City of San Pablo website provides access to public notices, including the time and place at which City residents may provide input, as well as other opportunities for public involvement in the City decision-making process. Meeting agendas and minutes are posted in a timely manner. The City adequately provides accountability with regard to citizen participation.
c) The City of San Pablo demonstrated accountability and transparency by disclosing financial and service-related information in response to LAFCO requests.
d) The City of San Pablo has a Community Services Standing Committee.
7. Any other matter related to efficient service delivery, as required by commission policy
a) COVID-19 is having effects on San Pablo’s General Fund revenues. In response to COVID-19, the City is holding some virtual programs. The City indicates they have begun some virtual services (day camps, sports programs, and cooking classes) and staff is working to host additional virtual classes and events.
City of San Ramon Parks and Recreation Services MSR Determinations
1. Growth and Population Projections
a) The California Department of Finance estimates the City of San Ramon’s 2020 population to be 83,118. The Association of Bay Area Governments projects San Ramon’s population to increase by 7,680 residents between 2020 and 2040, to a total of 90,798. This represents a compound annual growth rate of 0.44%.

Contra Costa LAFCO Parks & Recreation MSR/SOI Update June 2021 7. City Parks & Recreation & Services Page 120
Economic & Planning Systems, Inc. Z:\Shared\Projects\Oakland\191000s\191105_ContraCostaLAFCO_Parks&RecMSR\Report\191105 CC LAFCO Parks and Rec MSR-SOI Final 2021June14.docx
2. The location and characteristics of any disadvantaged unincorporated communities within or contiguous to the sphere of influence
a) No disadvantaged communities were identified within the City’s SOI.
3. Present and Planned Capacity of Public Facilities and Adequacy of Public Services, Including Infrastructure Needs and Deficiencies
a) There are currently 377 acres of developed neighborhood and community parkland,36 3,261 acres of open space, and 57.1 miles of recreational trails within the City of San Ramon. Recreation facilities include four community centers, an aquatic center, an aquatic park, two gymnasiums, 26 tennis courts, a performing arts center, and a theater. Additional facilities that residents of San Ramon have access to include Bishop Ranch Regional Open Space, Iron Horse Regional Trail, Las Trampas Regional Wilderness, and Little Hills Picnic Ranch.
b) The City currently has 4.5 acres of developed parkland per 1,000 residents. c) The City of San Ramon has a level of service standard of 6.5 acres per 1,000 residents at
General Plan buildout (2035). Relative to this standard, the City is underproviding park acreage. The current LOS is short of this standard by 2.0 acres per resident. The City, therefore, needs 163.3 more acres to meet the standard for the current population. In order to meet the LOS for the projected 2040 City population, the City will need 213.2 more acres of parkland.
d) The City offers a variety of sports activities and classes for all ages. The City reported annual attendance at activities and programs of 102,022, annual attendance from facility rentals of 478,486, and annual attendance at other events and festivals of 52,587.
e) The City offers financial scholarships to residents that meet city scholarship program requirements.
f) CIP planning is conducted through the City’s Capital Improvement Program 2019/20 – 2023/24.
g) The City of San Ramon has a Parks, Open Space, Trails, and Recreation Master Plan that was adopted in 2020.
h) The City indicates there are three parks in the process of being developed: Sunrise Ridge, Critter Crossroads, and Rancho Phase II. There are plans to acquire additional open space.
i) The City indicates that seven of the 12 current parks-related CIP projects have funding sources fully identified, two have partial funding sources identified, and three have Alternative Funding listed as the source. Funding primarily comes from Debt Financing COP (Certificate of Participation) and the Park Development Fund.
j) The City indicates that six of the eight future parks-related CIP projects have funding sources fully identified, and two have at least some funding sources identified. Funding primarily comes from the Infrastructure Maintenance Fund.
k) The City indicates that of the 68 park and recreation facilities in the City, 62 are in very good condition, five are in moderate condition, and one is in poor condition.
36 Including 101 acres of community parkland, 116.18 acres of neighborhood parkland, 78.29 acres of shared school parkland, 61.37 acres of specialty parkland, and 20.11 acres of specialized rec areas and facilities.

Contra Costa LAFCO Parks & Recreation MSR/SOI Update June 2021 7. City Parks & Recreation & Services Page 121
Economic & Planning Systems, Inc. Z:\Shared\Projects\Oakland\191000s\191105_ContraCostaLAFCO_Parks&RecMSR\Report\191105 CC LAFCO Parks and Rec MSR-SOI Final 2021June14.docx
4. Financial Ability of Agencies to Provide Services
a) The City of San Ramon reported that the current level of financing is adequate for current parks and recreation service provision and the department recovered 25% of their total Parks and Recreation-related expenditures in FY2019-20 through service/user fees.
b) The 2019 City Services MSR indicated the City could experience fiscal challenges to service provision for its growing population if General Fund deficits persist. The City reports that while COVID-19 has been detrimental to park and recreation revenues due to inability to offer programs and rentals at standard capacity, the City has pivoted to providing more social services and is moving forward with planned CIP projects. The FY2019-20 financial information received for this MSR did not indicate that the City is experiencing fiscal challenges to service provision but it is pertinent to note this budget was prepared prior to the effects of COVID-19 being fully apparent.
c) The City has a Parkland Dedication Fee, an Open Space Development Impact Fee, and a Park and Recreation Facility Impact Fee adopted. The City annually approves a Fee Resolution that sets parks and recreation user fees. Fee updates are based on local rate studies and the Bay Area Consumer Price Index.
d) CSA M-29 provides financing for park and recreation facility maintenance in the Dougherty Valley Region of the City of San Ramon. The City uses CSA funds to provide park and facility maintenance services within City limits.
e) The City’s Parks & Community Services Department is funded primarily through the General Fund, which funds about 75% of the department’s activities.
5. Status of, and Opportunities for, Shared Facilities
a) The City shares two gymnasiums, 14 tennis courts, one track, two aquatic centers, and one performing arts center with the San Ramon Valley Unified School District. The City also shares two libraries with Contra Costa County.
b) The City is exploring an opportunity to expand on an existing partnership with the Discovery Counseling Center to expand counseling offerings.
c) The City of San Ramon shares significant areas of overlap with County Service Area M-29.
6. Accountability for Community Service Needs, Including Governmental Structure and Operational Efficiencies
a) The City of San Ramon website provides access to the agendas and minutes for the City Council and the Parks & Community Services Commission; the City’s budgets; and the City’s CAFRs. The City adequately provides accountability with regard to governance and municipal operations.
b) The City of San Ramon website provides access to public notices, including the time and place at which City residents may provide input, as well as other opportunities for public involvement in the City decision-making process. Meeting agendas and minutes are posted in a timely manner. The City adequately provides accountability with regard to citizen participation.
c) The City of San Ramon demonstrated accountability and transparency by disclosing financial and service-related information in response to LAFCO requests.
d) The City of San Ramon has a Parks & Community Services Commission and performs additional outreach through multiple Advisory Committees.

Contra Costa LAFCO Parks & Recreation MSR/SOI Update June 2021 7. City Parks & Recreation & Services Page 122
Economic & Planning Systems, Inc. Z:\Shared\Projects\Oakland\191000s\191105_ContraCostaLAFCO_Parks&RecMSR\Report\191105 CC LAFCO Parks and Rec MSR-SOI Final 2021June14.docx
7. Any other matter related to efficient service delivery, as required by commission policy
a) COVID-19 is having effects on San Ramon’s General Fund revenues. In response to COVID-19, the City has been unable to rent facilities and offer standards programs and has used reserves to cover revenue shortfalls and focused on decreasing expenditures. The City has pivoted to providing more social service support, offering virtual classes, collaborated with the County to distribute food and personal protective equipment (PPE) to the community, and developed protocols to provide safe child care, camps, and other opportunities that comply with County health guidelines.
City of Walnut Creek Parks and Recreation Services MSR Determinations
1. Growth and Population Projections
a) The California Department of Finance estimates the City of Walnut Creek’s 2020 population to be 70,860. The Association of Bay Area Governments projects Walnut Creek’s population to increase by 12,255 residents between 2020 and 2040, to a total of 83,115. This represents a compound annual growth rate of 0.80%.
2. The location and characteristics of any disadvantaged unincorporated communities within or contiguous to the sphere of influence
a) Disadvantaged communities were identified within the City’s SOI. The residents of the City’s disadvantaged community have equivalent access to park facilities as other members of the community.
3. Present and Planned Capacity of Public Facilities and Adequacy of Public Services, Including Infrastructure Needs and Deficiencies
a) There are currently 209 acres of developed neighborhood and community parkland, 2,701 acres of open space, 191 acres of other park-related acreage,37 and 52 miles of recreational trails within the City of Walnut Creek. Recreation facilities include two community centers, a center for community arts, an aquatics center, sports fields, a gymnasium, and a golf course. Additional facilities that residents of Walnut Creek have access to include Castle Rock Regional Recreation Area, Diablo Foothills Regional Park, and Las Trampas Regional Wilderness.
b) The City currently has 2.9 acres of developed parkland per 1,000 residents. c) The City of Walnut Creek has a level of service standard of 5 acres per 1,000 residents at
General Plan buildout (2035). Relative to this standard, the City is underproviding park acreage. The current LOS is short of this standard by 2.1 acres per resident. The City, therefore, needs 145.3 more acres to meet the standard for the current population. In order to meet the LOS for the projected 2040 city population, the City will need 412.6 more acres of parkland.
37 Including the 160-acre Boundary Oak Golf Course and 31 acres of undeveloped parkland.

Contra Costa LAFCO Parks & Recreation MSR/SOI Update June 2021 7. City Parks & Recreation & Services Page 123
Economic & Planning Systems, Inc. Z:\Shared\Projects\Oakland\191000s\191105_ContraCostaLAFCO_Parks&RecMSR\Report\191105 CC LAFCO Parks and Rec MSR-SOI Final 2021June14.docx
d) The City offers a variety of sports activities and classes for all ages. The City reports annual attendance at activities and programs of 102,022, annual attendance from parks and recreation classes at 28,750, art gallery attendance at 30,500, aquatics center fitness and recreational swimming attendance at 300,000, Lesher Center for the Arts attendance at 300,000, and annual rounds at boundary Oak Golf Course at 59,000.
e) The residents of the City’s disadvantaged communities have the same access to recreation facilities and programs as other residents. The City offers financial aid for low- and moderate-income Contra Costa County residents to participate in recreation classes and programming.
f) CIP planning is conducted through the City’s Ten-Year Capital Investment Program 2018-2028.
g) The City of Walnut Creek has a 10-Year Parks Plan for 2016-2026. h) The City indicates there is interest in acquiring additional parkland as it is one of the
Goals included in the City’s General Plan. i) The City did not specify the funding source status of the 11 current parks-related CIP
projects but indicated that all nine future parks-related CIP projects are funded. j) The City indicates that of the 17 developed park and recreation facilities in the City, 12
are in very good condition, four are in moderate condition, and one is in poor condition.
4. Financial Ability of Agencies to Provide Services
a) The City of Walnut Creek reports that the current level of financing is adequate for current parks and recreation service provision and the department recovered 51% of their total Parks and Recreation-related expenditures in FY2019-20 through service/user fees.
b) The 2019 City Services MSR indicated the City may experience funding obstacles to maintaining existing service levels or meeting overall infrastructure needs to accommodate projected population growth over the next five years. While the City-provided financial information for FY2019-20 does not indicate any such funding obstacles, the City reports that the COVID-19 pandemic has caused significant projected revenue shortfalls for the next two fiscal years compared to pre-pandemic estimates. In response to these projected shortfalls, the City indicates that annual contributions to the Capital Budget are reduced compared with prior years.
c) The City has a Parkland Dedication In-Lieu Fee adopted. The City adopted a cost recovery policy for Arts and Recreation programs in 2014, and updates user fees annually.
d) The City’s Arts and Recreation Department is funded through the City’s General Fund (49% in FY20) and service/user fees (51% in FY20).
5. Status of, and Opportunities for, Shared Facilities
a) The City shares facilities with the Walnut Creek School District and the Mt. Diablo Unified School District.
b) The City did not indicate if they are pursuing additional opportunities for shared facilities. c) The City of Walnut Creek is adjacent to and shares small areas of overlap with the
Pleasant Hill Recreation and Park District.

Contra Costa LAFCO Parks & Recreation MSR/SOI Update June 2021 7. City Parks & Recreation & Services Page 124
Economic & Planning Systems, Inc. Z:\Shared\Projects\Oakland\191000s\191105_ContraCostaLAFCO_Parks&RecMSR\Report\191105 CC LAFCO Parks and Rec MSR-SOI Final 2021June14.docx
6. Accountability for Community Service Needs, Including Governmental Structure and Operational Efficiencies
a) The City of Walnut Creek website provides access to the agendas and minutes for the City Council and the Park, Recreation and Open Space Commission; the City’s budgets; and the City’s CAFRs. The City adequately provides accountability with regard to governance and municipal operations.
b) The City of Walnut Creek website provides access to public notices, including the time and place at which City residents may provide input, as well as other opportunities for public involvement in the City decision-making process. Meeting agendas and minutes are posted in a timely manner. The City adequately provides accountability with regard to citizen participation.
c) The City of Walnut Creek demonstrated accountability and transparency by disclosing financial and service-related information in response to LAFCO requests.
d) The City of Walnut Creek has a Park, Recreation and Open Space Commission and performs additional outreach through its Arts Commission and Youth Leadership Commission.
7. Any other matter related to efficient service delivery, as required by commission policy
a) COVID-19 is having significant effects on Walnut Creek’s fiscal situation. In response to COVID-19, the City is hosting virtual Arts and Recreation Department classes and services, launched a program to help seniors with grocery delivery, and created a virtual Community Center. The City’s Parks and Open Spaces have remained open, and programming has been continued to the extent that County/State health orders allow.

Economic & Planning Systems, Inc. Z:\Shared\Projects\Oakland\191000s\191105_ContraCostaLAFCO_Parks&RecMSR\Report\191105 CC LAFCO Parks and Rec MSR-SOI Final 2021June14.docx
8. COMMUNITY SERVICES DISTRICTS
A Community Services District (CSD) is a governance structure that can be formed in an unincorporated area to ensure that basic service needs are met. CSDs can provide a variety of services including water, sewer, police, fire, garbage collection, recreation, landscaping, street lighting, mosquito abatement, graffiti abatement, library and more. Services not provided by a CSD are typically provided by the County and/or special districts in unincorporated areas.
Overv iew o f D i s t r i c t s
There are six CSDs within Contra Costa County, four of which provide park and recreation services to residents. This section provides an overview of the four CSDs providing park and recreation services, including how these services are provided, as well as growth and population projections, current and future service needs, infrastructure needs, service adequacy, and financing. Tables summarizing formation and subsequent changes to the Districts’ boundaries are provided in Appendix B, Tables B-5 through B-8.
Crockett Community Services District
The Crockett Community Services District (CCSD) was formed in July 2006 through the reorganization of three agencies: Crockett Sanitary District, County Sanitation District No. 5 (Port Costa), and County Service Area P-1. CCSD serves two separate and distinct communities— Crockett and Port Costa—and is authorized to provide the following services: wastewater collection, treatment, and disposal; public recreation; street lighting; landscape maintenance; graffiti abatement; and construction and maintenance of library buildings and cooperation with other governmental agencies for library services.
CCSD encompasses 686 acres (1.07 square miles); its sphere of influence (SOI) extends beyond the district boundary. The unincorporated Crockett and Port Costa communities are not contiguous.
Table 31 Crockett CSD Boundary History
Diablo Community Services District
The Diablo Community Services District was formed in 1969 by LAFCO and the Contra Costa Board of Supervisors to provide security and the maintenance of roads, bridges, culverts and Kay’s Trail within the community of Diablo. Kay’s Trail is an equestrian/pedestrian path located between Alameda Diablo and Mt Diablo Scenic Boulevard.
Project Name and/or Type of Action
LAFCO Resolution Date
ChangeType
AcresAffected Recording Agency
Formation 2006 Formation 686 State Board of Equalization
Sources: Crockett Community Services District; Contra Costa LAFCO.

Contra Costa LAFCO Parks & Recreation MSR/SOI Update June 2021 8. Community Services Districts Page 126
Economic & Planning Systems, Inc. Z:\Shared\Projects\Oakland\191000s\191105_ContraCostaLAFCO_Parks&RecMSR\Report\191105 CC LAFCO Parks and Rec MSR-SOI Final 2021June14.docx
The unincorporated community of Diablo is located at the foot of Mount Diablo and was settled in the early 1900s as a community of summer homes. Today Diablo consists of 390 homes, Diablo Country Club and a US Post Office. Diablo encompasses approximately 1,000 acres and the District’s sphere of influence (SOI) is coterminous with its service boundary.
Town of Discovery Bay Community Services District
The Town of Discovery Bay Community Services District (TDBCSD) provides and manages water, sewer, lighting, landscaping, levee maintenance, and parks and recreation services for the community. In addition, while the CSD Board has no land use or zoning authority, the CSD does advise the County on decisions related to police and fire services, residential and commercial development, and more.
TDBCSD encompasses 4,838 acres; its sphere of influence (SOI) extends beyond the district boundary.
Kensington Police Protection and Community Services District
The Kensington Police Protection and Community Services (KPPCSD) provides police protection, parks and recreation, and waste management services to the unincorporated Kensington community. KPPCSD maintains the Community Center, Kensington Park and surrounding amenities, including the tot lot, swings, picnic areas, basketball court, and tennis courts.
KPPCSD encompasses 1.2 square miles; its sphere of influence (SOI) is coterminous with its service boundary.
Impact o f COVID-19
The global pandemic and statewide shelter-in-place public health directives beginning in March 2020 have affected residents’ ability to access and use park and recreation facilities and services in each of the CSDs. However, most of the CSDs’ revenues come from property taxes and parcel taxes, which are relatively secure and have not been adversely affected by COVID. User charges for recreational programming have been severely diminished but so have recreational programming operating costs. In terms of capital improvements, none of the CSDs indicated that COVID is affecting their capital project planning.
Growth and Popu la t ion P ro jec t ions
The CSDs are all slow growth areas with annual growth rates ranging from 0.17% to 0.23% between 2020 and 2040. By contrast, Countywide annual average growth for this same time period is approximately 0.72%. With the exception of Discovery Bay, the populations of Crockett, Diablo and Kensington CSDs are small, ranging from 700 to 15,000. The Town of Discovery Bay has a population of approximately 15,000. In terms of absolute growth, Crockett, Diablo and Kensington are expected to add a few dozen to a couple hundred residents by 2040, while Discovery Bay is expected to add about 500 residents.
For the Crockett, Discovery Bay and Kensington CSDs, the 2020 population estimate was arrived by taking the 2019 ESRI Business Analyst population estimate and applying the long-term growth rate of the relevant MTC Transportation Analysis Zone (TAZ). The 2019 ESRI Business Analyst figure was judged to be more accurate than the respective CSDs population estimates that was published in the 2019 LAFCO Directory, which was a more rough, rounded estimate.

Contra Costa LAFCO Parks & Recreation MSR/SOI Update June 2021 8. Community Services Districts Page 127
Economic & Planning Systems, Inc. Z:\Shared\Projects\Oakland\191000s\191105_ContraCostaLAFCO_Parks&RecMSR\Report\191105 CC LAFCO Parks and Rec MSR-SOI Final 2021June14.docx
Furthermore, it should be noted that because even the 2019 population estimates are derivations based on 2010 Census figures, the 2020 Census is likely to re-establish the current population benchmark. For the Diablo CSD, the 2020 population estimate was arrived at by taking the 2019 LAFCO Directory estimate and applying the long-term growth rate of the relevant TAZ.
As with all growth projections, it should be noted that these are estimates based on the best available information at the time. Given that the COVID-19 pandemic is an unprecedented public health crisis, its impacts on future growth in the District are uncertain, and the projections shown in Figure 7 may vary from actual future growth.
Figure 7 Comparison CSDs’ Growth and Population Projections tables
Service Duplication and Boundary Overlap
Each of the four CSDs provides services to unincorporated communities in the County, and there are no instances of boundary overlap – with cities, other CSDs, or CSAs. The County boundary includes each of the CSAs as does the SOI of the East Bay Regional Park District. The Diablo CSD abuts the Green Valley RPD, CSA R-7, and the Town of Danville, but there are no indications of service duplication.

Contra Costa LAFCO Parks & Recreation MSR/SOI Update June 2021 8. Community Services Districts Page 128
Economic & Planning Systems, Inc. Z:\Shared\Projects\Oakland\191000s\191105_ContraCostaLAFCO_Parks&RecMSR\Report\191105 CC LAFCO Parks and Rec MSR-SOI Final 2021June14.docx
Shared Facilities and Cooperation
The Crockett CSD shares Rithet Park, which is owned and maintained by C&H Sugar, and rents the swimming pool to John Swett High School for use by the swim team. In addition, the Crockett Bocce League maintains the bocce ball courts.
None of the other CSDs indicated that they share facilities or identified that there are opportunities to share facilities in the future.
Disadvantaged Unincorporated Communities
A portion of the area served by the Crockett CSD, the area west of Interstate 80, qualifies as a Disadvantaged Unincorporated Community. The residents of the disadvantaged community within the District have access to park and recreation facilities and services, although the District’s primary parks and recreation facilities are located east of Interstate 80.
No other disadvantaged communities were identified within or contiguous to the other districts’ SOIs.
Presen t and P lanned Capa c i ty o f Fac i l i t i e s an d Adequ acy o f Pub l i c Se rv i ces
Figure 8 CSD Park Acreage Levels of Service

Contra Costa LAFCO Parks & Recreation MSR/SOI Update June 2021 8. Community Services Districts Page 129
Economic & Planning Systems, Inc. Z:\Shared\Projects\Oakland\191000s\191105_ContraCostaLAFCO_Parks&RecMSR\Report\191105 CC LAFCO Parks and Rec MSR-SOI Final 2021June14.docx
Figure 9 Condition of Existing CSD Park and Recreation Facilities
Crockett Community Services District
There are currently two parks in the CCSD service area that total approximately 6.2 acres; the largest is Alexander Park (5.2 acres) and the smaller of the two is Rithet Park (approx. 1 acre). The CCSD also owns and operates a Community Center, public swimming pool, tennis courts,
and bocce courts at Alexander Park, as well as a landscaped plaza in the downtown area, some bench seating at the World War I Memorial Hall, and the Rolph Memorial. The CSD provides nearly two acres of parks per 1,000 residents.
The Crockett Community Center, originally built by the C&H Sugar Company, was transferred from the County to the CCSD as one of the conditions of LAFCO approval of the reorganization. The facility is now the venue for many local events and is available for rental by private users.
There is limited recreational programming offered within the District to meet the needs of youths and adults.
0
1 2
1
5
0
4
1
1
0% 10% 20% 30% 40% 50% 60% 70% 80% 90% 100%
Crockett CSD
Diablo CSD
Discovery Bay CSD
Kensington CSD
DNR Poor Condition Moderate Condition Good Condition
*DNR: Did Not Respond with condition for certain facilities.Source: Economic & Planning Systems

Contra Costa LAFCO Parks & Recreation MSR/SOI Update June 2021 8. Community Services Districts Page 130
Economic & Planning Systems, Inc. Z:\Shared\Projects\Oakland\191000s\191105_ContraCostaLAFCO_Parks&RecMSR\Report\191105 CC LAFCO Parks and Rec MSR-SOI Final 2021June14.docx
Planned capital improvements are described in the District’s budget documents and include investment in the Community Center, the Aquatics Center, and the tennis courts and bocce ball courts.
Table 32 Crockett CSD Park and Recreation Facilities
Diablo Community Services District
The DCSD maintains a 100-yard (approximately 1-acre) pedestrian and equestrian trail called Kay’s Trail and has no plans to expand parks and recreation in the future. In FY 2015, the District paid $4,500 to a surveyor to plot the trail, and in FY 2021 the District will pay $8,000 toward trail maintenance and safety improvements. No other maintenance or capital planning is identified in the District’s budget. The DCSD does not provide any recreational programming.
Table 33 Diablo CSD Park and Recreation Facilities
Name Address/Location AcresParkType Facilities
SharedFacilities Condition
Alexander Park [1] Pomona St and Rolph Ave 5.2 Active Lawn area and picnic benches Bocce ball courtsBBQ areasPlay structures and swingsTennis courts Restrooms
Very Good
Crockett Community Center
850 Pomona St AuditoriumMuti-purpose roomBBQ Area
Moderate
Swimming Pool Pomona St and Rolph Ave Public swimming pool X Moderate
Rithet Park Loring Ave and Winslow St between Rolph Ave and West St
1.0 Active Bocce ball courtsLawnBenches and lighting
Very Good
Downtown Plaza Corner of Pomona St and 2nd Ave
Benches Very Good
WWI Memorial Hall 102 Alexander St Benches Poor
Rolph Memorial Very GoodTotal 6.2
Acreage per 1,000 Residents 1.9
[1] Acreage of Alexander Park includes the Community Center and swimming pool.
Source: Crockett Community Services District
Name Address/Location AcresParkType Facilities
SharedFacilities Condition
Kay's Trail between Alameda Diablo and Mt.Diablo Scenic
1.0 Active Pedestrian and Equestrian Trail
N/A Moderate
Total 1.0Acreage per 1,000 Residents 1.2
Source: Diablo Community Services District

Contra Costa LAFCO Parks & Recreation MSR/SOI Update June 2021 8. Community Services Districts Page 131
Economic & Planning Systems, Inc. Z:\Shared\Projects\Oakland\191000s\191105_ContraCostaLAFCO_Parks&RecMSR\Report\191105 CC LAFCO Parks and Rec MSR-SOI Final 2021June14.docx
Town of Discovery Bay Community Services District
There are currently six parks in the TDBCSD service area for a total of nearly 30 acres, including one community center, representing approximately 2 acres of parks per 1,000 residents. The parks feature sports fields, tennis courts, pickleball courts, basketball courts, horse shoes, bocce ball, BBQ areas, picnic tables, playgrounds, restrooms, dog areas, shade structures, and a community garden. There is a swimming pool at the Community Center and a splash pad at Ravenswood Park. In FY 2019/20, the District spent $61,000 on capital improvements, including nearly $39,000 at the Community Center Pool.
The District maintains all of the public parks and landscaped areas in Discovery Bay. The landscaped areas in Discovery Bay are divided into five (5) landscape zones, two are owned by the District, and the remaining three are owned by Contra Costa County and maintained under contract by the District.
The TDBCSD offers robust recreational programming to meet the needs of all residents, although programming was significantly affected by COVID-19. Classes and programs are published seasonally in the “Discovery Bay Activity Guide.” Classes and programs are taught by contract instructors.
Planned capital improvements are described in the District’s budget documents and include investment in the Community Center Pool and the Ravenswood Park Play Structure, both of which were postponed from FY 2019/20 to FY 2020/21.
Table 34 Discovery Bay CSD Park and Recreation Facilities
Name Address/Location AcresParkType Facilities
SharedFacilities Condition
Cornell Park 505 Discovery Bay Blvd. 8.4 Neighborhood Baseball field and soccer field, Restrooms, BBQ Area, Picnic Tables, Playground, Tennis, Pickleball, Basketball, Horse Shoes, Bocce Ball
Raveswood Park Cullen Drive 2.5 Neighborhood Playground, soccer field, splash pad, picnic tables, BBQ
Roberta Fuss Tot Lot Clipper Drive Neighborhood Playground, picnic tableSlifer Park Newport Drive 6.0 Neighborhood Playground, soccer field,
basketball courts, shade structures, picnic tables, BBQ
County Owned
Regatta Park Sailboat Drive 5.5 Neighborhood Playground, soccer field, baseball field, basketball, picnic tables, BBQ
County Owned
Community Center 1601 Discovery Bay Blvd., Discovery Bay, CA 94505
7.4 N/A Community centerLawn and gardenPool
Moderate
Total 29.8Acreage per 1,000 Residents 2.0
Source: Town of Discovery Bay Community Services District.

Contra Costa LAFCO Parks & Recreation MSR/SOI Update June 2021 8. Community Services Districts Page 132
Economic & Planning Systems, Inc. Z:\Shared\Projects\Oakland\191000s\191105_ContraCostaLAFCO_Parks&RecMSR\Report\191105 CC LAFCO Parks and Rec MSR-SOI Final 2021June14.docx
Kensington Police Protection and Community Services District
There is currently one community center (also referred to as the Youth Hut) located in the 10-acre Kensington Park in the KPPCSD service area, as well as adjacent basketball courts and two full-size tennis courts and practice backboard. The KPPCSD provides approximately two acres of parks per 1,000 residents.
The Community Center was recently renovated with seismic upgrades, abatement work, and parking upgrades. Public restroom upgrades in Kensington Park were completed as well. Funding was partially addressed with EBRPD Measure WW grant funds. With the renovation of the Community Center, the District’s park and recreation facilities are in very good repair.
While the CSD does not provide recreational programming, there is some recreational programming offered through the Kensington Community Council.
Table 35 Kensington CSD Park and Recreation Facilities
Name Address/Location AcresParkType Facilities
SharedFacilities Condition
Kensington Park and Community Center
59 Arlington Avenue 10.0 Active Tennis Courts, Basketball Courts
N/A Very Good
Total 10.0Acreage per 1,000 Residents 1.9
Source: Kensington Police Protection and Community Services District.

Contra Costa LAFCO Parks & Recreation MSR/SOI Update June 2021 8. Community Services Districts Page 133
Economic & Planning Systems, Inc. Z:\Shared\Projects\Oakland\191000s\191105_ContraCostaLAFCO_Parks&RecMSR\Report\191105 CC LAFCO Parks and Rec MSR-SOI Final 2021June14.docx
F inanc ia l Ab i l i t y to P rov ide Serv i ces
Each of the CSDs have one or more secure sources of revenue to fund park and recreation services, including property taxes, special taxes, assessments, parcel taxes, and cost recovery charges. In each case, the park maintenance and/or recreation services are just one component of services offered by the CSDs, and the CSDs’ revenues exceed those needed for the park and recreation expenditures.
Crockett Community Services District
CCSD funds parks and recreation services with revenue from a tax of $50 per parcel and transfers of property tax revenue from CCSD’s General Fund. Other revenue sources include grants, loans, interest on invested reserves, cost recovery, facility rental fees, user charges, and miscellaneous fees. Each year, the CCSD reviews its park and recreation user fees to make sure its fee schedule is in line with other jurisdictions.
Diablo Community Services District
There is no dedicated funding source for the District’s only recreation asset, the equestrian/pedestrian trail (Kay’s Trail). Rather, District funding for maintenance of Kay’s trail comes from property tax revenue and Measure B revenue. Measure B is a special tax measure passed by voters in March 2018. Of the District’s expenditures, maintenance of Kay’s Trail is less than 1% of total expenditures each year (approximately $8,000).
Town of Discovery Bay Community Services District
The TDBCSD funds park maintenance and recreation services through property tax revenues to Landscape and Lighting District Zone #8, assessments to Landscape and Lighting District Zone #9, and cost recovery fees and charges for recreational classes, facility rentals, donations, novelty/beverage/food sales, and community center events. Capital expenditures are funded with reserves.
Kensington Police Protection and Community Services District
District funding for park and recreation facilities comes primarily from non-operating revenue such as property tax allocation and the Landscape & Lighting Maintenance District Assessment, and has required General Fund subsidy in the past as shown in Figure 10. Revenues also come from operating revenue generated by community center rentals and tennis court charges. Because the Community Center has been closed for renovation, no rental revenue has been generated. With the renovation complete, the rental revenue is expected to increase.
One of the Board’s priorities for the coming fiscal year is to review the Landscape Maintenance District assessment for ongoing maintenance of Kensington Park and discuss whether or not to propose increasing the assessment levy for Kensington Park to reduce or eliminate the current general fund subsidy for maintenance activities at that location.

Contra Costa LAFCO Parks & Recreation MSR/SOI Update June 2021 8. Community Services Districts Page 134
Economic & Planning Systems, Inc. Z:\Shared\Projects\Oakland\191000s\191105_ContraCostaLAFCO_Parks&RecMSR\Report\191105 CC LAFCO Parks and Rec MSR-SOI Final 2021June14.docx
Figure 10 CSDs’ FY19-20 Revenues and Expenditures Per Capita
Management & Accountab i l i t y
Each of the CSDs evaluated in this MSR is governed by a five-member board and staffed by a General Manager, although the General Manager position for the Crockett CSD is unfilled, as of March 2021.
AB 2257, approved on September 9, 2016, requires district and governmental websites to include Board meeting agendas for all meetings occurring on or after January 1, 2019.38 On September 14, 2018, the Governor signed SB 929 which added Government Code Section 6270.6 and 53087.8 which requires that every independent special district in California maintain a website by January 1, 2020. The intent of the bill is to provide the public easily accessible and accurate information about the district.39
38 Assembly Bill No. 2257, filed September 9, 2016. https://leginfo.legislature.ca.gov/faces/billNavClient.xhtml?bill_id=201520160AB2257. 39 Senate Bill No. 929, filed September 14, 2018. https://leginfo.legislature.ca.gov/faces/billTextClient.xhtml?bill_id=201720180SB929.
$351
$0
$63
$7
$249
$55
$24
$0 $50 $100 $150 $200 $250 $300 $350 $400
Crockett CSD
Diablo CSD
Discovery Bay CSD
Kensington CSD
FY19‐20 Revenue per Capita FY19‐20 Expenditures per Capita
Source: Economic & Planning Systems

Contra Costa LAFCO Parks & Recreation MSR/SOI Update June 2021 8. Community Services Districts Page 135
Economic & Planning Systems, Inc. Z:\Shared\Projects\Oakland\191000s\191105_ContraCostaLAFCO_Parks&RecMSR\Report\191105 CC LAFCO Parks and Rec MSR-SOI Final 2021June14.docx
Currently, all four CSDs maintain websites that are easily accessible and that provide links to Board meeting agendas:
Crockett Community Services District: https://www.town.crockett.ca.us/ Diablo Community Services District: https://www.diablocsd.org/home.html Town of Discovery Bay Community Services District: https://www.todb.ca.gov/ Kensington Police Protection and Community Services District: https://www.kppcsd.org/
Crockett Community Services District
The CCSD has a five-member governing body. Board meetings are held on the fourth Wednesday of each month. Meetings are held at the Crockett Community Center, 850 Pomona Avenue, Crockett, at 7 PM. The meeting agenda and minutes from previous meetings are posted on the CCSD website. Administrative services are housed at 628 Second Avenue, Suite 206, Crockett, where the department leases office space.
With the formation of the CCSD in 2006, a Recreation Department was formed. The Department is managed by the Recreation Commission, which is composed of existing Committee members and Crockett Recreation Association Board members.
The CCSD has six full-time employees and numerous temporary employees. The General Manager has the administrative authority and responsibility for the operation of the CCSD and the enforcement of all CCSD rules and regulations. The General Manager also has emergency authority as may be granted by the Board of Directors. The CCSD obtains legal services from an attorney under fee agreement with the law corporation Meyers, Nave, Riback, Silver and Wilson. The CCSD obtains engineering services from a practicing engineer under fee agreement with RMA/Engineering and Management. There are three Commissions that serve in an advisory capacity and are appointed to oversee the three departments in the District.
Table 36 Crockett CSD Governing Body and Contact Information
Item
Governing Board Members
Manner of Selection Elected-at-LargeLength of Term Four YearsMeetings 4th Wednesday of the month at 7:00pmAgenda Distribution https://www.town.crockett.ca.us/board-meetingsMinutes Distribution https://www.town.crockett.ca.us/board-meetingsContact Ron WilsonMailing Address 850 Pomona Street, Crockett, CA 94525Email / Website https://www.town.crockett.ca.us/board-meetings
Source: Crockett Community Services District.
5 Board Members (names/terms available at www.town.crockett.ca.us/board-members)
Information
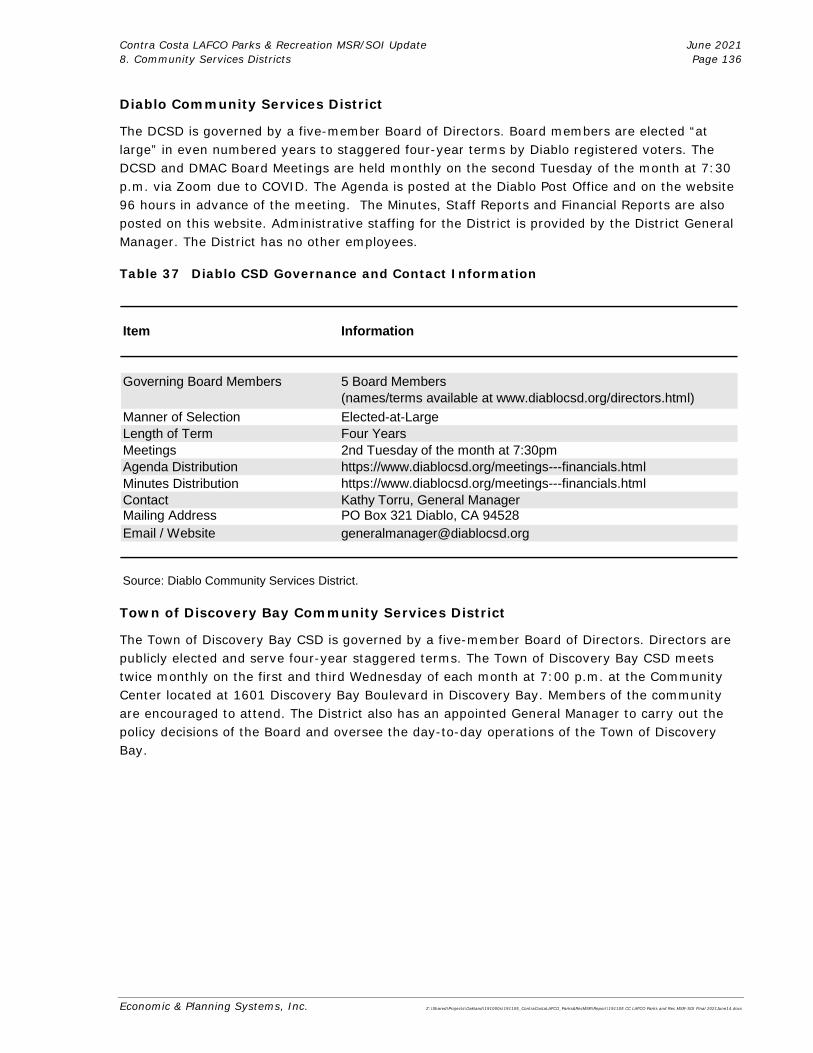
Contra Costa LAFCO Parks & Recreation MSR/SOI Update June 2021 8. Community Services Districts Page 136
Economic & Planning Systems, Inc. Z:\Shared\Projects\Oakland\191000s\191105_ContraCostaLAFCO_Parks&RecMSR\Report\191105 CC LAFCO Parks and Rec MSR-SOI Final 2021June14.docx
Diablo Community Services District
The DCSD is governed by a five-member Board of Directors. Board members are elected “at large” in even numbered years to staggered four-year terms by Diablo registered voters. The DCSD and DMAC Board Meetings are held monthly on the second Tuesday of the month at 7:30 p.m. via Zoom due to COVID. The Agenda is posted at the Diablo Post Office and on the website 96 hours in advance of the meeting. The Minutes, Staff Reports and Financial Reports are also posted on this website. Administrative staffing for the District is provided by the District General Manager. The District has no other employees.
Table 37 Diablo CSD Governance and Contact Information
Town of Discovery Bay Community Services District
The Town of Discovery Bay CSD is governed by a five-member Board of Directors. Directors are publicly elected and serve four-year staggered terms. The Town of Discovery Bay CSD meets twice monthly on the first and third Wednesday of each month at 7:00 p.m. at the Community Center located at 1601 Discovery Bay Boulevard in Discovery Bay. Members of the community are encouraged to attend. The District also has an appointed General Manager to carry out the policy decisions of the Board and oversee the day-to-day operations of the Town of Discovery Bay.
Item
Governing Board Members
Manner of Selection Elected-at-LargeLength of Term Four YearsMeetings 2nd Tuesday of the month at 7:30pmAgenda Distribution https://www.diablocsd.org/meetings---financials.htmlMinutes Distribution https://www.diablocsd.org/meetings---financials.htmlContact Kathy Torru, General ManagerMailing Address PO Box 321 Diablo, CA 94528Email / Website [email protected]
Source: Diablo Community Services District.
5 Board Members (names/terms available at www.diablocsd.org/directors.html)
Information

Contra Costa LAFCO Parks & Recreation MSR/SOI Update June 2021 8. Community Services Districts Page 137
Economic & Planning Systems, Inc. Z:\Shared\Projects\Oakland\191000s\191105_ContraCostaLAFCO_Parks&RecMSR\Report\191105 CC LAFCO Parks and Rec MSR-SOI Final 2021June14.docx
Table 38 Town of Discovery Bay CSD Governing Body and Contact Information
Kensington Police Protection and Community Services District
The Kensington Police Protection and Community Services District is governed by 5 unpaid board members elected to office by the community to serve staggered 4-year terms. Board meetings are held twice monthly, on the second and fourth Thursdays of the month. (November and December meetings occur only on the second Thursday.) Each December, the Board elects one of its members to serve as Board President and one to serve as Board Vice President for the next calendar year. The President of the Board assigns each of the Board members to serve as Chairpersons for the various committees serving the Board.
Table 39 Kensington CSD Governance and Contact Information
Item Information
Governing Board Members
Manner of Selection Elected-at-LargeLength of Term Four YearsMeetings 1st and 3rd Wednesdays of the month at 7:00pmAgenda Distribution https://www.todb.ca.gov/agendas-minutesMinutes Distribution https://www.todb.ca.gov/agendas-minutesContact Michael Davies, General ManagerMailing Address 1800 Willow Lake Road, Discovery Bay, CA 94505-9376Email / Website https://www.todb.ca.gov/
Source: Town of Discovery Bay Community Services District.
5 Board Members (names/terms available at www.todb.ca.gov/board-directors)
Item Information
Governing Board Members
Manner of Selection Elected-at-LargeLength of Term Four YearsMeetings 2nd Thursday of the month at 7:00pmAgenda Distribution https://www.kppcsd.org/meetingsMinutes Distribution https://www.kppcsd.org/kppcsd-boardContact Marti Brown, General ManagerMailing Address 217 Arlington Avenue, Kensington CA 94707Email / Website https://www.kppcsd.org/board-of-directors
Source: Kensington Police Protection and Community Services District.
5 Board Members (names/terms available at www.kppcsd.org/board-of-directors)

Contra Costa LAFCO Parks & Recreation MSR/SOI Update June 2021 8. Community Services Districts Page 138
Economic & Planning Systems, Inc. Z:\Shared\Projects\Oakland\191000s\191105_ContraCostaLAFCO_Parks&RecMSR\Report\191105 CC LAFCO Parks and Rec MSR-SOI Final 2021June14.docx
Table 40 Summary of CSD Staffing
Croc ke t t Com muni ty Se rv i c es D is t r i c t MSR Dete rminat ions
1. Growth and Population Projections
a) The residential population served by the District is relatively stable, with expected growth of approximately 5%, or 156 people, between 2020 and 2040, for a total population in 2040 of approximately 3,465 people.
2. The location and characteristics of any disadvantaged unincorporated communities within or contiguous to the sphere of influence
a) The portion of the CCSD service area west of Interstate 80 is considered a disadvantaged community in that the median household income is less than 80% of the statewide median household income.
b) The residents of the disadvantaged communities within the District have access to park and recreation facilities and services, although the District’s primary parks and recreation facilities are located east of Interstate 80.
3. Present and Planned Capacity of Public Facilities and Adequacy of Public Services, Including Infrastructure Needs and Deficiencies
a) There are currently two parks in the CCSD service area featuring bocce courts, one community center, one swimming pool, and tennis courts.
b) CCSD staff report that the Community Center turned 100 years old in 2020 and needs some work, as does the pool building at the swimming pool. Alexander Park and Rithet Park are in good condition as reported by the District and do not need major improvements at this time.
c) The CCSD provides 1.9 acres of parks per 1,000 residents, which is insufficient relative to the County’s goal of 4.0 acres per 1,000 residents.
Parks and Recreation Type of Staff Crockett CSD Diablo CSD Kensington CSD Discovery Bay CSD
Full-Time (Paid) 1 - - 6Part-Time (Paid) 4 - - 1Seasonal (Paid) 25 - - 18Full Time Equivalents (FTE) 2 - 2 6
Volunteer (Unpaid) 8 - - -Other (Please Define) - - - -
Staff (FTE) per 1,000 Residents 0.6 0.0 0.38 0.4Staff (FTE) per Acre 0.4 0.0 0.20 0.2
Sources: Crockett CSD; Diablo CSD; Kensington CSD; Discovery Bay CSD.
Annual Average

Contra Costa LAFCO Parks & Recreation MSR/SOI Update June 2021 8. Community Services Districts Page 139
Economic & Planning Systems, Inc. Z:\Shared\Projects\Oakland\191000s\191105_ContraCostaLAFCO_Parks&RecMSR\Report\191105 CC LAFCO Parks and Rec MSR-SOI Final 2021June14.docx
d) There is limited recreational programming offered within the District to meet the needs of youths and adults.
e) The District’s annual budget includes a CIP list and funding strategy. Funding sources have been identified for 100% (nearly $170,000) of the District’s current planned parks and recreation-related capital expenditures for fiscal year 2020/21. Most of the identified funding comes from grants, Return-to-Source (RTS) funding, and the capital reserve fund.
4. Financial Ability of Agencies to Provide Services
a) District funding for park and recreation services comes primarily from operating revenue generated by community center rentals, aquatics center revenue, and revenue from parks, bocce, and tennis court charges and rentals. Revenues also come from non-operating revenue such as the District’s recreation parcel tax, transfers of property tax revenues, and grants.
5. Status of, and Opportunities for, Shared Facilities
a) Rithet Park was built in 1912 and renovated in 1997. While the park is owned and maintained by C&H Sugar, it is an important asset to the community and is accessible to all residents.
b) The District did not identify other opportunities for shared facilities.
6. Accountability for Community Service Needs, Including Governmental Structure and Operational Efficiencies
a) The District is accountable to its service population and provides transparent governance and operations. The District’s website provides access to the agendas and minutes for the Board meetings and its various commissions and committees, including the Recreation Commission, as well as annual budgets and audits.
b) The District fully responded to LAFCO’s requests for information. c) The District makes efforts to reach out to the community through publication of an
annual newsletter about the District and the periodic “Crockett Engaged” newsletter.
7. Any other matter related to efficient service delivery, as required by commission policy
a) COVID-19 is having a significant effect on the District’s ability to fund and provide Park and Recreation services. In response to COVID-19, the District is providing updated information related to the status of facilities. Most facilities are closed for recreational and public use; tennis courts are open with social distancing requirements in place. A note on the District’s website indicates that The Recreation Department has lost over $40K through May 2020 and anticipates an additional $40K+ in lost income at the Community Center through the end of September 2020. The Recreation Department had to furlough two employees.

Contra Costa LAFCO Parks & Recreation MSR/SOI Update June 2021 8. Community Services Districts Page 140
Economic & Planning Systems, Inc. Z:\Shared\Projects\Oakland\191000s\191105_ContraCostaLAFCO_Parks&RecMSR\Report\191105 CC LAFCO Parks and Rec MSR-SOI Final 2021June14.docx
Diab lo Communi ty Se rv i ces D i s t r i c t MSR Dete rminat ions
1. Growth and Population Projections
a) The residential population served by the District is relatively stable, with expected growth of approximately 3%, or 26 people, between 2020 and 2040, for a total population in 2040 of approximately 835 people.
2. The location and characteristics of any disadvantaged unincorporated communities within or contiguous to the sphere of influence
a) No disadvantaged communities were identified within or contiguous to the District’s sphere of influence.
3. Present and Planned Capacity of Public Facilities and Adequacy of Public Services, Including Infrastructure Needs and Deficiencies
a) The DCSD maintains a 100-yard long (one acre area) pedestrian and equestrian trail called Kay’s Trail and has no plans to expand parks and recreation in the future.
b) Beyond the General Manager, the CSD does not have employees. c) The CSD does not provide recreational programming. d) The District’s annual budget includes a CIP list. Currently, there are no planned capital
projects affecting Kay’s Trail.
4. Financial Ability of Agencies to Provide Services
a) District funding for maintenance of Kay’s trail comes from property tax revenue and Measure B revenue. Measure B is a special tax measure passed by voters in March 2018. Of the District’s expenditures, maintenance of Kay’s Trail is less than 1% of total expenditures each year (approximately $8,000).
5. Status of, and Opportunities for, Shared Facilities
a) The District does not currently share any park and recreation facilities and did not identify any opportunities for shared facilities.
6. Accountability for Community Service Needs, Including Governmental Structure and Operational Efficiencies
a) The District is accountable to its service population and provides transparent governance and operations information. The District’s website provides access to the agendas and minutes for the Board meetings, as well as annual budgets and audits.
b) The District responded to LAFCO’s requests for information.
7. Any other matter related to efficient service delivery, as required by commission policy
a) COVID-19 has not had a material effect on the District’s ability to fund its maintenance of Kay’s Trail. The District’s General Manager notes that if property values decrease in

Contra Costa LAFCO Parks & Recreation MSR/SOI Update June 2021 8. Community Services Districts Page 141
Economic & Planning Systems, Inc. Z:\Shared\Projects\Oakland\191000s\191105_ContraCostaLAFCO_Parks&RecMSR\Report\191105 CC LAFCO Parks and Rec MSR-SOI Final 2021June14.docx
future years as a result of the pandemic-induced recession, the ad valorem tax revenue the District receives would decrease which would strain the District’s budget.
Town o f D i scovery Bay Communi ty Serv i ces D i s t r i c t MSR Determinat ion s
1. Growth and Population Projections
a) The residential population served by the District is relatively stable, with expected growth of approximately 3.5%, or 539 people, between 2020 and 2040, for a total population in 2040 of approximately 15,754 people.
b) The future development of the Pantages Bay residential homes project will be in an area surrounded by Discovery Bay, and the Newport Pointe residential homes project will be in an area adjoining Discovery Bay. These development projects have been approved by Contra Costa County. While LAFCO already approved the SOI update and annexation of Newport Pointe to the District, the Discovery Bay CSD anticipates the area of the Pantages Bay residential homes project will be brought into the Town's SOI and service boundary as well. The CSD also recognizes the potential for future residential and commercial development surrounding the SOI and Town boundary, which may necessitate future expansion and annexation.
2. The location and characteristics of any disadvantaged unincorporated communities within or contiguous to the sphere of influence
a) No disadvantaged communities were identified within or contiguous to the District’s sphere of influence.
3. Present and Planned Capacity of Public Facilities and Adequacy of Public Services, Including Infrastructure Needs and Deficiencies
a) There are currently six (6) parks in the TDBCSD service area for a total of nearly 30 acres, including one community center. The parks feature sports fields, tennis courts, BBQ areas, picnic tables, playgrounds, restrooms, and dog areas. There is a swimming pool at the Community Center and a splash pad at Ravenswood Park.
b) The District maintains all of the public parks and landscaped areas in Discovery Bay. The landscaped areas in Discovery Bay are divided into five (5) landscape zones, two are owned by the District, and the remaining three are owned by Contra Costa County and maintained under contract by the District.
c) The CSD provides approximately two acres of parks per 1,000 residents. d) The CSD offers robust recreational programming to meet the needs of all residents,
although programming was significantly affected by COVID-19. Classes and programs are published seasonally in the “Discovery Bay Activity Guide.” Classes and programs are taught by contract instructors.
e) The District’s annual budget includes a CIP list and funding strategy. In fiscal year 20/21 plans are underway to complete the Community Center pool project; convert two tennis courts to pickleball courts; and prepare a Landscaping Master Plan.
f) The majority of the District’s parks facilities are in moderate condition as reported by the District, with Regatta Park needing more substantial renovation while Slifer Park is in very good condition.

Contra Costa LAFCO Parks & Recreation MSR/SOI Update June 2021 8. Community Services Districts Page 142
Economic & Planning Systems, Inc. Z:\Shared\Projects\Oakland\191000s\191105_ContraCostaLAFCO_Parks&RecMSR\Report\191105 CC LAFCO Parks and Rec MSR-SOI Final 2021June14.docx
4. Financial Ability of Agencies to Provide Services
a) District funding for the maintenance of parks and landscaped areas comes from property tax revenues to Landscape and Lighting District Zone #8 and assessments to Landscape and Lighting District Zone #9.
b) Funding for recreation services, also provided through Landscape and Lighting District Zone #8, comes primarily from cost recovery fees and charges for recreational classes, facility rentals, donations, novelty/beverage/food sales and community center events.
c) Reserve Funds have been established for emergency use for the Lighting and Landscape District Zone #8 and the Lighting and Landscape District Zone #9. The reserves are 50% of Zone #8 and Zone #9 operating budgets.
5. Status of, and Opportunities for, Shared Facilities
a) The District does not share any facilities with other jurisdictions and did not identify any opportunities for shared facilities.
6. Accountability for Community Service Needs, Including Governmental Structure and Operational Efficiencies
a) The District is accountable to its service population and provides transparent governance and operations. The District’s website provides access to the agendas and minutes for the Park & Recreation Committee, as well as annual budgets and audits.
b) The District responded to LAFCO’s requests for information in a timely manner. c) The District makes efforts to reach out to the community through publication of its
seasonal Activity Guide. Staff has increased use of the Town’s Facebook page and website to promote our various recreation programs, activities and events occurring throughout the year.
7. Any other matter related to efficient service delivery, as required by commission policy
a) COVID-19 has affected the District’s ability to offer recreation classes, programs, and activities, and the District is now providing virtual programs. The District’s fiscal situation has not changed significantly; however, the longer the pandemic precludes the District from offering recreational programming, the more likely the District is to experience negative fiscal effects.
Kens in gton P o l i ce P ro tec t i on and Comm uni ty Serv i ces D i s t r i c t MSR Dete rminat ions
1. Growth and Population Projections
a) The residential population served by KPPCSD is relatively stable, with expected growth of approximately 3.6%, or 92 people, between 2020 and 2040, for a total population in 2040 of approximately 2,672 people.

Contra Costa LAFCO Parks & Recreation MSR/SOI Update June 2021 8. Community Services Districts Page 143
Economic & Planning Systems, Inc. Z:\Shared\Projects\Oakland\191000s\191105_ContraCostaLAFCO_Parks&RecMSR\Report\191105 CC LAFCO Parks and Rec MSR-SOI Final 2021June14.docx
2. The location and characteristics of any disadvantaged unincorporated communities within or contiguous to the sphere of influence
a) No disadvantaged communities were identified within or contiguous to the District’s sphere of influence.
3. Present and Planned Capacity of Public Facilities and Adequacy of Public Services, Including Infrastructure Needs and Deficiencies
a) There is currently one community center (also referred to as the Youth Hut) located in Kensington Park in the CSD service area, as well as adjacent basketball courts and two full-size tennis courts and practice backboard.
b) The Community Center was recently renovated with seismic upgrades, abatement work, and parking upgrades. Public restroom upgrades in Kensington Park were completed as well. Funding was partially addressed with EBRPD Measure WW grant funds.
c) The KPPCSD provides nearly 1.9 acres of parks per 1,000 residents, which is insufficient relative to the County’s goal of 4.0 acres per 1,000 residents.
d) While the KPPCSD does not provide recreational programming, there is some recreational programming offered through the Kensington Community Council.
e) The District’s annual budget includes a capital outlay plan. For fiscal year 2020/21, the most significant capital outlay is the Community Center loan repayment.
f) With the renovation of the Community Center, the District’s park and recreation facilities are in very good repair.
4. Financial Ability of Agencies to Provide Services
a) District funding for park and recreation facilities comes primarily from non-operating revenue such as property tax allocation and the Landscape & Lighting Maintenance District Assessment. Revenues also comes from operating revenue generated by community center rentals and tennis court charges. Because the Community Center is closed for renovation, no rental revenue has been generated. With the renovation, the rental revenue is expected to increase.
b) Currently, park and recreation facility expenses exceed revenues and require subsidy from the District’s General Fund. One of the Board’s priorities for the coming fiscal year is to review the Landscape Maintenance District assessment for ongoing maintenance of Kensington Park and discuss whether or not to propose increasing the assessment levy for Kensington Park to reduce or eliminate the current General Fund subsidy for maintenance activities at that location.
5. Status of, and Opportunities for, Shared Facilities
a) The District did not identify opportunities for shared facilities.
6. Accountability for Community Service Needs, Including Governmental Structure and Operational Efficiencies
a) The District is accountable to its service population and provides transparent governance and operations information. The District’s website provides access to the agendas and minutes for the Board meetings, as well as annual budgets and audits.
b) The District responded to LAFCO’s requests for information.

Contra Costa LAFCO Parks & Recreation MSR/SOI Update June 2021 8. Community Services Districts Page 144
Economic & Planning Systems, Inc. Z:\Shared\Projects\Oakland\191000s\191105_ContraCostaLAFCO_Parks&RecMSR\Report\191105 CC LAFCO Parks and Rec MSR-SOI Final 2021June14.docx
c) For some time, the CSD Board was focused on recruiting and retaining a permanent General Manager. This management position was filled in early 2021.
d) The District makes limited efforts to reach out to the community through publication of an occasional newsletter.
7. Any other matter related to efficient service delivery, as required by commission policy
a) Between the planned renovation of the Community Center which meant the facility was closed and unavailable to rent (beginning March 2019), and COVID-19 (beginning March 2020), the District has faced nearly two years of diminished facility rental revenue.

Economic & Planning Systems, Inc. Z:\Shared\Projects\Oakland\191000s\191105_ContraCostaLAFCO_Parks&RecMSR\Report\191105 CC LAFCO Parks and Rec MSR-SOI Final 2021June14.docx
9. COUNTY SERVICE AREAS
There are eight County Service Areas (CSAs) in Contra Costa County that provide funding for enhanced park and recreation services in a specific area. CSAs M-16, M-17, R-7, R-9, and R-10 are administered by Contra Costa County for park and recreation services in unincorporated areas, and CSAs M-29, M-30 and R-4 are administered by the City of San Ramon, the Town of Danville and the Town of Moraga, respectively, for enhanced park and recreation services provided within the city limits.
Overv iew o f D i s t r i c t s
The boundary histories are presented in Appendix B, Table B-4. Maps of each CSA are provided in Appendix E and are also available on the Contra Costa LAFCO website.
Impact o f COVID-19
As with many offices adjusting to the social distancing and stay-at-home orders of 2020, the County is altering its work. While Special Districts staff is largely working remotely and therefore largely unaffected, necessary in-person functions such as landscape maintenance have been reduced to essential services since the Spring of 2020. The effect of the pandemic is not yet anticipated to have an impact on funding. The CSA Manager is being strategic with capital plans, taking advantage of this opportunity to increase the focus on planning and design as opposed to moving ahead with new projects.
Growth and Popu la t ion P ro jec t ions
Many of the CSAs are in slow-growth areas with average annual projected growth rates that are substantially lower than the Countywide average of 0.72% population growth during the next 20 years. Meanwhile, all but CSA R-9 are expected to have growth rates of less than 0.2%during that time. Even CSA R-9, the fastest growing of the eight park and recreation CSAs in the County, is only expected to grow by roughly 0.6% by 2040. The absolute number of new residents ranges from very small CSAs such as M-30, which is expected to add fewer than 10 residents, to larger CSAs such as R-9, which is expected to add nearly 1,700 residents.
For CSAs M-16, M-17, R-4, R-7, R-9 and R-10, the 2020 population estimate was arrived at by taking the 2019 ESRI Business Analyst population estimate and applying the long-term growth rate of the relevant TAZ. The 2019 ESRI Business Analyst figure was judged to be more accurate than the CSAs population estimates that was published in the 2019 LAFCO Directory, which was an estimate.
For the two CSAs which deviated from this methodology (CSA M-29 and M-30), the 2020 population estimates were derived from the 2019 LAFCO Directory estimate and applying the long-term growth rate of the relevant TAZ. In the case of these two CSAs, the LAFCO Directory figures appear to be more accurate than ESRI Business Analyst population estimates. For CSA M-29, the County’s estimates also closely match the City of San Ramon’s expectation of growth in that area.

Contra Costa LAFCO Parks & Recreation MSR/SOI Update June 2021 9. County Service Areas Page 146
Economic & Planning Systems, Inc. Z:\Shared\Projects\Oakland\191000s\191105_ContraCostaLAFCO_Parks&RecMSR\Report\191105 CC LAFCO Parks and Rec MSR-SOI Final 2021June14.docx
As with all growth projections, it should be noted that these are estimates based on the best available information at the time. Given that the COVID-19 pandemic is an unprecedented public health crisis, its impacts on future growth in the District are uncertain, and the projections listed in Table 41 may vary from actual future growth.
Table 41 CSAs Growth and Population Projections
Boundary Overlaps
Boundary overlaps occur in the following areas:
CSA R-4 boundary includes all of the Town of Moraga as well as unincorporated areas CSA M-30 is located entirely within CSA R-7 CSA M-29 is partially located within the City of San Ramon and partially located in the
unincorporated area
Shared Facilities and Cooperation
CSAs engage in joint financing arrangements related to staffing and share facilities for park maintenance, landscaping, and administrative purposes. Several of the CSAs share facilities with local school districts. No other facility sharing opportunities were identified.
Disadvantaged Communities
There is one disadvantaged unincorporated community within the SOI of CSA R-10, the community of Rodeo. No other disadvantaged communities were identified within the CSAs.
AbsoluteChange
AnnualGrowth Rate
CSA M-16 733 750 17 0.11%CSA M-17 9,757 10,058 302 0.15%CSA M-29 33,057 34,228 1,171 0.17%CSA M-30 140 145 5 0.18%CSA R-4 17,916 18,474 558 0.15%CSA R-7 15,587 16,111 524 0.17%CSA R-9 14,546 16,217 1,671 0.55%CSA R-10 9,141 9,393 252 0.14%
Contra Costa County 1,153,561 1,332,206 178,645 0.72%
Sources: CA Department of Finance; Contra Costa LAFCO Directory; ESRI Business Analyst; ABAG/MTC Population Projections; Economic & Planning Systems, Inc.
Total Residents 2020 2040(2020 - 2040)
Contra Costa LAFCO Parks & Recreation MSR/SOI Update June 2021 9. County Service Areas Page 147
Economic & Planning Systems, Inc. Z:\Shared\Projects\Oakland\191000s\191105_ContraCostaLAFCO_Parks&RecMSR\Report\191105 CC LAFCO Parks and Rec MSR-SOI Final 2021June14.docx
Presen t and P lanned Capa c i ty o f Fac i l i t i es an d Adequ acy o f Pub l i c Serv i c es
Table 42 presents the park and recreation facilities within each CSA. Of the CSAs that are administered by Contra Costa County for park and recreation services in unincorporated areas (CSAs M-16, M-17, R-7, R-9, and R-10), only CSA M-16, which serves the community of Clyde provides an adequate level of parkland within the boundary of the CSA for residents (3.3 acres per 1,000 residents). CSAs M-29, M-30 and R-4 are administered by the City of San Ramon, the Town of Danville and the Town of Moraga, respectively, for enhanced park and recreation services provided within the city limits. Residents in these CSA, whether they live in the incorporated boundary or not, have access to the city’s facilities and programming.
The CSAs serve as financing mechanisms for enhanced park maintenance and recreation services, and as such, do not directly offer recreation programming or community events. The exception is R-7, which is managed through the Alamo Municipal Advisory Committee, and typically sponsors community events, such as “Movies under the Stars” and a summer concert series at Livorna Park.
F inanc ia l Ab i l i t y to P rov ide Serv i ces
The County practices fund accounting, with separate funds established for each legally separate CSA. CSAs are primarily financed through property taxes. In addition, CSAs M-29 and M-30 also receive assessment revenue. All revenues for CSAs M-29, M-30 and R-4 are transferred to the respective city for use as the city sees fit for approved services. CSA R-9 has no regular financing source and assessments were denied twice by voters. CSA R-10 has no dedicated funding source and relies on facility rental revenue and program/user fees.
Figure 11 and 12 present budgeted revenues and expenditures for FY 2020-2021, as adopted by the Board of Supervisors and as summarized in the County’s Special Districts Budget. Differences between budgeted figures and actual figures will correct for unanticipated expenses and/or actual costs incurred.
The County reported that the current financing level for the County-administered CSAs is not adequate to deliver services; however, on behalf of CSA R-7, the Alamo MAC reports an annual surplus with current reserves of approximately $4 million.40 The County has repeatedly proposed measures to increase assessment revenues; however, these efforts have been rejected by voters. The County is presently looking for alternate funding sources to fill the funding gap, such as grants. The County is also looking for alternative ways to provide services at a reduced cost, such as working with non-profit organizations to provide recreation services in county-owned facilities. The cities reported that financing, while constrained, is generally sufficient to provide park and recreation services.
40 The Alamo MAC reports that the surplus would, ideally, be used for parkland acquisition; however, no land has been identified for this purpose at this time. Alternatively, the surplus may be used to replace facilities at the end of their useful life, and/or to further develop recreational programming.

Contra Costa LAFCO Parks & Recreation MSR/SOI Update June 2021 9. County Service Areas Page 148
Economic & Planning Systems, Inc. Z:\Shared\Projects\Oakland\191000s\191105_ContraCostaLAFCO_Parks&RecMSR\Report\191105 CC LAFCO Parks and Rec MSR-SOI Final 2021June14.docx
Table 42 Summary of Inventory of Parkland and Recreation Facilities for County-Administered CSAs
CSA & Park Name Address/Location AcresParkType Facilities
SharedFacilities Condition
CSA M-16Big Oak Tree Park Middlesex Street, Clyde 0.1 Passive Park benches, BBQ area,
water fountainN/A Moderate
Clyde Park Sussex & Wellington, Clyde 2.0 Active Grassed play area, tennis court, picnic and BBQ area, playground
N/A Moderate
Marie Porter Park Normand & Kilburn, Clyde 0.2 Active Basketball court N/A PoorMaybeck Park Medburn & Amy Lane, Clyde 0.1 Passive Picnic table N/A Very Good
Total 2.4 [1]Acreage per 1,000 residents 3.3
CSA M-17Montalvin Park Denise Drive, Pinole 7.0 Passive Playground, basketball court,
tennis court, picnic and BBQ area, grassy play area
N/A Moderate
Montarabay Park Community Center and Ball Field Complex
Tara Hills Drive, San Pablo 4.0 Active Community center, lighted ball field
N/A Moderate
Total 11.0Acreage per 1,000 residents 1.1
CSA R-7Andrew Young Park Danville Blvd & Jackson Way 0.2 Passive Picnic tables N/A Very GoodAlamo Elementary School and Park
Wilson Rd., Alamo 3.1 Active Baseball field, batting cage, soccer field, pathway system, picnic and BBQ area, two sports courts
N/A
Hap Magee Ranch Park La Gonda Way, Danville 17.2 Passive Original structures, path, picnic facilities, playground, meditative labyrinth, dog park, bathrooms, community garden
Yes - Town of Danville
Very Good
Rancho Romero School Sports Field and Park
Hemme Ave, Danville 5.4 Active Ballfield, basketball court, soccer field, playground, BBQ, picnic facilities
Yes
Hemme Station Park 0.7 Active Bathrooms, shade structure, picnic tables, playground, water fountains (3)
N/A Very Good
Livorna Park Miranda Ave, Danville 4.4 Passive Gazebo, grassy play area, sport court, tot lot, playground, bocce ball courts, bathrooms
N/A Very Good
Total 31.0Acreage per 1,000 residents 2.0
CSA R-9Children's Reading GardenNote: This park facility is no longer being maintained by CSA R-7.
Appian Way 0.1 Passive Garden
Total 0.1Acreage per 1,000 residents 0.0
CSA R-10Lefty Gomez Recreation Building and Ballfield Complex
Parker Ave 11.0 Active Community center, two ball fields, two tennis courts, playground, picnic and BBQ areas, cocession stand
Yes - John Swett Unified School District
Poor
Total 11.0Acreage per 1,000 residents 1.2
[1] Rail Trail Park, a bicycle and pedestrian trail located within CSA M-16, is neither funded nor managed by the CSA, and, therefore, not included in this inventory.
Sources: County CSA Manager; Alamo Municipal Advisory Council.

Contra Costa LAFCO Parks & Recreation MSR/SOI Update June 2021 9. County Service Areas Page 149
Economic & Planning Systems, Inc. Z:\Shared\Projects\Oakland\191000s\191105_ContraCostaLAFCO_Parks&RecMSR\Report\191105 CC LAFCO Parks and Rec MSR-SOI Final 2021June14.docx
Figure 11 CSA’s Fiscal Year 2020/21 Revenue Composition
$32,000
$204,000
$3,600,000
$35,000
$1,268,524
$15,775,000
$54,500
$4,200
$20,000
$50,000
$32,300
0% 10% 20% 30% 40% 50% 60% 70% 80% 90% 100%
CSA M‐16Revenue: $32,110
CSA M‐17Revenue: $225,620
CSA M‐29Revenue: $19,391,150
CSA M‐30Revenue: $54,500
CSA R‐4Revenue: $35,000
CSA R‐7Revenue: $1,329,624
CSA R‐10Revenue: $36,500
Fiscal Year 2020/21 Revenues
Taxes Current Property Charges for Services Use of Money & Property Intergovernmental Revenue Misc. Revenue
Note: CSA R‐9 does not have a revenue source.Sources: County of Contra Costa, Special Districts Budget (Fiscal Year 2020‐2021); Economic & Planning Systems.

Contra Costa LAFCO Parks & Recreation MSR/SOI Update June 2021 9. County Service Areas Page 150
Economic & Planning Systems, Inc. Z:\Shared\Projects\Oakland\191000s\191105_ContraCostaLAFCO_Parks&RecMSR\Report\191105 CC LAFCO Parks and Rec MSR-SOI Final 2021June14.docx
Figure 12 CSA’s Fiscal Year 2020/21 Expenditure Composition
Capital improvements are funded with impact fee or parkland Quimby in-lieu fee revenue if available, or grants, or County General Fund revenue. In the unincorporated area, the County imposes park-related development impact fees on new development with fees for single family units ranging from $6,616 per unit in East County to $8,129 per unit in the West/Central County. The County also requires parkland dedication for residential projects requiring a development plan or subdivision. Development requirements in place by the County require that new developments dedicate land for park and recreation facilities, or pay an in-lieu fee of $3,142 per single family home in East County or $4,489 in West/Central County.41
Regarding those CSAs that overlap with cities, the Town of Moraga charges a park development impact fee of $9,073 and a park in-lieu fee of $14,141 for a total park development fee of $23,214 per single family unit. The City of San Ramon does not charge a park development impact fee for units associated with the Dougherty Valley Specific Plan; however, it requires parkland dedications at a density of 6.5 acres per 1,000 residents.
41 https://www.contracosta.ca.gov/DocumentCenter/View/42080/Park-Fees-Overview?bidId=
$11,000
$225,134
$25,512,064
$100,590
$381,910
$27,696
$56,748
$20,300
$78,597
$0
$301,100
$5,032
$10,800
$91,271
$80,000
$35,002
$148,900
$10,000
0% 10% 20% 30% 40% 50% 60% 70% 80% 90% 100%
CSA M‐16Expenditures: $122,571
CSA M‐17Expenditures: $383,731
CSA M‐29Expenditures: $25,537,084
CSA M‐30Expenditures: $104,290
CSA R‐4Expenditures: $35,002
CSA R‐7Expenditures: $831,910
CSA R‐9Expenditures: $33,728
CSA R‐10Expenditures: $77,548
Fiscal Year 2020/21 Expenditures
Services and Supplies Other Charges Expenditure Transfers
Sources: County of Contra Costa, Special Districts Budget (Fiscal Year 2020‐2021); Economic & Planning Systems.

Contra Costa LAFCO Parks & Recreation MSR/SOI Update June 2021 9. County Service Areas Page 151
Economic & Planning Systems, Inc. Z:\Shared\Projects\Oakland\191000s\191105_ContraCostaLAFCO_Parks&RecMSR\Report\191105 CC LAFCO Parks and Rec MSR-SOI Final 2021June14.docx
Contra Costa County received State Proposition 68 revenue, allocated on a per capita basis to be used for park and recreation capital improvements. The County allocated $80,000 to each Supervisorial District and is in the process of determining how revenue will be spent. The County’s Capital Improvement Plan (CIP) is more than ten years old and in the process of being updated. However, as of December 2020, there is no current CIP to reference. Preliminary ideas include as the following:
CSA M-16: a new play structure at Big Oak Tree Park
CSA M-17: a new roof for the Montarabay Community Center; ADA Parking lot and improvements to sports facilities
CSA R-7: shade structure at Hemme Station Park (note: County staff reports the shade structure is in the design stage and is expected to be installed by the end of 2021)
CSA R-9: no improvements planned at this time
CSA R-10: no improvements planned at this time
Management & Accountab i l i t y
All CSAs are dependent special districts governed by the County Board of Supervisors. Board members are elected by supervisorial districts and serve staggered four-year terms. Board meetings are held weekly. Current board members and terms are shown in Table 43. In instances where a committee has been established (e.g., the Alamo Municipal Advisory Committee (MAC) and CSA R-7), the MAC advises the Board of Supervisors.
CSAs M-16, M-17, R-7, R-9, and R-10 are staffed and managed by the County Public Works Department Special Districts Unit. Special Districts staff include one full-time Civil Engineer, one full-time Manager, one full-time Administrative Services Analyst II, one full-time Administrative Services Analyst III, and one full-time Senior Engineering Technician. In addition, the Unit has the support of one student worker until May 2021. In addition to the CSAs included in the MSR, the Special Districts Unit staffs 32 Lighting and Landscaping Districts and three (3) County Facility Districts. The County does not designate specific staff to the respective CSAs; rather, all full-time staff splits their time between all areas served. Staff reports to the Special Districts Manager, and the Manager reports to the Senior Civil Engineer. The Senior Civil Engineer reports to the Engineering Services Division Manager. The Division Manager reports to the Assistant Public Works Directors. For each of the CSAs, the administrative staff formulates and monitors budgets, and coordinates and oversees infrastructure improvements and installation specific to each district. The County estimates that approximately one full-time equivalent from the Special Districts Unit is dedicated to these five CSAs. In addition, the General Services Department provides staff for maintenance of the CSA M-16, R-7 and R-9 park facilities. The County estimated that there are 1.3 full-time equivalents dedicated to the maintenance of R-7 facilities, while the maintenance of M-16 is done through a contractor and the maintenance of R-9 facilities is performed by request.

Contra Costa LAFCO Parks & Recreation MSR/SOI Update June 2021 9. County Service Areas Page 152
Economic & Planning Systems, Inc. Z:\Shared\Projects\Oakland\191000s\191105_ContraCostaLAFCO_Parks&RecMSR\Report\191105 CC LAFCO Parks and Rec MSR-SOI Final 2021June14.docx
With the exception residents in CSA R-7, who are represented through the Alamo MAC, accountability to constituents within the CSAs is constrained due to a lack of representation on advisory committees and the lack of a citizens advisory committee altogether. Further, there is generally a lack of outreach and information promoting the availability of recreation programming within the CSAs. Additionally, accountability would be improved if the County included a brief description of what each CSA funds within the Special Districts Budget each year.
Table 43 CSAs Governance and Contact Information
Item
ALL CSAsGoverning Board Members Position / Title Term (Dates of Service)
John M. Gioia District 1 Supervisor 1999-2022Candace Andersen District 2 Supervisor; BOS Chair 2012-2024Diane Burgis District 3 Supervisor 2016-2024Karen Mitchoff District 4 Supervisor 2010-2022Federal Glover District 5 Supervisor 2000-2024
Manner of SelectionLength of Term
MeetingsAgenda DistributionMinutes Distribution
Mailing AddressEmail / Website
County Administered CSAs Citizens Advisory Committee1
Dominic Aliano R-10 RepresentativeDominic Aliano M-16 RepresentativeNo advisory body at this time. James Lyons is the staff liaison for Supervisor Gioia.
M-17 Representative
Anne Struthers R-7 RepresentativeNo advisory body at this time. James Lyons is the staff liaison for Supervisor Gioia.
R-9 Representative
Sources: Contra Costa County Board of Supervisors; County Special Districts Manager.
1025 Escobar St., Martinez, CA 94553www.contracosta.ca.gov
[1] While the five CSAs listed here are administered by the County, the three remaining CSAs are administered by a city or town. For example, CSA M-29 is administered by the City of San Ramon; CSA M-30 is administered by the Town of Danville; and CSA R-4 is administered by the Town of Moraga.
All meetings are live streamed online and broadcast on Contra Costa TV, Comcast Channel 27, Astound Channel 32, AT&T UVerse Channel 99. Archives of meeting minutes and videos also available on CCC BOS
website.
Information
Elections by DistrictFour Years
Every Tuesday, 9amOnline and posted

Contra Costa LAFCO Parks & Recreation MSR/SOI Update June 2021 9. County Service Areas Page 153
Economic & Planning Systems, Inc. Z:\Shared\Projects\Oakland\191000s\191105_ContraCostaLAFCO_Parks&RecMSR\Report\191105 CC LAFCO Parks and Rec MSR-SOI Final 2021June14.docx
CSA M-16 MSR and SOI Dete rm in a t ions
MSR Determinations
1. Growth and Population Projections
a) The CSA provides park maintenance services to the unincorporated community of Clyde. The residential population served by the District is relatively stable, with expected growth of approximately 2.3%, or 17 people, between 2020 and 2040, for a total population in 2040 of approximately 750 people. This level of projected growth is not anticipated to materially impact service demand.
b) Clyde is located three miles from Downtown Concord on the east side of the Port Chicago Highway, north of Highway 4. The community of Clyde is entirely within the City of Concord’s SOI and is also included in the Concord General Plan, although Concord has no plans to annex Clyde at this time.
2. The location and characteristics of any disadvantaged unincorporated communities within or contiguous to the sphere of influence
a) No disadvantaged communities were identified within or contiguous to the District’s sphere of influence.
3. Present and Planned Capacity of Public Facilities and Adequacy of Public Services, Including Infrastructure Needs and Deficiencies
a) There are currently four parks within the boundaries of CSA M-16, totaling 2.4 acres of passive parkland and representing 3.3 acres per 1,000 residents. CSA M-16 appears to have sufficient capacity to serve the residents within its boundaries.
b) All four parks are owned and maintained by the County. Maybeck Park is reported to be in “Very Good” condition, while Big Oak Tree Park, Clyde Park, and Marie Porter Park are in “Moderate” condition.
c) The CSA does not provide recreational programming.

Contra Costa LAFCO Parks & Recreation MSR/SOI Update June 2021 9. County Service Areas Page 154
Economic & Planning Systems, Inc. Z:\Shared\Projects\Oakland\191000s\191105_ContraCostaLAFCO_Parks&RecMSR\Report\191105 CC LAFCO Parks and Rec MSR-SOI Final 2021June14.docx
4. Financial Ability of Agencies to Provide Services
a) District funding for park maintenance comes from property taxes. The most significant challenge for the District is unfunded deferred maintenance. b) County staff reports that the current level of funding is not sufficient for adequate service provision. There are significant capital needs which have not been addressed because the current financing level is not adequate to provide services. Planned FY 2020/21 expenditures are expected to exceed revenues by approximately $90,000, which means maintenance and other
expenses may need to be partially deferred.
5. Status of, and Opportunities for, Shared Facilities
a) The District does not currently share any facilities and County staff did not identify opportunities for shared facilities.
6. Accountability for Community Service Needs, Including Governmental Structure and Operational Efficiencies
a) Typically, accountability to local voters would be achieved through the CSA advisory committee; however, the M-16 advisory committee has effectively dissolved as each of the seven seats is vacant.
b) The CSA, via County staff, demonstrated accountability and transparency by responding to LAFCO requests for information.
c) The County’s Special District budget provides transparent revenue and expenditure information. However, the Special District budget lacks information regarding the District’s purpose and services.
7. Any other matter related to efficient service delivery, as required by commission policy
a) COVID-19 is not significantly affecting the County’s ability to maintain the four parks within the boundaries of the CSA, and the County’s parks are open as of the fall of 2020. Some features/amenities remain closed such as water fountains and basketball courts.
SOI Option
1) Retain existing coterminous SOI
Current Recommendation
Retain the existing coterminous SOI. Based on the research and determinations in the MSR, there have not been any changes since 2010 that would alter this recommendation, and the current recommendation is to retain the existing coterminous SOI until such time that the City of

Contra Costa LAFCO Parks & Recreation MSR/SOI Update June 2021 9. County Service Areas Page 155
Economic & Planning Systems, Inc. Z:\Shared\Projects\Oakland\191000s\191105_ContraCostaLAFCO_Parks&RecMSR\Report\191105 CC LAFCO Parks and Rec MSR-SOI Final 2021June14.docx
Concord annexes the area. The district is contiguous to the City of Concord and with Concord’s SOI.
SOI Determinations
1. Present and planned land uses in the area, including agricultural and open-space lands.
The District boundaries encompass primarily residential uses. The CSA has no land use authority; however, County plans include land uses and population growth that may impact the service population within the District and, therefore, the District’s ability to provide services. No changes in present and planned land uses will result from this SOI update.
2. Present and probable need for public facilities and services in the area.
There is a present and probable future need for ongoing park and recreation services within the boundaries of the CSA. Population within the District is expected to increase at an annual rate of approximately 0.11%. No changes in public facilities or services provided by CSA M-16 will result from this SOI update.
3. Present capacity of public facilities and adequacy of public services that the agency provides or is authorized to provide.
The County generally provides adequate park maintenance services within CSA M-16. There are 2.4 acres of parkland maintained within the District, which translates into 3.3 acres of parkland per 1,000 district residents, short of the County’s General Plan goal of 4.0 acres of parkland per 1,000 residents. The SOI update will not impact the present capacity of public facilities and adequacy of public services that CSA M-16 provides or is authorized to provide.
4. Existence of any social or economic communities of interest in the area if the commission determines that they are relevant to the agency.
No disadvantaged communities were identified within or contiguous to the District’s sphere of influence. The SOI update will not affect the existence of any social or economic communities of interest.
5. Nature, location, and extent of any functions or classes of services provided by existing districts. (For Special Districts only.)
CSA M-16 funds park maintenance within the community of Clyde. Clyde is located three miles from Downtown Concord on the east side of the Port Chicago Highway, north of Highway 4. The community of Clyde is entirely within the City of Concord’s SOI and is also included in the Concord General Plan, although Concord has no plans to annex Clyde at this time.

Contra Costa LAFCO Parks & Recreation MSR/SOI Update June 2021 9. County Service Areas Page 156
Economic & Planning Systems, Inc. Z:\Shared\Projects\Oakland\191000s\191105_ContraCostaLAFCO_Parks&RecMSR\Report\191105 CC LAFCO Parks and Rec MSR-SOI Final 2021June14.docx
CSA M-17 MSR and SOI Dete rm in a t ions
MSR Determinations
1. Growth and Population Projections
a) The CSA provides park maintenance services to the unincorporated community of Tara Hills, Bayview and Montalvin Manor. The residential population served by the District is relatively stable, with expected growth of approximately 3.1%, or 302 people, between 2020 and 2040, for a total population in 2040 of approximately 10,058 people. This level of projected growth is not anticipated to materially impact service demand.
2. The location and characteristics of any disadvantaged unincorporated communities within or contiguous to the sphere of influence
a) No disadvantaged communities were identified within the District’s sphere of influence, but there is a disadvantaged community adjacent to CSA M-17 within the City of Richmond.
3. Present and Planned Capacity of Public Facilities and Adequacy of Public Services, Including Infrastructure Needs and Deficiencies
a) There are currently two parks within the boundaries of CSA M-17, totaling 11 acres of passive and active parkland and representing 1.1 acres per 1,000 residents. The Montarabay Park includes a Community Center and Ball Field Complex. With respect to the County’s General Plan goal of 4.0 acres of neighborhood park facilities per 1,000 residents, CSA M-17 appears to have insufficient capacity to serve the residents within its boundaries.
b) Motalvin Park and Montarabay Park and associated facilities are owned and maintained by the County, and both are reported to be in “Moderate” condition.
4. Financial Ability of Agencies to Provide Services
a) District funding for park maintenance comes from property taxes and rental of the Community Center. The most significant challenge for the District is unfunded deferred maintenance.
b) County staff reports that the current level of funding is not sufficient for adequate service provision. There are significant capital needs which have not been addressed because the current financing level is not adequate to provide services. Planned FY 2020/21 expenditures are expected to exceed revenues by approximately $158,000, which means maintenance and other expenses may need to be partially deferred.
c) When the contract with the maintenance provider expires in the coming months, County staff expects maintenance costs to increase.

Contra Costa LAFCO Parks & Recreation MSR/SOI Update June 2021 9. County Service Areas Page 157
Economic & Planning Systems, Inc. Z:\Shared\Projects\Oakland\191000s\191105_ContraCostaLAFCO_Parks&RecMSR\Report\191105 CC LAFCO Parks and Rec MSR-SOI Final 2021June14.docx
5. Status of, and Opportunities for, Shared Facilities
a) The District does not currently share any facilities and County staff did not identify opportunities for shared facilities.
6. Accountability for Community Service Needs, Including Governmental Structure and Operational Efficiencies
a) Accountability to local voters typically is achieved through the CSA advisory committee. However, the CSA M-17 advisory committee is currently inactive.
b) The CSA, via County staff, demonstrated accountability and transparency by responding to LAFCO requests for information.
c) The County’s Special District budget provides transparent revenue and expenditure information. However, the Special District budget lacks information regarding the District’s purpose and services.
7. Any other matter related to efficient service delivery, as required by commission policy
a) COVID-19 is not significantly affecting the County’s ability to maintain the two parks within the boundaries of the CSA, and the County’s parks are open as of the fall of 2020. Some features/amenities remain closed such as water fountains, bathrooms, basketball courts, and the community center.
SOI Options
1) Retain existing coterminous SOI
Current Recommendation
Retain the existing coterminous SOI. Based on the research and determinations in the MSR, there have not been any changes since 2010 that would alter this recommendation, and the current recommendation is to retain the existing coterminous SOI. The district is contiguous to the cities of Pinole and Richmond.
SOI Determinations
1. Present and planned land uses in the area, including agricultural and open-space lands.
The District boundaries encompass primarily residential uses, with some limited commercial uses. The CSA has no land use authority; however, County plans include land uses and population growth that may impact the service population within the District and, therefore, the District’s ability to provide services. No changes in present and planned land uses will result from this SOI update.
2. Present and probable need for public facilities and services in the area.
There is a present and probable future need for ongoing park and recreation services within the boundaries of the CSA. Population within the District is expected to increase at an annual

Contra Costa LAFCO Parks & Recreation MSR/SOI Update June 2021 9. County Service Areas Page 158
Economic & Planning Systems, Inc. Z:\Shared\Projects\Oakland\191000s\191105_ContraCostaLAFCO_Parks&RecMSR\Report\191105 CC LAFCO Parks and Rec MSR-SOI Final 2021June14.docx
rate of approximately 0.15%. No changes in public facilities or services provided by CSA M-17 will result from this SOI update.
3. Present capacity of public facilities and adequacy of public services that the agency provides or is authorized to provide.
The County generally provides adequate park maintenance services within CSA M-17. There are 11 acres of parkland maintained within the District, which translates into 1.1 acres of parkland per 1,000 district residents, short of the County’s General Plan goal of 4.0 acres of parkland per 1,000 residents. The SOI update will not impact the present capacity of public facilities and adequacy of public services that CSA M-17 provides or is authorized to provide.
4. Existence of any social or economic communities of interest in the area if the commission determines that they are relevant to the agency.
No disadvantaged communities were identified within the District’s sphere of influence, but there is a disadvantaged community adjacent to CSA M-17 within the City of Richmond. The SOI update will not affect the existence of any social or economic communities of interest.
5. Nature, location, and extent of any functions or classes of services provided by existing districts. (For Special Districts only.)
CSA M-17 provides park maintenance services to the unincorporated community of Tara Hills, Bayview and Montalvin Manor. Other services are provided by the County.
CSA M-29 MSR and SOI Dete rm in a t ions
MSR Determinations
1. Growth and Population Projections
a) The CSA boundary is consistent with the Dougherty Valley Specific Plan area, most of which lies within the boundaries of the City of San Ramon. The residential population served by the District is steadily growing, with expected growth of approximately 3.5%, or 1,171 people, between 2020 and 2040, for a total population in 2040 of approximately 34,228 people.
2. The location and characteristics of any disadvantaged unincorporated communities within or contiguous to the sphere of influence
a) No disadvantaged communities were identified within or contiguous to the District’s sphere of influence.
3. Present and Planned Capacity of Public Facilities and Adequacy of Public Services, Including Infrastructure Needs and Deficiencies
a) The CSA provides financing for park and recreation facility maintenance in the City of San Ramon. The City uses CSA funds to provide park and facility maintenance services within City limits.

Contra Costa LAFCO Parks & Recreation MSR/SOI Update June 2021 9. County Service Areas Page 159
Economic & Planning Systems, Inc. Z:\Shared\Projects\Oakland\191000s\191105_ContraCostaLAFCO_Parks&RecMSR\Report\191105 CC LAFCO Parks and Rec MSR-SOI Final 2021June14.docx
4. Financial Ability of Agencies to Provide Services
a) The County’s budget indicates the District’s funding comes from charges for services and property taxes. Planned FY 2020/21 expenditures are expected to exceed revenues by approximately $6.1 million, which means maintenance and other expenses may need to be partially deferred.
5. Status of, and Opportunities for, Shared Facilities
a) The City shares facilities with the San Ramon Valley Unified School District (SRVUSD) at every school site in San Ramon. No additional opportunities for facility sharing within the CSA’s boundaries were identified by the City.
6. Accountability for Community Service Needs, Including Governmental Structure and Operational Efficiencies
a) CSA M-29 funds are administered by the Finance Division of the City of San Ramon. CSA M-29 funds for park and recreation facility maintenance are managed by the Director of the Public Services Department, who reports to the City Manager. There is also a Parks and Community Services Commission that advises the City Council regarding matters related to park and recreation services. The Commission is comprised of seven members and a student commissioner—all residents of the City of San Ramon. Individuals from the unincorporated portion of the CSA may not sit on the Commission. In this way residents of the CSA are not represented as decisions about how to spend funding are made.
b) The CSA, via County staff, demonstrated accountability and transparency by responding to LAFCO requests for information.
c) The County’s Special District budget provides transparent revenue and expenditure information. However, the Special District budget lacks information regarding the District’s purpose and services.
7. Any other matter related to efficient service delivery, as required by commission policy
a) Funding provided through CSA M-29 has not been adversely affected by COVID-19.
SOI Option
1) Retain existing coterminous SOI
Current Recommendation
Retain the existing coterminous SOI. Based on the research and determinations in the MSR, there have not been any changes since 2010 that would alter this recommendation, and the current recommendation is to retain the existing coterminous SOI. CSA M-29 has a steady revenue source through the City, and is integral to ensuring continued service in the future for the DVSP development. The City recently completed its final Dougherty Valley annexation. Once the area has been built-out and the territory within CSA M-29 has been entirely annexed by the City, it is recommended that the City and County collaborate to find a more efficient manner for the City to continue to receive financing for these services. One possibility may be the establishment of an assessment district within the City of San Ramon.

Contra Costa LAFCO Parks & Recreation MSR/SOI Update June 2021 9. County Service Areas Page 160
Economic & Planning Systems, Inc. Z:\Shared\Projects\Oakland\191000s\191105_ContraCostaLAFCO_Parks&RecMSR\Report\191105 CC LAFCO Parks and Rec MSR-SOI Final 2021June14.docx
SOI Determinations
1. Present and planned land uses in the area, including agricultural and open-space lands.
The CSA boundary is consistent with the Dougherty Valley Specific Plan area, most of which lies within the boundaries of the City of San Ramon. The District boundaries encompass primarily residential and commercial uses, with parkland. The CSA has no land use authority; however, City plans include land uses and population growth that may impact the service population within the District and, therefore, the availability of funding. No changes in present and planned land uses will result from this SOI update.
2. Present and probable need for public facilities and services in the area.
There is a present and probable future need for ongoing park and recreation services within the boundaries of the CSA. Population within the District is expected to increase at an annual rate of approximately 0.17%. No changes in public facilities or services funded by CSA M-29 will result from this SOI update.
3. Present capacity of public facilities and adequacy of public services that the agency provides or is authorized to provide.
The City of San Ramon generally provides adequate park maintenance services for residents within CSA M-29. The SOI update will not impact the present capacity of public facilities and adequacy of public services that CSA M-29 funds.
4. Existence of any social or economic communities of interest in the area if the commission determines that they are relevant to the agency.
No disadvantaged communities were identified within the District’s sphere of influence. The SOI update will not affect the existence of any social or economic communities of interest.
5. Nature, location, and extent of any functions or classes of services provided by existing districts. (For Special Districts only.)
The CSA boundary is consistent with the Dougherty Valley Specific Plan area, most of which lies within the boundaries of the City of San Ramon.
CSA M-30 MSR and SOI Dete rm in a t ions
MSR Determinations
1. Growth and Population Projections
a) The CSA provides financing for extended facilities and services in the unincorporated community of Alamo Springs through the Town of Danville. The residential population served by the District is relatively stable, with expected growth of approximately 3.6%, or 5 people, between 2020 and 2040, for a total population in 2040 of approximately 145 people. There are 40 parcels within CSA M-30 that have had a building permit issued. This level of projected growth is not anticipated to materially impact service demand.

Contra Costa LAFCO Parks & Recreation MSR/SOI Update June 2021 9. County Service Areas Page 161
Economic & Planning Systems, Inc. Z:\Shared\Projects\Oakland\191000s\191105_ContraCostaLAFCO_Parks&RecMSR\Report\191105 CC LAFCO Parks and Rec MSR-SOI Final 2021June14.docx
2. The location and characteristics of any disadvantaged unincorporated communities within or contiguous to the sphere of influence
a) No disadvantaged communities were identified within or contiguous to the District’s sphere of influence.
3. Present and Planned Capacity of Public Facilities and Adequacy of Public Services, Including Infrastructure Needs and Deficiencies
a) The CSA provides financing for extended facilities and services in the unincorporated community of Alamo Springs through the Town of Danville. Among the services funded, the Town uses CSA funds to provide park, recreation and other services within Town limits – there are no park facilities within the CSA boundary.
4. Financial Ability of Agencies to Provide Services
a) The Final Annual Report for FY 2020/21 for CSA M-30 indicates revenue comes from an annual levy of assessments on the parcels located within CSA M-30. Each year the service charge is adjusted by CPI plus 2.0%, resulting in an annual rate for 2020/21 of $1,356.22 per parcel. Planned FY 2020/21 expenditures are expected to exceed revenues by approximately $50,000, which means maintenance and other expenses may need to be partially deferred.
5. Status of, and Opportunities for, Shared Facilities
a) There are no park facilities located within the District. Both CSA M-30 and CSA R-7 contribute funding toward the maintenance of Hap Magee Ranch Park.
6. Accountability for Community Service Needs, Including Governmental Structure and Operational Efficiencies
a) CSA M-30 funds are administered by the Town of Danville, specifically the Parks and Leisure Services Commission, which oversees park maintenance and recreation programs in the Town.
b) The Town’s Commission is comprised of seven members, one alternate and one junior member. All members of the Commission must be residents of the Town of Danville. Residents of the CSA may not sit on the Commission. In this way residents of the CSA are not represented as decisions about how to spend funding are made. The County has not received comments or complaints from CSA M-30 residents in the unincorporated County.
c) The CSA, via County staff, demonstrated accountability and transparency by responding to LAFCO requests for information.
d) The County’s Special District budget provides transparent revenue and expenditure information. However, the Special District budget lacks information regarding the District’s purpose and services.
e) Because CSA M-30 is located within the boundaries of CSA R-7, residents of CSA M-30 are paying property taxes to CSA R-7 and an assessment to CSA M-30, yet there are no park facilities located within CSA M-30. Governance alternatives proposed in the past included the reduction of CSA R-7 to exclude the area of overlap with CSA M-30, or consolidation of the two CSAs.

Contra Costa LAFCO Parks & Recreation MSR/SOI Update June 2021 9. County Service Areas Page 162
Economic & Planning Systems, Inc. Z:\Shared\Projects\Oakland\191000s\191105_ContraCostaLAFCO_Parks&RecMSR\Report\191105 CC LAFCO Parks and Rec MSR-SOI Final 2021June14.docx
7. Any other matter related to efficient service delivery, as required by commission policy
a) Funding provided through CSA M-30 has not been adversely affected by COVID-19.
SOI Options
1) Retain existing coterminous SOI 2) Adopt a zero SOI (to signal future dissolution or consolidation with another local agency)
Current Recommendation
Retain existing coterminous SOI. CSA R-7 encompasses the bounds of CSA M-30. Residents of M-30 pay an assessment to the County, which is transferred to the Town for enhanced parks and recreation, law enforcement, street maintenance, landscaping, and street lighting. Residents of M-30 also pay property taxes to CSA R-7 for park and recreation services. As noted in the 2010 MSR report, a governance option is to remove the M-30 territory from CSA R-7 to eliminate duplication of services. Another option is to consolidate the two CSAs into a single CSA, and create a zone for the area formerly within CSA M-30 to maintain the financing mechanism for enhanced services by the Town of Danville per the agreement between the Town and the County. Given the duplication in service, it was recommended that the Commission adopt a zero SOI for CSA M-30. The Commission directed LAFCO staff to work with the County to combine R-7 and M-30 to address the service overlap and report back to the Commission within 12 months. However, each CSA was formed based on unique objectives, with CSA M-30 providing services beyond those provided by CSA R-7. At this time, the recommendation is to retain the existing coterminous SOI, which will leave the funding mechanism in place.
SOI Determinations
1. Present and planned land uses in the area, including agricultural and open-space lands.
CSA M-30 provides financing for extended facilities and services in the unincorporated community of Alamo Springs through the Town of Danville. The District boundaries encompass residential uses. The CSA has no land use authority; however, City and County plans include land uses and population growth that may impact the service population within the District and, therefore, the availability of funding. No changes in present and planned land uses will result from this SOI update.
2. Present and probable need for public facilities and services in the area.
There is a present and probable future need for ongoing park and recreation services within the boundaries of CSA M-30. Population within the District is expected to increase at an annual rate of approximately 0.18%. No changes in public facilities or services funded by CSA M-30 will result from this SOI update.

Contra Costa LAFCO Parks & Recreation MSR/SOI Update June 2021 9. County Service Areas Page 163
Economic & Planning Systems, Inc. Z:\Shared\Projects\Oakland\191000s\191105_ContraCostaLAFCO_Parks&RecMSR\Report\191105 CC LAFCO Parks and Rec MSR-SOI Final 2021June14.docx
3. Present capacity of public facilities and adequacy of public services that the agency provides or is authorized to provide.
The Town of Danville generally provides adequate park maintenance services within CSA M-30. The SOI update will not impact the present capacity of public facilities and adequacy of public services that CSA M-30 funds.
4. Existence of any social or economic communities of interest in the area if the commission determines that they are relevant to the agency.
No disadvantaged communities were identified within the District’s sphere of influence. The SOI update will not affect the existence of any social or economic communities of interest.
5. Nature, location, and extent of any functions or classes of services provided by existing districts. (For Special Districts only.)
The CSA boundary is consistent with the Alamo Springs neighborhood area, which is located entirely in the unincorporated County but contiguous with the northwest boundary of the Town of Danville.
CSA R-4 MSR and SOI Dete rmina t ions
MSR Determinations
1. Growth and Population Projections
a) The CSA boundary includes the Town of Moraga (9.3 square miles) and the unincorporated area to the southeast of the Town (8.3 square miles). The residential population within the District is relatively stable, with expected growth of approximately 3.1%, or 558 people, between 2020 and 2040, for a total population in 2040 of approximately 18,474 people. This level of projected growth is not anticipated to materially impact service demand.
2. The location and characteristics of any disadvantaged unincorporated communities within or contiguous to the sphere of influence
a) No disadvantaged communities were identified within or contiguous to the District’s sphere of influence.
3. Present and Planned Capacity of Public Facilities and Adequacy of Public Services, Including Infrastructure Needs and Deficiencies
a) The CSA provides financing for expanded operation and maintenance services of park and recreation facilities and recreation programming in the Town of Moraga – there are no park facilities within the unincorporated area of CSA boundary.
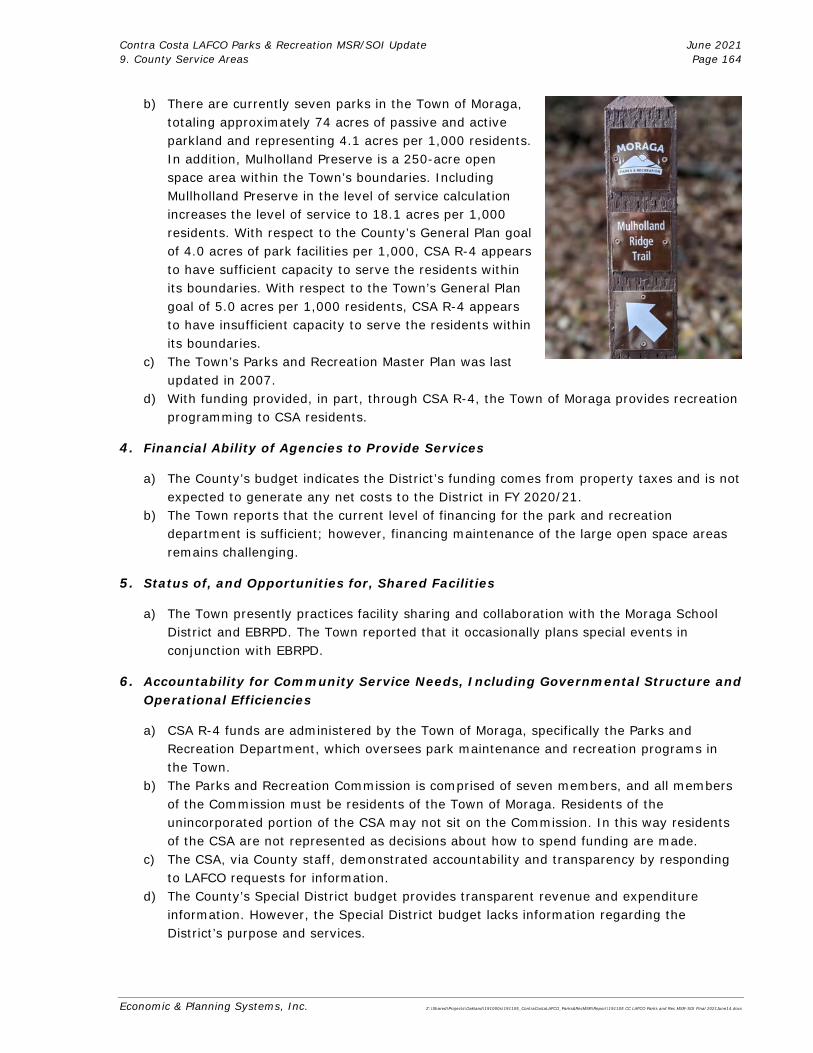
Contra Costa LAFCO Parks & Recreation MSR/SOI Update June 2021 9. County Service Areas Page 164
Economic & Planning Systems, Inc. Z:\Shared\Projects\Oakland\191000s\191105_ContraCostaLAFCO_Parks&RecMSR\Report\191105 CC LAFCO Parks and Rec MSR-SOI Final 2021June14.docx
b) There are currently seven parks in the Town of Moraga, totaling approximately 74 acres of passive and active parkland and representing 4.1 acres per 1,000 residents. In addition, Mulholland Preserve is a 250-acre open space area within the Town’s boundaries. Including Mullholland Preserve in the level of service calculation increases the level of service to 18.1 acres per 1,000 residents. With respect to the County’s General Plan goal of 4.0 acres of park facilities per 1,000, CSA R-4 appears to have sufficient capacity to serve the residents within its boundaries. With respect to the Town’s General Plan goal of 5.0 acres per 1,000 residents, CSA R-4 appears to have insufficient capacity to serve the residents within its boundaries.
c) The Town’s Parks and Recreation Master Plan was last updated in 2007.
d) With funding provided, in part, through CSA R-4, the Town of Moraga provides recreation programming to CSA residents.
4. Financial Ability of Agencies to Provide Services
a) The County’s budget indicates the District’s funding comes from property taxes and is not expected to generate any net costs to the District in FY 2020/21.
b) The Town reports that the current level of financing for the park and recreation department is sufficient; however, financing maintenance of the large open space areas remains challenging.
5. Status of, and Opportunities for, Shared Facilities
a) The Town presently practices facility sharing and collaboration with the Moraga School District and EBRPD. The Town reported that it occasionally plans special events in conjunction with EBRPD.
6. Accountability for Community Service Needs, Including Governmental Structure and Operational Efficiencies
a) CSA R-4 funds are administered by the Town of Moraga, specifically the Parks and Recreation Department, which oversees park maintenance and recreation programs in the Town.
b) The Parks and Recreation Commission is comprised of seven members, and all members of the Commission must be residents of the Town of Moraga. Residents of the unincorporated portion of the CSA may not sit on the Commission. In this way residents of the CSA are not represented as decisions about how to spend funding are made.
c) The CSA, via County staff, demonstrated accountability and transparency by responding to LAFCO requests for information.
d) The County’s Special District budget provides transparent revenue and expenditure information. However, the Special District budget lacks information regarding the District’s purpose and services.
Contra Costa LAFCO Parks & Recreation MSR/SOI Update June 2021 9. County Service Areas Page 165
Economic & Planning Systems, Inc. Z:\Shared\Projects\Oakland\191000s\191105_ContraCostaLAFCO_Parks&RecMSR\Report\191105 CC LAFCO Parks and Rec MSR-SOI Final 2021June14.docx
7. Any other matter related to efficient service delivery, as required by commission policy
a) Property tax revenues provided to the Town through CSA R-4 have not been adversely affected by COVID-19.
SOI Options
1) Retain existing coterminous SOI 2) Adjust SOI to remove vacant unincorporated areas and expand to include entire Moraga
bounds 3) Adjust SOI to exclude incorporated Town of Moraga 4) Adopt a zero SOI
Current Recommendation
Retain existing coterminous SOI. CSA R-4 was formed prior to the incorporation of Moraga, which occurred in 1974. Pursuant to the CKH Act and CSA law (Government Code Section 25210 et seq.), whenever territory is incorporated into a new city or annexed to a city, it is typically detached from county service areas. As noted above, CSA R-4 contains most of the Town of Moraga and surrounding unincorporated areas, most of which are vacant lands. This raises questions regarding the need for, level of, and possible duplication of parks and recreation services provided through the CSA. In 2010, it was recommended that the Commission defer the SOI update for CSA R-4; and direct LAFCO staff to further discuss with the County and Town of Moraga governance and boundary options and report back to the Commission within 12 months. In 2013, LAFCO retained the existing SOI for CSA R-4. This action followed discussions with County and Town of Moraga staff. It was determined that the existing government structure is appropriate and enables the Town to continue to include this unincorporated area in its long-term planning for parks and recreation services.
SOI Determinations
1. Present and planned land uses in the area, including agricultural and open-space lands.
CSA R-4 provides financing for extended facilities and services in the Town of Moraga as well as unincorporated areas to the southeast of the Town. The District boundaries encompass residential uses, with limited commercial uses in the Town. The CSA has no land use authority; however, City and County plans include land uses and population growth that may impact the service population within the District and, therefore, the availability of funding. No changes in present and planned land uses will result from this SOI update.
2. Present and probable need for public facilities and services in the area.
There is a present and probable future need for ongoing park and recreation services within the boundaries of CSA R-4. Population within the District is expected to increase at an annual rate of approximately 0.15%. No changes in public facilities or services funded by CSA R-4 will result from this SOI update.

Contra Costa LAFCO Parks & Recreation MSR/SOI Update June 2021 9. County Service Areas Page 166
Economic & Planning Systems, Inc. Z:\Shared\Projects\Oakland\191000s\191105_ContraCostaLAFCO_Parks&RecMSR\Report\191105 CC LAFCO Parks and Rec MSR-SOI Final 2021June14.docx
3. Present capacity of public facilities and adequacy of public services that the agency provides or is authorized to provide.
The Town of Moraga generally provides adequate park maintenance services within the portion of CSA R-4 that is coterminous with the Town. The SOI update will not impact the present capacity of public facilities and adequacy of public services that CSA R-4 funds.
4. Existence of any social or economic communities of interest in the area if the commission determines that they are relevant to the agency.
No disadvantaged communities were identified within the District’s sphere of influence. The SOI update will not affect the existence of any social or economic communities of interest.
5. Nature, location, and extent of any functions or classes of services provided by existing districts. (For Special Districts only.)
The CSA boundary includes the Town of Moraga as well as unincorporated areas to the southeast of the Town.
CSA R-7 MSR and SOI Dete rmina t ions
MSR Determinations
1. Growth and Population Projections
a) The CSA provides park and recreation facility operation and maintenance and recreation programming to the unincorporated community of Alamo. The residential population served by the District is relatively stable, with expected growth of approximately 3.4%, or 524 people, between 2020 and 2040, for a total population in 2040 of approximately 16,111 people. This level of projected growth is not anticipated to materially impact service demand.
2. The location and characteristics of any disadvantaged unincorporated communities within or contiguous to the sphere of influence
a) No disadvantaged communities were identified within or contiguous to the District’s sphere of influence.
3. Present and Planned Capacity of Public Facilities and Adequacy of Public Services, Including Infrastructure Needs and Deficiencies
a) There are currently six parks within the boundaries of CSA R-7, totaling 31 acres of passive and active parkland and representing 2.0 acres per 1,000 residents. With respect to the County’s General Plan goal of 4.0 acres of park facilities per 1,000 residents, CSA R-7 appears to have insufficient capacity to serve the residents within its boundaries. However, there are very significant community and regional parks within the vicinity of the CSA, including the Diablo Foothills Regional Park.
b) Two of the CSA’s six parks are shared with the San Ramon Valley Unified School District (Alamo Elementary School and Park and Rancho Romero School Sports Field and Park).

Contra Costa LAFCO Parks & Recreation MSR/SOI Update June 2021 9. County Service Areas Page 167
Economic & Planning Systems, Inc. Z:\Shared\Projects\Oakland\191000s\191105_ContraCostaLAFCO_Parks&RecMSR\Report\191105 CC LAFCO Parks and Rec MSR-SOI Final 2021June14.docx
c) All three of the parks that are owned and maintained by the County (e.g., Livorna Park, Hemme Station Park, and Andrew H. Young Park) are reported to be in “Very Good” condition. Hap Magee Ranch Park is jointly owned by the County and by the Town of Danville, and the Town provides the maintenance services. Hap Magee Ranch Park is reported to be in “Very Good” condition.
d) Typically (pre-COVID), the CSA sponsors popular community events, such as “Movies under the Stars” and a summer concert series at Livorna Park.
4. Financial Ability of Agencies to Provide Services
a) District funding for park maintenance comes primarily from property taxes and facility rentals.
b) County staff reports that the current level of funding allows for adequate service provision, and the Alamo Municipal Advisory Council (MAC) confirms that the District has sufficient funding to maintain parks and facilities.
c) The Alamo MAC reports that one of its most significant challenges is establishing and supporting a successful recreation program, due to insufficient registrations and an inability to guarantee participation.
5. Status of, and Opportunities for, Shared Facilities
a) The District shares facilities with the school district and shares maintenance costs at Hap Magee Ranch Park with the Town of Danville. No other opportunities for shared facilities were identified.
6. Accountability for Community Service Needs, Including Governmental Structure and Operational Efficiencies
a) Accountability to local voters is achieved through the CSA’s eight-member MAC. The advisory council acts as a sounding board for the community to voice local preferences to the County Board of Supervisors.
b) The CSA, via County staff and the Alamo MAC, demonstrated accountability and transparency by responding to LAFCO requests for information and reviewing drafts of the MSR/SOI Update.
c) The County’s Special District budget provides transparent revenue and expenditure information. However, the Special District budget lacks information regarding the District’s purpose and services.
d) Because CSA M-30 is located within the boundaries of CSA R-7, residents of CSA M-30 are paying property taxes and/or assessments to two CSAs, yet there are no park facilities located within CSA M-30 or this area of overlap. Governance alternatives proposed in the past included the reduction of CSA R-7 to exclude the area of overlap with CSA M-30, or consolidation of two CSAs. The Alamo MAC is opposed to a governance option that would reduce the territory of CSA R-7 to exclude the area of overlap with CSA M-30. The prior MSR also proposed consolidation with the Green Valley Recreation and Park District; however, County Public Works is not in favor.

Contra Costa LAFCO Parks & Recreation MSR/SOI Update June 2021 9. County Service Areas Page 168
Economic & Planning Systems, Inc. Z:\Shared\Projects\Oakland\191000s\191105_ContraCostaLAFCO_Parks&RecMSR\Report\191105 CC LAFCO Parks and Rec MSR-SOI Final 2021June14.docx
7. Any other matter related to efficient service delivery, as required by commission policy
a) COVID-19 is not significantly affecting the County’s ability to maintain the parks and facilities within the boundaries of the CSA, and the County’s parks are open as of the fall of 2020. Some features/amenities remain closed such as water fountains, bathrooms, and basketball courts. Recreation programming and community events were severely affected by COVID-19.
SOI Options
1) Retain existing coterminous SOI 2) Reduce the SOI to exclude the CSA M-30 territory 3) Consolidate R-7 and M-30 4) Expand the SOI to include the Green Valley Recreation & Park District (GVRPD) to signal
a future consolidation of these districts
Current Recommendation
Retain existing coterminous SOI.
CSA R-7 encompasses the bounds of CSA M-30. Further discussion with the County is needed to address any potential service duplication and boundary issues. Previously the LAFCO Commission directed LAFCO staff to work with County and Town of Danville staff to combine R-7 and M-30 to address service overlap. However, each CSA was formed based on unique objectives, with CSA M-30 providing services beyond those provided by CSA R-7. The Alamo MAC is opposed to a governance option that would reduce the territory of CSA R-7 to exclude the area of overlap with CSA M-30. Consolidation of GVPRD and CSA R-7 could enhance the operation and maintenance of the Green Valley pool; however, in 2010, County Public Works was opposed to the option, noting that there are inadequate financial resources to cover costs for maintenance and capital improvements to the pool. Also, members of the Alamo community, the Alamo MAC and District III County Supervisor expressed opposition to such a consolidation.
At this time, the recommendation is to retain the existing coterminous SOI, which will leave the funding mechanism in place.
SOI Determinations
1. Present and planned land uses in the area, including agricultural and open-space lands.
The District boundaries encompass primarily residential and commercial uses. The CSA has no land use authority; however, County plans include land uses and population growth that may impact the service population within the District and, therefore, the District’s ability to provide services. No changes in present and planned land uses will result from this SOI update.
2. Present and probable need for public facilities and services in the area.
There is a present and probable future need for ongoing park and recreation services within the boundaries of the CSA. Population within the District is expected to increase at an annual

Contra Costa LAFCO Parks & Recreation MSR/SOI Update June 2021 9. County Service Areas Page 169
Economic & Planning Systems, Inc. Z:\Shared\Projects\Oakland\191000s\191105_ContraCostaLAFCO_Parks&RecMSR\Report\191105 CC LAFCO Parks and Rec MSR-SOI Final 2021June14.docx
rate of approximately 0.17%. No changes in public facilities or services provided by CSA R-7 will result from this SOI update.
3. Present capacity of public facilities and adequacy of public services that the agency provides or is authorized to provide.
The County generally provides adequate park maintenance services within CSA R-7. There are 31 acres of parkland maintained within the District, which translates into 2.0 acres of parkland per 1,000 district residents, short of the County’s General Plan goal of 4.0 acres of parkland per 1,000 residents. The SOI update will not impact the present capacity of public facilities and adequacy of public services that CSA R-7 provides or is authorized to provide.
4. Existence of any social or economic communities of interest in the area if the commission determines that they are relevant to the agency.
No disadvantaged communities were identified within the District’s sphere of influence. The SOI update will not affect the existence of any social or economic communities of interest.
5. Nature, location, and extent of any functions or classes of services provided by existing districts. (For Special Districts only.)
CSA R-7 provides park maintenance services to the unincorporated community of Alamo. Other services are provided by the County.
CSA R-9 MSR and SOI Dete rmina t ions
MSR Determinations
1. Growth and Population Projections
a) The CSA boundary includes the unincorporated community of El Sobrante. The CSA is almost entirely within the City of Richmond’s SOI with the exception of a small portion in the north that lies within the City of Pinole’s SOI and the southwestern most island, which is in the City of San Pablo’s SOI. The residential population within the District is growing, with expected growth of approximately 11.5%, or 1,671 people, between 2020 and 2040, for a total population in 2040 of approximately 16,217 people.
2. The location and characteristics of any disadvantaged unincorporated communities within or contiguous to the sphere of influence
a) No disadvantaged communities were identified within the District’s sphere of influence, but the disadvantaged community of San Pablo is partially contiguous to the boundary of CSA R-9.

Contra Costa LAFCO Parks & Recreation MSR/SOI Update June 2021 9. County Service Areas Page 170
Economic & Planning Systems, Inc. Z:\Shared\Projects\Oakland\191000s\191105_ContraCostaLAFCO_Parks&RecMSR\Report\191105 CC LAFCO Parks and Rec MSR-SOI Final 2021June14.docx
3. Present and Planned Capacity of Public Facilities and Adequacy of Public Services, Including Infrastructure Needs and Deficiencies
a) CSA R-9 is no longer maintaining the Children’s Reading Garden at the El Sobrante Library. Any maintenance that is occurring is provided by the library and volunteer community members.
b) The County reports that relying on volunteer community members is not sustainable due to liability and accountability issues.
c) The Reading Garden is just 0.1 acres and does not provide sufficient capacity to meet existing or future demand from residents in the CSA boundary. Additional park facilities are available to CSA residents outside of the CSA’s boundaries.
4. Financial Ability of Agencies to Provide Services
a) The CSA does not have a secure source of revenue. Planned FY 2020/21 expenditures are expected to exceed revenues by approximately $34,000, which means maintenance and other expenses may need to be partially deferred.
b) Two past attempts to pass an assessment measure failed (1985 and 1998).
5. Status of, and Opportunities for, Shared Facilities
a) If CSA R-9 had a sustainable, secure source of revenue, there would be an opportunity to share the Children’s Reading Garden.
6. Accountability for Community Service Needs, Including Governmental Structure and Operational Efficiencies
a) CSA R-9 does not have an established or secure source of revenue and, as such, is not able to address the needs of the El Sobrante community.
b) The CSA, via County staff, demonstrated accountability and transparency by responding to LAFCO requests for information.
c) The County’s Special District budget provides transparent revenue and expenditure information. However, the Special District budget lacks information regarding the District’s purpose and services.
7. Any other matter related to efficient service delivery, as required by commission policy
a) While COVID-19 is affecting the County’s ability to maintain the parks and facilities within some of the CSAs, the more pressing concern for CSA R-9 is the lack of an established or secure source of revenue.
SOI Options
1) Retain the existing coterminous SOI

Contra Costa LAFCO Parks & Recreation MSR/SOI Update June 2021 9. County Service Areas Page 171
Economic & Planning Systems, Inc. Z:\Shared\Projects\Oakland\191000s\191105_ContraCostaLAFCO_Parks&RecMSR\Report\191105 CC LAFCO Parks and Rec MSR-SOI Final 2021June14.docx
2) Adopt a zero SOI to signal future dissolution of the District
Current Recommendation
Adopt a zero SOI. CSA R-9 has no regular source of financing to maintain the Children’s Reading Garden at the County library in El Sobrante and depends on volunteers for periodic upkeep. The recommendation is to dissolve CSA R-9 and shift the park maintenance duties to the Landscape and Lighting District.
SOI Determinations
1. Present and planned land uses in the area, including agricultural and open-space lands.
The District boundaries encompass primarily residential and commercial uses. The CSA has no land use authority; however, County plans include land uses and population growth that may impact the service population within the District and, therefore, the District’s ability to provide services. No changes in present and planned land uses will result from this SOI update.
2. Present and probable need for public facilities and services in the area.
There is a present and probable future need for ongoing park and recreation services within the boundaries of the CSA. Population within the District is expected to increase at an annual rate of approximately 0.55%. The SOI Update will reflect that there is no funding source for CSA R-9 and shift the park maintenance duties to the Landscape and Lighting District.
3. Present capacity of public facilities and adequacy of public services that the agency provides or is authorized to provide.
With no funding source, the County is not able to maintain the Children’s Reading Garden, the one park located within CSA R-9, and relies on volunteers.
4. Existence of any social or economic communities of interest in the area if the commission determines that they are relevant to the agency.
No disadvantaged communities were identified within the District’s sphere of influence, but the disadvantaged community of San Pablo is partially contiguous to the boundary of CSA R-9. The SOI update will not affect the existence of any social or economic communities of interest.
5. Nature, location, and extent of any functions or classes of services provided by existing districts. (For Special Districts only.)
With no funding source, the County is not able to maintain the Children’s Reading Garden. The SOI Update recognizes there is no funding source for CSA R-9 and shifts the park maintenance duties to the Landscape and Lighting District. Other services are provided by the County.
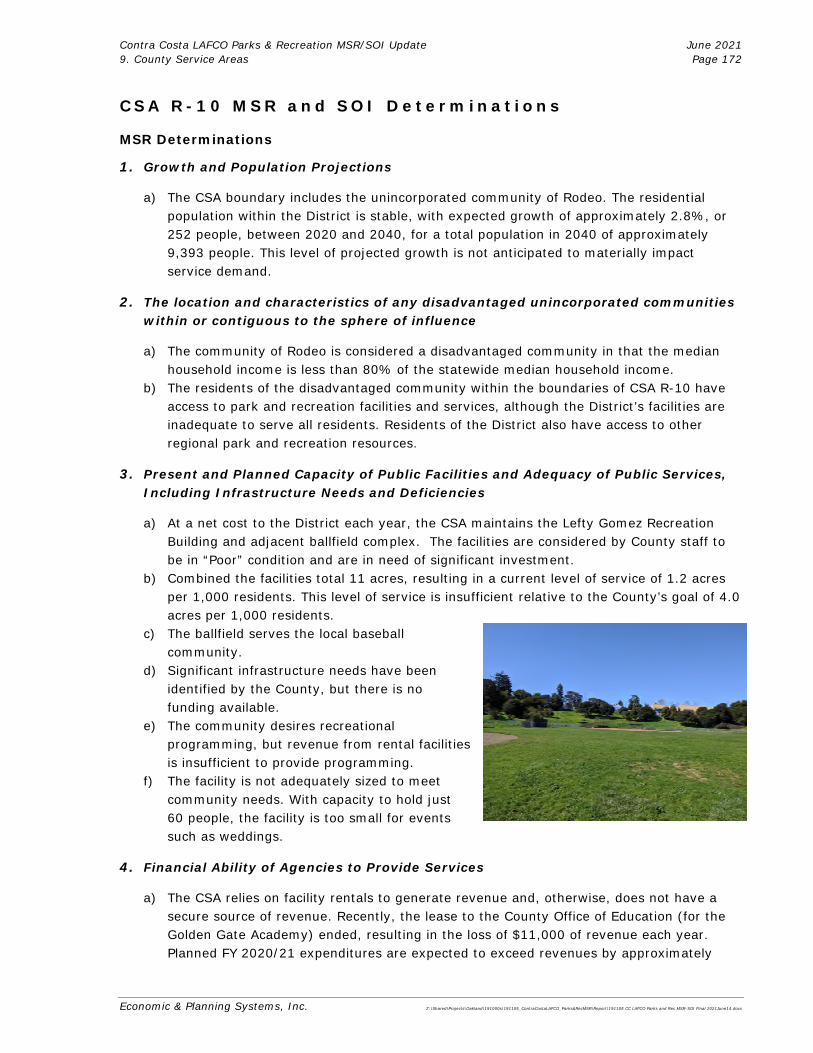
Contra Costa LAFCO Parks & Recreation MSR/SOI Update June 2021 9. County Service Areas Page 172
Economic & Planning Systems, Inc. Z:\Shared\Projects\Oakland\191000s\191105_ContraCostaLAFCO_Parks&RecMSR\Report\191105 CC LAFCO Parks and Rec MSR-SOI Final 2021June14.docx
CSA R-10 MSR and SOI De term in at ions
MSR Determinations
1. Growth and Population Projections
a) The CSA boundary includes the unincorporated community of Rodeo. The residential population within the District is stable, with expected growth of approximately 2.8%, or 252 people, between 2020 and 2040, for a total population in 2040 of approximately 9,393 people. This level of projected growth is not anticipated to materially impact service demand.
2. The location and characteristics of any disadvantaged unincorporated communities within or contiguous to the sphere of influence
a) The community of Rodeo is considered a disadvantaged community in that the median household income is less than 80% of the statewide median household income.
b) The residents of the disadvantaged community within the boundaries of CSA R-10 have access to park and recreation facilities and services, although the District’s facilities are inadequate to serve all residents. Residents of the District also have access to other regional park and recreation resources.
3. Present and Planned Capacity of Public Facilities and Adequacy of Public Services, Including Infrastructure Needs and Deficiencies
a) At a net cost to the District each year, the CSA maintains the Lefty Gomez Recreation Building and adjacent ballfield complex. The facilities are considered by County staff to be in “Poor” condition and are in need of significant investment.
b) Combined the facilities total 11 acres, resulting in a current level of service of 1.2 acres per 1,000 residents. This level of service is insufficient relative to the County’s goal of 4.0 acres per 1,000 residents.
c) The ballfield serves the local baseball community.
d) Significant infrastructure needs have been identified by the County, but there is no funding available.
e) The community desires recreational programming, but revenue from rental facilities is insufficient to provide programming.
f) The facility is not adequately sized to meet community needs. With capacity to hold just 60 people, the facility is too small for events such as weddings.
4. Financial Ability of Agencies to Provide Services
a) The CSA relies on facility rentals to generate revenue and, otherwise, does not have a secure source of revenue. Recently, the lease to the County Office of Education (for the Golden Gate Academy) ended, resulting in the loss of $11,000 of revenue each year. Planned FY 2020/21 expenditures are expected to exceed revenues by approximately

Contra Costa LAFCO Parks & Recreation MSR/SOI Update June 2021 9. County Service Areas Page 173
Economic & Planning Systems, Inc. Z:\Shared\Projects\Oakland\191000s\191105_ContraCostaLAFCO_Parks&RecMSR\Report\191105 CC LAFCO Parks and Rec MSR-SOI Final 2021June14.docx
$41,000, which means maintenance and other expenses may need to be partially deferred.
b) The Lefty Gomez Recreation Building and adjacent ballfield are owned by the John Swett Unified School District and leased to Contra Costa County. The lease expires in 2045. While the lease is not a significant cost, the maintenance of the facilities and field is a financial burden.
c) County staff report that facility rental rates were reviewed and increased within the past year.
d) The Rodeo Baseball Association provides some maintenance of the ball fields as part of its contract with the County; however, County staff report that the CSA may lose funding from the Rodeo Baseball Association.
5. Status of, and Opportunities for, Shared Facilities
a) The Lefty Gomez Recreation Building and Ballfield Complex is owned by the John Swett Unified School District and the CSA provides funding for maintenance. The Rodeo Baseball Association provides some maintenance of the ball fields as part of its contract with the County.
6. Accountability for Community Service Needs, Including Governmental Structure and Operational Efficiencies
a) CSA R-10 does not have an established or secure source of revenue and, as such, is not able to address the needs of the Rodeo community.
b) Typically, accountability to local voters would be achieved through the CSA advisory committee; however, the R-10 advisory committee has effectively dissolved as each of the five seats is vacant.
c) The CSA, via County staff, demonstrated accountability and transparency by responding to LAFCO requests for information.
d) The County’s Special District budget provides transparent revenue and expenditure information. However, the Special District budget lacks information regarding the District’s purpose and services.
7. Any other matter related to efficient service delivery, as required by commission policy
a) COVID-19 has affected the County’s ability to rent the Lefty Gomez Recreation Building, which is the CSA’s primary source of revenue.
SOI Options
1) Adopt a zero SOI to signal future dissolution of the District 2) Retain the existing coterminous SOI
Current Recommendation
Adopt a zero SOI. The CSA’s only sources of revenue are from facility rentals and program fees, both of which have been severely challenged by COVID. While the lasting effects of COVID remain unknown, the current recommendation is to adopt a zero SOI to signal future dissolution of the District, in which case the County is the successor agency. County staff anticipates that

Contra Costa LAFCO Parks & Recreation MSR/SOI Update June 2021 9. County Service Areas Page 174
Economic & Planning Systems, Inc. Z:\Shared\Projects\Oakland\191000s\191105_ContraCostaLAFCO_Parks&RecMSR\Report\191105 CC LAFCO Parks and Rec MSR-SOI Final 2021June14.docx
maintenance of the outdoor/field areas could be provided by Landscape and Lighting District (LLD) Zone 38 without causing an undue burden. In the longer term, because the Lefty Gomez Community Center and the adjacent ballfields are located on a parcel owned by the John Swett Unified School District, the parcels may be returned to the School District.
SOI Determinations
1. Present and planned land uses in the area, including agricultural and open-space lands.
The District boundaries encompass primarily residential and commercial uses. The CSA has no land use authority; however, County plans include land uses and population growth that may impact the service population within the District and, therefore, the District’s ability to provide services. No changes in present and planned land uses will result from this SOI update.
2. Present and probable need for public facilities and services in the area.
There is a present and probable future need for ongoing park and recreation services within the boundaries of the CSA. Population within the District is expected to increase at an annual rate of approximately 0.14%. No changes in public facilities or services provided by CSA R-10 will result from this SOI update.
3. Present capacity of public facilities and adequacy of public services that the agency provides or is authorized to provide.
The County is not able to provide adequate park maintenance services within CSA R-10. There are 11 acres of parkland maintained within the District, which translates into 1.2 acres of parkland per 1,000 district residents, short of the County’s General Plan goal of 4.0 acres of parkland per 1,000 residents. The SOI update will not impact the present capacity of public facilities and adequacy of public services that CSA R-10 provides or is authorized to provide.
4. Existence of any social or economic communities of interest in the area if the commission determines that they are relevant to the agency.
The community of Rodeo is considered a disadvantaged community in that the median household income is less than 80% of the statewide median household income. The residents of the disadvantaged community within the boundaries of CSA R-10 have access to park and recreation facilities and services, although the District’s facilities are inadequate to serve all residents. Residents of the District also have access to other regional park and recreation resources. The SOI update will not affect the existence of any social or economic communities of interest.
5. Nature, location, and extent of any functions or classes of services provided by existing districts. (For Special Districts only.)
CSA R-10 provides park maintenance services and limited recreation programming to the unincorporated community of Rodeo. Other services are provided by the County.

APPENDICES:
Appendix A: City Data (Support Tables)
Appendix B: Boundary History Tables
Appendix C: Maps of Cities’ Boundaries and Spheres of Influence in Contra Costa County
Appendix D: Maps of CSDs’ Boundaries and Spheres of Influence in Contra Costa County
Appendix E: Maps of CSAs’ Boundaries and Spheres of Influence in Contra Costa County
Appendix F: LAFCO & MSR History
Appendix G: Acronyms and Glossary of Terms

APPENDIX A:
City Data (Support Tables)
Antioch
Table 1 Governing Bodies & Contact Information .......................... A-1
Table 2 Summary Inventory of Parkland and Recreation Facilities .... A-2
Table 3 Summary of Staffing ...................................................... A-3
Table 4 Operating Revenues/Expenditures Over Time .................... A-4
Table 5 Rates and User Fees ...................................................... A-5
Table 6 Capital Planning and Funding .......................................... A-6
Table 7 City Facilities Rentals and Event Attendance ...................... A-7
Brentwood
Table 1 Governing Bodies & Contact Information .......................... A-8
Table 2 Summary Inventory of Parkland and Recreation Facilities .... A-9
Table 3 Summary of Staffing .................................................... A-10
Table 4 Operating Revenues/Expenditures Over Time .................. A-11
Table 5 Rates and User Fees .................................................... A-12
Table 6 Capital Planning and Funding ........................................ A-13
Table 7 City Facilities Rentals and Event Attendance .................... A-14

Clayton
Table 1 Governing Bodies & Contact Information .................................................. A-15
Table 2 Summary Inventory of Parkland and Recreation Facilities ............................ A-16
Table 3 Summary of Staffing ............................................................................. A-17
Table 4 Operating Revenues/Expenditures Over Time ............................................ A-18
Table 5 Rates and User Fees .............................................................................. A-19
Table 6 Capital Planning and Funding .................................................................. A-20
Table 7 City Facilities Rentals and Event Attendance .............................................. A-21
Concord
Table 1 Governing Bodies & Contact Information .................................................. A-22
Table 2 Summary Inventory of Parkland and Recreation Facilities ............................ A-23
Table 3 Summary of Staffing ............................................................................. A-24
Table 4 Operating Revenues/Expenditures ........................................................... A-25
Table 5 Rates and User Fees .............................................................................. A-26
Table 6 Capital Planning and Funding .................................................................. A-27
Table 7 City Facilities Rentals and Event Attendance .............................................. A-28
Danville
Table 1 Governing Bodies & Contact Information .................................................. A-29
Table 2 Summary Inventory of Parkland and Recreation Facilities ............................ A-30
Table 3 Summary of Staffing ............................................................................. A-31
Table 4 Operating Revenues/Expenditures Over Time ............................................ A-32
Table 5 Rates and User Fees .............................................................................. A-33
Table 6 Capital Planning and Funding .................................................................. A-34
Table 7 City Facilities Rentals and Event Attendance .............................................. A-35
El Cerrito
Table 1 Governing Bodies & Contact Information .................................................. A-36
Table 2 Summary Inventory of Parkland and Recreation Facilities ............................ A-37
Table 3 Summary of Staffing ............................................................................. A-38
Table 4 Operating Revenues/Expenditures Over Time ............................................ A-39
Table 5 Rates and User Fees .............................................................................. A-40

Table 6 Capital Planning and Funding .................................................................. A-41
Table 7 City Facilities Rentals and Event Attendance .............................................. A-42
Hercules
Table 1 Governing Bodies & Contact Information .................................................. A-43
Table 2 Summary Inventory of Parkland and Recreation Facilities ............................ A-44
Table 3 Summary of Staffing ............................................................................. A-45
Table 4 Operating Revenues/Expenditures Over Time ............................................ A-46
Table 5 Rates and User Fees .............................................................................. A-47
Table 6 Capital Planning and Funding .................................................................. A-48
Table 7 City Facilities Rentals and Event Attendance .............................................. A-49
Lafayette
Table 1 Governing Bodies & Contact Information .................................................. A-50
Table 2 Summary Inventory of Parkland and Recreation Facilities ............................ A-51
Table 3 Summary of Staffing ............................................................................. A-52
Table 4 Operating Revenues/Expenditures Over Time ............................................ A-53
Table 5 Rates and User Fees .............................................................................. A-54
Table 6 Capital Planning and Funding .................................................................. A-55
Table 7 City Facilities Rentals and Event Attendance .............................................. A-56
Martinez
Table 1 Governing Bodies & Contact Information .................................................. A-57
Table 2 Summary Inventory of Parkland and Recreation Facilities ............................ A-58
Table 3 Summary of Staffing ............................................................................. A-59
Table 4 Operating Revenues/Expenditures Over Time ............................................ A-60
Table 5 Rates and User Fees .............................................................................. A-61
Table 6 Capital Planning and Funding .................................................................. A-62
Table 7 City Facilities Rentals and Event Attendance .............................................. A-63
Moraga
Table 1 Governing Bodies & Contact Information .................................................. A-64
Table 2 Summary Inventory of Parkland and Recreation Facilities ............................ A-65

Table 3 Summary of Staffing ............................................................................. A-66
Table 4 Operating Revenues/Expenditures Over Time ............................................ A-67
Table 5 Rates and User Fees .............................................................................. A-68
Table 6 Capital Planning and Funding .................................................................. A-69
Table 7 City Facilities Rentals and Event Attendance .............................................. A-70
Oakley
Table 1 Governing Bodies & Contact Information .................................................. A-71
Table 2 Summary Inventory of Parkland and Recreation Facilities ............................ A-72
Table 3 Summary of Staffing ............................................................................. A-73
Table 4 Operating Revenues/Expenditures Over Time ............................................ A-74
Table 5 Rates and User Fees .............................................................................. A-75
Table 6 Capital Planning and Funding .................................................................. A-76
Table 7 City Facilities Rentals and Event Attendance .............................................. A-77
Orinda
Table 1 Governing Bodies & Contact Information .................................................. A-78
Table 2 Summary Inventory of Parkland and Recreation Facilities ............................ A-79
Table 3 Summary of Staffing ............................................................................. A-80
Table 4 Operating Revenues/Expenditures Over Time ............................................ A-81
Table 5 Rates and User Fees .............................................................................. A-82
Table 6 Capital Planning and Funding .................................................................. A-83
Table 7 City Facilities Rentals and Event Attendance .............................................. A-84
Pinole
Table 1 Governing Bodies & Contact Information .................................................. A-85
Table 2 Summary Inventory of Parkland and Recreation Facilities ............................ A-86
Table 3 Summary of Staffing ............................................................................. A-87
Table 4 Operating Revenues/Expenditures Over Time ............................................ A-88
Table 5 Rates and User Fees .............................................................................. A-89
Table 6 Capital Planning and Funding .................................................................. A-90
Table 7 City Facilities Rentals and Event Attendance .............................................. A-91

Pittsburg
Table 1 Governing Bodies & Contact Information .................................................. A-92
Table 2 Summary Inventory of Parkland and Recreation Facilities ............................ A-93
Table 3 Summary of Staffing ............................................................................. A-94
Table 4 Operating Revenues/Expenditures Over Time ............................................ A-95
Table 5 Rates and User Fees .............................................................................. A-96
Table 6 Capital Planning and Funding .................................................................. A-97
Table 7 City Facilities Rentals and Event Attendance .............................................. A-98
Pleasant Hill
Table 1 Governing Bodies & Contact Information .................................................. A-99
Richmond
Table 1 Governing Bodies & Contact Information ................................................. A-100
Table 2 Summary Inventory of Parkland and Recreation Facilities ........................... A-101
Table 3 Summary of Staffing ............................................................................ A-102
Table 4 Operating Revenues/Expenditures Over Time ........................................... A-103
Table 5 Rates and User Fees ............................................................................. A-104
Table 6 Capital Planning and Funding ................................................................. A-105
Table 7 City Facilities Rentals and Event Attendance ............................................. A-106
San Pablo
Table 1 Governing Bodies & Contact Information ................................................. A-107
Table 2 Summary Inventory of Parkland and Recreation Facilities ........................... A-108
Table 3 Summary of Staffing ............................................................................ A-109
Table 4 Operating Revenues/Expenditures Over Time ........................................... A-110
Table 5 Rates and User Fees ............................................................................. A-111
Table 6 Capital Planning and Funding ................................................................. A-112
Table 7 City Facilities Rentals and Event Attendance ............................................. A-113
San Ramon
Table 1 Governing Bodies & Contact Information ................................................. A-114
Table 2 Summary Inventory of Parkland and Recreation Facilities ........................... A-115

Table 3 Summary of Staffing ............................................................................ A-116
Table 4 Operating Revenues/Expenditures Over Time ........................................... A-117
Table 5 Rates and User Fees ............................................................................. A-118
Table 6 Capital Planning and Funding ................................................................. A-119
Table 7 City Facilities Rentals and Event Attendance ............................................. A-120
Walnut Creek
Table 1 Governing Bodies & Contact Information ................................................. A-121
Table 2 Summary Inventory of Parkland and Recreation Facilities ........................... A-122
Table 3 Summary of Staffing ............................................................................ A-123
Table 4 Operating Revenues/Expenditures Over Time ........................................... A-124
Table 5 Rates and User Fees ............................................................................. A-125
Table 6 Capital Planning and Funding ................................................................. A-126
Table 7 City Facilities Rentals and Event Attendance ............................................. A-127

Antioch Table 1Governing Bodies & Contact InformationContra Costa LAFCO Parks & Recreation MSR/SOI Update; EPS# 191105
Item
Antioch City CouncilManner of Selection
Length of TermMeetings
Agenda DistributionMinutes Distribution
ContactMailing AddressEmail / Website
Antioch Parks and Recreation CommissionManner of Selection
Length of TermMeetings
Agenda DistributionMinutes Distribution
ContactMailing AddressEmail / Website
Source: City of Antioch
Third Thursday of every month at 7pmFour Years
Application, Mayor Recommendation, Council Approval
https://www.antiochca.gov/government/boards-P.O. Box 5007, Antioch, CA 94531-5007
City HallPosted online on city government websitePosted online on city government website
Information
Elections - Directly Elected MayorTwo and Four Years
Bi-monthly City Council MeetingsPosted online on city government websitePosted online on city government website
City Hall200 H Street, Antioch, CA 94509-1285
https://www.antiochca.gov/government/city-council/
A-1

Antioch Table 2Summary Inventory of Parkland and Recreation FacilitiesContra Costa LAFCO Parks & Recreation MSR/SOI Update; EPS# 191105
City Parkland Address/Location AcresParkType Facilities
SharedFacilities Condition
Almond Ridge Park Almondridge Drive &Beechnut Street
5.4 Neighborhood BBQ Pits, Picnic Tables, Restrooms, Soccer Fields, Softball Fields, Tennis Courts, Tot Play Area, Turf/Landscaping, Youth Play Area
DNR
Prewett Community Park 4703 Lone Tree Way 100.0 Community Antioch Community Center Antioch Water Park Antioch Skate Park Disc Golf Course Burrowing Owl Preserve Trails/Open Space
DNR
Antioch Community Park James Donlon Blvd & Blyth Drive 20.0 Community BBQ Pits, Group Picnic Area, Horseshoes, Picnic Tables, Restrooms, Soccer Fields, Softball Fields, Tot Play Area, Turf/Landscaping, Volleyball/Sports Court, Youth Play Area, Trails/Open Space
DNR
Canal Park Gentrytown Drive & Curtis Drive 4.8 Neighborhood BBQ Pits, Picnic Tables, Restrooms, Tot Play Area, Turf/Landscaping, Youth Play Area, Trails/Open Space
DNR
Chaparral Park Prewett Ranch & Candlewood 5.0 Neighborhood BBQ Pits, Baseball Fields, Basketball Courts, Exercise Court, Group Picnic Area, Horseshoes, Picnic Tables, Restrooms, Soccer Fields, Softball Fields, Tennis Courts, Tot Play Area, Turf/Landscaping, Volleyball/Sport Court, Youth Play Area, Trails/Open Space
DNR
Chichibu Park Longview Road & Acorn Drive 6.3 Neighborhood BBQ Pits, Group Picnic Area, Horseshoes, Picnic Tables, Restrooms, Tennis Courts, Tot Play Area, Turf/Landscaping, Youth Play Area
DNR
City Park Tenth & A Streets 5.0 Neighborhood BBQ Pits, Group Picnic Area, Horseshoes, Picnic Tables, Restrooms, Softball Fields, Tot Play Area, Turf/Landscaping, Youth Play Area
DNR
Contra Loma Estates Park Mahogany Drive & Manzanita Way 5.0 Neighborhood Tennis Courts, Tot Play Area, Turf/Landscaping, Youth Play Area DNRCountry Manor Park Asilomar & Carpenteria Drives 20.0 Neighborhood BBQ Pits, Horseshoes, Picnic Tables, Restrooms, Soccer Fields, Softball Fields,
Youth Play Area, Trails/Open SpaceDNR
Dallas Ranch Park Prewett Ranch Drive 5.0 Neighborhood BBQ Pits, Basketball Courts, Picnic Tables, Restrooms, Tot Play Area, Turf/Landscaping, Volleyball/Sport Court, Youth Play Area, Trails/Open Space
DNR
Deerfield Park Deerfield & Buckskin Drives 0.5 Neighborhood BBQ Pits, Picnic Tables, Turf/Landscaping, Youth Play Area DNRDiablo West Park 2000 Prewett Ranch Drive 4.0 Neighborhood BBQ Pits, Basketball Courts, Picnic Tables, Restrooms, Tot Play Area, Turf
Landscaping, Youth Play Area, Trails/Open SpaceDNR
Eaglesridge Park Eaglesridge & Greystone Drives 5.4 Neighborhood BBQ Pits, Picnic Tables, Restrooms, Tot Play Area, Turf/Landscaping, Youth Play Area
DNR
Fairview Park Crestview & Aster Drives 3.0 Neighborhood BBQ Pits, Basketball Courts, Picnic Tables, Restrooms, Turf/Landscaping, Youth Play Area
DNR
Gentrytown Park Carmona Way & Monterey Drive 14.0 Neighborhood BBQ Pits, Baseball Fields, Picnic Tables, Restrooms, Softball Fields, Turf/Landscaping, Youth Play Area
DNR
Gino Marchetti Park Kendree Street & Delta Fair Blvd 5.0 Neighborhood BBQ Pits, Baseball Fields, Picnic Tables, Restrooms, Softball Fields, Tennis Courts, Tot Play Area, Turf/Landscaping, Youth Play Area, Trails/Open Space
DNR
Hansen Park Nortonville and Hanson 5.9 Neighborhood BBQ Pits, Picnic Tables, Restrooms, Tennis Courts, Tot Play Area, Turf/Landscaping, Youth Play Area
DNR
Harbour Park Ashburton & Lindley Drives 7.9 Neighborhood BBQ Pits Group Picnic Area, Picnic Tables, Restrooms, Softball Fields, Tennis Courts, Tot Play Area, Turf/Landscaping, Youth Play Area
DNR
Heidorn Park Vista Grande Drive 3.0 Neighborhood BBQ Pits, Picnic Tables, Restrooms, Soccer Fields, Tot Play Area, Turf/Landscaping, Youth Play Area, Trails/Open Space
DNR
Hillcrest Park Larkspur & Sunflower Drives 18.0 Neighborhood BBQ Pits, Basketball Courts, Exercise Court, Picnic Tables, Restrooms, Tennis Courts, Tot Play Area, Turf/Landscaping, Volleyball/Sport Court, Youth Play Area
DNR
Jacobson Park Jacobsen Drive 1.3 Neighborhood BBQ Pits, Basketball Courts, Picnic Tables, Tot Play Area, Turf/Landscaping, Youth Play Area
DNR
Knoll Park Country Hills Drive & Valley Way 5.0 Neighborhood BBQ Pits, Horseshoes, Picnic Tables, Restrooms, Tot Play Area, Turf/Landscaping, Youth Play Area
DNR
Markley Creek Park E. Somersville Road 2.0 Neighborhood Large and Small Dog Park Attached, Open Play Field, Picnic Area, Restroom, Tot Play Area
DNR
Meadow Creek Park Vista Grande Drive 5.0 Neighborhood BBQ Pits, Basketball Courts, Picnic Tables, Restrooms, Tot Play Area, Turf/Landscaping, Youth Play Area
DNR
Meadowbrook Park Yellowstone Drive & Calaveras Circle 8.5 Neighborhood BBQ Pits, Basketball Courts, Picnic Tables, Turf/Landscaping, Volleyball/Sports Court, Youth Play Area
DNR
Memorial Park Putnam St. & Spartan Way 12.0 Community Softball Fields, Open Play FieldShared with Antioch Unified School District AUSD - School and City Joint Use
DNR
Mira Vista Hills Park Silverado Drive & Cordoba Way 9.2 Neighborhood BBQ Pits, Basketball Courts, Horseshoes, Picnic Tables, Restrooms, Softball Fields, Tennis Courts, Turf/Landscaping, Youth Play Area
DNR
Mira Vista Park S. Francisco Way & Hacienda Way 6.8 Neighborhood BBQ Pits, Group Picnic Area, Picnic Tables, Restrooms, Softball Fields, Tot Play Area, Turf/Landscaping, Youth Play Area
DNR
Mountaire Park Sunset Land & Elmo Road 5.1 Neighborhood BBQ Pits, Picnic Tables, Tot Play Area, Turf/Landscaping, Youth Play Area DNRNelson Ranch Park 4700 Wildhorse Road 9.3 Neighborhood BBQ Pits, Basketball Courts, Picnic Tables, Restrooms, Soccer Fields, Tot Play
Area, Turf/Landscaping, Youth Play Area, Trails/Open SpaceDNR
Prosserville Park Sixth & O Streets 1.6 Neighborhood BBQ Pits, Basketball Courts, Picnic Tables, Turf/Landscaping, Youth Play Area DNR
Village East Park Gentrytwon Drive & Melon Court 7.4 Neighborhood BBQ Pits, Picnic Tables, Turf/Landscaping DNRWilliamson Ranch Park Lone Tree Way & Hillcrest Avenue 5.0 Neighborhood BBQ Pits, Picnic Tables, Restrooms, Tot Play Area, Turf/Landscaping, Youth Play
AreaDNR
Waldie Plaza Historic Downtown Antioch 1.0 Community Group Picnic Area, Turf/Landscaping, Trails/Open Space DNR
Total Developed Park Acreage 322.4
Developed Park Acreage per 1,000 residents 2.87
*DNR = Did Not Respond
Source: City of Antioch
A-2
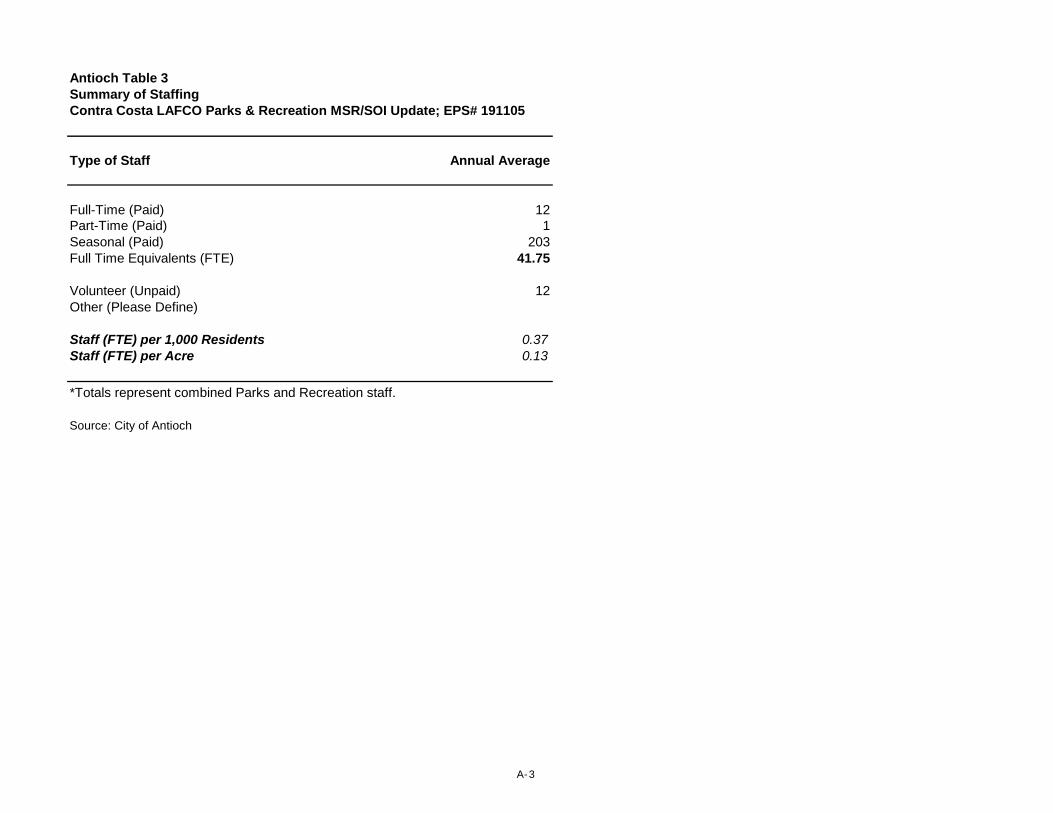
Antioch Table 3Summary of StaffingContra Costa LAFCO Parks & Recreation MSR/SOI Update; EPS# 191105
Type of Staff Annual Average
Full-Time (Paid) 12Part-Time (Paid) 1Seasonal (Paid) 203Full Time Equivalents (FTE) 41.75
Volunteer (Unpaid) 12Other (Please Define)
Staff (FTE) per 1,000 Residents 0.37Staff (FTE) per Acre 0.13
*Totals represent combined Parks and Recreation staff.
Source: City of Antioch
A-3

Antioch Table 4Operating Revenues/Expenditures Over TimeContra Costa LAFCO Parks & Recreation MSR/SOI Update; EPS# 191105
Item FY 19-20
Annual Operating Budget
Revenue
General Fund $2,459,506
User Fees / Charges $2,072,500
Non-major Governmental Funds $0
Operating Grants and Contributions $0
Total Revenue $4,532,006
Expenditures
Park Maintenance $1,672,882
Parks and Recreation Administrative Support1 $0
Recreation Programs $3,623,082
Civic Arts $66,954
Senior Bus $19,696
Child Care $2,253
Other Item #1 - Park In Lieu $342,128
Other Item #2- Water Park2 $0
Total Expenditures $5,726,995
Total Expenditures per Capita $51
General Fund ExpendituresGeneral Fund Expenditures on Parks & Recreation Functions $2,459,506Citywide General Fund Expenditures $68,732,357Parks and Recreation as a Share of Citywide General Fund Expenditures 3.58%
[1] Expenditures included within Park Maintenance & Recreation Programs line items.[2] 19-20 value included within Recreation Programs line item.
Sources: City of Antioch 2019-21 Operating Budget; City of Antioch FY2010 and 2015 CAFRs; Economic & Planning Systems, Inc
A-4

Antioch Table 5Rates and User FeesContra Costa LAFCO Parks & Recreation MSR/SOI Update; EPS# 191105
Types or Categories of User Fees Link to Fee Schedule Last Update Alternative RatesAverage Annual
Increase
Facility Rentals Fee Schedule 9/1/2019 Alternative rates/ fees for non-residents and non-profits.
Cost of Living SF Bay Area Index
Athletic Field Use Fee Schedule 9/1/2019Picnic Area Rentals Fee Schedule 9/1/2019Plaza Use Fees Fee Schedule 9/1/2019Water Park Fees Fee Schedule 9/1/2019
Source: City of Antioch Master Fee Schedule
A-5

Antioch Table 6Capital Planning and FundingContra Costa LAFCO Parks & Recreation MSR/SOI Update; EPS# 191105
Item FY 18-19 (Total) Funded Unfunded Funding Source
Annual Capital BudgetRevenue
Park In-Lieu Fund $25,000 N / ADelta Fair Fund $50,000 N / APrewett Park CIP Fund $14,518 N / ADevelopment Impact Fees - N / AOther - N / ATotal Capital Revenues $89,518
ExpenditureCurrent CIP Projects:1
Park Facilities Upgrade $450,000 $450,000 $0 Park In Lieu FundContra Loma Estates Park Basketball Courts $145,000 $145,000 $0 Delta Fair FundChichibu Park Upgrades $390,000 $390,000 $0 Park In Lieu FundJacobsen and Marchetti Park Renovation $295,000 $295,000 $0 Park In Lieu FundAntioch Lumber Co. Yard Phase I Site Assessment $1,305,000 $1,305,000 $0 Park In Lieu Fund
Total Future CIP Projects:Facilities $35,773,000 $7,286,000 $28,487,000 Development Impact FeesNew Community Center $17,761,000 $14,498,000 $3,263,000 Development Impact FeesNew Library $31,872,000 $6,492,000 $25,380,000 Development Impact Fees
Total Planned Capital Expenditures $87,991,000 $30,861,000 $57,130,000
Fee LevelsPark In-Lieu Fees (per unit)
Single Family, detached $1,500Single Family, attached $1,100Duplexes $950Multi Family $950Mobile Home $950
Development Impact FeesSingle Family (per unit) $3,261Multi Family (per unit) $2,065Non-Residential (per sq. ft.) $0
1 Current CIP Projects include those within the 5-Year CIP for 2019-2024.
Source: City of Antioch 5 Year Capital Improvement Program 2019-2024; City of Antioch Master Fee Schedule; City of Antioch; Economic & Planning Systems, Inc.
A-6

Antioch Table 7City Facilities Rentals and Event AttendanceContra Costa LAFCO Parks & Recreation MSR/SOI Update; EPS# 191105
Facility and/or Event DescriptionAnnual
AttendanceAnnual
Revenues
Activities / Programs
Water Park Guests / Program Participants Daily admissions, swimming lessons, group reservations 28,876 DNR
Recreation Classes / Program Participants Youth activity and enrichment, adult activity and enrichment 5,904 DNR
Worth Shaw Sports Complex Tournaments Youth and adult softball, baseball, soccer tournaments 36 DNR
Worth Shaw Sports Complex City Programs Jr Giants, adult leagues, youth events 3,650 DNR
Total 38,466 DNR
Facility RentalsWorth Shaw Sports Complex Turf Field Rentals Artifical turf fields used for youth and adult soccer year round 784 $89,993.00Nick Rodriguez Community Center Rentals for private family events, community meetings 430 $72,705.00Antioch Community Center Rentals for private family events, community meetings 751 $222,237.00Water Park Community Center Rentals for private family events, community meetings 51 $44,645.00Total 2,016 $429,580.00
Other Events / Annual Festivals / Etc.Event #1 Summer Concert Series Saturday Concerts in the Park - 6 total 6,000 $0Event #2 Recreation & Health Expo One Day Expo in May to kick off summer active living 2,500 $0Event #3 Big Truck Day One Day Outreach Event - All Big Trucks, in the fall 3,000 $0Total 11,500 $0
*DNR = Did Not Respond
Sources: 2019 CAFR; City of Antioch; Economic & Planning Systems, Inc.
A-7

Brentwood Table 1Governing Bodies & Contact InformationContra Costa LAFCO Parks & Recreation MSR/SOI Update; EPS# 191105
Item
Brentwood City CouncilManner of Selection
Length of TermMeetings
Agenda DistributionMinutes Distribution
ContactMailing AddressEmail / Website
Brentwood Parks and Recreation CommissionManner of Selection
Length of Term
MeetingsAgenda DistributionMinutes Distribution
ContactMailing AddressEmail / Website
Source: City of Brentwood
Information
Elections - Directly Elected MayorFour Years
Bi-monthly City Council MeetingsPosted online on city government websitePosted online on city government website
City Hall150 City Park Way, Brentwood, CA 94513
Application, selection by P & R Director, City Manager and Mayor3 years. Terms staggered so that no more than two terms shall expire in any one year. Maximum
term for any commissioner is three consecutive three-year terms.Fourth Thursday of each month at 7:00 pm
City Website & posting boardsCity Website & posting boards
City Hall150 City Park Way, Brentwood CA 94513
https://www.brentwoodca.gov/gov/boards/parks/default.asp
A-8

Brentwood Table 2Summary Inventory of Parkland and Recreation FacilitiesContra Costa LAFCO Parks & Recreation MSR/SOI Update; EPS# 191105
City Parkland Address/Location AcresParkType Facilities
SharedFacilities Condition
Almanor Park DNR 0.1 Neighborhood DNR DNR GoodAlmond Park DNR 1.4 Neighborhood DNR DNR GoodAmber Park DNR 0.3 Neighborhood DNR DNR GoodAnastasia Park DNR 0.8 Neighborhood DNR DNR GoodAppaloosa Park DNR 0.7 Neighborhood DNR DNR GoodApple Hill Park DNR 4.9 Community DNR DNR GoodApricot Park DNR 0.3 Neighborhood DNR DNR GoodArbor View Park DNR 5.6 Community DNR DNR GoodBalfour-Guthrie Park DNR 6.4 Community DNR DNR GoodBella Fiore Park DNR 0.3 Neighborhood DNR DNR GoodBerkshire Park DNR 0.4 Neighborhood DNR DNR GoodBig Basin Park DNR 1.0 Neighborhood DNR DNR GoodBlack Gold Park DNR 6.2 Neighborhood DNR DNR GoodBlue Goose Park DNR 4.0 Community DNR DNR GoodBosk Pocket Park DNR 0.1 Pocket DNR DNR GoodBrentwood Family Aquatic Complex DNR 7.0 Community DNR DNR GoodBrentwood Skate Park DNR 0.5 Community DNR DNR GoodCaboose Park DNR 1.0 Neighborhood DNR DNR GoodCeleste Park DNR 1.1 Neighborhood DNR DNR GoodCherry Park DNR 0.4 Neighborhood DNR DNR GoodCity Park DNR 2.5 Community DNR DNR GoodCortona ParkS DNR 0.5 Neighborhood DNR DNR GoodCreekside Park DNR 6.2 Community DNR DNR GoodCreekside Trailhead Park DNR 0.4 Community DNR DNR GoodCrocket Pocket Park DNR 0.1 Pocket DNR DNR GoodCurtis Park DNR 0.1 Neighborhood DNR DNR GoodDakota Park DNR 4.7 Neighborhood DNR DNR GoodDaytona Park DNR 1.2 Neighborhood DNR DNR GoodDolphin Park DNR 1.9 Neighborhood DNR DNR GoodEgret Park DNR 1.5 Neighborhood DNR DNR GoodFiorita Pocket Park DNR 0.1 Pocket DNR DNR GoodFruitwood Park DNR 0.4 Neighborhood DNR DNR GoodGann Street Pocket Park DNR 0.2 Pocket DNR DNR GoodGarin Park DNR 6.4 Community DNR DNR GoodGemini Park DNR 0.8 Neighborhood DNR DNR GoodGiotto Pocket Park DNR 0.1 Pocket DNR DNR GoodGlory Park DNR 1.1 Neighborhood DNR DNR GoodGolden Poppy Park DNR 0.8 Neighborhood DNR DNR GoodGranville Green Park DNR 1.8 Neighborhood DNR DNR GoodHeron Park DNR 10.8 Neighborhood DNR DNR GoodHomecoming Park DNR 2.0 Neighborhood DNR DNR GoodIron Horse Trailhead DNR 0.7 Pocket DNR DNR GoodKaleidoscope Park DNR 0.5 Neighborhood DNR DNR GoodKestrel Park DNR 1.3 Neighborhood DNR DNR GoodKing Park DNR 3.9 Neighborhood DNR DNR GoodLa Pergola Pocket Park DNR 0.2 Pocket DNR DNR GoodLake Park DNR 1.5 Neighborhood DNR DNR GoodLexington Park DNR 0.2 Neighborhood DNR DNR GoodLoma Vista Park DNR 4.5 Neighborhood DNR DNR GoodMallard Park DNR 1.5 Neighborhood DNR DNR GoodMarsh Creek Staging Area DNR 1.3 Community DNR DNR GoodMarsh Creek Trailhead Park DNR 0.8 Community DNR DNR GoodMarsh Creek Vista Park DNR 0.5 Neighborhood DNR DNR GoodMcClarren Park DNR 3.2 Neighborhood DNR DNR GoodMedallion Park DNR 1.3 Neighborhood DNR DNR GoodMission Grove Park DNR 2.2 Neighborhood DNR DNR GoodMiwok Park DNR 10.2 Neighborhood DNR DNR GoodMonarch Park DNR 2.3 Neighborhood DNR DNR GoodOak Meadow Park DNR 9.7 Community DNR DNR GoodOrchard Park DNR 5.2 Neighborhood DNR DNR GoodOutrigger Circle Pocket Park DNR 1.0 Pocket DNR DNR GoodPalmilla Park DNR 2.6 Neighborhood DNR DNR GoodPalomino Park DNR 0.6 Neighborhood DNR DNR GoodPeach Park DNR 0.8 Neighborhood DNR DNR GoodPelican Park DNR 1.1 Neighborhood DNR DNR GoodPistachio Park DNR 1.1 Neighborhood DNR DNR Good
Portofino Park DNR 1.3 Neighborhood DNR DNR Good
Rainbows End Park DNR 0.8 Neighborhood DNR DNR Good
Rice Pocket Park DNR 0.3 Pocket DNR DNR Good
Rolling Hills Park DNR 2.1 Neighborhood DNR DNR Good
Rose Garden Park DNR 3.1 Neighborhood DNR DNR Good
Sage Glen Park DNR 2.0 Neighborhood DNR DNR Good
Sawyer Pocket Park DNR 0.2 Pocket DNR DNR GoodSeedling Park DNR 1.4 Neighborhood DNR DNR GoodSparrow Park DNR 0.6 Neighborhood DNR DNR Good
Spirit Park DNR 0.5 Neighborhood DNR DNR GoodSteeplechase Park DNR 1.1 Neighborhood DNR DNR GoodStonehaven Park DNR 0.2 Neighborhood DNR DNR GoodSummerset Commons Park DNR 13.1 Community DNR DNR GoodSummerwood Park DNR 4.5 Community DNR DNR GoodSungold Park DNR 1.7 Neighborhood DNR DNR GoodSunset Park Athletic Complex DNR 39.8 Community DNR DNR GoodSweetgrass Pocket Park DNR 0.3 Pocket DNR DNR GoodTopaz Park DNR 0.3 Neighborhood DNR DNR GoodTulare Park DNR 1.4 Neighborhood DNR DNR GoodVeterans Park DNR 10.5 Community DNR DNR GoodWalnut Park DNR 5.1 Neighborhood DNR DNR GoodWheatfield Park DNR 1.3 Neighborhood DNR DNR GoodWindsor Way Park DNR 0.2 Neighborhood DNR DNR GoodYokut Park DNR 1.3 Neighborhood DNR DNR Good
Total Developed Park Acreage 237.1Developed Park Acreage per 1,000 residents 3.64
*DNR = Did Not Respond
Source: City of Brentwood
A-9
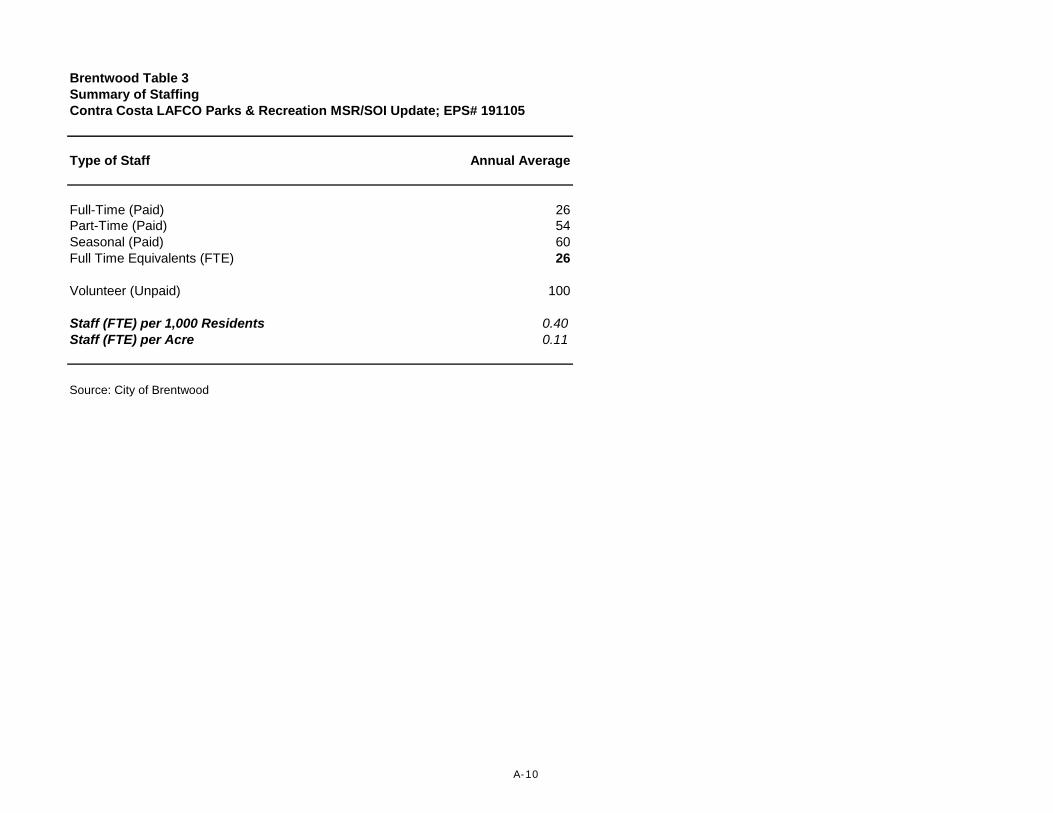
Brentwood Table 3Summary of StaffingContra Costa LAFCO Parks & Recreation MSR/SOI Update; EPS# 191105
Type of Staff Annual Average
Full-Time (Paid) 26Part-Time (Paid) 54Seasonal (Paid) 60Full Time Equivalents (FTE) 26
Volunteer (Unpaid) 100
Staff (FTE) per 1,000 Residents 0.40Staff (FTE) per Acre 0.11
Source: City of Brentwood
A-10

Brentwood Table 4Operating Revenues/Expenditures Over TimeContra Costa LAFCO Parks & Recreation MSR/SOI Update; EPS# 191105
Item FY 19-20
Annual Operating Budget
Revenue
General Fund $2,567,324
User Fees / Charges $1,108,738
Non-major Governmental Funds $0
Operating Grants and Contributions $0
Capital Grants and Contributions $0
Other Source #1 $67,167
Other Source #2 ( LLAD revenue) $9,197,743
Total Revenue $12,940,972
Expenditures
Personnel Services $4,401,834Supplies and Services $9,040,310Internal Services $2,972,621Parks Maintenance ( Included in above expenditures) $0
Other Item #1 $30,304
Total Expenditures $16,445,069
Total Expenditures per Capita $253
General Fund ExpendituresGeneral Fund Expenditures on Parks & Recreation Functions $2,567,324Citywide General Fund Expenditures $61,489,569Parks and Recreation as a Share of Citywide General Fund Expenditures 4.18%
Sources: City of Brentwood 2018/19-2019/20 Operating Budget; City of Brentwood CAFR FY2010 and 2015; Economic & Planning Systems, Inc.
A-11

Brentwood Table 5Rates and User FeesContra Costa LAFCO Parks & Recreation MSR/SOI Update; EPS# 191105
Types or Categories of User Fees Link to Web Page Last Update Alternative RatesAverage Annual
Increase
Landing Page Parks, Trails, and Facility RentalsBuilding Rentals Building Rentals 9/1/19 Resident/Non Resident, Commerical, Non Profit 0-3%
Athletic Field Use Athletic Fields 10/1/19 Resident/Non Resident, Commerical, Non Profit 0-7%
Picnic Area Rentals Picnic Rentals 10/1/19 Resident/Non Resident, Commerical, Non Profit 0-3%
Source: City of Brentwood
A-12

Brentwood Table 6Capital Planning and FundingContra Costa LAFCO Parks & Recreation MSR/SOI Update; EPS# 191105
Item FY 19-20 through 23-24 Funding Source
Parks and Trail Improvement SummaryProject Funding
General Fund $0 N / ADevelopment Impact Fees $0 N / AEnterprise $0 N / ADevelopment Impact Fees $0 N / AReplacement $3,649,092 N / AOther $0 N / ATotal Capital Revenues $3,649,092
Project Expenditures by ProjectAquatic Complex Locker Rooms Remodeling $400,000 ReplacementAquatic Complex Mechanical Room Improvements $350,000 ReplacementAquatic Complex Pool Decking $400,000 Replacement- Completed 19/20Aquatic Complex Slide Replacement $300,000 ReplacementAquatic Complex Water Play Structure Replacement $300,000 ReplacementBlue Goose Playground Replacement $324,730 ReplacementHomecoming Park Playground Replacement $306,000 ReplacementMilwok Park Playground Replacement $200,000 ReplacementSunset Field Natural Turf Improvement $300,000 ReplacementSunset Park Playground Replacement $300,000 ReplacementWalnut Park Playground Replacement $318,362 ReplacementWindsor Way Park Playground Replacement $150,000 Replacement
Total Planned Capital Expenditures $3,649,092
Fee LevelsParks and Trails Development Impact Fee
Single Family (per unit) $6,201Multi Family (per unit) $4,583
Source: City Brentwood 5 Year Capital Improvement Program 2019-2024; City of Brentwood
A-13

Brentwood Table 7City Facilities Rentals and Event AttendanceContra Costa LAFCO Parks & Recreation MSR/SOI Update; EPS# 191105
Facility and/or Event Description Annual AttendanceAnnual
Revenues
Activities / ProgramsYouth Programs Ages 0-17 4,073 $319,982Adult Programs Ages 18- 54 1,440 $86,638Senior Programs Ages 55 + 3,067 $90,851Senior Ongoing Activities Ages 55+ 25,125 $0Recreational & Lap Swim All Ages 19,484 $110,466Total 53,189 $607,937
Total Programs Offered (est.) 1,064
Facility RentalsBrentwood Community Center Multi Purpose Facility 517 $422,950Brentwood Senior Activity Center Senior Activity Center and rental facility 93 $148,079Brentwood Family Aquatic Complex Multipurpose Aquatic Facility 46 $7,453Field & Picnic Rentals Rentals at various picnic areas and field rentals 293 $168,373Total 949 $746,854
Other Events / Annual Festivals / Etc.Deck the Park Christmas tree decorating event 2,000 $3,160Annual Tree Lighting Free tree lighting ceremony 2,800 $04th of July Parade Community parade around downtown 3,000 $0Scarecrows in the Park Scarecrow decorating event 500 $416Movies in the Park Free family movie night in the park 400 $0Concerts in the Park Free live concerts in the park during summer 30,000 $0Youth in Government High school seniors shadow City employees 150 $0Total 38,850 $3,576
Sources: City of Brentwood
A-14

Clayton Table 1Governing Bodies & Contact InformationContra Costa LAFCO Parks & Recreation MSR/SOI Update; EPS# 191105
Item
City of Clayton - City CouncilManner of Selection
Length of TermMeetings
Agenda DistributionMinutes Distribution
ContactMailing AddressEmail / Website
Clayton Trails and Landscape CommitteeManner of Selection
Length of TermMeetings
Agenda DistributionMinutes Distribution
ContactMailing AddressEmail / Website
*DNR = Did Not Respond
Source: City of Clayton
ApplicationDNR
Third Monday of each month at 7:00 pmCity Website & posting boards
Information
Elections - Mayoral Rotation4 years
First and third Tuesdays of each month at 7:00 p.m. electronic and hardcopieselectronic and hardcopies
City ClerkCity Hall, 6000 Heritage Trail, Clayton, CA 94517
https://ci.clayton.ca.us/city-clerk-department/city-council/
City Website & posting boardsCity Hall
Clayton Library, 6125 Clayton Roadhttps://ci.clayton.ca.us/maintenance/trails-and-landscape-committee/
A-15

Clayton Table 2Summary Inventory of Parkland and Recreation FacilitiesContra Costa LAFCO Parks & Recreation MSR/SOI Update; EPS# 191105
City Parkland Address/Location AcresParkType Facilities
SharedFacilities Condition
Lydia Lane End of Lydia Lane 2.2 DNRPicnic Table(s), Play Equipment, Trails/ trail access, Grass
Very Good
Clayton Community Park 7411 Marsh Creek Road 8.9 DNR
Picnic Areas for Rental, Group Picnic Areas for Rental, Picnic Table(s), Barbecues, Baseball Fields for Rent, Soccer Fields for Rent, Play Equipment, Restrooms, Drinking Fountains, Trails/ trail access, Grass
Moderate
The Grove 6100 Main Street 1.2 DNR
Picnic Areas for Rental, Group Picnic Areas for Rental, Picnic Table(s), Play Equipment, Restrooms, Drinking Fountains, Water Play Area, Trails/ trail access, Grass
Very Good
North Valley Park Keller Ridge / Golden Eagle 1.7 DNRPicnic Table(s), Play Equipment, Trails/ trail access, Grass
Very Good
Stranahan Park DNR 0.3 DNR None Very GoodWestwood Park DNR 1.8 DNR None Very Good
Dog Park Across from Community Park 0.6 DNRPicnic Table(s), Drinking Fountains, Dogs Allowed Off-Leash, Trails/ trail access
Very Good
El Molino Park DNR 0.8 DNR Walking Trail Very Good
Total Developed Park Acreage 17.52Developed Park Acreage per 1,000 residents 1.55
*DNR = Did Not Respond
Source: City of Clayton
A-16

Clayton Table 3Summary of StaffingContra Costa LAFCO Parks & Recreation MSR/SOI Update; EPS# 191105
Type of Staff Annual Average
Full-Time (Paid) 1.5Part-Time (Paid) 0Seasonal (Paid) 0Full Time Equivalents (FTE) 1.5
Volunteer (Unpaid) 0Other (Please Define) 0
Staff (FTE) per 1,000 Residents 0.13Staff (FTE) per Acre 0.09
Source: City of Clayton
A-17

Clayton Table 4Operating Revenues/Expenditures Over TimeContra Costa LAFCO Parks & Recreation MSR/SOI Update; EPS# 191105
Item FY 19-20
Annual Operating Budget
Revenue
General Fund $176,820
User Fees / Charges $0
Non-major Governmental Funds $0
Operating Grants and Contributions $0
Total Revenue $176,820
Expenditures
Personnel Services $26,000
Materials & Supplies $2,000
Contracted Services $0
Equipment $0
Total Expenditures $176,820
Total Expenditures per Capita $16
General Fund ExpendituresGeneral Fund Expenditures on Parks & Recreation Functions $176,820Citywide General Fund Expenditures $4,774,450Parks and Recreation as a Share of Citywide General Fund Expenditures 3.70%
*DNR = Did Not Respond
Sources: City of Clayton
A-18

Clayton Table 5Rates and User FeesContra Costa LAFCO Parks & Recreation MSR/SOI Update; EPS# 191105
Types or Categories of User Fees Link to Web Page Last Update Alternative RatesAverage Annual
Increase
Facility Rentals Master Fee Schedule 7/1/2019Alternative rates/ fees for non-residents and non-profits.
2.10%
Source: City of Clayton
A-19

Clayton Table 6Capital Planning and FundingContra Costa LAFCO Parks & Recreation MSR/SOI Update; EPS# 191105
Item FY 19-20 through 23-24 Funding Source
Parks and Trail Improvement SummaryProject Funding
General Fund DNR N / ADevelopment Impact Fees DNR N / AEnterprise DNR N / ADevelopment Impact Fees DNR N / AReplacement DNR N / AOther DNR N / ATotal Capital Revenues DNR
Project Expenditures by ProjectCurrent CIP Projects:1
CCP - Field #1 Rehab $100,000Garbage Franchise Community
Enhancement Fee - Partially Unfunded
Future CIP Projects:Samuel Ct. Park $85,000 UnfundedSkateboard Park $750,000 UnfundedCommunity Park Lighting, etc. $4,084,000 UnfundedSchool Bridge Area Improvements $207,263 CIP Const. Fund
Total Planned Capital Expenditures $5,226,263
Fee LevelsParkland Dedication (per unit)
Single Family $2,569Multi Family $1,666Duplex $2,180
*DNR = Did Not Respond1 Current CIP Projects include those within the 5-Year CIP for 2019-2024.
Source: City of Clayton 5 Year Capital Improvement Program 2019-2024; City of Clayton
A-20

Clayton Table 7City Facilities Rentals and Event AttendanceContra Costa LAFCO Parks & Recreation MSR/SOI Update; EPS# 191105
Facility and/or Event Description Annual AttendanceAnnual
Revenues
Facility RentalsEndeavor Hall Rentals (days) DNR 139 DNRHoyer Hall Rentals DNR 92 DNRBallfield (hours rented) DNR 1,225 DNRTotal 1,456 -
Sources: City of Clayton
A-21

Concord Table 1Governing Bodies & Contact InformationContra Costa LAFCO Parks & Recreation MSR/SOI Update; EPS# 191105
Item
City of Concord - City CouncilManner of Selection
Length of TermMeetings
Agenda Distribution
Minutes DistributionContact
Mailing AddressEmail / Website
City of Concord - Recreation, Cultural Affairs and Community Services MembersManner of Selection
Length of TermMeetings
Agenda Distribution
Minutes Distribution
Contact
Mailing AddressEmail / Website
City of Concord - Parks, Recreation & Open Space CommissionManner of Selection
Length of TermMeetings
Agenda Distribution
Minutes DistributionContact
Mailing AddressEmail / Website https://www.cityofconcord.org/398/Parks-Recreation-Open-Space-Commission
Source: City of Concord
1950 Parkside Drive, Concord, CA 94519
Parks, Recreation & Open Space AgendasParks, Recreation & Open Space Minutes
https://www.cityofconcord.org/404/Recreation-Cultural-Affairs-Community-Se
Volunteer2 years
7pm, as needed
Information
Elections - Mayoral RotationFour years
1st, 2nd and 4th Tuesdays of the month at 6:30 p.m. City Council AgendasCity Council Minutes
[email protected] - 925-671-3158 1950 Parkside Drive, Concord, CA 94519
https://www.cityofconcord.org/237/Mayor-City-Council
Appointed by Mayor1 year
Recreation, Cultural Affairs and Community Services [email protected] - C: 925-348-5918
[email protected] - C: 510-812-81801950 Parkside Drive, Concord, CA 94519
As needed, when a meeting is called. Previously monthlyRecreation, Cultural Affairs and Community Services Agendas
A-22

Concord Table 2Summary Inventory of Parkland and Recreation FacilitiesContra Costa LAFCO Parks & Recreation MSR/SOI Update; EPS# 191105
City Parkland Address/Location AcresParkType Facilities
SharedFacilities Shared Detail Condition
John F. Baldwin Park Parkside Circle 18.0 Community Barbecues, Baseball / Softball Diamond, n/a n/a GoodBART Linear Park Port Chicago Highway 5.3 Trail Walking Track X - BART n/a GoodBART Park Mesa Street 5.0 Trail Walking Track X - BART n/a Good
Bayview Circle Park Bayview Circle 1.7 NeighborhoodPicnic Table(s), Play Equipment, Trails/ trail access, Grass
n/a n/a Good
Boatwright Youth Sports Complex Alberta Way 9.0 Sports Complex Baseball / Softball Diamond, Soccer Field X - CSU East Bay Joint use agreement GoodBrazil Quarry Kent Way 4.0 Neighborhood Butterfly Garden, Playground, Walking Track n/a n/a GoodCambridge Park Victory Lane 10.0 Community Picnic Tables, Playground, Soccer Field n/a n/a Good
Concord Community Park Cowell Road 30.0 CommunityBarbecues, Picnic Areas, Picnic Tables, Swimming Pool
n/a n/a Good
Concord Skate Park Cowell Road and San Miguel Road 0.3 Skate Skate Park n/a n/a GoodDave Brubeck Park Concord Boulevard 8.0 Community Picnic Tables, Playground, Stage n/a n/a Good
El Dorado Middle School Play FieldsConcord Boulevard and Mendocino Drive
11.2 Sports ComplexBaseball / Softball Diamond, Playground, Soccer Field, Volleyball Court, Walking Track
X - Mt. Diablo Unified School District
Joint use agreement Good
Ellis Lake Park Ellis Street 10.0 Community Lake, Playground, Walking Track n/a n/a GoodLen Hester Park Hookston Road and Hampton Drive 4.0 Neighborhood Picnic Areas, Walking Track n/a n/a Good
Highlands ParkPennsylvania Boulevard and Maine Drive
9.0 Community Picnic Areas, Playground, Waking Track n/a n/a Good
Hillcrest Community Park Grant Street and Olivera Road 26.0 CommunityBaseball / Softball Diamond, Model Airplane Flying Area, Picnic Areas, Playground, Soccer Field
n/a n/a Good
Iron Horse Park Solano Way and Hilltop Road 0.8 Neighborhood Barbecues, Bocce Courts, Picnic Tables n/a n/a Good
Krueger Fields Cowell Road and Almar Street 4.0 Sports Complex n/aX - Mt. Diablo Unified School District
Joint use agreement Good
Markham Nature Park and Arboretum La Vista Court and La Vista Avenue 16.0 CommunityArbor, Community Gardens, Summer Day Camp Facility
n/a n/a Good
Meadow Homes Park Sunshine Drive and Detroit Avenue 12.0 CommunityBarbecues, Picnic Areas, Sports Fields, Spray Park
n/a n/a Good
Newhall Community Park 1351 Newhall Parkway 126.0 CommunityBocce Courts, Dog Park, Picnic Areas, Playground, Ponds, Sports Fields
n/a n/a Good
Rick Seers Park Sierra Road and Fox Meadow Way 0.8 NeighborhoodBasketball Court, Picnic Areas, Playground, Walking Track
n/a n/a Good
Sun Terrace Park Vancouver Way and Montreal Circle 2.6 Neighborhood Playground n/a n/a GoodTodos Santos Park Willow Pass Road and Grant Street 2.5 Community Picnic Tables, Playground n/a n/a Good
Willow Pass Community Park 2748 E Olivera Road 40.0 CommunityBaseball / Softball Diamond, Batting Cage, Community Building, Lake, Pickleball Court, Tennis Court
n/a n/a Good
Ygnacio Valley Park Oak Grove Road and David Avenue 9.5 CommunityBarbecues, Picnic Areas, Playground, Sports Fields, Walking Track
n/a n/a Good
Total Developed Park Acreage 365.7Developed Park Acreage per 1,000 residents 2.8
Lime Ridge Open Space Lime Ridge Trail Run 175.0 Open Space Community Building, Trails n/a n/a Good
Greater Lime Ridge Open Space same as abovesee
aboveOpen Space n/a n/a n/a Good
Total Open Space Acreage 175.0
Diablo Creek Golf Course4050 Port Chicago Hwy, Concord, CA 94520
160.0 Golf CourseLegends & Heros Sports Bar, golf course, driving range
X - Diablo Creek Golf Course and Legends & Heros Sports Bar
Leased - operations contracted out
Good
Other Acreage 160.0
Source: City of Concord
A-23

Concord Table 3Summary of StaffingContra Costa LAFCO Parks & Recreation MSR/SOI Update; EPS# 191105
Type of Staff Annual Average
Full-Time (Paid) 40Part-Time (Paid) 90Seasonal (Paid) 39Full Time Equivalents (FTE) 77
Volunteer (Unpaid) 0Other (Please Define) 0
Staff (FTE) per 1,000 Residents 0.59Staff (FTE) per Acre 0.21
Source: City of Concord
A-24

Concord Table 4Operating Revenues/ExpendituresContra Costa LAFCO Parks & Recreation MSR/SOI Update; EPS# 191105
Item FY 19-20
Annual Operating Budget
Revenues
General Fund $0
User Fees / Charges $1,796,126
Non-major Governmental Funds $2,379,337
Operating Grants and Contributions $0
Capital Grants and Contributions $49,735
Enterprise Fund Revenue $1,634,103
Use of Property Revenue $865,030
Other Investment Revenue $11,200
Total Revenue $6,735,531
Expenditures
Employee Expenses $4,748,123
Temporary Salaries (Part Time Wages & FICA) $780,071
Administration $1,210,915
Materials & Supplies $544,379
Contracted Services $854,335
Equipment $0
Enterprise Fund Expense $1,371,835Internal Service Funds $1,979,603Other Expenses $83,814
Total Expenditures $11,573,075
Total Expenditures per Capita $89
General Fund ExpendituresGeneral Fund Expenditures on Parks & Recreation $0Citywide General Fund Expenditures $108,170,941Parks and Recreation as a Share of Citywide General Fund Expenditures 0.00%
Sources: City of Concord 2019-20 Operating Budget; City of Concord FY2010 and FY2015 CAFR; City of Concord; Economic & Planning Systems, Inc
A-25

Concord Table 5Rates and User FeesContra Costa LAFCO Parks & Recreation MSR/SOI Update; EPS# 191105
Types or Categories of User Fees Link to Web Page Last Update Alternative RatesAverage Annual
Increase
Facility Rentals Master Fee Schedule 4/23/2019 Alternative rates/ fees for non-residents and non-profits.
Activity Registrations Master Fee Schedule 4/23/2019 Alternative rates/ fees for non-residents and non-profits.
Lease AgreementsCPI or 2-5% (Depending
on Agreement)
Source: City of Concord
A-26

Concord Table 6Capital Planning and FundingContra Costa LAFCO Parks & Recreation MSR/SOI Update; EPS# 191105
Item Total Value Funding Source
Annual Capital Budget - Parks ProjectsRevenue
450 Parkland Dedication Area A and 480 Measure $227,857 N / A286 Public Art: Bond Proceeds $74,987 N / A401 Measure Q Projects $532,566 N / A402 Capital Projects- Reimburs $0 N / A400 Capital Projects General Fund Projects $67,247 N / A700 Golf Course $52,412 N / A120 Pavilion $45,000 N / ATotal Capital Revenues $1,000,069
Project ExpendituresCurrent CIP Projects:1
Replace Pump System Components at 4 Park Locations, Project #2242 $440,688
DNR
Todos Santos Plaza Decorative Tree Lighting, $46,443 DNRWater Quality Improvements at City Park Ponds, $644,110 DNRPark System Immediate Needs, Project #2372 $234,357 DNRGatewayBlvd Median Replant, Project #2373 $66,551 DNRStreet Median Turf Conversion, Project #2384 $364,449 DNRPark and Median Smart Irrigation Controllers, $132,753 DNRPlayground Replacement Program, Project #2387 $649,815 DNRGolf Course Maintenance and Safety Needs, $347,588 DNRConcord Pavilion - City Capital Expenditure Contribution $597,780 DNRWillow Pass Park Pedestrian Crossing, Project #2523 $220,000 DNRDiablo Creek Golf Course Bridges, Project #2532 $327,600 DNRCamp Concord Maintenance Repairs to Buildings and $234,382 DNRParks - Deferred Maintenance (Phase 1), $2,300,000 DNRTotal Planned Capital Expenditures $6,606,516
Completed CIP Projects:2
Willow Pass Park Restroom & Concession Facility $759,700 Capital Projects General Fund, Concord Pavilion - City Capital Expenditure $1,368,032 Pavilion, Partially Unfunded
Total Planned Capital Expenditures $2,127,732
Fee LevelsParkland In-Lieu Fee (per unit)
Low Density Zoning $11,910 - $16,691Medium Density Zoning $8,170 - $11,470High Density Zoning $7,055 - $9,914
Downtown, Seniors, Special Needs Housing $5,233 - $7,304Conservation Design $5,955 - $8,345ADU $4,173
Source: City of Concord Capital Budget FY 2018-19 and 2019-20; City of Concord
[1] Current CIP Projects include those within the 2-Year Capital Budget for 2020-2022.[2] Completed CIP Projects include those within the 2-Year Capital Budget for 2018-2020.
*DNR = Did Not Respond
A-27

Concord Table 7City Facilities Rentals and Event AttendanceContra Costa LAFCO Parks & Recreation MSR/SOI Update; EPS# 191105
Facility and/or Event Description Annual Attendance1Annual
Revenues
Activities / ProgramsYouth Programs Lifelong Learning, Enrichment, Health & Wellness etc. 4,902 $758,952Adult Programs Lifelong Learning, Enrichment, Health & Wellness etc. 7,189 $556,770Camp Concord Family & Group Camps 1,538 $272,148Aquatics Lap Swim, Rec Swim 25,836 $131,024Sports & Events Adult Leagues 3,495 $164,202
Total 42,960 $1,883,096
Facility RentalsCommunity Centers room rentals DNR $601,150Group Picnic Site Rentals picnic tables & BBQ DNR $66,384Athletic Facility Rentals baseball/soccer fields, tennis/pickleball courts & pool DNR $230,303Total - $897,837
Other Events / Annual Festivals / Etc. Farmer's Market City Sponsored, year-around event 16,500Spring Brewfest Permit Event, Annual 3,500Easter Egg Hunt Permit Event, Annual 500Concord Family Carnival Permit Event, Annual DNRSpring Basisakhi Diversity Festival Permit Event, Annual DNRSweep Away the Stigma Permit Event, Annual DNRMomDay MDMEF Music Festival City Sponsored, Annual DNRArmed Forces Marathon Permit Event, Annual DNRBay Area KidFest Permit Event, Annual 15,000Music & Market City Produced Event, All Summer 140,000Tuesday Night Blues City Produced Event, Thursdays in July 8,600Cool Concord Cars City Produced Event, Annual 300Vette-o-Rame Permit Event, Annual 500AAUW Concord Crawl Permit Event, Annual DNRStars and Stripes 5k City Sponsored, Annual DNR4th of July Parade and Fireworks City Sponsored, Annual DNRBlue Devils Viewing Party Permit Event, Annual DNRConcord Taco Fest Permit Event, Annual 4,000De La Salle Cross Country Invitational Permit Event, Annual DNRPraise in the Park Permit Event, Annual 3,500Diablo Dash 5k Permit Event, Annual DNREBAL Cross Country Permit Event, Annual DNRConcord 5000 Permit Event, Annual DNRConcord Tree Lighting and Sing-a-long City Produced Event, Annual DNR
Total 192,400
*DNR = Did Not Respond[1] 2019 calendar year values.
Source: City of Concord
A-28

Danville Table 1Governing Bodies & Contact InformationContra Costa LAFCO Parks & Recreation MSR/SOI Update; EPS# 191105
Item
Town of Danville - Town CouncilManner of Selection
Length of TermMeetings
Agenda DistributionMinutes Distribution
ContactMailing AddressEmail / Website
Town of Danville - Parks, Recreation & Arts Commission Manner of Selection
Length of TermMeetings
Agenda DistributionMinutes Distribution
ContactMailing AddressEmail / Website
Source: Town of Danville
Information
Mayoral RotationFour years
1st and 3rd Tuesday of every Month at 7:30 p.m.Available on the website and notification through Civic Send Available on the website and notification through Civic Send
925-314-3378510 La Gonda Way, Danville, CA 94526
https://www.danville.ca.gov/287/Town-Council
Appointed by Council 4 years and 2 years for Youth Commissioner2nd Wednesday of every month at 7:00 p.m.
Available on the website and notification through Civic Send Available on the website and notification through Civic Send
925-314-3454420 Front Street, Danville, CA 94526
https://www.danville.ca.gov/280/Parks-Recreation-Arts-Commission
A-29

Danville Table 2Summary Inventory of Parkland and Recreation FacilitiesContra Costa LAFCO Parks & Recreation MSR/SOI Update; EPS# 191105
City Parkland Address/Location AcresParkType Facilities
SharedFacilities Condition
Sycamore Valley Park 2101 Holbrook Drive 48.9 Community ParkChildren's play area, water features, 5 baseball/softball fields, 4 soccer fields, picnic tables, and BBQ's, jogging path and ancillary parking, bocce courts
N/A Very good
Hap Magee Ranch Park 1025 La Gonda Way 17.0 Community Park Three ranch-style homes, water play feature, children's playground, picnic area, perimeter trail, large meadow and ancillary parking, dog park
X - Owned jointly with the Alamo Parks & Recreation Committee R-7A each owning a half undivided interest
Very good
Oak Hill Park 3005 Stone Valley Road 43.7 Community Park
Children's "ranch style" play area, community building, horseshoes, pond fishing, picnic tables and BBQ's, open space trails and ancillary parking. (Park area will expand to 47.33 acres with Weber/Davidon dedication
N/A Very good
Osage Station Park 816 Brookside Drive 35.0 Community Park Children's "Old Town" play area, rose garden, par course,4 tennis courts, 4 baseball/softball fields, 5 soccer fields, picnic tables and BBQ's, jogging path and ancillary parking
N/A Very good
Danville South Park 1885 Camino Ramon 1.4 Neighborhood Park Children's play area, basketball court, picnic tables N/A Very goodDiablo Vista Park 1000 Tassajara Ranch Drive 20.0 Community Park "Snake" water feature, picnic tables, BBQ, volleyball,
basketball court, 2 tennis courts, 2 baseball/softball fields, 2 soccer fields, children's play area, snack shack and ancillary parking, night lighting
N/A Very good
Town Green 420 Front Street 3.0 Special Use Site N/A N/A Very goodFront Street Park 420 Front Street 0.36 Pocket Park Picnic table, benches, drinking fountain, public art N/A Very good
Total Developed Park Acreage 169.3Developed Park Acreage per 1,000 residents 3.9
Source: Town of Danville
A-30

Danville Table 3Summary of StaffingContra Costa LAFCO Parks & Recreation MSR/SOI Update; EPS# 191105
Type of Staff Annual Average
Full-Time (Paid) 15.75Part-Time (Paid) 26.25Seasonal (Paid) 82Full Time Equivalents (FTE) 124
Volunteer (Unpaid) 842
Staff (FTE) per 1,000 Residents 2.83Staff (FTE) per Acre 0.73
Source: Town of Danville
A-31
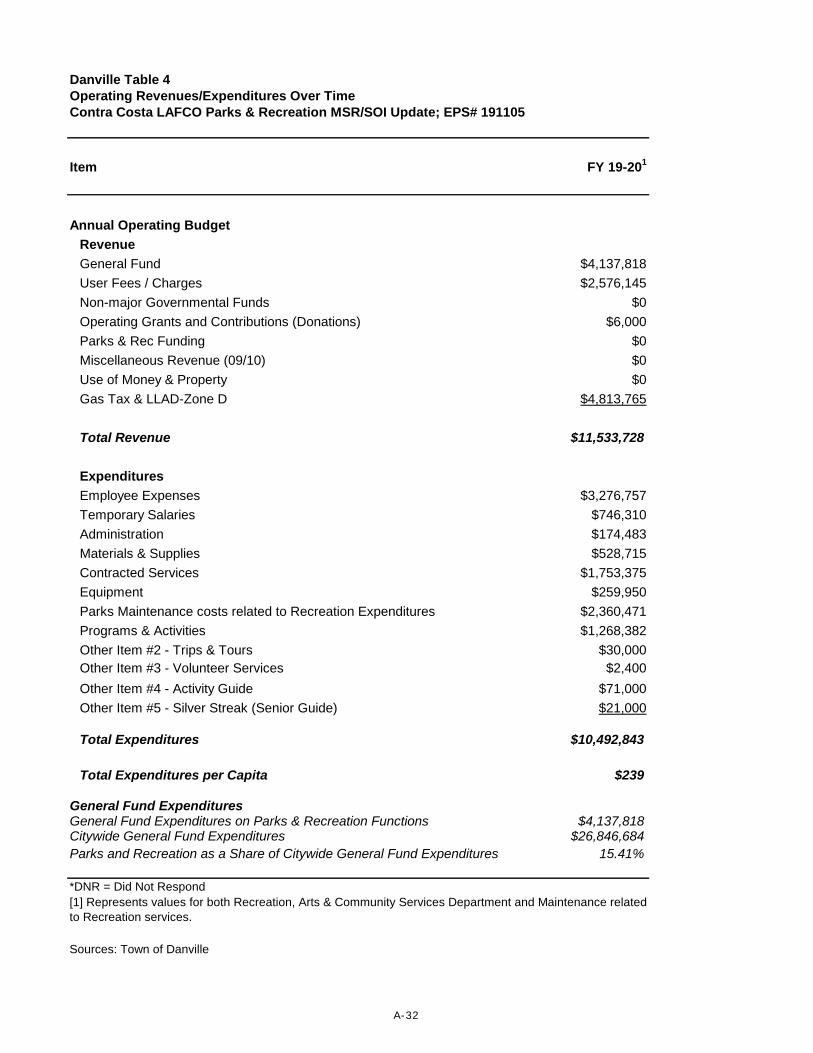
Danville Table 4Operating Revenues/Expenditures Over TimeContra Costa LAFCO Parks & Recreation MSR/SOI Update; EPS# 191105
Item FY 19-201
Annual Operating Budget
Revenue
General Fund $4,137,818
User Fees / Charges $2,576,145
Non-major Governmental Funds $0
Operating Grants and Contributions (Donations) $6,000
Parks & Rec Funding $0
Miscellaneous Revenue (09/10) $0
Use of Money & Property $0
Gas Tax & LLAD-Zone D $4,813,765
Total Revenue $11,533,728
Expenditures
Employee Expenses $3,276,757
Temporary Salaries $746,310
Administration $174,483
Materials & Supplies $528,715
Contracted Services $1,753,375
Equipment $259,950
Parks Maintenance costs related to Recreation Expenditures $2,360,471
Programs & Activities $1,268,382
Other Item #2 - Trips & Tours $30,000Other Item #3 - Volunteer Services $2,400
Other Item #4 - Activity Guide $71,000
Other Item #5 - Silver Streak (Senior Guide) $21,000
Total Expenditures $10,492,843
Total Expenditures per Capita $239
General Fund ExpendituresGeneral Fund Expenditures on Parks & Recreation Functions $4,137,818Citywide General Fund Expenditures $26,846,684Parks and Recreation as a Share of Citywide General Fund Expenditures 15.41%
*DNR = Did Not Respond
Sources: Town of Danville
[1] Represents values for both Recreation, Arts & Community Services Department and Maintenance related to Recreation services.
A-32

Danville Table 5Rates and User FeesContra Costa LAFCO Parks & Recreation MSR/SOI Update; EPS# 191105
Types or Categories of User Fees Link to Web Page Last Update Alternative Rates Average Annual Increase
Facility Rentals / Fees Master Fee Schedule - 2020 6/4/2019Alternative rates/ fees for non-residents and non-profits.
3%
Source: Town of Danville
A-33
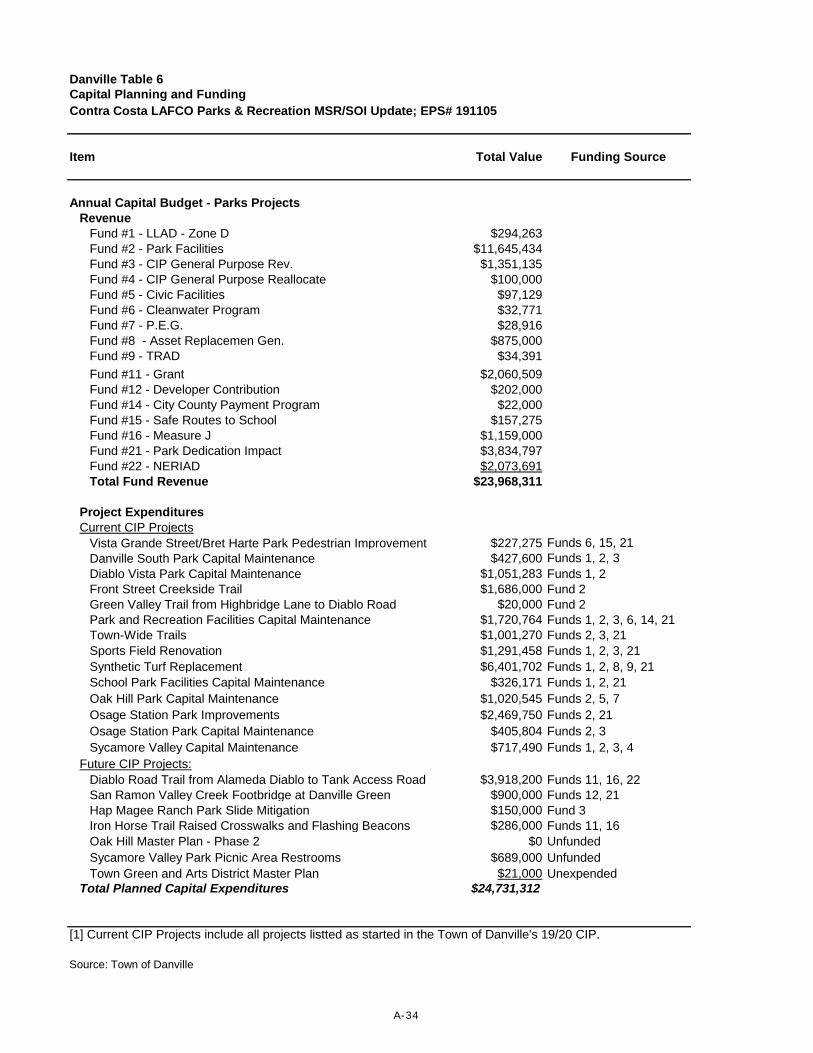
Danville Table 6Capital Planning and FundingContra Costa LAFCO Parks & Recreation MSR/SOI Update; EPS# 191105
Item Total Value Funding Source
Annual Capital Budget - Parks ProjectsRevenue
Fund #1 - LLAD - Zone D $294,263Fund #2 - Park Facilities $11,645,434Fund #3 - CIP General Purpose Rev. $1,351,135Fund #4 - CIP General Purpose Reallocate $100,000Fund #5 - Civic Facilities $97,129Fund #6 - Cleanwater Program $32,771Fund #7 - P.E.G. $28,916Fund #8 - Asset Replacemen Gen. $875,000Fund #9 - TRAD $34,391
Fund #11 - Grant $2,060,509Fund #12 - Developer Contribution $202,000Fund #14 - City County Payment Program $22,000Fund #15 - Safe Routes to School $157,275Fund #16 - Measure J $1,159,000Fund #21 - Park Dedication Impact $3,834,797Fund #22 - NERIAD $2,073,691Total Fund Revenue $23,968,311
Project ExpendituresCurrent CIP Projects
Vista Grande Street/Bret Harte Park Pedestrian Improvement $227,275 Funds 6, 15, 21Danville South Park Capital Maintenance $427,600 Funds 1, 2, 3Diablo Vista Park Capital Maintenance $1,051,283 Funds 1, 2Front Street Creekside Trail $1,686,000 Fund 2Green Valley Trail from Highbridge Lane to Diablo Road $20,000 Fund 2Park and Recreation Facilities Capital Maintenance $1,720,764 Funds 1, 2, 3, 6, 14, 21Town-Wide Trails $1,001,270 Funds 2, 3, 21Sports Field Renovation $1,291,458 Funds 1, 2, 3, 21Synthetic Turf Replacement $6,401,702 Funds 1, 2, 8, 9, 21School Park Facilities Capital Maintenance $326,171 Funds 1, 2, 21Oak Hill Park Capital Maintenance $1,020,545 Funds 2, 5, 7Osage Station Park Improvements $2,469,750 Funds 2, 21Osage Station Park Capital Maintenance $405,804 Funds 2, 3Sycamore Valley Capital Maintenance $717,490 Funds 1, 2, 3, 4
Future CIP Projects:Diablo Road Trail from Alameda Diablo to Tank Access Road $3,918,200 Funds 11, 16, 22San Ramon Valley Creek Footbridge at Danville Green $900,000 Funds 12, 21Hap Magee Ranch Park Slide Mitigation $150,000 Fund 3Iron Horse Trail Raised Crosswalks and Flashing Beacons $286,000 Funds 11, 16Oak Hill Master Plan - Phase 2 $0 UnfundedSycamore Valley Park Picnic Area Restrooms $689,000 UnfundedTown Green and Arts District Master Plan $21,000 Unexpended
Total Planned Capital Expenditures $24,731,312
[1] Current CIP Projects include all projects listted as started in the Town of Danville's 19/20 CIP.
Source: Town of Danville
A-34

Danville Table 7City Facilities Rentals and Event AttendanceContra Costa LAFCO Parks & Recreation MSR/SOI Update; EPS# 191105
Facility and/or Event DescriptionAnnual
AttendanceAnnual
Revenues
Activities / ProgramsCourse Registration Classes (language, exercise, art,etc.) 18,225 $1,789,144Trips/Excursions Various senior trips & teen outings 568 $53,870Summer Camps Summer program camps 1,440 $308,091Total 20,233 $2,151,105
Facility RentalsFacility Rentals/Permits Weddings, memorials, meetings, private parties, etc. 599 $277,742Picnic Rentals Private picnic rentals 361 $57,112Total 960 $334,855
Other Events / Annual Festivals / Etc.Special Events Eggstravaganza, May the 4th, Elf Workshop, Kids Night Out,
Senior Variety Show 3,782 $25,883Total 3,782 $25,883
Sources: Town of Danville
A-35

El Cerrito Table 1Governing Bodies & Contact InformationContra Costa LAFCO Parks & Recreation MSR/SOI Update; EPS# 191105
Item
City of El Cerrito - Town CouncilManner of Selection
Length of TermMeetings
Agenda DistributionMinutes Distribution
ContactMailing AddressEmail / Website
City of El Cerrito - Park & Recreation Commission Manner of Selection
Length of TermMeetings
Agenda DistributionMinutes Distribution
ContactMailing AddressEmail / Website
Source: City of El Cerrito
http://www.el-cerrito.org/107/Park-Recreation-Commissionhttp://www.el-cerrito.org/107/Park-Recreation-Commission
Christopher Jones, Recreation Director7007 Moeser Lane, El Cerrito, CA 94530
https://www.el-cerrito.org/107/Park-Recreation-Commission
Appointed by Council4 years
4th Wednesday of each month at 7:00 p.m.
http://el-cerrito.org/482/Council-Meeting-Videos-Materials
10890 San Pablo Ave., El Cerrito, CA 94530https://www.el-cerrito.org/113/City-Council
510-215-4300
Information
Elections4 years
1st and 3rd Tuesdays of each monthhttp://el-cerrito.org/482/Council-Meeting-Videos-Materials
A-36

El Cerrito Table 2Summary Inventory of Parkland and Recreation FacilitiesContra Costa LAFCO Parks & Recreation MSR/SOI Update; EPS# 191105
City Parkland Address/Location AcresParkType Facilities
SharedFacilities Condition
Arlington Park 1120 Arlington Boulevard 5.2 City Parkclubhouse, public restrooms, tennis courts, basketball court, playgrounds, picnic tables and BBQ's, open space, ponds
Good
Baxter Creek Gateway ParkKey Boulevard at Conlon Avenue and Ohlone Greenway
1.4 City Park seating areas, creek, interprative signage Fair
Bruce King Memorial Dog Park 1600 Lexington Avenue 0.3 City Dog Parksmall and large dog areas fenced in with agility equipment, access to water and benches
Good
Canyon Trail Park 6767 Gatto Avenue 10.9 City Parkclubhouse, public restrooms, tennis courts, play field, playground, picnic tables, open space and trails, creek
Good
Castro Park1 1420 Norvell Street 3.5 City Parkclubhouse, public restrooms, tennis courts, play field, playground, picnic tables
X - West Contra Costa USD Good
Centennial Park Eureka Avenue at Liberty Street 0.6 City Park play equipment, trail, "tai chi" plaza Very Good
Central Park2 5701 Central Avenue 1.7 City Park play field, play equipment, basketball court X - City of Richmond Fair
Cerrito Vista Park 7300 Moeser Lane 7.7 City Parkplay field, public restrooms, playgrounds, picnic tables and BBQ's, trail
Good
Community Center and Swim Center 2.8 Community DNR DNRCreekside Park 3499 Santa Clara Avenue 1.5 City Park playground, trail, creek Good
Fairmont Playfield1 715 Lexington Avenue 0.8 City Park playfield, playground, childcare clubhouse X - West Contra Costa USD Fair
Harding Park1 7115 C Street 1.8 City Parkplayfield, playground, childcare clubhouse, tennis courts, picnic tables and BBQ's
X - West Contra Costa USD Good
Huber Park 7111 Terrace Drive 2.9 City Parkplayground, public restroom, trails, picnic tables and BBQ's, small clubhouse
Good
Madera Playground1 1500 Devonshire Drive 0.1 City Playground playground, childcare clubhouse Fair
Poinsett Park 5611 Poinsett Avenue 1.1 City Parkplayground, clubhouse, public restroom, open space, basketball courts
Good
Richmond/Blake Pocket Park Richmond Street at Blake Street 0.1 City Park bench Fair
Tassajara Park 2575 Tassajara Avenue 3.0 City Parkplayground, clubhouse, public restroom, tennis courts, basketball courts, picnic tables and BBQ
Good
Total Developed Park Acreage 45.3Developed Park Acreage per 1,000 residents 1.82
Hillside Natural Area 7501 Schmidt Lane 102.0 Special-Use Open Space open space, trails, benches Fair
Total Open Space Acreage 102.0
Dorothy Rosenberg Memorial Park and Facility
945 King Drive 1.6 Undeveloped future park, currently closed to public Undeveloped
Casa Cerrito Childcare 0.6 Preschool DNR DNR
Ohlone Greenway1 24.0 Trail DNR DNRCerrito Creek 1.0 Creek DNR DNR
Other Acreage 27.2
*DNR = Did Not Respond[1] Not owned by the City of El Cerrito but City-maintained or operated.[2] Jointly owned by El Cerrito and Richmond.
Source: El Cerrito Parks and Recreation Facilities Master Plan, City of El Cerrito
A-37

El Cerrito Table 3Summary of StaffingContra Costa LAFCO Parks & Recreation MSR/SOI Update; EPS# 191105
Type of Staff Annual Average
Full-Time (Paid) 25Part-Time (Paid) 25.8Seasonal (Paid) 13.8Full Time Equivalents (FTE) 64.6
Volunteer (Unpaid) 207
Staff (FTE) per 1,000 Residents 2.59Staff (FTE) per Acre 1.43
Source: City of El Cerrito
A-38

El Cerrito Table 4Operating Revenues/Expenditures Over TimeContra Costa LAFCO Parks & Recreation MSR/SOI Update; EPS# 191105
Item FY 19-20
Annual Operating Budget
Revenue
General Fund $0
User Fees / Charges $3,143,548
Non-major Governmental Funds $0
Operating Grants and Contributions $0
Total Revenue $3,143,548
Expenditures
Employee Expenses $3,901,870
Temporary Salaries $0
Administration $707,193
Materials & Supplies $241,088
Contracted Services $917,991
Equipment $63,396
Parks Maintenance $207,959
Total Expenditures $6,039,497
Total Expenditures per Capita $242
General Fund ExpendituresGeneral Fund Expenditures on Parks & Recreation Functions $0Citywide General Fund Expenditures $39,867,793Parks and Recreation as a Share of Citywide General Fund Expenditures 0.00%
*DNR = Did Not Respond
Sources: City of El Cerrito
A-39

El Cerrito Table 5Rates and User FeesContra Costa LAFCO Parks & Recreation MSR/SOI Update; EPS# 191105
Types or Categories of User Fees Link to Web Page Last Update Alternative RatesAverage Annual
Increase
Facility Rentals / Fees Master Fee Schedule 5/5/2020Alternative rates/ fees for non-residents and non-profits.
3.00%
Source: City of El Cerrito
A-40

El Cerrito Table 6Capital Planning and FundingContra Costa LAFCO Parks & Recreation MSR/SOI Update; EPS# 191105
Item Total Value Funding Source
Annual Capital Budget - Parks ProjectsRevenue
Capital Improvement Program Fund $40,500 N / AMeasure A $30,000 N / AGeneral Fund $45,000 N / ATotal Capital Revenues $115,500 N / A
Project ExpendituresCurrent CIP Projects
Hillside Natural Area (HNA) Improvements DNR OtherUrban Forest Management Program DNR OtherCentennial Park Improvements DNR Other
HNA Trail Entry & Signage Improvements $40,500Other Sources - Secure
(Measure WW)Baxter Creek Gateway Park Improvements DNR OtherCanyon Trail Clubhouse Enhancements $30,000 Measure A Swim Center FundPark Facilities Rehab & Improvement Program $45,000 General Fund
Future CIP Projects:1
Urban Greening DNR OtherDorothy Rosenberg Memorial Park DNR OtherParks and Recreation Facilities Master Plan DNR Other
Total Planned Capital Expenditures $115,500
Fee LevelsPark-Related Fees - Measure H
Single Family (per unit) $58Multi Family (per unit) $45Non-Residential (per acre) $410
*DNR = Did Not Respond[1] Projects with TBD project numbers are assumed to be future projects.
Source: El Cerrito 10-Year CIP; City of El Cerrito
A-41

El Cerrito Table 7City Facilities Rentals and Event AttendanceContra Costa LAFCO Parks & Recreation MSR/SOI Update; EPS# 191105
Facility and/or Event Description
Annual
Attendance1Annual
Revenues
Activities / Programs
Aquatics Enrollmentslap swim, family swim, swim teams, swim lessons, water aerobics, red cross courses
6,221 $789,534
Senior Services Enrollmentenrichment, health, fitness and wellness programs; lunch program; technology support; taxes and medicaid/medicare services; support services; special events, talks and seminars
2,214 $122,932
Adult/Community Services Enrollment enrichment, health, fitness and wellness programs 2,472 $310,232
Youth Services Enrollmentschildcare, preschool, summer and school holiday camps, enrichment, health, fitness and wellness programs, special events
12,161 $3,078,793
Total 23,068 $4,301,491
Facility RentalsAquatic Rentals Rec Pool, Lap Pool, Splash Pad and Picnic Area rentals 298 $48,165Senior Services Facility Rentals Midtown Activity Center rentals 5 $0
Adult/Community Services Facility Rentals Community Center, Clubhouse, Picnic, Tennis Court and Play Field rentals 1,397 $226,678
Total 1,700 $274,843
Other Events / Annual Festivals / Etc.Crab Feed Crab dinner fundraiser for scholarship fund 153 $11,297Egg Hunt Outdoor community event for families 400 $200
Fourth of July Community event - art & craft vendors, food vendors, rides, games, music 11,000 $76,500
Halloween Community event - carnival with games, bounce house, haunted house 200 $6,650
Midtown Holiday Party Community building event for older adults including performances by community groups and refreshments
50 $0
Pancake Breakfast Fundraiser breakfast, childcare sing-along and entertainment 200 $2,100
Senior Resource Fair Community informational event - vendors distribute information/resources for older adults, prizes, lunch
110 $1,750
Sweetheart Dance Community event for families, dj dance party, cookie decorating, crafts 100 $1,440
Volunteer Recognition Volunteer appreciation event - refreshments, recognition souvenier & certificate for department volunteers
60 $0
Total 12,273 $99,937
*DNR = Did Not Respond[1] FY 2019 values.
Sources: City of El Cerrito 2019 CAFR; City of El Cerrito
A-42

Hercules Table 1Governing Bodies & Contact InformationContra Costa LAFCO Parks & Recreation MSR/SOI Update; EPS# 191105
Item
City of Hercules - City CouncilManner of Selection
Length of TermMeetings
Agenda DistributionMinutes Distribution
ContactMailing AddressEmail / Website
City of Hercules - Community and Library Services Commission Manner of Selection
Length of TermMeetings
Agenda DistributionMinutes Distribution
ContactMailing AddressEmail / Website
Source: City of Hercules
Information
Two year
2001 Refugio Valley Road, Hercules, CAhttps://www.ci.hercules.ca.us/government/commissions-committees
Mayoral RotationFour year
2nd and 4th Tuesday of the month at 7:00 p.m.72 hours in advance
City Website510-799-8215
111 Civic Drive, Hercules, CAhttps://www.ci.hercules.ca.us/government/city-council
2nd Monday of each month at 7:00 p.m.72 hours in advance
City Website510-799-8228
Appointed by Council
A-43

Hercules Table 2Summary Inventory of Parkland and Recreation FacilitiesContra Costa LAFCO Parks & Recreation MSR/SOI Update; EPS# 191105
City Parkland Address/Location AcresParkType Facilities
SharedFacilities Condition
Bayside Park Tsushima/Central Street 0.6 NeighborhoodBenches, Multi-Use Field, Outdoor restrooms, Playground
Good
Duck Pond Park 997 Sycamore Avenue 1.6 Community Benches, Bocce Ball Court, Gazebo, Horseshoe Pits, Multi-use Field, Picnic Tables, Restroom and 1/2 Basketball Court
Good
Foxboro Park 1025 Canterbury 2.4 Community Basketball Court, BBQ Grill, Multi-Use Field, Outdoor Restrooms, Picnic Tables, Playground, Swings, Tennis Courts
Good
Frog Pad Park 1000 Willet Street 0.5 Community Benches, Picnic Tables, Playground, Swings Good
Hanna Ranch Park 2480 Refugio Valley Road 11.2 Community Baseball Field, Multi-Use/Soccer Field, Benches, Outdoor Restrooms,
Good
Ohlone Dog Park 190 Turquoise Drive 1.3 Community Outdoor Restrooms, Picnic Tables, Large Dog Park, and Small Dog Park
DNR
Railroad ParkCorner of Santa Fe and Railroad Avenue
0.3 NeighborhoodPlayground, Swings, Picnic Tables, Benches, Grass space
Good
Refugio Valley Park & Trail 1515 Refugio Valley Park 9.0 Community BBQ Grill, Benches, Gazebo, Lake, Multi-Use Field, Outdoor Restrooms, Picnic Tables, Playgrounds
Good
Refugio Valley Tennis Courts 1515 Refugio Valley Park 0.6 Community Tennis Courts DNR
Shoreline Park 1000 Tug Boat Lane 1.5 Community BBQ Grill, Benches, Multi-Use Field, Outdoor Restrooms, Picnic Tables, Playground
Good
Woodfield Park 1991 Lupine Road 1.5 Community Baseball/Multi-Use Field, Basketball Courts, BBQ Grill, Benches, Outdoor Restrooms, Picnic Tables, Playground, Tennis Courts
Fair
Sierra Park 2000 Shasta Lane 0.5 NeighborhoodBBQ Grill, Covered Picnic Tables, Grass Area, Playground amenities
New
Shasta Park 1700 John Muir Parkway 0.4 NeighborhoodBBQ Grill, Covered Picnic Tables, Grass Area, Playground
New
Total Developed Park Acreage 31.3Developed Park Acreage per 1,000 residents 1.2
*DNR = Did Not Respond
Source: City of Hercules
A-44

Hercules Table 3Summary of StaffingContra Costa LAFCO Parks & Recreation MSR/SOI Update; EPS# 191105
Type of Staff Annual Average
Full-Time (Paid) 4Part-Time (Paid) 35Seasonal (Paid) 12Full Time Equivalents (FTE) 51
Volunteer (Unpaid) 10
Staff (FTE) per 1,000 Residents 2.00Staff (FTE) per Acre 1.63
Source: City of Hercules
A-45

Hercules Table 4Operating Revenues/Expenditures Over TimeContra Costa LAFCO Parks & Recreation MSR/SOI Update; EPS# 191105
Item FY 19-201
Annual Operating Budget
Revenue
General Fund $0
User Fees / Charges $1,654,150
Non-major Governmental Funds $0
Operating Grants and Contributions $0
Total Revenue $1,654,150
Expenditures
Employee Expenses $1,616,485
Temporary Salaries DNR
Administration DNR
Materials & Supplies DNR
Contracted Services $417,666
Equipment DNR
Parks Maintenance DNR
Other Services $128,545
Cost Allocation $234,453
Total Expenditures $2,397,149
Total Expenditures per Capita $94
General Fund ExpendituresGeneral Fund Expenditures on Parks & Recreation Functions $0Citywide General Fund Expenditures $15,864,500Parks and Recreation as a Share of Citywide General Fund Expenditures 0.00%
*DNR = Did Not Respond[1] Figures shown are budgeted values.
Sources: City of Hercules FY2015 CAFR; City of Hercules Adopted Budget FY2020; City of Hercules
A-46

Hercules Table 5Rates and User FeesContra Costa LAFCO Parks & Recreation MSR/SOI Update; EPS# 191105
Types or Categories of User Fees Link to Web Page Last Update Alternative RatesAverage Annual
Increase
Facility Rentals / Fees Master Fee Schedule 7/9/2020Alternative rates/ fees for non-residents and non-profits.
3.00%
Source: City of Hercules
A-47

Hercules Table 6Capital Planning and FundingContra Costa LAFCO Parks & Recreation MSR/SOI Update; EPS# 191105
Item Total Value Funding Source
Annual Capital Budget - Parks ProjectsRevenue
Fund #1 DNR N / AFund #2 DNR N / AOther DNR N / ATotal Capital Revenues DNR
Project ExpendituresCurrent CIP Projects
Resurface Tennis Courts at Refugio Valley Park $167,000 Completed/Gen Fund & LLADBackstop at Woodfield Park $20,000 FY20-21/LLAD
Total Planned Capital Expenditures $187,000
Fee LevelsPark and Recreation Development Impact Fee
Single Family (per unit) $1,577Multi Family (per unit) $956
*DNR = Did Not Respond
Source: City of Hercules
A-48

Hercules Table 7City Facilities Rentals and Event AttendanceContra Costa LAFCO Parks & Recreation MSR/SOI Update; EPS# 191105
Facility and/or Event DescriptionAnnual
AttendanceAnnual
Revenues1
Activities / ProgramsDNR DNR DNR DNRTotal - -
Facility RentalsCommunity Centers/Picnic Rentals Community Swim Center/Sr Center/Teen Center/other DNR $181,427Total - $181,427
Other Events / Annual Festivals / Etc.
Movies In the Park 3 FREE events annually 750 $0
Community Clean Up Day 1x per year 225 $1,000
Holiday events Eggstravaganza/Tree Lighting/etc 1,000 $200Total 1,975 $1,200
*DNR = Did Not Respond[1] Represents average annual revenues.
Sources: City of Hercules
A-49

Lafayette Table 1Governing Bodies & Contact InformationContra Costa LAFCO Parks & Recreation MSR/SOI Update; EPS# 191105
Item
City of Lafayette - City CouncilManner of Selection
Length of TermMeetings
Agenda DistributionMinutes Distribution
ContactMailing AddressEmail / Website
City of Lafayette - Parks, Trails, & Rec Commission Manner of Selection
Length of TermMeetings
Agenda DistributionMinutes Distribution
ContactMailing AddressEmail / Website
Source: City of Lafayette
Information
Mayoral Rotation4 years
2nd and 4th Monday of the month at 7:00 p.m.Posted at City Offices, website, email, hard copy mail on request
City website925-284-1968
3491 Mt. Diablo Blvd, Lafayette, CA 94549https://www.lovelafayette.org/city-hall/city-council
Appointed by CouncilTwo years
2nd Wednesday of the month at 7:00 p.m.Posted at City Offices, website, email, hard copy mail on request
Action Agendas on City website925-284-2232
500 St. mary's Road, Lafayette, CA 94549Parks, Trails, & Rec Commission Site
A-50

Lafayette Table 2Summary Inventory of Parkland and Recreation FacilitiesContra Costa LAFCO Parks & Recreation MSR/SOI Update; EPS# 191105
City Parkland Address/Location AcresParkType Facilities
SharedFacilities Condition
Community Park 480 St. Mary's Rd 68.0Community Park with playing fields, trails,
playground and group picnic areaBaseball Field, Soccer Field, Group Picnic Area, Tot Playground, Restrooms, Petanque Court
moderate
Buckeye Fields 711 Saint Mary's Rd 11.5Two sports fields used for baseball and
soccer
Baseball Fields, Juniors Soccer Field, Batting Cages, Meeting Room, Picnic Area, Restrooms, Plaza Area, Concession Stand, Paved Parking
moderate
Brook Street Park 3562 Brook St 0.4 Neighborhood Park - Playground Play Structure, Shade Structure, Picnic Table poor
Leigh Creekside Park Corner of Moraga Blvd and 4th St 0.6 Neighborhood ParkPicnic Tables, Benches, Drinking Fountain, Informal Paths
moderate
Elam & Margaret Brown PlazaCorner of Moraga Rd and Mt. Diablo Blvd
0.3 Downtown Park Benches very good
Mildred Lane Pocket Park End of Mildred Lane 0.1 Passive Pocket Park Bench very goodMurray Lane Site Murray Lane 2.2 One trail Trail very goodLafayette Community Center 500 St. Mary's Road 8.2 moderate
Lafayette Reservoir Off of Highway 24 N / A EBMUD owned and operatedPicnic Tables, Restrooms, Play Structures, Boating, Fishing
EBMUD, not shared
DNR
Total Developed Park Acreage 91.3Developed Park Acreage per 1,000 residents 3.6
Hamlin Nature Park 3333 Hamlin Road 19.8Undeveloped nature park (recent
acquisition)None undeveloped
Other Acreage 19.8
*DNR = Did Not Respond
Source: City of Lafayette
A-51

Lafayette Table 3Summary of StaffingContra Costa LAFCO Parks & Recreation MSR/SOI Update; EPS# 191105
Type of Staff Annual Average
Full-Time (Paid) 7.15Part-Time (Paid) 35Seasonal (Paid) 60Full Time Equivalents (FTE) 7.15
Volunteer (Unpaid) 35
Staff (FTE) per 1,000 Residents 0.28Staff (FTE) per Acre 0.08
Source: City of Lafayette
A-52

Lafayette Table 4Operating Revenues/Expenditures Over TimeContra Costa LAFCO Parks & Recreation MSR/SOI Update; EPS# 191105
Item FY 18-191
Annual Operating Budget
Revenue
General Fund $728,547
User Fees / Charges $1,649,938
Non-major Governmental Funds $0
Operating Grants and Contributions $0
Facilities Development Fees $645,839
Parkland Development Fees $643,316
Youth Commission GF Event Fees $13,160
Senior Commission GF Program Fees $6,500
Total Revenue $3,687,300
Expenditures
Employee Expenses $994,003
Temporary Salaries $261,231
Administration $0
Materials & Supplies $273,065
Contracted Services $977,869
Equipment $22,713
Parks Maintenance $0Capital Improvements $58,419
Land $1,100,000
Total Expenditures $3,687,300
Total Expenditures per Capita
General Fund ExpendituresGeneral Fund Expenditures on Parks & Recreation Functions $728,547Citywide General Fund Expenditures $14,881,084Parks and Recreation as a Share of Citywide General Fund Expenditures 4.90%
[1] The City of Lafayette provided FY18-19 numbers.
Sources: City of Lafayette
A-53

Lafayette Table 5Rates and User FeesContra Costa LAFCO Parks & Recreation MSR/SOI Update; EPS# 191105
Types or Categories of User Fees Link to Web Page Last Update Alternative RatesAverage Annual
Increase
Picnic Area Rental FeesPicnic Area Rental Application and Fees
2011 Yes, Res, Non-Res, Non Profit N / A
Sports Field Rental FeesSports Field Rental Application and Fee Rates
2011 Use and Organization N / A
Rink Rental Rates 2018 DNR N / A
Group Picnic Area Rates 2011 Yes, Res, Non-Res, Non Profit N / A
Community Center Room Rentals Applications and Rates 2018 Yes, Res, Non-Res, Non Profit N / A
*DNR = Did Not Respond
Source: City of Lafayette
A-54

Lafayette Table 6Capital Planning and FundingContra Costa LAFCO Parks & Recreation MSR/SOI Update; EPS# 191105
Item Final 2019-2020 Budget Values Funding Source
Annual Capital Budget - Parks ProjectsRevenue
Fund 12 Facilities $896,693 N / AFund 17 Parkland $693,543 N / ATotal Capital Revenues $1,590,236
Project ExpendituresCurrent CIP Projects
Community Center Restrooms $450,000 Fund 12Brook Street Park $430,000 Fund 12Total Capital Expenditures $880,000
Fee Levels
Parkland Development FeesAdditions (per sq. ft.) $2Single Family (per unit) $8,150Duplex/Townhouse (per unit) $5,659Apartments/Condominiums (per unit) $4,927Mobile Homes (per unit) $4,813ADU proportional to primary unit
Park Facility Development FeesAdditions (per sq. ft.) $2Single Family (per unit) $7,903Duplex/Townhouse (per unit) $5,488Apartments/Condominiums (per unit) $4,777Mobile Homes (per unit) $4,668ADU proportional to primary unit
*DNR = Did Not Respond
Source: City of Lafayette
A-55

Lafayette Table 7City Facilities Rentals and Event AttendanceContra Costa LAFCO Parks & Recreation MSR/SOI Update; EPS# 191105
Facility and/or Event DescriptionAnnual
AttendanceAnnual
Revenues
Activities / ProgramsRecreation Programs Run by the Parks, Trails and Recreation Department 9,581 $1,649,938Total 9,581 $1,649,938
Facility RentalsJRB Classes, Basketball, room rentals include parties, non profit meetings and events 2,213 $22,518Live Oak Lego parties, ASA, CA, non profit events, parties, senior classes 3,678 $29,143Sequoia Commission meetings, classes, League of Women Voters 99 $2,849Arts and Crafts Carpentry, lego classes, art classes both for kids and adults, summer classes 378 $3,873Fields Used for sports - LMYA, LLL, sports summer camps 1,747 $24,575Rink Rink - pickle ball, basketball, rentals include lacrosse and roller hockey 354 $11,019Buckeye Meeting Room (Hut) Used for classes including art for adults and kids, as well as AA meetings 8,151 $12,400Community Park Picnic Area Used for group picnics of all sizes both residents and non residents 824 $760Total 17,444 $107,135
Other Events / Annual Festivals / Etc.Bunny Brunch Easter event put on by the Lafayette Community Center Foundation and PTR Staff 225 $0LYC Dances Dances for 7th and 8th graders only, includes a DJ 620 $5,631Father Daughter Dance hosted by the PTR staff 376 $4,705Haunted House Hosted by LYC 1,011 $3,842Total 2,232 $14,178
Sources: City of Lafayette
A-56

Martinez Table 1Governing Bodies & Contact InformationContra Costa LAFCO Parks & Recreation MSR/SOI Update; EPS# 191105
Item
City of Martinez - City CouncilManner of Selection
Length of TermMeetings
Agenda DistributionMinutes Distribution
ContactMailing AddressEmail / Website
City of Martinez - Parks, Recreation, Marina & Cultural CommissionManner of Selection
Length of TermMeetings
Agenda DistributionMinutes Distribution
ContactMailing AddressEmail / Website
Source: City of Martinez
AppointmentFour-year term
City of Martinez City Hall 525 Henrietta Street, Martinez, CA 94553Commission Website
3rd Tuesday of the month at 7:00 p.m.72 hours in advance to Commission and posted on website
Information
Directly Elected MayorFour-year term
3rd Tuesday of every month at 7 p.m.72 hours in advance to Commission and posted on website
Typically approved at following meeting and posted on website Admin Aide III Veronica Sepulveda: [email protected] City of Martinez City Hall 525 Henrietta Street, Martinez, CA 94553
https://www.cityofmartinez.org/gov/mayor.asp
Typically approved at following meeting and posted on [email protected]
A-57

Martinez Table 2Summary Inventory of Parkland and Recreation FacilitiesContra Costa LAFCO Parks & Recreation MSR/SOI Update; EPS# 191105
City Parkland Address/Location AcresParkType Facilities
SharedFacilities Condition
Cappy Ricks Park Brown Street and Arreba Street 1.0 NeighborhoodPlayground, basketball court, tennis courts, picnic areas
n/a Very good
Temporary Dog Park 115 Tarantino Drive 1.0 Dog Large/Small dog park areas n/a Very goodFerry Point Picnic Area North Court Street 3.5 Passive Open field, benches picnic area n/a Moderate
Foothills ParkAlhambra Avenue and Chatswood Drive
2.3 Passive Basketball court n/a Very good
Golden Hills ParkEnd of Bernice Lane off Blue Ridge Drive
7.0 NeighborhoodPlaygrounds, tennis courts, soccer field, meeting room, picnic areas
n/aUnder construction
Hidden Lakes ParkMorello Avenue at Chilpancingo Parkway
26.0 NeighborhoodPlaygrounds, ballfields, basketball court, turf soccer field, picnic areas
n/a Moderate
Hidden Valley Park Center Avenue at Redwood Drive 16.0 NeighborhoodPlaygrounds, ballfields, soccer fields, tennis courts, picnic areas
n/a Very good
Highland Avenue ParkHighland Avenue and Merrithew Drive
0.3 Neighborhood Playground, 1/2 basketball court n/aUnder construction
Holiday Highlands Park Fig Tree Lane and Eastwoodbury 2.0 Neighborhood Playgrounds, 1/2 soccer field, picnic areas n/a Very good
John Muir Park Vista Way and Pine Street 1.5 Neighborhood/SchoolPlaygrounds, soccer field (school use only during school hours)
n/a Moderate
Morello School ParkMorello Avenue at Morello Park Drive
5.0 SchoolPlaygrounds, ballfields, basketball court (school use during school hours)
n/a Moderate
Mountain View Park Parkway Drive off Howe Road 4.5 NeighborhoodPlayground, ballfield, basketball court, 1/2 soccer field, concession stand, picnic areas
n/a Moderate
Nancy Boyd ParkPleasant Hill Road East and Church Street
8.5 NeighborhoodPlaygrounds, ballfields, tennis courts, concession stand, picnic areas
n/a Very good
Plaza Ignacio ParkAlhambra Avenue and Henrietta Street
1.0 Plaza Water fountain, benches n/a Very good
Rankin Park West end of Buckley Street 41.0 Neighborhood Playgrounds, ballfield, gazebo, concession stand n/a Very good
Susana Street ParkSusana Street and Estudillo Street
1.0 Neighborhood Stage, restroom n/a Very good
Waterfront ParkNorth Court Street via Ferry Street
150.0 Ballfield/Event ComplexBallfields, soccer fields, playgrounds, picnic areas, restrooms
n/a Very good
Total Developed Park Acreage 271.6Developed Park Acreage per 1,000 residents 7.3
Source: City of Martinez
A-58

Martinez Table 3Summary of StaffingContra Costa LAFCO Parks & Recreation MSR/SOI Update; EPS# 191105
Type of Staff Annual Average
Full-Time (Paid) 15Part-Time (Paid) 5Seasonal (Paid) 65Full Time Equivalents (FTE) 17
Volunteer (Unpaid) 80
Staff (FTE) per 1,000 Residents 0.46Staff (FTE) per Acre 0.06
Source: City of Martinez
A-59

Martinez Table 4Operating Revenues/Expenditures Over TimeContra Costa LAFCO Parks & Recreation MSR/SOI Update; EPS# 191105
Item FY 19-201
Annual Operating Budget
Revenue
General Fund DNR
User Fees / Charges $338,604
Measure H Funding (note: only eligible for Capital Expenditures) $220,000
Non-major Governmental Funds $0
Operating Grants and Contributions $0
Total Revenue $558,604
Expenditures
Employee Expenses $2,646,659
Temporary Salaries $1,118,017
Materials & Supplies $905,958
Contracted Services $891,578
Parks Operating $569,714
Total Expenditures $6,131,926
Total Expenditures per Capita $165
General Fund ExpendituresGeneral Fund Expenditures on Parks & Recreation Functions DNRCitywide General Fund Expenditures $26,438,521Parks and Recreation as a Share of Citywide General Fund Expenditures N / A
[1] Revenue values provided by the City of Martinez reflect May 2020 YTD values.
Sources: City of Martinez
A-60

Martinez Table 5Rates and User FeesContra Costa LAFCO Parks & Recreation MSR/SOI Update; EPS# 191105
Types or Categories of User Fees Link to Web Page Last Update Alternative Rates Average Annual Increase
Master Fee Schedule Master Fee Schedule 4/4/2019yes, resident and non-profit discount
Typically biennial adjustments based on market rate ranging from around 5%-10% when implemented
*DNR = Did Not Respond
Source: City of Martinez
A-61

Martinez Table 6Capital Planning and FundingContra Costa LAFCO Parks & Recreation MSR/SOI Update; EPS# 191105
Item Total Value Funding Source
Annual Capital Budget - Parks ProjectsRevenue
Measure H $220,000 N / AGeneral Fund $60,000 N / ATotal Capital Revenues $280,000
Project ExpendituresCurrent CIP Projects (Park Improvement Project)
Golden Hills Park Improvements $2,385,000Measure H, Park in Lieu, Park and Rec, Gas Tax
Highland Park Improvements Included aboveMeasure H, Park in Lieu, Park and Rec, Gas Tax
John Muir Park Improvements Included aboveMeasure H, Park in Lieu, Park and Rec, Gas Tax
John Sparacino Park Improvements Included aboveMeasure H, Park in Lieu, Park and Rec, Gas Tax
Future CIP Projects:Hidden Lakes Park $484,000 DNR
Total Planned Capital Expenditures $2,869,000
Fee LevelsParks & Recreation Impact Fee
Single-Family (per unit) $2,509Multi-Family (per unit) $1,834Retail (per sq. ft.) $1.09Office (per sq. ft.) $1.41Industrial (per sq. ft.) $0.61
Park In-Lieu FeeSingle-Family (per unit) $5,095Multi-Family (per unit) $3,723
*DNR = Did Not Respond
Source: City of Martinez
A-62

Martinez Table 7City Facilities Rentals and Event AttendanceContra Costa LAFCO Parks & Recreation MSR/SOI Update; EPS# 191105
Facility and/or Event Description
Annual
Attendance1
Annual
Revenues1
Activities / ProgramsGeneral Recreation Fees Day camps, special events, etc. 2,510 $55,408Recreation Classes Contract classes 50 $1,320Senior Center Classes 21 classes repreated throughout the year 12,883 $37,399Sports Programs Adult softball league 505 $6,481Swimming Pool Admissions Rec swim, family swim 9,500 $69,415Swim Lessons Private classes 1,220 $19,648Water Aerobics Classes 412 $8,644Pool Sundries Sale of sundries at aquatic facility from July-Oct 2019 only 0 $1,180Total 27,080 $199,495
Facility RentalsPark Rental Picnic rentals DNR $16,913Field Usage Field rentals 3,000 $21,189Pool Parties Pool parties - private, schools DNR $7,950Contract Pool Use Martinez Community Swim Team 310 $21,256Total 3,310 $67,308
Other Events / Annual Festivals / Etc.Tournaments Baseball, softball, soccer, youth/adult DNR $29,142Special Events (Permitted and City-Run) DNR DNR $0Senior Center Special Events 13 events; events are paid by Club 943 $0Total 943 $29,142
*DNR = Did Not Respond
Sources: City of Martinez
[1] The City of Martinez provided FY 2019-20 values and indicated they are skewed lower than is typical due to COVID restrictions.
A-63

Moraga Table 1Governing Bodies & Contact InformationContra Costa LAFCO Parks & Recreation MSR/SOI Update; EPS# 191105
Item
Town of Moraga - Town CouncilManner of Selection
Length of TermMeetings
Agenda DistributionMinutes Distribution
ContactMailing AddressEmail / Website
Town of Moraga - Park and Recreation CommissionManner of Selection
Length of TermMeetings
Agenda DistributionMinutes Distribution
ContactMailing AddressEmail / Website
Source: Town of Moraga
Information
Mayoral RotationFour years
2nd and 4th Wednesday of the month at 7:00 p.m. Electronic Distribution / Posted in Website Agenda Center Electronic Distribution / Posted in Website Agenda Center
Marty McInturf, Town Clerk335 Rheem Boulevard
http://www.moraga.ca.us/council/members
Appointed by Council4 Years
3rd Tuesday of the monthElectronic Distribution / Posted in Website Agenda Center Electronic Distribution / Posted in Website Agenda Center
Breyana Brandt, Parks & Recreation Director2100 Donald Drive Moraga, CA 94556
http://www.moraga.ca.us/commissions/park-rec/about
A-64
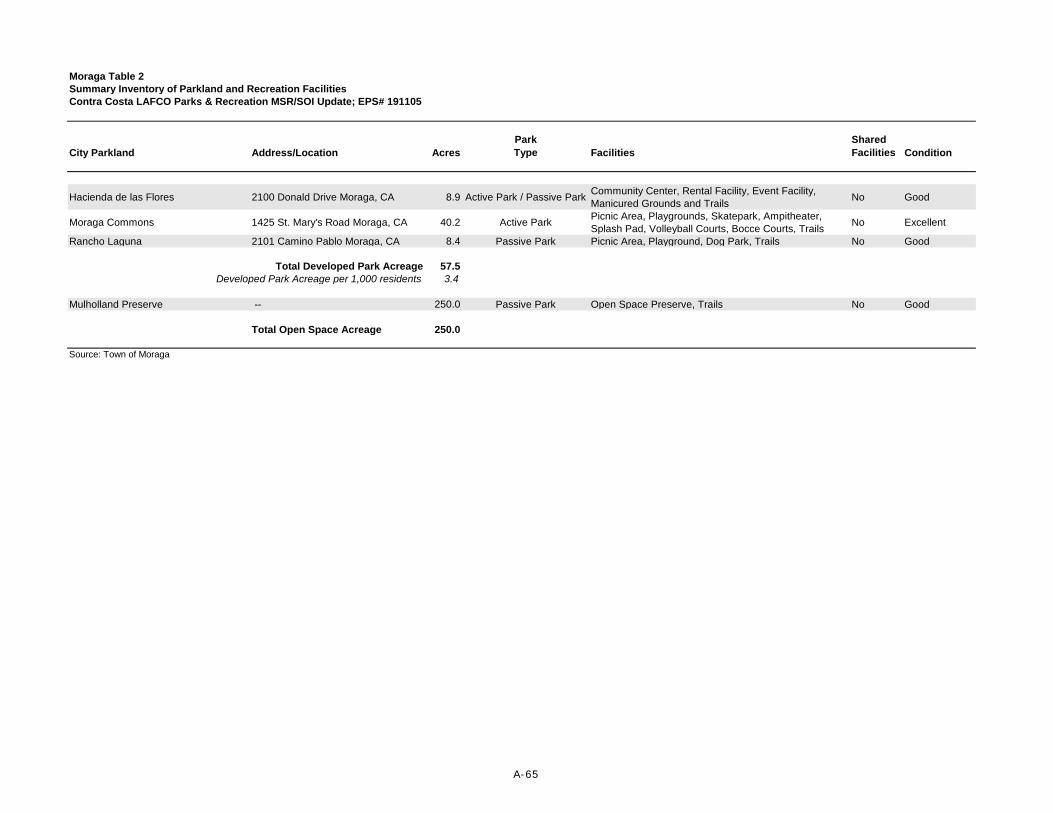
Moraga Table 2Summary Inventory of Parkland and Recreation FacilitiesContra Costa LAFCO Parks & Recreation MSR/SOI Update; EPS# 191105
City Parkland Address/Location AcresParkType Facilities
SharedFacilities Condition
Hacienda de las Flores 2100 Donald Drive Moraga, CA 8.9 Active Park / Passive ParkCommunity Center, Rental Facility, Event Facility,Manicured Grounds and Trails
No Good
Moraga Commons 1425 St. Mary's Road Moraga, CA 40.2 Active ParkPicnic Area, Playgrounds, Skatepark, Ampitheater, Splash Pad, Volleyball Courts, Bocce Courts, Trails
No Excellent
Rancho Laguna 2101 Camino Pablo Moraga, CA 8.4 Passive Park Picnic Area, Playground, Dog Park, Trails No Good
Total Developed Park Acreage 57.5Developed Park Acreage per 1,000 residents 3.4
Mulholland Preserve -- 250.0 Passive Park Open Space Preserve, Trails No Good
Total Open Space Acreage 250.0
Source: Town of Moraga
A-65

Moraga Table 3Summary of StaffingContra Costa LAFCO Parks & Recreation MSR/SOI Update; EPS# 191105
Type of Staff Annual Average
Full-Time (Paid) 6.39Part-Time (Paid) 0Seasonal (Paid) 0Full Time Equivalents (FTE) 6.39
Volunteer (Unpaid) 0
Staff (FTE) per 1,000 Residents 0.38Staff (FTE) per Acre 0.11
Source: Town of Moraga
A-66

Moraga Table 4Operating Revenues/Expenditures Over TimeContra Costa LAFCO Parks & Recreation MSR/SOI Update; EPS# 191105
Item FY 19-20
Annual Operating Budget
Revenue
General Fund $424,504
Service/User Fees $600,680
Operating Grants and Contributions $0
Capital Grants and Contributions $0
Total Revenue $1,025,184
Expenditures
Employee Expenses $732,521Temporary Salaries $49,000Administration $70,450Materials & Supplies $33,300Contracted Services $186,410Equipment $14,050
Parks and Facility Maintenance $381,835
Utilities $133,000
Total Expenditures $1,600,566
Total Expenditures per Capita $94
General Fund ExpendituresGeneral Fund Expenditures on Parks & Recreation Functions $424,504
Citywide General Fund Expenditures $8,171,099Parks and Recreation as a Share of Citywide General Fund Expenditures 5.20%
Sources: Town of Moraga
A-67

Moraga Table 5Rates and User FeesContra Costa LAFCO Parks & Recreation MSR/SOI Update; EPS# 191105
Types or Categories of User Fees Link to Web Page Last Update Alternative Rates Average Annual Increase
Master Fee Schedule Master Fee Schedule DNRyes, resident and non-profit discount
2-3%
*DNR = Did Not Respond
Source: Town of Moraga
A-68

Moraga Table 6Capital Planning and FundingContra Costa LAFCO Parks & Recreation MSR/SOI Update; EPS# 191105
Item Total Value Funding Source
Annual Capital Budget - Parks ProjectsRevenue
Restricted Revenue $190,000 Developer FeesRestricted Revenue $14,000 Asset Replacement Grants $704,000 Grants (Multiple) Donation $24,000 Donations (Various) Total Capital Revenues $932,000
Project ExpendituresCurrent CIP Projects
Commons Park Irrigation $190,000 FundedCommons Park Picinc Area $19,000 Funded
Roof Replacement - Bandshell $19,500 FundedLaguna Creek Restoration at Hacienda $693,000 Funded Minor CIP Projects $30,000 Funded
Future CIP Projects:1
Commons Park Picnic Area $157,500 Funded Commons Park Enhancement (aka Restroom) $300,000 Partially FundedMulholland Open Space Preserve Improvements $386,000 UnfundedTrail Development and Expansion $4,643,000 UnfundedCommunity Sports Field $11,348,000 Unfunded
Total Planned Capital Expenditures $17,786,000
Fee LevelsPark Development Impact Fee
Single Family Detached (per unit) $9,073Single Family Attached/Townhouse (per unit) $9,073Multi-Family/Mixed Use (per unit) $5,871Senior Housing (per unit) $4,537Miscellaneous (Residential) (per resident) $2,669
Park In-Lieu FeeSingle Family Detached (per unit) $14,141Single Family Attached/Townhouse (per unit) $14,141Multi-Family/Mixed Use (per unit) $9,151Senior Housing (per unit) $7,071Miscellaneous (Residential) (per resident) $4,159
[1] Unscheduled projects categorized as future projects.
Source: Town of Moraga
A-69

Moraga Table 7City Facilities Rentals and Event AttendanceContra Costa LAFCO Parks & Recreation MSR/SOI Update; EPS# 191105
Facility and/or Event DescriptionAnnual
AttendanceAnnual
Revenues
Activities / ProgramsParks and Recreation Classes DNR 1,611 $223,515Total 1,611 $223,515
Facility Rentals DNRTotal 7,900 $177,567
Other Events / Annual Festivals / Etc. DNRTotal 21,000 $16,875
Sources: Town of Moraga
*DNR = Did Not Respond
A-70

Oakley Table 1Governing Bodies & Contact InformationContra Costa LAFCO Parks & Recreation MSR/SOI Update; EPS# 191105
Item
City of Oakley - City CouncilManner of Selection
Length of TermMeetings
Agenda DistributionMinutes Distribution
ContactMailing AddressEmail / Website
Source: City of Oakley
Information
Mayoral RotationFour years; Mayor and Vice Mayor serve one-year terms
2nd and 4th Tuesday of the month at 6:30 p.m.Hard copies available at City Hall; electronic copies via email listserv
https://www.ci.oakley.ca.us/agendas-minutes-videos-archive/ Libby Vreonis
3231 Main Street, Oakley, CA 94561https://www.ci.oakley.ca.us/departments/city-council/
A-71

Oakley Table 2Summary Inventory of Parkland and Recreation FacilitiesContra Costa LAFCO Parks & Recreation MSR/SOI Update; EPS# 191105
City Parkland Address/Location Acres Park Facilities Shared Condition
Briarwood Park 100 Michaelangelo Dr. and Dalia 2.0 Neighborhood Grass Area, Playground, 1/2 Court Basketball, BBQs, Picnic Tables, GoodCatamaran Park 2695 Manresa Shore Lane 1.6 Neighborhood Grass Area, Playground, Picnic Tables, Drinking Fountain GoodCivic Center Park Main St. and Norcross Lane 1.7 Community Amphitheater, Grass Area, Veteran's Memorial, Concessions Stand and GoodClaremont Bay Park 4676 Bayside Way 0.3 Neighborhood Climbing Rock, Picnic Tables, Other GoodCreekside Park 3900 Creekside Way 10.0 Neighborhood Large Grass Area, Community Garden, Pedestrian Bridge w/ Trail Marsh Creek Trail w/ EBRPD GoodWorld of Discovery at Crockett Park 4150 Richard Way 4.7 Community Large Grass Area, Public Restroom, Drinking Fountains, Walking Path, GoodCypress Grove Park & Pond 4001 Frank Hengel Way 6.0 Neighborhood Large Grass Area, Sports Field, Stormwater Pond, Parking stalls, GoodDaffodil Park 590 Daffodil Drive 1.7 Neighborhood Grass Area, Playground, 1/2 Court Basketball, Picnic Tables GoodDelaney Park 100 Marathon Drive 10.0 Neighborhood Large Grass Area, Playground, Picnic Tables, BBQs, 1/2 Basketball Good
Dewey Park 215 2nd Street 0.3 Neighborhood Grass Area, Picnic Tables, Horse shoe Pit, Senior Center Building X- Joint Use with Oakley Seniors Club
Good
Duarte Ranch Park 586 Sapphire Parkway 1.9 Neighborhood Grass Area, Playground, Picnic Tables, Drinking Fountain GoodEmerson Ranch Park 300 Shearwater Way 10.0 Neighborhood Large Grass Area, Playground, Picnic Tables, BBQ, 1/2 Basketball Good
Freedom Basin Park O’Hara Ave & Neroly Road 8.5 CommunityLarge Grass Area, Trail, Picnic Tables, Forebay and wetland area with viewing deck
X- Joint Use with Liberty Union High School
Good
Harvest Park Harvest Circle 0.1 Neighborhood Grass Area, BBQ, Picnic Tables GoodHeartwood Park 240 Heartwood Drive 1.5 Neighborhood Grass Area, Playground, Picnic Tables GoodHeather Park 5164 Claremont Lane 0.2 Neighborhood Grass Area, BBQ, Picnic Tables, Bench, Drinking Fountain GoodHolly Creek Park 4758 Hagar Court 6.7 Neighborhood Large Grass Area, BBQ, Picnic Tables, Playground, Shade Area, GoodLaurel Ball Fields Park 850 Laurel Road 13.6 Community Benches, Drinking Fountain, Sports Fields, Picnic Tables, Basketball GoodLeeward Park 4289 Summer Lake Drive 0.7 Neighborhood Small Grass Area, Picnic Tables, Stationary Exercise Equipment GoodLakeside Park 4351 E Summer Lake Drive 1.6 Neighborhood Grass Area, Playgound, Picnic Tables, Drinking Fountain GoodLakewood Park 1882 Lakewood Drive 0.6 Neighborhood Grass Area, Playground, Picnic Area, BBQ, Benches GoodLive Oak Ranch Park 19 Solitude Court 1.0 Neighborhood Grass Area, Benches GoodMain Street Park Main St. and Gardenia Ave. 0.4 Community Grass Area, Benches GoodMagnolia Park 5301 Daffodil Drive 5.0 Neighborhood Large Grass Area, Playground, Picnic Tables, Benches, Sports Fields, GoodManresa Park 1088 Clear Lake Drive 0.3 Neighborhood Grass Area, Tables, Benches GoodMarsh Creek Glenn Park 430 Hill Ave. 2.4 Neighborhood Playground, Picnic Tables, Benches, BBQ, Grass Area, Pedestrian Marsh Creek Trail w/ EBRPD GoodNovarina Park 100 Brown Street 2.2 Neighborhood Large Grass Area, Playground with dinosaur dig feature, Picnic Tables, GoodNunn-Wilson Family Park 100 Oxford Drive 8.7 Community Dog Park, Playground, Adult Fitness Area, Water Feature, Practice GoodNutmeg park 1068 Nutmeg Drive 2.6 Neighborhood Grass Area, Playground, Picnic Tables, Benches, BBQ Area, Skate GoodOak Grove Park 403 White Oak Court 0.8 Neighborhood Grass Area, Playground, Tables, Benches, BBQ GoodRiata Park 607 Saddlebrook Way 1.7 Neighborhood Grass Area, Play Areas, Tables, Drinking Fountain, Benches GoodShady Oak Community Park Cedar Glenn Dr. and Shady Oak 5.0 Neighborhood Grass Area, Playground, Tables with Checkers/Chess, Water Feature, GoodSimoni Ranch Open Space 20 Simoni Ranch Drive 1.0 Neighborhood Grass Area, Picnic Tables GoodSummer Lake Park 4020 Summer Lake Drive 17.0 Neighborhood Grass Area, Picnic Tables, Benches, Basketball Court, Drinking GoodSycamore Park 1799 Park Place and Sycamore 0.2 Neighborhood Grass Area, Picnic Tables, Benches GoodOakley Recreation Center & 1250 O'Hara Ave 5.8 Community Recreation Buildings, Public Restrooms, Drinking Fountain, Large Good
Oakley Elementary School Park 501 Norcross Lane 10.0 Picnic Tables, Grass Area, Playground, Sports Fields X- Joint Use Agreement with OUESD
Unknown
O'Hara Park Middle School 1100 O'Hara Ave 12.6 Picnic Tables, Grass Area, Playground, Sports Fields X- Joint Use Agreement with OUESD
Unknown
Vintage Parkway Elementary 1000 Vintage Parkway 3.7 Grass Area, Playground, Sports Fields X- Joint Use Agreement with OUESD
Unknown
Gehringer Elementary School 100 Simoni Ranch Road 3.9 Grass Area, Sports Field X- Joint Use Agreement with OUESD
Unknown
Total Developed Park Acreage 168.0Developed Park Acreage per 1,000 residents 4.0
*DNR = Did Not Respond
Source: City of Oakley
A-72

Oakley Table 3Summary of StaffingContra Costa LAFCO Parks & Recreation MSR/SOI Update; EPS# 191105
Type of Staff Annual Average1
Full-Time (Paid) 7Part-Time (Paid) 1Seasonal (Paid) 9Full Time Equivalents (FTE) 19.1
Volunteer (Unpaid) VariesRec Class Instructors 8
Staff (FTE) per 1,000 Residents 0.45Staff (FTE) per Acre 0.11
Source: City of Oakley
[1] Values shown represent both the Recreation Department and the Park MaintenanceDivision of the Public Works Department.
A-73

Oakley Table 4Operating Revenues/Expenditures Over TimeContra Costa LAFCO Parks & Recreation MSR/SOI Update; EPS# 191105
Item FY 19-20
Annual Operating Budget
Revenue
General Fund $1,406,706
User Fees / Charges $102,767
Operating Grants and Contributions $0
Capital Grants and Contributions $0
LLAD $4,845,132
CFD $1,554,115
Total Revenue $7,908,720
Expenditures
Recreation Operating Expenditures $1,509,473
Park Employee Expenses $723,893
Parks Operating Expenditures $6,507,865
Total Expenditures $8,741,231
Total Expenditures per Capita $206
General Fund ExpendituresGeneral Fund Expenditures on Recreation Functions $1,406,706Citywide General Fund Expenditures DNRParks and Recreation as a Share of Citywide General Fund Expenditures DNR
*DNR = Did Not Respond
Sources: City of Oakley
A-74

Oakley Table 5Rates and User FeesContra Costa LAFCO Parks & Recreation MSR/SOI Update; EPS# 191105
Types or Categories of User Fees Link to Web Page Last Update Alternative Rates Average Annual Increase
Master Fee Schedule Master Fee Schedule 7/1/2019yes, resident and non-profit discount
No annual increase
*DNR = Did Not Respond
Source: City of Oakley
A-75

Oakley Table 6Capital Planning and FundingContra Costa LAFCO Parks & Recreation MSR/SOI Update; EPS# 191105
Item Total Value Funding Source
Annual Capital Budget - Parks ProjectsRevenue
Park Impact Fee $1,479,685 N / ACommunity Park Fund $550,000 N / ALease Revenue Bond 2016 $4,000,000 N / AGrant $214,000 N / AGeneral Capital Fund $4,400,000 N / ALighting & Landscape Assessment District Fund $140,000 N / ATotal Capital Revenues $10,783,685
Project ExpendituresCurrent CIP Projects:
Oakley Community Park Project $550,000 Funded
Oakley Recreation Center Project $9,864,000 FundedAthletic Field Project at Nunn-Wilson Park $750,000 FundedSummerlake Park Tennis Court Rehabilitation Project $40,000 FundedCitywide Park Playground Rubber Surfacing Repair & Replacement $100,000 Funded
Total Planned Capital Expenditures $11,304,000
Fee LevelsPark Improvement Development Impact Fee
Single Family (per unit) $913.39Multi-Family (per unit) $596.94Secondary Dwelling Unit $280.56
Park Acquisition FeeSingle Family (per unit) $7,936.97Multi-Family (per unit) $5,186.52Secondary Dwelling Unit $2,437.66
Source: City of Oakley
A-76

Oakley Table 7City Facilities Rentals and Event AttendanceContra Costa LAFCO Parks & Recreation MSR/SOI Update; EPS# 191105
Facility and/or Event DescriptionAnnual
AttendanceAnnual
Revenues
Activities / Programs
Parks and Recreation ClassesClasses include children, teen and adult special interest classes. Examples would be yoga, tai chi, arts and crafts, sports, zumba and more
1,311 $4,498
Total 1,311 $4,498
Facility Rentals
Sports FieldsSports Fields rented include: Creekside Park, Cypress Grove Park, Emerson Ranch Park, Freedom Basin Park, Holly Creek Park, Laurel Ball Fields Park, Magnolia Park, Nunn Wilson Park, Shady Oak Park and Summer Lake Park
3,600 $27,575
Picnic AreasThere are 4 group picnic sites available for rent: Crockett Park, Creekside Park, Summer Lake Park and Nunn Wilson Park
3,095 $3,112
Recreation Center The Recreation Center was only available for rentals from June 2019 to March 2020 2,810 $25,882Total 9,505 $56,569
Other Events / Annual Festivals / Etc.Total 26,016 $17,357
*DNR = Did Not Respond
Sources: City of Oakley
A-77

Orinda Table 1Governing Bodies & Contact InformationContra Costa LAFCO Parks & Recreation MSR/SOI Update; EPS# 191105
Item
City of Orinda - City CouncilManner of Selection
Length of TermMeetings
Agenda DistributionMinutes Distribution
ContactMailing AddressEmail / Website
City of Orinda - Park and Recreation CommissionManner of Selection
Length of TermMeetings
Agenda DistributionMinutes Distribution
ContactMailing AddressEmail / Website
Source: City of Orinda
Information
Mayoral RotationFour years
1st and 3rd Tuesday of the month at 7:00 p.m.http://orindaca.iqm2.com/Citizens/Board/1000-City-Councilhttp://orindaca.iqm2.com/Citizens/Board/1000-City-Council
Sheri Smith, City Clerk22 Orinda Way, Orinda, CA 94563
[email protected]; [email protected]; [email protected];
Volunteer and Council Appointment3 years
2nd Wednesdays of the month at 7:00 p.m.https://www.cityoforinda.org/AgendaCenter/Parks-Recreation-Commission-10 https://www.cityoforinda.org/AgendaCenter/Parks-Recreation-Commission-10
Sheri Smith, City Clerk22 Orinda Way, Orinda, CA 94563
https://www.cityoforinda.org/210/Parks-Recreation-Commission
A-78

Orinda Table 2Summary Inventory of Parkland and Recreation FacilitiesContra Costa LAFCO Parks & Recreation MSR/SOI Update; EPS# 191105
City Parkland Address/Location AcresParkType Facilities
SharedFacilities Condition
Orinda Oaks Park Moraga Way 1.5Neighborhood Park with
attached open spacePicnic area, restrooms, grassy area; Open Space Very Good
Orinda Community Center & Park 28 Orinda Way 1.5 Community ParkCommunity Center, tennis courts (with practice wall), picnic area, tot lots, restrooms, meadow, amphitheater
Moderate
Wilder Park & Sports Fields Wilder Road 40.0 Community Park5 athletic fields including 3 synthetic turf and 2 lighted; tot lots, community center, Ranch House, restrooms, parking, walking paths
Very Good
Pine Grove Park Altarinda Road 3.3 Neighborhood Park Athletic field, tot lot, restrooms Very GoodOrinda Sports Fields Orinda Sports Field 4.3 Neighboorhood Park Athletic fields, small parking lot ModerateArt and Garden Center 20 Orinda Fields Lane 0.2 NA See Wilder Park Very GoodWagner Ranch Gym 350 Camino Pablo 0.1 NA Full size gymnasium Shared with OUSD Very Good
Total Developed Park Acreage 50.8Developed Park Acreage per 1,000 residents 2.7
DNR DNR 111.0 Open Space DNR DNR
Total Open Space Acreage 111.0
Source: City of Orinda
A-79

Orinda Table 3Summary of StaffingContra Costa LAFCO Parks & Recreation MSR/SOI Update; EPS# 191105
Type of Staff Annual Average
Full-Time (Paid) 9Part-Time (Paid) 0.5Seasonal (Paid) 20Full Time Equivalents (FTE) 9.5
Volunteer (Unpaid) 0
Staff (FTE) per 1,000 Residents 0.50Staff (FTE) per Acre 0.19
Source: City of Orinda
A-80

Orinda Table 4Operating Revenues/Expenditures Over TimeContra Costa LAFCO Parks & Recreation MSR/SOI Update; EPS# 191105
Item FY 19-201
Annual Operating Budget
Revenue
General Fund $8,210
Service/User Fees $1,755,007
Operating Grants and Contributions $5,112
Capital Grants and Contributions $217,551
Interest Revenue $57,412
Other (Wilder CFD and LLDs) $297,479
Total Revenue $2,340,772
Expenditures
Employee Expenses $1,073,562
Temporary Salaries $135,926
Administration $39,688
Materials & Supplies $897,412
Contracted Services $1,208,666
Equipment $3,818
Other $156,501
Total Expenditures $3,515,573
Total Expenditures per Capita $185
General Fund ExpendituresGeneral Fund Expenditures on Parks & Recreation Functions $8,210Citywide General Fund Expenditures $14,180,574Parks and Recreation as a Share of Citywide General Fund Expenditures 0.06%
[1] Values represent Actual FY2019-20 values.
Sources: City of Orinda
A-81

Orinda Table 5Rates and User FeesContra Costa LAFCO Parks & Recreation MSR/SOI Update; EPS# 191105
Types or Categories of User Fees Link to Web Page Last Update Alternative Rates Average Annual Increase
Master Fee Schedule Master Fee Schedule 8/1/2020yes, four groups (OUSD/MHS; Nonprofit; Private; and Commercial)
CPI
*DNR = Did Not Respond
Source: City of Orinda
A-82

Orinda Table 6Capital Planning and FundingContra Costa LAFCO Parks & Recreation MSR/SOI Update; EPS# 191105
Item Total Value Funding Source
Annual Capital Budget - Parks ProjectsRevenue
General Fund $18,045 N / APark Dedication Fee $510,000 N / AOther Grants $550,000 N / ALibrary Parcel Tax $102,255 N / AWilder Community Maintenance Endowment $270,000 N / ATotal Capital Revenues $1,450,300
Project ExpendituresCurrent CIP Projects:
Wilder Park Field #4 Synthetic Turf $225,000 FundedCommunity Park Renovation Plan & Improvements $897,793 Funded
Park Tree Removal Program $120,000 FundedFuture CIP Projects:
Mini Park (Crossroads Park) $250,000 FundedCommunity Park Pathway Improvement $20,000 FundedResurface Community Park Tennis Courts $100,000 FundedReplace Natural Grass Turf at Wilder Field 3 $200,000 DNRArt and Garden Center Sound Absorption $70,000 FundedSt. Stephens Trail and Drainage Improvements $80,000 DNRWilder Fields 1&2 Turf Replacement $1,000,000 FundedPark and Recreation Master Plan $75,000 UnfundedParklands Acquisition TBD UnfundedArt & Garden Center Parking Lot $150,000 UnfundedPark Monument Signage $15,000 UnfundedOrinda Oaks Park Restroom Replacement $100,000 Unfunded
Total Planned Capital Expenditures $3,302,793
Fee LevelsPark Dedication Impact Fee
Single Family Detached (per unit) $17,358Single Family Attached or Townhouse (per unit) $11,794Multi-Family Duplex/Condominium (per unit) $12,113
*DNR = Did Not Respond
Source: City of Orinda
A-83

Orinda Table 7City Facilities Rentals and Event AttendanceContra Costa LAFCO Parks & Recreation MSR/SOI Update; EPS# 191105
Facility and/or Event DescriptionAnnual
AttendanceAnnual
Revenues
Activities / ProgramsParks and Recreation Classes - Youth DNR 4,336 $469,885Parks and Recreation Classes - Adult DNR 4,425 $372,050Youth Summer Camps DNR 4,132 $486,155Orinda Youth Sports DNR 1,675 $310,607Total 14,568 $1,638,697
Facility RentalsCommunity Center rentals DNR 13,800 $93,219Sports Field rentals DNR DNR $587,285Wanger Gymnasium rentals DNR DNR $70,719Total 13,800 $56,569
Other Events / Annual Festivals / Etc.Annual summer concerts and movies DNR 2,000 $0Annual Holiday Bizaar DNR 250 $4,000Total 2,250 $4,000
*DNR = Did Not Respond
Sources: City of Orinda
A-84

Pinole Table 1Governing Bodies & Contact InformationContra Costa LAFCO Parks & Recreation MSR/SOI Update; EPS# 191105
Item
City of Pinole - City CouncilManner of Selection
Length of TermMeetings
Agenda DistributionMinutes Distribution
ContactMailing AddressEmail / Website
Source: City of Pinole
Information
Mayoral RotationFour year terms
1st and 3rd Tuesday of the month at 6:00 p.m.https://www.ci.pinole.ca.us/cms/one.aspx?pageId=14626563#citycouncil https://www.ci.pinole.ca.us/cms/one.aspx?pageId=14626563#citycouncil
[email protected] Pear Street, Pinole, CA 94564
https://www.ci.pinole.ca.us/cms/one.aspx?pageId=14626563#citycouncil
A-85

Pinole Table 2Summary Inventory of Parkland and Recreation FacilitiesContra Costa LAFCO Parks & Recreation MSR/SOI Update; EPS# 191105
City Parkland Address/Location AcresParkType Facilities
SharedFacilities Condition
Amber Swartz Park 3450 Savage Ave 5.0 Neighborhood Park trails, creek bridge ModerateBayfront Park 1 Tennent Ave 2.0 Regional Park/Bay Trail Restroom, trails, benches, bay shore access, parking lot EBRPD ModerateCanyon Drive Park 1818 Canyon Drive 0.5 Neighborhood Park play structure, grassy area Moderate
Fernandez Park 595 Tennent Ave 6.0 Community ParkRestroom, Baseball diamond, bleachers, play structure (2), Gazebo, Basketball Court, grassy areas
Moderate
Louis Francis Park 596 Marlesta Road 2.0 Neighborhood Park Grassy areas, play structure ModerateMeadow Park 1095 Nob Hill Ave 1.5 Neighborhood Park Basketball Court, play structure, grassy areas Moderate
Pinole Valley Park 3790 Pinole Valley road 231.0 Community ParkRestroom (2), dog park (2), skate park, softbell diamond, soccer fields (2), parking lots (5), Snack shack, play structure, walking trails, creek bridge
Moderate
Pinon Park 1600 Primrose Lane 0.5 Neighborhood Park play structure, grassy area ModerateSarah Drive Park 1850 Sarah Drive 4.0 Neighborhood Park open space with trails ModeratePinole Creek Trail adjacent to Pinole Creek DNR Community Trail paved trails, informational signage ModerateTennis Courts 2955 Pinole Valley Road DNR Community Facilities Tennis Courts Moderate
Total Developed Park Acreage 252.5Developed Park Acreage per 1,000 residents 12.9
View Park 2021 Henry Ave 2.0 Open Space none ModerateHugh Young Park 3760 Victor Street 10.0 Open Space none Moderate
Total Open Space Acreage 12.0
*DNR = Did Not Respond
Source: City of Pinole
A-86

Pinole Table 3Summary of StaffingContra Costa LAFCO Parks & Recreation MSR/SOI Update; EPS# 191105
Type of Staff Annual Average1
Full-Time (Paid) 3.3Part-Time (Paid) 3.35Seasonal (Paid) 7.08Full Time Equivalents (FTE) 13.73
Volunteer (Unpaid) 100.1
Staff (FTE) per 1,000 Residents 0.70Staff (FTE) per Acre 0.05
[1] Includes both Recreation staff and relevant Public Works staff.
Source: City of Pinole
A-87

Pinole Table 4Operating Revenues/Expenditures Over TimeContra Costa LAFCO Parks & Recreation MSR/SOI Update; EPS# 191105
Item FY 19-201
Annual Operating Budget
Revenue
General Fund $706,065
Service/User Fees $466,478
Operating Grants and Contributions $16,563
Capital Grants and Contributions $0
Total Revenue $1,189,106
Expenditures
Employee Expenses $374,154
Temporary Salaries $0
Administration $0
Materials, Supplies, Maintenance & Utilities $606,579
Contracted Services $0
PV Park care taker $15,360
Equipment $17,000
Park Projects/Improvements $359,186
Total Expenditures $1,372,279
Total Expenditures per Capita $70
General Fund ExpendituresGeneral Fund Expenditures on Parks & Recreation Functions $706,065Citywide General Fund Expenditures $14,214,912Parks and Recreation as a Share of Citywide General Fund Expenditures 4.97%
[1] Includes values for both Recreation and relevant Public Works functions.
Sources: City of Pinole
A-88

Pinole Table 5Rates and User FeesContra Costa LAFCO Parks & Recreation MSR/SOI Update; EPS# 191105
Types or Categories of User Fees Link to Web Page Last Update Alternative Rates Average Annual Increase
Master Fee Schedule Master Fee Schedule MultiplePinole Youth Center Hall 9/3/2019 Resident/Non Resident/Non Profit N/APinole Senior Center Hall 9/3/2019 Resident/Non Resident/Non Profit N/AAlex Clark Room 9/3/2019 Resident/Non Resident N/APinole Senior Center Meeting Rooms 9/3/2019 Resident/Non Resident/Non Profit N/AFernandez Park BBQ area 9/3/2019 Resident/Non Resident N/AFernandez Park Gazebo area 9/3/2019 Resident/Non Resident N/AFernandez Park Baseball Field 9/3/2019 Resident/Non Resident N/AFernandez Park Baseball Field-Light fee 9/3/2019 Resident/Non Resident N/APinole Valley Picnic Grove 9/3/2019 Resident/Non Resident N/APinole Valley Soccer Fields 9/3/2019 Resident/Non Resident N/APinole Valley Baseball Field 9/3/2019 Resident/Non Resident N/ATennis Courts 9/3/2019 Resident/Non Resident N/AYouth Enrichment Programs 9/3/2019 Resident/Non Resident N/ATiny Tot Programs 9/3/2019 Resident/Non Resident N/ASenior Center Drop in Programs 9/3/2019 Member/Non-Member N/ASenior Center Lunch Program 9/3/2019 N/ASenior Center Special Events/Fundraisers 9/3/2019 N/A
Source: City of Pinole
A-89

Pinole Table 6Capital Planning and FundingContra Costa LAFCO Parks & Recreation MSR/SOI Update; EPS# 191105
Item Total Value Funding Source
Annual Capital Budget - Parks ProjectsRevenue
Parkland Dedication $18,045 N / APark Grants $510,000 N / ATotal Capital Revenues $528,045
Project ExpendituresCurrent CIP Projects:
Park Funding for Benches and Picnic Tables DNR FundedRehabilitation of Play Fields at Fernandez Park DNR FundedReplace HVAC at Senior Center DNR FundedReplace Roof at Senior Center DNR FundedReplace Chips with Rubber Matting at Select Parks DNR FundedReplace Lighting at Louis Francis Park DNR FundedRestrooms in Fernandez Park DNR FundedSenior Center Parking Lot Pavement Maintenance DNR FundedUniform Park Signage DNR UnfundedCaretaker's House Drainage Repair DNR Funded
Future CIP Projects:Park Master Plan $100,000 Funded (20/21)Pinole Valley Park Soccer Field Rehabilitation $200,000 Funded (20/21)Fernandez Park Baseball Field Rehabilitation $200,000 Funded (20/21)
Total Planned Capital Expenditures $500,000
Fee LevelsPark Dedication Impact Fee
Single Family Detached (per unit) $8,013.78Multi-Family (per unit) $6,071.05
*DNR = Did Not Respond
Source: City of Pinole
A-90

Pinole Table 7City Facilities Rentals and Event AttendanceContra Costa LAFCO Parks & Recreation MSR/SOI Update; EPS# 191105
Facility and/or Event DescriptionAnnual
AttendanceAnnual
Revenues
Activities / ProgramsTiny Tots Recreation program for pre-school aged children 316 $200,146Youth Programs Variety of enrichment classes offered to children and youth 182 $32,309Youth Center Donations Ongoing donation program used to offer scholarships to the youth in the community 3 $7,887Youth Snack Program Participants can purchase snacks when they attend the classes 100 $381Youth Theater Program Recreation youth theater program offered by the Pinole Players 100 $46,168Senior Center Programs Senior drop in programs include exercise, dance, writing, arts & crafts, table and card games 1,682 $65,538Senior Center Membership Membership includes a monthly newsletter, early access to events, program and lunch discounts 970 $23,685Senior Center Travel Program The senior center partners with a travel company to offer various trips throughout the year 40 $52,266Senior Center Dance Program The center hosts two dances per month and a live band or DJ is featured 55 $13,103Senior Center Fundraising Various fundraisers are offered throughout the year 200 $30,440Senior Center Giftshop The center receives donations of various items throughout the year to be sold in the giftshop 200 $8,892Senior Center Lunch Program Daily lunch and 10 themed luncheons a year 225 $112,479Swim Center The swim center offers swim lessons, lap swim and recreation swim 6,340 $57,070Total 10,413 $650,362
Facility RentalsPinole Youth Center Meeting room and main hall is available for rental includes kitchen, table and chairs 80 $23,898Pinole Senior Center Meeting rooms and main hall available for both small and large events 100 $65,809Alex Clark Room Meeting room available for small meetings includes table and chairs 40Community Playhouse Annual lease with the Pinole Community Players $5,000Tennis Courts Tennis courts available for individuals, groups and teams 35 $370Baseball and Soccer Fields Athletic fields available for individuals, groups and leagues 120 $7,207Fernandez Park BBQ Area Picnic area with tables and BBQ area max capacity 75 60 $7,725Total 435 $110,009
Other Events / Annual Festivals / Etc.Halloween Festival Annual community event includes kids activities and games 100 $1,500Spring Egg Hunt/Kids Expo Annual free community event includes kids activities, games, family resources and egg hunt 300 $600Tiny Tots Annual T-shirt Sale Tiny Tot participants encouraged to design a t-shirt, top choice is selected as the annual design 40 $501Tree lighting Annual free community event includes kids activities, performances, pictures with Santa and treats 300 $750Sounds in the Park Two bands featured on select summer Thursdays, this is a free event at Fernandez Park 100 $1,250Movies in the Park Three movies featured on select summer Fridays, this is a free event at Fernandez Park 100 $1,250Total 940 $5,851
*DNR = Did Not Respond
Sources: City of Pinole
A-91

Pittsburg Table 1Governing Bodies & Contact InformationContra Costa LAFCO Parks & Recreation MSR/SOI Update; EPS# 191105
Item
City of Pittsburg - City CouncilManner of Selection
Length of TermMeetings
Agenda DistributionMinutes Distribution
ContactMailing AddressEmail / Website
Source: City of Pittsburg
Information
Mayoral RotationFour Years
1st and 3rd Monday of the month at 7:00 p.m. http://www.ci.pittsburg.ca.us/index.aspx?page=111 http://www.ci.pittsburg.ca.us/index.aspx?page=395
[email protected] Civic Avenue, Pittsburg, CA 94565
http://www.ci.pittsburg.ca.us/index.aspx?page=109
A-92

Pittsburg Table 2Summary Inventory of Parkland and Recreation FacilitiesContra Costa LAFCO Parks & Recreation MSR/SOI Update; EPS# 191105
City Parkland Address/Location AcresParkType Facilities
SharedFacilities Condition
8th St. Greenbelt 8th St 4.7 Linear Park BBQ Grills, Picnic Tables, Play Equipment ModerateAmericana Park N Parkside Dr 2.0 Neighborhood Park BBQ Grills, Picnic Tables, Play Equipment GoodBuchanan Park 4150 Harbor St 16.0 Community Park Restrooms, BBQ Grills, Picnic Tables, Play Equipment Poor
Buckley Park Plaza 1.0 Community Park Restrooms, Play Equipment, Horseshoes, Bocce Ball, Swimming Pool Good
California Seasons Park Seasons Way 2.5 Neighborhood Park BBQ Grills, Picnic Tables, Play Equipment, Basketball Courts ModerateCentral Harbor Park Marina Blvd 1.5 Community Park Restrooms Poor
Central Park Pittsburg / Antioch Hwy 8.0 Community ParkRestrooms, BBQ Grills, Picnic Tables, Play Equipment, Baseball Fields, Soccer Fields, Basketball Courts, Horseshoes
Poor
City Park 17th & Railroad Ave 28.0 Community ParkRestrooms, BBQ Grills, Picnic Tables, Play Equipment, Baseball Fields, Soccer Fields, Basketball Courts, Horseshoes, Bocce Ball
Poor
Columbia Linear Park Columbia Ave 4.4 Linear Park PoorDe Anza Park Trident Dr 3.5 Neighborhood Park Picnic Tables, Play Equipment, Basketball Courts Poor
Giacomelli Park 2011 W Leland Rd 2.0 Community Park Restrooms, BBQ Grills, Picnic Tables, Play Equipment, Soccer Fields Good
Heritage Park Plaza East 4th St 0.1 Neighborhood Park Picnic Tables PoorHighlands Park Golden Hill Dr & St Paul Cir 4.5 Neighborhood Park BBQ Grills, Picnic Tables, Play Equipment, Basketball Courts Moderate
Highlands Ranch Park Buchanan Rd 10.0 Community ParkRestrooms, BBQ Grills, Picnic Tables, Play Equipment, Baseball Fields, Soccer Fields, Basketball Courts, Tennis Courts, Volleyball Courts
Good
Hillsdale Park Doffodil & Jacqueline Dr 3.5 Neighborhood Park BBQ Grills, Picnic Tables, Play Equipment, Bocce Ball Moderate
John Henry Johnson Park W Leland & John Henry Johnson Pwky 8.0 Community ParkRestrooms, BBQ Grills, Picnic Tables, Play Equipment, Soccer Fields, Basketball Courts, Horseshoes
Moderate
Larry Lasater Park San Marcos Blvd 3.0 Neighborhood Park BBQ Grills, Picnic Tables, Play Equipment GoodMarina Walk Park W 6th & Cutter 1.7 Neighborhood Park BBQ Grills, Picnic Tables, Play Equipment, Basketball Courts Moderate
Mariner Park 8th St & Herb White Way 3.6 Community ParkRestrooms, BBQ Grills, Picnic Tables, Play Equipment, Baseball Fields, Soccer Fields
Moderate
Oak Hills Park Southwood Dr 5.0 Neighborhood ParkBBQ Grills, Picnic Tables, Play Equipment, Basketball Courts, Tennis Courts
Moderate
Riverview Park Bayside Dr 4.0 Community Park Restrooms, BBQ Grills, Picnic Tables, Play Equipment Poor
Small World Park 2551 Harbor St 8.0 Community Park Restrooms, BBQ Grills, Picnic Tables, Play Equipment, Horseshoes Moderate
Stoneman Trailhead John Henry Johnson Pkwy 190.0 Community Park Restrooms, BBQ Grills, Picnic Tables, Play Equipment, Horseshoes Moderate
Santa Fe Linear Park Santa Fe Ave 2.6 Linear Park BBQ Grills, Picnic Tables PoorWoodland Hills Park Crestview & Alta Vista Dr 2.4 Neighborhood Park Picnic Tables, Play Equipment, Basketball Courts, Tennis Courts ModerateVillage Park at New York Landing Cambria Dr 2.0 Neighborhood Park Picnic Tables Moderate
Total Developed Park Acreage 322.0Developed Park Acreage per 1,000 residents 4.3
*DNR = Did Not Respond
Source: City of Pittsburg
A-93

Pittsburg Table 3Summary of StaffingContra Costa LAFCO Parks & Recreation MSR/SOI Update; EPS# 191105
Type of Staff Annual Average
Full-Time (Paid) 8Part-Time (Paid) 4Seasonal (Paid) 55Full Time Equivalents (FTE) 8.75
Volunteer (Unpaid) 0
Staff (FTE) per 1,000 Residents 0.12Staff (FTE) per Acre 0.03
Source: City of Pittsburg
A-94

Pittsburg Table 4Operating Revenues/Expenditures Over TimeContra Costa LAFCO Parks & Recreation MSR/SOI Update; EPS# 191105
Item FY 19-20
Annual Operating Budget
Revenue
General Fund $1,591,307
Service/User Fees $601,000
Operating Grants and Contributions $0
Capital Grants and Contributions $0
Total Revenue $2,192,307
Expenditures
Employee Expenses DNR
Temporary Salaries DNR
Administration DNR
Materials, Supplies, Maintenance & Utilities DNR
Contracted Services DNR
Equipment DNR
Total Expenditures $2,192,307
Total Expenditures per Capita $29
General Fund ExpendituresGeneral Fund Expenditures on Parks & Recreation Functions $1,591,307Citywide General Fund Expenditures $47,124,308Parks and Recreation as a Share of Citywide General Fund Expenditures 3.38%
*DNR = Did Not Respond
Sources: City of Pittsburg
A-95

Pittsburg Table 5Rates and User FeesContra Costa LAFCO Parks & Recreation MSR/SOI Update; EPS# 191105
Types or Categories of User Fees Link to Web Page Last Update Alternative Rates Average Annual Increase
Master Fee Schedule Master Fee Schedule 4/4/2020 Multiple DNR
*DNR = Did Not Respond
Source: City of Pittsburg
A-96

Pittsburg Table 6Capital Planning and FundingContra Costa LAFCO Parks & Recreation MSR/SOI Update; EPS# 191105
Item Total Value Funding Source
Annual Capital Budget - Parks ProjectsRevenue
Parkland Dedication $1,057,140 N / APark Grants $0 N / ATotal Capital Revenues $1,057,140
Project ExpendituresCurrent and Future CIP Projects:
PK - 1: Central Harbor Park Restrooms $482,000 UnfundedOld Growth Tree Care $100,000 UnfundedPK - 3: Small World Park Improvements $20,000 FundedPK - 4: Annual Playground Replacement Project $480,000 FundedPK - 5: CASP Accessibility Improvements in Parks $150,000 FundedPK - 6: City Park Soccer Field Turf Replacement $250,000 FundedDe Anza Park Walkway Rehabilitation and Basketball Court $500,000 FundedPK - 8: Biennial Playfield Replacement $500,000 FundedPK - 9: Annual Park Features Replacement Project $450,000 FundedPK - 10: Biennial Restroom Replacement/Rehabilitation $500,000 FundedPK - 11: Buchanan Swim Center Improvements / Solar Heating $300,000 UnfundedPK - 12: All Abilities Playground $2,000,000 FundedPK - 13: Park and Landscaping Improvement Project $200,000 FundedPK - 14: Skateboard Park $480,000 UnfundedPK - 15: Annual Citywide Park Sign Replacement Project $250,000 FundedPK - 26: Buchanan Park Renovations $8,500,000 UnfundedPK - 40: Dredge Buchanan Park Pond $200,000 UnfundedPK - 41: Buchanan Park School Age Playground $250,000 Unfunded
Total Planned Capital Expenditures $15,612,000
Fee LevelsPark Dedication Impact Fee
Single Family Detached (per unit) DNRMulti-Family (per unit) DNR
*DNR = Did Not Respond
Source: City of Pittsburg
A-97

Pittsburg Table 7City Facilities Rentals and Event AttendanceContra Costa LAFCO Parks & Recreation MSR/SOI Update; EPS# 191105
Facility and/or Event DescriptionAnnual
AttendanceAnnual
Revenues
Activities / ProgramsDNR DNR DNR DNR
Total - $601,000
Facility RentalsAquatics DNR DNR $19,441Sports Fields DNR DNR $108,384Small World Park DNR DNR $31,518Senior Center DNR DNR $20,880Other facilities DNR DNR $36,885Total - $217,108
Other Events / Annual Festivals / Etc.DNR DNR DNR DNR
Total - -
*DNR = Did Not Respond
Sources: City of Pittsburg
A-98

Pleasant Hill Table 1Governing Bodies & Contact InformationContra Costa LAFCO Parks & Recreation MSR/SOI Update; EPS# 191105
Item
City of Pleasant Hill - City CouncilManner of Selection
Length of TermMeetings
Agenda DistributionMinutes Distribution
ContactMailing AddressEmail / Website
Source: City of Pleasant Hill
https://www.ci.pleasant-hill.ca.us/Archive.aspx?AMID=30
100 Gregory Lane, Pleasant Hill, CA 94523https://www.ci.pleasant-hill.ca.us/64/City-Council
Information
Elections - Mayor Appointed from CouncilFour Years
1st and 3rd Monday of the month at 7:00 p.m.https://www.ci.pleasant-hill.ca.us/Archive.aspx?AMID=30
https://www.ci.pleasant-hill.ca.us/forms.aspx?FID=137
A-99

Richmond Table 1Governing Bodies & Contact InformationContra Costa LAFCO Parks & Recreation MSR/SOI Update; EPS# 191105
Item
City of Richmond - City CouncilManner of Selection
Length of TermMeetings
Agenda DistributionMinutes Distribution
ContactMailing AddressEmail / Website
City of Richmond - Recreation and Parks CommissionManner of Selection
Length of TermMeetings
Agenda DistributionMinutes Distribution
Contact Ranjana Maharaj [email protected] AddressEmail / Website
Source: City of Richmond
Information
440 Civic Center Plaza, Richmond, CA 94804http://www.ci.richmond.ca.us/3600/Recreation-Parks-Commission
Directly Elected MayorFour years
1st, 3rd, and 4th Tuesday of the month at 6:30pm http://www.ci.richmond.ca.us/Archive.aspx?AMID=30 http://www.ci.richmond.ca.us/Archive.aspx?AMID=31
Trina Jackson450 Civic Center Plaza, Richmond, CA 94804https://www.ci.richmond.ca.us/29/City-Council
Appointed by MayorThree Years
1st Wednesday of the month at 6:00pmhttps://www.ci.richmond.ca.us/Archive.aspx?AMID=130 https://www.ci.richmond.ca.us/Archive.aspx?AMID=131
A-100
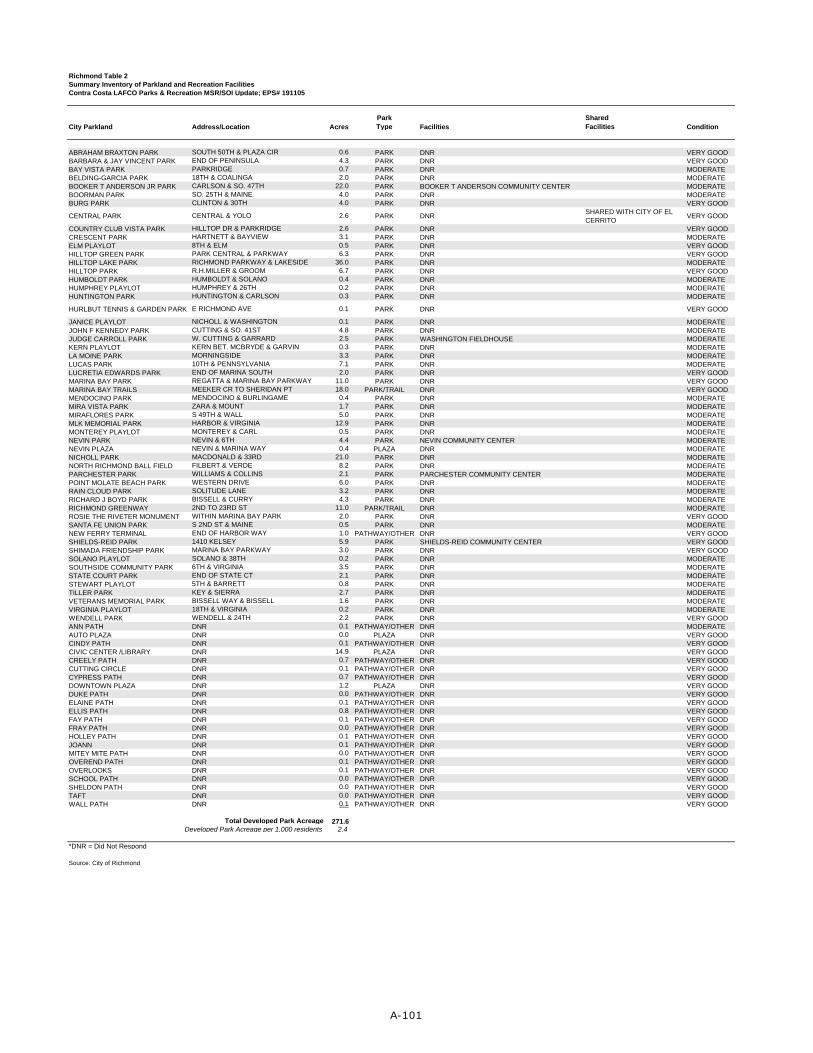
Richmond Table 2Summary Inventory of Parkland and Recreation FacilitiesContra Costa LAFCO Parks & Recreation MSR/SOI Update; EPS# 191105
City Parkland Address/Location AcresParkType Facilities
SharedFacilities Condition
ABRAHAM BRAXTON PARK SOUTH 50TH & PLAZA CIR 0.6 PARK DNR VERY GOODBARBARA & JAY VINCENT PARK END OF PENINSULA 4.3 PARK DNR VERY GOODBAY VISTA PARK PARKRIDGE 0.7 PARK DNR MODERATE BELDING-GARCIA PARK 18TH & COALINGA 2.0 PARK DNR MODERATE BOOKER T ANDERSON JR PARK CARLSON & SO. 47TH 22.0 PARK BOOKER T ANDERSON COMMUNITY CENTER MODERATE BOORMAN PARK SO. 25TH & MAINE 4.0 PARK DNR MODERATE BURG PARK CLINTON & 30TH 4.0 PARK DNR VERY GOOD
CENTRAL PARK CENTRAL & YOLO 2.6 PARK DNRSHARED WITH CITY OF EL CERRITO
VERY GOOD
COUNTRY CLUB VISTA PARK HILLTOP DR & PARKRIDGE 2.6 PARK DNR VERY GOODCRESCENT PARK HARTNETT & BAYVIEW 3.1 PARK DNR MODERATE ELM PLAYLOT 8TH & ELM 0.5 PARK DNR VERY GOODHILLTOP GREEN PARK PARK CENTRAL & PARKWAY 6.3 PARK DNR VERY GOODHILLTOP LAKE PARK RICHMOND PARKWAY & LAKESIDE 36.0 PARK DNR MODERATE HILLTOP PARK R.H.MILLER & GROOM 6.7 PARK DNR VERY GOODHUMBOLDT PARK HUMBOLDT & SOLANO 0.4 PARK DNR MODERATE HUMPHREY PLAYLOT HUMPHREY & 26TH 0.2 PARK DNR MODERATE HUNTINGTON PARK HUNTINGTON & CARLSON 0.3 PARK DNR MODERATE
HURLBUT TENNIS & GARDEN PARK E RICHMOND AVE 0.1 PARK DNR VERY GOOD
JANICE PLAYLOT NICHOLL & WASHINGTON 0.1 PARK DNR MODERATE JOHN F KENNEDY PARK CUTTING & SO. 41ST 4.8 PARK DNR MODERATE JUDGE CARROLL PARK W. CUTTING & GARRARD 2.5 PARK WASHINGTON FIELDHOUSE MODERATE KERN PLAYLOT KERN BET. MCBRYDE & GARVIN 0.3 PARK DNR MODERATE LA MOINE PARK MORNINGSIDE 3.3 PARK DNR MODERATE LUCAS PARK 10TH & PENNSYLVANIA 7.1 PARK DNR MODERATE LUCRETIA EDWARDS PARK END OF MARINA SOUTH 2.0 PARK DNR VERY GOODMARINA BAY PARK REGATTA & MARINA BAY PARKWAY 11.0 PARK DNR VERY GOODMARINA BAY TRAILS MEEKER CR TO SHERIDAN PT 18.0 PARK/TRAIL DNR VERY GOODMENDOCINO PARK MENDOCINO & BURLINGAME 0.4 PARK DNR MODERATE MIRA VISTA PARK ZARA & MOUNT 1.7 PARK DNR MODERATE MIRAFLORES PARK S 49TH & WALL 5.0 PARK DNR MODERATE MLK MEMORIAL PARK HARBOR & VIRGINIA 12.9 PARK DNR MODERATE MONTEREY PLAYLOT MONTEREY & CARL 0.5 PARK DNR MODERATE NEVIN PARK NEVIN & 6TH 4.4 PARK NEVIN COMMUNITY CENTER MODERATE NEVIN PLAZA NEVIN & MARINA WAY 0.4 PLAZA DNR MODERATE NICHOLL PARK MACDONALD & 33RD 21.0 PARK DNR MODERATE NORTH RICHMOND BALL FIELD FILBERT & VERDE 8.2 PARK DNR MODERATE PARCHESTER PARK WILLIAMS & COLLINS 2.1 PARK PARCHESTER COMMUNITY CENTER MODERATE POINT MOLATE BEACH PARK WESTERN DRIVE 6.0 PARK DNR MODERATE RAIN CLOUD PARK SOLITUDE LANE 3.2 PARK DNR MODERATE RICHARD J BOYD PARK BISSELL & CURRY 4.3 PARK DNR MODERATE RICHMOND GREENWAY 2ND TO 23RD ST 11.0 PARK/TRAIL DNR MODERATE ROSIE THE RIVETER MONUMENT WITHIN MARINA BAY PARK 2.0 PARK DNR VERY GOODSANTA FE UNION PARK S 2ND ST & MAINE 0.5 PARK DNR MODERATE NEW FERRY TERMINAL END OF HARBOR WAY 1.0 PATHWAY/OTHER DNR VERY GOODSHIELDS-REID PARK 1410 KELSEY 5.9 PARK SHIELDS-REID COMMUNITY CENTER VERY GOODSHIMADA FRIENDSHIP PARK MARINA BAY PARKWAY 3.0 PARK DNR VERY GOODSOLANO PLAYLOT SOLANO & 38TH 0.2 PARK DNR MODERATE SOUTHSIDE COMMUNITY PARK 6TH & VIRGINIA 3.5 PARK DNR MODERATE STATE COURT PARK END OF STATE CT 2.1 PARK DNR MODERATE STEWART PLAYLOT 5TH & BARRETT 0.8 PARK DNR MODERATE TILLER PARK KEY & SIERRA 2.7 PARK DNR MODERATE VETERANS MEMORIAL PARK BISSELL WAY & BISSELL 1.6 PARK DNR MODERATE VIRGINIA PLAYLOT 18TH & VIRGINIA 0.2 PARK DNR MODERATE WENDELL PARK WENDELL & 24TH 2.2 PARK DNR VERY GOODANN PATH DNR 0.1 PATHWAY/OTHER DNR MODERATE AUTO PLAZA DNR 0.0 PLAZA DNR VERY GOODCINDY PATH DNR 0.1 PATHWAY/OTHER DNR VERY GOODCIVIC CENTER /LIBRARY DNR 14.9 PLAZA DNR VERY GOODCREELY PATH DNR 0.7 PATHWAY/OTHER DNR VERY GOODCUTTING CIRCLE DNR 0.1 PATHWAY/OTHER DNR VERY GOODCYPRESS PATH DNR 0.7 PATHWAY/OTHER DNR VERY GOODDOWNTOWN PLAZA DNR 1.2 PLAZA DNR VERY GOODDUKE PATH DNR 0.0 PATHWAY/OTHER DNR VERY GOODELAINE PATH DNR 0.1 PATHWAY/OTHER DNR VERY GOODELLIS PATH DNR 0.8 PATHWAY/OTHER DNR VERY GOODFAY PATH DNR 0.1 PATHWAY/OTHER DNR VERY GOODFRAY PATH DNR 0.0 PATHWAY/OTHER DNR VERY GOODHOLLEY PATH DNR 0.1 PATHWAY/OTHER DNR VERY GOODJOANN DNR 0.1 PATHWAY/OTHER DNR VERY GOODMITEY MITE PATH DNR 0.0 PATHWAY/OTHER DNR VERY GOODOVEREND PATH DNR 0.1 PATHWAY/OTHER DNR VERY GOODOVERLOOKS DNR 0.1 PATHWAY/OTHER DNR VERY GOODSCHOOL PATH DNR 0.0 PATHWAY/OTHER DNR VERY GOODSHELDON PATH DNR 0.0 PATHWAY/OTHER DNR VERY GOODTAFT DNR 0.0 PATHWAY/OTHER DNR VERY GOODWALL PATH DNR 0.1 PATHWAY/OTHER DNR VERY GOOD
Total Developed Park Acreage 271.6Developed Park Acreage per 1,000 residents 2.4
*DNR = Did Not Respond
Source: City of Richmond
A-101

Richmond Table 3Summary of StaffingContra Costa LAFCO Parks & Recreation MSR/SOI Update; EPS# 191105
Type of Staff Annual Average
Full-Time (Paid) 21Part-Time (Paid) 9Seasonal (Paid) 73Full Time Equivalents (FTE) 25.6
Volunteer (Unpaid) 0
Staff (FTE) per 1,000 Residents 0.23Staff (FTE) per Acre 0.09
Source: City of Richmond
A-102

Richmond Table 4Operating Revenues/Expenditures Over TimeContra Costa LAFCO Parks & Recreation MSR/SOI Update; EPS# 191105
Item FY 19-201
Annual Operating Budget
Revenue
General Fund DNR
Service/User Fees $1,253,592
Operating Grants and Contributions $159,221
Capital Grants and Contributions $0
Other $50,000
Total Revenue $1,462,813
Expenditures
Employee Expenses $3,520,103
Temporary Salaries $1,424,295
Administration $441,665
Materials & Supplies $4,711
Contracted Services $84,088
Equipment $11,000
Other $1,091,843
Total Expenditures $6,577,705
Total Expenditures per Capita $59
General Fund ExpendituresGeneral Fund Expenditures on Parks & Recreation Functions DNRCitywide General Fund Expenditures DNRParks and Recreation as a Share of Citywide General Fund Expenditures DNR
*DNR = Did Not Respond
Sources: City of Richmond
[1] Values represent Recreation Department values only. City unable to provide parks-related Public Works financial detail.
A-103

Richmond Table 5Rates and User FeesContra Costa LAFCO Parks & Recreation MSR/SOI Update; EPS# 191105
Types or Categories of User Fees Link to Web Page Last Update Alternative Rates Average Annual Increase
Master Fee Schedule Master Fee Schedule DNR Multiple DNR
*DNR = Did Not Respond
Source: City of Richmond
A-104

Richmond Table 6Capital Planning and FundingContra Costa LAFCO Parks & Recreation MSR/SOI Update; EPS# 191105
Item Total Value Funding Source
Annual Capital Budget - Parks ProjectsRevenue
Park Impact Fee $23,352Park Grants - Urban Greening $72,666 CA- Natural Resources AgencyPark Grants - JFK Park Basketball Court $182,740 CA- Natural Resources AgencyPark Grants - Unity Park Basketball Court $171,553 CA- Natural Resources AgencyOther - Open Space Impact Fee $343,270Total Capital Revenues $793,581
Project ExpendituresCurrent CIP Projects:
Richmond Wellness Trail DNR FundedBay Trail: Goodrick Avenue Gap Closure $191,862 Partially FundedBay Trail: Point Richmond to Point Molate $113,640 Chevron UUT Settlement Other Project - Harbour 8 Park Expansion $2,500 GrantOther Project - JFK Parks Basketball Court $5,260 Park Impact FeeOther Project - MLK Park Improvements $8,376 Open Space Impact Fee
Future CIP Projects:
MLK Turf Field $250,000Local Initiatives Support Corporation and Friends of Recreation
Boorman Park Revitalization $4,165,000CA-Department of Parks and Recreation-Statewide Park Development and Community Revitalization Program 2018
Harbour 8 Park Expansion $8,500,000CA-Department of Parks and Recreation-Statewide Park Development and Community Revitalization Program 2018
Total Planned Capital Expenditures $13,236,638
Fee LevelsPark Dedication Impact Fee
Single Family Detached (per unit) $16,804Multi-Family (per unit) $13,540
*DNR = Did Not Respond
Source: City of Richmond
A-105

Richmond Table 7City Facilities Rentals and Event AttendanceContra Costa LAFCO Parks & Recreation MSR/SOI Update; EPS# 191105
Facility and/or Event Description
Annual
Attendance1Annual
Revenues
Activities / ProgramsYouth Sports Programs DNR 922 $25,250Adult Sports Programs DNR 270 $6,000Plunge Programs DNR 562 $13,708Swim Center Programs DNR 64 $26,863Tiny Heroes Programs DNR 22 DNRDay Camp / Afterschool Programs DNR 586 DNRSummer Camp DNR 204 DNRFitness Memberships DNR 195 DNRCamps and Leagues DNR 1,089 DNR
Total 3,914 $71,821
Facility RentalsOutdoor Facilities DNR DNR $70,693Indoor Facilities DNR DNR ($43)Convention Center Facilities DNR DNR $41,793Aquatics Facilities DNR DNR $23,162
Total - $135,605
Other Events / Annual Festivals / Etc.DNR DNR DNR DNR
Total - -
[1] Values represent FY2019-20 actual values.*DNR = Did Not Respond
Sources: City of Richmond
A-106

San Pablo Table 1Governing Bodies & Contact InformationContra Costa LAFCO Parks & Recreation MSR/SOI Update; EPS# 191105
Item
City of San Pablo - City CouncilManner of Selection
Length of TermMeetings
Agenda DistributionMinutes Distribution
ContactMailing AddressEmail / Website
Source: City of San Pablo
Information
Mayoral Rotation2 year terms
1st and 3rd Mondays of the month at 6:00 pm Agenda Distribution
https://www.sanpabloca.gov/Archive.aspx Dorothy Gantt, City Clerk
13831 San Pablo Avenue, San Pablo, CA 94806 https://www.sanpabloca.gov/319/City-Council
A-107

San Pablo Table 2Summary Inventory of Parkland and Recreation FacilitiesContra Costa LAFCO Parks & Recreation MSR/SOI Update; EPS# 191105
City Parkland Address/Location AcresParkType Facilities
SharedFacilities Condition
Maple Hall 1000 Gateway Avenue at Alvarado Square DNRNew facility (City Hall) no park space. 2700 sq foot Maple Hall for events. Community Space
Very Good
Church Lane Senior Center 1943 Church Lane DNR Senior Center Moderate Community Hall/Center 2450 Road 20 DNR Community Center, no public park space Very Good
Davis Park Fields 1665 Folsom Avenue 11.6 DNR2 regulation league size baseball fields with field lights, open field
Moderate
Davis Park Multi-Purpose Room 1665 Folsom Avenue DNR facility located inside of park Moderate Davis Park Senior Center 1665 Folsom Avenue DNR facility located inside of park Moderate El Portal Soccer Field 2600 Moraga Road 2.9 DNR soccer fields Moderate
Rumrill Sports Complex 1509 Rumrill Blvd. 5.4 DNR3 under 10 turf soccer fields with field lights, 1 small practice/warm-up field. 2 vendor kiosk stations
Very Good
14th Street Neighborhood Park Cross section of Broadway Ave, Rivers & 14th St 0.1 DNRopen space small bench in middle of intersection near bus stop
Poor
Newly purchased park Bush Street 1701 Bush Street 0.1 DNR open space Moderate
Brentz Lane Neighborhood Park Corner of Morrow Drive and Brentz Lane 0.8 DNR playground small walking space picnic area Moderate Kennedy Plaza Corner of San Pablo Ave. Road 20, and 23rd Street 1.8 DNR open space/tables Poor
Wanlass Park 2999 21st Street 4.6 DNRPlayground, tree area, open sapce, picnic area, garden boxes and facility inside of park
Very Good
Wildcat Creek Trail Linear trail between Davis Park to 23rd Street 0.3 DNR linear park/trail/ biking pedestrian Moderate
Total Developed Park Acreage 27.6Developed Park Acreage per 1,000 residents 0.9
*DNR = Did Not Respond
Source: City of San Pablo
A-108

San Pablo Table 3Summary of StaffingContra Costa LAFCO Parks & Recreation MSR/SOI Update; EPS# 191105
Type of Staff Annual Average
Full-Time (Paid) 14Part-Time (Paid) 50Seasonal (Paid) 30Full Time Equivalents (FTE) 42.8
Volunteer (Unpaid) 40
Staff (FTE) per 1,000 Residents 1.36Staff (FTE) per Acre 1.55
Source: City of San Pablo
A-109

San Pablo Table 4Operating Revenues/Expenditures Over TimeContra Costa LAFCO Parks & Recreation MSR/SOI Update; EPS# 191105
Item FY 19-20
Annual Operating Budget
Revenue
General Fund DNR
Service/User Fees $230,000
Operating Grants and Contributions DNR
Capital Grants and Contributions DNR
Total Revenue $230,000
Expenditures
Employee Expenses $1,380,505
Temporary Salaries DNR
Administration DNR
Materials & Supplies $589,072
Contracted Services DNR
Equipment DNR
Total Expenditures $1,969,577
Total Expenditures per Capita $63
General Fund ExpendituresGeneral Fund Expenditures on Parks & Recreation Functions $1,969,577Citywide General Fund Expenditures $41,065,978Parks and Recreation as a Share of Citywide General Fund Expenditures 4.80%
*DNR = Did Not Respond
Sources: City of San Pablo
A-110

San Pablo Table 5Rates and User FeesContra Costa LAFCO Parks & Recreation MSR/SOI Update; EPS# 191105
Types or Categories of User Fees Link to Web Page Last Update Alternative Rates Average Annual Increase
Master Fee Schedule Master Fee Schedule DNR Multiple DNR
*DNR = Did Not Respond
Source: City of San Pablo
A-111

San Pablo Table 6Capital Planning and FundingContra Costa LAFCO Parks & Recreation MSR/SOI Update; EPS# 191105
Item Total Value Funding Source
Annual Capital Budget - Parks ProjectsRevenue
Parkland Dedication DNRPark Grants DNRTotal Capital Revenues -
Project ExpendituresCurrent CIP Projects:
Wildcat Creek Restoration & Greenway Trail Project $6,200,000 FundedFuture CIP Projects:
Renovation and Expansion of El Portal Soccer Fields TBDTotal Planned Capital Expenditures $6,200,000
Fee LevelsPark Dedication Impact Fee
Single Family Detached (per unit) DNRMulti-Family (per unit) DNR
*DNR = Did Not Respond
Source: City of San Pablo
A-112

San Pablo Table 7City Facilities Rentals and Event AttendanceContra Costa LAFCO Parks & Recreation MSR/SOI Update; EPS# 191105
Facility and/or Event DescriptionAnnual
AttendanceAnnual
Revenues
Activities / ProgramsParks and Recreation Classes DNR 3,500 $90,800
Total 3,500 $90,800
Facility RentalsMaple Hall DNR 15,600 $60,000San Pablo Community Center DNR 14,800 $48,400Davis Park Multi-Purpose DNR 8,300 $20,800Davis Park Senior Center DNR 1,560 $265Wanlass Park 7,800 DNR
Total 48,060 $129,465
Other Events / Annual Festivals / Etc.4th of July Multi-Cultural Celebration Fireworks, entertainment, vendors, food etc. 7,200 $8,075Unity Day Anti-Bullying event 200 $1,125City Hall-O-Ween Social Gathering 2,000 $0Veteran's Day Brunch, Guest Speakers, honoring Vets 100 $0Holiday Tree Lighting Entertainment, refreshments, 1,000 $0Valentine's Day Family Dance Family Dance 80 $0Eggstravaganza Vendor, egg hunt 1,200 $0Movies Under The Stars Movie on large protable screen, refreshments 1,000 $535
Total 12,780 $9,735
*DNR = Did Not Respond
Sources: City of San Pablo
A-113
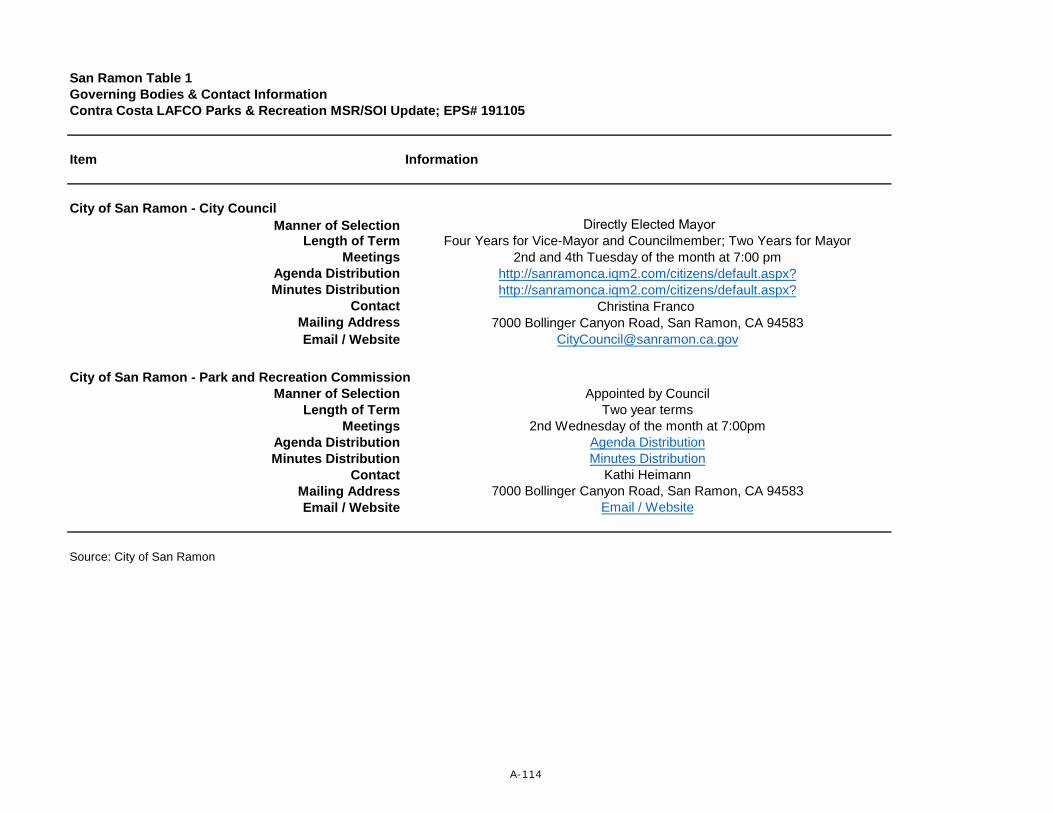
San Ramon Table 1Governing Bodies & Contact InformationContra Costa LAFCO Parks & Recreation MSR/SOI Update; EPS# 191105
Item
City of San Ramon - City CouncilManner of Selection
Length of TermMeetings
Agenda DistributionMinutes Distribution
ContactMailing AddressEmail / Website
City of San Ramon - Park and Recreation CommissionManner of Selection
Length of TermMeetings
Agenda DistributionMinutes Distribution
ContactMailing AddressEmail / Website
Source: City of San Ramon
Information
Directly Elected MayorFour Years for Vice-Mayor and Councilmember; Two Years for Mayor
2nd and 4th Tuesday of the month at 7:00 pmhttp://sanramonca.iqm2.com/citizens/default.aspx?http://sanramonca.iqm2.com/citizens/default.aspx?
Christina Franco 7000 Bollinger Canyon Road, San Ramon, CA 94583
Appointed by CouncilTwo year terms
2nd Wednesday of the month at 7:00pmAgenda DistributionMinutes Distribution
Kathi Heimann7000 Bollinger Canyon Road, San Ramon, CA 94583
Email / Website
A-114

San Ramon Table 2Summary Inventory of Parkland and Recreation FacilitiesContra Costa LAFCO Parks & Recreation MSR/SOI Update; EPS# 191105
City Parkland Address/Location AcresParkType Facilities1
SharedFacilities Condition
Alcosta Senior & Community Center Park & Gardens
9300 Alcosta Blvd. 7.8 Specialized Rec Areas and Facilities Very good
Amador Rancho Center 1998 Rancho Park Loop Road - Specialized Rec Areas and Facilities Very goodAmarante Park 2.3 Neighborhood Park Very goodArlington Park 3735 Knights Bridge Way 4.1 Neighborhood Park ModerateAthan Downs 2975 Montevideo Drive 20.0 Community Park ModerateBark and Ride 1120 S Wedgewood Road 6.7 Specialty Parks Moderate
Bella Vista Elementary School Park 1050 Trumpet Vine Lane 2.6 School Park X - SRVUSD Very good
Bellingham Square 1281 Bellingham Square 4.1 Neighborhood Park Very good
Bollinger Canyon Elementary School 2300 Talavera Drive 3.4 School Park X - SRVUSD Very good
Boone Acres 9716 Davona Drive 5.5 Neighborhood Park ModerateCal High Tennis Court and Track 9900 Broadmoor Drive - Specialized Rec Areas and Facilities X - SRVUSD Very goodCentennial Park Westside Drive 5.3 Neighborhood Park Very goodCentral Park 12501 Alcosta Blvd 45.0 Community Park Very goodCompass Point Park 545 Balmoral Court 1.4 Neighborhood Park Very goodCountry Club Elementary School Park
7534 Blue Fox Way 7.1 School Park X - SRVUSD Very good
Country Fair Park 320 Terrazzo Circle 0.3 Neighborhood Park Very goodCoyote Creek School Park 8700 North Gale Ridge Road 5.3 School Park X - SRVUSD Very goodCoyote Crossing 3495 Rosincress Drive 11.7 Neighborhood Park Very goodCreekside Park 1343 S Wedgewood Road 6.0 Neighborhood Park Very goodCrow Canyon Gardens 105 Park Place 9.7 Specialty Parks PoorDel Mar Dog Park 2143 Pine Valley Road 1.2 Specialty Parks ModerateDougherty Station Community Center
17011 Bollinger Canyon Road 1.8 Specialized Rec Areas and Facilities Very good
Dougherty Valley Aquatic Center 10550 Albion Road 3.0 Specialized Rec Areas and Facilities X - SRVUSD Very goodDougherty Valley High School Tennis Courts
10550 Albion Road 3.0 School Park X - SRVUSD Very good
Dougherty Valley Performing Arts Center
10550 Albion Road 1.6 Specialized Rec Areas and Facilities X - SRVUSD Very good
East Branch Park Harcourt Way 5.1 Neighborhood Park Very goodFire Truck Park 270 Arlington Way 1.2 Neighborhood Park Very goodForrest Home Farms Historic Park 19953 San Ramon Valley Blvd. 14.5 Specialty Parks Very goodFront Row Theater 17011 Bollinger Canyon Road - Specialized Rec Areas and Facilities Very goodGale Ranch Middle School Park 6400 Main Branch Road 6.5 School Park X - SRVUSD Very goodGolden View Elementary School Park
5025 Canyon Crest 5.0 School Park X - SRVUSD Very good
Hidden Crest Park 1672 Star Jasmine Drive 2.1 Neighborhood Park Very good
Hidden Hills Elementary School Park 12995 Harcourt Way 3.0 School Park X - SRVUSD Very good
Hidden Valley Park 10907 Albion Road 4.5 Neighborhood Park Very goodHummingbird Playground 0.5 Neighborhood Park Very goodInverness Park 13000 Broadmoor Drive 5.8 Neighborhood Park Very good
Iron Horse Community Gymnasium 12601 Alcosta Blvd - Specialized Rec Areas and Facilities X - SRVUSD Very good
Iron Horse Middle School Park 12601 Alcosta Blvd - School Park X - SRVUSD Very goodLimerick Park 2850 Bethany Road 2.8 Neighborhood Park Very goodLive Oak Elementary School Park 5151 Sherwood Way 1.5 School Park X - SRVUSD Very goodMemorial Park Bollinger Canyon Road 16.0 Community Park Very goodMill Creek Hollow 2100 Deerwood Drive 3.5 Neighborhood Park Very goodMonarch Park 8502 N Monarch Road 6.3 Neighborhood Park Very good
Montevideo Elementary School Park 13000 Broadmoor Drive 3.7 School Park X - SRVUSD Very good
Mosaic Park 1001 S Wedgewood Road 1.6 Neighborhood Park Very goodNeil Armstrong Elementary School Park
2849 Calais Drive 4.2 School Park X - SRVUSD Very good
Old Ranch Park 1000 Vista Monte Drive 6.7 Neighborhood Park Very goodPiccadilly Square 2503 Piccadilly Circle 4.1 Neighborhood Park Very good
Pine Valley Community Gymnasium 3000 Pine Valley Road - Specialized Rec Areas and Facilities X - SRVUSD Very good
Pine Valley Middle School Park 3000 Pine Valley Road 9.4 School Park X - SRVUSD Very good
Quail Run Elementary School Park 400 Goldenbay Avenue 6.5 School Park X - SRVUSD Very good
Ramona Park 6330 Murdock Way 4.1 Neighborhood Park Very goodRancho San Ramon Community Park
2000 Rancho Park Loop 20.0 Community Park Very good
Red Willow Park 190 Red Willow Road 4.9 Neighborhood Park Very goodRichard Fahey Village Green Park 9540 Village Pkwy 4.4 Neighborhood Park Very goodSan Ramon Community Center at Central Park
12501 Alcosta Blvd - Specialized Rec Areas and Facilities Very good
San Ramon Olympic Pool and Aquatic Park
9900 Broadmoor Drive 6.0 Specialized Rec Areas and Facilities X - SRVUSD Very good
San Ramon Sports Park 5261 Sherwood Way 14.8 Specialty Parks Very goodSherwood Park Jamie Place 1.5 Neighborhood Park Very goodSix Pillars Park 12219 Windemere Pkwy 2.7 Neighborhood Park Very goodSouyen Park 1548 Watermill Road 2.4 Neighborhood Park Very goodSummit View Trail Park 1000 Vistamonte Drive 13.5 Specialty Parks Very goodTassajara Ridge Staging Area 12295 Windemere Pkwy 1.0 Specialty Parks Very good
Twin Creek Elementary School Park 2785 Marsh Drive 3.7 School Park X - SRVUSD Very good
Valley View Park N Monarch and N Wedgeweeo 10.0 Neighborhood Park Very good
Walt Disney Elementary School Park 3250 Pine Valley Road 4.7 School Park X - SRVUSD Very good
Windemere Ranch School Park 11611 East Branch Pkwy 9.0 School Park X - SRVUSD Very goodWindy Hills Park 1236 Ustilago Drive 1.4 Neighborhood Park Very good
Total Developed Park Acreage 377.0Developed Park Acreage per 1,000 residents 4.5
City owned Open Space DNR 169.0 Open SpaceOpen Space Acerage (GHAD) DNR 3,092.0 Open Space
Total Open Space Acreage 3,261.0
Source: City of San Ramon
[1] Park facilities can be viewed in San Ramon's 2020 Parks, Trails, Open Space, and Recreation Master Plan.
A-115

San Ramon Table 3Summary of StaffingContra Costa LAFCO Parks & Recreation MSR/SOI Update; EPS# 191105
Type of Staff Annual Average
Full-Time (Paid) 28Part-Time (Paid) 50Seasonal (Paid) 200Full Time Equivalents (FTE) 28
Volunteer (Unpaid) 550
Staff (FTE) per 1,000 Residents 0.34Staff (FTE) per Acre 0.07
Source: City of San Ramon
A-116

San Ramon Table 4Operating Revenues/Expenditures Over TimeContra Costa LAFCO Parks & Recreation MSR/SOI Update; EPS# 191105
Item FY 19-201
Annual Operating Budget
Revenue
General Fund $15,196,239
Service/User Fees $5,024,532
Operating Grants and Contributions $122,275
Capital Grants and Contributions $0
Other $500
Total Revenue $20,343,546
Expenditures
Employee Expenses $10,474,737
Temporary Salaries $1,543,707
Administration $0
Materials & Supplies $930,057
Contracted Services $7,315,630
Equipment $0
Other $79,415
Total Expenditures $20,343,546
Total Expenditures per Capita $245
General Fund ExpendituresGeneral Fund Expenditures on Parks & Recreation Functions $15,196,239Citywide General Fund Expenditures $48,100,000Parks and Recreation as a Share of Citywide General Fund Expenditures 31.59%
[1] Includes combined values for Parks and Recreation and Public Services.
Sources: City of San Ramon
A-117

San Ramon Table 5Rates and User FeesContra Costa LAFCO Parks & Recreation MSR/SOI Update; EPS# 191105
Types or Categories of User Fees Link to Web Page Last Update Alternative Rates Average Annual Increase
Master Fee Schedule Master Fee Schedule 7/1/2020 Multiple DNR
*DNR = Did Not Respond
Source: City of San Ramon
A-118

San Ramon Table 6Capital Planning and FundingContra Costa LAFCO Parks & Recreation MSR/SOI Update; EPS# 191105
Item Total Value Funding Source
Annual Capital Budget - Parks ProjectsRevenue
City Beautification Fund $260,000 N / AInfrastructure Maintenance $946,400 N / ADebt Financing COP $4,565,874 N / ADougherty Valley County Service Area M-29 Funds $492,760 N / APark Development Fund $3,767,408 N / ATotal Capital Revenues $10,032,442
Project ExpendituresCurrent CIP Projects:
Citywide Parks Amenities Replacement and Improvements $170,813 Park DevelopmentFountain Repairs and Replacemnet $62,160 DV CSA/Infrastructure Maint. Fund/Park DevelopmentIrrigation Booster Pump Installation $192,500 Alternative Funding/Park Development/DV CSAPublic Art In the Park $40,000 City Beautification FundDougherty Station Community Center and Library Renovations $500,000 Debt Financing COPDougherty Valley Aquatic Center Equipment Replacement $69,440 Infrastructure Maint. FundSan Ramon Olympic Pool and Aquatic Park Renovation $2,065,874 Debt Financing COPSan Ramon Olympic Pool Equipment Replacement $43,592 Infrastructure Maint. FundForest Home Farms Structures $125,800 Alternative Funding/Infrastructure Maint. Recreation Program and Facilties Equipment Replacement $46,000 Alternative FundingMiddle School Teen Center Portables $247,000 Alternative FundingOpen Space Preservation $500,000 Alternative Funding
Future CIP Projects:Citywide Parks Amenities Replacement and Improvements $6,499,540 Park DevelopmentFountain Repairs and Replacemnet $427,330 DV CSA/Infrastructure Maint. Fund/Park DevelopmentIrrigation Booster Pump Installation $2,469,186 Alternative Funding/Park Development/DV CSAPublic Art In the Park $159,960 City Beautification FundDougherty Station Community Center and Library Renovations $2,000,000 Debt Financing COPDougherty Valley Aquatic Center Equipment Replacement $1,850,341 Infrastructure Maint. FundSan Ramon Olympic Pool Equipment Replacement $1,888,825 Infrastructure Maint. FundForest Home Farms Structures $664,600 Alternative Funding/Infrastructure Maint.
Total Planned Capital Expenditures $20,022,961
Fee LevelsParkland Dedication Fee (Quimby Act)
Single Family Detached (per unit) Appraised Value of 687 sf of land x 1.02Multi-Family (per unit)
Open Space Development Impact FeeSingle Family Detached (per unit) $1,141Multi-Family (per unit) $750
Park and Recreation Facility Impact FeeSubdivision Projects
Single Family Detached (per unit) $4,968.83Multi-Family (per unit) $2,757.68
Non-Subdivision ProjectsSingle Family Detached (per unit) $19,303.81Multi-Family (per unit) $11,582.29
*DNR = Did Not Respond
Source: City of San Ramon
Appraised Value of 451 sf of land x 1.02
A-119

San Ramon Table 7City Facilities Rentals and Event AttendanceContra Costa LAFCO Parks & Recreation MSR/SOI Update; EPS# 191105
Facility and/or Event DescriptionAnnual
AttendanceAnnual
Revenues
Activities / ProgramsParks and Recreation Classes All registration based classes 20,133 $2,766,346Senior Drop-in Programs Fitness, arts & crafts, games, etc. 28,200 $84,600Aquatics Rec/Lap Swim drop-in recreation swim and lap swim 53,689 $283,113
Total 102,022 $3,134,059
Facility RentalsGroup Picnic Rentals Picnic areas located in parks 14,550 $41,528Field User Rentals Soccer, cricket, ball field rentals 125,406 $385,887Gymnasium Rentals 10,820 $145,752Indoor Facility Rentals Rooms located at community centers, etc. 99,635 $762,939Aquatics Rentals User groups, swim meets, etc. 205,750 $323,930Theatre Rentals Rentals at two theatres 19,125 $233,278School Field Trip Program/Customized Education Tours Grade 3 field trips for SRVUSD classes 3,200 $16,625
Total 478,486 $1,909,939
Other Events / Annual Festivals / Etc.Run San Ramon Fitness Race Fitness race held on 7/4 640 $29,365Bah Humbug Fitness Race Fitness race held the first Saturday of December 593 $26,120Culture in the Community Fall event celebrating different cultures 1,200 $3,750Art & Wind Festival Annual Festival held Memorial Day Weekend 30,000 $118,037Performing Arts Presenting Series Concerts/Acts at Theatre 2,104 $108,030Summer Concerts Five concerts held in July/August on Sundays 10,000 $0Friday Foreign Film Series 5 foreign films - watch and discussion 442 $3,820Summer Dive In Movies Free events for the public at the pools 1,358 $0Saturday Fun on the Farm Saturday drop-in programs at Forest Home Farms Historic Park 6,250 $0
Total 52,587 $289,122
Sources: City of San Ramon
A-120

Walnut Creek Table 1Governing Bodies & Contact InformationContra Costa LAFCO Parks & Recreation MSR/SOI Update; EPS# 191105
Item
City of Walnut Creek - City CouncilManner of Selection
Length of TermMeetings
Agenda DistributionMinutes Distribution
ContactMailing AddressEmail / Website
City of Walnut Creek - Park, Recreation and Open Space CommissionManner of Selection
Length of TermMeetings
Agenda DistributionMinutes Distribution
ContactMailing AddressEmail / Website
Source: City of Walnut Creek
Information
Mayoral RotationFour Years
1st and 3rd Tuesday of the month at 6:00 pmCity Council AgendasCity Council Minutes
Suzie Martinez, City Clerk1666 North Main Street, Walnut Creek, CA, 94596
https://www.walnut-creek.org/government/city-council
Heather Ballenger1666 North Main Street, Walnut Creek, CA, 94596
https://www.walnut-creek.org/government/commissions-committees/park-
Appointed by Council4 year terms.
6:00 p.m. on the first Monday of every even monthPublic Meeting AgendasPublic Meeting Minutes
A-121

Walnut Creek Table 2Summary Inventory of Parkland and Recreation FacilitiesContra Costa LAFCO Parks & Recreation MSR/SOI Update; EPS# 191105
City Parkland Address/Location AcresParkType Facilities
SharedFacilities Condition
Alma Park California Blvd at Botelho Dr 2 Park Picnic areas, benches, views Very good
Arbolado Park Arbolado Dr at Doncaster Dr 26 ParkPlayground, sports fields and courts, picnic areas, restrooms, trail connections
Very good
Castle Rock Park 800 Hutchinson Rd near Walnut Ave 6 Park Sports fields Very good
Civic Park 1375 Civic Dr 17 ParkPlayground, sports courts, community center, library, gazebo, picnic area, native plant/butterfly habitat garden, restrooms, trail connections
Very good
Diablo Shadows Park 3205 Diablo Shadows Dr 3 Park Playground, picnic areas, trail connections Very goodEl Divisadero Park El Divisadero Dr east of San Carlos Dr 3 Park Sports fields Very good
Heather Farm Park 301 N. San Carlos Dr 91 Park
Clarke Swim Center, playground, sports fields and courts, community center, equestrian center, bike paths, fishing pond, picnic areas, nature pond, restrooms, trail connections, limited off-leash dog area
Moderate
Howe Homestead Park 2950 Walnut Blvd 7 Park1930s-era residence, community gardens, trail connections
Very good
Lancaster Lancaster Rd at Lilac Dr 1 Viewshed Moderate
Larkey Park Buena Vista Ave at First Ave 12 ParkLarkey Swim Center, playground, sports courts, Lindsay Wildlife Experience, Model Railroad Society, picnic areas, restrooms
Very good
Northgate Park Castle Rock Rd next to Northgate High School 4 ParkLawn and benches bordered by Northgate High School and Eagle Park Elementary School
Very good
Rudgear Park 2261 Dapplegray Ln near Stewart Ave 12 ParkPlayground, sports fields and courts, picnic areas, restrooms, trail connections
Moderate
San Miguel Park 10 San Jose Ct 5 ParkPlayground, sports, trail connections, limited off-leash dog area
Moderate
Tice Valley Park 2055 Tice Valley Blvd 8 ParkPlayground, gymnasium, sports fields, picnic areas, restrooms
Very good
Valle Verde Park Valley Verde Ct at Peach Willow Dr 1 Park Picnic areas Very good
Walden Park 2628 Oak Rd near CCWD Canal 5 ParkPlayground, basketball courts, picnic area, restrooms, trail connections
Very good
Ygnacio Heights Park DNR 6 Park Viewshed Poor
Total Developed Park Acreage 209Developed Park Acreage per 1,000 residents 2.9
Acalanes Ridge Sousa Drive 179 Open Space Open Space, trails, views Very goodLime Ridge Ygnacio Valley Road 924 Open Space Open Space, views, interpretive tours Very good
Shell Ridge 1035 Castle Rock Rd 1,421 Open SpaceOpen Space, historic working Borges Ranch, trails, views
Very good
Sugarloaf 2161 Youngs Valley Road 177 Open Space Open Space, trails, views, picnic areas, restrooms Very good
Total Open Space Acreage 2,701
Boundary Oak Golf Course DNR 160 Golf18 hole golf course, pro shop, driving range, practice greens, restaurant
Very good
Lar Rieu 196 El Camino Corto 10 Undeveloped Undeveloped park land ModerateOld Oak Park Rossmoor Pkwy 16 Park Undeveloped park land PoorPine Creek Park and Greenway DNR 5 Park Undeveloped park land CCC Flood Control
Other Acreage 191
Source: City of Walnut Creek
*DNR = Did Not Respond
A-122

Walnut Creek Table 3Summary of StaffingContra Costa LAFCO Parks & Recreation MSR/SOI Update; EPS# 191105
Type of Staff Annual Average1
Full-Time (Paid) 0Part-Time (Paid) 0Seasonal (Paid) 350Full Time Equivalents (FTE) 54.5
Volunteer (Unpaid) 425
Staff (FTE) per 1,000 Residents 0.77Staff (FTE) per Acre 0.26
Source: City of Walnut Creek
[1] Represents FY20 adopted budget values for the Arts and Recreation Department.
A-123

Walnut Creek Table 4Operating Revenues/Expenditures Over TimeContra Costa LAFCO Parks & Recreation MSR/SOI Update; EPS# 191105
Item FY 19-201
Annual Operating Budget
Revenue
General Fund $20,259,845
Service/User Fees $21,489,469
Operating Grants and Contributions $0
Capital Grants and Contributions $0
Total Revenue $41,749,314
Expenditures
Employee Expenses $23,096,739
Temporary Salaries $0
Administration $0
Materials & Supplies $18,652,574
Contracted Services $0
Equipment $0
Total Expenditures $41,749,313
Total Expenditures per Capita $589
General Fund ExpendituresGeneral Fund Expenditures on Parks & Recreation Functions $20,259,845Citywide General Fund Expenditures $91,204,343Parks and Recreation as a Share of Citywide General Fund Expenditures 22.21%
Sources: City of Walnut Creek
[1] Includes combined General Fund values for Arts and Recreation and relevant Public Works Department financials.
A-124

Walnut Creek Table 5Rates and User FeesContra Costa LAFCO Parks & Recreation MSR/SOI Update; EPS# 191105
Types or Categories of User Fees Link to Web Page Last Update Alternative Rates Average Annual Increase
Master Fee Schedule Master Fee Schedule 7/7/2020 Multiple 3%
Source: City of Walnut Creek
A-125

Walnut Creek Table 6Capital Planning and FundingContra Costa LAFCO Parks & Recreation MSR/SOI Update; EPS# 191105
Item Total Value Funding Source
Annual Capital Budget - Parks ProjectsRevenue
Parkland Dedication $8,195,000 N / ATotal Capital Revenues $8,195,000
Project ExpendituresCurrent CIP Projects:
Alma Park Improvements $200,000 DNRPlanning and Public Outreach: Arbolado Park $25,000 DNRVarious Parks: Par Course $70,000 DNRBooce at Larkey and Rudgear Parks $300,000 DNRWalden Park Parking Lot Expansion $250,000 DNROld Oak Park: Trails $100,000 DNRCommunity Gardens $100,000 DNROpen Space Improvements $250,000 DNRHeather Farm - Master Plan Update $250,000 DNRLar Rieu Park Improvements - Phase 2 $200,000 DNRNorthgate Tennis Court Reconstruction $300,000 DNR
Future CIP Projects:Civic Park, Implementation Phase I of Master Plan $1,000,000 FundedArbolado Park Improvements $400,000 FundedOld Oak Park - Parking and Improvements $150,000 FundedHeather Farm Group Picnic Area Development $2,000,000 FundedTice Park Ballfield Lighting $400,000 FundedCivic Park, Implement Phase II of Master Plan $500,000 FundedHeather Farm Tennis Center Court Repaving $500,000 FundedAll-Weather Sports Fields $3,500,000 FundedHeather Farm: Batting Cages $200,000 Funded
Total Planned Capital Expenditures $10,695,000
Fee LevelsParkland Dedication In-Lieu Fee
Single Family Detached (per unit)Multi-Family (per unit)
*DNR = Did Not Respond
Source: City of Walnut Creek
Based on number of bedroomsBased on General Plan density
A-126

Walnut Creek Table 7City Facilities Rentals and Event AttendanceContra Costa LAFCO Parks & Recreation MSR/SOI Update; EPS# 191105
Facility and/or Event DescriptionAnnual
AttendanceAnnual
Revenues
Activities / ProgramsParks and Recreation Classes Recreation, Social Services, and Center for Community Arts programs 28,750 $4,456,902Lesher Center for the Arts Lesher Center for the Arts ticket sales & events 300,000 $5,415,350Aquatics Fitness and recreational swimming 300,000 $805,400Bedford Gallery Bedford Gallery attendance 30,500 $295,300Boundary Oak Golf Course Boundary Oak Golf Course rounds 59,000 $5,921,306
Total 718,250 $16,894,258
Facility RentalsAll Community Center Rentals (Indoor) 1,400 $647,100
Total 1,400 $647,100
Other Events / Annual Festivals / Etc.DNR DNR DNR DNR
Total - -
*DNR = Did Not Respond
Sources: City of Walnut Creek
A-127

APPENDIX B:
Boundary History Tables
Table B-1 Ambrose RPD Boundary History ....................................... B-1
Table B-2 Green Valley RPD Boundary History ................................. B-2
Table B-3 Pleasant Hill RPD Boundary History .................................. B-3
Table B-4 County Service Areas (CSAs) Boundary Histories ............... B-4
Table B-5 Crockett CSD Boundary History ....................................... B-5
Table B-6 Diablo CSD Boundary History .......................................... B-6
Table B-7 Town of Discovery Bay CSD Boundary History ................... B-7
Table B-8 Kensington CSD Boundary History ................................... B-8

Table B-1Ambrose RPD Boundary HistoryContra Costa LAFCO Parks & Recreation MSR/SOI Update; EPS# 191105
Project Name and/or Type of Action
LAFCO Resolution Date
Change TypeAcres
AffectedRecording Agency
Formation 9/15/1946 Formation Data Not Available State Board of EqualizationPre-LAFCO Annexation 8/5/1952 Annexation Data Not Available State Board of EqualizationPre-LAFCO Reorganization 10/28/1960 Annexation/
DetachmentData Not Available State Board of Equalization
Naval Weapons Station / City of Concord Reorganization
7/1/1970 Annexation/Detachment
Data Not Available State Board of Equalization and Contra Costa LAFCO
Baker West #2 and Challenge Reorganization
5/2/1973 Annexation/Detachment
11.611.2
State Board of Equalization and Contra Costa LAFCO
Avila Road Reorganization 1992 Detachment 129.5 State Board of Equalization and Contra Costa LAFCO
California Skyline Annexation 1993 Annexation 63.5 State Board of Equalization and Contra Costa LAFCO
Smith Reorganization 1996 Detachment 101.9 State Board of Equalization and Contra Costa LAFCO
Oak Hills South Reorganization
1998 Detachment 45.4 State Board of Equalization and Contra Costa LAFCO
Oak Hills South Reorganization
2001 Detachment 1.6 State Board of Equalization and Contra Costa LAFCO
Oak Hills South Reorganization
2002 Detachment 1.1 State Board of Equalization and Contra Costa LAFCO
Sources: 2010 Parks and Recreation & Cemetery Services MSR; Ambrose RPD; Contra Costa LAFCO District Book.
B-1

Table B-2Green Valley RPD Boundary HistoryContra Costa LAFCO Parks & Recreation MSR/SOI Update; EPS# 191105
Project Name and/or Type of Action
LAFCO Resolution Date
Acres Affected
Recording Agency
Formation 1949 165.0 State Board of EqualizationReorganization 12/28/1961 State Board of Equalization and
Contra Costa LAFCOBoundary Revision State Board of Equalization and
Contra Costa LAFCOSub. 4894 Reorganization 2/27/1978 State Board of Equalization and
Contra Costa LAFCO
Sources: 2010 Parks and Recreation & Cemetery Services MSR; Green Valley RPD; Contra Costa LAFCO District Book.
B-2
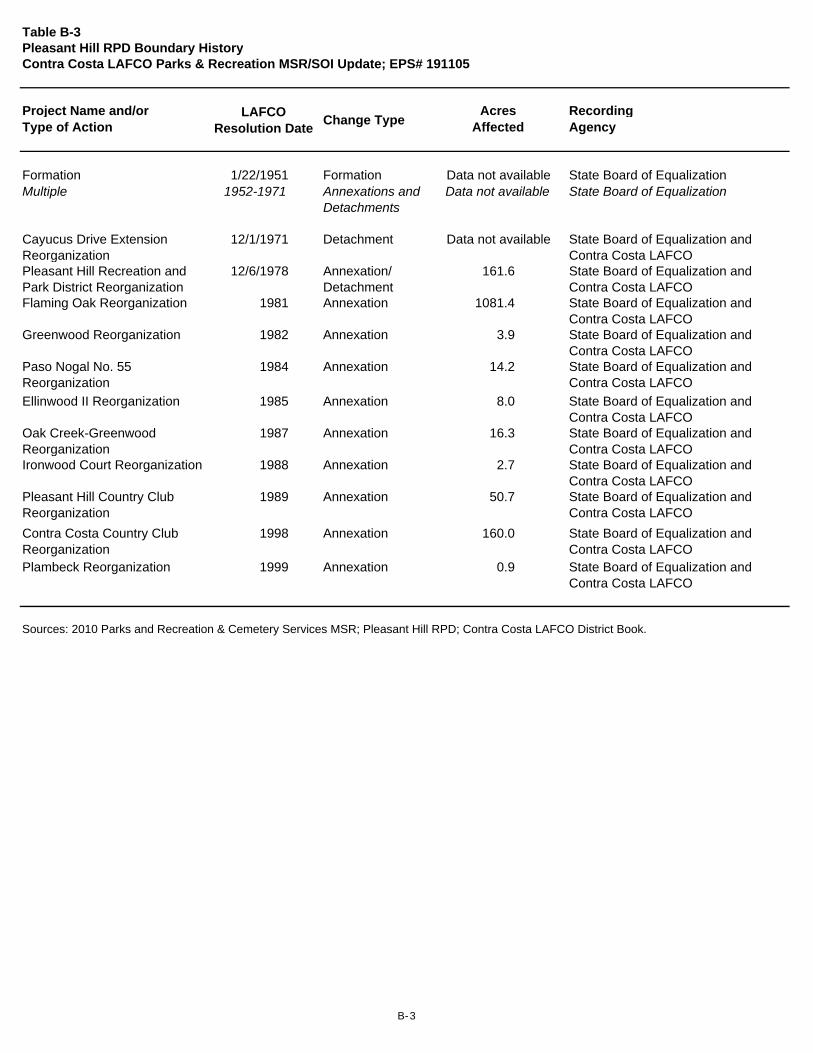
Table B-3Pleasant Hill RPD Boundary HistoryContra Costa LAFCO Parks & Recreation MSR/SOI Update; EPS# 191105
Project Name and/or Type of Action
LAFCO Resolution Date
Change TypeAcres
AffectedRecordingAgency
Formation 1/22/1951 Formation Data not available State Board of EqualizationMultiple 1952-1971 Annexations and
DetachmentsData not available State Board of Equalization
Cayucus Drive Extension Reorganization
12/1/1971 Detachment Data not available State Board of Equalization and Contra Costa LAFCO
Pleasant Hill Recreation and Park District Reorganization
12/6/1978 Annexation/Detachment
161.6 State Board of Equalization and Contra Costa LAFCO
Flaming Oak Reorganization 1981 Annexation 1081.4 State Board of Equalization and Contra Costa LAFCO
Greenwood Reorganization 1982 Annexation 3.9 State Board of Equalization and Contra Costa LAFCO
Paso Nogal No. 55 Reorganization
1984 Annexation 14.2 State Board of Equalization and Contra Costa LAFCO
Ellinwood II Reorganization 1985 Annexation 8.0 State Board of Equalization and Contra Costa LAFCO
Oak Creek-Greenwood Reorganization
1987 Annexation 16.3 State Board of Equalization and Contra Costa LAFCO
Ironwood Court Reorganization 1988 Annexation 2.7 State Board of Equalization and Contra Costa LAFCO
Pleasant Hill Country ClubReorganization
1989 Annexation 50.7 State Board of Equalization and Contra Costa LAFCO
Contra Costa Country Club Reorganization
1998 Annexation 160.0 State Board of Equalization and Contra Costa LAFCO
Plambeck Reorganization 1999 Annexation 0.9 State Board of Equalization and Contra Costa LAFCO
Sources: 2010 Parks and Recreation & Cemetery Services MSR; Pleasant Hill RPD; Contra Costa LAFCO District Book.
B-3

Table B-4County Service Areas (CSAs) Boundary HistoriesContra Costa LAFCO Parks & Recreation MSR/SOI Update; EPS# 191105
CSA & Project NameLAFCO
Resolution DateChange Type
Acres Affected Recording Agency
CSA M-16Formation 6/16/1964 Formation 90 State Board of EqualizationPort of Chicago Detachment 1972 Detachment 210 Contra Costa LAFCOLighting District Change 1986 Transfer of Lighting
Servies to CSAN/A Lighting District Reorganization
CSA M-17Formation 1/26/1965 Formation n/a State Board of EqualizationCounty Sanitation Annexation 12/14/1971 Annexation n/a State Board of Equalization
Yancy Reorganization 11/14/1979 Detachment 1.4 Contra Costa LAFCORogers-Konica-Bradshaw Reorganization
1/9/1980 Detachment 20.0 Contra Costa LAFCO
Garrity Ridge / Willow Brook Reorganization
6/10/1988 Detachment 34.3 State Board of Equalization and Contra Costa LAFCO
Mosby/Donelly Reorganization
1989 Detachment 0.7 State Board of Equalization and Contra Costa LAFCO
Gozzano Reorganization 1989 Detachment 0.8 State Board of Equalization and Contra Costa LAFCO
CSA M-29Formation 7/9/1996 Formation 5,100 Figure 3-2, Dougherty Valley Draft
Specific PlanBoundary Revision 1997/1998 Revision 910 Figure 3-2, Dougherty Valley Draft
Specific Plan
CSA M-30Formation 11/17/1997 Formation 147 State Board of Equalization
CSA R-4Formation 12/1/1970 Formation 11,264 State Board of EqualizationLafayette-Moraga Reorganization
1972 Annexation 109 Contra Costa LAFCO
CSA R-7Formation 1971 Formation State Board of EqualizationMultiple 1975-1994 State Board of Equalization and
Contra Costa LAFCOAnnexation 5/9/2012 Annexation Contra Costa LAFCO
CSA R-9Formation 11/6/1974 Formation State Board of EqualizationMultiple 1979-1990 State Board of Equalization and
Contra Costa LAFCO
CSA R-10Formation 6/24/1988 Formation 4,717 State Board of Equalization
Sources: 2010 Parks and Recreation & Cemetery Services MSR; Contra Costa LAFCO District Book.
B-4

Table B-5Crockett CSD Boundary HistoryContra Costa LAFCO Parks & Recreation MSR/SOI Update; EPS# 191105
Project Name and/or Type of Action
LAFCO Resolution Date
Change TypeAcres
Affected Recording Agency
Formation 2006 Formation 686.0 State Board of Equalization
Sources: Crockett Community Services District; Contra Costa LAFCO District Book.
B-5

Table B-6Diablo CSD Boundary HistoryContra Costa LAFCO Parks & Recreation MSR/SOI Update; EPS# 191105
Project Name and/or Type of Action
LAFCO Resolution Date
Change TypeAcres
Affected Recording Agency
Formation 5/15/1969 Formation State Board of EqualizationCalle Arroyo Annexation 2/27/1974 Annexation 3.2 State Board of Equalization and
Contra Costa LAFCO
Curtola-Smiley Annexation 11/15/1976 Annexation 193.0 State Board of Equalization and Contra Costa LAFCO
Batts Annexation 0205 11/19/1983 Annexation 0.1 State Board of Equalization and Contra Costa LAFCO
Thiele/Oliver Annexation 0105 2/11/1988 Annexation 99.0 State Board of Equalization and Contra Costa LAFCO
Mt Diablo Scenic Annexation(8 homes)
10/27/2011 Annexation 11.0 State Board of Equalization and Contra Costa LAFCO
Sources: Diablo Community Services District; Contra Costa LAFCO District Book.
B-6

Table B-7Town of Discovery Bay CSD Boundary HistoryContra Costa LAFCO Parks & Recreation MSR/SOI Update; EPS# 191105
Project Name and/or Type of Action
LAFCO Action Date Record Date
ChangeType
AcresAffected Recording Agency
Formation 4/9/1997 10/5/1998 Formation 3,955.00 State Board of Equalization
Discovery Bay West Annexation
3/8/2000 5/5/2000 Annexation 760.53 Contra Costa LAFCO
Annexation No. 2002-04 3/10/2004 4/19/2004 Annexation 23.67State Board of Equalization and Contra Costa LAFCO
Ravenswood Annexation 9/15/2004 5/27/2005 Annexation 60.06State Board of Equalization and Contra Costa LAFCO
Old River Elementary Schoo 6/11/2008 7/24/2008 Annexation 17.42State Board of Equalization and Contra Costa LAFCO
Newport Pointe Annexation (resubmitted 6/28/20)
1/13/2021 2/19/2021 Annexation 21.64State Board of Equalization and Contra Costa LAFCO
Total Acreage 4,838.32
Source: Contra Costa LAFCO District Book.
B-7

Table B-8Kensington CSD Boundary HistoryContra Costa LAFCO Parks & Recreation MSR/SOI Update; EPS# 191105
Project Name and/or Type of Action
LAFCO Resolution Date
Change TypeAcres
Affected Recording Agency
Formation 1/29/1953 Formation State Board of EqualizationAnsco Annexation 3/14/1957 Annexation State Board of Equalization and
Contra Costa LAFCOSunset View Cemetery Annexation
10/5/1998 Annexation State Board of Equalization and Contra Costa LAFCO
Source: Contra Costa LAFCO District Book.
B-8

APPENDIX C:
Maps of Cities’ Boundaries and Spheres of Influence in Contra Costa County

SacramentoCounty
BrownsIsland
WinterIsland
ANTIOCH
OAKLEY
BRENTWOOD
PITTSBURG San Joaquin River
Broad Slough
ContraLomaReservoir
AntiochMunicipalReservoir
ShermanLake
ÄÅ160ÄÅ44
ÄÅ44
ÄÅ44
G St
Lone Tree Way
18th St
Deer
Valle
y Rd
A St
Oakley RdBuchananRd
Davison Dr
Laurel Rd
10th St
Viera
Ave
Wilbur Ave
Dalla
sRan
chRd
Century BlvdCo
ntra
Loma
Blvd
4th St
Bridg
ehea
d Rd
Balfour Rd
L St
Deer Valley Rd
Somersvill
e Rd
Auto
Cente
r Dr
Pittsburg Antioch Hwy
Hillcrest Ave
Main St
James Donlon Blvd
City of Antioch Boundary, SOI, and Urban Growth Boundary
0 1 20.5
MilesMap created 06/14/2019by Contra Costa County Department of
Conservation and Development, GIS Group30 Muir Road, Martinez, CA 9455337:59:41.791N 122:07:03.756W
This map or dataset was created by the Contra Costa County Department of Conservationand Development with data from the Contra Costa County GIS Program. Some
base data, primarily City Limits, is derived from the CA State Board of Equalization'stax rate areas. While obligated to use this data the County assumes no responsibility for
its accuracy. This map contains copyrighted information and may not be altered. It may be reproduced in its current state if the source is cited. Users of this map agree to read and
accept the County of Contra Costa disclaimer of liability for geographic information. ®
City of Antioch
Antioch SOI
City Boundaries
County Boundary
Antioch Urban Growth Bnd
By LAFCO actionon 06/12/2019,
the City of Antioch boundary and SOI
were approved.

Vasco Rd
BRENTWOOD
ANTIOCH
OAKLEYÄÅ44
ÄÅ44
ÄÅ44
Selle
rs Av
e
Balfour Rd
Deer Valley Rd
Fairv
iew Av
e
Lone Tree Way
Ohar
a Ave
Concord Ave
Sand Creek Rd
Garin
Pkw
y
Delta Rd
Marsh Creek Rd
Hillc
rest A
ve
Camino Diablo
Sunset Rd
Oak St
Main
StWa
lnut B
lvd
Empir
e Ave
Adam
s Ln
Brentwood BlvdNeroly Rd
Marsh Creek Rd
Central Blvd
City of Brentwood Boundary and Sphere of Influence
0 1 20.5
MilesMap created 06/14/2019by Contra Costa County Department of
Conservation and Development, GIS Group30 Muir Road, Martinez, CA 9455337:59:41.791N 122:07:03.756W
This map or dataset was created by the Contra Costa County Department of Conservationand Development with data from the Contra Costa County GIS Program. Some
base data, primarily City Limits, is derived from the CA State Board of Equalization'stax rate areas. While obligated to use this data the County assumes no responsibility for
its accuracy. This map contains copyrighted information and may not be altered. It may be reproduced in its current state if the source is cited. Users of this map agree to read and
accept the County of Contra Costa disclaimer of liability for geographic information. ®
City of Brentwood
Brentwood SOI
City Boundaries
County Urban Limit Line
By LAFCO action on 06/12/2019,
the City of Brentwood boundary and SOI
were approved.

Clayton Rd
Marsh Creek Rd
Kirker Pass Rd
Clayton Rd
Concord Blvd
MarshCree k Rd
Oakhurst Dr
Pine Hollow Rd
Mitch
ell C
anyo
n Rd
CLAYTON
CONCORD
City of Clayton Boundary and Sphere of Influence
0 0.4 0.80.2
MilesMap created 06/14/2019
by Contra Costa County Department ofConservation and Development, GIS Group
30 Muir Road, Martinez, CA 9455337:59:41.791N 122:07:03.756W
This map or dataset was created by the Contra Costa County Department of Conservationand Development with data from the Contra Costa County GIS Program. Some
base data, primarily City Limits, is derived from the CA State Board of Equalization'stax rate areas. While obligated to use this data the County assumes no responsibility for
its accuracy. This map contains copyrighted information and may not be altered. It may be reproduced in its current state if the source is cited. Users of this map agree to read and
accept the County of Contra Costa disclaimer of liability for geographic information. ®
City of Clayton
Clayton SOI
City Boundaries
County Urban Limit Line
By LAFCO action on 06/12/2019,
the City of Claytonboundary and SOI
were approved.

CONCORD
PLEASANTHILL
PITTSBURG
WALNUTCREEK
CLAYTON
MARTINEZ
BayPoint
Pacheco
VineHill
ContraCostaCentre
Clyde
SuisunBay
HonkerBay
§̈¦680 ÄÅ242
Clayton Rd
Treat B
lvd
Bailey RdConcord Blvd
Tay
lor Blvd
Ygnacio Valley Rd
Leland RdWi
llow
Pass
Rd
Olivera Rd
Geary Rd
Minert Rd
Bates Ave
Imhoff Dr
Bancroft Rd
Evora Rd
Port C
hicag
o Hwy
Cowell Rd
Pacifica Ave
Pine Hollow Rd
Monument Blvd
Concord Ave
Oak Grove Rd
Kirker Pass Rd
Contra Costa Blvd
ÄÅ4
ÄÅ4
ÄÅ4
§̈¦680
SolanoCounty
City of Concord Boundary and Sphere of Influence
0 1.5 30.75
MilesMap created 06/14/2019by Contra Costa County Department of
Conservation and Development, GIS Group30 Muir Road, Martinez, CA 9455337:59:41.791N 122:07:03.756W
This map or dataset was created by the Contra Costa County Department of Conservationand Development with data from the Contra Costa County GIS Program. Some
base data, primarily City Limits, is derived from the CA State Board of Equalization'stax rate areas. While obligated to use this data the County assumes no responsibility for
its accuracy. This map contains copyrighted information and may not be altered. It may be reproduced in its current state if the source is cited. Users of this map agree to read and
accept the County of Contra Costa disclaimer of liability for geographic information. ®
City of Concord
Concord SOI
City Boundaries
County Boundary
County Urban Limit Line
By LAFCO action on 06/12/2019, the City of Concord boundary
and SOI were approved.

DANVILLE
SANRAMON
Alamo
Blackhawk
Diablo
CaminoTassajara
§̈¦680
Crow Canyon Rd
Camino Tassajara
Diablo Rd
Danville Blvd
El Capitan Dr
Lawr
ence
Rd
Camino Ramon
Sycamore Valley Rd
Doug
herty
RdBl
ackh
awk R
d
Paraiso Dr
Hartz Ave
Gree
n Vall
ey
Rd
Stone Valley Rd
Bollinger Canyon Rd
San Ramon Valley Blvd
Railroad Ave0 1.5 30.75
MilesMap created 06/14/2019
by Contra Costa County Department ofConservation and Development, GIS Group
30 Muir Road, Martinez, CA 9455337:59:41.791N 122:07:03.756W
This map or dataset was created by the Contra Costa County Department of Conservationand Development with data from the Contra Costa County GIS Program. Some
base data, primarily City Limits, is derived from the CA State Board of Equalization'stax rate areas. While obligated to use this data the County assumes no responsibility for
its accuracy. This map contains copyrighted information and may not be altered. It may be reproduced in its current state if the source is cited. Users of this map agree to read and
accept the County of Contra Costa disclaimer of liability for geographic information. ®
Town of Danville Boundary and Sphere of Influence
Town of Danville
Town of Danville SOI
City Boundaries
County Boundary
County Urban Limit Line
By LAFCO action on 06/12/2019,
the Town of Danville boundary and SOI
were approved.

EL CERRITO
RICHMOND
RICHMOND Kensington
EastRichmond
Heights
Arlington Blvd
San Pablo Ave
Richmond St
Potrero Ave Ashbury Ave
Barrett Ave
Carlson Blvd
Moeser Ln
Arlington Ave
Fairmount Ave Central Ave
AlamedaCounty
§̈¦8080
§̈¦580
City of El Cerrito Boundary and Sphere of Influence
0 0.5 10.25
MilesMap created 09/18/2019
by Contra Costa County Department ofConservation and Development, GIS Group
30 Muir Road, Martinez, CA 9455337:59:41.791N 122:07:03.756W
This map or dataset was created by the Contra Costa County Department of Conservationand Development with data from the Contra Costa County GIS Program. Some
base data, primarily City Limits, is derived from the CA State Board of Equalization'stax rate areas. While obligated to use this data the County assumes no responsibility for
its accuracy. This map contains copyrighted information and may not be altered. It may be reproduced in its current state if the source is cited. Users of this map agree to read and
accept the County of Contra Costa disclaimer of liability for geographic information. ®
City of El Cerrito
El Cerrito SOI
City Boundaries
Contra Costa County
County Urban Limit Line
By LAFCO action on 06/12/2019,the City of El Cerrito boundary and SOI
were approved. Subsequent annexationsand SOI amendments have occurred.

HERCULES
PINOLE
RICHMOND
Rodeo
Crockett
TaraHills
El Sobrante
BayView
MontalvinManor
SolanoCounty
MarinCounty
Carquinez StraitSanPabloBay
§̈¦8080
§̈¦8080
ÄÅ44
San Pablo Ave
Cummings Skwy
Giant Hwy
Willow Ave
Atlas RdTu
rquo
ise D
r
Marlesta Rd
Shawn Dr
Simas Ave
Sarah Dr
Hilltop DrBlume D
rRamona St
Violet
Rd
Loring Ave
Galbreth Rd
0 2 41
MilesMap created 06/14/2019by Contra Costa County Department of
Conservation and Development, GIS Group30 Muir Road, Martinez, CA 9455337:59:41.791N 122:07:03.756W
This map or dataset was created by the Contra Costa County Department of Conservationand Development with data from the Contra Costa County GIS Program. Some
base data, primarily City Limits, is derived from the CA State Board of Equalization'stax rate areas. While obligated to use this data the County assumes no responsibility for
its accuracy. This map contains copyrighted information and may not be altered. It may be reproduced in its current state if the source is cited. Users of this map agree to read and
accept the County of Contra Costa disclaimer of liability for geographic information. ®
City of Hercules Boundary and Sphere of Influence
City of Hercules
Hercules SOI
City Boundaries
Contra Costa County
County Urban Limit Line
By LAFCO action on 06/12/2019, the City of Hercules boundary
and SOI were approved.

LAFAYETTE
ORINDA
MORAGA
WALNUTCREEK
WALNUTCREEK
PLEASANTHILL
Saranap
ReliezValley
AcalanesRidge
St Marys Rd
Happy Valley Rd
Rheem Blvd
Reliez Valley Rd
Tay lor B
l vd
Mor
aga R
d
Pleasant Hill Rd
Moraga Way
Geary Rd
Mt Diablo Blvd
Boyd Rd G
loriet
ta Blvd
Olympic Blvd
Deer Hill Rd
Rheem Blvd
BrionesReservoir
ÄÅ2424
City of Lafayette Boundary and Sphere of Influence
0 0.75 1.50.375
MilesMap created 06/14/2019
by Contra Costa County Department ofConservation and Development, GIS Group
30 Muir Road, Martinez, CA 9455337:59:41.791N 122:07:03.756W
This map or dataset was created by the Contra Costa County Department of Conservationand Development with data from the Contra Costa County GIS Program. Some
base data, primarily City Limits, is derived from the CA State Board of Equalization'stax rate areas. While obligated to use this data the County assumes no responsibility for
its accuracy. This map contains copyrighted information and may not be altered. It may be reproduced in its current state if the source is cited. Users of this map agree to read and
accept the County of Contra Costa disclaimer of liability for geographic information. ®
City of Lafayette
Lafayette SOI
City Boundaries
County Urban Limit Line
By LAFCO action on 06/12/2019,
the City of Lafayetteboundary and SOI
were approved.

MARTINEZ
PLEASANTHILL
CONCORD
Pacheco
VineHill
ReliezValley
AlhambraValley
MtView
§̈¦680
§̈¦780
§̈¦680
ÄÅ4
ÄÅ242
Muir Rd
Taylor Blvd
Pacheco Blvd
Contra Costa Blvd
Center Ave
Reliez
Ar nol d DrMarsh Dr
Shell
Ave
Waterfront Rd
Howe
Rd
Imhoff Dr
Pine StAlhambra Ave
Grayson Rd
Morello Ave
Gregory Ln
Berrellesa St
Midhill Rd
Morello Ave
Center Ave
Alha
mbra
Ave
Valley RdAlhambraValley Rd
ÄÅ4
§̈¦680
SolanoCounty
SuisunBay
CarquinezStrait
City of Martinez Boundary and Sphere of Influence
0 1 20.5
MilesMap created 11/30/2020by Contra Costa County Department of
Conservation and Development, GIS Group30 Muir Road, Martinez, CA 9455337:59:41.791N 122:07:03.756W
This map or dataset was created by the Contra Costa County Department of Conservationand Development with data from the Contra Costa County GIS Program. Some
base data, primarily City Limits, is derived from the CA State Board of Equalization'stax rate areas. While obligated to use this data the County assumes no responsibility for
its accuracy. This map contains copyrighted information and may not be altered. It may be reproduced in its current state if the source is cited. Users of this map agree to read and
accept the County of Contra Costa disclaimer of liability for geographic information. ®
City of Martinez
Martinez SOI
City Boundaries
County Boundary
County Urban Limit Line
By LAFCO action on 06/12/2019, the City of Martinez boundary andSOI were approved. Subsequent
annexations have occurred.

MORAGA
LAFAYETTE
ORINDA
St M
arys
Rd
Pinehurst Rd
Mor
aga R
d
Can
yon R
d
St Marys Rd Moraga Way
Rheem Blvd
Rheem Blvd
SanLeandroReservoir
AlamedaCounty
Town of Moraga Boundary and Sphere of Influence
0 0.5 10.25
MilesMap created 06/14/2019by Contra Costa County Department of
Conservation and Development, GIS Group30 Muir Road, Martinez, CA 9455337:59:41.791N 122:07:03.756W
This map or dataset was created by the Contra Costa County Department of Conservationand Development with data from the Contra Costa County GIS Program. Some
base data, primarily City Limits, is derived from the CA State Board of Equalization'stax rate areas. While obligated to use this data the County assumes no responsibility for
its accuracy. This map contains copyrighted information and may not be altered. It may be reproduced in its current state if the source is cited. Users of this map agree to read and
accept the County of Contra Costa disclaimer of liability for geographic information. ®
Town of Moraga
Moraga SOI
City Boundaries
Contra Costa County
County Urban Limit Line
By LAFCO action on 06/12/2019,
the Town of Moragaboundary and SOI
were approved.

JerseyIsland
HollandTract
OAKLEY
ANTIOCH
BRENTWOOD
Knightsen
BethelIsland
SandmoundSlough
SacramentoCounty
SanJoaquinRiver
BigBreak
Dutch Slough
Sand
moun
d Slou
gh
Delta Rd Sell
ers A
ve
O'H
ara A
ve
Emp
ire Av
e
Byr
on H
wy
E 18th St
Hillc
rest
Ave
Bre
ntwo
od B
lvd
Oakley Rd Main St
E Cypress Rd Neroly Rd M
ain S
t
Lone Tree Way
Main St
Beth
el Isl
and R
d
Laurel Rd
ÄÅ44
ÄÅ160
0 1.5 30.75
MilesMap created 06/14/2019
by Contra Costa County Department ofConservation and Development, GIS Group
30 Muir Road, Martinez, CA 9455337:59:41.791N 122:07:03.756W
This map or dataset was created by the Contra Costa County Department of Conservationand Development with data from the Contra Costa County GIS Program. Some
base data, primarily City Limits, is derived from the CA State Board of Equalization'stax rate areas. While obligated to use this data the County assumes no responsibility for
its accuracy. This map contains copyrighted information and may not be altered. It may be reproduced in its current state if the source is cited. Users of this map agree to read and
accept the County of Contra Costa disclaimer of liability for geographic information. ®
City of Oakley Boundary and Sphere of Influence
City of Oakley
Oakley SOI
City Boundaries
Contra Costa County
County Urban Limit Line
By LAFCO action on 06/12/2019, the City of Oakley boundary
and SOI were approved.

ORINDA
LAFAYETTE
MORAGA
AlamedaCounty
BrionesReservoir
San PabloReservoir
Bear Creek Rd
Happy Valley Rd
Rheem Blvd
Moraga Way
Glor
ietta
Blvd
Pinehurst Rd
Camino Pablo
San Pablo Dam Rd
Fish Ranch Rd
ÄÅ2424
ÄÅ1313
City of Orinda Boundary and Coterminous Sphere of Influence
0 0.75 1.50.375
MilesMap created 06/14/2019by Contra Costa County Department of
Conservation and Development, GIS Group30 Muir Road, Martinez, CA 9455337:59:41.791N 122:07:03.756W
This map or dataset was created by the Contra Costa County Department of Conservationand Development with data from the Contra Costa County GIS Program. Some
base data, primarily City Limits, is derived from the CA State Board of Equalization'stax rate areas. While obligated to use this data the County assumes no responsibility for
its accuracy. This map contains copyrighted information and may not be altered. It may be reproduced in its current state if the source is cited. Users of this map agree to read and
accept the County of Contra Costa disclaimer of liability for geographic information. ®
City of Orinda (coterminous with SOI)
City Boundaries
Contra Costa County
County Urban Limit Line
By LAFCO action on 06/12/2019, City ofOrinda boundaryand coterminous
SOI were approved

SanPablo
Bay
§̈¦80
ÄÅ4
Richmond Pkwy
Hilltop Dr
Pinole Valley Rd
Giant H
wy
Willow Ave
Refugio Valley Rd
Lupine Rd
Simas Ave
Wright Ave
Sarah Dr
San Pablo AveAppian Way
Tara Hills Dr
Marlesta RdPINOLE
HERCULES
RICHMOND
RICHMONDSANPABLO
Rodeo
ElSobrante
TaraHills
BayViewMontalvinManor
MarinCounty
0 2 41
MilesMap created 06/14/2019by Contra Costa County Department of
Conservation and Development, GIS Group30 Muir Road, Martinez, CA 9455337:59:41.791N 122:07:03.756W
This map or dataset was created by the Contra Costa County Department of Conservationand Development with data from the Contra Costa County GIS Program. Some
base data, primarily City Limits, is derived from the CA State Board of Equalization'stax rate areas. While obligated to use this data the County assumes no responsibility for
its accuracy. This map contains copyrighted information and may not be altered. It may be reproduced in its current state if the source is cited. Users of this map agree to read and
accept the County of Contra Costa disclaimer of liability for geographic information. ®
City of Pinole Boundary and Sphere of Influence
City of Pinole
Pinole SOI
City Boundaries
County Boundary
County Urban Limit Line
By LAFCO action on 06/12/2019,
the City of Pinoleboundary and SOI
were approved.

SolanoCounty
SacramentoCounty
Sacramento River
San Joaquin River
New York Slough
Middle Slough
SuisunBay
HonkerBay
Broad Slough
ÄÅ4
ÄÅ4 W Leland Rd
Baile
y Rd
Railro
ad Av
e
10th St
Harb
or St
Buchanan Rd
Parkside DrWillow Pass Rd
Kirker PassR
d
Evora Rd
Love
ridge
Rd
Port Chicago Hwy
Landana Dr
Pacifica Ave
Canal Rd
Somers
ville R
d
Century Blvd
Polaris Dr
James Donlan Blvd
3rd St
San M
arco
Blvd
Wood
hill D
r
E Leland Rd
Harb
orSt
Willow Pass Rd
Pittsburg Antioch Hwy
ÄÅ4
BrownIsland
WinterIsland
PITTSBURG
CONCORDANTIOCH
BayPoint
0 2 41
MilesMap created 06/14/2019by Contra Costa County Department of
Conservation and Development, GIS Group30 Muir Road, Martinez, CA 9455337:59:41.791N 122:07:03.756W
This map or dataset was created by the Contra Costa County Department of Conservationand Development with data from the Contra Costa County GIS Program. Some
base data, primarily City Limits, is derived from the CA State Board of Equalization'stax rate areas. While obligated to use this data the County assumes no responsibility for
its accuracy. This map contains copyrighted information and may not be altered. It may be reproduced in its current state if the source is cited. Users of this map agree to read and
accept the County of Contra Costa disclaimer of liability for geographic information. ®
City of Pittsburg Boundary and Sphere of Influence
City of Pittsburg
Pittsburg SOI
City Boundaries
County Boundary
Pittsburg Urban
By LAFCO action on 06/12/2019, the City of Pittsburg boundary
and SOI were approved.

MARTINEZ
PLEASANTHILL
CONCORD
LAFAYETTE WALNUTCREEK
Pacheco
ReliezValley
ContraCostaCentre
§̈¦680ÄÅ44
ÄÅ242
§̈¦680
Taylor Blvd
Reliez Valley Rd
Contra Costa Blvd
N Ma
in St
Geary Rd
Boyd Rd
Concord Ave
Pacheco Blvd
Oak Park Blvd
Center Ave
Morello Ave
Grayson Rd
Plea
sant
Hill
Rd
Solano Way
Monument Blvd
Tay
lor B
lvd
Gregory Ln
Alhambra Ave
Ple
asant Hill Rd
Mor
ello A
ve
Reli e
z Vall
eyRd
Treat Blvd
City of Pleasant Hill Boundary and Sphere of Influence
0 0.5 10.25
MilesMap created 06/14/2019
by Contra Costa County Department ofConservation and Development, GIS Group
30 Muir Road, Martinez, CA 9455337:59:41.791N 122:07:03.756W
This map or dataset was created by the Contra Costa County Department of Conservationand Development with data from the Contra Costa County GIS Program. Some
base data, primarily City Limits, is derived from the CA State Board of Equalization'stax rate areas. While obligated to use this data the County assumes no responsibility for
its accuracy. This map contains copyrighted information and may not be altered. It may be reproduced in its current state if the source is cited. Users of this map agree to read and
accept the County of Contra Costa disclaimer of liability for geographic information. ®
City of Pleasant Hill
Pleasant Hill SOI
City Boundaries
County Urban Limit Line
By LAFCO action on 06/12/2019, the City of Pleasant Hillboundary and SOI
were approved.

RICHMOND
RICHMOND
PINOLEHERCULES
RICHMOND
EL CERRITO
SANPABLO
ORINDA
ElSobrante
Kensington
TaraHills
NorthRichmond
BayView
MontalvinManor
MarinCounty
SanFrancisco
CountyAlamedaCounty
SanPablo
Bay
SanFrancisco
Bay
RichmondInner Harbor
San PabloReservoir
BrionesReservoir
Harbor Channel
§̈¦80
§̈¦580
§̈¦580
ÄÅ4
Richmond Pkwy
23rd
St
San Pablo Ave
Castr
o St
Bear Creek Rd
Western Dr
Hilltop Dr
34th
St
Carlson Blvd
7th St
3rd S
t
Richmond StCutting Blvd
Gian
t Rd
Rheem Ave
Pino le Val ley Rd
Solano Ave
Giant Hwy
Atlas Rd
Castro Ranch Rd
55th
St
Appian WayBlum
e Dr
Refugio Valley Rd
MacDonald Ave
Sarah Dr
Regatta BlvdSan Mateo St
13th
St
Barrett Ave
Canal Blvd
San Pablo Ave
Garra
rd Blv
d
San Pablo Dam Rd
Valley ViewRd
Arlington Blvd
§̈¦80
City of Richmond Boundary and Sphere of Influence
0 5 102.5
MilesMap created 09/18/2019by Contra Costa County Department of
Conservation and Development, GIS Group30 Muir Road, Martinez, CA 9455337:59:41.791N 122:07:03.756W
This map or dataset was created by the Contra Costa County Department of Conservationand Development with data from the Contra Costa County GIS Program. Some
base data, primarily City Limits, is derived from the CA State Board of Equalization'stax rate areas. While obligated to use this data the County assumes no responsibility for
its accuracy. This map contains copyrighted information and may not be altered. It may be reproduced in its current state if the source is cited. Users of this map agree to read and
accept the County of Contra Costa disclaimer of liability for geographic information. ®
City of Richmond
Richmond SOI
City Boundaries
County Boundary
County Urban Limit Line
By LAFCO action on 06/12/2019 ,the City of
Richmond boundary and SOI were approved. Subsequent
annexations and SOI amendments have occurred.
RICHMOND
RICHMOND
SANPABLO
EL CERRITO
ElSobrante
EastRichmond
Heights
Rollingwood
§̈¦80
34th
St Amador St
Hillc
rest Rd
San Pablo Ave
San Pablo Dam RdEl Portal Dr
Roosevelt Ave
Arlington Blvd
InsetMap

AlamedaCounty
AlamedaCounty
§̈¦680
§̈¦680
Alcosta Blvd
Camino Tassajara
Crow Canyon Rd
Davona Dr
Bollinger Canyon Rd
Broadmoor Dr
Dougherty Rd
Blac
khaw
k Rd
Doughe rtyRd
Bollin
ger Canyon Rd
Windemere Pkwy
Cami
noTa
ssaja
ra
San Ramon Valley Blvd
San Ramon Valley BlvdSAN
RAMON
DANVILLE Blackhawk
CaminoTassajara
NorrisCanyon
§̈¦680
Alcosta Blvd
Dougherty Rd
Crow
Can
yon R
dCamino Tassajara
Village Pkwy
Paraiso Dr
Camino Ramon
Stoneleaf Rd
0 2 41
MilesMap created 11/30/2020by Contra Costa County Department of
Conservation and Development, GIS Group30 Muir Road, Martinez, CA 9455337:59:41.791N 122:07:03.756W
This map or dataset was created by the Contra Costa County Department of Conservationand Development with data from the Contra Costa County GIS Program. Some
base data, primarily City Limits, is derived from the CA State Board of Equalization'stax rate areas. While obligated to use this data the County assumes no responsibility for
its accuracy. This map contains copyrighted information and may not be altered. It may be reproduced in its current state if the source is cited. Users of this map agree to read and
accept the County of Contra Costa disclaimer of liability for geographic information. ®
City of San Ramon Boundary and Sphere of Influence
City of San Ramon
San Ramon SOI
City Boundaries
County Boundary
San Ramon Urban Growth Boundary
By LAFCO action on 06/12/2019, the City ofSan Ramon boundary
and SOI were approved.Subsequent annexations
have occurred.

RICHMOND
SANPABLO Rollingwood
EastRichmond
Heights
NorthRich.
ElSob
rante
RICHMOND
23r
d St
San Pablo Ave
Gian
t Rd
Richmond Pkwy
Garvin Ave
Market Ave
Blume Dr
29th
St
Rumrill Blvd
El Portal Dr
Mc Bryde Ave
Maricopa Ave
Church Ln
Sanford Ave
13th
St
Road 20
Gian
t Hwy
Robert Miller Dr
Vale Rd
Parr Blvd
San Pablo Dam Rd
Brookside Dr
San
Pablo
Ave
Rum
rill B
lvd
Esmond Ave
Hilltop Dr
§̈¦8080
City of San Pablo Boundary and Sphere of Influence
0 0.4 0.80.2
MilesMap created 06/14/2019
by Contra Costa County Department ofConservation and Development, GIS Group
30 Muir Road, Martinez, CA 9455337:59:41.791N 122:07:03.756W
This map or dataset was created by the Contra Costa County Department of Conservationand Development with data from the Contra Costa County GIS Program. Some
base data, primarily City Limits, is derived from the CA State Board of Equalization'stax rate areas. While obligated to use this data the County assumes no responsibility for
its accuracy. This map contains copyrighted information and may not be altered. It may be reproduced in its current state if the source is cited. Users of this map agree to read and
accept the County of Contra Costa disclaimer of liability for geographic information. ®
City of San Pablo
San Pablo SOI
City Boundaries
County Urban Limit Line
By LAFCO action on 06/12/2019, the City of San Pablo boundary
and SOI were approved.

ÄÅ24
Treat Blvd
WALNUTCREEK
CONCORD
LAFAYETTE
PLEASANTHILL
Danville
MORAGA Alamo
Saranap
ReliezValley
SanMiguel
NorthGate
CastleHill
ShellRidge
ContraCostaCentre
AcalanesRidge
§̈¦680
§̈¦680
Ygnacio Valley Rd
N Ma
in StTaylo
rB
lvd
Danville Blvd
Walnut B lvd
St M
arys
Rd
Geary Rd
Rudgear Rd
Livorna Rd
Minert Rd
Citru
sAve
Bancroft Rd
2nd Ave
Olympic Blvd
Camino Diablo
Walnut Ave
Oak Park Blvd
Civic
DrSan Luis Rd
California Blvd
Cont
ra C
osta
Blvd
Broadway
Rossmoor Pkwy
Cowell Rd
MayhewWay
Newell
Stone Valley Rd
Plea
sant
Hill R
d
North Gate Rd
Tice Valley Blvd
AveMain St
Oak Grove Rd
City of Walnut Creek Boundary and SOI
0 1 20.5
MilesMap created 06/14/2019
by Contra Costa County Department ofConservation and Development, GIS Group
30 Muir Road, Martinez, CA 9455337:59:41.791N 122:07:03.756W
This map or dataset was created by the Contra Costa County Department of Conservationand Development with data from the Contra Costa County GIS Program. Some
base data, primarily City Limits, is derived from the CA State Board of Equalization'stax rate areas. While obligated to use this data the County assumes no responsibility for
its accuracy. This map contains copyrighted information and may not be altered. It may be reproduced in its current state if the source is cited. Users of this map agree to read and
accept the County of Contra Costa disclaimer of liability for geographic information. ®
City of Walnut Creek
Walnut Creek SOI
City Boundaries
County Urban Limit Line
By LAFCO actionon 06/12/2019, theCity of Walnut Creekboundary and SOIwere approved.

APPENDIX D:
Maps of CSDs’ Boundaries and Spheres of Influence in Contra Costa County

Pool
Carquinez Strait
§̈¦8080
§̈¦8080
CrockettPort
Costa
Cummings Skwy
Pomona St
Crockett Blvd
San Pablo Ave
McE
wen R
d
Duperu Dr
Vista del Rio St
Loring Ave
Edwards StW anda StCarquinez Scenic Dr
Rolph Park Dr
Winslow St
Reservoir St
Flora St
Alhambra St
Rolp
h Ave
Dowrelio Dr
Ceres StKendall Ave
Rose St Baldw inAv
e
Francis St
Starr St
Canyon Lake Dr
AlexanderPark
RithetPark
George Morrison Rolph
Memorial Park
DowntownPlaza
WWIMemorial
HallCrockettCommunity Center
SolanoCounty
0 0.5 10.25
MilesMap created 06/14/2019by Contra Costa County Department of
Conservation and Development, GIS Group30 Muir Road, Martinez, CA 9455337:59:41.791N 122:07:03.756W
This map or dataset was created by the Contra Costa County Department of Conservationand Development with data from the Contra Costa County GIS Program. Some
base data, primarily City Limits, is derived from the CA State Board of Equalization'stax rate areas. While obligated to use this data the County assumes no responsibility for
its accuracy. This map contains copyrighted information and may not be altered. It may be reproduced in its current state if the source is cited. Users of this map agree to read and
accept the County of Contra Costa disclaimer of liability for geographic information. ®
Crockett Community Service District Boundary and SOI
Crockett Community Service District
CCSD SOI
Parks maintained by CCSD
Contra Costa County
County Urban Limit Line
Parcels
By LAFCO actionon 06/12/2019,
Crockett CSD boundaryand SOI were approved.

DANVILLE
Diablo
Alamo
BlackhawkDiablo Rd
Alameda Diablo
E l NidoCameo Dr
Stone Valley RdMc Cauley Rd
Calle Arroyo
Caballo Ranchero Dr
Valle V
ista
Mera
no St
Moun
t Diab
loScen
ic Blvd
Pulido Rd
Verde Mesa Dr
Bel gian D r
White Gate Rd
Jay Ln
Roan Dr
L ack land Dr
Clydesdale Dr
Emmons Canyon Dr
Parkmont Dr
Rima Ct
Club House Rd
Via D iablo
Virginia St
La Cadena
Plaza C ir
Casa Nuestra
Pulido Ct
Piedras Cir
Fallbrook Dr
Diab
loRa
nch P
l
Maide
n Ln
Ray Ct
Aven
idaNu
eva
Savo
na
CtAre nd
s DrDiablo Cr
eek P
l
Fairway Dr
Greg Ct
Merl in Ct
Came
ron C
t
Park MeadowDr
Via Cima Ct
Volterra Ct
Lisa Ct
Hope Ln
Montana Dr
Holly Oak Dr
Janis Ct
VagabondW a
y
Jessica Ct
Diablo Community Services District and Coterminous SOI
0 1,000 2,000500
FeetMap created 01/11/2021by Contra Costa County Department of
Conservation and Development, GIS Group30 Muir Road, Martinez, CA 9455337:59:41.791N 122:07:03.756W
This map or dataset was created by the Contra Costa County Department of Conservationand Development with data from the Contra Costa County GIS Program. Some
base data, primarily City Limits, is derived from the CA State Board of Equalization'stax rate areas. While obligated to use this data the County assumes no responsibility for
its accuracy. This map contains copyrighted information and may not be altered. It may be reproduced in its current state if the source is cited. Users of this map agree to read and
accept the County of Contra Costa disclaimer of liability for geographic information. ®
Diablo CSD
Trails maintained by DCSD
City Boundaries
Parcels
County Urban Limit Line
By action on 6/12/2019, LAFCOreaffirmed the Diablo CSD
boundary and coterminous SOI

Rinc on Rd
ELCERRITO
RICHMOND
Kensington
BERKELEYALBANY
ContraCosta
County
AlamedaCounty
Moeser Ln
Arlington Ave
Richmond St
Grizzly Peak Blvd Colusa Ave
Fairmount Ave
Navellier St
San
ta Fe
Ave
Ashbury Ave
Ter ra ce Dr
Balra Dr
Colusa Ave
Purdue Ave
SeaviewDr
Highgate RdPomona Ave
Beloit Ave
Carmel Ave
Lake Dr
Canon Dr
RamonaAve
Franciscan Way
Bonnie DrK ing Dr
Ken yon Ave
ShevlinDr
Gal vin Dr
San Carlos Av e
Behrens St
Central P ark Dr
Eureka Ave
Amherst Ave
Highland Blvd
Sunset Dr
Central Ave
Kingston RdStanford Ave
Vil lag e Dr
Grizzly PeakBlvd
Ward Ave
WindsorAve
Stratford Rd
Anson Way
Lenox Rd
Kerr Ave
Trinity AveWelle
sley Ave
Norwood Ave
Gelsto n Pl
Los Alto s Dr
Arlm
ont Dr
Bates Ave
Cambridge Ave
Kensington Ct
Edwin Dr
Willamette Ave
Sea ViewDr
Av
on Rd
Arlin
gton Ct
Oakview Ave
Ga rden Dr
Levi
ston Ave
Craft Ave
Edgecro f t Rd
Coventry Rd
Yale Ave
Balra Dr
Highland Blvd
Pomona Ave
Eureka Ave
Berk
eley P
ark B
lvd
Spr
uce S
t
KensingtonCommunity ParkKensington
CommunityCenter
0 0.5 10.25
MilesMap created 01/11/2021by Contra Costa County Department of
Conservation and Development, GIS Group30 Muir Road, Martinez, CA 9455337:59:41.791N 122:07:03.756W
This map or dataset was created by the Contra Costa County Department of Conservationand Development with data from the Contra Costa County GIS Program. Some
base data, primarily City Limits, is derived from the CA State Board of Equalization'stax rate areas. While obligated to use this data the County assumes no responsibility for
its accuracy. This map contains copyrighted information and may not be altered. It may be reproduced in its current state if the source is cited. Users of this map agree to read and
accept the County of Contra Costa disclaimer of liability for geographic information. ®
Kensington Police Protection and Community Services District and Coterminous SOI
KPPCSD and Coterminous SOI
Parks maintained by KPPCSD
City Boundaries
Contra Costa County
County Urban Limit Line
By LAFCO action on 06/12/2019, Kensington Police
Protection & CommunityServices District boundary and
coterminous SOI were approved.

Bixl
er Rd
NewportDr
Point of Timber Rd
Balfour Rd
Willow L ake Rd
Clipper Dr
Cher
ryHi
llsDr
Marsh Creek Rd
Clubhouse Dr
Beaver Ln
Marina Rd
Fer
tado L
n
Riverlake Rd
Windward Pt
Sailboat Dr
Marlin Dr
Sand Point Rd
Cabrillo Pt
D rakes Dr
S Lakef r ont L
oop
Seal Way
Learning Ln
N Lakefront Loop
StarboardDr
Beacon Pl
Slifer Dr
Dolph in
Pl
L a kesho r eC i
r
Prestw i ck Dr
Saint Andrews Dr
Fallman Blvd
Wayfar
e rDr
Discovery Pt
Wayfarer Ct
Newberry Ln
North Pt
Beac
h Ct
Lighthouse Pl
Newport Ln
Harbor Dr
Newport DrDi
scov
ery B
ay B
lvd
Regatta Dr
OrwoodTract
ByronTract
DiscoveryBay Indian Slough
Dredgers Cut
ÄÅ44 ÄÅ44
CornellPark
RavenswoodPark
RobertaFussTot Lot
Discovery BayCommunity
Center
RegattaPark
SliferPark
Town of Discovery Bay CSD Boundary and SOI
0 2,000 4,0001,000
FeetMap created 01/11/2021by Contra Costa County Department of
Conservation and Development, GIS Group30 Muir Road, Martinez, CA 9455337:59:41.791N 122:07:03.756W
This map or dataset was created by the Contra Costa County Department of Conservationand Development with data from the Contra Costa County GIS Program. Some
base data, primarily City Limits, is derived from the CA State Board of Equalization'stax rate areas. While obligated to use this data the County assumes no responsibility for
its accuracy. This map contains copyrighted information and may not be altered. It may be reproduced in its current state if the source is cited. Users of this map agree to read and
accept the County of Contra Costa disclaimer of liability for geographic information. ®
Town of Discovery Bay CSD
Town of Discovery Bay CSD SOI
Parks maintained by ToDBCSD
County Urban Limit Line
By LAFCO action on 06/12/2019, Town of Discovery Bay CSD boundary and SOI were approved. Subsequent SOI amendments have occurred.

APPENDIX E:
Maps of CSAs’ Boundaries and Spheres of Influence in Contra Costa County

ClydePark
Big Oak ParkMarie
Porter Park
MaybeckPark
Park St
Port Chicago Hwy Norman Ave
Wellington Ave
Medburn St
Sussex St
Forn
i Dr
Commercial Cir
Trafalgar Cir
Middlesex St
Dean Lesher Dr
Highland Ct
Trafalgar Ct
Kilburn St
CONCORD
Clyde
County Service Area M-16 (Community of Clyde) and Coterminus SOI
0 750 1,500375
FeetMap created 01/11/2021by Contra Costa County Department of
Conservation and Development, GIS Group30 Muir Road, Martinez, CA 9455337:59:41.791N 122:07:03.756W
This map or dataset was created by the Contra Costa County Department of Conservationand Development with data from the Contra Costa County GIS Program. Some
base data, primarily City Limits, is derived from the CA State Board of Equalization'stax rate areas. While obligated to use this data the County assumes no responsibility for
its accuracy. This map contains copyrighted information and may not be altered. It may be reproduced in its current state if the source is cited. Users of this map agree to read and
accept the County of Contra Costa disclaimer of liability for geographic information. ®
CSA M-16 (Community of Clyde)
Parks maintained by CSA M-16
City Boundaries
Parcels
County Urban Limit Line

San PabloBay
MontalvinPark
MonTaraBay Park & Ball Field Complex
CommunityCenter
RICHMOND
PINOLE
TaraHills
Bay View
MontalvinManor
El Sobrante
§̈¦8080
San Pablo Ave
Richmond Pkwy
Shawn Dr
Tara Hills Dr
Shamrock Dr
Hillto
p Dr Blume Dr
Fitzge
rald D
r
Marlesta Rd
Flannery RdAtlas Rd
Lake
side D
r
Del Monte Dr
Hilltop Mall Rd
Pinole
Sho
res R
d
Klose Way
County Service Area M-17 (Tara Hills, Montalvin Manor, West Contra Costa) and Coterminus SOI
0 1,500 3,000750
FeetMap created 01/11/2021by Contra Costa County Department of
Conservation and Development, GIS Group30 Muir Road, Martinez, CA 9455337:59:41.791N 122:07:03.756W
This map or dataset was created by the Contra Costa County Department of Conservationand Development with data from the Contra Costa County GIS Program. Some
base data, primarily City Limits, is derived from the CA State Board of Equalization'stax rate areas. While obligated to use this data the County assumes no responsibility for
its accuracy. This map contains copyrighted information and may not be altered. It may be reproduced in its current state if the source is cited. Users of this map agree to read and
accept the County of Contra Costa disclaimer of liability for geographic information. ®
CSA M-17 (Tara Hills, Montalvin Manor, West Contra Costa)
Parks maintained by CSA M-17
City Boundaries
Parcels
County Urban Limit Line

Doug
herty
Rd
Alcosta Blvd
Bollin
ger C
anyo
n Rd
E Branch Pkwy
Village
Pkwy
Bollinger Canyon Rd
Windemere Pkwy
Alcosta Blvd
Crow Canyon Rd
San Ramon Valley
Blvd
Old R a n ch Rd
Dougherty Rd
SANRAMON
DANVILLE CaminoTassajara
AlamedaCounty
§̈¦680
County Service Area M-29 (San Ramon, Dougherty Valley) and Coterminus SOI
0 3,000 6,0001,500
FeetMap created 11/30/2020by Contra Costa County Department of
Conservation and Development, GIS Group30 Muir Road, Martinez, CA 9455337:59:41.791N 122:07:03.756W
This map or dataset was created by the Contra Costa County Department of Conservationand Development with data from the Contra Costa County GIS Program. Some
base data, primarily City Limits, is derived from the CA State Board of Equalization'stax rate areas. While obligated to use this data the County assumes no responsibility for
its accuracy. This map contains copyrighted information and may not be altered. It may be reproduced in its current state if the source is cited. Users of this map agree to read and
accept the County of Contra Costa disclaimer of liability for geographic information. ®
CSA M-29 (San Ramon, Dougherty Valley)
City Boundaries
Contra Costa County
County Urban Limit Line

DANVILLE
Alamo
Danville Blvd
Stone Valley RdStone Valley Rd
Alamo Springs Dr
Valle
yOak
s Dr
Daniel Dr
LaGo
nda Way
Gary Way El Pinto
High Eagle Rd
Pebble Dr
Corwin Dr
Adrienne Dr
Britain Ct
Camille
Ave
Pebble Ln
Muir Ln
Massoni Ct
Kimberley Pl
Corrie Pl
Hemme Ave
Pebble Ct Nelda Way
El Alamo
Kemline Ct
Alamo Ranch Rd
ElAl
am
o Ct
Sandra Ct
Angela Ave
Valley Oaks Ct
StPa
ulDr
§̈¦680
County Service Area M-30 (Alamo) and Coterminus SOI
0 750 1,500375
FeetMap created 08/14/2020by Contra Costa County Department of
Conservation and Development, GIS Group30 Muir Road, Martinez, CA 9455337:59:41.791N 122:07:03.756W
This map or dataset was created by the Contra Costa County Department of Conservationand Development with data from the Contra Costa County GIS Program. Some
base data, primarily City Limits, is derived from the CA State Board of Equalization'stax rate areas. While obligated to use this data the County assumes no responsibility for
its accuracy. This map contains copyrighted information and may not be altered. It may be reproduced in its current state if the source is cited. Users of this map agree to read and
accept the County of Contra Costa disclaimer of liability for geographic information. ®
CSA M-30 (Alamo)
City Boundaries
Parcels
County Urban Limit Line

MORAGA
LAFAYETTE
ORINDA
WALNUTCREEK
Saranap
CastleHill
San LeandroReservoir
St Marys Rd
Rheem Blvd
Ivy DrPinehurst Rd
Canyon Rd
Moraga Way
Larch Ave
Tice Creek Dr
Rohrer DrHall D
r
Campolindo Dr
Glenside Dr
Olympic Blvd
Zand
er D
r
Burton Dr
Rossmoor Pkwy
St Marys Rd
Camino Pablo
Bollinger Canyon Rd
AlamedaCounty
County Service Area R-4 (Moraga) and Coterminus SOI
0 4,000 8,0002,000
FeetMap created 08/14/2020by Contra Costa County Department of
Conservation and Development, GIS Group30 Muir Road, Martinez, CA 9455337:59:41.791N 122:07:03.756W
This map or dataset was created by the Contra Costa County Department of Conservationand Development with data from the Contra Costa County GIS Program. Some
base data, primarily City Limits, is derived from the CA State Board of Equalization'stax rate areas. While obligated to use this data the County assumes no responsibility for
its accuracy. This map contains copyrighted information and may not be altered. It may be reproduced in its current state if the source is cited. Users of this map agree to read and
accept the County of Contra Costa disclaimer of liability for geographic information. ®
CSA R-4 (Moraga)
City Boundaries
Contra Costa County
County Urban Limit Line

DANVILLE
WALNUTCREEK
WALNUTCREEK
Alamo
Diablo
CastleHill
San Miguel Rudgear Rd
Miranda Ave
Livorna Rd
Gre
en Va
lley R
d
Stone Valley Rd
Danville Blvd
Danville Blvd Diablo Rd
El Cerro Blvd
Hap MageeRanch Park
LivornaPark
Rancho RomeroSports Field
and Park
AlamoElementary
School Park
Andrew H.Young Park
HemmeStation
Park MonteVistaHigh
School Pool
§̈¦680
0 1 20.5
MilesMap created 01/14/2021by Contra Costa County Department of
Conservation and Development, GIS Group30 Muir Road, Martinez, CA 9455337:59:41.791N 122:07:03.756W
This map or dataset was created by the Contra Costa County Department of Conservationand Development with data from the Contra Costa County GIS Program. Some
base data, primarily City Limits, is derived from the CA State Board of Equalization'stax rate areas. While obligated to use this data the County assumes no responsibility for
its accuracy. This map contains copyrighted information and may not be altered. It may be reproduced in its current state if the source is cited. Users of this map agree to read and
accept the County of Contra Costa disclaimer of liability for geographic information. ®
County Service Area R-7 (Alamo) and Coterminus SOI
CSA R-7 (Alamo)
Parks maintained by CSA R-7
City Boundaries
County Urban Limit Line

RICHMOND
PINOLE
HERCULES
EL CERRITO
SANPABLO
ElSobrante
TaraHills
ElSobrante
EastRichmond
Heights
MontalvinManor
ElSobrante
Rolling-wood
RICHMOND
RICHMOND
§̈¦8080
Hilltop Dr
Appian Way
Valley View Rd
San Pablo Dam Rd
Blume Dr
Tara Hills Dr
Sarah Dr
Fitzger
ald Dr
Santa Rita RdMorningside Dr
Sobrante Ave
San Pablo Ave
Richmond Pkwy
Manor Rd
Hillside Dr
Castro Ranch Rd
Faria Ave
La Paloma Rd
Pinole Valley Rd
El SobranteLibrary Children's
Reading Garden
County Service Area R-9 (El Sobrante) and Coterminus SOI
0 3,000 6,0001,500
FeetMap created 05/18/2021by Contra Costa County Department of
Conservation and Development, GIS Group30 Muir Road, Martinez, CA 9455337:59:41.791N 122:07:03.756W
This map or dataset was created by the Contra Costa County Department of Conservationand Development with data from the Contra Costa County GIS Program. Some
base data, primarily City Limits, is derived from the CA State Board of Equalization'stax rate areas. While obligated to use this data the County assumes no responsibility for
its accuracy. This map contains copyrighted information and may not be altered. It may be reproduced in its current state if the source is cited. Users of this map agree to read and
accept the County of Contra Costa disclaimer of liability for geographic information. ®
CSA R-9 (El Sobrante)
Parks maintained by CSA R-9
City Boundaries
County Urban Limit Line

4th St
Willow Ave
San Pabl
o Ave
Parker Ave
Sycamore Ave Willow Ave
San Pablo Ave
San
Pablo
Ave
7th St
San
Pab
lo Av
e
HERCULES
Rodeo
Lefty GomezRecreation Building &
Ballfield Complex
Rodeo Creek Trail
Rodeo Creek Trail
San PabloBay
§̈¦8080
ÄÅ44
County Service Area R-10 (Rodeo) and Coterminus SOI
0 1,500 3,000750
FeetMap created 01/19/2021by Contra Costa County Department of
Conservation and Development, GIS Group30 Muir Road, Martinez, CA 9455337:59:41.791N 122:07:03.756W
This map or dataset was created by the Contra Costa County Department of Conservationand Development with data from the Contra Costa County GIS Program. Some
base data, primarily City Limits, is derived from the CA State Board of Equalization'stax rate areas. While obligated to use this data the County assumes no responsibility for
its accuracy. This map contains copyrighted information and may not be altered. It may be reproduced in its current state if the source is cited. Users of this map agree to read and
accept the County of Contra Costa disclaimer of liability for geographic information. ®
CSA R-10 (Rodeo)
Parks maintained by CSA R-10
City Boundaries
Parcels
County Urban Limit Line

APPENDIX F:
LAFCO & MSR History

APPENDIX F:
LAFCO & MSR History

Economic & Planning Systems, Inc. Z:\Shared\Projects\Oakland\191000s\191105_ContraCostaLAFCO_Parks&RecMSR\Report\Appendices\AppF_LAFCO MSR History_2021.docx
LAFCO & MSR HISTORY
LAFCO H is to ry
After World War II, California experienced dramatic growth in population and economic development. With this boom came a demand for housing, jobs and public services. To accommodate this demand, many new local government agencies were formed, often with little forethought as to the ultimate governance structures in a given region, and existing agencies often competed for expansion areas. The lack of coordination and adequate planning led to a multitude of overlapping, inefficient jurisdictional and service boundaries, and the premature conversion of California’s agricultural and open-space lands.
Recognizing this problem, in 1959, Governor Edmund G. Brown, Sr. appointed the Commission on Metropolitan Area Problems. The Commission's charge was to study and make recommendations on the “misuse of land resources” and the growing complexity of local governmental jurisdictions. The Commission's recommendations on local governmental reorganization were introduced in the Legislature in 1963, resulting in the creation of a Local Agency Formation Commission, or LAFCO.
LAFCO is responsible for coordinating logical and timely changes in local governmental boundaries, including annexations and detachments of territory, incorporations of cities, formations of special districts, and consolidations, mergers and dissolutions of districts, as well as reviewing ways to reorganize, simplify, and streamline governmental structure. The Commission's efforts are focused on ensuring that services are provided efficiently and economically while agricultural and open-space lands are protected. To better inform itself and the community as it seeks to exercise its charge, LAFCO conducts service reviews to evaluate the provision of municipal services within the County.
Munic ipa l Se rv i ce Rev iew Or ig ins
The MSR requirement was enacted by the Legislature months after the release of two studies recommending that LAFCOs conduct reviews of local agencies. The “Little Hoover Commission” focused on the need for oversight and consolidation of special districts, whereas the “Commission on Local Governance for the 21st Century” focused on the need for regional planning to ensure adequate and efficient local governmental services as the California population continues to grow.
Little Hoover Commission
In May 2000, the Little Hoover Commission released a report entitled Special Districts: Relics of the Past or Resources for the Future? This report focused on governance and financial challenges among independent special districts, and the barriers to LAFCO’s pursuit of district consolidation

CC LAFCO Parks & Recreation MSR/SOI Updates June 2021 Appendix F: LAFCO & MSR History Page 2
Economic & Planning Systems, Inc. Z:\Shared\Projects\Oakland\191000s\191105_ContraCostaLAFCO_Parks&RecMSR\Report\Appendices\AppF_LAFCO MSR History_2021.docx
and dissolution. The report raised the concern that “the underlying patchwork of special district governments has become unnecessarily redundant, inefficient and unaccountable.”1
In particular, the report raised concern about a lack of visibility and accountability among some independent special districts. The report indicated that many special districts hold excessive reserve funds and some receive questionable property tax revenue. The report expressed concern about the lack of financial oversight of the districts. It asserted that financial reporting by special districts is inadequate, that districts are not required to submit financial information to local elected officials, and concluded that district financial information is “largely meaningless as a tool to evaluate the effectiveness and efficiency of services provided by districts, or to make comparisons with neighboring districts or services provided through a city or county.”2
The report questioned the accountability and relevance of certain special districts with uncontested elections and without adequate notice of public meetings. In addition to concerns about the accountability and visibility of special districts, the report raised concerns about special districts with outdated boundaries and outdated missions. The report questioned the public benefit provided by health care districts that have sold, leased or closed their hospitals, and asserted that LAFCOs consistently fail to examine whether they should be eliminated. The report pointed to service improvements and cost reductions associated with special district consolidations, and asserted that LAFCOs have generally failed to pursue special district reorganizations.
The report called on the Legislature to increase the oversight of special districts by mandating that LAFCOs identify service duplications and study reorganization alternatives when service duplications are identified, when a district appears insolvent, when district reserves are excessive, when rate inequities surface, when a district’s mission changes, when a new city incorporates, and when service levels are unsatisfactory. To accomplish this, the report recommended that the State strengthen the independence and funding of LAFCOs, require districts to report to their respective LAFCO, and require LAFCOs to study service duplications.
Commission on Local Governance for the 21st Century
The Legislature formed the Commission on Local Governance for the 21st Century (21st Century Commission) in 1997 to review statutes on the policies, criteria, procedures and precedents for city, county and special district boundary changes. After conducting extensive research and holding 25 days of public hearings throughout the State at which it heard from over 160 organizations and individuals, the 21st Century Commission released its final report, Growth Within Bounds: Planning California Governance for the 21st Century, in January 2000.3 The report examines the way that government is organized and operates and establishes a vision of how the State will grow by “making better use of the often invisible LAFCOs in each county.”
1 Little Hoover Commission, 2000, p.12. 2 Little Hoover Commission, 2000, p.24. 3 The Commission on Local Governance for the 21st Century ceased to exist on July 1, 2000, pursuant to a statutory sunset provision.

CC LAFCO Parks & Recreation MSR/SOI Updates June 2021 Appendix F: LAFCO & MSR History Page 3
Economic & Planning Systems, Inc. Z:\Shared\Projects\Oakland\191000s\191105_ContraCostaLAFCO_Parks&RecMSR\Report\Appendices\AppF_LAFCO MSR History_2021.docx
The report points to the expectation that California’s population will double over the first four decades of the 21st Century, and raises concern that our government institutions were designed when our population was much smaller and our society was less complex. The report warns that without a strategy, open spaces will be swallowed up, expensive freeway extensions will be needed, job centers will become farther removed from housing, and this will lead to longer commutes, increased pollution and more stressful lives. Growth Within Bounds acknowledges that local governments face unprecedented challenges in their ability to finance service delivery since voters cut property tax revenues in 1978 and the Legislature shifted property tax revenues from local government to schools in 1993. The report asserts that these financial strains have created governmental entrepreneurism in which agencies compete for sales tax revenue and market share.
The 21st Century Commission recommended that effective, efficient and easily understandable government be encouraged. In accomplishing this, the 21st Century Commission recommended consolidation of small, inefficient or overlapping providers, transparency of municipal service delivery to the people, and accountability of municipal service providers. The sheer number of special districts, the report asserts, “has provoked controversy, including several legislative attempts to initiate district consolidations,”4 but cautions LAFCOs that decisions to consolidate districts should focus on the adequacy of services, not on the number of districts.
Growth Within Bounds stated that LAFCOs cannot achieve their fundamental purposes without a comprehensive knowledge of the services available within its county, the current efficiency of providing service within various areas of the county, future needs for each service, and expansion capacity of each service provider. Comprehensive knowledge of water and sanitary providers, the report argued, would promote consolidations of water and sanitary districts, reduce water costs and promote a more comprehensive approach to the use of water resources. Further, the report asserted that many LAFCOs lack such knowledge and should be required to conduct such a review to ensure that municipal services are logically extended to meet California’s future growth and development.
MSRs would require LAFCO to look broadly at all agencies within a geographic region that provide a particular municipal service and to examine consolidation or reorganization of service providers. The 21st Century Commission recommended that the review include water, wastewater, and other municipal services that LAFCO judges to be important to future growth. The Commission recommended that the service review be followed by consolidation studies and be performed in conjunction with updates of SOIs. The recommendation was that service reviews be designed to make nine determinations, each of which was incorporated verbatim in the subsequently adopted legislation. The legislature since consolidated the determinations into six required findings.
Munic ipa l Se rv i ce Rev iew Leg is la t ion
The Cortese-Knox-Hertzberg Local Government Reorganization Act of 2000 requires LAFCO review and update SOIs not less than every five years and to review municipal services before updating SOIs. The requirement for service reviews arises from the identified need for a more
4 Commission on Local Governance for the 21st Century, 2000, p. 70.
CC LAFCO Parks & Recreation MSR/SOI Updates June 2021 Appendix F: LAFCO & MSR History Page 4
Economic & Planning Systems, Inc. Z:\Shared\Projects\Oakland\191000s\191105_ContraCostaLAFCO_Parks&RecMSR\Report\Appendices\AppF_LAFCO MSR History_2021.docx
coordinated and efficient public service structure to support California’s anticipated growth. The service review provides LAFCO with a tool to study existing and future public service conditions comprehensively and to evaluate organizational options for accommodating growth, preventing urban sprawl, and ensuring that critical services are provided efficiently.
Effective January 1, 2008, Government Code §56430 requires LAFCO to conduct a review of municipal services provided in the county by region, sub-region or other designated geographic area, as appropriate, for the service or services to be reviewed, and prepare a written statement of determination with respect to each of the following topics:
1) Growth and population projections for the affected area;
2) Present and planned capacity of public facilities and adequacy of public services, includinginfrastructure needs or deficiencies;
3) Financial ability of agencies to provide services;
4) Status of, and opportunities for shared facilities;
5) Accountability for community service needs, including governmental structure andoperational efficiencies; and
6) Any other matter related to effective or efficient service delivery, as required by commissionpolicy.
Spheres o f In f luence
An SOI is a LAFCO-approved plan that designates an agency’s probable future boundary and service area. Spheres are planning tools used to provide guidance for individual boundary change proposals and are intended to encourage efficient provision of organized community services, discourage urban sprawl and premature conversion of agricultural and open space lands, and prevent overlapping jurisdictions and duplication of services. Every determination made by a commission must be consistent with the SOIs of local agencies affected by that determination;5 for example, territory may not be annexed to a city or district unless it is within that agency's sphere. SOIs should discourage duplication of services by local governmental agencies, guide the Commission’s consideration of individual proposals for changes of organization, and identify the need for specific reorganization studies, and provide the basis for recommendations to particular agencies for government reorganizations.
Contra Costa LAFCO policies are that LAFCO discourages inclusion of land in an agency’s SOI if a need for services provided by that agency within a 5-10 year period cannot be demonstrated. SOIs generally will not be amended concurrently with an action on the related change of organization or reorganization. A change of organization or reorganization will not be approved solely because an area falls within the SOI of any agency. In other words, the SOI essentially defines where and what types of government reorganizations (e.g., annexation, detachment, dissolution and consolidation) may be initiated. If and when a government reorganization is
5 Government Code §56375.5.

CC LAFCO Parks & Recreation MSR/SOI Updates June 2021 Appendix F: LAFCO & MSR History Page 5
Economic & Planning Systems, Inc. Z:\Shared\Projects\Oakland\191000s\191105_ContraCostaLAFCO_Parks&RecMSR\Report\Appendices\AppF_LAFCO MSR History_2021.docx
initiated, there are a number of procedural steps that must be conducted for a reorganization to be approved. Such steps include more in-depth analysis, LAFCO consideration at a noticed public hearing, and processes by which affected agencies and/or residents may voice their approval or disapproval.
The Cortese-Knox-Hertzberg Act requires LAFCO to develop and determine the SOI of each local governmental agency within the county and to review and update the SOI every five years, as necessary. LAFCOs are empowered to adopt, update and amend the SOI. They may do so with or without an application, and any interested person may submit an application proposing an SOI amendment.
LAFCO may recommend government reorganizations of particular agencies in the county, using the SOIs as the basis for those recommendations. Based on review of the guidelines and practices of Contra Costa LAFCO as well as other LAFCOs in the State, various conceptual approaches have been identified from which to choose in designating an SOI:
1) Coterminous Sphere: The sphere for a city or special district that is the same as its existingboundary.
2) Annexable Sphere: A sphere larger than the agency’s boundary identifies areas the agency isexpected to annex. The annexable area is outside its boundary and inside the sphere.
3) Detachable Sphere: A sphere that is smaller than the agency’s boundaries identifies areasthe agency is expected to detach. The detachable area is the area within the agency boundsbut not within its sphere.
4) Zero Sphere: A zero sphere indicates the affected agency’s public service functions should bereassigned to another agency and the agency should be dissolved or combined with one ormore other agencies.
5) Consolidated Sphere: A consolidated sphere includes two or more local agencies andindicates the agencies should be consolidated into one agency.
6) Limited Service Sphere: A limited service sphere is the territory included within the SOI of amulti-service provider agency that is also within the boundary of a limited purpose districtwhich provides the same service (e.g., fire protection), but not all needed services.
7) Sphere Planning Area: LAFCO may choose to designate a sphere planning area to signal thatit anticipates expanding an agency’s SOI in the future to include territory not yet within itsofficial SOI.
8) Provisional Sphere: LAFCO may designate a provisional sphere that automatically sunsets ifcertain conditions occur.
LAFCO is required to establish SOIs for all local agencies and enact policies to promote the logical and orderly development of areas within the SOIs. Furthermore, LAFCO must update those SOIs every five years, as necessary. In updating the SOI, LAFCO is required to conduct a municipal service review (MSR) and adopt related determinations. In addition, in adopting or amending an SOI, LAFCO must make the following determinations:

CC LAFCO Parks & Recreation MSR/SOI Updates June 2021 Appendix F: LAFCO & MSR History Page 6
Economic & Planning Systems, Inc. Z:\Shared\Projects\Oakland\191000s\191105_ContraCostaLAFCO_Parks&RecMSR\Report\Appendices\AppF_LAFCO MSR History_2021.docx
Present and planned land uses in the area, including agricultural and open-space lands;
Present and probable need for public facilities and services in the area;
Present capacity of public facilities and adequacy of public service that the agency providesor is authorized to provide; and
Existence of any social or economic communities of interest in the area if the Commissiondetermines these are relevant to the agency.
LAFCO law requires additional determinations be made when updating SOIs for special districts.
MSR a nd SOI Update P roc ess
The MSR process does not require LAFCO to initiate changes of organization based on service review findings, only that LAFCO identify potential government structure options. However, LAFCO, other local agencies, and the public may subsequently use the determinations to analyze prospective changes of organization or reorganization or to establish or amend SOIs. LAFCO may act with respect to a recommended change of organization or reorganization on its own initiative, at the request of any agency, or in response to a petition.
MSRs are exempt from California Environmental Quality Act (CEQA) pursuant to §15262 (feasibility or planning studies) or §15306 (information collection) of the CEQA Guidelines. LAFCO’s actions to adopt MSR determinations are not considered “projects” subject to CEQA.
This report identifies preliminary SOI policy alternatives and recommends SOI options for the three parks and recreation districts and the eight CSAs. Development of actual SOI updates will involve additional steps, including recommendations by LAFCO staff, opportunity for public input at a LAFCO public hearing, and consideration and changes made by Commissioners. A CEQA determination will then be made on a case-by-case basis once the proposed project characteristics are clearly identified.
LAFCO must notify affected agencies 21 days before holding a public hearing to consider the SOI and may not update the SOI until after that hearing. The LAFCO Executive Officer must issue a report including recommendations on the SOI amendments and updates under consideration at least five days before the public hearing.

APPENDIX G:
Acronyms and Glossary of Terms

Economic & Planning Systems, Inc. Z:\Shared\Projects\Oakland\191000s\191105_ContraCostaLAFCO_Parks&RecMSR\Report\Appendices\AppG_Acronyms and Glossary_2021.docx
Acronyms
ABAG .......................................................................... Association of Bay Area Governments
ARPD .......................................................................... Ambrose Recreation and Park District
BA ........................................................................................................Berkson Associates
CAFR ............................................................................ Comprehensive Annual Fiscal Report
CIP ............................................... Capital Improvement Plan or Capital Improvement Program
CSA .................................................................................................... County Service Area
CSD .......................................................................................... Community Service District
EBRPD ................................................................................. East Bay Regional Park District
EPS ............................................................................... Economic & Planning Systems, Inc.
FTE ......................................................................................................Full-time equivalent
GVPRD ................................................................... Green Valley Recreation and Park District
PHRPD .................................................................... Pleasant Hill Recreation and Park District
LAFCO ........................................................................... Local Agency Formation Commission
MAC ........................................................................................... Municipal Advisory Council
MSR ............................................................................................. Municipal Service Review
SOI ..................................................................................................... Sphere of Influence
Glossa ry o f Te rms
Annexation: The inclusion, attachment, or addition of territory to a city or district.
Assessment: This MSR/SOI Update uses the term “assessment” broadly, to encompass benefit assessments, special taxes, special assessments, and/or parcel taxes. In some cases, the formation documents are vague, referring to a “benefit assessment or service charge” while the annual property tax bills refer to “special taxes and assessments.” A Benefit Assessment requires a professional engineer’s report that describes the benefit, proposed costs, and presents a benefit formula that is used to determine each property’s share of the cost. A majority vote is required to approve a rate increase. A Special Tax, on the other hand, is imposed for a specific purpose and must be approved by a 2/3 majority of the qualified voters in the service area. A Special Tax is not necessarily limited to the relative benefit it provides to the property owners or taxpayers.
Capital Improvement Plan: A multi-year financial plan containing appropriations for major construction projects and other fixed assets.

CC LAFCO Parks & Recreation MSR/SOI Updates June 2021 Appendix G: Acronyms & Glossary of Terms Page 2
Economic & Planning Systems, Inc. Z:\Shared\Projects\Oakland\191000s\191105_ContraCostaLAFCO_Parks&RecMSR\Report\Appendices\AppG_Acronyms and Glossary_2021.docx
Deficit: An excess of expenditures over revenues.
Direct Debt: The total amount of general obligation debt of a municipality or local government.
Disadvantaged Community or Disadvantaged Unincorporated Community (DAC or DUC): A disadvantaged community includes Census Tracts, Block Groups, and Places where the median household income is less than 80% of the statewide median household income. According to U.S. Census data (American Community Survey, 2015-2019), the statewide median household income in 2019 was $75,235; 80% of that amount is $60,188.
Expenditure: The use of fund resources.
Fiscal Year: The 12-month period of time to which a budget applies, typically July 1st through June 30th.
Fund: A group of related accounts used to manage resources assigned for specific activities or objectives.
General Fund: The main operating fund of a jurisdiction, including cities, counties, and special districts.
General Plan: A local government’s long-term blueprint for the community’s vision of future growth.
Intergovernmental Tax Revenue: Transfers of funds from one level of government to another. This may be to fund general government operations or for specific purposes.
Joint Powers Authority (JPA): A joint powers agency or joint powers authority is a new, separate government organization created by the member agencies, but is legally independent from them. A JPA is generally formed by any two or more governmental entities (federal, state, or local) to provide a common service. Many are financing tools that let government agencies pool their scarce resources. Some run programs jointly. Councils of government are JPAs.
Municipal Service Review: A study and evaluation of municipal service(s) by specific area, subregion or region culminating in written determinations regarding nine specific evaluation categories. An MSR study is prepared before a LAFCO revises an SOI for cities and special districts.
Net Position: The excess of all the City’s assets over all its liabilities, regardless of fund.
Sphere of Influence: The SOI is a plan that designates an agency’s probable future boundary and service area. SOIs are intended to encourage efficient provision of organized community services and prevent duplication of service delivery. Annexation of a territory to a city or district cannot occur unless the territory is within that agency's SOI.