river marsh - pembroke ma comprehensive permit application ...
195
-
Upload
khangminh22 -
Category
Documents
-
view
0 -
download
0
Transcript of river marsh - pembroke ma comprehensive permit application ...


BUILDING-1
EX-1
EXISTINGCONDITIONSPLAN
LOCUS MAPLOCUS MAP
CO
MP
RE
HE
NS
IVE
PE
RM
IT P
LA
N(A
SS
ES
SO
R'S
MA
P E
-17
, LO
T 0
AN
D E
-17
A,
LO
T 2
74
)
WA
TE
R S
TR
EE
TP
EM
BR
OK
E,
MA
SS
AC
HU
SE
TTS
RIV
ER
MA
RS
H V
ILLA
GE
PE
RM
IT P
LA
N S
ET
AP
PLIC
AN
T:
Riv
er
Ma
rsh, LLC
29
3R
Wa
shin
gto
n S
tre
et
No
rwe
ll, M
ass
achuse
tts
02
06
1
OVERALL MAP
150 LONGWATER DRIVE SUITE 101
NORWELL, MA 02061
PHONE: (781) 792-3900 FAX: (781) 792-0333
mckeng.com
McKenzie Engineering GroupCivil Engineers & Land Surveyors
AutoCAD SHX Text
x
AutoCAD SHX Text
x
AutoCAD SHX Text
x
AutoCAD SHX Text
x
AutoCAD SHX Text
x
AutoCAD SHX Text
25
AutoCAD SHX Text
20
AutoCAD SHX Text
15
AutoCAD SHX Text
20
AutoCAD SHX Text
23
AutoCAD SHX Text
26
AutoCAD SHX Text
14
AutoCAD SHX Text
22
AutoCAD SHX Text
24
AutoCAD SHX Text
18
AutoCAD SHX Text
16
AutoCAD SHX Text
CHARLES W. & CAROLYN M. CROSSLEY
AutoCAD SHX Text
M: E15 L: 8
AutoCAD SHX Text
N/F
AutoCAD SHX Text
BRIAN M. & MICHELLE M. LENAGHAN
AutoCAD SHX Text
M: E15 L: 17A
AutoCAD SHX Text
N/F
AutoCAD SHX Text
JOHN J. JR. & BRENDA J. MCDONNELL
AutoCAD SHX Text
M: E15 L: 17B
AutoCAD SHX Text
N/F
AutoCAD SHX Text
MARTIN P. & JANE L. COURNAN
AutoCAD SHX Text
M: E15 L: 17C
AutoCAD SHX Text
N/F
AutoCAD SHX Text
JOHN JACE WILSON
AutoCAD SHX Text
M: E15 L: 17D
AutoCAD SHX Text
N/F
AutoCAD SHX Text
SHANNON F. LAMB WILSON
AutoCAD SHX Text
TWO THIRTY-SIX WATER STREET TRUST
AutoCAD SHX Text
M: E15 L: 10
AutoCAD SHX Text
N/F
AutoCAD SHX Text
LESLIE J. MOLYNEAUX TRUSTEE
AutoCAD SHX Text
PETER J. & CARMEN M. TELLIER
AutoCAD SHX Text
M: E15 L: 12
AutoCAD SHX Text
N/F
AutoCAD SHX Text
M: E15 L: 5
AutoCAD SHX Text
N/F
AutoCAD SHX Text
MICHAEL MCMANN
AutoCAD SHX Text
M: E15 L: 5B
AutoCAD SHX Text
N/F
AutoCAD SHX Text
MICHAEL SERODE
AutoCAD SHX Text
M: E15 L: 5A
AutoCAD SHX Text
N/F
AutoCAD SHX Text
SHAWN M. &
AutoCAD SHX Text
M: F15 L: 8
AutoCAD SHX Text
N/F
AutoCAD SHX Text
TOWN OF PEMBROKE
AutoCAD SHX Text
M: F15 L: 9
AutoCAD SHX Text
N/F
AutoCAD SHX Text
MAGOUN CEMETERY
AutoCAD SHX Text
SLOPE EASEMENT
AutoCAD SHX Text
EASEMENT
AutoCAD SHX Text
NO. 260
AutoCAD SHX Text
NO. 248
AutoCAD SHX Text
NO. 268
AutoCAD SHX Text
NO. 274
AutoCAD SHX Text
WG
AutoCAD SHX Text
HYD
AutoCAD SHX Text
WELL
AutoCAD SHX Text
HYD
AutoCAD SHX Text
UP
AutoCAD SHX Text
UP
AutoCAD SHX Text
UP
AutoCAD SHX Text
UP
AutoCAD SHX Text
MICHAEL SERODE
AutoCAD SHX Text
MICHAEL MCMANN
AutoCAD SHX Text
x
AutoCAD SHX Text
x
AutoCAD SHX Text
x
AutoCAD SHX Text
x
AutoCAD SHX Text
x
AutoCAD SHX Text
x
AutoCAD SHX Text
RHC 18 TP 1A
AutoCAD SHX Text
RHC 15
AutoCAD SHX Text
TP J
AutoCAD SHX Text
RHC 1
AutoCAD SHX Text
RHC 5
AutoCAD SHX Text
RHC 4
AutoCAD SHX Text
TP I
AutoCAD SHX Text
TP H
AutoCAD SHX Text
RHC 13
AutoCAD SHX Text
UNRECORDED
AutoCAD SHX Text
UNRECORDED
AutoCAD SHX Text
UNRECORDED
AutoCAD SHX Text
RHC 14
AutoCAD SHX Text
TB D
AutoCAD SHX Text
TP E
AutoCAD SHX Text
R=17
AutoCAD SHX Text
TP B
AutoCAD SHX Text
RHC 12
AutoCAD SHX Text
RHC 3
AutoCAD SHX Text
RHC 2
AutoCAD SHX Text
RHC 8
AutoCAD SHX Text
TP G
AutoCAD SHX Text
RHC 16
AutoCAD SHX Text
TP F
AutoCAD SHX Text
R=17
AutoCAD SHX Text
RHC 10
AutoCAD SHX Text
RHC 9
AutoCAD SHX Text
TP C
AutoCAD SHX Text
R=6
AutoCAD SHX Text
R=8
AutoCAD SHX Text
UNRECORDED
AutoCAD SHX Text
UNRECORDED
AutoCAD SHX Text
RHC 17
AutoCAD SHX Text
RHC 7
AutoCAD SHX Text
RHC 6
AutoCAD SHX Text
UNRECORDED
AutoCAD SHX Text
UNRECORDED
AutoCAD SHX Text
TP 2B
AutoCAD SHX Text
TP ?
AutoCAD SHX Text
EL=12.6
AutoCAD SHX Text
TP A
AutoCAD SHX Text
UNRECORDED
AutoCAD SHX Text
RHC 19
AutoCAD SHX Text
OLD UNRECORDED
AutoCAD SHX Text
OLD UNREC
AutoCAD SHX Text
TP 9
AutoCAD SHX Text
TP 11
AutoCAD SHX Text
EL=8.8
AutoCAD SHX Text
TP 12
AutoCAD SHX Text
OLD UNRECORDED
AutoCAD SHX Text
TP ?
AutoCAD SHX Text
EL=8.3
AutoCAD SHX Text
TP ?
AutoCAD SHX Text
EL=9.3
AutoCAD SHX Text
EL=8.8
AutoCAD SHX Text
TP ?
AutoCAD SHX Text
TP 10
AutoCAD SHX Text
TP 10
AutoCAD SHX Text
EL=9.8
AutoCAD SHX Text
OLD UNREC
AutoCAD SHX Text
OLD UNRECORDED
AutoCAD SHX Text
UNRECORDED
AutoCAD SHX Text
UNRECORDED
AutoCAD SHX Text
RHC 11
AutoCAD SHX Text
EL=9.1
AutoCAD SHX Text
OLD UNREC
AutoCAD SHX Text
TP 5
AutoCAD SHX Text
OLD UNREC
AutoCAD SHX Text
OLD UNRECORDED
AutoCAD SHX Text
SPIKE SET IN
AutoCAD SHX Text
24" MAPLE
AutoCAD SHX Text
ELEV.=10.88
AutoCAD SHX Text
TP 6A
AutoCAD SHX Text
TP 4
AutoCAD SHX Text
TP 3
AutoCAD SHX Text
TP ?
AutoCAD SHX Text
EL=10.2
AutoCAD SHX Text
TP 1
AutoCAD SHX Text
TP 2
AutoCAD SHX Text
TP 6
AutoCAD SHX Text
EL=8.5
AutoCAD SHX Text
TP 6B
AutoCAD SHX Text
SCENIC RIVER CORRIDOR
AutoCAD SHX Text
TP 13
AutoCAD SHX Text
TP 14
AutoCAD SHX Text
TP 8
AutoCAD SHX Text
TP 7
AutoCAD SHX Text
OLD UNRECORDED
AutoCAD SHX Text
SCENIC RIVER CORRIDOR
AutoCAD SHX Text
OLD UNRECORDED
AutoCAD SHX Text
OLD UNRECORDED
AutoCAD SHX Text
14
AutoCAD SHX Text
16
AutoCAD SHX Text
22
AutoCAD SHX Text
21
AutoCAD SHX Text
19
AutoCAD SHX Text
18
AutoCAD SHX Text
17
AutoCAD SHX Text
10
AutoCAD SHX Text
12
AutoCAD SHX Text
11
AutoCAD SHX Text
24
AutoCAD SHX Text
23
AutoCAD SHX Text
22
AutoCAD SHX Text
21
AutoCAD SHX Text
20
AutoCAD SHX Text
19
AutoCAD SHX Text
18
AutoCAD SHX Text
17
AutoCAD SHX Text
16
AutoCAD SHX Text
15
AutoCAD SHX Text
17
AutoCAD SHX Text
19
AutoCAD SHX Text
20
AutoCAD SHX Text
21
AutoCAD SHX Text
22
AutoCAD SHX Text
10
AutoCAD SHX Text
11
AutoCAD SHX Text
12
AutoCAD SHX Text
13
AutoCAD SHX Text
DH 2
AutoCAD SHX Text
DH 4
AutoCAD SHX Text
DH 1
AutoCAD SHX Text
DH 3
AutoCAD SHX Text
DH 6
AutoCAD SHX Text
DH 5
AutoCAD SHX Text
6
AutoCAD SHX Text
6
AutoCAD SHX Text
20
AutoCAD SHX Text
25
AutoCAD SHX Text
30
AutoCAD SHX Text
HGW-8.3
AutoCAD SHX Text
HGW-8.5
AutoCAD SHX Text
HGW-8.3
AutoCAD SHX Text
15" TREE
AutoCAD SHX Text
15" TREE
AutoCAD SHX Text
15" TREE
AutoCAD SHX Text
48" TREE
AutoCAD SHX Text
EXISTING DRIVEWAY
AutoCAD SHX Text
EXISTING
AutoCAD SHX Text
G
AutoCAD SHX Text
G
AutoCAD SHX Text
G
AutoCAD SHX Text
G
AutoCAD SHX Text
G
AutoCAD SHX Text
G
AutoCAD SHX Text
W
AutoCAD SHX Text
W
AutoCAD SHX Text
W
AutoCAD SHX Text
W
AutoCAD SHX Text
W
AutoCAD SHX Text
APPROXIMATE LOCATION
AutoCAD SHX Text
8" CI WATER MAIN
AutoCAD SHX Text
APPROX. LOCATION
AutoCAD SHX Text
4" GAS MAIN
AutoCAD SHX Text
DEBORAH K. DEEGAN
AutoCAD SHX Text
JULIE A. NICOLO
AutoCAD SHX Text
JEFFREY B. &
AutoCAD SHX Text
M: F15 L: 7A
AutoCAD SHX Text
N/F
AutoCAD SHX Text
TEDESCHI
AutoCAD SHX Text
N/F
AutoCAD SHX Text
M: F15 L: 7B
AutoCAD SHX Text
BRIAN S.
AutoCAD SHX Text
25
AutoCAD SHX Text
29
AutoCAD SHX Text
28
AutoCAD SHX Text
27
AutoCAD SHX Text
26
AutoCAD SHX Text
10
AutoCAD SHX Text
24
AutoCAD SHX Text
25
AutoCAD SHX Text
26
AutoCAD SHX Text
27
AutoCAD SHX Text
28
AutoCAD SHX Text
23
AutoCAD SHX Text
9
AutoCAD SHX Text
N 72°02'54" W
AutoCAD SHX Text
354.53'
AutoCAD SHX Text
N 71°50'23" W
AutoCAD SHX Text
140.49'
AutoCAD SHX Text
N 72°30'59" W
AutoCAD SHX Text
183.46'
AutoCAD SHX Text
1185'±
AutoCAD SHX Text
710'±
AutoCAD SHX Text
117'±
AutoCAD SHX Text
52'±
AutoCAD SHX Text
3100'%%P
AutoCAD SHX Text
R=845.40'
AutoCAD SHX Text
R=1811.26' L=70.02'
AutoCAD SHX Text
134.89'
AutoCAD SHX Text
N 72°02'54" W
AutoCAD SHX Text
213.02'
AutoCAD SHX Text
N 17°57'06" E
AutoCAD SHX Text
62.85'
AutoCAD SHX Text
N 72°02'54" W
AutoCAD SHX Text
325.37'
AutoCAD SHX Text
N 17°57'06" E
AutoCAD SHX Text
487.73'
AutoCAD SHX Text
N 72°02'54" W
AutoCAD SHX Text
304.40'
AutoCAD SHX Text
N 71°39'38" W
AutoCAD SHX Text
540.09'
AutoCAD SHX Text
N 72°15'38" W
AutoCAD SHX Text
250.14'
AutoCAD SHX Text
N 72°08'36" W
AutoCAD SHX Text
375'±
AutoCAD SHX Text
N 72°08'36" W
AutoCAD SHX Text
284.68'
AutoCAD SHX Text
N 17°57'06" E
AutoCAD SHX Text
30
AutoCAD SHX Text
31
AutoCAD SHX Text
31
AutoCAD SHX Text
27
AutoCAD SHX Text
24
AutoCAD SHX Text
24
AutoCAD SHX Text
25
AutoCAD SHX Text
24
AutoCAD SHX Text
25
AutoCAD SHX Text
25
AutoCAD SHX Text
26
AutoCAD SHX Text
26
AutoCAD SHX Text
25
AutoCAD SHX Text
27
AutoCAD SHX Text
28
AutoCAD SHX Text
29
AutoCAD SHX Text
27
AutoCAD SHX Text
28
AutoCAD SHX Text
25
AutoCAD SHX Text
22
AutoCAD SHX Text
18
AutoCAD SHX Text
16
AutoCAD SHX Text
21
AutoCAD SHX Text
24
AutoCAD SHX Text
23
AutoCAD SHX Text
27
AutoCAD SHX Text
28
AutoCAD SHX Text
10
AutoCAD SHX Text
12
AutoCAD SHX Text
12
AutoCAD SHX Text
11
AutoCAD SHX Text
10
AutoCAD SHX Text
17
AutoCAD SHX Text
18
AutoCAD SHX Text
19
AutoCAD SHX Text
20
AutoCAD SHX Text
24
AutoCAD SHX Text
22
AutoCAD SHX Text
25
AutoCAD SHX Text
29
AutoCAD SHX Text
29
AutoCAD SHX Text
28
AutoCAD SHX Text
25
AutoCAD SHX Text
26
AutoCAD SHX Text
28
AutoCAD SHX Text
18
AutoCAD SHX Text
20
AutoCAD SHX Text
21
AutoCAD SHX Text
22
AutoCAD SHX Text
17
AutoCAD SHX Text
23
AutoCAD SHX Text
25
AutoCAD SHX Text
25
AutoCAD SHX Text
26
AutoCAD SHX Text
27
AutoCAD SHX Text
28
AutoCAD SHX Text
26
AutoCAD SHX Text
27
AutoCAD SHX Text
28
AutoCAD SHX Text
29
AutoCAD SHX Text
30
AutoCAD SHX Text
30
AutoCAD SHX Text
30
AutoCAD SHX Text
15
AutoCAD SHX Text
17
AutoCAD SHX Text
20
AutoCAD SHX Text
10
AutoCAD SHX Text
9
AutoCAD SHX Text
9
AutoCAD SHX Text
9
AutoCAD SHX Text
9
AutoCAD SHX Text
9
AutoCAD SHX Text
9
AutoCAD SHX Text
9
AutoCAD SHX Text
9
AutoCAD SHX Text
8
AutoCAD SHX Text
7
AutoCAD SHX Text
7
AutoCAD SHX Text
6
AutoCAD SHX Text
15
AutoCAD SHX Text
10
AutoCAD SHX Text
20
AutoCAD SHX Text
19
AutoCAD SHX Text
20
AutoCAD SHX Text
22
AutoCAD SHX Text
22
AutoCAD SHX Text
23
AutoCAD SHX Text
24
AutoCAD SHX Text
17
AutoCAD SHX Text
16
AutoCAD SHX Text
13
AutoCAD SHX Text
12
AutoCAD SHX Text
11
AutoCAD SHX Text
11
AutoCAD SHX Text
13
AutoCAD SHX Text
13
AutoCAD SHX Text
15
AutoCAD SHX Text
16
AutoCAD SHX Text
17
AutoCAD SHX Text
14
AutoCAD SHX Text
11
AutoCAD SHX Text
6
AutoCAD SHX Text
7
AutoCAD SHX Text
8
AutoCAD SHX Text
5
AutoCAD SHX Text
6
AutoCAD SHX Text
7
AutoCAD SHX Text
8
AutoCAD SHX Text
5
AutoCAD SHX Text
14
AutoCAD SHX Text
14
AutoCAD SHX Text
12
AutoCAD SHX Text
13
AutoCAD SHX Text
15
AutoCAD SHX Text
11
AutoCAD SHX Text
12
AutoCAD SHX Text
14
AutoCAD SHX Text
15
AutoCAD SHX Text
8
AutoCAD SHX Text
7
AutoCAD SHX Text
6
AutoCAD SHX Text
6
AutoCAD SHX Text
7
AutoCAD SHX Text
6
AutoCAD SHX Text
7
AutoCAD SHX Text
7
AutoCAD SHX Text
6
AutoCAD SHX Text
6
AutoCAD SHX Text
6
AutoCAD SHX Text
7
AutoCAD SHX Text
5
AutoCAD SHX Text
5
AutoCAD SHX Text
5
AutoCAD SHX Text
6
AutoCAD SHX Text
5
AutoCAD SHX Text
6
AutoCAD SHX Text
6
AutoCAD SHX Text
8
AutoCAD SHX Text
7
AutoCAD SHX Text
SCENIC RIVER CORRIDOR
AutoCAD SHX Text
23
AutoCAD SHX Text
22
AutoCAD SHX Text
32
AutoCAD SHX Text
PAVED
AutoCAD SHX Text
DRIVE
AutoCAD SHX Text
R=52.64' L=75.12'
AutoCAD SHX Text
R=845.40' L=16.31'
AutoCAD SHX Text
LIMIT OF PRIORITY HABITAT OF RARE SPECIES
AutoCAD SHX Text
LIMIT OF PRIORITY HABITAT OF RARE SPECIES
AutoCAD SHX Text
LIMIT OF PRIORITY HABITAT OF RARE SPECIES
AutoCAD SHX Text
x
AutoCAD SHX Text
x
AutoCAD SHX Text
x
AutoCAD SHX Text
x
AutoCAD SHX Text
x
AutoCAD SHX Text
x
AutoCAD SHX Text
x
AutoCAD SHX Text
x
AutoCAD SHX Text
x
AutoCAD SHX Text
x
AutoCAD SHX Text
x
AutoCAD SHX Text
8
AutoCAD SHX Text
8
AutoCAD SHX Text
8
AutoCAD SHX Text
8
AutoCAD SHX Text
PROFESSIONAL ENGINEER:
AutoCAD SHX Text
-
AutoCAD SHX Text
DESCRIPTION
AutoCAD SHX Text
-
AutoCAD SHX Text
-
AutoCAD SHX Text
-
AutoCAD SHX Text
BY
AutoCAD SHX Text
REV
AutoCAD SHX Text
DATE
AutoCAD SHX Text
-
AutoCAD SHX Text
APP
AutoCAD SHX Text
DWG. No:
AutoCAD SHX Text
DWG. TITLE:
AutoCAD SHX Text
SBS
AutoCAD SHX Text
SBS
AutoCAD SHX Text
BCM
AutoCAD SHX Text
BCM
AutoCAD SHX Text
8/10/2016
AutoCAD SHX Text
1"=80'
AutoCAD SHX Text
215-181
AutoCAD SHX Text
DESIGNED BY:
AutoCAD SHX Text
PROJECT NO.:
AutoCAD SHX Text
APPROVED BY:
AutoCAD SHX Text
CHECKED BY:
AutoCAD SHX Text
DATE:
AutoCAD SHX Text
SCALE:
AutoCAD SHX Text
DRAWN BY:
AutoCAD SHX Text
C MCKENZIE ENGINEERING GROUP, INC.
AutoCAD SHX Text
M:\MEG\2015 PROJECTS\215-181\DWGS\CUT SHEETS\ZBA APPLICATION\SUBMISSION NO 1\215-181 EX COND.DWG
AutoCAD SHX Text
SCALE: 1" = 80'
AutoCAD SHX Text
80
AutoCAD SHX Text
0
AutoCAD SHX Text
240
AutoCAD SHX Text
160
AutoCAD SHX Text
40
AutoCAD SHX Text
Not to Scale
AutoCAD SHX Text
SITE
AutoCAD SHX Text
NORTH RIVER
AutoCAD SHX Text
WATER STREET
AutoCAD SHX Text
CHURCH STREET
AutoCAD SHX Text
WATER STREET
AutoCAD SHX Text
CROSS STREET
AutoCAD SHX Text
OLD LANDING ROAD
AutoCAD SHX Text
SCHOOSETT STREET
AutoCAD SHX Text
LORNA AVE
AutoCAD SHX Text
ROUTE 139
AutoCAD SHX Text
ROUTE 139
AutoCAD SHX Text
NOTE: EXISTING CONDITIONS INFORMATION OBTAINED FROM AN ON-THE-GROUND SURVEY CONDUCTED BY LAND PLANNING, INC. IN MAY OF 2002.
AutoCAD SHX Text
1"=250'

ROAD "A"
CHUR
CH
STRE
ET
WATER
STREET
NORTH RIVER
WATER
STREET
CHUR
CH
ST
REET
(RTE
139)
(PUBLIC - 45' W
IDE)
ROAD "C"
BUILD
ING-11
BUILD
ING-3
BUILDING
-4
BUILD
ING-15
BUILDING
-5
BUILDING-7
BUILD
ING-14
BUILDING-13
BUILDING-8
BUILDING
-9
BUILDING-12
ROAD "A"
ROAD "B"
ROAD "a"
BUILDING-1
BUIILD
ING-6
BUILDING-2
BUILD
ING-10
PE
RM
IT
P
LA
N S
ET
OW
NE
R/A
PP
LIC
AN
T:
RIV
ER
M
AR
SH
, LLC
293R
W
AS
HIN
GT
ON
S
TR
EE
T
NO
RW
ELL, M
AS
SA
CH
US
ET
TS
02061
(A
SS
ES
SO
R'S
M
AP
E
-17, LO
T 0 &
E
-17A
, LO
T 274)
PE
MB
RO
KE
, M
AS
SA
CH
US
ET
TS
Assinippi Office Park
150 Longwater Drive, Suite 101
Norwell, MA 02061
P: 781.792.3900
F: 781.792.0333
www.mckeng.com
M C K E N Z I E
ENGINEERING GROUP
RIV
ER
MA
RS
H V
ILLA
GE
CO
MP
RE
HE
NS
IVE
PE
RM
IT P
LAN
WA
TE
R S
TR
EE
T
LOCUS MAPLOCUS MAP
OVERALL MAP
OPEN SPACE AND DENSITY CALCULATIONS
BUILDING INDEX ROAD INDEX
SYMBOL LEGEND
ABBREVIATIONS
PreliminarySite Layout
Plan
C-1
AutoCAD SHX Text
APPROX. LIMIT OF WORK (TYP.)
AutoCAD SHX Text
APPROX. LIMIT OF WORK (TYP.)
AutoCAD SHX Text
APPROX. LIMIT OF WORK (TYP.)
AutoCAD SHX Text
APPROX. LIMIT OF WORK (TYP.)
AutoCAD SHX Text
x
AutoCAD SHX Text
x
AutoCAD SHX Text
x
AutoCAD SHX Text
x
AutoCAD SHX Text
x
AutoCAD SHX Text
20
AutoCAD SHX Text
15
AutoCAD SHX Text
LP1
AutoCAD SHX Text
LP2
AutoCAD SHX Text
LP3
AutoCAD SHX Text
LP4
AutoCAD SHX Text
LP5
AutoCAD SHX Text
LP6
AutoCAD SHX Text
LP7
AutoCAD SHX Text
LP8
AutoCAD SHX Text
LP9
AutoCAD SHX Text
LP10
AutoCAD SHX Text
LP11
AutoCAD SHX Text
LP12
AutoCAD SHX Text
LP13
AutoCAD SHX Text
LP14
AutoCAD SHX Text
LP15
AutoCAD SHX Text
LP16
AutoCAD SHX Text
LP17
AutoCAD SHX Text
LP18
AutoCAD SHX Text
LP19
AutoCAD SHX Text
LP20
AutoCAD SHX Text
LP21
AutoCAD SHX Text
LP22
AutoCAD SHX Text
LP23
AutoCAD SHX Text
LP24
AutoCAD SHX Text
20
AutoCAD SHX Text
23
AutoCAD SHX Text
26
AutoCAD SHX Text
14
AutoCAD SHX Text
22
AutoCAD SHX Text
24
AutoCAD SHX Text
16
AutoCAD SHX Text
ZONE LINE
AutoCAD SHX Text
BUSINESS B
AutoCAD SHX Text
RESIDENCE A
AutoCAD SHX Text
SLOPE EASEMENT
AutoCAD SHX Text
EASEMENT
AutoCAD SHX Text
NO. 260
AutoCAD SHX Text
NO. 248
AutoCAD SHX Text
NO. 268
AutoCAD SHX Text
NO. 274
AutoCAD SHX Text
x
AutoCAD SHX Text
x
AutoCAD SHX Text
x
AutoCAD SHX Text
x
AutoCAD SHX Text
x
AutoCAD SHX Text
x
AutoCAD SHX Text
TP ?
AutoCAD SHX Text
EL=12.6
AutoCAD SHX Text
TP 9
AutoCAD SHX Text
EL=8.8
AutoCAD SHX Text
TP ?
AutoCAD SHX Text
EL=8.3
AutoCAD SHX Text
TP ?
AutoCAD SHX Text
EL=9.3
AutoCAD SHX Text
EL=8.8
AutoCAD SHX Text
TP ?
AutoCAD SHX Text
TP 10
AutoCAD SHX Text
EL=9.8
AutoCAD SHX Text
EL=9.1
AutoCAD SHX Text
TP 6A
AutoCAD SHX Text
TP ?
AutoCAD SHX Text
EL=10.2
AutoCAD SHX Text
EL=8.5
AutoCAD SHX Text
TP 6B
AutoCAD SHX Text
14
AutoCAD SHX Text
16
AutoCAD SHX Text
21
AutoCAD SHX Text
19
AutoCAD SHX Text
18
AutoCAD SHX Text
17
AutoCAD SHX Text
10
AutoCAD SHX Text
12
AutoCAD SHX Text
11
AutoCAD SHX Text
24
AutoCAD SHX Text
23
AutoCAD SHX Text
22
AutoCAD SHX Text
21
AutoCAD SHX Text
20
AutoCAD SHX Text
19
AutoCAD SHX Text
18
AutoCAD SHX Text
17
AutoCAD SHX Text
16
AutoCAD SHX Text
17
AutoCAD SHX Text
19
AutoCAD SHX Text
20
AutoCAD SHX Text
21
AutoCAD SHX Text
22
AutoCAD SHX Text
10
AutoCAD SHX Text
11
AutoCAD SHX Text
12
AutoCAD SHX Text
13
AutoCAD SHX Text
NATURAL
AutoCAD SHX Text
NATURAL RIVER BANK
AutoCAD SHX Text
RESTRICTED AREA
AutoCAD SHX Text
6
AutoCAD SHX Text
6
AutoCAD SHX Text
20
AutoCAD SHX Text
25
AutoCAD SHX Text
HGW-8.3
AutoCAD SHX Text
HGW-8.5
AutoCAD SHX Text
HGW-8.3
AutoCAD SHX Text
15" TREE
AutoCAD SHX Text
15" TREE
AutoCAD SHX Text
15" TREE
AutoCAD SHX Text
48" TREE
AutoCAD SHX Text
EXISTING DRIVEWAY
AutoCAD SHX Text
EXISTING
AutoCAD SHX Text
G
AutoCAD SHX Text
G
AutoCAD SHX Text
G
AutoCAD SHX Text
G
AutoCAD SHX Text
G
AutoCAD SHX Text
G
AutoCAD SHX Text
W
AutoCAD SHX Text
W
AutoCAD SHX Text
W
AutoCAD SHX Text
W
AutoCAD SHX Text
W
AutoCAD SHX Text
APPROXIMATE LOCATION
AutoCAD SHX Text
8" CI WATER MAIN
AutoCAD SHX Text
APPROX. LOCATION
AutoCAD SHX Text
4" GAS MAIN
AutoCAD SHX Text
25
AutoCAD SHX Text
29
AutoCAD SHX Text
28
AutoCAD SHX Text
27
AutoCAD SHX Text
26
AutoCAD SHX Text
10
AutoCAD SHX Text
24
AutoCAD SHX Text
25
AutoCAD SHX Text
26
AutoCAD SHX Text
27
AutoCAD SHX Text
28
AutoCAD SHX Text
23
AutoCAD SHX Text
9
AutoCAD SHX Text
LIMIT OF BORDERING
AutoCAD SHX Text
VEGETATED WETLANDS
AutoCAD SHX Text
RIVER
AutoCAD SHX Text
BANK
AutoCAD SHX Text
30
AutoCAD SHX Text
31
AutoCAD SHX Text
31
AutoCAD SHX Text
27
AutoCAD SHX Text
24
AutoCAD SHX Text
24
AutoCAD SHX Text
25
AutoCAD SHX Text
24
AutoCAD SHX Text
25
AutoCAD SHX Text
25
AutoCAD SHX Text
26
AutoCAD SHX Text
26
AutoCAD SHX Text
25
AutoCAD SHX Text
27
AutoCAD SHX Text
28
AutoCAD SHX Text
29
AutoCAD SHX Text
27
AutoCAD SHX Text
28
AutoCAD SHX Text
25
AutoCAD SHX Text
22
AutoCAD SHX Text
18
AutoCAD SHX Text
16
AutoCAD SHX Text
21
AutoCAD SHX Text
24
AutoCAD SHX Text
23
AutoCAD SHX Text
27
AutoCAD SHX Text
28
AutoCAD SHX Text
10
AutoCAD SHX Text
12
AutoCAD SHX Text
12
AutoCAD SHX Text
11
AutoCAD SHX Text
10
AutoCAD SHX Text
17
AutoCAD SHX Text
18
AutoCAD SHX Text
19
AutoCAD SHX Text
20
AutoCAD SHX Text
24
AutoCAD SHX Text
22
AutoCAD SHX Text
25
AutoCAD SHX Text
29
AutoCAD SHX Text
29
AutoCAD SHX Text
28
AutoCAD SHX Text
25
AutoCAD SHX Text
26
AutoCAD SHX Text
28
AutoCAD SHX Text
18
AutoCAD SHX Text
20
AutoCAD SHX Text
21
AutoCAD SHX Text
22
AutoCAD SHX Text
17
AutoCAD SHX Text
23
AutoCAD SHX Text
25
AutoCAD SHX Text
25
AutoCAD SHX Text
26
AutoCAD SHX Text
27
AutoCAD SHX Text
28
AutoCAD SHX Text
26
AutoCAD SHX Text
27
AutoCAD SHX Text
28
AutoCAD SHX Text
29
AutoCAD SHX Text
30
AutoCAD SHX Text
30
AutoCAD SHX Text
30
AutoCAD SHX Text
15
AutoCAD SHX Text
17
AutoCAD SHX Text
20
AutoCAD SHX Text
10
AutoCAD SHX Text
9
AutoCAD SHX Text
9
AutoCAD SHX Text
9
AutoCAD SHX Text
9
AutoCAD SHX Text
9
AutoCAD SHX Text
9
AutoCAD SHX Text
9
AutoCAD SHX Text
9
AutoCAD SHX Text
8
AutoCAD SHX Text
7
AutoCAD SHX Text
7
AutoCAD SHX Text
6
AutoCAD SHX Text
15
AutoCAD SHX Text
10
AutoCAD SHX Text
20
AutoCAD SHX Text
19
AutoCAD SHX Text
20
AutoCAD SHX Text
22
AutoCAD SHX Text
22
AutoCAD SHX Text
23
AutoCAD SHX Text
24
AutoCAD SHX Text
17
AutoCAD SHX Text
16
AutoCAD SHX Text
13
AutoCAD SHX Text
12
AutoCAD SHX Text
11
AutoCAD SHX Text
11
AutoCAD SHX Text
15
AutoCAD SHX Text
16
AutoCAD SHX Text
17
AutoCAD SHX Text
14
AutoCAD SHX Text
11
AutoCAD SHX Text
6
AutoCAD SHX Text
7
AutoCAD SHX Text
8
AutoCAD SHX Text
5
AutoCAD SHX Text
6
AutoCAD SHX Text
7
AutoCAD SHX Text
8
AutoCAD SHX Text
5
AutoCAD SHX Text
14
AutoCAD SHX Text
14
AutoCAD SHX Text
12
AutoCAD SHX Text
13
AutoCAD SHX Text
15
AutoCAD SHX Text
11
AutoCAD SHX Text
12
AutoCAD SHX Text
14
AutoCAD SHX Text
15
AutoCAD SHX Text
8
AutoCAD SHX Text
7
AutoCAD SHX Text
6
AutoCAD SHX Text
6
AutoCAD SHX Text
7
AutoCAD SHX Text
6
AutoCAD SHX Text
7
AutoCAD SHX Text
7
AutoCAD SHX Text
6
AutoCAD SHX Text
6
AutoCAD SHX Text
6
AutoCAD SHX Text
7
AutoCAD SHX Text
5
AutoCAD SHX Text
5
AutoCAD SHX Text
5
AutoCAD SHX Text
6
AutoCAD SHX Text
5
AutoCAD SHX Text
6
AutoCAD SHX Text
6
AutoCAD SHX Text
8
AutoCAD SHX Text
7
AutoCAD SHX Text
23
AutoCAD SHX Text
22
AutoCAD SHX Text
32
AutoCAD SHX Text
PAVED
AutoCAD SHX Text
DRIVE
AutoCAD SHX Text
9
AutoCAD SHX Text
9
AutoCAD SHX Text
9
AutoCAD SHX Text
8
AutoCAD SHX Text
8
AutoCAD SHX Text
8
AutoCAD SHX Text
8
AutoCAD SHX Text
8
AutoCAD SHX Text
E15-17 48.9± ACRES
AutoCAD SHX Text
13
AutoCAD SHX Text
CB/LP
AutoCAD SHX Text
CHB
AutoCAD SHX Text
DH
AutoCAD SHX Text
DH
AutoCAD SHX Text
CHB
AutoCAD SHX Text
DH
AutoCAD SHX Text
DH
AutoCAD SHX Text
WF D7A
AutoCAD SHX Text
PT.
AutoCAD SHX Text
HI
AutoCAD SHX Text
PT.
AutoCAD SHX Text
HI
AutoCAD SHX Text
LOW
AutoCAD SHX Text
PT.
AutoCAD SHX Text
PT.
AutoCAD SHX Text
HI
AutoCAD SHX Text
LOW
AutoCAD SHX Text
PT.
AutoCAD SHX Text
LOW
AutoCAD SHX Text
PT.
AutoCAD SHX Text
R1-1
AutoCAD SHX Text
R1-1
AutoCAD SHX Text
PT.
AutoCAD SHX Text
HI
AutoCAD SHX Text
x
AutoCAD SHX Text
x
AutoCAD SHX Text
x
AutoCAD SHX Text
x
AutoCAD SHX Text
x
AutoCAD SHX Text
ZONE AE (EL.8)
AutoCAD SHX Text
FEMA LINE
AutoCAD SHX Text
BRIAN M. & MICHELLE M. LENAGHAN
AutoCAD SHX Text
M: E15 L: 17A
AutoCAD SHX Text
N/F
AutoCAD SHX Text
JOHN J. JR. & BRENDA J. MCDONNELL
AutoCAD SHX Text
M: E15 L: 17B
AutoCAD SHX Text
N/F
AutoCAD SHX Text
MARTIN P. & JANE L. COURNAN
AutoCAD SHX Text
M: E15 L: 17C
AutoCAD SHX Text
N/F
AutoCAD SHX Text
JOHN JACE WILSON
AutoCAD SHX Text
M: E15 L: 17D
AutoCAD SHX Text
N/F
AutoCAD SHX Text
SHANNON F. LAMB WILSON
AutoCAD SHX Text
M: E15 L: 10
AutoCAD SHX Text
SHAWN M. &
AutoCAD SHX Text
M: F15 L: 8
AutoCAD SHX Text
N/F
AutoCAD SHX Text
TOWN OF PEMBROKE
AutoCAD SHX Text
M: F15 L: 9
AutoCAD SHX Text
N/F
AutoCAD SHX Text
MAGOUN CEMETERY
AutoCAD SHX Text
ZONE LINE
AutoCAD SHX Text
BUSINESS B
AutoCAD SHX Text
RESIDENCE A
AutoCAD SHX Text
SLOPE EASEMENT
AutoCAD SHX Text
EASEMENT
AutoCAD SHX Text
NO. 260
AutoCAD SHX Text
NO. 248
AutoCAD SHX Text
NO. 268
AutoCAD SHX Text
NO. 274
AutoCAD SHX Text
WG
AutoCAD SHX Text
HYD
AutoCAD SHX Text
WELL
AutoCAD SHX Text
HYD
AutoCAD SHX Text
UP
AutoCAD SHX Text
UP
AutoCAD SHX Text
UP
AutoCAD SHX Text
UP
AutoCAD SHX Text
x
AutoCAD SHX Text
x
AutoCAD SHX Text
x
AutoCAD SHX Text
x
AutoCAD SHX Text
SPIKE SET IN
AutoCAD SHX Text
24" MAPLE
AutoCAD SHX Text
ELEV.=10.88
AutoCAD SHX Text
SCENIC RIVER CORRIDOR
AutoCAD SHX Text
NATURAL
AutoCAD SHX Text
15" TREE
AutoCAD SHX Text
15" TREE
AutoCAD SHX Text
15" TREE
AutoCAD SHX Text
48" TREE
AutoCAD SHX Text
EXISTING DRIVEWAY
AutoCAD SHX Text
EXISTING
AutoCAD SHX Text
G
AutoCAD SHX Text
G
AutoCAD SHX Text
G
AutoCAD SHX Text
G
AutoCAD SHX Text
G
AutoCAD SHX Text
G
AutoCAD SHX Text
W
AutoCAD SHX Text
W
AutoCAD SHX Text
W
AutoCAD SHX Text
W
AutoCAD SHX Text
W
AutoCAD SHX Text
APPROXIMATE LOCATION
AutoCAD SHX Text
8" CI WATER MAIN
AutoCAD SHX Text
APPROX. LOCATION
AutoCAD SHX Text
4" GAS MAIN
AutoCAD SHX Text
DEBORAH K. DEEGAN
AutoCAD SHX Text
JULIE A. NICOLO
AutoCAD SHX Text
JEFFREY B. &
AutoCAD SHX Text
M: F15 L: 7A
AutoCAD SHX Text
N/F
AutoCAD SHX Text
TEDESCHI
AutoCAD SHX Text
N/F
AutoCAD SHX Text
M: F15 L: 7B
AutoCAD SHX Text
BRIAN S.
AutoCAD SHX Text
N 72°02'54" W
AutoCAD SHX Text
354.53'
AutoCAD SHX Text
N 71°50'23" W
AutoCAD SHX Text
140.49'
AutoCAD SHX Text
N 72°30'59" W
AutoCAD SHX Text
183.46'
AutoCAD SHX Text
1185'±
AutoCAD SHX Text
R=845.40'
AutoCAD SHX Text
R=1811.26' L=70.02'
AutoCAD SHX Text
134.89'
AutoCAD SHX Text
N 72°02'54" W
AutoCAD SHX Text
213.02'
AutoCAD SHX Text
N 17°57'06" E
AutoCAD SHX Text
62.85'
AutoCAD SHX Text
N 72°02'54" W
AutoCAD SHX Text
325.37'
AutoCAD SHX Text
N 17°57'06" E
AutoCAD SHX Text
487.73'
AutoCAD SHX Text
N 72°02'54" W
AutoCAD SHX Text
304.40'
AutoCAD SHX Text
N 71°39'38" W
AutoCAD SHX Text
540.09'
AutoCAD SHX Text
N 72°15'38" W
AutoCAD SHX Text
284.68'
AutoCAD SHX Text
N 17°57'06" E
AutoCAD SHX Text
RIVER
AutoCAD SHX Text
BANK
AutoCAD SHX Text
8
AutoCAD SHX Text
8
AutoCAD SHX Text
8
AutoCAD SHX Text
SCENIC RIVER CORRIDOR
AutoCAD SHX Text
PAVED
AutoCAD SHX Text
DRIVE
AutoCAD SHX Text
ZONE X
AutoCAD SHX Text
R=52.64' L=75.12'
AutoCAD SHX Text
R=845.40' L=16.31'
AutoCAD SHX Text
8
AutoCAD SHX Text
8
AutoCAD SHX Text
8
AutoCAD SHX Text
8
AutoCAD SHX Text
8
AutoCAD SHX Text
LIMIT OF BORDERING VEGETATED WETLAND (BVW)
AutoCAD SHX Text
LIMIT OF BORDERING VEGETATED WETLAND (BVW)
AutoCAD SHX Text
LIMIT OF 100' WETLAND BUFFER ZONE TO BVW
AutoCAD SHX Text
LIMIT OF BORDERING VEGETATED WETLAND (BVW)
AutoCAD SHX Text
LIMIT OF BORDERING VEGETATED WETLAND (BVW)
AutoCAD SHX Text
LIMIT OF 100-YR FLOODPLAIN PER FIRM PANELS 25023CO206J & 25023CO207J EFFECTIVE DATE:JULY 17, 2012
AutoCAD SHX Text
LIMIT OF 100' WETLAND BUFFER ZONE TO BVW
AutoCAD SHX Text
LIMIT OF 100' WETLAND BUFFER ZONE TO BVW
AutoCAD SHX Text
LIMIT OF 100' WETLAND BUFFER ZONE TO BVW
AutoCAD SHX Text
LIMIT OF INLAND BANK (INTERMITTENT STREAM)
AutoCAD SHX Text
LIMIT OF INLAND BANK (INTERMITTENT STREAM)
AutoCAD SHX Text
LIMIT OF 100' WETLAND BUFFER ZONE TO BVW
AutoCAD SHX Text
E15-17 48.9± ACRES
AutoCAD SHX Text
CB/LP
AutoCAD SHX Text
CHB
AutoCAD SHX Text
DH
AutoCAD SHX Text
DH
AutoCAD SHX Text
CHB
AutoCAD SHX Text
DH
AutoCAD SHX Text
DH
AutoCAD SHX Text
WF D1
AutoCAD SHX Text
WF D2
AutoCAD SHX Text
WF D3
AutoCAD SHX Text
WF D4
AutoCAD SHX Text
WF D5
AutoCAD SHX Text
WF D6
AutoCAD SHX Text
WF D7
AutoCAD SHX Text
WF D8
AutoCAD SHX Text
WF D9
AutoCAD SHX Text
WF D10
AutoCAD SHX Text
WF D10
AutoCAD SHX Text
WF D11
AutoCAD SHX Text
WF D12
AutoCAD SHX Text
WF D13
AutoCAD SHX Text
WF D14
AutoCAD SHX Text
WF D15
AutoCAD SHX Text
WF D16
AutoCAD SHX Text
WF D17
AutoCAD SHX Text
WF D18
AutoCAD SHX Text
WF D19
AutoCAD SHX Text
WF D20
AutoCAD SHX Text
WF D21
AutoCAD SHX Text
WF D22
AutoCAD SHX Text
WF D23
AutoCAD SHX Text
WF D24
AutoCAD SHX Text
WF D25
AutoCAD SHX Text
WF D26
AutoCAD SHX Text
WF D27
AutoCAD SHX Text
WF A1
AutoCAD SHX Text
WF A2
AutoCAD SHX Text
WF A3
AutoCAD SHX Text
WF A4
AutoCAD SHX Text
WF A5
AutoCAD SHX Text
WF A6
AutoCAD SHX Text
WF A7
AutoCAD SHX Text
WF A8
AutoCAD SHX Text
WF A9
AutoCAD SHX Text
WF A10
AutoCAD SHX Text
WF A11
AutoCAD SHX Text
WF A12
AutoCAD SHX Text
WF A13
AutoCAD SHX Text
WF A14
AutoCAD SHX Text
WF A15
AutoCAD SHX Text
WF A16
AutoCAD SHX Text
WF A17
AutoCAD SHX Text
WF A18
AutoCAD SHX Text
WF A19
AutoCAD SHX Text
WF A20
AutoCAD SHX Text
WF A21
AutoCAD SHX Text
WF A22
AutoCAD SHX Text
WF A23
AutoCAD SHX Text
WF A24
AutoCAD SHX Text
WF A25
AutoCAD SHX Text
WF A26
AutoCAD SHX Text
WF A27
AutoCAD SHX Text
WF A28
AutoCAD SHX Text
WF A29
AutoCAD SHX Text
WF A30
AutoCAD SHX Text
WF A31
AutoCAD SHX Text
WF A32
AutoCAD SHX Text
WF A33
AutoCAD SHX Text
WF A34
AutoCAD SHX Text
WF A35
AutoCAD SHX Text
WF A36
AutoCAD SHX Text
WF A37
AutoCAD SHX Text
WF IB111
AutoCAD SHX Text
WF IB110
AutoCAD SHX Text
WF IB109
AutoCAD SHX Text
WF IB108
AutoCAD SHX Text
WF IB107
AutoCAD SHX Text
WF IB106
AutoCAD SHX Text
WF IB105
AutoCAD SHX Text
WF IB104
AutoCAD SHX Text
WF IB103
AutoCAD SHX Text
WF IB102
AutoCAD SHX Text
WF IB101
AutoCAD SHX Text
WF IB100
AutoCAD SHX Text
WF IB2
AutoCAD SHX Text
WF IB3
AutoCAD SHX Text
WF IB4
AutoCAD SHX Text
WF IB5
AutoCAD SHX Text
WF IB6
AutoCAD SHX Text
WF IB7
AutoCAD SHX Text
WF IB8
AutoCAD SHX Text
WF IB9
AutoCAD SHX Text
WF IB10
AutoCAD SHX Text
WF IB11
AutoCAD SHX Text
WF IB12
AutoCAD SHX Text
WF IB13
AutoCAD SHX Text
WF B17
AutoCAD SHX Text
WF B18
AutoCAD SHX Text
WF B19
AutoCAD SHX Text
WF B20
AutoCAD SHX Text
WF B21
AutoCAD SHX Text
WF B22
AutoCAD SHX Text
WF B23
AutoCAD SHX Text
WF A38
AutoCAD SHX Text
WF A39
AutoCAD SHX Text
WF A40
AutoCAD SHX Text
WF A41
AutoCAD SHX Text
WF A42
AutoCAD SHX Text
WF A43
AutoCAD SHX Text
WF A44
AutoCAD SHX Text
WF A45
AutoCAD SHX Text
WF A46
AutoCAD SHX Text
WF A47
AutoCAD SHX Text
WF A48
AutoCAD SHX Text
WF A49
AutoCAD SHX Text
WF A50
AutoCAD SHX Text
WF IB116
AutoCAD SHX Text
WF IB115
AutoCAD SHX Text
WF IB18
AutoCAD SHX Text
WF IB17
AutoCAD SHX Text
WF IB16
AutoCAD SHX Text
WF IB15
AutoCAD SHX Text
WF IB14
AutoCAD SHX Text
WF IB112
AutoCAD SHX Text
WF IB113
AutoCAD SHX Text
WF IB114
AutoCAD SHX Text
WF B12
AutoCAD SHX Text
WF B13
AutoCAD SHX Text
WF B14
AutoCAD SHX Text
WF B15
AutoCAD SHX Text
WF B16
AutoCAD SHX Text
WF B24
AutoCAD SHX Text
WF B25
AutoCAD SHX Text
WF B26
AutoCAD SHX Text
WF B27
AutoCAD SHX Text
WF B28
AutoCAD SHX Text
WF B29
AutoCAD SHX Text
WF B11
AutoCAD SHX Text
WF B10
AutoCAD SHX Text
WF B9
AutoCAD SHX Text
WF B8
AutoCAD SHX Text
WF B7
AutoCAD SHX Text
WF B6
AutoCAD SHX Text
WF B5
AutoCAD SHX Text
WF B4
AutoCAD SHX Text
WF B3
AutoCAD SHX Text
WF B2
AutoCAD SHX Text
WF B1
AutoCAD SHX Text
WF A51
AutoCAD SHX Text
WF A52
AutoCAD SHX Text
WF A53
AutoCAD SHX Text
WF A54
AutoCAD SHX Text
WF A55
AutoCAD SHX Text
WF A56
AutoCAD SHX Text
WF A57
AutoCAD SHX Text
WF A58
AutoCAD SHX Text
WF A60
AutoCAD SHX Text
WF A61
AutoCAD SHX Text
WF A62
AutoCAD SHX Text
WF A63
AutoCAD SHX Text
WF A64
AutoCAD SHX Text
WF D7A
AutoCAD SHX Text
5+00
AutoCAD SHX Text
3+00
AutoCAD SHX Text
4+00
AutoCAD SHX Text
5+00
AutoCAD SHX Text
6+00
AutoCAD SHX Text
7+00
AutoCAD SHX Text
8+00
AutoCAD SHX Text
9+00
AutoCAD SHX Text
10+00
AutoCAD SHX Text
7+00
AutoCAD SHX Text
0+00
AutoCAD SHX Text
1+00
AutoCAD SHX Text
2+00
AutoCAD SHX Text
6+00
AutoCAD SHX Text
PT.
AutoCAD SHX Text
HI
AutoCAD SHX Text
PT.
AutoCAD SHX Text
HI
AutoCAD SHX Text
LOW
AutoCAD SHX Text
PT.
AutoCAD SHX Text
PT.
AutoCAD SHX Text
HI
AutoCAD SHX Text
8+00
AutoCAD SHX Text
9+00
AutoCAD SHX Text
STOP
AutoCAD SHX Text
WETLAND REPLICATION AREA
AutoCAD SHX Text
1+00
AutoCAD SHX Text
LOW
AutoCAD SHX Text
PT.
AutoCAD SHX Text
3+00
AutoCAD SHX Text
1+00
AutoCAD SHX Text
2+00
AutoCAD SHX Text
0+00
AutoCAD SHX Text
LOW
AutoCAD SHX Text
PT.
AutoCAD SHX Text
4+00
AutoCAD SHX Text
0+00
AutoCAD SHX Text
STOP
AutoCAD SHX Text
2+00
AutoCAD SHX Text
R1-1
AutoCAD SHX Text
R1-1
AutoCAD SHX Text
10+00
AutoCAD SHX Text
11+00
AutoCAD SHX Text
12+00
AutoCAD SHX Text
4 SPACES
AutoCAD SHX Text
10 SPACES
AutoCAD SHX Text
10 SPACES
AutoCAD SHX Text
10 SPACES
AutoCAD SHX Text
11+00
AutoCAD SHX Text
12+00
AutoCAD SHX Text
12+67.25
AutoCAD SHX Text
PT.
AutoCAD SHX Text
HI
AutoCAD SHX Text
PROP STORMWATER DETENTION BASIN
AutoCAD SHX Text
PROP 'STOP' SIGN
AutoCAD SHX Text
PROP 'STOP' SIGN
AutoCAD SHX Text
PROP (4) UNIT TOWNHOUSE (TYP.)
AutoCAD SHX Text
PROP OPEN SPACE (RECREATIONAL USE) OVER SOIL ABSORPTION SYSTEM
AutoCAD SHX Text
PROP GRAVEL TURN-AROUND AREA
AutoCAD SHX Text
PROP (3) UNIT TOWNHOUSE (TYP.)
AutoCAD SHX Text
20' BUILDING OFFSET (TYP.)
AutoCAD SHX Text
PROP (5) UNIT TOWNHOUSE (TYP.)
AutoCAD SHX Text
PROP GRASSED AREA (TYP.)
AutoCAD SHX Text
PROP 9'X18' PARKING SPACE (TYP.)
AutoCAD SHX Text
EXIST. BUILDING 1 TO BE RETAINED
AutoCAD SHX Text
20' BUILDING OFFSET (TYP.)
AutoCAD SHX Text
20' BUILDING OFFSET (TYP.)
AutoCAD SHX Text
PROP SILT SOCK BARRIER (TYP.)
AutoCAD SHX Text
PROP BIT. CONC. DRIVEWAY AND GARAGE (TYP.) SIZES VARY
AutoCAD SHX Text
CCB
AutoCAD SHX Text
CCB
AutoCAD SHX Text
CCB
AutoCAD SHX Text
CCB
AutoCAD SHX Text
CCB
AutoCAD SHX Text
CCB
AutoCAD SHX Text
CCB
AutoCAD SHX Text
CCB
AutoCAD SHX Text
CCB
AutoCAD SHX Text
CCB
AutoCAD SHX Text
CCB
AutoCAD SHX Text
CCB
AutoCAD SHX Text
CCB
AutoCAD SHX Text
CCB
AutoCAD SHX Text
CCB
AutoCAD SHX Text
CCB
AutoCAD SHX Text
CCB
AutoCAD SHX Text
CCB
AutoCAD SHX Text
CCB
AutoCAD SHX Text
CCB
AutoCAD SHX Text
CCB
AutoCAD SHX Text
CCB
AutoCAD SHX Text
GRASSED PATHWAY FOR MAINTENANCE ACCESS/WALKING TRAIL
AutoCAD SHX Text
PROP BIT. CONC. DRIVEWAY AND GARAGE (TYP.) SIZES VARY
AutoCAD SHX Text
GRASSED PATHWAY FOR MAINTENANCE ACCESS/WALKING TRAIL
AutoCAD SHX Text
CCB
AutoCAD SHX Text
CCB
AutoCAD SHX Text
LIMIT OF PROP. BIT. CONC. PAVEMENT & BERM
AutoCAD SHX Text
PROP. 7' H x 14' W OPEN BOTTOM ARCH CULVERT WITH HEADWALLS
AutoCAD SHX Text
APPROX. LIMIT OF WORK (TYP.)
AutoCAD SHX Text
APPROX. LIMIT OF WORK (TYP.)
AutoCAD SHX Text
APPROX. LIMIT OF WORK (TYP.)
AutoCAD SHX Text
APPROX. LIMIT OF WORK (TYP.)
AutoCAD SHX Text
20' BUILDING OFFSET (TYP.)
AutoCAD SHX Text
DESCRIPTION
AutoCAD SHX Text
BY
AutoCAD SHX Text
REV
AutoCAD SHX Text
DATE
AutoCAD SHX Text
APP
AutoCAD SHX Text
DWG. NO:
AutoCAD SHX Text
DWG. TITLE:
AutoCAD SHX Text
215-181
AutoCAD SHX Text
DESIGNED BY:
AutoCAD SHX Text
PROJECT NO.:
AutoCAD SHX Text
APPROVED BY:
AutoCAD SHX Text
CHECKED BY:
AutoCAD SHX Text
DATE:
AutoCAD SHX Text
SCALE:
AutoCAD SHX Text
DRAWN BY:
AutoCAD SHX Text
C MCKENZIE ENGINEERING GROUP, INC.
AutoCAD SHX Text
M:\MEG\2015 PROJECTS\215-181\DWGS\CUT SHEETS\ZBA APPLICATION\SUBMISSION NO 1\215-181 C-1.DWG
AutoCAD SHX Text
COMMENTS PER MASSHOUSING
AutoCAD SHX Text
SBS
AutoCAD SHX Text
1
AutoCAD SHX Text
5/12/2017
AutoCAD SHX Text
BCM
AutoCAD SHX Text
PROFESSIONAL ENGINEER:
AutoCAD SHX Text
SEPTEMBER 22, 2016
AutoCAD SHX Text
PREPARED BY:
AutoCAD SHX Text
BCM
AutoCAD SHX Text
BCM
AutoCAD SHX Text
SBS
AutoCAD SHX Text
SBS
AutoCAD SHX Text
COMMENTS PER MASSHOUSING
AutoCAD SHX Text
SBS
AutoCAD SHX Text
2
AutoCAD SHX Text
7/14/2017
AutoCAD SHX Text
BCM
AutoCAD SHX Text
ZBA APPLICATION
AutoCAD SHX Text
AJC
AutoCAD SHX Text
3
AutoCAD SHX Text
10/5/2018
AutoCAD SHX Text
BCM
AutoCAD SHX Text
1"=40'
AutoCAD SHX Text
SCALE: 1" = 40'
AutoCAD SHX Text
40
AutoCAD SHX Text
0
AutoCAD SHX Text
160
AutoCAD SHX Text
80
AutoCAD SHX Text
20
AutoCAD SHX Text
Not to Scale
AutoCAD SHX Text
NORTH RIVER
AutoCAD SHX Text
WATER STREET
AutoCAD SHX Text
CHURCH STREET
AutoCAD SHX Text
WATER STREET
AutoCAD SHX Text
CROSS STREET
AutoCAD SHX Text
OLD LANDING ROAD
AutoCAD SHX Text
SCHOOSETT STREET
AutoCAD SHX Text
LORNA AVE
AutoCAD SHX Text
ROUTE 139
AutoCAD SHX Text
ROUTE 139
AutoCAD SHX Text
SCALE:1"=250'
AutoCAD SHX Text
SITE
AutoCAD SHX Text
(1)P1-UNIT BUILDING P1-UNIT BUILDING (3)3-UNIT BUILDINGS 3-UNIT BUILDINGS (9)4-UNIT BUILDINGS 4-UNIT BUILDINGS (2) 5-UNIT BUILDINGS=56 TOTAL UNITS 5-UNIT BUILDINGS=56 TOTAL UNITS =56 TOTAL UNITS 56 TOTAL UNITS (UNIT LAYOUT AND FLOOR AREAS VARY) PARKING SUMMARY 56 UNITS X 4 SPACES=224 SPACES =224 SPACES VISITOR SPACES= 34 SPACES = 34 SPACES PARKING PROVIDED=258 SPACES =258 SPACES
AutoCAD SHX Text
ROAD A=1,267 LF =1,267 LF ROAD B=948 LF =948 LF ROAD C=207 LF =207 LF 2,422 LF TOTAL LENGTH OF ROAD2,422 LF TOTAL LENGTH OF ROAD
AutoCAD SHX Text
TOTAL LAND AREA = 48.9 AC. UPLAND LAND AREA= 21.49 AC. ROAD/PARKING AREA= 2.52 AC. BUILDING AREA= 2.24 AC. UPLAND OPEN SPACE= 16.73 AC. UNIT DENSITY= 2.61 UNITS/UPLAND AC.
AutoCAD SHX Text
OPEN SPACE
AutoCAD SHX Text
D
AutoCAD SHX Text
GG
AutoCAD SHX Text
WG
AutoCAD SHX Text
H
AutoCAD SHX Text
H
AutoCAD SHX Text
D
AutoCAD SHX Text
Y
AutoCAD SHX Text
D
AutoCAD SHX Text
Y
AutoCAD SHX Text
S
AutoCAD SHX Text
LP
AutoCAD SHX Text
RD
AutoCAD SHX Text
B
AutoCAD SHX Text
G
AutoCAD SHX Text
E
AutoCAD SHX Text
W
AutoCAD SHX Text
APPROX. ASPH. BIT. CCB CB CONC. DMH EL. F.F. GG HYD L LP N/F No. PROP PVC R RCP RD REM SMH TYP. M VGC WG
AutoCAD SHX Text
APPROXIMATE ASPHALT BITUMINOUS BITUMINOUS CAPE COD BERM CATCH BASIN CONCRETE DRAIN MANHOLE ELEVATION FIRST FLOOR GAS GATE HYDRANT LENGTH LIGHT POLE NOW OR FORMERLY NUMBER PROPOSED POLYVINYL CHLORIDE RIM REINFORCED CONCRETE PIPE ROOF DRAIN REMOVE SEWER MANHOLE TYPICAL METER VERTICAL GRANITE CURB WATER GATE
AutoCAD SHX Text
CATCH BASIN UTILITY POLE SEWER MANHOLE DRAIN MANHOLE WATER GATE HYDRANT GAS GATE LIGHT POLE BOLLARD ROOF DRAIN DRAIN LINE SEWER LINE GAS MAIN UNDERGROUND ELECTRIC WATER LINE

WATER
STREET
CHUR
CH
ST
REET
(RTE
139)
(PUBLIC - 45' W
IDE)
ROAD "C"
BUILD
ING-11
BUILD
ING-3
BUILDING
-4
BUILD
ING-15
BUILDING
-5
BUILDING-7
BUILD
ING-14
BUILDING-13
BUILDING-8
BUILDING
-9
BUILDING-12
ROAD "A"
ROAD "B"
ROAD "a"
BUILDING-1
BUIILD
ING-6
BUILDING-2
BUILD
ING-10
PreliminaryGrading &
Drainage Plan
PE
RM
IT
P
LA
N S
ET
OW
NE
R/A
PP
LIC
AN
T:
RIV
ER
M
AR
SH
, LLC
293R
W
AS
HIN
GT
ON
S
TR
EE
T
NO
RW
ELL, M
AS
SA
CH
US
ET
TS
02061
(A
SS
ES
SO
R'S
M
AP
E
-17, LO
T 0 &
E
-17A
, LO
T 274)
PE
MB
RO
KE
, M
AS
SA
CH
US
ET
TS
Assinippi Office Park
150 Longwater Drive, Suite 101
Norwell, MA 02061
P: 781.792.3900
F: 781.792.0333
www.mckeng.com
M C K E N Z I E
ENGINEERING GROUP
RIV
ER
MA
RS
H V
ILLA
GE
CO
MP
RE
HE
NS
IVE
PE
RM
IT P
LAN
WA
TE
R S
TR
EE
T
C-2
AutoCAD SHX Text
x
AutoCAD SHX Text
x
AutoCAD SHX Text
x
AutoCAD SHX Text
x
AutoCAD SHX Text
x
AutoCAD SHX Text
20
AutoCAD SHX Text
15
AutoCAD SHX Text
ZONE AE (EL.8)
AutoCAD SHX Text
20
AutoCAD SHX Text
23
AutoCAD SHX Text
26
AutoCAD SHX Text
14
AutoCAD SHX Text
22
AutoCAD SHX Text
24
AutoCAD SHX Text
16
AutoCAD SHX Text
CHARLES W. & CAROLYN M. CROSSLEY
AutoCAD SHX Text
M: E15 L: 8
AutoCAD SHX Text
N/F
AutoCAD SHX Text
FEMA LINE
AutoCAD SHX Text
BRIAN M. & MICHELLE M. LENAGHAN
AutoCAD SHX Text
M: E15 L: 17A
AutoCAD SHX Text
N/F
AutoCAD SHX Text
JOHN J. JR. & BRENDA J. MCDONNELL
AutoCAD SHX Text
M: E15 L: 17B
AutoCAD SHX Text
N/F
AutoCAD SHX Text
MARTIN P. & JANE L. COURNAN
AutoCAD SHX Text
M: E15 L: 17C
AutoCAD SHX Text
N/F
AutoCAD SHX Text
JOHN JACE WILSON
AutoCAD SHX Text
M: E15 L: 17D
AutoCAD SHX Text
N/F
AutoCAD SHX Text
SHANNON F. LAMB WILSON
AutoCAD SHX Text
TWO THIRTY-SIX WATER STREET TRUST
AutoCAD SHX Text
M: E15 L: 10
AutoCAD SHX Text
N/F
AutoCAD SHX Text
LESLIE J. MOLYNEAUX TRUSTEE
AutoCAD SHX Text
M: E15 L: 5
AutoCAD SHX Text
N/F
AutoCAD SHX Text
MICHAEL MCMANN
AutoCAD SHX Text
M: E15 L: 5B
AutoCAD SHX Text
N/F
AutoCAD SHX Text
MICHAEL SERODE
AutoCAD SHX Text
M: E15 L: 5A
AutoCAD SHX Text
N/F
AutoCAD SHX Text
SHAWN M. &
AutoCAD SHX Text
M: F15 L: 8
AutoCAD SHX Text
N/F
AutoCAD SHX Text
TOWN OF PEMBROKE
AutoCAD SHX Text
M: F15 L: 9
AutoCAD SHX Text
N/F
AutoCAD SHX Text
MAGOUN CEMETERY
AutoCAD SHX Text
SLOPE EASEMENT
AutoCAD SHX Text
EASEMENT
AutoCAD SHX Text
NO. 260
AutoCAD SHX Text
NO. 248
AutoCAD SHX Text
NO. 268
AutoCAD SHX Text
NO. 274
AutoCAD SHX Text
WG
AutoCAD SHX Text
HYD
AutoCAD SHX Text
WELL
AutoCAD SHX Text
HYD
AutoCAD SHX Text
UP
AutoCAD SHX Text
UP
AutoCAD SHX Text
UP
AutoCAD SHX Text
UP
AutoCAD SHX Text
MICHAEL SERODE
AutoCAD SHX Text
MICHAEL MCMANN
AutoCAD SHX Text
x
AutoCAD SHX Text
x
AutoCAD SHX Text
x
AutoCAD SHX Text
x
AutoCAD SHX Text
RHC 18 TP 1A
AutoCAD SHX Text
RHC 15
AutoCAD SHX Text
RHC 1
AutoCAD SHX Text
RHC 5
AutoCAD SHX Text
RHC 4
AutoCAD SHX Text
RHC 14
AutoCAD SHX Text
RHC 12
AutoCAD SHX Text
RHC 3
AutoCAD SHX Text
RHC 2
AutoCAD SHX Text
RHC 8
AutoCAD SHX Text
RHC 16
AutoCAD SHX Text
RHC 10
AutoCAD SHX Text
RHC 9
AutoCAD SHX Text
RHC 17
AutoCAD SHX Text
RHC 7
AutoCAD SHX Text
RHC 6
AutoCAD SHX Text
TP 2B
AutoCAD SHX Text
RHC 19
AutoCAD SHX Text
TP 11
AutoCAD SHX Text
TP 12
AutoCAD SHX Text
TP 10
AutoCAD SHX Text
RHC 11
AutoCAD SHX Text
TP 5
AutoCAD SHX Text
SPIKE SET IN
AutoCAD SHX Text
24" MAPLE
AutoCAD SHX Text
ELEV.=10.88
AutoCAD SHX Text
TP 4
AutoCAD SHX Text
TP 3
AutoCAD SHX Text
TP 1
AutoCAD SHX Text
TP 2
AutoCAD SHX Text
TP 6
AutoCAD SHX Text
TP 13
AutoCAD SHX Text
TP 14
AutoCAD SHX Text
TP 8
AutoCAD SHX Text
TP 7
AutoCAD SHX Text
SCENIC RIVER CORRIDOR
AutoCAD SHX Text
21
AutoCAD SHX Text
19
AutoCAD SHX Text
18
AutoCAD SHX Text
17
AutoCAD SHX Text
24
AutoCAD SHX Text
23
AutoCAD SHX Text
22
AutoCAD SHX Text
21
AutoCAD SHX Text
20
AutoCAD SHX Text
19
AutoCAD SHX Text
18
AutoCAD SHX Text
17
AutoCAD SHX Text
16
AutoCAD SHX Text
17
AutoCAD SHX Text
19
AutoCAD SHX Text
20
AutoCAD SHX Text
21
AutoCAD SHX Text
22
AutoCAD SHX Text
10
AutoCAD SHX Text
11
AutoCAD SHX Text
12
AutoCAD SHX Text
13
AutoCAD SHX Text
NATURAL
AutoCAD SHX Text
20
AutoCAD SHX Text
25
AutoCAD SHX Text
15" TREE
AutoCAD SHX Text
15" TREE
AutoCAD SHX Text
15" TREE
AutoCAD SHX Text
48" TREE
AutoCAD SHX Text
EXISTING DRIVEWAY
AutoCAD SHX Text
EXISTING
AutoCAD SHX Text
G
AutoCAD SHX Text
G
AutoCAD SHX Text
G
AutoCAD SHX Text
G
AutoCAD SHX Text
G
AutoCAD SHX Text
G
AutoCAD SHX Text
APPROX. LOCATION
AutoCAD SHX Text
4" GAS MAIN
AutoCAD SHX Text
DEBORAH K. DEEGAN
AutoCAD SHX Text
JULIE A. NICOLO
AutoCAD SHX Text
JEFFREY B. &
AutoCAD SHX Text
M: F15 L: 7A
AutoCAD SHX Text
N/F
AutoCAD SHX Text
TEDESCHI
AutoCAD SHX Text
N/F
AutoCAD SHX Text
M: F15 L: 7B
AutoCAD SHX Text
BRIAN S.
AutoCAD SHX Text
25
AutoCAD SHX Text
29
AutoCAD SHX Text
28
AutoCAD SHX Text
27
AutoCAD SHX Text
26
AutoCAD SHX Text
10
AutoCAD SHX Text
24
AutoCAD SHX Text
25
AutoCAD SHX Text
26
AutoCAD SHX Text
27
AutoCAD SHX Text
28
AutoCAD SHX Text
9
AutoCAD SHX Text
RIVER
AutoCAD SHX Text
BANK
AutoCAD SHX Text
30
AutoCAD SHX Text
31
AutoCAD SHX Text
31
AutoCAD SHX Text
27
AutoCAD SHX Text
24
AutoCAD SHX Text
24
AutoCAD SHX Text
25
AutoCAD SHX Text
24
AutoCAD SHX Text
25
AutoCAD SHX Text
25
AutoCAD SHX Text
26
AutoCAD SHX Text
26
AutoCAD SHX Text
25
AutoCAD SHX Text
27
AutoCAD SHX Text
28
AutoCAD SHX Text
29
AutoCAD SHX Text
27
AutoCAD SHX Text
28
AutoCAD SHX Text
25
AutoCAD SHX Text
22
AutoCAD SHX Text
18
AutoCAD SHX Text
16
AutoCAD SHX Text
21
AutoCAD SHX Text
24
AutoCAD SHX Text
23
AutoCAD SHX Text
27
AutoCAD SHX Text
28
AutoCAD SHX Text
10
AutoCAD SHX Text
12
AutoCAD SHX Text
12
AutoCAD SHX Text
11
AutoCAD SHX Text
10
AutoCAD SHX Text
17
AutoCAD SHX Text
18
AutoCAD SHX Text
19
AutoCAD SHX Text
20
AutoCAD SHX Text
24
AutoCAD SHX Text
22
AutoCAD SHX Text
25
AutoCAD SHX Text
29
AutoCAD SHX Text
29
AutoCAD SHX Text
28
AutoCAD SHX Text
25
AutoCAD SHX Text
26
AutoCAD SHX Text
28
AutoCAD SHX Text
18
AutoCAD SHX Text
20
AutoCAD SHX Text
21
AutoCAD SHX Text
22
AutoCAD SHX Text
17
AutoCAD SHX Text
23
AutoCAD SHX Text
25
AutoCAD SHX Text
25
AutoCAD SHX Text
26
AutoCAD SHX Text
27
AutoCAD SHX Text
28
AutoCAD SHX Text
26
AutoCAD SHX Text
27
AutoCAD SHX Text
28
AutoCAD SHX Text
29
AutoCAD SHX Text
30
AutoCAD SHX Text
30
AutoCAD SHX Text
30
AutoCAD SHX Text
15
AutoCAD SHX Text
17
AutoCAD SHX Text
20
AutoCAD SHX Text
10
AutoCAD SHX Text
9
AutoCAD SHX Text
9
AutoCAD SHX Text
9
AutoCAD SHX Text
9
AutoCAD SHX Text
9
AutoCAD SHX Text
9
AutoCAD SHX Text
19
AutoCAD SHX Text
20
AutoCAD SHX Text
22
AutoCAD SHX Text
22
AutoCAD SHX Text
23
AutoCAD SHX Text
24
AutoCAD SHX Text
17
AutoCAD SHX Text
16
AutoCAD SHX Text
13
AutoCAD SHX Text
12
AutoCAD SHX Text
11
AutoCAD SHX Text
11
AutoCAD SHX Text
15
AutoCAD SHX Text
16
AutoCAD SHX Text
17
AutoCAD SHX Text
14
AutoCAD SHX Text
11
AutoCAD SHX Text
6
AutoCAD SHX Text
7
AutoCAD SHX Text
8
AutoCAD SHX Text
5
AutoCAD SHX Text
6
AutoCAD SHX Text
7
AutoCAD SHX Text
8
AutoCAD SHX Text
5
AutoCAD SHX Text
14
AutoCAD SHX Text
14
AutoCAD SHX Text
12
AutoCAD SHX Text
13
AutoCAD SHX Text
15
AutoCAD SHX Text
11
AutoCAD SHX Text
12
AutoCAD SHX Text
14
AutoCAD SHX Text
15
AutoCAD SHX Text
6
AutoCAD SHX Text
5
AutoCAD SHX Text
6
AutoCAD SHX Text
6
AutoCAD SHX Text
8
AutoCAD SHX Text
7
AutoCAD SHX Text
SCENIC RIVER CORRIDOR
AutoCAD SHX Text
23
AutoCAD SHX Text
22
AutoCAD SHX Text
32
AutoCAD SHX Text
PAVED
AutoCAD SHX Text
DRIVE
AutoCAD SHX Text
ZONE X
AutoCAD SHX Text
9
AutoCAD SHX Text
9
AutoCAD SHX Text
9
AutoCAD SHX Text
8
AutoCAD SHX Text
8
AutoCAD SHX Text
8
AutoCAD SHX Text
8
AutoCAD SHX Text
8
AutoCAD SHX Text
LIMIT OF BORDERING VEGETATED WETLAND (BVW)
AutoCAD SHX Text
LIMIT OF BORDERING VEGETATED WETLAND (BVW)
AutoCAD SHX Text
LIMIT OF 100' WETLAND BUFFER ZONE TO BVW
AutoCAD SHX Text
LIMIT OF BORDERING VEGETATED WETLAND (BVW)
AutoCAD SHX Text
LIMIT OF BORDERING VEGETATED WETLAND (BVW)
AutoCAD SHX Text
LIMIT OF 100-YR FLOODPLAIN PER FIRM PANELS 25023CO206J & 25023CO207J EFFECTIVE DATE:JULY 17, 2012
AutoCAD SHX Text
LIMIT OF 100' WETLAND BUFFER ZONE TO BVW
AutoCAD SHX Text
LIMIT OF 100' WETLAND BUFFER ZONE TO BVW
AutoCAD SHX Text
LIMIT OF 100' WETLAND BUFFER ZONE TO BVW
AutoCAD SHX Text
LIMIT OF INLAND BANK (INTERMITTENT STREAM)
AutoCAD SHX Text
LIMIT OF INLAND BANK (INTERMITTENT STREAM)
AutoCAD SHX Text
LIMIT OF 100' WETLAND BUFFER ZONE TO BVW
AutoCAD SHX Text
E15-17 48.9± ACRES
AutoCAD SHX Text
13
AutoCAD SHX Text
CB/LP
AutoCAD SHX Text
CHB
AutoCAD SHX Text
DH
AutoCAD SHX Text
DH
AutoCAD SHX Text
CHB
AutoCAD SHX Text
DH
AutoCAD SHX Text
DH
AutoCAD SHX Text
WF D1
AutoCAD SHX Text
WF D2
AutoCAD SHX Text
WF D3
AutoCAD SHX Text
WF D4
AutoCAD SHX Text
WF D5
AutoCAD SHX Text
WF D6
AutoCAD SHX Text
WF D7
AutoCAD SHX Text
WF D8
AutoCAD SHX Text
WF D9
AutoCAD SHX Text
WF D10
AutoCAD SHX Text
WF D10
AutoCAD SHX Text
WF D11
AutoCAD SHX Text
WF D12
AutoCAD SHX Text
WF D13
AutoCAD SHX Text
WF D14
AutoCAD SHX Text
WF D15
AutoCAD SHX Text
WF D16
AutoCAD SHX Text
WF D17
AutoCAD SHX Text
WF D18
AutoCAD SHX Text
WF D19
AutoCAD SHX Text
WF D20
AutoCAD SHX Text
WF D21
AutoCAD SHX Text
WF D22
AutoCAD SHX Text
WF D23
AutoCAD SHX Text
WF D24
AutoCAD SHX Text
WF D25
AutoCAD SHX Text
WF D26
AutoCAD SHX Text
WF D27
AutoCAD SHX Text
WF A1
AutoCAD SHX Text
WF A2
AutoCAD SHX Text
WF A3
AutoCAD SHX Text
WF A4
AutoCAD SHX Text
WF A5
AutoCAD SHX Text
WF A6
AutoCAD SHX Text
WF A7
AutoCAD SHX Text
WF A8
AutoCAD SHX Text
WF A9
AutoCAD SHX Text
WF A10
AutoCAD SHX Text
WF A11
AutoCAD SHX Text
WF A12
AutoCAD SHX Text
WF A13
AutoCAD SHX Text
WF A14
AutoCAD SHX Text
WF A15
AutoCAD SHX Text
WF A16
AutoCAD SHX Text
WF A17
AutoCAD SHX Text
WF A18
AutoCAD SHX Text
WF A19
AutoCAD SHX Text
WF A20
AutoCAD SHX Text
WF A21
AutoCAD SHX Text
WF A22
AutoCAD SHX Text
WF A23
AutoCAD SHX Text
WF A24
AutoCAD SHX Text
WF A25
AutoCAD SHX Text
WF A26
AutoCAD SHX Text
WF A27
AutoCAD SHX Text
WF A28
AutoCAD SHX Text
WF A29
AutoCAD SHX Text
WF A30
AutoCAD SHX Text
WF A31
AutoCAD SHX Text
WF A32
AutoCAD SHX Text
WF A33
AutoCAD SHX Text
WF A34
AutoCAD SHX Text
WF A35
AutoCAD SHX Text
WF A36
AutoCAD SHX Text
WF A37
AutoCAD SHX Text
WF IB111
AutoCAD SHX Text
WF IB110
AutoCAD SHX Text
WF IB109
AutoCAD SHX Text
WF IB108
AutoCAD SHX Text
WF IB107
AutoCAD SHX Text
WF IB106
AutoCAD SHX Text
WF IB105
AutoCAD SHX Text
WF IB104
AutoCAD SHX Text
WF IB103
AutoCAD SHX Text
WF IB102
AutoCAD SHX Text
WF IB101
AutoCAD SHX Text
WF IB100
AutoCAD SHX Text
WF IB3
AutoCAD SHX Text
WF IB4
AutoCAD SHX Text
WF IB5
AutoCAD SHX Text
WF IB6
AutoCAD SHX Text
WF IB7
AutoCAD SHX Text
WF IB8
AutoCAD SHX Text
WF IB9
AutoCAD SHX Text
WF IB10
AutoCAD SHX Text
WF IB11
AutoCAD SHX Text
WF IB12
AutoCAD SHX Text
WF IB13
AutoCAD SHX Text
WF B17
AutoCAD SHX Text
WF B18
AutoCAD SHX Text
WF B19
AutoCAD SHX Text
WF B20
AutoCAD SHX Text
WF B21
AutoCAD SHX Text
WF B22
AutoCAD SHX Text
WF B23
AutoCAD SHX Text
WF A38
AutoCAD SHX Text
WF A39
AutoCAD SHX Text
WF A40
AutoCAD SHX Text
WF A41
AutoCAD SHX Text
WF A42
AutoCAD SHX Text
WF A43
AutoCAD SHX Text
WF A44
AutoCAD SHX Text
WF A45
AutoCAD SHX Text
WF A46
AutoCAD SHX Text
WF A47
AutoCAD SHX Text
WF A48
AutoCAD SHX Text
WF A49
AutoCAD SHX Text
WF A50
AutoCAD SHX Text
WF IB116
AutoCAD SHX Text
WF IB115
AutoCAD SHX Text
WF IB18
AutoCAD SHX Text
WF IB17
AutoCAD SHX Text
WF IB16
AutoCAD SHX Text
WF IB15
AutoCAD SHX Text
WF IB14
AutoCAD SHX Text
WF IB112
AutoCAD SHX Text
WF IB113
AutoCAD SHX Text
WF IB114
AutoCAD SHX Text
WF B12
AutoCAD SHX Text
WF B13
AutoCAD SHX Text
WF B14
AutoCAD SHX Text
WF B15
AutoCAD SHX Text
WF B16
AutoCAD SHX Text
WF B24
AutoCAD SHX Text
WF B25
AutoCAD SHX Text
WF B26
AutoCAD SHX Text
WF B27
AutoCAD SHX Text
WF B28
AutoCAD SHX Text
WF B29
AutoCAD SHX Text
WF B11
AutoCAD SHX Text
WF B10
AutoCAD SHX Text
WF B9
AutoCAD SHX Text
WF B8
AutoCAD SHX Text
WF B7
AutoCAD SHX Text
WF B6
AutoCAD SHX Text
WF B5
AutoCAD SHX Text
WF B4
AutoCAD SHX Text
WF B3
AutoCAD SHX Text
WF B2
AutoCAD SHX Text
WF B1
AutoCAD SHX Text
WF A51
AutoCAD SHX Text
WF A52
AutoCAD SHX Text
WF A53
AutoCAD SHX Text
WF A54
AutoCAD SHX Text
WF A55
AutoCAD SHX Text
WF A56
AutoCAD SHX Text
WF A57
AutoCAD SHX Text
WF A58
AutoCAD SHX Text
WF A60
AutoCAD SHX Text
WF A61
AutoCAD SHX Text
WF A62
AutoCAD SHX Text
WF A63
AutoCAD SHX Text
WF A64
AutoCAD SHX Text
WF A65
AutoCAD SHX Text
WF D7A
AutoCAD SHX Text
5+00
AutoCAD SHX Text
3+00
AutoCAD SHX Text
4+00
AutoCAD SHX Text
5+00
AutoCAD SHX Text
6+00
AutoCAD SHX Text
7+00
AutoCAD SHX Text
8+00
AutoCAD SHX Text
9+00
AutoCAD SHX Text
10+00
AutoCAD SHX Text
7+00
AutoCAD SHX Text
0+00
AutoCAD SHX Text
1+00
AutoCAD SHX Text
2+00
AutoCAD SHX Text
6+00
AutoCAD SHX Text
20
AutoCAD SHX Text
21
AutoCAD SHX Text
22
AutoCAD SHX Text
23
AutoCAD SHX Text
24
AutoCAD SHX Text
25
AutoCAD SHX Text
26
AutoCAD SHX Text
27
AutoCAD SHX Text
20
AutoCAD SHX Text
22
AutoCAD SHX Text
18
AutoCAD SHX Text
26
AutoCAD SHX Text
27
AutoCAD SHX Text
26
AutoCAD SHX Text
25
AutoCAD SHX Text
24
AutoCAD SHX Text
23
AutoCAD SHX Text
22
AutoCAD SHX Text
21
AutoCAD SHX Text
30
AutoCAD SHX Text
29
AutoCAD SHX Text
27
AutoCAD SHX Text
27
AutoCAD SHX Text
28
AutoCAD SHX Text
25
AutoCAD SHX Text
26
AutoCAD SHX Text
26
AutoCAD SHX Text
26
AutoCAD SHX Text
26
AutoCAD SHX Text
25
AutoCAD SHX Text
22
AutoCAD SHX Text
23
AutoCAD SHX Text
19
AutoCAD SHX Text
18
AutoCAD SHX Text
17
AutoCAD SHX Text
18
AutoCAD SHX Text
16
AutoCAD SHX Text
19
AutoCAD SHX Text
18.0
AutoCAD SHX Text
PT.
AutoCAD SHX Text
HI
AutoCAD SHX Text
PT.
AutoCAD SHX Text
HI
AutoCAD SHX Text
LOW
AutoCAD SHX Text
PT.
AutoCAD SHX Text
PT.
AutoCAD SHX Text
HI
AutoCAD SHX Text
25
AutoCAD SHX Text
24
AutoCAD SHX Text
23
AutoCAD SHX Text
20
AutoCAD SHX Text
19
AutoCAD SHX Text
18
AutoCAD SHX Text
24.2
AutoCAD SHX Text
TC=21.0
AutoCAD SHX Text
23.5
AutoCAD SHX Text
TC=27.3
AutoCAD SHX Text
25.5
AutoCAD SHX Text
TC=25.7
AutoCAD SHX Text
27.3
AutoCAD SHX Text
TC=28.3
AutoCAD SHX Text
22.0
AutoCAD SHX Text
14
AutoCAD SHX Text
13
AutoCAD SHX Text
10
AutoCAD SHX Text
10
AutoCAD SHX Text
15
AutoCAD SHX Text
16
AutoCAD SHX Text
15
AutoCAD SHX Text
15
AutoCAD SHX Text
13
AutoCAD SHX Text
10
AutoCAD SHX Text
13
AutoCAD SHX Text
13
AutoCAD SHX Text
10
AutoCAD SHX Text
12
AutoCAD SHX Text
11
AutoCAD SHX Text
23.0
AutoCAD SHX Text
TC=24.5
AutoCAD SHX Text
TC=25.2
AutoCAD SHX Text
24.5
AutoCAD SHX Text
TC=25.0
AutoCAD SHX Text
TC=23.5
AutoCAD SHX Text
23.0
AutoCAD SHX Text
TC=23.8
AutoCAD SHX Text
22.5
AutoCAD SHX Text
TC=23.5
AutoCAD SHX Text
23.6
AutoCAD SHX Text
TC=24.6
AutoCAD SHX Text
22.8
AutoCAD SHX Text
TC=23.8
AutoCAD SHX Text
17.4
AutoCAD SHX Text
TC=18.5
AutoCAD SHX Text
19.5
AutoCAD SHX Text
TC=18.0
AutoCAD SHX Text
TC=19.8
AutoCAD SHX Text
18.8
AutoCAD SHX Text
TC=20.5
AutoCAD SHX Text
TC=20.5
AutoCAD SHX Text
19.0
AutoCAD SHX Text
19.0
AutoCAD SHX Text
25.2
AutoCAD SHX Text
TC=24.5
AutoCAD SHX Text
TC=26.5
AutoCAD SHX Text
TC=26.2
AutoCAD SHX Text
TC=28.3
AutoCAD SHX Text
26.3
AutoCAD SHX Text
27.3
AutoCAD SHX Text
TC=27.5
AutoCAD SHX Text
24.0
AutoCAD SHX Text
26.5
AutoCAD SHX Text
25.2
AutoCAD SHX Text
TC=23.0
AutoCAD SHX Text
TC=25.0
AutoCAD SHX Text
25
AutoCAD SHX Text
8+00
AutoCAD SHX Text
9+00
AutoCAD SHX Text
8
AutoCAD SHX Text
WETLAND REPLICATION AREA
AutoCAD SHX Text
26
AutoCAD SHX Text
26
AutoCAD SHX Text
10
AutoCAD SHX Text
16
AutoCAD SHX Text
18
AutoCAD SHX Text
20
AutoCAD SHX Text
23
AutoCAD SHX Text
18
AutoCAD SHX Text
22
AutoCAD SHX Text
20
AutoCAD SHX Text
24
AutoCAD SHX Text
22
AutoCAD SHX Text
22
AutoCAD SHX Text
22
AutoCAD SHX Text
23
AutoCAD SHX Text
1+00
AutoCAD SHX Text
LOW
AutoCAD SHX Text
PT.
AutoCAD SHX Text
3+00
AutoCAD SHX Text
1+00
AutoCAD SHX Text
2+00
AutoCAD SHX Text
0+00
AutoCAD SHX Text
LOW
AutoCAD SHX Text
PT.
AutoCAD SHX Text
4+00
AutoCAD SHX Text
22.8
AutoCAD SHX Text
22
AutoCAD SHX Text
22
AutoCAD SHX Text
20
AutoCAD SHX Text
20
AutoCAD SHX Text
22
AutoCAD SHX Text
21
AutoCAD SHX Text
19
AutoCAD SHX Text
18
AutoCAD SHX Text
24
AutoCAD SHX Text
19
AutoCAD SHX Text
18
AutoCAD SHX Text
26
AutoCAD SHX Text
23
AutoCAD SHX Text
0+00
AutoCAD SHX Text
2+00
AutoCAD SHX Text
18
AutoCAD SHX Text
22
AutoCAD SHX Text
24
AutoCAD SHX Text
10+00
AutoCAD SHX Text
11+00
AutoCAD SHX Text
12+00
AutoCAD SHX Text
20
AutoCAD SHX Text
TC=27.3
AutoCAD SHX Text
TC=28.3
AutoCAD SHX Text
26.3
AutoCAD SHX Text
27.3
AutoCAD SHX Text
24
AutoCAD SHX Text
18
AutoCAD SHX Text
28
AutoCAD SHX Text
18
AutoCAD SHX Text
16
AutoCAD SHX Text
17
AutoCAD SHX Text
11+00
AutoCAD SHX Text
12+00
AutoCAD SHX Text
12+67.25
AutoCAD SHX Text
17
AutoCAD SHX Text
16
AutoCAD SHX Text
17
AutoCAD SHX Text
18
AutoCAD SHX Text
15
AutoCAD SHX Text
15
AutoCAD SHX Text
18
AutoCAD SHX Text
28
AutoCAD SHX Text
14
AutoCAD SHX Text
16
AutoCAD SHX Text
27
AutoCAD SHX Text
27
AutoCAD SHX Text
14
AutoCAD SHX Text
12
AutoCAD SHX Text
13
AutoCAD SHX Text
18
AutoCAD SHX Text
16
AutoCAD SHX Text
14
AutoCAD SHX Text
PT.
AutoCAD SHX Text
HI
AutoCAD SHX Text
25
AutoCAD SHX Text
26
AutoCAD SHX Text
25
AutoCAD SHX Text
26.0
AutoCAD SHX Text
TF=27.0
AutoCAD SHX Text
TF=28.0
AutoCAD SHX Text
26.0
AutoCAD SHX Text
16
AutoCAD SHX Text
PROP STORMWATER DETENTION BASIN TOP OF BERM=13.80 BOTTOM OF BASIN=9.50 100 YR. STORM EL.=12.76
AutoCAD SHX Text
PROP SEDIMENT FOREBAY TOP OF BERM=12.00 BOTTOM OF BASIN=9.50
AutoCAD SHX Text
MEET & MATCH EXISTING EOP
AutoCAD SHX Text
MEET & MATCH EXISTING EOP
AutoCAD SHX Text
3:1 MAX. SLOPE (TYP.)
AutoCAD SHX Text
PROP RCP OUTLET TO PLUNGE POOL OUTLET EL.=9.00
AutoCAD SHX Text
PROP EMERGENCY OVERFLOW SPILLWAY EL.=12.32 TO PLUNGE POOL EL.=10.00
AutoCAD SHX Text
20' BUILDING OFFSET (TYP.)
AutoCAD SHX Text
20' BUILDING OFFSET (TYP.)
AutoCAD SHX Text
20' BUILDING OFFSET (TYP.)
AutoCAD SHX Text
OPEN SPACE (RECREATIONAL USE) 1% MIN./4% MAX SLOPE
AutoCAD SHX Text
APPROX. LIMIT OF WORK (TYP.)
AutoCAD SHX Text
APPROX. LIMIT OF WORK (TYP.)
AutoCAD SHX Text
APPROX. LIMIT OF WORK (TYP.)
AutoCAD SHX Text
APPROX. LIMIT OF WORK (TYP.)
AutoCAD SHX Text
PROP. BORDERING VEGETATED WETLAND (BVW) ALTERATION=609 SF PERMANENT=223 SF TEMPORARY=386 SF
AutoCAD SHX Text
PROP. OUTLET CONTROL STRUCTURE (SEE DETAIL)
AutoCAD SHX Text
PROP 12" FES INV.=10.00
AutoCAD SHX Text
PROP. 7' H x 14' W OPEN BOTTOM ARCH CULVERT WITH HEADWALLS
AutoCAD SHX Text
PROP PRECAST CONC. CATCHBASIN (TYP.)
AutoCAD SHX Text
PROP PRECAST CONC. DRAIN MANHOLE (TYP.)
AutoCAD SHX Text
PROP 12" RCP DRAIN PIPE (TYP.)
AutoCAD SHX Text
PROP 12" RCP DRAIN PIPE (TYP.)
AutoCAD SHX Text
DWG. TITLE:
AutoCAD SHX Text
1"=40'
AutoCAD SHX Text
SCALE: 1" = 40'
AutoCAD SHX Text
40
AutoCAD SHX Text
0
AutoCAD SHX Text
160
AutoCAD SHX Text
80
AutoCAD SHX Text
20
AutoCAD SHX Text
DESCRIPTION
AutoCAD SHX Text
BY
AutoCAD SHX Text
REV
AutoCAD SHX Text
DATE
AutoCAD SHX Text
APP
AutoCAD SHX Text
DWG. NO:
AutoCAD SHX Text
DWG. TITLE:
AutoCAD SHX Text
215-181
AutoCAD SHX Text
DESIGNED BY:
AutoCAD SHX Text
PROJECT NO.:
AutoCAD SHX Text
APPROVED BY:
AutoCAD SHX Text
CHECKED BY:
AutoCAD SHX Text
DATE:
AutoCAD SHX Text
SCALE:
AutoCAD SHX Text
DRAWN BY:
AutoCAD SHX Text
C MCKENZIE ENGINEERING GROUP, INC.
AutoCAD SHX Text
M:\MEG\2015 PROJECTS\215-181\DWGS\CUT SHEETS\ZBA APPLICATION\SUBMISSION NO 1\215-181 C-2.DWG
AutoCAD SHX Text
COMMENTS PER MASSHOUSING
AutoCAD SHX Text
SBS
AutoCAD SHX Text
1
AutoCAD SHX Text
5/12/2017
AutoCAD SHX Text
BCM
AutoCAD SHX Text
PROFESSIONAL ENGINEER:
AutoCAD SHX Text
SEPTEMBER 22, 2016
AutoCAD SHX Text
PREPARED BY:
AutoCAD SHX Text
BCM
AutoCAD SHX Text
BCM
AutoCAD SHX Text
SBS
AutoCAD SHX Text
SBS
AutoCAD SHX Text
COMMENTS PER MASSHOUSING
AutoCAD SHX Text
SBS
AutoCAD SHX Text
2
AutoCAD SHX Text
7/14/2017
AutoCAD SHX Text
BCM
AutoCAD SHX Text
ZBA APPLICATION
AutoCAD SHX Text
AJC
AutoCAD SHX Text
3
AutoCAD SHX Text
10/5/2018
AutoCAD SHX Text
BCM

WATER
STREET
CHUR
CH
ST
REET
(RTE
139)
(PUBLIC - 45' W
IDE)
ROAD "C"
BUILD
ING-11
BUILD
ING-3
BUILDING
-4
BUILD
ING-15
BUILDING
-5
BUILDING-7
BUILD
ING-14
BUILDING-13
BUILDING-8
BUILDING
-9
BUILDING-12
ROAD "A"
ROAD "B"
ROAD "a"
BUILDING-1
BUIILD
ING-6
BUILDING-2
BUILD
ING-10
PE
RM
IT
P
LA
N S
ET
OW
NE
R/A
PP
LIC
AN
T:
RIV
ER
M
AR
SH
, LLC
293R
W
AS
HIN
GT
ON
S
TR
EE
T
NO
RW
ELL, M
AS
SA
CH
US
ET
TS
02061
(A
SS
ES
SO
R'S
M
AP
E
-17, LO
T 0 &
E
-17A
, LO
T 274)
PE
MB
RO
KE
, M
AS
SA
CH
US
ET
TS
Assinippi Office Park
150 Longwater Drive, Suite 101
Norwell, MA 02061
P: 781.792.3900
F: 781.792.0333
www.mckeng.com
M C K E N Z I E
ENGINEERING GROUP
RIV
ER
MA
RS
H V
ILLA
GE
CO
MP
RE
HE
NS
IVE
PE
RM
IT P
LAN
WA
TE
R S
TR
EE
T
PreliminaryUtility Plan
C-3
AutoCAD SHX Text
x
AutoCAD SHX Text
x
AutoCAD SHX Text
x
AutoCAD SHX Text
x
AutoCAD SHX Text
x
AutoCAD SHX Text
ZONE AE (EL.8)
AutoCAD SHX Text
CHARLES W. & CAROLYN M. CROSSLEY
AutoCAD SHX Text
M: E15 L: 8
AutoCAD SHX Text
N/F
AutoCAD SHX Text
FEMA LINE
AutoCAD SHX Text
BRIAN M. & MICHELLE M. LENAGHAN
AutoCAD SHX Text
M: E15 L: 17A
AutoCAD SHX Text
N/F
AutoCAD SHX Text
JOHN J. JR. & BRENDA J. MCDONNELL
AutoCAD SHX Text
M: E15 L: 17B
AutoCAD SHX Text
N/F
AutoCAD SHX Text
MARTIN P. & JANE L. COURNAN
AutoCAD SHX Text
M: E15 L: 17C
AutoCAD SHX Text
N/F
AutoCAD SHX Text
JOHN JACE WILSON
AutoCAD SHX Text
M: E15 L: 17D
AutoCAD SHX Text
N/F
AutoCAD SHX Text
SHANNON F. LAMB WILSON
AutoCAD SHX Text
TWO THIRTY-SIX WATER STREET TRUST
AutoCAD SHX Text
M: E15 L: 10
AutoCAD SHX Text
N/F
AutoCAD SHX Text
LESLIE J. MOLYNEAUX TRUSTEE
AutoCAD SHX Text
M: E15 L: 12
AutoCAD SHX Text
M: E15 L: 5
AutoCAD SHX Text
N/F
AutoCAD SHX Text
MICHAEL MCMANN
AutoCAD SHX Text
M: E15 L: 5B
AutoCAD SHX Text
N/F
AutoCAD SHX Text
MICHAEL SERODE
AutoCAD SHX Text
SHAWN M. &
AutoCAD SHX Text
M: F15 L: 8
AutoCAD SHX Text
N/F
AutoCAD SHX Text
TOWN OF PEMBROKE
AutoCAD SHX Text
M: F15 L: 9
AutoCAD SHX Text
N/F
AutoCAD SHX Text
MAGOUN CEMETERY
AutoCAD SHX Text
NO. 260
AutoCAD SHX Text
NO. 248
AutoCAD SHX Text
NO. 268
AutoCAD SHX Text
NO. 274
AutoCAD SHX Text
WG
AutoCAD SHX Text
HYD
AutoCAD SHX Text
WELL
AutoCAD SHX Text
HYD
AutoCAD SHX Text
UP
AutoCAD SHX Text
UP
AutoCAD SHX Text
UP
AutoCAD SHX Text
UP
AutoCAD SHX Text
x
AutoCAD SHX Text
x
AutoCAD SHX Text
x
AutoCAD SHX Text
SPIKE SET IN
AutoCAD SHX Text
24" MAPLE
AutoCAD SHX Text
ELEV.=10.88
AutoCAD SHX Text
SCENIC RIVER CORRIDOR
AutoCAD SHX Text
NATURAL
AutoCAD SHX Text
HGW-8.3
AutoCAD SHX Text
HGW-8.5
AutoCAD SHX Text
HGW-8.3
AutoCAD SHX Text
15" TREE
AutoCAD SHX Text
15" TREE
AutoCAD SHX Text
15" TREE
AutoCAD SHX Text
48" TREE
AutoCAD SHX Text
EXISTING DRIVEWAY
AutoCAD SHX Text
EXISTING
AutoCAD SHX Text
G
AutoCAD SHX Text
G
AutoCAD SHX Text
G
AutoCAD SHX Text
G
AutoCAD SHX Text
G
AutoCAD SHX Text
G
AutoCAD SHX Text
W
AutoCAD SHX Text
W
AutoCAD SHX Text
W
AutoCAD SHX Text
W
AutoCAD SHX Text
W
AutoCAD SHX Text
APPROXIMATE LOCATION
AutoCAD SHX Text
8" CI WATER MAIN
AutoCAD SHX Text
APPROX. LOCATION
AutoCAD SHX Text
4" GAS MAIN
AutoCAD SHX Text
DEBORAH K. DEEGAN
AutoCAD SHX Text
JULIE A. NICOLO
AutoCAD SHX Text
JEFFREY B. &
AutoCAD SHX Text
M: F15 L: 7A
AutoCAD SHX Text
N/F
AutoCAD SHX Text
TEDESCHI
AutoCAD SHX Text
N/F
AutoCAD SHX Text
M: F15 L: 7B
AutoCAD SHX Text
BRIAN S.
AutoCAD SHX Text
RIVER
AutoCAD SHX Text
BANK
AutoCAD SHX Text
8
AutoCAD SHX Text
8
AutoCAD SHX Text
8
AutoCAD SHX Text
SCENIC RIVER CORRIDOR
AutoCAD SHX Text
PAVED
AutoCAD SHX Text
DRIVE
AutoCAD SHX Text
ZONE X
AutoCAD SHX Text
8
AutoCAD SHX Text
8
AutoCAD SHX Text
8
AutoCAD SHX Text
8
AutoCAD SHX Text
8
AutoCAD SHX Text
LIMIT OF BORDERING VEGETATED WETLAND (BVW)
AutoCAD SHX Text
LIMIT OF 100' WETLAND BUFFER ZONE TO BVW
AutoCAD SHX Text
LIMIT OF BORDERING VEGETATED WETLAND (BVW)
AutoCAD SHX Text
LIMIT OF BORDERING VEGETATED WETLAND (BVW)
AutoCAD SHX Text
LIMIT OF 100-YR FLOODPLAIN PER FIRM PANELS 25023CO206J & 25023CO207J EFFECTIVE DATE:JULY 17, 2012
AutoCAD SHX Text
LIMIT OF 100' WETLAND BUFFER ZONE TO BVW
AutoCAD SHX Text
LIMIT OF 100' WETLAND BUFFER ZONE TO BVW
AutoCAD SHX Text
LIMIT OF 100' WETLAND BUFFER ZONE TO BVW
AutoCAD SHX Text
LIMIT OF INLAND BANK (INTERMITTENT STREAM)
AutoCAD SHX Text
LIMIT OF INLAND BANK (INTERMITTENT STREAM)
AutoCAD SHX Text
LIMIT OF 100' WETLAND BUFFER ZONE TO BVW
AutoCAD SHX Text
E15-17 48.9± ACRES
AutoCAD SHX Text
CB/LP
AutoCAD SHX Text
CHB
AutoCAD SHX Text
DH
AutoCAD SHX Text
DH
AutoCAD SHX Text
CHB
AutoCAD SHX Text
DH
AutoCAD SHX Text
DH
AutoCAD SHX Text
WF D1
AutoCAD SHX Text
WF D2
AutoCAD SHX Text
WF D3
AutoCAD SHX Text
WF D4
AutoCAD SHX Text
WF D5
AutoCAD SHX Text
WF D6
AutoCAD SHX Text
WF D7
AutoCAD SHX Text
WF D8
AutoCAD SHX Text
WF D9
AutoCAD SHX Text
WF D10
AutoCAD SHX Text
WF D10
AutoCAD SHX Text
WF D11
AutoCAD SHX Text
WF D12
AutoCAD SHX Text
WF D13
AutoCAD SHX Text
WF D14
AutoCAD SHX Text
WF D15
AutoCAD SHX Text
WF D16
AutoCAD SHX Text
WF D17
AutoCAD SHX Text
WF D18
AutoCAD SHX Text
WF D19
AutoCAD SHX Text
WF D20
AutoCAD SHX Text
WF D21
AutoCAD SHX Text
WF D22
AutoCAD SHX Text
WF D23
AutoCAD SHX Text
WF D24
AutoCAD SHX Text
WF D25
AutoCAD SHX Text
WF D26
AutoCAD SHX Text
WF D27
AutoCAD SHX Text
WF A1
AutoCAD SHX Text
WF A2
AutoCAD SHX Text
WF A3
AutoCAD SHX Text
WF A4
AutoCAD SHX Text
WF A5
AutoCAD SHX Text
WF A6
AutoCAD SHX Text
WF A7
AutoCAD SHX Text
WF A8
AutoCAD SHX Text
WF A9
AutoCAD SHX Text
WF A10
AutoCAD SHX Text
WF A11
AutoCAD SHX Text
WF A12
AutoCAD SHX Text
WF A13
AutoCAD SHX Text
WF A14
AutoCAD SHX Text
WF A15
AutoCAD SHX Text
WF A16
AutoCAD SHX Text
WF A17
AutoCAD SHX Text
WF A18
AutoCAD SHX Text
WF A19
AutoCAD SHX Text
WF A20
AutoCAD SHX Text
WF A21
AutoCAD SHX Text
WF A22
AutoCAD SHX Text
WF A23
AutoCAD SHX Text
WF A24
AutoCAD SHX Text
WF A25
AutoCAD SHX Text
WF A26
AutoCAD SHX Text
WF A27
AutoCAD SHX Text
WF A28
AutoCAD SHX Text
WF A29
AutoCAD SHX Text
WF A30
AutoCAD SHX Text
WF A31
AutoCAD SHX Text
WF A32
AutoCAD SHX Text
WF A33
AutoCAD SHX Text
WF A34
AutoCAD SHX Text
WF A35
AutoCAD SHX Text
WF A36
AutoCAD SHX Text
WF A37
AutoCAD SHX Text
WF IB111
AutoCAD SHX Text
WF IB110
AutoCAD SHX Text
WF IB109
AutoCAD SHX Text
WF IB108
AutoCAD SHX Text
WF IB107
AutoCAD SHX Text
WF IB106
AutoCAD SHX Text
WF IB105
AutoCAD SHX Text
WF IB104
AutoCAD SHX Text
WF IB103
AutoCAD SHX Text
WF IB102
AutoCAD SHX Text
WF IB4
AutoCAD SHX Text
WF IB5
AutoCAD SHX Text
WF IB6
AutoCAD SHX Text
WF IB7
AutoCAD SHX Text
WF IB8
AutoCAD SHX Text
WF IB9
AutoCAD SHX Text
WF IB10
AutoCAD SHX Text
WF IB11
AutoCAD SHX Text
WF IB12
AutoCAD SHX Text
WF IB13
AutoCAD SHX Text
WF B17
AutoCAD SHX Text
WF B18
AutoCAD SHX Text
WF B19
AutoCAD SHX Text
WF B20
AutoCAD SHX Text
WF B21
AutoCAD SHX Text
WF B22
AutoCAD SHX Text
WF B23
AutoCAD SHX Text
WF A38
AutoCAD SHX Text
WF A39
AutoCAD SHX Text
WF A40
AutoCAD SHX Text
WF A41
AutoCAD SHX Text
WF A42
AutoCAD SHX Text
WF A43
AutoCAD SHX Text
WF A44
AutoCAD SHX Text
WF A45
AutoCAD SHX Text
WF A46
AutoCAD SHX Text
WF A47
AutoCAD SHX Text
WF A48
AutoCAD SHX Text
WF A49
AutoCAD SHX Text
WF A50
AutoCAD SHX Text
WF IB116
AutoCAD SHX Text
WF IB115
AutoCAD SHX Text
WF IB18
AutoCAD SHX Text
WF IB17
AutoCAD SHX Text
WF IB16
AutoCAD SHX Text
WF IB15
AutoCAD SHX Text
WF IB14
AutoCAD SHX Text
WF IB112
AutoCAD SHX Text
WF IB113
AutoCAD SHX Text
WF IB114
AutoCAD SHX Text
WF B12
AutoCAD SHX Text
WF B13
AutoCAD SHX Text
WF B14
AutoCAD SHX Text
WF B15
AutoCAD SHX Text
WF B16
AutoCAD SHX Text
WF B24
AutoCAD SHX Text
WF B25
AutoCAD SHX Text
WF B26
AutoCAD SHX Text
WF B27
AutoCAD SHX Text
WF B28
AutoCAD SHX Text
WF B11
AutoCAD SHX Text
WF B10
AutoCAD SHX Text
WF B9
AutoCAD SHX Text
WF B8
AutoCAD SHX Text
WF B7
AutoCAD SHX Text
WF B6
AutoCAD SHX Text
WF B5
AutoCAD SHX Text
WF B4
AutoCAD SHX Text
WF B3
AutoCAD SHX Text
WF B2
AutoCAD SHX Text
WF B1
AutoCAD SHX Text
WF A51
AutoCAD SHX Text
WF A52
AutoCAD SHX Text
WF A53
AutoCAD SHX Text
WF A54
AutoCAD SHX Text
WF A55
AutoCAD SHX Text
WF A56
AutoCAD SHX Text
WF A57
AutoCAD SHX Text
WF A58
AutoCAD SHX Text
WF A60
AutoCAD SHX Text
WF A61
AutoCAD SHX Text
WF A62
AutoCAD SHX Text
WF A63
AutoCAD SHX Text
WF A64
AutoCAD SHX Text
WF A65
AutoCAD SHX Text
WF D7A
AutoCAD SHX Text
5+00
AutoCAD SHX Text
3+00
AutoCAD SHX Text
4+00
AutoCAD SHX Text
5+00
AutoCAD SHX Text
6+00
AutoCAD SHX Text
7+00
AutoCAD SHX Text
8+00
AutoCAD SHX Text
9+00
AutoCAD SHX Text
10+00
AutoCAD SHX Text
7+00
AutoCAD SHX Text
0+00
AutoCAD SHX Text
1+00
AutoCAD SHX Text
2+00
AutoCAD SHX Text
6+00
AutoCAD SHX Text
PT.
AutoCAD SHX Text
HI
AutoCAD SHX Text
PT.
AutoCAD SHX Text
HI
AutoCAD SHX Text
LOW
AutoCAD SHX Text
PT.
AutoCAD SHX Text
PT.
AutoCAD SHX Text
HI
AutoCAD SHX Text
W
AutoCAD SHX Text
W
AutoCAD SHX Text
W
AutoCAD SHX Text
G
AutoCAD SHX Text
ETC
AutoCAD SHX Text
ETC
AutoCAD SHX Text
G
AutoCAD SHX Text
G
AutoCAD SHX Text
G
AutoCAD SHX Text
G
AutoCAD SHX Text
H
AutoCAD SHX Text
Y
AutoCAD SHX Text
D
AutoCAD SHX Text
S
AutoCAD SHX Text
S
AutoCAD SHX Text
S
AutoCAD SHX Text
S
AutoCAD SHX Text
S
AutoCAD SHX Text
S
AutoCAD SHX Text
S
AutoCAD SHX Text
S
AutoCAD SHX Text
G
AutoCAD SHX Text
G
AutoCAD SHX Text
H
AutoCAD SHX Text
Y
AutoCAD SHX Text
D
AutoCAD SHX Text
H
AutoCAD SHX Text
Y
AutoCAD SHX Text
D
AutoCAD SHX Text
SMH 14
AutoCAD SHX Text
SMH 15
AutoCAD SHX Text
SMH 19
AutoCAD SHX Text
S
AutoCAD SHX Text
W
AutoCAD SHX Text
W
AutoCAD SHX Text
W
AutoCAD SHX Text
W
AutoCAD SHX Text
W
AutoCAD SHX Text
W
AutoCAD SHX Text
W
AutoCAD SHX Text
W
AutoCAD SHX Text
W
AutoCAD SHX Text
W
AutoCAD SHX Text
W
AutoCAD SHX Text
W
AutoCAD SHX Text
W
AutoCAD SHX Text
W
AutoCAD SHX Text
W
AutoCAD SHX Text
W
AutoCAD SHX Text
W
AutoCAD SHX Text
W
AutoCAD SHX Text
W
AutoCAD SHX Text
W
AutoCAD SHX Text
W
AutoCAD SHX Text
W
AutoCAD SHX Text
W
AutoCAD SHX Text
W
AutoCAD SHX Text
W
AutoCAD SHX Text
W
AutoCAD SHX Text
W
AutoCAD SHX Text
W
AutoCAD SHX Text
W
AutoCAD SHX Text
W
AutoCAD SHX Text
W
AutoCAD SHX Text
W
AutoCAD SHX Text
W
AutoCAD SHX Text
W
AutoCAD SHX Text
W
AutoCAD SHX Text
W
AutoCAD SHX Text
W
AutoCAD SHX Text
W
AutoCAD SHX Text
ETC
AutoCAD SHX Text
ETC
AutoCAD SHX Text
ETC
AutoCAD SHX Text
ETC
AutoCAD SHX Text
ETC
AutoCAD SHX Text
ETC
AutoCAD SHX Text
ETC
AutoCAD SHX Text
ETC
AutoCAD SHX Text
ETC
AutoCAD SHX Text
ETC
AutoCAD SHX Text
ETC
AutoCAD SHX Text
ETC
AutoCAD SHX Text
ETC
AutoCAD SHX Text
ETC
AutoCAD SHX Text
ETC
AutoCAD SHX Text
ETC
AutoCAD SHX Text
ETC
AutoCAD SHX Text
ETC
AutoCAD SHX Text
G
AutoCAD SHX Text
G
AutoCAD SHX Text
G
AutoCAD SHX Text
G
AutoCAD SHX Text
G
AutoCAD SHX Text
G
AutoCAD SHX Text
G
AutoCAD SHX Text
G
AutoCAD SHX Text
G
AutoCAD SHX Text
G
AutoCAD SHX Text
G
AutoCAD SHX Text
G
AutoCAD SHX Text
G
AutoCAD SHX Text
H
AutoCAD SHX Text
Y
AutoCAD SHX Text
D
AutoCAD SHX Text
H
AutoCAD SHX Text
Y
AutoCAD SHX Text
D
AutoCAD SHX Text
SMH 0
AutoCAD SHX Text
SMH 1
AutoCAD SHX Text
SMH 2
AutoCAD SHX Text
SMH 4
AutoCAD SHX Text
SMH 5
AutoCAD SHX Text
SMH 17
AutoCAD SHX Text
G
AutoCAD SHX Text
G
AutoCAD SHX Text
8+00
AutoCAD SHX Text
9+00
AutoCAD SHX Text
SMH 21
AutoCAD SHX Text
ETC
AutoCAD SHX Text
SMH 6
AutoCAD SHX Text
ETC
AutoCAD SHX Text
S
AutoCAD SHX Text
S
AutoCAD SHX Text
W
AutoCAD SHX Text
W
AutoCAD SHX Text
W
AutoCAD SHX Text
W
AutoCAD SHX Text
W
AutoCAD SHX Text
W
AutoCAD SHX Text
W
AutoCAD SHX Text
W
AutoCAD SHX Text
SMH 22
AutoCAD SHX Text
S
AutoCAD SHX Text
G
AutoCAD SHX Text
G
AutoCAD SHX Text
1+00
AutoCAD SHX Text
LOW
AutoCAD SHX Text
PT.
AutoCAD SHX Text
3+00
AutoCAD SHX Text
1+00
AutoCAD SHX Text
2+00
AutoCAD SHX Text
0+00
AutoCAD SHX Text
LOW
AutoCAD SHX Text
PT.
AutoCAD SHX Text
4+00
AutoCAD SHX Text
SMH 20
AutoCAD SHX Text
S
AutoCAD SHX Text
G
AutoCAD SHX Text
G
AutoCAD SHX Text
G
AutoCAD SHX Text
SMH 18
AutoCAD SHX Text
S
AutoCAD SHX Text
ETC
AutoCAD SHX Text
0+00
AutoCAD SHX Text
2+00
AutoCAD SHX Text
10+00
AutoCAD SHX Text
11+00
AutoCAD SHX Text
12+00
AutoCAD SHX Text
FM
AutoCAD SHX Text
FM
AutoCAD SHX Text
FM
AutoCAD SHX Text
ETC
AutoCAD SHX Text
FM
AutoCAD SHX Text
11+00
AutoCAD SHX Text
12+00
AutoCAD SHX Text
12+67.25
AutoCAD SHX Text
PT.
AutoCAD SHX Text
HI
AutoCAD SHX Text
PROP 8"X8" DI TAPPING SLEEVE AND VALVE
AutoCAD SHX Text
PROP GAS CONNECTION (COORD WITH GAS CO.)
AutoCAD SHX Text
PROP 12"X12" DI TAPPING SLEEVE AND VALVE
AutoCAD SHX Text
PROP GAS CONNECTION (COORD WITH GAS CO.)
AutoCAD SHX Text
PROP ELECTRIC, TELEPHONE AND CABLE CONNECTION VIA RISER TO EXIST U.P. (COORD. WITH ELEC. CO.)
AutoCAD SHX Text
PROP FIRE HYDRANT (TYP.)
AutoCAD SHX Text
PROP SEPTIC TANK (TYP.)
AutoCAD SHX Text
PROP SEWER MANHOLE (TYP.)
AutoCAD SHX Text
PROP ELECTRIC, TELEPHONE AND CABLE CONDUIT (TYP.) (COORD WITH ELEC. CO.)
AutoCAD SHX Text
PROP 8" CLDI (CL.52) WATER PIPE (TYP.)
AutoCAD SHX Text
PROP 8" PVC GRAVITY SEWER PIPE (TYP.)
AutoCAD SHX Text
PROP SEPTIC PUMP CHAMBER (SIZE TO BE DETERMINED)
AutoCAD SHX Text
PROP 3" PVC (SCH-80) SEWER FORCE MAIN (TYP.)
AutoCAD SHX Text
PROP SEPTIC DOSING CHAMBER
AutoCAD SHX Text
PROP (2) 54'x90' SOIL ABSORPTION SYSTEM (DOSED SYSTEM)
AutoCAD SHX Text
PROP 8" CLDI (CL.52) WATER PIPE (TYP.)
AutoCAD SHX Text
PROP 8" CLDI (CL.52) WATER PIPE (TYP.)
AutoCAD SHX Text
PROP 8" CLDI (CL.52) WATER PIPE (TYP.)
AutoCAD SHX Text
PROP FIRE HYDRANT (TYP.)
AutoCAD SHX Text
PROP FIRE HYDRANT (TYP.)
AutoCAD SHX Text
PROP FIRE HYDRANT (TYP.)
AutoCAD SHX Text
PROP 8" PVC GRAVITY SEWER PIPE (TYP.)
AutoCAD SHX Text
PROP ELECTRIC, TELEPHONE AND CABLE CONDUIT (TYP.) (COORD WITH ELEC. CO.)
AutoCAD SHX Text
PROP ELECTRIC, TELEPHONE AND CABLE CONDUIT (TYP.) (COORD WITH ELEC. CO.)
AutoCAD SHX Text
PROP 3" PVC (SCH-80) SEWER FORCE MAIN (TYP.)
AutoCAD SHX Text
PROP FIRE HYDRANT (TYP.)
AutoCAD SHX Text
PROP SEWER MANHOLE (TYP.)
AutoCAD SHX Text
PROP GAS PIPE (TYP.) (COORD WITH GAS CO.)
AutoCAD SHX Text
PROP GAS PIPE (TYP.) (COORD WITH GAS CO.)
AutoCAD SHX Text
PROP SEPTIC TANK (TYP.)
AutoCAD SHX Text
PROP SEWER MANHOLE (TYP.)
AutoCAD SHX Text
PROP 8" PVC GRAVITY SEWER PIPE (TYP.)
AutoCAD SHX Text
PROP 6" SEWER SERVICE CONNECTION WITH C.O. (TYP.)
AutoCAD SHX Text
PROP 8" CLDI (CL.52) WATER PIPE (TYP.)
AutoCAD SHX Text
PROP 6" SEWER SERVICE CONNECTION WITH C.O. (TYP.)
AutoCAD SHX Text
APPROX. LIMIT OF WORK (TYP.)
AutoCAD SHX Text
APPROX. LIMIT OF WORK (TYP.)
AutoCAD SHX Text
APPROX. LIMIT OF WORK (TYP.)
AutoCAD SHX Text
APPROX. LIMIT OF WORK (TYP.)
AutoCAD SHX Text
PROP STORMWATER DETENTION BASIN
AutoCAD SHX Text
DWG. TITLE:
AutoCAD SHX Text
1"=40'
AutoCAD SHX Text
SCALE:
AutoCAD SHX Text
SCALE: 1" = 40'
AutoCAD SHX Text
40
AutoCAD SHX Text
0
AutoCAD SHX Text
160
AutoCAD SHX Text
80
AutoCAD SHX Text
20
AutoCAD SHX Text
DESCRIPTION
AutoCAD SHX Text
BY
AutoCAD SHX Text
REV
AutoCAD SHX Text
DATE
AutoCAD SHX Text
APP
AutoCAD SHX Text
DWG. NO:
AutoCAD SHX Text
DWG. TITLE:
AutoCAD SHX Text
215-181
AutoCAD SHX Text
DESIGNED BY:
AutoCAD SHX Text
PROJECT NO.:
AutoCAD SHX Text
APPROVED BY:
AutoCAD SHX Text
CHECKED BY:
AutoCAD SHX Text
DATE:
AutoCAD SHX Text
SCALE:
AutoCAD SHX Text
DRAWN BY:
AutoCAD SHX Text
C MCKENZIE ENGINEERING GROUP, INC.
AutoCAD SHX Text
M:\MEG\2015 PROJECTS\215-181\DWGS\CUT SHEETS\ZBA APPLICATION\SUBMISSION NO 1\215-181 C-3.DWG
AutoCAD SHX Text
COMMENTS PER MASSHOUSING
AutoCAD SHX Text
SBS
AutoCAD SHX Text
1
AutoCAD SHX Text
5/12/2017
AutoCAD SHX Text
BCM
AutoCAD SHX Text
PROFESSIONAL ENGINEER:
AutoCAD SHX Text
SEPTEMBER 22, 2016
AutoCAD SHX Text
PREPARED BY:
AutoCAD SHX Text
BCM
AutoCAD SHX Text
BCM
AutoCAD SHX Text
SBS
AutoCAD SHX Text
SBS
AutoCAD SHX Text
COMMENTS PER MASSHOUSING
AutoCAD SHX Text
SBS
AutoCAD SHX Text
2
AutoCAD SHX Text
7/14/2017
AutoCAD SHX Text
BCM
AutoCAD SHX Text
ZBA APPLICATION
AutoCAD SHX Text
AJC
AutoCAD SHX Text
3
AutoCAD SHX Text
10/5/2018
AutoCAD SHX Text
BCM
AutoCAD SHX Text
GENERAL UTILITY NOTES: 1.THE CONTRACTOR IS SPECIFICALLY CAUTIONED THAT THE LOCATION AND/OR ELEVATION OF EXISTING UTILITIES AND STRUCTURES AS SHOWN THE CONTRACTOR IS SPECIFICALLY CAUTIONED THAT THE LOCATION AND/OR ELEVATION OF EXISTING UTILITIES AND STRUCTURES AS SHOWN ON THESE PLANS IS BASED ON RECORDS OF VARIOUS UTILITY COMPANIES, TOWN OF PEMBROKE, AND WHERE POSSIBLE, MEASUREMENTS TAKEN IN THE FIELD. THIS INFORMATION IS NOT TO BE RELIED UPON AS BEING EXACT OR COMPLETE. THE LOCATION OF ALL UNDERGROUND UTILITIES AND STRUCTURES SHALL BE VERIFIED IN THE FIELD BY THE CONTRACTOR PRIOR TO THE START OF CONSTRUCTION. THE CONTRACTOR MUST CONTACT THE APPROPRIATE UTILITY COMPANY, ANY GOVERNING PERMITTING AUTHORITY, AND "DIGSAFE" AT LEAST 72 HOURS PRIOR TO ANY EXCAVATION WORK TO REQUEST EXACT FIELD LOCATION OF UTILITIES AND THE ENGINEER SHALL BE NOTIFIED IN WRITING OF ANY UTILITIES INTERFERING WITH THE PROPOSED CONSTRUCTION AND APPROPRIATE REMEDIAL ACTION SHALL BE TAKEN BEFORE PROCEEDING WITH THE WORK. IT SHALL BE THE RESPONSIBILITY OF THE CONTRACTOR TO RELOCATE ALL EXISTING UTILITIES WHICH CONFLICT WITH THE PROPOSED IMPROVEMENTS SHOWN ON THE PLAN. 2.MASSACHUSETTS STATE LAW REQUIRES UTILITY NOTIFICATION AT LEAST THREE BUSINESS DAYS PRIOR TO CONSTRUCTION. THE CONTRACTOR MASSACHUSETTS STATE LAW REQUIRES UTILITY NOTIFICATION AT LEAST THREE BUSINESS DAYS PRIOR TO CONSTRUCTION. THE CONTRACTOR SHALL CALL DIG-SAFE AT 1-888-344-7233 IN ORDER TO COMPLY WITH STATE LAW. 3.THE CONTRACTOR SHALL BE RESPONSIBLE FOR ESTABLISHING AND MAINTAINING ALL CONTROL POINTS AND BENCHMARKS NECESSARY FOR THE CONTRACTOR SHALL BE RESPONSIBLE FOR ESTABLISHING AND MAINTAINING ALL CONTROL POINTS AND BENCHMARKS NECESSARY FOR THE WORK. 4.THE CONTRACTOR SHALL EXCAVATE THE UTILITY TRENCHES IN THE LOCATIONS SHOWN ON THE PLAN PRIOR TO COMMENCING WORK TO THE CONTRACTOR SHALL EXCAVATE THE UTILITY TRENCHES IN THE LOCATIONS SHOWN ON THE PLAN PRIOR TO COMMENCING WORK TO VERIFY THE ELEVATIONS AND LOCATIONS OF EXISTING UTILITIES. 5.THE CONTRACTOR SHALL BE RESPONSIBLE FOR NOTIFYING THE DESIGN ENGINEER FOR INSPECTION OR AS-BUILT LOCATIONS, AS REQUIRED BY THE CONTRACTOR SHALL BE RESPONSIBLE FOR NOTIFYING THE DESIGN ENGINEER FOR INSPECTION OR AS-BUILT LOCATIONS, AS REQUIRED BY THE TOWN OF PEMBROKE. 6.IF ANY PART OF THIS DESIGN IS TO BE ALTERED IN ANY WAY, THE DESIGN ENGINEER, AS WELL AS THE APPROVING AUTHORITIES, SHALL BE IF ANY PART OF THIS DESIGN IS TO BE ALTERED IN ANY WAY, THE DESIGN ENGINEER, AS WELL AS THE APPROVING AUTHORITIES, SHALL BE NOTIFIED IN WRITING BEFORE CONSTRUCTION. 7.THE WATER SERVICE SERVICE SHALL BE CEMENT LINED DUCTILE IRON (CLASS 52) AND SHALL BE INSTALLED WITH APPROPRIATELY SIZED THE WATER SERVICE SERVICE SHALL BE CEMENT LINED DUCTILE IRON (CLASS 52) AND SHALL BE INSTALLED WITH APPROPRIATELY SIZED TAPPING SLEEVE, GATE VALVE AND BOX. THE SERVICE APPURTENANCES, MATERIALS, METHODS OF INSTALLATION SHALL MEET OR EXCEED ALL STATE AND LOCAL MUNICIPAL REQUIREMENTS. 8.A MINIMUM OF 10 FEET CLEAR HORIZONTALLY SHALL BE MAINTAINED BETWEEN SANITARY SEWER SERVICES AND WATER SERVICES. WHENEVER A MINIMUM OF 10 FEET CLEAR HORIZONTALLY SHALL BE MAINTAINED BETWEEN SANITARY SEWER SERVICES AND WATER SERVICES. WHENEVER CONDITIONS PREVENT A LATERAL SEPARATION OF 10 FEET TO A WATER SERVICE THE ELEVATION OF THE CROWN OF THE SEWER SHALL BE AT LEAST 18 INCHES BELOW THE INVERT OF THE WATER SERVICE. 9.THE MINIMUM SIZE OF ALL STORM DRAIN PIPE SHALL BE 12" AND MATERIAL SHALL BE REINFORCED CONCRETE PIPE OF ADEQUATE STRENGTH. THE MINIMUM SIZE OF ALL STORM DRAIN PIPE SHALL BE 12" AND MATERIAL SHALL BE REINFORCED CONCRETE PIPE OF ADEQUATE STRENGTH. 10.ALL GRAVITY SEWER PIPE SHALL BE POLYVINYL CHLORIDE (PVC) SDR-35 UNLESS OTHERWISE NOTED. ALL GRAVITY SEWER PIPE SHALL BE POLYVINYL CHLORIDE (PVC) SDR-35 UNLESS OTHERWISE NOTED. 11.WHERE SANITARY SEWERS CROSS WATER MAINS, THE SEWER SHALL BE LAID AT SUCH AN ELEVATION THAT THE CROWN OF THE SEWER IS AT WHERE SANITARY SEWERS CROSS WATER MAINS, THE SEWER SHALL BE LAID AT SUCH AN ELEVATION THAT THE CROWN OF THE SEWER IS AT LEAST 18 INCHES BELOW THE INVERT OF THE WATER MAIN. IF THE ELEVATION OF THE SEWER CANNOT BE VARIED TO MEET THIS REQUIREMENT, THE WATER MAIN SHALL BE RELOCATED TO PROVIDE THIS SEPARATION OR CONSTRUCTED WITH MECHANICAL-JOINT PIPE FOR A DISTANCE OF 10 FEET ON EACH SIDE OF THE SEWER. ONE FULL LENGTH OF WATER MAIN SHALL BE CENTERED OVER THE SEWER SO THAT BOTH JOINTS WILL BE AS FAR FROM THE SEWER AS POSSIBLE. WHENEVER IT IS IMPOSSIBLE TO OBTAIN VERTICAL SEPARATION AS STIPULATED ABOVE, BOTH THE WATER MAIN AND THE SEWER MAIN SHALL BE ENCASED IN CONCRETE FOR A MINIMUM DISTANCE OF 10 FEET FROM THE CROSSING POINT OF THE OTHER PIPE AS MEASURED NORMALLY FROM ALL POINTS ALONG THE PIPE. 12.ALL SEWER AND STORM DRAINAGE WORK (EXCEPT PLUMBING) SHALL BE PERFORMED BY LICENSED DRAIN LAYER (LICENSED BY TOWN OF ALL SEWER AND STORM DRAINAGE WORK (EXCEPT PLUMBING) SHALL BE PERFORMED BY LICENSED DRAIN LAYER (LICENSED BY TOWN OF PEMBROKE BOARD OF HEALTH) AND THE DRAIN LAYER SHALL PULL A PERMIT FOR THE SITE FROM THE WATER DEPARTMENT PRIOR TO BEGINNING WORK. 13.ALL NEW SEWER AND DRAIN CONNECTIONS MUST BE CORED AND ATTACHED WITH AN INSERTA TEE OR APPROVED EQUAL IF FACTORY WYE IS ALL NEW SEWER AND DRAIN CONNECTIONS MUST BE CORED AND ATTACHED WITH AN INSERTA TEE OR APPROVED EQUAL IF FACTORY WYE IS NOT AVAILABLE OR DAMAGED. 14.THE LOCATIONS OF PROPOSED ELECTRIC SERVICES ARE APPROXIMATE. THE PROJECT ELECTRICAL ENGINEER SHALL VERIFY THESE LOCATIONS THE LOCATIONS OF PROPOSED ELECTRIC SERVICES ARE APPROXIMATE. THE PROJECT ELECTRICAL ENGINEER SHALL VERIFY THESE LOCATIONS PRIOR TO THE START OF CONSTRUCTION. COORDINATE ALL ELECTRICAL WORK WITH THE APPROPRIATE UTILITY COMPANIES. 15.THE PROPOSED GAS SERVICE LOCATION IS APPROXIMATE ONLY. THE CONTRACTOR SHALL COORDINATE THE GAS SERVICE INSTALLATION WITH THE PROPOSED GAS SERVICE LOCATION IS APPROXIMATE ONLY. THE CONTRACTOR SHALL COORDINATE THE GAS SERVICE INSTALLATION WITH THE LOCAL GAS COMPANY. THE CONTRACTOR SHALL GIVE ADVANCE NOTICE OF WHEN THE GAS LINE CAN BE INSTALLED.

C-4
CONSTRUCTION
DETAILS
SHEET 1 OF 4
PE
RM
IT
P
LA
N S
ET
OW
NE
R/A
PP
LIC
AN
T:
RIV
ER
M
AR
SH
, L
LC
293R
W
AS
HIN
GT
ON
S
TR
EE
T
NO
RW
ELL, M
AS
SA
CH
US
ET
TS
02061
(A
SS
ES
SO
R'S
M
AP
E
-17, LO
T 0 &
E
-17A
, LO
T 274)
PE
MB
RO
KE
, M
AS
SA
CH
US
ET
TS
Assinippi Office Park
150 Longwater Drive, Suite 101
Norwell, MA 02061
P: 781.792.3900
F: 781.792.0333
www.mckeng.com
M C K E N Z I E
ENGINEERING GROUP
RIV
ER
MA
RS
H V
ILLA
GE
CO
MP
RE
HE
NS
IVE
PE
RM
IT P
LAN
WA
TE
R S
TR
EE
T
AutoCAD SHX Text
%%UGENERAL UTILITY NOTES
AutoCAD SHX Text
THE CONTRACTOR SHALL PROVIDE SIEVE ANALYSIS SUBMITTALS TO THE ENGINEER FOR APPROVAL PRIOR TO INSTALLATION OF THE SAND/SILT MATERIAL TO BE USED.
AutoCAD SHX Text
8.
AutoCAD SHX Text
THE CONTRACTOR SHALL PROVIDE INLET PROTECTION, SUCH AS SILT SACKS, AT ALL CATCH BASINS TO PREVENT SEDIMENT FROM ENTERING THE EXTENDED DETENTION WETLAND AREA. INLET PROTECTION WILL ALLOW THE STORM DRAIN INLETS TO BE USED BEFORE FINAL STABILIZATION.
AutoCAD SHX Text
7.
AutoCAD SHX Text
1.
AutoCAD SHX Text
2.
AutoCAD SHX Text
3.
AutoCAD SHX Text
4.
AutoCAD SHX Text
5.
AutoCAD SHX Text
6.
AutoCAD SHX Text
SEE SHEET C-10 FOR PEMBROKE WATER DEPT. CONSTRUCTION DETAILS, NOTES, AND SPECIFICATIONS.
AutoCAD SHX Text
DOMESTIC WATER SERVICES 2 INCHES AND SMALLER SHALL BE TYPE K COPPER TUBING AND SHALL BE INSTALLED WITH APPROPRIATELY SIZED CORPORATION STOP WITH APPROVED SADDLE, CURB STOP, GATE AND BOX.
AutoCAD SHX Text
ALL WATER SERVICES SHALL BE INSTALLED WITH 5' OF COVER EXCEPT AS NOTED OR DETAILED OTHERWISE.
AutoCAD SHX Text
THE CONTRACTOR SHALL EXCAVATE THE TEST PITS IN THE LOCATIONS SHOWN ON THE PLAN PRIOR TO COMMENCING WORK TO VERIFY THE ELEVATIONS AND LOCATIONS OF EXISTING UTILITIES. THE CONTRACTOR SHALL PROVIDE THE OWNER AND ENGINEER WITH THE RESULTS PRIOR TO COMMENCING ANY WORK.
AutoCAD SHX Text
THE CONTRACTOR SHALL BE RESPONSIBLE FOR ESTABLISHING AND MAINTAINING ALL CONTROL POINTS AND BENCHMARKS NECESSARY FOR THE WORK.
AutoCAD SHX Text
THE CONTRACTOR IS SPECIFICALLY CAUTIONED THAT THE LOCATION AND/OR ELEVATION OF EXISTING UTILITIES AND STRUCTURES AS SHOWN ON THESE PLANS IS BASED ON RECORDS OF VARIOUS UTILITY COMPANIES AND WHERE POSSIBLE, MEASUREMENTS TAKEN IN THE FIELD. THIS INFORMATION IS NOT TO BE RELIED UPON AS BEING EXACT OR COMPLETE. THE LOCATION OF ALL UNDERGROUND UTILITIES AND STRUCTURES SHALL BE VERIFIED IN THE FIELD BY THE CONTRACTOR PRIOR TO THE START OF CONSTRUCTION. THE CONTRACTOR MUST CONTACT THE APPROPRIATE UTILITY COMPANY, ANY GOVERNING PERMITTING AUTHORITY, AND "DIGSAFE" AT LEAST 72 HOURS PRIOR TO ANY EXCAVATION WORK TO REQUEST EXACT FIELD LOCATION OF UTILITIES AND THE ENGINEER SHALL BE NOTIFIED IN WRITING OF ANY UTILITIES INTERFERING WITH THE PROPOSED CONSTRUCTION AND APPROPRIATE REMEDIAL ACTION TAKEN BEFORE PROCEEDING WITH THE WORK. IT SHALL BE THE RESPONSIBILITY OF THE CONTRACTOR TO RELOCATE ALL EXISTING UTILITIES WHICH CONFLICT WITH THE PROPOSED IMPROVEMENTS SHOWN ON THE PLAN.
AutoCAD SHX Text
TYPICAL ELECTRIC/TELEPHONE/CABLE CONDUIT (US-UTILITY SERVICE) SCALE: N.T.S
AutoCAD SHX Text
1.
AutoCAD SHX Text
2.
AutoCAD SHX Text
HS-20 LOADING.
AutoCAD SHX Text
3.
AutoCAD SHX Text
4.
AutoCAD SHX Text
MORTAR ALL PIPE CONNECTIONS.
AutoCAD SHX Text
2" MAX. CLEARANCE TO OUTSIDE OF PIPE.
AutoCAD SHX Text
PROVIDE "V" KNOCKOUTS FOR PIPES WITH
AutoCAD SHX Text
JOINT SEALANT BETWEEN PRECAST SECTIONS
AutoCAD SHX Text
SHALL BE PREFORMED BUTYL RUBBER.
AutoCAD SHX Text
ALL SECTIONS SHALL BE DESIGNED FOR
AutoCAD SHX Text
DIA.
AutoCAD SHX Text
VARIES
AutoCAD SHX Text
OUTLET
AutoCAD SHX Text
SUBGRADE
AutoCAD SHX Text
COMPACTED
AutoCAD SHX Text
SEE NOTE 3
AutoCAD SHX Text
8"
AutoCAD SHX Text
24"
AutoCAD SHX Text
8"
AutoCAD SHX Text
ALTERNATE TOP SLAB
AutoCAD SHX Text
24" SQUARE
AutoCAD SHX Text
OPENING (TYP)
AutoCAD SHX Text
48" DIA. (MIN.)
AutoCAD SHX Text
MIN.
AutoCAD SHX Text
8"
AutoCAD SHX Text
12"
AutoCAD SHX Text
SEE NOTE 4
AutoCAD SHX Text
GRADE
AutoCAD SHX Text
FINISH
AutoCAD SHX Text
4' (MIN.)
AutoCAD SHX Text
48" DIA. (MIN)
AutoCAD SHX Text
INVERT
AutoCAD SHX Text
HOOD
AutoCAD SHX Text
AS REQ'D.
AutoCAD SHX Text
RISER
AutoCAD SHX Text
SECTION(S)
AutoCAD SHX Text
MONOLITHIC
AutoCAD SHX Text
BASE SECTION
AutoCAD SHX Text
(TYP.)
AutoCAD SHX Text
12"
AutoCAD SHX Text
CONE SECTION
AutoCAD SHX Text
CONCENTRIC
AutoCAD SHX Text
SEE ALTERNATE
AutoCAD SHX Text
TOP SLAB
AutoCAD SHX Text
%%uALTERNATE ECCENTRIC CONE SECTION
AutoCAD SHX Text
CEMENT CONCRETE INVERT
AutoCAD SHX Text
COMPACTED SUBGRADE
AutoCAD SHX Text
MONOLITHIC
AutoCAD SHX Text
BASE SECTION
AutoCAD SHX Text
(TYP.)
AutoCAD SHX Text
12"
AutoCAD SHX Text
AS REQ'D.
AutoCAD SHX Text
SECTION(S)
AutoCAD SHX Text
RISER
AutoCAD SHX Text
48" DIA. (MIN.)
AutoCAD SHX Text
VARIES
AutoCAD SHX Text
DIA.
AutoCAD SHX Text
NOTE 5.
AutoCAD SHX Text
SEE ALTERNATE
AutoCAD SHX Text
ECCENTRIC
AutoCAD SHX Text
CONE SECTION
AutoCAD SHX Text
TOP SLAB
AutoCAD SHX Text
FINISH
AutoCAD SHX Text
GRADE
AutoCAD SHX Text
SEE
AutoCAD SHX Text
12"
AutoCAD SHX Text
(MIN.)
AutoCAD SHX Text
8"
AutoCAD SHX Text
ALTERNATE TOP SLAB
AutoCAD SHX Text
STEPS, SEE
AutoCAD SHX Text
NOTE 2.
AutoCAD SHX Text
ACCESS
AutoCAD SHX Text
24" DIA.
AutoCAD SHX Text
8"
AutoCAD SHX Text
8"
AutoCAD SHX Text
48" DIA. (MIN.)
AutoCAD SHX Text
24" DIA.
AutoCAD SHX Text
ACCESS
AutoCAD SHX Text
OUTLET
AutoCAD SHX Text
MORTAR ALL PIPE CONNECTIONS.
AutoCAD SHX Text
2" MAX. CLEARANCE TO OUTSIDE OF PIPE.
AutoCAD SHX Text
PROVIDE "V" KNOCKOUTS FOR PIPES WITH
AutoCAD SHX Text
JOINT SEALANT BETWEEN PRECAST SECTIONS
AutoCAD SHX Text
SHALL BE PREFORMED BUTYL RUBBER.
AutoCAD SHX Text
ALL SECTIONS SHALL BE DESIGNED FOR
AutoCAD SHX Text
COPOLYMER MANHOLE STEPS SHALL BE
AutoCAD SHX Text
INSTALLED AT 12" O.C. FOR THE FULL
AutoCAD SHX Text
SEE NOTE 4.
AutoCAD SHX Text
5.
AutoCAD SHX Text
4.
AutoCAD SHX Text
3.
AutoCAD SHX Text
HS-20 LOADING.
AutoCAD SHX Text
DEPTH OF THE STRUCTURE.
AutoCAD SHX Text
2.
AutoCAD SHX Text
1.
AutoCAD SHX Text
DRAIN MANHOLE FRAME AND COVER
AutoCAD SHX Text
SHALL BE SET IN FULL MORTAR BED.
AutoCAD SHX Text
ADJUST TO GRADE WITH CLAY BRICK AND
AutoCAD SHX Text
MORTAR (2 BRICK COURSES TYPICALLY,
AutoCAD SHX Text
5 BRICK COURSES MAXIMUM)
AutoCAD SHX Text
DIA.
AutoCAD SHX Text
VARIES
AutoCAD SHX Text
SHELF TO BE CONCRETE
AutoCAD SHX Text
FORMED AT A SLOPE OF
AutoCAD SHX Text
1" PER FOOT.
AutoCAD SHX Text
CATCH BASIN FRAME AND GRATE SHALL
AutoCAD SHX Text
BE SET IN FULL MORTAR BED. ADJUST
AutoCAD SHX Text
TO GRADE WITH CLAY BRICK AND
AutoCAD SHX Text
MORTAR (2 BRICK COURSES TYPICALLY, 5
AutoCAD SHX Text
BRICK COURSES MAXIMUM)
AutoCAD SHX Text
SEALANT
AutoCAD SHX Text
BUTYL JOINT
AutoCAD SHX Text
(MIN.)
AutoCAD SHX Text
%%UIN PAVED AREAS
AutoCAD SHX Text
SHEETING IF USED
AutoCAD SHX Text
SHALL BE LEFT IN
AutoCAD SHX Text
VARIES
AutoCAD SHX Text
THIS ELEVATION
AutoCAD SHX Text
PLACE BELOW
AutoCAD SHX Text
SHEETING AS
AutoCAD SHX Text
REQUIRED
AutoCAD SHX Text
OR SEWER
AutoCAD SHX Text
%%UIN EARTH
AutoCAD SHX Text
%%UIN ROCK
AutoCAD SHX Text
DRAIN
AutoCAD SHX Text
ROCK
AutoCAD SHX Text
APPROVED SLOPE
AutoCAD SHX Text
6" LOAM AND SEED OR
AutoCAD SHX Text
PROTECTION
AutoCAD SHX Text
6"
AutoCAD SHX Text
%%UCROSS COUNTRY
AutoCAD SHX Text
VARIES
AutoCAD SHX Text
MATERIAL
AutoCAD SHX Text
(4" MIN.)
AutoCAD SHX Text
SCREENED GRAVEL
AutoCAD SHX Text
BACKFILL MATERIAL
AutoCAD SHX Text
DEPTH VARIES
AutoCAD SHX Text
1"-0"
AutoCAD SHX Text
1'-0"
AutoCAD SHX Text
MIN.
AutoCAD SHX Text
SAND BLANKET
AutoCAD SHX Text
RESURFACING AS REQUIRED
AutoCAD SHX Text
SUITABLE BACKFILL
AutoCAD SHX Text
BASE COURSE
AutoCAD SHX Text
2 1/2" MIN. PAVEMENT
AutoCAD SHX Text
18" GRAVEL
AutoCAD SHX Text
TRENCH WIDTH AND DEPTH TO BE IN ACCORDANCE WITH THE TELEPHONE COMPANY AND THE ELECTRIC COMPANY REQUIREMENTS AS APPLICABLE.
AutoCAD SHX Text
FINISHED GROUND SURFACE
AutoCAD SHX Text
BURIED CONDUIT MARKER
AutoCAD SHX Text
PROPOSED CONDUITS FOR TELEPHONE, CABLE AND ELECTRICAL SERVICE
AutoCAD SHX Text
6" MIN.
AutoCAD SHX Text
6" MIN.
AutoCAD SHX Text
PROVIDE 3" MIN. COVER OF CONCRETE
AutoCAD SHX Text
COVER 3'-0" MIN.
AutoCAD SHX Text
1'-0"
AutoCAD SHX Text
DRAIN MANHOLE COVER SHALL HAVE A DIAMOND PATTERN, PICKHOLES & THE WORD "DRAIN" CAST IN 3" LETTERS (LEBARON LK 110-A).
AutoCAD SHX Text
6.
AutoCAD SHX Text
12" COMPACTED CRUSHED STONE (MASSDOT M2.01.4, CRUSHED STONE)
AutoCAD SHX Text
12" COMPACTED CRUSHED STONE (MASSDOT M2.01.4, CRUSHED STONE)
AutoCAD SHX Text
%%UPLAN VIEW
AutoCAD SHX Text
20' (MIN.)
AutoCAD SHX Text
EDGE OF PAVEMENT
AutoCAD SHX Text
DRIVEWAY APRON
AutoCAD SHX Text
%%UISOMETRIC VIEW
AutoCAD SHX Text
20' (MIN.)
AutoCAD SHX Text
(MAX.)
AutoCAD SHX Text
APRON
AutoCAD SHX Text
6.25%%%
AutoCAD SHX Text
(4' MAX)
AutoCAD SHX Text
DRIVEWAY
AutoCAD SHX Text
HEIGHT OF BERM 3" (MIN.)
AutoCAD SHX Text
PROP. 0" REVEAL AT END OF DRIVEWAY APRON/ LEADING EDGE OF SIDEWALK AT DRIVEWAY
AutoCAD SHX Text
NOTE: THE DRIVEWAY GRADE WITHIN 75' OF THE STREET LINE SHALL NOT EXCEED 5%.
AutoCAD SHX Text
BIT. CONC. DRIVEWAY
AutoCAD SHX Text
2'-0"
AutoCAD SHX Text
6.25%%%
AutoCAD SHX Text
GUTTER LINE
AutoCAD SHX Text
ROADWAY
AutoCAD SHX Text
DRIVEWAY
AutoCAD SHX Text
VARIES TO MEET GARAGE
AutoCAD SHX Text
4'-0" (MAX.)
AutoCAD SHX Text
4.
AutoCAD SHX Text
3.
AutoCAD SHX Text
2.
AutoCAD SHX Text
1.
AutoCAD SHX Text
5.
AutoCAD SHX Text
ALL SECTIONS SHALL BE DESIGNED FOR HS-20 LOADING.
AutoCAD SHX Text
PROVIDE DOGHOUSE OPENING FOR PIPES WITH 2" MAX. CLEARANCE TO OUTSIDE OF PIPE. TOP SLAB SHALL NOT REST DIRECTLY ON PIPE. GROUT ALL PIPE CONNECTIONS (NON-SHRINK GROUT).
AutoCAD SHX Text
JOINT SEALANT BETWEEN PRECAST SECTIONS SHALL BE PREFORMED BUTYL RUBBER.
AutoCAD SHX Text
CATCH BASIN FRAME AND GRATE (4" DEPTH) SHALL BE SET IN FULL MORTAR BED.
AutoCAD SHX Text
ADJUST TO FINISH GRADE WITH CLAY BRICK AND MORTAR AS REQUIRED.
AutoCAD SHX Text
22" x 44" OPENING
AutoCAD SHX Text
IN TOP SLAB
AutoCAD SHX Text
PLAN
AutoCAD SHX Text
SUBGRADE
AutoCAD SHX Text
COMPACTED
AutoCAD SHX Text
TYP.
AutoCAD SHX Text
12"
AutoCAD SHX Text
48" DIA. (MIN.)
AutoCAD SHX Text
24"
AutoCAD SHX Text
BASE SECTION
AutoCAD SHX Text
4' MIN.
AutoCAD SHX Text
INVERT
AutoCAD SHX Text
TOP
AutoCAD SHX Text
SLAB
AutoCAD SHX Text
MONOLITHIC
AutoCAD SHX Text
SEE NOTE 3
AutoCAD SHX Text
HOOD
AutoCAD SHX Text
SEE NOTE 4
AutoCAD SHX Text
FINISH GRADE
AutoCAD SHX Text
4.
AutoCAD SHX Text
3.
AutoCAD SHX Text
2.
AutoCAD SHX Text
1.
AutoCAD SHX Text
5.
AutoCAD SHX Text
30" (MIN.)
AutoCAD SHX Text
ALL SECTIONS SHALL BE DESIGNED FOR HS-20 LOADING.
AutoCAD SHX Text
PROVIDE DOGHOUSE OPENING FOR PIPES WITH 2" MAX. CLEARANCE TO OUTSIDE OF PIPE. TOP SLAB SHALL NOT REST DIRECTLY ON PIPE. GROUT ALL PIPE CONNECTIONS (NON-SHRINK GROUT).
AutoCAD SHX Text
JOINT SEALANT BETWEEN PRECAST SECTIONS SHALL BE PREFORMED BUTYL RUBBER.
AutoCAD SHX Text
CATCH BASIN FRAME AND GRATE (4" DEPTH) SHALL BE SET IN FULL MORTAR BED.
AutoCAD SHX Text
ADJUST TO FINISH GRADE WITH CLAY BRICK AND MORTAR AS REQUIRED.
AutoCAD SHX Text
SQUARE
AutoCAD SHX Text
INVERT
AutoCAD SHX Text
12" CRUSHED STONE (MASSDOT M2.01.4, CRUSHED STONE)
AutoCAD SHX Text
LEBARON L24SG01 GRATE (2) AND LV2448-2 RECTANGULAR FRAME OR EQUAL.
AutoCAD SHX Text
%%USECTION VIEW
AutoCAD SHX Text
APRON
AutoCAD SHX Text
8" GRAVEL BORROW SUBBASE (TYPE B, MASSDOT M1.03.0)
AutoCAD SHX Text
1-1/2" BITUMINOUS CONCRETE PAVEMENT SURFACE COURSE (TYPE I-1, MASSDOT SPEC 460)
AutoCAD SHX Text
2" BITUMINOUS CONCRETE PAVEMENT BASE COURSE (TYPE I-1, MASSDOT SPEC 460)
AutoCAD SHX Text
CATCH BASIN W/HOOD SCALE: N.T.S.
AutoCAD SHX Text
SHALLOW CATCH BASIN W/HOOD SCALE: N.T.S.
AutoCAD SHX Text
TYPICAL TRENCH DETAIL SCALE: N.T.S.
AutoCAD SHX Text
DOUBLE GRATE CATCH BASIN DETAIL SCALE: N.T.S.
AutoCAD SHX Text
DRAIN MANHOLE DETAIL SCALE: N.T.S.
AutoCAD SHX Text
MANHOLE JOINT DETAILS SCALE: N.T.S.
AutoCAD SHX Text
TYPICAL DRIVEWAY DETAIL SCALE: N.T.S.
AutoCAD SHX Text
PROOFING MATERIAL.
AutoCAD SHX Text
5 BRICK COURSES MAXIMUM)
AutoCAD SHX Text
AND MORTAR (2 BRICK COURSES TYPICALLY,
AutoCAD SHX Text
BED. ADJUST TO GRADE WITH CLAY BRICK
AutoCAD SHX Text
COVER SHALL BE SET IN FULL MORTAR
AutoCAD SHX Text
STANDARD SEWER MANHOLE FRAME AND
AutoCAD SHX Text
JOINT SEALANT BETWEEN PRECAST SECTIONS
AutoCAD SHX Text
SHALL BE PREFORMED BUTYL RUBBER.
AutoCAD SHX Text
OUTLET
AutoCAD SHX Text
5.
AutoCAD SHX Text
4.
AutoCAD SHX Text
ALL EXTERIOR SURFACES SHALL BE GIVEN
AutoCAD SHX Text
TWO COATS OF BITUMINOUS WATER-
AutoCAD SHX Text
ALL SECTIONS SHALL BE DESIGNED FOR
AutoCAD SHX Text
COPOLYMER MANHOLE STEPS SHALL BE
AutoCAD SHX Text
INSTALLED AT 12" O.C. FOR THE FULL
AutoCAD SHX Text
DEPTH OF THE STRUCTURE.
AutoCAD SHX Text
3.
AutoCAD SHX Text
2.
AutoCAD SHX Text
1.
AutoCAD SHX Text
HS-20 LOADING.
AutoCAD SHX Text
%%UNOTES:
AutoCAD SHX Text
SHELF TO BE BRICK
AutoCAD SHX Text
LAID FLAT AT A
AutoCAD SHX Text
SLOPE OF 1"/FOOT
AutoCAD SHX Text
BRICK CHIP AND
AutoCAD SHX Text
MORTAR OR CEMENT
AutoCAD SHX Text
CONCRETE FILL
AutoCAD SHX Text
ARCH INVERT TO BE CONSTRUCTED
AutoCAD SHX Text
WITH CLAY BRICK LAID AS
AutoCAD SHX Text
STRETCHERS AND ON EDGE.
AutoCAD SHX Text
SEWER MANHOLE DETAIL SCALE: N.T.S.
AutoCAD SHX Text
4" LOAM & SEED (TYP)
AutoCAD SHX Text
(LOCATION VARIES)
AutoCAD SHX Text
(LOCATION VARIES)
AutoCAD SHX Text
COVER
AutoCAD SHX Text
5'(MIN)
AutoCAD SHX Text
WATER
AutoCAD SHX Text
CONCRETE
AutoCAD SHX Text
BASIN
AutoCAD SHX Text
CATCH
AutoCAD SHX Text
PRECAST
AutoCAD SHX Text
SUMP
AutoCAD SHX Text
4'-0"
AutoCAD SHX Text
3:1 MAX
AutoCAD SHX Text
3:1 MAX
AutoCAD SHX Text
C
AutoCAD SHX Text
11'
AutoCAD SHX Text
11'
AutoCAD SHX Text
CUT
AutoCAD SHX Text
FILL
AutoCAD SHX Text
FILL
AutoCAD SHX Text
CUT
AutoCAD SHX Text
3:1 MAX
AutoCAD SHX Text
3:1 MAX
AutoCAD SHX Text
BURIED UTILITIES
AutoCAD SHX Text
(TEL., ELEC., CATV)
AutoCAD SHX Text
LANE WIDTH
AutoCAD SHX Text
LANE WIDTH
AutoCAD SHX Text
1-1/2" BIT. CONC. TOP COURSE (TYPE I-1)
AutoCAD SHX Text
2 -1/2" BIT. CONC. BASE COURSE (TYPE I-1)
AutoCAD SHX Text
4" DENSE GRADED CRUSHED STONE OVER 8" GRAVEL BORROW TYPE B
AutoCAD SHX Text
COVER
AutoCAD SHX Text
2'-6"(MIN)
AutoCAD SHX Text
DRAIN
AutoCAD SHX Text
2%%%
AutoCAD SHX Text
2%%%
AutoCAD SHX Text
1'
AutoCAD SHX Text
CAPE COD BERM
AutoCAD SHX Text
3"
AutoCAD SHX Text
1'
AutoCAD SHX Text
CAPE COD BERM
AutoCAD SHX Text
GRASS STRIP
AutoCAD SHX Text
4" LOAM & SEED
AutoCAD SHX Text
GRASS STRIP
AutoCAD SHX Text
TYPICAL ROADWAY CROSS SECTION SCALE: N.T.S.
AutoCAD SHX Text
COMPACTED SUBGRADE
AutoCAD SHX Text
PREFORMED FLEXIBLE JOINT SEALANT
AutoCAD SHX Text
12" COMPACTED CRUSHED STONE (MASSDOT M2.01.4, CRUSHED STONE)
AutoCAD SHX Text
COMPACTED SUBGRADE
AutoCAD SHX Text
MONOLITHIC
AutoCAD SHX Text
BASE SECTION
AutoCAD SHX Text
(TYP.)
AutoCAD SHX Text
12"
AutoCAD SHX Text
AS REQ'D.
AutoCAD SHX Text
SECTION(S)
AutoCAD SHX Text
RISER
AutoCAD SHX Text
48" DIA. (MIN.)
AutoCAD SHX Text
NOTE 5.
AutoCAD SHX Text
SEE ALTERNATE
AutoCAD SHX Text
ECCENTRIC
AutoCAD SHX Text
CONE SECTION
AutoCAD SHX Text
TOP SLAB
AutoCAD SHX Text
FINISH
AutoCAD SHX Text
GRADE
AutoCAD SHX Text
SEE
AutoCAD SHX Text
12"
AutoCAD SHX Text
(MIN.)
AutoCAD SHX Text
8"
AutoCAD SHX Text
ALTERNATE TOP SLAB
AutoCAD SHX Text
STEPS, SEE
AutoCAD SHX Text
NOTE 2.
AutoCAD SHX Text
ACCESS
AutoCAD SHX Text
24" DIA.
AutoCAD SHX Text
8"
AutoCAD SHX Text
8"
AutoCAD SHX Text
48" DIA. (MIN.)
AutoCAD SHX Text
24" DIA.
AutoCAD SHX Text
ACCESS
AutoCAD SHX Text
SEE NOTE 4.
AutoCAD SHX Text
DIA.
AutoCAD SHX Text
VARIES
AutoCAD SHX Text
FLEXIBLE WATERTIGHT GASKET OR SLEEVE
AutoCAD SHX Text
%%UNOTES:
AutoCAD SHX Text
%%UNOTES:
AutoCAD SHX Text
%%UNOTES:
AutoCAD SHX Text
%%UNOTES:
AutoCAD SHX Text
PROP. SLOPED GRANITE CURB
AutoCAD SHX Text
PROP. SLOPED GRANITE CURB R=2' (TYP.)
AutoCAD SHX Text
AS NOTED
AutoCAD SHX Text
DESCRIPTION
AutoCAD SHX Text
BY
AutoCAD SHX Text
REV
AutoCAD SHX Text
DATE
AutoCAD SHX Text
APP
AutoCAD SHX Text
DWG. NO:
AutoCAD SHX Text
DWG. TITLE:
AutoCAD SHX Text
215-181
AutoCAD SHX Text
DESIGNED BY:
AutoCAD SHX Text
PROJECT NO.:
AutoCAD SHX Text
APPROVED BY:
AutoCAD SHX Text
CHECKED BY:
AutoCAD SHX Text
DATE:
AutoCAD SHX Text
SCALE:
AutoCAD SHX Text
DRAWN BY:
AutoCAD SHX Text
C MCKENZIE ENGINEERING GROUP, INC.
AutoCAD SHX Text
M:\MEG\2015 PROJECTS\215-181\DWGS\CUT SHEETS\ZBA APPLICATION\SUBMISSION NO 1\215-181 DETAILS.DWG
AutoCAD SHX Text
COMMENTS PER MASSHOUSING
AutoCAD SHX Text
SBS
AutoCAD SHX Text
1
AutoCAD SHX Text
5/12/2017
AutoCAD SHX Text
BCM
AutoCAD SHX Text
PROFESSIONAL ENGINEER:
AutoCAD SHX Text
SEPTEMBER 22, 2016
AutoCAD SHX Text
PREPARED BY:
AutoCAD SHX Text
BCM
AutoCAD SHX Text
BCM
AutoCAD SHX Text
SBS
AutoCAD SHX Text
SBS
AutoCAD SHX Text
COMMENTS PER MASSHOUSING
AutoCAD SHX Text
SBS
AutoCAD SHX Text
2
AutoCAD SHX Text
7/14/2017
AutoCAD SHX Text
BCM
AutoCAD SHX Text
ZBA APPLICATION
AutoCAD SHX Text
AJC
AutoCAD SHX Text
3
AutoCAD SHX Text
10/5/2018
AutoCAD SHX Text
BCM

C-5
CONSTRUCTION
DETAILS
SHEET 2 OF 4
PE
RM
IT
P
LA
N S
ET
OW
NE
R/A
PP
LIC
AN
T:
RIV
ER
M
AR
SH
, L
LC
293R
W
AS
HIN
GT
ON
S
TR
EE
T
NO
RW
ELL, M
AS
SA
CH
US
ET
TS
02061
(A
SS
ES
SO
R'S
M
AP
E
-17, LO
T 0 &
E
-17A
, LO
T 274)
PE
MB
RO
KE
, M
AS
SA
CH
US
ET
TS
Assinippi Office Park
150 Longwater Drive, Suite 101
Norwell, MA 02061
P: 781.792.3900
F: 781.792.0333
www.mckeng.com
M C K E N Z I E
ENGINEERING GROUP
RIV
ER
MA
RS
H V
ILLA
GE
CO
MP
RE
HE
NS
IVE
PE
RM
IT P
LAN
WA
TE
R S
TR
EE
T
AutoCAD SHX Text
12" BERM
AutoCAD SHX Text
3" REVEAL
AutoCAD SHX Text
4" LOAM BORROW & SEED
AutoCAD SHX Text
12" LEVEL
AutoCAD SHX Text
75°
AutoCAD SHX Text
GUTTER LINE
AutoCAD SHX Text
PAVEMENT
AutoCAD SHX Text
COMPACTED SUBGRADE
AutoCAD SHX Text
MONOLITHIC BITUMINOUS CONCRETE BERM (CAPE COD BERM) DETAIL SCALE: N.T.S.
AutoCAD SHX Text
F
AutoCAD SHX Text
lawn areas
AutoCAD SHX Text
Practices Operation and Maintenance Plan"
AutoCAD SHX Text
to early October. When seeded areas are not mulched, plantings should be made from early spring to May 20 or from August 10 to September 1.
AutoCAD SHX Text
and rates of seeding.
AutoCAD SHX Text
for the site. Methods include broadcasting, drilling, and hydroseeding. Where broadcasting is used, cover seed with 0.25 inch of soil or less, by cultipacking or raking.
AutoCAD SHX Text
seeding and incorporated into the soil. Kinds and amounts of lime and fertilizer should be based on evaluation of soil tests. When a soil test is not available, the following minimum amounts should be applied:
AutoCAD SHX Text
they interfere with seeding and future maintenance of the area. Where feasible, the soil should be tilled to a depth of about four inches to prepare a seedbed and mix fertilizer and lime into the soil. The seedbed should be left in a reasonably firm and smooth condition. The last tillage operation should be performed across the slope wherever practical.
AutoCAD SHX Text
Seeding Recommendations
AutoCAD SHX Text
to prevent drowning or winter killing of the plants.
AutoCAD SHX Text
1. %%USeedbed Preparation
AutoCAD SHX Text
%%uSEEDING SPECIFICATIONS
AutoCAD SHX Text
b. Stones larger than four inches and trash should be removed because
AutoCAD SHX Text
a. Surface and seepage water should be drained or diverted from the site
AutoCAD SHX Text
2. %%UEstablishing a Stand
AutoCAD SHX Text
2
AutoCAD SHX Text
2
AutoCAD SHX Text
5
AutoCAD SHX Text
fertilizer of 1,000 lbs. per acre of 5-10-10)
AutoCAD SHX Text
%%uPOUNDS / 1,000 S.F.%%u
AutoCAD SHX Text
0.45
AutoCAD SHX Text
0.45
AutoCAD SHX Text
0.05
AutoCAD SHX Text
0.95
AutoCAD SHX Text
a. Lime and fertilizer should be applied prior to or at the time of
AutoCAD SHX Text
Agricultural limestone: 2 tons per acre or 100 lbs. per sq. ft.
AutoCAD SHX Text
Nitrogen (N): 50 lbs. per acre or 1.1 lbs. per 1000 sq. ft.
AutoCAD SHX Text
Phosphate (P O ): 100 lbs. per acre or 2.2 lbs. per 1000 sq. ft.
AutoCAD SHX Text
Potash (K O): 100 lbs. per acre or 2.2 lbs. per 1000 sq. ft.
AutoCAD SHX Text
(Note: This is the equivalent of 500 lbs. per acre of 10-20-20
AutoCAD SHX Text
b. Seed should be spread uniformly by the method most appropriate
AutoCAD SHX Text
20
AutoCAD SHX Text
20
AutoCAD SHX Text
2
AutoCAD SHX Text
42
AutoCAD SHX Text
A. tall fescue
AutoCAD SHX Text
redtop
AutoCAD SHX Text
total
AutoCAD SHX Text
creeping red fescue
AutoCAD SHX Text
%%uPOUND / ACRE%%u
AutoCAD SHX Text
%%uSEEDING RATES%%U
AutoCAD SHX Text
3. %%UMulch
AutoCAD SHX Text
0.35
AutoCAD SHX Text
0.35
AutoCAD SHX Text
0.95
AutoCAD SHX Text
0.25
AutoCAD SHX Text
0.45
AutoCAD SHX Text
0.45
AutoCAD SHX Text
0.20
AutoCAD SHX Text
1.10
AutoCAD SHX Text
seeding.
AutoCAD SHX Text
weed growth.
AutoCAD SHX Text
4. %%UMaintenance to Establish a Stand
AutoCAD SHX Text
0.25
AutoCAD SHX Text
0.10
AutoCAD SHX Text
0.35
AutoCAD SHX Text
0.70
AutoCAD SHX Text
0.75
AutoCAD SHX Text
1.20
AutoCAD SHX Text
2.00
AutoCAD SHX Text
0.45
AutoCAD SHX Text
c. Refer to Seeding Rates and Seeding Guides for appropriate seed mixtures
AutoCAD SHX Text
a. Hay, straw, or other mulch, when needed, should be applied immediately after
AutoCAD SHX Text
b. Mulch will be held in place using techniques as specified in the "Best Management
AutoCAD SHX Text
d. When seeded areas are mulched, plantings may be made from early spring
AutoCAD SHX Text
a. Planted areas should be protected from damage by fire, grazing, traffic, and dense
AutoCAD SHX Text
4.00
AutoCAD SHX Text
3.60
AutoCAD SHX Text
2.00
AutoCAD SHX Text
2.50
AutoCAD SHX Text
(Best for fall seeding, Aug 15 to Sept. 5)
AutoCAD SHX Text
(Best for spring seeding, before May 15)
AutoCAD SHX Text
(may be used early spring also)
AutoCAD SHX Text
(Best for fall seeding, Aug 15 to Sept. 15)
AutoCAD SHX Text
1.00
AutoCAD SHX Text
fertilizer is usually the key to fully complete the establishment of the stand because
AutoCAD SHX Text
most perennials take 2 to 3 years to become established.
AutoCAD SHX Text
occasional mowing may be necessary to control growth of woody vegetation.
AutoCAD SHX Text
c. In waterways, channels, or swales where uniform flow conditions are anticipated,
AutoCAD SHX Text
2.00
AutoCAD SHX Text
b. Fertilization needs should be determined by onsite inspections. Supplemental
AutoCAD SHX Text
15
AutoCAD SHX Text
10
AutoCAD SHX Text
15
AutoCAD SHX Text
40
AutoCAD SHX Text
B. tall fescue
AutoCAD SHX Text
total
AutoCAD SHX Text
birdsfoot trefoil
AutoCAD SHX Text
creeping red fescue
AutoCAD SHX Text
20
AutoCAD SHX Text
20
AutoCAD SHX Text
8
AutoCAD SHX Text
48
AutoCAD SHX Text
C. tall fescue
AutoCAD SHX Text
total
AutoCAD SHX Text
birdsfoot trefoil
AutoCAD SHX Text
creeping red fescue
AutoCAD SHX Text
10
AutoCAD SHX Text
5
AutoCAD SHX Text
15
AutoCAD SHX Text
30
AutoCAD SHX Text
redtop
AutoCAD SHX Text
total
AutoCAD SHX Text
reed canary grass
AutoCAD SHX Text
D. birdsfoot trefoil
AutoCAD SHX Text
30
AutoCAD SHX Text
50
AutoCAD SHX Text
85
AutoCAD SHX Text
flatpea
AutoCAD SHX Text
total
AutoCAD SHX Text
F. creeping red fescue 1/
AutoCAD SHX Text
E. tall fescue
AutoCAD SHX Text
20
AutoCAD SHX Text
170
AutoCAD SHX Text
150
AutoCAD SHX Text
total
AutoCAD SHX Text
G. tall fescue 1/
AutoCAD SHX Text
80
AutoCAD SHX Text
112
AutoCAD SHX Text
oats
AutoCAD SHX Text
H. winter rye
AutoCAD SHX Text
annual ryegrass
AutoCAD SHX Text
40
AutoCAD SHX Text
kentucky bluegrass 1/
AutoCAD SHX Text
85
AutoCAD SHX Text
%%UTEMPORARY SEEDING RATES
AutoCAD SHX Text
1/ for heavy use athletic fields consult the University of New Hampshire Cooperative Extension
AutoCAD SHX Text
Turf Specialist for current varieties and seeding rates.
AutoCAD SHX Text
%%uSEEDING GUIDE%%U
AutoCAD SHX Text
%%umixture 1/%%u
AutoCAD SHX Text
E
AutoCAD SHX Text
D
AutoCAD SHX Text
%%UUSE%%U
AutoCAD SHX Text
fills, borrow
AutoCAD SHX Text
steep cuts and
AutoCAD SHX Text
and disposal
AutoCAD SHX Text
areas
AutoCAD SHX Text
waterways, emergency
AutoCAD SHX Text
channels with
AutoCAD SHX Text
flowing water
AutoCAD SHX Text
spillways, and other
AutoCAD SHX Text
Seeding
AutoCAD SHX Text
PREPARED SEEDED LAWN
AutoCAD SHX Text
PREPARED SUBGRADE
AutoCAD SHX Text
(NO STONES LARGER
AutoCAD SHX Text
PREPARED SCREENED TOPSOIL
AutoCAD SHX Text
THAN 1 1/4")
AutoCAD SHX Text
OR SOD
AutoCAD SHX Text
4"
AutoCAD SHX Text
NOTES: 1.TOP OF LOAM (TOPSOIL) IS FINISHED GRADE. TOP OF LOAM (TOPSOIL) IS FINISHED GRADE. 2.LOAM AND SOD OR SEED, SHALL CONFORM TO MASSDOT MATERIAL LOAM AND SOD OR SEED, SHALL CONFORM TO MASSDOT MATERIAL SPECIFICATIONS M1.05.0, M1.07.0 AND M1.06.1, AND CONSTRUCTION METHODS 751.60 TO 751.63.
AutoCAD SHX Text
A
AutoCAD SHX Text
SPILLWAY W/REINFORCED CONCRETE OR GRANITE SILL (REFER TO SPILLWAY DETAIL)
AutoCAD SHX Text
2' MIN.
AutoCAD SHX Text
E.S.H.G.W.
AutoCAD SHX Text
REINFORCED CONCRETE OR GRANITE SILL
AutoCAD SHX Text
100 YR. FLOOD ELEV=12.76
AutoCAD SHX Text
2 YR. STORM ELEV=10.65
AutoCAD SHX Text
10 YR. STORM ELEV=11.36
AutoCAD SHX Text
25 YR. STORM ELEV=11.89
AutoCAD SHX Text
100 YR. STORM ELEV=12.76
AutoCAD SHX Text
6" LOAMY SAND & SEED
AutoCAD SHX Text
SPILLWAY ELEVATION
AutoCAD SHX Text
"LOOKING UPSTREAM"
AutoCAD SHX Text
6" CRUSHED STONE ( " TO 1 " DIA STONE)34" TO 1 " DIA STONE)12" DIA STONE)
AutoCAD SHX Text
%%USECTION A-A
AutoCAD SHX Text
FABRIC
AutoCAD SHX Text
FILTER
AutoCAD SHX Text
FABRIC
AutoCAD SHX Text
FILTER
AutoCAD SHX Text
2'-0" MIN. BEYOND
AutoCAD SHX Text
CARRY SPILLWAY
AutoCAD SHX Text
DIKE
AutoCAD SHX Text
DETENTION
AutoCAD SHX Text
BASIN
AutoCAD SHX Text
(SEE NOTE 1)
AutoCAD SHX Text
18" OF RIP RAP STONE
AutoCAD SHX Text
NOTE:
AutoCAD SHX Text
GRANITE SILL
AutoCAD SHX Text
CONCRETE OR
AutoCAD SHX Text
REINFORCED
AutoCAD SHX Text
2'-0" (TYP.)
AutoCAD SHX Text
DIKE CREST
AutoCAD SHX Text
6"
AutoCAD SHX Text
OR GRANITE SILL
AutoCAD SHX Text
REINFORCED CONCRETE
AutoCAD SHX Text
2
AutoCAD SHX Text
1
AutoCAD SHX Text
(TYP.)
AutoCAD SHX Text
GRAVEL
AutoCAD SHX Text
2
AutoCAD SHX Text
1
AutoCAD SHX Text
A
AutoCAD SHX Text
LENGTH
AutoCAD SHX Text
(TYP.)
AutoCAD SHX Text
LOAM
AutoCAD SHX Text
10'-0" MIN.
AutoCAD SHX Text
3
AutoCAD SHX Text
1
AutoCAD SHX Text
& SEED (TYP.)
AutoCAD SHX Text
6" LOAM
AutoCAD SHX Text
AND REPLACE WITH GRAVEL
AutoCAD SHX Text
REMOVE UNSUITABLE MATERIAL
AutoCAD SHX Text
AS DIRECTED
AutoCAD SHX Text
3
AutoCAD SHX Text
1
AutoCAD SHX Text
GRAVEL AS DIRECTED
AutoCAD SHX Text
12" COMPACTED
AutoCAD SHX Text
%%UINFILTRATION AREA
AutoCAD SHX Text
%%uDIKE SECTION
AutoCAD SHX Text
%%UNOTES:
AutoCAD SHX Text
SUPERGRO EROSION CONTROL FABRIC BY AMOCO OR APPROVED EQUAL OVER BERM AREA
AutoCAD SHX Text
1
AutoCAD SHX Text
3
AutoCAD SHX Text
SEDIMENT FOREBAY
AutoCAD SHX Text
FOREBAY ELEV=9.50
AutoCAD SHX Text
6" LOAM AND SEED
AutoCAD SHX Text
(SEE DETAIL)
AutoCAD SHX Text
SEDIMENT TRAP
AutoCAD SHX Text
RCP FLARED-END
AutoCAD SHX Text
FLOW
AutoCAD SHX Text
SECTION
AutoCAD SHX Text
10' MIN.
AutoCAD SHX Text
INVERT IN
AutoCAD SHX Text
SPILLWAY ELEV.
AutoCAD SHX Text
12.32
AutoCAD SHX Text
SPILLWAY SCHEDULE
AutoCAD SHX Text
1
AutoCAD SHX Text
LENGTH
AutoCAD SHX Text
10 FT
AutoCAD SHX Text
BASIN
AutoCAD SHX Text
1.RIP RAP TO BE HAND CHINKED WITH A RIP RAP TO BE HAND CHINKED WITH A SMOOTH SURFACE ALONG THE TOP OF THE DIKE AND A ROUGH SURFACE ALONG THE DOWNSTREAM FACE AND TOE OF THE DIKE. STONE TO MEET MASSDOT (M2.02.3) REQUIREMENTS.
AutoCAD SHX Text
100-YR FLOOD ELEV.
AutoCAD SHX Text
12.76
AutoCAD SHX Text
SEED WITH NEW ENGLAND EROSION CONTROL/RESTORATION MIX FOR DETENTION BASINS AND MOIST SITES
AutoCAD SHX Text
COMPACTED
AutoCAD SHX Text
GRAVEL ASTM
AutoCAD SHX Text
D2487 TYPE GM OR GC
AutoCAD SHX Text
6" GRAVEL BORROW TYPE B (MASSDOT M1.03.0)
AutoCAD SHX Text
18" CRUSHED STONE
AutoCAD SHX Text
(MASSDOT M2.02.3)
AutoCAD SHX Text
1.FILL AND BASE FOR DIKES SHALL INSURE WATER TIGHTNESS AND STABILITY. FILL AND BASE FOR DIKES SHALL INSURE WATER TIGHTNESS AND STABILITY. 2.BASIN SIDE SLOPES AND BOTTOM SHALL BE PROVIDED WITH 6" OF LOAMY SAND, SEEDED AT A RATE OF 2 BASIN SIDE SLOPES AND BOTTOM SHALL BE PROVIDED WITH 6" OF LOAMY SAND, SEEDED AT A RATE OF 2 POUNDS OF RED TOP, 15 POUNDS OF CREEPING RED FESCUE AND 20 POUNDS TALL FESCUE PER ACRE. 3.THE CONTRACTOR SHALL NOT DISCHARGE SEDIMENT-LADEN WATER TO INFILTRATION BASIN COMPONENTS THE CONTRACTOR SHALL NOT DISCHARGE SEDIMENT-LADEN WATER TO INFILTRATION BASIN COMPONENTS DURING CONSTRUCTION, INCLUDING DEWATERING OR TEMPORARY SURFACE RUNOFF. 4.ALL CONTRIBUTING AREAS TO THE BASIN SHALL BE FULLY STABILIZED PRIOR TO THE BASIN BEING PLACED ALL CONTRIBUTING AREAS TO THE BASIN SHALL BE FULLY STABILIZED PRIOR TO THE BASIN BEING PLACED INTO SERVICE. 5.THE CONTRACTOR SHALL PROVIDE PROTECTION ABOVE AND AROUND THE INFILTRATION AREA OF THE THE CONTRACTOR SHALL PROVIDE PROTECTION ABOVE AND AROUND THE INFILTRATION AREA OF THE BASIN FROM CONSTRUCTION VEHICLE ACTIVITY. NO HEAVY EQUIPMENT SHALL BE ALLOWED ON THE BASIN FLOORS AFTER INSTALLATION. CONTRACTOR SHALL MINIMIZE CONSTRUCTION EQUIPMENT TRAFFIC WITHIN THE BASIN AT ALL TIMES DURING AND AFTER CONSTRUCTION.
AutoCAD SHX Text
6"
AutoCAD SHX Text
FILTER FABRIC
AutoCAD SHX Text
12"
AutoCAD SHX Text
6" CRUSHED STONE ( " TO 1 " DIA STONE)34" TO 1 " DIA STONE)12" DIA STONE)
AutoCAD SHX Text
6" GRAVEL BORROW TYPE B (MASSDOT M1.03.0)
AutoCAD SHX Text
D+2' MIN.
AutoCAD SHX Text
D+2' MIN.
AutoCAD SHX Text
D
AutoCAD SHX Text
3
AutoCAD SHX Text
1
AutoCAD SHX Text
RCP FLARED END SECTION
AutoCAD SHX Text
18" CRUSHED STONE
AutoCAD SHX Text
(MASSDOT M2.02.3)
AutoCAD SHX Text
10' MIN.
AutoCAD SHX Text
1-1/2" BITUMINOUS CONCRETE SURFACE COURSE (TYPE I-1, MASSDOT SPEC 460)
AutoCAD SHX Text
6" GRAVEL BORROW SUBBASE (TYPE B, MASSDOT M1.03.0)
AutoCAD SHX Text
2-1/2" BITUMINOUS CONCRETE BASE COURSE (TYPE I-1, MASSDOT SPEC 460)
AutoCAD SHX Text
4" DENSE GRADED CRUSHED STONE (MASSDOT M2.01.7)
AutoCAD SHX Text
COMPACTED SUBGRADE
AutoCAD SHX Text
SEEDED OR SODDED LAWN DETAIL SCALE: N.T.S.
AutoCAD SHX Text
BITUMINOUS CONCRETE PAVEMENT DETAIL SCALE: N.T.S.
AutoCAD SHX Text
INFILTRATION BASIN SECTION (BASIN #1 AND #2) NFILTRATION BASIN SECTION (BASIN #1 AND #2) SCALE: N.T.S.
AutoCAD SHX Text
SPILLWAY DETAIL SCALE: N.T.S.
AutoCAD SHX Text
TYPICAL SEDIMENT TRAP DETAIL SCALE: N.T.S.
AutoCAD SHX Text
1'-0"
AutoCAD SHX Text
CRUSHED STONE
AutoCAD SHX Text
12" MIN OF 3/4"-1&1/2"
AutoCAD SHX Text
%%USECTION A-A
AutoCAD SHX Text
%%UFRONT ELEVATION
AutoCAD SHX Text
7'-0"
AutoCAD SHX Text
4'-0"
AutoCAD SHX Text
1'-0"
AutoCAD SHX Text
1'-0"
AutoCAD SHX Text
ELEV.=14.00
AutoCAD SHX Text
ELEV.=9.50
AutoCAD SHX Text
C
AutoCAD SHX Text
L
AutoCAD SHX Text
A
AutoCAD SHX Text
4'-0"
AutoCAD SHX Text
%%UPLAN
AutoCAD SHX Text
8"
AutoCAD SHX Text
4'-0"
AutoCAD SHX Text
8"
AutoCAD SHX Text
INV.=9.75
AutoCAD SHX Text
C
AutoCAD SHX Text
L
AutoCAD SHX Text
2'-0"
AutoCAD SHX Text
A
AutoCAD SHX Text
HDPE OUTLET
AutoCAD SHX Text
DIA.=12"
AutoCAD SHX Text
2'-0"
AutoCAD SHX Text
(MIN)
AutoCAD SHX Text
HDPE OUTLET
AutoCAD SHX Text
12" DIA.
AutoCAD SHX Text
#4 @ 12" O.C.
AutoCAD SHX Text
1'-0"
AutoCAD SHX Text
INV=9.75
AutoCAD SHX Text
#4 @ 12" O.C.
AutoCAD SHX Text
E.W. E.F.
AutoCAD SHX Text
8"
AutoCAD SHX Text
3
AutoCAD SHX Text
1
AutoCAD SHX Text
4'-0"
AutoCAD SHX Text
8"
AutoCAD SHX Text
ELEV.=14.00
AutoCAD SHX Text
4'-0"
AutoCAD SHX Text
6"
AutoCAD SHX Text
ELEV.=5.50
AutoCAD SHX Text
100 YR. STORM ELEV
AutoCAD SHX Text
ELEV=12.76
AutoCAD SHX Text
100 YR. STORM ELEV
AutoCAD SHX Text
ELEV=12.76
AutoCAD SHX Text
LEBARON RECTANGULAR FRAME & COVER LV2537 OR EQUIVALENT
AutoCAD SHX Text
2'-8"
AutoCAD SHX Text
FLOW
AutoCAD SHX Text
PROP. STAINLESS STEEL TRASH RACK ATTACHED TO STRUCTURE W/ STAINLESS STEEL BOLTS (MAX. GRATE OPENING SIZE 12"HIGH x 4"WIDE)
AutoCAD SHX Text
2'-0"
AutoCAD SHX Text
PROP. STAINLESS STEEL TRASH RACK ATTACHED TO STRUCTURE W/ STAINLESS STEEL BOLTS (MAX. GRATE OPENING SIZE 12"HIGH x 4"WIDE)
AutoCAD SHX Text
PROP. 2' HIGH x 2' WIDE RECTANGULAR WEIR ELEV.=10.80
AutoCAD SHX Text
ELEV.=9.50
AutoCAD SHX Text
PROP. 2' HIGH x 2' WIDE RECTANGULAR WEIR ELEV.=10.80
AutoCAD SHX Text
PROP. 2' HIGH x 2' WIDE RECTANGULAR WEIR ELEV.=10.80
AutoCAD SHX Text
12 DIA. HDPE OUTLET INV.=9.75
AutoCAD SHX Text
OUTLET CONTROL STRUCTURE SCALE: N.T.S.
AutoCAD SHX Text
TOP OF DIKE ELEV=13.80
AutoCAD SHX Text
TOP OF BERM ELEV=12.00
AutoCAD SHX Text
FABRIC
AutoCAD SHX Text
FILTER
AutoCAD SHX Text
AS NOTED
AutoCAD SHX Text
DESCRIPTION
AutoCAD SHX Text
BY
AutoCAD SHX Text
REV
AutoCAD SHX Text
DATE
AutoCAD SHX Text
APP
AutoCAD SHX Text
DWG. NO:
AutoCAD SHX Text
DWG. TITLE:
AutoCAD SHX Text
215-181
AutoCAD SHX Text
DESIGNED BY:
AutoCAD SHX Text
PROJECT NO.:
AutoCAD SHX Text
APPROVED BY:
AutoCAD SHX Text
CHECKED BY:
AutoCAD SHX Text
DATE:
AutoCAD SHX Text
SCALE:
AutoCAD SHX Text
DRAWN BY:
AutoCAD SHX Text
C MCKENZIE ENGINEERING GROUP, INC.
AutoCAD SHX Text
M:\MEG\2015 PROJECTS\215-181\DWGS\CUT SHEETS\ZBA APPLICATION\SUBMISSION NO 1\215-181 DETAILS.DWG
AutoCAD SHX Text
COMMENTS PER MASSHOUSING
AutoCAD SHX Text
SBS
AutoCAD SHX Text
1
AutoCAD SHX Text
5/12/2017
AutoCAD SHX Text
BCM
AutoCAD SHX Text
PROFESSIONAL ENGINEER:
AutoCAD SHX Text
SEPTEMBER 22, 2016
AutoCAD SHX Text
PREPARED BY:
AutoCAD SHX Text
BCM
AutoCAD SHX Text
BCM
AutoCAD SHX Text
SBS
AutoCAD SHX Text
SBS
AutoCAD SHX Text
COMMENTS PER MASSHOUSING
AutoCAD SHX Text
SBS
AutoCAD SHX Text
2
AutoCAD SHX Text
7/14/2017
AutoCAD SHX Text
BCM
AutoCAD SHX Text
ZBA APPLICATION
AutoCAD SHX Text
AJC
AutoCAD SHX Text
3
AutoCAD SHX Text
10/5/2018
AutoCAD SHX Text
BCM

C-6
CONSTRUCTION
DETAILS
SHEET 3 OF 4
PE
RM
IT
P
LA
N S
ET
OW
NE
R/A
PP
LIC
AN
T:
RIV
ER
M
AR
SH
, L
LC
293R
W
AS
HIN
GT
ON
S
TR
EE
T
NO
RW
ELL, M
AS
SA
CH
US
ET
TS
02061
(A
SS
ES
SO
R'S
M
AP
E
-17, LO
T 0 &
E
-17A
, LO
T 274)
PE
MB
RO
KE
, M
AS
SA
CH
US
ET
TS
Assinippi Office Park
150 Longwater Drive, Suite 101
Norwell, MA 02061
P: 781.792.3900
F: 781.792.0333
www.mckeng.com
M C K E N Z I E
ENGINEERING GROUP
RIV
ER
MA
RS
H V
ILLA
GE
CO
MP
RE
HE
NS
IVE
PE
RM
IT P
LAN
WA
TE
R S
TR
EE
T
AutoCAD SHX Text
CONCRETE BACKING AGAINST
AutoCAD SHX Text
UNDISTURBED MATERIAL *
AutoCAD SHX Text
2'-0" FROM
AutoCAD SHX Text
CURBING
AutoCAD SHX Text
5'-0" MIN.
AutoCAD SHX Text
WATER MAIN
AutoCAD SHX Text
COVER
AutoCAD SHX Text
GRADE
AutoCAD SHX Text
TYPE K COPPER
AutoCAD SHX Text
SERVICE
AutoCAD SHX Text
CORP. STOP
AutoCAD SHX Text
CURBING
AutoCAD SHX Text
MAXIMUM SIZE
AutoCAD SHX Text
TAPPED CONNECTION
AutoCAD SHX Text
WATER MAIN
AutoCAD SHX Text
DIAMETER
AutoCAD SHX Text
4"
AutoCAD SHX Text
6"
AutoCAD SHX Text
8"
AutoCAD SHX Text
12"
AutoCAD SHX Text
MAXIMUM TAP
AutoCAD SHX Text
DIAMETER
AutoCAD SHX Text
1/2"
AutoCAD SHX Text
3/4"
AutoCAD SHX Text
3/4"
AutoCAD SHX Text
1"
AutoCAD SHX Text
*
AutoCAD SHX Text
D
AutoCAD SHX Text
CONCRETE BACKING AGAINST
AutoCAD SHX Text
UNDISTURBED MATERIAL *
AutoCAD SHX Text
MAX.
AutoCAD SHX Text
45%%d
AutoCAD SHX Text
H
AutoCAD SHX Text
2
AutoCAD SHX Text
MAX.
AutoCAD SHX Text
H
AutoCAD SHX Text
45%%d
AutoCAD SHX Text
MAX.
AutoCAD SHX Text
%%UGENERAL NOTES
AutoCAD SHX Text
THRUST BLOCK BEARING AREAS FOR WATER PIPE
AutoCAD SHX Text
TABLE OF BEARING AREAS IN SQ. FT. AGAINST
AutoCAD SHX Text
TEES AND PLUGS
AutoCAD SHX Text
ENCASED IN CONCRETE. BEARING AREAS MAY BE DIREGARDED FOR TRENCHES
AutoCAD SHX Text
WORKING DRAWINGS FOR EACH THRUST BLOCK TO THE ENGINEER FOR
AutoCAD SHX Text
THE CONTRACTOR SHALL SUBMIT 2 WEEKS IN ADVANCE OF PLACEMENT,
AutoCAD SHX Text
THE PIPE. HOWEVER, CONCRETE BACKING SHALL BE PLACED BETWEEN THE
AutoCAD SHX Text
IN ROCK WHERE THE TOP OF THE ROCK FACE IS AT OR ABOVE THE CROWN OF
AutoCAD SHX Text
AND INTERNAL WATER PRESSURE OF 150 P.S.I.G. JOINTS SHALL NOT BE
AutoCAD SHX Text
BEARING AREAS BASED ON HORIZONTAL PASSIVE SOIL PRESSURE OF 2000 P.S.F.
AutoCAD SHX Text
FOR FITTINGS WITH LESS THAN 45 DEFLECTION, USE BEARING AREAS FOR
AutoCAD SHX Text
THOSE GIVEN WILL REQUIRE LARGER BEARING AREAS.
AutoCAD SHX Text
GRANULAR, 9 OR MORE BLOWS PER FOOT. SOIL CONDITIONS OTHER THAN
AutoCAD SHX Text
* TYPE OF SOIL IS MEDIUM CLAYEY, 6 OR MORE BLOWS PER FOOT, OR LOOSE
AutoCAD SHX Text
UNDISTURBED MATERIAL FOR WATER MAIN FITTINGS*
AutoCAD SHX Text
4. ALL TEES, GATE VALVES, HYDRANTS AND FITTINGS SHALL BE
AutoCAD SHX Text
JOINT TAPPING VALVE
AutoCAD SHX Text
PROPOSED WATER MAIN
AutoCAD SHX Text
PROPOSED WATER MAIN
AutoCAD SHX Text
MECHANICAL JOINT / PUSH-ON
AutoCAD SHX Text
VALVE BOX OR VALVE INDICATOR
AutoCAD SHX Text
* SEE TABLE ON THRUST BLOCK BEARING AREAS
AutoCAD SHX Text
FOR THE AREA OF CONCRETE REQUIRED.
AutoCAD SHX Text
UNDER ACCESS PIPE ON COMPACTED
AutoCAD SHX Text
PLACE MASONRY BLOCK FRAME
AutoCAD SHX Text
TO BUILDING SERVICE
AutoCAD SHX Text
STANDARD VALVE BOX
AutoCAD SHX Text
& COVER IN SIDEWALK
AutoCAD SHX Text
CURB STOP
AutoCAD SHX Text
SIDEWALK
AutoCAD SHX Text
FILL. DO NOT REST ON VALVE
AutoCAD SHX Text
MECHANICAL JOINT
AutoCAD SHX Text
TAPPING SLEEVE
AutoCAD SHX Text
EXIST. WATER MAIN
AutoCAD SHX Text
POST AS REQUIRED
AutoCAD SHX Text
EXIST. WATER MAIN
AutoCAD SHX Text
* SEE TABLE ON THRUST BLOCK BEARING AREAS
AutoCAD SHX Text
FOR THE AREA OF CONCRETE REQUIRED.
AutoCAD SHX Text
UNDISTURBED MATERIAL *
AutoCAD SHX Text
CONCRETE BACKING AGAINST
AutoCAD SHX Text
H
AutoCAD SHX Text
WATER MAIN
AutoCAD SHX Text
WATER MAIN
AutoCAD SHX Text
UNDISTURBED MATERIAL *
AutoCAD SHX Text
CONCRETE BACKING AGAINST
AutoCAD SHX Text
H
AutoCAD SHX Text
2
AutoCAD SHX Text
MAX.
AutoCAD SHX Text
GROUND SURFACE
AutoCAD SHX Text
APPROVAL PRIOR TO INSTALLATION.
AutoCAD SHX Text
PIPE AND THE ROCK FACE.
AutoCAD SHX Text
MAX.
AutoCAD SHX Text
45%%d
AutoCAD SHX Text
3.
AutoCAD SHX Text
45 BEND.
AutoCAD SHX Text
NOTES:
AutoCAD SHX Text
2.
AutoCAD SHX Text
1.
AutoCAD SHX Text
8
AutoCAD SHX Text
6
AutoCAD SHX Text
(IN.)
AutoCAD SHX Text
SIZE OF MAIN
AutoCAD SHX Text
16
AutoCAD SHX Text
12
AutoCAD SHX Text
MAX.
AutoCAD SHX Text
45%%d
AutoCAD SHX Text
TEE
AutoCAD SHX Text
6
AutoCAD SHX Text
4
AutoCAD SHX Text
21
AutoCAD SHX Text
12
AutoCAD SHX Text
BEND
AutoCAD SHX Text
90
AutoCAD SHX Text
o
AutoCAD SHX Text
4
AutoCAD SHX Text
2.5
AutoCAD SHX Text
16
AutoCAD SHX Text
9
AutoCAD SHX Text
12
AutoCAD SHX Text
7
AutoCAD SHX Text
3
AutoCAD SHX Text
2
AutoCAD SHX Text
o
AutoCAD SHX Text
BEND
AutoCAD SHX Text
45
AutoCAD SHX Text
MECHANICAL JOINTS WITH MEGA-LUGS.
AutoCAD SHX Text
5. THRUST BLOCKS SHALL BE BARREL BLOCKS.
AutoCAD SHX Text
WITH HALF LAPPED, 10 MIL.
AutoCAD SHX Text
BARS AND 2" INTO CONCRETE
AutoCAD SHX Text
WRAP EXPOSED PORTIONS OF
AutoCAD SHX Text
PVC TAPE
AutoCAD SHX Text
COVER AS REQUIRED
AutoCAD SHX Text
2 #6 BARS
AutoCAD SHX Text
8 #4 BARS
AutoCAD SHX Text
1'-0" MIN.
AutoCAD SHX Text
CLEAR OF CONCRETE
AutoCAD SHX Text
NUTS SHALL BE KEPT
AutoCAD SHX Text
FLANGES, BOLTS, &
AutoCAD SHX Text
B
AutoCAD SHX Text
A
AutoCAD SHX Text
2" TYP
AutoCAD SHX Text
VALVE BOX
AutoCAD SHX Text
ADJUSTABLE
AutoCAD SHX Text
FINISHED GROUND SURFACE
AutoCAD SHX Text
ANCHOR BLOCK DIMENSIONS (FT.)
AutoCAD SHX Text
1.5
AutoCAD SHX Text
2.O
AutoCAD SHX Text
3.0
AutoCAD SHX Text
3.0
AutoCAD SHX Text
3.0
AutoCAD SHX Text
3.5
AutoCAD SHX Text
12"
AutoCAD SHX Text
10"
AutoCAD SHX Text
8"
AutoCAD SHX Text
6"
AutoCAD SHX Text
4"
AutoCAD SHX Text
3"
AutoCAD SHX Text
A
AutoCAD SHX Text
SIZE OF GATE VALVE
AutoCAD SHX Text
1.5
AutoCAD SHX Text
1.5
AutoCAD SHX Text
1.5
AutoCAD SHX Text
2.0
AutoCAD SHX Text
2.0
AutoCAD SHX Text
1.5
AutoCAD SHX Text
B
AutoCAD SHX Text
200 PSI TEST
AutoCAD SHX Text
2.5
AutoCAD SHX Text
2.5
AutoCAD SHX Text
2.0
AutoCAD SHX Text
2.0
AutoCAD SHX Text
2.0
AutoCAD SHX Text
2.0
AutoCAD SHX Text
250 PSI TEST
AutoCAD SHX Text
ALL WATER MAIN MATERIALS AND INSTALLATION SHALL BE IN ACCORDANCE WITH THE PEMBROKE WATER DEPARTMENT RULES AND REGULATIONS.
AutoCAD SHX Text
* WHERE THE SIZE OF THE CONNECTION EXCEEDS THAT GIVEN IN THE TABLE A BOSS SHALL BE PROVIDED OR THE TAP SHALL BE MADE BY MEANS OF MUTIPLE CORP. STOPS AND BRANCH FITTINGS, TAPPED TEE, OR TAPPED SADDLE.
AutoCAD SHX Text
1.IF SHEETING IS USED, IT SHALL BE CUT OFF NO MORE THAN 12" ABOVE TOP OF IF SHEETING IS USED, IT SHALL BE CUT OFF NO MORE THAN 12" ABOVE TOP OF PIPE. 2.ALL PIPES SHALL BE PRESSURE TESTED AT 200 PSI WORKING PRESSURE FOR A ALL PIPES SHALL BE PRESSURE TESTED AT 200 PSI WORKING PRESSURE FOR A MINIMUM DURATION OF TWO HOUR. 3.WATER SYSTEM IS TO BE DISINFECTED TO 50 P.P.M. AVAILABLE CHLORINE AND WATER SYSTEM IS TO BE DISINFECTED TO 50 P.P.M. AVAILABLE CHLORINE AND AFTER 24 HOURS TO 25 P.P.M. OR AS REQUIRED BY PEMBROKE WATER SUPERINTENDENT/ENGINEER. 4.WATER PIPE IS TO BE CEMENT LINED DUCTILE IRON "TYTON" OR EQUAL TYPE JOINT, WATER PIPE IS TO BE CEMENT LINED DUCTILE IRON "TYTON" OR EQUAL TYPE JOINT, CONFORMING TO A.N.S.I./A.W.W.A. C150/A21.50, CLASS 52, AS APPROVED BY THE PEMBROKE WATER SUPERINTENDENT/ENGINEER. 5.ALL PIPING SHALL BE INSTALLED AND TESTED IN ACCORDANCE WITH A.W.W.A. ALL PIPING SHALL BE INSTALLED AND TESTED IN ACCORDANCE WITH A.W.W.A. STANDARDS PRIOR TO PAVING IF PAVING ABOVE TRENCH IS REQUIRED.
AutoCAD SHX Text
6.BACKFILL IS TO BE COMPACTED TO 90% MAXIMUM DRY DENSITY BY AASHTO T-180 D. BACKFILL IS TO BE COMPACTED TO 90% MAXIMUM DRY DENSITY BY AASHTO T-180 D. 7.ALL WATER PIPE SHALL BE LAID WITH A MINIMUM OF 5 FEET OF COVER OF APPROVED ALL WATER PIPE SHALL BE LAID WITH A MINIMUM OF 5 FEET OF COVER OF APPROVED MATERIALS. 8.ALL HYDRANT LOCATIONS ARE TO BE APPROVED BY FIRE DEPARTMENT. ALL HYDRANT LOCATIONS ARE TO BE APPROVED BY FIRE DEPARTMENT. 9.RESULTS FROM PRESSURE TESTING AND DISINFECTION SHALL BE FURNISHED TO THE RESULTS FROM PRESSURE TESTING AND DISINFECTION SHALL BE FURNISHED TO THE DIRECTOR OF PUBLIC WORKS FOR APPROVAL PRIOR TO WATER BEING TURNED ON 10.ALL WORK SHALL BE IN CONFORMANCE WITH PEMBROKE WATER DEPARTMENT ALL WORK SHALL BE IN CONFORMANCE WITH PEMBROKE WATER DEPARTMENT STANDARDS. 11.ALL PERMITS REQUIRED FOR STREET OPENINGS AND WATER MAIN TAPPING MUST BE ALL PERMITS REQUIRED FOR STREET OPENINGS AND WATER MAIN TAPPING MUST BE OBTAINED. 12.NO WATER WILL BE TURNED ON IN THE PROJECT WITHOUT WATER DEPARTMENT NO WATER WILL BE TURNED ON IN THE PROJECT WITHOUT WATER DEPARTMENT APPROVAL.
AutoCAD SHX Text
TYPICAL WATER MAIN PLUG SCALE: N.T.S
AutoCAD SHX Text
TYPICAL WATER MAIN TEE THRUST BLOCK DETAILS SCALE: N.T.S.
AutoCAD SHX Text
WATER GATE DETAIL SCALE: N.T.S.
AutoCAD SHX Text
TYPICAL WATER MAIN BEND THRUST BLOCK DETAILS SCALE: N.T.S.
AutoCAD SHX Text
TYPICAL WATER MAIN THRUST BLOCK SECTION DETAILS SCALE: N.T.S.
AutoCAD SHX Text
COPPER SERVICE CONNECTION SCALE: N.T.S.
AutoCAD SHX Text
HYDRANT DETAIL SCALE: N.T.S.
AutoCAD SHX Text
TYPICAL TAPPING SLEEVE AND VALVE SCALE: N.T.S.
AutoCAD SHX Text
CURB/EDGE OF PAVEMENT
AutoCAD SHX Text
STALL
AutoCAD SHX Text
WIDTH
AutoCAD SHX Text
8'-6"
AutoCAD SHX Text
18'-0"
AutoCAD SHX Text
%%USTANDARD SPACE
AutoCAD SHX Text
2'-6"
AutoCAD SHX Text
SIGN R1-1
AutoCAD SHX Text
2'-6"
AutoCAD SHX Text
STOP
AutoCAD SHX Text
ROADWAY
AutoCAD SHX Text
TOP OF CURB
AutoCAD SHX Text
2'MIN.
AutoCAD SHX Text
STEEL SIGN POST
AutoCAD SHX Text
2"x2"x8'-0" SQUARE
AutoCAD SHX Text
1'-6"
AutoCAD SHX Text
8'-6"
AutoCAD SHX Text
1'-0"
AutoCAD SHX Text
7'-0" (MIN.)
AutoCAD SHX Text
LANDSCAPED SURFACE
AutoCAD SHX Text
5'MAX.
AutoCAD SHX Text
TYPICAL STRIPING DETAILS SCALE: N.T.S.
AutoCAD SHX Text
SIGN DETAIL SCALE: N.T.S.
AutoCAD SHX Text
R=16"
AutoCAD SHX Text
3"
AutoCAD SHX Text
3'-10"
AutoCAD SHX Text
3'-6"
AutoCAD SHX Text
4"
AutoCAD SHX Text
VAN
AutoCAD SHX Text
8'-0" (MIN.)
AutoCAD SHX Text
8'-0" (VAN)
AutoCAD SHX Text
4" WIDE YELLOW PAINTED LINES (INCL AISLES)
AutoCAD SHX Text
PAINTED WHITE SYMBOL
AutoCAD SHX Text
CONCRETE
AutoCAD SHX Text
%%UPOST
AutoCAD SHX Text
OR FIN.
AutoCAD SHX Text
GRADE
AutoCAD SHX Text
SIDEWALK
AutoCAD SHX Text
HOLES PUNCHED
AutoCAD SHX Text
@ 1" O.C.
AutoCAD SHX Text
1 13/16"
AutoCAD SHX Text
%%UPARTIAL ELEVATION
AutoCAD SHX Text
%%UMOUNTING
AutoCAD SHX Text
SCREW OR BOLT
AutoCAD SHX Text
5/16" MACHINE
AutoCAD SHX Text
SIGN
AutoCAD SHX Text
LOCK WASHER
AutoCAD SHX Text
NUT AND
AutoCAD SHX Text
N.T.S.
AutoCAD SHX Text
%%UPOST SECTION
AutoCAD SHX Text
CHANNEL
AutoCAD SHX Text
3 1/2"
AutoCAD SHX Text
1 1/4"
AutoCAD SHX Text
(GALVANIZED)
AutoCAD SHX Text
4 LB/FT "U"
AutoCAD SHX Text
SPACES ONLY
AutoCAD SHX Text
VAN ACCESSIBLE
AutoCAD SHX Text
1"
AutoCAD SHX Text
36" - 3/8"
AutoCAD SHX Text
18"
AutoCAD SHX Text
6"
AutoCAD SHX Text
PAINTED HANDICAP SYMBOL DETAIL SCALE: N.T.S.
AutoCAD SHX Text
HANDICAP PARKING STALL DETAIL SCALE: N.T.S.
AutoCAD SHX Text
4" WIDE PAINTED WHITE STRIPES
AutoCAD SHX Text
NOTE: WHERE NO PAVED SIDEWALK EXIST CURB STOPS & VALVE BOXES TO BE INSTALLED IN STREET
AutoCAD SHX Text
HYDRANT
AutoCAD SHX Text
FINISHED GRADE
AutoCAD SHX Text
CAST IRON VALVE BOX AND COVER
AutoCAD SHX Text
CONC. THRUST BLOCK
AutoCAD SHX Text
VALVE ANCHORING TEE
AutoCAD SHX Text
WATER MAIN
AutoCAD SHX Text
PROVIDE 12" SQ. BY 4" THICK CONC. BASE
AutoCAD SHX Text
1/2 C.Y. OF CRUSHED STONE 6" ABOVE DRAIN
AutoCAD SHX Text
6" DI PIPE
AutoCAD SHX Text
UNDISTURBED SIDE OF TRENCH
AutoCAD SHX Text
AS NOTED
AutoCAD SHX Text
DESCRIPTION
AutoCAD SHX Text
BY
AutoCAD SHX Text
REV
AutoCAD SHX Text
DATE
AutoCAD SHX Text
APP
AutoCAD SHX Text
DWG. NO:
AutoCAD SHX Text
DWG. TITLE:
AutoCAD SHX Text
215-181
AutoCAD SHX Text
DESIGNED BY:
AutoCAD SHX Text
PROJECT NO.:
AutoCAD SHX Text
APPROVED BY:
AutoCAD SHX Text
CHECKED BY:
AutoCAD SHX Text
DATE:
AutoCAD SHX Text
SCALE:
AutoCAD SHX Text
DRAWN BY:
AutoCAD SHX Text
C MCKENZIE ENGINEERING GROUP, INC.
AutoCAD SHX Text
M:\MEG\2015 PROJECTS\215-181\DWGS\CUT SHEETS\ZBA APPLICATION\SUBMISSION NO 1\215-181 DETAILS.DWG
AutoCAD SHX Text
COMMENTS PER MASSHOUSING
AutoCAD SHX Text
SBS
AutoCAD SHX Text
1
AutoCAD SHX Text
5/12/2017
AutoCAD SHX Text
BCM
AutoCAD SHX Text
PROFESSIONAL ENGINEER:
AutoCAD SHX Text
SEPTEMBER 22, 2016
AutoCAD SHX Text
PREPARED BY:
AutoCAD SHX Text
BCM
AutoCAD SHX Text
BCM
AutoCAD SHX Text
SBS
AutoCAD SHX Text
SBS
AutoCAD SHX Text
COMMENTS PER MASSHOUSING
AutoCAD SHX Text
SBS
AutoCAD SHX Text
2
AutoCAD SHX Text
7/14/2017
AutoCAD SHX Text
BCM
AutoCAD SHX Text
ZBA APPLICATION
AutoCAD SHX Text
AJC
AutoCAD SHX Text
3
AutoCAD SHX Text
10/5/2018
AutoCAD SHX Text
BCM

C-7
PE
RM
IT
P
LA
N S
ET
OW
NE
R/A
PP
LIC
AN
T:
RIV
ER
M
AR
SH
, L
LC
293R
W
AS
HIN
GT
ON
S
TR
EE
T
NO
RW
ELL, M
AS
SA
CH
US
ET
TS
02061
(A
SS
ES
SO
R'S
M
AP
E
-17, LO
T 0 &
E
-17A
, LO
T 274)
PE
MB
RO
KE
, M
AS
SA
CH
US
ET
TS
Assinippi Office Park
150 Longwater Drive, Suite 101
Norwell, MA 02061
P: 781.792.3900
F: 781.792.0333
www.mckeng.com
M C K E N Z I E
ENGINEERING GROUP
RIV
ER
MA
RS
H V
ILLA
GE
CO
MP
RE
HE
NS
IVE
PE
RM
IT P
LAN
WA
TE
R S
TR
EE
T
CONSTRUCTION
DETAILS
SHEET 4 OF 4
AutoCAD SHX Text
STABILIZATION PRACTICES UTILIZED FOR THE PROJECT WILL INCLUDE TEMPORARY SEEDING, GEOTEXTILES (JUTE MESH), MULCHING, AND PERMANENT SEEDING.
AutoCAD SHX Text
EROSION AND SEDIMENTATION CONTROL MEASURES.
AutoCAD SHX Text
McKENZIE ENGINEERING GROUP, INC. FOR STRUCTURAL STABILIZATION AND DUST CONTROL
AutoCAD SHX Text
REFER TO CONSTRUCTION PHASE BEST MANAGEMENT PRACTICES AS SPECIFIED IN
AutoCAD SHX Text
"BEST MANAGEMENT PRACTICES OPERATION AND MAINTENANCE PLAN" PREPARED BY
AutoCAD SHX Text
STRUCTURAL PRACTICES UTILIZED FOR THE PROJECT WILL INCLUDE SEDIMENT FENCE/HAYBALE BARRIER CONTROLS, STABILIZED CONSTRUCTION ENTRANCE, TEMPORARY DIVERSION SWALES WITH STONE CHECK DAMS, SEDIMENT BASINS, AND INLET PROTECTION SUBJECT TO THE TOWN OF PEMBROKE CONSERVATION COMMISSION APPROVAL.
AutoCAD SHX Text
IN GENERAL, THE SMALLEST POSSIBLE AREA OF LAND SHALL BE EXPOSED AT ONE TIME. WHEN LAND IS EXPOSED DURING DEVELOPMENT, THE EXPOSURE SHALL BE CONFINED TO A MAXIMUM PERIOD OF 3 MONTHS. LAND SHALL NOT BE EXPOSED DURING THE WINTER MONTHS. ANY DISTURBED AREAS WHICH ARE TO BE LEFT TEMPORARILY AND THAT WILL BE REGRADED AT A LATER DATE SHALL BE MACHINE HAY MULCHED AND SEEDED WITH WINTER RYE TO PREVENT EROSION.
AutoCAD SHX Text
%%uEROSION AND SEDIMENTATION CONTROL
AutoCAD SHX Text
MINIMUM DEPTH OF 4".
AutoCAD SHX Text
FLOW OR DRAINAGE.
AutoCAD SHX Text
CONSTRUCTION NOTES:
AutoCAD SHX Text
FENCE POSTS WITH WIRE TIES OR STAPLES.
AutoCAD SHX Text
AND MID SECTION.
AutoCAD SHX Text
CONSTRUCTION NOTES:
AutoCAD SHX Text
1) WOVEN WIRE FENCE TO BE FASTENED SECURELY TO
AutoCAD SHX Text
2) FILTER CLOTH TO BE FASTENED SECURELY TO WOVEN
AutoCAD SHX Text
WIRE FENCE WITH TIES SPACED EVERY 24" AT TOP
AutoCAD SHX Text
3) WHEN TWO SECTIONS OF FILTER CLOTH ADJOIN EACH
AutoCAD SHX Text
OTHER, THEY SHALL BE OVERLAPPED BY 6 INCHES AND FOLDED.
AutoCAD SHX Text
4) MAINTENANCE SHALL BE PERFORMED AS NEEDED AND MATERIAL
AutoCAD SHX Text
REMOVED WHEN "BULGES" DEVELOP IN THE SILT FENCE.
AutoCAD SHX Text
ABUTTING THE ADJACENT BALES.
AutoCAD SHX Text
1) BALES SHALL BE PLACED IN A ROW WITH ENDS TIGHTLY
AutoCAD SHX Text
2) EACH BALE SHALL BE EMBEDDED IN THE SOIL A
AutoCAD SHX Text
3) BALES SHALL BE SECURELY ANCHORED IN PLACE BY
AutoCAD SHX Text
STAKES OR RE-BARS DRIVEN THROUGH THE BALES.
AutoCAD SHX Text
THE FIRST STAKE IN EACH BALE SHALL BE ANGLED TOWARD
AutoCAD SHX Text
PREVIOUSLY LAID BALE TO FORCE BALES TOGETHER.
AutoCAD SHX Text
4) INSPECTION SHALL BE FREQUENT, AND REPAIR OR
AutoCAD SHX Text
REPLACEMENT SHALL BE MADE PROMPTLY AS REQUIRED.
AutoCAD SHX Text
5) BALES SHALL BE REMOVED WHEN THEY HAVE SERVED THEIR
AutoCAD SHX Text
USEFULLNESS, SO AS NOT TO BLOCK OR IMPEDE STORM
AutoCAD SHX Text
TOGETHER.
AutoCAD SHX Text
TOE OF SLOPE
AutoCAD SHX Text
%%uPLAN
AutoCAD SHX Text
EMBANKMENT
AutoCAD SHX Text
STAKES EA. BALE
AutoCAD SHX Text
(2)2"X2"X3'
AutoCAD SHX Text
EXIST.
AutoCAD SHX Text
RESULTING GRADES AT TOE OF SLOPE
AutoCAD SHX Text
*- VARIES DEPENDING ON HEIGHT OF
AutoCAD SHX Text
EXIST. GROUND INTERSECTION.
AutoCAD SHX Text
SLOPE AND STEEPNESS OF
AutoCAD SHX Text
OVERLAP BALES
AutoCAD SHX Text
%%USECTION
AutoCAD SHX Text
GROUND
AutoCAD SHX Text
%%USECTION
AutoCAD SHX Text
6' %%P
AutoCAD SHX Text
ROADWAY SLOPE OR
AutoCAD SHX Text
EXISTING GROUND
AutoCAD SHX Text
SLOPE
AutoCAD SHX Text
HAY BALES
AutoCAD SHX Text
STAKED
AutoCAD SHX Text
OR IN WIDE DITCHES.
AutoCAD SHX Text
WHERE EXIST. GROUND
AutoCAD SHX Text
%%UPLAN
AutoCAD SHX Text
TOE OF THE EMBANKMENT.
AutoCAD SHX Text
SLOPES IN TOWARD THE
AutoCAD SHX Text
TO BE USED IN LOCATIONS
AutoCAD SHX Text
%%uNOTE:
AutoCAD SHX Text
L
AutoCAD SHX Text
FLOW
AutoCAD SHX Text
FLOW
AutoCAD SHX Text
TO BE USED AROUND CATCH BASINS.
AutoCAD SHX Text
C SWALE
AutoCAD SHX Text
%%uNOTE:
AutoCAD SHX Text
CATCH BASIN
AutoCAD SHX Text
FLOW
AutoCAD SHX Text
FLOW
AutoCAD SHX Text
CULVERT
AutoCAD SHX Text
WHERE HEAVY FLOW MAY BE ANTICIPATED
AutoCAD SHX Text
STAKED HAY BALES
AutoCAD SHX Text
SLOPES IN TOWARD THE
AutoCAD SHX Text
TOE OF THE EMBANKMENT.
AutoCAD SHX Text
WHERE EXIST. GROUND
AutoCAD SHX Text
OR IN NARROW DITCHES.
AutoCAD SHX Text
%%UPLAN
AutoCAD SHX Text
EMBANKMENT.
AutoCAD SHX Text
THE TOE OF THE
AutoCAD SHX Text
GROUND SLOPES AWAY FROM
AutoCAD SHX Text
TO BE USED WHERE EXIST.
AutoCAD SHX Text
BALES TO BUTT
AutoCAD SHX Text
%%uNOTE:
AutoCAD SHX Text
TO BE USED AROUND CULVERT INLETS
AutoCAD SHX Text
%%UNOTE:
AutoCAD SHX Text
OF SLOPE
AutoCAD SHX Text
HEADWALL OR TOE
AutoCAD SHX Text
OVERLAP BALES
AutoCAD SHX Text
%%uSECTION
AutoCAD SHX Text
FLOW
AutoCAD SHX Text
BOTTOM OF FILL SLOPE
AutoCAD SHX Text
EXISTING GROUND
AutoCAD SHX Text
ROADWAY SLOPE OR
AutoCAD SHX Text
STAKED HAY BALES
AutoCAD SHX Text
FLOW
AutoCAD SHX Text
L
AutoCAD SHX Text
C SWALE
AutoCAD SHX Text
TO BE USED IN LOCATIONS
AutoCAD SHX Text
%%UNOTE:
AutoCAD SHX Text
TO BE USED AT BOTTOM OF FILL SLOPE
AutoCAD SHX Text
%%UNOTE:
AutoCAD SHX Text
*
AutoCAD SHX Text
*
AutoCAD SHX Text
DEWATERING METHODS SHALL BE EMPLOYED IN ANY AREA WHERE PUMPING OF GROUNDWATER IS NECESSARY TO CONSTRUCT THE PROPOSED PARKING LOT AND UTILITIES. DETAILS SHOWN ON THIS PLAN SHALL BE USED AND ANY MODIFICATION SHALL BE APPROVED BY THE TOWN OF PEMBROKE.
AutoCAD SHX Text
SECTION A
AutoCAD SHX Text
JOINING SECTIONS OF SILTATION FENCE
AutoCAD SHX Text
BACKFILL
AutoCAD SHX Text
NATIVE SOIL
AutoCAD SHX Text
B
AutoCAD SHX Text
COUPLER
AutoCAD SHX Text
SUPPORT NET
AutoCAD SHX Text
FILTER FABRIC
AutoCAD SHX Text
POST
AutoCAD SHX Text
~
AutoCAD SHX Text
SECTION A
AutoCAD SHX Text
FLOW
AutoCAD SHX Text
SECTION B
AutoCAD SHX Text
~
AutoCAD SHX Text
SECTION B
AutoCAD SHX Text
TOP VIEW
AutoCAD SHX Text
A
AutoCAD SHX Text
POSTS
AutoCAD SHX Text
STONE
AutoCAD SHX Text
LEVEL
AutoCAD SHX Text
FINISH
AutoCAD SHX Text
WATER
AutoCAD SHX Text
DIA. WASHED
AutoCAD SHX Text
12" OF 3/4"
AutoCAD SHX Text
%%USECTION
AutoCAD SHX Text
SILT FENCE
AutoCAD SHX Text
SILT FENCE
AutoCAD SHX Text
STAKED HAYBALES
AutoCAD SHX Text
%%UPLAN
AutoCAD SHX Text
12" OF 3/4" DIA.
AutoCAD SHX Text
WASHED STONE
AutoCAD SHX Text
GRADE
AutoCAD SHX Text
26'
AutoCAD SHX Text
1.STONE FOR A STABILIZATION CONSTRUCTION ENTRANCE SHALL BE 1 TO 2 STONE FOR A STABILIZATION CONSTRUCTION ENTRANCE SHALL BE 1 TO 2 INCH STONE, RECLAIMED STONE. 2.THE LENGTH OF THE STABILIZED ENTRANCE SHALL NOT BE LESS THAN 50 THE LENGTH OF THE STABILIZED ENTRANCE SHALL NOT BE LESS THAN 50 FEET, EXCEPT FOR A SINGLE RESIDENTIAL LOT A 30 FOOT MINIMUM LENGTH WOULD APPLY. 3.THE THICKNESS OF THE STONE FOR THE STABILIZED ENTRANCE SHALL NOT THE THICKNESS OF THE STONE FOR THE STABILIZED ENTRANCE SHALL NOT BE LESS THAN 6 INCHES. 4.GEOTEXTILE FILTER CLOTH SHALL BE PLACED OVER THE ENTIRE AREA PRIOR GEOTEXTILE FILTER CLOTH SHALL BE PLACED OVER THE ENTIRE AREA PRIOR TO PLACING THE STONE. 5.ALL SURFACE WATER THAT IS FLOWING TO OR DEVERTED TOWARDS THE ALL SURFACE WATER THAT IS FLOWING TO OR DEVERTED TOWARDS THE CONSTRUCTION ENTRANCE SHALL BE PIPED BENEATH THE ENTRANCE. IF PIPING IS IMPRACTICAL, A BERM WITH 5:1 SLOPES THAT CAN BE CROSSED BY VEHICLES MAY BE SUBSTITUTED FOR THE PIPE. 6.THE ENTRANCE SHALL BE MAINTAINED IN A CONDITION THAT WILL PREVENT THE ENTRANCE SHALL BE MAINTAINED IN A CONDITION THAT WILL PREVENT TRACKING OR FLOWING OF SEDIMENT ONTO PUBLIC RIGHTS-OF-WAY. THIS MAY REQUIRE PERIODIC TOPDRESSING WITH ADDITIONAL STONE AS CONDITIONS DEMAND AND REPAIR AND/OR CLEANOUT OF ANY MEASURES USED TO TRAP SEDIMENT. ALL SEDIMENT SPILLED, WASHED, OR TRACKED ONTO PUBLIC RIGHT-OF-WAY MUST BE REMOVED PROMPTLY.
AutoCAD SHX Text
50' MINIMUM
AutoCAD SHX Text
EXISTING PAVEMENT
AutoCAD SHX Text
GEOTEXTILE FILTER FABRIC
AutoCAD SHX Text
6"MIN.
AutoCAD SHX Text
50' MINIMUM
AutoCAD SHX Text
PROFILE
AutoCAD SHX Text
1" TO 2" COARSE AGGREGATE (TYP.)
AutoCAD SHX Text
PLAN VIEW
AutoCAD SHX Text
10'
AutoCAD SHX Text
MIN.
AutoCAD SHX Text
EXISTING PAVEMENT
AutoCAD SHX Text
10'
AutoCAD SHX Text
10'
AutoCAD SHX Text
STABILIZED CONSTRUCTION ENTRANCE DETAIL SCALE: N.T.S.
AutoCAD SHX Text
CONSTRUCTION SPECIFICATIONS:CONSTRUCTION SPECIFICATIONS:
AutoCAD SHX Text
%%USILT SACK SEDIMENT TRAP CONTRUCTION NOTES:
AutoCAD SHX Text
%%uPLAN VIEW
AutoCAD SHX Text
%%uSECTION VIEW
AutoCAD SHX Text
EXPANSION RESTRAINT
AutoCAD SHX Text
FLOW
AutoCAD SHX Text
FLOW
AutoCAD SHX Text
SILTSACK
AutoCAD SHX Text
GRATE
AutoCAD SHX Text
CATCH BASIN
AutoCAD SHX Text
CATCH BASIN GRATE
AutoCAD SHX Text
SILTSACK
AutoCAD SHX Text
1" REBAR FOR
AutoCAD SHX Text
BAG REMOVAL
AutoCAD SHX Text
INSTALL SILTSACK IN ALL CATCH BASINS WHERE INDICATED ON THE PLAN
AutoCAD SHX Text
BEFORE COMMENCING WORK OR IN PAVED AREAS AFTER BINDER COURSE
AutoCAD SHX Text
IS PLACED AND HAY BALES HAVE BEEN REMOVED.
AutoCAD SHX Text
GRATE TO BE PLACED OVER SILTSACK.
AutoCAD SHX Text
SILTSACK SHALL BE INSPECTED PERIODICALLY AND AFTER ALL STORM
AutoCAD SHX Text
EVENTS AND CLEANING OR REPLACEMENT SHALL BE PERFORMED
AutoCAD SHX Text
PROMPTLY AS NEEDED. MAINTAIN UNTIL UPSTREAM AREAS HAVE BEEN
AutoCAD SHX Text
PERMANENTLY STABILIZED
AutoCAD SHX Text
1.
AutoCAD SHX Text
2.
AutoCAD SHX Text
3.
AutoCAD SHX Text
SILTSACK SEDIMENT TRAP SCALE: N.T.S.
AutoCAD SHX Text
WATER FLOW
AutoCAD SHX Text
SECTION VIEW
AutoCAD SHX Text
1"x1" STAKES EVERY 8 LF
AutoCAD SHX Text
18" DIAM. BIODEGRADABLE SILT
AutoCAD SHX Text
COMPOST BLEND
AutoCAD SHX Text
SOCK FILLED WITH WOOD CHIP
AutoCAD SHX Text
DISTURBED AREA
AutoCAD SHX Text
TRAPPED SEDIMENT
AutoCAD SHX Text
PROTECTED RESOURCE AREA
AutoCAD SHX Text
PLAN VIEW
AutoCAD SHX Text
DISTURBED AREA
AutoCAD SHX Text
18" DIAM. BIODEGRADABLE SILT SOCK FILLED WITH WOOD CHIP COMPOST BLEND
AutoCAD SHX Text
REPLACEMENT SHALL BE MADE PROMPTLY AS REQUIRED.
AutoCAD SHX Text
1"x1" STAKES EVERY 8 LF
AutoCAD SHX Text
WATER FLOW
AutoCAD SHX Text
2) SILT SOCKS SHALL BE SECURELY ANCHORED IN PLACE BY
AutoCAD SHX Text
3) INSPECTION SHALL BE FREQUENT, AND REPAIR OR
AutoCAD SHX Text
USEFULNESS, SO AS NOT TO BLOCK OR IMPEDE STORM
AutoCAD SHX Text
4) SILT SOCKS SHALL BE REMOVED WHEN THEY HAVE SERVED THEIR
AutoCAD SHX Text
FLOW OR DRAINAGE.
AutoCAD SHX Text
STAKES OR RE-BARS DRIVEN EVERY 8 LF.
AutoCAD SHX Text
ABUTTING OR LAPPING THE ADJACENT SECTIONS.
AutoCAD SHX Text
1) SILT SOCKS SHALL BE PLACED IN A ROW WITH ENDS TIGHTLY
AutoCAD SHX Text
CONSTRUCTION NOTES:
AutoCAD SHX Text
PROTECTED RESOURCE AREA
AutoCAD SHX Text
SILTSOCK EROSION CONTROL BARRIER DETAIL SCALE: N.T.S.
AutoCAD SHX Text
SILTATION FENCE DETAIL SCALE: N.T.S.
AutoCAD SHX Text
DEWATERING FILTER DETAIL SCALE: N.T.S.
AutoCAD SHX Text
TEMPORARY EROSION CONTROL SCALE: N.T.S.
AutoCAD SHX Text
%%UNOTE:
AutoCAD SHX Text
FINAL DESIGN OF BOTTOMLESS PRECAST CONCRETE BOX CULVERTS W/"LIGHT PORT" TO BE FINALIZED PRIOR TO CONSTRUCTION BY CONSPAN BRIDGE SYSTEMS, INC. DETAILS ON THIS SHEET ARE FOR ILLUSTRATIVE PURPOSES ONLY.
AutoCAD SHX Text
2%%%
AutoCAD SHX Text
2%%%
AutoCAD SHX Text
1'
AutoCAD SHX Text
C
AutoCAD SHX Text
L
AutoCAD SHX Text
PROP. REINFORCED CONC. RETAINING WALL
AutoCAD SHX Text
PROP. WOOD GUARDRAIL BOLTED TO WALL
AutoCAD SHX Text
1'
AutoCAD SHX Text
PROP. WOOD GUARDRAIL BOLTED TO WALL
AutoCAD SHX Text
PROP. 14 FT SPAN REINFORCED CONCRETE BOTTOMLESS ARCH CULVERTS
AutoCAD SHX Text
A
AutoCAD SHX Text
A
AutoCAD SHX Text
CULVERT CROWN ROAD B STA.=10+42.09
AutoCAD SHX Text
12"
AutoCAD SHX Text
%%UNOTES
AutoCAD SHX Text
BOTTOMLESS PRECAST CONCRETE ARCH CULVERT SECTION ROAD B STA 10+42.09 SCALE: N.T.S.
AutoCAD SHX Text
BOTTOMLESS PRECAST CONCRETE ARCH CULVERT SECTION ROAD B STA 10+42.09 SECTION A-A SCALE: N.T.S.
AutoCAD SHX Text
12' WIDE GRAVEL MAINTENANCE ROAD
AutoCAD SHX Text
PROP. UTILITY CONDUITS (ELEC., TEL., CATV)
AutoCAD SHX Text
PROP CROWN 8"± THICKNESS
AutoCAD SHX Text
CULVERT CROWN
AutoCAD SHX Text
2' COVER (MIN.)
AutoCAD SHX Text
FINISH GRADE
AutoCAD SHX Text
PROP. CULVERT FOOTING PAD
AutoCAD SHX Text
FINISH GRADE
AutoCAD SHX Text
ROADWAY GRADE
AutoCAD SHX Text
14' SPAN
AutoCAD SHX Text
CONCRETE RETAINING WALL
AutoCAD SHX Text
4' CLEARANCE (MIN.)
AutoCAD SHX Text
7' RISE
AutoCAD SHX Text
1. CONCRETE - 3000 PSI, 3/4" AGGREGATE
AutoCAD SHX Text
EXCAVATE FOOTING AREAS AND PERFORM DEWATERING OPERATIONS TO LOWER THE GROUNDWATER LEVEL AS REQUIRED TO PROVIDE A STABLE, DRY SUBGRADE FOR THE CONSTRUCTION OF THE CULVERT FOOTINGS AND PREVENT SURFACE WATER TO ACCUMULATE IN EXCAVATION AREAS. WATER SHALL BE PUMPED TO A SEDIMENTATION BASIN FOR TREATMENT PRIOR TO DISCHARGING THE WETLAND.
AutoCAD SHX Text
ONCE PAVED, THE STRUCTURE IS CAPABLE OF CARRYING HS-20 LIVE LOADS. ANY CONSTRUCTION TRAFFIC LOADING THAT EXCEEDS THIS LEVEL OR IS APPLIED PRIOR TO PAVING MUST BE REVIEWED AND APPROVED BY THE MANUFACTURER.
AutoCAD SHX Text
UPON COMPLETION OF CONSTRUCTION ANY DISTURBED SOILS WILL BE REGRADED TO THEIR ORIGINAL ELEVATION AND STABILIZED WITH PLANTINGS AS SHOWN ON THE PLANS AND LOAM AND SEED.
AutoCAD SHX Text
INSTALL SECTIONS OF BOX CULVERT AND BACKFILL ROADWAY ENTRANCE AREA.
AutoCAD SHX Text
THE CONTRACTOR SHALL PROVIDE SOIL BORINGS IN THE FOOTING LOCATIONS FOR REVIEW AND APPROVAL BY THE MANUFACTURER TO ENSURE PROPER FOOTING SIZING.
AutoCAD SHX Text
4.
AutoCAD SHX Text
5.
AutoCAD SHX Text
3.
AutoCAD SHX Text
BOX CULVERT CONSTRUCTION SEQUENCE
AutoCAD SHX Text
FORM AND POUR CULVERT FOOTINGS.
AutoCAD SHX Text
C.
AutoCAD SHX Text
B.
AutoCAD SHX Text
2.
AutoCAD SHX Text
A.
AutoCAD SHX Text
%%uGENERAL NOTES:
AutoCAD SHX Text
1.
AutoCAD SHX Text
PRECAST CONCRETE BOX CULVERTS TO BE MANUFACTURED BY CONSPAN BRIDGE
AutoCAD SHX Text
SYSTEMS INC.
AutoCAD SHX Text
4" CRUSHED STONE FOR WEARING SURFACE M2.01.0, M2.01.1
AutoCAD SHX Text
3:1 MAX
AutoCAD SHX Text
3:1 MAX
AutoCAD SHX Text
C
AutoCAD SHX Text
11'
AutoCAD SHX Text
11'
AutoCAD SHX Text
CUT
AutoCAD SHX Text
FILL
AutoCAD SHX Text
FILL
AutoCAD SHX Text
CUT
AutoCAD SHX Text
3:1 MAX
AutoCAD SHX Text
3:1 MAX
AutoCAD SHX Text
LANE WIDTH
AutoCAD SHX Text
LANE WIDTH
AutoCAD SHX Text
2%%%
AutoCAD SHX Text
2%%%
AutoCAD SHX Text
COMPACTED SUBGRADE
AutoCAD SHX Text
8" DENSE GRADED CRUSHED STONE FOR SUB-BASE, M2.01.7
AutoCAD SHX Text
TYPICAL ROADWAY GRAVEL MAINTENANCE ROAD SCALE: N.T.S.
AutoCAD SHX Text
4" CRUSHED STONE FOR WEARING SURFACE M2.01.0, M2.01.1
AutoCAD SHX Text
8" DENSE GRADED CRUSHED STONE FOR SUB-BASE, M2.01.7
AutoCAD SHX Text
AS NOTED
AutoCAD SHX Text
DESCRIPTION
AutoCAD SHX Text
BY
AutoCAD SHX Text
REV
AutoCAD SHX Text
DATE
AutoCAD SHX Text
APP
AutoCAD SHX Text
DWG. NO:
AutoCAD SHX Text
DWG. TITLE:
AutoCAD SHX Text
215-181
AutoCAD SHX Text
DESIGNED BY:
AutoCAD SHX Text
PROJECT NO.:
AutoCAD SHX Text
APPROVED BY:
AutoCAD SHX Text
CHECKED BY:
AutoCAD SHX Text
DATE:
AutoCAD SHX Text
SCALE:
AutoCAD SHX Text
DRAWN BY:
AutoCAD SHX Text
C MCKENZIE ENGINEERING GROUP, INC.
AutoCAD SHX Text
M:\MEG\2015 PROJECTS\215-181\DWGS\CUT SHEETS\ZBA APPLICATION\SUBMISSION NO 1\215-181 DETAILS.DWG
AutoCAD SHX Text
COMMENTS PER MASSHOUSING
AutoCAD SHX Text
SBS
AutoCAD SHX Text
1
AutoCAD SHX Text
5/12/2017
AutoCAD SHX Text
BCM
AutoCAD SHX Text
PROFESSIONAL ENGINEER:
AutoCAD SHX Text
SEPTEMBER 22, 2016
AutoCAD SHX Text
PREPARED BY:
AutoCAD SHX Text
BCM
AutoCAD SHX Text
BCM
AutoCAD SHX Text
SBS
AutoCAD SHX Text
SBS
AutoCAD SHX Text
COMMENTS PER MASSHOUSING
AutoCAD SHX Text
SBS
AutoCAD SHX Text
2
AutoCAD SHX Text
7/14/2017
AutoCAD SHX Text
BCM
AutoCAD SHX Text
ZBA APPLICATION
AutoCAD SHX Text
AJC
AutoCAD SHX Text
3
AutoCAD SHX Text
10/5/2018
AutoCAD SHX Text
BCM

DRAINAGE CALCULATIONS AND STORMWATER
MANAGEMENT PLAN
For:
COMPREHENSIVE PERMIT PLAN
RIVER MARSH VILLAGE
PEMBROKE, MA
Located:
0 WATER STREET (ASSESSOR’S MAP E-17, LOT 0 & E-17A, LOT 274)
PEMBROKE, MASSACHUSETTS
Submitted to:
TOWN OF PEMBROKE
Prepared For:
RIVER MARSH, LLC
293R WASHINGTON STREET
NORWELL, MA 02061
SEPTEMBER 7, 2018
M c K e n z i e E n g i n e e r i n g G r o u p , I n c .
150 Longwater Drive, Suite 101, Norwell, Massachusetts 02061 P: (781) 792-3900 F: (781) 792-0333 www.mckeng.com

TABLE OF CONTENTS
1. NARRATIVE Page
� Project Summary 1
� Pre-Development Condition 1
� Post-Development Condition 3
� Figure 1 (USGS Locus Map) 5
� Figure 2 (FEMA Flood Map) 6
� Figure 3 (SCS Soils Map) 7
2. APPENDICES
� APPENDIX A: Pre-Development Condition
� APPENDIX B: Post-Development Condition

1
Preliminary Hydrologic Analysis
Comprehensive Permit Plan
River March Village
Pembroke, Massachusetts
Project Summary
The project proponent River Marsh, LLC, proposes to develop an approximate 49.94-acre parcel
of land located at 0 Water Street (Assessor’s Map E-17, Lot 0 and E-17A, Lot 274) in Pembroke,
Massachusetts. The development is being permitted under MGL Ch. 40B Comprehensive Permit
and will consist of 56 condominium units comprised of 3, 4, and 5-unit buildings. The proposed
development will involve the construction of approximately 2,422 linear feet of bituminous
roadways, residential buildings, driveways, stormwater management system, utilities and other
related infrastructure.
The development will be comprised of two parcels which are shown on the Assessor’s Map E-17,
Lot 0 and E-17A, Lot 274. The site is located between the North River to the west and Water
Street, at the intersection of Church Street (Route 139) to the east in Pembroke, Massachusetts.
Virtually the entire site is within the Residence “A” Zoning District. Access to the site is from the
east off Water Street and through the Business “B” Zoning District. Approximately 10,700 +/-
square feet are in the Business “B” Zoning District. Within less than one mile east of the
property, is an Industrial Zone ‘B’ developed area, which abuts Pilgrims Highway (Massachusetts
State Route 3). Homes within the immediate area are generally colonial-style, wooded-framed
structures. Refer to Figure 1- USGS Locus Map for the location of the parcel.
The project will access utility infrastructure located on Water Street including electric, water,
telephone and cable television. The lots will be served by a shared subsurface sewage disposal
system with a pump chamber and connections to the municipal water system which will extend
from Water Street throughout the proposed development. All stormwater management
facilities will be designed provide renovation of stormwater and meet the requirements of the
Department of Environment Protection’s Stormwater Management Regulations. The existing
and proposed site conditions are illustrated on the project site plans entitled “River March
Village, Comprehensive Permit Plan, Water Street, Pembroke, Massachusetts”, prepared by
McKenzie Engineering Group, Inc. dated September, 2018.
This report contains preliminary stormwater runoff calculations for the pre-development and
post-development conditions and includes the sizing of the proposed low impact drainage
system and stormwater best management practices (BMPs).
Pre-Development Condition
The site is located primarily within the Residence “A” Zoning District and is comprised of 22.53
acres of upland and 27.41 acres of wetland. The Pembroke Conservation Commission has
confirmed the wetland resource area by issuance of an Order of Resource Area Delineation
(ORAD) dated June 3, 2003 for DEP File #SE 56-732. The wetland that was approved under this
ORAD, is classified as a tidal wetland. Per the Massachusetts Stormwater Handbook Standard 2
(Reduce Peak Rate Discharge) may be waived for discharges to land subject to coastal storm
flowage as defined in 310 CMR 10.04.

2
One single family home currently exists on parcel Map E-17A Lot 274, which is to be retained.
The project site is partially wooded and partially cleared with grass cover and wetlands toward
the west side of the site approaching the North River. No improvements have been made to the
land. The topography of the site is varied with elevations ranging from 30’ along the eastern
boundary of the parcel of 5’ mean se level (MSL) at the natural riverbank of the North River.
Slopes vary from gentle to somewhat steeper grades sloping toward the wetlands on the west
side of the site.
Review of available environmental databases such as MassGIS reveals that the site is not located
within a mapped Natural Heritage Area, a Zone II or Zone III Groundwater Recharge Area, an
Interim Wellhead Protection Area (IWPA), or a Contributing Watershed to Outstanding Resource
Water (ORW). Review of the Town of Pembroke’s Zoning Map reveals that the site is not
located within any other protection area.
The site is within Zone AE (Elevation 8) and Zone X of the Flood Insurance Rate Map, as shown
on the current FEMA Flood Insurance Rate Map Panel Nos. 25023C0206J and 25023C0207J with
an effective date of July 17, 2012. Refer to Figure 2 – FEMA Flood Map.
The Natural Resources Conservation Service (NRCS) has identified the soil on the site as
Scarboro, Ipswich, Squamscott, Eldridge, Hinckley, Merrimac, Windsor and Deerfield soils. The
soils range in hydrological soil group classifications from 'A' to 'D'. In addition to the NRCS
information, subsurface exploration has been conducted by R.H. Cole & Associate in July of 1992
and September of 1993. The deep observation holes revealed primarily fine to coarse sand (HSG
A) throughout the upland areas of the site. Refer to Figure 3 – Soil Map.
The existing watershed analyzed in this report is comprised of approximately 18.5 acres and
consists of three (3) sub-catchments. Refer to the Pre-Development Watershed Plan WS-1 in
Appendix A for a delineation of drainage subcatchments for the pre-development design
condition.
The SCS Technical Release 20 (TR-20) and Technical Release 55 (TR-55) method-based program
“HydroCAD” was employed to develop pre- and post-development peak flows. Drainage
calculations were prepared for the pre-development condition for the 2, 10, 25 and 100-year,
Type III storm events. Refer to Appendix A for computer results, soil characteristics, cover
descriptions and times of concentrations for all subareas.

3
The peak rates of runoff and elevations for this condition are as follows:
Table 1 – Pre-Development Results
Design Storm (flow in cfs)
2-Year Storm 10-Year Storm 25-Year Storm 100-Year Storm
Design Point Flow (CFS)
Flow (CFS)
Flow (CFS)
Flow (CFS)
DP-1 0.22 2.57 5.67 13.28
DP-2 0.01 0.15 4.75 1.27
Design Storm (volume in ac-ft)
2-Year Storm 10-Year Storm 25-Year Storm 100-Year Storm
Design Point Volume (AC-FT)
Volume (AC-FT)
Volume (AC-FT)
Volume (AC-FT)
DP-1 0.129 0.518 0.924 1.733
DP-2 0.006 0.043 0.084 0.169
Post-Development Condition
The proposed development will consist of 56 condominium units comprised of 3, 4, and 5-unit
buildings with bituminous concrete access roadways, parking areas and associated
infrastructure. Visitor parking will be dispersed throughout the site. Access to the site will be
provided by a private 22 ft. wide roadway with two access points from Water Street.
Watershed areas were analyzed in the post-development condition to design low impact
stormwater management facilities to mitigate impacts resulting from developing the property.
The objective in designing the proposed drainage facilities for the project was to maintain
existing drainage patterns to the extent practicable and to ensure that the post-development
rates of runoff are less than pre-development rates at the design points.
Refer to the Post-Development Watershed Plan WS-2 in Appendix B for a delineation of post-
development drainage subareas. The design points for the post-development design conditions
correspond to those analyzed for the pre-development design condition.
Drainage calculations were prepared by employing the SCS TR-20 Methods for the 2, 10, 25 and
100-year, type III storm events. Refer to Appendix B for computer results. The subsurface
infiltration chambers were designed to accommodate peak flows generated by all storms up to
and including the 100-year storm event. Refer to site plans for the drainage system design.

4
The peak rates of runoff and elevations for this condition are as follows:
Table 2 – Post-Development Results
Design Storm (flow in cfs)
2-Year Storm 10-Year Storm 25-Year Storm 100-Year Storm
Design Point Flow (CFS)
Flow (CFS)
Flow (CFS)
Flow (CFS)
DP-1 0.00 0.43 1.27 3.75
DP-2 0.00 0.00 0.01 0.06
Design Storm (volume in ac-ft)
2-Year Storm 10-Year Storm 25-Year Storm 100-Year Storm
Design Point Volume (AC-FT)
Volume (AC-FT)
Volume (AC-FT)
Volume (AC-FT)
DP-1 0.000 0.519 1.107 2.174
DP-2 0.000 0.001 0.005 0.014
Although exempt from Standard 2 – Peak Rate Discharges, because discharge is to land subject
to coastal storm flowage, a comparison of the pre-development and post-development peak
rates of runoff indicate that the peak rates of runoff for the post-development condition at all
Design Points will be less than the pre-development condition for all storm events.

USGS LOCUS MAP
FIGURE - 1
U.S. GEOLOGICAL SURVEY
7.5 X 15 MINUTE SERIES
SITECHURCH STREET
RO
UTE 3
WATER STREET
PEMBROKE, MASSACHUSETTS
WA
TE
R S
TR
EE
T
Assinippi Office Park
150 Longwater Drive, Suite 101
Norwell, MA 02061
P: 781.792.3900
F: 781.792.0333
www.mckeng.com

FEMA FLOOD MAP
FIGURE - 2
COMMUNITY PANELS NO: 25023C0206J, 25023C0207J
EFFECTIVE DATE: JULY 17, 2012
WATER STREET
PEMBROKE, MASSACHUSETTS
SITE
RO
UTE 3
CHURCH STREET
WA
TE
R
STREET
Assinippi Office Park
150 Longwater Drive, Suite 101
Norwell, MA 02061
P: 781.792.3900
F: 781.792.0333
www.mckeng.com

SOIL MAP
FIGURE - 3
PLYMOUTH COUNTY, MASSACHUSETTS
SOIL SURVEY
SITE
WATER STREET
PEMBROKE, MASSACHUSETTS
CHURCH STREET
Assinippi Office Park
150 Longwater Drive, Suite 101
Norwell, MA 02061
P: 781.792.3900
F: 781.792.0333
www.mckeng.com

A P P E N D I X A
Pre-Development Condition

EXISTINGDRAINAGE
WATERSHED
1 OF 1
DP-X
PE
RM
IT
TIN
G
OW
NE
R/A
PP
LIC
AN
T:
RIV
ER
M
AR
SH
, L
LC
293
R W
AS
HIN
GT
ON
S
TR
EE
T
NO
RW
ELL
, M
A 0
20
61
RIV
ER
MA
RS
H V
ILLA
GE
CO
MP
RE
HE
NS
IVE
PE
RM
IT P
LAN
WA
TE
R S
TR
EE
T
PE
MB
RO
KE
, M
AS
SA
CH
US
ET
TS
(A
SS
ES
SO
R'S
M
AP
E
-1
7, L
OT
0
A
ND
E
-1
7A
, L
OT
2
74
)
Assinippi Office Park
150 Longwater Drive, Suite 101
Norwell, MA 02061
P: 781.792.3900
F: 781.792.0333
www.mckeng.com

E1
SW Property
E2
Central Property
E3
SE Property
DP-1
Wetland
DP-2
Water St
Routing Diagram for 215-181 PRE-DEVPrepared by McKenzie Engineering Group, Inc.
HydroCAD® 10.00-21 s/n 00452 © 2018 HydroCAD Software Solutions LLC
Subcat Reach Pond Link

215-181 PRE-DEVPrepared by McKenzie Engineering Group, Inc.
Page 2HydroCAD® 10.00-21 s/n 00452 © 2018 HydroCAD Software Solutions LLC
Area Listing (all nodes)
Area
(acres)
CN Description
(subcatchment-numbers)
0.270 49 50-75% Grass cover, Fair, HSG A (E3)
0.018 98 Paved parking, HSG A (E3)
4.362 36 Woods, Fair, HSG A (E1)
7.986 30 Woods, Good, HSG A (E2, E3)
5.922 70 Woods, Good, HSG C (E2, E3)
18.558 45 TOTAL AREA

215-181 PRE-DEVPrepared by McKenzie Engineering Group, Inc.
Page 3HydroCAD® 10.00-21 s/n 00452 © 2018 HydroCAD Software Solutions LLC
Soil Listing (all nodes)
Area
(acres)
Soil
Group
Subcatchment
Numbers
12.636 HSG A E1, E2, E3
0.000 HSG B
5.922 HSG C E2, E3
0.000 HSG D
0.000 Other
18.558 TOTAL AREA

215-181 PRE-DEVPrepared by McKenzie Engineering Group, Inc.
Page 4HydroCAD® 10.00-21 s/n 00452 © 2018 HydroCAD Software Solutions LLC
Ground Covers (all nodes)
HSG-A
(acres)
HSG-B
(acres)
HSG-C
(acres)
HSG-D
(acres)
Other
(acres)
Total
(acres)
Ground
Cover
Subcatchment
Numbers
0.270 0.000 0.000 0.000 0.000 0.270 50-75% Grass cover, Fair E3
0.018 0.000 0.000 0.000 0.000 0.018 Paved parking E3
4.362 0.000 0.000 0.000 0.000 4.362 Woods, Fair E1
7.986 0.000 5.922 0.000 0.000 13.908 Woods, Good E2, E3
12.636 0.000 5.922 0.000 0.000 18.558 TOTAL AREA

Type III 24-hr 2-yr Rainfall=3.40"215-181 PRE-DEVPrepared by McKenzie Engineering Group, Inc.
Page 5HydroCAD® 10.00-21 s/n 00452 © 2018 HydroCAD Software Solutions LLC
Time span=0.00-72.00 hrs, dt=0.05 hrs, 1441 pointsRunoff by SCS TR-20 method, UH=SCS, Weighted-CN
Reach routing by Stor-Ind+Trans method - Pond routing by Stor-Ind method
Runoff Area=190,029 sf 0.00% Impervious Runoff Depth=0.00"Subcatchment E1: SW Property Flow Length=406' Tc=12.0 min CN=36 Runoff=0.00 cfs 0.000 af
Runoff Area=536,132 sf 0.00% Impervious Runoff Depth=0.13"Subcatchment E2: Central Property Flow Length=808' Tc=17.9 min CN=48 Runoff=0.22 cfs 0.129 af
Runoff Area=82,214 sf 0.94% Impervious Runoff Depth=0.04"Subcatchment E3: SE Property Flow Length=290' Tc=13.3 min CN=43 Runoff=0.01 cfs 0.006 af
Inflow=0.22 cfs 0.129 afReach DP-1: Wetland Outflow=0.22 cfs 0.129 af
Inflow=0.01 cfs 0.006 afReach DP-2: Water St Outflow=0.01 cfs 0.006 af
Total Runoff Area = 18.558 ac Runoff Volume = 0.136 af Average Runoff Depth = 0.09"99.90% Pervious = 18.540 ac 0.10% Impervious = 0.018 ac

Type III 24-hr 2-yr Rainfall=3.40"215-181 PRE-DEVPrepared by McKenzie Engineering Group, Inc.
Page 6HydroCAD® 10.00-21 s/n 00452 © 2018 HydroCAD Software Solutions LLC
Summary for Subcatchment E1: SW Property
[45] Hint: Runoff=Zero
Runoff = 0.00 cfs @ 0.00 hrs, Volume= 0.000 af, Depth= 0.00"
Runoff by SCS TR-20 method, UH=SCS, Weighted-CN, Time Span= 0.00-72.00 hrs, dt= 0.05 hrsType III 24-hr 2-yr Rainfall=3.40"
Area (sf) CN Description
190,029 36 Woods, Fair, HSG A
190,029 100.00% Pervious Area
Tc Length Slope Velocity Capacity Description(min) (feet) (ft/ft) (ft/sec) (cfs)
10.2 50 0.0300 0.08 Sheet Flow, START off propertyWoods: Light underbrush n= 0.400 P2= 3.40"
1.8 356 0.0400 3.22 Shallow Concentrated Flow, To WetlandUnpaved Kv= 16.1 fps
12.0 406 Total
Subcatchment E1: SW Property
Runoff
Hydrograph
Time (hours)727068666462605856545250484644424038363432302826242220181614121086420
Flo
w
(cfs
)
1
0
Type III 24-hr
2-yr Rainfall=3.40"
Runoff Area=190,029 sf
Runoff Volume=0.000 af
Runoff Depth=0.00"
Flow Length=406'
Tc=12.0 min
CN=36
0.00 cfs

Type III 24-hr 2-yr Rainfall=3.40"215-181 PRE-DEVPrepared by McKenzie Engineering Group, Inc.
Page 7HydroCAD® 10.00-21 s/n 00452 © 2018 HydroCAD Software Solutions LLC
Summary for Subcatchment E2: Central Property
Runoff = 0.22 cfs @ 13.77 hrs, Volume= 0.129 af, Depth= 0.13"
Runoff by SCS TR-20 method, UH=SCS, Weighted-CN, Time Span= 0.00-72.00 hrs, dt= 0.05 hrsType III 24-hr 2-yr Rainfall=3.40"
Area (sf) CN Description
299,040 30 Woods, Good, HSG A237,092 70 Woods, Good, HSG C
536,132 48 Weighted Average536,132 100.00% Pervious Area
Tc Length Slope Velocity Capacity Description(min) (feet) (ft/ft) (ft/sec) (cfs)
13.4 50 0.0150 0.06 Sheet Flow, A-BWoods: Light underbrush n= 0.400 P2= 3.40"
4.5 758 0.0310 2.83 Shallow Concentrated Flow, B-CUnpaved Kv= 16.1 fps
17.9 808 Total
Subcatchment E2: Central Property
Runoff
Hydrograph
Time (hours)727068666462605856545250484644424038363432302826242220181614121086420
Flo
w
(cfs
)
0.24
0.23
0.22
0.21
0.2
0.19
0.18
0.17
0.16
0.15
0.14
0.13
0.12
0.11
0.1
0.09
0.08
0.07
0.06
0.05
0.04
0.03
0.02
0.01
0
Type III 24-hr
2-yr Rainfall=3.40"
Runoff Area=536,132 sf
Runoff Volume=0.129 af
Runoff Depth=0.13"
Flow Length=808'
Tc=17.9 min
CN=48
0.22 cfs

Type III 24-hr 2-yr Rainfall=3.40"215-181 PRE-DEVPrepared by McKenzie Engineering Group, Inc.
Page 8HydroCAD® 10.00-21 s/n 00452 © 2018 HydroCAD Software Solutions LLC
Summary for Subcatchment E3: SE Property
Runoff = 0.01 cfs @ 15.62 hrs, Volume= 0.006 af, Depth= 0.04"
Runoff by SCS TR-20 method, UH=SCS, Weighted-CN, Time Span= 0.00-72.00 hrs, dt= 0.05 hrsType III 24-hr 2-yr Rainfall=3.40"
Area (sf) CN Description
48,838 30 Woods, Good, HSG A20,856 70 Woods, Good, HSG C11,750 49 50-75% Grass cover, Fair, HSG A
770 98 Paved parking, HSG A
82,214 43 Weighted Average81,444 99.06% Pervious Area
770 0.94% Impervious Area
Tc Length Slope Velocity Capacity Description(min) (feet) (ft/ft) (ft/sec) (cfs)
11.5 50 0.0220 0.07 Sheet Flow, A-BWoods: Light underbrush n= 0.400 P2= 3.40"
1.8 240 0.0200 2.28 Shallow Concentrated Flow, B-CUnpaved Kv= 16.1 fps
13.3 290 Total
Subcatchment E3: SE Property
Runoff
Hydrograph
Time (hours)727068666462605856545250484644424038363432302826242220181614121086420
Flo
w
(cfs
)
0.01
0.009
0.009
0.008
0.008
0.007
0.007
0.006
0.006
0.005
0.005
0.004
0.004
0.003
0.003
0.002
0.002
0.001
0.001
0.000
0
Type III 24-hr
2-yr Rainfall=3.40"
Runoff Area=82,214 sf
Runoff Volume=0.006 af
Runoff Depth=0.04"
Flow Length=290'
Tc=13.3 min
CN=43
0.01 cfs

Type III 24-hr 2-yr Rainfall=3.40"215-181 PRE-DEVPrepared by McKenzie Engineering Group, Inc.
Page 9HydroCAD® 10.00-21 s/n 00452 © 2018 HydroCAD Software Solutions LLC
Summary for Reach DP-1: Wetland
[40] Hint: Not Described (Outflow=Inflow)
Inflow Area = 16.670 ac, 0.00% Impervious, Inflow Depth = 0.09" for 2-yr eventInflow = 0.22 cfs @ 13.77 hrs, Volume= 0.129 afOutflow = 0.22 cfs @ 13.77 hrs, Volume= 0.129 af, Atten= 0%, Lag= 0.0 min
Routing by Stor-Ind+Trans method, Time Span= 0.00-72.00 hrs, dt= 0.05 hrs
Reach DP-1: Wetland
InflowOutflow
Hydrograph
Time (hours)727068666462605856545250484644424038363432302826242220181614121086420
Flo
w
(cfs
)
0.24
0.23
0.22
0.21
0.2
0.19
0.18
0.17
0.16
0.15
0.14
0.13
0.12
0.11
0.1
0.09
0.08
0.07
0.06
0.05
0.04
0.03
0.02
0.01
0
Inflow Area=16.670 ac0.22 cfs
0.22 cfs

Type III 24-hr 2-yr Rainfall=3.40"215-181 PRE-DEVPrepared by McKenzie Engineering Group, Inc.
Page 10HydroCAD® 10.00-21 s/n 00452 © 2018 HydroCAD Software Solutions LLC
Summary for Reach DP-2: Water St
[40] Hint: Not Described (Outflow=Inflow)
Inflow Area = 1.887 ac, 0.94% Impervious, Inflow Depth = 0.04" for 2-yr eventInflow = 0.01 cfs @ 15.62 hrs, Volume= 0.006 afOutflow = 0.01 cfs @ 15.62 hrs, Volume= 0.006 af, Atten= 0%, Lag= 0.0 min
Routing by Stor-Ind+Trans method, Time Span= 0.00-72.00 hrs, dt= 0.05 hrs
Reach DP-2: Water St
InflowOutflow
Hydrograph
Time (hours)727068666462605856545250484644424038363432302826242220181614121086420
Flo
w
(cfs
)
0.01
0.009
0.009
0.008
0.008
0.007
0.007
0.006
0.006
0.005
0.005
0.004
0.004
0.003
0.003
0.002
0.002
0.001
0.001
0.000
0
Inflow Area=1.887 ac0.01 cfs
0.01 cfs

Type III 24-hr 10-yr Rainfall=4.70"215-181 PRE-DEVPrepared by McKenzie Engineering Group, Inc.
Page 11HydroCAD® 10.00-21 s/n 00452 © 2018 HydroCAD Software Solutions LLC
Time span=0.00-72.00 hrs, dt=0.05 hrs, 1441 pointsRunoff by SCS TR-20 method, UH=SCS, Weighted-CN
Reach routing by Stor-Ind+Trans method - Pond routing by Stor-Ind method
Runoff Area=190,029 sf 0.00% Impervious Runoff Depth=0.07"Subcatchment E1: SW Property Flow Length=406' Tc=12.0 min CN=36 Runoff=0.04 cfs 0.025 af
Runoff Area=536,132 sf 0.00% Impervious Runoff Depth=0.48"Subcatchment E2: Central Property Flow Length=808' Tc=17.9 min CN=48 Runoff=2.57 cfs 0.492 af
Runoff Area=82,214 sf 0.94% Impervious Runoff Depth=0.27"Subcatchment E3: SE Property Flow Length=290' Tc=13.3 min CN=43 Runoff=0.15 cfs 0.043 af
Inflow=2.57 cfs 0.518 afReach DP-1: Wetland Outflow=2.57 cfs 0.518 af
Inflow=0.15 cfs 0.043 afReach DP-2: Water St Outflow=0.15 cfs 0.043 af
Total Runoff Area = 18.558 ac Runoff Volume = 0.561 af Average Runoff Depth = 0.36"99.90% Pervious = 18.540 ac 0.10% Impervious = 0.018 ac

Type III 24-hr 10-yr Rainfall=4.70"215-181 PRE-DEVPrepared by McKenzie Engineering Group, Inc.
Page 12HydroCAD® 10.00-21 s/n 00452 © 2018 HydroCAD Software Solutions LLC
Summary for Subcatchment E1: SW Property
Runoff = 0.04 cfs @ 15.37 hrs, Volume= 0.025 af, Depth= 0.07"
Runoff by SCS TR-20 method, UH=SCS, Weighted-CN, Time Span= 0.00-72.00 hrs, dt= 0.05 hrsType III 24-hr 10-yr Rainfall=4.70"
Area (sf) CN Description
190,029 36 Woods, Fair, HSG A
190,029 100.00% Pervious Area
Tc Length Slope Velocity Capacity Description(min) (feet) (ft/ft) (ft/sec) (cfs)
10.2 50 0.0300 0.08 Sheet Flow, START off propertyWoods: Light underbrush n= 0.400 P2= 3.40"
1.8 356 0.0400 3.22 Shallow Concentrated Flow, To WetlandUnpaved Kv= 16.1 fps
12.0 406 Total
Subcatchment E1: SW Property
Runoff
Hydrograph
Time (hours)727068666462605856545250484644424038363432302826242220181614121086420
Flo
w
(cfs
)
0.042
0.04
0.038
0.036
0.034
0.032
0.03
0.028
0.026
0.024
0.022
0.02
0.018
0.016
0.014
0.012
0.01
0.008
0.006
0.004
0.002
0
Type III 24-hr
10-yr Rainfall=4.70"
Runoff Area=190,029 sf
Runoff Volume=0.025 af
Runoff Depth=0.07"
Flow Length=406'
Tc=12.0 min
CN=36
0.04 cfs

Type III 24-hr 10-yr Rainfall=4.70"215-181 PRE-DEVPrepared by McKenzie Engineering Group, Inc.
Page 13HydroCAD® 10.00-21 s/n 00452 © 2018 HydroCAD Software Solutions LLC
Summary for Subcatchment E2: Central Property
Runoff = 2.57 cfs @ 12.46 hrs, Volume= 0.492 af, Depth= 0.48"
Runoff by SCS TR-20 method, UH=SCS, Weighted-CN, Time Span= 0.00-72.00 hrs, dt= 0.05 hrsType III 24-hr 10-yr Rainfall=4.70"
Area (sf) CN Description
299,040 30 Woods, Good, HSG A237,092 70 Woods, Good, HSG C
536,132 48 Weighted Average536,132 100.00% Pervious Area
Tc Length Slope Velocity Capacity Description(min) (feet) (ft/ft) (ft/sec) (cfs)
13.4 50 0.0150 0.06 Sheet Flow, A-BWoods: Light underbrush n= 0.400 P2= 3.40"
4.5 758 0.0310 2.83 Shallow Concentrated Flow, B-CUnpaved Kv= 16.1 fps
17.9 808 Total
Subcatchment E2: Central Property
Runoff
Hydrograph
Time (hours)727068666462605856545250484644424038363432302826242220181614121086420
Flo
w
(cfs
)
2
1
0
Type III 24-hr
10-yr Rainfall=4.70"
Runoff Area=536,132 sf
Runoff Volume=0.492 af
Runoff Depth=0.48"
Flow Length=808'
Tc=17.9 min
CN=48
2.57 cfs

Type III 24-hr 10-yr Rainfall=4.70"215-181 PRE-DEVPrepared by McKenzie Engineering Group, Inc.
Page 14HydroCAD® 10.00-21 s/n 00452 © 2018 HydroCAD Software Solutions LLC
Summary for Subcatchment E3: SE Property
Runoff = 0.15 cfs @ 12.51 hrs, Volume= 0.043 af, Depth= 0.27"
Runoff by SCS TR-20 method, UH=SCS, Weighted-CN, Time Span= 0.00-72.00 hrs, dt= 0.05 hrsType III 24-hr 10-yr Rainfall=4.70"
Area (sf) CN Description
48,838 30 Woods, Good, HSG A20,856 70 Woods, Good, HSG C11,750 49 50-75% Grass cover, Fair, HSG A
770 98 Paved parking, HSG A
82,214 43 Weighted Average81,444 99.06% Pervious Area
770 0.94% Impervious Area
Tc Length Slope Velocity Capacity Description(min) (feet) (ft/ft) (ft/sec) (cfs)
11.5 50 0.0220 0.07 Sheet Flow, A-BWoods: Light underbrush n= 0.400 P2= 3.40"
1.8 240 0.0200 2.28 Shallow Concentrated Flow, B-CUnpaved Kv= 16.1 fps
13.3 290 Total
Subcatchment E3: SE Property
Runoff
Hydrograph
Time (hours)727068666462605856545250484644424038363432302826242220181614121086420
Flo
w
(cfs
)
0.16
0.15
0.14
0.13
0.12
0.11
0.1
0.09
0.08
0.07
0.06
0.05
0.04
0.03
0.02
0.01
0
Type III 24-hr
10-yr Rainfall=4.70"
Runoff Area=82,214 sf
Runoff Volume=0.043 af
Runoff Depth=0.27"
Flow Length=290'
Tc=13.3 min
CN=43
0.15 cfs

Type III 24-hr 10-yr Rainfall=4.70"215-181 PRE-DEVPrepared by McKenzie Engineering Group, Inc.
Page 15HydroCAD® 10.00-21 s/n 00452 © 2018 HydroCAD Software Solutions LLC
Summary for Reach DP-1: Wetland
[40] Hint: Not Described (Outflow=Inflow)
Inflow Area = 16.670 ac, 0.00% Impervious, Inflow Depth = 0.37" for 10-yr eventInflow = 2.57 cfs @ 12.46 hrs, Volume= 0.518 afOutflow = 2.57 cfs @ 12.46 hrs, Volume= 0.518 af, Atten= 0%, Lag= 0.0 min
Routing by Stor-Ind+Trans method, Time Span= 0.00-72.00 hrs, dt= 0.05 hrs
Reach DP-1: Wetland
InflowOutflow
Hydrograph
Time (hours)727068666462605856545250484644424038363432302826242220181614121086420
Flo
w
(cfs
)
2
1
0
Inflow Area=16.670 ac2.57 cfs
2.57 cfs

Type III 24-hr 10-yr Rainfall=4.70"215-181 PRE-DEVPrepared by McKenzie Engineering Group, Inc.
Page 16HydroCAD® 10.00-21 s/n 00452 © 2018 HydroCAD Software Solutions LLC
Summary for Reach DP-2: Water St
[40] Hint: Not Described (Outflow=Inflow)
Inflow Area = 1.887 ac, 0.94% Impervious, Inflow Depth = 0.27" for 10-yr eventInflow = 0.15 cfs @ 12.51 hrs, Volume= 0.043 afOutflow = 0.15 cfs @ 12.51 hrs, Volume= 0.043 af, Atten= 0%, Lag= 0.0 min
Routing by Stor-Ind+Trans method, Time Span= 0.00-72.00 hrs, dt= 0.05 hrs
Reach DP-2: Water St
InflowOutflow
Hydrograph
Time (hours)727068666462605856545250484644424038363432302826242220181614121086420
Flo
w
(cfs
)
0.16
0.15
0.14
0.13
0.12
0.11
0.1
0.09
0.08
0.07
0.06
0.05
0.04
0.03
0.02
0.01
0
Inflow Area=1.887 ac0.15 cfs
0.15 cfs

Type III 24-hr 25-yr Rainfall=5.60"215-181 PRE-DEVPrepared by McKenzie Engineering Group, Inc.
Page 17HydroCAD® 10.00-21 s/n 00452 © 2018 HydroCAD Software Solutions LLC
Time span=0.00-72.00 hrs, dt=0.05 hrs, 1441 pointsRunoff by SCS TR-20 method, UH=SCS, Weighted-CN
Reach routing by Stor-Ind+Trans method - Pond routing by Stor-Ind method
Runoff Area=190,029 sf 0.00% Impervious Runoff Depth=0.21"Subcatchment E1: SW Property Flow Length=406' Tc=12.0 min CN=36 Runoff=0.13 cfs 0.077 af
Runoff Area=536,132 sf 0.00% Impervious Runoff Depth=0.83"Subcatchment E2: Central Property Flow Length=808' Tc=17.9 min CN=48 Runoff=5.65 cfs 0.847 af
Runoff Area=82,214 sf 0.94% Impervious Runoff Depth=0.54"Subcatchment E3: SE Property Flow Length=290' Tc=13.3 min CN=43 Runoff=0.45 cfs 0.084 af
Inflow=5.67 cfs 0.924 afReach DP-1: Wetland Outflow=5.67 cfs 0.924 af
Inflow=0.45 cfs 0.084 afReach DP-2: Water St Outflow=0.45 cfs 0.084 af
Total Runoff Area = 18.558 ac Runoff Volume = 1.009 af Average Runoff Depth = 0.65"99.90% Pervious = 18.540 ac 0.10% Impervious = 0.018 ac

Type III 24-hr 25-yr Rainfall=5.60"215-181 PRE-DEVPrepared by McKenzie Engineering Group, Inc.
Page 18HydroCAD® 10.00-21 s/n 00452 © 2018 HydroCAD Software Solutions LLC
Summary for Subcatchment E1: SW Property
Runoff = 0.13 cfs @ 12.61 hrs, Volume= 0.077 af, Depth= 0.21"
Runoff by SCS TR-20 method, UH=SCS, Weighted-CN, Time Span= 0.00-72.00 hrs, dt= 0.05 hrsType III 24-hr 25-yr Rainfall=5.60"
Area (sf) CN Description
190,029 36 Woods, Fair, HSG A
190,029 100.00% Pervious Area
Tc Length Slope Velocity Capacity Description(min) (feet) (ft/ft) (ft/sec) (cfs)
10.2 50 0.0300 0.08 Sheet Flow, START off propertyWoods: Light underbrush n= 0.400 P2= 3.40"
1.8 356 0.0400 3.22 Shallow Concentrated Flow, To WetlandUnpaved Kv= 16.1 fps
12.0 406 Total
Subcatchment E1: SW Property
Runoff
Hydrograph
Time (hours)727068666462605856545250484644424038363432302826242220181614121086420
Flo
w
(cfs
)
0.14
0.13
0.12
0.11
0.1
0.09
0.08
0.07
0.06
0.05
0.04
0.03
0.02
0.01
0
Type III 24-hr
25-yr Rainfall=5.60"
Runoff Area=190,029 sf
Runoff Volume=0.077 af
Runoff Depth=0.21"
Flow Length=406'
Tc=12.0 min
CN=36
0.13 cfs

Type III 24-hr 25-yr Rainfall=5.60"215-181 PRE-DEVPrepared by McKenzie Engineering Group, Inc.
Page 19HydroCAD® 10.00-21 s/n 00452 © 2018 HydroCAD Software Solutions LLC
Summary for Subcatchment E2: Central Property
Runoff = 5.65 cfs @ 12.35 hrs, Volume= 0.847 af, Depth= 0.83"
Runoff by SCS TR-20 method, UH=SCS, Weighted-CN, Time Span= 0.00-72.00 hrs, dt= 0.05 hrsType III 24-hr 25-yr Rainfall=5.60"
Area (sf) CN Description
299,040 30 Woods, Good, HSG A237,092 70 Woods, Good, HSG C
536,132 48 Weighted Average536,132 100.00% Pervious Area
Tc Length Slope Velocity Capacity Description(min) (feet) (ft/ft) (ft/sec) (cfs)
13.4 50 0.0150 0.06 Sheet Flow, A-BWoods: Light underbrush n= 0.400 P2= 3.40"
4.5 758 0.0310 2.83 Shallow Concentrated Flow, B-CUnpaved Kv= 16.1 fps
17.9 808 Total
Subcatchment E2: Central Property
Runoff
Hydrograph
Time (hours)727068666462605856545250484644424038363432302826242220181614121086420
Flo
w
(cfs
)
6
5
4
3
2
1
0
Type III 24-hr
25-yr Rainfall=5.60"
Runoff Area=536,132 sf
Runoff Volume=0.847 af
Runoff Depth=0.83"
Flow Length=808'
Tc=17.9 min
CN=48
5.65 cfs

Type III 24-hr 25-yr Rainfall=5.60"215-181 PRE-DEVPrepared by McKenzie Engineering Group, Inc.
Page 20HydroCAD® 10.00-21 s/n 00452 © 2018 HydroCAD Software Solutions LLC
Summary for Subcatchment E3: SE Property
Runoff = 0.45 cfs @ 12.40 hrs, Volume= 0.084 af, Depth= 0.54"
Runoff by SCS TR-20 method, UH=SCS, Weighted-CN, Time Span= 0.00-72.00 hrs, dt= 0.05 hrsType III 24-hr 25-yr Rainfall=5.60"
Area (sf) CN Description
48,838 30 Woods, Good, HSG A20,856 70 Woods, Good, HSG C11,750 49 50-75% Grass cover, Fair, HSG A
770 98 Paved parking, HSG A
82,214 43 Weighted Average81,444 99.06% Pervious Area
770 0.94% Impervious Area
Tc Length Slope Velocity Capacity Description(min) (feet) (ft/ft) (ft/sec) (cfs)
11.5 50 0.0220 0.07 Sheet Flow, A-BWoods: Light underbrush n= 0.400 P2= 3.40"
1.8 240 0.0200 2.28 Shallow Concentrated Flow, B-CUnpaved Kv= 16.1 fps
13.3 290 Total
Subcatchment E3: SE Property
Runoff
Hydrograph
Time (hours)727068666462605856545250484644424038363432302826242220181614121086420
Flo
w
(cfs
)
0.5
0.48
0.46
0.44
0.42
0.4
0.38
0.36
0.34
0.32
0.3
0.28
0.26
0.24
0.22
0.2
0.18
0.16
0.14
0.12
0.1
0.08
0.06
0.04
0.02
0
Type III 24-hr
25-yr Rainfall=5.60"
Runoff Area=82,214 sf
Runoff Volume=0.084 af
Runoff Depth=0.54"
Flow Length=290'
Tc=13.3 min
CN=43
0.45 cfs

Type III 24-hr 25-yr Rainfall=5.60"215-181 PRE-DEVPrepared by McKenzie Engineering Group, Inc.
Page 21HydroCAD® 10.00-21 s/n 00452 © 2018 HydroCAD Software Solutions LLC
Summary for Reach DP-1: Wetland
[40] Hint: Not Described (Outflow=Inflow)
Inflow Area = 16.670 ac, 0.00% Impervious, Inflow Depth = 0.67" for 25-yr eventInflow = 5.67 cfs @ 12.36 hrs, Volume= 0.924 afOutflow = 5.67 cfs @ 12.36 hrs, Volume= 0.924 af, Atten= 0%, Lag= 0.0 min
Routing by Stor-Ind+Trans method, Time Span= 0.00-72.00 hrs, dt= 0.05 hrs
Reach DP-1: Wetland
InflowOutflow
Hydrograph
Time (hours)727068666462605856545250484644424038363432302826242220181614121086420
Flo
w
(cfs
)
6
5
4
3
2
1
0
Inflow Area=16.670 ac5.67 cfs
5.67 cfs

Type III 24-hr 25-yr Rainfall=5.60"215-181 PRE-DEVPrepared by McKenzie Engineering Group, Inc.
Page 22HydroCAD® 10.00-21 s/n 00452 © 2018 HydroCAD Software Solutions LLC
Summary for Reach DP-2: Water St
[40] Hint: Not Described (Outflow=Inflow)
Inflow Area = 1.887 ac, 0.94% Impervious, Inflow Depth = 0.54" for 25-yr eventInflow = 0.45 cfs @ 12.40 hrs, Volume= 0.084 afOutflow = 0.45 cfs @ 12.40 hrs, Volume= 0.084 af, Atten= 0%, Lag= 0.0 min
Routing by Stor-Ind+Trans method, Time Span= 0.00-72.00 hrs, dt= 0.05 hrs
Reach DP-2: Water St
InflowOutflow
Hydrograph
Time (hours)727068666462605856545250484644424038363432302826242220181614121086420
Flo
w
(cfs
)
0.5
0.48
0.46
0.44
0.42
0.4
0.38
0.36
0.34
0.32
0.3
0.28
0.26
0.24
0.22
0.2
0.18
0.16
0.14
0.12
0.1
0.08
0.06
0.04
0.02
0
Inflow Area=1.887 ac0.45 cfs
0.45 cfs

Type III 24-hr 100-yr Rainfall=7.00"215-181 PRE-DEVPrepared by McKenzie Engineering Group, Inc.
Page 23HydroCAD® 10.00-21 s/n 00452 © 2018 HydroCAD Software Solutions LLC
Time span=0.00-72.00 hrs, dt=0.05 hrs, 1441 pointsRunoff by SCS TR-20 method, UH=SCS, Weighted-CN
Reach routing by Stor-Ind+Trans method - Pond routing by Stor-Ind method
Runoff Area=190,029 sf 0.00% Impervious Runoff Depth=0.56"Subcatchment E1: SW Property Flow Length=406' Tc=12.0 min CN=36 Runoff=0.96 cfs 0.203 af
Runoff Area=536,132 sf 0.00% Impervious Runoff Depth=1.49"Subcatchment E2: Central Property Flow Length=808' Tc=17.9 min CN=48 Runoff=12.46 cfs 1.529 af
Runoff Area=82,214 sf 0.94% Impervious Runoff Depth=1.07"Subcatchment E3: SE Property Flow Length=290' Tc=13.3 min CN=43 Runoff=1.27 cfs 0.169 af
Inflow=13.28 cfs 1.733 afReach DP-1: Wetland Outflow=13.28 cfs 1.733 af
Inflow=1.27 cfs 0.169 afReach DP-2: Water St Outflow=1.27 cfs 0.169 af
Total Runoff Area = 18.558 ac Runoff Volume = 1.902 af Average Runoff Depth = 1.23"99.90% Pervious = 18.540 ac 0.10% Impervious = 0.018 ac

Type III 24-hr 100-yr Rainfall=7.00"215-181 PRE-DEVPrepared by McKenzie Engineering Group, Inc.
Page 24HydroCAD® 10.00-21 s/n 00452 © 2018 HydroCAD Software Solutions LLC
Summary for Subcatchment E1: SW Property
Runoff = 0.96 cfs @ 12.42 hrs, Volume= 0.203 af, Depth= 0.56"
Runoff by SCS TR-20 method, UH=SCS, Weighted-CN, Time Span= 0.00-72.00 hrs, dt= 0.05 hrsType III 24-hr 100-yr Rainfall=7.00"
Area (sf) CN Description
190,029 36 Woods, Fair, HSG A
190,029 100.00% Pervious Area
Tc Length Slope Velocity Capacity Description(min) (feet) (ft/ft) (ft/sec) (cfs)
10.2 50 0.0300 0.08 Sheet Flow, START off propertyWoods: Light underbrush n= 0.400 P2= 3.40"
1.8 356 0.0400 3.22 Shallow Concentrated Flow, To WetlandUnpaved Kv= 16.1 fps
12.0 406 Total
Subcatchment E1: SW Property
Runoff
Hydrograph
Time (hours)727068666462605856545250484644424038363432302826242220181614121086420
Flo
w
(cfs
)
1
0
Type III 24-hr
100-yr Rainfall=7.00"
Runoff Area=190,029 sf
Runoff Volume=0.203 af
Runoff Depth=0.56"
Flow Length=406'
Tc=12.0 min
CN=36
0.96 cfs

Type III 24-hr 100-yr Rainfall=7.00"215-181 PRE-DEVPrepared by McKenzie Engineering Group, Inc.
Page 25HydroCAD® 10.00-21 s/n 00452 © 2018 HydroCAD Software Solutions LLC
Summary for Subcatchment E2: Central Property
Runoff = 12.46 cfs @ 12.30 hrs, Volume= 1.529 af, Depth= 1.49"
Runoff by SCS TR-20 method, UH=SCS, Weighted-CN, Time Span= 0.00-72.00 hrs, dt= 0.05 hrsType III 24-hr 100-yr Rainfall=7.00"
Area (sf) CN Description
299,040 30 Woods, Good, HSG A237,092 70 Woods, Good, HSG C
536,132 48 Weighted Average536,132 100.00% Pervious Area
Tc Length Slope Velocity Capacity Description(min) (feet) (ft/ft) (ft/sec) (cfs)
13.4 50 0.0150 0.06 Sheet Flow, A-BWoods: Light underbrush n= 0.400 P2= 3.40"
4.5 758 0.0310 2.83 Shallow Concentrated Flow, B-CUnpaved Kv= 16.1 fps
17.9 808 Total
Subcatchment E2: Central Property
Runoff
Hydrograph
Time (hours)727068666462605856545250484644424038363432302826242220181614121086420
Flo
w
(cfs
)
13
12
11
10
9
8
7
6
5
4
3
2
1
0
Type III 24-hr
100-yr Rainfall=7.00"
Runoff Area=536,132 sf
Runoff Volume=1.529 af
Runoff Depth=1.49"
Flow Length=808'
Tc=17.9 min
CN=48
12.46 cfs

Type III 24-hr 100-yr Rainfall=7.00"215-181 PRE-DEVPrepared by McKenzie Engineering Group, Inc.
Page 26HydroCAD® 10.00-21 s/n 00452 © 2018 HydroCAD Software Solutions LLC
Summary for Subcatchment E3: SE Property
Runoff = 1.27 cfs @ 12.25 hrs, Volume= 0.169 af, Depth= 1.07"
Runoff by SCS TR-20 method, UH=SCS, Weighted-CN, Time Span= 0.00-72.00 hrs, dt= 0.05 hrsType III 24-hr 100-yr Rainfall=7.00"
Area (sf) CN Description
48,838 30 Woods, Good, HSG A20,856 70 Woods, Good, HSG C11,750 49 50-75% Grass cover, Fair, HSG A
770 98 Paved parking, HSG A
82,214 43 Weighted Average81,444 99.06% Pervious Area
770 0.94% Impervious Area
Tc Length Slope Velocity Capacity Description(min) (feet) (ft/ft) (ft/sec) (cfs)
11.5 50 0.0220 0.07 Sheet Flow, A-BWoods: Light underbrush n= 0.400 P2= 3.40"
1.8 240 0.0200 2.28 Shallow Concentrated Flow, B-CUnpaved Kv= 16.1 fps
13.3 290 Total
Subcatchment E3: SE Property
Runoff
Hydrograph
Time (hours)727068666462605856545250484644424038363432302826242220181614121086420
Flo
w
(cfs
)
1
0
Type III 24-hr
100-yr Rainfall=7.00"
Runoff Area=82,214 sf
Runoff Volume=0.169 af
Runoff Depth=1.07"
Flow Length=290'
Tc=13.3 min
CN=43
1.27 cfs

Type III 24-hr 100-yr Rainfall=7.00"215-181 PRE-DEVPrepared by McKenzie Engineering Group, Inc.
Page 27HydroCAD® 10.00-21 s/n 00452 © 2018 HydroCAD Software Solutions LLC
Summary for Reach DP-1: Wetland
[40] Hint: Not Described (Outflow=Inflow)
Inflow Area = 16.670 ac, 0.00% Impervious, Inflow Depth = 1.25" for 100-yr eventInflow = 13.28 cfs @ 12.30 hrs, Volume= 1.733 afOutflow = 13.28 cfs @ 12.30 hrs, Volume= 1.733 af, Atten= 0%, Lag= 0.0 min
Routing by Stor-Ind+Trans method, Time Span= 0.00-72.00 hrs, dt= 0.05 hrs
Reach DP-1: Wetland
InflowOutflow
Hydrograph
Time (hours)727068666462605856545250484644424038363432302826242220181614121086420
Flo
w
(cfs
)
14
13
12
11
10
9
8
7
6
5
4
3
2
1
0
Inflow Area=16.670 ac13.28 cfs
13.28 cfs

Type III 24-hr 100-yr Rainfall=7.00"215-181 PRE-DEVPrepared by McKenzie Engineering Group, Inc.
Page 28HydroCAD® 10.00-21 s/n 00452 © 2018 HydroCAD Software Solutions LLC
Summary for Reach DP-2: Water St
[40] Hint: Not Described (Outflow=Inflow)
Inflow Area = 1.887 ac, 0.94% Impervious, Inflow Depth = 1.07" for 100-yr eventInflow = 1.27 cfs @ 12.25 hrs, Volume= 0.169 afOutflow = 1.27 cfs @ 12.25 hrs, Volume= 0.169 af, Atten= 0%, Lag= 0.0 min
Routing by Stor-Ind+Trans method, Time Span= 0.00-72.00 hrs, dt= 0.05 hrs
Reach DP-2: Water St
InflowOutflow
Hydrograph
Time (hours)727068666462605856545250484644424038363432302826242220181614121086420
Flo
w
(cfs
)
1
0
Inflow Area=1.887 ac1.27 cfs
1.27 cfs

A P P E N D I X B
Post-Development Condition

POST-DEVELOPMENTWATERSHED
PLAN
1 OF 1
DP-X
PE
RM
IT
TIN
G
OW
NE
R/A
PP
LIC
AN
T:
RIV
ER
M
AR
SH
, L
LC
293
R W
AS
HIN
GT
ON
S
TR
EE
T
NO
RW
ELL
, M
A 0
20
61
RIV
ER
MA
RS
H V
ILLA
GE
CO
MP
RE
HE
NS
IVE
PE
RM
IT P
LAN
WA
TE
R S
TR
EE
T
PE
MB
RO
KE
, M
AS
SA
CH
US
ET
TS
(A
SS
ES
SO
R'S
M
AP
E
-1
7, L
OT
0
A
ND
E
-1
7A
, L
OT
2
74
)
Assinippi Office Park
150 Longwater Drive, Suite 101
Norwell, MA 02061
P: 781.792.3900
F: 781.792.0333
www.mckeng.com

P1
SW Property
P2
Central Overland
P2a
Developed Site
P3
SE Property
DP-1
Wetland
DP-2
Water St
1P
Infiltration Pond
Routing Diagram for 215-181 Post-DEVPrepared by McKenzie Engineering Group, Inc.
HydroCAD® 10.00-21 s/n 00452 © 2018 HydroCAD Software Solutions LLC
Subcat Reach Pond Link

215-181 Post-DEVPrepared by McKenzie Engineering Group, Inc.
Page 2HydroCAD® 10.00-21 s/n 00452 © 2018 HydroCAD Software Solutions LLC
Area Listing (all nodes)
Area
(acres)
CN Description
(subcatchment-numbers)
5.874 39 >75% Grass cover, Good, HSG A (P1, P2, P2a, P3)
0.145 76 Gravel roads, HSG A (P1, P2)
2.372 98 Paved parking, HSG A (P2a)
2.354 98 Roofs, HSG A (P2a)
3.468 36 Woods, Fair, HSG A (P1)
4.345 30 Woods, Good, HSG A (P2, P3)
18.558 52 TOTAL AREA

215-181 Post-DEVPrepared by McKenzie Engineering Group, Inc.
Page 3HydroCAD® 10.00-21 s/n 00452 © 2018 HydroCAD Software Solutions LLC
Soil Listing (all nodes)
Area
(acres)
Soil
Group
Subcatchment
Numbers
18.558 HSG A P1, P2, P2a, P3
0.000 HSG B
0.000 HSG C
0.000 HSG D
0.000 Other
18.558 TOTAL AREA

215-181 Post-DEVPrepared by McKenzie Engineering Group, Inc.
Page 4HydroCAD® 10.00-21 s/n 00452 © 2018 HydroCAD Software Solutions LLC
Ground Covers (all nodes)
HSG-A
(acres)
HSG-B
(acres)
HSG-C
(acres)
HSG-D
(acres)
Other
(acres)
Total
(acres)
Ground
Cover
Subcatchment
Numbers
5.874 0.000 0.000 0.000 0.000 5.874 >75% Grass cover, Good P1, P2,
P2a, P3
0.145 0.000 0.000 0.000 0.000 0.145 Gravel roads P1, P2
2.372 0.000 0.000 0.000 0.000 2.372 Paved parking P2a
2.354 0.000 0.000 0.000 0.000 2.354 Roofs P2a
3.468 0.000 0.000 0.000 0.000 3.468 Woods, Fair P1
4.345 0.000 0.000 0.000 0.000 4.345 Woods, Good P2, P3
18.558 0.000 0.000 0.000 0.000 18.558 TOTAL AREA

215-181 Post-DEVPrepared by McKenzie Engineering Group, Inc.
Page 5HydroCAD® 10.00-21 s/n 00452 © 2018 HydroCAD Software Solutions LLC
Pipe Listing (all nodes)
Line# Node
Number
In-Invert
(feet)
Out-Invert
(feet)
Length
(feet)
Slope
(ft/ft)
n Diam/Width
(inches)
Height
(inches)
Inside-Fill
(inches)
1 1P 9.75 9.29 46.0 0.0100 0.013 12.0 0.0 0.0

Type III 24-hr 2-yr Rainfall=3.40"215-181 Post-DEVPrepared by McKenzie Engineering Group, Inc.
Page 6HydroCAD® 10.00-21 s/n 00452 © 2018 HydroCAD Software Solutions LLC
Time span=0.00-72.00 hrs, dt=0.05 hrs, 1441 pointsRunoff by SCS TR-20 method, UH=SCS, Weighted-CN
Reach routing by Stor-Ind+Trans method - Pond routing by Stor-Ind method
Runoff Area=190,029 sf 0.00% Impervious Runoff Depth=0.00"Subcatchment P1: SW Property Flow Length=400' Tc=12.0 min CN=38 Runoff=0.00 cfs 0.000 af
Runoff Area=255,881 sf 0.00% Impervious Runoff Depth=0.00"Subcatchment P2: Central Overland Flow Length=190' Tc=17.0 min CN=33 Runoff=0.00 cfs 0.000 af
Runoff Area=347,600 sf 59.22% Impervious Runoff Depth=1.17"Subcatchment P2a: Developed Site Tc=0.0 min CN=74 Runoff=12.10 cfs 0.779 af
Runoff Area=14,865 sf 0.00% Impervious Runoff Depth=0.00"Subcatchment P3: SE Property Flow Length=290' Tc=13.3 min CN=35 Runoff=0.00 cfs 0.000 af
Inflow=0.00 cfs 0.000 afReach DP-1: Wetland Outflow=0.00 cfs 0.000 af
Inflow=0.00 cfs 0.000 afReach DP-2: Water St Outflow=0.00 cfs 0.000 af
Peak Elev=10.65' Storage=15,616 cf Inflow=12.10 cfs 0.779 afPond 1P: Infiltration Pond Discarded=0.71 cfs 0.779 af Primary=0.00 cfs 0.000 af Outflow=0.71 cfs 0.779 af
Total Runoff Area = 18.558 ac Runoff Volume = 0.779 af Average Runoff Depth = 0.50"74.54% Pervious = 13.832 ac 25.46% Impervious = 4.725 ac

Type III 24-hr 2-yr Rainfall=3.40"215-181 Post-DEVPrepared by McKenzie Engineering Group, Inc.
Page 7HydroCAD® 10.00-21 s/n 00452 © 2018 HydroCAD Software Solutions LLC
Summary for Subcatchment P1: SW Property
Runoff = 0.00 cfs @ 23.99 hrs, Volume= 0.000 af, Depth= 0.00"
Runoff by SCS TR-20 method, UH=SCS, Weighted-CN, Time Span= 0.00-72.00 hrs, dt= 0.05 hrsType III 24-hr 2-yr Rainfall=3.40"
Area (sf) CN Description
151,064 36 Woods, Fair, HSG A33,865 39 >75% Grass cover, Good, HSG A5,100 76 Gravel roads, HSG A
190,029 38 Weighted Average190,029 100.00% Pervious Area
Tc Length Slope Velocity Capacity Description(min) (feet) (ft/ft) (ft/sec) (cfs)
10.2 50 0.0300 0.08 Sheet Flow, START off propertyWoods: Light underbrush n= 0.400 P2= 3.40"
1.8 350 0.0410 3.26 Shallow Concentrated Flow, To WetlandUnpaved Kv= 16.1 fps
12.0 400 Total
Subcatchment P1: SW Property
Runoff
Hydrograph
Time (hours)727068666462605856545250484644424038363432302826242220181614121086420
Flo
w
(cfs
)
0.002
0.002
0.002
0.002
0.002
0.002
0.002
0.002
0.002
0.001
0.001
0.001
0.001
0.001
0.001
0.001
0.001
0.001
0.000
0.000
0.000
0.000
0
0
Type III 24-hr
2-yr Rainfall=3.40"
Runoff Area=190,029 sf
Runoff Volume=0.000 af
Runoff Depth=0.00"
Flow Length=400'
Tc=12.0 min
CN=38
0.00 cfs

Type III 24-hr 2-yr Rainfall=3.40"215-181 Post-DEVPrepared by McKenzie Engineering Group, Inc.
Page 8HydroCAD® 10.00-21 s/n 00452 © 2018 HydroCAD Software Solutions LLC
Summary for Subcatchment P2: Central Overland
[45] Hint: Runoff=Zero
Runoff = 0.00 cfs @ 0.00 hrs, Volume= 0.000 af, Depth= 0.00"
Runoff by SCS TR-20 method, UH=SCS, Weighted-CN, Time Span= 0.00-72.00 hrs, dt= 0.05 hrsType III 24-hr 2-yr Rainfall=3.40"
Area (sf) CN Description
183,339 30 Woods, Good, HSG A71,317 39 >75% Grass cover, Good, HSG A1,225 76 Gravel roads, HSG A
255,881 33 Weighted Average255,881 100.00% Pervious Area
Tc Length Slope Velocity Capacity Description(min) (feet) (ft/ft) (ft/sec) (cfs)
15.8 50 0.0100 0.05 Sheet Flow, A-BWoods: Light underbrush n= 0.400 P2= 3.40"
1.2 140 0.0150 1.97 Shallow Concentrated Flow, B-CUnpaved Kv= 16.1 fps
17.0 190 Total
Subcatchment P2: Central Overland
Runoff
Hydrograph
Time (hours)727068666462605856545250484644424038363432302826242220181614121086420
Flo
w
(cfs
)
1
0
Type III 24-hr
2-yr Rainfall=3.40"
Runoff Area=255,881 sf
Runoff Volume=0.000 af
Runoff Depth=0.00"
Flow Length=190'
Tc=17.0 min
CN=33
0.00 cfs

Type III 24-hr 2-yr Rainfall=3.40"215-181 Post-DEVPrepared by McKenzie Engineering Group, Inc.
Page 9HydroCAD® 10.00-21 s/n 00452 © 2018 HydroCAD Software Solutions LLC
Summary for Subcatchment P2a: Developed Site
[46] Hint: Tc=0 (Instant runoff peak depends on dt)
Runoff = 12.10 cfs @ 12.01 hrs, Volume= 0.779 af, Depth= 1.17"
Runoff by SCS TR-20 method, UH=SCS, Weighted-CN, Time Span= 0.00-72.00 hrs, dt= 0.05 hrsType III 24-hr 2-yr Rainfall=3.40"
Area (sf) CN Description
141,768 39 >75% Grass cover, Good, HSG A103,305 98 Paved parking, HSG A102,527 98 Roofs, HSG A
347,600 74 Weighted Average141,768 40.78% Pervious Area205,832 59.22% Impervious Area
Subcatchment P2a: Developed Site
Runoff
Hydrograph
Time (hours)727068666462605856545250484644424038363432302826242220181614121086420
Flo
w
(cfs
)
13
12
11
10
9
8
7
6
5
4
3
2
1
0
Type III 24-hr
2-yr Rainfall=3.40"
Runoff Area=347,600 sf
Runoff Volume=0.779 af
Runoff Depth=1.17"
Tc=0.0 min
CN=74
12.10 cfs

Type III 24-hr 2-yr Rainfall=3.40"215-181 Post-DEVPrepared by McKenzie Engineering Group, Inc.
Page 10HydroCAD® 10.00-21 s/n 00452 © 2018 HydroCAD Software Solutions LLC
Summary for Subcatchment P3: SE Property
[45] Hint: Runoff=Zero
Runoff = 0.00 cfs @ 0.00 hrs, Volume= 0.000 af, Depth= 0.00"
Runoff by SCS TR-20 method, UH=SCS, Weighted-CN, Time Span= 0.00-72.00 hrs, dt= 0.05 hrsType III 24-hr 2-yr Rainfall=3.40"
Area (sf) CN Description
5,946 30 Woods, Good, HSG A8,919 39 >75% Grass cover, Good, HSG A
14,865 35 Weighted Average14,865 100.00% Pervious Area
Tc Length Slope Velocity Capacity Description(min) (feet) (ft/ft) (ft/sec) (cfs)
11.5 50 0.0220 0.07 Sheet Flow, A-BWoods: Light underbrush n= 0.400 P2= 3.40"
1.8 240 0.0200 2.28 Shallow Concentrated Flow, B-CUnpaved Kv= 16.1 fps
13.3 290 Total
Subcatchment P3: SE Property
Runoff
Hydrograph
Time (hours)727068666462605856545250484644424038363432302826242220181614121086420
Flo
w
(cfs
)
1
0
Type III 24-hr
2-yr Rainfall=3.40"
Runoff Area=14,865 sf
Runoff Volume=0.000 af
Runoff Depth=0.00"
Flow Length=290'
Tc=13.3 min
CN=35
0.00 cfs

Type III 24-hr 2-yr Rainfall=3.40"215-181 Post-DEVPrepared by McKenzie Engineering Group, Inc.
Page 11HydroCAD® 10.00-21 s/n 00452 © 2018 HydroCAD Software Solutions LLC
Summary for Reach DP-1: Wetland
[40] Hint: Not Described (Outflow=Inflow)
Inflow Area = 18.216 ac, 25.94% Impervious, Inflow Depth = 0.00" for 2-yr eventInflow = 0.00 cfs @ 23.99 hrs, Volume= 0.000 afOutflow = 0.00 cfs @ 23.99 hrs, Volume= 0.000 af, Atten= 0%, Lag= 0.0 min
Routing by Stor-Ind+Trans method, Time Span= 0.00-72.00 hrs, dt= 0.05 hrs
Reach DP-1: Wetland
InflowOutflow
Hydrograph
Time (hours)727068666462605856545250484644424038363432302826242220181614121086420
Flo
w
(cfs
)
0.002
0.002
0.002
0.002
0.002
0.002
0.002
0.002
0.002
0.001
0.001
0.001
0.001
0.001
0.001
0.001
0.001
0.001
0.000
0.000
0.000
0.000
0
0
Inflow Area=18.216 ac0.00 cfs
0.00 cfs

Type III 24-hr 2-yr Rainfall=3.40"215-181 Post-DEVPrepared by McKenzie Engineering Group, Inc.
Page 12HydroCAD® 10.00-21 s/n 00452 © 2018 HydroCAD Software Solutions LLC
Summary for Reach DP-2: Water St
[40] Hint: Not Described (Outflow=Inflow)
Inflow Area = 0.341 ac, 0.00% Impervious, Inflow Depth = 0.00" for 2-yr eventInflow = 0.00 cfs @ 0.00 hrs, Volume= 0.000 afOutflow = 0.00 cfs @ 0.00 hrs, Volume= 0.000 af, Atten= 0%, Lag= 0.0 min
Routing by Stor-Ind+Trans method, Time Span= 0.00-72.00 hrs, dt= 0.05 hrs
Reach DP-2: Water St
InflowOutflow
Hydrograph
Time (hours)727068666462605856545250484644424038363432302826242220181614121086420
Flo
w
(cfs
)
1
0
Inflow Area=0.341 ac
0.00 cfs
0.00 cfs

Type III 24-hr 2-yr Rainfall=3.40"215-181 Post-DEVPrepared by McKenzie Engineering Group, Inc.
Page 13HydroCAD® 10.00-21 s/n 00452 © 2018 HydroCAD Software Solutions LLC
Summary for Pond 1P: Infiltration Pond
Inflow Area = 7.980 ac, 59.22% Impervious, Inflow Depth = 1.17" for 2-yr eventInflow = 12.10 cfs @ 12.01 hrs, Volume= 0.779 afOutflow = 0.71 cfs @ 11.85 hrs, Volume= 0.779 af, Atten= 94%, Lag= 0.0 minDiscarded = 0.71 cfs @ 11.85 hrs, Volume= 0.779 afPrimary = 0.00 cfs @ 0.00 hrs, Volume= 0.000 af
Routing by Stor-Ind method, Time Span= 0.00-72.00 hrs, dt= 0.05 hrsPeak Elev= 10.65' @ 14.57 hrs Surf.Area= 14,460 sf Storage= 15,616 cf
Plug-Flow detention time= 233.3 min calculated for 0.778 af (100% of inflow)Center-of-Mass det. time= 233.3 min ( 1,086.0 - 852.8 )
Volume Invert Avail.Storage Storage Description
#1 9.50' 75,823 cf Custom Stage Data (Prismatic) Listed below (Recalc)
Elevation Surf.Area Inc.Store Cum.Store(feet) (sq-ft) (cubic-feet) (cubic-feet)
9.50 12,792 0 010.00 13,508 6,575 6,57511.00 14,981 14,245 20,82012.00 19,481 17,231 38,05113.00 21,280 20,381 58,43113.80 22,200 17,392 75,823
Device Routing Invert Outlet Devices
#1 Primary 10.80' 2.0' long x 2.00' rise Sharp-Crested Rectangular Weir 2 End Contraction(s)
#2 Device 1 9.75' 12.0" Round Culvert L= 46.0' CPP, projecting, no headwall, Ke= 0.900 Inlet / Outlet Invert= 9.75' / 9.29' S= 0.0100 '/' Cc= 0.900 n= 0.013 Corrugated PE, smooth interior, Flow Area= 0.79 sf
#3 Discarded 9.50' Special & User-Defined Head (feet) 0.00 0.10 1.00 1.50 1.69 1.70 4.00 Disch. (cfs) 0.000 0.714 0.714 0.714 0.714 0.000 0.000
Discarded OutFlow Max=0.71 cfs @ 11.85 hrs HW=9.65' (Free Discharge)3=Special & User-Defined (Custom Controls 0.71 cfs)
Primary OutFlow Max=0.00 cfs @ 0.00 hrs HW=9.50' (Free Discharge)1=Sharp-Crested Rectangular Weir ( Controls 0.00 cfs)
2=Culvert ( Controls 0.00 cfs)

Type III 24-hr 2-yr Rainfall=3.40"215-181 Post-DEVPrepared by McKenzie Engineering Group, Inc.
Page 14HydroCAD® 10.00-21 s/n 00452 © 2018 HydroCAD Software Solutions LLC
Pond 1P: Infiltration Pond
InflowOutflowDiscardedPrimary
Hydrograph
Time (hours)727068666462605856545250484644424038363432302826242220181614121086420
Flo
w
(cfs
)
13
12
11
10
9
8
7
6
5
4
3
2
1
0
Inflow Area=7.980 ac
Peak Elev=10.65'
Storage=15,616 cf
12.10 cfs
0.71 cfs
0.71 cfs
0.00 cfs

Type III 24-hr 10-yr Rainfall=4.70"215-181 Post-DEVPrepared by McKenzie Engineering Group, Inc.
Page 15HydroCAD® 10.00-21 s/n 00452 © 2018 HydroCAD Software Solutions LLC
Time span=0.00-72.00 hrs, dt=0.05 hrs, 1441 pointsRunoff by SCS TR-20 method, UH=SCS, Weighted-CN
Reach routing by Stor-Ind+Trans method - Pond routing by Stor-Ind method
Runoff Area=190,029 sf 0.00% Impervious Runoff Depth=0.12"Subcatchment P1: SW Property Flow Length=400' Tc=12.0 min CN=38 Runoff=0.07 cfs 0.042 af
Runoff Area=255,881 sf 0.00% Impervious Runoff Depth=0.02"Subcatchment P2: Central Overland Flow Length=190' Tc=17.0 min CN=33 Runoff=0.02 cfs 0.010 af
Runoff Area=347,600 sf 59.22% Impervious Runoff Depth=2.13"Subcatchment P2a: Developed Site Tc=0.0 min CN=74 Runoff=22.72 cfs 1.415 af
Runoff Area=14,865 sf 0.00% Impervious Runoff Depth=0.05"Subcatchment P3: SE Property Flow Length=290' Tc=13.3 min CN=35 Runoff=0.00 cfs 0.001 af
Inflow=1.62 cfs 0.449 afReach DP-1: Wetland Outflow=1.62 cfs 0.449 af
Inflow=0.00 cfs 0.001 afReach DP-2: Water St Outflow=0.00 cfs 0.001 af
Peak Elev=11.36' Storage=26,505 cf Inflow=22.72 cfs 1.415 afPond 1P: Infiltration Pond Discarded=0.71 cfs 1.018 af Primary=1.52 cfs 0.397 af Outflow=2.23 cfs 1.415 af
Total Runoff Area = 18.558 ac Runoff Volume = 1.468 af Average Runoff Depth = 0.95"74.54% Pervious = 13.832 ac 25.46% Impervious = 4.725 ac

Type III 24-hr 10-yr Rainfall=4.70"215-181 Post-DEVPrepared by McKenzie Engineering Group, Inc.
Page 16HydroCAD® 10.00-21 s/n 00452 © 2018 HydroCAD Software Solutions LLC
Summary for Subcatchment P1: SW Property
Runoff = 0.07 cfs @ 14.79 hrs, Volume= 0.042 af, Depth= 0.12"
Runoff by SCS TR-20 method, UH=SCS, Weighted-CN, Time Span= 0.00-72.00 hrs, dt= 0.05 hrsType III 24-hr 10-yr Rainfall=4.70"
Area (sf) CN Description
151,064 36 Woods, Fair, HSG A33,865 39 >75% Grass cover, Good, HSG A5,100 76 Gravel roads, HSG A
190,029 38 Weighted Average190,029 100.00% Pervious Area
Tc Length Slope Velocity Capacity Description(min) (feet) (ft/ft) (ft/sec) (cfs)
10.2 50 0.0300 0.08 Sheet Flow, START off propertyWoods: Light underbrush n= 0.400 P2= 3.40"
1.8 350 0.0410 3.26 Shallow Concentrated Flow, To WetlandUnpaved Kv= 16.1 fps
12.0 400 Total
Subcatchment P1: SW Property
Runoff
Hydrograph
Time (hours)727068666462605856545250484644424038363432302826242220181614121086420
Flo
w
(cfs
)
0.075
0.07
0.065
0.06
0.055
0.05
0.045
0.04
0.035
0.03
0.025
0.02
0.015
0.01
0.005
0
Type III 24-hr
10-yr Rainfall=4.70"
Runoff Area=190,029 sf
Runoff Volume=0.042 af
Runoff Depth=0.12"
Flow Length=400'
Tc=12.0 min
CN=38
0.07 cfs

Type III 24-hr 10-yr Rainfall=4.70"215-181 Post-DEVPrepared by McKenzie Engineering Group, Inc.
Page 17HydroCAD® 10.00-21 s/n 00452 © 2018 HydroCAD Software Solutions LLC
Summary for Subcatchment P2: Central Overland
Runoff = 0.02 cfs @ 21.65 hrs, Volume= 0.010 af, Depth= 0.02"
Runoff by SCS TR-20 method, UH=SCS, Weighted-CN, Time Span= 0.00-72.00 hrs, dt= 0.05 hrsType III 24-hr 10-yr Rainfall=4.70"
Area (sf) CN Description
183,339 30 Woods, Good, HSG A71,317 39 >75% Grass cover, Good, HSG A1,225 76 Gravel roads, HSG A
255,881 33 Weighted Average255,881 100.00% Pervious Area
Tc Length Slope Velocity Capacity Description(min) (feet) (ft/ft) (ft/sec) (cfs)
15.8 50 0.0100 0.05 Sheet Flow, A-BWoods: Light underbrush n= 0.400 P2= 3.40"
1.2 140 0.0150 1.97 Shallow Concentrated Flow, B-CUnpaved Kv= 16.1 fps
17.0 190 Total
Subcatchment P2: Central Overland
Runoff
Hydrograph
Time (hours)727068666462605856545250484644424038363432302826242220181614121086420
Flo
w
(cfs
)
0.017
0.016
0.015
0.014
0.013
0.012
0.011
0.01
0.009
0.008
0.007
0.006
0.005
0.004
0.003
0.002
0.001
0
Type III 24-hr
10-yr Rainfall=4.70"
Runoff Area=255,881 sf
Runoff Volume=0.010 af
Runoff Depth=0.02"
Flow Length=190'
Tc=17.0 min
CN=33
0.02 cfs

Type III 24-hr 10-yr Rainfall=4.70"215-181 Post-DEVPrepared by McKenzie Engineering Group, Inc.
Page 18HydroCAD® 10.00-21 s/n 00452 © 2018 HydroCAD Software Solutions LLC
Summary for Subcatchment P2a: Developed Site
[46] Hint: Tc=0 (Instant runoff peak depends on dt)
Runoff = 22.72 cfs @ 12.01 hrs, Volume= 1.415 af, Depth= 2.13"
Runoff by SCS TR-20 method, UH=SCS, Weighted-CN, Time Span= 0.00-72.00 hrs, dt= 0.05 hrsType III 24-hr 10-yr Rainfall=4.70"
Area (sf) CN Description
141,768 39 >75% Grass cover, Good, HSG A103,305 98 Paved parking, HSG A102,527 98 Roofs, HSG A
347,600 74 Weighted Average141,768 40.78% Pervious Area205,832 59.22% Impervious Area
Subcatchment P2a: Developed Site
Runoff
Hydrograph
Time (hours)727068666462605856545250484644424038363432302826242220181614121086420
Flo
w
(cfs
)
25
24
23
22
21
20
19
18
17
16
15
14
13
12
11
10
9
8
7
6
5
4
3
2
1
0
Type III 24-hr
10-yr Rainfall=4.70"
Runoff Area=347,600 sf
Runoff Volume=1.415 af
Runoff Depth=2.13"
Tc=0.0 min
CN=74
22.72 cfs

Type III 24-hr 10-yr Rainfall=4.70"215-181 Post-DEVPrepared by McKenzie Engineering Group, Inc.
Page 19HydroCAD® 10.00-21 s/n 00452 © 2018 HydroCAD Software Solutions LLC
Summary for Subcatchment P3: SE Property
Runoff = 0.00 cfs @ 15.75 hrs, Volume= 0.001 af, Depth= 0.05"
Runoff by SCS TR-20 method, UH=SCS, Weighted-CN, Time Span= 0.00-72.00 hrs, dt= 0.05 hrsType III 24-hr 10-yr Rainfall=4.70"
Area (sf) CN Description
5,946 30 Woods, Good, HSG A8,919 39 >75% Grass cover, Good, HSG A
14,865 35 Weighted Average14,865 100.00% Pervious Area
Tc Length Slope Velocity Capacity Description(min) (feet) (ft/ft) (ft/sec) (cfs)
11.5 50 0.0220 0.07 Sheet Flow, A-BWoods: Light underbrush n= 0.400 P2= 3.40"
1.8 240 0.0200 2.28 Shallow Concentrated Flow, B-CUnpaved Kv= 16.1 fps
13.3 290 Total
Subcatchment P3: SE Property
Runoff
Hydrograph
Time (hours)727068666462605856545250484644424038363432302826242220181614121086420
Flo
w
(cfs
)
0.002
0.002
0.002
0.002
0.002
0.002
0.002
0.002
0.001
0.001
0.001
0.001
0.001
0.001
0.001
0.001
0.001
0.000
0.000
0.000
0.000
0
0
Type III 24-hr
10-yr Rainfall=4.70"
Runoff Area=14,865 sf
Runoff Volume=0.001 af
Runoff Depth=0.05"
Flow Length=290'
Tc=13.3 min
CN=35
0.00 cfs

Type III 24-hr 10-yr Rainfall=4.70"215-181 Post-DEVPrepared by McKenzie Engineering Group, Inc.
Page 20HydroCAD® 10.00-21 s/n 00452 © 2018 HydroCAD Software Solutions LLC
Summary for Reach DP-1: Wetland
[40] Hint: Not Described (Outflow=Inflow)
Inflow Area = 18.216 ac, 25.94% Impervious, Inflow Depth = 0.30" for 10-yr eventInflow = 1.62 cfs @ 14.57 hrs, Volume= 0.449 afOutflow = 1.62 cfs @ 14.57 hrs, Volume= 0.449 af, Atten= 0%, Lag= 0.0 min
Routing by Stor-Ind+Trans method, Time Span= 0.00-72.00 hrs, dt= 0.05 hrs
Reach DP-1: Wetland
InflowOutflow
Hydrograph
Time (hours)727068666462605856545250484644424038363432302826242220181614121086420
Flo
w
(cfs
)
1
0
Inflow Area=18.216 ac1.62 cfs
1.62 cfs

Type III 24-hr 10-yr Rainfall=4.70"215-181 Post-DEVPrepared by McKenzie Engineering Group, Inc.
Page 21HydroCAD® 10.00-21 s/n 00452 © 2018 HydroCAD Software Solutions LLC
Summary for Reach DP-2: Water St
[40] Hint: Not Described (Outflow=Inflow)
Inflow Area = 0.341 ac, 0.00% Impervious, Inflow Depth = 0.05" for 10-yr eventInflow = 0.00 cfs @ 15.75 hrs, Volume= 0.001 afOutflow = 0.00 cfs @ 15.75 hrs, Volume= 0.001 af, Atten= 0%, Lag= 0.0 min
Routing by Stor-Ind+Trans method, Time Span= 0.00-72.00 hrs, dt= 0.05 hrs
Reach DP-2: Water St
InflowOutflow
Hydrograph
Time (hours)727068666462605856545250484644424038363432302826242220181614121086420
Flo
w
(cfs
)
0.002
0.002
0.002
0.002
0.002
0.002
0.002
0.002
0.001
0.001
0.001
0.001
0.001
0.001
0.001
0.001
0.001
0.000
0.000
0.000
0.000
0
0
Inflow Area=0.341 ac0.00 cfs
0.00 cfs

Type III 24-hr 10-yr Rainfall=4.70"215-181 Post-DEVPrepared by McKenzie Engineering Group, Inc.
Page 22HydroCAD® 10.00-21 s/n 00452 © 2018 HydroCAD Software Solutions LLC
Summary for Pond 1P: Infiltration Pond
Inflow Area = 7.980 ac, 59.22% Impervious, Inflow Depth = 2.13" for 10-yr eventInflow = 22.72 cfs @ 12.01 hrs, Volume= 1.415 afOutflow = 2.23 cfs @ 12.86 hrs, Volume= 1.415 af, Atten= 90%, Lag= 51.2 minDiscarded = 0.71 cfs @ 11.60 hrs, Volume= 1.018 afPrimary = 1.52 cfs @ 12.86 hrs, Volume= 0.397 af
Routing by Stor-Ind method, Time Span= 0.00-72.00 hrs, dt= 0.05 hrsPeak Elev= 11.36' @ 12.86 hrs Surf.Area= 16,601 sf Storage= 26,505 cf
Plug-Flow detention time= 238.0 min calculated for 1.414 af (100% of inflow)Center-of-Mass det. time= 238.1 min ( 1,073.0 - 835.0 )
Volume Invert Avail.Storage Storage Description
#1 9.50' 75,823 cf Custom Stage Data (Prismatic) Listed below (Recalc)
Elevation Surf.Area Inc.Store Cum.Store(feet) (sq-ft) (cubic-feet) (cubic-feet)
9.50 12,792 0 010.00 13,508 6,575 6,57511.00 14,981 14,245 20,82012.00 19,481 17,231 38,05113.00 21,280 20,381 58,43113.80 22,200 17,392 75,823
Device Routing Invert Outlet Devices
#1 Primary 10.80' 2.0' long x 2.00' rise Sharp-Crested Rectangular Weir 2 End Contraction(s)
#2 Device 1 9.75' 12.0" Round Culvert L= 46.0' CPP, projecting, no headwall, Ke= 0.900 Inlet / Outlet Invert= 9.75' / 9.29' S= 0.0100 '/' Cc= 0.900 n= 0.013 Corrugated PE, smooth interior, Flow Area= 0.79 sf
#3 Discarded 9.50' Special & User-Defined Head (feet) 0.00 0.10 1.00 1.50 1.69 1.70 4.00 Disch. (cfs) 0.000 0.714 0.714 0.714 0.714 0.000 0.000
Discarded OutFlow Max=0.71 cfs @ 11.60 hrs HW=9.65' (Free Discharge)3=Special & User-Defined (Custom Controls 0.71 cfs)
Primary OutFlow Max=2.23 cfs @ 12.86 hrs HW=11.36' (Free Discharge)1=Sharp-Crested Rectangular Weir (Passes 2.23 cfs of 2.59 cfs potential flow)
2=Culvert (Inlet Controls 2.23 cfs @ 2.84 fps)

Type III 24-hr 10-yr Rainfall=4.70"215-181 Post-DEVPrepared by McKenzie Engineering Group, Inc.
Page 23HydroCAD® 10.00-21 s/n 00452 © 2018 HydroCAD Software Solutions LLC
Pond 1P: Infiltration Pond
InflowOutflowDiscardedPrimary
Hydrograph
Time (hours)727068666462605856545250484644424038363432302826242220181614121086420
Flo
w
(cfs
)
24
22
20
18
16
14
12
10
8
6
4
2
0
Inflow Area=7.980 ac
Peak Elev=11.36'
Storage=26,505 cf
22.72 cfs
2.23 cfs
0.71 cfs1.52 cfs

Type III 24-hr 25-yr Rainfall=5.60"215-181 Post-DEVPrepared by McKenzie Engineering Group, Inc.
Page 24HydroCAD® 10.00-21 s/n 00452 © 2018 HydroCAD Software Solutions LLC
Time span=0.00-72.00 hrs, dt=0.05 hrs, 1441 pointsRunoff by SCS TR-20 method, UH=SCS, Weighted-CN
Reach routing by Stor-Ind+Trans method - Pond routing by Stor-Ind method
Runoff Area=190,029 sf 0.00% Impervious Runoff Depth=0.29"Subcatchment P1: SW Property Flow Length=400' Tc=12.0 min CN=38 Runoff=0.33 cfs 0.106 af
Runoff Area=255,881 sf 0.00% Impervious Runoff Depth=0.11"Subcatchment P2: Central Overland Flow Length=190' Tc=17.0 min CN=33 Runoff=0.08 cfs 0.053 af
Runoff Area=347,600 sf 59.22% Impervious Runoff Depth=2.85"Subcatchment P2a: Developed Site Tc=0.0 min CN=74 Runoff=30.64 cfs 1.896 af
Runoff Area=14,865 sf 0.00% Impervious Runoff Depth=0.17"Subcatchment P3: SE Property Flow Length=290' Tc=13.3 min CN=35 Runoff=0.01 cfs 0.005 af
Inflow=3.42 cfs 1.135 afReach DP-1: Wetland Outflow=3.42 cfs 1.135 af
Inflow=0.01 cfs 0.005 afReach DP-2: Water St Outflow=0.01 cfs 0.005 af
Peak Elev=11.89' Storage=35,905 cf Inflow=30.64 cfs 1.896 afPond 1P: Infiltration Pond Discarded=0.71 cfs 0.921 af Primary=3.11 cfs 0.976 af Outflow=3.11 cfs 1.896 af
Total Runoff Area = 18.558 ac Runoff Volume = 2.061 af Average Runoff Depth = 1.33"74.54% Pervious = 13.832 ac 25.46% Impervious = 4.725 ac

Type III 24-hr 25-yr Rainfall=5.60"215-181 Post-DEVPrepared by McKenzie Engineering Group, Inc.
Page 25HydroCAD® 10.00-21 s/n 00452 © 2018 HydroCAD Software Solutions LLC
Summary for Subcatchment P1: SW Property
Runoff = 0.33 cfs @ 12.51 hrs, Volume= 0.106 af, Depth= 0.29"
Runoff by SCS TR-20 method, UH=SCS, Weighted-CN, Time Span= 0.00-72.00 hrs, dt= 0.05 hrsType III 24-hr 25-yr Rainfall=5.60"
Area (sf) CN Description
151,064 36 Woods, Fair, HSG A33,865 39 >75% Grass cover, Good, HSG A5,100 76 Gravel roads, HSG A
190,029 38 Weighted Average190,029 100.00% Pervious Area
Tc Length Slope Velocity Capacity Description(min) (feet) (ft/ft) (ft/sec) (cfs)
10.2 50 0.0300 0.08 Sheet Flow, START off propertyWoods: Light underbrush n= 0.400 P2= 3.40"
1.8 350 0.0410 3.26 Shallow Concentrated Flow, To WetlandUnpaved Kv= 16.1 fps
12.0 400 Total
Subcatchment P1: SW Property
Runoff
Hydrograph
Time (hours)727068666462605856545250484644424038363432302826242220181614121086420
Flo
w
(cfs
)
0.36
0.34
0.32
0.3
0.28
0.26
0.24
0.22
0.2
0.18
0.16
0.14
0.12
0.1
0.08
0.06
0.04
0.02
0
Type III 24-hr
25-yr Rainfall=5.60"
Runoff Area=190,029 sf
Runoff Volume=0.106 af
Runoff Depth=0.29"
Flow Length=400'
Tc=12.0 min
CN=38
0.33 cfs

Type III 24-hr 25-yr Rainfall=5.60"215-181 Post-DEVPrepared by McKenzie Engineering Group, Inc.
Page 26HydroCAD® 10.00-21 s/n 00452 © 2018 HydroCAD Software Solutions LLC
Summary for Subcatchment P2: Central Overland
Runoff = 0.08 cfs @ 15.15 hrs, Volume= 0.053 af, Depth= 0.11"
Runoff by SCS TR-20 method, UH=SCS, Weighted-CN, Time Span= 0.00-72.00 hrs, dt= 0.05 hrsType III 24-hr 25-yr Rainfall=5.60"
Area (sf) CN Description
183,339 30 Woods, Good, HSG A71,317 39 >75% Grass cover, Good, HSG A1,225 76 Gravel roads, HSG A
255,881 33 Weighted Average255,881 100.00% Pervious Area
Tc Length Slope Velocity Capacity Description(min) (feet) (ft/ft) (ft/sec) (cfs)
15.8 50 0.0100 0.05 Sheet Flow, A-BWoods: Light underbrush n= 0.400 P2= 3.40"
1.2 140 0.0150 1.97 Shallow Concentrated Flow, B-CUnpaved Kv= 16.1 fps
17.0 190 Total
Subcatchment P2: Central Overland
Runoff
Hydrograph
Time (hours)727068666462605856545250484644424038363432302826242220181614121086420
Flo
w
(cfs
)
0.09
0.085
0.08
0.075
0.07
0.065
0.06
0.055
0.05
0.045
0.04
0.035
0.03
0.025
0.02
0.015
0.01
0.005
0
Type III 24-hr
25-yr Rainfall=5.60"
Runoff Area=255,881 sf
Runoff Volume=0.053 af
Runoff Depth=0.11"
Flow Length=190'
Tc=17.0 min
CN=33
0.08 cfs

Type III 24-hr 25-yr Rainfall=5.60"215-181 Post-DEVPrepared by McKenzie Engineering Group, Inc.
Page 27HydroCAD® 10.00-21 s/n 00452 © 2018 HydroCAD Software Solutions LLC
Summary for Subcatchment P2a: Developed Site
[46] Hint: Tc=0 (Instant runoff peak depends on dt)
Runoff = 30.64 cfs @ 12.00 hrs, Volume= 1.896 af, Depth= 2.85"
Runoff by SCS TR-20 method, UH=SCS, Weighted-CN, Time Span= 0.00-72.00 hrs, dt= 0.05 hrsType III 24-hr 25-yr Rainfall=5.60"
Area (sf) CN Description
141,768 39 >75% Grass cover, Good, HSG A103,305 98 Paved parking, HSG A102,527 98 Roofs, HSG A
347,600 74 Weighted Average141,768 40.78% Pervious Area205,832 59.22% Impervious Area
Subcatchment P2a: Developed Site
Runoff
Hydrograph
Time (hours)727068666462605856545250484644424038363432302826242220181614121086420
Flo
w
(cfs
)
34
32
30
28
26
24
22
20
18
16
14
12
10
8
6
4
2
0
Type III 24-hr
25-yr Rainfall=5.60"
Runoff Area=347,600 sf
Runoff Volume=1.896 af
Runoff Depth=2.85"
Tc=0.0 min
CN=74
30.64 cfs

Type III 24-hr 25-yr Rainfall=5.60"215-181 Post-DEVPrepared by McKenzie Engineering Group, Inc.
Page 28HydroCAD® 10.00-21 s/n 00452 © 2018 HydroCAD Software Solutions LLC
Summary for Subcatchment P3: SE Property
Runoff = 0.01 cfs @ 13.86 hrs, Volume= 0.005 af, Depth= 0.17"
Runoff by SCS TR-20 method, UH=SCS, Weighted-CN, Time Span= 0.00-72.00 hrs, dt= 0.05 hrsType III 24-hr 25-yr Rainfall=5.60"
Area (sf) CN Description
5,946 30 Woods, Good, HSG A8,919 39 >75% Grass cover, Good, HSG A
14,865 35 Weighted Average14,865 100.00% Pervious Area
Tc Length Slope Velocity Capacity Description(min) (feet) (ft/ft) (ft/sec) (cfs)
11.5 50 0.0220 0.07 Sheet Flow, A-BWoods: Light underbrush n= 0.400 P2= 3.40"
1.8 240 0.0200 2.28 Shallow Concentrated Flow, B-CUnpaved Kv= 16.1 fps
13.3 290 Total
Subcatchment P3: SE Property
Runoff
Hydrograph
Time (hours)727068666462605856545250484644424038363432302826242220181614121086420
Flo
w
(cfs
)
0.009
0.009
0.008
0.007
0.007
0.006
0.006
0.005
0.005
0.004
0.004
0.003
0.003
0.002
0.002
0.001
0.001
0.000
0
Type III 24-hr
25-yr Rainfall=5.60"
Runoff Area=14,865 sf
Runoff Volume=0.005 af
Runoff Depth=0.17"
Flow Length=290'
Tc=13.3 min
CN=35
0.01 cfs
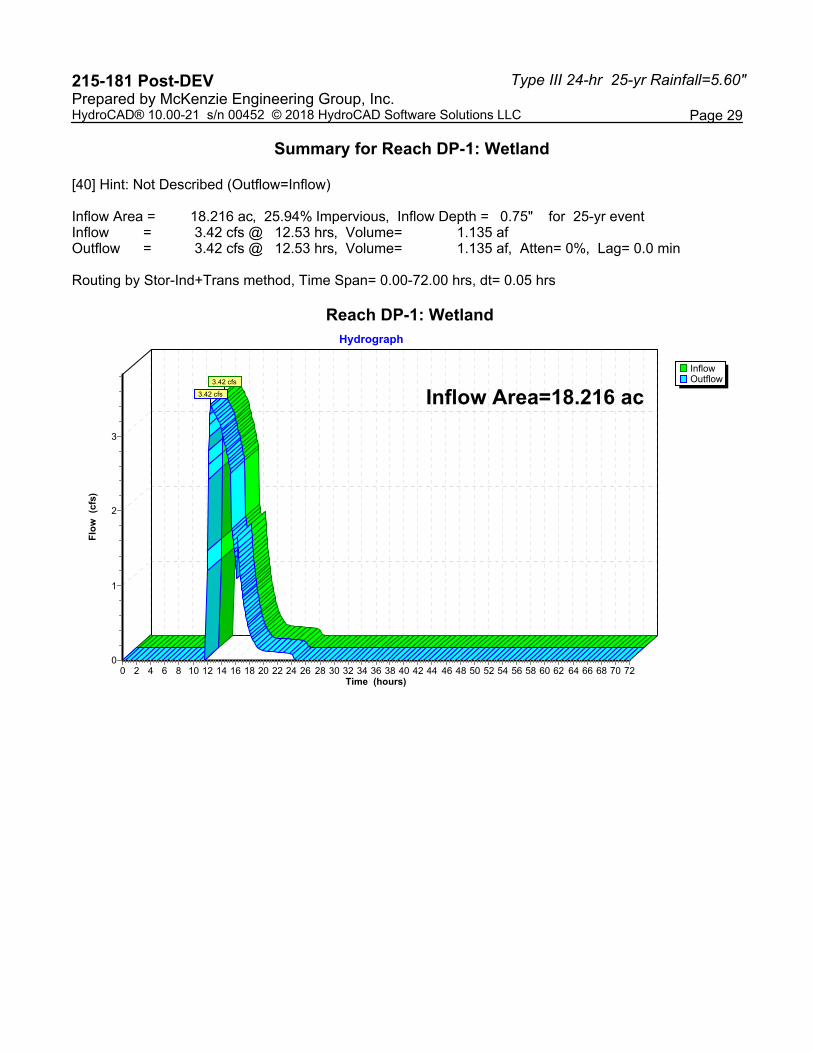
Type III 24-hr 25-yr Rainfall=5.60"215-181 Post-DEVPrepared by McKenzie Engineering Group, Inc.
Page 29HydroCAD® 10.00-21 s/n 00452 © 2018 HydroCAD Software Solutions LLC
Summary for Reach DP-1: Wetland
[40] Hint: Not Described (Outflow=Inflow)
Inflow Area = 18.216 ac, 25.94% Impervious, Inflow Depth = 0.75" for 25-yr eventInflow = 3.42 cfs @ 12.53 hrs, Volume= 1.135 afOutflow = 3.42 cfs @ 12.53 hrs, Volume= 1.135 af, Atten= 0%, Lag= 0.0 min
Routing by Stor-Ind+Trans method, Time Span= 0.00-72.00 hrs, dt= 0.05 hrs
Reach DP-1: Wetland
InflowOutflow
Hydrograph
Time (hours)727068666462605856545250484644424038363432302826242220181614121086420
Flo
w
(cfs
)
3
2
1
0
Inflow Area=18.216 ac3.42 cfs
3.42 cfs

Type III 24-hr 25-yr Rainfall=5.60"215-181 Post-DEVPrepared by McKenzie Engineering Group, Inc.
Page 30HydroCAD® 10.00-21 s/n 00452 © 2018 HydroCAD Software Solutions LLC
Summary for Reach DP-2: Water St
[40] Hint: Not Described (Outflow=Inflow)
Inflow Area = 0.341 ac, 0.00% Impervious, Inflow Depth = 0.17" for 25-yr eventInflow = 0.01 cfs @ 13.86 hrs, Volume= 0.005 afOutflow = 0.01 cfs @ 13.86 hrs, Volume= 0.005 af, Atten= 0%, Lag= 0.0 min
Routing by Stor-Ind+Trans method, Time Span= 0.00-72.00 hrs, dt= 0.05 hrs
Reach DP-2: Water St
InflowOutflow
Hydrograph
Time (hours)727068666462605856545250484644424038363432302826242220181614121086420
Flo
w
(cfs
)
0.009
0.009
0.008
0.007
0.007
0.006
0.006
0.005
0.005
0.004
0.004
0.003
0.003
0.002
0.002
0.001
0.001
0.000
0
Inflow Area=0.341 ac0.01 cfs
0.01 cfs

Type III 24-hr 25-yr Rainfall=5.60"215-181 Post-DEVPrepared by McKenzie Engineering Group, Inc.
Page 31HydroCAD® 10.00-21 s/n 00452 © 2018 HydroCAD Software Solutions LLC
Summary for Pond 1P: Infiltration Pond
Inflow Area = 7.980 ac, 59.22% Impervious, Inflow Depth = 2.85" for 25-yr eventInflow = 30.64 cfs @ 12.00 hrs, Volume= 1.896 afOutflow = 3.11 cfs @ 12.78 hrs, Volume= 1.896 af, Atten= 90%, Lag= 46.5 minDiscarded = 0.71 cfs @ 11.25 hrs, Volume= 0.921 afPrimary = 3.11 cfs @ 12.78 hrs, Volume= 0.976 af
Routing by Stor-Ind method, Time Span= 0.00-72.00 hrs, dt= 0.05 hrsPeak Elev= 11.89' @ 12.78 hrs Surf.Area= 18,979 sf Storage= 35,905 cf
Plug-Flow detention time= 221.7 min calculated for 1.895 af (100% of inflow)Center-of-Mass det. time= 221.8 min ( 1,048.3 - 826.4 )
Volume Invert Avail.Storage Storage Description
#1 9.50' 75,823 cf Custom Stage Data (Prismatic) Listed below (Recalc)
Elevation Surf.Area Inc.Store Cum.Store(feet) (sq-ft) (cubic-feet) (cubic-feet)
9.50 12,792 0 010.00 13,508 6,575 6,57511.00 14,981 14,245 20,82012.00 19,481 17,231 38,05113.00 21,280 20,381 58,43113.80 22,200 17,392 75,823
Device Routing Invert Outlet Devices
#1 Primary 10.80' 2.0' long x 2.00' rise Sharp-Crested Rectangular Weir 2 End Contraction(s)
#2 Device 1 9.75' 12.0" Round Culvert L= 46.0' CPP, projecting, no headwall, Ke= 0.900 Inlet / Outlet Invert= 9.75' / 9.29' S= 0.0100 '/' Cc= 0.900 n= 0.013 Corrugated PE, smooth interior, Flow Area= 0.79 sf
#3 Discarded 9.50' Special & User-Defined Head (feet) 0.00 0.10 1.00 1.50 1.69 1.70 4.00 Disch. (cfs) 0.000 0.714 0.714 0.714 0.714 0.000 0.000
Discarded OutFlow Max=0.71 cfs @ 11.25 hrs HW=9.63' (Free Discharge)3=Special & User-Defined (Custom Controls 0.71 cfs)
Primary OutFlow Max=3.11 cfs @ 12.78 hrs HW=11.89' (Free Discharge)1=Sharp-Crested Rectangular Weir (Passes 3.11 cfs of 6.62 cfs potential flow)
2=Culvert (Inlet Controls 3.11 cfs @ 3.97 fps)

Type III 24-hr 25-yr Rainfall=5.60"215-181 Post-DEVPrepared by McKenzie Engineering Group, Inc.
Page 32HydroCAD® 10.00-21 s/n 00452 © 2018 HydroCAD Software Solutions LLC
Pond 1P: Infiltration Pond
InflowOutflowDiscardedPrimary
Hydrograph
Time (hours)727068666462605856545250484644424038363432302826242220181614121086420
Flo
w
(cfs
)
34
32
30
28
26
24
22
20
18
16
14
12
10
8
6
4
2
0
Inflow Area=7.980 ac
Peak Elev=11.89'
Storage=35,905 cf
30.64 cfs
3.11 cfs
0.71 cfs3.11 cfs

Type III 24-hr 100-yr Rainfall=7.00"215-181 Post-DEVPrepared by McKenzie Engineering Group, Inc.
Page 33HydroCAD® 10.00-21 s/n 00452 © 2018 HydroCAD Software Solutions LLC
Time span=0.00-72.00 hrs, dt=0.05 hrs, 1441 pointsRunoff by SCS TR-20 method, UH=SCS, Weighted-CN
Reach routing by Stor-Ind+Trans method - Pond routing by Stor-Ind method
Runoff Area=190,029 sf 0.00% Impervious Runoff Depth=0.70"Subcatchment P1: SW Property Flow Length=400' Tc=12.0 min CN=38 Runoff=1.40 cfs 0.253 af
Runoff Area=255,881 sf 0.00% Impervious Runoff Depth=0.37"Subcatchment P2: Central Overland Flow Length=190' Tc=17.0 min CN=33 Runoff=0.53 cfs 0.182 af
Runoff Area=347,600 sf 59.22% Impervious Runoff Depth=4.04"Subcatchment P2a: Developed Site Tc=0.0 min CN=74 Runoff=43.44 cfs 2.688 af
Runoff Area=14,865 sf 0.00% Impervious Runoff Depth=0.49"Subcatchment P3: SE Property Flow Length=290' Tc=13.3 min CN=35 Runoff=0.06 cfs 0.014 af
Inflow=5.89 cfs 2.221 afReach DP-1: Wetland Outflow=5.89 cfs 2.221 af
Inflow=0.06 cfs 0.014 afReach DP-2: Water St Outflow=0.06 cfs 0.014 af
Peak Elev=12.76' Storage=53,316 cf Inflow=43.44 cfs 2.688 afPond 1P: Infiltration Pond Discarded=0.71 cfs 0.902 af Primary=4.18 cfs 1.785 af Outflow=4.18 cfs 2.688 af
Total Runoff Area = 18.558 ac Runoff Volume = 3.137 af Average Runoff Depth = 2.03"74.54% Pervious = 13.832 ac 25.46% Impervious = 4.725 ac

Type III 24-hr 100-yr Rainfall=7.00"215-181 Post-DEVPrepared by McKenzie Engineering Group, Inc.
Page 34HydroCAD® 10.00-21 s/n 00452 © 2018 HydroCAD Software Solutions LLC
Summary for Subcatchment P1: SW Property
Runoff = 1.40 cfs @ 12.37 hrs, Volume= 0.253 af, Depth= 0.70"
Runoff by SCS TR-20 method, UH=SCS, Weighted-CN, Time Span= 0.00-72.00 hrs, dt= 0.05 hrsType III 24-hr 100-yr Rainfall=7.00"
Area (sf) CN Description
151,064 36 Woods, Fair, HSG A33,865 39 >75% Grass cover, Good, HSG A5,100 76 Gravel roads, HSG A
190,029 38 Weighted Average190,029 100.00% Pervious Area
Tc Length Slope Velocity Capacity Description(min) (feet) (ft/ft) (ft/sec) (cfs)
10.2 50 0.0300 0.08 Sheet Flow, START off propertyWoods: Light underbrush n= 0.400 P2= 3.40"
1.8 350 0.0410 3.26 Shallow Concentrated Flow, To WetlandUnpaved Kv= 16.1 fps
12.0 400 Total
Subcatchment P1: SW Property
Runoff
Hydrograph
Time (hours)727068666462605856545250484644424038363432302826242220181614121086420
Flo
w
(cfs
)
1
0
Type III 24-hr
100-yr Rainfall=7.00"
Runoff Area=190,029 sf
Runoff Volume=0.253 af
Runoff Depth=0.70"
Flow Length=400'
Tc=12.0 min
CN=38
1.40 cfs

Type III 24-hr 100-yr Rainfall=7.00"215-181 Post-DEVPrepared by McKenzie Engineering Group, Inc.
Page 35HydroCAD® 10.00-21 s/n 00452 © 2018 HydroCAD Software Solutions LLC
Summary for Subcatchment P2: Central Overland
Runoff = 0.53 cfs @ 12.58 hrs, Volume= 0.182 af, Depth= 0.37"
Runoff by SCS TR-20 method, UH=SCS, Weighted-CN, Time Span= 0.00-72.00 hrs, dt= 0.05 hrsType III 24-hr 100-yr Rainfall=7.00"
Area (sf) CN Description
183,339 30 Woods, Good, HSG A71,317 39 >75% Grass cover, Good, HSG A1,225 76 Gravel roads, HSG A
255,881 33 Weighted Average255,881 100.00% Pervious Area
Tc Length Slope Velocity Capacity Description(min) (feet) (ft/ft) (ft/sec) (cfs)
15.8 50 0.0100 0.05 Sheet Flow, A-BWoods: Light underbrush n= 0.400 P2= 3.40"
1.2 140 0.0150 1.97 Shallow Concentrated Flow, B-CUnpaved Kv= 16.1 fps
17.0 190 Total
Subcatchment P2: Central Overland
Runoff
Hydrograph
Time (hours)727068666462605856545250484644424038363432302826242220181614121086420
Flo
w
(cfs
)
0.55
0.5
0.45
0.4
0.35
0.3
0.25
0.2
0.15
0.1
0.05
0
Type III 24-hr
100-yr Rainfall=7.00"
Runoff Area=255,881 sf
Runoff Volume=0.182 af
Runoff Depth=0.37"
Flow Length=190'
Tc=17.0 min
CN=33
0.53 cfs

Type III 24-hr 100-yr Rainfall=7.00"215-181 Post-DEVPrepared by McKenzie Engineering Group, Inc.
Page 36HydroCAD® 10.00-21 s/n 00452 © 2018 HydroCAD Software Solutions LLC
Summary for Subcatchment P2a: Developed Site
[46] Hint: Tc=0 (Instant runoff peak depends on dt)
Runoff = 43.44 cfs @ 12.00 hrs, Volume= 2.688 af, Depth= 4.04"
Runoff by SCS TR-20 method, UH=SCS, Weighted-CN, Time Span= 0.00-72.00 hrs, dt= 0.05 hrsType III 24-hr 100-yr Rainfall=7.00"
Area (sf) CN Description
141,768 39 >75% Grass cover, Good, HSG A103,305 98 Paved parking, HSG A102,527 98 Roofs, HSG A
347,600 74 Weighted Average141,768 40.78% Pervious Area205,832 59.22% Impervious Area
Subcatchment P2a: Developed Site
Runoff
Hydrograph
Time (hours)727068666462605856545250484644424038363432302826242220181614121086420
Flo
w
(cfs
)
48
46
44
42
40
38
36
34
32
30
28
26
24
22
20
18
16
14
12
10
8
6
4
2
0
Type III 24-hr
100-yr Rainfall=7.00"
Runoff Area=347,600 sf
Runoff Volume=2.688 af
Runoff Depth=4.04"
Tc=0.0 min
CN=74
43.44 cfs

Type III 24-hr 100-yr Rainfall=7.00"215-181 Post-DEVPrepared by McKenzie Engineering Group, Inc.
Page 37HydroCAD® 10.00-21 s/n 00452 © 2018 HydroCAD Software Solutions LLC
Summary for Subcatchment P3: SE Property
Runoff = 0.06 cfs @ 12.47 hrs, Volume= 0.014 af, Depth= 0.49"
Runoff by SCS TR-20 method, UH=SCS, Weighted-CN, Time Span= 0.00-72.00 hrs, dt= 0.05 hrsType III 24-hr 100-yr Rainfall=7.00"
Area (sf) CN Description
5,946 30 Woods, Good, HSG A8,919 39 >75% Grass cover, Good, HSG A
14,865 35 Weighted Average14,865 100.00% Pervious Area
Tc Length Slope Velocity Capacity Description(min) (feet) (ft/ft) (ft/sec) (cfs)
11.5 50 0.0220 0.07 Sheet Flow, A-BWoods: Light underbrush n= 0.400 P2= 3.40"
1.8 240 0.0200 2.28 Shallow Concentrated Flow, B-CUnpaved Kv= 16.1 fps
13.3 290 Total
Subcatchment P3: SE Property
Runoff
Hydrograph
Time (hours)727068666462605856545250484644424038363432302826242220181614121086420
Flo
w
(cfs
)
0.065
0.06
0.055
0.05
0.045
0.04
0.035
0.03
0.025
0.02
0.015
0.01
0.005
0
Type III 24-hr
100-yr Rainfall=7.00"
Runoff Area=14,865 sf
Runoff Volume=0.014 af
Runoff Depth=0.49"
Flow Length=290'
Tc=13.3 min
CN=35
0.06 cfs

Type III 24-hr 100-yr Rainfall=7.00"215-181 Post-DEVPrepared by McKenzie Engineering Group, Inc.
Page 38HydroCAD® 10.00-21 s/n 00452 © 2018 HydroCAD Software Solutions LLC
Summary for Reach DP-1: Wetland
[40] Hint: Not Described (Outflow=Inflow)
Inflow Area = 18.216 ac, 25.94% Impervious, Inflow Depth = 1.46" for 100-yr eventInflow = 5.89 cfs @ 12.47 hrs, Volume= 2.221 afOutflow = 5.89 cfs @ 12.47 hrs, Volume= 2.221 af, Atten= 0%, Lag= 0.0 min
Routing by Stor-Ind+Trans method, Time Span= 0.00-72.00 hrs, dt= 0.05 hrs
Reach DP-1: Wetland
InflowOutflow
Hydrograph
Time (hours)727068666462605856545250484644424038363432302826242220181614121086420
Flo
w
(cfs
)
6
5
4
3
2
1
0
Inflow Area=18.216 ac5.89 cfs
5.89 cfs

Type III 24-hr 100-yr Rainfall=7.00"215-181 Post-DEVPrepared by McKenzie Engineering Group, Inc.
Page 39HydroCAD® 10.00-21 s/n 00452 © 2018 HydroCAD Software Solutions LLC
Summary for Reach DP-2: Water St
[40] Hint: Not Described (Outflow=Inflow)
Inflow Area = 0.341 ac, 0.00% Impervious, Inflow Depth = 0.49" for 100-yr eventInflow = 0.06 cfs @ 12.47 hrs, Volume= 0.014 afOutflow = 0.06 cfs @ 12.47 hrs, Volume= 0.014 af, Atten= 0%, Lag= 0.0 min
Routing by Stor-Ind+Trans method, Time Span= 0.00-72.00 hrs, dt= 0.05 hrs
Reach DP-2: Water St
InflowOutflow
Hydrograph
Time (hours)727068666462605856545250484644424038363432302826242220181614121086420
Flo
w
(cfs
)
0.065
0.06
0.055
0.05
0.045
0.04
0.035
0.03
0.025
0.02
0.015
0.01
0.005
0
Inflow Area=0.341 ac0.06 cfs
0.06 cfs

Type III 24-hr 100-yr Rainfall=7.00"215-181 Post-DEVPrepared by McKenzie Engineering Group, Inc.
Page 40HydroCAD® 10.00-21 s/n 00452 © 2018 HydroCAD Software Solutions LLC
Summary for Pond 1P: Infiltration Pond
Inflow Area = 7.980 ac, 59.22% Impervious, Inflow Depth = 4.04" for 100-yr eventInflow = 43.44 cfs @ 12.00 hrs, Volume= 2.688 afOutflow = 4.18 cfs @ 12.79 hrs, Volume= 2.688 af, Atten= 90%, Lag= 47.3 minDiscarded = 0.71 cfs @ 10.60 hrs, Volume= 0.902 afPrimary = 4.18 cfs @ 12.79 hrs, Volume= 1.785 af
Routing by Stor-Ind method, Time Span= 0.00-72.00 hrs, dt= 0.05 hrsPeak Elev= 12.76' @ 12.79 hrs Surf.Area= 20,843 sf Storage= 53,316 cf
Plug-Flow detention time= 215.3 min calculated for 2.686 af (100% of inflow)Center-of-Mass det. time= 215.5 min ( 1,031.9 - 816.4 )
Volume Invert Avail.Storage Storage Description
#1 9.50' 75,823 cf Custom Stage Data (Prismatic) Listed below (Recalc)
Elevation Surf.Area Inc.Store Cum.Store(feet) (sq-ft) (cubic-feet) (cubic-feet)
9.50 12,792 0 010.00 13,508 6,575 6,57511.00 14,981 14,245 20,82012.00 19,481 17,231 38,05113.00 21,280 20,381 58,43113.80 22,200 17,392 75,823
Device Routing Invert Outlet Devices
#1 Primary 10.80' 2.0' long x 2.00' rise Sharp-Crested Rectangular Weir 2 End Contraction(s)
#2 Device 1 9.75' 12.0" Round Culvert L= 46.0' CPP, projecting, no headwall, Ke= 0.900 Inlet / Outlet Invert= 9.75' / 9.29' S= 0.0100 '/' Cc= 0.900 n= 0.013 Corrugated PE, smooth interior, Flow Area= 0.79 sf
#3 Discarded 9.50' Special & User-Defined Head (feet) 0.00 0.10 1.00 1.50 1.69 1.70 4.00 Disch. (cfs) 0.000 0.714 0.714 0.714 0.714 0.000 0.000
Discarded OutFlow Max=0.71 cfs @ 10.60 hrs HW=9.63' (Free Discharge)3=Special & User-Defined (Custom Controls 0.71 cfs)
Primary OutFlow Max=4.18 cfs @ 12.79 hrs HW=12.76' (Free Discharge)1=Sharp-Crested Rectangular Weir (Passes 4.18 cfs of 14.40 cfs potential flow)
2=Culvert (Inlet Controls 4.18 cfs @ 5.32 fps)

Type III 24-hr 100-yr Rainfall=7.00"215-181 Post-DEVPrepared by McKenzie Engineering Group, Inc.
Page 41HydroCAD® 10.00-21 s/n 00452 © 2018 HydroCAD Software Solutions LLC
Pond 1P: Infiltration Pond
InflowOutflowDiscardedPrimary
Hydrograph
Time (hours)727068666462605856545250484644424038363432302826242220181614121086420
Flo
w
(cfs
)
45
40
35
30
25
20
15
10
5
0
Inflow Area=7.980 ac
Peak Elev=12.76'
Storage=53,316 cf
43.44 cfs
4.18 cfs
0.71 cfs4.18 cfs