UT to Pembroke Creek Wetland and Stream Restoration ...
55
UT to Pembroke Creek Wetland and Stream Restoration Monitoring Report EEP Project # 283 EEP Contract # 004475 Monitoring Year 05 Submitted to: NCDENR-EEP, 1652 Mail Service Center, Raleigh, NC 27699-1652 Data Collection: 2012 Construction Completed: February 2008 Submitted: January 2013
-
Upload
khangminh22 -
Category
Documents
-
view
0 -
download
0
Transcript of UT to Pembroke Creek Wetland and Stream Restoration ...
UT to Pembroke Creek Wetland and Stream Restoration Monitoring Report
EEP Project # 283 EEP Contract # 004475 Monitoring Year 05
Submitted to:
NCDENR-EEP, 1652 Mail Service Center, Raleigh, NC 27699-1652
Data Collection: 2012
Construction Completed: February 2008 Submitted: January 2013

UT Pembroke KCI Associates of North Carolina EEP Project # 283 2012- MY05
Monitoring Firm
Landmark Center II, Suite 220 4601 Six Forks Road Raleigh, NC 27609
Phone: (919) 278-2514 Fax: (919) 783-9266
Project Contact: Adam Spiller Email: [email protected]
KCI Project No: 16121788_MY05
Design Firm
EcoEngineering, A Division of the John R. McAdams Company Inc. 2905 Meridian Parkway
Durham, NC 27713

UT Pembroke KCI Associates of North Carolina EEP Project # 283 2012- MY05
TABLE OF CONTENTS 1.0 EXECUTIVE SUMMARY / PROJECT ABSTRACT ................................................1 2.0 METHODOLOGY .........................................................................................................2 3.0 REFERENCES ................................................................................................................2
Appendix A – Project Vicinity Map and Background Tables Figure 1. Vicinity Map ................................................................................................................... 4 Table 1a. Project Restoration Components ..................................................................................... 5 Table 1b. Project Component Summations ..................................................................................... 5 Table 2. Project Activity and Reporting History .......................................................................... 6 Table 3. Project Contacts Table .................................................................................................... 7 Table 4. Project Attribute Table .................................................................................................... 8
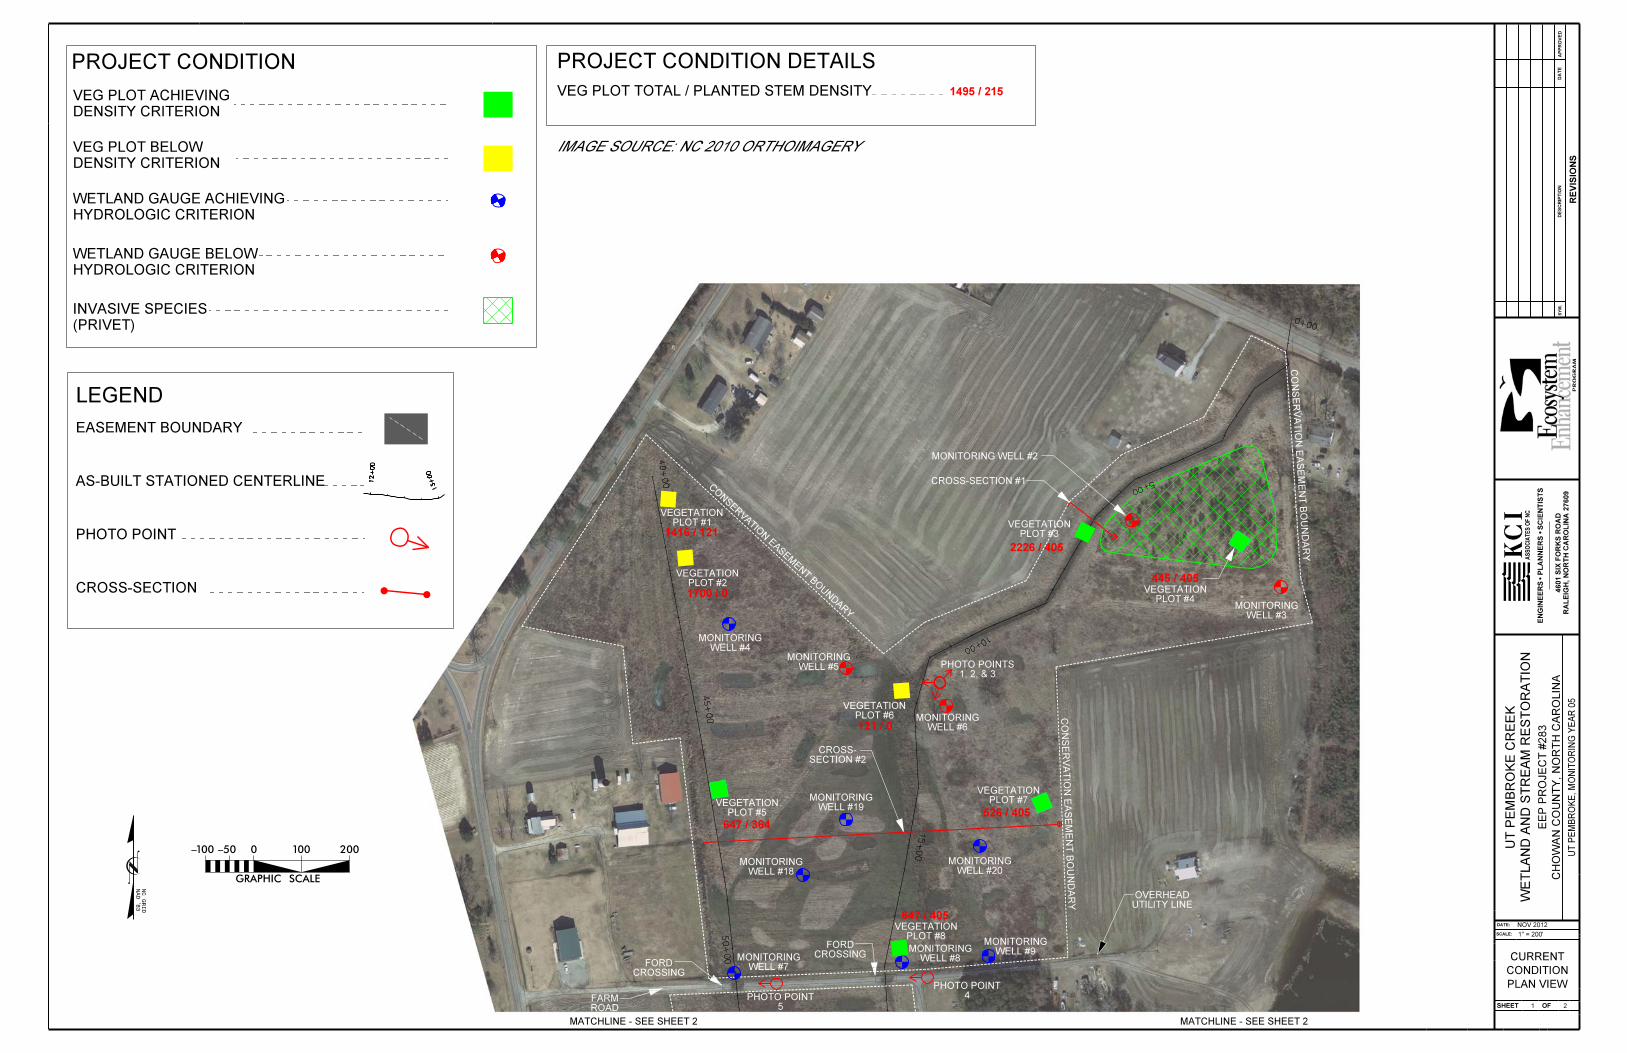
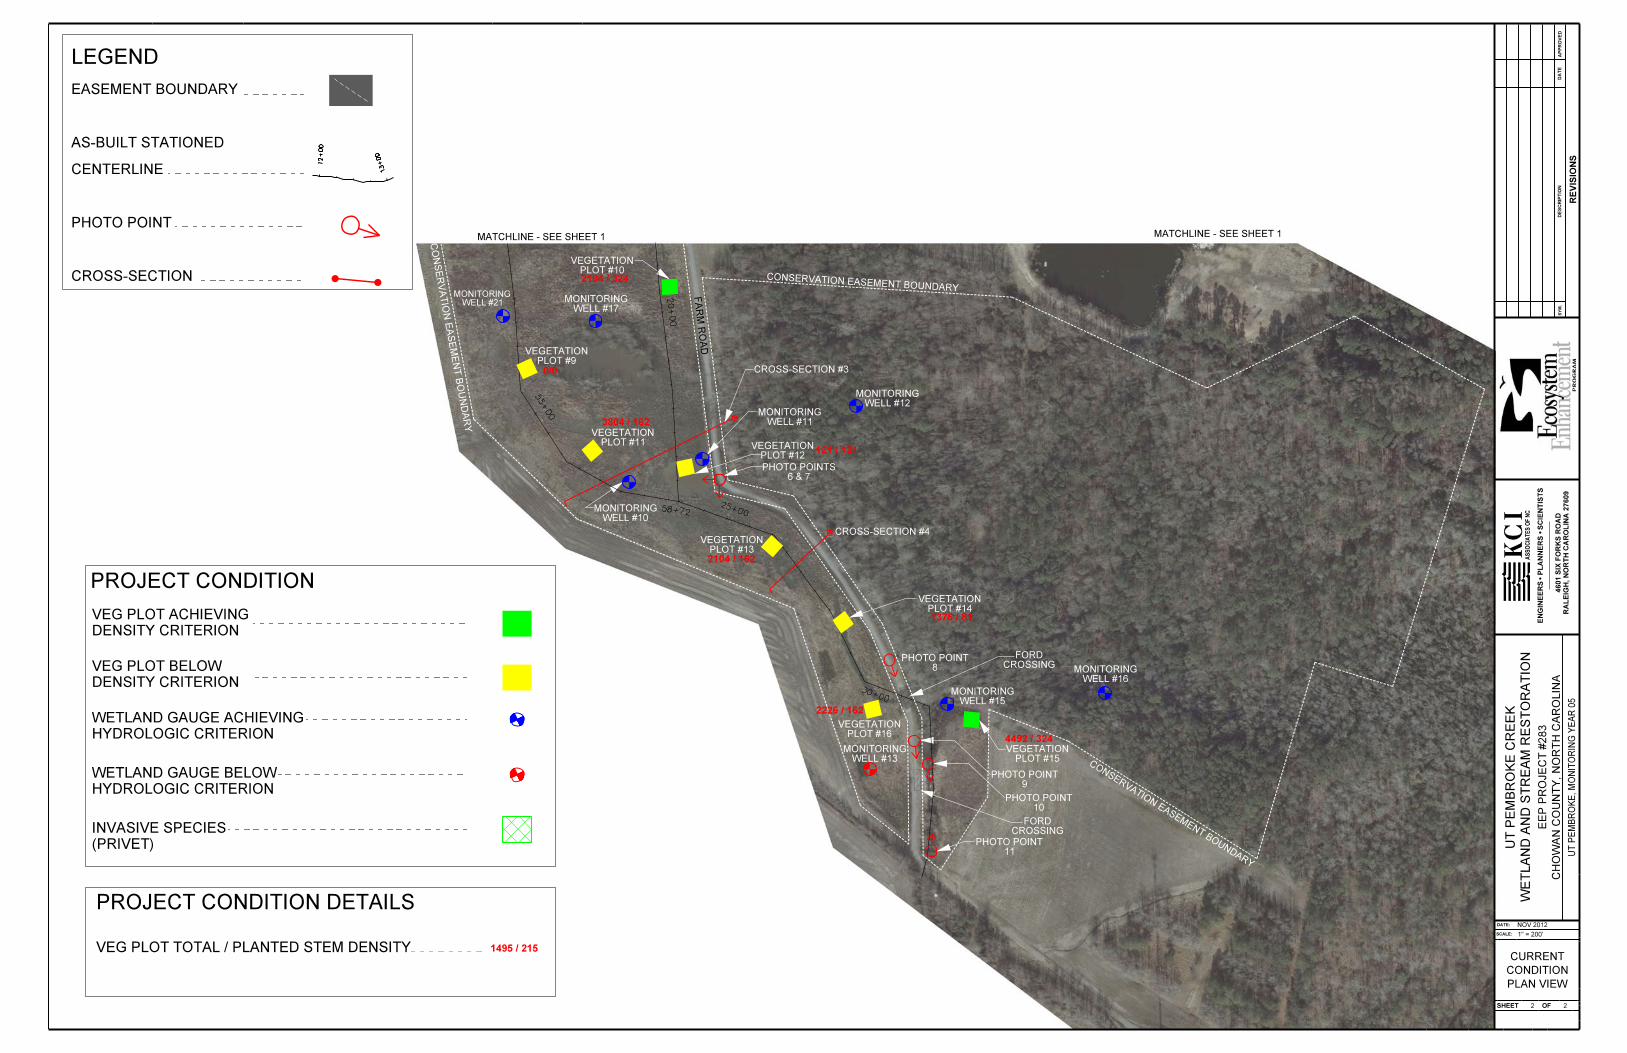
Appendix B – Visual Assessment Data Figure 2. Current Condition Plan View .......................................................................................... 9 Table 5. Vegetation Condition Assessment .................................................................................. 12 Photo Point Photos .................................................................................................................................... 13 Vegetation Monitoring Plot Photos ........................................................................................................... 17
Appendix C – Vegetation Plot Data Table 6. Vegetation Plot Mitigation Success Summary Table ..................................................... 26 Table 7. CVS Vegetation Plot Metadata ....................................................................................... 27 Table 8. CVS Stem Count Total and Planted by Plot and Species ............................................... 28
Appendix D – Hydrologic Data
30-70 Percentile Graph ............................................................................................................................. 32 Precipitation and Water Level Plots .......................................................................................................... 33 Table 9. Wetland Hydrology Criteria Attainment ........................................................................ 52
UT Pembroke 1 KCI Associates of North Carolina EEP Project # 283 2012- MY05
1.0 EXECUTIVE SUMMARY / PROJECT ABSTRACT The North Carolina Ecosystem Enhancement Program (EEP) restored, enhanced, and preserved wetlands and restored a headwater wetland valley, which is analogous to a stream in this setting, at the UT Pembroke Site in Chowan County, North Carolina. The 59-acre site is located within the USGS 8-digit HUC 03010205 of the Pasquotank River Basin. These assets and their acreage totals were revised by the EEP during the summer of 2009, with the revised totals reflected in Table 1 of this report. The project goals and objectives are listed below.
Goal: Modify the channelized water features, based on reference conditions, with the intent to restore the site’s primary wetland functions such as nutrient cycling, flood storage, and wildlife habitat.
Objectives: • Improve water quality in the basin by filtering nutrients through on-site wetlands. • Buffer flood flows downstream by increasing infiltration and storage areas. • Design a waterway through the wetland complex with appropriate cross-section, slope, and
pattern as to provide nutrient filtering, flood storage, and wildlife habitat while meeting the appropriate success criteria for the wetland.
• Improve terrestrial and aquatic habitat diversity. • Establish a contiguous buffer along the project that can serve as a migration corridor for local
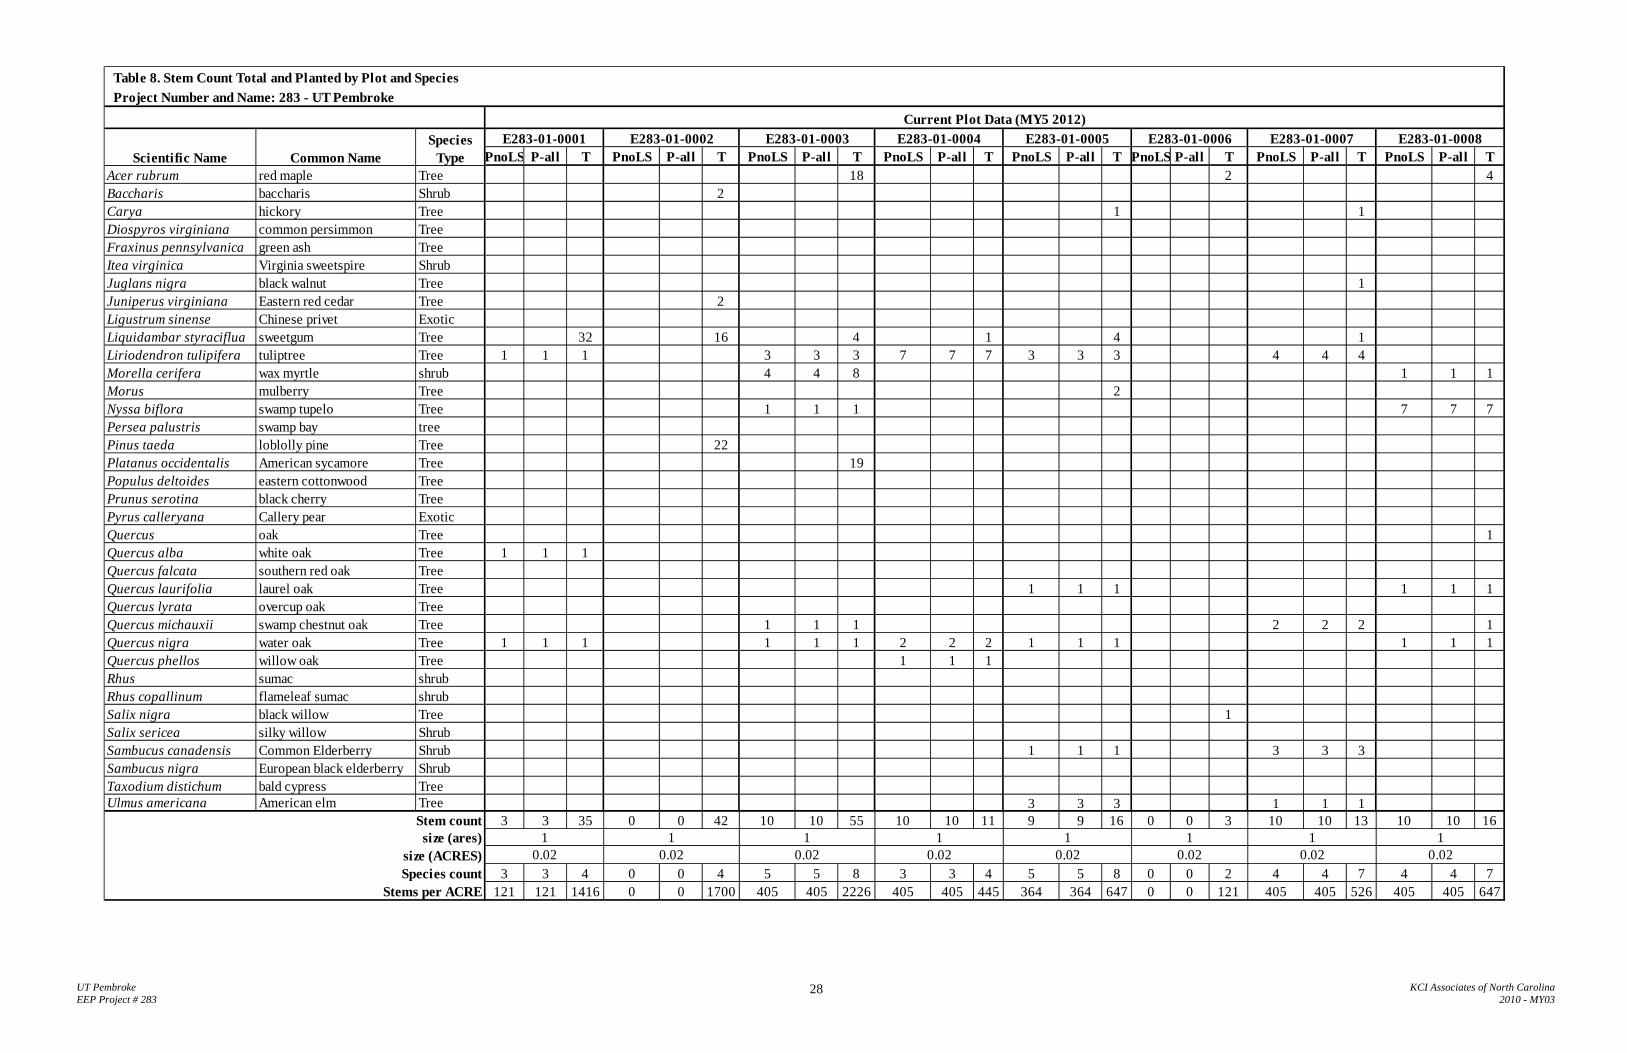
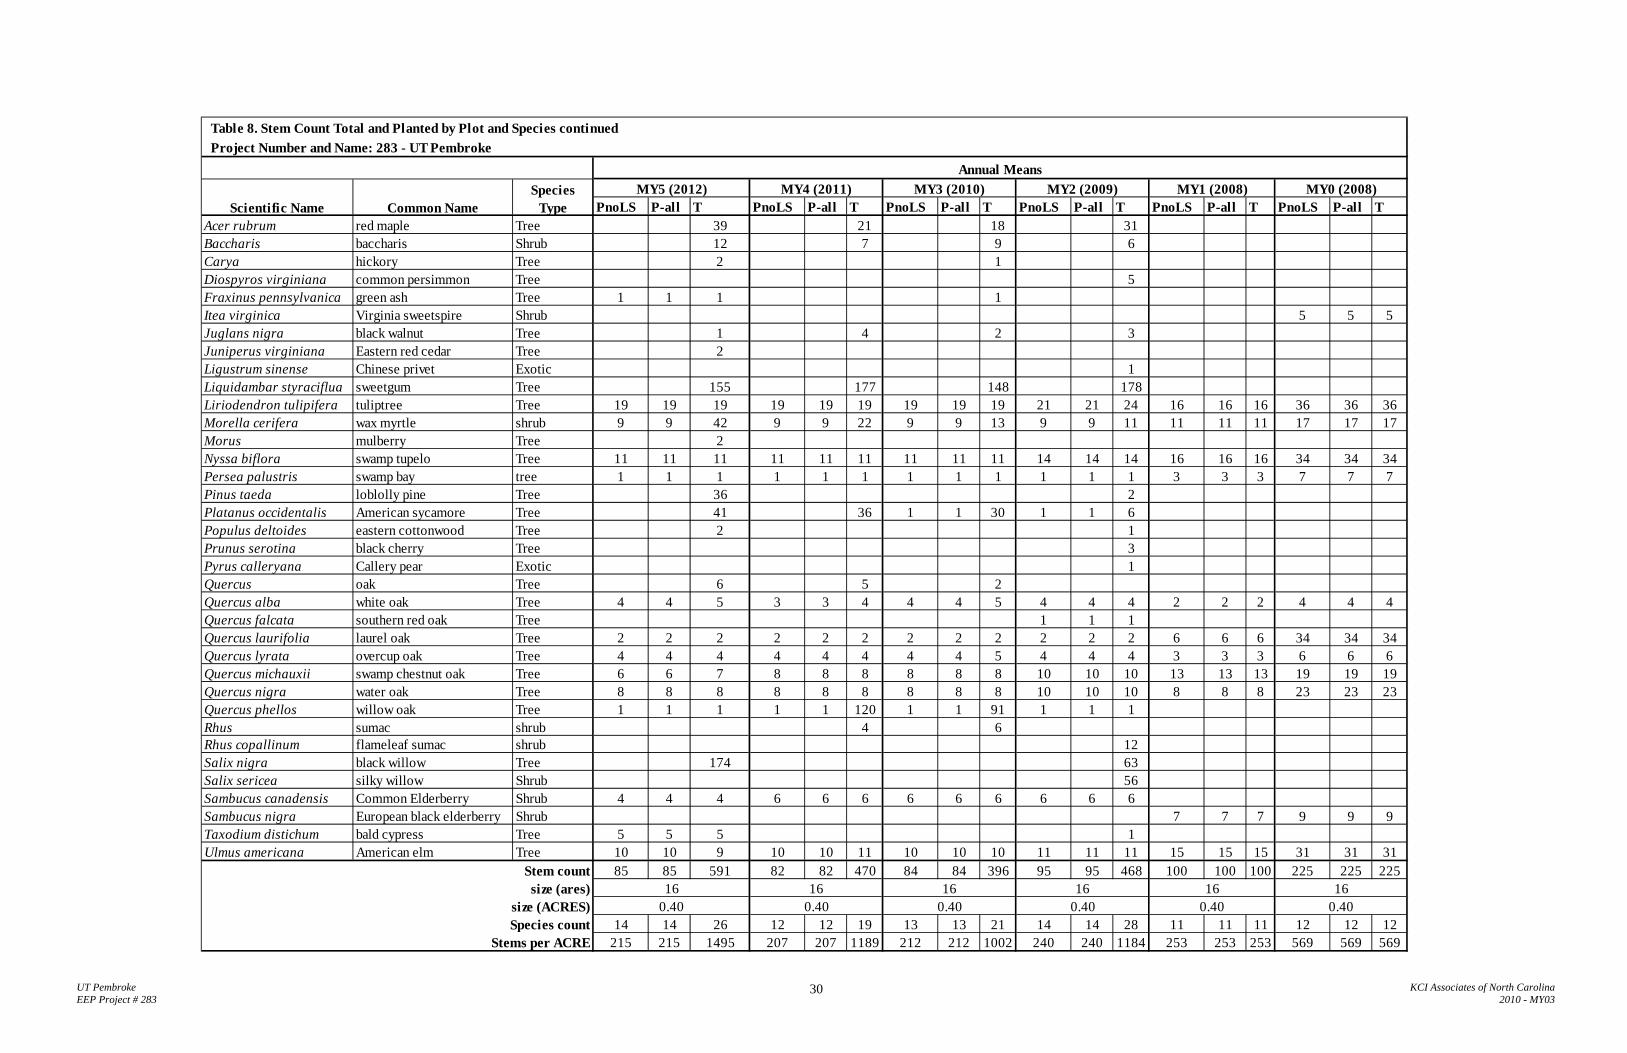
fauna. The restored wetlands and headwater wetland valley were planted with one of three different planting zones, each with various species of bare root trees and shrubs. Following the CVS-EEP protocol, sixteen vegetation monitoring plots were established during the baseline data collection immediately after the site was planted. Plot number 14 was damaged during road maintenance and was reset in the same location during the second year of monitoring. The fifth year of monitoring found a site average of 215 planted stems/acre, with nine of the sixteen vegetation monitoring plots having planted stem densities less than the five-year success criteria of 260 stems/acre. The site’s average total stem density including volunteers is 1,495 stems/acre. Volunteer trees that are sporadically present throughout the site are; black willow (Salix nigra), sycamore (Platanus occidentalis), sweetgum (Liquidambar styraciflua), and loblolly pine (Pinus taeda). The only exotic species identified at the site are parrotfeather (Myriophyllum aquaticum), which is present in areas of open standing water, honeysuckle (Lonicera japonica), which is scattered throughout the site, a few Chinaberry trees (Melia azedarach), and privet (Ligustrum sinense), which is predominantly found in the enhancement wetland and has been shown on the CCPV. Some parts of the site have large cattail (Typha latifolia) populations, which may out compete desirable vegetation and become problematic. There are also areas where the Juncus effusus is growing so vigorously that there are no planted stems in the surrounding area. Supplemental planting of the site was conducted in December of 2011. An open water area that is approximately 0.3 acres is located near vegetation plot 12, which results in a bare area of 0.9% of planted acreage for the site. The restored headwater wetland valley is stable. In the parts of the site where there are large areas of standing water, the feature becomes less visually defined, but there is still active flow of water across the site. A maintenance plan was implemented in the fall of 2011 to enhance the movement or water through the headwater stream and prevent ponding along the existing farm road. This maintenance included adding a new road crossing and the removal of the top level of the drop down structure. For further details, please see the UT Pembroke Creek Wetland and Stream Restoration Site Repair Baseline Report (KCI, 2012).
UT Pembroke KCI Associates of North Carolina EEP Project # 283 2012- MY05
2
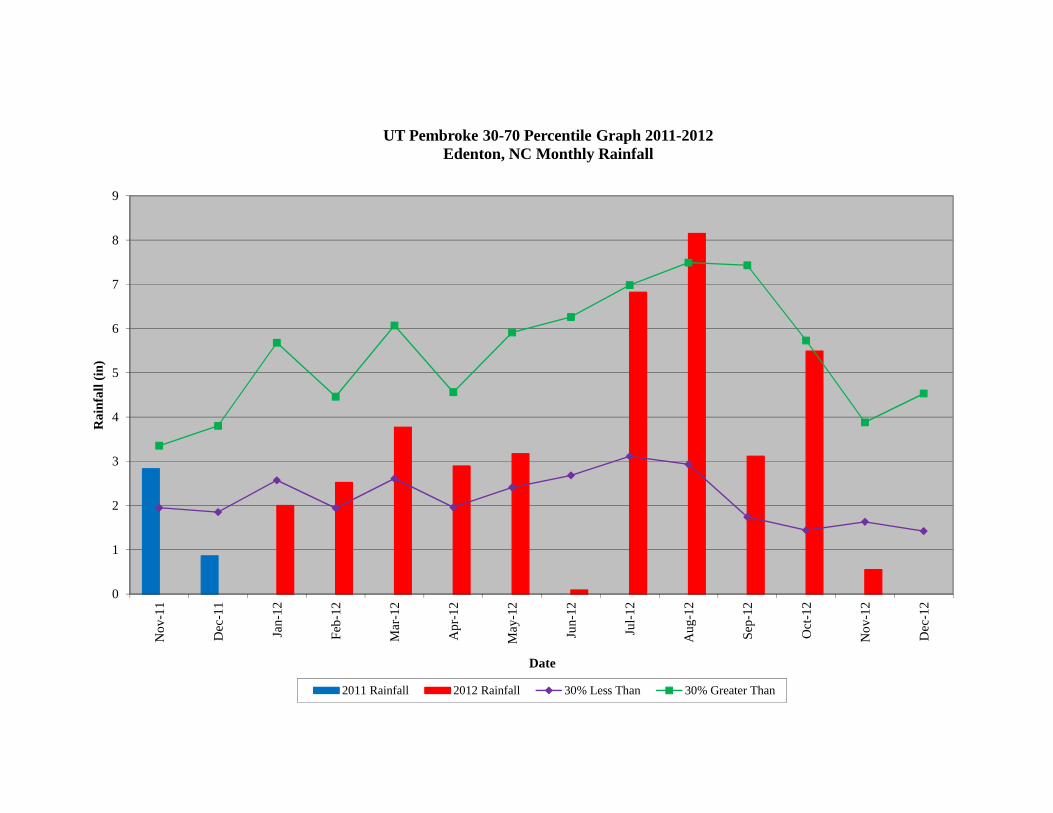
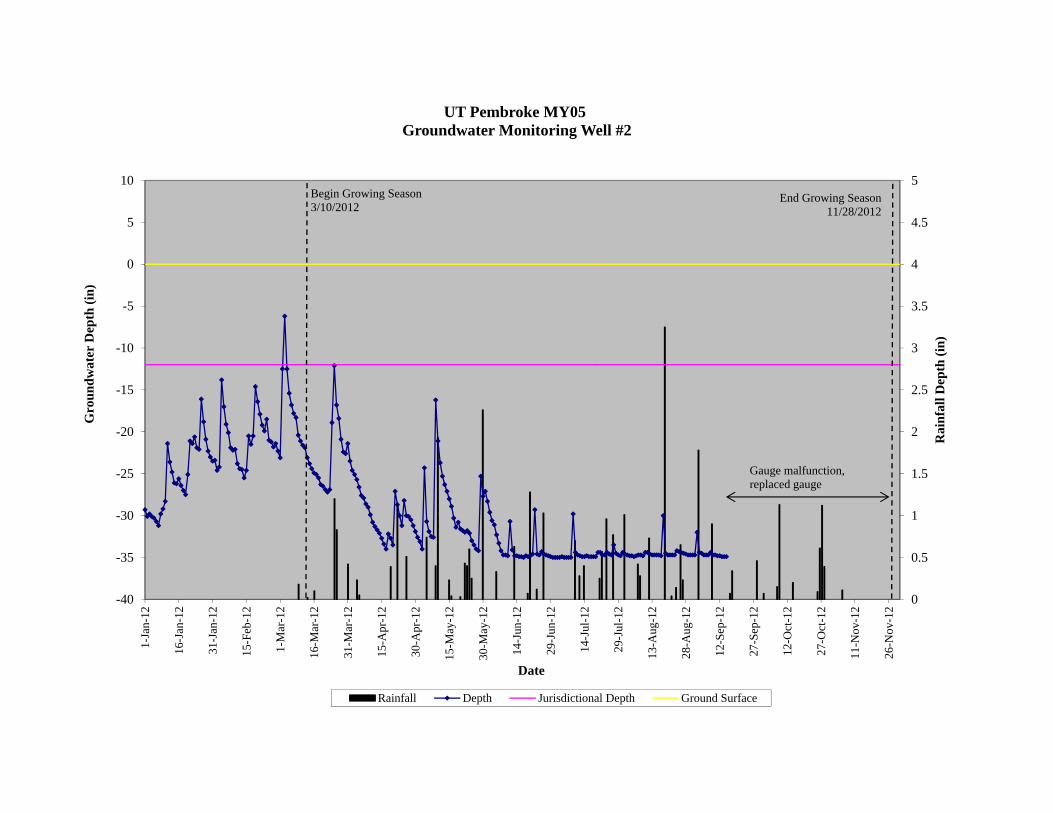
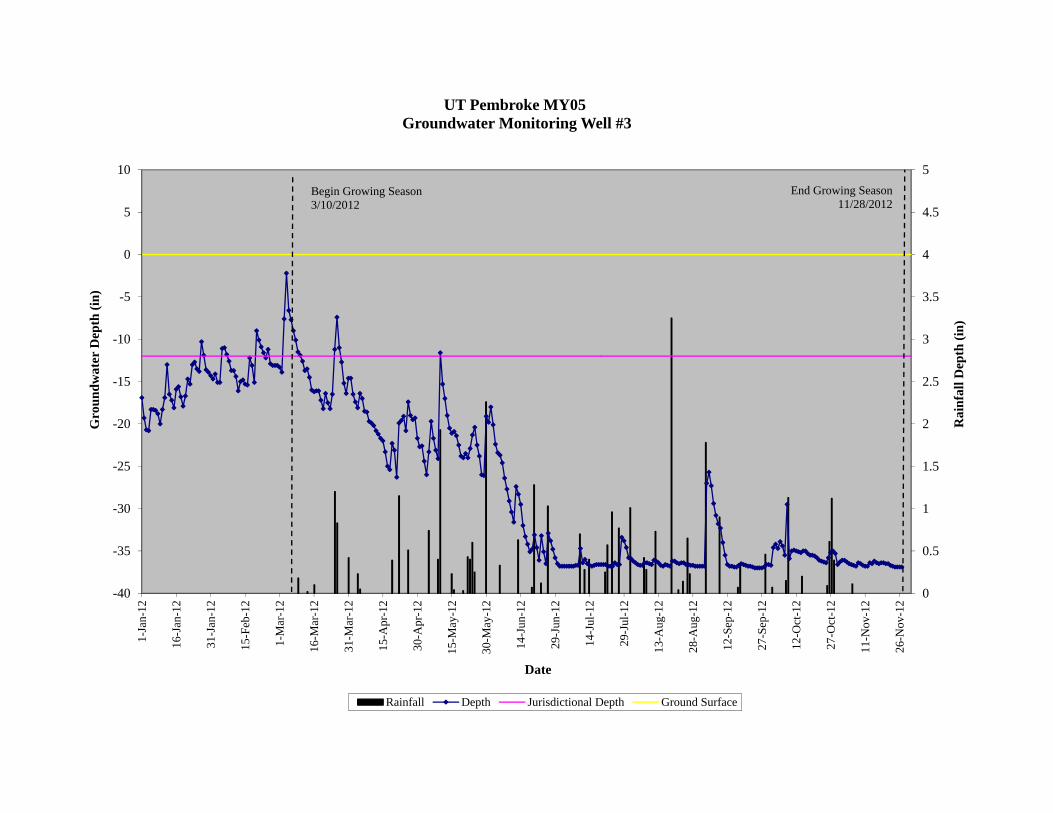
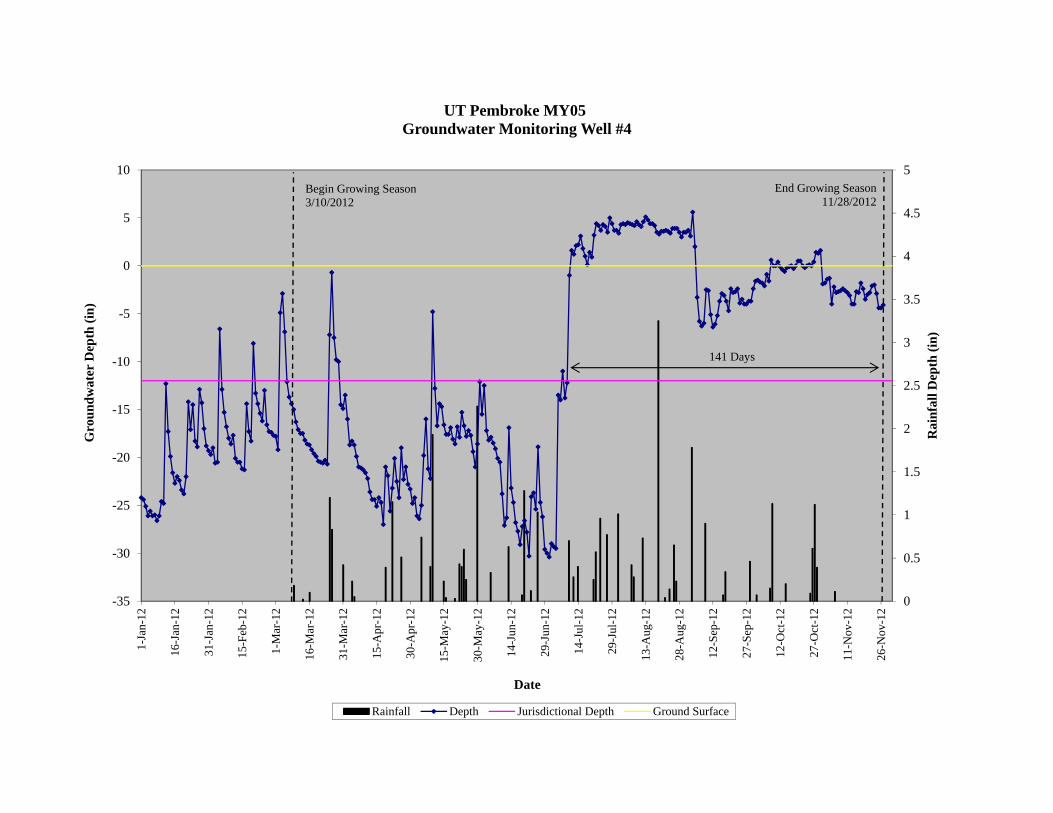
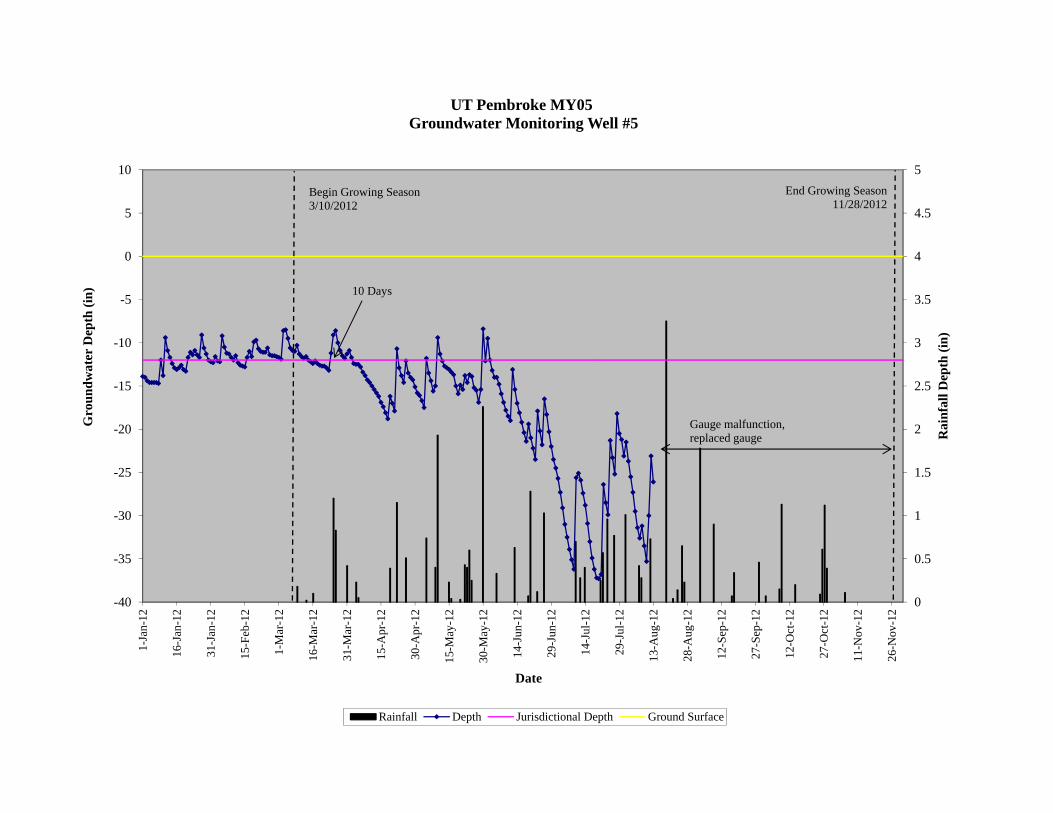
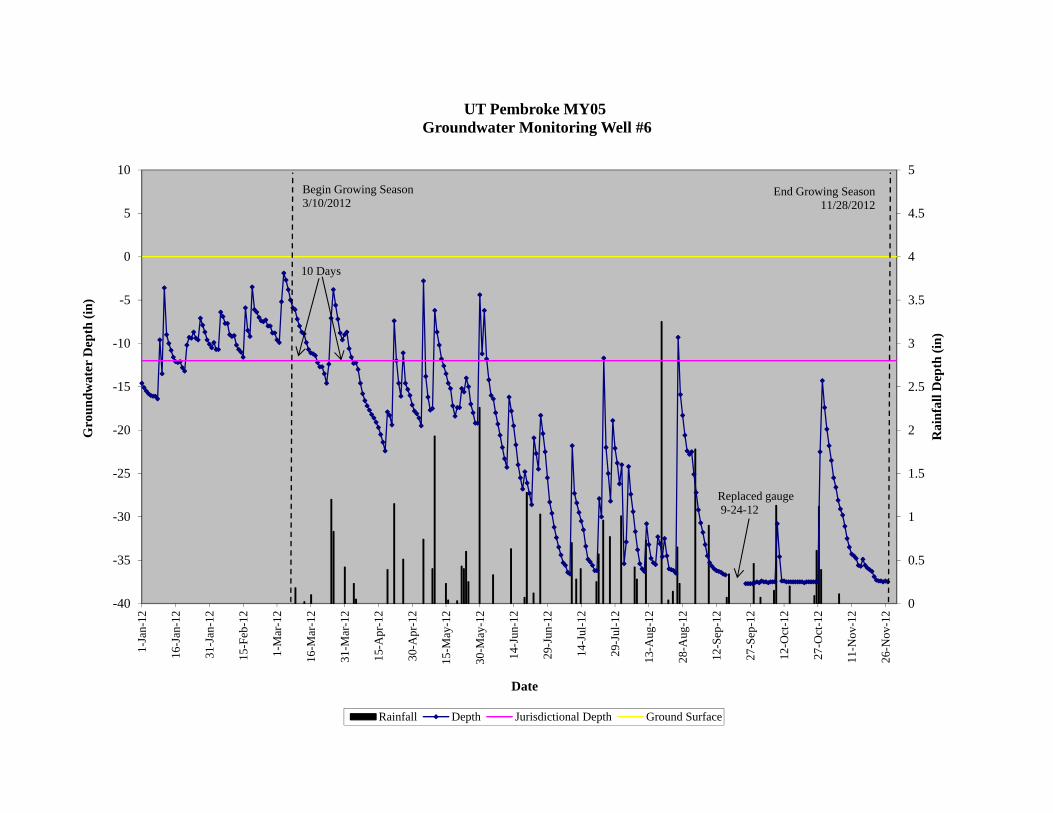
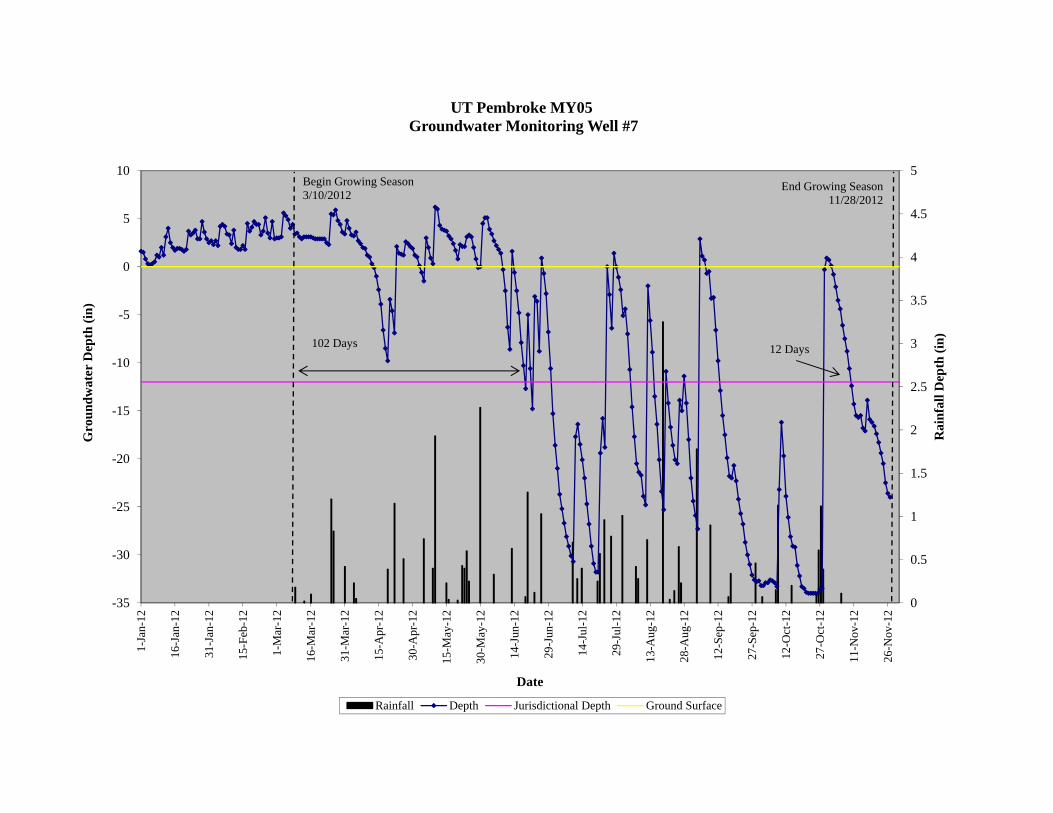
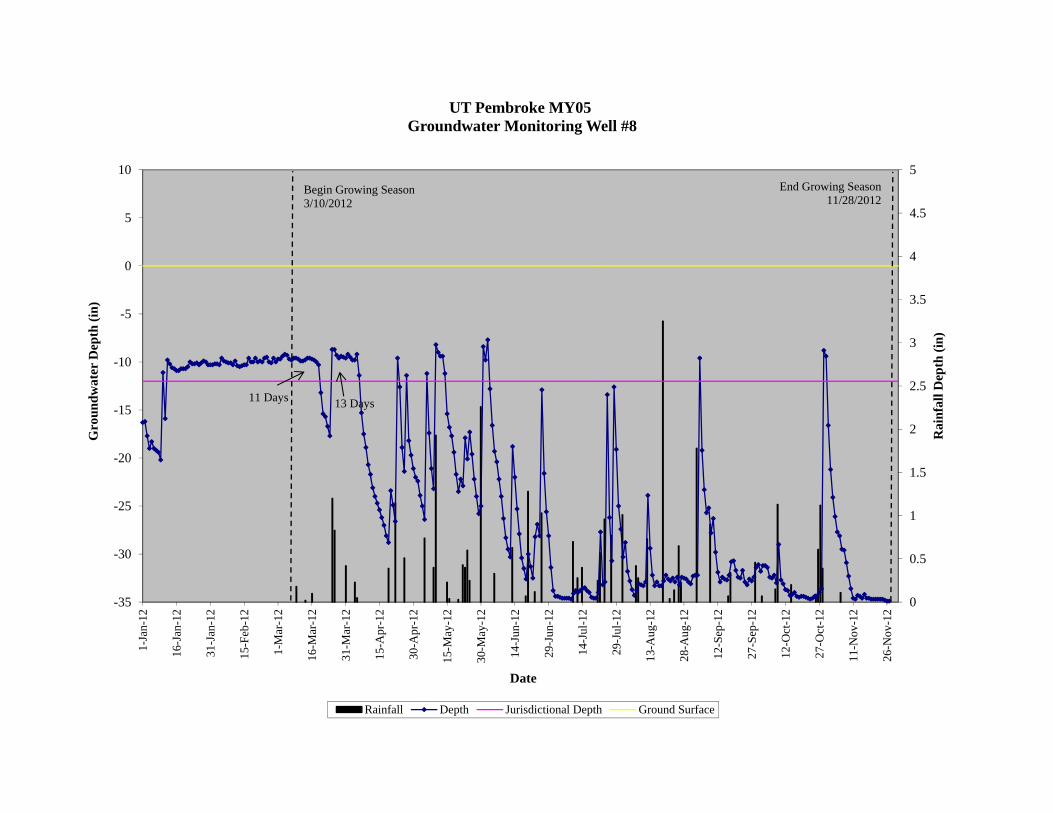
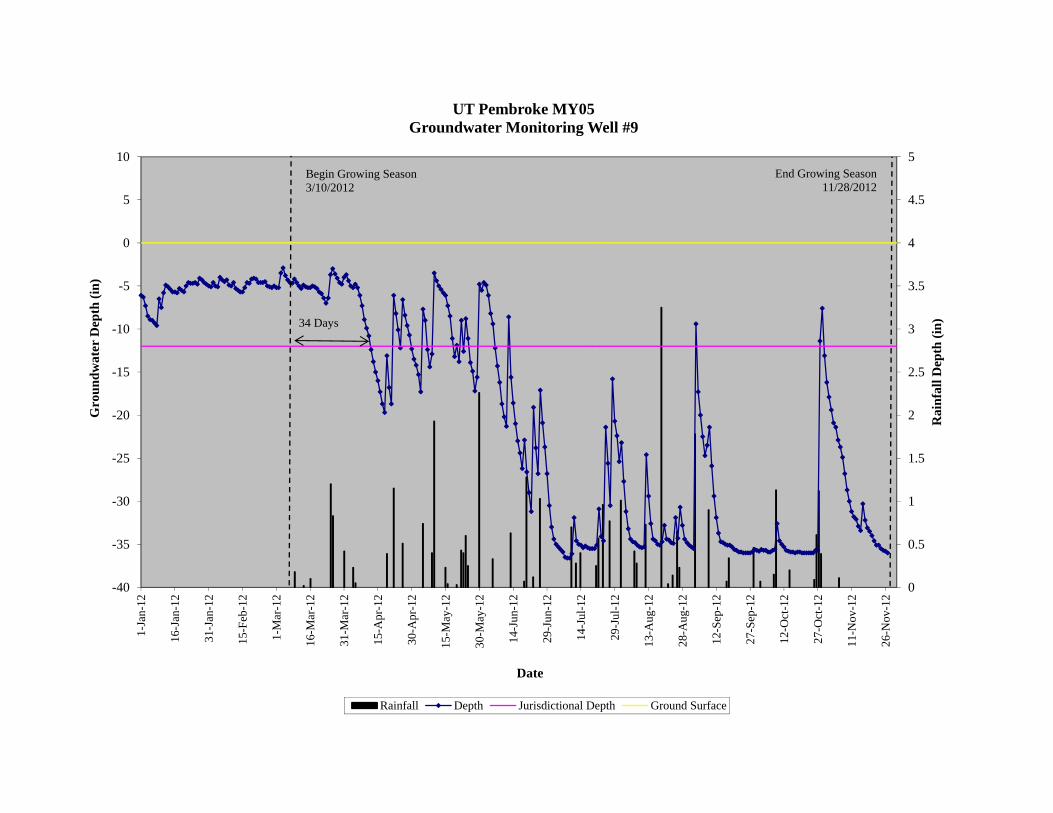
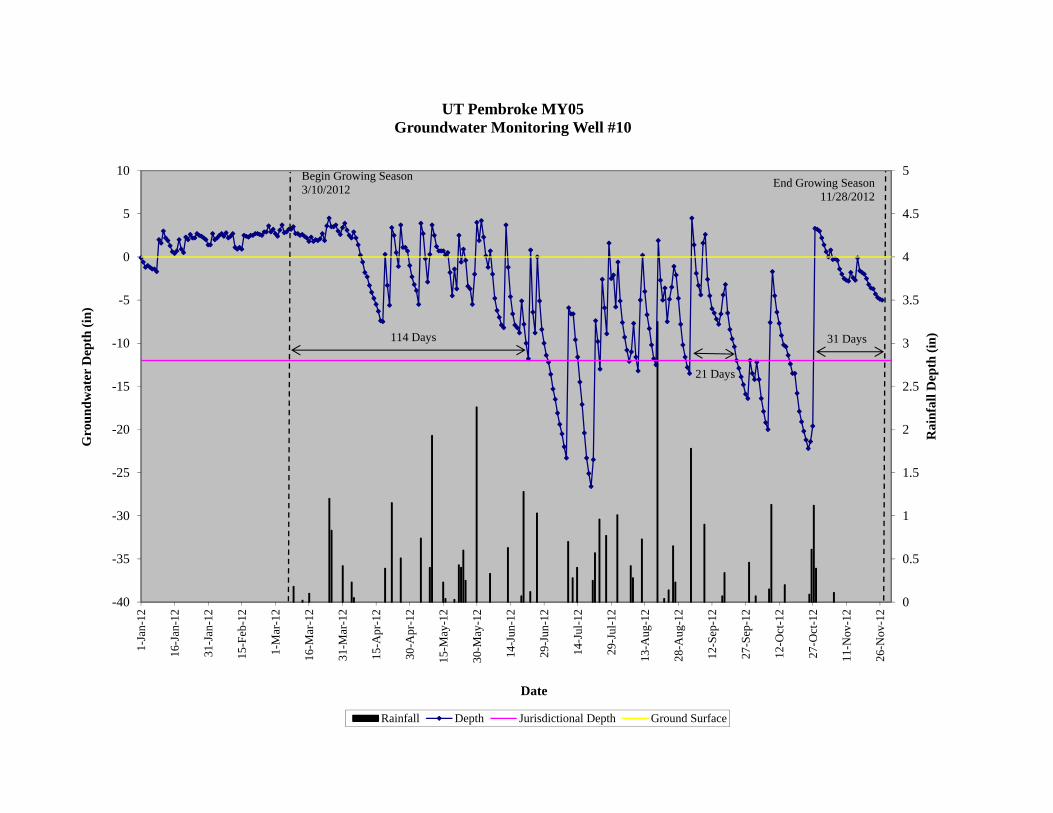
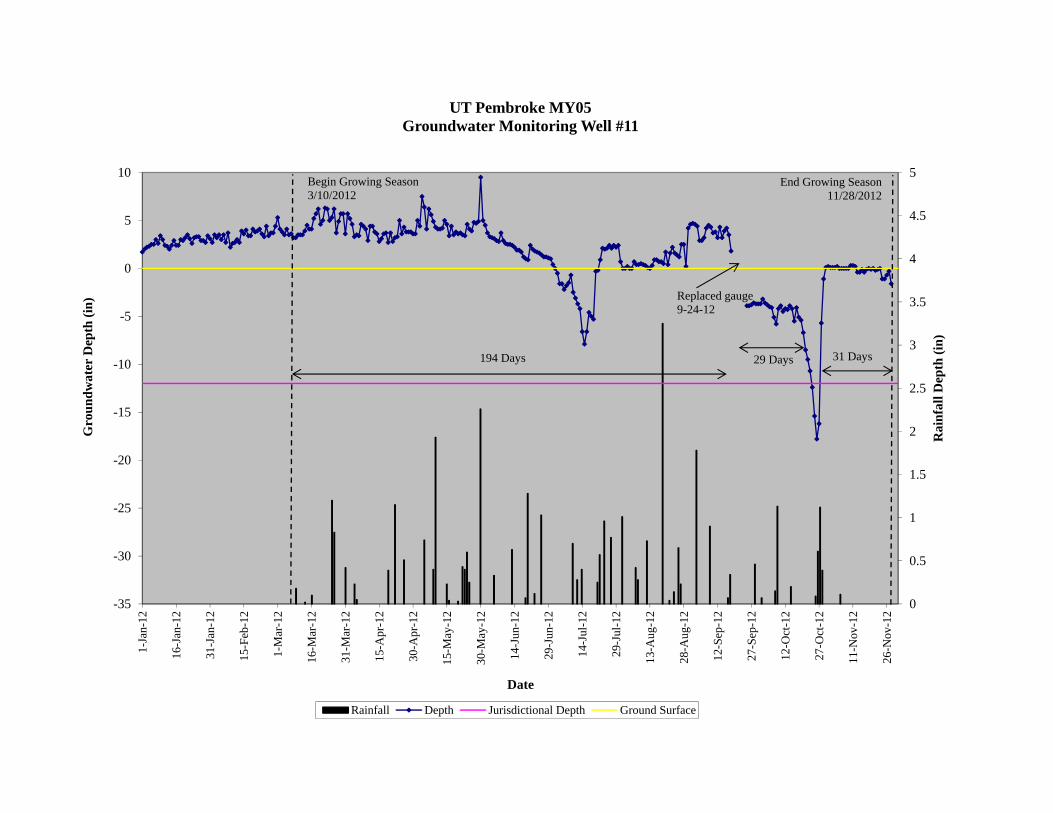
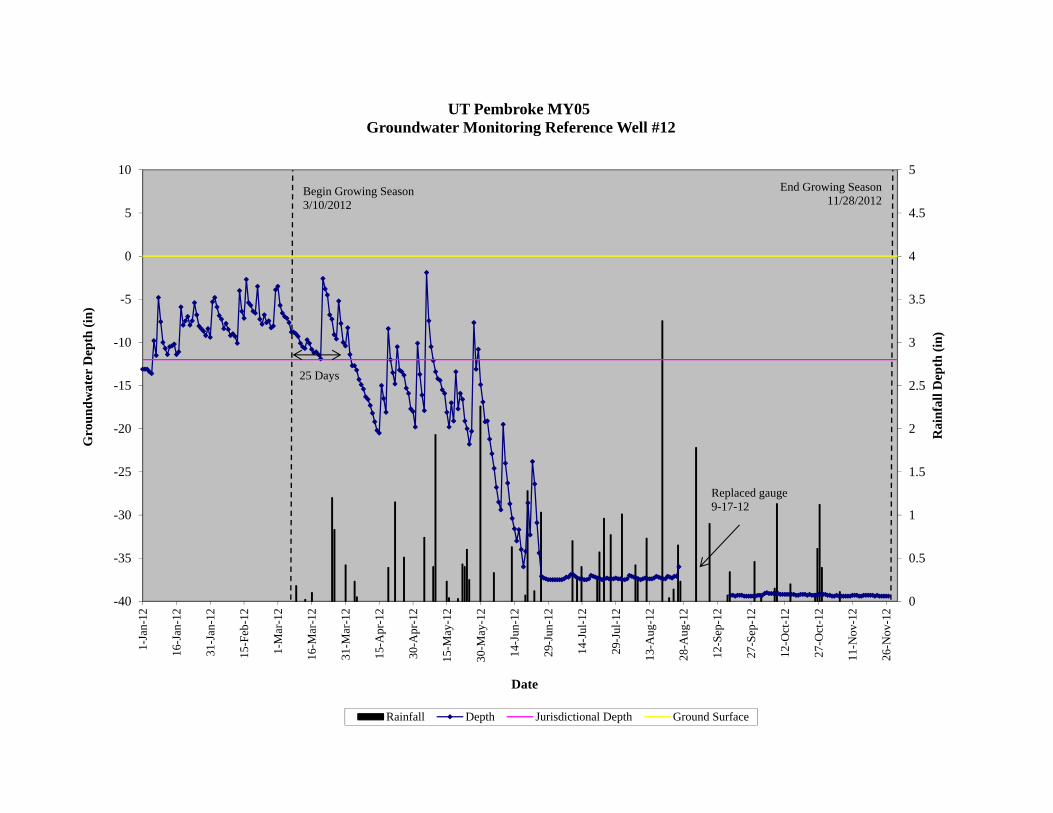
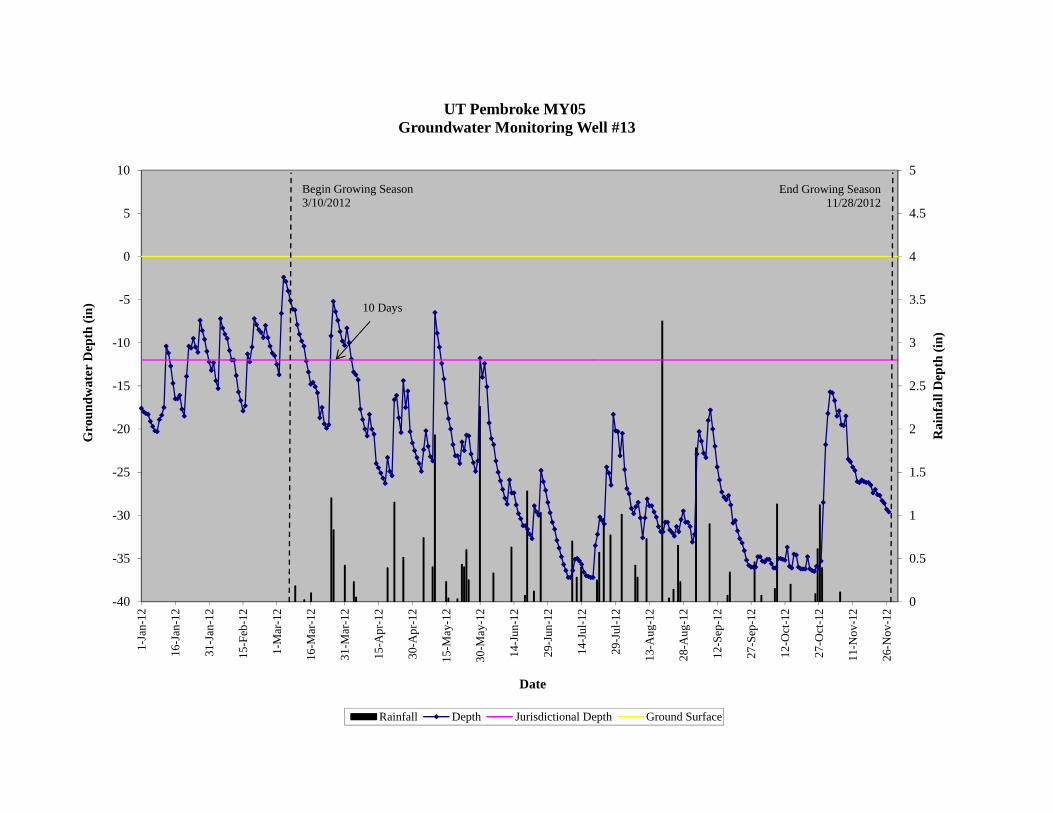
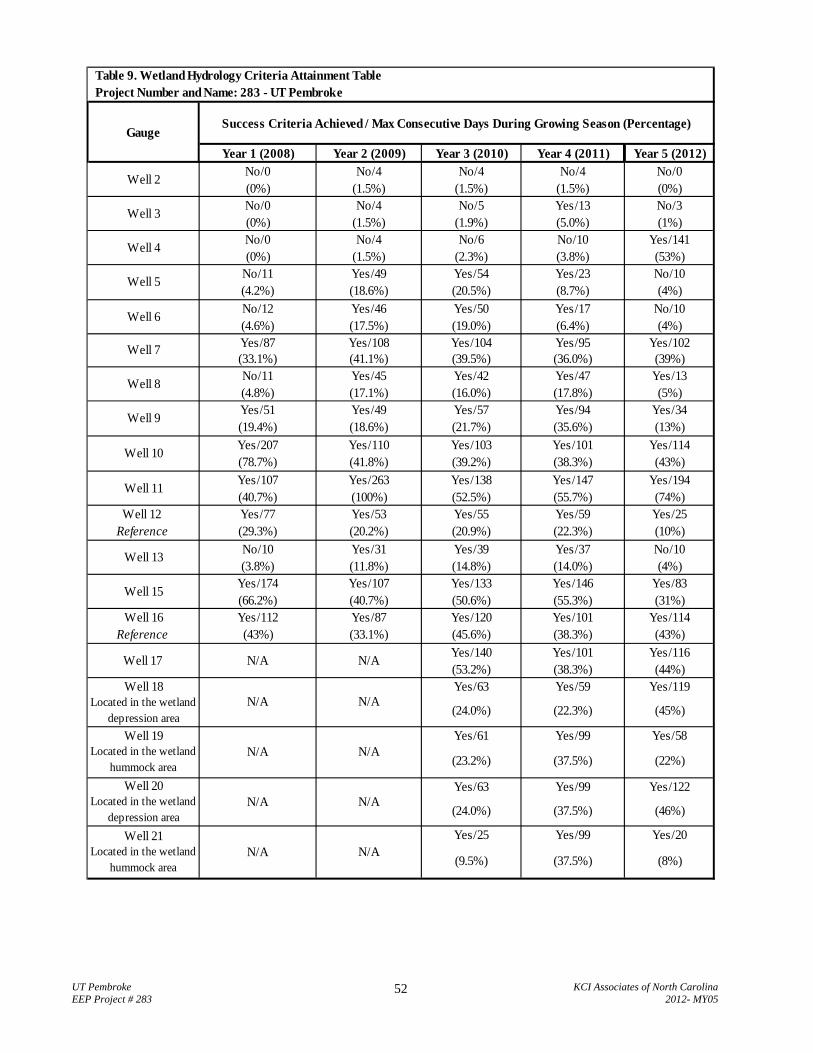
Nineteen groundwater monitoring wells have been established to monitor wetland hydrology. Of these wells, five (4, 5, 6, 9, and 13) were installed in restored wetlands, two (2 and 3) were installed in enhanced wetlands, five (7, 8, 10, 11, and 15) were installed in the headwater wetland valley, and two (12 and 16) were installed in the preserved wetlands as reference wells. An additional monitoring well, Monitoring Well 17, was installed in the restored wetland in April 2009. In June 2010, four more monitoring wells, Monitoring Wells 18, 19, 20, and 21, were installed. During the site’s fifth growing season, 12 of the 17 wells in the restoration and enhancement areas met the success criterion of having saturated soil conditions occurring within 12 inches of the ground surface for a minimum continuous period of 5% (13 days) of the 263 day growing season (March 10 to November 28) during average climatic conditions. The daily rainfall data obtained from a local weather station shows that the area had average rainfall during the 2012 growing season. The months of February, March, April, May, July, September, and October experienced average rainfall. Rainfall was less than average in January, June, and November, while August experienced above average rainfall. The wells that did not meet the success criteria - Wells 5, 6, and 13 each had water above the jurisdictional depth for a maximum of ten consecutive days. Monitoring Well 5 experienced two gauge malfunctions which resulted in the gauges being replaced twice during the end of the growing season. Monitoring Wells 2 and 3 are in the enhanced wetland and Wells 5, 6, and 13 are in the restored non-riparian wetland. KCI is currently investigating the areas that are not meeting the hydrologic success. Summary information/data related to the occurrence of items such as beaver or encroachment and statistics related to performance of various project and monitoring elements can be found in the tables and figures in the report appendices. Narrative background and supporting information formerly found in these reports can be found in the Baseline Monitoring Report (formerly Mitigation Plan) and in the Mitigation Plan (formerly the Restoration Plan) documents available on the EEP’s website. All raw data supporting the tables and figures in the appendices are available from the EEP upon request. 2.0 METHODOLOGY The Level 2 of the CVS-EEP protocol (http://cvs.bio.unc.edu/methods.htm) was used to collect vegetation data from the UT Pembroke site. 3.0 REFERENCES Lee, M. T., R. K. Peet, S. D. Roberts, and T. R. Wentworth. 2006. CVS-EEP Protocol for Recording
Vegetation, Version 4.0 (http://cvs.bio.unc.edu/methods.htm) Weakley, A. S. 2006. Flora of the Carolinas, Virginia, Georgia, and Surrounding Areas.
(http://www.herbarium.unc.edu/FloraArchives/WeakleyFlora_2006-Jan.pdf) KCI, 2012. UT Pembroke Creek Wetland and Stream Restoration Site Repair Baseline Report.

UT Pembroke KCI Associates of North Carolina EEP Project # 283 2012- MY05
3
Appendix A
Project Vicinity Map and Background Tables
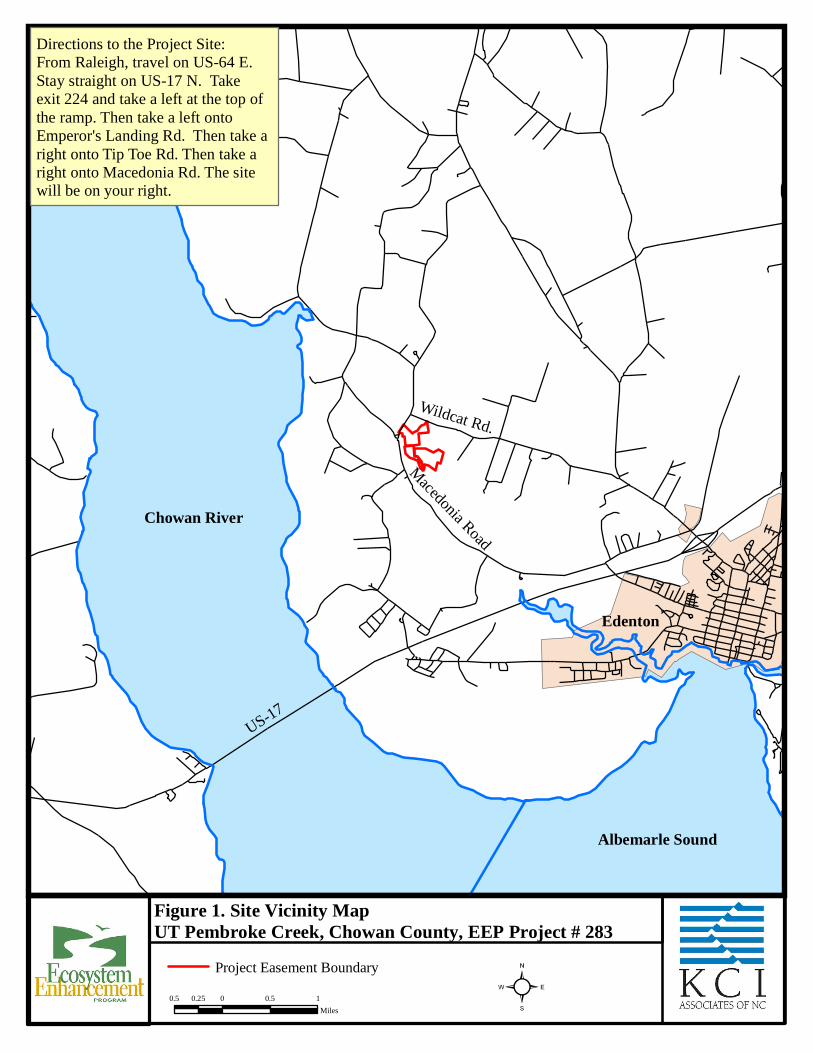
Figure 1. Site Vicinity MapUT Pembroke Creek, Chowan County, EEP Project # 283
²0.5 0 0.5 10.25Miles
Chowan River
Albemarle Sound
Macedonia Road
Wildcat Rd.
US-17
Edenton
Project Easement Boundary
Directions to the Project Site:From Raleigh, travel on US-64 E. Stay straight on US-17 N. Take exit 224 and take a left at the top of the ramp. Then take a left onto Emperor's Landing Rd. Then take a right onto Tip Toe Rd. Then take a right onto Macedonia Rd. The site will be on your right.

UT Pembroke KCI Associates of North Carolina EEP Project # 283 2012- MY05
5
Segment/ Reach ID E
xist
ing
Lin
ear
Feet
Res
tora
tion
Lev
el
App
roac
h
Lin
ear
Feet
/ A
crea
ge
Stationing Miti
gatio
n R
atio
Miti
gatio
n U
nits
BM
P E
lem
ents
CommentHeadwater Wetland Valley
- R - 4,488 lf 00+00 to 34+73 and 40+00 to 58+72 1:1 4,488 -
This feature is 100 feet wide for its entire length, encompassing 9.96 acres.
Riparian Wetlands - R - 13.81 ac - 1:1 13.81 -
Non-Riparian Wetlands - R - 4.46 ac - 1:1 4.46 -
Non-Riparian Wetlands - E - 5.26 ac - 2:1 2.63 -
Riparian Wooded Wetlands
- P - 8.95 ac - 5:1 1.79 -
Non-Riparian Wooded Wetlands
- P - 25.92 ac - 5:1 5.18 -
R = Restoration E = Enhancement P = Preservation
Table 1a. Project Restoration Components Project Number and Name: 283 - UT to Pembroke Creek
Restoration Stream Non-Ripar Upland BufferLevel (lf) (Ac) (Ac) (Ac) BMP
Riverine Non-RiverineRestoration 4,488 13.81 4.46Enhancement 5.26Enhancement I Enhancement IICreationPreservation 8.95 25.92HQ Preservation
0 22.76Totals
(Feet/Acres) 4,488 35.64 0
MU Totals 4,488 12.27 0
Table 1b. Project Component Summations Project Number and Name: 283 - UT to Pembroke Creek
RiparianWetland (Ac)
22.76
15.60
UT Pembroke KCI Associates of North Carolina EEP Project # 283 2012- MY05
6
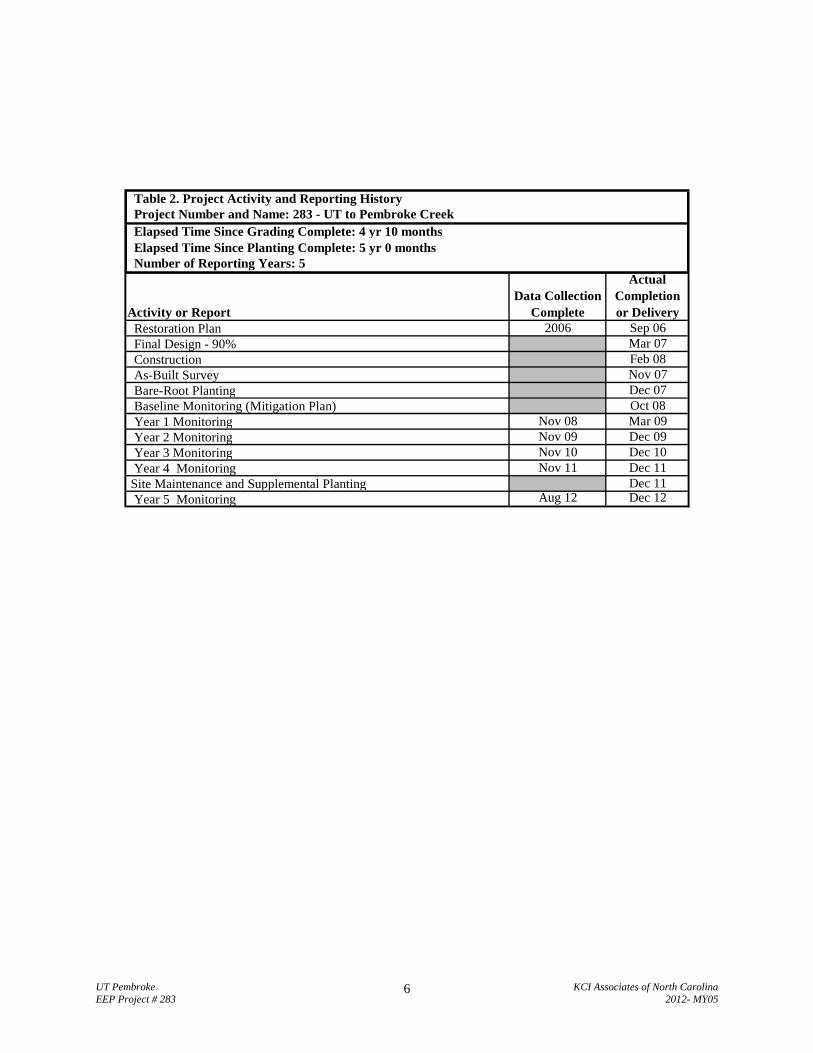
Project Number and Name: 283 - UT to Pembroke Creek Elapsed Time Since Grading Complete: 4 yr 10 months Elapsed Time Since Planting Complete: 5 yr 0 months Number of Reporting Years: 5
Restoration Plan 2006 Sep 06 Final Design - 90% Mar 07 Construction Feb 08 As-Built Survey Nov 07 Bare-Root Planting Dec 07 Baseline Monitoring (Mitigation Plan) Oct 08 Year 1 Monitoring Nov 08 Mar 09 Year 2 Monitoring Nov 09 Dec 09 Year 3 Monitoring Nov 10 Dec 10 Year 4 Monitoring Nov 11 Dec 11 Site Maintenance and Supplemental Planting Dec 11 Year 5 Monitoring Aug 12 Dec 12
Table 2. Project Activity and Reporting History
Activity or ReportData Collection
Complete
Actual Completion or Delivery
UT Pembroke KCI Associates of North Carolina EEP Project # 283 2012- MY05
7
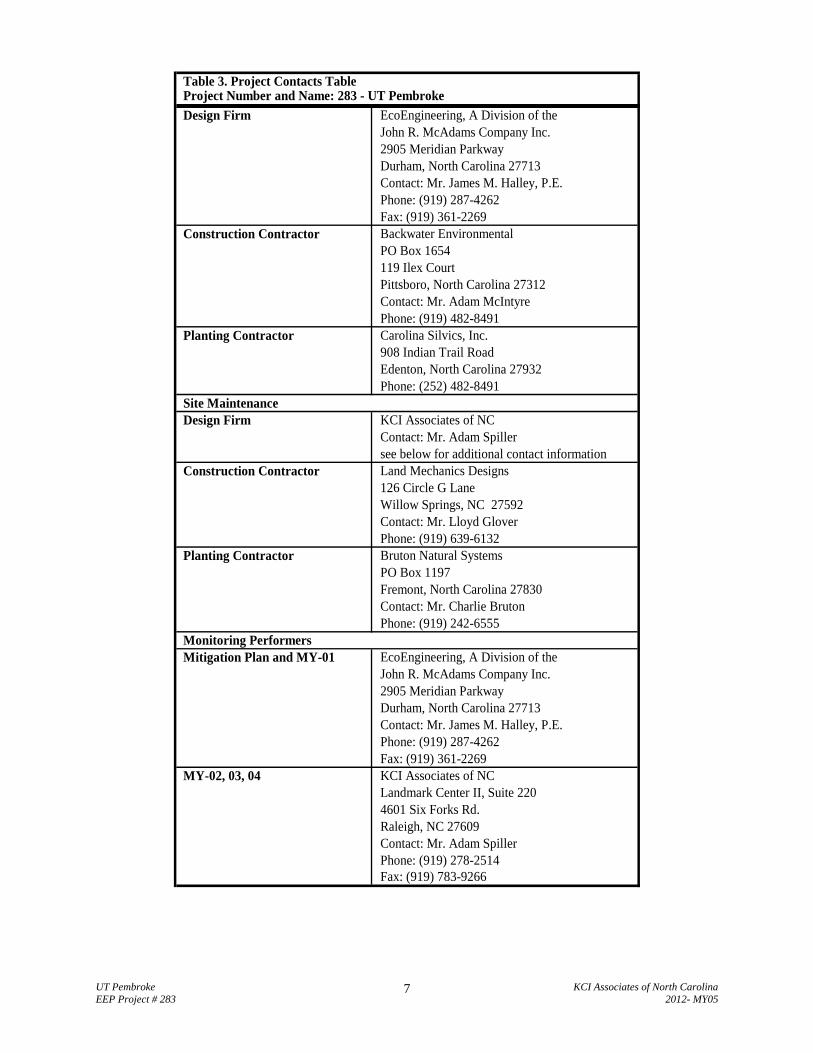
Design Firm EcoEngineering, A Division of the John R. McAdams Company Inc. 2905 Meridian Parkway Durham, North Carolina 27713 Contact: Mr. James M. Halley, P.E. Phone: (919) 287-4262 Fax: (919) 361-2269
Construction Contractor Backwater Environmental PO Box 1654 119 Ilex Court Pittsboro, North Carolina 27312 Contact: Mr. Adam McIntyre Phone: (919) 482-8491
Planting Contractor Carolina Silvics, Inc. 908 Indian Trail Road Edenton, North Carolina 27932 Phone: (252) 482-8491
Site Maintenance Design Firm KCI Associates of NC
Contact: Mr. Adam Spiller see below for additional contact information
Construction Contractor Land Mechanics Designs 126 Circle G Lane Willow Springs, NC 27592 Contact: Mr. Lloyd Glover Phone: (919) 639-6132
Planting Contractor Bruton Natural Systems PO Box 1197 Fremont, North Carolina 27830 Contact: Mr. Charlie Bruton Phone: (919) 242-6555
Mitigation Plan and MY-01 EcoEngineering, A Division of the John R. McAdams Company Inc. 2905 Meridian Parkway Durham, North Carolina 27713 Contact: Mr. James M. Halley, P.E. Phone: (919) 287-4262 Fax: (919) 361-2269
MY-02, 03, 04 KCI Associates of NC Landmark Center II, Suite 220 4601 Six Forks Rd. Raleigh, NC 27609 Contact: Mr. Adam Spiller Phone: (919) 278-2514 Fax: (919) 783-9266
Table 3. Project Contacts Table Project Number and Name: 283 - UT Pembroke
Monitoring Performers
UT Pembroke KCI Associates of North Carolina EEP Project # 283 2012- MY05
8
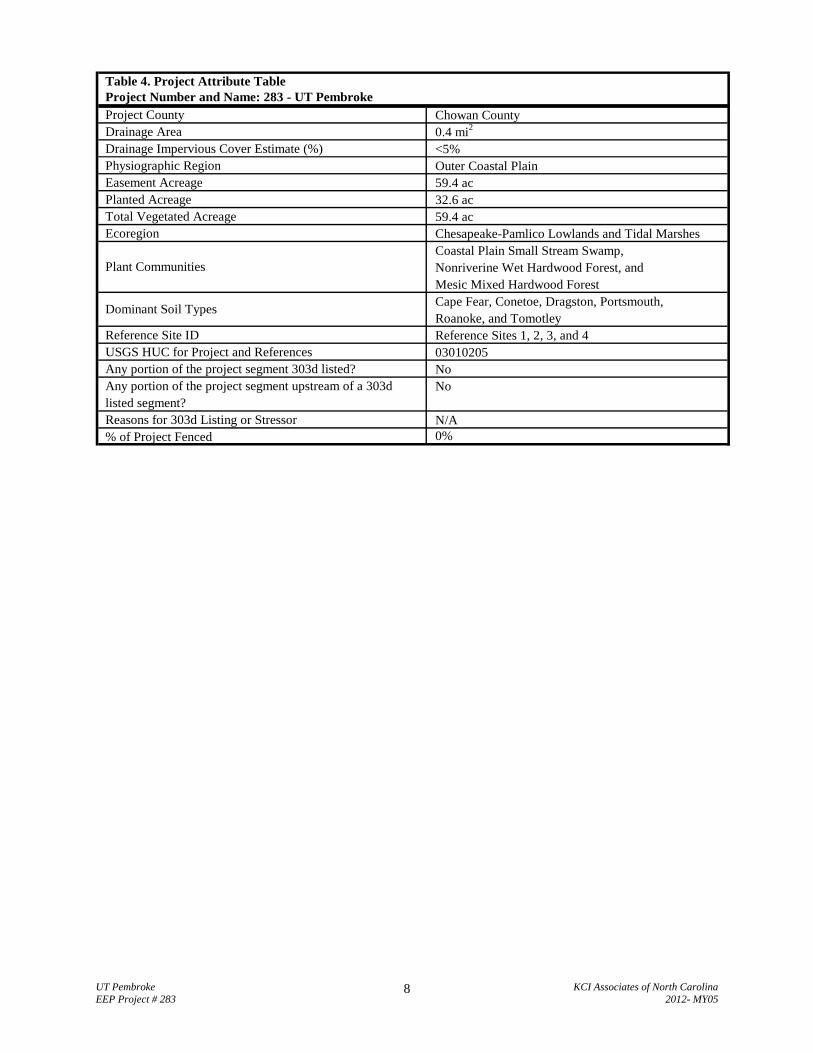
Project County Chowan County Drainage Area 0.4 mi2
Drainage Impervious Cover Estimate (%) <5% Physiographic Region Outer Coastal Plain Easement Acreage 59.4 ac Planted Acreage 32.6 ac Total Vegetated Acreage 59.4 ac Ecoregion Chesapeake-Pamlico Lowlands and Tidal Marshes
Coastal Plain Small Stream Swamp, Nonriverine Wet Hardwood Forest, and Mesic Mixed Hardwood Forest Cape Fear, Conetoe, Dragston, Portsmouth, Roanoke, and Tomotley
Reference Site ID Reference Sites 1, 2, 3, and 4 USGS HUC for Project and References 03010205 Any portion of the project segment 303d listed? No Any portion of the project segment upstream of a 303d No listed segment? Reasons for 303d Listing or Stressor N/A % of Project Fenced 0%
Plant Communities
Dominant Soil Types
Table 4. Project Attribute Table Project Number and Name: 283 - UT Pembroke

UT Pembroke KCI Associates of North Carolina EEP Project # 283 2012- MY05
9
Appendix B
Visual Assessment Data

UT Pembroke KCI Associates of North Carolina EEP Project # 283 2012- MY05
12
Table 5. Vegetation Condition AssessmentProject Number and Name: 283 - UT to Pembroke Creek Wetland and Stream
Planted Acreage 32.6 Easement Acreage 59.4
1. Bare AreasVery limited cover of both woody and herbaceous material. 0.1 acres Pattern and Color 1 0.30 0.9%
2. Low Stem Density Areas
Woody stem densities clearly below target levels based on MY3, 4, or 5 stem count criteria.
0.1 acresNot Depicted, Covers Most of Restoration
Area0 0.00 0.0%
1 0.30 0.9%
3. Areas of Poor Growth Rates or Vigor
Areas with woody stems of a size class that are obviously small given the monitoring year.
0.25 acres Pattern and Color 0 0.00 0.0%
1 0.30 0.9%
4. Invasive Areas of Concern
Areas or points (if too small to render as polygons at map scale). 1000 SF Pattern and Color 1 1.40 2.4%
5. Easement Encroachment Areas
Areas or points (if too small to render as polygons at map scale). none Pattern and Color 0 0.00 0.0%
% of Planted Acreage
Total
Cumulative Total
Vegetation Category Definitions Mapping Threshold CCPV DepictionNumber of Polygons
Combined Acreage
UT Pembroke KCI Associates of North Carolina EEP Project # 283 2012- MY05
13
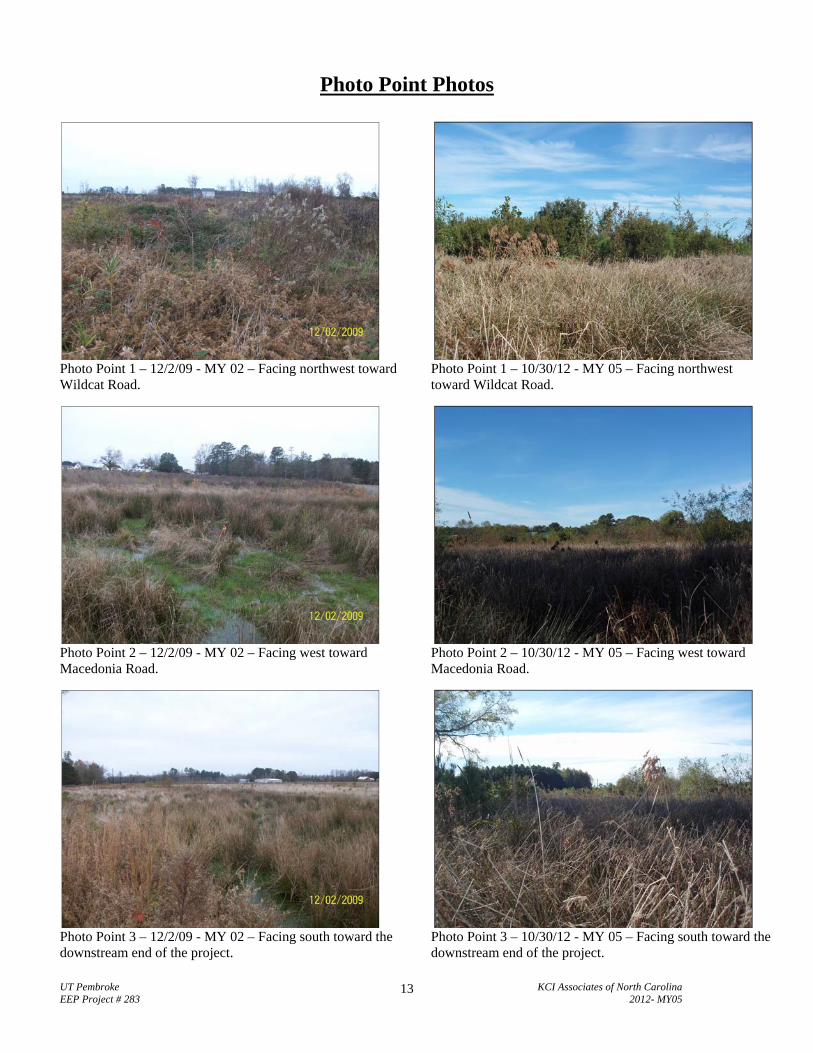
Photo Point Photos
Photo Point 1 – 12/2/09 - MY 02 – Facing northwest toward Wildcat Road.
Photo Point 2 – 12/2/09 - MY 02 – Facing west toward Macedonia Road.
Photo Point 3 – 12/2/09 - MY 02 – Facing south toward the downstream end of the project.
Photo Point 1 – 10/30/12 - MY 05 – Facing northwest toward Wildcat Road.
Photo Point 2 – 10/30/12 - MY 05 – Facing west toward Macedonia Road.
Photo Point 3 – 10/30/12 - MY 05 – Facing south toward the downstream end of the project.
UT Pembroke KCI Associates of North Carolina EEP Project # 283 2012- MY05
14
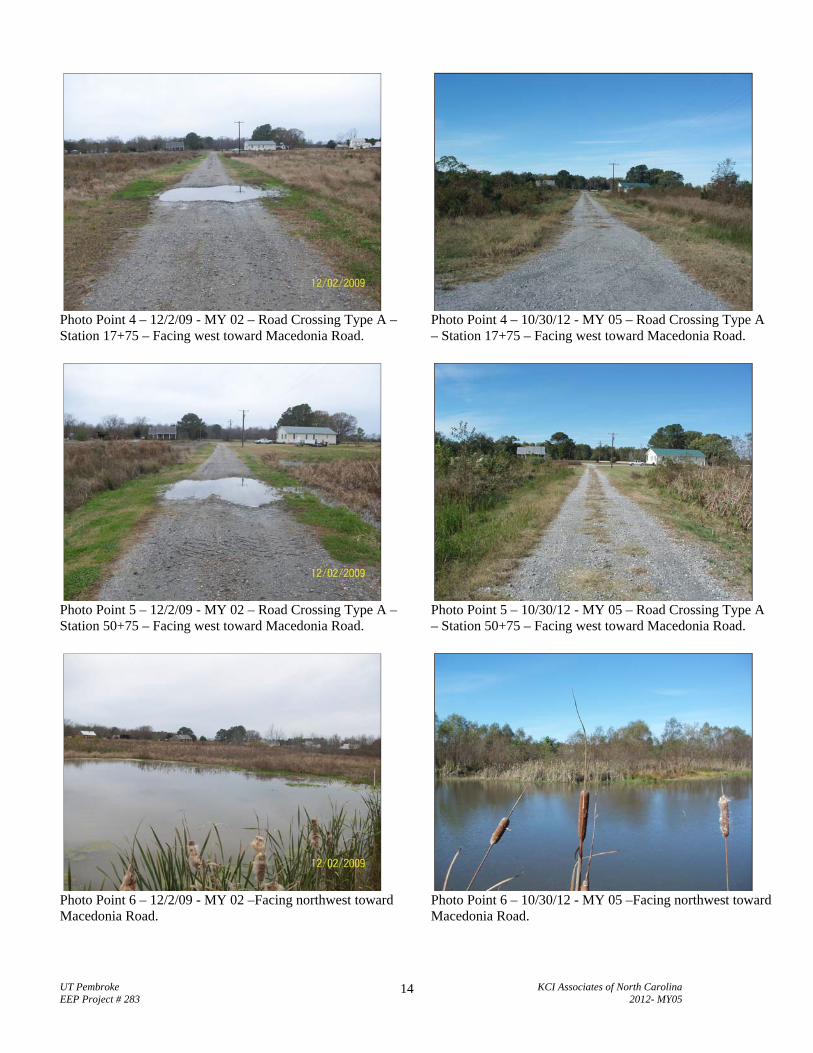
Photo Point 4 – 12/2/09 - MY 02 – Road Crossing Type A – Station 17+75 – Facing west toward Macedonia Road.
Photo Point 5 – 12/2/09 - MY 02 – Road Crossing Type A – Station 50+75 – Facing west toward Macedonia Road.
Photo Point 6 – 12/2/09 - MY 02 –Facing northwest toward Macedonia Road.
Photo Point 4 – 10/30/12 - MY 05 – Road Crossing Type A – Station 17+75 – Facing west toward Macedonia Road.
Photo Point 5 – 10/30/12 - MY 05 – Road Crossing Type A – Station 50+75 – Facing west toward Macedonia Road.
Photo Point 6 – 10/30/12 - MY 05 –Facing northwest toward Macedonia Road.
UT Pembroke KCI Associates of North Carolina EEP Project # 283 2012- MY05
15
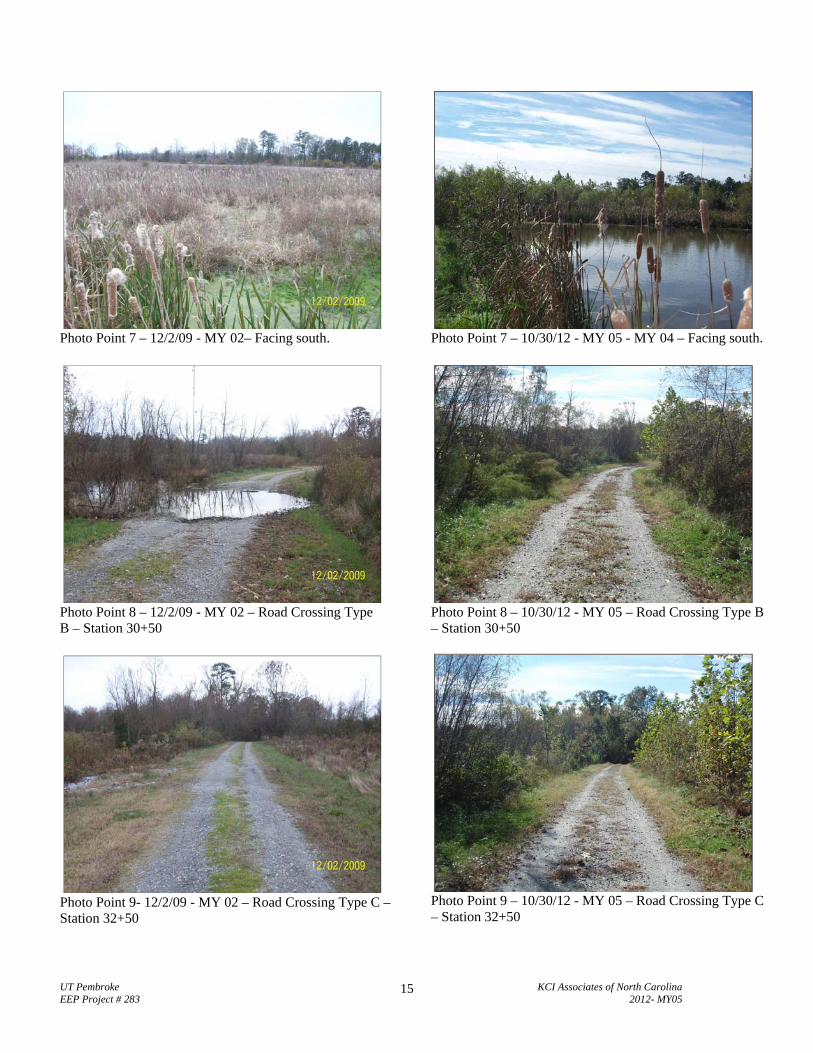
Photo Point 7 – 12/2/09 - MY 02– Facing south.
Photo Point 8 – 12/2/09 - MY 02 – Road Crossing Type B – Station 30+50
Photo Point 9- 12/2/09 - MY 02 – Road Crossing Type C – Station 32+50
Photo Point 7 – 10/30/12 - MY 05 - MY 04 – Facing south.
Photo Point 8 – 10/30/12 - MY 05 – Road Crossing Type B – Station 30+50
Photo Point 9 – 10/30/12 - MY 05 – Road Crossing Type C – Station 32+50
UT Pembroke KCI Associates of North Carolina EEP Project # 283 2012- MY05
16
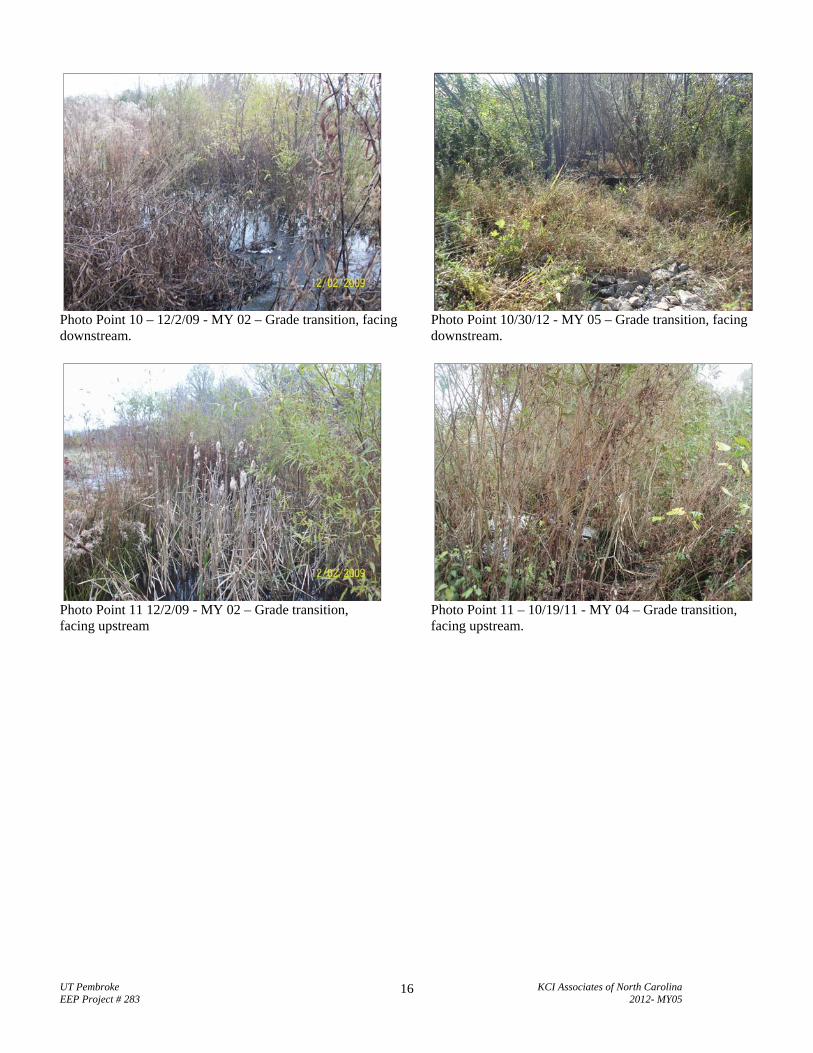
Photo Point 10 – 12/2/09 - MY 02 – Grade transition, facing downstream.
Photo Point 11 12/2/09 - MY 02 – Grade transition, facing upstream
Photo Point 10/30/12 - MY 05 – Grade transition, facing downstream.
Photo Point 11 – 10/19/11 - MY 04 – Grade transition, facing upstream.
UT Pembroke KCI Associates of North Carolina EEP Project # 283 2012- MY05
17
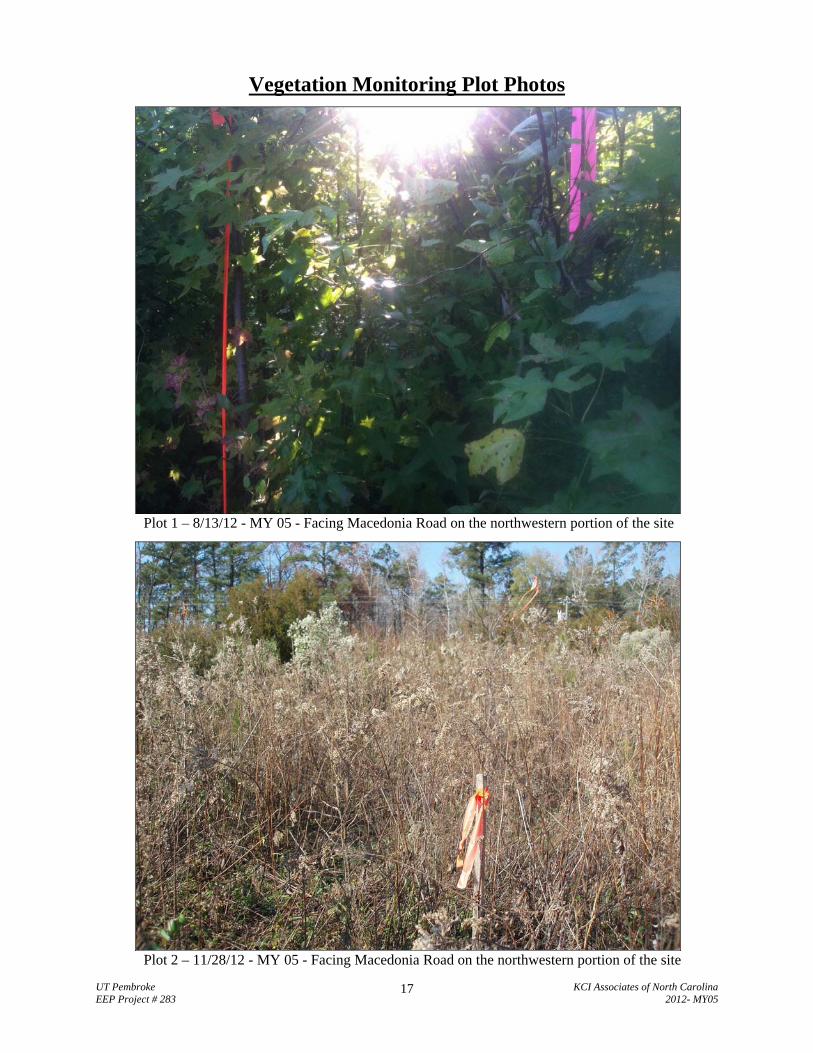
Vegetation Monitoring Plot Photos
Plot 1 – 8/13/12 - MY 05 - Facing Macedonia Road on the northwestern portion of the site
Plot 2 – 11/28/12 - MY 05 - Facing Macedonia Road on the northwestern portion of the site
UT Pembroke KCI Associates of North Carolina EEP Project # 283 2012- MY05
18
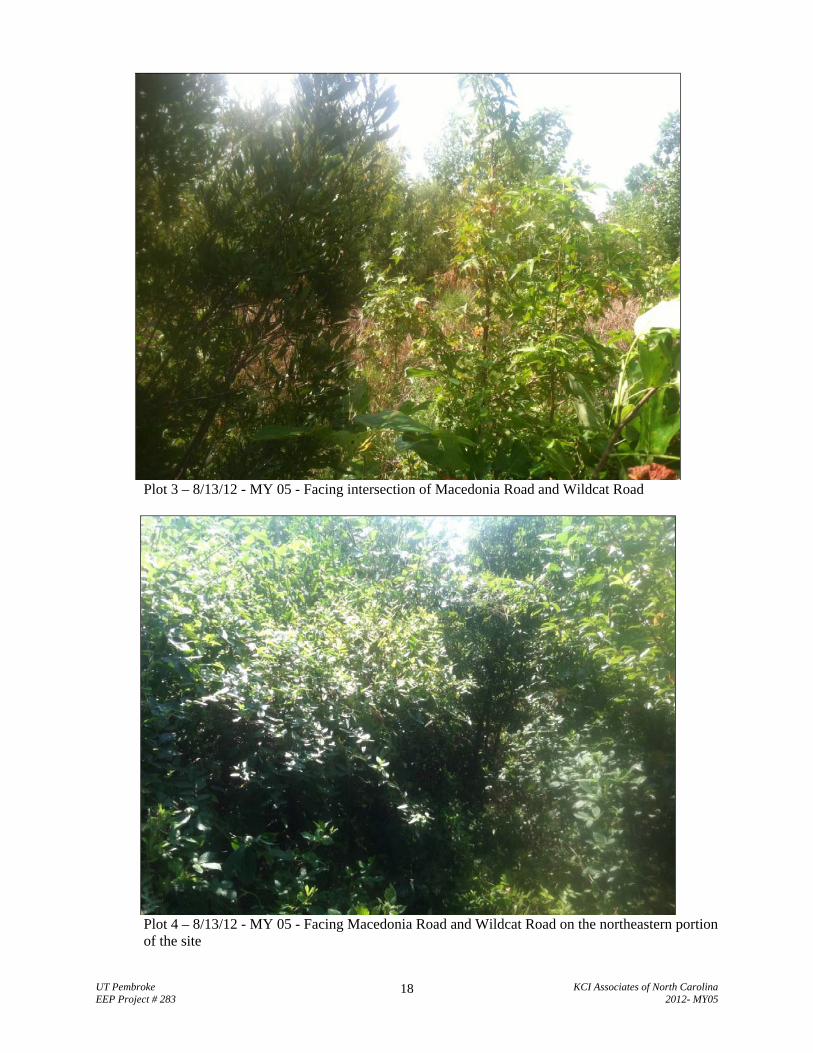
Plot 3 – 8/13/12 - MY 05 - Facing intersection of Macedonia Road and Wildcat Road
Plot 4 – 8/13/12 - MY 05 - Facing Macedonia Road and Wildcat Road on the northeastern portion of the site
UT Pembroke KCI Associates of North Carolina EEP Project # 283 2012- MY05
19
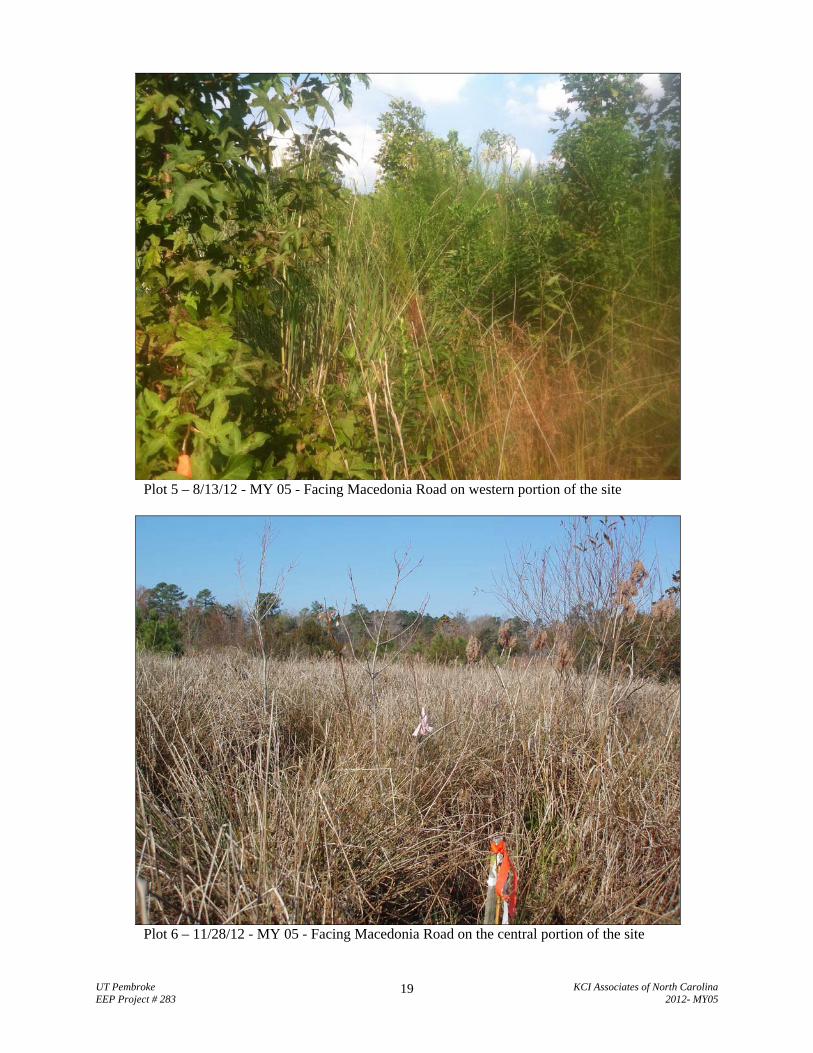
Plot 5 – 8/13/12 - MY 05 - Facing Macedonia Road on western portion of the site
Plot 6 – 11/28/12 - MY 05 - Facing Macedonia Road on the central portion of the site
UT Pembroke KCI Associates of North Carolina EEP Project # 283 2012- MY05
20
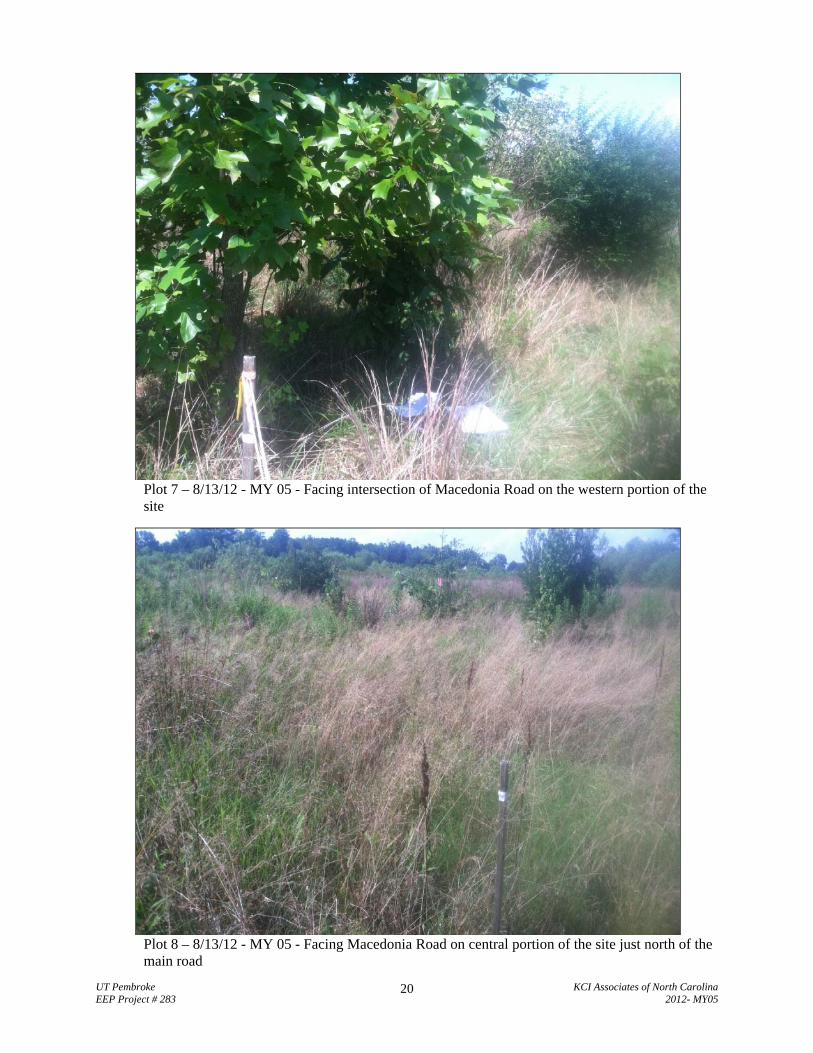
Plot 7 – 8/13/12 - MY 05 - Facing intersection of Macedonia Road on the western portion of the site
Plot 8 – 8/13/12 - MY 05 - Facing Macedonia Road on central portion of the site just north of the main road
UT Pembroke KCI Associates of North Carolina EEP Project # 283 2012- MY05
21
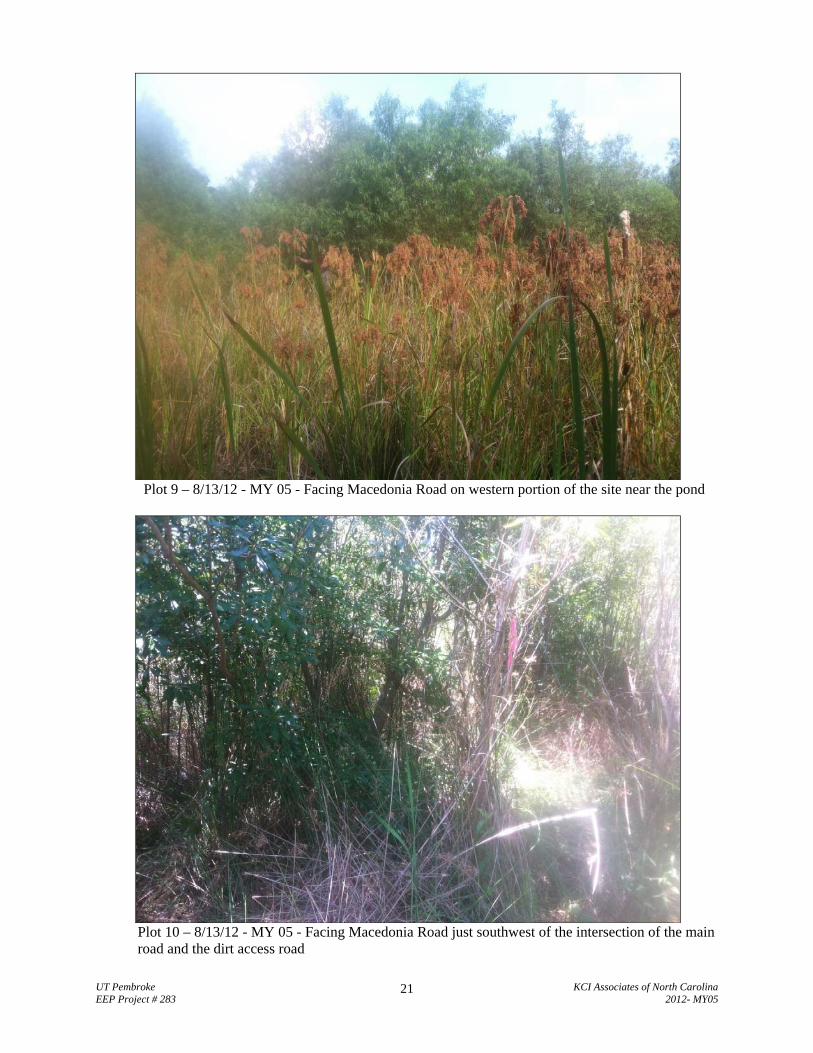
Plot 9 – 8/13/12 - MY 05 - Facing Macedonia Road on western portion of the site near the pond
Plot 10 – 8/13/12 - MY 05 - Facing Macedonia Road just southwest of the intersection of the main road and the dirt access road
UT Pembroke KCI Associates of North Carolina EEP Project # 283 2012- MY05
22
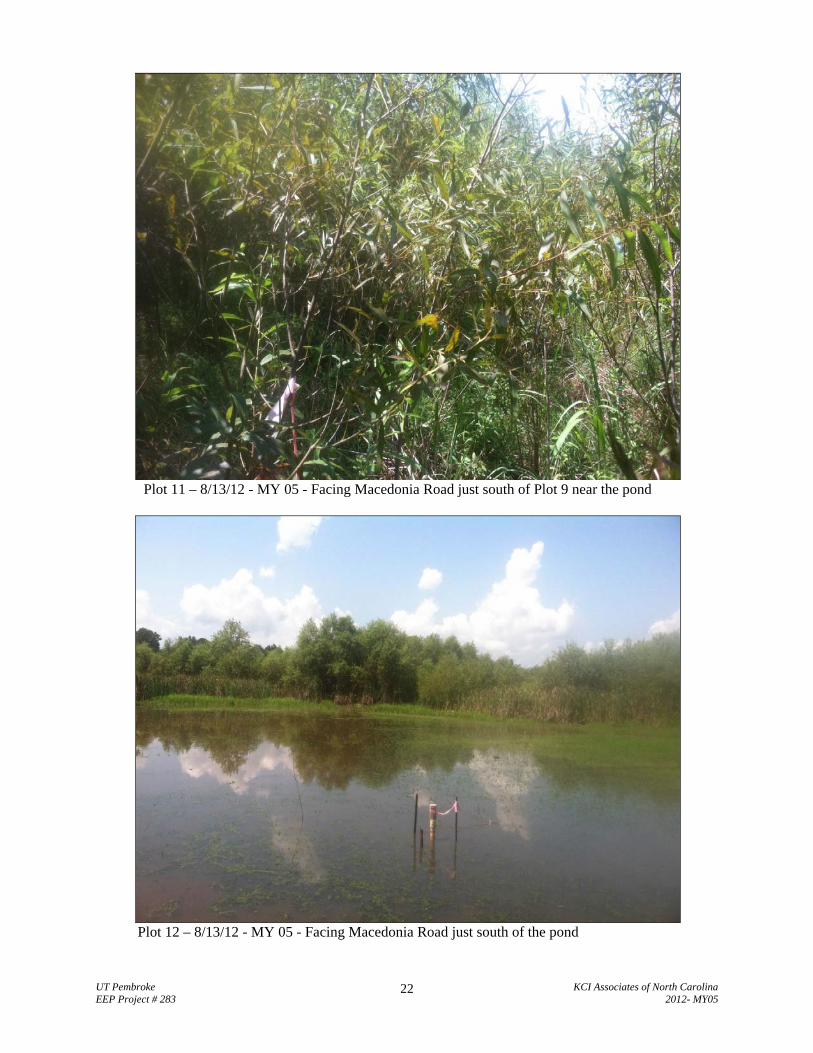
Plot 11 – 8/13/12 - MY 05 - Facing Macedonia Road just south of Plot 9 near the pond
Plot 12 – 8/13/12 - MY 05 - Facing Macedonia Road just south of the pond
UT Pembroke KCI Associates of North Carolina EEP Project # 283 2012- MY05
23
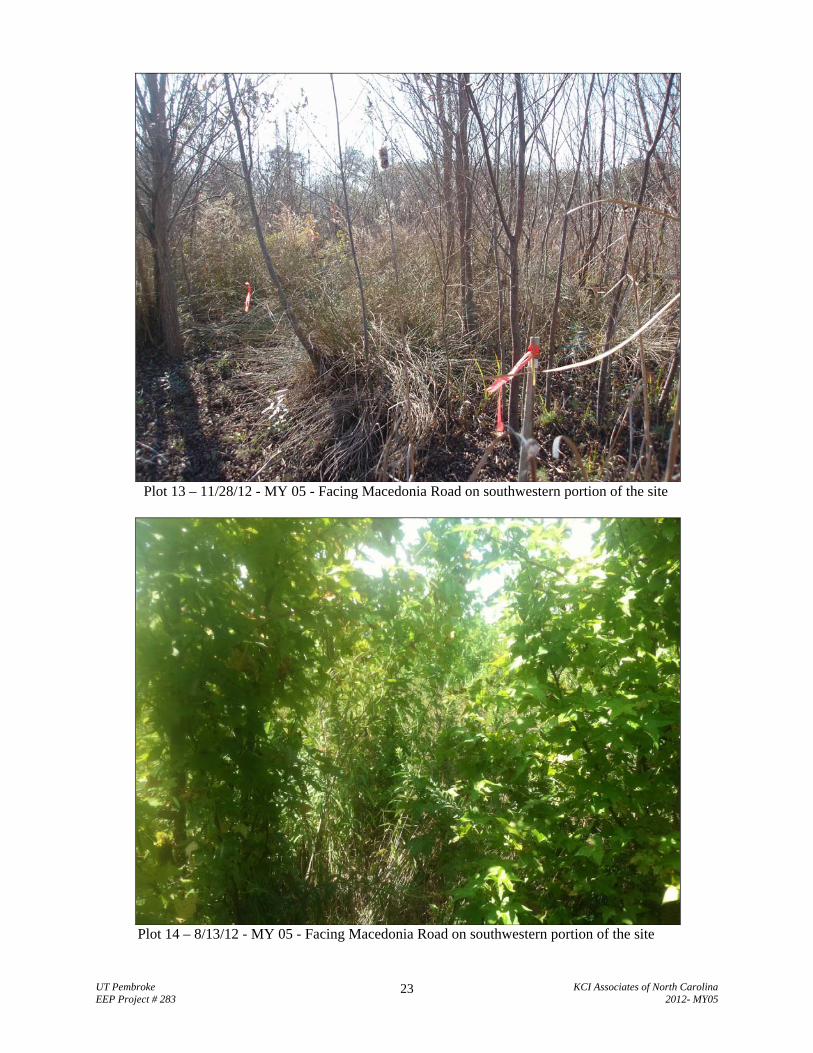
Plot 13 – 11/28/12 - MY 05 - Facing Macedonia Road on southwestern portion of the site
Plot 14 – 8/13/12 - MY 05 - Facing Macedonia Road on southwestern portion of the site
UT Pembroke KCI Associates of North Carolina EEP Project # 283 2012- MY05
24
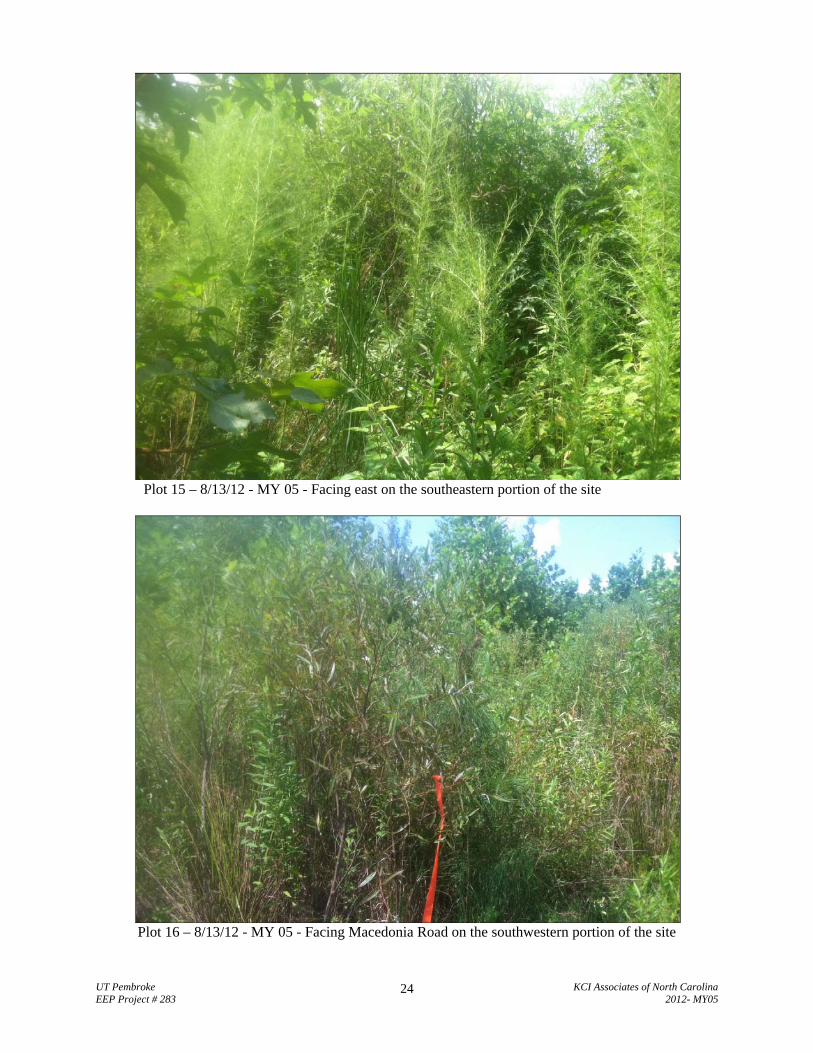
Plot 15 – 8/13/12 - MY 05 - Facing east on the southeastern portion of the site
Plot 16 – 8/13/12 - MY 05 - Facing Macedonia Road on the southwestern portion of the site
UT Pembroke KCI Associates of North Carolina EEP Project # 283 2012- MY05
25
Appendix C
Vegetation Plot Data
UT Pembroke KCI Associates of North Carolina EEP Project # 283 2012- MY05
26
Vegetation Plot IDMonitoring Year 05
Planted Stem Density (260 stems/acre)
Vegetation Survival Threshold Met?
Monitoring Year 05 Total Stem Density
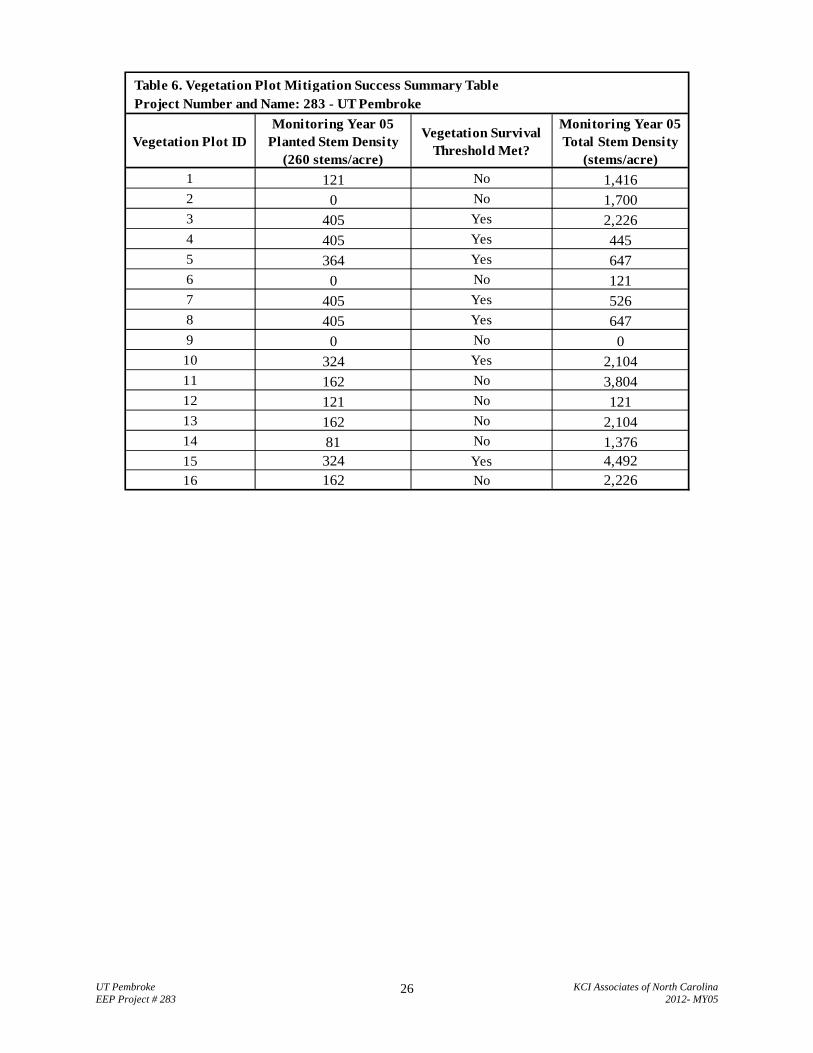
(stems/acre)1 121 No 1,4162 0 No 1,7003 405 Yes 2,2264 405 Yes 4455 364 Yes 6476 0 No 1217 405 Yes 5268 405 Yes 6479 0 No 010 324 Yes 2,10411 162 No 3,80412 121 No 12113 162 No 2,10414 81 No 1,37615 324 Yes 4,49216 162 No 2,226
Table 6. Vegetation Plot Mitigation Success Summary Table Project Number and Name: 283 - UT Pembroke

UT Pembroke KCI Associates of North Carolina EEP Project # 283 2012- MY05
27
Table 7. CVS Vegetation Plot MetadataProject Number and Name: 283 - UT PembrokeReport Prepared By April HelmsDate Prepared 10/30/2012 9:11database name KCI‐2012‐A.mdbdatabase location M:\2007\12071067_2007 EEP OPEN END\Veg_databasecomputer name 12‐CV76KF1file size 59768832DESCRIPTION OF WORKSHEETS IN THIS DOCUMENT------------
MetadataDescription of database file, the report worksheets, and a summary of project(s) and project data.
Proj, plantedEach project is listed with its PLANTED stems per acre, for each year. This excludes live stakes.
Proj, total stemsEach project is listed with its TOTAL stems per acre, for each year. This includes live stakes, all planted stems, and all natural/volunteer stems.
PlotsList of plots surveyed with location and summary data (live stems, dead stems, missing, etc.).
Vigor Frequency distribution of vigor classes for stems for all plots.Vigor by Spp Frequency distribution of vigor classes listed by species.
DamageList of most frequent damage classes with number of occurrences and percent of total stems impacted by each.
Damage by Spp Damage values tallied by type for each species.Damage by Plot Damage values tallied by type for each plot.Planted Stems by Plot and Spp
A matrix of the count of PLANTED living stems of each species for each plot; dead and missing stems are excluded.
ALL Stems by Plot and sppA matrix of the count of total living stems of each species (planted and natural volunteers combined) for each plot; dead and missing stems are excluded.
PROJECT SUMMARY-------------------------------------Project Code 283project Name UT PembrokeDescription Stream and wetland restoration site in Chowan County, NCRiver Basin Roanokelength(ft) 4,488stream-to-edge width (ft) 50area (sq m) 41,691Required Plots (calculated) 11Sampled Plots 16
UT Pembroke KCI Associates of North Carolina EEP Project # 283 2010 - MY03
28
PnoLS P-all T PnoLS P-all T PnoLS P-all T PnoLS P-all T PnoLS P-all T PnoLS P-all T PnoLS P-all T PnoLS P-all TAcer rubrum red maple Tree 18 2 4Baccharis baccharis Shrub 2Carya hickory Tree 1 1Diospyros virginiana common persimmon TreeFraxinus pennsylvanica green ash TreeItea virginica Virginia sweetspire ShrubJuglans nigra black walnut Tree 1Juniperus virginiana Eastern red cedar Tree 2Ligustrum sinense Chinese privet ExoticLiquidambar styraciflua sweetgum Tree 32 16 4 1 4 1Liriodendron tulipifera tuliptree Tree 1 1 1 3 3 3 7 7 7 3 3 3 4 4 4Morella cerifera wax myrtle shrub 4 4 8 1 1 1Morus mulberry Tree 2Nyssa biflora swamp tupelo Tree 1 1 1 7 7 7Persea palustris swamp bay treePinus taeda loblolly pine Tree 22Platanus occidentalis American sycamore Tree 19Populus deltoides eastern cottonwood TreePrunus serotina black cherry TreePyrus calleryana Callery pear ExoticQuercus oak Tree 1Quercus alba white oak Tree 1 1 1Quercus falcata southern red oak TreeQuercus laurifolia laurel oak Tree 1 1 1 1 1 1Quercus lyrata overcup oak TreeQuercus michauxii swamp chestnut oak Tree 1 1 1 2 2 2 1Quercus nigra water oak Tree 1 1 1 1 1 1 2 2 2 1 1 1 1 1 1Quercus phellos willow oak Tree 1 1 1Rhus sumac shrubRhus copallinum flameleaf sumac shrubSalix nigra black willow Tree 1Salix sericea silky willow ShrubSambucus canadensis Common Elderberry Shrub 1 1 1 3 3 3Sambucus nigra European black elderberry ShrubTaxodium distichum bald cypress TreeUlmus americana American elm Tree 3 3 3 1 1 1
3 3 35 0 0 42 10 10 55 10 10 11 9 9 16 0 0 3 10 10 13 10 10 16
3 3 4 0 0 4 5 5 8 3 3 4 5 5 8 0 0 2 4 4 7 4 4 7121 121 1416 0 0 1700 405 405 2226 405 405 445 364 364 647 0 0 121 405 405 526 405 405 647
Table 8. Stem Count Total and Planted by Plot and Species Project Number and Name: 283 - UT Pembroke
Scientific Name Common NameSpecies
TypeE283-01-0001 E283-01-0002
Current Plot Data (MY5 2012)E283-01-0003 E283-01-0004 E283-01-0005 E283-01-0006 E283-01-0007 E283-01-0008
Stem count1
Species count0.02 0.02 0.02 0.02 0.02
1 1 1 1
Stems per ACRE
1 1 10.02 0.02 0.02
size (ares)size (ACRES)

UT Pembroke KCI Associates of North Carolina EEP Project # 283 2010 - MY03
29
PnoLS P-all T PnoLS P-all T PnoLS P-all T PnoLS P-all T PnoLS P-all T PnoLS P-all T PnoLS P-all T PnoLS P-all TAcer rubrum red maple Tree 7 6 2Baccharis baccharis Shrub 1 4 5Carya hickory TreeDiospyros virginiana common persimmon TreeFraxinus pennsylvanica green ash Tree 1 1 1Itea virginica Virginia sweetspire ShrubJuglans nigra black walnut TreeJuniperus virginiana Eastern red cedar TreeLigustrum sinense Chinese privet ExoticLiquidambar styraciflua sweetgum Tree 2 1 11 72 11Liriodendron tulipifera tuliptree Tree 1 1 1Morella cerifera wax myrtle shrub 3 3 3 1 1 1 16 3 7 3Morus mulberry TreeNyssa biflora swamp tupelo Tree 3 3 3Persea palustris swamp bay tree 1 1 1Pinus taeda loblolly pine Tree 3 11Platanus occidentalis American sycamore Tree 8 3 11Populus deltoides eastern cottonwood Tree 2Prunus serotina black cherry TreePyrus calleryana Callery pear ExoticQuercus oak Tree 2 2 1Quercus alba white oak Tree 3 3 4Quercus falcata southern red oak TreeQuercus laurifolia laurel oak TreeQuercus lyrata overcup oak Tree 2 2 2 2 2 2Quercus michauxii swamp chestnut oak Tree 3 3 3Quercus nigra water oak Tree 1 1 1 1 1 1Quercus phellos willow oak TreeRhus sumac shrubRhus copallinum flameleaf sumac shrubSalix nigra black willow Tree 33 84 23 7 5 21Salix sericea silky willow ShrubSambucus canadensis Common Elderberry ShrubSambucus nigra European black elderberry ShrubTaxodium distichum bald cypress Tree 3 3 3 2 2 2Ulmus americana American elm Tree 2 2 2 2 2 2 1 1 1 1 1 1
0 0 0 8 8 52 4 4 94 3 3 3 4 4 52 2 2 34 8 8 111 4 4 55
0 0 0 3 3 7 3 3 7 1 1 1 3 3 8 1 1 7 4 4 10 3 3 80 0 0 324 324 2104 162 162 3804 121 121 121 162 162 2104 81 81 1376 324 324 4492 162 162 2226Stems per ACRE
1 1 1
Species count0.02 0.02
Stem countsize (ares)
size (ACRES)1 1
0.02 0.021
0.02 0.02 0.02 0.021 1
E283-01-0013 E283-01-0014 E283-01-0015
Table 8. Stem Count Total and Planted by Plot and Species continued Project Number and Name: 283 - UT Pembroke
Current Plot Data (MY5 2012)
Scientific Name Common NameSpecies
TypeE283-01-0016E283-01-0009 E283-01-0010 E283-01-0011 E283-01-0012
UT Pembroke KCI Associates of North Carolina EEP Project # 283 2010 - MY03
30
PnoLS P-all T PnoLS P-all T PnoLS P-all T PnoLS P-all T PnoLS P-all T PnoLS P-all TAcer rubrum red maple Tree 39 21 18 31Baccharis baccharis Shrub 12 7 9 6Carya hickory Tree 2 1Diospyros virginiana common persimmon Tree 5Fraxinus pennsylvanica green ash Tree 1 1 1 1Itea virginica Virginia sweetspire Shrub 5 5 5Juglans nigra black walnut Tree 1 4 2 3Juniperus virginiana Eastern red cedar Tree 2Ligustrum sinense Chinese privet Exotic 1Liquidambar styraciflua sweetgum Tree 155 177 148 178Liriodendron tulipifera tuliptree Tree 19 19 19 19 19 19 19 19 19 21 21 24 16 16 16 36 36 36Morella cerifera wax myrtle shrub 9 9 42 9 9 22 9 9 13 9 9 11 11 11 11 17 17 17Morus mulberry Tree 2Nyssa biflora swamp tupelo Tree 11 11 11 11 11 11 11 11 11 14 14 14 16 16 16 34 34 34Persea palustris swamp bay tree 1 1 1 1 1 1 1 1 1 1 1 1 3 3 3 7 7 7Pinus taeda loblolly pine Tree 36 2Platanus occidentalis American sycamore Tree 41 36 1 1 30 1 1 6Populus deltoides eastern cottonwood Tree 2 1Prunus serotina black cherry Tree 3Pyrus calleryana Callery pear Exotic 1Quercus oak Tree 6 5 2Quercus alba white oak Tree 4 4 5 3 3 4 4 4 5 4 4 4 2 2 2 4 4 4Quercus falcata southern red oak Tree 1 1 1Quercus laurifolia laurel oak Tree 2 2 2 2 2 2 2 2 2 2 2 2 6 6 6 34 34 34Quercus lyrata overcup oak Tree 4 4 4 4 4 4 4 4 5 4 4 4 3 3 3 6 6 6Quercus michauxii swamp chestnut oak Tree 6 6 7 8 8 8 8 8 8 10 10 10 13 13 13 19 19 19Quercus nigra water oak Tree 8 8 8 8 8 8 8 8 8 10 10 10 8 8 8 23 23 23Quercus phellos willow oak Tree 1 1 1 1 1 120 1 1 91 1 1 1Rhus sumac shrub 4 6Rhus copallinum flameleaf sumac shrub 12Salix nigra black willow Tree 174 63Salix sericea silky willow Shrub 56Sambucus canadensis Common Elderberry Shrub 4 4 4 6 6 6 6 6 6 6 6 6Sambucus nigra European black elderberry Shrub 7 7 7 9 9 9Taxodium distichum bald cypress Tree 5 5 5 1Ulmus americana American elm Tree 10 10 9 10 10 11 10 10 10 11 11 11 15 15 15 31 31 31
85 85 591 82 82 470 84 84 396 95 95 468 100 100 100 225 225 225
14 14 26 12 12 19 13 13 21 14 14 28 11 11 11 12 12 12215 215 1495 207 207 1189 212 212 1002 240 240 1184 253 253 253 569 569 569
Table 8. Stem Count Total and Planted by Plot and Species continued Project Number and Name: 283 - UT Pembroke
Species countStems per ACRE
Annual Means
0.40 0.40 0.40 0.40 0.4016 16 16 16 16
MY0 (2008)
160.40
Stem countsize (ares)
size (ACRES)
MY2 (2009) MY1 (2008)Scientific Name Common Name
Species Type
MY5 (2012) MY4 (2011) MY3 (2010)
UT Pembroke KCI Associates of North Carolina EEP Project # 283 2012- MY05
31
Appendix D
Hydrologic Data
0
1
2
3
4
5
6
7
8
9
Nov
-11
Dec
-11
Jan-
12
Feb-
12
Mar
-12
Apr
-12
May
-12
Jun-
12
Jul-1
2
Aug
-12
Sep-
12
Oct
-12
Nov
-12
Dec
-12
Rai
nfal
l (in
)
Date
UT Pembroke 30-70 Percentile Graph 2011-2012Edenton, NC Monthly Rainfall
2011 Rainfall 2012 Rainfall 30% Less Than 30% Greater Than
0
0.5
1
1.5
2
2.5
3
3.5
4
4.5
5
-40
-35
-30
-25
-20
-15
-10
-5
0
5
10
1-Ja
n-12
16-J
an-1
2
31-J
an-1
2
15-F
eb-1
2
1-M
ar-1
2
16-M
ar-1
2
31-M
ar-1
2
15-A
pr-1
2
30-A
pr-1
2
15-M
ay-1
2
30-M
ay-1
2
14-J
un-1
2
29-J
un-1
2
14-J
ul-1
2
29-J
ul-1
2
13-A
ug-1
2
28-A
ug-1
2
12-S
ep-1
2
27-S
ep-1
2
12-O
ct-1
2
27-O
ct-1
2
11-N
ov-1
2
26-N
ov-1
2
Rai
nfal
l Dep
th (i
n)
Gro
undw
ater
Dep
th (i
n)
Date
UT Pembroke MY05Groundwater Monitoring Well #2
Rainfall Depth Jurisdictional Depth Ground Surface
Begin Growing Season3/10/2012
End Growing Season11/28/2012
Gauge malfunction, replaced gauge
0
0.5
1
1.5
2
2.5
3
3.5
4
4.5
5
-40
-35
-30
-25
-20
-15
-10
-5
0
5
10
1-Ja
n-12
16-J
an-1
2
31-J
an-1
2
15-F
eb-1
2
1-M
ar-1
2
16-M
ar-1
2
31-M
ar-1
2
15-A
pr-1
2
30-A
pr-1
2
15-M
ay-1
2
30-M
ay-1
2
14-J
un-1
2
29-J
un-1
2
14-J
ul-1
2
29-J
ul-1
2
13-A
ug-1
2
28-A
ug-1
2
12-S
ep-1
2
27-S
ep-1
2
12-O
ct-1
2
27-O
ct-1
2
11-N
ov-1
2
26-N
ov-1
2
Rai
nfal
l Dep
th (i
n)
Gro
undw
ater
Dep
th (i
n)
Date
UT Pembroke MY05Groundwater Monitoring Well #3
Rainfall Depth Jurisdictional Depth Ground Surface
Begin Growing Season3/10/2012
End Growing Season11/28/2012
0
0.5
1
1.5
2
2.5
3
3.5
4
4.5
5
-35
-30
-25
-20
-15
-10
-5
0
5
10
1-Ja
n-12
16-J
an-1
2
31-J
an-1
2
15-F
eb-1
2
1-M
ar-1
2
16-M
ar-1
2
31-M
ar-1
2
15-A
pr-1
2
30-A
pr-1
2
15-M
ay-1
2
30-M
ay-1
2
14-J
un-1
2
29-J
un-1
2
14-J
ul-1
2
29-J
ul-1
2
13-A
ug-1
2
28-A
ug-1
2
12-S
ep-1
2
27-S
ep-1
2
12-O
ct-1
2
27-O
ct-1
2
11-N
ov-1
2
26-N
ov-1
2
Rai
nfal
l Dep
th (i
n)
Gro
undw
ater
Dep
th (i
n)
Date
UT Pembroke MY05Groundwater Monitoring Well #4
Rainfall Depth Jurisdictional Depth Ground Surface
Begin Growing Season3/10/2012
End Growing Season11/28/2012
141 Days
0
0.5
1
1.5
2
2.5
3
3.5
4
4.5
5
-40
-35
-30
-25
-20
-15
-10
-5
0
5
10
1-Ja
n-12
16-J
an-1
2
31-J
an-1
2
15-F
eb-1
2
1-M
ar-1
2
16-M
ar-1
2
31-M
ar-1
2
15-A
pr-1
2
30-A
pr-1
2
15-M
ay-1
2
30-M
ay-1
2
14-J
un-1
2
29-J
un-1
2
14-J
ul-1
2
29-J
ul-1
2
13-A
ug-1
2
28-A
ug-1
2
12-S
ep-1
2
27-S
ep-1
2
12-O
ct-1
2
27-O
ct-1
2
11-N
ov-1
2
26-N
ov-1
2
Rai
nfal
l Dep
th (i
n)
Gro
undw
ater
Dep
th (i
n)
Date
UT Pembroke MY05Groundwater Monitoring Well #5
Rainfall Depth Jurisdictional Depth Ground Surface
Begin Growing Season3/10/2012
End Growing Season11/28/2012
Gauge malfunction,replaced gauge
10 Days
0
0.5
1
1.5
2
2.5
3
3.5
4
4.5
5
-40
-35
-30
-25
-20
-15
-10
-5
0
5
10
1-Ja
n-12
16-J
an-1
2
31-J
an-1
2
15-F
eb-1
2
1-M
ar-1
2
16-M
ar-1
2
31-M
ar-1
2
15-A
pr-1
2
30-A
pr-1
2
15-M
ay-1
2
30-M
ay-1
2
14-J
un-1
2
29-J
un-1
2
14-J
ul-1
2
29-J
ul-1
2
13-A
ug-1
2
28-A
ug-1
2
12-S
ep-1
2
27-S
ep-1
2
12-O
ct-1
2
27-O
ct-1
2
11-N
ov-1
2
26-N
ov-1
2
Rai
nfal
l Dep
th (i
n)
Gro
undw
ater
Dep
th (i
n)
Date
UT Pembroke MY05Groundwater Monitoring Well #6
Rainfall Depth Jurisdictional Depth Ground Surface
Begin Growing Season3/10/2012
End Growing Season11/28/2012
Replaced gauge9-24-12
10 Days
0
0.5
1
1.5
2
2.5
3
3.5
4
4.5
5
-35
-30
-25
-20
-15
-10
-5
0
5
10
1-Ja
n-12
16-J
an-1
2
31-J
an-1
2
15-F
eb-1
2
1-M
ar-1
2
16-M
ar-1
2
31-M
ar-1
2
15-A
pr-1
2
30-A
pr-1
2
15-M
ay-1
2
30-M
ay-1
2
14-J
un-1
2
29-J
un-1
2
14-J
ul-1
2
29-J
ul-1
2
13-A
ug-1
2
28-A
ug-1
2
12-S
ep-1
2
27-S
ep-1
2
12-O
ct-1
2
27-O
ct-1
2
11-N
ov-1
2
26-N
ov-1
2
Rai
nfal
l Dep
th (i
n)
Gro
undw
ater
Dep
th (i
n)
Date
UT Pembroke MY05Groundwater Monitoring Well #7
Rainfall Depth Jurisdictional Depth Ground Surface
Begin Growing Season3/10/2012
End Growing Season11/28/2012
102 Days 12 Days
0
0.5
1
1.5
2
2.5
3
3.5
4
4.5
5
-35
-30
-25
-20
-15
-10
-5
0
5
10
1-Ja
n-12
16-J
an-1
2
31-J
an-1
2
15-F
eb-1
2
1-M
ar-1
2
16-M
ar-1
2
31-M
ar-1
2
15-A
pr-1
2
30-A
pr-1
2
15-M
ay-1
2
30-M
ay-1
2
14-J
un-1
2
29-J
un-1
2
14-J
ul-1
2
29-J
ul-1
2
13-A
ug-1
2
28-A
ug-1
2
12-S
ep-1
2
27-S
ep-1
2
12-O
ct-1
2
27-O
ct-1
2
11-N
ov-1
2
26-N
ov-1
2
Rai
nfal
l Dep
th (i
n)
Gro
undw
ater
Dep
th (i
n)
Date
UT Pembroke MY05Groundwater Monitoring Well #8
Rainfall Depth Jurisdictional Depth Ground Surface
Begin Growing Season3/10/2012
End Growing Season11/28/2012
11 Days 13 Days
0
0.5
1
1.5
2
2.5
3
3.5
4
4.5
5
-40
-35
-30
-25
-20
-15
-10
-5
0
5
101-
Jan-
12
16-J
an-1
2
31-J
an-1
2
15-F
eb-1
2
1-M
ar-1
2
16-M
ar-1
2
31-M
ar-1
2
15-A
pr-1
2
30-A
pr-1
2
15-M
ay-1
2
30-M
ay-1
2
14-J
un-1
2
29-J
un-1
2
14-J
ul-1
2
29-J
ul-1
2
13-A
ug-1
2
28-A
ug-1
2
12-S
ep-1
2
27-S
ep-1
2
12-O
ct-1
2
27-O
ct-1
2
11-N
ov-1
2
26-N
ov-1
2
Rai
nfal
l Dep
th (i
n)
Gro
undw
ater
Dep
th (i
n)
Date
UT Pembroke MY05Groundwater Monitoring Well #9
Rainfall Depth Jurisdictional Depth Ground Surface
Begin Growing Season3/10/2012
End Growing Season11/28/2012
34 Days
0
0.5
1
1.5
2
2.5
3
3.5
4
4.5
5
-40
-35
-30
-25
-20
-15
-10
-5
0
5
10
1-Ja
n-12
16-J
an-1
2
31-J
an-1
2
15-F
eb-1
2
1-M
ar-1
2
16-M
ar-1
2
31-M
ar-1
2
15-A
pr-1
2
30-A
pr-1
2
15-M
ay-1
2
30-M
ay-1
2
14-J
un-1
2
29-J
un-1
2
14-J
ul-1
2
29-J
ul-1
2
13-A
ug-1
2
28-A
ug-1
2
12-S
ep-1
2
27-S
ep-1
2
12-O
ct-1
2
27-O
ct-1
2
11-N
ov-1
2
26-N
ov-1
2
Rai
nfal
l Dep
th (i
n)
Gro
undw
ater
Dep
th (i
n)
Date
UT Pembroke MY05Groundwater Monitoring Well #10
Rainfall Depth Jurisdictional Depth Ground Surface
Begin Growing Season3/10/2012 End Growing Season
11/28/2012
114 Days 31 Days
21 Days
0
0.5
1
1.5
2
2.5
3
3.5
4
4.5
5
-35
-30
-25
-20
-15
-10
-5
0
5
10
1-Ja
n-12
16-J
an-1
2
31-J
an-1
2
15-F
eb-1
2
1-M
ar-1
2
16-M
ar-1
2
31-M
ar-1
2
15-A
pr-1
2
30-A
pr-1
2
15-M
ay-1
2
30-M
ay-1
2
14-J
un-1
2
29-J
un-1
2
14-J
ul-1
2
29-J
ul-1
2
13-A
ug-1
2
28-A
ug-1
2
12-S
ep-1
2
27-S
ep-1
2
12-O
ct-1
2
27-O
ct-1
2
11-N
ov-1
2
26-N
ov-1
2
Rai
nfal
l Dep
th (i
n)
Gro
undw
ater
Dep
th (i
n)
Date
UT Pembroke MY05Groundwater Monitoring Well #11
Rainfall Depth Jurisdictional Depth Ground Surface
Begin Growing Season3/10/2012
End Growing Season11/28/2012
194 Days
Replaced gauge9-24-12
31 Days29 Days
0
0.5
1
1.5
2
2.5
3
3.5
4
4.5
5
-40
-35
-30
-25
-20
-15
-10
-5
0
5
10
1-Ja
n-12
16-J
an-1
2
31-J
an-1
2
15-F
eb-1
2
1-M
ar-1
2
16-M
ar-1
2
31-M
ar-1
2
15-A
pr-1
2
30-A
pr-1
2
15-M
ay-1
2
30-M
ay-1
2
14-J
un-1
2
29-J
un-1
2
14-J
ul-1
2
29-J
ul-1
2
13-A
ug-1
2
28-A
ug-1
2
12-S
ep-1
2
27-S
ep-1
2
12-O
ct-1
2
27-O
ct-1
2
11-N
ov-1
2
26-N
ov-1
2
Rai
nfal
l Dep
th (i
n)
Gro
undw
ater
Dep
th (i
n)
Date
UT Pembroke MY05Groundwater Monitoring Reference Well #12
Rainfall Depth Jurisdictional Depth Ground Surface
Begin Growing Season3/10/2012
End Growing Season11/28/2012
25 Days
Replaced gauge9-17-12
0
0.5
1
1.5
2
2.5
3
3.5
4
4.5
5
-40
-35
-30
-25
-20
-15
-10
-5
0
5
10
1-Ja
n-12
16-J
an-1
2
31-J
an-1
2
15-F
eb-1
2
1-M
ar-1
2
16-M
ar-1
2
31-M
ar-1
2
15-A
pr-1
2
30-A
pr-1
2
15-M
ay-1
2
30-M
ay-1
2
14-J
un-1
2
29-J
un-1
2
14-J
ul-1
2
29-J
ul-1
2
13-A
ug-1
2
28-A
ug-1
2
12-S
ep-1
2
27-S
ep-1
2
12-O
ct-1
2
27-O
ct-1
2
11-N
ov-1
2
26-N
ov-1
2
Rai
nfal
l Dep
th (i
n)
Gro
undw
ater
Dep
th (i
n)
Date
UT Pembroke MY05Groundwater Monitoring Well #13
Rainfall Depth Jurisdictional Depth Ground Surface
Begin Growing Season3/10/2012
End Growing Season11/28/2012
10 Days
0
0.5
1
1.5
2
2.5
3
3.5
4
4.5
5
-35
-30
-25
-20
-15
-10
-5
0
5
10
1-Ja
n-12
16-J
an-1
2
31-J
an-1
2
15-F
eb-1
2
1-M
ar-1
2
16-M
ar-1
2
31-M
ar-1
2
15-A
pr-1
2
30-A
pr-1
2
15-M
ay-1
2
30-M
ay-1
2
14-J
un-1
2
29-J
un-1
2
14-J
ul-1
2
29-J
ul-1
2
13-A
ug-1
2
28-A
ug-1
2
12-S
ep-1
2
27-S
ep-1
2
12-O
ct-1
2
27-O
ct-1
2
11-N
ov-1
2
26-N
ov-1
2
Rai
nfal
l Dep
th (i
n)
Gro
undw
ater
Dep
th (i
n)
Date
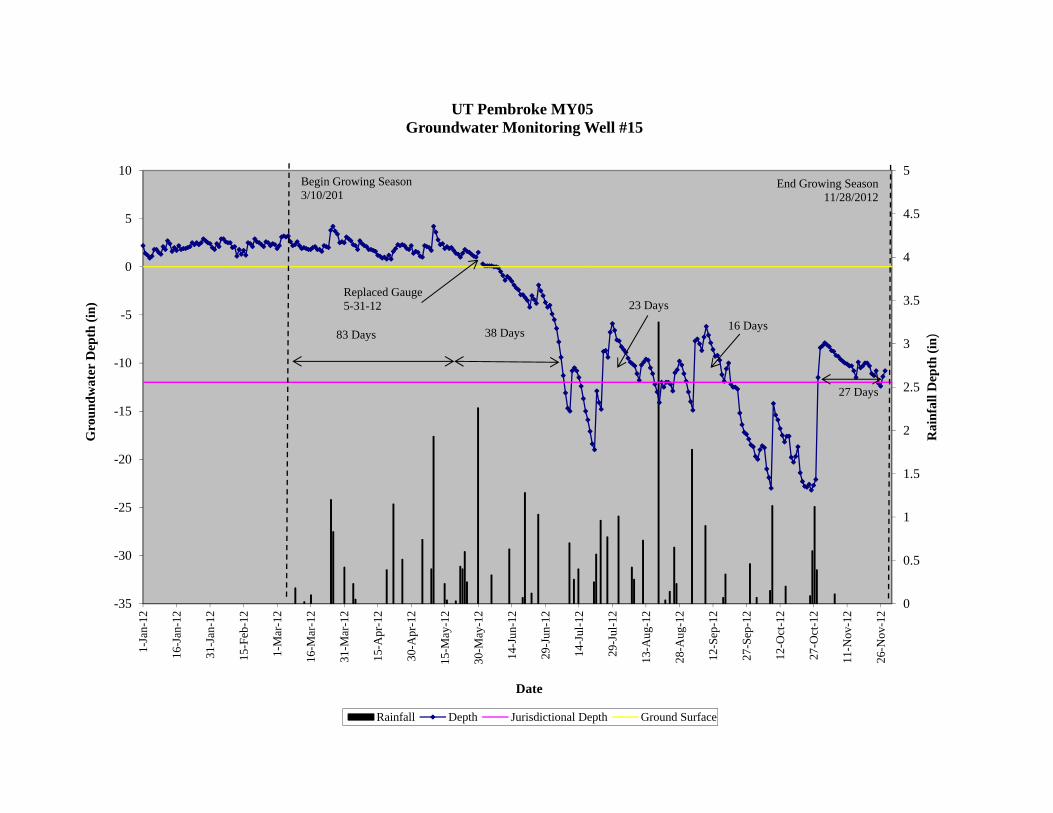
UT Pembroke MY05Groundwater Monitoring Well #15
Rainfall Depth Jurisdictional Depth Ground Surface
Begin Growing Season3/10/201
End Growing Season11/28/2012
38 Days83 Days
27 Days
23 Days
16 Days
Replaced Gauge5-31-12
0
0.5
1
1.5
2
2.5
3
3.5
4
4.5
5
-35
-30
-25
-20
-15
-10
-5
0
5
10
1-Ja
n-12
16-J
an-1
2
31-J
an-1
2
15-F
eb-1
2
1-M
ar-1
2
16-M
ar-1
2
31-M
ar-1
2
15-A
pr-1
2
30-A
pr-1
2
15-M
ay-1
2
30-M
ay-1
2
14-J
un-1
2
29-J
un-1
2
14-J
ul-1
2
29-J
ul-1
2
13-A
ug-1
2
28-A
ug-1
2
12-S
ep-1
2
27-S
ep-1
2
12-O
ct-1
2
27-O
ct-1
2
11-N
ov-1
2
26-N
ov-1
2
Rai
nfal
l Dep
th (i
n)
Gro
undw
ater
Dep
th (i
n)
Date
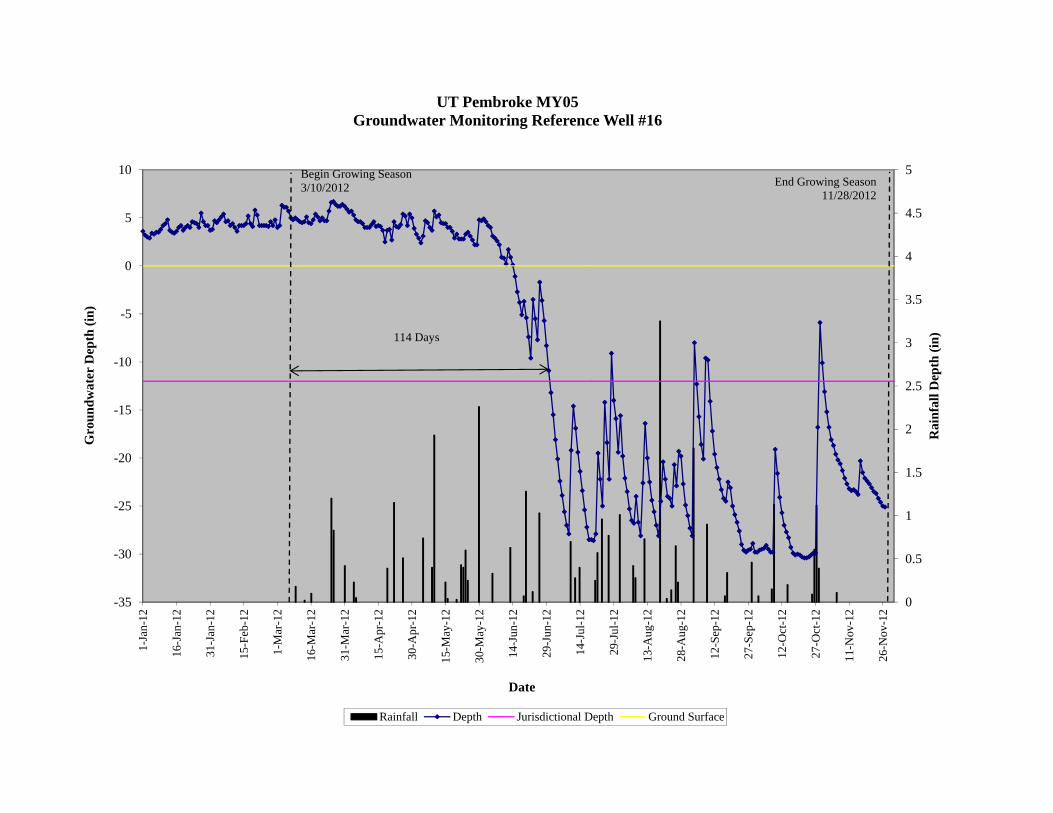
UT Pembroke MY05Groundwater Monitoring Reference Well #16
Rainfall Depth Jurisdictional Depth Ground Surface
Begin Growing Season3/10/2012 End Growing Season
11/28/2012
114 Days
0
0.5
1
1.5
2
2.5
3
3.5
4
4.5
5
-40
-35
-30
-25
-20
-15
-10
-5
0
5
10
1-Ja
n-12
16-J
an-1
2
31-J
an-1
2
15-F
eb-1
2
1-M
ar-1
2
16-M
ar-1
2
31-M
ar-1
2
15-A
pr-1
2
30-A
pr-1
2
15-M
ay-1
2
30-M
ay-1
2
14-J
un-1
2
29-J
un-1
2
14-J
ul-1
2
29-J
ul-1
2
13-A
ug-1
2
28-A
ug-1
2
12-S
ep-1
2
27-S
ep-1
2
12-O
ct-1
2
27-O
ct-1
2
11-N
ov-1
2
26-N
ov-1
2
Rai
nfal
l Dep
th (i
n)
Gro
undw
ater
Dep
th (i
n)
Date
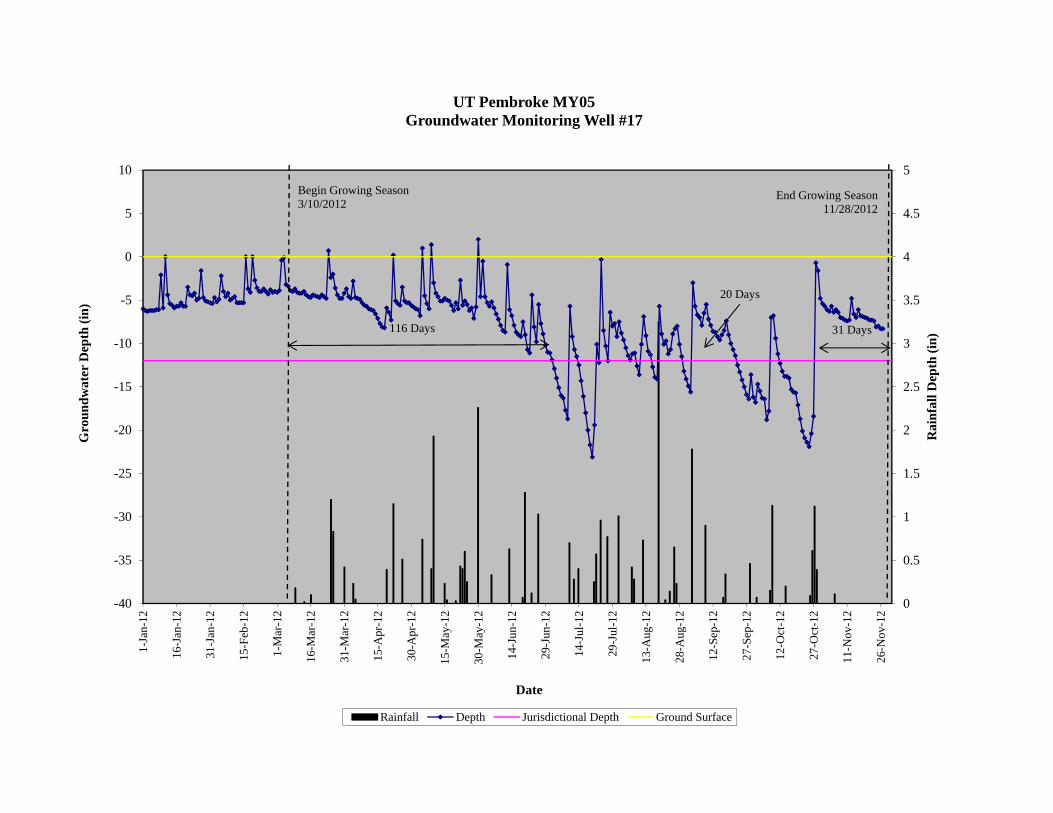
UT Pembroke MY05Groundwater Monitoring Well #17
Rainfall Depth Jurisdictional Depth Ground Surface
Begin Growing Season3/10/2012
End Growing Season11/28/2012
116 Days 31 Days
20 Days
0
0.5
1
1.5
2
2.5
3
3.5
4
4.5
5
-35
-30
-25
-20
-15
-10
-5
0
5
101-
Jan-
12
16-J
an-1
2
31-J
an-1
2
15-F
eb-1
2
1-M
ar-1
2
16-M
ar-1
2
31-M
ar-1
2
15-A
pr-1
2
30-A
pr-1
2
15-M
ay-1
2
30-M
ay-1
2
14-J
un-1
2
29-J
un-1
2
14-J
ul-1
2
29-J
ul-1
2
13-A
ug-1
2
28-A
ug-1
2
12-S
ep-1
2
27-S
ep-1
2
12-O
ct-1
2
27-O
ct-1
2
11-N
ov-1
2
26-N
ov-1
2
Rai
nfal
l Dep
th (i
n)
Gro
undw
ater
Dep
th (i
n)
Date
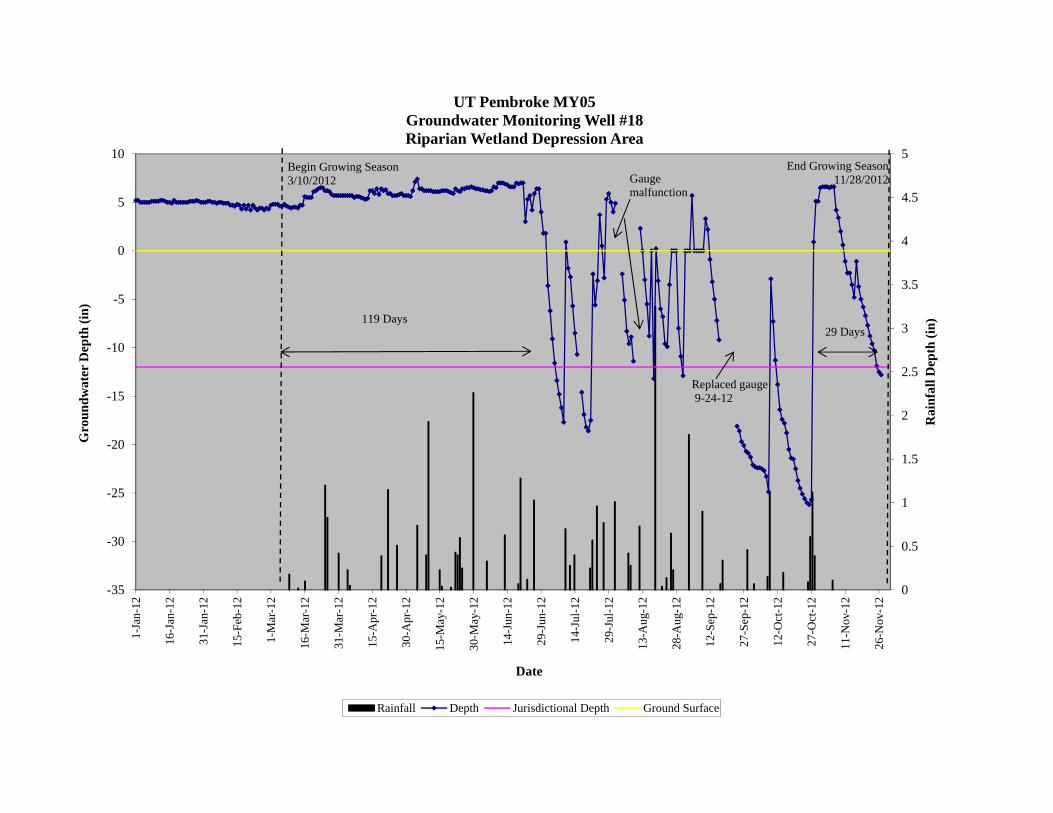
UT Pembroke MY05Groundwater Monitoring Well #18Riparian Wetland Depression Area
Rainfall Depth Jurisdictional Depth Ground Surface
Begin Growing Season3/10/2012
End Growing Season11/28/2012
119 Days
Replaced gauge9-24-12
29 Days
Gauge malfunction
0
0.5
1
1.5
2
2.5
3
3.5
4
4.5
5
-40
-35
-30
-25
-20
-15
-10
-5
0
5
101-
Jan-
12
16-J
an-1
2
31-J
an-1
2
15-F
eb-1
2
1-M
ar-1
2
16-M
ar-1
2
31-M
ar-1
2
15-A
pr-1
2
30-A
pr-1
2
15-M
ay-1
2
30-M
ay-1
2
14-J
un-1
2
29-J
un-1
2
14-J
ul-1
2
29-J
ul-1
2
13-A
ug-1
2
28-A
ug-1
2
12-S
ep-1
2
27-S
ep-1
2
12-O
ct-1
2
27-O
ct-1
2
11-N
ov-1
2
26-N
ov-1
2
Rai
nfal
l Dep
th (i
n)
Gro
undw
ater
Dep
th (i
n)
Date
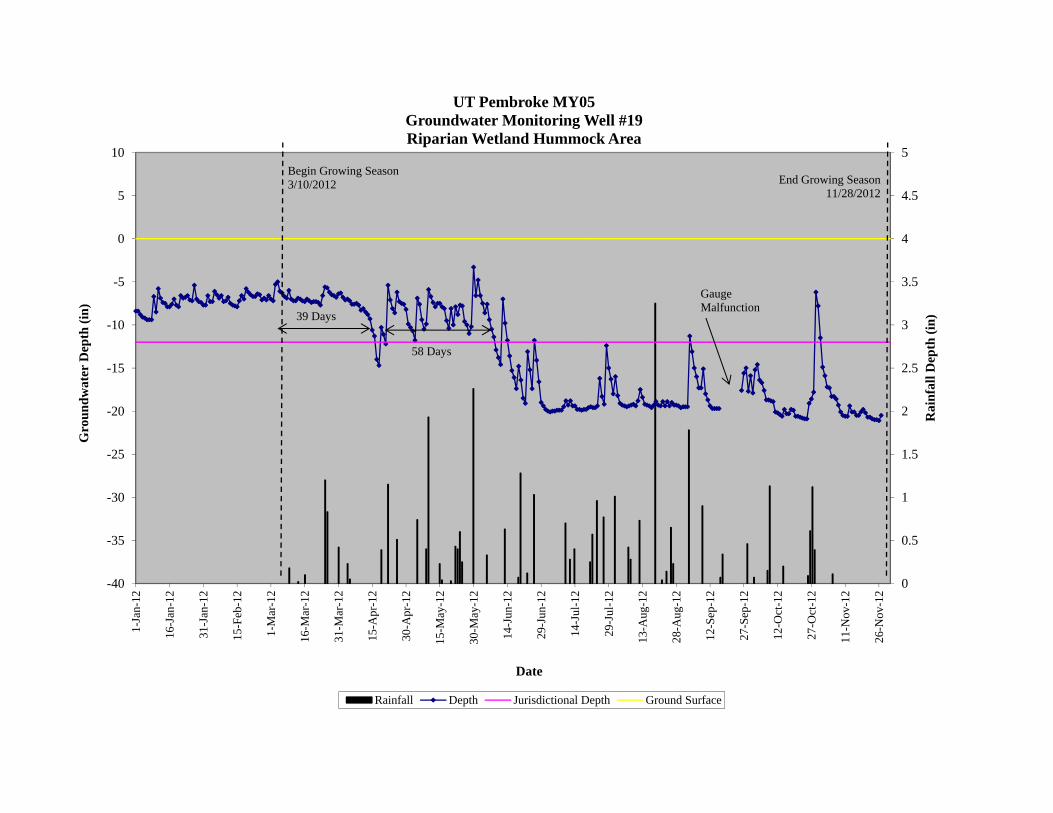
UT Pembroke MY05Groundwater Monitoring Well #19Riparian Wetland Hummock Area
Rainfall Depth Jurisdictional Depth Ground Surface
Begin Growing Season3/10/2012 End Growing Season
11/28/2012
39 Days
58 Days
Gauge Malfunction
0
0.5
1
1.5
2
2.5
3
3.5
4
4.5
5
-30
-25
-20
-15
-10
-5
0
5
10
15
20
25
30
35
1-Ja
n-12
16-J
an-1
2
31-J
an-1
2
15-F
eb-1
2
1-M
ar-1
2
16-M
ar-1
2
31-M
ar-1
2
15-A
pr-1
2
30-A
pr-1
2
15-M
ay-1
2
30-M
ay-1
2
14-J
un-1
2
29-J
un-1
2
14-J
ul-1
2
29-J
ul-1
2
13-A
ug-1
2
28-A
ug-1
2
12-S
ep-1
2
27-S
ep-1
2
12-O
ct-1
2
27-O
ct-1
2
11-N
ov-1
2
26-N
ov-1
2
Rai
nfal
l Dep
th (i
n)
Gro
undw
ater
Dep
th (i
n)
Date
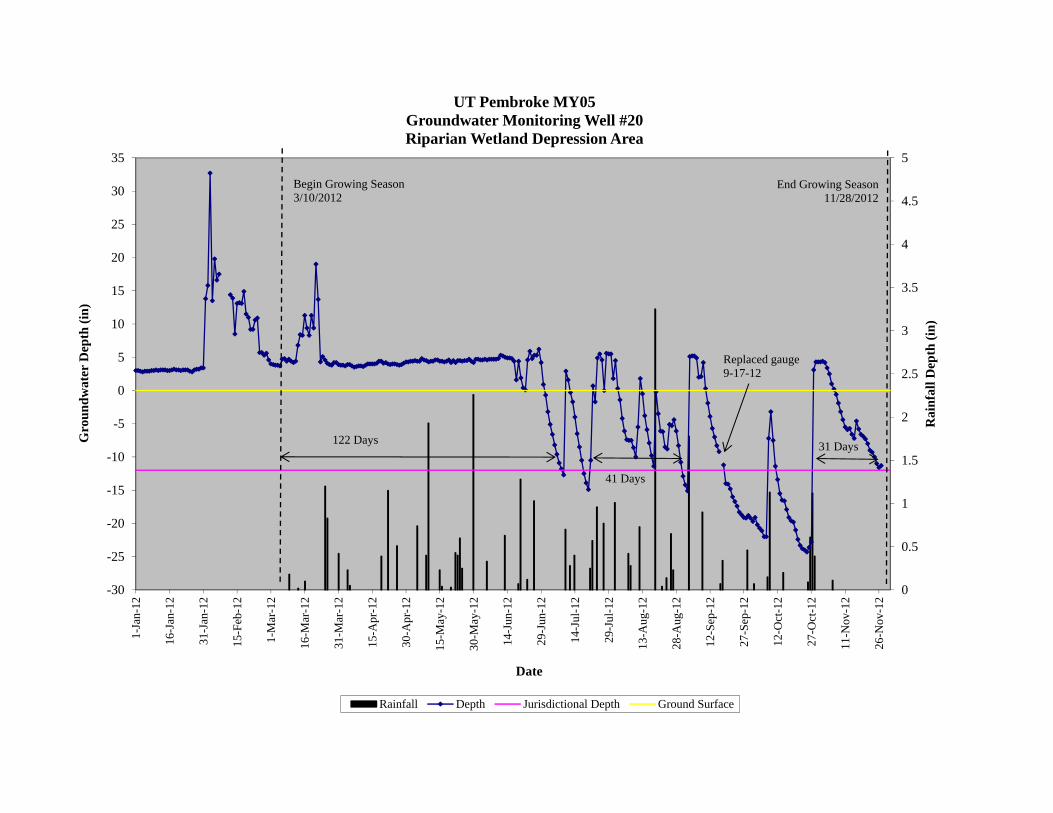
UT Pembroke MY05Groundwater Monitoring Well #20Riparian Wetland Depression Area
Rainfall Depth Jurisdictional Depth Ground Surface
Begin Growing Season3/10/2012
End Growing Season11/28/2012
122 Days
Replaced gauge9-17-12
41 Days
31 Days
0
0.5
1
1.5
2
2.5
3
3.5
4
4.5
5
-45
-35
-25
-15
-5
5
1-Ja
n-12
16-J
an-1
2
31-J
an-1
2
15-F
eb-1
2
1-M
ar-1
2
16-M
ar-1
2
31-M
ar-1
2
15-A
pr-1
2
30-A
pr-1
2
15-M
ay-1
2
30-M
ay-1
2
14-J
un-1
2
29-J
un-1
2
14-J
ul-1
2
29-J
ul-1
2
13-A
ug-1
2
28-A
ug-1
2
12-S
ep-1
2
27-S
ep-1
2
12-O
ct-1
2
27-O
ct-1
2
11-N
ov-1
2
26-N
ov-1
2
Rai
nfal
l Dep
th (i
n)
Gro
undw
ater
Dep
th (i
n)
Date
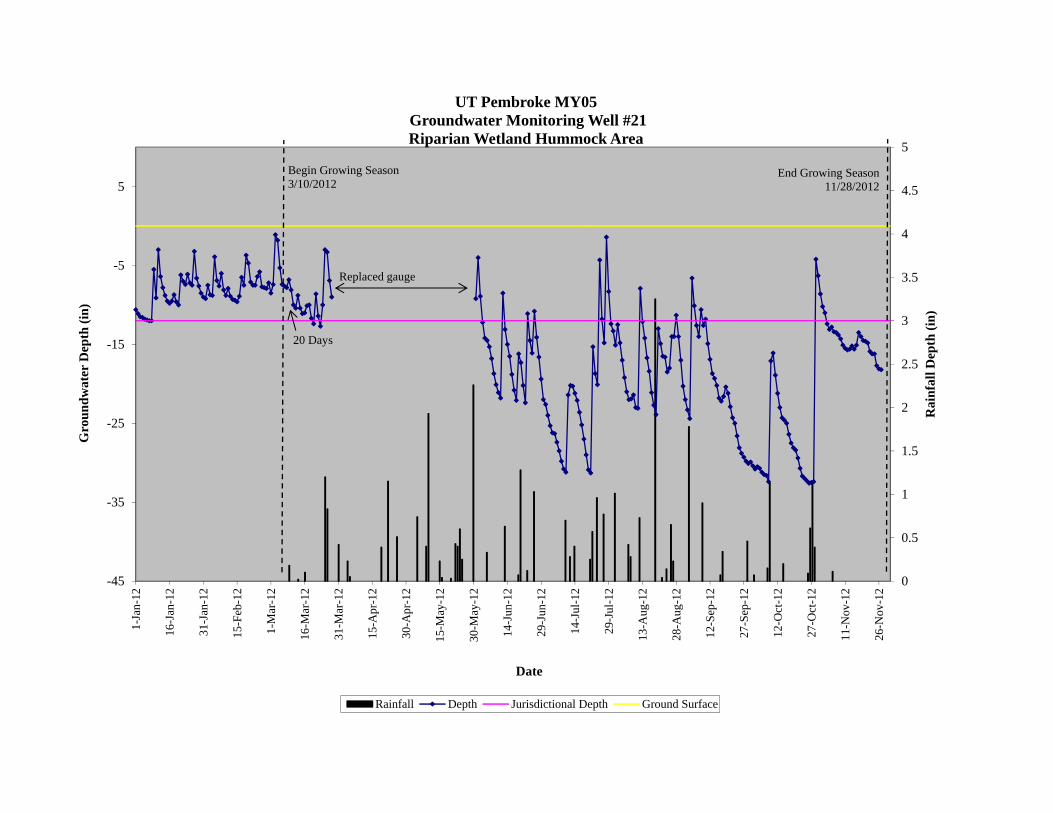
UT Pembroke MY05Groundwater Monitoring Well #21Riparian Wetland Hummock Area
Rainfall Depth Jurisdictional Depth Ground Surface
Begin Growing Season3/10/2012
End Growing Season11/28/2012
Replaced gauge
20 Days
UT Pembroke KCI Associates of North Carolina EEP Project # 283 2012- MY05
52
Table 9. Wetland Hydrology Criteria Attainment Table Project Number and Name: 283 - UT Pembroke
Year 1 (2008) Year 2 (2009) Year 3 (2010) Year 4 (2011) Year 5 (2012)No/0 No/4 No/4 No/4 No/0(0%) (1.5%) (1.5%) (1.5%) (0%)No/0 No/4 No/5 Yes/13 No/3(0%) (1.5%) (1.9%) (5.0%) (1%)No/0 No/4 No/6 No/10 Yes/141(0%) (1.5%) (2.3%) (3.8%) (53%)
No/11 Yes/49 Yes/54 Yes/23 No/10(4.2%) (18.6%) (20.5%) (8.7%) (4%)No/12 Yes/46 Yes/50 Yes/17 No/10(4.6%) (17.5%) (19.0%) (6.4%) (4%)Yes/87 Yes/108 Yes/104 Yes/95 Yes/102(33.1%) (41.1%) (39.5%) (36.0%) (39%)No/11 Yes/45 Yes/42 Yes/47 Yes/13(4.8%) (17.1%) (16.0%) (17.8%) (5%)Yes/51 Yes/49 Yes/57 Yes/94 Yes/34(19.4%) (18.6%) (21.7%) (35.6%) (13%)Yes/207 Yes/110 Yes/103 Yes/101 Yes/114(78.7%) (41.8%) (39.2%) (38.3%) (43%)Yes/107 Yes/263 Yes/138 Yes/147 Yes/194(40.7%) (100%) (52.5%) (55.7%) (74%)
Well 12 Yes/77 Yes/53 Yes/55 Yes/59 Yes/25Reference (29.3%) (20.2%) (20.9%) (22.3%) (10%)
No/10 Yes/31 Yes/39 Yes/37 No/10(3.8%) (11.8%) (14.8%) (14.0%) (4%)
Yes/174 Yes/107 Yes/133 Yes/146 Yes/83(66.2%) (40.7%) (50.6%) (55.3%) (31%)
Well 16 Yes/112 Yes/87 Yes/120 Yes/101 Yes/114Reference (43%) (33.1%) (45.6%) (38.3%) (43%)
Yes/140 Yes/101 Yes/116(53.2%) (38.3%) (44%)Yes/63 Yes/59 Yes/119
(24.0%) (22.3%) (45%)
Yes/61 Yes/99 Yes/58
(23.2%) (37.5%) (22%)
Yes/63 Yes/99 Yes/122
(24.0%) (37.5%) (46%)
Yes/25 Yes/99 Yes/20
(9.5%) (37.5%) (8%)
N/A
N/A
N/A
N/A
Well 13
Well 18 Located in the wetland
depression areaWell 19
Located in the wetland hummock area
Well 20 Located in the wetland
depression area
Well 17
Well 15
Well 21 Located in the wetland
hummock area
N/A
N/A
N/A
N/A
Success Criteria Achieved / Max Consecutive Days During Growing Season (Percentage)
Well 11
N/A N/A
Gauge
Well 3
Well 2
Well 4
Well 8
Well 6
Well 5
Well 7
Well 9
Well 10