TRS 2011 Comprehensive Annual Financial Report
163
C O M P R E H E N S I V E A N N U A L F I N A N C I A L R E P O R T Teacher Retirement System of Texas 2011 A Component Unit of the State of Texas FISCAL YEAR ENDED AUGUST 31, 2011
-
Upload
khangminh22 -
Category
Documents
-
view
2 -
download
0
Transcript of TRS 2011 Comprehensive Annual Financial Report

C O M P R E H E N S I V E A N N U A L
F I N A N C I A L R E P O R T
Teacher Retirement System of Texas
2011
A Component Unit of the State of Texas
FISCAL YEAR ENDED AUGUST 31, 2011

TRS Mission Statement
The mission of the Teacher Retirement System of Texas is:
1. to deliver retirement and related benefits authorized by law for members
and their beneficiaries; and
2. to prudently invest and manage the assets held in trust for members and beneficiaries
in an actuarially sound system administered in accordance
with applicable fiduciary principles.

FINANCIAL SECTION
TEACHER RETIREMENT SYSTEM OF TEXAS COMPREHENSIVE ANNUAL FINANCIAL REPORT 2011
1
COMPREHENSIVE ANNUAL FINANCIAL REPORT
TEACHER RETIREMENT SYSTEM OF TEXAS
A Component Unit of the State of Texas
FISCAL YEAR ENDEDAugust 31, 2011
Brian K. Guthrie, Executive Director
Prepared byTeacher Retirement System of Texas
1000 Red River StreetAustin, Texas 78701-2698
(512) 542-64001-800-223-8778
www.trs.state.tx.us

TEACHER RETIREMENT SYSTEM OF TEXAS COMPREHENSIVE ANNUAL FINANCIAL REPORT 2011
2
FINANCIAL SECTION
INTRODUCTORY SECTION Board of Trustees .................................................................................................................................................................................... 3 Professional Awards ................................................................................................................................................................................ 4 Letter of Transmittal ................................................................................................................................................................................ 6 Organization Chart ................................................................................................................................................................................... 8 Staff and Advisors ................................................................................................................................................................................... 9 Membership .......................................................................................................................................................................................... 10 Communications ................................................................................................................................................................................... 11FINANCIAL SECTION Independent Auditor’s Report ............................................................................................................................................................... 14 Management’s Discussion and Analysis ............................................................................................................................................... 16 Basic Financial Statements Exhibit I - Statement of Fiduciary Net Assets ............................................................................................................................... 24 Exhibit II - Statement of Changes in Fiduciary Net Assets ............................................................................................................ 28 Exhibit III - Statement of Net Assets - Proprietary Funds .............................................................................................................. 32 Exhibit IV - Statement of Revenues, Expenses and Changes in Fund Net Assets - Proprietary Funds ........................................... 34 Exhibit V - Statement of Cash Flows - Proprietary Funds .............................................................................................................. 36 Notes to the Financial Statements ............................................................................................................................................... 39 Required Supplementary Information .................................................................................................................................................... 64 Exhibit A - Combining Statement of Changes in Assets and Liabilities - Agency Funds ......................................................................... 66 Supporting Schedules Schedule 1 - Comparative Schedule of Changes in Account Balance - Pension Trust Fund Interest Account .................................................................................................................................................................. 68 Member Savings Account ................................................................................................................................................... 69 State Contribution Account ................................................................................................................................................. 70 Retired Reserve Account ..................................................................................................................................................... 71 Deferred Retirement Option Account ................................................................................................................................... 72 Expense Account ................................................................................................................................................................. 73 Schedule 2 - Schedule of Administrative and Capital Expenses - Budget and Actual on Budgetary Basis - All Fund Types ........................................................................................................................................ 74 Schedule 3 - Comparative Schedule of Investing Activity Expenses - Pension Trust Fund ............................................................. 78 Schedule 4 - Schedule of Professional and Consulting Fees - Budgetary Basis - All Fund Types .................................................... 79INVESTMENT SECTION Investment Overview ............................................................................................................................................................................ 83 Total Time-Weighted Returns ................................................................................................................................................................ 84 Asset Allocation .................................................................................................................................................................................... 85 Investment Summary ............................................................................................................................................................................ 86 Largest Holdings ................................................................................................................................................................................... 88 Schedule of Fees and Commissions ...................................................................................................................................................... 90ACTUARIAL SECTION Pension Trust Fund Actuary’s Certification Letter ...................................................................................................................................................... 110 Actuarial Present Value of Future Benefits .................................................................................................................................. 112 Actuarial Methods and Assumptions .......................................................................................................................................... 113 Other Actuarial Information ........................................................................................................................................................ 117 TRS-Care Actuary’s Certification Letter ...................................................................................................................................................... 120 Actuarial Present Value of Future Benefits .................................................................................................................................. 121 Actuarial Methods and Assumptions .......................................................................................................................................... 122STATISTICAL SECTION Statistical Section Overview ............................................................................................................................................................... 127 Financial Trends Information Ten-Year Summary Changes in Fiduciary Net Assets and Revenues, Expenses, and Changes in Net Assets ........................................................................................................................................................................ 128 Benefits and Refund Deductions from Net Assets by Type and Health Care Claims Deductions/ Expenses from Net Assets by Type .................................................................................................................................... 136 Operating Information Average Benefit Payments ......................................................................................................................................................... 138 Average Health Care Claims ....................................................................................................................................................... 139 Retired Members by Type of Benefit and Health Care Claims by Benefit Range .......................................................................... 140 Principal Participating Reporting Entities ..................................................................................................................................... 142 Listing of Participating Reporting Entities ............................................................................................................................................ 144BENEFITS SECTION 2011 Changes in TRS Law .................................................................................................................................................................. 150 Summary of Benefits ........................................................................................................................................................................... 153 Average Monthly Benefit ..................................................................................................................................................................... 157 Growth of the System ......................................................................................................................................................................... 158
Table of Contents

INTR
OD
UC
TOR
Y SECTIO
N

TEACHER RETIREMENT SYSTEM OF TEXAS COMPREHENSIVE ANNUAL FINANCIAL REPORT 2011
2
INTRODUCTORY SECTION
Board of Trustees
This page is intentionally left blank.

INTRODUCTORY SECTION
TEACHER RETIREMENT SYSTEM OF TEXAS COMPREHENSIVE ANNUAL FINANCIAL REPORT 2011
3
Board of Trustees
The TRS Board of Trustees is responsible for administration of the system under provisions of the state constitution and laws. The board is comprised of nine trustees, all of whom are appointed by the governor to staggered six-year terms. Three trustees are direct appointments of the governor. Two trustees are appointed from a list prepared by the State Board of Education. Two trustees are appointed from the three public school district active member candidates who have been nominated for each position by employees of public school districts. One trustee is appointed from the three higher education active member candidates nominated by employees of institutions of higher education. One trustee is appointed from the three retired member candidates who are nominated by TRS retirees. Appointments are subject to confirmation by the Senate. Board member terms expire August 31 of odd numbered years.
In August 2011, Governor Perry reappointed R. David Kelly of Plano as board chair for a term ending August 31, 2017. He also appointed two new trustees to six-year terms ending August 31, 2017 – T. Karen Charleston of Houston (replac-ing Philip Mullins) and Anita Palmer of Wichita Falls (replacing Linus D. Wright). In addition, Joe Colonnetta of Dallas was appointed by Governor Perry to fill the position formerly held by Robert P. Gauntt who resigned from the board in August 2011.
Linus D. Wright
(Vice Chair)Retired educator and administrator, DallasRetiree positionTerm expires 2011
R. David Kelly
(Chair) Managing Partner, Straight Line Realty Partners, PlanoDirect appointment of the governorTerm expires 2011
Todd Barth
President, Bowers Properties Inc., HoustonDirect appointment of the governorTerm expires 2015
Charlotte Clifton
Teacher, Snyder ISDSnyderActive public education positionTerm expires 2013
Robert P. Gauntt
Partner, Avalon Advisors L.P., HoustonDirect appointment of the governorTerm expires 2013
Eric C. McDonald
Owner and CIO, McDonald Capital ManagementLubbockPosition nominated by the State Board of Education Term expires 2013
Christopher Moss
Vice PresidentThe Advanced Financial Group, LufkinPosition nominated by the State Board of Education Term expires 2015
Philip Mullins
Power Plant Operator University of TexasAustinHigher education positionTerm expires 2011
Nanette Sissney
Counselor Whitesboro ISDWhitesboroActive public education positionTerm expires 2015

TEACHER RETIREMENT SYSTEM OF TEXAS COMPREHENSIVE ANNUAL FINANCIAL REPORT 2011
4
INTRODUCTORY SECTION
Professional Awards

INTRODUCTORY SECTION
TEACHER RETIREMENT SYSTEM OF TEXAS COMPREHENSIVE ANNUAL FINANCIAL REPORT 2011
5
Professional Awards

TEACHER RETIREMENT SYSTEM OF TEXAS COMPREHENSIVE ANNUAL FINANCIAL REPORT 2011
6
INTRODUCTORY SECTION
Letter of Transmittal
November 10, 2011
The Honorable Rick Perry
The Honorable David Dewhurst
The Honorable Joe Straus
The Board of Trustees and Members of the Teacher Retirement System
Dear Governor Perry, Lieutenant Governor Dewhurst, Speaker Straus, TRS Board of Trustees, and Members of the Teacher Retirement System:
On behalf of the board of trustees, I am pleased to present this Com-prehensive Annual Financial Report (CAFR) of the Teacher Retirement System of Texas (TRS or System) for the fiscal year ended August 31, 2011, the System’s 74th year of operation. During the past fiscal year, the System experienced steady growth as membership grew to more than 1,316,500 participants. The pension trust fund continued to rebound from the stock market decline of 2008-2009 ending the 2011 fiscal year with net assets of $107.4 billion compared to $95.7 billion at the close of the 2010 fiscal year. Although continued funding progress is needed to return the fund to a fully funded status, TRS is well positioned to ensure that benefits are secure for our current and future retirees. Benefit payments continued to grow as TRS paid out $7.18 billion to annuitants during fiscal year 2011.
MANAGEMENT RESPONSIBILITY
This report consists of management’s representations concerning TRS finances. Management assumes full responsibility for the completeness and reliability of all information presented in this report. To provide a reasonable basis for making these representations, management has established a comprehensive internal control framework that is designed both to protect the assets from loss, theft, or misuse and to compile sufficient, reliable information for the preparation of TRS financial statements in conformity with generally accepted account-ing principles. The internal control framework has been designed to provide reasonable rather than absolute assurance that the financial statements will be free from material misstatement. As management, we assert that, to the best of our knowledge and belief, this financial report is complete and reliable in all material respects.
CERTIFICATE OF ACHIEVEMENT FOR EXCELLENCE INFINANCIAL REPORTING
The Government Finance Officers Association of the United States and Canada (GFOA) awarded TRS the Certificate of Achievement for Excellence in Financial Reporting for its Comprehensive Annual Financial Report for the previous fiscal year. To be awarded the cer-
tificate, a report must meet or exceed program standards and must satisfy both generally accepted accounting principles and applicable legal requirements. TRS has received a Certificate of Achievement for the last 21 years. We believe that the current report continues to meet program requirements, and it is being submitted to the GFOA for consideration again this year.
FINANCIAL INFORMATION
The basic financial statements have been prepared in accordance with generally accepted accounting principles applied on a consistent basis as promulgated by the Governmental Accounting Standards Board. The Management’s Discussion and Analysis (MD&A), includes a narrative introduction, overview, and analysis to accompany the basic financial statements. This transmittal letter is designed to complement the MD&A and should be read in conjunction with it. The MD&A can be found immediately following the report of the independent auditors.
INVESTMENTS
For the 12 month period ending August 31, 2011, the total portfolio had a return of 15.5 percent, with investment gains totaling $11.8 billion for fiscal year 2011. For the past 10 years, the time-weighted compound annual return has been 5.8 percent.
Investment risks are diversified over a very broad range of market sectors and securities. This strategy reduces portfolio risk to adverse developments in sectors and issuers experiencing unusual difficulties and offers opportunity to benefit from future markets. The System has completed its transition to the long-term asset allocation adopted by the TRS Board in fiscal year 2008. That asset allocation has increased TRS holdings in private markets and reduced holdings in public markets. This shift in assets is intended to increase investment diversification and returns without increasing risks to the fund.
PENSION PLAN BENEFITS
For fiscal year 2011, TRS paid pension benefit payments to more than 312,000 retirees and their beneficiaries totaling $7.18 billion. These

INTRODUCTORY SECTION
TEACHER RETIREMENT SYSTEM OF TEXAS COMPREHENSIVE ANNUAL FINANCIAL REPORT 2011
7
Letter of Transmittal
Respectfully submitted,
Brian K. GuthrieExecutive Director
Brian K. Guthrie
benefits were funded from a combination of cumulative investment income, member contributions, and state and employer contributions.
ACTUARIAL SOUNDNESS OF THE PENSION TRUST FUND
As of August 31, 2011, the System had a funded ratio of 82.7% with an Unfunded Actuarial Accrued Liability of $24.1 billion. However, because of poor investment performance in fiscal years 2008 and 2009, the System is now deferring net investment losses of $7.8 billion.
Because of the two significant market downturns in the last 10 years, current contributions are not sufficient to amortize the unfunded li-abilities and therefore the funding period is “never”. Absent ongoing investment gains in excess of eight percent, adjustments will need to be made to contributions and/or benefits to bring the fund back into a position to amortize unfunded liabilities over 30 years.
ACTIVE MEMBER HEALTH BENEFITS PROGRAM
TRS-ActiveCare, initiated in 2002, is a self-funded health benefits program that offers options ranging from catastrophic coverage with reduced premiums to a comprehensive plan with near first-dollar coverage at higher premiums. TRS-ActiveCare covers members cur-rently employed by public educational employers that participate in the plan. TRS establishes premiums to pay for the cost of the program.
RETIREE HEALTH BENEFITS PROGRAM
TRS also administers TRS-Care, a health benefits program for retir-ees that was established in 1985. TRS-Care is the source of health benefits coverage, which almost all retired public school employees rely upon. Funding is provided by premium payments from retiree participants and contributions from the state, school districts, and active employees. During 2011, TRS-Care also received additional revenue from the Medicare Part D prescription drug program and Early Retiree Reinsurance Program.
An actuarial valuation for TRS-Care was conducted as of August 31, 2011. The valuation results indicate that TRS-Care has an Unfunded Actuarial Accrued Liability of $28.9 billion. More detailed information about the valuation results is included in the Notes to the Financial Statements and the Required Supplementary Information.
Based on projections, TRS-Care is solvent from a cash flow perspec-tive until FY 2014. As in the past, changes to the benefit structure and/or funding structure will need to be considered to extend the life of the program. TRS trustees remain focused on the need to balance revenues and expenses in a fiscally responsible manner, and to offer a program that best suits all participants’ needs given available resources.
At the conclusion of the 82nd Texas Legislature, a rider was added to the General Appropriations Act, requiring TRS to conduct a study of TRS-Care and report to the legislature on potential changes to improve the program’s sustainability. Staff will evaluate possible changes, seek public input, and complete this study in the coming year.
ORGANIZATIONAL CHANGE
On September 1, 2011, I began serving as executive director of the retirement system, and Ken Welch assumed his new responsibilities as the agency’s deputy director. These changes followed Ronnie Jung’s announcement that he will retire in January 2012, after serving as
the agency’s chief financial officer, deputy director and then as executive director since 2004. TRS trustees and I especially appreciate his invaluable assistance during the transition before his retirement. Mr. Jung guided TRS during one of the most challenging periods in the agency’s history, which included significant growth in membership, one of the nation’s deepest recessions and, most recently, signifi-cant gains in plan net assets. We wish to acknowledge his valuable leadership and considerable contributions to the agency and all TRS members.
ACKNOWLEDGMENTS
We wish to express our appreciation for the support of the Governor’s, Lieutenant Governor’s, and Speaker’s Offices, as well as members of the legislature, in maintaining a strong retirement system, which provides valuable benefits for public education employees and retirees.
Trustee willingness to accept the substantial responsibilities of direct-ing system administration is a great service to the state and to the members served by TRS. We are grateful for the dedicated service and leadership provided by our outgoing trustees, Robert Gauntt, Philip Mullins and Linus Wright. We also look forward to the future contributions of our new trustees, Karen Charleston, Joe Colonnetta and Anita Smith Palmer.
TRS trustees and staff are keenly focused on prudent pension trust fund portfolio management and efficient, service-oriented delivery of valuable retirement and related benefits for public education employees and retirees. We are pleased to report on operational results for the year and to acknowledge the substantial support of state leadership, trustees, members, interested associations, and TRS staff.
Respectfully submitted,
Brian K. GuthrieExecutive Director

TEACHER RETIREMENT SYSTEM OF TEXAS COMPREHENSIVE ANNUAL FINANCIAL REPORT 2011
8
INTRODUCTORY SECTION
Organization Chart
Effective September 1, 2011

INTRODUCTORY SECTION
TEACHER RETIREMENT SYSTEM OF TEXAS COMPREHENSIVE ANNUAL FINANCIAL REPORT 2011
9
EXECUTIVE ADMINISTRATIVE STAFF
Brian K. Guthrie, Executive Director Ken Welch, Deputy Director T. Britton Harris IV, Chief Investment OfficerConni H. Brennan, General CounselAmy L. Barrett, Chief Audit ExecutiveMarianne Woods Wiley, Chief Benefit OfficerVacant, Chief Financial Officer Howard J. Goldman, Director, CommunicationsRay Spivey, Director, Governmental RelationsAnnette Dominguez, Director, Human ResourcesAmy L. Morgan, Director, Information TechnologyBetsey Jones, Director, Special Projects
GENERAL INVESTMENT CONSULTANTHewitt Ennis Knupp, Chicago, IL
CONSULTING ACTUARYGabriel, Roeder, Smith & Company, Dallas
INVESTMENT CONSULTANTSHamilton Lane Advisors, L.L.C., Bala Cynwyd, PA (Domestic Private Equity)Albourne America, L.L.C., San Francisco, CA (Absolute Return)The Townsend Group, Inc., Cleveland, OH (Real Estate)
INVESTMENT ADVISORSKeith C. Brown, Ph.D., Austin
AUDIT SERVICESTexas State Auditor’s Office, Austin
FIDUCIARY COUNSELReinhart Boerner Van Deuren, S.C., Milwaukee, WI
MEDICAL BOARDDr. Alice Cox, FredericksburgDr. James Reinarz, AustinDr. Larry D. Wilson, Austin
TEXAS PUBLIC SCHOOL RETIRED EMPLOYEES GROUP INSURANCEPROGRAM ADVISORY COMMITTEEB. Sue Passmore, Chair, Dallas Wendell Whittenburg, SweetwaterWilliam (Bill) W. Barnes, HasletKim Kriegel, Red OakDr. Ignacio Salinas, Jr., Benavides Nelda Van Dyke, BrenhamBeth Wallace, San AntonioLeona Ellyce Warns, San AntonioGary R. Willis, Midland
HEALTH CARE CONSULTANTGabriel, Roeder, Smith & Company, Dallas
MASTER CUSTODIAN AND SECURITIESLENDING AGENTState Street Bank and Trust Company, Boston, MA
PERFORMANCE MEASUREMENTState Street Bank and Trust Company, Boston, MA
Effective September 1, 2011
Staff and Advisors

TEACHER RETIREMENT SYSTEM OF TEXAS COMPREHENSIVE ANNUAL FINANCIAL REPORT 2011
10
INTRODUCTORY SECTION
Membership
PENSION TRUST FUNDMembership includes employees of state-supported educational institutions in Texas. At August 31, 2011, participating entities included the following: Independent School Districts 1,030 Charter Schools 197 Community and Junior Colleges 51 Senior Colleges and Universities 46 Regional Education Service Centers 20 Education Districts 5 Medical and Dental Schools 9 State Agencies 2 Total 1,360
Employees and retirees from these entities comprise the membership of the Teacher Retirement System of Texas.
At August 31, 2011, and August 31, 2010, membership consisted of the following: Year Ended August 31, 2011 2010
Current Members: Active Contributing 847,523 853,984 Active Non-contributing 109,545 107,203 Deferred Retirement Option 324 466 Inactive Non-vested 14,881 13,497 Inactive Vested 31,613 29,039 Total Current Members 1,003,886 1,004,189Retirement Recipients: Service 292,838 277,088 Disability 8,785 8,677 Survivor 11,057 10,726 Total Retirement Recipients 312,680 296,491 TOTAL MEMBERSHIP 1,316,566 1,300,680
Membership changes are summarized below:
2011 2010
Active Membership: New Members 66,337 74,780 Members Withdrawing (40,402) (36,140) Service Retirements (20,401) (16,054) Disability Retirements (753) (652) In-Service Deaths (1,266) (1,285) Other Changes (3,818) (5,428)Net Increase/(Decrease) (303) 15,221Retired Membership: Retirements 21,154 16,706 Deaths After Retirement (6,753) (6,436) Option Continuations 1,983 1,852 Other Changes (195) (245)Net Increase 16,189 11,877
Active Member Profile 2011 2010Average Annual Salary $ 44,392 $ 43,916Average Age 44.3 44.2Average Years of Service 9.9 9.7
Annuitant andBeneficiary Profile 2011 2010
Average Monthly Annuities Life Annuities $ 1,897 $ 1,863 Disability Annuities $ 1,174 $ 1,167 Annuities Certain $ 984 $ 1,000Average Age of Current Retirees 70.2 70.2Average Age at Retirement All Retirees 59.8 59.8 Current Year Retirees 61.0 60.7Average Years of Service All Retirees 24.6 24.6 Current Year Retirees 24.6 24.0Average Salary at Retirement All Retirees $ 39,234 $38,023 Current Year Retirees $ 51,130 $49,345Ratio of Current Members to Retirees 3.2 to 1 3.4 to 1
TEXAS PUBLIC SCHOOL RETIRED EMPLOYEES GROUP INSURANCE PROGRAM (TRS-CARE) Participation for the Retired Plan is summarized below:
2011 2010
Retirees 167,726 161,578 Surviving Spouses 5,063 4,802 Surviving Children 70 65 Dependent Spouses 33,701 31,889 TOTAL * 206,560 198,334
* Excludes 6,182 and 5,887 dependent children for 2011 and 2010, respectively.
TEXAS ACTIVE SCHOOL EMPLOYEES UNIFORM GROUP BENEFITS PROGRAM (TRS-ACTIVECARE) Participation for the Active Plan is summarized below:
2011 2010
Employees 270,490 245,686 Dependents 188,110 168,435 TOTAL 458,600 414,121
As of September 1, 2011, there were 1,120 participating entities.

INTRODUCTORY SECTION
TEACHER RETIREMENT SYSTEM OF TEXAS COMPREHENSIVE ANNUAL FINANCIAL REPORT 2011
11
During fiscal year 2011, TRS expanded its efforts to improve communications with its members, retirees, and the general public.
The year began with a concerted effort to reach out to members and retirees regarding TRS-related matters throughout the state. TRS staff spoke at conferences across Texas to provide updates on new legislation, investment performance, pension- and health care-related issues, and to explain new ways that members and retirees can obtain the latest information from TRS.
Listed below are achievements of the past year, including those pertaining to the agency’s website, toll-free telephone service, print publications, benefit presentations and employer training programs.
PRINT PUBLICATIONSDuring fiscal year 2011, TRS published three TRS News issues to provide members, retirees and employers with important information relating to their benefits. In addition, the agency introduced a comprehensive new booklet to help those seeking information on returning to work for a TRS-covered employer after retirement.
Titled Employment After Retirement, the booklet is divided into three sections – for those who are retired, those who have not yet retired, and those who have taken disability retirement. The TRS Benefits Handbook continues to be the primary guide for members and retirees wishing to learn about their retirement and health care benefits. Featured on the TRS website and mailed to members and retirees, the handbook is also available in Spanish. Additional benefit information is available to members and retirees through brochures, newsletters, other print materials and the TRS website.
THE INTERNETDuring the past year, TRS undertook two major website initiatives: MyTRS, a new and improved online access section of the TRS website, and the TRS Broker Relations Portal.
Prior to MyTRS, separate web applications had allowed members to view account information, register for benefit presentations, and request information from TRS. However, in November 2010, TRS launched MyTRS by mailing temporary user IDs and passwords to members with the 2010 TRS Annual Statement of Account. This enabled members to create their own unique MyTRS user IDs and passwords.
Once active members select a valid user ID and password for MyTRS, they can:
• Obtain personalized retirement estimates using data on file with TRS
• View and print a copy of their most recent annual statement
• View their account balance, including current year contributions received to date by TRS
• Request a bill for reinstatement of withdrawn service
• Obtain information on their withdrawn, unreported, military and out-of-state special service credit purchases that are already in progress
• Register for group benefit presentations held around the state
TRS annuitants with a valid user ID and password can do the following:
• View and print a copy of their most recent 1099-R tax form
• View and calculate their withholding tax amount using data on file with TRS
• View a summary of their current annuity payments
• View a summary of health benefit premiums paid in the prior two years by deduction from their TRS annuities
MyTRS also features an e-mail subscription service that offers members and retirees the ability to receive TRS announcements and various TRS publications electronically when they subscribe for such service. Those who register not only receive information more quickly than by mail, but they also help reduce TRS printing and postage expenses.
Most recently, MyTRS introduced options to register to receive electronic notification of 1099-Rs and TRS Annual Statements of Account rather than receiving them by mail. Members were also given the ability to register for field office visits around the state. By the end of the fiscal year, nearly 170,000 members and retirees had registered for MyTRS. Participation is expected to increase significantly as new MyTRS features continue to be introduced.
During the past year, TRS also introduced the TRS Broker Relations Portal, a Web-based application to manage broker relations, including numerous compliance and evaluation documents that are exchanged between brokers and TRS’ Trade Management team. The system automates processes used by brokers and TRS traders, reduces paper, and saves staff time. The annual compliance process with brokers was successfully completed using the system in the spring of 2011.
Communications

TEACHER RETIREMENT SYSTEM OF TEXAS COMPREHENSIVE ANNUAL FINANCIAL REPORT 2011
12
INTRODUCTORY SECTION
TRS has also begun posting online surveys to its website that enable visitors to provide feedback regarding the site and offer suggestions for improvements.This information will play an important role in helping TRS better serve members and retirees.
During fiscal year 2011, the TRS website received a total of 1,987,815 visits, representing a 24.18 percent increase from 1,600,691 visits in the previous fiscal year. In addition, 1,102,462 unique visitors used the site during fiscal year 2011 — a 29.54 percent increase from 851,070 visitors in fiscal year 2010.
VIDEO PRODUCTIONFiscal year 2011 saw TRS produce the first in a series of issue-oriented videos called “TRS Today.” The first videos featured interviews with TRS executives on topics such as TRS-Care, TRS-ActiveCare and various communication initiatives. Subsequent videos have focused on new legislation, actuarial valuations and other topics. More “TRS Today” programs are slated for the coming year. In addition to issue-oriented videos, TRS produced instructional videos on topics such as “Steps to Retirement.” TRS also produced a video to illustrate how TRS adds value to its members, the Texas and local economies, and state’s educational system. Finally, TRS established a video library for use in future video productions.
WEBCASTING OF BOARD MEETINGSAs part of its commitment towards open and transparent communication, TRS began webcasting all board meetings during the past year. Meetings are now streamed live so members and others can watch the proceedings as they take place from anywhere in Texas or around the world. Each meeting is also recorded for playback on demand. All TRS Board meetings are archived on the TRS website where individual agenda items can be easily accessed.
ASSOCIATION AND REPORT CARD TOUR MEETINGSIn the fall of 2010, TRS continued its outreach to members and retirees through a series of Texas Retired Teacher Association meetings. TRS officials spoke to retirees at more than 40 conventions around the state and provided updates on TRS developments. In addition, in November 2010, TRS trustees and staff hosted town-hall style Report Card Tour meetings in San Antonio, El Paso and Lufkin. The San Antonio meeting was webcast live and recorded for on-demand viewing. These meetings provide an opportunity for trustees and TRS executives to meet with members and retirees face-to-face not only to provide an update on the
fund’s status and other pertinent information, but also to answer any questions they may have. Legislators or their representatives from the area typically attend the meetings as do members of the news media.
GROUP PRESENTATIONS AND INDIVIDUAL RETIREMENT COUNSELING SESSIONSOver the past year, TRS made a number of group presentations to professional associations, to employee and retiree groups and at regional education service centers. Presentations focused on retirement options, health care benefits for active and retired members, long-term care insurance, employment after retirement, and other TRS benefits. A total of 15,921 people attended 212 group presentations, and 34,900 people attended nine conventions where TRS was represented. In addition, 10,088 people visited individually with a TRS counselor – 9,645 in Austin and 433 in field office visit locations. Fiscal year 2011 was the fifth year that one-on-one retirement counseling sessions were offered in limited field locations throughout Texas (450 available appointments in 10 cities).
TELECOMMUNICATIONSIn fiscal year 2011, the agency’s Benefit Counseling department handled a total of 496,210 calls. In addition, 273,132 calls were completed during the past year within the agency’s automated telephone system.
TRS and its contractors also provided telephone assistance to a large number of members seeking health care-related information. TRS-ActiveCare staff and contractors responded to 1,015,102 calls, and TRS-Care staff and contractors responded to 442,559 calls.
COORDINATION WITH REPORTING ENTITIESThe TRS Reporting and Query System (TRAQS), the agency’s Internet-based reporting system for employers, had 1,360 reporting entities submit monthly reports to TRS by year-end. TRAQS training was conducted through 10 webinar sessions with a total of 800 reporting entity staff participating. Some sessions were recorded and placed in the Employers section of the TRS website. Webinars offer participants greater convenience than traveling to a central location. They also save TRS staff time and travel expenses. More sessions are planned in the coming year. TRS-ActiveCare training seminars were conducted in 20 locations around the state for approximately 1,590 administrators of 987 districts/entities. These seminars provided information regarding enrollment and ongoing administrative issues for TRS-ActiveCare.
Communications

FINANCIAL SECTION
TEACHER RETIREMENT SYSTEM OF TEXAS COMPREHENSIVE ANNUAL FINANCIAL REPORT 2011
13
FINA
NC
IAL SEC
TION

TEACHER RETIREMENT SYSTEM OF TEXAS COMPREHENSIVE ANNUAL FINANCIAL REPORT 2011
14
FINANCIAL SECTION

FINANCIAL SECTION
TEACHER RETIREMENT SYSTEM OF TEXAS COMPREHENSIVE ANNUAL FINANCIAL REPORT 2011
15

TEACHER RETIREMENT SYSTEM OF TEXAS COMPREHENSIVE ANNUAL FINANCIAL REPORT 2011
16
FINANCIAL SECTION
The following is Management’s Discussion and Analysis (MD&A) of the Teacher Retirement System’s (TRS or system) financial performance for the fiscal year ended August 31, 2011. The information presented here should be considered in conjunction with other areas of the Financial Section as well as information presented in the Executive Director’s Letter of Transmittal in the Introductory Section of the TRS Comprehensive Annual Financial Report.FINANCIAL HIGHLIGHTS• The net assets of the TRS Pension Trust Fund were $107.4 billion at August 31, 2011, an increase of 12.3%, in fiscal year 2011. • As of August 31, 2011, the date of the most recent actuarial valuation, the TRS Pension Trust Fund’s ratio of actuarial assets, as a percentage of actuarial liabilities, was 82.7%, which is lower than the 82.9% level at August 31, 2010.• The TRS annual rate of return on investments for the year ended August 31, 2011 was 15.5% on a market value basis and was due to strong performance in private equities and real assets. The rate of return for fiscal year 2010 was 10.7%. • Net Assets of TRS-Care (Retired Plan) were $890.9 million at August 31, 2011, an increase of 9.3% in fiscal year 2011.• As of August 31, 2011, the date of the most recent actuarial valuation, the TRS-Care trust fund’s unfunded actuarial accrued liability was $28.9 billion, which is greater than the $25.0 billion reported at August 31, 2010.• Net assets of TRS-ActiveCare (Active plan) were $188.1 million at August 31, 2011, a decrease of $111.7 million or 37.3% in fiscal year 2011.
OVERVIEW OF THE FINANCIAL STATEMENTSThis discussion and analysis is intended to serve as an introduction to the TRS financial presentation, which consists of the following components:• Fund financial statements• Notes to the financial statements• Required supplementary information• Other supplementary schedulesCollectively, this information presents the net assets available for pension and other post-employment benefits, health care benefits, and other purposes as of August 31, 2011, and summarizes any changes in net assets for the same. The information available in each of these sections is summarized as follows:Fund Financial StatementsIndividual fund financial statements are presented for all fiduciary and proprietary funds as of August 31, 2011 and for the year then ended. Comparative data in total as of August 31, 2010,
and for the year then ended has also been presented with the exception of agency funds. These financial statements reflect the resources available to pay benefits to retirees and other benefi-ciaries, to pay health care benefits for covered participants, and to administer the 403(b) Certification Program. Fiduciary funds presented include the Pension Trust Fund, TRS-Care and Agency Funds. Fiduciary funds are used to account for resources held for the benefit of parties outside of TRS. Proprietary funds account for business-type activities and include the TRS-ActiveCare and the non-major 403(b) Certification Program enterprise funds. Notes to the Financial StatementsThe financial statement notes provide additional information that is essential to a full understanding of the data provided in the fund financial statements. Information available in the notes to the financial statements is described below:• Note 1 provides a summary of significant accounting policies, including the basis of accounting, budgets and appropriations, explanations of major asset and liability classes, and legal reserve account information. Also included is a general description of TRS as well as a description of each of the funds administered by TRS.• Note 2 provides information on capital assets.• Note 3 describes deposits and investments, including investing authority, investment risk categorizations, and additional information about cash, derivatives, securities lending, alternative investments and contingent commitments.• Note 4 provides information on employee compensable leave.• Note 5 provides information on the operating lease.• Note 6 provides information on fringe benefits paid by the state and federal government on behalf of employees and participants of the health care plans.• Note 7 describes deferred compensation plans available to TRS employees.• Note 8 provides information on contingent liabilities such as TRS employees’ accumulated sick leave, lump sum death benefits and incentive compensation as well as retiree benefits and any pending litigation.• Note 9 addresses TRS’ continuance subject to review under the Texas Sunset Act.• Note 10 describes other post-employment health care benefits provided to TRS’ employees and retired public school employees, contributions to the plan and its funded status.• Note 11 addresses risk management issues related to the health benefits program for active school district employees.• Note 12 provides pension disclosure information including detailed data on the plan description, contributions required and made, legal reserve balances and funded status.
Management’s Discussion and Analysis

FINANCIAL SECTION
TEACHER RETIREMENT SYSTEM OF TEXAS COMPREHENSIVE ANNUAL FINANCIAL REPORT 2011
17
• Note 13 provides information on subsequent events.Required Supplementary InformationRequired supplementary information consists of schedules related to the funding progress and the contributions from employers and other contributing entities of both the pension plan and the other employee benefit plan administered by TRS. Also included in this component is Management’s Discussion and Analysis.Other Supplementary SchedulesOther schedules include information on agency funds, changes in statutory reserve account balances, budgets for administra-tive and capital expenses, investing activity expenses, and payments to consultants.FINANCIAL ANALYSIS OF TRS FUNDS
Pension and Other EmployeeBenefit Trust Funds
Pension Trust FundNet assets held in trust for benefits at August 31, 2011, were $107.4 billion, an increase of $11.7 billion over the $95.7 billion at August 31, 2010.
Additions to net assets in the form of member, state and reporting entity contributions for fiscal year 2011 were $2.2 billion, $1.9 billion and $0.4 billion, respectively. Total contributions increased $77.7 million, or 1.7%, during fiscal year 2011. A decrease in active membership offset with overall payroll growth which resulted in the slight increase in total contributions. The state contribution rate was 6.644% for fiscal year 2011 as provided by Section 17.13(c), Article IX of the General Appropriations Act. The member contribution rate remained at 6.4% for fiscal year 2011.
Management’s Discussion and Analysis
Deductions from TRS net assets held in trust for benefits are predominately retirement, death, and survivor benefits. During fiscal year 2011, benefit payments totaled $7.2 billion, an increase of approximately $570.7 million, or 8.6%, from fiscal year 2010 benefit payments of $6.7 billion. Other deductions for fiscal year 2011 include $334.3 million in refunds, an increase of $69.1 million from fiscal year 2010, and administrative expenses of $35.8 million, an increase of $5.9 million over fiscal year 2010. Administrative expenses excluding investing activities expense on a cost per member basis were $27.23 for fiscal year 2011 as compared to $23.06 in fiscal year 2010. During fiscal year 2011, in accordance with Generally Accepted Accounting Principles (GAAP), a one-time expense adjustment or impairment for the remaining net book value of a 2001 technology project was made. Excluding this one-time adjustment, the cost per member would be $24.46.

TEACHER RETIREMENT SYSTEM OF TEXAS COMPREHENSIVE ANNUAL FINANCIAL REPORT 2011
18
FINANCIAL SECTION
Net Assets – Pension Trust Fund Fiscal Year Fiscal Year Dollar Percentage 2011 2010 Change Change
AssetsCash and Receivables $ 2,381,172 $ 1,483,683 $ 897,489 60.5%Investments 106,048,102 94,925,160 11,122,942 11.7Invested Securities Lending Collateral 22,760,168 23,601,465 (841,297) -3.6Capital Assets 29,045 30,998 (1,953) -6.3
TOTAL ASSETS $ 131,218,487 $ 120,041,306 $ 11,177,181 9.3%
LiabilitiesBenefits Payable $ 649,897 $ 578,168 $ 71,729 12.4%Investments Purchased Payable 235,904 119,435 116,469 97.5Accounts Payable and Other 132,675 73,609 59,066 80.2Collateral Obligations 22,779,224 23,581,689 (802,465) -3.4
TOTAL LIABILITIES $ 23,797,700 $ 24,352,901 $ (555,201) -2.3%
Net Assets $ 107,420,787 $ 95,688,405 $ 11,732,382 12.3%
(Dollars in Thousands)
Changes in Net Assets – Pension Trust Fund Fiscal Year Fiscal Year Dollar Percentage 2011 2010 Change Change
AdditionsMember Contributions $ 2,243,955 $ 2,205,017 $ 38,938 1.8%State Contributions and Other 2,461,638 2,383,453 78,185 3.3Investment Income 14,636,935 9,411,447 5,225,488 55.5
TOTAL ADDITIONS $ 19,342,528 $ 13,999,917 $ 5,342,611 38.2%
DeductionsRetirement Benefits $ 7,240,027 $ 6,669,305 $ 570,722 8.6% Refunds of Contributions 334,269 265,186 69,083 26.1Administrative Expenses 35,850 29,993 5,857 19.5
TOTAL DEDUCTIONS $ 7,610,146 $ 6,964,484 $ 645,662 9.3%
Change in Net Assets $ 11,732,382 $ 7,035,433 $ 4,696,949 66.8%
(Dollars in Thousands)
Management’s Discussion and Analysis
On a GAAP basis, the overall financial condition of the fund improved during 2011 due to net investment income during the year of $14.6 billion – an increase of 55.5% over fiscal year 2010. This net gain is comprised of net appreciation in fair value of investments of $12.6 billion, $2.1 billion in
interest and dividends, and net income of $79.5 million from securities lending reduced by investing activity expenses of $183.4 million. The net investment gain for fiscal year 2010 was $9.4 billion.

FINANCIAL SECTION
TEACHER RETIREMENT SYSTEM OF TEXAS COMPREHENSIVE ANNUAL FINANCIAL REPORT 2011
19
These asset allocation investment categories and targets are determined by and subject to the system’s investment policy guidelines which are reviewed and adjusted by the board as necessary to aid the fund in achieving the long-term portfolio return of 8 percent. TRS had an annual rate of return of 15.5 percent for the fiscal year of 2011 on investments. At the end of fiscal year 2011 the Pension Trust Fund’s investment value was approximately $11.8 billion more than at the end of fiscal year 2010. TRS’ investment strategy is designed to address three different potential market scenarios and have an advantage in each of them by allocating 60 percent to global equities, 20 percent to real return, and 20 percent to stable value. This allocation provides for good performance in any of the three scenarios. TRS continues to enhance its asset management capabilities by adding a new strategic partner, an internal gold fund, a bubble monitor and building a Co-Investment Program for lower fees and increased transparency. Due to lower interest rates today and European sovereign debt concerns, the outlook is for muted returns over the next few years. For additional details on investments and their performance refer to the Investment
Fiscal Year 2011 Fiscal Year 2010 Target Actual Target Actual
Public Equity 50.0% 50.7% 52.0% 51.7% Private Equity 10.0 10.4 8.0 9.0
TOTAL GLOBAL EQUITY 60.0% 61.1% 60.0% 60.7%
Fixed Income 15.0% 14.1% 15.0% 15.3% Short-Term 1.0 1.3 1.0 1.0 Hedge Funds 4.0 4.0 4.0 4.2
TOTAL STABLE VALUE 20.0% 19.4% 20.0% 20.5%
Global Inflation Linked Bonds 8.0% 5.3% 8.0% 8.6% Real Assets 8.0 9.7 2.0 6.0 Commodities 2.0 3.1 8.0 2.2 REITS (Real Estate Investment Trust) 2.0 1.4 2.0 2.0
TOTAL REAL RETURN 20.0% 19.5% 20.0% 18.8%
TOTAL 100.0% 100.0% 100.0% 100.0%
INVESTMENTS The following investment information is calculated per the Certified Financial Analyst (CFA) Institute guidelines. When comparing returns, it is important to remember that as a pen-sion fund, the TRS investment performance has a very long horizon.
Below are rate of return results for the total fund for the peri-ods ending August 31, 2011:
• One-Year 15.5%• Three-Years 3.6%• Five-Years 4.0%• Ten-Years 5.8%
The following table presents the actual investment allocations as of fiscal year end 2011 and 2010 as compared to the target allocations for 2011 and 2010.
Management’s Discussion and Analysis
INVESTMENT ALLOCATIONS
Section. For a reconciliation of the CFA basis to the GAAP basis investment value refer to the Market Values table also in the Investment Section.

TEACHER RETIREMENT SYSTEM OF TEXAS COMPREHENSIVE ANNUAL FINANCIAL REPORT 2011
20
FINANCIAL SECTION
Net Assets – TRS-Care (Retired Plan)
Fiscal Year Fiscal Year Dollar Percentage 2011 2010 Change Change
AssetsCash and Receivables $ 991,128 $ 945,970 $ 45,158 4.8%
TOTAL ASSETS $ 991,128 $ 945,970 $ 45,158 4.8%
LiabilitiesAccounts Payable and Other $ 1,323 $ 3,398 $ (2,075) -61.1%Health Care Claims Payable 98,935 127,608 (28,673) -22.5
TOTAL LIABILITIES $ 100,258 $ 131,006 $ (30,748) -23.5%
Total Net Assets $ 890,870 $ 814,964 $ 75,906 9.3%
(Dollars in Thousands)
TRS-Care (Retired Plan)Net assets of the TRS-Care (Retired Plan) increased $76 million, from $814.9 million at the end of fiscal year 2010 to $890.9 million at the end of fiscal year 2011.Additions to net assets include health care premiums; active member, state and reporting entity contributions; investment earnings and federal revenue. Retiree premiums of $345.2 million for fiscal year 2011 increased $12.7 million over fiscal year 2010. The total contributions of $625.4 million increased by 1.4% from the fiscal year 2010 total of $616.7 million due to overall payroll growth and an increase in plan participation. Federal revenue payments received in fiscal year 2011 from the federal government include Medicare Part D retiree drug subsidy payments totaling $66.3 million and $70.6 million for the Early Retiree Reinsurance Program (ERRP). This resulted in an increase in federal revenue of $66.1 million primarily due to receipt of the new ERRP funds (See Note 6 for more details). Investment income of $8.2 million decreased $3.5 million from fiscal year 2010 as a result of lower interest rates in fiscal year 2011.Deductions from net assets include claims payments, claims processing costs, and administrative expenses. Claims payments and processing costs during fiscal year 2011 totaled
$1.037 billion and increased $22.7 million or 2.2% over fiscal year 2010 claims of $1.014 billion. The increase is due to the rising costs of health care and growth in plan participation. A fiscal year end decrease in the estimated amount for claims incurred but not reported resulted in an increase of $27.3 million in net assets. Administrative expenses increased by 3.7% from fiscal year 2010 primarily due to slight increases in personnel costs.
Management’s Discussion and Analysis

FINANCIAL SECTION
TEACHER RETIREMENT SYSTEM OF TEXAS COMPREHENSIVE ANNUAL FINANCIAL REPORT 2011
21
Changes in Net Assets – TRS-Care (Retired Plan)
Fiscal Year Fiscal Year Dollar Percentage 2011 2010 Change Change
AdditionsMember Contributions $ 183,809 $ 181,513 $ 2,296 1.3%State Contributions 256,997 253,626 3,371 1.3Reporting Entities and Other Contributions 184,617 181,644 2,973 1.6%Health Care Premiums 345,164 332,482 12,682 3.8Federal Revenue 136,888 70,796 66,092 93.4Investment Income 8,169 11,679 (3,510) -30.1
TOTAL ADDITIONS $ 1,115,644 $ 1,031,740 $ 83,904 8.1%
DeductionsHealth Care Claims $ 992,478 $ 971,357 $ 21,121 2.2%Health Care Claims Processing 44,116 42,535 1,581 3.7Administrative Expenses 3,144 3,032 112 3.7
TOTAL DEDUCTIONS $ 1,039,738 $ 1,016,924 $ 22,814 2.2%
Change in Net Assets $ 75,906 $ 14,816 $ 61,090 412.3%
(Dollars in Thousands)
Enterprise Funds
TRS-ActiveCareThe TRS-ActiveCare program operates under the authority of the Texas Insurance Code, Title 8, Subtitle H, Chapter 1579 and the Texas Administrative Code, Title 34, Part 3, Chapter 41, and began operations in fiscal year 2003. Net assets of the plan were $188.1 million at the end of fiscal year 2011, a decrease of $111.7 million, or 37.3%, from fiscal year 2010.Revenues for fiscal year 2011 included $1.5 billion from health care premiums, an increase of $220.4 million, or 16.6%, over fiscal year 2010. This increase is due to an increase in plan participation. Investment income for the year was $3.4 million which decreased $3.0 million or 47.3% from fiscal year 2010 due to lower interest rates and reduced cash balances in fiscal year 2011. Federal revenue reimbursements are related to the American Recovery and Reinvestment Act (ARRA). Federal and other revenues for 2011 totaled $871 thousand, a decrease of $544 thousand from fiscal year 2010. The decrease is primarily attributable to the ARRA program which is nearing an end.Health care claims for fiscal year 2011 were $1.5 billion, a $197.0 million, or 15%, increase over the $1.3 billion in fiscal year 2010. The increase is due to the rising costs of health care
and pharmacy benefits and to growth in plan participation. Other expenses included claims processing costs of $77 million, $76.3 million for HMO premium reimbursements, and $2.2 million for administrative expenses. An upward adjustment to claims incurred but not reported decreased plan net assets by $3.8 million for fiscal year 2011.
Management’s Discussion and Analysis

TEACHER RETIREMENT SYSTEM OF TEXAS COMPREHENSIVE ANNUAL FINANCIAL REPORT 2011
22
FINANCIAL SECTION
Net Assets – TRS-ActiveCare
Fiscal Year Fiscal Year Dollar Percentage 2011 2010 Change Change
AssetsCash and Receivables $ 365,374 $ 451,561 $ (86,187) -19.1%
TOTAL ASSETS $ 365,374 $ 451,561 $ (86,187) -19.1%
LiabilitiesAccounts Payable and Other $ 326 $ 342 $ (16) -4.7%Premiums Payable to HMO’s 6,238 5,309 929 17.5Health Care Claims Payable 170,741 146,100 24,641 16.9
TOTAL LIABILITIES $ 177,305 $ 151,751 $ 25,554 16.8%
Total Net Assets $ 188,069 $ 299,810 $ (111,741) -37.3%
(Dollars in Thousands)
Statement of Revenues, Expenses, and Changes in Net Assets - TRS-ActiveCare Fiscal Year Fiscal Year Dollar Percentage 2011 2010 Change Change
Revenues (Operating and Non-Operating)Health Care Premiums $ 1,549,531 $ 1,329,171 $ 220,360 16.6%Investment Income 3,387 6,421 (3,034) -47.3 Federal Revenue and Other 871 1,415 (544) -38.4
TOTAL REVENUE $ 1,553,789 $ 1,337,007 $ 216,782 16.2%
ExpensesHealth Care Claims $ 1,510,091 $ 1,313,114 $ 196,977 15.0%Health Care Claims Processing 76,961 67,907 9,054 13.3Premium Payments to HMO’s 76,271 64,532 11,739 18.2 Administrative Expenses 2,207 1,883 324 17.2
TOTAL EXPENSES $ 1,665,530 $ 1,447,436 $ 218,094 15.1%
Change in Net Assets $ (111,741) $ (110,429) $ (1,312) 1.2%
(Dollars in Thousands)
Management’s Discussion and Analysis

FINANCIAL SECTION
TEACHER RETIREMENT SYSTEM OF TEXAS COMPREHENSIVE ANNUAL FINANCIAL REPORT 2011
23
403(b) Certification Program (Non-Major Fund) The 403(b) Certification Program began on September 1, 2001, and operates under the authority of Vernon’s Civil Statutes, Title 109, Article 6228a-5 and Sections 4-8A. Net assets were $122.0 thousand for fiscal year 2011 as compared to $245.8 thousand in fiscal year 2010. The fund’s total revenues of $24.7 thousand decreased $38.7 thousand from the fiscal year 2010 total of $63.4 thousand due to fewer companies seeking product registration for marketing. Deductions from the fund were administrative expenses of $148.4 thousand for fiscal year 2011 including personnel costs. This represents a decrease of $24.4 thousand from the fiscal year 2010 total of $172.8 thousand which is attributable to reduced program staff. REQUEST FOR INFORMATIONThis financial report is designed to provide a general overview of the Teacher Retirement System for those with an interest in the system’s finances.Questions concerning any of the information provided in this report or requests for additional information should be addressed to the Communications Department of the Teacher Retirement System, 1000 Red River Street, Austin, Texas 78701.
Management’s Discussion and Analysis

TEACHER RETIREMENT SYSTEM OF TEXAS COMPREHENSIVE ANNUAL FINANCIAL REPORT 2011
24
FINANCIAL SECTION
ASSETS Cash Cash in State Treasury $ 891,767,954 $ 928,047,496 Cash in Bank (Note 3A) 184,856,481 Cash on Hand (Note 3B) 2,563,416
TOTAL CASH $ 1,079,187,851 $ 928,047,496
Receivables Sale of Investments $ 931,132,294 $ Interest and Dividends 244,762,871 657,739 Member and Retiree 80,060,214 39,998,328 Reporting Entities 44,574,753 8,680,440 Other 234,809 10,948,726 Due from State’s General Fund 2,795,631 Due from Employees Retirement System of Texas 1,219,459
TOTAL RECEIVABLES $ 1,301,984,400 $ 63,080,864
Investments (Notes 1F and 3E) Short-Term $ 12,213,781,658 $ Short-Term Foreign Currency Contracts (44,158) Equities 41,913,520,425 Fixed Income 20,442,247,585 Alternative Investments 26,905,492,896 Derivative Investments (93,266,114) Pooled Investments 4,666,369,268
TOTAL INVESTMENTS $ 106,048,101,560 $ 0
Invested Securities Lending Collateral $ 22,760,168,002 $ 0
Capital Assets (Note 2) Intangible Assets $ 8,839,708 $ Less Accumulated Amortization (7,908,543) Depreciable Assets 46,476,931 Less Accumulated Depreciation (20,692,331) Non-Depreciable Assets 2,329,417
TOTAL CAPITAL ASSETS $ 29,045,182 $ 0
TOTAL ASSETS $ 131,218,486,995 $ 991,128,360
PensionTrust Fund
TRS-Care (Retired Plan)
FIDUCIARY FUNDTYPES
PENSION AND OTHEREMPLOYEE BENEFIT TRUST FUNDS
Statement of Fiduciary Net AssetsAUGUST 31, 2011
(With Comparative Data for Pension and Other Employee Benefit Trust Funds for August 31, 2010)E
X H
I B
I T
I

FINANCIAL SECTION
TEACHER RETIREMENT SYSTEM OF TEXAS COMPREHENSIVE ANNUAL FINANCIAL REPORT 2011
25
2011 2010
$ 1,819,815,450 $ 1,735,044,840 $ 3,977 184,856,481 84,868,536 2,563,416 3,672,003
$ 2,007,235,347 $ 1,823,585,379 $ 3,977
$ 931,132,294 $ 147,800,560 $ 245,420,610 224,372,715 120,058,542 121,996,630 53,255,193 57,397,895 11,183,535 11,656,975 2,795,631 41,871,897 1,219,459 971,294
$ 1,365,065,264 $ 606,067,966 $ 0
$ 12,213,781,658 $ 8,175,829,363 $ (44,158) (467,338) 41,913,520,425 42,805,497,400 20,442,247,585 19,502,462,264 26,905,492,896 21,070,904,758 (93,266,114) (123,664,947) 4,666,369,268 3,494,599,035
$ 106,048,101,560 $ 94,925,160,535 $ 0
$ 22,760,168,002 $ 23,601,464,926 $ 0
$ 8,839,708 $ 12,853,867 $ (7,908,543) (7,753,817) 46,476,931 40,899,745 (20,692,331) (18,622,169) 2,329,417 3,620,047
$ 29,045,182 $ 30,997,673 $ 0
$ 132,209,615,355 $ 120,987,276,479 $ 3,977
(to next page)
FIDUCIARY FUND TYPES
AgencyFunds
TOTAL - PENSION AND OTHER EMPLOYEE BENEFIT TRUST FUNDS

TEACHER RETIREMENT SYSTEM OF TEXAS COMPREHENSIVE ANNUAL FINANCIAL REPORT 2011
26
FINANCIAL SECTION
Statement of Fiduciary Net AssetsAUGUST 31, 2011
(With Comparative Data for Pension and Other Employee Benefit Trust Funds for August 31, 2010)
LIABILITIES (Note 1F) Accounts Payable $ 7,783,405 $ 977,410 Payroll Payable 3,645,801 162,475 External Manager Fees Payable 44,297,345 Benefits Payable 649,896,558 Health Care Claims Payable 98,934,646 Investments Purchased Payable 235,903,809 Collateral Obligations 22,779,223,912 Due to State’s General Fund 45,577,164 Due to Employees Retirement System of Texas 5,656,783 Purchased Service Installment Receipts 19,563,023 Compensable Absences Payable (Note 4) 4,618,755 183,523 Deferred Rent 1,533,547 Funds Held for Others
TOTAL LIABILITIES $ 23,797,700,102 $ 100,258,054
NET ASSETS HELD IN TRUSTFOR PENSION/OTHER EMPLOYEE BENEFITS $ 107,420,786,893 $ 890,870,306 The accompanying Notes to the Financial Statements are an integral part of this financial statement.
PensionTrust Fund
TRS-Care(Retired Plan)
FIDUCIARY FUNDTYPES
PENSION AND OTHEREMPLOYEE BENEFIT TRUST FUNDS
E X
H I
B I
T
I(concluded)

FINANCIAL SECTION
TEACHER RETIREMENT SYSTEM OF TEXAS COMPREHENSIVE ANNUAL FINANCIAL REPORT 2011
27
2011 2010
$ 8,760,815 $ 4,927,492 $ 3,808,276 14,488,487 44,297,345 4,082,409 649,896,558 578,168,075 98,934,646 127,607,686 235,903,809 119,435,388 22,779,223,912 23,581,689,266 45,577,164 19,411,437 5,656,783 5,126,112 19,563,023 21,223,985 4,802,278 5,538,937 1,533,547 2,207,893 3,977
$ 23,897,958,156 $ 24,483,907,167 $ 3,977
$ 108,311,657,199 $ 96,503,369,312 $ 0
FIDUCIARY FUND TYPES
AgencyFunds
TOTAL - PENSION AND OTHEREMPLOYEE BENEFIT TRUST FUNDS

TEACHER RETIREMENT SYSTEM OF TEXAS COMPREHENSIVE ANNUAL FINANCIAL REPORT 2011
28
FINANCIAL SECTION
Statement of Changes in Fiduciary Net AssetsFOR THE FISCAL YEAR ENDED AUGUST 31, 2011 (With Comparative Data for August 31, 2010)
ADDITIONS Contributions Contributions Paid by Member $ 2,243,954,725 $ 183,808,580 Employer (Notes 10 and 12): Contributions from State’s General Fund 1,595,771,774 256,997,446 Contributions from Federal/Private Funding Sources 324,764,720 25,784,985 Legislative Revenue from State’s General Fund Paid on Behalf of TRS for Employee Fringe Benefits (Note 6) 108,440 Reporting Entities 411,889,817 155,471,641 Purchase of Service Credit - Refundable 45,158,612 Purchase of Service Credit - Non-Refundable 60,018,492 Contributions from Employee’s Retirement System of Texas: For Service Contributions 12,628,712 For 415 Excess Benefit Arrangement 45,053 Contributions from the State for 415 Excess Benefit Arrangement 1,705,535 Employment after Retirement Surcharge paid by Reporting Entities: Employee 3,983,605 Employer 4,095,094 3,252,369 Health Care Premiums 345,164,271 Federal Revenue (Note 6) 136,887,805
TOTAL CONTRIBUTIONS AND PREMIUMS $ 4,704,016,139 $ 1,107,475,537 Investment Income From Investing Activities: Net Appreciation in Fair Value of Investments $ 12,616,681,465 $ Interest 1,003,311,852 8,168,640 Dividends 1,120,858,771
Total Investing Activities Income $ 14,740,852,088 $ 8,168,640
Less: Investing Activity Expenses (Schedule 3) (183,369,775)
Net Income From Investing Activities $ 14,557,482,313 $ 8,168,640
From Securities Lending Activities: Securities Lending Income $ 135,755,199 $ Securities Lending Expenses: Borrower Rebates (36,111,713) Management Fees (20,190,571)
Net Income from Securities Lending Activities $ 79,452,915 $ 0
TOTAL NET INVESTMENT INCOME $ 14,636,935,228 $ 8,168,640
Other Additions Legislative Appropriations $ $ Miscellaneous Revenues 1,576,613
TOTAL OTHER ADDITIONS $ 1,576,613 $ 0
TOTAL ADDITIONS $ 19,342,527,980 $ 1,115,644,177
PensionTrust Fund
TRS-Care(Retired Plan)
PENSION AND OTHEREMPLOYEE BENEFIT TRUST FUNDS
E X
H I
B I
T
I I

FINANCIAL SECTION
TEACHER RETIREMENT SYSTEM OF TEXAS COMPREHENSIVE ANNUAL FINANCIAL REPORT 2011
29
$ 2,427,763,305 $ 2,386,530,281
1,852,769,220 1,828,247,655 350,549,705 332,407,488
108,440 262,486 567,361,458 559,521,632 45,158,612 37,442,030 60,018,492 47,077,732
12,628,712 11,167,772 45,053 43,562 1,705,535 1,460,948
3,983,605 2,989,345 7,347,463 5,675,767 345,164,271 332,481,933 136,887,805 70,795,686
$ 5,811,491,676 $ 5,616,104,317
$ 12,616,681,465 $ 7,542,738,000 1,011,480,492 924,165,767 1,120,858,771 958,159,970
$ 14,749,020,728 $ 9,425,063,737
(183,369,775) (111,918,654)
$ 14,565,650,953 $ 9,313,145,083
$ 135,755,199 $ 164,683,341 (36,111,713) (40,036,033) (20,190,571) (16,331,481)
$ 79,452,915 $ 108,315,827
$ 14,645,103,868 $ 9,421,460,910
$ $ 2,805,955 1,576,613 2,453,980
$ 1,576,613 $ 5,259,935
$ 20,458,172,157 $ 15,042,825,162
(to next page)
TOTAL - PENSION AND OTHER EMPLOYEE BENEFIT TRUST FUNDS
2011 2010

TEACHER RETIREMENT SYSTEM OF TEXAS COMPREHENSIVE ANNUAL FINANCIAL REPORT 2011
30
FINANCIAL SECTION
DEDUCTIONS Benefits $ 7,173,504,788 $ 415 Excess Benefit Arrangement 1,547,229 Benefits Paid to Employee’s Retirement System of Texas: For Service Contributions 64,772,079 For 415 Excess Benefit Arrangement 203,359 Refunds of Contributions - Active 330,284,482 Refunds of Contributions - Death 3,984,340 Health Care Claims 992,478,380 Health Care Claims Processing 44,007,586 Premium Payments to HMO’s 108,286 Administrative Expenses, Excluding Investing Activity Expenses: Salaries and Wages 17,207,826 1,679,019 Payroll Related Costs 4,705,791 402,013 Professional Fees and Services 488,028 799,324 Travel 148,784 4,486 Materials and Supplies 4,824,890 118,957 Communications and Utilities 474,586 1,466 Repairs and Maintenance 794,811 Rentals and Leases 252,570 116,564 Printing and Reproduction 291,769 14,276 Depreciation 1,128,178 Amortization 154,726 Loss on Impairment of Capital Asset 4,477,619 Other Expenses 900,241 7,817
TOTAL DEDUCTIONS $ 7,610,146,096 $ 1,039,738,174
Change in Net Assets $ 11,732,381,884 $ 75,906,003
NET ASSETS HELD IN TRUST FOR PENSION/OTHEREMPLOYEE BENEFITS - BEGINNING OF YEAR $ 95,688,405,009 $ 814,964,303
NET ASSETS HELD IN TRUST FOR PENSION/OTHEREMPLOYEE BENEFITS - END OF YEAR $ 107,420,786,893 $ 890,870,306
The accompanying Notes to the Financial Statements are an integral part of this financial statement.
PensionTrust Fund
TRS-Care (Retired Plan)
PENSION AND OTHEREMPLOYEE BENEFIT TRUST FUNDS
Statement of Changes in Fiduciary Net AssetsFOR THE FISCAL YEAR ENDED AUGUST 31, 2011 (With Comparative Data for August 31, 2010)
E X
H I
B I
T
I I(concluded)

FINANCIAL SECTION
TEACHER RETIREMENT SYSTEM OF TEXAS COMPREHENSIVE ANNUAL FINANCIAL REPORT 2011
31
$ 7,173,504,788 $ 6,617,397,376 1,547,229 1,301,151 64,772,079 61,570,749 203,359 203,359 330,284,482 261,475,649 3,984,340 3,710,940 992,478,380 971,356,805 44,007,586 42,435,939 108,286 99,662
18,886,845 17,680,495 5,107,804 4,896,860 1,287,352 2,238,578 153,270 23,974 4,943,847 2,277,466 476,052 845,934 794,811 2,081,982 369,134 419,804 306,045 518,411 1,128,178 659,943 154,726 824,572 4,477,619 908,058 556,275
$ 8,649,884,270 $ 7,992,575,924
$ 11,808,287,887 $ 7,050,249,238
$ 96,503,369,312 $ 89,453,120,074
$ 108,311,657,199 $ 96,503,369,312
2011 2010
TOTAL - PENSION AND OTHEREMPLOYEE BENEFIT TRUST FUNDS

E X
H I
B I
T
I I I
TEACHER RETIREMENT SYSTEM OF TEXAS COMPREHENSIVE ANNUAL FINANCIAL REPORT 2011
32
FINANCIAL SECTION
Enterprise Funds
Major Fund Non-Major Fund
403(b) Certification TRS-ActiveCare Program
ASSETS Current Assets Cash Cash in State Treasury $ 259,110,267 $ 146,859
TOTAL CASH $ 259,110,267 $ 146,859
Accounts Receivable Interest $ 224,584 $ 99 Health Care Premiums 105,994,766 ARRA Cobra Premiums 44,519
TOTAL ACCOUNTS RECEIVABLE $ 106,263,869 $ 99
TOTAL ASSETS $ 365,374,136 $ 146,958
LIABILITIES (Note 1F) Current Liabilities Accounts Payable $ 84,790 $ Payroll Payable 113,364 11,737 Premiums Payable to HMOs 6,238,055 Health Care Claims Payable 170,741,328 Compensable Absences Payable (Note 4) 80,504 8,501
TOTAL CURRENT LIABILITIES $ 177,258,041 $ 20,238
Non-Current Liabilities Compensable Absences Payable (Note 4) $ 46,668 $ 4,688
TOTAL NON-CURRENT LIABILITIES $ 46,668 $ 4,688
TOTAL LIABILITIES $ 177,304,709 $ 24,926
NET ASSETS Restricted for Health Care Programs $ 188,069,427 $ Restricted for 403(b) Program Administration 122,032
TOTAL NET ASSETS $ 188,069,427 $ 122,032
The accompanying Notes to the Financial Statements are an integral part of this financial statement.
Statement of Net AssetsPROPRIETARY FUNDS
AUGUST 31, 2011 (With Comparative Data for August 31, 2010)
FINANCIAL SECTION
TEACHER RETIREMENT SYSTEM OF TEXAS COMPREHENSIVE ANNUAL FINANCIAL REPORT 2011
33
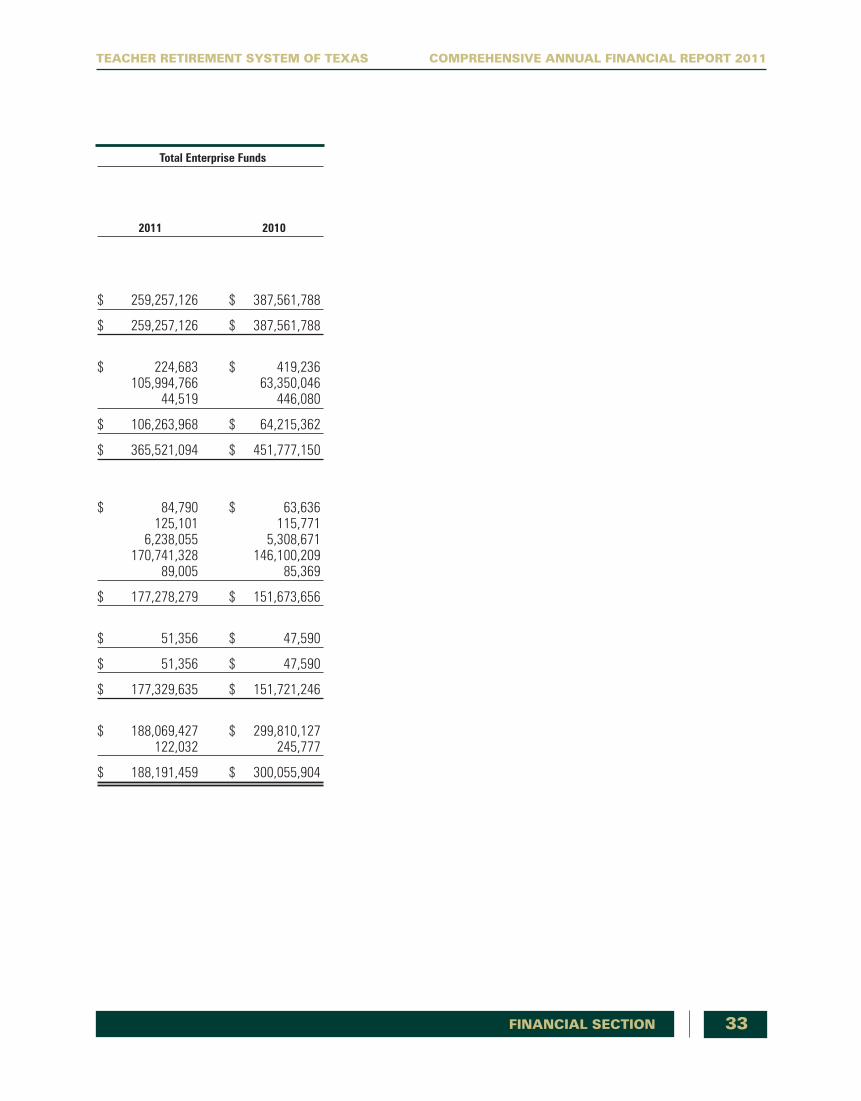
Total Enterprise Funds
2011 2010
$ 259,257,126 $ 387,561,788
$ 259,257,126 $ 387,561,788
$ 224,683 $ 419,236 105,994,766 63,350,046 44,519 446,080
$ 106,263,968 $ 64,215,362
$ 365,521,094 $ 451,777,150
$ 84,790 $ 63,636 125,101 115,771 6,238,055 5,308,671 170,741,328 146,100,209 89,005 85,369
$ 177,278,279 $ 151,673,656
$ 51,356 $ 47,590
$ 51,356 $ 47,590
$ 177,329,635 $ 151,721,246
$ 188,069,427 $ 299,810,127 122,032 245,777
$ 188,191,459 $ 300,055,904

E X
H I
B I
T
I V
TEACHER RETIREMENT SYSTEM OF TEXAS COMPREHENSIVE ANNUAL FINANCIAL REPORT 2011
34
FINANCIAL SECTION
Statement of Revenues, Expenses and Changes in Fund Net Assets
PROPRIETARY FUNDSFOR THE FISCAL YEAR ENDED AUGUST 31, 2011 (With Comparative Data for August 31, 2010)
Enterprise Funds
Major Fund Non-Major Fund
403(b) Certification TRS-ActiveCare Program
OPERATING REVENUES Health Care Premiums $ 1,549,530,891 $ Administrative Fees 135,917 Certification Fees 12,000 Product Registration Fees 3,000
TOTAL OPERATING REVENUES $ 1,549,666,808 $ 15,000
OPERATING EXPENSES Health Care Claims $ 1,510,090,981 $ Health Care Claims Processing 76,960,951 Premium Payments to HMOs 76,270,706 Administrative Expenses Salaries and Wages 1,144,484 115,014 Payroll Related Cost 257,632 33,430 Professional Fees and Services 726,115 Materials and Supplies 4,390 Communication and Utilities 883 Travel 2,221 Rental and Leases 65,140 Printing and Reproduction 885 Other Operating Expenses 5,301
TOTAL OPERATING EXPENSES $ 1,665,529,689 $ 148,444
OPERATING (LOSS) $ (115,862,881) $ (133,444)
NON-OPERATING REVENUES Investment Income $ 3,387,062 $ 1,801 Federal Revenue - ARRA Cobra Reimbursements 667,746 On Behalf Fringe Benefits Paid by the State (Note 6) 67,373 7,898
TOTAL NON-OPERATING REVENUES $ 4,122,181 $ 9,699
Change in Net Assets $ (111,740,700) $ (123,745)
TOTAL NET ASSETS - BEGINNING $ 299,810,127 $ 245,777
TOTAL NET ASSETS - ENDING $ 188,069,427 $ 122,032
The accompanying Notes to the Financial Statements are an integral part of this financial statement.

FINANCIAL SECTION
TEACHER RETIREMENT SYSTEM OF TEXAS COMPREHENSIVE ANNUAL FINANCIAL REPORT 2011
35
Total Enterprise Funds
2011 2010
$ 1,549,530,891 $ 1,329,171,411 135,917 125,321 12,000 30,000 3,000 21,000
$ 1,549,681,808 $ 1,329,347,732
$ 1,510,090,981 $ 1,313,114,197 76,960,951 67,906,654 76,270,706 64,532,253 1,259,498 1,217,962 291,062 275,858 726,115 478,581 4,390 9,121 883 1,021 2,221 3,358 65,140 65,745 885 209 5,301 4,128
$ 1,665,678,133 $ 1,447,609,087
$ (115,996,325) $ (118,261,355)
$ 3,388,863 $ 6,425,587 667,746 1,225,158
75,271 72,362
$ 4,131,880 $ 7,723,107
$ (111,864,445) $ (110,538,248)
$ 300,055,904 $ 410,594,152
$ 188,191,459 $ 300,055,904

E X
H I
B I
T
V
TEACHER RETIREMENT SYSTEM OF TEXAS COMPREHENSIVE ANNUAL FINANCIAL REPORT 2011
36
FINANCIAL SECTION
Enterprise Funds
Major Fund Non-Major Fund
403(b) Certification TRS-ActiveCare Program
CASH FLOWS FROM OPERATING ACTIVITIES Receipts from Health Care Premiums $ 1,506,886,171 $ Receipts from Long-Term Care Administrative Fees 135,917 Receipts from Certification/Product Registration Fees 15,000 Payments for Administrative Expenses (2,164,504) (153,105) Payments for Health Care Claims (1,485,449,862) Payments for Health Care Claims Processing (76,960,951) Payments for HMO Premiums (75,341,322)
NET CASH (USED) BY OPERATING ACTIVITIES $ (132,894,551) $ (138,105)
CASH FLOWS FROM NON-CAPITAL FINANCING ACTIVITIES Proceeds from Federal Revenue $ 1,069,307 $ Proceeds from on Behalf Fringe Benefits Paid by the State 67,373 7,898
NET CASH PROVIDED BY NON-CAPITAL FINANCING ACTIVITIES $ 1,136,680 $ 7,898
CASH FLOWS FROM INVESTING ACTIVITIES Interest Received $ 3,581,445 $ 1,971
NET CASH PROVIDED BY INVESTING ACTIVITIES $ 3,581,445 $ 1,971
Net (Decrease) in Cash $ (128,176,426) $ (128,236)
CASH AND CASH EQUIVALENTS - SEPTEMBER 1 $ 387,286,693 $ 275,095
CASH AND CASH EQUIVALENTS - AUGUST 31 $ 259,110,267 $ 146,859
RECONCILIATION OF OPERATING (LOSS) TONET CASH (USED) BY OPERATING ACTIVITIESOperating (Loss) $ (115,862,881) $ (133,444)
Adjustments to Reconcile Operating (Loss) to Net Cash (Used) by Operating Activities: Changes in Assets and Liabilities: (Increase) in Health Care Premiums Receivable $ (42,644,720) $ Increase (Decrease) in Premiums Payable to HMOs 929,384 Increase in Health Care Claims Payable 24,641,119 Increase (Decrease) in Accounts Payable 21,154 Increase (Decrease) in Payroll Payable 9,955 (625) Increase (Decrease) in Compensable Absences Payable 11,438 (4,036)
Total Adjustments $ (17,031,670) $ (4,661)
Net Cash (Used) by Operating Activities $ (132,894,551) $ (138,105)
The accompanying Notes to the Financial Statements are an integral part of this financial statement.
Statement of Cash FlowsPROPRIETARY FUNDS
FOR THE FISCAL YEAR ENDED AUGUST 31, 2011 (With Comparative Data for August 31, 2010)

FINANCIAL SECTION
TEACHER RETIREMENT SYSTEM OF TEXAS COMPREHENSIVE ANNUAL FINANCIAL REPORT 2011
37
Total Enterprise Funds
2011 2010
$ 1,506,886,171 $ 1,322,251,502 135,917 125,321 15,000 51,000 (2,317,609) (2,075,599) (1,485,449,862) (1,295,363,008) (76,960,951) (67,812,825) (75,341,322) (64,559,935)
$ (133,032,656) $ (107,383,544)
$ 1,069,307 $ 949,297
75,271 72,362
$ 1,144,578 $ 1,021,659
$ 3,583,416 $ 6,795,240
$ 3,583,416 $ 6,795,240
$ (128,304,662) $ (99,566,645)
$ 387,561,788 $ 487,128,433
$ 259,257,126 $ 387,561,788
$ (115,996,325) $ (118,261,355)
$ (42,644,720) $ (6,765,305) 929,384 (27,682) 24,641,119 17,845,019 21,154 (196,612) 9,330 3,309
7,402 19,082
$ (17,036,331) $ 10,877,811
$ (133,032,656) $ (107,383,544)

TEACHER RETIREMENT SYSTEM OF TEXAS COMPREHENSIVE ANNUAL FINANCIAL REPORT 2011
38
FINANCIAL SECTION
This page is intentionally left blank.

FINANCIAL SECTION
TEACHER RETIREMENT SYSTEM OF TEXAS COMPREHENSIVE ANNUAL FINANCIAL REPORT 2011
39
NOTE 1 - Summary of Significant Accounting Policies ...................................................40
NOTE 2 - Capital Assets ................................................................................................43
NOTE 3 - Deposits and Investments ..............................................................................44
NOTE 4 - Employee Compensable Leave .......................................................................56
NOTE 5 - Operating Leases ............................................................................................56
NOTE 6 - Fringe Benefits Paid by the State of Texas and the Federal Government .........56
NOTE 7 - Deferred Compensation ..................................................................................57
NOTE 8 - Contingent Liabilities ......................................................................................57
NOTE 9 - Continuance Subject to Review ......................................................................57
NOTE 10 - Post-employment Health Care Benefits ..........................................................57
NOTE 11 - Risk Management ..........................................................................................60
NOTE 12 - Pension Disclosure..........................................................................................60
NOTE 13 - Subsequent Events .........................................................................................63
Notes to the Financial Statements

TEACHER RETIREMENT SYSTEM OF TEXAS COMPREHENSIVE ANNUAL FINANCIAL REPORT 2011
40
FINANCIAL SECTION
NOTE 1: SUMMARY OF SIGNIFICANT ACCOUNTING POLICIESA. REPORTING ENTITY The Teacher Retirement System of Texas (TRS or system) is governed by a nine member board of trustees which has significant independence in the operations and management of the system. The state legislature confirms trustees appointed by the governor, establishes laws with regard to structure, benefits and contributions, and authorizes Pension Trust Fund administrative expenses. State contributions and appropriations received by TRS are determined by the legislature. TRS is a separate legal entity and considered a discrete component unit of the State of Texas. This report includes all activities and programs for which TRS exercises fiscal control and responsibility and includes all funds that comprise the system’s legal entity. TRS administers retirement and related benefits to employees and beneficiaries of employees of the public, state-supported, educational institutions of Texas. It operates primarily under the provisions of Texas Constitution, Article XVI, Section 67 and Texas Government Code, Title 8, Subtitle C. The pension trust fund is a defined benefit retirement plan that is a qualified pension trust under Section 401(a) of the Internal Revenue Code. The system administers the Texas Public School Retired Employees Group Insurance Program and the Texas Active School Employees Uniform Group Benefits Program. These programs provide two separate health care plans, TRS-Care (Retired Plan) and TRS-ActiveCare (Active Plan), respectively. TRS-Care is considered an employee benefit trust fund and provides health care coverage for certain persons (and their dependents) who retire under TRS. The statutory authority for the program is Texas Insurance Code, Chapter 1575 and Texas Administrative Code, Title 34, Part 3, Chapter 41. The inception of the plan was fiscal year 1986. TRS-ActiveCare provides health care coverage to employees (and their dependents) of participating public education entities. Op-tional life and long-term care insurance which are provided to active members and retirees are also accounted for in the fund. Authority for the plan can be found in the Texas Insurance Code, Title 8, Subtitle H, Chapter 1579 and in the Texas Administrative Code, Title 34, Part 3, Chapter 41. The plan began operations on September 1, 2002. The system also administers a 403(b) Certification Program in which companies must be certified by TRS to offer to public educa-tion employees a qualified investment product under IRS Code 403(b) through payroll deduction. Authority for the program can be found in Vernon’s Civil Statutes, Title 109, Article 6228a-5, Sections 4-8A and in the Texas Administrative Code, Title 34, Part 3, Chapter 53. The program began operations on September 1, 2001. Agency funds are used to account for the purchase of savings bonds by participating TRS employees and also garnishments of salaries and wages for child support payments from TRS employees.
B. MEASUREMENT FOCUS, BASIS OF ACCOUNTING, AND BASIS OF PRESENTATION The accounts of TRS are organized on the basis of funds, each of which is considered a separate accounting entity. The operations of each fund are accounted for with a complete set of self-balancing accounts that comprise its assets, liabilities, additions/revenues and deductions/expenses. The following fund types are used to reflect the system’s transactions: • FiduciaryFunds–includethePensionTrustFund,TRS-Care(RetiredPlanortheemployeebenefittrustfund)andAgencyFunds. •ProprietaryFunds–includeTRS-ActiveCareandthe403(b)CertificationProgramwhichisnotconsideredamajorfund.Both
are Enterprise Funds.Fiduciary funds are used to report assets held in a trustee or agency capacity on behalf of others. The reporting focus is on net assets and changes in net assets. The pension and other employee benefit trust funds are used to report resources held in trust for the members and beneficiaries of the defined benefit pension plan and the other employee benefit plan. Agency funds are used to report resources held in a purely custodial capacity by the reporting government. The proprietary, enterprise funds account for business-type activities. The reporting focus is on the determination of operating income, changes in net assets, financial position, and cash flows. Separate financial statements are provided for each fund. The fiduciary (excluding agency funds) and proprietary financial state-ments are reported using the economic resources measurement focus and the accrual basis of accounting. Additions are recognized when earned, and deductions are recognized when the liability is incurred, regardless of the timing of related cash flows. Contributions are recognized in the period in which amounts are due, pursuant to state law. Benefits and refunds of contributions are recognized when due and payable in accordance with the terms of the plan. All economic resources, including financial and capital assets, and related liabilities, both current and long-term, and the changes therein are reported in the funds’ financial statements. Capital assets are depreciated or amortized if appropriate. Agency funds are custodial in nature and do not measure the results of operations. Assets and liabilities are recorded using the accrual basis of accounting. Agency funds are used to report assets collected and transferred to the state or other entities. Private-sector standards of accounting and financial reporting issued prior to December 1, 1989, generally are followed in the proprietary funds’ financial statements to the extent that those standards do not conflict with or contradict guidance of the Governmen-
Notes to the Financial Statements

FINANCIAL SECTION
TEACHER RETIREMENT SYSTEM OF TEXAS COMPREHENSIVE ANNUAL FINANCIAL REPORT 2011
41
tal Accounting Standards Board (GASB). Governments also have the option of following subsequent private-sector guidance for their enterprise funds, subject to the same limitation. TRS has elected not to follow subsequent private-sector guidance.
C. NEW ACCOUNTING PRONOUNCEMENTS GASB Statement No. 59, Financial Instruments Omnibus was issued in June 2010, and is effective for periods beginning after June 15, 2010. The objective of this Statement is to update and improve existing standards regarding financial reporting and disclosure requirements of certain financial instruments and external investment pools for which significant issues have been identified in practice. The requirements of this statement were implemented by TRS during fiscal year 2011.
D. COMPARATIVE DATA IN TOTAL The basic financial statements include certain prior-year summarized comparative data in total but not at the level of detail required for a presentation in conformity with generally accepted accounting principles. Accordingly, such information should be read in conjunc-tion with the system’s financial statements for the fiscal year ended August 31, 2010, from which the summarized information was derived. Certain items from the prior year’s financial statements have been reclassified to conform to the presentation in the current year’s financial statements. These reclassifications had no effect on previously reported net assets.
E. BUDGETS AND APPROPRIATIONS The administrative costs and capital outlay for each of the system’s funds and programs are controlled by annual budgets approved by the board of trustees. The Pension Trust Fund receives state contributions for retirement benefits from general revenue appropriations. In fiscal years 2011 and 2010, contributions were made to the retirement system at the rate of 6.644% of the aggregate compensation paid to active retirement system members for each year. Although appropriated by the legislature, administrative expenses and capital outlay for the Pension Trust Fund are paid from the fund’s Expense Account, and not from the state’s General Fund. However, for each fiscal year of the 2010-2011 biennium, the 81st Legislature, Regular Session appropriated $3.7 million of general revenue to fund exempt salary posi-tions. In response to the letter from the Governor, Lieutenant Governor and Speaker of the House dated January 15, 2010, requesting a reduction in General Revenue and General Revenue-Dedicated spending by five percent, TRS returned all of the appropriations as a part of this statewide cost saving effort. TRS-Care (Retired Plan) receives appropriations from the state’s General Fund equal to 1.0% of the salaries of public education employees. Administrative expenses for this program are paid from the trust fund. The two Enterprise Funds, TRS-ActiveCare and the 403(b) Certification Program, are supported by fees and receive no appropriations from the state for administrative expenses. Effective September 1, 1997, legislation authorized TRS to administer a governmental excess benefit arrangement under section 415(m) of the Internal Revenue Code of 1986 (26 U.S.C. section 415(m)). This legislation created a separate, non-qualified, unfunded excess benefit arrangement outside the trust fund of the retirement system. Contributions to this arrangement are made from the state’s general revenue appropriations. These contributions are not held in trust and may not be commingled with other funds of the retirement system. They yield no net assets; therefore, for reporting purposes only the contributions and benefits are reflected on Exhibit II, State-ment of Changes in Fiduciary Net Assets.
F. ASSETS, LIABILITIES AND LEGAL RESERVESInvestments
Short-term investments are those maturing within one year of purchase date. Included in short-term investments are foreign cur-rency contracts. At the time the system is notified that an international trade has been consummated, the system trader will buy or sell a foreign currency exchange contract in the currency native to the security transaction for settlement date. These foreign exchange contracts are reported at the spot rate and the net difference between the value of the foreign currency and the U.S. dollar is reported in the net appreciation (depreciation) in fair value of investments. Risks associated with such contracts include movement in the value of the foreign currency related to the U.S. dollar and the ability of the counterparty to perform. Transactions involving foreign currency are accounted for in accordance with FASB Accounting Standards Codification (ASC) 946-830; the subtopic “Foreign Currency Matters” of the topic “Financial Services – Investment Companies”. Investments are reported at fair value. The framework for measuring fair value is based on a hierarchy that gives the highest priority to the use of observable inputs in an active market and the lowest priority to the use of unobservable inputs. Management’s estimated market values for investments without readily ascertainable market values could differ significantly if a ready market for these assets existed. Because of the inherent uncertainties in estimating fair value, it is at least reasonably possible that the estimates will change in the near-term. Global foreign exchange holdings are translated using the London 4 O’clock Closing Spot Rate from a third party vendor. The fair value of equity investments is measured based on the primary exchange last sale price or the official close price from the
Notes to the Financial Statements

TEACHER RETIREMENT SYSTEM OF TEXAS COMPREHENSIVE ANNUAL FINANCIAL REPORT 2011
42
FINANCIAL SECTION
pricing vendor for all exchange listed equities. For delisted securities, the last available close price is utilized. The fair value of local access products, including equity-linked certificates and participation notes which replicate the performance of an underlying security, index, or market for which investment in the local market or in the American Depository Receipt (ADR) or Global Depository Receipt (GDR), or the total return swap market would be difficult or costly, or both, is estimated using a proprietary pricing service. The fair value of fixed income investments is measured based on exchange quotes or vendor sourced evaluated bid prices. Where constituent data is available, the system will also use a benchmark source. Mortgage backed securities are priced on a pool specific basis or, if not available, using the income method which considers the prepayment speed. The system has ownership interests in the form of Limited Partnerships (LP). These LPs include equity securities of companies that have not “gone public” (i.e., private equity), various investment vehicles in real estate companies (i.e., real estate), and diversified baskets of investments in collective vehicles whose returns are intended to be largely independent of the returns of the public markets (i.e., absolute return). These investments are generally illiquid, and the system’s ability to gain insight into the underlying portfolios of some of the LPs may be limited. The fair value of these LPs is measured based on the Net Asset Value (NAV) of the entity as provided from the General Partner (GP). The system determines whether the NAV is in accordance with the Investment Companies Guide and is in phase with TRS’ fiscal year end. If these conditions are not met, the system adjusts the NAV accordingly or performs further analysis to estimate fair value of its LP interest. A NAV that is out of phase may be adjusted for subsequent contributions, distributions, manage-ment fees and reserves, material changes in fair value of the underlying investments which make up the NAV, or an updated valuation obtained from the GP. A commingled fund is a pool of assets from multiple investors which are under the direction of an external fund manager. These instruments are typically entered into by executing an Investment Management Agreement or are registered, publicly traded pools that are accessible by many investors. The fair value of commingled funds is generally estimated by the fund administrator retained by the fund manager. Investment derivative instruments are reported at fair value. When the fund holds investment derivatives with offsetting market risks, it nets the offsetting positions. The fair value of option and future contracts traded in active markets is estimated based on the current exchange close price. For option contracts, if a current day close price is not available, a fully vetted valuation model to estimate fair value is discerned through coordination with the portfolio manager and/or the independent clearing broker. TRS did not enter into any option contracts during fiscal year 2011. For future contracts, if a current day close price is not available, the last price or settlement price may also be used, depending on availability; or if quoted prices are not available, a fully vetted valuation model to estimate fair value is discerned through coordination with the portfolio manager and/or the independent clearing broker. Futures contracts are marked to market daily. The net offsetting positions are reported as accruals, with a daily variation margin (the gain or loss) recorded between the daily value of the contracts and the value on the previous day. The fair value of fairly generic credit default swap and interest rate swap arrangements are estimated using appropriate pricing models. At each day’s close, if the variables required to successfully complete the pricing model are not available, the system utilizes a “proxy price” to estimate the fair value at the closing day. Once the variables are available, the system corrects the proxy price. These arrangements are priced “clean” meaning the fair values do not include accrued interest. The fair value of total return and other more complex swap arrangements are estimated using a pricing model or a proprietary pricing agent. The fair value of forward contracts is estimated by adding the forward points to the corresponding spot rate. These rates are then applied to the outstanding currency exchange to derive a change in valuation.
Securities Lending The system reports loaned securities, the invested cash collateral, and the related liabilities resulting from securities lending trans-actions on Exhibit I, Statement of Fiduciary Net Assets. The system also reports the earned income from securities lending on Exhibit II, Statement of Changes in Fiduciary Net Assets. Both the loaned securities and the invested cash collateral are reported at quoted market prices.
Liabilities Accounts payable represents the liability for assets or services received at fiscal year end for which payment is pending. Benefits payable for the Pension Trust Fund represents the liability for retirement, disability, and death benefits due at fiscal year end and payable within the next 30 days. The health care claims payable for TRS-Care and TRS-ActiveCare includes an estimate for health care claims incurred but not reported to the system at August 31, 2011. Investments purchased payable represents the liability for securities purchased prior to fiscal year end for which cash payment will be made after fiscal year end. Foreign investments purchased payable is reported at current exchange rates. Purchased service installment receipts are payments for service purchases establishing additional creditable service. Payments are made on a monthly basis for up to five years until sufficient to cover the total cost of the service purchased. Amounts paid, less administrative expenses, are refundable on demand. Revenues will be reported at the time the payments are sufficient to cover the
Notes to the Financial Statements

FINANCIAL SECTION
TEACHER RETIREMENT SYSTEM OF TEXAS COMPREHENSIVE ANNUAL FINANCIAL REPORT 2011
43
total cost. Until that time, these funds are a deferred revenue. Compensable absences payable represents the liability that becomes due upon the occurrence of relevant events such as resigna-tion, retirement and use of leave balances by covered employees. These obligations are normally paid from the same funding source from which each employee’s salary or wage compensation was paid. Liabilities are reported separately as either current or non-current in the statement of net assets for enterprise funds, if appropriate. Deferred rent represents a reduction to rental expenses for the rent abatement and incentives received from the non-cancelable operating lease that are being amortized over the lease term. Collateral Obligations represent both collateral associated with securities lending and that associated with derivative instrument activity.
Interfund/Interagency Transactions And Balances Transactions between the system’s funds have been classified in accordance with the following criteria that are consistent with generally accepted accounting principles (GAAP). The Pension Trust Fund provides various administrative services to other TRS programs and accounts for these services as reciprocal interfund activity. These transactions are reported using the appropriate classification accounts for additions/revenues or deductions/expenses as if transacted with parties external to the state, i.e., they are not presented as transfers. The interfund receivables and payables related to reciprocal interfund activity are classified as accounts receivable and accounts payable on the financial statements. Interagency transactions have been classified using the above criteria for reciprocal interfund activity.
Legal Reserve Accounts The Pension Trust Fund has five statutorily required reserves. The Member Savings Account reserve represents the accumulation of active member deposits plus interest. The State Contribution Account consists of reserves available to fund future active member retirement, death, and survivor benefits. The Retired Reserve Account represents reserves to pay retirement, death, survivor benefits and post-retirement benefit increases. The Deferred Retirement Option Account consists of the accumulation of participating member deposits plus interest less benefits paid out. Net investment gains or losses are accumulated in the Interest Account and transferred to the State Contribution Account together with any other balance remaining in the Interest Account. The Expense Account represents reserves to pay administrative expenses of the Pension Trust Fund that exceed the state’s appropriations and that are required to per-form the fiduciary duties of the board. The statutory accounts are a requirement of the Texas Government Code, Chapter 825, Sections 307-313.
NOTE 2: CAPITAL ASSETS Capital assets are presented at historical cost or, if not purchased, at fair value at the date of acquisition. When appropriate, de-preciation and amortization have been charged over the estimated useful lives of the assets or lease period, whichever is shorter, using the straight-line method. All capital assets belong to the Pension Trust Fund. Capitalization thresholds for all capital asset classes and useful lives for exhaustible assets are as follows:n
Useful
Capitalization Threshold Depreciable Asset Class in Dollars Life
Land $ 0 - - Construction in Progress $ 0 - - Buildings $ 100,000 50 years Building Improvements $ 100,000 15 years Facilities and Other Improvements $ 100,000 10 years Leasehold Improvements $ 100,000 6 years Furniture and Equipment $ 5,000 5 years Internally Generated Computer Software $ 1,000,000 5 years Other Computer Software $ 100,000 5 years Other Capital Assets Various Various Capital asset balances and current year transactions are presented in the table on the following page.
Notes to the Financial Statements

TEACHER RETIREMENT SYSTEM OF TEXAS COMPREHENSIVE ANNUAL FINANCIAL REPORT 2011
44
FINANCIAL SECTION
Reclassifications Balance Balance and 08/31/2011 Asset Class 09/01/2010 Completed CIP Additions Deletions (Exhibit I) Non-Depreciable Assets: Land and Land Improvements $ 1,658,310 $ $ $ $ 1,658,310 Construction in Progress 1,837,601 (1,776,610) 485,980 546,971 Other Tangible Capital Assets 124,136 124,136
Total Non-Depreciable Assets $ 3,620,047 $ (1,776,610) $ 485,980 $ 0 $ 2,329,417
Depreciable Assets: Buildings and Building Improvements $ 31,087,285 $ 1,635,003 $ 2,161,468 $ 34,883,756 Furniture and Equipment 6,422,928 1,592,784 (185,123) 7,830,589 Vehicles, Boats and Aircraft 45,721 45,721 Leasehold Improvements 3,096,189 3,096,189 Other Capital Assets 247,622 29,432 277,054 Facilities and Other Improvements 141,607 202,015 343,622
Total Depreciable Assets at Historical Cost $ 40,899,745 $ 1,776,610 $ 3,985,699 $ (185,123) $ 46,476,931
Less Accumulated Depreciation for: Buildings and Building Improvements $ (13,677,060) $ $ (927,383) $ $ (14,604,443) Furniture and Equipment (3,953,629) (789,218) 184,576 (4,558,271) Vehicles, Boats and Aircraft (45,721) (45,721) Leasehold Improvements (774,047) (516,031) (1,290,078) Other Capital Assets (171,712) (9,142) (180,854) Facilities and Other Improvements (12,964) (12,964)
Total Accumulated Depreciation $ (18,622,169) $ 0 $ (2,254,738) $ 184,576 $ (20,692,331)
Depreciable Assets, Net $ 22,277,576 $ 1,776,610 $ 1,730,961 $ (547) $ 25,784,600
Intangible Assets: Computer Software $ 12,853,867 $ $ 462,913 $ (4,477,072) $ 8,839,708
Total Amortizable Assets at Historical Cost $ 12,853,867 $ 0 $ 462,913 $ (4,477,072) $ 8,839,708
Less Accumulated Amortization for: Computer Software $ (7,753,817) $ $ (154,726) $ $ (7,908,543)
Total Accumulated Amortization $ (7,753,817) $ 0 $ (154,726) $ 0 $ (7,908,543)
Intangible Assets, Net $ 5,100,050 $ 0 $ 308,187 $ (4,477,072) $ 931,165
Fiduciary Capital Assets, Net of Accumulated Depreciation/Amortization $ 30,997,673 $ 0 $ 2,525,128 $ (4,477,619) $ 29,045,182
NOTE 3: DEPOSITS AND INVESTMENTSA. CASH IN BANK AND DEPOSITS Cash and deposits of the system are maintained in bank accounts or in the State Treasury. Foreign bank deposits are reported at current exchange rates. At August 31, 2011, the carrying amount totaled $184,856,481 and the bank balance totaled $184,854,794. The State Treasury invests funds in time deposits, repurchase and reverse repurchase agreements, obligations of the United States, and obligations of various federal credit organizations. The State Treasury has an arrangement with financial institutions to collateralize state deposits in excess of depository insurance.
Notes to the Financial Statements

FINANCIAL SECTION
TEACHER RETIREMENT SYSTEM OF TEXAS COMPREHENSIVE ANNUAL FINANCIAL REPORT 2011
45
B. CASH ON HAND AND CASH EQUIVALENTS At August 31, 2011, the system had $2,563,416 in cash on hand. This total is related to checks for purchases of special service that were being held pending approval of rollover transfer forms. Investments with an original maturity of three months or less and that are used for cash management rather than investing activities are considered cash equivalents. Highly liquid investments invested as part of a short-term investment fund are not considered cash equivalents.
C. CUSTODY OF INVESTMENTS The system has contracted with State Street Bank and Trust Company to serve as custodian for the system’s investments.
D. INVESTMENT LEGAL PROVISIONS AND OTHER CONSTRAINTS Under the Texas Property Code, Section 117.003, a trustee of the board owes a duty to the beneficiaries of the trust to comply with the prudent investor rule. In making investments, the board shall exercise the judgment and care under the circumstances then prevailing that persons of ordinary prudence, discretion, and intelligence exercise in the management of their own affairs, not in regard to speculation, but in regard to the permanent disposition of their funds, considering the probable income therefrom as well as the probable safety of their capital. Texas Government Code, Section 825.301(a), Texas Property Code, Section 117.004, and the Texas Constitution, Article XVI, Section 67(a)(3) apply in determining whether a trustee has exercised prudence with respect to an investment decision. Determination shall be made taking into consideration the investment of all the assets of the trust, or the assets of the collective invest-ment vehicle, over which the trustee had management and control. Trustees follow the guidelines provided by the TRS Investment Policy Statement in establishing specific asset allocations, benchmarks, eligible investments and quantitative criteria with the assistance of their investment counsel and investment advisors. Trustees utilize asset allocations and portfolio standards they believe are prudent and appropriate for the long-term objectives of the fund. Categories of permissible investments include equities, debt securities, cash equivalents, alternative investments including private equity, real assets, absolute return, hedge funds, other absolute return investments, derivative instruments authorized by law, mutual funds, closed-end funds, exchange-traded funds, and commingled funds. Investment categories are based on the risk profiles exhibited by those invest-ments. The objectives of the Private Equity and Real Asset investments is to provide a long-term rate of return in excess of the return of the Investment Policy benchmark for each authorized strategy, provide diversification to the Total Fund, and provide for enhanced returns and diversification within the portfolio by allocating assets among the various strategies. Private equity funds build portfolios of private investments in the equity or equity-rights securities of privately-owned operating companies. Real assets focus on private or public real estate equity, private or public real estate debt, infrastructure, timber, agricultural real estate, oil and gas, real asset mezzanine debt or equity, mortgage-related investments, entity-level investments, REITS, MLPs, non-fixed assets and other opportunistic investments in real assets. Funding of committed capital in either the Private Equity or the Real Asset Portfolio will occur over an extended time period and may take several years before the total allocation to each asset class is fully invested. Because an individual investment may begin to return capital to the investor prior to the full funding of the investor’s commitment, the outstanding invested capital of a Private Equity or Real Asset investment might at times be substantially less than the total commitment. Hedge funds are private commingled invest-ment vehicles with the general characteristics as set forth in Texas Government Code, Section 825.3012. Hedge funds include private investment fund of funds or a commingled vehicle that itself invests in hedge funds. TRS investment policy establishes criteria to analyze and determine whether a private investment fund should be classified as a hedge fund. During fiscal year 2011, the permissible hedge fund allocation was increased from a maximum of 5% to a maximum of 10% of the market value of the total fund on the date of each hedge fund investment as a result of a change in the Government Code. Other Absolute Return investments include credit sensitive investments as well as other limited partnerships that are not hedge funds, private equity, or real assets. A commingled fund is a fund which is (i) exempt under the provisions of Section 501(a) of the Internal Revenue Code of 1986, (ii) is not required to be registered as an investment company under Section 3(c)(1), 3(c)(7) or other provisions of the Investment Company Act of 1940, or (iii) is an investment company registered under the Investment Company Act of 1940, as amended, provided that investment and reinvestment of assets complies with the investment guidelines in all respects.
Notes to the Financial Statements

TEACHER RETIREMENT SYSTEM OF TEXAS COMPREHENSIVE ANNUAL FINANCIAL REPORT 2011
46
FINANCIAL SECTION
Pension Trust Fund Investment Type Fair Value
Short-Term Investments: Short-Term Investment Fund $ 7,070,923,524 Other Short-Term 5,142,858,134 Short-Term Foreign Currency Contracts (44,158) Equities: Domestic Equities: Equity Securities 19,009,420,961 Equity Commingled Funds 1,565,541,883 International Equities: Equity Securities 22,904,099,464 Equity Commingled Funds 2,779,834,064 Equity Mutual Funds 94,571,615 Debt Securities: Domestic Debt Securities: Asset and Mortgage Backed 979,350,073 Corporate 169,086,716 U.S. Treasury 13,551,666,360 U.S. Treasury STRIPS 74,163,157 U.S. Treasury TIPS 5,627,763,979 U.S. Government Agency 12,532,454 Debt Commingled Funds 151,420,783 International Debt Securities: Government 12,249,634 Corporate 15,435,212 Debt Commingled Funds 11,805,720 Alternative Investments: Domestic Alternative Investments: Private Equity 8,020,684,628 Real Assets 8,123,515,611 Absolute Return - Hedge Funds 3,995,283,051 Other Absolute Return 1,688,767,744 International Alternative Investments: Private Equity 3,077,485,846 Real Assets 1,671,124,629 Absolute Return - Hedge Funds 328,631,387 Investment Derivatives: Domestic Investment Derivatives: Forward Contracts (27,320,899) Swap Contracts (65,570,546) Warrants 80,817 International Investment Derivatives: Swap Contracts (478,509) Warrants 23,023 Other Investments: Other Commingled Funds - Domestic 63,195,203
Total Investments (Exhibit I) $ 106,048,101,560
Invested Securities Lending Collateral: Securities Lending Pooled Investments $ 22,760,168,002
Total Securities Lending Collateral (Exhibit I) $ 22,760,168,002
Notes to the Financial Statements
E. INVESTMENTS The fair values of investments at August 31, 2011, are shown in the following table.

FINANCIAL SECTION
TEACHER RETIREMENT SYSTEM OF TEXAS COMPREHENSIVE ANNUAL FINANCIAL REPORT 2011
47
F. DERIVATIVES The fair value balances and notional amounts of investment derivative instruments outstanding at August 31, 2011, classified by type, and the changes in fair value of such investment derivative instruments for the fiscal year ended August 31, 2011 are as follows. Changes in Fair Value Fair Value at August 31, 2011
Classification Amount Classification Amount Notional Gain/(Loss) Fiduciary Funds Investment Derivatives:
Forward Contracts Investment Revenue $ (49,953,250) Investment $ (27,320,899) $11,619,782,632 Futures Contracts Investment Revenue $ 220,711,897 Investment $ -0- $14,149,497,819 Swap Contracts Investment Revenue $ 1,750,131,755 Investment $ (66,049,055) $ 6,062,787,733 Warrants Investment Revenue $ 881,051 Investment $ 103,840 $ 355,247 The methods and significant assumptions used to estimate fair value of the system’s investment derivative instruments are presented in Note 1. Summary of Significant Accounting Policies, Section F. Assets, Liabilities and Legal Reserves. Derivatives are financial instruments the value of which are derived, in whole or part, from the value of any one or more underlying securities or assets, or index of securities or assets (such as bonds, stocks, financial commodities, and currencies). Derivatives include futures contracts, options, options on futures contracts, forward contracts, swap contracts, and any instrument or contract intended to manage transaction or currency exchange risk in purchasing, selling or holding investments. The system’s investment policy states that derivatives may only be used to efficiently manage and reduce the risk of the overall investment portfolio in accordance with applicable law, and must comply with the fiduciary standard of prudence set forth in the Texas Constitution, Article XVI, Section 67(a)(3). Consistent with these objectives, derivative applications may be used to implement investment strategies in a lower cost and efficient manner; efficiently manage the fund’s portfolio by altering the portfolio’s market exposure in lieu of trading the underlying cash market securities through purchases or short sales, or both, of appropriate derivatives; construct portfolios with risk and return characteristics that could not be created with cash market securities consistently with the objectives in the investment policy and in compliance with applicable law; hedge and control risks so that the fund’s risk-return profile is more closely aligned with the fund’s targeted risk-return profile through purchases or short sales, or both, of appropriate derivatives; and facilitate transition trading when holdings must be rebalanced or reallocated among permissible investments as a result of changes to applicable benchmark indexes or investment policy changes. Derivatives may not be used for any activity a primary purpose of which is speculation or to profit while materially increasing risk to the system. The tenor of interest rate over-the-counter swaps may not exceed thirty years or shorter based on market liquidity. The tenor of all other over-the-counter derivative instruments may not exceed five years. Derivative applications may not be used to invest in asset classes that are not consistent with the system’s legally permissible and policy asset categories, implementation strategies, and risk-return characteristics. Derivatives underlain by physical commodities may only be made through investments in funds that issue securities or other structures that also provide limited liability or limited risk of loss to investors. Investments in cash settled derivatives which reference commodities are permitted. Any counterparty to an over-the-counter derivative transaction must have a credit rating of at least A- (Standard & Poors or Fitch) or A3 (Moody’s) and is subject to established ISDA Master Agreements. All ISDA Master Agreements provide that netting applies. The system and external managers may also use collateral arrangements to mitigate counterparty credit or performance risk. The net market value of all over-the-counter derivative positions, less collateral posted, for any individual counterparty may not exceed $500 million.
Forward Contracts A forward contract is a non-standardized contract for the physical or electronic (through a bookkeeping entry) delivery of a commodity or financial instrument at a specified price at some point in the future.
Futures Contracts A futures contract is a commitment to buy or sell a specified quantity of a commodity or financial instrument at a specified price with payment and delivery occurring at a specified future date. Futures contracts are used primarily as a tool to increase or decrease market exposure to various asset classes.
Swap Contracts The system’s swap contracts are a bilateral financial contract in that the parties agree to exchange cash flows of defined investment assets in amounts and times specified by the contract. Swap transactions are used to efficiently manage or reduce the risk of the overall investment portfolio, or both. An interest rate swap is structured such that one stream of future interest payments is exchanged for another based on the notional amount. A total return swap is structured such that the total return (cash flows plus capital appreciation/
Notes to the Financial Statements

TEACHER RETIREMENT SYSTEM OF TEXAS COMPREHENSIVE ANNUAL FINANCIAL REPORT 2011
48
FINANCIAL SECTION
depreciation) is exchanged, rather than just the cash flows. Investment managers or sponsors of Real Asset Funds investments in commodities are limited to swaps and instruments that constitute a security that is underlain by a financial instrument as opposed to a physical commodity.
Option Contracts An option contract provides the right, but not the obligation, to buy or sell a specific amount of a specific security within a predetermined time period. During fiscal year 2011 and at August 31, 2011, respectively, the system entered into and held no option contracts.
G. DEPOSITS AND INVESTMENTS RISK FACTORS Deposits and investments of state and local governments are exposed to risks that have the potential to result in losses. GASB Statement No. 40, Deposit and Investment Risk Disclosures - an amendment to GASB Statement No. 3 updated the custodial credit risk disclosure requirements of Statement 3 and established more comprehensive disclosure requirements addressing other common risks of deposits and investments such as credit risk, concentration of credit risk, interest rate risk and foreign currency risk. The required disclosures related to these risks are presented on the following pages.
Custodial Credit Risk – Deposits The custodial credit risk for deposits is the risk that, in the event of bank failure, the government will not be able to recover deposits or will not be able to recover collateral securities that are in the possession of an outside party. The system does not have a formal deposit policy for custodial credit risk. The State Treasury has specific guidelines for cash and deposits that are maintained in the State Treasury. The deposits in the bank in excess of the insured amount are uninsured and uncollateralized. As of August 31, 2011, the balance of uncollateralized cash in U.S. and non-U.S. banks for investments pending settlement was $151,906,367.
Custodial Credit Risk – Investments The custodial credit risk for investments (including exchange traded investment derivative instruments) is the risk that, in the event of a failure of the counterparty, the government will not be able to recover the value of investment or collateral securities that are in the possession of an outside party. The system does not have a formal investment policy for custodial credit risk. Short-Term investments totaling $5,112,558,134 are held by the custodian’s agent in an investment pool not evidenced by a security, and are not exposed to custodial credit risk. All other investments (including exchange traded investment derivative instruments) are registered in the name of Teacher Retirement System or in the name of the system’s custodian which was established through a master trust custodial agreement. The securities are held by the custodian in the name of the system. Any cash collateral received associated with investment derivative activity is invested in an agent managed pool that is not evidenced by securities that exist in physical or book entry form. At August 31, 2011, the system held $30,300,000 associated with investment derivative activity. At August 31, 2011, the deposits with broker to open futures contracts in the amount of $505,261,049 were uninsured and uncollateralized.
Credit Risk of Investment Derivative Instruments and Debt Securities The credit risk for the system’s investments in debt securities, Short-Term Investment Funds, and over-the-counter investment derivative instruments in asset positions is the risk that an issuer or other counterparty to an investment will not fulfill its obligations. The system’s investment policy establishes tracking error limits that are intended to reduce the tracking error of the asset class. The system does not have a formal credit risk policy relating to its investments in Short-Term Investment Funds. For over-the-counter (OTC) derivatives, any counterparty in a transaction with TRS must have a credit rating of at least A- (Standard & Poors or Fitch) or A3 (Moody’s) or better at the inception of the contract. All OTC derivative transactions, including those managed through Agency Agreements, must be subject to established ISDA Master Agreements and have full documentation of all legal obligations of TRS under the transactions. All ISDA Master Agreements provide that netting applies. To minimize the system’s exposure to loss related to credit risk, the system may use collateral arrangements to mitigate counterparty credit risk. The system has negotiated thresholds for each counterparty above which collateral must be posted. The net market value of all over-the-counter derivative positions, less collateral posted, for any individual counterparty may not exceed $500 million. The net market value of all over-the-counter derivative positions, without consideration collateral, may not exceed five percent of the total market value of the fund. The system’s investment policy clarifies that termination of the transaction is allowed. Repurchase transactions and triparty repurchase transactions may not exceed five percent of the market value of the total investment portfolio, including cash and cash equivalents, unless those transactions are covered by a third-party indemnification agreement by an organization that bears a long-term NRSRO credit rating of A- or better and is enhanced by acceptable collateral. A securities lending agent must be an organization rated A- or better by a NRSRO. The system’s rated counterparties on investment derivative instruments in an asset position, and rated debt investments as of
Notes to the Financial Statements

FINANCIAL SECTION
TEACHER RETIREMENT SYSTEM OF TEXAS COMPREHENSIVE ANNUAL FINANCIAL REPORT 2011
49
August 31, 2011, using the Standard & Poor’s (S&P) rating scale, are as follows: Investment Derivative Instruments - the aggregate fair value of investment derivative instruments in asset positions at August 31, 2011, was $50,308,626. This represents the maximum loss that would be recognized at August 31, 2011, if all counterparties failed to perform as contracted. This maximum exposure is reduced by $30,300,000 of collateral held and by $173,448,571 of liabilities included in netting arrangements with those counterparties resulting in a zero net exposure of investment derivative instruments to credit risk. The aggregate fair value of investment derivative instruments in asset positions of $50,308,626 at August 31, 2011, was executed with two counterparties, 27% with an S&P rating of AA and 73% with an S&P rating of A.
Debt Securities:
Investment Type S&P Rating Fair Value
Short-Term Investment Fund NR $ 7,070,923,524
Other Short-Term NR 5,142,858,134
Total Credit Risk of Short-Term $ 12,213,781,658
Short-Term Foreign Currency Contracts $ (44,158)
Total Short-Term (Exhibit I) $ 12,213,737,500
U.S. Government Agency Obligations AA $ 9,349,765 U.S. Government Agency Obligations NR 32,240
Total U.S. Government Agency Obligations $ 9,382,005
Asset and Mortgage Backed Obligations AAA $ 6,973,360 Asset and Mortgage Backed Obligations AA 62,311,003 Asset and Mortgage Backed Obligations A 43,094,307 Asset and Mortgage Backed Obligations BBB 16,269,703 Asset and Mortgage Backed Obligations BB 23,726,965 Asset and Mortgage Backed Obligations B 101,352,584 Asset and Mortgage Backed Obligations CCC 323,948,592 Asset and Mortgage Backed Obligations CC 106,903,363 Asset and Mortgage Backed Obligations D 75,975,316 Asset and Mortgage Backed Obligations NR 218,794,880Total Asset and Mortgage Backed Obligations $ 979,350,073
(to next page)
Notes to the Financial Statements

TEACHER RETIREMENT SYSTEM OF TEXAS COMPREHENSIVE ANNUAL FINANCIAL REPORT 2011
50
FINANCIAL SECTION
Investment Type S&P Rating Fair Value
Corporate Obligations AAA $ 384,844 Corporate Obligations AA 3,959,823 Corporate Obligations A 17,935,626 Corporate Obligations BBB 43,430,987 Corporate Obligations BB 12,149,396 Corporate Obligations B 27,749,796 Corporate Obligations CCC 1,781,050 Corporate Obligations CC 1,317,098 Corporate Obligations NR 60,378,096
Total Corporate Obligations $ 169,086,716
International Government Obligations AAA $ 4,844,629 International Government Obligations CC 1,671,106 International Government Obligations NR 5,733,899
Total International Government Obligations $ 12,249,634
International Corporate Obligations AA $ 890,495 International Corporate Obligations A 2,132,633 International Corporate Obligations BBB 6,822,851 International Corporate Obligations BB 981,849 International Corporate Obligations B 4,104,257 International Corporate Obligations NR 503,127
Total International Corporate Obligations $ 15,435,212
Total Credit Risk of Debt Securities (excluding Short-Term) $ 1,185,503,640
U.S. Government Obligations and U.S. Government Agency Obligations $ 19,256,743,945
Total Fixed Income (Exhibit I) $ 20,442,247,585
Interest Rate Risk of Debt Securities and Investment Derivative Instruments Interest rate risk is the risk that changes in interest rates will adversely affect the fair value of an investment. Duration is a measure of a debt investment’s exposure to fair value changes arising from changes in interest rates. It uses the present value of cash flows, weighted for those cash flows as a percentage of the investment’s full price. The system does not have a formal interest rate risk policy. The table on the next page shows the long-term fixed income investments by investment type, fair value, and the effective weighted duration rate as of August 31, 2011.
(concluded)
Notes to the Financial Statements

FINANCIAL SECTION
TEACHER RETIREMENT SYSTEM OF TEXAS COMPREHENSIVE ANNUAL FINANCIAL REPORT 2011
51
Effective Weighted Investment Type Fair Value Duration Rate*
U.S. Government Obligations $ 19,253,593,496 11.49 U.S. Government Agency Obligations 12,532,454 8.99 Asset and Mortgage Backed Obligations 979,350,073 4.32 Corporate Obligations 169,086,716 5.55 International Government Obligations 12,249,634 7.65 International Corporate Obligations 15,435,212 6.32
Total Fixed Income (Exhibit I) $ 20,442,247,585 11.09
*The effective weighted duration rate is an option-adjusted measure of a bond’s (or portfolio’s) sensitivity to changes in interest rates. It is calculated as the average percentage change in a bond’s value (price plus accrued interest) under shifts of the Treasury curve +/-100 bps. It incorporates the effect of embedded options for corporate bonds and changes in prepayments for mortgage backed securities (including pass-throughs, CMOs and ARMs).
The table below shows the maturities of the system’s Swap contracts at August 31, 2011.
Maturities in Years
Less than 1 Year 1-5 6-10 11-20 Total
$ (64,093,651) $ 2,076,453 $ 589,996 $ (626,393) $ (62,053,595)
Investments Highly Sensitive to Interest Rate Changes The system’s investments in long-term Asset and Mortgage Backed Obligations are subject to prepayments by the obligees of the underlying assets in periods of decreasing interest rates. The resultant reduction in expected cash flows will affect the fair value of these securities. Prepayments by the obligee of the underlying assets in periods of declining interest rates could reduce or eliminate the stream of income that would have been received. As of August 31, 2011, these securities totaled $979,350,073. The system invests in Commingled Funds which hold a preponderance of investments with fair values that are highly sensitive to market conditions. The fair value of the Commingled Fund fluctuates as market conditions fluctuate. Interest rate changes are a part of changes in market conditions. As of August 31, 2011, these funds totaled $163,226,503. The system’s investments in Swap contracts have various reference rates based on various interbank offered rates and Treasury Bill rates. As these reference rates fluctuate, the payments due to/from the system fluctuate. At August 31, 2011, the notional amount and fair value of these contracts appear on the following page.
Notes to the Financial Statements

TEACHER RETIREMENT SYSTEM OF TEXAS COMPREHENSIVE ANNUAL FINANCIAL REPORT 2011
52
FINANCIAL SECTION
Terms Notional Fair Value
U.S. LIBOR-Varied Terms $ 3,267,238,636 $ (174,566,287)
GBP LIBOR-Varied Terms 4,210,946 177,552
1 month EURIBOR 6,287,029 (251,882)
1 month STIBOR 820,285 (80,220)
1 month HIBOR 4,179,756 104,115
1 month U.S. Treasury Bill 728,327,376 45,606,838
3 month Canada Banker’s Acceptance 30,269,819 16,615,320
3 month STIBOR 72,137,883 10,063,980
3 month U.S. Treasury Bill 1,726,916,784 73,951,099
6 month EURIBOR 30,992,862 6,451,950
JPY Overnight 855,988 33,346
U.S. Fed Funds Effective Rate 28,849,662 (1,304,251)
Fixed Rate 154,067,917 (38,855,155)
Total $ 6,055,154,943 $ (62,053,595)
Foreign Currency Risk – Deposits and Investments Foreign currency risk is the risk that changes in exchange rates will adversely affect the fair value of a deposit or an investment.The system does not have a formal deposit policy for foreign currency risk. The risk of holding investments in foreign currency is managed by engaging in currency overlay strategies. The maximum notional exposure of the fund to any single non-U.S. dollar developed market currency and any emerging market currency will be limited to 2% and 1% of the market value of the fund respectively. The system’s exposure to foreign currency risk at August 31, 2011, is presented in the tables on the following pages.
Notes to the Financial Statements

FINANCIAL SECTION
TEACHER RETIREMENT SYSTEM OF TEXAS COMPREHENSIVE ANNUAL FINANCIAL REPORT 2011
53
Deposits:
Cash in Currency Non-U.S. Banks
Australian Dollar $ 4,355,235 Botswana Pula 9,809 Brazilian Real 3,779,330 Canadian Dollar 1,163,953 Chilean Peso 139,660 Colombian Peso 96,678 Croatian Kuna 100,846 Czech Koruna 73,459 Danish Krone 297,430 Egyptian Pound 126,058 Euro 27,249,109 Ghanaian Cedi 10,247 Hong Kong Dollar 30,118,228 Hungarian Forint 61,940 Indian Rupee 6,064,412 Indonesian Rupiah 1,753,231 Israeli Shekel 74,412 Japanese Yen 35,324,555 Jordanian Dinar 160,969 Kenyan Shilling 150,334 Lithuania Litas 44,861 Malaysian Ringgit 941,671 Mauritius Rupee 71,358 Mexican Peso 128,751 Moroccan Dirham 129,485 New Turkish Lira 275,114 New Zealand Dollar 46,723 Nigerian Naira 94,751 Norwegian Krone 1,252,517 Pakistan Rupee 87,883 Peruvian Nuevo Sol 54,835 Philippine Peso 100,384 Polish Zloty 573,288 Pound Sterling 16,464,381 Qatar Riyal 74,510 Singapore Dollar 721,681 South African Rand 4,805,459 South Korean Won 1,317,647 Swedish Krona 2,485,855 Swiss Franc 3,178,658 Taiwan Dollar 6,775,501 Thai Baht 1,171,162 United Arab Emirates Dirham (3)*
Total Deposits Subject to Foreign Currency Risk $ 151,906,367
* Balance is related to the timing of trade related costs.
Notes to the Financial Statements

TEACHER RETIREMENT SYSTEM OF TEXAS COMPREHENSIVE ANNUAL FINANCIAL REPORT 2011
54
FINANCIAL SECTION
Investments:
Alternative Total Currency Debt Equity Investments Derivatives Fair Value
Australian Dollar $ 970,403 $ 734,955,748 $ $ (185,134) $ 735,741,017 Botswana Pula 4,854,270 4,854,270 Brazilian Real 975,801,805 975,801,805 Canadian Dollar 1,805,333 1,085,102,548 (102,345) 1,086,805,536 Chilean Peso 72,413,682 72,413,682 Colombian Peso 18,664,609 18,664,609 Croatian Kuna 5,492,938 5,492,938 Czech Koruna 33,602,172 33,602,172 Danish Krone 108,178,032 108,178,032 Egyptian Pound 50,697,112 50,697,112 Euro 6,434,602 2,816,038,728 2,606,298,201 (149,425) 5,428,622,106 Ghanaian Cedi 3,942,575 3,942,575 Hong Kong Dollar 1,713,190,010 104,117 1,713,294,127 Hungarian Forint 49,021,599 49,021,599 Indian Rupee 826 394,122,977 394,123,803 Indonesian Rupiah 360,574,376 360,574,376 Israeli Shekel 53,365,729 53,365,729 Japanese Yen 2,294,525,774 33,346 2,294,559,120 Jordanian Dinar 6,821,148 6,821,148 Kenyan Shilling 4,785,483 4,785,483 Malaysian Ringgit 181,502,632 22,803 181,525,435 Mauritius Rupee 6,128,271 6,128,271 Mexican Peso 365,497,667 365,497,667 Moroccan Dirham 15,258,678 15,258,678 New Turkish Lira 213,649,668 213,649,668 New Zealand Dollar 12,062,793 12,062,793 Nigerian Naira 6,353,387 6,353,387 Norwegian Krone 175,154,778 175,154,778 Pakistan Rupee 15,935,578 15,935,578 Peruvian Nuevo Sol 4,820,829 4,820,829 Philippine Peso 53,071,305 53,071,305 Polish Zloty 81,070,934 81,070,934 Pound Sterling 2,561,891,922 156,010,516 177,552 2,718,079,990 Qatar Riyal 18,594,074 18,594,074 Romanian Leu 3,033,513 3,033,513 Singapore Dollar 140,801,095 140,801,095 South African Rand 681,707,169 681,707,169 South Korean Won 1,181,566,847 1,181,566,847 Swedish Krona 3,039,295 255,089,705 (380,861) 257,748,139 Swiss Franc 1,026,733,478 24,460 1,026,757,938 Taiwan Dollar 656,628,491 656,628,491 Thai Baht 255,884,007 255,884,007 United Arab Emirates Dirham 11,134,450 11,134,450
Total Investments Subject to Foreign Currency Risk $ 12,250,459 $ 18,709,722,586 $ 2,762,308,717 $ (455,487) $ 21,483,826,275
H. SECURITIES LENDING The system is authorized by Texas Government Code, Section 825.303 to contractually lend securities to borrowers in accordance with policy established by the board of trustees and as required by statute. The system has a contract with State Street Bank and Trust Company to administer its securities lending program for domestic and international equity and fixed income securities. Authorized collateral for the program consists of cash or government securities eligible for book entry in either the Federal Reserve System or Participants Trust Company. The required collateral is based upon the lent security’s fair value plus accrued income. At a loan’s incep-tion, the value of the collateral must be at least 102% of the value of domestic lent securities and at least 105% for international lent
Notes to the Financial Statements

FINANCIAL SECTION
TEACHER RETIREMENT SYSTEM OF TEXAS COMPREHENSIVE ANNUAL FINANCIAL REPORT 2011
55
Cash collateral can be invested in a cash collateral pool, U.S. government or U.S. government sponsored entity securities, time de-posits, bank certificates of deposit, bankers’ acceptances, master notes, repurchase agreements, bank and corporate notes, commercial paper, asset backed securities, and derivative instruments. The system’s policies for securities lending provide investment guidelines for different asset classes to limit its exposure to different types of risks. The par value, dollar-weighted average maturity of the collective cash collateral investment may not exceed 120 days. The expected final maturity of any individual fixed-rate instrument has a limit of 36 months and any floating-rate instrument has a limit of seven years. Each instrument having a maturity of 13 months or less at the time of purchase must qualify as “first tier securities” within Rule 2a-7 under the Investment Company Act of 1940 and any instrument over 13 months must be rated within the highest major, long-term rating category of an NRSRO, or, if unrated, be determined to be of comparable quality by the trustees. The system does not have a formal custodial credit risk policy relating to its securities lending program. All cash collateral received is invested in an unrated cash collateral pool held by the counterparty, the system’s securities lending agent and is not exposed to custodial credit risk. The following table shows the underlying securities for non-cash collateral loans which are also held by the counterparty, the securities lending agent, but not in the system’s name and are not insured.
Investment Type Fair Value
U.S. Government Obligations $ 254,803,385 Domestic Equities 20,483,793 International Equities 8,334,579
Total $ 283,621,757
The system earns income from fees paid by the borrowers and interest earned from investing the cash collateral. The contract requires the custodian to indemnify the system if the borrower fails to return the securities or income distributions made while the securities are on loan. Non-cash collateral cannot be pledged or sold unless the borrower defaults. Substantially all securities loans can be terminated on demand either by the system or the borrower, although, as of August 31, 2011, the weighted average term of these loans was 8 days. As of August 31, 2011, the weighted average maturity of the invested cash collateral was 31 days, and there was no credit risk exposure to borrowers because the amounts owed to borrowers exceeded the amounts owed to the system. During the year there were no borrower or custodian default losses and no recoveries of prior period losses. Authorized borrowers have specific limits that vary from $50 million to $5.5 billion. During fiscal year 2011, one of TRS’ approved borrowers exceeded their borrowing limit. At all times, the loan was sufficiently collateralized and no losses were incurred. The borrower was brought into full compliance with its borrowing limit within 20 days and the exception was presented to the Compliance Committee of the TRS Board. During the year, there were no other significant violations of contractual provisions. The total market value of all loans cannot exceed 30% of the portfolio. The following table represents the fair market values of the securities lending transactions based on type of collateral received as of August 31, 2011.
Cash Non-Cash Total
Securities on Loan $ 22,119,226,323 $ 283,621,757 $ 22,402,848,080 Collateral Received $ 22,748,923,912 $ 289,961,257 $ 23,038,885,169 Reinvested Collateral $ 22,760,168,002 $ 22,760,168,002
For fiscal year 2011, the system earned income of $79,452,915 from securities lending.
I. OTHER INVESTMENTS AND CONTINGENT COMMITMENTS The system’s investment derivative instruments include provisions that require the system to post collateral in the event that the fair value surpasses a specified contractual threshold. At August 31, 2011, the aggregate fair value of all investment derivative instruments with these collateral posting provisions is ($93,266,114). If the collateral posting thresholds of all these investment derivative instru-ments did not exist at August 31, 2011, the system would be required to post the aggregate amount of $173,448,571 in collateral to its counterparties. Where none of the contractual thresholds were surpassed, the system has posted no collateral at August 31, 2011. The system’s investments in certain limited partnerships commit the system to possible future capital contributions. At August 31, 2011, the remaining commitment was $14,305,596,488.
securities. Collateral is marked to market daily, and in the case it falls below 100% for domestic or 105% for international, it is reinstated to the original requirements by the borrower.
Notes to the Financial Statements

TEACHER RETIREMENT SYSTEM OF TEXAS COMPREHENSIVE ANNUAL FINANCIAL REPORT 2011
56
FINANCIAL SECTION
NOTE 4: EMPLOYEE COMPENSABLE LEAVE Salary costs related to employees’ rights to be compensated for leave balances are accrued as expenses of the period in which the services were rendered. Accumulated compensable leave liabilities are reported in the Statement of Fiduciary Net Assets for the Pen-sion and Other Employee Benefit Trust Funds and in the Statement of Net Assets for the Enterprise Funds. The employees’ compensable leave activity for fiscal year 2011 is shown in the table below.
Beginning Ending Amounts Due Amounts Balance Balance Within One Due 09/01/10 Additions Reductions 08/31/11 Year Thereafter Fiduciary Funds: Pension Trust Fund $ 5,361,881 $ 4,496,542 $ (5,239,668) $ 4,618,755 $ 2,656,156 $ 1,962,599 TRS-Care (Retired Plan) 177,056 200,724 (194,257) 183,523 116,228 67,295 Proprietary Funds TRS-ActiveCare 115,734 134,934 (123,496) 127,172 80,504 46,668 403(b) Certification Program 17,225 17,702 (21,738) 13,189 8,501 4,688
Total $ 5,671,896 $ 4,849,902 $ (5,579,159) $ 4,942,639 $ 2,861,389 $ 2,081,250
NOTE 5: OPERATING LEASES In fiscal year 2009, TRS entered into a non-cancelable operating lease agreement for building space which expires March 31, 2015. As part of the building lease, TRS received one month of rent abatement, a construction allowance, and an additional allowance. The rent abatement, construction allowance, and additional allowance are being amortized on a straight-line basis over the life of the lease as a reduction of rental expenses. Rental expenses related to the lease for the fiscal year ended August 31, 2011 for the Pension Trust Fund were $1,693,775 and include amortization of deferred rent of $674,345. The future minimum lease payments for the next four years are as follows:
Fiscal Year Ending Amount
August 31, 2012 $ 1,726,423
August 31, 2013 1,773,457
August 31, 2014 1,821,274
August 31, 2015 1,061,742
Total $ 6,382,896
NOTE 6: FRINGE BENEFITS PAID BY THE STATE OF TEXAS AND THE FEDERAL GOVERNMENT The state has a joint contributory retirement plan for substantially all its employees. The employees of TRS participate in the same plan they administer (Note 12). For the fiscal year ended August 31, 2011, the state provided retirement contributions of $108,440 on behalf of employees paid from TRS-Care (Retired Plan). In the Enterprise Funds, the state provided on behalf retirement contributions of $67,373 for TRS-ActiveCare and $7,898 for the 403(b) Certification Program. Although these fringe benefits were not paid by these funds, GASB Statement No. 24 requires recognition of these benefits as expenses of the programs, with offsetting revenues recorded.
Notes to the Financial Statements

FINANCIAL SECTION
TEACHER RETIREMENT SYSTEM OF TEXAS COMPREHENSIVE ANNUAL FINANCIAL REPORT 2011
57
Federal legislation enacted in January 2006 established prescription drug coverage for Medicare beneficiaries known as Medicare Part D. One of the provisions of Medicare Part D provided retiree drug subsidy reimbursements to TRS-Care on behalf of certain plan participants totaling $66,258,009 for the fiscal year ended August 31, 2011. The Patient Protection and Affordable Care Act, signed into law on March 23, 2010, along with the Health Care and Education Af-fordability Reconciliation Act of 2010, signed into law on March 30, 2010 (together, the PPACA), embody sweeping federal health care legislation. Under the PPACA, TRS-Care received $70,629,796 for the fiscal year ended August 31, 2011 from the U.S. Department of Health and Human Services for participation in the Early Retiree Reinsurance Program, a program that went into effect June 1, 2010. The program reimburses participating plans for a portion of health benefit costs for retirees age 55 and older who are not eligible for Medicare, and their spouses, surviving spouses, and dependents.
NOTE 7: DEFERRED COMPENSATION Employees of the system may elect to defer a portion of their earnings for income tax and investment purposes pursuant to authority granted in the Tex. Gov. Code Ann., Sec. 609.001. Two plans are available for employees. Both plans are administered by the Employees Retirement System. The system has no additional or unfunded liability for this program.
NOTE 8: CONTINGENT LIABILITIES Sick leave, the accumulation of which is unlimited, is earned at the rate of eight hours per month and is taken only in the event of illness or paid to the estate of an employee in the event of death. The maximum sick leave that may be paid to an employee’s estate is one-half of the employee’s accumulated entitlement or 336 hours, whichever is less. The system’s policy is to recognize the cost of any sick leave when paid. A Performance Incentive Compensation Plan was adopted effective July 1, 2006, to enable the system to remain competitive in its efforts to attract, retain and motivate high caliber investment division staff. The July 1, 2006 Plan was terminated by the board of trustees September 13, 2007, and a new Plan was adopted effective October 1, 2007 and modified effective October 1, 2008. The purpose of the Plan is to provide the opportunity for investment division employees to earn performance incentive pay based on the fund’s investment performance and the employee’s job performance. As of August 31, 2011, the liability is estimated not to exceed $5.8 million for the first half of the incentive plan year ending September 30, 2011. Payments can only be earned following years in which the fund experiences a positive return, and employees must be employed by TRS on the designated dates in the Plan to earn and receive payment. The board of trustees may cancel or modify the Plan at any time. The system is contingently liable for benefits payable to retiring members who remain in a pending status longer than 30 days after fiscal year end. In addition, under Texas Insurance Code, Article 3.51-7, the system is contingently liable to pay a lump sum death benefit not to exceed $5,000 when added to the death benefit authorized under Texas Government Code, Title 8, Chapter 824, to the beneficiaries of deceased, retired employees. TRS is a defendant in litigation involving issues arising from its normal activities. The outcome of this litigation cannot be determined at this time. Based upon consultation with legal counsel, management believes there will be no material adverse effect on the basic financial statements as a result of the ultimate outcome of these matters.
NOTE 9: CONTINUANCE SUBJECT TO REVIEW As provided by Texas Government Code, Title 8, Section 825.006, “The board of trustees of the Teacher Retirement System of Texas is subject to review under Chapter 325 (Texas Sunset Act), but is not abolished under that chapter. The board shall be reviewed during the period in which state agencies abolished in 2019, and every 12th year after that year, are reviewed.”
NOTE 10: POST-EMPLOYMENT HEALTH CARE BENEFITS A. PLAN DESCRIPTION
TRS Employees Employees of the system who retire with 10 or more years of eligible service credit and meet the Rule of 80 or are at least 65 years of age continue to receive health care and basic life insurance benefits through the Group Benefits Program of the State Retiree Health Plan (SRHP) in accordance with Texas Insurance Code, Chapter 1551. The SRHP is maintained and administered through the Employees Retirement System (ERS) of Texas and is considered a cost-sharing, multiple-employer, defined benefit post-employment health care plan. ERS issues a publicly available financial report that includes financial statements and required supplementary information for the SRHP.
Notes to the Financial Statements

TEACHER RETIREMENT SYSTEM OF TEXAS COMPREHENSIVE ANNUAL FINANCIAL REPORT 2011
58
FINANCIAL SECTION
That report may be obtained by visiting the ERS website at www.ers.state.tx.us, by writing to the Finance Division of the Employees Retirement System of Texas at 200 East 18th Street, Austin, Texas 78701, or by calling 1-877-275-4377. Benefits and contribution provisions of the SRHP are not actuarially determined, but are authorized by state law and may be amended by the Texas Legislature. For the year ended August 31, 2011, the system contributed up to a maximum monthly amount on a pay-as-you-go basis toward a retiree’s health and basic life insurance premiums as follows:
Employer Contribution RatesRetiree Health and Basic Life Premium
Type of Coverage FY 2011 FY 2010 FY 2009
Member Only $ 411.04 $ 385.38 $ 360.54 Member/Spouse $ 647.38 $ 605.70 $ 566.57 Member/Children $ 569.30 $ 532.90 $ 498.49 Member/Family $ 805.64 $ 753.22 $ 704.52
The system covers 100% of a Member Only premium and 50% of their additional premiums for family coverage. The basic plan includes up to $2,500 for life insurance for the retiree. The retiree contributes any premium over and above the system’s contribution for additional coverage. The board has adopted contributions based on rates set by the Texas Legislature on a biennial basis. At August 31, 2011, there were 173 retirees and their beneficiaries receiving post-employment health care and basic life insurance benefits. Contractually required contributions to the SRHP are currently based on the annual pay-as-you-go expenses of the SRHP. For the year ended August 31, 2011, 2010, and 2009 the system recognized expenditures of $1,113,697, $996,954 and $908,334, respectively, for these benefits. The system has annually made 100 percent of its contractually required contributions to the SRHP.
Public School Employees TRS, as trustee, administers the Texas Public School Retired Employees Group Insurance Program (TRS-Care) and the related fund in accordance with Texas Insurance Code, Chapter 1575. Sections 1575.202 to 204 establish state, active employee, and public school contributions. Section 1575.052 grants the board the authority to establish basic and optional group insurance coverage for participants. TRS-Care is a cost-sharing, multiple-employer, defined benefit, other post-employment benefit (OPEB) plan that is currently funded on a pay-as-you-go basis and is subject to change based on available funding. The Texas Legislature determines the funding of benefits and has no continuing obligation to provide benefits beyond each fiscal year. At the inception of the plan in fiscal year 1986, funding was projected to last 10 years through fiscal year 1995. The original funding was sufficient to maintain the solvency of the fund through fiscal year 2000. Since that time, appropriations and contributions have been established to be sufficient to provide benefits for the biennium. Eligibility generally includes TRS public school retirees with more than 10 years of service and their dependents. Retirees can receive a free basic level of coverage, and optional coverage is also available. All dependent coverage is optional. Basic coverage is a comprehensive major medical group health insurance plan. During fiscal year 2011, deductibles were $1,800 for those eligible for Part A of Medicare, $3,000 for those not eligible for Part A, but eligible for Part B, and $4,000 for those not eligible for either Part A or Part B.
At August 31, 2011, the number of reporting entities was:
Independent School Districts 1,029* Charter Schools 197 Regional Education Service Centers 20 Education Districts 5
Total 1,251
*Excludes Windham School District which is not covered by OPEB.
In addition, other contributing entities included the State of Texas and the Federal Government.
Notes to the Financial Statements

FINANCIAL SECTION
TEACHER RETIREMENT SYSTEM OF TEXAS COMPREHENSIVE ANNUAL FINANCIAL REPORT 2011
59
At August 31, 2011, OPEB membership before actuarial adjustments consisted of the following:
Retirees and beneficiaries receiving benefits 179,877* Active plan members 681,457
Total 861,334
*Excludes 6,182 dependent children
B. CONTRIBUTIONS Funding for free basic coverage is provided by the program based upon public school district payroll. The State of Texas, active public school employee and reporting entities contribution rates and amounts collected are reflected in the table below for fiscal year 2011. Per Texas Insurance Code, Chapter 1575, the public school contribution may not be less than 0.25% or greater than 0.75% of the salary of each active employee of the public school. Funding for optional coverage is provided by those participants selecting the optional coverage. Actuarial implications of the overall funding are determined by the system’s actuary.
Contribution Rate Amount
Active Employee .65% $ 183,808,580 State 1.00 257,105,886 Reporting Entities .55 155,471,641 Federal or Private Funding Sources 1.00 25,784,985
Total $ 622,171,092
C The contributions shown above and premium contributions of $345,164,271 contribute toward the total plan expenditures of $1,039,738,174. Expenses for TRS-Care are recognized as retirees report claims and include a provision for estimated claims incurred but not yet received. The actuarial valuation as of August 31, 2011, is similar to the actuarial valuations performed for the pension plan; however, certain economic and behavioral assumptions are unique to medical benefits. The demographic assumptions are identical to those used in the August 31, 2011 valuation for the pension plan. Additional valuation information follows:
Valuation Date August 31, 2011 Actuarial Cost Method Projected Unit Credit Amortization Method Level Percent, Open Remaining Amortization Period 30 Years Asset Valuation Method Market Actuarial Assumptions: Investment Rate of Return * 5.25 % Projected Salary Increases * 4.25% to 7.25 % Weighted-Average at Valuation Date 5.62 % Payroll Growth Rate 3.50 % Health Care Trend Rates * 10.00% to 4.25 %**
* Includes Inflation at 3.00%
** Initial rates are 10% for medical and 9.5% for prescriptions. The ultimate rate is 4.25% for both medical and prescriptions.
Notes to the Financial Statements

TEACHER RETIREMENT SYSTEM OF TEXAS COMPREHENSIVE ANNUAL FINANCIAL REPORT 2011
60
FINANCIAL SECTION
The results of the actuarial valuation reflect a long-term perspective, are dependent on the actuarial assumptions used, and are subject to continual revision as actual results are compared to past expectations and new estimates are made about the future. Actual results can differ, as actual experience deviates from the assumptions. Even seemingly minor changes in the assumptions can materially change the liabilities, calculated contribution rates and funding periods. The actuarial assumptions used are designed to reduce short-term volatility in the liabilities and assets. The plan provisions used in the actuarial valuation are based on the expectations of cost sharing between the employer and plan members. The calculations are based on the benefits provided under the terms of the substantive plan in effect at the time of the valu-ation and on the pattern of sharing of costs between the employer and plan members to that point. The projection of the benefits for financial reporting does not explicitly incorporate the potential effects of legal or contractual funding limitations on the pattern of cost sharing between the employer and plan members in the future.
C. FUNDED STATUS AND FUNDING PROGRESS – OPEB PLAN See TRS-Care funded status below (dollar amounts in millions):
(7) (3) (4) (5) UAAL as (1) (2) Actuarial Unfunded Funded Ratio (6) a % of Valuation Actuarial Accrued AAL Assets as a Annual Covered as of Value Liability (UAAL) % of AAL Covered Payroll August 31 of Assets (AAL) (3)-(2) (2)/(3) Payroll (4)/(6)
2011 $891 $29,785 $28,894 3.0% $30,515 95%
The Schedule of Funding Progress located immediately following the Notes to the Financial Statements in the Required Supplemen-tary Information (RSI) presents multi-year trend information about whether the actuarial value of plan assets is increasing or decreasing relative to the actuarial accrued liability for benefits paid. The required schedule reflects information beginning for the fiscal year ended August 31, 2007 as it was the date of the first actuarial valuation for TRS-Care.
NOTE 11: RISK MANAGEMENT The 77th Texas Legislature enacted the Texas Active School Employees Uniform Group Benefits Act (H.B. 3343), establishing a new statewide health coverage program for public school employees and their dependents. TRS began administering this program, known as TRS-ActiveCare, September 1, 2002. The plan is available to all public school districts, charter schools, education service centers and certain other employers. The risk associated with this program is retained by the plan’s participants, and no risk is transferred to the plan’s administrators, to employers, or to the state.
NOTE 12: PENSION DISCLOSUREA. PLAN DESCRIPTION TRS is the administrator of a multiple-employer public employee retirement system (PERS). It is a cost-sharing PERS with one exception: risks and costs are generally not shared by the employing district but are the liability of the State of Texas. That is, unless the employing district is a senior college, medical school, or state agency, in which case the employer is considered the State of Texas. By statute, the State of Texas contributes to the retirement system an amount equal to the current authorized rate times the aggregate annual compensation of all members of the pension trust fund during that fiscal year. However, for fiscal year 2011 the Pension Trust Fund paid the employer’s share for its own employees. For members of the system entitled to the minimum salary for certain school personnel under Section 21.402 Education Code, the employing district shall pay the state’s contribution on the portion of the member’s salary that exceeds the statutory minimum.
Notes to the Financial Statements

FINANCIAL SECTION
TEACHER RETIREMENT SYSTEM OF TEXAS COMPREHENSIVE ANNUAL FINANCIAL REPORT 2011
61
At August 31, 2011, the number of reporting entities was as follows:
Independent School Districts 1,030 Charter Schools 197 Community and Junior Colleges 51 Senior Colleges and Universities 46 Regional Education Service Centers 20 Education Districts 5 Medical and Dental Schools 9 State Agencies 2
Total 1,360
All employees of public, state-supported educational institutions in Texas who are employed for one-half or more of the standard work load and who are not exempted from membership under Texas Government Code, Title 8, Section 822.002, are covered by the system. At August 31, 2011, TRS gross membership before actuarial adjustments consisted of the following:
Retirees and beneficiaries currently receiving benefits 312,680 Terminated employees entitled to benefits but not yet receiving them 64,703
Total 377,383
Current Active Members: Fully-Vested 588,694 Non-Vested 368,698
Total 957,392
Benefits are established primarily under the authority of the provisions of Texas Constitution, Article XVI, Section 67 and Texas Government Code, Title 8, Subtitle C. The normal service retirement is at age 65 with 5 years of credited service or when the sum of the member’s age and years of credited service equals or exceeds 80 years. Reduced service retirement is at age 55 with 5 years of credited service and any age below 50 with 30 years of credited service. A member is fully vested after 5 years of creditable service and entitled to any benefit for which eligibility requirements have been met.
B. CONTRIBUTIONS Contribution requirements are not actuarially determined but are established pursuant to the following state funding policy: (1) The state constitution requires the legislature to establish a member contribution rate of not less than 6% of the member’s annual compensation and a state contribution rate of not less than 6% and not more than 10% of the aggregate annual compensation of all members of the system during the fiscal year; (2) state statute prohibits benefit improvements, if as a result of the particular action, the time required to amortize TRS’ unfunded actuarial liabilities would be increased to a period that exceeds 31 years, or, if the amortization period already exceeds 31 years, the period would be increased by such action. Actuarial implications of the funding provided in this manner are determined by the system’s actuary. Current contribution rates and contributions for fiscal year 2011 are shown in the table on the following page. For fiscal years 2010-11 the State of Texas contribution rate was 6.644% and in 2009 the state’s rate was 6.58%. The member contribution rate was 6.4% for fiscal years 2009-2011. These rates are set by the General Appropriations Act. In certain instances, the reporting entity (public school, college, university, medical school or other entity) is required to make all or a portion of the state’s and/or member’s contribution.
Notes to the Financial Statements

TEACHER RETIREMENT SYSTEM OF TEXAS COMPREHENSIVE ANNUAL FINANCIAL REPORT 2011
62
FINANCIAL SECTION
Contribution Rate Amount
Member 6.400% $ 2,243,954,725 State 6.644 1,595,771,774 Reporting Entities 6.644 411,889,817 Federal or Private Funding Sources 6.644 324,764,720
Total $ 4,576,381,036
Effective September 1, 2007, H.B. 2358, 80th Legislature, amended Section 825.406(b) of the Government Code and Section 1575.252 of the Insurance Code, requiring that contributions received by an employer from federal or private funding sources be depos-ited in the state contribution account and in the retired school employees group insurance fund (relates to OPEB see Note 10) of TRS, respectively, instead of the general revenue fund of the state treasury.
C. LEGAL RESERVE ACCOUNT BALANCES The balances in the five legally required reserve accounts are sufficient to meet statutory requirements. As of August 31, 2011 the reserve accounts had the following balances:
Member Savings Account $ 29,150,974,343 State Contribution Account 15,672,128,723 Retired Reserve Account 62,479,240,823 Deferred Retirement Option Account 83,931,941 Expense Account 34,511,063
Total (Exhibit I) $107,420,786,893
D. FUNDED STATUS AND FUNDING PROGRESS – PENSION PLAN The funded status of the Pension Trust Fund as of August 31, 2011, the most recent actuarial valuation date, is as follows (dollar amounts in millions):
(7) (3) (4) (5) UAAL as (1) (2) Actuarial Unfunded Funded Ratio (6) a % of Valuation Actuarial Accrued AAL Assets as a Annual Covered as of Value Liability (UAAL) % of AAL Covered Payroll August 31 of Assets (AAL) (3)-(2) (2)/(3) Payroll (4)/(6)
2011 $115,253 $139,315 $24,062 82.7% $36,797 65.4%
The Schedule of Funding Progress located immediately following the Notes to the Financial Statements in the Required Supplementary Information (RSI) presents multi-year trend information about whether the actuarial value of plan assets is increasing or decreasing over time. These indicators and trends may be useful in assessing progress made in accumulating sufficient assets to pay benefits when due for the Pension Trust Fund.
Notes to the Financial Statements
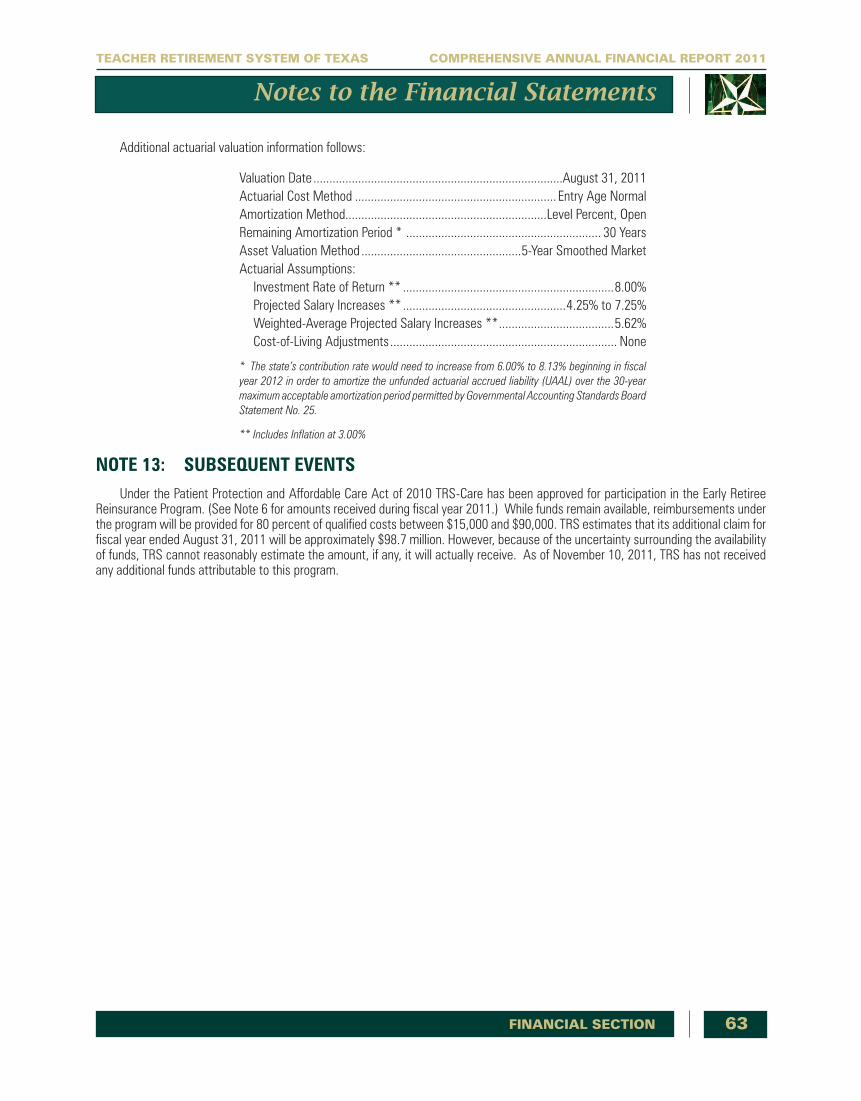
FINANCIAL SECTION
TEACHER RETIREMENT SYSTEM OF TEXAS COMPREHENSIVE ANNUAL FINANCIAL REPORT 2011
63
Additional actuarial valuation information follows: Valuation Date ..............................................................................August 31, 2011 Actuarial Cost Method ............................................................... Entry Age Normal Amortization Method...............................................................Level Percent, Open Remaining Amortization Period * ............................................................. 30 Years Asset Valuation Method ..................................................5-Year Smoothed Market Actuarial Assumptions: Investment Rate of Return ** ..................................................................8.00% Projected Salary Increases ** ...................................................4.25% to 7.25% Weighted-Average Projected Salary Increases ** ....................................5.62% Cost-of-Living Adjustments ....................................................................... None
* The state’s contribution rate would need to increase from 6.00% to 8.13% beginning in fiscal year 2012 in order to amortize the unfunded actuarial accrued liability (UAAL) over the 30-year maximum acceptable amortization period permitted by Governmental Accounting Standards Board Statement No. 25.
** Includes Inflation at 3.00%
NOTE 13: SUBSEQUENT EVENTS Under the Patient Protection and Affordable Care Act of 2010 TRS-Care has been approved for participation in the Early Retiree Reinsurance Program. (See Note 6 for amounts received during fiscal year 2011.) While funds remain available, reimbursements under the program will be provided for 80 percent of qualified costs between $15,000 and $90,000. TRS estimates that its additional claim for fiscal year ended August 31, 2011 will be approximately $98.7 million. However, because of the uncertainty surrounding the availability of funds, TRS cannot reasonably estimate the amount, if any, it will actually receive. As of November 10, 2011, TRS has not received any additional funds attributable to this program.
Notes to the Financial Statements

TEACHER RETIREMENT SYSTEM OF TEXAS COMPREHENSIVE ANNUAL FINANCIAL REPORT 2011
64
FINANCIAL SECTION
Required Supplementary InformationPENSION TRUST FUND
FISCAL YEARS 2006-2011
SCHEDULE OF FUNDING PROGRESS
Taking into account only the dollar amounts of aggregate actuarial accrued liabilities and unfunded actuarial accrued liabilities (UAAL) can be misleading. The dollar amounts of these two items can be increasing at a time when their actual substance may be decreasing. Dividing valuation asset dollars by aggregate actuarial accrued liability dollars and dividing UAAL dollars by active member payroll dollars provide clarifying indices. The larger the ratio of valuation assets to aggregate actuarial accrued liabilities, the stronger the system. Observation of these relative indices over a period of years will give an indication of whether the system is becoming stronger or weaker.
(DOLLAR AMOUNTS SHOWN IN MILLIONS)
(7) (3) (4) (5) UAAL as (1) (2) Actuarial Unfunded Funded Ratio (6) a % of Valuation Actuarial Accrued AAL Assets as a Annual Covered as of Value Liability (UAAL) % of AAL Covered PayrollAugust 31 of Assets (AAL) (3)-(2) (2)/(3) Payroll (4)/(6)
2006 $ 94,218 $ 107,912 $ 13,694 87.3% $ 28,397 48.2% 2007 103,419 115,964 12,545 89.2 31,114 40.3 2008 110,233 121,756 11,523 90.5 33,238 34.7 2009 106,384 128,030 21,646 83.1 35,097 61.7 2010 111,293 134,191 22,898 82.9 36,629 62.5 2011 115,253 139,315 24,062 82.7 36,797 65.4
SCHEDULE OF CONTRIBUTIONS FROM STATE AND REPORTING ENTITIES
State and Reporting Entities Annual Required Contributions (ARC)
Fiscal From State Percentage Year ARC From State Federal Funds/ From Reporting of ARC Ended Rate General Fund Private Grants Entities Total Contributed 2006 7.19% $ 1,596,301,608 $ $ 316,538,818 $ 1,912,840,426 83% 2007 7.02 1,721,223,689 324,945,946 2,046,169,635 85 2008 6.47 1,426,771,115 247,210,170 346,051,153 2,020,032,438 102 2009 6.10 1,373,745,903 255,108,385 380,362,287* 2,009,216,575* 108 2010 7.72 1,829,819,802 356,466,503 475,562,176 2,661,848,481 86 2011 7.77 1,866,217,141 379,804,617 481,695,346 2,727,717,104 86
*Calculation revision from fiscal year 2009 CAFR.

FINANCIAL SECTION
TEACHER RETIREMENT SYSTEM OF TEXAS COMPREHENSIVE ANNUAL FINANCIAL REPORT 2011
65
Required Supplementary InformationTRS-CARE (RETIRED PLAN)FISCAL YEARS 2007-2011
SCHEDULE OF FUNDING PROGRESS(DOLLAR AMOUNTS SHOWN IN MILLIONS)
(7) (3) (4) (5) UAAL as (1) (2) Actuarial Unfunded Funded Ratio (6) a % of Valuation Actuarial Accrued AAL Assets as a Annual Covered as of Value Liability (UAAL) % of AAL Covered PayrollAugust 31 of Assets (AAL) (3)-(2) (2)/(3) Payroll (4)/(6)
2007 $ 623 $ 19,748 $ 19,125 3.2% $ 26,076 73% 2008 729 22,313 21,584 3.3 27,979 77 2009 800 24,357 23,557 3.3 29,490 80 2010 815 25,808 24,993 3.2 30,758 81 2011 891 29,785 28,894 3.0 30,515 95
SCHEDULE OF CONTRIBUTIONS FROM EMPLOYERS AND OTHER CONTRIBUTING ENTITIES
(DOLLAR AMOUNTS SHOWN IN THOUSANDS)
Annual Required Contributions
Actual Contributions (2) (5) (1) Annual (4) On-Behalf (7) Fiscal Required (3) From From (6) Percentage Year Contributions From Reporting Federal Total Contributed Ended (ARC) State Entities Government (3)+(4)+(5) (6)/(2) 2007 $ 1,436,756 $ 238,191 $ 136,009 $ 52,330 $ 426,530 29.7% 2008 1,535,975 254,722 141,673 59,486 455,881 29.7 2009 1,655,647 267,471 149,563 61,531 478,565 28.9 2010 1,806,751 279,251 155,918 70,796 505,965 28.0 2011 1,821,817 282,891 158,724 136,888 578,503 31.8
NOTES TO REQUIRED SUPPLEMENTARY INFORMATION
The August 31, 2007 actuarial valuation was the first actuarial valuation of TRS-Care. This and future valuations will set the ARC on a prospective basis, meaning each valuation will set the ARC for the following fiscal year. The employer ARC was determined by netting the active employee contributions (0.65%) out of the total ARC rate (7.09%). The ARC for fiscal year 2011 was determined by applying the employer ARC determined in the 2010 valuation as a percentage of payroll (6.44%) to the actual payroll paid in fiscal year 2011 ($28.3 billion).

E X
H I
B I
T
A
TEACHER RETIREMENT SYSTEM OF TEXAS COMPREHENSIVE ANNUAL FINANCIAL REPORT 2011
66
FINANCIAL SECTION
Combining Statement of Changes inAssets and Liabilities
AGENCY FUNDS
FOR THE FISCAL YEAR ENDED AUGUST 31, 2011
Balances Balances September 1, August 31, 2010 Additions Deductions 2011
Employees’ Savings Bond Account
Assets: Cash in State Treasury $ 500 $ $ 500 $ 0
Liabilities: Funds Held for Others $ 500 $ $ 500 $ 0
Child Support Employee Deductions
Assets: Cash in State Treasury $ 3,607 $ 36,473 $ 36,103 $ 3,977
Liabilities: Funds Held for Others $ 3,607 $ 32,866 $ 32,496 $ 3,977
Totals - All Agency Funds (Exhibit I)Assets: Cash in State Treasury $ 4,107 $ 36,473 $ 36,603 $ 3,977
TOTAL ASSETS $ 4,107 $ 36,473 $ 36,603 $ 3,977
Liabilities: Funds Held for Others $ 4,107 $ 32,866 $ 32,996 $ 3,977
TOTAL LIABILITIES $ 4,107 $ 32,866 $ 32,996 $ 3,977

FINANCIAL SECTION
TEACHER RETIREMENT SYSTEM OF TEXAS COMPREHENSIVE ANNUAL FINANCIAL REPORT 2011
67
This page is intentionally left blank.

S C
H E
D U
L E
1
TEACHER RETIREMENT SYSTEM OF TEXAS COMPREHENSIVE ANNUAL FINANCIAL REPORT 2011
68
FINANCIAL SECTION
Comparative Schedule of Changes inAccount Balance
PENSION TRUST FUND
FOR THE FISCAL YEAR ENDED AUGUST 31, 2011 (With Comparative Data for August 31, 2010)
INTEREST ACCOUNT 2011 2010
Additions: Interest, Dividends and Other Income: Short-Term $ 49,926,058 $ 49,813,039 Equities 1,120,858,771 958,159,969 Fixed Income 973,604,208 868,114,125 Derivatives (20,218,414) (5,440,626) Securities Lending Program 79,452,915 108,315,827 Miscellaneous 1,665,193 Net Appreciation in Fair Value of Investments 12,616,681,465 7,542,738,000
TOTAL ADDITIONS $ 14,820,305,003 $ 9,523,365,527
Deductions: Transfers Out: Allocation of Interest to/(from): Member Savings Account $ 1,385,602,532 $ 1,300,356,529 State Contribution Account (4,100,053,356) (3,900,921,846) Retired Reserve Account 4,692,033,648 4,432,496,003 Deferred Retirement Option Account 4,829,832 5,639,288 Expense Account 83,256,827 66,482,415 Transfer to State Contribution Account for Net Appreciation in Fair Value of Investments 12,616,681,465 7,542,738,000 External Manager Fees 137,954,055 76,575,138
TOTAL DEDUCTIONS $ 14,820,305,003 $ 9,523,365,527
Net Change in Account Balance $ 0 $ 0
Account Balance - Beginning September 1 $ 0 $ 0
Account Balance - Ending August 31 $ 0 $ 0

S C
H E
D U
L E 1
FINANCIAL SECTION
TEACHER RETIREMENT SYSTEM OF TEXAS COMPREHENSIVE ANNUAL FINANCIAL REPORT 2011
69
MEMBER SAVINGS ACCOUNT 2011 2010
Additions: Contributions: Contributions Paid by Member $ 2,243,954,725 $ 2,205,017,425 Employment After Retirement Surcharge Paid by Reporting Entities - Employee 3,983,605 2,989,345 Purchase of Service Credit - Refundable 45,158,612 37,442,030 Transfer In: Allocation from Interest Account 1,385,602,532 1,300,356,529
TOTAL ADDITIONS $ 3,678,699,474 $ 3,545,805,329
Deductions: Refund of Contributions - Active $ 330,284,482 $ 261,475,648 Transfers Out: Transfer to Retired Reserve Account: For Dormant Accounts 18,046,747 17,544,399 To Fund Benefits 1,915,168,372 1,439,582,886
TOTAL DEDUCTIONS $ 2,263,499,601 $ 1,718,602,933
Net Change in Account Balance $ 1,415,199,873 $ 1,827,202,396
Account Balance - Beginning September 1 $ 27,735,774,470 $ 25,908,572,074
Account Balance - Ending August 31 $ 29,150,974,343 $ 27,735,774,470
Comparative Schedule of Changes inAccount Balance
PENSION TRUST FUND
FOR THE FISCAL YEAR ENDED AUGUST 31, 2011 (With Comparative Data for August 31, 2010)

S C
H E
D U
L E
1
TEACHER RETIREMENT SYSTEM OF TEXAS COMPREHENSIVE ANNUAL FINANCIAL REPORT 2011
70
FINANCIAL SECTION
STATE CONTRIBUTION ACCOUNT 2011 2010
Additions: Contributions: State Contributions - General Fund $ 1,595,771,774 $ 1,574,621,766 Contributions - Federal/Private Funding Sources 324,764,720 306,782,830 Reporting Entities 411,889,817 406,218,171 Employment After Retirement Surcharge Paid by Reporting Entities - Employer 4,095,094 3,060,987 Purchase of Service Credit - Non-Refundable 60,018,492 47,077,732 Transfers In: Transfers from Interest Account: For Investment Income (4,100,053,356) (3,900,921,846) For Net Appreciation in Fair Value of Investments 12,616,681,465 7,542,738,000 Transfers from Retired Reserve Account: For Retirement Benefits Forfeited While Member Returned to Teaching 36,576,537 52,061,421 For Retirement Benefits Waived by Member 46,176 43,650 Based on Actuarial Valuation as of August 31 572,244,213
TOTAL ADDITIONS $ 10,949,790,719 $ 6,603,926,924
Deductions: Transfers Out: Transfers to Retired Reserve Account: To Fund Benefits $ 4,745,429,605 $ 4,015,209,483 Based on Actuarial Valuation as of August 31 497,268,028
TOTAL DEDUCTIONS $ 5,242,697,633 $ 4,015,209,483
Net Change in Account Balance $ 5,707,093,086 $ 2,588,717,441
Account Balance - Beginning September 1 $ 9,965,035,637 $ 7,376,318,196
Account Balance - Ending August 31 $ 15,672,128,723 $ 9,965,035,637
Comparative Schedule of Changes inAccount Balance
PENSION TRUST FUND
FOR THE FISCAL YEAR ENDED AUGUST 31, 2011 (With Comparative Data for August 31, 2010)

S C
H E
D U
L E 1
FINANCIAL SECTION
TEACHER RETIREMENT SYSTEM OF TEXAS COMPREHENSIVE ANNUAL FINANCIAL REPORT 2011
71
RETIRED RESERVE ACCOUNT 2011 2010
Additions: Contributions Transferred in From Employees Retirement System of Texas $ 12,628,712 $ 11,167,772 Transfers In: Allocation from Interest Account 4,692,033,648 4,432,496,003 Transfer from Member Savings Account: For Dormant Accounts 18,046,747 17,544,399 To Fund Benefits 1,915,168,372 1,439,582,886 Transfer from State Contribution Account: To Fund Benefits 4,745,429,605 4,015,209,483 Based on Actuarial Valuation as of August 31 497,268,028
TOTAL ADDITIONS $ 11,880,575,112 $ 9,916,000,543
Deductions: Benefits Paid: Service Retirement Annuities $ 6,241,946,655 $ 5,841,963,927 Partial Lump Sums 524,925,790 385,555,126 Disability Retirement Annuities 144,865,109 141,396,837 Death and Survivor Benefits: Annual Salary 47,295,194 45,698,147 Survivor Annuities 86,898,720 82,574,358 Life Annuities 84,893,007 83,238,898 60 Monthly Payments 11,564,275 10,824,948 Remainder of Contributions 3,293,923 3,537,843 Refund of Contributions - Death 3,984,340 3,710,941 Benefits Transferred to Employees Retirement System of Texas 64,772,079 61,570,750 Transfers Out: Transfer to Deferred Retirement Option Account to Fund Benefits 956,666 5,161,454 Transfers to State Contribution Account: For Retirement Benefits Forfeited While Member Returned to Teaching 36,576,537 52,061,421 For Retirement Benefits Waived by Member 46,176 43,650 Based on Actuarial Valuation as of August 31 572,244,213
TOTAL DEDUCTIONS $ 7,252,018,471 $ 7,289,582,513
Net Change in Account Balance $ 4,628,556,641 $ 2,626,418,030
Account Balance - Beginning September 1 $ 57,850,684,182 $ 55,224,266,152
Account Balance - Ending August 31 $ 62,479,240,823 $ 57,850,684,182
Comparative Schedule of Changes inAccount Balance
PENSION TRUST FUND
FOR THE FISCAL YEAR ENDED AUGUST 31, 2011 (With Comparative Data for August 31, 2010)

S C
H E
D U
L E
1
TEACHER RETIREMENT SYSTEM OF TEXAS COMPREHENSIVE ANNUAL FINANCIAL REPORT 2011
72
FINANCIAL SECTION
DEFERRED RETIREMENT OPTION ACCOUNT 2011 2010
Additions: Transfers In: Transfer from Retired Reserve Account to Fund Benefits $ 956,666 $ 5,161,454 Allocation from Interest Account 4,829,832 5,639,288
TOTAL ADDITIONS $ 5,786,498 $ 10,800,742
Deductions: Benefits Paid $ 27,822,115 $ 22,607,290
Net Change in Account Balance $ (22,035,617) $ (11,806,548)
Account Balance - Beginning September 1 $ 105,967,558 $ 117,774,106
Account Balance - Ending August 31 $ 83,931,941 $ 105,967,558
Comparative Schedule of Changes inAccount Balance
PENSION TRUST FUND
FOR THE FISCAL YEAR ENDED AUGUST 31, 2011 (With Comparative Data for August 31, 2010)

S C
H E
D U
L E 1
FINANCIAL SECTION
TEACHER RETIREMENT SYSTEM OF TEXAS COMPREHENSIVE ANNUAL FINANCIAL REPORT 2011
73
EXPENSE ACCOUNT 2011 2010
Additions: Legislative Appropriations $ $ 2,805,955 On Behalf Fringe Benefits Paid by the State 160,975 Miscellaneous Revenues 1,576,613 788,787 Transfers In: Allocation from Interest Account 83,256,827 66,482,415
TOTAL ADDITIONS $ 84,833,440 $ 70,238,132
Deductions: Administrative Expenses: Salaries and Other Personnel Costs $ 57,695,600 $ 43,008,202 Professional Fees and Services 4,619,847 7,089,576 Consumable Supplies and Fuels 399,778 410,343 Utilities 706,891 880,128 Travel 709,149 690,540 Rentals 1,384,529 1,859,462 Dues, Fees and Staff Development 299,043 277,052 Subscriptions and Reference Information 195,529 202,629 Printing and Reproduction Services 311,082 538,358 Postage, Mailing and Delivery Services 2,059,866 2,305,069 Software Purchases and Maintenance 2,348,229 1,890,191 Maintenance - Computer Hardware 349,574 362,032 Maintenance - Buildings and Equipment 727,166 831,101 Miscellaneous Expenses 803,571 688,781 Insurance Premiums 668,723 727,826 Furniture and Equipment - Expensed 1,099,878 733,724 Depreciation 2,254,739 1,500,507 Amortization 154,726 1,340,603 Loss on Impairment of Capital Assets 4,477,619
TOTAL DEDUCTIONS $ 81,265,539 * $ 65,336,124
Net Change in Account Balance $ 3,567,901 $ 4,902,008
Account Balance - Beginning September 1 $ 30,943,162 $ 26,041,154
Account Balance - Ending August 31 $ 34,511,063 $ 30,943,162
* This amount includes total internal administrative investing activity expenses of $45,415,720 (Schedule 3). Total administrative expenses net of investing activity expenses are $35,849,819 (Exhibit II).
Comparative Schedule of Changes inAccount Balance
PENSION TRUST FUND
FOR THE FISCAL YEAR ENDED AUGUST 31, 2011 (With Comparative Data for August 31, 2010)

TEACHER RETIREMENT SYSTEM OF TEXAS COMPREHENSIVE ANNUAL FINANCIAL REPORT 2011
74
FINANCIAL SECTION
Schedule of Administrative and Capital Expenses -Budget and Actual on Budgetary Basis
FOR THE FISCAL YEAR ENDED AUGUST 31, 2011
FIDUCIARY FUND
VarianceActualBudget
Expenses: Salaries and Wages $ 47,657,535 $ 46,197,804 $ 1,459,731
Other Personnel Costs: Longevity Pay $ 621,820 $ 590,580 $ 31,240 Employer Retirement Contributions 2,575,000 2,354,167 220,833 Employer FICA Contributions 3,113,191 2,683,568 429,623 Employer Health Insurance Contributions 3,962,554 3,959,468 3,086 Benefit Replacement Pay 143,965 138,039 5,926 Other Employee Benefits 45,000 33,609 11,391
TOTAL OTHER PERSONNEL COSTS $ 10,461,530 $ 9,759,431 $ 702,099
Professional Fees and Services $ 8,550,771 $ 4,777,632 $ 3,773,139
Other Operating Expenses: Consumable Supplies and Fuels $ 468,353 $ 385,329 $ 83,024 Utilities 984,787 783,043 201,744 Travel 900,157 715,481 184,676 Rentals 2,195,826 2,066,383 129,443 Dues, Fees and Staff Development 418,901 290,099 128,802 Subscriptions and Reference Information 240,266 198,030 42,236 Printing and Reproduction Services 359,300 335,663 23,637 Postage, Mailing and Delivery Services 2,245,850 2,065,564 180,286 Software Purchases and Maintenance 2,784,429 2,604,797 179,632 Computer Hardware Maintenance 469,100 347,454 121,646 Miscellaneous Expenses 1,032,702 812,077 220,625 Insurance Premiums 701,446 668,723 32,723 Furniture and Equipment - Expensed 403,650 366,014 37,636 Maintenance - Buildings and Equipment 937,021 817,646 119,375
TOTAL OTHER OPERATING EXPENSES $ 14,141,788 $ 12,456,303 $ 1,685,485
TOTAL ADMINISTRATIVE EXPENSES - BUDGETARY BASIS $ 80,811,624 $ 73,191,170 $ 7,620,454
Pension Trust Fund:
Adjustments Between Budgetary Basis and GAAP: Salaries and Wages $ 2,492,221 Professional Fees and Services 31,478 Other Operating Expenses (816,859) Reclass from Capital Assets 609,430 Depreciation Expense 2,254,739 Loss on Impairment of Capital Asset 4,477,619 Amortization 154,726 Change in Compensable Absence Obligation (743,127) Prior Year Adjustments (385,858)
TOTAL DEDUCTIONS (SCHEDULE 1 - EXPENSE ACCOUNT) GAAP BASIS $ 81,265,539 *
Capital Expenses: Furniture and Equipment - Capitalized $ 890,203 $ 844,327 $ 45,876 Capital Projects 5,827,996 5,636,896 191,100
TOTAL CAPITAL EXPENSES $ 6,718,199 $ 6,481,223 $ 236,976
* This amount includes total internal administrative investing activity expenses of $45,415,720 (Schedule 3). Administrative expenses net of investing activity expenses are $35,849,819 (Exhibit II).
PENSION AND OTHER EMPLOYEE BENEFIT TRUST FUNDS
S C
H E
D U
L E
2
PENSION TRUST FUND

FINANCIAL SECTION
TEACHER RETIREMENT SYSTEM OF TEXAS COMPREHENSIVE ANNUAL FINANCIAL REPORT 2011
75
FIDUCIARY FUND
PENSION AND OTHER EMPLOYEE BENEFIT TRUST FUNDS
Budget Actual Variance
$ 1,655,000 $ 1,614,819 $ 40,181
$ 46,560 $ 45,100 $ 1,460 110,070 108,440 1,630 124,164 121,526 2,638 172,717 172,047 670 13,631 12,633 998 16,250 16,250
$ 483,392 $ 459,746 $ 23,646
$ 1,093,000 $ 799,865 $ 293,135
$ 5,482 $ 2,749 $ 2,733 2,131 1,466 665 8,827 4,486 4,341 119,693 116,564 3,129 3,595 3,270 325 570 242 328 23,730 14,276 9,454 137,280 117,101 20,179 11,000 5,240 5,760 1,250 45 1,205 500 500
$ 314,058 $ 265,439 $ 48,619
$ 3,545,450 $ 3,139,869 $ 405,581
TRS-Care:
$ 6,467 (2,414)
TOTAL ADMINISTRATIVE EXPENSES (EXHIBIT II)GAAP BASIS $ 3,143,922
(to next page)
TRS-CARE (RETIRED PLAN)

TEACHER RETIREMENT SYSTEM OF TEXAS COMPREHENSIVE ANNUAL FINANCIAL REPORT 2011
76
FINANCIAL SECTION
Expenses: Salaries and Wages $ 1,147,053 $ 1,103,421 $ 43,632
Other Personnel Costs: Longevity Pay $ 30,060 $ 27,820 $ 2,240 Employer Retirement Contributions 75,150 67,373 7,777 Employer FICA Contributions 89,229 82,758 6,471 Employer Health Insurance Contributions 114,469 107,501 6,968 Benefit Replacement Pay 2,400 1,805 595 Other Employee Benefits 9,825 9,825
TOTAL OTHER PERSONNEL COSTS $ 321,133 $ 287,257 $ 33,876
Professional Fees and Services $ 965,000 $ 866,115 $ 98,885
Other Operating Expenses: Consumable Supplies and Fuels $ 3,500 $ 1,151 $ 2,349 Utilities 1,600 883 717 Travel 8,000 2,221 5,779 Rentals 65,140 65,140 Dues, Fees and Staff Development 5,550 5,255 295 Subscriptions and Reference Information 1,000 689 311 Printing and Reproduction Services 1,400 885 515 Postage, Mailing and Delivery Services 4,750 2,883 1,867 Software Purchases and Maintenance Computer Hardware Maintenance Miscellaneous Expenses 3,000 1,251 1,749 Insurance Premiums Furniture and Equipment - Expensed 4,250 132 4,118 Maintenance - Buildings and Equipment 500 500
TOTAL OTHER OPERATING EXPENSES $ 98,690 $ 80,490 $ 18,200
TOTAL ADMINISTRATIVE EXPENSES $ 2,531,876 $ 2,337,283 $ 194,593
TRS-ActiveCare:
Adjustments Between Budgetary Basis and GAAP: Professional Fees and Services $ (140,000) Other Operating Expenses (975) Change in Compensable Absence Obligation 11,438 Prior Year Adjustments (695)
TOTAL ADMINISTRATIVE EXPENSES (Exhibit IV) - GAAP BASIS $ 2,207,051
S C
H E
D U
L E
2
Schedule of Administrative and Capital Expenses -Budget and Actual on Budgetary Basis
FOR THE FISCAL YEAR ENDED AUGUST 31, 2011
PROPRIETY FUND
VarianceActualBudget
ENTERPRISE FUND MAJOR FUND
TRS-ACTIVECARE
(concluded)

FINANCIAL SECTION
TEACHER RETIREMENT SYSTEM OF TEXAS COMPREHENSIVE ANNUAL FINANCIAL REPORT 2011
77
$ 127,200 $ 116,830 $ 10,370
$ 2,500 $ 2,220 $ 280 8,600 7,898 702 9,658 8,433 1,225 20,000 17,099 2,901 3,150 3,150
$ 43,908 $ 35,650 $ 8,258
$ $ $
$ $ $
$ 0 $ 0 $ 0
$ 171,108 $ 152,480 $ 18,628
403(b) Certification Program
$ 4,036
TOTAL ADMINISTRATIVEEXPENSES (EXHIBIT IV) - GAAP BASIS $ 148,444
PROPRIETARY FUND
ENTERPRISE FUND NON-MAJOR FUND
Budget Actual Variance403(b) CERTIFICATION PROGRAM

S C
H E
D U
L E
3
TEACHER RETIREMENT SYSTEM OF TEXAS COMPREHENSIVE ANNUAL FINANCIAL REPORT 2011
78
FINANCIAL SECTION
2011 2010
Direct Expenses: Salaries and Other Personnel Costs $ 29,476,277 $ 16,283,310 Professional Fees and Services 3,767,718 5,232,615 Consumable Supplies 35,633 41,972 Travel 506,220 490,522 Building Lease 1,019,436 1,486,486 Copier Rentals 75,000 74,039 Dues, Fees and Staff Development 27,648 41,146 Subscriptions and Reference Materials 36,796 40,989 Reproduction and Printing Services 12,721 Software Upgrades 150,796 196,123 Telecommunication and Data Services 322,907 357,760 Furniture and Equipment - Expensed 40,086 246,601 Depreciation - Leasehold Improvements 516,031 516,031
Total Direct Expenses $ 35,987,269 $ 25,007,594
Indirect Expenses: Depreciation $ 200,523 $ 173,164 Executive Management Support 1,030,719 827,413 Legal Support 1,515,794 1,585,381 Audit Support 761,710 1,442,557 Human Resources Support 609,223 558,432 Fiscal Management Support 1,531,627 1,505,945 Information Technology Support 2,339,344 2,643,578 Staff Services Support 1,057,415 1,191,293 Other Support Services 382,096 408,159
Total Indirect Expenses $ 9,428,451 $ 10,335,922
Total Internal AdministrativeInvesting Activity Expenses* $ 45,415,720 $ 35,343,516
External Manager Fees ** $ 137,954,055 $ 76,575,138
Total Investing Activity Expenses (Exh. II) *** $ 183,369,775 $ 111,918,654
* Not netted against or included in performance calculations.
** Performance calculations net of External Manager Fees
*** The investing activity expenses do not include the following expenditures:
During fiscal year 2011, the system paid commissions to various brokers totaling $58,304,167. A portion of the total commissions was paid to soft dollar brokers generating $6,516,399 of soft dollar credits. Soft dollar credits were spent during fiscal year 2011 in accordance with Section 28(e) of the Securities Exchange Act of 1934 totaling $6,155,201. Unspent soft dollar credits (totaling $2,428,236) are held by the receiving broker and will be utilized in the new fiscal year. Another portion of the total commissions was paid through various Commission Sharing Arrangements (CSA) generating $11,036,887 in CSA proceeds. These proceeds were used to acquire research services from various investment related firms totaling $14,536,387. Unspent CSA proceeds (totaling $6,396,266) are held by either State Street Bank and Trust Company as the system’s CSA agent or by the CSA broker as a reserve for future expenses.
Through its contractual agreements with various firms, the system benefited from $6,773,218 in vendor paid expenses and contractual allowances. Vendor paid expenses are legal arrangements that are used to acquire investment related items other than those paid for with Soft Dollar credits and CSA proceeds.
In addition to the commission expenses mentioned above, $416,378,165 was paid to various Alternative and Pooled Investment General Partners for a total of $474,712,229 in fees and commissions which are not included in Investing Activities Expense on Exhibit II. These amounts are reported in the Schedule of Fees and Commissions and are netted against investment performance on Exhibit II in the Net Appreciation in Fair Value of Investments amount. Custodial management fees were netted against income from securities lending activities.
Comparative Schedule of InvestingActivity Expenses
PENSION TRUST FUND
FOR THE FISCAL YEAR ENDED AUGUST 31, 2011 (With Comparative Data for August 31, 2010)

FINANCIAL SECTION
TEACHER RETIREMENT SYSTEM OF TEXAS COMPREHENSIVE ANNUAL FINANCIAL REPORT 2011
79
Schedule of Professional and Consulting Fees -Budgetary Basis
FOR THE FISCAL YEAR ENDED AUGUST 31, 2011 Individual or Firm Nature of Service Amount
Fulbright & Jaworski, LLP Legal Services $ 1,320,839 Gabriel, Roeder, Smith, & Company Actuarial Services and Health Care Consulting 1,000,319 Hewitt Ennis Knupp, Inc. Consulting Services 675,000 Albourne America, LLC Consulting Services 400,070 Grant Thornton, LLP Consulting Services 334,950 State Auditors Office Audit Services 298,341 Akin Gump Strauss Hauer & Feld, LLP Legal Services 286,676 Reinhart Boerner Van Deuren, SC Legal Services 255,228 Duff & Phelps, LLC Audit Services 239,017 Jackson Walker, LLP Legal Services 215,796 Austin Project Group Consulting Services 165,374 Ernst & Young Financial and Accounting Services 152,635 Sagebrush Solutions, Inc. Audit Services 150,000 Clifton Gunderson, LLP Audit Services 140,000 SR Batliboi & Company Financial and Accounting Services 130,456VR Election Services DBA Voice Retrieval Board Election Services 125,000 Seyfarth Shaw, LLP Legal Services 100,000 Easyvista, Inc. Consulting Services 59,137 Keith C. Brown Consulting Services 48,000 Cooley Godward Kronish, LLP Legal Services 39,300 Alice D. Cox, MD Medical Services 33,300 James Allen Reinarz, MD Medical Services 33,300 Larry Wilson, MD Medical Services 33,300 Provaliant Holdings, LLC Consulting Services 30,850 Ice Miller Legal Services 30,326 Sourcepulse, LLC Consulting Services 25,500 Career Management Associates of Iowa, LLC Temporary Employment Services 18,127 Workers Assistance Program, Inc. Other Professional Services 16,012 SHI Government Solutions Other Professional Services 15,307 MACTEC Engineering and Consulting, Inc. Architectural/Engineering Services 13,939 Korn/Ferry International Consulting Services 12,742RFD & Associates, Inc. Consulting Services 9,600 Bickerstaff Heath Delgado Acosta, LLP Legal Services 7,176 Texas Facilities Commission Consulting Services 7,000 INX, Inc. Consulting Services 4,995 Allied Consultants, Inc. Consulting Services 4,080 SFW, LLC Consulting Services 2,900 Workplace Dynamics, LLC Consulting Services 2,883 Terracon Consultants, Inc. Consulting Services 1,915 The Network, Inc. Financial and Accounting Services 1,830 Jaster-Quintanilla & Associates, Inc. Architectural/Engineering Services 642 John W Peavy III Ph.D., CFA Educational/Training Services 600 Riva Jackson Educational/Training Services 555 J. Robert Anderson Landscape Architects Architectural/Engineering Services 231 Karen A. Knowlton Medical Services 200 MWM Design Group, Inc. Architectural/Engineering Services 61 The Townsend Group, Inc. Consulting Services 47 Timothy Wei Other Professional Services 31 Ysabel Soliz Medical Services 25
TOTAL PROFESSIONAL AND CONSULTING FEES $ 6,443,612
METHOD OF FINANCE:Fiduciary Funds: Pension Trust Fund $ 4,777,632 TRS-Care (Retired Plan) 799,865 Total Fiduciary Funds 5,577,497Proprietary Fund: TRS-ActiveCare 866,115 Total Proprietary Fund 866,115 TOTAL METHOD OF FINANCE $ 6,443,612
S C
H E
D U
L E 4

TEACHER RETIREMENT SYSTEM OF TEXAS COMPREHENSIVE ANNUAL FINANCIAL REPORT 2011
80
FINANCIAL SECTION
This page is intentionally left blank.

INVESTMENT SECTION
TEACHER RETIREMENT SYSTEM OF TEXAS COMPREHENSIVE ANNUAL FINANCIAL REPORT 2011
81
INV
ESTMEN
T SECTIO
N

TEACHER RETIREMENT SYSTEM OF TEXAS COMPREHENSIVE ANNUAL FINANCIAL REPORT 2011
82
INVESTMENT SECTION
This page is intentionally left blank.

INVESTMENT SECTION
TEACHER RETIREMENT SYSTEM OF TEXAS COMPREHENSIVE ANNUAL FINANCIAL REPORT 2011
83
PORTFOLIO STRUCTURE
In 2008, TRS began a transition to a more diversified invest-ment strategy. That transition is now complete. The investment strategy focuses on three possible economic scenarios. Scenario One is characterized by favorable Gross Domestic Product (GDP) growth and an average Consumer Price Index (CPI) which, since 1948, has been the prevailing economic condition 66% of the time. Scenario Two is one of low GDP growth and high CPI, which has occurred 21% of the time. Finally, Scenario Three is characterized by stagnant GDP and low CPI, which has occurred 13% of the time. TRS is positioned to take advantage of any of these various market scenarios by allocating 60% to global equity markets, which perform well under Scenario One, 20% to real return, which should perform well in Scenario Two, and 20% to a stable value portfolio, which should perform well and minimize downside risk in Scenario Three.
INVESTMENT PORTFOLIO PERFORMANCE
TRS had a return of 15.5% for the year ending August 31, 2011, which exceeded the fund’s benchmark by 1%. This return ranked in the second quartile of public pension funds for the year. The total investment value of the trust as of August 31 was $107.1 billion. Annual rates of return for the three-, five- and 10-year periods ending August 31, 2011 were 3.6%, 4.0% and 5.8% respectively.
Additional performance information is included on the Total Time-Weighted Returns and Asset Allocation Charts on the following pages. The Total Time-Weighted Returns shown are for the 12-month period ended June 30, 2011, and include com-parisons with established benchmarks for the same time period.
Investment performance is calculated using a time-weighted rate of return. Returns are calculated by State Street Bank and Trust Company, the fund’s custodian bank, independently and using industry best practices.
STRATEGIC INITIATIVES
In July 2011, the Investment Management Division (IMD) celebrated the third anniversary of its Strategic Partnership Network (SPN). Four managers, JP Morgan, Neuberger Berman, Morgan Stanley, and BlackRock, were funded $1 billion each to invest globally across the same public asset classes as the trust. The IMD gains valuable insight from the positioning of each Strategic Partner and incorporates that information into our own Tactical Asset Allocation models. In addition, each year the SPN collaborates to produce eight research projects used to benefit the trust, with a special focus on asset allocation. In July 2011, a fifth partner, Barclays Capital, was added to the SPN with an allocation of $500 million. As of August 31, 2011, the total SPN is valued at $5 billion. For the three-year period as of August 31, the SPN returned 5.3% annually, which added 1.83% over
its three-year benchmark. For the one-year period, the SPN returned 14.89% to the trust, adding 0.8% over its benchmark.
The Investment Management Division has a dedicated risk management function. Risk Management performs an inde-pendent risk certification for every new manager commitment and monitors the performance of each manager and portfolio monthly with a risk alarm review. During the last 12 months, the Risk Management team launched an improved suite of tools and reports, which monitor the risk levels of the trust and its portfolios. One of the tools developed is a bubble monitor, which scans the global markets for significant overvaluations in an asset class. The indications from this monitor provide an independent alert on asset classes where something abnormal is occurring. The IMD investigates each signal and may decide to lower our exposure to that asset class, either through entering into protective derivatives or an outright sale.
On October 1, 2009, the IMD launched an internal gold fund to provide protection in times of uncertainty. Uncertainty has continued in the last 12 months due to continued concerns about Europe and potential currency devaluation in the US. For the one-year ended August 31, 2011, the gold fund produced a return of 41.94%.
In 2011, the Private Markets Group continued to build TRS’ first Principal Investments Program. Since the beginning of the program in 2009, the trust has committed $2.7 billion in nine private equity principal investments and nine real asset principal investments. While this program is still growing, we believe the combination of lower fees and increased transparency into the decision-making of our private partners will be accretive to the trust.
In September, the board reviewed and adjusted the invest-ment policy to help achieve the trust’s targeted 8% long-term return. The primary adjustments starting October 1, 2011 are to incorporate the increased allocation to hedge funds approved by the Texas Legislature and to increase the amount allocated to private equity. These changes result in a 2% increase to Global Equity from current 60% policy benchmark to a 62% allocation and corresponding decrease in Stable Value from a current 20% policy benchmark to a 18% allocation. This adjustment will provide greater flexibility for the IMD to respond to changes in market conditions.
Looking forward, our investment outlook has not changed in the past 12 months. Due to the very low interest rates today and the European sovereign debt concerns, our expectations are for muted returns over the next few years.
Prepared by:Investment staff of the system
Investment Overview

TEACHER RETIREMENT SYSTEM OF TEXAS COMPREHENSIVE ANNUAL FINANCIAL REPORT 2011
84
INVESTMENT SECTION
Total Time-Weighted ReturnsPENSION TRUST FUND - FOR PERIODS ENDED JUNE 30
1 Time-weighted rates of return adjusted for cash flows. Returns are calculated net of external manager fees.2 42% S&P 500/ 7.5% S&P 400/ 3% S&P 600/ 13% MS ACWI free-ex-US/ 28.5% SB Large Pension Fund/ 1% SB High Yield Market Index/ 3% Private Equity Composite (3 years at 0, then Russell 2000 + 500 bps)/ 1.5% Absolute Return Composite (6-month T-Bill + 300 bps through 3/03; then 70% 3-month LIBOR/ 30% S&P 500)/ 0.5% 91-day T-Bill through 6/04; 42% S&P 500/ 7.5% S&P 400/ 3% S&P 600/ 13% MS ACWI free-ex-US/ 28.5% LB Aggregate/ 1% SB High Yield Market Index/ 3% Private Equity Composite (3 years at 0, then Russell 2000 + 500 bps)/ 1.5% Absolute Return Composite (70% 3-month LIBOR/ 30% S&P 500)/ 0.5% 91-day T-Bill through 01/05; 50% Total Domestic Equity Composite/ 13.4% MS ACWI Ex-US/ 28.35% LB Aggregate/ 2.06% Citigroup High Yield Index/ 4.12% Private Equity Composite (3 years at 0, then Russell 2000 + 500 bps)/ 1.55% Absolute Return Composite (70% 3-month LIBOR/ 30% S&P 500)/ 0.52% 91-day T-Bill through 9/07; 15% Russell 1000 Growth/15% Russell 1000 Value/5% Russell 2000/15% MSCI EAFE + Canada/5% MSCI EM/5 % Russell 3000 + 5%/10% Lehman Long Treasuries/4% 3-month LIBOR + 2%/5% Lehman Intermediate Gov-Credit/1% Citigroup 90-day US Treasury/10% Lehman Global Inflation Linked Bonds/4% Real Estate Composite/1% US Core CPI + 5%/3% Goldman Sachs Commodity Index, 2% NAREIT through 9/08; 10% Russell 1000 Growth/ 10% Russell 1000 Value/ 5% Russell 2000/ 8% MSCI EAFE + Canada/ 5% MSCI EM/ 15% MSCI World/ 7% Russell 3000 + 5%/ 12% BC Long Treasuries/ 4% 3-month LIBOR + 2%/ 3% BC Intermediate Gov-Credit/ 1% Citigroup 90-day US Treasury/ 5% BC Global Inflation Linked Bonds/ 5% BC US TIPS/ 5% Real Estate Composite/ 1% US Core CPI + 5%/ 2% Goldman Sachs Commodity Index/ 2% NAREIT through 9/09; 5% MSCI USA Small Cap/ 8% MSCI USA Large Cap/ 33% MSCI World Net/ 6% MSCI EM Net, 4% 3-month LIBOR+2%/ 15% BC Long Treasury/ 2% Goldman Sachs Commodity/ 8% BC US TIPS/ 8% SSPEI 1 QTR lagged/ 8% NCREIF ODCE Net lagged/ 2% MSCI US REIT/ 1% 90-day US Treasury through 9/10; currently 5% MSCI Small Cap / 20% MSCI USA/ 15% MSCI EAFE+Canada/10% MSCI EM/ 15% BC Long Treasuries/ 4% 3-month LIBOR + 2%/ 1% Citigroup 90-day US Treasury/ 8% BC US TIPS/ 2% MSCI US REIT/ 10% SSPEI 1 QTR lagged/ 2% Goldman Sachs Commodity Index/ 8% NCREIF Open Ended fund lagged.3 64% S&P 500/ 11% S&P 400/ 5% S&P 600, 20% MSCI ACWI free-ex-US through 6/04; 61% S&P 500/ 12% S&P 400/ 6% S&P 600, 21% MSCI ACWI free-ex-US through 6/05; 60.16% S&P 500/ 12.20% S&P 400/ 6.5% S&P 600, 21.14% MSCI ACWI free-ex-US through 3/06; 59.82% S&P 500/ 11.97% S&P 400/ 5.99% S&P 600, 22.22% MSCI ACWI free-ex-US through 9/07; 27.27% Russell 1000 Growth/27.27% Russell 1000 Value/9.09% Russell 2000/27.27% MSCI EAFE + Canada/9.10% MSCI EM through 9/08; 18.9% Russell 1000 Growth/18.9% Russell 1000 Value/9.4% Russell 2000/ 15.1% MSCI EAFE + Canada/ 9.4% MSCI EM/ 28.3% MSCI World through 9/09; 11.5% MSCI EM/ 63.5% MSCI All-Country World Net/ 9.6% MSCI USA Small Cap/ 15.4% MSCI USA Large Cap through 9/10; currently 20% MSCI EM/ 30% MSCI EAFE+Canada/ 40% MSCI USA Gross/ 10% MSCI USA Small Cap. 4 3 years at 0, then Russell 2000 + 500 bps through 9/07; Russell 3000 + 5% through 9/09; currently SSPEI. 5 61.31% S&P 500/ 10.95% S&P 400/ 4.38% S&P 600, 18.98% MSCI ACWI free-ex-US/4.38% Private Equity Composite (3 years 0, then Russell 2000+5%) through 6/04; 57% S&P 500/ 11% S&P 400/ 6% S&P 600, 20% MSCI ACWI free-ex-US/6% Russell 2000+5% through 6/05, 56.48% S&P 500/ 11.45% S&P 400/ 6.11% S&P 600, 19.85% MSCI ACWI free-ex-US/6.11% Russell 2000+5% through 3/06; 56.00% S&P 500/ 11.21% S&P 400/ 5.6% S&P 600, 20.8% MSCI ACWI free-ex-US/6.39% Russell 2000+5% through 9/07; 25% Russell 1000 Growth/25% Russell 1000 Value/8.33% Russell 2000/25% MSCI EAFE + Canada/8.33% MSCI EM, 8.34% Russell 3000 + 5% through 9/08; 16.67% Russell 1000 Growth/ 16.67% Russell 1000 Value/ 8.33% Russell 2000/ 13.33% MSCI EAFE + Canada/ 8.33% MSCI EM/ 25% MSCI World/ 11.67% Russell 3000 + 5% through 9/09; 10% MSCI EM Net/ 55% AC World Net/13.3 SSPEI 1 QTR lagged/ 8.4% MSCI USA Small Cap/ 13.3% MSCI USA Large Cap through 9/10; currently 16.7% MSCI EM/ 25% MSCI EAFE+Canada/ 8.3% MSCI USA Small Cap/ 33.3% MSCI USA Gross/ 16.7% SSPEI 1 QTR lagged. 6 96.61% SB Large Pension Fund/3.39% SB High Yield Market Index through 12/03; 96.61% LB Aggregate/3.39% SB High Yield Market Index through 06/04; 93.22% LB Aggregate/ 6.78% Citigroup High Yield Index through 03/05; 93.22% LB Aggregate/ 6.78% Lehman US Corp High Yield Index through 03/06; 100% LB Universal through 9/07; 66.67% Lehman Long Treasury/ 33.33% Lehman Intermediate Gov-Credit through 9/08; 80% BC Long Treasury/ 20% BC Intermediate Gov-Credit through 9/09; currently 100% BC Long Treasury. 7 6-month T-Bill + 300 bps through 3/03; 70% 3-month LIBOR/ 30% S&P 500 through 9/07; currently 3-month LIBOR + 2%.8 90.48% SB Large Pension Fund/3.17% SB High Yield Index/4.76% Hedge Fund Composite, 1.59%/91-day T-Bill through 12/03; 90.48% LB Aggregate/3.17% SB High Yield Index /4.76% Hedge Fund Composite/1.59% 91 day T-Bill through 06/04; 87.3% LB Aggregate/ 6.35% Citigroup High Yield Index /4.76% Hedge Fund Composite/1.59% 91-day T-Bill through 03/05; 87.3% LB Aggregate/ 6.35% Lehman High Yield /4.76% Hedge Fund Composite/1.59% 91-day T-Bill through 03/06; 93.63% LB Aggregate/4.77% Hedge Fund Composite/1.6% 91-day T-Bill through 9/07; 50% Lehman Long Treasury/ 25% Lehman Intermediate Gov-Credit/ 20% Hedge Fund Composite/ 5% 91 day T-Bill through 9/08; 60% Lehman Long Treasury/ 15% Lehman Intermediate Gov-Credit/ 20% Hedge Fund Composite/ 5% 91-day T-Bill through 9/09, currently 75% Lehman Long Treasury/ 20% Hedge Fund Composite/ 5% 91-day T-Bill. 9 Index established 4/2006, NCREIF Property Index (1 quarter lag) + 200 bps through 9/07; 80% Real Estate Composite Index/ 20% US Core CPI + 5% through 9/08; 83% Real Estate Composite Index/ 17% US Core CPI + 5% through 9/09; currently NCREIF Open Ended Net 1 QTR lagged.10 Index established 4/2006, NCREIF Property Index (1 quarter lag) + 200 bps through 9/07; 50% LB Global Inflation Linked Bond Index/ 20% Real Estate Composite Index/ 5% US Core CPI + 5%/ 15% Goldman Sachs Commodity Index/ 10% NAREIT Index through 9/08; 25% BC Global Inflation Linked Bond Index/ 25% BC US TIPS Index/ 25% Real Estate Composite Index/ 5% US Core CPI + 5%/ 10% Goldman Sachs Commodity Index/ 10% NAREIT Index through 9/09; currently 40% BC Global Inflation Linked Bond Index/ 40% NCREIF Open Ended Net 1 QTR lagged/ 10% Goldman Sachs Commodity Index/ 10% MSCI US REIT.
3 5 10 Total Portfolio 1 2006 2007 2008 2009 2010 2011 Years Years Years
TRS 10.4% 17.5% -2.1% -21.9% 15.6% 22.2% 3.4% 4.9% 5.7%Custom Benchmark 2 9.7% 16.9% -2.0% -19.5% 12.8% 21.2% 3.3% 4.7% 5.4%
TRS Public Equity 14.0% 21.9% -10.3% -26.8% 14.4% 30.3% 2.6% 3.4% 4.7%Public Equity Composite Benchmark 3 13.5% 22.1% -10.9% -27.3% 14.3% 31.2% 2.9% 3.4% 4.5%
TRS Private Equity 45.3% 32.4% 14.8% -28.8% 24.6% 24.6% 3.4% 10.9% 13.1%Private Equity Composite Benchmark 4 19.6% 21.4% -12.4% -22.8% 34.9% 21.9% 8.3% 6.3% 7.5%
Total TRS Global Equity 14.8% 22.3% -8.8% -27.7% 16.1% 29.5% 2.8% 3.9% 5.1% Global Equity Composite Benchmark 5 13.9% 22.1% -10.9% -27.0% 17.0% 30.3% 3.6% 3.9% 4.8%
TRS Fixed Income -0.3% 6.7% 4.4% -0.7% 21.9% 4.6% 8.2% 7.3% 6.6%Fixed Income Composite Benchmark 6 -0.5% 6.6% 9.2% 6.6% 11.7% -1.1% 5.6% 6.5% 6.2%
TRS Hedge Funds 11.2% 15.2% -1.2% -10.5% 7.7% 5.9% 0.5% 2.9% 4.5%Hedge Fund Composite Benchmark 7 5.8% 9.8% 5.9% 3.9% 2.4% 2.3% 2.9% 4.8% 5.4%
Total TRS Stable Value 0.5% 7.2% 4.5% -3.6% 19.1% 5.0% 6.5% 6.2% 6.2% Stable Value Composite Benchmark 8 -0.1% 6.7% 8.4% 6.0% 9.3% -0.3% 4.9% 6.0% 5.9%
TRS Real Assets n/a 13.7% 7.0% -33.0% -8.9% 19.4% -10.0% -2.4% n/a Real Assets Composite Benchmark 9 n/a 18.8% 9.7% -24.6% -15.7% 19.0% -8.9% -0.3% n/a
Total TRS Real Return 11.7% 13.7% 24.5% -25.7% 7.7% 17.4% -02.0% 5.5% n/a Real Return Composite Benchmark 10 n/a 18.8% 18.6% -22.3% 2.6% 16.8% -2.4% 5.6% n/a

INVESTMENT SECTION
TEACHER RETIREMENT SYSTEM OF TEXAS COMPREHENSIVE ANNUAL FINANCIAL REPORT 2011
85
POLICY RANGES Low High Neutral Actual
Public Equity 45.0% 55.0% 50.0% 50.7%Private Equity 5.0% 15.0% 10.0% 10.4%
TOTAL GLOBAL EQUITY 55.0% 65.0% 60.0% 61.1%
Fixed Income 1 0.0% 20.0% 15.0% 14.1%Short-Term 0.0% 5.0% 1.0% 1.3%Hedge Funds 0.0% 5.0% 4.0% 4.0%
TOTAL STABLE VALUE 15.0% 25.0% 20.0% 19.4%
Inflation Linked Bonds 0.0% 13.0% 8.0% 5.3%Real Assets 0.0% 13.0% 8.0% 9.7%Commodities 0.0% 7.0% 2.0% 3.1%REITS 2 0.0% 7.0% 2.0% 1.4%
TOTAL REAL RETURN 15.0% 25.0% 20.0% 19.5%
TOTAL 100.0%
1 Does not include Inflation Linked Bonds in Real Return Portfolio.2 Dedicated portfolio in addition to Global Equity holdings.
Asset AllocationPENSION TRUST FUND - AUGUST 31, 2011

TEACHER RETIREMENT SYSTEM OF TEXAS COMPREHENSIVE ANNUAL FINANCIAL REPORT 2011
86
INVESTMENT SECTION
Investment SummaryPENSION TRUST FUND - AUGUST 31
MARKET VALUES (in billions)1
2006 2007 2008 2009 2010 2011
Public Equity $ 65.971 $ 70.551 $ 58.125 $ 48.718 $ 49.363 $ 54.312 Private Equity 2.326 3.796 6.064 5.867 8.501 11.099
TOTAL GLOBAL EQUITY $ 68.297 $ 74.347 $ 64.189 $ 54.585 $ 57.864 $ 65.411
Fixed Income 2 $ 27.664 $ 32.076 $ 16.161 $ 13.333 $ 14.833 $ 15.121Short-Term 2.032 1.313 1.167 0.800 0.700 1.376Hedge Funds 1.682 2.817 3.997 3.582 3.947 4.324
TOTAL STABLE VALUE $ 31.378 $ 36.206 $ 21.325 $ 17.715 $ 19.480 $ 20.821
Inflation Linked Bonds $ n/a $ n/a $ 10.288 $ 8.509 $ 8.167 $ 5.635Real Assets 0.261 1.214 3.657 3.742 5.704 10.343Commodities n/a n/a 3.211 1.697 2.068 3.323REITS 3 n/a n/a 1.804 1.936 1.960 1.537
TOTAL REAL RETURN $ 0.261 $ 1.214 $ 18.960 $ 15.884 $ 17.899 $ 20.838
TOTAL $ 99.936 $ 111.767 $ 104.474 $ 88.184 $ 95.243 $ 107.070
1 Investment values are based on industry standard investment performance methodology. Investment values in Exhibit I are in compliance with GASB report-ing standards. A reconciliation is provided below:
Total Market Value at 8/31/11 $ 107.070 Less Investment Related Cash (0.184) Less Investment Related Receivables (2.481) Plus Investment Related Payables 1.586 Plus Short-Term Asset Pool Adjustment From Amortized Cost to Fair Value 0.027 Plus Amounts Related to Collateral Activities 0.030
Total Investments Exhibit I $ 106.048
2 Does not include Inflation Linked Bonds in Real Return Portfolio.3 Dedicated portfolio in addition to Global Equity holdings.
Valu
e in
Bill
ions

INVESTMENT SECTION
TEACHER RETIREMENT SYSTEM OF TEXAS COMPREHENSIVE ANNUAL FINANCIAL REPORT 2011
87
PERCENTAGE OF MARKET VALUES
2006 2007 2008 2009 2010 2011
Public Equity 66.0% 63.1% 55.6% 55.2% 51.8% 50.7% Private Equity 2.3% 3.4% 5.8% 6.7% 8.9% 10.4%
TOTAL GLOBAL EQUITY 68.3% 66.5% 61.4% 61.9% 60.7% 61.1%
Fixed Income 1 27.7% 28.7% 15.5% 15.1% 15.6% 14.1%Short-Term 2.0% 1.2% 1.1% 0.9% 0.7% 1.3%Hedge Funds 1.7% 2.5% 3.8% 4.1% 4.1% 4.0%
TOTAL STABLE VALUE 31.4% 32.4% 20.4% 20.1% 20.4% 19.4%
Inflation Linked Bonds n/a n/a 9.9% 9.7% 8.6% 5.3%Real Assets 0.3% 1.1% 3.5% 4.2% 6.0% 9.7%Commodities n/a n/a 3.1% 1.9% 2.2% 3.1%REITS 2 n/a n/a 1.7% 2.2% 2.1% 1.4%
TOTAL REAL RETURN 0.3% 1.1% 18.2% 18.0% 18.9% 19.5%
TOTAL 100.0% 100.0% 100.0% 100.0% 100.0% 100.0%
1 Does not include Inflation Linked Bonds in Real Return Portfolio.2 Dedicated portfolio in addition to Global Equity holdings.
Investment SummaryPENSION TRUST FUND - AUGUST 31

TEACHER RETIREMENT SYSTEM OF TEXAS COMPREHENSIVE ANNUAL FINANCIAL REPORT 2011
88
INVESTMENT SECTION
Top Ten Domestic Equity Market Holdings
Market Total Issuer Name Value Shares
Apple Incorporated $ 496,638,508 1,290,540 Vanguard Small Cap ETF 482,580,000 7,000,000 General Growth Properties 328,175,645 24,059,798 SPDR Gold Shares 312,999,403 1,761,888 Exxon Mobil Corporation 289,769,978 3,913,695 Johnson & Johnson 268,483,543 4,080,297 AT&T Incorporated 239,461,435 8,408,056 Microsoft Corporation 236,025,205 8,873,128 International Business Machines Corporation 226,558,986 1,317,893 Google Incorporated A Shares 226,042,841 417,855 $ 3,106,735,544 61,123,150
Top Ten International Equity Market Holdings
Market Total Issuer Name Value Shares
Vanguard Emerging Markets ETF $ 1,117,792,260 25,433,271 Nestle SA 232,937,882 3,763,830 Samsung Electronics Company LTD. 216,984,251 311,142 Novartis AG 205,091,291 3,519,810 Roche AG 180,879,545 1,033,808 Schlumberger LTD. 177,097,728 2,266,996 Royal Dutch Shell A Shares 172,964,714 5,144,180 Vodafone Group 161,085,657 61,448,275 Sanofi 126,669,001 1,736,613 British American Tobacco 120,880,069 2,706,004 $ 2,712,382,398 107,363,929
Largest HoldingsPENSION TRUST FUND - AUGUST 31, 2011

INVESTMENT SECTION
TEACHER RETIREMENT SYSTEM OF TEXAS COMPREHENSIVE ANNUAL FINANCIAL REPORT 2011
89
Top Ten Fixed Income Market Holdings
Market Par Description Value Value
U.S. TREASURY 4.375% due 15 Nov 2039 $ 1,335,395,476 $ 1,166,050,000 U.S. TREASURY 4.500% due 15 Feb 2036 1,004,217,612 854,050,000 U.S. TREASURY 4.375% due 15 Feb 2038 928,656,805 807,900,000 U.S. TREASURY 3.500% due 15 Feb 2039 860,564,804 871,820,000 U.S. TREASURY 4.250% due 15 May 2039 799,808,630 712,074,000 U.S. TREASURY 4.375% due 15 May 2040 674,369,035 589,195,000 U.S. TREASURY 2.375% due 15 Jan 2025 627,577,359 508,159,805 U.S. TREASURY 3.875% due 15 Aug 2040 610,047,227 579,970,000 U.S. TREASURY 5.500% due 15 Aug 2028 563,589,091 425,100,000 U.S. TREASURY 6.125% due 15 Nov 2027 537,962,363 382,600,000 $ 7,942,188,402 $ 6,896,918,805
Note: A complete listing of portfolio holdings is available by contacting the TRS Communications Department.
Largest HoldingsPENSION TRUST FUND - AUGUST 31, 2011

TEACHER RETIREMENT SYSTEM OF TEXAS COMPREHENSIVE ANNUAL FINANCIAL REPORT 2011
90
INVESTMENT SECTION
INVESTMENT SECTIONSchedule of Fees and Commissions
PENSION TRUST FUND
FOR THE FISCAL YEAR ENDED AUGUST 31, 2011
ACI Multi-Strategy Market Neutral Fund LTD $ 4,709,365 Advent International GPE VI-A, L.P. 2,731,201 AEW Core Property Trust (U.S.), Inc. 916,917 AEW Senior Housing Investors, L.P. 444,902 AG Real Value Fund, LLC 2,247,669 Aleutian Fund LTD 4,805,257 Alpha Private Equity Fund V, L.P. 46,815 Alterna Core Capital Assets Fund, L.P. 1,612,325 Amici Fund International LTD 4,041,829 Apax Europe V-A, L.P. 692,314 Apax Europe VII-A, L.P. 5,671,968 Apollo Credit Opportunity Fund II, L.P. 2,840,507 Apollo Investment Fund VII, L.P. 6,026,398 AQR Global Stock Selection Fund, LLC 1,691,947 ARA Asia Dragon LTD 2,250,001 Austin Ventures VIII, L.P. 523,676 Avenue Special Situations Fund V, L.P. 5,629,578 Bain Capital Fund VIII, L.P. 598,809 Bain Capital VII Coinvestment Fund, L.P. 228,128 Bain Capital VIII Coinvestment Fund, L.P. 626,285 Black Diamond Relative Value LTD 1,650,542 BlackRock Diamond Property Fund, Inc. 545,564 BlackRock Retail Opportunity Fund, LLC 388,350 Blackstone / GSO Capital Solutions Fund, L.P. 340,000 Blackstone Capital Partners V, L.P. 3,944,137 Blackstone Capital Partners VI, L.P. 2,051,267 Blackstone GGP Principal Transaction Partners, L.P. 27,481 Blackstone Real Estate Partners Europe III, L.P. 3,484,813 Blackstone Real Estate Partners V, L.P. 1,814,992 Blackstone Real Estate Partners VI, L.P. 3,749,404 BlueTrend Fund LTD 4,198,660 Bridgepoint Europe IV, L.P. 3,863,367 Brockton Capital Fund II, L.P. 2,976,241 Brookfield Americas Infrastructure Fund, L.P. 2,682,671 Camden Multifamily Co-Investment Fund, L.P. 35,474 Camden Multifamily Value Add Fund, L.P. 2,250,000 Candover 2001 Fund, L.P. 146,736 Canyon-Johnson Urban Fund III, L.P. 1,000,000 Capmark Commercial Realty Partners II, L.P. 602,138 Capmark Commercial Realty Partners III, L.P. 1,467,900 Capmark Structured Real Estate Partners, L.P. 942,493
Fund Name* Fees

INVESTMENT SECTION
TEACHER RETIREMENT SYSTEM OF TEXAS COMPREHENSIVE ANNUAL FINANCIAL REPORT 2011
91
Capri Urban Investors, LLC $ 835,456 Carlyle Europe Partners III, L.P. 1,734,835 Carlyle Europe Real Estate Partners III, L.P. 1,462,327 Carlyle Partners III, L.P. 71,973 Carlyle Partners IV, L.P. 773,333 Carlyle Partners V, L.P. 5,334,273 Carlyle Realty Partners V, L.P. 1,437,429 CB Richard Ellis Strategic Partners U.S. Opportunity V, L.P. 623,680 CB Richard Ellis Strategic Partners U.S. Value V, L.P. 957,234 Cerberus Institutional (Series Four), L.P. 1,385,096 Charterhouse Capital Partners IX, L.P. 5,943,353 Charterhouse Capital Partners VIII, L.P. 949,365 CIM Fund III, L.P. 2,109,376 CIM Urban REIT, LLC 1,544,355 Colony Distressed Credit Fund, L.P. 3,817,300 Colony Investors VIII, L.P. 3,082,900 Congress Avenue Partners, L.P. 5,048,967 CPI Capital Partners Europe, L.P. 919,324 Credit Suisse CFIG Middle Market Buyout 1,800,000 Credit Suisse CFIG RE-UP Bridge Program 163,247 Crestview Partners II, L.P. 1,480,428 CSFB Emerging Opportunities Fund, L.P. 3,329,656 CVC Capital Partners Asia Pacific III, L.P. 4,137,082 CVC European Equity Partners IV, L.P. 251,806 CVC European Equity Partners Tandem Fund, L.P. 375,230 CVC European Equity Partners V, L.P. 3,898,993 D. E. Shaw BMCAE Special Fund, L.P. 2,162,464 Deephaven Global Multi-Strategy Fund LTD 61,497 Double Black Diamond LTD 3,841,830 EnCap Energy Capital Fund VII, L.P. 905,992 EnCap Energy Infrastructure Fund, L.P. 1,347,358 Energy Fund XV, L.P. 1,807,243 ESL Limited 4,164,012 FC Co-Investment Partners, L.P. 2,667 First Reserve Energy Infrastructure Fund, L.P. 2,847,175 First Reserve Fund X, L.P. 425,098 First Reserve Fund XI, L.P. 1,887,000 First Reserve Fund XII, L.P. 4,238,000 Five Arrows Realty Securities V Co-Investment, L.P. 53,739 Five Arrows Realty Securities V, L.P. 297,189 Five Mile Capital Partners II, L.P. 3,000,000
INVESTMENT SECTIONSchedule of Fees and Commissions
PENSION TRUST FUND
FOR THE FISCAL YEAR ENDED AUGUST 31, 2011
Fund Name* Fees
(continued)

TEACHER RETIREMENT SYSTEM OF TEXAS COMPREHENSIVE ANNUAL FINANCIAL REPORT 2011
92
INVESTMENT SECTION
INVESTMENT SECTION
Focus Select Fund LTD $ 1,608,887 Footbridge Captital Fund, Inc. 4,407 Fore Multi Strategy Offshore Fund LTD 5,957,012 Forum Asian Realty Income II, L.P. 993,319 Forum Asian Realty Income III, L.P. 2,000,001 Forum Europe Realty Income III, L.P. 1,523,831 Fudo Capital II, L.P. 2,625,000 GoldenTree Offshore Fund LTD 267,911 Goldman Sachs Vintage Fund, L.P. 25,994 Gores Capital Partners III, L.P. 3,849,000 Gramercy Offshore Fund LTD 25,299 Green Equity Investors V, L.P. 419,574 GSO Special Situations Fund, L.P. 5,536,686 Halcyon European Structured Opportunities Offshore Fund LTD 51,343 Halcyon Partners Offshore LTD 3,419,609 Heitman America Real Estate Trust, L.P. 936,574 Hellman & Friedman Capital Partners V, L.P. 219,457 Hellman & Friedman Capital Partners VI, L.P. 1,499,000 Henderson Asia Pacific Absolute Return Fund LTD 1,861,018 Henderson Japan Absolute Return Fund LTD 880,160 HgCapital 5, L.P. ** (1,010,446) HgCapital 6, L.P. 2,626,252 Highland Capital Partners VI - B, L.P. 914,384 Invesco San Jacinto Core Fund, L.P. 341,366 Investcorp Interlachen Multi-Strategy Fund LTD 50,865 Investcorp Silverback Arbitrage Fund LTD 1,116,837 Investcorp Waterloo Macro Fund LTD 1,862,574 Investcorp White Eagle European Fund LTD 284,640 Iron Point Real Estate Partners, L.P. 1,500,000 Ivory Offshore Flagship Fund LTD 1,528,407 J.H. Whitney V, L.P. 370,220 J.H. Whitney VI, L.P. 248,585 JPMCB Strategic Property Fund 2,474,760 Kelso Investment Associates VII, L.P. 498,388 Kelso Investment Associates VIII, L.P. 4,491,000 King Street Capital LTD 4,669,295 KKR 2006 Fund, L.P. 3,251,534 KKR FI Partners I, L.P. 1,126,769 KKR Mezzanine Partners I, L.P. 1,402,033 KKR Natural Resources I, L.P. 1,562,500 Kohlberg TE Investors VI, L.P. 1,528,703
INVESTMENT SECTIONSchedule of Fees and Commissions
PENSION TRUST FUND
FOR THE FISCAL YEAR ENDED AUGUST 31, 2011
Fund Name* Fees
(continued)

INVESTMENT SECTION
TEACHER RETIREMENT SYSTEM OF TEXAS COMPREHENSIVE ANNUAL FINANCIAL REPORT 2011
93
*Fees are earned by the funds based on each fund’s governing documents. TRS calculates returns for these funds net of all fees.
L&B Diversified Strategy Partners, L.P. $ 1,116,570 Lansdowne Pecan Street Europe, L.P. 1,598,289 LaSalle Property Fund, L.P. 379,576 Lee Equity Partners, L.P. 2,943,467 Level Global Overseas LTD 590,536 Level Global, L.P. 226,608 Lindsay Goldberg III, L.P. 3,601,218 Lion Capital Fund I, L.P. 357,816 Lion Capital Fund II, L.P. 2,968,589 Lion Capital Fund III, L.P. 4,273,916 Lionstone Cash Flow Real Estate Partners One, L.P. 555,281 Lone Star Real Estate Fund II (U.S.), L.P. 4,575,000 Longacre International LTD 1,366,982 MacFarlane Urban Real Estate Fund II, L.P. 1,034,503 Madison Dearborn Capital Partners IV, L.P. 360,121 Marathon Credit Dislocation Fund, L.P. 3,207,580 MKP Credit Offshore LTD 6,595,773 Morgan Creek Partners Asia, L.P. 1,058,274 Morgan Stanley Infrastructure Partners, L.P. 3,000,000 Morgan Stanley RE Mezzanine Partners A, L.P. 115,972 Nautic Partners V, L.P. 89,600 New Enterprise Associate-s XIII, L.P. 1,629,204 Nordic Capital Fund V, L.P. 200,012 Northwest Fund LTD 2,674,783 NuWave Offshore Fund LTD 2,799,392 Oak Investment Partners X, L.P. 1,076,671 Oak Investment Partners XI, L.P. 1,512,510 Oak Investment Partners XII, L.P. 2,464,829 Oaktree Loan Fund 2x, L.P. 860,670 Oaktree Opportunities Fund VIII, L.P. 1,359,194 Oaktree TT Multi-Strategy Fund, L.P. 895,917 OCM Opportunities Fund VI, L.P. 258,856 OCM Opportunities Fund VII, L.P. 658,414 OCM Opportunities Fund VIIb, L.P. 1,434,389 O’Connor Global Fundamental Market Neutral Long/Short LTD 4,913,987 Onex Partners II, L.P. 834,838 Onex Partners III, L.P. 3,703,742 Onex Partners, L.P. 280,615 P2 Capital Master Fund VI, L.P. 4,373,335 Parkway Properties Office Fund II, L.P. 733,900 Patria-Brazilian Private Equity IV, L.P. 986,301
INVESTMENT SECTIONSchedule of Fees and Commissions
PENSION TRUST FUND
FOR THE FISCAL YEAR ENDED AUGUST 31, 2011
Fund Name* Fees
(continued)

TEACHER RETIREMENT SYSTEM OF TEXAS COMPREHENSIVE ANNUAL FINANCIAL REPORT 2011
94
INVESTMENT SECTION
INVESTMENT SECTION
PCCP Mezzanine Recovery Partners II, L.P. $ 714,440 Permira Europe III, L.P. 504,904 Permira IV, L.P. 2,644,575 Perry Partners International, Inc. 4,986,651 PIMCO Distressed Mortgage Fund, L.P. 7,537,111 PLA Residential Fund III, L.P. 2,332,963 PLA Residential Fund IV, L.P. 1,498,471 PLA Retail Fund I, L.P. 756,936 Polaris Venture Partners IV, L.P. 1,977,138 PREI Mezzanine Fund I, L.P. 1,134,861 Prime Property Fund, LLC 1,719,400 Principal Green Property Fund I, L.P. 1,107,386 Principal Green Property Sidecar I, L.P. 183,447 Principal Real Estate Strategic Debt Fund I, L.P. 991,928 Principal Real Estate Strategic Equity Fund I, L.P. 1,318,750 PRISA 1,747,887 PRISA II 1,490,934 ProLogis Mexico Industrial Fund I, L.P. 491,940 Prologis Targeted U.S. Logistics REIT, Inc. 951,252 Providence Equity Partners V, L.P. 457,097 Providence Equity Partners VI, L.P. 1,143,597 Quad-C Partners VI, L.P. 58,663 Quad-C Partners VII Co-Investment, L.P. 270,849 Quad-C Partners VII, L.P. 1,014,759 Ranger Co-Investment Fund, L.P. 733,093 Red River Direct Investment Fund, L.P. 2,500,001 Red River HYPI 2,917 Red River Venture Capital Fund, L.P. 290,044 Republic Loan Funding LTD 2,150,239 RLJ Real Estate Fund III, L.P. 843,750 RMBS Opportunities Fund, L.P. 397,299 Rock Creek Limestone Emerging Markets, L.P. 2,775,175 RREEF America REIT III, Inc. 460,981 Shepherd Investments International LTD 675,621 SP5 Wood Partners Co-Investment Venture 2, L.P. 11,625 SP5 Wood Partners Development, L.P. 130,381 Squadron Emerging Asia Fund, L.P. 1,000,000 Square Mile Partners III, L.P. 2,187,500 SteelRiver Infrastructure Fund North America, L.P. 4,024,056 STG Capital Fund LTD 407,137 Stockbridge Real Estate Fund II, L.P. 696,244
INVESTMENT SECTIONINVESTMENT SECTIONSchedule of Fees and Commissions
PENSION TRUST FUND
FOR THE FISCAL YEAR ENDED AUGUST 31, 2011
Fund Name* Fees
(continued)

INVESTMENT SECTION
TEACHER RETIREMENT SYSTEM OF TEXAS COMPREHENSIVE ANNUAL FINANCIAL REPORT 2011
95
Stockbridge Real Estate Fund III, L.P. $ 2,250,000 Stratford Land Fund III, L.P. 1,846,182 Stratford Land Fund IV, L.P. 2,605,575 TA X, L.P. 672,652 TA XI, L.P. 1,505,815 Texas Growth Fund II - 1998 Trust 3,984,123 Thayer Hotel Investors V, L.P. 2,332,882 The Resolute Fund, L.P. ** (504,024) Thomas H. Lee Equity Partners V, L.P. 110,107 TLF Logistics II, L.P. 90,762 TLF Logistics, L.P. 1,217,137 TPG Partners V, L.P. 836,608 TPG Partners VI, L.P. 2,798,544 TPG STAR, L.P. 1,971,015 Tricon IX, L.P. 1,175,000 Triton Fund II, L.P. 297,506 Triton Fund III, L.P. 3,517,388 TT-EEIF Co-Investments, LLC 51,318 U.S. Government Building Fund, LLC 917,911 U.S. Republic Core Fund, L.P. 444,923 Vicis Capital Fund (International) 254,946 Walker Smith International Fund LTD 3,174,167 Walton Street Real Estate Fund Sidecar V, L.P. 170,288 Walton Street Real Estate Fund V, L.P. 906,564 Walton Street Real Estate Fund VI, L.P. 1,218,314 Warburg Pincus Private Equity X, L.P. 3,303,397 Wayzata Opportunities Fund II, L.P. 3,428,444 Westbrook Real Estate Fund VIII, L.P. 2,250,000 Willis Stein & Partners III, L.P. 581,717 Wolverine Convertible Arbitrage Fund LTD 7,844,378 Zachry Hastings Infrastructure Partners, L.P. 1,476,866 Zais Lubeck II-A CLO Fund, L.P. 171,609 Zaxis Offshore LTD 1,937,668 Total $ 416,378,165 * Fees are earned by the funds based on each fund’s governing documents. TRS calculates returns for these funds net of all fees.
** Negative balance is equal to the refund in the current year of expenses paid in a prior year.
INVESTMENT SECTIONSchedule of Fees and Commissions
PENSION TRUST FUND
FOR THE FISCAL YEAR ENDED AUGUST 31, 2011
Fund Name* Fees
(continued)

TEACHER RETIREMENT SYSTEM OF TEXAS COMPREHENSIVE ANNUAL FINANCIAL REPORT 2011
96
INVESTMENT SECTION
Acadian Asset Management, LLC $ $874,705 Alliance Bernstein, L.P. 885,780 Artio Global Investment Management, LLC**** (1,036) Artisan Partners Limited Partnership 3,933,137 Barclays Capital Fund Solutions - Americas 163,580 Baring International Investment LTD 3,513,211 BlackRock Financial Management, Inc. 6,757,453 BME Investment Partners, LLC 374,304 Brandes Investment Partners, L.P. 3,020,878 Cantillion Pacific LTD 3,201,790 DePrince Race & Zolllo, Inc. 3,003,335 Dimensional Fund Advisors, L.P. 7,377,092 Eaton Vance Management 5,276,314 GMO, LLC 1,234,127 Goldman Sachs Asset Management, L.P. 1,261,083 Independent Franchise Partners, LLP 392,134 Jennison Associates, LLC 2,458,120 JP Morgan Asset Management, Inc. 17,023,093 Knight Vinke Asset Management, LLC 2,203,727 Lazard Asset Management, LLC 4,700,714 Marathon Asset Management 7,186,414 Mondrian Investment Partners LTD 744,201 Morgan Stanley Investment Management, Inc. 7,592,636 Neuberger Berman, LLC 17,052,365 Omega Advisors, Inc. 19,472,146 P2 Capital Partners, LLC **** (599,002) Penn Capital Management Co., Inc. 638,045 Platinum Investment Management LTD 3,566,607 Sasco Capital, Inc. 2,278,491 Security Capital Research & Management, Inc. 805,314 Stephens Investment Management Group 1,237,896 Vaughan Nelson Investment Management, L.P. 1,962,708 Wellington Management Company, LLP 5,985,636 Westwood Management Corp. 2,377,057 Total $ 137,954,055 *** Fees are accrued or paid to external investment managers based on assets under management and the performance of the investment manager. TRS calculates returns for these managers net of all fees.
**** Negative balances are equal to the refund in the current year of expenses accrued in the prior year.
INVESTMENT SECTIONINVESTMENT SECTIONSchedule of Fees and Commissions
PENSION TRUST FUND
FOR THE FISCAL YEAR ENDED AUGUST 31, 2011 (continued)
External Manager *** Fees

INVESTMENT SECTION
TEACHER RETIREMENT SYSTEM OF TEXAS COMPREHENSIVE ANNUAL FINANCIAL REPORT 2011
97
Abel Noser Corporation 18,900 $ 283 $ 0.015 ABN AMRO Bank N.V. 92,935 4,036 0.045 Access Securities, Inc. 44,780 1,343 0.030 Allen & Company, LLC 4,778 177 0.037 American Technology Research, Inc. 441,033 16,149 0.037 Ancora Securities, Inc. 151,460 6,058 0.040 Assent, LLC 95,500 1,537 0.020 Atlantic Equities, L.P. 128,850 2,148 0.017 Auerbach Grayson & Co. 51,760 1,812 0.035 Avondale Partners, LLC 284,040 11,362 0.040 Barclays Capital, Inc. 600,302,521 4,871,740 0.027 Bear Stearns Securities Corp. 460,008 18,353 0.040 Bley Investment Group 4,055,172 117,266 0.027 Bloomberg Tradebook, LLC 8,042,796 139,676 0.015 BMO Capital Markets 11,187,726 339,248 0.034 BMO Nesbitt Burns, Inc. 104,336 5,386 0.047 BNP Paribas Securities Corp. 41,500 1,824 0.066 BNY Convergex 21,825,859 893,371 0.039 BNY Mellon 247,205 9,551 0.039 BOE Securities, Inc./Broadcort Cap Corp. 1,965,102 49,080 0.026 Brean Murray, Carret & Co., LLC 177,003 6,965 0.038 Bridge Trading Company 35,690 1,428 0.040 Broadcort Capital Corp. 130,800 5,232 0.040 Brockhouse & Cooper, Inc. 120,697 2,136 0.019 Brown Brothers Harriman & Co. 19,200 768 0.040 Brunswick Warburg Nominees 4,843,548 21,883 0.004 BTIG, LLC 7,849,263 110,504 0.019 B-Trade Services, LLC 4,466,491 89,330 0.020 Buckingham Research Group, Inc. 85,660 3,286 0.039 Cabrera Capital Markets 586,262 17,588 0.030 Canaccord Genuity, Inc. 1,136,499 39,787 0.037 Canadian Imperial Bank of Commerce 58,643 2,595 0.057 Cantor Fitzgerald & Co. 25,580,765 775,570 0.032 Capital Institutional Services, Inc. 5,894,528 145,655 0.020 Caris & Company, Inc. 78,906 2,629 0.036 Carr Securities Corp. 713 21 0.029
Average Shares Commissions Commission Brokerage Firm - Domestic Traded Paid per Share
INVESTMENT SECTIONSchedule of Fees and Commissions
PENSION TRUST FUND
FOR THE FISCAL YEAR ENDED AUGUST 31, 2011 (continued)

TEACHER RETIREMENT SYSTEM OF TEXAS COMPREHENSIVE ANNUAL FINANCIAL REPORT 2011
98
INVESTMENT SECTION
INVESTMENT SECTION
Cedel Bank 53,866 $ 1,001 $ 0.019 Charles River Brokerage 150 2 0.013 Citation Group 898,916 16,767 0.018 Citigroup Global Markets, Inc. 48,826,662 934,783 0.021 CL King & Associates, Inc. 163,710 5,112 0.037 CLSA Singapore Pte. LTD 83,200 6,799 0.083 Collins Stewart, LLC 106,719 3,709 0.037 Cowen & Company, LLC 3,794,081 131,067 0.037 Craig - Hallum 621,045 24,585 0.039 Credit Agricole 4,566,016 96,382 0.024 Credit Lyonnais Securities, Inc. 138,500 4,155 0.030 Credit Research & Trading, LLC 33,100 1,324 0.040 Credit Suisse First Boston 465,759,858 5,050,733 0.023 CSI US Institutional Desk 673,082 26,656 0.039 Cuttone & Co., Inc. 5,200 117 0.023 Dahlman Rose & Company, LLC 64,815 2,593 0.040 Davenport & Co. of Virginia, Inc. 189,829 7,593 0.040 David H. Rankin & Co. 1,170,497 23,410 0.020 Davidson D.A. & Company, Inc. 65,849 2,634 0.040 Dematted Monness, LLC 176,400 6,422 0.033 Deutsche Bank Securities, Inc. 58,118,892 1,409,455 0.021 Dominick & Dominick 166,981 6,208 0.033 Dowling & Partners 41,117 1,606 0.039 East Shore Partners, Inc. 258,933 9,376 0.038 Evercore Group, LLC 217,797 8,058 0.037 Fidelity Capital Markets 3,830,230 81,251 0.024 Fig Partners, LLC 148,187 5,927 0.040 Financial Advisory Clinic Investments, Inc. 38,180 1,145 0.030 First Analysis Securities Corp. 31,200 1,560 0.050 First Clearing, LLC 249,140 9,966 0.040 Fortis Clearing Americas, LLC 1,944,293 45,986 0.024 Friedman, Billings & Ramsey 2,035,291 68,585 0.032 GFI Securities, LLC 748 28 0.037 GMP Securities, L.P. 6,800 272 0.040 Goldman Sachs & Co. 101,503,245 2,116,738 0.021 Goldsmith & Harris 28,320 1,133 0.040
INVESTMENT SECTIONINVESTMENT SECTIONSchedule of Fees and Commissions
PENSION TRUST FUND
FOR THE FISCAL YEAR ENDED AUGUST 31, 2011 (continued)
Average Shares Commissions Commission Brokerage Firm - Domestic Traded Paid per Share

INVESTMENT SECTION
TEACHER RETIREMENT SYSTEM OF TEXAS COMPREHENSIVE ANNUAL FINANCIAL REPORT 2011
99
Gordon, Haskett & Company 570,960 $ 22,838 $ 0.040 Green Street Advisors 100,588 3,498 0.036 Greig Middleton & Co. 406,600 15,044 0.037 Guggenheim Capital Markets, LLC 14,566 539 0.037 Guzman & Co. 5,083,193 116,284 0.021 Heflin & Co., LLC 73,660 2,946 0.040 Height Securities, LLC 47,700 1,908 0.040 Hibernia Southcoast Capital, Inc. 733,776 28,972 0.039 Howard Weil, Inc. 767,776 30,479 0.039 HSBC Securities, Inc. 4,930,170 105,264 0.023 Hudson Securities, Inc. 25,800 1,032 0.040 ING Bank N.V. 735,825 15,952 0.103 Instinet, LLC 25,610,765 703,993 0.018 Invemed Associates 18,800 752 0.040 Investment Technology Group, Inc. 24,504,063 484,002 0.019 ISI Group, Inc. 3,479,265 94,539 0.029 Island Trader Securities, Inc. 45,693 1,698 0.038 J.A. Glynn & Co. 79,100 1,582 0.020 Jackson Partners & Associates, Inc. 560,310 22,412 0.040 Jackson Securities 3,545,050 106,522 0.031 Janco Partners, Inc. 42,940 1,718 0.040 Janney Montgomery Scott, LLC 717,066 28,235 0.039 Jefferies & Company, Inc. 32,492,264 785,274 0.026 JFD Securities 819,876 25,436 0.031 JMP Securities 333,889 13,069 0.041 JNK Securities, Inc. 45,385 1,815 0.040 Johnson Rice & Co. 378,389 15,136 0.040 Jones Trading Institutional Services, LLC 16,400,104 521,451 0.035 JP Morgan Securities, Inc. 111,390,827 1,994,980 0.023 Kaufman Brothers 25,400 1,016 0.040 Keefe Bruyette & Woods, Inc. 592,353 20,655 0.030 Keybanc Capital Markets, Inc. 1,713,109 61,428 0.039 Knight Securities 16,587,239 447,768 0.019 LaBranche Financial Services, LLC 8,925 89 0.010 Lazard Capital Markets, LLC 1,488,727 49,334 0.037 Leerink Swann & Company 499,503 19,359 0.039
INVESTMENT SECTIONSchedule of Fees and Commissions
PENSION TRUST FUND
FOR THE FISCAL YEAR ENDED AUGUST 31, 2011 (continued)
Average Shares Commissions Commission Brokerage Firm - Domestic Traded Paid per Share

TEACHER RETIREMENT SYSTEM OF TEXAS COMPREHENSIVE ANNUAL FINANCIAL REPORT 2011
100
INVESTMENT SECTION
INVESTMENT SECTION
Liquidnet, Inc. 15,211,242 $ 303,349 $ 0.020 Longbow Securities, LLC 199,807 7,992 0.040 Loop Capital Markets, LLC 5,403,619 108,072 0.020 M.R. Beal & Company 6,103,703 119,732 0.016 M.S. Howells & Co. 21,540 862 0.040 Macquarie Bank Limited 1,292,090 74,362 0.052 Madison Williams and Company 82,200 2,793 0.035 Man Securities, Inc. 55,040 2,067 0.035 Maxim Group 26,400 1,056 0.040 Melvin Securities 7,300 73 0.010 Merrill Lynch and Co., Inc. 76,434,571 1,491,866 0.024 Merriman Curhan Ford & Co. 380,160 15,206 0.040 Miller Tabak & Company, LLC 109,440 4,332 0.039 Mizuho Securities USA, Inc. 390,027 15,601 0.040 MKM Partners, LLC 176,835 7,029 0.039 Mogavero Lee & Co., Inc. 729,660 29,186 0.040 Morgan Joseph & Co., Inc. 207,170 7,479 0.035 Morgan Keegan & Co., Inc. 448,413 17,852 0.038 Morgan Stanley Co., Inc. 84,874,990 2,364,624 0.022 National Financial Services Corp. 9,492,928 272,427 0.023 Needham & Company 860,026 30,520 0.036 Nomura Securities International, Inc. 12,866,611 263,532 0.019 O’Connor & Co., LLC 628,800 13,681 0.024 Oppenheimer & Co., Inc. 2,953,957 108,804 0.036 Oscar Gruss & Son, Inc. 38,600 1,544 0.040 Pacific Crest Securities 45,372 2,048 0.043 Penserra Securities, LLC 6,780,850 178,203 0.021 Penson Financial Services, Inc. 1,258,006 45,797 0.036 Pershing, LLC 80,684,745 694,485 0.033 Pickering Energy Partners, Inc. 447,534 17,118 0.037 Pipeline Trading Systems, LLC 1,173,873 16,225 0.015 Piper Jaffray 1,663,428 43,138 0.041 Portales Partners, LLC 124,905 4,792 0.039 Prime Executions, Inc. 64,600 1,938 0.030 Pritchard Capital Partners, LLC 81,205 3,248 0.040 Pulse Trading, LLC 244,841 4,974 0.016
INVESTMENT SECTIONINVESTMENT SECTIONINVESTMENT SECTIONSchedule of Fees and Commissions
PENSION TRUST FUND
FOR THE FISCAL YEAR ENDED AUGUST 31, 2011 (continued)
Average Shares Commissions Commission Brokerage Firm - Domestic Traded Paid per Share

INVESTMENT SECTION
TEACHER RETIREMENT SYSTEM OF TEXAS COMPREHENSIVE ANNUAL FINANCIAL REPORT 2011
101
Raymond James & Associates, Inc. 3,025,749 $ 117,475 $ 0.040 RBC Capital Markets 16,091,488 446,451 0.028 RBS Securities, Inc. 24,272 302 0.013 Renaissance Capital 17,977,036 22,748 0.028 Reynders, Gray & Company, Inc. 662,470 26,499 0.040 Ridge Clearing & Outsourcing Solutions 2,969,395 95,677 0.033 Robert W. Baird & Co., Inc. 2,882,336 115,866 0.040 Rochdale Securities, LLC 1,272,080 50,354 0.039 Rosenblatt Securities, LLC 2,137 43 0.020 ROTH Capital Partners, LLC 1,295,716 41,560 0.034 Sanders Morris Harris 131,330 5,253 0.040 Sandler O’Neill & Partners, L.P. 445,689 17,653 0.038 Sanford C. Bernstein Co., LTD 24,436,418 534,798 0.020 Santander Investment Securities, Inc. 455,900 18,236 0.040 Schneider Bernet & Hickman, Inc. 45,100 1,804 0.040 Scotia Capital (USA), Inc. 26,601 760 0.038 Scott & Stringfellow, Inc. 425,889 16,939 0.040 SG Americas Securities, LLC 10,176,485 206,032 0.020 Sidoti & Company, LLC 311,396 13,092 0.044 Simmons & Company International 182,308 7,140 0.040 SJ Levinson & Sons, LLC 8,935,893 249,828 0.025 Soleil Securities 57,365 2,295 0.040 Spear, Leeds & Kellogg 412,296 5,538 0.014 Standard Chartered Bank 6,400 569 0.088 State Street Global Markets, LLC 189,058 5,470 0.030 Stephens, Inc. 1,137,795 45,473 0.040 Sterne Agee & Leach, Inc. 4,187,198 138,758 0.037 Stifel Nicolaus & Co., Inc. 7,713,077 244,243 0.036 Strategas Securities, LLC 72,810 2,912 0.040 Stuart Frankel & Co., Inc. 23,400 936 0.040 Suntrust Capital Markets, Inc. 460,322 17,763 0.039 TD Waterhouse 3,428 127 0.034 The Benchmark Company, LLC 245,062 9,744 0.037 Thinkequity Partners, LLC 123,711 5,731 0.047 Troika Dialog (UK) LTD 1,622,017 11,141 0.014 Tudor, Pickering, Holt & Co. 333,207 9,448 0.026
INVESTMENT SECTIONSchedule of Fees and Commissions
PENSION TRUST FUND
FOR THE FISCAL YEAR ENDED AUGUST 31, 2011 (continued)
Average Shares Commissions Commission Brokerage Firm - Domestic Traded Paid per Share

TEACHER RETIREMENT SYSTEM OF TEXAS COMPREHENSIVE ANNUAL FINANCIAL REPORT 2011
102
INVESTMENT SECTION
INVESTMENT SECTION
Tuohy Brothers Investment Research, Inc. 23,700 $ 948 $ 0.040 UBS AG 46,144,821 978,429 0.020 UniCredit Bank AG 10,000 589 0.059 VTB Bank Europe PLC 16,845,549 22,943 0.023 Watermill Institutional Trading, LLC 5,300 212 0.040 Wedbush Morgan Securities, Inc. 167,075 6,546 0.039 Wedge Securities, LLC 298,900 11,956 0.040 Weeden & Co. 27,676,100 557,479 0.019 Wells Fargo Securities, LLC 3,461,902 127,140 0.038 William Blair & Company LLC 963,818 41,637 0.044 William O’Neal + Co. 262,295 9,705 0.037 Williams Capital Group, L.P. 644,105 25,555 0.034 Wunderlich Securities, Inc. 518,488 20,739 0.040 Zacks & Company 9,100 364 0.040 Total 2,168,449,909 $ 34,144,841 $ 0.023 ,
INVESTMENT SECTIONINVESTMENT SECTIONINVESTMENT SECTIONINVESTMENT SECTIONSchedule of Fees and Commissions
PENSION TRUST FUND
FOR THE FISCAL YEAR ENDED AUGUST 31, 2011 (continued)
Average Shares Commissions Commission Brokerage Firm - Domestic Traded Paid per Share
Average Contracts Commissions Commission Futures Contracts Brokerage Firm - Domestic Traded Paid per Contract
Goldman Sachs & Co. 838,884 $ 1,841,430 $ 2.287 Morgan Stanley Co. Incorporated 13,874 34,635 2.132 Total 852,758 $ 1,876,065 $ 2.267

INVESTMENT SECTION
TEACHER RETIREMENT SYSTEM OF TEXAS COMPREHENSIVE ANNUAL FINANCIAL REPORT 2011
103
ABG Securities 3,862,692 $ 17,727 $ 0.011 ABN AMRO Bank N.V. 6,770,344 65,389 0.143 Ak Yatirim Menkul Degerler A.S. 100,746 989 0.011 Ambit Capital Pvt. LTD 41,200 813 0.020 Antique Stock Broking LTD 994,028 25,555 0.046 Arbuthnot Securities Limited 17,610 456 0.026 Atlantic Equities, LLP 100,000 5,209 0.052 Banchile Corredores de Bolsa S.A. 84,937 2,580 0.065 Banco Itau S.A. 2,730,561 66,841 0.032 Banco Pactual S.A. 229,612 4,538 0.027 Banco Santander 3,534,825 62,745 0.045 Bank am Bellevue AG 32,371 977 0.046 Bank of New York 458,696 4,485 0.026 Bank Vonobel AG 268,461 33,523 0.205 Banque Nationale Du Canada 78,900 2,406 0.030 Barclays Capital, Inc. 42,239,733 786,074 0.097 Barnard Jacobs Mellett & Co. (Pty) LTD 11,979,255 18,120 0.018 Batlivala & Karani Securities India Pvt. LTD 225,286 6,216 0.041 Batucha Securities and Investments LTD 159,912 2,760 0.015 Beltone Securities Brokerage 10,556 164 0.015 Bloomberg Tradebook, LLC 115,899 1,946 0.018 BNP Paribas Securities Corp. 27,189,640 158,255 0.147 Bradesco S.A. CTVM 675,635 19,073 0.038 Brockhouse & Cooper, Inc. 839,678 12,865 0.010 CACEIS Bank Deutschland GmbH 4,769 923 0.194 Cadiz Stock Broking 284,984 1,557 0.006 Calyon Securities, Inc. 1,300,800 6,433 0.009 Canaccord Genuity Corp. 287,851 1,217 0.015 Canadian Imperial Bank of Commerce 279,800 1,751 0.006 Cantor Fitzgerald & Co. 2,147,887 6,238 0.015 Carnegie Investment Bank 2,408,539 54,861 0.066 Celfin Capital S.A. Corredores de Bolsa 183,147 12,475 0.068 Central Securities Clearing System LTD 13,330,837 11,031 0.001 Chase Manhattan Frankfurt 190,500 2,458 0.013 Cheuvreux de Virieu 592,145 16,744 0.046 China International Cap Corp. HK Secs LTD 29,634,739 69,833 0.006
INVESTMENT SECTION (continued)
INVESTMENT SECTIONSchedule of Fees and Commissions
PENSION TRUST FUND
FOR THE FISCAL YEAR ENDED AUGUST 31, 2011 (continued)
Average Shares Commissions Commission Brokerage Firm - International Traded Paid per Share

TEACHER RETIREMENT SYSTEM OF TEXAS COMPREHENSIVE ANNUAL FINANCIAL REPORT 2011
104
INVESTMENT SECTION
INVESTMENT SECTION
CIMB Securities (HK) LTD. 51,100 $ 365 $ 0.007 Citigroup Global Markets, Inc. 160,209,163 1,536,480 0.088 CLSA Securities 45,650,257 207,288 0.624 Collins Stewart & Co. 675,208 15,389 0.023 Commerzbank 15,100 1,705 0.113 Credit Agricole 24,093,446 365,742 0.163 Credit Lyonnais Securities 109,118,711 297,781 0.101 Credit Suisse First Boston 341,418,430 1,722,173 0.060 Crestco LTD 619,795 2,876 0.005 Daewoo Securities Co. LTD 53,370 12,209 0.261 Daiwa Securities Group Inc. 17,534,572 83,769 0.048 Dalal & Broacha Stock Broking Pvt. LTD 16,500 695 0.042 Danske Bank Group 12,353 1,258 0.107 Davy Stockbrokers 175,910 8,837 0.053 DBS Vickers Securities 658,210 4,993 0.008 Deutsche Bank Securities, Inc. 123,890,569 974,118 0.086 Deutsche Boerse AG 222,459 4,036 0.032 Dexia Securities France 138,586 10,389 0.076 Dhanki Securities Pvt. LTD 5,597 781 0.149 DnB NOR 805,851 10,105 0.039 Dolat Capital Markets LTD 135,338 2,991 0.033 Dongwon Securities 109,499 18,115 0.261 Dundee Securities Corp. 26,400 516 0.020 Edelweiss Securities Pvt. LTD 1,039,949 37,824 0.053 EFG Eurobank Securities S.A. 9,150,000 11,323 0.006 EFG Istanbul Menkul De Erler Anonim Sirketi 753,027 7,203 0.019 ENAM Securities Pvt. LTD 383,416 9,237 0.040 Erik Penser Fondkommission AB 21,066 3,529 0.167 Euroclear Bank S.A. N.V. 24,186 885 0.059 Euromobiliare Sim S.P.A. 207,503 3,090 0.015 Evolution Beeson Gregory LTD 288,103 368 0.001 Evolution Securities LTD 64,051 2,469 0.039 Exane S.A. 1,494,714 40,604 0.066 Execution LTD 675,900 866 0.008 Financial Brokerage Group (FBG) 2,926,737 24,411 0.044 G Trade Services LTD 11,922,199 125,695 0.062
INVESTMENT SECTIONINVESTMENT SECTIONINVESTMENT SECTIONINVESTMENT SECTIONSchedule of Fees and Commissions
PENSION TRUST FUND
FOR THE FISCAL YEAR ENDED AUGUST 31, 2011 (continued)
Average Shares Commissions Commission Brokerage Firm - International Traded Paid per Share

INVESTMENT SECTION
TEACHER RETIREMENT SYSTEM OF TEXAS COMPREHENSIVE ANNUAL FINANCIAL REPORT 2011
105
Geojit BNP Paribas Financial Service LTD 315,997 $ 9,979 $ 0.079 Goldman Sachs & Co. 102,977,828 690,202 0.098 Hannuri Investment & Securities Co. LTD 7,785 6,607 0.859 Helvea S.A. 33,565 14,945 0.750 Hoare Govett (India) Securities Pvt. LTD 4,651,876 16,368 0.040 HSBC Securities, Inc. 95,103,140 981,720 0.090 HVB Capital Markets, Inc. 26,554 3,916 0.200 ICAP Securities LTD 14,717 474 0.024 Icatu DTVM LTD 488,388 17,682 0.043 Icici Brokerage Services 5,900 98 0.017 IM Trust S.A. Corredores de Bolsa 94,904 2,028 0.021 India Infoline LTD 250,269 16,532 0.072 Infinity Financial Services 97,854 3,287 0.029 ING Bank N.V. 1,418,119 31,017 0.066 Instinet, LLC 96,588,862 380,566 0.050 Intermonte Sec SIM Spa 233,986 9,776 0.059 Investec Securities 483,273 9,670 0.026 Investment Technology Group, Inc. 84,817,605 322,395 0.047 JBWere Pty LTD 131,066 1,221 0.010 Jefferies & Company, Inc. 9,605,614 198,777 0.037 JM Financial Institutional Securities Private 1,483,383 13,981 0.028 JM Morgan Stanley Secs Pvt. LTD 5,660,837 81,232 0.040 JP Morgan Securities, Inc. 379,900,503 2,808,155 0.097 KAS-Associatie N.V. 384,621 26,282 0.076 KBC Peel Hunt LTD 83,074 735 0.009 Kepler Equities 466,095 4,977 0.062 KGI Securities (Hong Kong) Co. LTD 765,600 3,384 0.005 Kim Eng Holdings Limited 2,746,600 3,990 0.002 Kingsway Financial Services Group LTD 800 10 0.012 Knight Securities 1,507,546 8,173 0.014 Kotak Securities LTD 794,486 19,996 0.026 LarrainVial S.A. 1,322,648 5,699 0.022 Liberum Capital Limited 843,353 11,231 0.008 Link S.A. CCTVM 34,000 798 0.044 Liquidnet, Inc. 25,314,037 57,660 0.074 Loop Capital Markets, LLC 208,605 3,369 0.122
INVESTMENT SECTIONSchedule of Fees and Commissions
PENSION TRUST FUND
FOR THE FISCAL YEAR ENDED AUGUST 31, 2011 (continued)
Average Shares Commissions Commission Brokerage Firm - International Traded Paid per Share

TEACHER RETIREMENT SYSTEM OF TEXAS COMPREHENSIVE ANNUAL FINANCIAL REPORT 2011
106
INVESTMENT SECTION
INVESTMENT SECTION
M. M. Warburg & Co. 32,000 $ 501 $ 0.016 Macquarie Bank Limited 102,680,159 435,461 0.083 MainFirst Bank AG 41,886 6,087 0.158 Man Financial Sify Securities India Pvt. LTD 16,476 988 0.060 MBI Corredos de Bolsa 930,660 13,175 0.025 Merrill Lynch and Co., Inc. 263,834,027 1,508,821 0.063 MF Global 636,057 14,170 0.032 Miller Tabak Roberts Securities, LLC 450,900 1,570 0.003 Mischler Financial Group, Inc. 3,962,554 92,382 0.028 Mitsubishi UFJ Securities 23,000 479 0.017 Mizuho Securities USA, Inc. 256,961 11,197 0.099 Morgan Stanley 593,391,441 3,250,568 0.098 Motilal Oswal Securities Limited 767,249 16,111 0.038 Natexis Bleichroeder, Inc. 49,571 2,046 0.041 NCB Stockbrokers LTD 8,040 167 0.022 Nesbitt Burns 6,916,821 206,204 0.029 Nomura Financial 31,976,658 222,638 0.086 Nordea Bank Norge ASA 76,509 2,378 0.020 Numis Securities Limited 4,366,224 46,722 0.014 Oddo Finance 118,629 6,286 0.049 Parel 11,861 1,365 0.115 Penson Financial Services, Inc. 49,300 1,903 0.033 Pereire Tod Limited 1,369,084 17,361 0.026 Pershing Securities Limited 10,578,225 126,489 0.189 Petercam S.A. 135,495 4,549 0.055 Quaker Securities 11,710,734 70,003 0.029 Raymond James & Associates, Inc. 332,204 8,206 0.295 Redburn Partners, LLP 319,753 12,380 0.032 Renaissance Capital 196,564 19,951 0.105 Ridge Clearing & Outsourcing Solutions 444,200 8,913 0.021 Royal Bank Of Canada 3,301,243 85,632 0.027 Royal Bank Of Scotland PLC 2,704,206 56,329 0.032 Salomon Smith Barney, Inc. 7,377,814 39,287 0.012 Samsung Securities Co. LTD 1,482,869 27,756 0.084 Sanford C. Bernstein LTD 4,509,886 62,359 0.269 Scotia Capital 320,898 10,354 0.030
INVESTMENT SECTIONINVESTMENT SECTIONINVESTMENT SECTIONINVESTMENT SECTIONINVESTMENT SECTIONSchedule of Fees and Commissions
PENSION TRUST FUND
FOR THE FISCAL YEAR ENDED AUGUST 31, 2011 (continued)
Average Shares Commissions Commission Brokerage Firm - International Traded Paid per Share

INVESTMENT SECTION
TEACHER RETIREMENT SYSTEM OF TEXAS COMPREHENSIVE ANNUAL FINANCIAL REPORT 2011
107
SG Securities 79,088,203 $ 32,466 $ 0.004 Six Sis Ag 2,674 380 0.117 SJ Levinson & Sons, LLC 7,017,838 56,051 0.017 Skandinaviska Enskilda Bank 650,109 24,355 0.073 Societe Generale 9,488,732 78,963 0.042 SS Kantilal Ishwarlal Securities 392,170 7,695 0.029 Standard Bank 207,452 9,452 0.092 Standard Chartered Bank 1,339,529 11,114 0.011 State Street Bank & Trust Co. 38,150 597 0.013 Stockbrokers Botswana LTD 420,833 2,944 0.012 Sungard Institutional Brokerage, Inc. 2,185 55 0.031 Svenska Handelsbanken 301,842 22,250 0.088 Swedbank Group 392,000 510 0.001 TD Waterhouse Cda 190,661 5,606 0.028 TONGYANG Securities, Inc. 1,025 4,222 4.119 Toronto Dominion Bank 45,600 912 0.020 UBS AG 133,059,545 1,023,696 0.064 Upline International S.A. 12,800 2,149 0.543 Valores Finamex, S.A. de C.V. 1,819,683 5,547 0.003 Weeden & Co. LTD 15,935,311 194,182 0.033 WOOD & Company 18,769 1,031 0.159 Woori Investment Securities 119,397 19,876 0.799 Xp Investimentos CCTVM S.A. 63,373 908 0.013 Yuanta Core Pacific Securities 4,685,884 5,877 0.004 Total 3,137,511,263 $ 20,703,900 $ 0.083
Average Contracts Commissions Commission Futures Contracts Brokerage Firm - International Traded Paid per Contract
Goldman Sachs & Co. 480,051 $ 1,524,368 $ 3.845 Morgan Stanley Co. Incorporated 20,600 54,993 3.545 Total 500,651 $ 1,579,361 $ 3.828
INVESTMENT SECTIONSchedule of Fees and Commissions
PENSION TRUST FUND
FOR THE FISCAL YEAR ENDED AUGUST 31, 2011 (continued)
Average Shares Commissions Commission Brokerage Firm - International Traded Paid per Share

TEACHER RETIREMENT SYSTEM OF TEXAS COMPREHENSIVE ANNUAL FINANCIAL REPORT 2011
108
INVESTMENT SECTION
INVESTMENT SECTION
This page is intentionally left blank.

ACTUARIAL SECTION
TEACHER RETIREMENT SYSTEM OF TEXAS COMPREHENSIVE ANNUAL FINANCIAL REPORT 2011
109
AC
TUA
RIA
L SECTIO
N

TEACHER RETIREMENT SYSTEM OF TEXAS COMPREHENSIVE ANNUAL FINANCIAL REPORT 2011
110
ACTUARIAL SECTION
November 1, 2011
BOARD OF TRUSTEESTeacher Retirement System of Texas1000 Red River StreetAustin, TX 78701-2698
Subject: Actuary’s Certification of the Actuarial Valuation as of August 31, 2011
We certify that the information included herein and contained in the 2011 Actuarial Valuation Report is accurate and fairly presents the actuarial position of the Teacher Retirement System of Texas (TRS) as of August 31, 2011.
All calculations have been made in conformity with generally accepted actuarial principles and practices, and with the Actuarial Standards of Practice issued by the Actuarial Standards Board. In our opinion, the results presented comply with the requirements of the Texas statutes and, where applicable, the Internal Revenue Code, ERISA, and the Statements of the Governmental Accounting Standards Board. The undersigned are independent actuaries. Mr. White and Mr. Newton are members of the American Academy of Actuaries, and are also Enrolled Actuaries. All are experienced in performing valuations for large public retirement systems.
Actuarial Valuations
The primary purpose of the valuation report is to determine the adequacy of the current State contribution rate through measuring the resulting funding period, to describe the current financial condition of the System, and to analyze changes in the System’s condition. In addition, the report provides information required by the System in connection with Governmental Accounting Standards Board Statement No. 25 (GASB No. 25), and it provides various summaries of the data.
Valuations are prepared annually, as of August 31 of each year, the last day of the System’s plan and fiscal year.
Financing Objective of the Plan
Contribution rates are established by Law that, over time, are intended to remain level as a percent of payroll. The employee and State contribution rates are set by Law. The actuarially determined contribution rates determined in this actuarial valuation are intended to provide for the normal cost plus the level percentage of payroll required to amortize the unfunded actuarial accrued liability over a period not in excess of 30 years.
Progress Toward Realization of Financing Objective
The actuarial accrued liability, the unfunded actuarial accrued liability (UAAL), and the calculation of the resulting funding period illustrate the progress toward the realization of financing objectives. Based on this actuarial valuation as of August 31, 2011, the System’s under-funded status has increased to $24.1 billion from $22.9 billion as of August 31, 2010. This increase in the UAAL is due to a loss on the actuarial value of assets of the System.
This valuation shows a normal cost equal to 10.60% of pay. The State set its contribution rate to 6.00% of pay as of September 1, 2011, which combined with the member contribution rate of 6.40% of pay provides a total contribution rate of 12.40% of pay. Therefore, there is 1.80% of pay available to amortize the UAAL. If payroll grows as expected, the contributions provided by this portion of the contribution rate are insufficient to amortize the current unfunded actuarial accrued liabilities of the System over any period of time (i.e. the funding period is never). Although the state contribution is scheduled to increase to 6.40% in fiscal year 2013, if the current assumptions are met (the trust earns an average 8.0% per annum) and the current 6.40% member contribution rate and the State fiscal year 2013 contribution rate of 6.40% continue, the fund is projected to remain solvent until the year 2075, after which the funding would return to a pay-as-you-go status. Therefore, for the current benefit structure to be sustainable, the contribution levels will need to be increased if all of the current assumptions are met.
The actuarial valuation report as of August 31, 2011 reveals that while the System has an unfunded liability of $24.1 billion, it still has a funded ratio (the ratio of actuarial assets to actuarial accrued liability) of 82.7%. However, because of the significant shortfall in investment income in FY2009, the System is still deferring net investment losses of $7.8 billion compared to the last valuation when the System was deferring $15.6 billion in deferred losses and the funded status using the market value of assets is only 77.1%. If there are no significant investment gains or other actuarial gains over the next several years, the funded status of the System would be expected to decline towards this number.
The System earned a 15.5% return on a dollar-weighted market value of assets basis for the plan year ending August 31, 2011, net of expenses. The System experienced a loss on the actuarial value of assets of $2.0 billion and a gain on the actuarial liabilities of

ACTUARIAL SECTION
TEACHER RETIREMENT SYSTEM OF TEXAS COMPREHENSIVE ANNUAL FINANCIAL REPORT 2011
111
$1.4 billion and a gain due to assumption change of $0.3 billion for a total experience related loss of $0.3 billion.
In the absence of significant actuarial gains in the near future, the contribution rate needed to amortize the UAAL over 30 years will increase over the next few valuation cycles.
Plan Provisions
The plan provisions used in the actuarial valuation are described in Table 21 of the valuation report. There have been no changes to the benefit provisions of the System since the prior valuation.
Disclosure of Pension Information
Effective for the fiscal year ending August 31, 1996, the Board of Trustees adopted compliance with the requirements of Governmental Accounting Standards Board (GASB) Statement No. 25. The required disclosure information is included in the body of the valuation report.
This report should not be relied on for any purpose other than the purpose described above. Determinations of the financial results associated with the benefits described in this report in a manner other than the intended purpose may produce significantly different results.
Actuarial Methods and Assumptions
The actuarial methods and assumptions have been selected by the Board of Trustees of the Teacher Retirement System of Texas based upon our analysis and recommendations. These assumptions and methods are detailed in Table 22 of the valuation report. The Board of Trustees has sole authority to determine the actuarial assumptions used for the plan. The actuarial methods and assumptions are based on a study of actual experience for the four year period ending August 31, 2010 and were adopted on April 8, 2011.
The following assumptions and methods have been modified since the prior valuation:
• Small reductions in the rates of retirement at most age and service combinations
• Decrease in the post-retirement rates of mortality for both males and females
• The salary increase assumption in the first year of employment was reduced
• The method for determining the actuarial value of assets was modified to a method that sets the actuarial value of assets as the expected actuarial value of assets plus 20% of the difference between the actual market value of assets and the expected actuarial value of assets
The results of the actuarial valuation are dependent on the actuarial assumptions used. Actual results can and almost certainly will differ, as actual experience deviates from the assumptions. Even seemingly minor changes in the assumptions can materially change the liabilities, calculated contribution rates and funding periods. The actuarial calculations are intended to provide information for rational decision making.
In our opinion, the actuarial assumptions used are appropriate for purposes of the valuation and are internally consistent and reasonably related to the experience of the System and to reasonable expectations. The actuarial assumptions and methods used in this report comply with the parameters for disclosure that appear in GASB 25.
Data
In preparing the August 31, 2011 actuarial valuation, we have relied upon member and asset data provided by the Teacher Retirement System of Texas. We have not subjected this data to any auditing procedures, but have examined the data for reasonableness and for consistency with prior years’ data.
The schedules shown in the actuarial section and the trend data schedules in the financial section of the TRS financial report include selected actuarial information prepared by TRS staff. Six year historical information included in these schedules was based upon our work. For further information please see the full actuarial valuation report.
Respectfully submitted,Gabriel, Roeder, Smith & Company
Lewis Ward Joseph P. Newton, FSA, EA, MAAA Daniel J. White, FSA, EA, MAAAConsultant Senior Consultant Senior Consultant

TEACHER RETIREMENT SYSTEM OF TEXAS COMPREHENSIVE ANNUAL FINANCIAL REPORT 2011
112
ACTUARIAL SECTION
2011 2010
Present Value of Benefits Presently Being Paid Service Retirement Benefits $ 61,583,573,864 $ 56,633,460,577 Disability Retirement Benefits 909,607,883 891,512,713 Death Benefits 769,355,667 754,052,179 Present Survivor Benefits 207,631,666 197,246,581
TOTAL PRESENT VALUE OF BENEFITS PRESENTLY BEING PAID $ 63,470,169,080 $ 58,476,272,050
Present Value of Benefits Payable in theFuture to Present Active Member Service Retirement Benefits $ 95,886,611,576 $ 95,802,642,330 Disability Retirement Benefits 1,343,397,174 1,265,949,485 Termination Benefits 6,952,317,408 6,067,357,073 Death and Survivor Benefits 1,744,820,375 1,513,834,539
TOTAL ACTIVE MEMBER LIABILITIES $ 105,927,146,533 $ 104,649,783,427
Present Value of Benefits Payable in theFuture to Present Inactive Members Inactive Vested Participants: Retirement Benefits $ 2,221,502,905 1,798,775,860 Death Benefits 128,252,686 122,792,410
TOTAL INACTIVE VESTED BENEFITS $ 2,349,755,591 $ 1,921,568,270
Refunds of Contributions to Inactive Non-vested Members $ 311,886,726 $ 294,211,296
Future Survivor Benefits Payable on Behalf of Present Annuitants $ 1,145,189,668 $ 1,103,421,506
TOTAL INACTIVE LIABILITIES $ 3,806,831,985 $ 3,319,201,072
TOTAL ACTUARIAL PRESENT VALUEOF FUTURE BENEFITS $ 173,204,147,598 $ 166,445,256,549
Summary of Cost Items 2011 2010
Actuarial Present Value of Future Benefits $ 173,204,147,598 $ 166,445,256,549 Present Value of Future Normal Costs (33,889,057,041) (32,254,146,314)
Actuarial Accrued Liability $ 139,315,090,557 $ 134,191,110,235 Actuarial Value of Assets (115,252,828,399) (111,292,527,887)
UNFUNDED ACTUARIALACCRUED LIABILITY $ 24,062,262,158 $ 22,898,582,348
Actuarial Information Pension Trust Fund
Actuarial Present Value of Future BenefitsFrom Actuarial Valuation as of August 31, 2011 (With Comparative Data for August 31, 2010)

ACTUARIAL SECTION
TEACHER RETIREMENT SYSTEM OF TEXAS COMPREHENSIVE ANNUAL FINANCIAL REPORT 2011
113
Actuarial Methods and Assumptions
The actuarial valuation of TRS is prepared by Gabriel, Roeder, Smith & Company. The actuary relies on membership data and asset information provided by TRS staff. While not verifying the data at their source, the actuary performs such tests for consistency and reasonableness as deemed necessary to be satisfied with the appropriateness of using the data supplied.
A summary of the actuarial assumptions and methods used by the actuary are as follows:
The entry age normal actuarial cost method of valuation was used in determining liabilities and normal cost. Differences in the past between assumed experience and actual experience (“actuarial gains and losses”) become part of the actuarial accrued liabilities. Unfunded actuarial accrued liabilities are amortized to produce payments (principal and interest) which are level percents of payroll contributions. These assumptions were adopted in April 2011.
Actuarial Assumptions
1. Investment Rate of Return: 8.00% per annum, net of investment and administrative expenses, compounded annually, composed of an assumed 3.00% inflation rate and a 5.00% real rate of return.
2. Mortality, Disability Retirement, Withdrawal and Service Retirement Rates: Rates and scales developed in the actuarial investigation as of August 31, 2007, with values at specimen ages shown in the tables below.
a) Probability of Decrement due to Death and Disability Retirement
Probability of Decrement due to Death and Disability Retirement
Male Members Female Members
Disability Disability Age Death Retirement Age Death Retirement
20 0.000297 0.000003 20 0.000189 0.000006 30 0.000624 0.000042 30 0.000291 0.000065 40 0.000849 0.000381 40 0.000449 0.000234 50 0.001458 0.001287 50 0.000923 0.001256 60 0.003979 0.002455 60 0.002084 0.002436 70 0.012940 0.001760 70 0.007621 0.001658
Mortality Improvement: To account for future mortality improvement, the rates were chosen so that the assumed mortality rates are smaller than the rates observed in the most recent experience study. The ratio of the actual member of deaths occurring during this period to the expected number based on the selected assumptions was 108% for healthy male annuitants, 112% for healthy female annuitants, 103% for disabled male annuitants, and 110% for disabled female annuitants.
Actuarial Information Pension Trust Fund

TEACHER RETIREMENT SYSTEM OF TEXAS COMPREHENSIVE ANNUAL FINANCIAL REPORT 2011
114
ACTUARIAL SECTION
Probability of Decrement Due to Retirement
Male MembersYears of Service
Age 5-9 10-14 15-18 19 20-24 25-29 30+
50 0.000 0.000 0.000 0.000 0.000 0.000 0.010 55 0.010 0.010 0.010 0.010 0.010 0.010 0.010 60 0.020 0.020 0.020 0.020 0.240 0.240 0.240 65 0.250 0.250 0.250 0.250 0.250 0.250 0.250 70 0.200 0.200 0.200 0.200 0.200 0.200 0.200 74 1.000 1.000 1.000 1.000 1.000 1.000 1.000
Female MembersYears of Service
Age 5-9 10-14 15-18 19 20-24 25-29 30+
50 0.000 0.000 0.000 0.000 0.000 0.000 0.010 55 0.010 0.010 0.010 0.010 0.010 0.010 0.010 60 0.030 0.030 0.030 0.030 0.250 0.250 0.250 65 0.250 0.250 0.250 0.250 0.250 0.250 0.250 70 0.250 0.250 0.250 0.250 0.250 0.250 0.250 74 1.000 1.000 1.000 1.000 1.000 1.000 1.000
For members hired after August 31, 2007, the retirement rates for members once they reach unreduced retirement eligibility at age 60 are increased 10% for each year the member is beyond the rule of 80 (i.e. if the member reached the Rule of 80 at age 58 then the probability of retirement at age 60 is 120% of the rate shown above).
Probability of Decrement Due to WithdrawalMale MembersYears of Service
Age 0 1 2 3 4 5 6 7 8 9
20 0.2606 0.2266 0.1716 0.1335 0.1050 0.0000 0.0000 0.0000 0.0000 0.0000 30 0.2173 0.1890 0.1560 0.1233 0.0952 0.0789 0.0652 0.0648 0.0628 0.0536 40 0.2172 0.1888 0.1430 0.1253 0.0873 0.0833 0.0690 0.0608 0.0542 0.0464 50 0.1937 0.1684 0.1245 0.0993 0.0754 0.0684 0.0644 0.0544 0.0512 0.0466 60 0.2021 0.1757 0.1324 0.1160 0.0751 0.0664 0.0518 0.0495 0.0426 0.0341 70 0.2371 0.2062 0.1724 0.1174 0.1017 0.0000 0.0000 0.0000 0.0000 0.0000
Female MembersYears of Service
Age 0 1 2 3 4 5 6 7 8 9
20 0.1938 0.1685 0.1438 0.1263 0.1075 0.0000 0.0000 0.0000 0.0000 0.0000 30 0.1948 0.1694 0.1435 0.1218 0.1007 0.0935 0.0825 0.0724 0.0564 0.0570 40 0.1807 0.1571 0.1235 0.1052 0.0826 0.0743 0.0641 0.0578 0.0560 0.0459 50 0.1755 0.1526 0.1199 0.0971 0.0792 0.0708 0.0638 0.0549 0.0472 0.0402 60 0.1959 0.1703 0.1356 0.1082 0.0846 0.0660 0.0671 0.0509 0.0463 0.0438 70 0.2483 0.2159 0.1929 0.1994 0.1254 0.0000 0.0000 0.0000 0.0000 0.0000
b) Probability of Decrement Due to Withdrawal: The following tables are used for the first 10 years of employment.
c) Probability of Decrement Due to Retirement (Rates of Retirement - for members hired after August 21, 2007)
Actuarial Information Pension Trust Fund

ACTUARIAL SECTION
TEACHER RETIREMENT SYSTEM OF TEXAS COMPREHENSIVE ANNUAL FINANCIAL REPORT 2011
115
3. Rates of Salary Increase: The following table reflects an inflation rate of 3.00%, plus productivity component of 1.25%, plus step-rate/promotional component as shown:
Rates of Salary Increase Annual Step Rate/ Promotional Rates of Increase Total Annual Rate of Increase
Years of Service Male Members Female Members Male Members Female Members
1 3.00% 3.00% 7.25% 7.25% 2 3.00 3.00 7.25 7.25 3 2.75 2.75 7.00 7.00 4 2.50 2.50 6.75 6.75 5 2.25 2.25 6.50 6.50 6 2.00 2.00 6.25 6.25 7-8 1.75 1.75 6.00 6.00 9-10 1.50 1.50 5.75 5.75 11 1.25 1.25 5.50 5.50 12 1.00 1.00 5.25 5.25 13-18 0.75 0.75 5.00 5.00 19-21 0.50 0.50 4.75 4.75 22-24 0.25 0.25 4.50 4.50 25 or more 0.00 0.00 4.25 4.25
This weighted average salary increase rate is 6.49% based on the active member service distribution as of August 31, 2011.
Disability Annuitants
1. Investment Rate of Return: 8.00% per annum, compounded annually. 2. Mortality: The PBGC Male Disabled Mortality Table for plan terminations after December 1, 1980, with a six-year setback and the PBGC Female Disabled Mortality Table for plan terminations after December 1, 1980, with a four-year setback.
Service Retirement Annuitants, Nominees and Survivors
1. Investment Rate of Return: 8.00% per annum, compounded annually (benefit increase reserve account eliminated by the 1995 legislative session). 2. Mortality: Client specific tables; used for service retirement annuitants, beneficiaries and survivors. These tables are selected to best reflect the experience developed in the actuarial investigation as of August 31, 2010.
Probability of Mortality and Life Expectancy Male Members Female Members
Probability of Life Expectancy Probability of Life Expectancy Age Mortality (Years) Mortality (Years)
55 0.003684 27.42 0.002806 31.16 65 0.010893 18.83 0.006117 22.22 75 0.032206 11.53 0.019424 14.04 85 0.095215 6.14 0.068615 7.83 95 0.231740 3.33 0.163248 4.68
Actuarial Information Pension Trust Fund

TEACHER RETIREMENT SYSTEM OF TEXAS COMPREHENSIVE ANNUAL FINANCIAL REPORT 2011
116
ACTUARIAL SECTION
Actuarial Information Pension Trust Fund
Actuarial Value of Assets
The actuarial value of assets is equal to the market value of assets less a five-year phase in of the excess (shortfall) between expected investment return and actual income with the resulting value not being less than 80% or more than 120% of the market value of assets.
Funding of Unfunded Actuarial Accrued Liability
Funded by the excess of future state contributions required by Law over the amount of such contributions required to fund the normal cost of benefits. Based on a study of all new entrants hired in the period from 2007 through 2010 and taking into account all changes in benefit provisions, the normal cost for benefits provided by the System is 10.60% of payroll (6.40% by members plus 4.20% by the State), which is 1.80% of payroll less than the total contributions required by Law. It is intended that the excess amount of 1.80% of payroll will be used to amortize any unfunded actuarial accrued liabilities of the System, assuming that total payroll increases by 3.50% per year.
As of the valuation as of August 31, 2011, these excess contributions of 1.80% of pay are insufficient to amortize the UAAL under the required time period.
Assumed State Contribution Rate
Effective September 1, 2011, the General Appropriations Act decreased the State contribution rate to 6.00% for fiscal year 2012 and will increase it to 6.40% in fiscal year 2013. For purposes of determining the funding period, it was assumed that the State contribution rate (6.40%) would remain in place indefinitely.
Schedule of Active Member Valuation Data
See table below:
Schedule of Active Member Valuation Data Annual Valuation Annual Average Percentage as of Payroll in Annual Increase in August 31 Number Thousands Pay Average Pay
2006 761,658 $28,397,283 $37,284 2.8% 2007 777,789 31,114,096 40,003 7.3 2008 801,455 33,237,904 41,472 3.7 2009 817,537 35,096,890 42,930 3.5 2010 834,060 36,628,844 43,916 2.3 2011 828,919 36,797,011 44,392 1.1

ACTUARIAL SECTION
TEACHER RETIREMENT SYSTEM OF TEXAS COMPREHENSIVE ANNUAL FINANCIAL REPORT 2011
117
Other Actuarial InformationThe Schedule of Retirees, Beneficiaries and Disabled Participants Added to and Removed from Rolls, the Solvency Test, and the Analysis of Financial Experience appear in the following tables:
Actuarial Information Pension Trust Fund
Added to Rolls Removed from Rolls Rolls - End of Year
(1) (8) (9) Valuation (3) (5) (7) % Increase Average as of (2) Annual (4) Annual (6) Annual in Annual Annual August 31 Number Allowances Number Allowances Number Allowances Allowances Allowance
2006 15,810 $324,292,542 7,175 $120,623,840 257,144 $5,282,107,571 4.0% $20,541 2007 15,861 336,348,640 7,698 131,295,705 265,307 5,487,160,506 3.9 20,682 2008 17,727 391,920,863 7,806 135,160,090 275,228 5,743,921,279 4.7 20,870 2009 17,326 392,452,923 7,940 136,537,511 284,614 5,999,836,691 4.5 21,081 2010 20,076 473,512,423 8,199 142,187,645 296,491 6,331,161,469 5.5 21,354 2011 24,688 620,038,676 8,499 147,985,004 312,680 6,803,215,141 7.5 21,758
Solvency TestA short-term solvency test is one means of checking a retirement system’s progress under its funding program. The schedule below provides a historical illustration of a short-term solvency test for TRS wherein present assets are compared with: (1) active member contributions on deposit; (2) the liabilities for future benefits to present annuitants (Retirees and Beneficiaries); (3) the liabilities for active members under the entry age normal actuarial cost method including a projection of future salary increases and anticipated future service (Active Members (State Financed Portion)).
Under the level percent of payroll financing followed by TRS, liabilities for active member contributions on deposit and the liabilities for future benefits to present retirees and beneficiaries will be fully covered by present assets except in rare circumstances. In addition, liabilities for active member benefits earned or to be earned in the future will be partially covered by the remainder of present assets. Generally, if the system has been using level cost financing, the funded portion of active member benefits will increase over time.
A Schedule of Funding Progress including a 6-year Summary of Actuarial Accrued Liabilities and Unfunded Actuarial Accrued Li-abilities can be found in the Required Supplementary Information immediately following the Notes to the Financial Statements.
Solvency Test(AMOUNTS SHOWN IN MILLIONS)
Portion of Aggregate Actuarial Accrued Aggregate Actuarial Accrued Liabilities For Liabilities Covered By Valuation Assets (3) (4) (8) (1) (2) Active Members (6) (7) Active Members Valuation Active Retirees (State (5) Active Retirees (State as of Member and Financed Valuation Member and Financed August 31 Contributions* Beneficiaries* Portion) Assets Contributions* Beneficiaries* Portion)
2006 $ 20,590 $ 49,144 $ 38,177 $ 94,128 100% 100% 64.1% 2007 22,236 51,293 42,435 103,419 100 100 70.4 2008 23,928 53,243 44,585 110,233 100 100 74.2 2009 23,914 55,484 48,632 106,384 100 100 55.5 2010 27,559 58,476 48,156 111,293 100 100 52.5 2011 28,911 63,470 46,934 115,253 100 100 48.7
* Adjusted for pending transfers to retired reserve at August 31 for pending retirements.
Schedule of Retirees, Beneficiaries and Disabled Participants Added to and Removed from Rolls

TEACHER RETIREMENT SYSTEM OF TEXAS COMPREHENSIVE ANNUAL FINANCIAL REPORT 2011
118
ACTUARIAL SECTION
Analysis of Financial Experience
Changes in Unfunded Actuarial Accrued Liabilities (UAAL)*Resulting from Differences Between Assumed Experience and Actual Experience
Increase/(Decrease) for Year (in Billions)
2011 2010 2009 2008 2007 2006
Investment (Gains)/Losses $ 1.958 $ 1.161 $ 10.321 $ (1.232) $ (4.140) $ (.264) Legislative Changes/ Benefit Increases .360 Contribution Experience 0.826 0.797 0.149 0.228 .496 .508 Assumption Changes (0.271) .676 Liability Experience (1.350) (0.705) (0.347) (.694) 2.135 .254
Net Increase/(Decrease) $ 1.163 $ 1.253 $ 10.123 $ (1.022) $ (1.149) $ .498 Beginning UAAL 22.899 21.646 11.523 12.545 13.694 13.196
Ending UAAL $ 24.062 $ 22.899 $ 21.646 $ 11.523 $ 12.545 $ 13.694
* Calculated on a 5-year smoothed market basis.
Actuarial Information Pension Trust Fund

ACTUARIAL SECTION
TEACHER RETIREMENT SYSTEM OF TEXAS COMPREHENSIVE ANNUAL FINANCIAL REPORT 2011
119
This page is intentionally left blank.
Actuarial Information Pension Trust Fund

TEACHER RETIREMENT SYSTEM OF TEXAS COMPREHENSIVE ANNUAL FINANCIAL REPORT 2011
120
ACTUARIAL SECTION
November 1, 2011
BOARD OF TRUSTEESTeacher Retirement System of Texas1000 Red River StreetAustin, TX 78701-2698
Subject: GASB 43 Actuarial Valuation as of August 31, 2011 for TRS-Care
Submitted in this report are the results of an Actuarial Valuation of the liabilities associated with the employer financed retiree health benefits provided through TRS-Care, a benefit program designed to provide post retirement medical benefits for certain members of the Teacher Retirement System of Texas (TRS). The date of the valuation was August 31, 2011. This report was prepared at the request of TRS.
The actuarial calculations were prepared for purposes of complying with the requirements of Statements 43 and 45 of the Governmental Accounting Standards Board (GASB). The calculations reported herein have been made on a basis consistent with our understanding of these accounting standards. Determinations of the liability associated with the benefits described in this report for purposes other than satisfying the financial reporting requirements of TRS-Care and participating employers may produce significantly different results.
The valuation was based upon information, furnished by TRS, concerning retiree health benefits, members’ census, and financial data. Data was checked for internal consistency but was not otherwise audited. Certain demographic and economic assumptions are identical to the set of demographic and economic assumptions adopted by the Board based on the 2010 Experience Study of TRS. Assumptions applicable only to TRS-Care have changed since the prior report, and they are disclosed in the assumptions section of this report.
To the best of our knowledge, this report is complete and accurate and was made in accordance with generally recognized actuarial methods.
One or more of the undersigned are members of the American Academy of Actuaries and meet the Qualification Standards of the Academy of Actuaries to render the actuarial opinion herein.
Respectfully submitted,
William J. Hickman Joseph P. Newton, FSA, MAAA Mehdi Riazi, ASA, EA, MAAASenior Consultant Senior Consultant Actuary

ACTUARIAL SECTION
TEACHER RETIREMENT SYSTEM OF TEXAS COMPREHENSIVE ANNUAL FINANCIAL REPORT 2011
121
Actuarial Present Value of Future BenefitsFrom Actuarial Valuation as of August 31, 2011 (With Comparative Data for August 31, 2010) Based on a 5.25% discount rate 2011 2010
Present Value of Benefits Being Paid Future Medical Claims $ 8,970,466,574 $ 7,098,035,116 Future Rx Claims 9,560,281,792 8,484,675,649 Retiree Premiums Collected (4,820,521,600) (4,664,226,865)
NET PRESENT VALUE OF BENEFITS FOR CURRENT RETIREES $ 13,710,226,766 $ 10,918,483,900
Present Value of Benefits Payable in theFuture to Present Active Members Future Medical Claims $ 22,513,074,606 $ 21,258,228,041 Future Rx Claims 19,700,869,923 20,923,712,165 Retiree Premiums Collected (10,795,062,742) (12,748,598,151)
NET PRESENT VALUE OF BENEFITS FOR FUTURE RETIREES $ 31,418,881,787 $ 29,433,342,055
TOTAL ACTUARIAL PRESENT VALUEOF FUTURE BENEFITS $ 45,129,108,553 $ 40,351,825,955
Summary of Cost Items
2011 2010
Actuarial Present Value of Future Benefits $ 45,129,108,553 $ 40,351,825,955Present Value of Future Normal Costs (15,343,939,596) (14,544,057,386)
Actuarial Accrued Liability $ 29,785,168,957 $ 25,807,768,569Actuarial Value of Assets (890,870,306) (814,964,303)
UNFUNDED ACTUARIALACCRUED LIABILITY $ 28,894,298,651 $ 24,992,804,266
Actuarial Information TRS-Care

TEACHER RETIREMENT SYSTEM OF TEXAS COMPREHENSIVE ANNUAL FINANCIAL REPORT 2011
122
ACTUARIAL SECTION
* Expected employer provided claims and expenses (net of retiree premiums).
Annual Allowances in Column (7) include increases due to health care inflation for continuing retirees. Therefore, the annual allowance is not equal to the beginning of year allowance plus the “Added to Rolls” allowance minus the “Removed from Rolls” allowance.
Solvency Test
A short-term solvency test is one means of checking a post-employment benefit fund’s progress under its funding program. The following schedule provides a historical illustration of a short-term solvency test for TRS-Care wherein present valuation assets are compared with: (1) active member contributions on deposit; (2) the liabilities for future benefits to members who have retired or for terminated members with vested benefits; (3) the liabilities for service already rendered by active members.
In a system that has been following the discipline of level contribution rate financing; the liabilities for future benefits for terminated employees will be fully covered by present assets, except in rare circumstances. The liabilities for services rendered by members will be at least partially covered by the remainder of present assets. Generally, if the system has been using level contribution rate financing, the funded portion of liability will increase over time. A decrease generally occurs in those years when substantial benefit improvements are granted, when full recommended contributions have not been made, or when there are actuarial experience losses. The funded ratio of the system based on total actuarial accrued liabilities provides an indication of how well the system is funded.
Actuarial Methods and Assumptions
The actuarial valuation of TRS-Care (Retired Plan) is prepared by Gabriel, Roeder, Smith & Company. The actuary relies on membership data and asset information provided by TRS staff. While not verifying the data at their source, the actuary performs such tests for consistency and reasonableness as deemed necessary to be satisfied with the appropriateness of using the data supplied.
A summary of the actuarial assumptions and methods used by the actuary are as follows:
The projected unit credit method of valuation was used in determining liabilities and normal costs. Differences in the past between assumed experience and actual experience (“actuarial gains and losses”) become part of the actuarial accrued liabilities. Unfunded actuarial accrued liabilities are amortized to produce payments (principal and interest) which are level percents of payroll contributions.
A schedule of Funding Progress including a 5-year Summary of Actuarial Accrued Liabilities (AAL) and Unfunded Actuarial Accrued Liabilities (UAAL) can be found in the Required Supplementary Information found immediately following the Notes to the Financial Statements.
Added to Rolls Removed from Rolls Rolls - End of Year
(1) (8) (9) Valuation (3) (5) (7) % Increase Average as of (2) Annual (4) Annual (6) Annual in Annual Annual August 31 Number Allowances Number Allowances Number Allowances* Allowances Allowances
2008 $ $ 198,968 $ 605,932 252 NA $ 3,045 2009 12,158 54,271,769 8,192 19,365,868 202,934 694,017,558 14.5% 3,420 2010 14,996 71,136,696 7,924 21,837,784 210,006 757,979,912 9.2 3,609 2011 20,467 109,331,023 8,019 24,802,618 222,454 898,001,599 18.5 4,037
Schedule of Retirees and Beneficiaries Added to and Removed from Rolls
Actuarial Information TRS-Care

ACTUARIAL SECTION
TEACHER RETIREMENT SYSTEM OF TEXAS COMPREHENSIVE ANNUAL FINANCIAL REPORT 2011
123
Solvency Test(AMOUNTS SHOWN IN MILLIONS)
Portion of Aggregate Actuarial Accrued Aggregate Actuarial Accrued Liabilities For Liabilities Covered By Valuation Assets (8) (4) (6) (7) Members (1) (2) (3) Members Active Beneficiaries (Employer Valuation Active Beneficiaries (Employer (5) Member and Vested Financed as of Member and Vested Financed Valuation Contributions Terminations Portion) August 31 Contributions* Terminations Portion) Assets (5)/(2) [(5)-(2)]/3 [(5)-(2)-(3)]/(4)
2007 NA $ 8,329 $ 11,419 $ 623 NA 7.5% 0.0% 2008 NA 9,318 12,944 729 NA 7.8 0.0 2009 NA 9,642 14,716 800 NA 8.3 0.0 2010 NA 10,918 14,889 815 NA 7.5 0.0 2011 NA 13,710 16,075 891 NA 6.5 0.0
* Active member contributions are non-refundable.
Analysis of Financial Experience(AMOUNTS SHOWN IN MILLIONS)
Valuation New Benefit as of Asset Liability Assumptions Changes Contributions Net August 31 Gain/(Loss) Gain/(Loss) Gain/(Loss) Gain/(Loss) Gain/(Loss) Gain/(Losses)
2011 $ (36) $ (44) $ (2,003) $ 0 $ (1,243) $ (3,326)
Actuarial Information TRS-Care

TEACHER RETIREMENT SYSTEM OF TEXAS COMPREHENSIVE ANNUAL FINANCIAL REPORT 2011
124
ACTUARIAL SECTION
This page is intentionally left blank.

STATISTICAL SECTION
TEACHER RETIREMENT SYSTEM OF TEXAS COMPREHENSIVE ANNUAL FINANCIAL REPORT 2011
125
STATISTIC
AL SEC
TION

TEACHER RETIREMENT SYSTEM OF TEXAS COMPREHENSIVE ANNUAL FINANCIAL REPORT 2011
126
STATISTICAL SECTION
This page is intentionally left blank.
STATISTICAL SECTION
TEACHER RETIREMENT SYSTEM OF TEXAS COMPREHENSIVE ANNUAL FINANCIAL REPORT 2011
127
The Statistical Section presents additional information to provide financial statement users with added histori-cal perspective, context and detail to assist in using the information in the financial statements, notes to financial statements, and required supplementary information to understand and assess the system’s financial condition. In-formation is presented for Pension Trust Fund, TRS-Care (Retired Plan), TRS-ActiveCare (Active Plan), and the Non-major 403(b) Certification Program.
FINANCIAL TRENDS INFORMATION
The schedules on the following pages show financial trends information that assists users in understanding and as-sessing how the system’s financial position has changed over time. The financial trend schedules presented are:
•ChangesinFiduciaryNetAssets
•Revenues,Expenses,andChangesinNetAssets
•Benefits and Refund Deductions from Net As-sets by Type
•HealthCareClaimsDeductions/ExpensesfromNetAssets by Type
OPERATING INFORMATION
The schedules presented immediately following the Fi-nancial Trends Information contain benefit and reporting operating information to provide contextual data about the system’s operations and resources to assist users in using financial statement information to understand the benefit services provided by the system. The operating information schedules presented are:
•AverageBenefitPayments
•AverageHealthCareClaims
•RetiredMembersbyTypeofBenefit
•HealthCareClaimsbyBenefitRange
•PrincipalParticipatingReportingEntities
In addition, a complete listing of participating reporting entities has been included. The information in this section was derived from internal sources and the CAFR for the relevant year.
Statistical Section Overview

TEACHER RETIREMENT SYSTEM OF TEXAS COMPREHENSIVE ANNUAL FINANCIAL REPORT 2011
128
STATISTICAL SECTION
Changes in Fiduciary Net Assets PENSIONTRUSTFUND
FORTHEFISCALYEARSENDEDAUGUST31 2011 2010 2009 2008
Additions: MemberContributions $ 2,349,131,829 $ 2,289,537,187 $ 2,181,600,283 $ 2,085,345,861 StateContributions 1,922,287,082 1,885,876,036 1,758,579,809 1,704,088,048 ReportingEntitiesContributions 419,968,516 412,268,503 412,728,096 353,524,480 Service Contributions Transferred in fromERS 12,628,712 11,167,772 9,558,927 8,897,722 Investment Income: Interest,DividendsandSecurities Lending 2,203,623,538 1,978,962,334 2,126,151,392 3,414,753,511 NetAppreciation(Depreciation) inFairValue 12,616,681,465 7,542,738,000 (16,030,794,035) (7,992,472,030) Less:InvestingActivityExpenses (183,369,775) (111,918,654) (68,990,517) (29,330,150) Other 1,576,613 2,453,980 1,768,337 2,080,418
TOTALADDITIONS $19,342,527,980 $ 14,011,085,158 $ (9,609,397,708) $ (453,112,140)
Deductions: Benefits $ 7,173,504,788 $ 6,617,397,374 $ 6,294,434,115 $ 6,406,644,540 ExcessBenefits 1,750,588 1,504,510 1,553,381 1,646,494 RefundsofContributions 334,268,822 265,186,589 266,695,076 278,002,614 Service Contributions Transferred toERS 64,772,079 61,570,750 57,135,135 52,773,854 AdministrativeExpenses,Excluding InvestingActivityExpenses 35,849,819 29,992,608 28,310,448 26,122,662
TOTALDEDUCTIONS $ 7,610,146,096 $ 6,975,651,831 $ 6,648,128,155 $ 6,765,190,164
Net Increase (Decrease) $11,732,381,884 $ 7,035,433,327 $(16,257,525,863) $ (7,218,302,304)
Net Assets - Beginning of Year $95,688,405,009 $ 88,652,971,682 $104,910,497,545 $112,128,799,849
Restatements
Beginning of Year, As Restated $95,688,405,009 $ 88,652,971,682 $104,910,497,545 $112,128,799,849
Net Assets - End of Year $107,420,786,893 $ 95,688,405,009 $88,652,971,682 $104,910,497,545
Financial Trends Information1
0 -
Y E
A R
S
U M
M A
R Y

STATISTICAL SECTION
TEACHER RETIREMENT SYSTEM OF TEXAS COMPREHENSIVE ANNUAL FINANCIAL REPORT 2011
129
2007 2006 2005 2004 2003 2002
$ 1,949,093,276 $ 1,853,971,836 $ 1,728,333,818 $ 1,721,504,445 $ 1,672,212,387 $ 1,560,700,102 1,472,584,963 1,333,143,442 1,258,597,882 1,242,305,696 1,239,532,126 1,201,948,321 282,077,713 267,399,619 221,158,942 192,395,672 182,536,228 157,781,530
7,913,660 6,908,439 6,188,845 5,600,176 4,037,793 3,091,464
3,084,172,953 2,640,734,877 2,360,711,299 2,134,920,032 2,144,222,155 2,413,196,778
11,232,429,170 6,326,056,726 9,607,205,397 7,024,439,015 5,673,389,054 (8,477,880,514) (20,942,402) (19,099,395) (17,394,917) (16,252,645) (14,604,331) (12,921,671) 2,892,262 3,178,512 2,324,123 2,754,738 3,272,714 3,270,611
$18,010,221,595 $12,412,294,056 $15,167,125,389 $12,307,667,129 $ 10,904,598,126 $ (3,150,813,379)
$ 5,762,885,044 $ 5,540,134,272 $ 5,349,900,638 $ 5,452,404,274 $ 4,727,518,136 $ 4,342,750,926 1,453,605 1,041,961 926,187 516,529 461,925 690,735 280,005,584 267,810,017 245,148,971 221,857,340 187,379,932 187,925,863
48,538,424 45,716,307 41,200,491 38,068,440 28,609,871 24,183,510
27,502,276 26,444,405 25,114,716 24,841,300 23,428,162 24,597,361
$ 6,120,384,933 $ 5,881,146,962 $ 5,662,291,003 $ 5,737,687,883 $ 4,967,398,026 $ 4,580,148,395
$11,889,836,662 $ 6,531,147,094 $ 9,504,834,386 $ 6,569,979,246 $ 5,937,200,100 $ (7,730,961,774)
$100,238,963,187 $93,707,816,093 $84,202,981,707 $77,633,002,461 $ 71,695,802,361 $79,427,814,814
(1,050,679)
$100,238,963,187 $93,707,816,093 $84,202,981,707 $77,633,002,461 $ 71,695,802,361 $79,426,764,135
$112,128,799,849 $100,238,963,187 $93,707,816,093 $84,202,981,707 $ 77,633,002,461 $71,695,802,361
Financial Trends Information

TEACHER RETIREMENT SYSTEM OF TEXAS COMPREHENSIVE ANNUAL FINANCIAL REPORT 2011
130
STATISTICAL SECTION
Changes in Fiduciary Net Assets TRS-CARE(RETIREDPLAN)
FORTHEFISCALYEARSENDEDAUGUST31 2011 2010 2009 2008
Additions: HealthCarePremiums $ 345,164,271 $ 332,481,933 $ 329,723,191 $ 328,505,433 StateContributions 282,782,431 279,250,547 267,471,299 254,722,174 MemberContributions 183,808,580 181,512,856 173,856,344 165,569,413 ReportingEntitiesContributions 158,724,010 155,918,241 149,562,613 141,672,630 OnBehalfFringeBenefitsPaidby theState 108,440 101,511 95,929 91,945 FederalRevenue 136,887,805 70,795,686 61,530,735 59,486,239 InvestmentIncome 8,168,640 11,679,229 17,482,143 29,252,347 LegislativeAppropriationsTransfer from TRS-ActiveCare
TOTALADDITIONS $ 1,115,644,177 $ 1,031,740,003 $ 999,722,254 $ 979,300,181
Deductions: HealthCareClaims $ 992,478,380 $ 971,356,805 $ 885,132,865 $ 833,509,538 HealthCareClaimsProcessing 44,115,872 42,535,601 40,364,063 36,747,710 AdministrativeExpenses,Excluding InvestingActivityExpenses 3,143,922 3,031,686 2,916,259 3,000,536 LegislativeAppropriationsTransfer to TRS-ActiveCare
TOTALDEDUCTIONS $ 1,039,738,174 $ 1,016,924,092 $ 928,413,187 $ 873,257,784
Net Increase (Decrease) $ 75,906,003 $ 14,815,911 $ 71,309,067 $ 106,042,397
Net Assets - Beginning of Year $ 814,964,303 $ 800,148,392 $ 728,839,325 $ 622,796,928
Restatements
Beginning of Year, As Restated $ 814,964,303 $ 800,148,392 $ 728,839,325 $ 622,796,928
Net Assets - End of Year $ 890,870,306 $ 814,964,303 $ 800,148,392 $ 728,839,325
Financial Trends Information1
0 -
Y E
A R
S
U M
M A
R Y

STATISTICAL SECTION
TEACHER RETIREMENT SYSTEM OF TEXAS COMPREHENSIVE ANNUAL FINANCIAL REPORT 2011
131
2007 2006 2005 2004 2003 2002
$ 323,957,945 $ 326,844,982 $ 322,780,191 $ 248,552,679 $ 162,917,666 $ 143,797,748 238,190,720 215,666,940 266,569,733 454,791,657 265,001,861 380,271,220 154,823,968 140,183,511 101,198,783 99,297,097 49,170,399 47,378,092 136,008,512 118,607,527 80,914,228 79,457,387
55,932 53,283 41,994 37,173 36,344 35,842 52,329,617 34,611,607 32,671,539 21,435,792 11,258,874 4,803,809 3,394,956 7,140,560
42,000,000
$ 938,038,233 $ 857,403,642 $ 782,763,803 $ 928,939,802 $ 480,521,226 $ 578,623,462
$ 742,293,147 $ 687,086,291 $ 660,559,083 $ 581,354,957 $ 571,744,362 $ 451,709,670 33,407,937 31,975,150 31,262,147 23,914,851 19,388,818 16,828,256
2,526,189 2,513,102 2,070,863 2,417,349 2,301,516 2,163,441 42,000,000
$ 778,227,273 $ 721,574,543 $ 693,892,093 $ 607,687,157 $ 635,434,696 $ 470,701,367
$ 159,810,960 $ 135,829,099 $ 88,871,710 $ 321,252,645 $ (154,913,470) $ 107,922,095
$ 462,985,968 $ 327,156,869 $ 238,285,159 $ (82,967,486) $ 71,945,984 $ (35,950,516)
(25,595)
$ 462,985,968 $ 327,156,869 $ 238,285,159 $ (82,967,486) $ 71,945,984 $ (35,976,111)
$ 622,796,928 $ 462,985,968 $ 327,156,869 $ 238,285,159 $ (82,967,486) $ 71,945,984
Financial Trends Information

TEACHER RETIREMENT SYSTEM OF TEXAS COMPREHENSIVE ANNUAL FINANCIAL REPORT 2011
132
STATISTICAL SECTION
Revenues, Expenses, and Changes in Net Assets TRS-ACTIVECARE(ACTIVEPLAN)*
FORTHEFISCALYEARSENDEDAUGUST31 2011 2010 2009 2008
Revenues HealthCarePremiums $ 1,549,530,891 $ 1,329,171,411 $ 1,172,011,048 $ 1,096,537,022 AdministrativeFees 135,917 125,321 187,813 186,844 InvestmentIncome 3,387,062 6,421,269 11,597,992 21,164,640 Federal Revenue ARRA - Cobra Reimbursements** 667,746 1,225,158 170,219 OnBehalfFringeBenefitsPaidby theState 67,373 64,328 64,975 61,894 LegislativeAppropriationsTransfer From TRS-Care (Retired Plan) State Contributions
TOTALREVENUES $ 1,553,788,989 $ 1,337,007,487 $ 1,184,032,047 $ 1,117,950,400
Expenses HealthCareClaims $ 1,510,090,981 $ 1,313,114,197 $ 1,122,646,958 $ 952,156,339 HealthCareClaimsProcessing 76,960,951 67,906,654 60,934,432 54,583,499 PremiumPaymentstoHMOs 76,270,706 64,532,253 64,820,440 68,204,743 AdministrativeExpenses 2,207,051 1,883,148 1,861,949 1,830,258 LegislativeAppropriationsTransfer to TRS-Care (Retired Plan)
TOTALEXPENSES $ 1,665,529,689 $ 1,447,436,252 $ 1,250,263,779 $ 1,076,774,839
Change in Net Assets $ (111,740,700) $ (110,428,765) $ (66,231,732) $ 41,175,561
Net Assets - Beginning of Year $ 299,810,127 $ 410,238,892 $ 476,470,624 $ 435,295,063
Restatements
Beginning of Year, As Restated $ 299,810,127 $ 410,238,892 $ 476,470,624 $ 435,295,063
Net Assets - End of Year $ 188,069,427 $ 299,810,127 $ 410,238,892 $ 476,470,624
* The TRS-ActiveCare Plan, enacted by H.B. 3343, 77th Legislature, began operations in fiscal year 2003 and is accounted for as a proprietary fund. Prior to fiscal year 2003, TRS accounted for TRS-ActiveCare (Active Plan) as a fiduciary fund. The net assets of the Active Plan were transferred to TRS-ActiveCare on September 1, 2002.
** The American Recovery and Reinvestment Act (ARRA) of 2009 which was signed into law on February 17, 2009 was created to preserve jobs and promote economic recovery.
Financial Trends Information1
0 -
Y E
A R
S
U M
M A
R Y

STATISTICAL SECTION
TEACHER RETIREMENT SYSTEM OF TEXAS COMPREHENSIVE ANNUAL FINANCIAL REPORT 2011
133
2007 2006 2005 2004 2003 2002
$ 939,694,028 $ 861,464,205 $ 823,726,341 $ 758,062,552 $ 584,572,852 $ 184,937 183,470 183,317 192,763 136,288 108,198 26,016,380 18,650,516 8,915,711 3,641,100 2,459,154 590,967
46,446 40,979 35,626 24,050 31,266 23,843
42,000,000 2,674,579
$ 965,941,791 $ 880,339,170 $ 832,860,995 $ 761,920,465 $ 629,199,560 $ 3,397,587
$ 801,148,962 $ 708,972,484 $ 663,361,138 $ 520,998,423 $ 473,450,544 $ (34,455) 48,177,777 53,013,214 53,697,572 53,564,510 42,411,388 58,742,363 49,466,150 42,574,641 40,210,539 1,775,831 1,680,952 1,607,113 918,619 1,771,441 2,750,107 42,000,000
$ 909,844,933 $ 813,132,800 $ 761,240,464 $ 657,692,091 $ 517,633,373 $ 2,715,652
$ 56,096,858 $ 67,206,370 $ 71,620,531 $ 104,228,374 $ 111,566,187 $ 681,935
$ 379,198,205 $ 311,991,835 $ 240,371,304 $ 136,421,779 $ 24,855,592 $ 24,179,853
(278,849) (6,196)
$ 379,198,205 $ 311,991,835 $ 240,371,304 $ 136,142,930 $ 24,855,592 $ 24,173,657
$ 435,295,063 $ 379,198,205 $ 311,991,835 $ 240,371,304 $ 136,421,779 $ 24,855,592
Financial Trends Information

TEACHER RETIREMENT SYSTEM OF TEXAS COMPREHENSIVE ANNUAL FINANCIAL REPORT 2011
134
STATISTICAL SECTION
Revenues, Expenses, and Changes in Net Assets 403(b)CERTIFICATIONPROGRAM
FORTHEFISCALYEARSENDEDAUGUST31
2011 2010 2009 2008
Revenues: CertificationFees $ 12,000 $ 30,000 $ 6,000 $ 30,000 ProductRegistrationFees 3,000 21,000 9,000 180,000 InvestmentIncome 1,801 4,318 8,558 19,337 OnBehalfFringeBenefitsPaid bytheState 7,898 8,034
TOTALREVENUES $ 24,699 $ 63,352 $ 23,558 $ 229,337
Expenses: AdministrativeExpenses $ 148,444 $ 172,835 $ 88,000 $ 192,000
TOTALEXPENSES $ 148,444 $ 172,835 $ 88,000 $ 192,000
Change in Net Assets $ (123,745) $ (109,483) $ (64,442) $ 37,337
Net Assets - Beginning of Year $ 245,777 $ 355,260 $ 419,702 $ 382,365
Net Assets - End of Year $ 122,032 $ 245,777 $ 355,260 $ 419,702
Financial Trends Information1
0 -
Y E
A R
S
U M
M A
R Y

STATISTICAL SECTION
TEACHER RETIREMENT SYSTEM OF TEXAS COMPREHENSIVE ANNUAL FINANCIAL REPORT 2011
135
2007 2006 2005 2004 2003 2002
$ 171,000 $ 30,000 $ 10,000 $ 15,000 $ 55,000 $ 325,000 12,070 9,532 5,529 3,495 4,617 1,164 1,197 3,953
$ 183,070 $ 39,532 $ 15,529 $ 18,495 $ 60,814 $ 330,117
$ 24,000 $ 24,000 $ 24,000 $ 24,000 $ 45,074 $ 124,118
$ 24,000 $ 24,000 $ 24,000 $ 24,000 $ 45,074 $ 124,118
$ 159,070 $ 15,532 $ (8,471) $ (5,505) $ 15,740 $ 205,999
$ 223,295 $ 207,763 $ 216,234 $ 221,739 $ 205,999 $
$ 382,365 $ 223,295 $ 207,763 $ 216,234 $ 221,739 $ 205,999
Financial Trends Information

TEACHER RETIREMENT SYSTEM OF TEXAS COMPREHENSIVE ANNUAL FINANCIAL REPORT 2011
136
STATISTICAL SECTION
Benefits and Refund Deductionsfrom Net Assets by Type
PENSIONTRUSTFUNDLASTTENFISCALYEARS
2011 2010 2009 2008
Type of Benefit ServiceRetirements** $ 6,241,946,655 $ 5,841,963,927 $ 5,565,925,090 $ 5,649,308,335* DeferredRetirementOption 27,822,115 22,607,290 23,272,668 26,757,772 PartialLumpSumOption 524,925,790 385,555,126 348,261,100 363,668,944 DisabilityRetirements 144,865,109 141,396,837 138,569,650 146,907,654 DeathandSurvivorBenefits: AnnualSalary 47,295,194 45,698,147 43,235,232 42,216,290 SurvivorAnnuities 86,898,720 82,574,358 79,951,723 78,862,569 LifeAnnuities 84,893,007 83,238,898 81,764,240 85,576,098 60MonthlyPayments 11,564,275 10,824,948 10,180,012 10,169,530 RemainderofContributions 3,293,923 3,537,843 3,274,400 3,177,348 ExcessBenefits 1,750,588 1,504,510 1,553,381 1,646,494
TOTALBENEFITS $ 7,175,255,376 $ 6,618,901,884 $ 6,295,987,496 $ 6,408,291,034
Type of Refund Death $ 3,984,340 $ 3,710,941 $ 3,084,718 $ 2,520,283 Separation 330,284,482 261,475,648 263,610,358 275,482,331
TOTALREFUNDS $ 334,268,822 $ 265,186,589 $ 266,695,076 $ 278,002,614
* A one-time supplemental payment capped at $2,400 was distributed to eligible retirees in January 2008.** For fiscal years 2010 and prior, Service Retirements changed due to the reclassification of Transfers of Service Contributions with Employees Retirement
System of Texas.
Health Care Claims Deductions from Net Assets by Type TRS-CARE(RETIREDPLAN)
LASTTENFISCALYEARS
2011 2010 2009 2008
Type of Claim Medical $ 608,461,321 $ 575,539,788 $ 531,239,020 $ 498,767,038 PrescriptionDrugs 384,017,059 395,817,017 353,893,845 334,742,500
TOTAL $ 992,478,380 $ 971,356,805 $ 885,132,865 $ 833,509,538
Health Care Claims Expenses from Net Assets by Type TRS-ACTIVECARE(ACTIVEPLAN)
LASTNINEFISCALYEARS(SINCEPLANINCEPTION)
2011 2010 2009 2008
Type of Claim Medical $ 1,242,673,156 $ 1,092,107,916 $ 934,733,927 $ 788,240,087 PrescriptionDrugs 267,417,825 221,006,281 187,913,031 163,916,252
TOTAL $ 1,510,090,981 $ 1,313,114,197 $ 1,122,646,958 $ 952,156,339
Financial Trends Information

STATISTICAL SECTION
TEACHER RETIREMENT SYSTEM OF TEXAS COMPREHENSIVE ANNUAL FINANCIAL REPORT 2011
137
2007 2006 2005 2004 2003 2002
$ 5,064,191,508 $ 4,857,348,525 $ 4,674,681,613 $ 4,289,249,761 $ 3,892,777,093 $ 3,591,219,348 31,939,855 36,033,028 55,152,336 139,047,656 89,305,527 48,697,685 325,688,244 313,359,714 288,088,743 696,201,755 427,944,774 386,442,648 134,866,736 132,155,505 129,331,288 125,992,690 122,409,366 119,913,327 38,928,295 37,880,818 40,838,680 41,669,051 41,284,946 43,685,098 76,116,829 74,115,776 74,325,670 74,320,247 70,611,609 71,664,740 78,322,931 77,537,970 76,113,908 75,839,736 74,581,837 72,919,628 9,386,943 8,581,053 7,583,719 7,089,131 6,385,087 5,649,671 3,443,703 3,121,883 3,784,681 2,994,247 2,217,897 2,558,781 1,453,605 1,041,961 926,187 516,529 461,925 690,735
$ 5,764,338,649 $ 5,541,176,233 $ 5,350,826,825 $ 5,452,920,803 $ 4,727,980,061 $ 4,343,441,661
$ 2,073,365 $ 2,322,538 $ 1,766,957 $ 1,460,631 $ 1,297,262 $ 1,504,798 277,932,219 265,487,479 243,382,014 220,396,709 186,082,670 186,421,065
$ 280,005,584 $ 267,810,017 $ 245,148,971 $ 221,857,340 $ 187,379,932 $ 187,925,863
2007 2006 2005 2004 2003 2002
$ 437,519,746 $ 427,553,404 $ 431,036,095 $ 366,840,457 $ 368,462,963 $ 287,729,917 304,773,401 259,532,887 229,522,988 214,514,500 203,281,399 163,979,753
$ 742,293,147 $ 687,086,291 $ 660,559,083 $ 581,354,957 $ 571,744,362 $ 451,709,670
2007 2006 2005 2004 2003
$ 659,478,760 $ 587,513,767 $ 546,106,804 $ 425,394,453 $ 392,085,280 141,670,202 121,458,717 117,254,334 95,603,970 81,365,264
$ 801,148,962 $ 708,972,484 $ 663,361,138 $ 520,998,423 $ 473,450,544
Financial Trends Information

TEACHER RETIREMENT SYSTEM OF TEXAS COMPREHENSIVE ANNUAL FINANCIAL REPORT 2011
138
STATISTICAL SECTION
Years Credited Service
Retirement Effective Dates 5-10 11-15 16-20 21-25 26-30 30+
9-1-01to8-31-02 AverageMonthlyBenefit* $235.62 $465.19 $ 948.58 $1,446.47 $2,210.88 $3,032.32 AverageFinalAverageSalary $20,405 $24,637 $ 31,300 $ 36,564 $ 46,505 $ 53,956 NumberofRetirees 1,207 1,252 1,648 3,077 4,982 4,722
9-1-02to8-31-03 AverageMonthlyBenefit* $267.23 $501.44 $ 969.32 $1,476.39 $2,222.05 $3,044.63 AverageFinalAverageSalary $23,438 $26,804 $ 31,814 $ 37,452 $ 46,435 $ 53,748 NumberofRetirees 1,504 1,637 2,157 3,790 6,000 5,085
9-1-03to8-31-04 AverageMonthlyBenefit* $269.62 $482.03 $ 983.69 $1,498.10 $2,181.65 $3,039.38 AverageFinalAverageSalary $23,472 $26,777 $ 32,463 $ 38,613 $ 46,745 $ 54,523 NumberofRetirees 1,795 2,278 3,090 5,670 7,998 6,254
9-1-04to8-31-05 AverageMonthlyBenefit* $272.29 $534.30 $1,058.22 $1,602.60 $2,333.09 $3,268.08 AverageFinalAverageSalary $24,774 $28,314 $ 35,336 $ 41,197 $ 49,446 $ 58,164 NumberofRetirees 1,410 1,227 1,427 2,073 3,174 2,492
9-1-05to8-31-06 AverageMonthlyBenefit* $279.86 $581.08 $1,094.99 $1,632.03 $2,339.64 $3,311.32 AverageFinalAverageSalary $25,456 $30,647 $ 36,767 $ 42,297 $ 49,650 $ 58,987 NumberofRetirees 1,494 1,129 1,578 2,483 3,332 2,701
9-1-06to8-31-07 AverageMonthlyBenefit* $309.31 $599.69 $1,118.68 $1,697.33 $2,424.40 $3,454.36 AverageFinalAverageSalary $27,448 $31,601 $ 37,444 $ 44,120 $ 51,683 $ 61,103 NumberofRetirees 1,575 1,183 1,554 2,626 3,290 2,835
9-1-07to8-31-08 AverageMonthlyBenefit* $314.01 $619.37 $1,149.46 $1,756.45 $2,534.82 $3,507.17 AverageFinalAverageSalary $27,891 $32,392 $ 38,415 $ 45,578 $ 53,609 $ 61,837 NumberofRetirees 1,532 1,282 1,902 2,942 3,754 3,332
9-1-08to8-31-09 AverageMonthlyBenefit* $350.03 $656.43 $1,216.76 $1,769.01 $2,607.96 $3,626.69 AverageFinalAverageSalary $29,740 $33,084 $ 40,362 $ 45,647 $ 54,736 $ 63,059 NumberofRetirees 1,464 1,377 1,917 2,877 3,361 3,229
9-1-09to8-31-10 AverageMonthlyBenefit* $362.62 $669.56 $1,224.03 $1,836.62 $2,634.63 $3,726.76 AverageFinalAverageSalary $30,285 $34,364 $ 40,460 $ 47,303 $ 55,169 $ 64,233 NumberofRetirees 1,676 1,603 2,238 3,517 3,823 4,186
9-1-10to8-31-11 AverageMonthlyBenefit* $385.71 $711.76 $1,266.00 $1,870.17 $2,665.53 $3,766.87 AverageFinalAverageSalary $32,046 $35,690 $ 42,073 $ 48,182 $ 55,116 $ 64,929 NumberofRetirees 1,737 1,692 2,407 3,852 4,283 5,510
* Average monthly benefits have been reduced for Partial Lump Sum Option payments of $386.4, $427.9, $696.2, $288.1, $313.4, $325.7, $363.7, $348.3, $385.6 and $524.9 million in fiscal years 2002, 2003, 2004, 2005, 2006, 2007, 2008, 2009, 2010 and 2011 respectively.
Average Benefit PaymentsPENSIONTRUSTFUNDLASTTENFISCALYEARS
Operating Information

STATISTICAL SECTION
TEACHER RETIREMENT SYSTEM OF TEXAS COMPREHENSIVE ANNUAL FINANCIAL REPORT 2011
139
2011 AverageClaimsPerParticipant $ 4,718.15 HealthCareClaims $992,478,380 AverageParticipants 210,3532010 AverageClaimsPerParticipant $ 4,790.25 HealthCareClaims $971,356,805 AverageParticipants 202,7782009 AverageClaimsPerParticipant $ 4,464.01 HealthCareClaims $885,132,865 AverageParticipants 198,2822008 AverageClaimsPerParticipant $ 4,302.36 HealthCareClaims $833,509,538 AverageParticipants 193,7332007 AverageClaimsPerParticipant $ 3,891.49 HealthCareClaims $742,293,147 AverageParticipants 190,7482006 AverageClaimsPerParticipant $ 3,658.53 HealthCareClaims $687,086,291 AverageParticipants 187,8042005 AverageClaimsPerParticipant $ 3,563.06 HealthCareClaims $660,559,083 AverageParticipants 185,3912004 AverageClaimsPerParticipant $ 3,434.58 HealthCareClaims $581,354,957 AverageParticipants 169,2652003 AverageClaimsPerParticipant $ 3,698.31 HealthCareClaims $571,744,362 AverageParticipants 154,5962002 AverageClaimsPerParticipant $ 3,156.18 HealthCareClaims $451,709,670 AverageParticipants 143,119
AverageHealth Care Claims
TRS-CARE (RETIRED PLAN)LAST TEN FISCAL YEARS
2011 AverageClaimsPerParticipant $ 3,661.85 HealthCareClaims $1,510,090,981 AverageParticipants 412,3852010 AverageClaimsPerParticipant $ 3,509.11 HealthCareClaims $1,313,114,197 AverageParticipants 374,2012009 AverageClaimsPerParticipant $ 3,323.59 HealthCareClaims $1,122,646,958 AverageParticipants 337,7812008 AverageClaimsPerParticipant $ 3,059.63 HealthCareClaims $ 952,156,339 AverageParticipants 311,2002007 AverageClaimsPerParticipant $ 2,834.53 HealthCareClaims $ 801,148,962 AverageParticipants 282,6392006 AverageClaimsPerParticipant $ 2,744.75 HealthCareClaims $ 708,972,484 AverageParticipants 258,3012005 AverageClaimsPerParticipant $ 2,714.19 HealthCareClaims $ 663,361,138 AverageParticipants 244,4052004 AverageClaimsPerParticipant $ 2,357.20 HealthCareClaims $ 520,998,423 AverageParticipants 221,0242003 AverageClaimsPerParticipant $ 2,616.24 HealthCareClaims $ 473,450,544 AverageParticipants 180,966
Operating Information
AverageHealth Care ClaimsTRS-ACTIVECARE (ACTIVE PLAN)
LAST NINE FISCAL YEARS(SINCE PLAN INCEPTION)

TEACHER RETIREMENT SYSTEM OF TEXAS COMPREHENSIVE ANNUAL FINANCIAL REPORT 2011
140
STATISTICAL SECTION
Number Amount of of Type of Retirement a Monthly Retired Benefit Members 1 2 3 4 5 6 7 $ 1-200 12,890 4,847 6,555 321 1,063 53 37 14$ 201-400 33,923 8,399 11,715 651 1,832 1,052 766 9,508$ 401-600 21,855 9,774 8,326 1,336 1,879 276 264 0$ 601-800 19,331 10,734 5,084 1,338 1,556 340 279 0$ 801-1,000 18,448 11,945 3,494 1,052 1,388 354 215 0$1,001-1,200 16,077 11,145 2,511 772 1,197 291 161 0$1,201-1,400 13,901 9,440 2,300 635 1,181 225 120 0$1,401-1,600 14,663 9,927 2,751 576 1,071 241 97 0$1,601-1,800 15,039 10,635 2,651 508 923 230 92 0$1,801-2,000 15,924 12,065 2,375 413 781 236 54 0$ over2,000 130,629 113,834 8,817 1,257 5,379 1,239 103 0
Totals 312,680 212,745 56,579 8,859 18,250 4,537 2,188 9,522
Retired Members by Type of BenefitPENSIONTRUSTFUNDASOFAUGUST31,2011
a Type of Retirement:1-NormalRetirementofAgeandService2-EarlyRetirement3-DisabilityRetirement4-SurvivorPayment,JointLifeorGuarantee5-SurvivorPayment,DeathinService6-SurvivorPayment,AfterDisabilityRetirement7-SurvivorPayment,AfterServiceRetirement
Benefit Average Range Participants
$ 0 27,375$ 1-5,000 134,135$ 5,001-10,000 29,365$ 10,001-20,000 11,373$ 20,001-30,000 3,009$ 30,001-40,000 1,413$ 40,001-50,000 943$ 50,001-100,000 1,671$ over100,000 1,069 Total 210,353
Health Care Claimsby Benefit Range
TRS-CARE(RETIREDPLAN)ASOFAUGUST31,2011
Health Care Claimsby Benefit RangeTRS-ACTIVECARE(ACTIVEPLAN)ASOFAUGUST31,2011
Operating Information
Benefit Average Range Participants
$ 0 62,192$ 1-5,000 294,597$ 5,001-10,000 28,299$ 10,001-20,000 14,293$ 20,001-30,000 4,973$ 30,001-40,000 2,430$ 40,001-50,000 1,612$ 50,001-100,000 2,578$ over100,000 1,411 Total 412,385

STATISTICAL SECTION
TEACHER RETIREMENT SYSTEM OF TEXAS COMPREHENSIVE ANNUAL FINANCIAL REPORT 2011
141
Benefit Average Range Participants
$ 0 27,375$ 1-5,000 134,135$ 5,001-10,000 29,365$ 10,001-20,000 11,373$ 20,001-30,000 3,009$ 30,001-40,000 1,413$ 40,001-50,000 943$ 50,001-100,000 1,671$ over100,000 1,069 Total 210,353
Benefit Average Range Participants
$ 0 62,192$ 1-5,000 294,597$ 5,001-10,000 28,299$ 10,001-20,000 14,293$ 20,001-30,000 4,973$ 30,001-40,000 2,430$ 40,001-50,000 1,612$ 50,001-100,000 2,578$ over100,000 1,411 Total 412,385
Option Selected b 1 2 3 4 5 6 5,902 4,504 1,049 413 970 5210,939 7,230 2,099 924 1,786 10,94510,609 6,293 2,367 952 1,634 0 9,054 5,620 2,565 897 1,195 0 8,633 5,130 2,675 878 1,132 0 6,969 4,885 2,576 715 932 0 5,478 4,662 2,391 563 807 0 5,677 5,019 2,482 618 867 0 5,767 5,194 2,561 589 928 0 5,809 5,621 2,888 584 1,022 045,491 48,740 24,844 4,279 7,275 0
120,328 102,898 48,497 11,412 18,548 10,997 b Option Selected:Option1-LifeAnnuityOption2-JointtoSurvivorOption3-JointtoSurvivor50%/JointtoSurvivor75%Option4-5-YearGuaranteeOption5-10-YearGuaranteeOption6-SurvivorBenefit
Operating Information

TEACHER RETIREMENT SYSTEM OF TEXAS COMPREHENSIVE ANNUAL FINANCIAL REPORT 2011
142
STATISTICAL SECTION
2011 2002
Percentage Percentage of Total of Total Covered Covered Covered Covered Participating Reporting Entity Employees Rank Employment Employees Rank Employment
HoustonISD 23,777 1 2.92% 25,646 1 3.75%DallasISD 19,780 2 2.43 19,327 2 2.82UTMDAndersonCancerCenter 16,254 3 1.99 10,415 4 1.52CypressFairbanksISD 13,193 4 1.62 9,098 8 1.33NorthsideISD 12,775 5 1.57 9,362 7 1.37AustinISD 12,299 6 1.51 10,716 3 1.57FortWorthISD 10,987 7 1.35 10,254 5 1.50UTatAustin 10,111 8 1.24 8,963 9 1.31UTMedicalBranchatGalveston 9,128 9 1.12 9,866 6 1.44NorthEastISD 8,956 10 1.10ElPasoISD 8,567 10 1.25
Allother 678,029 83.15 562,148 82.14
Total 815,289 100.00% 684,362 100.00%
Source: May report month information submitted to the Teacher Retirement System by participating reporting entities.
Principal Participating Reporting EntitiesPENSIONTRUSTFUND
CURRENTFISCALYEARANDNINEYEARSAGO
Operating Information

STATISTICAL SECTION
TEACHER RETIREMENT SYSTEM OF TEXAS COMPREHENSIVE ANNUAL FINANCIAL REPORT 2011
143
2011 2002
Percentage Percentage of Total of Total Covered Covered Covered Covered OPEB OPEB OPEB OPEB Participating Reporting Entity Employees Rank Employment Employees Rank Employment
HoustonISD 23,777 1 3.52% 25,646 1 4.44%DallasISD 19,780 2 2.92 19,327 2 3.35CypressFairbanksISD 13,193 3 1.95 9,098 6 1.58NorthsideISD 12,775 4 1.89 9,362 5 1.62AustinISD 12,299 5 1.82 10,716 3 1.86FortWorthISD 10,987 6 1.62 10,254 4 1.78NorthEastISD 8,956 7 1.32ElPasoISD 8,860 8 1.31 8,567 7 1.48AldineISD 8,538 9 1.26 7,741 9 1.34ArlingtonISD 8,119 10 1.20 7,671 10 1.33SanAntonioISD 7,856 8 1.36
Allother 548,992 81.19 461,084 79.86
Total 676,276 100.00% 577,322 100.00%
Source: May report month information submitted to the Teacher Retirement System by participating reporting entities.
Principal Participating Reporting EntitiesTRS-CARE(RETIREDPLAN)
CURRENTFISCALYEARANDNINEYEARSAGO
Operating Information

TEACHER RETIREMENT SYSTEM OF TEXAS COMPREHENSIVE ANNUAL FINANCIAL REPORT 2011
144
STATISTICAL SECTION
Community and JuniorColleges
AlamoCommCollegeDistAlvin Community CollegeAmarillo CollegeAngelina CollegeAustin Community CollegeBlinnCollegeBrazosportCollegeCentral Texas CollegeCisco Junior CollegeClarendon CollegeCoastalBendCollegeCollegeoftheMainlandCollin Cty Comm CollegeDallasCtyCommCollDistDelMarCollegeElPasoCommunityCollegeFrank Phillips CollegeGalvestonCollegeGraysonCountyCollegeHillCollegeHoustonCommCollSystemHowardCtyJrCollDistKilgore CollegeLaredoCommunityCollegeLeeCollegeLoneStarCollegeSystemMcLennanCommCollegeMidlandCollegeNavarro CollegeNorth Central Tx CollegeNortheast Tx Comm CollegeOdessaCollegePanola CollegeParis Junior CollegeRanger Junior College SanJacintoCollegeDistSouth Plains CollegeSouth Texas Comm CollegeSouthwest Tx Jr College TarrantCountyCollDistTemple CollegeTexarkana CollegeTexas Southmost CollegeTexas State Tech CollegeTrinity Valley Jr CollegeTyler Junior CollegeVernon CollegeVictoria CollegeWeatherford CollegeWestern Texas CollegeWharton County Jr College
Universities
AngeloStateUniversityLamarInstofTechnologyLamarStCollatOrangeLamarStCollatPortArthurLamarUniversityMidwesternStateUnivPrairieViewA&MUnivSamHoustonStateUnivStephenFAustinStateUSulRossStateUniversity TarletonStateUniversityTexasA&MatGalvestonTexasA&M-CentralTexas(Killeen)TexasA&MCorpusChristiTexasA&MU-CommerceTexasA&MU-Kingsville
TexasA&M-SanAntonioTexasA&MU-TexarkanaTexasA&MUniversityTexasAgriLifeResearch TexasAgriLifeExtServiceTexasEngExpStationTexasEngExtServiceTexas Forest ServiceTexasSouthernUniversity TexasStateUniv-SanMarcosTexasStateUnivSystemTexasTechUniversityTexas Transportation InstTexasWomansUniversityTxA&MInternationalUnivTxA&MUSystemsOfficeUHatHoustonUofNTexasSystemAdminUTatArlington UTatAustinUTatDallasUTatElPasoUTatSanAntonioUTatTylerUTPanAmericanUTPermianBasinUnivTxatBrownsvilleUniversityofNorthTxUniversityofNorthTxatDallasWestTexasA&MUniv
Medical Schools
TAMUSystemHSCTexasVeterinaryMed DiagnosticLabUNTHSCatFortWorthUTHSCatHoustonUTHSCatSanAntonioUTHealthCtratTylerUTMDAndersonHospitalUTMedBratGalvestonUTSWMedicalCenter
School Districts
AbbottISD AbernathyISD AbileneISD AcademyISDAdrianISDAguaDulceISD AlamoHeightsISD AlbaGoldenISD AlbanyISD AldineISD AledoISDAliceISD AliefISD AllenISD AlpineISD AltoISD AlvaradoISDAlvinISD AlvordISD AmarilloISDAmherstISDAnahuacISDAndersonShiroConsISD AndrewsISDAngletonISDAnnaISD AnsonISD
AnthonyISDAntonISD AppleSpringsISDAquillaISDAransasCountyISDAransasPassISD ArcherCityISD ArgyleISDArlingtonISDArpISD AspermontISD AthensISD AtlantaISD AubreyISD AustinISD AustwellTivoliISD AvalonISD AveryISD AvingerISDAxtellISDAzleISDBairdISD BallingerISD BalmorheaISDBanderaISD BangsISDBanqueteISD BarbersHillISDBartlettISD BastropISD BayCityISD BeaumontISD BeckvilleISD BeevilleISD BellevueISD BellsISD BellvilleISD BeltonISD BenBoltPalitoISDBenavidesISDBenjaminISD BigSandyISD,BigSandyBigSandyISD,Dallardsville BigSpringISD BirdvilleISD BishopConsISDBlackwellISDBlancoISD BlandISDBlanketISDBloomburgISDBloomingGroveISD BloomingtonISDBlueRidgeISDBluffDaleISDBlumISD BoerneISDBolesISD BolingISDBonhamISD BookerISDBordenCountyISD BorgerISDBosquevilleISD BovinaISD BowieISD BoydISDBoysRanchISD BrackettISD BradyISD BrazosISDBrazosportISDBreckenridgeISD BremondISD BrenhamISD
BridgeCityISD BridgeportISDBroaddusISDBrockISDBronteISDBrookelandISDBrooksCountyISDBrookesmithISD BrownfieldISD BrownsboroISD BrownsvilleISD BrownwoodISDBrucevilleEddyISD BryanISD BrysonISDBuckholtsISD BuenaVistaISD BuffaloISD BullardISD BunaISD BurkburnettISD BurkevilleISD BurlesonISD BurnetConsISDBurtonISDBushlandISD ByersISD BynumConsISDCaddoMillsISD CalallenISDCaldwellISDCalhounCountyISDCallisburgISDCalvertISD CameronISDCampbellISDCanadianISDCantonISDCanutilloISDCanyonISDCarlisleISD CarrizoSpringsCISDCarrollISD CarrolltonFarmersBranchISD CarthageISDCastleberryISD CayugaISD CedarHillISDCelesteISDCelinaISD CenterISD CenterPointISDCentervilleISD,CentervilleCentervilleISD,GrovetonCentralISDCentralHeightsISDChannelviewISDChanningISDChapelHillISD,Mt.PleasantChapelHillISD,Tyler CharlotteISDCherokeeISDChesterISD ChicoISD ChildressISDChillicotheISDChiltonISDChinaSpringISD ChirenoISDChisumISD ChristovalISDCiscoISDCityViewISDClarendonConsISD ClarksvilleISD
Listing of Participating Reporting Entities

STATISTICAL SECTION
TEACHER RETIREMENT SYSTEM OF TEXAS COMPREHENSIVE ANNUAL FINANCIAL REPORT 2011
145
BridgeCityISD BridgeportISDBroaddusISDBrockISDBronteISDBrookelandISDBrooksCountyISDBrookesmithISD BrownfieldISD BrownsboroISD BrownsvilleISD BrownwoodISDBrucevilleEddyISD BryanISD BrysonISDBuckholtsISD BuenaVistaISD BuffaloISD BullardISD BunaISD BurkburnettISD BurkevilleISD BurlesonISD BurnetConsISDBurtonISDBushlandISD ByersISD BynumConsISDCaddoMillsISD CalallenISDCaldwellISDCalhounCountyISDCallisburgISDCalvertISD CameronISDCampbellISDCanadianISDCantonISDCanutilloISDCanyonISDCarlisleISD CarrizoSpringsCISDCarrollISD CarrolltonFarmersBranchISD CarthageISDCastleberryISD CayugaISD CedarHillISDCelesteISDCelinaISD CenterISD CenterPointISDCentervilleISD,CentervilleCentervilleISD,GrovetonCentralISDCentralHeightsISDChannelviewISDChanningISDChapelHillISD,Mt.PleasantChapelHillISD,Tyler CharlotteISDCherokeeISDChesterISD ChicoISD ChildressISDChillicotheISDChiltonISDChinaSpringISD ChirenoISDChisumISD ChristovalISDCiscoISDCityViewISDClarendonConsISD ClarksvilleISD
ClaudeISDClearCreekISD CleburneISDClevelandISDCliftonISD ClintISD ClydeISD CoahomaISDColdspringOakhurstISD ColemanISDCollegeStationISD CollinsvilleISDColmesneilISD ColoradoISDColumbiaBrazoriaISD ColumbusISDComalISD ComancheISD ComfortISDCommerceISDCommunityISDComoPicktonISD ComstockISDConnallyConsISD ConroeISD CoolidgeISD CooperISDCoppellISDCopperasCoveISD CorpusChristiISD CorriganCamdenCISDCorsicanaISDCottonCenterISDCotullaISDCouplandISDCovingtonISDCrandallISD CraneISDCranfillsGapISD CrawfordISDCrockettISDCrockettCtySchoolDist CrosbyISD CrosbytonConsISD CrossPlainsISD CrossRoadsISD CrowellConsISDCrowleyISDCrystalCityISD CueroISDCulbersonCounty-AllamooreISD CumbyISDCushingISDCypressFairbanksISDDHanisISDDaingerfieldISD DalhartISD DallasISD DamonISD DanburyISDDarrouzettISD DawsonISD,DawsonDawsonISD,Welch DaytonISDDeKalbISD DeLeonISDDeSotoISD DecaturISDDeerParkISD DelValleISDDellCityISD DenisonISD DentonISDDenverCityISD DetroitISD
DeversISD DevineISDDewISDDeweyvilleISD DibollISDDickinsonISD DilleyISDDimeBoxISD DimmittISDDivideISD DoddCityISD DonnaISDDossConsCSDDouglassISDDrippingSpringsISDDriscollISD DublinISD DumasISD DuncanvilleISDEagleMountSaginawISDEaglePassISDEanesISDEarlyISDEastBernardISDEastCentralISD EastChambersISD EastlandISD EctorISD EctorCtyISD EdcouchElsaISD EdenCISD EdgewoodISD,EdgewoodEdgewoodISD,SanAntonio EdinburgCISD EdnaISD ElCampoISDElPasoISD ElectraISD ElginISD ElkhartISDElysianFieldsISD EnnisISDEraISDEtoileISDEulaISD EustaceISDEvadaleISDEvantISDEvermanISDExcelsiorISDEzzellISDFabensISD FairfieldISDFallsCityISDFannindelISD FarmersvilleISD FarwellISDFayettevilleISD FerrisISD FlatoniaISD FlorenceISD FloresvilleISDFlourBluffISD FloydadaISD FollettISDForestburgISD ForneyISDForsanISDFortBendISDFortDavisISDFortElliottConsISDFortHancockISDFortSamHoustonISD FortStocktonISDFortWorthISD
FranklinISD FrankstonISD FredericksburgISDFreerISDFrenshipISDFriendswoodISD FrionaISD FriscoISDFrostISDFruitvaleISDGainesvilleISD GalenaParkISD GalvestonISD GanadoISD GarlandISDGarnerISD GarrisonISDGaryISD GatesvilleISDGauseISD GeorgeWestISDGeorgetownISDGholsonISD GiddingsISD GilmerISD GladewaterCtyLineISD GlasscockCountyISD GlenRoseISD GodleyISDGoldburgISD GoldthwaiteISD GoliadISD GonzalesISD GoodrichISD GooseCreekISD GordonISD GormanISDGradyISD GrafordISD GrahamISD GranburyISD GrandPrairieISD GrandSalineISDGrandfallsRoyaltyISD GrandviewISDGrandviewHopkinsISD GrangerISDGrapeCreekISD GrapelandISD GrapevineColleyvilleISD GreenvilleISDGreenwoodISD GregoryPortlandCISD GroesbeckISD GroomISD GrovetonISD GruverISDGunterISD GustineISDGuthrieCSD HaleCenterISD HallettsvilleISDHallsburgISDHallsvilleISD HamiltonISD HamlinISDHamshireFannettISD HappyISDHardinISDHardinJeffersonISD HarlandaleISDHarletonISD HarlingenISDHarmonyISDHarperISD
HarroldISDHartISDHartleyISDHartsBluffISD HaskellCISDHawkinsISD HawleyISDHaysConsISD HearneISD HedleyISD HemphillISD HempsteadISD HendersonISD HenriettaISD HerefordISD HermleighISD HicoISD HidalgoISD HigginsISDHighIslandISDHighlandISD HighlandParkISD,AmarilloHighlandParkISD,Dallas HillsboroISDHitchcockISD HollandISD HollidayISD HondoISD HoneyGroveISD HooksISD HoustonISD HoweISD HubbardISD,HubbardHubbardISD,NewBostonHuckabayISDHudsonISDHuffmanISD HughesSpringsISD HullDaisettaISD HumbleISD HuntISD HuntingtonISD HuntsvilleISDHurstEulessISDHuttoISDIdalouISDIndustrialISDInglesideISDIngramISD IolaISD IowaParkConsISDIraISDIraanSheffieldISDIredellISDIrionCountyISD IrvingISD ItalyISD ItascaISD JacksboroISD JacksonvilleISD JarrellISD JasperISD Jayton-GirardISD JeffersonISDJimHoggCountyISDJimNedConsISD JoaquinISDJohnsonCityISDJonesboroISD JoshuaISD JourdantonISDJudsonISD JunctionISDKarnackISD KarnesCityISD
Listing of Participating Reporting Entities (Continued)

TEACHER RETIREMENT SYSTEM OF TEXAS COMPREHENSIVE ANNUAL FINANCIAL REPORT 2011
146
STATISTICAL SECTION
KatyISD KaufmanISD KeeneISD KellerISD KeltonISD KempISDKenedyISDKenedyCountySchoolDistKennardISDKennedaleISD KerensISDKermitISD KerrvilleISD KilgoreISD KilleenISD KingsvilleISD KirbyvilleConsISDKleinISD KlondikeISD KnippaISD KnoxCityOBrienCISDKopperlISD KountzeISD KressISD KrumISDLaFeriaISDLaGloriaISD LaGrangeISDLaJoyaISDLaMarqueISD LaPorteISDLaPoynerISDLaPryorISDLaVegaISD LaVerniaISDLaVillaISDLacklandISDLagoVistaISDLakeDallasISDLakeTravisISDLakeWorthISDLamarConsISD LamesaISD LampasasISD LancasterISD LanevilleISD LaredoISD LasaraISDLatexoISDLazbuddieISD LeakeyISDLeanderISDLearyISD LeforsISD LeggettISDLeonISD LeonardISD LevellandISD LeverettsChapelISD LewisvilleISD LexingtonISD LibertyISDLibertyEylauISDLibertyHillISD LindaleISD LindenKildareConsISDLindsayISDLinglevilleISD LipanISDLittleElmISD LittlefieldISD LivingstonISD LlanoISD LockhartISD LockneyISD
LohnISD LometaISD LondonISD LoneOakISD LongviewISDLoopISD LoraineISD LorenaISD LorenzoConsISD LosFresnosConsISDLouiseISDLovejoyISD LoveladyISD LtleCyprsMrcvleCISDLubbockISDLubbockCooperISD LuedersAvocaISD LufkinISDLulingISDLumbertonISD LyfordConsISD LytleISDMabankISD MadisonvilleConsISDMagnoliaISD MalakoffISD MaloneISDMaltaISD ManorISD MansfieldISD MarathonISD MarbleFallsISD MarfaISDMarionISDMarlinISD MarshallISD MartISD MartinsMillISDMartinsvilleISD MasonISD MatagordaISD MathisISD MaudISDMayISD MaypearlISD McAllenISD McCameyISDMcDadeISD McGregorISD McKinneyISD McLeanISD McLeodISDMcMullenCountyISDMeadowISDMedinaISDMedinaValleyISDMelissaISD MemphisISD MenardISD MercedesISD MeridianISD MerkelISD MesquiteISD MexiaISDMeyersvilleISD MiamiISD MidlandISD MidlothianISDMidwayISD,HenriettaMidwayISD,Waco MilanoISDMildredISD MilesISD MilfordISDMillerGroveISD
MillsapISD MineolaISD MineralWellsISD MissionConsISD MonahansWickettISDMontagueISDMonteAltoISD MontgomeryISD MoodyISD MoranISD MorganISDMorganMillISD MortonISDMotleyCountyISD MoultonISD MountCalmISD MountEnterpriseISD MountPleasantISD MountVernonISDMuensterISD MuleshoeISD MullinISD MumfordISD MundayISD MurchisonISDNacogdochesISD NataliaISDNavarroISDNavasotaISDNazarethISD NechesISD NederlandISD NeedvilleISD NewBostonISD NewBraunfelsISDNewCaneyISDNewDealISDNewDianaISDNewHomeISDNewSummerfieldISDNewWaverlyISD NewcastleISD NewtonISD NixonSmileyCISD NoconaISD NordheimISD NormangeeISDNorthEastISDNorthForestISDNorthHopkinsISDNorthLamarISD NorthZulchISDNorthsideISD,SanAntonioNorthsideISD,VernonNorthwestISDNoviceISDNuecesCanyonConsISDNurseryISDODonnellISDOakwoodISD OdemEdroyISD OglesbyISDOlfenISD OlneyISD OltonISD OnalaskaISD OrangeGroveISDOrangefieldISD OreCityISD OvertonISDPaducahISDPaintCreekISDPaintRockISD PalaciosISD PalestineISD
PalmerISDPaloPintoISD PampaISD PanhandleISDPantherCreekConsISD ParadiseISD ParisISD PasadenaISDPattonSpringsISD PawneeISDPearlandISD PearsallISDPeasterISD PecosBarstowToyahISDPenelopeISD PerrinWhittConsISD PerrytonISD PetersburgISD PetroliaISDPettusISDPewittConsISD PflugervilleISD PharrSanJuanAlamoISD PilotPointISDPineTreeISD PittsburgISD PlainsISDPlainviewISD PlanoISDPleasantGroveISD PleasantonISDPlemonsStinnettPhillipsCISD PointIsabelISDPonderISD PoolvilleISD PortAransasISD PortArthurISDPortNechesGrovesISD PostISD PoteetISD PothConsISDPottsboroISD PrairieLeaISDPrairieValleyISDPrairilandISD PremontISD PresidioISDPriddyISD PrincetonISDPringleMorseConsISDProgresoISDProsperISD QuanahISD QueenCityISD QuinlanISD QuitmanISDRainsISDRallsISDRamirezCommonSD RandolphFieldISD RangerISD RankinISD RaymondvilleISD ReaganCountyISDRedLickISD RedOakISD RedwaterISDRefugioISD RicardoISDRiceISDRiceConsISD RichardsISD RichardsonISD RichlandSpringsISD RieselISD
Listing of Participating Reporting Entities (Continued)

STATISTICAL SECTION
TEACHER RETIREMENT SYSTEM OF TEXAS COMPREHENSIVE ANNUAL FINANCIAL REPORT 2011
147
RioGrandeCityCISD RioHondoISD RioVistaISD RisingStarISDRiverRoadISDRivercrestISD RivieraISD RobertLeeISDRobinsonISD RobstownISD RobyCISD RochelleISD RockdaleISD RockspringsISD RockwallISD RogersISDRomaISDRooseveltISD RopesISD RoscoeISD RosebudLottConsISD RotanISD RoundRockISDRoundTopCarmineISD RoxtonISDRoyalISD RoyseCityISD RuleISD RungeISDRuskISDS&SConsISDSabinalISDSabineISDSabinePassISD SaintJoISD SaladoISD SaltilloISDSamRayburnConsISDSamnorwoodISD SanAngeloISD SanAntonioISD SanAugustineISD SanBenitoConsISD SanDiegoISD SanElizarioISDSanFelipeDelRioISDSanIsidroISD SanMarcosConsISDSanPerlitaISDSanSabaISDSanVicenteISDSandsConsISDSanfordISD SangerISD SantaAnnaISDSantaFeISDSantaGertrudisISDSantaMariaISD SantaRosaISD SantoISD SavoyISDSchertzCiboloISDSchleicherCtyISD SchulenburgISDScurryRosserISDSeagravesISD SealyISD SeguinISDSeminole Public Schools SeymourISDShallowaterISD ShamrockISD SharylandISD ShelbyvilleISDSheldonISD
ShepherdISD ShermanISD ShinerISD SidneyISDSierraBlancaISD SilsbeeISD SilvertonISDSimmsISD SintonISDSivellsBendISD SkidmoreTynanISD SlatonISD SlidellISDSlocumISD SmithvilleISD SmyerISDSnookISD SnyderISDSocorroISD SomersetISD SomervilleISD SonoraISD SouthSanAntonioISDSouthTexasISD SouthlandISDSouthsideISDSouthwestISDSpearmanISDSplendoraISD SpringISDSpringBranchISDSpringCreekISDSpringHillISD SpringlakeEarthISD SpringtownISD SpurISDSpurgerISDStaffordMuncplSchDist StamfordISD StantonISDStarISD StephenvilleISD SterlingCityISD StockdaleISD StratfordISD StrawnISD SudanISD SulphurBluffISD SulphurSpringsISDSundownISDSunnyvaleISD SunrayISD SweenyISDSweetHomeISD SweetwaterISDTaftISD TahokaISDTarkingtonISD TatumISD TaylorISD TeagueISD TempleISD TenahaISD--__TerlinguaCSD TerrellISDTerrellCountyISD TexarkanaISD TexasCityISD TexhomaISD TexlineISD ThorndaleISD ThrallISD ThreeRiversISD ThreeWayISDThrockmortonISD
TidehavenISD TimpsonISDTiogaISD TolarISDTomBeanISD TomballISDTornilloISD TrentISD TrentonISD TrinidadISD TrinityISD TroupISD TroyISD TuliaISDTulosoMidwayISD TurkeyQuitaqueCISD TylerISDUnionGroveISDUnionHillISDUnitedISDUtopiaISDUvaldeConsISDValentineISD ValleyMillsISD ValleyViewISD,PharrValleyViewISD,ValleyView VanISD VanAlstyneISDVanVleckISD VegaISD VenusISDVeribestISD VernonConsISD VictoriaISDVidorISDVysehradISDWacoISD WaelderISDWalcottISDWallISD WallerISDWalnutBendISD WalnutSpringsISDWarrenISD WaskomISD WaterValleyISD WaxahachieISD WeatherfordISDWebbCISD WeimarISD WellingtonISDWellmanUnionISD WellsISD WeslacoISD WestISDWestHardinCtyCISDWestOrangeCoveCISDWestOsoISDWestRuskCtyConsISDWestSabineISD WestbrookISDWesthoffISDWestphaliaISDWestwoodISD WhartonISD WheelerISD WhiteDeerISDWhiteOakISDWhiteSettlementISD WhitefaceISD WhitehouseISD WhitesboroISD WhitewrightISD WhitharralISD WhitneyISD
WichitaFallsISDWildoradoISD WillisISD WillsPointISD WilsonISDWimberleyISDWindhamSchoolDistrictWindthorstISDWinfieldISD WinkLovingConsISD WinnsboroISDWinonaISD WintersISD WodenISD WolfeCityISD WoodsboroISD WoodsonISD WoodvilleISD WorthamISD WylieISD,AbileneWylieISD,WylieYantisISD YoakumISD YorktownISDYsletaISDZapataISDZavallaISDZephyrISD
Regional ServiceCenters
Region01EdServCenter Region02EdServCenter Region03EdServCenter Region04EdServCenter Region05EdServCenter Region06EdServCenter Region07EdServCenter Region08EdServCenter Region09EdServCenter Region10EdServCenter Region11EdServCenter Region12EdServCenter Region13EdServCenter Region14EdServCenter Region15EdServCenter Region16EdServCenter Region17EdServCenter Region18EdServCenter Region19EdServCenter Region20EdServCenter
Charter Schools
A+ AcademyAcademy of AcceleratedAcademy of Careers and TechAcademyofDallasAccelerated Int AcademyAliefMontessoriSchoolALPHACharterSchoolAlphonso Crutch’s CharterAmbassador’s Prep Academy AmericanInstofLearningAmigos Por Vida CharterArlington Classics AcadArrow AcademyAustinDiscoverySchoolAWBrownFlwshpChtrSchAzlewayCharterSchoolBayAreaCharterSchoolBeatriceMayesInstitute
Listing of Participating Reporting Entities (Continued)

TEACHER RETIREMENT SYSTEM OF TEXAS COMPREHENSIVE ANNUAL FINANCIAL REPORT 2011
148
STATISTICAL SECTION
Benji’sSpecialEducAcadBexarCountyAcademyBigSpringsCharterSchBobHopeSchoolBrazosRiverCharterSchBrazosSchoolforInquiryBrightIdeasCharterSchBrooksAcademyofScience &EngineeringBurnhamWoodCharterSchCalvin Nelms Charter Cedars International AcadChapelHillAcademyChildrenFirstAcHoustonChildrenFirstEleAcadCityCenter-HealthCareersCom Quest AcademyCompass AcademyCorpusChristiMontessori Charter SchoolCrosstimbers AcademyCumberland AcademyDallasCanAcademyDallasCommCharterSchDr.Garza-GonzalezChSchDrawAcademyEagleAdvantageSchoolEastFortWorthMontessoriEastTexasCharterSchoolEdenParkAcademyEducationCenterIntAcadElPasoAcademyEastErathExcels!AcademyEvolutionAcademyCharterFaithFamilyAcadOakCliffFaith Fam Acad WaxahachieFocusLearningAcademyFt Worth Acad Fine ArtsGabrielTafollaCharterGatewayAcademyGatewayCharterAcademyGeorgeGervinAcademyGeorgeISanchezCharter,HoustonGeorgeISanchezCharter,SanAntonioGirls&BoysPrepAcadGoldenRuleCharterSchoolGulfCoastTradesCenterHamptonPreparatoryHarmonySchoolAcademy,BrownsvilleHarmonySchoolAcademy,LaredoHarmonySchoolofExcellence,HoustonHarmonySchoolofScience,HoustonHarmonyScienceAcademy,AustinHarmonyScienceAcademy,ElPasoHarmonyScienceAcademy,FortWorthHarmonyScienceAcademy,HoustonHarmonyScienceAcademy,LubbockHarmonyScienceAcademy,SanAntonioHarmonyScienceAcademy,WacoHeightsAcademyHenryFordAcademyHiggsCarterKingAcademyHonorsAcademyHoustonAltPrepCharterHoustonGatewayCharterHoustonHghtsLearningAcIdea Public SchoolsInspired Vision AcademyJamie’sHouseCharterSchJeanMassieuAcademyJohnH.WoodCharterSchJuanB.GalavizCharterJubilee Academic CenterKatherine Anne Porter SchK I P P Academy
K I P P Aspire AcademyK I P P Austin CollegeKIPPSoutheastHoustonK I P P Truth AcademyKoinonia Community LearningAcademyLaAcademiadeEstrellasLaAmistadAcademyLeFePreparatorySchoolLeadershipPrepSchoolLifeCharterSchoolLighthouseCharterSchoolMainlandPrepAcademyManaraAcademyMeadowlandCharterSchoolMedicalCenterCharterMeridianWorldSchoolMetroCharterAcademyMeyerParkElementaryMidValleyAcademyMidlandAcademyNHoustonHSBusinessNew Frontiers Charter SchoolNewman International AcademyNorthTexasElementarySchool of ArtsNorthwest Prep AcademyNova Charter SchoolNova Charter SoutheastNYOSCharterSchoolOdysseyAcademyOneStopMultiserviceOrendaCharterSchoolOutreachWordAcademyPanola Charter SchoolParadigm Accelerated SchPasoDelNorteAcademyPeak Preparatory SchoolPegasus Charter SchoolPhoenix Charter SchoolPineywoods AcademyPor Vida IncPremierLearningAcademyRadianceAcadofLearningRanch AcademyRapoport AcademyRaulYzaguirreSchoolReconciliation Scholar’s AcademyResponsiveEducationSolutionsRichardMilburn-AmarilloRichardMilburn-CorpusChristiRichardMilburn-FortWorthRichardMilburn-HoustonRichardMilburn-KilleenRichardMilburn-OdessaRipleyHouseCharterSchoolRise AcademyS T A R Charter SchoolSan Antonio Prep AcademySan Antonio Sch InquirySan Antonio Tech AcademySchoolofExcellenceSchoolofScience&TECH-Discovery- San AntonioSchool of Science & Technology - Corpus ChristiSchool of Science & Technology - San AntonioSeashoreLearningCtrSeashoreMiddleAcademySer-NinosShekinah Radiance AcademySouth Plains AcademySouthwestHighSchoolSouthwest Preparatory Sch
St. Anthony SchoolSt.Mary’sCharterSchoolSteppingStonesCharterElementarySummit International PreparatoryTechnologyEducationChtrTEKOAAcademyTexasEmpowermentAcademyTexas Preparatory SchoolTexas Serenity AcademyTheEastAustinCollegePrepAcademyTheEducationCenterTheEhrhartSchoolTheEncinoSchoolTheLegendsAcademyTheNorthHillsSchoolThe Rhodes SchoolTLCAcademy-SanAngeloTOVASTransformative CharterTreetops InternationalTrinityBasinPreparatoryTrinity Charter SchoolTwoDimensionsPrepAcadUniversalAcademyVanguard AcademyVarnett Charter SchoolVictory Prep AcademyVista del Futuro Charter SchoolWaco Charter SchoolWalipp AcademyWestHoustonCharterWestlake AcademyWilliams PreparatoryWinfree Academy Charter SchoolsYesPreparatoryPublicSchoolsZoeLearningAcademy
Other EducationalDistricts
AndersonCtySpcEdCoOpBowieCountySchDistDallasCountySchoolDistHarrisCtyDeptEducationParkerCountyCoOp
Other Entities
Teacher Retirement SystemTexasEducationAgency
Listing of Participating Reporting Entities (Continued)

BENEFITS SECTION
TEACHER RETIREMENT SYSTEM OF TEXAS COMPREHENSIVE ANNUAL FINANCIAL REPORT 2011
149
BEN
EFITS SECTIO
N

TEACHER RETIREMENT SYSTEM OF TEXAS COMPREHENSIVE ANNUAL FINANCIAL REPORT 2011
150
BENEFITS SECTION
S T A T EIn fiscal year 2011, the 82nd Texas Legislature, Regular Session, enacted several significant new laws affecting TRS.
FUNDING, INTERIM STUDIES, AND OTHERGENERAL APPROPRIATIONS ACT PROVISIONS
Under House Bill 1, the General Appropriations Act (GAA), the state contribution rate to the retirement plan was reduced from 6.644 percent in the FY 2010-2011 biennium to 6.0 percent of payroll for the first year of the 2012-2013 biennium. Effective September 1, 2012, the state contribution rate will increase to 6.4 percent for the second year of the biennium.
The member contribution rate for the retirement plan remains at 6.4 percent for both years of the biennium. The state contribu-tion rate to TRS-Care remains at 1 percent effective September 1, 2011 but is reduced to 0.5 percent effective September 1, 2012 for the second year of the biennium. The active member contribution rate to TRS-Care and the participating employer rate remain unchanged.
Several GAA riders are important to TRS participants:
• TRS is required to conduct a study of TRS-Care and report to the legislature on potential changes to improve the program’s sustainability.
• The legislature expressed its intent that TRS not increase retiree health insurance premiums for the 2012-2013 biennium. At its June 2011 meeting, the TRS Board of Trustees considered updated financial information and left TRS-Care premiums unchanged for the 2011-2012 school year.
• TRS is required to report to the legislature on the im-pact of potential changes to the pension plan, including retirement eligibility, final average salary, benefit multiplier, and the creation of a hybrid defined contribution/defined benefit retirement plan.
• TRS is authorized to establish a pilot program for TRS participants in the group health benefit programs to test alternatives to traditional fee-for-service payments.
INVESTMENTS
Under House Bill 1061, TRS is authorized to use derivatives in its investment portfolio and to use external managers to invest up to 30 percent of the TRS fund until September 1, 2019. TRS is authorized to increase its allocation to hedge funds from five percent to 10 percent until September 1, 2019.
PURCHASING SERVICE CREDIT
Senate Bill 1668 makes significant changes to the cost of certain kinds of purchased service credit and makes other administrative adjustments.
• To purchase out-of-state service credit, developmental leave service credit, and unreported service or compen-sation credit (including substitute service), the cost will increase to the actuarial cost of the additional benefit resulting from the credit.
• To purchase withdrawn service credit, the member will be required to deposit the withdrawn amount plus a fee of eight percent (increased from six percent).
• For withdrawn service, developmental leave, unreported service or compensation credit (including substitute service credit), an eligible member may purchase credit for eligible service rendered before September 1, 2011 at the old cost, if the credit is purchased before September 1, 2013, or an installment agreement is signed and received by TRS before that date. For out-of-state service credit to be purchased at the old cost, the same September 1, 2013 deadline applies, but the out-of-state service must have been rendered before January 1, 2006 by a person who was a member of TRS on December 31, 2005.
• A person with unreported service or compensation, including substitute service, will be required to verify the service to TRS within five years of when it was rendered in order for it to be creditable. For service rendered before September 1, 2011, the person will have until August 31, 2016 to verify the service. The person will no longer be required, however, to purchase verified unreported service to receive retirement benefits.
• For members with military service that qualifies as USERRA service (Uniformed Services Employment and Reemployment Rights Act of 1994), the service may be counted toward length of service requirements for TRS benefit eligibility (but not benefit amount), even if the member does not purchase credit for the service.
EMPLOYMENT AFTER RETIREMENT
Senate Bill 1669 made substantial changes to employment after retirement restrictions.
• Service retirees who retired before January 1, 2011 may now work in Texas public education in any capacity without any loss of monthly annuities. Surcharge require-ments for employers still apply to retirees who retired after September 1, 2005 and are working in TRS-eligible positions. Following enactment of the legislation, the TRS Board of Trustees established new TRS-Care surcharge rates, effective September 1, 2011.
• Service retirees who retire after January 1, 2011 may work full time for as much as 12 months each school year without any loss of annuities only if they have a break in service of 12 full consecutive calendar months after retire-ment. Though the 12-month break need not immediately
2011 Changes in TRS Law

BENEFITS SECTION
TEACHER RETIREMENT SYSTEM OF TEXAS COMPREHENSIVE ANNUAL FINANCIAL REPORT 2011
151
follow retirement, a retiree will forfeit monthly annuities for months in which the retiree works full time until after a 12-month break has occurred. The bill repeals the former exceptions that allowed service retirees to work on a full-time basis without loss of annuities in certain circum-stances (i.e., the bill repeals the six-month exception, the bus driver exception, the principal/assistant principal exception, the acute shortage area exception, and the nurse faculty exception). Retirees who have not served a 12-full-consecutive-calendar-month break in service after retirement may only work as substitutes or on a one-half time basis. Working full-time in the absence of the break in service of 12 full consecutive calendar months will re-sult in the loss of the annuity for the month in which the full-time work occurs. Also, working in any capacity for a TRS-covered employer, including work as a substitute, will reset the computation of the required 12-full-consecutive-calendar-month break in service.
STANDARDIZED SCHOOL YEAR
Under House Bill 2561, starting with the 2012-2013 school year, all TRS members will use a standardized school year of September 1 through August 31 for TRS benefit purposes. This means that TRS service credit and creditable compensation will be determined on a September 1–August 31 basis.
TRS ADMINISTRATION
Senate Bill 1667 is a TRS omnibus bill that covers a range of administrative and benefit matters, including the following:
• Service Credit not on Member’s Annual Statement. Members now must notify TRS in writing if eligible member-ship service is not shown as service credit on the member’s annual statement. To receive TRS credit for the missing service, the member must notify TRS within five years of when the service was rendered. The bill also provides a transition period for members who have service that was rendered more than five years before the bill takes effect on September 1, 2011. A member who seeks to establish credit for service rendered before September 1, 2011, but that is not credited on the annual statement must notify TRS in writing by August 31, 2016.
• Qualified Domestic Relations Orders. For members and retirees who are subject to a Qualified Domestic Rela-tions Order (QDRO), a court order that divides their TRS retirement benefits (usually as a result of divorce), the bill repeals the requirement that the QDRO must state the par-ties’ social security numbers. TRS may allow the parties to use an alternate method, acceptable to TRS, to verify their social security numbers. The bill also authorizes TRS to establish a fee for administering a QDRO and to require use of the TRS model QDRO.
• Amounts Owed to TRS. If a TRS beneficiary or other
participant owes TRS money, TRS may deduct that amount from the participant’s TRS benefit payments.
• Benefits not Payable to Person Causing Death of TRS Participant. The bill expands the grounds for mak-ing a person ineligible to receive benefits payable on the death of a member or annuitant to include being found not guilty of causing the death by reason of insanity or found incompetent to stand trial.
• TRS Board of Trustee Nominating Elections. TRS will have greater flexibility to use electronic voting in board nominating elections. Also, if fewer than three persons are nominated for a board position that has a nominating election, TRS may forward fewer than three names to the governor. The bill also authorizes the governor to appoint the trustee if no person is nominated.
• Access to Criminal History Information. TRS is authorized to obtain criminal history information about applicants or employees.
• Board Meeting Participation by Telephone Confer-ence Call. A member of the TRS Board of Trustees may now participate in one board meeting per year by telephone conference call (not counting an emergency meeting).
Additionally, House Bill 2120 modified the nominating election requirements for one position on the TRS Board of Trustees. The current higher education trustee position will now be an “at-large” seat. TRS retirees, members in public school districts, and members in higher education institutions may run for nomination to this trustee position in the next election (2017). The top three vote recipients’ names will be submitted to the governor for appointment.
F E D E R A LOn the federal level, TRS continued to monitor significant health care and financial reform laws enacted in earlier years, which have potential for significant effect on TRS programs.
TAX LAWS, REGULATIONS, AND GUIDANCE
Federal tax law changes often have significant impact on the TRS pension plan because, under state law, the TRS pension plan is intended to operate as a “qualified” retirement plan. A qualified plan must meet specific federal tax law requirements in order to enable member contributions to receive certain favorable tax treatments. Additionally, TRS is subject to federal tax law requirements regarding reporting and withholding of income paid to annuitants and other participants, as well as requirements applicable to investment activity.
• Normal Retirement Age Regulations. In October 2009, the Internal Revenue Service (IRS) issued Notice 2009-86 to indicate that the IRS and the U.S. Treasury Department intend to extend the date by which govern-
2011 Changes in TRS Law

TEACHER RETIREMENT SYSTEM OF TEXAS COMPREHENSIVE ANNUAL FINANCIAL REPORT 2011
152
BENEFITS SECTION
mental plans must comply with final regulations concerning distributions from a pension plan upon attainment of “normal retirement age.” The extension changed the effective date to plan years beginning on or after January 1, 2013, giv-ing the IRS and the U.S. Treasury Department additional time to consider comments received with respect to the effect of the regulations on governmental plans. The final regulations continue to generate significant discussion in the governmental plan community due to concern that the regulations do not allow a definition of “normal retirement age” that is conditioned directly or indirectly on the completion of a stated number of years of service. The regulations appear to require normal retirement age to be stated in terms of age only. In governmental plans, including the TRS retirement plan, using years of service, or years of service in combination with age, is a common method of determining eligibility for unreduced service retirement benefits. The IRS could consider a distribution prior to its definition of “normal retirement age” to be an “in service” distribution, not permitted for qualified plans. The IRS continues to receive information from governmental plans about how the regulations will negatively impact their members, but to date it has not issued additional guidance to address plan concerns. TRS continues to monitor developments. In the absence of federal regula-tion changes to address governmental plan concerns, TRS could be required to obtain state law amendments to its plan in order to comply with the current final regulations effective September 1, 2013, which is the starting date of the first TRS plan year after the January 1, 2013 effective date of the federal regulations.
• Vendor Tax Withholding Regulations. In May 2011, the IRS issued final regulations relating to Section 3402(t) of the Internal Revenue Code, which was added by Section 511 of the Tax Increase Prevention and Reconciliation Act of 2005 (“TIPRA”, Public Law 109–222). Section 3402(t)(1) provides that the Government of the United States, every state, every political subdivision thereof, and every instrumentality of the foregoing (including multi-state agencies) making any payment to any person providing any property or services (including any payment made in connection with a government voucher or certificate program which functions as a payment for property or services) shall deduct and withhold from such payment a tax in an amount equal to three percent of such payment. Under the statute, section 3402(t) applies to payments made after December 31, 2010. As reported in TRS’ annual report for fiscal year 2009, the American Recovery and Reinvestment Act of 2009 (ARRA) delayed implementa-tion of the withholding requirement for federal, state, and local government payers to apply to payments made after December 31, 2011. In the final regulations, the effective date was again extended to apply the new requirements
to payments made after December 31, 2012. This TIPRA withholding provision continues to draw negative reaction from state governments due to the administrative burdens and cost of compliance, but to date Congress has not repealed or substantially modified the requirement. TRS continues to evaluate the extent to which this provision applies to its business operations and the possible effects.
• Health Care. The Patient Protection and Affordable Care Act, signed into law on March 23, 2010, along with the Health Care and Education Affordability Reconciliation Act of 2010, signed into law on March 30, 2010 (together, the PPACA), embody the sweeping federal health care legislation that affects the TRS-Care and TRS-ActiveCare health benefit programs.
During fiscal year 2011, TRS-Care was accepted as an approved plan in the Early Retiree Reinsurance Program (the ERRP) established under the PPACA. Through the ERRP, TRS-Care has received approximately $70 million in federal funds. As long as funds remain available, the ERRP may reimburse participating plans for a substantial portion of the health care claims for retirees age 55 and older who are not eligible for Medicare, as well as claims for their spouses, surviving spouses, and dependents. TRS-Care has applied to receive additional funding under the ERRP during the next fiscal year.
Also during fiscal year 2011, TRS prepared for the imple-mentation of various other provisions of the PPACA that will impact the health benefit plans administered by TRS. Four significant areas of impact are: (1) TRS-Care and TRS-ActiveCare no longer are permitted to “opt out” of the special enrollment provisions of the Health Insurance Portability and Accountability Act of 1996 (HIPAA); (2) both health plans are required to extend dependent coverage for adult children to age 26; (3) TRS-ActiveCare (but not TRS-Care) is required to provide first dollar coverage, without any cost sharing requirements, for preventive health services; and (4) both health plans are required to have an internal appeals process, followed by an external review process involving independent review organizations.
2011 Changes in TRS Law

BENEFITS SECTION
TEACHER RETIREMENT SYSTEM OF TEXAS COMPREHENSIVE ANNUAL FINANCIAL REPORT 2011
153
The Teacher Retirement System of Texas (TRS) administers a defined benefit retirement plan that is a qualified pension trust under Section 401(a) of the Internal Revenue Code. The pension trust fund provides service and disability retirement, as well as death and survivor benefits, to eligible employees of public and higher education in Texas and their beneficiaries. A general information booklet, TRS Benefits Handbook, is provided to each TRS member and annuitant. Retirement benefits are financed by member, state, and employer contributions, and through investment earnings of the pension trust fund.
TRS administers TRS-ActiveCare, the statewide health benefits program for eligible public education employees of participating entities. The program is financed by plan participant premium payments and investment income from the assets of the trust. In addition to TRS-ActiveCare, the system administers a separate trust that provides comprehensive health benefits coverage for retired members through TRS-Care. This program is financed by contributions from the state, active public school employees, reporting entities (employers), premium payments from plan participants, and investment income from the assets of the trust.
TRS also administers an optional long-term care insurance program for eligible retirees and public school employees. Certain family members are also eligible. The plan is available on an enrollee-pay-all basis.
R E T I R E M E N T P L A N B E N E F I T S
This summary of benefits is based on statutory provisions of the plan effective for FY 2011.
The major retirement plan benefits are:
SERVICE RETIREMENT
Normal Retirement Eligibility - Age 65 with at least five years of credited service, or when the sum of member’s age and years of credited service (five years minimum) equals or exceeds 80 for members who established membership before September 1, 2007 and maintained membership until retirement.
Age 65 with five years of credited service, or age 60 and the sum of member’s age and years of credited service (five years minimum) equals or exceeds 80 for members who established TRS membership on or after September 1, 2007.
For grandfathered members who re-enter TRS on or after September 1, 2007, age 55 with at least 20 years of service
credit and the sum of member’s age and years of credited service equals or exceeds 80.
Standard Annuity - A monthly benefit payable at retirement throughout the retiree’s lifetime and calculated according to the statutory benefit formula.
Benefit Formula - 2.3 percent times the average of the five highest annual creditable salaries times years of credited service equals an annual standard annuity. For members who are grandfathered, the three highest annual salaries are used.
Minimum Benefit - $150 per month less any reduction for early age or optional annuity selection.
Early Retirement Eligibility - Age 55 with at least five years of credited service, or any age below 50 with 30 or more years of credited service, provided the sum of the member’s age and years of credited service is less than 80 for members who established membership before September 1, 2007 and maintained membership until retirement.
Age 55 with at least five years of credited service, age and credited service total 80 but less than age 60, or 30 years of credited service but less than age 60 for members who established TRS membership on or after September 1, 2007.
Early Retirement Benefit - The standard annuity calculated under the benefit formula (or the minimum benefit, if applicable) reduced for early retirement. The amount of the reduction varies depending on age, years of service credit, and whether a member is grandfathered. The date a member joined TRS (before September 1, 2007, or on or after September 1, 2007), also can determine whether the standard annuity will be reduced.
DISABILITY RETIREMENT
Eligibility - Physical or mental disability precludes the member’s continued performance of current duties and the disability is probably permanent, as certified by the TRS Medical Board.
Benefit - For disabled members with at least 10 years of credited service, the greater of the standard annuity unre-duced for early age or $150 per month minimum benefit, less any reduction for the selection of an optional annuity. For disabled members with fewer than 10 years of credited service, $150 per month.
Duration - For retirees with 10 or more years of credited service, payments continue for as long as the disability con-tinues. For those with fewer than 10 years of credited service, payments continue for the life of the retiree, the duration of the disability, or the number of months of credited service, whichever is shorter.
Summary of Benefits

TEACHER RETIREMENT SYSTEM OF TEXAS COMPREHENSIVE ANNUAL FINANCIAL REPORT 2011
154
BENEFITS SECTION
Earnings Limit - Disability retirees who retired after August 31, 2007 are subject to an annual limit on earnings from any employment. Excess earnings will cause benefits to be forfeited until such time as the excess earnings cease or are reduced to an allowable amount.
ANNUITY PAYMENT OPTIONS
All service and eligible disability retirees may select an optional form of payment that reduces the standard annuity by application of age-related actuarial reduction factors in order to continue payment to a beneficiary after the retiree’s death. Actuarial factors for disability retirees are different from those for service retirees because of different assumptions about life expectancy for the two groups. The available options include 100, 75, and 50 percent joint and survivor annuities, and five- and 10-year guaranteed period annuities. Selection of a 100 or 75 percent joint and survivor annuity may be unavailable to certain retirees based on the minimum distribution provisions of federal tax law.
THE POP-UP PROVISION
If a designated beneficiary under any of the joint and survivor options dies while the retiree is still living, the retiree’s future monthly payment increases to the amount of the standard annuity.
PARTIAL LUMP SUM OPTION
Under the Partial Lump Sum Option (PLSO), at the time of retirement, qualifying members may elect to receive an actuarially reduced service retirement annuity plus a cash lump sum distribution.
Members may participate in the PLSO if they are eligible for service retirement, meet the Rule of 90 (age and years of service credit equal at least 90), are not participating in the Deferred Retirement Option Plan (DROP), and are not retiring with disability retirement benefits. Grandfathered members may elect PLSO at retirement if they are eligible for normal age service retirement, are not participating in DROP, and are not retiring with disability retirement benefits. Members retiring under the proportionate retirement program are not eligible to elect the PLSO.
Partial lump sum distributions equal to 12, 24, or 36 months of a standard service retirement annuity may be selected. When a member selects this option, the monthly annuity is actuarially reduced to reflect the lump sum distribution. Flexible distribution options are available, including rollovers to another eligible retirement plan.
DEFERRED RETIREMENT OPTION PLAN
The Deferred Retirement Option Plan (DROP), which is closed
to new participants, is a preretirement benefit provision for active members who are eligible for normal age service retirement and have at least 25 years of credited service.
Members who elected to participate in DROP (before enrollment was closed effective December 31, 2005) chose to freeze their salary amounts and service credit used to calculate their retirement benefits and to have a portion of the standard annuity amount deposited into a DROP account while continuing to work for a TRS-covered employer. Interest on DROP accounts is credited at the rate of five percent per annum. Members are not considered to be retired while participating in DROP.
Members who elected DROP chose to participate in 12-month increments for up to five years. During DROP participation, the member does not accrue additional service credit, nor is any compensation earned during DROP participation to be considered in calculating the standard annuity. Also, during DROP participation, the member’s statutory contributions to TRS continue; however, contributions are not credited to the member’s contribution account and are not subject to refund.
Participation in DROP ends at the earliest of the expiration of the election period, retirement, or death. The accumulated DROP account may be distributed at the member’s election as a single lump sum or in monthly or yearly installments covering five or 10 years; distributions commence at retirement or in the event the member dies before retiring, at the member’s death. Eligible distributions may be rolled over to another eligible retirement plan.
MINIMUM SERVICE CREDIT REQUIRED FOR SERVICE RETIREMENT BENEFITS
Under current law, a member who has completed at least five years of credited service has earned a right to service retirement benefits after reaching eligible retirement age, provided that the member’s accumulated contributions are not withdrawn from the system. An eligible member must apply for benefits and meet other requirements, such as termination of Texas public education employment, in order to begin receiving benefits.
DEATH AND SURVIVOR BENEFITS
Active Members - The beneficiary of an active member may elect to receive one of the following benefits in the event of the member’s death before retirement, if the member dies during a school year in which the member performed service or if the member dies while performing qualified military service as defined by applicable federal law. These benefits also are available due to death when the member is absent from service as described by law, such as when the absence is due to sickness, accident, or other involuntary cause or
Summary of Benefits

BENEFITS SECTION
TEACHER RETIREMENT SYSTEM OF TEXAS COMPREHENSIVE ANNUAL FINANCIAL REPORT 2011
155
when the member is within five years of being eligible to retire when leaving employment:
1. A lump sum payment equal to twice the member’s annual compensation or $80,000, whichever is less.
2. Sixty monthly payments equal to the member’s stan-dard annuity without reduction for early age, provided the member had at least five years of service credit at the time of death.
3. For a sole beneficiary, lifetime payments equal to a 100 percent joint and survivor annuity, provided the member had at least five years of service credit subject to any reduction applicable for early age.
4. An amount equal to a return of the member’s con-tributions with accumulated interest.
5. Survivor benefits of $2,500 lump sum payment plus a monthly benefit. For example, $350 per month to a beneficiary spouse with minor children, continuing until the youngest child reaches age 18. At age 65, the spouse would begin receiving $250 per month for life.
In addition to these five options, a lump sum death benefit of $160,000 is available if the active member is employed in a TRS-covered position and dies as the result of a physical assault during the performance of the employee’s regular job duties.
Also, the DROP beneficiary of a DROP participant will receive the accumulated DROP account balance, payable as a lump sum or in periodic installments.
Retirees - In addition to any joint and survivor or guaranteed period annuity that may be payable under an optional form of payment a retiree elected, the beneficiary of a service or disability retiree is entitled to a $10,000 lump sum payment. In certain circumstances, eligible survivors may select alter-nate payment options in lieu of the lump sum benefit. The alternate payment options include a lump sum payment of $2,500 and an applicable monthly survivor benefit payment.
If total payments made before death to a retiree and, when applicable, to a beneficiary for an optional service retirement annuity are less than accumulated contributions at retirement, an amount equal to the remainder is paid to the beneficiary or as otherwise provided by law. Should a retiree die prior to receiving all PLSO payments that are due, TRS will pay any remaining PLSO payments in a single lump sum payment to the beneficiary. If the retiree participated in DROP and died before receiving all DROP distributions, any unpaid DROP pay-ments are paid to the beneficiary designated by the retiree.
GRANDFATHER PROVISIONS
A person who, as a member, met any one of the following criteria on or before August 31, 2005, is grandfathered under plan provisions repealed with respect to non-grandfathered members:
• the member was at least 50 years old, or
• the member’s age and years of service credit equaled at least 70 (“Rule of 70”), or
• the member had at least 25 years of service credit
Members who are grandfathered will have their benefits determined in the following manner:
• Final Average Salary at retirement will be de-termined by the highest three years (instead of five years) of salary.
• Preservation of certain retirement reduction factors means that members age 55 or older with 20 to 24 years of credited service who take early retirement will receive a lesser reduction to their annuities than those members who are not grandfathered.
• Partial Lump Sum Option eligibility will require either age 65 with at least five years of service credit, or a combined age plus years of credited service that equals at least 80 (“Rule of 80”) instead of 90.
H E A L T H B E N E F I TSThe major health benefits and long-term care provisions are:
HEALTH BENEFITS FOR ACTIVE PUBLICSCHOOL EMPLOYEES
TRS-ActiveCare, the statewide health benefits program for employees of school districts, open enrollment charter schools, regional education service centers, and other educational districts whose employees are members of TRS, went into effect on September 1, 2002. The program initially addressed the most critical areas of the state with regard to availability and affordability of health benefits for public school employees and therefore focused on smaller districts. The program has now been expanded to include larger school districts and more than 1,118 entities participated in the program in fiscal year 2011. Employees of participating entities can choose from four preferred provider organization plans, and employees of certain areas also have the option of choosing coverage under a health maintenance organization.
Summary of Benefits
TEACHER RETIREMENT SYSTEM OF TEXAS COMPREHENSIVE ANNUAL FINANCIAL REPORT 2011
156
BENEFITS SECTION
RETIREE HEALTH COVERAGE
The program under the Texas Public School Retired Employees Group Benefits Act, known as TRS-Care, makes available a basic level of health coverage without cost to eligible TRS public school retirees. Eligible retirees and their eligible dependents may pay premiums and participate in one of two plans of more comprehensive benefits and coverage. For information on TRS-Care eligibility, please refer to the TRS website.
LONG-TERM CARE INSURANCE PROGRAM
Eligible active and retired members, their dependents, and certain other family members may participate in the TRS long-term care insurance program. The plan pays benefits if the participant becomes unable to perform at least two activities of daily living without substantial assistance from another person. The plan also pays benefits as a result of a severe cognitive impairment that requires supervision or verbal direction from another person in order to protect the member or others from serious injury.
Summary of Benefits

BENEFITS SECTION
TEACHER RETIREMENT SYSTEM OF TEXAS COMPREHENSIVE ANNUAL FINANCIAL REPORT 2011
157
* Before adjustment for the Partial Lump Sum Option, average original benefits were $1,755, $1,982, $2,298 and $2,440 for fiscal years 2000, 2005, 2010 and 2011, respectively.
** For each of the retirement years shown, number of service retirees currently receiving benefits.
Average Monthly Benefit

TEACHER RETIREMENT SYSTEM OF TEXAS COMPREHENSIVE ANNUAL FINANCIAL REPORT 2011
158
BENEFITS SECTION
Benefit payments during fiscal year 2011 totaled approxi-mately $7.18 billion, an increase of $556 million from the previous year. As of August 2011, the monthly annuity payroll had grown to approximately $568 million, and TRS was paying benefits to 312,680 recipients.
Service recipients include retirees and beneficiaries re-ceiving continuing monthly annuity payments. Disability recipients are disabled members who are receiving con-tinuing monthly disability payments. Survivor recipients are beneficiaries who have elected to receive death benefits
in the form of monthly benefits. The number of retiree accounts increased by 16,189 during fiscal year 2011.
Of the current TRS member accounts, 847,847 (active contributing and deferred retirement option participants) were employed during fiscal year 2011 and made contribu-tions to the system. The remaining 156,039 members are no longer employed by TRS-covered employers but have maintained their membership in TRS by leaving their con-tributions with the system. The number of current member accounts decreased by 303 during fiscal year 2011.
Growth of the System

1000 Red River StreetAustin, Texas 78701-2698
(512) 542-64001-800-223-8778
Teacher Retirement System of Texas
www.trs.state.tx.us