comprehensive annual financial report - City of Midland
177
COMPREHENSIVE ANNUAL FINANCIAL REPORT FOR THE FISCAL YEAR ENDED SEPTEMBER 30, 2012 MIDLAND, TEXAS
-
Upload
khangminh22 -
Category
Documents
-
view
1 -
download
0
Transcript of comprehensive annual financial report - City of Midland

COMPREHENSIVE ANNUAL
FINANCIAL REPORT
FOR THE FISCAL YEAR ENDED
SEPTEMBER 30, 2012
MIDLAND, TEXAS

THE CITY OF MIDLAND, TEXAS
COMPREHENSIVE ANNUAL
FINANCIAL REPORT
FOR THE FISCAL YEAR ENDED SEPTEMBER 30, 2012
Prepared By: Finance Department Robert McNaughton, Director of Finance Thomas R. Howell, Comptroller Charlene A. Fox, Accounting Manager

City of Midland Comprehensive Annual Financial Report
For the Fiscal Year Ended September 30, 2012
TABLE OF CONTENTS INTRODUCTORY SECTION Page Letter of Transmittal ....................................................................................................... i GFOA Certificate of Achievement ................................................................................. viii Organizational Chart ...................................................................................................... ix List of Principal Officials .................................................................................................. x
FINANCIAL SECTION Independent Auditors’ Report ......................................................................................... 1 Management’s Discussion and Analysis ......................................................................... 3 Basic Financial Statements: Government-wide Financial Statements: Statement of Net Assets .................................................................................... 19 Statement of Activities ....................................................................................... 20 Fund Financial Statements: Balance Sheet - Governmental Funds .............................................................. 21 Statement of Revenues, Expenditures, and Changes in Fund Balances - Governmental Funds ........................................................ 22 Reconciliation of the Statement of Revenues, Expenditures, and Changes in Fund Balances of Government Funds to the Statement of Activities ....................................................................... 23 Statement of Net Assets - Proprietary Funds .................................................... 24 Statement of Revenues, Expenses, and Changes in Fund Net Assets - Proprietary Funds .......................................................... 26 Statement of Cash Flows - Proprietary Funds ................................................... 28 Notes to Basic Financial Statements ....................................................................... 31
Required Supplementary Information (unaudited): Schedule of Revenues, Expenditures, and Changes in Fund Balances - Budget and Actual - General Fund .................................................. 89 Notes to Required Supplementary Information ....................................................... 90 Adjustments to Revenues, Expenditures, and Other Financing Uses from GAAP Basis to Budgetary Basis ...................................... 91 Schedule of Actuarial Liabilities and Funding Progress - Texas Municipal Retirement System .................................................................. 92 Schedule of Actuarial Liabilities and Funding Progress – Midland Firemen’s Relief and Retirement Fund ................................................ 93 Schedule of Actuarial Liabilities and Funding Progress - Retiree Health Plan ........................................................................................... 94
Combining and Individual Fund Statements and Schedules: Combining Balance Sheet - Nonmajor Governmental Funds ................................. 98 Combining Statement of Revenues, Expenditures And Changes in Fund Balances - Nonmajor Governmental Funds ........................................................................................ 100

TABLE OF CONTENTS FINANCIAL SECTION (continued) Page Schedule of Revenues, Expenditures and Changes in Fund Balances - Budget and Actual - Debt Service Fund .............................................. 102 Combining Statement of Net Assets - Internal Service Funds .................................... 104 Combining Statement of Revenues, Expenses, and Changes in Fund Net Assets - Internal Service Funds ............................................................. 105 Combining Statement of Cash Flows - Internal Service Funds ................................... 106 STATISTICAL SECTION (unaudited) Table 1 Net Assets by Component ..................................................................................... 109 Table 2 Changes in Net Assets ......................................................................................... 110 Table 3 Fund Balances, Governmental Funds ................................................................... 112 Table 4 Changes in Fund Balances, Governmental Funds ................................................ 113 Table 5 Tax Revenues by Source, Governmental Funds .................................................. 114 Table 6 Assessed Value and Actual Value of Taxable Property ........................................ 115 Table 7 Direct and Overlapping Property Tax Rates ......................................................... 116 Table 8 Principal Property Tax Payers ............................................................................... 117 Table 9 Property Tax Levies and Collections ..................................................................... 118 Table 10 Taxable Sales by Category ................................................................................... 119 Table 11 Direct and Overlapping Sales Tax Rates .............................................................. 120 Table 12 Sales Tax Revenue Payers by Industry ............................................................... 121 Table 13 Ratios of Outstanding Debt by Type ..................................................................... 122 Table 14 Ratios of General Bonded Debt Outstanding ........................................................ 123 Table 15 Direct and Overlapping Governmental Activities Debt .......................................... 124 Table 16 Debt Margin Information ........................................................................................ 125 Table 17 Pledged-Revenue Coverage ................................................................................ 126 Table 18 Demographic and Economic Statistics .................................................................. 127 Table 19 Principal Employers .............................................................................................. 128 Table 20 Full-Time Equivalent City Government Employees by Function/Program ............................................................................................ 129 Table 21 Operating Indicators by Function/Program ............................................................ 130 Table 22 Capital Asset Statistics by Function/Program ....................................................... 131 SUPPLEMENTAL SECTION (unaudited) Tax Supported Debt Table 1 Valuation, Exemptions, and General Obligation Debt ........................................... 135 Table 2 Taxable Assessed Valuations by Category ........................................................... 136 Table 3A Valuation and General Obligation Debt History ..................................................... 137 Table 3B Derivation of General Purpose Funded Tax Debt ................................................. 137 Table 4 Tax Rate, Levy and Collection History .................................................................. 137 Table 5 Ten Largest Taxpayers ......................................................................................... 138 Table 6 Tax Adequacy ....................................................................................................... 138

TABLE OF CONTENTS SUPPLEMENTAL SECTION (continued) Tax Supported Debt (continued) Page Table 7 Estimated Overlapping Debt ................................................................................. 138 Table 8A General Obligation Debt Service Requirements ................................................... 139 Table 8B Division of Debt Service Requirements ................................................................. 139 Table 9 Interest and Sinking Fund Budget Projection ........................................................ 140 Table 10 Computation of Self-Supporting Debt .................................................................... 140 Table 11 Authorized but Unissued General Obligation Bonds ............................................. 141 Table 12 Other Obligations .................................................................................................. 141 Table 13 General Fund Revenue and Expenditure History .................................................. 142 Table 14 Municipal Sales Tax History .................................................................................. 143 Table 15 Current Investments .............................................................................................. 143 Table 16A Airport Statement of Operations ............................................................................ 144 Table 16B Water & Sewer Statement of Operations ................................................................ 145 Table 17 Outstanding System Revenue Bonds ..................................................................... 146 Table 18 Historical Water Pumpage and Consumption ......................................................... 146 Water & Sewer Revenue Debt Table 1 Historical Statement of Operations – Waterworks and Sewer System ................ 148 Table 2 Outstanding System Revenue Bonds ................................................................... 149 Table 3 Historical Debt Service Coverage ......................................................................... 149 Table 4 Fund Balances ...................................................................................................... 149 Table 5 Calculation of Coverage of Prior Lien Bonds, Subordinate Lien Bonds and CRMWD Contract Revenue Bond Debt Service Requirements ............... 150 Table 6 Fund Balances - CRMWD Contract Revenue Bonds ............................................ 150 Table 7 Monthly Water Rates (Effective October 1, 2007) .................................................. 151 Table 8 Monthly Sewer Rates (Effective October 1, 2007) ................................................. 151 Table 9 Value of the System .............................................................................................. 152 Table 10 City’s Equity in the System ..................................................................................... 152 Table 11 Pro-Forma System Revenue Bond Debt Service Requirements .......................... 153 Table 12 Other System Obligations ..................................................................................... 154 Table 13A Historical Water Pumpage and Consumption ....................................................... 154 Table 13B Water Deliveries from CRMWD ............................................................................. 154 Table 13C Ten Largest Water Customers .............................................................................. 154 Table 14A Sewage Flows ....................................................................................................... 155 Table 14B Ten Largest Wastewater Customers ..................................................................... 155 Table 15 Current Investments .............................................................................................. 155 Airport Revenue Debt Table 1 Passenger Enplanements on Scheduled Airline Flights ........................................ 157 Table 2 Airline/Airport Use Agreement ............................................................................... 158 Table 3 Airport Revenue Debt Service Requirements ....................................................... 159 Table 4 Authorized But Unissued Airport Revenue Bonds ................................................. 159 Table 5 Other Airport Obligations ....................................................................................... 159 Table 6 Airport Statement of Operations ............................................................................ 160 Table 7 Coverage ............................................................................................................... 161 Table 8 Current Investments .............................................................................................. 161


300 N. Loraine 432.685.7203 P.O. Box 1152 Fax 432.686.1600 Midland, TX 79702-1152
March 20, 2013 Honorable Mayor and Members of the City Council City of Midland, Texas Dear Mayor and Council: The Comprehensive Annual Financial Report (CAFR) for the City of Midland (the City) for the year ended September 30, 2012 is submitted herewith in compliance with Article IV, Section 29, of the City Charter. This report is published to give our citizens convenient access to a report of the financial condition of our City, its resources during the past fiscal year and uses made of such resources, the results of operations of the various proprietary funds, and comparative and statistical information. The information contained herein will also serve our City Council, management, and staff as a guide in formulating policies and conducting the City's day-to-day affairs. The City's Finance Department is responsible for the accuracy of the data presented and the completeness and fairness of the presentation. We believe the data presented is accurate in all material aspects and that all disclosures necessary to enable the reader to acquire an understanding of the City's financial activity have been provided. Independent audits are an essential element of financial control and accountability. The City Charter requires an annual audit to be made of the financial records of the City by a competent public accountant selected by the City Council. Federal guidelines established for local governments receiving federal assistance require that programs receiving federal assistance be audited in conjunction with the local government's annual audit under the "single audit" concept. The City has complied with these requirements. The independent auditor’s report is located at the front of the financial section of this report. Management’s Discussion and Analysis (MD&A) provides a narrative introduction, overview, and analysis of the basic financial statements, including comparative data from past year. It can be found immediately following the independent auditor’s report. MD&A complement this letter of transmittal and should be read in conjunction with it.
PROFILE OF THE GOVERNMENT The City was incorporated on January 11, 1911, under the provisions of H.B. 901 of the Texas Legislature. It was subsequently chartered on November 5, 1940 (amended May 4, 1996) and operates under a Council-Manager form of government. The City Council comprises a Mayor and seven members and is responsible for enacting ordinances, resolutions, and regulations governing the City, as well as appointing the members of various statutory and advisory boards, the City Manager, City Attorney, City Secretary, and Municipal Judge. The City Manager is the

chief administrative officer of the government and is responsible for the enforcement of laws and ordinances, the appointment and supervision of department managers, and the performance of functions within the municipal organization. The financial reporting entity contains all funds of the primary government (i.e., the City of Midland as legally defined), as well as its component units. Component units are legally separate entities for which the primary government is financially accountable. The City provides a wide range of services to the citizens, including police and fire protection, health and social services, public improvements, streets, traffic control, planning and zoning, water and sewer, solid waste, airports, parks and recreation facilities and general administrative services. Discretely presented component units are reported in a separate column in the government-wide financial statements to emphasize that they are legally separate from the primary government and to differentiate their financial position, results of operations and cash flows from those of the primary government. The Midland Football/Soccer and Baseball Complex Development Corporation (SCDC) and the Midland Development Corporation (MDC) are reported as discretely presented component units.
LOCAL ECONOMY Midland is located midway between Fort Worth and El Paso, along Interstate 20, in West Texas. The city has remained a management center, reflecting a unique concentration of highly trained and educated personnel. According to the U.S. Census Bureau 2007-2011 American Community Survey 5-year estimate, bachelor’s degrees or higher are held by 18.6% of the population 25 years and older, and graduate or professional degrees are held by 6.7%. Attributes, such as the educational levels of the populace, in conjunction with good weather, the high quality of life, low cost of living and the central location, which facilitates travel and shipping to both coasts, have made Midland a viable candidate in the recruitment of new or relocating businesses. With over 7.5 million square feet of office space, Midland ranks near the top in the state and serves as a regional administrative center for petroleum production. In general, the economic outlook for the City is stable. According to the Texas Workforce Commission, Midland reported an unemployment rate of 3.3% for September 2012, lowest among Texas Metropolitan Statistical Areas. During the past year, Midland again received a number one ranking related to economic performance. The Milken Institute, a non-partisan policy think tank, gave Midland top ranking for the fourth straight year among small metropolitan areas based on the city’s five-year job (2011) and salary growth (2010) rates and one-year salary growth rate (2010). Midland is doing an excellent job of utilizing economic development resources, primarily economic development tax funds, to expand the economic base by attracting new companies and also assisting local existing businesses with funding expansion projects. The Tax Increment Reinvestment Zone (the TIRZ) for downtown Midland was created to fuel growth in the downtown portion of the city by reinvesting the tax revenues from the increased values in the TIRZ back into downtown. It is anticipated that improvements will significantly enhance the zone and benefit the whole city. Nearly 28 million in improvements is forecast to be spent over the projected 30 year life of the TIRZ. During 2012, the downtown area experienced substantial growth in assessed value of real property, as did the city as a whole. The city's residential, commercial and industrial growth has been influenced by the development of two city airports, Midland International Airport and Midland Airpark. Midland International Airport is the hub of aviation activity for a 41 county area of West Texas and southeast New Mexico. The full service Foreign Trade Zone (FTZ) at the Midland International Airport assists in the development of a diversified economy. Midland International is also a designated Port of
cfox
Line
CFox
Typewritten Text
ii

Entry and has a U.S. Customs Office. The city’s population, estimated to be 117,967, has been growing steadily. Strong energy prices continue and are increasing the demand for labor and growth in the population base. A steady growth in the number of utility connections and annexations has created more demand on the water system and development of the T-Bar well field will help meet the demands of a growing city. This growth will continue to present major opportunities in commercial, industrial and residential areas. The past several years have seen the opening of a number of new national chain retail and service businesses. Normal growth is expected in the property tax base for Fiscal Year 2013, and the growth rate for sales tax receipts continues to be strong due to higher, stable energy prices.
LONG-TERM FINANCIAL PLANNING Every year, the City Council sets a list of priorities as targets for action during the next year. The list is a product of the Strategic Planning Session where City Council and City Staff come together and design a blueprint for action. This includes examining where we have been as well as planning and preparing for the future needs of the City.
During the 2012 Strategic Planning Session, ten goals were refined and agreed upon as the top priorities for 2012-2013. The top five planning goals are listed below:
STRATEGIC INITIATIVES
4A: Develop a plan to facilitate Economic Development, dealing with Housing, Education, Infrastructure, Water and Technology. Review all opportunities; do not focus only on incentives.
4B: Develop education plan concerning the extension of collection of the ¼ cent sales
tax after 2016. 4B sales tax dollars help support maintenance and capital costs of the Scharbauer Sports Complex. Loss of that revenue stream will require General Fund support for the complex.
Water: Educate all residents that water will be limited until the T Bar Ranch comes on line. Create Education Plan for Water Consumption to show how the cost of water may increase.
Downtown Development: Review smart plan developed in 2007 and take advantage of
opportunities that have no impact on the General Fund.
Sales Tax Revenue: Develop a plan to use excess sales tax for non-recurring funds or one time capital improvements. Maintain reserves at 30%.
MAJOR PROJECTS
Building an additional Fire Station: Midland Fire Department is experiencing the growth of Midland with record numbers of calls for service. The City has acquired the land for the new fire station 10 and has designated C.O. money for the fire fighting facility.
Technology and Information Systems: With constant changes in technology and
information systems there is a need to upgrade systems across many service lines throughout the city. C.I.S.D. communications and technology upgrade needs have been identified and funding has been established.
cfox
Line
CFox
Typewritten Text
iii

New Municipal Court Building – Land is being acquired for the construction of a new
Municipal Court Building to serve the City for the next thirty years
Raw water & water purification plant upgrades have established funding to proceed with the necessary upgrades needed to meet the demands and regulations established.
MBR Water reclamation project has been designed and established funding designated to
begin the project.
Elevated water tower recoating and repair needs were established in the 2012 bond issue and the uses and needs identified to maintain our current water storage.
The five planning goals discussed during the 2012 Strategic Planning Session are all key items that will enhance the energy and quality of life in the City Of Midland.
ACCOUNTING SYSTEM AND BUDGETARY CONTROL The accrual basis of accounting is used to report all City financial activity in the government-wide financial statements. Under the accrual basis, revenues are recognized in the accounting period in which they are earned. Expenses are recorded in the accounting period incurred. The City uses the modified accrual basis of accounting for all Governmental Funds (General, Special Revenue, Debt Service, and Capital Projects), and the financial statements for these funds have been prepared on this basis. Under this basis, expenditures are recorded when liabilities are incurred and revenues are recorded when they become both measurable and available. The accrual basis of accounting is followed for the Enterprise and Internal Service Funds. The financial statements for these funds are presented on that basis. Under the accrual basis, revenues are recognized in the accounting period in which they are earned. Expenses are recorded in the accounting period incurred. The City Manager, through his appointee, the Director of Finance, is responsible for maintaining an adequate and effective system of accounts and for establishing and maintaining an internal accounting control system that gives reasonable assurance that assets are being safeguarded against loss from unauthorized use or disposition, and that the financial records can be relied upon for preparing financial statements and maintaining accountability for assets. We believe that the City's internal controls adequately safeguard assets and provide reasonable assurance of proper recording of financial transactions. Prior to the beginning of each fiscal year, the City Manager submits to the City Council a proposed budget for the fiscal year beginning on the following October 1. The operating budget, which represents the financial plan for the ensuing fiscal year, includes proposed expenditures and the means of financing them. Public hearings are conducted at which comments from all interested persons concerning the budget are heard. The budget is legally enacted by the City Council through passage of an ordinance. Appropriations are legally adopted at the division level for the General Fund and Debt Service Fund on a basis consistent with generally accepted accounting principles. Budgetary controls are maintained at the major category of expenditure level within each operating division. All anticipated expenditures are budgeted for control purposes. Encumbrances are used for managerial control through the year. Budget appropriations and encumbrances other than project appropriations lapse at the end of the fiscal year.
CFox
Typewritten Text
iv

FINANCIAL PRACTICES The City adheres to the following financial and managerial practices: 1. Prudent budgeting and effective budget control. Budgeting replacement of capital
equipment as the need arises (office machines, automobiles, heavy equipment, etc.).
2. Prudent use of federal funds when available. 3. Pay-as-you-go financing of capital improvements where feasible. 4. Scheduling bond issues so that retirements over the life of the issues produce a
total debt service schedule with a declining balance. 5. Plan capital improvements on a five-year plan, updated annually. 6. Passing a share of the cost of extending utilities and improvements in subdivisions
to property owners of the subdivisions rather than to the general public. 7. Providing working capital in all funds sufficient to meet current operating needs. 8. Protection of investment principal, including required pledging of collateral to protect
deposits within our depository bank. 9. Accounting and reporting in accordance with methods prescribed by the
Governmental Accounting Standards Board (GASB), and making such reports available to bond rating agencies and other financially interested organizations.
MAJOR INITIATIVES Service to the citizenry is a priority of governments. Maintaining and improving infrastructure and quality of life are a large part of that service. The Water Purification Plant Upgrades continue. The current project is to upgrade the basins and raw water facilities with an estimated cost of $7.1 million and scheduled completion date of August 2013. Construction of an interceptor wastewater treatment plant will treat wastewater to drinking water standards for irrigation purposes for our largest single site irrigation customer. The project estimated completion date is July 2013 and has an estimated cost of $6.5 million. The Water Pollution Control Plant project to replace the influent screens at the headworks and rehabilitate the final digester has an estimated cost of $5.4 million and scheduled completion date of September 2013. Also, the Airport and Paul Davis Well field project will upgrade both wells fields with an estimated cost of $4.8 million with a scheduled completion date of May 2013. In July 2012, the city accepted A.I.P Grant No. 3-48-0150-53-12 in the amount of $2,936,924 to be used for the payment of cost associated with the Reconstruct Executive Apron Area B Project.
GENERAL GOVERNMENTAL FUNCTIONS All eligible property within the City is subject to assessment, levy, and collection by the City of a continuing, direct ad valorem tax sufficient to provide for the payment of principal and interest on outstanding bonds within the limits prescribed by law, and the payment of operation and maintenance costs as approved by the City Council. According to Article V, Section 2, of the City Charter, the maximum tax levy is $2.00 per $100.00 of assessed valuation, which includes debt service. Based upon an assessed valuation of 100% of market valuation, the tax rate for Fiscal Year 2012 was established at 47.054 cents per $100.00 of assessed valuation.
BBrown
Typewritten Text
CFox
Typewritten Text
v

A comparison of tax rates, together with allocations to the General Fund and the Debt Service Fund are as follows:
Roll Year 2012 2011 2010 2009 2008
Fiscal Year 12/13 11/12 10/11 09/10 08/09
General Fund $.404049 $.41845 $.41719 $.3975 $.4352
Debt Service .057039 .05209 .05566 .0593 .0507
Total $.461088 $.47054 $.47285 $.4568 $.4859 The City sales tax rate is 1%. Sales taxes are collected by the State of Texas (the State) and remitted to the City monthly. This source of revenue amounted to $35,472,615, which was an increase of 17.1% from the prior fiscal year. Sales tax receipts are expected to remain strong with anticipated receipts exceeding fiscal year 2012 by more than 10% due to a growing local economy and strong, stable oil and gas prices. Gross receipt taxes include franchise taxes levied on the electric, gas, telephone, water, sanitation, and cable television utilities. A hotel occupancy tax partially funds the operation of the Midland Center, also funding economic development and promotion of tourism. The hotel occupancy tax was particularly strong during 2012, exceeding budget by $2.2 million or 92%.
DEBT ADMINISTRATION
The City's strong, positive, and responsive management is reflected by the fact the City has maintained its strong ratings through the challenges of changing economies. During 2012, both Moody’s Investors Service and Standard & Poor’s reaffirmed the underlying rating on the City’s general obligation debt at Aa1 and AA+, respectively. Standard & Poor’s reaffirmed ratings on both the Water and Sewer Senior Lien Revenue Bonds and Water and Sewer Variable Rate Junior Lien Revenue Bonds at AA-. However, Moody’s Investors Service reduced the ratings on both the Water and Sewer Senior Lien Revenue Bonds and Water and Sewer Variable Rate Junior Lien Revenue Bonds from Aa2 to Aa3. The City of Midland has never defaulted on any required debt payment or other debt obligation. Additional information regarding bonded debt is presented in the supplementary information in the statistical tables. The following summary represents the ratings currently assigned to the City of Midland debt obligations by the major rating agencies:
Moody's Investors _Service_
Standard&
Poor's General Obligation Bonds Aa1 AA+Water and Sewer Revenue Bonds Aa3 AAWater and Sewer Variable Rate Junior Lien Revenue Bonds Aa3 AA-
CFox
Typewritten Text
vi

CFox
Typewritten Text
CFox
Typewritten Text
CFox
Typewritten Text
CFox
Typewritten Text

thowell
Typewritten Text
CFox
Typewritten Text
CFox
Typewritten Text
CFox
Typewritten Text
CFox
Typewritten Text
viii

CITY COUNCIL
CITY MANAGER
Courtney Sharp
CITY SECRETARY
Amy TurnerCITY ATTORNEY
Keith Stretcher
MUNICIPAL COURT
UTILITIES
Stuart Purvis
Garage
DEPUTY CITY MANAGER
Tommy T. Hudson
FINANCE
Bob McNaughton
Employee Health &
Wellness
Michelle Vasquez
Accounting
Thomas Howell
Investments
Rolly Hughes
Customer Service
Tony Goyang
DEVELOPMENT SERVICES
Community
Development
Sylvester Cantu
Transportation
Gary Saunders
Purchasing
Regina
Stephenson
Vehicle Services
Jerry Lawrence
Facilities Services
Mark Garcia
Warehouse
Art Delgado
Human Resources
Stephanie Young
BOARDS & COMMISSIONS
COMMUNITY SERVICES
MANAGER
Tina Jauz
MLK Center
Environmental
Compliance Division
Joanna Lowder
Paul Davis Well Field
Raymond Saddler
Parks
Maintenance
Golf Course
David Byrd
Scharbauer
Sports Complex
Litter Abatement
Meter Shop
German Aguirre
POLICE
Price Robinson
Administration
Investigative
Services
Jerry Compton
Support
Services
JR Smith
FIRE
Robert Isbell
Support Services
Chip Balzer
Prevention /
Investigation
Jeff Meiner
AIRPORTS
Marv Esterly
International
Airport
Industrial Park
Airpark
Director of Public
Communication
Persephone
Dakopolos
ORGANIZATION CHART
Code Administration
Steve Thorpe
Planning
Cameron Walker
ADMINISTRATIVE
SERVICES
Catherine Clifton
CITIZENS
OF MIDLAND
GENERAL SERVICES
Robert Patrick
SOLID WASTE
MANAGEMENT
Morris Williams
Landfill
Jill Reed
Communications
Eva Luna
INFORMATION SYSTEMS
Sharlett Chowning
Health & Senior
Services
Sal Garcia
Operations
Fritz Niggeler
Field Operations
Jeff Darr
Communications
Maintenance
David Flores
GIS
Bill Hodge
Animal Services
Paul O’Neill
Information Systems
Scarborough/
Linebery House
Safety & Risk
Management
INTERNAL
AUDITOR
Debbie Gotovac
September 2012
Solid Waste
Jeffrey Ahrlett
Airport Well Field and
Towers
Raymond Saddler
Spraberry Effluent Farm
Water & Wastewater
Maintenance
Leroy Montez
Water Pollution Control
Plant
Water Purification Plant
Raymond Saddler
Judge Sharon HattenRobin Smith
Presiding Judge
ASSISTANT CITY MANAGER
Jim Nichols
DOWN TOWN
DEVELOPMENT
Genora Young
ENGINEERING SERVICES
INTERIM DIRECTOR
DAVID BEARD
Design
Jeff Cohen
bbrown
Typewritten Text
ix

CITY OF MIDLAND
PRINCIPAL OFFICIALS
CITY COUNCIL
The Honorable W. Wesley Perry .......................................................................... Mayor A. Scott Dufford ...................................... At Large ............................. . Council Member Jerry F. Morales .................................... At Large ............................... Mayor Pro Tem W. Jeffrey Sparks .................................. District 1 .............................. Council Member Vicky Hailey ........................................... District 2 .............................. Council Member John H. James ...................................... District 3 ............................... Council Member Michael B. Trost .................................... District 4 .............................. Council Member
OTHER PRINCIPAL OFFICERS
Courtney B. Sharp ...................................................................................... City Manager Tommy T. Hudson ......................................................................... Deputy City Manager James R. Nichols ...................................................................... Assistant City Manager Keith Stretcher ........................................................................................... City Attorney Amy M. Turner ..........................................................................................City Secretary Price Robinson ......................................................................................... Chief of Police Robert Isbell .................................................................................................... Fire Chief Robert McNaughton ......................................................................... Director of Finance Tina Jauz ....................................................................... Director of Community Services Marv Esterly ...................................................................................... Director of Airports Stuart Purvis ....................................................................................... Director of Utilities Morris Williams ...................................................... Director of Solid Waste Management Robert Patrick ................................................................... Director of General Services
BBrown
Typewritten Text
x


BBrown
Typewritten Text
BBrown
Typewritten Text
2
bbrown
Typewritten Text
cfox
Line

CITY OF MIDLAND, TEXAS MANAGEMENT’S DISCUSSION AND ANALYSIS
September 30, 2012 (Unaudited)
As management of the City of Midland, Texas (City of Midland or City), we offer readers of the City’s basic financial statements this narrative overview and analysis of the financial activities of the City of Midland for the fiscal year ended September 30, 2012. We encourage readers to consider the information presented here in conjunction with additional information that we have furnished in our letter of transmittal, which can be found on pages i-vii of this report. All amounts, unless otherwise indicated, are expressed in millions of dollars. Financial Highlights • The assets of the City of Midland exceeded its liabilities at the close of the most recent fiscal
year by $428.2 million (net assets). Unrestricted net assets of $137.4 million, an increase of $9.7 million from the prior year, may be used to meet the government’s ongoing obligations to citizens and creditors.
• As of the close of the current fiscal year, the City of Midland governmental activities reported
combined net assets of $142.4 million, an increase of $13.4 million in comparison with the prior year. Approximately 37.4% of this total amount, $53.2 million, is available for spending at the government’s discretion (unrestricted net assets).
• As of September 30, 2012, unassigned fund balance for the General Fund was $49 million, or
59.9% of total General Fund expenditures. At the close of the prior fiscal year, unassigned fund balance for the General Fund was $39.7 million or 51.5% of that year’s expenditures.
• The government’s business-type activities total net assets increased from $272.2 million in
Fiscal Year 2011 to $285.8 million in the current year, a change of 5.0%. Factors in this change were $4.3 million net revenues in water and sewer activities, $5.5 million net revenues in sports complex activities and $6.2 million in airport grants and contributions.
• The City of Midland’s total debt increased by $21.8 million during the current fiscal year.
The source of this increase was the issuance of $29.4 million certificates of obligation, the retirement of $9.3 million in debt principal and increases in deferred amounts of $1.7 million.
Overview of the Financial Statements This discussion and analysis are intended to serve as an introduction to the City of Midland’s basic financial statements. The City of Midland’s basic financial statements comprise three components: 1) government-wide financial statements, 2) fund financial statements, and 3) notes to basic financial statements. This report also contains other required supplementary information in addition to the basic financial statements.
BBrown
Typewritten Text
3

CITY OF MIDLAND, TEXAS MANAGEMENT’S DISCUSSION AND ANALYSIS
September 30, 2012 (Unaudited)
Government-wide Financial Statements The statement of net assets presents information on all of the City of Midland’s assets and liabilities, with the difference between the two reported as net assets. Over time, increases or decreases in net assets may serve as a useful indicator of whether the financial position of the City of Midland is improving or deteriorating. The statement of activities presents information showing how the government’s net assets changed during the most recent fiscal year. All changes in net assets are reported as soon as the underlying event giving rise to the change occurs, regardless of the timing of related cash flows. Thus, revenues and expenses are reported in this statement for some items that will only result in cash flows in future fiscal periods (e.g., uncollected taxes and earned but unused vacation leave). Both of the government-wide financial statements distinguish functions of the City of Midland that are principally supported by taxes and intergovernmental revenues (governmental activities) from other functions that are intended to recover all or a significant portion of their costs through user fees and charges (business-type activities). The governmental activities of the City of Midland include general government, development services, engineering, community services, police and fire. The business-type activities of the City of Midland include airport, water and sewer, sanitation, sports complex and golf course operations. The government-wide financial statements include not only the City of Midland itself (known as the primary government), but also a legally separate sports complex development corporation and a legally separate economic development corporation for which the City of Midland is financially accountable. Financial information for these component units is reported separately from the financial information presented for the primary government itself. Fund Financial Statements A fund is a grouping of related accounts that is used to maintain control over resources that have been segregated for specific activities or objectives. The City of Midland, like other state and local governments, uses fund accounting to ensure and demonstrate compliance with finance-related legal requirements. All of the funds of the City of Midland can be divided into three categories: governmental funds, proprietary funds, and fiduciary funds. 1. Governmental Funds Governmental funds are used to account for essentially the same functions
reported as governmental activities in the government-wide financial statements. However, unlike the government-wide financial statements, governmental fund financial statements focus on near-term inflows and outflows of spendable resources, as well as on balances of spendable resources available at the end of the fiscal year. Such information may be useful in evaluating a government’s near-term financing requirements.
BBrown
Typewritten Text
4

CITY OF MIDLAND, TEXAS MANAGEMENT’S DISCUSSION AND ANALYSIS
September 30, 2012 (Unaudited)
Fund Financial Statements (continued) 1. Governmental Funds (continued) Because the focus of governmental funds is narrower than that of the
government-wide financial statements, it is useful to compare the information presented for governmental funds with similar information presented for governmental activities in the government-wide financial statements. By doing so, readers may better understand the long-term impact of the government’s near-term financing decisions. Both the governmental fund balance sheet and the governmental fund statement of revenues, expenditures, and changes in fund balances provide a reconciliation to facilitate this comparison between governmental funds and governmental activities.
The City of Midland maintains 21 individual governmental funds. Information is presented separately in the governmental fund balance sheet and in the governmental fund statement of revenues, expenditures, and changes in fund balances for the General Fund and the Debt Service Fund, both of which are considered to be major funds. Data from the other 19 governmental funds is combined into a single, aggregated presentation. Individual fund data for each of these nonmajor governmental funds is provided in the form of combining statements elsewhere in this report.
2. Proprietary Funds The City of Midland maintains two different types of proprietary funds. Enterprise
Funds are used to report the same functions presented as business-type activities in the government-wide financial statements. The City of Midland uses enterprise funds to account for its airport, water and sewer, sanitation, sports complex and golf course operations. Internal Service Funds are an accounting device used to accumulate and allocate costs internally among the City of Midland’s various functions. The City of Midland uses internal service funds to account for its warehouse, garage, technology equipment and support, and three self-insurance funds. Because the warehouse services predominantly benefit business-type rather than governmental functions, the Warehouse Fund has been included within business-type activities in the government-wide financial statements. The remaining internal service funds predominantly benefit governmental rather than business-type functions and have been included within governmental activities in the government-wide financial statements.
Proprietary funds provide the same type of information as the business-type
activities in the government-wide financial statements, only in more detail. The Proprietary fund financial statements provide separate information for the Airport Fund, the Water and Sewer Fund, the Sanitation Fund and for the Scharbauer Sports Complex Fund, each of which is considered to be a major fund of the City of Midland.
BBrown
Typewritten Text
5

CITY OF MIDLAND, TEXAS MANAGEMENT’S DISCUSSION AND ANALYSIS
September 30, 2012 (Unaudited)
Fund Financial Statements (continued) 2. Proprietary Funds (continued) Although it does not meet the criteria for a major fund, the Golf Course Fund is
also presented separately since it is the only remaining enterprise fund. Conversely, all internal service funds are combined into a single, aggregated presentation in the proprietary fund financial statements. Individual fund data for the internal service funds is provided in the form of combining statements elsewhere in this report.
Notes to Basic Financial Statements The notes provide additional information that is essential to a full understanding of the data provided in the government-wide and fund financial statements. Other Information In addition to the basic financial statements and accompanying notes, this report also presents certain required supplementary information concerning the City of Midland’s progress in funding its obligation to provide pension benefits to its employees, other postemployment benefits, and budgetary comparison schedules. The City of Midland adopts annual appropriated budgets for its General and Debt Service funds. A budgetary comparison schedule is presented as required supplementary information for the General Fund to demonstrate budgetary compliance. The combining statements referred to earlier in connection with nonmajor governmental funds and internal service funds are presented immediately following the required supplementary information on pensions. Government-wide Financial Analysis As noted earlier, net assets may serve over time as a useful indicator of a government’s financial position. In the case of the City of Midland, assets exceeded liabilities by $428.2 million at the close of the most recent fiscal year and by $401.1 million at the close of the previous fiscal year. By far the largest portion of the City of Midland’s net assets, 62.9%, reflects its investment in capital assets (e.g., infrastructure, land, buildings, machinery, and equipment), less any related debt used to acquire those assets that is still outstanding. The City of Midland uses these capital assets to provide services to citizens; consequently, these assets are not available for future spending. Although the City of Midland’s investment in its capital assets is reported net of related debt, it should be noted that the resources needed to repay this debt must be provided from other sources, since the capital assets themselves cannot be used to liquidate these liabilities.
BBrown
Typewritten Text
6

CITY OF MIDLAND, TEXAS MANAGEMENT’S DISCUSSION AND ANALYSIS
September 30, 2012 (Unaudited)
Government-wide Financial Analysis (continued)
2012 2011 2012 2011 2012 2011Current and other assets $118,045 $88,448 $143,960 $124,500 $262,005 $212,948Capital assets 95,588 95,014 278,361 269,819 373,949 364,833 Total assets 213,633 183,462 422,321 394,319 635,954 577,781Long-term liabilities outstanding 62,092 47,147 118,554 112,647 180,646 159,794Other liabilities 9,132 7,341 17,962 9,518 27,094 16,859 Total liabilities 71,224 54,488 136,516 122,165 207,740 176,653Net assets: Invested in capital assets, net of related debt 79,951 77,140 189,427 178,170 269,378 255,310 Restricted 9,227 6,518 12,228 11,615 21,455 18,133 Unrestricted 53,231 45,316 84,150 82,369 137,381 127,685Total net assets $142,409 $128,974 $285,805 $272,154 $428,214 $401,128
Table 1City of Midland's Net Assets
(In Thousands)
TotalsGovernmental Business-type
Activities Activities
The restricted portion of the City of Midland’s net assets ($21.5 million) represents resources that are subject to external restrictions on how they may be used. The remaining balance of unrestricted net assets, $137.4 million, may be used to meet the government’s ongoing obligations to citizens and creditors. At the end of the current fiscal year, the City of Midland is able to report positive balances in all three categories of net assets, both for the government as a whole, as well as for its separate governmental and business-type activities. The same situation held true for the prior fiscal year. The government’s net assets increased $27.1 million during the current fiscal year. Net assets of governmental activities increased $13.4 million and the net assets of business-type activities increased $13.7 million. The increase in governmental activities net assets is the product of increased revenue from property taxes, sales taxes, hotel-motel taxes, and charges for services offsetting an increase in levels of expenses. The increase in the net assets of business type activities is attributable to contributions, grants received, assets contributed by developers, and an increase in payments received due to the growth in sales tax.
BBrown
Typewritten Text
7

CITY OF MIDLAND, TEXAS MANAGEMENT’S DISCUSSION AND ANALYSIS
September 30, 2012 (Unaudited)
Government-wide Financial Analysis (continued)
2012 2011 2012 2011 2012 2011Revenues:Program revenues:
Charges for services $9,807 $9,067 $73,820 $73,848 $83,627 $82,915Operating grants and contributions 1,474 1,690 383 353 1,857 2,043Capital grants and contributions 3,725 4,604 6,325 5,384 10,050 9,988
General revenues:Property taxes 34,239 32,698 - - 34,239 32,698Sales taxes 35,473 30,282 - - 35,473 30,282Other taxes 16,310 14,805 - - 16,310 14,805Other 454 1,859 587 1,217 1,041 3,076
Total revenues 101,482 95,005 81,115 80,802 182,597 175,807
Expenses:General government:
Administration 1,420 1,132 - - 1,420 1,132Support services 12,749 11,941 - - 12,749 11,941Fiscal management 2,225 2,140 - - 2,225 2,140
Other 4,121 5,727 - - 4,121 5,727Development services 3,534 13,837 - - 3,534 13,837Engineering 10,643 - - - 10,643 0Community services 9,934 10,137 - - 9,934 10,137Police 24,025 23,313 - - 24,025 23,313Fire 22,289 20,864 - - 22,289 20,864Interest on long-term debt 1,222 1,029 - - 1,222 1,029Airport - - 8,835 9,295 8,835 9,295 Water and sewer - - 37,402 37,131 37,402 37,131 Sanitation - - 10,813 10,490 10,813 10,490 Sports complex - - 4,243 4,383 4,243 4,383 Golf course - - 2,056 1,910 2,056 1,910
Total expenses 92,162 90,120 63,349 63,209 155,511 153,329 Increase/(decrease) in net assets
before transfers 9,320 4,885 17,766 17,593 27,086 22,478Transfers 4,115 4,388 (4,115) (4,388) - - Increase in net assets 13,435 9,273 13,651 13,205 27,086 22,478Net assets - October 1 128,974 119,701 272,154 258,949 401,128 378,650 Net assets - September 30 $142,409 $128,974 $285,805 $272,154 $428,214 $401,128
Table 2City of Midland's Changes in Net Assets
(in Thousands)
Governmental Business-typeActivities Activities Totals
BBrown
Typewritten Text
8

CITY OF MIDLAND, TEXAS MANAGEMENT’S DISCUSSION AND ANALYSIS
September 30, 2012 (Unaudited)
Governmental Activities
Increase2012 2011 (decrease)
Property taxes $34,239 $32,698 $1,541Sales taxes 35,473 30,282 5,191Gross receipts taxes 11,210 11,233 (23)Hotel/motel taxes 4,606 3,085 1,521Other taxes 493 487 6Unrestricted investment earnings 432 783 (351)Miscellaneous 23 1,076 (1,053)
Total general revenues $86,476 $79,644 $6,832
Table 3City of Midland's General Revenues
(in Thousands)
The City’s general revenues provided $86.5 million, an increase of $6.8 million from fiscal year 2011, to fund the costs associated with activities that are not self-supporting. It is anticipated that governmental activities will not be self-supporting and be paid for through general revenues. Revenues for governmental activities were $101.5 million, excluding transfers from other funds of $4.1 million, and were used to pay for expenses associated with governmental activities of $92.2 million. This is compared with revenues in Fiscal Year 2011 for governmental activities of $95.0 million, excluding transfers from other funds of $4.4 million, paying for governmental activities of $90.1 million in that year. The primary sources of revenue for governmental activities are taxes, fees, investment earnings and grants and contributions. During fiscal year 2012, property taxes generated $34.2 million, an increase of $1.5 million over the previous year, and were derived from a property tax base of $7.095 billion, up from $6.757 billion the previous year, combined with a property tax rate of 47.054 cents per hundred dollars valuation, a decrease of 0.00231 cents from the previous year. An economy affected by higher oil prices generated sales taxes of $35.5 million, an increase from the previous year of $5.2 million. Gross receipts taxes, or franchise fees, contributed $11.2 million to operations. Operating grants and contributions provided $1.5 million, while capital grants and contributions provided another $3.7 million. Developer contributions comprised $2.3 million, or 62%, of the total capital contributions. Investment income provided $0.4 million, a decrease of $0.4 million. This was due to lower interest rates on the funds available for investment. The most significant expenses of governmental activities are those associated with providing police protection, fire protection, engineering, development services, community services and the support services necessary to provide these services. Police protection, $24.0 million, and fire protection, $22.3 million, represent a combined 50.3% of all governmental activities
BBrown
Typewritten Text
9

CITY OF MIDLAND, TEXAS MANAGEMENT’S DISCUSSION AND ANALYSIS
September 30, 2012 (Unaudited)
Governmental Activities (continued)
expenses this year, an increase of $2.14 million from the previous year. Other postemployment benefits accounts for $2.5 million of the police and fire costs. Support services for all City functions, $12.7 million, followed by engineering, $10.6 million, and community services, $9.9 million, are the largest governmental activities expenses outside of public safety related costs. The governmental activities expenses were funded with $9.8 million charged for services rendered, $1.5 million received as operating grants and contributions, and $90.6 million in general revenues and transfers. During Fiscal Year 2011, development services, $13.8 million, followed by the support services for all City functions, $11.9 million, and community services, $10.1 million, were the largest governmental activities expenses outside of public safety related costs. The governmental activities expenses for Fiscal Year 2011 were funded with $9.1 million charged for services rendered, $1.7 million received as operating grants and contributions, and $84.0 million in general revenues and transfers.
Business-Type Activities
Fiscal Year 2012 revenues of business-type activities contributed $81.1 million to the operations of the City of Midland. Expenses of these activities were $63.3 million before transfers of $4.1 million, resulting in an increase to the City’s net assets of $13.7 million from business-type activities. Fiscal Year 2011 revenues of business-type activities contributed $80.8 million to the operations of the City of Midland. Fiscal Year 2011 expenses of these activities were $63.2 million before transfers of $4.4 million, resulting in an increase to the City’s net assets of $13.2 million from business-type activities.
Charges for services for business-type activities decreased .04%. Water and Sewer revenue accounts for the largest portion of this decrease. Water restrictions due to drought conditions contributed to a revenue decrease of $3.5 million from the previous year. Scharbauer Sports Complex had an increase of $1.4 million from the previous year in contractual revenue based on sales tax receipts. Sanitation charges for services increased $1.0 million due to an increasing customer base and increased rates. The Airport and Golf Course provided the remainder of business-type activity charges for services.
Grants and contributions, $6.7 million, and investment earnings, $0.7 million, were the other components of business-type activity revenue for the City. During Fiscal Year 2011, these two revenue streams were $5.7 million and $1.2 million, respectively. The increase in grant revenues during Fiscal Year 2012 is related to funding for a large Airport project constructed during 2012. The $0.6 million decrease in investment earnings is a result of decreased interest rates and the amount of investable funds.
Expenses of business-type activities were less than combined revenues and grants. The Water and Sewer system had $37.4 million in expenses, prior to $2.2 million in transfers, Airport expenses were $8.8 million, and Sanitation had $11.2 million in expenses. Expenses were $4.2 million and $2.1 million, respectively, for the Scharbauer Sports Complex and Golf Course. Net assets of all business-type activities increased from Fiscal Year 2011.
BBrown
Typewritten Text
10

CITY OF MIDLAND, TEXAS MANAGEMENT’S DISCUSSION AND ANALYSIS
September 30, 2012 (Unaudited)
Financial Analysis of the Government’s Funds
As noted earlier, the City of Midland uses fund accounting to ensure and demonstrate compliance with finance-related legal requirements. 1. Governmental Funds The focus of the City of Midland’s governmental funds is to provide information
on near-term inflows, outflows, and balances of spendable resources. Such information is useful in assessing the City of Midland’s financing requirements. In particular, unassigned fund balance may serve as a useful measure of a government’s net resources available for spending at the end of the fiscal year.
As of the end of the current fiscal year, the City of Midland’s governmental funds
reported combined ending fund balance of $93.6 million, an increase of $26.1 million in comparison with the prior year. Approximately 52.4% ($49.0 million) of this total amount constitutes unassigned fund balance and is available for spending at the government’s discretion. The remainder of fund balance is not available for new spending because it has already been 1) restricted by specific legal requirements, such as by debt covenants or other purposes ($30.3 million), 2) committed and assigned to pay for specific types of expenditures ($13.4 million), 3) nonspendable – prepayments or advances ($0.9 million).
The General Fund is the chief operating fund of the City of Midland. At the end
of the current fiscal year, unassigned fund balance of the General Fund was $49.0 million, compared with $39.7 million last year, while 2012 total fund balance increased to $58.7 million from $48.6 million in 2011. As a measure of the General Fund’s liquidity, it may be useful to compare both unassigned fund balance and total fund balance to total fund expenditures. Unassigned fund balance currently represents 59.9% of total General Fund expenditures, up from 51.5% in 2011, while total fund balance represents 71.7%, compared with 63.0% in 2011, of that same amount.
Fund balance of the City of Midland’s General Fund increased $10.1 million
during the current fiscal year. Key factors in this increase are as follows: Sales tax receipts, which are driven by numerous economic conditions, were up $5.2 million in accordance with the growth in the local economy, largely due to higher oil prices. Ad valorem tax revenues increased $1.5 million due to an increased property valuation base which offset a rate decrease of $0.00231 per hundred dollar valuation.
Expenditures in total were $111,561 less than original budget. The major components of this difference included $1.5 million budgeted for seal coating that was transferred to a multi-year capital project and $1.1 million reduction in
BBrown
Typewritten Text
11

CITY OF MIDLAND, TEXAS MANAGEMENT’S DISCUSSION AND ANALYSIS
September 30, 2012 (Unaudited)
Financial Analysis of the Government’s Funds (continued)
1. Governmental Funds (continued) equipment costs related to postponed equipment acquisition with fuel and repair
costs below original budget. Capital project expenditures not in the original budget accounted for the $3.3 million in increases to the budget. Detail of these expenditures by activity is listed in the General Fund Budgetary Highlights below.
The total fund balance for the Debt Service Fund is $0.4 million, all of which is restricted for the payment of debt service.
2. Proprietary Funds
The City of Midland’s Proprietary Funds provide the same type of information found in the government-wide financial statements, but in more detail.
Unrestricted net assets of the Water and Sewer Fund at the end of the year amounted to $51.7 million, a decrease of $5.7 million from 2011. The change in Water and Sewer total net assets was an increase of $2.4 million. A year of drought conditions had an impact on water revenue, which was $3.8 million lower than last year. Capital contributions of $0.4 million contributed to the increase in total net assets.
Airport Fund unrestricted net assets amounted to $9.1 million, up from $8.0 million
in Fiscal Year 2011. Airport Fund net assets invested in capital assets, net of related debt, increased by $3.6 million, and total net assets increased $4.8 million. The Airport received $6.2 million in capital and operating grants.
Unrestricted net assets of the Sanitation Fund at the end of the year amounted to $0.4 million, up from ($0.6) million in 2011. However, Sanitation Fund net assets invested in capital assets, net of related debt, decreased by $0.9 million. The resulting change in total net assets of $0.2 million is mainly attributable to the increase in revenue over the previous fiscal year because of the additional tonnage accepted at the Municipal Solid Waste Facility due to the expanding population base.
The Scharbauer Sports Complex Fund unrestricted net assets increased by
$4.5 million and total net assets increased by $5.7 million compared with the prior fiscal year. The Sports Complex Development Corporation contract revenue, which is a result of sales tax revenue to this component unit of the City of Midland, exceeded the payments for debt service by $5.8 million.
Unrestricted net assets of the Golf Course Fund at the end of the year amounted
to $(0.3) million, an increase of $0.3 million from the previous fiscal year.
Other factors concerning the finances of these five funds have already been addressed in the discussion of the City of Midland’s business-type activities.
BBrown
Typewritten Text
12

CITY OF MIDLAND, TEXAS MANAGEMENT’S DISCUSSION AND ANALYSIS
September 30, 2012 (Unaudited)
General Fund Budgetary Highlights Differences between the original budget and the final amended budget resulted in an increase in appropriations of $111,720 and can be briefly summarized, in thousands of dollars, as follows: $ (43) decreases allocated to general government activities $ 80 increases allocated to development services $(1,413) decreases allocated to engineering $ 860 increases allocated to community services $ (583) decreases allocated to the police department $ 1,009 increases allocated to the fire department $ 202 increases allocated to other General fund in total had personnel budget increases of $0.7 million due to mid-year salary adjustments, although open positions in engineering and community services caused personnel budget decreases of $0.7 million and $0.3 million, respectively. Engineering also had reductions in seal coating funds ($1.5 million) that were transferred to a multi-year project and in hire of equipment due to less than anticipated fuel and repair costs ($0.4 million). The increase in community services was the net of $1.7 million budgeted for capital projects offset by reductions of $0.4 million for grounds maintenance, $0.3 million in water related to usage restrictions caused by the drought and other miscellaneous reductions. The decrease of $0.6 million in the police department is attributable in part to lower than budgeted hire of equipment ($0.4 million) due to below budget fuel costs and delayed equipment acquisition. Reduced costs for lodging prisoners ($0.5 million), which were not estimable at September 30 due to changes in the contract with Midland County, also had an impact. These reductions were offset by increases due to grant-related project costs and various other items. The fire department had increased personnel costs of $1.1 million. There were also reallocations of original budget amounts among the various activities, including minor capital projects that had a zero dollar net effect. With the adjustments made during Fiscal Year 2012, the actual-on-a-budgetary-basis expenditures were $82.1 million, $77.4 million in Fiscal Year 2011, compared to the re-estimated budget amount of $82.1 million, $77.4 million in Fiscal Year 2011. The City of Midland has an actual-on-a-budgetary-basis General Fund balance of $58.7 million as of the fiscal year-end ($48.6 million in Fiscal Year 2011), compared with the re-estimated budget fund balance of $48.8 million ($35.8 million in Fiscal Year 2011). The variance in the fund balance is due to the fact that the City of Midland does not adjust budget estimates for revenue items. Capital Assets and Debt Administration Capital Assets The City of Midland’s investment in capital assets for its governmental and business
type activities as of September 30, 2012, amounts to $373.9 million (net of accumulated
BBrown
Typewritten Text
13

CITY OF MIDLAND, TEXAS MANAGEMENT’S DISCUSSION AND ANALYSIS
September 30, 2012 (Unaudited)
Capital Assets and Debt Administration (continued) Capital Assets (continued) depreciation), $364.8 million (net of accumulated depreciation) at September 30, 2011.
This investment in capital assets includes land, buildings, improvements, machinery and equipment, park facilities, roads and highways, water lines, and drainage improvements.
2012 2011 2012 2011 2012 2011Land $ 4,852 $ 4,852 $ 9,582 $ 9,582 $ 14,434 $ 14,434Buildings 16,516 12,039 34,979 31,992 51,495 44,031Improvements other than buildings 6,252 7,514 46,231 39,428 52,483 46,942Machinery and equipment 17,168 16,796 4,180 4,030 21,348 20,826Infrastructure 41,757 40,667 151,450 150,796 193,207 191,463Other 2,540 3,580 1,633 1,923 4,173 5,503Construction in progress 6,503 9,566 30,306 32,068 36,809 41,634 Totals $ 95,588 $ 95,014 $ 278,361 $ 269,819 $ 373,949 $ 364,833
Table 4Capital Assets at September 30, 2012(Net of Depreciation, in Thousands)
Governmental Business-typeActivities Activities Totals
Major capital assets events during the current fiscal year included the following:
Engineering – The Jal Draw Channel Rehabilitation project began during 2010. Currently budgeted at $3.8 million, the project will stabilize the slopes and prevent deterioration of the channel through erosion. Estimated completion date is second quarter of 2013. The Lamesa Road Repair project began in January 2012. The 5 phase project includes water line replacement, new sidewalk, sewer repair, and traffic signal replacement. Estimated cost is $1.8 million and estimated completion date is third quarter of 2014. Community Services – The Martin Luther King Jr. Community Center renovations were completed in February 2012 with an estimated cost of $2.2 million. I-20 Wildlife Preserve will be complete January 2013 with an estimated cost of $2.0 million. Utilities – Upgrades to the Water Purification Plant continue. The current project is to upgrade the basins and raw water facilities with an estimated cost of $7.1 million. Scheduled completion is August 2013. The City is constructing of an interceptor wastewater treatment plant to intercept wastewater and treat it to drinking water standards for irrigation purposes for our largest single site irrigation customer. Project estimated cost is $6.5 million with an estimated completion date of July 2013.
BBrown
Typewritten Text
14

CITY OF MIDLAND, TEXAS MANAGEMENT’S DISCUSSION AND ANALYSIS
September 30, 2012 (Unaudited)
Capital Assets and Debt Administration (continued)
Capital Assets (continued)
The water pollution control plant project is scheduled to be complete September 2013. The estimated cost to replace the influent screens at the headworks and rehabilitate the final digester is $5.4 million.
The Airport and Paul Davis Well field project will upgrade well fields at both locations at an estimated cost of $4.8 million with a scheduled completion date of May 2013.
Airport Projects – Northwest Taxiway Extension/Northwest Roads and Parking Project was complete as of September 30, 2012 at a cost of $2.3 million.
The Reconstruct Executive Apron Area B Project, with an estimated cost of $3.2 million, began in 2012.
Executive Apron Reconstruction Project began in 2011 and was 70% complete as of September 30, 2012. Total project cost is estimated to be $3.3 million.
Rehab Taxiway Systems Project will be complete in fiscal year 2013 at an estimated cost of $4.6 million.
Additional information regarding capital asset activity of the City of Midland may be found in note #6 in the Notes to Basic Financial Statements.
Long-Term Debt
At the end of the current fiscal year, the City of Midland had total bonded debt outstanding of $141.7 million. Of this amount, $38.3 million is general government debt, $38 million supported through the interest and sinking fund levy on property taxes and $0.3 million supported by Water and Sewer system revenues. Business-type activity debt is supported by Water and Sewer system revenues, $76.2 million, Golf Course revenues, $0.2 million, a combination of Airport revenues and Airport passenger facility charges, $6.0 million, and a contract with the Midland Football/Soccer and Baseball Development Corporation, $21.1 million.
2012 2011 2012 2011 2012 2011General Obligation Bonds serviced by tax revenues $ - $ - $ - $ - $ - $ - Certificates of Obligation serviced by tax revenues 38,042 26,579 - - 38,042 26,579Notes Payable 285 370 - - 285 370Certificates of Obligation serviced by Enterprise Funds revenues - - 65,223 50,013 65,223 50,013General Obligation Bonds serviced by Enterprise Funds revenues - - 27,247 30,316 27,247 30,316Revenue Bonds - - 10,955 12,685 10,955 12,685
$ 38,327 $ 26,949 $ 103,425 $ 93,014 $ 141,752 $ 119,963
Table 5Outstanding Bonded Debt, at Year-end
( in Thousands)
Governmental Business-typeActivities Activities Totals
BBrown
Typewritten Text
15

CITY OF MIDLAND, TEXAS MANAGEMENT’S DISCUSSION AND ANALYSIS
September 30, 2012 (Unaudited)
Capital Asset and Debt Administration (continued) Long-Term Debt (continued)
The City of Midland’s total bonded debt increased by $21.8 million during the current fiscal year. Debt serviced by tax revenues increased by $11.4 million and debt serviced by Enterprise Fund revenues increased by $10.4 million.
The City maintains Aa1 rating with Moody’s Investment Service and AA+ rating with Standard & Poor’s on tax-supported debt and Aa3 rating with Moody’s Investment Service
and AA rating with Standard & Poor’s for water and sewer revenue debt. Water and Sewer Junior Lien debt is rated Aa3 and AA- by the two agencies, respectively. The City of Midland carefully plans debt acquisition to fund only capital replacement and new construction. This process includes matching the maturity of the debt to the useful lives of the assets to be funded, as closely as possible. This allows for the use of debt to compliment operations by allowing for matching the cash flows of asset cost to the period deriving the benefit from the asset. Additionally, this allows the City to plan for and structure debt payments in such a manner that debt service tends to be generally declining across the years creating a known, decreasing demand upon resources for debt service and limiting the demand upon resources to a managed level. As a result of the development and refinement of this process, the impact of current debt upon present and future operations is minimized and annual operations can be based upon a known level of expendable, available resources to respond to the immediate needs of the City. The Constitution and Statutes of the State of Texas and the Charter of the City of Midland do not provide for a legal debt limit. However, the 8% debt limit rate used to calculate debt margin of $436.1 million has been adopted by the City Council as a safe debt limit. Additional information concerning the City’s long-term debt may be found in note #9 in the Notes to Basic Financial Statements.
Economic Factors and Next Year’s Budgets and Rates The budgetary process for Fiscal Year 2013 focused on the allocation of limited resources to maintenance of the current level of City services. The combined property tax rate was increased to 46.1088 cents per $100 valuation, compared with a rate of 47.054 in Fiscal Year 2012. The budget presented for all City operations for the 2013 fiscal year totals $206.7 million. This is a 14.0% increase from the Fiscal Year 2012 budget of $181.3 million. The Fiscal Year 2013 operating budget is supported by combined revenues of $187.5 million, up $16.4 million from budgeted Fiscal Year 2012. Sales tax revenue and property tax revenue reflect the largest amount of increase over fiscal year 2012, at $5.1 million and $2.1 million, respectively. Other major components of this increase include $3.6 million in water and sewer
BBrown
Typewritten Text
16
CITY OF MIDLAND, TEXAS MANAGEMENT’S DISCUSSION AND ANALYSIS
September 30, 2012 (Unaudited)
Economic Factors And Next Year’s Budgets and Rates (continued) revenue and $1.4 million increase in hotel/motel, with anticipated higher occupancy rates and the addition of new hotels. The Sanitation revenue increased by $1.1 million because of an increase in rates and an expanding service area. Total General Fund revenues for Fiscal Year 2013 are budgeted at $90.6 million, an increase of $7.8 million from budgeted Fiscal Year 2012 revenues. Factors impacting the budget include increases of $5.1 million in sales tax revenue and $1.4 million in property tax revenue. The increase in budgeted sales tax revenue is driven by numerous economic conditions. These receipts were up in accordance with a growing economy in Fiscal Year 2012. The growth of new businesses in the City and an increasing population also generated a positive influence. The increased collections from property taxes are the result of a larger property tax base offset by a decrease in the maintenance and operations property tax rate to 40.4049 cents per $100 valuation, compared with a rate of 41.845 in Fiscal Year 2012. Gross receipts taxes are calculated as a percentage of revenue for various utilities. As the revenues increase or decrease, so do the associated franchise fees. The expenditures budget for the General Fund is $90.6 million. This yields a balanced budget for the 2013 fiscal year. The General Fund Unappropriated Fund Balance at its current level in relation to expenditures is essential for bond ratings, self-insurance considerations, disaster recovery and major economic or regulatory changes. The Water and Sewer Fund revenues are estimated to increase by 8.11% from budgeted 2011 – 2012 revenues. This increase is based upon consideration of several factors, including September rainfall events that increased our water supply together with T-Bar well field scheduled to come on line by June 1 2013, both increasing the amount of water available to sell. Annual water and sewer revenues should provide adequate cash flow for the fund. Also, this fund is required by debt covenants to maintain a net revenue to debt ratio of 1.5. The current rate structure should provide adequate revenues to meet this requirement. Water and Sewer Fund expenses are budgeted to increase $8,103,524, 15.75%, from the previous fiscal year. The largest single component of this increase is a decrease in interfund transfers and an increase in contractual services. In addition, the cost of water delivery to the City is expected to increase $10.1 million. Sanitation Fund revenues are estimated to increase by 10.4% during fiscal year 2012-2013. This increase is based upon consideration of several factors, including increased customer numbers, a rate increase per ton for dumping at the sanitary landfill, and enactment of a $25.00 haulers permit fee effective October 1, 2012. Revenues generated should provide adequate cash flow to meet the operating needs of the fund and provide for small capital expenditures. Expenses of this fund are budgeted to increase 4.3% from the previous year. An increase of $0.6 million in hire of equipment is related to increased fuel costs and the acquisition of new equipment. A portion of the landfill costs result from unfunded, federally mandated regulations and are mainly reflected in depreciation of capitalized costs and landfill closure costs.
BBrown
Typewritten Text
17
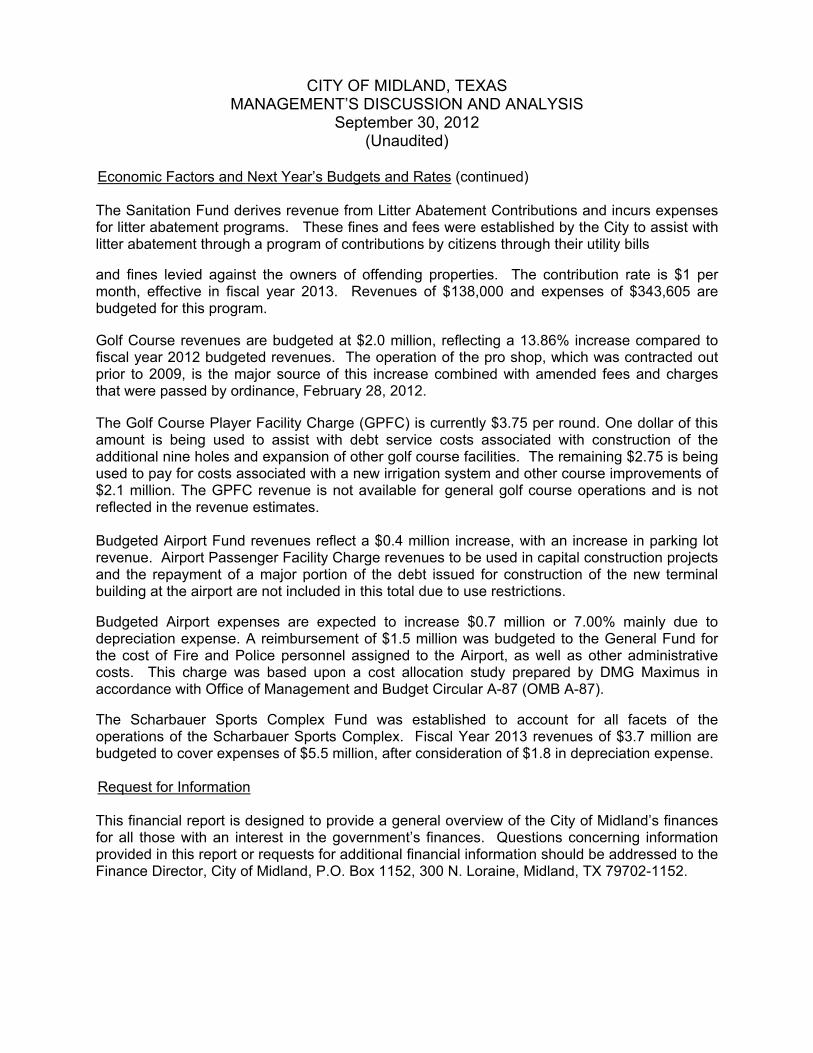
CITY OF MIDLAND, TEXAS MANAGEMENT’S DISCUSSION AND ANALYSIS
September 30, 2012 (Unaudited)
Economic Factors and Next Year’s Budgets and Rates (continued) The Sanitation Fund derives revenue from Litter Abatement Contributions and incurs expenses for litter abatement programs. These fines and fees were established by the City to assist with litter abatement through a program of contributions by citizens through their utility bills and fines levied against the owners of offending properties. The contribution rate is $1 per month, effective in fiscal year 2013. Revenues of $138,000 and expenses of $343,605 are budgeted for this program. Golf Course revenues are budgeted at $2.0 million, reflecting a 13.86% increase compared to fiscal year 2012 budgeted revenues. The operation of the pro shop, which was contracted out prior to 2009, is the major source of this increase combined with amended fees and charges that were passed by ordinance, February 28, 2012. The Golf Course Player Facility Charge (GPFC) is currently $3.75 per round. One dollar of this amount is being used to assist with debt service costs associated with construction of the additional nine holes and expansion of other golf course facilities. The remaining $2.75 is being used to pay for costs associated with a new irrigation system and other course improvements of $2.1 million. The GPFC revenue is not available for general golf course operations and is not reflected in the revenue estimates. Budgeted Airport Fund revenues reflect a $0.4 million increase, with an increase in parking lot revenue. Airport Passenger Facility Charge revenues to be used in capital construction projects and the repayment of a major portion of the debt issued for construction of the new terminal building at the airport are not included in this total due to use restrictions. Budgeted Airport expenses are expected to increase $0.7 million or 7.00% mainly due to depreciation expense. A reimbursement of $1.5 million was budgeted to the General Fund for the cost of Fire and Police personnel assigned to the Airport, as well as other administrative costs. This charge was based upon a cost allocation study prepared by DMG Maximus in accordance with Office of Management and Budget Circular A-87 (OMB A-87). The Scharbauer Sports Complex Fund was established to account for all facets of the operations of the Scharbauer Sports Complex. Fiscal Year 2013 revenues of $3.7 million are budgeted to cover expenses of $5.5 million, after consideration of $1.8 in depreciation expense. Request for Information This financial report is designed to provide a general overview of the City of Midland’s finances for all those with an interest in the government’s finances. Questions concerning information provided in this report or requests for additional financial information should be addressed to the Finance Director, City of Midland, P.O. Box 1152, 300 N. Loraine, Midland, TX 79702-1152.
BBrown
Typewritten Text
18

CITY OF MIDLAND, TEXASStatement of Net Assets
September 30, 2012
Governmental Business-Type Sports Complex Midland DevelopmentActivities Activities Total Development Corporation
ASSETSCash and cash equivalents $ 42,969,326 $ 70,112,412 $ 113,081,738 $ - $ 26,512,145 Investments 28,399,490 30,608,812 59,008,302 - - Receivables (net of allowance
for uncollectibles) 11,800,759 8,202,028 20,002,787 1,551,488 1,551,488 Interest receivable 66,842 102,093 168,935 - - Due from component unit - 1,551,488 1,551,488 - - Due from primary government - - - - 7,520,000 Internal balances (568,064) 568,064 - - - Inventories 352,053 446,382 798,435 - - Prepaid items and other assets 112,770 69,666 182,436 - - Notes receivable - 242,140 242,140 - 3,325,000 Deferred charges 369,073 864,478 1,233,551 - - Investment in joint venture 16,018 - 16,018 - - Restricted assets:
Cash and cash equivalents 29,723,984 24,961,165 54,685,149 - - Investments 4,790,344 6,230,574 11,020,918 - - Interest receivable 12,868 1,198 14,066 - -
Capital assets not being depreciated:Land 4,851,815 9,582,401 14,434,216 - 727,969 Construction in progress 6,502,662 30,305,743 36,808,405 - -
Capital assets net of accumulated depreciation:
Buildings 16,516,354 34,978,807 51,495,161 - 1,063,774 Improvements other than buildings 6,252,159 46,231,075 52,483,234 - 343,073 Machinery and equipment 17,168,024 4,180,079 21,348,103 - 20,344 Infrastructure 41,757,232 151,449,963 193,207,195 - 417,732 Intangible and other 2,539,543 1,632,683 4,172,226 - -
Total assets 213,633,252 422,321,251 635,954,503 1,551,488 41,481,525
LIABILITIESAccounts payable and other current liabilities 7,917,139 7,332,767 15,249,906 - 57,285 Customer deposits - 2,776,318 2,776,318 - - Accrued interest payable 387,719 737,629 1,125,348 - - Due to primary government - - - 1,551,488 - Due to component unit 595,000 6,925,000 7,520,000 - - Unearned revenue 232,588 190,226 422,814 - - Noncurrent liabilities:
Due within one year 7,778,715 7,386,418 15,165,133 - 15,000 Due in more than one year 54,313,489 111,167,356 165,480,845 - 10,341
Total liabilities 71,224,650 136,515,714 207,740,364 1,551,488 82,626
NET ASSETSInvested in capital assets, net of related debt 79,950,737 189,427,031 269,377,768 - 2,572,892 Restricted for:
Debt service 26,025 7,228,596 7,254,621 - - Rate stabilization - 5,000,000 5,000,000 - - Special revenue 8,990,317 - 8,990,317 - - Other purposes 210,897 - 210,897 - 20,036,000
Unrestricted 53,230,626 84,149,910 137,380,536 - 18,790,007
Total net assets $ 142,408,602 $ 285,805,537 $ 428,214,139 $ - $ 41,398,899
The notes to the basic financial statements are an integral part of this statement.
Component UnitsPrimary Government
BBrown
Typewritten Text
19
thowell
Typewritten Text

Operating CapitalCharges for Grants and Grants and Governmental Business-type Sports Complex Midland Development
Functions/Programs Expenses Services Contributions Contributions Activities Activities Total Development CorporationPrimary government:
Governmental activities:General government:
Administration $ 1,419,691 $ 240,307 $ - $ - $ (1,179,384) $ - $ (1,179,384) $ - $ - Support services 12,749,373 319,902 - - (12,429,471) - (12,429,471) - - Fiscal management 2,225,291 60,315 - - (2,164,976) - (2,164,976) - - Other 4,120,660 - 1,000 75,302 (4,044,358) - (4,044,358) - -
Development services 3,534,375 1,998,231 772,946 435,479 (327,719) - (327,719) - - Engineering 10,642,676 1,963 - 2,256,798 (8,383,915) - (8,383,915) - - Community services 9,933,581 898,904 370,990 950,496 (7,713,191) - (7,713,191) - - Police 24,025,334 4,272,412 328,916 7,098 (19,416,908) - (19,416,908) - - Fire 22,289,161 2,015,471 - - (20,273,690) - (20,273,690) - - Interest on long-term debt 1,221,970 - - - (1,221,970) - (1,221,970) - -
Total governmental activities 92,162,112 9,807,505 1,473,852 3,725,173 (77,155,582) - (77,155,582) - -
Business-type activities:Airport 8,835,469 8,816,871 229,749 5,949,640 - 6,160,791 6,160,791 - - Water and sewer 37,401,624 41,236,729 - 375,333 - 4,210,438 4,210,438 - - Sanitation 10,813,252 11,636,597 153,235 - - 976,580 976,580 - - Sports complex 4,242,836 9,781,813 - - - 5,538,977 5,538,977 - - Golf course 2,056,066 2,348,194 - - - 292,128 292,128 - -
Total business-type activities 63,349,247 73,820,204 382,984 6,324,973 - 17,178,914 17,178,914 - - Total primary government $ 155,511,359 $ 83,627,709 $ 1,856,836 $ 10,050,146 (77,155,582) 17,178,914 (59,976,668) - -
Component units:Sports Complex Development Corporation $ 8,872,054 $ - $ 3,900 $ - - - - (8,868,154) - Midland Economic Development Corporation 1,525,268 - - - - - - - (1,525,268)
Total component units $ 10,397,322 $ - $ 3,900 $ - - - - (8,868,154) (1,525,268)
General revenues:Property taxes 34,238,579 - 34,238,579 - - Sales taxes 35,472,615 - 35,472,615 8,868,154 8,868,154Gross receipts taxes 11,210,488 - 11,210,488 - - Hotel-motel taxes 4,606,037 - 4,606,037 - - Other taxes 493,405 - 493,405 - - Unrestricted investment earnings 431,732 587,737 1,019,469 - 28,668 Miscellaneous 22,017 - 22,017 - 155,948
Transfers 4,115,018 (4,115,018) - - - Total general revenues and transfers 90,589,891 (3,527,281) 87,062,610 8,868,154 9,052,770
Change in net assets 13,434,309 13,651,633 27,085,942 - 7,527,502 Net assets – beginning 128,974,293 272,153,904 401,128,197 - 33,871,397 Net assets – ending $ 142,408,602 $ 285,805,537 $ 428,214,139 $ - $ 41,398,899
The notes to the basic financial statements are an integral part of this statement.
CITY OF MIDLAND, TEXASStatement of Activities
For the Year Ended September 30, 2012
Component UnitsPrimary GovernmentProgram Revenues Changes in Net Assets
Net (Expense) Revenue and
bbrown
Typewritten Text
20

CITY OF MIDLAND, TEXASBalance Sheet
Governmental FundsSeptember 30, 2012
Nonmajor TotalDebt Governmental Governmental
General Service Funds FundsASSETS
Cash and cash equivalents $ 33,708,173 $ 239,564 $ 28,729,537 $ 62,677,274 Investments 22,280,369 159,793 5,509,149 27,949,311 Receivables (net of allowance for uncollectibles):
Interest receivable 64,541 651 14,518 79,710 Property taxes 564,711 107,542 353,151 1,025,404 Sales taxes 6,205,953 - - 6,205,953 Accounts receivable 2,594,464 4,360 1,189,879 3,788,703 Assessments receivable 517,257 - - 517,257 Intergovernmental receivable 183,823 - 98,027 281,850
Prepaid items and other assets 39,724 - - 39,724 Due from other funds 85,448 - - 85,448 Advances to other funds 842,221 - - 842,221
Total assets $ 67,086,684 $ 511,910 $ 35,894,261 $ 103,492,855
LIABILITIES AND FUND BALANCESLiabilities:
Accounts payable $ 1,477,678 $ - $ 301,921 $ 1,779,599 Accrued payroll 2,640,806 - - 2,640,806 Retainage payable 124,917 - 21,819 146,736 Due to other funds - - 23,669 23,669 Due to component unit 595,000 - - 595,000 Deferred revenue 2,369,942 98,166 943,149 3,411,257 Unearned revenue 158,809 - 73,779 232,588 Other liabilities 1,042,012 - 1 1,042,013
Total liabilities 8,409,164 98,166 1,364,338 9,871,668
Fund balances:Nonspendable:
Prepayments 39,724 - - 39,724 Advances 842,221 - - 842,221
Restricted for:Debt service - 413,744 - 413,744 Public safety 54,855 - 809,604 864,459 Court 156,042 - 685,740 841,782 Communications - - 3,590,536 3,590,536 Downtown - - 644,886 644,886 Buildings and renovations - - 7,823,627 7,823,627 Streets and drainage - - 8,376,344 8,376,344 Parks and recreation - - 2,359,965 2,359,965 Other purposes - - 5,433,282 5,433,282
Committed to:Buildings and renovations 43,442 - 245,817 289,259 Streets and drainage 6,045,481 - 1,482,584 7,528,065 Parks and recreation 251,574 - - 251,574 Public safety 890,256 - - 890,256 Technology 701,554 - - 701,554 Other Purposes 554,611 - 3,077,538 3,632,149
Assigned to:Streets and drainage 73,228 - - 73,228
Unassigned:General fund 49,024,532 - - 49,024,532 Total fund balances 58,677,520 413,744 34,529,923 93,621,187
Total liabilities and fund balances $ 67,086,684 $ 511,910 $ 35,894,261
77,700,742
16,018
3,530,330
Cash $ 10,016,036Investments 5,240,523Receivables 231,592Capital assets net of depreciation 17,887,047Internal balances (1,472,064)Other assets 425,099Current liabilities (2,307,985)Noncurrent liabilities (3,438,672)
26,581,576
(59,041,251)
$ 142,408,602
The notes to the financial statements are an integral part of this statement.
Net assets of governmental activities
fleet management and self-insurance costs to individual funds.
(net of amount allocated to business-type activities of $3,880,430)
Long-term liabilities, including bonds payable, are not due and payablein the current period and, therefore, are not reported in the funds.
The assets and liabilities of the internal service funds are includedin governmental activities in the statement of net assets
Other long-term assets are not available to pay for current-periodexpenditures and, therefore, are deferred in the funds.
Internal service funds are used by management to charge the costs of
Amounts reported for governmental activities in the statement of netassets are different because:
Capital assets used in governmental activities are not financialresources and, therefore, are not reported in the funds.
The City has an equity interest in a joint venture. This investment is nota current financial resource and, therefore, is not reported in the funds.
BBrown
Typewritten Text
21

Nonmajor TotalDebt Governmental Governmental
General Service Funds FundsREVENUESTaxes:
Property $ 29,626,195 $ 3,695,569 $ 986,238 $ 34,308,002 Sales 35,472,615 - - 35,472,615 Gross receipts 11,210,488 - - 11,210,488 Mixed beverage 383,897 - - 383,897 Hotel-motel - - 4,606,037 4,606,037 Miscellaneous 109,508 - - 109,508
Licenses and permits 1,936,372 - 483,094 2,419,466 Fines and forfeitures 3,808,669 - - 3,808,669 Charges for services 2,685,136 - - 2,685,136 Rentals 11,344 - 201,618 212,962 Assessments - - 121,572 121,572 Intergovernmental 1,442,040 - 1,133,716 2,575,756 Investment earnings: Interest income 335,174 6,036 95,199 436,409 Net decrease in the fair value of investments 17,353 460 6,086 23,899 Contributions and donations 277,895 - - 277,895 Miscellaneous 211,057 - 418,814 629,871 Total revenues 87,527,743 3,702,065 8,052,374 99,282,182
EXPENDITURESCurrent:
General government: Administration 1,229,487 - - 1,229,487 Support services 11,986,500 - - 11,986,500 Fiscal management 2,154,462 - - 2,154,462
Development services 2,484,995 - - 2,484,995 Engineering 7,700,839 - - 7,700,839 Community services 10,597,142 - - 10,597,142 Police 22,766,719 - - 22,766,719 Fire 20,918,880 - - 20,918,880 Other 2,004,107 - 3,000,405 5,004,512
Debt service:Principal - 2,891,115 - 2,891,115 Interest - 954,843 - 954,843 Debt issuance costs - - 157,813 157,813 Paying agents' fees - 1,051 - 1,051
Capital outlay - - 1,153,962 1,153,962 Total expenditures 81,843,131 3,847,009 4,312,180 90,002,320
Excess (deficiency) of revenues over (under) expenditures 5,684,612 (144,944) 3,740,194 9,279,862
OTHER FINANCING SOURCES (USES)Issuance of long-term debt - - 13,589,132 13,589,132 Premium on debt issuance - - 770,560 770,560 Accrued interest on debt issuance - 499 - 499 Transfers in 4,932,814 110,183 - 5,042,997 Transfers out (515,103) - (2,019,724) (2,534,827) Total other financing sources (uses) 4,417,711 110,682 12,339,968 16,868,361
Net change in fund balances 10,102,323 (34,262) 16,080,162 26,148,223Fund balances – beginning 48,575,197 448,006 18,449,761 67,472,964 Fund balances – ending $ 58,677,520 $ 413,744 $ 34,529,923 $ 93,621,187
The notes to the financial statements are an integral part of this statement.
CITY OF MIDLAND, TEXASStatement of Revenues, Expenditures and Changes in Fund Balances
Governmental FundsFor the Year Ended September 30, 2012
BBrown
Typewritten Text
22

Amounts reported for governmental activities in the statement of activities (page 20) aredifferent because:
Net change in fund balances–total governmental funds (page 22) $ 26,148,223
Governmental funds report capital outlays as expenditures. However, in thestatement of activities, the cost of those assets is allocated over their estimateduseful lives and reported as depreciation expense. This is the amount by whichdepreciation exceeded capital outlays in the current period. (1,687,416)
The net effect of various miscellaneous transactions involving capital assets(i.e., sales, trade-ins, and donations) is to increase net assets. 2,254,817
Governmental funds report investment in joint venture as an expenditure. However, in the statement of activities, the equity interest is treated as an asset. (140,959)
Revenues in the statement of activities that do not provide current financial resourcesare not reported as revenues in the funds (i.e., deferred revenues and earned butunavailable revenues). (131,099)
The issuance of long-term debt (e.g. bonds, leases) provides current financialresources to governmental funds, while the repayment of the principal of long-termdebt consumes the current financial resources of governmental funds. Neithertransaction, however, has any effect on net assets. Also, governmental fundsreport the effect of issuance costs, premiums, discounts, and similar items whendebt is first issued, whereas these amounts are deferred and amortized in the statement of activities. This amount is the net effect of these differences in thetreatment of long-term debt and related items. (11,311,263)
Some expenses reported in the statement of activities do not require the use of current financial resources and, therefore, are not reported as expenditures ingovernmental funds. (3,885,009)
Internal service funds are used by management to charge the costs of the garage,warehouse and three self-insurance funds to individual funds. The net revenue ofcertain activities of internal service funds is reported with governmental activities. 2,187,015
Change in net assets of governmental activities (page 20) $ 13,434,309
The notes to the financial statements are an integral part of this statement.
For the Year Ended September 30, 2012
CITY OF MIDLAND, TEXASReconciliation of the Statement of Revenues,
Expenditures, and Changes in Fund Balances of Governmental Fundsto the Statement of Activities
BBrown
Typewritten Text
23
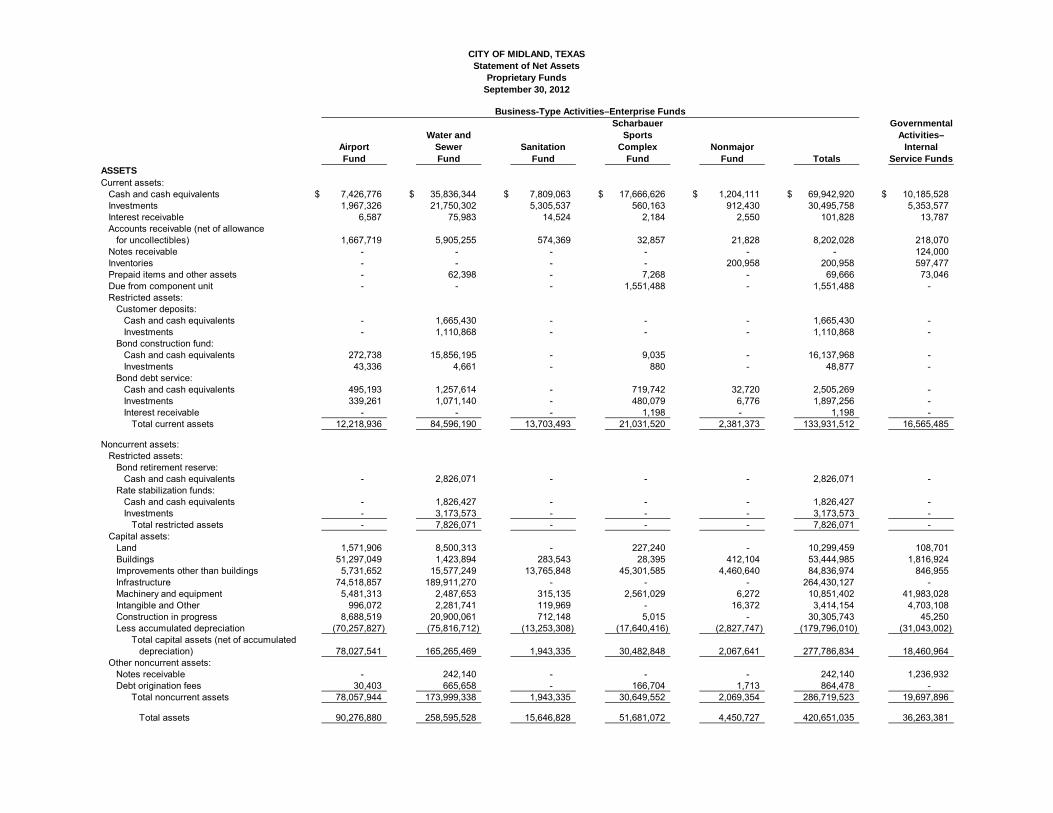
CITY OF MIDLAND, TEXASStatement of Net Assets
Proprietary FundsSeptember 30, 2012
Scharbauer Governmental Water and Sports Activities–
Airport Sewer Sanitation Complex Nonmajor InternalFund Fund Fund Fund Fund Totals Service Funds
ASSETSCurrent assets:
Cash and cash equivalents $ 7,426,776 $ 35,836,344 $ 7,809,063 $ 17,666,626 $ 1,204,111 $ 69,942,920 $ 10,185,528 Investments 1,967,326 21,750,302 5,305,537 560,163 912,430 30,495,758 5,353,577 Interest receivable 6,587 75,983 14,524 2,184 2,550 101,828 13,787 Accounts receivable (net of allowance
for uncollectibles) 1,667,719 5,905,255 574,369 32,857 21,828 8,202,028 218,070 Notes receivable - - - - - - 124,000 Inventories - - - - 200,958 200,958 597,477 Prepaid items and other assets - 62,398 - 7,268 - 69,666 73,046 Due from component unit - - - 1,551,488 - 1,551,488 - Restricted assets:
Customer deposits:Cash and cash equivalents - 1,665,430 - - - 1,665,430 - Investments - 1,110,868 - - - 1,110,868 -
Bond construction fund:Cash and cash equivalents 272,738 15,856,195 - 9,035 - 16,137,968 - Investments 43,336 4,661 - 880 - 48,877 -
Bond debt service:Cash and cash equivalents 495,193 1,257,614 - 719,742 32,720 2,505,269 - Investments 339,261 1,071,140 - 480,079 6,776 1,897,256 - Interest receivable - - - 1,198 - 1,198 -
Total current assets 12,218,936 84,596,190 13,703,493 21,031,520 2,381,373 133,931,512 16,565,485
Noncurrent assets:Restricted assets:
Bond retirement reserve:Cash and cash equivalents - 2,826,071 - - - 2,826,071 -
Rate stabilization funds:Cash and cash equivalents - 1,826,427 - - - 1,826,427 - Investments - 3,173,573 - - - 3,173,573 -
Total restricted assets - 7,826,071 - - - 7,826,071 - Capital assets:
Land 1,571,906 8,500,313 - 227,240 - 10,299,459 108,701 Buildings 51,297,049 1,423,894 283,543 28,395 412,104 53,444,985 1,816,924 Improvements other than buildings 5,731,652 15,577,249 13,765,848 45,301,585 4,460,640 84,836,974 846,955 Infrastructure 74,518,857 189,911,270 - - - 264,430,127 - Machinery and equipment 5,481,313 2,487,653 315,135 2,561,029 6,272 10,851,402 41,983,028 Intangible and Other 996,072 2,281,741 119,969 - 16,372 3,414,154 4,703,108 Construction in progress 8,688,519 20,900,061 712,148 5,015 - 30,305,743 45,250 Less accumulated depreciation (70,257,827) (75,816,712) (13,253,308) (17,640,416) (2,827,747) (179,796,010) (31,043,002)
Total capital assets (net of accumulateddepreciation) 78,027,541 165,265,469 1,943,335 30,482,848 2,067,641 277,786,834 18,460,964
Other noncurrent assets:Notes receivable - 242,140 - - - 242,140 1,236,932 Debt origination fees 30,403 665,658 - 166,704 1,713 864,478 -
Total noncurrent assets 78,057,944 173,999,338 1,943,335 30,649,552 2,069,354 286,719,523 19,697,896
Total assets 90,276,880 258,595,528 15,646,828 51,681,072 4,450,727 420,651,035 36,263,381
Business-Type Activities–Enterprise Funds
bbrown
Typewritten Text
24

LIABILITIESCurrent liabilities:
Accounts payable 1,134,258 3,533,165 549,183 44,886 115,999 5,377,491 2,231,709 Accrued payroll 90,019 247,274 146,764 - 27,762 511,819 84,540 Retainage payable 111,103 988,435 - - - 1,099,538 - Due to other funds 61,779 - - - - 61,779 - Due to component unit - 6,925,000 - - - 6,925,000 - Customer deposits - 2,776,318 - - - 2,776,318 - Revenue bonds payable
from unrestricted assets - 1,061,667 - - - 1,061,667 - General obligation bonds payable
from unrestricted assets 579,167 - - 795,833 27,865 1,402,865 - Deferred amount on refunding (1,136) 141,997 - (156,765) 990 (14,914) - Certificates of obligation payable
from unrestricted assets - 821,250 - - - 821,250 - Notes payable - - - - 124,000 124,000 - Compensated absences 139,605 183,394 76,911 - 40,659 440,569 80,037 Estimated unpaid claims - - - - - - 1,126,867 Unearned revenue - 25,800 47,156 25,000 92,270 190,226 - Other liabilities 8,332 223,508 97,110 - 5,784 334,734 921
Current liabilities payable from restricted assets:
Accrued interest payable 23,621 626,671 - 86,852 485 737,629 - Revenue bonds payable - 758,333 - - - 758,333 - General obligation bonds payable 810,833 - - 1,114,167 39,011 1,964,011 - Certificates of obligation payable - 943,750 - - - 943,750 -
Total current liabilities 2,957,581 19,256,562 917,124 1,909,973 474,825 25,516,065 3,524,074
Noncurrent liabilities:Revenue bonds payable - 9,135,000 - - - 9,135,000 - General obligation bonds payable 4,600,000 - - 19,955,000 127,261 24,682,261 - Deferred amount on refunding (1,377) 1,965,952 - (645,160) 1,037 1,320,452 - Certificates of obligation payable - 61,350,000 - - - 61,350,000 - Compensated absences 75,178 87,935 22,570 - 25,644 211,327 50,328 Other postemployment benefits payable 510,871 1,446,522 763,214 - 157,874 2,878,481 542,207 Estimated unpaid claims - - - - - - 1,684,766 Notes payable - - - - 1,236,932 1,236,932 - Advances from other funds - - - - 842,221 842,221 - Landfill closure/postclosure care - - 11,553,189 - - 11,553,189 -
Total noncurrent liabilities 5,184,672 73,985,409 12,338,973 19,309,840 2,390,969 113,209,863 2,277,301
Total liabilities 8,142,253 93,241,971 13,256,097 21,219,813 2,865,794 138,725,928 5,801,375
NET ASSETSInvested in capital assets, net of related debt 72,150,748 103,457,866 1,943,335 9,429,688 1,871,477 188,853,114 20,417,226 Restricted for debt service 834,454 5,154,825 - 1,199,821 39,496 7,228,596 - Restricted for rate stabilization - 5,000,000 - - - 5,000,000 - Unrestricted 9,149,425 51,740,866 447,396 19,831,750 (326,040) 80,843,397 10,044,780
Total net assets $ 82,134,627 $ 165,353,557 $ 2,390,731 $ 30,461,259 $ 1,584,933 281,925,107 $ 30,462,006
Reconciliation to government-wide statement of net assets:Adjustment to reflect the consolidation of Internal Service Fund activities related to Enterprise Funds. 3,880,430
Net assets of business-type activities $ 285,805,537
The notes to the basic financial statements are an integral part of this statement.
bbrown
Typewritten Text
25

CITY OF MIDLAND, TEXASStatement of Revenues, Expenses, and Changes in Fund Net Assets
Proprietary FundsFor the Year Ended September 30, 2012
Scharbauer Governmental Water and Sports Activities–
Airport Sewer Sanitation Complex Nonmajor InternalFund Fund Fund Fund Fund Totals Service Funds
Operating revenues: International Airport parking revenues $ 2,245,055 $ - $ - $ - $ - $ 2,245,055 $ - International Airport building rentals 3,107,199 - - - - 3,107,199 - International Airport aviation rentals 234,823 - - - - 234,823 - International Airport landing fees 435,169 - - - - 435,169 - International Airport commercial rentals 181,789 - - - - 181,789 - International Airport fuel and oil commissions 98,528 - - - - 98,528 - Airpark rentals 145,220 - - - - 145,220 - Airpark fuel and oil commissions 18,874 - - - - 18,874 - Water sales - 29,533,842 - - - 29,533,842 - Sewer charges - 10,040,328 - - - 10,040,328 - Tap installations and service charges - 337,546 - - - 337,546 - Garbage collection fees - - 11,399,973 - - 11,399,973 - Penalties - 357,377 89,254 - - 446,631 - Course usage fees - - - - 820,485 820,485 - Golf cart fees - - - - 533,959 533,959 - Pro shop rentals - - - - 12,311 12,311 - Pro shop sales - - - - 697,691 697,691 - Tournament fees - - - - 3,165 3,165 - Snack bar concession rentals - - - - 51,828 51,828 - Football-soccer stadium - - - 447,955 - 447,955 - Baseball stadium - - - 353,347 - 353,347 - Common areas - - - 67,200 - 67,200 - Billings to other funds - - - - - - 10,473,165 Motor vehicle repair billings - - - - - - 4,279,898 Motor vehicle lease charges - - - - - - 4,676,714 Equipment lease–other - - - - - - 973,549 Charges for fuel - - - - - - 2,681,580 Employee payments - - - - - - 2,072,230 Miscellaneous 95,197 160,771 - - - 255,968 - Total operating revenues 6,561,854 40,429,864 11,489,227 868,502 2,119,439 61,468,886 25,157,136
Operating expenses: Cost of goods sold - - - - 490,655 490,655 1,488,160 Salaries and fringe benefits 1,929,992 5,392,602 3,229,078 - 598,647 11,150,319 2,065,388 Contractual services 1,816,722 18,718,955 4,921,902 783,842 642,557 26,883,978 4,788,714 Maintenance of structure 65,661 412,906 16,577 298,424 46,903 840,471 17,440 Maintenance of equipment 52,287 335,035 46,172 13,689 11,237 458,420 1,474,616 Payment of claims - - - - - - 7,653,066 Franchise fees - 2,398,143 436,372 - - 2,834,515 - Depreciation 4,425,147 5,812,161 1,055,646 1,724,233 203,055 13,220,242 3,881,361 Closure and postclosure care - - 782,961 - - 782,961 - Supplies 64,927 1,805,380 641,784 79,300 78,298 2,669,689 3,098,798 Other expenses 154,132 15 77,111 69,001 - 300,259 2,140 Total operating expenses 8,508,868 34,875,197 11,207,603 2,968,489 2,071,352 59,631,509 24,469,683
Business-Type Activities–Enterprise Funds
bbrown
Typewritten Text
26

Operating income (loss) (1,947,014) 5,554,667 281,624 (2,099,987) 48,087 1,837,377 687,453
Nonoperating revenues (expenses): Investment income: Interest income 40,386 454,322 69,459 37,542 12,165 613,874 117,581 Net increase in the fair value of investments 3,835 30,140 6,405 3,770 1,537 45,687 4,858 Interest expense (330,302) (2,559,556) - (1,274,819) (51,856) (4,216,533) - Rentals - 167,534 - - - 167,534 - Water royalties 55,827 - - - - 55,827 - Intergovernmental grants 229,749 - 8,000 - - 237,749 -
Gain on sale of capital assets - - - - - - 111,868 Recoveries of damages to City property - - - - - - 25,254 Passenger facility charge revenues 2,126,221 - - - - 2,126,221 - Player facility charge revenues - - - - 225,353 225,353 - SCDC construction contract revenue - - - 8,868,154 - 8,868,154 - Litter abatement contributions - - 145,235 - - 145,235 - Other 59,297 612,994 147,371 12,449 2,674 834,785 133,568 Total nonoperating revenues 2,185,013 (1,294,566) 376,470 7,647,096 189,873 9,103,886 393,129
Income before contributions and transfers 237,999 4,260,101 658,094 5,547,109 237,960 10,941,263 1,080,582
Capital contributions 5,949,640 375,333 - - - 6,324,973 - Transfers in - - - 515,103 - 515,103 2,000,000 Transfers out (1,409,574) (2,231,837) (492,332) (372,595) (99,218) (4,605,556) (417,717)
Change in net assets 4,778,065 2,403,597 165,762 5,689,617 138,742 13,175,783 2,662,865
Total net assets – beginning 77,356,562 162,949,960 2,224,969 24,771,642 1,446,191 27,799,141
Total net assets – ending $ 82,134,627 $ 165,353,557 $ 2,390,731 $ 30,461,259 $ 1,584,933 $ 30,462,006
Reconciliation to government-wide statements of activities:Adjustment to reflect the consolidation of Internal Service Fund activities related to Enterprise Funds. 475,850
Change in net assets of business-type activities $ 13,651,633
The notes to the basic financial statements are an integral part of this statement.
bbrown
Typewritten Text
27

CITY OF MIDLAND, TEXASStatement of Cash Flows
Proprietary FundsFor the Year ended September 30, 2012
Scharbauer GovernmentalWater and Sports Activities–
Airport Sewer Sanitation Complex Nonmajor InternalFund Fund Fund Fund Fund Total Service Funds
CASH FLOWS FROM OPERATING ACTIVITIES: Receipts from customers and users $ 5,765,181 $ 40,023,841 $ 11,474,618 $ 952,113 $ 2,136,427 $ 60,352,180 $ 1,959,295 Receipts from interfund services provided 55,827 - - - - 55,827 23,180,854 Payments to suppliers (1,544,266) (22,665,255) (6,068,278) (1,735,551) (1,364,546) (33,377,896) (17,997,066) Payments to employees (1,797,103) (5,068,925) (3,025,079) - (559,070) (10,450,177) (1,952,409) Payments for interfund services used (100,613) (55,827) - - - (156,440) - Receipts from other operating revenues 59,297 780,528 147,371 12,449 2,674 1,002,319 - Net cash provided (used) by operating activities 2,438,323 13,014,362 2,528,632 (770,989) 215,485 17,425,813 5,190,674
CASH FLOWS FROM NONCAPITAL FINANCINGACTIVITIES:
Grants and contributions 229,749 - 153,235 - - 382,984 - Transfers from other funds - - - 515,103 - 515,103 2,000,000 Transfers to other funds (1,409,574) (2,231,837) (492,332) (372,595) (99,218) (4,605,556) (417,717) Advances from other funds - - - - 22,562 22,562 - Net cash provided (used) by noncapital financing activities (1,179,825) (2,231,837) (339,097) 142,508 (76,656) (3,684,907) 1,582,283
CASH FLOWS FROM CAPITAL AND RELATED FINANCING ACTIVITIES:
Issuance of capital debt - 16,652,623 - - - 16,652,623 - Payment of debt origination fees - (82,347) - - - (82,347) - Loans from component units - 925,000 - - - 925,000 - Capital contributions 5,949,640 5,664 - - - 5,955,304 - Acquisition and construction of capital assets (6,733,260) (12,950,115) (175,504) (1,234,633) - (21,093,512) (3,850,137) Principal paid on capital debt and notes payable (1,320,000) (3,165,000) - (1,830,000) (88,885) (6,403,885) - Repayment of loans to other funds - - - - (120,442) (120,442) 120,442 Interest and fees paid on capital debt and notes payable (316,750) (2,643,000) - (1,074,990) (52,262) (4,087,002) - Proceeds from sales of capital assets - 1,557 - - - 1,557 124,821 Passenger facility charge revenues 2,126,221 - - - - 2,126,221 - Player facility charge revenues - - - - 225,353 225,353 - SCDC contract revenue - - - 8,646,833 - 8,646,833 - Net cash provided (used) by capital and related financing activities (294,149) (1,255,618) (175,504) 4,507,210 (36,236) 2,745,703 (3,604,874)
Business-Type Activities–Enterprise Funds
bbrown
Typewritten Text
28

CASH FLOWS FROM INVESTING ACTIVITIES: Purchase of investments (2,349,923) (27,110,545) (5,305,537) (1,041,122) (919,206) (36,726,333) (5,353,577) Proceeds from maturities of investments 2,344,374 29,100,693 4,506,179 1,260,225 814,720 38,026,191 4,994,633 Interest received 46,567 523,917 78,775 43,452 14,214 706,925 125,615 Net cash provided (used) by investing activities 41,018 2,514,065 (720,583) 262,555 (90,272) 2,006,783 (233,329)
Net increase in cash and cash equivalents 1,005,367 12,040,972 1,293,448 4,141,284 12,321 18,493,392 2,934,754 Cash and cash equivalents at beginning of year 7,189,340 47,227,109 6,515,615 14,254,119 1,224,510 76,410,693 7,250,774
Cash and cash equivalents at end of year $ 8,194,707 $ 59,268,081 $ 7,809,063 $ 18,395,403 $ 1,236,831 $ 94,904,085 $ 10,185,528
Reconciliation of operating income to net cash provided (used) by operating activities:
Operating income (loss) $ (1,947,014) $ 5,554,667 $ 281,624 $ (2,099,987) $ 48,087 $ 1,837,377 $ 687,453
Adjustments to reconcile operating income (loss) to net cash provided (used) by operating activities: Depreciation expense 4,425,147 5,812,161 1,055,646 1,724,233 203,055 13,220,242 3,881,361 Other income 115,124 780,528 147,371 12,449 2,674 1,058,146 158,822 Change in assets and liabilities: (Increase) decrease in accounts receivable (801,903) (576,859) (28,117) 83,611 1,061 (1,322,207) (175,809) Increase in inventories - - - - (40,360) (40,360) (28,290) Increase in prepaid items and other assets - (33,261) - (7,268) - (40,529) (53,046) Decrease in public improvement district - 44,725 - - - 44,725 - Increase (decrease) in accounts payable 742,560 698,214 71,640 (484,027) (54,536) 973,851 754,515 Increase (decrease) in accrued payroll (655) (1,557) 3,349 - 2,437 3,574 379 Increase (decrease) retainage payable (133,097) 284,399 - - - 151,302 - Decrease in due to other funds (100,613) - - - - (100,613) - Increase in customer deposits - 69,755 - - - 69,755 - Decrease in estimated unpaid claims - - - - - - (147,510) Increase in unearned revenue - - 13,560 - 14,745 28,305 - Increase (decrease) in compensated absences 5,381 (32,866) (13,780) - (2,614) (43,879) (20,062) Increase in other postemployment benefits 128,163 358,100 214,430 - 39,754 740,447 132,662 Increase in closure/postclosure care - - 782,961 - - 782,961 - Increase (decrease) in other liabilities 5,230 56,356 (52) - 1,182 62,716 199 Total adjustments 4,385,337 7,459,695 2,247,008 1,328,998 167,398 15,588,436 4,503,221
Net cash provided (used) by operating activities $ 2,438,323 $ 13,014,362 $ 2,528,632 $ (770,989) $ 215,485 $ 17,425,813 $ 5,190,674
Noncash investing, capital, and financing activities:
Change in fair value of investments $ 3,835 $ 30,140 $ 6,405 $ 3,770 $ 1,537 $ 45,687 $ 4,858 Contributions of capital assets - 369,669 - - - 369,669 -
The notes to the basic financial statements are an integral part of this statement.
BBrown
Typewritten Text
29
bbrown
Typewritten Text
bbrown
Typewritten Text
29

City of Midland Notes to the Comprehensive Annual Financial Report
For the Fiscal Year Ended September 30, 2012
Note Page
1. Summary of Significant Accounting Policies ............................................................ 31 A. Reporting Entity .................................................................................................. 32 B. Joint Venture ...................................................................................................... 33 C. Government-wide and Fund Financial Statements ............................................ 33 D. Measurement Focus and Basis of Accounting ................................................... 35 E. Cash, Cash Equivalents and Investments .......................................................... 39 F. Inventories and Prepaid Items ............................................................................ 40 G. Receivables, Payables and Interfund Transactions ........................................... 40 H. Capital Assets .................................................................................................... 40 I. Compensated Absences .................................................................................... 41 J. Federal and State Grants ................................................................................... 41 K. Long-Term Debt ................................................................................................. 42 L. Retirement Plans ................................................................................................ 42 M. Indirect and Centralized Expenses ..................................................................... 42 N. Nature and Purpose of Classifications of Fund Equity ........................................ 43
2. Reconciliation of Government-Wide and Fund Financial Statements ...................... 43 3. Deposits and Investments ......................................................................................... 45 4. Property Taxes ......................................................................................................... 49 5. Receivables .............................................................................................................. 50 6. Capital Assets .......................................................................................................... 51 7. Employee Benefit Plan ............................................................................................. 53 8. Leases ...................................................................................................................... 65 9. Long-Term Debt ....................................................................................................... 69 10. Restricted Assets ..................................................................................................... 78 11. Interfund Transfers .................................................................................................... 78 12. Status of Capital Grants ........................................................................................... 80 13. Contingent Liabilities ................................................................................................ 80 14. Risk Management .................................................................................................... 81 15. Commitments ............................................................................................................ 83 16. Litigation .................................................................................................................... 85 17. Closure and Postclosure Care Cost .......................................................................... 85 18. Related Organizations ............................................................................................... 87 19. Joint Venture ............................................................................................................ 87 20. Discretely Presented Component Units .................................................................... 87 21. Fund Deficit ............................................................................................................... 88
BBrown
Typewritten Text
30

CITY OF MIDLAND, TEXAS
NOTES TO BASIC FINANCIAL STATEMENTS
(continued)
September 30, 2012
1. Summary of Significant Accounting Policies The City of Midland, Texas (the City) is a municipal corporation incorporated under the laws of the State of Texas (the State). The City operates under a Council-Manager form of government and provides such services as are authorized by its charter to advance the welfare, health, comfort, safety, and convenience of the City and its inhabitants. The accounting policies of the City of Midland, as reflected in the accompanying financial statements, conform to generally accepted accounting principles for local government units as prescribed by the Governmental Accounting Standards Board (GASB), the accepted body for promulgating governmental accounting and reporting principles. GASB Statement No. 34, as amended by GASB Statement Nos. 37 and 38, requires that the basic financial statements and required supplementary information (RSI) for general purpose governments should consist of:
• Management’s Discussion and Analysis (MD&A) – MD&A is RSI presented before the basic financial statements, which introduces the basic financial statements and provides an analytical overview of the government’s financial activities.
• Basic Financial Statements – The basic financial statements, including notes to the basic
financial statements that are essential to a user’s understanding of the statements, are presented at two basic levels:
A. The government-wide level where all statements are prepared using the
economic resources measurement focus and the accrual basis of accounting. These statements present all assets, liabilities, revenues, expenses and gains and losses of the City and distinguish between governmental and business type activities of the City and activities of the City’s discretely presented component units.
B. The fund level, where governmental fund statements are prepared using the
current financial resources measurement focus and the modified-accrual basis of accounting, and proprietary fund statements are prepared using the economic resources measurement focus and the accrual basis of accounting.
These statements focus on information about the City’s major governmental and
enterprise funds.
BBrown
Typewritten Text
31

CITY OF MIDLAND, TEXAS
NOTES TO BASIC FINANCIAL STATEMENTS
(continued)
1. Summary of Significant Accounting Policies (continued)
• RSI – Other than MD&A, RSI includes budgetary comparison schedules for the General Fund and any major Special Revenue Funds and other data, such as pension-related and other post employment data, required by GASB statements.
A. The Financial Reporting Entity
The financial reporting entity presented in the basic financial statements of the
City of Midland includes the primary government, the City of Midland, and its component units. Component units are legally separate organizations for which the City is financially accountable and organizations which, if excluded, would cause the City’s basic financial statements to be misleading or incomplete. GASB Statement No. 14, as amended by GASB Statement No. 39, establishes the criteria to be considered in determining component units of a primary government.
These criteria are financial accountability, appointment of board members,
imposition of will, financial burden on or benefit to the primary government, dependency, and accuracy and completeness of the reporting entity's financial statements. In the absence of financial accountability, if the organization is a legally separate, tax-exempt entity meeting the following criteria, it should also be discretely presented as a component unit:
1. The resources of the organization are entirely or almost entirely for the
direct benefit of the City, its component units, or its constituents. 2. The City, or its component units, is entitled to, or has access to a majority
of the resources of the organization. 3. The resources of the organization are significant to the City. The Midland Football/Soccer and Baseball Complex Development Corporation
(SCDC) and the Midland Development Corporation (MDC) are the only component units of the City and are discretely presented. The SCDC is discretely presented because it is a legally separate entity with a majority of its board appointed by the City and the City can impose its will upon the SCDC. Additionally, the City Council and the SCDC boards are not substantively the same and the SCDC does not provide services entirely or almost entirely to the City.
The SCDC is a legally separate nonprofit corporation organized under the Texas
Development Corporation Act of 1979, Article 5190.6 Vernon’s Texas Revised Civil Statutes Annotated as amended and governed by Section 4B of the Act. The purpose of the SCDC is to improve the quality of life and the public welfare of, for, and on behalf of the City by developing, implementing, providing, and financing the construction of a football-soccer stadium and baseball stadium and related infrastructure, streets, water and sewer facilities, landscaping, land
BBrown
Typewritten Text
32

CITY OF MIDLAND, TEXAS
NOTES TO BASIC FINANCIAL STATEMENTS
(continued)
1. Summary of Significant Accounting Policies (continued)
A. The Financial Reporting Entity (continued) acquisition, automobile parking facilities and other related infrastructure and
improvements. Complete audited financial statements of the SCDC may be examined at City of Midland, City Hall, 300 North Loraine, Room 320, Midland, Texas.
The MDC is discretely presented because it is a legally separate entity with a
majority of its board appointed by the City and the City can impose its will upon the MDC. Additionally, the City Council and the MDC boards are not substantively the same and the MDC does not provide services entirely or almost entirely to the City.
The MDC is a legally separate nonprofit corporation organized under the Texas
Development Corporation Act of 1979, Article 5190.6 Vernon’s Texas Revised Civil Statutes Annotated as amended and governed by Section 4A of the Act. The purposes of the MDC include, but are not limited to, keeping existing jobs and businesses in the City, expansion of current and attraction of new business to the City, providing long-term employment opportunities, and other such purposes as delineated in Article 4 of the Articles of Incorporation of the MDC. Complete audited financial statements of the SCDC and MDC may be examined at City of Midland, City Hall, 300 North Loraine, Room 320, Midland, Texas.
B. Joint Venture A joint venture is a legal entity or other organization that results from a
contractual agreement and that is owned, operated or governed by two or more participants as a separate and specific activity subject to joint control in which the participants retain (a) an on-going financial interest or (b) an on-going financial responsibility. The City participates in the following joint venture:
The Midland-Odessa Urban Transit District (MOUTD) was established through
an interlocal agreement between the City of Midland and the City of Odessa on August 28, 2001 to provide mass transit to both cities. The MOUTD is to be exclusively governed by both City Councils or through an equally appointed board. At September 30, 2012, the Transit Board (the Board) is the official governing agency of MOUTD. It is comprised of six individuals from both cities, appointed by their respective City Councils. The Board approves the budget, routes, fares, schedules, policies and procedures, new services, etc. Further information concerning MOUTD may be found in note 19 of this financial report.
C. Government-wide and Fund Financial Statements As previously discussed, the basic financial statements of the City are presented
at two basic levels, the government-wide level and the fund level. These
BBrown
Typewritten Text
33

CITY OF MIDLAND, TEXAS
NOTES TO BASIC FINANCIAL STATEMENTS
(continued)
1. Summary of Significant Accounting Policies (continued) C. Government-wide and Fund Financial Statements (continued) statements focus on the City as a whole at the government-wide level and on
major funds at the fund level. The government-wide financial statements (i.e., the statement of net assets and the statement of activities) report information on all of the nonfiduciary activities for the financial reporting entity of the City.
Although the effect of indirect interfund activity has been removed from these
statements, interfund services provided and used are not eliminated in the process of consolidation. Governmental activities, which are normally supported by taxes and intergovernmental revenues, are reported separately from business-type activities, which rely to a significant extent on fees and charges for services. Likewise, the City is reported separately from certain legally separate component units that meet the criteria for discrete presentation as set forth in GASB Statements No. 14 and 39. The government-wide statement of net assets reports all financial and capital resources of the City and is presented in an “assets minus liabilities equal net assets” format. Assets and liabilities are presented in relative order of liquidity with liabilities that have an average maturity of more than one year separated into the amount due within one year and the amount due in more than one year.
The government-wide statement of activities identifies the relative financial
burden of each of the City’s functions (Development Services, Community Service, Fire, Police, etc.) or segments (Water and Sewer, Sanitation, Golf Course, Airport, etc.) on the taxpayers by identifying direct expenses and the extent of self-support through program revenues. Direct expenses are clearly identifiable expenses that can be specifically associated with a function or segment. Program revenues are revenues derived directly from the function or segment, or from other sources that reduce the net cost of the function to be financed from general government revenues.
Program revenues are 1) charges to customers who purchase, use, or directly
benefit from services provided by a function or segment and which are generated by that function, 2) grants and contributions restricted to operating requirements of a function or segment and 3) grants and contributions restricted to capital requirements of a function or segment. Items such as taxes, investment earnings and nonspecific grants are not included as program revenues but are instead reported as general revenues, which normally cover the net cost of a function or segment.
Internal service funds report activities that provide goods or services to the
financial reporting entity on a cost-reimbursement basis. Any net profit or loss from these activities is allocated back to the function or segment that benefited from the goods or services provided based upon their proportionate benefit, to the extent possible. The effect of internal service fund activities in the
BBrown
Typewritten Text
34

CITY OF MIDLAND, TEXAS
NOTES TO BASIC FINANCIAL STATEMENTS
(continued)
1. Summary of Significant Accounting Policies (continued) C. Government-wide and Fund Financial Statements (continued) government-wide statements is eliminated, as necessary, to avoid the effect of
“doubling up” internal service fund activity. Any residual assets of internal service funds, except the Warehouse Fund, are reported with governmental activities at the entity-wide level. Residual assets of the Warehouse Fund are reported with business-type activities at the entity-wide level because the Warehouse Fund provides support predominantly to the enterprise funds.
Separate fund level financial statements are presented for governmental funds
and proprietary funds. The financial information for each major fund is presented in a separate column, with nonmajor funds aggregated and displayed in a single column, on either the governmental or proprietary fund financial statements. A major fund is defined by GASB Statement No. 34, paragraph 76, as amended by GASB Statement No. 37, paragraph 15, as a fund meeting certain specific asset, liability, revenue, or expenditure/expense criteria relative to all funds of that type and relative to the total for all governmental and enterprise funds combined. Additionally, any fund deemed particularly important by the City may be reported as a major fund.
Internal Service Funds, which traditionally provide services primarily to other
funds of the government, are presented in summary form as part of the proprietary fund financial statements.
D. Measurement Focus and Basis of Accounting The government-wide statements and proprietary fund statements are prepared
using the economic resources measurement focus and the accrual basis of accounting. Exchange and exchange-like transactions, transactions in which the City gives or receives value and receives or gives equal value, that create revenues, expenses, gains, losses, assets or liabilities are recognized when the exchange occurs. Nonexchange transactions, transactions in which the City gives or receives value without receiving or giving equal value in exchange, that result in revenues, expenses, gains, losses, assets or liabilities are recognized in accordance with GASB Statement No. 33, as amended by GASB Statement No’s. 34 and 36. The treatment of nonexchange transactions is grouped in four classes based upon the principal characteristics of the transaction and reported according to those characteristics. Property taxes are recognized in the year for which they are levied. Grants and similar items are recognized as revenue as soon as all eligibility requirements have been met. Capital assets are reported at historical cost and depreciated, except for inexhaustible assets such as land, in accordance with the City’s depreciation policy. Governmental fund financial statements are reported using a current financial resources measurement focus and modified-accrual basis of accounting. Under the modified-accrual basis of accounting, revenues are recognized when susceptible to accrual, that is, both measurable and available.
BBrown
Typewritten Text
35

CITY OF MIDLAND, TEXAS
NOTES TO BASIC FINANCIAL STATEMENTS
(continued)
1. Summary of Significant Accounting Policies (continued) D. Measurement Focus and Basis of Accounting (continued) “Measurable” means the amount of the transaction can be determined and
“available” means collectible within the current period or soon enough thereafter to be used to pay liabilities of the current period. In the case of property and sales taxes, available means due within the current period and collected within the current period or soon enough thereafter to be used to pay liabilities of the current period. Such time thereafter shall not exceed 60 days. Ambulance and grant revenues are considered to be available if they are to be received within one year.
Expenditures are generally recorded when a liability is incurred. However,
expenditures related to general long-term debt, compensated absences, and claims and judgments are recorded only when payment is due.
Governmental fund-level revenues that have been accrued based upon the
susceptible to accrual concept are: General Fund - ad valorem taxes, sales taxes, ambulance, interest and federal
and state grant proceeds, except where such grants are expenditure driven and other requirements related to the grant have not been met.
Special Revenue Funds - ad valorem taxes, occupancy taxes, federal and state
grant proceeds and interest, except where such grants are expenditure driven and other requirements related to the grant have not been met.
Debt Service Fund - ad valorem taxes and interest. Capital Projects Fund – interest and assessments. Deferred revenue is recorded
for assessments that are not available to meet liabilities of the current period. This deferred revenue is offset against assessments receivable to present a net amount that is both measurable and available to meet the liabilities of the current period.
Proprietary fund activities are accounted for using the economic resources
measurement focus and the accrual basis of accounting. This measurement focus includes all assets and liabilities on the balance sheet. Operating statements using this focus present a net total assets view of increases (revenues) and decreases (expenses) in the fund.
Enterprise funds apply all applicable GASB pronouncements as well as all
Financial Accounting Standards Board (FASB) Statements and Interpretations, Accounting Principles Board Opinions and Accounting Research Bulletins issued on or before November 30, 1989, unless those pronouncements conflict with or contradict GASB pronouncements. The City has elected not to apply pronouncements of FASB issued after November 30, 1989, in accordance with
BBrown
Typewritten Text
36

CITY OF MIDLAND, TEXAS
NOTES TO BASIC FINANCIAL STATEMENTS
(continued)
1. Summary of Significant Accounting Policies (continued) D. Measurement Focus and Basis of Accounting (continued) GASB Statement No. 20. Proprietary fund operating statements distinguish
between operating and nonoperating revenues and expenses. Operating revenues and expenses generally are the result of providing or delivering goods or services in association with the fund’s principal ongoing operations.
The principal operating revenues of the City’s water and sewer, sanitation, golf
course, airport and sports complex fund are charges of this type. Operating expenses include the costs of administration, sales, services and depreciation. Transactions resulting in nonoperating revenues and expenses are normally created by such items as cash flows from capital and related financing activities, noncapital financing activities, investing activities, and include most nonexchange and exchange-like revenues such as the Passenger Facility Charges (PFC) reported in the Airport Fund. It is the City’s general policy to first use restricted assets, such as the PFC revenues, for costs that meet the resource restrictions and then unrestricted assets as needed.
Internal service funds are used to account for the financing of goods or services
provided by one department or agency to other departments or agencies of the government and other government units, on a cost-reimbursement basis. These activities include, but are not limited to, warehouse, garage, and self-insurance services for workers’ compensation, medical/dental and general liability.
The following major funds are used by the City: 1. Governmental Funds a. General Fund – The principal operating unit of the City, this fund
accounts for the primary activities of the City, such as police protection, fire protection, public works, maintenance of parks and general administration, which are not accounted for and reported in any other fund.
b. Debt Service Fund – This fund is used to account for and report
financial resources that are restricted to expenditure for principal and interest.
c. Other Governmental Funds – This is a summarization of all of the
nonmajor governmental funds. Included are the following funds:
1. Special Revenue Funds – These funds are used to account for and report the proceeds of specific revenue sources that are restricted or committed to expenditure for specified purposes other than debt service or capital projects.
BBrown
Typewritten Text
37

CITY OF MIDLAND, TEXAS
NOTES TO BASIC FINANCIAL STATEMENTS
(continued)
1. Summary of Significant Accounting Policies (continued) D. Measurement Focus and Basis of Accounting (continued) 1. Governmental Funds (continued) c. Other Governmental Funds (continued)
2. Capital Projects Funds - These funds account for and report financial resources that are restricted, committed or assigned to be used for the acquisition or construction of capital facilities and other capital assets other than those financed by business-type activities.
2. Proprietary Funds a. Water and Sewer Fund - This fund is used to account for the
operation of the City’s water and sewer utility. Activities of the fund include administration, operation and maintenance of the water and sewer system, and billing and collection for water and sewer services. The fund is also used to accumulate resources for certain capital projects and to meet the requirements of bond indentures, obligations for capital leases and other long-term obligations of the system. Charges to customers, based upon rates that are reviewed on a regular basis, and investment income provide the revenue stream to finance these costs.
b. Sanitation Fund - This fund is used to account for the collection of
refuse, delivery of refuse to the landfill and landfill operations. The fund is also used to accumulate resources for certain capital projects and to meet the obligations for capital leases and other long-term obligations of the system. Charges to customers, based upon rates that are reviewed on a regular basis, and investment income provide the revenue stream to finance these costs.
c. Airport Fund - This fund is used to account for the operation and
maintenance of the airfield, terminal building, parking facilities, general aviation airport, and industrial park. The fund is also used to accumulate resources for certain capital projects and to meet the requirements of bond indentures and other long-term oblige-tions of the airport. Charges to customers provide the revenue stream to finance operating costs, some capital projects costs, and other long-term obligations of the airport. The Passenger Facility Charge, which is nonoperating revenue, is used to supplement charges to customers in supporting the requirements of bond indentures and certain capital projects.
BBrown
Typewritten Text
38

CITY OF MIDLAND, TEXAS
NOTES TO BASIC FINANCIAL STATEMENTS
(continued)
1. Summary of Significant Accounting Policies (continued) D. Measurement Focus and Basis of Accounting (continued) 2. Proprietary Funds (continued) d. Scharbauer Sports Complex Fund - This fund is used to account
for the operation and maintenance of the sports complex, accumulate resources for capital projects, and meet the requirements of bond indentures, obligations for capital leases and other long-term obligations of the system. Operations, maintenance costs and obligations for capital leases are financed through user charges. Revenues to provide for the retirement of long-term debt associated with the construction of the complex are provided from a contract with the SCDC.
e. Golf Course Fund - This fund does not meet the criteria for
inclusion as a major fund. However, this is the only remaining proprietary fund of the City and as such is presented in a separate column. This fund is used to account for the operation and maintenance of the golf course and pro shop, accumulate resources for capital projects, and meet the requirements of bond indentures and other long-term obligations of the system. All costs are financed through user charges. In 2009, the City assumed operation of the pro shop and related inventories.
3. Other Fund Types Internal Service Funds – account for fleet management services,
provision of goods through a warehouse, technology equipment and services, and self-insurance activities in the areas of workers’ compensation, health and general liability to the financial reporting entity on a cost- reimbursement basis.
E. Cash, Cash Equivalents and Investments Cash and cash equivalents include any cash on hand, demand deposits and any
highly liquid investments that have an original maturity of three months or less from date of purchase. Investments in TexPool, LOGIC, and TexStar (2a7-like pools) are considered cash equivalents as the amounts are available on demand. Investments, other than investments in 2a7-like pools, are recorded at fair value based upon verifiable market prices.
BBrown
Typewritten Text
39

CITY OF MIDLAND, TEXAS
NOTES TO BASIC FINANCIAL STATEMENTS
(continued)
1. Summary of Significant Accounting Policies (continued) F. Inventories and Prepaid Items Inventories are valued at average cost. Inventories for all funds consist of
expendable supplies and are recorded as expenditures or expenses, as appropriate, when consumed rather than when purchased.
The City makes certain payments to vendors in the current year for expenses/
expenditures applicable to future accounting periods. A reserve for inventories and prepayments in governmental funds is recognized at the fund level to indicate that a portion of the fund balance is not appropriable for expenditure. Prepaid items are recorded as expenditures or expenses when consumed.
G. Receivables, Payables and Interfund Transactions Short-term loans between funds are reported as interfund receivables in the fund
making the loan and as interfund payables in the fund receiving the loan. Arms- length transactions between funds for goods and services are reported as revenues in the selling fund and as expenses/expenditures in the acquiring fund. Any unpaid amounts are appropriately recorded as interfund receivables/ payables when liquidation is expected within one year. If anticipated repayment is longer than one year, amounts are classified as advances to/from other funds. Flows of assets from one fund to another with no requirement for repayment or without an equivalent flow of assets in return are accounted for as transfers.
H. Capital Assets Capital assets are defined as a purchase or other acquisition of any equipment,
facilities or other similar assets or the cost of construction of such asset the cost of which is in excess of $5,000 and has a useful life of more than one year. These assets include property, plant, equipment, infrastructure, and all other tangible and intangible assets purchased or acquired. Purchased or constructed assets are carried at historical cost or estimated historical cost. Infrastructure assets, which include streets and associated drainage, sidewalks, bridges, drainage systems, water and sewer systems, runways and taxiways, lighting systems and other similar type assets, have been recorded at historical cost for all assets acquired after April 1986. Infrastructure assets acquired prior to April 1986 and after June 1980 were capitalized based upon estimated historical cost obtained from bond documents used to obtain financing for construction of infrastructure assets. Contributed assets are recorded at estimated fair value at the time of acquisition.
BBrown
Typewritten Text
40

CITY OF MIDLAND, TEXAS
NOTES TO BASIC FINANCIAL STATEMENTS
(continued)
1. Summary of Significant Accounting Policies (continued) H. Capital Assets (continued) Major outlays for capital assets and improvements are capitalized as projects are
constructed. Interest incurred during the construction phase of capital assets for business-type activities is capitalized as part of the value of the asset. During fiscal year 2012, $0.35 million in capitalized interest was recorded. Depreciable capital assets are depreciated using the straight-line method over the following estimated useful lives:
Asset Classification Years Buildings 10–40 Infrastructure 20–50 Improvements other than buildings 2–50 Machinery and equipment 4–30 Intangible and Other 3–15 I. Compensated Absences The City’s employees earn vacation, which may either be taken or accumulated,
subject to a specified maximum, until paid upon retirement or termination. Unused sick leave is accumulated up to certain limits, which are subject to specific reductions if deposited into a Retiree Reimbursement Account (RRA) upon retirement. The City’s employees are allowed to accumulate compensatory time up to a specified maximum.
The City has accrued vacation, sick leave, compensatory time and related salary
payments based on the criteria set forth in GASB Statement No. 16. This liability has been accrued in the government-wide and proprietary fund statements. Governmental funds report liabilities only for the matured portion of these liabilities.
J. Federal and State Grants Community Development Block Grants proceeds and certain other public safety
grants are accounted for within special revenue funds. Other grants and entitlements received for purposes normally financed through the general government are accounted for within the General Fund. Grant revenues are recognized when the expenditures are accrued and other related requirements are met. Airport Improvement Program (AIP) grants are accounted for within the Airport Fund, which is an enterprise fund. Grant revenues are recognized on an accrual basis.
BBrown
Typewritten Text
41

CITY OF MIDLAND, TEXAS
NOTES TO BASIC FINANCIAL STATEMENTS
(continued)
1. Summary of Significant Accounting Policies (continued) K. Long-Term Debt General Obligation Bonds and Certificates of Obligation that have been issued to
fund capital projects of the general government that are to be repaid from tax revenues of the City are reported in the government-wide statement of net assets.
Certificates of Obligation, which are secured by tax revenues, and Revenue
Bonds, which have been issued to fund capital projects of proprietary funds that are to be repaid with funds from proprietary fund assets, are reported in the proprietary funds. Bonds payable are reported net of the associated premium or discount at the government-wide level and in the fund level proprietary fund statements.
The government-wide and proprietary fund level statements defer bond
premiums, discounts and issuance costs and amortize these items over the life of the issue using the effective interest rate method. In the fund level statements, governmental fund types recognize these items in the current period.
L. Retirement Plans The City has two separate defined-benefit retirement plans that cover
substantially all employees. The Texas Municipal Retirement System provides benefits for all full-time employees who are not firefighters. The Midland Firemen’s Relief and Retirement Fund provides benefits for all full-time firefighters. The City’s contributions to both funds are recorded on an accrual basis.
M. Indirect and Centralized Expenses
The City does not allocate indirect expenses among functions. The City charges proprietary type funds for “centralized” expenses, which include an administrative overhead component, provided by the General Fund. These costs are determined on an annual basis through a full cost allocation study, except in the case of the Airport Fund. Airport Fund costs are determined in accordance with Office of Management and Budget (OMB) Circular A-87. However, the City does not charge the full cost determined through the OMB Circular A-87 study to the Airport Fund. All charges for these “centralized” expenses are treated as transfers in the proprietary funds.
BBrown
Typewritten Text
42

CITY OF MIDLAND, TEXAS
NOTES TO BASIC FINANCIAL STATEMENTS
(continued)
1. Summary of Significant Accounting Policies (continued)
N. Nature and Purpose of Classifications of Fund Equity Governmental Funds fund balances classified as restricted are balances with
constraints placed on the use of resources by creditors, grantors, contributors or laws or regulations of other governments. Fund balances classified as committed can only be used for specific purposes pursuant to constraints imposed by the City Council through an ordinance or resolution. Assigned fund balances are constrained by the intent to be used for specific purposes but are neither restricted nor committed. Assignments are made by City management based on Council direction.
2. Reconciliation of Government-Wide and Fund Financial Statements A. Explanation of Certain Differences between the Governmental Fund Balance
Sheet and the Government-Wide Statement of Net Assets The governmental fund balance sheet includes a reconciliation between fund
balance - total government funds and net assets - governmental activities as reported in the government-wide statement of net assets. One element of that reconciliation explains that “long-term liabilities, including bonds payable, are not due and payable in the current period and therefore are not reported in the funds.”
The details of this $59,041,251 difference are as follows:
Another element of that reconciliation states that “Other long-term assets are not
available to pay for current-period expenditures and, therefore, are deferred funds.”
The details of this $3,530,330 difference are as follows:
Property taxes receivable $ 574,450Lot clearing and paving liens receivable (net) 1,560,080Municipal court fines receivable (net) 1,026,727Unamortized debt issuance costs 369,073
Net adjustment to increase fund balance – total governmental funds to arrive at net assets – governmental activities
$ 3,530,330
Bonds, notes payable and certificates of obligation payable $38,326,981Accrued interest payable 387,719 Compensated absences 5,367,200Other postemployment benefits 14,959,351 Net adjustment to reduce fund balance – total governmental funds to arrive at net assets – governmental activities
$59,041,251
BBrown
Typewritten Text
43

CITY OF MIDLAND, TEXAS
NOTES TO BASIC FINANCIAL STATEMENTS
(continued)
2. Reconciliation of Government-Wide and Fund Financial Statements (continued) B. Explanation of Certain Differences Between the Governmental Fund Statement
of Revenues, Expenditures and Changes in Fund Balances and the Government-Wide Statement of Activities
The governmental fund statement of revenues, expenditures, and changes in
fund balance includes a reconciliation between net changes in fund balances – total governmental funds and changes in net assets of governmental activities as reported in the government-wide statement of activities. One element of that reconciliation explains that “Governmental funds report capital outlays as expenditures. However, in the statement of activities, the cost of those assets is allocated over their estimated useful lives and reported as depreciation expense.”
The details of this ($1,687,416) difference are as follows:
Capital outlay (includes $2,867,311 reported in General Fund functional activities) $4,021,273Depreciation expense (5,708,689)
Net adjustment to decrease net changes in fund balance – total governmental funds to arrive at changes in net assets of governmental activities
($1,687,416)
Another element of that reconciliation states that “The net effect of various miscellaneous transactions involving capital assets (i.e., sales, trade-ins, and donations) is to increase net assets.”
The details of this $2,254,817 difference are as follows:
Donations of capital assets increase net assets in the statement of activities, but do not appear in the governmental funds because they are not financial resources. $2,254,817 Net adjustment to increase net changes in fund balances – total governmental funds to arrive at changes in net assets of governmental activities $2,254,817
Another element of that reconciliation states that, “The issuance of long-term
debt (e.g., bonds, leases) provides current financial resources to governmental funds, while the repayment of the principal of long-term debt consumes the current financial resources of governmental funds. Neither transaction, however, has any effect on net assets.”
Also, governmental funds report the effect of issuance costs, premiums,
discounts, and similar items when debt is first issued, whereas these amounts are deferred and amortized in the statement of activities.”
BBrown
Typewritten Text
44

CITY OF MIDLAND, TEXAS
NOTES TO BASIC FINANCIAL STATEMENTS
(continued)
2. Reconciliation of Government-Wide and Fund Financial Statements (continued) B. Explanation of Certain Differences Between the Governmental Fund Statement
of Revenues, Expenditures and Changes in Fund Balances and the Government-Wide Statement of Activities (continued)
The details of this ($11,311,263) difference are as follows:
Debt issued or incurred: Issuance of certificates of obligation ($13,589,132) Plus premium (770,560) Plus accrued interest received (499) Deferral of issuance costs 157,813 Principal repayments: General obligation debt 1,486,115 Certificates of obligation 1,320,000 Notes payable 85,000
Net adjustment to decrease net changes in fund balances – total governmental funds to arrive at changes in net assets of governmental activities ($11,311,263)
Another element of that reconciliation states that “Some expenses reported in the statement of activities do not require the use of current financial resources and, therefore, are not reported as expenditures in governmental funds.”
The details of this ($3,885,009) difference are as follows:
Reversal of prior year interest accrual $ 84,895 Accrued interest (387,719) Amortization of issuance and reacquisition costs 36,748 Change in compensated absences 201,161 Change in other postemployment benefits (3,820,094) Net adjustment to decrease net changes in fund balances – total governmental funds to arrive at changes in net assets of governmental activities ($3,885,009)
3. Deposits and Investments Deposits – State statute requires that public funds in the City’s depository institution be secured by eligible securities, as defined in V.T.C.A., Local Government Code Chapter 2257, in an amount not less than the amount on deposit plus any accrued interest less any amount provided for by insurance of the United States or an instrumentality thereof. The City’s depository agreement further restricts acceptable collateral, 65% secured by direct obligations of the United States and 35% meeting the requirements of Chapter 2257, and the level of collateral to 102% of City funds on deposit or the amount of City funds on deposit plus $1,000,000, whichever is greater. City deposits were fully insured or collateralized as of
BBrown
Typewritten Text
45

CITY OF MIDLAND, TEXAS
NOTES TO BASIC FINANCIAL STATEMENTS
(continued)
3. Deposits and Investments (continued) September 30, 2012. At September 30, 2012, the carrying amount of cash for the City and MDC was ($1,287,947) and $1,997,101, respectively. The bank balance of ($192,885) was insured by the Federal Deposit Insurance Corporation (FDIC) for $250,000. The remaining bank balance was collateralized by securities, fair value of $7,565,756 at September 30, 2012, held in the City's name by the Federal Reserve Bank of Minneapolis as agent for the City. In addition to these bank balances, the Federal Reserve Bank serves as Custodian for eligible federal treasury and agency securities in the amount of $70,029,220. Investments – The City's investment policies are governed by State statutes. The City’s investment policies further limit State statutes such that eligible investments include the following: A. Obligations of the United States or Its Agencies and Instrumentalities 1. United States of America Treasury Securities; 2. Farmers Home Administration (FmHA) obligations backed by the full faith
and credit of the United States; 3. Federal Home Loan Bank (FHLB) bonds; 4. Federal National Mortgage Association (Fannie Mae or FNMA) notes and
debentures; 5. Farm Credit System obligations; 6. Federal Home Loan Mortgage Corporation (Freddie Mac or FHLMC)
obligations, i.e. discount notes or debentures. B. Direct Obligations of the State of Texas or Its Agencies Texas State, City, County, or School District General Obligation Bonds with a
remaining maturity of ten years or less having been rated as to investment quality by Moody’s or Standard and Poor’s (nationally recognized investment rating firms) and having received a rating of no less than "A" or its equivalent.
C. Certificates of Deposit Issued by State and National Banks Domiciled in This State Certificates of Deposit issued by state and national banks domiciled in this state
that are: (1) guaranteed or insured by the Federal Deposit Insurance Corporation, or its successor; or (2) secured by obligations that are described in V.T.C.A., Local Government Code Sections 105.001 et seq.
BBrown
Typewritten Text
46

CITY OF MIDLAND, TEXAS
NOTES TO BASIC FINANCIAL STATEMENTS
(continued)
3. Deposits and Investments (continued) D. Fully Collateralized Repurchase Agreements Having a Defined Termination Date Fully collateralized direct repurchase agreements and reverse repurchase
agreements with a defined termination date of no more than 90 days from the date such investment is purchased, and secured by obligations of the United States or its agencies and instrumentalities with a market value of not less than the amount of the funds disbursed and held by a custodian for the City.
Repurchase agreements must be purchased through a primary government
securities dealer, as defined by the Federal Reserve, or a bank domiciled in Texas. Money received under the terms of a reverse repurchase agreement shall be used to acquire additional eligible investments whose maturity does not exceed the expiration date of the reverse repurchase agreement.
E. Money Market Funds Money Market Funds fully authorized by State statute of both public and private
sponsorship. F. Other Securities or Obligations Approved by the City Council Other such securities or obligations as authorized by State statute and approved
by the City Council. Investments of the City, other than for 2a7-like pools, are valued based upon quotes obtained from Bloomberg. Investments in 2a7-like pools are valued based upon the value of pool shares. No investments are reported at amortized cost. The City invests in three 2a7-like pools; the Local Government Investment Cooperative (LOGIC), TexStar, and the Texas Local Government Investment Pool (TexPool), all of which were created under the Interlocal Cooperation Act, Texas Government Code Ann. ch. 791 and the Texas Government Code Ann. ch. 2256. Investments in the 2a7-like pools are considered to be cash equivalents when preparing these financial statements. LOGIC is governed by a five-member Board of Directors consisting of four individuals from participating Government Entities in the pool and one unaffiliated individual. The business and affairs of LOGIC are managed by the Board. J.P. Morgan Investment Management, Inc. provides investment management, fund accounting, transfer agency and custodial services for the pool and First Southwest Asset Management, Inc. provides administrative, marketing and participant services. The Texas Treasury Safekeeping Trust Company (the Trust) is trustee of TexPool and is a limited purpose trust company authorized pursuant to Texas Government Code Ann. Section 404.103 for which the Texas State Comptroller is the sole officer, director and shareholder. The advisory board of TexPool is composed of members appointed pursuant to the requirements of the Public Funds Investment Act, Texas Government Code Ann. ch. 2256. TexStar is governed by a five-member Board of Directors comprising three government
BBrown
Typewritten Text
47

CITY OF MIDLAND, TEXAS
NOTES TO BASIC FINANCIAL STATEMENTS
(continued)
3. Deposits and Investments (continued) officials or employees and two other persons with expertise in public finance. Additionally, TexStar has a five-member advisory board. Fair value of the City’s position in all three pools is, in all material respects, the same as the value of the pool shares. Investment income earned on pooled cash and investments is allocated to each fund based upon each fund’s weighted average daily cash and investment balances. State statutes permit the City to enter into reverse repurchase agreements, that is, a sale of securities with a simultaneous agreement to repurchase them in the future at the same price plus a contract rate of interest. The market value of the securities underlying reverse repurchase agreements normally exceeds the cash received, providing the dealers a margin against a decline in market value of the securities. If the dealers default on their obligations to resell these securities to the City or provide securities or cash of equal value, the City would suffer an economic loss equal to the difference between the market value plus accrued interest of the underlying securities and the agreement obligation, including accrued interest. During the year ended September 30, 2012, the City invested in no reverse repurchase agreements. Credit Risk – In compliance with the City’s investment policy, as of September 30, 2012, the City minimized credit risk by limiting investments to the safest types of securities and diversifying the portfolio so that potential losses on individual securities were minimized. The 2a7-like pools (which represent approximately 70.7% of the portfolio) are rated AAAm by Standard and Poor’s. The Farm Credit System obligations, Federal Home Loan Bank notes and Federal Home Loan Mortgage Corporation obligations were all rated AAA by Standard and Poor’s. Interest Rate Risk – As a means of minimizing risk of loss due to interest rate fluctuations, the City’s investment policy requires that the portfolio remain sufficiently liquid to enable the City to meet operating requirements that might be reasonably anticipated. Liquidity shall be achieved by matching investment maturities with forecasted cash flow requirements. Liquidity and marketability will be ensured by investing in securities with active secondary markets. Final stated maturities may not exceed ten years with no more than 30% exceeding seven years and dollar weighted average portfolio maturity not to exceed five years in the investments listed above in sections A through F. At September 30, 2012, the weighted average portfolio maturity was 2.86 years.
BBrown
Typewritten Text
48

CITY OF MIDLAND, TEXAS
NOTES TO BASIC FINANCIAL STATEMENTS
(continued)
3. Deposits and Investments (continued) The City’s investments carried at fair value as of September 30, 2012 are:
Primary Component Weighted Average CreditInvestments: Government Units Total Maturity (in years) RiskFHLB $ 70,029,220 $ - $ 70,029,220 9.77 AAASubtotal investments 70,029,220 - 70,029,220 2a7-Like Pools 169,054,834 24,515,044 193,569,878 - AAAmTotal Fair Value $ 239,084,054 $ 24,515,044 $ 263,599,098
Portfolio Weighted Average Maturity 2.86 Concentration of Credit Risk – The City’s investment policy states that the portfolio(s) shall be diversified by type of investment and maturities to reduce risks resulting from undue investment concentration. At September 30, 2012, more than 5% of the City’s investments are in Federal Home Loan Bank notes. This investment is 29.3% of the City’s total portfolio. The investments in 2a7-like pools balance as of September 30, 2012, consisted of TexPool, LOGIC, and TexStar in the amounts of $86,156,452, $182,537, and $107,230,889, respectively. 4. Property Taxes Property taxes for the current fiscal year are levied on October 1; attach as an enforceable lien on property as of January 1; and become delinquent at January 31, unless the half-payment option is elected by the taxpayer, in which case one-half of the tax is due November 30, and the balance due the following June 30. On February 1, delinquent taxes are assessed a 6% penalty plus 1% interest. Penalty and interest rates each increase 1% per month through June. According to Article V, Section (2) of the City Charter, the maximum tax rate is $2.00 per $100.00 assessed valuation, which includes debt service. The combined tax rate of the 2011 tax roll or Fiscal Year 2011–2012 was $0.47054 per $100.00 assessed valuation, resulting in a tax levy in the amount of $33,384,453 on an assessed valuation of $7,094,923,400. The levy is composed of maintenance and operations levy of $0.41845 and an interest and sinking fund (debt service) levy of $0.05209 per $100.00 assessed valuation. Property taxes are imposed nonexchange revenues and, as such, require different revenue recognition at the government-wide level and fund level. In the government-wide statements, property taxes are recorded on an accrual basis with a receivable for any delinquent taxes and the associated revenue recognized at September 30 of each year. At the fund level, property tax revenues are recognized on the modified-accrual basis of accounting, meaning collected within the current period or soon enough thereafter, not to exceed 60 days, to be used to pay liabilities of the current period.
BBrown
Typewritten Text
49

CITY OF MIDLAND, TEXAS
NOTES TO BASIC FINANCIAL STATEMENTS
(continued)
5. Receivables
Receivables as of September 30, 2012 for the City’s individual major and nonmajor funds, and internal service funds in the aggregate, including applicable allowances for uncollectible amounts, are as follows:
Nonmajor
Debt Water and Sports and Other
General Service Airport Sewer Sanitation Complex Funds Total
Receivables:
Interest 64,541$ 651$ 6,587$ 75,983$ 14,524$ 3,382$ 30,855$ 196,523$
Property Taxes 713,155 126,020 - - - - 353,151 1,192,326
Sales Taxes 6,205,953 - - - - - - 6,205,953
Accounts 5,550,167 4,360 380,112 6,745,930 600,773 32,857 1,429,777 14,743,976
Assessments 517,257 - - - - - - 517,257 Intergovernmental 183,823 - 1,305,230 - 8,000 - 98,027 1,595,080
Gross receivables 13,234,896 131,031 1,691,929 6,821,913 623,297 36,239 1,911,810 24,451,115
Less: allowance forUncollectibles (3,104,147) (18,478) (17,623) (840,675) (34,404) - - (4,015,327)
Net total receivables 10,130,749$ 112,553$ 1,674,306$ 5,981,238$ 588,893$ 36,239$ 1,911,810$ 20,435,788$
The City reports deferred revenue, revenue earned but not available to liquidate liabilities of the current period, and unearned revenue, revenue received but not yet earned, in its governmental funds. At September 30, 2012, the composition of these revenues was as follows:
Unavailable UnearnedDelinquent property taxes receivable (General Fund) $ 476,284 $ -
Lot clearing receivable (General Fund) 349,674 - Municipal Court fines (General Fund) 1,026,727 - Delinquent property taxes receivable (Debt Service Fund) 98,166 - Lot clearing receivable (other governmental funds) 943,149 - Street paving liens receivable (General Fund) 517,257 - Grant drawdowns prior to meeting all eligibility requirements - 232,448Prepayment of various charges - 140
Total deferred/unearned revenue for governmental funds $ 3,411,257 $ 232,588
BBrown
Typewritten Text
50

CITY OF MIDLAND, TEXAS
NOTES TO BASIC FINANCIAL STATEMENTS
(continued)
6. Capital Assets
Capital asset activity for the year ended September 30, 2012 was as follows:
Primary Government
Beginning Additions/ Retirements/ EndingBalance Completions Adjustments Balance
Governmental activities:Capital assets, not being depreciated:
Land $ 4,851,815 $ - $ - $ 4,851,815 Construction in progress 9,565,945 3,870,563 (6,933,846) 6,502,662
Total capital assets, not being depreciated 14,417,760 3,870,563 (6,933,846) 11,354,477Capital assets, being depreciated:
Buildings 21,851,960 4,782,284 457,138 27,091,382 Improvements other than buildings 15,001,898 173,588 (792,808) 14,382,678 Machinery and equipment 47,584,001 4,055,111 (1,344,248) 50,294,864 Infrastructure 88,581,802 4,163,532 335,670 93,081,004 Other 8,786,621 14,995 - 8,801,616
Total capital assets, being depreciated 181,806,282 13,189,510 (1,344,248) 193,651,544 Less accumulated depreciation for:
Buildings (9,812,587) (762,441) - (10,575,028) Improvements other than buildings (7,487,774) (642,745) - (8,130,519) Machinery and equipment (30,788,487) (3,669,647) 1,331,294 (33,126,840) Infrastructure (47,914,386) (3,409,386) - (51,323,772) Other (5,207,170) (1,054,903) - (6,262,073)
Total accumulated depreciation (101,210,404) (9,539,122) 1,331,294 (109,418,232) Total capital assets, being depreciated, net 80,595,878 3,650,388 (12,954) 84,233,312 Governmental activities capital assets, net $ 95,013,638 $ 7,520,951 $ (6,946,800) $ 95,587,789
Beginning Additions/ Retirements/ EndingBalance Completions Adjustments Balance
Business-type activities:Capital assets, not being depreciated:
Land $ 9,582,401 $ - $ - $ 9,582,401 Construction in progress 32,068,493 20,373,952 (22,136,702) 30,305,743
Total capital assets, not being depreciated 41,650,894 20,373,952 (22,136,702) 39,888,144 Capital assets, being depreciated: 63,282,528
Water rights 717,058 - - 717,058 Buildings 49,255,298 4,213,491 - 53,468,789 Improvements other than buildings 74,778,118 10,558,856 - 85,336,974 Machinery and equipment 10,071,357 867,705 (87,660) 10,851,402 Infrastructure 256,493,229 7,936,898 - 264,430,127 Other 3,538,259 - - 3,538,259
Total capital assets, being depreciated 394,853,319 23,576,950 (87,660) 418,342,609 Less accumulated depreciation for:
Water rights (717,058) - - (717,058) Buildings (17,263,852) (1,226,130) - (18,489,982) Improvements other than buildings (35,350,120) (3,755,779) - (39,105,899) Machinery and equipment (6,041,280) (716,146) 86,103 (6,671,323) Infrastructure (105,697,441) (7,282,723) - (112,980,164) Other (1,615,184) (290,392) - (1,905,576)
Total accumulated depreciation (166,684,935) (13,271,170) 86,103 (179,870,002) Total capital assets, being depreciated, net 228,168,384 10,305,780 (1,557) 238,472,607 Business-type activities capital assets, net $ 269,819,278 $ 30,679,732 $ (22,138,259) $ 278,360,751
BBrown
Typewritten Text
51
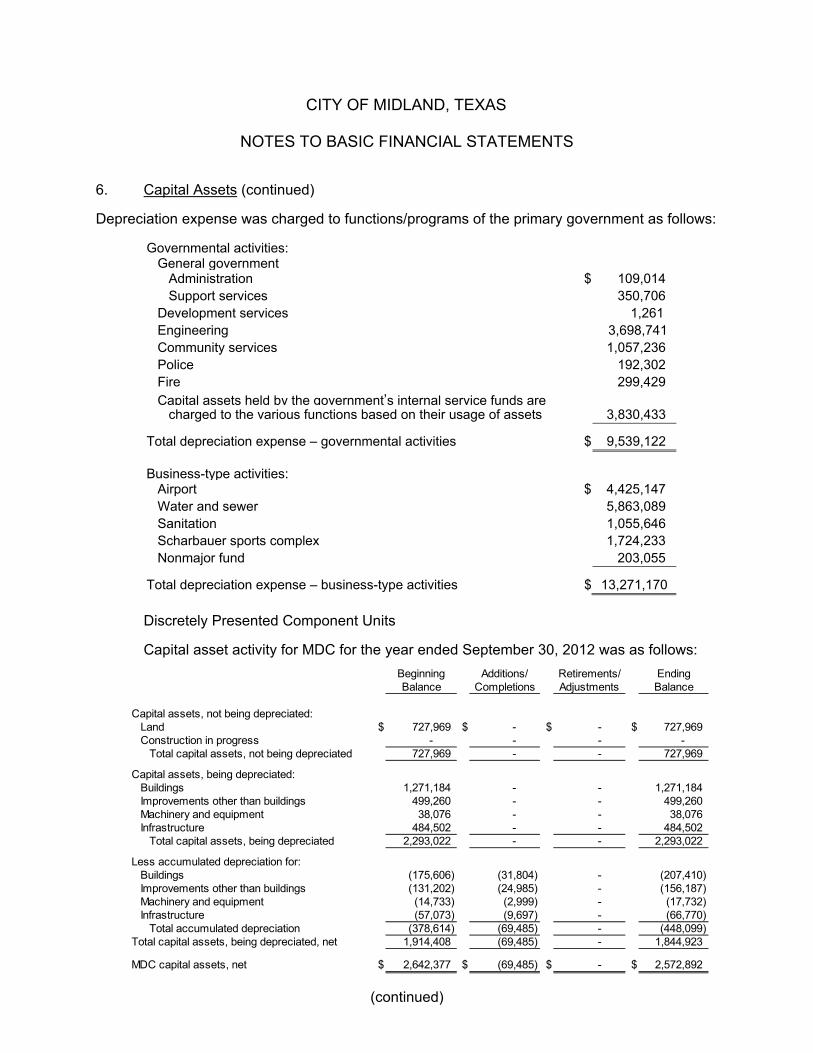
CITY OF MIDLAND, TEXAS
NOTES TO BASIC FINANCIAL STATEMENTS
(continued)
Beginning Additions/ Retirements/ EndingBalance Completions Adjustments Balance
Capital assets, not being depreciated:Land $ 727,969 $ - $ - $ 727,969 Construction in progress - - - -
Total capital assets, not being depreciated 727,969 - - 727,969
Capital assets, being depreciated:Buildings 1,271,184 - - 1,271,184 Improvements other than buildings 499,260 - - 499,260 Machinery and equipment 38,076 - - 38,076 Infrastructure 484,502 - - 484,502
Total capital assets, being depreciated 2,293,022 - - 2,293,022
Less accumulated depreciation for:Buildings (175,606) (31,804) - (207,410) Improvements other than buildings (131,202) (24,985) - (156,187) Machinery and equipment (14,733) (2,999) - (17,732) Infrastructure (57,073) (9,697) - (66,770)
Total accumulated depreciation (378,614) (69,485) - (448,099) Total capital assets, being depreciated, net 1,914,408 (69,485) - 1,844,923
MDC capital assets, net $ 2,642,377 $ (69,485) $ - $ 2,572,892
6. Capital Assets (continued)
Depreciation expense was charged to functions/programs of the primary government as follows:
Governmental activities: General government Administration $ 109,014 Support services 350,706 Development services 1,261 Engineering 3,698,741 Community services 1,057,236 Police 192,302 Fire 299,429 Capital assets held by the government’s internal service funds are charged to the various functions based on their usage of assets 3,830,433
Total depreciation expense – governmental activities $ 9,539,122 Business-type activities: Airport $ 4,425,147 Water and sewer 5,863,089 Sanitation 1,055,646 Scharbauer sports complex 1,724,233 Nonmajor fund 203,055
Total depreciation expense – business-type activities $ 13,271,170
Discretely Presented Component Units
Capital asset activity for MDC for the year ended September 30, 2012 was as follows:
BBrown
Typewritten Text
52

CITY OF MIDLAND, TEXAS
NOTES TO BASIC FINANCIAL STATEMENTS
(continued)
7. Employee Benefit Plans A. Texas Municipal Retirement System 1. Plan Description The City provides pension benefits for all of its full-time employees who
are not firefighters through a nontraditional, joint contributory, hybrid defined-benefit plan in the state-wide Texas Municipal Retirement System (TMRS), one of 847 administered by TMRS, an agent multiple-employer public employee retirement system. Each of the 847 municipalities have an annual, individual actuarial valuation performed. All assumptions for the December 31, 2011 valuations are contained in the 2011 TMRS Comprehensive Annual Financial Report, the report is available on TMRS’ website at www.TMRS.com.
Benefits depend upon the sum of the employee’s contributions to the
plan, with interest, and the City-financed monetary credits, with interest. At the date the plan began, the City granted monetary credits for service rendered before the plan began of a theoretical amount equal to two times what would have been contributed by the employee, with interest, prior to establishment of the plan. Monetary credits for service since the plan began are a percentage (100%, 150%, or 200%) of the employee’s accumulated contributions. In addition, the City can grant, as often as annually, another type of monetary credit referred to as an updated service credit, which is a theoretical amount that, when added to the employee’s accumulated contributions and the monetary credits for service since the plan began, would be the total monetary credits and employee contributions accumulated with interest if the current employee contribution rate and City-matching percentage had always been in existence and if the employee’s salary had always been the average of his/her salary in the last three years that are one year before the effective date. At retirement, the benefit is calculated as if the sum of the employee’s accumulated contributions with interest and the employer-financed monetary credits with interest were used to purchase an annuity.
The plan provisions are adopted by the governing body of the City, within
the options available in the state statutes governing TMRS. Plan provisions for the City are as follows:
Deposit rate 7% Matching ratio (City to employee) 2 to 1 Years required for vesting 5 years Service Retirement Eligibility (expressed as years of service/age
5 yrs/age 60, 20 yrs/any age
Updated Service Credit 100% repeating, transfers Annuity increase (to retirees) 50% of CPI repeating
BBrown
Typewritten Text
53

CITY OF MIDLAND, TEXAS
NOTES TO BASIC FINANCIAL STATEMENTS
(continued)
7. Employee Benefit Plans (continued) A. Texas Municipal Retirement System (continued) 2. Funding Policy Under the State law governing TMRS, the contribution rate for each city is
determined annually by the actuary, using the Projected Unit Credit actuarial cost method. This rate consists of the normal cost contribution rate and the prior service cost contribution rate, which is calculated to be a level percentage of payroll from year to year. The normal cost contribution rate finances the portion of an active member’s projected benefit allocated annually. The prior service contribution rate amortizes the unfunded (overfunded) actuarial liability (asset) over the applicable period for that city. Both the normal cost and prior service contribution rates include recognition of the projected impact of annually repeating benefits, such as Updated Service Credits and Annuity Increases.
The City contributes to the TMRS Plan at an actuarially determined rate.
Both the employees and the City make contributions monthly. Since the City needs to know its contribution rate in advance for budgetary purposes, there is a one-year delay between the actuarial valuation that serves as the basis for the rate and the calendar year when the rate goes into effect (i.e., December 31, 2011 valuation is effective for rates beginning January 2013).
Contributions by the City were $7,580,704 or 22.01% of covered payroll
of $34,442,094 as required by the actuarial valuation. Total payroll for Fiscal Year 2012 was $50,110,665. Annual TMRS pension cost, net pension obligation (NPO) and related information for the last three years is as follows:
BBrown
Typewritten Text
54

CITY OF MIDLAND, TEXAS
NOTES TO BASIC FINANCIAL STATEMENTS
(continued)
7. Employee Benefit Plans (continued) A. Texas Municipal Retirement System (continued) 2. Funding Policy (continued)
2011
2010
2009
Annual required contribution (ARC) $ 7,580,704 $ 7,600,134 $ 7,306,910
Annual pension cost 7,580,704 7,600,134 7,306,910 Contributions made 7,580,704 7,600,134 7,306,910 Change in NPO - - - NPO, beginning of year - - - NPO, end of year $ - $ - $ -
Contributions as a percentage of annual pension cost
100%
100%
100%
Actuarial valuation date December 31, 2010 December 31, 2010 December 31, 2009
Actuarial cost method Projected Unit Credit
Projected Unit Credit
Projected Unit Credit
Amortization method Level % of payroll
Level % of payroll
Level % of payroll
Asset valuation method 10-year Smoothed
Market 10-year Smoothed
Market 10-year Smoothed
Market
Amortization period
26.0-year closed period
26.9-year closed period
28-year closed period
Actuarial assumptions: Investment rate of return 7% 7.0% 7.5% Inflation rate 3.0% 3.0% 3.0% Cost-of-living adjustments 1.5% 1.5% 1.5% Projected salary increases Varies by age and
service Varies by age and
service Varies by age and
service
3. Funded Status and Funding Progress
As of December 31, 2011, the most recent actuarial valuation date, the plan was 84.5% funded. The actuarial accrued liability for benefits was $239.8 million, and the actuarial value of assets was $210.7 million, resulting in an unfunded actuarial accrued liability (UAAL) of $29.1 million. The covered payroll (annual payroll of active employees covered by the plan) was $34.4 million, and the ratio of UAAL to the covered payroll was 84.5%.
Actuarial valuations involve estimates of the value of reported amounts and assumptions about the probability of events far into the future. Actuarially determined amounts are subject to continual revision as actual results are compared to past expectations and new estimates are made about the future.
BBrown
Typewritten Text
55

CITY OF MIDLAND, TEXAS
NOTES TO BASIC FINANCIAL STATEMENTS
(continued)
7. Employee Benefit Plans (continued) A. Texas Municipal Retirement System (continued) 3. Funded Status and Funding Progress (continued)
Actuarial calculations are based on the benefits provided under the terms of the substantive plan in effect at the time of each valuation, and reflect a long-term perspective. Consistent with that perspective, actuarial methods and assumptions used includes techniques that are designed too reduce short-term volatility in actuarial accrued liabilities and actuarial value of assets. The schedule of funding progress, presented as required supplementary information following the notes to the financial statements, presents the six-year historical trend information relative to the funding progress and employer contributions.
B. Midland Firemen’s Relief and Retirement Fund 1. Plan Description The Board of Trustees of the Midland Firemen’s Relief and Retirement
Fund (the Fund) is the administrator of a single-employer defined benefit pension plan. The Fund is a separate legal entity with an independently elected board and issues its own audited financial statements. Additionally, the Fund has its own actuarial valuations performed as of December 31 in odd numbered years. The last actuarial valuation report available is for the year ended December 31, 2011. All assumptions for this valuation are contained in the Midland Firemen’s
Relief and Retirement Fund Actuarial Valuation Report and Review as of January 1, 2012, a copy of which may be obtained by writing the Midland Firemen’s Relief and Retirement Fund Board of Trustees, 1500 W. Wall, Midland, TX 79701.
A degree of financial dependence upon the City does exist to the extent the City makes contributions to the Fund equal to 20.2% of plan participants’ pay. In the City’s professional judgment, this dependence is not sufficient to warrant inclusion of the Fund’s activities within the City’s basic financial statements.
BBrown
Typewritten Text
56

CITY OF MIDLAND, TEXAS
NOTES TO BASIC FINANCIAL STATEMENTS
(continued)
7. Employee Benefit Plans (continued) B. Midland Firemen’s Relief and Retirement Fund (continued) 1. Plan Description (continued) Firefighters in the Midland Fire Department are covered by the Midland
Firemen’s Relief and Retirement Fund. The table below summarizes the membership of the fund at December 31, 2011, December 31, 2010, and December 31, 2009:
Dec. 31,
2011 Dec. 31,
2010 Dec. 31,
2009
Retirees and beneficiaries currently receiving benefits and terminated employees entitled to benefits but not yet receiving them
131
129
130
Current employees a. Vested 109 84 107 b. Nonvested 81 106 81 Total 321 319 318
The Midland Firemen’s Relief and Retirement Fund provides service
retirement, death, disability and withdrawal benefits. These benefits become fully vested after 20 years of credited service. Employees may retire with a normal retirement benefit at age 50 with 20 years of service. A partially vested benefit is provided for employees who terminate employment with at least 10 but less than 20 years of service. Firefighters may retire with 25 years of service at any age. Employees are also eligible for a reduced early service retirement benefit upon termination of eligible employment with between 20 and 25 years of service and after attaining age 45. Benefits of retired firefighters are determined on a “formula” plan with normal benefits based on a percentage of the highest 60 months’ average pay: 75% plus $80 per month for each service year in excess of 20 years to the last completed month for service and disability benefits.
Widow benefits are based on 75% of the benefit the deceased firefighter
would have been entitled to as a normal service retirement based upon the firefighter’s salary and service at the time of death. The widow’s benefit is 75% of the benefit the firefighter was receiving at the time of death if the firefighter was retired. Children’s benefits until age 22 are 11.25% of the firefighter’s average highest 60 months’ pay if there is a surviving spouse. If there is no surviving spouse, children receive 22.50% of the firefighter’s average highest 60 months’ pay.
BBrown
Typewritten Text
57

CITY OF MIDLAND, TEXAS
NOTES TO BASIC FINANCIAL STATEMENTS
(continued)
7. Employee Benefit Plans (continued) B. Midland Firemen’s Relief and Retirement Fund (continued) 1. Plan Description (continued) There are four Deferred Retirement Option Plans (DROP) and a 100%
joint and survivor option. DROP 1 allows a firefighter to contract with the fund to retire while he/she
continues to be employed as a regular firefighter. His/her benefit and contributions are accumulated in a separate account with interest. DROP 1 may last no longer than three years at which time he/she leaves the Fire Department, receives his/her accumulated lump sum and begins receiving benefits as contracted for three years earlier.
DROP 2 is a reverse plan whereby the firefighter contracts to receive
90% of his/her normal retirement benefit and receives as a lump sum the reduced monthly benefit multiplied by 24 months.
DROP 3 allows a firefighter with at least 20 years of service and age 50 to
declare his/her effective retirement date as no earlier than the date he/she actually had 20 years of service and was at least 50 years old. He/she receives a lump sum consisting of the benefit as of the effective date, his/her contributions since that date and interest thereon. A firefighter can DROP back to no more than three years. The 100% joint and survivor option allows the firefighter and his/her spouse to receive the same benefit for life, the normal benefit being reduced by 10% plus 0.4% per year that the beneficiary’s age is less than the firefighter’s age and minus 0.4% that the beneficiary’s age is greater than the firefighter’s. All benefits are subject to the IRS Sec. 415 limitation. Additionally, there is a $10,000 death benefit for a beneficiary and a $500 monthly supplement for the firefighter who retires at or after age 50 with 20 years of service or more. A 2% COLA is incorporated the January following 5 years of actual receipt of benefits and physical departure from the Fire Department. Under this plan, Midland firefighters are required to contribute 13.2% of their pay to the fund.
DROP 4 provides a Combined (Forward and Retroactive) DROP plan
benefit. This option states that the firefighter must retire within three years of his Combined (Forward and Retroactive) DROP. The monthly benefit he will receive is determined based upon his salary and service at the beginning of the DROP period. At the conclusion of the DROP period, the firefighter will be paid an amount which is the sum of his employee contributions from the Forward DROP portion of the period plus the product of his monthly benefit amount times the number of months of the Forward DROP portion of the Combined (Forward and Retroactive) DROP period.
BBrown
Typewritten Text
58
CITY OF MIDLAND, TEXAS
NOTES TO BASIC FINANCIAL STATEMENTS
(continued)
7. Employee Benefit Plans (continued) B. Midland Firemen’s Relief and Retirement Fund (continued)
1. Plan Description (continued) The plan was amended on October 1, 2008 to include a cost of living
adjustment. Eligible firefighters and beneficiaries will receive payment on August 1 following the fifth full audited year of receipt of benefits by a firefighter and following a firefighter’s physical departure from the Fire Department.
The City of Midland is statutorily required to make contributions that will
equal the lesser of 9.00% or the firefighters’ contribution rate. However, the City makes contributions equal to 20.20% of pay as authorized by Ordinance 8930 that adopted the Fiscal Year 2012 budget that incorporated the increase above the statutory rate. The benefit and contribution provisions of this plan, other than the City’s contribution rate, are authorized by the Texas Local Fire Fighters Retirement Act (TELFRA).
a. Basis of Accounting – The Midland Firemen’s Relief and
Retirement Fund financial statements are prepared using the accrual basis of accounting. The fund’s fiscal year is a calendar year. Employee and employer contributions are recognized as revenues in the period in which they are received by the Fund for benefit purposes but reported as accrued in the audited statements. Benefits paid and refunds of contributions are recognized when due and payable in accordance with the terms of the plan.
b. Method Used to Value Investments – The Midland Firemen’s
Relief and Retirement Fund’s investments are reported at fair value. Investments in securities traded on a national securities exchange are valued based on the latest quoted market price as of each year-end. Investments that are not traded on a national securities exchange are valued at their fair values determined by the Trustees based on the market values of similar investments or on the basis of information obtained from qualified sources such as the custodial bank trust department, brokers, pricing services or appraisers.
2. Summary of Significant Accounting Policies and Plan Asset Matters In accordance with the policy of stating investments at market value,
the amount reflected as the net appreciation (depreciation) in fair value represents the net changes in market values from the beginning of the year or date of purchase (whichever is later) to the end of the year,
BBrown
Typewritten Text
59

CITY OF MIDLAND, TEXAS
NOTES TO BASIC FINANCIAL STATEMENTS
(continued)
7. Employee Benefit Plans (continued) B. Midland Firemen’s Relief and Retirement Fund (continued)
2. Summary of Significant Accounting Policies and Plan Asset Matters (cont.) adjusted for securities sold during the year. The fund has investments in
Westwood Trust Smid Cap Equity, 2514 Muti-Strategy Fund Limited Partnership, and Loomis Sayles Multisector Trust that represent 5% or more of the Fund’s net assets. The fair value of these investments is $9,084,198, $6,477,584, and $5,000,000, respectively. The Midland Firemen’s Relief and Retirement Fund adopted the current plan effective October 1, 2000, amended November 1, 2002 and October 1, 2008.
3. Funding Status and Progress The Fund is required by statute to conduct actuarial studies once every
three years and conducted the last study December 31, 2011 for the plan in effect at that time. The following disclosures relative to the funding and progress of the plan are made for the plan in effect and for the plan year ended December 31, 2011.
The funding policy of the Fund requires contributions equal to 13.2% of
pay by the firefighters and 20.2% of pay by the City of Midland, effective October 1, 2007.
While the contribution requirements are not actuarially determined, State
law requires that a qualified actuary must approve each plan of benefits adopted by the Fund. The actuary certifies either the adequacy or inadequacy of the financing arrangement of the contribution commitments by the firefighters and the City.
BBrown
Typewritten Text
60

CITY OF MIDLAND, TEXAS
NOTES TO BASIC FINANCIAL STATEMENTS
(continued)
7. Employee Benefit Plans (continued) B. Midland Firemen’s Relief and Retirement Fund (continued) 3. Funding Status and Progress (continued) Contributions by the City were $2,477,724, or 20.2% of covered payroll of
$12,265,959, as required by the actuarial valuation. Total payroll for fiscal year 2012 was $50,110,665. Annual FRRF pension cost, NPO and related information for the last three years are as follows:
2011 2010 2009 ARC $ 2,477,724 $ 2,331,557 $ 2,348,033
Annual pension cost 2,477,724 2,331,557 2,348,033
Contributions made 2,477,724 2,331,557 2,348,033
Change in NPO - - - NPO, beginning of year - - - NPO, end of year $ - $ - $ -
Contributions as a percentage of annual pension cost
100% 100% 100% Actuarial valuation date December 31, 2011 N/A December 31, 2009 Actuarial cost method Entry age normal N/A Entry age normal Amortization method Level % of payroll N/A Level % of payroll Asset valuation method Smoothed market
value Smoothed market value
Smoothed market value
Amortization period 41.2 years open N/A 41.2 years open Actuarial assumptions: Investment rate of return 8.00% 8.00% 8.00% Inflation rate 3.00% 3.00% 3.00% Cost-of-living adjustments 2.00% after 5 years 2.00% after 5 years 2.00% after 5 years Projected salary increases 11.50%–6.00% 11.50%–6.00% 11.50%–6.00%
As of January 1, 2012, the most recent actuarial valuation date, the plan
was 72.2% funded. The actuarial accrued liability for benefits was $101.2 million, and the actuarial value of assets was $73.1 million, resulting in an UAAL of $28.1 million. The covered payroll (annual payroll of active employees covered by the plan) was $12.3 million, and the ratio of the UAAL to the covered payroll was 229.0%.
The required supplementary information reporting the six-year historical
trend information relative to the FRRF’s funding progress and employer contributions is presented in the RSI Section of the City’s CAFR, following the notes.
BBrown
Typewritten Text
61

CITY OF MIDLAND, TEXAS
NOTES TO BASIC FINANCIAL STATEMENTS
(continued)
7. Employee Benefit Plans (continued) C. Deferred Compensation The City offers all employees a deferred-compensation plan created in
accordance with Internal Revenue Code Section 457. The plan permits them to defer a portion of their salary until future years. The deferred compensation is not available to employees until termination, retirement, death or unforeseeable emergency.
In compliance with the Small Business Job Protection Act of 1996 and the
Taxpayer Relief Act of 1997, the nature of assets held by the U.S. Conference of Mayors and Hartford Variable Annuity Life Insurance Company is assets held in trust by the plan providers for the exclusive benefit of plan participants and their beneficiaries. The City retains no rights to plan assets or property nor has any liability for those assets.
D. Flexible Spending Account The City offers all employees a flexible spending account, known as a cafeteria
plan, which was established under Section 125 of the IRS code. Administration of the plan is contracted to a third party administrator. Employee contributions are transferred to the administrator and posted to a debit card which the employee may use to pay for qualified medical expenses. The City retains no assets or liabilities of the plan.
E. Health Reimbursement Account
The City established a Health Reimbursement Account (HRA) in accordance with Internal Revenue Code Section 105-106 for employees who participate in the City’s health insurance program. Administration of the plan is handled by a third party administrator. The City contributes $750 per year for each eligible employee to pay medical expenses which meet the guidelines of the City’s HRA plan. Reimbursement dollars received by the employee are tax free and unspent dollars can be rolled over from year to year.
F. Other Postemployment Retirement Benefits (OPEB) 1. Plan Description
The City OPEB plan is a single-employer defined benefit “substantive plan” as understood by past practices of the employer and its employees. City employees are eligible for retiree medical benefits if they are eligible for retirement plan benefits under the provisions of the Texas Municipal Retirement System or the City of Midland Fireman’s Relief and Retirement Fund. Generally, employees eligible for retiree medical benefits are employees who retire with 25 years of service at any age or
BBrown
Typewritten Text
62

CITY OF MIDLAND, TEXAS
NOTES TO BASIC FINANCIAL STATEMENTS
(continued)
7. Employee Benefit Plans (continued) F. Other Postemployment Retirement Benefits (OPEB) (continued) 1. Plan Description (continued)
those employees who retire at age 60 with 10 years of service. Eligible participants include eligible spouses. The eligible member shall not be gainfully employed if receiving benefits from this plan. The City OPEB plan does not issue a publicly available financial report.
Benefits are payable through a self-insured plan for eligible retirees and spouses until age 65. A Medicare Supplement Plan is available for eligible retirees and spouses who are age 65 and over.
2. Funding Policy
The City of Midland allows retired employees to enroll in the City’s health insurance plan. The City pays a fixed dollar amount toward the cost of group health coverage, based upon length of service (as of September 30, 2012, the amounts were $247 per month for the retiree with 25 or more years service, $221 for less than 25 years service, $184 for less than 20 years service, and $110 for 10 years or less service) or will provide a fixed dollar amount toward the purchase of a Medicare supplement policy (as of September 30, 2012, the amount was $30 per month) if the retiree is eligible for Medicare. City contributions for these postemployment retirement benefits are strictly discretionary and are financed on a pay-as-you-go basis. OPEB contributions during the year ended September 30, 2012 were $553,228, and there were 343 retirees participating in the plan at that date. The retired employees are required to pay the balance of their respective health plan contributions or premiums to participate in either plan.
3. Annual OPEB Cost and Net OPEB Obligation
The City’s annual other postemployment benefit (OPEB) cost (expense) is calculated based on the annual required contribution of the employer (ARC), an amount actuarially determined in accordance with the para-meters of GASB Statement No. 45. The ARC represents a level of funding that, if paid on an ongoing basis, is projected to cover normal cost each year and amortize any unfunded actuarial liabilities (or funding excess) over a period not to exceed thirty years. The following table shows the components of the City’s annual OPEB cost for the year, the amount actually contributed to the plan, and the changes in the City’s net OPEB obligation.
BBrown
Typewritten Text
63

CITY OF MIDLAND, TEXAS
NOTES TO BASIC FINANCIAL STATEMENTS
(continued)
7. Employee Benefit Plans (continued) F. Other Postemployment Retirement Benefits (OPEB) (continued 3. Annual OPEB Cost and Net OPEB Obligation (continued)
OPEB Annual required contribution $5,387,901Interest on net OPEB obligation 415,086 Adjustment to annual required contribution (705,912) Annual OPEB cost (expense) 5,097,075Contributions made 553,228 Adjust Balance to Actuarial Study 149,356 Increase in net OPEB obligation 4,693,203Net OPEB obligation – beginning of the year 13,686,836Net OPEB obligation – end $18,380,039
The City’s annual OPEB cost, the percentage of annual OPEB cost contributed to the plan, and the net OPEB obligation for 2012 and the preceding years were as follows:
Fiscal Year
Annual
OPEB Costs
Percentage of Annual OPEB
Cost Contributed
Net OPEB
Obligation 2009 $4,970,163 9.6% $4,492,264 2010 2011
$5,111,625 $5,111,626
9.8% 9.8%
$9,102,094 $13,686,836
2012 $5,097,075 10.8% $18,380,039
Funded Status and Funding Progress
The date of the most recent actuarial valuation date is May 2012. As of September 30, 2012, the actuarial accrued liability for benefits was $52,657,298, all of which was unfunded. The covered payroll (annual payroll of active employees covered by the plan) was $50,110,665, and the ratio of the unfunded actuarial accrued liability to the covered payroll was 105%. Actuarial values of the program involve estimates of the value of reported amounts and assumptions of the probability of occurrence of events far into the future.
Examples include assumptions about future employment, mortality, and the healthcare costs trend. Amounts determined regarding the funded status of the program and the annual required contributions of the employer are subject to continual revision as actual results are compared with past expectations and new estimates are made about the future. information following the notes to the financial statements, presents multiyear trend information about whether the actuarial value of plan assets is increasing or decreasing over time relative to the actuarial accrued liabilities for benefits.
BBrown
Typewritten Text
64

CITY OF MIDLAND, TEXAS
NOTES TO BASIC FINANCIAL STATEMENTS
(continued)
7. Employee Benefit Plans (continued) F. Other Postemployment Retirement Benefits (OPEB) (continued)
Actuarial Methods and Assumptions
Projections of benefits for financial reporting purposes are based on the substantive plan (the plan as understood by the employer and the plan members) and include the types of benefits provided at the time of each valuation and the historical pattern of sharing of benefit costs between the employer and plan members to that point. The actuarial methods and assumptions used include techniques that are designed to reduce the effects of short-term volatility in actuarial accrued liabilities and the actuarial value of assets, consistent with the long-term perspective of the calculations.
In the May 2012, actuarial valuation, the projected unit credit actuarial cost method was used. The actuarial assumptions included a 3.0 percent inflation rate and investment rate of return. The annual healthcare cost trend rate assumption is 11 percent initially, reduced by decrements to an ultimate rate of 5.5 percent after seven years. The UAAL is being amortized as a level dollar amount on an open basis. The remaining amortization period at September 30, 2012, was thirty years.
8. Operating Leases The City enters in operating leases involving terminal space and other airport facilities at
Midland International Airport. Additionally, the City has entered into an operating lease for use of and naming rights for the Citibank Ballpark and Grande Stadium at the Scharbauer Sports Complex. Current year income for these leases was $3,669,031 and $401,551 for the Airport and Sports Complex, respectively. Minimum future rentals on noncancelable operating leases as of September 30, 2012 for each of the five subsequent fiscal years and in five-year increments thereafter are as follows:
Airport Sports Complex TotalFiscal Year(s) Minimum Minimum Minimum
Ending Future Future FutureSeptember 30 Rentals Rentals Rentals
2013 1,822,054$ 253,790$ 2,075,844$ 2014 758,064 228,790 986,854 2015 383,198 228,790 611,988 2016 383,198 228,790 611,988 2017 383,198 228,790 611,988
2018–2022 495,020 855,832 1,350,852 2023–2027 538,066 195,000 733,066 2028–2032 581,111 - 581,111 2033–2037 602,634 - 602,634
Total 5,946,543$ 2,219,782$ 8,166,325$
BBrown
Typewritten Text
65
CITY OF MIDLAND, TEXAS
NOTES TO BASIC FINANCIAL STATEMENTS
(continued)
8. Operating Leases (continued) In general, the City’s leasing arrangements for operating leases are as follows: Airport
A. Airline Exclusive Space and Joint Use Space
Scheduled airlines operating at Midland International Airport are required to sign a standard airline/airport use and lease agreement. These agreements allow the signatory airline the use of certain premises and facilities and the exercise of certain rights and privileges at the Midland International Airport in connection with the operation of an air transportation system.
Terminal building joint use and exclusive rates are currently $20.50 per square foot per year (s.f.y.). The rate used to calculate the amount of rent to be paid by the airline to the City shall be reviewed annually and may be adjusted if the Airport’s financial data for the Airport System Cost/Revenue indicates such need. In no event shall the square footage rate be less than $20.50 per s.f.y.
All current airline lease agreements will terminate at midnight on January 31, 2014, unless terminated sooner according to various provisions within each agreement.
B. Fixed Base Operator (FBO) Leased Space
Currently, there are two Commercial Fixed Base Operator City-owned building/ facility/land lease agreements between the Department of Airports and the existing FBOs.
The first lease agreement for properties located at Midland Airpark expires April 30, 2014. Rental rates for this lease vary by location with ground rental at $0.05 per s.f.y. and building rentals from $0.11 to $1.13 per s.f.y. This agreement allows for rent to be adjusted annually, beginning January 1, 2009, to reflect changes in the Consumer Price Index (CPI).
The second lease is for ground rental at Midland International Airport (MAF). This lease expires December 31, 2037. Rental rates for this lease are currently at $0.061 s.f.y. This lease provides for annual rental adjustments based on percentage increases in annual general aviation and military fuel sales. This lease also incorporates minimum base rental increases every five years throughout the term of this agreement. In no event will rental be adjusted below $0.05 s.f.y.
BBrown
Typewritten Text
66

CITY OF MIDLAND, TEXAS
NOTES TO BASIC FINANCIAL STATEMENTS
(continued)
8. Operating Leases (continued)
C. Rental Car Facilities Lease Space
Car rental concessionaires operating at MAF are required to sign a standard Car Rental Concession agreement. These agreements guarantee minimum monthly/annual payments to the Airport and allow the concessionaire the use of certain premises and the exercise of certain rights, privileges and uses therein, as necessary to provide car rental service on the property at the Airport.
Minimum annual guarantee amounts are reviewed annually and adjusted as follows: the minimum annual guarantee will be the greater of the base year, or 85% of the previous year’s actual rent payments. In no event will the annual guarantee be lower than the base year. All Car Rental Concession agreements expire January 31, 2013.
D. Terminal Building Concession Lease Space
Restaurant and Gift Shop Concessionaires operating at MAF are required to sign a standard Concession agreement. These agreements guarantee minimum monthly/annual payments to the Airport and allow the concessionaire to use certain premises and exercise certain rights, privileges, and uses therein, as necessary to provide restaurant and gift shop services on the property at the Airport.
Minimum annual guarantee amounts are reviewed annually and adjusted as follows: the minimum annual guarantee will be the greater of the base year, or 85% of the previous year’s actual rent payments. Minimum annual guarantees are subject to CPI adjustment every five years. In no event will the annual guarantee be lower than the base year. Restaurant and gift shop agreements expire September 30, 2019.
Scharbauer Sports Complex A. Citibank Ballpark Use Lease
The Citibank Ballpark use lease is a lease between Midland Sports, Inc. and the City with an initial 20-year term beginning April 1, 2002, and ending March 30, 2022, with two 5-year options to renew. The lease is noncancelable during the initial 20-year term. The lease agreement is for rights to use Citibank Ballpark and executive office space and requires a good faith effort to play 68 home games each year by a AA major league baseball franchise. The lease rate was $4,160 per month, due on the first day of each month, until May 1, 2007 when the rate increased to $4,165 per month. The lease rate increased to $4,170 on May 1, 2012 and shall increase to $4,175 and May 1, 2017. An additional lump- sum lease fee of $50,000 per year is due on September 30 of each year for the first 15 years of the initial 20-year lease term. 15% of net concession sales is payable to the City during the term of the lease.
BBrown
Typewritten Text
67

CITY OF MIDLAND, TEXAS
NOTES TO BASIC FINANCIAL STATEMENTS
(continued)
8. Operating Leases (continued) Scharbauer Sports Complex B. Citibank Ballpark Naming Rights
The Citibank naming rights license agreement is an agreement between the City and Citibank Texas to name the baseball stadium at the Scharbauer Sports Complex Citibank Ballpark. The full term of this agreement is 25 years and is divided into five units of 5 years each. The first 5 years is the initial term, the next 5 years is the second term, and so on through the fifth term of the agreement. The agreement requires payments of $385,000, $414,856, $469,371, $450,000, and $450,000 during the initial through fifth terms, respectively. The agreement is cancelable any time during the initial or second terms upon payment of $150,000 to the City. Additionally, the agreement is cancelable at the end of the first or second terms upon proper written notification to the City by Citibank and payment of any additional license payments due during the term plus $25,000. The agreement is cancelable at any time during the final three terms of the agreement upon one year written notice with no penalties.
C. Grande Stadium Use Lease
The Grande Stadium, a football/soccer stadium, use lease is a noncancelable lease between Midland Independent School District (MISD) and the City for use of the football/soccer stadium. The stadium is to be the home stadium of all MISD football and soccer teams and may be used by MISD for other MISD events with the consent of the City. The lease term is 20 years, August 1, 2002 through July 31, 2022. Under the terms of the lease, MISD is to pay the City $50,000 per year rent plus a $30,000 per year operating contribution plus 50% of net concession revenue. Subsequent to the initial five-year period of the lease and at every subsequent five-year period, the annual rent shall be adjusted based upon the change in the CPI - All Urban Consumers, All Items, Dallas - Fort Worth Area.
D. Grande Communications Naming Rights
The Grande Communications naming rights license agreement is an agreement between the City and Grande Communications - ClearSource, Inc. to name the football/soccer stadium at the Scharbauer Sports Complex Grande Communications Stadium. The full term of the agreement is 25 years. The agreement required payment of $30,000 on or before December 1, 2002 and $48,750 per year for the remaining term of the agreement. These payments are due on June 1 of each year with the first payment due June 1, 2003, and the final payment due on June 1, 2026. The agreement is noncancelable during the term of the agreement, except in the event of default as defined in the agreement, by either party.
BBrown
Typewritten Text
68

CITY OF MIDLAND, TEXAS
NOTES TO BASIC FINANCIAL STATEMENTS
(continued)
9. Long-Term Debt The following is a summary of debt transactions, including current portion, for the year ended September 30, 2012:
Balance at Balance at
October 1, September 30, Due Within
2011 Increase Decrease 2012 One Year
Governmental Activities:General Obligation Bonds 4,731,979$ - $ (1,486,115)$ 3,245,864$ 1,118,125$
Certificates of Obligation 21,565,000 13,590,000 (1,320,000) 33,835,000 1,610,000
Plus Deferred Amounts
for issuance premiums 287,274 770,191 (93,238) 964,227 103,451
Less Deferred Amounts on Refunding (5,346) - 2,236 (3,110) (1,542)
Total Bonds Payable 26,578,907 14,360,191 (2,897,117) 38,041,981 2,830,034
Notes Payable 370,000 - (85,000) 285,000 90,000
Compensated Absences Liability 5,704,347 4,941,183 (5,173,288) 5,472,242 3,731,814
Other Postemployment Benefits Payable 11,534,205 4,383,255 (436,112) 15,481,348 -
Self-Insurance Liability 2,959,143 7,653,066 (7,800,576) 2,811,633 1,126,867
Total Governmental Activity
Long-term Debt 47,146,602$ 31,337,695$ (16,392,093)$ 62,092,204$ 7,778,715$
Business-Type Activities:Water and Sewer:
Revenue Bonds 12,685,000$ - $ (1,730,000)$ 10,955,000$ 1,820,000$
Certificates of Obligation 48,695,000 15,855,000 (1,435,000) 63,115,000 1,765,000
Plus Deferred Amounts
for issuance premiums 1,318,416 899,400 (109,867) 2,107,949 141,997
Airport:
General Obligation Refunding Bonds 7,310,000 - (1,320,000) 5,990,000 1,390,000
Less Deferred Amounts on Refunding (3,967) - 1,454 (2,513) (1,136)
Sports Complex:
General Obligation Refunding Bonds 23,695,000 - (1,830,000) 21,865,000 1,910,000
Less Deferred Amounts on Refunding (971,843) 169,918 (801,925) (156,765)
Nonmajor Fund:
General Obligation Refunding Bonds 283,021 - (88,885) 194,136 66,876
Plus Deferred Amounts on Refunding 3,452 - (1,425) 2,027 990
Total Bonds Payable 93,014,079 16,754,400 (6,343,805) 103,424,674 6,936,962
Water and Sewer Fund:
Notes Payable (a) 6,000,000 - (6,000,000) - -
Compensated Absences Liability 318,636 325,282 (347,266) 296,652 192,281
Other Postemployment Benefits Payable 1,103,019 439,766 (76,053) 1,466,732 -
Sanitation Fund:
Closure/postclosure care 10,770,228 782,961 - 11,553,189 -
Compensated Absences Liability 113,261 165,528 (179,308) 99,481 76,911
Other Postemployment Benefits Payable 548,784 242,191 (27,761) 763,214 -
Airport Fund:
Compensated Absences Liability 209,402 139,561 (134,180) 214,783 139,605
Other Postemployment Benefits Payable 382,708 141,465 (13,302) 510,871 -
Nonmajor Fund:
Compensated Absences Liability 68,917 16,088 (18,702) 66,303 40,659
Other Postemployment Benefits Payable 118,120 39,754 - 157,874 -
Total Business-Type
Activity Long-term Debt 112,647,154$ 19,046,996$ (13,140,377)$ 118,553,773$ 7,386,418$
a. Notes Payable was reclassified to Current Liability-Due to Component Unit.
BBrown
Typewritten Text
69

CITY OF MIDLAND, TEXAS
NOTES TO BASIC FINANCIAL STATEMENTS
(continued)
9. Long-Term Debt (continued) Long-term debt at September 30, 2012 consists of the following issues:
Final AnnualOriginal Interest Maturity Principal Principal CallIssue Rates Date Outstanding Installments Provisions
General obligation bonds servicedby tax revenues:
General Obligation Refunding Bonds,Series 2009 $ 7,708,926 3.00% 2016 $ 3,245,864 $ 570,857–1,118,125 1
Total $ 3,245,864
Certificates of obligation servicedby tax revenues:
Tax and Waterworks and Sewer System(Limited Pledge) Revenue, Series 2003 $ 4,950,000 3.50–4.00% 2018 $ 2,415,000 $ 360,000–450,000 4
Tax and Waterworks and Sewer System(Limited Pledge) Revenue, Series 2005 4,950,000 3.50–4.00% 2020 3,040,000 330,000–435,000 5
Tax and Waterworks and Sewer System(Limited Pledge) Revenue, Series 2007 6,910,000 4.00–5.00% 2027 5,860,000 280,000–530,000 7
Tax and Waterworks and Sewer System(Limited Pledge) Revenue, Series 2009 9,855,000 3.00–4.25% 2029 8,930,000 400,000–700,000 9
Tax and Waterworks and Sewer System(Limited Pledge) Revenue, Series 2012 13,590,000 3.00–4.25% 2032 13,590,000 240,000–950,000 10
Total $ 33,835,000
Notes payable:HUD Section 108 Note Payable $ 1,045,000 6.08–6.25% 2015 $ 285,000 $ 90,000–100,000 3
General obligation bonds servicedby Enterprise Fund revenues:
Airport Fund:General Obligation Refunding Bonds,
Series 2006A $ 13,160,000 4.00–5.00% 2016 $ 5,990,000 $ 1,390,000–1,605,000 1
Scharbauer Sports Complex Fund:General Obligation Refunding Bonds,
Series 2006B 28,970,000 4.00–5.00% 2022 21,865,000 835,000–2,800,000 6
Nonmajor Fund:General Obligation Refunding Bonds,
Series 2009 461,074 3.00% 2016 194,136 34,143–66,875 1
Total $ 28,049,136
Certificates of obligation servicedby Enterprise Fund revenues:
Water and Sewer Fund:Combination Tax and Revenue Refunding Bonds,
Series 2007 $ 4,995,000 4.00% 2016 $ 2,195,000 $ 515,000–585,000 1
Tax and Waterworks and Sewer System(Limited Pledge) Revenue, Series 2007 48,595,000 4.00–5.00% 2037 45,065,000 975,000–3,035,000 8
Tax and Waterworks and Sewer System(Limited Pledge) Revenue, Series 2012 15,855,000 3.00–4.25% 2032 15,855,000 275,000–1,110,000 10
Total $ 63,115,000
Revenue bonds:Waterworks and Sewer Fund Senior Lien Bonds:
Waterworks and Sewer System RevenueRefunding Bonds, Series 2002 $ 10,460,000 5.00% 2013 $ 1,245,000 $ 1,245,000 1
Total 1,245,000
Waterworks and Sewer Fund Junior Lien Bonds,Series 1999 $ 15,285,000 Variable Rate 2024 9,710,000 575,000–1,095,000 2
Total $ 10,955,000
BBrown
Typewritten Text
70

CITY OF MIDLAND, TEXAS
NOTES TO BASIC FINANCIAL STATEMENTS
(continued)
9. Long-Term Debt (continued) Call provisions for long-term debt of the City are as follows:
1. The bonds are not optional for redemption prior to maturity.
2. Callable as a whole or in part prior to maturity on any interest payment date upon not less than ten days’ notice to the Texas Small Business Industrial Development Corporation and Ameritrust Corporation, National Association, Dallas, Texas at par plus accrued interest.
3. The aggregate principal amount of the note or any unpaid principal amount may be
defeased in whole or in part as of any principal due date.
4. Callable as a whole or in part, bonds maturing 2012 through 2018, on March 1, 2011, or on any interest payment date thereafter at par plus accrued interest.
5. Callable as a whole or in part, bonds maturing 2015 through 2020, on March 1, 2014, or
on any interest payment date thereafter at par plus accrued interest.
6. Callable as a whole or in part, bonds maturing 2017 through 2022, on March 1, 2016, or on any interest payment date thereafter at par plus accrued interest.
7. Callable as a whole or in part, bonds maturing 2018 through 2027, on March 1, 2017, or
on any interest payment date thereafter at par plus accrued interest.
8. Callable as a whole or in part, bonds maturing 2018 through 2037, on March 1, 2017, or on any interest payment date thereafter at par plus accrued interest.
9. Callable as a whole or in part, bonds maturing 2020 through 2029, on March 1, 2019, or
on any interest payment date thereafter at par plus accrued interest. 10. Callable as a whole or in part, bonds maturing 2022 through 2032, on March 1, 2021, or
on any interest payment date thereafter at par plus accrued interest.
The annual requirements to amortize debt outstanding as of September 30, 2012, including interest payments of approximately $57,874,757, follow. Due to the nature of the self-insurance liability and the compensated absences liability, annual requirements to amortize such obligations are not determinable and have not been included in the following summary. The City intends to retire all of the long-term debt associated with governmental activities, other than bonds payable and certificates of obligation, from General Fund revenues as it has done in prior years. Debt associated with business-type activities will be retired with revenues generated by those activities.
BBrown
Typewritten Text
71

CITY OF MIDLAND, TEXAS
NOTES TO BASIC FINANCIAL STATEMENTS
(continued)
9. Long-Term Debt (continued)
City of Midland, TexasDebt Service Requirements to Maturity
September 30, 2012
Supported by General Government Supported by Enterprise Funds
General Obligation Bonds, Certificates ofFiscal Year Obligation and Notes Payable Revenue Bonds and Notes Payable Total All
Ending Debt ServiceSeptember 30, Principal Interest Total Principal Interest Principal Interest Total Requirements
2013 $ 2,818,125 $ 1,600,143 $ 4,418,268 $ 1,820,000 $ 80,244 $ 5,131,875 $ 4,324,737 $ 11,356,856 $ 15,775,124
2014 2,982,154 1,253,110 4,235,264 610,000 16,874 5,662,846 3,787,676 10,077,396 14,312,660
2015 2,655,857 1,154,288 3,810,145 645,000 15,687 5,909,143 3,519,222 10,089,052 13,899,197
2016 2,659,728 1,059,042 3,718,770 685,000 14,430 6,180,272 3,244,255 10,123,957 13,842,727
2017 2,150,000 975,036 3,125,036 725,000 13,097 4,150,000 2,998,101 7,886,198 11,011,234
2018 2,230,000 891,511 3,121,511 770,000 11,683 4,335,000 2,810,851 7,927,534 11,049,045
2019 1,850,000 817,418 2,667,418 815,000 10,185 4,515,000 2,634,756 7,974,941 10,642,359
2020 1,925,000 746,791 2,671,791 865,000 8,597 4,720,000 2,430,936 8,024,533 10,696,324
2021 1,550,000 677,479 2,227,479 920,000 6,910 4,950,000 2,198,005 8,074,915 10,302,394
2022 1,615,000 614,969 2,229,969 975,000 5,118 3,080,000 2,015,018 6,075,136 8,305,105
2023 1,675,000 549,336 2,224,336 1,030,000 3,222 2,340,000 1,901,434 5,274,656 7,498,992
2024 1,750,000 478,719 2,228,719 1,095,000 1,214 2,450,000 1,795,281 5,341,495 7,570,214
2025 1,825,000 402,804 2,227,804 - - 2,565,000 1,678,481 4,243,481 6,471,285
2026 1,900,000 327,099 2,227,099 - - 2,685,000 1,560,656 4,245,656 6,472,755
2027 1,975,000 253,146 2,228,146 - - 2,800,000 1,446,593 4,246,593 6,474,739
2028 1,495,000 185,596 1,680,596 - - 2,915,000 1,327,431 4,242,431 5,923,027
2029 1,555,000 126,425 1,681,425 - - 3,040,000 1,202,106 4,242,106 5,923,531
2030 885,000 82,722 967,722 - - 3,175,000 1,068,991 4,243,991 5,211,713
2031 920,000 51,113 971,113 - - 3,320,000 922,381 4,242,381 5,213,494
2032 950,000 17,219 967,219 - - 3,475,000 767,494 4,242,494 5,209,713
2033 - - - - - 2,485,000 626,125 3,111,125 3,111,125
2034 - - - - - 2,615,000 498,625 3,113,625 3,113,625
2035 - - - - - 2,745,000 364,625 3,109,625 3,109,625
2036 - - - - - 2,885,000 223,875 3,108,875 3,108,875
2037 - - - - - 3,035,000 75,875 3,110,875 3,110,875
$ 37,365,864 $ 12,263,966 $ 49,629,830 $ 10,955,000 $ 187,261 $ 91,164,136 $ 45,423,530 $ 147,729,927 $ 197,359,757
General Obligation Bonds,Certificates of Obligation
The City issues general obligation bonds and certificates of obligation to provide funds for the acquisition and construction of major capital facilities. The City is restricted by City Charter to a maximum of $2.00 on each $100.00 of appraised valuation. The City’s current tax levy is $0.05209 per $100.00 valuation for the payment of debt. The Constitution and Statutes of the State of Texas and the Charter of the City of Midland do not provide for a legal debt limit. However, a limit of 8% of assessed value has been recommended by the Finance Advisory Board of the City of Midland and has been adopted by the City Council as a guideline of safe debt limit. This guideline provides the City with a debt margin of $436,115,354. The City has also issued certificates of obligation to provide funds for the acquisition and construction of major capital facilities owned and operated by the enterprise funds of the City. These certificates of obligation are supported by revenues of the respective enterprise funds and appropriately recorded as liabilities of the appropriate fund. There are a number of restrictions and requirements contained in the various indentures. Management believes that the City is in compliance with such restrictions and requirements at September 30, 2012.
BBrown
Typewritten Text
72

CITY OF MIDLAND, TEXAS
NOTES TO BASIC FINANCIAL STATEMENTS
(continued)
9. Long-Term Debt (continued) The ordinances authorizing the Waterworks and Sewer System Senior Lien Revenue Bonds stipulate that the City will deposit, in addition to principal and interest requirements, certain amounts in a reserve fund until the balance of such fund is an amount not less than the average annual principal and interest requirements of all Outstanding Bonds Similarly Secured calculated (i) on a Fiscal Year Basis and (ii) as of the dated date of the last series of Bonds Similarly Secured (after giving effect to the issuance and delivery of such Bonds Similarly Secured) and after the delivery of the last series of Bonds Similarly Secured, calculated as of the first day of each Fiscal Year following the delivery of the last series of Bonds Similarly Secured. In such calculations, a fractional part of a Fiscal Year shall be treated as if it were a full Fiscal Year. The amount in the above-defined reserve fund is $1,297,571. Amounts in the reserve fund are to be used to pay principal and interest on outstanding bonds at any time sufficient funds are not available in the bond interest and redemption fund. The ordinances also stipulate that there shall be deposited into the bond interest and redemption fund such amounts as will be sufficient to pay the next maturing principal and interest on outstanding bonds. Amounts in the reserve fund and interest and redemption fund at September 30, 2012 are adequate to meet reserve requirements and the City is in compliance with the various requirements of the bond ordinances at that date. On May 1, 1993, the City issued $14,300,000 of City of Midland, Texas, Waterworks and Sewer System Revenue Bonds, Series 1993 for the purpose of financing construction of improvements and extensions to the City’s waterworks and sanitary sewer system and funding an amount to be held in reserve. The bonds were scheduled to mature over a 20-year period and had interest rates ranging from 5.0% to 7.0%. Annual debt service requirements on this issue (including principal and interest) ranged from $883,975 to $1,345,125. All issues of these bonds subsequent to the March 2003 payment of $740,000 have been defeased by placing proceeds from the Waterworks and Sewer System Revenue Refunding Bonds, Series 2002, in an irrevocable trust to provide for all future principal and interest payments on the bonds. As of September 30, 2012, there is $1,275,000 in aggregate principal, with an interest rate of 5.5%, of the refunded principal of these bonds outstanding. On June 1, 1996, the City issued $8,730,000 of City of Midland, Texas (Midland and Martin Counties), Waterworks and Sewer System Revenue Bonds, Series 1996 for the purpose of financing the expansion of and improvements to the City’s primary wastewater treatment plant and funding an amount to be held in reserve. The bonds mature over a 20-year period and have interest rates ranging from 2.85% to 4.85%. Annual debt service requirements on this issue (including principal and interest) range from $596,077 to $673,453. All issues of these bonds subsequent to the May 2007 payment of $425,000 have been defeased by placing proceeds from the City of Midland, Texas (Midland and Martin Counties), Combination Tax and Revenue Refunding Bonds, Series 2007 in an irrevocable trust to provide for all future principal and interest payments on the bonds. As of September 30, 2012, there is $2,385,000 in aggregate of the refunded principal of these bonds outstanding, with interest rates ranging from 4.75% to 4.85%. On December 1, 1999, the City of Midland sold $15,285,000 of Waterworks and Sewer System Junior Lien Revenue Bonds, Series 1999 to the Texas Small Business Industrial Development
BBrown
Typewritten Text
73

CITY OF MIDLAND, TEXAS
NOTES TO BASIC FINANCIAL STATEMENTS
(continued)
9. Long-Term Debt (continued) Corporation for the purpose of providing $11,860,000 of the Series 1999 Bonds in exchange for and to refund the City’s outstanding $11,860,000 Waterworks and Sewer System Junior Lien Revenue Bonds Series 1989 and to provide $3,425,000 to be used in conjunction with other City funds to fund acquisition extensions, construction, improvements or repair of the City’s water and sewer system, fully fund the Junior Lien Bond Reserve Fund, and pay costs associated with issuance of the Bonds. The Bonds mature over a 25-year period and bear a variable interest rate determined weekly equal to the “Adjustable Interest Rate” as defined in the ordinance. Summarized, the adjustable interest rate is that rate which, in the judgment of the Remarketing Agent, is the lowest interest rate that will permit the agent to sell the bonds at par plus accrued interest in the secondary market. The adjustable interest rate has a maximum rate of 15% per year over the life of the bond and no minimum rate. As defined by the ordinance, “maximum annual debt service requirements” for these bonds shall be calculated at 6% per annum for the purpose of compliance with bond covenants. Interest is payable on the first Wednesday of each month. The $11,860,000 Series 1999 Bonds issued to exchange and refund the outstanding $11,860,000 Series 1989 Bonds provided for a par exchange of bonds with variable interest rates determined on the same basis for both Series 1999 and Series 1989 bonds. As a result of this exchange and refunding, the City recognized no economic gain or loss. The ordinance authorizing the Series 1999 Bonds required that the City establish a reserve fund of $1,528,500, which is 10% of this issue. Additionally, the ordinance authorizing the Series 1999 Bonds required that a $5,000,000 Water and Sewer Rate Stabilization Fund be established and used for any lawful Water and Sewer System purpose to stabilize rates and charges of the System. Covenants require that, should the Rate Stabilization Fund be drawn below $5,000,000, system net revenues be deposited in the Rate Stabilization Fund so that a balance of $5,000,000 is attained no later than three years following the date it was first drawn below $5,000,000. Amounts in the Reserve Fund and Rate Stabilization Fund at September 30, 2012 are adequate to meet ordinance requirements, and the City is in compliance with the various other covenants of the bond ordinance at that date. On November 27, 2000, the City entered into a contract for Loan Guarantee Assistance under Section 108 of the Housing and Community Development Act of 1974, as Amended, 42 U.S.C., Section 108 in the amount of $1,045,000 for the purpose of paying costs of aiding in the establishment of an Advanced Technology Center to provide secondary and post secondary education opportunities using innovative technology and pay professional services rendered in relation to such project and the financing thereof. The terms of the contract require 15 annual principal payments with interest payments made semiannually. Interest payments from the date of the contract through August 9, 2001 were at a variable rate of the London Interbank Offered Rate plus 20 basis points. At August 9, 2001, Trust Certificates guaranteed by the Secretary of Housing and Urban Development were sold by the United States Department of Housing and Urban Development and interest rates on the outstanding maturities under the contract were fixed at rates ranging from 3.66% to 6.25%. Annual debt service requirements (including principal and interest) range from $79,297 to $109,476. All required payments made under the
BBrown
Typewritten Text
74

CITY OF MIDLAND, TEXAS
NOTES TO BASIC FINANCIAL STATEMENTS
(continued)
9. Long-Term Debt (continued) contract will be made using Water and Sewer Fund revenues. As of September 30, 2012, there is $285,000 in aggregate principal of this loan outstanding. On May 15, 2002, the City entered into a refunding transaction whereby $10,460,000 of Waterworks and Sewer System Revenue Refunding Bonds, Series 2002, with interest rates ranging from 3.00% to 5.00%, were issued to call for redemption all outstanding Waterworks and Sewer System Revenue Bonds, Series 1993 maturities subsequent to May 1, 2003, principal amount of $10,035,000, at the May 1, 2003 payment date, and as such, these maturities are not included in the City’s basic financial statements. The difference between the reacquisition price and the net carrying amount of the old debt was $399,272. This amount was deferred and is being amortized as a component of interest expense over the life of the refunding bonds. The refunding bonds mature over an 11-year period and have annual debt service requirements (including principal and interest) ranging from $509,792 to $1,307,250. As registrar for the Series 1993 Refunded Obligations, The Bank of New York, New York, caused appropriate notation to be made so registered bond holders received proper notice of such redemption as permitted by the bond ordinances. The City placed in escrow with the J. P. Morgan Chase Bank of New York, New York, $10,411,489, net bond proceeds of $10,365,148 plus $46,341 of additional City funds, to be used to purchase $10,410,309 of U.S. Treasury Notes with principal amounts of $10,004,000 and interest rates of 5.75%, maturing on April 30, 2003, such that the principal amount of the U.S. Treasury Notes plus interest at April 30, 2003, were sufficient to call all outstanding maturities of the Waterworks and Sewer System Revenue Bonds, Series 1993. This refunding transaction resulted in a $448,706 savings on debt service payments with a present value savings, economic gain, of $323,097. On February 15, 2003, the City issued $4,950,000 of Tax and Limited Pledge Revenue Certificates of Obligation, Series 2003 for the purpose of paying contractual obligations to be incurred for construction, improvement, and acquisition of public works and equipment for traffic signage and signalization, streets, including paving and drainage, park improvements, Midland Center Facilities improvements, downtown Midland improvements (curb and gutter construction and improvement, landscape improvements, and traffic signs and signalization), and paying for professional services rendered in relation to such projects and the financing of such projects. The bonds mature over a 15-year period and have interest rates ranging from 3.00% to 4.00%. On February 15, 2005, the City issued $4,950,000 of Tax and Limited Pledge Revenue Certificates of Obligation, Series 2005 for the purpose of paying contractual obligations to be incurred for construction, improvement, and acquisition of public works and equipment for public safety equipment, streets, including paving, drainage, traffic signage and signalization, park improvements, improvements to City facilities (including fire station site study and design, Martin Luther King, Jr. Community Center improvements, Doug Russell Pool Bathhouse renovations, and HVAC upgrades at City Hall) downtown Midland improvements (including Downtown Master Plan development and streetscape improvements), and paying for professional services rendered in relation to such projects and the financing of such projects. The bonds mature over a 15-year period and have interest rates ranging from 3.50% to 4.00%.
BBrown
Typewritten Text
75

CITY OF MIDLAND, TEXAS
NOTES TO BASIC FINANCIAL STATEMENTS
(continued)
9. Long-Term Debt (continued) On February 1, 2006, the City entered into a refunding transaction whereby $13,160,000 of City of Midland, Texas General Obligation Refunding Bonds, Series 2006A, with interest rates ranging from 4.00% to 5.00%, were issued to call for redemption all outstanding Airport Subordinate Lien Revenue and Tax Certificates of Obligation, Series 1996 maturities subsequent to the March 1, 2006 payment date, principal amount, $13,415,000, on February 23, 2006, and as such, these 1996 maturities are not included in the City’s basic financial statements. The refunding bonds mature over a ten-year period and have annual debt service requirements (including principal and interest) ranging from $366,277 to $1,642,050. The refunding transaction resulted in a debt service savings of $1,346,451 and a present value benefit of $1,069,423 to the City. The difference between the reacquisition price and the net carrying amount of the old debt was $461,208. This amount was deferred and is being amortized as a component of interest expense over the life of the refunding bonds, which is the same as the life of the refunded debt. On February 1, 2006, the City entered into a refunding transaction whereby $28,970,000 of City of Midland, Texas General Obligation Refunding Bonds, Series 2006B, with interest rates ranging from 3.40% to 5.00%, were issued to advance refund City of Midland, Texas, Tax and Limited Pledge Revenue Certificates of Obligation Series 2000, dated March 1, 2000, maturing on March 1 in each of the years 2011 through 2030, inclusive, and aggregating in the principal amount $30,250,000. As a result, the refunded bonds are considered to be defeased and the liability is not included in the City’s basic financial statements. The refunding bonds mature over a 16-year period from March 1, 2007 through March 1, 2022, and have annual debt service requirements (including principal and interest) ranging from $813,169 to $2,907,243. On January 15, 2007, the City entered into a refunding transaction whereby $4,995,000 of City of Midland, Texas (Midland and Martin Counties), Combination Tax and Revenue Refunding Bonds, Series 2007 with interest rates ranging from 4.00% to 4.25%, were issued to call for redemption all outstanding Waterworks and Sewer System Revenue Bonds, Series 1996 maturities subsequent to the May 1, 2007 payment date, principal amount, $5,245,000 on February 23, 2007, and as such, these 1996 maturities are not included in the City’s basic financial statements. The refunding bonds mature over a ten-year period and have annual debt service requirements (including principal and interest) ranging from $565,527 to $608,400. The refunding transaction resulted in a debt service savings of $596,283 and a present value benefit of $116,970 to the City. On January 15, 2007, the City issued $55,505,000 of City of Midland, Texas (Midland and Martin Counties), Tax and Limited Pledge Revenue Certificates of Obligation, Series 2007 for the purpose of financing improvements and expansion to the water and sewer system, parks, streets, traffic systems, fire stations, and City facilities, and to pay the costs associated with the issuance of the certificates. The bonds mature over a 30-year period and have interest rates ranging from 4% to 5%. Annual debt service requirements on this issue (including principal and interest) range from $3,108,875 to $4,289,426. On February 1, 2009, the City issued $9,855,000 of City of Midland, Texas (Midland and Martin Counties), Tax and Limited Pledge Revenue Certificates of Obligation, Series 2009 for the
BBrown
Typewritten Text
76

CITY OF MIDLAND, TEXAS
NOTES TO BASIC FINANCIAL STATEMENTS
(continued)
9. Long-Term Debt (continued) purpose of paying contractual obligations to be incurred for construction, improvement, and acquisition of public works and equipment, improving, renovating and equipping existing City-owned buildings, including the Martin Luther King Community Center, the Midland Municipal Court Building, and the Midland Senior Center Building, acquiring, constructing, equipping and improving parks and park facilities within the City, including the Jenna Welch Nature Study Center, constructing and improving streets, including paving, drainage, traffic signage, and signalization, and paying professional services rendered in relation to such projects and the financing thereof. The bonds mature over a 20-year period and have interest rates ranging from 3% to 4.25%. Annual debt service requirements on this issue (including principal and interest) range from $711,563 to $716,555. On May 1, 2009, the City entered into a refunding transaction whereby $8,170,000 of City of Midland, Texas (Midland and Martin Counties), General Obligation Refunding Bonds, Series 2009 with interest rates ranging from 2.5% to 3%, were issued to redeem the following:
City of Midland, Texas, Tax and Waterworks and Sewer System (Limited Pledge) Revenue Certificates of Obligation, Series 1997, dated February 15, 1997, scheduled to mature on March 1 in each of the years 2010 through 2012, inclusive, aggregating in principal amount $1,215,000, and called for redemption on June 3, 2009 at the price of par plus accrued interest to the date of redemption; and
City of Midland, Texas, Tax and Waterworks and Sewer System (Limited Pledge) Revenue Certificates of Obligation, Series 1998, dated March 1, 1998, scheduled to mature on March 1 in each of the years 2010 through 2013, inclusive, aggregating in principal amount $725,000, and called for redemption on June 3, 2009 at the price of par plus accrued interest to the date of redemption; and
City of Midland, Texas, Tax and Waterworks and Sewer System (Limited Pledge) Revenue Certificates of Obligation, Series 1999, dated February 15, 1999, scheduled to mature on March 1 in each of the years 2010 through 2014, inclusive, aggregating in principal amount $2,025,000, and called for redemption on June 3, 2009 at the price of par plus accrued interest to the date of redemption; and
City of Midland, Texas, Tax and Limited Pledge Revenue Certificates of Obligation, Series 2001, dated February 15, 2001, scheduled to mature on March 1 in each of the years 2010 through 2016, inclusive, and aggregating in principal amount $4,130,000, and called for redemption on June 3, 2009 at the price of par plus accrued interest to the date of redemption; and
As such, these maturities are not included in the City’s basic financial statements. The refunding bonds mature over a eight-year period and have annual debt service requirements (including principal and interest) ranging from $178,817 to $1,706,888. The refunding transaction resulted in a debt service savings of $424,744 and a present value benefit, economic gain, of $445,184 to the City.
BBrown
Typewritten Text
77
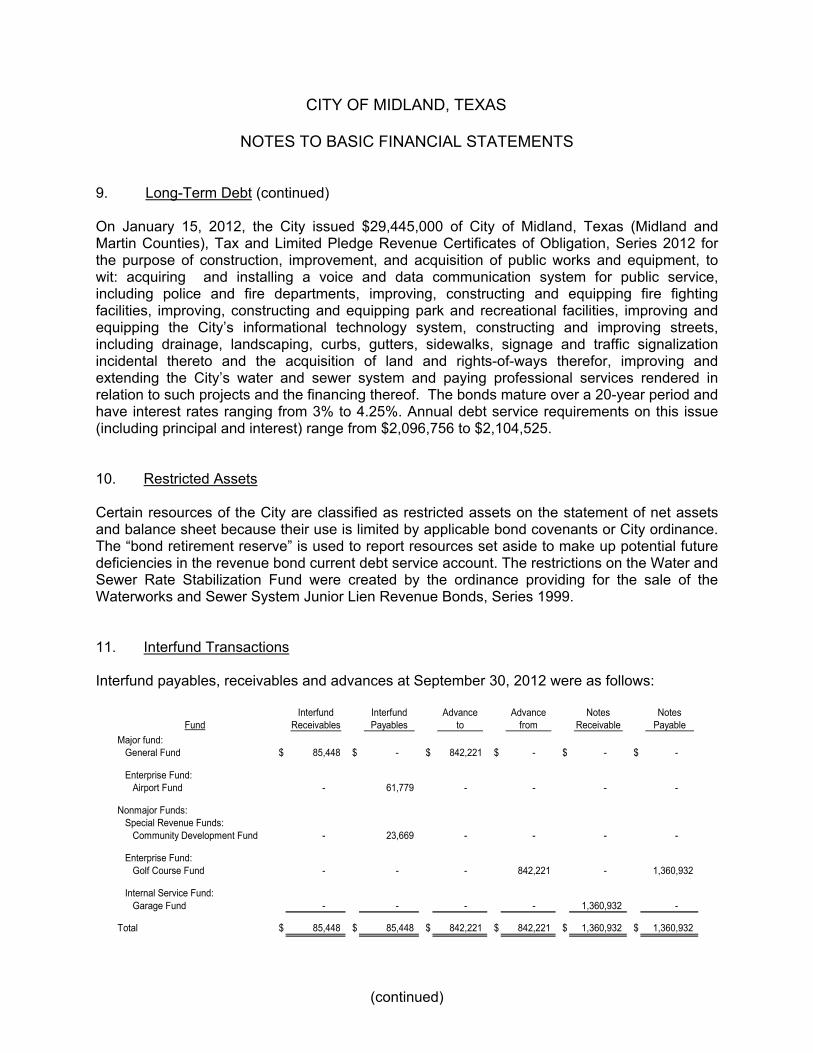
CITY OF MIDLAND, TEXAS
NOTES TO BASIC FINANCIAL STATEMENTS
(continued)
9. Long-Term Debt (continued) On January 15, 2012, the City issued $29,445,000 of City of Midland, Texas (Midland and Martin Counties), Tax and Limited Pledge Revenue Certificates of Obligation, Series 2012 for the purpose of construction, improvement, and acquisition of public works and equipment, to wit: acquiring and installing a voice and data communication system for public service, including police and fire departments, improving, constructing and equipping fire fighting facilities, improving, constructing and equipping park and recreational facilities, improving and equipping the City’s informational technology system, constructing and improving streets, including drainage, landscaping, curbs, gutters, sidewalks, signage and traffic signalization incidental thereto and the acquisition of land and rights-of-ways therefor, improving and extending the City’s water and sewer system and paying professional services rendered in relation to such projects and the financing thereof. The bonds mature over a 20-year period and have interest rates ranging from 3% to 4.25%. Annual debt service requirements on this issue (including principal and interest) range from $2,096,756 to $2,104,525. 10. Restricted Assets Certain resources of the City are classified as restricted assets on the statement of net assets and balance sheet because their use is limited by applicable bond covenants or City ordinance. The “bond retirement reserve” is used to report resources set aside to make up potential future deficiencies in the revenue bond current debt service account. The restrictions on the Water and Sewer Rate Stabilization Fund were created by the ordinance providing for the sale of the Waterworks and Sewer System Junior Lien Revenue Bonds, Series 1999. 11. Interfund Transactions Interfund payables, receivables and advances at September 30, 2012 were as follows:
Interfund Interfund Advance Advance Notes NotesFund Receivables Payables to from Receivable Payable
Major fund:General Fund $ 85,448 $ - $ 842,221 $ - $ - $ -
Enterprise Fund:Airport Fund - 61,779 - - - -
Nonmajor Funds:Special Revenue Funds:
Community Development Fund - 23,669 - - - -
Enterprise Fund:Golf Course Fund - - - 842,221 - 1,360,932
Internal Service Fund:Garage Fund - - - - 1,360,932 -
Total $ 85,448 $ 85,448 $ 842,221 $ 842,221 $ 1,360,932 $ 1,360,932
BBrown
Typewritten Text
78

CITY OF MIDLAND, TEXAS
NOTES TO BASIC FINANCIAL STATEMENTS
(continued)
11. Interfund Transactions (continued) The advance to the Golf Course Fund is related to Golf Course Fund debt service and is to be repaid from Golf Course Player Facility Charge revenues upon retirement of the Golf Course Fund debt associated with the General Obligation Refunding Bonds, Series 2009. The note payable from the Golf Course Fund to the Garage Fund was generated in order to make capital improvements to Hogan Park Golf Course. The note is interest bearing and is to be repaid as revenue becomes available from a Golf Course Player Facility Charge instituted specifically for capital improvements of the Golf Course. Interfund transfers during the year ended September 30, 2012 were as follows:
Fund/Purpose of Transfer Transfer From Transfer To
Major governmental funds:General Fund:
Nondepartmental services - $ 750,000$ Direct cost allocation - 4,182,814 Sports complex support 515,103 -
Debt Service Fund:Section 108 loan servicing - 107,683 Limited water and sewer revenue pledge - 2,500
Nonmajor governmental funds:Special Revenue Fund:
Hotel-Motel Fund – direct cost allocation 19,724 - Capital Projects Fund:
2012 General Purpose Certificates of Obligation Fund 2,000,000 Major proprietary funds:
Enterprise funds:Water and Sewer Fund:
Nondepartmental services 750,000 - Limited water and sewer revenue pledge 2,500 - Direct cost allocation 1,371,654 - Section 108 loan - debt service 107,683 -
Sanitation Fund – direct cost allocation 492,332 - Airport Fund – direct cost allocation 1,409,574 - Sports Complex Fund:
Direct cost allocation 372,595 - Sports complex support - 515,103
Nonmajor proprietary funds:Golf Course Fund:
Direct cost allocation 99,218 - Internal Service Funds:
Garage Fund – direct cost allocation 393,152 - Warehouse Fund – direct cost allocation 24,565 - Technology Fund – Initial cost. - 2,000,000
Totals 7,558,100$ 7,558,100$
The interfund transfers of $515,103 to the Sports Complex Fund alleviated cash flow deficits in Fiscal Year 2012.
BBrown
Typewritten Text
79

CITY OF MIDLAND, TEXAS
NOTES TO BASIC FINANCIAL STATEMENTS
(continued)
12. Status of Capital Grants In September 2011, the City accepted A.I.P. Grant No. 3-48-0150-52-11 in the amount of $7,543,382 to be used for the payment of cost associated with two projects – the Rehabilitate Taxiway Systems with an estimated cost of $4,396,637; and the Executive Apron Reconstruction – Area A with an estimated cost of $3,143,745. In July 2012, the City accepted A.I.P. Grant No. 3-48-0150-53-12 in the amount of $2,936,924 to be used for the payment of cost associated with the Reconstruct Executive Apron Area B Project. 13. Contingent Liabilities The City participates in numerous federally assisted programs, on both a direct and state pass-through basis, as well as on a service-provider basis. Principal among these are Community Development Block Grants, Airport Improvement Program Grants, and various construction and capital acquisition grants. In connection with these grants, the City is required to comply with specific terms and agreements, as well as applicable federal and state laws and regulations. Such compliance is subject to review and audit by the grantors and their representatives, including audits under the “single audit” concept and compliance examinations, which build upon such audits. In the opinion of management, the City has complied with all requirements. However, since such programs are subject to future audit or review, the possibility of disallowed expenditures exists. In the event of such disallowance of claimed expenditures, if any, the City expects the resulting liability to be immaterial. The City appealed a Class I classification of a waste pit by the Texas Water Commission Waste Classification Group to the Environmental Protection Agency (E.P.A.). The E.P.A. denied the City’s appeal and upheld the Class I classification of the waste pit. Subsequently, the City applied to the Texas Natural Resource Conservation Commission (T.N.R.C.C.) for permission to close the waste pit in place. The application to close the waste pit in place was approved and closure was completed and approved by T.N.R.C.C. in June 1997. The City has properly recorded the property deed and must inspect the waste pit quarterly through June 1999 and annually thereafter. The City has $7.5 million in interest free forgivable loans as part of economic development agreements with the MDC for various infrastructure construction projects. The City anticipates that the terms of the agreement will be satisfied and repayment will not be required.
BBrown
Typewritten Text
80

CITY OF MIDLAND, TEXAS
NOTES TO BASIC FINANCIAL STATEMENTS
(continued)
14. Risk Management The City is exposed to various risks of loss related to torts: environmental or eminent domain claims; civil rights claims; equal employment opportunity claims; wage and hour claims; theft of, damage to, and destruction of assets; errors and omissions; injuries to employees; medical and dental claims of employees and their dependents; and natural disasters. The City maintains fire and extended coverage insurance for City buildings, furnishings, and computer equipment. This coverage provides replacement cost coverage with an annual limit of $218,911,830, and a $25,000 per occurrence deductible. The City also maintains the following other insurance coverage: Law Enforcement Liability coverage with a $25,000 per occurrence deductible, $3,000,000 per claim limit and a $6,000,000 aggregate annual limit; Errors and Omissions coverage with a $25,000 per occurrence deductible, $3,000,000 per claim limit and a $6,000,000 aggregate annual limit; Healthcare Professional Liability Protection for the Health Department with a $1,000,000 per occurrence, $2,000,000 aggregate limit with a $5,000 per occurrence deductible; Airport Liability coverage for Personal Injury Liability and Malpractice Aggregate Liability coverage with a $10,000,000 per occurrence and annual aggregate with $25,000 per occurrence deductible for each type of coverage, Ground Hangar Keepers Legal Liability coverage with a $10,000,000 per occurrence and annual aggregate with $5,000 deductible, and $50,000 Fire Damage coverage; Special Events coverage with a $1,000,000 per occurrence and $2,000,000 annual aggregate, Personal and Advertising Injury coverage of $1,000,000, Damage to Premises coverage of $100,000, and Medical coverage of $5,000 with no deductible; Medical claims stop-loss coverage for claims exceeding $175,000 per occurrence with an annual aggregate reinsurance limit on claims in excess of $9,122,360 and Specific Excess and Aggregate Excess Workers’ Compensation coverage for claims in excess of $450,000 per occurrence up to $1,000,000 per occurrence, which is the statutory employer’s maximum liability per occurrence. No settlements during each of the last three years have exceeded commercial coverage purchased. Other than the above coverages provided by insurance, the City retains all risk of loss. The City charges interfund premiums based primarily upon the insured funds’ claims experience and exposure, which are reported as insurance expenditure/expense in the funds charged and operating revenue in the self-insurance funds, which are accounted for as internal service funds. The City accrues all losses and claims if information available before the financial statements are issued indicates that it is probable that an asset has been impaired or a liability incurred at the date of the financial statements and the amount of loss can be reasonably estimated. Claims incurred but not reported (IBNR) are also accrued if it is probable that a claim will be asserted and the loss can be reasonably estimated. The accrued liabilities for IBNR in the General Liability and Workers’ Compensation Self-Insurance Funds are estimates calculated by an actuary. The accrued liability for IBNR in the Medical/Dental Self-Insurance Fund is based on management’s estimate. The City maintains a Workers’ Compensation Self-Insurance Fund. The purpose of this fund is to pay workers’ compensation claims that are outside the limitations of purchased coverage from assets of the fund.
BBrown
Typewritten Text
81

CITY OF MIDLAND, TEXAS
NOTES TO BASIC FINANCIAL STATEMENTS
(continued)
14. Risk Management (continued) The City also maintains a Medical/Dental Self-Insurance Fund. The purpose of this fund is to pay medical and dental claims that are outside the limitations of purchased coverage, for City of Midland employees and their covered dependents and to minimize the cost of medical and dental insurance to the City. The City also maintains a General Liability Self-Insurance Fund to pay general liability claims, other than those covered by purchased insurance against the City from accumulated assets of the Fund. The Texas Tort Claims Act provides for statutory limits of $250,000 per person and $500,000 per occurrence for bodily injury or death and $100,000 per occurrence for property damage in liability claims against a municipality. The claims liabilities for self-insurance funds are based on the requirements of GASB Statement No. 10, which requires that a liability for claims be reported if information prior to the issuance of the financial statements indicates it is probable a liability has been incurred and the amount of the loss can be reasonably estimated at the date of the financial statements. Changes in the claims liability amounts for each of the self-insurance funds in the fiscal years ended September 30, 2011 and 2012 were:
Beginning Current Yearof Fiscal Claims and Balance at
Year Changes in Claim FiscalLiability Estimates Payments Year End
2010-2011
Workers' Compensation $ 935,493 $ 639,481 $ 574,788 $ 1,000,186
Medical/Dental 576,488 7,320,662 7,256,343 640,807
General Liability 1,720,353 (171,306) 230,897 1,318,150Total $ 3,232,334 $ 7,788,837 $ 8,062,028 $ 2,959,143
2011-2012
Workers' Compensation $ 1,000,186 $ 709,724 $ 599,717 $ 1,110,193
Medical/Dental 640,807 6,886,923 6,891,443 636,287
General Liability 1,318,150 56,419 309,416 1,065,153Total $ 2,959,143 $ 7,653,066 $ 7,800,576 $ 2,811,633
BBrown
Typewritten Text
82

CITY OF MIDLAND, TEXAS
NOTES TO BASIC FINANCIAL STATEMENTS
(continued)
15. Commitments The City leases water rights that represent approximately 19% of the City’s water sources. One of the leases renewed in August 2008, the second, smaller lease was renewed in February 2011 and both require payment at a constant five-year rate of $0.40 per 1000 gallons. Total royalty paid amounted to $607,911 in Fiscal Year 2012. The City owns property that serves as a wastewater disposal site. There are approximately 6,000 acres at two sites for this purpose. The Colorado River Municipal Water District (the CRMWD) was issued a permit in May 1985 by the Texas Commission on Environmental Quality (formerly, Texas Natural Resource Conservation Commission) to construct a 554,000-acre-feet dam and reservoir on the Colorado River and impound water in Coleman, Concho and Runnels Counties, Texas. This project is known as the O. H. Ivie Reservoir (the Project). The City of Midland entered into a contract with CRMWD in September 1985, under which the City obtained a 16.54% interest in the Project’s water rights. CRMWD agreed to provide the City a source of water from O. H. Ivie Reservoir limited annually to 16.54% of the safe yield of the reservoir. The City agreed to pay CRMWD a sum equal to 16.54% of the cost of the Project plus annual operating costs. CRMWD is responsible for the care, operation, and maintenance of the Project. The City does not have an ownership interest in the assets of the Project or CRMWD nor is it directly liable for the revenue bonds issued by CRMWD to finance the Project. The City’s share of project costs is expensed as water rights in the Water and Sewer Fund. Payments by the City to CRMWD are made solely from the gross revenues of the City’s water and sewer system. The terms of the City-CRMWD contracts shall continue and be effective during the entire useful life of the Project. In November 1985, CRMWD issued $53,590,000 of revenue bonds with interest rates ranging from 8.25% to 11.25%. The City’s operating cost to reimburse CRMWD for the Project costs is estimated to approximate $900,000 per year through the year 2016 with expected payments totaling $26,000,000. The annual required payment as specified above will be reduced by an amount equal to 16.54% of the estimated investment earnings attributable to the proceeds from the sale of the revenue bonds. The City paid $795,241 to CRMWD in Fiscal Year 2012, as the City’s 16.54% interest in the Project costs. This amount is recorded as an expense in the City’s financial statements for the year ended September 30, 2012. CRMWD and the City of Midland entered into a water transmission contract on June 29, 1988, which provides for the construction and operation of raw water transmission pipelines, pump stations, and other facilities required to transmit water from O.H. Ivie Reservoir to Midland.
BBrown
Typewritten Text
83

CITY OF MIDLAND, TEXAS
NOTES TO BASIC FINANCIAL STATEMENTS
(continued)
15. Commitments (continued) The water transmission system was constructed with the proceeds of $115,000,000 Water System Revenue Bonds (Water Transmission Facilities Project), Series 1991 sold August 6, 1991, $9,000,000 Water System Revenue Bonds (Water Transmission Facilities Project), Series 1994 sold September 27, 1994, and $3,500,000 of Colorado River Municipal Water District cash contributions. The system consists of a main pump station with five intermediate booster pump stations; each includes pumping units, electric motor controls and appurtenances, a steel- or earth-constructed surge tank and pipelines necessary to complete the Project. Electrical transmission lines sufficient to service the main pump station and booster pumps were constructed from suitable generating sources. The pipeline is approximately 158 miles long with lines ranging in diameter from 53 to 60 inches. The water transmission system was constructed in three segments: Segment 1 is capable of delivering up to 90 million gallons per day to a junction point near San Angelo. Segment 2 is capable of delivering up to 65 million gallons per day to a junction point near Big Spring. Segment 3 is capable of delivering up to 55 million gallons per day to Odessa/Midland termination point. The City of Midland shared in the total construction costs at the rate of 22.222% of Segment 1, 30.769% of Segment 2, and 36.364% of Segment 3. The City also shared 22.222% of the total construction costs of the O. H. Ivie Pump Station Substructure. Operation and maintenance of the system is provided for by contractual agreements executed between the parties. The City paid $2,493,843 to CRMWD in 2012, pursuant to this agreement. The City’s estimated annual commitment for the pipeline construction under this contract is $2.76 million per year for a 30-year period beginning in 1994. On February 23, 2012 the City entered into an Interlocal Agreement with the Midland County Fresh Water Supply District No. 1 (the “District”) regarding T-Bar Ranch Groundwater Delivery, which provides for the construction and operation of groundwater transmission pipelines, pump stations, and other facilities required to transmit water from T-Bar Ranch to Midland. On September 26, 2012, the District issued $63,310,000 of revenue refunding bonds with interest rates ranging from 2.00% to 5.00% and $128,266,160 of revenue notes with interest rates ranging from 3.25% to 5.05%. The City is obligated to pay the District a rate for the delivery of water that is sufficient to pay all cost, including costs associated with the District Debt and operations and maintenance expense as cost arise and become due. Construction of the water transmission infrastructure is in progress as of September 30, 2012 with an expected completion date of May 2013. Upon completion, the City will record the infrastructure and the associated debt as a capital lease. As of September 30, 2012 the total cost incurred to the District was $85,512,447 and no cost has been incurred by the City.
BBrown
Typewritten Text
84

CITY OF MIDLAND, TEXAS
NOTES TO BASIC FINANCIAL STATEMENTS
(continued)
15. Commitments (continued) The City has active construction projects as of September 30, 2012. Total commitments for ongoing capital projects are composed of the following:
Municipal Court $ 1,443,003
General Facilities 2,084,008
Streets and Drainage 7,062,258
Parks and Recreation 1,188,122
Technology 2,516,054
Police 501,767
Fire 640,150
Water and Sewer 22,731,435
Sanitation 517,927
Airport 7,221,844
Sports Complex 554,984
Total Capital Projects $ 46,461,552
16. Litigation The City is a party to several legal actions arising in the ordinary course of its business. In the opinion of the City’s management, upon advice of the City Attorney, the City has adequate legal defense and/or insurance coverage regarding each of these actions and does not believe that they will materially affect the City’s operations or financial position. 17. Closure and Postclosure Care Cost The City adopted GASB Statement No. 18, Accounting for Municipal Solid Waste Landfill Closure and Postclosure Care Costs, for the fiscal year beginning October 1, 1993. State and federal laws and regulations require the City to place a final cover on the City of Midland Municipal Solid Waste Facility, Texas Natural Resource Conservation Commission Permit #1605 site when it stops accepting waste and to perform certain maintenance and monitoring functions at the site for 30 years after closure . Although closure and postclosure care costs will be only near or after the date the landfill stops accepting waste, the City reports a portion of these closure and postclosure care costs as an operating expense in each period based on landfill capacity used as of each balance sheet date. Total current cost has been adjusted for the effects of inflation by using the Consumer Price Index for all Urban Consumers (CPI-U): Selected areas by Expenditure Category and Commodity and Service Group for Dallas-Fort Worth, Texas. The base period selected was June 1993. The index change from July 2011 through July 2012 was 1.01%. The amount expensed for the year ended September 30, 2012 is $782,961. The
BBrown
Typewritten Text
85
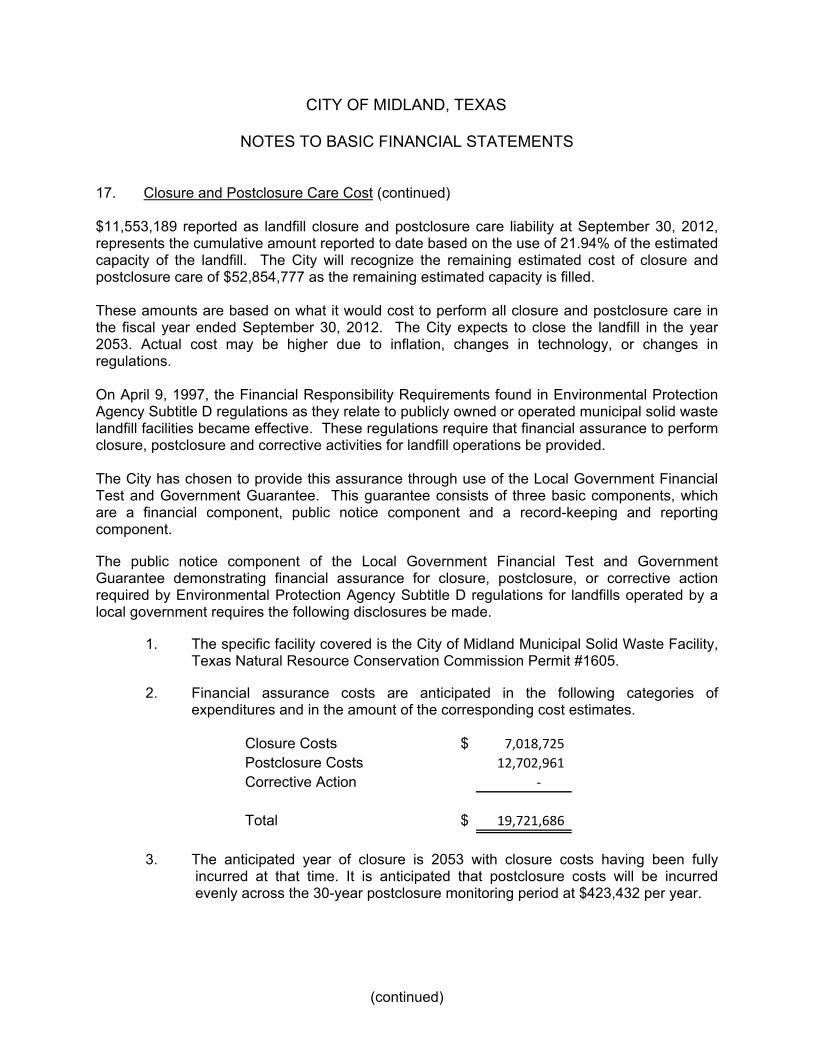
CITY OF MIDLAND, TEXAS
NOTES TO BASIC FINANCIAL STATEMENTS
(continued)
17. Closure and Postclosure Care Cost (continued) $11,553,189 reported as landfill closure and postclosure care liability at September 30, 2012, represents the cumulative amount reported to date based on the use of 21.94% of the estimated capacity of the landfill. The City will recognize the remaining estimated cost of closure and postclosure care of $52,854,777 as the remaining estimated capacity is filled. These amounts are based on what it would cost to perform all closure and postclosure care in the fiscal year ended September 30, 2012. The City expects to close the landfill in the year 2053. Actual cost may be higher due to inflation, changes in technology, or changes in regulations. On April 9, 1997, the Financial Responsibility Requirements found in Environmental Protection Agency Subtitle D regulations as they relate to publicly owned or operated municipal solid waste landfill facilities became effective. These regulations require that financial assurance to perform closure, postclosure and corrective activities for landfill operations be provided. The City has chosen to provide this assurance through use of the Local Government Financial Test and Government Guarantee. This guarantee consists of three basic components, which are a financial component, public notice component and a record-keeping and reporting component. The public notice component of the Local Government Financial Test and Government Guarantee demonstrating financial assurance for closure, postclosure, or corrective action required by Environmental Protection Agency Subtitle D regulations for landfills operated by a local government requires the following disclosures be made.
1. The specific facility covered is the City of Midland Municipal Solid Waste Facility, Texas Natural Resource Conservation Commission Permit #1605.
2. Financial assurance costs are anticipated in the following categories of
expenditures and in the amount of the corresponding cost estimates.
Closure Costs $ 7,018,725 Postclosure Costs 12,702,961 Corrective Action ‐
Total $ 19,721,686
3. The anticipated year of closure is 2053 with closure costs having been fully
incurred at that time. It is anticipated that postclosure costs will be incurred evenly across the 30-year postclosure monitoring period at $423,432 per year.
BBrown
Typewritten Text
86

CITY OF MIDLAND, TEXAS
NOTES TO BASIC FINANCIAL STATEMENTS
(continued)
18. Related Organizations The City is responsible for appointing the members of the boards of the Midland Economic Development Corporation (MEDCO) and the Midland Housing Finance Corporation (MHFC) but the City’s accountability for these organizations does not extend beyond making the appointments. For the year ended September 30, 2012, the City appropriated no funds for the use of either organization.
19. Joint Venture An interlocal agreement between the Cities of Midland and Odessa established the MOUTD as an urban transportation system provider under Chapter 458 of the Texas Transportation Code. The MOUTD began operating bus routes during the year ended September 30, 2004. Federal and state grants were obtained to cover start-up costs and purchases of buses and vehicles, as well as portions of operating costs. Both cities also contribute money for operations to the MOUTD. Should either city choose to withdraw from the interlocal agreement, a pro rata share of net assets and capital equipment acquired by MOUTD with Texas Department of Transportation section 5307 funds or 5307 matching funds during the time in which the local government was a party to the agreement shall be transferred to the local government. Upon dissolution of the MOUTD, the net assets shall be disposed in accordance with the agreement of the cities and the laws of the State of Texas and the United States. Audited financial statements are available by contacting the Midland-Odessa Urban Transit District at 8007 E. Highway 80, Odessa, TX 79765. 20. Discretely Presented Component Units Significant Accounting Policies The SCDC and the MDC are accounted for using the economic resources measurement focus and are presented as a discretely presented component units. The SCDC and the MDC are presented on the accrual basis of accounting. Revenues and Expenses The main revenue source for the SCDC is the Type B sales tax revenue and SCDC is bound by contract to pay all Type B sales tax revenues received to the City to pay for costs associated with the 2000 and 2001A City of Midland Certificates of Obligation and the City of Midland General Obligation Refunding Bonds, Series 2006B (see note 9). In addition, the proceeds of the Type B sales tax revenue may be used for maintenance costs of the football/soccer stadium, the baseball stadium and related parking facilities, and related infrastructure and improvements, not to exceed ten percent of the audited Type B sales tax revenue collected for the previous twelve months prior to September 30 of the previous fiscal year. The main revenue source for the MDC is the Type A sales tax revenue, which became effective April 1, 2002. The MDC will incur expenses for economic development activities and
bbrown
Typewritten Text
87

CITY OF MIDLAND, TEXAS
NOTES TO BASIC FINANCIAL STATEMENTS
(continued)
20. Discretely Presented Component Units (continued) Revenues and Expenses (continued) operating expenses. The MDC expenses for fiscal year 2012 consisted of consulting and administrative expenses of $1,415,268 and economic development expenses of $110,000. Assets and Liabilities The SCDC assets consist solely of accrued sales tax revenues. A liability in the exact amount of the accrued sales tax revenues is recognized because of the SCDC contractual liability to the City. The MDC assets consist primarily of sales tax revenues receivable, investments made with reserves and capital assets in the form of land, a building and improvements. The MDC’s liabilities as of September 30, 2012 consist of amounts due for contractual agreements. 21. Fund Deficit The Medical/Dental Self-Insurance Fund had an accumulated deficit of $234,720 at September 30, 2012. This deficit will be eliminated during the fiscal year ending September 30, 2013.
bbrown
Typewritten Text
88

CITY OF MIDLAND, TEXAS
General FundSchedule of Revenues, Expenditures and Changes in Fund Balance
Budget and ActualFor the Year Ended September 30, 2012
Variance withAdjustments– Actual on a Final Budget –
Actual Budgetary Budgetary PositiveOriginal Final Amounts Basis Basis (Negative)
Revenues: Taxes $ 68,406,266 $ 68,406,266 $ 76,802,703 $ - $ 76,802,703 $ 8,396,437 Licenses and permits 1,138,800 1,138,800 1,936,372 - 1,936,372 797,572 Fines and forfeitures 3,650,000 3,650,000 3,808,669 - 3,808,669 158,669 Charges for services 6,677,413 6,677,413 2,685,136 4,394,512 7,079,648 402,235 Rentals 8,244 8,244 11,344 - 11,344 3,100 Intergovernmental 1,051,992 1,051,992 1,442,040 - 1,442,040 390,048 Investment earnings 715,000 715,000 352,527 - 352,527 (362,473) Contributions and donations 150,000 150,000 277,895 - 277,895 127,895 Miscellaneous 219,040 219,040 211,057 - 211,057 (7,983)
Total revenues 82,016,755 82,016,755 87,527,743 4,394,512 91,922,255 9,905,500 Expenditures: General government:
Administration 1,170,519 1,230,194 1,229,487 - 1,229,487 707 Support services 12,200,032 11,989,520 11,986,500 - 11,986,500 3,020 Fiscal management 2,046,710 2,154,872 2,154,462 - 2,154,462 410
Development services 2,617,674 2,697,478 2,484,995 211,698 2,696,693 785 Engineering 9,115,094 7,701,851 7,700,839 - 7,700,839 1,012 Community services 9,738,966 10,598,856 10,597,142 - 10,597,142 1,714 Police 23,351,564 22,768,547 22,766,719 - 22,766,719 1,828 Fire 19,911,316 20,920,644 20,918,880 - 20,918,880 1,764 Other 1,802,817 2,004,450 2,004,107 - 2,004,107 343
Total expenditures 81,954,692 82,066,412 81,843,131 211,698 82,054,829 11,583
Excess (deficiency) of revenues over (under) expenditures 62,063 (49,657) 5,684,612 4,182,814 9,867,426 9,917,083
Other financing sources (uses): Transfers in 750,000 750,000 4,932,814 (4,182,814) 750,000 - Transfers out - (515,103) (515,103) - (515,103) -
Total other financing sources (uses) 750,000 234,897 4,417,711 (4,182,814) 234,897 -
Net change in fund balances 812,063 185,240 10,102,323 - 10,102,323 9,917,083
Fund balances – beginning 48,575,197 48,575,197 48,575,197 - 48,575,197 -
Fund balances – ending $ 49,387,260 $ 48,760,437 $ 58,677,520 $ - $ 58,677,520 $ 9,917,083
The notes to required supplementary information are an integral part of this schedule.
Budgeted Amounts
Required Supplementary Information
(Unaudited)
BBrown
Typewritten Text
89

CITY OF MIDLAND, TEXAS
NOTES TO REQUIRED SUPPLEMENTARY INFORMATION
September 30, 2012 Budgetary Data The City Council follows these procedures in establishing the annual budget: 1. Prior to the beginning of each fiscal year, the City Manager submits to the City
Council a proposed budget for the fiscal year beginning on the following October 1. The operating budget includes proposed expenditures and the means of financing them. Annual budgets are legally adopted for the General Fund and the Debt Service Fund on a basis consistent with generally accepted accounting principles, except for the classification of interfund transfers for General Fund services to other funds as charges for services for budgetary purposes instead of interfund transfers. Formal budgetary integration is not employed for the proprietary funds. The City adopts an annual budget for managerial control for all proprietary funds.
2. Public hearings are conducted at which all interested persons’ comments
concerning the budget are heard. 3. The budget is legally enacted by the City Council through passage of an
ordinance. 4. Expenditures may not legally exceed appropriations at the division level for
legally adopted annual operating budgets. The City Manager has the authority to transfer appropriation balances from one department, the primary subunits of each fund, or division and the primary subunit of each department, to another within a single fund of the City. Department heads may approve amendments of amounts between line items within a division so long as the transfers do not significantly change the work program contemplated in the approved budget.
5. Supplemental appropriations during the year must be approved and adopted by the City Council through passage of resolution. During fiscal year 2012, there were $111,720 in appropriation increases for the General Fund.
6. At the close of each fiscal year, unexpended budgetary appropriations lapse or
revert to the undesignated fund balance. The unexpended appropriation balances in capital projects do not lapse at year-end.
The Budgetary Comparison Schedule, included in the required supplementary information, presents a comparison of the original and final amended budgets for the period to actual results of operations for the General Fund. There are no major special revenue funds.
BBrown
Typewritten Text
90

GAAP basis $ 10,102,323Revenues:
Increase due to redefining interfundcharges as interfund transfers 4,394,512
Expenditures:Increase due to redefining interfund
charges as interfund transfers (211,698)Other financing (uses):
Decrease due to redefining interfundcharges as interfund transfers (4,182,814)
Budgetary basis $ 10,102,323
The notes to required supplementary information are an integral part of this statement.
CITY OF MIDLAND, TEXASAdjustments to Revenues, Expenditures and Other
Financing Uses from GAAP Basis to Budgetary BasisFor the Year Ended September 30, 2012
Net Changein Fund Balances
General Fund
(Unaudited)
BBrown
Typewritten Text
91

Prior to Restructured (3) Restructuring (3)
Actuarial Valuation Date 12/31/11 12/31/10 12/31/10 12/31/09
Actuarial Value of Assets (1) $ 210,714,570 $ 199,085,018 $ 99,661,674 $ 97,184,684
Actuarial Accrued Liability (1) 239,826,317 232,544,622 155,654,806 154,573,465
Percentage Funded 87.86% 85.61% 64.03% 62.87%
Unfunded Actuarial Accrued Liability (UAAL) 29,111,747 33,459,604 55,993,132 57,388,781
Annual Covered Payroll (2) 34,442,094 33,898,901 33,898,901 34,288,661
UAAL as a Percentage of Covered Payroll 84.52% 98.70% 165.18% 167.37%
Net Pension Obligation (NPO) at the Beginning of Period - - - -
Annual Pension Cost (2): Annual Required Contribution (ARC) 7,580,704 7,600,134 7,600,134 7,306,910 Interest on NPO - - - - Adjustment to ARC - - - -
Contributions Made (2) 7,580,704 7,600,134 7,600,134 7,306,910
Increase in NPO - - - -
City of Midland, TexasRequired Supplementary Information
Schedule of Actuarial Liabilities and Funding ProgressTexas Municipal Retirement System
Last Three Calendar Years(Unaudited)
NPO at the end of period $ - $ - $ - $ -
(1) Information is from appropriate year supplements to TMRS annual reports.
(2) Extracted from City of Midland annual reports.
(3) In June, 2011, SB 350 was enacted by the Texas Legislature, resulting in a restructure of the TMRS funds. This legislationprovided for the actuarial valuation to be completed, as if restructuring had occurred on December 31, 2010. In addition, theactuarial assumptions were updated for the new fund structure, based on an actuarial experience study that was adopted by TMRS Board at their May, 2011 meeting (the review compared actual to expected experience for the four-year period ofJanuary 1, 2006 through December 31, 2009).
Note: For years ending December 31, 2007 and later, the actuarial accrued liability was calculated using the Projected UnitCredit actuarial funding method.
BBrown
Typewritten Text
92

City of Midland, TexasRequired Supplementary Information
Schedule of Actuarial Liabilities and Funding ProgressMidland Firemen's Relief and Retirement Fund
Last Three Calendar Years(Unaudited)
Actuarial Valuation Date 12/31/11 12/31/10 (1) 12/31/09
Actuarial Value of Assets (2) $ 73,066,776 $ 68,522,532 $ 70,554,953
Actuarial Accrued Liability (2) 101,158,743 N/A 90,338,198
Percentage Funded 72.23% N/A 78.10%
Unfunded Actuarial Accrued Liability (UAAL) 28,091,967 N/A 19,783,245
Annual Covered Payroll (2) 12,265,959 11,542,359 11,901,777
UAAL as a Percentage of Covered Payroll 229.02% N/A 166.22%
Net Pension Obligation (NPO) at the Beginning of Period - - -
Annual Pension Cost (2): Annual Required Contribution (ARC) 2,477,724 2,331,557 2,348,033 Interest on NPO - - - Adjustment to ARC - - -
Contributions Made (2) 2,477,724 2,331,557 2,348,033
Increase in NPO - - -
NPO at the end of period $ - $ - $ -
(1) Actuarial valuations were not completed as of December 31, 2010.
(2) Information is from actuarial reports prepared for the Midland Firemen's Relief and Retirement Fund. In years where an actuarial report is not prepared, the value of plan assets is extracted from the Midland Firemen's Relief and Retirement Fund audit for the appropriate year and Annual Covered Payroll and Contributions Made is extracted from the appropriate year City of Midland audit.
BBrown
Typewritten Text
93

Actuarial Valuation Date 12/31/11 12/31/10 (3) 12/31/09
Actuarial Value of Assets (1) $ - $ - $ -
Actuarial Accrued Liability (1) 52,657,298 N/A 47,972,658
Percentage Funded 0.00% N/A 0.00%
Unfunded Actuarial Accrued Liability (UAAL) 52,657,298 N/A 47,972,658
Annual Covered Payroll (2) 50,110,665 46,619,740 46,133,089
UAAL as a Percentage of Covered Payroll 105.08% N/A 103.99%
(1) As of April 30, 2012, the date of the actuarial reports prepared for the City of Midland.
(2) Extracted from City of Midland annual reports.
( ) f
City of Midland, TexasRequired Supplementary Information
Schedule of Actuarial Liabilities and Funding ProgressRetiree Health Plan
(Unaudited)
(3) Actuarial valuation was not completed as of December 31, 2010.
BBrown
Typewritten Text
94

NONMAJOR GOVERNMENTAL FUNDS
SPECIAL REVENUE FUNDS Special revenue funds are used to account for specific revenues that are legally restricted to expenditure for particular purposes. The City’s Special Revenue Funds are as follows: COMMUNITY DEVELOPMENT FUND – to account for federal funds received through various Community Development Block Grants. FEDERAL POLICE SPECIAL PURPOSES FUND – to account for funds received from forfeited property under federal jurisdiction. Such funds are used solely for law enforcement purposes such as salaries, training, equipment, supplies and items used by officers in direct law enforcement duties. STATE POLICE SPECIAL PURPOSES FUND - to account for funds received from forfeited property under state jurisdiction. Such funds are used solely for law enforcement purposes such as salaries, training, equipment, supplies and items used by officers in direct law enforcement duties. H.I.T.D.A. FEDERAL SEIZURE FUND - High Intensity Drug Trafficking Area seizure funds are received from the Drug Enforcement Administration. The funds are to be used to supplement and/or enhance law enforcement activities with priority given to supporting community policing activities, training, and law enforcement activities calculated to result in further seizures or forfeitures. DEPARTMENT OF JUSTICE GRANT FUND - to account for funds received from the Department of Justice, Office of Justice programs. The purpose of the Justice Assistance Grant (JAG) program is to support a broad range of activities to prevent and control crime. TAX INCREMENT REINVESTMENT ZONE FUND - to account for funds received from taxing units that levy taxes on real property in a designated reinvestment zone, a contiguous geographic area in the City of Midland, as prescribed under the provisions of Chapter 311 of the Texas Tax Code. The purpose of the fund is to enhance the value of real property in the zone through improvements. HOTEL-MOTEL TAX FUND - to account for funds received from the occupancy tax collected from hotels and motels. These funds are restricted by law for use for specified purposes. MUNICIPAL COURT TECHNOLOGY FUND - to account for funds collected from the defendant upon conviction for a misdemeanor offense in the City of Midland Municipal Court as a cost of court. These funds are restricted for the purchase of technological enhancements for the benefit of City of Midland Municipal Court by Texas Code of Criminal Procedure Article 102.0172. MUNICIPAL COURT BUILDING SECURITY FUND - to account for funds collected from the defendant upon conviction for a misdemeanor offense in the City of Midland Municipal Court as a cost of court. These funds are restricted for the purchase of building security enhancements for the benefit of City of Midland Municipal Court by Texas Code of Criminal Procedure Article 102.017. STREET REPAIR IMPROVEMENT AND NEW STREET AND SIDEWALK INSTALLATION FUND - to account for funds received from a supplemental building permit charge and a supplemental street improvement charge on specified classes of property. These funds are committed to improving, repairing or installing streets, alleys and/or sidewalks.
BBrown
Typewritten Text
95

CAPITAL PROJECTS FUNDS Capital projects funds account for financial resources to be used for the acquisition or construction of major capital facilities other than those financed by proprietary type funds. The City’s Capital Projects Funds are as follows: ANIMAL SHELTER FACILITY AND EQUIPMENT FUND – to account for the costs of building improvements and the purchase of equipment related to the Animal Shelter Facility, financed by funds received from a supplemental animal license fee. 1998 GENERAL PURPOSE CERTIFICATES OF OBLIGATION FUND – to account for the costs of street and drainage improvements, traffic improvements, park improvements, drainage improvements, downtown Midland improvements, and City Hall renovation and land acquisition, financed by certificates of obligation proceeds. 1999 GENERAL PURPOSE CERTIFICATES OF OBLIGATION FUND – to account for the costs of park improvements, buildings and structures for public gatherings, street improvements, drainage improvements, fire stations, golf course facilities, and fire fighting equipment, financed by certificates of obligation proceeds. 2001 GENERAL PURPOSE CERTIFICATES OF OBLIGATION FUND – to account for the costs of street and drainage improvements, traffic lights and controls, public safety equipment, park improvements, Midland Community Center equipment and improvements, records storage equipment and professional services related to planning and zoning projects. 2003 GENERAL PURPOSE CERTIFICATES OF OBLIGATION FUND – to account for the costs of traffic signage and signalization, street and drainage improvements, park improvements, Midland Center Facilities improvements, downtown Midland improvements and professional services rendered in relation to such projects financed by certificates of obligation proceeds. 2005 GENERAL PURPOSE CERTIFICATES OF OBLIGATION FUND – to account for the costs of public safety equipment, street paving, drainage, traffic signage and signalization improvements, park improvements, improvements to City facilities, downtown Midland improvements and professional services rendered in relation to such projects financed by certificates of obligation proceeds. 2007 GENERAL PURPOSE CERTIFICATES OF OBLIGATION FUND – to account for the costs of street, drainage, and traffic signalization, park and recreation improvements, acquiring, equipping, improving and renovating a building for storage of municipal property and fire fighting facilities, including the acquisition of land therefore and professional services rendered in relation to such projects financed by certificates of obligation proceeds. 2009 GENERAL PURPOSE CERTIFICATES OF OBLIGATION FUND – to account for the costs of acquiring, constructing, improving, renovating, or equipping existing City-owned buildings, parks and park facilities, constructing, paving or improving streets, drainage, traffic signage, and signalization and professional services rendered in relation to such projects financed by certificates of obligation proceeds.
2012 GENERAL PURPOSE CERTIFICATES OF OBLIGATION FUND – to account for the costs of constructing, improving, renovating, or equipping the voice and data communication system for public services, fire fighting facilities, park and recreational facilities, technology system, and streets. Acquire land and right-of way to improve and extend the City’s water and sewer system financed by certificates of obligation proceeds.
BBrown
Typewritten Text
96

BBrown
Typewritten Text
97

CITY OF MIDLAND, TEXASCombining Balance Sheet
Nonmajor Governmental FundsSeptember 30, 2012
Street RepairFederal State Department Tax Municipal ImprovementPolice Police H.I.T.D.A. of Increment Hotel Municipal Court
Community Special Special Federal Justice Reinvestment Motel Court Building and SidewalkDevelopment Purposes Purposes Seizure Grant Zone Tax Technology Security Installation
Fund Fund Fund Fund Fund Fund Fund Fund Fund Fund TotalASSETSCash and cash equivalents 7$ 430,898$ 44,562$ 7,789$ 73,928$ 1,662,822$ 4,393,005$ 189,146$ 221,756$ 888,386$ 7,912,299$ Investments - 287,416 29,723 - - 1,109,129 2,930,204 126,163 147,916 592,568 5,223,119 Receivables: Property taxes - - - - - 353,151 - - - - 353,151 Accounts receivable 943,149 - - - - - 246,730 - - - 1,189,879 Interest receivable - 793 66 - - 2,436 8,163 348 411 1,630 13,847 Intergovernmental receivable 98,027 - - - - - - - - - 98,027
Total assets 1,041,183$ 719,107$ 74,351$ 7,789$ 73,928$ 3,127,538$ 7,578,102$ 315,657$ 370,083$ 1,482,584$ 14,790,322$
LIABILITIES Accounts payable 55,654$ - $ - $ - $ - $ 50,000$ 79,657$ - $ - $ - $ 185,311$ Retainage payable 13,975 - - - - - - - - - 13,975 Due to other funds 23,669 - - - - - - - - - 23,669 Deferred and unearned revenue 943,149 - - - 73,779 - - - - - 1,016,928 Other - - - - - - - - - - -
Total liabilities 1,036,447 - - - 73,779 50,000 79,657 - - - 1,239,883
FUND BALANCESRestricted for: Public Safety - 719,107 74,351 7,789 149 - - - - - 801,396 Court - - - - - - - 315,657 370,083 - 685,740 Communications - - - - - - - - - - - Downtown - - - - - - - - - - -
B ildi d ti 2 005 989 2 005 989
Special Revenue
and New Street
Buildings and renovations - - - - - - 2,005,989 - - - 2,005,989 Streets and drainage - - - - - - - - - - - Parks and recreation - - - - - - 79,814 - - - 79,814 Other purposes 4,736 - - - - - 5,412,642 - - - 5,417,378 Committed to: Buildings and renovations - - - - - - - - - - - Streets and drainage - - - - - - - - - 1,482,584 1,482,584 Other purposes - - - - - 3,077,538 - - - - 3,077,538
Total fund balances 4,736 719,107 74,351 7,789 149 3,077,538 7,498,445 315,657 370,083 1,482,584 13,550,439
Total liabilities and fund balances 1,041,183$ 719,107$ 74,351$ 7,789$ 73,928$ 3,127,538$ 7,578,102$ 315,657$ 370,083$ 1,482,584$ 14,790,322$
BBrown
Typewritten Text
98

1998 1999 2001 2003 2005 2007 2009 2012General General General General General General General General
Animal Purpose Purpose Purpose Purpose Purpose Purpose Purpose PurposeShelter Certificates Certificates Certificates Certificates Certificates Certificates Certificates Certificates Total
Facility and of of of of of of of of NonmajorEquipment Obligation Obligation Obligation Obligation Obligation Obligation Obligation Obligation Governmental
Fund Fund Fund Fund Fund Fund Fund Fund Fund Total Funds
147,295$ 171,816$ 7,261$ 106,302$ 427,499$ 428,496$ 728,247$ 6,659,472$ 12,140,850$ 20,817,238$ 28,729,537$ 98,248 21 57 344 695 935 3,632 181,545 553 286,030 5,509,149
- - - - - - - - - - 353,151 - - - - - - - - - - 1,189,879 274 - - 1 2 3 - 390 1 671 14,518
- - - - - - - - - - 98,027
245,817$ 171,837$ 7,318$ 106,647$ 428,196$ 429,434$ 731,879$ 6,841,407$ 12,141,404$ 21,103,939$ 35,894,261$
- $ - $ - $ - $ - $ 2,750$ - $ 113,860$ - $ 116,610$ 301,921$ - - - - - - - 7,844 - 7,844 21,819 - - - - - - - - - - 23,669
- - - - - - - - - - 1,016,928 - - - - - - 1 - - 1 1
- - - - - 2,750 1 121,704 - 124,455 1,364,338
- - - - - 8,208 - - - 8,208 809,604 - - - - - - - - - - 685,740 - - - - - - - - 3,590,536 3,590,536 3,590,536 - 171,837 - - 388,833 84,216 - - - 644,886 644,886
112 374 122 413 1 465 431 4 117 420 5 817 638 7 823 627
Capital Projects Funds
- - - - - 112,374 122,413 1,465,431 4,117,420 5,817,638 7,823,627 - - 4,708 90,743 - 200,959 432,343 5,145,628 2,501,963 8,376,344 8,376,344 - - 2,610 - 39,363 20,927 177,122 108,644 1,931,485 2,280,151 2,359,965 - - - 15,904 - - - - - 15,904 5,433,282
245,817 - - - - - - - - 245,817 245,817 - - - - - - - - - - 1,482,584 - - - - - - - - - - 3,077,538
245,817 171,837 7,318 106,647 428,196 426,684 731,878 6,719,703 12,141,404 20,979,484 34,529,923
245,817$ 171,837$ 7,318$ 106,647$ 428,196$ 429,434$ 731,879$ 6,841,407$ 12,141,404$ 21,103,939$ 35,894,261$
BBrown
Typewritten Text
99

CITY OF MIDLAND, TEXASCombining Statement of Revenues, Expenditures and Changes in Fund Balances
Nonmajor Governmental FundsFor the Year Ended September 30, 2012
Street RepairFederal State Department Tax Municipal ImprovementPolice Police H.I.T.D.A. of Increment Hotel Municipal Court
Community Special Special Federal Justice Reinvestment Motel Court Building and SidewalkDevelopment Purposes Purposes Seizure Grant Zone Tax Technology Security Installation
Fund Fund Fund Fund Fund Fund Fund Fund Fund Fund TotalREVENUES Ad valorem tax revenues - $ - $ - $ - $ - $ 986,238$ - $ - $ - $ - $ 986,238$ Hotel-Motel tax revenues - - - - - - 4,606,037 - - - 4,606,037 Street improvement charge - - - - - - - - - 459,351 459,351 Pet licenses - - - - - - - - - - - Municipal Court technology assessment - - - - - - - 69,515 - - 69,515 Municipal Court Security Fee - - - - - - - - 52,057 - 52,057 Midland Center rentals - - - - - - 201,618 - - - 201,618 Intergovernmental grants 1,091,954 18,179 - - 23,583 - - - - - 1,133,716 Investment income: Interest income 11,007 3,653 351 - 82 12,621 34,782 1,682 2,021 7,187 73,386 Net increase (decrease) in the fair value of investments - 362 41 - - 982 3,466 167 179 712 5,909 Program income 162,915 - - - - - - - - - 162,915 Miscellaneous - 208,318 47,581 - - - - - - - 255,899 Total revenues 1,265,876 230,512 47,973 - 23,665 999,841 4,845,903 71,364 54,257 467,250 8,006,641
EXPENDITURES Administration 131,915 - - - - - - - - - 131,915 Clearance activities 78,487 - - - - - - - - - 78,487 Community involvement 100,000 - - - - - - - - - 100,000 Housing programs 601,008 - - - - - - - - - 601,008 Economic development - - - - - - 1,822,380 - - - 1,822,380 Capital outlay 435,479 - - - - - 105,261 - - - 540,740 Other - 36,358 29,307 - 23,599 51,990 88,631 36,730 - - 266,615 Total expenditures 1,346,889 36,358 29,307 - 23,599 51,990 2,016,272 36,730 - - 3,541,145
Excess (deficiency) of revenues over (under) expenditures (81,013) 194,154 18,666 - 66 947,851 2,829,631 34,634 54,257 467,250 4,465,496
OTHER FINANCING SOURCES (USES)
and New Street
Special Revenue
SOURCES (USES) Issuance of long-term debt - - - - - - - - - - - Premium on debt issuance - - - - - - - - - - - Transfers out - - - - - - (19,724) - - - (19,724)
Total other financing sources (uses) - - - - - - (19,724) - - - (19,724)
Net change in fund balances (81,013) 194,154 18,666 - 66 947,851 2,809,907 34,634 54,257 467,250 4,445,772
Fund balances – beginning 85,749 524,953 55,685 7,789 83 2,129,687 4,688,538 281,023 315,826 1,015,334 9,104,667
Fund balances – ending 4,736$ 719,107$ 74,351$ 7,789$ 149$ 3,077,538$ 7,498,445$ 315,657$ 370,083$ 1,482,584$ 13,550,439$
BBrown
Typewritten Text
100
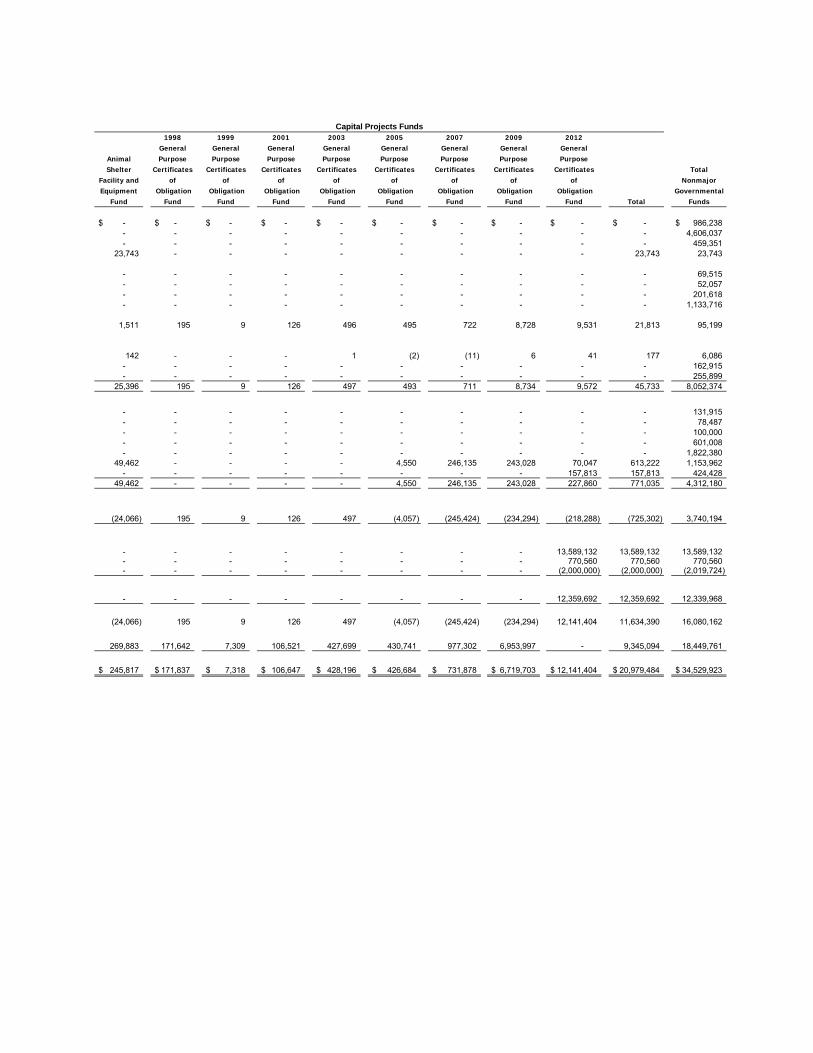
1998 1999 2001 2003 2005 2007 2009 2012General General General General General General General General
Animal Purpose Purpose Purpose Purpose Purpose Purpose Purpose PurposeShelter Certificates Certificates Certificates Certificates Certificates Certificates Certificates Certificates Total
Facility and of of of of of of of of NonmajorEquipment Obligation Obligation Obligation Obligation Obligation Obligation Obligation Obligation Governmental
Fund Fund Fund Fund Fund Fund Fund Fund Fund Total Funds
- $ - $ - $ - $ - $ - $ - $ - $ - $ - $ 986,238$ - - - - - - - - - - 4,606,037 - - - - - - - - - - 459,351
23,743 - - - - - - - - 23,743 23,743
- - - - - - - - - - 69,515 - - - - - - - - - - 52,057 - - - - - - - - - - 201,618 - - - - - - - - - - 1,133,716
1,511 195 9 126 496 495 722 8,728 9,531 21,813 95,199
142 - - - 1 (2) (11) 6 41 177 6,086 - - - - - - - - - - 162,915 - - - - - - - - - - 255,899
25,396 195 9 126 497 493 711 8,734 9,572 45,733 8,052,374
- - - - - - - - - - 131,915 - - - - - - - - - - 78,487 - - - - - - - - - - 100,000 - - - - - - - - - - 601,008 - - - - - - - - - - 1,822,380
49,462 - - - - 4,550 246,135 243,028 70,047 613,222 1,153,962 - - - - - - - - 157,813 157,813 424,428
49,462 - - - - 4,550 246,135 243,028 227,860 771,035 4,312,180
(24,066) 195 9 126 497 (4,057) (245,424) (234,294) (218,288) (725,302) 3,740,194
Capital Projects Funds
- - - - - - - - 13,589,132 13,589,132 13,589,132 - - - - - - - - 770,560 770,560 770,560 - - - - - - - - (2,000,000) (2,000,000) (2,019,724)
- - - - - - - - 12,359,692 12,359,692 12,339,968
(24,066) 195 9 126 497 (4,057) (245,424) (234,294) 12,141,404 11,634,390 16,080,162
269,883 171,642 7,309 106,521 427,699 430,741 977,302 6,953,997 - 9,345,094 18,449,761
245,817$ 171,837$ 7,318$ 106,647$ 428,196$ 426,684$ 731,878$ 6,719,703$ 12,141,404$ 20,979,484$ 34,529,923$
BBrown
Typewritten Text
101

CITY OF MIDLAND, TEXASDebt Service Fund
Schedule of Revenues, Expenditures and Changes in Fund BalancesBudget and Actual
For the Year Ended September 30, 2012
Variance withFinal Budget–
Actual PositiveOriginal Final Amounts (Negative)
REVENUESProperty taxes $ 3,616,117 $ 3,616,117 $ 3,695,569 $ 79,452 Investment earnings: Interest income 12,000 12,000 6,036 (5,964) Net increase in the fair value of investments - - 460 460
Total revenues 3,628,117 3,628,117 3,702,065 73,948
EXPENDITURESDebt service:
Principal 2,891,115 2,891,115 2,891,115 - Interest 954,844 954,844 954,843 1 Paying agent fees 1,055 1,055 1,051 4
Total expenditures 3,847,014 3,847,014 3,847,009 5
Deficiency of revenuesunder expenditures (218,897) (218,897) (144,944) 73,953
OTHER FINANCING SOURCES (USES)Transfers in 110,184 110,184 110,183 (1) Accrued interest on debt issuance - - 499 499
Total other financing sources 110,184 110,184 110,682 498
Net change in fund balances (108,713) (108,713) (34,262) 74,451
Fund balances – beginning 448,006 448,006 448,006 -
Fund balances – ending $ 339,293 $ 339,293 $ 413,744 $ 74,451
Budgeted Amounts
BBrown
Typewritten Text
102

INTERNAL SERVICE FUNDS Internal service funds are used to account for the financing of goods or services provided by one department or agency to other departments or agencies of the government and to other government units, on a cost reimbursement basis. The City’s Internal Service Funds are as follows: WAREHOUSE FUND – to account for the revenues and cost of operations of a central store for the City. GARAGE FUND – to account for the revenues and cost of operations of a central motor pool. Vehicles are rented to user departments at estimated cost. Additions and replacements are financed by the Garage Fund and by transfers from the General Fund and Special Revenue Funds. TECHNOLOGY FUND – to account for the revenues and cost of operations of a central technology asset pool for the City. New and replacement technological assets are funded by the Technology fund, to be reimbursed by the user funds at an amortized rate over a specified asset life. WORKER'S COMPENSATION SELF-INSURANCE FUND – to account for the revenues and expenses of a worker's compensation plan consisting of purchased insurance and self-insurance for claims prior to October 1, 1996. Departments of the City are charged premiums consistent with the cost of comparable insurance plans. MEDICAL/DENTAL SELF-INSURANCE FUND – to account for the revenues and expenses of a group life insurance, medical insurance and dental insurance self-insurance plan for employees, dependents and retirees. Departments of the City are charged premiums consistent with the cost of comparable insurance plans. Claims are provided for as incurred. GENERAL LIABILITY SELF-INSURANCE FUND – to account for the revenues and expenses of a self-insured general liability insurance fund. Departments of the City are charged premiums consistent with the cost of comparable insurance plans. Claims are provided for as incurred.
BBrown
Typewritten Text
103

CITY OF MIDLAND, TEXASInternal Service Funds
Combining Statement of Net AssetsSeptember 30, 2012
Worker's Medical/ General Compensation Dental Liability
Self- Self- Self-Warehouse Garage Technology Insurance Insurance Insurance
Fund Fund Fund Fund Fund Fund TotalASSETSCurrent assets: Cash and cash equivalents $ 169,492 $ 5,114,827 $ 1,979,339 $ 1,611,726 $ 363,055 $ 947,089 $ 10,185,528 Investments 113,054 3,219,839 15,854 1,075,047 298,059 631,724 5,353,577 Accounts receivable - 11,438 - - 206,632 - 218,070 Interest receivable 265 8,337 - 3,023 415 1,747 13,787 Notes receivable - 124,000 - - - - 124,000 Inventories 245,424 352,053 - - - - 597,477 Prepaid items and other assets - - - 20,000 53,046 - 73,046 Total current assets 528,235 8,830,494 1,995,193 2,709,796 921,207 1,580,560 16,565,485
Noncurrent assets:Capital assets: Land - - - - - 108,701 108,701 Buildings 23,804 1,788,120 - - - 5,000 1,816,924 Improvements other than buildings 500,000 346,955 - - - - 846,955 Machinery and equipment - 41,870,867 70,431 - 7,003 34,727 41,983,028 Intangible and Other 124,105 4,188,444 6,000 187,105 9,954 187,500 4,703,108 Construction in progress - - 45,250 - - - 45,250 Less accumulated depreciation (73,992) (30,798,135) (5,001) (74,868) (15,331) (75,675) (31,043,002) Total capital assets (net of accumulated depreciation) 573,917 17,396,251 116,680 112,237 1,626 260,253 18,460,964
Other noncurrent assets: Notes receivable - 1,236,932 - - - - 1,236,932
Total noncurrent assets 573,917 18,633,183 116,680 112,237 1,626 260,253 19,697,896
Total assets 1,102,152 27,463,677 2,111,873 2,822,033 922,833 1,840,813 36,263,381
LIABILITIESCurrent liabilities: Accounts payable 5,557 1,472,017 331 17,823 510,285 225,696 2,231,709 Accrued payroll 3,628 73,215 - - - 7,697 84,540 Compensated absences 8,887 62,692 - - - 8,458 80,037 Estimated unpaid claims - - - 277,549 636,287 213,031 1,126,867 Other liabilities - - - - 921 - 921 Total current liabilities 18,072 1,607,924 331 295,372 1,147,493 454,882 3,524,074
Noncurrent liabilities: Compensated absences 16,436 31,908 - - - 1,984 50,328 Other postemployment benefits payable 20,210 452,868 - 8,910 10,060 50,159 542,207 Estimated unpaid claims - - - 832,644 - 852,122 1,684,766
Total noncurrent liabilities 36,646 484,776 - 841,554 10,060 904,265 2,277,301
Total liabilities 54,718 2,092,700 331 1,136,926 1,157,553 1,359,147 5,801,375
NET ASSETS Invested in capital assets 573,917 17,396,251 2,072,942 112,237 1,626 260,253 20,417,226 Unrestricted 473,517 7,974,726 38,600 1,572,870 (236,346) 221,413 10,044,780
Total net assets $ 1,047,434 $ 25,370,977 $ 2,111,542 $ 1,685,107 $ (234,720) $ 481,666 $ 30,462,006
bbrown
Typewritten Text
104
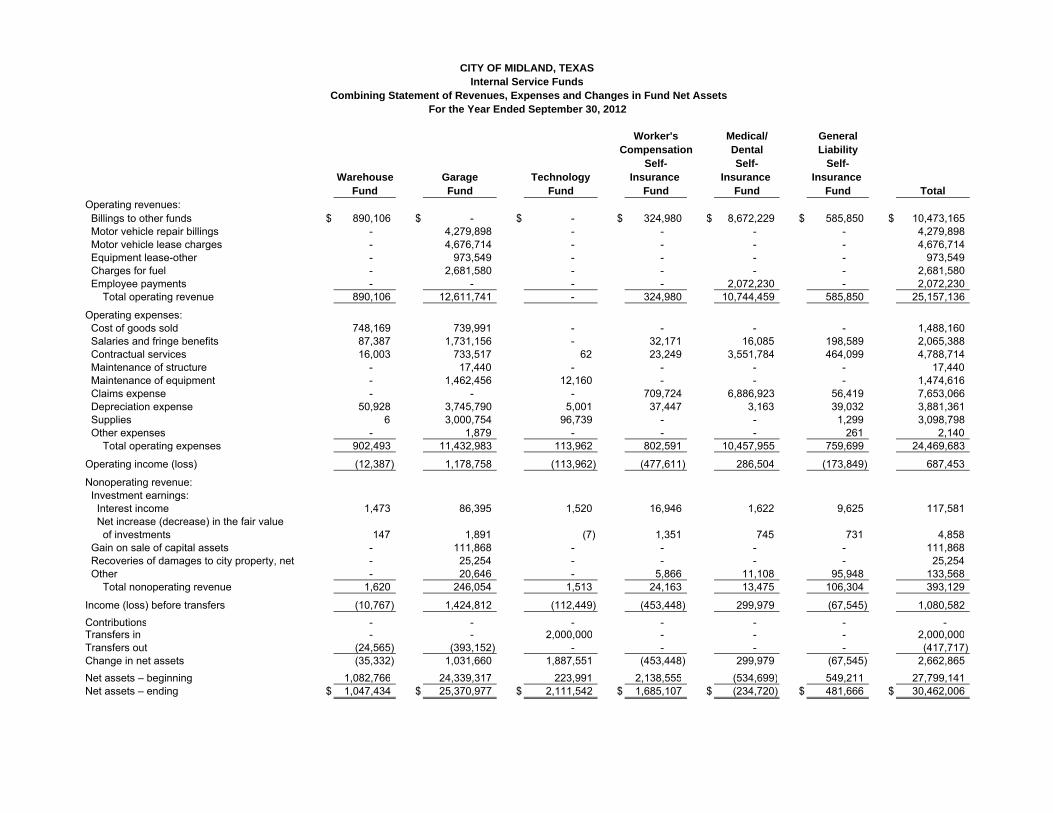
Worker's Medical/ General Compensation Dental Liability
Self- Self- Self-Warehouse Garage Technology Insurance Insurance Insurance
Fund Fund Fund Fund Fund Fund TotalOperating revenues: Billings to other funds $ 890,106 $ - $ - $ 324,980 $ 8,672,229 $ 585,850 $ 10,473,165 Motor vehicle repair billings - 4,279,898 - - - - 4,279,898 Motor vehicle lease charges - 4,676,714 - - - - 4,676,714 Equipment lease-other - 973,549 - - - - 973,549 Charges for fuel - 2,681,580 - - - - 2,681,580 Employee payments - - - - 2,072,230 - 2,072,230 Total operating revenue 890,106 12,611,741 - 324,980 10,744,459 585,850 25,157,136
Operating expenses: Cost of goods sold 748,169 739,991 - - - - 1,488,160 Salaries and fringe benefits 87,387 1,731,156 - 32,171 16,085 198,589 2,065,388 Contractual services 16,003 733,517 62 23,249 3,551,784 464,099 4,788,714 Maintenance of structure - 17,440 - - - - 17,440 Maintenance of equipment - 1,462,456 12,160 - - - 1,474,616 Claims expense - - - 709,724 6,886,923 56,419 7,653,066 Depreciation expense 50,928 3,745,790 5,001 37,447 3,163 39,032 3,881,361 Supplies 6 3,000,754 96,739 - - 1,299 3,098,798 Other expenses - 1,879 - - - 261 2,140 Total operating expenses 902,493 11,432,983 113,962 802,591 10,457,955 759,699 24,469,683
Operating income (loss) (12,387) 1,178,758 (113,962) (477,611) 286,504 (173,849) 687,453
Nonoperating revenue: Investment earnings: Interest income 1,473 86,395 1,520 16,946 1,622 9,625 117,581 Net increase (decrease) in the fair value of investments 147 1,891 (7) 1,351 745 731 4,858 Gain on sale of capital assets - 111,868 - - - - 111,868 Recoveries of damages to city property, net - 25,254 - - - - 25,254 Other - 20,646 - 5,866 11,108 95,948 133,568 Total nonoperating revenue 1,620 246,054 1,513 24,163 13,475 106,304 393,129
Income (loss) before transfers (10,767) 1,424,812 (112,449) (453,448) 299,979 (67,545) 1,080,582
Contributions - - - - - - - Transfers in - - 2,000,000 - - - 2,000,000 Transfers out (24,565) (393,152) - - - - (417,717) Change in net assets (35,332) 1,031,660 1,887,551 (453,448) 299,979 (67,545) 2,662,865
Net assets – beginning 1,082,766 24,339,317 223,991 2,138,555 (534,699) 549,211 27,799,141 Net assets – ending $ 1,047,434 $ 25,370,977 $ 2,111,542 $ 1,685,107 $ (234,720) $ 481,666 $ 30,462,006
CITY OF MIDLAND, TEXASInternal Service Funds
Combining Statement of Revenues, Expenses and Changes in Fund Net AssetsFor the Year Ended September 30, 2012
bbrown
Typewritten Text
105

CITY OF MIDLAND, TEXASInternal Service Funds
Combining Statement of Cash FlowsFor the Year Ended September 30, 2012
Worker's Medical/ General Compensation Dental Liability
Self- Self- Self-Warehouse Garage Technology Insurance Insurance Insurance
Fund Fund Fund Fund Fund Fund TotalCASH FLOWS FROM OPERATING ACTIVITIES
Receipts from customers and users $ - $ 49,855 $ - $ 5,866 $ 1,903,574 $ - $ 1,959,295 Interfund services provided 890,106 12,611,741 - 324,980 8,672,229 681,798 23,180,854 Payments to suppliers (838,698) (5,247,298) (148,558) (609,981) (10,591,634) (560,897) (17,997,066) Payments to employees (70,797) (1,650,171) - (30,104) (15,052) (186,285) (1,952,409)
Net cash provided (used) by operating activities (19,389) 5,764,127 (148,558) (309,239) (30,883) (65,384) 5,190,674
CASH FLOWS FROM NONCAPITAL FINANCINGACTIVITIES:
Transfers in from other funds - - 2,000,000 - - - 2,000,000 Transfers out to other funds (24,565) (393,152) - - - - (417,717)
Net cash provided (used) by noncapital financing activities (24,565) (393,152) 2,000,000 - - - 1,582,283
CASH FLOWS FROM CAPITAL AND RELATED FINANCING ACTIVITIES:
Purchases of capital assets - (3,734,456) (115,681) - - - (3,850,137) Repayment of loans to other funds - 120,442 - - - - 120,442 Proceeds from sale of capital assets - 124,821 - - - - 124,821
Net cash used by capital and related financing activities - (3,489,193) (115,681) - - - (3,604,874)
CASH FLOWS FROM INVESTING ACTIVITIES:Purchases of investments (113,054) (3,219,839) (15,854) (1,075,047) (298,059) (631,724) (5,353,577) Proceeds from sales and maturities of investments 132,425 2,595,823 105,200 1,213,868 281,174 666,143 4,994,633
Interest received 1,832 88,669 1,513 19,956 2,640 11,005 125,615 Net cash provided (used) by investing activities 21,203 (535,347) 90,859 158,777 (14,245) 45,424 (233,329)
Net increase (decrease) in cash and cash equivalents (22,751) 1,346,435 1,826,620 (150,462) (45,128) (19,960) 2,934,754 Cash and cash equivalents at beginning of year 192,243 3,768,392 152,719 1,762,188 408,183 967,049 7,250,774 Cash and cash equivalents at end of year $ 169,492 $ 5,114,827 $ 1,979,339 $ 1,611,726 $ 363,055 $ 947,089 $ 10,185,528
Reconciliation of operating income (loss) to net cash provided (used) by operating activities:Operating income (loss): $ (12,387) $ 1,178,758 $ (113,962) $ (477,611) $ 286,504 $ (173,849) $ 687,453 Adjustments to reconcile operating income (loss)
to net cash provided (used) by operating activities:Depreciation 50,928 3,745,790 5,001 37,447 3,163 39,032 3,881,361 Other income - 45,900 - 5,866 11,108 95,948 158,822 (Increase) decrease in accounts receivable - 3,955 - - (179,764) - (175,809) (Increase) decrease in inventory 8,906 (37,196) - - - - (28,290) Increase in prepaid items - - - - (53,046) - (53,046) Increase (decrease) in accounts payable (83,426) 745,935 (39,597) 12,985 (95,560) 214,178 754,515 Increase (decrease) in accrued payroll 95 308 - - - (24) 379 Increase (decrease) in estimated unpaid claims - - - 110,007 (4,520) (252,997) (147,510) Increase (decrease) in compensated absences 10,882 (30,517) - - - (427) (20,062) Increase in other postemployment benefits 5,613 111,194 - 2,067 1,033 12,755 132,662 Increase in other liabilities - - - - 199 - 199
Total adjustments (7,002) 4,585,369 (34,596) 168,372 (317,387) 108,465 4,503,221 Net cash provided (used) by operating activities $ (19,389) $ 5,764,127 $ (148,558) $ (309,239) $ (30,883) $ (65,384) $ 5,190,674
Noncash Investing, Capital and Financing Activities:Change in fair value of investments $ 147 $ 1,891 $ (7) $ 1,351 $ 745 $ 731 $ 4,858
bbrown
Typewritten Text
106

STATISTICAL SECTION
(Unaudited)
This part of the City of Midland’s comprehensive annual financial report presents detailedinformation as a context for understanding what the information in the financial statements, notesdisclosures, and required supplementary information says about the City’s overall financial health.
Sources: Unless otherwise noted, the information in these schedules is derived from thecomprehensive annual financial reports for the relevant year. The City implemented Statement 34 in 2002; schedules presenting government-wide information include information beginning in that year.
CONTENTS
Page Financial Trends 109
These schedules contain trend information to help the reader understand how the City’s financial performance and well-being have changed over time.
Revenue Capacity 114
These schedules contain information to help the reader assess the factors affecting the City’s ability to generate its property and sales taxes.
Debt Capacity 122
These schedules present information to help the reader assess the affordability of the City’s current levels of outstanding debt and the City’s ability to issue additional debt in the future.
Demographic and Economic Information 127
These schedules offer demographic and economic indicators to help the reader understand the environment within which the City’s financial activities take place.
Operating Information 129 These schedules contain information about the City’s operations and resources to help the reader understand how the City’s financial information relates to the service the City provides and the activities it performs.
BBrown
Typewritten Text
107

bbrown
Typewritten Text
bbrown
Typewritten Text
bbrown
Typewritten Text
108

Table 1CITY OF MIDLAND, TEXASNet Assets by Component
Last Ten Fiscal Years(accrual basis of accounting)
2003 2004 2005 2006 2007 2008 2009 2010 2011 2012
Governmental activitiesInvested in capital assets, net of related debt 38,542,651$ 39,547,580$ 41,993,822$ 47,625,042$ 53,378,805$ 62,688,027$ 70,220,858$ 74,338,808$ 77,139,942$ 79,950,737$ Restricted 44,877 168,149 118,651 255,331 34,810 156,130 20,367 326,991 6,518,425 9,227,239 Unrestricted 30,412,325 33,791,542 36,840,714 45,834,804 52,877,175 57,985,984 52,799,760 45,035,305 45,315,926 53,230,626
Total governmental activities net assets 68,999,853$ 73,507,271$ 78,953,187$ 93,715,177$ 106,290,790$ 120,830,141$ 123,040,985$ 119,701,104$ 128,974,293$ 142,408,602$
Business-type activitiesInvested in capital assets, net of related debt 113,409,800$ 119,949,907$ 130,705,342$ 138,474,174$ 146,453,011$ 149,714,918$ 166,637,943$ 169,294,026$ 178,169,630$ 189,427,031$ Restricted 8,216,615 8,195,706 8,195,706 8,195,706 7,826,071 7,826,071 7,826,071 7,826,071 11,615,537 12,228,596 Unrestricted 51,170,413 48,488,356 48,130,545 52,601,112 60,855,833 75,370,522 75,294,643 81,828,896 82,368,737 84,149,910
Total business-type activities net assets 172,796,828$ 176,633,969$ 187,031,593$ 199,270,992$ 215,134,915$ 232,911,511$ 249,758,657$ 258,948,993$ 272,153,904$ 285,805,537$
Primary governmentInvested in capital assets, net of related debt 151,952,451$ 159,497,487$ 172,699,164$ 186,099,216$ 199,831,816$ 212,402,945$ 236,858,801$ 243,632,834$ 255,309,572$ 269,377,768$ Restricted 8,261,492 8,363,855 8,314,357 8,451,037 7,860,881 7,982,201 7,846,438 8,153,062 18,133,962 21,455,835 Unrestricted 81,582,738 82,279,898 84,971,259 98,435,916 113,733,008 133,356,506 128,094,403 126,864,201 127,684,663 137,380,536
Total primary government net assets 241,796,681$ 250,141,240$ 265,984,780$ 292,986,169$ 321,425,705$ 353,741,652$ 372,799,642$ 378,650,097$ 401,128,197$ 428,214,139$
(Unaudited-See Accompanying Independent Auditors' Report)
bbrown
Typewritten Text
109

Table 2CITY OF MIDLAND, TEXAS
Changes in Net AssetsLast Ten Fiscal Years
(accrual basis of accounting)
2003 2004 2005 2006 2007 2008 2009 2010 2011 2012
ExpensesGovernmental activities:
General government 9,825,012$ 9,852,827$ 10,614,765$ 11,120,377$ 15,915,793$ 16,426,985$ 18,834,377$ 18,971,123$ 20,939,401$ 20,515,015$ Development services 9,700,172 8,806,275 8,730,237 9,200,295 11,318,654 11,221,695 13,479,488 14,369,010 13,837,291 3,534,375 Engineering - - - - - - - - - 10,642,676 Community services 6,722,669 6,611,580 6,791,555 7,228,250 7,963,767 9,200,826 9,739,208 10,084,652 10,137,221 9,933,581 Police 15,015,699 15,180,842 15,422,161 16,296,584 17,502,258 18,937,778 21,965,119 23,156,588 23,312,992 24,025,334 Fire 12,695,274 13,013,865 13,098,191 13,475,104 15,131,600 16,391,606 19,342,454 20,137,685 20,863,640 22,289,161 Other 4,692,589 4,171,108 4,083,732 4,376,474 - - - - - - Interest on long-term debt 1,045,023 971,925 991,790 995,050 1,071,259 1,085,505 1,152,879 1,103,073 1,028,942 1,221,970
Total governmental activities expenses 59,696,438 58,608,422 59,732,431 62,692,134 68,903,331 73,264,395 84,513,525 87,822,131 90,119,487 92,162,112
Business-type activities:Airport 6,842,549 6,684,861 7,008,505 6,912,437 7,541,223 8,047,073 8,690,847 9,201,993 9,295,323 8,835,469 Water and sewer 27,428,950 27,540,899 28,883,107 29,984,197 31,282,624 34,615,012 32,828,147 33,642,297 37,130,696 37,401,624 Sanitation 5,468,311 5,314,761 5,071,081 6,988,197 7,299,073 9,115,773 10,129,743 8,450,443 10,489,726 10,813,252 Sports complex 5,574,237 4,650,685 4,616,902 3,603,742 4,319,956 4,276,725 4,404,185 4,337,123 4,382,696 4,242,836 Golf course 1,339,880 1,097,870 1,163,787 1,448,110 1,502,814 1,478,505 1,903,417 1,923,190 1,910,254 2,056,066
Total business-type activities expenses 46,653,927 45,289,076 46,743,382 48,936,683 51,945,690 57,533,088 57,956,339 57,555,046 63,208,695 63,349,247 Total primary government expenses 106,350,365$ 103,897,498$ 106,475,813$ 111,628,817$ 120,849,021$ 130,797,483$ 142,469,864$ 145,377,177$ 153,328,182$ 155,511,359$
Program RevenuesGovernmental activities:
Charges for services:General government 787,438$ 836,248$ 815,161$ 736,932$ 781,719$ 527,757$ 447,368$ 596,304$ 536,478$ 620,524$ Development services 857 541 858 130 1 120 819 1 263 840 1 492 539 1 378 365 948 114 818 445 1 781 309 1 998 231Development services 857,541 858,130 1,120,819 1,263,840 1,492,539 1,378,365 948,114 818,445 1,781,309 1,998,231 Engineering - - - - - - - - - 1,963 Community services 874,671 908,581 919,699 1,090,698 1,075,048 1,001,491 929,448 923,658 875,790 898,904 Police 2,007,002 3,135,333 2,816,797 2,641,553 3,045,172 3,741,616 4,035,131 2,393,857 4,105,681 4,272,412 Fire 1,118,367 1,378,829 929,250 1,179,917 1,329,561 1,974,577 1,775,129 1,838,814 1,767,777 2,034,214
Operating grants and contributions 2,334,184 1,625,602 1,279,426 2,782,305 1,619,363 1,504,100 2,134,574 2,551,762 1,689,509 1,455,109 Capital grants and contributions 341,975 2,470,006 2,200,278 3,036,995 4,408,946 7,295,001 4,661,290 2,996,562 4,603,959 3,725,173
Total governmental activities program revenues 8,321,178 11,212,729 10,081,430 12,732,240 13,752,348 17,422,907 14,931,054 12,119,402 15,360,503 15,006,530
Business-type activities:Charges for services:
Airport 5,903,111 6,835,372 6,923,314 7,456,268 8,139,157 8,663,825 7,549,954 7,572,534 8,017,966 8,816,871 Water and sewer 28,799,731 27,764,094 30,841,175 34,648,349 37,812,622 44,267,408 41,138,165 40,370,745 44,728,124 41,236,729 Sanitation 5,553,450 5,761,502 6,320,995 6,598,321 7,465,121 7,906,457 8,504,251 8,982,565 10,679,562 11,636,597 Sports complex 3,987,854 4,129,763 4,624,481 5,646,149 6,505,378 7,278,806 6,565,148 6,541,457 8,360,882 9,781,813 Golf course 1,215,469 1,196,293 1,102,694 1,248,394 1,364,233 1,491,119 1,905,706 1,822,464 2,061,100 2,348,194
Operating grants and contributions 427,409 431,238 509,106 470,160 441,440 362,610 353,931 454,463 353,020 382,984 Capital grants and contributions 2,751,166 5,621,328 9,208,150 6,381,973 6,447,085 3,640,719 10,518,716 3,643,920 5,383,946 6,324,973
Total business-type activities program revenues 48,638,190 51,739,590 59,529,915 62,449,614 68,175,036 73,610,944 76,535,871 69,388,148 79,584,600 80,528,161 Total primary government program revenues 56,959,368$ 62,952,319$ 69,611,345$ 75,181,854$ 81,927,384$ 91,033,851$ 91,466,925$ 81,507,550$ 94,945,103$ 95,534,691$
Net (Expense)/RevenueGovernmental Activities (51,375,260)$ (47,395,693)$ (49,651,001)$ (49,959,894)$ (55,150,983)$ (55,841,488)$ (69,582,471)$ (75,702,729)$ (74,758,984)$ (77,155,582)$ Business-type Activities 1,984,263 6,450,514 12,786,533 13,512,931 16,229,346 16,077,856 18,579,532 11,833,102 16,375,905 17,178,914 Total primary government net expense (49,390,997)$ (40,945,179)$ (36,864,468)$ (36,446,963)$ (38,921,637)$ (39,763,632)$ (51,002,939)$ (63,869,627)$ (58,383,079)$ (59,976,668)$
bbrown
Typewritten Text
110
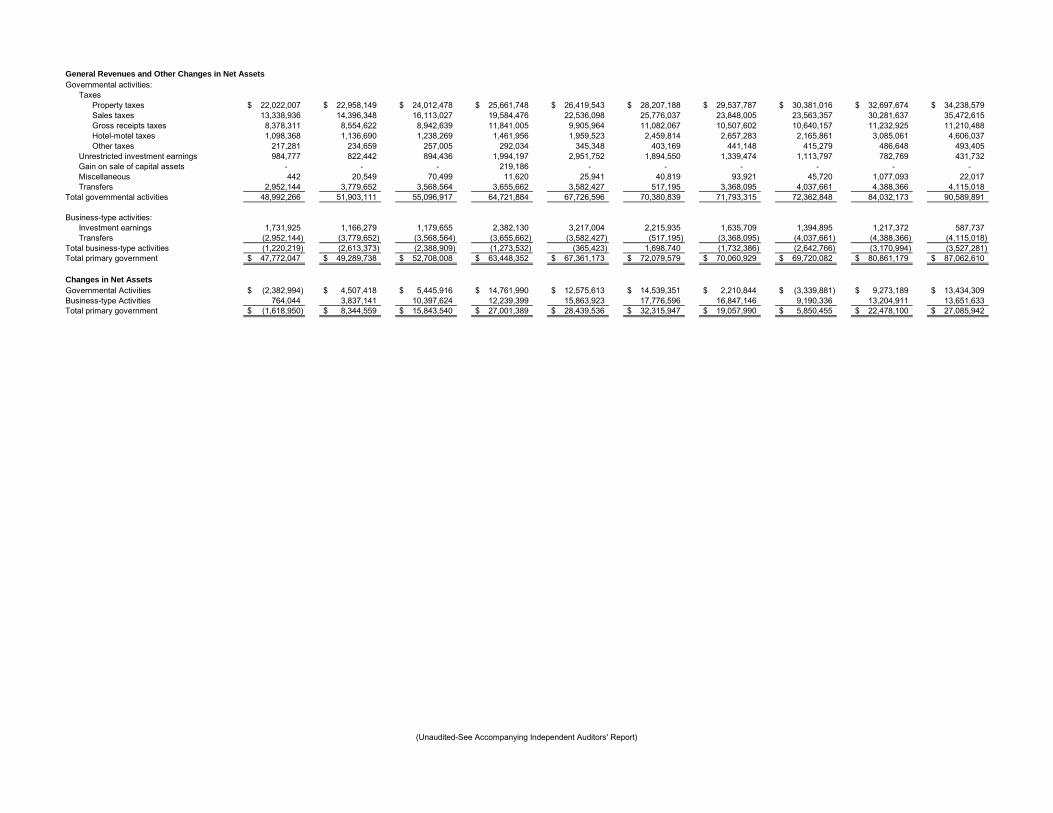
General Revenues and Other Changes in Net AssetsGovernmental activities:
TaxesProperty taxes 22,022,007$ 22,958,149$ 24,012,478$ 25,661,748$ 26,419,543$ 28,207,188$ 29,537,787$ 30,381,016$ 32,697,674$ 34,238,579$ Sales taxes 13,338,936 14,396,348 16,113,027 19,584,476 22,536,098 25,776,037 23,848,005 23,563,357 30,281,637 35,472,615 Gross receipts taxes 8,378,311 8,554,622 8,942,639 11,841,005 9,905,964 11,082,067 10,507,602 10,640,157 11,232,925 11,210,488 Hotel-motel taxes 1,098,368 1,136,690 1,238,269 1,461,956 1,959,523 2,459,814 2,657,283 2,165,861 3,085,061 4,606,037 Other taxes 217,281 234,659 257,005 292,034 345,348 403,169 441,148 415,279 486,648 493,405
Unrestricted investment earnings 984,777 822,442 894,436 1,994,197 2,951,752 1,894,550 1,339,474 1,113,797 782,769 431,732 Gain on sale of capital assets - - - 219,186 - - - - - - Miscellaneous 442 20,549 70,499 11,620 25,941 40,819 93,921 45,720 1,077,093 22,017 Transfers 2,952,144 3,779,652 3,568,564 3,655,662 3,582,427 517,195 3,368,095 4,037,661 4,388,366 4,115,018
Total governmental activities 48,992,266 51,903,111 55,096,917 64,721,884 67,726,596 70,380,839 71,793,315 72,362,848 84,032,173 90,589,891
Business-type activities:Investment earnings 1,731,925 1,166,279 1,179,655 2,382,130 3,217,004 2,215,935 1,635,709 1,394,895 1,217,372 587,737 Transfers (2,952,144) (3,779,652) (3,568,564) (3,655,662) (3,582,427) (517,195) (3,368,095) (4,037,661) (4,388,366) (4,115,018)
Total business-type activities (1,220,219) (2,613,373) (2,388,909) (1,273,532) (365,423) 1,698,740 (1,732,386) (2,642,766) (3,170,994) (3,527,281) Total primary government 47,772,047$ 49,289,738$ 52,708,008$ 63,448,352$ 67,361,173$ 72,079,579$ 70,060,929$ 69,720,082$ 80,861,179$ 87,062,610$
Changes in Net AssetsGovernmental Activities (2,382,994)$ 4,507,418$ 5,445,916$ 14,761,990$ 12,575,613$ 14,539,351$ 2,210,844$ (3,339,881)$ 9,273,189$ 13,434,309$ Business-type Activities 764,044 3,837,141 10,397,624 12,239,399 15,863,923 17,776,596 16,847,146 9,190,336 13,204,911 13,651,633 Total primary government (1,618,950)$ 8,344,559$ 15,843,540$ 27,001,389$ 28,439,536$ 32,315,947$ 19,057,990$ 5,850,455$ 22,478,100$ 27,085,942$
(Unaudited-See Accompanying Independent Auditors' Report)
bbrown
Typewritten Text
111

Table 3CITY OF MIDLAND, TEXAS
Fund Balances, Governmental FundsLast Ten Fiscal Years
(modified accrual basis of accounting)
2003 2004 2005 2006 2007 2008 2009 2010 2011 2012
General FundNonspendable - $ - $ - $ - $ - $ - $ - $ - $ 878,796$ 881,945$ Reserved 1,924,700 1,985,752 2,327,253 3,143,510 5,060,354 5,601,854 12,232,616 8,966,970 - - Unreserved 15,261,985 16,330,749 17,542,860 25,409,316 29,812,023 32,460,043 27,502,467 29,106,932 - - Restricted - - - - - - - - 195,668 210,897 Committed - - - - - - - - 7,728,867 8,486,918 Assigned - - - - - - - - 67,166 73,228 Unassigned - - - - - - - - 39,704,700 49,024,532
Total general fund 17,186,685$ 18,316,501$ 19,870,113$ 28,552,826$ 34,872,377$ 38,061,897$ 39,735,083$ 38,073,902$ 48,575,197$ 58,677,520$
All Other Governmental FundsReserved 2,334,817$ 2,624,518$ 3,630,166$ 3,877,898$ 7,590,172$ 3,176,012$ 4,392,945$ 6,888,698$ - $ - $ Unreserved, reported in:
Special revenue funds 1,370,695 1,832,380 2,113,539 1,245,470 2,420,879 3,929,760 4,394,896 5,952,978 - - Capital projects funds 6,062,180 4,771,649 7,272,992 2,367,582 3,493,158 2,319,159 6,937,027 4,756,115 - -
Restricted for:Debt service - - - - - - - - 448,006 413,744 Public safety - - - - - - - - 596,708 809,604 Court - - - - - - - - 596,849 685,740 Communications - - - - - - - - - 3,590,536 , ,Downtown - - - - - - - - 644,144 644,886 Building renovations - - - - - - - - 1,771,388 7,823,627 Streets and drainage - - - - - - - - 6,083,529 8,376,344 Parks and recreation - - - - - - - - 525,786 2,359,965 Other capital projects - - - - - - - - 42,166 - Other purposes - - - - - - - - 4,774,287 5,433,282
Committed to:Building renovations - - - - - - - - 269,883 245,817 Streets and drainage - - - - - - - - 1,015,334 1,482,584 Other purposes - - - - - - - - 2,129,687 3,077,538
Total all other governmental funds 9,767,692$ 9,228,547$ 13,016,697$ 7,490,950$ 13,504,209$ 9,424,931$ 15,724,868$ 17,597,791$ 18,897,767$ 34,943,667$
(Unaudited-See Accompanying Independent Auditors' Report)
bbrown
Typewritten Text
112

Table 4CITY OF MIDLAND, TEXAS
Changes in Fund Balances, Governmental FundsLast Ten Fiscal Years
(modified accrual basis of accounting)
2003 2004 2005 2006 2007 2008 2009 2010 2011 2012Revenues
Taxes 45,067,234$ 47,354,745$ 50,511,124$ 58,902,891$ 61,060,586$ 68,058,393$ 67,107,946$ 67,077,164$ 77,835,427$ 86,090,547$ Licenses and permits 895,208 988,003 1,020,416 1,170,553 1,349,074 1,461,320 1,124,144 1,187,504 1,991,056 2,419,466 Fines and forfeitures 2,173,560 2,248,896 2,283,272 2,425,291 2,667,017 3,166,584 3,134,799 3,276,328 3,648,203 3,808,669 Charges for services 2,181,511 2,410,693 1,943,476 2,093,062 2,239,596 2,289,241 2,553,851 2,356,353 2,311,691 2,685,136 Rentals 206,780 214,848 201,274 220,312 214,059 220,283 198,555 211,115 203,293 212,962 Assessments 91,028 97,278 99,270 121,816 109,589 120,613 115,544 116,859 117,117 121,572 Intergovernmental 2,361,702 1,876,985 1,927,026 3,357,245 2,061,721 1,934,972 4,537,251 4,061,605 2,833,751 2,575,756 Investment earnings 697,678 600,425 828,198 1,699,793 2,513,712 1,631,545 1,109,384 974,529 792,232 460,308 Contributions and donations - 434,356 234,304 865,966 259,596 205,805 612,493 161,187 1,264,310 277,895 Miscellaneous 548,126 521,181 515,864 450,332 633,704 473,926 674,347 725,415 1,782,060 629,871
Total revenues 54,222,827 56,747,410 59,564,224 71,307,261 73,108,654 79,562,682 81,168,314 80,148,059 92,779,140 99,282,182
ExpendituresGeneral government 9,638,003 9,811,679 10,705,471 11,222,344 12,170,359 12,213,221 14,083,339 14,314,539 14,797,484 15,370,449 Development services 7,467,590 6,945,427 7,115,914 8,017,698 8,295,919 9,410,143 11,692,087 11,090,190 10,639,275 2,484,995 Engeering 7,700,839 Community services 6,120,339 6,033,278 6,591,145 7,211,703 7,246,431 8,595,533 9,037,633 9,783,237 9,591,163 10,597,142 Police 14,637,524 15,237,947 15,692,926 16,361,191 17,505,378 19,210,537 20,668,423 21,044,525 21,393,542 22,766,719 Fire 12,635,389 13,121,068 13,627,472 13,668,119 15,348,015 16,466,900 18,337,470 18,203,854 18,782,600 20,918,880 Other 4,508,411 4,487,683 4,367,939 4,638,911 4,515,769 4,936,332 5,446,695 5,517,045 4,486,670 5,004,512 Capital outlay 2,093,678 1,485,800 1,765,279 7,717,921 2,965,213 6,336,797 5,806,226 433,004 1,810,455 1,153,962 Debt services:
Principal 2,054,023 2,060,961 2,227,787 2,484,724 2,691,551 2,808,488 2,274,389 2,530,065 2,812,808 2,891,115 Interest 961,812 1,043,591 886,932 1,074,354 876,390 1,282,233 887,869 1,325,357 1,040,860 954,843 Debt issuance costs 20,476 - 93,138 - 83,852 - 153,789 - - 157,813 Refunding bond issuance
costs and escrow - - - - - - 207,720 - - - Paying agents' fees 4,020 2,797 3,070 3,081 3,081 3,143 2,481 1,051 1,051 1,051
Total expenditures 60,141,265 60,230,231 63,077,073 72,400,046 71,701,958 81,263,327 88,598,121 84,242,867 85,355,908 90,002,320
Excess of revenues over (under) expenditures (5,918,438) (3,482,821) (3,512,849) (1,092,785) 1,406,696 (1,700,645) (7,429,807) (4,094,808) 7,423,232 9,279,862
Other Financing Sources (Uses)Sale of capital assets - - - 323,475 168,000 - - - - - Refunding bonds issued 2,485,000 - - - - - 7,708,926 - - - Issuance of long-term debt 4,950,000 - 4,950,000 - 6,910,000 - 9,850,132 - - 13,589,132 Payment to refunded bond
escrow agent (2,445,000) - - - - - (7,638,159) - - - Premium on debt issuance - - 45,950 - 181,709 - 281,634 - - 770,560 Accrued interest on debt issuance - - 21,989 - 32,093 - 47,160 - - 499 Transfers in 3,196,701 4,207,723 4,046,110 4,343,644 4,377,586 4,423,913 6,111,466 4,778,476 5,055,682 5,042,997 Transfers out (184,474) (134,231) (209,438) (417,368) (743,274) (3,613,026) (958,229) (471,926) (677,643) (2,534,827)
Total other financing sources (uses) 8,002,227 4,073,492 8,854,611 4,249,751 10,926,114 810,887 15,402,930 4,306,550 4,378,039 16,868,361
Net change in fund balances 2,083,789$ 590,671$ 5,341,762$ 3,156,966$ 12,332,810$ (889,758)$ 7,973,123$ 211,742$ 11,801,271$ 26,148,223$
Debt service as a percentage of noncapital expenditures 5.2% 5.3% 5.2% 5.7% 5.3% 5.6% 4.0% 4.8% 4.8% 4.5%
Note: Noncapital expenditures excludes capital expenditures reported in the various functional categories of current expenditures presented above.
(Unaudited-See Accompanying Independent Auditors' Report)
bbrown
Typewritten Text
113
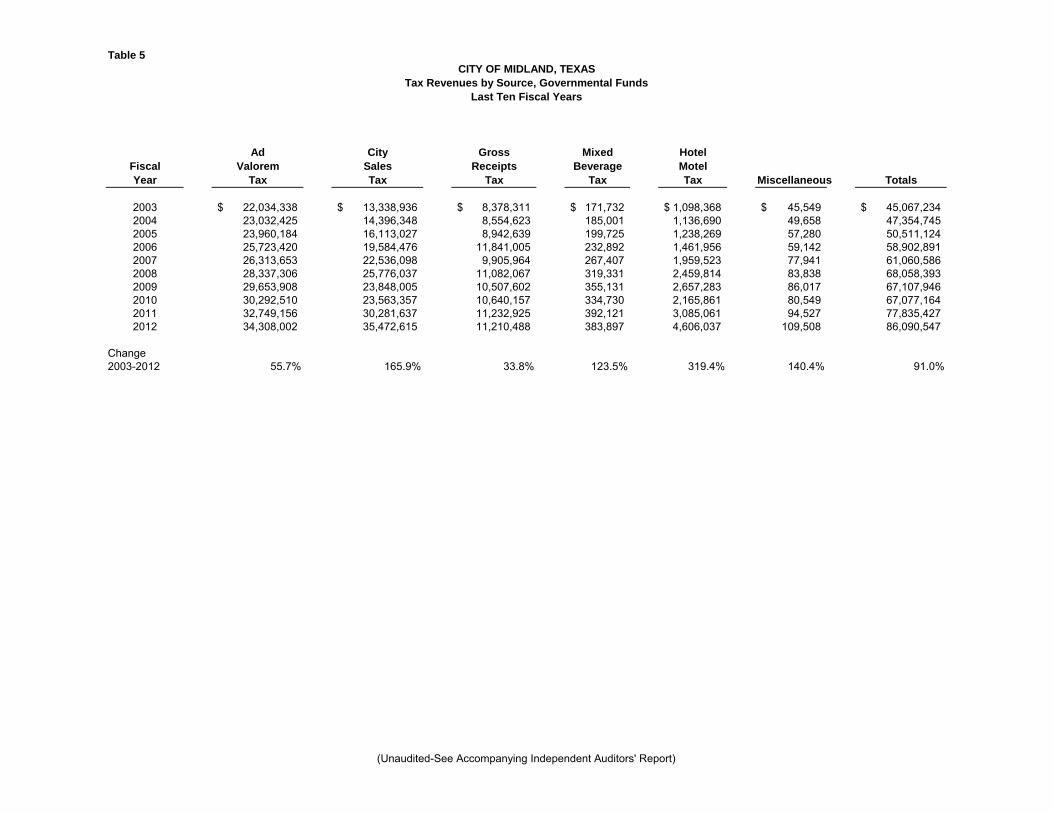
Table 5CITY OF MIDLAND, TEXAS
Tax Revenues by Source, Governmental FundsLast Ten Fiscal Years
Ad City Gross Mixed HotelFiscal Valorem Sales Receipts Beverage MotelYear Tax Tax Tax Tax Tax Miscellaneous Totals
2003 22,034,338$ 13,338,936$ 8,378,311$ 171,732$ 1,098,368$ 45,549$ 45,067,234$ 2004 23,032,425 14,396,348 8,554,623 185,001 1,136,690 49,658 47,354,7452005 23,960,184 16,113,027 8,942,639 199,725 1,238,269 57,280 50,511,1242006 25,723,420 19,584,476 11,841,005 232,892 1,461,956 59,142 58,902,8912007 26,313,653 22,536,098 9,905,964 267,407 1,959,523 77,941 61,060,5862008 28,337,306 25,776,037 11,082,067 319,331 2,459,814 83,838 68,058,3932009 29,653,908 23,848,005 10,507,602 355,131 2,657,283 86,017 67,107,9462010 30,292,510 23,563,357 10,640,157 334,730 2,165,861 80,549 67,077,1642011 32,749,156 30,281,637 11,232,925 392,121 3,085,061 94,527 77,835,4272012 34,308,002 35,472,615 11,210,488 383,897 4,606,037 109,508 86,090,547
Change2003-2012 55.7% 165.9% 33.8% 123.5% 319.4% 140.4% 91.0%
(Unaudited-See Accompanying Independent Auditors' Report)
bbrown
Typewritten Text
114

Table 6CITY OF MIDLAND, TEXAS
Assessed Value and Actual Value of Taxable PropertyLast Ten Fiscal Years
(in thousands of dollars)
Fiscal TotalYear Less: Total Taxable Direct
Ended Real Personal Minerals Tax-Exempt Assessed TaxSeptember 30, Property Property Property Property Value Rate
2003 3,147,530$ 557,850$ 12,230$ 335,479$ 3,382,131$ 0.6464$ 2004 3,285,374 561,123 12,808 343,428 3,515,877 0.6464 2005 3,449,861 580,053 15,953 344,824 3,701,043 0.6424 2006 3,656,062 610,948 24,999 344,419 3,947,590 0.6420 2007 4,111,423 682,286 37,335 403,036 4,428,008 0.5870 2008 5,176,698 739,893 38,426 776,942 5,178,075 0.5386 2009 6,141,934 792,798 45,844 971,455 6,009,121 0.4859 2010 6,543,503 808,358 36,343 874,523 6,513,681 0.4568 2011 6,657,433 750,432 51,731 702,824 6,756,772 0.4729 2012 6,844,436 806,228 47,912 603,653 7,094,923 0.4705
Source: Midland Central Appraisal District
Note: Property in the city is reassessed each year. Property is assessed at actual value; therefore, the assessed values are equal to actual value. Tax rates are per $100 of assessed value.
(Unaudited-See Accompanying Independent Auditors' Report)
bbrown
Typewritten Text
115

Table 7CITY OF MIDLAND, TEXAS
Direct and Overlapping Property Tax RatesLast Ten Fiscal Years
(rate per $100 of assessed value)
City Direct Rates Overlapping Rates a
General Midland MidlandObligation Independent Midland County
Basic Debt Total School Junior Midland HospitalYear Rate Service Direct District College County District
2003 0.5606$ 0.0858$ 0.6464$ 1.6050$ 0.1906$ 0.2637$ 0.1412$ 2004 0.5611 0.0853 0.6464 1.6269 0.1906 0.2939 0.1499 2005 0.5604 0.0820 0.6424 1.6425 0.1906 0.2939 0.1715 2006 0.5545 0.0875 0.6420 1.6275 0.2247 0.2885 0.1684 2007 0.5102 0.0768 0.5870 1.4575 0.2062 0.2488 0.1571 2008 0.4633 0.0753 0.5386 1.1681 0.1911 0.2305 0.1423 2009 0.4352 0.0507 0.4859 1.1651 0.1729 0.2075 0.1202 2010 0.3975 0.0593 0.4568 1.1526 0.1719 0.2118 0.1813 2011 0.4172 0.0557 0.4729 1.1451 0.1699 0.2118 0.1663 2012 0.4185 0.0521 0.4705 1.1411 0.1679 0.1982 0.1622
Note: Rates for debt service are set based on each year's requirements.
a Overlapping rates are those of local and county governments that apply to property owners within the City of Midland.
Source: Midland Central Appraisal District
(Unaudited-See Accompanying Independent Auditors' Report)
bbrown
Typewritten Text
116

Table 8CITY OF MIDLAND, TEXAS
Principal Property Tax PayersCurrent Year and Nine Years Ago
Fiscal Year 2012 Fiscal Year 2003Percentage Percentageof Total City of Total City
Taxable Taxable Taxable TaxableAssessed Assessed Assessed Assessed
Taxpayer Value Value Taxpayer Value Value
TRA Midland Properties LLC 66,019,670$ 0.93% Southwestern Bell Telephone 45,251,260$ 1.34%TXU Electric Delivery Co 45,149,210 0.64% ONCOR Electric Delivery Co. 40,592,260 1.20%Wal-Mart Properties 40,153,730 0.57% Simon Property Group 24,571,280 0.73%Midland Park Mall, LP 37,589,240 0.53% Cumming Baccus Midland LP 16,425,000 0.49%Southwestern Bell Telephone 33,437,230 0.47% Cox Communications 12,809,080 0.38%Artificial Lift Division of STC 24,741,240 0.35% MRO Southwest, Inc. 12,802,010 0.38%Claydesta Center Lp et Al 22,743,720 0.32% Claydesta Building LP 11,978,500 0.35%JM Cox Resources LP 18,262,550 0.26% W B Summit Properties Inc 10,955,700 0.32%Midland FC LTD 17,016,980 0.24% Pure Resources 9,465,920 0.28%Wireline Division of STC 15,687,520 0.22% Energas 9,319,320 0.28%
Total 320,801,090$ 4.52% Total 194,170,330$ 5.74%
Source: Midland Central Appraisal District
(Unaudited-See Accompanying Independent Auditors' Report)
bbrown
Typewritten Text
117

Table 9CITY OF MIDLAND, TEXAS
Property Tax Levies and CollectionsLast Ten Fiscal Years
Fiscal Adjusted Collected within theYear Taxes Levied Taxes Levied Fiscal Year of the Levy Collections Total Collections
Ended for the Adjustments for the Percentage in Subsequent PercentageSeptember 30, Fiscal Year to the Levy Fiscal Year Amount of Levy Years Amount of Levy
2003 21,862,087$ (31,030)$ 21,831,057$ 21,385,082$ 97.96% 423,878$ 21,808,960$ 99.90%2004 22,726,390 (3,711) 22,722,679 22,320,900 98.23% 378,148 22,699,047 99.90%2005 23,775,520 (47,056) 23,728,464 23,288,426 98.15% 410,213 23,698,639 99.87%2006 25,343,526 (46,893) 25,296,633 24,907,178 98.46% 363,667 25,270,845 99.90%2007 25,992,405 (138,286) 25,854,120 25,457,058 98.46% 363,606 25,820,665 99.87%2008 27,889,113 (218,159) 27,670,954 27,287,802 98.62% 346,579 27,634,381 99.87%2009 29,198,318 (127,435) 29,070,883 28,644,131 98.53% 386,012 29,030,143 99.86%2010 29,754,496 (90,545) 29,663,952 29,260,114 98.64% 338,169 29,598,282 99.78%2011 31,949,398 (61,046) 31,888,352 31,522,686 98.85% 238,584 31,761,269 99.60%2012 33,384,453 33,163 33,417,616 33,021,270 98.81% - 33,021,270 98.81%
Source: Midland Central Appraisal District
(Unaudited-See Accompanying Independent Auditors' Report)
bbrown
Typewritten Text
118

Table 10CITY OF MIDLAND, TEXASTaxable Sales by CategoryLast Ten Calendar Years(in thousands of dollars)
2002 2003 2004 2005 2006 2007 2008 2009 2010 2011
Agriculture, Forestry, Fishing, Hunting - $ 5$ 4$ 61$ 42$ 6$ 9$ 2$ 1$ 3$ Mining 83,534 84,674 120,800 116,080 139,760 157,197 183,665 131,288 259,423 468,320 Utilities 3,609 6,111 3,589 1,280 1,357 1,701 4,128 1,614 1,109 12 Construction 23,372 26,753 34,640 41,189 48,495 60,430 65,047 54,739 69,073 90,610 Manufacturing 16,748 30,835 41,970 39,072 43,380 49,102 54,214 46,183 53,011 71,407 Wholesale Trade 46,170 53,399 69,311 99,366 120,684 195,254 403,058 163,054 240,314 327,609 Retail Trade 625,168 686,588 777,440 906,881 966,680 999,585 1,043,751 984,145 1,060,820 1,249,127 Transportation, Warehousing 1,563 2,014 1,326 1,413 3,157 4,394 5,158 5,645 10,210 17,847 Information 38,692 36,962 37,696 41,354 43,985 42,621 43,895 41,168 43,214 49,424 Finance, Insurance 2,406 2,570 2,456 2,461 3,142 3,848 5,265 8,570 3,843 3,978 Real Estate, Rental, Leasing 14,762 19,220 20,631 17,134 22,071 31,128 46,016 28,232 37,188 64,100 Professional, Scientific, Technical Svc 33,004 28,029 38,157 48,672 64,733 78,849 69,681 41,756 73,569 86,885 Management of Companies, Enterprises - - 6,146 6,114 4,586 - - - - 1 Admin, Support, Waste Mgmt, Remed 26,636 40,582 47,333 35,324 33,316 34,491 37,813 38,487 37,205 41,560 Educational Services 466 330 469 429 448 592 537 637 646 601 Health Care, Social Assistance 670 771 704 748 995 1,037 1,957 2,075 2,220 2,875 Arts, Entertainment, Recreation 10,322 10,496 12,936 13,038 13,653 21,648 25,214 23,935 24,042 26,962 Accommodation, Food Services 131,498 134,267 141,467 156,470 177,495 191,076 213,062 207,058 222,912 257,748 Other Services 27,753 29,186 31,505 36,107 41,859 45,827 49,190 43,962 48,100 59,119 Public Administration 1,135 1,112 1,177 1,289 2,916 6,409 1,467 1,593 1,846 1,976 Other 37,889 1,790 599 327 3 - - 10,522 - -
Total 1,125,397$ 1,195,694$ 1,390,356$ 1,564,809$ 1,732,757$ 1,925,195$ 2,253,127$ 1,834,665$ 2,188,746$ 2,820,164$
City direct sales tax rate 1.00% 1.00% 1.00% 1.00% 1.00% 1.00% 1.00% 1.00% 1.00% 1.00%
Source: Texas Comptroller of Public Accounts
Note: Category changes ocurred in 2002 due to National American Industry Classification System revisions.
(Unaudited-See Accompanying Independent Auditors' Report)
bbrown
Typewritten Text
119

Table 11CITY OF MIDLAND, TEXAS
Direct and Overlapping Sales Tax RatesLast Ten Fiscal Years
MidlandFootball/Soccer and
City Baseball Complex MidlandFiscal Direct Midland Development DevelopmentYear Rate County Corporation Corporation
2003 1.00% 0.50% 0.25% 0.25%2004 1.00% 0.50% 0.25% 0.25%2005 1.00% 0.50% 0.25% 0.25%2006 1.00% 0.50% 0.25% 0.25%2007 1.00% 0.50% 0.25% 0.25%2008 1.00% 0.50% 0.25% 0.25%2009 1.00% 0.50% 0.25% 0.25%2010 1.00% 0.50% 0.25% 0.25%2011 1.00% 0.50% 0.25% 0.25%2012 1.00% 0.50% 0.25% 0.25%
(Unaudited-See Accompanying Independent Auditors' Report)
bbrown
Typewritten Text
120

Table 12CITY OF MIDLAND, TEXAS
Sales Tax Revenue Payers by IndustryCurrent Calendar Year and Nine Years Ago
(in thousands of dollars)
2011 2002
Number Percentage Tax Percentage Number Percentage Tax Percentageof Filers of Total Liability of Total of Filers of Total Liability of Total
Agriculture, Forestry, Fishing, Hunting 5 0.10 % -$ - % 5 0.12 % -$ - %Mining 256 5.16 4,683 16.61 123 2.88 835 7.43 Utilities 4 0.08 - - 10 0.23 36 0.32 Construction 391 7.88 906 3.21 270 6.32 233 2.07 Manufacturing 275 5.54 714 2.53 131 3.07 167 1.49 Wholesale Trade 271 5.46 3,276 11.62 226 5.29 461 4.10 Retail Trade 1,706 34.37 12,491 44.30 1,677 39.26 6,251 55.59 Transportation, Warehousing 44 0.89 178 0.63 20 0.47 15 0.13 Information 72 1.45 494 1.75 108 2.53 386 3.43 Finance, Insurance 42 0.85 39 0.14 32 0.75 24 0.21 Real Estate Rental Leasing 164 3 30 641 2 27 75 1 76 147 1 31Real Estate, Rental, Leasing 164 3.30 641 2.27 75 1.76 147 1.31 Professional, Scientific, Technical Svc 339 6.83 868 3.08 266 6.23 330 2.93 Management of Companies, Enterprises 4 0.08 - - 2 0.05 - - Admin, Support, Waste Mgmt, Remed 263 5.30 415 1.47 250 5.85 266 2.37 Educational Services 62 1.25 6 0.02 49 1.15 4 0.04 Health Care, Social Assistance 44 0.89 28 0.10 31 0.73 6 0.05 Arts, Entertainment, Recreation 120 2.42 269 0.95 56 1.31 103 0.92 Accommodation, Food Services 405 8.16 2,577 9.14 315 7.38 1,314 11.69 Other Services 455 9.17 591 2.10 375 8.78 277 2.46 Public Administration 4 0.08 19 0.07 4 0.09 11 0.10 Nonclassifiable - - - - - - - - Other 38 0.77 - - 246 5.76 378 3.36
Total 4,964 100.00 % 28,195$ 100.00 % 4,271 100.00 % 11,244$ 100.00 %
Source: Texas Comptroller of Public Accounts
Notes: Due to confidentiality issues, the names of the ten largest revenue payers are not available. The categories presented are intended to provide alternative information regarding the sources of the city's revenue.
(Unaudited-See Accompanying Independent Auditors' Report)
bbrown
Typewritten Text
121

Table 13CITY OF MIDLAND, TEXAS
Ratios of Outstanding Debt by TypeLast Ten Fiscal Years
Governmental Activities Business-Type ActivitiesGeneral
General Certificates Obligation Certificates Total PercentageFiscal Obligation of Other Revenue Refunding of Other Primary of Personal PerYear Bonds Obligation Obligations Bonds Bonds Obligation Obligations Government Income a Capita a
2003 4,505,000$ 19,366,985$ 900,000$ 31,005,000$ - $ 54,463,015$ - $ 110,240,000$ 2.89% 936$ 2004 3,640,000 18,226,024 845,000 29,265,000 - 52,878,976 55,100 104,910,100 2.60% 886 2005 2,770,000 21,873,237 790,000 27,455,000 - 51,206,763 51,950 104,146,950 2.28% 834 2006 1,860,000 20,358,513 730,000 25,575,000 42,130,000 5,786,487 47,650 96,487,650 1.86% 743 2007 935,000 25,566,962 665,000 18,810,000 40,220,000 58,043,038 43,900 144,283,900 2.38% 1,077 2008 - 23,763,474 595,000 17,385,000 38,240,000 56,751,526 39,850 136,774,850 2.08% 1,086 2009 7,609,852 23,875,000 525,000 15,895,000 36,635,148 54,110,000 35,400 138,685,400 1.80% 1,037 2010 6,189,787 22,840,000 450,000 14,325,000 34,410,213 51,930,000 - 130,145,000 1.82% 898 2011 4,731,979 21,565,000 370,000 12,685,000 31,288,021 48,695,000 - 119,335,000 1.55% 871 2012 3,245,864 33,835,000 285,000 10,955,000 28,049,136 63,115,000 - 139,485,000 1.53% 994
a See Table 18 for personal income and population data. These ratios are calculated using personal income and population for the prior calendar year.Note: Details regarding the City's outstanding debt can be found in the notes to the financial statements.
(Unaudited-See Accompanying Independent Auditors' Report)
bbrown
Typewritten Text
122
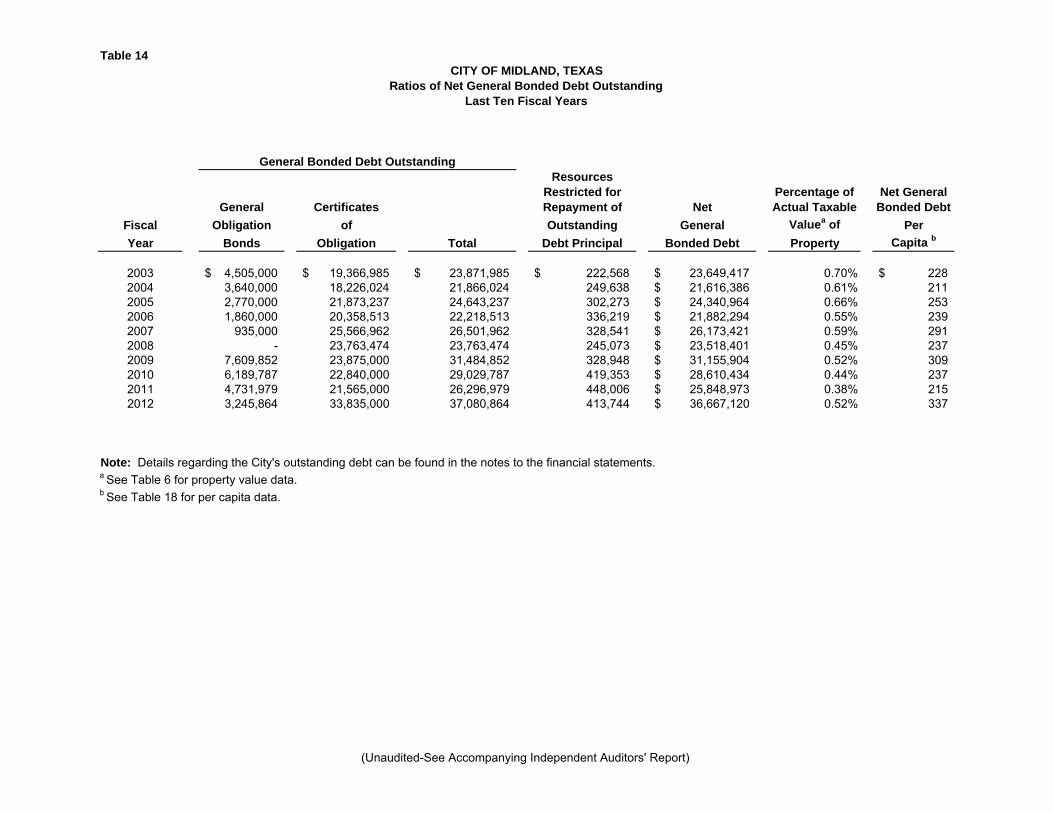
Table 14CITY OF MIDLAND, TEXAS
Ratios of Net General Bonded Debt OutstandingLast Ten Fiscal Years
General Bonded Debt OutstandingResources
Restricted for Percentage of Net GeneralGeneral Certificates Repayment of Net Actual Taxable Bonded Debt
Fiscal Obligation of Outstanding General Valuea of PerYear Bonds Obligation Total Debt Principal Bonded Debt Property Capita b
2003 4,505,000$ 19,366,985$ 23,871,985$ 222,568$ 23,649,417$ 0.70% 228$ 2004 3,640,000 18,226,024 21,866,024 249,638 21,616,386$ 0.61% 2112005 2,770,000 21,873,237 24,643,237 302,273 24,340,964$ 0.66% 2532006 1,860,000 20,358,513 22,218,513 336,219 21,882,294$ 0.55% 2392007 935,000 25,566,962 26,501,962 328,541 26,173,421$ 0.59% 2912008 - 23,763,474 23,763,474 245,073 23,518,401$ 0.45% 2372009 7,609,852 23,875,000 31,484,852 328,948 31,155,904$ 0.52% 3092010 6,189,787 22,840,000 29,029,787 419,353 28,610,434$ 0.44% 2372011 4,731,979 21,565,000 26,296,979 448,006 25,848,973$ 0.38% 2152012 3,245,864 33,835,000 37,080,864 413,744 36,667,120$ 0.52% 337
Note: Details regarding the City's outstanding debt can be found in the notes to the financial statements.a See Table 6 for property value data.b See Table 18 for per capita data.
(Unaudited-See Accompanying Independent Auditors' Report)
bbrown
Typewritten Text
123

Table 15CITY OF MIDLAND, TEXAS
Direct and Overlapping Governmental Activities DebtAs of September 30, 2012
EstimatedEstimated Share of
Debt Percentage OverlappingGovernmental Unit Outstanding Applicable a Debt
Debt repaid with property taxes
Midland Independent School District 108,685,730$ 58.35% 63,418,123$ Midland Junior College 32,595,346 58.35% 19,019,384 Midland County 27,805,000 54.78% 15,231,579 Midland County Hospital District 110,790,000 54.78% 60,690,762
Subtotal, overlapping debt 158,359,849
City of Midland (direct debt) 38,045,091
Total direct and overlapping debt 196,404,940$
Sources: Assessed value data used to estimate applicable percentages provided by the Midland Central Appraisal District and Assessment Debt outstanding data provided by each governmental unit.
Note: Overlapping governments are those that coincide, at least in part, with the geographic boundaries of the city. This schedule estimates the portion of the outstanding debt of those overlapping governments that is borne by the residents and businesses of Midland. This process recognizes that, when considering the city's ability to issue and repay long-term debt, the entire debt burden borne by the residents and businesses should be taken into account. However, this does not imply that every taxpayer is a resident, and therefore responsible for repaying the debt, of each overlapping government.
a For debt repaid with property taxes, the percentage of overlapping debt applicable is estimated using taxable assessed property values. Applicable percentages were estimated by determining the portion of another governmental unit's taxable assessed value that is within the city's boundaries and dividing it by each unit's total taxable assessed value.
(Unaudited-See Accompanying Independent Auditors' Report)
bbrown
Typewritten Text
124

Table 16CITY OF MIDLAND, TEXAS
Debt Margin InformationLast Ten Fiscal Years
(dollars in thousands)
Debt Margin Calculation for Fiscal Year 2012Assessed value 7,094,923$ Debt limit (8% of assessed value) 567,594Debt applicable to limit:
Total bonded debt 139,485Less:
Net assets in Debt Service Fund (414)Water and Sewer bonds (5,506)Airport bonds (848)Sports Complex bonds (1,201)Golf Course bonds (37)
Total net debt applicable to limit 131,479Debt margin 436,115$
2003 2004 2005 2006 2007 2008 2009 2010 2011 2012
Debt limit 270,570$ 281,270$ 296,083$ 315,807$ 354,241$ 414,246$ 480,730$ 521,094$ 540,542$ 567,594$
Total net debt applicable to limit 103 339 98 641 97 655 89 167 135 646 129 604 131 476 122 737 111 659 131 479Total net debt applicable to limit 103,339 98,641 97,655 89,167 135,646 129,604 131,476 122,737 111,659 131,479
Debt margin 167,231$ 182,629$ 198,428$ 226,640$ 218,595$ 284,642$ 349,254$ 398,357$ 428,883$ 436,115$
Total net debt applicable to the limit as a percentage of debt limit 38.19% 35.07% 32.98% 28.23% 38.29% 31.29% 27.35% 23.55% 20.66% 23.16%
Included in the total amount of debt applicable to debt limit is $60,920,000 Tax and Limited Pledge Revenue Certificates of Obligation and $2,195,000 Combination Tax and Revenue Refunding Bonds; and $5,990,000 Tax and Airport Subordinate Lien Revenue Certificates of Obligation; and $194,136 Tax and Waterworks and Sewer System (Limited Pledge) Revenue Certificates of Obligation; and $21,865,000 Tax and Waterworks and Sewer System (Limited Pledge) Revenue Certificates of Obligation. Principal and interest on these certificates are being financed by the Water and Sewer Fund, Airport Fund, Golf Course Fund, and the Scharbauer Sports Complex Fund, respectively.
Note: The Constitution and Statutes of the state of Texas and the Charter of the City of Midland do not provide for a legal debt limit. The 8% debt limit rate used herein is that recommended by the Finance Advisory Board of the City of Midland and adopted by the City Council as a guideline of safe debt limit.
(Unaudited-See Accompanying Independent Auditors' Report)
bbrown
Typewritten Text
125

Table 17CITY OF MIDLAND, TEXAS
Pledged-Revenue CoverageLast Ten Fiscal Years
Water and Sewer Revenue Bonds Airport Revenue Bonds
Net Revenue Revenue Net Revenue RevenueFiscal Gross Operating Available for Bond Debt Gross Operating Available For Bond DebtYear Revenue a Expense b Debt Service Service c Coverage Revenue a Expense b Debt Service Service c Coverage
2003 30,054,259$ 23,685,327$ 6,368,932$ 2,550,188$ 2.50 6,090,718$ 4,312,412$ 1,778,306$ 130,500$ 13.63 2004 28,384,654 24,477,287 3,907,367 2,824,705 1.38 7,040,355 4,104,996 2,935,359 174,863 16.79 2005 31,721,170 25,872,779 5,848,391 2,939,791 1.99 7,136,960 4,380,702 2,756,258 167,963 16.41 2006 36,551,272 26,941,508 9,609,764 2,898,879 3.31 7,711,547 4,701,521 3,010,026 160,913 18.71 2007 38,843,893 26,519,562 12,324,331 2,273,232 5.42 8,435,823 4,891,659 3,544,164 151,149 23.45 2008 44,358,068 29,955,214 14,402,854 2,204,304 6.53 8,933,959 5,269,760 3,664,200 - - 2009 42,384,339 29,737,767 12,646,572 2,134,553 5.92 7,799,712 5,678,225 2,121,487 - - 2010 41,059,387 29,904,315 11,155,072 2,140,761 5.21 7,928,367 6,081,691 1,846,676 - - 2011 45,273,768 32,305,890 12,967,878 2,121,268 6.11 8,237,826 5,725,677 2,512,149 - - 2012 41,572,651 30,434,690 11,137,961 2,064,539 5.39 9,076,228 5,493,295 3,582,933 - -
b Total expense exclusive of depreciation, interest, and amortization expenses.c Excludes debt defeasance transactions.
Note: Details regarding the City's outstanding debt can be found in the notes to the financial statements.a The sum of operating revenue and net nonoperating income, excluding interest expense, reduced by interest income from investments by funds restricted for construction.
(Unaudited-See Accompanying Independent Auditors' Report)
bbrown
Typewritten Text
126
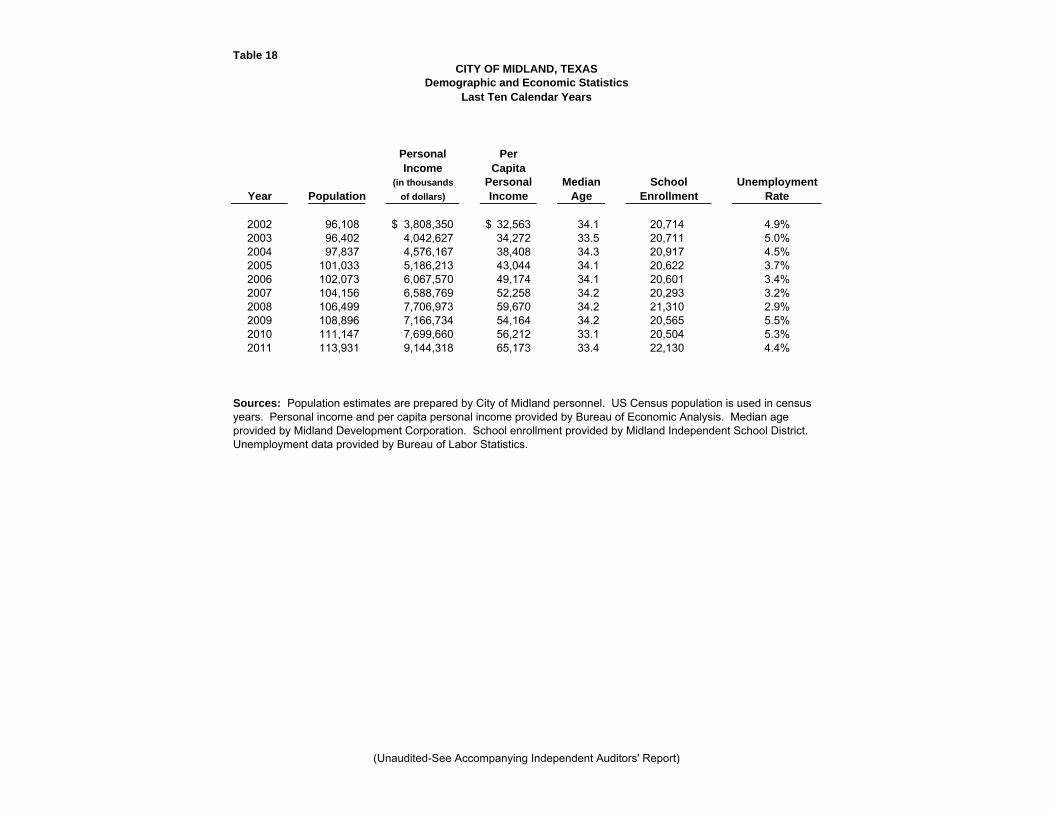
Table 18CITY OF MIDLAND, TEXAS
Demographic and Economic StatisticsLast Ten Calendar Years
Personal PerIncome Capita
(in thousands Personal Median School UnemploymentYear Population of dollars) Income Age Enrollment Rate
2002 96,108 3,808,350$ 32,563$ 34.1 20,714 4.9%2003 96,402 4,042,627 34,272 33.5 20,711 5.0%2004 97,837 4,576,167 38,408 34.3 20,917 4.5%2005 101,033 5,186,213 43,044 34.1 20,622 3.7%2006 102,073 6,067,570 49,174 34.1 20,601 3.4%2007 104,156 6,588,769 52,258 34.2 20,293 3.2%2008 106,499 7,706,973 59,670 34.2 21,310 2.9%2009 108,896 7,166,734 54,164 34.2 20,565 5.5%2010 111,147 7,699,660 56,212 33.1 20,504 5.3%2011 113,931 9,144,318 65,173 33.4 22,130 4.4%
Sources: Population estimates are prepared by City of Midland personnel. US Census population is used in census years. Personal income and per capita personal income provided by Bureau of Economic Analysis. Median age provided by Midland Development Corporation. School enrollment provided by Midland Independent School District. Unemployment data provided by Bureau of Labor Statistics.
(Unaudited-See Accompanying Independent Auditors' Report)
bbrown
Typewritten Text
127

Table 19CITY OF MIDLAND, TEXAS
Principal EmployersCurrent Year and Nine Years Ago
2012 2003Percentage Percentageof Total City of Total City
Employer Employees Employment Employer Employees Employment
Midland Independent School District 3,009 3.56% Midland Independent School District 3,348 5.57%Warren Equipment Companies 2,008 2.37% Key Energy Services, Inc 2,072 3.45%Midland Memorial Hospital 1,670 1.97% Basic Energy Services 1,500 2.50%Dawson Geophysical 1,522 1.80% Memorial Hospital & Medical Center 1,300 2.16%Midland College 1,201 1.42% Midland Junior College 995 1.66%Schlumberger Oil Field Service 950 1.12% Warren Equipment Companies 949 1.58%City of Midland 909 1.07% City of Midland 897 1.49%Wal-Mart Super Center 790 0.93% Cingular Wireless 780 1.30%Midland County 600 0.71% Oxy Permian USA, Inc 625 1.04%Concho Resources 509 0.60% Chevron / Texaco 600 1.00%
Total 13,168 15.56% 13,066 21.76%
Source: Midland Chamber of Commerce, Bureau of Labor Statistics, individual employers
(Unaudited-See Accompanying Independent Auditors' Report)
bbrown
Typewritten Text
128

Table 20CITY OF MIDLAND, TEXAS
Full-time Equivalent City Government Employees by Function/Program Last Ten Fiscal Years
2003 2004 2005 2006 2007 2008 2009 2010 2011 2012Function/Program
General governmentAdministration 6 6 6 6 5 5 6 5 5 8 Support services 90 85 93 98 118 120 123 120 122 114 Fiscal management 15 15 15 15 15 15 17 17 18 17
Development services 95 92 83 88 96 93 105 96 92 89 Community services 62 67 60 62 66 65 72 68 65 70 Police 209 206 205 206 206 208 222 220 223 225 Fire 186 189 187 187 190 193 191 191 184 181 Other 26 26 27 27 1 2 1 1 1 - Airport 27 26 24 26 26 25 30 29 27 26 Water and sewer 115 106 100 96 100 96 104 93 88 86 Sanitation 46 46 47 45 46 48 51 46 48 51 Sports complex - - - - - - - - - - Golf course 9 9 9 10 9 8 10 10 8 9
Total 886 873 856 866 878 878 932 896 881 876
Source: City departments
(Unaudited-See Accompanying Independent Auditors' Report)
bbrown
Typewritten Text
129

Table 21CITY OF MIDLAND, TEXAS
Operating Indicators by Function/ProgramLast Ten Fiscal Years
Function/Program 2003 2004 2005 2006 2007 2008 2009 2010 2011 2012
Development servicesStreet resurfacing (miles) N/A N/A N/A 10.43 6.96 10.51 13.03 - 16.51 - Potholes repaired N/A N/A N/A 14,544 15,835 12,755 17,414 39,622 8,495 19,794
Community servicesAnimal control animals handled 11,102 11,876 10,857 10,690 11,229 10,906 10,711 8,472 6,706 7,087 Health department immunizations given 20,647 17,766 15,015 15,275 19,757 22,372 25,452 22,251 22,989 16,521
PoliceTraffic citations 16,722 18,361 13,721 14,945 13,774 18,354 18,318 17,076 16,364 17,795 Parking citations 4,699 4,448 5,844 6,131 4,277 5,173 4,468 4,111 4,539 3,508 Criminal misdemeanor citations 6,508 7,489 6,651 6,687 6,624 6,583 5,713 5,198 5,054 4,993
FireEmergency responses 4,914 5,859 6,262 7,238 7,484 8,860 8,873 10,829 12,674 13,490 Fires extinguished 489 507 587 606 537 600 661 543 818 564 Inspections 4,751 5,027 5,329 3,895 4,502 6,117 5,843 6,647 5,246 6,622
AirportMajor airlines 4 3 3 3 3 4 3 3 4 4 Passengers boardings 398,746 405,413 440,723 466,419 489,369 496,911 433,738 426,288 463,874 488,138 Commercial Landings 8,671 7,881 8,020 8,290 8,580 8,277 7,691 7,936 7,765 7,911
Water and sewerNew accounts - net 401 412 673 1,188 1,056 916 249 260 523 320 Water main breaks 45 93 53 42 84 41 54 61 79 81 Average daily consumption (MGD) 23.554 23.350 22.200 23.747 20.867 24.516 24.308 22.821 23.531 15.532 Peak daily consumption (MGD) 41.409 41.919 41.593 43.360 33.971 42.349 42.347 40.041 35.374 27.116 Average daily sewage treatment (MGD) 11.218 12.273 11.975 10.950 12.025 11.665 11.663 10.005 10.553 10.123
SanitationRefuse collected (tons) 132,671 127,111 148,677 149,514 171,795 188,450 210,373 180,422 200,711 195,663 Recyclables collected (tons) 7,517 5,849 5,101 4,448 4,774 5,020 1,787 2,016 1,547 1,506
Sports complex
Baseball stadium attendance a 19,394 12,493 11,396 30,462 31,366 332,497 325,064 329,688 322,272 331,195 Football/soccer stadium attendance 244,364 160,392 152,273 181,043 179,677 162,354 172,977 167,086 197,665 123,475
Golf courseAttendance 63,895 52,663 50,281 54,572 59,933 64,451 62,940 57,104 60,236 63,205 Tournaments N/A 109 120 125 150 118 89 90 90 82
Source: City departmentsNotes: N/A - Data not availablea Beginning fiscal year 2008, attendance for baseball games, concerts, and outdoor events are included in the count for baseball stadium attendance.
(Unaudited-See Accompanying Independent Auditors' Report)
bbrown
Typewritten Text
130

Table 22CITY OF MIDLAND, TEXAS
Capital Asset Statistics by Function/ProgramLast Ten Fiscal Years
Function/Program 2003 2004 2005 2006 2007 2008 2009 2010 2011 2012
Development servicesStreets - paved (miles) 581 569 561 574 566 571 584 736 741 597Streets - unpaved (miles) 20 35 21 16 14 12 12 29 28 33Alleys - paved (miles) 96 100 103 103 109 123 125 133 133 128Streetlights 5,629 5,496 5,763 5,523 5,667 6,020 6,005 6,050 6,096 6,209Signalized locations 114 115 118 117 117 116 116 117 118 118
Community servicesParks acreage 1,177 1,254 1,256 1,256 1,256 1,256 1,256 1,275 1,275 1,275 Playgrounds 38 38 38 38 40 40 40 39 39 39 Baseball/softball diamonds 82 82 82 82 82 64 64 64 64 64 Football/soccer fields 56 56 56 56 56 52 52 49 49 49 Community Centers 1 1 1 1 1 1 1 1 1 1 Senior Centers 2 2 2 2 2 2 2 2 2 2
PoliceStations 1 1 1 1 1 1 1 1 1 1Marked patrol units N/A N/A N/A 116 130 128 114 110 138 138
FireStations 9 9 9 9 9 9 9 9 9 9
AirportPrimary runway (feet) 9,501 9,501 9,501 9,501 9,501 9,501 9,501 9,501 9,501 9,501 Primary crosswind runway (feet) 8,305 8,305 8,305 8,305 8,305 8,302 8,302 8,302 8,302 8,302 General aviation runways (feet) 8,944 8,944 8,944 8,944 8,944 8,944 8,944 8,944 8,944 8,944
Water and sewerWater mains (miles) 655 700 735 805 818 838 861 668 771 782Fire hydrants 2,736 2,795 2,926 2,998 3,121 3,202 3,301 3,297 3,425 3,418System capacity (million gallons) 60 60 51 51 51 51 51 51 51 51 Sanitary sewers (miles) 508 513 529 572 577 591 600 527 585 591Storm sewers (miles) 41 46 54 54 46 47 47 43 43 44
SanitationRefuse trucks N/A N/A N/A 38 43 42 42 43 46 37
Sports complexStadiums 2 2 2 2 2 2 2 2 2 2
Golf courseCourses 2 2 2 2 2 2 2 2 2 2Holes 36 36 36 36 36 36 36 36 36 36
Source: City departmentsNotes: N/A - Data not available
(Unaudited-See Accompanying Independent Auditors' Report)
bbrown
Typewritten Text
131

bbrown
Typewritten Text
132

SUPPLEMENTAL SECTION
(Unaudited) The supplemental section contains certain bond and financial information presented in compliance with Securities and Exchange Commission Rule 15c2-12, as amended.
BBrown
Typewritten Text
133

TAX SUPPORTED DEBT
(Unaudited)
BBrown
Typewritten Text
134

City of Midland, Texas
Table 1 - Valuation, Exemptions and General Obligation Debt
2012 Market Valuation Established By Midland Central Appraisal District(excluding totally exempt property) $ 7,916,076,863
Less Exemptions/Reductions at 100% Market Value: Residential Homestead Exemptions $ 146,405,313 Disabled Veterans 4,466,600 Abatements 0 Open-Space and Land Use Restrictions and Tax Increment Value 43,876,902 194,748,815
2012 Taxable Assessed Valuation $ 7,721,328,048
City Funded Debt Payable From Ad Valorem Taxes (as of 9-30-11) General Obligation Bonds and Certificates of Obligation (1) $ 128,245,000
Funded Debt Payable from Ad Valorem Taxes $ 128,245,000
Less: Self Supporting Debt (2) Scharbauer Sports Complex General Obligation Debt $ 21,865,000 Water and Sewer General Obligation Debt 47,260,000 Airport General Obligation Debt 5,990,000 75,115,000
General Purpose Funded Debt Payable from Ad Valorem Taxes $ 53,130,000
Interest and Sinking Fund (as of 9-30-12) (3) $ 453,250
Ratio Funded Debt to Taxable Assessed Valuation 1.66%Ratio General Purpose Funded Debt to Taxable Assessed Valuation 0.69%
(Unaudited - See Accompanying Independent Auditors' Report)
2012 Estimated Population ........................................................................ 115,892Per Capita 2012 Taxable Assessed Valuation ........................................... 66,625.20$ Per Capita Total Funded Debt .................................................................... 1,106.59$ Per Capita General Purpose Funded Debt ................................................ 458.44$
Tax and Revenue Refunding Bonds, Series 2007
Water and Sewer General Obligation Debt, and $848,701 to the credit of the Interest and Sinking Fund for Airport General Obligation Debt.
(2) The City provides for debt service on general obligation debt issued to fund a Football /Soccer and Baseball Sports Complex and Airport improvements from
"Scharbauer Sports Complex General Obligation Debt" consists of $21,865,000 General Obligation Refunding Bonds, Series 2006B
"Airport General Obligation Debt" consists of $5,990,000 General Obligation Refunding Bonds, Series 2006A.
(3) Excludes $1,201,019 to the credit of the Interest and Sinking Fund for Scharbauer Sports complex General Obligation Debt, $999,431 to the credit of the
"Water and Sewer General Obligation Debt" consists of $45,065,000 Tax and Limited Pledge Revenue Certificates of Obligation, Series 2007 and $2,195,000
the Midland Football/Soccer and Baseball Complex Development Corporation.
(1) The above statement of indebtedness does not include currently outstanding $1,245,000 Waterworks and Sewer System Revenue Bonds as these bondsare payable solely from a first lien on the Net Revenues of the system. The statement also does not include $9,710,000 Waterworks and Sewer System JuniorLien Revenue Bonds, Series 1999, which are payable solely from a junior lien on the Net Revenues of the system.
surplus (net) revenues of these systems. Included in the net revenues of the Scharbauer Sports Complex are receipts from a 1/4 of 1% sales tax received from
(Unaudited - See Accompanying Independent Auditors' Report)
BBrown
Typewritten Text
135

City of Midland, Texas
Table 2 - Taxable Assessed Valuations by Category
Taxable Appraised Value for Fiscal Year Ended 9-302013 2012 2011
% of % of % ofCategory Amount Total Amount Total Amount Total
Real, Residential, Single-Family $ 5,115,928,260 61.47% $ 4,767,285,960 61.92% $ 4,642,728,300 62.24%Real, Residential, Multi-Family 438,623,740 5.27% 419,574,040 5.45% 403,415,390 5.41%Real, Vacant Lots/Tracts 186,972,900 2.25% 176,793,950 2.30% 174,263,370 2.34%Real, Acreage (Land Only) 99,080,780 1.19% 90,204,850 1.17% 92,264,270 1.24%Real, Farm and Ranch Improvements 30,133,660 0.36% 28,971,370 0.38% 28,437,740 0.38%Real, Commercial and Industrial 1,444,017,790 17.35% 1,345,917,590 17.48% 1,297,470,220 17.39%Real, Oil, Gas and Other Mineral Reserves 60,451,810 0.73% 47,912,550 0.62% 51,730,530 0.69%Real and Tangilble Personal, Utilities 112,239,820 1.35% 107,330,570 1.39% 107,921,810 1.45%Tangible Personal, Commercial and Industrial 788,023,400 9.47% 673,917,980 8.75% 624,187,260 8.37%Tangible Personal, Other 3,736,860 0.04% 3,451,290 0.04% 3,079,110 0.04%Real Property, Inventory (1) 42,888,950 0.52% 37,485,910 0.49% 34,098,010 0.46%Total Appraised Value Before Exemptions $ 8,322,097,970 100.00% $ 7,698,846,060 100.00% $ 7,459,596,010 100.00%Less: Total Exemptions/Reductions 600,769,922 603,922,660 702,823,690Taxable Assessed Value $ 7,721,328,048 $ 7,094,923,400 $ 6,756,772,320
Taxable Appraised Value for Fiscal Year Ended 9-302010 2009 2008
% of % of % ofCategory Amount Total Amount Total Amount Total
Real, Residential, Single-Family $ 4,561,016,060 65.40% $ 4,342,386,160 65.30% $ 3,622,645,000 64.24%Real, Residential, Multi-Family 332,676,180 4.77% 309,918,460 4.66% 195,455,830 3.47%Real, Vacant Lots/Tracts 78,126,970 1.12% 79,178,100 1.19% 89,312,480 1.58%Real, Acreage (Land Only) 61,657,000 0.88% 59,359,030 0.89% 55,253,560 0.98%Real, Farm and Ranch Improvements 27,260,670 0.39% 24,493,660 0.37% 22,733,680 0.40%Real, Commercial and Industrial 1,056,487,960 15.15% 980,266,340 14.74% 861,699,080 15.28%Real, Oil, Gas and Other Mineral Reserves 36,159,410 0.52% 45,725,380 0.69% 38,327,960 0.68%Real and Tangilble Personal, Utilities 115,114,640 1.65% 121,178,920 1.82% 127,127,430 2.25%Tangible Personal, Commercial and Industrial 662,557,080 9.50% 644,617,950 9.69% 588,989,550 10.44%Tangible Personal, Other 2,749,280 0.04% 2,440,610 0.04% 2,472,050 0.04%Real Property, Inventory (1) 39,857,780 0.57% 39,954,900 0.60% 35,023,390 0.62%
(Unaudited - See Accompanying Independent Auditors' Report)
Total Appraised Value Before Exemptions $ 6,973,663,030 100.00% $ 6,649,519,510 100.00% $ 5,639,040,010 100.00%Less: Total Exemptions/Reductions 455,105,278 640,777,030 461,334,772Taxable Assessed Value $ 6,518,557,752 $ 6,008,742,480 $ 5,177,705,238
NOTE: Valuations shown are certified taxable assessed values reported by the Midland Central Appraisal District to the State Controller of Public Accounts Certified values are subject to change throughout the year as contested values are resolved and the Appraisal District updates records. (1) Real inventory properties in the hands of developers or builders; each group of properties in this category is appraised on the basis of its value as a whole as a sale to another developer or builder.
(Unaudited - See Accompanying Independent Auditors' Report)
BBrown
Typewritten Text
136

City of Midland, Texas
Table 3A - Valuation and General Obligation Debt History
General Ratio GeneralPurpose Purpose GeneralFunded Funded Purpose
Fiscal Taxable Tax Debt Tax Debt FundedYear Estimated Taxable Assessed Outstanding to Taxable Tax Debt
Ended City Assessed Valuation at End Assessed Per9-30 Population (1) Valuation (2) Per Capita of Year (3) Valuation Capita2008 106,561 $ 5,177,705,238 $ 48,589 $ 24,325,000 0.47% $ 2282009 108,666 6,008,742,480 55,296 31,940,000 0.53% 2942010 111,147 6,518,557,752 58,648 29,400,000 0.45% 2652011 113,931 6,756,772,320 59,306 26,580,000 0.39% 2332012 115,892 7,094,923,400 61,220 37,275,000 0.53% 322
2013 (4) 117,967 7,721,328,048 65,453 34,480,000 0.45% 292
(1) Source: City of Midland, Texas; the 2010 U.S. Census population was 111,147(2) Basis of assessment for all years 100% of market value. All taxable property is revalued each year.(3) General Purpose Funded Tax Debt less Self-Supporting Funded Tax Debt (see "Table 3B - Derivation of General Purpose Funded Tax Debt").(4) Projected
Table 3B - Derivation of General Purpose Funded Tax Debt
Less: Self-Supporting Funded Tax DebtTotal Funded
Fiscal Tax Debt Airport Water Scharbauer GeneralYear Outstanding General and Sewer Sports Complex Purpose
Ending At End Obligation General General Funded9-30 of Year Debt Obligation Debt Obligation Debt Tax Debt2008 $ 118,755,000 $ 10,960,000 $ 52,665,000 $ 30,805,000 $ 24,325,0002009 122,230,000 9,790,000 51,400,000 29,100,000 31,940,000
(Unaudited - See Accompanying Independent Auditors' Report)
2010 115,370,000 8,575,000 50,075,000 27,320,000 29,400,0002011 106,280,000 7,310,000 48,695,000 23,695,000 26,580,0002012 128,245,000 5,990,000 63,115,000 21,865,000 37,275,000
2013 (1) 120,385,000 4,600,000 61,350,000 19,955,000 34,480,000
(1) Projected
Table 4 - Tax Rate, Levy and Collection History
Fiscal InterestYear and
Ended Tax General Sinking % Current % Total9-30 Rate Fund Fund Tax Levy Collections Collections2008 0.5386 0.4633 0.0753 27,889,113 94.95% 98.90%2009 0.4859 0.4352 0.0507 29,198,318 95.54% 98.13%2010 0.4568 0.3975 0.0593 29,754,496 95.49% 98.26%2011 0.47285 0.41719 0.05566 31,949,398 95.92% 98.86%2012 0.47054 0.41845 0.05209 33,384,453 96.31% 98.70%2013 0.46109 0.40405 0.05704 35,602,117 N/A N/A
(Unaudited - See Accompanying Independent Auditors' Report)
BBrown
Typewritten Text
137

City of Midland, Texas
Table 5 - Ten Largest Taxpayers
2012 Taxable
Assessed Name of Taxpayer Nature of Property Valuation TRA Midland Properties LLC Real Estate $TXU Electric Delivery Co Electric UtilityMidland Park Mall, LP RetailBasic Energy Service Oil and Gas Service CoClaydesta Buildings LP Real EstatePalms at Briarwood LLC Real EstateSouthwestern Bell Telephone Telephone UtilityFasken Midland LLC Real EstateKLP Blue Ridge Apts LP Real EstateThe Clusters Apartments Real Estate
$
Table 6 - Tax Adequacy
Maximum Principal and Interest Requirements, All General Obligation Debt..................……. $$.18573 Tax Rate at 96% Collection Produces.......................................................................... $
Maximum Principal and Interest Requirements General Purpose General Obligation Debt, 2012............................................................................................................... $$.05913 Tax Rate at 96% Collection Produces.......................................................................... $
Valuation
0.36%
% of 2012Total
TaxableAssessed
0.40%
13,767,338
4,382,996
3.95%303,879,520
13,767,297
4,382,381
0.20%
75,495,03043,437,90036,042,430
0.56%0.98%
19,177,650
15,147,160
0.47%30,744,52027,460,610
0.25%19,859,220 0.26%
0.21%16,500,000
20,015,000 0.26%
Table 7 - Estimated Overlapping Debt
Taxable City'sAssessed Total Estimated Overlapping AuthorizedValuation Funded % Funded But Unissued
As Of Tax Debt As Of Applicable Debt As Of Debt As OfTaxing Jurisdiction 9-30-12 (1) Rate (1) 9-30-12 to City (1) 9-30-12 9-30-12
City of Midland $ 7,721,328,048 $ 0.461088 $ 37,275,000 (6) 100.00% $ 37,275,000 $ 0Midland Independent School District 14,782,675,318 1.140050 108,685,730 (2) 58.35% 63,418,123 0Midland Community College District 15,657,642,819 0.144180 32,595,346 (5) 58.35% 19,019,384 0Midland County 16,262,336,431 0.154789 27,805,000 (3) 54.78% 15,231,579 0Midland County Hospital District 16,623,210,414 0.139730 110,790,000 (4) 54.78% 60,690,762 0
Total Direct and Overlapping G.O. Debt $ 195,634,849
Ratio of Direct and Overlapping G.O. Debt to Taxable Assessed Valuation 2.53%
Per Capita Overlapping G.O. Debt $ 1,658.39
Sources:(1) Midland Central Appraisal District(2) Midland Independent School District(3) Midland County(4) Midland County Hospital District(5) Midland Community College District(6) General Purpose Funded Debt; excludes self-supporting funded debt
(Unaudited - See Accompanying Independent Auditors' Report)
BBrown
Typewritten Text
138

City of Midland, Texas
Table 8A - General Obligation Debt Service Requirements andTable 8b - Division of Debt Service Requirements
Less: Less:Sports Complex Water
Less: Development and SewerFiscal Airport Corporation System GeneralYear % of General General General Purpose
Ending Outstanding Requirements Principal Obligation Obligation Obligation Funded9 - 30 Principal Interest Total Retired Debt Debt Tax Debt Tax Debt2013 7,860,000 $ 5,907,297 $ 13,767,297 6.13% 1,638,700 2,904,478 4,841,738 4,382,3812014 8,550,000 5,028,675 13,578,675 12.80% 1,637,450 2,906,478 4,845,799 4,188,9482015 8,465,000 4,667,260 13,132,260 19.40% 1,637,575 2,903,478 4,851,599 3,739,6082016 8,840,000 4,303,297 13,143,297 26.29% 1,637,100 2,900,353 4,851,274 3,754,5702017 6,300,000 3,973,137 10,273,137 31.20% - 2,906,603 4,241,499 3,125,0352018 6,565,000 3,702,362 10,267,362 36.32% - 2,904,428 4,241,424 3,121,5102019 6,365,000 3,452,174 9,817,174 41.28% - 2,907,183 4,242,574 2,667,4172020 6,645,000 3,177,727 9,822,727 46.47% - 2,907,113 4,243,824 2,671,7902021 6,500,000 2,875,484 9,375,484 51.53% - 2,905,488 4,242,518 2,227,4782022 4,695,000 2,629,987 7,324,987 55.20% - 852,744 4,242,274 2,229,9692023 4,015,000 2,450,770 6,465,770 58.33% - - 4,241,434 2,224,3362024 4,200,000 2,274,000 6,474,000 61.60% - - 4,245,281 2,228,7192025 4,390,000 2,081,285 6,471,285 65.02% - - 4,243,481 2,227,8042026 4,585,000 1,887,755 6,472,755 68.60% - - 4,245,656 2,227,0992027 4,775,000 1,699,739 6,474,739 72.32% - - 4,246,594 2,228,1452028 4,410,000 1,513,027 5,923,027 75.76% - - 4,242,431 1,680,5962029 4,595,000 1,328,531 5,923,531 79.34% - - 4,242,106 1,681,4252030 4,060,000 1,151,713 5,211,713 82.51% - - 4,243,991 967,7222031 4,240,000 973,494 5,213,494 85.82% - - 4,242,381 971,1132032 4,425,000 784,713 5,209,713 89.27% - - 4,242,494 967,2192033 2,485,000 626,125 3,111,125 91.20% - - 3,111,125 - 2034 2,615,000 498,625 3,113,625 93.24% - - 3,113,625 - 2035 2,745,000 364,625 3,109,625 95.38% - - 3,109,625 - 2036 2,885,000 223,875 3,108,875 97.63% - - 3,108,875 - 2037 3,035,000 75,875 3,110,875 100.00% - - 3,110,875 -
Total $ 128,245,000 $ 57,651,552 $ 185,896,552 $ 6,550,825 $ 26,998,346 $ 102,834,497 $ 49,512,884
(Unaudited - See Accompanying Independent Auditors' Report)(Unaudited - See Accompanying Independent Auditors' Report)
BBrown
Typewritten Text
139

City of Midland, Texas
Table 9 - Interest and Sinking Fund Budget Projection
Water GeneralAirport and Sewer Scharbauer Purpose Combined
General General Sports Complex General GeneralObligation Obligation General Obligation Obligation
Debt Debt Obligation Debt Debt Debt
Debt Service Requirements, Fiscal Year Ending 9-30-13 $ 1,638,700 $ 4,841,738 $ 2,904,478 $ 4,382,381 $ 13,767,297
Source of Funds, Fiscal Year Ending 9-30-13
Interest and Sinking Funds, 9-30-12 $ 848,701 $ 1,543,526 $ 1,201,019 $ 453,250 $ 4,046,495 Budgeted Ad Valorem Tax Receipts, Including Delinquent Tax Collections 4,288,766 4,288,766
Budgeted Transfers:From Water and Sewer Fund 0 4,990,596 0 0 4,990,596From Airport Fund 496,187 0 0 0 496,187From Airport Passenger Facility Fund 1,171,107 0 0 0 1,171,107From Sports Complex Operations Fund 0 0 2,952,751 0 2,952,751From Golf Course Fund 0 0 0 66,109 66,109Estimated Investment Income 10,000 13,000 10,000 10,000 43,000
Total Sources of Funds $ 2,525,995 $ 6,547,122 $ 4,163,770 $ 4,818,125 $ 18,055,011
Estimated Balance, 9-30-13 $ 887,295 $ 1,705,384 $ 1,259,292 $ 435,744 $ 4,287,714
Table 10 - Computation of Self-Supporting Debt
(Unaudited - See Accompanying Independent Auditors' Report)
Water & Sewer Sports Complex (1)
Net Revenues, Fiscal Year Ended 9-30-12 $ $ 11,137,961 $Less: Prior Lien Revenue Bonds Revenue Requirements Fiscal Year 2012 – 2013 1,307,250
Balance Available for Subordinate Lien Revenue Bond Requirements $ $ 9,830,711Less: Subordinate Lien Revenue Bond Requirements Fiscal Year 2012 – 2013 1,157,600
Balance Available for Other Purposes $ $ 8,673,111 $Less: System General Obligation Debt Requirements, Fiscal Year 2012 – 2013 4,841,739
Balance $ $ 3,831,372 $
Percentage of System General Obligation Debt Self-Supporting 100.00%
(1) The Scharbauer Sports Complex Fund was established to account for all payments from the 4b developmentcorporation to the City and all revenues and expenses of the Scharbauer Sports Complex.
Scharbauer
1,944,233
3,582,933
1,638,700
3,582,933Airport
0
3,582,933
0
100.00%
9,061,255
0
9,061,255
0
9,061,255
2,904,478
6,156,777
100.00%
(Unaudited - See Accompanying Independent Auditors' Report)
BBrown
Typewritten Text
140

City of Midland, Texas
Table 11 - Authorized but Unissued General Obligation Bonds
The City has no authorized but unissued general obligation bonds.
Table 12 - Other Obligations
The City has no lease-purchase agreements for the acquisition of any assets.
Housing and Urban Development Section 108 Program Note
On November 27, 2000, the City entered into a note agreement with the Department of Housing and Urban Development
1974, as amended, in the amount of $1,045,000. The Note was issued to aid in the establishment of an Advanced Technology Center in order to provide secondary and post secondary education opportunities using innovative technology and pay professional services rendered in relation to such project and the financing thereof. Under the terms of the Note, the City will make annual principal payments on August 1, of each year beginning in 2001 through 2015;interest payments were due semi-annually at a variable rate of 20 basis points above London Interbank Offered Ratesuntil a fixed rate was established pursuant to the note agreement. As of August 9, 2001, the interest rate on the $1,000,000 outstanding balance of this note agreement was fixed as part of a $313,756,000 U.S. Department of Housing and Urban Development, Section 108 Government Guaranteed Participation Certificates, Series HUD 2001-A. The Notewill be paid from the City’s Water and Sewer System.
The following represents the outstanding maturities and associated annual interest payments of this note:
City of Midland, TexasHUD Section 108 LoanDebt Service Schedlue
Fiscal YearEnding 9-30 Principal Interest Total
2013 90,000 17,584 107,5842014 95,000 12,112 107,1122015 100,000 6,250 106,250
Total Issue $ 285,000 $ 35,945 $ 320,945
(“HUD”) for loan guarantee assistance under Section 108 of title 1 of the Housing and Community Development Act
(Unaudited - See Accompanying Independent Auditors' Report)
BBrown
Typewritten Text
141

City of Midland, Texas
Table 13 - General Fund Revenues and Expenditure History
For Fiscal Years Ending September 30,
2012 2011 2010 2009 2008RevenuesTaxes $ 76,802,703 $ 70,176,536 $ 60,344,593 $ 60,751,913 $ 61,383,573Licenses and permits 1,936,372 1,604,258 990,770 958,895 1,175,585Fines and forfeitures 3,808,669 3,648,203 3,276,328 3,134,799 3,166,584Charges for current services 2,685,136 2,311,691 2,356,353 2,553,851 2,289,242Rentals 11,344 14,344 24,655 19,769 16,694Intergovernmental grants 1,442,040 2,194,974 2,500,250 3,635,438 970,550Investment income 352,527 640,809 818,008 915,026 1,239,475Miscellaneous 488,952 2,704,778 514,520 940,774 430,092Total revenues $ 87,527,743 $ 83,295,593 $ 70,825,477 $ 72,910,465 $ 70,671,795
ExpendituresAdministration $ 1,229,487 $ 1,027,080 $ 1,002,054 $ 1,013,656 $ 734,604Support services 11,986,500 11,779,518 11,571,007 11,180,291 9,855,289Fiscal management 2,154,462 1,990,886 1,741,478 1,889,392 1,623,328Development services 2,484,995 10,639,275 11,090,190 11,692,087 9,410,143Engineering 7,700,839 - - - - Community services 10,597,142 9,591,163 9,783,237 9,037,633 8,595,533Police 22,766,719 21,393,542 21,044,525 20,668,423 19,210,537Fire 20,918,880 18,782,600 18,203,854 18,337,470 16,466,900Other 2,004,107 1,952,344 2,266,613 2,473,180 2,298,884Total expenditures $ 81,843,131 $ 77,156,408 $ 76,702,958 $ 76,292,132 $ 68,195,218
Excess of revenues over (under) expenditures $ 5,684,612 $ 6,139,185 $ (5,877,481) $ (3,381,667) $ 2,476,577
Other financing sources (uses):
Sale of capital assets $ - $ - $ - $ - $ - Transfers in 4,932,814 4,948,358 4,668,811 6,003,361 4,307,920 Transfers out (515,103) (586,248) (452,511) (948,508) (3,594,977)Total Other Financing Sources (Uses) $ 4,417,711 $ 4,362,110 $ 4,216,300 $ 5,054,853 $ 712,943
Excess of revenues and other sources over (under) expenditures and other uses $ 10,102,323 $ 10,501,295 $ (1,661,181) $ 1,673,186 $ 3,189,520
Fund balance at beginning of the year 48,575,197 38,073,902 39,735,083 38,061,897 34,872,377
Fund balance at the end of the year $ 58,677,520 $ 48,575,197 $ 38,073,902 $ 39,735,083 $ 38,061,897
(Unadited - See Accompanying Independent Auditors' Report)
bbrown
Typewritten Text
142

City of Midland, Texas
Table 14 - Municipal Sales Tax History
FiscalYear % of Equivalent of
Ended Total Ad Valorem Ad Valorem Per9-30 Collected Tax Levy Tax Rate Capita (1)2008 25,776,037 92.42% 0.4978 241.892009 23,848,005 81.68% 0.3969 219.462010 23,563,357 79.19% 0.3615 212.002011 30,281,637 94.78% 0.4482 268.202012 35,472,615 106.25% 0.5000 306.08
(1) See "Estimated Population" under "Table 3A - Valuation and Funded Debt History"
Table 15 - Current Investments
As of September 30, 2012, the City's investable funds were invested in the following categories:
Type of Investment% of
Description Market Value Market ValueU.S. Treasury Notes and Bills 0.00% $ 0
(Unaudited - See Accompanying Independent Auditors' Report)
U.S. Agency and Instrumentality 29.12% 70,029,220
Cash and Local Government Pools 70.88% 170,485,783
Totals 100.00% $ 240,515,003
As of such date, 70.29% of the City's investment portfolio was invested in immediately availablefunds from pools. The market value of the investment portfolio was 100% of its fair value and the effective investment yield was 0.6991%. Average maturity of the portfolio was 34.89 months.
(Unaudited - See Accompanying Independent Auditors' Report)
BBrown
Typewritten Text
143

City of Midland, Texas
Table 16A - Airport Statement of Operations
For Fiscal Year Ending September 30,
2012 2011 2010 2009 2007Operating RevenuesTerminal ( 1 ) Airport Parking $ 2,245,055 $ 2,047,487 $ 1,815,315 $ 1,814,053 $ 2,007,896 Airport Building Rental 3,107,199 2,924,153 2,658,054 2,800,906 3,058,919 Airport Aviation Rental 234,823 219,237 211,114 224,054 240,575 Airport Landing Fees 435,169 430,466 424,918 416,877 457,275 Airport Commercial Rentals 181,789 145,659 144,567 142,144 121,803 Airport Fuel and Oil Commissions 98,528 94,520 84,603 80,832 96,305 Miscellaneous 95,197 113,309 132,630 143,374 221,235
$ 6,397,760 $ 5,974,831 $ 5,471,201 $ 5,622,240 $ 6,204,008
Air Park ( 2 ) Airpark Rentals $ 145,220 $ 144,432 $ 143,856 $ 142,097 $ 142,097 Airpark Fuel and Oil Commissions 18,874 18,250 14,468 15,293 17,474
$ 164,094 $ 162,682 $ 158,324 $ 157,390 $ 159,571Total Operating Revenues $ 6,561,854 $ 6,137,513 $ 5,629,525 $ 5,779,630 $ 6,363,579
Nonoperating Revenues Passenger Facility Charges $ 2,126,221 $ 1,816,827 $ 1,808,537 $ 1,638,332 $ 1,997,918 Other Nonoperating 388,153 283,486 490,305 381,750 572,463
Total Nonoperating Revenues $ 2,514,374 $ 2,100,313 $ 2,298,842 $ 2,020,082 $ 2,570,381
GROSS REVENUES $ 9,076,228 $ 8,237,826 $ 7,928,367 $ 7,799,712 $ 8,933,960
OPERATING AND MAINTENANCE EXPENSES ( 3)Salaries and Fringe Benefits $ 1,929,992 $ 1,889,317 $ 1,891,405 $ 1,863,637 $ 1,581,556Contractual Services 1,816,722 2,091,181 2,338,144 2,095,244 1,821,675Maintenance of Structures 65,661 51,563 153,539 62,362 116,312Maintenance of Equipment 52,287 40,181 48,711 35,994 57,173Foreign Trade Zone 154,132 169,730 146,988 160,877 189,501General Fund Services 1,409,574 1,410,971 1,424,839 1,373,011 1,443,885Supplies 64,927 72,734 78,065 61,631 59,228Other Expenses - - - 25,469 430
TOTAL OPERATING AND MAINTENANCE EXPENSES $ 5,493,295 $ 5,725,677 $ 6,081,691 $ 5,678,225 $ 5,269,760
NET REVENUES $ 3,582,933 $ 2,512,149 $ 1,846,676 $ 2,121,487 $ 3,664,200
(1) "Terminal" means Midland International Airport
(2) "Airpark" is a 500 acre airport, part of the Airport System, located in north Midland.
(3) "Operating and Maintenance Expenses" do not include depreciation, capital outlay or debt service.
(Unaudited - See Accompanying Independent Auditors' Report)
bbrown
Typewritten Text
144
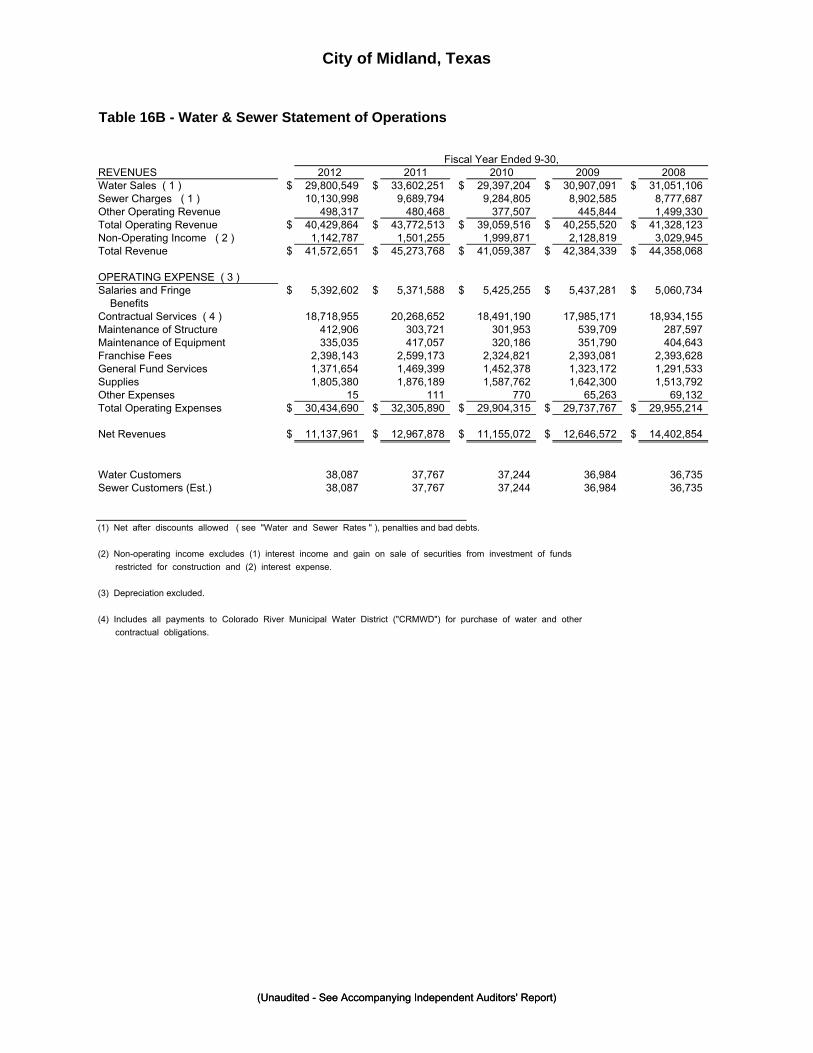
City of Midland, Texas
Table 16B - Water & Sewer Statement of Operations
Fiscal Year Ended 9-30,REVENUES 2012 2011 2010 2009 2008Water Sales ( 1 ) $ 29,800,549 $ 33,602,251 $ 29,397,204 $ 30,907,091 $ 31,051,106Sewer Charges ( 1 ) 10,130,998 9,689,794 9,284,805 8,902,585 8,777,687Other Operating Revenue 498,317 480,468 377,507 445,844 1,499,330Total Operating Revenue $ 40,429,864 $ 43,772,513 $ 39,059,516 $ 40,255,520 $ 41,328,123Non-Operating Income ( 2 ) 1,142,787 1,501,255 1,999,871 2,128,819 3,029,945Total Revenue $ 41,572,651 $ 45,273,768 $ 41,059,387 $ 42,384,339 $ 44,358,068
OPERATING EXPENSE ( 3 )Salaries and Fringe $ 5,392,602 $ 5,371,588 $ 5,425,255 $ 5,437,281 $ 5,060,734 BenefitsContractual Services ( 4 ) 18,718,955 20,268,652 18,491,190 17,985,171 18,934,155Maintenance of Structure 412,906 303,721 301,953 539,709 287,597Maintenance of Equipment 335,035 417,057 320,186 351,790 404,643Franchise Fees 2,398,143 2,599,173 2,324,821 2,393,081 2,393,628General Fund Services 1,371,654 1,469,399 1,452,378 1,323,172 1,291,533Supplies 1,805,380 1,876,189 1,587,762 1,642,300 1,513,792Other Expenses 15 111 770 65,263 69,132Total Operating Expenses $ 30,434,690 $ 32,305,890 $ 29,904,315 $ 29,737,767 $ 29,955,214
Net Revenues $ 11,137,961 $ 12,967,878 $ 11,155,072 $ 12,646,572 $ 14,402,854
Water Customers 38,087 37,767 37,244 36,984 36,735Sewer Customers (Est.) 38,087 37,767 37,244 36,984 36,735
(1) Net after discounts allowed ( see "Water and Sewer Rates " ), penalties and bad debts.
(2) Non-operating income excludes (1) interest income and gain on sale of securities from investment of funds
restricted for construction and (2) interest expense.
(Unaudited - See Accompanying Independent Auditors' Report)
(3) Depreciation excluded.
(4) Includes all payments to Colorado River Municipal Water District ("CRMWD") for purchase of water and other
contractual obligations.
(Unaudited - See Accompanying Independent Auditors' Report)
bbrown
Typewritten Text
145

City of Midland, Texas
Table 17 - Outstanding System Revenue Bonds
Prior Lien Bonds:
Waterworks and Sewer System (Prior Lien) Revenue Bonds Outstanding, 9-30-12.............. $ 9,710,000
Subordinate Lien Bonds:
Waterworks and Sewer System Junior Lien Revenue Bonds Outstanding, 9-30-12.............. 15,855,000
Total Waterworks and Sewer System Revenue Bonds Outstanding, 9-30-12....................... $ 25,565,000
Table 18 - Historical Water Pumpage and Consumption
FiscalYear Water Pumpage Total
Ended Average Day Total Pumpage Consumption9-30 Pumpage (MGD) (Million Gallons) (Million Gallons)2008 25.31 42.35 9,262 22.50 8,2352009 24.93 42.35 9,099 23.36 8,5282010 23.74 40.04 8,664 21.54 7,8632011 25.35 35.37 9,254 24.00 8,7592012 15.92 27.12 5,826 15.56 5,694
Average Number of Accounts, 10/11 - 9/12 (est.)........ 37,927 Average Monthly Water Bill, 10/11 - 9/12 (est.)............ $87.74Average Monthly Consumption per Account................ 12.51
WaterConsumption
Peak Day Average DayPumpage (MGD) Consumption (MGD)
(Unaudited - See Accompanying Independent Auditors' Report)
g y p p
(Unaudited - See Accompanying Independent Auditors' Report)
bbrown
Typewritten Text
146

WATER & SEWER REVENUE DEBT
(Unaudited)
BBrown
Typewritten Text
147

City of Midland, Texas
Table 1 - Historical Statement of Operations - Waterworks and Sewer System
Fiscal Year Ended 9-30,REVENUES 2012 2011 2010 2009 2008Water Sales ( 1 ) $ 29,800,549 $ 33,602,251 $ 29,397,204 $ 30,907,091 $ 31,051,106Sewer Charges ( 1 ) 10,130,998 9,689,794 9,284,805 8,902,585 8,777,687Other Operating Revenue 498,317 480,468 377,507 445,844 1,499,330Total Operating Revenue $ 40,429,864 $ 43,772,513 $ 39,059,516 $ 40,255,520 $ 41,328,123Non-Operating Income ( 2 ) 1,142,787 1,501,255 1,999,871 2,128,819 3,029,945Total Revenue $ 41,572,651 $ 45,273,768 $ 41,059,387 $ 42,384,339 $ 44,358,068
OPERATING EXPENSE ( 3 )Salaries and Fringe $ 5,392,602 $ 5,371,588 $ 5,425,255 $ 5,437,281 $ 5,060,734 BenefitsContractual Services ( 4 ) 18,718,955 20,268,652 18,491,190 17,985,171 18,934,155Maintenance of Structure 412,906 303,721 301,953 539,709 287,597Maintenance of Equipment 335,035 417,057 320,186 351,790 404,643Franchise Fees 2,398,143 2,599,173 2,324,821 2,393,081 2,393,628General Fund Services 1,371,654 1,469,399 1,452,378 1,323,172 1,291,533Supplies 1,805,380 1,876,189 1,587,762 1,642,300 1,513,792Other Expenses 15 111 770 65,263 69,132Total Operating Expenses $ 30,434,690 $ 32,305,890 $ 29,904,315 $ 29,737,767 $ 29,955,214
Net Revenues $ 11,137,961 $ 12,967,878 $ 11,155,072 $ 12,646,572 $ 14,402,854
Water Customers 38,087 37,767 37,244 36,984 36,735Sewer Customers (Est.) 38,087 37,767 37,244 36,984 36,735
(1) Net after discounts allowed ( see "Water and Sewer Rates " ), penalties and bad debts.
(2) Non-operating income excludes (1) interest income and gain on sale of securities from investment of funds restricted for construction and (2) interest expense.
(3) Depreciation excluded.
(4) Includes all payments to Colorado River Municipal Water District ("CRMWD") for purchase of water and other contractual obligations.
(Unaudited - See Accompanying Independent Auditors' Report)
BBrown
Typewritten Text
148

City of Midland, Texas
Table 2 - Outstanding System Revenue Bonds
Prior Lien Bonds:
Waterworks and Sewer System (Prior Lien) Revenue Bonds Outstanding, 9-30-12.............. $ 9,710,000
Subordinate Lien Bonds:
Waterworks and Sewer System Junior Lien Revenue Bonds Outstanding, 9-30-12.............. 15,855,000
Total Waterworks and Sewer System Revenue Bonds Outstanding, 9-30-12....................... $ 25,565,000
Table 3 - Historical Debt Service Coverage
Required Maximum MaximumUse of Annual Debt ServiceRate Principal Requirements Coverage of
Fiscal Stabilization and Interest Combined CombinedYear Fund Requirements Coverage of Prior Lien Prior Lien
Ended Net Subordinate Prior Lien Prior Lien and Subordinate and Subordinate9-30 Revenues Lien Bonds Bonds (1) Bonds (1) Lien Bonds (2) Lien Bonds (2)2008 $ 14,402,854 $ - $ 1,307,250 11.02x $ 2,466,800 5.84x2009 12,646,572 - 1,307,250 9.67x 2,466,800 5.13x2010 11,155,072 - 1,307,250 8.53x 2,466,800 4.52x2011 12,967,878 - 1,307,250 9.92x 2,466,800 5.26x2012 11,137,961 - 1,307,250 8.52x 2,464,850 4.52x
(1) Calculated as of 9-30 for each Fiscal Year. Rate Covenant requires not less than 1.25 times coverage.
(2) Calculated as of 9-30 for each Fiscal Year with interest on the Subordinate Lien Bonds calculated at 8%. for fiscal years 1999 and prior and 6% thereafter. Rate covenant requires not less than 1.50 times coverage.
Table 4 - Fund Balances
Interest and Reserve FundSinking Funds (Fully Established)
Prior Lien Bonds, 9-30-12 $ 570,511 $ 1,297,571
Subordinate Lien Bonds, 9-30-12 $ 565,331 $ 1,528,500
(Unaudited - See Accompanying Independent Auditors' Report)
BBrown
Typewritten Text
149

City of Midland, Texas
Table 5 - Calculation of Prior Lien Bonds and Subordinate Lien BondsDebt Service Requirements
Fiscal YearEnded
Debt Service Requirements (As Paid) 09/30/12Prior Lien Bonds $ 1,297,758
Subordinate Lien Bonds 786,102
Total Prior and Subordinate Lien Bonds $ 2,083,860
Estimated System Net Revenues, Fiscal Year Ended 9-30-12 $ 11,137,961
Use of Rate Stabilization Fund -
Coverage of Combined Debt Service Requirements by Net Revenues, Fiscal Year Ended 9-30-12 5.34 Times
Table 6 - Fund Balances - CRMWD Contract Revenue Bonds
The final payment to retire these bonds was made on March 1, 1998.
(Unaudited - See Accompanying Independent Auditors' Report)
BBrown
Typewritten Text
150

City of Midland, Texas
Table 7 - Monthly Water Rates (Effective April 1, 2012)
Previous Rates Previous Rates Current Rates
(Effective 10-1-10) (Effective 10-1-11) (Effective 4-1-12)All Customers (except Apartments)First 2,000 Gallons $ 14.00 (Minimum) $ 14.35 (Minimum) $ 14.35 (Minimum)Over 2,000 Gallons up to 10,000 Gallons 3.18 / 1,000 gallons 3.26 / 1,000 gallons 3.26 / 1,000 gallonsOver 10,000 Gallons up to 35,000 Gallons 3.39 / 1,000 gallonsOver 35,000 Gallons 3.66 / 1,000 gallonsOver 10,000 Gallons up to 25,000 Gallons (ED 10-1-11) 3.91 / 1,000 gallons 19.55 / 1,000 gallonsOver 25,000 Gallons (ED 10-1-11) 4.50 / 1,000 gallons 22.50 / 1,000 gallons
Apartments (1)First 2,000 Gallons per unit $ 10.50 / unit (Minimum) $ 11.50 / unit (Minimum) $ 11.50 / unit (Minimum)Over 2,000 up to 10,000 Gallons times number of units 3.18 / 1,000 gallons 3.26 / 1,000 gallons 3.26 / 1,000 gallonsOver 10,000 Gallons up to 35,000 Gallons 3.39 / 1,000 gallonsOver 35,000 Gallons 3.66 / 1,000 gallonsOver 10,000 Gallons up to 25,000 Gallons (ED 10-1-11) 3.91 / 1,000 gallons 19.55 / 1,000 gallonsOver 25,000 Gallons (ED 10-1-11) 4.50 / 1,000 gallons 22.50 / 1,000 gallons
(1) Example for 100 unit apartment: First 200,000 Gallons per unit (100x2,000 gallons) $ 1,050.00 (Minimum) $ 1,150.00 (Minimum) $ 1,150.00 (Minimum) 200,001 to 1,000,000 Gallons times number of units 3.18 / 1,000 gallons 3.26 / 1,000 gallons 3.26 / 1,000 gallons 1,000,001 to 3,500,000 Gallons times number of units 3.39 / 1,000 gallons 3,500,001 and over Gallons times number of units 3.66 / 1,000 gallons 1,000,001 to 2,500,000 Gallons times number of units 3.91 / 1,000 gallons 19.55 / 1,000 gallons 2,500,001 and over Gallons times number of units 4.50 / 1,000 gallons 22.50 / 1,000 gallons
All water rates will increase by 2.5% on the anniversary of theeffective date unless otherwise modified by the City Council(1.25% prior to 10-1-09)
Table 8 - Monthly Sewer Rates (Effective April 1, 2012)
Previous Rates Previous Rates Current Rates(Effective 10-1-10) (Effective 10-1-11) (Effective 4-1-12)
Residential (1) $ 16.96 (Minimum) $ 17.39 (Minimum) $ 17.39 (Minimum)
Commercial (Based on Water Consumption)First 25,000 Gallons $ 16.96 (Minimum) $ 17.39 (Minimum) $ 17.39 (Minimum)Next 475,000 Gallons 0.68 / 1,000 gallons 0.70 / 1,000 gallons 0.70 / 1,000 gallonsOver 500,000 Gallons 0.52 / 1,000 gallons 0.53 / 1,000 gallons 0.53 / 1,000 gallons
(1) Each apartment classified as a separate dwelling unit.
(Unaudited - See Accompanying Independent Auditors' Report)
BBrown
Typewritten Text
151

City of Midland, Texas
Table 9 - Value of the System
2012 2011 2010 2009 2008Property, Plant and Equipment $ 220,182,120 $ 202,371,426 $ 192,318,262 $ 184,108,867 $ 174,455,522Less: Allowance for Depreciation (75,816,712) (70,090,654) (89,132,079) (85,230,042) (81,670,094)
144,365,408 132,280,772 103,186,183 98,878,825 92,785,428Construction in Process 20,900,061 25,127,612 46,732,588 39,686,714 18,342,725
Net System Value $ 165,265,469 $ 157,408,384 $ 149,918,771 $ 138,565,539 $ 111,128,153
Table 10 - City's Equity in System
2012 2011 2010 2009 2008Net Fixed Asset Value $ 165,265,469 $ 157,408,384 $ 149,918,771 $ 138,565,539 $ 111,128,153Plus: Net Bond Construction Funds 14,370,346 2,127,166 6,285,760 15,885,689 40,850,976Other Long-Term Assets 907,798 821,816 911,600 1,017,814 1,162,315Net Working Capital ( 1 ) 62,431,344 65,160,203 57,493,659 55,273,979 51,005,212
Value of the System $ 242,974,957 $ 225,517,569 $ 214,609,790 $ 210,743,021 $ 204,146,656
Net Debt (net of unamortized charges)Revenue Bonds Outstanding $ 10,955,000 $ 12,685,000 $ 14,325,000 $ 15,895,000 $ 17,385,000Certificates of Obligation Outstanding 63,115,000 48,695,000 50,075,000 51,400,000 52,665,000Notes Payable 0 6,000,000 0 35,400 39,850
$ 74,070,000 $ 67,380,000 $ 64,400,000 $ 67,330,400 $ 70,089,850Less: Interest and Sinking and Reserve Funds (5,154,825) (4,604,132) (4,577,737) (4,519,398) (4,341,613)
$ 68,915,175 $ 62,775,868 $ 59,822,263 $ 62,811,002 $ 65,748,237
Fixed Asset Value of the Waterworks and Sewer SystemFiscal Year Ended September 30,
Fiscal Year Ended September 30,City's Equity in the Waterworks and Sewer System
Plus: Accrued Interest 626,671 302,646 343,333 342,910 367,625Compensated Absences 271,329 304,195 322,508 346,722 266,767Other Postemployment Benefits 1,446,522 1,088,422 732,187 - -
Net Debt $ 71,259,697 $ 64,471,131 $ 61,220,291 $ 63,500,634 $ 66,382,629
City's Equity in System $ 171,715,260 $ 161,046,438 $ 153,389,499 $ 147,242,387 $ 137,764,027
Percentage City's Equity inSystem 70.67% 71.41% 71.47% 69.87% 67.48%
( 1 ) Current portion of capital leases payable classified as a current liability.
(Unaudited - See Accompanying Independent Auditors' Report)
BBrown
Typewritten Text
152
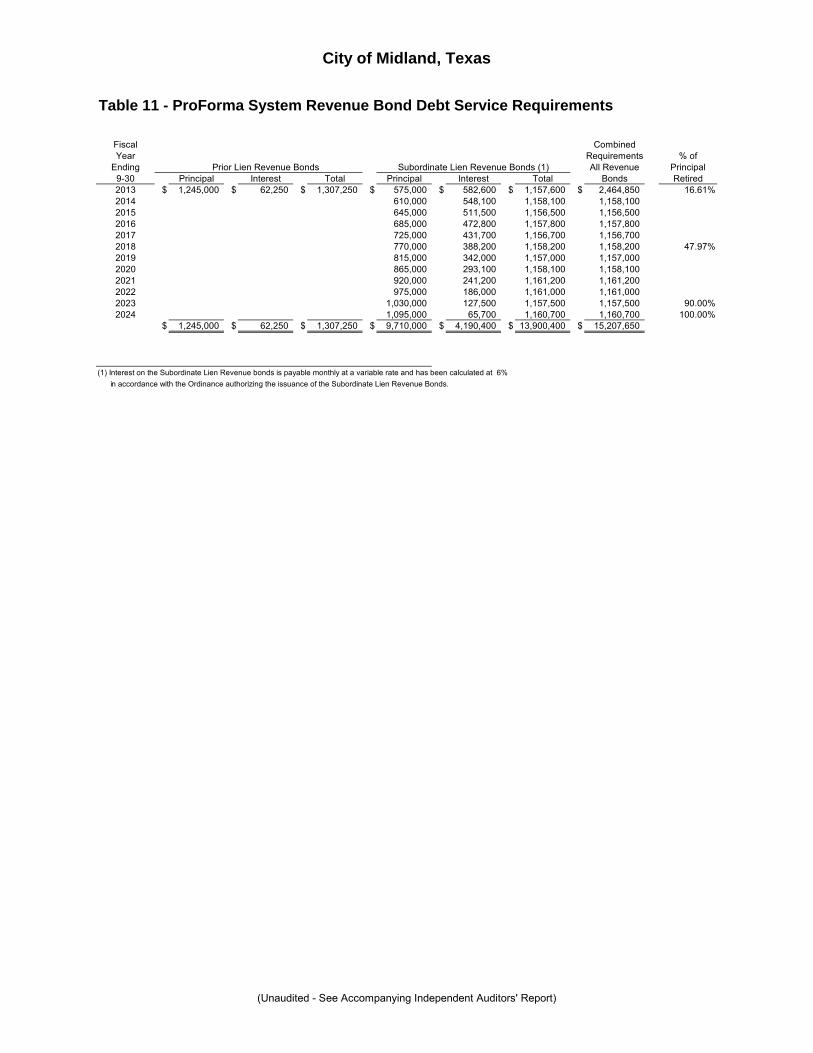
City of Midland, Texas
Table 11 - ProForma System Revenue Bond Debt Service Requirements
Fiscal CombinedYear Requirements % of
Ending Prior Lien Revenue Bonds Subordinate Lien Revenue Bonds (1) All Revenue Principal9-30 Principal Interest Total Principal Interest Total Bonds Retired2013 $ 1,245,000 $ 62,250 $ 1,307,250 $ 575,000 $ 582,600 $ 1,157,600 $ 2,464,850 16.61%2014 610,000 548,100 1,158,100 1,158,1002015 645,000 511,500 1,156,500 1,156,5002016 685,000 472,800 1,157,800 1,157,8002017 725,000 431,700 1,156,700 1,156,7002018 770,000 388,200 1,158,200 1,158,200 47.97%2019 815,000 342,000 1,157,000 1,157,0002020 865,000 293,100 1,158,100 1,158,1002021 920,000 241,200 1,161,200 1,161,2002022 975,000 186,000 1,161,000 1,161,0002023 1,030,000 127,500 1,157,500 1,157,500 90.00%2024 1,095,000 65,700 1,160,700 1,160,700 100.00%
$ 1,245,000 $ 62,250 $ 1,307,250 $ 9,710,000 $ 4,190,400 $ 13,900,400 $ 15,207,650
(1) Interest on the Subordinate Lien Revenue bonds is payable monthly at a variable rate and has been calculated at 6% in accordance with the Ordinance authorizing the issuance of the Subordinate Lien Revenue Bonds.
(Unaudited - See Accompanying Independent Auditors' Report)
BBrown
Typewritten Text
153

City of Midland, Texas
Table 12 - Other System Obligations
The City has no lease-purchase agreements for the acquisition of any assets in the Water and Sewer system.
Table 13A - Historical Water Pumpage and Consumption
FiscalYear Water Pumpage Total
Ended Average Day Total Pumpage Consumption9-30 Pumpage (MGD) (Million Gallons) (Million Gallons)2008 25.31 42.35 9,262 22.50 8,2352009 24.93 42.35 9,099 23.36 8,5282010 23.74 40.04 8,664 21.54 7,8632011 25.35 35.37 9,254 24.00 8,7592012 15.92 27.12 5,826 15.56 5,694
Average Number of Accounts, 10/11 - 9/12 (est.)........ 37,927 Average Monthly Water Bill, 10/11 - 9/12 (est.)........... $87.74Average Monthly Consumption per Account................ 12.51
Table 13B - Water Deliveries from CRMWD
AverageFiscal Water PumpingYear Delivered Cost Per
Ended (Million Total 1,000 Total
WaterConsumption
Peak Day Average DayPumpage (MGD) Consumption (MGD)
1966 Contract Ivie Reservior Deliveries
Average WaterPrice Delivered
Per 1,000 (MillionEnded (Million Total 1,000 Total9-30 Gallons) Cost Gallons Cost2008 4883.63 1.6085 7,855,324 2144.38 0.6727 1,442,438 2009 5473.32 1.5767 8,629,782 1936.01 0.4769 923,329 2010 5557.73 1.6085 8,939,609 1269.86 0.5883 747,060 2011 5584.43 1.7533 9,791,181 1534.80 0.5887 903,479 2012 5652.77 1.6587 9,376,243 75.93 3.0977 235,209
Table 13C - Ten Largest Water Customers (October, 2011 - September, 2012)
Bill AmountCity of Midland 91,871 $ 512,025 Midland Schools 64,312 285,098 Midland Memorial Hostpital 56,507 250,355 Midland College 38,110 234,463 Northridge Court Apartments LP Apartments 21,566 92,056 Summit Building 20,104 88,656 Midland Memorial West Campus 19,984 89,784 Fasken Midland LLC 17,629 77,442 Blue Ridge C/O Velocity 16,963 75,168 Kington Properties 16,048 69,639
363,094 $ 1,774,684
Per 1,000 (MillionGallons Gallons)
Water ConsumptionCustomer Type of Industry (Thousand Gallons)
Hospital
Incorporated CityPublic Schools
Total
Office BuildingsApartmentsApartments
HospitalCommunitiy College
Office Buildings
(Unaudited - See Accompanying Independent Auditors' Report)
BBrown
Typewritten Text
154

City of Midland, Texas
Table 14A - Sewage Flows
Fiscal DailyYear Average
Ended Flow9-30 (MGD)2008 11.632009 11.702010 10.982011 10.592012 10.95
Table 14B - Ten Largest Wastewater Customers (October, 2011 - September, 2012)
Bill AmountMidland Memorial Hospital Hospital 55,545 $ 31,427 Midland Schools Public Schools 24,751 26,093 Summit Building Office Building 20,104 11,650 Midland Memorial West Campus Hospital 19,984 11,356 Fasken Midland LLC Office Building 17,629 10,713 Culligan Soft Water Water Purification 15,984 9,388 Midland College Community College 13,512 12,309 Superwash Coin Laundry Coin Operated Laundry 13,264 9,029 Midland County Auditor County Administration 12,611 8,538 H.E. Butt Grocery Co. Grocery Store 12,393 7,572
205,777 $ 138,074
Wastewater VolumeCustomer Type of Industry (Thousand Gallons)
Table 15 - Current Investments
As of September 30, 2012, the City's investable funds were invested in the following categories:
Type of Investment% of
Description Market Value Market ValueU.S. Treasury Notes and Bills 0.00% $ 0
U.S. Agency and Instrumentality 29.12% 70,029,220
Cash and Local Government Pools 70.88% 170,485,783
Totals 100.00% $ 240,515,003
As of such date, 70.29% of the City's investment portfolio was invested in immediately availablefunds from pools. The market value of the investment portfolio was 100% of its fair value and the effective investment yield was 0.6991%. Average maturity of the portfolio was 34.89 months.
(Unaudited - See Accompanying Independent Auditors' Report)
bbrown
Typewritten Text
155

AIRPORT REVENUE DEBT
(Unaudited)
bbrown
Typewritten Text
156
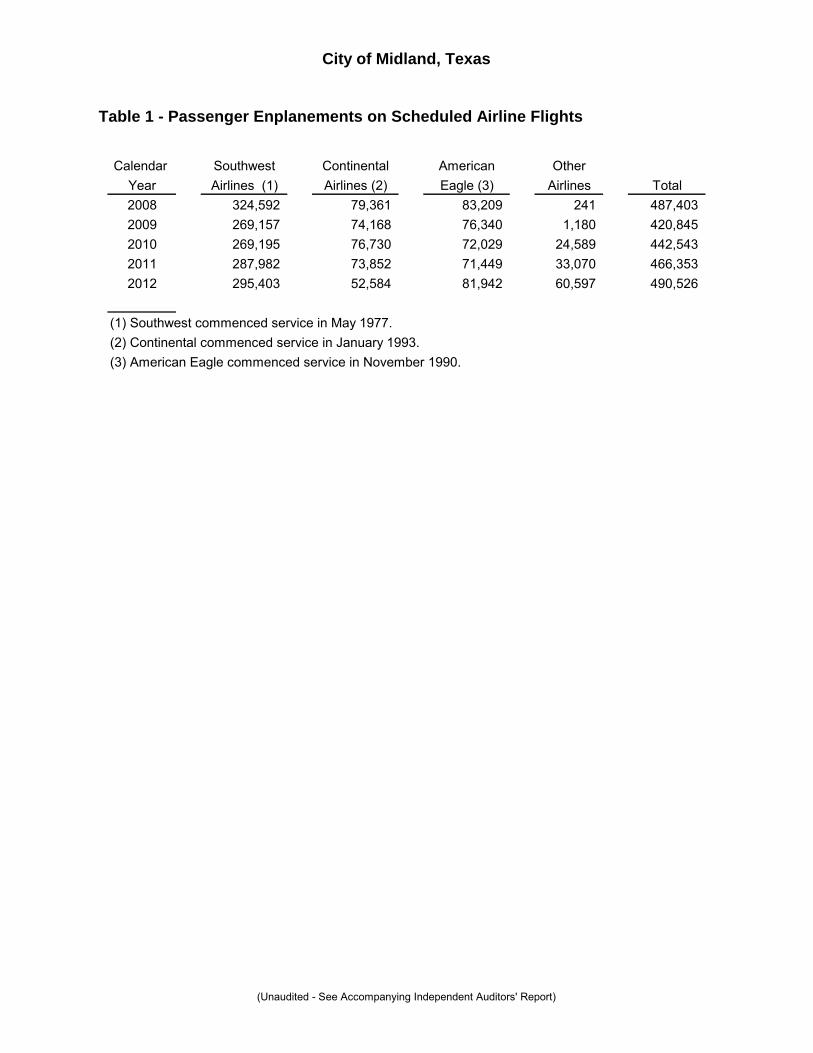
Table 1 - Passenger Enplanements on Scheduled Airline Flights
City of Midland, Texas
Calendar Southwest Continental American OtherYear Airlines (1) Airlines (2) Eagle (3) Airlines Total2008 324,592 79,361 83,209 241 487,4032009 269,157 74,168 76,340 1,180 420,8452010 269,195 76,730 72,029 24,589 442,5432011 287,982 73,852 71,449 33,070 466,3532012 295,403 52,584 81,942 60,597 490,526
(1) Southwest commenced service in May 1977.(2) Continental commenced service in January 1993.(3) American Eagle commenced service in November 1990.
(Unaudited - See Accompanying Independent Auditors' Report)
bbrown
Typewritten Text
157

Table 2 - Airline / Airport Use Agreement
City of Midland, Texas
Certificated Passenger Airline/Airport Use Agreement
Scheduled airlines operating at Midland International Airport are required to sign standard Airline/Airport use and leaseagreements (the "Agreements"). These agreements allow the signatory airline the use of certain premises and facilities andfor the exercise of certain rights and privileges at the Midland International Airport in connection with the operation of an airtransportation system. All current airline agreements will terminate at midnight on January 31, 2014, unless terminatedsooner according to various provisions within each agreement.
Landing Fees
On August 1, 2008, the rate for landing fees was temporarily rolled back from $0.70 to $0.60 per 1,000 Gross Landing WeightThis reduction, enacted to assist the airlines during the crisis generated by high fuel costs, lapsed on February 1, 2009. At that time the rate returned to the $0.70 per 1,000 Gross Landing Weight. The City has no plans to increase landing fees abovethat level during the year ended September 30, 2013.
Rentals
Terminal Building joint use and exclusive rates are currently $20.50 per square foot per year. The rate used to calculate the amount of rent to be paid by the airline to the City shall be reviewed annually and may be adjusted if the Airport’s financial datafor the Airport System Cost/Revenue indicates such need. In no event shall the square footage rate be less than the base$20.50 rate. No change in rates is anticipated for Fiscal Year 2013.
Exclusive Terminal Building SpaceIncludes ticket counters, operations offices, airfreight handling areas, and administrative offices.
Non-exclusive Terminal Building SpaceJoint Use Area - 20% of the total monthly charge divided equally among all scheduled airlines. 40% of the total is proratedamong all scheduled airlines based upon the ratio of each such airline's number of revenue landings during the calendar monthfor which such charges are being determined, to the total of all revenue landings for all scheduled airlines. The remaining 40%is prorated among all scheduled airlines based upon the ratio of each such scheduled airline's number of enplaned passengersto the total of enplaned passengers for the calendar month.
Passenger Loading Bridges and Baggage Claim System
Under the terms of the Airline/Airport Use and Lease agreement between the City of Midland and the airlines serving the Airport,the airlines have responsibility for operation of these systems. In accordance with the Aircraft Passenger Loading Bridge andBaggage System Maintenance contract, charges for maintenance are assessed to the airlines based upon labor performedplus parts, materials and shipping costs.
Extraordinary Costs and Expenses
The agreements provide for timely renegotiation and adjustments to rentals, landing fees and other charges in the event extra-ordinary costs or expenses are incurred by the City, including technical advances or new governmental requirements.
(Unaudited - See Accompanying Independent Auditors' Report)
bbrown
Typewritten Text
158

Table 3 - Airport Revenue Debt Service Requirements
City of Midland, Texas
The final payment to retire the Airport Revenue Bonds, Series 1997 was made on December 1, 2006.
Table 4 - Authorized But Unissued Airport Revenue Bonds; Anticipated Issuanceof Airport Revenue Bonds
The City has no authorized but unissued revenue bonds, and pursuant to State law is not required to approve its revenue bonds through election. The City does not anticipate the issuance of additional Airport Revenue Bonds in the foreseeable future.
Table 5 - Other Airport Obligations
The City has no lease, lease-purchase or note obligations secured by Airport revenues. The City'sTax and Airport Subordinate Lien Revenue and Tax Certificates of Obligation, Series 1996 wasrefunded upon issuance of General Obligation Refunding Bonds, Series 2006A (outstanding principalbalance at 9-30-12 is $5,990,000). This debt is secured by an ad valorem tax.
(Unaudited - See Accompanying Independent Auditors' Report)
bbrown
Typewritten Text
159

City of Midland, Texas
Table 6 - Airport Statement of Operations
For Fiscal Year Ending September 30,
2012 2011 2010 2009 2008Operating RevenuesTerminal ( 1 ) Airport Parking $ 2,245,055 $ 2,047,487 $ 1,815,315 $ 1,814,053 $ 2,007,896 Airport Building Rental 3,107,199 2,924,153 2,658,054 2,800,906 3,058,919 Airport Aviation Rental 234,823 219,237 211,114 224,054 240,575 Airport Landing Fees 435,169 430,466 424,918 416,877 457,275 Airport Commercial Rentals 181,789 145,659 144,567 142,144 121,803 Airport Fuel and Oil Commissions 98,528 94,520 84,603 80,832 96,305 Miscellaneous 95,197 113,309 132,630 143,374 221,235
$ 6,397,760 $ 5,974,831 $ 5,471,201 $ 5,622,240 $ 6,204,008
Air Park ( 2 ) Airpark Rentals $ 145,220 $ 144,432 $ 143,856 $ 142,097 $ 142,097 Airpark Fuel and Oil Commissions 18,874 18,250 14,468 15,293 17,474
$ 164,094 $ 162,682 $ 158,324 $ 157,390 $ 159,571Total Operating Revenues $ 6,561,854 $ 6,137,513 $ 5,629,525 $ 5,779,630 $ 6,363,579
Nonoperating Revenues Passenger Facility Charges $ 2,126,221 $ 1,816,827 $ 1,808,537 $ 1,638,332 $ 1,997,918 Other Nonoperating 388,153 283,486 490,305 381,750 572,463
Total Nonoperating Revenues $ 2,514,374 $ 2,100,313 $ 2,298,842 $ 2,020,082 $ 2,570,381
GROSS REVENUES $ 9,076,228 $ 8,237,826 $ 7,928,367 $ 7,799,712 $ 8,933,960
OPERATING AND MAINTENANCE EXPENSES ( 3)Salaries and Fringe Benefits $ 1,929,992 $ 1,889,317 $ 1,891,405 $ 1,863,637 $ 1,581,556Contractual Services 1,816,722 1,820,549 2,338,144 2,095,244 1,821,675Maintenance of Structures 65,661 51,563 153,539 62,362 116,312Maintenance of Equipment 52,287 40,181 48,711 35,994 57,173Foreign Trade Zone 154,132 169,730 146,988 160,877 189,501General Fund Services 1,409,574 1,410,971 1,424,839 1,373,011 1,443,885Supplies 64,927 72,734 78,065 61,631 59,228Other Expenses - - - 25,469 430
TOTAL OPERATING AND MAINTENANCE EXPENSES $ 5,493,295 $ 5,455,045 $ 6,081,691 $ 5,678,225 $ 5,269,760
NET REVENUES $ 3,582,933 $ 2,782,781 $ 1,846,676 $ 2,121,487 $ 3,664,200
(1) "Terminal" means Midland International Airport
(2) "Airpark" is a 500 acre airport, part of the Airport System, located in north Midland.
(3) "Operating and Maintenance Expenses" do not include depreciation, capital outlay or debt service.
(Unaudited - See Accompanying Independent Auditors' Report)
bbrown
Typewritten Text
160

City of Midland, Texas
Table 7 - Coverage
Maximum Principal and Interest Requirements, 2012....................................................$ 0Coverage of Maximum Requirements by 9-30-11 Net Revenues......................................… n/aCoverage of Maximum Requirements by 9-30-12 Net Revenues......................................... n/a
Airport Revenue Bonds to be Outstanding, 9-30-12.......................................................$ 0
Table 8 - Current Investments
As of September 30, 2012, the City's investable funds were invested in the following categories:
Type of Investment% of
Description Market Value Market ValueU.S. Treasury Notes and Bills 0.00% $ 0
U.S. Agency and Instrumentality 29.12% 70,029,220
Cash and Local Government Pools 70.88% 170,485,783
Totals 100.00% $ 240,515,003
As of such date, 70.29% of the City's investment portfolio was invested in immediately availablefunds from pools. The market value of the investment portfolio was 100% of its fair value and the effective investment yield was 0.6991%. Average maturity of the portfolio was 34.89 months.
(Unaudited - See Accompanying Independent Auditors' Report)
bbrown
Typewritten Text
161