Comprehensive Annual Financial Report - Kansas ...
150
-
Upload
khangminh22 -
Category
Documents
-
view
1 -
download
0
Transcript of Comprehensive Annual Financial Report - Kansas ...


Comprehensive Annual Financial Report
of the
Wichita Public Schools
Unified School District 259
Wichita, Sedgwick County, Kansas
For the Year Ended June 30, 2016
Prepared by:
Financial Services Department

WICHITA PUBLIC SCHOOLS MISSION STATEMENT
The work of Wichita Public Schools is to empower all students with the 21st
century skills and knowledge necessary for success by providing a coherent,
rigorous, safe and nurturing, culturally responsive, and inclusive learning
community.

Table of Contents
Wichita Public Schools
INTRODUCTORY SECTION
Page Letter of Transmittal ................................................................................................................................ 1 Organizational Chart ............................................................................................................................... 9 Board of Education ............................................................................................................................... 10 Shared Beliefs/Objectives ..................................................................................................................... 11 Government Finance Officers Association Certificate of Achievement .................................................. 12 Association of School Business Officials Certificate of Excellence ........................................................ 13
FINANCIAL SECTION
Independent Auditor’s Report ............................................................................................................... 15
Management’s Discussion and Analysis ............................................................................................... 17 Basic Financial Statements Government-Wide Financial Statements: Statement of Net Position .................................................................................................... 27 Statement of Activities ......................................................................................................... 28 Fund Financial Statements: Balance Sheet – Governmental Funds ................................................................................ 29 Reconciliation of the Balance Sheet of Governmental Funds to the Statement of Net Position .............................................................................................. 30 Statement of Revenues, Expenditures, and Changes in Fund Balances – Governmental Funds ................................................................................... 31 Reconciliation of the Statement of Revenues, Expenditures, and Changes in Fund Balances of Governmental Funds to the Statement of Activities ....................... 32 Statement of Net Position – Proprietary Funds .................................................................... 33 Statement of Revenues, Expenses, and Changes in Fund Net Position – Proprietary Funds .......................................................................... 34 Statement of Cash Flows – Proprietary Funds .................................................................... 35 Statement of Fiduciary Net Position – Fiduciary Funds ....................................................... 36 Statement of Changes in Fiduciary Net Position – Fiduciary Funds ..................................... 37 Notes to the Financial Statements............................................................................................. 38
Required Supplementary Information: Other Postemployment Benefits Other Than Pensions ............................................................. 63 Kansas Public Employees Retirement System .......................................................................... 65 Schedules of Revenues, Expenditures and Changes in Fund Balances – Budget and Actual General Fund ................................................................................................................ 68 Special Education Fund ................................................................................................. 69 Nutrition Services Fund ................................................................................................. 70 Supplementary Information: Combining and Individual Fund Statements and Schedules: Combining Balance Sheet – General Fund ............................................................................... 71 Combining Schedule of Revenues, Expenditures and Changes in Fund Balances – General Fund ..................................................................................... 72 Combining Balance Sheet – Nonmajor Governmental Funds .................................................... 73 Combining Schedule of Revenues, Expenditures and Changes in Fund Balances - Nonmajor Governmental Funds .......................................................... 75

Table of Contents
Wichita Public Schools
Schedule of Revenues, Expenditures and Changes in Fund Balances – Budget and Actual: Supplemental General Fund .......................................................................................... 77 Professional Development Fund .................................................................................... 78 Four Year Old State Intervention Fund .......................................................................... 79 State Intervention Fund (K-12) ...................................................................................... 80 Bilingual Education Fund ............................................................................................... 81 Vocational Education Fund ............................................................................................ 82 Virtual Education Program ............................................................................................. 83 Latchkey Fund ............................................................................................................... 84 Parents As Teachers Fund ............................................................................................ 85 Summer School Fund .................................................................................................... 86 Special Liability Expense Fund ...................................................................................... 87 KPERS Retirement Contributions .................................................................................. 88 Special Assessment Fund ............................................................................................. 89 Capital Outlay Fund ....................................................................................................... 90 Bond and Interest Fund ................................................................................................. 91 Combining Schedule of Net Position – Internal Service Funds .................................................. 93 Combining Schedule of Revenues, Expenses, and Changes in Fund Net Position - Internal Service Funds ......................................................................... 94 Combining Schedule of Cash Flows - Internal Service Funds ................................................... 95 Combining Schedule of Fiduciary Net Position – Fiduciary Funds – Employee Benefit Trust Funds ............................................................................................ 97 Combining Schedule of Changes in Fiduciary Net Position – Fiduciary Funds – Employee Benefit Trust Funds ............................................................................................................. 98 Combining Schedule of Fiduciary Assets and Liabilities – Fiduciary Funds – Agency Funds .... 99 Combining Schedule of Changes in Assets and Liabilities - Fiduciary Funds - Agency Funds .100
STATISTICAL SECTION
Financial Trends Statement of Revenues, Expenditures and Changes in Fund Balances, Governmental Funds ........................................................................................ 102 Fund Balances, Governmental Funds ..................................................................................... 104 Schedule of Changes in Net Position ...................................................................................... 105 Net Position by Component..................................................................................................... 106 State Revenue by Source, Governmental Funds .................................................................... 107 Revenue Capacity Assessed and Estimated Actual Value of Taxable Property .................................................... 108 Property Tax Rates - Direct and Overlapping Governments .................................................... 109 Principal Property Taxpayers .................................................................................................. 110 Property Tax Levies and Collections ....................................................................................... 111 Debt Capacity Computation of Direct and Overlapping Debt .......................................................................... 112 Ratio of Net General Bonded Debt Outstanding ...................................................................... 113 Legal Debt Margin ................................................................................................................... 114 Ratio of Annual Debt Service Expenditures for General Bonded Debt to Total Current Governmental Expenditures ........................................................................ 115

Table of Contents
Wichita Public Schools
Demographic and Economic Information Demographic Statistics ........................................................................................................... 116 Principal Employers ................................................................................................................ 117 Miscellaneous Statistics .......................................................................................................... 118 Operating Information Operating Indicators by Function/Program .............................................................................. 119 Capital Asset Statistics by Function/Program .......................................................................... 120 Teacher Salary Schedule ........................................................................................................ 121 Supplemental Salary Schedule ............................................................................................... 122 District Feeder Program .......................................................................................................... 123

Table of Contents
Wichita Public Schools

Intro
du
cto
ry S
ec
tion


Wichita Public Schools Page 1
John Allison December 7, 2016 Superintendent
To the Board of Education and the Citizens of Unified School District No. 259
The Comprehensive Annual Financial Report (CAFR) for the Wichita Public Schools, Unified School District No. 259 (District) for the fiscal year ended June 30, 2016, is submitted herewith. Generally Accepted Accounting Principles require that these financial statements present the District (the primary government) and its component units, if any. A component unit is a separate entity for which the District is financially accountable or the nature and significance of the relationship between the District and entity are such that exclusion would cause the District’s financial statements to be misleading or incomplete. The District has determined that it does not have any component units.
The District’s Financial Services Department prepared this report. Responsibility for both the accuracy of the presented data and the completeness and fairness of the presentation, including all disclosures, rests with the District’s administrative team and, ultimately, with the Board of Education (Board). We believe the data presented in this report is accurate in all material aspects, presents fairly the financial position and results of operations as measured by the financial activity of the various funds, and includes all footnotes and disclosures necessary to gain an understanding of the District’s financial activity.
This report conforms to the Governmental Accounting Standards Board’s (GASB) financial reporting principles. All disclosures necessary to enable the reader to gain maximum understanding of the District’s financial activity have been included. The notes to the financial statements are considered to be an integral part of the financial statements and contain certain information not shown on the face of the financial statements that is required to be disclosed under Generally Accepted Accounting Principles. Readers of the financial statements are encouraged to thoroughly review the information contained in the notes in connection with their overall review of the financial statements.
The District is required to undergo an annual single audit in conformity with the provisions of Subpart F of 2 CFR Part 200 “Uniform Administrative Requirements, Cost Principles, and Audit Requirements of Federal Awards.” Information related to this single audit is included in a separately issued single audit report.
This report consists of three major sections:
1. Introductory Section – which contains a Table of Contents, Letter of Transmittal, District’s organizational chart, List of the Board of Education members, the Shared Beliefs/Objectives, the Governmental Finance Officers Association (GFOA) Certificate of Achievement, and the Association of School Business Officials (ASBO) Certificate of Excellence.

Introductory Section
Wichita Public Schools Page 2
2. Financial Section – which begins with the Independent Auditor’s Report and includes Management’s Discussion and Analysis, the Basic Financial Statements and footnotes that provide an overview of the District’s financial position and operating results, the combining statements for nonmajor funds, and other schedules that provide detailed information relative to the Basic Financial Statements.
3. Statistical Section – presents social and economic data, financial trends, and demographic data about the District for the last ten years.
School District General Description
The District is in Sedgwick County located in south central Kansas. The major city within the District is Wichita with a population of more than 380,000, where approximately 97% of the students reside. The District covers 152 square miles and serves more than 50,000 students. The District consists of more than 100 schools and other centers.
The District is the largest school district in Kansas. The District provides a full range of school programs and services authorized by state statutes. For the 2016 fiscal year, these services include educational programs for grades K-12, special education, Federal Title programs, pre-kindergarten, vocational education, bilingual education and other educational programs, transportation, nutrition services, health services, support services, and professional development activities for educators. Also, under supervision of the District, individuals and groups may utilize District facilities for community functions.
The District enjoys a richly diverse student population. No single ethnic group comprises greater than 1/3 of all students. The student community comes from 96 countries and more than 119 languages are spoken in the homes of district students. 75% of students come from homes of poverty, presenting additional challenges for the District to overcome.
The District was established on July 1, 1965. A seven-member elected Board of Education (Board) governs the District. The District receives funding from local, state, and federal government sources and must comply with the requirements of these funding source entities. However, the District is not included in any other governmental “reporting entity” as defined by the Governmental Accounting Standards Board. The Board of Education members are elected by the public and have policy setting authority, the ability to significantly influence operations, and primary responsibility for fiscal matters.
Reporting Entity
The District is organized under the laws of the State of Kansas (State), and as mentioned before, is governed by an elected seven-member board. Accounting principles generally accepted in the United States of America (GAAP) require that these financial statements present the District (the primary government) and its component units. There are no component units for which the District is considered to be financially accountable.
Major Initiatives
Important educational initiatives continued or implemented were:
The District began implementation of a new certified staff evaluation process and procedure in FY’14. The new evaluation process will add consistency and efficiencies to the evaluation process for teachers and administrators and will meet the new evaluation

Introductory Section
Wichita Public Schools Page 3
criteria established by the Kansas State Board of Education. Implementation continued throughout 2015-2016, and full implementation is expected by 2018-2019.
The District began aligning its curriculum to meet the State Department of Education’s College and Career Ready Standards. Additionally, the District’s evaluation model for licensed staff provided instructional tools to equip educators with strategies to leverage student learning. The District began challenging teachers to move from a retrieval level of instruction where students recognize and recall facts to a knowledge utilization level of instruction where students are problem solving, investigating, experimenting and decision making. This systemic instructional change will empower students with 21st century skills and knowledge necessary for success, as well as align with the Kansas Assessment Program.
The District has increased graduation rates by 19.5% over the last six years.
Following the 2008, $370 million bond election, the District has completed 99% of all remaining bond projects in the community-developed facility master plan which includes:
Adding 9 new schools to meet current and projected student population growth and to replace antiquated schools
Adding over 200 new classrooms Building 60 storm shelter safe rooms Upgrading technical education
Renovating or rebuilding physical education, athletic and fine art facilities
As the District looks ahead to the 2016-17 school year, all but one of the Wichita schools (Robinson Middle) will have completed a storm shelter, with the final space to be completed March 2017. FEMA/safe room construction caps a major milestone for families in Wichita.
Financial Information, Management, and Control
The accounts of the District are organized and operated on the basis of funds. A fund is an independent fiscal and accounting entity with a self-balancing set of accounts. Fund accounting segregates funds according to their intended purpose and is used to aid management in demonstrating compliance with finance-related legal and contractual provisions. The minimum number of funds is maintained consistent with legal and managerial requirements. Fund descriptions have been provided where applicable.
Management Responsibility
This report consists of management’s representations concerning the finances of the District. Consequently, management assumes full responsibility for the completeness and reliability of all of the information presented in this report. The management of the District is also responsible for establishing and maintaining an internal control structure. In fulfilling this responsibility, estimates and judgments by management are required to assess the expected benefits and related costs of internal control structure policies and procedures. The objectives of an internal control structure are to provide management with reasonable, but not absolute, assurance that the assets of the government are safeguarded against loss from unauthorized use or disposition, that transactions are executed in accordance with management’s authorization and recorded properly to permit the preparation of financial statements in accordance with Generally Accepted Accounting Principles, and that federal and state financial assistance programs are managed in compliance with applicable laws and regulations. Because of inherent limitations in

Introductory Section
Wichita Public Schools Page 4
any internal control structure, errors, irregularities, or instances of noncompliance may nevertheless occur and not be detected.
Legislation
Below is a brief description of the most significant school finance legislation:
1. In 2015, the Kansas legislature dramatically changed the way schools are funded in FY’16 and FY’17. Statutes enacted eliminated the previous school funding formula that included weightings for bilingual students, vocational students, students transported over 2½ miles, low income students, and enrollments of more than 1,622. The funding formula was replaced with a block grant formula that sets the spending level for FY’16 and FY’17 while a new funding formula is being developed. The block grant eliminated the calculations for enrollment and set the funding for FY’16 at the same amount as the final legal maximum budget for FY’15 after reductions were made to equalization aid. There are some allowances for virtual education and new facilities, and special education funding calculations remained intact. However, the result is flat funding for the years the block grant is in effect.
2. Since 1992, school districts have not had control over the level of ad valorem taxes levied for their General fund. The State sets the General fund tax levy for all Kansas public school districts. That levy peaked at 37 mills in 1995 and is currently set at 20 mills. However, the first $20,000 of a personal residence’s market value is exempt from the General fund tax levy. Prior to FY’15, the revenue from the General fund levy was remitted directly to the school districts. Legislation now requires that the revenue be sent to the State and returned to districts as general state aid.
3. School districts are authorized to create a Supplemental General fund which enables them to spend above the level dictated by the State for the General fund. The block grant enacted for FY’16 and FY’17 has eliminated the ability of districts to increase the Supplemental General fund budget and set the legal maximum budgets for all districts at the FY’15 level.
4. The school finance formula that was in place through the end of FY’15 required any year-end unencumbered cash balance in the General fund to become a deduction from the following year’s state aid. The block grant legislation now allows unencumbered cash carry-over in the General fund in FY’16 and FY’17 without any reduction in the subsequent year’s state aid.
5. On May 27, 2016, the Kansas Supreme Court issued its decision on the equity portion of Gannon v. State of Kansas, affirming the ruling of a three-judge panel that the state had failed to correct unconstitutional inequities in Kansas’ school funding system specifically related to formulas for Capital Outlay and Supplemental General state aid. The Court ruled the block grant funding system did not equitably distribute funds among lower-property wealth districts and districts with higher property wealth. As a result of this ruling, on June 24, 2016 the Kansas Legislature passed a school funding equity bill which provided $5.8 million in additional Supplemental General state aid that resulted in property tax reductions for Sedgwick County property owners. The bill also added $4.9 million to the District’s Capital Outlay funding for FY’17.
Budgetary Control In developing and evaluating the District’s accounting control system, consideration is given to the adequacy of internal accounting controls. Accounting control comprises the plan of

Introductory Section
Wichita Public Schools Page 5
organization and the procedures and records that are concerned with the safeguarding of assets and the reliability of financial records.
State statutes require that budgets be legally adopted for all funds, unless exempted by a specific statute. All legal operating budgets are prepared using the modified accrual basis of accounting, modified further by the encumbrance method of accounting. Revenues are recognized when cash is received. Expenditures include disbursements, accounts payable, and encumbrances. Encumbrances are commitments for future payments and are supported by a document evidencing the commitment, such as a purchase order or contract. All unencumbered appropriations (legal budget expenditure authority) lapse at year-end. Encumbered appropriations are not re-appropriated in the ensuing year’s budget but are carried forward until liquidated or canceled. Accordingly, the data presented in the budgetary comparison statements differ from the data presented in the financial statements prepared in accordance with GAAP.
The budget is prepared by fund, function, object and program. Once the Board adopts the budget, budgetary control is maintained through an online accounting system that includes encumbering estimated expenditures prior to the release of purchase orders to vendors. Purchase orders that exceed available budgeted funds are not released until additional appropriations are made. Monthly budget reports showing orders outstanding and funds available are provided to each manager of a specific location, function, or program.
Financial Condition
In accordance with Governmental Accounting Standards Board (GASB) Statement 34, management is responsible for preparing a Management Discussion and Analysis of the District. This discussion follows the Independent Auditors’ Report, providing an assessment of District finances for 2016.
Operating Budget Policy
For FY’16 the District continued to follow the policy of confirming that current revenues were sufficient to support the current operating expenditures. The Financial Services department estimated annual revenues by an objective, analytical process. Fees and user charges were reviewed to ensure they were set at a level that fully supported the total direct and indirect costs of the related activities.
The District utilizes non-recurring revenues for non-recurring purposes rather than for support of on-going operating expenditures. The operating budget for FY’16 included state aid revenue for new facilities, a non-recurring funding source. These funds were transferred to Capital Outlay for future one-time facilities’ costs.
Capital Improvement Budget Policy
The District’s 5-Year Capital Improvement Plan (CIP) is designed to provide District facility improvements concurrent with the Bond Issue Master Plan. The CIP was updated in FY’16, as required by District policy. FY’16 projects included new wireless clock systems at four schools, intercom replacement at six schools, floor tile/carpet replacement at nine schools, ceiling tile replacement at three schools, plumbing upgrades at six schools, remodels at three schools, construction of a new high school, new service drive at one high school, new auditorium at one middle school and ADA improvements at one high school. Funding sources for these projects included a combination of bond proceeds and the Capital Outlay fund.

Introductory Section
Wichita Public Schools Page 6
Economic Outlook and Conditions
State of Kansas Education Funding
As previously mentioned, education funding has taken a dramatic turn with the implementation of block grant funding for FY’16 and FY’17. The block grant essentially froze operational funding at the FY’15 level with no increase in funding for enrollment increases or fixed cost increases. The block grant funding is scheduled to sunset at the end of FY’17, with the intent that a new school funding formula will be developed by that time.
The District reduced both salary and non-salary spending to balance the FY’17 budget. The District continues to support instruction by making cuts as far from the classroom as possible. However, additional budget cuts were required for FY’17 in order to be able to absorb inflationary cost increases in areas such as transportation, health insurance, and utilities, as well as to avoid spending additional contingency funds on operational expenditures.
State General Fund tax revenue was $41 million higher in FY’16 than FY’15, but still $575 million less than FY’13. Even after sales tax and cigarette tax increases were established by the 2015 legislature, the State’s FY’17 expenditures continue to far exceed tax revenues, causing the State to transfer funds from other sources such as the state transportation fund. Revenue receipts for FY’17 are not meeting projections, setting up possible mid-year cuts to avoid a deficit cash balance.
District Outlook
The District’s enrollment trend over the last ten years has reflected an average increase of 200 students a year. However, budget reduction measures are beginning to impact this trend. In FY’17, official enrollment decreased by 572 students, or one percent. The decline can be attributed to cost-cutting measures under the block grant, including the outsourcing of adult learning, denial of out-of-district students and the consolidation of alternative high school programs. In the past, enrollment growth has helped the District deal with fixed cost increases when State funding remains flat. With the implementation of the block grant that provides flat funding, inflationary cost increases and healthcare program increases of $22.7 million for FY’17 required other budgetary cuts, but the cuts might have been worse had the District not implemented these changes. The District did see some enrollment rebound at the end of the first nine weeks in its virtual programs, increasing student enrollment by 316 students from September 20 to October 21.
Demographics are also changing. For the first time in the District’s history, the number of Hispanic students exceeded the number of non-Hispanic whites to become the largest ethnic group in the District. The District is improving its delivery of instruction to this diverse population and continues to improve graduation rates and achievement scores. The Wichita community depends on a strong school system in promoting and recruiting new businesses and economic growth. The City of Wichita uses the District’s successes in their economic development plan.
The oldest District facility was originally built in 1919, and the average age of all facilities is 53 years. Twenty percent of the District’s school buildings have been constructed since 2000. Through the bond elections in 2000 and 2008, the community voiced support of the District’s plans for major maintenance, additional class space, and new facilities. Through these bond projects, the District has been able to take care of deferred maintenance and bring the facilities up to high standards. Even though the District has some old buildings, all of them have been

Introductory Section
Wichita Public Schools Page 7
updated. Once the 2008 bond projects are finished with completion of an additional new high school in FY’17, all of the major and deferred maintenance on District facilities will be addressed.
For the Future
Schools for Fair Funding filed a lawsuit in 2010 against the State of Kansas for failing to provide suitable funding for education. In September 2016, the Supreme Court heard oral arguments on the adequacy portion of Gannon v. State of Kansas. Districts around Kansas await the Court’s decision, as well as action to be taken by the Kansas Legislature in the 2017 session to develop a new school finance formula, as funding under the block grant sunsets June 30, 2017.
During the 2016 Economic Outlook Conference, the Wichita State University Center for Economic Development and Business Research projected:
“Wichita total nonfarm employment is expected to increase 2,487 jobs, which implies the employment growth rate is anticipated to be .8%.”
“The production sectors are forecast to grow by 0.1 percent, adding 88 jobs. Manufacturing is expected to grow 0.4 percent, while the natural resources and construction sector is projected to contract slightly. The trade, transportation and utilities sector is forecast to add over 400 jobs, or .8%. The service sectors are forecast again to be the fastest growing portion with a 1.4% growth adding over 1000 jobs in professional and business services sectors alone.”
In November 2016, the Consensus Estimating Group met to revise the Kansas State General Fund revenue projections for FY’17 and make the first official assessment of FY’18. For FY’17, the revenue estimate was decreased by $345.9 million, or 5.5 percent. The initial revenue estimate for FY’18 is down $443.7 million below the revised FY’17 figure. The 2017 Legislature will have to address these revenue shortfall issues, and school finance will be a critical component in budget discussions. With 58 newcomers in the Kansas legislature and the retention of all eleven judges in the state-level courts, the environment seems more amenable to change, including the possible reinstatement of at least a portion of the 2012 tax cuts that have been a large factor in the subsequent revenue shortages.
Independent Audit
The District is required under state law to have an annual audit of the books of accounts, financial records, and transactions by an independent certified public accounting firm. This requirement has been complied with, and the auditors’ report is presented in the financial section of this report. The auditors’ report related specifically to the single audit of federal financial assistance programs is available by separate cover.
Awards
The GFOA awarded a Certificate of Achievement for Excellence in Financial Reporting to the District for its Comprehensive Annual Financial Report (CAFR) for the fiscal year ended June 30, 2015. This certificate of achievement is a prestigious national award recognizing conformance with the highest standards for preparation of state and local government financial reports. The same CAFR also earned the ASBO Certificate of Excellence Award. Both certificates are awarded only to governmental units that publish an easily readable and efficiently organized CAFR. Such a CAFR must comply with both Generally Accepted Accounting Principles and applicable legal requirements.

Introductory Section
Wichita Public Schools Page 8
Both a Certificate of Achievement and a Certificate of Excellence are valid for a period of one year only. We believe our current report continues to conform to the requirements of both certificate programs, and we will again submit it for recognition.
Acknowledgments
The timely preparation of this CAFR could not have been completed without the dedicated efforts of the Financial Services Department. We would like to express our gratitude to everyone who assisted in its preparation. We also extend our appreciation to our independent auditors, Allen, Gibbs & Houlik, L.C., for their assistance and the professional manner in which the audit was accomplished. We also commend the Board for their interest and support in planning and conducting the financial operations of the District in a responsible and progressive manner.
Respectfully submitted,
John Allison Superintendent of Schools
Susan Willis Chief Financial Officer

Introductory Section
Wichita Public Schools Page 9
Division Director of
Operations
Director of Equity &
Accountability
Division Director of
Marketing &
Communications
Executive Director of
Governmental Relations
Assistant Superintendent
of Student Support
Services
Chief Human Resources
Officer
Assistant Superintendent
of Elementary Schools
Division Director of
Facilities
Assistant Superintendent
of Secondary Schools
Chief Information Officer
Board of Education
Superintendent
Chief Legal Counsel
Assistant Superintendent
of Learning Services
Chief Financial Officer
WICHITA PUBLIC SCHOOLS DISTRICT ADMINISTRATION ORGANIZATION CHART

Introductory Section
Wichita Public Schools Page 10
WICHITA BOARD OF EDUCATION To contact Board of Education members, feel free to call the Clerk of the Board’s office at 316-973-4553.
District 1 Betty Arnold
5311 Pembrook Wichita, KS 67220
District 2 Joy Eakins
P.O. Box 20066 Wichita, KS 67208
District 3
Barbara Fuller 6900 E. Zimmerly
Wichita, KS 67207
District 4 Jeff Davis
1941 W. Greenfield St Wichita, KS 67217
District 5 Mike Rodee
6514 W. Briarwood Cir Wichita, KS 67212
District 6 Lynn W. Rogers
912 Spaulding Wichita, KS 67203
At-Large
Sheril Logan 1505 N. Valleyview Ct.
Wichita, KS 67212
OFFICERS OF THE BOARD President ...................... Sheril Logan Vice President ............ Barbara Fuller Board Counsel ............... Tom Powell Treasurer ...................... Susan Willis Clerk of the Board ....... Mike Willome
SUPERINTENDENT OF SCHOOLS John Allison

Introductory Section
Wichita Public Schools Page 11

Introductory Section
Wichita Public Schools Page 12
The Government Finance Officers Association of the United States and Canada (GFOA) awarded a Certificate of Achievement for Excellence in Financial Reporting to the Wichita Public Schools for the Comprehensive Annual Financial Report for the fiscal year ended June 30, 2015. This was the twenty-fourth consecutive year that the District has achieved this prestigious award.
In order to be awarded a Certificate of Achievement, a governmental unit must publish an easily readable and efficiently organized Comprehensive Annual Financial Report. This report must comply with both Generally Accepted Accounting Principles and applicable legal requirements.
A Certificate of Achievement is valid for a period of one year only. We believe that our current Comprehensive Annual Financial Report continues to meet the Certificate of Achievement Program’s requirements, and we are submitting it to GFOA to determine its eligibility for another certificate.

Introductory Section
Wichita Public Schools Page 13
The Association of School Business Officials (ASBO) awarded a Certificate of Excellence in Financial Reporting to the Wichita Public Schools for the Comprehensive Annual Financial Report for the fiscal year ended June 30, 2015. This was the twenty-fourth consecutive year that the District has achieved this prestigious award.
The Certificate of Excellence is an award of recognition granted by the Association of School Business Officials of the United States and Canada. The award certifies that the recipient school system has presented its Comprehensive Annual Financial Report to the ASBO Panel of Review for critical review and evaluation and that the report was judged to have complied with the principles and practices of financial reporting recognized by ASBO. The Certificate of Excellence is issued for a period of one year.
Receiving the award is recognition that a school system has met the highest standards of excellence in school financial reporting. We believe the current report continues to conform to certificate of Excellence program requirements, and we are submitting it to the ASBO to determine its eligibility for another certificate.

Introductory Section
Wichita Public Schools Page 14

Fin
an
cia
l Se
ctio
n


15
INDEPENDENT AUDITOR'S REPORT The Board of Education Wichita Public Schools Unified School District No. 259 Report on the Financial Statements We have audited the accompanying financial statements of the governmental activities, each major fund, and the aggregate remaining fund information of the Wichita Public Schools Unified School District No. 259 (District), as of and for the year ended June 30, 2016, and the related notes to the financial statements, which collectively comprise the District’s basic financial statements as listed in the table of contents. Management’s Responsibility for the Financial Statements Management is responsible for the preparation and fair presentation of these financial statements in accordance with accounting principles generally accepted in the United States of America; this includes the design, implementation, and maintenance of internal control relevant to the preparation and fair presentation of financial statements that are free from material misstatement, whether due to fraud or error. Auditor’s Responsibility Our responsibility is to express opinions on these financial statements based on our audit. We conducted our audit in accordance with auditing standards generally accepted in the United States of America, the Kansas Municipal Audit and Accounting Guide, and the standards applicable to financial audits contained in Government Auditing Standards, issued by the Comptroller General of the United States. Those standards require that we plan and perform the audit to obtain reasonable assurance about whether the financial statements are free from material misstatement. An audit involves performing procedures to obtain audit evidence about the amounts and disclosures in the financial statements. The procedures selected depend on the auditor’s judgment, including the assessment of the risks of material misstatement of the financial statements, whether due to fraud or error. In making those risk assessments, the auditor considers internal control relevant to the entity’s preparation and fair presentation of the financial statements in order to design audit procedures that are appropriate in the circumstances, but not for the purpose of expressing an opinion on the effectiveness of the entity’s internal control. Accordingly, we express no such opinion. An audit also includes evaluating the appropriateness of accounting policies used and the reasonableness of significant accounting estimates made by management, as well as evaluating the overall presentation of the financial statements. We believe that the audit evidence we have obtained is sufficient and appropriate to provide a basis for our audit opinions. Opinions In our opinion, the financial statements referred to above present fairly, in all material respects, the respective financial position of the governmental activities, each major fund, and the aggregate remaining fund information of the District as of June 30, 2016, and the respective changes in financial position, and, where applicable, cash flows thereof for the year then ended in accordance with accounting principles generally accepted in the United States of America. Emphasis of Matter As discussed in Note II. A. to the financial statements, for fiscal years ending June 30, 2016, state aid will be provided in the form of a block grant, with the amount based in part on , and be at least equal to, total state financial support as determined in the fiscal year ended June 30, 2015. Additionally, state aid that had been previously restricted to use in specific funds was no longer deemed to be restricted. Based on

16
this change, certain funds that had previously been reported as special revenue funds were reclassified and reported as part of the General fund beginning with the fiscal year ended June 30, 2016. This included the 4 Year Old State Intervention, State Intervention (K-12), Bilingual Education, Vocational Education, and Textbook Rental Funds. Our opinions are not modified with respect to this matter. Other Matters Required Supplementary Information Accounting principles generally accepted in the United States of America require that the management’s discussion and analysis and required supplementary information listed on the table of contents be presented to supplement the basic financial statements. Such information, although not a part of the basic financial statements, is required by the Governmental Accounting Standards Board who considers it to be an essential part of financial reporting for placing the basic financial statements in an appropriate operational, economic, or historical context. We have applied certain limited procedures to the required supplementary information in accordance with auditing standards generally accepted in the United States of America, which consisted of inquiries of management about the methods of preparing the information and comparing the information for consistency with management’s responses to our inquiries, the basic financial statements, and other knowledge we obtained during our audit of the basic financial statements. We do not express an opinion or provide any assurance on the information because the limited procedures do not provide us with sufficient evidence to express an opinion or provide any assurance. Supplementary and Other Information Our audit was conducted for the purpose of forming opinions on the financial statements that collectively comprise the District’s basic financial statements. The combining and individual fund statements and schedules and the introductory and statistical sections as listed in the table of contents are presented for purposes of additional analysis and are not a required part of the basic financial statements. The combining and individual fund statements and schedules are the responsibility of management and were derived from and relate directly to the underlying accounting and other records used to prepare the basic financial statements. Such information has been subjected to the auditing procedures applied in the audit of the basic financial statements and certain additional procedures, including comparing and reconciling such information directly to the underlying accounting and other records used to prepare the basic financial statements or to the basic financial statements themselves, and other additional procedures in accordance with auditing standards generally accepted in the United States of America. In our opinion, the combining and individual fund statements and schedules are fairly stated, in all material respects, in relation to the basic financial statements as a whole. The introductory and statistical sections have not been subjected to the auditing procedures applied in the audit of the basic financial statements, and accordingly, we do not express an opinion or provide any assurance on it. Other Reporting Required by Government Auditing Standards In accordance with Government Auditing Standards, we have also issued our report dated December 7, 2016 on our consideration of the District’s internal control over financial reporting and on our tests of its compliance with certain provisions of laws, regulations, contracts, and grant agreements and other matters. The purpose of that report is to describe the scope of our testing of internal control over financial reporting and compliance and the results of that testing, and not to provide an opinion on internal control over financial reporting or on compliance. That report is an integral part of an audit performed in accordance with Government Auditing Standards in considering the District’s internal control over financial reporting and compliance.
Allen, Gibbs & Houlik, L.C. CERTIFIED PUBLIC ACCOUNTANTS December 7, 2016 Wichita, Kansas

Financial Section
Wichita Public Schools Page 17
Management’s Discussion and Analysis
It is a privilege to present to you the financial picture of the Wichita Public Schools Unified District 259 (District). This discussion and analysis provides an overall review of the District’s financial activities for the fiscal year ended June 30, 2016. The intent of this discussion and analysis is to look at the School District’s financial performance as a whole. Readers should also review the transmittal letter, notes to the basic financial statements, and financial statements to enhance their understanding of the District’s financial performance. The Management’s Discussion and Analysis (MD&A) is an element of the reporting model adopted by the Governmental Accounting Standards Board (GASB) in their Statement No. 34 Basic Financial Statements and Management’s Discussion and Analysis for State and Local Governments. Certain comparative information between the current year and the prior year is required to be presented in the MD&A.
Financial Highlights
Under the block grant, FY’16 revenues were essentially flat. The District increased the Supplemental General fund (LOB) mill levy from 16.212 to 18.498 mills to maximize the LOB budget authority for FY’16. Spending the full amount of the LOB legal maximum budget is required under the block grant in FY’16 and FY’17 in order to avoid further reduction in LOB equalization aid. The District realized savings in FY’16 from lower than expected fuel, student transportation, and utility costs, as well as payroll savings from unfilled positions. The District was therefore able to transfer a portion of the unspent cash to the Textbook and Capital Outlay funds to assist in supporting upcoming curriculum adoptions and capital improvement projects. Due to a change in the law for FY’16, the District was also able to carry forward the remainder of the unspent cash in the General fund to FY’17, providing funding for one-time bonuses to employees.
Overview of the Financial Statements
The basic financial statements of the District include the government-wide financial statements and the fund financial statements. The notes to the financial statements follow the basic financial statements and are essential for the reader’s understanding of the financial statements. Other supplementary information is also included at the end of this report to provide additional information for the reader.
The first two statements are government-wide financial statements that provide both short-term and long-term information about the District’s overall financial status.
The remaining statements are fund financial statements that focus on individual parts of the District, reporting the District’s operations in more detail than the government-wide statements.
The governmental funds statements tell how basic services such as regular and special education were financed in the short-term, as well as what remains for future spending.

Financial Section
Wichita Public Schools Page 18
The proprietary funds statements provide information on internal service activities which manage multiple types of risk for the District.
Fiduciary funds statements provide information about the financial relationships in which the District acts solely as a trustee or agent for the benefit of others.
The financial statements also include notes that explain some of the information in the statements and provide more detailed data. Users of the report have an opportunity to compare the net position of the Wichita Public Schools to other entities using the government-wide financial statements. Those users can address relevant issues and broaden the basis of comparison (year-to-year or government-to-government) to enhance the District’s accountability. Government-Wide Financial Statements The government-wide statements report information about the District as a whole using the accrual basis of accounting, the method used by private-sector companies. The Statement of Net Position includes all of the District’s assets and liabilities. All of the current year’s revenues and expenses are accounted for in the Statement of Activities, regardless of when cash is received or paid. The two government-wide statements report the District’s net position and how it has changed. Net position – the difference between the District’s assets and deferred outflows and the liabilities and deferred inflows – is one way to measure the District’s financial health or position.
Over time, increases or decreases in the District’s net position is an indicator of whether its financial position is improving or deteriorating, respectively.
To assess the District’s overall health, you need to consider additional non-financial factors such as changes in the District’s property tax base and the condition of school buildings and other facilities.
In the government-wide financial statements, the District’s activities are divided into two categories:
Governmental activities: All of the District’s basic services are included here, such as regular and special education, transportation, and administration. Property taxes and state aid finance most of these activities.
Business-type activities: The District does not have any business-type activities.
Fund Financial Statements A fund is a fiscal entity with a set of self-balancing accounts that is used to maintain control over resources that have been segregated for specific activities or objectives. The Wichita Public Schools, like other state and local governments, uses fund accounting to ensure and demonstrate compliance with finance-related legal requirements. The fund financial statements provide more information about the District’s most significant funds – not the District as a whole.

Financial Section
Wichita Public Schools Page 19
All of the funds of the Wichita Public Schools can be divided into three categories: governmental funds, proprietary funds, and fiduciary funds.
Governmental funds: Governmental fund financial statements are prepared on the modified accrual basis. Under the modified accrual basis, revenues are recognized when they become measurable and available, and expenditures are recognized when the related fund liability is incurred, with the exception of long-term debt and other similar items which are recorded when due. The focus, therefore, is on the short-term financial picture of the operations reported, rather than the District as a whole. Most of the District’s basic operations are reported in the governmental fund financial statements. The information reported in these statements can be compared to the governmental activities information in the government-wide statements. The reconciliation at the end of the fund financial statements details the relationship between the two types of financial statements.
Proprietary funds: Services for which the District charges a fee are generally reported in
proprietary funds. Proprietary funds are prepared on the accrual basis of accounting. The District’s internal service funds report activities that provide supplies and services for its other programs and activities. The District currently has the following four internal service funds: the workers’ compensation fund, the disability fund, the health fund, and the risk management fund.
Fiduciary funds: Fiduciary funds are used by the District to account for resources held
by the District for the benefit of a third party. Because the resources of these funds are not available for the District’s operation, they are not presented in the government-wide financial statements. The District is responsible for ensuring that the assets reported in these funds are used only for their intended purposes and by those to whom the assets belong.
The District as a Whole
Table 1 reflects the net position of Wichita Public Schools as of June 30. The District’s overall financial position increased by $12,706,897. The improvement in net position is the net effect of several changes, as explained in the following bullets:
Current and other assets decreased $62.8 million, primarily due to spending down cash in the Bond Capital Projects fund on the completion of various construction projects, including renovation of existing facilities and a new comprehensive high school related to the 2008 community-approved $370 million bond issue. This also resulted in increases in capital assets and net investment in capital assets.
The $24.6 million decrease in current and other liabilities is due to decreases in accounts payable and accrued payroll. The accounts payable balance declined as a result of the completion of the construction projects noted in the above bullet. There was a substantial decrease in accrued payroll due to a very large increase in the number of teachers that requested a lump sum salary payment in June for the months of July and August, a consequence of a threat by the Kansas Supreme Court to close schools in July if the legislature failed to restore funding equalization for FY’17.

Financial Section
Wichita Public Schools Page 20
An increase in the District’s proportionate share of the Kansas Public Employees Retirement System (KPERS) collective net pension liability in FY'16 accounts for the change in long-term liabilities due in more than one year.
The $36 million decrease in deferred inflows – pension is due to the net effect of a decrease in the investment experience of the KPERS trust and increases related to actuarial experience and changes in assumptions.
The $6.8 million decrease in net position restricted for instruction and support services is due to the Textbook Rental fund no longer meeting the requirements of a special revenue fund and therefore being combined with the General fund (unrestricted).
The $9 million decrease in net position restricted for self-insurance claims is in large part a result of a reduction in cash in the self-insured Health Care fund due to an increase in claims payments.
Table 1
Net Position Governmental Activities
As of June 30
Change
2016
2015 Increase
(Decrease)
Assets
Current and other assets $190,694,714 $253,462,938 ($62,768,224)
Capital assets 810,841,157 767,983,407 42,857,750
Total Assets $1,001,535,871 $1,021,446,345 ($19,910,474)
Deferred Outflows of Resources
Deferred charge on refunding $2,525,572 $628,666 $1,896,906
Deferred outflows – pension 37,245,317 39,972,920 (2,727,603)
Total Deferred Outflows of Resources $39,770,889 $40,601,586 ($830,697)
Liabilities
Current and other liabilities $21,856,029 $46,489,047 ($24,633,018)
Long-term liabilities:
Due within one year 50,369,859 46,404,573 3,965,286
Due in more than one year 974,741,515 951,300,422 23,441,093
Total Liabilities $1,046,967,403 $1,044,194,042 $2,773,361
Deferred Inflows of Resources
Deferred inflows – pension $29,079,104 $65,300,533 ($36,221,429)
Total Deferred Inflows of Resources $29,079,104 $65,300,533 ($36,221,429)

Financial Section
Wichita Public Schools Page 21
Net Position
Net investment in capital assets $379,706,034 $355,521,886 $24,184,148
Restricted:
Instruction and support services 3,666,331 10,428,626 (6,762,295)
Facilities and capital projects 22,077,676 22,162,727 (85,051)
Debt service 29,282,262 25,973,964 3,308,298
Self-insurance claims 19,940,071 29,107,028 (9,166,957)
Special Education 8,104,950 7,246,306 858,644
Nutrition services 13,405,797 12,032,973 1,372,824
Federal and state grant programs 882,256 1,572,155 (689,899)
Unrestricted (511,805,124) (511,492,309) (312,815)
Total Net Position ($34,739,747) ($47,446,644) $12,706,897
Table 2 below shows condensed revenues, expenses, and change in net position for fiscal years 2016 and 2015.
Table 2
Changes in Net Position Governmental Activities
Fiscal Years Ended June 30
Change
Increase 2016 2015 (Decrease)
Revenues:
Program Revenues:
Charges for services $9,139,660 $8,412,812 $726,848
Operating grants and contributions 172,972,436 268,015,891 (95,043,455)
Capital grants and contributions 87,111 1,673,980 (1,586,869)
General Revenues:
Property taxes $105,863,014 $100,385,117 5,477,897
State and federal aid not restricted to specific purposes 325,453,330 240,108,713 85,344,617
State aid received for debt service (principal) 8,102,250 7,196,500 905,750
Other 1,717,727 2,020,997 (303,270)
Total Revenues $623,335,528 $627,814,010 ($4,478,482)
Program Expenses:
Instruction $346,455,686 $361,233,411 $(14,777,725)
Student and instructional support 78,375,866 82,846,535 (4,470,669)
Administration 42,201,508 43,939,152 (1,737,644)
Operations and maintenance 74,830,191 74,032,676 797,515
Student transportation service 26,386,173 27,097,070 (710,897)
Nutrition services 24,014,679 26,918,661 (2,903,982)
Interest on long-term debt 18,364,528 19,803,124 (1,438,596)
Total Expenses $610,628,631 $635,870,629 ($25,241,998)

Financial Section
Wichita Public Schools Page 22
Increase/Decrease in Net Position $12,706,897 ($8,056,619) $20,763,516
Net Position-Beginning (47,446,644) 438,038,899 (485,485,543)
Prior Period Adjustment - (477,428,924) 477,428,924
Net Position-Ending ($34,739,747) ($47,446,644) $12,706,897
The decrease in operating grants and contributions and the increase in state and federal aid not restricted to specific purposes are due primarily to the State Intervention (K-12), 4 Year Old State Intervention, Bilingual Education, and Vocational Educational funds no longer meeting the requirements to be special revenue funds and thus being combined with the General fund. State aid formerly restricted to each of those specific purposes is now unrestricted and therefore no longer included in operating grants and contributions.
The increase in property taxes is due to a slight increase in assessed valuation and the previously mentioned higher tax levy in the Supplemental General fund for the FY’16 budget.
The decreases in program expenses in the areas of instruction, student and instructional support, student transportation service and administration are a result of targeted staffing and expense cuts necessary to cover increased fixed costs while revenues remained flat in FY’16.
The results of this year’s operations as a whole are reported in the Statement of Activities on page 28. All expenses are reported first. Specific charges for services, grants, revenues and subsidies that directly relate to specific expense categories are represented to determine the final amount of the District’s activities that are supported by other general revenues.
The School District’s Funds At June 30, 2016, the District governmental funds reported a combined fund balance of $134.3 million, a decrease of $31 million from FY’15. This decrease is largely due to the net effect of a decrease in the cash in the Bond Capital Projects fund as a result of completion of bond projects now reflected as capital assets and an increase in the General fund due to a large transfer of unspent year-end cash to the Textbook fund for future textbook purchases.
Table 3
Governmental Fund Balances
As of June 30 Year End
Change
In Fund
Governmental Funds
2016
2015
Balance
General
$39,107,191
$32,637,406
$6,469,785
Special Education
10,958,709
11,228,256
(269,547)
Nutrition Services 15,293,178 13,978,906 1,314,272
Bond Capital Projects 1,826,784 44,344,947 (42,518,163)
Capital Outlay
21,871,225
22,155,922
(284,697)

Financial Section
Wichita Public Schools Page 23
Bond and Interest
41,504,964
36,564,585
4,940,379
Nonmajor Governmental
3,710,513
4,356,844
(646,331)
Total Governmental Fund Balances
$134,272,564
$165,266,866
($30,994,302)
General Fund Budgeting Highlights The District’s budget is prepared according to state statutes and uses the statutory basis of accounting, in which revenues are recognized when cash is received and expenditures include disbursements, accounts payable, and encumbrances. The most significant budgeted fund is the General fund. Kansas Statutes permit transferring budgeted amounts from one object or purpose to another within the same fund; however, such statutes prohibit creating expenditures in excess of the total amount of the adopted budget of expenditures of individual funds. Management may amend the amount of a specific object or purpose appropriation without obtaining authorization from the Board of Education, providing the amendments or transfers do not create a total budgeted expenditure amount for a specific fund in excess of the amount originally adopted by the Board. The District’s total General fund budget was not amended in FY’16. However, the final legal maximum budget was reduced from $426,884,492 to $416,260,096 by the Kansas State Department of Education, primarily a result of the State’s decision to defer the FY’16 fourth quarter KPERS remittance to 2018 due to revenue shortages. The District’s ending unobligated cash balance in the General fund was $5,520,450 due to lower than expected utility expenses and diesel fuel costs. Special Education Fund The Special Education fund balance remained stable in FY’16, with a slight decrease of $269,547. The $11 million FY’16 ending fund balance will enable the District to fund the FY’17 program until state aid is received in October. Since Special Education is a special revenue fund, all fund balances are restricted for special education purposes. Nutrition Services Fund The Nutrition Services Fund increased $1.3 million from FY’15. Since this fund is a special revenue fund, all fund balances are restricted for expenditures related to child nutrition. Bond Capital Projects Fund The Bond Capital Projects fund balance decreased from $44.3 million in FY’15 to $1.8 million in FY’16 due to ongoing construction projects authorized by the November 4, 2008, bond election, as previously noted. Bond proceeds authorized by the 2008 bond election have been used to construct one new high school, one new K-8 school and six new elementary schools, as well as to renovate high school fine arts and athletic facilities, add classrooms and multi-purpose rooms, upgrade middle school auditoriums, and add tracks at middle schools.

Financial Section
Wichita Public Schools Page 24
The full amount of the June 30, 2016, fund balance is restricted for use on bond projects. The final phase of the bond construction projects is in progress. Construction on the high school will be completed in early FY’17, and the school will open for students for the 16-17 school year. The last major bond project, an auditorium and storm shelter at Robinson Middle School, is due to be completed in March 2017. Capital Outlay Fund The District has the authority to levy up to 8 mills in the Capital Outlay fund. The actual levy was 7.93 mills for FY’16, just short of the maximum allowed. The Capital Outlay fund balance remained stable for FY’16. The District continued a conservative approach to making Capital Outlay expenditures, only moving forward on critical repair projects and deferring routine maintenance to keep the funds at a stable level. Additional costs for the new high school and the planned remodel of the old high school to house the Alvin E. Morris Administrative Center are part of the District’s 5-year Capital Improvement Plan. Due to legislative action in June 2016, equalization state aid was restored for FY’17 in the Capital Outlay fund, which will result in $4.9 million additional state aid. The Capital Outlay fund balance is restricted to furnishing, equipping, improving, repairing, acquiring, and constructing buildings and sites, as well as to purchase software and pay for maintenance. Bond and Interest Fund This fund is used to make principal and interest payments on the long-term debt obligations of the District authorized by the 2000 and 2008 bond elections. The fund balance in the Bond and Interest fund increased from $36.6 million to $41.5 million due to the mill levy remaining higher than necessary to fund the FY’16 debt service expenditures. The District held the property tax levy in this fund at 9.4 mills. The District is intentionally allowing cash to build in the fund in order to insure the ability to cover future debt payments without the need for annual mill levy adjustments. The District plans to slightly decrease the mill levy in FY’17 to slow the cash accumulation in the fund as the target balance nears. The entire June 30, 2016, fund balance is restricted for payment of bond principal, interest, and issuance costs.
Capital Assets and Debt Administration Capital Assets At the end of the fiscal years 2016 and 2015, the District had $810,841,157 and $767,983,407, respectively, invested in capital assets (net of depreciation). The increase in buildings and improvements is primarily attributable to capitalization of assets related to construction projects authorized by the 2008 bond election. The increase in construction in progress is primarily due to construction in FY’16 on the new high school that was noted previously.

Financial Section
Wichita Public Schools Page 25
Table 4 Capital Assets - Net of Depreciation
Governmental Activities
Change
2016 2015 Increase
(Decrease)
Land $21,098,403 $21,098,403 $ -
Land Improvements 27,373,236 27,062,618 310,618
Intangibles 4,047,434 2,474,162 1,573,272
Construction in progress 73,301,334 51,588,127 21,713,207
Buildings and improvements 668,234,760 650,171,595 18,063,165
Machinery and equipment 16,785,990 15,588,502 1,197,488
Total capital assets - net of depreciation $810,841,157 $767,983,407 $42,857,750
Additional information about the District’s capital assets can be found in Note III.B of the Notes to the Financial Statements. Debt At June 30, 2016, the District had $431,790,000 in bonds and notes outstanding. Table 5 summarizes debt outstanding.
Table 5
Governmental Activities
Outstanding Debt, at Year End
Change
2016 2015 Increase
(Decrease)
General Obligation Bonds $431,790,000 $451,160,000 ($19,370,000)
All outstanding bonds are related to two bond elections. In April 2000, the voters approved a $284.5 million bond issue, of which all bonds have been sold and all construction completed. In November 2008, the voters approved $370 million in bond improvements. The $19.4 million decrease in general obligation bonds payable is a result of the net of the normal annual bond payments during FY’16 and issuance of the final $1.24 million of the 2008 bond election. The ratio of net bonded debt to estimated actual value and the net bonded debt per capita are useful indicators of the District’s debt position. The net bonded debt to estimated actual value decreased slightly from 2.62% in FY’15 to 2.46% in FY’16, and the net bonded debt per capita decreased from $1,125 to $1,062. Additionally, net bonded debt per pupil decreased from $8,510 in FY’15 to $8,101 in FY’16.

Financial Section
Wichita Public Schools Page 26
For more information on the District’s debt administration, please refer to Note III.C of the Notes to the Financial Statements.
Other Potentially Significant Matters The following significant facts were known by management as of the date of the independent auditor’s report:
In July, the District was notified of the Title IA allocation for FY’17 in the amount of $22.1 million and the Title IIA allocation of $2.4 million for FY’17.
In November, the District received notice of the Special Education IDEA VI-B allocation for FY’17 in the amount of $11.1 million for the 3-5 Early Childhood and 3-21 Pass Through programs.
Contacting the School District’s Financial Management Budgeting Web Page: http://www.usd259.org/site/Default.aspx?PageID=1421 Contact Budgeting by E-mail: [email protected] Write the Budgeting Office: Unified School District #259 Attention: Dee Grunder 201 N. Water, Suite 603 Wichita, KS 67202 Contact Budgeting by Phone: Susan Willis, Chief Financial Officer (316) 973-4529 Dee Grunder, Director of Budgeting (316) 973-4528 Fax: Attention: Dee Grunder (316) 973-4600

Ba
sic
Fin
an
cia
l Sta
tem
en
ts


Financial Section
Wichita Public Schools Page 27
Unified School District No. 259
Governmental
Activities
Assets
Cash, cash equivalents and investments 143,071,491$
Restricted cash, cash equivalents and investments 10,936,715
Receivables:
State aid 28,705,096
Interest 43,280
Intergovernmental 5,904,936
Inventory 2,033,196
Capital assets:
Land and construction in progress 94,399,737
Other capital assets, net of depreciation 716,441,420
Total assets 1,001,535,871
Deferred outflows of resources
Deferred charge on refunding 2,525,572
Deferred outflows - pension 37,245,317
39,770,889
Liabilities
Accounts payable 10,234,771
Accrued payroll 5,169,516
Interest payable 5,326,146
Advance - grants 1,125,596
Long-term liabilities, including claims payable
Due within one year 50,369,859
Due in more than one year 974,741,515
Total liabilities 1,046,967,403
Deferred inflows of resources
Deferred inflows - pension 29,079,104
Net Position
Net investment in capital assets 379,706,034
Restricted for:
Instruction and support services 3,666,331
Facilities and capital projects 22,077,676
Debt service 29,282,262
Self-insurance claims 19,940,071
Special education 8,104,950
Nutrition service 13,405,797
Federal and state grant programs 882,256
Unrestricted (511,805,124)
Total net position (34,739,747)$
The accompanying notes are an integral part of the basic financial statements.
Wichita Public Schools
Statement of Net Position
June 30, 2016

Financial Section
Wichita Public Schools Page 28
Un
ifie
d S
ch
oo
l D
istr
ict
No
. 2
59
Ne
t (E
xp
en
se
)
Re
ve
nu
e a
nd
Ch
an
ge
s in
Ne
t P
os
itio
n
Op
era
tin
gC
ap
ita
lT
ota
l
Ch
arg
es
fo
rG
ran
ts a
nd
Gra
nts
an
dG
ov
ern
me
nta
l
Fu
nc
tio
ns
/Pro
gra
ms
Ex
pe
ns
es
Se
rvic
es
Co
ntr
ibu
tio
ns
Co
ntr
ibu
tio
ns
Ac
tiv
itie
s
Go
ve
rnm
en
tal a
cti
vit
ies
:
Instr
uctio
n3
46
,45
5,6
86
$
5,6
66
,17
0$
73
,76
3,9
54
$
-$
(26
7,0
25
,56
2)
$
Stu
de
nt a
nd
instr
uctio
na
l sup
po
rt7
8,3
75
,86
6
13
0,7
60
33
,40
4,8
55
87
,11
1
(44
,75
3,1
40
)
Ad
min
istr
atio
n4
2,2
01
,50
8
-
3,7
30
,32
9
-
(38
,47
1,1
79
)
Op
era
tio
ns a
nd
ma
inte
na
nce
74
,83
0,1
91
4,7
55
7,5
60
,72
4
-
(67
,26
4,7
12
)
Stu
de
nt tr
ansp
ort
atio
n s
erv
ice
26
,38
6,1
73
-
19
,87
9,2
39
-
(6,5
06
,93
4)
Nutr
itio
n s
erv
ice
s2
4,0
14
,67
9
3,3
37
,97
5
22
,82
6,0
38
-
2,1
49
,33
4
Inte
rest o
n lo
ng
-te
rm d
eb
t1
8,3
64
,52
8
-
11
,80
7,2
97
-
(6,5
57
,23
1)
To
tal p
rim
ary
go
vern
me
nt
61
0,6
28
,63
1$
9,1
39
,66
0$
17
2,9
72
,43
6$
87
,11
1$
(42
8,4
29
,42
4)
Ge
ne
ral re
ve
nu
es
:
P
rop
ert
y ta
xes le
vie
d fo
r:
G
ene
ral p
urp
ose
s5
6,5
58
,31
1
D
eb
t se
rvic
e2
7,1
61
,30
0
C
ap
ita
l outla
y2
2,1
43
,40
3
S
tate
and
fe
de
ral a
id n
ot re
str
icte
d to
sp
ecific
purp
ose
s3
25
,45
3,3
30
S
tate
aid
re
ce
ive
d fo
r d
eb
t se
rvic
e (
pri
ncip
al)
8,1
02
,25
0
E
arn
ing
s o
n inve
stm
ents
37
2,3
50
M
isce
llane
ous
1,3
45
,37
7
T
ota
l ge
ne
ral r
eve
nue
s4
41
,13
6,3
21
C
ha
ng
e in n
et p
ositio
n1
2,7
06
,89
7
Ne
t p
os
itio
n-b
eg
inn
ing
(47
,44
6,6
44
)
Ne
t p
os
itio
n-e
nd
ing
(34
,73
9,7
47
)$
Th
e a
cco
mp
an
yin
g n
ote
s a
re a
n in
teg
ral p
art
of th
e b
asic
fin
an
cia
l sta
tem
en
ts.
Wic
hit
a P
ub
lic
Sc
ho
ols
Sta
tem
en
t o
f A
cti
vit
ies
Fo
r th
e Y
ea
r E
nd
ed
Ju
ne
30
, 2
01
6
Pro
gra
m R
ev
en
ue
s

Financial Section
Wichita Public Schools Page 29
Wic
hit
a P
ub
lic
Sc
ho
ols
Un
ifie
d S
ch
oo
l D
istr
ict
No
. 2
59
Ba
lan
ce
Sh
ee
t
Go
ve
rnm
en
tal F
un
ds
Ju
ne
30
, 2
01
6
No
nm
ajo
rT
ota
l
Sp
ec
ial
Nu
trit
ion
Bo
nd
Ca
pit
al
Ca
pit
al
Bo
nd
an
dG
ove
rnm
en
tal
Go
ve
rnm
en
tal
Ge
ne
ral
Ed
uc
ati
on
Se
rvic
es
Pro
jec
tsO
utl
ay
Inte
res
tFu
nd
sFu
nd
s
As
se
ts:
C
as
h, ca
sh
eq
uiv
ale
nts
an
d in
ves
tme
nts
16
,14
1,9
07
$
12
,29
3,9
25
$
14
,79
1,7
54
$
-$
26
,09
2,8
50
$
33
,50
3,1
69
$
5,8
92
,50
4$
10
8,7
16
,10
9$
R
es
tric
ted
ca
sh
, ca
sh
eq
uiv
ale
nts
a
nd
in
ves
tme
nts
-
-
-
2,9
34
,92
0
-
8,0
01
,79
5
-
10
,93
6,7
15
In
terg
ove
rnm
en
tal re
ce
iva
ble
s1
1,3
98
4,7
67
,06
9
-
-
-
1,1
05
,23
9
21
,23
0
5,9
04
,93
6
S
tate
aid
re
ce
iva
ble
28
,70
5,0
96
-
-
-
-
-
-
28
,70
5,0
96
In
tere
st re
ce
iva
ble
-
-
-
-
43
,28
0
-
-
43
,28
0
In
ven
tory
1,0
69
,42
9
-
96
3,7
67
-
-
-
-
2,0
33
,19
6
T
ota
l a
ss
ets
45
,92
7,8
30
$
17
,06
0,9
94
$
15
,75
5,5
21
$
2,9
34
,92
0$
26
,13
6,1
30
$
42
,61
0,2
03
$
5,9
13
,73
4$
15
6,3
39
,33
2$
Lia
bilit
ies
:
A
cco
un
ts p
aya
ble
2,9
12
,09
3$
72
6,3
49
$
31
1,3
92
$
1,1
08
,13
6$
4,0
98
,84
5$
-$
74
6,8
82
$
9,9
03
,69
7$
A
ccru
ed
pa
yro
ll3
,62
6,9
65
60
8,8
67
15
0,9
51
-
12
8,9
39
-
64
9,4
45
5,1
65
,16
7
A
dva
nce
- g
ran
ts2
81
,58
1
-
-
-
37
,12
1
-
80
6,8
94
1,1
25
,59
6
T
ota
l lia
bilitie
s6
,82
0,6
39
1,3
35
,21
64
62
,34
31
,10
8,1
36
4,2
64
,90
5-
2,2
03
,22
11
6,1
94
,46
0
De
ferr
ed
In
flo
ws
of
Re
so
urc
es
:
U
na
vaila
ble
re
ven
ue
- re
ce
iva
ble
s-
4,7
67
,06
9
-
-
-
1,1
05
,23
9
-
5,8
72
,30
8
T
ota
l d
efe
rre
d in
flo
ws
of re
so
urc
es
-
4,7
67
,06
9
-
-
-
1,1
05
,23
9
-
5,8
72
,30
8
Fu
nd
Ba
lan
ce
s:
N
on
sp
en
da
ble
1,0
69
,42
9
-
96
3,7
67
-
-
-
-
2,0
33
,19
6
R
es
tric
ted
88
2,2
56
10
,95
8,7
09
14
,32
9,4
11
1,8
26
,78
4
21
,87
1,2
25
41
,50
4,9
64
4,6
70
,73
1
96
,04
4,0
80
A
ss
ign
ed
18
,22
9,2
40
-
-
-
-
-
-
18
,22
9,2
40
U
na
ss
ign
ed
18
,92
6,2
66
-
-
-
-
-
(96
0,2
18
)
17
,96
6,0
48
T
ota
l fu
nd
ba
lan
ce
s3
9,1
07
,19
1
10
,95
8,7
09
15
,29
3,1
78
1,8
26
,78
4
21
,87
1,2
25
41
,50
4,9
64
3,7
10
,51
3
13
4,2
72
,56
4
T
ota
l lia
bilitie
s, d
efe
rre
d in
flo
ws
of
re
so
urc
es
a
nd
fu
nd
ba
lan
ce
s
45
,92
7,8
30
$
17
,06
0,9
94
$
15
,75
5,5
21
$
2,9
34
,92
0$
26
,13
6,1
30
$
42
,61
0,2
03
$
5,9
13
,73
4$
15
6,3
39
,33
2$
Th
e a
cco
mp
an
yin
g n
ote
s a
re a
n in
teg
ral p
art
of th
e b
asic
fin
an
cia
l sta
tem
en
ts.
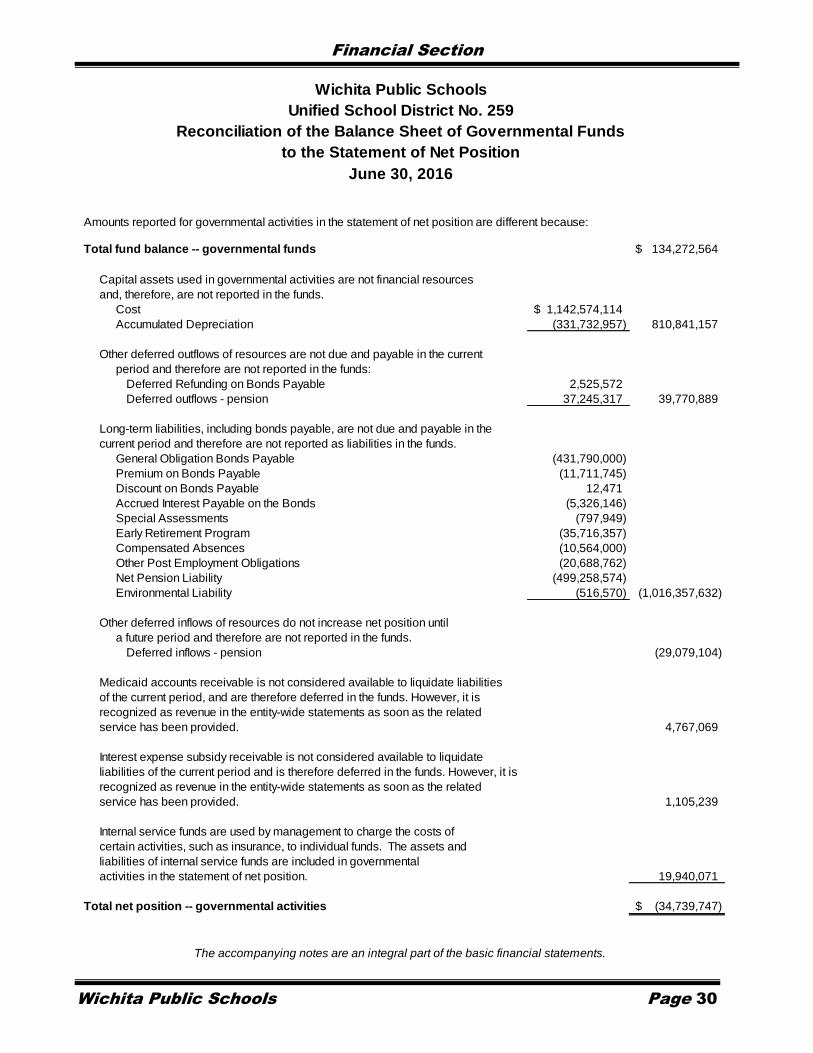
Financial Section
Wichita Public Schools Page 30
Amounts reported for governmental activities in the statement of net position are different because:
Total fund balance -- governmental funds 134,272,564$
Capital assets used in governmental activities are not financial resources
and, therefore, are not reported in the funds.
Cost 1,142,574,114$
Accumulated Depreciation (331,732,957) 810,841,157
Other deferred outflows of resources are not due and payable in the current
period and therefore are not reported in the funds:
Deferred Refunding on Bonds Payable 2,525,572
Deferred outflows - pension 37,245,317 39,770,889
Long-term liabilities, including bonds payable, are not due and payable in the
current period and therefore are not reported as liabilities in the funds.
General Obligation Bonds Payable (431,790,000)
Premium on Bonds Payable (11,711,745)
Discount on Bonds Payable 12,471
Accrued Interest Payable on the Bonds (5,326,146)
Special Assessments (797,949)
Early Retirement Program (35,716,357)
Compensated Absences (10,564,000)
Other Post Employment Obligations (20,688,762)
Net Pension Liability (499,258,574)
Environmental Liability (516,570) (1,016,357,632)
Other deferred inflows of resources do not increase net position until
a future period and therefore are not reported in the funds.
Deferred inflows - pension (29,079,104)
Medicaid accounts receivable is not considered available to liquidate liabilities
of the current period, and are therefore deferred in the funds. However, it is
recognized as revenue in the entity-wide statements as soon as the related
service has been provided. 4,767,069
Interest expense subsidy receivable is not considered available to liquidate
liabilities of the current period and is therefore deferred in the funds. However, it is
recognized as revenue in the entity-wide statements as soon as the related
service has been provided. 1,105,239
Internal service funds are used by management to charge the costs of
certain activities, such as insurance, to individual funds. The assets and
liabilities of internal service funds are included in governmental
activities in the statement of net position. 19,940,071
Total net position -- governmental activities (34,739,747)$
The accompanying notes are an integral part of the basic financial statements.
June 30, 2016
Wichita Public Schools
Unified School District No. 259
Reconciliation of the Balance Sheet of Governmental Funds
to the Statement of Net Position

Financial Section
Wichita Public Schools Page 31
Wichita Public Schools
Statement of Revenues, Expenditures and Changes in Fund Balances
Governmental Funds
For the Year Ended June 30, 2016
Nonmajor Total
Special Nutrition Bond Capital Capital Bond and Governmental Governmental
General Education Services Projects Outlay Interest Funds Funds
Revenues:
Taxes 55,560,688$ -$ -$ -$ 22,143,403$ 27,161,300$ 997,623$ 105,863,014$
Intergovernmental - State 333,982,449 44,276,340 256,362 - 4,525,512 15,500,450 30,220,422 428,761,535
Intergovernmental - Federal - 18,508,702 21,355,195 - 86,683 - 32,436,024 72,386,604
Interest expense subsidy - Federal - - - - - 4,409,097 - 4,409,097
Charges for services 1,688,844 - 3,337,975 - 4,755 - 4,108,086 9,139,660
Earnings on investments 134,356 - 26,098 23,709 104,697 13,002 3,737 305,599
Other 633,125 97,930 2,105 - - - 79,119 812,279
Contributions 553,526 - - - 428 - - 553,954
Total revenues 392,552,988 62,882,972 24,977,735 23,709 26,865,478 47,083,849 67,845,011 622,231,742
Expenditures:
Current:
Instruction 203,176,024 62,578,260 - - 5,233,261 - 39,564,096 310,551,641
Student and instructional support 31,900,028 24,318,886 - - 103,768 - 20,021,656 76,344,338
Administration 34,661,798 2,481,172 - - - - 3,417,067 40,560,037
Operations and maintenance 56,121,536 4,329,101 - - 9,122,062 - 4,357,369 73,930,068
Student transportation service 14,373,863 11,852,632 - - 42,938 - 137,943 26,407,376
Nutrition services 8,050 - 23,617,099 - - - 1,239,387 24,864,536
Sub-total current expenditures 340,241,299 105,560,051 23,617,099 - 14,502,029 - 68,737,518 552,657,996
Facility acquisition and construction service - - - 43,914,230 16,084,712 - - 59,998,942
Debt Service:
Principal retirement - - - - 20,775,000 - 20,775,000
Interest - - - - - 21,378,841 - 21,378,841
Other - - - - 194,813 - 194,813
Total expenditures 340,241,299 105,560,051 23,617,099 43,914,230 30,586,741 42,348,654 68,737,518 655,005,592
Excess (deficiency) of revenues
over (under) expenditures 52,311,689 (42,677,079) 1,360,636 (43,890,521) (3,721,263) 4,735,195 (892,507) (32,773,850)
Other financing sources (uses):
Refunding bond issuance - - - 1,240,000 - 38,160,000 - 39,400,000
Premium on bond issuance - - - 132,358 - 4,478,634 - 4,610,992
Payment on refunded bond - - - - - (42,433,450) - (42,433,450)
Sale of property - - - - 534,492 - - 534,492
Transfers in 36,045 42,407,532 - - 2,902,074 - 282,221 45,627,872
Transfers out (45,991,827) - - - - - (36,045) (46,027,872)
Total other financing sources (uses) (45,955,782) 42,407,532 - 1,372,358 3,436,566 205,184 246,176 1,712,034
Net change in fund balances 6,355,907 (269,547) 1,360,636 (42,518,163) (284,697) 4,940,379 (646,331) (31,061,816)
Fund balances at beginning of year 32,637,406 11,228,256 13,978,906 44,344,947 22,155,922 36,564,585 4,356,844 165,266,866
Change in reserve for inventory 113,878 - (46,364) - - - - 67,514
Fund balances at end of year 39,107,191$ 10,958,709$ 15,293,178$ 1,826,784$ 21,871,225$ 41,504,964$ 3,710,513$ 134,272,564$
The accompanying notes are an integral part of the basic financial statements.
Unified School District No. 259
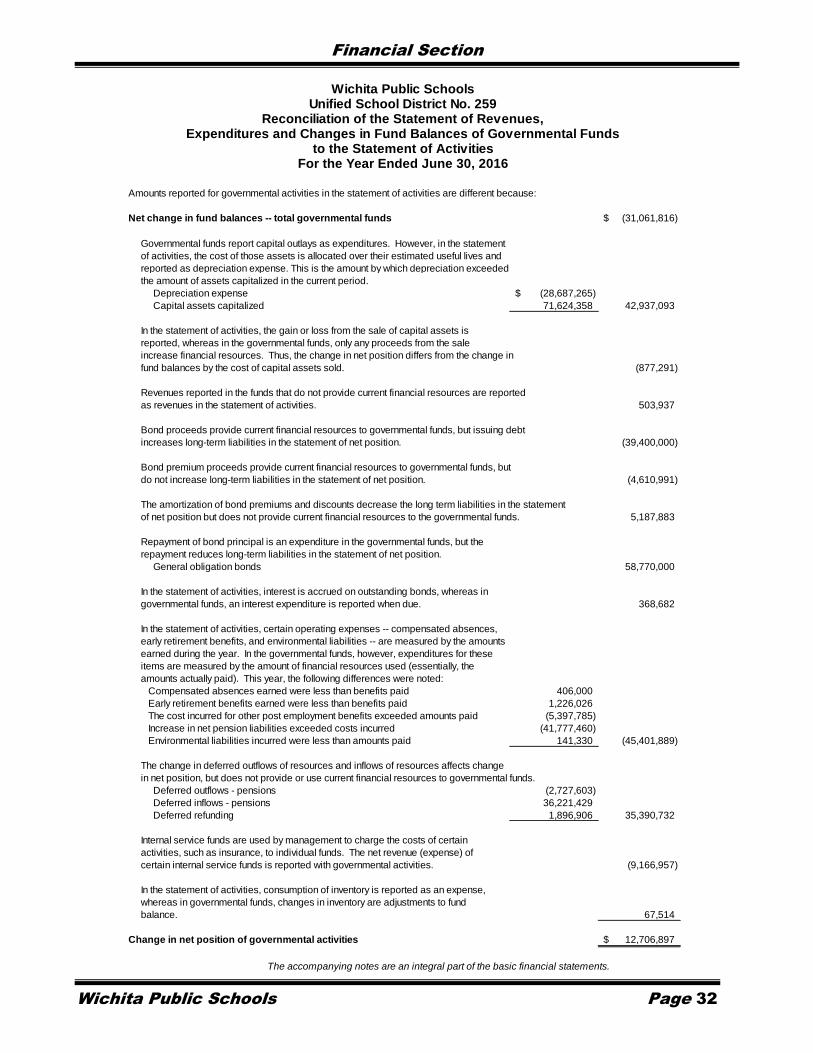
Financial Section
Wichita Public Schools Page 32
Amounts reported for governmental activities in the statement of activities are different because:
Net change in fund balances -- total governmental funds (31,061,816)$
Governmental funds report capital outlays as expenditures. However, in the statement
of activities, the cost of those assets is allocated over their estimated useful lives and
reported as depreciation expense. This is the amount by which depreciation exceeded
the amount of assets capitalized in the current period.
Depreciation expense (28,687,265)$
Capital assets capitalized 71,624,358 42,937,093
In the statement of activities, the gain or loss from the sale of capital assets is
reported, whereas in the governmental funds, only any proceeds from the sale
increase financial resources. Thus, the change in net position differs from the change in
fund balances by the cost of capital assets sold. (877,291)
Revenues reported in the funds that do not provide current financial resources are reported
as revenues in the statement of activities. 503,937
Bond proceeds provide current financial resources to governmental funds, but issuing debt
increases long-term liabilities in the statement of net position. (39,400,000)
Bond premium proceeds provide current financial resources to governmental funds, but
do not increase long-term liabilities in the statement of net position. (4,610,991)
The amortization of bond premiums and discounts decrease the long term liabilities in the statement
of net position but does not provide current financial resources to the governmental funds. 5,187,883
Repayment of bond principal is an expenditure in the governmental funds, but the
repayment reduces long-term liabilities in the statement of net position.
General obligation bonds 58,770,000
In the statement of activities, interest is accrued on outstanding bonds, whereas in
governmental funds, an interest expenditure is reported when due. 368,682
In the statement of activities, certain operating expenses -- compensated absences,
early retirement benefits, and environmental liabilities -- are measured by the amounts
earned during the year. In the governmental funds, however, expenditures for these
items are measured by the amount of financial resources used (essentially, the
amounts actually paid). This year, the following differences were noted:
Compensated absences earned were less than benefits paid 406,000
Early retirement benefits earned were less than benefits paid 1,226,026
The cost incurred for other post employment benefits exceeded amounts paid (5,397,785)
Increase in net pension liabilities exceeded costs incurred (41,777,460)
Environmental liabilities incurred were less than amounts paid 141,330 (45,401,889)
The change in deferred outflows of resources and inflows of resources affects change
in net position, but does not provide or use current financial resources to governmental funds.
Deferred outflows - pensions (2,727,603)
Deferred inflows - pensions 36,221,429
Deferred refunding 1,896,906 35,390,732
Internal service funds are used by management to charge the costs of certain
activities, such as insurance, to individual funds. The net revenue (expense) of
certain internal service funds is reported with governmental activities. (9,166,957)
In the statement of activities, consumption of inventory is reported as an expense,
whereas in governmental funds, changes in inventory are adjustments to fund
balance. 67,514
Change in net position of governmental activities 12,706,897$
The accompanying notes are an integral part of the basic financial statements.
For the Year Ended June 30, 2016
Wichita Public Schools
Reconciliation of the Statement of Revenues,Expenditures and Changes in Fund Balances of Governmental Funds
to the Statement of Activities
Unified School District No. 259

Financial Section
Wichita Public Schools Page 33
Unified School District No. 259
Internal
Service
Funds
Assets:
Current assets:
Cash, cash equivalents and investments 34,355,382$
Total current assets 34,355,382
Liabilities:
Current liabilities:
Accrued liabilities 335,423
Current portion - claims payable 9,522,904
Total current liabilities 9,858,327
Noncurrent liabilities
Long-term claims payable 4,556,984
Total liabilities 14,415,311
Net Position:
Total net position restricted for self-insurance claims 19,940,071$
The accompanying notes are an integral part of the basic financial statements.
Wichita Public Schools
Statement of Net Position
Proprietary Funds
June 30, 2016

Financial Section
Wichita Public Schools Page 34
Unified School District No. 259
Internal
Service
Funds
Operating revenues:
Charges for services 59,440,557$
Other insurance reimbursements 18,394
Total operating revenues 59,458,951
Operating expenses:
Contractual services 69,092,659
Total operating expenses 69,092,659
Operating income (loss) (9,633,708)
Nonoperating revenues:
Interest 66,751
Total nonoperating revenues 66,751
Income (loss) before transfers (9,566,957)
Transfers in 400,000
Change in net position (9,166,957)
Total net position-beginning of year 29,107,028
Total net position-end of year 19,940,071$
The accompanying notes are an integral part of the basic financial statements.
Wichita Public Schools
Statement of Revenues, Expenses, and Changes in Fund Net Position
Proprietary Funds
For the Year Ended June 30, 2016

Financial Section
Wichita Public Schools Page 35
Unified School District No. 259
Internal
Service
Funds
Cash flows from operating activities:
Cash received from services 59,440,557$
Cash payments for claims (67,711,566)
Net cash flow from operating activities (8,252,615)
Cash flows from non-capital financing activities:
Transfers from other funds 400,000
Net cash flow from non-capital financing activities 400,000
Cash flows from investing activities:
Interest on investments 66,751
Net cash flow from investing activities 66,751
Net change in cash and cash equivalents (7,785,864)
Cash and cash equivalents-beginning of the year 42,141,246
Cash and cash equivalents-end of the year 34,355,382$
Reconciliation of operating income to net cash flow from operating activities:
Operating income (loss) (9,633,708)$
Adjustments to reconcile operating income (loss) to net cash flow from operating activities:
Change in accrued liabilities 227,660
Change in claims payable 1,153,433
Net cash flow from operating activities (8,252,615)$
The accompanying notes are an integral part of the basic financial statements.
Wichita Public Schools
Statement of Cash Flows
Proprietary Funds
For the Year Ended June 30, 2016

Financial Section
Wichita Public Schools Page 36
Wichita Public Schools
Unified School District No. 259
Statement of Fiduciary Net Position
Fiduciary Funds
June 30, 2016
Employee
Benefit
Trust Funds Agency Funds
Assets:
Cash and cash equivalents 2,036,174$ 4,327,692$
Certificates of deposit 11,370,000 -
Investments 8,221,376 -
Interest receivable 54,052 -
Total assets 21,681,602 4,327,692
Liabilities:
Due to others - 4,327,692
Total liabilities - 4,327,692
Net Position:
Held in trust for other employee benefits 21,681,602 -
Total net position 21,681,602$ -$
The accompanying notes are an integral part of the basic financial statements.

Financial Section
Wichita Public Schools Page 37
Wichita Public Schools
Unified School District No. 259
Statement of Changes in Fiduciary Net Position
Fiduciary Funds
For the Year Ended June 30, 2016
Employee
Benefit
Trust Funds
Additions:
Employer contributions 16,361,780$
Interest income 122,363
Total additions 16,484,143
Deductions:
Benefits 19,335,568
Administration 188,122
Total deductions 19,523,690
Change in net position (3,039,547)
Net position - beginning of year 24,721,149
Net position - end of year 21,681,602$
The accompanying notes are an integral part of the basic financial statements.

Financial Section
Wichita Public Schools Page 38
WICHITA PUBLIC SCHOOLS
UNIFIED SCHOOL DISTRICT NO. 259
NOTES TO THE FINANCIAL STATEMENTS
INDEX I. SUMMARY OF SIGNIFICANT ACCOUNTING POLICIES
A. Reporting Entity B. Government-wide and Fund Financial Statements C. Measurement Focus, Basis of Accounting, and Financial Statement Presentation
D. Assets, Deferred Outflows of Resources, Liabilities, Deferred Inflows of Resources and Net Position 1. Deposits and Investments 2. Receivables 3. Inventories 4. Capital Assets 5. Compensated Absences 6. Long-Term Obligations 7. Pensions 8. Deferred Inflows of Resources/Deferred Outflows of Resources 9. Fund Equity
10. Net Position 11. Estimates
II. STEWARDSHIP, COMPLIANCE, AND ACCOUNTABILITY
A. Budgetary Information
III. DETAILED NOTES ON DISTRICT ACCOUNTS
A. Deposits and Investments B. Capital Assets C. Long-Term Obligations D. Interfund Transfers E. Fund Balances
IV. OTHER INFORMATION
A. Risk Management B. Environmental Matters C. Contingent Liabilities D. Construction Commitments and Encumbrances E. Defined Benefit Pension Plan F. Postemployment Healthcare Plan G. Other Employee Benefit Trust Funds H. Pending Governmental Accounting Standards

Financial Section
Wichita Public Schools Page 39
WICHITA PUBLIC SCHOOLS UNIFIED SCHOOL DISTRICT NO. 259
NOTES TO THE FINANCIAL STATEMENTS
June 30, 2016
I. SUMMARY OF SIGNIFICANT ACCOUNTING POLICIES A. Reporting Entity The Wichita Public Schools, Unified School District No. 259, (District) is organized under the laws of the State of Kansas (Kansas) and is governed by an elected seven-member board. Accounting principles generally accepted in the United States of America (GAAP) require these financial statements present the District (the primary government) and its component units. There are no component units for which the District is considered to be financially accountable. B. Government-wide and Fund Financial Statements Government-wide Financial Statements – The statement of net position and the statement of activities report information on all of the nonfiduciary activities of the primary government. The effect of interfund activity has been eliminated from these statements unless immaterial. The statement of net position presents the financial condition of the governmental activities of the District at year-end. The statement of activities demonstrates the degree to which the direct expenses of a given function or segment is offset by program revenues. Direct expenses are those that are clearly identifiable with a specific function or segment. Program revenues include: 1) charges to customers or applicants who purchase, use or directly benefit from goods, services, or privileges provided by a given function or segment and 2) grants and contributions that are restricted to meeting the operational or capital requirements of a particular function or segment. Taxes and other items not properly included among program revenues are reported instead as general revenues. Fund Financial Statements – The fund financial statements include separate financial statements that are provided for governmental funds, proprietary funds, and fiduciary funds, even though the latter are excluded from the government-wide financial statements. Major individual governmental funds are reported as separate columns in the fund financial statements. Nonmajor funds are aggregated and presented in a single column. Expenditures in the financial statements are grouped by function. Following are descriptions of the District’s functions. Instruction – Activities dealing directly with the interaction between teachers and students, and contracted instructional services. Student and Instruction Support – Activities designed to assess, improve the well-being of students, supplement the teaching process, and assist the instructional staff with learning experiences for students. Includes student attendance, social work, student substance abuse assistance, nursing, psychology, speech pathology, audiology, curriculum improvement, counseling and guidance services, and library and media costs.

Financial Section
Wichita Public Schools Page 40
Administration – Activities concerned with establishing and administering policy for the operation of the school district. Includes only Board of Education support staff, special education central-office costs, community relations, school administration, staff relations/union negotiations, the superintendent’s staff, assistant superintendents, area directors, and the superintendent. Operations and Maintenance – Activities concerned with the recruitment, hiring, and paying of staff. Includes the budgeting, purchasing, paying for, distributing, exchanging, and warehousing of goods and services. Also includes the Chief Financial Officer and business support costs such as printing and duplication, fiscal services, budgeting, payroll, and financial accounting. Includes other instructional and supporting services such as planning, research, development, evaluation, information, and data processing, in addition to, other supplemental services such as operations, maintenance, and security of schools and central office buildings including heating, lighting, ventilation, repair and maintenance of facilities, plus care and upkeep of grounds, equipment, and vehicles. Student Transportation Services – Activities concerned with conveying students to and from school, as provided by State and Federal law, as well as District policy. This includes trips between home and school, and trips to and from school activities. Nutrition Services – Activities concerned with providing food to students and staff in a school or local education agency. This service area includes preparing and serving regular and incidental meals, lunches, or snacks in connection with school activities and food delivery. Facility Acquisition and Construction Service – Activities concerned with acquiring land and buildings, remodeling buildings, constructing buildings, additions to buildings, initially installing or extending service systems and other built-in equipment, and improving sites. Debt Service – Servicing the debt of the local education agency, including payments of both principal and interest. C. Measurement Focus, Basis of Accounting, and Financial Statement Presentation Government-Wide Financial Statements – The government-wide financial statements are reported using the economic resources measurement focus and the accrual basis of accounting, as are the proprietary fund and fiduciary fund financial statements, except for agency funds, which have no measurement focus. All assets plus deferred outflows of resources, and liabilities plus deferred inflows of resources associated with the operation of the District are included on the statement of net position. Revenues are recorded when earned and expenses are recorded when a liability is incurred, regardless of the timing of related cash flows. Property taxes are recognized as revenues in the budget year for which they are levied. Grants and similar items are recognized as revenue as soon as all eligibility requirements imposed by the provider have been met. Fund Financial Statements – Governmental fund financial statements are reported using the current financial resources measurement focus and the modified accrual basis of accounting. With this measurement focus, only current assets and current liabilities generally are included on the balance sheet. Revenues are recognized as soon as they are both measurable and available. Revenues are considered to be available when they are collectible within the current period or soon enough thereafter to pay liabilities of the current period. For this purpose, the District considers revenues to be available if they are collected within 60 days of the end of the current fiscal period. Expenditures generally are recorded when a liability is incurred, as under accrual accounting. However, debt service expenditures, as well as expenditures related to compensated absences and claims and judgments, are recorded only when payment is due.

Financial Section
Wichita Public Schools Page 41
State aid is considered to be susceptible to accrual and so has been recognized as revenue of the current period. Entitlements are recorded as revenue when all eligibility requirements are met, including any time requirements, and the amount is received during the period or within the availability period for this revenue source. Expenditure-driven grants are recognized as revenues when the qualifying expenditures have been incurred and all other grant requirements have been met. Other receipts become measurable and available when cash is received by the government and is recognized as revenue at that time. The District reports the following major governmental funds:
General fund – this is the District’s primary operating fund.
Special Education – used to account for programs which deliver educational services to special needs students. The primary revenues supporting this fund are from restricted federal grants and state aid restricted for this purpose.
Nutrition Services – used to account for revenues and expenditures attributable to the food service program. The program is administered according to the state plan of child nutrition operations under which federal funds and commodities are received pursuant to federal acts relating to child nutrition. The programs are administered and meals are served on a nonprofit basis.
Bond Capital Projects – used to account for the acquisition or construction of major capital facilities funded from general obligation bond proceeds.
Capital Outlay – used to account for the acquisition and construction of major capital facilities other than those financed from general obligation bond proceeds and maintaining and equipping of District property and equipment necessary for District purposes.
Bond and Interest – used for payment of principal and interest on the District’s general obligation bonds when such bonds are outstanding.
Additionally, the District reports the following fund types:
Internal Service funds – these funds account for the District’s self-insurance programs provided to other departments or agencies of the government, on a cost reimbursement basis.
Fiduciary funds – the District has three agency funds which are used to account for assets held by the District as an agent for others. The funds include assets held for activities such as student organizations and athletics, funds held for employee payroll withholdings and flexible spending accounts. They are custodial in nature, and do not involve measurement of results of operations.
The District also has two employee benefit trust funds to account for activities related to the District’s other post-employment healthcare plan, and its early retirement incentive plan. The trusts accumulate resources for payment of benefits to qualified employees under each plan.
Proprietary funds distinguish operating revenues and expenses from nonoperating items. Operating revenues and expenses generally result from providing services and producing and delivering goods in connection with a proprietary fund’s principal ongoing operations. The principal operating revenues of the District’s internal service funds are charges for insurance services. Operating expenses for internal service funds include the cost of services, administrative expenses, and depreciation on capital

Financial Section
Wichita Public Schools Page 42
capital assets. All revenues and expenses not meeting this definition are reported as nonoperating revenues and expenses. When both restricted and unrestricted resources are available for use, it is the District’s policy to use unrestricted resources first, then restricted resources as they are needed. D. Assets, Deferred Outflows of Resources, Liabilities, Deferred Inflows of Resources and Net Position 1. Deposits and Investments K.S.A. 12-1667 authorizes the District to invest moneys not regulated by other statutes in time deposits, repurchase agreements consisting of obligations insured by the U.S. government or any agency thereof, U.S. Treasury bills or notes with maturities not exceeding two years, and the Kansas Municipal Investment Pool. Investments are reported at fair value. The investments of proceeds of long-term debt are governed by specific statutes and authorize the District to invest in the following:
Investments authorized by K.S.A. 12-1675 Direct obligations of the U.S. government or any other agency thereof Money market funds comprised entirely of obligations of the U.S. Treasury and agencies
thereof Obligations of any municipality of Kansas Investment agreements with a financial institution rated in the three highest rating categories by
Moody’s or Standard and Poor’s.
Cash resources of the individual funds (except for the proceeds of general obligation bonds, which are separately invested) are combined to form a pool of cash and temporary investments that are managed by the District Treasurer. Investments of the pooled accounts consist primarily of certificates of deposits. Interest income earned is allocated to various funds based upon statutory requirements. Restricted cash and investments include the unspent proceeds from general obligation bond issues. For purposes of the statement of cash flows, the District considers all investments by fund in the District’s cash and investment pool to be cash equivalents. For the year ended June 30, 2016, the District implemented GASB 72, Fair Value Measurement and Application, which establishes a framework for measuring fair value that requires or permits fair value measurement and enhances disclosures about fair value measurements. Fair value is defined as the exchange price that would be received to sell an asset or paid to transfer a liability (an exit price) in the principal or most advantageous market for the asset or liability in an orderly transaction. There is a fair value hierarchy which requires an entity to maximize the use of observable inputs when measuring fair value. The guidance requires three levels of fair value measurement based on the respective inputs. 2. Receivables Taxes are assessed on a calendar-year basis and become a lien on the property on November 1 of each year. The County Treasurer is the tax collection agent for all tax entities within the county. Property owners have the option of paying one-half or the full amount of the taxes levied on or before December 20 during the year levied with the balance to be paid on or before May 10 of the ensuing

Financial Section
Wichita Public Schools Page 43
year. Tax installments paid to the County Treasurer in May are budgeted to finance the current year’s operations and are distributed to the District prior to fiscal year end. State statutes provide that in the month of June of each school year, payment (from the State to District) shall be made of the full amount of the general state aid for the year. The State did not make the final state aid payment of $28,705,096 for the fiscal year ended June 2016 until July 2016. The District was instructed by the State to record the final payment as though it had been received on June 30, 2016. This receipt was recorded for the budgetary basis; however it was recorded as a receivable by the General and Supplemental General Funds for the government-wide and fund financial statements. 3. Inventories Inventories of supplies are stated at cost using the standard cost method. Inventories in the general fund consist of educational and maintenance supplies. Inventories in the special revenue funds are food supplies. The purchase method is used to account for governmental fund type inventories. Under the purchase method, inventories are recorded as expenditures when purchased; however, material amounts of inventories are reported as assets of the respective fund. Reported inventories in these funds are equally offset by the nonspendable fund balance category, which indicates they are unavailable for appropriation even though they are a component of reported assets. Textbooks are expensed at the time of purchase and equally offset by the textbook rental fund. On hand quantities of textbooks are tracked internally, and a replacement value for textbooks is established using the “purchasing list price” of the textbook multiplied by the on hand quantity. 4. Capital Assets General capital assets are those assets not specifically related to activities reported in the proprietary funds. These assets generally result from expenditures in the governmental funds. These assets are reported in the governmental activities column of the government-wide statement of net position, but are not reported in the fund financial statements. All capital assets are capitalized at cost (or estimated historical cost) and updated for additions and retirements during the year. Donated capital assets are recorded at their estimated acquisition value as of the date received. The District maintains a capitalization threshold of $2,000 for regular capital assets, $100,000 for special assessments and $1,000,000 for other intangibles. The District does not possess any infrastructure. Improvements are capitalized; the costs of normal maintenance and repairs that do not add to the value of the asset or materially extend an asset’s life are not capitalized. All reported capital assets except land are depreciated. Improvements are depreciated over the remaining useful lives of the related capital assets. Depreciation is computed using the straight-line method over the following useful lives:
Asset Class Estimated Useful Lives
Buildings 40-50 years Building Improvements 5-30 years Land Improvements 10-30 years Machinery and Equipment 5-20 years Intangibles 20-50 years
5. Compensated Absences The District annually grants employees temporary leave, the amount of which varies with the classification of the employee. All vacation days accrue monthly. As of June 30 each year, vacation in

Financial Section
Wichita Public Schools Page 44
in excess of 40 days is converted to temporary leave for purposes of any future severance pay computation. Temporary leave, which consists primarily of sick and personal leave, is allowed to accrue without limit. Upon separation from the District, unused accrued vacation leave up to 20 days is paid on the basis of current salary. An employee who dies or who retires or resigns honorably after reaching age 55 or completing 5 years of employment is eligible for a severance payment. The severance payment is paid at a rate of $3.75 per unused accrued temporary leave hour and unused accrued vacation leave hours in excess of 20 days. All vacation pay is accrued when incurred in the government-wide and proprietary fund financial statements. A liability for these amounts is reported in the governmental funds only if they have matured, for example, as a result of employee resignations and retirements. 6. Long-Term Obligations In the government-wide financial statements, long-term debt and other long-term obligations are reported as liabilities in the applicable governmental activities. Bond premiums and discounts are deferred and amortized over the life of the bonds using the effective interest method. Bonds payable are reported net of the applicable bond premium or discount. In the fund financial statements, governmental fund types recognize bond premiums and discounts, as well as bond issuance costs, during the current period. The face amount of debt issued is reported as other financing sources. Premiums received on debt issuances are reported as other financing sources while discounts on debt issuances are reported as other financing uses. Issuance costs, whether or not withheld from the actual debt proceeds received, are reported as debt service expenditures. 7. Pensions The net pension liability is calculated as the difference between the actuarially calculated value of the projected benefit payments attributed to past periods of employee service and the plan’s net fiduciary position. The total pension expense is comprised of the service cost or actuarial present value of projected benefit payments attributed to the valuation year, interest on the total pension liability, plan administrative expense, current year benefit changes, and other changes in plan fiduciary net positon less employee contributions and projected earnings on plan investments. Additionally, the total pension expense includes the annual recognition of outflows and inflows of resources due to pension assets and liability. For purposes of measuring the net pension liability, deferred outflows of resources and deferred inflows of resources related to pensions and pension expense, information about the fiduciary net position of the Kansas Public Employees Retirement System (KPERS) and additions to/deductions from KPERS’ fiduciary net position have been determined on the same basis as they are reported by KPERS. For this purpose, benefit payments (including refunds of employee contributions) are recognized when due and payable in accordance with the benefit terms. Investments are reported at fair value. 8. Deferred Inflows of Resources/Deferred Outflows of Resources
In addition to assets, the statement of financial position will sometimes report a separate section for deferred outflows of resources. This separate financial statement element, deferred outflows of resources, represents a consumption of net position that applies to a future period(s) and so will not be recognized as an outflow of resources (expense/expenditure) until then. The District has two items that qualify for reporting in this category, deferred charge on refunding and collective deferred outflows for pensions. A deferred charge on refunding results from the difference in the carrying value of refunded debt and its reacquisition price. The amount is deferred and amortized over the shorter of

Financial Section
Wichita Public Schools Page 45
the life of the refunded or refunding debt. See Note IV. E. for more information on the deferred outflows for pensions. In addition to liabilities, the statement of financial position will sometimes report a separate section for deferred inflows of resources. This separate financial statement element, deferred inflows of resources, represents an acquisition of net position that applies to future period(s) and so will not be recognized as an inflow of resources (revenue) until that time. The government has two items that qualify for reporting in this category. Accordingly, the first item, unavailable revenue – receivables, is reported only in the governmental funds balance sheet as it arises only under a modified accrual basis of accounting. The governmental funds report unavailable revenues from two sources: Medicaid reimbursement and federal interest subsidy. These amounts are deferred and recognized as an inflow of resources in the period that the amounts become available. The second item, deferred inflows for pensions, is reported only in the Statement of Net Position. See Note IV. E. for more information on this deferred inflow. 9. Fund Equity As prescribed by GASB Statement No. 54, Fund Balance Reporting and Governmental Fund Type Definitions, governmental funds report fund balance classifications based primarily on the extent to which the District is bound to honor constraints on the specific purposes for which amounts in the funds can be spent. In the governmental funds, equity is shown as fund balance and classified into five components:
(1) Nonspendable: Assets that are not in spendable form (such as inventory). (2) Restricted: Amounts with externally imposed constraints, such as those mandated by
creditors, grantors, contributors, or laws and regulations. Such constraint is binding unless modified or rescinded by the applicable external body, laws or regulations.
(3) Committed: Amounts with a purpose formally imposed by resolution of the Board of Education; binding unless modified or rescinded by the Board of Education.
(4) Assigned: The Board of Education adopted board policy P3414 authorizing the Board of Education or Chief Financial Officer to assign fund balance. Encumbrances shall be considered assigned unless they specifically meet the requirements to be restricted or committed.
(5) Unassigned: All amounts not included in the other classifications. The District considers unrestricted amounts to be spent prior to restricted amounts when an expenditure is incurred for purposes for which both restricted and unrestricted fund balances are available. When expenditures are incurred for purposes for which amounts in any of the unrestricted fund balance classifications could be used (committed, assigned or unassigned), the District considers committed amounts to be spent first, followed by assigned and then unassigned amounts. 10. Net Position Net position represents the difference between assets and liabilities. Net investment in capital assets, consists of capital assets, net of accumulated depreciation, reduced by the outstanding balances of any borrowings used for the acquisition, construction or improvement of those assets. Net position is reported as restricted when there are limitations imposed on the use either through the enabling legislation adopted by the District or through external restrictions imposed by creditors, grantors or laws or regulations of other governments. Restricted resources are used first to fund appropriations.

Financial Section
Wichita Public Schools Page 46
11. Estimates The preparation of financial statements in conformity with GAAP requires management to make estimates and assumptions that affect: (1) the reported amounts of assets and liabilities, (2) disclosures such as contingencies, and (3) the reported amounts of revenues and expenses included in such financial statements. Actual results could differ from those estimates.
II. STEWARDSHIP, COMPLIANCE, AND ACCOUNTABILITY A. Budgetary Information Kansas statutes require budgets be adopted for all funds, unless exempted by a specific statute. The statutes provide for the following sequence and timetable in the adoption of the legal budget.
1. Preparation of the budget for the current fiscal year on or before August 1.
2. Publication in local newspaper of the proposed budget and notice of hearing on the budget on or before August 5.
3. Public hearing on or before August 15, but at least 10 days after publication of notice of hearing.
4. Adoption of the final budget on or before August 25. Kansas statutes allow school districts to operate from July 1 to August 25 without an adopted budget. The District’s legal level of budget control is at the fund level. Kansas statutes allow for the governing body to increase the original adopted budget for previously unbudgeted increases in revenue other than ad valorem taxes. To do this, a notice of public hearing to amend the budget must be published in the local newspaper. At least 10 days after the publication, the hearing may be held and the governing body may amend the budget at that time. Kansas statutes permit transferring budgeted amounts from one object or purpose to another within the same fund; however, such statutes prohibit creating expenditures in excess of the total amount of the adopted budget of expenditures of individual funds. Management may amend the amount of a specific object or purpose appropriation without obtaining authorization from the Board of Education providing the amendments or transfers do not create a total budgeted expenditure amount for a specific fund in excess of the amount originally adopted by the Board of Education. All legal annual operating budgets are prepared using the statutory basis of accounting, in which revenues are recognized when cash is received and expenditures include disbursements, accounts payable, and encumbrances. Encumbrances are commitments for future payments and are supported by a document evidencing the commitment, such as a purchase order or contract. All unencumbered appropriations (legal budget expenditure authority) lapse at year-end. Encumbered appropriations are not reappropriated in the ensuing year’s budget but are carried forward until liquidated or canceled. Accordingly, the data presented in the budgetary comparison statements differ from the data presented in the financial statements prepared in accordance with GAAP. A legal operating budget is not required for the internal service funds, the agency funds and the following funds:
General fund subfunds: Supplemental grants – state and local Contingency reserve Textbook rental

Financial Section
Wichita Public Schools Page 47
Special revenue funds: Athletic activity Student material revolving Supplemental grants – federal
Music rental
Capital project funds: Bond capital projects
The spending in funds which are not subject to legal annual operating budget requirement is controlled by federal regulations, other statutes, or by the use of internal spending limits established by the Board. The State of Kansas allows spending above legal operating budgets by amounts received from unbudgeted grants and reimbursements. During the 2015 legislative session, House Substitute for Senate Bill 7 passed, amending and repealing numerous statutes pertaining to how public schools are financed in Kansas. For fiscal years ending June 30, 2016 and 2017, state aid will be provided in the form of a block grant, with the amount based in part on, and be at least equal to, total state financial support as determined in the fiscal year ending June 30, 2015. Additionally, state aid that had been previously restricted to use in specific funds was no longer deemed to be restricted. The Bill states that unencumbered fund balances in various funds previously restricted as to use may be used for the payment of expenses directly attributable to those funds, or may be transferred to the General Fund to pay for general operating expenses as approved by the District’s board of education. Based on this change, certain funds that had previously been reported as special revenue funds (due to previously having revenue sources that were restricted to specific purposes) were reclassified and reported as part of the General Fund beginning with the fiscal year ended June 30, 2016. This included the 4 Year Old State Intervention, State Intervention (K-12), Bilingual Education, Vocational Education, and Textbook Rental Funds.
III. DETAILED NOTES ON DISTRICT ACCOUNTS A. Deposits and Investments Custodial Credit Risk. For deposits and investments, custodial credit risk is the risk that, in the event of the failure of the counterparty, the District will not be able to recover the value of its investments or collateral securities that are in the possession of an outside party. As of June 30, 2016, District deposits were not exposed to custodial credit risk since all were either covered by federal depository insurance or the collateral was held by the District’s agent in the District’s name. The District does not have a formal policy regarding custodial credit risk, though it follows Kansas statutes, which require that deposits be secured 100%, and investments be perfected in the name of the investing entity and be delivered to a third-party custodian. None of the District’s investments were exposed to custodial credit risk as they were being held by the proper third party custodian. Credit Risk. State law limits the types of investments that the District may make (see Note I.D.1). The District’s investment policy does not add any further limitations. As of June 30, 2016, the securities underlying the District’s repurchase agreements include FNMA government agency securities rated AA+ by Standard and Poor’s. Concentration of Credit Risk. State statutes place no limit on the amount the District may invest in any one issuer as long as the investments are adequately secured under K.S.A. 9-1402 and 9-1405. The District has investments in repurchase agreements, U.S Treasury bills and Treasury obligation mutual funds.

Financial Section
Wichita Public Schools Page 48
Interest Rate Risk. State law and the District’s investment policy limit investments in U.S. Treasury bills or notes to those with maturities not exceeding two years. District policy also states that portfolio maturities shall be staggered in a way that avoids undue concentration of assets in a specific maturity sector, and that the investment portfolio shall remain sufficiently liquid to enable the District to meet all operating requirements which might reasonably be anticipated. Fair Value Measurements. The District categorizes its fair value measurements within the fair value hierarchy established by generally accepted accounting principles. The hierarchy is based on the valuation inputs used to measure the fair value of the investment. Level 1 inputs are quoted prices in active markets for identical assets; Level 2 inputs are significant other observable inputs, either directly or indirectly observable, and fair value can be determined through the use of models or other valuation methodologies; Level 3 inputs are significant unobservable inputs in situations where there is little or no market activity for the asset or liability and the entity makes estimates and assumptions related to the pricing of the asset or liability including assumptions regarding risk. The District has the following recurring fair value measurements as of year-end: U.S. Treasury securities and the Treasury obligation mutual funds are valued using quoted market prices (Level 1 inputs). The repurchase agreement is an overnight instrument, with the fair value of the collateral underlying the repurchase agreement being in excess of the amount invested. Given the short-term nature of the agreement, it is measured at amortized cost. As of June 30, 2016, the District had the following investments and maturities:
Investment Maturities (in Years)
Fair Value Hierarchy
Investment Type Fair Value Less than 1 1-5
Repurchase agreements $ 10,000,000 $ 10,000,000 $ -- N/A U.S. Treasury bills 8,217,415 8,217,415 -- Level 1 Treasury obligation mutual
funds 11,690,315 11,690.315 -- Level 1
Total $ 29,907,730 $ 29,907,730 $ --
Deposits and investments at June 30, 2016 appear in the financial statements as summarized below:
Carrying amount of deposits $ 150,055,718 Carrying amount of investments 29,907,730
Total $ 179,963,448

Financial Section
Wichita Public Schools Page 49
Cash and investments - governmental funds, balance sheet $ 119,652,824 Cash and investments - internal service funds, statement of net position 34,355,382
Cash and investments - governmental activities statement of net position 154,008,206 Cash and investments - fiduciary funds 25,955.242
Total $ 179,963,448
B. Capital Assets Capital asset activity for the year ended June 30, 2016 was as follows:
Balance July 1,
2015
Increases
Decreases
Balance June 30, 2016
Governmental activities:
Capital assets, not being depreciated:
Land $ 21,098,403 $ -- $ -- $ 21,098,403 Construction in progress 51,588,127 65,924,928 44,211,721 73,301,334
Total capital assets, not being depreciated 72,686,530
65,924,928 44,211,721 94,399,737
Capital assets, being depreciated:
Buildings and improvements 923,670,363 42,801,955 2,389,744 964,082,574 Machinery and equipment 35,930,122 4,387,848 1,956,580 38,361,390 Land improvements 40,401,369 1,803,148 1,047,763 41,156,754 Intangibles 2,857,511 1,716,148 -- 4,573,659
Total capital assets being depreciated 1,022,859,365
50,709,099 5,394,087 1,048,174,377
Less accumulated depreciation for: Buildings and improvements 273,498,768 23,980,277 1,631,231 295,847,814 Machinery and equipment 20,341,620 3,057,113 1,823,333 21,575,400 Land improvements 13,338,751 1,506,999 1,062,232 13,783,518 Intangibles 383,349 142,876 -- 526,225
Total accumulated depreciation 307,562,488 28,687,265 4,516,796 331,732,957
Total capital assets, being depreciated, net 695,296,877
22,021,834 877,291 716,441,420
Governmental activities capital
assets, net $ 767,983,407
$ 87,946,762 $ 45,089,012 $ 810,841,157

Financial Section
Wichita Public Schools Page 50
Depreciation expense was charged to functions/programs of the primary government as follows:
Governmental activities: Instruction $ 26,654,214 Student and Instructional Support 58,267 Administration 7,070 Operations and Maintenance 1,597,097 Transportation 8,816 Nutrition Services 361,801
Total depreciation expense – governmental activities $ 28,687,265
C. Long-Term Obligations Long-term liability activity for the year ended June 30, 2016 was as follows:
Balance
June 30, 2015
Additions
Reductions Balance
June 30, 2016
Due within one year
General obligation bonds $ 451,160,000 $ 39,400,000 $ 58,770,000 $ 431,790,000 $ 21,915,000
Special assessments -- 797,949 -- 797,949 797,949
Early retirement program 36,942,384 15,134,332 16,360,359 35,716,357 14,138,751
Compensated absences 10,970,000 17,385,000 17,791,000 10,564,000 701,000
Premium on bonds 12,290,352 4,610,992 5,189,599 11,711,745 3,018,849
Discount on bonds (14,187 ) -- (1,716 ) (12,471 ) (2,424 ) Environmental liability 657,900 -- 141,330 516,570 277,830
Claims payable 12,926,455 63,137,187 61,983,754 14,079,888 9,522,904 OPEB 15,290,977 8,452,946 3,055,161 20,688,762 --
--
Net pension liability 457,481,114 63,325,542 21,548,082 499,258,574 --
Total $ 997,704,995
$ 212,243,948 $184,837,569 $1,025,111,374
$ 50,369,859
Compensated absences and the early retirement program are liquidated by the fund where each employee’s regular salary is charged (primarily the General Fund and various special revenue funds). The net pension liability will be liquidated primarily through KPERS employer contributions made from the KPERS Retirement Contribution Fund. The environmental liability will be liquidated primarily with funds from the Special Liability Expense Fund. The OPEB liability will be liquidated by the Retiree Health Benefits Trust Fund as discussed in Note IV.F. General Obligation Bonds. On May 27, 2009, the District issued $58,760,000 in General Obligation Refunding and School Building Bonds with interest rates with an average yield of 3.35% due October 1, 2021, and $132,500,000 in Taxable General Obligation School Building bonds (Build America Bonds), with a taxable interest rate of 6.22% (32% of interest cost is subsidized by the federal government) due October 1, 2028. The bond proceeds were used to construct, furnish, and equip new school facilities and make additions and improvements to existing school facilities throughout the District. The debt service requirements for general obligation bonds are being paid with property tax revenues. On December 15, 2009, the District issued $32,000,000 in General Obligation School Building Bonds (Qualified School Construction – Tax Credit Bonds), with a federal bond holder tax credit rate of 5.90% and a District funded supplemental coupon of 1.35% due September 15, 2026. The bond proceeds were used to fund certain school building improvement projects throughout the District. The debt service requirements for general obligation bonds are being paid with property tax revenues. The

Financial Section
Wichita Public Schools Page 51
The Qualified School Construction bonds are not subject to optional or mandatory sinking fund redemption prior to their stated maturity date. However, the District is required to set aside deposits for payment of the bonds, in annual amounts of $2,000,000 beginning September 15, 2012. Such funds will be applied to payment of the principal amount of the bonds at maturity. As of June 30, 2016, this sinking fund had a balance of $8,001,795, which is recorded as restricted cash in the Bond and Interest Fund. On March 3, 2010, the District issued $6,450,000 in General Obligation Refunding Bonds, with interest rates from 2 – 4% and an average yield of 1.84% due October 1, 2015, and $100,000,000 in Taxable General Obligation School Building Bonds (Build America Bonds), with taxable interest rates from 5.10 – 5.39% (32% of interest cost is subsidized by the federal government) due October 1, 2025. The debt proceeds were used to construct, furnish, and equip new school facilities and make additions and improvements to existing school facilities throughout the District. The debt service requirements for general obligation bonds are being paid with property tax revenues. On October 1, 2013, the District issued $49,340,000 in General Obligation Refunding and School Building Bonds with interest rates with an average yield of 1.72% due October 1, 2022. The bond proceeds will be used to construct, furnish, and equip new school facilities and advance refund $500,000 of the Series 2009 bonds. The net proceeds related to the advance refunding of the Series 2009 bonds of $592,979 were deposited in an irrevocable trust with an escrow agent to provide for future debt service payments on the Series 2009 bonds. As a result, a portion of the Series 2009 bonds is considered to be defeased and the liability for those bonds has been removed from the government-wide statement of net position. On November 15, 2015, the District issued $39,400,000 in General Obligation Refunding and Improvement Bonds with interest rates with an average yield of 1.412% due October 1, 2021. The bond proceeds will be used to construct, furnish, and equip new school facilities and advance refund $37,995,000 of the Series 2009A bonds. The net proceeds related to the refunding of the Series 2009A bonds of $42,433,450 were deposited in an irrevocable trust with an escrow agent to provide for future debt service payments on the Series 2009A bonds. As a result, a portion of the Series 2009A bonds is considered to be defeased and the liability for those bonds has been removed from the government-wide statement of net position. The refunding resulted in a reduction in total debt service payments of $2,089,589 over the next 6 years and a present value savings (economic gain) of $2,034,744. As of June 30, 2016, $38,495,000 of advance refunded bonds have not been called. Annual debt service requirements to maturity for general obligation bonds are as follows:
Year Ended June 30, Principal Interest
2017 $ 21,915,000 $ 20,486,375 2018 23,085,000 19,561,763 2019 24,225,000 18,585,481 2020 24,875,000 17,557,769 2021 26,230,000 16,551,425
2022 – 2026 164,310,000 61,582,965 2027 – 2029 147,150,000 9,495,535
Total $ 431,790,000 $ 163,821,313

Financial Section
Wichita Public Schools Page 52
Early Retirement Incentive Program. At the discretion of the Board of Education, the District offers a voluntary early retirement incentive program. The District follows GASB 47, Accounting for Termination Benefits, in recognizing and reporting the liability related to the early retirement incentive. Eligible employees are those who have been employed by the District in a permanent position for 15 or more years, are at least age 50 when they retire, and have an effective hire date prior to July 1, 1996. Benefits at attaining age 60 are based on the retiree’s final average salary used by the Kansas Public Employees Retirement System (KPERS), a 1.4% multiplier for all years of participating service credit with KPERS, and the total number of years of credited KPERS service (excluding any purchased or repurchased years), paid in not more than 60 monthly payments. The benefits also include an amount equal to the amount of the social security benefit the retiree would have been eligible to receive if the employee were age 62, paid in not more than 24 monthly payments. This benefit will be reduced by 5% for each year by which the employee’s years of qualified service are less than 20. At year-end, there are 534 retirees receiving benefits. For the year ended June 30, 2016, the District paid $16,360,359 in benefits. The liability for the early retirement program includes the expected cash outflows related to future benefit payments, discounted at 4.50%. This program is primarily funded on a pay-as-you-go basis, with costs expended as paid. In June 2011, the District established an employee benefit grantor revocable trust for employer contributions to fund benefits paid under the program. The District made an initial contribution of $13,363,566 in June 2011. Effective January 1, 2012, the trust was changed to become a qualified irrevocable trust under Section 401(a) of the Internal Revenue Code. Since trust assets are to be retained for the exclusive benefit of participants under the trust, assets held in the trust as of June 30, 2016 were recorded as a reduction to the liability and additional contributions made during 2016 are included with “Reductions” on the Long-Term Debt table at the beginning of this section. Contributions will continue to be made on a pay-as-you-go basis, and any additional employer contributions to the trust are at the sole discretion of the District. D. Interfund Transfers A summary of interfund transfers by fund type for the year ended June 30, 2016 is as follows:
Transfer to:
Special Capital Nonmajor Internal General Education Outlay Governmental Service Fund Total
Transfer from:
General fund $ 42,407,532 $ 2,902,074 $ 282,221 $ 400,000 $ -- $ 45,991,827
Nonmajor Governmental fund -- -- -- -- 36,045 36,045
Total $ 42,407,532 $ 2,902,074 $ 282,221 $ 400,000 $ 36,045 $ 46,027,872
Transfers are used primarily to move revenues collected in the General Fund to finance various programs accounted for in other funds in accordance with budgetary authorizations.

Financial Section
Wichita Public Schools Page 53
E. Fund Balances A summary of the components of fund balance, by purpose, is as follows:
IV. OTHER INFORMATION
A. Risk Management The District has adopted self-insurance programs for workers’ compensation, short-term disability, health, pharmacy and dental. Liabilities are reported when it is probable a loss has occurred and the amount can be reasonably estimated. Liabilities include an amount for claims that have been incurred but not reported (IBNR). The District uses internal service funds to account for this activity. Each program is funded by a monthly contribution made by the District for each eligible employee. Contribution amounts are determined by the District and the insurance carrier for the District’s stop loss policy, if applicable. There have been no settlements in excess of insurance coverage during any of the prior three years. There have been no significant reductions in insurance coverage from the prior year in any category below. Healthcare. All active employees of the District who are .75 to 1.0 FTE, as well as grandfathered employees who are .5 to .75 FTE, are eligible for health, pharmacy and dental benefits. Health, prescription and dental benefits are provided through a self-funded program to District employees and all eligible dependents. The District’s annual liability for benefits is limited to $500,000 per individual claim by a specific stop loss policy. There is no aggregate stop loss policy. Short-Term Disability. The District provides disability benefits covering employees working in a benefited position at least half-time. Short term disability benefits for certificated employees are provided for disabilities resulting from occupational or non-occupational illnesses and injuries at a rate of 70% of the employee’s regular daily rate. Short-term disability benefits for classified employees are provided for disability resulting from non-occupational illness at a rate of 70% of the employee’s regular hourly rate of pay. Benefits are provided for a maximum of 180 calendar days from the beginning date of the disability. The outstanding claims liability is calculated from historical data and future expectations. This liability includes an estimated liability for known claims as well as estimated liability for claims incurred but not reported. Short-term disability coverage for classified employees has been reduced from prior years through negotiation to eliminate the 70% coverage for occupational injuries, which are instead covered under workers’ compensation. Workers’ Compensation. Workers’ compensation benefits are provided for medical expenses and indemnity resulting from occupational illness or accidental injury to all employees under the Kansas Workers
Special Nutrition Bond Capital Capital Bond and Nonmajor
General Education Services Projects Outlay Interest Governmental Total
Nonspendable:
Inventory 1,069,429$ --$ 963,767$ --$ --$ --$ --$ 2,033,196$
Restricted for:
Instruction -- -- -- -- -- -- 3,666,331 3,666,331
Facilities -- -- -- 1,826,784 21,871,225 -- 1,004,400 24,702,409
Debt Svc -- -- -- -- -- 41,504,964 -- 41,504,964
Spec Ed -- 10,958,709 -- -- -- -- 10,958,709
Nutrition -- -- 14,329,411 -- -- -- -- 14,329,411
Fed & State 882,256 -- -- -- -- -- 882,256
Assigned to:
Instruction 18,229,240 -- -- -- -- -- -- 18,229,240
Unassigned 18,926,266 -- -- -- -- -- (960,218) 17,966,048
Total 39,107,191$ 10,958,709$ 15,293,178$ 1,826,784$ 21,871,225$ 41,504,964$ 3,710,513$ 134,272,564$

Financial Section
Wichita Public Schools Page 54
Workers Compensation Act. Benefits are paid according to Kansas statute governing workers compensation benefits and are self-funded by the District. The District’s liability for benefits is limited by a specific stop loss policy of $500,000 per claim. The District pays an annual assessment fee to the State of Kansas for the state insurance fund and an assessment for the operation of the Division of Workers Compensation in the Kansas Department of Labor. The outstanding claims liability is calculated from historical data and case reserves set by District staff, and evaluated by an independent actuarial opinion. This includes an estimated liability for known claims as well as an estimated liability for claims incurred but not reported (IBNR). These limits are the same as for the prior year. Risk Management. The District has a self-insurance program to provide legal defense and pay claims against the Board of Education when an incident occurs during the course of employment. There is a $500,000 limitation for Kansas claims based on government immunity law. The deductible portion of the property and casualty, general liability, automobile, and aviation premiums are paid from the risk management fund. This limit is the same as for the prior year. Changes in the claims liabilities during the past two years are as follows:
Healthcare Disability Reserve
Workers’ Compensation
Risk Management
Unpaid claims, June 30, 2014 $ 5,044,000 $ 74,000 $ 7,622,538 $ -- Incurred claims (including IBNR) 59,758,606 839,364 278,285 1,007,114 Claims payments (59,214,606 ) (827,364 ) (648,368 ) (1,007,114 )
Unpaid claims, June 30, 2015 5,588,000 86,000 7,252,455 --
Incurred claims (including IBNR) 60,353,411 781,300 1,317,031
685,445
Claim payments (58,970,158 ) (785,300 ) (1,542,851 ) (685,445 )
Unpaid claims, June 30, 2016 $ 6,971,253 $ 82,000 $ 7,026,635 $ --
B. Environmental Matters An area near the District’s School Service Center has been designated by the Kansas Department of Health and Environment (KDHE) as a groundwater contamination site. As a result of that contamination, the District entered into an agreement with KDHE to perform a Remediation Investigation and Feasibility Study (RI/FS) to investigate the contamination and develop a clean-up plan. The District has recently revised the Feasibility Study and Remediation Plan with the assistance of Geosyntech Consultants, Inc., an environmental consulting and remediation company. The revised plan, approved by KDHE, is currently being implemented. While the revised Feasibility Study and remedial measures progress, the District is required to perform semi-annual monitoring of the groundwater. The present value of the costs required for the Feasibility Study, monitoring activities, and interim remedial measures is estimated at $516,570. This amount has been recorded with long-term liabilities on the statement of net position and is based on engineering estimates and actual costs incurred. Until the Remediation Plan developed through the Feasibility Study has been completed, it is not yet possible to estimate the District’s ultimate cost for clean-up of the site. There are no anticipated recoveries on this project.

Financial Section
Wichita Public Schools Page 55
C. Contingent Liabilities The District is a defendant in various lawsuits. Although the outcome of these lawsuits is not presently determinable, it is the opinion of the District’s counsel that resolution of these matters will not have a materially adverse effect on the financial condition of the District. D. Construction Commitments and Encumbrances As of June 30, 2016, the District has outstanding construction commitments of $1,826,784 under its current general obligation bond projects to construct, furnish, and equip new school facilities and make additions and improvements to existing school facilities throughout the District. This amount is reflected as reserve for encumbrances in the bond capital projects fund. Listed below are all encumbrances for the District:
General $ 3,049,518 Special Education 685,058 Nutrition Services 4,844,066 Bond Capital Projects 1,826,784 Capital Outlay 11,949,783 Nonmajor Governmental 5,703,749
Total $ 28,058,958
E. Defined Benefit Pension Plan General Information about the Pension Plan Plan description: The District participates in the Kansas Public Employees Retirement System (KPERS), a cost-sharing multiple-employer defined benefit pension plan as provided by K.S.A. 74-4901, et. seq. Kansas law establishes and amends benefit provisions. KPERS issues a publicly available financial report that includes financial statements and required supplementary information. KPERS’ financial statements are included in its Comprehensive Annual Financial Report which can be found on the KPERS’ website at http://www.kpers.org or by writing to KPERS (611 South Kansas, Suite 100, Topeka, KS 66603) or by calling 1-888-275-5737. Benefits provided. KPERS provides retirement benefits, life insurance, disability income benefits, and death benefits. Benefits are established by statute and may only be changed by the General Assembly. Member employees with ten or more years of credited service may retire as early as age 55, with an actuarially reduced monthly benefit. Normal retirement is at age 65, age 62 with ten years of credited service, or whenever an employee’s combined age and years of credited service equal 85 “points”. Monthly retirement benefits are based on a statutory formula that includes final average salary and years of service. When ending employment, member employees may withdraw their contributions from their individual accounts, including interest. Member employees who withdraw their accumulated contributions lose all rights and privileges of membership. The accumulated contributions and interest are deposited into and disbursed from the membership accumulated reserve fund as established by K.S.A. 74-4922. Member employees choose one of seven payment options for their monthly retirement benefits. At retirement a member employee may receive a lump-sum payment of up to 50% of the actuarial present value of the member employee’s lifetime benefit. His or her monthly retirement benefit is then permanently reduced based on the amount of the lump-sum. Benefit increases, including ad hoc post-

Financial Section
Wichita Public Schools Page 56
retirement benefit increases, must be passed into law by the Kansas Legislature. Benefit increases are under the authority of the Legislature and the Governor of the State of Kansas. The retirement benefits are disbursed from the retirement benefit payment reserve fund as established by K.S.A. 74-4922. The 2012 Legislature made changes affecting new hires, current member employees and employers. A new KPERS 3 cash balance retirement plan for new hires starting January 1, 2015, was created. Normal retirement age for KPERS 3 is 65 with five years of service or 60 years with 30 years of service. Early retirement is available at age 55 with ten years of service, with a reduced benefit. Monthly benefit options are an annuity benefit based on the account balance at retirement. Contributions. K.S.A. 74-4919 and K.S.A. 74-49,210 establish the KPERS member-employee contributions rates. KPERS has multiple benefit structures and contribution rates depend on whether the employee is a KPERS 1, KPERS 2 or KPERS 3 member. KPERS 1 members are active and contributing members hired before July 1, 2009. KPERS 2 members were first employed in a covered position on or after July 1, 2009. KPERS 3 members were first employed in a covered position on or after January 1, 2015. Effective January 1, 2015, Kansas law established the KPERS member-employee contribution rate at 6% of covered salary for KPERS 1, KPERS 2 and KPERS 3 members. Member employee contributions are withheld by their employer and paid to KPERS according to the provisions of Section 414(h) of the Internal Revenue Code. State law provides that the employer contribution rates for KPERS 1, KPERS 2 and KPERS 3 be determined based on the results of each annual actuarial valuation. KPERS is funded on an actuarial reserve basis. Kansas law sets a limitation on annual increases in the employer contribution rates. For the fiscal year ended June 30, 2015, the statutory contribution rate was 15.41%, and the actuarially determined employer contribution rate (not including the .85% contribution rate for the Death and Disability Program) was 10.27% for the first quarter and 11.27% for the second quarter. During the last two quarters of 2015, the governor, using the budgetary allotment process, reduced the KPERS school employer rate to 8.65%, due to budgetary constraints. For the fiscal year ended June 30, 2016, the actuarially determined employer contribution rate (not including .85% contribution rate for Death and Disability program in the first quarter and 1.00% in the last three quarters) was 11.06% in the first quarter and 10.91% for the last three quarters. The statutory contribution rate was 16.00% for the fiscal year ended June 30, 2016. For public school districts, K.S.A. 74-4939 states that the State of Kansas shall budget for the transfer from the state general fund sufficient sums to satisfy the participating district’s obligations for employer contributions. K.S.A. 74-4939a then establishes the procedures for the actual distribution by the state, and subsequent remittance to KPERS, of the district’s employer contributions. Under this statute, the state Department of Education disburses to the school district an amount equal to the participating employer’s obligation. Upon receipt of each quarterly disbursement from the Department of Education, the school district must remit an equal amount to KPERS to satisfy the school district’s obligation as a participating employer. Under these statutes, the District received and remitted amounts equal to the statutory contribution rate. Contributions to the pension plan from the District (excluding contributions for the Death and Disability Program) were $26,426,489 and $30,172,889 for the periods ended June 30, 2016 and 2015, respectively. Since the statutes require the State of Kansas to set the KPERS employer rate and also to budget and transfer a sufficient amount for employer contributions, the statutes do not permit the District to contribute additional amounts to the retirement program for the purposes of improving the funding status and reducing the liability recorded on the District’s financial statements.

Financial Section
Wichita Public Schools Page 57
Pension Liabilities, Pension Expense, and Deferred Outflows of Resources and Deferred Inflows of Resources Related to Pensions At June 30, 2016, the District reported a liability of $499,258,574 for its proportionate share of the KPERS’ collective net pension liability. The collective net pension liability was measured by KPERS as of June 30, 2015, and the total pension liability used to calculate the collective net pension liability was determined by an actuarial valuation as of December 31, 2014, which was rolled forward to June 30, 2015. The District’s proportion of the collective net pension liability was based on the ratio of the District’s actual contributions to KPERS, relative to the total employer and nonemployer contributions of the State/School subgroup within KPERS for the fiscal year ended June 30, 2015. The contributions used exclude contributions made for prior service, excess benefits and irregular payments. At June 30, 2015, the District’s proportion was 7.210%, which was an increase of 0.051% from its proportion measured as of June 30, 2014. For the year ended June 30, 2016, the District recognized pension expense of $34,710,123. At June 30, 2016, the District reported deferred outflows of resources and deferred inflows of resources related to pensions from the following sources:
Deferred Outflows of
Resources Deferred Inflows of
Resources
Difference between expected and actual experience $ - $ 14,961,655 Net difference between projected and
actual earnings on pension plan investments - 13,006,342
Changes in proportionate share 10,818,828 - Changes in assumptions - 1,111,107 District contributions subsequent to measurement date 26,426,489 -
Total $ 37,245,317 $ 29,079,104
The $26,426,489 reported as deferred outflows of resources related to pensions resulting from District contributions subsequent to the measurement date will be recognized as a reduction of the net pension liability for the year ended June 30, 2017. Other amounts reported as deferred outflows of resources and deferred inflows of resources related to pensions will be recognized in pension expense as follows:
Year ended June 30: Deferred Outflows
(Inflows) of Resources
2017 $ (7,834,871) 2018 (7,834,871) 2019 (7,834,871) 2020 5,919,117 2021 (674,780)
$ (18,260,276)

Financial Section
Wichita Public Schools Page 58
Actuarial assumptions. The total pension liability for KPERS in the December 31, 2014 actuarial valuation was determined using the following actuarial assumptions, applied to all periods included in the measurement:
Price inflation 3.00 percent Wage inflation 4.00 percent Salary increases, including wage increases 4.00 to 16.00 percent, including inflation Long-term rate of return net of investment
expense, and including price inflation
8.00 percent
Mortality rates were based on the RP-2000 Combined Mortality Table for Males or Females, as appropriate, with adjustments for mortality improvements based on Scale AA. The actuarial assumptions used in the December 31, 2014 valuation were based on the results of an actuarial experience study conducted for the three-year period beginning December 31, 2012. Changes in actuarial assumptions from the December 31, 2013 valuation include a change in the maximum salary increase from 12.50% to 16.00%. The long-term expected rate of return on pension plan investments was determined using a building-block method in which best-estimate ranges of expected future real rates of return (expected returns, net of pension plan investment expense and inflation) are developed for each major asset class. These ranges are combined to produce the long-term expected rate of return by weighting the expected future real rates of return by the target asset allocation percentage and by adding expected inflation. Best estimates of arithmetic real rates of return for each major asset class included in the pension plan’s target asset allocations as of June 30, 2015 are summarized in the following table:
Asset Class
Target
Allocation
Long-Term Expected
Real Rate of Return
Global equity 47% 6.30%
Fixed income 13 0.80
Yield driven 8 4.20
Real return 11 1.70
Real estate 11 5.40
Alternatives 8 9.40
Short-term investments 2 (0.50)
Total 100%
Discount rate. The discount rate used by KPERS to measure the total pension liability was 8.00%. The projection of cash flows used to determine the discount rate assumed that contributions from plan members will be made at the contractually required rate. The State/School subgroup of employers do not necessarily contribute the full actuarial determined rate. Based on legislation passed in 1993, the employer contribution rates certified by the KPERS’ Board of Trustees for this group may not increase by more than the statutory cap. The expected KPERS employer statutory contribution was modeled for future years, assuming all actuarial assumptions are met in the future. Based on those assumptions, the pension plan’s fiduciary net position was projected to be available to make all projected future benefit payments of current plan members. Therefore, the long-term expected rate of return on pension plan investments was applied to all periods of projected benefit payments to determine the total pension liability.
Sensitivity of the District’s proportionate share of the collective net pension liability to changes in the discount rate. The following presents the District’s proportionate share of the collective net pension liability calculated using the discount rate of 8.00%, as well as what the District’s proportionate share of the collective net pension liability would be if it were calculated using a discount rate that is 1-percentage-point lower (7.00%) or 1-percentage-point higher (9.00%) than the current rate:
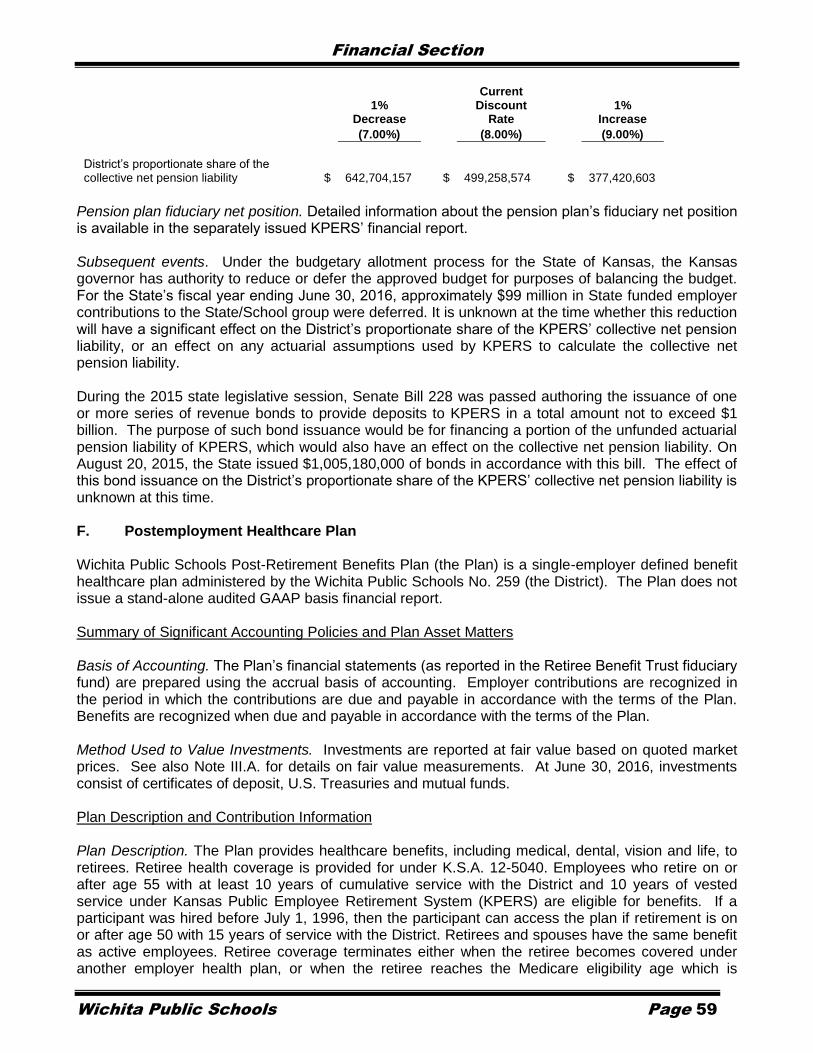
Financial Section
Wichita Public Schools Page 59
Current
1% Decrease
Discount Rate
1% Increase
(7.00%)
(8.00%)
(9.00%)
District’s proportionate share of the collective net pension liability
$
642,704,157
$
499,258,574
$
377,420,603
Pension plan fiduciary net position. Detailed information about the pension plan’s fiduciary net position is available in the separately issued KPERS’ financial report.
Subsequent events. Under the budgetary allotment process for the State of Kansas, the Kansas governor has authority to reduce or defer the approved budget for purposes of balancing the budget. For the State’s fiscal year ending June 30, 2016, approximately $99 million in State funded employer contributions to the State/School group were deferred. It is unknown at the time whether this reduction will have a significant effect on the District’s proportionate share of the KPERS’ collective net pension liability, or an effect on any actuarial assumptions used by KPERS to calculate the collective net pension liability.
During the 2015 state legislative session, Senate Bill 228 was passed authoring the issuance of one or more series of revenue bonds to provide deposits to KPERS in a total amount not to exceed $1 billion. The purpose of such bond issuance would be for financing a portion of the unfunded actuarial pension liability of KPERS, which would also have an effect on the collective net pension liability. On August 20, 2015, the State issued $1,005,180,000 of bonds in accordance with this bill. The effect of this bond issuance on the District’s proportionate share of the KPERS’ collective net pension liability is unknown at this time. F. Postemployment Healthcare Plan Wichita Public Schools Post-Retirement Benefits Plan (the Plan) is a single-employer defined benefit healthcare plan administered by the Wichita Public Schools No. 259 (the District). The Plan does not issue a stand-alone audited GAAP basis financial report. Summary of Significant Accounting Policies and Plan Asset Matters Basis of Accounting. The Plan’s financial statements (as reported in the Retiree Benefit Trust fiduciary fund) are prepared using the accrual basis of accounting. Employer contributions are recognized in the period in which the contributions are due and payable in accordance with the terms of the Plan. Benefits are recognized when due and payable in accordance with the terms of the Plan. Method Used to Value Investments. Investments are reported at fair value based on quoted market prices. See also Note III.A. for details on fair value measurements. At June 30, 2016, investments consist of certificates of deposit, U.S. Treasuries and mutual funds. Plan Description and Contribution Information Plan Description. The Plan provides healthcare benefits, including medical, dental, vision and life, to retirees. Retiree health coverage is provided for under K.S.A. 12-5040. Employees who retire on or after age 55 with at least 10 years of cumulative service with the District and 10 years of vested service under Kansas Public Employee Retirement System (KPERS) are eligible for benefits. If a participant was hired before July 1, 1996, then the participant can access the plan if retirement is on or after age 50 with 15 years of service with the District. Retirees and spouses have the same benefit as active employees. Retiree coverage terminates either when the retiree becomes covered under another employer health plan, or when the retiree reaches the Medicare eligibility age which is

Financial Section
Wichita Public Schools Page 60
currently age 65. Spousal coverage is available until the retiree becomes covered under another employer health plan, attains Medicare eligibility age, or dies. Membership of the Plan consisted of the following at July 1, 2015, the date of the latest actuarial valuation:
Retirees and beneficiaries receiving benefits 943 Active plan members 6,527
Total 7,470
Contributions. As provided by K.S.A. 12-5040, the District allows retirees to participate in the group health insurance plan. The funding policy of the District is to pay premiums as they come due. The contribution requirements of Plan members and the District are established and may be amended by the Board of Education. The required contribution is based on projected pay-as-you-go financing requirements. District retirees pay 100% of their premiums; the District is not required to share costs of retiree premiums. Administrative costs of the Plan are financed by the premiums paid into the Retiree Benefit Trust fund. In June 2011, the District established an irrevocable trust for the exclusive benefit of providing funds to pay benefits under the Plan. The District made an initial contribution of $10 million to the trust in June 2011 to pre-fund benefits. Additional employer contributions to the trust are at the sole discretion of the District. Pay-as-you-go contributions and corresponding benefit payments began to be reported in the Retiree Benefit Trust fund effective July 1, 2011. Funded Status and Funding Progress Annual OPEB Cost and Net OPEB Obligation. The Districts’s annual other postemployment benefit (OPEB) cost (expense) is calculated based on the annual required contribution of the employer (ARC), an amount actuarially determined in accordance with the parameters of GASB Statements 43 and 45. The ARC represents a level of funding that, if paid on an ongoing basis, is projected to cover normal cost each year and amortize any unfunded actuarial liabilities (or funding excess) over a period not to exceed thirty years. The following table shows the components of the District’s annual OPEB cost for the year, the actuarial amount contributed to the plan, and changes in the Districts’ net OPEB obligation to the Plan:
Annual required contribution $ 8,734,975 Interest on net OPEB obligation 535,184 Adjustment to annual required contribution (817,213 )
Annual OPEB cost (expense) 8,452,946 Contributions made (3,055,161 )
Increase in net OPEB obligation 5,397,785 Net OPEB obligation – beginning of year 15,290,977
Net OPEB obligation – end of year $ 20,688,762
The District’s annual OPEB cost, the percentage of annual OPEB cost contributed to the Plan, and the net OPEB obligation were as follows for the most recent three fiscal years:
Fiscal Year
Ended
Annual
OPEB Cost
Percentage of Annual OPEB
Cost Contributed
Net OPEB Obligation
6/30/16 $ 8,452,946 36.1% $20,688,792 6/30/15 $ 6,289,838 39.3% $15,290,977 6/30/14 $ 6,076,742 44.7% $11,472,741

Financial Section
Wichita Public Schools Page 61
As of July 1, 2015, the most recent actuarial valuation date, the Plan was partially funded. The actuarial accrued liability for benefits was $76.3 million, and $10.1 million of actuarial value of assets, resulting in an unfunded actuarial accrued liability (UAAL) of $66.2 million, and a funded ratio of 13.2 percent. The covered payroll (annual payroll of active employees covered by the Plan) was $289.7 million, and the ratio of the UAAL to the covered payroll was 22.8 percent. Actuarial valuations of an ongoing plan involve estimates of the value of reported amounts and assumptions about the probability of occurrence of events far into the future. Examples include assumptions about future employment, mortality, and the healthcare cost trend. Amounts determined regarding the funded status of the Plan and the annual required contributions of the employer are subject to continual revision as actual results are compared with past expectations and new estimates are made about the future. The schedule of funding progress, presented as required supplementary information following the notes to the financial statements, presents multi-year trend information about whether the actuarial value of Plan assets is increasing or decreasing over time relative to the actuarial accrued liability for benefits. Actuarial Methods and Assumptions. Projections of benefits for financial reporting purposes are based on the substantive Plan (the Plan as understood by the employer and the plan members) and include the types of benefits provided at the time of each valuation and the historical pattern of sharing of benefit costs between the employer and Plan members to that point. In the July 1, 2015, actuarial valuation, the projected unit credit actuarial cost method was used. The actuarial assumptions included a 3.5 percent investment rate of return (net of administrative expenses), which is a blended rate of the expected long-term investment returns on plan assets and on the District’s own investments calculated based on the funded level of the plan at the valuation date, and an annual healthcare cost trend rate of 7.25 percent initially, reduced to an ultimate rate of 5 percent after nine years. Both rates included a 2.5 percent inflation assumption. The UAAL is being amortized as a level dollar of projected payroll on a closed basis. The remaining amortization period at July 1, 2015, ranged twenty-four years on the original base to thirty years on amounts added in 2015. Actuarial methods and assumptions used includes techniques that are consistent with the long-term perspective of the calculations. G. Other Employee Benefit Trust Funds The District has two trust funds which include assets held for other postemployment healthcare benefits and early retirement incentives. Listed below are condensed financial statements for both trusts.
Early Retirement Incentive Plan Trust
Retiree Benefit Trust
Totals
Total assets
$ 15,980,648
$ 5,700,954
$ 21,681,602
Total liabilities
-
-
-
Net position
$ 15,980,648
$ 5,700,954
$ 21,681,602
Additions
$ 16,414,697
$ 69,446
$ 16,484,143
Deductions
15,065,318
4,458,372
19,523,690
Change in net position
1,349,379
(4,388,926)
(3,039,547)
Beginning net position
14,631,269
10,089,880
24,721,149
Ending net position
$ 15,980,648
$ 5,700,954
$ 21,681,602

Financial Section
Wichita Public Schools Page 62
H. Pending Governmental Accounting Standards The effect on the District’s financial statements of the following statements issued, but not yet adopted, has not yet been determined. GASB Statement No. 74, Financial Reporting for Postemployment Benefit Plans Other Than Pension Plans, establishes financial reporting standards for state and local governmental OPEB plans that are administered through trusts or equivalent arrangements and for governments that hold assets accumulated for purposes of providing OPEB through defined benefit OPEB plans that are not administered through a trust or equivalent arrangement. The provisions of this statement are effective for financial statements for the District’s fiscal year ending June 30, 2017.
GASB Statement No. 75, Accounting and Financial Reporting by Employers for Post-Employment Benefits Other Than Pensions, replaces the requirements of GASB Statement No. 45, Accounting and Financial Reporting by Employers for Post-Employment Benefits Other Than Pensions and requires governments to report a liability on the face of the financial statements for the OPEB that they provide. Statement No. 75 requires governments in all types of OPEB plans to present more extensive note disclosures and required supplementary information (RSI) about their OPEB liabilities. Among the new note disclosures is a description of the effect on the reported OPEB liability of using a discount rate and a healthcare cost trend rate that are one percentage point higher and one percentage point lower than assumed by the government. The new RSI includes a schedule showing the causes of increases and decreases in the OPEB liability and a schedule comparing a government’s actual OPEB contributions to its contribution requirements. The provisions of this statement are effective for financial statements for the District’s fiscal year ending June 30, 2018. GASB Statement No. 77, Tax Abatement Disclosures, increases the disclosure requirements for tax abatements affecting the government entity and its ability to raise resources in the future. This standard applies to a reporting government’s own tax abatement agreements or agreements entered into by other governments and that reduce the reporting government’s tax revenues. The government that enters into the agreement must begin disclosing (1) brief descriptive information, such as the tax being abated, the authority under which tax abatements are provided, eligibility criteria, the mechanism by which taxes are abated, provision for recapturing abated taxes, and the types of commitments made by tax abatement recipients, (2) the gross dollar amount of taxes abated during the period and (3) commitments made by a government, other than to abate taxes, as part of a tax abatement agreement. For governments impacted by other governments’ tax abatements, the following must be disclosed: (1) the names of the governments that entered into the agreements, (2) the specific taxes being abated, and (3) the gross dollar amount of taxes abated during the period. The provisions of this statement are effective for financial statements for the District’s fiscal year ending June 30, 2017. GASB Statement No. 82, Pension Issues, addresses certain issues that have been raised with respect to Statement No. 67, Statement No. 68 and Statement No. 73. Specifically, this Statement addresses issues regarding (1) the presentation of payroll-related measures in required supplementary information, (2) the selection of assumptions and the treatment of deviations from the guidance in the Actuarial Standard of Practice for financial reporting purposes, and (3) the classification of payments made by employers to satisfy employee (plan member) contribution requirements. The provisions of this statement are effective for financial statements for the District’s fiscal year ending June 30, 2017.

Re
qu
ired
Su
pp
lem
en
tary
Info
rma
tion


Financial Section
Wichita Public Schools Page 63
WICHITA PUBLIC SCHOOLS
UNIFIED SCHOOL DISTRICT NO. 259
REQUIRED SUPPLEMENTARY INFORMATION
June 30, 2016
OPEB Schedule of Funding Progress
Actuarial UAAL as a
Actuarial Accrued Percent of
Actuarial Value of Liability Unfunded Funded Covered Covered
Valuation Assets (AAL) AAL Ratio Payroll Payroll
Date (a) (b) (b-a) (a/b) ( c) ((b-a)/c)
07/01/15 $10,089,880 $ 76,272,909 $ 66,189,029 13.2% $ 289,740,091 22.8%
07/01/13 $10,019,053 $ 54,775,634 $ 44,756,581 18.3% $ 278,817,461 16.1%
07/01/11 $10,000,000 $ 50,548,903 $ 40,548,903 19.8% $ 277,798,463 14.6%
OPEB Schedule of Employer Contributions*
Year Ended June 30
Annual Required Contribution
Percentage Contributed
2016 $8,734,975 35.0% 2015 $6,462,562 38.2% 2014 $6,222,117 43.7% 2013 $6,038,230 46.7% 2012 $5,791,289 39.0%
*The District created an employee benefit trust in June 2011. Prior to June 2011, the Plan was administered through the
Healthcare internal service fund, and did not have its own Statement of Fiduciary Net Position and Statement of Changes in Fiduciary Net Position. Activity related to employee and employer contributions and the payment of benefits started being recognized as additions / deductions to the trust’s net position starting in fiscal 2012.

Financial Section
Wichita Public Schools Page 64
WICHITA PUBLIC SCHOOLS
UNIFIED SCHOOL DISTRICT NO. 259
REQUIRED SUPPLEMENTARY INFORMATION
June 30, 2016 Note 1 Significant Factors Affecting Trends in Actuarial Information Changes in the Actuarial Accrued Liability for the valuation completed at July 1, 2015 are primarily
due to:
The healthcare trend rates were changed to better anticipate short term and long term medical increases.
The mortality table was updated from the projection of RP2000 rates to 2013 to the RPH-2014 White Collar Mortality Tables with MP-2015 Generational Improvement Scale.
The discount rate was changed from 4.5% to 3.5%.
The percentage of future retirees who are assumed to pay the extra working spouse premium was reduced from 7% to 5%.
The percentage of future retirees who are assumed to use tobacco (so need to pay an additional premium) was reduced form 3% to 2%.
The percentage of future spouses of retirees who are assumed to use tobacco (so need to pay an additional premium) was reduced from 5% to 3%.

Financial Section
Wichita Public Schools Page 65
2016 2015 2014
Measurement Date June 30, 2015 June 30, 2014 June 30, 2013
7.210% 7.159% 6.997%
$ 499,258,574 $ 457,481,114 $ 508,221,480
$ 315,685,482 $ 311,279,122 $ 304,023,616
158% 147% 167%
64.95% 66.60% 59.94%
Note: Information on this schedule is measured as of the measurement date.
* GASB 68 requires presentation of ten years. As of June 30, 2016 only three
years of information is available.
Plan fiduciary net position as a
percentage of the total pension
liability
WICHITA PUBLIC SCHOOLS
UNIFIED SCHOOL DISTRICT NO. 259
REQUIRED SUPPLEMENTARY INFORMATION
June 30, 2016
Share of the Collective Net Pension Liability
Kansas Public Employees Retirement System
Last Three Fiscal Years*
District's proportion of the collective
net pension liability
District's proportionate share of the
collective net pension liability
District's covered-employee payroll
District's proportionate share of the
collective net pension liability as a
percentage of its covered-employee
payroll
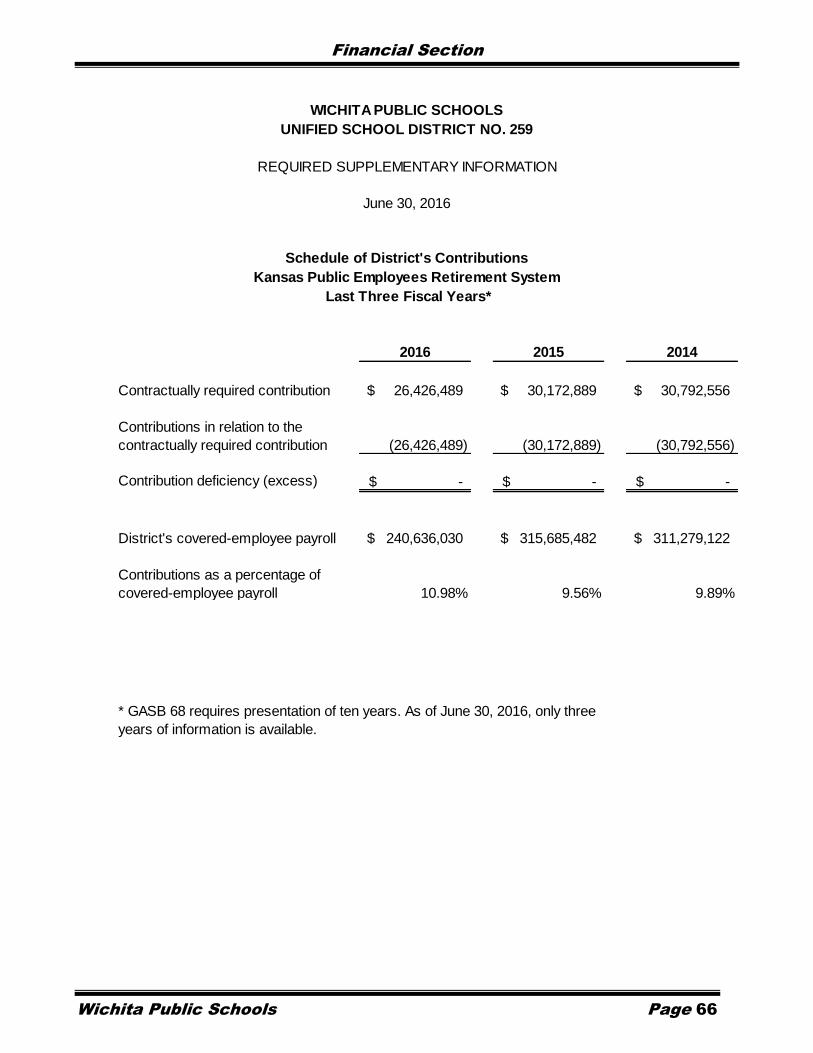
Financial Section
Wichita Public Schools Page 66
2016 2015 2014
Contractually required contribution 26,426,489$ 30,172,889$ 30,792,556$
Contributions in relation to the
contractually required contribution (26,426,489) (30,172,889) (30,792,556)
Contribution deficiency (excess) -$ -$ -$
District's covered-employee payroll 240,636,030$ 315,685,482$ 311,279,122$
Contributions as a percentage of
covered-employee payroll 10.98% 9.56% 9.89%
* GASB 68 requires presentation of ten years. As of June 30, 2016, only three
years of information is available.
WICHITA PUBLIC SCHOOLS
UNIFIED SCHOOL DISTRICT NO. 259
REQUIRED SUPPLEMENTARY INFORMATION
June 30, 2016
Schedule of District's Contributions
Kansas Public Employees Retirement System
Last Three Fiscal Years*

Financial Section
Wichita Public Schools Page 67
WICHITA PUBLIC SCHOOLS
UNIFIED SCHOOL DISTRICT NO. 259
REQUIRED SUPPLEMENTARY INFORMATION
June 30, 2016 Changes in benefit terms for KPERS. Effective January 1, 2014, KPERS Tier 1 members’ employee contribution rate increased to 5.0% and then on January 1, 2015, increased to 6.0% with an increase in benefit multiplier to 1.85% for future years of service. For Tier II members retiring after July 1, 2012, the cost of living adjustment (COLA) is eliminated, but members will receive a 1.85% multiplier for all years of service. January 1, 2015, the KPERS 3 cash balance plan became effective. Members enrolled in this plan are ones first employed in a KPERS covered position on or after January 1, 2015, or KPERS 1 or KPERS 2 members who left employment before vesting and returned to employment on or after January 1, 2015. The retirement benefit is an annuity based on the account balance at retirement.
Changes in assumptions. The major items of impact in the actuarial valuation dated December 31, 2014 relative to the prior valuation are as follows:
Reduce disability rates by 20% for all three KPERS groups.
Increase the termination of employment rates for State-Males and Local Males and Females.
Modify the election of a deferred benefit by Local vested members who terminate employment in future years.
Modify the retirement rates for the C60 group.
Increase the load for the impact of final average salary provisions for Local, C55 and C60 members hired before July 1, 1993.
Establish an interest crediting rate of 6.50% for KPERS 3 members.

Financial Section
Wichita Public Schools Page 68
Actual Variance with
Amounts Final Budget
Budgetary Over/
Original Final Basis (Under)
Revenues:
Taxes -$ -$ 8,701$ 8,701$
Intergovernmental - State 423,398,926 416,260,096 412,547,146 (3,712,950)
Other 253,037 253,037 185,938 (67,099)
Earnings on investments - - 131,069 131,069
Total revenue 423,651,963 416,513,133 412,872,854 (3,640,279)
Expenditures:
Current:
Instruction 112,634,902 112,088,831 109,380,336 (2,708,495)
Student and instructional support 25,925,626 25,925,626 26,760,852 835,226
Administration 32,319,800 32,319,800 31,668,371 (651,429)
Operations and maintenance 33,909,359 33,909,359 32,889,327 (1,020,032)
Student transportation service 170,000 170,000 74,451 (95,549)
Total expenditures 204,959,687 204,413,616 200,773,337 (3,640,279)
Revenue over expenditures 218,692,276 212,099,517 212,099,517 -
Other financing sources (uses):
Transfer in 3,000,000 3,000,000 3,036,044 36,044
Transfer out (221,924,805) (211,846,480) (209,847,640) 1,998,840
Total other financing sources (uses) (218,924,805) (208,846,480) (206,811,596) 2,034,884
Revenues and other financing sources over (under)
expenditures and other uses (232,529) 3,253,037 5,287,921 2,034,884
Fund balances at beginning of year 232,529 232,529 232,529 -
Fund balances at end of year -$ 3,485,566$ 5,520,450$ 2,034,884$
Explanation of difference between budgetary and GAAP fund balances:
Separately budgeted general fund subfunds:
Supplemental General, including $2,947,593 of encumbrances 6,073,145
Professional Development, including $5,203 of encumbrances 5,203
State Intervention (K-12), including $164,300 of encumbrances 164,301
Bilingual Education, including $7,566 of encumbrances 7,567
Vocational Education, including $115 of encumbrances 2,461
Textbook Rental, including $156,228 of encumbrances 12,928,636
Non-budgeted general fund subfunds:
Contingency Reserve 10,122,327
Supplemental Grants - State and Local, including $20,841 of encumbrances 2,903,597
Encumbrances for equipment and supplies ordered but not received are not reported for GAAP
purposes until received. 310,075
Inventory purchases are outflows of budgetary resources but are not expenditures for GAAP. 1,069,429
GAAP fund balance at end of year 39,107,191$
Budgeted Amounts
Wichita Public Schools
Schedule of Revenues, Expenditures and Changes in Fund Balances - Budget and Actual
General Fund
Year ended June 30, 2016
Unified School District No. 259

Financial Section
Wichita Public Schools Page 69
Wichita Public Schools
Schedule of Revenues, Expenditures and Changes in
Fund Balance - Budget and Actual
Year ended June 30, 2016
Actual Variance with
Amounts Final Budget
Budgetary Over/
Original Final Basis (Under)
Revenues:
Intergovernmental - Federal 19,500,000$ 19,500,000$ 18,508,702 (991,298)$
Other 151,427 151,427 156,195 4,768
Total revenues 19,651,427 19,651,427 18,664,897 (986,530)
Expenditures:
Current:
Instruction 65,626,970 65,626,970 62,620,432 (3,006,538)
Student and instructional support 25,109,465 25,109,465 24,361,544 (747,921)
Administration 2,513,066 2,513,066 2,467,856 (45,210)
Operations and maintenance 4,494,956 4,494,956 4,336,431 (158,525)
Student transportation service 12,255,543 12,255,543 11,562,506 (693,037)
Total expenditures 110,000,000 110,000,000 105,348,769 (4,651,231)
Revenues over (under) expenditures (90,348,573) (90,348,573) (86,683,872) 3,664,701
Other financing sources (uses):
Transfers in 89,348,572 89,348,572 86,683,872 (2,664,700)
Total other financing sources (uses) 89,348,572 89,348,572 86,683,872 (2,664,700)
Revenues and other financing sources over (under)
expenditures and other uses (1,000,001) (1,000,001) - 1,000,001
Fund balances at beginning of year 11,000,001 11,000,001 11,000,001 -
Fund balances at end of year 10,000,000$ 10,000,000$ 11,000,001$ 1,000,001$
Explanation of difference between budgetary and GAAP fund balances:
Encumbrances for equipment and supplies ordered but not received are not reported
for GAAP purposes until received. (41,292)
GAAP fund balance at end of year 10,958,709$
Budgeted Amounts
Unified School District No. 259
Special Education Fund

Financial Section
Wichita Public Schools Page 70
Wichita Public Schools
Schedule of Revenues, Expenditures and Changes in Fund Balance - Budget and Actual
Year ended June 30, 2016
Actual Variance with
Amounts Final Budget
Budgetary Over/
Original Final Basis (Under)
Revenues:
Intergovernmental - State 231,563$ 231,563$ 256,362$ 24,799$
Intergovernmental - Federal 19,859,492 19,859,492 21,355,195 1,495,703
Charges for services 3,907,542 3,907,542 3,337,975 (569,567)
Earnings on investments - - 26,098 26,098
Other - - 1,004,616 1,004,616
Total revenues 23,998,597 23,998,597 25,980,246 1,981,649
Expenditures:
Current:
Nutrition services 28,114,916 28,114,916 24,336,127 (3,778,789)
Total expenditures 28,114,916 28,114,916 24,336,127 (3,778,789)
Revenues over (under) expenditures (4,116,319) (4,116,319) 1,644,119 5,760,438
Other financing sources (uses):
Transfers in 13,000 13,000 - (13,000)
Total other financing sources (uses) 13,000 13,000 - (13,000)
Revenues and other financing sources over
(under) expenditures and other uses (4,103,319) (4,103,319) 1,644,119 5,747,438
Fund balances at beginning of year 7,841,227 7,841,227 7,841,227 -
Fund balances at end of year 3,737,908$ 3,737,908$ 9,485,346$ 5,747,438$
Explanation of difference between budgetary and GAAP fund balances:Encumbrances for equipment and supplies ordered but not received are not reported for GAAP purposes until received. 4,844,066
GAAP fund balance at end of year 15,293,178$
Budgeted Amounts
Unified School District No. 259
Nutrition Services Fund

Su
pp
lem
en
tary
Info
rma
tion

General Funds – the general funds maintained by the District and the purpose of each are as follows:
General – used in conjunction with the Supplemental General fund to account for all financial resources except those required
to be accounted for in another fund.
Supplemental General – used in conjunction with the General fund to account for all financial resources except those
required to be accounted for in another fund.
Contingency Reserve – used to provide resources for unforeseen and unplanned needs.
Supplemental Grants – State and Local – used to account for revenue and expenses of programs administered in
accordance with state and nongovernmental and/or local grants awarded to the District. Professional Development – used to account for teacher in-service training program.
4-Year-Old State Intervention – created by Kansas Statute in 2005 and provides early childhood programs for the District.
State Intervention (K-12) – used to account for costs incurred to support the needs of the elementary, middle, and high
school at-risk students. Bilingual Education – used to account for costs incurred in administering programs to provide special help for pupils whose
native language is not English. Vocational Education – used to account for secondary education vocational programs approved by the State and funded by
the General fund weighting formula. Textbook Rental – used to account for the receipt of student textbook rental fees and the expenditures for student textbooks.
Special Revenue Funds - used to account for specific revenues that are legally restricted to expenditures for particular purposes. The
special revenue funds maintained by the District and the purpose of each are as follows:
Virtual Education – used to provide lessons, resources, training and teaching support online for K-8 families and to provide
an online alternative learning option for high school students in Wichita and the Wichita Metro Area. Latchkey – used to account for expenditures associated with the before and after school programs for children 5 to 12 years
of age. Parents As Teachers – used to account for the home/school partnership program that helps parents understand more about
how young children grow and learn, so they can be better teachers of their preschool children. Summer School – used to account for costs associated with the summer school programs.
Special Liability Expense – used to pay for the cost of providing for the defense of the District and its employees and for the
payment of claims. Athletic Activity – used to account for gate receipts at secondary school athletic functions and expenditures relating to those
functions. Music Rental – used to account for the collection of student music rental fees and the expenditures for musical instruments. Student Material Revolving – used to account for revenues from student materials fees and the expenditures associated with
the purchase of student materials. Supplemental Grants – Federal – used to account for revenue and expenditures of programs administered in accordance
with Federal grants awarded to the District. KPERS Retirement Contributions – used to account for revenues and expenditures of the Kansas Public Employees
Retirement System. KPER provides statewide defined-benefit retirement plans for state and local public employees.
Capital Project Funds – used to account for financial resources to be used for the acquisition, construction, remodeling, and equipping
of major capital facilities. The capital project funds maintained by the District and the purpose of each are as follows:
Special Assessments – used to pay for costs associated with capital improvements such as streets, sewers, curbs, and
gutters.

Financial Section
Wichita Public Schools Page 71
Wic
hit
a P
ub
lic
Sc
ho
ols
Un
ifie
d S
ch
oo
l D
istr
ict
No
. 2
59
Co
mb
inin
g B
ala
nc
e S
he
et
Ge
ne
ral F
un
dJ
un
e 3
0,
20
16
Ge
ne
ral F
un
d S
ub
fun
ds
Sup
ple
me
nta
l4
Ye
ar
Old
Sta
teT
ota
l
Sup
ple
me
nta
lC
onting
ency
Gra
nts
-P
rofe
ssio
na
lS
tate
Inte
rve
ntio
n
Bili
ng
ua
lV
oca
tio
na
l T
ext
bo
ok
Ge
ne
ral
Ge
ne
ral
Ge
ne
ral
Re
se
rve
Sta
te a
nd
Lo
ca
lD
eve
lop
me
nt
Inte
rve
ntio
n
(K-1
2)
Ed
uca
tio
n
Ed
uca
tio
n
Re
nta
lF
un
d
As
se
ts:
C
ash, ca
sh e
quiv
ale
nts
and
inve
stm
ents
-$
-$
-$
1,3
95
,27
8$
17
2,3
54
$
15
,11
7$
65
7,0
84
$
13
2,0
22
$
27
8,9
98
$
13
,49
1,0
54
$
16
,14
1,9
07
$
In
terg
ove
rnm
enta
l re
ce
iva
ble
s-
-
-
11
,39
8
-
-
-
-
-
-
11
,39
8
S
tate
aid
re
ce
iva
ble
28
,70
5,0
96
-
-
-
-
-
-
-
-
-
28
,70
5,0
96
D
ue
fro
m o
the
r fu
nd
s-
7,6
15
,41
2
10
,12
2,3
27
2,1
42
,61
2
-
-
-
-
-
-
19
,88
0,3
51
In
vento
ry1
,06
9,4
29
-
-
-
-
-
-
-
-
-
1,0
69
,42
9
T
ota
l asse
ts2
9,7
74
,52
5$
7,6
15
,41
2$
10
,12
2,3
27
$
3,5
49
,28
8$
17
2,3
54
$
15
,11
7$
65
7,0
84
$
13
2,0
22
$
27
8,9
98
$
13
,49
1,0
54
$
65
,80
8,1
81
$
Lia
bilit
ies
:
A
cco
unts
pa
yab
le6
34
,11
6$
1,0
65
,60
3$
-$
35
8,9
95
$
4,2
97
$
-$
49
,86
9$
15
,54
1$
22
1,2
54
$
56
2,4
18
$
2,9
12
,09
3$
A
ccru
ed
pa
yro
ll2
,36
0,1
04
47
6,6
64
-
5,1
15
16
2,8
54
15
,11
7
44
2,9
14
10
8,9
14
55
,28
3
-
3,6
26
,96
5
A
dva
nce
- g
rants
-
-
-
28
1,5
81
-
-
-
-
-
-
28
1,5
81
D
ue
to
oth
er
fund
s1
9,8
80
,35
1
-
-
-
-
-
-
-
-
-
19
,88
0,3
51
T
ota
l lia
bili
tie
s2
2,8
74
,57
11
,54
2,2
67
-
64
5,6
91
16
7,1
51
15
,11
7
49
2,7
83
12
4,4
55
27
6,5
37
56
2,4
18
26
,70
0,9
90
Fu
nd
Ba
lan
ce
s:
N
onsp
end
ab
le1
,06
9,4
29
-
-
-
-
-
-
-
-
-
1,0
69
,42
9
R
estr
icte
d-
-
-
88
2,2
56
-
-
-
-
-
-
88
2,2
56
A
ssig
ne
d3
10
,08
9
2,9
47
,59
3
-
1,8
63
,39
0
5,2
03
-
16
4,3
01
7,5
67
2,4
61
12
,92
8,6
36
18
,22
9,2
40
U
na
ssig
ne
d5
,52
0,4
36
3,1
25
,55
2
10
,12
2,3
27
15
7,9
51
-
-
-
-
-
-
18
,92
6,2
66
T
ota
l fund
ba
lance
s6
,89
9,9
54
6,0
73
,14
5
10
,12
2,3
27
2,9
03
,59
7
5,2
03
-
16
4,3
01
7,5
67
2,4
61
12
,92
8,6
36
39
,10
7,1
91
T
ota
l lia
bili
tie
s, d
efe
rre
d inflo
ws o
f
re
so
urc
es a
nd
fund
ba
lance
s
29
,77
4,5
25
$
7,6
15
,41
2$
10
,12
2,3
27
$
3,5
49
,28
8$
17
2,3
54
$
15
,11
7$
65
7,0
84
$
13
2,0
22
$
27
8,9
98
$
13
,49
1,0
54
$
65
,80
8,1
81
$

Financial Section
Wichita Public Schools Page 72
Wic
hit
a P
ub
lic
Sc
ho
ols
Un
ifie
d S
ch
oo
l D
istr
ict
No
. 2
59
Co
mb
inin
g S
ch
ed
ule
of
Re
ve
nu
es
, E
xp
en
dit
ure
s a
nd
Ch
an
ge
s in
Fu
nd
Ba
lan
ce
sG
en
era
l F
un
dF
or
the
Ye
ar
En
de
d J
un
e 3
0,
20
16
Ge
ne
ral F
un
d S
ub
fun
ds
Sup
ple
me
nta
l4
Ye
ar
Old
Sta
teT
ota
l
Sup
ple
me
nta
lC
onting
ency
Gra
nts
-P
rofe
ssio
na
lS
tate
Inte
rve
ntio
n
Bili
ng
ua
l V
oca
tio
na
l T
ext
bo
ok
Ge
ne
ral
Ge
ne
ral
Ge
ne
ral
Re
se
rve
Sta
te a
nd
Lo
ca
lD
eve
lop
me
nt
Inte
rve
ntio
n
(K-1
2)
Ed
uca
tio
n
Ed
uca
tio
n
Re
nta
l F
un
d
Re
ve
nu
es
:
Ta
xes
8,7
01
$
55
,55
1,9
87
$
-$
-$
-$
-$
-$
-$
-$
-$
55
,56
0,6
88
$
Inte
rgo
vern
me
nta
l - S
tate
27
9,3
03
,01
4
54
,55
9,9
01
-
84
,04
8
-
-
-
-
35
,48
6
-
33
3,9
82
,44
9
Cha
rge
s fo
r se
rvic
es
-
-
-
39
6,4
46
-
-
99
,38
6
-
60
0,0
13
59
2,9
99
1,6
88
,84
4
Ea
rnin
gs o
n inve
stm
ents
13
1,0
69
-
-
3,2
87
-
-
-
-
-
-
13
4,3
56
Oth
er
-
8,1
86
-
62
4,9
39
-
-
-
-
-
-
63
3,1
25
Co
ntr
ibutio
ns
-
-
-
55
3,5
26
-
-
-
-
-
-
55
3,5
26
T
ota
l re
venue
s2
79
,44
2,7
84
11
0,1
20
,07
4
-
1,6
62
,24
6
-
-
99
,38
6
-
63
5,4
99
59
2,9
99
39
2,5
52
,98
8
Ex
pe
nd
itu
res
:
Curr
ent:
In
str
uctio
n1
09
,36
9,5
39
22
6,3
92
-
84
5,0
46
-
4,0
64
,47
5
66
,07
7,5
03
11
,22
8,6
50
9,0
07
,70
2
2,3
56
,71
7
20
3,1
76
,02
4
S
tud
ent a
nd
instr
uctio
na
l sup
po
rt2
6,8
22
,46
3
1,0
93
,86
2
-
12
9,1
61
1,6
53
,31
1
26
,76
8
1,3
11
,58
1
85
6,5
08
6,3
74
-
31
,90
0,0
28
A
dm
inis
tra
tio
n3
1,6
74
,77
1
85
9,1
82
-
75
,97
7
-
88
8
84
2,4
31
57
2,5
18
63
6,0
31
-
34
,66
1,7
98
O
pe
ratio
ns a
nd
ma
inte
na
nce
32
,90
6,7
09
21
,07
4,0
19
-
1,8
00
,52
6
-
75
,84
7
17
9,7
55
-
84
,68
0
-
56
,12
1,5
36
S
tud
ent tr
ansp
ort
atio
n s
erv
ice
74
,45
1
14
,29
4,9
79
-
89
-
-
-
4,3
44
-
-
14
,37
3,8
63
N
utr
itio
n s
erv
ice
s-
-
-
8,0
50
-
-
-
-
-
-
8,0
50
T
ota
l exp
end
iture
s2
00
,84
7,9
33
37
,54
8,4
34
-
2,8
58
,84
9
1,6
53
,31
1
4,1
67
,97
8
68
,41
1,2
70
12
,66
2,0
20
9,7
34
,78
7
2,3
56
,71
7
34
0,2
41
,29
9
Exc
ess (
de
ficie
ncy)
of re
venue
s
o
ver
(und
er)
exp
end
iture
s7
8,5
94
,85
1
72
,57
1,6
40
-
(1,1
96
,60
3)
(1,6
53
,31
1)
(4,1
67
,97
8)
(68
,31
1,8
84
)
(12
,66
2,0
20
)
(9,0
99
,28
8)
(1,7
63
,71
8)
52
,31
1,6
89
Oth
er
fin
an
cin
g s
ou
rce
s (
us
es
):
T
ransfe
rs in
3,0
36
,04
4
-
-
-
1,6
53
,30
5
4,1
68
,10
2
68
,26
9,7
86
12
,66
8,0
95
8,9
90
,63
5
8,5
65
,46
3
10
7,3
51
,43
0
T
ransfe
rs o
ut
(76
,60
3,5
08
)
(73
,70
3,7
04
)
(3,0
00
,00
0)
-
-
-
-
-
-
-
(15
3,3
07
,21
2)
T
ota
l oth
er
fina
ncin
g s
ourc
es (
use
s)
(73
,56
7,4
64
)
(73
,70
3,7
04
)
(3,0
00
,00
0)
-
1,6
53
,30
5
4,1
68
,10
2
68
,26
9,7
86
12
,66
8,0
95
8,9
90
,63
5
8,5
65
,46
3
(45
,95
5,7
82
)
N
et cha
ng
e in fund
ba
lance
s5
,02
7,3
87
(1,1
32
,06
4)
(3,0
00
,00
0)
(1,1
96
,60
3)
(6)
12
4
(42
,09
8)
6,0
75
(10
8,6
53
)
6,8
01
,74
5
6,3
55
,90
7
Fu
nd
ba
lan
ce
s a
t b
eg
inn
ing
of
ye
ar
1,7
58
,68
9
7,2
05
,20
9
13
,12
2,3
27
4,1
00
,20
0
5,2
09
(12
4)
20
6,3
99
1,4
92
11
1,1
14
6,1
26
,89
1
32
,63
7,4
06
Cha
ng
e in r
ese
rve
fo
r in
vento
ry1
13
,87
8
-
-
-
-
-
-
-
-
-
11
3,8
78
Fu
nd
ba
lan
ce
s a
t e
nd
of
ye
ar
6,8
99
,95
4$
6,0
73
,14
5$
10
,12
2,3
27
$
2,9
03
,59
7$
5,2
03
$
-$
16
4,3
01
$
7,5
67
$
2,4
61
$
12
,92
8,6
36
$
39
,10
7,1
91
$

Financial Section
Wichita Public Schools Page 73
Wic
hit
a P
ub
lic
Sc
ho
ols
Wic
hit
a P
ub
lic
Sc
ho
ols
Un
ifie
d S
ch
oo
l D
istr
ict
No
. 2
59
Un
ifie
d S
ch
oo
l D
istr
ict
No
. 2
59
Co
mb
inin
g B
ala
nc
e S
he
et
Co
mb
inin
g B
ala
nc
e S
he
et
No
nm
ajo
r G
ov
ern
me
nta
l F
un
ds
No
nm
ajo
r G
ov
ern
me
nta
l F
un
ds
Ju
ne
30
, 2
01
6(c
on
tin
ue
d)
Pa
rents
Sp
ecia
l
Vir
tua
la
sS
um
me
rL
iab
ility
Ath
letic
Ed
uca
tio
nL
atc
hke
yT
ea
che
rsS
cho
ol
Exp
ense
Activi
ty
As
se
ts:
C
ash, ca
sh e
quiv
ale
nts
a
nd
inve
stm
ents
32
3,7
93
$
1,4
34
,55
9$
11
9,8
49
$
28
7,1
02
$
81
0,0
96
$
39
0,4
03
$
A
cco
unts
re
ce
iva
ble
-
-
21
,23
0
-
-
-
In
vento
ry-
-
-
-
-
-
T
ota
l asse
ts3
23
,79
3$
1,4
34
,55
9$
14
1,0
79
$
28
7,1
02
$
81
0,0
96
$
39
0,4
03
$
Lia
bilit
ies
:
A
cco
unts
pa
yab
le2
03
,55
3$
29
,66
8$
1,5
78
$
-$
26
,09
1$
44
,61
1$
A
ccru
ed
pa
yro
ll1
0,4
67
2,9
89
7,6
31
45
,18
2
-
-
A
dva
nce
- g
rants
-
-
25
,00
0
-
-
-
T
ota
l lia
bili
tie
s2
14
,02
0
32
,65
7
34
,20
9
45
,18
2
26
,09
1
44
,61
1
Fu
nd
Ba
lan
ce
s:
N
onsp
end
ab
le-
-
-
-
-
-
R
estr
icte
d1
09
,77
3
1,4
01
,90
2
10
6,8
70
24
1,9
20
78
4,0
05
34
5,7
92
U
na
ssig
ne
d-
-
-
-
-
-
T
ota
l fund
ba
lance
s1
09
,77
3
1,4
01
,90
2
10
6,8
70
24
1,9
20
78
4,0
05
34
5,7
92
T
ota
l lia
bili
tie
s, d
efe
rre
d inflo
ws o
f
r
eso
urc
es a
nd
fund
ba
lance
s
32
3,7
93
$
1,4
34
,55
9$
14
1,0
79
$
28
7,1
02
$
81
0,0
96
$
39
0,4
03
$
-
-
-
-
(co
ntinue
d)
Sp
ec
ial R
ev
en
ue
Fu
nd
s

Financial Section
Wichita Public Schools Page 74
Wic
hit
a P
ub
lic
Sc
ho
ols
Un
ifie
d S
ch
oo
l D
istr
ict
No
. 2
59
Co
mb
inin
g B
ala
nc
e S
he
et
No
nm
ajo
r G
ov
ern
me
nta
l F
un
ds
Ju
ne
30
, 2
01
6(c
on
tin
ue
d)
Ca
pit
al
Pro
jec
t
Fu
nd
s
To
tal
Stu
de
nt
Sup
ple
me
nta
lK
PE
RS
No
nm
ajo
r
Music
Ma
teri
al
Gra
nts
-R
etire
me
nt
Sp
ecia
lG
ov
ern
me
nta
l
Re
nta
lR
evo
lvin
gF
ed
era
lC
ontr
ibutio
ns
Asse
ssm
ents
Fu
nd
s
As
se
ts:
C
ash, ca
sh e
quiv
ale
nts
a
nd
inve
stm
ents
14
6,3
42
$
55
3,0
31
$
82
2,9
29
$
-$
1,0
04
,40
0$
5,8
92
,50
4$
A
cco
unts
re
ce
iva
ble
-
-
-
-
-
21
,23
0
In
vento
ry-
-
-
-
-
-
T
ota
l asse
ts1
46
,34
2$
55
3,0
31
$
82
2,9
29
$
-$
1,0
04
,40
0$
5,9
13
,73
4$
Lia
bilit
ies
:
A
cco
unts
pa
yab
le-
$
23
,30
4$
41
8,0
77
$
-$
-$
74
6,8
82
$
A
ccru
ed
pa
yro
ll-
-
58
3,1
76
-
-
64
9,4
45
A
dva
nce
- g
rants
-
-
78
1,8
94
-
-
80
6,8
94
T
ota
l lia
bili
tie
s-
23
,30
4
1,7
83
,14
7
-
-
2,2
03
,22
1
Fu
nd
Ba
lan
ce
s:
N
onsp
end
ab
le-
-
-
-
-
-
R
estr
icte
d1
46
,34
2
52
9,7
27
-
-
1,0
04
,40
0
4,6
70
,73
1
U
na
ssig
ne
d-
-
(96
0,2
18
)
-
-
(96
0,2
18
)
T
ota
l fund
ba
lance
s1
46
,34
2
52
9,7
27
(96
0,2
18
)
-
1,0
04
,40
0
3,7
10
,51
3
T
ota
l lia
bili
tie
s, d
efe
rre
d inflo
ws o
f
r
eso
urc
es a
nd
fund
ba
lance
s
14
6,3
42
$
55
3,0
31
$
82
2,9
29
$
-$
1,0
04
,40
0$
5,9
13
,73
4$
-
-
-
-
Sp
ec
ial R
ev
en
ue
Fu
nd
s

Financial Section
Wichita Public Schools Page 75
Wic
hit
a P
ub
lic
Sc
ho
ols
Wic
hit
a P
ub
lic
Sc
ho
ols
Un
ifie
d S
ch
oo
l D
istr
ict
No
. 2
59
Un
ifie
d S
ch
oo
l D
istr
ict
No
. 2
59
Co
mb
inin
g S
ch
ed
ule
of
Re
ve
nu
es
, E
xp
en
dit
ure
s a
nd
Ch
an
ge
s in
Fu
nd
Ba
lan
ce
sC
om
bin
ing
Sc
he
du
le o
f R
ev
en
ue
s,
Ex
pe
nd
itu
res
an
d C
ha
ng
es
in
Fu
nd
Ba
lan
ce
sN
on
ma
jor
Go
ve
rnm
en
tal F
un
ds
No
nm
ajo
r G
ov
ern
me
nta
l F
un
ds
Fo
r th
e Y
ea
r E
nd
ed
Ju
ne
30
, 2
01
6F
or
the
Ye
ar
En
de
d J
un
e 3
0,
20
16
(co
nti
nu
ed
)
Sp
ec
ial R
ev
en
ue
Fu
nd
s
Pa
rents
Sp
ecia
l
Vir
tua
la
s
Sum
me
rL
iab
ility
Ath
letic
Ed
uca
tio
nL
atc
hke
yT
ea
che
rsS
cho
ol
Exp
ense
Activi
ty
Re
ve
nu
es
:
T
axe
s-
$
-$
-$
-$
28
$
-$
In
terg
ove
rnm
enta
l - S
tate
1,2
22
,62
8
-
33
8,0
43
-
-
-
In
terg
ove
rnm
enta
l - F
ed
era
l-
65
9,5
33
21
,23
0
-
-
-
C
ha
rge
s fo
r se
rvic
es
-
3,0
09
,55
8
-
12
3,6
37
-
49
0,8
06
E
arn
ing
s o
n inve
stm
ents
-
-
-
-
2,4
23
1,3
14
O
the
r-
-
-
-
-
78
,76
5
T
ota
l re
venue
s1
,22
2,6
28
3,6
69
,09
1
35
9,2
73
12
3,6
37
2,4
51
57
0,8
85
Ex
pe
nd
itu
res
:
C
urr
ent:
In
str
uctio
n1
,06
6,5
29
3,3
74
,16
9
-
62
,92
8
-
85
6,2
87
S
tud
ent a
nd
instr
uctio
na
l sup
po
rt1
79
,49
1
-
35
0,2
58
11
,99
8
-
-
A
dm
inis
tra
tio
n1
83
,00
0
-
-
7,4
67
-
-
O
pe
ratio
ns a
nd
ma
inte
na
nce
-
-
-
3,3
68
36
7,3
79
-
S
tud
ent tr
ansp
ort
atio
n s
erv
ice
67
,39
7
-
-
-
-
-
N
utr
itio
n s
erv
ice
s-
-
-
-
-
-
T
ota
l exp
end
iture
s1
,49
6,4
17
3,3
74
,16
9
35
0,2
58
85
,76
1
36
7,3
79
85
6,2
87
E
xce
ss o
f re
venue
s o
ver
(und
er)
exp
end
iture
s(2
73
,78
9)
29
4,9
22
9,0
15
37
,87
6
(36
4,9
28
)
(28
5,4
02
)
Oth
er
fin
an
cin
g s
ou
rce
s (
us
es
):
T
ransfe
rs in
28
2,2
21
-
-
-
-
-
T
ransfe
rs o
ut
-
-
-
(36
,04
5)
-
-
T
ota
l oth
er
fina
ncin
g s
ourc
es (
use
s)
28
2,2
21
-
-
(36
,04
5)
-
-
Ne
t cha
ng
e in fund
ba
lance
s8
,43
2
29
4,9
22
9,0
15
1,8
31
(36
4,9
28
)
(28
5,4
02
)
Fu
nd
ba
lan
ce
s a
t b
eg
inn
ing
of
ye
ar
10
1,3
41
1,1
06
,98
0
97
,85
5
24
0,0
89
1,1
48
,93
3
63
1,1
94
Cha
ng
e in r
ese
rve
fo
r in
vento
ry-
-
-
-
-
-
Fu
nd
ba
lan
ce
s a
t e
nd
of
ye
ar
10
9,7
73
$
1,4
01
,90
2$
10
6,8
70
$
24
1,9
20
$
78
4,0
05
$
34
5,7
92
$
(co
ntinue
d)

Financial Section
Wichita Public Schools Page 76
Wic
hit
a P
ub
lic
Sc
ho
ols
Un
ifie
d S
ch
oo
l D
istr
ict
No
. 2
59
Co
mb
inin
g S
ch
ed
ule
of
Re
ve
nu
es
, E
xp
en
dit
ure
s a
nd
Ch
an
ge
s in
Fu
nd
Ba
lan
ce
sN
on
ma
jor
Go
ve
rnm
en
tal F
un
ds
Fo
r th
e Y
ea
r E
nd
ed
Ju
ne
30
, 2
01
6
(co
nti
nu
ed
)
Ca
pit
al
Pro
jec
t
Fu
nd
s
To
tal
Stu
de
nt
Sup
ple
me
nta
lK
PE
RS
No
nm
ajo
r
Music
Ma
teri
al
Gra
nts
-
Re
tire
me
nt
Sp
ecia
lG
ov
ern
me
nta
l
Re
nta
lR
evo
lvin
gF
ed
era
lC
ontr
ibutio
ns
Asse
ssm
ents
Fu
nd
s
Re
ve
nu
es
:
T
axe
s-
$
-$
-$
-$
99
7,5
95
$
99
7,6
23
In
terg
ove
rnm
enta
l - S
tate
-
-
-
28
,65
9,7
51
-
30
,22
0,4
22
In
terg
ove
rnm
enta
l - F
ed
era
l-
-
31
,75
5,2
61
-
-
32
,43
6,0
24
C
ha
rge
s fo
r se
rvic
es
53
,95
5
43
0,1
30
-
-
-
4,1
08
,08
6
E
arn
ing
s o
n inve
stm
ents
-
-
-
-
-
3,7
37
O
the
r-
-
35
4
-
-
79
,11
9
T
ota
l re
venue
s5
3,9
55
43
0,1
30
31
,75
5,6
15
28
,65
9,7
51
99
7,5
95
67
,84
5,0
11
Ex
pe
nd
itu
res
:
C
urr
ent:
In
str
uctio
n4
3,2
52
43
6,9
42
15
,64
3,2
97
18
,08
0,6
92
-
39
,56
4,0
96
S
tud
ent a
nd
instr
uctio
na
l sup
po
rt4
4
19
0,5
15
14
,81
4,9
19
4,4
74
,43
1
-
20
,02
1,6
56
A
dm
inis
tra
tio
n-
-
72
1,1
25
2,5
05
,47
5
-
3,4
17
,06
7
O
pe
ratio
ns a
nd
ma
inte
na
nce
-
-
96
9,7
32
3,0
16
,89
0
-
4,3
57
,36
9
S
tud
ent tr
ansp
ort
atio
n s
erv
ice
-
-
13
,67
5
56
,87
1
-
13
7,9
43
N
utr
itio
n s
erv
ice
s-
-
71
3,9
95
52
5,3
92
-
1,2
39
,38
7
T
ota
l exp
end
iture
s4
3,2
96
62
7,4
57
32
,87
6,7
43
28
,65
9,7
51
-
68
,73
7,5
18
E
xce
ss o
f re
venue
s o
ver
(und
er)
exp
end
iture
s1
0,6
59
(19
7,3
27
)
(1,1
21
,12
8)
-
99
7,5
95
(89
2,5
07
)
Oth
er
fin
an
cin
g s
ou
rce
s (
us
es
):
T
ransfe
rs in
-
-
-
-
-
28
2,2
21
T
ransfe
rs o
ut
-
-
-
-
-
(36
,04
5)
T
ota
l oth
er
fina
ncin
g s
ourc
es (
use
s)
-
-
-
-
-
24
6,1
76
Ne
t cha
ng
e in fund
ba
lance
s1
0,6
59
(19
7,3
27
)
(1,1
21
,12
8)
-
99
7,5
95
(64
6,3
31
)
Fu
nd
ba
lan
ce
s a
t b
eg
inn
ing
of
ye
ar
13
5,6
83
72
7,0
54
16
0,9
10
-
6,8
05
4,3
56
,84
4
Cha
ng
e in r
ese
rve
fo
r in
vento
ry-
-
-
-
-
-
Fu
nd
ba
lan
ce
s a
t e
nd
of
ye
ar
14
6,3
42
$
52
9,7
27
$
(96
0,2
18
)$
-$
1,0
04
,40
0$
3,7
10
,51
3$
Sp
ec
ial R
ev
en
ue
Fu
nd
s

Financial Section
Wichita Public Schools Page 77
Wichita Public Schools
Schedule of Revenues, Expenditures and Changes in
Fund Balance - Budget and Actual
Year ended June 30, 2016
Actual Variance with
Amounts Final Budget
Budgetary Over/
Original Final Basis (Under)
Revenues:
Taxes 52,601,802$ 52,601,802$ 55,551,987$ 2,950,185$
Intergovernmental - State - - - -
Other - - 175,368 175,368
Total revenues 52,601,802 52,601,802 55,727,355 3,125,553
Expenditures:
Current:
Instruction 140,000 140,000 229,605 89,605
Student and instructional support 738,268 738,268 1,079,207 340,939
Administration 1,084,129 1,084,129 891,736 (192,393)
Operations and maintenance 24,262,984 24,262,984 21,402,519 (2,860,465)
Student transportation service 16,503,503 16,503,503 14,062,695 (2,440,808)
Total expenditures 42,728,884 42,728,884 37,665,762 (5,063,122)
Revenues over (under) expenditures 9,872,918 9,872,918 18,061,593 8,188,675
Other financing sources (uses):
Transfers in 54,559,901 54,559,901 54,559,901 -
Transfers out (68,640,581) (68,640,581) (73,703,704) 5,063,123
Total other financing sources (uses) (14,080,680) (14,080,680) (19,143,803) 5,063,123
Revenues and other financing sources over (under)
expenditures and other uses (4,207,762) (4,207,762) (1,082,210) 3,125,552
Fund balances at beginning of year 4,207,762 4,207,762 4,207,762 -
Fund balances at end of year -$ -$ 3,125,552$ 3,125,552$
Budgeted Amounts
Unified School District No. 259
Supplemental General Fund

Financial Section
Wichita Public Schools Page 78
Wichita Public Schools
Schedule of Revenues, Expenditures and Changes in
Fund Balance - Budget and Actual
Year ended June 30, 2016
Actual Variance with
Amounts Final Budget
Budgetary Over/
Original Final Basis (Under)
Revenues:
Other -$ -$ -$ -$
Total revenues - - - -
Expenditures:
Current:
Student and instructional support 2,168,223 2,168,223 1,653,305 (514,918)
Total expenditures 2,168,223 2,168,223 1,653,305 (514,918)
Revenues over (under) expenditures (2,168,223) (2,168,223) (1,653,305) 514,918
Other financing sources (uses):
Transfers in 2,168,223 2,168,223 1,653,305 (514,918)
Total other financing sources (uses) 2,168,223 2,168,223 1,653,305 (514,918)
Revenues and other financing sources over (under)
expenditures and other uses - - - -
Fund balances at beginning of year - - - -
Fund balances at end of year -$ -$ -$ -$
Budgeted Amounts
Unified School District No. 259
Professional Development Fund

Financial Section
Wichita Public Schools Page 79
Wichita Public Schools
Schedule of Revenues, Expenditures and Changes in
Fund Balance - Budget and Actual
Year ended June 30, 2016
Actual Variance with
Amounts Final Budget
Budgetary Over/
Original Final Basis (Under)
Revenues:
Other -$ -$ -$ -$
Total revenues - - - -
Expenditures:
Current:
Instruction 4,667,548 4,667,548 4,064,599 (602,949)
Student and instructional support 4,152 4,152 26,768 22,616
Administration - - 888 888
Operations and maintenance 72,477 72,477 75,847 3,370
Total expenditures 4,744,177 4,744,177 4,168,102 (576,075)
Revenues over (under) expenditures (4,744,177) (4,744,177) (4,168,102) 576,075
Other financing sources (uses):
Transfers in 4,744,177 4,744,177 4,168,102 (576,075)
Total other financing sources (uses) 4,744,177 4,744,177 4,168,102 (576,075)
Revenues and other financing sources over (under)
expenditures and other uses - - - -
Fund balances at beginning of year - - - -
Fund balances at end of year -$ -$ -$ -$
Budgeted Amounts
Unified School District No. 259
Four Year Old State Intervention Fund

Financial Section
Wichita Public Schools Page 80
Wichita Public Schools
Schedule of Revenues, Expenditures and Changes in
Fund Balance - Budget and Actual
Year ended June 30, 2016
Actual Variance with
Amounts Final Budget
Budgetary Over/
Original Final Basis (Under)
Revenues:
Charges for services 87,000$ 87,000$ 99,386$ 12,386$
Other 16,419 16,419 28,955 12,536
Total revenues 103,419 103,419 128,341 24,922
Expenditures:
Current:
Instruction 67,215,312 67,215,312 66,048,046 (1,167,266)
Student and instructional support 1,371,412 1,371,412 1,316,597 (54,815)
Administration 778,766 778,766 852,429 73,663
Operations and maintenance 160,812 160,812 181,055 20,243
Total expenditures 69,526,302 69,526,302 68,398,127 (1,128,175)
Revenues over (under) expenditures (69,422,883) (69,422,883) (68,269,786) 1,153,097
Other financing sources (uses):
Transfers in 69,422,883 69,422,883 68,269,786 (1,153,097)
Total other financing sources (uses) 69,422,883 69,422,883 68,269,786 (1,153,097)
Revenues and other financing sources over (under)
expenditures and other uses - - - -
Fund balances at beginning of year - - - -
Fund balances at end of year -$ -$ -$ -$
Budgeted Amounts
Unified School District No. 259
State Intervention Fund (K-12)

Financial Section
Wichita Public Schools Page 81
Wichita Public Schools
Schedule of Revenues, Expenditures and Changes in
Fund Balance - Budget and Actual
Year ended June 30, 2016
Actual Variance with
Amounts Final Budget
Budgetary Over/
Original Final Basis (Under)
Revenues:
Other -$ -$ 1,711$ 1,711$
Total revenues - - 1,711 1,711
Expenditures:
Current:
Instruction 11,261,054 11,525,018 11,231,658 (293,360)
Student and instructional support 878,357 952,546 861,266 (91,280)
Administration 642,873 642,873 572,538 (70,335)
Operations and maintenance 70 7,721 - (7,721)
Transportation - 21,000 4,344 (16,656)
Total expenditures 12,782,354 13,149,158 12,669,806 (479,352)
Revenues over (under) expenditures (12,782,354) (13,149,158) (12,668,095) 481,063
Other financing sources (uses):
Transfers in 12,782,354 13,149,158 12,668,095 (481,063)
Total other financing sources (uses) 12,782,354 13,149,158 12,668,095 (481,063)
Revenues and other financing sources over (under)
expenditures and other uses - - - -
Fund balances at beginning of year - - - -
Fund balances at end of year -$ -$ -$ -$
Budgeted Amounts
Unified School District No. 259
Bilingual Education Fund

Financial Section
Wichita Public Schools Page 82
Wichita Public Schools
Schedule of Revenues, Expenditures and Changes in
Fund Balance - Budget and Actual
Year ended June 30, 2016
Actual Variance with
Amounts Final Budget
Budgetary Over/
Original Final Basis (Under)
Revenues:
Intergovernmental - State 35,374$ 35,374$ 35,486$ 112$
Charges for services 504,742 504,742 600,013 95,271
Other - - 17,157 17,157
Total revenues 540,116 540,116 652,656 112,540
Expenditures:
Current:
Instruction 9,002,388 9,002,388 8,989,220 (13,168)
Student and instructional support - - 6,374 6,374
Administration 633,893 633,893 635,976 2,083
Operations and maintenance 81,083 81,083 84,680 3,597
Total expenditures 9,717,364 9,717,364 9,716,250 (1,114)
Revenues over (under) expenditures (9,177,248) (9,177,248) (9,063,594) 113,654
Other financing sources (uses):
Transfers in 9,101,943 9,101,943 8,990,635 (111,308)
Total other financing sources (uses) 9,101,943 9,101,943 8,990,635 (111,308)
Revenues and other financing sources over (under)
expenditures and other uses (75,305) (75,305) (72,959) 2,346
Fund balances at beginning of year 75,305 75,305 75,305 -
Fund balances at end of year -$ -$ 2,346$ 2,346$
Budgeted Amounts
Unified School District No. 259
Vocational Education Fund

Financial Section
Wichita Public Schools Page 83
Wichita Public Schools
Schedule of Revenues, Expenditures and Changes in
Fund Balance - Budget and Actual
Year ended June 30, 2016
Actual Variance with
Amounts Final Budget
Budgetary Over/
Original Final Basis (Under)
Revenues:
Other -$ -$ 362$ 362$
Total revenues - - 362 362
Expenditures:
Current:
Instruction 1,313,624 1,313,624 1,075,576 (238,048)
Student and instructional support 172,750 172,750 179,142 6,392
Administration 174,211 174,211 183,000 8,789
Operations and maintenance 52,512 52,512 67,493 14,981
Total expenditures 1,713,097 1,713,097 1,505,211 (207,886)
Revenues over (under) expenditures (1,713,097) (1,713,097) (1,504,849) 208,248
Other financing sources (uses):
Transfers in 1,713,097 1,713,097 1,504,849 (208,248)
Total other financing sources (uses) 1,713,097 1,713,097 1,504,849 (208,248)
Revenues and other financing sources over (under)
expenditures and other uses - - - -
Fund balances at beginning of year - - - -
Fund balances at end of year -$ -$ -$ -$
Unified School District No. 259
Virtual Education Program
Budgeted Amounts

Financial Section
Wichita Public Schools Page 84
Wichita Public Schools
Schedule of Revenues, Expenditures and Changes in
Fund Balance - Budget and Actual
Year ended June 30, 2016
Actual Variance with
Amounts Final Budget
Budgetary Over/
Original Final Basis (Under)
Revenues:
Intergovernmental - Federal 670,000$ 670,000$ 659,533$ (10,467)$
Charges for services - - 3,009,558 3,009,558
Other 2,500,000 2,500,000 10,621 (2,489,379)
Total revenues 3,170,000 3,170,000 3,679,712 509,712
Expenditures:
Current:
Student and instruction support 4,234,804 4,234,804 3,437,445 (797,359)
Total expenditures 4,234,804 4,234,804 3,437,445 (797,359)
Revenues over (under) expenditures (1,064,804) (1,064,804) 242,267 1,307,071
Fund balances at beginning of year 1,064,804 1,064,804 1,064,804 -
Fund balances at end of year -$ -$ 1,307,071$ 1,307,071$
Budgeted Amounts
Unified School District No. 259
Latchkey Fund

Financial Section
Wichita Public Schools Page 85
Wichita Public Schools
Schedule of Revenues, Expenditures and Changes in
Fund Balance - Budget and Actual
Year ended June 30, 2016
Actual Variance with
Amounts Final Budget
Budgetary Over/
Original Final Basis (Under)
Revenues:Intergovernmental - State & Local 317,000$ 317,000$ 338,043$ 21,043$
Other 100,000 100,000 (117,728) (217,728)
Total revenues 417,000 417,000 220,315 (196,685)
Expenditures:
Current:
Student and instructional support 507,862 507,862 201,207 (306,655)
Total expenditures 507,862 507,862 201,207 (306,655)
Revenues over (under) expenditures (90,862) (90,862) 19,108 109,970
Fund balances at beginning of year 90,862 90,862 90,862 -
Fund balances at end of year -$ -$ 109,970$ 109,970$
Budgeted Amounts
Unified School District No. 259
Parents As Teachers Fund

Financial Section
Wichita Public Schools Page 86
Wichita Public Schools
Schedule of Revenues, Expenditures and Changes in
Fund Balance - Budget and Actual
Year ended June 30, 2016
Actual Variance with
Amounts Final Budget
Budgetary Over/
Original Final Basis (Under)
Revenues:
Charges for services 120,000$ 120,000$ 123,637$ 3,637$
Total revenues 120,000 120,000 123,637 3,637
Expenditures:
Current:
Instruction 206,323 206,323 62,928 (143,395)
Student and instructional support 5,442 5,442 11,998 6,556
Administration 4,680 4,680 7,467 2,787
Operations and maintenance - - 3,368 3,368
Total expenditures 216,445 216,445 85,761 (130,684)
Revenues over (under) expenditures (96,445) (96,445) 37,876 134,321
Other financing sources (uses):
Transfers out - - (36,045) 36,045
Total other financing sources (uses) - - (36,045) 36,045
Revenues and other financing sources over
(under) expenditures and other uses (96,445) (96,445) 1,831 98,276
Fund balances at beginning of year 240,088 240,088 240,088 -
Fund balances at end of year 143,643$ 143,643$ 241,919$ 98,276$
Budgeted Amounts
Unified School District No. 259
Summer School Fund

Financial Section
Wichita Public Schools Page 87
Wichita Public Schools
Schedule of Revenues, Expenditures and Changes in
Fund Balance - Budget and Actual
Year ended June 30, 2016
Actual Variance with
Amounts Final Budget
Budgetary Over/
Original Final Basis (Under)
Revenues:
Taxes -$ -$ 28$ 28$
Earnings on investments - - 2,423 2,423
Other - - 292 292
Total revenues - - 2,743 2,743
Expenditures:
Current:
Administration 990,600 990,600 476,359 (514,241)
Total expenditures 990,600 990,600 476,359 (514,241)
Revenues over (under) expenditures (990,600) (990,600) (473,616) 516,984
Fund balances at beginning of year 1,123,100 1,123,100 1,123,100 -
Fund balances at end of year 132,500$ 132,500$ 649,484$ 516,984$
Budgeted Amounts
Unified School District No. 259
Special Liability Expense Fund
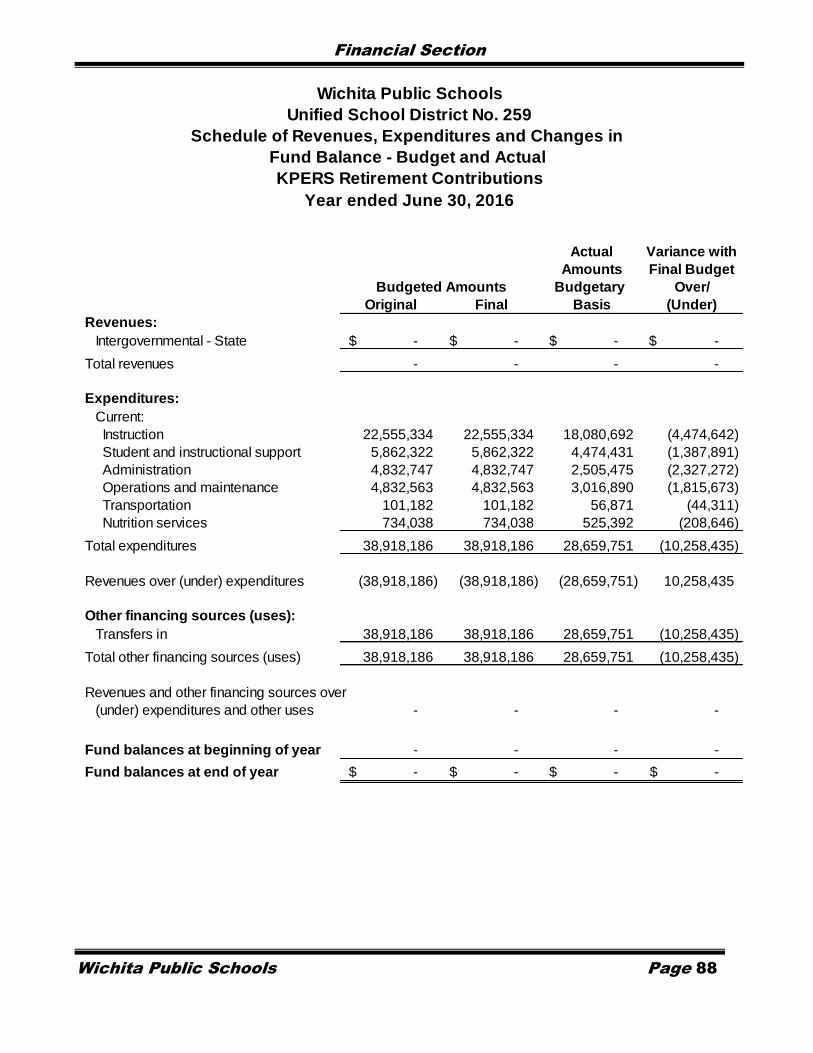
Financial Section
Wichita Public Schools Page 88
Wichita Public Schools
Schedule of Revenues, Expenditures and Changes in
Fund Balance - Budget and Actual
Year ended June 30, 2016
Actual Variance with
Amounts Final Budget
Budgetary Over/
Original Final Basis (Under)
Revenues:
Intergovernmental - State -$ -$ -$ -$
Total revenues - - - -
Expenditures:
Current:
Instruction 22,555,334 22,555,334 18,080,692 (4,474,642)
Student and instructional support 5,862,322 5,862,322 4,474,431 (1,387,891)
Administration 4,832,747 4,832,747 2,505,475 (2,327,272)
Operations and maintenance 4,832,563 4,832,563 3,016,890 (1,815,673)
Transportation 101,182 101,182 56,871 (44,311)
Nutrition services 734,038 734,038 525,392 (208,646)
Total expenditures 38,918,186 38,918,186 28,659,751 (10,258,435)
Revenues over (under) expenditures (38,918,186) (38,918,186) (28,659,751) 10,258,435
Other financing sources (uses):
Transfers in 38,918,186 38,918,186 28,659,751 (10,258,435)
Total other financing sources (uses) 38,918,186 38,918,186 28,659,751 (10,258,435)
Revenues and other financing sources over
(under) expenditures and other uses - - - -
Fund balances at beginning of year - - - -
Fund balances at end of year -$ -$ -$ -$
Budgeted Amounts
Unified School District No. 259
KPERS Retirement Contributions

Financial Section
Wichita Public Schools Page 89
Wichita Public Schools
Schedule of Revenues, Expenditures and Changes in
Fund Balance - Budget and Actual
Year ended June 30, 2016
Actual Variance with
Amounts Final Budget
Budgetary Over/
Original Final Basis (Under)
Revenues:
Taxes 977,666$ 977,666$ 997,595$ 19,929$
Total revenues 977,666 977,666 997,595 19,929
Expenditures:
Current:
Facility acquisition and construction service 984,471 984,471 - (984,471)
Total expenditures 984,471 984,471 - (984,471)
Revenues over (under) expenditures (6,805) (6,805) 997,595 1,004,400
Fund balances at beginning of year 6,805 6,805 6,805 -
Fund balances at end of year -$ -$ 1,004,400$ 1,004,400$
Budgeted Amounts
Unified School District No. 259
Special Assessment Fund

Financial Section
Wichita Public Schools Page 90
Wichita Public Schools
Schedule of Revenues, Expenditures and Changes in
Fund Balance - Budget and Actual
Year ended June 30, 2016
Actual Variance with
Amounts Final Budget
Budgetary Over/
Original Final Basis (Under)
Revenues:
Taxes 21,864,017$ 21,864,017$ 22,143,403$ 279,386$
Charges for services - - 4,755 4,755
Earnings on investments 47,000 47,000 70,992 23,992
Sale of property - - 534,492 534,492
Contributions and donations - - 428 428
Other 300,000 300,000 754,939 454,939
Total revenues 22,211,017 22,211,017 23,509,009 1,297,992
Expenditures:
Current:
Instruction 7,389,449 7,389,449 5,001,722 (2,387,727)
Student and instructional support 1,315,800 1,315,800 56,348 (1,259,452)
Operations and maintenance 6,182,504 6,182,504 9,114,530 2,932,026
Transportation 84,000 84,000 42,938 (41,062)
Facility acquisition and construction service 18,987,993 18,987,993 13,126,916 (5,861,077)
Total expenditures 33,959,746 33,959,746 27,342,454 (6,617,292)
Revenues over (under) expenditures (11,748,729) (11,748,729) (3,833,445) 7,915,284
Other financing sources (uses):
Transfers in 5,427,586 5,427,586 7,427,586 2,000,000
Total other financing sources (uses) 5,427,586 5,427,586 7,427,586 2,000,000
Revenues and other financing sources over (under)
expenditures and other uses (6,321,143) (6,321,143) 3,594,141 9,915,284
Fund balances at beginning of year 22,979,447 22,979,447 22,979,447 -
Prior period adjustment * - - (16,658,304) (16,658,304)
Fund balances at end of year 16,658,304$ 16,658,304$ 9,915,284$ (6,743,020)$
* A prior period adjustment was made to fund balance for prior year expenditures that were not included on this schedule.
Budgeted Amounts
Unified School District No. 259
Capital Outlay Fund

Financial Section
Wichita Public Schools Page 91
Wichita Public Schools
Schedule of Revenues, Expenditures and Changes in
Fund Balance - Budget and Actual
Actual Variance with
Amounts Final Budget
Budgetary Over/
Original Final Basis (Under)
Revenues:
Taxes 26,614,310$ 26,614,311$ 27,161,300$ 546,989$
Intergovernmental - State 15,644,705 15,644,705 15,500,450 (144,255)
Interest expense subsidy - Federal 4,397,238 4,397,238 4,409,097 11,859
Earnings on investments - 12,238 12,238 -
Total revenues 46,656,253 46,668,492 47,083,085 414,593
Expenditures:
Current:
Principal/Interest on long-term debt 44,611,866 87,240,131 86,782,103 (458,028)
Total expenditures 44,611,866 87,240,131 86,782,103 (458,028)
Revenues over (under) expenditures 2,044,387 (40,571,639) (39,699,018) 872,621
Other financing sources (uses):
Issuance of refunding bonds - 38,160,000 38,160,000 -
Premium on refunding bonds - 4,478,634 4,478,634 -
Total other financing sources (uses) - 42,638,634 42,638,634 -
Revenues over (under) expenditures 2,044,387 2,066,995 2,939,616 872,621
Fund balances at beginning of year 30,563,553 30,563,553 30,563,553 -
Fund balances at end of year 32,607,940$ 32,630,548$ 33,503,169$ 872,621$
Budgeted Amounts
Unified School District No. 259
Bond and Interest Fund
Year ended June 30, 2016

Financial Section
Wichita Public Schools Page 92

INTERNAL SERVICE FUNDS
Internal Service Funds are used by state and local governments to account for the financing of goods and services provided by one
department or agency to other departments or agencies and to other government units, on a cost-reimbursement basis. These funds are not required by the State to have adopted budgets. The internal service funds maintained by the District and the purpose of each are as follows:
Heathcare – used to account for premium deposits and expenditures to health care providers of medical and dental services for
covered District employees.
Disability Reserve - used to account for premiums and disability claims paid by the District on behalf of covered employees.
Workers’ Compensation – used to account for benefits provided for medical expenses and indemnity resulting from occupational
illness or injury to all employees under the Kansas Worker’s Compensation Act.
Risk Management – used to account for legal defense and payment of claims against the Board of Education when an incident
occurs during the course of employment. The deductible portion of the property and casualty, general liability, automobile and aviation premiums are also accounted for in this fund.


Financial Section
Wichita Public Schools Page 93
June 30, 2016
Disability Workers' Risk
Healthcare Reserve Compensation Management Total
Assets:
Current assets:
Cash and cash equivalents 11,777,741$ 3,626,217$ 16,025,007$ 2,926,417$ 34,355,382$
Total current assets 11,777,741 3,626,217 16,025,007 2,926,417 34,355,382
Liabilities:
Current liabilities:
Accrued liabilities 103,655 8,089 156,603 67,076 335,423
Current portion - claims payable 6,971,253 82,000 2,469,651 - 9,522,904
Total current liabilities 7,074,908 90,089 2,626,254 67,076 9,858,327
Noncurrent liabilities:
Long-term claims payable - - 4,556,984 - 4,556,984
Total liabilities 7,074,908 90,089 7,183,238 67,076 14,415,311
Net Position:
Total net position restricted for
self-insurance claims 4,702,833$ 3,536,128$ 8,841,769$ 2,859,341$ 19,940,071$
Wichita Public Schools
Combining Schedule of Net Position
Internal Service Funds
Unified School District No. 259

Financial Section
Wichita Public Schools Page 94
Disability Workers' Risk
Healthcare Reserve Compensation Management Total
Operating revenues:
Charges for services 54,913,965$ 1,326,127$ 2,327,971$ 872,494$ 59,440,557$
Other insurance reimbursements 5,125 - 13,269 - 18,394
Total operating revenues 54,919,090 1,326,127 2,341,240 872,494 59,458,951
Operating expenses:
Contractual services 64,569,944 985,477 1,895,938 1,641,300 69,092,659
Total operating expenses 64,569,944 985,477 1,895,938 1,641,300 69,092,659
Operating income (loss) (9,650,854) 340,650 445,302 (768,806) (9,633,708)
Nonoperating revenues:
Interest 13,499 7,847 36,048 9,357 66,751
Total nonoperating revenue 13,499 7,847 36,048 9,357 66,751
Income (loss) before transfers (9,637,355) 348,497 481,350 (759,449) (9,566,957)
Transfers in - - - 400,000 400,000
Change in net position (9,637,355) 348,497 481,350 (359,449) (9,166,957)
Total net position-beginning of year 14,340,188 3,187,631 8,360,419 3,218,790 29,107,028
Total net position-end of year 4,702,833$ 3,536,128$ 8,841,769$ 2,859,341$ 19,940,071$
Year ended June 30, 2016
Wichita Public Schools
Combining Schedule of Revenues, Expenses, and Changes in Fund Net Position
Internal Service Funds
Unified School District No. 259

Financial Section
Wichita Public Schools Page 95
Disability Workers' Risk
Healthcare Reserve Compensation Management Total
Cash flows from operating activities:
Cash received for services 54,913,965$ 1,326,127$ 2,327,971$ 872,494$ 59,440,557$
Cash received from insurance companies 5,125 - 13,269 - 18,394
Cash payments for claims (63,098,723) (981,412) (2,016,913) (1,614,518) (67,711,566)
Net cash flow from operating activities (8,179,633) 344,715 324,327 (742,024) (8,252,615)
Cash flows from non-capital financing activities:
Transfers from other funds - - - 400,000 400,000
Net cash flow from non-capital financing activities - - - 400,000 400,000
Cash flows from investing activities:
Interest on investments 13,499 7,847 36,048 9,357 66,751
Net cash flow from investing activities 13,499 7,847 36,048 9,357 66,751
Change in cash and cash equivalents (8,166,134) 352,562 360,375 (332,667) (7,785,864)
Cash and cash equivalents-beginning of the year 19,943,875 3,273,655 15,664,632 3,259,084 42,141,246
Cash and cash equivalents-end of the year 11,777,741$ 3,626,217$ 16,025,007$ 2,926,417$ 34,355,382$
Reconciliation of operating income (loss) to net cash
flow from operating activities:
Operating income (loss) (9,650,854)$ 340,650$ 445,302$ (768,806)$ (9,633,708)$
Adjustments to reconcile operating income (loss) to
net cash flow from operating activities:
Change in accrued liabilities 87,968 8,065 104,845 26,782 227,660
Change in claims payable 1,383,253 (4,000) (225,820) - 1,153,433
Net cash flow from operating activities (8,179,633)$ 344,715$ 324,327$ (742,024)$ (8,252,615)$
Year ended June 30, 2016
Wichita Public Schools
Combining Schedule of Cash Flows
Internal Service Funds
Unified School District No. 259

Financial Section
Wichita Public Schools Page 96

FIDUCIARY FUNDS
Fiduciary Funds are used when a government holds or manages financial resources in an agent or fiduciary capacity. The fiduciary
funds maintained by the District and the purpose of each are listed below:
Early Retirement Incentive Plan Trust – used to account for early retirement incentives.
Retiree Benefit Trust – used to account for other post-employment benefits (OPEB). Provides healthcare benefits, including
medical, dental, vision, and life, to eligible retirees. Student Activity – used to account for funds used to support co-curricular and extra-curricular student activities.
Payroll Trust – used to account for payroll taxes and other withholdings from employee wages that are owed to other
governmental agencies or others. Flexible Spending – used to account for elective pre-tax payroll withholdings from employee wages and payment of eligible
medical and dependent care costs.


Financial Section
Wichita Public Schools Page 97
Wichita Public Schools
Unified School District No. 259
Combining Schedule of Fiduciary Net Position
Fiduciary Funds - Employee Benefit Trust Funds
June 30, 2016
Early
Retirement
Incentive Plan
Trust
Retiree Benefit
Trust Total
Assets:
Cash 1,456,847$ 579,327$ 2,036,174$
Certificates of deposit 10,300,000 1,070,000 11,370,000
Investments 4,193,433 4,027,943 8,221,376
Interest receivable 30,368 23,684 54,052
Total assets 15,980,648 5,700,954 21,681,602
Liabilities:
Due to others - - -
Total liabilities - - -
Net Position:
Held in trust for other employee benefits 15,980,648 5,700,954 21,681,602
Total net position 15,980,648$ 5,700,954$ 21,681,602$

Financial Section
Wichita Public Schools Page 98
Wichita Public Schools
Unified School District No. 259
Combining Schedule of Changes in Fiduciary Net Position
Fiduciary Funds - Employee Benefit Trust Funds
For the Year Ended June 30, 2016
Early
Retirement
Incentive Plan
Trust
Retiree Benefit
Trust Total
Additions:
Employer contributions 16,361,780$ -$ 16,361,780$
Interest income 52,917 69,446 122,363
Total additions 16,414,697 69,446 16,484,143
Deductions:
Benefits 15,065,318 4,270,250 19,335,568
Administration - 188,122 188,122
Total deductions 15,065,318 4,458,372 19,523,690
Change in net position 1,349,379 (4,388,926) (3,039,547)
Net position - beginning of year 14,631,269 10,089,880 24,721,149
Net position - end of year 15,980,648$ 5,700,954$ 21,681,602$

Financial Section
Wichita Public Schools Page 99
Unified School District No. 259
Student Payroll Total
Activity Trust Flexible Agency
Funds Fund Spending Funds
Assets
Cash and cash equivalents 3,831,536$ 890,474$ (394,318)$ 4,327,692$
Total assets 3,831,536$ 890,474$ (394,318)$ 4,327,692$
Liabilities
Due to others 3,831,536$ 890,474$ (394,318)$ 4,327,692$
Total liabilities 3,831,536$ 890,474$ (394,318)$ 4,327,692$
Agency Funds
Wichita Public Schools
Combining Schedule of Fiduciary Assets and Liabilities
Fiduciary Funds - Agency Funds
June 30, 2016
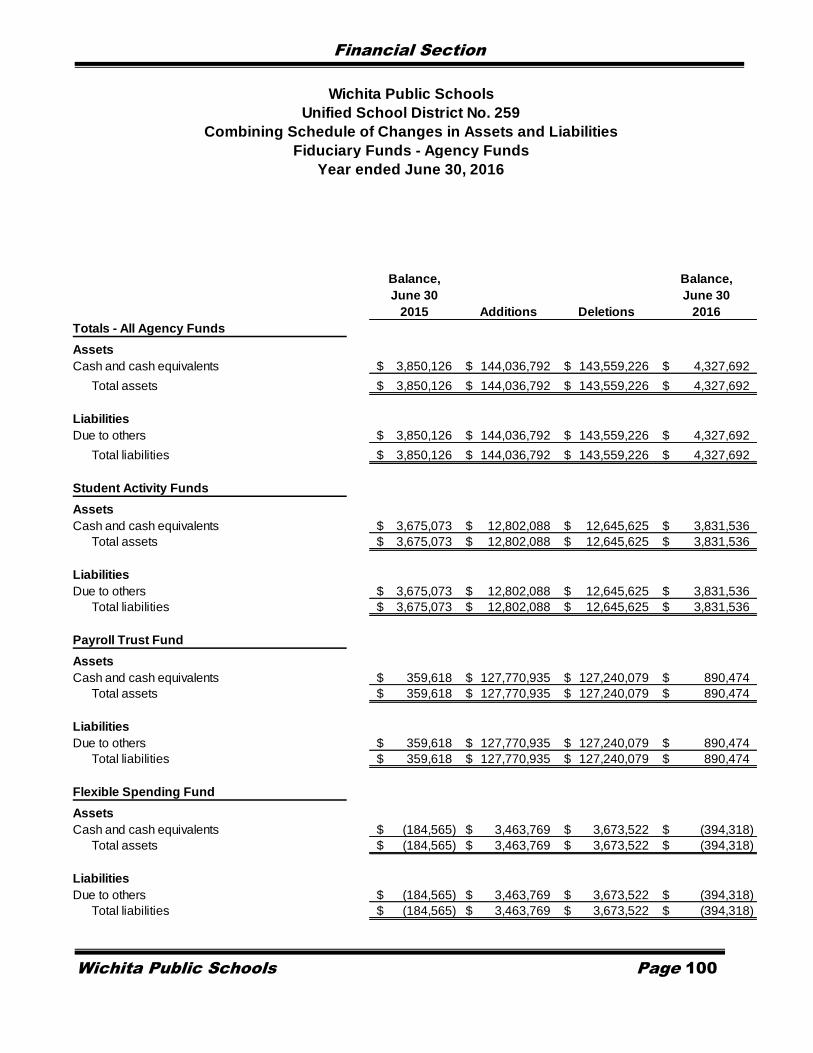
Financial Section
Wichita Public Schools Page 100
Unified School District No. 259
Balance, Balance,
June 30 June 30
2015 Additions Deletions 2016
Totals - All Agency Funds
Assets
Cash and cash equivalents 3,850,126$ 144,036,792$ 143,559,226$ 4,327,692$
Total assets 3,850,126$ 144,036,792$ 143,559,226$ 4,327,692$
Liabilities
Due to others 3,850,126$ 144,036,792$ 143,559,226$ 4,327,692$
Total liabilities 3,850,126$ 144,036,792$ 143,559,226$ 4,327,692$
Student Activity Funds
Assets
Cash and cash equivalents 3,675,073$ 12,802,088$ 12,645,625$ 3,831,536$
Total assets 3,675,073$ 12,802,088$ 12,645,625$ 3,831,536$
Liabilities
Due to others 3,675,073$ 12,802,088$ 12,645,625$ 3,831,536$
Total liabilities 3,675,073$ 12,802,088$ 12,645,625$ 3,831,536$
Payroll Trust Fund
Assets
Cash and cash equivalents 359,618$ 127,770,935$ 127,240,079$ 890,474$
Total assets 359,618$ 127,770,935$ 127,240,079$ 890,474$
Liabilities
Due to others 359,618$ 127,770,935$ 127,240,079$ 890,474$
Total liabilities 359,618$ 127,770,935$ 127,240,079$ 890,474$
Flexible Spending Fund
Assets
Cash and cash equivalents (184,565)$ 3,463,769$ 3,673,522$ (394,318)$
Total assets (184,565)$ 3,463,769$ 3,673,522$ (394,318)$
Liabilities
Due to others (184,565)$ 3,463,769$ 3,673,522$ (394,318)$
Total liabilities (184,565)$ 3,463,769$ 3,673,522$ (394,318)$
Wichita Public Schools
Combining Schedule of Changes in Assets and Liabilities
Fiduciary Funds - Agency Funds
Year ended June 30, 2016

Sta
tistic
al S
ec
tion


Statistical Section
Wichita Public Schools Page 101
STATISTICAL SECTION
This part of the Wichita Public Schools Comprehensive Annual Financial Report presents detailed information as a context for understanding what the information in the financial statements, note disclosures, and required supplementary information indicates about the Wichita Public Schools’ overall financial health. Contents Page Financial Trends These schedules contain trend information to help the reader 102 understand how the District’s financial performance and well- being have changed over time. Revenue Capacity These schedules contain information to help the reader 108 assess the District’s financially significant local revenue source, the property tax. Debt Capacity These schedules present information to help the reader 112 assess the affordability of the District’s current levels of outstanding debt and the District’s ability to issue additional debt in the future. Demographic and Economic Information These schedules offer demographic and economic indicators 116 to help the reader understand the environment within which the District’s financial activities take place. Operating Information These schedules contain service and infrastructure data to 119 help the reader understand how the information in the District’s financial report relates to the services the District provides and the activities it performs. Sources: Unless otherwise noted, the information in these schedules is derived from the Comprehensive Annual Financial Reports for the relevant year.

Statistical Section
Wichita Public Schools Page 102
2007 2008 2009 2010
Revenues:
Taxes (5) 126,534,430$ 138,635,857$ 142,769,888$ 149,855,266$
Intergovernmental - State (5) 315,665,158 344,323,411 361,839,622 320,824,377
Intergovernmental - Federal 59,971,569 57,235,874 58,799,705 96,757,118
Interest expense subsidy - Federal (2) - - - 2,435,821
Charges for services 6,011,281 5,561,626 6,492,556 5,890,320
Earnings on investments (3) 10,859,048 10,380,375 5,701,943 2,566,359
Other 6,953,381 3,763,512 2,763,531 2,397,458
Contributions 360,647 1,217,199 972,267 856,818
Total revenues 526,355,514 561,117,854 579,339,512 581,583,537
Expenditures:
Current:
Instruction 263,913,393 287,752,823 291,195,270 290,231,979
Student and instructional support 69,652,446 74,075,547 79,389,067 76,125,699
Administration 34,610,127 37,197,292 42,609,103 41,568,245
Operations and maintenance 57,507,190 65,557,633 70,351,157 61,571,070
Student transportation service 19,140,522 20,095,468 21,509,033 26,958,550
Nutrition services 16,727,652 17,424,261 19,342,146 18,974,782
Sub-total current expenditures 461,551,330 502,103,024 524,395,776 515,430,325
Facility acquisition and construction service 18,926,102 33,939,625 31,360,422 43,723,073
Debt Service:
Principal retirement (4) 11,465,000 12,264,999 13,075,000 13,955,000
Interest 13,860,796 13,211,519 12,907,387 21,802,132
Other - - - 887,791
Total expenditures 505,803,228 561,519,167 581,738,585 595,798,321
Excess (deficiency) of revenues
over (under) expenditures 20,552,286 (401,313) (2,399,073) (14,214,784)
Other financing sources (uses):
Bond issuance (1) - - 191,260,000 141,800,000
Refunding bond issuance - - - -
Premium on bond issuance (1) - - 5,336,620 1,193,154
Discount on bond issuance (1) - - (29,083) -
Payment to refunded bond escrow (1) - - (3,000,000) (9,285,000)
Premiums on bonds sold - - - -
Sale of property - - - 427,431
Transfers in 135,756,406 161,735,935 182,742,671 178,170,320
Transfers out (139,284,085) (161,867,852) (182,874,588) (181,794,428)
Total other financing sources (uses) (3,527,679) (131,917) 193,435,620 130,511,477
Net change in fund balances 17,024,607 (533,230) 191,036,547 116,296,693
Fund balances at beginning of year 202,152,788 219,457,827 218,586,019 409,711,044
Change in reserve for inventory 280,432 (338,577) 88,478 (301,488)
Fund balances at end of year 219,457,827$ 218,586,020$ 409,711,044$ 525,706,249$
Ratio of total debt service expenditures to
noncapital expenditures. 5.11% 4.79% 4.60% 6.47%
(1) In November 2008, Wichita citizens approved the passage of a $370 million bond issue.
(2) In the 2009 Federal stimulus plan, a new bond option w as created that allow ed bonds to be issued as taxable securities w ith the District
receiving a subsidy of 35% of the interest from the U.S. Treasury. Due to sequestration, the subsidy w as reduced to 32.48% in FY 2014,
32.45% in FY 2015 and the f irst half of FY16, and 32.62% in the second half of FY16.
(3) Decreases in investment earnings since FY 2008 are due to low er interest rates caused by the economic dow nturn, as w ell as
reduced balances resulting from reductions in state funding.
(4) The increase in FY 2013 is due to the current refunding of general obligation bonds. Advance refundings in prior years are
reflected in Other Financing Sources (Uses).
(5) The reduction in Taxes and increase in Intergovernmental - State in FY 2015 is due to a legislative change requiring counties to remit
school districts' General Fund taxes to the State of Kansas. The taxes are then distributed to districts as state aid.
STATEMENT OF REVENUES, EXPENDITURES AND CHANGES IN FUND BALANCES
GOVERNMENTAL FUNDS
Last Ten Fiscal Years Ended June 30,
(Continued on next page)

Statistical Section
Wichita Public Schools Page 103
2011 2012 2013 2014 2015 2016
148,191,597$ 152,246,674$ 151,694,016$ 152,072,266$ 100,385,117$ 105,863,014$
334,143,207 340,963,641 362,539,736 374,108,949 433,219,516 428,761,535
99,248,416 74,047,748 72,517,008 73,167,160 77,701,708 72,386,604
4,888,103 4,743,515 4,743,515 4,366,406 4,399,610 4,409,097
5,173,988 5,315,600 5,295,618 7,672,429 8,412,812 9,139,660
2,511,719 874,998 208,885 351,946 228,736 305,599
4,268,316 1,331,039 1,598,306 1,114,157 1,223,057 812,279
653,523 1,110,602 1,679,427 932,121 1,012,126 553,954
599,078,869 580,633,817 600,276,511 613,785,434 626,582,682 622,231,742
301,439,506 291,958,123 304,831,401 317,047,741 322,726,073 310,551,641
71,632,655 68,401,079 71,916,610 74,194,422 80,675,328 76,344,338
45,409,783 38,273,012 40,049,966 41,632,066 42,353,120 40,560,037
60,773,798 65,790,223 71,311,684 79,911,405 70,759,974 73,930,068
25,105,244 27,369,629 26,645,532 28,767,496 27,114,304 26,407,376
18,612,253 20,656,227 23,337,086 23,198,725 26,431,099 24,864,536
522,973,239 512,448,293 538,092,279 564,751,855 570,059,898 552,657,996
127,522,666 133,472,994 71,273,321 44,096,432 71,362,132 59,998,942
20,110,000 17,830,000 42,595,000 17,215,000 19,450,000 20,775,000
26,852,512 23,386,402 22,084,519 22,387,746 22,617,759 21,378,841
1,075,953 - 190,630 426,671 - 194,813
698,534,370 687,137,689 674,235,749 648,877,704 683,489,789 655,005,592
(99,455,501) (106,503,872) (73,959,238) (35,092,270) (56,907,107) (32,773,850)
- - 22,930,000 48,760,000 - -
39,960,000 - - 580,000 - 39,400,000
4,557,196 - 3,170,002 6,179,106 - 4,610,992
- - - - - -
(76,180,000) (37,790,000) - (592,979) - (42,433,450)
- - - - - -
268,111 350,877 1,716,015 1,319,650 1,648,681 534,492
45,048,382 62,519,291 58,629,955 59,978,723 61,255,205 45,627,872
(45,180,299) (62,651,208) (63,139,942) (60,110,640) (61,655,205) (46,027,872)
(31,526,610) (37,571,040) 23,306,030 56,113,860 1,248,681 1,712,034
(130,982,111) (144,074,912) (50,653,208) 21,021,590 (55,658,426) (31,061,816)
525,706,249 394,799,503 250,382,283 200,125,823 221,591,556 165,266,866
75,365 (342,308) 396,748 444,143 (666,264) 67,514
394,799,503$ 250,382,283$ 200,125,823$ 221,591,556$ 165,266,866$ 134,272,564$
8.17% 7.40% 11.10% 6.71% 6.93% 7.23%
(4)
STATEMENT OF REVENUES, EXPENDITURES AND CHANGES IN FUND BALANCES
GOVERNMENTAL FUNDS
Last Ten Fiscal Years Ended June 30,
(Continued from previous page)
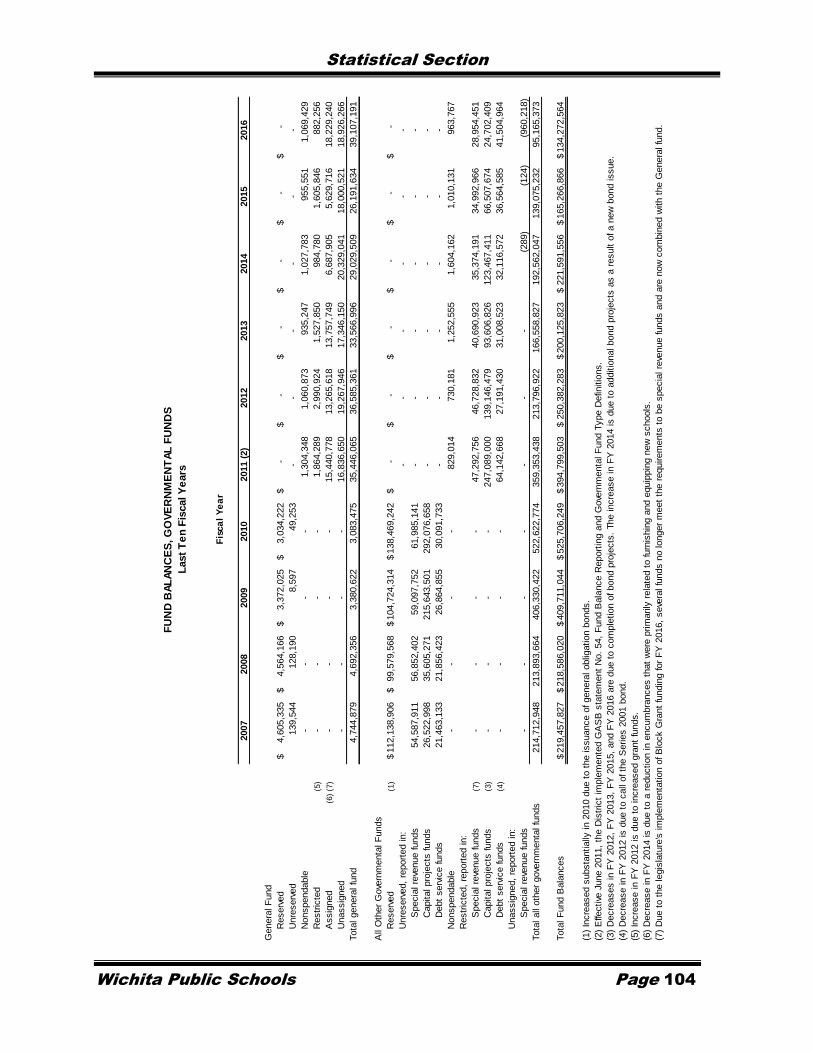
Statistical Section
Wichita Public Schools Page 104
2007
2008
2009
2010
2011 (
2)
2012
2013
2014
2015
2016
Genera
l F
und
Reserv
ed
4,6
05,3
35
$
4,5
64,1
66
$
3,3
72,0
25
$
3,0
34,2
22
$
$
-
$
-
$
-
$
-
$
-
$
-
Unre
serv
ed
139,5
44
128,1
90
8,5
97
49,2
53
--
--
--
Nonspendable
--
--
1,3
04,3
48
1,0
60,8
73
935,2
47
1,0
27,7
83
955,5
51
1,0
69,4
29
Restr
icte
d(5
)-
--
-1,8
64,2
89
2,9
90,9
24
1,5
27,8
50
984,7
80
1,6
05,8
46
882,2
56
Assig
ned
(6)
(7)
--
--
15,4
40,7
78
13,2
65,6
18
13,7
57,7
49
6,6
87,9
05
5,6
29,7
16
18,2
29,2
40
Unassig
ned
--
--
16,8
36,6
50
19,2
67,9
46
17,3
46,1
50
20,3
29,0
41
18,0
00,5
21
18,9
26,2
66
Tota
l genera
l fu
nd
4,7
44,8
79
4,6
92,3
56
3,3
80,6
22
3,0
83,4
75
35,4
46,0
65
36,5
85,3
61
33,5
66,9
96
29,0
29,5
09
26,1
91,6
34
39,1
07,1
91
All
Oth
er
Gove
rnm
enta
l F
unds
Reserv
ed
(1)
112,1
38,9
06
$
99,5
79,5
68
$
104,7
24,3
14
$
138,4
69,2
42
$
$
-
$
-
$
-
$
-
$
-
$
-
Unre
serv
ed,
report
ed in:
--
--
--
Specia
l re
venue funds
54,5
87,9
11
56,8
52,4
02
59,0
97,7
52
61,9
85,1
41
-
--
--
-
Capital pro
jects
funds
26,5
22,9
98
35,6
05,2
71
215,6
43,5
01
292,0
76,6
58
--
--
--
Debt
serv
ice funds
21,4
63,1
33
21,8
56,4
23
26,8
64,8
55
30,0
91,7
33
-
--
--
-
Nonspendable
--
--
829,0
14
730,1
81
1,2
52,5
55
1,6
04,1
62
1,0
10,1
31
963,7
67
Restr
icte
d,
report
ed in:
Specia
l re
venue funds
(7)
--
--
47,2
92,7
56
46,7
28,8
32
40,6
90,9
23
35,3
74,1
91
34,9
92,9
66
28,9
54,4
51
Capital pro
jects
funds
(3)
--
--
247,0
89,0
00
139,1
46,4
79
93,6
06,8
26
123,4
67,4
11
66,5
07,6
74
24,7
02,4
09
Debt
serv
ice funds
(4)
--
--
64,1
42,6
68
27,1
91,4
30
31,0
08,5
23
32,1
16,5
72
36,5
64,5
85
41,5
04,9
64
Unassig
ned,
report
ed in:
Specia
l re
venue funds
--
--
--
-(2
89)
(124)
(9
60,2
18)
Tota
l all
oth
er
gove
rnm
enta
l fu
nds
214,7
12,9
48
213,8
93,6
64
406,3
30,4
22
522,6
22,7
74
359,3
53,4
38
213,7
96,9
22
166,5
58,8
27
192,5
62,0
47
139,0
75,2
32
95,1
65,3
73
Tota
l F
und B
ala
nces
219,4
57,8
27
$
218,5
86,0
20
$
409,7
11,0
44
$
525,7
06,2
49
$
394,7
99,5
03
$
250,3
82,2
83
$
200,1
25,8
23
$
221,5
91,5
56
$
165,2
66,8
66
$
134,2
72,5
64
$
(1)
Incre
ased s
ubsta
ntially
in 2
010 d
ue t
o t
he issuance o
f genera
l oblig
ation b
onds.
(2)
Effe
ctive
June 2
011,
the D
istr
ict
imple
mente
d G
AS
B s
tate
ment
No.
54,
Fund B
ala
nce R
eport
ing a
nd G
ove
rnm
enta
l F
und T
ype D
efin
itio
ns.
(3)
Decre
ases in F
Y 2
012,
FY
2013,
FY
2015,
and F
Y 2
016 a
re d
ue t
o c
om
ple
tion o
f bond p
roje
cts
. The incre
ase in F
Y 2
014 is d
ue t
o a
dditio
nal bond p
roje
cts
as a
result o
f a n
ew
bond issue.
(4)
Decre
ase in F
Y 2
012 is d
ue t
o c
all
of th
e S
eries 2
001 b
ond.
(5)
Incre
ase in F
Y 2
012 is d
ue t
o incre
ased g
rant
funds.
(6)
Decre
ase in F
Y 2
014 is d
ue t
o a
reduction in e
ncum
bra
nces t
hat
were
prim
arily
rela
ted t
o furn
ishin
g a
nd e
quip
pin
g n
ew
schools
.
(7)
Due t
o t
he legis
latu
re's
im
ple
menta
tion o
f B
lock G
rant
fundin
g for
FY
2016,
seve
ral fu
nds n
o longer
meet
the r
equirem
ents
to b
e s
pecia
l re
venue funds a
nd a
re n
ow
com
bin
ed w
ith t
he G
enera
l fu
nd.
FU
ND
BA
LA
NC
ES
, G
OV
ER
NM
EN
TA
L F
UN
DS
Last
Te
n F
iscal Y
ears
Fis
ca
l Y
ea
r

Statistical Section
Wichita Public Schools Page 105
2007
2008
2009
2010 (
3)
2011
2012
2013
2014
2015
2016
Ex
pe
nse
s
Gove
rnm
enta
l activi
ties:
Instr
uction
(1)
288,5
93,3
64
$
302,6
62,7
54
$
311,7
41,0
71
$
304,1
75,6
35
$
324,0
59,3
24
$
304,4
92,9
92
$
310,4
36,7
96
$
346,6
85,3
99
$
361,2
33,4
11
$
346,4
55,6
86
$
Stu
dent
and instr
uctional support
72,5
36,3
22
74,3
97,2
53
80,9
05,2
16
75,2
54,5
86
72,6
00,4
64
66,1
54,3
24
70,4
66,9
57
75,3
91,2
83
82,8
46,5
35
78,3
75,8
66
Adm
inis
tration
36,0
72,3
51
37,4
38,1
48
43,1
70,6
71
41,3
77,7
98
42,7
05,4
47
36,8
96,4
38
39,5
67,2
65
42,0
55,7
47
43,9
39,1
52
42,2
01,5
08
Opera
tions a
nd m
ain
tenance
(9)
61,2
84,6
41
66,2
25,1
49
72,1
10,5
71
66,4
82,8
72
65,6
17,6
12
65,1
31,6
62
69,2
26,7
27
82,5
20,4
06
74,0
32,6
76
74,8
30,1
91
Stu
dent
transport
ation s
erv
ices
19,5
25,8
00
20,2
80,1
50
22,0
40,1
31
26,5
74,0
28
25,3
02,5
89
27,4
85,1
48
26,0
44,8
01
29,1
59,0
38
27,0
97,0
70
26,3
86,1
73
Nutr
itio
n s
erv
ices
17,2
18,1
79
17,6
08,6
51
19,6
61,9
02
19,1
99,9
80
18,7
82,9
75
20,6
61,4
01
20,6
36,3
34
20,9
58,8
61
26,9
18,6
61
24,0
14,6
79
Inte
rest
on long-t
erm
debt
(4)
12,9
64,7
77
12,3
05,1
56
12,5
30,1
01
22,7
52,9
09
24,2
52,5
96
21,1
62,2
87
19,9
28,8
85
20,3
03,2
68
19,8
03,1
24
18,3
64,5
28
Tota
l prim
ary
gove
rnm
ent
expenses
508,1
95,4
34
$
530,9
17,2
61
$
562,1
59,6
63
$
555,8
17,8
08
$
573,3
21,0
07
$
541,9
84,2
52
$
556,3
07,7
65
$
617,0
74,0
02
$
635,8
70,6
29
$
610,6
28,6
31
$
Pro
gra
m R
eve
nu
es
Gove
rnm
enta
l activi
ties:
Charg
es for
serv
ices
Instr
uction
(6)
1,5
97,1
91
$
1,6
96,7
80
$
2,4
81,2
55
$
2,2
16,3
42
$
1,9
64,4
20
$
2,0
60,8
64
$
1,9
93,6
94
$
7,1
38,2
21
$
5,0
33,8
29
$
5,6
66,1
70
$
Stu
dent
and instr
uctional support
64,2
13
69,2
16
75,0
60
108,9
82
82,6
19
37,2
94
108,4
00
78
21,8
21
130,7
60
Opera
tions a
nd m
ain
tenance
(7)
620,8
56
--
-
-
-
-
-
4,3
20
4,7
55
Nutr
itio
n s
erv
ices
3,7
29,0
21
3,7
95,6
30
3,9
36,2
41
3,5
64,9
96
3,1
26,7
97
3,2
17,4
42
3,1
93,5
24
3,2
81,8
89
3,3
52,8
42
3,3
37,9
75
Opera
ting g
rants
and c
ontr
ibutions
(2)
(11)
137,1
95,5
13
131,7
16,0
12
132,8
72,9
05
261,9
12,9
62
270,8
53,0
79
245,9
91,4
67
249,4
60,5
14
256,1
61,5
15
268,0
15,8
91
172,9
72,4
36
Capital gra
nts
and c
ontr
ibutions
(5)
-
-
218,5
97
-
-
6,4
87,5
75
4,1
45,2
71
1,2
11,7
08
1,6
73,9
80
87,1
11
Tota
l prim
ary
gove
rnm
ent
pro
gra
m r
eve
nues
143,2
06,7
94
$
137,2
77,6
38
$
139,5
84,0
58
$
267,8
03,2
82
$
276,0
26,9
15
$
257,7
94,6
42
$
258,9
01,4
03
$
267,7
93,4
11
$
278,1
02,6
83
$
182,1
99,2
07
$
Ne
t (E
xp
en
se)/
Re
ve
nu
e
Tota
l prim
ary
gove
rnm
ent
net
expense
(364,9
88,6
40)
$
(393,6
39,6
23)
$
(422,5
75,6
05)
$
(288,0
14,5
26)
$
(297,2
94,0
92)
$
(284,1
89,6
10)
$
(297,4
06,3
62)
$
(349,2
80,5
91)
$
(357,7
67,9
46)
$
(428,4
29,4
24)
$
Ge
ne
ral
Re
ve
nu
e a
nd
Oth
er
Ch
an
ge
s in
Ne
t P
osi
tio
n
Gove
rnm
enta
l activi
ties:
Taxes
Pro
pert
y t
axes levi
ed for
genera
l purp
oses
(10)
90,8
71,3
64
$
101,5
68,3
85
$
104,9
14,5
77
$
103,8
99,2
33
$
102,7
54,7
94
$
107,5
64,0
69
$
110,7
10,1
76
$
116,3
49,9
86
$
51,3
55,6
34
$
56,5
58,3
11
$
Pro
pert
y t
axes levi
ed for
debt
serv
ice
16,6
47,0
85
16,9
96,6
67
17,3
26,5
43
25,6
92,9
71
25,6
78,5
90
27,0
04,2
92
27,0
56,4
92
22,9
63,3
46
27,4
38,4
03
27,1
61,3
00
Pro
pert
y t
axes levi
ed for
capital outlay
19,0
15,9
81
20,0
70,8
05
20,5
28,7
68
20,2
63,0
62
19,7
58,2
13
17,6
78,3
13
13,9
27,3
48
12,7
58,9
34
21,5
91,0
80
22,1
43,4
03
Sta
te a
nd federa
l aid
not
restr
icte
d t
o s
pecifi
c p
urp
oses
(10)
(11)
238,7
90,8
46
271,0
60,4
71
288,5
20,0
92
158,9
61,1
72
168,0
80,1
71
168,2
35,2
82
181,5
57,7
19
188,8
24,3
83
240,1
08,7
13
325,4
53,3
30
Sta
te a
id r
eceiv
ed for
debt
serv
ice (
princip
al)
-
-
-
-
-
4,8
14,1
00
5,6
08,5
00
6,0
23,1
00
7,1
96,5
00
8,1
02,2
50
Earn
ings o
n inve
stm
ents
(8)
11,7
60,3
89
11,0
69,0
66
5,9
50,6
37
2,6
29,0
93
2,5
98,0
57
919,0
21
279,1
78
397,0
61
274,5
84
372,3
50
Sale
of pro
pert
y-
-
519,5
92
427,4
31
--
-
-
-
-
Mis
cella
neous
6,9
64,3
96
3,8
03,5
13
2,2
43,9
39
2,3
97,4
58
4,2
68,4
66
1,3
31,0
39
1,5
98,3
06
1,1
14,1
60
1,7
46,4
13
1,3
45,3
77
Tota
l prim
ary
gove
rnm
ent
genera
l re
venue
384,0
50,0
61
$
424,5
68,9
07
$
440,0
04,1
48
$
314,2
70,4
20
$
323,1
38,2
91
$
327,5
46,1
16
$
340,7
37,7
19
$
348,4
30,9
70
$
349,7
11,3
27
$
441,1
36,3
21
$
Ch
an
ge
in
Ne
t P
osi
tio
n
Tota
l prim
ary
gove
rnm
ent
19,0
61,4
21
$
30,9
29,2
84
$
17,4
28,5
43
$
26,2
55,8
94
$
25,8
44,1
99
$
43,3
56,5
06
$
43,3
31,3
57
$
(8
49,6
21)
$
(8
,056,6
19)
$
12,7
06,8
97
$
(1)
The D
istr
ict's
expenses for
instr
uction incre
ased s
ignifi
cantly fro
m F
Y 2
007 t
o F
Y 2
009 a
s a
result o
f th
e B
oard
initia
tive
to r
educe c
lass s
ize a
nd t
o e
xpand a
ll-day k
inderg
art
en t
o a
ll ele
menta
ries.
FY
2010 a
nd F
Y 2
012 r
eductions a
re
due t
o S
tate
aid
cuts
. F
Y 2
011 incre
ase is d
ue t
o F
edera
l fu
nds.
(2)
The D
istr
ict
receiv
es F
edera
l dolla
rs for
nin
e T
itle
fundin
g s
ourc
es,
specia
l education,
and o
ther
gra
nts
inclu
din
g t
he A
merican R
ein
vestm
ent
and R
ecove
ry A
ct
(AR
RA
) in
2010 a
nd 2
011.
(3)
Sta
rtin
g in F
Y 2
010,
Sta
te a
id g
enera
ted for
at-
risk,
bili
ngual, v
irtu
al, a
nd s
pecia
l education form
erly r
eport
ed in S
tate
and federa
l aid
not
restr
icte
d t
o s
pecifi
c p
urp
oses is r
efle
cte
d in o
pera
ting g
rants
and c
ontr
ibutions.
FY
2010 h
as
been r
esta
ted for
com
parison p
urp
oses.
(4)
The incre
ase in 2
010 is d
ue t
o a
dditio
nal bond issuances.
(5)
Am
ounts
show
n a
re p
rim
arily
att
ributa
ble
to F
EM
A fundin
g o
f sto
rm s
helters
. F
Y 2
013 t
hro
ugh F
Y 2
016 a
lso inclu
de fundin
g fro
m G
race M
ed H
ealth C
linic
and t
he D
epart
ment
of H
um
an R
esourc
es &
Serv
ices A
dm
inis
tration for
constu
ction o
f health c
linic
s a
t school sites t
o s
erv
e s
tudents
and s
taff
at
those s
chools
and t
he s
urr
oundin
g c
om
munity.
FY
2016 d
ecre
ased d
ue t
o c
onstr
uction o
f fe
wer
sto
rm s
helters
and c
linic
s.
(6)
The incre
ase in F
Y 2
014 is d
ue t
o a
net
impairm
ent
gain
rela
ted t
o a
fire in a
school build
ing a
nd a
change in t
he m
eth
od in w
hic
h L
atc
hkey fees a
re h
andle
d.
(7)
The F
Y 2
007 a
mount
is a
ttributa
ble
to a
gra
nt.
(8)
Decre
ases in inve
stm
ent
earn
ings s
ince F
Y 2
008 a
re d
ue t
o low
er
inte
rest
rate
s c
aused b
y t
he e
conom
ic d
ow
ntu
rn,
as w
ell
as r
educed b
ala
nces r
esultin
g fro
m r
eductions in s
tate
fundin
g.
(9)
The incre
ase in F
Y 2
014 is a
result o
f tw
o p
rim
ary
facto
rs:
1)
A c
onsid
era
bly
hig
her
num
ber
of ro
of re
pairs r
ela
ted t
o h
ail
dam
age t
han in p
rior
years
, and,
2)
Expensin
g m
any s
mall
item
s t
hat
did
not
meet
the D
istr
ict's
capitaliz
ation
thre
shold
(re
pla
cem
ents
of item
s d
estr
oyed in a
school fir
e).
(10)
The F
Y 2
015 d
ecre
ase in p
ropert
y t
axes levi
ed for
genera
l purp
oses a
nd incre
ase in s
tate
and federa
l aid
not
restr
icte
d t
o s
pecifi
c p
urp
oses is d
ue t
o a
legis
lative
change r
equirin
g c
ounties t
o r
em
it s
chool dis
tric
ts' G
enera
l F
und t
axes
to t
he S
tate
of K
ansas.
The t
axes a
re t
hen d
istr
ibute
d t
o d
istr
icts
as s
tate
aid
.
(11)
D
ue t
o t
he legis
latu
re's
im
ple
menta
tion o
f B
lock G
rant
fundin
g for
FY
2016,
sta
te a
id t
hat
was p
revi
ously
desig
nate
d for
specifi
c p
urp
oses a
nd inclu
ded in O
pera
ting g
rants
and c
ontr
ibutions is n
o longer
restr
icte
d t
o t
hose p
urp
oses.
It
is t
here
fore
now
inclu
ded in S
tate
and federa
l aid
not
restr
icte
d t
o s
pecifi
c p
urp
oses.
Fis
ca
l Y
ea
r
SC
HE
DU
LE
OF
CH
AN
GE
S IN
NE
T P
OS
ITIO
N
La
st
Te
n F
isc
al Y
ea
rs
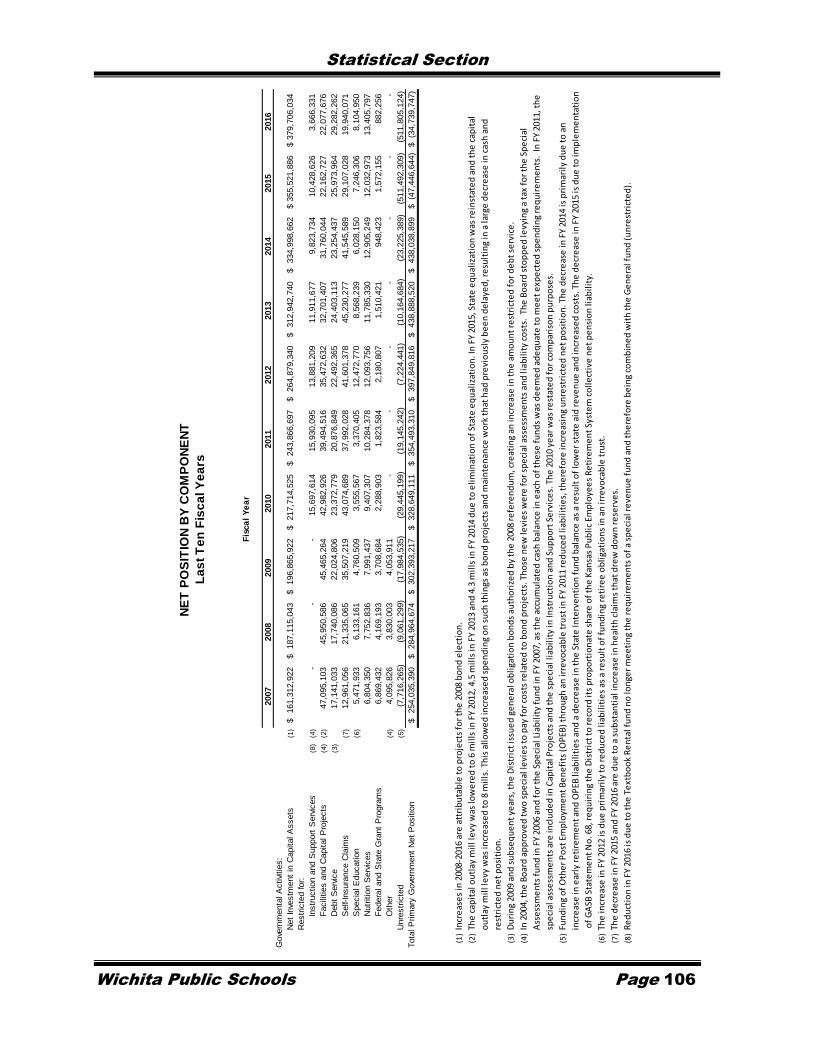
Statistical Section
Wichita Public Schools Page 106
2007
2008
2009
2010
2011
2012
2013
2014
2015
2016
Gove
rnm
enta
l A
ctivi
ties:
Net
Inve
stm
ent
in C
apital A
ssets
(1)
161,3
12,9
22
$
187,1
15,0
43
$
196,8
65,9
22
$
217,7
14,5
25
$
243,8
66,6
97
$
264,8
79,3
40
$
312,9
42,7
40
$
334,9
98,6
62
$
355,5
21,8
86
$
379,7
06,0
34
$
Restr
icte
d for:
Instr
uction a
nd S
upport
Serv
ices
(8)
(4)
-
-
-
15,6
97,6
14
15,9
30,0
95
13,8
81,2
09
11,9
11,6
77
9,8
23,7
34
10,4
28,6
26
3,6
66,3
31
Facili
ties a
nd C
apital P
roje
cts
(4)
(2
)
47,0
95,1
03
45,9
50,5
86
45,4
65,2
64
42,9
82,9
26
39,4
94,5
16
35,4
72,6
32
32,7
01,4
07
31,7
60,0
44
22,1
62,7
27
22,0
77,6
76
Debt
Serv
ice
(3)
17,1
41,0
33
17,7
40,0
86
22,0
24,8
06
23,3
72,7
79
20,8
76,8
49
22,4
92,3
65
24,4
03,1
13
23,2
54,4
37
25,9
73,9
64
29,2
82,2
62
Self-
Insura
nce C
laim
s(7
)
12,9
61,0
56
21,3
35,0
65
35,5
07,2
19
43,0
74,6
89
37,9
92,0
28
41,6
01,3
78
45,2
30,2
77
41,5
45,5
89
29,1
07,0
28
19,9
40,0
71
Specia
l E
ducation
(6)
5,4
71,9
33
6,1
33,1
61
4,7
60,5
09
3,5
55,5
67
3,3
70,4
05
12,4
72,7
70
8,5
68,2
39
6,0
28,1
50
7,2
46,3
06
8,1
04,9
50
Nutr
itio
n S
erv
ices
6,8
04,3
50
7,7
52,8
36
7,9
91,4
37
9,4
07,3
07
10,2
84,3
78
12,0
93,7
56
11,7
85,3
30
12,9
05,2
49
12,0
32,9
73
13,4
05,7
97
Federa
l and S
tate
Gra
nt
Pro
gra
ms
6,8
69,4
32
4,1
69,1
93
3,7
08,6
84
2,2
88,9
03
1,8
23,5
84
2,1
80,8
07
1,5
10,4
21
948,4
23
1,5
72,1
55
882,2
56
Oth
er
(4)
4,0
95,8
26
3,8
30,0
03
4,0
53,9
11
-
--
-
-
-
-
Unre
str
icte
d(5
)
(7,7
16,2
65)
(9,0
61,2
99)
(17,9
84,5
35)
(2
9,4
45,1
99)
(1
9,1
45,2
42)
(7
,224,4
41)
(10,1
64,6
84)
(2
3,2
25,3
89)
(5
11,4
92,3
09)
(5
11,8
05,1
24)
Tota
l P
rim
ary
Gove
rnm
ent
Net
Positio
n254,0
35,3
90
$
284,9
64,6
74
$
302,3
93,2
17
$
328,6
49,1
11
$
354,4
93,3
10
$
397,8
49,8
16
$
438,8
88,5
20
$
438,0
38,8
99
$
(4
7,4
46,6
44)
$
(34,7
39,7
47)
$
(1)
In
cre
ase
s in
200
8-20
16 a
re a
ttri
bu
tab
le t
o p
roje
cts
for
the
200
8 b
on
d e
lect
ion
.
(2)
Th
e c
apit
al o
utl
ay m
ill l
evy
was
low
ere
d t
o 6
mil
ls in
FY
2012
, 4.5
mil
ls in
FY
2013
an
d 4
.3 m
ills
in F
Y 20
14 d
ue
to
eli
min
atio
n o
f St
ate
eq
ual
izat
ion
. In
FY
2015
, Sta
te e
qu
aliz
atio
n w
as r
ein
stat
ed
an
d t
he
cap
ital
ou
tlay
mil
l le
vy w
as in
cre
ase
d t
o 8
mil
ls. T
his
all
ow
ed
incr
eas
ed
sp
en
din
g o
n s
uch
th
ings
as
bo
nd
pro
ject
s an
d m
ain
ten
ance
wo
rk t
hat
had
pre
vio
usl
y b
ee
n d
ela
yed
, re
sult
ing
in a
larg
e d
ecr
eas
e in
cas
h a
nd
rest
rict
ed
ne
t p
osi
tio
n.
(3)
D
uri
ng
2009
an
d s
ub
seq
ue
nt
year
s, t
he
Dis
tric
t is
sue
d g
en
era
l ob
liga
tio
n b
on
ds
auth
ori
zed
by
the
200
8 re
fere
nd
um
, cre
atin
g an
incr
eas
e in
th
e a
mo
un
t re
stri
cte
d f
or
de
bt
serv
ice
.
(4)
In
200
4, t
he
Bo
ard
ap
pro
ved
tw
o s
pe
cial
levi
es
to p
ay f
or
cost
s re
late
d t
o b
on
d p
roje
cts.
Th
ose
ne
w le
vie
s w
ere
fo
r sp
eci
al a
sse
ssm
en
ts a
nd
liab
ilit
y co
sts.
Th
e B
oar
d s
top
pe
d le
vyin
g a
tax
for
the
Sp
eci
al
Ass
ess
me
nts
fu
nd
in F
Y 20
06 a
nd
fo
r th
e S
pe
cial
Lia
bil
ity
fun
d in
FY
2007
, as
the
acc
um
ula
ted
cas
h b
alan
ce in
eac
h o
f th
ese
fu
nd
s w
as d
ee
me
d a
de
qu
ate
to
me
et
exp
ect
ed
sp
en
din
g re
qu
ire
me
nts
. In
FY
2011
, th
e
spe
cial
ass
ess
me
nts
are
incl
ud
ed
in C
apit
al P
roje
cts
and
th
e s
pe
cial
liab
ilit
y in
Inst
ruct
ion
an
d S
up
po
rt S
erv
ice
s. T
he
201
0 ye
ar w
as r
est
ate
d f
or
com
par
iso
n p
urp
ose
s.
(5)
Fu
nd
ing
of
Oth
er
Po
st E
mp
loym
en
t B
en
efi
ts (
OP
EB)
thro
ugh
an
irre
voca
ble
tru
st in
FY
2011
re
du
ced
liab
ilit
ies,
th
ere
fore
incr
eas
ing
un
rest
rict
ed
ne
t p
osi
tio
n. T
he
de
cre
ase
in F
Y 20
14 is
pri
mar
ily
du
e t
o a
n
incr
eas
e in
ear
ly r
eti
rem
en
t an
d O
PEB
liab
ilit
ies
and
a d
ecr
eas
e in
th
e S
tate
Inte
rve
nti
on
fu
nd
bal
ance
as
a re
sult
of
low
er
stat
e a
id r
eve
nu
e a
nd
incr
eas
ed
co
sts.
Th
e d
ecr
eas
e in
FY
2015
is d
ue
to
imp
lem
en
tati
on
of
GA
SB S
tate
me
nt
No
. 68,
re
qu
irin
g th
e D
istr
ict
to r
eco
rd it
s p
rop
ort
ion
ate
sh
are
of
the
Kan
sas
Pu
bli
c Em
plo
yee
s R
eti
rem
en
t Sy
ste
m c
oll
ect
ive
ne
t p
en
sio
n li
abil
ity.
(6)
Th
e in
cre
ase
in F
Y 20
12 is
du
e p
rim
aril
y to
re
du
ced
liab
ilit
ies
as a
re
sult
of
fun
din
g re
tire
e o
bli
gati
on
s in
an
irre
voca
ble
tru
st.
(7)
Th
e d
ecr
eas
e in
FY
2015
an
d F
Y 20
16 a
re d
ue
to
a s
ub
stan
tial
incr
eas
e in
he
alth
cla
ims
that
dre
w d
ow
n r
ese
rve
s.
(8)
R
ed
uct
ion
in F
Y 20
16 is
du
e t
o t
he
Te
xtb
oo
k R
en
tal f
un
d n
o lo
nge
r m
ee
tin
g th
e r
eq
uir
em
en
ts o
f a
spe
cial
re
ven
ue
fu
nd
an
d t
he
refo
re b
ein
g co
mb
ine
d w
ith
th
e G
en
era
l fu
nd
(u
nre
stri
cte
d).
NE
T P
OS
ITIO
N B
Y C
OM
PO
NE
NT
La
st
Te
n F
isc
al Y
ea
rs
Fis
ca
l Y
ea
r

Statistical Section
Wichita Public Schools Page 107
2007
2008
2009
2010
2011
2012
2013
2014
2015
2016
Re
ve
nu
es:
Unre
str
icte
d s
tate
school aid
(2)
(5
)
(6)
191,1
16,4
43
$
195,0
68,8
82
$
194,8
62,0
53
$
155,6
81,9
24
$
161,1
95,7
04
$
166,6
27,0
15
$
175,6
58,9
38
$
183,3
71,1
38
$
239,1
16,6
17
$
332,4
71,2
14
$
Tra
nsport
ation a
id(6
)
7,1
85,7
52
7,6
19,9
45
7,5
47,3
20
8,1
49,1
74
8,6
80,6
91
8,5
20,1
20
8,3
31,5
30
8,4
12,8
96
8,0
00,6
04
-
New
facili
ties a
id4,6
90,6
29
5,4
97,6
87
6,7
45,9
67
2,8
31,4
88
1,6
86,6
11
1,3
27,5
36
5,7
42,0
32
5,2
88,3
80
884,8
04
898,6
72
Juve
nile
dete
ntion c
ente
rs a
id1,0
85,9
06
872,1
76
721,6
00
1,1
44,3
38
1,0
73,5
05
901,8
94
925,6
91
811,3
53
696,1
89
493,0
29
eS
chool vi
rtual education a
id(1
)
-
-
1,0
04,9
60
1,2
87,8
52
1,7
75,5
87
1,8
04,1
94
960,6
51
867,3
88
769,6
30
1,2
22,6
28
Unre
str
icte
d s
tate
gra
nt
1,1
26,6
62
530,4
91
241,4
83
402,2
87
174,0
17
113,9
42
156,7
49
157,2
59
107,2
92
84,0
48
Specia
l education a
id32,2
33,5
61
38,1
55,0
49
39,1
41,9
60
36,8
51,4
23
38,1
45,5
00
41,0
81,6
97
42,6
35,9
58
42,1
47,8
85
44,5
36,0
09
44,2
76,3
40
Sta
te inte
rvention a
id(3
)
(6)
41,5
07,0
58
55,3
46,4
09
67,7
86,8
40
68,5
79,1
21
69,8
93,9
55
69,1
94,0
34
72,0
91,0
73
70,6
84,0
66
70,5
76,2
56
-
Capital outlay a
id(5
)
-
-
-
-
-
1,1
26
-
-
4,5
25,5
12
4,5
25,5
12
Bond a
nd inte
rest
aid
5,2
76,9
07
5,5
34,4
60
5,7
02,0
65
7,5
03,3
04
9,8
85,7
46
9,6
07,1
17
10,7
58,6
58
12,3
13,0
84
14,6
77,2
15
15,5
00,4
50
4-y
ear-
old
aid
(6)
3,9
43,4
08
3,9
41,7
34
4,1
05,2
00
3,8
39,2
35
3,7
63,7
72
3,6
13,6
80
3,6
69,1
28
3,6
69,1
29
3,6
82,5
12
-
Bili
ngual education a
id(4
)
(6)
5,1
92,2
77
6,0
15,1
25
6,4
31,9
20
6,9
72,4
54
7,7
64,1
58
7,7
74,7
04
8,4
85,8
18
8,9
60,1
95
9,0
80,3
20
-
Latc
hkey a
id-
-
-
-
-
2,7
94
-
-
-
-
School fo
od a
ssis
tance a
id224,6
87
224,5
31
219,5
42
220,1
70
186,7
69
268,0
64
265,1
69
254,7
00
257,2
71
256,3
62
Pare
nts
as t
eachers
aid
512,5
17
534,0
37
504,4
19
510,1
30
505,3
11
158,3
88
328,7
42
467,2
51
403,5
07
338,0
43
Vocational education a
id3,5
43,3
50
3,5
28,0
68
3,3
52,8
00
3,0
47,1
14
2,9
70,0
73
2,8
23,6
61
3,0
15,4
06
3,0
79,0
29
3,0
49,5
63
35,4
86
KP
ER
S c
ontr
ibutions
17,5
73,7
03
20,7
41,9
82
22,9
80,8
06
23,5
60,2
67
26,1
98,2
02
27,1
43,6
75
29,5
14,1
93
33,6
25,1
96
32,8
56,2
15
28,6
59,7
51
New
teacher
mento
ring a
id119,6
50
154,2
00
181,3
00
163,9
50
136,0
10
-
-
-
-
-
Sta
te s
afe
ty a
id150,8
70
187,1
10
63,2
70
80,1
46
107,5
96
-
-
-
-
-
Pro
fessio
nal deve
lopm
ent
aid
181,7
78
202,7
63
246,1
17
-
-
-
-
-
-
-
T
ota
l re
ve
nu
es
315,6
65,1
58
$
344,1
54,6
49
$
361,8
39,6
22
$
320,8
24,3
77
$
334,1
43,2
07
$
340,9
63,6
41
$
362,5
39,7
36
$
374,1
08,9
49
$
433,2
19,5
16
$
428,7
61,5
35
$
(1)
The S
tate
cre
ate
d a
new
fund in 2
008-0
9.
This
fundin
g w
as p
revi
ously
inclu
ded in G
enera
l fu
nd s
tate
aid
.
(2)
Incre
ase in 2
011 w
as t
o p
art
ially
offs
et
loss o
f F
edera
l stim
ulu
s funds.
(3)
Incre
ases a
re d
ue t
o t
he c
ontinual in
cre
ase in low
-incom
e s
tudents
, as w
ell
as incre
ased S
tate
support
in fis
cal years
2007,
2008,
and 2
009 a
s a
result o
f lit
igation.
(4)
Incre
ases a
re d
ue t
o t
he incre
asin
g p
opula
tion o
f non-E
nglis
h s
peakin
g s
tudents
.
(5)
Equaliz
ation s
tate
aid
was r
ein
sta
ted in 2
014-1
5 a
s a
result o
f a S
upre
me C
ourt
rulin
g.
(6)
Due t
o t
he legis
latu
re's
im
ple
menta
tion o
f B
lock G
rant
fundin
g for
the 2
015-1
6 s
chool year,
sta
te a
id t
hat
was p
revi
ously
desig
nate
d for
specifi
c p
urp
oses is n
o longer
restr
icte
d t
o t
hose p
urp
oses
and is t
here
fore
inclu
ded in U
nre
str
icte
d S
tate
School A
id.
ST
AT
E R
EV
EN
UE
BY
SO
UR
CE
, G
OV
ER
NM
EN
TA
L F
UN
DS
La
st
Te
n F
isc
al Y
ea
rs

Statistical Section
Wichita Public Schools Page 108
AS
SES
SM
EN
T
YEA
R
FIS
CA
L
YEA
RA
SS
ES
SED
VA
LU
EES
TIM
AT
ED
AC
TU
AL
AS
SES
SED
VA
LU
EES
TIM
AT
ED
AC
TU
AL
AS
SES
SED
VA
LU
EES
TIM
AT
ED
AC
TU
AL
2006
06-0
72,0
36,5
64,1
91
$
13,8
55,9
02,3
36
$
277,0
58,4
68
$
1,1
31,5
52,2
50
$
115,2
68,5
05
$
349,2
98,5
00
$
2007
07-0
82,1
85,1
82,8
88
$
14,7
86,2
44,4
52
$
247,1
27,2
36
$
(1)
1,0
09,5
02,0
60
$
108,8
28,9
81
$
329,7
84,7
91
$
2008
08-0
92,3
22,4
94,4
46
$
15,6
42,3
26,8
69
$
221,4
41,3
53
$
(1)
902,7
29,0
20
$
103,9
94,3
84
$
315,1
34,4
97
$
2009
09-1
02,3
40,4
41,4
83
$
15,7
88,9
65,3
58
$
189,0
36,3
15
$
(1)
773,0
93,0
70
$
97,3
45,4
67
$
294,8
96,2
64
$
2010
10-1
12,3
62,8
20,9
42
$
14,6
49,3
24,1
04
$
170,8
90,8
08
$
693,7
43,4
21
$
96,3
66,0
14
$
292,0
18,2
24
$
2011
11-1
22,3
65,1
10,4
74
$
14,7
02,8
94,9
10
$
165,7
64,7
36
$
675,1
49,5
06
$
96,8
22,0
40
$
293,4
00,1
21
$
2012
12-1
32,3
28,9
27,4
28
$
15,6
11,0
09,9
18
$
165,0
57,5
10
$
673,6
61,3
97
$
94,4
02,8
28
$
286,0
69,1
76
$
2013
13-1
42,3
33,9
41,1
29
$
15,6
08,9
94,7
98
$
161,4
97,6
23
$
658,9
89,8
46
$
90,4
17,4
60
$
273,9
92,3
03
$
2014
14-1
52,3
63,8
82,9
22
$
15,7
95,6
72,1
10
$
144,3
31,9
04
$
599,4
59,8
26
$
88,1
29,3
25
$
267,0
58,5
61
$
2015
15-1
62,3
89,4
05,7
88
$
15,9
57,1
65,6
06
$
135,0
24,3
71
$
558,1
38,6
12
$
99,7
12,5
03
$
302,1
59,1
00
$
AS
SES
SM
EN
T
YEA
R
FIS
CA
L
YEA
R
TO
TA
L
AS
SES
SED
VA
LU
E
TO
TA
L
ES
TIM
AT
ED
AC
TU
AL
RA
TIO
OF T
OT
AL
AS
SES
SED
TO
TO
TA
L
ES
TIM
AT
ED
AC
TU
AL
DIR
EC
T T
AX
RA
TE
2006
06-0
72,4
28,8
91,1
64
$
15,3
36,7
53,0
86
$
15.8
4%
51.2
96
2007
07-0
82,5
41,1
39,1
05
$
16,1
25,5
31,3
03
$
15.7
6%
53.2
38
2008
08-0
92,6
47,9
30,1
83
$
16,8
60,1
90,3
86
$
15.7
1%
53.3
09
2009
09-1
02,6
26,8
23,2
65
$
16,8
57,0
44,6
92
$
15.5
8%
56.8
50
2010
10-1
12,6
30,0
77,7
64
$
15,6
35,0
85,7
49
$
16.8
2%
56.9
28
2011
11-1
22,6
27,6
97,2
50
$
15,6
71,4
44,5
37
$
16.7
7%
57.0
17
2012
12-1
32,5
88,3
87,7
66
$
16,5
70,7
40,4
91
$
15.6
2%
57.1
84
2013
13-1
42,5
85,8
56,2
12
$
16,5
41,9
76,9
47
$
15.6
3%
57.2
15
2014
14-1
52,5
96,3
44,1
51
$
16,6
62,1
90,4
97
$
15.5
8%
53.7
35
2015
15-1
62,6
24,1
42,6
62
$
16,8
17,4
63,3
18
$
15.6
0%
56.2
78
Sourc
e:
Sedgw
ick C
ounty
Cle
rk
(1)
The S
tate
rem
ove
d s
om
e p
ers
onal pro
pert
y fro
m t
he t
ax r
olls
.
AS
SE
SS
ED
AN
D E
ST
IMA
TE
D A
CT
UA
L V
AL
UE
OF
TA
XA
BL
E P
RO
PE
RT
Y
Last
Te
n F
iscal Y
ears
PER
SO
NA
L P
RO
PER
TY
REA
L E
ST
AT
EU
TIL
ITIE
S

Statistical Section
Wichita Public Schools Page 109
ASSESSMENT
YEAR (1)
USD 259
FISCAL
YEAR GENERAL
SUPPL.
GENERAL
CAPITAL
OUTLAY
BOND &
INTEREST
SPECIAL
ASSESSMENT (4)
TOTAL
USD 259
2006 06-07 20.000 18.341 7.000 5.955 - 51.296
2007 07-08 20.000 20.356 7.000 5.882 - 53.238
2008 08-09 20.000 20.411 7.000 5.898 - 53.309
2009 09-10 20.000 20.439 7.000 9.411 (3) - 56.850
2010 10-11 20.000 20.482 7.015 9.431 - 56.928
2011 11-12 20.000 21.549 (5) 6.014 (5) 9.454 - 57.017
2012 12-13 20.000 23.154 (5) 4.534 (5) 9.496 - 57.184
2013 13-14 20.000 25.200 (6) 4.254 (6) 7.761 (6) - 57.215
2014 14-15 20.000 16.212 (7) 8.000 (7) 9.523 (7) - 53.735
2015 15-16 20.000 18.498 (8) 7.930 9.441 0.409 56.278
ASSESSMENT
YEAR (1)
USD 259
FISCAL
YEAR
STATE &
COUNTY
CITY OF
WICHITA
CITY OF
BEL AIRE
CITY OF
EASTBOROUGH
CITY OF
KECHI
CITY OF
PARK CITY
2006 06-07 32.815 31.953 23.959 58.221 21.154 37.236
2007 07-08 32.833 31.979 33.503 60.252 24.037 37.145
2008 08-09 31.877 32.056 34.908 62.241 23.954 37.450
2009 09-10 31.368 32.142 35.970 58.351 33.857 37.332
2010 10-11 30.859 32.272 39.050 57.944 33.774 37.395
2011 11-12 30.928 32.359 46.118 59.999 33.676 37.792
2012 12-13 30.946 32.471 46.162 62.073 33.714 39.607
2013 13-14 30.877 32.509 45.695 64.597 33.706 39.890
2014 14-15 30.978 32.652 45.730 64.597 33.866 40.051
2015 15-16 30.883 32.686 46.246 64.664 33.699 40.111
Source: Sedgwick County Clerk
(1) The year shown is the year in which taxes are levied for collection in the following calendar year.
(2) Overlapping rates are those of local and county governments that apply to property owners within the boundary of USD 259.
(3) In April 2008, the community approved a $370 million bond issue.
(4) Taxes were levied in 2015 for the purpose of funding special assessments at the new Southeast High School.
(5) In 2011, one mill for technology was moved from the Capital Outlay fund to the Supplemental General fund. An additional 1.5 mills were moved in
2012. The State of Kansas is no longer funding capital outlay, so the mills were moved to maximize the state aid that could be received in the
Supplemental General fund without impacting the overall mill levy.
(6) The Bond & Interest and Capital Outlay mill levies were reduced in order to increase the Supplemental General mill levy for the purpose of
maximizing the Supplemental General state aid. This is intended to be a one-year change.
(7) Due to the State of Kansas fully reinstating equalization state aid in the Supplemental General and Capital Outlay funds for FY 2015, the mill levy
decreased in the Supplemental General fund, allowing the District to increase the Capital Outlay mill levy in order to fully maximize the matching
state aid in that fund. The Bond & Interest mill levy was also restored to the 2012 level as planned.
(8) In FY2016 the State of Kansas eliminated the school funding formula and replaced it with a block grant system that provided essentially the same
funding as FY2015 after mid-year cuts to equalization state aid. An increase to the Supplemental General mill levy was necessary to avoid losing
additional state aid.
OTHER OVERLAPPING GOVERNMENTS (2)
USD 259
PROPERTY TAX RATES - DIRECT AND OVERLAPPING GOVERNMENTS
(Per $1,000 of Assessed Value)
Last Ten Fiscal Years

Statistical Section
Wichita Public Schools Page 110
2006 2015 (1)
TAXPAYER
TAXABLE
ASSESSED
VALUATION Rank
PERCENT OF
TOTAL
ASSESSED
VALUATION
TAXABLE
ASSESSED
VALUATION Rank
PERCENT OF
TOTAL
ASSESSED
VALUATION
Kansas Gas & Electric 93,682,621$ 1 2.17% 43,130,564$ 1 1.64%
Beechcraft Corp. (2) - - - 41,434,159 2 1.58%
Cessna Aircraft Co. 25,467,274 5 0.59% 37,203,774 3 1.42%
City of Wichita - - - 27,634,274 4 1.05%
Simon Property Group LP 18,411,522 7 0.43% 25,630,817 5 0.98%
Kansas Gas Service-A Division of Oneok 15,854,817 9 0.37% 17,775,489 6 0.68%
Walmart/Sams - - - 13,922,032 7 0.53%
Southwestern Bell Telephone Co 49,683,265 3 1.15% 12,929,852 8 0.49%
Wesley Medical Center LLC 26,165,336 4 0.61% 10,628,482 9 0.41%
Bradley Fair One LLC - - - 9,744,828 10 0.37%
Raytheon Aircraft Company (2) 18,303,417 8 0.42% - - -
Spirit Aerosystems, Inc. 85,302,070 2 1.98% - - -
Boeing IDS Wichita/Boeing Company (3) 21,276,849 6 0.49% - - -
Basic Chemicals Co. (formerly Vulcan Materials) 12,797,850 10 0.30% - - -
Total 366,945,021$ 8.51% 240,034,271$ 9.15%
Total Assessed Value 2,428,891,164$ 2,624,142,662$
Source: Sedgw ick County Clerk - Sedgw ick County 2015 tax roll
(1) Data for 2016 is not available until December.
(2) Beechcraft Corporation's property w as formerly ow ned by Raytheon Aircraft Company.
(3) Includes Boeing Military Airplane Company.
PRINCIPAL PROPERTY TAXPAYERS
Current Year and Nine Years Ago
For the Year Ended December 31,

Statistical Section
Wichita Public Schools Page 111
ASSESSMENT
YEAR
COLLECTION
YEAR
TOTAL
TAX LEVY
(1)
CURRENT TAX
COLLECTIONS
(2)
PERCENT OF
LEVY
COLLECTED
2006 2007 118,198,862$ 114,338,778$ 96.73%
2007 2008 128,846,365$ 121,305,025$ 94.15%
2008 2009 133,916,687$ 127,433,823$ 95.16%
2009 2010 142,023,772$ 136,492,306$ 96.11%
2010 2011 143,768,168$ 135,624,083$ 94.34%
2011 2012 145,056,331$ 136,021,698$ 93.77%
2012 2013 143,292,358$ 135,979,816$ 94.90%
2013 2014 143,226,111$ 134,625,675$ 94.00%
2014 2015 (6) 86,953,849$ 83,065,435$ 95.53%
2015 2016 95,198,647$ 88,314,972$ (5) 92.77% (5)
ASSESSMENT
YEAR
COLLECTION
YEAR
DELINQUENT
TAX
COLLECTIONS
(2) (3)
TOTAL TAX
COLLECTED
PERCENT OF
TOTAL TAX
COLLECTED
TO LEVY
2006 2007 2,705,282$ 117,044,060$ 99.02%
2007 2008 3,154,760$ 124,459,785$ 96.60%
2008 2009 3,736,413$ 131,170,236$ 97.95%
2009 2010 2,284,364$ 138,776,670$ 97.71%
2010 2011 3,808,854$ 139,432,937$ 96.98%
2011 2012 4,406,040$ 140,427,738$ 96.81%
2012 2013 4,403,176$ 140,382,992$ 97.97%
2013 2014 2,899,128$ 137,524,803$ 96.02%
2014 2015 2,550,002$ 85,615,437$ 98.46%
2015 2016 N/A (4) N/A (4) N/A (4)
(1) Source: Sedgwick County Treasurer.
(2) Source: District Tax Year Report.
(3) All delinquent taxes collected in a year are applied to the previous year, as they are assumed to
be predominantly related to that year.
(4) Information is not applicable, as all delinquent amounts collected during the year were for taxes
assessed in previous years. No current year taxes are yet delinquent.
(5) Includes only the taxes collected during the period of January 1 through the District's June 30
fiscal year-end.
(6) Beginning in 2015, General Fund taxes are now required to be remitted directly to the State of
Kansas rather than to school districts. Since collections do not include the General Fund amount,
the Total Tax Levy amount has been reduced by the taxes levied in the General Fund for purposes
of comparability.
PROPERTY TAX LEVIES AND COLLECTIONS
Last Ten Fiscal Years

Statistical Section
Wichita Public Schools Page 112
GOVERNMENT UNITS
AMOUNT
OF DEBT
OUTSTANDING (2)
PERCENTAGE
APPLICABLE
TO TAXPAYERS
OF USD 259
TOTAL DIRECT
AND
OVERLAPPING
DEBT
Overlapping Debt:
Sedgwick County $56,075,000 59.50% (1) $33,364,625
City of Wichita 568,570,000 69.95% (1) 397,714,715
City of Bel Aire 20,120,000 96.50% (1) 19,415,800
City of Eastborough 620,000 100.00% (1) 620,000
City of Kechi 5,365,000 77.77% (1) 4,172,361
City of Park City 17,940,000 73.74% (1) 13,228,956
Sub-total $468,516,457
Direct Debt:
USD 259 443,489,274 (3) 100.00% 443,489,274
Total Direct and Overlapping Debt $912,005,731
Note: Overlapping governments are those that coincide, at least in part, with the geographic
boundaries of USD 259. This schedule estimates the portion of the outstanding debt of those
overlapping governments that is borne by the property owners of USD 259.
(1) The percentage of overlapping debt applicable to taxpayers of USD 259 is estimated using
assessed valuations. For Sedgwick County, since 100 percent of USD 259 lies within Sedgwick
County, the District’s total assessed valuation was divided by the County’s assessed valuation to
determine the percentage of the County’s debt applicable to taxpayers of the District. For all other
entities, the portion of each entity’s assessed valuation that is related to property located within
USD 259 boundaries was divided by the entity’s total assessed valuation.
(2) Source: Sedgwick County Clerk
(3) Includes premiums and discounts.
COMPUTATION OF DIRECT AND OVERLAPPING DEBT
For the Year Ended June 30, 2016

Statistical Section
Wichita Public Schools Page 113
ASSESSMENT
YEAR
FISCAL
YEAR POPULATION (1)
TOTAL
DISTRICT
ENROLLMENT (2)
TOTAL
ESTIMATED
ACTUAL
VALUE
GENERAL
OBLIGATION
DEBT (3)
GENERAL
OBLIGATION DEBT
AS PERCENTAGE
OF PERSONAL
INCOME
BONDED
DEBT PER
CAPITA
2006 06-07 357,698 48,770 15,336,753,086$ $ 295,133,035 3.63% $ 825
2007 07-08 361,016 48,705 16,125,531,303$ $ 282,167,436 3.13% $ 782
2008 08-09 356,564 49,146 16,860,190,386$ $ 461,558,975 5.42% $ 1,294
2009 09-10 359,306 50,042 16,857,044,692$ $ 579,496,211 6.38% $ 1,613
2010 10-11 383,142 50,033 15,635,085,749$ $ 525,674,860 5.88% $ 1,372
2011 11-12 384,439 50,103 15,671,444,537$ $ 468,413,312 5.24% $ 1,218
2012 12-13 385,586 50,639 16,570,740,491$ $ 449,856,476 4.77% $ 1,167
2013 13-14 386,558 51,169 16,541,976,947$ $ 484,800,076 5.12% $ 1,254
2014 14-15 388,413 51,330 16,662,190,497$ $ 462,807,499 4.82% $ 1,192
2015 15-16 389,955 51,133 16,817,463,318$ $ 443,489,274 4.47% $ 1,137
ASSESSMENT
YEAR
FISCAL
YEAR
DEBT SERVICE
FUNDS
AVAILABLE
NET BONDED
DEBT
NET BONDED DEBT
TO ESTIMATED
ACTUAL VALUE
NET BONDED
DEBT PER
CAPITA
NET BONDED
DEBT PER
PUPIL
2006 06-07 17,141,033$ 277,992,002$ 1.81% $ 777 $ 5,700
2007 07-08 17,740,086$ 264,427,350$ 1.64% $ 732 $ 5,429
2008 08-09 22,024,806$ 439,534,169$ 2.61% $ 1,233 $ 8,943
2009 09-10 23,372,779$ 556,123,432$ 3.30% $ 1,548 $ 11,113
2010 10-11 20,876,849$ 504,798,011$ 3.23% $ 1,318 $ 10,089
2011 11-12 22,492,365$ 445,920,947$ 2.85% $ 1,160 $ 8,900
2012 12-13 24,403,113$ 425,453,363$ 2.57% $ 1,103 $ 8,402
2013 13-14 23,254,437$ 461,545,639$ 2.79% $ 1,194 $ 9,020
2014 14-15 25,973,964$ 436,833,535$ 2.62% $ 1,125 $ 8,510
2015 15-16 29,282,262$ 414,207,012$ 2.46% $ 1,062 $ 8,101
(2) Source: USD 259 Student Records and Enrollment Services - 9/20 Official Enrollment Report
(3) Includes premiums and discounts.
(1) Source: U.S. Census Bureau, 2015 American Community Survey 1-Year Estimate
RATIO OF NET GENERAL BONDED DEBT OUTSTANDING
Last Ten Fiscal Years

Statistical Section
Wichita Public Schools Page 114
2007
2008
2009
2010
2011
2012
2013
2014
2015
2016
Assessed V
alu
e (
1)
2,4
28,8
91,1
64
$
2,5
41,1
39,1
05
$
2,6
47,9
30,1
83
$
2,6
26,8
23,2
65
$
2,6
30,0
77,7
64
$
2,6
27,6
97,2
50
$
2,5
88,3
87,7
66
$
2,5
85,8
56,2
12
$
2,5
96,3
44,1
51
$
2,6
24,1
42,6
62
$
Taxable
Valu
e o
f M
oto
r V
ehic
les (
1)
309,7
93,9
61
317,6
24,3
87
323,2
68,8
35
317,5
61,6
67
305,4
60,8
28
298,6
53,4
31
299,2
63,9
78
305,9
28,0
45
311,4
05,0
14
320,6
13,9
50
Tota
l A
ssessed V
alu
ation (
2)
2,7
38,6
85,1
25
$
2,8
58,7
63,4
92
$
2,9
71,1
99,0
18
$
2,9
44,3
84,9
32
$
2,9
35,5
38,5
92
$
2,9
26,3
50,6
81
$
2,8
87,6
51,7
44
$
2,8
91,7
84,2
57
$
2,9
07,7
49,1
65
$
2,9
44,7
56,6
12
$
Bonded D
ebt
Lim
it P
erc
enta
ge (
3)
14.0
0%
14.0
0%
14.0
0%
14.0
0%
14.0
0%
14.0
0%
14.0
0%
14.0
0%
14.0
0%
14.0
0%
Bonded S
tatu
tory
Debt
Lim
it383,4
15,9
18
$
400,2
26,8
89
$
415,9
67,8
63
$
412,2
13,8
90
$
410,9
75,4
03
$
409,6
89,0
95
$
404,2
71,2
44
$
404,8
49,7
96
$
407,0
84,8
83
$
412,2
65,9
26
$
Plu
s:
Additio
nal A
uth
ority
(4)
00
087,5
11,1
10
65,5
04,5
97
48,9
60,9
05
32,7
13,6
15
61,7
59,7
17
38,0
74,0
86
11,5
22,2
79
Legal D
ebt
Lim
it383,4
15,9
18
$
400,2
26,8
89
$
415,9
67,8
63
$
499,7
25,0
00
$
476,4
80,0
00
$
458,6
50,0
00
$
436,9
84,8
59
$
466,6
09,5
13
$
445,1
58,9
69
$
423,7
88,2
05
$
Am
ount
of O
uts
tandin
g D
ebt
(5)
289,1
20,0
00
$
276,8
55,0
00
$
452,0
40,0
00
$
570,6
00,0
00
$
514,2
70,0
00
$
458,6
50,0
00
$
438,9
85,0
00
$
470,6
10,0
00
$
451,1
60,0
00
$
431,7
90,0
00
$
Less:
Am
ount
in S
inkin
g F
und
00
00
00
2,0
00,1
41
4,0
00,4
87
6,0
01,0
31
8,0
01,7
95
Less:
Debt
Not
Applic
able
To t
he L
imit
(C
rossove
r A
dva
nce R
efu
ndin
g)
70,8
75,0
00
70,8
75,0
00
70,8
75,0
00
70,8
75,0
00
37,7
90,0
00
00
00
0
Tota
l D
ebt
Applic
able
to t
he L
imit
218,2
45,0
00
$
205,9
80,0
00
$
381,1
65,0
00
$
499,7
25,0
00
$
476,4
80,0
00
$
458,6
50,0
00
$
436,9
84,8
59
$
466,6
09,5
13
$
445,1
58,9
69
$
423,7
88,2
05
$
Legal D
ebt
Marg
in165,1
70,9
18
$
194,2
46,8
89
$
34,8
02,8
63
$
0$
0
0$
0
$
0
0$
0
Tota
l D
ebt
Applic
able
To t
he L
imit
as a
Perc
enta
ge o
f D
ebt
Lim
it56.9
2%
51.4
7%
91.6
3%
100.0
0%
100.0
0%
100.0
0%
100.0
0%
100.0
0%
100.0
0%
100.0
0%
(1)
Sourc
e:
Sedgw
ick C
ounty
Cle
rk a
s o
f D
ecem
ber
31,
2015.
(2)
Com
pute
d in a
ccord
ance w
ith K
.S.A
. 10-3
10.
(3)
K.S
.A.
72-6
761.
(4)
On S
epte
mber
9,
2008,
the S
tate
Board
of E
ducation a
ppro
ved a
n a
dditio
nal $246,6
82,1
12 t
o t
he legal debt
limit o
f th
e D
istr
ict,
as p
rescribed b
y K
.S.A
. 75-2
318.
This
appro
val w
as n
eeded in o
rder
for
the D
istr
ict
to h
old
an e
lection for
the issuance o
f bonds in t
he a
mount
of $370,0
00,0
00,
whic
h o
therw
ise w
ould
have
caused t
he S
chool
Dis
tric
t's b
onded indebte
dness t
o e
xceed t
he g
enera
l oblig
ation b
ond d
ebt
limit.
The incre
ased a
uth
ority
applie
s o
nly
to b
onds issued u
nder
the 2
008 e
lection,
is v
alid
as
long a
s d
ebt
rela
ted t
o t
hat
ele
ction is o
uts
tandin
g,
and c
annot
be u
sed for
a futu
re e
lection t
o issue a
dditio
nal debt.
There
fore
, th
e a
mount
of th
e a
dditio
nal auth
ority
refle
cte
d is a
dju
ste
d a
nnually
(not
to e
xceed $
246,6
82,1
12)
to a
rriv
e a
t a L
egal D
ebt
Marg
in o
f zero
.
(5)
As o
f Ju
ne 3
0,
2016.
LE
GA
L D
EB
T M
AR
GIN
Last
Te
n F
iscal Y
ears
En
de
d J
un
e 3
0,

Statistical Section
Wichita Public Schools Page 115
FISC
AL
YEA
R
INTE
RES
T A
ND
FISC
AL
CHA
RG
ES
TOTA
L D
EBT
SER
VIC
E (1
)
TOTA
L CU
RR
ENT
GO
VER
NM
ENTA
L
EXPE
ND
ITU
RES
RA
TIO
OF
DEB
T
SER
VIC
E TO
TO
TAL
GEN
ERA
L
EXPE
ND
ITU
RES
06
-07
$1
1,4
65
,00
01
3,8
60
,79
6$
25
,32
5,7
96
$
46
1,5
51
,33
0$
5.4
9%
07
-08
$1
2,2
64
,99
91
3,2
11
,51
9$
25
,47
6,5
18
$
50
2,1
03
,02
4$
5.0
7%
08
-09
$1
3,0
75
,00
01
2,5
43
,84
7$
25
,61
8,8
47
$
58
1,7
38
,58
5$
4.4
0%
09
-10
$1
3,9
55
,00
02
1,8
02
,13
2$
35
,75
7,1
32
$
59
5,7
98
,32
1$
6.0
0%
10
-11
$2
0,1
10
,00
02
7,9
28
,46
5$
48
,03
8,4
65
$
52
2,9
73
,23
9$
9.1
9%
11
-12
$1
7,8
30
,00
02
3,3
86
,40
2$
41
,21
6,4
02
$
51
2,4
48
,29
3$
8.0
4%
12
-13
$4
2,5
95
,00
0(2
)2
2,2
75
,14
9$
64
,87
0,1
49
$
53
8,0
92
,27
9$
12
.06
%(2
)
13
-14
$1
7,2
15
,00
02
2,8
14
,41
7$
40
,02
9,4
17
$
56
4,7
51
,85
5$
7.0
9%
14
-15
$1
9,4
50
,00
02
2,6
17
,75
9$
42
,06
7,7
59
$
57
0,0
59
,89
8$
7.3
8%
15
-16
$2
0,7
75
,00
02
1,5
73
,65
4$
42
,34
8,6
54
$
55
2,6
57
,99
6$
7.6
6%
Sourc
e: U
SD
259 A
udite
d F
inancia
l Sta
tem
ents
(1)
Fund in
clu
ded: D
ebt S
erv
ice
(2)
Incre
ase is
due to r
efu
ndin
g o
f genera
l oblig
atio
n b
onds.
PRIN
CIPA
L
RA
TIO
OF
AN
NU
AL
DEB
T SE
RV
ICE
EXPE
ND
ITU
RES
FO
R G
ENER
AL
BO
ND
ED D
EBT
TO T
OTA
L CU
RR
ENT
GO
VER
NM
ENTA
L EX
PEN
DIT
UR
ES
Last
Ten
Fis
cal Y
ears

Statistical Section
Wichita Public Schools Page 116
CALENDAR
YEAR
FISCAL
YEAR
CITY OF
WICHITA
POPULATION (1)
WICHITA TOTAL
PERSONAL
INCOME
WICHITA PER
CAPITA
INCOME (1)
CITY OF
WICHITA
MEDIAN AGE (1)
USD 259
ENROLLMENT (3)
2006 06-07 357,698 8,131,906,332$ $ 22,734 34.8 48,770
2007 07-08 361,016 9,018,179,680$ $ 24,980 35.0 48,705
2008 08-09 356,564 8,509,756,424$ $ 23,866 34.5 49,146
2009 09-10 359,306 9,086,130,128$ $ 25,288 34.5 50,042
2010 10-11 383,142 8,942,151,138$ $ 23,339 33.9 50,033
2011 11-12 384,439 8,930,902,409$ $ 23,231 34.3 50,103
2012 12-13 385,586 9,431,819,146$ $ 24,461 35.1 50,639
2013 13-14 386,558 9,471,444,116$ $ 24,502 34.0 51,169
2014 14-15 388,413 9,610,502,859$ $ 24,743 34.0 51,330
2015 15-16 389,955 9,929,034,210$ $ 25,462 34.6 51,133
WICHITA
WICHITA
ELECTRICITY
WICHITA MID-CONTINENT
AIRPORT ACTIVITY (4)
CALENDAR
YEAR
FISCAL
YEAR
TAXABLE
RETAIL
SALES (4)
CONSUMED IN
KILOWATT
HOURS (4)
AIR
PASSENGERS
INBOUND
AIR
PASSENGERS
OUTBOUND
CITY OF WICHITA
UNEMPLOYMENT
RATE (2)
2006 06-07 8,088,252,015$ 6,217,885,000 755,692 748,662 4.6%
2007 07-08 8,467,165,395$ 6,320,720,000 837,479 827,383 4.6%
2008 08-09 8,287,942,146$ 5,898,842,000 761,388 754,314 10.1%
2009 09-10 8,055,177,921$ 5,884,120,000 765,033 757,477 9.6%
2010 10-11 8,193,427,230$ 6,173,909,000 782,485 774,592 8.9%
2011 11-12 8,685,224,619$ 6,120,423,000 776,219 771,167 7.8%
2012 12-13 8,965,184,409$ 5,839,845,000 743,449 744,037 7.0%
2013 13-14 9,427,875,142$ 5,862,989,000 774,736 771,085 6.0%
2014 14-15 9,526,700,614$ 5,701,334,000 775,312 767,217 5.0%
2015 15-16 9,773,059,070$ 5,573,792,867 802,885 797,564 5.1%
(2) Source: Kansas Department of Labor w ebsite as of June
(3) Source: USD 259 Student Records and Enrollment Services - 9/20 Official Enrollment Report
(4) Source: Wichita State University Center for Economic Development & Business Research, f igures for the Wichita Metropolitan Statistical
Area, based on f iscal year ending June 30.
(1) Source: U.S. Census Bureau, 2015 American Community Survey 1-Year Estimate
DEMOGRAPHIC STATISTICS
Last Ten Fiscal Years

Statistical Section
Wichita Public Schools Page 117
2006 2015
Employer
Full-Time
Civilian
Employees Rank
Percentage
of Total
Wichita MSA
Employment (1)
Full-Time
Civilian
Employees Rank
Percentage
of Total
Wichita MSA
Employment (1)
Spirit AeroSystems, Inc. 8,300 2 2.67% 10,900 1 3.63%
Via Christi Health 4,810 6 1.55% 6,027 2 2.01%
Wichita Public Schools USD #259 5,033 5 1.62% 5,620 3 1.87%
State of Kansas 3,977 7 1.28% 4,803 4 1.60%
McConnell Air Force Base - - - 4,576 5 1.52%
Koch Industries Inc. - - - 3,600 6 1.20%
City of Wichita 3,070 9 0.99% 2,752 7 0.92%
U.S. Government 5,435 4 1.75% 2,658 8 0.88%
Sedgwick County 2,719 10 0.88% 2,542 9 0.85%
Wesley Medical Center & Galichia Heart Hospital - - - 2,072 10 0.69%
Cessna Aircraft Company 9,393 1 3.02% - - -
Raytheon Aircraft Corporation 6,259 3 2.02% - - -
Boeing IDS Wichita 3,700 8 1.19% - - -
Totals 52,696 16.97% 45,550 15.17%
Source: Sedgwick County Comprehensive Annual Financial Report
Note: MSA - Metropolitan Statistical Area
Data for 2016 is not available until December.
(1) Includes Butler, Harvey, Sedgwick, and Sumner counties.
PRINCIPAL EMPLOYERS
Current Year and Nine Years Ago
For the Year Ended December 31,

Statistical Section
Wichita Public Schools Page 118
Da
te E
sta
bli
she
d a
s U
nif
ied
Sch
oo
l Dis
tric
t 2
59
July
1, 1
96
5
Ge
ogr
ap
hic
al A
rea
15
2 s
qu
are
mil
es
Form
of O
rga
niz
ati
on
7-m
em
be
r b
oa
rd
Acc
red
ita
tio
nK
an
sas
Sta
te D
ep
art
me
nt
of E
du
cati
on
2006-0
72007-0
82008-0
92009-1
02010-1
12011-1
22012-1
32013-1
42014-1
52015-1
6
STU
DEN
T D
ATA
Ele
me
nta
ry s
cho
ol e
nro
llm
en
t24,2
71
24,3
48
24,9
26
25,2
90
25,3
55
25,4
76
25,9
15
26,2
43
26,3
59
26,4
59
Mid
dle
sch
oo
l en
roll
me
nt
9,9
21
9,7
30
9,5
88
9,8
44
9,9
51
10,1
81
10,2
17
10,2
67
10,1
05
10,0
65
Hig
h s
cho
ol e
nro
llm
en
t12,7
63
12,7
66
12,7
71
12,6
27
12,4
93
12,3
30
12,3
39
12,4
08
12,6
37
12,7
06
Alt
ern
ati
ve a
nd
sp
eci
al s
cho
ol e
nro
llm
en
t (5
)1,8
15
1,8
61
1,7
97
2,2
81
2,2
34
2,1
16
2,1
68
2,2
51
2,2
29
1,9
03
Ave
rage
da
ily
att
en
da
nce
93.8
%94.0
%94.3
%93.9
%94.3
%94.5
%94.1
%94.0
%94.0
%94.0
%
Co
mp
osi
te A
CT
sco
res
20.6
20.7
20.4
19.8
19.8
19.7
19.8
19.7
19.6
19.7
STU
DEN
T/TE
AC
HER
RA
TIO
S
Ele
me
nta
ry s
cho
ol
21.6
21.0
21.0
20.8
20.6
20.4
19.8
19.7
19.0
18.6
Mid
dle
sch
oo
l18.2
13.1
13.1
13.3
13.4
14.9
14.1
16.1
14.3
14.8
Hig
h s
cho
ol
22.3
21.8
21.7
21.5
15.2
17.4
17.4
18.8
18.6
18.5
RA
CIA
L A
ND
ETH
NIC
PER
CEN
TAG
ES O
F ST
UD
ENTS
Afr
ica
n-A
me
rica
n20.9
%20.1
%19.9
%19.5
%19.2
%18.6
%18.2
%18.3
%18.5
%18.8
%
Asi
an
5.1
%5.0
%5.3
%4.9
%4.8
%4.7
%4.5
%4.5
%4.5
%4.4
%
His
pa
nic
22.3
%22.2
%23.8
%28.1
%29.6
%31.1
%32.1
%33.1
%33.5
%33.7
%
Na
tive
Am
eri
can
-In
dia
n2.7
%2.6
%2.5
%1.7
%1.6
%1.4
%1.4
%1.2
%1.3
%1.1
%
Na
tive
Ha
wa
iia
n-
--
0.2
%0.1
%0.2
%0.2
%0.5
%0.2
%0.2
%
Mu
lti R
aci
al
7.6
%9.8
%10.2
%7.5
%8.0
%8.2
%8.6
%8.3
%8.0
%7.8
%
Wh
ite
or
oth
er
41.4
%40.3
%38.3
%38.1
%36.7
%35.8
%35.1
%34.0
%34.1
%33.9
%
MA
LE/F
EMA
LE P
ERC
ENTA
GES
OF
STU
DEN
TS
Ma
le50.8
%53.0
%51.0
%51.1
%51.2
%51.3
%51.4
%50.8
%51.0
%51.2
%
Fem
ale
49.2
%47.0
%49.0
%48.9
%48.8
%48.7
%48.6
%49.2
%49.0
%48.8
%
EMP
LOY
EES
Inst
ruct
ion
(3)
5,3
54
5,5
45
5,6
19
5,6
52
5,6
80
5,5
11
5,5
68
5,7
11
5,8
48
5,7
74
Inst
ruct
ion
al S
up
po
rt (3
)111
127
128
117
84
60
56
54
55
54
Op
era
tio
ns
(4)
928
918
924
910
899
891
975
973
939
956
Oth
er
Co
mm
itm
en
ts/C
ap
ita
l Pro
ject
s (4
)87
87
90
95
95
95
24
23
48
48
Lea
de
rsh
ip (6
)18
22
23
23
17
18
18
18
18
13
LATC
HK
EY C
ENTE
RS
(1)
43
43
44
45
45
46
48
48
49
49
CH
ILD
DEV
ELO
PM
ENT
CEN
TER
S (2
)10
10
10
10
99
88
87
(1) A
lso
kn
ow
n a
s Sc
ho
ol A
ge P
rogr
am
Ce
nte
rs.
La
tch
key
cen
ters
are
ru
n b
y U
SD 2
59
. In
form
ati
on
pro
vid
ed
by
Wic
hit
a P
ub
lic
Sch
oo
ls.
(2) M
etr
o-M
idto
wn
Ch
ild
De
velo
pm
en
t C
en
ter
clo
sed
at
the
en
d o
f 20
09
-10
, an
d M
etr
o-B
ou
leva
rd c
lose
d in
20
12
-13
. Me
tro
-Me
rid
ian
clo
sed
at
the
en
d o
f 20
14
-15
.
(3) D
ecr
ea
ses
in 2
01
0-1
1 a
nd
20
11
-12
are
pri
ma
rily
du
e t
o c
uts
in s
tate
an
d fe
de
ral a
id.
(4) I
n 2
01
2-2
01
3, 7
1 p
osi
tio
ns
we
re m
ove
d fr
om
Ca
pit
al P
roje
cts
to O
pe
rati
on
s d
ue
to
th
e s
tate
eli
min
ati
ng
fun
din
g fo
r ca
pit
al o
utl
ay.
In 2
01
4-2
01
5, p
osi
tio
ns
we
re m
ove
d fr
om
Op
era
tio
ns
to C
ap
ita
l Pro
ject
s d
ue
to
ch
an
ges
in C
ap
ita
l Ou
tla
y re
gula
tio
ns.
(5) D
ue
to
sta
te fu
nd
ing
issu
es
in 2
01
5-1
6, a
n a
du
lt le
arn
ing
cen
ter
wa
s ch
an
ged
to
a v
irtu
al f
orm
at,
ca
usi
ng
en
roll
me
nt
to d
ecl
ine
.
(6) D
ue
to
bu
dge
t re
du
ctio
ns,
1.0
FTE
wa
s m
ove
d t
o S
tud
en
t Su
pp
ort
Se
rvic
es,
3.0
FTE
cle
rica
l va
can
cie
s w
ere
eli
min
ate
d, a
nd
1.0
FTE
for
Ch
ief O
pe
rati
on
s O
ffic
er
wa
s e
lim
ina
ted
.
MIS
CEL
LAN
EOU
S ST
ATI
STIC
S
Ten
-Ye
ar C
om
par
iso
n

Statistical Section
Wichita Public Schools Page 119
Fun
ctio
n/P
rogr
am2006-0
72007-0
82008-0
92009-1
02010-1
12011-1
22012-1
32013-1
42014-1
52015-1
6
Inst
ruct
ion
Dis
tric
t-W
ide
Enro
llm
ent
48,7
70
48,7
05
49,1
46
50,0
42
50,0
33
50,1
03
50,6
39
51,1
69
51,3
30
51,1
33
Enro
llm
ent
Per
cen
tage
Ch
an
ge f
rom
Ba
se Y
ear
(3)
104.7
%104.6
%105.5
%107.4
%107.4
%107.6
%108.7
%109.9
%110.2
%109.8
%
Bil
ingu
al
Enro
llm
ent
5,5
73
6,0
79
6,5
74
7,3
09
7,8
50
8,1
81
8,6
86
9,0
80
9,5
60
9,5
50
Spec
ial
Edu
cati
on
En
roll
men
t8,2
51
7,8
53
7,6
79
7,7
06
7,8
12
7,9
15
7,8
95
7,9
36
7,8
76
7,9
67
At-
Ris
k En
roll
men
t26,3
98
26,6
54
27,4
64
30,4
16
31,6
68
32,7
21
33,3
03
34,4
02
33,1
65
33,1
71
Da
ys S
cho
ol
in S
essi
on
172
171
173
171
167
173
169
169
173
169
Stu
den
t A
tten
da
nce
Per
cen
tage
(1
)93.9
%94.0
%94.3
%93.9
%94.2
%94.5
%94.1
%93.9
%93.9
%94.0
%
Stu
den
t a
nd
In
stru
ctio
na
l Su
pp
ort
Per
cen
tage
of
Sen
iors
Gra
du
ati
ng
(1)
(2)
76.4
%79.3
%80.1
%63.1
%66.2
%74.1
%76.5
%75.1
%75.3
%N
/A
Ad
min
istr
ati
on
.
Nu
mb
er o
f St
ud
ent
Susp
ensi
on
s13,1
09
12,8
27
13,6
97
13,2
20
12,7
73
11,3
91
10,9
34
10,3
00
11,0
35
10,6
39
Nu
mb
er o
f St
ud
ent
Exp
uls
ion
s69
139
191
141
138
92
42
20
30
26
Op
era
tio
ns
an
d M
ain
ten
an
ce
Nu
mb
er o
f W
ork
Ord
ers
Co
mp
lete
d34,4
16
32,1
72
31,0
68
29,6
55
30,8
78
29,3
53
29,9
76
33,0
66
33,0
59
32,1
11
Tra
nsp
ort
ati
on
Nu
mb
er o
f St
ud
ents
Tra
nsp
ort
ed (
1)
19,5
59
19,8
27
19,3
15
19,1
75
18,7
32
18,6
21
17,9
98
18,1
12
17,9
85
18,6
49
Nu
trit
ion
Ser
vice
s
Bre
akf
ast
s Se
rved
1,4
75,3
02
1,5
16,6
43
1,5
69,1
90
1,5
65,0
19
1,6
45,6
64
1,8
27,5
16
1,8
81,9
98
2,0
08,0
89
2,1
63,8
71
2,2
28,1
02
Lun
ches
Ser
ved
4,9
93,0
09
5,0
29,0
26
5,2
64,8
81
5,3
39,7
48
5,3
36,2
54
5,5
75,5
61
5,3
36,9
82
5,4
93,0
14
5,5
66,7
53
5,4
81,1
55
N/A
= N
ot
Ava
ila
ble
(1)
Sou
rce:
Ka
nsa
s D
epa
rtm
ent
of
Edu
cati
on
(2)
Gra
du
ati
on
da
ta p
rio
r to
20
08
-09
use
d t
he
Na
tio
na
l C
ente
r fo
r Ed
uca
tio
n S
tati
stic
s (N
CES
) fo
rmu
la. 2
00
8-0
9 g
rad
ua
tio
n d
ata
use
d t
he
No
Ch
ild
Lef
t B
ehin
d (
NC
LB)
form
ula
.
20
09
-10
gra
du
ati
on
da
ta a
nd
th
erea
fter
use
s th
e Fo
ur-
Yea
r a
nd
Fiv
e-Ye
ar
Ad
just
ed C
oh
ort
fo
rmu
las
wh
ich
are
sig
nif
ica
ntl
y d
iffe
ren
t th
an
th
e N
CES
an
d N
CLB
fo
rmu
las.
Th
eref
ore
,
no
co
mp
ari
son
s ca
n b
e m
ad
e b
etw
een
gra
du
ati
on
da
ta f
rom
20
09
an
d e
arl
ier
an
d g
rad
ua
tio
n d
ata
fro
m 2
01
0 a
nd
bey
on
d.
(3)
The
ba
se y
ear
is 1
99
5-9
6 e
nro
llm
ent
of
46
,57
9.
This
is
the
po
int
of
the
low
est
enro
llm
ent
du
rin
g th
e p
rio
r 2
0-y
ear
per
iod
.
OP
ERA
TIN
G IN
DIC
ATO
RS
BY
FUN
CTIO
N/P
RO
GR
AM
Last
Ten
Fis
cal Y
ears

Statistical Section
Wichita Public Schools Page 120
Fun
ctio
n/P
rogr
am2006-0
72007-0
82008-0
92009-1
02010-1
12011-1
22012-1
32013-1
42014-1
52015-1
6
Inst
ruct
ion
Elem
enta
ry S
choo
ls (5
)56
56
56
56
56
56
54
54
54
54
K-8
Scho
ols
(7)
11
22
22
33
33
Mid
dle
Scho
ols
(2)
16
16
16
16
16
15
15
15
15
15
Hig
h Sc
hool
s (3
)11
11
11
11
10
10
10
10
10
10
Alt
erna
tive
and
Spe
cial
Sch
ools
(6)
16
16
16
16
16
13
13
13
11
10
Stud
ent
and
Inst
ruct
iona
l Sup
port
Num
ber
of C
ompu
ter
Serv
ers
302
321
412
417
438
452
487
476
497
523
Num
ber
of M
icro
wav
e To
wer
s49
47
47
48
49
49
49
49
49
49
Num
ber
of C
ompu
ters
(8)
21,1
48
23,6
28
25,9
96
28,1
45
27,0
53
31,7
50
37,0
62
41,3
68
43,8
32
45,6
09
Adm
inis
trat
ion
Non
-Sch
ool B
uild
ings
(4)
15
12
12
12
12
11
10
11
13
15
Acr
es o
f Uni
mpr
oved
Lan
d (1
)80
80
82
82
349
127
127
127
127
0
Ope
rati
ons
and
Mai
nten
ance
Num
ber
of O
pera
tion
al V
ehic
les
Mai
ntai
ned
244
230
230
245
249
258
251
253
241
256
Num
ber
of H
eavy
Equ
ipm
ent
Mai
ntai
ned
106
106
106
106
114
114
115
115
101
94
Nut
riti
on S
ervi
ces
Num
ber
of N
utri
tion
Ser
vice
s V
ehic
les
Mai
ntai
ned
24
24
24
23
23
26
26
26
27
31
Indi
cato
rs a
re n
ot a
vaila
ble
for
the
Tran
spor
tati
on p
rogr
am, s
ince
the
Dis
tric
t co
ntra
cts
out
stud
ent
buss
ing
and
ther
efor
e do
es n
ot o
wn
the
asse
ts.
(1) I
n 20
10-1
1, 2
67 a
cres
of u
nim
prov
ed la
nd w
ere
purc
hase
d fo
r th
ree
addi
tion
al n
ew s
choo
ls, a
s w
ell a
s ad
diti
ons
and
impr
ovem
ents
to
exis
ting
bui
ldin
gs. T
he d
ecre
ase
in 2
011-
12
is d
ue t
o co
mpl
etio
n of
man
y of
the
se p
roje
cts.
In
2015
-16,
con
stru
ctio
n of
a n
ew s
choo
l is
near
ing
com
plet
ion
on t
he r
emai
ning
land
.
(2) B
lack
bear
Bos
in A
cade
my
clos
ed in
201
1-12
.
(3) M
etro
Mid
tow
n cl
osed
at
the
end
of 2
009-
10.
(4) K
ello
gg, S
outh
Hill
side
, and
Fun
ston
pro
pert
ies
wer
e so
ld d
urin
g 20
07-0
8. C
arte
r pr
oper
ty w
as s
old
in 2
011-
12. L
inco
ln w
as s
old
in 2
012-
13. O
pen
ed a
Gra
ce M
ed C
linic
at
Dod
ge
in 2
013-
14.
Ope
ned
Gra
ce M
edic
al C
linic
s at
Clo
ud a
nd G
ardi
ner
in 2
014-
15. O
pen
ed G
race
Med
Clin
ics
at Ja
rdin
e an
d W
est
in 2
015-
16, a
nd t
he a
dult
lear
ning
cen
ter
that
was
prev
ious
ly lo
cate
d in
the
Dun
bar
Supp
ort
Cen
ter
was
mov
ed in
to a
noth
er e
xist
ing
faci
lity,
so
Dun
bar
is n
ow a
non
-sch
ool b
uild
ing.
Add
itio
nally
, the
Alv
in E
. Mor
ris
Adm
inis
trat
ive
Cen
ter
build
ing
was
sol
d in
201
5-16
.
(5) I
n 20
12-1
3 B
ryan
t, L
inco
ln, a
nd E
mer
son
clos
ed, a
nd O
rtiz
ope
ned
.
(6) L
ease
s w
ere
not
ren
ewed
for
thre
e si
tes
in 2
011-
12. J
udge
Rid
del B
oys
Ran
ch a
nd R
iver
side
Aca
dem
y cl
osed
in 2
014-
15. D
unba
r Su
ppor
t Ce
nte
r w
as m
oved
to
the
non-
scho
ol
build
ings
cou
nt in
201
5-16
, sin
ce it
is n
o lo
nger
uti
lized
for
inst
ruct
iona
l pur
pose
s.
(7) G
ordo
n Pa
rks
Aca
dem
y op
ened
in 2
008-
09. C
hris
ta M
cAul
iffe
Aca
dem
y op
ened
in 2
012-
13.
(8) T
he in
crea
se in
201
2-13
is d
ue t
o a
tim
ing
issu
e. S
choo
ls h
ave
rece
ived
the
ir n
ew c
ompu
ters
but
hav
e no
t ye
t di
scar
ded
the
ir o
ld c
ompu
ters
.
CAP
ITA
L A
SSET
STA
TIST
ICS
BY
FUN
CTIO
N/P
RO
GR
AM
Last
Ten
Fis
cal Y
ears

Statistical Section
Wichita Public Schools Page 121
Ed. S
p.
Ed. S
p.+
Ed. S
p.+
BA
+ B
A+
BA
+ M
A+
MA
+M
A+
or
MA
+1
0 o
r M
A+
20
or
MA
+
Init
ial
BA
1
0 G
r.
20
Gr.
3
0 G
r.
MA
+1
0 G
r.2
0 G
r.3
0 G
r. 4
0 G
r.
50
Gr.
60
Gr.
Earn
ed
Pla
cem
en
tSt
ep
De
gre
eH
ou
rsH
ou
rsH
ou
rsD
egr
ee
Ho
urs
Ho
urs
Ho
urs
Ho
urs
Ho
urs
Ho
urs
Do
cto
rate
02
39,1
46
$
39,6
80
$
40,2
15
$
40,7
50
$
41,5
86
$
42,1
21
$
42,6
55
$
43,1
90
$
43,7
24
$
44,2
59
$
44,7
94
$
45,3
28
$
13
40,0
86
$
40,6
21
$
41,1
56
$
41,6
90
$
42,8
28
$
43,3
63
$
43,8
98
$
44,4
32
$
44,9
67
$
45,5
01
$
46,0
36
$
46,5
71
$
24
41,0
27
$
41,5
62
$
42,0
96
$
42,6
31
$
44,0
71
$
44,6
05
$
45,1
40
$
45,6
75
$
46,2
09
$
46,7
44
$
47,2
78
$
47,8
13
$
35
41,9
68
$
42,5
02
$
43,0
37
$
43,5
71
$
45,3
13
$
45,8
48
$
46,3
82
$
46,9
17
$
47,4
52
$
47,9
86
$
48,5
21
$
49,0
55
$
46
42,9
08
$
43,4
43
$
43,9
77
$
44,5
12
$
46,5
56
$
47,0
90
$
47,6
25
$
48,1
59
$
48,6
94
$
49,2
29
$
49,7
63
$
50,2
98
$
57
43,8
49
$
44,3
83
$
44,9
18
$
45,4
53
$
47,7
98
$
48,3
33
$
48,8
67
$
49,4
02
$
49,9
36
$
50,7
41
$
51,0
06
$
51,5
40
$
68
44,7
89
$
45,3
24
$
45,8
59
$
46,3
93
$
49,0
41
$
49,5
75
$
50,1
10
$
50,6
44
$
51,1
79
$
51,7
13
$
52,2
48
$
52,7
83
$
79
45,7
30
$
46,2
65
$
46,7
99
$
47,3
34
$
50,2
83
$
50,8
18
$
51,3
52
$
51,8
87
$
52,4
21
$
52,9
56
$
53,4
90
$
54,0
25
$
81
047,2
05
$
47,7
40
$
48,2
74
$
51,5
25
$
52,0
60
$
52,5
95
$
53,1
29
$
53,6
64
$
54,1
98
$
54,7
33
$
55,2
68
$
91
148,6
81
$
49,2
15
$
52,7
68
$
53,3
02
$
53,8
37
$
54,3
72
$
54,9
06
$
55,4
41
$
55,9
75
$
56,5
10
$
10
12
50,1
56
$
54,0
10
$
54,5
45
$
55,0
79
$
55,6
14
$
56,1
49
$
56,6
83
$
57,2
18
$
57,7
52
$
11
13
55,2
53
$
55,7
87
$
56,3
22
$
56,8
56
$
57,3
91
$
57,9
26
$
58,4
60
$
58,9
95
$
12
14
57,5
64
$
58,0
99
$
58,6
33
$
59,1
68
$
59,7
03
$
60,2
37
$
13
+1
559,8
76
$
60,4
10
$
60,9
45
$
61,4
80
$
A f
ract
ion
al
pa
rt o
f a
yea
r's
serv
ice
sha
ll b
e p
aid
on
th
e b
asi
s th
at
the
nu
mb
er o
f co
ntr
act
da
ys w
ork
ed b
ears
to
th
e to
tal
nu
mb
er o
f co
ntr
act
da
ys i
n
the
con
tra
ct y
ear.
The
ba
se c
on
tra
ct s
ala
ry s
ha
ll b
e p
rora
ted
fo
r a
ny
tea
cher
wh
o t
each
es l
ess
tha
n f
ull
tim
e.
TEA
CH
ER S
ALA
RY
SC
HED
ULE
2015
-201
6
Sou
rce
: A
gre
em
en
t b
etw
ee
n t
he
Un
ifie
d S
cho
ol D
istr
ict
No
. 25
9 B
oar
d o
f Ed
uca
tio
n a
nd
th
e U
nit
ed
Te
ach
ers
of
Wic
hit
a.
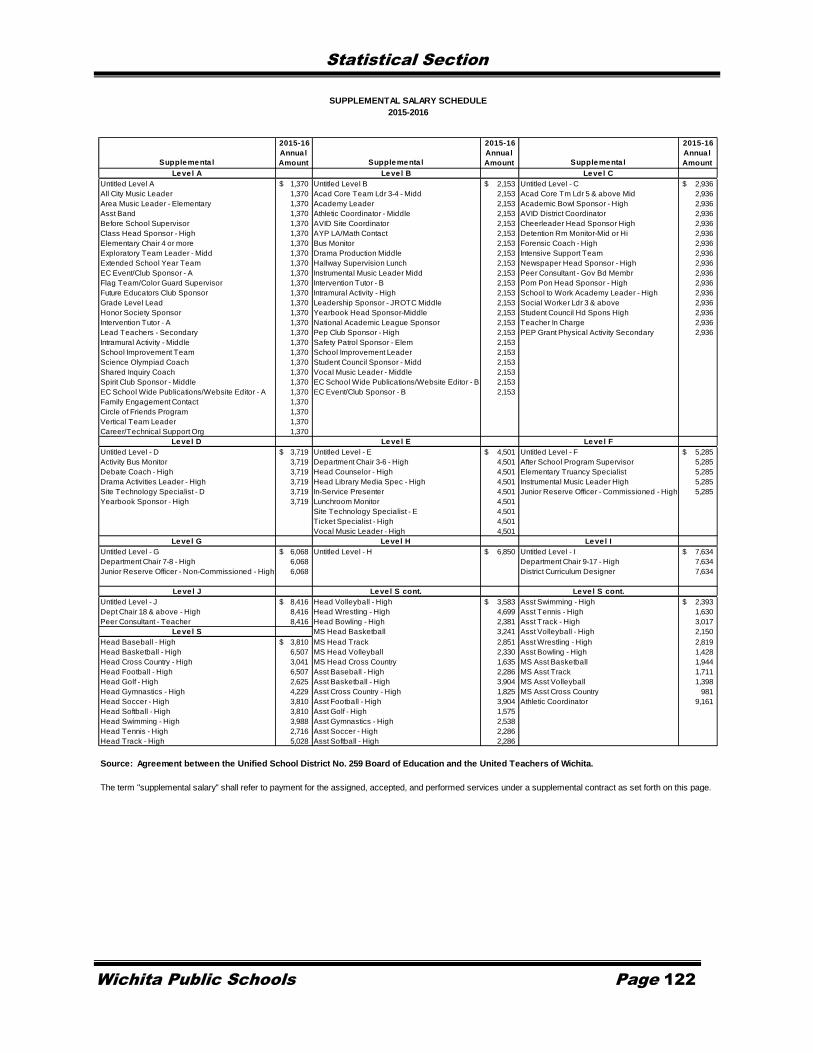
Statistical Section
Wichita Public Schools Page 122
Supplementa l
2015-16
Annua l
Amount Supplementa l
2015-16
Annua l
Amount Supplementa l
2015-16
Annua l
Amount
Leve l A Leve l B Leve l C
Untitled Level A 1,370$ Untitled Level B 2,153$ Untitled Level - C 2,936$
All City Music Leader 1,370 Acad Core Team Ldr 3-4 - Midd 2,153 Acad Core Tm Ldr 5 & above Mid 2,936
Area Music Leader - Elementary 1,370 Academy Leader 2,153 Academic Bowl Sponsor - High 2,936
Asst Band 1,370 Athletic Coordinator - Middle 2,153 AVID District Coordinator 2,936
Before School Supervisor 1,370 AVID Site Coordinator 2,153 Cheerleader Head Sponsor High 2,936
Class Head Sponsor - High 1,370 AYP LA/Math Contact 2,153 Detention Rm Monitor-Mid or Hi 2,936
Elementary Chair 4 or more 1,370 Bus Monitor 2,153 Forensic Coach - High 2,936
Exploratory Team Leader - Midd 1,370 Drama Production Middle 2,153 Intensive Support Team 2,936
Extended School Year Team 1,370 Hallway Supervision Lunch 2,153 Newspaper Head Sponsor - High 2,936
EC Event/Club Sponsor - A 1,370 Instrumental Music Leader Midd 2,153 Peer Consultant - Gov Bd Membr 2,936
Flag Team/Color Guard Supervisor 1,370 Intervention Tutor - B 2,153 Pom Pon Head Sponsor - High 2,936
Future Educators Club Sponsor 1,370 Intramural Activity - High 2,153 School to Work Academy Leader - High 2,936
Grade Level Lead 1,370 Leadership Sponsor - JROTC Middle 2,153 Social Worker Ldr 3 & above 2,936
Honor Society Sponsor 1,370 Yearbook Head Sponsor-Middle 2,153 Student Council Hd Spons High 2,936
Intervention Tutor - A 1,370 National Academic League Sponsor 2,153 Teacher In Charge 2,936
Lead Teachers - Secondary 1,370 Pep Club Sponsor - High 2,153 PEP Grant Physical Activity Secondary 2,936
Intramural Activity - Middle 1,370 Safety Patrol Sponsor - Elem 2,153
School Improvement Team 1,370 School Improvement Leader 2,153
Science Olympiad Coach 1,370 Student Council Sponsor - Midd 2,153
Shared Inquiry Coach 1,370 Vocal Music Leader - Middle 2,153
Spirit Club Sponsor - Middle 1,370 EC School Wide Publications/Website Editor - B 2,153
EC School Wide Publications/Website Editor - A 1,370 EC Event/Club Sponsor - B 2,153
Family Engagement Contact 1,370
Circle of Friends Program 1,370
Vertical Team Leader 1,370
Career/Technical Support Org 1,370
Leve l D Leve l E Leve l F
Untitled Level - D 3,719$ Untitled Level - E 4,501$ Untitled Level - F 5,285$
Activity Bus Monitor 3,719 Department Chair 3-6 - High 4,501 After School Program Supervisor 5,285
Debate Coach - High 3,719 Head Counselor - High 4,501 Elementary Truancy Specialist 5,285
Drama Activities Leader - High 3,719 Head Library Media Spec - High 4,501 Instrumental Music Leader High 5,285
Site Technology Specialist - D 3,719 In-Service Presenter 4,501 Junior Reserve Officer - Commissioned - High 5,285
Yearbook Sponsor - High 3,719 Lunchroom Monitor 4,501
Site Technology Specialist - E 4,501
Ticket Specialist - High 4,501
Vocal Music Leader - High 4,501
Leve l G Leve l H Leve l I
Untitled Level - G 6,068$ Untitled Level - H 6,850$ Untitled Level - I 7,634$
Department Chair 7-8 - High 6,068 Department Chair 9-17 - High 7,634
Junior Reserve Officer - Non-Commissioned - High 6,068 District Curriculum Designer 7,634
Leve l J Leve l S cont. Leve l S cont.
Untitled Level - J 8,416$ Head Volleyball - High 3,583$ Asst Swimming - High 2,393$
Dept Chair 18 & above - High 8,416 Head Wrestling - High 4,699 Asst Tennis - High 1,630
Peer Consultant - Teacher 8,416 Head Bowling - High 2,381 Asst Track - High 3,017
Leve l S MS Head Basketball 3,241 Asst Volleyball - High 2,150
Head Baseball - High 3,810$ MS Head Track 2,851 Asst Wrestling - High 2,819
Head Basketball - High 6,507 MS Head Volleyball 2,330 Asst Bowling - High 1,428
Head Cross Country - High 3,041 MS Head Cross Country 1,635 MS Asst Basketball 1,944
Head Football - High 6,507 Asst Baseball - High 2,286 MS Asst Track 1,711
Head Golf - High 2,625 Asst Basketball - High 3,904 MS Asst Volleyball 1,398
Head Gymnastics - High 4,229 Asst Cross Country - High 1,825 MS Asst Cross Country 981
Head Soccer - High 3,810 Asst Football - High 3,904 Athletic Coordinator 9,161
Head Softball - High 3,810 Asst Golf - High 1,575
Head Swimming - High 3,988 Asst Gymnastics - High 2,538
Head Tennis - High 2,716 Asst Soccer - High 2,286
Head Track - High 5,028 Asst Softball - High 2,286
SUPPLEMENTAL SALARY SCHEDULE
2015-2016
Source: Agreement between the Unified School District No. 259 Board of Education and the United Teachers of Wichita.
The term "supplemental salary" shall refer to payment for the assigned, accepted, and performed services under a supplemental contract as set forth on this page.

Statistical Section
Wichita Public Schools Page 123
DISTRICT FEEDER PROGRAM
The District schools are organized into units called high school feeder patterns. Students move from the elementary school to middle school and
on to the high school located in their neighborhoods.
East High School Feeder Pattern Heights High School Feeder Pattern North High School Feeder Pattern
Number of students in the feeder pattern: 7,853 Number of students in the feeder pattern: 6,146 Number of students in the feeder pattern: 7,853
Number of buildings in the feeder pattern: 11 Number of buildings in the feeder pattern: 13 Number of buildings in the feeder pattern: 15
Average school building age: 56 years 15-16 Average school building age: 30 years 15-16 Average school building age: 64 years 15-16
Enrollment Enrollment Enrollment
East High School 2,217 Heights High School 1,152 North High School 2,166
Jardine Middle School 503 Brooks Middle School 551 Hadley Middle School 516
Mead Middle School 528 Gordon Parks Middle School 113 Horace Mann Middle School 161
Robinson Middle School 792 Stucky Middle School 548 Marshall Middle School 505
Pleasant Valley Middle School 665
Anderson Elementary School 634 Buckner Elementary School 400
College Hill Elementary School 423 Chisholm Trail Elementary School 473 Cloud Elementary School 642
Colvin Elementary School 763 Earhart Elementary School 404 Horace Mann Elementary School 443
Griffith Elementary School 557 Gammon Elementary School 457 Irving Elementary School 488
Hyde Elementary School 316 Gordon Parks Elementary School 339 McLean Elementary School 260
Linwood Elementary School 598 Jackson Elementary School 405 OK Elementary School 298
Washington Elementary School 522 L’Ouverture Elementary School 329 Ortiz Elementary School 400
Mueller Elementary School 432 Park Elementary School 336
Spaght Elementary School 543 Pleasant Valley Elementary School 360
Riverside Elementary School 268
Woodland Elementary School 345
Northeast High School Feeder Pattern Northwest High School Feeder Pattern South High School Feeder Pattern
Number of students in the feeder pattern: 2,954 Number of students in the feeder pattern: 4,459 Number of students in the feeder pattern: 5,706
Number of buildings in the feeder pattern: 6 Number of buildings in the feeder pattern: 7 Number of buildings in the feeder pattern: 7
Average school building age: 39 years 15-16 Average school building age: 57 years 15-16 Average school building age: 51 years 15-16
Enrollment Enrollment Enrollment
Northeast Magnet High School 693 Northwest High School 1,429 South High School 1,788
Allison Middle School 532 Wilbur Middle School 844 Truesdell Middle School 1,015
Black Elementary School 439 Benton Elementary School 358 Cessna Elementary School 533
Bostic Elementary School 285 Cleaveland Elementary School 275 Enterprise Elementary School 477
Enders Elementary School 444 Kensler Elementary School 632 Kelly Elementary School 533
Isely Elementary School 561 McCollom Elementary School 474 White Elementary School 667
Peterson Elementary School 447 Woodman Elementary School 693
Southeast High School Feeder Pattern West High School Feeder Pattern Alternative and Special Schools
Number of students in the feeder pattern: 8,226 Number of students in the feeder pattern: 5,796 Number of students in the feeder pattern: 1,488
Number of buildings in the feeder pattern: 14 Number of buildings in the feeder pattern: 10 Number of buildings in the feeder pattern: 2 *
Average school building age: 46 years 15-16 Average school building age: 70 years 15-16 Average school building age: 77 years 15-16
Enrollment Enrollment Enrollment
Southeast High School 1,586 West High School 1,438 Metro-Boulevard Alternative High School 99
Metro-Meridian Alternative High School 138
Christa McAuliffe Middle School 382 Hamilton Middle School 547
Coleman Middle School 534 Mayberry Middle School 606
Curtis Middle School 723 Learning Centers/Other Sites 1,251
Dodge Elementary School 584
Adams Elementary School 492 Franklin Elementary School 367
Allen Elementary School 529 Gardiner Elementary School 634 * Excludes Learning Centers / Other Sites
Beech Elementary School 563 Harry Street Elementary School 421
Caldwell Elementary School 560 Lawrence Elementary School 428
Christa McAuliffe Elementary School 368 Payne Elementary School 320
Clark Elementary School 377 Stanley Elementary School 451
Jefferson Elementary School 429
Minneha Elementary School 670
Price-Harris Elementary School 446
Seltzer Elementary School 567
Special Education Schools Early Childhood Education Schools Other District Buildings
Number of students in the feeder pattern: 268 Number of students in the feeder pattern: 384
Number of buildings in the feeder pattern: 5 Number of buildings in the feeder pattern: 1 Number of buildings: 3
Average school building age: 48 years 15-16 Average school building age: 62 years 15-16 Average building age: 46 years
Enrollment Enrollment
Chisholm Life Skills Center 88 Little Early Childhood Center 384 Joyce Focht Instructional Support Center
Greiffenstein Special Education Center 36 Management Information Systems Center
Levy Special Education Center 64 School Service Center
Sowers Special Education Center 54
Wells Special Education Center 26
15-16 Student Enrollment Total: 51,133
Note: Information provided by Wichita Public Schools
Student Records and Enrollment Services.

Statistical Section
Wichita Public Schools Page 124