Comprehensive Annual Financial Report - Jefferson County
223
Jefferson County, Colorado Comprehensive Annual Financial Report For the year ended December 31, 2015
-
Upload
khangminh22 -
Category
Documents
-
view
6 -
download
0
Transcript of Comprehensive Annual Financial Report - Jefferson County

Jefferson County, Colorado Comprehensive Annual
Financial Report
For the year ended December 31, 2015
Comprehensive Annual Financial
Report
L I B B Y S Z A B O , C A S E Y T I G H E A N D D O N A L D R O S I E R JEFFERSON COUNTY, COLORADO BOARD OF COMMISSIONERS
Prepared by
Jefferson County Accounting Division
For the year ended December 31, 2015

Front Cover: The county jail and the sheriff’s office are located at the county government complex in Golden. The Jefferson County Sheriff’s Office was founded in November 1859 and today serves 550,000 residents of Jefferson County with a patrolling responsibility to 189,720 of those residents in the 773 square miles of unincorporated areas the county. As chief law enforcement office of the county, the Sheriff oversees the largest full service sheriff’s office in Colorado with 542 state certified deputies and 283 professional staff. Additionally, about 300 volunteers support Sheriff’s operations.
Back Cover: The Traffic Unit responds to community concerns about speeding and reckless driving on Jefferson County roads. Traffic Unit deputies use Harley-Davidson motorcycles and laser speed guns to enforce traffic laws around the county. Because these deputies do not respond to routine calls, they are free to focus on traffic enforcement alone. Other patrol duties support the Traffic Unit.

ABOUT THE REPORT
Jefferson County, Colorado is pleased to present the 2015 Comprehensive Annual Financial Report. This document was only made possible with the strong support of the Board of Commissioners, other elected officials, the County Manager, the Audit Committee and the staff of the various County departments. The Comprehensive Annual Financial Report is presented in three sections: Introductory, Financial, and Statistical. The Introductory Section includes the Accounting Division’s transmittal letter, the elected officials, and the County’s organization chart. The Financial Section includes the auditor’s opinion, management’s discussion and analysis, the basic financial statements, and the combining statements and schedules. The Statistical Section includes fiscal, economic, and demographic information about the County. The Comprehensive Annual Financial Report and other financial reports are available on the Internet at: http://jeffco.us/accounting/

Sheriff Jeff Shrader’s career began in 1984. Ten years after his hire, he attended the FBI National Academy as a sergeant. In 1999 he was promoted to the rank of Division Chief. As a Division Chief he commanded each major function of the Sheriff’s Office. Sheriff Shrader was elected on November 4, 2014 and took office January 13, 2015.


Jefferson County, Colorado Comprehensive Annual Financial Report
Page 1
Table of Contents
Introductory Section Page
Letter of Transmittal ............................................................................................................................................ 6 Elected and Appointed Officials ........................................................................................................................ 10 Organizational Chart .......................................................................................................................................... 11 GFOA Certificate of Achievement .................................................................................................................... 12
Financial Section Independent Auditor’s Report ............................................................................................................................ 14 Management’s Discussion and Analysis ............................................................................................................ 18 Basic Financial Statements Government-wide Financial Statements Statement of Net Position ..................................................................................................................... 37 Statement of Activities .......................................................................................................................... 38
Fund Financial Statements Balance Sheet – Governmental Funds .................................................................................................. 40 Reconciliation of Total Governmental Fund Balances to the Statement of Net Assets ........................ 41 Statement of Revenues, Expenditures, and Changes in Fund Balances – Governmental Funds .......... 42 Reconciliation of the Statement of Revenues, Expenditures, and Changes in Funds Balances of Governmental Funds to the Statement of Activities .................................................................. 43 Combined Statement of Net Position – Proprietary Funds ................................................................... 44 Statement of Revenues, Expenses, and Changes in Net Position – Proprietary Funds ......................... 45 Statement of Cash Flows – Proprietary Funds ...................................................................................... 46 Statement of Fiduciary Assets and Liabilities – Fiduciary Funds ......................................................... 48
Notes to the Basic Financial Statements Note 1. Summary of Significant Accounting Policies ......................................................................... 51 Note A. Government-wide Financial Statements .......................................................................... 51 Note B. Financial Reporting Entity ............................................................................................... 51 Note C. Measurement Focus ......................................................................................................... 52 Note D. Basis of Accounting ......................................................................................................... 54 Note E. Eliminating Internal Activity ........................................................................................... 54 Note F. Encumbrance Accounting ................................................................................................ 55 Note 2. Accounting Policies for Specific Assets, Liabilities, and Net Position ................................... 55 Note 3. Accounting Policies for Revenues and Expenditures/Expenses ............................................. 58 Note 4. Stewardship, Compliance, and Accountability ....................................................................... 59 Note 5. Deposits and Investments ........................................................................................................ 60 Note 6. Interfund Transactions ............................................................................................................ 62 Note 7. Capital Assets .......................................................................................................................... 63 Note 8. Commitments .......................................................................................................................... 66 Note 9. Joint Ventures......................................................................................................................... 67 Note 10. Certificates of Participation ................................................................................................... 70 Note 11. Bonds Payable ....................................................................................................................... 71 Note 12. Loans Payable ....................................................................................................................... 74 Note 13. Lease Commitments .............................................................................................................. 75

Jefferson County, Colorado Comprehensive Annual Financial Report
Page 2
Note 14. Summary of Annual Long-Term Debt Requirements ........................................................... 76 Note 15. Changes in Long-term Liabilities .......................................................................................... 76 Note 16. Conduit Debt Obligations ...................................................................................................... 77 Note 17. Reservations and Designations of Fund Balances ................................................................. 78 Note 18. Retirement Plan ..................................................................................................................... 80 Note 19. Deferred Compensation ......................................................................................................... 80 Note 20. Risk Management .................................................................................................................. 80 Note 21. Contingencies ........................................................................................................................ 82 Note 22. Subsequent Events ................................................................................................................. 83
Required Supplementary Information Schedule of Revenues, Expenditures, and Changes in Fund Balance – Budget and Actual General Fund ......................................................................................................................................... 87 Road and Bridge Special Revenue Fund ............................................................................................... 96 Social Services Special Revenue Fund ................................................................................................. 97 Notes to the Required Supplementary Information ............................................................................... 98
Supplementary Information Nonmajor Governmental Funds Combining Balance Sheet .................................................................................................................... 100 Combining Statement of Revenues, Expenditures, and Changes in Fund Balances ............................ 101
Special Revenue Funds Nonmajor Special Revenue Funds Combining Balance Sheet ............................................................................................................ 104 Combining Statement of Revenues, Expenditures, and Changes in Fund Balances .................... 108 Schedule of Revenues, Expenditures, and Changes in Fund Balance – Budget and Actual Open Space Special Revenue Fund ........................................................................................ 112 Open Space Cities Share Special Revenue Fund ................................................................... 113 Conservation Trust Special Revenue Fund ............................................................................ 114 Developmentally Disabled Special Revenue Fund ................................................................ 115 South Traffic Impact Special Revenue Fund ......................................................................... 116 North Traffic Impact Special Revenue Fund ......................................................................... 117 Evergreen Conifer Traffic Impact Special Revenue Fund ..................................................... 118 Workforce Development Special Revenue Fund ................................................................... 119 Headstart Special Revenue Fund ........................................................................................... 120 Contingent Special Revenue Fund ......................................................................................... 121 Patrol Special Revenue Fund ................................................................................................. 122 Inmate Welfare Special Revenue Fund .................................................................................. 123 Wildland Fire Special Revenue Fund .................................................................................... 124 Solid Waste Disposal Site & Facility Special Revenue Fund ................................................ 125 Solid Waste Facility Management Special Revenue Fund .................................................... 126 Community Development Special Revenue Fund ................................................................. 127

Jefferson County, Colorado Comprehensive Annual Financial Report
Page 3
Debt Service Funds Combining Balance Sheet ................................................................................................................... 130 Combining Statement of Revenues, Expenditures, and Changes in Fund Balances ........................... 131 Schedule of Revenues, Expenditures, and Changes in Fund Balance – Budget and Actual 2009 Bond Open Space Debt Service Fund ................................................................................. 132 2010 Bond Open Space Debt Service Fund ................................................................................. 133 2013 Bond Open Space Debt Service Fund ................................................................................. 134 Sales Tax Local Improvement District Debt Service Fund .......................................................... 135
Capital Projects Funds Schedule of Revenues, Expenditures, and Changes in Fund Balance – Budget and Actual Budgetary Basis Capital Expenditures Capital Projects Fund ...................................................... 139 Combining Balance Sheet ................................................................................................................... 140 Combining Statement of Revenues, Expenditures, and Changes in Fund Balances ........................... 141 Schedule of Revenues, Expenditures, and Changes in Fund Balance – Budget and Actual 2013 Bond Open Space Capital Projects Fund ............................................................................. 142 Sales Tax Local Improvement District Capital Projects Fund ..................................................... 143
Proprietary Funds Enterprise Fund Schedule of Revenues, Expenditures, and Changes in Net Position – Budget and Actual Budgetary Basis Airport Enterprise Fund ............................................................................... 147 Internal Service Funds Combining Statement of Net Position .......................................................................................... 148 Combining Statement of Revenues, Expenses, and Changes in Net Position .............................. 149 Combining Statement of Cash Flows ........................................................................................... 150 Schedule of Revenues, Expenditures, and Changes in Net Position – Budget and Actual Budgetary Basis Workers’ Compensation Internal Service Fund ..................................................................... 151 Self Insurance Internal Service Fund ..................................................................................... 152 Employee Benefits Internal Service Fund ............................................................................. 153 Fleet Internal Services Fund .................................................................................................. 154
Fiduciary Funds Agency Funds Combining Statement of Changes in Fiduciary Assets and Liabilities ............................................... 156
Component Units Balance Sheet ...................................................................................................................................... 158 Reconciliation of Component Units Fund Balances to the Statement of Net Position ........................ 159 Statement of Revenues, Expenditures, and Changes in Fund Balance ............................................... 160 Reconciliation of Statement of Revenues, Expenditures, and Changes in Funds Balances of Component Units to the Statement of Activities .......................................................................... 161 Schedule of Revenues, Expenditures, and Changes in Net Position – Budget and Actual Jefferson County Public Library District ..................................................................................... 162 Jefferson County Public Health .................................................................................................... 163
Supplementary Information Required by the Colorado Department of Human Services ......................... 166
Local Highway Finance Report ................................................................................................................. 168

Jefferson County, Colorado Comprehensive Annual Financial Report
Page 4
Statistical Section (unaudited)
Net Position by Component ............................................................................................................................. 172 Changes in Net Position ................................................................................................................................... 174 Fund Balances, Governmental funds ............................................................................................................... 176 Changes in Fund Balances, Governmental funds ............................................................................................. 178 Assessed and Estimated Actual Value of Taxable Property ............................................................................ 180 Direct and Overlapping Governments Property Tax Rates .............................................................................. 182 Ten Principal Property Tax Payers................................................................................................................... 184 Property Tax Levies and Collections ............................................................................................................... 185 Legal Debt Margin Information ....................................................................................................................... 186 Ratios of Outstanding Debt .............................................................................................................................. 188 Pledged Revenue Bond Coverage, Southeast Jefferson County LID .............................................................. 190 Pledged Revenue Bond Coverage, Open Space Tax Revenue Bonds.............................................................. 191 Demographic and Economic Statistics ............................................................................................................. 192 Principal Employers ......................................................................................................................................... 193 Full Time Equivalent County Government Employees ................................................................................... 194 Operating Indicators by Function ..................................................................................................................... 196 Capital Asset Statistics by Function ................................................................................................................. 200
Continuing Disclosure (unaudited)
Continuing Disclosure (unaudited) .................................................................................................................. 203 Information Applicable to the COPs and Revenue Bonds ............................................................................... 204 Open Space Sales Tax Revenue Refunding Bonds, Series 2009, April 22, 2009 ............................................ 206 Open Space Sales Tax Revenue Refunding Bonds, Series 2010, September 29, 2010 ................................... 207 Facilities and Equipment COPs, November 5, 2009 ........................................................................................ 208 Building Permit Issuance for New Structures in Unincorporated Jefferson County ........................................ 209 2015 Certified Assessed Valuation of Classes of Property in the County ....................................................... 210 History of Foreclosures – Jefferson County ............................................................................................ 211 Retail Sales ....................................................................................................................................................... 212 Comparison of Monthly Open Space Sales Tax Collections ........................................................................... 213 Open Space Sales Tax Revenue Bonds Pro-Forma Historical Debt Service Coverage ................................... 214 Annual History of Open Space Sales Tax Collections ..................................................................................... 215 Ten Principal Generators of Open Space Sales Tax Revenues ........................................................................ 216

Jefferson County, Colorado Comprehensive Annual Financial Report
Page 5
Introductory Section

Jefferson County, Colorado Comprehensive Annual Financial Report
Page 6
DEPARTMENT OF FINANCE AND IT
June 3, 2016 To the Board of Commissioners, members of the Audit Committee and citizens of Jefferson County, Colorado: We submit, for your information and review, the Comprehensive Annual Financial Report of Jefferson County, Colorado, for the year ended December 31, 2015.
Colorado Revised Statutes (CRS) 29-1-603 requires that local governments have an audit of the financial statements performed in accordance with generally accepted auditing standards by a firm of licensed certified public accountants. CRS 29-6-605 requires the financial statements be presented in conformity with Generally Accepted Accounting Principles (GAAP). Pursuant to this requirement, we hereby issue the Comprehensive Annual Financial Report of Jefferson County, Colorado, for fiscal year ended December 31, 2015.
This report consists of management’s representations concerning the finances of the County. Consequently, management assumes full responsibility for the completeness and reliability of the information presented in this report.
Management of the County has established a comprehensive internal control framework that has enabled the County to compile sufficient reliable information for the preparation of the financial statements in conformity with GAAP. The cost of any entities’ internal controls should not outweigh the benefits and accordingly, the County’s comprehensive framework of internal controls has been designed to provide reasonable, rather than absolute, assurance that the financial statements will be free from material misstatement.
Management believes that the financial statements are fairly presented in all material aspects. They are presented in a manner designed to set forth the financial position, results of operations, and changes in net position or fund balances, of the major funds and nonmajor funds in the aggregate. All required disclosures have been included to assist the members of the Board, the financial community, and the public in understanding the County’s financial affairs.
GAAP requires that management provide a narrative introduction, overview, and analysis to accompany the basic financial statements in the form of a Management’s Discussion and Analysis (MD&A). This letter of transmittal is designed to complement the MD&A and should be read in conjunction with it. Jefferson County’s MD&A can be found immediately following the report of the Independent Certified Public Accountants.
COUNTY PROFILE
Jefferson County was created in 1861 as one of the 16 original counties in the Colorado territory. It is currently 773 square miles and is highly urbanized in the east, containing virtually all of the

Jefferson County, Colorado Comprehensive Annual Financial Report
Page 7
suburbs in the western portion of the Denver metropolitan area, and it is highly mountainous in the west and south with vast amounts of national forest land.
As required by state statute, the County is divided into three districts of relatively equal population. Commissioners are elected from each district by the voters of the entire county to serve staggered four-year terms. The Board of County Commissioners (the Board) is charged with overseeing the organization and budgets of a wide variety of programs designed to benefit citizens of the County.
The Assessor, Clerk and Recorder, Coroner, District Attorney, Sheriff, and Treasurer are elected at-large while the Governor appoints the Public Trustee. All elected officials including the Board of Commissioners are term limited to eight years of continuous service. Jefferson County Public Health and Jefferson County Public Library have separate part-time boards and are presented as component units in the County’s financial statements.
Jefferson County provides a full range of services that includes law enforcement, public safety, planning and zoning, highways and streets, culture and recreation, public health, human services, election, and general administrative services. Reporting directly to the Board is the County Manager and the County Attorney. The responsibilities of these offices are:
The County Manager directs the day-to-day operations of the County, enforcing policies and procedures established by the Board of County Commissioners. The Departments of Parks, Development and Transportation, Human Services, and Finance and Information Technology Services report directly to the County Manager.
The County Attorney’s Office provides legal advice, counsel and/or assistance to the Board of County Commissioners, other elected officials and the operating departments and divisions.
ASSESSMENT OF THE COUNTY’S ECONOMIC CONDITION
On an annual basis the national economy posted the second lowest increase in the consumer price index (CPI) in 50 years. The 0.7 percent December-to-December change was the smallest since 2008 and 0.7 was last posted in 1961. There has been a 1.9 percent average increase over the last 10 years. Even though there was a price increase in certain core areas, the energy index decreased 12.6 percent which included significant decreases in gasoline prices and natural gas. The Colorado consumer price index for 2015 was 1.2 percent which was a decrease of 1.6 percent from the 2.8 percent CPI in 2014. The CPI forecast listed by 2016 Colorado Business Economic Outlook from CU Leeds School of Business for 2016 for the Denver-Boulder-Greeley area is expected to rise 1.9 percent.
The national unemployment rate for 2015 was 4.5 percent with Colorado’s rate at 3.5 percent (Colorado Department of Labor and Employment, December 2015). This compares very favorably to 2014 with the United States at 6.2 percent and Colorado at 5.0 percent. Nonfarm payroll jobs increased 46,600 with an estimate of 41,300 in the private sector and 5,300 in government. Income rose in the State, real estate prices escalated, and the value of new construction grew from the prior year.
The Federal Reserve remains committed to its dual mandate of employment and inflation. Employment growth is healthy, but the inflation rate has been low mainly due to the energy prices which fell sharply in 2014 and again in 2015.
Colorado housing has not been able to keep up with the increased households. There were slightly over 19,000 increased housing units compared to 33,000 increased households between July 2013 and June 2014. New housing construction needs to increase to keep up with the demand. Colorado’s

Jefferson County, Colorado Comprehensive Annual Financial Report
Page 8
aging population is forecasted to increase in the 65 plus range from 555,000 to 900,000 between 2010 and 2020.
Notices of valuation sent out by the County Assessor May 1, 2015 shows that the average value of an existing single family home in the County increased from $267,335 in 2014 to $321,101 in 2015. This is an increase of 20.1 percent primarily due to a low inventory of residences and a high demand for these properties.
Jefferson County's population is approximately 565,000 in 2015 according to the United States Census Bureau. The population growth over the last five years has been about 5.8%.
Colorado’s financial sector continues to be stable, but one bank did fail in 2015. Federal rules continue to preclude banks from serving marijuana businesses, although with certain compliance requirements about a dozen small banks are servicing the industry at their own risk. The Colorado State voters in November 2015 voted to allow the state to keep and spend $66.1 million in taxes collected from the sale of recreational marijuana that otherwise would have had to be refunded to Colorado taxpayers due to TABOR.
Ranch and farm income is projected to fall to $824 million the lowest level since 2009 with lower cattle prices as the main cause. This industry helped lead the Colorado economy out of the recession, but it is estimated in 2016 to be at a level not seen since 2002.
LONG-TERM FINANCIAL PLANNING AND MAJOR INITIATIVES
The County utilizes a five-year Project Plan as one of the fundamental building blocks in developing an effective budget process and anticipating future impacts on the County’s financial position. The Project Plan serves as an important planning tool for departments to plan for, and anticipate growth. Citizens’ demands for both services and low taxes are taken into account.
The annual budget serves as the foundation for Jefferson County’s financial planning and control. Prior to October 15th of each year, the County Manager submits to the Board a proposed operating budget for the fiscal year commencing the following January 1st. Certification of the mill levy must be made to the taxing authorities, including the Board, on or before December 15th. The Commissioners adopt, through passage of appropriate resolutions, the final budget prior to the certification of the mill levy. The Board must approve transfers between funds, or increases to a fund’s budget. Budgets for all governmental funds are adopted on the modified accrual basis in conformity with US GAAP and can be found in the supplementary information of this report.
Jefferson County’s Board of Commissioners adopted a $451.2 million and $387.4 million, budget, excluding interdepartmental transfers, for fiscal years 2016 and 2015, respectively. The Salaries and Benefits category was increased by $13.6 million in 2016 over 2015 which includes a 2.6% merit increase and a one-time county-wide, non-base salary pool and an approximately 6.9% increase in benefits that the county and employees will be sharing equally. The Supplies and Services & Charges category increased $10.5 million in 2016 from 2015. Excluding capital outlay, the operating expenditures budgeted in 2016 were $27.5 million more than 2015.
The estimated revenues for 2016 are anticipated to be higher than 2015’s estimate. Property tax revenues are expected to be up about $16.1 million or 8.6% for 2016. Sales tax revenues are also expected to increase in 2016 by about $1.5 million. Auto Ownership Tax is expected to increase $2.0 million and Intergovernmental Revenue is expected to increase $5.0 million in 2016. The other revenue categories overall are expected to remain somewhat static in 2016 as compared to 2015.

Jefferson County, Colorado Comprehensive Annual Financial Report
Page 9
RELEVANT FINANCIAL POLICIES
Under the Taxpayer’s Bill of Rights (TABOR), state spending is only allowed to increase at local growth rate plus inflation. Any money the County raises above that amount must be returned to taxpayers through a complex set of formulas. With the Colorado economy once again booming and housing assessed values rising, it is projected that the County will need to either reduce the mill rate or will have to refund some property tax revenue going forward.
INDEPENDENT AUDIT
Eide Bailly LLP has audited the County’s financial statements. The independent auditors concluded, with an unmodified opinion, that the County’s financial statements for the year ended December 31, 2015, are fairly presented in conformity with GAAP. The report of the Independent Certified Public Accountants is presented on page 14 of this report.
Congress passed a single audit act that clarifies the County and auditor’s responsibility for ensuring that federal moneys are used and accounted for properly. Under the requirements of this act, transactions of major federal programs are audited. The County prepares a Schedule of Expenditures of Federal Awards for inclusion in the auditor’s Single Audit Report. The auditor issues reports on the schedule, the financial statement, internal controls, and compliance with the requirements of federal assistance programs.
AWARDS AND ACKNOWLEDGEMENTS
The Government Finance Officers Association of the United States and Canada (GFOA) awarded a Certificate of Achievement for Excellence in Financial Reporting to Jefferson County for its Comprehensive Annual Financial Report for the fiscal year ended December 31, 2014. This was the twenty-seventh year that the County achieved this prestigious award. In order to be awarded a Certificate of Achievement, a government must publish an easily readable and efficiently organized comprehensive annual financial report. This report must satisfy both generally accepted principles and applicable legal requirements. A Certificate of Achievement is valid for a period of one year only.
Jefferson County received the GFOA’s Award for Distinguished Budget Presentation for its 1994 through 2015 budgets. Continued participation ensures that a well-prepared budget document will communicate productive information for its intended users.
We acknowledge the cooperation of each of the County’s divisions as we work together to conduct the County’s financial operations. By working together as a unified effective team, we are able to achieve the excellence for which the County strives. The CAFR was made possible by the dedicated service of the Accounting Department. We especially thank the Board of County Commissioners for its continued guidance and support in planning and conducting the financial activities of the County in a responsible and progressive manner. The excellent financial condition of Jefferson County is a tribute to the Commissioners’ leadership.
Respectfully submitted,
Deborah Freischlag, CPA IL Director of Accounting

Jefferson County, Colorado Comprehensive Annual Financial Report
Page 10
Elected Officials
Appointed Officials
2015 Elected & Appointed Officials
Libby Szabo, Commissioner, District 1
Casey Tighe, Commissioner, District 2
Donald Rosier, Commissioner, District 3
Ron Sandstrom, Assessor
Faye Griffin, Clerk & Recorder
John Graham, Coroner
Peter A. Weir, District Attorney
Jeff Shrader, Sheriff
Robert Hennessy, Surveyor
Tim Kauffman, Treasurer
Margaret T. Chapman, Public Trustee (Governor appointed)
Ralph Schell, County Manager
Ellen Wakeman, County Attorney
Tom Hoby, Parks Director
Holly Björklund, Finance and IT Director
Lynn Johnson, Human Services Director
Jeanie Rossillon, Development & Transportation Director
Mark B. Johnson, M.D., Public Health Director
Pam Nissler, Public Library Director

Jefferson County, Colorado Comprehensive Annual Financial Report
Page 11

Jefferson County, Colorado Comprehensive Annual Financial Report
Page 12

Jefferson County, Colorado Comprehensive Annual Financial Report
Page 13
2015 Comprehensive Annual Financial Report
Financial Section

Jefferson County, Colorado Comprehensive Annual Financial Report
Page 14

Jefferson County, Colorado Comprehensive Annual Financial Report
Page 15

Jefferson County, Colorado Comprehensive Annual Financial Report
Page 16

Jefferson County, Colorado Comprehensive Annual Financial Report
Page 17
Management’s Discussion and Analysis

Jefferson County, Colorado Comprehensive Annual Financial Report
Page 18
MANAGEMENT’S DISCUSSION AND ANALYSIS
This section of Jefferson County’s Comprehensive Annual Financial Report (CAFR) provides readers with a narrative overview and analysis of the County’s financial performance during the fiscal year that ended on December 31, 2015. We encourage readers to consider the information presented here in conjunction with the letter of transmittal at the front of this report, the County’s basic financial statements, and the notes to the basic financial statements, to enhance their understanding of the activities and financial condition of the County.
FINANCIAL HIGHLIGHTS
The assets and deferred outflows of the County’s governmental activities exceeded liabilities and deferred inflows by $1,114.2 million and $1,091.3 million in 2015 and 2014, respectively. The unrestricted net position decreased slightly to $68.9 million in 2015 from $69.1 million in 2014. This consistency is the result of continued cost control by the County as well as increases in revenues and more investment in capital assets.
The assets of the business-type activities (Rocky Mountain Metropolitan Airport) exceeded liabilities by $66.1 million and $65.9 million in 2015 and 2014, respectively. The unrestricted net position increased to $2.6 million in 2015 as compared to $0.2 million in 2014. The net investment in capital assets reduced by $2.2 million, mainly due to an increase in depreciation.
At December 31, 2015 the governmental fund assets of $364.7 million exceeded the liabilities and deferred inflows of $194.4 million resulting in total fund balances of $170.4 million in 2015, compared to $173.7 million in 2014. The reason for this decrease was mainly the purchase of additional open space land and continued costs for the detention facility expansion. The remaining funds from the 2009 COP issuance will be used over the next year for the HVAC system for the Courts and Administration Building.
The net position of the internal service funds increased by $69,000 to $35.8 million in 2015 compared to net position of $35.7 million in 2014. The slight increase was mainly due to an increase in capital assets.
OVERVIEW OF THE BASIC FINANCIAL STATEMENTS
The Management’s Discussion and Analysis (MD&A) is intended to serve as an introduction to the County’s Basic Financial Statements. The Basic Financial Statements contain three components:

Jefferson County, Colorado Comprehensive Annual Financial Report
Page 19
government-wide financial statements (including component unit statements), fund financial statements and notes to the financial statements. The MD&A, Basic Financial Statements, and Notes to the Basic Financial Statements provide an overview for users who require less detailed information about the County’s finances than is contained in the balance of the report.
Government-wide financial statements
The government-wide financial statements are designed to provide the reader with a broad overview of Jefferson County’s finances, in a manner similar to a private-sector business.
The Statement of Net Position includes all of the County’s assets and liabilities, both short and long-term as well as deferred outflows and inflows of resources. Net position, which is the difference between the County’s assets plus deferred outflows of resources and liabilities plus deferred inflows of resources, are one way to measure the County’s current financial position. Over time, changes in the County’s net position are an indicator of the stewardship of the assets entrusted to the County’s management by its citizens.
The Statement of Activities presents information showing how the County’s net position changed during the year. All changes in net position are reported as soon as the underlying event giving rise to the change occurs, regardless of the timing of the related cash flows. Thus, some revenues and expenses, such as uncollected taxes or employee sick and annual leave payoffs, which are reported in this statement, would only impact cash flows in a future period.
These statements distinguish the functions of the County that are principally supported by taxes and intergovernmental revenues (governmental activities) from others that are expected to recover all or most of their expenses from user fees and charges (business-type activities). The governmental activities include general government, public safety, highways and streets, culture and recreation, economic development, welfare, and sanitation. The business-type activity is made up solely of the Rocky Mountain Metropolitan Airport.
The County includes the Jefferson County Public Library and the Jefferson County Public Health in its report. Although legally separate, these “component units” are included because the County is either financially accountable for them, or may impose its will upon them.
Fund Financial Statements
The fund financial statements provide more detailed financial information about the County’s funds. Funds are self-balancing legal entities that governments use to track both specific sources of funding and/or spending for specified purposes. Some funds are required by state law or by bond covenants. In addition, the Board of County Commissioners may establish funds to control and manage resources segregated for particular purposes like debt service or capital projects, or to show that certain taxes and grants are used appropriately.
The County has three types of funds:
Governmental funds:
Most of the County’s basic services are included in governmental funds. These funds focus on how cash and other liquid financial assets flow in and out, and the balances left at year-end that are available for future spending. The governmental fund statements provide a short-term view that helps determine whether there are more or fewer financial resources that can be spent in the near future to finance the County’s programs. Since this information does not encompass the additional long-term focus of the government-wide statements, a reconciliation providing additional
Jefferson County, Colorado Comprehensive Annual Financial Report
Page 20
information is on the subsequent page of the governmental funds statement to explain the differences between the two types of statements.
Proprietary funds:
Services for which the County charges customers a fee can be reported in proprietary funds. Proprietary funds, like the government-wide statements, provide both long-term and short-term financial information and are operated similar to a private business.
The County’s Enterprise Fund (Airport Fund) is classified as a business-type activity on the government-wide statements. More detailed information, such as its cash flows, is provided in the Proprietary Fund Statements.
The County’s Internal Service Funds are used to report activities that provide supplies and services for the County’s other programs and activities. In 2015 internal service funds were used for risk management, self insurance activities for property, liability, health and dental, and the County’s vehicle fleet (excluding the Sheriff’s Office).
Fiduciary funds:
Fiduciary funds are used to account for resources held for the benefit of other entities, including other governments. All of the County’s fiduciary activities are reported in a separate statement of fiduciary assets and liabilities. These balances are excluded from the County’s government-wide financial statements because the County cannot use these assets to finance its operations.
The County is the trustee, or fiduciary, for the Treasurer’s Fund. The Treasurer, by statute, collects and distributes all property tax revenues to other County funds and local governments. The County also maintains an agency fund to account for the property tax mill levy collections on behalf of the Meadow Ranch Public Improvement District. The County provides all the financial services for, and acts in a fiduciary manner, regarding the District. The foreclosure and release activities of the Public Trustee’s office are accounted for in the Public Trustee Agency Fund.
Notes to the Basic Financial Statements
The notes provide additional information that is essential to a full understanding of the data provided in the government-wide and fund financial statements.
Other Information
In addition to the basic financial statements and accompanying notes, this report also presents certain required supplementary information concerning the County’s major funds and their budgets. These funds are the General Fund and the Road and Bridge and Social Services Special Revenue Funds. This information includes their original budget, and their revised budgets compared to the final actual revenues and expenditures for the year.
GOVERNMENT-WIDE FINANCIAL ANALYSIS
The amount of total net position is one measure of the health of the County’s finances. The County reports positive balances in its governmental activities. However, this measure must be used with care as the County has an investment in its infrastructure such as roads and bridges, in addition to land for open space and other recreational purposes. These assets benefit the citizens and businesses that utilize them. Thus, the County reports them on its government-wide financial statements at their historical cost less accumulated depreciation, as a business would report its capital assets.

Jefferson County, Colorado Comprehensive Annual Financial Report
Page 21
The following table was derived from the current and prior years’ Statement of Net Position:
Governmental accounting principles require that the amount of net position represented by the County’s equity in capital assets be presented separately as Net Investment in Capital Assets, in order to show that they are not financial assets available for appropriation. Of the County’s total equity of $1,180.2 million, only $69.4 million is not invested in capital assets or restricted by an entity external to the County
Another measure of the County’s financial condition is the change in net position from the prior year. This is measured the same way a business measures its net profit or loss from year to year, using full accrual accounting. Investments by the County in capital assets are not recorded as expenses when they occur, but rather as depreciation expense over the life of the asset. This would include roads, bridges, buildings, and equipment. In the fund statements discussed later, these assets would be expenditures when the purchase was made.
The County implemented GASB Statement No. 68. Accounting and Financial Reporting for Pensions, an Amendment of GASB Statement No. 27 and GASB Statement No. 71 Pension Transition for Contributions Made Subsequent to the Measurement Date an Amendment of GASB Statement No. 68. One pension plan with one employee was subject to the new standards and due to the insignificance of the net pension liability, the County determined that no entries warranted recording at the Government-Wide Financial Statement level. There was no effect on the financial statements at the fund level.
2015 2014 2015 2014 2015 2014
Noncapital assets 391,844$ 393,188$ 4,796$ 3,596$ 396,640$ 396,784$
Capital assets 1,082,179 1,072,795 62,961 65,396 1,145,140 1,138,191
Total Assets 1,474,023 1,465,983 67,757 68,992 1,541,780 1,534,975
Deferred outflows
of resources 3,148 3,689 - - 3,148 3,689
Current liabilities 24,608 27,338 927 2,121 25,535 29,459 Noncurrent liabilities 168,220 186,147 776 1,018 168,996 187,165
Total Liabilities 192,828 213,485 1,703 3,139 194,531 216,624
Deferred inflowsof resources 170,193 164,881 - - 170,193 164,881
Net investment in capital assets 943,171 919,720 62,265 64,481 1,005,436 984,201
Restricted 104,165 102,507 1,175 1,175 105,340 103,682 Unrestricted 66,814 69,079 2,614 197 69,428 69,276
Total Net Position 1,114,150$ 1,091,306$ 66,054$ 65,853$ 1,180,204$ 1,157,159$
(amounts in thousands)
Total Primary
Government
Governmental
Activities
Business-Type
Activities

Jefferson County, Colorado Comprehensive Annual Financial Report
Page 22
The following table was derived from the current and prior years’ Statement of Activities:
The change in net position for the governmental activities was an increase of $22.8 million for 2015 compared to an $18.8 million increase in 2014. This number is very similar to the net income number found on a business operating statement. It represents the number that most stakeholders focus on first, whether in government or in business.
Property tax revenue increased only slightly by $1.6 million in 2015 from 2014 because property values are assessed every two years in an odd-numbered year, so the county is delayed in seeing the impact from the economic recovery until 2016. The 2015 property taxes would be based on the 2013 assessment period. Investment income decreased slightly as the rates have been persistently low since 2008. The County Treasurer during this time is keeping investment duration very short as interest rates are anticipated to rise as the economy continues to recover. Sales tax revenue increased in 2015 from 2014 as consumer confidence increases with employment and personal income growth and low CPI. Charges for services increased $4.7 million mainly in General Government as that went up $4.4 million. Some of the reasons for the increase in General Government were releases of deed charges, treasurer fees for collecting property taxes, motor vehicle fees and real estate recording fees. The need for welfare services has increased as well as
2015 2014 2015 2014 2015 2014Revenues
Program RevenuesCharges for services 43,278$ 38,855$ 3,344$ 3,031$ 46,622$ 41,886$ Operating grants 62,874 58,814 - - 62,874 58,814 Capital grants 1,049 1,081 1,231 12,950 2,280 14,031
General Revenues
Property Taxes 178,916 177,290 - - 178,916 177,290
Sales Taxes 61,305 57,796 240 307 61,545 58,103
Investment Income 2,162 2,819 100 34 2,262 2,853
Miscellaneous 2,079 2,368 1,667 1 3,746 2,369
Total Revenues 351,663 339,023 6,582 16,323 358,245 355,346
ExpensesGeneral government 49,565 47,043 - - 49,565 47,043 Public safety 130,532 126,843 - - 130,532 126,843 Highways and streets 45,044 44,570 - - 45,044 44,570 Culture and recreation 27,707 28,994 - - 27,707 28,994 Economic development and assistance 7,485 7,787 - - 7,485 7,787 Welfare 61,171 57,096 - - 61,171 57,096 Sanitation 648 917 - - 648 917 Interest on long-term debt 6,667 6,945 - - 6,667 6,945 Airport - - 6,381 5,290 6,381 5,290
Total Expenses 328,819 320,195 6,381 5,290 335,200 325,485
Change in net position 22,844 18,828 201 11,033 23,045 29,861
Net position January 1 1,091,306 1,072,478 65,853 54,820 1,157,159 1,127,298
Net position December 31 1,114,150$ 1,091,306$ 66,054$ 65,853$ 1,180,204$ 1,157,159$
Activities Activities
(amounts in thousands)
GovernmentGovernmental Business-Type Total Primary

Jefferson County, Colorado Comprehensive Annual Financial Report
Page 23
the grants that help fund those services. Also the County continued to receive $450,000 in FEMA monies through the State for the September 2013 flood expenditures. The County pays approximately 20 percent of the total cost in the Social Services Fund with the remaining 80 percent made up of State and Federal funds passed through the State. The State’s share loaded on to the
clients EBT cards are not shown as a County expense. The County has used current revenues and existing fund balance of its Social Services Fund plus some funds transferred from the General Fund in order to match the entire allocation available from the State of Colorado.
Interest on long-term debt in 2015 decreased slightly but is expected to remain consistent over the next several years. The County does not plan to add to its long term debt amounts but rather will continue to refund existing issues.
The net position of the Airport, the sole business-type activity of the County,
increased slightly by $200,000 in 2015, compared to $11.0 million in 2014. In 2014 the Airport had an increase in construction projects which were completed during 2015.
In 2015, total general revenues for the primary government increased by $4.2 million over 2014 (1.7 percent). Sales tax revenue increased by 3.5 million making up the majority of this increase.
TABOR, a state constitutional provision, limits how much the County’s revenues can grow each year by a combination of inflation, as measured by the Denver-Boulder-Greeley Price Index, and local growth, as measured by new construction less demolition of older improvements (see Note 4 in the Notes to the Basic Financial Statements). The County, through a temporary reduction of its mill levy is below the TABOR limitation.
The expenses of the primary government increased by 3.0% between 2015 and 2014. This was an increase of $9.7 million in expenses. The majority of the increase was in General Government, Public Safety and Welfare.
Component Units
The County has two discretely presented component units. They are the Jefferson County Public Library and the Jefferson County Public Health. The Public Library Fund accounts for the monies received from property taxes and other sources and expended to provide library services countywide. Property taxes make up nearly 92 percent of the Library’s revenue. The Public Health Fund accounts for monies received from the County, State, and Federal governments, plus fees from licenses, permits, and other services.
$-
$20,000
$40,000
$60,000
$80,000
$100,000
$120,000
Thousands
Governmental Expenses by Function
2013
2014
2015

Jefferson County, Colorado Comprehensive Annual Financial Report
Page 24
The following table was derived from the current and prior years’ Statement of Net Position:
The following table was derived from the current and prior years’ Statement of Activities:
2015 2014 2015 2014
Noncapital assets 47,190$ 37,394$ 2,793$ 2,662$
Capital assets 20,659 23,404 346 29
Total Assets 67,849 60,798 3,139 2,691
Current liabilities 909 1,201 1,060 929 Noncurrent liabilities 956 1,014 635 714
Total Liabilities 1,865 2,215 1,695 1,643
Deferred inflowsof resources 33,173 23,947 - -
Invested in capital assets,net of related debt 20,659 23,404 346 29
Unrestricted 12,152 11,232 1,098 1,019
Total Net Position 32,811$ 34,636$ 1,444$ 1,048$
(amounts in thousands)
Public Library Public Health
2015 2014 2015 2014Revenues
Program RevenuesCharges for services 817$ 900$ 2,087$ 2,103$ Operating grants 363 332 11,474 11,035 Capital grants 679 868 - -
General Revenues
Property Taxes 23,623 23,475 - -
Investment Income 172 224 5 6
Total Revenues 25,654 25,799 13,566 13,144
ExpensesCulture and recreation 27,479 24,934 - - Health - - 13,170 13,058
Total Expenses 27,479 24,934 13,170 13,058
Change in net position (1,825) 865 396 86
Net position January 1 34,636 33,771 1,048 962
Net position December 31 32,811$ 34,636$ 1,444$ 1,048$
Public Library Public Health
(amounts in thousands)

Jefferson County, Colorado Comprehensive Annual Financial Report
Page 25
FINANCIAL ANALYSIS OF THE GOVERNMENT’S FUNDS Jefferson County uses fund accounting to ensure and demonstrate compliance with finance-related legal requirements.
Governmental funds
The focus of the governmental funds is to provide information on near-term inflows, outflows, and balances of spendable resources. Such information is useful in assessing the County’s financing requirements. In particular, unrestricted fund balance may serve as a useful measure of a government’s net resources available for spending at the end of the fiscal year.
Revenues for all governmental funds were $360.6 million in 2015 compared to $349.9 million in 2014. Other financing sources exceeded other
financing uses by $0.7 million in 2015 compared to $.8 million in 2014.
Expenditures were $364.0 million in 2015 compared to $362.2 million in 2014. An increase in general government spending was the primary reason for the increase in expenditures.
Expenditures for general government increased in 2015 from 2014 as salary and benefits increased which included a 2.6% merit increase and a one-time county-wide, non-base salary pool and an approximately 6.9% increase in benefits that the county and employees shared equally. In 2009, the County saw an opportunity with the significant decline in interest rates as the world recovered from the financial crisis of 2008, to borrow money both in the tax exempt market and with the new Build America Bonds. This borrowing has been used to rebuild various systems at the jail and finance new facilities construction both on the main campus and two new government centers in the densely populated areas of the County. The remaining proceeds should be spent within the next year.
-
100,000
200,000
300,000
400,000
2011 2012 2013 2014 2015
Governmental Funds Sources
Taxes Intergovernmental
Other Revenues Other Fin. Sources
Thousands
-
100,000
200,000
300,000
2011 2012 2013 2014 2015
Governmental Funds Uses
Operating Capital Debt Service Intergovernmental
Thousands

Jefferson County, Colorado Comprehensive Annual Financial Report
Page 26
General Fund
The General Fund of Jefferson County accounts for all transactions not accounted for in other funds. As the County’s major operating fund, the General Fund accounts for ordinary operating expenditures financed primarily by property taxes and charges for services. These general-purpose revenues are collected without regard to how they can be spent.
The General Fund had a fund balance of $76.6 million and $76.5 million on December 31, 2015 and 2014, respective-ly. Of these amounts $41.0 million and $40.5 million was unassigned in 2015 and 2014, respectively.
The Board of County Commissioners has available the unassigned fund balance, along with 2016’s estimated revenues to appropriate in 2016. The amount shown in the chart to the right labeled as nonspendable/restricted/assigned in 2015 includes $2.7 million that is nonspendable, $7.0 million restricted primarily for the TABOR emergency reserve and $25.9 million as assigned per the Budget Office. The County’s policy is to assign 7.0 to 12.0 percent of expenditures above the emergency reserve as security for unforeseen events and working capital needs as recommended by the Government Finance Officers Association.
Property taxes are the main source of revenue for the General Fund. Revenues from this source were $120.1 million and $119.8 million in 2015 and 2014, respectively. This was an increase of 0.3 percent over 2014. Colorado state statute requires reassessment every two years. The tax revenues in 2015 increased and were based on the 2013 assessment period. As the chart on the left demonstrates, property tax revenues are level for each two year assessment cycle as shown by 2015 and 2014. Increases in property tax
revenues can only occur from new construction or mill levy changes in the second year.
Vehicle ownership taxes relatively the same at $2.5 million in both 2015 and 2014. Vehicle ownership taxes are set by the State and based upon the value of the individual vehicles registered in the county. They are paid when license plates are renewed. The bulk of the other revenues are for charges for services. Charges to external customers are primarily in Planning and Zoning, the Clerk and Recorder’s office and the Treasurer’s office. Interdepartmental charges are for services provided to the other funds and to the divisions in the General Fund from the central functions for accounting, budget, legal fees, human resources, and purchasing
$-
$10,000
$20,000
$30,000
$40,000
$50,000
$60,000
$70,000
$80,000
2011 2012 2013 2014 2015
Fund Balance of the General Fund
Nonspendable/Restricted/AssignedUnassigned/Unreserved
Thousands
$-
$40,000
$80,000
$120,000
$160,000
2011 2012 2013 2014 2015
General Fund Revenues by Source
Other
Investment Income
Intergovernmental
Fees and charges
Taxes
Thousands

Jefferson County, Colorado Comprehensive Annual Financial Report
Page 27
In 2015, the General Fund’s revenues and other financing sources exceeded expenditures and other financing uses by $0.1 million while the 2014 expenditures and other financing uses exceeded revenues and other financing sources by $5.8 million.
Major transfers from the General Fund were $15.9 million and $15.6 million to the Patrol Fund in 2015 and 2014, respectively, and $4.8 million and $4.7 million to the Public Health Department, a component unit, in 2015 and 2014, respectively. The Patrol Fund provides
police services to the unincorporated areas of the County. It is supported primarily from the Law Enforcement Authority property tax levy.
Other Major Funds
The Road and Bridge Fund, the Social Services Fund, and the Capital Expenditures Fund are the current other major funds of the County.
The Road and Bridge Fund is mandated by state law. This fund accounts for the monies generated by property taxes and other revenues for the maintenance and repair of the County’s Roads. The Social Services Fund is also mandated and accounts for the revenues received from property taxes, State, and Federal grants for social programs. The Capital Expenditures Fund, a capital projects fund, is used to accumulate and provide monies for major capital expenditures and lease payments for the County. The fund is also used to pay for the debt service of the bonds issued in 2009, which will be used for a variety of County-wide construction projects.
The Road and Bridge Fund had ending fund balances of $11.3 million and $10.1 million in 2015 and 2014, respectively. In 2015, 56.2 percent of the fund’s revenues were from property taxes on real property and vehicles, compared to 54.7 percent in 2014. The fund’s second largest revenue source is fuel tax distributions from the State. This source, which is based on vehicle registrations and relative lane miles, increased $0.6 in 2015 from 2014.
The Social Services Fund had an ending fund balance of $5.1 million in 2015 and 2014. Property tax revenues were $10.0 million in 2015 and 2014. In 2015 and 2014, approximately 75.3 and 73.0 percent of the fund’s revenues were from Federal and State grants.
The Capital Expenditures Fund had an ending fund balance of $14.5 million both in 2015 and 2014. During 2015, the County continued working on the major construction project of expanding the existing detention facility.
Proprietary Funds
The Rocky Mountain Metropolitan Airport Fund is the sole enterprise fund of the County. In 2015 operating revenues increased slightly to $3.3 million from $3.0 million in 2014. The operating expenses increased in 2015 to $6.2 million from $5.2 million in 2014 primarily due to an increase in depreciation of $1.1 million. The ending net position was $66.1 million and $65.9 million in 2015 and 2014, respectively for the Airport.
$-
$40,000
$80,000
$120,000
$160,000
2011 2012 2013 2014 2015
General Fund Expenditures by Use
Other
Transfer to Patrol
Operating
Salaries and benefits
Thousands

Jefferson County, Colorado Comprehensive Annual Financial Report
Page 28
In 2015, the County had four internal service funds. These funds provide goods and services to other County programs on a cost reimbursement basis. They use full accrual accounting in order to measure their costs in the same manner that a business does.
The Workers’ Compensation Fund is a self-insurance fund for work-related injuries incurred by County employees on the job. The Self-Insurance Fund provides the County with insurance for property and automobile physical damage, surety and other liability coverage deductibles. The Employee Benefits Fund is a self-insurance fund for a portion of the medical and dental insurance provided to employees. The Fleet Services Fund provides automobile, truck and road equipment to the County’s departments as well as maintenance of the County’s fleet.
The Employee Benefits Fund provides medical, dental, life, and vision insurance to County employees, plus COBRA, employee assistance, and a wellness program. The fund has both a self-insurance option and a full indemnity option for employees and their dependents.
The Fleet Services Fund maintains a large balance because it pays for the replacement of road equipment. The fund was originally established in 1999 and at that time it received cash from the General Fund and the Road and Bridge Fund equal to the accumulated depreciation of the equipment that was contributed to the Fleet Services Fund. That significant cash contribution plus the investment earnings on the cash and the depreciation charges to the various departments that use the equipment allow the fund to be self-funded for capital replacement.
Other Governmental Funds of Significance
The Open Space Fund together with the Open Space Cities Share Fund had a total ending fund balance of $26.2 million and $32.9 million in 2015 and 2014, respectively. Capital Outlay for culture and recreation increased by $5.3 million in 2015. Open Space received $29.1 million and $26.3 million in sales tax revenue in 2015 and 2014, respectively. Of these amounts $12.9 million and $12.0 million were appropriated in 2015 and 2014, respectively, to various cities in the county for interagency cooperative agreements related to their open space efforts.
The Patrol Fund of Jefferson County accounts for monies generated from the Jefferson County Law Enforcement Authority (LEA), additional funding from the General Fund and other sources. These funds are expended for law enforcement patrol services in the unincorporated areas of the County. The Patrol Fund had revenues from the LEA of $9.5 million in both 2015 and 2014. The fund also had other revenues of $1.4 million and $1.5 million in 2015 and 2014, respectively. The balance of expenditures is funded from the General Fund transfer to the Patrol Fund to provide law enforcement services in the unincorporated portions of the county.
Net Change NetPosition In Net Position
2014 Position 2015
Workers' Compensation 550,022$ 304,685$ 854,707$
Self Insurance 3,241,579 (860,194) 2,381,385
Employee Benefits 3,959,365 (214,907) 3,744,458
Fleet Services 27,958,481 839,081 28,797,562
Total 35,709,447$ 68,665$ 35,778,112$

Jefferson County, Colorado Comprehensive Annual Financial Report
Page 29
Pursuant to state statute, the County maintains a contingent fund for natural disasters. The ending fund balance of this fund was $2.8 million in both 2015 and 2014. In 2015 the fund’s expenditures were limited to administrative costs. The entire fund balance is reserved for emergencies in order to help satisfy the TABOR requirement to maintain 3 percent of fiscal year spending as an emergency reserve. The balance of the TABOR requirement is reserved in the General Fund.
GENERAL FUND BUDGETARY HIGHLIGHTS The Board of County Commissioners possesses complete authority over the County’s expenditures through the budgetary process, which is mandated in state statute. The County uses budgetary control in its accounting system to ensure compliance with the annual appropriated amounts. The Board may revise the budget from time to time and the CAFR presents both the original and final budget for the year.
The budget lapses at year-end. Projects uncompleted or goods and services not received prior to year-end must be charged to the subsequent year’s appropriation. The County has a process where-by agencies may request a carry-forward (supplemental appropriation) to the budget which began January 1, for these uncompleted projects of the prior year, or to pay for goods and services received in the new year, which were intended to be received in the prior year, but were not received in the prior year due to unforeseen circumstances.
General Fund final budgetary revenues were $180.0 million and $176.4 million in 2015 and 2014, respectively. The actual revenue amounts were $180.5 million and $178.2 million in 2015 and 2014, respectively.

Jefferson County, Colorado Comprehensive Annual Financial Report
Page 30
A comparison of 2015 actual to the 2015 original and final budgets and 2014 actual by revenue source and object of expenditures follows:
In 2015, the County experienced unexpected increases in licenses and permits revenue as well as charges for services revenue. There were also decreases in property taxes, interdepartmental and other revenues in actual versus budget. However, the budget was not significantly modified to reflect the change in revenues resulting in sizable variances between the final budgets and the actual revenues for these line items.
There was a $5.5 million variance between the original budget and final budget of the General Fund which was mainly due to carry-forwards from 2014 into 2015 for other services and charges, personnel services and supplies. The biggest carryforward for the General Fund was monies for the Thompson Reuters project for the Treasurer’s Office in the amount of $2.1 million. For 2015 actual expenditures were $16.6 million less than the final budget compared to 2014 in which actual expenditures were $16.5 million less than the final budget. Salaries and benefits were $2.2 million or 2.0 percent lower than the final budget and other services and charges were $1.8 million or 5.9 percent lower than budgeted. Also, actual transfers-out/interdepartmental charges were less than budgeted by $7.4 million.
CAPITAL ASSET AND DEBT ADMINISTRATION
Capital Assets
At the end of 2015 the County had invested $1,145 million, net of accumulated depreciation in capital assets, compared to $1,138 million, net of accumulated depreciation in capital assets, at the
Original Final VarianceActuals Budget Budget Actuals From Final
General Fund 2014 2015 2015 2015 Budget
Budgetary Revenues
Taxes 122,408,041$ 123,248,901$ 123,248,901$ 122,737,158$ (511,743)$ Licenses and permits 3,569,877 2,866,610 2,866,610 3,814,924 948,314 Intergovernmental 8,502,002 8,006,720 8,686,409 9,148,548 462,139 Charges for services 22,656,226 21,880,315 22,225,230 25,232,577 3,007,347 Investment income 1,419,607 865,439 865,439 1,110,361 244,922 Interdepartmental 17,074,124 18,190,357 18,729,486 16,469,830 (2,259,656) Other 2,615,090 3,260,244 3,276,910 2,011,914 (1,264,996)
Total Budgetary Revenues 178,244,967 178,318,586 179,898,985 180,525,312 626,327
Budgetary ExpendituresPersonnel services 106,330,523 111,905,058 112,879,991 110,672,441 2,207,550 Supplies 8,882,726 8,415,199 9,442,480 8,866,537 575,943 Other services and charges 26,646,439 26,361,564 29,914,029 28,160,173 1,753,856 Capital outlay 2,478,394 8,297,529 7,272,887 4,274,735 2,998,152 Patrol Fund transfer 15,590,754 15,613,348 15,613,348 15,867,668 (254,320) Component units 4,633,539 6,773,173 6,773,173 4,769,983 2,003,190 Intergovernmental
Services 303,679 306,557 306,557 305,960 597 Grants 1,244,041 1,061,574 1,905,574 1,968,697 (63,123)
Transfers-out/Interdepartmental 6,363,719 11,286,479 12,974,878 5,555,708 7,419,170
Total Budgetary Expenditures 172,473,814 190,020,481 197,082,917 180,441,902 16,641,015
Budgetary Gain/(Loss) 5,771,153$ (11,701,895)$ (17,183,932)$ 83,410$ 17,267,342$
Jefferson County, Colorado Comprehensive Annual Financial Report
Page 31
end of 2014. This excludes the capital assets of the component units. These capital assets consist of a broad range of assets including land, land improvements, buildings, park facilities, roads, bridges, heavy machinery, vehicles, equipment, road surfaces and airport facilities.
The net change in capital assets was $7.0 million increase in 2015 and $23.2 million increase in 2014. While the County began a significant program of facilities additions to be funded with the issuance of certificates of participation in November 2009, the bulk of those proceeds was spent in 2013 and 2014 and some in 2015; a small remainder plans to be spent in 2016. Additional information on the County’s capital assets can be found in Note 7 of the Notes to the Financial Statements.
Long-Term Debt
Colorado Revised Statutes provide for a general obligation debt limit of 3.0% of assessed valuation. The County had a general obligation debt capacity of $245.3 million and $213.3 million in 2015 and 2014, respectively. The County currently has no debt subject to the limitation.
For the primary government including blended component units the outstanding debt at December 31 consisted of the following:
Certificates of Participation in the amount of $78.3 million and $83.5 million in 2015 and 2014, respectively. These were issued to finance the construction, acquisition and equipping of governmental facilities. Payments may be budgeted, appropriated and paid from any of the County’s available funds including the General Fund. The County receives general-purpose revenues from a variety of sources. The main sources are property taxes on real estate, interest and penalties on property taxes, and automobile ownership taxes. Additional sources are licenses and permits, intergovernmental revenues, including federal payments in lieu of taxes, state cigarette taxes, gaming impact fees, and other payments passed through from the state, charges for services, fines and forfeitures, and investment income.
Sales Tax Revenue Bonds in the amount of $68.5 million and $80.1 million in 2015 and 2014, respectively. The Southeast Jefferson County Local Improvement District has $8.3 million outstanding of the sales tax revenue bonds funded by a one-half percent sales tax within the District. These special revenue bonds were issued to construct street improvements within a portion of the southern unincorporated boundaries of the County. The remaining $60.2 million in bonds were issued for land acquisitions for open space preservation and are funded by a countywide one-half percent sales tax.
Loans Payable in the amount of $696,000 in 2015 and $915,000 in 2014 represent the amount the Airport borrowed through a State Infrastructure Bank loan from the State of Colorado for the development of airport land.
There was no outstanding debt for the County’s discretely presented component units at the end of 2015.
Additional information on the County’s long-term debt can be found in the notes to the financial statements following the Basic Financial Statements. (See notes 10-15 beginning on page 70.)
ECONOMIC FACTORS AND NEXT YEAR’S BUDGETS AND RATES
Property taxes are a stable source of income over time, and generate the bulk of the County’s revenues. Property tax revenue increased slightly in 2015 from 2014 and decreased in percentage to

Jefferson County, Colorado Comprehensive Annual Financial Report
Page 32
50.9 percent of the governmental activities total revenue for 2015, compared to 52.3 percent of revenues in 2014. The reason for the percentage decrease is that the County had a higher increase in operating grants and sales tax. Sales taxes have increased as the economy has been growing at a steady rate for several quarters and consumer confidence has increased.
For both years the maximum allowable mill levy was 25.978 under the Taxpayer Bill of Rights (TABOR), but it was reduced temporarily in 2014 to 25.846 and the mill levy remained at that level for 2015. For the Library, a component unit, their maximum allowable mill levy is 3.500 but was reduced to 3.425 in 2015 and 2014. In the November 2015 election the Jefferson County voters increased the allowable Library mill to 4.500 and exempted the Library from TABOR which will take effect with the 2016 mill levy.
The Colorado legislature requires that each property be re-valued by county assessors in odd-numbered years. The assessed value for 2015 is based on the market values as of June 30, 2014. The property taxes based on the assessed value for 2015 are received in calendar year 2016. The property tax revenues for 2015 and 2014 were relatively level since the County kept the mill levy stable for both years and they are based on the same assessment period of 2013. The only change was for new construction or reassessment requested by the property owner. For 2016, the Jefferson County property assessments are greater than the allowable growth stated in TABOR and the 5.5 percent Property Tax Revenue Limit known as the Annual Levy Law. The other areas that the voters have exempted the county from TABOR are the Developmentally Disabled Fund mill levy and Open Space sales tax, besides the new exemption for the Library. Colorado is in the midst of record state in-migration and economic boom (Colorado Business Review). Employment growth will place Colorado in the top 10 states in 2016. The average value of a single family residence in Jefferson County rose 20 percent between 2014 and 2015. The increase is a result of the change in the economy, a low inventory of residences and high demand for these properties. Because of decreases in prior years the average value in 2015 increased only 12 percent since 2008. The property taxes will not rise 20 percent because the property tax increase will be limited by TABOR (Jefferson County Assessor Presentation).
The County’s 2016 adopted budget excluding interdepartmental transfers is $451.2 million which compares to a 2015 adopted budget of $413.7 million or a 9.1 percent decrease. The budgeted amount for debt service payments both in 2016 and 2015 is $24 million. Services and charges is budgeted for a 19.2% increase from 2015 to 2016, salary expenses will be higher to reflect a 2.6% merit increase, one-time county-wide non-base salary pool, pay plan adjustments, and an approximately 6.9% increase in benefits that the county employees will be sharing.
TABOR allowable growth for 2016 above 2015 for property tax and total non-exempt revenue is estimated to be 1.176 percent inflation over 2015 (as measured by the Denver-Boulder-Greeley CPI) and 0.75 percent local growth as defined by TABOR.
The combined County and Library mill levy increased from 25.978 to 26.978 between years 2015 and 2016 due to the Library increase of 1.000 mill through the November 2015 election. Because TABOR limits the allowable property tax revenue growth by a percentage that is the combination of inflation, plus new construction minus demolition, the County will have to be cognizant over the next few years in determining the temporary mill levy in the future. It is forecasted that property tax refunds may be required after 2016 collections because the CPI came in so low at 1.176 percent.
Inflation at the national level was 0.7 percent and 1.2 percent for Colorado in 2015 compared to 0.8 percent nationally in 2014 and 2.8 percent for Colorado. Colorado Legislative Council is forecasting 2.4 percent for 2016 and Colorado Office of State Planning and Budgeting is forecasting 1.8 percent

Jefferson County, Colorado Comprehensive Annual Financial Report
Page 33
for Colorado. Unemployment in Colorado was 3.5 percent in 2015 compared to 5.0 nationally. Jefferson County’s population is projected to be 565,000 in 2015 by the United States Census Bureau. The population has only increased slightly in the last decade as most of the growth in the Denver metro area has been in every direction except west-ward.
The construction of the RTD’s Light Rail including a rail station and parking garage on the County’s campus was completed in early 2013. This has become a major transportation boon to the central Jefferson County area.
CONTACTING THE COUNTY’S FINANCIAL MANAGEMENT This financial report is designed to provide our citizens, taxpayers, customers, investors and creditors with a general overview of the County’s finances and to demonstrate the County’s accountability for the money it receives. If you have questions about this report or need additional financial information, contact the Jefferson County Accounting Division, 100 Jefferson County Parkway, Golden, Colorado, 80419, [email protected] or by telephone at (303) 271-8528.

Jefferson County, Colorado Comprehensive Annual Financial Report
Page 34
On November 7, 1859, the Kansas Legislature allowed twelve new county governments to be created 600 miles to the west in the old area know as Arapahoe County. Jefferson County was one of those original twelve counties. William Steele, Provisional Governor of the new Jefferson Territorial Legislature appointed the first twelve Sheriffs and gave them specific duties and responsibilities. Walter Pollard, an original member of the Boston Company who arrived in and founded Golden City in June of 1959 was named the first Sheriff of Jefferson County. The Sheriffs of the Territory were charged with serving all civil processes, maintaining the County Jail, preventing crime arresting all law breakers, serving as coroner and serving as executioner. The Territory of Colorado was officially created on February 28, 1861.

Jefferson County, Colorado Comprehensive Annual Financial Report
Page 35
Basic Financial Statements

Jefferson County, Colorado Comprehensive Annual Financial Report
Page 36
On April 11, 1877 the Board of County Commissioners voted to build a new Jail and Courthouse, fronting Washington Avenue between 5th and 6th Streets (now 15th and 16th Streets) with a frontage of 600 feet and 140 feet in depth. The cornerstone was dedicated on June 23, 1877 and the keys to the new building were turned over to the County Commissioners on February 15, 1878. The total cost was $31,900.00.
On March 24, 1913, the Board of County Commissioners canvassed bids for a new Jefferson County Jail and Sheriff’s residence. The bid was given to Lyon and Axtell of Golden for $14,652.00 The Pauley Iron Works would construct the interior of the new Jail for $7,274.00. Both contracts specified a completion date of September of 1913. The site selected for the new Justice Complex was directly adjacent and south of the previous courthouse.
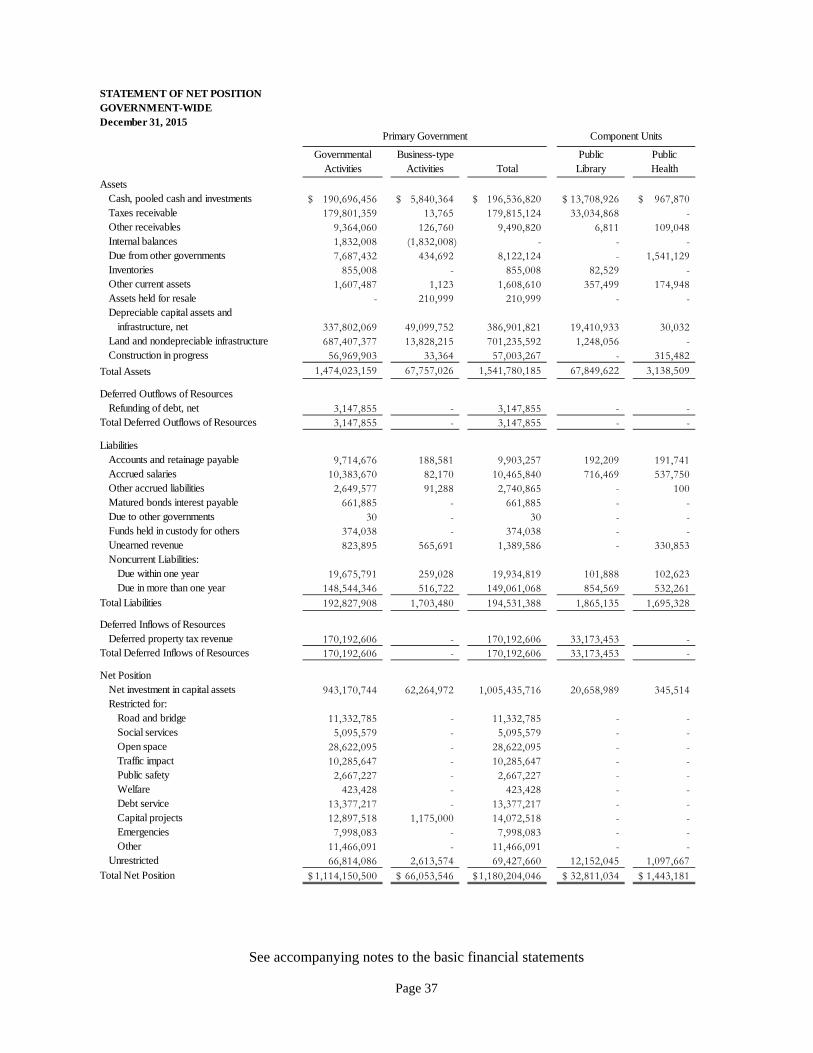
See accompanying notes to the basic financial statements
Page 37
STATEMENT OF NET POSITIONGOVERNMENT-WIDEDecember 31, 2015
Governmental Business-type Public PublicActivities Activities Total Library Health
AssetsCash, pooled cash and investments 190,696,456$ 5,840,364$ 196,536,820$ 13,708,926$ 967,870$ Taxes receivable 179,801,359 13,765 179,815,124 33,034,868 - Other receivables 9,364,060 126,760 9,490,820 6,811 109,048 Internal balances 1,832,008 (1,832,008) - - - Due from other governments 7,687,432 434,692 8,122,124 - 1,541,129 Inventories 855,008 - 855,008 82,529 - Other current assets 1,607,487 1,123 1,608,610 357,499 174,948 Assets held for resale - 210,999 210,999 - - Depreciable capital assets and
infrastructure, net 337,802,069 49,099,752 386,901,821 19,410,933 30,032 Land and nondepreciable infrastructure 687,407,377 13,828,215 701,235,592 1,248,056 - Construction in progress 56,969,903 33,364 57,003,267 - 315,482
Total Assets 1,474,023,159 67,757,026 1,541,780,185 67,849,622 3,138,509
Deferred Outflows of ResourcesRefunding of debt, net 3,147,855 - 3,147,855 - -
Total Deferred Outflows of Resources 3,147,855 - 3,147,855 - -
LiabilitiesAccounts and retainage payable 9,714,676 188,581 9,903,257 192,209 191,741 Accrued salaries 10,383,670 82,170 10,465,840 716,469 537,750 Other accrued liabilities 2,649,577 91,288 2,740,865 - 100 Matured bonds interest payable 661,885 - 661,885 - - Due to other governments 30 - 30 - - Funds held in custody for others 374,038 - 374,038 - - Unearned revenue 823,895 565,691 1,389,586 - 330,853 Noncurrent Liabilities:
Due within one year 19,675,791 259,028 19,934,819 101,888 102,623 Due in more than one year 148,544,346 516,722 149,061,068 854,569 532,261
Total Liabilities 192,827,908 1,703,480 194,531,388 1,865,135 1,695,328
Deferred Inflows of ResourcesDeferred property tax revenue 170,192,606 - 170,192,606 33,173,453 -
Total Deferred Inflows of Resources 170,192,606 - 170,192,606 33,173,453 -
Net PositionNet investment in capital assets 943,170,744 62,264,972 1,005,435,716 20,658,989 345,514 Restricted for:
Road and bridge 11,332,785 - 11,332,785 - - Social services 5,095,579 - 5,095,579 - - Open space 28,622,095 - 28,622,095 - - Traffic impact 10,285,647 - 10,285,647 - - Public safety 2,667,227 - 2,667,227 - - Welfare 423,428 - 423,428 - - Debt service 13,377,217 - 13,377,217 - - Capital projects 12,897,518 1,175,000 14,072,518 - - Emergencies 7,998,083 - 7,998,083 - - Other 11,466,091 - 11,466,091 - -
Unrestricted 66,814,086 2,613,574 69,427,660 12,152,045 1,097,667 Total Net Position 1,114,150,500$ 66,053,546$ 1,180,204,046$ 32,811,034$ 1,443,181$
Primary Government Component Units

See accompanying notes to the basic financial statements
Page 38
STATEMENT OF ACTIVITIES
For the Year Ended December 31, 2015
Operating Capital
Charges for Grants and Grants and
Functions/Programs Expenses Services Contributions Contributions
Primary Government
Governmental Activities
General government 49,564,426$ 24,837,014$ 3,638,039$ -$
Public safety 130,531,604 10,754,353 8,609,075 1,610
Highways and streets 45,044,210 5,931,700 1,403,495 1,047,375
Culture and recreation 27,707,260 776,531 1,415,656 -
Economic development and assistance 7,484,526 368,474 7,093,096 -
Welfare 61,171,256 116,099 40,714,491 -
Sanitation 648,401 493,824 - -
Interest on long-term debt 6,667,395 - - - Total Governmental Activities 328,819,078 43,277,994 62,873,852 1,048,985
Business-Type Activities
Airport 6,381,280 3,344,070 - 1,230,677
Total Primary Government 335,200,358$ 46,622,064$ 62,873,852$ 2,279,662$
Component Units
Public Library 27,479,992$ 816,704$ 363,204$ 679,016$
Public Health 13,170,414 2,086,606 11,474,444 -
Total Component Units 40,650,406$ 2,903,310$ 11,837,648$ 679,016$
General Revenues
Taxes:
Property
Sales
Investment income
Miscellaneous
Total General Revenues
Change in Net Assets
Net Position - January 1
Net Position - December 31
Program Revenues

See accompanying notes to the basic financial statements
Page 39
Governmental Business-type Public Public
Activites Activities Total Library Health
(21,089,373)$ -$ (21,089,373)$ -$ -$ (111,166,566) - (111,166,566) - - (36,661,640) - (36,661,640) - - (25,515,073) - (25,515,073) - -
(22,956) - (22,956) - - (20,340,666) - (20,340,666) - -
(154,577) - (154,577) - - (6,667,395) - (6,667,395) - -
(221,618,247) - (221,618,246) - -
- (1,806,533) (1,806,533) - -
(221,618,247) (1,806,533) (223,424,779) - -
- - - (25,621,068) - - - - - 390,636 - - - (25,621,068) 390,636
178,916,658 - 178,916,658 23,623,522 - 61,305,362 239,672 61,545,034 - - 2,161,945 99,529 2,261,474 172,372 4,763 2,079,294 1,667,633 3,746,927 - -
244,463,259 2,006,834 246,470,093 23,795,894 4,763
22,845,012 200,301 23,045,314 (1,825,174) 395,399
1,091,305,488 65,853,245 1,157,158,733 34,636,208 1,047,782
1,114,150,500$ 66,053,546$ 1,180,204,046$ 32,811,034$ 1,443,181$
Net (Expense) Revenue and
Changes in Net Assets
Primary Government Component Units

See accompanying notes to the basic financial statements
Page 40
BALANCE SHEETGOVERNMENTAL FUNDSDecember 31, 2015
Road and Social Capital OtherGeneral Bridge Services Expenditures Governmental Total
AssetsCash, pooled cash and investments 78,910,392$ 11,126,937$ 86,166$ 8,426,930$ 57,797,450$ 156,347,875$ Taxes receivable 125,013,046 11,038,075 10,469,191 7,551,285 25,729,762 179,801,359 Other receivables 1,647,430 822 37,045 24,190 1,585,710 3,295,197 Due from other funds 2,089,154 - 500,000 - - 2,589,154 Due from other governments 1,269,969 234,743 4,641,057 - 1,541,663 7,687,432 Inventories 330,469 - - - - 330,469 Other current assets 752,980 - - - 12,839 765,819 Restricted cash - - 280,211 - - 280,211 Restricted investments - - 3,552,588 6,302,656 2,153,995 12,009,239 Advances 1,608,882 - - - - 1,608,882
Total Assets 211,622,322$ 22,400,577$ 19,566,258$ 22,305,061$ 88,821,419$ 364,715,637$
LiabilitiesAccounts and retainage payable 3,556,649$ 408,714$ 492,173$ 291,639$ 4,237,401$ 8,986,576$ Accrued salaries 5,749,242 654,828 1,793,874 - 2,059,132 10,257,076 Other accrued liabilities 64,061 - - - 8 64,069 Due to other funds - - 1,500,000 - 866,028 2,366,028 Due to other governments 14 - - - 16 30 Funds held in custody for others 107,223 - 215,441 - 51,374 374,038 Unearned amounts 559,422 - - - 264,473 823,895
Total Liabilities 10,036,611 1,063,542 4,001,488 291,639 7,478,432 22,871,712
Deferred Inflows of ResourcesUnavailable property tax revenue 125,013,046 10,004,250 10,469,191 7,551,285 17,154,834 170,192,606 Unavailable revenue - - - - 1,300,000 1,300,000
Total Deferred Inflows of Resources 125,013,046 10,004,250 10,469,191 7,551,285 18,454,834 171,492,606
Fund BalancesNonspendable 2,692,331 - - - - 2,692,331 Restricted 6,990,700 11,332,785 5,095,579 14,462,137 62,888,153 100,769,354 Assigned 25,940,524 - - - - 25,940,524 Unassigned 40,949,110 - - - - 40,949,110
Total Fund Balances 76,572,665 11,332,785 5,095,579 14,462,137 62,888,153 170,351,319
Total Liabilities, Deferred Inflows of
Resources and Fund Balances 211,622,322$ 22,400,577$ 19,566,258$ 22,305,061$ 88,821,419$ 364,715,637$

See accompanying notes to the basic financial statements
Page 41
RECONCILIATION OF TOTAL GOVERNMENTAL FUND BALANCES TOTHE STATEMENT OF NET POSITIONDecember 31, 2015
Total Governmental Fund Balances 170,351,319$
Amounts reported for governmental activities in the statement of net positionare different because:
Capital assets used in governmental activities excluding internal service funds are not financial resources and therefore are not reported in the funds. 1,066,141,114
Revenues deferred in the governmental funds because they are not currentfinancial resources are accrued under the economic resources basis ofaccounting, and interest not recorded in the governmental funds butdue within one year is recorded in the statement of net assets.
Long-term receivables 6,000,000 Unearned revenue 1,300,000
7,300,000
Long-term liabilities are not due and payable in the current period and thereforeare not reported in the funds.
Certificates of participation (78,285,000) Notes and bonds payable (68,500,000) Accrued interest payable (661,885) Estimated liability for landfill postclosure costs (1,278,636) Compensated absences (18,168,263)
(166,893,784)
Deferred outflows of resources applicable to a future reporting period.Loss on refunding bond amortized over the life of the debt. 3,147,855
Amortization of bond premiums, recognized in full in the governmental funds when thedebt is first issued, is recorded in the statement of net position. (1,674,116)
Internal service funds are used by management to charge the costs ofinsurance and other services to individual funds. The assets and liabilities
of the internal service funds are included in governmental activities in the
statement of net position. 35,778,112
Net Position of Governmental Activities 1,114,150,500$

See accompanying notes to the basic financial statements
Page 42
STATEMENT OF REVENUES, EXPENDITURES, ANDCHANGES IN FUND BALANCESGOVERNMENTAL FUNDSFor the Year Ended December 31, 2015
Road and Social Capital OtherGeneral Bridge Services Expenditures Governmental Total
RevenuesTaxes and special assessments 122,737,158$ 36,444,702$ 10,104,682$ 7,290,510$ 63,644,969$ 240,222,021$ Licenses and permits 3,814,924 762,518 - - 1,522,989 6,100,431 Intergovernmental 9,148,548 547,252 37,155,730 2,351,260 12,660,846 61,863,636 Charges for services 41,098,225 1,635,512 88,089 1,611,599 2,135,166 46,568,591 Fines and forfeitures 213,483 - - - 587,490 800,973 Investment income 1,110,361 110,980 13,483 91,308 610,634 1,936,766 Donations and contributions 97,854 303,090 575 - 608,695 1,010,214 Other 1,099,450 3,985 17,466 24,084 300,558 1,445,543
Total Revenues 179,320,003 39,808,039 47,380,025 11,368,761 82,071,347 359,948,175
ExpendituresCurrent:
General government 43,960,529 - - 1,880,871 2,383 45,843,783 Public safety 98,900,079 - - - 27,693,537 126,593,616 Highways and streets 4,371,701 23,692,490 - - 477,993 28,542,184 Sanitation - - - - 484,192 484,192 Welfare - - 47,636,647 - 4,698,813 52,335,460 Culture and recreation 1,698,536 - 11,313,007 13,011,543 Economic development and assistance - - - - 4,870,493 4,870,493 Health 4,769,983 - - - - 4,769,983
Capital outlay:General government 1,688,836 - - 2,074,355 - 3,763,191 Public safety 1,937,441 - - - 101,731 2,039,172 Highways and streets 630,529 11,388,218 - - 4,043,261 16,062,008 Welfare - - 233,157 - - 233,157 Culture and recreation 17,927 - - - 12,147,371 12,165,298
Debt service:Principal - - - 5,240,000 11,580,000 16,820,000 Interest - - - 3,908,470 2,606,924 6,515,394 Fiscal and other charges - - - 4,607 500 5,107
Intergovernmental 1,968,697 3,436,196 1,403,375 - 23,131,219 29,939,487 Total Expenditures 159,944,258 38,516,904 49,273,179 13,108,303 103,151,424 363,994,068
Excess (Deficiency) of RevenuesOver Expenditures 19,375,745 1,291,135 (1,893,154) (1,739,542) (21,080,077) (4,045,893)
Other Financing Sources (Uses)Proceeds from sale of capital assets 601,127 - 60,590 - - 661,717 Transfers-in 572,345 - 1,936,501 1,696,097 20,058,947 24,263,890 Transfers-out (20,497,644) (36,496) (103,935) - (3,625,815) (24,263,890) Transfers from Internal Service funds 31,837 - - - - 31,837
Total Other Financing Sources (Uses) (19,292,335) (36,496) 1,893,156 1,696,097 16,433,132 693,554
Net Change in Fund Balance 83,410 1,254,639 2 (43,445) (4,646,945) (3,352,339)
Fund Balance, January 1 76,489,255 10,078,146 5,095,577 14,505,582 67,535,098 173,703,658 Fund Balance, December 31 76,572,665$ 11,332,785$ 5,095,579$ 14,462,137$ 62,888,153$ 170,351,319$

See accompanying notes to the basic financial statements
Page 43
RECONCILIATION OF THE STATEMENT OF REVENUES, EXPENDITURES AND CHANGESIN FUND BALANCES OF GOVERNMENTAL FUNDS TO THE STATEMENT OF ACTIVITIESFor the Year Ended December 31, 2015
Net Change In Fund Balances - Total Governmental Funds (3,352,339)$
Amounts reported for governmental activities in the statement of activities aredifferent because:
Governmental funds report capital outlays as expenditures. However, in thestatement of activities the cost of those assets is allocated over their estimateduseful lives and reported as depreciation expense. This is the amount by which capital outlays exceeded depreciation in the current period.
Capital asset additions 34,262,827 Depreciation expense (24,943,049) Construction in progress capitalized in previous years, expensed in current year (305,612)
Subtotal 9,014,166
Revenues in the governmental funds that provide current financial resources werepreviously accrued in the statement of activities when they were earned. (50,000)
Some revenues/expenses reported in the statement of activities do not provide/require theuse of current financial resources and therefore are not reported as revenues/expendituresin governmental funds.
Donation of capital assets (679,016) Capital contributions from other entities 1,048,985 Accrued bond interest 86,126 Amortization of bond premium and refunding loss (106,565) Estimated liability for landfill postclosure costs (18,636) Accrued compensated absences 654,904
Subtotal 985,798
Net book value of disposed assets is reported as revenues in the governmental funds and not reported as revenues in the statement of activities. (641,278)
Debt service payments for principal payments are reported as expenditures in thegovernmental funds but not reported as expenses in the statement of activities.
Debt service principal payments 16,820,000
Internal service funds are used by management to charge the costs of certain activities, such as insurance and fleet services, to individual funds. The net revenue(expense) of internal service funds is reported with governmental activities. 68,665
Change In Net Position Of Governmental Activities 22,845,012$

See accompanying notes to the basic financial statements
Page 44
COMBINED STATEMENT OF NET POSITIONPROPRIETARY FUNDSDecember 31, 2015
Business-type Governmental Activities Activities
Enterprise Fund Internal
Airport Service FundsAssets
Current Assets:Cash, pooled cash and investments 5,840,364$ 22,059,131$ Taxes receivable 13,765 - Other receivables 126,760 68,863 Due from other governments 434,692 - Inventories - 524,539 Other current assets 1,123 841,668 Assets held for resale 210,999 -
Total Current Assets 6,627,703 23,494,201
Noncurrent Assets:Depreciable capital assets and infrastructure, net 49,099,752 16,038,235 Land and nondepreciable infrastructure 13,828,215 - Construction in progress 33,364 -
Total Noncurrent Assets 62,961,331 16,038,235 Total Assets 69,589,034 39,532,436
LiabilitiesCurrent Liabilities:
Accounts and retainage payable 188,581 728,100 Accrued salaries 82,170 126,594 Other accrued liabilities 91,288 2,585,508 Unearned revenue 565,691 - Due to other funds 223,126 - Loans payable 225,293 - Compensated absences 33,735 28,230
Total Current Liabilities 1,409,884 3,468,432
Noncurrent Liabilities:Due to other funds - long-term 1,608,882 - Loans payable 471,066 - Compensated absences 45,656 285,892
Total Noncurrent Liabilities 2,125,604 285,892 Total Liabilities 3,535,488 3,754,324
Net PositionNet investment in capital assets 62,264,972 16,038,235 Restricted for:
FAA capital projects 1,175,000 - Fleet replacement - 11,466,091
Unrestricted 2,613,574 8,273,786 Total Net Position 66,053,546$ 35,778,112$

See accompanying notes to the basic financial statements
Page 45
STATEMENT OF REVENUES, EXPENSES, AND CHANGES IN NET POSITIONPROPRIETARY FUNDSFor The Year Ended December 31, 2015
Business-type GovernmentalActivities Activities
Enterprise Fund InternalAirport Service Funds
Operating RevenuesInsurance charges -$ 33,054,376$ Fleet rental charges - 7,984,085 Rental income 2,948,066 - Other 396,004 262,991
Total Operating Revenues 3,344,070 41,301,452
Operating ExpensesSalaries and related costs 1,375,686 2,513,459 Supplies 551,403 2,496,539 Other services and charges 636,636 33,219,321 Depreciation 3,421,290 2,925,263 Intergovernmental 2,430 - Interdepartmental charges 305,870 700,064
Total Operating Expenses 6,293,315 41,854,646
Operating Income (Loss) (2,949,245) (553,194)
Nonoperating Revenues (Expenses)Fuel taxes 239,672 - Investment income 99,529 225,183 Interest expense (87,965) - Gain on disposal of capital assets 1,667,633 428,513
Total Nonoperating Revenues (Expenses) 1,918,869 653,696
ContributionsCapital grants 1,230,677 -
Total Contributions 1,230,677 -
Transfers-out - (31,837) - (31,837)
Change In Net Position 200,301 68,665
Net Position, January 1 65,853,245 35,709,447 Net Position, December 31 66,053,546$ 35,778,112$

See accompanying notes to the basic financial statements
Page 46
STATEMENT OF CASH FLOWSPROPRIETARY FUNDSFor the Year Ended December 31, 2015
Business-type GovernmentalActivities Activities
Enterprise Fund Internal ServiceAirport Funds
Cash Flows from Operating ActivitiesCash received from:
Insurance charges -$ 33,047,139$ Rental income 2,948,227 7,997,106 Other 395,664 278,855
Cash payments to or on behalf of:Employees (1,382,340) (2,542,637) Suppliers (1,564,371) (35,310,509) Others (420,291) (1,736,530)
Net Cash Flows Provided (Used) by Operating Activities (23,111) 1,733,424
Cash Flows from Noncapital Financing ActivitiesFuel taxes 243,556 - Transfers-out - (31,837)
Net Cash Flows Provided (Used) by Noncapital Financing Activities 243,556 (31,837)
Cash Flows from Capital and Related Financing ActivitiesCash proceeds from the sale of capital assets 1,667,633 428,513 Cash paid for acquisition of capital assets (1,694,957) (3,566,935) Payment to the General Fund for capital loan (216,247) - Capital grants 3,404,185 - Interest payments (87,965) - Loan payments (218,731) -
Net Cash Flows Provided (Used) by Capital and Related Financing Activities 2,853,918 (3,138,422)
Cash Flows from Investing ActivitiesInvestment income 99,529 225,183
Net Cash Flows Provided by Investing Activities 99,529 225,183
Net Increase in Cash and Cash Equivalents 3,173,892 (1,211,652)
Cash and Cash Equivalents - Beginning of Year 2,666,472 23,270,783
Cash and Cash Equivalents - End of Year 5,840,364$ 22,059,131$

See accompanying notes to the basic financial statements
Page 47
Business-type GovernmentalActivities Activities
Enterprise Fund Internal ServiceAirport Funds
Reconciliation of Operating Income (Loss) to Net Cash Provided (Used) by Operating Activities
Operating loss (2,949,245)$ (553,194)$ Adjustments to reconcile operating loss to net
cash provided by operating activities:Depreciation 3,421,290 2,925,263 (Increase) decrease of assets:
Receivables 161 5,784 Inventories - (13,490) Other current assets (340) 5,248
Increase (decrease) of liabilities:Accounts payable (1,012,968) 418,841 Accrued salaries and benefits (6,654) (29,178) Other accrued liabilities 524,645 (1,025,850)
Net Cash Provided (Used) by Operating Activities (23,111)$ 1,733,424$
Noncash TransactionsAcquisition of capital assets in accounts payable balance 117,119$ -$ Capital grants in due from other governments balance 434,692$ -$

See accompanying notes to the basic financial statements
Page 48
STATEMENT OF FIDUCIARY ASSETS AND LIABILITIESDecember 31, 2015
Agency FundsAssets
Cash, pooled cash and investments 25,658,261$ Taxes receivable 45,918
Total Assets 25,704,179$
LiabilitiesAccounts payable 3,853,710$ Other accrued liabilities 145,178 Due to other governments 10,040,554 Funds held in custody for others 11,664,737
Total Liabilities 25,704,179$

Page 49
NOTES TO THE BASIC FINANCIAL STATEMENTS
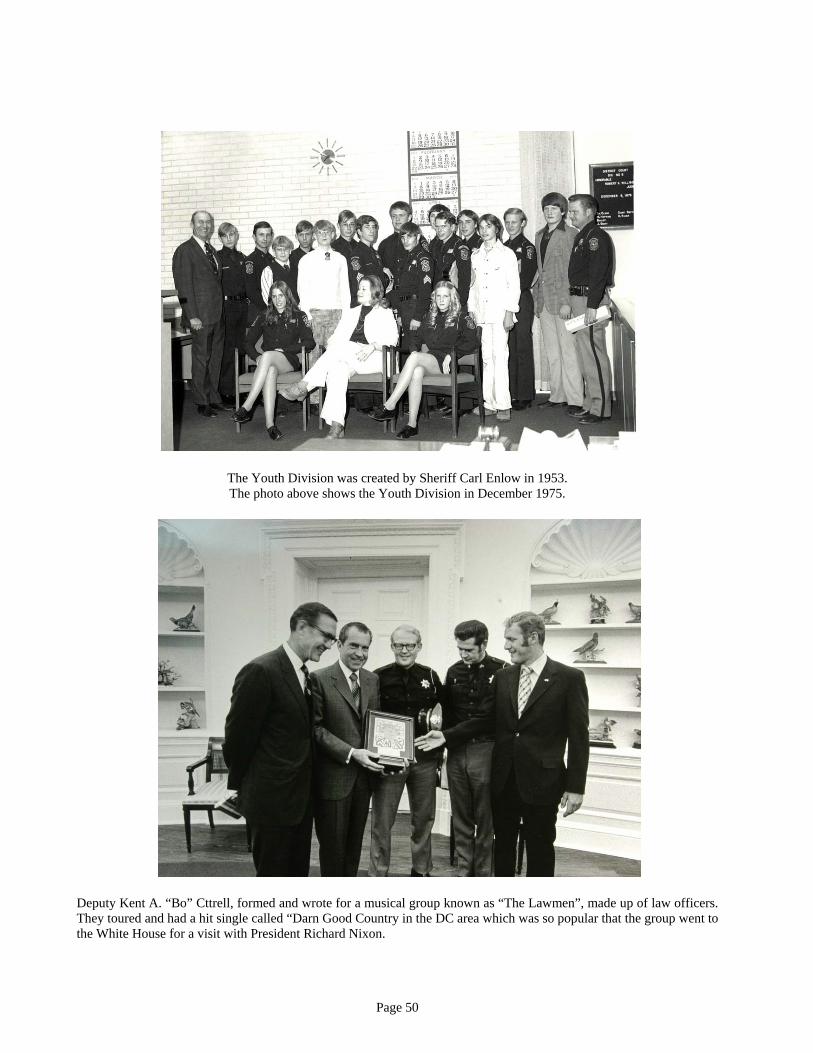
Page 50
The Youth Division was created by Sheriff Carl Enlow in 1953. The photo above shows the Youth Division in December 1975.
Deputy Kent A. “Bo” Cttrell, formed and wrote for a musical group known as “The Lawmen”, made up of law officers. They toured and had a hit single called “Darn Good Country in the DC area which was so popular that the group went to the White House for a visit with President Richard Nixon.

Page 51
Note 1. Summary of Significant Accounting Policies
The accounting and reporting policies of Jefferson County conform to accounting principles generally accepted in the United States of America (GAAP) as applicable to governmental units. The Governmental Accounting Standards Board (GASB) is the accepted standard-setting body for establishing governmental accounting and financial reporting principles.
The County implemented GASB Statement No. 68, Accounting and Financial Reporting for Pensions, an Amendment of GASB Statement No. 27 and GASB Statement No. 71, Pension Transition for Contributions Made Subsequent to the Measurement Date an Amendment of GASB Statement No. 68. One pension plan with one employee was subject to the new standards and due to the insignificance of the net pension liability, the County determined that no entries warranted recording at the Government Wide Financial Statement level. There was no effect on the financial statements at the fund level.
Note A. Government-wide Financial Statements
The government-wide financial statements report all nonfiduciary activities of the primary government and its component units. Fiduciary activities of the primary government and its component units are excluded from the government-wide statements because these resources are not available to fund the programs of the County. The government-wide statements include the Statement of Net Position and the Statement of Activities; these statements show the December 31 financial position and the changes in financial position during the current year.
Note B. Financial Reporting Entity
Jefferson County (the County), was incorporated in 1861. It is governed by an elected three member Board of Commissioners. There are also seven other elected officials of the County: the Assessor; Clerk and Recorder; Coroner; District Attorney; Sheriff; Surveyor; and Treasurer.
This Comprehensive Annual Financial Report (CAFR) presents the financial statements of the County, the primary government, and its component units. The County is the primary government because it has a separately elected governing body, is legally separate, and is fiscally independent of other state and local governments.
Discretely presented component units are legally separate organizations for which the elected officials of the primary government are financially accountable. Boards appointed by the County’s Board of Commissioners govern Jefferson County Public Library and Jefferson County Public Health. The County exercises fiscal control over these entities because the Board of County Commissioners has the power to approve and modify their budgets and is able to significantly influence the operations of these entities. Separate financial statements are not prepared for these two discretely presented component units.
Blended component units are, in substance, part of the County’s operations and, therefore, information on these units is blended with the financial information of the County. Included within the reporting entity as blended component units are:
The Jefferson County Finance Corporation was incorporated in July 1985 as a Colorado nonprofit corporation and was created to facilitate the County’s financings, including the acquisition of real estate, property and improvements for lease to the County or its instrumentalities (with the approval of the County). The Finance Corporation has a three-member board of directors, appointed by, and serving at the pleasure of, the Board of County Commissioners without compensation. The directors of the Finance Corporation have no private or proprietary interest in the Finance Corporation.
Jefferson County Law Enforcement Authority (LEA) is a separate taxing authority. The Board of Directors of the LEA is the Jefferson County Board of County Commissioners. The Board of Directors adopts and appropriates a LEA budget annually and certifies to the Board of County Commissioners of Jefferson County, and the State of Colorado, the mill levy for the LEA. The LEA

Page 52
provides its revenues to the County’s Patrol Fund to assist in the provision of law enforcement services to the unincorporated portions of the County.
The Public Trustee is a State statutorily mandated position, whose financial transactions are independent of the County. However, all expenditures and associated funding transaction relating to the operations of the County Office of the Public Trustee are included in the General Fund.
The County’s officials are also responsible for appointing the members of the boards of other organizations, but the County’s accountability for these organizations does not extend beyond making the appointments. The Board of County Commissioners appoint the members of the Jeffco Housing Authority Board as well as selects the executive director of the Jeffco Housing Authority.
Note C. Measurement Focus
Government-wide Financial Statements
The government-wide statements focus on the County as a whole. The Statement of Net Position and the Statement of Activities are presented using the economic resources measurement focus. Other than the agency funds, all revenues, expenses, and all current and long-term assets and liabilities of the County are reported, including capital assets, depreciation and long-term debt. Certain interfund governmental activity has been eliminated from these statements. Since assets of the fiduciary funds are not available to the County, these funds are not reported in the government-wide statements.
Governmental activities, which normally are supported by taxes and intergovernmental revenues, are reported separately from business-type activities, which rely, to a significant extent, on fees and charges for support. Likewise, the primary government is reported separate from certain legally separate component units for which the primary government is financially accountable.
The Statement of Net Position presents the financial position of the County. The net position section of the statement focuses on whether assets and deferred outflows, net of related liabilities and deferred inflows, have been restricted as to the purpose for which they may be used. The assets and liabilities of the Internal Service Fund are reported in the government-wide Statement of Net Position.
The Statement of Activities shows the change in financial position for the year. It focuses on the net program cost of individual functions and business-type activities of the County. It does this by netting program costs with program revenues, which consist primarily of charges for services and grants. This net amount is the tax burden of the program to the taxpayers of the County. The change in net position represents the increase or decrease in the overall financial position of the County on an annual basis.
Fund Financial Statements
The fund financial statements provide additional detail about the County and its component units. These statements are provided in three types: governmental funds, proprietary funds and fiduciary funds. With the exception of the proprietary and fiduciary funds, the Basic Financial Statements focus on the major funds of each type.
Governmental funds employ the current financial resources measurement focus, while the proprietary fund types employ the economic resources measurement focus similar to the government-wide financial statements. As agency funds do not report results of operations, measurement focus does not apply.
MAJOR FUNDS
Governmental Fund Type:
General Fund
This is the general operating fund of the County that accounts for all financial resources that are not accounted for in other funds. Operations of the County such as public safety, planning and zoning, property

Page 53
valuation, tax collection and distribution, vehicle licensing, county administration and other activities financed from taxes and general revenues are reflected in this fund.
The General Fund is always a major fund and GASB has defined other major funds based on percentage thresholds. However, management has the discretion to include funds, which are of particular importance to financial statement users.
Road and Bridge Fund
This fund records costs related to County road and bridge construction and maintenance except for engineering and public works administration, which are recorded in the General Fund. By State law, Colorado counties are required to maintain a Road and Bridge Fund and a portion of road and bridge taxes is allocated to cities and towns for use in their road and street activities. Most of this fund’s revenues come from property, auto ownership and highway users taxes.
Social Services Fund
This fund administers human services programs under state and federal regulations. Programs include, but are not limited to, Medicaid, Food Stamps, Child Welfare Program, Aging and Adult Services Programs, Job Training Services, and Temporary Assistance to Needy Families (TANF). Colorado counties are required by state law to maintain a Social Services Fund. Besides receiving most of its revenue from federal and state grant funds, this fund receives property taxes to cover the County’s portion to pay for these programs.
Capital Expenditures Fund
This fund is used to accumulate and provide monies for major capital expenditures and lease payments for the County. The fund is also used to pay for the debt service of bonds issued in 2009 and 2013. These bonds have been used for the construction and acquisition related to various projects County-wide including the construction of a new animal center, the renovation and expansion of the court facilities and the construction of detention facilities.
Proprietary Fund Type:
Airport Fund
This fund, the County’s only enterprise fund, accounts for the financial activities of the Rocky Mountain Metropolitan Airport.
NONMAJOR FUNDS
Governmental Fund Type:
Special Revenue Funds
These funds account for revenues generated from various sources such as sales and property taxes, grants, impact and other fees, and contributions. These funds expend those revenues for open space, welfare, contingencies, solid waste and other areas.
Debt Service Funds
These funds account for the payment of principal and interest on both certificates of participation as well as revenue bonds. The revenues used for the payment of the debt are generated from property and sales taxes.
Capital Projects Funds
These funds account for the financial resources that are collected and used to acquire or construct major capital assets including facilities, land and other County-wide projects.
Proprietary Fund Type:
Internal Service Funds
These funds account for the sales of goods or services to the departments on a cost-reimbursement basis. The County’s Internal Service funds report the financial activities of the Workers’ Compensation Insurance Fund, Self-Insurance Fund, Employee Benefits Fund and Fleet Services Fund.

Page 54
Fiduciary Fund Type:
Agency Funds
The County has three fiduciary funds. The Treasurer’s Fund accounts for transactions relating to assets held by the County in the capacity of trustee, custodian or agent for individuals, governmental entities and non-public organizations as established by resolution or state statute. By statute the Treasurer’s Fund collects and distributes all property tax revenues to local governments and other County funds. The Public Trustee Agency fund accounts for transactions relating to the activities in the Public Trustee’s office. The Meadow Ranch Agency Fund is used to account for the collection of property taxes for the Meadow Ranch Improvement District, a special assessment district that is separate from the County.
Note D. Basis of Accounting
The basis of accounting applied to a fund depends on both the type of fund and the financial statement in which the fund is presented.
Government-wide, Proprietary, and Fiduciary Fund Financial Statements
The government-wide, proprietary and fiduciary fund financial statements are reported using the accrual basis of accounting. For the government-wide and proprietary funds, revenues are recorded when earned, and expenses are recorded at the time liabilities are incurred, regardless of when the related cash flows take place.
Nonexchange transactions are those in which the County gives or receives value without directly receiving or giving equal value in exchange, include property taxes, grants, and donations. Revenues from property taxes are recognized in the fiscal year for which the taxes are levied. Revenues from grants and donations are recognized in the fiscal year in which all eligibility requirements have been satisfied.
Governmental Fund Financial Statements
Governmental funds are reported using the modified-accrual basis of accounting. Under this method, revenues are recognized when measurable and available. The County considers all revenues reported in the governmental funds to be available if the revenues are collected within sixty days after year-end for property taxes and one year after year-end for other revenues. Property taxes, sales taxes, licenses, and interest are considered to be susceptible to accrual.
Expenditures are recorded when the related fund liability is incurred, except that principal and interest on long-term debt, and employee compensated absences are recognized when due. Acquisitions of capital assets are reported as expenditures in governmental funds. Long-term debt and acquisitions under capital leases are reported as other financing sources.
Note E. Eliminating Internal Activity
Transactions between funds that would be treated as revenues, expenditures, or expenses if they involve entities external to the County are accounted for as revenues, expenditures, or expenses in the funds. At year-end, outstanding balances between funds are reported in the fund financial statements. Amounts reported in the funds as Due To or Due From Other Funds are eliminated in the governmental and business-type activities columns of the statement of net position, except for the net residual amounts due between governmental and business-type activities, which are presented as internal balances.
The County eliminates its internal service activity in the Statement of Activities. This is accomplished by eliminating the revenues and expenses of the internal service funds against each other, and then distributing the residual amount among the various functions based upon the volume of activity they had during the year with each internal service fund. Any interfund services provided and used were not eliminated in the functional areas in which they were incurred.
The County prepares an annual cost allocation plan to charge various activities for their portion of these overhead costs. Interdepartmental revenues and related expenses resulting from this cost allocation are

Page 55
eliminated in the Statement of Activities in the general government function. Intrafund transactions that result from cost allocations are also eliminated in the Statement of Revenues, Expenditures, and Changes in Fund Balance for the General Fund.
Note F. Encumbrance Accounting
The County uses encumbrance accounting as an extension of its budgetary scheme. Encumbrances are recorded when a purchase order or contract is issued. They are reduced when the related expenditure/expense is made. Encumbrances lapse at year-end but may be re-established in the subsequent year if the budget related to the encumbrance is approved by the Board of County Commissioners to be reappropriated to the subsequent year or if the subsequent year’s budget is adequate to cover the amount of the rolled over encumbrance. Any significant encumbrances are shown in Note 8 Commitments. The County does not restrict any fund balance for encumbrances unless those amounts are restricted for a specific purpose under GASB Statement No. 54 – Fund Balance Reporting and Governmental Fund Type Definitions.
Note 2. Accounting Policies for Specific Assets, Liabilities, Deferred Outflows and Inflows of Resources and Net Position
Pooled Cash and Investments
The County maintains a pooled cash and investments account for all the funds of the County. Interest is allocated to the funds based on their average daily balance. State statutes specify investment instruments in which the County may invest and require that public deposits be placed only in eligible public depositories in the State of Colorado.
Investments are reported at fair value for investments with quoted market prices. Investments in government pools or money market funds are reported at cost. All investment income, including changes in the fair value of investments, is reported as revenue in the statements of revenues, expenditures, and changes in fund balances.
For the purpose of reporting cash flows, cash and cash equivalents are considered to be cash on hand, demand deposits and equity in the pooled cash and investments of the County Treasurer.
Receivables
Property taxes are not due and payable until after the assessment year has ended. Thus, they are not included in the revenues or net position of the assessment year. They are recorded in the relevant funds as taxes receivable and deferred inflows of resources at December 31, 2015, as the amounts are measurable but not levied until 2016. Property tax abatements are recorded as an offset to property tax revenues when they are paid. An allowance for uncollectible property taxes is not provided, as the uncollectible amounts are not considered material.
Property taxes are levied on or before December 22 and attached as an enforceable lien on the property the following January 1st. Taxes are payable either in full on April 30 or in two installments due on February 28 and June 15. The County, through the Treasurer, bills and collects its own property taxes as well as the property taxes of all other taxing authorities within the County. Distribution of taxes to the various taxing entities is made by the 10th of each month following the month of collection.
Other receivables are reported gross, as the County’s experience does not warrant the establishment of an allowance for uncollectible accounts. The majority of these receivables are for sales, cigarette, and fuel taxes due the County. The other receivables at the Airport are for hangar rent and landing fees.
Inventories
Inventories with values of $5,000 or more in one location such as fleet parts and computers for resale are recorded at cost and valued using the weighted-average cost method. They then become expenditures/expenses of the funds when consumed.

Page 56
Restricted Assets
Certain proceeds of revenue bonds and lease agreements, as well as certain resources set aside for their repayment, are classified as restricted assets on the balance sheet because their use is limited by applicable bond covenants. It is the County’s policy to expend restricted assets first when both are available for the same purpose.
Capital Assets
Capital assets, which include property, plant, equipment, and infrastructure, are reported in the applicable governmental or business-type activities column in the government-wide financial statements. The County defines capital assets as assets with an initial, individual cost of $5,000 or more and a useful life of more than two years. Land is capitalized regardless of cost. Infrastructure assets are long-lived capital assets that are stationary in nature and normally can be preserved for a significantly greater number of years than most capital assets. All capital assets are valued at historical cost or estimated historical cost if actual historical cost is not available. Donated capital assets are recorded at estimated fair value at the date of donation. Any works of art that may be owned by the County are typically not capitalized.
Interest is capitalized during construction of capital assets that are reported in the enterprise fund. No interest was capitalized in 2015. The costs of normal maintenance and repairs that do not add to the value of the asset or materially extend assets lives are not capitalized.
All reported capital assets, with the exception of land, nondepreciable land improvements, and construction in progress, are depreciated over their remaining useful lives on a straight-line basis. The County uses the following estimates of useful lives for depreciation:
Capital Assets Buildings and Improvements 50 Years Infrastructure – Bridges 50 Years Infrastructure – Roads Arterial roads 10 Years Collector roads 15 Years Local roads 20 Years Infrastructure – Other 10-25 Years Heavy Equipment 8-20 Years Office Machinery and Equipment 5 Years Passenger Vehicles 5-8 Years Computer Equipment 3-5 Years
Deferred Outflow of Resources
For current refundings and advance refundings resulting in defeasance of debt, the difference between the reacquisition price and the net carrying amount of the old debt is reported as a deferred outflow (or inflow) of resources. Those amounts are amortized over the life of the old debt or the life of the new debt, whichever is shorter.
Unearned Amounts
Under reimbursement agreements, receipts from the federal government, state government, and other program sponsors are deferred until the expenditures are made, or eligibility requirements are met.
Compensated Absences
Annual leave is earned at increasing rates depending on the years of service. Employees earn 96 hours of leave every year, accruing each week at a rate of 1.85 hours. Annual leave earned increases by 24 hours per year for every five years of service, to a maximum of 168 hours per year (accruing each week at a rate of 3.23 hours). Employees may carry their current annual vacation accrual plus an additional 80 hours into the subsequent year. Sick leave accrues at the rate of 120 hours per year (with a weekly accrual of 2.32 hours),

Page 57
and up to 16 hours of sick leave may be used as personal leave in each year.
At termination an employee is paid 100 percent of accumulated annual leave and may be eligible for accrued sick leave depending primarily upon their hiring date and years of service with the County. Employees hired prior to July 1, 1994 are paid 100 percent for sick leave (maximum 1,040 hours) earned before July 1, 1994, and 25 percent for sick leave accrued after July 1, 1994. Airport employees hired prior to November 10, 1998 are paid 100 percent for sick leave earned before November 10, 1998, and 50 percent for sick leave accrued after November 10, 1998. County employees hired after those dates are not paid sick leave on termination. The payment of compensated absences upon termination is from the same fund that the employee’s salary was paid on the last workday employed.
Compensated absence liabilities related to the governmental funds are recognized as liabilities of the fund only to the extent that they are due and payable at December 31, 2015. For proprietary fund types, both current and long-term portions are recorded as liabilities. On the government-wide Statement of Net Position, all compensated absence liabilities are reported. The County uses the last-in/first-out (LIFO) method to account for compensated absences.
Long-term Obligations
Long-term debt and other long-term obligations are reported as liabilities in the government-wide and proprietary fund Statement of Net Position. Bond premiums and discounts are deferred and amortized over the life of the bonds using the effective interest method. Bonds payable are reported net of the applicable bond premium or discount.
In the governmental fund financial statements, issuance of bonds and bond premiums are reported as other financing sources in the current period. Bond discounts are reported as other financing uses in the current period.
Deferred Inflow of Resources
Property taxes are deferred in the year in which they are levied, whether the basis of accounting is accrual or modified accrual. They are recognized as revenue in the year in which they are required to be paid.
Net Position
Net position equals assets plus deferred outflows less liabilities less deferred inflows on the accrual basis of accounting. Net investment in capital assets consists of capital assets, net of accumulated depreciation, reduced by the outstanding balances of any borrowing used for the acquisition, construction or improvements of those assets. Net position is reported as restricted when there are limitations imposed on their use either through the enabling legislation adopted by the County or through external restrictions imposed by creditors, grantors, laws, or regulations of other governments.
Fund Balances
In the fund financial statements, governmental funds report restrictions of fund balance for amounts that are not available for appropriation because they are legally restricted by outside parties for a specific purpose. Fund balance commitments are not external legal restrictions, but are reserved for a specific purpose by formal action of the County’s Board of County Commissioners. If the funds are not spent on the committed purpose then removal of the commitment also requires formal action of the Board.
The Board first adopted a reserve policy in 2006 that reserves 10 percent of the projected revenues for each operating fund to provide working capital and a buffer if there was an unexpected decrease in revenues or increase in expenditures. These amounts are reported as assigned fund balance in the fund statements. In addition, if the subsequent year’s appropriation is greater than estimated revenues that amount is also assigned fund balance. These assignments are detailed in Note 17. Only the General Fund can have a positive unassigned fund balance.
The County’s policy is that if both restricted and unrestricted amounts are available for expenditure, the restricted amount is spent first. Likewise, if only unrestricted is available for an expenditure, then committed

Page 58
is spent first if allowable, before assigned or unassigned is spent.
Article X, Section 20 (TABOR) of the state constitution requires that 3 percent of the TABOR defined Fiscal Year Spending (FYS) be reserved for emergencies. FYS is defined by TABOR as all expenditures, except for those from certain revenues, and the net change in reserve balances. The Colorado Supreme Court in interrogatories on Senate Bill 93-74 has defined reserve balances in the TABOR language to be the fund balances of the various funds. The County restricts the entire balance of the Contingent Fund (a special revenue fund) and enough of the General Fund to meet the 3 percent requirement.
Reclassification
Certain amounts presented in the prior year data may have been reclassified in order to be consistent with the current year’s presentation.
Note 3. Accounting Policies for Revenues and Expenditures/Expenses
Revenues
The government-wide Statement of Activities presents two broad types of revenues, program revenues and general-purpose revenues. All taxes are reported as general-purpose revenues as well as the investment income earned on the general-purpose revenues of the County. Program revenues consist primarily of charges for services and grants. Grants are operating grants unless the sponsor specifically designates them primarily for capital purchases.
Capital contributions from a governmental fund to a proprietary fund are recognized as revenue in the proprietary fund, net of the accumulated depreciation that would have accrued, if the asset had been in the proprietary fund since it was first acquired by the County.
For proprietary funds operating revenues are for those revenues resulting from the principal activity of the fund, generally the sales of goods or services, and for transactions with other funds. Non-operating revenues are all other revenues of the proprietary fund.
Expenses/Expenditures
The functional classification of expenses/expenditures on the government-wide Statement of Activities and the Statement of Revenues, Expenditures, and Changes in Fund Balance include the allocation of indirect costs. In general, the allocation reduces costs in the general government function and increases costs in the other functions on the Statement of Activities, and reduces costs in the General Fund and increases costs in the other funds on the Statement of Revenues, Expenditures, and Changes in Fund Balance.
Proprietary funds distinguish operating expenses from non-operating expenses. Operating expenses usually involve exchange transactions. These are transactions in which each party receives and gives up essentially equal values. Expenses not associated with the principal activities of the fund are reported as non-operating expenses.
Use of Estimates
The County uses estimates and assumptions in the preparation of financial statements. Generally accepted accounting principles requires management to make estimates and assumptions that affect the amounts of assets and liabilities and disclosure of contingent assets and liabilities at the date of the financial statements and the reported amounts of revenue and expenditures during the reporting period. Actual results may differ from those estimates.

Page 59
Note 4. Stewardship, Compliance, and Accountability
TABOR
In 1992 Colorado voters passed an amendment to the State Constitution, Article X, Section 20, which has several limitations, including revenue raising, spending abilities, and other specific requirements of state and local governments. The County’s financial activity provides the basis for calculation of limitations adjusted for allowable increases tied to inflation and local growth.
The Amendment excludes from its provisions “enterprises.” Enterprises, defined as government-owned businesses authorized to issue revenue bonds and receiving less than 10 percent of their annual revenue in grants from all state and local governments combined, are excluded from the provisions of the amendment. The County is of the opinion that the Rocky Mountain Metropolitan Airport qualifies for this exclusion.
Fiscal year spending and property tax revenue limits are determined based on the prior year’s spending adjusted for inflation and local growth. Revenue in excess of the limit must be refunded unless the voters approve retention of such revenue at the next general election.
Fiscal year spending is generally defined as expenditures plus reserve increases with certain exceptions. In effect, it has been generally interpreted that fiscal year spending approximates nonexempt revenue. Spending excludes spending from certain revenue and financial sources such as federal funds, gifts, property sales, fund transfers, damage awards, and fund reserves.
The amendment requires, with certain exceptions, voter approval prior to imposing new taxes, increasing tax rates, increasing a mill levy above that for the prior year, extending an expiring tax, or implementing a tax policy change directly causing a net tax revenue gain to any local government. The County provides temporary mill levy reductions in order to refund or prevent revenues in excess of the allowable limit.
The County levied 25.846 mills for property taxes to be collected in 2015. The official mill levy of the County is 25.978 mills. The temporary mill levy reduction was 0.132 mills for 2015.
Except for bond refinancing at lower interest rates or adding employees to existing pension plans, the Amendment specifically prohibits the creation of multiple-fiscal year debt or other financial obligations without voter approval or irrevocably pledging present cash reserves for all future payments.
The amendment requires that an emergency reserve be established. This reserve must be at least 3 percent of Fiscal Year Spending (excluding bonded debt service) in years after 1994. Emergency reserves totaling $8,495,233 have been presented as a restriction of fund balance in the General and Contingent Funds. The County is not allowed to use the emergency reserves to compensate for economic conditions, revenue shortfalls, or salary and benefit increases.
The amendment is complex and subject to judicial interpretation. The County believes it is in compliance with the requirements of the amendment. However, the County has made certain interpretations in the amendment’s language in order to determine its compliance.
Budgetary Basis of Accounting
The County budgets on the modified accrual basis of accounting, including its proprietary funds, with the exception of certain GAAP requirements such as those related to accounting for capital leases proceeds. The reconciliation of the budgetary change in fund balance to GAAP fund balance is shown on the face of the relevant budgetary comparison statement as required supplementary information for the General and major Special Revenue funds (see Note RSI-1) and as supplementary information for the major Capital Project and the non-major budgeted funds.
Except for the Jefferson County Finance Corporation Debt Service and the Forfeiture Special Revenue funds, the County annually adopts the Budget Resolution for all operating funds of the County. Prior to October 15, the County Manager submits to the County Commissioners a proposed operating budget for the fiscal year commencing the following January 1.
Budgets for all governmental and proprietary funds are adopted on the modified accrual basis where capital
Page 60
outlays are treated as expenditures and depreciation is not budgeted. The operating budget includes proposed expenditures/expenses and the means of financing them. Public hearings are conducted in the county to obtain comments. On or before December 22 the County must certify the mill levy. However prior to certifying the mill levy, budgets by fund are legally enacted through passage of an appropriation resolution. The County Commissioners must approve transfers between funds, or increases to a fund’s budget.
Formal budgetary integration is employed as a management control device during the year for the General Fund, Special Revenue Funds, Debt Service Funds, Capital Projects Funds and Proprietary Funds. For budgetary purposes all encumbered, unencumbered and unexpended appropriations lapse at year-end.
Budgetary Expenditures in Excess of Appropriations
The budget is controlled at the category line level within each division within each fund. However, the legal level of appropriation is at the fund level. Administratively, operating budgets are controlled at the department level. In 2015, there were no departments or funds that had expenditures in excess of their appropriations.
Note 5. Deposits and Investments
The County Treasurer acts as a bank for all County funds except for the Jefferson County Finance Corpora-tion. Each fund’s equity is pooled and retains the characteristics of a demand deposit from the fund’s perspective. The Treasurer invests the cash until it is needed. All pooled cash and investments are considered short-term for accounting purposes.
Deposits
Colorado State Statutes, specifically the Public Deposit Protection Act (PDPA) of 1989, require all public monies to be deposited in financial institutions that have been designated as eligible public depositories. Eligible public depositories must pledge eligible collateral for any amounts in excess of the required Federal Deposit Insurance Corporation (FDIC) amount, as promulgated by the Colorado Division of Banking, having a market value in excess of 102% of the aggregate uninsured public deposits. Of bank balances totaling $64,134,473, $1,025,790 was covered by FDIC and $63,108,683 was covered by PDPA.
Investments
The County’s investment policy parallels Colorado statutes. They specify investment instruments, meeting defined rating and risk criteria in which local government entities may invest, which are:
Obligations of the United States and certain U.S. government agency securities
Certain international agency securities
General obligation and revenue bonds of local government entities
Bankers’ acceptances of certain banks
Commercial paper
Local government investment pools
Written repurchase agreements collateralized by certain authorized securities
Certain money market funds
Guaranteed investment contracts
Investments are reported at fair value.

Page 61
Investments in local government investment pools are included in the Investment Pooled Trusts amount listed above. The Colorado Division of Securities routinely monitors the investment pools with regard to operations and investments. At December 31, 2015, the County had $36,154,300 invested into Colorado Surplus Asset Fund Trust (CSAFE). The trust operates similar to a money market fund with each share maintaining a value of $1. The CSAFE pool is rated AAAm by Standard & Poor’s with a weighted average maturity of 83 days.
Interest Rate Risk
Through its investment policy, the County manages its exposure to fair value losses arising from increasing interest rates by limiting the effective duration of its purchased securities. These purchases are generally limited to those having a maturity of 5 years or less. However, securities with a maturity more than 5 years may be purchased if the effective duration is 3 years or less.
Credit Risk
The County’s general investment policy is to apply the prudent-person rule, as investments are made as a prudent person would be expected to act, with discretion and intelligence, to seek reasonable income, preserve capital, and in general, avoid speculative investments. The County’s investments in the bonds of US agencies were rated AA+ by Standard & Poor’s, Aaa by Moody’s Investors Service, and AAA by Fitch Ratings. The County’s investments in money market savings accounts are covered by the PDPA Colorado State Statute.
ModifiedInvestment Type Fair Value Duration
Bank Money Market Accounts 13,665,167$ - Investments in Pooled Trusts 36,154,300 - Corporate Securities 4,055,454 0.14 U.S Treasury Notes 9,997,660 0.49 Fannie Mae Govt. Agency Debentures 27,054,529 2.48 Farmer Mac Govt. Agency Debentures 10,023,005 1.44 Federal Home Loan Bank Govt. Agency Debentures 15,001,635 1.02 Freddie Mac Govt. Agency Debentures 37,093,181 1.90 Federal Farm Credit Bank Govt. Agency Debentures 22,832,826 2.26
175,877,757$
Reconciliation to Financial StatementsCarrying value of deposits 60,994,120$ Investments at fair value 175,877,757
236,871,877$
Cash, pooled cash and investments from statementsPrimary government 196,536,820$ Public Library 13,708,926 Public Health 967,870 Agency fund 25,658,261
236,871,877$

Page 62
Concentration of Credit Risk
The County’s investments comply with State law which limits the concentration of corporate and bank securities to fifty percent of the County’s overall portfolio and to five percent of the County’s portfolio in any single issuer. There is no State law or County policy limitation of the concentration of US Government or US Government Agency securities. The investments at December 31, 2015 included holdings in five different types of government agencies with the largest concentration at 21% in Federal Home Loan Bank Government Agency Debentures.
Custodial Credit Risk
For an investment, Custodial Credit Risk is the risk that, in the event of the failure of the counterparty, the County will not be able to recover the value of its investments or collateral securities that are in the possession of an outside party. The County adheres to state statutes regarding custody of investments and therefore has no additional written policy regarding custodial credit risk. All of the County’s investments at December 31, 2015 are held in the name of the County.
Note 6. Interfund Transactions
Interfund Receivables/Payables
Transactions between the various funds of the County can result in receivables and payables at year-end. The sum of all balances presented in the following table agrees with the sum of interfund balances presented in the balance sheets for governmental and statement of net position for the proprietary funds. Interfund balances not expected to be repaid within one year of the financial statement date are reported in the governmental fund balance sheets as long-term assets and the fund balance is reserved for that amount.
The payable amount in the Social Services Fund due to the General Fund is to cover a cash deficit due to restrictions in their cash balance at year end. The advance to the Airport from the General Fund is for a 40-year loan and a 4-year loan for capital improvements and capital equipment at the Airport. The payables in Other Governmental funds to the General and Social Services funds are for working capital loans to prevent cash deficits in the Workforce Development fund which receives 100% of its revenues on a reimbursement basis.
Amount to bepaid within
Receivable Fund Payable Fund Amount one yearGeneral Fund Social Services Fund 1,500,000$ 1,500,000$
General Fund Airport Fund 1,832,008 223,126
General Fund Other Governmental Funds 366,028 366,028
Social Services Fund Other Governmental Funds 500,000 500,000 Total 4,198,036$ 2,589,154$

Page 63
Interfund Transfers
Transfers are used for funding of capital projects or debt service, subsidies of various County operations and reallocation of special revenues. The following schedule briefly summarizes the County’s transfer activity:
Transfer activity in 2015 between the governmental funds and the internal service funds was limited to a transfer from the Fleet fund to the General fund in the amount of $31,837.
Note 7. Capital Assets
Primary Government
Capital Asset activity of the governmental activities for the year ended December 31, 2015 was as follows:
Capital Community Sales Tax SubtotalSocial Expendi- Open Workforce Head Solid Develop- LID Other Transfers-
General Services tures Space Development Start Patrol Waste ment Cap Proj Governmental outGeneral -$ 1,936,501$ 1,696,097$ 86,000$ -$ 888,713$ 15,867,668$ -$ 22,665$ -$ 16,865,046$ 20,497,644$ Road and Bridge 36,496 - - - - - - - - - - 36,496 Social Services - - - - - 103,935 - - - - 103,935 103,935 Other Governmental
Open Space 151,133 - - - - - - - - - - 151,133 Conservation Trust 380,683 - - - - - - - - - - 380,683 Workforce Development 4,033 - - - - - - - - - - 4,033 Community Development - - - - 63,624 - - - - - 63,624 63,624 Solid Waste - - - - - - - 26,342 - - 26,342 26,342 Sales Tax LID Debt Svc - - - - - - - - - 3,000,000 3,000,000 3,000,000
Subtotal Other Governmental 535,849 - - - 63,624 - - 26,342 - 3,000,000 3,089,966 3,625,815
Total 572,345$ 1,936,501$ 1,696,097$ 86,000$ 63,624$ 992,648$ 15,867,668$ 26,342$ 22,665$ 3,000,000$ 20,058,947$ 24,263,890$
Transfers-inOther Governmental funds
Beginning . EndingBalance Increases Transfers Decreases Balance
Governmental ActivitiesCapital Assets Not Being Depreciated
Land and Land Improvements 682,806,981$ 5,125,396$ -$ (525,000)$ 687,407,377$ Construction in Progress 51,254,390 15,539,832 (8,839,690) (984,629) 56,969,903
Total Capital Assets Not Being Depreciated 734,061,371 20,665,228 (8,839,690) (1,509,629) 744,377,280
Capital Assets Being DepreciatedBuildings and Improvements 253,983,248 577,384 207,283 - 254,767,915 Machinery and Equipment 104,850,621 6,827,529 420,391 (4,946,474) 107,152,067 Infrastructure 334,841,951 10,978,676 8,212,016 (5,836,103) 348,196,540
Total Capital Assets Being Depreciated 693,675,820 18,383,589 8,839,690 (10,782,577) 710,116,522
Less Accumulated DepreciationBuildings and Improvements (102,168,814) (6,064,495) - - (108,233,309) Machinery and Equipment (66,511,485) (8,244,003) - 4,660,124 (70,095,364) Infrastructure (186,262,070) (13,559,813) - 5,836,103 (193,985,780)
Total Accumulated Depreciation (354,942,369) (27,868,311) - 10,496,227 (372,314,453)
Total Capital Assets Being Depreciated, Net 338,733,451 (9,484,722) 8,839,690 (286,350) 337,802,069
Total Governmental Activities 1,072,794,822$ 11,180,506$ -$ (1,795,979)$ 1,082,179,349$

Page 64
Depreciation expense was charged to functions/programs of the primary government as follows:
Capital Asset activity of the business-type activities for the year ended December 31, 2015 was as follows:
Capital assets of Proprietary Funds acquired through federal funding are restricted in their use in that they may only be used to provide aeronautical services to the general public. Uses outside those allowed by the FAA require repayment of those costs contributed by federal funding.
In 2014, the Airport reclassified a parcel of land as an Asset Held for Resale. The original parcel, approximately 436 acres, was set aside to sell for future development near the Airport in the Verve Metropolitan District. In 2015, about 26 acres was sold to Suncap Boulder LLC. The sale resulted in a net gain of approximately $1.7M. The remainder of this land held for resale is expected to be sold in various smaller parcels in future years.
Governmental Activities
General Government 9,660,383$
Public Safety 3,239,607
Highways and Streets 12,925,404
Culture and Recreation 1,629,835
Welfare 404,148 Sanitation 8,934
Total Depreciation Expense - Governmental Activities 27,868,311$
Beginning . EndingBalance Increases Transfers Decreases Balance
Business-Type ActivitiesCapital Assets Not Being Depreciated
Land and Land Improvements 13,828,215$ -$ -$ -$ 13,828,215$ Construction in Progress 23,144,875 33,364 (23,144,875) - 33,364
Total Capital Assets Not Being Depreciated 36,973,090 33,364 (23,144,875) - 13,861,579
Capital Assets Being DepreciatedBuildings and Improvements 8,333,927 - - - 8,333,927 Machinery and Equipment 5,114,624 42,725 - - 5,157,349 Infrastructure 61,798,040 914,502 23,144,875 (9,112) 85,848,305
Total Capital Assets Being Depreciated 75,246,591 957,227 23,144,875 (9,112) 99,339,581
Less Accumulated DepreciationBuildings and Improvements (5,126,525) (235,403) - - (5,361,928) Machinery and Equipment (2,976,836) (260,707) - - (3,237,543) Infrastructure (38,720,228) (2,925,180) - 5,050 (41,640,358)
Total Accumulated Depreciation (46,823,589) (3,421,290) - 5,050 (50,239,829)
Total Capital Assets Being Depreciated, Net 28,423,002 (2,464,063) 23,144,875 (4,062) 49,099,752
Total Business-Type Activities 65,396,092$ (2,430,699)$ -$ (4,062)$ 62,961,331$

Page 65
Component Units
Capital Asset activity of the component units for the year ended December 31, 2015 was as follows:
Beginning Ending
Balance Increases Decreases Balance
Jefferson County Public Library District
Capital Assets Not Being Depreciated
Land 1,248,056$ -$ -$ 1,248,056$
Total Capital Assets Not Being Depreciated 1,248,056 - - 1,248,056
Capital Assets Being Depreciated
Buildings and Improvements 22,479,813 - - 22,479,813
Infrastructure 878,000 - - 878,000
Machinery and Equipment 6,576,541 848,895 (232,122) 7,193,314
Library Collection 7,914,582 2,375,107 (5,477,372) 4,812,317
Total Capital Assets Being Depreciated 37,848,936 3,224,002 (5,709,494) 35,363,444
Less Accumulated Depreciation
Buildings and Improvements (10,470,871) (455,836) - (10,926,707)
Infrastructure (8,269) (43,900) - (52,169)
Machinery and Equipment (4,426,396) (597,607) 232,122 (4,791,881)
Library Collection (787,302) (4,871,824) 5,477,372 (181,754)
Total Accumulated Depreciation (15,692,838) (5,969,167) 5,709,494 (15,952,511)
Total Capital Assets Being Depreciated, Net 22,156,098 (2,745,165) - 19,410,933
Total Library Activities 23,404,154$ (2,745,165)$ -$ 20,658,989$
Beginning Ending
Balance Increases Decreases Balance
Jefferson County Public Health
Capital Assets Not Being Depreciated
Construction in Progress -$ 315,482$ -$ 315,482$
Total Capital Assets Not Being Depreciated - 315,482 - 315,482
Capital Assets Being Depreciated
Machinery and Equipment 316,798 19,253 - 336,051
Total Capital Assets Being Depreciated 316,798 19,253 - 336,051
Less Accumulated Depreciation
Machinery and Equipment (287,988) (18,031) - (306,019)
Total Accumulated Depreciation (287,988) (18,031) - (306,019)
Total Capital Assets Being Depreciated, Net 28,810 1,222 - 30,032
Total Health Activities 28,810$ 316,704$ -$ 345,514$

Page 66
Depreciation expense was charged to the component units as follows:
Note 8. Commitments
During 2015, General Fund commitments consisted mainly of software projects including upgrades to the network capacity, security software, and a Data Microwave system for the Sheriff's office as well as energy upgrades for many County buildings. The Road & Bridge Fund included commitments for contracts for roads and concrete replacement and continued repairs due to the September 2013 flood. Other commitments for road projects are included in the Traffic Impact Funds and South East Capital Improvement Funds. These commitments are reflected in the totals for Other Governmental Funds. Other commitments reflected in the totals for Other Governmental Funds include an Open Space project for the Peaks to Plains trail system. The Capital Expenditures Fund has continued commitments related to the detention facilities expansion which will likely wrap up in the next year and improvements to the air handling units for the Jefferson County Courts & Administration Building.
The Airport has committed funds for safety area improvements. Airport improvements are being paid primarily with federal funds. The Airport has also committed funds to a developer who is working with the Airport on development of the area west of the airport.
A summary of these projects follows:
In addition, the County has committed Community Development grant funds to various non-profit organizations in the County. These organizations help provide assistance to low- and moderate-income persons in the areas of housing and economic opportunity. The commitments to these non-profits total almost $2.5 million, of which nearly $0.6 million is remaining.
The County participates in open space projects along with other governmental entities. Projects for the Open Space Fund are financed through a one half percent countywide sales tax.
Component Unit Activities
Public Library 5,969,168$
Public Health 18,031
Total Depreciation Expense - Component Unit Activities 5,987,199$
Original Spent Remaining
Projects Commitments to Date Commitments
General Fund 6,146,917$ 4,329,159$ 1,817,758$
Road & Bridge Fund 4,010,544 2,086,081 1,924,463
Capital Expenditures Fund 38,165,934 37,061,056 1,104,878
Other Governmental Funds 30,674,956 19,723,459 10,951,497
Airport 18,225,370 18,197,144 28,226
Total Primary Government 97,223,721$ 81,396,899$ 15,826,822$
Public Health 282,073$ 159,523$ 122,550$

Page 67
A summary of these projects follows:
Note 9. Joint Ventures
The County has entered into several multi-governmental agreements, or joint venture agreements, with other governments to provide needed services. Separate reports are not issued for these entities. The County does not claim any equity in the several joint ventures in which it participates, and considers its payments to the joint ventures as expenditures in the year in which they occur.
The significant agreements meeting the definition of “Joint Venture” for financial reporting purposes are summarized below:
E911 Emergency Telephone Service
The Emergency Telephone Service Authority (Emergency Authority), established in 1983, was formed between the county and 25 other governmental entities to administer the operation of the central emergency telephone service program. The governing board for the Emergency Authority consists of two members selected from a list of nominees submitted by cities and towns, two members selected by special districts, and one member of the County’s Board of County Commissioners who is designated annually to serve as the County’s representative.
The County makes annual contributions, as approved by the Board of County Commissioners, based on the Emergency Authority’s needs as defined in the annual budget for operating costs, as approved. No annual contribution from the County was necessary in 2015.
Shooting Range and Training Facility for Law Enforcement Personnel
The Shooting Range and Training Facility (Facility) for Law Enforcement Personnel, established in 1995, was formed between the County, five other governmental entities, and Red Rocks Community College to build a shooting range and training facility for police and other law enforcement personnel. The Lakewood Finance Department administers all funds and an annual audit report related to the Facility is available to
CITY/DISTRICT PROJECT YEAR GRANT AMOUNT DATE PROJECT AMOUNT BALANCE TO BE
APPROVED OF GRANT COMPLETED REIMBURSED REIMBURSEDCITIES & TOWNS
Arvada May View Ntr Ctr - Environ Ed/Community Agric. 2013 103,250$ 3/2/2015 103,250$ -$
Arvada Griffith Station Neighborhood Park 2014 55,000 3/2/2015 55,000 -
Arvada Van Bibber Regional Trail Connection - Stenger Lu 2015 140,000 - 140,000
Edgewater/Lakewood Walker Branch Park Improvements 2013 180,000 - 180,000
Golden Regional Trail Bridge Improvements 2013 46,000 - 46,000
Golden W. 44th Avenue Trail 2014 223,788 - 223,788
Golden W. 44th Avenue Trail - Supplemental 2014 108,519 - 108,519
Lakewood Two Creeks Trail System 2012 165,000 - 165,000
Lakewood Bear Creek lake Park - Flood Remediation 2014 100,000 3/9/2015 100,000 -
Wheat Ridge Clear Crk Trail/W.41st Ave Segment Relocation 2014 358,621 255,184 103,437
SUB-TOTAL CITIES/TOWNS 1,480,178 513,434 966,744
PARK & RECREATION DISTRICTS
Beaver Ranch CommunBeaver Ranch Park - Site/Community Master Plan 2015 20,000$ -$ 20,000$
Evergreen Audubon Evergreen Lake Interpretive Trail - Ph. 1 & II 2014 8,575 5,100 3,475
Evergreen P&R Dist Evergreen Lake boarwalk & Nature Trail Access 2014 79,000 7/16/2015 79,000 -
Evergreen P&R Dist Evergreen Lake Park - Bridge Improvement 2015 40,000 - 40,000
Foothills P&R Dist Clement Park Redevelopment Project 2015 1,000,000 - 1,000,000
Ken-Caryl Ranch MetroCommunity Splash Pad - Community Center 2013 21,000 - 21,000
Ken-Caryl Ranch MetroCommunity Center - Playground Improvements 2015 54,250 - 54,250
Normandy Estates Me Tennis Court/Playground Improvements 2015 8,750 10/22/2015 8,630 -
Pleasant View Historic Officers Club Interior Restoration 2010 45,000 - 45,000
Prospect P&R Dist. Applewood Park - Outdoor Fitness System 2015 15,750 12/14/2015 15,750 -
South Suburban P&R Trail Mark park - Port-o-let Enclosure 2014 6,125 10/9/2015 5,324 -
SUB-TOTAL PARK & RECREATION DISTRICTS 1,298,450 113,804 1,183,725
TOTAL -- CITIES & TOWNS/PARK & RECREATION DISTRICTS 2,778,628$ 627,238$ 2,150,469$
OPEN SPACE LOCAL GRANTS REPORTAS OF DECEMBER 31, 2015

Page 68
each party of the agreement. The governing board for the Facility consists of the Jefferson County Sheriff, the Lakewood Chief of Police, one member selected jointly by the County’s Sheriff and the Lakewood Chief of Police, and two members are elected by nomination by all parties to the agreement.
The initial capital contribution included the exchange of a parcel of real property between the City of Lakewood and the County to allow for the exclusive use of the premises for the Facility. In addition, the County contributed funds for the construction of the Facility and is required to make allocated additional contributions for the maintenance and repair of the Facility based upon total costs. Allocated costs are determined based upon the number of personnel using the Facility annually. The County contributed $28,464 as its annual contribution in 2015.
Jefferson County Hazardous Substance Response Authority
The Jefferson County Hazardous Substance Response Authority (Jefferson Authority), established in 1984, was formed between the County and 29 other governmental entities to administer and operate the County’s hazardous substance response program. The governing board of the Jefferson Authority is comprised of two members selected from a list of nominees submitted by participating cities and towns, two members selected by participating fire districts/departments within the County, and one member is nominated from the County by the Board of County Commissioners.
The County contributes towards the operating costs (including salaries, fuel, laboratory testing, packaging, shipping, equipment replacement) of the Jefferson Authority based upon population/assessed value, and if unreimbursed incidents occur with the County, specific usage. The contribution is made to the Adams and Jefferson County Hazardous Response Authority. The 2015 annual contribution made by the County was $41,543.
Foothills Animal Shelter
The Foothills Animal Shelter (formerly Table Mountain Animal Center), established in 1976, was formed between the County and three other governmental entities to establish an animal holding facility and engage personnel to operate the facility for the control, licensing, impounding, or disposition of pet animals. The governing board of the Foothills Animal Shelter is comprised of one member designated and appointed by each party to the agreement. The agreement was amended in 2012 and now includes six municipalities and the County.
The initial capital contribution by the County was $107,021. The 2015 annual contribution by the parties paid the debt service principal and interest payments, based upon estimated dog population. The County paid the entire debt service principal and interest payment, and then billed the other entities for their share. The net annual contribution for the County was $153,471 in 2015. The Shelter is responsible for the administration of the licensing program and any donations received by the County are remitted to the Shelter.
Rooney Road Recycling Center Authority
The Rooney Road Recycling Center (Rooney Center), originally established in 1993 as the Household Hazardous Waste Storage Authority, was formed between the County and eight other governmental entities. The purpose was to establish a hazardous waste collection program that provides a safe, convenient place for household hazardous waste from citizens of the County to be safely collected, stored and properly disposed of offsite. The Management Committee of the Rooney Center consists of one representative from each party to the agreement. That individual must be an employee unless the party has no qualified employee who can be a member of the Management Committee.
The County is required to make annual contributions for the operating costs, including the storage, sampling, transportation and disposal costs of household hazardous waste and other solid waste as approved by the Board of County Commissioners. The County’s pro-rated share of the cost is equal to the percentage of unincorporated Jefferson County population to the total population of all-participating municipalities and unincorporated Jefferson County. The County may also pay more than this proportionate share at its option. In 2015, the County’s annual contribution was $113,733.

Page 69
Ambulance Inspection
The Ambulance Inspection Committee (Committee), originally established in 1998, was formed between the County, Jefferson County Public Health, and four other counties. The agreement was amended in 2006 and now includes five other counties. The purpose was to establish an ambulance inspection program to provide inspection services for each ambulance operating in the jurisdiction of the participating entities. Currently, there are six participating counties.
The County administers this agreement. In addition, the County is required to pay its pro rata share annually which covers some of the administrative costs of administering the program. The initial County contribution was $2,720. The 2015 annual contribution made by the County was $10,925.
Law Enforcement Information Sharing System
The Law Enforcement Information Sharing System, established during 2005, was formed between the County’s Sheriff’s Office and six city police departments. The purpose was to establish a consortium that aids in the sharing of certain law enforcement information and therefore, enhances the effectiveness of law enforcement by increasing information related to crime and criminal activities. Member Agencies can access a software system called COPLINK.
The initial funding for this project was provided by grant funding sources at no cost to each Member Agency. Except to the extent grant funds are available, each Member Agency shall pay an equal share of the maintenance cost each year. For 2015, the County had no annual contributions to this joint venture.
Juvenile Assessment Center
The Juvenile Assessment Center (the Center), originally established in 2001, by agreement dated January 1, 2001 (the Agreement) was formed between the County, six cities, and the Jefferson County School District as parties and the District Attorney, First Judicial District and Jefferson County Sheriff as Sponsors as that term is defined in the Agreement. The purpose of the Center is to provide services including mental health and other intervention programs to juveniles and their families who are referred to the Center by the Sponsors. The Center conducts complete assessments of the needs of juveniles and their families such as screening for violence potential, self-destructive tendencies, abuse, neglect and future criminal behavior.
The County contributes annually towards the Center’s fiscal year operating costs. The County’s portion is 46% of the Center’s Annual Assessment as that term is defined in the Agreement. The Sheriff’s office also contributes a portion of the 40% shared contribution of all the law enforcement sponsors. The initial contribution by the County was $266,645. The 2015 annual contribution made by the County was $251,013.
Jefferson Parkway Public Highway Authority
The Jefferson Parkway Public Highway Authority (the Authority), established during 2008, was formed between the County and two other local governments. The Authority was created for the purpose of financing, constructing, operating and/or maintaining the Jefferson Parkway, a planned beltway which generally circumscribes the western perimeters of the Denver metropolitan region and is designed for regional traffic movement.
The County contributed a one-time participation fee of $100,000 in 2008. On October 16, 2008, the Authority’s Directors agreed that each member jurisdiction would contribute additional monies towards the Authority’s budget. The additional contributions are for continuing project management, engineering and legal representation. These additional contributions may also be reimbursable back to the entities at a later date. The County’s 2015 contribution was $200,000.
County Regional Crime Laboratory
The County Regional Crime Laboratory (Crime Lab), established in 2013, was formed between the County and four cities to provide a regional forensic crime laboratory in Jefferson County. The governing board for the Crime Lab consists of the Police Chiefs of the cities and the Jefferson County Sheriff.

Page 70
As part of the addition to the Jefferson County Detention Center, the County added the crime lab to the facility. The County’s initial contribution was the capital cost for the design and construction of the Crime Lab. The County is required to make ongoing contributions for costs related to repair and maintenance of the building where the Crime Lab is located, operating costs for that building and costs to carry all risk casualty insurance. The County was reimbursed approximately $242,000 by the cities in 2015 for their share of the operating costs. Note 10. Certificates of Participation
The County had no general obligation debt outstanding during 2015. It does have several bond issues backed by particular revenues of the County, and certificates of participation backed by certain assets. The County believes it is currently in compliance with all Federal arbitrage regulations related to these issues and does file reports with the Internal Revenue Service that demonstrate its compliance.
2013 Series - Facilities and Equipment
On September 10, 2013, Jefferson County Finance Corporation issued $24,355,000 of Refunding Certificates of Participation, Series 2013, with an interest rate of 2.39%, payable semiannually on June 1 and December 1. These 2013 Certificates mature serially beginning December 1, 2013, and continue through 2024. The 2013 Certificates are not subject to optional redemption prior to maturity.
The 2013 Certificates were issued to (i) refund all of the County’s outstanding Certificates of Participation, Series 2004; and (ii) pay the costs of issuing the 2013 Certificates. The transaction resulted in an economic gain of approximately $1.6 million and the aggregate difference in debt service between the refunding and the refunded debt is $1.8 million.
The County pledged the Courts and Administration Building as collateral. Payments, pursuant to the lease-purchase agreements, are included in the operating budgets of the various divisions and are made from various revenues including the property tax mill levy of the Capital Expenditures Fund, which is a Major Governmental Fund.
Certificates of Participation outstanding and related interest requirements as of December 31, 2015, are as follows:
2009 Series A & B - Facilities and Equipment
On November 5, 2009, Jefferson County Finance Corporation issued $67,715,000 of Certificates of Participation (Series 2009A) as Qualified Build America Bonds, with interest rates varying from 3.1% to 6.25%, payable semiannually on June 1 and December 1. These Certificates mature serially beginning December 1, 2013, and continue through 2029.
The 2009A Certificates maturing on or after December 1, 2020, may be called for redemption on December 1, 2019 or any date thereafter at the option of the County, in whole or in part in integral multiples of $5,000, from any maturities selected by the County and by lot within a maturity in such manner as the Trustee shall determine, at a redemption price equal to the principal amount so redeemed plus accrued interest to the redemption date without a redemption premium.
Year Principal Interest Total2016 2,045,000$ 480,749$ 2,525,749$ 2017 2,080,000 431,873 2,511,873 2018 2,130,000 382,161 2,512,161 2019 2,175,000 331,254 2,506,254 2020 2,225,000 279,272 2,504,272
2021-2024 9,460,000 572,166 10,032,166 Totals 20,115,000$ 2,477,475$ 22,592,475$

Page 71
The 2009A Certificates maturing on December 1, 2025 and December 1, 2029 are subject to mandatory sinking fund redemption, in part, by lot in such manner as the Trustee shall determine, on December 1 of the years shown below at a price equal to the principal amount of each 2009A Certificate or portion thereof redeemed, plus accrued interest to the redemption date.
On November 5, 2009, Jefferson County Finance Corporation issued $8,765,000 of tax exempt Certificates of Participation (Series 2009B), with interest rates varying from 2% to 2.5%, payable semiannually on June 1 and December 1. As of December 31, 2015, none of the Series 2009B Certificates remain outstanding.
The proceeds of the 2009 A & B Certificates, together with other available County funds, are expected to be utilized to construct and equip various capital improvements of the County, which may include, but are not limited to, the following: (i) expansion of the County’s detention facilities complex, including $15.0 million for a free-standing community corrections facility (approximately $45.0 million); (ii) the acquisition or construction of three multi-purpose buildings (approximately $7.0 million each for two of the buildings and $6.0 million for the third, for an estimated total of $20.0 million); (iii) expansion and renovation of court facilities (approximately $4.0 million); (iv) data center expansion (approximately $1.8 million); and (v) construction of a centralized animal shelter serving various agencies within the County (approximately $5.2 million).
Certificates of participation outstanding and related interest requirements for the 2009 Series A & B issue as of December 31, 2015, are as follows:
Note 11. Bonds Payable
2012 Series
On June 7, 2012, Jefferson County issued $11,760,000 of Southeast Jefferson County Local Improvement Districtwide Sales Tax Revenue Refunding Bonds, Series 2012, with interest rate of 1.76% payable semi-annually on June 1 and December 1. The 2012 Bonds mature serially beginning June 1, 2013 and continue through 2022. The 2012 Bonds are not subject to optional redemption prior to maturity.
The 2012 Bonds were issued to (i) refund all of the County’s outstanding Southeast Jefferson County Local Improvement District Sales Tax Revenue Bonds, Series 2002; and (ii) pay the costs of issuing the 2012 Bonds. The transaction resulted in an economic gain of approximately $1.7 million. These Bonds are secured by a 0.5 percent Sales Tax in the Southeast Jefferson County Local Improvement District.
Year Principal Interest Total2016 3,325,000$ 3,258,418$ 6,583,418$ 2017 3,420,000 3,118,768 6,538,768 2018 3,515,000 2,969,998 6,484,998 2019 3,625,000 2,797,763 6,422,763 2020 3,745,000 2,616,513 6,361,513
2021-2025 20,800,000 9,885,525 30,685,525 2026-2029 19,740,000 3,145,938 22,885,938
Totals 58,170,000$ 27,792,923$ 85,962,923$

Page 72
Bonds outstanding and related interest requirements as of December 31, 2015, are as follows:
2009 Series
On April 22, 2009, Jefferson County Open Space issued $66,905,000 of Sales Tax Revenue Refunding Bonds, Series 2009, with interest rates varying from 2% to 5% payable semiannually on May 1 and November 1. The 2009 Bonds mature serially beginning November 1, 2010, and continue through 2019. The 2009 Bonds are not subject to redemption prior to their respective maturities. The 2009 Bonds were issued to (i) refund all of the County’s outstanding Open Space Sales Tax Revenue Bonds, Series 1999; and (ii) pay the costs of issuing the 2009 Bonds. The refunding decreased the County’s total debt service payments by approximately $2.4 million. The transaction resulted in an economic gain of approximately $5.2 million and the aggregate difference in debt service between the refunding debt is $5.4 million. Bonds outstanding and related interest requirements as of December 31, 2015, are as follows:
2010 Series
On September 30, 2010, Jefferson County Open Space issued $21,130,000 of Sales Tax Revenue Refunding Bonds, Series 2010, with interest rates varying from 2.0% to 4.0 % payable semiannually on May 1 and November 1. The 2010 Bonds maturing on and after November 1, 2021, shall be subject to redemption prior to maturity at the option of the County, on November 1, 2020, and any date thereafter, in whole or in part, in integral multiples of $5,000, from such maturities or any portions of maturities selected by the County and by lot within a maturity in such manner as the Registrar shall determine, upon payment of the principal amount of each 2010 Bond or portion thereof so redeemed plus accrued interest thereon to the redemption date without redemption premium. The Bonds were issued to (i) refund all of the County’s outstanding Open Space Sales Tax Revenue Bonds, Series 2001; and (ii) pay the costs of issuing the 2010 Bonds. The refunding decreased the County’s total debt service payments by approximately $2.6 million. The transaction resulted in an economic gain of approximately $2.3 million and the aggregate difference in debt service between the refunding debt is $2.6 million.
Year Principal Interest Total2016 1,205,000$ 135,740$ 1,340,740$ 2017 1,240,000 114,224 1,354,224 2018 1,270,000 92,136 1,362,136 2019 1,305,000 69,476 1,374,476 2020 1,340,000 46,200 1,386,200
2021-2022 1,955,000 27,500 1,982,500
Totals 8,315,000$ 485,276$ 8,800,276$
Year Principal Interest Total2016 7,220,000$ 1,226,200$ 8,446,200$ 2017 7,505,000 937,400 8,442,400 2018 7,810,000 637,200 8,447,200 2019 8,120,000 324,800 8,444,800
Totals 30,655,000$ 3,125,600$ 33,780,600$

Page 73
Bonds outstanding and related interest requirements as of December 31, 2015, are as follows:
2013 Series
On September 19, 2013, Jefferson County Open Space issued $20,520,000 of Sales Tax Revenue Refunding Bonds, with an interest rate of 2.44% payable semiannually on May 1 and November 1. The 2013 Bonds mature serially beginning November 1, 2014, and continue through 2024. The 2013 Bonds maturing on and before November 1, 2021, shall be subject to redemption prior to their respective maturities, at the option of the County, on November 1, 2020, and any date thereafter, in whole or in part, in integral multiples of $5,000, from such maturities or any portions of maturities selected by the County and by lot within a maturity in such manner as the Registrar shall determine, upon payment of the principal amount of each 2013 Bond or portion thereof so redeemed plus accrued interest thereon to the redemption date without redemption premium. The 2013 Bonds were issued to (i) refund all of the County’s outstanding Open Space Sales Tax Revenue Bonds, Series 2005; and, (ii) pay the cost of issuing the 2013 bonds. The transaction resulted in an economic gain of approximately $1.1 million and the aggregate difference in debt service between the refunding debt and the refunded debt is $1.2 million. Bonds outstanding and related interest requirements as of December 31, 2015, are as follows:
The Series 2009, 2010 and 2013 Open Space Sales Tax Revenue Bonds are limited obligations of the County payable solely from Pledged Revenues. Pledged Revenues consist of: (1) the portion of the Net Sales Tax Revenues (defined as the revenues received by the County from the Open Space Sales Tax, currently 0.5 percent, excluding the following: (a) amounts withheld by retailers and vendors to cover their expenses in collecting and remitting the Open Space Sales Tax (currently 3-1/3% of the amount collected); (b) amounts collected by the County and subsequently determined to be subject to valid claims for refunds; (c) the proceeds of any increase in the Open Space Sales Tax Revenues by the Board of County Commissioners; and (d) the Cities Available Portion, (2) any additional taxes (other than a general ad valorem tax), funds, revenues or other moneys which the County hereafter pledges to the payment of the Bonds; (3) moneys deposited into and held in the Bond Account and the Reserve Account; and (4) interest or investment income
Year Principal Interest Total2016 1,895,000$ 380,600$ 2,275,600$ 2017 1,940,000 342,700 2,282,700 2018 1,990,000 294,200 2,284,200 2019 2,050,000 234,500 2,284,500 2020 2,140,000 152,500 2,292,500 2021 2,230,000 66,900 2,296,900
Totals 12,245,000$ 1,471,400$ 13,716,400$
Year Principal Interest Total2016 1,715,000$ 421,754$ 2,136,754$ 2017 1,765,000 379,908 2,144,908 2018 1,810,000 336,842 2,146,842 2019 1,860,000 292,678 2,152,678 2020 1,910,000 247,294 2,157,294
2021-2024 8,225,000 508,862 8,733,862 Totals 17,285,000$ 2,187,338$ 19,472,338$

Page 74
on the Bond Account and the Reserve Account; all to the extent that such moneys are required by the Bond Resolution to be deposited into and held in the Bond Account and the Reserve Account. Pursuant to the Bond Resolution, the County must make monthly deposits into the Bond Account (and to the extent necessary into the Reserve Account) from Net Sales Tax Revenues. It is estimated that sales tax revenues will produce at least 135 percent of the debt service requirement over the life of the bonds. For the current year, principal and interest paid were $12,855,252 and Net Pledged Revenues were $29,341,909. Net Sales Tax Revenues collected in 2015 produced 228 percent of the current debt service requirement. The Series 2012 Southeast Jefferson County Local Improvement District District-wide Sales Tax Revenue Refunding Bonds are special, limited obligations of the County payable solely from Pledged Revenues. Pledged Revenues consist of: (1) all of the revenues to be received by the County from the Sales Tax (including, without limitation, any revenues received by the County from interest and penalties on delinquent Sales Tax collection); (2) proceeds of Sales Tax Parity Obligations or other legally available moneys deposited into and held in the Bond Account, and (3) interest or investment income on the Bond Account; all to the extent that such moneys are at any time required by the Bond Resolution to be deposited into and held in the Bond Account; provided, however, that “Pledged Revenues” does not include: (a) moneys retained by the State Department of Revenue or the State Treasurer for costs of collection, administration and enforcement of the Sales Tax; (b) amounts withheld by retailers pursuant to the Sales Tax Resolution (currently 3-1/3% of the amount collected); (c) amounts collected and subsequently determined, pursuant to the Sales Tax Resolution and applicable law of the State, to be subject to valid claims for refunds; or (d) amounts in the Rebate Account (or any similar account established for any other obligations payable from Pledged Revenues) to the extent required to be paid to the United States as provided in the Bond Resolution. The Pledged Revenues also do not include any proceeds of any sales tax now or hereafter imposed by the County, other than the Sales Tax. The sales tax for the District is currently 0.5 percent with the exception of a portion of the District annexed to Lakewood which rate was reduced to .43%. Once sufficient sales tax revenue has been collected to satisfy paying off all outstanding bonds, the sales tax will be reduced from the .05 percent to .01 to be collected for maintenance and operations in that area. For the current year, principal and interest paid were $1,331,682 and Net Pledged Revenue was $5,391,756. Net Pledged Revenue in 2015 produced 405 percent of the current debt service requirement. Note 12. Loans Payable
Primary Government
On March 12, 2008, the Rocky Mountain Metropolitan Airport signed an agreement with the State of Colorado to borrow $2,100,000 of State Infrastructure Bank proceeds for Airport development. The Airport is required to make ten equal annual payments of $246,184 for principal and interest beginning March 14, 2009. The interest rate is fixed for the life of the loan at 3% per annum. The loan matures on March 15, 2018.
The outstanding loan principle amount and the related interest requirements as of December 31, 2015 are as follows:
Year Principal Interest Total2016 225,293$ 20,891$ 246,184$ 2017 232,052 14,132 246,184 2018 239,014 7,170 246,184
Totals 696,359$ 42,193$ 738,552$

Page 75
Note 13. Lease Commitments
Primary Government
Currently, there are no capital leases in any of the County’s operations. In 2015, the County had operating lease expenses of approximately $1.0 million primarily for building and equipment rent.
Currently, there are no operating or capital leases in the business activities fund. The following is a schedule by years of future minimum lease payments with the present value of the net minimum lease payments as of December 31, 2015 for operating building leases:
Component Units
In 2015, the Public Library and Public Health funds and had operating lease expenses of approximately $174 thousand primarily for building and equipment rent.
The following is a schedule by years of future minimum lease payment with the present value of the net minimum lease payments as of December 31, 2015 for operating leases:
GovernmentalYear Activities2016 172,388$ 2017 66,364
Total Minimum Lease Payments 238,752$
Operating Leases
Year Library Health2016 149,248$ 161,833$ 2017 155,802 114,905
Total Minimum Lease Payments 305,050$ 276,738$
Operating Leases

Page 76
Note 14. Summary of Annual Long-Term Debt Requirements
The following is a summary of the annual requirements of the County’s long-term debt obligations, including interest, but excluding compensated absences:
Primary Government
Note 15. Changes in Long-term Liabilities
Liabilities, other than debt, are liquidated in the fund in which the service is received. For capital leases this would be the fund that makes the lease payments. For compensated absences this would be the fund in which the employee’s salary is charged. Other than the General fund, funds which have personal services include Road & Bridge, Social Services, Open Space, Workforce Development, Head Start, Patrol, Inmate Welfare, Solid Waste Management and Community Development Special Revenue funds as well as all of the Internal Service funds. The County’s landfill liability is the present value of the estimated total costs to be paid to an outside party to monitor the methane gas discovered on the Rooney Road Landfill site.
Certificatesof Revenue Loans
Year Participation Bonds Payable Total
Governmental Activities2016 9,109,167$ 14,199,294$ -$ 23,308,461$ 2017 9,050,641 14,224,232 - 23,274,873 2018 8,997,159 14,240,378 - 23,237,537 2019 8,929,017 14,256,454 - 23,185,471 2020 8,865,785 5,835,994 - 14,701,779
2021-2025 40,717,691 13,013,262 - 53,730,953 2026-2028 22,885,938 - - 22,885,938
Total 108,555,398$ 75,769,614$ -$ 184,325,012$
Business-Type Activities2016 -$ -$ 246,184$ 246,184$ 2017 - - 246,184 246,184 2018 - - 246,184 246,184
Total -$ -$ 738,552$ 738,552$
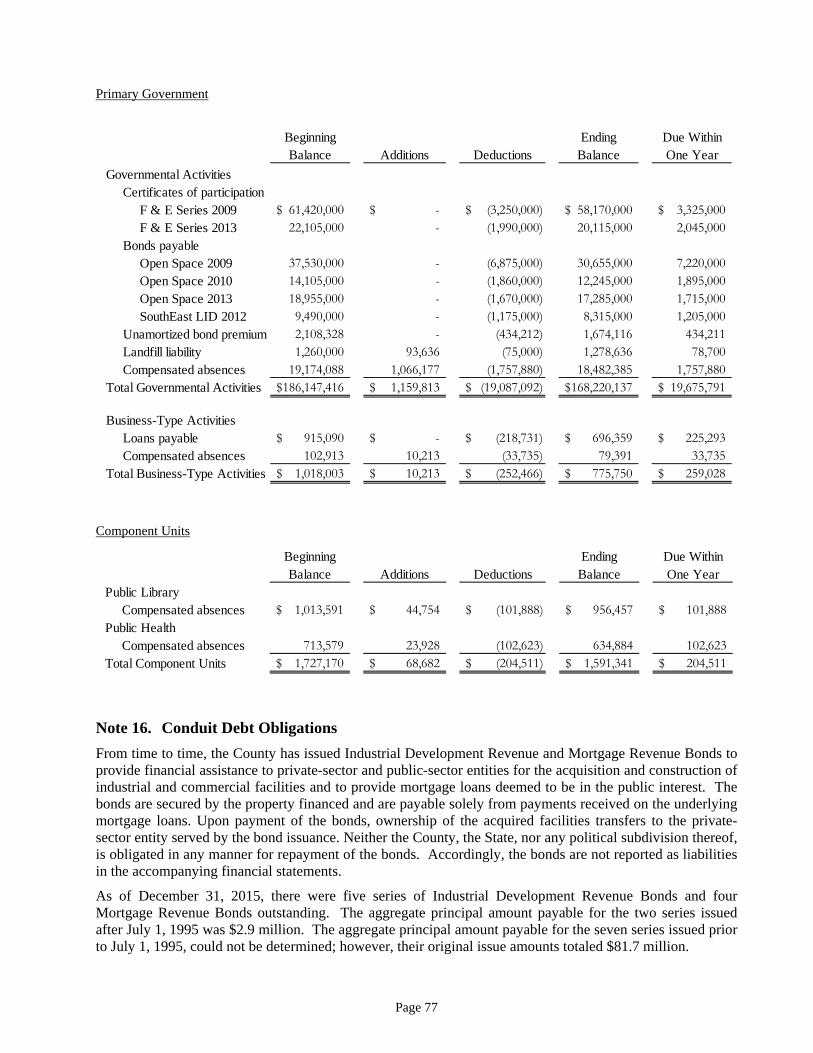
Page 77
Primary Government
Component Units
Note 16. Conduit Debt Obligations
From time to time, the County has issued Industrial Development Revenue and Mortgage Revenue Bonds to provide financial assistance to private-sector and public-sector entities for the acquisition and construction of industrial and commercial facilities and to provide mortgage loans deemed to be in the public interest. The bonds are secured by the property financed and are payable solely from payments received on the underlying mortgage loans. Upon payment of the bonds, ownership of the acquired facilities transfers to the private-sector entity served by the bond issuance. Neither the County, the State, nor any political subdivision thereof, is obligated in any manner for repayment of the bonds. Accordingly, the bonds are not reported as liabilities in the accompanying financial statements.
As of December 31, 2015, there were five series of Industrial Development Revenue Bonds and four Mortgage Revenue Bonds outstanding. The aggregate principal amount payable for the two series issued after July 1, 1995 was $2.9 million. The aggregate principal amount payable for the seven series issued prior to July 1, 1995, could not be determined; however, their original issue amounts totaled $81.7 million.
Beginning Ending Due WithinBalance Additions Deductions Balance One Year
Governmental ActivitiesCertificates of participation
F & E Series 2009 61,420,000$ -$ (3,250,000)$ 58,170,000$ 3,325,000$ F & E Series 2013 22,105,000 - (1,990,000) 20,115,000 2,045,000
Bonds payableOpen Space 2009 37,530,000 - (6,875,000) 30,655,000 7,220,000 Open Space 2010 14,105,000 - (1,860,000) 12,245,000 1,895,000 Open Space 2013 18,955,000 - (1,670,000) 17,285,000 1,715,000 SouthEast LID 2012 9,490,000 - (1,175,000) 8,315,000 1,205,000
Unamortized bond premium 2,108,328 - (434,212) 1,674,116 434,211 Landfill liability 1,260,000 93,636 (75,000) 1,278,636 78,700 Compensated absences 19,174,088 1,066,177 (1,757,880) 18,482,385 1,757,880
Total Governmental Activities 186,147,416$ 1,159,813$ (19,087,092)$ 168,220,137$ 19,675,791$
Business-Type ActivitiesLoans payable 915,090$ -$ (218,731)$ 696,359$ 225,293$ Compensated absences 102,913 10,213 (33,735) 79,391 33,735
Total Business-Type Activities 1,018,003$ 10,213$ (252,466)$ 775,750$ 259,028$
Beginning Ending Due WithinBalance Additions Deductions Balance One Year
Public LibraryCompensated absences 1,013,591$ 44,754$ (101,888)$ 956,457$ 101,888$
Public HealthCompensated absences 713,579 23,928 (102,623) 634,884 102,623
Total Component Units 1,727,170$ 68,682$ (204,511)$ 1,591,341$ 204,511$

Page 78
Note 17. Fund Balance
Nonspendable fund balance represents the amount of assets held in a form that will not be converted to cash such as inventories, prepaid expenses, or long-term receivables.
Restricted fund balance represents the amount that is externally restricted to purpose. These restrictions may have been imposed by debt covenants, grantors, the courts, Federal or state statutes, or the state constitution.
Committed fund balance is the amount for which the Board of County Commissioners has taken formal action to reserve the funds to be used only for a specific purpose. It cannot be expended for any other purpose without another formal action of the Board to lift the commitment. That formal action would come in the form of a board resolution, which could establish, modify or rescind a commitment to the fund balance.
Assigned fund balance includes funds and amounts that are covered by Jefferson County’s Fund Reserve Policy, and appropriations from fund balance required in the subsequent year because estimated revenues are less than appropriations. Amounts re-appropriated for General Fund projects and capital outlay are also included in the Assigned fund balance. Assigned fund balance can also include the residual amount of other governmental funds if not restricted. Assigned funds are assigned by the County Manager and the Budget Division for these specific purposes.
Unassigned is the residual amount of the fund balance in the General Fund that has not been classified as belonging in any of the previous categories.
If both restricted and unrestricted amounts of fund balance are available for use when an expenditure is incurred, it is County policy to use restricted amounts first. Unrestricted fund balance will be used in the following order; committed, assigned and unassigned.

Page 79
Nonspendable, restricted, committed, and assigned fund balances of the Governmental Funds consist of the following:
The County designates 10 percent of the appropriation as a reserve to cover working capital and unexpected events. Reserves are appropriated in the General Fund and the Contingent Fund. Where a portion of the fund balance is already reserved for emergencies under TABOR then that reservation is counted toward the 10 percent designation.
Primary Government Road and Social Capital OtherGeneral Bridge Services Expenditures Governmental
Fund balances:Nonspendable:
Inventory 330,469$ -$ -$ -$ -$ Prepaid items 752,980 - - - - Long-term receivables 1,608,882 - - - -
Restricted for:Federal grants 1,269,969 - 5,095,579 - 44,536 Debt service - - - 14,462,137 13,377,217 TABOR 5,720,731 - - - 2,774,502 Open space - - - - 26,216,649 Highways - 11,332,785 - - 15,015,107 Law enforcement - - - - 1,713,498 Conservation trust funds - - - - 2,414,023 Developmental disabilities - - - - 378,892 Wildland fire training - - - - 138,896
Sanitation - - - - 814,833 Assigned to:
Budget policy reservation 25,940,524 - - - - Unassigned 40,949,110 - - - -
Total fund balances 76,572,665$ 11,332,785$ 5,095,579$ 14,462,137$ 62,888,153$
Component Units Public PublicLibrary Health
Fund balances:Nonspendable:
Inventory 82,529$ -$ Prepaid expenses 357,499 174,948
Restricted for:Federal grants - 1,557,603
Assigned to:Library operations 12,668,474 -
Total fund balances 13,108,502$ 1,732,551$
Major Special Revenue Funds
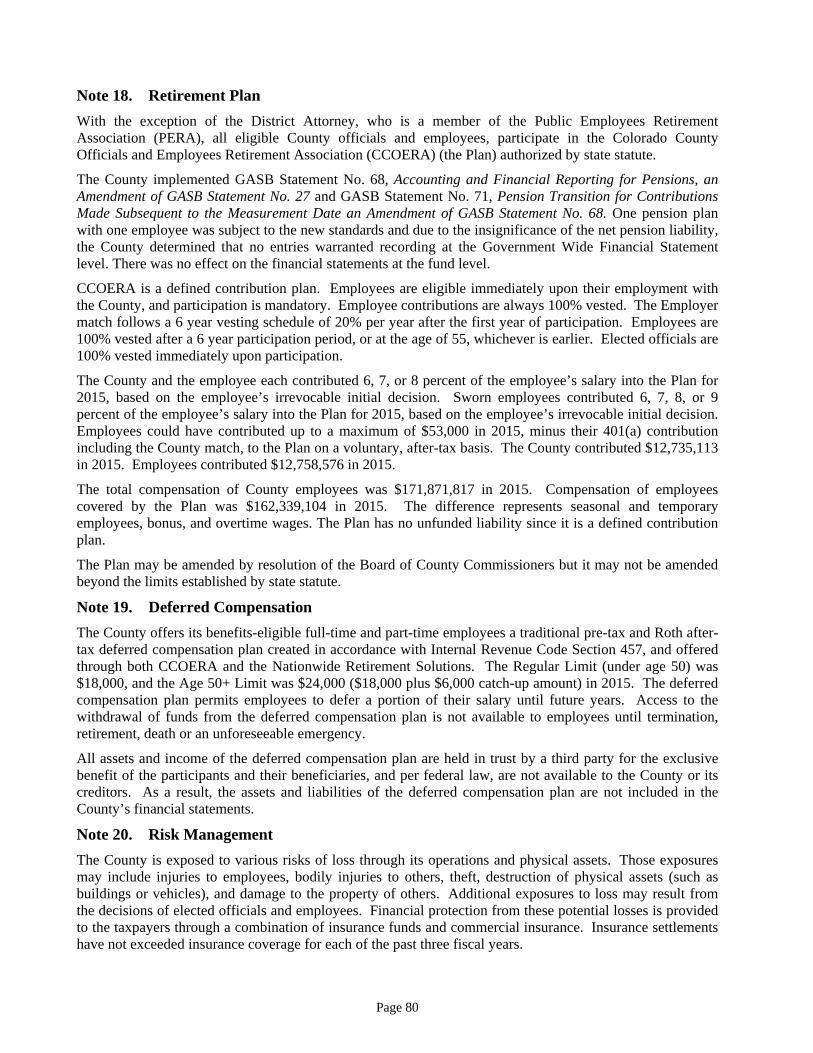
Page 80
Note 18. Retirement Plan
With the exception of the District Attorney, who is a member of the Public Employees Retirement Association (PERA), all eligible County officials and employees, participate in the Colorado County Officials and Employees Retirement Association (CCOERA) (the Plan) authorized by state statute.
The County implemented GASB Statement No. 68, Accounting and Financial Reporting for Pensions, an Amendment of GASB Statement No. 27 and GASB Statement No. 71, Pension Transition for Contributions Made Subsequent to the Measurement Date an Amendment of GASB Statement No. 68. One pension plan with one employee was subject to the new standards and due to the insignificance of the net pension liability, the County determined that no entries warranted recording at the Government Wide Financial Statement level. There was no effect on the financial statements at the fund level.
CCOERA is a defined contribution plan. Employees are eligible immediately upon their employment with the County, and participation is mandatory. Employee contributions are always 100% vested. The Employer match follows a 6 year vesting schedule of 20% per year after the first year of participation. Employees are 100% vested after a 6 year participation period, or at the age of 55, whichever is earlier. Elected officials are 100% vested immediately upon participation.
The County and the employee each contributed 6, 7, or 8 percent of the employee’s salary into the Plan for 2015, based on the employee’s irrevocable initial decision. Sworn employees contributed 6, 7, 8, or 9 percent of the employee’s salary into the Plan for 2015, based on the employee’s irrevocable initial decision. Employees could have contributed up to a maximum of $53,000 in 2015, minus their 401(a) contribution including the County match, to the Plan on a voluntary, after-tax basis. The County contributed $12,735,113 in 2015. Employees contributed $12,758,576 in 2015.
The total compensation of County employees was $171,871,817 in 2015. Compensation of employees covered by the Plan was $162,339,104 in 2015. The difference represents seasonal and temporary employees, bonus, and overtime wages. The Plan has no unfunded liability since it is a defined contribution plan.
The Plan may be amended by resolution of the Board of County Commissioners but it may not be amended beyond the limits established by state statute.
Note 19. Deferred Compensation
The County offers its benefits-eligible full-time and part-time employees a traditional pre-tax and Roth after-tax deferred compensation plan created in accordance with Internal Revenue Code Section 457, and offered through both CCOERA and the Nationwide Retirement Solutions. The Regular Limit (under age 50) was $18,000, and the Age 50+ Limit was $24,000 ($18,000 plus $6,000 catch-up amount) in 2015. The deferred compensation plan permits employees to defer a portion of their salary until future years. Access to the withdrawal of funds from the deferred compensation plan is not available to employees until termination, retirement, death or an unforeseeable emergency.
All assets and income of the deferred compensation plan are held in trust by a third party for the exclusive benefit of the participants and their beneficiaries, and per federal law, are not available to the County or its creditors. As a result, the assets and liabilities of the deferred compensation plan are not included in the County’s financial statements.
Note 20. Risk Management
The County is exposed to various risks of loss through its operations and physical assets. Those exposures may include injuries to employees, bodily injuries to others, theft, destruction of physical assets (such as buildings or vehicles), and damage to the property of others. Additional exposures to loss may result from the decisions of elected officials and employees. Financial protection from these potential losses is provided to the taxpayers through a combination of insurance funds and commercial insurance. Insurance settlements have not exceeded insurance coverage for each of the past three fiscal years.

Page 81
The County uses internal service funds to help finance these risks. The Workers' Compensation Self-Insurance Fund was established to account for specific expenditures arising from work-related injuries. The Insurance Fund was established for claims within the insurance coverage deductibles for County property, automobile physical damage, surety and crime. In addition, it applies to the County’s retained risk for various types of liability claims. The Employee Benefits Fund was established in 2001 to account for the new self-insured employee benefits plans including a self-funded health plan, dental plan, flexible spending accounts for medical and dependent care, life insurance, accidental death and long-term disability. The Public Library and the Public Health funds participate in the same manner as other county departments.
Property and Casualty Insurance
The County insures itself against property and casualty losses through a number of insurance policies. A description of the County’s risk financing/insurance program is as follows:
Liability
Coverage furnished under the Public Liability Policy includes general liability, automobile liability, law enforcement liability, and public officials liability which includes liability arising from the acts of public officials, and activities of the District Attorney’s Office. The County retains the first $250,000 of every liability claim, except for employment practices claims where it retains $500,000 of every claim. It insures above that amount up to $6,000,000 per occurrence/annual aggregate. In addition to the Public Liability Policy, the County purchases Airport Liability Insurance, with no deductible and a limit of $5,000,000 per occurrence/annual aggregate and Pollution Liability Insurance with a $50,000 retention and limit of $5,000,000 per loss/annual aggregate for environmental liability exposures arising out of airport operations.
Theft and Fraud $50,000 deductible
Insurance is provided for crime losses with a $50,000 deductible (per occurrence) for dishonesty, theft, forgery/alteration, computer fraud and wire transfer fraud. Crime coverage includes employee dishonesty ($5,000,000 limit), forgery or alteration ($5,000,000 limit), theft and destruction of currency and securities ($300,000 limit), robbery ($300,000 limit) with a $5,000 deductible, computer fraud ($5,000,000 limit), and wire transfers fraud ($5,000,000 limit).
Workers’ Compensation
Excess Workers’ Compensation coverage is provided with statutory limits excess of the County’s self-insured retention of $550,000 per occurrence for all employees. In addition to statutory Workers’ Compensation, the policy provides Employers liability coverage with limits of $1,000,000 per claim/policy aggregate in the event an employee brings suit against the County for a work related injury. The Workers’ Compensation self-insurance program has been in place since 1989.
Property Loss
The County maintains coverage under a commercial property policy with a blanket limit. Buildings and contents, electronic data processing, telephone equipment, towers, antennas, and equipment breakdown are insured for a blanket policy limit of $250,000,000. Vehicle coverage is included under special terms and conditions with a deductible of $100,000 per loss. Deductibles for property insurance vary from $50,000 for standard losses to $1,500,000 for losses due to flood for properties in flood zone “A”. Earthquake coverage has a sublimit of $100,000,000, flood coverage has a sublimit of $50,000,000, and both have a $100,000 deductible. Flood coverage is limited to $2,500,000 for locations in flood zone “A”. Additional flood coverage is provided for properties in flood zone “A” under the FEMA flood insurance program. Business interruption coverage also applies for both real and personal property losses, and boiler and machinery losses up to $5,177,944 with some exceptions. Various additional sublimits apply to selected exposures.
Medical and Dental Benefits
The County had two self-funded PPO plans that have been administered by UnitedHealthcare (UHC) since January 1, 2004. In addition, the County offers two medical DHMO plans through Kaiser

Page 82
Permanente which are fully-insured. The County had two dental plans administered by Delta Dental Plan of Colorado and the dental coverage became self-funded on January 1, 2005. The County offers a self-funded vision plan administered through Vision Service Plan (VSP) since January 1, 2006. These plans are available to all benefit eligible employees and their families through UnitedHealthcare, Kaiser Permanente, Delta Dental of Colorado and Vision Service Plan. Insurance coverage for new employees is effective the first day of the month following their first day of employment.
The annual individual exposure limit on the self-funded medical plans is $250,000.
Life and Disability Benefits
The County pays for basic life, accidental death and dismemberment, short-term and long-term disability coverage for benefit eligible employees as part of the County’s benefit package.
Claims and Judgments
The amounts paid on Colorado lawsuits and claims are significantly restricted by the Colorado Governmental Immunity Act (Act), limiting recovery for most claims to $350,000 per person and $990,000 per occurrence as of July 1, 2013, and barring many other claims in their entirety. There is also a 180-day reporting requirement under the Act. The County maintains a surety bond in compliance with the regulations of the Colorado Division of Insurance of approximately $5.0 million in the unlikely case that the County would have inadequate reserves to pay all valid claims of the fund.
Factors which favorably control costs relating to Workers’ Compensation claims are state reporting requirements of four working days and proper handling of claims which are regulated by the Division of Workers’ Compensation. The amounts of settlements did not exceed insurance coverage for each of the past three years.
These amounts have been estimated based on historical trends and actuarial analysis. Changes in the reported liability in the prior three years resulted from the following:
Note 21. Contingencies
Many County departments have grant and contract agreements with the federal and/or state governments, and other parties. These agreements generally provide for audits of the transactions pertaining to the agreements, with the County being liable to those parties for any disallowed expenditure. The County does not believe that there will be any actual assessments in material amounts regarding any of these matters.
Current YearClaims and
Beginning Changes in Claim EndingYear Liability Estimates Payments Liability
Workers' Compensation2015 1,900,000$ 640,033$ (1,340,347)$ 1,199,686$ 2014 1,741,342 1,369,586 (1,210,928) 1,900,000 2013 1,741,342 965,701 (965,701) 1,741,342
Self-Insurance2015 500,000$ 339,878$ (553,014)$ 286,864$ 2014 890,000 (153,180) (236,820) 500,000 2013 890,000 192,267 (192,267) 890,000
Employee Benefits2015 1,066,240$ 16,563,793$ (16,679,513)$ 950,520$ 2014 1,066,240 15,821,341 (15,821,341) 1,066,240 2013 1,066,240 14,521,893 (14,521,893) 1,066,240

Page 83
The County is named as a defendant by inmates of the County Detention Center who claim that the County was negligent in providing adequate or timely medical care. In addition, the County is the defendant in several lawsuits involving claims of inadequate, negligent, or unconstitutional treatment of prisoners. The County’s Sheriff’s Department has also been named in several suits involving actions taken by officers in the performance of their duties including excessive force. It is the County’s belief that the claims are without merit and it intends to vigorously defend against all of these claims. In 2015 an in-custody death occurred at the County Detention Center. There is a significant risk of liability in this case against the County and/or the jail medical provider.
The Department of Human Services has several suits pending in which the plaintiffs allege that the department was negligent in providing proper placement or care of individuals under the custody of the department. The County does not believe that there will be any actual awards or judgments in material amounts regarding any of these suits.
From time to time various individuals or business will sue the County regarding zoning, assessment, or other matters related to property. The County is also involved in several lawsuits claiming that the roadway design and /or maintenance including failure to remove snow and ice, contributed to an automobile or pedestrian accident. The County does not believe that there will be any actual assessments in material amounts regarding any of these matters.
The County is a defendant in several administrative or legal actions involving the rights of employees. Several suits regarding wrongful dismissal or discrimination have been or will be filed. The County does not believe that there will be any actual awards or judgments in material amounts regarding any of these matters.
At one time the County owned and operated a couple of landfills. The County did not estimate or accrue post-closure costs for these landfills. The Rooney Road Landfill was closed in 1980 and is no longer in operation. Methane gas was discovered on the site. Per state statute, the County is required to monitor the gas on the landfill. The County contracts with an outside party to monitor the landfill. Currently, the annual contract cost is $78,700. Engineers have determined that monitoring will be required for an additional 25 years. The County has recorded a liability based on the estimate for the required monitoring and the current annual contract.
Jefferson County operated the Pine Gulch Landfill from 1969-1978. There is no record that the landfill was issued a Certificate of Designation or that the closure report was prepared when the landfill was closed. The County is now required to mediate this landfill and monitor the site going forward for a minimum of 30 years. Jefferson County will complete remediation of the landfill site and begin post-closure care and monitoring in 2016. The costs cannot be estimated as of December 31, 2015 and the liability will be recorded when an agreement is in place and costs to complete the work can be measured.
In addition, the County has recorded a receivable from Green Tree Metropolitan District related to an intergovernmental agreement. This agreement authorized the County to advance the District a total of $6 million for the construction of a highway interchange at the intersection of Highway C-470 and Alameda Avenue. During 2011, the payment terms of this agreement were amended such that the repayment of this advance now begins ten years later in 2021 and is contingent upon the District’s ability to issue bonds for the purpose of repayment.
Note 22. Subsequent Events
The combined County and Library mill levy increased from 25.978 to 26.978 between years 2015 and 2016 due to the Library increase of 1.000 mill through the November 2015 election.

Page 84
Sheriff’s Office transportation through the years. .

Page 85
REQUIRED SUPPLEMENTARY INFORMATION

Page 86
GENERAL FUND
The General Fund accounts for all transactions not accounted for in other funds. As the County’s major operating fund, the General Fund accounts for ordinary operating expenditures financed primarily by property taxes and charges for services.
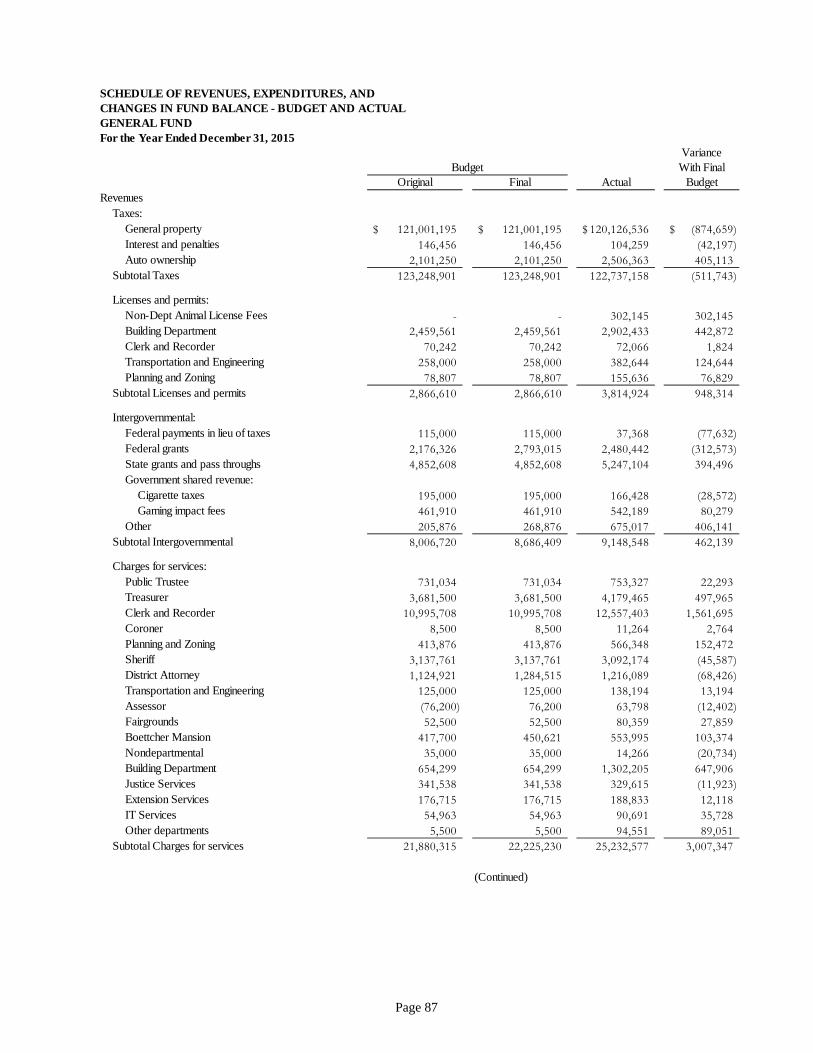
Page 87
SCHEDULE OF REVENUES, EXPENDITURES, ANDCHANGES IN FUND BALANCE - BUDGET AND ACTUALGENERAL FUNDFor the Year Ended December 31, 2015
VarianceWith Final
Original Final Actual BudgetRevenues
Taxes: General property 121,001,195$ 121,001,195$ 120,126,536$ (874,659)$ Interest and penalties 146,456 146,456 104,259 (42,197) Auto ownership 2,101,250 2,101,250 2,506,363 405,113
Subtotal Taxes 123,248,901 123,248,901 122,737,158 (511,743)
Licenses and permits:Non-Dept Animal License Fees - - 302,145 302,145 Building Department 2,459,561 2,459,561 2,902,433 442,872 Clerk and Recorder 70,242 70,242 72,066 1,824 Transportation and Engineering 258,000 258,000 382,644 124,644 Planning and Zoning 78,807 78,807 155,636 76,829
Subtotal Licenses and permits 2,866,610 2,866,610 3,814,924 948,314
Intergovernmental:Federal payments in lieu of taxes 115,000 115,000 37,368 (77,632) Federal grants 2,176,326 2,793,015 2,480,442 (312,573) State grants and pass throughs 4,852,608 4,852,608 5,247,104 394,496 Government shared revenue:
Cigarette taxes 195,000 195,000 166,428 (28,572) Gaming impact fees 461,910 461,910 542,189 80,279
Other 205,876 268,876 675,017 406,141 Subtotal Intergovernmental 8,006,720 8,686,409 9,148,548 462,139
Charges for services:Public Trustee 731,034 731,034 753,327 22,293 Treasurer 3,681,500 3,681,500 4,179,465 497,965 Clerk and Recorder 10,995,708 10,995,708 12,557,403 1,561,695 Coroner 8,500 8,500 11,264 2,764 Planning and Zoning 413,876 413,876 566,348 152,472 Sheriff 3,137,761 3,137,761 3,092,174 (45,587) District Attorney 1,124,921 1,284,515 1,216,089 (68,426) Transportation and Engineering 125,000 125,000 138,194 13,194 Assessor (76,200) 76,200 63,798 (12,402) Fairgrounds 52,500 52,500 80,359 27,859 Boettcher Mansion 417,700 450,621 553,995 103,374 Nondepartmental 35,000 35,000 14,266 (20,734) Building Department 654,299 654,299 1,302,205 647,906 Justice Services 341,538 341,538 329,615 (11,923) Extension Services 176,715 176,715 188,833 12,118 IT Services 54,963 54,963 90,691 35,728 Other departments 5,500 5,500 94,551 89,051
Subtotal Charges for services 21,880,315 22,225,230 25,232,577 3,007,347
(Continued)
Budget

Page 88
SCHEDULE OF REVENUES, EXPENDITURES, ANDCHANGES IN FUND BALANCE - BUDGET AND ACTUALGENERAL FUNDFor the Year Ended December 31, 2015(Continued) Variance
With FinalOriginal Final Actual Budget
Fines and forfeitures:Animal control 15,000 15,000 18,703 3,703 Nondepartmental administrative services 90,000 90,000 58,880 (31,120) Other departments 17,500 17,500 135,900 118,400
Subtotal Fines and forfeitures 122,500 122,500 213,483 90,983
Miscellaneous:Investment income 865,439 865,439 1,110,361 244,922 Rents 821,500 838,166 797,085 (41,081) Interdepartmental 18,190,357 18,729,486 16,469,830 (2,259,656) Other 2,191,244 2,191,244 400,219 (1,791,025) Proceeds from sale capital assets 125,000 125,000 601,127 476,127
Subtotal Miscellaneous 22,193,540 22,749,335 19,378,622 (3,370,713)
Total Revenues 178,318,586 179,898,985 180,525,312 626,327
ExpendituresGeneral Government:
County Commissioners:Current:
Personnel services 448,686 606,979 606,979 - Supplies 4,400 17,504 11,779 5,725 Other services and charges 39,000 44,000 49,725 (5,725)
Subtotal County Commissioners 492,086 668,483 668,483 -
County Manager:Current:
Personnel services 587,763 516,829 581,914 (65,085) Supplies 9,230 9,230 8,169 1,061 Other services and charges 225,150 174,687 169,786 4,901
Subtotal County Manager 822,143 700,746 759,869 (59,123)
Public Information OfficeCurrent:
Personnel services 627,371 635,762 565,564 70,198 Supplies 19,500 19,500 14,781 4,719 Other services and charges 90,797 90,797 71,573 19,224
Subtotal Public Information Office 737,668 746,059 651,918 94,141
County Attorney:Current:
Personnel services 3,387,431 3,649,432 3,679,955 (30,523) Supplies 110,000 110,000 116,330 (6,330) Other services and charges 236,665 236,665 168,391 68,274
Subtotal County Attorney 3,734,096 3,996,097 3,964,676 31,421
Budget

Page 89
VarianceWith Final
Original Final Actual BudgetPublic Trustee:
Current:Personnel services 504,297 504,297 456,274 48,023 Supplies 43,543 43,543 19,093 24,450 Other services and charges 62,071 62,071 26,379 35,692
Subtotal Public Trustee 609,911 609,911 501,746 108,165
Accounting, Payroll and Purchasing: Current:
Personnel services 2,111,600 2,120,997 2,071,348 49,649 Supplies 33,865 33,865 33,586 279 Other services and charges 461,670 461,670 337,479 124,191
Subtotal Accounting, Payroll and Purchasing 2,607,135 2,616,532 2,442,413 174,119
Surveyor:Current:
Personnel services 6,754 6,754 2,793 3,961 Subtotal Surveyor 6,754 6,754 2,793 3,961
Information Technology Services:Current:
Personnel services 7,801,186 7,818,938 6,714,958 1,103,980 Supplies 592,826 592,826 464,053 128,773 Other services and charges 3,362,700 4,016,518 3,280,825 735,693
Capital outlay 737,115 635,316 1,013,446 (378,130) Subtotal Information Technology Services 12,493,827 13,063,598 11,473,282 1,590,316
Planning and Zoning:Current:
Personnel services 3,251,088 3,349,088 3,185,230 163,858 Supplies 52,135 52,135 49,362 2,773 Other services and charges 232,580 232,580 201,393 31,187
Subtotal Planning and Zoning 3,535,803 3,633,803 3,435,985 197,818
Development and Transportation:Current:
Personnel services 214,317 214,317 218,776 (4,459) Supplies 1,250 1,250 (328) 1,578 Other services and charges 3,050 3,050 2,513 537
Subtotal Development and Transportation 218,617 218,617 220,961 (2,344)
(Continued)
Budget

Page 90
SCHEDULE OF REVENUES, EXPENDITURES, ANDCHANGES IN FUND BALANCE - BUDGET AND ACTUALGENERAL FUNDFor the Year Ended December 31, 2015(Continued) Variance
With FinalOriginal Final Actual Budget
General Government (Continued) Human Resources:
Current:Personnel services 1,326,571 1,348,177 1,209,472 138,705 Supplies 55,600 55,600 44,397 11,203 Other services and charges 148,570 148,570 167,947 (19,377)
Subtotal Human Resources 1,530,741 1,552,347 1,421,816 130,531
Finance and IT:Current:
Personnel services 214,318 214,318 218,559 (4,241) Supplies 1,800 1,800 1,411 389 Other services and charges 9,800 9,800 872 8,928
Subtotal Finance and IT 225,918 225,918 220,842 5,076 Budget and Management Analysis:
Current:Personnel services 608,123 619,499 544,374 75,125 Supplies 3,100 3,100 4,656 (1,556) Other services and charges 30,500 30,500 27,321 3,179
Subtotal Budget and Management Analysis 641,723 653,099 576,351 76,748 County Clerk and Recorder:
Current:Personnel services 7,031,916 7,120,247 6,558,214 562,033 Supplies 650,850 650,850 618,958 31,892 Other services and charges 1,319,495 1,345,935 1,484,582 (138,647)
Subtotal County Clerk and Recorder 9,002,261 9,117,032 8,661,754 455,278
Treasurer:Current:
Personnel services 1,007,352 1,007,352 942,168 65,184 Supplies 120,100 120,100 127,115 (7,015) Other services and charges 283,975 283,975 198,074 85,901
Capital outlay - 2,341,426 630,616 1,710,810 Subtotal Treasurer 1,411,427 3,752,853 1,897,973 1,854,880
County Assessor:Current:
Personnel services 3,843,562 3,843,562 3,814,773 28,789 Supplies 123,258 123,258 133,656 (10,398) Other services and charges 174,349 174,349 159,829 14,520
Subtotal County Assessor 4,141,169 4,141,169 4,108,258 32,911
Budget

Page 91
VarianceWith Final
Original Final Actual BudgetFacilities and Construction Management Services:
Current:Personnel services 4,243,361 4,353,361 4,248,139 105,222 Supplies 2,393,900 2,393,900 2,200,249 193,651 Other services and charges 2,208,250 4,041,312 3,785,114 256,198
Capital outlay 2,847,581 1,035,768 44,775 990,993 Subtotal Facilities Projects 11,693,092 11,824,341 10,278,277 1,546,064 Extension Services:
Current:Personnel services 343,138 312,138 305,817 6,321 Supplies 41,400 57,213 64,467 (7,254) Other services and charges 348,767 395,625 394,692 933
Subtotal Extension Services 733,305 764,976 764,976 -
Nondepartmental Administrative Services:Current:
Personnel services 1,518,519 (6,684) - (6,684) Supplies 49,000 49,000 38,436 10,564 Other services and charges 664,700 219,895 260,904 (41,009)
Subtotal Nondepartmental Administrative Services 2,232,219 262,211 299,340 (37,129)
Total General Government 56,869,895 58,554,546 52,351,713 6,202,833
Public Safety:Sheriff:
Current:Personnel services 45,207,216 46,333,978 47,400,485 (1,066,507) Supplies 3,167,406 4,015,161 3,981,186 33,975 Other services and charges 9,228,214 10,281,845 10,170,112 111,733
Capital outlay 3,644,975 2,414,342 1,867,622 546,720 Subtotal Sheriff 61,247,811 63,045,326 63,419,405 (374,079)
County Coroner:Current:
Personnel services 1,012,756 1,128,955 1,080,758 48,197 Supplies 41,081 41,081 38,476 2,605 Other services and charges 528,561 528,561 588,823 (60,262)
Subtotal County Coroner 1,582,398 1,698,597 1,708,057 (9,460)
Building Department:Current:
Personnel services 2,535,630 2,535,630 2,492,641 42,989 Supplies 63,200 63,200 65,016 (1,816) Other services and charges 85,100 85,100 105,600 (20,500)
Capital outlay 24,108 24,108 - 24,108 Subtotal Building Department 2,708,038 2,708,038 2,663,257 44,781
(Continued)
Budget

Page 92
SCHEDULE OF REVENUES, EXPENDITURES, ANDCHANGES IN FUND BALANCE - BUDGET AND ACTUALGENERAL FUNDFor the Year Ended December 31, 2015(Continued) Variance
With FinalOriginal Final Actual Budget
Public Safety (Continued)District Attorney:
Current:Personnel services 17,169,916 17,388,662 17,116,128 272,534 Supplies 294,552 434,552 336,312 98,240 Other services and charges 950,963 1,338,307 1,077,857 260,450
Capital outlay 418,750 179,000 69,820 109,180 Subtotal District Attorney 18,834,181 19,340,521 18,600,117 740,404 Justice Service:
Current:Personnel services 2,889,432 3,175,515 2,687,675 487,840 Supplies 91,368 75,821 60,226 15,595 Other services and charges 5,296,376 5,311,923 4,878,326 433,597
Subtotal Justice Service 8,277,176 8,563,259 7,626,227 937,032
Total Public Safety 92,649,604 95,355,741 94,017,063 1,338,678
Highways and Streets:Transportation and Engineering
Current:Personnel services 3,042,914 3,060,915 2,977,986 82,929 Supplies 379,425 379,425 339,317 40,108 Other services and charges 223,197 223,197 341,690 (118,493)
Capital outlay 625,000 625,000 630,529 (5,529) Total Highways and Streets 4,270,536 4,288,537 4,289,522 (985)
Culture and Recreation:Fairgrounds:
Current:Personnel services 641,876 671,876 636,750 35,126 Supplies 31,410 59,566 59,565 1 Other services and charges 70,004 102,037 137,164 (35,127)
Capital outlay - 5,894 5,894 - Subtotal Fairgrounds 743,290 839,373 839,373 -
Boettcher MansionCurrent:
Personnel services 327,965 349,097 354,711 (5,614) Supplies 41,000 39,000 36,269 2,731 Other services and charges 77,060 71,060 73,202 (2,142)
Capital outlay - 12,033 12,033 - Subtotal Boettcher Mansion 446,025 471,190 476,215 (5,025)
Total Culture and Recreation 1,189,315 1,310,563 1,315,588 (5,025)
InterdepartmentalTransfers out:
Patrol fund 15,613,348 15,613,348 15,867,668 (254,320) Open Space fund 86,000 86,000 86,000 - Other funds 11,200,479 12,888,878 5,469,708 7,419,170
Total Interdepartmental 26,899,827 28,588,226 21,423,376 7,164,850
Budget

Page 93
VarianceWith Final
Original Final Actual Budget
Nondepartmental - funding for Health Department 6,773,173 6,773,173 4,769,983 2,003,190
Intergovernmental Expenditures:Other services and charges:
Colorado Counties, Inc. 74,566 74,566 70,000 4,566 Denver Regional Council of Governments 133,200 133,200 133,200 - Jefferson County Business Resource Center 60,000 60,000 60,000 - Other 38,791 38,791 42,760 (3,969)
Subtotal Other services and charges 306,557 306,557 305,960 597
Intergovernmental Expenditures:Grants to other entities (Direct)
Jefferson Economic Development Corp 300,000 300,000 300,000 - Chatfield Watershed Authority 24,875 24,875 24,875 - Crime Victim Compensation - 675,000 675,000 - Bear Creek Water Shed 20,203 20,203 20,203 - Foothills Animal Center 200,000 200,000 302,145 (102,145) Colorado State Forest Service 121,958 120,458 122,668 (2,210) Jefferson Parkway Public Highway Authority 250,000 250,000 200,000 50,000 Jeffco Juvenile Assessment Center 139,778 139,778 133,814 5,964 Other grants 4,760 55,260 69,992 (14,732)
Subtotal Grants to other entities (Direct) 1,061,574 1,785,574 1,848,697 (63,123)
Grant expenditures for other entities (Pass through)Other grants - 120,000 120,000 -
Subtotal Grant expenditures for other entities(Pass through) - 120,000 120,000 -
Total Intergovernmental Expenditures 1,368,131 2,212,131 2,274,657 (62,526)
Total Expenditures 190,020,481 197,082,917 180,441,902 16,641,015
Budgetary Surplus (Loss) (11,701,895)$ (17,183,932)$ 83,410 17,267,342$
Fund Balance - GAAP Basis, January 1 76,489,255 Fund Balance - GAAP Basis, December 31 76,572,665$
Budget

Page 94
The Sheriff’s Office, in coordination with the Lakewood Police Department, offers a Peace Officer’s Standard Training Academy. The 22 week Jefferson County Sheriff’s Office and Lakewood Police Department Combined Regional Academy is made up of 880 curriculum hours to include 15 written tests. In addition to its success, the academy provides an exclusive electronic curriculum, the first of its kind in the metro area. 2015 was a busy year for the Academy with the addition of a third academy class. The 107 graduated recruits came from ten agencies. Approximately 125 instructors and 75 role players were instrumental in the Academy’s success. During the last three and one-half years the Academy has graduated 323 recruits with a 100 percent pass rate on the state exam.

Page 95
Special Revenue Major Funds
The Special Revenue Major Funds are used to account for all the proceeds of specific revenue sources that are restricted to expenditures for specified purposes. The County’s Special Revenue Major Funds include the following:
Road and Bridge This fund accounts for monies generated by property taxes
and other sources and expended for highway and street maintenance and repair.
Social Services This fund accounts for monies received from property taxes and state and federal grants expended for social welfare programs.

Page 96
SCHEDULE OF REVENUES, EXPENDITURES, ANDCHANGES IN FUND BALANCE - BUDGET AND ACTUALROAD AND BRIDGE SPECIAL REVENUE FUNDFor the Year Ended December 31, 2015
VarianceWith Final
Original Final Actual BudgetRevenues
Taxes:General property 9,666,988$ 9,666,988$ 9,648,012$ (18,976)$ Auto ownership 10,657,315 10,657,315 12,712,005 2,054,690 Highway user 13,000,000 13,000,000 14,076,344 1,076,344 Interest and penalties 13,130 13,130 8,341 (4,789)
Subtotal Taxes 33,337,433 33,337,433 36,444,702 3,107,269
Licenses and permits 850,000 850,000 762,518 (87,482) Intergovernmental - 200,000 547,252 347,252 Charges for services 10,000 10,000 84,840 74,840 Investment income 178,451 178,451 110,980 (67,471) Donations and contributions - - 303,090 303,090 Interdepartmental 610,000 610,000 1,550,672 940,672 Other - - 3,985 3,985
Total Revenues 34,985,884 35,185,884 39,808,039 4,622,155
ExpendituresPersonnel services 11,285,592 9,820,116 10,495,293 (675,177) Supplies 4,611,650 2,720,136 2,729,833 (9,697) Other services and charges 2,450,000 5,422,969 1,632,036 3,790,933 Capital outlay 5,475,303 12,077,045 11,388,218 688,827 Intergovernmental 2,883,177 4,558,177 3,436,196 1,121,981 Interdepartmental 10,542,377 9,749,356 8,871,824 877,532
Total Expenditures 37,248,099 44,347,799 38,553,400 5,794,399
Budgetary Surplus (Loss) (2,262,215)$ (9,161,915)$ 1,254,639 10,416,554$
Fund Balance - GAAP Basis, January 1 10,078,146
Fund Balance - GAAP Basis, December 31 11,332,785$
Budget
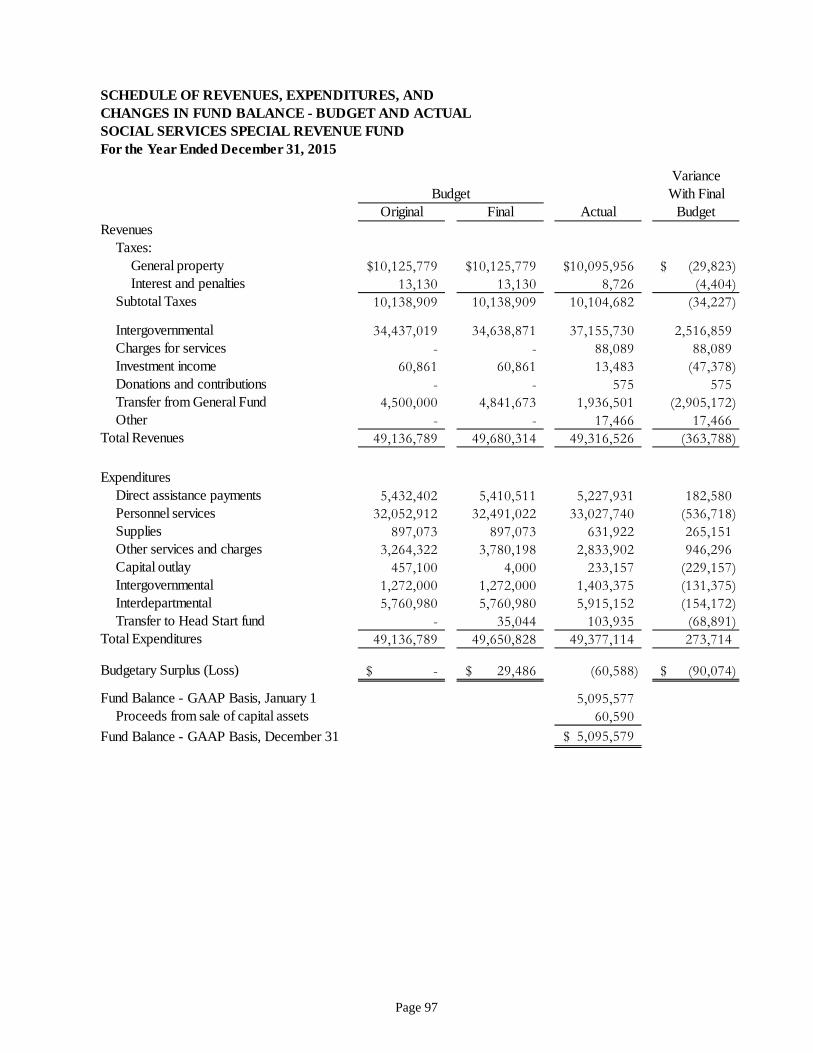
Page 97
SCHEDULE OF REVENUES, EXPENDITURES, ANDCHANGES IN FUND BALANCE - BUDGET AND ACTUALSOCIAL SERVICES SPECIAL REVENUE FUNDFor the Year Ended December 31, 2015
VarianceWith Final
Original Final Actual BudgetRevenues
Taxes:General property 10,125,779$ 10,125,779$ 10,095,956$ (29,823)$ Interest and penalties 13,130 13,130 8,726 (4,404)
Subtotal Taxes 10,138,909 10,138,909 10,104,682 (34,227)
Intergovernmental 34,437,019 34,638,871 37,155,730 2,516,859 Charges for services - - 88,089 88,089 Investment income 60,861 60,861 13,483 (47,378) Donations and contributions - - 575 575 Transfer from General Fund 4,500,000 4,841,673 1,936,501 (2,905,172) Other - - 17,466 17,466
Total Revenues 49,136,789 49,680,314 49,316,526 (363,788)
ExpendituresDirect assistance payments 5,432,402 5,410,511 5,227,931 182,580 Personnel services 32,052,912 32,491,022 33,027,740 (536,718) Supplies 897,073 897,073 631,922 265,151 Other services and charges 3,264,322 3,780,198 2,833,902 946,296 Capital outlay 457,100 4,000 233,157 (229,157) Intergovernmental 1,272,000 1,272,000 1,403,375 (131,375) Interdepartmental 5,760,980 5,760,980 5,915,152 (154,172) Transfer to Head Start fund - 35,044 103,935 (68,891)
Total Expenditures 49,136,789 49,650,828 49,377,114 273,714
Budgetary Surplus (Loss) -$ 29,486$ (60,588) (90,074)$
Fund Balance - GAAP Basis, January 1 5,095,577 Proceeds from sale of capital assets 60,590
Fund Balance - GAAP Basis, December 31 5,095,579$
Budget

Page 98
NOTES TO THE REQUIRED SUPPLEMENTARY INFORMATION
Note RSI-1 Budgetary Information
Budgets for major governmental funds are adopted on the modified accrual basis where capital outlays are treated as expenditures and depreciation is not budgeted. Exceptions to the modified accrual basis include certain GAAP requirements such as those related to accounting for capital lease proceeds as well as gains or losses from the sale of general fixed assets. The operating budget includes proposed expenditures and the means of financing them. The County Commissioners must approve transfers between funds, or increases to a fund’s budget. (See Note 4 for additional budgetary information.)
Note RSI-2 Expenditures/Expenses in Excess of Appropriation
Colorado’s budget law requires that expenditures and transfers for a department or fund cannot exceed the appropriations for that department or fund. Appropriations for a department or fund may be increased provided unanticipated resources offset them.
The budget is controlled at the category line level within each division within each fund. However, the legal level of appropriation is at the fund level. Administratively, operating budgets are controlled at the department level. In 2015, there were no departments or funds that had expenditures in excess of their appropriations.

Page 99
SUPPLEMENTARY INFORMATION

Page 100
COMBINING BALANCE SHEETOTHER GOVERNMENTAL FUNDSDecember 31, 2015
Total TotalNonmajor Total Nonmajor Total
Special Revenue Debt Service Capital Projects OtherFunds Funds Funds Governmental
AssetsCash, pooled cash and investments 44,939,484$ 8,040,925$ 4,817,041$ 57,797,450$ Taxes receivable 22,538,888 3,190,874 - 25,729,762 Other receivables 1,585,710 - - 1,585,710 Due from other governments 1,537,163 - 4,500 1,541,663 Other current assets 12,839 - - 12,839 Restricted investments - 2,145,418 8,577 2,153,995
Total Assets 70,614,084$ 13,377,217$ 4,830,118$ 88,821,419$
LiabilitiesAccounts and retainage payable 4,145,320$ -$ 92,081$ 4,237,401$ Accrued salaries 2,059,132 - - 2,059,132 Other accrued liabilities 8 - - 8 Due to other funds 866,028 - - 866,028 Due to other governments 16 - - 16 Funds held in custody for others 51,374 - - 51,374 Unearned amounts 264,473 - - 264,473
Total Liabilities 7,386,351 - 92,081 7,478,432
Deferred Inflows of ResourcesUnavailable property tax revenue 17,154,834 - - 17,154,834 Unavailable revenue 1,300,000 - - 1,300,000
Total Deferred Inflows of Resources 18,454,834 - - 18,454,834
Fund BalancesRestricted 44,772,899 13,377,217 4,738,037 62,888,153
Total Fund Balances 44,772,899 13,377,217 4,738,037 62,888,153
Total Liabilities, Deferred Inflows of
Resources and Fund Balances 70,614,084$ 13,377,217$ 4,830,118$ 88,821,419$

Page 101
COMBINING STATEMENT OF REVENUES, EXPENDITURES, ANDCHANGES IN FUND BALANCESOTHER GOVERNMENTAL FUNDSFor the Year Ended December 31, 2015 Total Total
Nonmajor Total Nonmajor TotalSpecial Revenue Debt Service Capital Projects Other
Funds Funds Funds GovernmentalRevenues
Taxes and special assessments 45,503,469$ 18,141,500$ -$ 63,644,969$ Licenses and permits 1,522,989 - - 1,522,989 Intergovernmental 12,577,482 - 83,364 12,660,846 Charges for services 2,065,726 - 69,440 2,135,166 Fines and forfeitures 587,490 - - 587,490 Investment income 484,662 107,651 18,321 610,634 Donations and contributions 608,695 - - 608,695 Other 107,987 - 192,571 300,558
Total Revenues 63,458,500 18,249,151 363,696 82,071,347
ExpendituresCurrent:
General government 2,383 - - 2,383 Public safety 27,693,537 - - 27,693,537 Highways and streets 61,021 - 416,972 477,993 Sanitation 484,192 - - 484,192 Welfare 4,698,813 - - 4,698,813 Culture and recreation 11,313,007 - - 11,313,007 Economic development and assistance 4,870,493 - - 4,870,493
Capital outlayPublic safety 101,731 - - 101,731 Highways and streets 2,735,512 - 1,307,749 4,043,261 Culture and recreation 12,147,371 - - 12,147,371
Debt servicePrincipal - 11,580,000 - 11,580,000 Interest - 2,606,924 - 2,606,924 Fiscal and other charges - 500 - 500
Intergovernmental 23,131,219 - - 23,131,219 Total Expenditures 87,239,279 14,187,424 1,724,721 103,151,424
Excess (Deficiency) Of RevenuesOver Expenditures (23,780,779) 4,061,727 (1,361,025) (21,080,077)
Other Financing Sources (Uses)Transfers-in 17,058,947 - 3,000,000 20,058,947 Transfers-out (625,815) (3,000,000) - (3,625,815)
Total Other Financing Sources (Uses) 16,433,132 (3,000,000) 3,000,000 16,433,132
Net Change In Fund Balance (7,347,647) 1,061,727 1,638,975 (4,646,945)
Fund Balance, January 1 52,120,546 12,315,490 3,099,062 67,535,098
Fund Balance, December 31 44,772,899$ 13,377,217$ 4,738,037$ 62,888,153$

Page 102
SPECIAL REVENUE FUNDS
The Nonmajor Special Revenue Funds are used to account for all the proceeds of taxes or other earmarked revenues of the County that finance specified activities as required by law or administrative action. The County’s Nonmajor Special Revenue Funds include the following:
Open Space This fund accounts for revenues generated from the ½ percent countywide sales tax, implemented in 1973 and expended for the acquisition, development and maintenance of Open Space land.
Open Space Cities Share This fund accounts for the “Cities Available Portion” of revenues generated from the ½ percent countywide sales tax that is shared with participating cities within the County.
Conservation Trust This fund was established as required by Section 31-25-220, Colorado Revised Statutes 1973, to account for monies received from the State of Colorado for Conservation Trust Fund purposes.
Developmentally Disabled This fund accounts for property tax revenues collected for use by the Developmental Disabilities Resource Center, Inc. and expended to provide services to the developmentally disabled.
Traffic Impact These funds account for monies generated by traffic impact fees on new development and expenditures relative to road improvements in various districts throughout the County.
Workforce Development This fund was established to account for the monies received as part of an intergovernmental agreement to serve Gilpin, Clear Creek and Jefferson Counties with a “one-stop" system integrating five county-administered employment and training programs.
Head Start This fund is used to account for monies received from the U.S. Department of Health and Human Services to administer the Head Start program for Jefferson, Gilpin, Clear Creek and Park Counties.

Page 103
Contingent This fund accounts for monies generated by property taxes and expended only for contingencies or emergencies as defined in state statutes. Colorado counties are authorized by state law (Section 30-25-107 C.R.S.) to maintain a contingency fund.
Patrol This fund accounts for revenues received from the Jefferson County Law Enforcement Authority (LEA) mill levy, grants and funding from the General Fund. Expenditures are for patrol services providing police protection in the unincorporated areas of the County.
Inmate Welfare This fund accounts for monies received from commissions for telephone services and jail commissary sales. These monies are spent for the welfare of incarcerated inmates/detainees.
Forfeiture This fund accounts for proceeds from seizures, forfeitures and restitution of the Sheriff’s and District Attorney’s Offices. State law restricts spending in this fund to non-budgeted Sheriff’s Office equipment, commodities and/or training.
Wildland Fire This fund accounts for monies generated by fireworks stand permits and expended to assist the County in mitigating wildfires.
Solid Waste These funds account for monies received from fees, state and federal grants, other local governments and contributions. The Solid Waste Funds are expended for solid waste program management and emergency and/or remediation operations.
Community Development This fund accounts for federal and state grant monies received and expended in accordance with grant requirements.

Page 104
COMBINING BALANCE SHEETNON-MAJOR SPECIAL REVENUE FUNDSDecember 31, 2015
Develop-Open Open Space Conservation mentallySpace Cities Share Trust Disabled
AssetsCash, pooled cash and investments 23,743,216$ 829,105$ 2,412,657$ 378,856$ Taxes receivable 3,064,044 2,320,010 - 8,016,226 Other receivables 1,350,275 - 1,366 36 Due from other governments 191,199 - - - Other current assets - - -
Total Assets 28,348,734$ 3,149,115$ 2,414,023$ 8,395,118$
LiabilitiesAccounts and retainage payable 1,302,572$ 2,271,388$ -$ -$ Accrued salaries 364,427 - - - Other accrued liabilities - - - - Due to other funds - - - - Due to other governments 16 - - - Funds held in custody for others 51,374 - - - Unearned amounts - - - -
Total Liabilities 1,718,389 2,271,388 - -
Deferred Inflows of ResourcesUnavailable property tax revenue - - - 8,016,226 Unavailable revenue 1,300,000 - - -
Total Deferred Inflows of Resources 1,300,000 - - 8,016,226
Fund BalancesRestricted 25,330,345 877,727 2,414,023 378,892
Total Fund Balances 25,330,345 877,727 2,414,023 378,892
Total Liabilities, Deferred Inflows of
Resources and Fund Balances 28,348,734$ 3,149,115$ 2,414,023$ 8,395,118$

Page 105
EvergreenSouth North ConiferTraffic Traffic Traffic Workforce HeadImpact Impact Impact Development Start Contingent
6,460,033$ 2,470,084$ 1,665,547$ -$ 128,654$ 2,774,502$ - - - - - - - 7,917 - 5,000 500 - - - - 1,008,982 40,532 - - - - 10,500 - -
6,460,033$ 2,478,001$ 1,665,547$ 1,024,482$ 169,686$ 2,774,502$
-$ 306,436$ 11,498$ 31,913$ 23,292$ -$ - - - 121,460 146,386 - - - - - 8 - - - - 866,028 - - - - - - - - - - - - - - - - - - - - - 306,436 11,498 1,019,401 169,686 -
- - - - - - - - - - - - - - - - - -
6,460,033 2,171,565 1,654,049 5,081 - 2,774,502 6,460,033 2,171,565 1,654,049 5,081 - 2,774,502
6,460,033$ 2,478,001$ 1,665,547$ 1,024,482$ 169,686$ 2,774,502$
(Continued)

Page 106
COMBINING BALANCE SHEETNON-MAJOR SPECIAL REVENUE FUNDSDecember 31, 2015(Continued)
Inmate WildlandPatrol Welfare Forfeiture Fire
AssetsCash, pooled cash and investments 1,252,935$ 1,343,036$ 447,869$ 138,896$ Taxes receivable 9,138,608 - - - Other receivables 100,904 - - - Due from other governments 82,622 - - - Other current assets - 2,339 - -
Total Assets 10,575,069$ 1,345,375$ 447,869$ 138,896$
LiabilitiesAccounts and retainage payable 68,432$ 36,729$ -$ -$ Accrued salaries 1,368,029 43,017 - - Other accrued liabilities - - - - Due to other funds - - - - Due to other governments - - - - Funds held in custody for others - - - - Unearned amounts - - - -
Total Liabilities 1,436,461 79,746 - -
Deferred Inflows of ResourcesUnavailable property tax revenue 9,138,608 - - - Unavailable revenue - - - -
Total Deferred Inflows of Resources 9,138,608 - - -
Fund BalancesRestricted - 1,265,629 447,869 138,896
Total Fund Balances - 1,265,629 447,869 138,896
Total Liabilities, Deferred Inflows of
Resources and Fund Balances 10,575,069$ 1,345,375$ 447,869$ 138,896$

Page 107
Solid TotalWaste Nonmajor
Disposal Site Community Special Revenue& Facility Development Funds
721,592$ 172,502$ 44,939,484$ - - 22,538,888
119,712 - 1,585,710 - 213,828 1,537,163 - - 12,839
841,304$ 386,330$ 70,614,084$
26,471$ 66,589$ 4,145,320$ - 15,813 2,059,132 - - 8 - - 866,028 - - 16 - - 51,374 - 264,473 264,473
26,471 346,875 7,386,351
- - 17,154,834 - - 1,300,000 - - 18,454,834
814,833 39,455 44,772,899 814,833 39,455 44,772,899
841,304$ 386,330$ 70,614,084$

Page 108
COMBINING STATEMENT OF REVENUES, EXPENDITURES, ANDCHANGES IN FUND BALANCESNON-MAJOR SPECIAL REVENUE FUNDSFor the Year Ended December 31, 2015 Open
Space Develop-Open Cities Conservation mentallySpace Share Trust Disabled
RevenuesTaxes and special assessments 16,209,370$ 12,878,148$ -$ 6,897,378$ Licenses and permits - - - - Intergovernmental 324,531 - 1,080,746 - Charges for services 370,272 - - - Fines and forfeitures 6,124 - - - Investment income 276,150 10,326 21,364 14,791 Donations and contributions 10,379 - - - Other 88,737 - - -
Total Revenues 17,285,563 12,888,474 1,102,110 6,912,169
ExpendituresCurrent:
General government - - - - Public safety - - - - Highways and streets - - - - Sanitation - - - - Welfare - - - 114,433 Culture and recreation 11,032,252 257,563 23,192 - Economic development and assistance - - - -
Capital outlayPublic safety - - - - Highways and streets - - - - Culture and recreation 12,147,371 - - -
Intergovernmental 763,938 12,608,256 65,903 6,819,762 Total Expenditures 23,943,561 12,865,819 89,095 6,934,195
Excess (Deficiency) Of RevenuesOver Expenditures (6,657,998) 22,655 1,013,015 (22,026)
Other Financing Sources (Uses)Transfers-in 86,000 - - - Transfers-out (151,133) - (380,683) -
Total Other Financing Sources (Uses) (65,133) - (380,683) -
Net Change In Fund Balance (6,723,131) 22,655 632,332 (22,026)
Fund Balance, January 1 32,053,476 855,072 1,781,691 400,918 Fund Balance, December 31 25,330,345$ 877,727$ 2,414,023$ 378,892$

Page 109
EvergreenSouth North ConiferTraffic Traffic Traffic Workforce HeadImpact Impact Impact Development Start Contingent
-$ -$ -$ -$ -$ -$ 458,132 800,594 250,930 - - - 137,703 - - 4,346,979 3,242,954 -
- - - 59,725 24,779 - - - - - - -
61,135 32,060 17,091 - - 26,834 - 274,455 8,629 - 315,232 - - - - 95 8,767 -
656,970 1,107,109 276,650 4,406,799 3,591,732 26,834
- - - - - 2,383 - - - - - -
12,887 35,193 12,941 - - - - - - - - - - - - - 4,584,380 - - - - - - - - - - 4,466,337 - -
- - - - - - 386,310 2,103,280 245,922 - - -
- - - - - - - - 108,445 - - -
399,197 2,138,473 367,308 4,466,337 4,584,380 2,383
257,773 (1,031,364) (90,658) (59,538) (992,648) 24,451
- - - 63,624 992,648 - - - - (4,033) - - - - - 59,591 992,648 -
257,773 (1,031,364) (90,658) 53 - 24,451
6,202,260 3,202,929 1,744,707 5,028 - 2,750,051 6,460,033$ 2,171,565$ 1,654,049$ 5,081$ -$ 2,774,502$
(Continued)
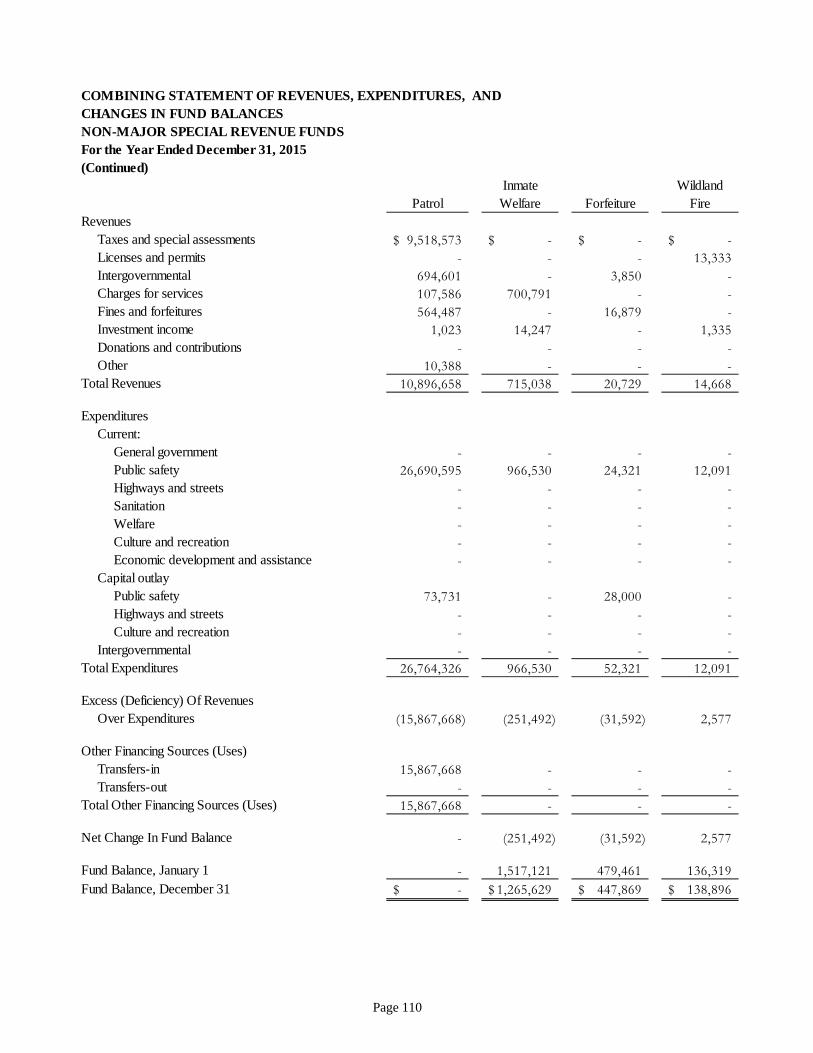
Page 110
COMBINING STATEMENT OF REVENUES, EXPENDITURES, ANDCHANGES IN FUND BALANCESNON-MAJOR SPECIAL REVENUE FUNDSFor the Year Ended December 31, 2015(Continued)
Inmate WildlandPatrol Welfare Forfeiture Fire
RevenuesTaxes and special assessments 9,518,573$ -$ -$ -$ Licenses and permits - - - 13,333 Intergovernmental 694,601 - 3,850 - Charges for services 107,586 700,791 - - Fines and forfeitures 564,487 - 16,879 - Investment income 1,023 14,247 - 1,335 Donations and contributions - - - - Other 10,388 - - -
Total Revenues 10,896,658 715,038 20,729 14,668
ExpendituresCurrent:
General government - - - - Public safety 26,690,595 966,530 24,321 12,091 Highways and streets - - - - Sanitation - - - - Welfare - - - - Culture and recreation - - - - Economic development and assistance - - - -
Capital outlayPublic safety 73,731 - 28,000 - Highways and streets - - - - Culture and recreation - - - -
Intergovernmental - - - - Total Expenditures 26,764,326 966,530 52,321 12,091
Excess (Deficiency) Of RevenuesOver Expenditures (15,867,668) (251,492) (31,592) 2,577
Other Financing Sources (Uses)Transfers-in 15,867,668 - - - Transfers-out - - - -
Total Other Financing Sources (Uses) 15,867,668 - - -
Net Change In Fund Balance - (251,492) (31,592) 2,577
Fund Balance, January 1 - 1,517,121 479,461 136,319 Fund Balance, December 31 -$ 1,265,629$ 447,869$ 138,896$

Page 111
Solid Solid TotalWaste Waste Nonmajor
Disposal Site Facility Community Special Revenue& Facility Management Development Funds
-$ -$ -$ 45,503,469$ - - - 1,522,989 - - 2,746,118 12,577,482
346,048 147,776 308,749 2,065,726 - - - 587,490
8,306 - - 484,662 - - - 608,695 - - - 107,987
354,354 147,776 3,054,867 63,458,500$
- - - 2,383 - - - 27,693,537 - - - 61,021
381,432 102,760 - 484,192 - - - 4,698,813 - - - 11,313,007 - - 404,156 4,870,493
- - - 101,731 - - - 2,735,512 - - - 12,147,371
41,543 113,733 2,609,639 23,131,219 422,975 216,493 3,013,795 87,239,279
(68,621) (68,717) 41,072 (23,780,779)
- 26,342 22,665 17,058,947 (26,342) - (63,624) (625,815) (26,342) 26,342 (40,959) 16,433,132
(94,963) (42,375) 113 (7,347,647)
909,796 42,375 39,342 52,120,546 814,833$ -$ 39,455$ 44,772,899$
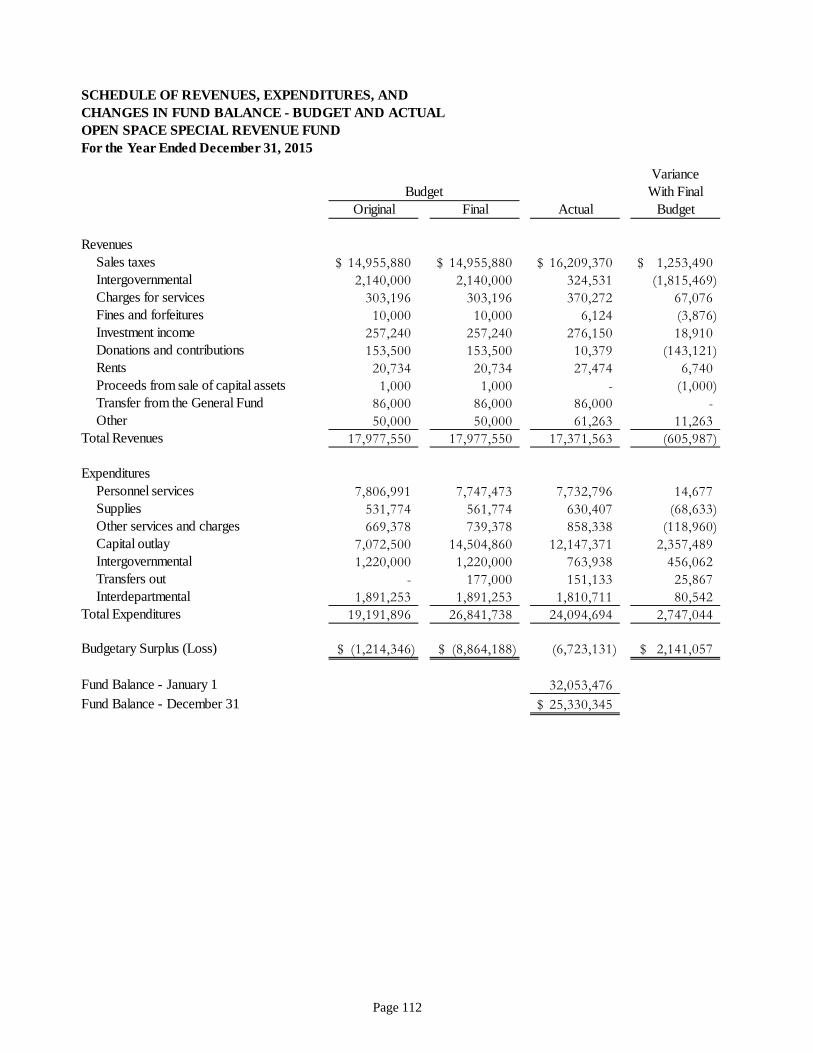
Page 112
SCHEDULE OF REVENUES, EXPENDITURES, ANDCHANGES IN FUND BALANCE - BUDGET AND ACTUALOPEN SPACE SPECIAL REVENUE FUNDFor the Year Ended December 31, 2015
VarianceWith Final
Original Final Actual Budget
Revenues Sales taxes 14,955,880$ 14,955,880$ 16,209,370$ 1,253,490$ Intergovernmental 2,140,000 2,140,000 324,531 (1,815,469) Charges for services 303,196 303,196 370,272 67,076 Fines and forfeitures 10,000 10,000 6,124 (3,876) Investment income 257,240 257,240 276,150 18,910 Donations and contributions 153,500 153,500 10,379 (143,121) Rents 20,734 20,734 27,474 6,740 Proceeds from sale of capital assets 1,000 1,000 - (1,000) Transfer from the General Fund 86,000 86,000 86,000 - Other 50,000 50,000 61,263 11,263
Total Revenues 17,977,550 17,977,550 17,371,563 (605,987)
ExpendituresPersonnel services 7,806,991 7,747,473 7,732,796 14,677 Supplies 531,774 561,774 630,407 (68,633) Other services and charges 669,378 739,378 858,338 (118,960) Capital outlay 7,072,500 14,504,860 12,147,371 2,357,489 Intergovernmental 1,220,000 1,220,000 763,938 456,062 Transfers out - 177,000 151,133 25,867 Interdepartmental 1,891,253 1,891,253 1,810,711 80,542
Total Expenditures 19,191,896 26,841,738 24,094,694 2,747,044
Budgetary Surplus (Loss) (1,214,346)$ (8,864,188)$ (6,723,131) 2,141,057$
Fund Balance - January 1 32,053,476 Fund Balance - December 31 25,330,345$
Budget

Page 113
SCHEDULE OF REVENUES, EXPENDITURES, ANDCHANGES IN FUND BALANCE - BUDGET AND ACTUALOPEN SPACE CITIES SHARE SPECIAL REVENUE FUNDFor The Year Ended December 31, 2015
VarianceWith Final
Original Final Actual BudgetRevenues
Taxes and special assessments 12,203,570$ 12,865,821$ 12,878,148$ 12,327$ Investment income 5,786 5,786 10,326 4,540
Total Revenues 12,209,356 12,871,607 12,888,474 16,867
ExpendituresOther services and charges 244,072 257,563 257,563 - Intergovernmental 11,959,496 12,608,256 12,608,256 -
Total Expenditures 12,203,568 12,865,819 12,865,819 -
Budgetary Surplus 5,788$ 5,788$ 22,655 16,867$
Fund Balance, January 1 855,072
Fund Balance, December 31 877,727$
Budget

Page 114
SCHEDULE OF REVENUES, EXPENDITURES, ANDCHANGES IN FUND BALANCE - BUDGET AND ACTUALCONSERVATION TRUST SPECIAL REVENUE FUNDFor The Year Ended December 31, 2015
VarianceWith Final
Original Final Actual BudgetRevenues
Intergovernmental 1,100,000$ 1,100,000$ 1,080,746$ (19,254)$ Investment income 7,930 7,930 21,364 13,434
Total Revenues 1,107,930 1,107,930 1,102,110 (5,820)
ExpendituresOther services and charges - - 23,192 (23,192) Capital outlay 95,100 - - - Intergovernmental 630,000 694,537 65,903 628,634 Transfer to the Boettcher Mansion Fund 100,000 100,000 100,000 - Transfer to the General Fund 25,000 421,261 280,683 140,578
Total Expenditures 850,100 1,215,798 469,778 746,020
Budgetary Surplus (Loss) 257,830$ (107,868)$ 632,332 740,200$
Fund Balance, January 1 1,781,691
Fund Balance, December 31 2,414,023$
Budget

Page 115
SCHEDULE OF REVENUES, EXPENDITURES, ANDCHANGES IN FUND BALANCE - BUDGET AND ACTUALDEVELOPMENTALLY DISABLED SPECIAL REVENUE FUNDFor The Year Ended December 31, 2015
VarianceWith Final
Original Final Actual BudgetRevenues
Taxes and special assessments 6,913,935$ 6,913,935$ 6,897,378$ (16,557)$ Investment income 21,648 21,648 14,791 (6,857)
Total Revenues 6,935,583 6,935,583 6,912,169 (23,414)
ExpendituresIntergovernmental 6,819,761 6,819,761 6,819,762 (1) Interdepartmental 115,822 115,822 114,433 1,389
Total Expenditures 6,935,583 6,935,583 6,934,195 1,388
Budgetary Loss -$ -$ (22,026) (22,026)$
Fund Balance, January 1 400,918
Fund Balance, December 31 378,892$
Budget

Page 116
SCHEDULE OF REVENUES, EXPENDITURES, ANDCHANGES IN FUND BALANCE - BUDGET AND ACTUALSOUTH TRAFFIC IMPACT SPECIAL REVENUE FUNDFor The Year Ended December 31, 2015
VarianceWith Final
Original Final Actual BudgetRevenues
Licenses and permits 350,000$ 350,000$ 458,132$ 108,132$ Intergovernmental - - 137,703 137,703 Investment income 60,856 60,856 61,135 279
Total Revenues 410,856 410,856 656,970 246,114
ExpendituresOther services and charges - 15,000 - 15,000 Capital outlay 555,000 1,277,630 386,310 891,320 Interdepartmental 12,886 12,886 12,887 (1)
Total Expenditures 567,886 1,305,516 399,197 906,319
Budgetary Surplus (Loss) (157,030)$ (894,660)$ 257,773 1,152,433$
Fund Balance, January 1 6,202,260
Fund Balance, December 31 6,460,033$
Budget
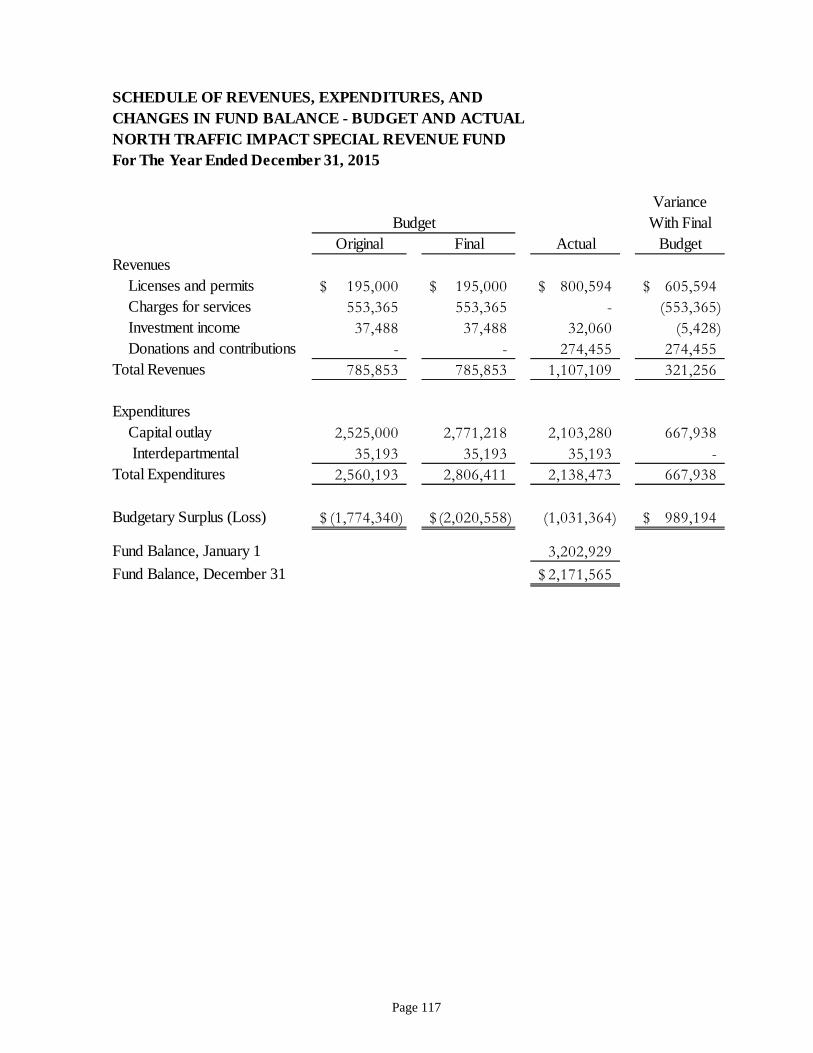
Page 117
SCHEDULE OF REVENUES, EXPENDITURES, ANDCHANGES IN FUND BALANCE - BUDGET AND ACTUALNORTH TRAFFIC IMPACT SPECIAL REVENUE FUNDFor The Year Ended December 31, 2015
VarianceWith Final
Original Final Actual BudgetRevenues
Licenses and permits 195,000$ 195,000$ 800,594$ 605,594$ Charges for services 553,365 553,365 - (553,365) Investment income 37,488 37,488 32,060 (5,428) Donations and contributions - - 274,455 274,455
Total Revenues 785,853 785,853 1,107,109 321,256
ExpendituresCapital outlay 2,525,000 2,771,218 2,103,280 667,938 Interdepartmental 35,193 35,193 35,193 -
Total Expenditures 2,560,193 2,806,411 2,138,473 667,938
Budgetary Surplus (Loss) (1,774,340)$ (2,020,558)$ (1,031,364) 989,194$
Fund Balance, January 1 3,202,929
Fund Balance, December 31 2,171,565$
Budget

Page 118
SCHEDULE OF REVENUES, EXPENDITURES, ANDCHANGES IN FUND BALANCE - BUDGET AND ACTUALEVERGREEN CONIFER TRAFFIC IMPACT SPECIAL REVENUE FUNDFor The Year Ended December 31, 2015
VarianceWith Final
Original Final Actual BudgetRevenues
Licenses and permits 85,000$ 85,000$ 250,930$ 165,930$ Investment income 10,776 10,776 17,091 6,315 Donations and contributions - - 8,629 8,629
Total Revenues 95,776 95,776 276,650 180,874
ExpendituresOther services and charges - - 9,500 (9,500) Capital outlay 95,000 245,000 245,922 (922) Intergovernmental 35,000 119,000 108,445 10,555 Interdepartmental 3,441 3,441 3,441 -
Total Expenditures 133,441 367,441 367,308 133
Budgetary Surplus (Loss) (37,665)$ (271,665)$ (90,658) 181,007$
Fund Balance, January 1 1,744,707
Fund Balance, December 31 1,654,049$
Budget

Page 119
SCHEDULE OF REVENUES, EXPENDITURES, ANDCHANGES IN FUND BALANCE - BUDGET AND ACTUALWORKFORCE DEVELOPMENT SPECIAL REVENUE FUNDFor The Year Ended December 31, 2015
VarianceWith Final
Original Final Actual BudgetRevenues
Intergovernmental 5,316,269$ 5,316,269$ 4,346,979$ (969,290)$ Interdepartmental - - 63,624 63,624 Charges for services - - 59,725 59,725 Miscellaneous - - 95 95
Total Revenues 5,316,269 5,316,269 4,470,423 (845,846)
ExpendituresPersonnel services 3,006,790 3,088,255 2,496,001 592,254 Supplies 359,206 359,206 57,467 301,739 Other services and charges 377,924 296,459 730,482 (434,023) Assistance payments 1,337,445 1,337,445 959,374 378,071 Interdepartmental 234,904 234,904 227,046 7,858
Total Expenditures 5,316,269 5,316,269 4,470,370 845,899
Budgetary Surplus -$ -$ 53 53$
Fund Balance, January 1 5,028
Fund Balance, December 31 5,081$
Budget
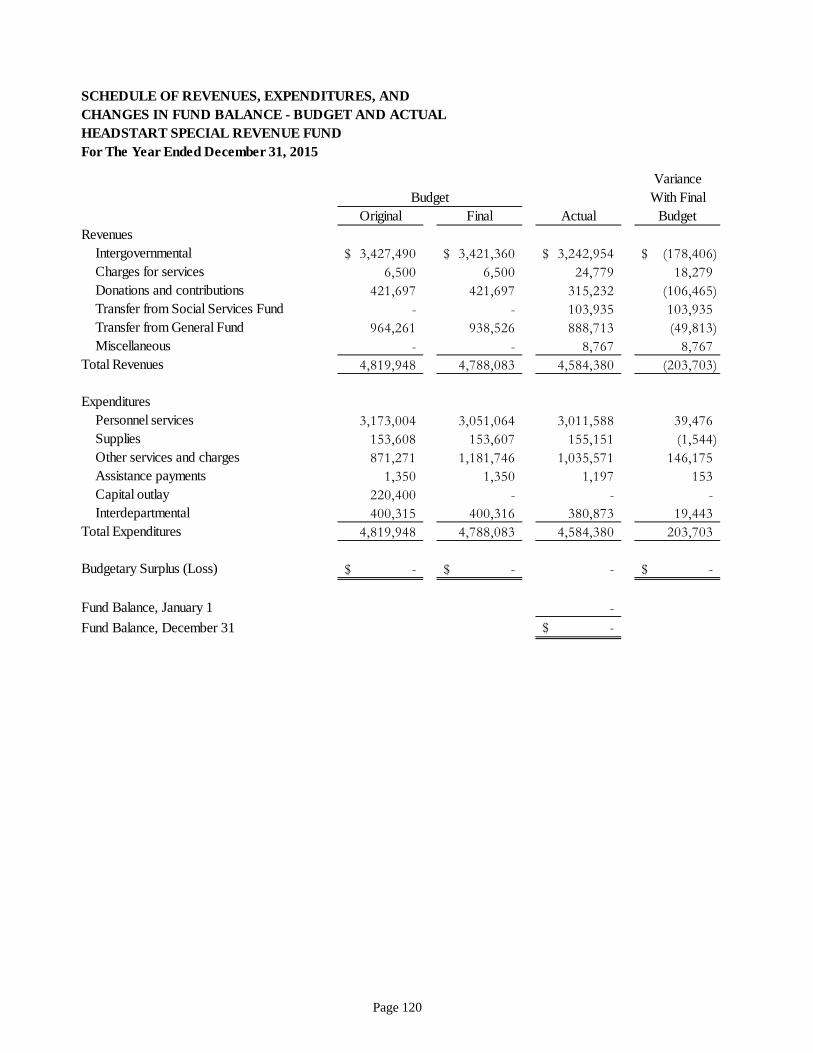
Page 120
SCHEDULE OF REVENUES, EXPENDITURES, ANDCHANGES IN FUND BALANCE - BUDGET AND ACTUALHEADSTART SPECIAL REVENUE FUNDFor The Year Ended December 31, 2015
VarianceWith Final
Original Final Actual BudgetRevenues
Intergovernmental 3,427,490$ 3,421,360$ 3,242,954$ (178,406)$ Charges for services 6,500 6,500 24,779 18,279 Donations and contributions 421,697 421,697 315,232 (106,465) Transfer from Social Services Fund - - 103,935 103,935 Transfer from General Fund 964,261 938,526 888,713 (49,813) Miscellaneous - - 8,767 8,767
Total Revenues 4,819,948 4,788,083 4,584,380 (203,703)
ExpendituresPersonnel services 3,173,004 3,051,064 3,011,588 39,476 Supplies 153,608 153,607 155,151 (1,544) Other services and charges 871,271 1,181,746 1,035,571 146,175 Assistance payments 1,350 1,350 1,197 153 Capital outlay 220,400 - - - Interdepartmental 400,315 400,316 380,873 19,443
Total Expenditures 4,819,948 4,788,083 4,584,380 203,703
Budgetary Surplus (Loss) -$ -$ - -$
Fund Balance, January 1 -
Fund Balance, December 31 -$
Budget

Page 121
SCHEDULE OF REVENUES, EXPENDITURES, ANDCHANGES IN FUND BALANCE - BUDGET AND ACTUALCONTINGENT SPECIAL REVENUE FUNDFor The Year Ended December 31, 2015
VarianceWith Final
Original Final Actual BudgetRevenues
Investment income 20,723$ 20,723$ 26,834$ 6,111$ Total Revenues 20,723 20,723 26,834 6,111
ExpendituresInterdepartmental 2,384 2,384 2,383 1
Total Expenditures 2,384 2,384 2,383 1
Budgetary Surplus 18,339$ 18,339$ 24,451 6,112$
Fund Balance, January 1 2,750,051 Fund Balance, December 31 2,774,502$
Budget

Page 122
SCHEDULE OF REVENUES, EXPENDITURES, ANDCHANGES IN FUND BALANCE - BUDGET AND ACTUALPATROL SPECIAL REVENUE FUNDFor the Year Ended December 31, 2015
VarianceWith Final
Original Final Actual BudgetRevenues
TaxesGeneral property 8,863,227$ 8,863,227$ 8,776,186$ (87,041)$ Auto ownership 667,145 667,145 734,297 67,152 Interest and penalties 11,100 11,100 8,090 (3,010)
Subtotal Taxes 9,541,472 9,541,472 9,518,573 (22,899)
Intergovernmental 641,348 735,348 694,601 (40,747) Charges for services 141,250 141,250 107,586 (33,664) Fines and forfeitures 451,700 451,700 564,487 112,787 Investment income 3,586 3,586 1,023 (2,563) Transfer from the General Fund 15,613,348 15,875,970 15,867,668 (8,302) Miscellaneous 15,000 15,000 10,388 (4,612)
Total Revenues 26,407,704 26,764,326 26,764,326 -
ExpendituresPersonnel services 25,084,812 25,347,434 25,406,432 (58,998) Supplies 514,708 514,708 480,645 34,063 Other services and charges 440,523 446,523 438,558 7,965 Capital outlay - 88,000 73,731 14,269 Interdepartmental 367,661 367,661 364,960 2,701
Total Expenditures 26,407,704 26,764,326 26,764,326 -
Budgetary Surplus (Loss) -$ -$ - -$
Fund Balance, January 1 -
Fund Balance, December 31 -$
Budget

Page 123
SCHEDULE OF REVENUES, EXPENDITURES, ANDCHANGES IN FUND BALANCE - BUDGET AND ACTUALINMATE WELFARE SPECIAL REVENUE FUNDFor The Year Ended December 31, 2015
VarianceWith Final
Original Final Actual BudgetRevenues
Charges for services 663,869$ 663,869$ 700,791$ 36,922$ Investment income 13,011 13,011 14,247 1,236
Total Revenues 676,880 676,880 715,038 38,158
ExpendituresPersonnel services 623,055 623,055 670,248 (47,193) Supplies 258,508 258,508 118,582 139,926 Other services and charges 58,350 466,897 144,491 322,406 Capital outlay 250,000 - - - Interdepartmental 33,209 33,209 33,209 -
Total Expenditures 1,223,122 1,381,669 966,530 415,139
Budgetary Surplus (Loss) (546,242)$ (704,789)$ (251,492) 453,297$
Fund Balance, January 1 1,517,121
Fund Balance, December 31 1,265,629$
Budget

Page 124
SCHEDULE OF REVENUES, EXPENDITURES, ANDCHANGES IN FUND BALANCE - BUDGET AND ACTUALWILDLAND FIRE SPECIAL REVENUE FUNDFor The Year Ended December 31, 2015
VarianceWith Final
Original Final Actual BudgetRevenues
Licenses and permits 15,000$ 15,000$ 13,333$ (1,667)$ Investment income 1,064 1,064 1,335 271
Total Revenues 16,064 16,064 14,668 (1,396)
ExpendituresSupplies 10,000 10,000 9,719 281 Interdepartmental 2,372 2,372 2,372 -
Total Expenditures 12,372 12,372 12,091 281
Budgetary Surplus (Loss) 3,692$ 3,692$ 2,577 (1,115)$
Fund Balance, January 1 136,319
Fund Balance, December 31 138,896$
Budget

Page 125
SCHEDULE OF REVENUES, EXPENDITURES, ANDCHANGES IN FUND BALANCE - BUDGET AND ACTUALSOLID WASTE DISPOSAL SITE & FACILITY SPECIAL REVENUE FUNDFor The Year Ended December 31, 2015
VarianceWith Final
Original Final Actual BudgetRevenues
Charges for services 140,000$ 140,000$ 346,048$ 206,048$ Investment income 8,536 8,536 8,306 (230)
Total Revenues 148,536 148,536 354,354 205,818
ExpendituresSupplies - - 2,109 (2,109) Other services and charges 10,000 626,299 160,257 466,042 Intergovernmental 42,000 42,000 41,543 457 Interdepartmental 9,754 9,754 245,408 (235,654)
Total Expenditures 61,754 678,053 449,317 228,736
Budgetary Surplus (Loss) 86,782$ (529,517)$ (94,963) 434,554$
Fund Balance, January 1 909,796
Fund Balance, December 31 814,833$
Budget

Page 126
SCHEDULE OF REVENUES, EXPENDITURES, ANDCHANGES IN FUND BALANCE - BUDGET AND ACTUALSOLID WASTE FACILITY MANAGEMENT SPECIAL REVENUE FUNDFor The Year Ended December 31, 2015
VarianceWith Final
Original Final Actual BudgetRevenues
Charges for services 410,000$ 410,000$ 147,776$ (262,224)$ Investment income 7,016 7,016 - (7,016) Interdepartmental - - 26,342 26,342
Total Revenues 417,016 417,016 174,118 (242,898)
ExpendituresPersonnel services 3,000 3,000 - 3,000 Supplies 5,000 5,000 2,757 2,243 Other services and charges 204,814 204,814 43,693 161,121 Intergovernmental 113,733 113,733 113,733 - Interdepartmental 84,464 84,464 56,310 28,154
Total Expenditures 411,011 411,011 216,493 194,518
Budgetary Surplus (Loss) 6,005$ 6,005$ (42,375) (48,380)$
Fund Balance, January 1 42,375 Fund Balance, December 31 -$
Budget

Page 127
SCHEDULE OF REVENUES, EXPENDITURES, ANDCHANGES IN FUND BALANCE - BUDGET AND ACTUALCOMMUNITY DEVELOPMENT SPECIAL REVENUE FUNDFor The Year Ended December 31, 2015
VarianceWith Final
Original Final Actual BudgetRevenues
Intergovernmental 1,915,873$ 2,746,119$ 2,746,118$ (1)$ Interdepartmental 25,000 22,665 22,665 - Charges for services - 308,749 308,749 -
Total Revenues 1,940,873 3,077,533 3,077,532 (1)
ExpendituresPersonnel services 244,329 272,234 272,234 - Supplies 1,200 9,963 9,965 (2) Other services and charges 35,331 28,630 28,630 - Intergovernmental 1,599,000 2,609,640 2,609,639 1 Interdepartmental 61,013 156,950 156,951 (1)
Total Expenditures 1,940,873 3,077,417 3,077,419 (2)
Budgetary Surplus (Loss) -$ 116$ 113 (3)$
Fund Balance, January 1 39,342
Fund Balance, December 31 39,455$
Budget

Page 128
The Special Weapons and Tactics (SWAT) is a select group of deputies and support staff from the Jefferson County Sheriff’s Office and the Arvada and Golden police departments. SWAT is used in high-risk incidents when disciplined teamwork, specialized weapons and tactical skills are required, such as incidents involving barricaded subjects or hostages.

Page 129
DEBT SERVICE FUNDS
The debt service funds are used to account for the payment of principal and interest on revenue bonds and certificates of participation financed by property and sales taxes.
Open Space Bonds These funds (2009, 2010 and 2013) hold the monies used to pay for the debt service of the bonds issued for land acquisitions for the purpose of open space preservation based on the Open Space Master Plan.
Sales Tax Local Improvement District
This fund holds the monies used to pay for debt service of the special revenue bonds issued to construct street improvements within a portion of the southern unincorporated boundaries of the County.

Page 130
COMBINING BALANCE SHEETDEBT SERVICE FUNDSDecember 31, 2015
Sales TaxOpen Open Open Local TotalSpace Space Space Improvement Debt Service
2009 Bond 2010 Bond 2013 Bond District FundsAssets
Cash, pooled cash and investments -$ -$ -$ 8,040,925$ 8,040,925$ Taxes receivable 1,407,700 379,267 356,126 1,047,781 3,190,874 Restricted investments 1,409,228 379,678 356,512 - 2,145,418
Total Assets 2,816,928$ 758,945$ 712,638$ 9,088,706$ 13,377,217$
LiabilitiesOther accrued liabilities -$ -$ -$ -$ -$
Total Liabilities - - - - -
Fund BalancesRestricted 2,816,928 758,945 712,638 9,088,706 13,377,217
Total Fund Balances 2,816,928 758,945 712,638 9,088,706 13,377,217
Total Liabilities and Fund Balances 2,816,928$ 758,945$ 712,638$ 9,088,706$ 13,377,217$

Page 131
COMBINING STATEMENT OF REVENUES, EXPENDITURES, ANDCHANGES IN FUND BALANCESDEBT SERVICE FUNDSFor the Year Ended December 31, 2015
Sales TaxOpen Open Open Local TotalSpace Space Space Improvement Debt Service
2009 Bond 2010 Bond 2013 Bond District FundsRevenues
Taxes and special assessments 8,439,343$ 2,275,417$ 2,132,428$ 5,294,312$ 18,141,500$ Investment income 6,717 1,830 1,659 97,445 107,651
Total Revenues 8,446,060 2,277,247 2,134,087 5,391,757 18,249,151
ExpendituresDebt service:
Principal 6,875,000 1,860,000 1,670,000 1,175,000 11,580,000 Interest 1,569,944 417,798 462,500 156,682 2,606,924 Fiscal and other charges - - - 500 500
Total Expenditures 8,444,944 2,277,798 2,132,500 1,332,182 14,187,424
Excess (Deficiency) of RevenuesOver Expenditures 1,116 (551) 1,587 4,059,575 4,061,727
Other Financing UsesTransfers-out - - - (3,000,000) (3,000,000)
Total Other Financing Uses - - - (3,000,000) (3,000,000)
Net Change in Fund Balance 1,116 (551) 1,587 1,059,575 1,061,727
Fund Balance, January 1 2,815,812 759,496 711,051 8,029,131 12,315,490 Fund Balance, December 31 2,816,928$ 758,945$ 712,638$ 9,088,706$ 13,377,217$

Page 132
SCHEDULE OF REVENUES, EXPENDITURES, ANDCHANGES IN FUND BALANCE - BUDGET AND ACTUAL2009 BOND OPEN SPACE DEBT SERVICE FUNDFor The Year Ended December 31, 2015
VarianceWith Final
Original Final Actual BudgetRevenues
Taxes and special assessments 8,444,950$ 8,444,950$ 8,439,343$ (5,607)$ Investment income 2,984 2,984 6,717 3,733
Total Revenues 8,447,934 8,447,934 8,446,060 (1,874)
ExpendituresDebt service:
Principal 6,875,000 6,875,000 6,875,000 - Interest 1,569,950 1,569,950 1,569,944 6
Total Expenditures 8,444,950 8,444,950 8,444,944 6
Budgetary Surplus (Loss) 2,984$ 2,984$ 1,116 (1,868)$
Fund Balance, January 1 2,815,812
Fund Balance, December 31 2,816,928$
Budget

Page 133
SCHEDULE OF REVENUES, EXPENDITURES, ANDCHANGES IN FUND BALANCE - BUDGET AND ACTUAL2010 BOND OPEN SPACE DEBT SERVICE FUNDFor The Year Ended December 31, 2015
VarianceWith Final
Original Final Actual BudgetRevenues
Taxes and special assessments 2,277,800$ 2,277,800$ 2,275,417$ (2,383)$ Investment income 1,096 1,096 1,830 734
Total Revenues 2,278,896 2,278,896 2,277,247 (1,649)
ExpendituresDebt service:
Principal 1,860,000 1,860,000 1,860,000 - Interest 417,800 417,800 417,798 2
Total Expenditures 2,277,800 2,277,800 2,277,798 2
Budgetary Surplus (Loss) 1,096$ 1,096$ (551) (1,647)$
Fund Balance, January 1 759,496
Fund Balance, December 31 758,945$
Budget

Page 134
SCHEDULE OF REVENUES, EXPENDITURES, ANDCHANGES IN FUND BALANCE - BUDGET AND ACTUAL2013 BOND OPEN SPACE DEBT SERVICE FUNDFor The Year Ended December 31, 2015
VarianceWith Final
Original Final Actual BudgetRevenues
Taxes and special assessments 2,132,502$ 2,132,502$ 2,132,428$ (74)$ Investment income 981 981 1,659 678
Total Revenues 2,133,483 2,133,483 2,134,087 604
ExpendituresDebt service:
Principal 1,670,000 1,670,000 1,670,000 - Interest 462,502 462,502 462,500 2
Total Expenditures 2,132,502 2,132,502 2,132,500 2
Budgetary Surplus 981$ 981$ 1,587 606$
Fund Balance, January 1 711,051
Fund Balance, December 31 712,638$
Budget
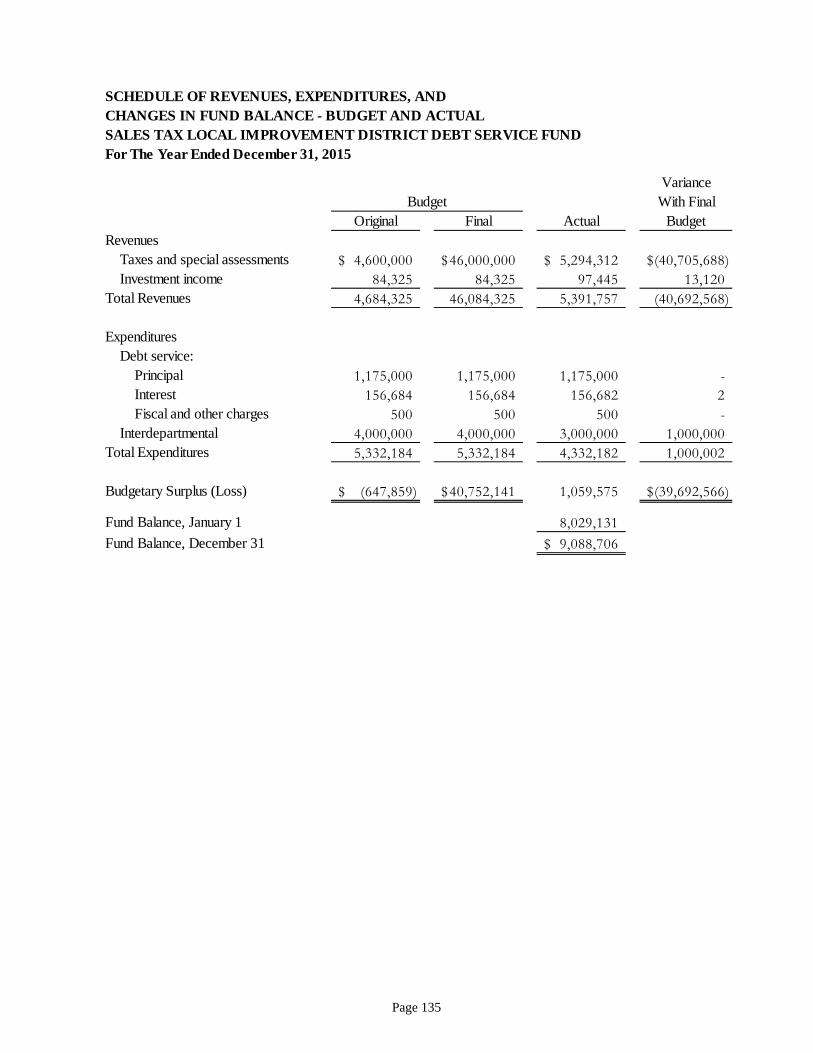
Page 135
SCHEDULE OF REVENUES, EXPENDITURES, ANDCHANGES IN FUND BALANCE - BUDGET AND ACTUALSALES TAX LOCAL IMPROVEMENT DISTRICT DEBT SERVICE FUNDFor The Year Ended December 31, 2015
VarianceWith Final
Original Final Actual BudgetRevenues
Taxes and special assessments 4,600,000$ 46,000,000$ 5,294,312$ (40,705,688)$ Investment income 84,325 84,325 97,445 13,120
Total Revenues 4,684,325 46,084,325 5,391,757 (40,692,568)
ExpendituresDebt service:
Principal 1,175,000 1,175,000 1,175,000 - Interest 156,684 156,684 156,682 2 Fiscal and other charges 500 500 500 -
Interdepartmental 4,000,000 4,000,000 3,000,000 1,000,000 Total Expenditures 5,332,184 5,332,184 4,332,182 1,000,002
Budgetary Surplus (Loss) (647,859)$ 40,752,141$ 1,059,575 (39,692,566)$
Fund Balance, January 1 8,029,131 Fund Balance, December 31 9,088,706$
Budget

Page 136
Mounted deputies through the decades

Page 137
CAPITAL PROJECTS FUNDS
The Capital Project Funds account for financial resources collected and used for the acquisition or construction of major capital facilities and land. Major capital projects fund:
Capital Expenditures This fund provides and accumulates monies for major
capital expenditures and lease payments of the County.
Nonmajor capital projects funds:
Open Space Bonds Acquisition
This fund accounts for the financial resources used for the acquisition and preservation of Open Space land.
Sales Tax Local Improvement District
This fund accounts for the financial resources used for the construction of street improvements within a portion of the southern unincorporated boundaries of the County.

Page 138
Animal Control officers investigate animal abuse, and provide services including leash law enforcement, regulating barking dogs, regulating vicious/dangerous dogs, dog licensing, rabies control, bite quarantines and courtesy dead animal removal. The Animal Control Section falls within the Patrol Division of the Jefferson County Sheriff's Office. This partnership began in January 1998 as a result of a county reorganization.
Each deputy serving with the cyclist program must complete extensive formal training. The course involves educational and practical instruction on the operation of mountain bikes and community policing strategies. Deputies on bicycles are a more visible deterrent to crime, especially when working in crowds than is possible from the inside of a duty vehicle.

Page 139
SCHEDULE OF REVENUES, EXPENDITURES, ANDCHANGES IN FUND BALANCE - BUDGET AND ACTUALCAPITAL EXPENDITURES CAPITAL PROJECTS FUNDFor The Year Ended December 31, 2015
VarianceWith Final
Original Final Actual BudgetRevenues
Taxes and special assessments 7,307,642$ 7,307,642$ 7,290,510$ (17,132)$ Investment income 73,435 73,435 91,308 17,873 Intergovernmental 1,479,173 1,479,173 2,351,260 872,087 Interdepartmental 1,122,678 3,453,313 3,307,696 (145,617) Other - 46,360 24,084 (22,276)
Total Revenues 9,982,928 12,359,923 13,064,858 704,935
ExpendituresOther services and charges - 12,906,296 1,651,433 11,254,863 Capital outlay - 10,115,461 2,074,355 8,041,106 Interdepartmental 152,079 190,079 229,438 (39,359) Debt service:
Principal 7,541,518 1,518,172 5,240,000 (3,721,828) Interest - - 3,908,470 (3,908,470) Fiscal and other charges - - 4,607 (4,607)
Total Expenditures 7,693,597 24,730,008 13,108,303 11,621,705
Budgetary Surplus (Loss) 2,289,331$ (12,370,085)$ (43,445) 12,326,640$
Fund Balance, January 1 14,505,582
Fund Balance, December 31 14,462,137$
Budget

Page 140
COMBINING BALANCE SHEETCAPITAL PROJECTS FUNDSDecember 31, 2015
Sales Tax TotalOpen Local NonmajorSpace Improvement Capital Projects
2013 Bond District FundsAssets
Cash, pooled cash and investments -$ 4,817,041$ 4,817,041$ Due from other governments - 4,500 4,500 Restricted investments 8,577 - 8,577
Total Assets 8,577$ 4,821,541$ 4,830,118$
LiabilitiesAccounts and retainage payable -$ 92,081$ 92,081$
Total Liabilities - 92,081 92,081
Fund BalancesRestricted 8,577 4,729,460 4,738,037
Total Fund Balances 8,577 4,729,460 4,738,037
Total Liabilities and Fund Balances 8,577$ 4,821,541$ 4,830,118$

Page 141
COMBINING STATEMENT OF REVENUES, EXPENDITURES, ANDCHANGES IN FUND BALANCESCAPITAL PROJECTS FUNDSFor the Year Ended December 31, 2015 Sales Tax Total
Open Local NonmajorSpace Improvement Capital Projects
2013 Bond District FundsRevenues
Intergovernmental -$ 83,364$ 83,364$ Charges for services - 69,440 69,440 Investment income 22 18,299 18,321 Other - 192,571 192,571
Total Revenues 22 363,674 363,696
ExpendituresCurrent:
Highways and streets - 416,972 416,972 Capital outlay:
Highways and streets - 1,307,749 1,307,749 Total Expenditures - 1,724,721 1,724,721
Deficiency of RevenuesOver Expenditures 22 (1,361,047) (1,361,025)
Other Financing SourcesTransfers-in - 3,000,000 3,000,000
Total Other Financing Sources - 3,000,000 3,000,000
Net Change in Fund Balance 22 1,638,953 1,638,975
Fund Balance, January 1 8,555 3,090,507 3,099,062 Fund Balance, December 31 8,577$ 4,729,460$ 4,738,037$

Page 142
SCHEDULE OF REVENUES, EXPENDITURES, ANDCHANGES IN FUND BALANCE - BUDGET AND ACTUAL2013 BOND OPEN SPACE CAPITAL PROJECTS FUNDFor The Year Ended December 31, 2015
VarianceWith Final
Original Final Actual BudgetRevenues
Investment income -$ -$ 22$ 22$ Total Revenues - - 22 22
ExpendituresOther services and charges - - - -
Total Expenditures - - - -
Budgetary Surplus (Loss) -$ -$ 22 22$
Fund Balance, January 1 8,555
Fund Balance, December 31 8,577$
Budget

Page 143
SCHEDULE OF REVENUES, EXPENDITURES, ANDCHANGES IN FUND BALANCE - BUDGET AND ACTUALSALES TAX LOCAL IMPROVEMENT DISTRICT CAPITAL PROJECTS FUNDFor The Year Ended December 31, 2015
VarianceWith Final
Original Final Actual BudgetRevenues
Intergovernmental -$ 400,000$ 83,364$ (316,636)$ Charges for services - 141,407 69,440 (71,967) Investment income 22,432 22,432 18,299 (4,133) Interdepartmental 4,000,000 4,000,000 3,000,000 (1,000,000) Other - - 192,571 192,571
Total Revenues 4,022,432 4,563,839 3,363,674 (1,200,165)
ExpendituresOther services and charges - 60,000 32,707 27,293 Capital outlay 1,345,000 2,930,051 1,307,749 1,622,302 Interdepartmental 677,153 677,153 384,265 292,888
Total Expenditures 2,022,153 3,667,204 1,724,721 1,942,483
Budgetary Surplus 2,000,279$ 896,635$ 1,638,953$ 742,318$
Fund Balance, January 1 3,090,507 Fund Balance, December 31 4,729,460$
Budget

Page 144
The K-9 Unit is used in high-risk situations such as building searches, tracking suspects or lost individuals and discovery of concealed narcotics and explosives. The Jefferson County Sheriff’s Office currently has German Sheperds trained to detect narcotics; a Belgian shepherd trained to detect explosives; and a bloodhound for tracking and cadaver searches.

Page 145
PROPRIETARY FUNDS
Enterprise Fund The Enterprise Fund accounts for operations that are financed and operated in a manner similar to private business enterprises – where the costs (expenses, including depreciation) of providing goods or services to the general public are being financed or recovered primarily through user charges on a continuing basis.
Rocky Mountain Metropolitan Airport
This fund is the County’s single enterprise fund.
Internal Service Funds The Internal Service Funds account for financing of goods or services provided by one department or agency to other departments or agencies within the County on a cost-reimbursement basis. The County’s internal service funds are:
Workers' Compensation This fund was established to account for specific expenditures of work-related injuries.
Self Insurance This fund was established for property and automobile physical damage, surety and other liability coverage deductibles.
Employee Benefits This fund was established to account for the self-insured employee benefits plans including a self-funded health plan, dental plan, flexible spending accounts for medical and dependent care, life insurance, accidental death and long-term disability.
Fleet Services This fund was established to account for revenues generated from interdepartmental charges to be used for regular vehicle maintenance, fuel and replacement of the County's fleet service vehicles.

Page 146
School Resource Officers serve as a liaison between the Sheriff’s Office and students, parents and administrators in unincorporated Jefferson County and the neighborhoods surrounding those schools. They also provide valuable, law-related supplementary education for students in the schools they serve and in affiliated elementary schools.

Page 147
SCHEDULE OF REVENUES, EXPENDITURES, AND CHANGES IN NET POSITIONBUDGET AND ACTUAL - BUDGETARY BASISAIRPORT ENTERPRISE FUNDFor The Year Ended December 31, 2015
VarianceWith Final
Original Final Actual BudgetRevenues
Rental income 2,964,000$ 2,964,000$ 2,948,066$ (15,934)$ Fuel taxes 302,000 302,000 239,672 (62,328) Other 369,700 369,700 396,004 26,304 Capital grants 954,560 3,204,560 1,230,677 (1,973,883) Investment income 50,138 50,138 99,529 49,391 Gain on sale of capital assets 20,500 20,500 1,667,633 1,647,133
Total Revenues 4,660,898 6,910,898 6,581,581 (329,317)
ExpendituresPersonnel services 1,584,362 1,584,362 1,375,686 208,676 Supplies 545,875 545,875 551,403 (5,528) Other services and charges 947,298 1,047,298 636,636 410,662 Interest expense - 100,000 87,965 12,035 Capital outlay 1,150,000 3,450,000 990,591 2,459,409 Intergovernmental - - 2,430 (2,430) Interdepartmental 318,169 318,169 305,870 12,299
Total Expenditures 4,545,704 7,045,704 3,950,581 3,095,123
Budgetary Surplus (Loss) 115,194$ (134,806)$ 2,631,000 2,765,806$
Net Position - GAAP Basis, January 1 65,853,245 Capitalization of asset purchases 990,591 Depreciation (3,421,290)
Net Position - GAAP Basis, December 31 66,053,546$
Budget

Page 148
COMBINING STATEMENT OF NET POSITIONINTERNAL SERVICE FUNDSDecember 31, 2015
Workers' Self- Employee FleetCompensation Insurance Benefits Services Total
AssetsCurrent Assets:
Cash, pooled cash and investments 1,811,374$ 2,446,949$ 5,007,526$ 12,793,282$ 22,059,131$ Other receivables - 20,595 3,700 44,568 68,863 Inventories - - - 524,539 524,539 Other current assets 251,940 235,864 353,864 - 841,668
Total Current Assets 2,063,314 2,703,408 5,365,090 13,362,389 23,494,201
Noncurrent Assets:Depreciable capital assets and infrastructure, net - - - 16,038,235 16,038,235
Total Noncurrent Assets - - - 16,038,235 16,038,235
Total Assets 2,063,314$ 2,703,408$ 5,365,090$ 29,400,624$ 39,532,436$
LiabilitiesCurrent Liabilities:
Accounts payable 8,921$ 7,667$ 484,443$ 227,069$ 728,100$ Accrued salaries - 17,579 16,490 92,525 126,594 Other accrued liabilities 1,199,686 288,335 1,097,487 - 2,585,508 Compensated absences - - - 28,230 28,230
Total Current Liabilities 1,208,607 313,581 1,598,420 347,824 3,468,432
Noncurrent Liabilities:Compensated absences - 8,442 22,212 255,238 285,892
Total Noncurrent Liabilities - 8,442 22,212 255,238 285,892 Total Liabilities 1,208,607 322,023 1,620,632 603,062 3,754,324
Net PositionInvested in capital assets - - - 16,038,235 16,038,235 Restricted for:
Fleet replacement - - - 11,466,091 11,466,091 Unrestricted 854,707 2,381,385 3,744,458 1,293,236 8,273,786
Total Net Position 854,707$ 2,381,385$ 3,744,458$ 28,797,562$ 35,778,112$
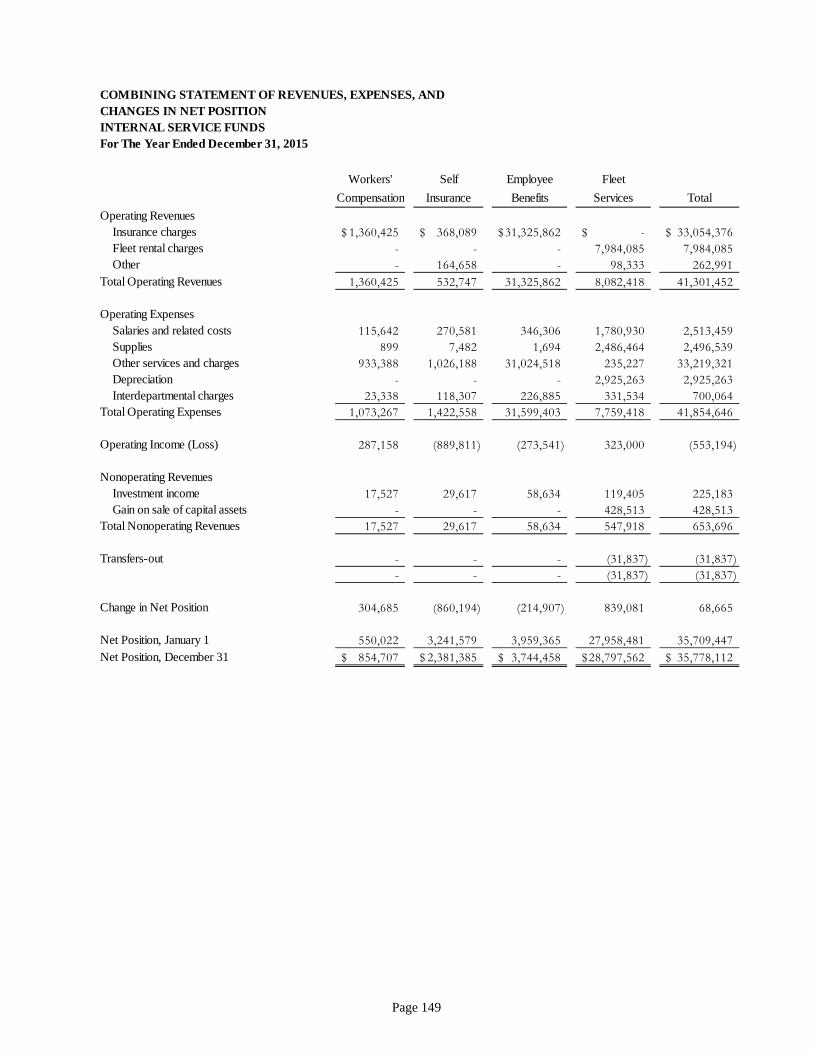
Page 149
COMBINING STATEMENT OF REVENUES, EXPENSES, AND CHANGES IN NET POSITIONINTERNAL SERVICE FUNDSFor The Year Ended December 31, 2015
Workers' Self Employee Fleet
Compensation Insurance Benefits Services Total
Operating RevenuesInsurance charges 1,360,425$ 368,089$ 31,325,862$ -$ 33,054,376$ Fleet rental charges - - - 7,984,085 7,984,085 Other - 164,658 - 98,333 262,991
Total Operating Revenues 1,360,425 532,747 31,325,862 8,082,418 41,301,452
Operating ExpensesSalaries and related costs 115,642 270,581 346,306 1,780,930 2,513,459 Supplies 899 7,482 1,694 2,486,464 2,496,539 Other services and charges 933,388 1,026,188 31,024,518 235,227 33,219,321 Depreciation - - - 2,925,263 2,925,263 Interdepartmental charges 23,338 118,307 226,885 331,534 700,064
Total Operating Expenses 1,073,267 1,422,558 31,599,403 7,759,418 41,854,646
Operating Income (Loss) 287,158 (889,811) (273,541) 323,000 (553,194)
Nonoperating RevenuesInvestment income 17,527 29,617 58,634 119,405 225,183 Gain on sale of capital assets - - - 428,513 428,513
Total Nonoperating Revenues 17,527 29,617 58,634 547,918 653,696
Transfers-out - - - (31,837) (31,837) - - - (31,837) (31,837)
Change in Net Position 304,685 (860,194) (214,907) 839,081 68,665
Net Position, January 1 550,022 3,241,579 3,959,365 27,958,481 35,709,447 Net Position, December 31 854,707$ 2,381,385$ 3,744,458$ 28,797,562$ 35,778,112$

Page 150
COMBINING STATEMENT OF CASH FLOWS
INTERNAL SERVICE FUNDS
For the Year Ended December 31, 2015Workers Self Employee Fleet
Compensation Insurance Benefits Services TotalCash Flows from Operating Activities
Cash Received From:Insurance charges 1,360,425$ 349,238$ 31,337,476$ -$ 33,047,139$ Rental income - - - 7,997,106 7,997,106 Other - 180,522 - 98,333 278,855
Cash Payments to or on Behalf of:Employees (115,642) (272,273) (344,580) (1,810,142) (2,542,637) Suppliers (955,304) (1,027,881) (30,799,102) (2,528,222) (35,310,509) Others (734,268) (329,972) (340,756) (331,534) (1,736,530)
Net Cash Provided (Used) by Operating Activities (444,789) (1,100,366) (146,962) 3,425,541 1,733,424
Cash Flows from Noncapital Financing ActivitiesTransfers-out - - - (31,837) (31,837)
Net Cash Flows Used by Noncapital Financing Activities - - - (31,837) (31,837)
Cash Flows from Capital and Related Financing ActivitiesProceeds from the sale of capital assets - - - 428,513 428,513 Cash paid for acquisition of capital assets - - - (3,566,935) (3,566,935)
Net Cash Flows Used by Capital and Related Financing Activities - - - (3,138,422) (3,138,422)
Cash Flows from Investing ActivitiesInvestment income 17,527 29,617 58,634 119,405 225,183
Net Cash Flows Provided by Investing Activities 17,527 29,617 58,634 119,405 225,183
Net Increase (Decrease) in Cash and Cash Equivalents (427,262) (1,070,749) (88,328) 374,687 (1,211,652)
Cash and Cash Equivalents - Beginning of Year 2,238,636 3,517,698 5,095,854 12,418,595 23,270,783
Cash and Cash Equivalents - End of Year 1,811,374$ 2,446,949$ 5,007,526$ 12,793,282$ 22,059,131$
Reconciliation of Operating Income (Loss) to Net Cash Provided (Used) by Operating Activities
Operating Income (Loss) 287,158$ (889,811)$ (273,541)$ 323,000$ (553,194)$ Adjustments to Reconcile Operating Income (Loss) to Net
Cash Provided (Used) by Operating Activities:Depreciation - - - 2,925,263 2,925,263 (Increase) Decrease of Assets:
Other receivables - (18,851) 11,614 13,021 5,784 Inventories - - - (13,490) (13,490) Other current assets (10,616) 15,864 - - 5,248
Increase (Decrease) of Liabilities:Accounts payable (21,017) 5,789 227,110 206,959 418,841 Accrued salaries and benefits - (1,692) 1,726 (29,212) (29,178) Other accrued liabilities (700,314) (211,665) (113,871) - (1,025,850)
Net Cash Provided (Used) by Operating Activities (444,789)$ (1,100,366)$ (146,962)$ 3,425,541$ 1,733,424$

Page 151
SCHEDULE OF REVENUES, EXPENDITURES, AND CHANGES IN NET POSITIONBUDGET AND ACTUAL - BUDGETARY BASISWORKERS' COMPENSATION INTERNAL SERVICE FUNDFor The Year Ended December 31, 2015
VarianceWith Final
Original Final Actual BudgetRevenues
Insurance charges 1,398,233$ 1,398,233$ 1,360,425$ (37,808)$ Investment income 32,533 32,533 17,527 (15,006)
Total Revenues 1,430,766 1,430,766 1,377,952 (52,814)
ExpendituresPersonnel services 151,332 151,332 115,642 35,690 Supplies 1,500 1,500 899 601 Other services and charges 1,349,562 1,349,562 933,388 416,174 Interdepartmental 23,338 23,338 23,338 -
Total Expenditures 1,525,732 1,525,732 1,073,267 452,465
Budgetary Surplus (Loss) (94,966)$ (94,966)$ 304,685 399,651$
Net Position - GAAP Basis, January 1 550,022 Net Position - GAAP Basis, December 31 854,707$
Budget

Page 152
SCHEDULE OF REVENUES, EXPENDITURES, AND CHANGES IN NET POSITIONBUDGET AND ACTUAL - BUDGETARY BASISSELF INSURANCE INTERNAL SERVICE FUNDFor The Year Ended December 31, 2015
VarianceWith Final
Original Final Actual BudgetRevenues
Insurance charges 1,104,266$ 1,104,266$ 368,089$ (736,177)$ Investment income 30,883 30,883 29,617 (1,266) Other - - 164,658 164,658
Total Revenues 1,135,149 1,135,149 562,364 (572,785)
ExpendituresPersonnel services 255,865 270,581 270,581 - Supplies 3,867 7,482 7,482 - Other services and charges 1,190,276 1,171,945 1,026,188 145,757 Interdepartmental 119,125 119,125 118,307 818
Total Expenditures 1,569,133 1,569,133 1,422,558 146,575
Budgetary Loss (433,984)$ (433,984)$ (860,194) (426,210)$
Net Position - GAAP Basis, January 1 3,241,579 Net Position - GAAP Basis, December 31 2,381,385$
Budget
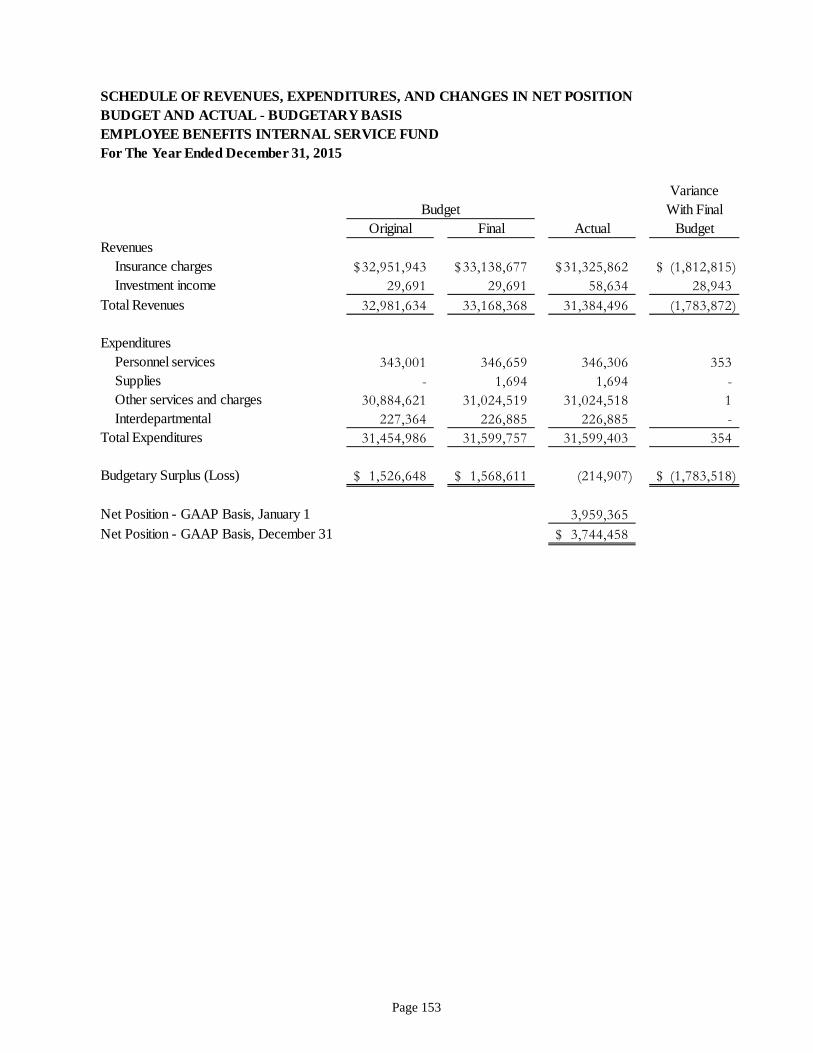
Page 153
SCHEDULE OF REVENUES, EXPENDITURES, AND CHANGES IN NET POSITIONBUDGET AND ACTUAL - BUDGETARY BASISEMPLOYEE BENEFITS INTERNAL SERVICE FUNDFor The Year Ended December 31, 2015
VarianceWith Final
Original Final Actual BudgetRevenues
Insurance charges 32,951,943$ 33,138,677$ 31,325,862$ (1,812,815)$ Investment income 29,691 29,691 58,634 28,943
Total Revenues 32,981,634 33,168,368 31,384,496 (1,783,872)
ExpendituresPersonnel services 343,001 346,659 346,306 353 Supplies - 1,694 1,694 - Other services and charges 30,884,621 31,024,519 31,024,518 1 Interdepartmental 227,364 226,885 226,885 -
Total Expenditures 31,454,986 31,599,757 31,599,403 354
Budgetary Surplus (Loss) 1,526,648$ 1,568,611$ (214,907) (1,783,518)$
Net Position - GAAP Basis, January 1 3,959,365 Net Position - GAAP Basis, December 31 3,744,458$
Budget
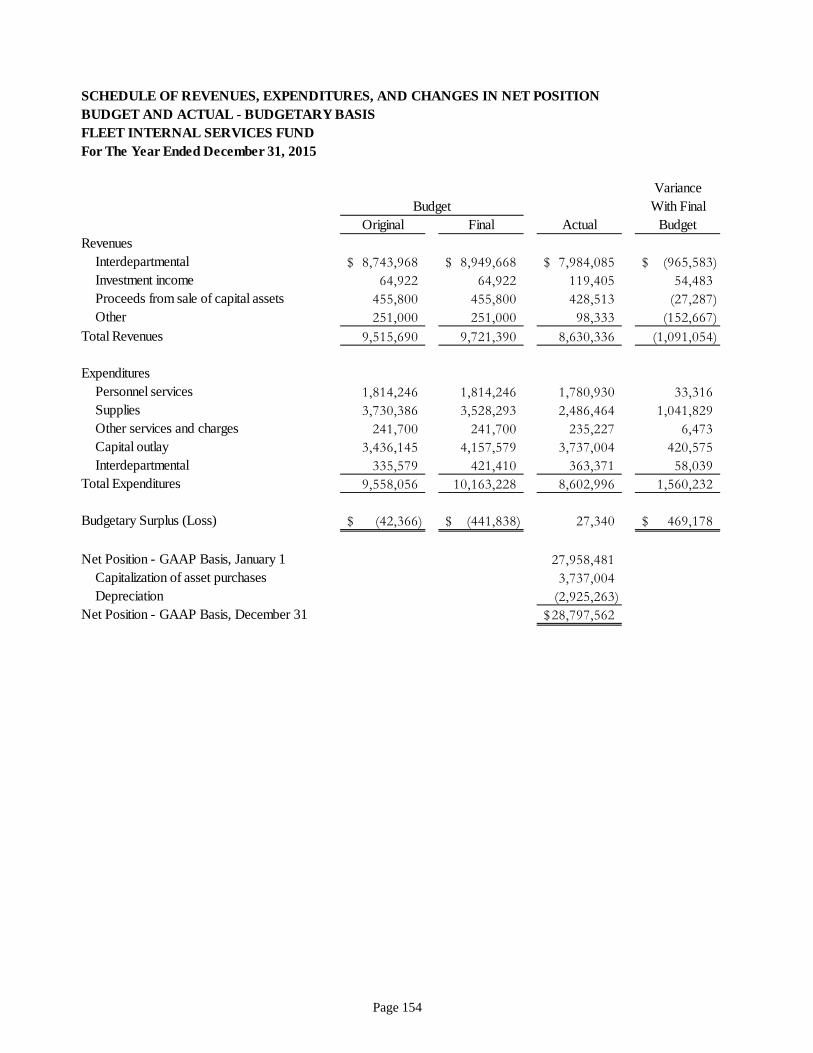
Page 154
SCHEDULE OF REVENUES, EXPENDITURES, AND CHANGES IN NET POSITIONBUDGET AND ACTUAL - BUDGETARY BASISFLEET INTERNAL SERVICES FUNDFor The Year Ended December 31, 2015
VarianceWith Final
Original Final Actual BudgetRevenues
Interdepartmental 8,743,968$ 8,949,668$ 7,984,085$ (965,583)$ Investment income 64,922 64,922 119,405 54,483 Proceeds from sale of capital assets 455,800 455,800 428,513 (27,287) Other 251,000 251,000 98,333 (152,667)
Total Revenues 9,515,690 9,721,390 8,630,336 (1,091,054)
ExpendituresPersonnel services 1,814,246 1,814,246 1,780,930 33,316 Supplies 3,730,386 3,528,293 2,486,464 1,041,829 Other services and charges 241,700 241,700 235,227 6,473 Capital outlay 3,436,145 4,157,579 3,737,004 420,575 Interdepartmental 335,579 421,410 363,371 58,039
Total Expenditures 9,558,056 10,163,228 8,602,996 1,560,232
Budgetary Surplus (Loss) (42,366)$ (441,838)$ 27,340 469,178$
Net Position - GAAP Basis, January 1 27,958,481 Capitalization of asset purchases 3,737,004 Depreciation (2,925,263)
Net Position - GAAP Basis, December 31 28,797,562$
Budget
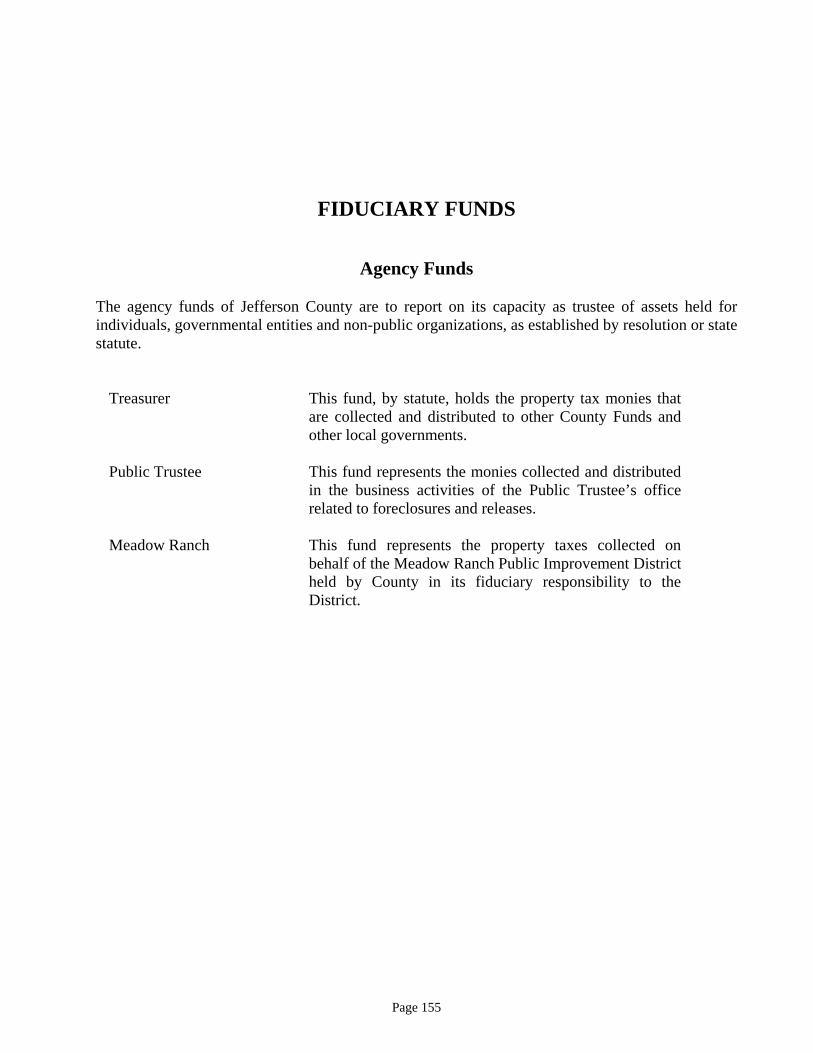
Page 155
FIDUCIARY FUNDS
Agency Funds The agency funds of Jefferson County are to report on its capacity as trustee of assets held for individuals, governmental entities and non-public organizations, as established by resolution or state statute.
Treasurer This fund, by statute, holds the property tax monies that are collected and distributed to other County Funds and other local governments.
Public Trustee
This fund represents the monies collected and distributed in the business activities of the Public Trustee’s office related to foreclosures and releases.
Meadow Ranch This fund represents the property taxes collected on behalf of the Meadow Ranch Public Improvement District held by County in its fiduciary responsibility to the District.

Page 156
COMBINING STATEMENT OF CHANGES IN FIDUCIARY ASSETS AND LIABILITIESFor the Year Ended December 31, 2015
Balance BalanceJanuary 1 Additions Deductions December 31
Treasurer's Agency FundAssets
Cash, pooled cash and investments 24,994,510$ 1,123,507,390$ 1,124,310,717$ 24,191,183$ Taxes receivable 81,914 546,823,147 546,859,143 45,918$
Total Assets 25,076,424$ 1,670,330,537$ 1,671,169,860$ 24,237,101$
LiabilitiesAccounts payable 3,924,746$ 44,622,412$ (44,693,448)$ 3,853,710$ Other accrued liabilities 394,047 592,063,126 (592,311,995) 145,178$ Due to other governments 10,083,803 10,514,707 (10,761,335) 9,837,175$ Funds held in custody for others 10,673,828 9,158,188 (9,430,978) 10,401,038$
Total Liabilities 25,076,424$ 656,358,433$ (657,197,756)$ 24,237,101$
Public Trustee Agency FundAssets
Cash, pooled cash and investments 1,021,486$ 40,270,959$ (40,028,746)$ 1,263,699$ Total Assets 1,021,486$ 40,270,959$ (40,028,746)$ 1,263,699$
LiabilitiesFunds held in custody for others 1,021,486$ 40,270,959$ (40,028,746)$ 1,263,699$
Total Liabilities 1,021,486$ 40,270,959$ (40,028,746)$ 1,263,699$
Meadow Ranch Agency FundAssets
Cash, pooled cash and investments 183,561$ 156,000$ (136,182)$ 203,379$ Total Assets 183,561$ 156,000$ (136,182)$ 203,379$
LiabilitiesDue to other governments 183,561$ 156,000$ (136,182)$ 203,379$
Total Liabilities 183,561$ 156,000$ (136,182)$ 203,379$
Total All Agency FundsAssets
Cash, pooled cash and investments 19,937,221$ 1,163,934,349$ (1,158,213,309)$ 25,658,261$ Taxes receivable 51,320 546,823,147 (546,828,549) 45,918
Total Assets 19,988,541$ 1,710,757,496$ (1,705,041,858)$ 25,704,179$
LiabilitiesAccounts payable 3,244,748$ 44,622,412$ (44,013,450)$ 3,853,710$ Other accrued liabilities 340,228 592,063,126 (592,258,176) 145,178 Due to other governments 9,214,460 10,670,707 (9,844,613) 10,040,554 Funds held in custody for others 7,189,105 49,429,147 (44,953,515) 11,664,737
Total Liabilities 19,988,541$ 696,785,392$ (691,069,754)$ 25,704,179$

Page 157
COMPONENT UNITS
Public Library This fund is a budgetary fund that accounts for the monies received from property taxes and other sources and expended to provide library services countywide.
Public Health This is a budgetary fund that accounts for monies received from state and federal grants, licenses, permits, other fees, and funding from the General Fund, and expended for countywide public health programs.

Page 158
BALANCE SHEETCOMPONENT UNITSDecember 31, 2015
Public PublicLibrary Health
AssetsCash, pooled cash and investments 13,708,926$ 967,870$ Taxes receivable 33,034,868 - Other receivables 6,811 109,048 Due from other governments - 1,541,129 Inventories 82,529 - Other current assets 357,499 174,948
Total Assets 47,190,633$ 2,792,995$
LiabilitiesAccounts payable 192,209$ 191,741$ Accrued salaries 716,469 537,750 Other accrued liabilities - 100 Unavailable revenue - 330,853
Total Liabilities 908,678 1,060,444
Deferred Inflows of ResourcesUnavailable property tax revenue 33,173,453 -
Total Deferred Inflows of Resources 33,173,453 -
Fund BalancesNonspendable 440,028 174,948 Restricted - 1,557,603 Assigned 12,668,474 -
Total Fund Balances 13,108,502 1,732,551
Total Liabilities and Fund Balances 47,190,633$ 2,792,995$

Page 159
RECONCILIATION OF COMPONENT UNITS FUND BALANCES
TO THE STATEMENT OF NET POSITION
December 31, 2015
Public Public
Library Health
Total Component Unit Fund Balances 13,108,502$ 1,732,551$
Amounts reported for component units in the
statement of activities are different because:
Capital assets used in component units are not financial
resources and therefore not reported in the funds.
Depreciable capital assets and infrastructure, net 19,410,933 30,032
Land and nondepreciable infrastructure 1,248,056 315,482
Long-term liabilities, including capital leases and compensated
absences, are not due and payable in the current period and
therefore not reported in the funds.
Compensated absences (956,457) (634,884)
Net Position of Component Units 32,811,034$ 1,443,181$

Page 160
STATEMENT OF REVENUES, EXPENDITURES, ANDCHANGES IN FUND BALANCECOMPONENT UNITSFor The Year Ended December 31, 2015
Public PublicLibrary Health
RevenuesTaxes and special assessments 23,623,522$ -$ Intergovernmental 204,448 6,661,716 Charges for services 99,643 2,082,800 Fines and forfeitures 621,284 - Investment income 172,372 4,763 Donations and contributions 155,426 - Funding from Jefferson County 3,330 4,812,728 Miscellaneous 93,956 3,806
Total Revenues 24,973,981 13,565,813
ExpendituresCurrent:
Health - 12,987,320 Culture and recreation 23,943,067 -
Capital Outlay:Health - 334,735 Culture and recreation 169,878 -
Intergovernmental - 243,758 Total Expenditures 24,112,945 13,565,813
Excess (Deficiency) of RevenuesOver Expenditures 861,036 -
Other Financing SourcesProceeds from sale of capital assets 1,821 -
Total Other Financing Sources 1,821 -
Net Change In Fund Balance 862,857 -
Fund Balance, January 1 12,245,645 1,732,551
Fund Balance, December 31 13,108,502$ 1,732,551$

Page 161
RECONCILIATION OF THE STATEMENT OF REVENUES,EXPENDITURES, AND CHANGES IN FUND BALANCES OFCOMPONENT UNITS TO THE STATEMENT OF ACTIVITIESFor The Year Ended December 31, 2015
Public PublicLibrary Health
Net Change in Component Unit Fund Balances 862,857$ -$
Amounts reported for component units in the statement ofactivities are different because:
Component units report capital outlays as expenditures; however, in thestatement of activities the cost of those assets is capitalized andallocated over the estimated useful lives as depreciation expense.This is the amount by which depreciation exceeded capital outlaysin the current period.
Capital asset additions 169,878 334,735 Donation of capital assets 679,016 - Library collection additions 2,375,107 - Depreciation expense (5,969,168) (18,031)
(Excess) Deficiency of depreciation over capital outlays (2,745,167) 316,704
Some expenses reported in the statement of activities do not require theuse of current financial resources and therefore are not reported asexpenditures in the component units.
Compensated absences 57,136 78,695 57,136 78,695
Changes in Net Position of Component Units (1,825,174)$ 395,399$

Page 162
SCHEDULE OF REVENUES, EXPENDITURES, ANDCHANGES IN FUND BALANCE - BUDGET AND ACTUALJEFFERSON COUNTY PUBLIC LIBRARYFor The Year Ended December 31, 2015
VarianceWith Final
Original Final Actual BudgetRevenues
Taxes:General property 23,667,631$ 23,667,631$ 23,603,116$ (64,515)$ Interest and penalties 24,240 24,240 20,406 (3,834)
Subtotal Taxes 23,691,871 23,691,871 23,623,522 (68,349)
Intergovernmental 108,000 108,000 204,448 96,448 Charges for services 161,325 161,325 99,643 (61,682) Fines and forfeitures 646,480 646,480 621,284 (25,196) Investment income 135,715 135,715 172,372 36,657 Rental income 13,500 13,500 11,914 (1,586) Donations and contributions 200,000 200,000 155,426 (44,574) Contribution from Jefferson County - - 3,330 3,330 Miscellaneous 107,300 107,300 82,042 (25,258)
Total Revenues 25,064,191 25,064,191 24,973,981 (90,210)
ExpendituresPersonnel services 14,493,057 14,093,057 13,495,603 597,454 Books and periodicals 1,955,000 3,481,171 3,433,872 47,299 Supplies 1,945,820 971,182 1,284,441 (313,259) Other services and charges 4,867,608 3,697,906 2,958,897 739,009 Capital outlay 553,389 429,219 169,878 259,341 Services from Jefferson County 1,249,317 2,860,917 2,770,254 90,663
Total Expenditures 25,064,191 25,533,452 24,112,945 1,420,507
Budgetary Surplus (Loss) -$ (469,261)$ 861,036 1,330,297$
Net Position - GAAP Basis, January 1 34,636,208 Capital outlay and collection development 2,544,985 Depreciation (5,969,168) Change in long-term compensated absences liability 57,136 Donation of capital assets 679,016 Proceeds from sale of capital assets 1,821
Net Position - GAAP Basis, December 31 32,811,034$
Budget

Page 163
SCHEDULE OF REVENUES, EXPENDITURES, ANDCHANGES IN FUND BALANCE - BUDGET AND ACTUALJEFFERSON COUNTY PUBLIC HEALTHFor The Year Ended December 31, 2015
VarianceWith Final
Original Final Actual BudgetRevenues
Intergovernmental 5,819,041$ 5,979,041$ 6,661,716$ 682,675$ Charges for services 1,981,169 1,981,169 2,082,800 101,631 Investment income 20,331 20,331 4,763 (15,568) Contribution from Jefferson County 6,815,918 6,935,918 4,812,728 (2,123,190) Miscellaneous - - 3,806 3,806
Total Revenues 14,636,459 14,916,459 13,565,813 (1,350,646)
ExpendituresPersonnel services 10,753,825 10,708,825 10,078,259 630,566 Supplies 592,039 592,039 508,308 83,731 Other services and charges 1,333,916 2,178,416 1,490,456 687,960 Capital outlay 803,500 300,000 334,735 (34,735) Intergovernmental 238,000 238,000 243,758 (5,758) Services from Jefferson County 915,179 915,179 910,297 4,882
Total Expenditures 14,636,459 14,932,459 13,565,813 1,366,646
Budgetary Surplus (Loss) -$ (16,000)$ - 16,000$
Net Position - GAAP Basis, January 1 1,047,782 Capital outlay 334,735 Depreciation (18,031) Change in long-term compensated absences liability 78,695
Net Position - GAAP Basis, December 31 1,443,181$
Budget

Page 164
Sheriff’s deputies patrol unincorporated Jefferson County around the clock, responding to emergencies and requests for assistance and enforcing criminal and traffic laws. Deputies work out of three community-based stations in the south, north and mountain areas of the county. With a patrolling responsibility to 189,720 residents in unincorporated areas of the 773 square miles of the county, day and night, deputies respond to calls for service and provide crime-prevention education to citizens.

Page 165
Supplementary Information Required by the
Colorado Department of Human Services
Note RSI-3 Electronic Benefits Transfer
Pursuant to Colorado Revised Statutes 26-1-122(2)(b) and 26-2-104 the Human Services Department was converted to the Colorado Electronic Benefit Transfer System on October 1, 1997. The method of payment to recipients and service providers changed from a paper warrant system to an electronic debit card or direct deposit system. These electronic payments are processed by the State of Colorado, and are not included in the County’s general purpose financial statements; however, the County continues to be responsible for administering the underlying programs to which these payments relate and for determining eligibility of the participants.
The programs in which the County participates that have been converted to EBT include the Colorado Works/Jobs, Child Care, Child Welfare, Low Income Energy Assistance, Aid to the Blind, Aid to the Needy and Disabled, Old Age Pension and Supplemental Nutrition Assistance Programs.

Page 166
Total County County Total Total
EBT Share of Warrants Authorizations & County Expenditures
Authorizations Authorizations Issued Warrants Issued
JDE CFMS
CO Works Administration-4100, 4125,4200, 4201,4210, 4211 5,275,990 947,262 3,576,633 8,852,623 4,523,894
Child Care Admin.-2100,2150,2250,2300 4,197,006 497,204 1,079,486 5,276,492 1,576,690
CW Administration 100%-1220 12,985,054 2,568,751 16,685,002 29,670,056 19,253,753
Cty Administration-1540, 4010, 7000 - - 8,376,596 8,376,596 8,376,596
Non Allocated Programs - 4020, 4021,4970,4290 36,822 35,290 65,544 102,366 100,834
Core -County Administration - 100% 3,355,155 519,742 1,298,194 4,653,349 1,817,937
Child Support Enforcement-8000, 770,609 762,570 4,335,008 5,105,618 5,097,579
LEAP Administration-5100,5200 2,278,050 - 186,105 2,464,154 186,105
1011 Adult Protective Services Payroll and Operating 38,658 7,732 1,033,461 1,072,119 1,041,193
4760 Aid to the Blind 281 56 - 281 56
Aid to Needy Disabled- Payroll & Operating 1,078,865 215,773 - 1,078,865 215,773
Home Care Allowance-4600,4610,4650, 4660 235,270 11,764 - 235,270 11,764
SSI-Home Care Allowance- 4680 273,048 13,652 - 273,048 13,652
OAP Admin-Allocated Payroll and Operating4075 7,700,145 - 201,000 7,901,144 201,000
Food Assistance Fraud-4400 50,791,306 44,321 399,978 51,191,284 444,299
Employment First-6150, 6100, 6000 Cty PaidEBT (9) - 190,812 190,803 190,812
CHILD SUPPORT GRANTS-8096 CO-PEP - - 95,949 95,949 95,949
IV-E Waiver 225,081 - 359,328 584,408 359,328
Child Welfare Discretionary Grants 300,045 - 404,134 704,179 404,134
Case Worker Training-1254, 1293 - - 159 159 159
Child Care Quality and Availibility 3,314 - 2,630 5,943 2,630
PSSF 11,926 - 138,110 150,036 138,110
IV-E Independent Living-2850 24,912 - 125,245 150,157 125,245
Common Supportive Training-4100 - - 805 805 805
Single Entry Point-1280 - - 2,513,866 2,513,866 2,513,866
Cty Wide Cost Alloc. Plan Pass Thru-9800 - - 1,950,619 1,950,619 1,950,619
TANF Collections-EBT-SCL Ref 4150,4151,4220,4226 (33,213) (6,643) - (33,213) (6,643)
Audit Adjustments-EBT (3,218) - (3,218) -
Medicaid Collections-4340 4350 (17,133) - - (17,133) -
TANF SCL IV-D 8500 (958,104) (191,621) (958,104) (191,621)
Other Local Sources-9900 208,809 208,809 202,686 411,496 411,496
Integrated Care Management - - 211,062 211,062 211,062
TOTAL EBT & Admin CFMS 88,778,670 5,634,662 43,432,412 132,211,080 49,067,077

Page 167
OTHER REPORT
The Local Highway Finance Report is required to be submitted annually to the Colorado Department of Transportation as part of the mileage certification process.

Page 168
Financial Planning 02/01
T he public report burden for this information collection is estimated to average 380 hours annually. Form # 350-050-36
City or County:Jefferson CountyYEAR ENDING :December 2015
This Information From The Records Of the County of Jefferson Prepared By: Joyce Neal, Sr. Financial AnalystPhone: 303-271-8535
A. Local B. Local C. Receipts from D. Receipts from Motor-Fuel Motor-Vehicle State Highway- Federal Highway
Taxes Taxes User Taxes Administration1. Total receipts available2. Minus amount used for collection expenses3. Minus amount used for nonhighway purposes4. Minus amount used for mass transit5. Remainder used for highway purposes
AMOUNT AMOUNTA. Receipts from local sources: A. Local highway disbursements: 1. Local highway-user taxes 1. Capital outlay (from page 2) 15,903,380 a. Motor Fuel (from Item I.A.5.) 2. Maintenance: 11,090,820 b. Motor Vehicle (from Item I.B.5.) 3. Road and street services: c. Total (a.+b.) a. Traffic control operations 289,499 2. General fund appropriations b. Snow and ice removal 6,119,497 3. Other local imposts (from page 2) 28,919,133 c. Other - Payments to Cities 2,851,821 4. Miscellaneous local receipts (from page 2) 3,353,287 d. Total (a. through c.) 9,260,817 5. Transfers from toll facilities 4. General administration & miscellaneous 7,993,682 6. Proceeds of sale of bonds and notes: 5. Highway law enforcement and safety 418,486 a. Bonds - Original Issues 6. Total (1 through 5) 44,667,184 b. Bonds - Refunding Issues B. Debt service on local obligations: c. Notes 1. Bonds: d. Total (a. + b. + c.) 0 a. Interest 157,182 7. Total (1 through 6) 32,272,420 b. Redemption 1,175,000B. Private Contributions c. Total (a. + b.) 1,332,182C. Receipts from State government 2. Notes: (from page 2) 15,027,793 a. InterestD. Receipts from Federal Government b. Redemption (from page 2) 579,388 c. Total (a. + b.) 0E. Total receipts (A.7 + B + C + D) 47,879,601 3. Total (1.c + 2.c) 1,332,182
C. Payments to State for highways D. Payments to toll facilitiesE. Total disbursements (A.6 + B.3 + C + D) 45,999,366
Opening Debt Amount Issued Redemptions Closing DebtA. Bonds (Total) 9,490,000 1,175,000 8,315,000 1. Bonds (Refunding Portion)B. Notes (Total) 0
A. Beginning Balance B. Total Receipts C. Total Disbursements D. Ending Balance E. Reconciliation4,258,284 47,879,601 45,999,366 6,138,519 (0)
Notes and Comments:Note: Budgeted transportation capital projects carried over from 2015 to 2016 totaled $5,477,333. Projects were delayed for various reasons.
FORM FHWA-536 (Rev. 1-05) PREVIOUS EDITIONS OBSOLETE (Next Page)
V. LOCAL ROAD AND STREET FUND BALANCE
ITEM
II. RECEIPTS FOR ROAD AND STREET PURPOSES
IV. LOCAL HIGHWAY DEBT STATUS(Show all entries at par)
ITEM AND STREET PURPOSES
LOCAL HIGHWAY FINANCE REPORT
I. DISPOSITION OF HIGHWAY-USER REVENUES AVAILABLE FOR LOCAL GOVERNMENT EXPENDITURE
ITEM
III. DISBURSEMENTS FOR ROAD

Page 169
STATE:ColoradoYEAR ENDING (mm/yy):December 2015
AMOUNT AMOUNTA.3. Other local imposts: A.4. Miscellaneous local receipts: a. Property Taxes and Assessments 9,511,604 a. Interest on investments 337,009 b. Other local imposts: b. Traffic Fines & Penalities 528,596 1. Sales Taxes 5,294,312 c. Parking Garage Fees 2. Infrastructure & Impact Fees 1,401,211 d. Parking Meter Fees 3. Liens e. Sale of Surplus Property 4. Licenses f. Charges for Services 154,280 5. Specific Ownership &/or Other 12,712,005 g. Other Misc. Receipts 1,747,226 6. Total (1. through 5.) 19,407,529 h. Other 586,176 c. Total (a. + b.) 28,919,133 i. Total (a. through h.) 3,353,287
(Carry forward to page 1) (Carry forward to page 1)
AMOUNT AMOUNTC. Receipts from State Government D. Receipts from Federal Government 1. Highway-user taxes 14,076,344 1. FHWA (from Item I.D.5.) 2. State general funds 2. Other Federal agencies: 3. Other State funds: a. Forest Service 54,896 a. State bond proceeds b. FEMA Flood - Pass Through State 307,371 b. Project Match c. HUD c. Motor Vehicle Registrations 762,518 d. Federal Transit Admin d. Other - State FEMA Dollars 51,228 e. U.S. Corps of Engineers e. Other - Faster 137,703 f. Other Federal Through State 217,122 f. Total (a. through e.) 951,449 g. Total (a. through f.) 579,388 4. Total (1. + 2. + 3.f) 15,027,793 3. Total (1. + 2.g)
(Carry forward to page 1)
ON NATIONAL OFF NATIONALHIGHWAY HIGHWAY TOTALSYSTEM SYSTEM
(a) (b) (c)A.1. Capital outlay: a. Right-Of-Way Costs 132,817 132,817 b. Engineering Costs 1,727,364 1,727,364 c. Construction: (1). New Facilities 0 0 (2). Capacity Improvements 3,292,865 3,292,865 (3). System Preservation 7,002,661 7,002,661 (4). System Enhancement & Operation 3,747,674 3,747,674 (5). Total Construction (1) + (2) + (3) + (4) 0 14,043,199 14,043,199 d. Total Capital Outlay (Lines 1.a. + 1.b. + 1.c.5) 0 15,903,380 15,903,380
(Carry forward to page 1)
Notes and Comments:Note: $120,000 was donated to CDOT for the Genesee Bike Path which is recorded under system enhancements.
FORM FHWA-536 (Rev.1-05) PREVIOUS EDITIONS OBSOLETE
III. DISBURSEMENTS FOR ROAD AND STREET PURPOSES - DETAIL
II. RECEIPTS FOR ROAD AND STREET PURPOSES - DETAIL
LOCAL HIGHWAY FINANCE REPORT
ITEM ITEM
ITEM ITEM

Page 170
The Detention Services Division strives to maintain a safe and secure facility, respond to community needs, and provide a variety of inmate services and programs for stability and enrichment. The Inmate Services Unit is comprised of 29 civilian professionals who process booking, and bonding as well as update court paperwork, administer visitations, and release inmates. The average daily population within the facility infrastructure is 1,203 inmates. The average length of stay is 24 days.

Page 171
STATISTICAL SECTION (Unaudited)
This part of Jefferson County’s comprehensive annual financial report presents detailed information as a framework for understanding this year’s financial statements, note disclosures, and supplementary information. Most of the schedules in this section include data for the County only and do not include the County’s discretely presented component units. Information regarding the discretely presented component units, however, was included in the Operating Information tables to present a complete picture of the services Jefferson County provides to its citizens. Page Financial Trends - These schedules contain trend information that may aid the reader in evaluating
the County’s current financial performance by placing it in historical perspective. Net position by component 172 Changes in net position 174 Fund balances, governmental funds 176 Changes in fund balances, governmental funds 178 Revenue Capacity - These schedules contain information that may aid the reader in assessing the County’s most significant sources of revenue. Assessed and estimated actual value of taxable property 180 Direct and overlapping governments property tax rates 182 Ten principal property tax payers 184 Property tax levies and collections 185 Debt Capacity -These schedules present information that may aid the reader in analyzing the extent of the County’s current level of debt and the County’s ability to issue debt in the
future. Jefferson County has elected not to present the Direct and Overlapping Governmental Activities Debt Schedule.
Legal debt margin information 186 Ratios of outstanding debt 188 Pledged revenue bond coverage – Southeast Jefferson County LID revenue bonds 190 Pledged revenue bond coverage – Open Space revenue bonds 191 Demographic and Economic Information - These schedules offer economic and demographic
indicators that are commonly used for financial analysis and that may aid the reader in understanding the County’s present and ongoing financial status.
Demographic and economic statistics 192 Principal employers 193 Operating Information - These schedules contain service and infrastructure indicators that
may aid the reader in ascertaining how the information in the County’s financial statements relate to the services the County provides and the activities it performs.
Full-time-equivalent county employees 194 Operating indicators by function 196 Capital asset statistics by function 200 Data Source: Unless otherwise noted, the information in these schedules is derived from the comprehensive annual financial reports for the relevant year. The County implemented GASB Statement No. 34 in the calendar year 2002.

Page 172
2015 2014 2013 2012
Governmental activitiesNet investment in capital assets 943,170,744$ 919,719,563$ 914,161,816$ 895,065,819$ Restricted 104,165,670 102,507,360 98,826,460 101,629,663 Unrestricted 66,814,086 69,078,565 59,489,749 60,491,578
Total governmental activities net position 1,114,150,500$ 1,091,305,488$ 1,072,478,025$ 1,057,187,060$
Business-type activities
Net investment in capital assets 62,264,972$ 64,481,002$ 53,614,715$ 48,256,372$ Restricted 1,175,000 1,175,000 1,175,000 - Unrestricted 2,613,574 197,243 30,741 789,747
Total business-type activities net position 66,053,546$ 65,853,245$ 54,820,456$ 49,046,119$
Primary government
Net investment in capital assets 1,005,435,716$ 984,200,565$ 967,776,531$ 943,322,191$ Restricted 105,340,670 103,682,360 100,001,460 101,629,663 Unrestricted 69,427,660 69,275,808 59,520,490 61,281,325
Total primary government net position 1,180,204,046$ 1,157,158,733$ 1,127,298,481$ 1,106,233,179$
Fiscal Year
NET POSITION BY COMPONENTLast Ten Fiscal Years
Schedule 1(accrual basis of accounting)

Page 173
2011 2010 2009 2008 2007 2006
888,502,135$ 859,573,795$ 831,448,675$ 808,030,468$ 761,968,275$ 729,565,326$ 108,241,377 114,015,353 124,220,367 133,006,146 150,682,312 174,001,262 66,380,640 77,897,294 62,865,521 54,188,255 37,480,177 24,194,622
1,063,124,152$ 1,051,486,442$ 1,018,534,563$ 995,224,869$ 950,130,764$ 927,761,210$
45,408,342$ 46,947,106$ 48,178,155$ 47,227,988$ 44,876,224$ 39,156,505$ - - - 212,800 212,800 212,800
1,681,821 966,375 174,909 (2,158,257) (2,380,013) (1,517,634) 47,090,163$ 47,913,481$ 48,353,064$ 45,282,531$ 42,709,011$ 37,851,671$
933,910,477$ 906,520,901$ 879,626,830$ 855,258,456$ 806,844,499$ 768,721,831$ 108,241,377 114,015,353 124,220,367 133,218,946 150,895,112 174,214,062 68,062,461 78,863,669 63,040,430 52,029,998 35,100,164 22,676,988
1,110,214,315$ 1,099,399,923$ 1,066,887,627$ 1,040,507,400$ 992,839,775$ 965,612,881$
Fiscal Year

Page 174
2015 2014 2013 2012 2011 2010 2009 2008 2007 2006
ExpensesGovernmental activities:
General government 49,565$ 47,043$ 37,253$ 41,270$ 45,286$ 43,677$ 44,272$ 42,106$ 41,123$ 59,026$
Public safety 130,532 126,843 122,750 126,303 120,530 119,264 121,797 117,304 115,656 105,751
Highways and streets 45,044 44,570 44,890 49,292 46,191 45,955 43,124 48,987 42,410 40,821
Culture and recreation 27,707 28,994 24,994 31,184 25,102 28,082 26,280 25,301 30,506 25,519
Economic development and assistance 7,485 7,787 7,528 9,048 9,063 10,849 10,498 6,426 4,696 7,941
Welfare 61,171 57,096 58,042 57,895 54,840 56,118 63,462 51,668 46,392 41,727
Sanitation 648 917 703 431 522 449 560 505 708 515
Interest on long-term debt 6,667 6,945 9,790 10,268 9,720 9,499 5,279 8,008 8,773 9,225
Total governmental activities expenses 328,819 320,195 305,950 325,691 311,254 313,893 315,272 300,305 290,264 290,525
Business-type activities:Airport 6,381 5,290 12,617 5,703 5,525 5,084 5,018 5,566 4,627 4,624
Total business-type activities expenses 6,381 5,290 12,617 5,703 5,525 5,084 5,018 5,566 4,627 4,624
Total primary government expenses 335,200$ 325,485$ 318,567$ 331,394$ 316,779$ 318,977$ 320,290$ 305,871$ 294,891$ 295,149$
Program Revenues
Governmental activities:
Charges for services:General government 24,837$ 20,893$ 26,021$ 12,236$ 13,455$ 12,794$ 16,584$ 20,076$ 18,186$ 18,226$
Public safety 10,754 10,692 11,132 17,353 10,516 11,320 15,475 12,719 8,968 12,029
Highways and streets 5,932 5,153 4,718 5,695 4,835 5,280 4,941 4,628 7,891 6,388
Culture and recreation 777 903 793 923 761 745 633 677 540 1,089
Economic development and assistance 368 641 746 2,424 1,540 43 189 54 23 14
Welfare 116 117 86 2,739 65 58 113 66 122 127
Sanitation 494 456 437 458 483 541 587 388 444 427
Total charges for services 43,278 38,855 43,933 41,828 31,655 30,781 38,522 38,608 36,174 38,300
Operating grants and contributions:General government 3,638 2,777 2,638 2,712 3,032 3,940 1,358 1,165 1,692 2,251
Public safety 8,609 8,634 7,830 8,949 8,035 9,169 5,197 6,184 5,040 4,416
Highways and streets 1,403 1,775 338 177 5,305 1,257 452 914 247 1,100
Culture and recreation 1,416 1,395 1,214 1,392 1,073 1,004 1,069 6,132 1,226 1,413
Economic development and assistance 7,093 7,132 6,688 6,744 7,550 10,963 10,322 6,550 5,004 8,246
Welfare 40,714 37,102 34,848 37,527 35,178 35,385 42,132 33,502 32,749 28,118
Sanitation - - - - - - 23 1 160 121
Total operating grants and contributions 62,873 58,815 53,556 57,501 60,173 61,718 60,553 54,448 46,118 45,665
Capital grants and contributions:General government - - 525 165 791 5,931 3,631 27 157 18
Public Safety 2 220 68 178 - 578 40 - 36 -
Highways and streets 1,047 860 13 1,133 607 7,724 9,032 2,128 2,364 2,816
Culture and recreation - - 65 15 771 839 720 178 - -
Total capital grants and contributions 1,049 1,080 671 1,491 2,169 15,072 13,423 2,333 2,557 2,834
Total governmental activities program revenue 107,200 98,750 98160 100,820 93,997 107,571 112,498 95,389 84,849 86,799
CHANGES IN NET POSITIONLast ten Fiscal Years
Schedule 2(amounts in thousands)
Continued
Fiscal Year

Page 175
2015 2014 2013 2012 2011 2010 2009 2008 2007 2006Business-type activities:
Charges for services:Airport 3,344 3,031 3,334 3,243 3,212 3,184 3,082 3,091 3,009 2,915
Operating grants and contributions:Airport - - - - - - - - - -
Capital grants and contributions:Airport 1,231 12,950 12,408 4,014 1,075 1,078 2,449 4,570 6,078 5,563
Total business type activities program revenues 4,575 15,981 15,742 7,257 4,287 4,262 5,531 7,661 9,087 8,478 Total primary government program revenues 111,775$ 114,731$ 113,902$ 108,077$ 98,284$ 111,833$ 118,029$ 103,050$ 93,936$ 95,277$
Net (Expense)/RevenueGovernmental activities (221,618)$ (221,445)$ (207,790)$ (224,871)$ (217,257)$ (206,322)$ (202,774)$ (204,916)$ (205,415)$ (203,726)$ Business-type activities (1,807) 10,691 3,125 1,554 (1,239) (822) 513 2,095 4,460 3,854
Total primary government net expense (223,425)$ (210,754)$ (204,665)$ (223,317)$ (218,496)$ (207,144)$ (202,261)$ (202,821)$ (200,955)$ (199,872)$
General Revenues and Other Changes in Net Position
Governmental activities:
Taxes
Property tax* 178,917$ 177,291$ 164,631$ 163,407$ 171,249$ 171,345$ 170,548$ 170,306$ 159,386$ 157,204$
Sales and excise tax* 61,305 57,796 56,021 53,501 51,548 62,552 49,228 47,897 48,122 48,660
Investment income 2,162 2,819 118 1,713 3,382 3,696 4,615 12,765 18,613 13,164
Miscellaneous 2,079 2,368 2,310 2,713 2,715 1,681 1,692 1,237 1,663 1,538
Total governmental activities general revenues 244,463 240,274 223,080 221,334 228,894 239,274 226,083 232,205 227,784 220,566
Business-type activities:
Sales and excise tax 240 307 302 371 338 333 249 429 372 386
Investment income 99 34 (10) 24 50 37 23 50 26 27
Miscellaneous 1,668 2 2,357 7 28 12 2,286 - - 470
Total business-type activities general revenues 2,007 343 2,649 402 416 382 2,558 479 398 883 Total primary government general revenues 246,470$ 240,617$ 225,729$ 221,736$ 229,310$ 239,656$ 228,641$ 232,684$ 228,182$ 221,449$
Change in Net Position
Governmental activities 22,845$ 18,829$ 15,290$ (3,537)$ 11,637$ 32,952$ 23,309$ 27,289$ 22,369$ 16,840$
Business-type activities 200 11,034 5,774 1,956 (823) (440) 3,071 2,574 4,858 4,737
Total primary government 23,045$ 29,863$ 21,064$ (1,581)$ 10,814$ 32,512$ 26,380$ 29,863$ 27,227$ 21,577$
Fiscal Year

Page 176
2015 2014 2013 2012 2011
General Fund
Nonspendable 2,692,331$ 3,526,430$ 2,993,353$ 3,635,974$ 2,976,513$
Restricted 6,990,700 7,378,121 6,699,461 5,919,092 5,923,161
Assigned 25,940,524 25,079,639 21,231,927 24,986,323 23,388,797
Unassigned 40,949,110 40,505,065 39,793,361 38,683,066 40,594,033
* Prior to 2010Reserved - - - - -
Unreserved
Designated - - - - -
Undesignated - - - - -
Total general fund 76,572,665$ 76,489,255$ 70,718,102$ 73,224,455$ 72,882,504$
All Other Governmental Funds
Nonspendable -$ 1,899$ 34,448$ 21,599$ 64,260$
Restricted 93,778,654 97,212,504 114,445,136 136,913,374 149,716,343
* Prior to 2010
Reserved - - - - -
Unreserved
Designated Special revenue funds - - - - -
Undesignated
Special revenue funds - - - - -
Capital project funds - - - - -
Total all other governmental funds 93,778,654$ 97,214,403$ 114,479,584$ 136,934,973$ 149,780,603$
Total general and all other governmental funds 170,351,319$ 173,703,658$ 185,197,686$ 210,159,428$ 222,663,107$
Note: * Fund Balances for prior years not available in new fund balance breakdown per GASB 54.
Fiscal Year
FUND BALANCES, GOVERNMENTAL FUNDSLast Ten Fiscal Years
Schedule 3

Page 177
2010 2009* 2008* 2007* 2006*
2,222,196$ -$ -$ -$ -$
6,048,690 - - - -
11,753,453 - - - -
48,153,789 - - - -
- 7,775,673 7,859,862 7,638,213 10,338,082
- 11,632,934 11,934,815 11,367,460 9,996,235
- 46,054,630 36,845,569 27,763,306 24,104,287
68,178,128$ 65,463,237$ 56,640,246$ 46,768,979$ 44,438,604$
36,320$ -$ -$ -$ -$
176,511,481 - - - -
- 107,202,603 35,767,821 39,049,931 55,855,705
- 11,136,800 11,010,095 11,086,477 10,231,505
- 68,135,605 73,811,651 78,446,148 79,963,564
- 3,917,607 2,823,482 3,636,771 4,024,836
176,547,801$ 190,392,615$ 123,413,049$ 132,219,327$ 150,075,610$
244,725,929$ 255,855,852$ 180,053,295$ 178,988,306$ 194,514,214$
Fiscal Year

Page 178
2015 2014 2013 2012Revenues
Taxes and special assessments 240,222$ 235,087$ 220,651$ 216,908$ Licenses and permits 6,100 5,938 5,523 5,487 Intergovernmental 61,864 57,834 52,803 56,491 Charges for services 46,569 44,894 47,432 42,114 Fines and forfeitures 801 835 1,038 1,067 Investment income 1,937 2,503 151 1,546 Donations and contributions 1,010 910 747 775 Component units - - - - Other revenues 1,445 1,878 1,408 1,349
Total revenues 359,948 349,879 329,753 325,737
Expenditures
General government 45,844 45,198 41,521 39,513 Public safety 126,594 122,997 119,807 121,465 Highways and streets 28,542 29,035 29,341 29,808 Sanitation 484 753 539 261 Welfare 52,336 49,144 49,573 48,994 Culture and recreation 13,012 12,277 12,125 12,274 Economic development and assistance 4,871 6,439 5,368 6,404 Capital outlay 34,262 41,733 43,864 21,991 Debt service
Interest 6,515 7,025 8,063 8,742 Principal 16,820 16,310 15,737 15,001 Fiscal and other charges 5 5 146 41 Bond issuance costs - - - -
Component units 4,770 4,634 5,407 4,361 Intergovernmental 29,939 26,624 28,182 35,727
Total expenditures 363,994 362,174 359,673 344,582
Excess of revenues over (under) expenditures (4,046) (12,295) (29,920) (18,845)
Other Financing Sources(Uses)
Proceeds from sale of capital assets 662 801 4,861 197 Issuance of bonds - - - - Issuance of refunding bonds - - 44,875 11,760 Bond premium - - - - Payments to bond escrow agent - - (44,732) (11,760) Proceeds of capital leases - - - - Transfers in 24,264 24,575 27,704 23,723 Transfers out (24,264) (24,575) (27,704) (23,723) Transfers from internal service funds 32 - 22 7,011 Transfers to internal service funds - - (69) (867)
Total other financing sources (uses) 694 801 4,957 6,341
Net change in fund balances (3,352)$ (11,494)$ (24,963)$ (12,504)$
Debt service as a percentage of noncapital expenditures 7.08% 7.28% 7.54% 7.36%
Fiscal Year
CHANGES IN FUND BALANCESGOVERNMENTAL FUNDS
Last Ten Fiscal YearsSchedule 4
(amounts in thousands)

Page 179
2011 2010 2009 2008 2007 2006
222,798$ 233,897$ 219,776$ 218,203$ 207,508$ 205,864$ 4,134 5,309 4,697 5,122 5,683 6,863
59,026 59,360 60,397 54,274 46,082 46,190 37,231 34,851 37,644 37,144 33,450 36,249 1,443 1,379 2,029 1,261 1,261 1,097 3,033 3,388 4,145 11,314 16,588 11,818
845 433 79 174 87 213 - - - - 675 -
648 352 581 394 364 313
329,158 338,969 329,348 327,886 311,698 308,607
42,679 42,365 36,992 39,231 38,041 52,343 116,830 116,330 116,592 113,312 112,730 101,604 28,507 27,842 26,568 24,714 26,427 24,943
345 243 329 267 498 368 45,813 45,597 54,041 43,841 40,329 35,780 11,962 11,701 11,421 11,277 11,278 11,194 4,796 6,200 7,338 4,882 3,664 5,438
40,724 40,276 29,428 25,236 37,408 42,115
9,285 9,730 5,279 8,144 8,773 9,272 14,598 10,170 4,830 16,970 16,355 15,865
2 274 765 - - - - - - - - -
4,895 5,218 5,230 4,918 5,880 5,421 31,907 34,993 32,502 38,614 36,779 29,336
352,343 350,939 331,315 331,406 338,162 333,679
(23,185) (11,970) (1,967) (3,520) (26,464) (25,072)
316 824 117 116 1,081 330 - - 76,480 - - - - 21,130 66,905 - - - - 1,032 3,559 - - - - (23,615) (73,795) - - - - - 352
21,432 27,343 18,694 31,146 45,372 35,319 (21,432) (27,343) (18,694) (31,146) (45,372) (35,319)
1,599 1,595 4,402 4,469 9,858 - (793) (126) (250) - - -
1,122 840 77,770 4,585 10,939 330
(22,063)$ (11,130)$ 75,803$ 1,065$ (15,525)$ (24,742)$
7.66% 6.41% 3.35% 8.20% 8.36% 8.62%
Fiscal Year

Page 180
Real and Personal Property
Fiscal Vacant Residential Commercial Industrial Agricultural
Year Land Property Property Property Property
2015 230,570$ 5,078,075$ 1,950,785$ 564,622$ 10,591$
2014 167,055 4,176,229 1,882,661 541,138 12,781
2013 178,135 4,143,137 1,865,138 536,099 12,763
2012 182,365 4,125,351 1,823,445 541,912 13,119
2011 191,910 4,107,639 1,853,077 534,493 13,699
2010 224,685 4,271,971 1,991,891 573,098 11,203
2009 238,842 4,260,360 2,035,714 582,178 11,901
2008 244,290 4,329,898 1,958,250 562,790 10,271
2007 263,871 4,290,574 1,936,436 538,325 10,212
2006 202,167 4,006,090 1,770,087 483,566 9,220
Source: Jefferson County Assessor's Office
Notes: The County assesses property annually.
2006 to 2015 non -residential properties were assessed at 29%
of replacement cost calculated on the base year's appraised value.
Residential real property was assessed as follows:
Assessment
Year Percentage Base Year
2015 7.96% 2012
2014 7.96% 2012
2013 7.96% 2010
2012 7.96% 2010
2011 7.96% 2008
2010 7.96% 2008
2009 7.96% 2006
2008 7.96% 2006
2007 7.96% 2004
2006 7.96% 2004
Last Ten Fiscal Years
ACTUAL VALUE OF TAXABLE PROPERTYASSESSED AND ESTIMATED
(amounts in thousands)
Schedule 5

Page 181
Assessed
Natural Oil Public Taxable Estimated Value as a
Resources And Utilities Assessed Total Direct Actual Taxable Percentage of
Property Gas Property Value Tax Rate Value Actual Value
6,062$ -$ 337,377$ 8,178,084$ 24.2120 74,484,614$ 11.0%
5,314 43 325,732 7,110,953 25.8460 62,584,929 11.4%
4,277 43 316,639 7,056,234 25.8460 62,094,622 11.4%
3,660 - 297,197 6,987,049 24.3460 61,693,943 11.3%
3,328 - 293,460 6,997,605 24.3460 61,568,911 11.4%
2,423 6 277,320 7,352,599 24.3460 64,290,837 11.4%
5,253 6 271,355 7,405,609 24.3460 63,510,784 11.7%
6,701 - 244,200 7,356,400 24.3460 64,831,923 11.3%
8,986 - 242,326 7,290,731 24.3460 64,247,052 11.3%
8,503 - 230,513 6,710,146 24.3460 59,652,097 11.2%
Total
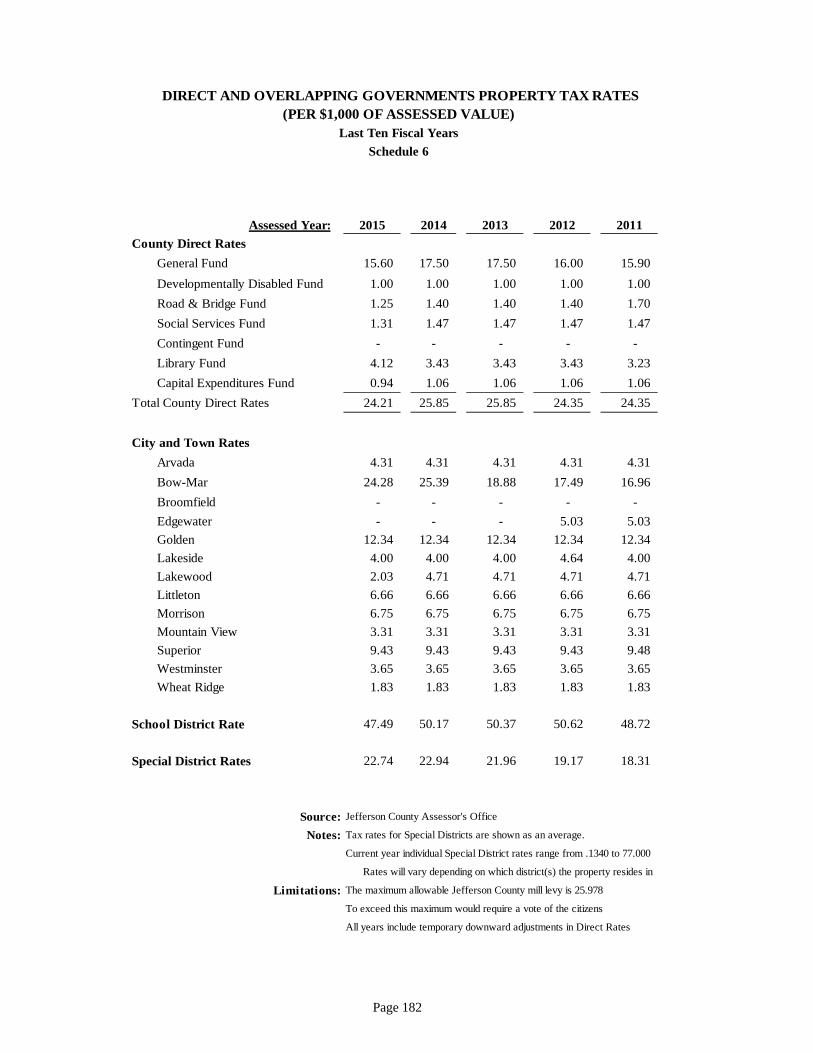
Page 182
Assessed Year: 2015 2014 2013 2012 2011
County Direct Rates
General Fund 15.60 17.50 17.50 16.00 15.90
Developmentally Disabled Fund 1.00 1.00 1.00 1.00 1.00
Road & Bridge Fund 1.25 1.40 1.40 1.40 1.70
Social Services Fund 1.31 1.47 1.47 1.47 1.47
Contingent Fund - - - - -
Library Fund 4.12 3.43 3.43 3.43 3.23
Capital Expenditures Fund 0.94 1.06 1.06 1.06 1.06
Total County Direct Rates 24.21 25.85 25.85 24.35 24.35
City and Town Rates
Arvada 4.31 4.31 4.31 4.31 4.31
Bow-Mar 24.28 25.39 18.88 17.49 16.96
Broomfield - - - - -
Edgewater - - - 5.03 5.03
Golden 12.34 12.34 12.34 12.34 12.34
Lakeside 4.00 4.00 4.00 4.64 4.00
Lakewood 2.03 4.71 4.71 4.71 4.71
Littleton 6.66 6.66 6.66 6.66 6.66
Morrison 6.75 6.75 6.75 6.75 6.75
Mountain View 3.31 3.31 3.31 3.31 3.31
Superior 9.43 9.43 9.43 9.43 9.48
Westminster 3.65 3.65 3.65 3.65 3.65
Wheat Ridge 1.83 1.83 1.83 1.83 1.83
School District Rate 47.49 50.17 50.37 50.62 48.72
Special District Rates 22.74 22.94 21.96 19.17 18.31
Source: Jefferson County Assessor's Office
Notes: Tax rates for Special Districts are shown as an average.
Current year individual Special District rates range from .1340 to 77.000
Rates will vary depending on which district(s) the property resides in
Limitations: The maximum allowable Jefferson County mill levy is 25.978
To exceed this maximum would require a vote of the citizens
All years include temporary downward adjustments in Direct Rates
Schedule 6
DIRECT AND OVERLAPPING GOVERNMENTS PROPERTY TAX RATES(PER $1,000 OF ASSESSED VALUE)
Last Ten Fiscal Years

Page 183
2010 2009 2008 2007 2006
16.10 15.70 15.70 15.91 15.91
1.00 1.00 1.00 1.00 1.00
1.50 1.90 1.90 1.90 1.90
1.47 1.47 1.27 1.05 1.05
- - - - -
3.23 3.23 3.43 3.43 3.43
1.06 1.06 1.06 1.06 1.06
24.35 24.35 24.35 24.35 24.35
4.31 4.31 4.31 4.31 4.31
15.31 14.73 14.49 13.90 16.38
- - - - -
5.03 5.03 5.03 5.03 5.03
12.34 12.34 12.34 12.34 12.34
4.00 4.00 4.00 4.00 4.00
4.71 4.71 4.71 4.71 4.71
6.66 6.66 6.66 6.66 6.66
6.75 6.75 6.75 6.75 6.75
3.31 3.31 3.31 3.42 3.42
9.48 8.05 8.05 8.05 8.81
3.65 3.65 3.65 3.65 3.65
1.83 1.83 1.83 1.83 1.83
48.21 48.15 48.28 48.12 49.03
18.17 17.77 17.94 17.15 16.81

Page 184
Percent Of Total
Taxpayer Assessed Value Rank Assessed ValuePublic Service Co of Colorado 198,295,599$ 1 2.42 %MillerCoors LLC/Coors Brewing Company 104,155,261 2 1.27 %Qwest Corp 62,484,200 3 0.76 %Colorado Mills Mall Limited Partnership 31,320,000 4 0.38 %Martin Marietta Corporation 30,547,318 5 0.37 %Ball Metal Beverage Container Corp 30,015,870 8 0.37 %Belmar Commercial Owner LP 26,809,572 6 0.33 %Lockheed Martin Corporation 20,652,930 7 0.25 %Plains End LLC 20,466,700 9 0.25 %Westmoor LLC 17,681,300 10 0.22 %
Total Principal Taxpayers 542,428,750 6.63 %
All Other Taxpayers 7,635,655,579 93.37 %
Total 8,178,084,329$ 100.00 %
Source: Calculations made by Jefferson County Accounting Division
Percent
Of Total
Taxpayer Assessed Value Rank Assessed Value
Adolph Coors Company 124,225,770$ 1 1.85 %
Public Service Comapany 122,210,600 2 1.82 %
Lockheed/Martin 68,827,040 3 1.03 %
Qwest Corporation 52,876,200 4 0.79 %
Colorado Mills Limited Partnership 45,675,000 5 0.68 %
SP4 Westmoor LP 39,121,980 6 0.58 %
Dever West Office 27,021,110 7 0.40 %
Southwest Denver Land LLC 22,263,160 8 0.33 %
Belmar Mainstreet Holdings LLC 18,559,900 9 0.28 %
Plains End LLC 12,620,700 10 0.19 %
Total Principal Taxpayers 533,401,460 7.95 %
All Other Taxpayers 6,176,744,060 92.05 %
Total 6,710,145,520$ 100.00 %
2015 Assessed - Payable in 2016
2006 Assessed - Payable in 2007
TEN PRINCIPAL PROPERTY TAX PAYERSCurrent Year and Nine Years Ago
Schedule 7

Page 185
Percent of
Percent of Collected Total Tax
Fiscal Total Tax Current Tax Levy in Subsequent Total Tax Collected
Year Levy1 Collected Collected Years Collected to Tax Levy
2015 182,290$ 181,426$ 99.53% -$ 181,426$ 99.53%
2014 181,831 180,692 99.37% 183 180,875 99.47%
2013 169,602 168,834 99.55% 271 169,105 99.71%
2012 169,088 168,187 99.47% 274 168,461 99.63%
2011 178,997 177,516 99.17% 199 177,715 99.28%
2010 180,295 177,767 98.60% 289 178,056 98.76%
2009 178,354 177,520 99.53% 143 177,663 99.61%
2008 177,484 176,294 99.33% 192 176,486 99.44%
2007 163,363 161,991 99.16% 141 162,132 99.25%
2006 170,345 168,679 99.02% 330 169,009 99.22%
Source: Jefferson County Treasurer
Notes: 1Net of positive and negative current year assessments.The information presented in this table relates to the County's own property tax levies, anddoes not include those in which it collects on behalf of other governments.
Collected within the Fiscal Total Collected to Date
Year of the Levy
PROPERTY TAX LEVIES AND COLLECTIONSLast Ten Fiscal Years
Schedule 8
(amounts in thousands)

Page 186
2015 2014 2013 2012
Assessed Value of Property 8,178,084,329$ 7,110,953,310$ 7,056,234,182$ 6,987,049,103$
Debt limit - 3% of total assessed value1
245,342,530 213,328,599 211,687,025 209,611,473
Amount of debt applicable to debt limit - - - -
Less amount available for debt service - - - -
Net amount of debt applicable to debt limit - - - -
Legal Debt Margin 245,342,530$ 213,328,599$ 211,687,025$ 209,611,473$
As a percentage of debt limit 100% 100% 100% 100%
Source: Jefferson County Assessor
Notes: 1Colorado Revised Statutes 30-26-301.3
Fiscal Year
LEGAL DEBT MARGIN INFORMATIONFor the Last Ten Years
Schedule 9

Page 187
2011 2010 2009 2008 2007 2006
6,997,605,972$ 7,352,599,610$ 7,405,609,040$ 7,356,400,430$ 7,290,731,100$ 6,710,145,520$
209,928,179 220,577,988 222,168,271 220,692,013 218,721,933 201,304,366
- - - - - -
- - - - - -
- - - - - -
209,928,179$ 220,577,988$ 222,168,271$ 220,692,013$ 218,721,933$ 201,304,366$
100% 100% 100% 100% 100% 100%
Fiscal Year

Page 188
Governmental Activities
Certificates Generalof Revenue Capital Obligation Special
Participation Bonds Leases Debt Assessment
2015 78,285,000$ 68,500,000$ -$ -$ -$
2014 83,525,000 80,080,000 - - -
2013 88,645,000 91,270,000 - - -
2012 92,065,000 101,205,000 304,884 - -
2011 96,655,000 111,545,000 593,032 - -
2010 101,135,000 121,595,000 865,364 - -
2009 105,330,000 127,820,000 1,122,748 - -
2008 30,260,000 134,835,000 3,142 - -
2007 39,130,000 143,660,000 14,604 - -
2006 47,685,000 151,460,000 31,152 - -
Source: Jefferson County Accounting DivisionNote: Property value data can be found on the Assessed and
Estimated Actual Value of Taxable Property Schedule.Population and personal income data can be found onthe Demographic and Economic Statistics Schedule.
RATIOS OF OUTSTANDING DEBTLast Ten Fiscal Years
Schedule 10

Page 189
Percentage Totalof Actual Outstanding
Total Percentage Value of DebtCapital Loans Primary of Personal Taxable PerLeases Payable Government Income Property Capita
-$ 696,359$ 147,481,359 0.47% 1.80% 260.98
- 915,090 164,520,090 0.57% 2.31% 294.56
- 1,127,451 181,042,451 0.71% 2.57% 331.74
- 1,333,626 194,908,510 0.77% 2.79% 357.15
- 1,533,796 210,326,828 0.86% 3.01% 389.73
- 1,728,136 225,323,500 0.96% 3.06% 420.65
- 1,916,816 236,189,564 1.01% 3.19% 443.46
- 2,461,841 167,559,983 0.66% 2.28% 315.81
- - 182,804,604 0.73% 2.51% 346.80
- - 199,176,152 0.83% 2.97% 379.69
ActivitiesBusiness Type

Page 190
Pledged Net Sales Tax Interest on Pledged TimesRevenue Reserves Revenue Principal Interest Total Coverage
2015 5,294,312$ 97,444$ 5,391,756 1,175,000$ 156,682$ 1,331,682 4.05
2014 5,186,321 138,344 5,324,665 1,145,000 177,100 1,322,100 4.03
2013 5,198,895 (19,845) 5,179,050 1,125,000 197,076 1,322,076 3.92
2012 5,064,013 44,052 5,108,065 985,000 391,583 1,376,583 3.71
2011 4,865,799 84,668 4,950,467 945,000 580,456 1,525,456 3.25
2010 6,746,141 152,963 6,899,104 910,000 615,238 1,525,238 4.52
2009 4,612,154 107,310 4,719,464 880,000 647,700 1,527,700 3.09
2008 4,140,513 253,030 4,393,543 850,000 675,850 1,525,850 2.88
2007 4,144,904 589,611 4,734,515 825,000 700,975 1,525,975 3.10
2006 3,891,478 569,354 4,460,832 805,000 725,425 1,530,425 2.91
Source: Applicable years' comprehensive annual financial reportNotes: The County pledged all of the 0.5 percent sales tax collected in the Southeast Sales Tax LID to repay these bonds
with the exception for incorporated territory. Pursuant to State law, if any portion of the sales tax is to be used for operation and maintenance of any improvements, that portion of the sales tax shall not apply to any territory withinthe District that has been annexed by or incorporated into a municipality. A small portion of the District (approximately452 acres), accounting for 38 sales tax licenses, has been annexed since formation of the District. The Board of CountyCommissioners adopted a resolution establishing that the sales tax rate attributable to the cost of maintaining the streetscape and fencing improvements within the District is 0.07% and reducing the 0.5% sales tax rate to 0.43%within the portion of the District annexed. However, the County covenants in the bond resolution that it will not spend revenues from the sales tax for operation and maintenance of improvements in an amount that would cause the amount of pledged revenues collected in any year to be less than 150% of the principal and interest requirements due in such year on all outstanding sales tax parity obligations. On June 7, 2012, the County issued $11,760,000 of Southeast Jefferson County Local Improvement District Districtwide Sales Tax Revenue Refunding Bonds, Series 2012, to refund all to refund all of the County's outstanding Southeast Jefferson County Local Improvement District Sales Tax RevenueBonds, Series 2002. Inerest on Reserves includes market adjustment amounts.
Schedule 11
PLEDGED REVENUE BOND COVERAGELast Ten Fiscal Years
Debt Service
Southeast Jefferson County Local Improvement DistrictDistrict wide Sales Tax Revenue Refunding Bonds

Page 191
Pledged Net Sales Tax Interest on Pledged TimesRevenue Reserves Revenue Principal Interest Total Coverage
2015 29,056,558$ 285,351$ 29,341,909 10,405,000$ 2,450,252$ 12,855,252 2.28
2014 27,166,853 417,507 27,584,360 10,045,000 2,799,702 12,844,702 2.15
2013 26,211,831 (33,076) 26,178,756 9,630,000 3,316,340 12,946,340 2.02
2012 24,649,270 236,577 24,885,847 9,355,000 3,579,490 12,934,490 1.92
2011 23,540,079 538,295 24,078,374 9,105,000 3,822,516 12,927,516 1.86
2010 29,944,031 452,641 30,396,673 5,065,000 3,873,736 8,938,736 3.40
2009 22,513,461 623,640 23,137,101 2,540,000 3,389,085 5,929,085 3.90
2008 23,057,654 1,744,955 24,802,609 7,250,000 5,893,495 13,143,495 1.89
2007 22,716,888 2,227,592 24,944,480 6,975,000 6,175,745 13,150,745 1.90
2006 22,140,804 1,738,321 23,879,125 6,710,000 6,444,897 13,154,897 1.82
Source: Applicable years' comprehensive annual financial reportNotes: The County pledged all of the 0.5 percent sales tax dedicated to open space to repay these bonds, less the cities attributable share.
First bonds issued in 1999 refunded in 2009.
If Net Pledged Revenues fall below 1.35 times the highest annual debt service requirement, the County will be required to start funding a reserve account for the Series 2009 and Series 2010 bonds.
Interest on Reserves includes market adjustment amounts.
PLEDGED REVENUE BOND COVERAGELast Ten Fiscal Years
Schedule 12
Debt Service
Open Space Sales Tax Revenue Bonds

Page 192
Personal Public Fiscal Income Per Capita Median School Unemployment
Year Population1
(in thousands)4
Income1
Age1
Enrollment2
Rate3
2015 565,106 31,434,450 55,626 41.4 86,571 3.5%
2014 558,532 28,630,911 51,261 41.3 86,011 4.5%
2013 551,281 26,077,248 47,303 41.3 85,542 6.3%
2012 545,739 25,459,586 46,652 41.1 85,793 7.4%
2011 539,680 24,391,425 45,196 40.8 84,602 8.1%
2010 535,651 23,569,131 44,001 40.5 84,643 8.6%
2009 532,606 23,462,319 44,052 40.2 84,643 7.9%
2008 530,565 25,561,174 48,177 39.9 84,796 4.7%
2007 527,120 24,950,320 47,333 39.8 86,200 3.7%
2006 524,579 24,029,942 45,808 39.6 86,154 4.2%
Sources: 1Colorado State Demographer2Jeffco Public Schools 3Colorado Department of Labor and Employment 4Bureau Economic Analysis
Notes: Figures included in this schedule represent the most recent data available.
Data is estimated and is subject to change based on updated information.
2015 personal income estimated on previous year increase of 9.792%.
DEMOGRAPHIC AND ECONOMIC STATISTICSLast Ten Fiscal Years
Schedule 13

Page 193
Percent ofNumber of Total County
Employer Employees Rank EmploymentJefferson County R-1 Schools* 13,000 1 5.85 %Denver Federal Center** 6,200 2 2.79 %Lockheed Martin Space & Strategic Missiles 5,900 3 2.66 %Jefferson County 2,845 4 1.28 %St Anthony Hospital 2,800 5 1.26 %Lutheran Medical Center 2,460 6 1.11 %Terumo BCT 2,220 7 1.00 %MillerCoors Brewing Company 2,080 8 0.94 %National Renewable Energry Laboratory 1,690 9 0.76 %CoorsTek 1,300 10 0.59 %
Total employed by principal employers 40,495 18.24 %
Employed by other employers 181,557 81.76 %
Total employed in Jefferson County 222,052 100.00 %
*Jefferson County R-1 Schools does not included part time employee counts for 2015.** Denver Federal Center from www.fedsmith.com
Percent of
Number of Total County
Employer Employees Rank Employment
Jefferson County R-1 School District 12,000 1 5.82 %
Denver Federal Center 6,000 2 2.91 %
Lockheed Martin Space & Strategic Missiles 5,500 3 2.67 %
Alpine Access Inc 4,660 4 2.26 %
Coors Brewery Company 3,000 5 1.46 %
Jefferson County 2,600 6 1.26 %
Exempla - Lutheran Medical Center 2,500 7 1.21 %
Gambro Companies 1,500 8 0.73 %
Ball Corporation 1,200 9 0.58 %
CoorsTek 1,200 10 0.58 %
Total employed by principal employers 40,160 19.49 %
Employed by other employers 165,875 80.51 %
Total employed in Jefferson County 206,035 100.00 %
Sources: Jefferson Economic Council and Colorado Department of Labor and Employment
2015
2006
PRINCIPAL EMPLOYERSCurrent Year and Nine Years Ago
Schedule 14

Page 194
2015 2014 2013 2012 2011Functions/Programs
Primary Government
Governmental activities:
General government 483 483 485 489 487
Public safety 1,044 1,029 1,040 1,032 1,046
Highways and streets 211 209 216 213 211
Culture and recreation 113 110 108 109 109
Economic development and assistance 40 43 43 34 34
Welfare 587 544 560 550 523
Total governmental activities FTE's 2,478 2,418 2,452 2,427 2,409
Business-type activities:Airport 19 18 21 20 21
Total business-type activities FTE's 19 18 21 20 21
Total primary government FTE's 2,497 2,436 2,473 2,447 2,429
Component Units
Public Library 200 200 201 210 175
Health 148 143 150 150 137
Total component units FTE's 348 343 351 360 312
Total Full Time Equivalent Employees 2,845 2,779 2,824 2,807 2,741
Source: Jefferson County Payroll Office
(as of December 31)
FULL-TIME EQUIVALENT COUNTY GOVERNMENT EMPLOYEES BY FUNCTION
Last Ten Fiscal YearsSchedule 15

Page 195
2010 2009 2008 2007 2006
495 497 486 504 533
1,051 1,058 1,019 1,016 991
212 209 209 213 215
108 107 107 105 104
35 34 36 32 40
493 509 518 462 455
2,393 2,414 2,375 2,332 2,339
20 20 21 21 20
20 20 21 21 20
2,413 2,434 2,396 2,353 2,358
194 207 199 195 196
155 155 143 138 140
349 362 342 333 336
2,762 2,796 2,738 2,686 2,694

Page 196
2015 2014 2013Functions/Programs
Primary Government
Governmental activities:
General government
Population 565,106 558,532 551,281
Number of registered voters 363,991 422,691 412,954
Percent of registered voters voting in election 51% 62% 43%
Number of motor vehicle transactions 1,107,977 1,087,818 1,068,821
Number of marriage licenses 34,155 3,873 3,967
Number of survey plats recorded 369 244 282
Number of real estate documents recorded 138,385 111,694 148,064
Actual value of newly constructed taxable real property improvements 550,395,704$ 424,176,759$ 394,275,220$
Public safety
Number of sheriff certified officers 530 538 533
Average daily inmate population 1,203 1,326 1,385
Average length of inmate stay at facility in days 26.0 25.0 28.9
Number of sheriff contacts and calls 140,407 142,984 151,614
Number of annual sheriff bookings 21,125 20,487 19,590
Number of sheriff case reports issued 27,713 25,451 30,372
Building Dept - all permits issued (unincorporated area) 13,062 14,220 13,730
Value of building permits issued (unincorporated area) 330,467,796$ 253,367,303$ 247,165,057$
Culture and recreation
Number of events with national representation at the Fairgrounds 81 79 50
Number of "event days" at the Fairgrounds 3,521 3,658 4,097
Number of visits to Open Space parks (in millions) 2.20 2.10 2.10
Economic development and assistance
Number of customers seeking Workforce services 22,438 30,509 35,015
Number of customers entering employment through Workforce 12,418 9,731 9,173
Welfare
Number of child support enforcement cases1 11,940 12,067 12,365
Business-type activities:Airport
Number of operations (take-offs, landings, fly-overs, touch and goes) 129,907 120,027 118,803
Gallons of jet fuel sold 3,139,180 3,070,496 3,178,570
Number of airport leases 294 293 288
Fiscal Year
OPERATING INDICATORS BY FUNCTIONLast Ten Fiscal Years
Schedule 16

Page 197
2012 2011 2010 2009 2008 2007 2006
545,739 539,680 535,651 532,606 530,565 527,120 524,579
413,853 386,010 381,127 334,085 371,145 340,084 295,285
76% 51% 77% 28% 80% 27% 71%
1,049,267 1,014,091 1,010,124 1,009,961 960,943 780,755 537,094
3,950 3,866 3,773 3,775 3,851 3,643 3,634
222 243 170 247 392 329 491
140,973 118,722 120,440 130,314 116,606 141,381 151,917
270,180,739$ 252,439,674$ 205,009,108$ 454,640,359$ 655,651,078$ 795,914,018$ 723,992,200$
561 548 562 562 536 534 529
1,371 1,287 1,311 1,406 1,397 1,301 1,480
25.0 24.7 25.8 25.4 23.6 19.1 22.6
153,463 158,483 167,711 145,329 145,365 144,503 179,014
21,640 19,028 19,456 20,811 22,783 23,614 23,898
31,637 34,104 36,984 42,343 45,533 41,936 48,017
14,005 11,147 16,529 14,543 10,950 11,916 12,935
216,195,739$ 166,970,638$ 246,908,324$ 214,354,306$ 243,334,614$ 248,154,151$ 306,679,430$
28 30 35 25 20 18 8
6,575 6,650 6,600 6,500 6,300 6,200 5,511
2.10 1.98 1.96 1.90 1.90 1.70 1.80
33,994 41,184 48,418 49,089 34,246 26,700 29,814
11,349 13,597 12,432 9,946 10,560 12,225 11,023
12,424 12,433 12,513 12,148 12,169 12,589 13,018
121,780 121,994 122,944 121,820 151,736 166,764 174,813
3,410,279 3,329,877 3,713,365 3,331,168 4,081,701 4,319,024 4,440,807
290 287 283 285 282 280 278
Fiscal Year

Page 198
2015 2014 2013
Component Units
Health
Number of birth certificates issued2 5,657 6,008 5,999
Number of family planning visits 4,210 4,400 6,711
Number of vaccines given - communicable control 4,631 5,201 6,471
Number of food facilities inspections 3,848 3,647 4,323
Number of eligible County residents served - women, infants & children 9,559 10,106 13,989
Other Indicators
School District
Number of teachers 4,341 4,372 4,250
Number of pupils 86,571 86,011 85,542
Source: Jefferson County
1The caseload numbers though lower in current years do NOT translate into lessened workload because performance expectations,
measurements and the number of required case management tasks have increased. These numbers reflect cases for Jefferson
County only, additional cases are handled for Clear Creek County and Gilpin County.2Prior to 2013 number of birth certificates issued were "all" issued - in 2013 only "first copy" counts are reported.
Fiscal Year

Page 199
2012 2011 2010 2009 2008 2007 2006
8,986 8,415 9,025 9,305 10,406 11,921 11,699
7,221 7,615 8,552 7,782 8,020 8,609 8,350
7,813 9,389 12,000 16,194 14,560 15,818 14,629
4,875 4,876 4,400 4,536 4,624 4,627 3,919
13,785 13,785 8,706 12,734 8,300 7,459 7,942
4,700 4,692 4,769 4,824 4,820 4,751 5,468
85,793 84,602 84,643 84,643 84,796 86,200 86,154
Fiscal Year

Page 200
2015 2014 2013 2012Functions/Programs
Primary Government
Governmental activities:
General government
Area 773 sq. miles 773 sq. miles 773 sq. miles 773 sq. miles
Public safety
Number of sheriff stations 3 3 3 3
Highways and streets
Miles of County maintained roads 1,289 1,287 1,287 1,269
Culture and recreation
Number of parks 30 30 30 30
(unincorporated area: some parks are undeveloped)
Park acreage 44,613 43,675 42,248 42,248
(unincorporated area only: includes conservation easments)
Miles of Trails 231 231 227 227
Component Units
Public Library
Number of libraries (includes bookmobiles, e-train and an 13 13 13 12
Online Library operated 24 hrs a day, 7 days a week)
Number of volumes and audiovisual materials 981,733 1,114,621 1,036,006 1,304,660
Other Indicators
School District
Number of schools 155 154 155 154
Source: Jefferson County and Jeffco R-1 School District
Fiscal Year
CAPITAL ASSET STATISTICS BY FUNCTIONLast Ten Fiscal Years
Schedule 17

Page 201
2011 2010 2009 2008 2007 2006
773 sq. miles 773 sq miles 773 sq miles 773 sq miles 773 sq miles 773 sq miles
3 3 3 3 3 3
1,268 1,266 1,259 1,252 1,243 1,240
32 32 32 32 30 30
41,881 40,512 41,940 41,539 41,063 40,137
210 207 204 202 202 194
12 12 12 11 11 11
1,305,600 1,323,000 1,290,000 1,282,000 1,270,000 1,255,500
154 159 158 153 150 152
Fiscal Year

Page 202
In Memorium
Sean Renfro David Baldwin Timothy Mossbrucker 1-3-15 1-26-14 4-28-95
Stephen Paul Miller William Truesdale Clarence Fugate 6-16-87 6-18-86 10-17-40

Page 203
CONTINUING DISCLOSURE (unaudited)
Certificates of Participation (COPs) Date of Issuance Amount Facilities & Equipment November 5, 2009 $ 76.48 million
Revenue Bonds Open Space Sales Tax Revenue Refunding Bonds April 22, 2009 $ 66.91 million Open Space Sales Tax Revenue Refunding Bonds September 30, 2010 $ 21.13 million
Quantitative and operating data provided in the Official Statements for the COPs and the Bonds have been updated throughout the Comprehensive Annual Financial Report (CAFR). Tables 2 through 4 are indices that contain cross-references between the Official Statements for the COPs and the Bonds with the CAFR, identifying where the updated information is contained in the CAFR. Table 1 is a narrative which updates operating information contained in the Official Statements not otherwise updated in the CAFR. Tables 5 through 12 update statistical data provided in the Official Statements not otherwise updated in the CAFR.

Page 204
CONTINUING DISCLOSURE For the Year Ended December 31, 2015
Table 1
Please refer to the original Offering Statements for definitions of the terms used in this Table
Information Applicable to the Open Space Sales Tax Revenue Bonds THE COUNTY Open Space Program The County established its Open Space Program in 1972 following the initial approval of the Sales Tax Resolution by the voters. According to the 2014-2019 Open Space Master Plan Update, the mission of Open Space is to acquire property rights for the preservation of open space and parklands, protect natural and park resources, and provide for healthy nature-based experiences. The vision is enriching life throughout Jefferson County with an abundance of open space parks, trails and nature-based outdoor experiences. Since its inception in 1972, the Open Space Division has spent more than $300 million in land acquisitions throughout the County for park and open space purposes. In that time, over 53,800 acres of park, recreation and open space areas have been preserved (including conservation easements) and more than 230 miles of trails and bike paths have been developed in 28 parks within the County. Open Space employees manage 42,000 acres of land within the unincorporated area and facilities such as the Hiwan Homestead Museum, the Lookout Mountain Nature Center, and Baehrden at Pine Valley Ranch Park. Representing the Cities Available Portion, $272 million has been used for the benefit of the 11 municipalities within the County. The current Local Park and Recreation Grants, with its predecessor Joint Venture Grant Program, has distributed another $48.78 million to municipalities and $34.07 million to park and recreation districts for capital improvements. In 2014 and 2015, the County spent $689,000 and $623,938 (unaudited) on Local Park and Recreation Grant projects; approximately $1.22 million is budgeted for 2016. REVENUES AVAILABLE FOR DEBT SERVICE Management’s Summary of Material Trends in Open Space Sales Tax Collections 2015 Open Space sales tax collections were up 7.2% relative to 2014. The 2015 rate of growth reflects the stabilization that is occurring in the economy. The County is fortunate to have more than 40 years of history for the Open Space Sales Tax. The average growth rate has been 6.4% from 1975 through 2015. The County has experienced continual commercial and residential development over the last 40 years as well. Incorporations and annexations by cities historically have had a relatively small impact on the County’s share of the Open Space Sales Tax revenue. The County’s share of Open Space Sales Tax revenue was 69.3% of the total collections for the year 2015. Even if the entire County was to become 100%

Page 205
incorporated, the County would still receive 50% of the County-wide Open Space Sales Tax. As of this time, there are no organized groups supporting the formation of any additional cities (or combined cities and counties) within the County, nor are any significant annexations pending. Information Applicable to the COPs and Revenue Bonds THE COUNTY Governing Body As of December 31, 2015, the County Commissioners, their districts, the dates upon which their respective terms expire and their lengths of service on the Board were as follows:
Name and District Title Term Expires Length of Service Casey Tighe, District 2 Chair January, 2017 3 Years Libby Szabo, District 1 Chair Pro Tem January, 2017 11 Months Donald Rosier, District 3 Commissioner January, 2019 5 Years
Capital Improvement Plan
Jefferson County has adopted a 2015-2019 Capital Improvement Plan (the “CIP”). The CIP currently contemplates approximately $168.5 million of major capital improvements. Jefferson County defines capital improvements as infrastructure, property, equipment or other depreciable assets with a value of $50,000 or more, having an asset life of greater than two years. Projects include road, drainage, irrigation, traffic safety, airport, road and bridge projects, building maintenance and improvements, technology enhancements, vehicle and equipment replacements (items costing more than $50,000), Open Space and certain operating expenses. These projects comprising the CIP are expected to be funded with available fund balance from various funds, bond proceeds, property taxes, highway users taxes, other taxes (including sales taxes) and fees and grants. For 2015, the CIP contemplates approximately $31.9 million of capital improvements. CIP projects are contemplated in the following approximate amounts in the other years of the CIP: 2016 - $53.8 million; 2017 - $31.1 million; 2018 - $23.2 million; and 2019 - $28.5 million. Notwithstanding the foregoing, the CIP is a planning document. Projects currently included in the CIP may be reprioritized or deleted from the plan and other projects may be added at the discretion of the Board. Insurance See Note 20, Notes to Financial Statements LEGAL MATTERS Litigation See Note 21, Notes to Financial Statements Source: County Attorney’s Office and the Accounting Division
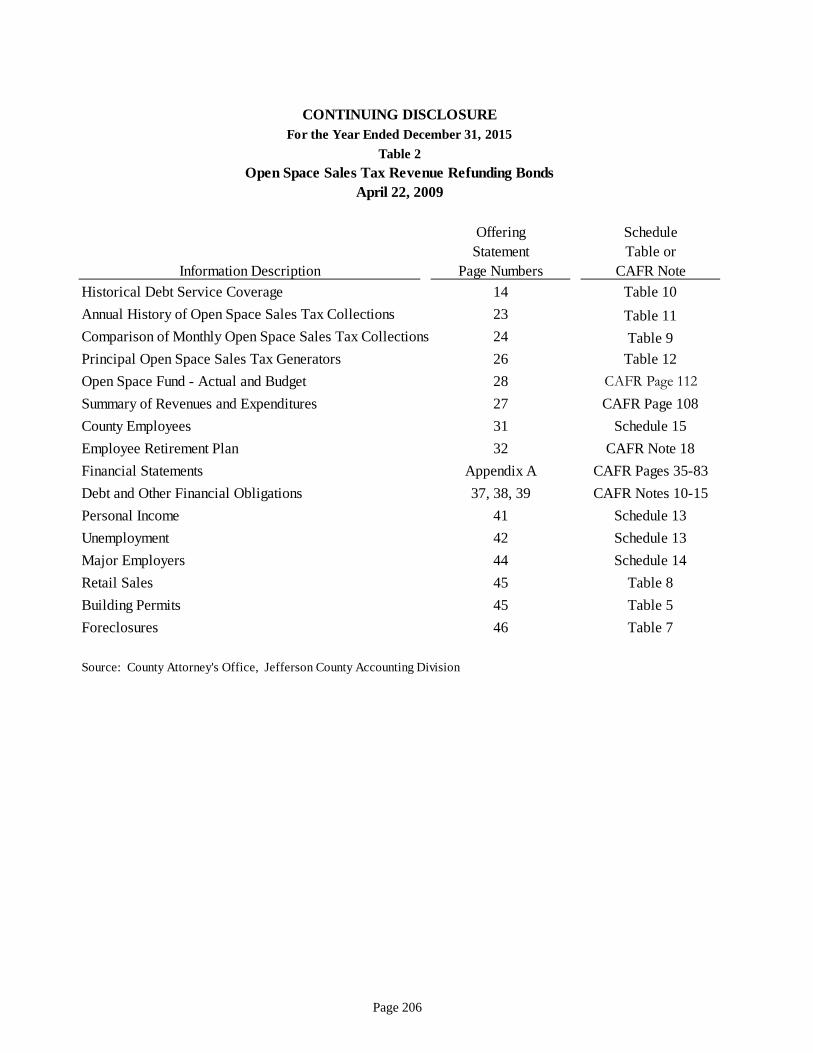
Page 206
Offering ScheduleStatement Table or
Information Description Page Numbers CAFR Note
Historical Debt Service Coverage 14 Table 10
Annual History of Open Space Sales Tax Collections 23 Table 11
Comparison of Monthly Open Space Sales Tax Collections 24 Table 9
Principal Open Space Sales Tax Generators 26 Table 12
Open Space Fund - Actual and Budget 28 CAFR Page 112
Summary of Revenues and Expenditures 27 CAFR Page 108
County Employees 31 Schedule 15
Employee Retirement Plan 32 CAFR Note 18
Financial Statements Appendix A CAFR Pages 35-83
Debt and Other Financial Obligations 37, 38, 39 CAFR Notes 10-15
Personal Income 41 Schedule 13
Unemployment 42 Schedule 13
Major Employers 44 Schedule 14
Retail Sales 45 Table 8
Building Permits 45 Table 5
Foreclosures 46 Table 7
Source: County Attorney's Office, Jefferson County Accounting Division
CONTINUING DISCLOSUREFor the Year Ended December 31, 2015
Table 2
April 22, 2009Open Space Sales Tax Revenue Refunding Bonds

Page 207
ScheduleOffering Statement Table or
Information Description Page Numbers CAFR Note
Historical Debt Service Coverage 17 Table 10
Annual History of Open Space Sales Tax Collections 23 Table 11
Comparison of Monthly Open Space Sales Tax Collections 25 Table 9
Principal Open Space Sales Tax Generators 26 Table 12
Open Space Fund - Actual and Budget 29 CAFR Page 112
Summary of Revenues and Expenditures 28 CAFR Page 108
County Employees 33 Schedule 15
Employee Retirement Plan 33 CAFR Note 18
Financial Statements Appendix A CAFR Pages 35-83
Debt and Other Financial Obligations 38, 39, 40 CAFR Notes 10-15
Personal Income 42 Schedule 13
Unemployment 43 Schedule 13
Major Employers 45 Schedule 14
Retail Sales 45 Table 8
Building Permits 46 Table 5
Foreclosures 46 Table 7
Source: County Attorney's Office, Jefferson County Accounting Division
September 30, 2010
CONTINUING DISCLOSUREFor the Year Ended December 31, 2015
Table 3
Series 2010Open Space Sales Tax Revenue Refunding Bonds

Page 208
Offering ScheduleStatement Table or
Information Description Page Numbers CAFR Note
Base Rentals Schedule 26 CAFR Note 10
County Employees 30 Schedule 15
Financial Statements Appendix A CAFR Pages 35-83
GFOA Award 46 CAFR Page 12
Summary of Revenues, Expenditures
& Changes in Fund Balance 48, 49 CAFR Pages 42; 141
Budget to Actual Comparison 50, 51 CAFR Page 87-93;
96; 139
Assessment Rate 34 Schedule 5
Historical Tax Levies and Collections 38,39 Schedule 5; 8
Assessed Valuations of Classes of Property in County 39 Table 6
Principal Taxpayers 40 Schedule 7
Employee Retirement Plan 31 CAFR Note 18
Long-Term Obligations Of The County 46, 47 CAFR Note 14
Personal Income 53 Schedule 13
Labor Force, Unemployment 54 Schedule 13
Major Employers 56 Schedule 14
Retail Sales 56 Table 8
Building Permits 57 Table 5
Source: County Attorney's Office, Jefferson County Accounting Division
CONTINUING DISCLOSUREFor the Year Ended December 31, 2015
Facilities and Equipment COPs, November 5, 2009
Table 4

Page 209
Residential Commercial/IndustrialYear Permits Amount Permits Amount
2006 623 167,724,438 68 58,673,507
2007 437 126,035,534 61 30,215,910
2008 246 76,799,548 42 43,862,584
2009 123 49,410,709 57 22,433,525
2010 147 51,785,033 27 5,370,440
2011 143 41,041,875 49 10,621,131
2012 246 67,046,401 62 15,239,152
2013 226 66,990,894 77 28,997,474
2014 305 119,027,035 58 15,859,884
2015 396 120,234,499 39 59,024,316
Source: Jefferson County Building Division
In Unincorporated Jefferson County
CONTINUING DISCLOSUREFor the Year Ended December 31, 2015
Building Permit Issuance For New Structures
Table 5

Page 210
Percent ofTotal Total Assessed
Property Class Assessed Valuation Valuation
Residential 5,078,075$ 62.09%
Commercial 1,950,785 23.85%
Vacant Land 230,570 2.82%
Industrial 564,622 6.90%
State Assessed 337,377 4.13%
Agricultural 10,591 0.13%
Natural Resources 6,062 0.07%
Oil and Gas - 0.00%
TOTAL: 8,178,082$ 100.00%
Source: Jefferson County Assessor's Office
CONTINUING DISCLOSUREFor the Year Ended December 31, 2015
2015 Certified Assessed Valuation of Classes of Property in the County
Table 6
(amounts in thousands)
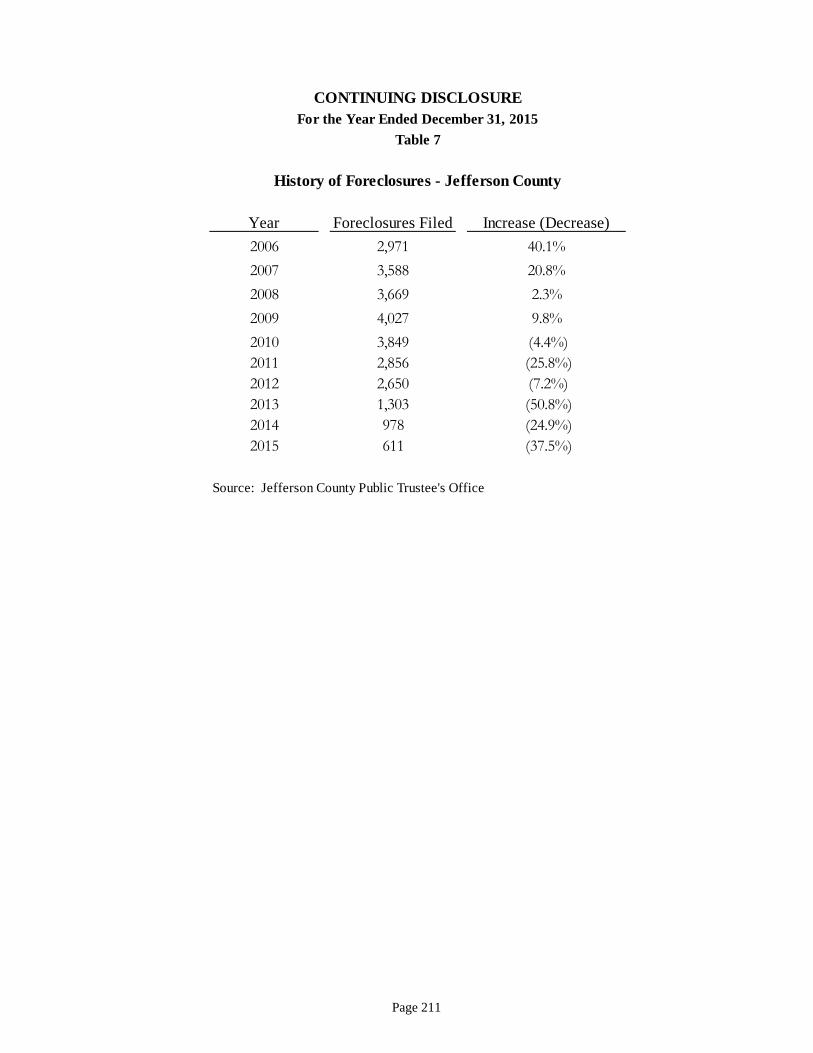
Page 211
Year Foreclosures Filed Increase (Decrease)
2006 2,971 40.1%
2007 3,588 20.8%
2008 3,669 2.3%
2009 4,027 9.8%
2010 3,849 (4.4%)2011 2,856 (25.8%)2012 2,650 (7.2%)2013 1,303 (50.8%)2014 978 (24.9%)2015 611 (37.5%)
Source: Jefferson County Public Trustee's Office
CONTINUING DISCLOSUREFor the Year Ended December 31, 2015
History of Foreclosures - Jefferson County
Table 7

Page 212
Year Jefferson County Percent Increase State Percent Increase
2006 12,560,631 4.2% 133,531,307 8.0%
2007 13,384,517 6.5% 148,673,216 11.3%
2008 13,325,195 (0.4%) 152,747,683 2.7%
2009 11,920,174 (10.7%) 134,135,323 (-12.3%)
2010 12,342,999 3.5% 142,980,300 6.6%
2011 13,434,714 8.8% 157,708,535 10.3%
2012 14,854,614 10.6% 163,414,104 3.6%
2013 15,609,247 5.1% 171,362,038 4.9%
2014(1) 15,925,861 2.0% 175,727,029 2.5%
2015(1) 17,075,453 7.2% 184,987,483 5.3%
Source: State of Colorado, Department of Revenue, Sales Tax Statistics
Note
amounts not available from the State of Colorado
CONTINUING DISCLOSUREFor the Year Ended December 31, 2015
Retail Sales (amounts in thousands)
Table 8
1State fiscal year total (July - June), calendar year

Page 213
Twelve-Month Period Twelve-Month Period Percent
Current Year Current Year Current YearMonth Month1 To Date
1Month
1To Date
1Month
1To Date
1
January 3,158,414 3,158,414$ 2,897,624$ 2,897,624$ 9.00% 9.00%
February 2,940,710 6,099,124 2,414,905 5,312,529 21.77% 14.81%
March 3,455,508 9,554,632 3,179,698 8,492,227 8.67% 12.51%
April 3,158,414 12,713,046 3,204,065 11,696,292 (1.42%) 8.69%
May 3,464,949 16,177,996 3,172,049 14,868,341 9.23% 8.81%
June 3,624,972 19,802,968 3,412,688 18,281,029 6.22% 8.33%
July 3,158,414 22,961,382 3,343,053 21,624,082 (5.52%) 6.18%
August 3,567,580 26,528,962 3,445,764 25,069,846 3.54% 5.82%
September 3,986,104 30,515,065 3,597,499 28,667,345 10.80% 6.45%
October 3,158,414 33,673,480 3,144,308 31,811,652 0.45% 5.85%
November 3,443,754 37,117,234 3,214,301 35,025,953 7.14% 5.97%
December 4,110,819 41,228,053 4,108,090 39,134,043 0.07% 5.35%
Source: Jefferson County Accounting Division
Note:1Cumulative totals may not add due to rounding
Ended December 31, 2015 Ended December 31, 2014 Increase (Decrease)
CONTINUING DISCLOSUREFor the Year Ended December 31, 2015
Comparison of Monthly Open Space Sales Tax Collections
Table 9

Page 214
Maximum AnnualDebt Service
Net Sales Tax on the 2009, 2010Year Revenues
1, 3and 2013 Bonds
2Coverage (x)
2006 22,140,804 13,222,703 1.67
2007 22,716,888 13,222,703 1.72
2008 23,057,653 13,222,703 1.74
2009 22,513,461 13,209,753 1.70
2010 29,944,031 12,995,515 2.30
2011 23,540,079 12,995,515 1.81
2012 24,649,270 12,995,515 1.90
2013 26,211,831 12,881,978 2.03
2014 27,166,853 12,881,978 2.11
2015 29,056,558 12,881,978 2.26
Source: Jefferson County Accounting DivisionNote:
add the amount collected for payment of debt service which previously
should have been included.
Cities Available Portion.2Represents the Maximum Annual Debt Service on the 2009 Bonds,
the 2010 Bonds and the 2013 Bonds. Series 1999 Bonds refunded in 2009.
Series 2001 Bonds refunded in 2010. Series 2005 Bonds refunded in 2013.3Historical numbers for Net Sales Tax revenues were adjusted to subtract theCities Available Portion which previously should have been excluded and to
1Includes proceeds of the 2% County administrative fee imposed on the
CONTINUING DISCLOSUREFor the Year Ended December 31, 2015
Table 10
Open Space Sales Tax Revenue BondsPro-Forma Historical Debt Service Coverage

Page 215
TotalOpen Space Cities NetSales Tax Percent Available Sales Tax Percent
Year Collections1
Increase Portion3
Collections4
Increase
2006 31,857,272 2.59% 9,716,468 22,140,804 1.70%
2007 32,648,589 2.48% 9,931,701 22,716,888 2.60%
2008 33,103,129 1.39% 10,045,476 23,057,653 1.50%
2009 32,337,634 (2.31%) 9,824,173 22,513,461 (2.36%)
20102
43,004,497 32.99% 13,060,466 29,944,031 33.01%
2011 33,787,970 (21.43%) 10,247,891 23,540,079 (21.39%)
2012 35,435,984 4.88% 10,786,713 24,649,270 4.71%
2013 37,714,865 6.43% 11,503,034 26,211,831 6.34%
2014 39,134,043 3.76% 11,967,190 27,166,853 3.64%
2015 41,934,706 7.16% 12,878,148 29,056,558 6.96%
Source: Jefferson County Accounting DivisionNote:
collections were up 2.39% over 2009.3Historical numbers for Cities Available Portion were previously calculated by
subtracting the Net Sales Tax Collections from the Total Open Space Sales Tax
Collections as explained in Note 4.4The historical numbers for Net Sales Tax Collections were adjusted to add the
amount collected for payment of debt service which previously should have
been included.
2Includes a one time payment of $9,894,189. Excluding this payment, 2010
CONTINUING DISCLOSUREFor the Year Ended December 31, 2015
Table 11
Annual History of Open Space Sales Tax Collections
1Includes proceeds of the 2% County administrative fee deducted from the
Cities Available Portion.

Page 216
Amount Percent of Total Collected Collections
1
3,981,285$ 9.49%
2,320,688 5.53%
2,262,904 5.40%
1,460,100 3.48%
1,278,819 3.05%
1,253,688 2.99%
779,285 1.86%
537,648 1.28%
527,173 1.26%
497,433 1.19%
14,899,023$ 35.53%
Source: Jefferson County Accounting DivisionNote:
41,934,706$
CONTINUING DISCLOSUREFor the Year Ended December 31, 2015
Ten Principal Generators of Open Space Sales Tax Revenues
Table 12
Type of Business
Public Utilities
Retailer
Retailer
Retailer
Open Space Sales Tax Collections of:
1Percentages are based upon total 2015
Retailer
Retailer
Retailer
Retailer
Public Utilities
Retailer

Page 217
Jefferson County Accounting Division 100 Jefferson County Parkway Golden, CO 80419 www.jeffco.us