Financial Report - September 2021 - Odinsa
25
Financial Report September 2021 Aeropuerto El Dorado
-
Upload
khangminh22 -
Category
Documents
-
view
0 -
download
0
Transcript of Financial Report - September 2021 - Odinsa

Financial ReportSeptember 2021
Aeropuerto El Dorado

Odinsa´s ConsolidatedResults
Aeropuerto El Dorado

Consolidated Results — September 2021
Increase in revenue ~ ∆+ 192,1k M, mainly due to:
✓ ∆+ 150,5k M Highway Concessions
✓ ∆+ 74,7k M Airport Concessions
✓ ∆- 5,9k M Others
✓ ∆- 10,9k M Accounting Eliminations
✓ ∆- 16,2k M Construction
Increase in EBITDA ~ ∆+ 158,9k M, mainly due to:
✓ ∆+ 108,2k M Highway Concessions
✓ ∆+ 74,7k M Airport Concessions
✓ ∆+ 8,8k M Accounting Eliminations
✓ ∆- 12,5k M Others
✓ ∆- 20,3k M Construction
2
1
Increase in net income ~ ∆+ 128,2k M, mainly due to:
✓ ∆+ 74,7k M Airport Concessions
✓ ∆+ 63,0k M Highway Concessions
✓ ∆+ 16,2k M Others
✓ ∆- 6,3k M Accounting Eliminations
✓ ∆- 19,4k M Construction
3
Real Real Variation
sep-20 sep-21 2021 vs 2020
Income 530,615 722,772 36%
Income by MPP - 49,184 28,142 157%
Cost 150,815 194,715 29%
Gross Profit 379,800 528,057 39%
Other income/expenses 3,982 5,810 46%
Operating Profit 257,234 403,542 57%
EBITDA 321,723 480,718 49%
Financial, net - 168,057 - 143,015 15%
Net income before taxes 81,380 253,883 212%
Taxes 72,196 84,402 17%
Net income 9,184 169,481 1745%
Non controlling profit/loss - - 0%
Profit/loss for the parent company 9,184 169,481 1745%
Income 37,901 69,920 84%
Income by MPP - 28,717 99,561 447%
Relevant numbers – Consolidated Income Statement

Summary
Aeropuerto El Dorado

22,6621,39 21,10
2020 2021 Ppto
27,9725,36 26,17
2020 2021 Ppto
4,555
7,085
2020 2021
39,29 41,13 39,06
2020 2021 Ppto
44,9547,57 45,88
2020 2021 Ppto
11,831
19,934
2020 2021
65.15178.094 72.043
2020 2021 Ppto
143.451
180.674 179.757
2020 2021 Ppto
24,94634,320
2020 2021
Summary
AKF ADN BTA
TPD accumulated
data
Revenues
EBITDA
EBITDA MARGIN
114,182107,755 107,471
20%
USD millions USD millions*Includes consortium
26%
15%
6%
45% 43% 40% 87% 86% 85%
5%
9%
81% 84% 81%
38%68% 56%
6%
COP millions

27.923
80.945
59.309
2020 2021 Ppto
59.736
125.036117.346
2020 2021 Ppto
14,181
26,807
2020 2021
157.013
180.940
161.714
2020 2021 Ppto
328.462
235.298 225.809
2020 2021 Ppto
5,169 6,580
2020 2021
-3.106
16.472
0
31.047
57.860
0
2020 2021 Ppto
14,09719,620
2020 2021
Summary
MVM P2 Túnel de Oriente
COP millions
2020
COP millions
2021
COP millions
15%
48% 77% 72%
86%
630%
28%
-10%
28% 109%
190%
47% 65% 51%
39% 27% 89%
TPD accumulated
data
Revenues
EBITDA
EBITDA MARGIN

310.666
525.883480.955
2020 2021 Ppto
5,42
11,452,42
3,11
2020 2021
61,02
77,57
63,97
2020 2021 Ppto
14.135
127.301
89.989
2020 2021 Ppto
0,63 0,72
0,55
0,84
2020 2021
38,03
51,87
40,88
2020 2021 Ppto
4,93
4,05
4,74
2020 2021 Ppto
7,02
6,16 6,45
2020 2021 Ppto
Summary
Green Corridor Quiport
Passengers
USD millionsUSD millions
*million passengers
*Includes MSIA financial revenue*Coverage revenues not included
18%
Opain
7.84
14.551.18
1..55
70% 66% 73%
12%
62% 67% 72%
111%
86%
27%
36%
69%
801%
5% 24% 19%
51%28%
31%
14%
Revenues
EBITDA
EBITDA MARGIN
*Coverage revenues not included
COP millions

Aeropuerto El Dorado
Revenues, EBITDA and Net ProfitContribution by segment
* Comparison Y/Y
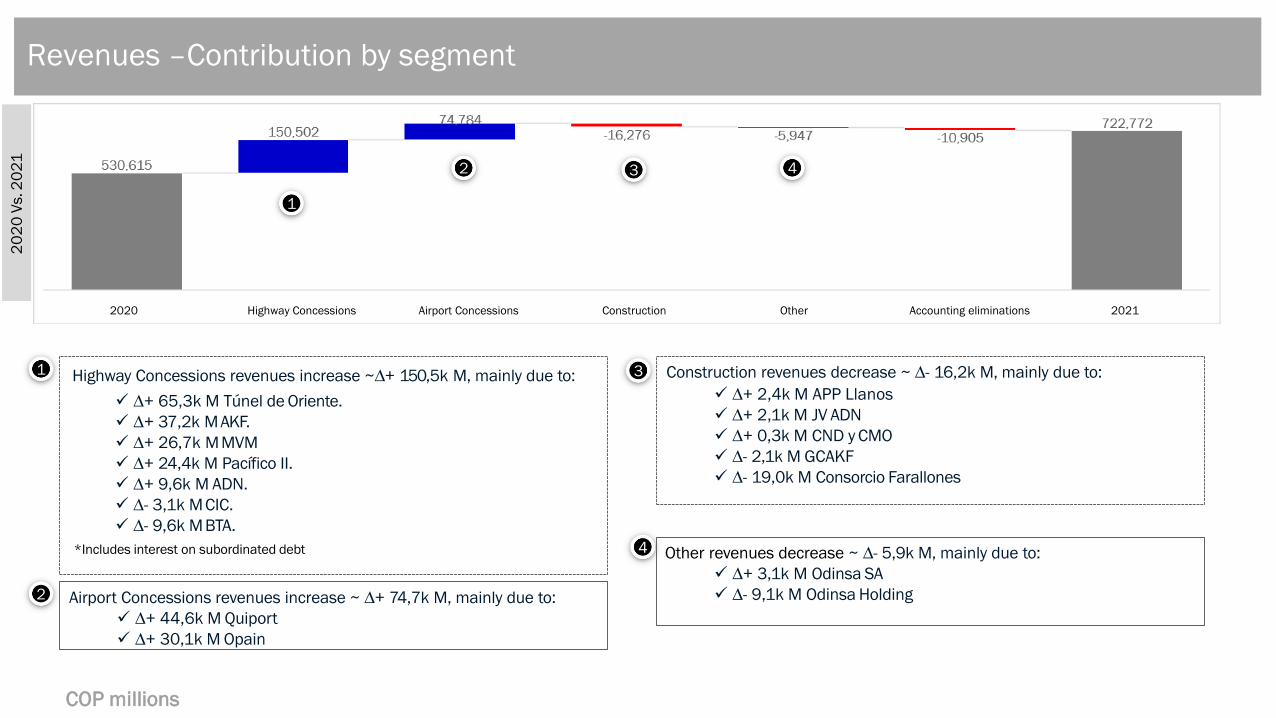
Revenues –Contribution by segment
COP millions
20
20
Vs.2
02
1
Highway Concessions revenues increase ~∆+ 150,5k M, mainly due to:1 Construction revenues decrease ~ ∆- 16,2k M, mainly due to:
✓ ∆+ 2,4k M APP Llanos
✓ ∆+ 2,1k M JV ADN
✓ ∆+ 0,3k M CND y CMO
✓ ∆- 2,1k M GCAKF
✓ ∆- 19,0k M Consorcio Farallones
3
2 Airport Concessions revenues increase ~ ∆+ 74,7k M, mainly due to:
✓ ∆+ 44,6k M Quiport
✓ ∆+ 30,1k M Opain
4 Other revenues decrease ~ ∆- 5,9k M, mainly due to:
✓ ∆+ 3,1k M Odinsa SA
✓ ∆- 9,1k M Odinsa Holding
1
2 3 4
✓ ∆+ 65,3k M Túnel de Oriente.
✓ ∆+ 37,2k MAKF.
✓ ∆+ 26,7k M MVM
✓ ∆+ 24,4k M Pacífico II.
✓ ∆+ 9,6k M ADN.
✓ ∆- 3,1k MCIC.
✓ ∆- 9,6k M BTA.
*Includes interest on subordinated debt
2020 Highway Concessions Airport Concessions Construction Other Accounting eliminations 2021

EBITDA –Contribution by segment
COP millions
1 Construction EBITDA decrease ~ ∆- 20,3k M, mainly due to:
✓ ∆+ 1,8k M Chamba Blou
✓ ∆+ 1,6k M JV ADN
✓ ∆+ 1,2k M Confase
✓ ∆+ 0,3k M CND y CMO
✓ ∆+ 0,2k M APP Llanos
✓ ∆- 0,1k M JV BTA
✓ ∆- 6,5k M GCAKF
✓ ∆- 19,0k M Consorcio Farallones
3
2Airport Concessions EBITDA increase ~ ∆+ 74,7k M, mainly due to:
✓ ∆+ 44,6k M Quiport
✓ ∆+ 30,1k M Opain
4Other EBITDA decrease ~ ∆- 12,5k M, mainly due to :
✓ ∆+ 0,4k M Odinsa PI
✓ ∆- 4,4k M Odinsa SA
✓ ∆- 8,6k M Odinsa Holding
1
2 3 4
20
20
Vs.2
02
1
Highway Concessions EBITDA increase ~ ∆+ 108,2k M, mainly due to:
✓ ∆+ 53,0k M Túnel de Oriente
✓ ∆+ 24,4k M Pacífico II
✓ ∆+ 18,9k M MVM
✓ ∆+ 12,9k M AKF
✓ ∆+ 6,8k M ADN
✓ ∆- 3,2k M CIC
✓ ∆- 4,7k M BTA
*Includes subordinated debt interests
2020 Highway Concessions Airport Concessions Construction Other Accounting eliminations 2021

Net Profit –Contribution by segment
1
2
34
COP millions
1 ~ ∆- 19,4k M, mainly due to:Construction net profit decrease
✓ ∆+ 1,9k M Chamba Blou
✓ ∆+ 0,7k M JV ADN y JV BTA
✓ ∆+ 0,4k M Confase
✓ ∆+ 0,3k M CND y CMO
✓ ∆+ 0,1k M APP Llanos
✓ ∆- 4,0k M GCAKF
✓ ∆- 19,0k M Consorcio Farallones
3
2Airport Concessions net profit increase ~ ∆+ 74,7k M, mainly due to:
✓ ∆+ 44,6k M Quiport
✓ ∆+ 30,1k M Opain
4Other net profit increase ~ ∆+ 16,2k M, mainly due to:
✓ ∆+ 17,6k M Odinsa SA
✓ ∆+ 0,5k M Odinsa PI
✓ ∆- 1,9k M Odinsa Holding
20
20
Vs.2
02
1
Highway Concessions net profit increase ~ ∆+ 63,0k M, mainly due to:
✓ ∆+ 24,4k M Pacífico II
✓ ∆+ 19,7k M Túnel de Oriente
✓ ∆+ 8,7k MMVM
✓ ∆+ 6,2k M AKF
✓ ∆+ 3,3k MBTA
✓ ∆+ 2,0k M ADN
✓ ∆- 1,4k M CIC
*Includes subordinated debt interests
2020 Highway Concessions Airport Concessions Construction Other Accounting eliminations 2021
Concessions’ Results
Aeropuerto El Dorado

Airport Concessions
Aeropuerto El Dorado

5,42
11,45
2,42
3,11
2020 2021
0,630,72
0,55
0,84
2020 2021
Airport Concessions’ Traffic
OPAIN QUIPORT
Million passengers – accumulated data, September
Domestic PassengersInternational Passengers
7.84
14.55
1.18
1.55
111%
86%
28%
31%
14%
51%

310.666
525.883
2020 2021
-120.247
-26.872
2020 2021
14.135
127.301
2020 2021
OPAIN
Total Revenues variation Y/Y +68%, mainly due to:
• Higher regulated revenues: ~ ∆+ COP 160,3k M
• Higher unregulated revenues: ~ ∆+ COP 54,8k M
• Lower coverage revenues: ~ ∆- COP 29,4k M
EBITDA increase +801%, mainly do to:
• ∆+ COP 215,2 M, total revenues
Net profit increase +78%, mainly due to:
• ∆+COP 77,9 M, in EBIT
• Increase in financial expenses, net ~ ∆+ COP 6.4k M
69% 801%
78%
REVENUES
COP millions
EBITDA
COP millions
NET PROFIT
COP millions

-22,87
3,07
-7,80
2020 2021 Ppto
38,03
51,87
40,88
2020 2021 Ppto
61,02
77,57
56,66
2020 2021 Ppto
Quiport
Total Revenues variation Y/Y +27%, mainly due to:
• Higher regulated revenues: ~ ∆+ USD 12,2 M
• Higher unregulated revenues: ~ ∆+ USD 5,8 M
EBITDA increase +36%, mainly due to:
• ∆+ USD 17,8 M, total revenues
Net profit increase 113%, mainly due to:
• Increase in EBIT ~ ∆+ USD 18,9 M.
*Includes MSIA financial revenue
113%
27%36%
REVENUES
USD millons
EBITDA
USD millons
NET PROFIT
USD millons

Highway Concessions
Aeropuerto El Dorado

3,886
7,318
2020 2021
3,862
5,356
2020 2021
1,416
1,796
2020 2021
1,248
1,934
2020 2021
3,242
5,442
2020 2021
6,84
9,37
2020 2021
Highway Concessions’ Traffic
Million vehicles – accumulated data, September
AKF ADN BTA
Pacífico II MVM CTAO
37% 68% 55%
27% 39% 88%

42.389
52.789
45.252
2020 2021 Ppto
65.151
78.09472.043
2020 2021 Ppto
143.451
180.674 179.757
2020 2021 Ppto
AKF + Consortium (aggregate)
Revenues variation Y/Y +26%, mainly due to:
• Higher toll collection revenues: ~ ∆+ COP 18,6K M
• Higher construction revenues: ~ ∆+ COP 18,8K M
EBITDA increase +20%, mainly due to:
• ∆+ COP 37,2k M, total revenues
Net profit increase +25%, mainly due to:
• Increase in EBIT ~ ∆+ COP 12,7k M
26% 20% 25%
204.333
243,850
208,765
121.377
114,182107,755
99.052
88,17584,536
* Interpretation includes only concession
3% 15% 16%
REVENUES
COP millions
EBITDA
COP millions
NET PROFIT
COP millions

17,9718,80 19,10
2020 2021 Ppto
39,2941,13
39,06
2020 2021 Ppto
44,9547,57
45,88
2020 2021 Ppto
ADN
Revenues variation Y/Y +6%, mainly due to:
• Higher operating revenues: ~ ∆+ USD 1,6 M
• Higher financial revenues: ~ ∆+ USD 0,9 M
EBITDA increase +5%, , mainly due to:
• ∆+ USD 2,61 M, total revenues
• Lower operating expenses ~ ∆- USD 0,36 M
Net profit increase +5%, mainly due to:
• ~ ∆+ USD 1,91 M, in EBIT
• Decrease in financial expenses, net ~ ∆ USD- 2,50 M
45,16
6% 5%5%
REVENUES
USD millions
EBITDA
USD millions
NET PROFIT
USD millions

5,10
6,43
5,76
2020 2021 Ppto
22,6621,39 21,10
2020 2021 Ppto
27,97
25,36 26,17
2020 2021 Ppto
BTA
Revenues variation Y/Y -9%, mainly due to:
• Lower operating revenues:~ ∆- USD 1,89 M
• Lower financial revenues: ~ ∆- USD 0,72 M
EBITDA decrease by -6%, mainly due to:
• ∆- USD 2,61 M, total revenues
• Lower operating costs~ ∆- USD 0,9 M.
• Increase in other revenues, net ~ ∆ +USD 0,66 M.
Net profit increase by +26%, mainly due to:
• Decrease in financial expenses, net ~ ∆+ USD 2,42 M.
• Taxes decrease ~ ∆- USD 0,3 M (+1,63 M current and -1,93
deferred)
9% 26%6%
REVENUES
USD millions
EBITDA
USD millions
NET PROFIT
USD millions

25.360
56.304
11.761
2020 2021 Ppto
157.013
180.940
161.714
2020 2021 Ppto
328.462
235.298225.809
2020 2021 Ppto
Pacífico II
Total Revenues variation Y/Y -28%, mainly due to:
• Higher toll collection revenues: ~ ∆+ COP 19,1k M
• Lower construction revenues:~∆- COP 112,3k M
EBITDA increase by +15%, mainly due to:
• Lower operating costs ~ ∆- COP 116,5k M
• Increase in other revenues, net ~ ∆+ COP 0,2k M
Net profit increase by +122%, mainly due to:
• ∆+ COP 23,9k M, in EBIT
• Increase in foreign exchange balance variation ~ ∆+ COP
10,0k M
• Taxes decrease ~ ∆- COP 18,8k M (deferred)
28% 15% 122%
REVENUES
COP millions
EBITDA
COP millions
NET PROFIT
COP millions

-3.918
13.863
0
-3.106
16.472
0
31.047
57.860
0
2020 2021 Ppto
Malla Vial del Meta
Total Revenues variation Y/Y +86%, mainly due to:
• Higher toll collection revenues: ~∆+ COP 23,8k M
• Higher construction revenues: ~∆+ COP 2,9k M
EBITDA increase +630%, mainly due to:
• ∆+ COP 26,8k M, total revenues
Net profit increase +454%, mainly due to:
• ∆+ COP 19,7k M, in EBIT
2021
2020
Ppto
2021
2020
Ppto
86% 630% 454%
REVENUES
COP millions
EBITDA
COP millions
NET PROFIT
COP millions

-11.741
28.493
6.883
2020 2021 Ppto
27.923
80.945
59.309
2020 2021 Ppto
59.736
125.036117.346
2020 2021 Ppto
Túnel de Aburrá Oriente
Total Revenues variation Y/Y +109%, mainly due to:
• Higher toll collection revenues: ~ ∆+ COP 61,0k M
• Higher financial income : ~ ∆+ COP 4,2k M
EBITDA increase +190%, mainly due to:
• ~ ∆+ COP 65,3k M, total revenues.
Net profit increase 343%, mainly due to:
• ∆+ COP 44,5k M, in EBIT
• Increase in financial expenses, net ~ ∆+ COP 6,7 K M
190%109% 343%
2020
REVENUES
COP millions
EBITDA
COP millions
NET PROFIT
COP millions

1,26
0,86
1,32
2020 2021 Ppto
4,93
4,05
4,74
2020 2021 Ppto
7,02
6,166,45
2020 2021 Ppto
Green Corridor
Total Revenues variation Y/Y -12%, mainly due to:
• Decrease in operating revenues: ~ ∆- USD 1,35 M
• Increase in financial revenues: ~ ∆+ USD 0,44 M
EBITDA decrease -18%, mainly due to:
• Decrease in revenues ~ ∆- USD 0,86 M
• Increase in operating costs and expenses ~ ∆+ USD 0,18
M
Net profit decrease -32, mainly due to:
• Decrease in EBIT ~ ∆- USD 0,88 M
18% 32%12%
REVENUES
USD millions
EBITDA
USD millions
NET PROFIT
USD millions