Romanian Economic Environment – 2008 Global Financial Crisis
33
Business Economics Business Economics Unit leader: Dr. Hristos N Paperwork: Claudiu Bejan Romanian Economic Environment – 2008 Global Financial Crisis SUBMISSION DATE: March 2014 ABSTRACT: European Community faced larger economic decline during 2008-2009 economic crisis consequently bringing unemployment and poverty in Central and Eastern Europe countries (CEE). With the exception of Baltic countries where the crisis enters beginning of 2007, the rest of Europe was touch by the crisis in late 2008. As part of European Community since January 2007, after an important economic growth during the years up to 2008, Romania faced a difficult period once the crisis started, big unemployment rate and negative macroeconomics trends; One of the most impacted industry sectors due to this crisis was automotive sector which faced big output declines worldwide. Since early 21 st century, the economy of CEE countries was positively affected by inflows capital from the West countries. Therefore, private sector, mainly multinational companies, represents important economic rate in CEE countries. Private sector faced during the crisis volumes drops, headcount downsize, relocations, turnover instability… Claudiu Bejan - Bucharest 1
-
Upload
independent -
Category
Documents
-
view
3 -
download
0
Transcript of Romanian Economic Environment – 2008 Global Financial Crisis
Business Economics
Business Economics
Unit leader: Dr. Hristos N
Paperwork: Claudiu Bejan
Romanian Economic Environment – 2008 Global
Financial Crisis
SUBMISSION DATE: March 2014
ABSTRACT: European Community faced larger economic decline during 2008-2009
economic crisis consequently bringing unemployment and poverty in Central and
Eastern Europe countries (CEE). With the exception of Baltic countries where the crisis
enters beginning of 2007, the rest of Europe was touch by the crisis in late 2008.
As part of European Community since January 2007, after an important
economic growth during the years up to 2008, Romania faced a difficult period
once the crisis started, big unemployment rate and negative macroeconomics
trends;
One of the most impacted industry sectors due to this crisis was automotive
sector which faced big output declines worldwide.
Since early 21st century, the economy of CEE countries was positively affected by
inflows capital from the West countries. Therefore, private sector, mainly
multinational companies, represents important economic rate in CEE countries.
Private sector faced during the crisis volumes drops, headcount downsize,
relocations, turnover instability…
Claudiu Bejan - Bucharest1
Business EconomicsThe aims of this article are to document above facts and to understand them. It will be
explained how the crisis impacted Romanian economy and how Romanian
government reacts and faced the crisis. Also, we will understand how the
multinational companies in automotive industry fight against the economic crisis,
against downsize and how they protected their employees’ to minimize the
unemployment rate in the area.
KEY WORDS: financial crisis, unemployment, GDP, inflation, output, demand,
government intervention.
Table of contents
1. Introduction – Global Financial Crisis (GFC)
…………………………………...........3
1.1. US – the place where the crisis born…………………………………………...3
1.2. European Community – Crisis impact…………………………………………4
1.3. Romania – economic crisis environment………………………………………5
2. The
crisis…......................................................
.............................................................
6
Claudiu Bejan - Bucharest2
Business Economics2.1. Romania – How deep the crisis touched Romanian economy?
……..………...6
2.2. Automotive industry and the crisis.……………………………………………9
2.3. How multinational companies faced the crisis? – Yazaki
Romania case…....10
3. The fight against the crisis…………………………………………………………….12
3.1. How Romanian Government react?…..…………………….………………...12
3.2. How Yazaki Romania management react?……………………...……………14
4. Conclusions……………………………………………………………………...……16
5. References………………………………………………………………………….....18
6. Appendix………………………………………………………………………………19
1. INTRODUCTION – Global Financial Crisis (GFC)
1.1. US – the place where the crisis born
Claudiu Bejan - Bucharest3
Business Economics“The global financial crisis (GFC) was born in the United
States of too loose money and too lax regulation, aided and
abetted by China’s willingness to provide credit to America
seemingly without limit” (Geoffrey Garrett, 2010). Before the
crisis, America was happy to use big amount of money to buy
massive quantities of goods made in China, therefore US was
used to have big trade deficits with China due to lower
interest rate. Many times the economists speak about imbalanced
China – US economy, “but neither China nor the US wanted to
stop the party while the music was still playing – their
economies benefitted too much from
them, in short term at least. Then
the music stopped” as Geoffrey
Garrett statement in Global Policy
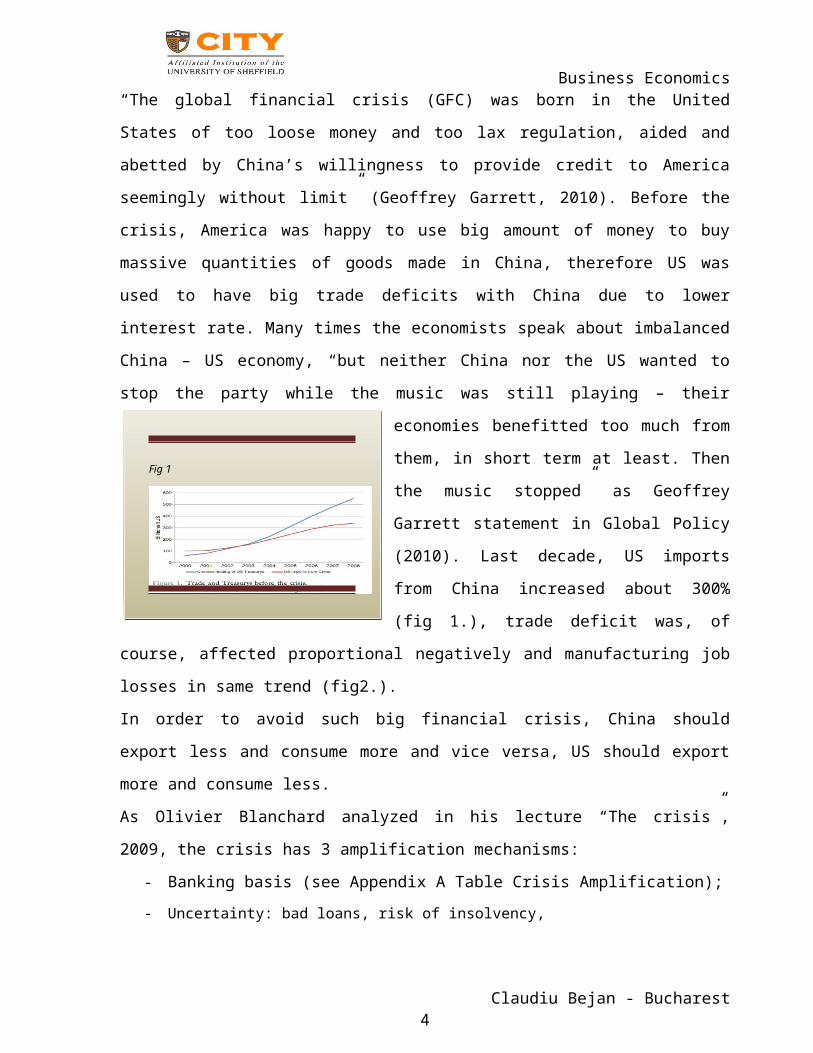
(2010). Last decade, US imports
from China increased about 300%
(fig 1.), trade deficit was, of
course, affected proportional negatively and manufacturing job
losses in same trend (fig2.).
In order to avoid such big financial crisis, China should
export less and consume more and vice versa, US should export
more and consume less.
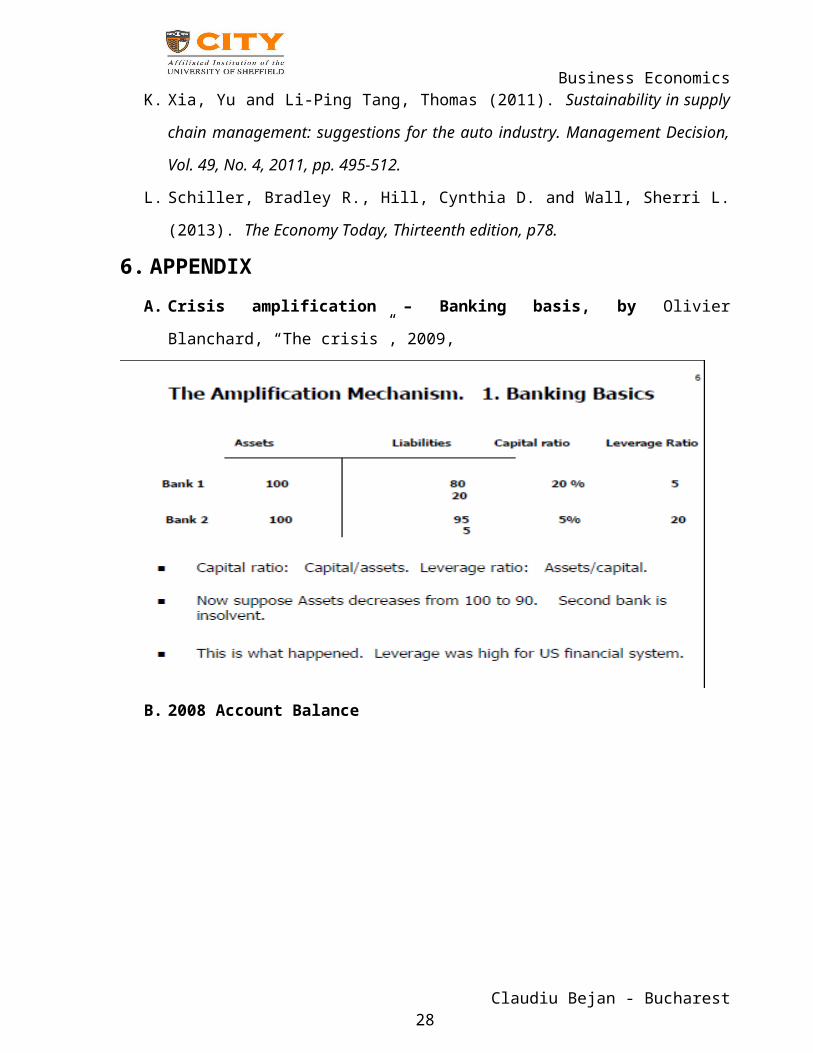
As Olivier Blanchard analyzed in his lecture “The crisis”,
2009, the crisis has 3 amplification mechanisms:
- Banking basis (see Appendix A Table Crisis Amplification);- Uncertainty: bad loans, risk of insolvency,
Claudiu Bejan - Bucharest4
Fig 1
Business Economicsreluctance of banks to lend to each other, investors taking
their founds out of the country, asset prices fall;
- Why happened: excess of optimism,
incentives and competence of rating agencies and, the most
important is the complex security as Mortgage-Backed Security
(MBS) which were financial products used by Wall Street banks
that initially provided more funds for homeownership.
1.2. European Community – crisis impact
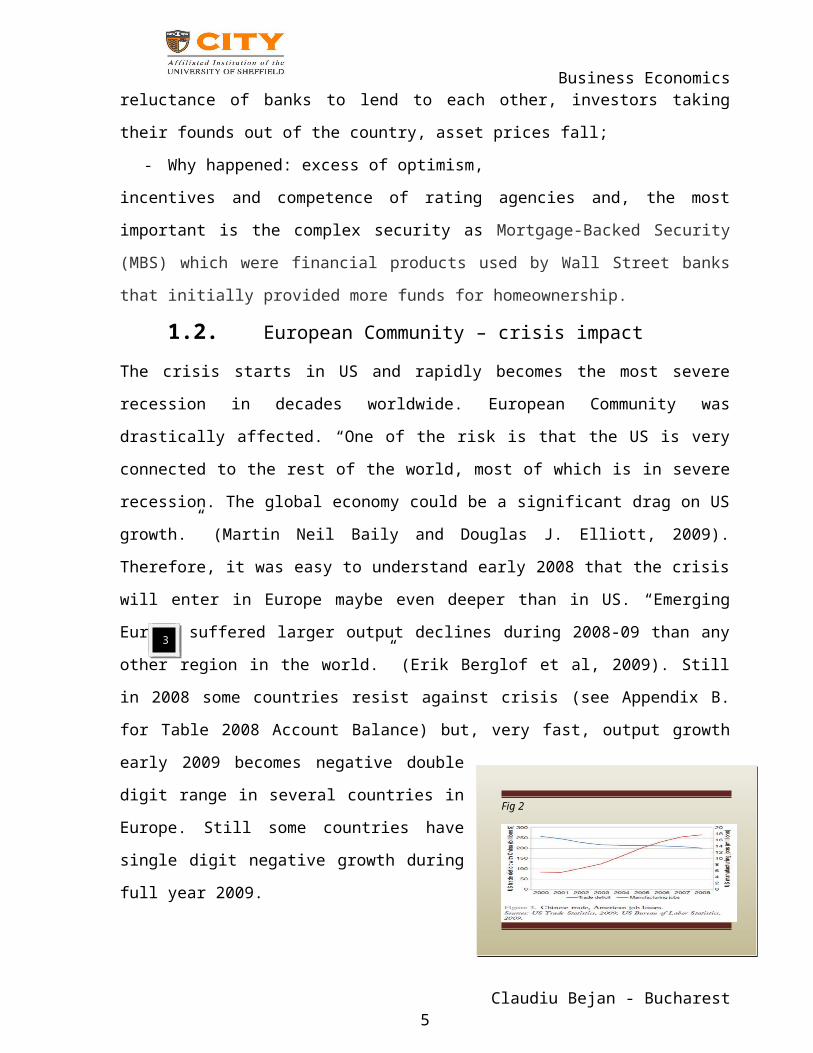
The crisis starts in US and rapidly becomes the most severe
recession in decades worldwide. European Community was
drastically affected. “One of the risk is that the US is very
connected to the rest of the world, most of which is in severe
recession. The global economy could be a significant drag on US
growth.” (Martin Neil Baily and Douglas J. Elliott, 2009).
Therefore, it was easy to understand early 2008 that the crisis
will enter in Europe maybe even deeper than in US. “Emerging
Europe suffered larger output declines during 2008-09 than any
other region in the world.” (Erik Berglof et al, 2009). Still
in 2008 some countries resist against crisis (see Appendix B.
for Table 2008 Account Balance) but, very fast, output growth
early 2009 becomes negative double
digit range in several countries in
Europe. Still some countries have
single digit negative growth during
full year 2009.
Claudiu Bejan - Bucharest5
Fig 2
3
Business Economics
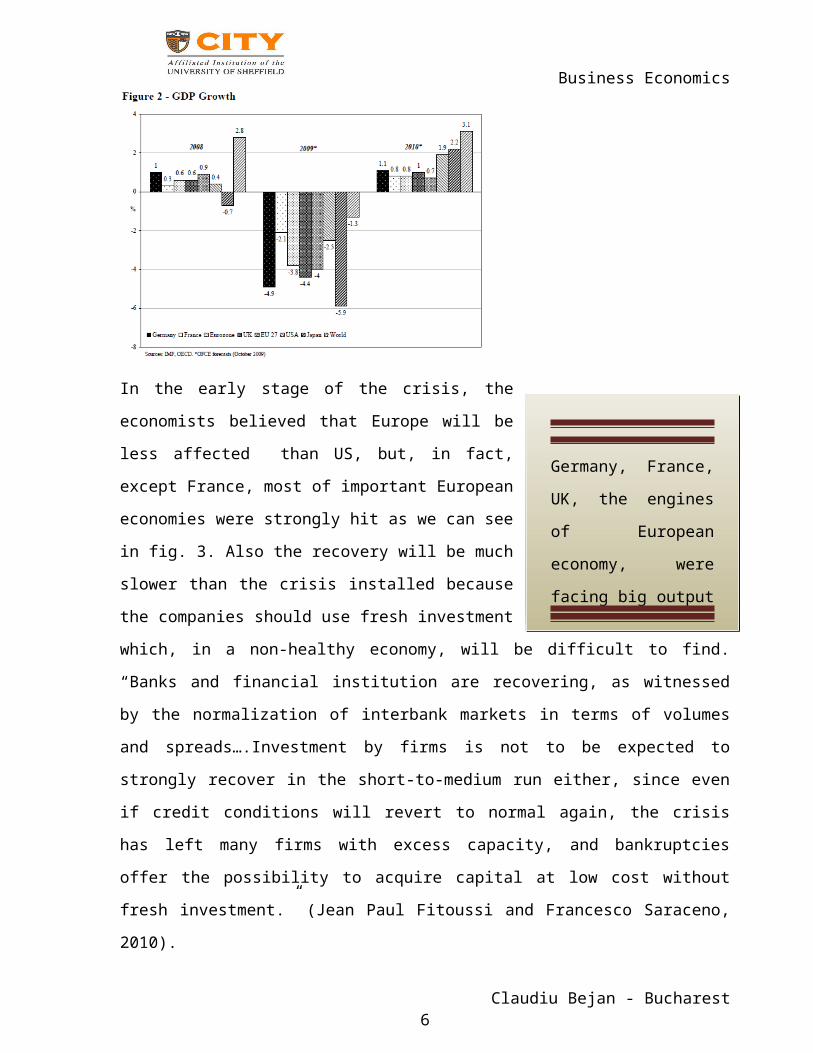
In the early stage of the crisis, the
economists believed that Europe will be
less affected than US, but, in fact,
except France, most of important European
economies were strongly hit as we can see
in fig. 3. Also the recovery will be much
slower than the crisis installed because
the companies should use fresh investment
which, in a non-healthy economy, will be difficult to find.
“Banks and financial institution are recovering, as witnessed
by the normalization of interbank markets in terms of volumes
and spreads….Investment by firms is not to be expected to
strongly recover in the short-to-medium run either, since even
if credit conditions will revert to normal again, the crisis
has left many firms with excess capacity, and bankruptcies
offer the possibility to acquire capital at low cost without
fresh investment.” (Jean Paul Fitoussi and Francesco Saraceno,
2010).
Claudiu Bejan - Bucharest6
Germany, France,
UK, the engines
of European
economy, were
facing big output
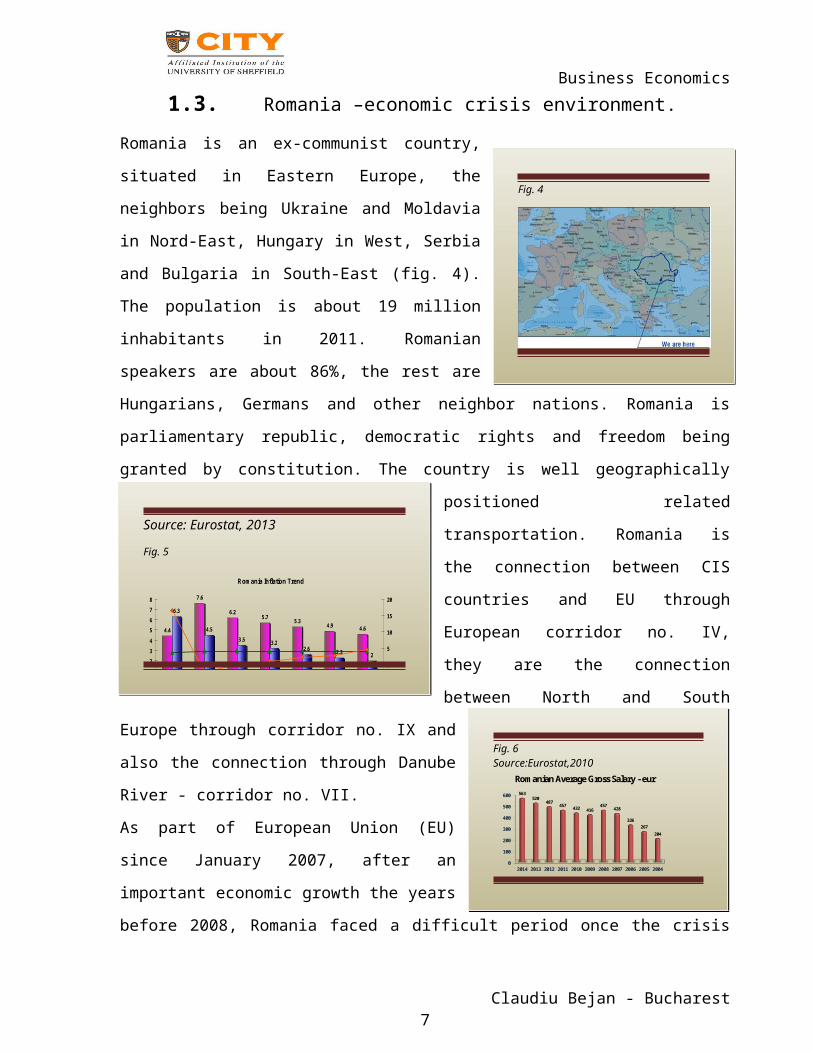
Business Economics1.3. Romania –economic crisis environment.
Romania is an ex-communist country,
situated in Eastern Europe, the
neighbors being Ukraine and Moldavia
in Nord-East, Hungary in West, Serbia
and Bulgaria in South-East (fig. 4).
The population is about 19 million
inhabitants in 2011. Romanian
speakers are about 86%, the rest are
Hungarians, Germans and other neighbor nations. Romania is
parliamentary republic, democratic rights and freedom being
granted by constitution. The country is well geographically
positioned related
transportation. Romania is
the connection between CIS
countries and EU through
European corridor no. IV,
they are the connection
between North and South
Europe through corridor no. IX and
also the connection through Danube
River - corridor no. VII.
As part of European Union (EU)
since January 2007, after an
important economic growth the years
before 2008, Romania faced a difficult period once the crisis
Claudiu Bejan - Bucharest7
Fig. 4
Source: Eurostat, 2013
Fig. 5
Rom ania Inflation Trend
4.4
7.6
6.25.7 5.3 4.9 4.6
6.3
4.53.5 3.2
2.6 2.3 2
012345678
2,008 2,009 2,010 2,011 2,012 2,013 2,014-5
0
5
10
15
20
Fig. 6 Source:Eurostat,2010
0
100
200
300
400
500
600
2014 2013 2012 2011 2010 2009 2008 2007 2006 2005 2004
563 520
487 457 432 416 457 428
326 267
204
Rom anian Average Gross Salary - eur
Business Economicsstarted. The unemployment was the most important economic
parameter which negatively impacts the economy. If in 2008,
before the GFC the unemployment was stable around 4.4%, after
the crisis never back to the same low level with 4.6%
expectation in 2014 (fig. 5). Also, the gross salary average
has a negative impact in quality of life by decreasing during
the crisis about 8% with recovery back only in 3 years’ time
(fig.6). Romanian government should hardly work to take strong
actions to keep the economy to a survival level in order to
successfully face the 2008 crisis. Political stability is one
of the most important variables to sustain the difficulties
which each CEE countries will meet. Last decade, Western
countries invested in CEE area in order to decrease their
production costs and to improve profits.
2. The crisis
2.1. Romania - How deep the crisis touched
Romanian economy?
Claudiu Bejan - Bucharest8
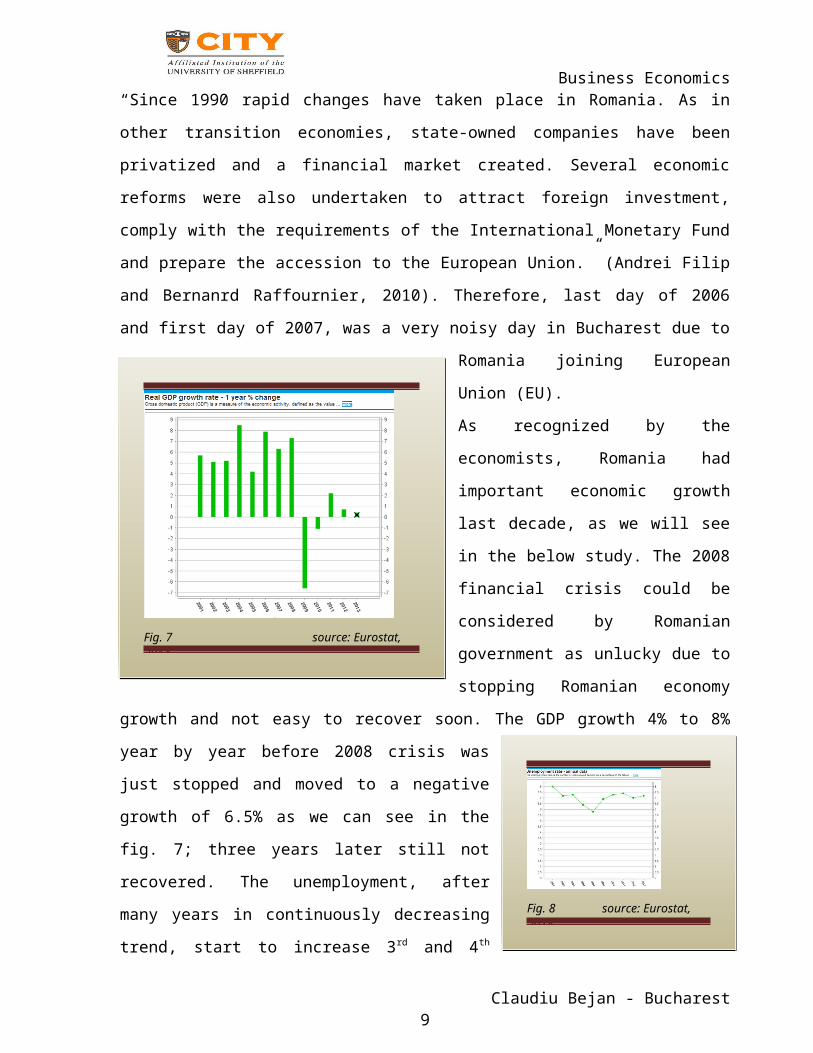
Business Economics“Since 1990 rapid changes have taken place in Romania. As in
other transition economies, state-owned companies have been
privatized and a financial market created. Several economic
reforms were also undertaken to attract foreign investment,
comply with the requirements of the International Monetary Fund
and prepare the accession to the European Union.” (Andrei Filip
and Bernanrd Raffournier, 2010). Therefore, last day of 2006
and first day of 2007, was a very noisy day in Bucharest due to
Romania joining European
Union (EU).
As recognized by the
economists, Romania had
important economic growth
last decade, as we will see
in the below study. The 2008
financial crisis could be
considered by Romanian
government as unlucky due to
stopping Romanian economy
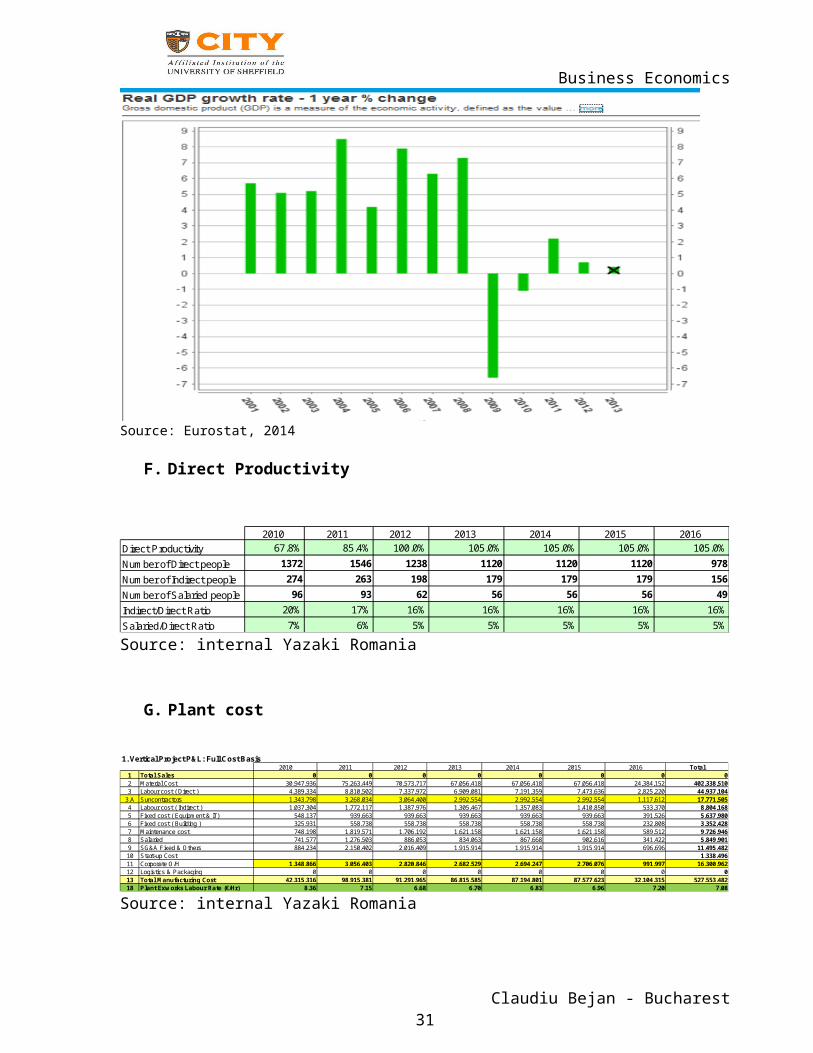
growth and not easy to recover soon. The GDP growth 4% to 8%
year by year before 2008 crisis was
just stopped and moved to a negative
growth of 6.5% as we can see in the
fig. 7; three years later still not
recovered. The unemployment, after
many years in continuously decreasing
trend, start to increase 3rd and 4th
Claudiu Bejan - Bucharest9
Fig. 7 source: Eurostat, 2014
Fig. 8 source: Eurostat, 2014
Business Economicsquarter of 2008 and since then, never reached the same value as
middle 2008 (fig. 8). “This recession has caused a lot of jobs
losses and more are to come. Past experience tells us that many
of the jobs lost in a recession do not ever return.” (Martin
Neil Baily and Douglas J. Elliott, 2009). To be able to create
new jobs, the government needs a healthy economy first, new
investment and new firms.
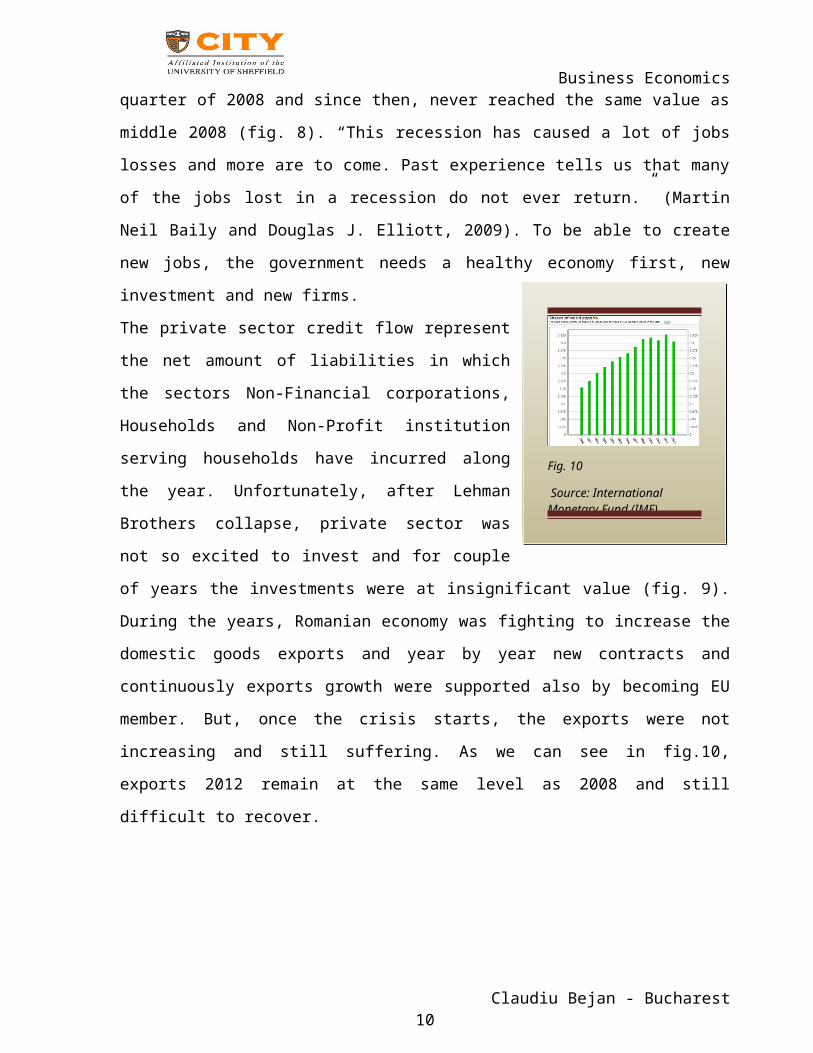
The private sector credit flow represent
the net amount of liabilities in which
the sectors Non-Financial corporations,
Households and Non-Profit institution
serving households have incurred along
the year. Unfortunately, after Lehman
Brothers collapse, private sector was
not so excited to invest and for couple
of years the investments were at insignificant value (fig. 9).
During the years, Romanian economy was fighting to increase the
domestic goods exports and year by year new contracts and
continuously exports growth were supported also by becoming EU
member. But, once the crisis starts, the exports were not
increasing and still suffering. As we can see in fig.10,
exports 2012 remain at the same level as 2008 and still
difficult to recover.
Claudiu Bejan - Bucharest10
Fig. 10
Source: International Monetary Fund (IMF)
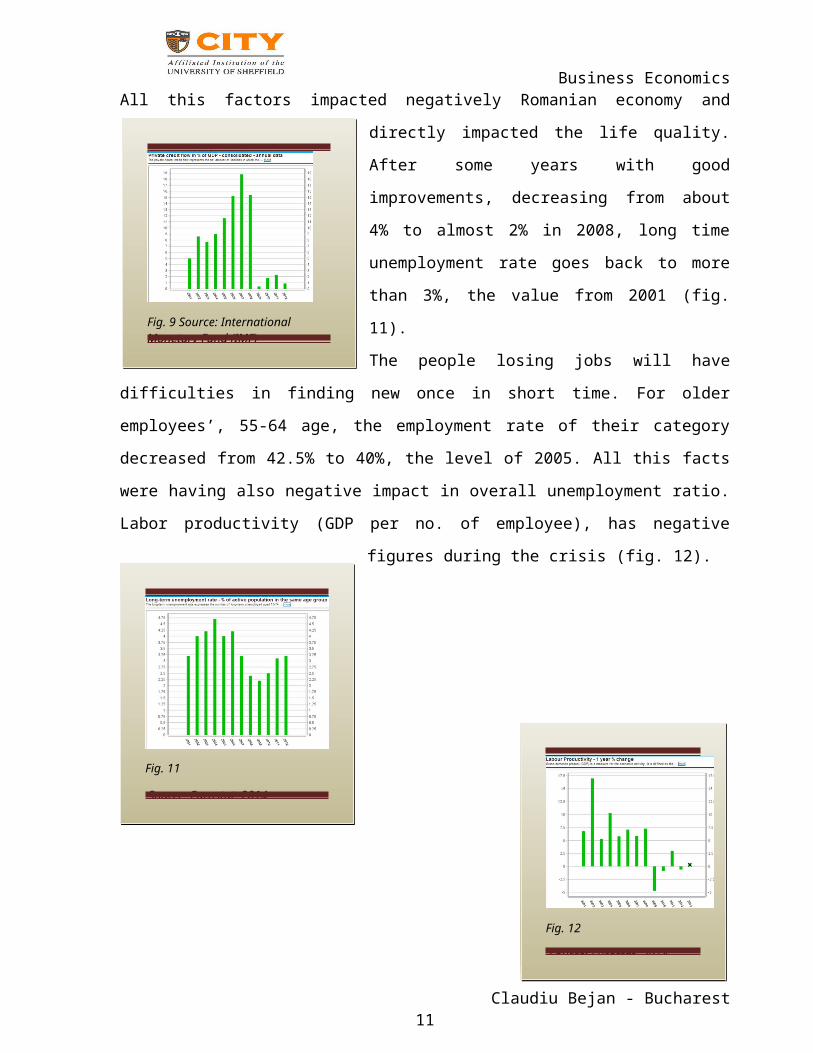
Business EconomicsAll this factors impacted negatively Romanian economy and
directly impacted the life quality.
After some years with good
improvements, decreasing from about
4% to almost 2% in 2008, long time
unemployment rate goes back to more
than 3%, the value from 2001 (fig.
11).
The people losing jobs will have
difficulties in finding new once in short time. For older
employees’, 55-64 age, the employment rate of their category
decreased from 42.5% to 40%, the level of 2005. All this facts
were having also negative impact in overall unemployment ratio.
Labor productivity (GDP per no. of employee), has negative
figures during the crisis (fig. 12).
Claudiu Bejan - Bucharest11
Fig. 9 Source: International Monetary Fund (IMF)
Fig. 11
Source: Eurostat, 2014
Fig. 12
Source: Eurostat, 2014
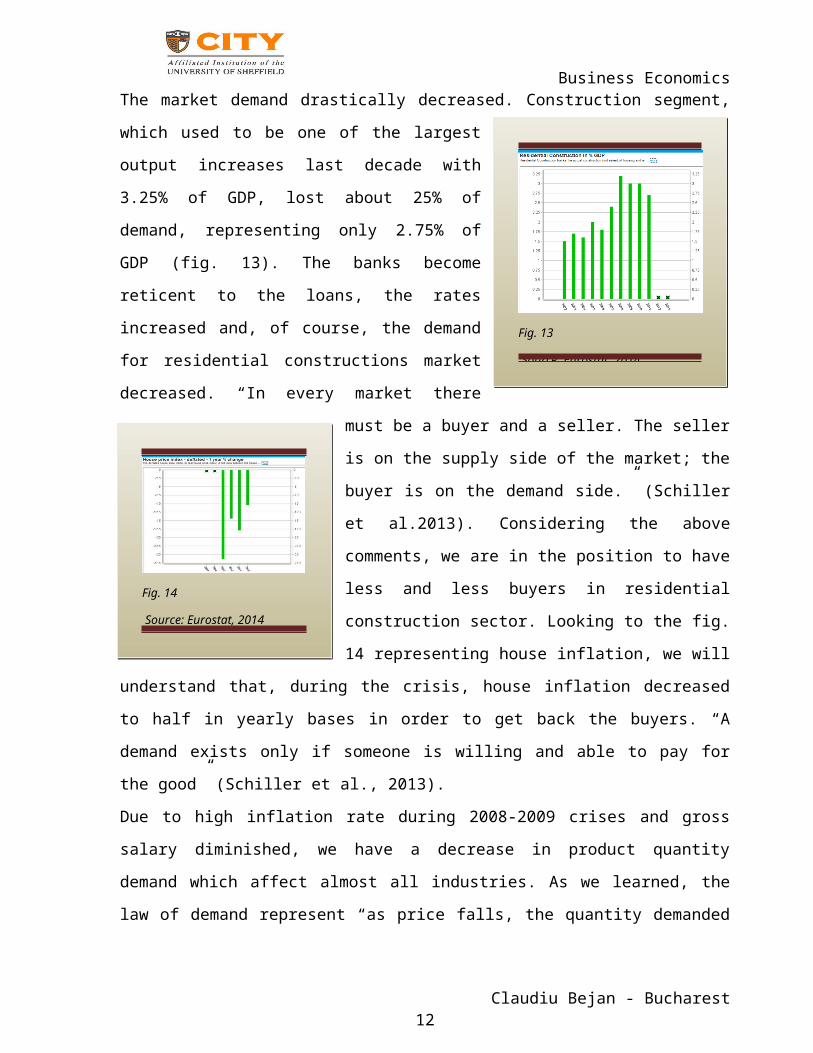
Business EconomicsThe market demand drastically decreased. Construction segment,
which used to be one of the largest
output increases last decade with
3.25% of GDP, lost about 25% of
demand, representing only 2.75% of
GDP (fig. 13). The banks become
reticent to the loans, the rates
increased and, of course, the demand
for residential constructions market
decreased. “In every market there
must be a buyer and a seller. The seller
is on the supply side of the market; the
buyer is on the demand side.” (Schiller
et al.2013). Considering the above
comments, we are in the position to have
less and less buyers in residential
construction sector. Looking to the fig.
14 representing house inflation, we will
understand that, during the crisis, house inflation decreased
to half in yearly bases in order to get back the buyers. “A
demand exists only if someone is willing and able to pay for
the good” (Schiller et al., 2013).
Due to high inflation rate during 2008-2009 crises and gross
salary diminished, we have a decrease in product quantity
demand which affect almost all industries. As we learned, the
law of demand represent “as price falls, the quantity demanded
Claudiu Bejan - Bucharest12
Fig. 13
Source: Eurostat, 2014
Fig. 14
Source: Eurostat, 2014
Business Economicsincreases” as Schiller mention in “The Economy Today” (2013),
fig.15.
Of course, during the crises, the
market should find equilibrium between
demand and supply in order to have the
most efficient economy. For this, we
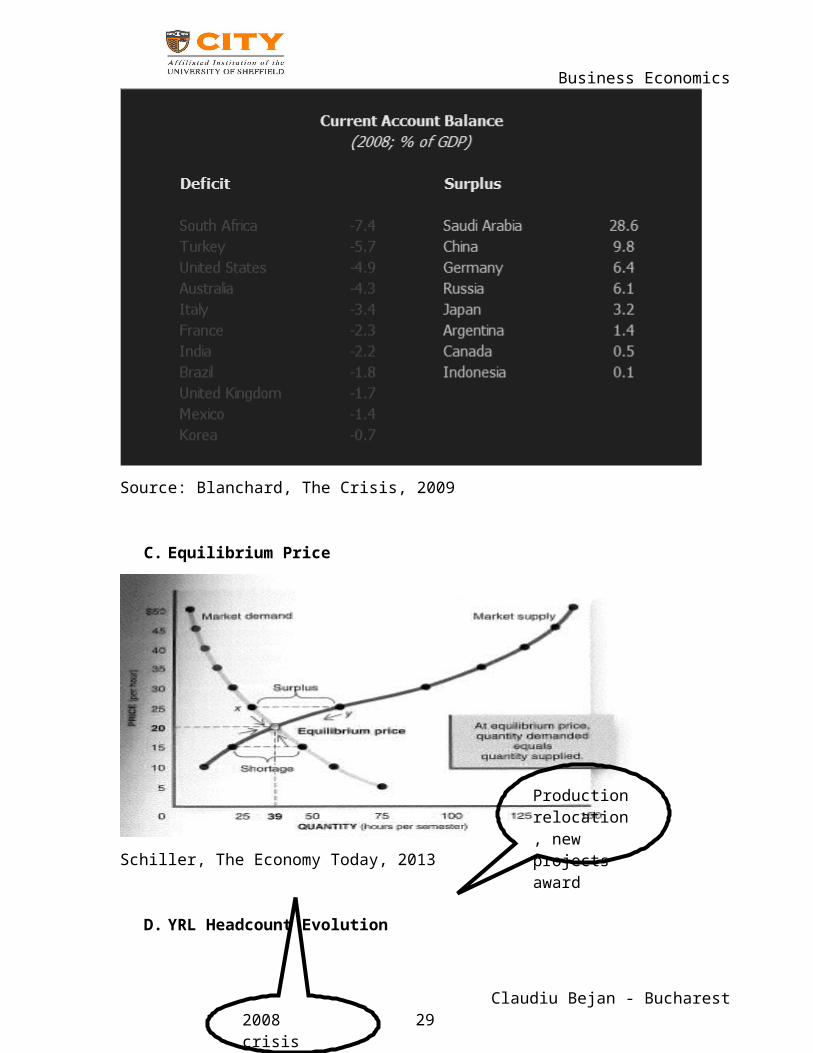
will need to clearly understand market
demand and market supply. According
Schiller (2013), market demand
represents “the total quantity of a
good or service people are willing and able to buy at
alternative price...” and market supply means “the total
quantity of a good that seller are willing and able to sell at
alternative price…” Therefore, in order to have an equilibrium
market, we need to have equilibrium price (see Appendix C
Table: Equilibrium Price). During the crises we should not have
market shortage or market surplus which represent
disequilibrium.
According above comments about some
specific financial parameters, we
understand that Romania entered in
declined economy mainly due to lower
demands and lower production outputs
which means also less exports. In the
same time, lower private capital
investment reached Romania and soon all
the industries were touched. Residential construction sector
Claudiu Bejan - Bucharest13
Fig. 16Olivier Blanchard
Fig. 15
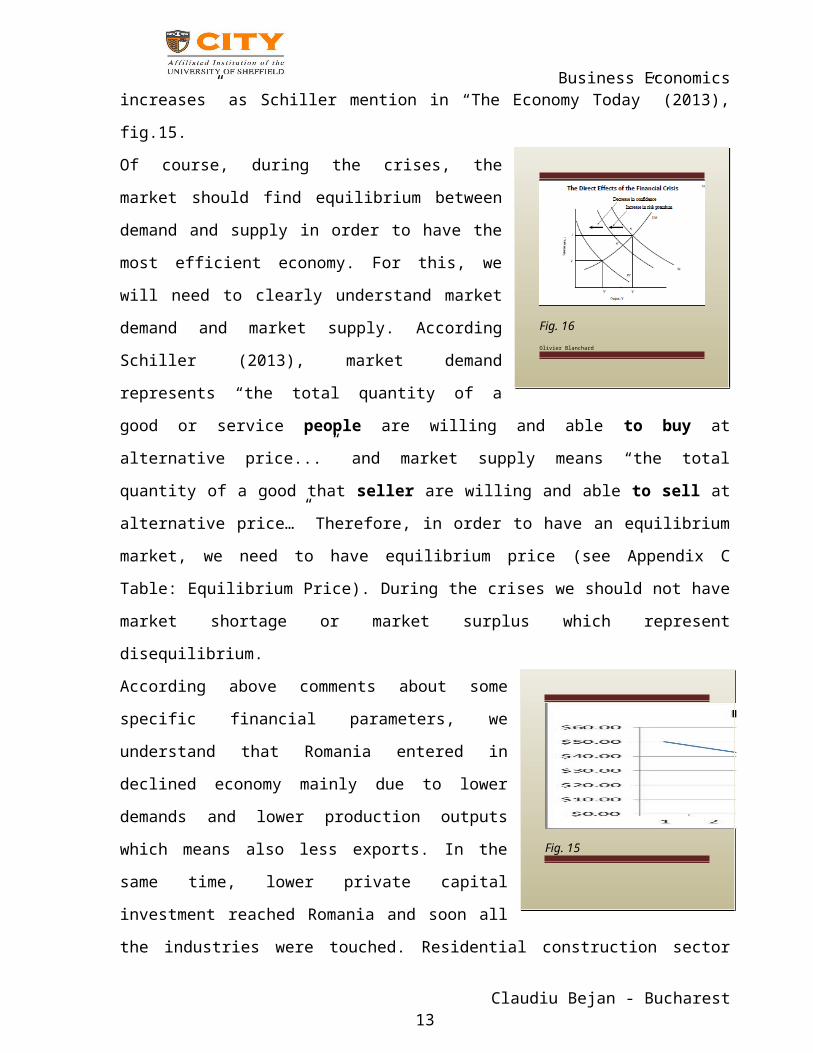
Business Economicsdeclined due to lack of buyers which had no investments from
banks. The banks became less attractive due to interest rate
increasing, the confidence decreased and the risk increased
naturally. This is the direct effect of financial crisis
described in fig. 16 by Olivier Blanchard, 2009 in “The
Crisis”.
2.2. Automotive industry and The Crisis
Automotive industry was one of the industries which “rings the
bell” about the crisis start. “The collapse of credit markets
for major industrial borrowers hit all auto companies and their
suppliers, with the drop in consumer borrowing leading to
massive declines in sales” mentioned Herman Rosenfeld in his
article “The North American Auto Industry in Crisis”, (2009).
The “Big Three” from Detroit, Ford, GM, Chrysler going very
close to bankruptcy. “Their problems are rooted in the
particular strategic choices they made in the pursuit of
profits, in the uneven impact and failures of the privatized
U.S. welfare state, in the destructive dynamics – to workers
and their communities – of the intensified global competition
that now characterized capitalism, and in overcapacity in the
auto industry.” (Herman Rosenfeld, 2009).
Claudiu Bejan - Bucharest14
Business EconomicsObama administration rejected initially restructuring plan of
“Big Three”. But, “the North American auto industry is not only
just an industry, but also a symbol of the nation. The industry
holds the ultimate responsibility to the American society”, Yu
Xia and Thomas Li-Ping Tang (2011). Obama and his auto
commission requested to the “Big Three” to align their
production methods and policy as
“Big Three” Japanese car makers,
Honda, Nisan, and Toyota. To be
able to be more productive and
cost efficient, they were
obliged to cut the overcapacity
they have, meaning to cut jobs,
to close plants. “According to
CSM Worldwide, an automotive
market consultancy firm, the world could produce about 94
million cars a year – about 34 million more than it is buying”,
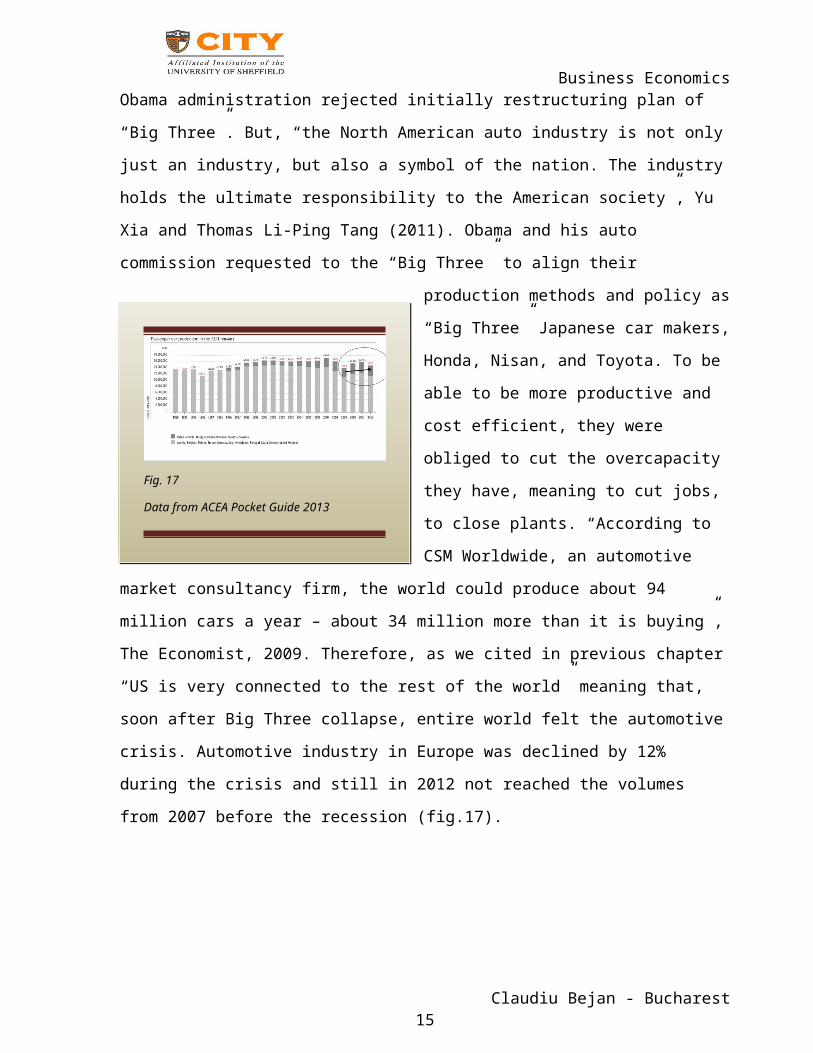
The Economist, 2009. Therefore, as we cited in previous chapter
“US is very connected to the rest of the world” meaning that,
soon after Big Three collapse, entire world felt the automotive
crisis. Automotive industry in Europe was declined by 12%
during the crisis and still in 2012 not reached the volumes
from 2007 before the recession (fig.17).
Claudiu Bejan - Bucharest15
Fig. 17
Data from ACEA Pocket Guide 2013
Business Economics2.3. How multinational companies faced the
crisis? – Yazaki Romania caseMultinational companies’ represents one of the important
sectors which contribute to the GDP’s of the countries. Due to
their worldwide network, some
companies felt the crisis harder
than others. According previous
chapter analyze, automotive
multinational companies suffered
too much during the GFC.
We will study in this chapter
the case of Japanese multinational company, Yazaki, which is an
independent automotive component manufacturer founded in 1941.
As automotive wire harnesses, their core product for which they
command a top share in the global market, they develop also
manufacture meters, electronic components and a host of other products for automotive use.
The Yazaki Group comprises of 215 companies in 43 countries and
employs approximately 220,000 employees. (http://www.yazaki-
group.com/global/network/).
In 2003, due to favorable conditions on the labor market,
Yazaki decided to establish first manufacturing unit in Romania
– YRL (Yazaki Romani Limited), specialized in wire harnesses
production for two strategic customers: Toyota and Ford.
Claudiu Bejan - Bucharest16
Fig. 18
2008
Forecast
2008
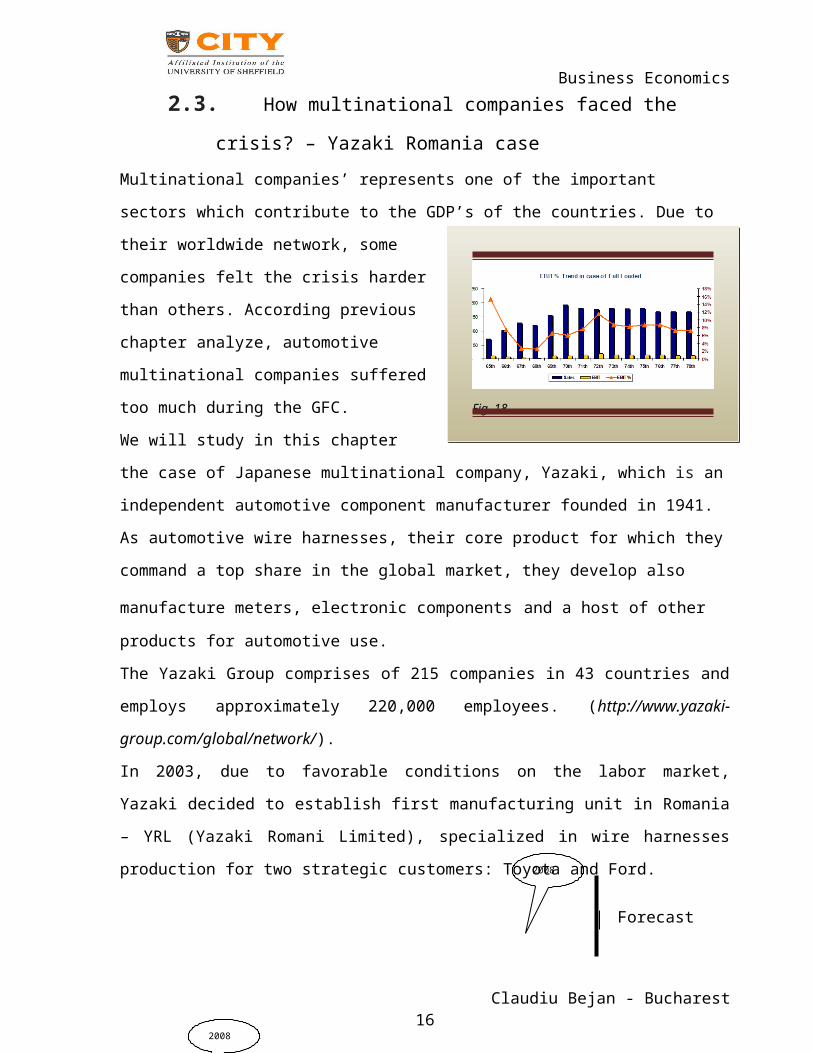
Business EconomicsYazaki Romania grows quickly, being able to reach an EBIT of
15% from sales in 2007 before the crisis. As we can see in
fig.18, after the crisis the EBIT % fall down to less than 8%
from sales and with a forecast that shows an EBIT % never back
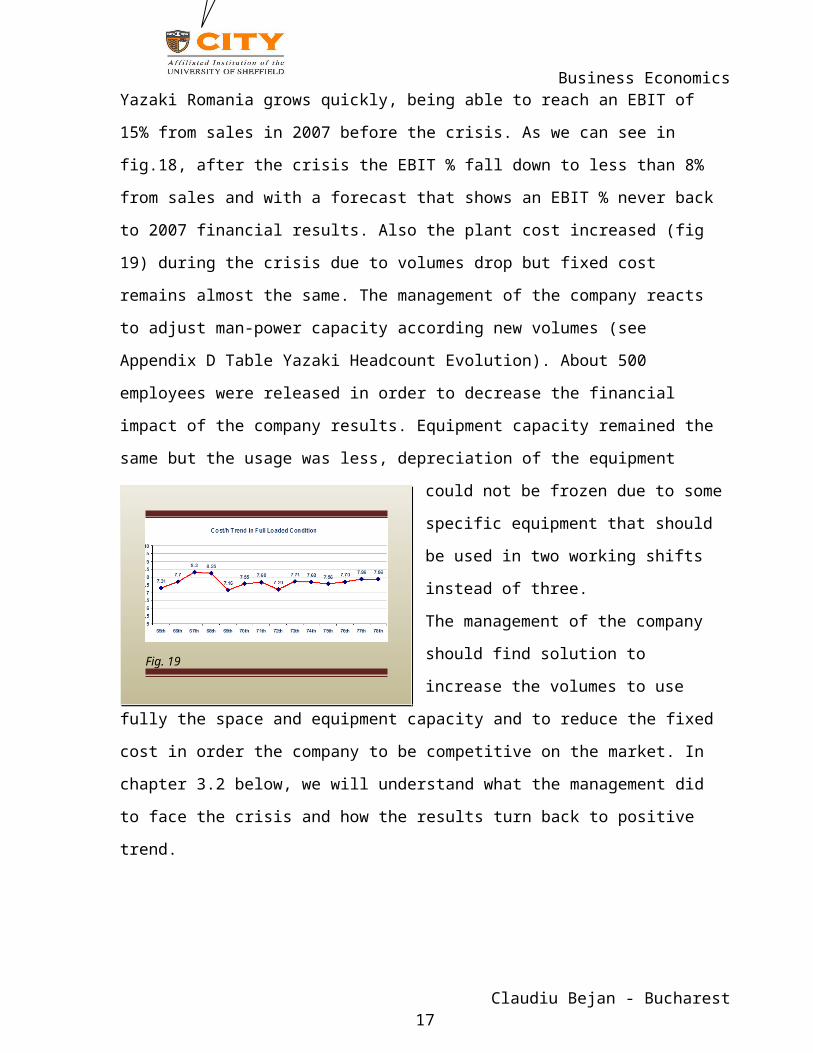
to 2007 financial results. Also the plant cost increased (fig
19) during the crisis due to volumes drop but fixed cost
remains almost the same. The management of the company reacts
to adjust man-power capacity according new volumes (see
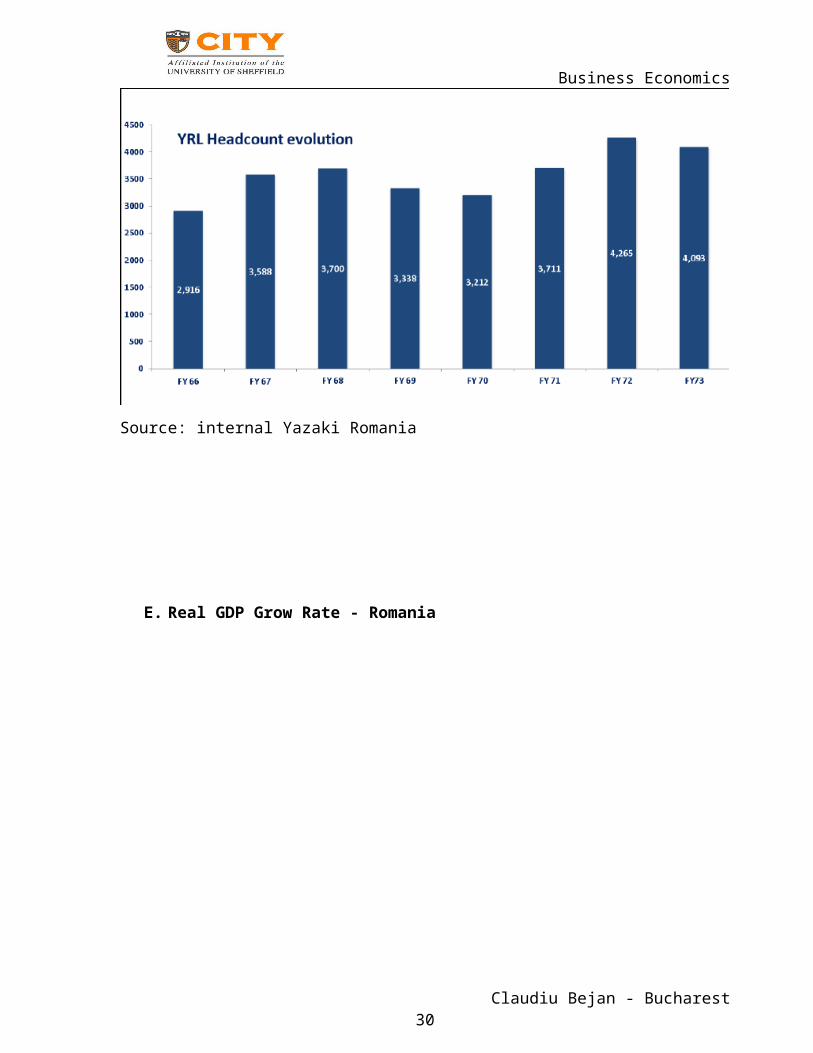
Appendix D Table Yazaki Headcount Evolution). About 500
employees were released in order to decrease the financial
impact of the company results. Equipment capacity remained the
same but the usage was less, depreciation of the equipment
could not be frozen due to some
specific equipment that should
be used in two working shifts
instead of three.
The management of the company
should find solution to
increase the volumes to use
fully the space and equipment capacity and to reduce the fixed
cost in order the company to be competitive on the market. In
chapter 3.2 below, we will understand what the management did
to face the crisis and how the results turn back to positive
trend.
Claudiu Bejan - Bucharest17
Fig. 19
2008
Business Economics3. The fight against the crisis
3.1. How Romanian Government react?
“The potential micro and macro failures of the marketplace
provide specific justifications for government intervention.”
(Schiller et al., 2013). The government intervention is needed
any time when the market is close to fail. The main reasons
that the market could fail
are:
A) public goods – a good
which can be consumed
not only by one person;
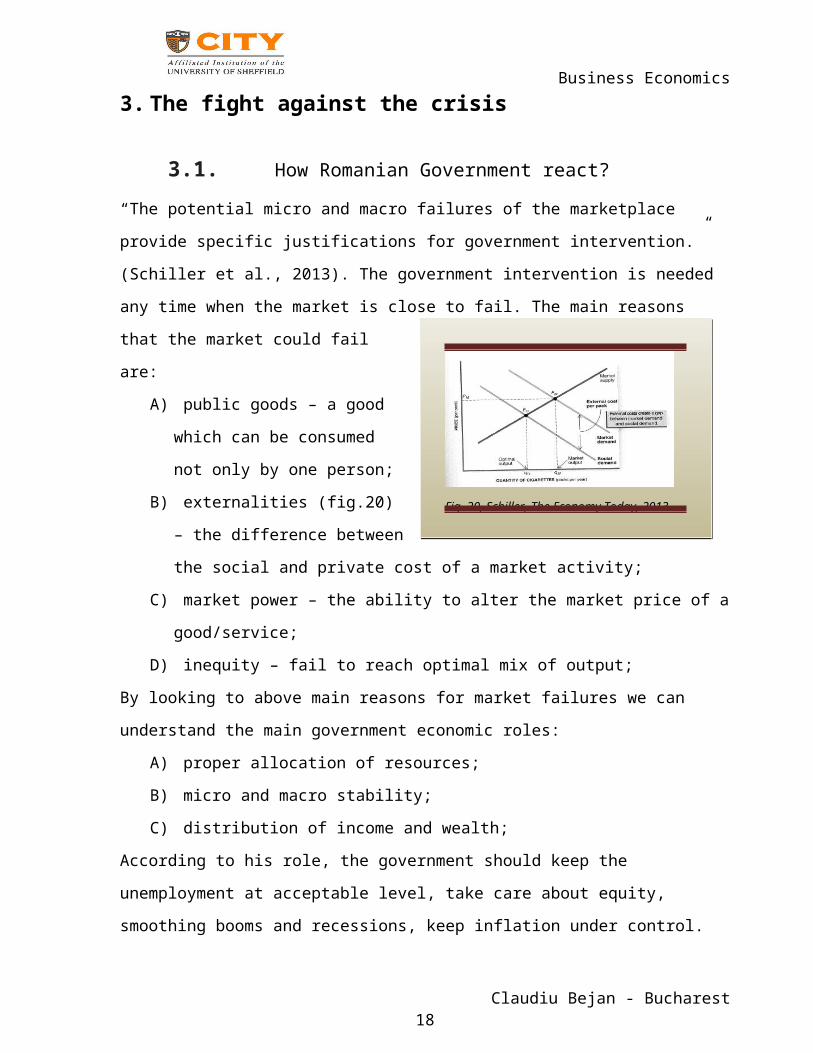
B) externalities (fig.20)
– the difference between
the social and private cost of a market activity;
C) market power – the ability to alter the market price of a
good/service;
D) inequity – fail to reach optimal mix of output;
By looking to above main reasons for market failures we can
understand the main government economic roles:
A) proper allocation of resources;
B) micro and macro stability;
C) distribution of income and wealth;
According to his role, the government should keep the
unemployment at acceptable level, take care about equity,
smoothing booms and recessions, keep inflation under control.
Claudiu Bejan - Bucharest18
Fig. 20, Schiller, The Economy Today, 2013
Business EconomicsOnce the crisis start, Romanian government was mainly looking
to three main areas to support the crisis fight:
A) Taxation;
B) Public sector;
C) Private sector investment.
Taxation
One of the important actions that Romanian government did was
to increase the VAT from 19% to 24%. Romania becomes one of the
countries with biggest VAT in EU. They were able to bring more
money in the budget in order to sustain less productive
sectors, “the tax-and-transfer system is the principal
mechanism for redistributing income” as we learnt from
Schiller, (2013). Also personal income tax and corporate income
tax is 16%; for nightclubs or gambling operations cannot be
lower than 5% from the total revenue obtain from such
activities; micro-companies can apply for a fiscal regime with
a tax of 3% from their revenue, doesn’t matter the expenses.
(Source: PFK, Doing Business in Romania). The minimum tax was
introduced starting May, 2009 by “Boc Government”.
Public sector
The public sector, administration and staff was and still is
too crowdie in Romania. The government has two options to
reduce the cost of this sector:
A) To reduce the staff’s in public sector and to adjust
according budget needs;
B) To keep the staff’s and reduce the wages according budget;
Claudiu Bejan - Bucharest19
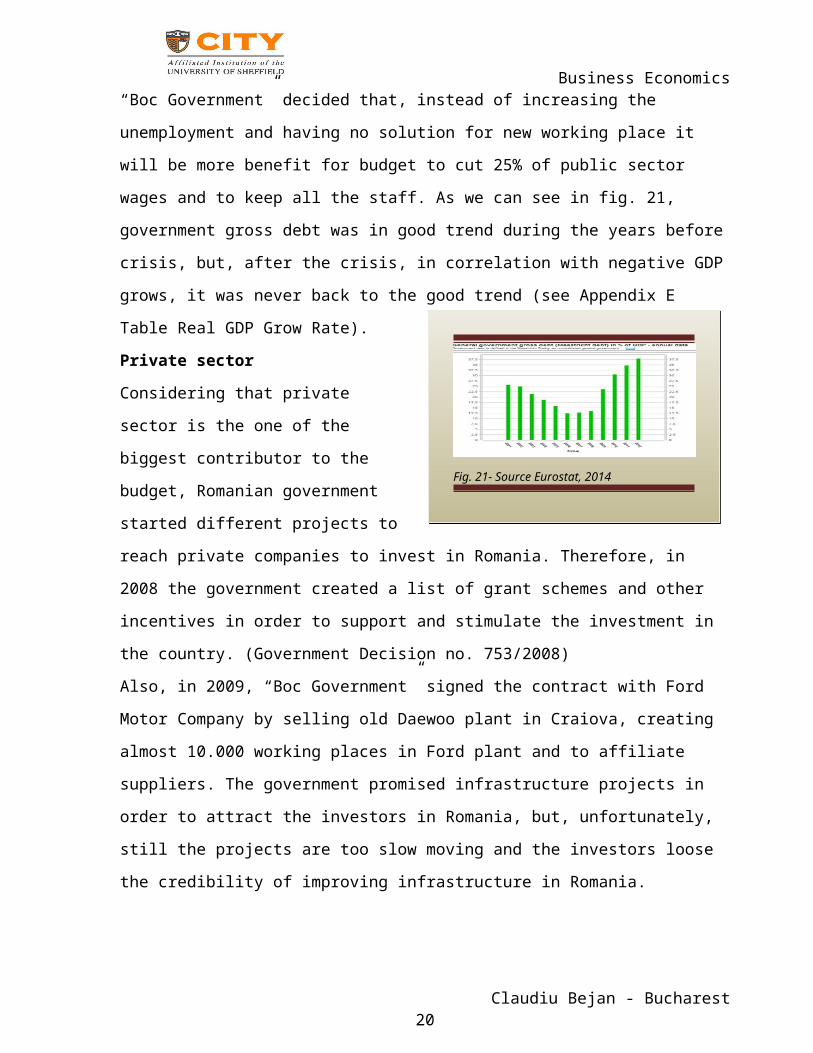
Business Economics“Boc Government” decided that, instead of increasing the
unemployment and having no solution for new working place it
will be more benefit for budget to cut 25% of public sector
wages and to keep all the staff. As we can see in fig. 21,
government gross debt was in good trend during the years before
crisis, but, after the crisis, in correlation with negative GDP
grows, it was never back to the good trend (see Appendix E
Table Real GDP Grow Rate).
Private sector
Considering that private
sector is the one of the
biggest contributor to the
budget, Romanian government
started different projects to
reach private companies to invest in Romania. Therefore, in
2008 the government created a list of grant schemes and other
incentives in order to support and stimulate the investment in
the country. (Government Decision no. 753/2008)
Also, in 2009, “Boc Government” signed the contract with Ford
Motor Company by selling old Daewoo plant in Craiova, creating
almost 10.000 working places in Ford plant and to affiliate
suppliers. The government promised infrastructure projects in
order to attract the investors in Romania, but, unfortunately,
still the projects are too slow moving and the investors loose
the credibility of improving infrastructure in Romania.
Claudiu Bejan - Bucharest20
Fig. 21- Source Eurostat, 2014
Business Economics3.2. How Yazaki Romania management react?
As we mention chapters above, Yazaki Romania was impacted by
the crisis: volumes decreased, plant cost increased, employees’
released and productivity decreased. In order to recover
financial results, Yazaki Romania management decides to work
harder in below topics:
A) New projects awards;
B) Outsourced production;
C) Productivity
improvement projects;
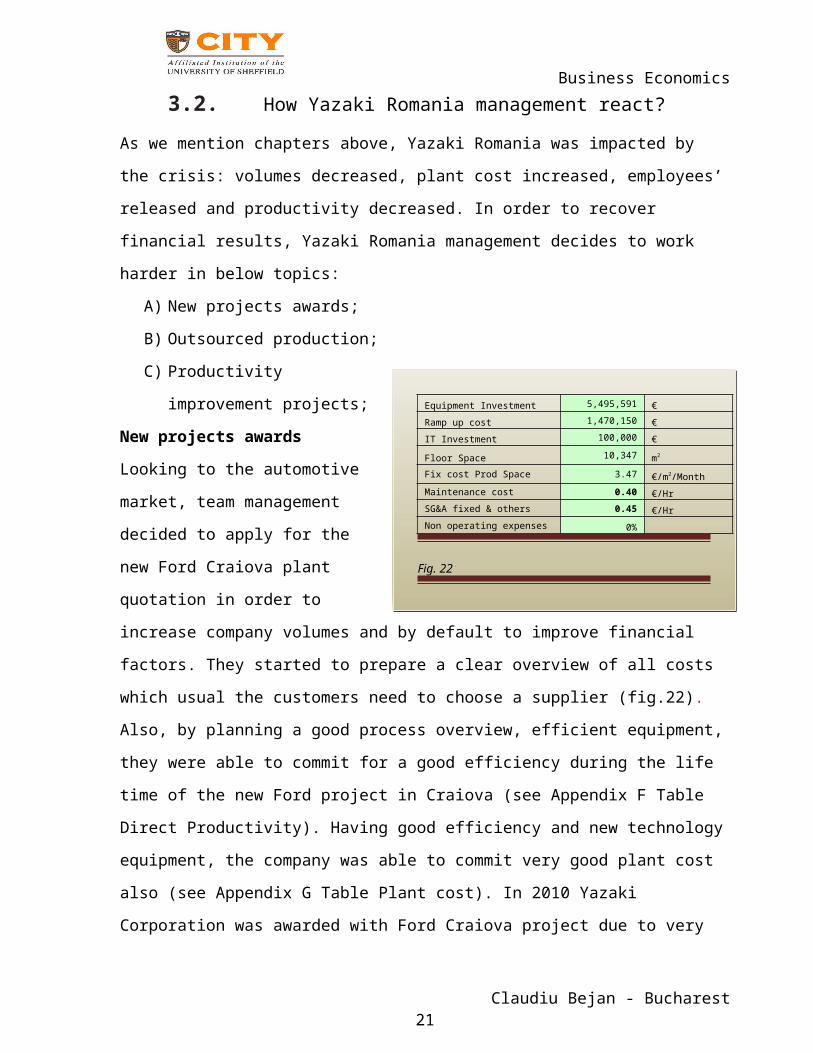
New projects awards
Looking to the automotive
market, team management
decided to apply for the
new Ford Craiova plant
quotation in order to
increase company volumes and by default to improve financial
factors. They started to prepare a clear overview of all costs
which usual the customers need to choose a supplier (fig.22).
Also, by planning a good process overview, efficient equipment,
they were able to commit for a good efficiency during the life
time of the new Ford project in Craiova (see Appendix F Table
Direct Productivity). Having good efficiency and new technology
equipment, the company was able to commit very good plant cost
also (see Appendix G Table Plant cost). In 2010 Yazaki
Corporation was awarded with Ford Craiova project due to very
Claudiu Bejan - Bucharest21
Equipment Investment 5,495,591 €Ramp up cost 1,470,150 €IT Investment 100,000 €
Floor Space 10,347 m2
Fix cost Prod Space 3.47 €/m2/MonthMaintenance cost 0.40 €/HrSG&A fixed & others 0.45 €/HrNon operating expenses 0%
Fig. 22
Business Economicsgood results of YRL, therefore, new volumes are coming for the
next years for Yazaki Romania.
Outsourced production
Even the company decided to release employees’ to be in line
with new capacity required, the fixed cost remained almost the
same. The management decided to relocate production in cheaper
area. Considering that Yazaki just been awarded with new Ford
project in Craiova they decided to establish the second
manufacturing unit in Romania, working for Ford Craiova and
also to relocate some production there in order to decrease the
cost. Considering Ford located in Craiova city, Yazaki decided
that the best location it will be Caracal city, 45 Km to
Craiova, Ford manufacturing plant. Below, we will explain how
Yazaki Romania choosen Caracal city as production relocation
and new project ramp-up.
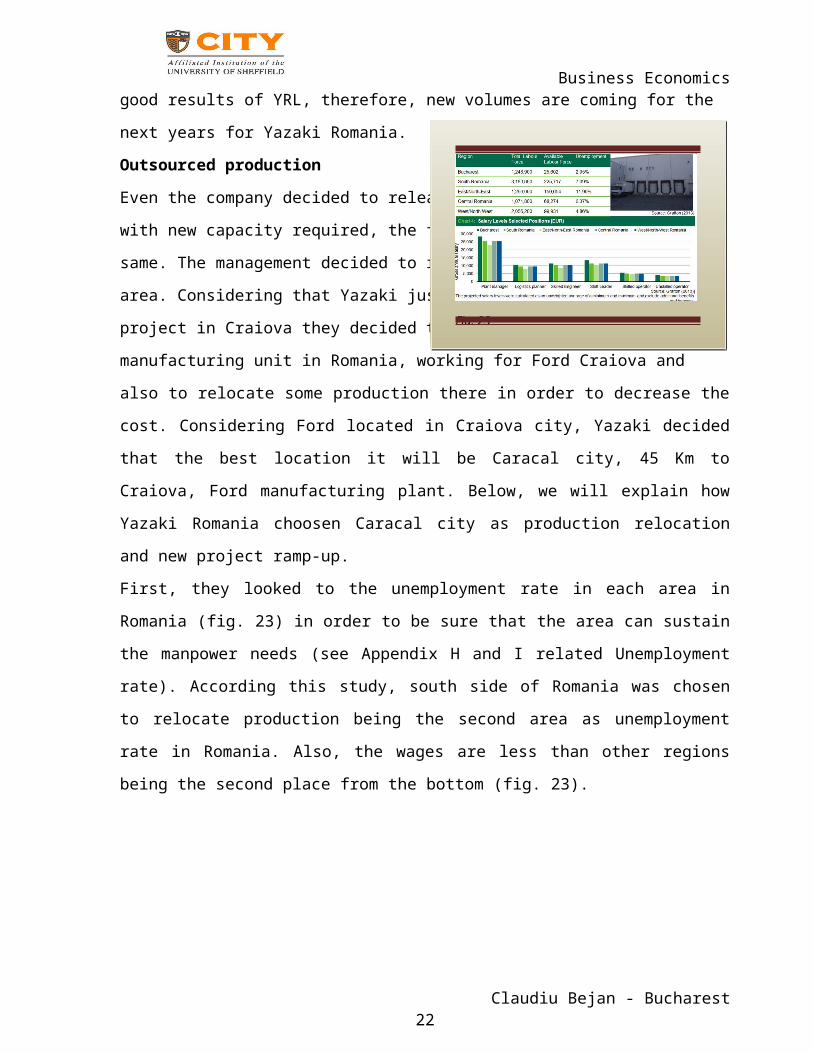
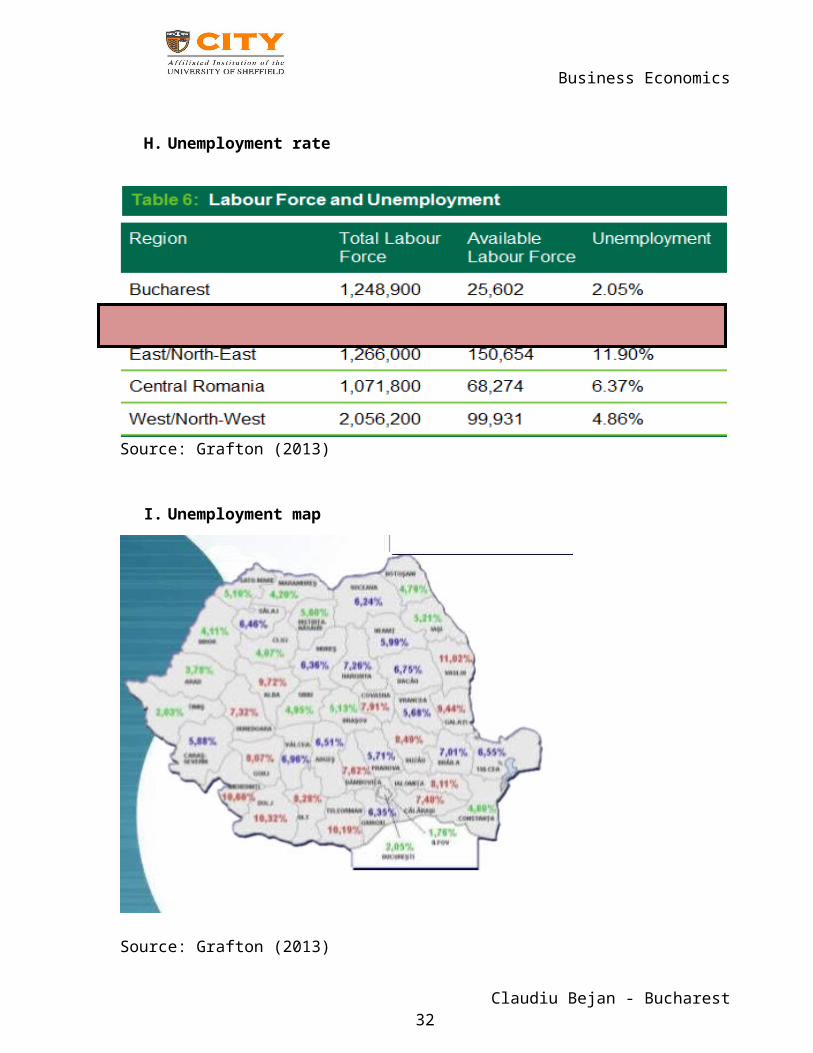
First, they looked to the unemployment rate in each area in
Romania (fig. 23) in order to be sure that the area can sustain
the manpower needs (see Appendix H and I related Unemployment
rate). According this study, south side of Romania was chosen
to relocate production being the second area as unemployment
rate in Romania. Also, the wages are less than other regions
being the second place from the bottom (fig. 23).
Claudiu Bejan - Bucharest22
Fig. 23
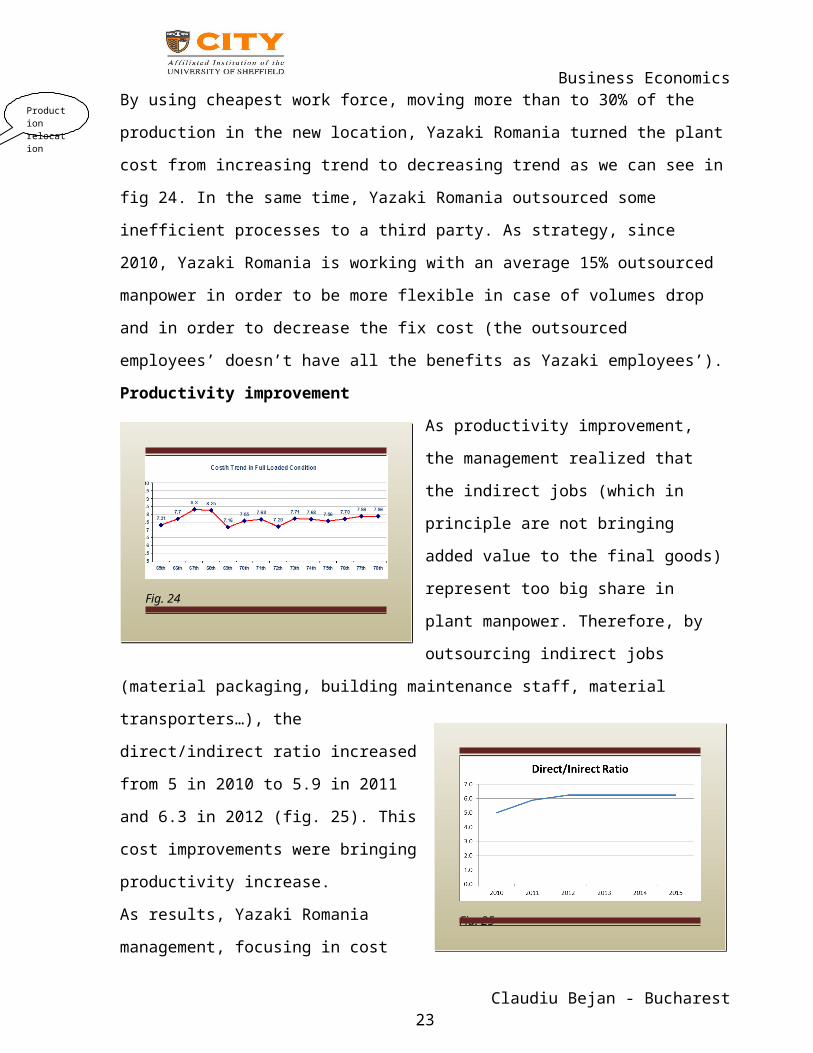
Business EconomicsBy using cheapest work force, moving more than to 30% of the
production in the new location, Yazaki Romania turned the plant
cost from increasing trend to decreasing trend as we can see in
fig 24. In the same time, Yazaki Romania outsourced some
inefficient processes to a third party. As strategy, since
2010, Yazaki Romania is working with an average 15% outsourced
manpower in order to be more flexible in case of volumes drop
and in order to decrease the fix cost (the outsourced
employees’ doesn’t have all the benefits as Yazaki employees’).
Productivity improvement
As productivity improvement,
the management realized that
the indirect jobs (which in
principle are not bringing
added value to the final goods)
represent too big share in
plant manpower. Therefore, by
outsourcing indirect jobs
(material packaging, building maintenance staff, material
transporters…), the
direct/indirect ratio increased
from 5 in 2010 to 5.9 in 2011
and 6.3 in 2012 (fig. 25). This
cost improvements were bringing
productivity increase.
As results, Yazaki Romania
management, focusing in cost
Claudiu Bejan - Bucharest23
Fig. 24
Production relocation
Fig. 25
Business Economicsreduction (production relocation or outsourcing), focusing in
new projects award (volumes increase, investment in future
business) and in productivity improvement, was able to improve
the plant cost, to support employment rate in the area by
hiring more people (as we can see in Appendix D. Table YRL
Headcount Evolution) and to assure automotive business survival
for the following years.
4. Conclusions
Based on all above study, we could understand that the Global
Economy is not mature enough to recover quickly such Lehman
brothers collapse.
Also, the governments are not prepared to face this kind of
quick expansion of the crisis. The signs of the crisis (output,
unemployment, inflation), were seeing too late by the
governments and the actions taken were inefficient to stop the
decline. The history we learned is showing that the capitalism
has periodically a systemic crisis. We can see “the great
depression of the 1930s”, also the crisis of regulated
capitalism of the 1970s. A systemic crisis means that we can go
out faster from the crisis only by major restructuring the
system. In Europe, some countries react faster in front of the
crisis turning back to positive GDP in only 2-3 years. The
Romanian government took the strongest action in public sector,
this sector being the non-profitable sector. By this systemic
countermeasure against the crisis, we could see that in 3
Claudiu Bejan - Bucharest24
Business Economicsyears, Romanian economy was back to positive trend, but still
not back to 2007 figures. By VAT increase, Romanian government
managed to bring more money to the budget but, in the same
time, affected some industries, mainly “luxury industry”, e.g.
automotive industry; this action contributes to the global
trend of decreasing sales in automotive market.
Multinational companies were affected by different economics in
different countries. Being “multinational” could be an
advantage due to flexibility of production in different
economic environments. By production relocation in cheaper
countries or areas, the multinational companies could be able
to recover faster the loses due to crisis. But, even they are
producing cheaper, the output should be according demand. As we
learned, one of the first sign of the crisis is the
output/demand factor. The companies should adjust their
production capacity according with market demand.
Overproduction is not helping during unhealthy economy.
As main conclusions, we should learn to “read” the crisis signs
and also we should learn to react faster when the signs appear.
The governments should have a quick intervention when the
output is much higher than the demand, they should react when
the imports are much higher than the exports in order to
protect their employment. The governments should keep the
balance of local products consumption versus imports and to
keep acceptable taxation for local products. Therefore, to
avoid the crisis, the economy should be well “in-out” balanced,
and production versus consumption ratio should be in very close
Claudiu Bejan - Bucharest25
Business Economicsrelation. The governments intervention is mandatory when market
fall dawn. The governments should take care about market
monopoly, price equity, mix of output… By all this factors, the
government will be able to protect their countries against
inflation and unemployment, against future economic crisis.
5. References
Claudiu Bejan - Bucharest26
Business EconomicsA. Garret, Geoffrey (2010). G2 in G20: China, the United States and the
World after the Global Financial Crisis. Global Policy Volume 1. Issue 1. January,
2010.
B. Blanchard, Olivier (2009). The Crisis. Lecture GWU. August, 2009.
C. Neil Baily, Martin and J. Elliott, Douglas (2009). The US
Financial and Economic Crisis: Where Does It Stand and Where Do We Go From
Here? Business and Public Policy. June, 2009, p2.
D. Berglof, Eric, Korniyenko, Yeveniya, Plekhanov, Alexander
and Zettelmeyer, Jeronim (2009). Understanding the crisis in
emerging Europe. European Bank for Reconstruction and Development,
November, 2009, p1.
E. Fitoussi, Jean Paul and Saraceno, Francesco (2010). Europe:
How Deep Is a Crisis? Policy Responses and Structural Factors Behind Diverging
Performances. Journal of Globalization and Development, Vol. 1, Issue 1, 2010,
article 17.
F. Filip, Andrei and Raffournier, Bernanrd (2010). The value
relevance of earnings in a transition economy: The case of Romania. The
International Journal of Accounting, 2010, p77-103.
G. Neil Baily, Martin and J. Elliott, Douglas (2009). The US
Financial and Economic Crisis: Where Does It Stand and Where Do We Go From
Here? Business and Public Policy. June, 2009, p2.
H. Schiller, Bradley R., Hill, Cynthia D. and Wall, Sherri L.
(2013). The Economy Today, Thirteenth edition, p49.
I. Schiller, Bradley R., Hill, Cynthia D. and Wall, Sherri L.
(2013). The Economy Today, Thirteenth edition, p54.
J. Rosenfeld, Herman (2009). The North American Auto Industry in Crisis.
Relay, April-June, 2009, p18-24.
Claudiu Bejan - Bucharest27
Business EconomicsK. Xia, Yu and Li-Ping Tang, Thomas (2011). Sustainability in supply
chain management: suggestions for the auto industry. Management Decision,
Vol. 49, No. 4, 2011, pp. 495-512.
L. Schiller, Bradley R., Hill, Cynthia D. and Wall, Sherri L.
(2013). The Economy Today, Thirteenth edition, p78.
6. APPENDIXA. Crisis amplification – Banking basis, by Olivier
Blanchard, “The crisis”, 2009,
B. 2008 Account Balance
Claudiu Bejan - Bucharest28
Business Economics
Source: Blanchard, The Crisis, 2009
C. Equilibrium Price
Schiller, The Economy Today, 2013
D. YRL Headcount Evolution
Claudiu Bejan - Bucharest292008
crisis
Production relocation, new projects award
Business Economics
Source: internal Yazaki Romania
E. Real GDP Grow Rate - Romania
Claudiu Bejan - Bucharest30
Business Economics
Source: Eurostat, 2014
F. Direct Productivity
2010 2011 2012 2013 2014 2015 2016Direct Productivity 67.8% 85.4% 100.0% 105.0% 105.0% 105.0% 105.0%Num ber of Direct people 1372 1546 1238 1120 1120 1120 978Num ber of Indirect people 274 263 198 179 179 179 156Num ber of Salaried people 96 93 62 56 56 56 49Indirect/Direct Ratio 20% 17% 16% 16% 16% 16% 16%Salaried/Direct Ratio 7% 6% 5% 5% 5% 5% 5%
Source: internal Yazaki Romania
G. Plant cost
1. Vertical Project P&L: Full Cost Basis2010 2011 2012 2013 2014 2015 2016 Total
1 Total Sales 0 0 0 0 0 0 0 02 M aterial Cost 30,947,936 75,263,449 70,573,717 67,056,418 67,056,418 67,056,418 24,384,152 402,338,5103 Labour cost ( Direct ) 4,389,334 8,810,502 7,337,972 6,909,081 7,191,359 7,473,636 2,825,220 44,937,1043.A Suncontractors 1,343,798 3,268,034 3,064,400 2,992,554 2,992,554 2,992,554 1,117,612 17,771,5054 Labour cost ( Indirect ) 1,037,304 1,772,117 1,387,976 1,305,467 1,357,083 1,410,850 533,370 8,804,1685 Fixed cost ( Equipm ent & IT) 548,137 939,663 939,663 939,663 939,663 939,663 391,526 5,637,9806 Fixed cost ( Building ) 325,931 558,738 558,738 558,738 558,738 558,738 232,808 3,352,4287 M aintenance cost 748,198 1,819,571 1,706,192 1,621,158 1,621,158 1,621,158 589,512 9,726,9468 Salaried 741,577 1,276,503 886,053 834,063 867,668 902,616 341,422 5,849,9019 SG&A Fixed & Others 884,234 2,150,402 2,016,409 1,915,914 1,915,914 1,915,914 696,696 11,495,48210 Start-up Cost 1,338,49611 Corporate O/H 1,348,866 3,056,403 2,820,846 2,682,529 2,694,247 2,706,076 991,997 16,300,96212 Logistics & Packaging 0 0 0 0 0 0 0 013 Total M anufacturing Cost 42,315,316 98,915,381 91,291,965 86,815,585 87,194,801 87,577,623 32,104,315 527,553,48218 Plant Exw orks Labour Rate (€/Hr) 8.36 7.15 6.68 6.70 6.83 6.96 7.20 7.08
Source: internal Yazaki Romania
Claudiu Bejan - Bucharest31
Business Economics
H. Unemployment rate
Source: Grafton (2013)
I. Unemployment map
Source: Grafton (2013)
Claudiu Bejan - Bucharest32

Business Economics
Claudiu Bejan - Bucharest33