the impact of the 2008-2013 financial crisis on university ...
43
THE IMPACT OF THE 2008-2013 FINANCIAL CRISIS ON UNIVERSITY RESEARCH OUTPUT Shiri M. Breznitz and Paige A. Clayton INNOVATION POLICY WHITE PAPER SERIES 2017-02
-
Upload
khangminh22 -
Category
Documents
-
view
1 -
download
0
Transcript of the impact of the 2008-2013 financial crisis on university ...
THEIMPACTOFTHE2008-2013FINANCIALCRISISON
UNIVERSITYRESEARCHOUTPUT
ShiriM.BreznitzandPaigeA.Clayton
INNOVATIONPOLICYWHITEPAPERSERIES2017-02
1
Abstract
Universities engage in knowledge transfer, policy development, and various economic
initiatives, and many of these activities are publicly funded. However, the global financial crisis
that started in 2008 and contributed to the global economic recession of 2008-2013 reduced state
government support for public universities in the United States and lower endowment returns for
private (nonprofit) universities, causing higher education institutions to tighten their budgets.
How did the financial crisis and its ensuing budget impacts affect universities’ output in terms of
research and commercialization? To answer this question, this paper analyzes changes in funding
and output over two decades at three research universities operating in the same region, but
attracting different kinds of students and different levels of research funding. We find that
universities’ output was negatively affected despite the federal government’s attempts to fill the
gap left by reductions in state funding with the American Recovery and Reinvestment Act
stimulus program. This paper reviews the results of these developments and examines the
reasons for them.
Keywords: universities; technology commercialization; publication; financial crisis; Great
Recession; recession; higher education finance
2
Universities are an important agent of regional and national economic growth, particularly
because of their role in innovation and entrepreneurship (Aoyama, Murphy and Hanson, 2011).
Beginning with the creation of the first university and the original mission of research and
teaching, universities have been important contributors of knowledge and human capital. During
the 1930s, with the introduction of neoliberal economic policies, universities, like private
businesses, were pressed to show their economic returns. During World War II the basic roles of
the university were expanded to add a third role: service. ‘Service’ refers to university activities
such as technology commercialization, policy research and promotion, and various economic
initiatives including real estate development and community involvement (Breznitz and
Feldman, 2012).
Studies have proven that universities generate positive outcomes for the economies of the region
in which they are located. University presence in urban areas affects employment growth rates,
earnings, and composition. Hence, the ability of a university to patent, license, and spin out firms
(university research output) supports regional development (Jaffe, Trajtenberg and Henderson,
1993; Stephan, 2012). Many public universities were created with a mandate to contribute to
local economies. Particularly in the U.S., some institutions were built on state land following the
Morrill Act of 1862 (Land Grant College Act) and many receive state funding to support local
students. Labor force training has always been part of universities’ mission, however, it has
become increasingly expensive as it requires a growing level of investment, a practice in which
no individual company would engage because firms prefer not to invest in activities whose
benefits spillover to other firms (Kenney, 1986). State universities rely heavily on state funding
for tuition and therefore are expected to teach more students and spend more on teaching. During
3
the 2008-2013 economic crisis, in particular, the tight job market increased demand for higher
education. As stated in a study from Georgetown University’s Public Policy Institute, a college
degree is indeed the best defense against unemployment. ‘It’s a tough job market for college
graduates,’ the report says, ‘but far worse for those without a college education’ (Carnevale,
Jayasundera and Cheah, 2012, p. 1). The study found that, compared to the loss of 230,000 jobs
among people with only a high school diploma, people with bachelor’s and associate degrees
gained between 1.6 and 2 million jobs between December 2007 and February 2012. Moreover,
the study found new jobs in all industries require more education. Even in industries hardest hit
by unemployment, such as manufacturing, jobs for those with only a high school diploma
dropped 25%, while it fell only 2% for those with a bachelor’s degree (Carnevale et al., 2012).
Over the years, much university research output was the result of national and local government
funding (Tahvanainen, 2004; Jaffe et al., 1993; Stephan, 2012). Studies show connections
between university revenue and commercialization output, student–faculty ratios, and university
prestige. Hence, the funding changes due to the 2008–2013 economic crisis provide an excellent
opportunity for evaluating these relationships. Moreover, the ability to evaluate the impact of
universities’ funding on research output, distinguishing between public and private institutions,
is important because of the decline in state appropriations for higher education. The ability to
control for a geographic location and its specific characteristics is also important. We provide a
unique opportunity to examine three universities in one region and state following one major
economic event affecting their ability to contribute to innovation and entrepreneurship.
So what happened in the 2008-2013 financial crisis?
4
The collapse of Lehman Brothers, a sprawling global bank, in September 2008
almost brought down the world’s financial system. It took huge taxpayer-financed
bail-outs to shore up the industry. Even so, the ensuing credit crunch turned what
was already a nasty downturn into the worst recession in 80 years. Massive
monetary and fiscal stimulus prevented a buddy-can-you-spare-a-dime
depression, but the recovery remains feeble compared with previous post-war
upturns (Economist, 2013).
The recession in the U.S. led many states, including Georgia, to tighten their belts. One of the
funding allocations hurt during the crisis were state appropriations for higher education.1
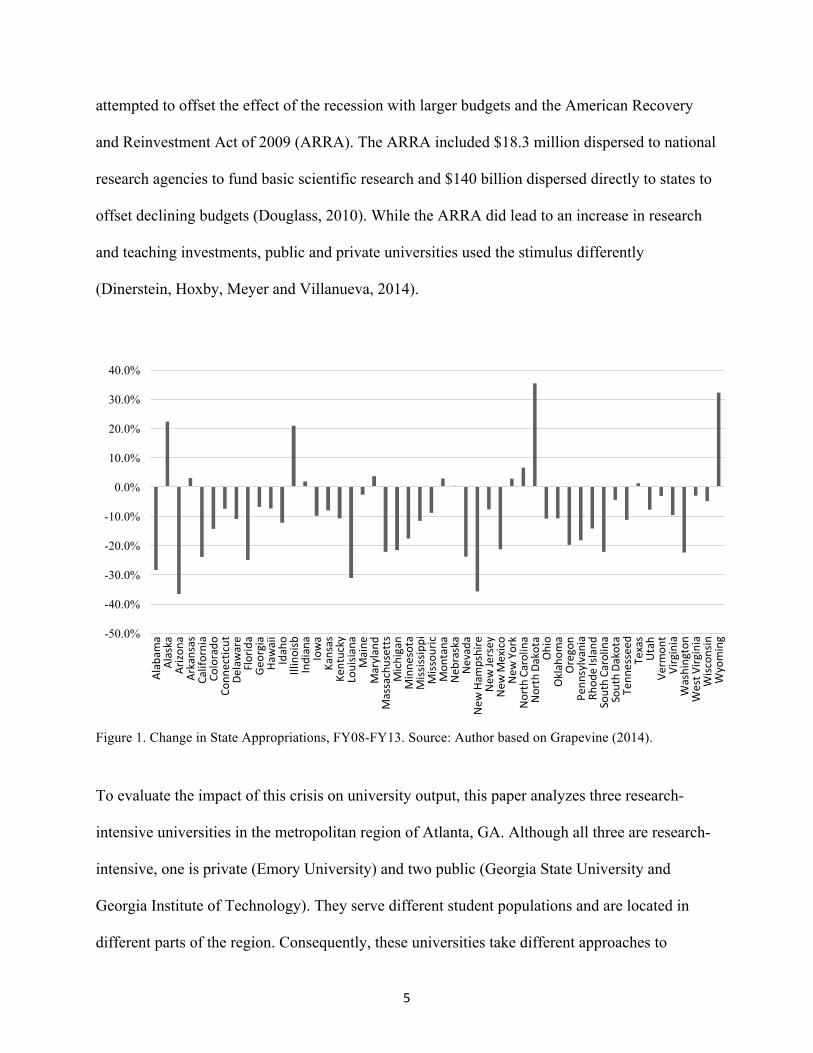
Between 2008 and 2013, state appropriations fell an average 17.5% across the country
(Grapevine, 2014; Mitchell et al., 2014), as seen in Figure 1. Such reductions are common
responses of state governments during economic downturns when revenues decrease. States have
more flexibility in cutting funds to higher education than to other programs such as Medicaid
since they can pass off costs to students through tuition and fees (Zumeta, 2010). Oliff et al.
(2013, pp. 12) argue the Great Recession “accelerated a longer-term cost shift from states to
students and families,” making access to higher education more difficult for highly qualified, less
advantaged students. Humphreys (2000) found that state appropriations are responsive to
business cycles and decreased as real per capita income decreased over the period 1969-1995.
Though private universities do not receive direct state appropriations, they do receive state and
local funding for research and in some cases, tuition subsidies. The federal government
1 Revenue received by an institution through acts of a legislative body, except grants and contracts. These funds are for meeting current operating expenses and not for specific projects or programs. The most common example is a state's general appropriation (U.S. Department of Education, 2015).
5
attempted to offset the effect of the recession with larger budgets and the American Recovery
and Reinvestment Act of 2009 (ARRA). The ARRA included $18.3 million dispersed to national
research agencies to fund basic scientific research and $140 billion dispersed directly to states to
offset declining budgets (Douglass, 2010). While the ARRA did lead to an increase in research
and teaching investments, public and private universities used the stimulus differently
(Dinerstein, Hoxby, Meyer and Villanueva, 2014).
Figure 1. Change in State Appropriations, FY08-FY13. Source: Author based on Grapevine (2014).
To evaluate the impact of this crisis on university output, this paper analyzes three research-
intensive universities in the metropolitan region of Atlanta, GA. Although all three are research-
intensive, one is private (Emory University) and two public (Georgia State University and
Georgia Institute of Technology). They serve different student populations and are located in
different parts of the region. Consequently, these universities take different approaches to
-50.0%
-40.0%
-30.0%
-20.0%
-10.0%
0.0%
10.0%
20.0%
30.0%
40.0%
Alabam
aAlaska
Arizo
naArkansas
California
Colorado
Conn
ecticut
Delaware
Florida
Georgia
Hawaii
Idaho
Illinoisb
Indiana
Iowa
Kansas
Kentucky
Louisia
naMaine
Maryland
Massachusetts
Michigan
Minne
sota
Miss
issippi
Miss
ouric
Mon
tana
Neb
raska
Nevada
New
Ham
pshire
New
Jersey
New
Mexico
New
York
NorthCarolina
NorthDakota
Ohio
Oklahom
aOregon
Penn
sylvania
Rhod
eIsland
SouthCarolina
SouthDa
kota
Tenn
esseed
Texas
Utah
Verm
ont
Virginia
Washington
WestV
irginia
Wisc
onsin
Wyoming
6
technology commercialization and have a different economic impact. The varied characteristics
of the three Atlanta metropolitan universities provide a cross-section of research universities
across the U.S. in varying stages of commercialization activity, and we situate this analysis in a
broader, national perspective. Focusing the analysis on institutions within one state furthermore
allays concerns of cross-state comparisons that are made difficult by the fact that each state funds
higher education through different processes and institutions and operates within different
political climates (Weerts and Ronca, 2012). The paper contributes to the literature on the
influence of the Great Recession on higher education topics such as finance and employment, but
expands current knowledge by focusing on its influence on research output.
The paper proceeds as follows: we first review the literature on technology transfer and the
economics of higher education, and posit two hypotheses. We next move to an explanation of the
research methodology, and provide historical background on the universities and technology
commercialization in Georgia. The subsequent section provides the results of the analysis. We
then offer a discussion of these results and conclude.
Theoretical Background
Studies show university research has a direct impact on local economic growth (Acs, Audretsch
and Feldman, 1992; Jaffe et al., 1993) and universities in general have a strong spillover effect
on their regional economies (Stephan, 2012). The regional impact of universities is in part based
on its research output. The commercial output of universities is based on funding availability,
academic prestige (often measured by publications), and research collaborations (Clark, 1998;
Godin, 2012; Kenney and Goe, 2004; Lockett and Wright, 2005; Massachusetts Institute of
7
Technology, 2013; Roberts, 1991; Shane, 2004; Zucker, Darby and Peng, 1998). Studies identify
a positive correlation between the amount of research grants, publications, and patents (Godin,
2012; Link and Siegel, 2007). Specifically, studies have found the level of federal research
funding is an indicator of technology transfer performance at universities, especially through
start-up creation. Moreover, and as a result, academic prestige in the form of the record of
publications is shown to lead to an increase in funding (funding brings funding) as well as an
increase in publication quality (Leslie et al., 2012).
The emphasis of universities on commercialization reflects a broader shift among universities
toward marketization, or “academic capitalism” (Slaughter and Rhoades, 2004). Clear examples
of such marketization include the commercialization of academic discoveries and college
athletics (Bok, 2009). The economic benefits and prestige these activities generate means that the
university as an institution may have difficulty reversing this trend, even if it wished to do so.
Furthermore, such a pivot toward market motives may make universities especially vulnerable to
economic fluctuations.
Studies of university scientific commercialization find three main factors affect
commercialization: policies, culture, and organization (Breznitz, 2014; Clark, 1998; O'Shea et
al., 2005). Studies point to funding as an important contributor to the success of technology
transfer offices (TTO), which are distinguished by their ability to evaluate technologies, patent,
and negotiate with industry. Many of these activities are based on the TTOs’ ability to employ
high-quality PhDs with business experience as well as outside lawyers, provide funding for
startups, and patent and follow patents through the legal system. Income from licenses and

8
funding from the university administration for the creation of entrepreneurship programs also
have a direct impact on university commercialization. Lastly, because inventions are based on
research outcomes, the ability to fund university research has a direct impact on
commercialization. Some universities are focused on disruptive technologies while other focus
on incremental ones (Breznitz and Ram, 2013).
Funding for university research comes from several sources. Federal funding, increasingly
replaced by state funding, underwrites 60% of higher education (down from 77% in 1965)
(Association of American Universities, 2015; Breznitz, 2014; Stephan, 2012). This level of
funding in the U.S. is similar to that in the U.K. and other OECD member countries (Bagchi-Sen
and Lawton Smith, 2012; Lawton Smith, 2007). Average support for higher education in most
states contributes about 5.5% of their R&D budget (Breznitz, 2014; Mitchell et al., 2014).
Industry provides on average 5%. While state funding shows a continuous downturn, private
foundations have been providing a growing share, as high as 30% in 2012 (Murray, 2012).
Lastly, many higher education institutions are now self-funding research, 20% in 2009 (Stephan,
2012). A reduction in federal R&D increases the likelihood university research will be self-
funded. Powers (2004) found growth in institutional (universities’) R&D is an indicator of
university entrepreneurship and that institutional funding of R&D grows with reductions in state
appropriations and federal R&D. Institutional funding originates mostly from state
appropriations and funds received for indirect costs from research grants, endowments, and
donations (Stephan, 2012).2
2 At a time of reductions in state appropriations, universities transfer funding that should be allocated to teaching to research.
9
Many universities consider the source when deciding how to allocate funding in their budgets.
Thus, in line with institutional theory, studies find that university funding from grants and
contracts is spent on research while funding from tuition or state appropriations is spent on
teaching. That said, administrators at research-intensive universities prioritize research
(Ehrenberg et al., 2007). Hence, if research support is reduced, universities are expected to
compensate by tapping other revenue sources, including those normally allocated for teaching.
However, the sources of funding differ between public and private universities. Public
universities rely on public funding, which requires them to accept more students than private
universities. Private universities tend to rely on their endowments and tuition (Leslie et al.,
2012). Thus, after the 2008-2013 financial crisis, we expect to find that universities divert
(institutional) funding from tuition subsidization to research, raise tuition at private universities,
and increase the student-faculty ratio at public universities.
How did universities respond to reductions in funding, and how did these changes affect research
output? Lowered appropriations required universities cut their budgets. They did so by laying off
faculty and staff, cutting salaries and services, increasing tuition, and reducing financial aid
(Douglass, 2010; Oliff et al., 2013). Many states also closed specific programs, merged schools,
or eliminated full-time positions for seasonal and contract workers (Mitchell et al., 2014). For
example, the three-member Arizona University System eliminated 2,100 positions, and
Louisiana State University, 1,210 full-time positions. In addition, universities cut services by
closing laboratories and extension campuses. Moreover, tuition increased by an average of 28%
more than the rate of inflation. In six states tuition grew more than 60% (Mitchell et al., 2014).

10
With such drastic reductions in university funding we expect research output to be negatively
affected. Two recent studies indicate the effect of economic downturn on entrepreneurial
activity, however, may not be entirely negative. Horta et al. (2016) test a “recession-push”, or
necessity entrepreneurship, hypothesis using data on spin-offs from Italian universities over the
period 1999 to 2013. This hypothesis states that rather than decreasing the number of spin-offs,
an economic downturn will push university graduates, academics, or tertiary education students
to start firms because they see self-employment is a better option during economic downturns.
They find a positive linear relationship between academic spin-off creation and levels of relative
skilled unemployment, though the relationship for general unemployment was non-linear.
Furthermore, Brint et al. (2016) find universities incorporated a wide range of practices to
weather the economic downturn that in some cases brought the university to a stronger position
than prior to the recession, arguing industry reporting on the effects of the recession on
universities was unreliable and unduly negative. These findings, combined, with tangible
evidence of reduced operating budgets at public as well as private universities necessitates a
deeper understanding of the mechanisms by which universities responded to funding reductions
and whether and how research output was subsequently influenced.
To explore these questions, we posit the following:
Hypothesis 1: A reduction in state appropriations increases institutional support for research at public
universities.
Hypothesis 2: The tightened budgets of public and private (nonprofit) higher education institutions during
economic downturn will negatively impact university publication and commercial research output.3
3 Commercialization output is measured by patents, licenses, and number of spinout companies. Research funding refers to all sources.
11
Data and Methodology
This paper evaluates the impact of the 2008–13 economic crisis on university research output. In
an attempt to control for historical and environmental factors, especially at the federal, state, and
regional level, we analyze three universities located in the same region. Moreover, because the
literature highlights the economic importance of intensive research, we focus on the three
research-intensive universities: Georgia Institute of Technology (Georgia Tech), Georgia State
University (Georgia State), and Emory University (Emory). We selected public and private
(nonprofit) universities because of their different funding sources, resource allocations, and
output. We use Atlanta as our case study to control for any national, state, and regional
differences.
The study uses both qualitative and quantitative techniques. Historical narratives of the three
universities and the Georgia policy environment surrounding higher education and
commercialization provide the context by which the impact of the economic recession might be
better understood. These accounts were compiled using secondary sources, three interviews with
university administrators, and a review of statements made on the universities’ websites
regarding their commercialization and economic development policies. Longitudinal data was
collected and analyzed in order to understand changes in research expenditures and outputs at the
three universities over time and how these changes correlate with economic fluctuations.
Research output was operationalized as the annual number of publications, licenses, spinouts,
and patent applications.
12
Data was retrieved from a variety of sources. Information on the universities research
expenditures and output was found from the universities’ annual fact books or reports to the
president, the National Science Foundation (NSF), the Association of University Technology
Managers (AUTM), and direct information from university administrators via e-mail or
interview. The number of publications per university was retrieved from the Web of Science™
(search terms outlined in the Appendix).
We also developed and administered an online survey of university faculty and researchers from
July to August 2014 to provide a richer understanding of the 2008 recession’s impact from the
perspective of researchers themselves. It was mailed to 249 researchers and faculty in the
physical and engineering sciences at the three institutions (see Appendix)—that is, ten faculty
members from each of the ten departments at Georgia Tech and Emory and six at Georgia State
that were most likely to be involved in commercialization. Six departments were surveyed at
Georgia State because it did not have ten meeting our criteria. The sample has a proportional mix
of assistants, associate and full professors, and research associates where possible. We received
sixty-six responses and six opted out, for a response rate of 27%. In addition, we sent a short
questionnaire to each university TTO, with a 100% response rate.
Empirical Context
Existing studies emphasize the importance of local history and the environment in which
universities operate in their ability to make an economic impact in general and to engage in
technology commercialization in particular (Breznitz, 2011; Rahm et al.; 2000; Lawton Smith
and Bagchi-Sen, 2011). Hence, we review the factors among our three cases that influence their
contributions to economic development and technology commercialization, activities which

13
bring universities into the market realm. The background of each institution sheds light on
activities and funding allocations made by each university during the economic crisis.
In 1990, in order to promote local economic development, the state of Georgia began to invest in
programs to support relations between universities and industry, university excellence, and the
commercialization of university activities, all of which benefited the three institutions of higher
education studied here. However, they each achieved different results due to their history and
research output. Georgia Tech, a public university of engineering, has strong ties to industry and
the state. Emory is a private university that ranks highly in medicine and healthcare policy and
has strong ties to federal laboratories. Georgia State is the youngest university in our analysis. It
was accredited later than the other two, and although it is considered a research-intensive
university, it is the lowest recipient of research funding.
The State of Georgia
Georgia legislators created the Georgia Research Alliance (GRA) as a collaborative partnership
among the state’s six research universities in 1990 to help elevate its high-technology industry
status. GRA’s primary aim is to build a technology-driven economy by promoting business,
government, and university partnerships (Georgia Research Alliance, 2011). These six
universities, which include Emory, Georgia Tech, and Georgia State, came together to foster
economic development through their research capacity.
Although GRA is funded primarily through private foundation and industry grants, funding is
also provided in the Georgia budget. GRA leveraged $225 million in state funding through
14
various programs to attract over $2.5 billion in federal and private investment in its first twenty
years (Georgia Research Alliance, 2011). The organization’s funding was threatened due to the
2008–2013 recession when the annual appropriation was reduced from around $20 million to
under $5 million (Conaway and Scott, 2015; Stuart, 2011).
How did Georgia respond to the financial crisis? State appropriations for higher education in
Georgia were reduced 24.8% between 2008 and 2013. GRA funding was cut 80%. In addition,
the University System of Georgia consolidated after 2011, shrinking the system from 35 to 29
campuses. Even with consolidations Georgia saved only about 0.1% of its $7.4 billion operating
budget (Rivard, 2013). Moreover, from 2008 to 2013, tuition for higher education in Georgia
grew on average 66.5%—the second-highest increase in the country (Mitchell et al., 2014).
Hence, despite its initiatives to achieve research excellence, Georgia reduced state appropriations
for higher education due to the financial crisis.
All three universities accept students on HOPE Scholarship awards (tuition subsidies for
qualified Georgia resident students). This includes Emory, which is a private school. HOPE is a
scholarship funded by state appropriated funds raised through Georgia’s lottery. The
qualifications for and amount of these subsidies has changed, but generally require a certain
grade point average be maintained. Deficits forecast for 2011 led policymakers to change HOPE
into a two-tiered system, which brought an immediate reduction in the number of full
scholarships awarded, essentially raising tuition for students. It is likely the recession was an
impetus for this change, as it depleted the state budget. In fact, the state’s annual per-student
15
funding of higher education reached an 18-year low in the 2012-13 academic year (Committee to
Preserve HOPE Scholarships, 2016).
Georgia Institute of Technology
From its inception, Georgia Tech was expected to make social and economic contributions to the
state. Georgia Tech was established in 1885 as part of an attempt to reconstruct and create the
‘New (Industrial) South’ (McMath, 1985; O'Mara, 2005). Its mission ‘to provide the state of
Georgia with the scientific and technological base, innovation, and workforce it needs to shape a
prosperous and sustainable future and quality of life for its citizens’ specifically targets the state
as main beneficiary of its innovation and scholarship (Georgia Institute of Technology, 2010).
Although Georgia Tech was not a land grant university, its early years were dedicated to
workforce development and training. Furthermore, the university implements many state science
and technology programs (Youtie and Shapira, 2008). Georgia Tech’s economic contribution is
seen through its university-industry relationships, patents, and spinouts (Oldach, 2009).
Furthermore, the university is a large employer. In 2012 Georgia Tech was the twenty-fourth
largest employer in the Atlanta MSA (Metro Atlanta Chamber, 2012).
Georgia Tech has established exceptionally strong connections with industry when compared to
other top research universities (Youtie and Shapira, 2008). This is evident in the amount of
funding the university receives from private industry and the number of patents it holds. The
university receives $45 million on average from private industry annually and its patented
innovations are more likely to be built upon by industry than those of most other institutions
(Patent Board, 2009). In 2009 Georgia Tech was listed as one of the top ten universities in the
16
Patent Score Card report, which made special mention of its ability to collaborate with industry
and make an economic impact through technological innovations.
An example of the strong connections between Georgia Tech and the state is the university’s
Enterprise Innovation Institute (EI²), created to focus on economic development concerns in the
state. The Advanced Technology Development Center (ATDC) was created within EI² to help
launch Georgia-based technology startups. Fully funded by the state of Georgia, ATDC has
graduated more than 150 companies since its 1980 inception.
In sum, Georgia Tech represents a top commercializing university with strong ties to industry
and the state of Georgia. This university views economic development as part of its mission and
its approach toward research excellence.
Emory University
The Georgia Methodist Conference opened Emory College in 1838 in Oxford, GA (Emory
University, 2010). In 1914 Emory College moved to Decatur, GA, adjacent Atlanta, and soon
after became Emory University. Emory has historical connections to the Atlanta business
community. The Atlanta Chamber supported its 1914 relocation with $500,000 in aid, has
promoted Emory’s financial campaign, and uses the university to promote Atlanta as an
educationally rich city (English, 1966; Garofalo, 1976).
Research is an important aspect of Emory’s mission. As of 2011 Emory’s total research
expenditures were $547 million. The majority of its research and technology transfer is in health
17
sciences (Emory University, 2012). In 2012 Emory was the third-largest employer in Atlanta
(Metro Atlanta Chamber, 2012).
Emory sponsors programs supporting innovation and entrepreneurship. EmTechBio
Development was an Emory-Georgia Tech start-up incubator that graduated nine companies and
was operative from 2000 to 2010 (Emory University Office of Technology Transfer, 2012).
EmTech Bio provided incubation space and a seed grant that awarded Emory and Georgia Tech
biotech researchers $75-100,000, with the goal of attracting funding from GRA’s VentureLab
and federal SBA programs (EmTechBio, 2008). In 2005 an Investor Challenge Fund was created
to match up to $500,000 of the funding of qualified investors investing in eligible Emory
technologies. Proponents argued the fund would bring strengthen university-industry
partnerships and bolster Georgia’s biotechnology industry (Moriarty, 2005). These programs
illustrate that while Emory’s leadership may desire its research to have a broad, global economic
impact, its commercialization culture acknowledges the importance of a supporting local
industries.
Emory is a private, research-focused university. Although the university has no specific local or
statewide economic development agenda, its distinguished research, collaborations with other
universities, federal labs and industry, and its local employment have a positive impact on the
local economy.

18
Georgia State University
Georgia State is the youngest university in our sample. It was officially accredited as a university
only in 1969. The impact of its late research start and lack of financial support from the state are
evident in its approach to economic development and commercialization.
Georgia State was founded in 1913 as Georgia Tech’s Evening School of Commerce in response
to pressure from industry partners who believed local business training would enhance the
education of Georgia Tech students and human capital in Atlanta (Flanders, 1955). The
university’s ownership shifted between Georgia Tech and the University of Georgia, in Athens,
GA, for several years. It received no state funding until 1936 (Reed, 2009).
Georgia State’s research capability was also late to develop. During the Cold War when Georgia
Tech and Emory’s research funding was growing, Georgia State was focused on achieving
independence and university accreditation. Georgia State’s beginnings also highlight it was not
created with the goal of being a leading research institution. Although it is considered a ‘very
high research activity’ university, these realities put the university behind its local peers in
research, slowing commercialization opportunities (Carnegie Foundation, 2012). It was not until
the late 1980s that research funding at the university began to noticeably increase (Reed, 2009).
CollabTech, Georgia State’s biotechnology incubator, is the university’s most direct attempt to
participate in Atlanta’s high-tech industry. It was created in 2001 to keep biotechnology start-ups
in Atlanta and is the only incubator in downtown Atlanta. By 2012 it gained GRA support and
tenants were provided access to GRA funding (Georgia State University, 2012).

19
Despite being a research-intensive university, Georgia State is new to the level of research and
commercialization that take place at Georgia Tech and Emory. It is also significantly weaker
than Georgia Tech and Emory in industry relationships. In 2010 only 2% of the university’s total
research grants were from industry. However, as a public university in downtown Atlanta it
makes a contribution, especially during the financial crisis as it responded to state business needs
and accepted the most students.
Results
In this section, we use data from secondary sources and our online survey to investigate basic
claims regarding the impact of the 2008–2013 financial crisis on universities’ output. We start by
reviewing findings from the secondary data. Interestingly, all three universities show that total
research expenditure continued to grow during and after 2008 (see Figure 2).

20
Figure 2. S&E R&D Expenditures (2009$), 1994-2015. Sources: NSF Academic R&D Expenditures Survey, 1993-2009; NSF HERD Survey, 2010-2015.
When we compare the three universities, we find the main reduction in funding sources for
Emory and Georgia Tech following the financial crisis were from state and local research
funding, followed by industry and institutional funding, while, for GSU it was mainly a
reduction in state and local funding (see Figures 3-5). State and local research funding includes
state and local government funds directed specifically to research. It excludes general-purpose
appropriations (National Science Foundation, 2012b).
0
10
20
30
40
50
60
70
0
100
200
300
400
500
600
700
800
1994 1996 1998 2000 2002 2004 2006 2008 2010 2012 2014
USA
Bill
ions
Geo
rgia
Tec
h, G
eorg
ia S
tate
& E
mor
yM
illio
ns
Georgia Tech Georgia State Emory USA

21
Figure 3. Georgia State S&E R&D Expenditures (2009$) by Source of Funding, 1994-2015. Sources: NSF Academic R&D Expenditures Survey, 1993-2009; NSF HERD Survey, 2010-2015.
Figure 4. Emory S&E R&D Expenditures (2009$) by Source of Funding, 1994-2015. Sources: NSF Academic R&D Expenditures Survey, 1993-2009; NSF HERD Survey, 2010-2015.
0
0.5
1
1.5
2
2.5
3
0
5
10
15
20
25
30
35
40
1994 1996 1998 2000 2002 2004 2006 2008 2010 2012 2014
Indu
stry
Millions
Federal,State&Lo
cal,&Institu
tional
Millions
Federal State&Local Institutional Industry
0
5
10
15
20
25
30
35
0
50
100
150
200
250
300
350
400
1994 1996 1998 2000 2002 2004 2006 2008 2010 2012 2014
Stat
e &
Loc
al &
Indu
stry
Mill
ions
Fede
ral &
Inst
itutio
nal
Mill
ions
Federal Institutional State & Local Industry
22
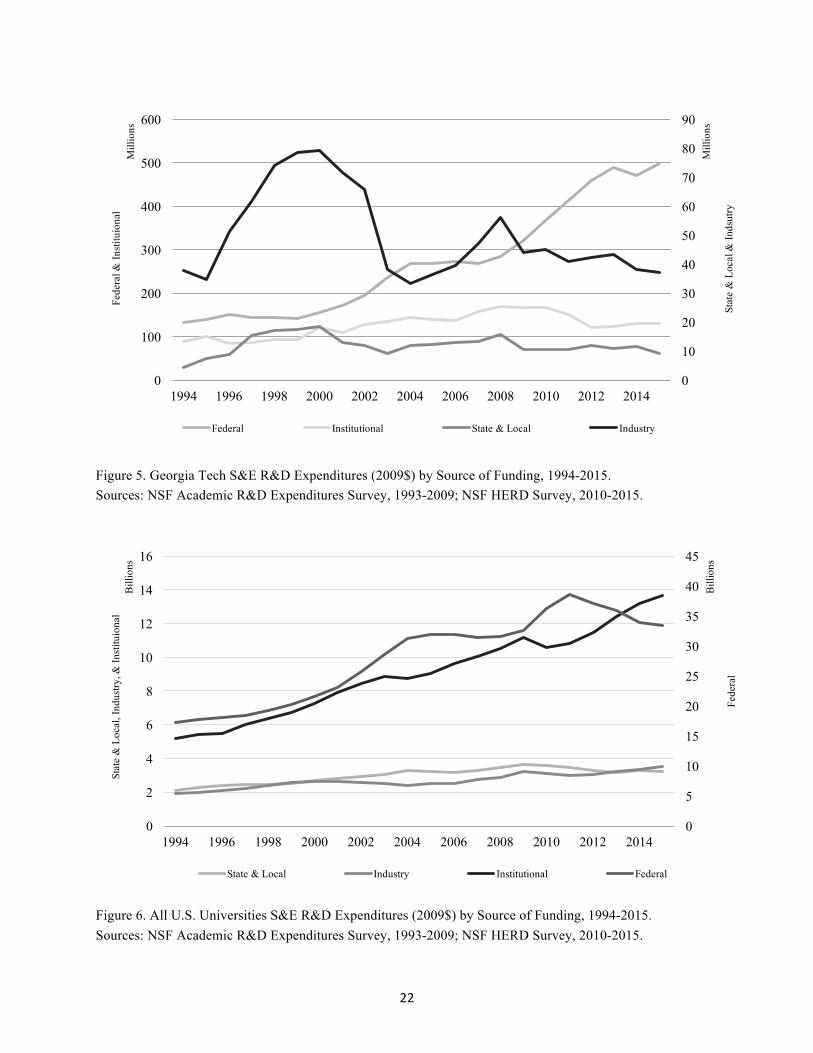
Figure 5. Georgia Tech S&E R&D Expenditures (2009$) by Source of Funding, 1994-2015. Sources: NSF Academic R&D Expenditures Survey, 1993-2009; NSF HERD Survey, 2010-2015.
Figure 6. All U.S. Universities S&E R&D Expenditures (2009$) by Source of Funding, 1994-2015. Sources: NSF Academic R&D Expenditures Survey, 1993-2009; NSF HERD Survey, 2010-2015.
0
10
20
30
40
50
60
70
80
90
0
100
200
300
400
500
600
1994 1996 1998 2000 2002 2004 2006 2008 2010 2012 2014
Stat
e &
Loc
al &
Inds
utry
Mill
ions
Fede
ral &
Inst
ituio
nal
Mill
ions
Federal Institutional State & Local Industry
0
5
10
15
20
25
30
35
40
45
0
2
4
6
8
10
12
14
16
1994 1996 1998 2000 2002 2004 2006 2008 2010 2012 2014
Fede
ral
Bill
ions
Stat
e &
Loc
al, I
ndus
try, &
Inst
ituio
nal
Bill
ions
State & Local Industry Institutional Federal
23
Though we do not see a reduction in the total amount of research funding, changes in funding
sources are evident: more institutional and less federal and state R&D funding.
The two public universities examined, Georgia State and Georgia Tech, had their state
appropriations reduced beginning in 2009 as a direct result of the economic crisis. Georgia State,
which does not enjoy the same level of federal funding as Emory and Georgia Tech, experienced
a sharp increase in institutional funding for research. However, at Georgia Tech, where federal
research funding continues to grow and at a higher rate due to the federal stimulus, institutional
support increased through 2010, but later decreased. These findings are consistent with and
provide support for the relationships posited between reduced state appropriations and increased
institutional R&D expenditures in H1. However, the results suggest this relationship is
moderated by the level of federal R&D funding.
The broader national trend is shown in Figure 6. Interestingly, a decline in institutional funding
is seen after 2009, followed by a return to previous levels of growth. State and local research
expenditures continue to decline post recession. The jump in federal is likely due to the increased
research budgets and stimulus funding, as described in Dinerstein et al. (2014), but this affect
appears to have subsided as federal levels fell. Industry funding has overall maintained its slight
growth rate.
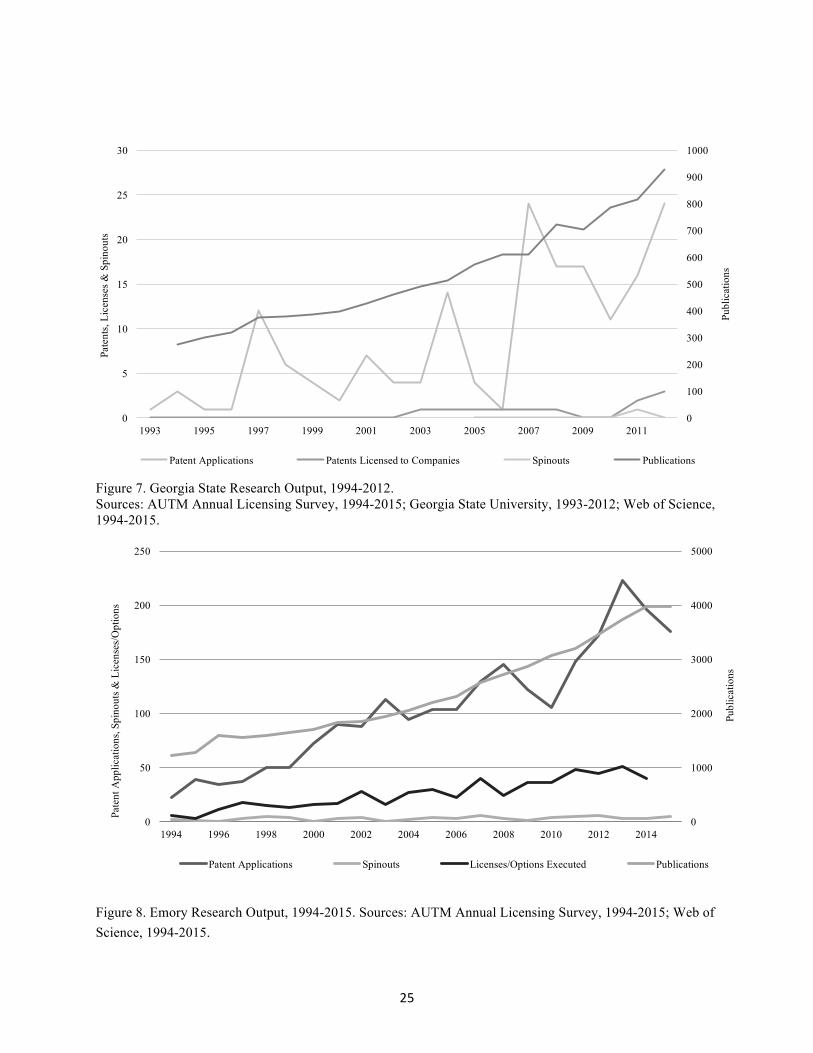
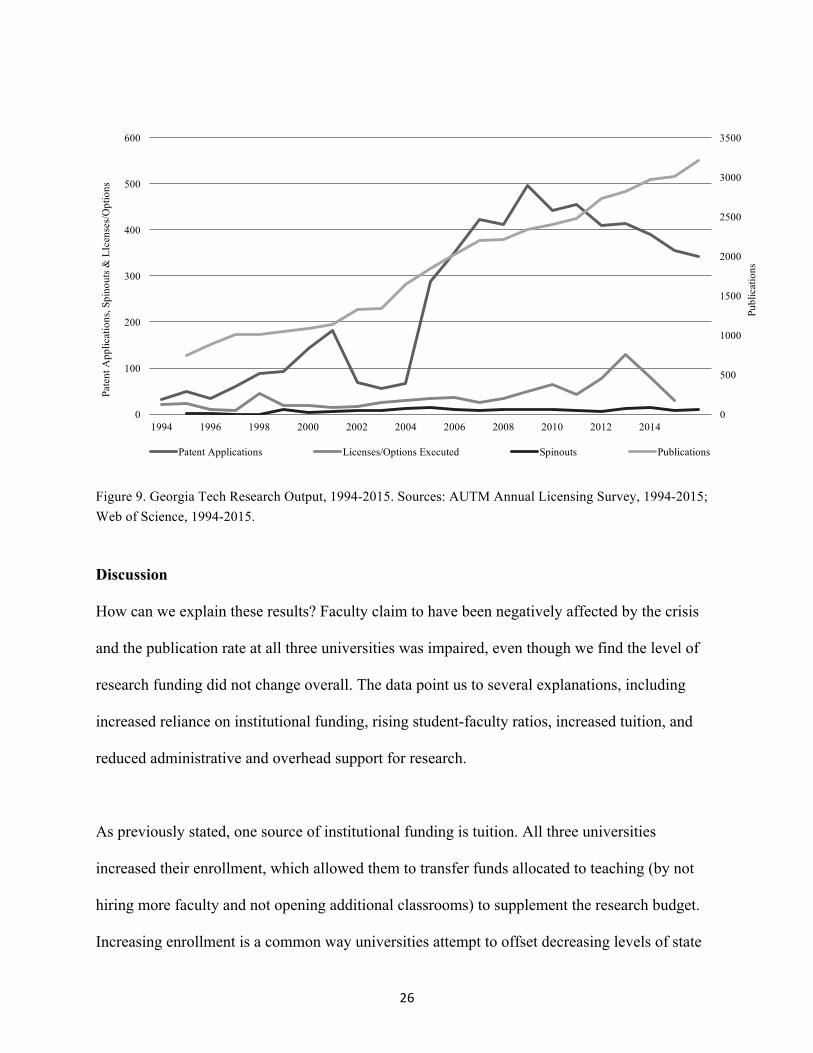
When we examine university output after 2008, we find the three universities saw a reduction in
publications regardless of the continuous growth in total research expenditure. Figures 7-9 shows

24
a reduction in the growth rate for the two years after the crisis began. Growth rates in
publications fell from 11 to 5% (Emory), 6 to 3% (Georgia Tech), and 15 to -2% (GSU). We see
an immediate effect on patent applications and license executions (in 2009-2010) and a delayed
impact on spinouts (in 2011). These are very small changes, from which the universities
recovered in a couple of years. When we consider survey results, we found 77.3% of respondents
believed their research and commercialization output was negatively affected by the financial
crisis. Of these respondents, 98% experienced a reduction in research funding because of a
diminution of government funds (84%) and increased competition for funds (74%).4
Overall, the data support H2. We see a negative impact on publication and commercialization
output immediately after the beginning of the financial crisis. The mechanisms behind this
negative impact will be explored next.
4 To explain these results, we examined the NSF proposals and awards during the crisis years. We found though the number of proposal grew 11%, the number of awards fell 1% from 2008-2010 (National Science Foundation, 2012a).
25
Figure 7. Georgia State Research Output, 1994-2012. Sources: AUTM Annual Licensing Survey, 1994-2015; Georgia State University, 1993-2012; Web of Science, 1994-2015.
Figure 8. Emory Research Output, 1994-2015. Sources: AUTM Annual Licensing Survey, 1994-2015; Web of Science, 1994-2015.
0
100
200
300
400
500
600
700
800
900
1000
0
5
10
15
20
25
30
1993 1995 1997 1999 2001 2003 2005 2007 2009 2011
Publ
icat
ions
Pate
nts,
Lice
nses
& S
pino
uts
Patent Applications Patents Licensed to Companies Spinouts Publications
0
1000
2000
3000
4000
5000
0
50
100
150
200
250
1994 1996 1998 2000 2002 2004 2006 2008 2010 2012 2014
Publ
icat
ions
Pate
nt A
pplic
atio
ns, S
pino
uts &
Lic
ense
s/O
ptio
ns
Patent Applications Spinouts Licenses/Options Executed Publications
26
Figure 9. Georgia Tech Research Output, 1994-2015. Sources: AUTM Annual Licensing Survey, 1994-2015; Web of Science, 1994-2015.
Discussion
How can we explain these results? Faculty claim to have been negatively affected by the crisis
and the publication rate at all three universities was impaired, even though we find the level of
research funding did not change overall. The data point us to several explanations, including
increased reliance on institutional funding, rising student-faculty ratios, increased tuition, and
reduced administrative and overhead support for research.
As previously stated, one source of institutional funding is tuition. All three universities
increased their enrollment, which allowed them to transfer funds allocated to teaching (by not
hiring more faculty and not opening additional classrooms) to supplement the research budget.
Increasing enrollment is a common way universities attempt to offset decreasing levels of state
0
500
1000
1500
2000
2500
3000
3500
0
100
200
300
400
500
600
1994 1996 1998 2000 2002 2004 2006 2008 2010 2012 2014
Publ
icat
ions
Pate
nt A
pplic
atio
ns, S
pino
uts &
LIc
ense
s/O
ptio
ns
Patent Applications Licenses/Options Executed Spinouts Publications
27
funding. Barr and Turner (2012) found U.S. universities increased enrollment during the 2008-
2013 recession by a larger amount than during the prior 2000-2002 economic downturn. When
we examine enrollment levels at our sample of universities, specifically, it is not surprising the
way in which the financial crisis affected the three universities depended on their mandate.
Though these increases fit their research focus and mandate, they still tell an interesting story.
Georgia State, a teaching university that always had more students than Emory and Georgia
Tech, increased the number of students 13% between 2008 and 2011. Georgia Tech, a public
institution but with strong support from privately funded research, increased the number of
students 8%. Emory, a private university that relies on offering smaller classes and on its
endowment, increased its enrollment 9% (Emory University Office of the Registrar, 1994-2013;
Georgia Institute of Technology, 1993-2013; Georgia State University, 1997-2013). The one-
percentage-point difference could be explained by the decline in Emory’s endowment by 21%
from 2008 to 2009, requiring the university compensate for the decline with higher tuition
(Payne, 2009).
The enrollment of additional students had its own effect on faculty. Because the universities
diverted tuition funding from teaching to research, the ratio of students per faculty increased. At
Georgia State, the ratio of students per faculty increased from 27% in 2008 to 29% through 2011,
at Georgia Tech from 19% to 19.5%, and at Emory from 4% to 4.5%.5 While only 50% of survey
respondents indicated that teaching loads had a negative effect on their research, the increased
ratio indicates that faculty had to devote more of their time to teaching.
5 This includes all, not just full-time, academic faculty. While the number of full-time faculty appointments at Georgia Tech was reduced, the number of total academic faculty continued to grow, indicating growth in part-time and adjunct faculty.
28
How much did tuition increase? Beginning in 2008, Georgia State and Georgia Tech increased
tuition by 11% and 12% respectively, while Emory maintained its previous tuition growth rate
average of 4%. These increases are consistent with the national trend of increased tuition among
all higher education institutions, though private nonprofit institutions on average raised tuition
less than others (Barr and Turner, 2013). These increases in tuition affect research. Research
faculty who hire graduate students pay for their tuition and fees from their research grants.
Hence, higher tuition means fewer research students per research project. But the issue goes
beyond mere tuition growth. Payment rates for graduate students have changed. Especially at
Georgia Tech, interviewees reported that in the past they would have been charged the lowest
tuition rate for those graduate students (e.g., the in-state rate, even for an international student),
but now they are charged the full tuition rate and fees, and even have to pay for their benefits.
What else contributes to the decline in output? When asked directly about the impact of the
financial crisis on publications, 45% of respondents stated that they had experienced a negative
impact. Of those, 81% claimed that the negative impact was due to the lower amount of grants
received. In comments, respondents referred to writing more grant proposals than usual and
spending more time on writing those proposals. Moreover, 61% of respondents indicated that
they had ‘less time to work on publication.’ In comments, respondents mentioned several factors
that impaired their ability to work on publications, including reduced administrative support for
grant proposals and reduced travel funds for research and conferences. The survey revealed
another important factor that should be considered, student work. Of the survey respondents who
experienced a negative impact from the financial crisis, 47% had a reduction in the availability of

29
research assistants (83%) and postdoctoral students (65%).6 The reduction is due in part to the
increase in tuition and fees, as mentioned earlier, as well as less central university and
departmental funding for fellowships and grants.
Overhead also affects research funding. Also called in-direct costs (for students, postdocs,
equipment, and faculty salaries), they are paid by external agencies such as the National
Institutes of Health or the National Science Foundation. According to Paula Stephan, indirect
costs cover much of the infrastructure and the administrative side of research. Moreover, Stephan
(2012) notes that in the 1990s funding agencies started to cap how much they would pay for
overhead. This cap limited overhead to about 55% in the late 1990s. But after 2008, the rates
regained the levels seen in the 1980s. Emory University (2015) increased its overhead rate from
53% in 2007 to 55% in 2009 and 56% in 2015. Georgia State University’s (2006, 2015) rate rose
from 44.5% in 2007 to 47.5% in 2013, and it is projected to rise to 51.5% in 2017. At Georgia
Tech (2015), overhead was capped at 51% in 2009, 52.7% in 2011, and 55.9% in 2014.
In sum, we see an impact of the 2008-2013 financial crisis on academic research. The need to
write more grants and spend more time on each grant due to the higher level of competition for
funding provides an explanation for the reduction in publications. Other explanations draw from
the fact that universities, mostly because of reductions in state funding, had fewer research
assistants and postdoctoral students, less administrative support, and a higher student-faculty
ratio. Students and postdocs are integral to research labs and publications, especially in
6 The survey was mostly conducted in engineering and computer science departments, therefore we cannot be sure whether the impact on grants received for social science was higher, resulting in a larger reduction in publication proportionately. However, examination of publications by field indicates the same level of publication rate impairment.
30
engineering and the sciences where they are needed for lab work. Overall, reduced state funding
and endowment returns forced universities to constrict their budgets in ways that reduced
publication and commercialization output.
Conclusion
This paper set out to analyze the impact of research funding on three universities’ output. The
role of universities is an important topic in debates on local economic development, but the
2008–2013 financial crisis and reduction in state funding for universities made this investigation
even more critical. In order to focus on the impact of state and federal funding, the paper
analyzed three universities in one region: Georgia State, Georgia Tech, and Emory.
The most evident impact of the crisis is the reduction in the university publication rate, patents,
and licenses. This result is not surprising, since existing studies indicate a strong correlation
between research funding and publication and commercialization. Moreover, all three
universities accepted more students, in line with their respective roles in the Georgia economy.
This may have reduced the time available for faculty to conduct research and hence contributed
to the total reduction in publications. Georgia State accepted the majority of those students
without raising tuition much, while Emory, as a private university, tried to keep its student–
faculty ratio low. The rise in student–faculty ratio and tuition were not high enough to prevent
the reduction in publications.
It is critical, especially for future research, to understand the outcome of this crisis on higher
education. Many articles in major newspapers and magazines discuss the impact on students

31
(Economist, 2015; Mitchell et al., 2014). Tuition increases reduce accessibility to higher
education, creating a social and economic divide and leaving graduates with huge debts.
However, what is lacking in this discussion is the impact on researchers and research output,
both of which confronted a new reality after the financial crisis began. Increases in tuition and
overhead will continue. Even though state appropriations have risen somewhat, they have not yet
returned to their pre-2008 levels. Even if those levels are recovered, however, it seems unlikely
that universities will reduce tuition and overhead costs. Hence, the new reality for researchers is
that no matter how big their research grant, after paying for research assistants, postdoctoral
students, and administrative overhead they will be left with less funding for actual research and
fewer students to work with. Lastly, but maybe most important, researchers will have less time to
work on their own projects. Increases in student–faculty ratios and reduced administrative
support from universities leave faculty with less time to work on research projects, producing
fewer publications, patents, licenses, and so on. As shown in the analysis, these trends impact
private institutions as well, even though by 2013 endowment returns were rising back to normal
levels (Barr and Turner, 2013).
These findings have implications for policymakers at the federal and state level. Federal stimulus
may not be sufficient to sustain research output levels during economic downturns. If academic
prestige is achieved through the number of publications and leads to increases in funding, as
argued by Leslie et al. (2012), then our findings indicate that policymakers should have a strong
incentive to support researchers during times of economic decline. They should aim to bolster
research so as not to let publication rates fall and thereby prevent a potential downward spiral in
funding and prestige. It is unclear whether more targeted state funding for research and

32
postdoctoral students would have strengthened research output. What is clear, however, is that
policymakers must provide those working in the sciences with enough resources to meet their
own demands for research output.
Although our findings are only preliminary, they provide a warning signal for researchers,
universities, and governments. We increasingly rely on academic research in society but have not
solved the contradiction between expectations and having the resources necessary to meet them.
As universities and their research programs are increasingly pushed to commercialize and
become more market-oriented, they are also pushed into a realm where they may be less resilient
to economic fluctuation. This problem is not just domestic, and neither is the solution, so we
encourage international exploration of the issues taken up here.
33
Appendix
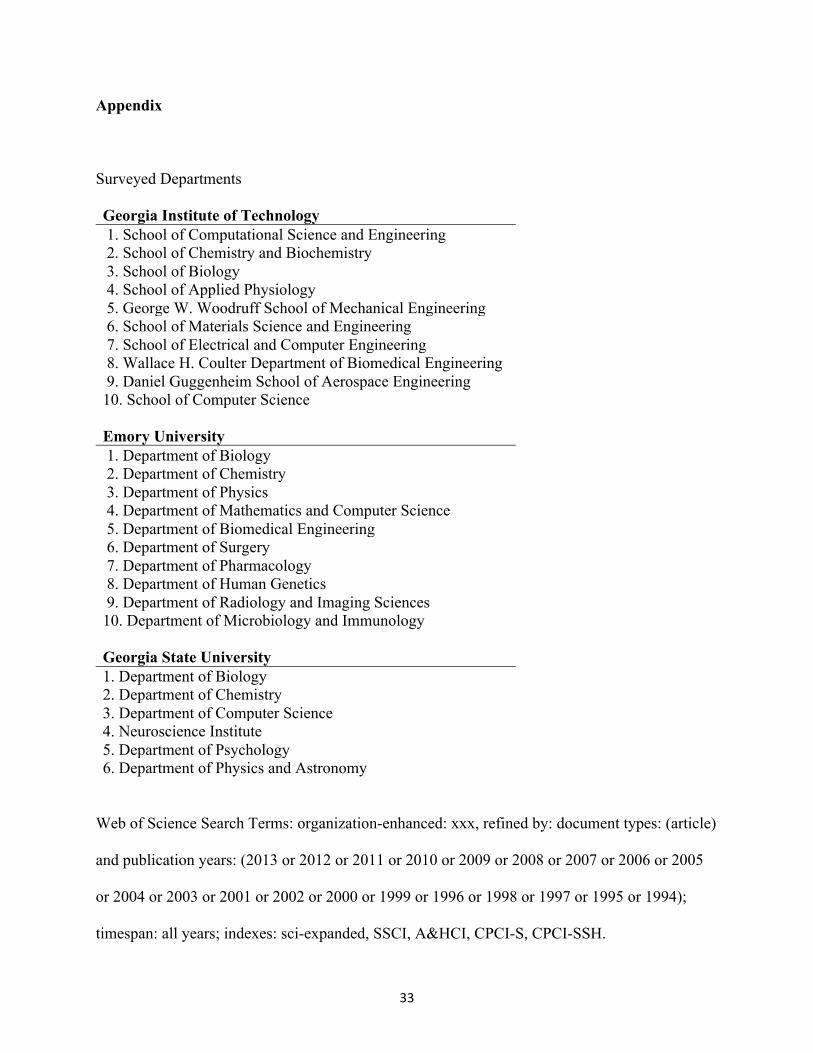
Surveyed Departments
Georgia Institute of Technology 1. School of Computational Science and Engineering 2. School of Chemistry and Biochemistry 3. School of Biology 4. School of Applied Physiology 5. George W. Woodruff School of Mechanical Engineering 6. School of Materials Science and Engineering 7. School of Electrical and Computer Engineering 8. Wallace H. Coulter Department of Biomedical Engineering 9. Daniel Guggenheim School of Aerospace Engineering 10. School of Computer Science Emory University 1. Department of Biology 2. Department of Chemistry 3. Department of Physics 4. Department of Mathematics and Computer Science 5. Department of Biomedical Engineering 6. Department of Surgery 7. Department of Pharmacology 8. Department of Human Genetics 9. Department of Radiology and Imaging Sciences 10. Department of Microbiology and Immunology Georgia State University 1. Department of Biology 2. Department of Chemistry 3. Department of Computer Science 4. Neuroscience Institute 5. Department of Psychology 6. Department of Physics and Astronomy
Web of Science Search Terms: organization-enhanced: xxx, refined by: document types: (article)
and publication years: (2013 or 2012 or 2011 or 2010 or 2009 or 2008 or 2007 or 2006 or 2005
or 2004 or 2003 or 2001 or 2002 or 2000 or 1999 or 1996 or 1998 or 1997 or 1995 or 1994);
timespan: all years; indexes: sci-expanded, SSCI, A&HCI, CPCI-S, CPCI-SSH.
34
References
Acs, Z.J., Audretsch, D.B. & Feldman, M.P. (1992). Real effects of academic research:
Comment. American Economic Review, 82, 1, 363-367. Retrieved from
www.jstor.org/stable/2117624
Aoyama, Y., Murphy, J.T. & Hanson, S. (2011). Key concepts in economic geography.
Thousand Oaks: SAGE.
Association of American Universities. (2015). AAU Data & Policy Brief: Basic Research at U.S.
Universities.
AUTM. Annual Licensing Survey, 1994-2013.
Bagchi-Sen, S. & Lawton Smith, H. (2012). The role of the university as an agent of regional
economic development. Geography Compass, 6, 439-453. doi: 10.1111/j.1749-
8198.2012.00497.x
Barr, A., & Turner, S.E. (2013). Expanding enrollments and contracting state budgets: The effect
of the Great Recession on higher education. Annals, AAPSS, 650, 168-193.
Bok, D. (2009). Universities in the marketplace: The commercialization of higher education.
Princeton University Press.
Breznitz, S.M. (2011). Improving or Impairing? Following Technology Transfer Changes at the
University of Cambridge. Regional Studies, 45, 463-478. doi:
10.1080/00343401003601909
Breznitz, S.M. (2014). The Fountain of Knowledge: The Role of Universities in Economic
Development. Stanford: Stanford University Press.
Breznitz, S.M. & Feldman, M.P. (2012). The Engaged University. Journal of Technology
Transfer, 37, 139-157. doi: 10.1007/s10961-010-9183-6
35
Breznitz, S.M. & Ram, N. (2013). Enhancing Economic Growth? University Technology
Commercialization. In: Audretsch, D. B. & Walshok, M. L. (eds.) Creating
Competitiveness. Cheltenham: Edward Elgar, 88-115.
Brint, S., Yoshikawa, S.R.K., Rotondi, M.B., Viggiano, T., & Maldonado, J. (2016). Surviving
and thriving: The adaptive responses of U.S. four-year colleges and universities during
the Great Recession. The Journal of Higher Education, 87, 6, 859-885.
Carnegie Foundation. (2012). Classification Description [Online]. Retrieved from
http://classifications.carnegiefoundation.org/descriptions/basic.php.
Carnevale, A.P., Jayasundera, T. & Cheah, B. (2012). The College Advantage: Weathering the
Economic Storm. Georgetown University Center on Education and the Workforce.
Clark, B.R. (1998). Creating entrepreneurial universities: Organizational pathways of
transformation. Oxford: Pergamon Press.
Committee to Preserve HOPE Scholarships. (2016). Georgia’s HOPE Scholarship: A victim of
its own success? [Online]. Retrieved from http://preservehopega.com/downloads/
Conaway, C. & Scott R.T. (2015). Innovation in Louisiana: Maximizing Investment in
University Research to Promote a Knowledge-Based Economy. Public Affairs Research
Council of Louisiana [Online]. Retrieved from
http://reports.parlouisiana.org/2015/InnovReport2015/index.html.
Dinerstein, M., Hoxby, C., Meyer, J., & Villanueva, P. (2014). Did the Fiscal Stimulus Work for
Universities. In: Brown, J.D., & Hoxby, C.M. (eds.) How the Financial Crisis and Great
Recession Affected Higher Education. University of Chicago Press, p. 263-320.
Douglass, J.A. (2010). Higher education budgets and the global recession: Tracking varied
36
national responses and their consequences. Center for Studies in Higher Education,
Research and Occasional Paper Series.
Economist. (2013). The origins of the financial crisis: Crash course. September 7.
Economist. (2015). The Whole World Is Going to University. Is it worth it? March 28.
Ehrenberg, M., Rizzo, J. & Jakubson, G.H. (2007). Who Bears the Growing Cost of Science at
Universities? In: Stephan, P. E. & Ehrenberg, R. G. (eds.) Science and the University.
Madison, WI: University of Wisconsin Press, 19-35.
Emory University. (2010). Emory History - Timeline 1936-1987 [Online]. Retrieved from
http://emoryhistory.emory.edu/timeline/1936.html.
Emory University. (2012). Emory School of Medicine - Timeline [Online]. Retrieved from
http://med.emory.edu/main/about/timeline.html.
Emory University. (2015). FAC Rates [Online]. Retrieved from
http://www.osp.emory.edu/facts/fac-rates.html.
Emory University Office of Technology Transfer. (2012). Start-Up Companies [Online].
Retrieved from http://www.ott.emory.edu/VentureLab/General/index.cfm
Emory University Office of the Registrar. (2013). RE: Total Number of Students.
EmTechBio. (2008). Seed Grant Program - Call for Proposals [Online]. Retrieved from
http://www.emtechbio.com/request.cfm.
English, T.H. (1966). Emory University 1915-1965: A semicentennial history. Atlanta, GA:
Emory University.
Flanders, B.H. (1955). A New Frontier in Education, Atlanta Division, University of Georgia.
Garofalo, C.P. (1976). The sons of Henry Grady: Atlanta boosters in the 1920s. The Journal of
Southern History, 42, 187-204. doi: 10.2307/2206750
37
Georgia Institute of Technology. (1993-2013). Georgia Institute of Technology Fact Book
Archives [Online]. Retrieved from http://www.irp.gatech.edu/fact-book-archives/.
Georgia Institute of Technology. (2010). General Information: Vision and Mission [Online].
Atlanta. Retrieved from http://www.catalog.gatech.edu/general/mission.php 2011.
Georgia Institute of Technology. (2015). Facilities & Administrative Rates [Online]. Retrieved
from www.osp.gatech.edu/rates.
Georgia Research Alliance. (2011). Georgia's 'Deal Maker' for University Research [Online].
Retrieved from http://www.gra.org/AboutGRA.aspx.
Georgia State University. (1993-2012). RE: Transfer Data Summary Report.
Georgia State University. (1980-1994). Georgia State University Fact Book.
Georgia State University. (1997-2013). Enrollment Reports.
Georgia State University. (2006). GSURF Information Fact Sheet for Proposals [Online].
Retrieved from www.gsu.edu/research/gsurf_fact_sheet.html.
Georgia State University. (2012). CollabTech [Online]. Retrieved from
http://www.gsu.edu/collabtech/index.html.
Georgia State University. (2015). F&A Rates [Online]. Retrieved from
http://ursa.research.gsu.edu/ursa/funding/proposal-development/fa-rates/.
Godin, B. (2012). “Innovation Studies”: The invention of a specialty. Minerva, 50, 397-421. doi:
10.1007/s11024-012-9212-8
Grapevine. (2014). An Annual Compilation of Data on State Fiscal Support for Higher
Education. Center for the Study of Education Policy at Illinois State University and the
State Higher Education Executive Officers.
Horta, H., Meoli, M., & Vismara, S. (2016). Skilled unemployment and the creation of academic
38
spin-offs: a recession-push hypothesis. Journal of Technology Transfer, 41: 798–817.
Humphreys, B.R. (2000). Do business cycles affect state appropriations to higher education?
Southern Economic Journal, 67, 2, 398-413.
Jaffe, A.B., Trajtenberg, M. & Henderson, R. (1993). Geographic localization of knowledge
spillovers as evidenced by patent citations. Quarterly Journal of Economics, 108, 577-
598. doi: 10.2307/2118401
Kenney, M. (1986). Biotechnology: The university-industrial complex. New Haven, CT: Yale
University Press.
Kenney, M. & Goe, R.W. (2004). The role of social embeddedness in professional
entrepreneurship: A comparison of electrical engineering and computer science at UC
Berkeley and Stanford. Research Policy, 33, 691-707. Retrieved from
http://dx.doi.org/10.1016/j.respol.2003.11.001
Lawton Smith, H. (2007). Universities, innovation, and territorial development: A review of the
evidence. Environment and Planning C: Government and Policy, 25, 98-114. Retrieved
from https://doi.org/10.1068/c0561
Lawton Smith, H. & Bagchi-Sen, S. (2011). The research university, entrepreneurship and
regional development: Research propositions and current evidence. Entrepreneurship &
Regional Development, 24, 383-404. Retrieved from
http://dx.doi.org/10.1080/08985626.2011.592547
Leslie, L., Slaughter, S., Taylor, B. & Zhang, L. (2012). How Do Revenue Variations Affect
Expenditures Within U.S. Research Universities? Research in Higher Education, 53,
614-639. doi: 10.1007/s11162-011-9248-x
39
Link, A.N. & Siegel, D.S. (2007). Innovation, Entrepreneurship, and Technological Change.
London: Oxford University Press.
Lockett, A. & Wright, M. (2005). Resources, capabilities, risk capital and the creation of
university spin-out companies. Research Policy, 34, 1043-1057. Retrieved from
http://dx.doi.org/10.1016/j.respol.2005.05.006
Massachusetts Institute of Technology. (2013). MIT Facts. [Online]. Retrieved from
http://web.mit.edu/facts/faculty.html.
McMath, R.C. (1985). Engineering the New South: Georgia Tech, 1885-1985. University of
Georgia.
Metro Atlanta Chamber. (2012). Metro Atlanta Top Employers.
Mitchell, M., Palacios, V. & Leachman, M. (2014). States Are Still Funding Higher Education
Below Pre-Recession Levels. Washington, DC: Center on Budget and Policy Priorities.
Moriarty, E. (2005). Emory starting biotech fund. Atlanta Business Chronicle, August 29, 2005.
Retrieved from http://ott.emory.edu/documents/news/082905_emory_biotech_fund.pdf
Murray, F. (2012). Evaluating the Role of Science Philanthropy in American Research
Universities. NBER/Innovation Policy and the Economy.
National Science Foundation. (2012a). Report to the National Science Board on the National
Science Foundation’s Merit Review Process Fiscal Year 2012.
National Science Foundation. (2012b). Science and Engineering Indicators 2012. [Online].
Retrieved from https://www.nsf.gov/statistics/seind12/c0/c0i.htm
National Science Foundation. National Center for Science and Engineering Statistics. Academic
Research and Development Expenditures: Fiscal Years 1993-2009. Detailed Statistical
Tables. Arlington, VA.

40
National Science Foundation. National Center for Science and Engineering Statistics. Higher
EducationResearchandDevelopment:FiscalYears2010-2013. Detailed Statistical Tables.
Arlington, VA.
Oldach, S. (2009). The Universities Patent Scorecard™ – 2009 University Leaders in Innovation.
[Online]. Retreived from http://www.iptoday.com/articles/2009-9-oldach.asp.
Oliff, P., Palacios, V., Johnson, I., & Leachman, M. (2013, Mar. 19). Recent deep state higher
education cuts may harm students and the economy for tears to come. Center on Budget
and Policy Priorities.
O'Mara, M.P. (2005). Cities of knowledge. Princeton: Princeton University Press.
O'Shea, R.P., Allen, T.J., Chevalier, A. & Roche, F. (2005). Entrepreneurial orientation,
technology transfer and spinoff performance of U.S. universities. Research Policy, 34,
994-1009. Retrieved from http://dx.doi.org/10.1016/j.respol.2005.05.011
Patent Board. (2009). University Leaders in Innovation.
Payne, D. (2009). Emory endowment update. Emory Report.
Powers, J. (2004). R&D Funding Sources and University Technology Transfer: What Is
Stimulating Universities to Be More Entrepreneurial? Research in Higher Education, 45,
1-23. doi:10.1023/B:RIHE.0000010044.41663.a0
Rahm, D., Kirkland, J. & Bozeman, B. (2000). University-industry R&D collaboration in the
United States, the United Kingdom, and Japan. The Netherlands: Kluwer Academic
Publishers.
Reed, M.E. (2009). Educating the urban New South: Atlanta and the rise of Georgia State
University, 1913-1969. Macon: Mercer University Press.
Rivard, R. (2013). Merging Into Controversy. Inside Higher Education.
41
Roberts, E.B. (1991). Entrepreneurs in high technology: Lessons from MIT and beyond. New
York: Oxford University Press.
Shane, S. (2004). Academic entrepreneurship: University spinoffs and wealth creation.
Cheltenham: Edward Elgar.
Slaughter, S., & Rhoades, R. (2004). Academic capitalism in the New Economy. Baltimore, Md.:
The Johns Hopkins University Press.
Stephan, P.E. (2012). How economics shapes science. Cambridge: Harvard University Press.
Stuart, J. (2011). Georgia Research Alliance Funding Cut by 75% in Proposed Budget [Online].
Retrieved from http://www.gpb.org/news/2011/01/28/research-alliance-funding-cut-by-
75-in-proposed-budget.
Tahvanainen, A. J. (2004). Growth inhibitors of entrepreneurial academic spin-offs: The case of
Finnish biotechnology. International Journal of Innovation and Technology
Management, 1, 455-475. Retrieved from http://dx.doi.org/10.1142/S0219877004000283
U.S. Department of Education. (2015). Finance for non-degree-granting public institutions using
GASB Reporting Standards [Online]. Retrieved from
https://surveys.nces.ed.gov/Ipeds/VisForms.aspx?survey=5&form=85&index=14&ri=0&
show=all&instid=495.
Weerts, D.J., & Ronca, J.M. (2012). Understanding differences in state support for higher
education across states, sectors, and institutions: A longitudinal study. The Journal of
Higher Education, 83, 2, 155-185.
Youtie, J. & Shapira, P. (2008). Building and Innovation Hub: A Case Study of the
Transformation of University Roles in Regional Technological and Economic
Development. Research Policy, 37, 1188-1204. Retrieved from http://dx.doi.org/1
42
0.1016/j.respol.2008.04.012
Zucker, L.G., Darby, M.R. & Peng, Y. (1998). Fundamentals of population dynamics and the
geographic distribution of U.S. biotechnology enterprises, 1976-1989. Cambridge:
NBER.
Zumeta, W. (2010). The Great Recession: Implications for higher education. The NEA 2010
Almanac of Higher Education.