Stock Index Futures Prices and the Asian Financial Crisis*
23
Stock Index Futures Prices and the Asian Financial Crisis n TAUFIQ HASSAN w , SHAMSHER MOHAMAD, MOHAMAD ARIFF ¼ AND ANNUAR MD NASSIR w w Department of Accounting and Finance, Universiti Putra Malaysia, Malaysia, ¼ Monash University, Australia ABSTRACT This study reports new findings on the behavior of index futures (FKLI: code name of Kuala Lumpur Index Futures contract) prices and also records the effect of a major financial crisis on the prices. Since the inception of trading in 1995, the FKLI has been selling at a discount, which gradually increased till early 1997; further, at the onset of the financial crisis in July 1997, FKLI prices were at a high premium relative to its theoretical values. This significant mispricing of the contract declined after the initial overreaction to the crisis. Herding behavior during crisis, liquidity constraint and imposition of trading restrictions are some plausible explanations for the mispricing. This study also investigates whether trades by foreign investors had any impact when compared with prices by domestic investors. We find that foreign investors had a negative influence on permanent price changes while the domestic investors had a positive effect. I. INTRODUCTION TO LITERATURE AND RESEARCH ISSUES Academics and practitioners have studied the pricing of futures contract and relative to their underlying spot values in few of the 58 futures exchanges as a legitimate inquiry: this is a paper on that vintage. Because major markets had not experienced a significant financial crisis such as the one included in this study, the pricing behavior of the Malaysia’s index futures during the pre- and the post-crisis periods is also unknown. We therefore add unique new findings as to how a less liquid market responds to a major financial crisis: we refer to the Asian Financial Crisis in July 1997 as the crisis in this study. MacKinlay and Ramaswamy (1987), Merrick (1987), Modest, M. and Sundaresan, M. (1983), Chung (1991), Cornell and French (1983) and Brenner, Subrahmanyam and Uno (1989) all document significant and sustained deviations between the stock index futures market prices and their theoretical values. Based on these n The authors wish to thank the reviewer (s) of the International Review of Finance for selecting this paper at the FMA-AFA Conference 2005 to be invited to be submitted for consideration by the Journal. For errors, the authors take full responsibility. r 2007 The Authors. Journal compilation r International Review of Finance Ltd. 2007. Published by Blackwell Publishing Ltd., 9600 Garsington Road, Oxford OX4 2DQ, UK and 350 Main Street, Malden, MA 02148, USA. International Review of Finance, 7:3–4, 2007: pp. 119–141
Transcript of Stock Index Futures Prices and the Asian Financial Crisis*

Stock Index Futures Prices and theAsian Financial Crisisn
TAUFIQ HASSANw, SHAMSHER MOHAMAD, MOHAMAD ARIFF
¼AND
ANNUAR MD NASSIRw
wDepartment of Accounting and Finance, Universiti Putra Malaysia, Malaysia,¼Monash University, Australia
ABSTRACT
This study reports new findings on the behavior of index futures (FKLI: codename of Kuala Lumpur Index Futures contract) prices and also records theeffect of a major financial crisis on the prices. Since the inception of tradingin 1995, the FKLI has been selling at a discount, which gradually increasedtill early 1997; further, at the onset of the financial crisis in July 1997, FKLIprices were at a high premium relative to its theoretical values. Thissignificant mispricing of the contract declined after the initial overreactionto the crisis. Herding behavior during crisis, liquidity constraint andimposition of trading restrictions are some plausible explanations for themispricing. This study also investigates whether trades by foreign investorshad any impact when compared with prices by domestic investors. We findthat foreign investors had a negative influence on permanent price changeswhile the domestic investors had a positive effect.
I. INTRODUCTION TO LITERATURE AND RESEARCH ISSUES
Academics and practitioners have studied the pricing of futures contract andrelative to their underlying spot values in few of the 58 futures exchanges as alegitimate inquiry: this is a paper on that vintage. Because major markets hadnot experienced a significant financial crisis such as the one included in thisstudy, the pricing behavior of the Malaysia’s index futures during the pre- andthe post-crisis periods is also unknown. We therefore add unique new findingsas to how a less liquid market responds to a major financial crisis: we refer to theAsian Financial Crisis in July 1997 as the crisis in this study. MacKinlay andRamaswamy (1987), Merrick (1987), Modest, M. and Sundaresan, M. (1983),Chung (1991), Cornell and French (1983) and Brenner, Subrahmanyam andUno (1989) all document significant and sustained deviations between thestock index futures market prices and their theoretical values. Based on these
n The authors wish to thank the reviewer (s) of the International Review of Finance for selectingthis paper at the FMA-AFA Conference 2005 to be invited to be submitted for consideration by theJournal. For errors, the authors take full responsibility.
r 2007 The Authors. Journal compilation r International Review of Finance Ltd. 2007. Published by BlackwellPublishing Ltd., 9600 Garsington Road, Oxford OX4 2DQ, UK and 350 Main Street, Malden, MA 02148, USA.
International Review of Finance, 7:3–4, 2007: pp. 119–141

findings, Merrick (1989) and Finnerty and Park (1988) demonstrated theprofitability of arbitrage-related program-trading strategies.1
Brenner and Subrahmanyam (1989) is a study on Japan’s Nikkei Index futurescontracts traded on the Singapore Exchange (SGX). While this and other worksare of great interest to gain a better understanding of index futures contractpricing behavior, there is also a need to externally validate observed behaviorwith what happens in emerging markets such as the one in Kuala Lumpur,which is the modest aim of this paper.
The KLCI stock index futures contract, FKLI, in Malaysia was introduced onDecember 15, 1995 on the Option and Financial Futures Exchange (KLOFFE),which was later renamed the MDEX (Malaysian Derivative Exchange). Thisfutures contract is based on 100 shares traded on the floor of the Kuala-Lumpurstock exchange, which was renamed the Bursa Malaysia.
Malaysia is one of the first countries in the East Asian region to introducestock index futures contract. Soon after its introduction, futures contractactivities slowed down, which obviously affected the pricing behavior of thenewly introduced futures contract. Malaysia, when faced with the AsianFinancial Crisis in July 1997, imposed capital control regulations because thefinancial crisis was then destabilizing the economy. Finally, the stock indexfutures contact was dominated by foreign investors (almost 60% of total tradingwas by foreigners) during the pre-crisis period. After the capital controls wereintroduced, foreign participation declined to only 15% of the total trading.Therefore, the results of this study on (a) the behavior of index futures prices ingeneral, (b) the prices during the financial crisis, and (c) the role of the foreigntraders will provide comparative findings adding to the literature to enablecomparisons with an emerging market behavior with what we know of theJapanese, US, UK, and perhaps other developed markets.
The rest of the paper is organized as follows: Section II provides a briefdiscussion of the stock index futures contract and the financial crisis. Section IIIintroduces the commonly used theoretical pricing model of stock index futurescontract by including transaction costs. Section IV provides a description of thedata and the trading structure of stock index futures contract. Section Vprovides the empirical results and the paper concludes as Section VI.
II. STOCK INDEX FUTURES PRICES AND THE FINANCIAL CRISIS
The role derivatives play during financial market meltdowns is still not clearlyunderstood, and hence there is no clear theory to guide this research. The Bradyreport blamed trading in stock index futures for the October 1987 stock marketcrash.2 The report explained that portfolio insurers tried to cover their equity
1 However, Saunders and Mahajan (1988) express an alternative approach, and concluded that
stock index futures are priced efficiently.
2 See ‘Report of the Presidential Task Force on Market Mechanisms,’ January 1988.
International Review of Finance
r 2007 The AuthorsJournal compilation r International Review of Finance Ltd. 2007120

risk exposure by mechanical price-sensitive selling of the stock market indexfuture stocks. As a result, futures prices headed downward and created hugearbitrage opportunities, which are termed reverse cash and carry strategy (buyfutures and sell underlying stocks). The consequence of this trading is the eventof the October 1987 stock market crash.
But the 1997–1998 Asian financial crisis is not exactly similar to the October1987 Black Monday. There are some similarities and differences in pricingbehavior between these two crises. One of the most important differences is therole of foreign investors. Kim and Wei (1999), Park and Song (1999) and Radeletand Sachs (1998) described the Asian crisis by looking at the role of foreigninvestors. For example, Radelet and Sachs put financial panic as the main causeof the Asian crisis. They agreed that the sudden and large pullout of cash flowsby foreign investors first by Japan in the face of the Kobe earthquake in October1996, and then the pulling out of the portfolio flows exacerbated the crisis bycreating a financial panic. This, combined with policy mistakes by Asiangovernments and the International Monetary Fund, bloomed into a majorcrisis, which is blamed for the slow recoveries of many economies in the region.
As a result, like many other Asian markets, the Bursa Malaysia experiencedtumultuous times during the last quarter of 1997. As the crisis affected theeconomy, the Bursa experienced its most severe crash in its history. Over a spanof four consecutive months, from September to December 1997, the marketindex lost 40% of its value. At the same time, it was observed that the volume offutures contract started to increase dramatically from the third quarter of 1997,3 months after the onset of the crisis.
In September 1998, the market index reached its lowest level of 262 pointswhereas the FKLI contract trading reached its peak, scoring on average 10,000contracts per day. Unlike the other Asian markets, the Malaysian market faceddifferent policy regimes during the crisis period. In September 1998, thegovernment imposed capital controls mostly on portfolio and FDI flows and italso fixed the exchange rate: the fixed rate is being slowly de-fixed starting inJuly 2005. These policy changes stabilized the cash market and the trading offutures contract started to decline to the pre-crisis level. Table 1 summarizes themeans and standard deviations of volume and open interest of stock indexfutures contract, before and after the crisis. There was a 15-fold increase in thevolatility of the open interest and the volume increased 12-fold during theperiod of the crisis.
Another important aspect that makes this study unique is the dominance offoreign investors in the KLCI futures market. Since the introduction of futurescontract, almost 60% of the trading was dominated by foreign institutionswhereas after the capital control regulation foreign participation declinedsignificantly. Figure 1 shows the foreign and domestic participation ratio.Foreign participation declined after the crisis, naturally due to the capitalcontrols rule, while the domestic traders reaped huge profits via arbitrageactions. Therefore, the important research issue of interest is how an adverseeconomic condition affects the relatively young futures contract’s price
Stock Index Futures Prices and the Asian Financial Crisis
r 2007 The AuthorsJournal compilation r International Review of Finance Ltd. 2007 121

behavior, which we do by documenting the possible role of foreign anddomestic participation in the pricing behavior of futures contracts.
It is evident from the two plots in Figure 1 that the potential for the pricereaction to become volatile is in fact the frequent changes in the regulatoryenvironment of the markets.
III. PRICING OF STOCK INDEX FUTURES CONTRACT
The underlying argument for the valuation of derivatives exploits theavailability of a replicating portfolio of existing assets whose value coincideswith the price of the derivative security at its expiration dates. The availability ofa perfect substitute for the derivative in frictionless markets guarantees that a
Table 1 Descriptive statistics of volume and open interest for stock index futures
Period Year Volume Open Interest
Mean Standard Mean Standard
Before crisis 1996 240.4 153.0 1389.6 543.2Before crisis 1997n 668.9 386.2 2720.7 702.7During crisis 1997nn 2007.8 966.3 8644.5 2217.4After crisis 1998 2496.2 1686.1 13963.6 9305.4After crisis 1999 1398.1 836.6 3613.4 1058.4After Crisis 2000 1504 623.7 3230 433.10After Crisis 2001 1183 517.54 2489 364.9
Sources: Daily Dairy published by Bursa Malaysia.nFrom January 97 to July 97.nnFrom August 97 to December 97.
0.00%
10.00%
20.00%
30.00%
40.00%
50.00%
60.00%
70.00%
80.00%
90.00%
100.00%
Aug-9
6
Nov-9
6
Feb-
97
May
-97
Aug-9
7
Nov-9
7
Feb-
98
May
-98
Aug-9
8
Nov-9
8
Feb-
99
May
-99
Aug-9
9
Nov-9
9
Feb-
00
May
-00
Aug-0
0
Nov-0
0
Foreign Investor
Local Investor
Source: Malaysian Derivative Exchange (MDEX)
Figure 1 Participation of foreign and domestic investors in stock index futuresmarket.
International Review of Finance
r 2007 The AuthorsJournal compilation r International Review of Finance Ltd. 2007122

profit opportunity, if available, would attract arbitrageurs who would quicklyclose the gap between the price of the derivative and of its substitutes.Therefore, if the price of derivative assets equals the price of the replicatingportfolio, then the derivative asset will be a perfect substitution of replicatingportfolio.
Applying this simple principle, it can be shown that the theoretical price of afutures contract is related to the underlying asset’s spot price plus the cost ofcarrying the spot between the current date and expiration date of the futurescontract. The carrying cost for stock index futures contract is the differencebetween the interest costs and the dividend received. Assume initially thatcapital markets are perfect and frictionless with zero transaction costs, taxes orinformation asymmetries. Following Cornell and French (1983), and Figlewski(1984), the theoretically fair price at t of a futures contract with maturity dateT is:
PFair ¼ Pcð1þ iÞðT�tÞ=365 �D ð1Þ
where PFAIR is the fair futures price for a stock index futures contract using thetheory, PC the current value of the underlying cash stock index, i the financingrate of interest or equivalent investment return, D the Ringgit dividend amountin index points received on the stock in the index from now until theexpiration of the futures contracts and T� t the number of days until expirationof the futures divided by 365.
Equation (1) shows both the relationship between the futures and currentcash values and the net difference between the financing (or opportunity) costsand the income received. The Ringgit dividend D must be recalculatedwhenever a stock in the index pays its dividend or a firm alters its dividend.The model shows that the role of dividends over the life of the futures contractis to lower the futures price. The relationship occurs because (a) the dividendreceived reduces the net funds needed to finance the cash position and (b) apurchase of the futures contract is an alternative to holding the cash stocks, buta long position in futures does not provide any income from dividendpayments.
The continuous time equivalent to the above cost of the carry equation isused frequently, because only the dividend yield rather than the frequency ofchanging of total Ringgit dividends is needed for its calculation:
PFAIR ¼ PCeðr�dÞðT�tÞ=365 ð2Þ
where d is the dividend yield on the stock index.If one has only the dividend yield, then an alternative to using equation (2) is
to convert the yield into Ringgit dividends, as shown in equation (3):
D ¼ dPCt: ð3Þ
Note that equation (2) provides a more accurate calculation of the effects ofdividends and is therefore used in many of the arbitrage computer models. Bothequations (1) and (2) illustrate the relationship between the futures and current
Stock Index Futures Prices and the Asian Financial Crisis
r 2007 The AuthorsJournal compilation r International Review of Finance Ltd. 2007 123

cash index values and the net difference between the financing costs and thedividend income received. In particular, the larger the difference between i andd, the larger the price difference between PFAIR and PC. In addition, the largerthe value of t, the larger the price difference between the futures and cash indexvalues.
The extent of mispricing is determined by using the cost of carry model tocompute the fair or theoretical value. Mispricing Mt is determined as:
Mt ¼ ðPF � PFAIRÞ=PFAIR:
In logarithmic form:
Mt ¼ InðPF=PFAIRÞwhere Mt is the percentage premium or mispricing of the FKLI price over fairvalue, PF the FKLI price, and PFAIR the FKLI fair value as implied from the KLSECI price.
The existence of transaction costs creates an upper and a lower boundproblem around the fair value of the futures price. This area around the fairvalue of the futures contract is the ‘no-arbitrage band.’ Mispricing that fallswithin this band is not arbitragable. Mathematically, the no-arbitrage band isgiven as follows:
Fþt ¼ Pcð1þ CþÞð1þ r � dÞt;T ð4Þ
F�t ¼ Pcð1þ C�Þð1þ r � dÞt;T ð5Þwhere Ft
1 is the theoretical futures price adjusted for the transaction cost of thecash and carry strategy, Ft
� the theoretical futures price adjusted for thetransaction cost of the reverse cash and carry strategy, C1 the transaction cost ofthe cash and carry, and C� the transaction cost of the reverse cash and carry.
Using these bounds, mispricing inclusive of transaction cost is determinedas:
Mt ¼PF � Fþt
Fþtif PF > Fþt
¼ 0 if F�t < PF < Fþt
¼PF � FþtF�t
if PF > F�t :
Therefore, when the actual stock index futures price differs from the cost ofcarryforward price by more than transactions costs, arbitrage opportunity iscreated. Equation (1) can be expressed to include transactions costs to definethe arbitrage opportunities for stock index futures:
PCð1þ iÞt �Dþ T < PF < PCð1þ iÞt �D� T ð6Þor more compactly as:
PFAIR þ T < PF < PFAIR T ; ð7Þwith T being the total transactions costs.
International Review of Finance
r 2007 The AuthorsJournal compilation r International Review of Finance Ltd. 2007124

IV. DATA AND TRADING STRUCTURE
Data for the KLCI index and KLCI index futures contracts are used in the study.The KLCI index consists of 100 stocks traded on the main board of the KualaLumpur stock exchange and KLCI represents more than 50% of the marketcapitalization of the main boards.3 The KLCI index is a capitalization-weightedindex, which means that the index is weighted to the market capitalization ofthe constituent stocks.
Although KLOFFE and COMMEX merged as MDEX (Malaysian DerivativeExchange) in 2001, the study period coincided with the KLOFFE’s tradingstructure. In essence, KLOFFE was an electronic exchange operating on a fullyautomated trading system known as ‘KATS’ (KLOFFE automated tradingsystem). Under this system, contracts can take place at any futures brokersoffice anywhere in the country and execution takes place almost instanta-neously once a match is found. There is a small time lag between a customerorder and execution of the order.
FKLI contract trading begins 15 min before the stock market opens, that is,08.45 hours Malaysian time and closes 15 min after the market closes in eachsession: that is 17.15 hours Malaysian time. The extra 15 min is to enableinvestors to hedge out whatever position that may have resulted from the day’strading and also over the early 15 min (opening time), which provides theopportunity to the investors who wish to adopt a pre-emptive position beforethe stock market opens. The index futures contract trades for 5 days a week. Thecontract has four maturity periods – such as the spot month and the nextmonth contract and the next two calendar quarterly months. However, indexfutures contract is considered to be an emerging market futures contract and itis thinly traded, with an average of only two contracts per day (spot and next-month contract only).
In terms of dividend payment patterns, most companies pay dividendsaround two periods – March and September. As most companies have Decemberas their fiscal year end, the declared final dividend gets paid typically in March.An interim dividend, which is announced in the middle of the fiscal year June,usually gets paid in September. As such, some contract months such as Marchcontract could see futures price lower than spot prices on several trading days.
Tracking error is an important factor in arbitrage transaction. There are twooptions for arbitrage transaction: either participants will choose a set of stocksthat are closely related to index movement or they will choose all 100 stocks inthe index. If participants choose the second option, then the transaction costand other trading cost will increase but there is no problem of tracking error.When only a subset of stocks (usually the more liquid) is chosen, then
3 Total market capitalization of main board during 1996–2001 was RM806.8 billion, RM375.8
billion, RM374.5, RM 552.1 billion, RM444.35 billion, and RM 465 billion, respectively. In the
same time period, the CI index capitalizations were RM 470 billion, RM187 billion, RM189
billion, RM280 billion, RM245 billion and RM265 billion, respectively.
Stock Index Futures Prices and the Asian Financial Crisis
r 2007 The AuthorsJournal compilation r International Review of Finance Ltd. 2007 125

execution risk and transaction costs are smaller but there is a high risk of nottracking the index perfectly. Hence, the arbitrageur should trade betweentracking error, execution risk, and transaction costs while carrying out arbitragetrading. In the case of the value-weighted index, it is slightly easier to track thestocks than that of the price-weighted index. In this study, the effect of trackingerror on arbitrage activity is not taken into consideration.
Domestic institutional investors were not allowed in index futures market;therefore, the transaction cost calculated is for the brokerage firm only.4 Thetransaction cost per RM 100,000 position established in futures is 0.16%,whereas for the cash market the transaction cost per RM 100,000 position is0.943%, which translates into a total arbitrage costs of 1.103%. The calculationsare as follows (approximately)5:
Brokerage Commission in futures RM 60Exchange trading fee RM 10Clearing house fee RM 10
Others (market impact) Bid-ask RM 80Total RM160Total (Percent Per RM 100,000) 0.16%
Brokerage Commission (stock market) RM700Stamp duty RM100Clearing fee RM40Others (market Impact) RM100Registration Fees RM3Total RM943Total (Percent per RM 100,000) 0.943%Total Arbitrage Cost 5 0.943% 1 0.16% 5 1.103%
MDEX was planning in 2005 to permit institutional investors to trade indexfutures, in which case the transaction cost will be higher than that of retail andother non-institutional investors.
Up to two futures contracts may trade on a particular trading day. The mostfrequently traded contract is the spot market contract, for which the maximummaturity is one month. These contracts are used by traders when theyarbitrage.6 The sample period is from January 1996 to December 2001. A totalof 72 different contracts (maximum trading periods are two months) are tradedover the 1487 trading days of the sample periods. Table 2 shows a summary on
4 Even though foreign institutions are permitted to trade in KLCI futures contract, they trade as
brokerage firms in MDEX and not as institutions.
5 Transaction costs are changing over time. This is an approximate calculation. Small differences
might not affect the results.
6 The volume of the next-month contract is much lower than that of the spot-month contract.
However, 1 week before the expiration of spot month contract, next-month contract is traded
heavily. This implies that investors switched from spot-month contract to next-month contract
one week before the expiration of spot-month contract.
International Review of Finance
r 2007 The AuthorsJournal compilation r International Review of Finance Ltd. 2007126
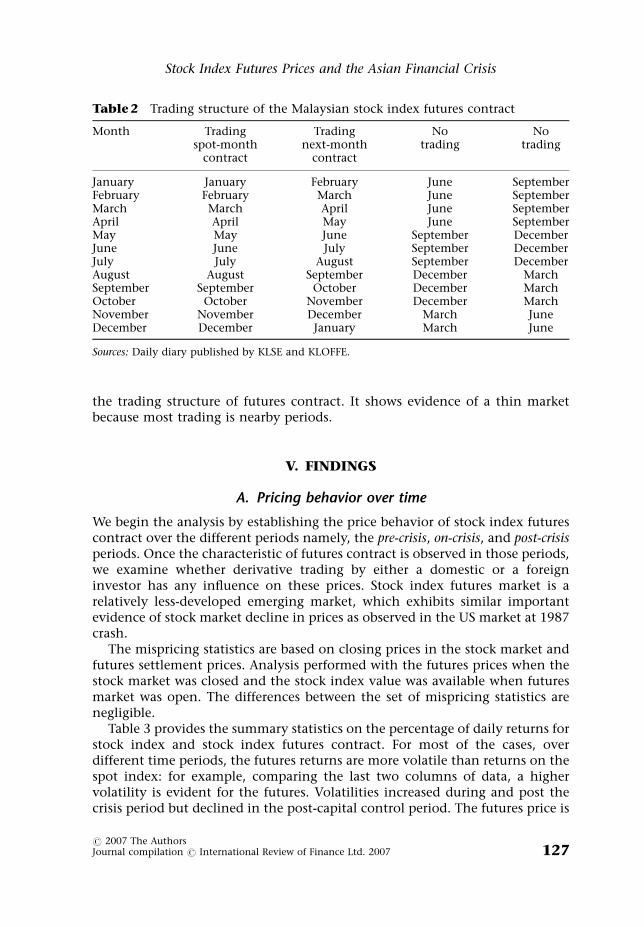
the trading structure of futures contract. It shows evidence of a thin marketbecause most trading is nearby periods.
V. FINDINGS
A. Pricing behavior over time
We begin the analysis by establishing the price behavior of stock index futurescontract over the different periods namely, the pre-crisis, on-crisis, and post-crisisperiods. Once the characteristic of futures contract is observed in those periods,we examine whether derivative trading by either a domestic or a foreigninvestor has any influence on these prices. Stock index futures market is arelatively less-developed emerging market, which exhibits similar importantevidence of stock market decline in prices as observed in the US market at 1987crash.
The mispricing statistics are based on closing prices in the stock market andfutures settlement prices. Analysis performed with the futures prices when thestock market was closed and the stock index value was available when futuresmarket was open. The differences between the set of mispricing statistics arenegligible.
Table 3 provides the summary statistics on the percentage of daily returns forstock index and stock index futures contract. For most of the cases, overdifferent time periods, the futures returns are more volatile than returns on thespot index: for example, comparing the last two columns of data, a highervolatility is evident for the futures. Volatilities increased during and post thecrisis period but declined in the post-capital control period. The futures price is
Table 2 Trading structure of the Malaysian stock index futures contract
Month Tradingspot-month
contract
Tradingnext-month
contract
Notrading
Notrading
January January February June SeptemberFebruary February March June SeptemberMarch March April June SeptemberApril April May June SeptemberMay May June September DecemberJune June July September DecemberJuly July August September DecemberAugust August September December MarchSeptember September October December MarchOctober October November December MarchNovember November December March JuneDecember December January March June
Sources: Daily diary published by KLSE and KLOFFE.
Stock Index Futures Prices and the Asian Financial Crisis
r 2007 The AuthorsJournal compilation r International Review of Finance Ltd. 2007 127

more volatile than the spot index values, a phenomenon also documented inthe US and other developed markets (Brenner et al. 1989).
The most important and intriguing information in this study is the deviationof futures contract pricing from fair or theory-suggested price over the differenteconomic periods. These deviations from 1996 to 2001 are presented in Table 4.First, stable negative mispricing can be observed since 1996 until the middle of1997: this is the period from the advent of the market to the start of thefinancial crisis. Such a negative mispricing phenomenon has also beendocumented in the US and other developed markets, and hence is normal inthe learning period. But in the developed markets, the mispricing was decliningover time as the market gained experience; and the pricing was insignificantlydifferent from the theoretical price for about 2 years. Second, the negativemispricing increased sharply in the middle of 1997, which was the startingpoint of a financial crisis in the region. Third, a very high positive mispricingoccurred as can be observed after the introduction of capital controlregulations.
Two years after the introduction of the regulation, the positive mispricingdeclined slowly and then became negative, the same as the behavior before thecrisis.
Figures 2–6 show the behavior of mispricing and the effect of crisis andcapital controls on the pricing behavior of contracts. Of the 72 values over thesix years of trading, it is evident that 66 contracts had mispricing. The t-valuesshown in brackets in the table verify these significant deviations.
Table 3 Descriptive statistic (mean, maximum, minimum and standard deviation)of spot and futures return for the period January 1996 to December 2001
Mean Maximum Minimum Standarddeviation
Stock Futures Stock Futures Stock Futures Stock Futures
1996 0.0881 0.0651 2.71 2.97 �3.12 �3.95 0.808 0.8641997 (Pre-crisis) �0.115 �0.129 2.47 2.62 �3.27 �4.28 0.976 1.081997 (During crisis) �0.551 �0.499 12.37 15.41 �11.08 � 11.83 3.17 4.001998 (Pre capital
control)�0.300 �0.254 23.14 19.84 �7.68 �9.44 2.97 3.41
1998 (Post capitalcontrol)
0.761 0.760 22.45 36.43 �21.45 � 37.99 4.98 7.26
1999 0.165 0.098 6.03 8.38 �5.85 �7.23 1.72 2.342000 �0.046 �0.096 4.23 5.12 �6.04 �7.41 1.38 1.582001 �0.018 �0.35 4.61 4.28 �6.15 �0.570 1.28 1.41
Notes: We calculate the futures return based on the two-month trading periods of the contracts.This is because the maximum trading period of a contract in MDEX is two month. Howeverexpiration month trading is much heavier than non-expiration month trading (spot monthcontract). Therefore if only spot month futures price are taken into consideration then returnmight be change slightly.
International Review of Finance
r 2007 The AuthorsJournal compilation r International Review of Finance Ltd. 2007128

Table 4 Summary statistic of mispricing based on the ‘cost of carry’ modelwithout transaction cost
Contract 1996 1997 1998 1999 2000 2001
January 0.219 �0.031 �0.702 3.96 1.33 0.681(3.24)n (�0.393) (�2.41)n (11.98)n (5.18)n (3.25)n
February 0.414 �0.065 �1.10 3.41 1.73 � 0.156(5.68)n (�0.967) (�4.88)n (7.45)n (6.23)n (� 1.59)
March 0.288 0.019 �0.758 1.26 1.05 � 0.377(3.01)n (0.301) (�3.85)n (3.85)n (7.05)n (� 3.97)n
April �0.189 �0.298 �1.68 1.10 0.591 � 0.770(�2.78)n (�3.87)n (�5.75)n (4.58)n (2.88)n (� 5.42)n
May �0.318 �0.943 �3.25 2.62 0.417 � 0.501(�5.78)n (�10.9)n (�9.96)n (8.24)n (2.59)n (3.12)n
June �0.560 �0.636 �2.69 2.20 0.598 � 0.350(�7.46)n (�4.60)n (�6.84)n (6.65)n (3.72)n (� 2.74)n
July �0.717 �0.459 �1.18 2.91 0.200 � 0.159(�11.62)n (�3.87)n (�4.70)n (9.52)n (1.34) (� 1.24)
August �0.812 �0.828 �0.467 2.96 0.364 0.696(�11.16)n (�5.35)n (�2.30)n (7.33)n (3.92)n (5.33)n
September �0.827 �2.57 1.36 1.86 0.469 0.995(�8.48)n (�6.28)n (2.30)n (6.97)n (4.91)n (6.18)n
October �0.290 �3.458 2.91 1.45 -0.045 0.136(�3.04)n (�10.4)n (5.53)n (6.80)n (�0.316) (0.841)
November 0.165 �2.201 2.84 1.80 0.305 0.266(2.92)n (�6.71)n (9.61)n (12.66)n (1.98)nn (2.41)n
December 0.258 �0.815 2.95 2.241 1.35 1.08(2.72)n (�2.66)n (12.13)n (12.88)n (12.66)n (9.32)n
Notes: The theoretical futures price is given by PFAIR 5 PC exp (ri) – Divt. There are 12 contracts inparticular year and 72 contracts in total. In bracket t-test are presented. Bold, italic values indicatea financial crisis period. Bold, roman values indicate a capital control period (capital controlregulation introduced in September 1998).n1% level of significance. nn5% level of significance.
Mispricing of all contract in 1996 and 1997
−10.00
−8.00
−6.00
−4.00
−2.00
0.00
2.00
4.00
Before Crisis from 1996-July 1997
After the Crisis Premium
Discount
Figure2 Time series of deviation (premiums and discount) of the actual settlementprice in relation to the theoretical futures price in 1996 and 1997 (transaction costs are
ignored in this calculation).
Stock Index Futures Prices and the Asian Financial Crisis
r 2007 The AuthorsJournal compilation r International Review of Finance Ltd. 2007 129

Table 5 provides a test of the mean differences between the theory andmarket prices across different economic periods.
As can be verified, the differences were statistically significant across thedifferent economic periods. The averages across the post-crisis periods are
Mispricing of all contracts in 1998 and 1999
−10.00
−5.00
0.00
5.00
10.00
15.00
20.00
Before CapitalControl
After Capital Control
Discount
Premium
Figure3 Time series of deviation (premiums and discount) of the actual settlementprice in relation to the theoretical futures price in 1998 and 1999 (transaction costs are
ignored in this calculation). Notes: Mispricing is the percentage deviation of thesettlement price of the futures contract on the Malaysian Derivative Exchange at 5.15
relative to the theoretical futures price based on the closing stock prices at 5.00Malaysian time. The theoretical price is given by PFAIR 5 PC exp(ri) – Divt. Transaction
costs are ignored in the calculation. Premium will exist when fair price is less thanactual settlement price and Discount will exist when fair price is higher than actual
settlement price.
Mispricing of all contracts in 2000 and 2001
−6.00
−4.00
−2.00
0.00
2.00
4.00
6.00
8.00
Premium
Discount
Figure4 Time series of deviation (premiums and discount) of the actual settlementprice in relation to the theoretical futures price in 2000 and 2001 (transaction costs areignored in this calculation). Notes: Mispricing is the percentage deviation of the settlementprice of the futures contract on the Malaysian Derivative Exchange at 5.15 relative to the
theoretical futures price based on the closing stock prices at 5.00 Malaysian time. Thetheoretical price is given by PFAIR 5 PC exp(ri) – Divt. Transaction costs are ignored in thecalculation. Premium will exist when fair price is less than actual settlement price and
Discount will exist when fair price is higher than actual settlement price.
International Review of Finance
r 2007 The AuthorsJournal compilation r International Review of Finance Ltd. 2007130

positive whereas the averages over pre-crisis are negative. This is somethingnot investigated in any other markets because there were no crises ofthis magnitude as in this case. This reversal of the direction is suspected to bearising from the activities of the foreign investors, who would be dominatingthe market in order to quit from the market as they were slowly exitingthe market following the capital control implementation in stages. The trading
Mispricing of all contracts with transaction cost in 1998 and 1999
−15.00
−10.00
−5.00
0.00
5.00
10.00
15.00
20.00
Before CapitalControl
After Capital Control
Premium
Discount
Figure5 Time series of deviation (premiums and discount) of the actual settlementprice in relation to the theoretical futures price in 1998 and 1999 (Transaction costs are
included in this calculation). Notes: Mispricing is the percentage deviation of thesettlement price of the futures contract on the Malaysian Derivative Exchange at 5.15
relative to the theoretical futures price based on the closing stock prices at 5.00Malaysian time. The theoretical price is given by PFAIR 5 PC exp(ri) – Divt. Transaction
costs are taking into in the calculation.
Mispricing of all contracts with transaction cost in 2000 and 2001
−6.00
−4.00
−2.00
0.00
2.00
4.00
6.00
Premium
Discount
Figure6 Time series of deviation (premiums and discount) of the actual settlementprice in relation to the theoretical futures price in 2000 and 2001 (Transaction costs are
included in this calculation). Notes: Mispricing is the percentage deviation of thesettlement price of the futures contract on the Malaysian Derivative Exchange at 5.15
relative to the theoretical futures price based on the closing stock prices at 5.00Malaysian time. The theoretical price is given by PFAIR 5 PC exp(ri) – Divt. Transaction
costs are taking into in the calculation.
Stock Index Futures Prices and the Asian Financial Crisis
r 2007 The AuthorsJournal compilation r International Review of Finance Ltd. 2007 131

by foreigners declined to 15% compared with a 60% in the pre-crisisperiod.
Table 6 provides information on the negative and positive mispricing. First,there are many deviations. The negative deviations are more common until thecapital control regulation took place. For example, 61% of the negativemispricing can be observed in 1996; however, it increases to 84% during thecrisis. Second, the positive deviations are common and larger than negativedeviation after the capital controls. For example, an 86% positive deviation canbe observed in 1998 and it increases to 87% in 1999. However, positivedeviation was declining in the year 2001. Third, the mean absolute deviation(in percentage) increased after the crisis but declined over time.
In general, after the financial crisis, the stock market was extremely volatileand many legal restrictions were imposed on the capital market, which makesthe arbitrage very risky. This may explain the large negative deviation during afinancial crisis. This implies that during the crisis, portfolio as well as individualinvestors tried to cover the high-risk exposure by selling the stock index futures.This is similar to the pricing behavior of the US market during the October 1987stock market crash. However, the Malaysian government changed the economicpolicy from a floating exchange rate system to a fixed exchange rate system byimposing capital control regulations, which prohibited short selling in the stockmarket. As a result, the stock market stabilized and FKLI started to move up.Therefore, arbitrageurs started to buy the underlying assets and were selling thefutures contracts, which pushed the futures prices down. This may explain alarge positive mispricing at post-capital control periods.
There is a systematic pattern in the size of the mispricing as a function of thetime to maturity. According to the theoretical perspective, mispricing should bezero or at least it should decline at the expiration date. Table 7 indicates thedeclining pattern of average mispricing according to the number of days toexpiration of the futures contract. Similar pricing behavior of futures contractswas observed at an early stage of the US and other developed stock index futuresmarket.
Persistence of the mispricing is also an important characteristic of thestock index futures contract. It indicates the existence of mispricing
Table 5 Mean differences of market versus theory prices across economic periods
Economic Periods Mean Difference T-Value (p-value)
Mispricing during pre-crisis �0.192 11.85n
Mispricing during-crisis �1.456 (0.000)Mispricing during-crisis �1.456 � 25.31n
Mispricing post-crisis 2.44 (0.000)Mispricing pre-crisis �0.192 � 31.69n
Mispricing post-crisis 2.44 (0.000)
Note:n1% level of significance.
International Review of Finance
r 2007 The AuthorsJournal compilation r International Review of Finance Ltd. 2007132

Ta
ble
6M
ean
ab
solu
tep
erce
nta
ge
an
dn
um
ber
of
po
siti
ve
an
dn
egati
ve
mis
pri
cin
gfr
om
1996
to2001
Co
ntr
act
sN
um
ber
of
Ob
serv
ati
on
Part
APart
BM
ean
Ab
solu
tePer
cen
tN
um
ber
of
Mis
pri
cin
gw
ith
ou
ttr
an
sact
ion
cost
Nu
mb
ero
fM
isp
rici
ng
wit
htr
an
sact
ion
cost
Po
siti
ve
Neg
ati
ve
Po
siti
ve
Neg
ati
ve
1996
(all
con
tract
s)n
484
183
(37.8
1%
)301
(61.1
9%
)9
(1.8
6%
)475
(98.1
4%
)0.5
412
1997
(all
con
tract
s)n
496
137
(27.6
2%
)359
(72.3
8%
)18
(3.6
3%
)478
(96.3
7%
)1.3
323
1997
(bef
ore
cris
is)
285
103
(36.1
4%
)182
(63.8
6%
)1
(.410%
)239
(99.3
9%
)0.5
887
1997
(aft
ercr
isis
)212
34
(16.0
4%
)178
(83.9
6%
)15
(5.9
%)
239
(94.1
0%
)2.3
732
1998
(all
con
tract
s)n
492
226
(45.9
3%
)266
(54.0
6%
)135
(27.3
8%
)358
(72.6
1%
)2.1
881
1998
(bef
ore
cap
ital
con
tro
l)n
325
80
(24.7
6%
)243
(75.2
3%
)20
(5.9
7)
315
(94.0
1%
)1.9
153
1998
(aft
erca
pit
al
con
tro
l)n
168
146
(86.9
1%
)22
(13.1
0%
)115
(73.2
5%
)42
(26.7
5%
)2.7
342
1999
(all
con
tract
s)n
495
431
(87.1
0%
)64
(12.9
3%
)332
(67.1
0%
)163
(32.9
2%
)2.3
879
2000
(all
con
tract
s)n
461
349
(75.7
1%
)112
(24.3
0%
)150
(32.5
4%
)311
(67.6
4%
)1.0
171
2001
(all
con
tract
s)n
484
230
(47.5
2%
)254
(52.4
8%
)101
(20.9
1%
)382
(79.1
0%
)0.8
339
Not
e:nT
wel
ve
con
tract
sin
ever
yyea
ran
dev
ery
con
trac
tare
trad
edfo
rtw
om
on
ths.
Stock Index Futures Prices and the Asian Financial Crisis
r 2007 The AuthorsJournal compilation r International Review of Finance Ltd. 2007 133

on the market over the many days. The longer the existence of mispricing in themarket, the higher the inefficiency of the arbitrageurs. Table 8 measuresthe persistence of mispricing with the autocorrelation function betweenlagged values of mispricing.7 The first-order (lag 1) autocorrelation is high forall contracts for all the years, but it was the highest in 1996 (0.820) andthe lowest in 2000 (0.710). The autocorrelation coefficient declines substan-tially by the eight lags but does not completely disappear. It indicates that themispricing always existed. Liquidity constraints as well as high transactioncosts in the underlying market are common phenomena in the emergingfutures market. Therefore, when arbitrage opportunities develop inany direction, liquidity constraints, tracking problem, and transaction costmay prevent arbitrageurs from completing the arbitrage activities within a fewdays.
In the mispricing calculation, the transaction costs are not taken intoconsideration. The execution of arbitrage trading in practice involves transac-tions cost, an important input in deciding the arbitrage strategies. In Section III,the transaction costs are estimated to be approximately 1.1% of the index valueto execute the arbitrage. The results of mispricing of futures contract withtransaction cost are reported in Appendix A. The findings indicate thatinclusion of transaction costs does not remove the positive mispricingafter the capital control regime. Table A1 (in Appendix A) shows thattransaction costs increase the level of negative mispricing during the pre-crisisand crisis periods and change the number of mispricings, which is reported in
Table 7 Average mispricing and days to expiration of the contracts
AverageMispricing
(4 60 days)
AverageMispricing
(4 30 days)
AverageMispricing
(4 15 days)
AverageMispricing(4 5 days)
1996 (whole year) �0.2193 �0.2209 �0.2137 � 0.19791997 (whole year) �1.044 �0.8377 �0.5955 � 0.40051997 (before crisis) �0.3489 �0.4148 �0.2444 � 0.18271997 (after crisis) �1.977 �1.6486 �1.0858 � 0.71751998 (whole year) �0.1043 0.1186 �0.0253 � 0.07151998 (before capital control) �1.461 �1.1138 �0.7905 � 0.44251998 (after capital control) 2.509 2.4530 1.4712 0.61211999 (whole year) 2.277 1.3843 0.8377 0.16292000 0.6065 0.3372 0.2396 0.051032001 0.1156 �0.4990 �0.0909 � 0.0662
Notes: We take the average mispricing of all individual contract of the year (12 contracts a year).we take the average mispricing of all individual contract of the year (12 contracts a year).
7 We took the average mispricing of all contracts in each year. We also calculated the
autocorrelation coefficient of every individual contract (12 contracts a year and 72 contracts
over the six-year period). The results on the individual contracts are similar to that reported in
the paper.
International Review of Finance
r 2007 The AuthorsJournal compilation r International Review of Finance Ltd. 2007134

Ta
ble
8Per
sist
ence
of
mis
pri
cin
gfr
om
1996–2
001
(Au
toco
rrel
ati
on
)n
Lag
1996
1997
1998
1999
2000
2001
AC
Q-S
tat
AC
Q-S
tat
AC
Q-S
tat
AC
Q-S
tat
AC
Q-S
tat
AC
Q-S
tat
10.8
18
326.3
0.7
13
252.3
80.7
21
257.0
40.7
98
317.6
90.7
12
235.2
40.7
36
264.1
52
0.7
62
610.5
0.6
02
432.8
10.6
93
494.8
40.6
77
546.7
30.5
44
373.0
60.6
01
440.2
33
0.6
81
837.8
0.6
03
614.1
80.5
97
671.6
30.5
62
704.7
10.3
83
441.3
20.5
10
567.5
94
0.6
32
1034
0.5
33
756.2
10.5
62
828.4
10.4
59
810.3
90.2
91
480.9
70.4
34
660.0
65
0.5
65
1190
0.4
67
865.5
00.5
27
966.8
30.3
76
881.5
10.2
59
512.2
70.4
12
743.5
66
0.5
34
1331
0.4
53
968.5
90.4
67
1075.9
0.2
91
924.1
70.2
38
538.7
80.3
85
816.3
57
0.5
29
1469
0.4
05
1051.2
0.4
82
1192.1
0.2
17
947.9
90.2
52
568.7
40.3
68
883.0
18
0.5
04
1595
0.3
91
1128.4
0.4
81
1307.9
0.1
58
960.6
00.2
82
606.2
60.3
23
934.4
19
0.4
69
1704
0.4
17
1216.2
0.4
73
1420.4
0.1
24
968.3
80.3
13
652.4
40.2
96
977.6
610
0.4
41
1800
0.3
71
1285.7
0.4
50
1522.3
0.0
87
972.2
60.2
98
694.5
80.3
00
1022.4
Not
es:
nG
iven
mea
sure
men
ts,
Y1,Y
2,.
..,Y
Nat
tim
eX
1,X
2,.
..,X
N,
the
lag
kau
toco
rrel
ati
on
fun
ctio
nis
defi
ned
as
r K¼
PN�
K
i¼1
ðYi�
� YÞð
Yiþ
K�
� YÞ
PN i¼1
ðYi�
� YÞ2
Ho
wev
er,in
stea
do
fco
rrel
atio
nb
etw
een
two
dif
fere
nt
vari
ab
les,
the
corr
elat
ion
isbet
wee
ntw
ovalu
eso
fth
esa
me
vari
able
at
tim
esX
ian
dX
i1
k.
Wh
enth
eau
toco
rrel
ati
on
isu
sed
tod
etec
tn
on
-ran
do
mn
ess,
itis
usu
all
yo
nly
the
firs
t(l
ag
1)
au
toco
rrel
ati
on
that
iso
fin
tere
st.
Wh
enth
eau
toco
rrel
ati
on
isu
sed
toid
enti
fyan
ap
pro
pri
ate
tim
ese
ries
mo
del
,th
eau
toco
rrel
ati
on
sare
usu
all
yfo
rm
any
lags.
Stock Index Futures Prices and the Asian Financial Crisis
r 2007 The AuthorsJournal compilation r International Review of Finance Ltd. 2007 135

Part B in Table 6. For example, most of the positive deviation in 1996 (183 days)disappears when transaction costs are included and similarly the entirepositive deviation in 1997 (before the crisis) disappears after inclusion oftransaction costs. Other than these 2 years, there are not many changes in thenumber of positive and negative deviations. Thus, it seems that selling thestocks and buying the futures may have been profitable in the pre-crisis period.In the post crisis and capital control regime, buying the stocks and selling thefutures (cash and carry strategy) were profitable even after inclusion oftransaction costs.
B. Impact of foreign and domestic investor on price
This study also examined whether trades by foreign investors had any impacton futures contract prices compared with trades by individuals and institu-tions.8 One of the unique features of this stock index futures contracts is thedominance of foreign institutions in terms of trading volume: almost 60% ofthe total trade was carried out by foreign institutions. However, after the capitalcontrol regulations became effective, the participation of foreign institutionswas very minimal (only 15%). Participations of foreign and local investors arereported in Table 9.
The results here are consistent with the foreign investors slowly exiting fromthe futures markets. It is useful to distinguish between the permanent andtemporary components of the price changes around a trade. This distinction,first used by Kraus and Stoll (1972), is commonly used in the empirical literatureon block trading. In a previous empirical work, the permanent component isdefined as the difference between the stocks price before and after the trade,
Table 9 Participation of foreign and domestic investors in stock index futuresmarketn
Classification of investors Beforecrisis (%)
Duringcrisis (%)
After crisis (%)
1999 2000 2001 2002
Foreign institutions 42 60 12 16 14 20Domestic institutions 3% 0 4 4 4 6Overseas retail 1 1 2 2 2 3Domestic retail 30 26 53 49 45 49Local members 19 12 26 28 31 21Proprietary 5% 1 3 1 4 1Total 100 100 100 100 100 100
Note:nPercentages are the monthly average of the trade by the particular group of investors.
8 It is important to note that Malaysian institutional investors are not able to invest in stock
index futures contact due to regulatory restriction.
International Review of Finance
r 2007 The AuthorsJournal compilation r International Review of Finance Ltd. 2007136

that is, P1�P0. In this study, Keim and Madhavan’s (1996) method was used todefine permanent and temporary price impacts associated with a trade. Atemporary component represents the transitory price movement necessary toprovide the liquidity to absorb the trade. A temporary component of price canbe defined as the difference between the trade price and the price on the dayfollowing the trade (subsequent traded price):
i ¼ � lnðPtþ1=PtÞ: ð8Þ
Accordingly, permanent price impact can be defined as the differencebetween before and after trade price:
p ¼ lnðPtþ1=Pt�1Þ: ð9Þ
The total price impact associated with the trade is the sum of the twocomponents, that is:
Total impact ¼ iþ p:
It is better to calculate the components of price impacts by using sell and buyprice trades. But due to data unavailability, this study did not separate sell pricetrades and buy price trades. Instead, the monthly mispricing between futuresand spot (Actual prices� Fair futures contract price) was chosen. If mispricing isnegative, we consider it as a buy price trade and if mispricing is positive, weconsider it as a sell price trade.
This study thus examines whether trades by non-residents investors had anypositive or negative impact on prices. The following regressions were estimated,which explain the size of the price impacts:
i ¼ a0 þ b1FIþ b2DIþ b3ORRþ b4DRþ b5LMþ b6PRþ b7D1 ð10Þ
p ¼ a0 þ b1FIþ b2DIþ b3ORRþ b4DRþ b5LMþ b6PRþ b7D1 ð11Þ
where FI 5 foreign investors; LM 5 local member; DI 5 domestic investors;PM 5 proprietary; ORR 5 overseas retailer; and DR 5 domestic retailer.
The directions of mispricing were estimated based on cost of the carry model.This section examines whether trades by non-resident investors had adestabilizing impact on price and compares them with Malaysian investorsvia simple regression; the results are reported in Table 10.
The findings show the marginal effects of trades associated with a domesticinstitution (the smallest trading group among the domestic investors), whichsuggests larger temporary price impacts. However, trades associated withforeign institution have a larger but a negative permanent price impact. Butdomestic retailer (the largest trading group among the domestic investors) has apositive marginal effect on permanent price impact. This implies that whateverthe position in the underlying market (stock market), foreign institutionsbecame negative feedback traders in the futures market. Domestic retailers andother domestic investors become positive feedback traders in the futuresmarket.
Stock Index Futures Prices and the Asian Financial Crisis
r 2007 The AuthorsJournal compilation r International Review of Finance Ltd. 2007 137

VI. CONCLUSION
This paper presented empirical evidence on the pricing of stock index futurescontract using data from an emerging market on the futures contract traded onthe Malaysian Derivative Exchange to examine the unique price effect from amajor financial crisis, ever documented in any futures market. The results areset in perspective by an analysis of the relevant transaction costs and arereported separately for the different regulatory regimes existing before and aftera financial crisis and the capital control regimes.
The deviations of actual from theoretical prices during one and half years oftrading seem to be small, and the deviations become very large immediatelyafter the financial crisis, for the most cases, in one direction: the actual futuresprices are lower than the theoretical prices. Transaction costs had littleinfluence on this deviation. A complex situation during the crisis (for example,moral hazard, herd behavior or panic psychology) may be responsible for mostof the large deviations during the crisis. However, after market regulations, theextent and frequency of systematic mispricing have considerably increasedagain but in the opposite direction (large positive mispricing); (b) themispricing has a high positive autocorrelation, which tended to decrease aftera few days but not disappear completely; (c) the mispricing tends to decreasewhen the contract approaches the expiration date, hence limiting theopportunity to arbitrage. Therefore, the simple hold to expiration trading ruleappears to provide very limited opportunities for arbitrage profit; and (d) theMalaysian stock index futures market was dominated by foreign institutions,
Table 10 Effect of foreign and domestic investors on temporal and permanentprice effect
Coefficients Temporal Price Effect Permanent Price Effect
Coefficient Value T-statistic Coefficient Value T-statistic
R2 5 0.243 DW 5 3.22 R2 5 0.294 DW 5 1.81
a0 0.0140 0.4599 �0.0271 �0.9101b1 0.0001 0.8398 �0.00024 �1.961n
b2 �0.0007 �1.909nn 0.00079 0.7419b3 0.0002 0.7195 �0.00032 �1.152b4 0.0002 0.5953 0.00005 1.743nn
b5 �0.0008 �0.989 �0.00011 �0.1722b6 0.0003 0.889 �0.00014 �0.6031b7 �0.0203 �0.445 0.0512 1.1485b8 0.0078 0.1169 �0.0232 �0.3573
Notes:nIndicate significant at 5 percent level andnnIndicate 10 percent level of significant.
International Review of Finance
r 2007 The AuthorsJournal compilation r International Review of Finance Ltd. 2007138

but the domination sharply decreased after the capital control regulation, aswould be expected. However, a domestic institution (the smallest trading groupamong the domestic investors) has a significant impact on temporal pricechange whereas foreign institutions and domestic retailers (the largest groupamong the domestic investors) have significant effects on permanent pricechanges.
The above results are consistent with earlier evidence on similar studies inthe US and developed stock index futures contract data, except for the crisis-effect first observed in this paper. The results in the futures contract thus bearsome similarities but there are differences from the developed marketexperience at their early stages. The result shows more negative mispricingthan what has commonly occurred in the US and Nikkei average futurescontracts in their early stages (Brenner et al. 1989). However, negativemispricing has lessened substantially (MacKinlay and Ramaswamy 1988). InMalaysia, the negative mispricing increased substantially due to the crisis. Oneof the unique similarities of the finding is that, during the October 87 crash andduring the 1997 financial crisis, a large negative mispricing was observed.According to the Brady report, ‘portfolio insurers tried to cover their equityexposure by price-sensitive selling stock market index futures’.9 This impliesthat their actions drove down futures prices and created arbitrage opportunities(large negative mispricing), which led arbitrageurs to buy the futures and sellunderlying stocks. Similar behavior appears to be observed during the Asianfinancial crisis in the Malaysian stock index futures market, and thiscontributed to the increase in volume, which was 10 times larger than duringthe pre-crisis period. This can be characterized as a vivid example of the direconsequences derivative securities can have during a financial crisis. Thefindings of this study raise serious questions on how regulation during anyfinancial crisis is a source of mispricing.
Finally, it can be argued that liquidity constraints and the absence of foreigninstitutional participation, restrictions on domestic institutional investors toenter into the market and lack of experience of domestic investors also raiseserious obstacles to the growth of the stock index futures market in an emergingmarket.
Taufiq HassanDepartment of Accounting and FinanceUniversiti Putra MalaysiaMalaysia35400 UPM, Selangor, [email protected]
9 Much has been written about the Brady Report, both supportive and critical. For further details:
see Kleidon and Whaley (1992), Blume et al. (1989) and Santoni (1988).
Stock Index Futures Prices and the Asian Financial Crisis
r 2007 The AuthorsJournal compilation r International Review of Finance Ltd. 2007 139
REFERENCES
Blume, M. E., C. A. MacKinlay, and B. Terker (1989), ‘Order Imbalances and Stock PriceMovement on October 19 and 20, 1987’, Journal of Finance, 44, 827–48.
Brenner, M., M. G. Subrahmanyam, and J. Uno (1989), ‘The Behavior of Prices in theNikkei Spot and Futures Market’, Journal of Financial Economics, 23, 363–83.
Chung, Y. P. (1991), ‘A Transactions Data Test of Stock Index Futures Market Efficiencyand Index Arbitrage Profitability’, The Journal of Finance, 46, 1791–809.
Cornell, B., and K. R. French (1983), ‘The Pricing of Stock Index Futures’, Journal ofFutures Markets, 3, 1–14.
Figlewski, S. (1984), ‘Explaining the Early Discount on Stock Index Futures: The Casefor Disequilibrium’, Financial Analysts Journal, 40, 43–47.
Finnerty, J. E., and H. Y. Park (1988), ‘How to Profit From Program Trading’, Journal ofPortfolio Management, 41–46.
Keim, D. B., and A. Madhavan (1996), ‘The Upstairs Market for Large-BlockTransactions: Analysis and Measurement of Price Effects’, Review of Financial Studies,9, 1–36.
Kin, W., and S. J. Wei (1999) Foreign portfolio investors before and during crisisWorking Paper Series, Chicago Graduate School of Business, Number 6, 1999.
Kleidon, A. W., and R. E. Whaley (1992), ‘One Market? Stocks, Futures and OptionsDuring October 1987’, Journal of Finance, 47, 851–77.
Kraus, A., and H. Stoll (1972), ‘Price Impact of Block Trading in the New York StockExchange’, Journal of Finance, 27, 569–88.
MacKinlay, A. C., and K. Ramaswamy (1987), ‘Program Trading and the Behavior ofStock Index Futures Prices’, Center for the Study of Futures Markets, Working PaperSeries CSFM 161.
MacKinlay, A. C., and K. Ramaswamy (1988), ‘Index Futures Arbitrage and thebehavior of Stock Index Futures Prices’, Review of Financial Studies, 1, 137–58.
Merrick, J. J. Jr (1987), ‘Hedging with Mispricied Futures’, Center for the Study ofFutures Markets. Working Paper Series CSFM 154.
Merrick, J. J. Jr (1989), ‘Early Unwindings and Rollovers of Stock Index FuturesArbitrage Programs: Analysis and Implications for Predicting Expiration Day Effect’,Journal of Futures Market, 9, 101–10.
Modest, M., and M. Sundaresan (1983), ‘The Relationship Between Spot and Futures inStock Index Futures: Some Preliminary Evidence’, Journal of Futures Markets,15–41.
Park, Y. C., and C. Y. Song (1999) Financial Contagion in the East Asian Crisis. WithSpecial Reference to the Republic of Korea, Working Paper, Korea University andKookmin University.
Radelet, S., and J. Sachs (1998) The Onset of the East Asian Crisis. UnpublishedManuscript, NBER Volume on Financial Crisis.
Santoni, G. J. (1988), ‘The October Crash: Some Evidence on the Cascade Theory,’Federal Reserve Bank of St. Louis Review May/June, 18–33.
Saunders, E. M., and A. Mahajan (1988), ‘An Empirical Examination of CompositeStock Index Futures Pricing’, Journal of Futures Market, 8, 211–28.
International Review of Finance
r 2007 The AuthorsJournal compilation r International Review of Finance Ltd. 2007140

APPENDIX A
Table A1 Summary Statistic of Mispricing based on the ‘Cost of Carry’ Model withTransaction Cost
Month 1996 1997 1998 1999 2000 2001
January � 0.872 �1.189 �1.782n 2.827n 0.227 �0.415February � 0.679 �1.152 �2.172n 2.283n 0.625 �1.242March � 0.818 �1.070 �1.838n 0.2639 � 0.052 �1.461n
April � 1.275nn �1.383n �2.474n �0.0032 � 0.504 �1.846n
May � 1.403nn �2.021n �4.303n 1.503n � 0.675 �1.583n
June � 1.642 �1.718 �3.754n 1.089n � 0.496 �1.435July � 1.797 �1.542 �2.255 1.785n � 0.890 �1.245n
August � 1.891nn �1.907 �1.550 1.837n � 0.728 �0.400September � 1.906 �3.630n 0.2253 0.756 � 0.624 �0.105October � 1.375nn �4.509 1.793n 0.342 � 1.130n �0.954November � 0.925 �3.265 1.724n 0.688 � 0.787 �0.825December � 0.833 �1.894 1.824n 1.128n 0.252 �0.020
Notes: The theoretical futures price is given by a transaction band of PFAIR 5 PC exp (ri) – Divt.There are 12 contracts in particular year and 72 contracts in total. Bold values indicate a capitalcontrol period (capital control regulation introduced in September 1998).n1% level of significance. nn5% level of significance.
Mispricing of all contract with transaction cost in 1996 and 1997
−12.00
−10.00
−8.00
−6.00
−4.00
−2.00
0.00
2.00
4.00
Before Crisis from 1996-JulyAfter the Crisis
Premium
Discount
FigureA1 Time series of deviation (premiums and discount) of the actual settlementprice in relation to the theoretical futures price in 1996 and 1997 (Transaction costs are
included in this calculation). Notes: Mispricing is the percentage deviation of thesettlement price of the futures contract on the Malaysian Derivative Exchange at 5.15
relative to the theoretical futures price based on the closing stock prices at 5.00Malaysian time. The theoretical price is given by PFAIR 5 PC exp(ri) – Divt. Transaction
costs are taking into in the calculation.
Stock Index Futures Prices and the Asian Financial Crisis
r 2007 The AuthorsJournal compilation r International Review of Finance Ltd. 2007 141