From non-causality to causality: degrees of freedom of the interference relay channel
Applied Financial Economics, 1998, 8, 167—174
Stock market prices, *causality+ andefficiency: evidence from the Athensstock exchange
NIKITAS A. NIARCHOS* and CHRISTOS A. ALEXAKISt
*Department of Economics, ºniversity of Athens, 5 Stadiou str., 105 62 Athens, Greeceand tDepartment of Economics, ºniversity of Pireaus, Greece
During the last few years there has been growing evidence against the Efficient MarketHypothesis. In this study we investigate the hypothesis using stock prices of commonand preferred stocks from the Athens Stock Exchange. In Greece, preferred shares areregarded as part of the equity capital of the Greek companies and they are notconsidered as part of the borrowed funds. Under the Efficient Market Hypothesistheir price behaviour, as far as the speed of adjustment to news is concerned, should bethe same. However, our empirical evidence contradicts the above proposition. Itseems that in the Greek market there are factors, other than news, which influence theprice behaviour of the two categories of stocks.
I . INTRODUCTION
According to Fama (1976), a market is efficient if prices fullyand instantaneously reflect all available information and noprofit opportunities are left unexploited. In an efficient mar-ket there is a large number of rational profit maximizinginvestors, actively competing with each other, trying topredict future market prices of individual securities whileimportant current information is almost freely available toall participants in the market. In an Efficient Marketthe competing market participants reflect informationrationally and instantaneously on prices, making past rel-evant information useless in predicting future prices. AnEfficient Market should react only to new information(‘news’), but since this is unpredictable by definition, pricechanges or returns in an efficient market, cannot be predicted.
Under the Efficient Market Hypothesis we have
Pt!P*
t/I
t~1"u
t(1)
where It~1
is the information set available at time t!1, P*t
is the expected price which is based on the information setIt~1
, so P*t
is uncorrelated with ut, and, additionally, the
forecast error Pt!P*
tis uncorrelated with variables in the
information set It~1
so that
E[(Pt!P*
t)/I
t~1]"0 or E (u
t)"0 (2)
0960—3107 ( 1998 Routledge
under the assumptions of a zero constant equilibrium returnand risk neutrality.
Tests for market efficiency usually examine whether theforecast error is uncorrelated with variables in the informa-tion set I
t~1. According to the Efficient Market Hypothesis
the best predictor of tomorrow’s price, which can be madeon the information set I
t, given today’s price, is today’s
price. Thus, in an efficient market, the series of pricechanges, and consequently the series of stock returns, areuncorrelated with the variables in the information set I
t~1.
Fama (1970), distinguished three types of market effi-ciency. A market is said to be weak form efficient if pastprices are useless in predicting future prices. A market issemi-strong efficient if all publicly available information likeinflation, interest rates and earnings have no predictivepower. Finally, a market is strong form efficient if all in-formation is reflected on prices, including the insideinformation.
The main purpose of this study is to investigate whether itis possible to predict stock price changes or returns in theGreek Stock Market (i.e. Athens Stock Exchange) under theassumption of a constant equilibrium return. The AthensStock Market (ASE) is an emerging small market with noadequate ‘depth’ and ‘width’ compared with other moredeveloped stock markets worldwide. Further, this study wasperformed to shed more light on the workings of a small
167
168 N. A. Niarchos and C. A. Alexakis
stock market, such as the Greek stock market. Thus, we willtry to test the Efficient Market Hypothesis for the ASE bytesting the validity of a predictive model, since a validpredictive model theoretically implies a violation of theEfficient Market Hypothesis.
In the international literature there is a wide variety ofmodels that can be used for predictive purposes in stockmarket prices. The existing models extend from simplelinear autoregressive ones, Cootner (1962), Osborne (1959,1962) to the more sophisticated non-linear dynamic onesPeters (1989, 1991), Hiemstra and Kramer (1995). In thisstudy the linear regression model was used. Our researchstarted from the ‘Granger causality’ models which testwhether a lagged explanatory variable, say X, can be usedto predict the dependent, say ½, and then cointegrationanalysis was applied.
II . THE GREEK STOCK MARKET (ASE)ENVIRONMENT
The ASE is an emerging market with speculative character-istics as to the movement of stock prices and with erraticand sometimes unjustifiable price swings. The latter give anindication that market prices may not, at all times, ra-tionally reflect all information existing in the market and itcan be possible that other factors may affect security prices.
There have been several studies so far, testing the pricebehaviour in the ASE and performing tests of the efficientmarket hypothesis (Niarchos, 1972; Panas, 1990; Alexakisand Petrakis, 1991; Alexakis, 1992; Alexakis and Xanthakis,1997). However, up to now there has been no research andsubsequently no evidence as to the price performance ofdifferent categories of shares issued by the same companyand their possible relationship.
In Greece, companies may issue three types of stocks, thatis, (a) common stocks with voting rights; (b) preferred stockswith non-voting rights; and (c) preferred stock with votingrights. The main privilege granted to preferred stocks is(I) priority of its dividends over common stock dividendsand (II) priority of its claim on assets over common-stockclaims in the event of liquidation. With respect to dividenddistribution, dividends on preferred stock are paid afterbond interest and income taxes, but prior to payment ofdividends on common stock. Preferred stocks are, some-times, cumulative; i.e. a preferred dividend which is by-passed is still owed to the shareholders. If a firm does notmake a profit, dividends to both the common and thepreferred shareholders are not paid. However, the dividendsthat the cumulative preferred stockholders should have re-ceived will accumulate. When the firm makes profits again,the cumulative preferred shareholders are entitled to thecurrent years’ dividend as well as the dividends accumulatedfrom prior years. In Greece, there are few cases of pre-ferred stocks with voting rights and the same privileges as
described above. According to the Greek legislation a com-pany can issue preferred shares which cannot exceed 50% ofcommon shares outstanding at the time of issue. It shouldbe noted that, in Greece, preferred shares are issued as partof the equity capital of Greek companies and hence are notconsidered as part of the borrowed funds. Thus, their stockmarket price behaviour should be at least similar to theprice behaviour of the common stocks with voting rights.Empirically though, this does not seem to be the case, atleast, after 1987.
In this study we will use ‘causality’ models in order to testthe price behaviour of these two types of shares in themarket, i.e. whether the prices of one type of shares affect theprices of the other and vice versa. Our final aim is todetermine any predictive factor that may arise from theprice movements of any one type of shares concerning theother. Looking at the price series of common and preferredshares the evidence indicates that the price fluctuations ofthese two categories of shares correlate, although there isa large discrepancy between their respective prices whichhas increased after 1987. However, we do not know whetherthe prices of common shares influence the prices of preferredshares or vice versa, i.e. whether there is any predictivefactor between them.
III . THE MODEL EMPLOYED
A very popular way to test the existence of any temporalstatistical relationship with predictive value between twotime series is the Granger ‘causality’ test, Granger (1969).Granger, in order to explain the notion of ‘causality’ — oftenreferred to as ‘Granger—Wiener causality’ in recognition ofthe early work of Wiener (1956) — starts from the premisethat the future cannot ‘cause’ the present or the past. Never-theless, the term ‘causality’ is unfortunate; for instance theweather forecast occurs before the weather but it obviouslydoes not cause the weather. Thus, when we test for ‘causal-ity’ we in fact test for precedence, and for linear precedencein particular. Granger’s definition for ‘causality’ is in termsof predictability: a variable X causes another variable ½,with respect to a given information set that includes X and½, if present ½ can be better forecasted by using past valuesof X than by not doing so.
The presence of ‘causality’ obviously implies market in-efficiency of the weak form: as pointed out earlier fora stock, say j, under the Efficient Market Hypothesis(EMH), it is true that
E (*Pjt/I
t~1)"0 (3)
where It~1
"[Pj, t~1
, Pj, t~2
, Pj, t~3
, 2 Pj, t~n
] and Pjt~1
,
2, Pjt~n
the price history of the stock j. If it is also true that
E(*Pjt/H
t~1)"0 (4)
Stock market prices, ‘causality’ and efficiency 169
where Ht~1
"[Pj,t~1
,Pj,t~2
,Pj,t~3
, 2,Pj,t~n
,Pk,t~1
, Pk, t~2
,Pk, t~3
,2, Pk, t~n
] and Pk, t~1
,2, Pk, t~n
the price history ofa variable k different than j, then no ‘Granger causality’exists and the market is still efficient with respect to theinformation set H
t~1. The opposite case implies that the
price history of variable k can help to predict the pricechange of stock j (variable k ‘Granger causes’ stock j ), andthe market is inefficient with respect to the informationset H
t~1.
The ‘Granger causality’ tests apart from the fact that theyhave been characterized as ‘soft econometrics’ (Rowley andJain, 1986), are usually performed on stationary data; andthe first difference transformation, which is usually appliedto achieve stationarity, filters out low frequency (long run)information. Cointegration and error correction modelsreintroduce, in a statistically acceptable way, the low fre-quency information. The basic idea of cointegration is thattwo or more series, say X and ½, move closely together inthe long run, even though the series themselves are trended,and the difference between them is constant
Zt"X
t!a½
t(5)
We may regard the cointegrating series as defining a longrun equilibrium relationship and the difference betweenthem to be stationary. The term equilibrium in this casesuggests a relationship which, on average, has been main-tained by a set of variables for a long period (Hall andHendry, 1988).
If two variables are cointegrated then according to theGranger Representation Theorem (Engle and Granger,1987), there must exist an Error Correction Representationof the following form
*Xt"!o
1zLt~1
#
n+j/1
ai*X
t~i#
n+j/1
bj*½
t~i#e
1t(6)
*½t"!o
2zLt~1
#
n+j/1
ci*½
t~i#
n+j/1
ji*X
t~i#e
2t(7)
where zt~1
is implicitly defined in Equation 5 ando1#o
2O0 and e
1tand e
2tare finite moving averages. Thus,
changes in the variables Xtand ½
tare partly driven by the
previous value of zt.
An Error Correction model that incorporates errors froma cointegrating regression has some interesting temporalcausality interpretations (Granger, 1988). Cointegrated vari-ables in the bivariate case must possess temporal ‘causality’in the Granger sense in at least one direction. For a pair ofseries to have an attainable equilibrium, there must be somecausation between them to provide the necessary dynamics.It follows from this that since z
t~1must occur in at least one
of the Error Correction equations, it must improve theforecasting ability of at least on one of X
tor ½
t. Thus, one
important implication to emerge from the cointegrationliterature (Engle and Granger, 1987), is that prices in anefficient speculative market cannot be cointegrated. If they
are, this implies in return the presence of a market ineffi-ciency since there must be ‘Granger causality’ running inone at least direction: i.e. one price can be used to forecastthe other price, even after taking into account the laggedvalues of the forecast price. Further, the temporal causalitycan emerge from two sources: the sum of the coefficients ofthe lagged change variables (the standard Granger test) orthe coefficient of the lagged error correction term. StandardGranger ‘causality’ tests overlook the latter channel. Theor-etically, temporal ‘causality’ can occur through the errorcorrection term alone. Thus, the standard Granger test mayoverlook existing temporal ‘causality’.
Engle and Granger (1987) point to the fact that vectorautoregressive estimates, which are derived from differenceddata, are misspecified in the case of cointegrated variablesbecause the Error Correction Terms which appear in theError Correction Models are excluded (MacDonald andKearney, 1987). The point is that the models employed totest ‘causality’ are misspecified if the variables which arebeing tested for the direction of ‘causality’ are cointegrated.
Tests for ‘causality’ and consequently for market effi-ciency have been performed in many stock market efficiencystudies, for example between different metal prices(McDonald and Taylor, 1988, 1989; Jones and Uri, 1989). Inthis study we will perform the above tests between thecommon and preferred stocks traded in the Athens StockExchange.
IV. THE DATA
To perform the above statistical analysis we used dailyclosing prices adjusted for stock splits, reverse splits anddividends, for 14 pairs of common and preferred stocks, ofthe most active stocks listed in the ASE, in order to avoidthin trading effects. The time period used is from 1 July 1991to 4 April 1994 with a total of 703 observations for everystock. The data were extracted from the Profile S.A. andthe Center of Financial Studies (University of Athens)databanks. In all cases we used the logarithmic transforma-tion of the original price series.
V. THE RESULTS
The order of integration of a series (that is the number oftimes it must be differenced before attaining stationarity)may be ascertained by the application of a set of tests,commonly known as the test for unit roots. A number oftests are available for testing whether a series is stationary.We performed the Augmented Dickey—Fuller regression inorder to ensure white noise residuals in the Dickey—Fullerregressions.
Table 1 presents the Augmented Dickey—Fuller statistics(ADF) for the series of the 14 companies used. It is clear
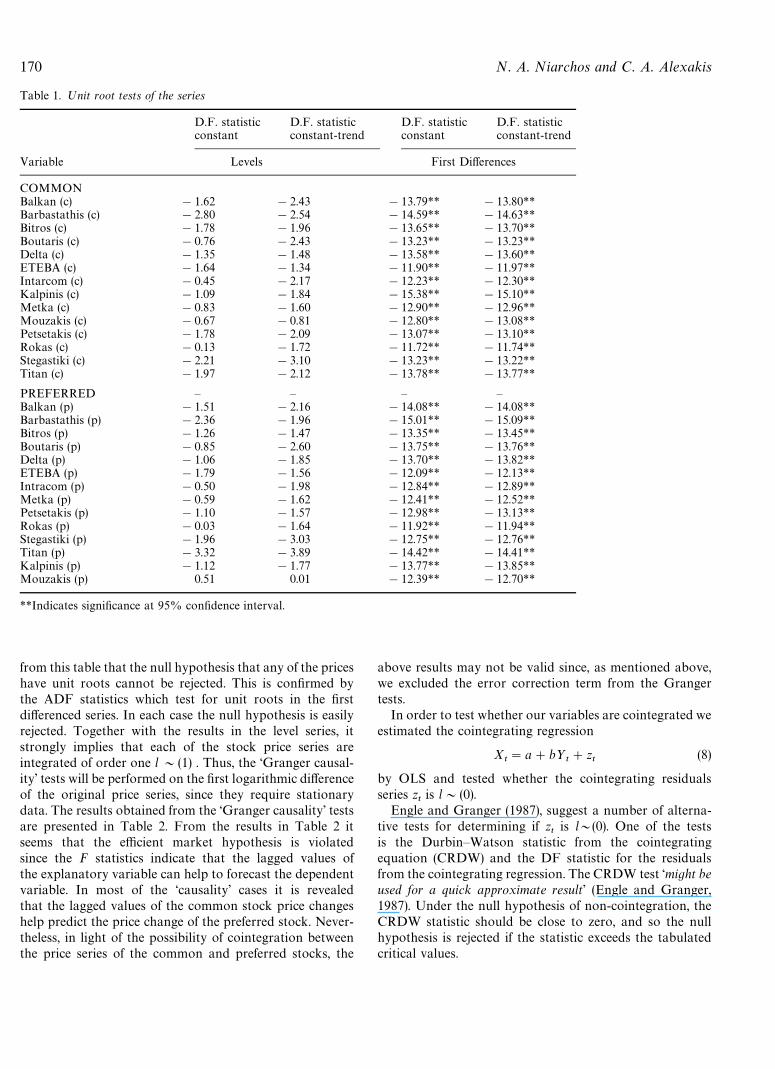
170 N. A. Niarchos and C. A. Alexakis
Table 1. ºnit root tests of the series
D.F. statistic D.F. statistic D.F. statistic D.F. statisticconstant constant-trend constant constant-trend
Variable Levels First Differences
COMMONBalkan (c) !1.62 !2.43 !13.79** !13.80**Barbastathis (c) !2.80 !2.54 !14.59** !14.63**Bitros (c) !1.78 !1.96 !13.65** !13.70**Boutaris (c) !0.76 !2.43 !13.23** !13.23**Delta (c) !1.35 !1.48 !13.58** !13.60**ETEBA (c) !1.64 !1.34 !11.90** !11.97**Intarcom (c) !0.45 !2.17 !12.23** !12.30**Kalpinis (c) !1.09 !1.84 !15.38** !15.10**Metka (c) !0.83 !1.60 !12.90** !12.96**Mouzakis (c) !0.67 !0.81 !12.80** !13.08**Petsetakis (c) !1.78 !2.09 !13.07** !13.10**Rokas (c) !0.13 !1.72 !11.72** !11.74**Stegastiki (c) !2.21 !3.10 !13.23** !13.22**Titan (c) !1.97 !2.12 !13.78** !13.77**
PREFERRED — — — —Balkan (p) !1.51 !2.16 !14.08** !14.08**Barbastathis (p) !2.36 !1.96 !15.01** !15.09**Bitros (p) !1.26 !1.47 !13.35** !13.45**Boutaris (p) !0.85 !2.60 !13.75** !13.76**Delta (p) !1.06 !1.85 !13.70** !13.82**ETEBA (p) !1.79 !1.56 !12.09** !12.13**Intracom (p) !0.50 !1.98 !12.84** !12.89**Metka (p) !0.59 !1.62 !12.41** !12.52**Petsetakis (p) !1.10 !1.57 !12.98** !13.13**Rokas (p) !0.03 !1.64 !11.92** !11.94**Stegastiki (p) !1.96 !3.03 !12.75** !12.76**Titan (p) !3.32 !3.89 !14.42** !14.41**Kalpinis (p) !1.12 !1.77 !13.77** !13.85**Mouzakis (p) 0.51 0.01 !12.39** !12.70**
**Indicates significance at 95% confidence interval.
from this table that the null hypothesis that any of the priceshave unit roots cannot be rejected. This is confirmed bythe ADF statistics which test for unit roots in the firstdifferenced series. In each case the null hypothesis is easilyrejected. Together with the results in the level series, itstrongly implies that each of the stock price series areintegrated of order one l&(1) . Thus, the ‘Granger causal-ity’ tests will be performed on the first logarithmic differenceof the original price series, since they require stationarydata. The results obtained from the ‘Granger causality’ testsare presented in Table 2. From the results in Table 2 itseems that the efficient market hypothesis is violatedsince the F statistics indicate that the lagged values ofthe explanatory variable can help to forecast the dependentvariable. In most of the ‘causality’ cases it is revealedthat the lagged values of the common stock price changeshelp predict the price change of the preferred stock. Never-theless, in light of the possibility of cointegration betweenthe price series of the common and preferred stocks, the
above results may not be valid since, as mentioned above,we excluded the error correction term from the Grangertests.
In order to test whether our variables are cointegrated weestimated the cointegrating regression
Xt"a#b½
t#z
t(8)
by OLS and tested whether the cointegrating residualsseries z
tis l&(0).
Engle and Granger (1987), suggest a number of alterna-tive tests for determining if z
tis l\(0). One of the tests
is the Durbin—Watson statistic from the cointegratingequation (CRDW) and the DF statistic for the residualsfrom the cointegrating regression. The CRDW test ‘might beused for a quick approximate result’ (Engle and Granger,1987). Under the null hypothesis of non-cointegration, theCRDW statistic should be close to zero, and so the nullhypothesis is rejected if the statistic exceeds the tabulatedcritical values.
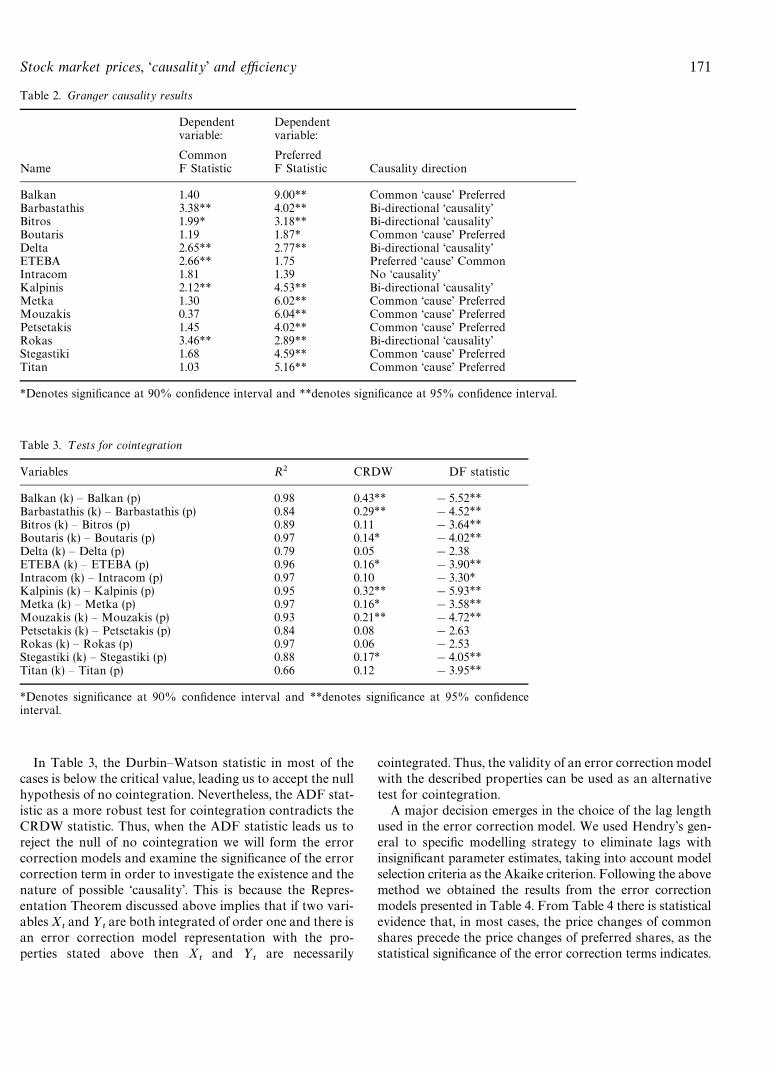
Stock market prices, ‘causality’ and efficiency 171
Table 2. Granger causality results
Dependentvariable:
Dependentvariable:
Common PreferredName F Statistic F Statistic Causality direction
Balkan 1.40 9.00** Common ‘cause’ PreferredBarbastathis 3.38** 4.02** Bi-directional ‘causality’Bitros 1.99* 3.18** Bi-directional ‘causality’Boutaris 1.19 1.87* Common ‘cause’ PreferredDelta 2.65** 2.77** Bi-directional ‘causality’ETEBA 2.66** 1.75 Preferred ‘cause’ CommonIntracom 1.81 1.39 No ‘causality’Kalpinis 2.12** 4.53** Bi-directional ‘causality’Metka 1.30 6.02** Common ‘cause’ PreferredMouzakis 0.37 6.04** Common ‘cause’ PreferredPetsetakis 1.45 4.02** Common ‘cause’ PreferredRokas 3.46** 2.89** Bi-directional ‘causality’Stegastiki 1.68 4.59** Common ‘cause’ PreferredTitan 1.03 5.16** Common ‘cause’ Preferred
*Denotes significance at 90% confidence interval and **denotes significance at 95% confidence interval.
Table 3. ¹ests for cointegration
Variables R2 CRDW DF statistic
Balkan (k) — Balkan (p) 0.98 0.43** !5.52**Barbastathis (k) — Barbastathis (p) 0.84 0.29** !4.52**Bitros (k) — Bitros (p) 0.89 0.11 !3.64**Boutaris (k) — Boutaris (p) 0.97 0.14* !4.02**Delta (k) — Delta (p) 0.79 0.05 !2.38ETEBA (k) — ETEBA (p) 0.96 0.16* !3.90**Intracom (k) — Intracom (p) 0.97 0.10 !3.30*Kalpinis (k) — Kalpinis (p) 0.95 0.32** !5.93**Metka (k) — Metka (p) 0.97 0.16* !3.58**Mouzakis (k) — Mouzakis (p) 0.93 0.21** !4.72**Petsetakis (k) — Petsetakis (p) 0.84 0.08 !2.63Rokas (k) — Rokas (p) 0.97 0.06 !2.53Stegastiki (k) — Stegastiki (p) 0.88 0.17* !4.05**Titan (k) — Titan (p) 0.66 0.12 !3.95**
*Denotes significance at 90% confidence interval and **denotes significance at 95% confidenceinterval.
In Table 3, the Durbin—Watson statistic in most of thecases is below the critical value, leading us to accept the nullhypothesis of no cointegration. Nevertheless, the ADF stat-istic as a more robust test for cointegration contradicts theCRDW statistic. Thus, when the ADF statistic leads us toreject the null of no cointegration we will form the errorcorrection models and examine the significance of the errorcorrection term in order to investigate the existence and thenature of possible ‘causality’. This is because the Repres-entation Theorem discussed above implies that if two vari-ables X
tand ½
tare both integrated of order one and there is
an error correction model representation with the pro-perties stated above then X
tand ½
tare necessarily
cointegrated. Thus, the validity of an error correction modelwith the described properties can be used as an alternativetest for cointegration.
A major decision emerges in the choice of the lag lengthused in the error correction model. We used Hendry’s gen-eral to specific modelling strategy to eliminate lags withinsignificant parameter estimates, taking into account modelselection criteria as the Akaike criterion. Following the abovemethod we obtained the results from the error correctionmodels presented in Table 4. From Table 4 there is statisticalevidence that, in most cases, the price changes of commonshares precede the price changes of preferred shares, as thestatistical significance of the error correction terms indicates.
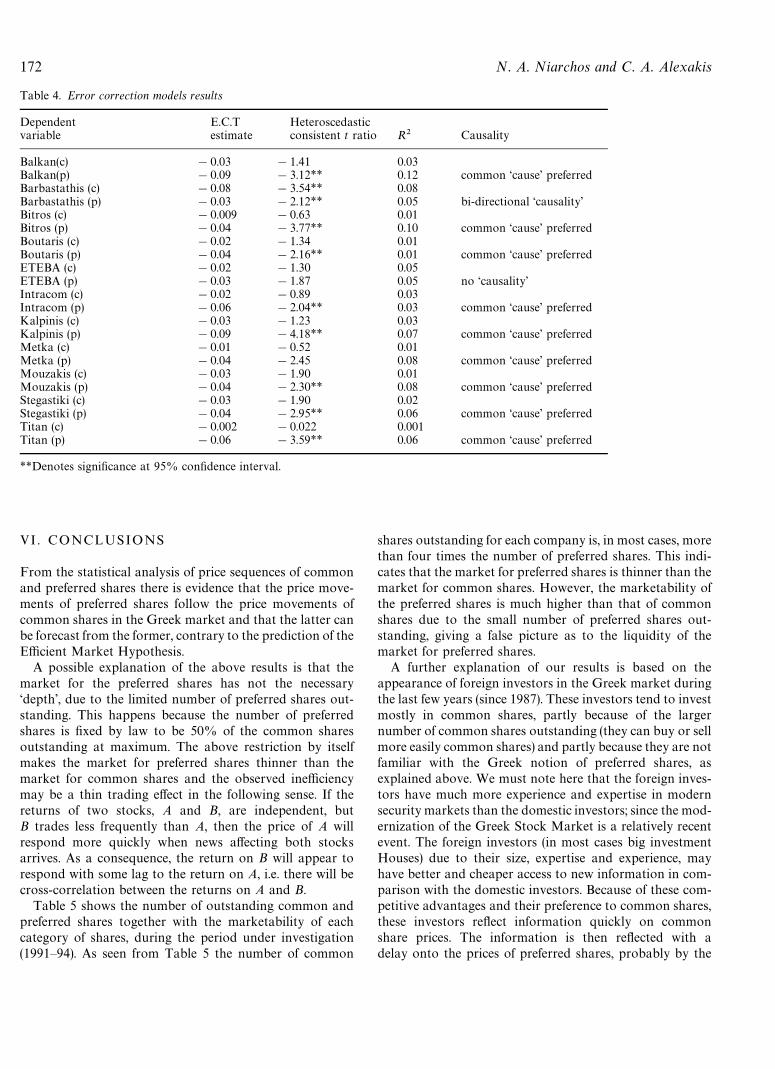
172 N. A. Niarchos and C. A. Alexakis
Table 4. Error correction models results
Dependent E.C.T Heteroscedasticvariable estimate consistent t ratio R2 Causality
Balkan(c) !0.03 !1.41 0.03Balkan(p) !0.09 !3.12** 0.12 common ‘cause’ preferredBarbastathis (c) !0.08 !3.54** 0.08Barbastathis (p) !0.03 !2.12** 0.05 bi-directional ‘causality’Bitros (c) !0.009 !0.63 0.01Bitros (p) !0.04 !3.77** 0.10 common ‘cause’ preferredBoutaris (c) !0.02 !1.34 0.01Boutaris (p) !0.04 !2.16** 0.01 common ‘cause’ preferredETEBA (c) !0.02 !1.30 0.05ETEBA (p) !0.03 !1.87 0.05 no ‘causality’Intracom (c) !0.02 !0.89 0.03Intracom (p) !0.06 !2.04** 0.03 common ‘cause’ preferredKalpinis (c) !0.03 !1.23 0.03Kalpinis (p) !0.09 !4.18** 0.07 common ‘cause’ preferredMetka (c) !0.01 !0.52 0.01Metka (p) !0.04 !2.45 0.08 common ‘cause’ preferredMouzakis (c) !0.03 !1.90 0.01Mouzakis (p) !0.04 !2.30** 0.08 common ‘cause’ preferredStegastiki (c) !0.03 !1.90 0.02Stegastiki (p) !0.04 !2.95** 0.06 common ‘cause’ preferredTitan (c) !0.002 !0.022 0.001Titan (p) !0.06 !3.59** 0.06 common ‘cause’ preferred
**Denotes significance at 95% confidence interval.
VI . CONCLUSIONS
From the statistical analysis of price sequences of commonand preferred shares there is evidence that the price move-ments of preferred shares follow the price movements ofcommon shares in the Greek market and that the latter canbe forecast from the former, contrary to the prediction of theEfficient Market Hypothesis.
A possible explanation of the above results is that themarket for the preferred shares has not the necessary‘depth’, due to the limited number of preferred shares out-standing. This happens because the number of preferredshares is fixed by law to be 50% of the common sharesoutstanding at maximum. The above restriction by itselfmakes the market for preferred shares thinner than themarket for common shares and the observed inefficiencymay be a thin trading effect in the following sense. If thereturns of two stocks, A and B, are independent, butB trades less frequently than A, then the price of A willrespond more quickly when news affecting both stocksarrives. As a consequence, the return on B will appear torespond with some lag to the return on A, i.e. there will becross-correlation between the returns on A and B.
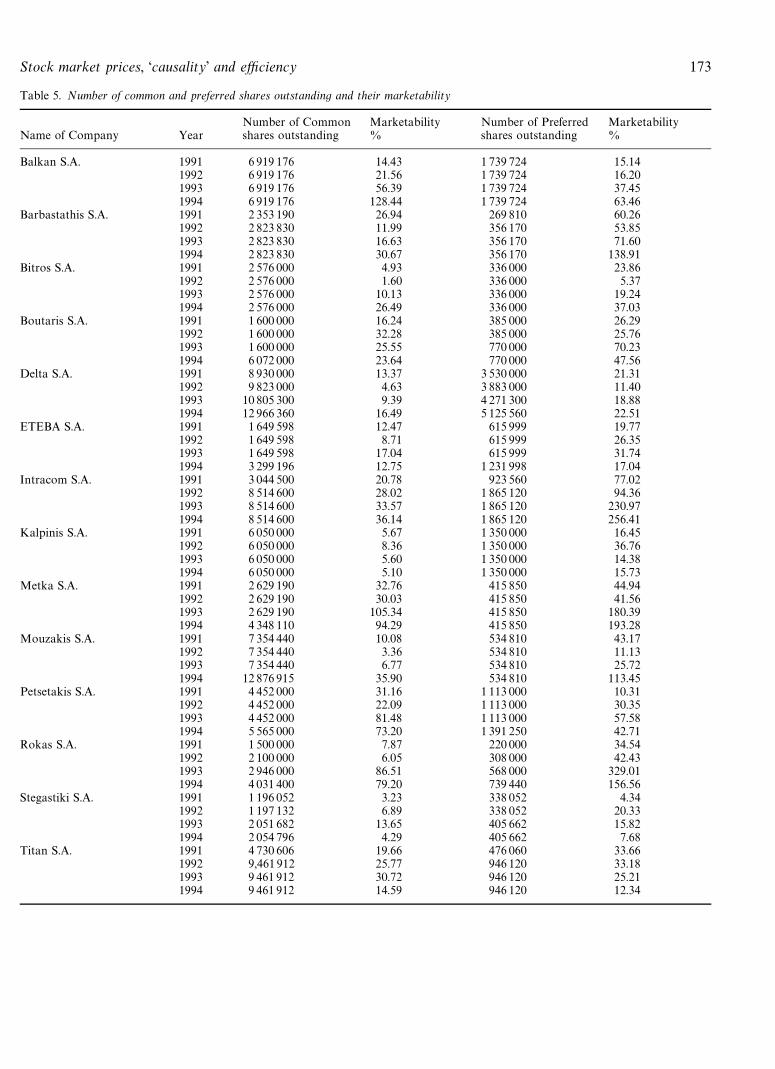
Table 5 shows the number of outstanding common andpreferred shares together with the marketability of eachcategory of shares, during the period under investigation(1991—94). As seen from Table 5 the number of common
shares outstanding for each company is, in most cases, morethan four times the number of preferred shares. This indi-cates that the market for preferred shares is thinner than themarket for common shares. However, the marketability ofthe preferred shares is much higher than that of commonshares due to the small number of preferred shares out-standing, giving a false picture as to the liquidity of themarket for preferred shares.
A further explanation of our results is based on theappearance of foreign investors in the Greek market duringthe last few years (since 1987). These investors tend to investmostly in common shares, partly because of the largernumber of common shares outstanding (they can buy or sellmore easily common shares) and partly because they are notfamiliar with the Greek notion of preferred shares, asexplained above. We must note here that the foreign inves-tors have much more experience and expertise in modernsecurity markets than the domestic investors; since the mod-ernization of the Greek Stock Market is a relatively recentevent. The foreign investors (in most cases big investmentHouses) due to their size, expertise and experience, mayhave better and cheaper access to new information in com-parison with the domestic investors. Because of these com-petitive advantages and their preference to common shares,these investors reflect information quickly on commonshare prices. The information is then reflected with adelay onto the prices of preferred shares, probably by the
Stock market prices, ‘causality’ and efficiency 173
Table 5. Number of common and preferred shares outstanding and their marketability
Number of Common Marketability Number of Preferred MarketabilityName of Company Year shares outstanding % shares outstanding %
Balkan S.A. 1991 6 919 176 14.43 1 739 724 15.141992 6 919 176 21.56 1 739 724 16.201993 6 919 176 56.39 1 739 724 37.451994 6 919 176 128.44 1 739 724 63.46
Barbastathis S.A. 1991 2 353 190 26.94 269 810 60.261992 2 823 830 11.99 356 170 53.851993 2 823 830 16.63 356 170 71.601994 2 823 830 30.67 356 170 138.91
Bitros S.A. 1991 2 576 000 4.93 336 000 23.861992 2 576 000 1.60 336 000 5.371993 2 576 000 10.13 336 000 19.241994 2 576 000 26.49 336 000 37.03
Boutaris S.A. 1991 1 600 000 16.24 385 000 26.291992 1 600 000 32.28 385 000 25.761993 1 600 000 25.55 770 000 70.231994 6 072 000 23.64 770 000 47.56
Delta S.A. 1991 8 930 000 13.37 3 530 000 21.311992 9 823 000 4.63 3 883 000 11.401993 10 805 300 9.39 4 271 300 18.881994 12 966 360 16.49 5 125 560 22.51
ETEBA S.A. 1991 1 649 598 12.47 615 999 19.771992 1 649 598 8.71 615 999 26.351993 1 649 598 17.04 615 999 31.741994 3 299 196 12.75 1 231 998 17.04
Intracom S.A. 1991 3 044 500 20.78 923 560 77.021992 8 514 600 28.02 1 865 120 94.361993 8 514 600 33.57 1 865 120 230.971994 8 514 600 36.14 1 865 120 256.41
Kalpinis S.A. 1991 6 050 000 5.67 1 350 000 16.451992 6 050 000 8.36 1 350 000 36.761993 6 050 000 5.60 1 350 000 14.381994 6 050 000 5.10 1 350 000 15.73
Metka S.A. 1991 2 629 190 32.76 415 850 44.941992 2 629 190 30.03 415 850 41.561993 2 629 190 105.34 415 850 180.391994 4 348 110 94.29 415 850 193.28
Mouzakis S.A. 1991 7 354 440 10.08 534 810 43.171992 7 354 440 3.36 534 810 11.131993 7 354 440 6.77 534 810 25.721994 12 876 915 35.90 534 810 113.45
Petsetakis S.A. 1991 4 452 000 31.16 1 113 000 10.311992 4 452 000 22.09 1 113 000 30.351993 4 452 000 81.48 1 113 000 57.581994 5 565 000 73.20 1 391 250 42.71
Rokas S.A. 1991 1 500 000 7.87 220 000 34.541992 2 100 000 6.05 308 000 42.431993 2 946 000 86.51 568 000 329.011994 4 031 400 79.20 739 440 156.56
Stegastiki S.A. 1991 1 196 052 3.23 338 052 4.341992 1 197 132 6.89 338 052 20.331993 2 051 682 13.65 405 662 15.821994 2 054 796 4.29 405 662 7.68
Titan S.A. 1991 4 730 606 19.66 476 060 33.661992 9,461 912 25.77 946 120 33.181993 9 461 912 30.72 946 120 25.211994 9 461 912 14.59 946 120 12.34
174 N. A. Niarchos and C. A. Alexakis
domestic investors, which have slower access to informa-tion, but they are also familiar with the notions of commonand preferred shares in Greece and consequently they donot distinguish between them.
In addition to the above, domestic investors’ trades referto substantially lower number of shares than foreign inves-tors’ trades. Thus, the thin market of preferred shares isnot a matter for serious consideration for the domesticinvestors.
If the above hypothesis is true then the Athens StockExchange can be regarded as a segmented market, i.e. smartmoney (foreign investors) is one group, and noise traders(domestic investors) is the other.
At this point we must note that there is another ‘anomaly’related to the common and preferred shares in Greece. Thepreferred shares sell at a discount in comparison to thecommon shares, which sometimes reaches 35—50%. How-ever, it should be said that this substantial difference be-tween the prices of common and preferred shares cannot bejustified, taking into account the characteristics of the twocategories of shares. Hence, there is a need for furtherinvestigation of the matter, since it is difficult to accept thatthe differences in voting rights and the number of outstand-ing shares can give such a difference in favour of the price ofcommon shares. We also believe that this big price discrep-ancy is not easily explained by the privileges of preferredshares, on distributed dividends and on the company’sassets in the case of insolvency.
ACKNOWLEDGEMENTS
The authors would like to thank Professor Nikolaos Mylonasand the anonymous referee for their helpful comments.
REFERENCES
Alexakis, C. (1992) An empirical investigation of the EfficientMarket Hypothesis: The case of the Athens Stock Exchange.PhD Thesis, University of York.
Alexakis, P. and Petrakis, P. (1991) Analysing stock market behav-iour in a small capital market, Journal of Banking and Finance,15, 471—83.
Alexakis, P. and Xanthakis, M. (1997) Day of the week effect in theGreek Stock Market, Applied Financial Economics, underpublication.
Cootner, P. H. (1962) Stock prices: random walk vs systematicchanges, Industrial Management Review, 3, 24—45.
Engle, R. and Granger, C. W. S. (1987) Cointegration and errorcorrection: representation estimation and testing, Econo-metrica, 55, 251—76.
Fama, E. (1970) Efficient capital markets: a review of the theoryand empirical work, Journal of Finance, 25, 383—416.
Fama, E. (1976) Efficient capital markets: reply, Journal of Finance,3, 143—45.
Granger, C. W. (1969) Investigating causal relations by econo-metric methods and cross spectral, Econometrica, 37, 24—36.
Granger, C. W. (1988) Some recent developments in the concept ofcausality, Journal of Econometrics, 39, 194—211.
Hall, S. G. and Henry, S. G. B. (1988) Macroeconomic Modeling,Chapter 2, North Holland, Amsterdam.
Hiemstra, C. and Kramer, C. (1995) Nonlinearity and endogeneityin macro-asset pricing. International Monetary Fund Work-ing Paper, March 1995.
Jones, J. and Uri, N. (1989) Market efficiency, spot metal prices andcointegration. Evidence from the U.S. 1964—1987, Unpub-lished Paper.
McDonald, R. and Taylor, M. P. (1988) Metal prices, efficiency andcointegration: some evidence from the London metal ex-change, Bulletin of Economic Research, 40, 235—39.
McDonald, R. and Taylor, M. P. (1989) Rational expectations, riskand efficiency in the London metal exchange: an empiricalanalysis, Applied Economics, 21, 143—53.
Niarchos, N. (1972) ¹he Greek Stock Market, Athens Stock Ex-change Publications.
Osborne, M. F. M. (1959) Brownian motion in the stock market,Operations Research, 7, 145—73.
Osborne, M. F. M. (1962) Periodic structure in the Brownianmotion of stock prices, Operations Research, 10, 345—79.
Panas, E. (1990) The behaviour of Athens stock prices, AppliedEconomics, 22, 1715—27.
Peters, E. E. (1989) Fractal structure in capital markets, FinancialAnalyst Journal, July/August.
Peters, E. E. (1991) Chaos and Order in Capital Markets, a New»iew of Cycle Prices and Market »olatility. John Wiley& Sons Inc, New York.
Rowley, R. and Jain, R. (1986) Sims on causality: an illustration ofsoft econometrics, Scottish Journal of Political Economy, 19,417—42.
Wiener, N. (1956) Modern Mathematics for Engineers, Series 1.McGraw-Hill, New York.
Copyright © 2022 FDOKUMEN