Causality-Dependent Consciousness and Consciousness-Dependent Causlity
DEPARTMENT OF ECONOMICS
ISSN 1441-5429
DISCUSSION PAPER 10/05
BIVARIATE CAUSALITY BETWEEN EXCHANGE RATES AND STOCK PRICES ON MAJOR ASIAN COUNTRIES
Hooi-Hooi Lean*, Marwan Halim† and Wing-Keung Wong‡
ABSTRACT
This paper studies the cointegration and the bivariate causality relationship between exchange
rates and stock prices on the seven Asian countries badly hit by the Asian Financial Crisis. Our
empirical results show that, before the 1997 Asian Financial Crisis, all countries, except the
Philippines and Malaysia, experience no evidence of Granger causality between the exchange
rates and the stock prices. However, the causality but not the cointegration between the capital
and financial markets appear to become strong during the Asian Financial Crisis period.
Surprisingly, after the 911-terrorist-attack, the causality relationship between the two markets
returns to normal as in the pre-Asian-crisis period and the cointegration relationship weakens
between exchange rates and stock prices. Thus, we conclude that (1) Asian Financial Crisis has a
bigger and more direct impact on the causality relationship between stock prices and currency
exchanges in Asian markets and the 911-terrorist-attack basically has no impact on the causality
relationship between the two markets; and (2) the financial and capital markets have become more
mature and efficient after the crisis.
Keywords: Asian Financial Crisis, 911-Terrorist-Attack, Dynamic Linkages, Cointegration,
Bivariate Causality
JEL: G15
* Department of Economics, Monash University, Australia. † PT. Trimegah Securities, Tbk.Indonesia. ‡ Department of Economics, National University of Singapore.
1
BIVARIATE CAUSALITY BETWEEN EXCHANGE RATES AND STOCK PRICES ON MAJOR ASIAN COUNTRIES
1. Introduction High exchange rate and stock price fluctuations during the crisis are popular topics in the financial
press and among academicians. We still can recall when financial crisis sparked in Thailand in July
1997, Asian countries started to experience a series of financial downfalls. For instance, the Hang
Seng Index lost more than 1400 points in October 1997 as a result of big jump of short-term
interest rate in Hong Kong in order to maintain its exchange rate against US dollar. Korean Won
also dropped dramatically for about 56% against US dollar in December 1997 as compared to its
value in January 1997. This currency crisis in South Korea caused further financial turmoil on its
stock markets, with a downfall of over 50%.
The devaluation of Thai Baht in July 1997 ignited a financial avalanche in other Southeast Asian
currencies. Indonesia, Malaysia, and Philippines experienced the most severe foreign exchange
pressures in the end of 1997. In late October, the scale of the crisis had dampened the regional
economy significantly as the pressure from depreciation of New Taiwan dollar spread to Hong
Kong and Korea currencies. This financial storm continued to deteriorate Asian economy and did
not slow down until the first quarter of 1998. This is known as the period of Asian Financial Crisis
which is also called Asian flu.
When Asian countries are working hard to find medicines to cure the Asian flu, unfortunately in
2001, the world’s economic super power, US was hit by terrorist attack. This may have big impact
on Asian economy and delay the recovery from the Asian crisis in 2001 further. As we can recall,
back on September 11, 2001, global financial markets went into tailspin in reaction to what has
generally been described as a severe blow on the US. For example, in late afternoon trading,
Nikkei 225 Average was down 6.5%, Hang Seng Index was down 9.5%, the Korea Composite
Price Index was down 10.3%, Malaysia’s KLSE lost 11.8%, Thailand Stock Exchange was also
down 18% and Taiwan Price Weighted plummeted to about 15.38%. In contrast to the significant
plunges in stock markets, currencies in major Asian markets were not affected by the terrorist
attack on US.
After observing how severe economy conditions in Asian countries was during the Asian Financial
Crisis and the 911-terrorist-attack, we are motivated to find out if stock market crash cause the
exchange rate depreciation or currency depreciation leads to stock price downfall and whether the
2
Asian Financial Crisis and the 911-terrorist-attack will alter this relationship. In fact, the relationship
between exchange rates and stock prices can be seen as a reciprocal causal effect. This means
that the fluctuation in exchange rates can substantially affect the value of the firm, which in the end
will have impact on stock prices. This is called the traditional approach (Frenkel and Rodriguez
1975, Boyer 1977). On the other hand, the movement of the stock market will cause capital
movements in a particular country resulting exchange rate fluctuation. This phenomenon is also
known as portfolio approach. i The majority of preceding studies support the traditional approach.
Only a few indicate the existence of portfolio approach or the feedback relationship between the
two markets.
This paper analyzes in detail the dynamic relationship between stock prices and exchange rates by
employing both the cointegration and bivariate causality techniques on the seven Asian countries
badly hit by the Asian Financial Crisis, namely Hong Kong, Indonesia, Singapore, Malaysia, Korea,
Philippines, and Thailand. Japan is included in our study for control purpose. We analyze the
relationship for the pre- and post-Asian Financial Crisis periods as well as pre- and post-911-
terrorist-attack as to study the effects of the Asian Financial Crisis and the 911-terrorist-attack on
the relationship. If this relation can be ascertained, practitioners can profit from the arbitrage
especially during a severe financial crisis.
Our empirical results show that, in the period before Asian Financial Crisis, all countries except the
Philippines and Malaysia, experience no evidence of Granger causality between the exchange
rates and the stock prices. However, the causality but not the cointegration between the capital
and financial markets appear to become strong during the Asian Financial Crisis period. In this
period, all countries show evidence of causality between the two markets. Surprisingly, after the
911-terrorist-attack, the causality relationship between the two markets return to normal as in the
pre-crisis period, where all countries, except Korea, are found to have no linkages between
exchange rates and stock prices. In addition, we find that there is no specific cointegration
relationship between the exchange rates and the stock prices before or during the 1997 Asian
Financial Crisis but after the 911-terrorist-attack, there are weaker cointegration relationships
between exchange rates and stock prices. Thus, we conclude that (1) the Asian Financial Crisis
has bigger and more direct impact on the causality relationship between stock prices and currency
exchanges in Asian markets; the 911-terrorist-attack basically has no impact on the causality
relationship between the two markets and (2) the financial and capital markets has become more
mature and efficient after the crisis.
The organization of the paper is as follows: Section 2 reviews the literature while Section 3
describes about data; Section 4 discusses the methodologies by employing both cointegration and
3
causality techniques; Section 5 elaborates upon our empirical results and Section 6 discuss the
possible reasoning for the cointegration and causality relationship for each country. The last
section concludes.
2. Literature Review The effect of exchange rates on stock market volatility has received much attention lately,
especially after the 1997 Asian Financial Crisis. As reported by Kamin (1999), Mishkin (1999) and
Kwack (2000), the major causes of Asian Financial Crisis were the devaluation of local currencies,
the short-term external debts and high interest rates and financial imbalances. In retrospect of the
literature, there are quite a number of studies that attempted to determine the impact on stock
prices and exchange rates changes. The findings, however, are not uniform across the various
studies.
Many literatures have supported the phenomenon of traditional approach that exchange rates’
fluctuation lead to stock prices movement. According to Dornbursh and Fisher (1980), changes in
exchange rates affect firm’s earning and hence impact its stock price. This study also explains that
the reciprocal causal effect between exchange rates and stock prices depends on whether the firm
is dealing with exporting or importing business. Aggarwal (1981) argued that a change in exchange
rates could change stock prices of multinational firms directly and the domestic firms indirectly.
Bodart and Reding (1999) showed that an increase in exchange rates volatility is accompanied by
a decline in international correlation between bonds and to a lesser extent, the stock market.
Kearney (1998) found that exchange rates volatility is a more significant determinant for volatility of
stock prices rather than interest rates volatility. Phylaktis and Ravazzolo (2000) discussed the
stock prices and exchange rates dynamics and found that the US stock market acts as a conduit
through which the foreign exchange market and local stock market were linked. In addition, Pan et
al. (2000) studied seven Asian emerging markets and concluded that in general, exchange rates
Granger-cause stock prices. They also found that countries which have a higher trade to GDP
ratio, exchange rate fluctuations tend to exhibit significant influence on the equity market,
regardless of the exchange rate arrangement system and the degree of capital control.
Conversely, it has been argued that the demand for money equation, which is derived from the
monetary portfolio allocation model, which makes it possible to make stock prices affect the
exchange rates. Gavin (1989) suggested that movements in stock prices may influence exchange
rates, and money demand could depend on the performance of the stock market. Qiao (1996) also
agreed that changes in stock prices might affect the inflow and outflow of capital, which would
result in changes in the currency values. In addition, Ajayi et al. (1998) explained in detail that
4
changes in stock prices lead to an increase in the demand for real money and, subsequently the
value of domestic currency.
Although all the above-mentioned theories suggested causal relations between stock prices and
exchange rates, yet other studies concluded that the exchange rates changes have no significant
impact on the stock prices (Solnik 1984). Jorion (1990, 1991), Bodnar and Gentry (1993), Amihud
(1993) and Bartov and Bodnar (1994) failed to find a significant relationship between simultaneous
dollar movements and stock returns for US firms. Griffin and Stulz (2001) showed that weekly
exchange rate shocks have a negligible impact on the value of industry indices across the world.
Using daily data in their study instead of monthly data as used in most prior studies, Chamberlain
et al. (1997), however, found that the US banking stocks returns are very sensitive to exchange
rates movements, but not for Japanese banking firms. On a macro level, Ma and Kao (1990) found
that currency appreciation negatively affected the domestic stock market for an export-dominant
country and positively affected domestic stock market for an import-dominant country, which is
consistent with the goods-market theory.
In addition, Qiao (1996) found the stock price-exchange rate causality to be different across
countries. Specifically, the direction of causation was bi-directional for Japan, was unidirectional
from the exchange rates to stocks returns for Hong Kong and was non-causal for Singapore. He
also noted the presence of a strong long-run relationship or cointegration existed in these three
countries. Using daily data for eight countries, Ajayi and Mougone (1996) showed significant
interaction between exchange rates and stock prices. Observations based on the emerging
markets of India, Korea, Pakistan and the Philippines, Abdalla and Murinde (1997) suggested
unidirectional causality from exchange rates to stock prices in all countries, except for the
Philippines, where it was stock prices that Granger caused the exchange rates. Moreover, they
found a long run relationship or cointegration existing in India and Pakistan. Using monthly data
from July 1973 to December 1988, Bahmani-Oskooee and Sohrabian (1992) evaluated the
interactions between the Standard and Poor’s Composite Index and the effective exchange rate of
the dollar and found the bi-directional causality between them. However, there was no long run
relationship or no cointegration between the two variables.
Malliaris and Urrutia (1992) analyzed the impact of 1987 crash on the relationships for six stock
market indices and found no lead-lag relationships for the period before and after the market crash
but there are feedback relationships and unidirectional causality during the month of crash.
Recently, Granger et al. (2000) also suggested that different countries have different relationships
between exchange rates and stock prices. They found that the Philippines was under portfolio
approach with negative correlation. Hong Kong, Malaysia, Singapore, Thailand, and Taiwan
5
indicated strong feedback relations, whereas those of Indonesia and Japan failed to reveal any
recognizable pattern.
3. The Data The data used are weekly stock market indices and exchange rates from Datastream for eight
major Asian countries, namely Hong Kong, Indonesia, Japan, Korea, Malaysia, the Philippines,
Singapore and Thailand. The sample period runs from January 1, 1991 to December 31, 2002,
which covers a reasonably long period of twelve years in our study. Instead of monthly data as in
most literatures, weekly data from Wednesday closing index for the emerging markets is used so
as to have higher power on the results and to capture the effect of capital movement, which is
intrinsically a short-run occurrence. We abandon the use of daily data to avoid the biases
associated with non-trading, bid-ask spread and asynchronous prices (Lo and MacKinlay 1988). If
Wednesday index is missing, then Tuesday price (or Monday if Tuesday’s is missing) is used.
To better analyze the relations between exchange rates and stock prices before and after Asian
Financial Crisis, we first divide the entire period into two sub-periods and call the first sub-period
which covered from 1991 to 1996 as pre-crisis period and the sub-period which covered from 1997
to 2002 as post-crisis period. In the post-crisis period, we further divided our sample into two sub-
periods, pre-911 and post-911 periods, to look into the effect of 911-terrorist-attack: Pre-911 period
is the period between the Asian Financial Crisis and 911-terrorist-attack (January 1, 1997 –
September 10, 2001) and post-911 period is the period after the 911-terrorist-attack (September
11, 2001 - December 31, 2002). We note that some studies use January 1, 1997 to separate the
pre-crisis and post-crisis periods while some use July 1, 1997. In this paper, we use both dates to
separate the pre- and post-crisis. Since similar results were obtained hence we only report the
results using January 1, 1997 as a cut-off point.ii We also note that the “Pre-911 period” can be
treated as the “during-the-crisis period” as we have used different cutting end points before
September 11, 2001 as the “during-the-crisis period” and the results are similar to that of the “Pre-
911 period”. In this connection, without loss of generality, we also call the “Pre-911 period” as
“during-the-crisis period” or simply “during the crisis” and the “Post-911 period” is in fact referring to
the actual “post-crisis period”.
--------------------------
INSERT TABLE 1
--------------------------
Table 1 shows the stock indices and exchange rates for all the countries in our study on different
sub-periods with their changes respectively. During the pre-crisis period, Indonesia, Korea, and
6
Thailand underwent currency depreciation and the other five countries have currencies
appreciation with modest changes ranging from -20% to 24% while stock markets are basically in a
bull run with increase ranging from 35% to more than 300% for all countries except Japan and
Korea. However, all eight economies exhibit pronounced structural breaks during the crisis. All
currencies suffered noticeable depreciations since January 1997. During the crisis period (January
1, 1997 – September 10, 2001), Indonesian Rupiah experienced the greatest loss in its value
(74.01%), followed by Peso of the Philippines (48.73%), Thai Baht (42.58%), Won of South Korea
(34.58%) and Malaysia Ringgit (33.52%). The rest of the currencies witnessed between 1% to 20%
depreciation. Similar freefalls in stock prices were witnessed ranging from 17% of the Korea
market to 60% of the Thailand market. In the post-crisis period, the currencies have appreciated for
all countries except the Philippines in which the rate of depreciation (4.29%) is much smaller than
during the crisis. Even though the stock markets remained down in the post-crisis period, the drop
rates are smaller than during the crisis.
4. Methodology Cointegration tests are important in determining the presence and nature of an equilibrium
economic relation. To examine the co-movements between stock indices and exchange rates, we
study the relationship:
St = α + βEt + ut (1)
where St , Et and ut denote the stock index, exchange rate and error term respectively.
The cointegration tests are performed in two steps. The first step is to examine the stationary
properties of the exchange rates and stock indices series. If a series has a stationary, invertible
and stochastic ARMA representation after differencing d times, it is said to be integrated of order d,
and denoted as I(d). It is necessary to first conduct a pre-test of the order of integration for the
series as a necessary condition for cointegration is that the two series be studied are of the same
order, usually order one. We apply the Dickey-Fuller (1979, 1981) unit root test procedure to test
the null hypothesis that Ho: zt = I(1) versus the alternative hypothesis H1: zt = I(0) based on the
OLS regression:
ttt uztz +++=∇ −1100 ααβ (2)
or apply the Augmented Dickey and Fuller (ADF) test based on:
∑=
−− +∇+++=∇p
itititt uzztz
11100 βααβ (3)
where and z1−−=∇ ttt zzz t can be St or Et as defined in equation (1).
7
The regressions in (2) and (3) allow for a drift term, a deterministic trend and a stochastic
structure in the error term, ut. The variable p is chosen to achieve white noise residuals. Testing
the null hypothesis of the presence of a unit root in zt is equivalent to testing the hypothesis that
01 =α in equation (2) and (3). If 1α is significantly less than zero, the null hypothesis of a unit root
is rejected. The test statistic used is the usual t-ratio, but the distribution is not the t-distribution
under the null hypothesis. When p=0, the test is known as the Dickey-Fuller (DF) test. This test
assumes that the residuals, ut, are independently and identically distributed. If serial correlation
exists in the residuals, then p>0 and the augmented Dickey-Fuller (ADF) test must be applied.
In addition, we test the hypothesis that zt is a random walk with drift, i.e. ( ) ( )0,0,,, 0100 βααβ = .
The test statistic is the likelihood ratio, 3Φ , found in Dickey and Fuller (1981). The decision rule is
to reject the null hypothesis if is larger than the critical value. We also test for the hypothesis of
random walk without drift, i.e.
3Φ
( ) ( )0,0,0,, 100 =ααβ . This test statistic, given by , also causes
rejection of the hypothesis if it exceeds the critical value. If the hypotheses that
2Φ
,01 =α ( ) ( )0,0,,, 0100 β= ) or ( ( )0,0,0,, 100β α α α α =β are accepted, then we can conclude that zt
is an integrated process of order 1. If we fail to reject the hypotheses that zt is I(1), then we test Ho:
zt = I(2) versus the alternative hypotheses H1: zt = I(1).
If both St and Et are in the same order, the next step is to estimate the cointegrating parameter of
regression (1) by OLS regression. If the residuals of the regression (1) are stationary, the two
series are cointegrated. Otherwise, the two series are not cointegrated.
The three most common tests for stationarity of estimated residuals are Cointegrating Regression
Durbin-Watson (CRDW), Dickey-Fuller (CRDF), and Augmented Dickey-Fuller (CRADF) tests.
Only the more reliable CRDF and CRADF testsiii are used on the OLS regression
t
p
ititt uuu ξγγ +∇+=∇ ∑
=−−
111 ˆˆˆ (4)
where ut are residuals from the cointegrating regression (1) and p is chosen to achieve empirical
white noise residuals. The null hypothesis of non-cointegration is rejected if the t-ratio is less than
the relevant critical value.iv
After determining cointegration, we test the causality between stock prices and exchange rates
using the appropriate formulation for Granger causality analysis. This analysis needs to incorporate
an error correction term into the test if variables are cointegrated (Granger, 1988). If exchange
8
rates and stock price are cointegrated, than an error correction term should be included in the
bivariate autoregression as follows:
∑ ∑= =
−−− ++∇+∇+=∇n
i
m
ittitiitit ECTESS
1 1111210 εδααα
∑ ∑= =
−−− ++∇+∇+=∇m
i
n
ittitiitit ECTESE
1 1212210 εδβββ (5)
where ΔEt is changes in exchange rate and ΔSt is changes in stock price. ECTt-1, which is St-1 –
γEt-1, is an error correction term derived from the long run cointegrating relationship in (1). The
error correction term can be estimated by using the residual from a cointegrating regression. The
estimates δ1 and δ2 denote the speed of adjustment. According to Engle and Granger (1987), the
existence of cointegration implies causality among the set of variables as manifested by |δ1| + |δ2| >
0. Reject (accept) H0: α21 = α22 = …..= α2m = 0 and δ1 = 0 suggests that exchange rates do (do not)
Granger cause stock prices. Likewise, reject (accept) H0: β11 = β12 = …..= β1m = 0 and δ2 = 0
suggests that stock prices do (do not) Granger cause exchange rates.
If cointegration does not exist, we shall modify (5) without considering error correction term (ECT)
to be:
∑ ∑= =
−− +∇+∇+=∇n
i
m
ititiitit ESS
1 11210 εααα
∑ ∑= =
−− +∇+∇+=∇m
i
n
ititiitit SEE
1 12210 εβββ (6)
Similarly, reject (accept) H0: α21 = α22 = …..= α2m = 0 suggests that exchange rates do (do not)
Granger cause stock prices, while reject (accept) H0: β11 = β12 = …..= β1m = 0 suggests that stock
prices do (do not) Granger cause exchange rates. These tests lead to no causality, unidirectional
causality or feedback causality relationship between the stock prices and exchange rates.
To test the 0...: 222210 ==== mH ααα , we apply the F test:
( )( )2/
/−−−
−=
nmNSSEmSSESSEF
F
FR
where N is the number of observations, n and m are defined in (5), SSEF, and SSER are the sum
of square of residuals for the full regression and the restricted regression respectively in (5). The
null hypothesis is rejected (accepted) at the α level of significance if F > (<) F(α; m, N-m-n-2).
Similarly, we can test for : 0H 022221 ==== mβββ L and then make decision on the causality
from S to E. We apply the usual simple t statistics to test for H0: δ1 = 0 and H0: δ2 = 0.
9
The minimum final prediction error criterion (Hsiao 1979, 1981) is also employed in this
paper to determine the optimum lag structures in the regressions (5) and (6), where n and m are
the maximum lags of the corresponding variables to be used in the right hand side of Equations (5)
and (6); and t1ε and t2ε are disturbance terms obeying the assumptions of the classical linear
regression models. The final prediction error statistic of tS∇ with n lags of and m lags of tS∇ tE∇
is
NmnN
SSmnNmnFPE tt
St )1()ˆ()1(
),(2
−−−
∇−∇+++= ∑
∇
where N is the number of observationsv. The FPE statistic for tE∇ is found by the same way. To
determine the minimum , the first step is to run the regression in first equation (5) excluded
and only lags of be included. We start from m=0 and n=1 and calculate . We
proceed the same step until n=n* where FPE is minimized for m=0. Then, by holding n=n*, we
systematically lag m until m=m* minimizes the FPE. The same procedure is repeated with the
second equation (5) where n=n** and m=m** minimize .
tSFPEΔ
tE∇ tS∇ )0,1(tSFPEΔ
),( mnFPEtEΔ
5. Empirical Findings We first employ the unit root tests to check for stationarity for the exchange rate and stock index
series of the eight countries being studied in this paper. The unit root results in Table 2 show that
there are unit roots in all level series for all periods and for all countries except exchange rates for
Indonesia and Hong Kong in the pre-crisis period and the exchange rates for Indonesia, Malaysia,
Singapore and Hong Kong in the post-911 period.vi We note that the non-unit root phenomenon for
Malaysia and Hong Kong in the post-911 period and Hong Kong in the pre-crisis period is due to
the peg of the currency to US dollar. We also note that in the pre-911 period (between 1997 Asian
Financial Crisis and 911-terrorist-attack), Hong Kong dollar still encounter fluctuations and the
Malaysian Ringgit consists of a non-peg period and hence both exchange rates appear to be I(1).
---------------------------------------------
INSERT TABLE 2 ABOUT HERE
---------------------------------------------
---------------------------------------------
INSERT TABLE 3 ABOUT HERE
---------------------------------------------
After performing the unit root tests, we then estimate the cointegrating equation in (1) and report
the results in Table 3. The results show that Thailand is the only country in our study which has the
cointegration effect of the exchange rate and stock index for all periods. The exchange rate is
10
cointegrated with stock index in the Philippines and Indonesia for the pre-crisis, post-crisis and pre-
911 periods while the exchange rate is cointegrated with stock index in Japan, Hong Kong and
Singapore only in the pre-crisis period. The exchange rate is also cointegrated with stock index in
Malaysia and Korea for the post-crisis period. These findings support most of the previous
literature that no definitive pattern on cointegration can be identified between the currency and
stock index not only before the Asian Financial Crisis, but also during the Asian Financial Crisis
(before the 911-terrorist-attack). However, our results also show that the cointegration between
exchange rate and the stock index disappear for nearly all countries being studied in this papervii
after the crisis, especially during the post-911-terrorist-attack. Thus, as opposed to the findings in
most of the previous studies, we claim that the financial and capital markets in Asia have become
more mature and efficient after the crisis.
We now turn to study the Granger causality relationship between exchange rate and stock index.
The causality results are reported in Tables 4a to 4d.
------------------------------------------------
INSERT TABLE 4 ABOUT HERE
------------------------------------------------
Similar to the cointegration results, our causality findings before the Asian Financial Crisis are in
line with most previous literatures (see for example Granger et al. 2000), which show that there is
no causal relation between stock index and exchange rate for most of the Asian countries including
Indonesia, Thailand, Korea, Singapore, Japan and Hong Kong. Only Malaysia and the Philippines
are observed to have the causality relationship such that Malaysia appears to have a feedback
relationship whereas the Philippines shows traditional approach.
However, our empirical results have demonstrated that this phenomenon is not going to continue
after the crisis. There is strong presence of causal relationship between exchange rates and stock
prices, especially in the period between the Asian Financial Crisis and the 911-terrorist-attack.
These anomalies contradict with the previous literature. During the post-crisis period, Hong Kong
and the Philippines followed the portfolio approach, which is stock prices lead currency rates,
whereas Singapore is described to have a strong relationship in unidirectional causality particularly
in agreement with the traditional approach. The rest of the countries in this period follow bi-
directional relationship, which is currency rates lead stock prices and vice versa.
Our findings of the causality anomalies may be due to the fact that both exchange rates and stock
prices fluctuate dramatically during the Asian Financial Crisis as our post-crisis period covers both
“during the crisis” and “after the crisis”. If this is true, the causality will eventually disappear after
11
the crisis. Also, we question whether the 911-terrorist-attack has the same impact on the financial
and capital markets. In this connection, we further study the behavior of relationship between
exchange rates and stock prices by dividing the post-crisis period into two periods: pre-911 period
(January 1, 1997 to September 10, 2001) and post-911 period (September 11, 2001 to December
31, 2002)viii.
Our findings show that in the pre-911 period, the relationship between stock prices and exchange
rates basically exists for all countries in our study such that Malaysia, Indonesia, Singapore and
Japan follow the traditional approach; Thailand and Korea experience feedback relationship while
the Philippines and Hong Kong are observed to have portfolio approach. However in the post-911
period, we find that the causal relationship between exchange rates and stock prices returns to
normal such that they vanish in all countries, except for Korea. This shows that the 911-terrorist-
attack does not create any causality relationship in the Asian countries as the Asian Financial
Crisis; and the causal relationship between exchange rates and stock prices in the post-911 period
are back to normal as in the pre-crisis period. Based on all results of our analysis above,
surprisingly the Asian Financial Crisis period appears to be the only period that the causality
relationship between stock prices and exchange rates exist significantly as compared to other
periods.
6. Discussion We now focus on the possible reasons for both cointegration and causality relationships for each
country. We first discuss the relationship for Indonesia. Table 3 shows that its exchange rate and
stock index are cointegrated with a negative beta during the crisis.ix This implies that the exchange
rate and stock index are moving in a different direction during the Asian Financial Crisis. Figures
1b and 1c confirm this result. In addition, Table 4 shows that the capital and financial markets have
no Granger causality relationship in both pre-crisis and post-911 periods but the exchange rate
significantly Granger causes the stock index and the exchange rate marginally Granger causes the
stock index in the pre-911 period. The possible explanation is that during the crisis, some big
investors can foresee both the stock prices and the currency will drop continually and short sell
both instruments while other investors follow too. Both the stock and the currency drop
continuously for very long period during the crisis. Hence the stock index is falling while the
exchange rate is rising continuously. Other factors such as political instability, weak law
enforcements, deteriorated banking system, etc. may contribute to economic turmoil in Indonesia.
Nasution (2000) argues that negative external shocks, weak fundamentals and incompetent
management was paralyzed by indecision over adoption of currency board, reduction of large
state-guaranteed investments and implementation of economic deregulations.
12
On the other hand, the short selling activities reduce after the crisis. Indonesia also tries to restore
its economy and gradually reduce its dependency on IMF, and its government is not loosening its
policy on capital control as well as intervention on its currency exchange. These imply that the
impact on the influence on both markets reduces after the crisis and, hence it is not surprising our
empirical research shows that there is no relationship between currency exchange and stock price
movement in the post-911 period.
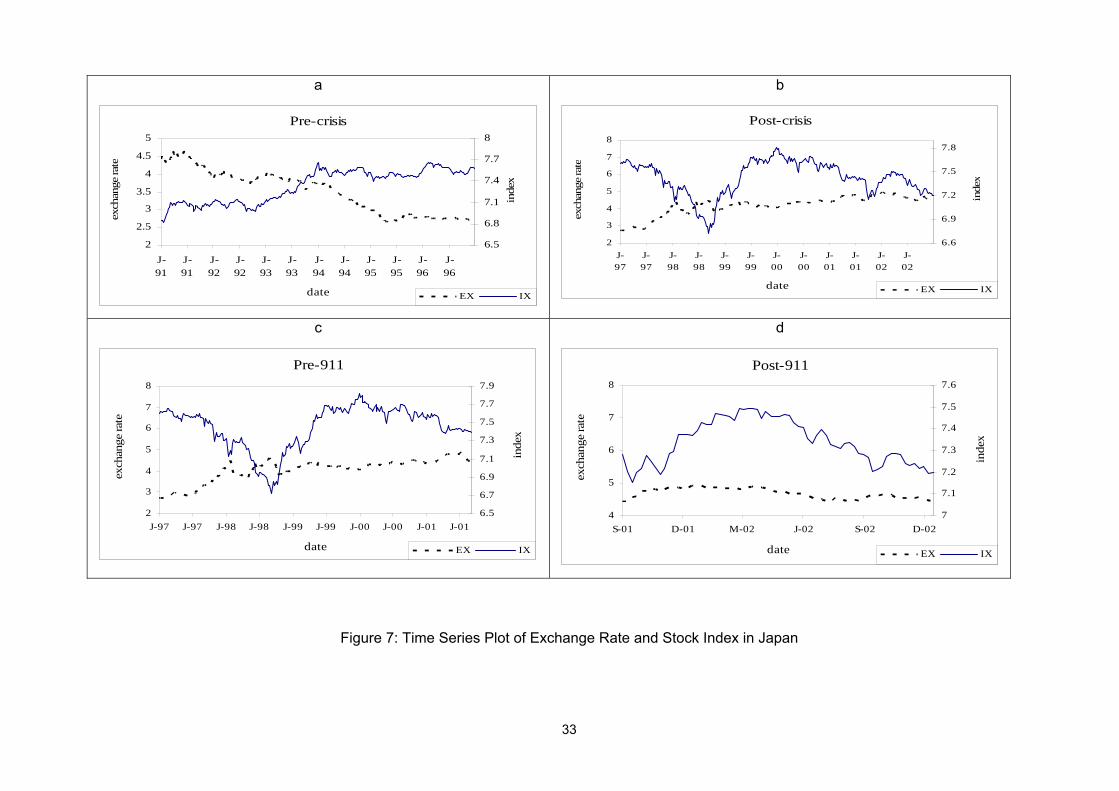
Before discussing the relationship on both markets for other Asian countries which are badly hit by
the Asian Financial Crisis, we herewith first examine Japan which is not badly hit by the crisis. As
we can observe from Table 3, Japan’s stock price and exchange rate are cointegrated in the pre-
crisis period, but neither in the pre-911 nor the post-911 period. Moreover, Table 4 also shows that
Japan is the only country in our study where there is no evidence of causal relation between the
foreign exchange and equity market in both periods before and after the Asian Financial Crisis.x
This is consistent with previous studies (He and Ng 1998, Chamberlain et al. 1997). It is well
known that Japan practices free floating exchange rate system together with no restriction in
capital control. According to Pan et al. (2000), for a country that does not employ a freely floating
exchange rate system, its exchange rates might not fully respond to stock prices movement.
Similarly, capital control might reduce dynamic linkages between foreign exchange and equity
prices. Another major possible reason is that there is no significant speculation activities occurs in
Japan. These factors strengthen our argument that there is no integration on Japan’s currency and
stock prices as shown in Figure 7b.
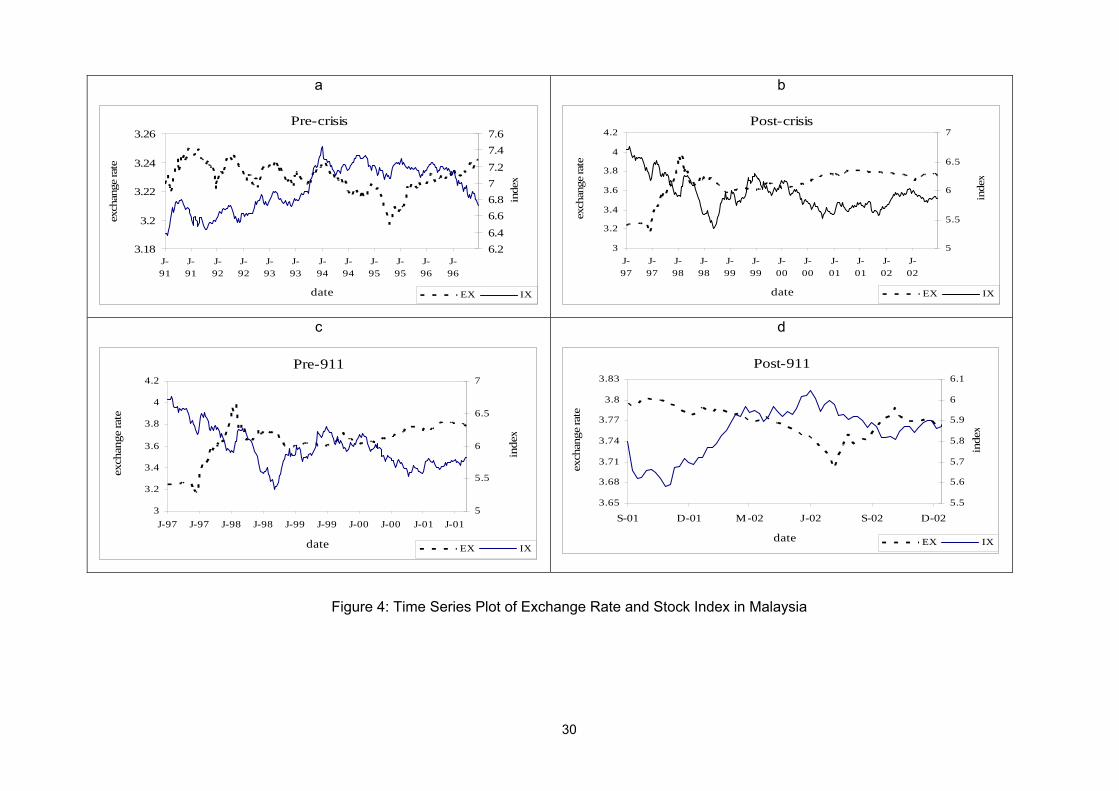
For Malaysia, we notice that this is the only country that has feedback causality relationship
between the capital market and stock market before the Asian Financial Crisis and the exchange
rate strongly Granger causes stock index in the pre-911 period but not the post-911 period. This is
because the Malaysian Government imposes capital control to anticipate speculation on its
financial market. This sudden change of government policies costs Malaysia to missed out from
most of the international capital that returned to the region in the beginning of quarter four 1998.
During the pre-911 period, we observe from Table 4c that exchange rate Granger causes stock
index. However, after the 911-terrorist-attack, there is no evidence of causal relation between
exchange rate and stock price. This lack of significant relationship between the two markets may
be result of intense government intervention on capital market after Asian Financial Crisis.
Furthermore, our result in Table 3 also shows that cointegration between Malaysian Ringgit and
KLCI exist only during post-crisis period. This finding is consistent with Ibrahim (2000).xi
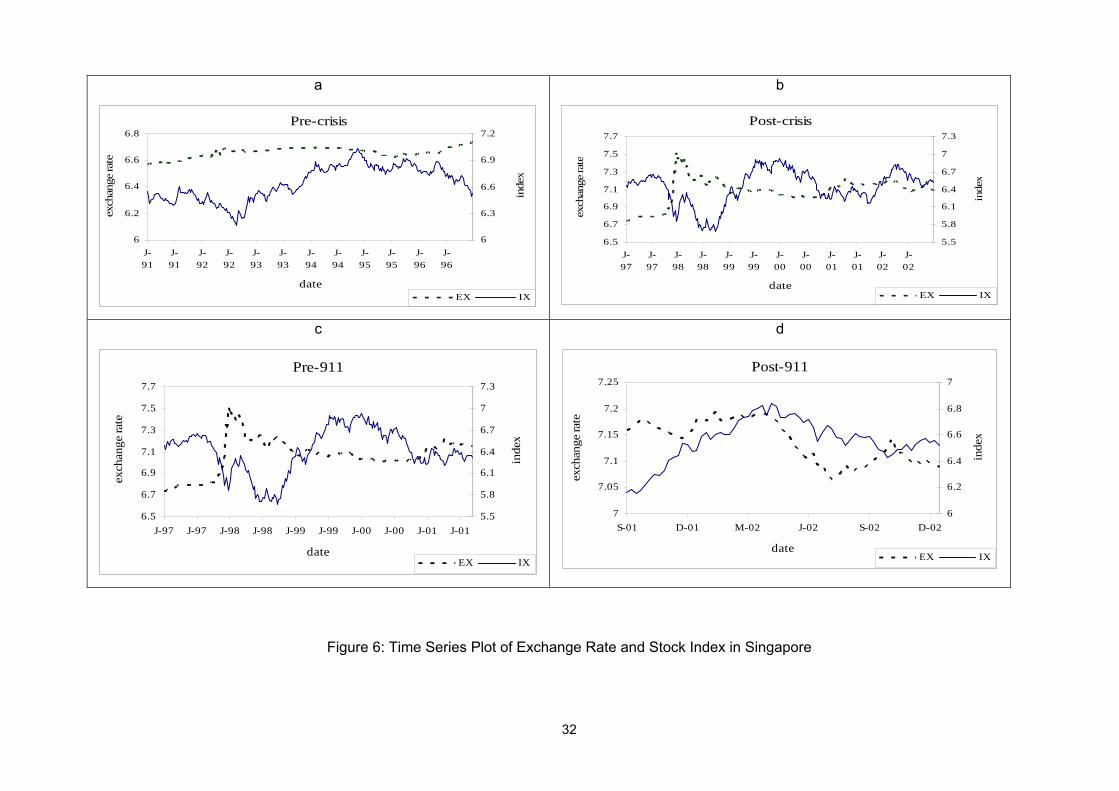
Although Singapore is an open city state economy and does not impose any capital control, its
economy depends largely on trading and investment activities with neighboring countries, mainly
13
Indonesia and Malaysia, as well as US and Europe. Singapore currency is pegged with a ‘basket’
of currencies; this means its currency is weighted in terms of the importance of the countries
concerning Singapore’s trade. The movements in short- and medium-term Singapore exchange
rates are dominated by capital market adjustments in different currencies. If foreign portfolio
holders expect the real return on Singapore financial assets to increase, they will buy Singapore
dollar to buy asset and thereby increase the demand of Singapore dollar. This is true during the
pre-911 period, as shown in Table 4c, Singapore dollar leads Singapore stock index. But this
phenomenon does not last long. During the period of post-911, the Singapore economy has
worsened. This is because of significant decrease in Foreign Direct Investment to Singapore.
When faced with the bitter pill of capital outflows, Singapore maintained the managed floating
exchange rate policy. As a result, we fail to observe any relationship between exchange rate and
stock price after 911-terrorist-attack (Figure 6d). The lack of relationship between Singapore dollar
and stock price can be attributed to Singapore’s small, highly open economy, with low inflation
relative to the rest of the world. Singapore government basically controls its currency exchange
rate, which is pegged against “a basket of currency”, in orders to serve the purpose of its economy
and does not allow future market speculation activities on its currency. These policies are set to
safeguard the danger of the capital market crash, especially while the stock market plummeted
during the crisis due to poor international sentiment. Hence, the capital market and stock market
are not cointegrated nor have any causal relationship during the crisis like other Asian countries.
We observe from Table 4a that the Philippines follows traditional approach in pre-crisis period.
However, during the pre-911 period, the relationship turns out to follow portfolio approach. The
reasons could be during the crisis, the Philippines faces the same situation as other Asian
economies, massive capital outflow causes the stock exchange to experience a great blow of
67.87% which led the Peso to slide 50.93% during the crisis period (see Table 1). Moreover, trade
deficit and inefficient banking system meant that the central bank was unable to maintain it’s a
strong currency value in the market. During the post-911 period, no evidence of causal relationship
is found. Figure 2d confirms this analysis by showing significant change of the stock price
movement and exchange rate fluctuation as compared to Figures 2a, 2b and 2c. As expected, the
Philippines government also imposes capital control and tightens its currency policy in order to
prevent further capital outflow and maintain economic stability. That is why we find that
cointegration between exchange rate and stock price for the Philippines exist only up to the pre-
911 period (see Table 3).
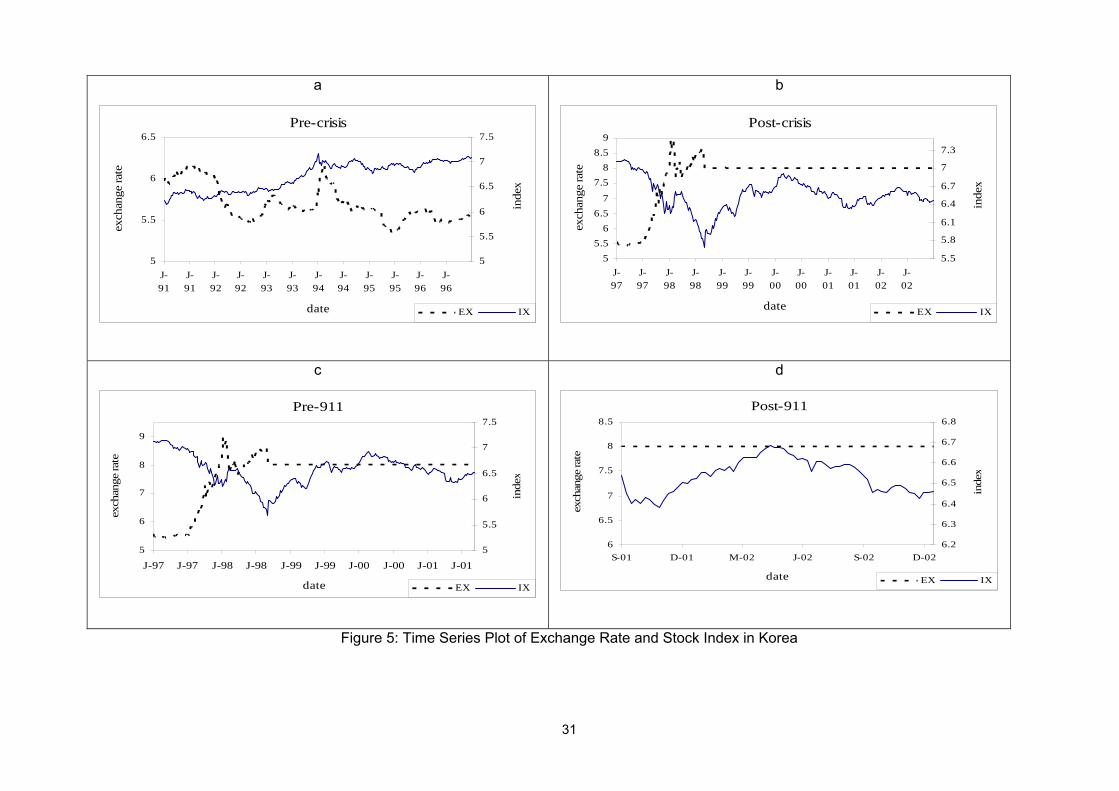
Korea is observed to possess long term strong relationship between stock price and exchange rate
in both pre-911 and post-911 periods. Moreover, Korea is also the only country to be observed to
have stock price Granger causeing exchange rate in the post-911 period (Table 4d). Our analysis
14
is consistent with Min (1999). Korea controlled financial market tightly in early and late 1980s
(Reisen and Yeches, 1991; Park, 1996). This is in line with our study that there is no linkage
between exchange rate and stock price during the pre-crisis period. Evidence from Figure 5a
clearly shows the Korean Won has a stagnant movement and is not fluctuating as much as the
stock index does. However, in 1999 Korea fully implemented the reform plan for capital
liberalization. As a result, the volume of international capital flow increase, particularly portfolio
investment. Also, foreign direct investment (FDI) had been fluctuated and increased in 1996 but
the amount was not significant compared to portfolio investment liabilities. This deregulation by
Korean government strengthens our analysis about feedback relationship between exchange rate
and stock price during the post-crisis period (see Table 4). Capital liberalization leads movement in
capital market and demand for Korean Won. During post-911 period, the feedback relationship
between the two markets still exists. This is due to the capital flight that drags down stock price and
currency depreciation simultaneously.
Thailand, like other developing countries, has not fully implemented an open equity market to
foreigners and is also reluctant to adopt a completely free floating foreign exchange system.
However, interestingly, Thailand is the only country in our study that has long term strong
relationship between stock price and exchange rate in all periods (Table 3). This implies that the
past information of exchange rate can be used to predict the stock price and vice versa. Since
Asian Financial Crisis was first triggered in Thailand, Thai government has taken much concern
about its economy and watched over its capital in- and out-flows. Although the government allowed
the Thai Bath to float on July 2, 1997, we find feedback relationship during the crisis. But, this
situation did not last long. During post-911 period, there is no relationship between stock price and
exchange rate, back to the situation as pre-crisis.
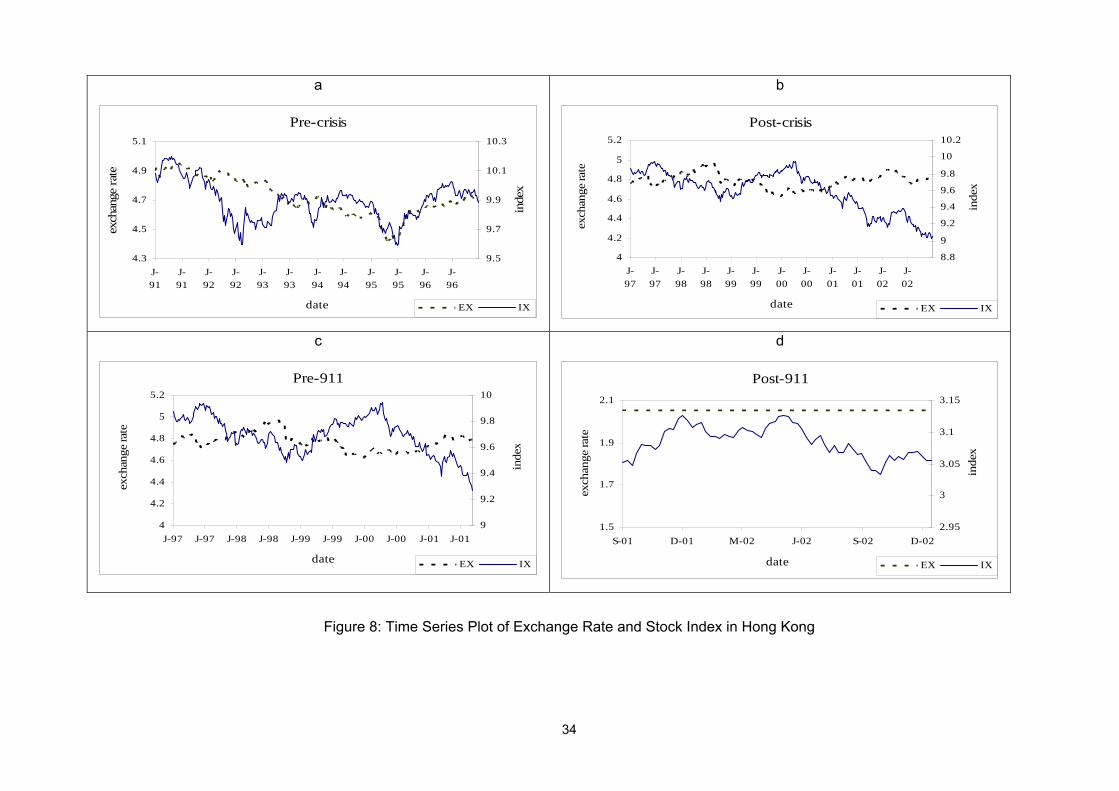
In the pre-crisis period, Hong Kong experienced no interaction between stock index and exchange
rate (see Tables 2 to 4). Even though Hong Kong dollar is pegged against US dollar and only
depreciated 0.82% during the crisis period (see Table 1), Hong Kong has portfolio approach
relationship during the crisis. But, we again find no causality relationship between the two markets
in the post-911 period. As Hong Kong is also considered to be one of the highly open economies
with no capital control, our results basically show that Hong Kong’s exchange rate and stock price
has no interaction with each other. This is mainly because its currency is pegged against US dollar.
For long term, Hong Kong is speculated to have no relationship between its currency and stock
index. Our empirical results show that there is no evidence of cointegration between the two
markets in the post-crisis period (Table 3).xii
15
In general, we find in our study that the relationship between exchange rate and stock prices
become more intense during the Asian Financial Crisis as compared to pre-crisis period. However,
the phenomenon in the post-911 is somewhat reminiscent of the pre-crisis period. This implies that
the Asian Financial Crisis has a more significant and direct impact on relationship between
currency exchanges and stock prices in Asian markets and the 911-terrorist-attack basically has no
effect on these markets. During Asian Financial Crisis, there are strong factors that caused
economic collapse in major Asian countries. Woo (2000) elaborated factors such as: investor
panic, tightening macroeconomic policies and improper handling of the insolvent banks in
Indonesia, Korea and Thailand have been accused to cause a mess in major Asian economies.
Besides, Wong et al. (2003) found that strong tendency of co-movement after Asian Financial
Crisis between emerging markets in Asia has also contributed to regional financial woes. This
statement is also in agreement with the notion contagion effects (or tequila effects) which means
exchange rate crisis in one country that contaminates other countries with proximity and/or similar
level of economic development with economic structure. In particular, we notice that this effect can
be more detrimental to the economy if improper co-ordination occurs in the remedy of the crisis.
Inappropriate government policies during the turmoil will also contribute panic in the market and
lead to sharp withdrawal of funds in a country or a region. The economy will deteriorate further if
political stability in that particular country follows. Min (1999) called this phenomenon the
coordination failure effects.
The cause of Asian Financial Crisis was also highlighted by Krugman (1998a, 1998b). The crisis
also causes many firms to bankruptcy and this magnified vulnerability of financial sector and at the
end, decreases investor confidence. On the other hand, the 911-terrorist-attack is viewed to have
indirect impact from US economy. Further tightening of capital control and government intervention
in financial market has led us to conclude that there is no linkage between stock prices and
currency exchanges at least for short period of time in near future.
7. Conclusion Prior studies based on monthly data have found either little relation can be established between
the two markets or exchange rate leads stock price. In this paper, we apply weekly data to analyze
the problem in the Asian economies. The result indicates that during the pre-crisis and post-911
periods, markets in general are largely characterized by the phenomenon predicted under no
relationship between stock prices and currency exchanges or at least no special patterns in the
cointegration and causality relationships. However, all markets exhibit significant evidence of either
change in exchange rates leads that in stock prices or either market can take the lead (feedback or
bilateral causality) during the Asian Financial Crisis period. This specific phenomenon during the
crisis is mainly due to investor panic, tightening macroeconomic policies and improper handling of
16
the insolvent banks. The notion of contagion effect also cannot be downplayed. This financial
tsunami in 1997 that cause the collapse of stock prices and currency values in major East Asia
countries are believed to be contaminated by Thailand and Korea.
We also find interesting evidences in our study that the relationship between stock prices and
currency rates in post-911 period has somewhat returned to the situation during pre-crisis period.,
We believe this is because major Asian governments have reverted to their policies to tighten
capital movement as compared to early 1990s when barriers to capital movement are gradually
removed. Most Asian countries have experienced capital outflow during the crisis and imposed
regulation that prevent further capital flight in order to restore their economy. Capital movement in
and out of the Asian economies is as beneficial as it is detrimental. The Asian Financial Crisis
certainly has put the stock and the currency markets in a spotlight that suggests financial markets
in the Asian economies need an overhaul.
Last but not least, our empirical research also finds that cointegration or long term relationship
between exchange rates and stock prices in Asian market weakened during the post-911 period.
This leads to the conclusion that the stock markets in this region have become more efficient after
the 911 event.
17
REFERENCES
Abdalla, I. S. A. and Murinde, V., 1997, Exchange Rate and Stock Price Interactions in Emerging
Financial Markets: Evidence on India, Korea, Pakistan, and Philippines, Applied Financial
Economics 7, 25-35.
Aggarwal, R., 1981, Exchange Rates and Stock Prices: A Study of the US Capital Markets Under
Floating Exchange Rates, Akron Business Economic Review 12, 7-12.
Ajayi, R.A. and Mougoue. M., 1996, On the Dynamic Relationship between Stock Prices and
Exchange Rates, Journal of Financial Research 19, 193-207.
Ajayi, R.A., Friedman J. and Mehdian, S. M., 1998, On the Relationship between Stock Returns
and Exchange Rates: Tests of Granger Causality, Global Finance Journal 9, 241-251.
Amihud, Y., 1993, Exchange Rates and the Valuation of Equity Shares, in Y. Amihud and R.
Levich, eds.: Exchange Rates and Corporate Performance (Homewood, Irwin).
Bahmani-Oskooee, M. and Sohrabian, A., 1992, Stock Prices and the Effective Exchange Rate of
the Dollar, Applied Economics 24, 459-464.
Bartov, E. and Bodnar, G.M., 1994, Firm Valuation, Earnings Expectations and the Exchange Rate
Exposure Effect, Journal of Finance 49, 1755-1786.
Bodart, V. and Reding, P., 1999, Exchange Rate Regime, Volatility and International Correlation on
Bond and Stock Markets, Journal of International Money and Finance 18, 133-151.
Bodnar, G.M. and Gentry, W.M., 1993, The Exchange Rate Exposure and Industry Characteristics:
Evidence from Canada, Japan and the US, Journal of International, Monetary and Finance
12, 29-45.
Boyer, R.S., 1977, Devaluation and Portfolio Balance, American Economic Review 67, 54-63.
Chamberlain, S., Howe, J.S. and Popper, H., 1997, The Exchange Rate Exposure of US and
Japanese Banking Institutions, Journal of Banking and Finance 21, 871-892.
Dickey, D.A. and Fuller, W.A., 1979, Distribution of the Estimators for Autoregressive Time Series
with a Unit Root, Journal of American Statistical Association 74, 427-431.
Dickey, D.A. and Fuller, W.A., 1981, Likelihood Ratio Statistics for Auto-regressive Time Series
with Unit Roots, Econometrica 49.
Dornbursh, R. and Fischer, S., 1980, Exchange Rates and Current Account, American Economic
Review 70, 960-971.
Engle, R.F. and Granger, C.W.J., 1987, Cointegration and Error Correction: Representation,
Estimation, and Testing, Econometrica 55, 251-276.
18
Engle, R.F. and Granger, C.W.J., 1991, Long-Run Economic Relationship (Oxford University
Press).
Engle, R.F. and Yoo, S., 1987, Forecasting and Testing in Cointegrated Systems, Journal of
Econometrics 35, 113-159.
Frenkel, P. and Rodriguez, C.A., 1975, Portfolio Equilibrium and the Balance of Payments: A
Monetary Approach, American Economics Review 65, 674-688.
Gavin, M., 1989, The Stock Market and Exchange Rate Dynamics, Journal of International
Monetary and Finance 8, 181-200.
Granger, C.W.J., 1988, Some Recent Developments in a Concept of Causality, Journal of
Econometrics 39, 199–211.
Granger, C.W.J., Huang, B.N. and Yang, C.W., 2000, A Bivariate Causality between Stock Prices
and Exchanges Rates: Evidence from Recent Asian Flu, The Quarterly Review of
Economics and Finance 40, 337-354.
Griffin, J.M. and Stulz, R.M., 2001, International Competition and Exchange Rate Shocks: A Cross-
Country Industry Analysis of Stock Returns, Review of Financial Studies 14, 215 – 241.
He, J. and Ng, L.K., 1998, The Foreign Exchange Exposure of Japanese Multinational
Corporations, Journal of Finance 53, 733-753.
Hsiao, C., 1979, Autoregressive Modeling of Canadian Money and Income Data, Journal of the
American Statistical Society 74, 553-560.
Hsiao, C., 1981, Autoregressive Modeling of Money Income Causality Detection, Journal of
Monetary Economics 7, 85-106.
Ibrahim, M.H., 2000, Cointegration and Granger Causality Tests of Stock Price and Exchange Rate
Interactions in Malaysia, ASEAN Economic Bulletin 17, 36 - 47.
Jorion, P., 1990, The Exchange Exposure of US Multinational Firm, Journal of Business 63, 331-
345.
Jorion, P., 1991, The Pricing of Exchange Rate Risk in the Stock Market, Journal of Financial and
Quantitative Analysis 26, 363 – 376.
Kamin, S.B., 1999, The Current International Financial Crisis: How Much is New? Journal of
International Monetary and Finance 18, 501-514.
Kearney, C., 1998, The Causes of Volatility in Small Internationally Integrated Stock Markets:
Ireland, July 1975-June 1994, Journal of Financial Research 21, 85-104.
Krueger, A.O., 1983, Exchange Rate Determination (Cambridge University Press, Cambridge).
19
Krugman, Paul, 1998a, What Happened to Asia? (http://web.mit.edu/krugman/www/).
Krugman, Paul, 1998b, Will Asia Bounce Back? (http://web.mit.edu/krugman/www/).
Kwack, S.Y., 2000, An Empirical Analysis of Factors Determining the Financial Crisis in Asia,
Journal of Asian Economics 11, 195-206.
Lo, Andrew W. and MacKinlay, A Craig, 1988, Stock Market Prices do not Follow Random Walks:
Evidence from a Simple Specification Test, Review of Financial Studies 1, 41-66.
Ma, C.K. and Kao, G.W., 1990, On Exchange Rate Changes and Stock Price Reactions, Journal of
Business, Finance & Accounting 17, 441-449.
Malliaris, A.G. and Urrutia, J. L., 1992, The International Crash of October 1987: Causality Tests,
Journal of Financial and Quantitative Analysis 27, 353-364.
Min, Byung S., 1999, South Korea’s Financial Crisis in 1997: What Have We Learned? ASEAN
Economic Bulletin 16, 175-189.
Mishkin, F.S., 1999, Lesson from Asian Crisis, Journal of International Money and Finance 18,
709-724.
Nasution, A., 2000, The Meltdown of the Indonesian Economy: Causes, Responses and Lessons,
ASEAN Economic Bulletin 17, 148-162.
Pan, Ming-Shiun, Robert Chi-Wing Fok and Angela Y. Liu, 2000, Dynamic Linkages Between
Exchange Rates and Stock Prices: Evidence from Pacific Rim Countries, Working Paper,
Financial Management Association Annual Meeting.
Park, W.A., 1996, Financial Liberization: The Korean Experience, in Financial Deregulation and
Integration in East Asia, eds.: T.Ito and A. Krueger (The University of Chicago Press,
Chicago).
Phylaktis, K. and Ravazzolo, F., 2000, Stock Prices and Exchange Rates Dynamics, Working
Paper, EFMA Conference, Athens.
Qiao, Y., 1996, Stock Prices and Exchange Rates: Experiences in Leading East Asian Financial
Centres-Tokyo, Hong Kong and Singapore, Singapore Economic Review 41, 47-56.
Reisen, H. and Yeches, H., 1991, Time-varying Estimates on the Openness of the Capital Account
in Korea and Taiwan, Technical Paper 42, (OECD, Paris).
Solnik, B.H., 1984, Stock and Money Variables: The International Evidence, Financial Analyst
Journal, 69-73.
Stock, J., 1987, Asymptotic Properties of Least Squares Estimators of Cointegrating Vectors,
Econometrica 55, 381-386.
20
Wong, W.K., Penm, J., Terrell, R.D. and Lim, K., 2003, The Relationship between Stock Markets of
Major Developed Countries and Asian Emerging Markets, Journal of Applied Mathematics
& Decision Sciences, forthcoming.
Woo, W.T., 2000, The Asian Financial Crisis: Hindsight, Insight, Foresight, ASEAN Economic
Bulletin 17, 113-119.
21
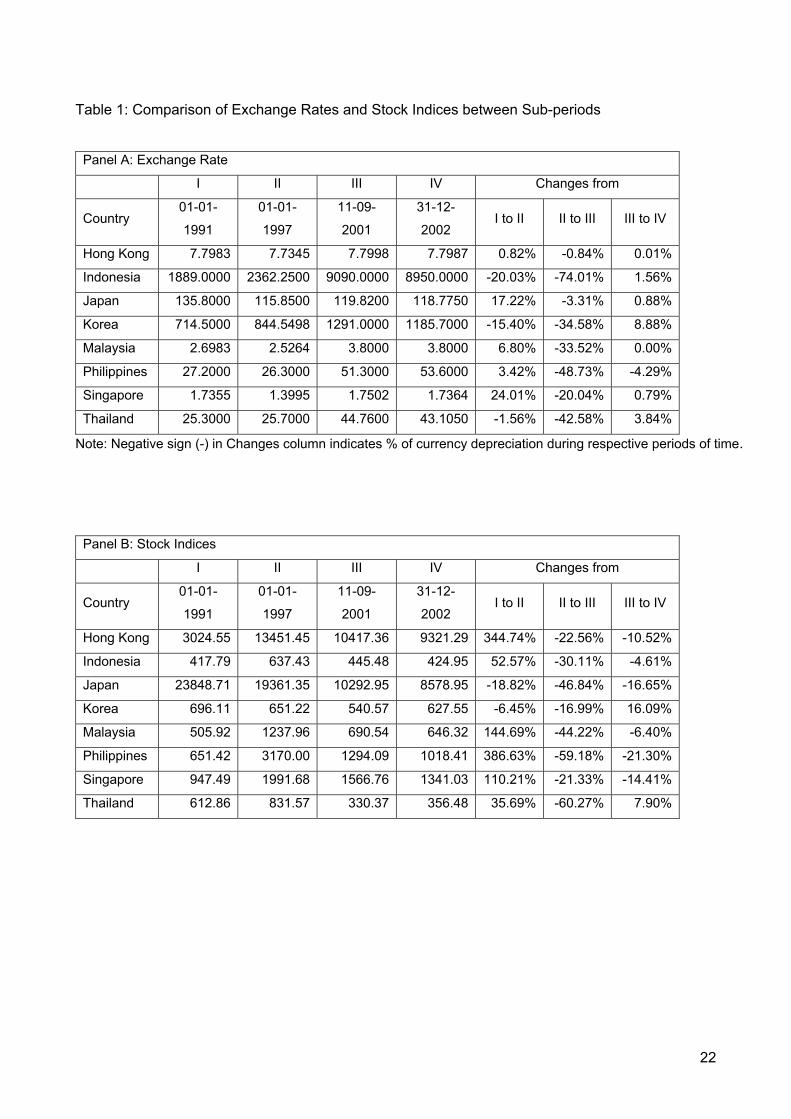
Table 1: Comparison of Exchange Rates and Stock Indices between Sub-periods
Panel A: Exchange Rate I II III IV Changes from
Country 01-01-
1991
01-01-
1997
11-09-
2001
31-12-
2002 I to II II to III III to IV
Hong Kong 7.7983 7.7345 7.7998 7.7987 0.82% -0.84% 0.01%
Indonesia 1889.0000 2362.2500 9090.0000 8950.0000 -20.03% -74.01% 1.56%
Japan 135.8000 115.8500 119.8200 118.7750 17.22% -3.31% 0.88%
Korea 714.5000 844.5498 1291.0000 1185.7000 -15.40% -34.58% 8.88%
Malaysia 2.6983 2.5264 3.8000 3.8000 6.80% -33.52% 0.00%
Philippines 27.2000 26.3000 51.3000 53.6000 3.42% -48.73% -4.29%
Singapore 1.7355 1.3995 1.7502 1.7364 24.01% -20.04% 0.79%
Thailand 25.3000 25.7000 44.7600 43.1050 -1.56% -42.58% 3.84%
Note: Negative sign (-) in Changes column indicates % of currency depreciation during respective periods of time.
Panel B: Stock Indices I II III IV Changes from
Country 01-01-
1991
01-01-
1997
11-09-
2001
31-12-
2002 I to II II to III III to IV
Hong Kong 3024.55 13451.45 10417.36 9321.29 344.74% -22.56% -10.52%
Indonesia 417.79 637.43 445.48 424.95 52.57% -30.11% -4.61%
Japan 23848.71 19361.35 10292.95 8578.95 -18.82% -46.84% -16.65%
Korea 696.11 651.22 540.57 627.55 -6.45% -16.99% 16.09%
Malaysia 505.92 1237.96 690.54 646.32 144.69% -44.22% -6.40%
Philippines 651.42 3170.00 1294.09 1018.41 386.63% -59.18% -21.30%
Singapore 947.49 1991.68 1566.76 1341.03 110.21% -21.33% -14.41%
Thailand 612.86 831.57 330.37 356.48 35.69% -60.27% 7.90%
22
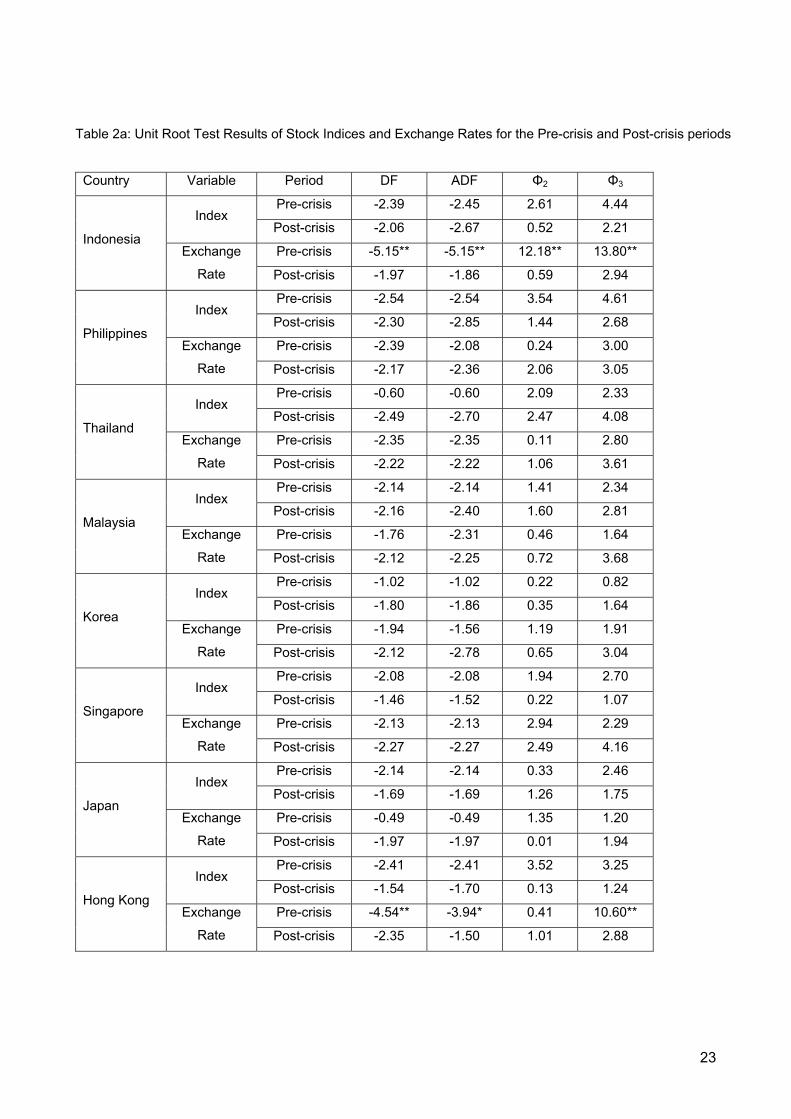
Table 2a: Unit Root Test Results of Stock Indices and Exchange Rates for the Pre-crisis and Post-crisis periods
Country Variable Period DF ADF Φ2 Φ3
Pre-crisis -2.39 -2.45 2.61 4.44 Index
Post-crisis -2.06 -2.67 0.52 2.21
Pre-crisis -5.15** -5.15** 12.18** 13.80** Indonesia
Exchange
Rate Post-crisis -1.97 -1.86 0.59 2.94
Pre-crisis -2.54 -2.54 3.54 4.61 Index
Post-crisis -2.30 -2.85 1.44 2.68
Pre-crisis -2.39 -2.08 0.24 3.00 Philippines
Exchange
Rate Post-crisis -2.17 -2.36 2.06 3.05
Pre-crisis -0.60 -0.60 2.09 2.33 Index
Post-crisis -2.49 -2.70 2.47 4.08
Pre-crisis -2.35 -2.35 0.11 2.80 Thailand
Exchange
Rate Post-crisis -2.22 -2.22 1.06 3.61
Pre-crisis -2.14 -2.14 1.41 2.34 Index
Post-crisis -2.16 -2.40 1.60 2.81
Pre-crisis -1.76 -2.31 0.46 1.64 Malaysia
Exchange
Rate Post-crisis -2.12 -2.25 0.72 3.68
Pre-crisis -1.02 -1.02 0.22 0.82 Index
Post-crisis -1.80 -1.86 0.35 1.64
Pre-crisis -1.94 -1.56 1.19 1.91 Korea
Exchange
Rate Post-crisis -2.12 -2.78 0.65 3.04
Pre-crisis -2.08 -2.08 1.94 2.70 Index
Post-crisis -1.46 -1.52 0.22 1.07
Pre-crisis -2.13 -2.13 2.94 2.29 Singapore
Exchange
Rate Post-crisis -2.27 -2.27 2.49 4.16
Pre-crisis -2.14 -2.14 0.33 2.46 Index
Post-crisis -1.69 -1.69 1.26 1.75
Pre-crisis -0.49 -0.49 1.35 1.20 Japan
Exchange
Rate Post-crisis -1.97 -1.97 0.01 1.94
Pre-crisis -2.41 -2.41 3.52 3.25 Index
Post-crisis -1.54 -1.70 0.13 1.24
Pre-crisis -4.54** -3.94* 0.41 10.60** Hong Kong
Exchange
Rate Post-crisis -2.35 -1.50 1.01 2.88
23
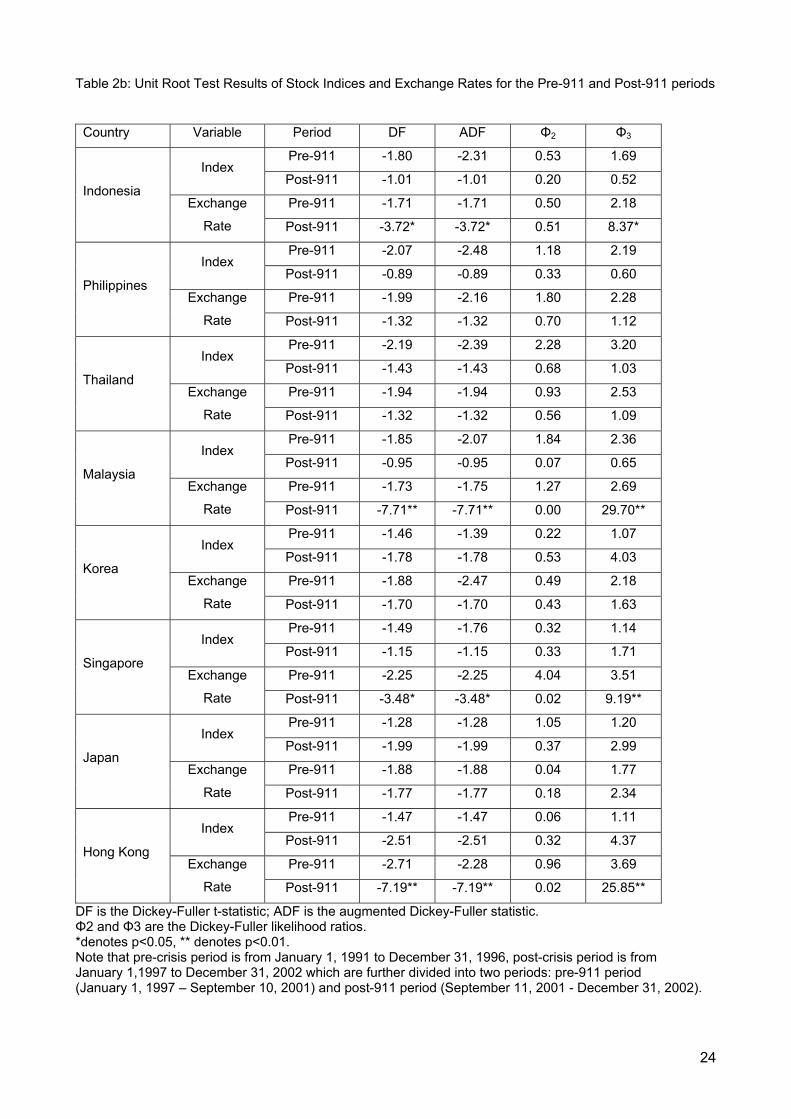
Table 2b: Unit Root Test Results of Stock Indices and Exchange Rates for the Pre-911 and Post-911 periods
Country Variable Period DF ADF Φ2 Φ3
Pre-911 -1.80 -2.31 0.53 1.69 Index
Post-911 -1.01 -1.01 0.20 0.52
Pre-911 -1.71 -1.71 0.50 2.18 Indonesia
Exchange
Rate Post-911 -3.72* -3.72* 0.51 8.37*
Pre-911 -2.07 -2.48 1.18 2.19 Index
Post-911 -0.89 -0.89 0.33 0.60
Pre-911 -1.99 -2.16 1.80 2.28 Philippines
Exchange
Rate Post-911 -1.32 -1.32 0.70 1.12
Pre-911 -2.19 -2.39 2.28 3.20 Index
Post-911 -1.43 -1.43 0.68 1.03
Pre-911 -1.94 -1.94 0.93 2.53 Thailand
Exchange
Rate Post-911 -1.32 -1.32 0.56 1.09
Pre-911 -1.85 -2.07 1.84 2.36 Index
Post-911 -0.95 -0.95 0.07 0.65
Pre-911 -1.73 -1.75 1.27 2.69 Malaysia
Exchange
Rate Post-911 -7.71** -7.71** 0.00 29.70**
Pre-911 -1.46 -1.39 0.22 1.07 Index
Post-911 -1.78 -1.78 0.53 4.03
Pre-911 -1.88 -2.47 0.49 2.18 Korea
Exchange
Rate Post-911 -1.70 -1.70 0.43 1.63
Pre-911 -1.49 -1.76 0.32 1.14 Index
Post-911 -1.15 -1.15 0.33 1.71
Pre-911 -2.25 -2.25 4.04 3.51 Singapore
Exchange
Rate Post-911 -3.48* -3.48* 0.02 9.19**
Pre-911 -1.28 -1.28 1.05 1.20 Index
Post-911 -1.99 -1.99 0.37 2.99
Pre-911 -1.88 -1.88 0.04 1.77 Japan
Exchange
Rate Post-911 -1.77 -1.77 0.18 2.34
Pre-911 -1.47 -1.47 0.06 1.11 Index
Post-911 -2.51 -2.51 0.32 4.37
Pre-911 -2.71 -2.28 0.96 3.69 Hong Kong
Exchange
Rate Post-911 -7.19** -7.19** 0.02 25.85**
DF is the Dickey-Fuller t-statistic; ADF is the augmented Dickey-Fuller statistic. Φ2 and Φ3 are the Dickey-Fuller likelihood ratios. *denotes p<0.05, ** denotes p<0.01. Note that pre-crisis period is from January 1, 1991 to December 31, 1996, post-crisis period is from January 1,1997 to December 31, 2002 which are further divided into two periods: pre-911 period (January 1, 1997 – September 10, 2001) and post-911 period (September 11, 2001 - December 31, 2002).
24
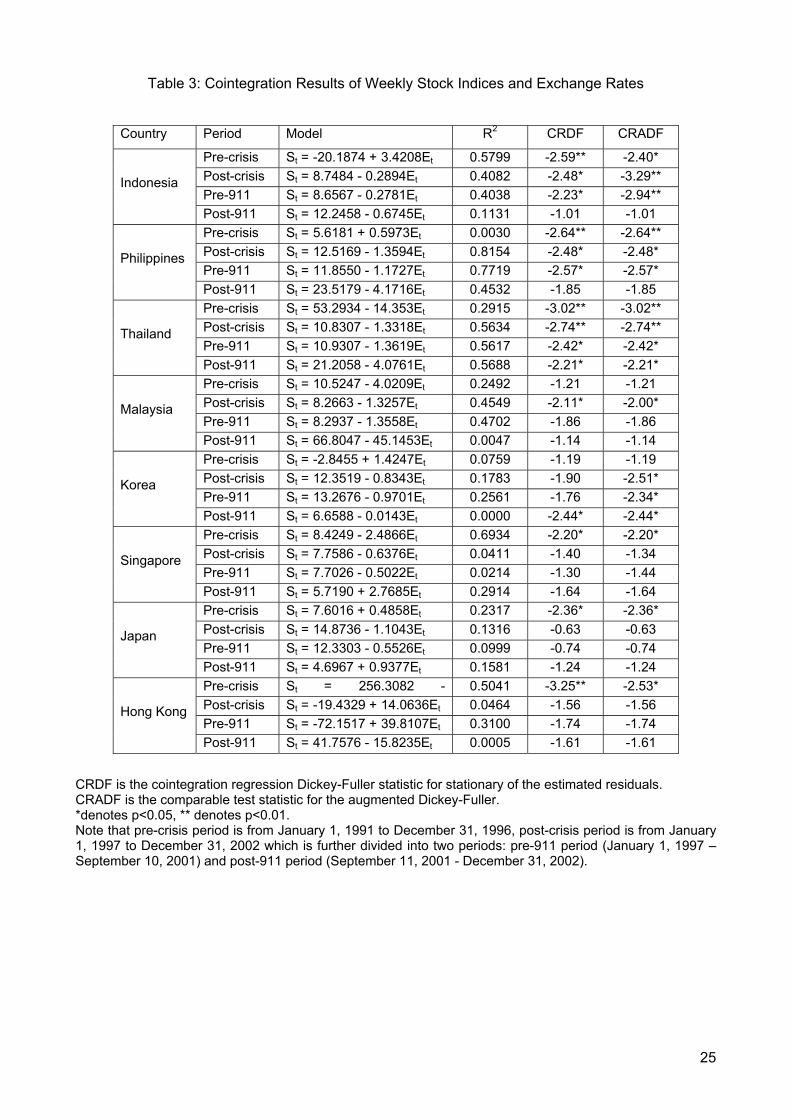
Table 3: Cointegration Results of Weekly Stock Indices and Exchange Rates
Country Period Model R2 CRDF CRADF
Pre-crisis St = -20.1874 + 3.4208Et 0.5799 -2.59** -2.40* Post-crisis St = 8.7484 - 0.2894Et 0.4082 -2.48* -3.29** Pre-911 St = 8.6567 - 0.2781Et 0.4038 -2.23* -2.94**
Indonesia
Post-911 St = 12.2458 - 0.6745Et 0.1131 -1.01 -1.01 Pre-crisis St = 5.6181 + 0.5973Et 0.0030 -2.64** -2.64** Post-crisis St = 12.5169 - 1.3594Et 0.8154 -2.48* -2.48* Pre-911 St = 11.8550 - 1.1727Et 0.7719 -2.57* -2.57*
Philippines
Post-911 St = 23.5179 - 4.1716Et 0.4532 -1.85 -1.85 Pre-crisis St = 53.2934 - 14.353Et 0.2915 -3.02** -3.02** Post-crisis St = 10.8307 - 1.3318Et 0.5634 -2.74** -2.74** Pre-911 St = 10.9307 - 1.3619Et 0.5617 -2.42* -2.42*
Thailand
Post-911 St = 21.2058 - 4.0761Et 0.5688 -2.21* -2.21* Pre-crisis St = 10.5247 - 4.0209Et 0.2492 -1.21 -1.21 Post-crisis St = 8.2663 - 1.3257Et 0.4549 -2.11* -2.00* Pre-911 St = 8.2937 - 1.3558Et 0.4702 -1.86 -1.86
Malaysia
Post-911 St = 66.8047 - 45.1453Et 0.0047 -1.14 -1.14 Pre-crisis St = -2.8455 + 1.4247Et 0.0759 -1.19 -1.19 Post-crisis St = 12.3519 - 0.8343Et 0.1783 -1.90 -2.51* Pre-911 St = 13.2676 - 0.9701Et 0.2561 -1.76 -2.34*
Korea
Post-911 St = 6.6588 - 0.0143Et 0.0000 -2.44* -2.44* Pre-crisis St = 8.4249 - 2.4866Et 0.6934 -2.20* -2.20* Post-crisis St = 7.7586 - 0.6376Et 0.0411 -1.40 -1.34 Pre-911 St = 7.7026 - 0.5022Et 0.0214 -1.30 -1.44
Singapore
Post-911 St = 5.7190 + 2.7685Et 0.2914 -1.64 -1.64 Pre-crisis St = 7.6016 + 0.4858Et 0.2317 -2.36* -2.36* Post-crisis St = 14.8736 - 1.1043Et 0.1316 -0.63 -0.63 Pre-911 St = 12.3303 - 0.5526Et 0.0999 -0.74 -0.74
Japan
Post-911 St = 4.6967 + 0.9377Et 0.1581 -1.24 -1.24 Pre-crisis St = 256.3082 - 0.5041 -3.25** -2.53* Post-crisis St = -19.4329 + 14.0636Et 0.0464 -1.56 -1.56 Pre-911 St = -72.1517 + 39.8107Et 0.3100 -1.74 -1.74
Hong Kong
Post-911 St = 41.7576 - 15.8235Et 0.0005 -1.61 -1.61
CRDF is the cointegration regression Dickey-Fuller statistic for stationary of the estimated residuals. CRADF is the comparable test statistic for the augmented Dickey-Fuller. *denotes p<0.05, ** denotes p<0.01. Note that pre-crisis period is from January 1, 1991 to December 31, 1996, post-crisis period is from January 1, 1997 to December 31, 2002 which is further divided into two periods: pre-911 period (January 1, 1997 – September 10, 2001) and post-911 period (September 11, 2001 - December 31, 2002).
25
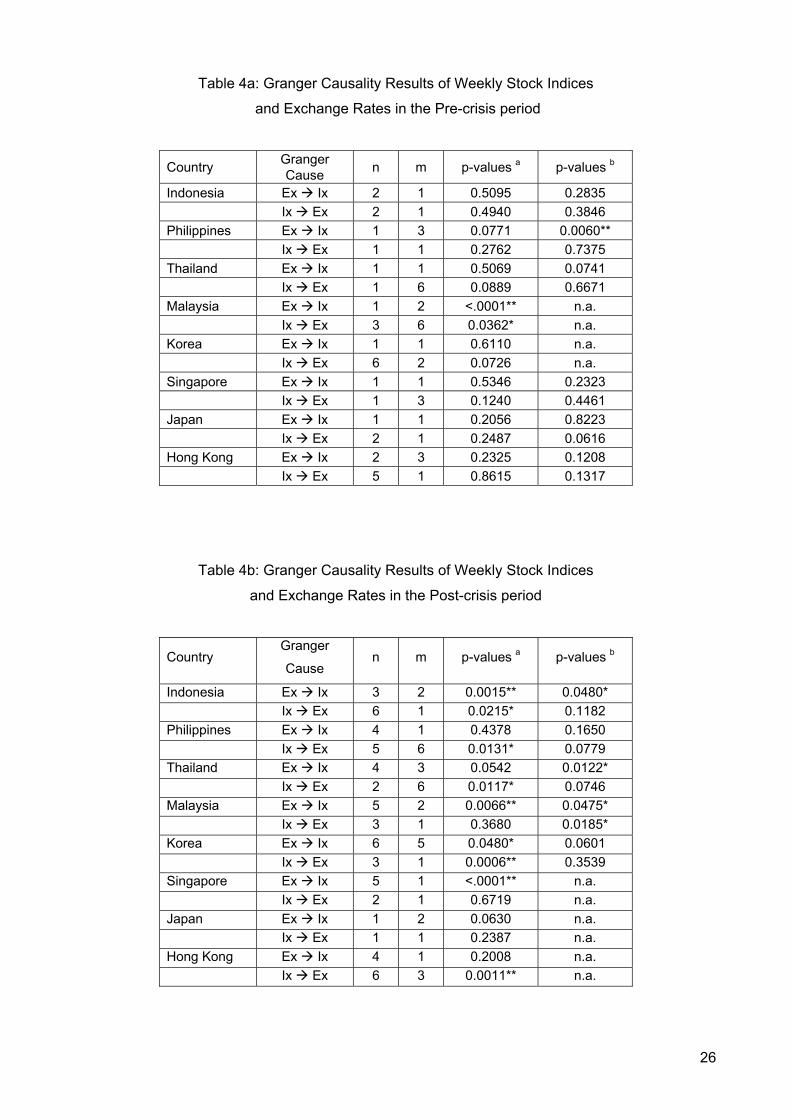
Table 4a: Granger Causality Results of Weekly Stock Indices
and Exchange Rates in the Pre-crisis period
Country Granger Cause n m p-values a p-values b
Indonesia Ex Ix 2 1 0.5095 0.2835 Ix Ex 2 1 0.4940 0.3846 Philippines Ex Ix 1 3 0.0771 0.0060** Ix Ex 1 1 0.2762 0.7375 Thailand Ex Ix 1 1 0.5069 0.0741 Ix Ex 1 6 0.0889 0.6671 Malaysia Ex Ix 1 2 <.0001** n.a. Ix Ex 3 6 0.0362* n.a. Korea Ex Ix 1 1 0.6110 n.a. Ix Ex 6 2 0.0726 n.a. Singapore Ex Ix 1 1 0.5346 0.2323 Ix Ex 1 3 0.1240 0.4461 Japan Ex Ix 1 1 0.2056 0.8223 Ix Ex 2 1 0.2487 0.0616 Hong Kong Ex Ix 2 3 0.2325 0.1208 Ix Ex 5 1 0.8615 0.1317
Table 4b: Granger Causality Results of Weekly Stock Indices
and Exchange Rates in the Post-crisis period
Country Granger
Cause n m p-values a p-values b
Indonesia Ex Ix 3 2 0.0015** 0.0480* Ix Ex 6 1 0.0215* 0.1182 Philippines Ex Ix 4 1 0.4378 0.1650 Ix Ex 5 6 0.0131* 0.0779 Thailand Ex Ix 4 3 0.0542 0.0122* Ix Ex 2 6 0.0117* 0.0746 Malaysia Ex Ix 5 2 0.0066** 0.0475* Ix Ex 3 1 0.3680 0.0185* Korea Ex Ix 6 5 0.0480* 0.0601 Ix Ex 3 1 0.0006** 0.3539 Singapore Ex Ix 5 1 <.0001** n.a. Ix Ex 2 1 0.6719 n.a. Japan Ex Ix 1 2 0.0630 n.a. Ix Ex 1 1 0.2387 n.a. Hong Kong Ex Ix 4 1 0.2008 n.a. Ix Ex 6 3 0.0011** n.a.
26
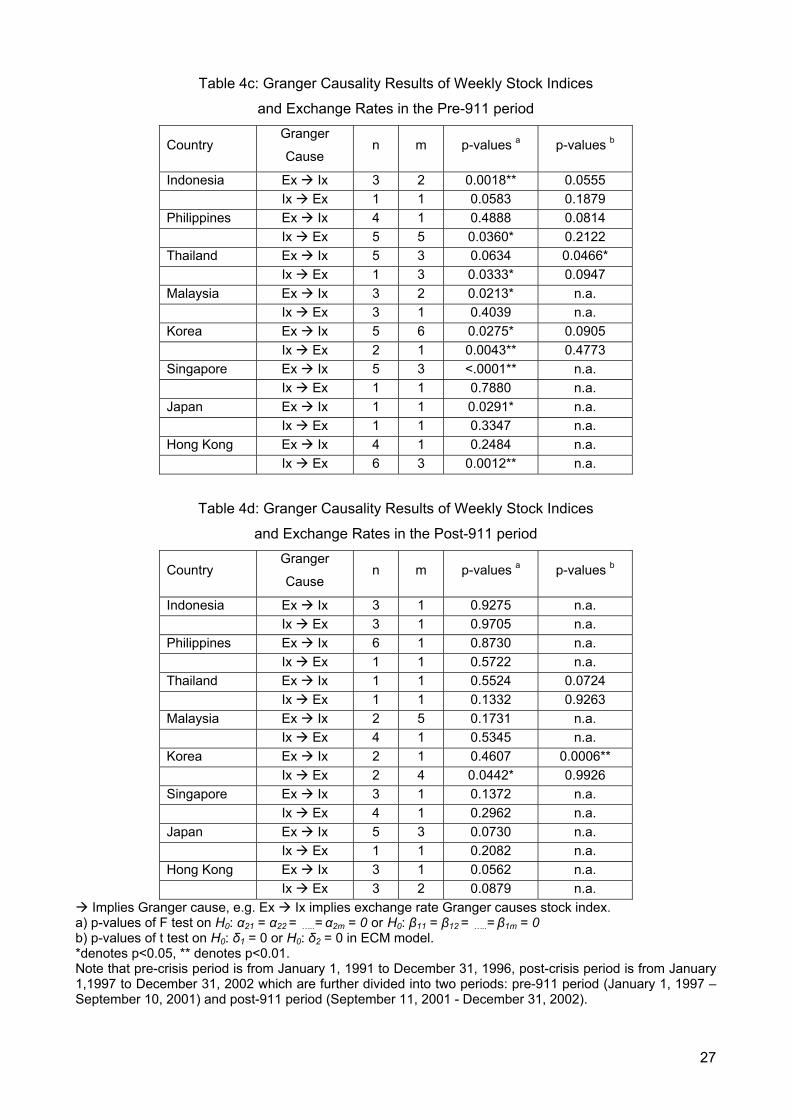
Table 4c: Granger Causality Results of Weekly Stock Indices
and Exchange Rates in the Pre-911 period
Country Granger
Cause n m p-values a p-values b
Indonesia Ex Ix 3 2 0.0018** 0.0555 Ix Ex 1 1 0.0583 0.1879 Philippines Ex Ix 4 1 0.4888 0.0814 Ix Ex 5 5 0.0360* 0.2122 Thailand Ex Ix 5 3 0.0634 0.0466* Ix Ex 1 3 0.0333* 0.0947 Malaysia Ex Ix 3 2 0.0213* n.a. Ix Ex 3 1 0.4039 n.a. Korea Ex Ix 5 6 0.0275* 0.0905 Ix Ex 2 1 0.0043** 0.4773 Singapore Ex Ix 5 3 <.0001** n.a. Ix Ex 1 1 0.7880 n.a. Japan Ex Ix 1 1 0.0291* n.a. Ix Ex 1 1 0.3347 n.a. Hong Kong Ex Ix 4 1 0.2484 n.a. Ix Ex 6 3 0.0012** n.a.
Table 4d: Granger Causality Results of Weekly Stock Indices
and Exchange Rates in the Post-911 period
Country Granger
Cause n m p-values a p-values b
Indonesia Ex Ix 3 1 0.9275 n.a. Ix Ex 3 1 0.9705 n.a. Philippines Ex Ix 6 1 0.8730 n.a. Ix Ex 1 1 0.5722 n.a. Thailand Ex Ix 1 1 0.5524 0.0724 Ix Ex 1 1 0.1332 0.9263 Malaysia Ex Ix 2 5 0.1731 n.a. Ix Ex 4 1 0.5345 n.a. Korea Ex Ix 2 1 0.4607 0.0006** Ix Ex 2 4 0.0442* 0.9926 Singapore Ex Ix 3 1 0.1372 n.a. Ix Ex 4 1 0.2962 n.a. Japan Ex Ix 5 3 0.0730 n.a. Ix Ex 1 1 0.2082 n.a. Hong Kong Ex Ix 3 1 0.0562 n.a. Ix Ex 3 2 0.0879 n.a.
Implies Granger cause, e.g. Ex Ix implies exchange rate Granger causes stock index. a) p-values of F test on H0: α21 = α22 = …..= α2m = 0 or H0: β11 = β12 = …..= β1m = 0 b) p-values of t test on H0: δ1 = 0 or H0: δ2 = 0 in ECM model. *denotes p<0.05, ** denotes p<0.01. Note that pre-crisis period is from January 1, 1991 to December 31, 1996, post-crisis period is from January 1,1997 to December 31, 2002 which are further divided into two periods: pre-911 period (January 1, 1997 – September 10, 2001) and post-911 period (September 11, 2001 - December 31, 2002).
27
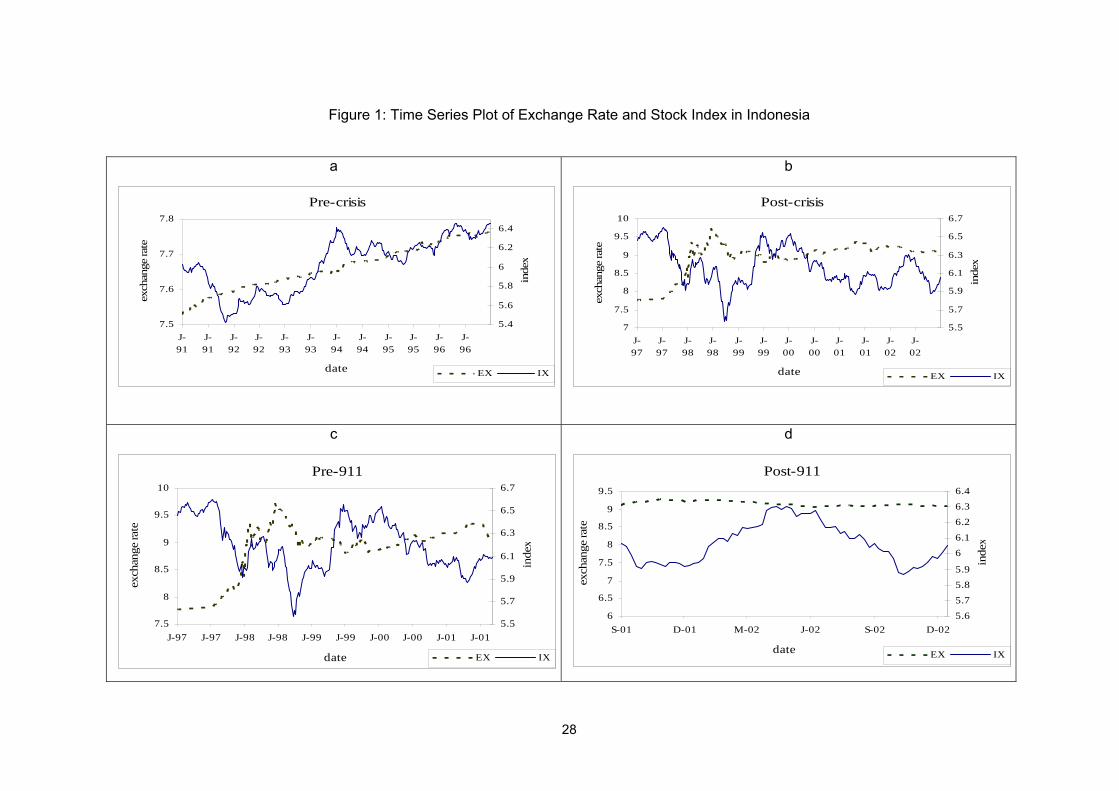
Figure 1: Time Series Plot of Exchange Rate and Stock Index in Indonesia
a
Pre-crisis
7.5
7.6
7.7
7.8
J-91
J-91
J-92
J-92
J-93
J-93
J-94
J-94
J-95
J-95
J-96
J-96
date
exch
ange
rate
5.4
5.6
5.8
6
6.2
6.4
inde
x
EX IX
b
Post-crisis
7
7.5
8
8.5
9
9.5
10
J-97
J-97
J-98
J-98
J-99
J-99
J-00
J-00
J-01
J-01
J-02
J-02
date
exch
ange
rate
5.5
5.7
5.9
6.1
6.3
6.5
6.7
inde
x
EX IX
c
Pre-911
7.5
8
8.5
9
9.5
10
J-97 J-97 J-98 J-98 J-99 J-99 J-00 J-00 J-01 J-01
date
exch
ange
rate
5.5
5.7
5.9
6.1
6.3
6.5
6.7
inde
x
EX IX
d
Post-911
6
6.5
7
7.5
8
8.5
9
9.5
S-01 D-01 M-02 J-02 S-02 D-02
date
exch
ange
rate
5.65.75.85.9
66.1
6.26.36.4
inde
x
EX IX
28
Figure 2: Time Series Plot of Exchange Rate and Stock Index in Philippines
a
Pre-crisis
4.6
4.7
4.8
4.9
5
5.1
J-91
J-91
J-92
J-92
J-93
J-93
J-94
J-94
J-95
J-95
J-96
J-96
date
exch
ange
rate
6
6.5
7
7.5
8
8.5
inde
x
EX IX
b
Post-crisis
4.64.8
55.25.45.65.8
66.2
J-97
J-97
J-98
J-98
J-99
J-99
J-00
J-00
J-01
J-01
J-02
J-02
date
exch
ange
rate
6.56.76.97.17.37.57.77.98.18.3
inde
x
EX IX
c
Pre-911
4.64.8
55.2
5.45.6
5.8
6
6.2
J-97 J-97 J-98 J-98 J-99 J-99 J-00 J-00 J-01 J-01
date
exch
ange
rate
6.56.76.97.17.37.57.77.98.18.3
inde
x
EX IX
d
Post-911
5.5
5.6
5.7
5.8
5.9
6
S-01 D-01 M-02 J-02 S-02 D-02
date
exch
ange
rate
6.6
6.8
7
7.2
7.4
inde
x
EX IX
Figure 3: Time Series Plot of Exchange Rate and Stock Index in Thailand
29
a
Pre-crisis
3.18
3.2
3.22
3.24
3.26
J-91
J-91
J-92
J-92
J-93
J-93
J-94
J-94
J-95
J-95
J-96
J-96
date
exch
ange
rate
6.26.46.66.877.27.47.6
inde
x
EX IX
b
Post-crisis
3
3.2
3.4
3.6
3.8
4
4.2
J-97
J-97
J-98
J-98
J-99
J-99
J-00
J-00
J-01
J-01
J-02
J-02
date
exch
ange
rate
5
5.5
6
6.5
7
inde
x
EX IX
c
Pre-911
3
3.2
3.4
3.6
3.8
4
4.2
J-97 J-97 J-98 J-98 J-99 J-99 J-00 J-00 J-01 J-01
date
exch
ange
rate
5
5.5
6
6.5
7
inde
x
EX IX
d
Post-911
3.65
3.68
3.71
3.74
3.77
3.8
3.83
S-01 D-01 M-02 J-02 S-02 D-02
date
exch
ange
rate
5.5
5.6
5.7
5.8
5.9
6
6.1
inde
x
EX IX
Figure 4: Time Series Plot of Exchange Rate and Stock Index in Malaysia
30
a
Pre-crisis
5
5.5
6
6.5
J-91
J-91
J-92
J-92
J-93
J-93
J-94
J-94
J-95
J-95
J-96
J-96
date
exch
ange
rate
5
5.5
6
6.5
7
7.5
inde
x
EX IX
b
Post-crisis
55.5
66.5
77.5
88.5
9
J-97
J-97
J-98
J-98
J-99
J-99
J-00
J-00
J-01
J-01
J-02
J-02
date
exch
ange
rate
5.5
5.8
6.1
6.4
6.7
7
7.3
inde
x
EX IX
c
Pre-911
5
6
7
8
9
J-97 J-97 J-98 J-98 J-99 J-99 J-00 J-00 J-01 J-01
date
exch
ange
rate
5
5.5
6
6.5
7
7.5
inde
x
EX IX
d
Post-911
6
6.5
7
7.5
8
8.5
S-01 D-01 M-02 J-02 S-02 D-02
dateex
chan
ge ra
te
6.2
6.3
6.4
6.5
6.6
6.7
6.8
inde
x
EX IX
Figure 5: Time Series Plot of Exchange Rate and Stock Index in Korea
31
a
Pre-crisis
6
6.2
6.4
6.6
6.8
J-91
J-91
J-92
J-92
J-93
J-93
J-94
J-94
J-95
J-95
J-96
J-96
date
exch
ange
rate
6
6.3
6.6
6.9
7.2
inde
x
EX IX
b
Post-crisis
6.5
6.7
6.9
7.1
7.3
7.5
7.7
J-97
J-97
J-98
J-98
J-99
J-99
J-00
J-00
J-01
J-01
J-02
J-02
date
exch
ange
rate
5.5
5.8
6.1
6.4
6.7
7
7.3
inde
x
EX IX
c
Pre-911
6.5
6.7
6.9
7.1
7.3
7.5
7.7
J-97 J-97 J-98 J-98 J-99 J-99 J-00 J-00 J-01 J-01
date
exch
ange
rate
5.5
5.8
6.1
6.4
6.7
7
7.3
inde
x
EX IX
d
Post-911
7
7.05
7.1
7.15
7.2
7.25
S-01 D-01 M-02 J-02 S-02 D-02
date
exch
ange
rate
6
6.2
6.4
6.6
6.8
7
inde
x
EX IX
Figure 6: Time Series Plot of Exchange Rate and Stock Index in Singapore
32
a
Pre-crisis
2
2.5
3
3.5
4
4.5
5
J-91
J-91
J-92
J-92
J-93
J-93
J-94
J-94
J-95
J-95
J-96
J-96
date
exch
ange
rate
6.5
6.8
7.1
7.4
7.7
8
inde
x
EX IX
b
Post-crisis
2
3
4
5
6
7
8
J-97
J-97
J-98
J-98
J-99
J-99
J-00
J-00
J-01
J-01
J-02
J-02
date
exch
ange
rate
6.6
6.9
7.2
7.5
7.8
inde
x
EX IX
c
Pre-911
2
3
4
5
6
7
8
J-97 J-97 J-98 J-98 J-99 J-99 J-00 J-00 J-01 J-01
date
exch
ange
rate
6.5
6.7
6.9
7.1
7.3
7.5
7.7
7.9
inde
x
EX IX
d
Post-911
4
5
6
7
8
S-01 D-01 M-02 J-02 S-02 D-02
date
exch
ange
rate
7
7.1
7.2
7.3
7.4
7.5
7.6
inde
x
EX IX
Figure 7: Time Series Plot of Exchange Rate and Stock Index in Japan
33
a
Pre-crisis
4.3
4.5
4.7
4.9
5.1
J-91
J-91
J-92
J-92
J-93
J-93
J-94
J-94
J-95
J-95
J-96
J-96
date
exch
ange
rate
9.5
9.7
9.9
10.1
10.3
inde
x
EX IX
b
Post-crisis
4
4.2
4.4
4.6
4.8
5
5.2
J-97
J-97
J-98
J-98
J-99
J-99
J-00
J-00
J-01
J-01
J-02
J-02
date
exch
ange
rate
8.8
9
9.2
9.4
9.6
9.8
10
10.2
inde
x
EX IX
c
Pre-911
4
4.2
4.4
4.6
4.8
5
5.2
J-97 J-97 J-98 J-98 J-99 J-99 J-00 J-00 J-01 J-01
date
exch
ange
rate
9
9.2
9.4
9.6
9.8
10
inde
x
EX IX
d
Post-911
1.5
1.7
1.9
2.1
S-01 D-01 M-02 J-02 S-02 D-02
date
exch
ange
rate
2.95
3
3.05
3.1
3.15
inde
x
EX IX
Figure 8: Time Series Plot of Exchange Rate and Stock Index in Hong Kong
34
a
Pre-crisis
2.04
2.05
2.06
J-91
J-91
J-92
J-92
J-93
J-93
J-94
J-94
J-95
J-95
J-96
J-96
date
exch
ange
rate
2.5
2.7
2.9
3.1
3.3
inde
x
EX IX
b
Post-crisis
1.5
1.6
1.7
1.8
1.9
2
2.1
J-97
J-97
J-98
J-98
J-99
J-99
J-00
J-00
J-01
J-01
J-02
J-02
date
exch
ange
rate
2.7
2.8
2.9
3
3.1
3.2
3.3
inde
x
EX IX
c
Pre-911
1.5
1.6
1.7
1.8
1.9
2
2.1
J-97 J-97 J-98 J-98 J-99 J-99 J-00 J-00 J-01 J-01
date
exch
ange
rate
2.7
2.8
2.9
3
3.1
3.2
3.3
inde
x
EX IX
d
Post-911
1.5
1.7
1.9
2.1
S-01 D-01 M-02 J-02 S-02 D-02
date
exch
ange
rate
2.95
3
3.05
3.1
3.15
inde
x
EX IX
35
NOTES
tE tS∇
i For an intuitive explanation of the portfolio approach, see Krueger (1983, pp.81-91). Other related works
include, Frenkel and Rodriguez (1975) and Boyer (1977). ii The results of using July, 1 as cut-off point are available on request. iii Engle and Granger (1987) suggest that the CRDW test might be used to obtain a quick approximate result.
The power of the CRDW test is greater than the DF type tests for the case where the alternative hypothesis
is a simple stationary first-order autoregressive process but is sensitive to the dynamic structure of the error
term. Thus CRDW test is not a reliable test for cointegration. iv Engle and Granger have tabulated these critical values for the case where p=0 (CRDF) and for p>0
(CRADF) for the bivariate regression with a sample of 100 observations while Engle and Yoo (1987) have
provided critical values for samples varying from 50 to 200 observations. One may refer to Manzur et al.
(1999) for more detail in the cointegration modeling. v The conditions that∇ and are stationary is necessary for the validity of the statistic. vi We tested for I(1) versus I(2) for all series and conclude that all series are I(1). The results are available on
request. vii All countries except Thailand and Korea both have marginally cointegration relationship at the 10% level. viii Refer to section 3. ix The results show that exchange rate and stock index are also cointegrated in the pre-crisis period but this results
cannot be used as exchange rate is I(0) while Index is I(1) in this period (Table 2). x Table 3 shows that there is marginal causality from Exchange Rate to Stock Index during the crisis but no
causality after the crisis period. xi Refer to Ibrahim (2000) for details explanation. xii Table 3 shows that the financial market and capital market in Hong Kong are cointegrated in the pre-crisis
period but this results cannot be used as Table 2 shows that Exchange Rate is I(0) while Stock Index is I(1).
36
Copyright © 2022 FDOKUMEN