Long-run stock performance following stock repurchases
10
This article appeared in a journal published by Elsevier. The attached copy is furnished to the author for internal non-commercial research and education use, including for instruction at the authors institution and sharing with colleagues. Other uses, including reproduction and distribution, or selling or licensing copies, or posting to personal, institutional or third party websites are prohibited. In most cases authors are permitted to post their version of the article (e.g. in Word or Tex form) to their personal website or institutional repository. Authors requiring further information regarding Elsevier’s archiving and manuscript policies are encouraged to visit: http://www.elsevier.com/copyright
-
Upload
independent -
Category
Documents
-
view
1 -
download
0
Transcript of Long-run stock performance following stock repurchases

This article appeared in a journal published by Elsevier. The attachedcopy is furnished to the author for internal non-commercial researchand education use, including for instruction at the authors institution
and sharing with colleagues.
Other uses, including reproduction and distribution, or selling orlicensing copies, or posting to personal, institutional or third party
websites are prohibited.
In most cases authors are permitted to post their version of thearticle (e.g. in Word or Tex form) to their personal website orinstitutional repository. Authors requiring further information
regarding Elsevier’s archiving and manuscript policies areencouraged to visit:
http://www.elsevier.com/copyright
Author's personal copy
The Quarterly Review of Economics and Finance 50 (2010) 323–331
Contents lists available at ScienceDirect
The Quarterly Review of Economics and Finance
journa l homepage: www.e lsev ier .com/ locate /qre f
Long-run stock performance following stock repurchases
Ken C. Yook ∗
The Johns Hopkins Carey Business School, 100 N. Charles Street, Baltimore, MD 21201, United States
a r t i c l e i n f o
Article history:Received 2 December 2009Received in revised form 11 March 2010Accepted 24 March 2010Available online 8 April 2010
JEL classification:G30G32G35
Keywords:Stock repurchase programLong-run stock returnUnderreaction
a b s t r a c t
Studies examining long-term performance after stock repurchases provide mixed results. I point outtwo substantive problems in samplings of early studies. First, we should distinguish whether or notfirms actually repurchase shares following announcements of repurchase programs. Second, as somefirms frequently announce repurchase programs, we should consider overlapping announcements dur-ing the performance estimation period to avoid any confounding effects. Using a sample that correctsfor these problems and the calendar portfolio regression method, I find strong evidence that firms thatannounce repurchase programs infrequently and repurchase shares actually experience significant long-term abnormal returns. These findings provide an explanation of why some previous studies failed to findsignificant positive long-term performance.
© 2010 The Board of Trustees of the University of Illinois. Published by Elsevier B.V. All rights reserved.
1. Introduction
In an earlier study that investigated the long-term price behav-ior of tender offer repurchasers following repurchase programannouncements, Lakonishok and Vermaelen (1990) report that theportfolio of repurchasing firms earns significant positive abnormalbuy-and-hold returns. This positive return is mainly due to smallfirms in the sample whose stock prices had substantially decreasedprior to the repurchase, while large firms experienced positiveabnormal returns prior to the repurchase and zero abnormalreturns afterwards.1 Ikenberry, Lakonishok, and Vermaelen (1995)report similar results for open-market share repurchase: over a4-year period after the announcement, the buy-and-hold strat-egy outperforms the market index by 12.1%. This return is mainlydriven by high book-to-market stocks in the sample. High book-to-market stocks (also referred to as ‘value’ stocks) experience anaverage abnormal return of 45.3%, whereas low book-to-marketstocks (also referred to as ‘glamour’ stocks) experience essentiallyno abnormal performance. Ikenberry, Lakonishok, and Vermaelen(2000) extended their prior study by investigating the long-term
∗ Tel.: +1 410 516 8583.E-mail address: [email protected].
1 Lakonishok and Vermaelen (1990) argue that this result suggests that corporaterestructuring activity may be an important motive for tender offer repurchases bylarge firms whereas tender offer repurchases by small firms may be an attempt tosignal underevaluation of the firm.
performance of open-market stock repurchases in Canada. The3-year holding period strategy shows abnormal performance ofroughly 7% per year.
To investigate whether observed patterns in post-announcement stock return behavior is driven by markettiming skills of managers or an aggregate time-series versionof pseudo-market timing bias, Chan, Ikenberrry, and Lee (2004,2007) reexamined long-term stock return drifts following open-market repurchase announcements. Their study found robust andsignificant evidence of positive long-term stock return, using boththe buy-and-hold returns method and calendar-time portfoliomethod. They concluded that managers possess some timingability and that pseudo-market timing explains, at best, only asmall portion of the buyback return drift.2
Taken together, these studies appear to strongly support theexistence of long-term positive drift in stock prices for 3–4 yearsafter announcements of both tender offers and open-market repur-chase programs. In addition, the abnormal performance is mainlydriven by small size and high book-to-market ratio firms. Thesestudies interpret their findings of long-term positive performanceas the result of the market’s underreaction or delayed reactionto the positive signal sent by the repurchase announcement.
2 The notion of managerial market timing skills is contentious. Ginglinger andHamon (2007) contend that share repurchases largely reflect contrarian tradingrather than managerial timing ability.
1062-9769/$ – see front matter © 2010 The Board of Trustees of the University of Illinois. Published by Elsevier B.V. All rights reserved.doi:10.1016/j.qref.2010.03.006
Author's personal copy
324 K.C. Yook / The Quarterly Review of Economics and Finance 50 (2010) 323–331
Because the undervaluation signal is not fully revealed aroundthe announcement date, stock prices drift upwards during thepost-announcement period. Therefore, it is possible to earn abnor-mal returns by trading the repurchasing firms’ stock after theannouncement, which violates the implication of the efficient mar-ket hypothesis. The literature documents some evidence that themarket underreacts to many other types of firm-specific announce-ments (see Ikenberry & Ramnath, 2002, for a review).
Not all studies report evidence of abnormal stock performancefollowing stock repurchase announcements. Fama (1998) arguesthat the long-term return anomalies are sensitive to method-ology and that tend to either diminish or disappear when thecalendar-time portfolio approach is used. Mitchell and Stafford(2000) and Bradford (2008) find no evidence of long-run abnor-mal stock return after announcements of repurchase programsusing the calendar-time portfolio regression method. Mitchell andStafford (2000) summarize the potential problems of the meanbuy-and-hold abnormal return – the most popular estimator oflong-term abnormal performance amongst most early studies – asfollows:
“The preferred methodology in this literature is to calculateaverage multiyear buy-and-hold abnormal returns and conductinferences via a bootstrapping procedure. We show that thismethodology is severely flawed because it assumes indepen-dence of multiyear abnormal returns for event firms, producingtest statistics that are up to four times too large. After account-ing for the positive crosscorrelations of event firm abnormalreturns, we find virtually no evidence of reliable abnormal per-formance for our samples.”
Reviewing the existing literature, I find potentially importantand significant flaws in the sampling method of most early stud-ies. First, long-term share performance was measured regardless ofwhether or not the announcements were followed by actual sharerepurchases. In an open-market repurchase, the firm typically buysback shares in the open market over a long time period. As man-agement retains the right to decide when and how many sharesare actually repurchased, it can choose to buy more or less sharesthan the number initially authorized for repurchase, or sometimesbuying no shares at all. The firm has no legal obligation to completethe announced repurchase program. In fact, a significant fractionof firms that announce repurchase programs ultimately do not buyany shares (Ikenberry & Vermaelen, 1996; Stephens & Weisbach,1998).3
If a repurchase program signals managerial beliefs about thefirm’s future performance or maximizes shareholder wealth, it iscrucial to distinguish between firms that repurchase shares andfirms that choose not to complete the announced repurchase pro-gram. Management is less likely to launch repurchases unlessit believes that the expected performance of the firm’s stock isbetter than expected by the market, even after the repurchase pro-gram was announced. Lie (2005) compared long-term operatingperformance following open-market repurchase announcementsbetween a group of firms that do not purchase any shares in theannounced quarter and a group of firms that initiate the repur-chases in the same quarter. Lie found that only the latter groupexperiences improvements in operating performance. This findingimplies that actual repurchases, not announcements themselves,
3 Stephens and Weisbach (1998) investigate whether firms actually followthrough with the repurchase announcements reported by SDC. Using various prox-ies for actual open-market share repurchases, they estimate that the average firmacquires between 74% and 82% of announced shares in the 3 years following theannouncement.
predict future operating performance improvements. As a firm’soperating performance is incorporated into its stock price, we mustfocus on firms that actually repurchase their shares in order toevaluate the long-term share performance correctly.
Another problem with previous sampling methodology is thatmost early studies failed to consider the frequency of repurchaseprogram announcements made by each firm. If signaling insideinformation of undervaluation is an important motive behind sharerepurchases, it is not conceivable that a firm sends such a signalon a frequent or regular basis. As Jagannathan and Stephens (2003)argue, firms that frequently repurchase their shares likely have dif-ferent reasons or motives than firms that repurchase infrequently.
Therefore, we should take into account the total number ofrepurchase programs announced by each firm during the sam-pling period. There are two reasons why it is important to focus onthe frequency of repurchase programs: first, as the recent spike instock repurchase activity shows, some firms repeatedly repurchasetheir shares. It is not uncommon that a firm announces multi-ple repurchase programs during a short time period. If the firmannounced and initiated new stock repurchase programs duringthe performance estimation period following its announcementof a repurchase program, the confounding effect would contam-inate a clean estimation of price performance subsequent to thefirst repurchase program.
Second, it has been reported in the literature that the wealtheffect of announcements declines as a firm repeatedly launchesa major corporate event. For example, announcement reactionsbecome less favorable in subsequent deals if the firm makesfrequent acquisitions (Billett & Qian, 2008; Fuller, Netter, &Stegemoller, 2002). Announcement return also declines as firmsbuy back more and more shares (Jagannathan & Stephens, 2003).As infrequent repurchasers earn a much stronger announcementreturn than frequent repurchasers, one might expect that post-announcement share performance of these two groups will differ.
This paper attempts to resolve the controversy regarding thelong-term stock performance of repurchase firms using a samplethat rectifies the problems discussed above. Analyzing abnormalperformance over long horizons of up to 3 years following repur-chase program announcements, results of this study shed newinsight into why some existing studies failed to find significantpositive long-term performance.
Two main results exist: strong evidence of significant abnormallong-term performance of infrequent repurchasers who actuallyrepurchase shares during the first four quarters following theirannouncements is found. This finding indicates that the two sam-pling issues, whether or not firms actually repurchase shares andhow frequently a firm announces repurchase programs, could haveinfluenced results reported in previous studies. However, thesefindings are at odds with the notion of the efficient market the-ory that the stock market incorporates all relevant informationquickly and completely as it becomes available. One argument thatcan reconcile this conflicting evidence is the view that the marketunderreacts to the announcement of repurchase programs becausethe market does not necessarily view the announcement as a firmcommitment to actually repurchase the shares.
In addition, early studies document that both size and book-to-market value of equity provide significant explanatory power forsubsequent market performance, and that the post-announcementabnormal performance is mainly driven by small and high book-to-market value of equity stocks in their samples. This phenomenondoes not occur in this study’s sample: the positive abnormal returnsappear across different sizes and book-to-market value of equityportfolios.
The remainder of this paper is organized as follows: Section 2describes the data and methodology. Section 3 presents the main
Author's personal copy
K.C. Yook / The Quarterly Review of Economics and Finance 50 (2010) 323–331 325
empirical results of the paper. Section 4 contains the summary andconcluding remarks.
2. Data and methodology
2.1. Data
The sample is drawn from the SDC Platinum Mergers and Acqui-sitions database.4 The database contains information on stockrepurchases since the 1980s. 1994 is designated as the starting yearof my sample due to the fact that the data coverage is more compre-hensive in and after 1994. The data includes repurchase programsannounced by firms that are listed on the NYSE, AMEX, or the NAS-DAQ. The announcement date is defined as the initial authorizationdate of a program, which is when a company’s board of directorsfirst authorizes the repurchase program.5
I exclude repurchasing firms that do not have data availableon the CRSP monthly returns database for the 6-month periodprior to the announcement month and up to the 36-month periodafter the announcement month. Firms should have stock price,number of shares outstanding, and nonnegative book values ofequity data prior to the announcement month on the Compus-tat, enabling calculation of their size and book-to-market valueof equity ratios. The initial sample consists of 9551 repurchaseprograms that were announced between 1994 and 2007 by 5014firms.
While many earlier studies about stock repurchases examinedeither open-market repurchases or tender offers only, there arealso some studies that successfully aggregated all types of repur-chases (for example, Dittmar, 2000; Skinner, 2008). This study’ssample includes all stock repurchases, regardless of the methodused. Consistent with Dittmar’s (2000) rationale for the aggre-gation of data, we can obtain a better insight into the long-runstock performance of stock repurchases by including all types ofrepurchases. However, this study also subdivides the sample intoopen-market repurchases and tender offer repurchases and exam-ine whether there is a significant difference between these twotypes of repurchases.
As discussed earlier, firms that announce intentions to repur-chase shares often do not actually do so. To sort out whether firmsactually make repurchases, I calculate each firm’ repurchases inthe fiscal quarters from the announcement quarter through quar-ter t + 4, based on the Dittmar and Dittmar (2008) methodology.Repurchases in each fiscal quarter are computed as Compustatdata item PRSTKCY (purchase of common and preferred stock) lessany decrease in preferred stock. PRSTKCY is a year-to-date item.Therefore, each quarter’s repurchases, except the first quarter ofthe fiscal year, are the current quarter’s PRSTKCY minus the pre-vious quarter’s PRSTKCY. Preferred stock is measured as, in orderof preference, data item PSTKRV (redemption value), item PSTKL(liquidating value), or item PSTK (carrying value). After calculat-ing each quarter’s repurchases, total repurchases over the 1-year
4 There have been issues regarding the way that SDC collects the data. Somescholars have questioned the accuracy of the SDC database, particularly theannouncement date and aggregate dollar amount of repurchases (Jagannathan,Stephens, & Weisbach, 2000; Oswald & Young, 2004). I hand-collected some repur-chase announcement cases from a variety sources and compared them with theSDC database. I found a small number of reporting errors such as inaccurateannouncement dates and multiple reporting of a repurchase program. This maybe an unavoidable limitation for using a large sample collected from a database.
5 A repurchase program may have multiple board authorizations. These subse-quent announcements authorize changes in the previously announced programs,such as an expansion of an existing program. These subsequent authorizations arenot included in the sample.
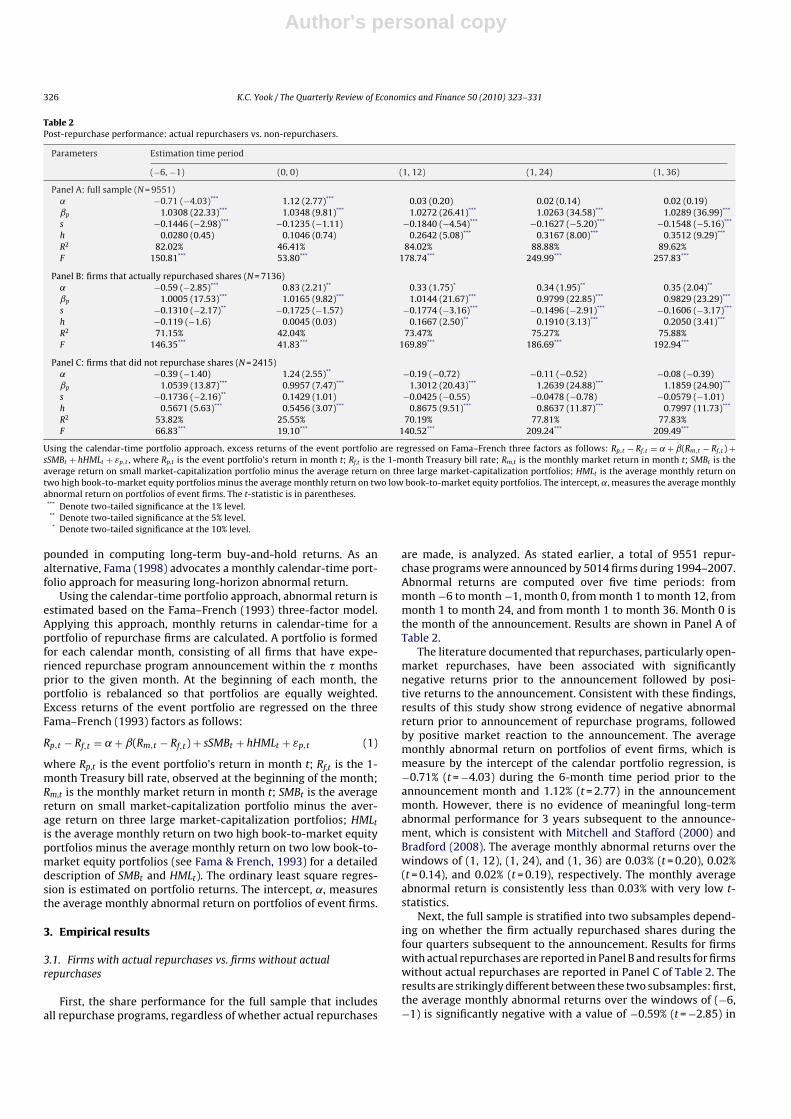
Table 1Sample distribution.
Year Full sample Firms with actualrepurchases
Firms with actual andinfrequent repurchases
1994 550 354 2471995 546 358 2391996 650 415 2751997 614 452 3061998 1002 713 5101999 864 565 3902000 780 499 3342001 713 420 2732002 589 374 2122003 476 377 1562004 561 513 2102005 676 642 2992006 677 633 3102007 853 821 447
Total 9551 7136 4208
period from the announcement quarter through quarter t + 4 werecalculated.
Depending on whether total repurchases for the 1-year periodare positive or zero, the sample is divided into two subsamples:one subsample consists of firms that have a positive number ofrepurchases and the other subsample consists of firms that haveno repurchases. The first subsample includes 7136 repurchase pro-grams, which is 75% of the full initial sample. The remaining 25%includes 2415 repurchase programs that fall into the second sub-sample. Calculations of the value of total repurchases during thefirst four quarters divided by the market value of equity resulted inmean and median values of 5.73% and 3.46%, respectively.
The group of firms that have a positive number of repurchasesis further stratified into two groups depending on the frequency ofrepurchases. If a repurchasing firm does not announce any addi-tional repurchase programs during the 3-year period after the firstrepurchase program announcement, it is defined as an infrequentrepurchaser. If there are one or more overlapping repurchase pro-gram announcements during the same period, it is defined as afrequent repurchaser. Imposing this restriction reduces the sam-ple of 7136 repurchase programs to 4208 repurchase programs.Table 1 describes this sample distribution.
2.2. Methodology: calculation of abnormal returns
Whether the positive abnormal returns reported by many earlystudies are due to underreaction or delayed reaction as arguedby most early studies, or simply the result of methodology prob-lems as argued by Fama (1998) and Mitchell and Stafford (2000),is an issue of ongoing debate. Most of previous studies reportingpositive long-run abnormal performance are based on the buy-and-hold abnormal return (BHAR) method. While some scholars assertthat the BHAR is the appropriate estimator because it “preciselymeasures investor experience,” some other scholars argue againstthe BHAR methodology because it suffers from the crosscorrela-tion problem and the bad model problem (for a comprehensivediscussion of event study methodology to measure long-horizonabnormal performance, see Brav, 2000; Barber & Lyon, 1997; Fama,1998; Kothari & Warner, 1997; Lyon, Barber, & Tsai, 1999; Mitchell& Stafford, 2000).
The crosscorrelation problem arises because matching on thebasis of several firm-specific characteristics cannot completelyremove the correlation between event firms’ returns. The badmodel problem arises because no benchmark provides a perfectestimate of the expected return, and errors from the differencebetween the return of an event firm and its benchmark are com-
Author's personal copy
326 K.C. Yook / The Quarterly Review of Economics and Finance 50 (2010) 323–331
Table 2Post-repurchase performance: actual repurchasers vs. non-repurchasers.
Parameters Estimation time period
(−6, −1) (0, 0) (1, 12) (1, 24) (1, 36)
Panel A: full sample (N = 9551)˛ −0.71 (−4.03)*** 1.12 (2.77)*** 0.03 (0.20) 0.02 (0.14) 0.02 (0.19)ˇp 1.0308 (22.33)*** 1.0348 (9.81)*** 1.0272 (26.41)*** 1.0263 (34.58)*** 1.0289 (36.99)***
s −0.1446 (−2.98)*** −0.1235 (−1.11) −0.1840 (−4.54)*** −0.1627 (−5.20)*** −0.1548 (−5.16)***
h 0.0280 (0.45) 0.1046 (0.74) 0.2642 (5.08)*** 0.3167 (8.00)*** 0.3512 (9.29)***
R2 82.02% 46.41% 84.02% 88.88% 89.62%F 150.81*** 53.80*** 178.74*** 249.99*** 257.83***
Panel B: firms that actually repurchased shares (N = 7136)˛ −0.59 (−2.85)*** 0.83 (2.21)** 0.33 (1.75)* 0.34 (1.95)** 0.35 (2.04)**
ˇp 1.0005 (17.53)*** 1.0165 (9.82)*** 1.0144 (21.67)*** 0.9799 (22.85)*** 0.9829 (23.29)***
s −0.1310 (−2.17)** −0.1725 (−1.57) −0.1774 (−3.16)*** −0.1496 (−2.91)*** −0.1606 (−3.17)***
h −0.119 (−1.6) 0.0045 (0.03) 0.1667 (2.50)** 0.1910 (3.13)*** 0.2050 (3.41)***
R2 71.15% 42.04% 73.47% 75.27% 75.88%F 146.35*** 41.83*** 169.89*** 186.69*** 192.94***
Panel C: firms that did not repurchase shares (N = 2415)˛ −0.39 (−1.40) 1.24 (2.55)** −0.19 (−0.72) −0.11 (−0.52) −0.08 (−0.39)ˇp 1.0539 (13.87)*** 0.9957 (7.47)*** 1.3012 (20.43)*** 1.2639 (24.88)*** 1.1859 (24.90)***
s −0.1736 (−2.16)** 0.1429 (1.01) −0.0425 (−0.55) −0.0478 (−0.78) −0.0579 (−1.01)h 0.5671 (5.63)*** 0.5456 (3.07)*** 0.8675 (9.51)*** 0.8637 (11.87)*** 0.7997 (11.73)***
R2 53.82% 25.55% 70.19% 77.81% 77.83%F 66.83*** 19.10*** 140.52*** 209.24*** 209.49***
Using the calendar-time portfolio approach, excess returns of the event portfolio are regressed on Fama–French three factors as follows: Rp,t − Rf,t = ˛ + ˇ(Rm,t − Rf,t ) +sSMBt + hHMLt + εp,t , where Rp,t is the event portfolio’s return in month t; Rf,t is the 1-month Treasury bill rate; Rm,t is the monthly market return in month t; SMBt is theaverage return on small market-capitalization portfolio minus the average return on three large market-capitalization portfolios; HMLt is the average monthly return ontwo high book-to-market equity portfolios minus the average monthly return on two low book-to-market equity portfolios. The intercept, ˛, measures the average monthlyabnormal return on portfolios of event firms. The t-statistic is in parentheses.
*** Denote two-tailed significance at the 1% level.** Denote two-tailed significance at the 5% level.* Denote two-tailed significance at the 10% level.
pounded in computing long-term buy-and-hold returns. As analternative, Fama (1998) advocates a monthly calendar-time port-folio approach for measuring long-horizon abnormal return.
Using the calendar-time portfolio approach, abnormal return isestimated based on the Fama–French (1993) three-factor model.Applying this approach, monthly returns in calendar-time for aportfolio of repurchase firms are calculated. A portfolio is formedfor each calendar month, consisting of all firms that have expe-rienced repurchase program announcement within the � monthsprior to the given month. At the beginning of each month, theportfolio is rebalanced so that portfolios are equally weighted.Excess returns of the event portfolio are regressed on the threeFama–French (1993) factors as follows:
Rp,t − Rf,t = ˛ + ˇ(Rm,t − Rf,t) + sSMBt + hHMLt + εp,t (1)
where Rp,t is the event portfolio’s return in month t; Rf,t is the 1-month Treasury bill rate, observed at the beginning of the month;Rm,t is the monthly market return in month t; SMBt is the averagereturn on small market-capitalization portfolio minus the aver-age return on three large market-capitalization portfolios; HMLt
is the average monthly return on two high book-to-market equityportfolios minus the average monthly return on two low book-to-market equity portfolios (see Fama & French, 1993) for a detaileddescription of SMBt and HMLt). The ordinary least square regres-sion is estimated on portfolio returns. The intercept, ˛, measuresthe average monthly abnormal return on portfolios of event firms.
3. Empirical results
3.1. Firms with actual repurchases vs. firms without actualrepurchases
First, the share performance for the full sample that includesall repurchase programs, regardless of whether actual repurchases
are made, is analyzed. As stated earlier, a total of 9551 repur-chase programs were announced by 5014 firms during 1994–2007.Abnormal returns are computed over five time periods: frommonth −6 to month −1, month 0, from month 1 to month 12, frommonth 1 to month 24, and from month 1 to month 36. Month 0 isthe month of the announcement. Results are shown in Panel A ofTable 2.
The literature documented that repurchases, particularly open-market repurchases, have been associated with significantlynegative returns prior to the announcement followed by posi-tive returns to the announcement. Consistent with these findings,results of this study show strong evidence of negative abnormalreturn prior to announcement of repurchase programs, followedby positive market reaction to the announcement. The averagemonthly abnormal return on portfolios of event firms, which ismeasure by the intercept of the calendar portfolio regression, is−0.71% (t = −4.03) during the 6-month time period prior to theannouncement month and 1.12% (t = 2.77) in the announcementmonth. However, there is no evidence of meaningful long-termabnormal performance for 3 years subsequent to the announce-ment, which is consistent with Mitchell and Stafford (2000) andBradford (2008). The average monthly abnormal returns over thewindows of (1, 12), (1, 24), and (1, 36) are 0.03% (t = 0.20), 0.02%(t = 0.14), and 0.02% (t = 0.19), respectively. The monthly averageabnormal return is consistently less than 0.03% with very low t-statistics.
Next, the full sample is stratified into two subsamples depend-ing on whether the firm actually repurchased shares during thefour quarters subsequent to the announcement. Results for firmswith actual repurchases are reported in Panel B and results for firmswithout actual repurchases are reported in Panel C of Table 2. Theresults are strikingly different between these two subsamples: first,the average monthly abnormal returns over the windows of (−6,−1) is significantly negative with a value of −0.59% (t = −2.85) in
Author's personal copy
K.C. Yook / The Quarterly Review of Economics and Finance 50 (2010) 323–331 327
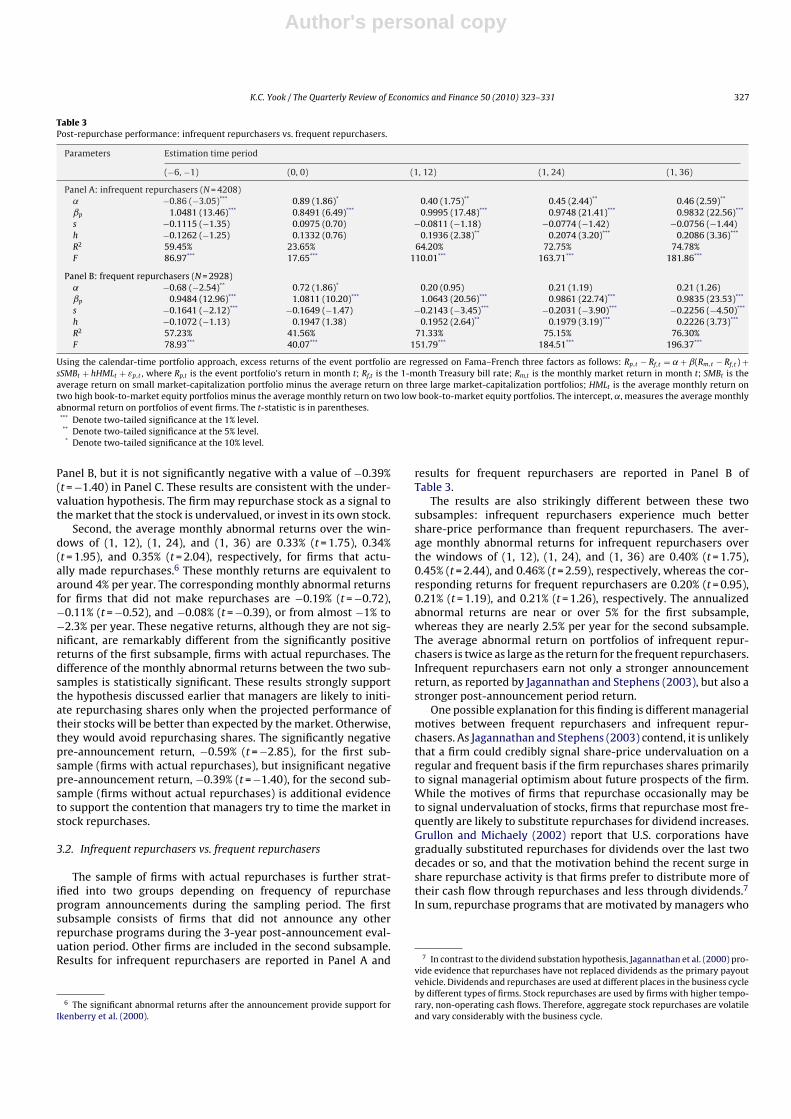
Table 3Post-repurchase performance: infrequent repurchasers vs. frequent repurchasers.
Parameters Estimation time period
(−6, −1) (0, 0) (1, 12) (1, 24) (1, 36)
Panel A: infrequent repurchasers (N = 4208)˛ −0.86 (−3.05)*** 0.89 (1.86)* 0.40 (1.75)** 0.45 (2.44)** 0.46 (2.59)**
ˇp 1.0481 (13.46)*** 0.8491 (6.49)*** 0.9995 (17.48)*** 0.9748 (21.41)*** 0.9832 (22.56)***
s −0.1115 (−1.35) 0.0975 (0.70) −0.0811 (−1.18) −0.0774 (−1.42) −0.0756 (−1.44)h −0.1262 (−1.25) 0.1332 (0.76) 0.1936 (2.38)** 0.2074 (3.20)*** 0.2086 (3.36)***
R2 59.45% 23.65% 64.20% 72.75% 74.78%F 86.97*** 17.65*** 110.01*** 163.71*** 181.86***
Panel B: frequent repurchasers (N = 2928)˛ −0.68 (−2.54)** 0.72 (1.86)* 0.20 (0.95) 0.21 (1.19) 0.21 (1.26)ˇp 0.9484 (12.96)*** 1.0811 (10.20)*** 1.0643 (20.56)*** 0.9861 (22.74)*** 0.9835 (23.53)***
s −0.1641 (−2.12)*** −0.1649 (−1.47) −0.2143 (−3.45)*** −0.2031 (−3.90)*** −0.2256 (−4.50)***
h −0.1072 (−1.13) 0.1947 (1.38) 0.1952 (2.64)** 0.1979 (3.19)*** 0.2226 (3.73)***
R2 57.23% 41.56% 71.33% 75.15% 76.30%F 78.93*** 40.07*** 151.79*** 184.51*** 196.37***
Using the calendar-time portfolio approach, excess returns of the event portfolio are regressed on Fama–French three factors as follows: Rp,t − Rf,t = ˛ + ˇ(Rm,t − Rf,t ) +sSMBt + hHMLt + εp,t , where Rp,t is the event portfolio’s return in month t; Rf,t is the 1-month Treasury bill rate; Rm,t is the monthly market return in month t; SMBt is theaverage return on small market-capitalization portfolio minus the average return on three large market-capitalization portfolios; HMLt is the average monthly return ontwo high book-to-market equity portfolios minus the average monthly return on two low book-to-market equity portfolios. The intercept, ˛, measures the average monthlyabnormal return on portfolios of event firms. The t-statistic is in parentheses.
*** Denote two-tailed significance at the 1% level.** Denote two-tailed significance at the 5% level.* Denote two-tailed significance at the 10% level.
Panel B, but it is not significantly negative with a value of −0.39%(t = −1.40) in Panel C. These results are consistent with the under-valuation hypothesis. The firm may repurchase stock as a signal tothe market that the stock is undervalued, or invest in its own stock.
Second, the average monthly abnormal returns over the win-dows of (1, 12), (1, 24), and (1, 36) are 0.33% (t = 1.75), 0.34%(t = 1.95), and 0.35% (t = 2.04), respectively, for firms that actu-ally made repurchases.6 These monthly returns are equivalent toaround 4% per year. The corresponding monthly abnormal returnsfor firms that did not make repurchases are −0.19% (t = −0.72),−0.11% (t = −0.52), and −0.08% (t = −0.39), or from almost −1% to−2.3% per year. These negative returns, although they are not sig-nificant, are remarkably different from the significantly positivereturns of the first subsample, firms with actual repurchases. Thedifference of the monthly abnormal returns between the two sub-samples is statistically significant. These results strongly supportthe hypothesis discussed earlier that managers are likely to initi-ate repurchasing shares only when the projected performance oftheir stocks will be better than expected by the market. Otherwise,they would avoid repurchasing shares. The significantly negativepre-announcement return, −0.59% (t = −2.85), for the first sub-sample (firms with actual repurchases), but insignificant negativepre-announcement return, −0.39% (t = −1.40), for the second sub-sample (firms without actual repurchases) is additional evidenceto support the contention that managers try to time the market instock repurchases.
3.2. Infrequent repurchasers vs. frequent repurchasers
The sample of firms with actual repurchases is further strat-ified into two groups depending on frequency of repurchaseprogram announcements during the sampling period. The firstsubsample consists of firms that did not announce any otherrepurchase programs during the 3-year post-announcement eval-uation period. Other firms are included in the second subsample.Results for infrequent repurchasers are reported in Panel A and
6 The significant abnormal returns after the announcement provide support forIkenberry et al. (2000).
results for frequent repurchasers are reported in Panel B ofTable 3.
The results are also strikingly different between these twosubsamples: infrequent repurchasers experience much bettershare-price performance than frequent repurchasers. The aver-age monthly abnormal returns for infrequent repurchasers overthe windows of (1, 12), (1, 24), and (1, 36) are 0.40% (t = 1.75),0.45% (t = 2.44), and 0.46% (t = 2.59), respectively, whereas the cor-responding returns for frequent repurchasers are 0.20% (t = 0.95),0.21% (t = 1.19), and 0.21% (t = 1.26), respectively. The annualizedabnormal returns are near or over 5% for the first subsample,whereas they are nearly 2.5% per year for the second subsample.The average abnormal return on portfolios of infrequent repur-chasers is twice as large as the return for the frequent repurchasers.Infrequent repurchasers earn not only a stronger announcementreturn, as reported by Jagannathan and Stephens (2003), but also astronger post-announcement period return.
One possible explanation for this finding is different managerialmotives between frequent repurchasers and infrequent repur-chasers. As Jagannathan and Stephens (2003) contend, it is unlikelythat a firm could credibly signal share-price undervaluation on aregular and frequent basis if the firm repurchases shares primarilyto signal managerial optimism about future prospects of the firm.While the motives of firms that repurchase occasionally may beto signal undervaluation of stocks, firms that repurchase most fre-quently are likely to substitute repurchases for dividend increases.Grullon and Michaely (2002) report that U.S. corporations havegradually substituted repurchases for dividends over the last twodecades or so, and that the motivation behind the recent surge inshare repurchase activity is that firms prefer to distribute more oftheir cash flow through repurchases and less through dividends.7
In sum, repurchase programs that are motivated by managers who
7 In contrast to the dividend substation hypothesis, Jagannathan et al. (2000) pro-vide evidence that repurchases have not replaced dividends as the primary payoutvehicle. Dividends and repurchases are used at different places in the business cycleby different types of firms. Stock repurchases are used by firms with higher tempo-rary, non-operating cash flows. Therefore, aggregate stock repurchases are volatileand vary considerably with the business cycle.
Author's personal copy
328 K.C. Yook / The Quarterly Review of Economics and Finance 50 (2010) 323–331
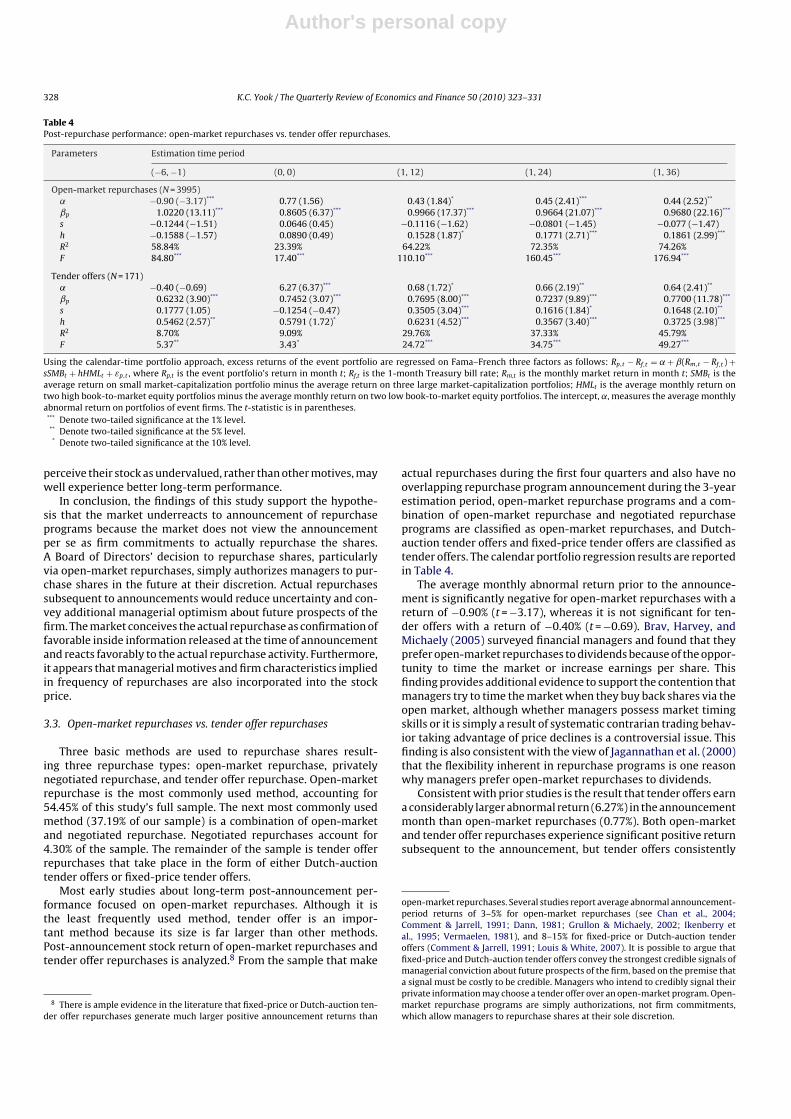
Table 4Post-repurchase performance: open-market repurchases vs. tender offer repurchases.
Parameters Estimation time period
(−6, −1) (0, 0) (1, 12) (1, 24) (1, 36)
Open-market repurchases (N = 3995)˛ −0.90 (−3.17)*** 0.77 (1.56) 0.43 (1.84)* 0.45 (2.41)*** 0.44 (2.52)**
ˇp 1.0220 (13.11)*** 0.8605 (6.37)*** 0.9966 (17.37)*** 0.9664 (21.07)*** 0.9680 (22.16)***
s −0.1244 (−1.51) 0.0646 (0.45) −0.1116 (−1.62) −0.0801 (−1.45) −0.077 (−1.47)h −0.1588 (−1.57) 0.0890 (0.49) 0.1528 (1.87)* 0.1771 (2.71)*** 0.1861 (2.99)***
R2 58.84% 23.39% 64.22% 72.35% 74.26%F 84.80*** 17.40*** 110.10*** 160.45*** 176.94***
Tender offers (N = 171)˛ −0.40 (−0.69) 6.27 (6.37)*** 0.68 (1.72)* 0.66 (2.19)** 0.64 (2.41)**
ˇp 0.6232 (3.90)*** 0.7452 (3.07)*** 0.7695 (8.00)*** 0.7237 (9.89)*** 0.7700 (11.78)***
s 0.1777 (1.05) −0.1254 (−0.47) 0.3505 (3.04)*** 0.1616 (1.84)* 0.1648 (2.10)**
h 0.5462 (2.57)** 0.5791 (1.72)* 0.6231 (4.52)*** 0.3567 (3.40)*** 0.3725 (3.98)***
R2 8.70% 9.09% 29.76% 37.33% 45.79%F 5.37** 3.43* 24.72*** 34.75*** 49.27***
Using the calendar-time portfolio approach, excess returns of the event portfolio are regressed on Fama–French three factors as follows: Rp,t − Rf,t = ˛ + ˇ(Rm,t − Rf,t ) +sSMBt + hHMLt + εp,t , where Rp,t is the event portfolio’s return in month t; Rf,t is the 1-month Treasury bill rate; Rm,t is the monthly market return in month t; SMBt is theaverage return on small market-capitalization portfolio minus the average return on three large market-capitalization portfolios; HMLt is the average monthly return ontwo high book-to-market equity portfolios minus the average monthly return on two low book-to-market equity portfolios. The intercept, ˛, measures the average monthlyabnormal return on portfolios of event firms. The t-statistic is in parentheses.
*** Denote two-tailed significance at the 1% level.** Denote two-tailed significance at the 5% level.* Denote two-tailed significance at the 10% level.
perceive their stock as undervalued, rather than other motives, maywell experience better long-term performance.
In conclusion, the findings of this study support the hypothe-sis that the market underreacts to announcement of repurchaseprograms because the market does not view the announcementper se as firm commitments to actually repurchase the shares.A Board of Directors’ decision to repurchase shares, particularlyvia open-market repurchases, simply authorizes managers to pur-chase shares in the future at their discretion. Actual repurchasessubsequent to announcements would reduce uncertainty and con-vey additional managerial optimism about future prospects of thefirm. The market conceives the actual repurchase as confirmation offavorable inside information released at the time of announcementand reacts favorably to the actual repurchase activity. Furthermore,it appears that managerial motives and firm characteristics impliedin frequency of repurchases are also incorporated into the stockprice.
3.3. Open-market repurchases vs. tender offer repurchases
Three basic methods are used to repurchase shares result-ing three repurchase types: open-market repurchase, privatelynegotiated repurchase, and tender offer repurchase. Open-marketrepurchase is the most commonly used method, accounting for54.45% of this study’s full sample. The next most commonly usedmethod (37.19% of our sample) is a combination of open-marketand negotiated repurchase. Negotiated repurchases account for4.30% of the sample. The remainder of the sample is tender offerrepurchases that take place in the form of either Dutch-auctiontender offers or fixed-price tender offers.
Most early studies about long-term post-announcement per-formance focused on open-market repurchases. Although it isthe least frequently used method, tender offer is an impor-tant method because its size is far larger than other methods.Post-announcement stock return of open-market repurchases andtender offer repurchases is analyzed.8 From the sample that make
8 There is ample evidence in the literature that fixed-price or Dutch-auction ten-der offer repurchases generate much larger positive announcement returns than
actual repurchases during the first four quarters and also have nooverlapping repurchase program announcement during the 3-yearestimation period, open-market repurchase programs and a com-bination of open-market repurchase and negotiated repurchaseprograms are classified as open-market repurchases, and Dutch-auction tender offers and fixed-price tender offers are classified astender offers. The calendar portfolio regression results are reportedin Table 4.
The average monthly abnormal return prior to the announce-ment is significantly negative for open-market repurchases with areturn of −0.90% (t = −3.17), whereas it is not significant for ten-der offers with a return of −0.40% (t = −0.69). Brav, Harvey, andMichaely (2005) surveyed financial managers and found that theyprefer open-market repurchases to dividends because of the oppor-tunity to time the market or increase earnings per share. Thisfinding provides additional evidence to support the contention thatmanagers try to time the market when they buy back shares via theopen market, although whether managers possess market timingskills or it is simply a result of systematic contrarian trading behav-ior taking advantage of price declines is a controversial issue. Thisfinding is also consistent with the view of Jagannathan et al. (2000)that the flexibility inherent in repurchase programs is one reasonwhy managers prefer open-market repurchases to dividends.
Consistent with prior studies is the result that tender offers earna considerably larger abnormal return (6.27%) in the announcementmonth than open-market repurchases (0.77%). Both open-marketand tender offer repurchases experience significant positive returnsubsequent to the announcement, but tender offers consistently
open-market repurchases. Several studies report average abnormal announcement-period returns of 3–5% for open-market repurchases (see Chan et al., 2004;Comment & Jarrell, 1991; Dann, 1981; Grullon & Michaely, 2002; Ikenberry etal., 1995; Vermaelen, 1981), and 8–15% for fixed-price or Dutch-auction tenderoffers (Comment & Jarrell, 1991; Louis & White, 2007). It is possible to argue thatfixed-price and Dutch-auction tender offers convey the strongest credible signals ofmanagerial conviction about future prospects of the firm, based on the premise thata signal must be costly to be credible. Managers who intend to credibly signal theirprivate information may choose a tender offer over an open-market program. Open-market repurchase programs are simply authorizations, not firm commitments,which allow managers to repurchase shares at their sole discretion.
Author's personal copy
K.C. Yook / The Quarterly Review of Economics and Finance 50 (2010) 323–331 329
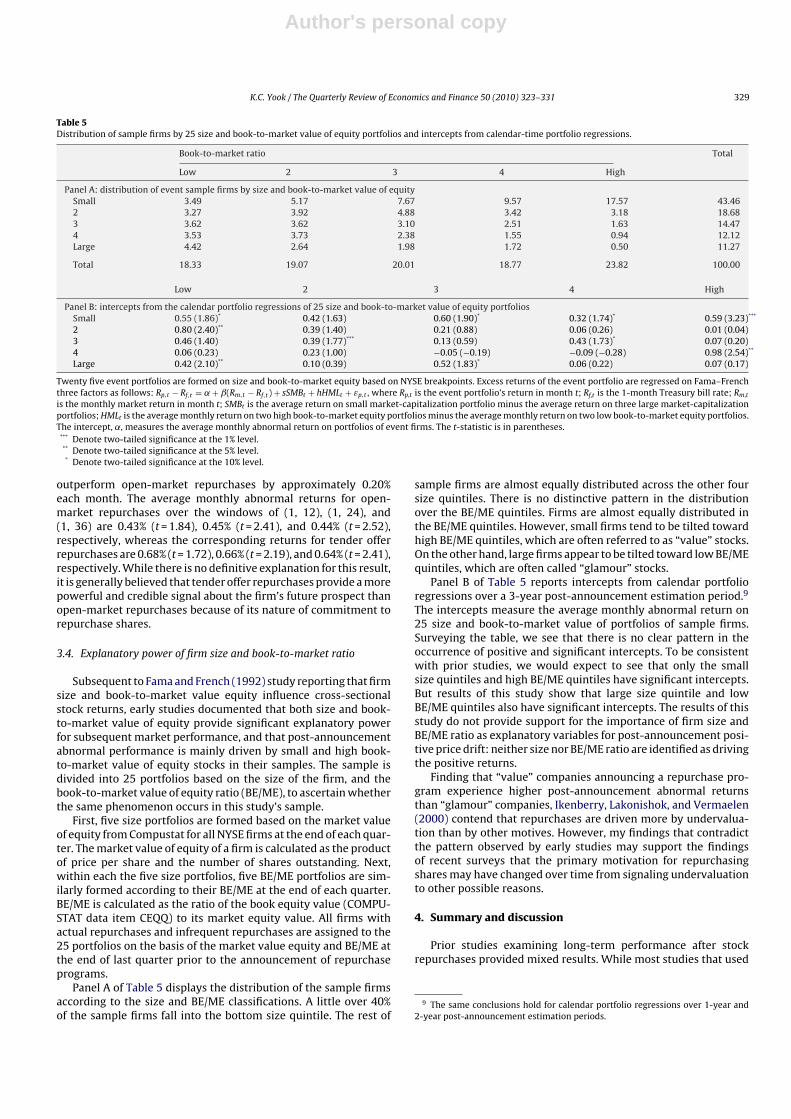
Table 5Distribution of sample firms by 25 size and book-to-market value of equity portfolios and intercepts from calendar-time portfolio regressions.
Book-to-market ratio Total
Low 2 3 4 High
Panel A: distribution of event sample firms by size and book-to-market value of equitySmall 3.49 5.17 7.67 9.57 17.57 43.462 3.27 3.92 4.88 3.42 3.18 18.683 3.62 3.62 3.10 2.51 1.63 14.474 3.53 3.73 2.38 1.55 0.94 12.12Large 4.42 2.64 1.98 1.72 0.50 11.27
Total 18.33 19.07 20.01 18.77 23.82 100.00
Low 2 3 4 High
Panel B: intercepts from the calendar portfolio regressions of 25 size and book-to-market value of equity portfoliosSmall 0.55 (1.86)* 0.42 (1.63) 0.60 (1.90)* 0.32 (1.74)* 0.59 (3.23)***
2 0.80 (2.40)** 0.39 (1.40) 0.21 (0.88) 0.06 (0.26) 0.01 (0.04)3 0.46 (1.40) 0.39 (1.77)*** 0.13 (0.59) 0.43 (1.73)* 0.07 (0.20)4 0.06 (0.23) 0.23 (1.00) −0.05 (−0.19) −0.09 (−0.28) 0.98 (2.54)**
Large 0.42 (2.10)** 0.10 (0.39) 0.52 (1.83)* 0.06 (0.22) 0.07 (0.17)
Twenty five event portfolios are formed on size and book-to-market equity based on NYSE breakpoints. Excess returns of the event portfolio are regressed on Fama–Frenchthree factors as follows: Rp,t − Rf,t = ˛ + ˇ(Rm,t − Rf,t ) + sSMBt + hHMLt + εp,t , where Rp,t is the event portfolio’s return in month t; Rf,t is the 1-month Treasury bill rate; Rm,t
is the monthly market return in month t; SMBt is the average return on small market-capitalization portfolio minus the average return on three large market-capitalizationportfolios; HMLt is the average monthly return on two high book-to-market equity portfolios minus the average monthly return on two low book-to-market equity portfolios.The intercept, ˛, measures the average monthly abnormal return on portfolios of event firms. The t-statistic is in parentheses.
*** Denote two-tailed significance at the 1% level.** Denote two-tailed significance at the 5% level.* Denote two-tailed significance at the 10% level.
outperform open-market repurchases by approximately 0.20%each month. The average monthly abnormal returns for open-market repurchases over the windows of (1, 12), (1, 24), and(1, 36) are 0.43% (t = 1.84), 0.45% (t = 2.41), and 0.44% (t = 2.52),respectively, whereas the corresponding returns for tender offerrepurchases are 0.68% (t = 1.72), 0.66% (t = 2.19), and 0.64% (t = 2.41),respectively. While there is no definitive explanation for this result,it is generally believed that tender offer repurchases provide a morepowerful and credible signal about the firm’s future prospect thanopen-market repurchases because of its nature of commitment torepurchase shares.
3.4. Explanatory power of firm size and book-to-market ratio
Subsequent to Fama and French (1992) study reporting that firmsize and book-to-market value equity influence cross-sectionalstock returns, early studies documented that both size and book-to-market value of equity provide significant explanatory powerfor subsequent market performance, and that post-announcementabnormal performance is mainly driven by small and high book-to-market value of equity stocks in their samples. The sample isdivided into 25 portfolios based on the size of the firm, and thebook-to-market value of equity ratio (BE/ME), to ascertain whetherthe same phenomenon occurs in this study’s sample.
First, five size portfolios are formed based on the market valueof equity from Compustat for all NYSE firms at the end of each quar-ter. The market value of equity of a firm is calculated as the productof price per share and the number of shares outstanding. Next,within each the five size portfolios, five BE/ME portfolios are sim-ilarly formed according to their BE/ME at the end of each quarter.BE/ME is calculated as the ratio of the book equity value (COMPU-STAT data item CEQQ) to its market equity value. All firms withactual repurchases and infrequent repurchases are assigned to the25 portfolios on the basis of the market value equity and BE/ME atthe end of last quarter prior to the announcement of repurchaseprograms.
Panel A of Table 5 displays the distribution of the sample firmsaccording to the size and BE/ME classifications. A little over 40%of the sample firms fall into the bottom size quintile. The rest of
sample firms are almost equally distributed across the other foursize quintiles. There is no distinctive pattern in the distributionover the BE/ME quintiles. Firms are almost equally distributed inthe BE/ME quintiles. However, small firms tend to be tilted towardhigh BE/ME quintiles, which are often referred to as “value” stocks.On the other hand, large firms appear to be tilted toward low BE/MEquintiles, which are often called “glamour” stocks.
Panel B of Table 5 reports intercepts from calendar portfolioregressions over a 3-year post-announcement estimation period.9
The intercepts measure the average monthly abnormal return on25 size and book-to-market value of portfolios of sample firms.Surveying the table, we see that there is no clear pattern in theoccurrence of positive and significant intercepts. To be consistentwith prior studies, we would expect to see that only the smallsize quintiles and high BE/ME quintiles have significant intercepts.But results of this study show that large size quintile and lowBE/ME quintiles also have significant intercepts. The results of thisstudy do not provide support for the importance of firm size andBE/ME ratio as explanatory variables for post-announcement posi-tive price drift: neither size nor BE/ME ratio are identified as drivingthe positive returns.
Finding that “value” companies announcing a repurchase pro-gram experience higher post-announcement abnormal returnsthan “glamour” companies, Ikenberry, Lakonishok, and Vermaelen(2000) contend that repurchases are driven more by undervalua-tion than by other motives. However, my findings that contradictthe pattern observed by early studies may support the findingsof recent surveys that the primary motivation for repurchasingshares may have changed over time from signaling undervaluationto other possible reasons.
4. Summary and discussion
Prior studies examining long-term performance after stockrepurchases provided mixed results. While most studies that used
9 The same conclusions hold for calendar portfolio regressions over 1-year and2-year post-announcement estimation periods.
Author's personal copy
330 K.C. Yook / The Quarterly Review of Economics and Finance 50 (2010) 323–331
the buy-and-hold portfolio return method found positive abnor-mal returns, studies that used the calendar-time portfolio methodfailed to find positive returns. I identify two substantive problemsin the sampling methodologies of early studies: first, whether firmsactually followed through with repurchases was overlooked as apotential factor affecting returns. Second, as many firms repeatedlyrepurchase shares, they may have overlapping announcementsduring the performance estimation period. Using a sample that cor-rected for these problems, I reexamine share performance over the3-year post-announcement period.
A full sample analysis including all repurchase programsannounced during 1994–2007, without correcting for the abovementioned sampling problems, shows the results that essentiallythe same as the findings of Mitchell and Stafford (2000) andBradford (2008). Long-term performance is not significantly pos-itive. When the full sample is stratified into firms with actualrepurchases and those without actual repurchases, however, theresults are strikingly different across these two subsamples: firmsthat initiate repurchasing shares during the four quarters from theannouncement quarter experience significant returns over a 3-yearperiod after the announcement. Firms that do not initiate repur-chasing shares experience negative return, although not significant,over the same period.
When the sample of firms with actual repurchases is furtherpartitioned into a subsample without any overlapping repurchaseprogram announcements in a 3-year period after the announce-ment and a subsample of firms with overlapping announcements,I find again strikingly distinct results across these two subsamples:infrequent repurchasers earn significantly larger returns than fre-quent repurchasers. In sum, this study provides strong evidencethat firms that announce repurchase programs infrequently andalso actually repurchase shares experience significant long-termreturn drifts.
This study’s findings provide one explanation of why someexisting studies failed to find significant positive long-term per-formance using the calendar portfolio regression method. Failureto consider factors such as completion of the announced repur-chase program as well as the confounding effects of overlappingrepurchase announcements may have led to conflicting findings ofprevious studies.
A widely accepted theory that can explain subsequent pos-itive long-term share performance is market underreaction, asmany prior studies contend. Studies interpret their finding of long-term positive performance as being the result of an underreactionor delayed reaction by the market to an undervaluation signalsent by the repurchase announcement. Underreaction occurs wheninvestors are not yet fully responding to the news of repurchaseannouncements and some residual information is incorporatedinto the long-horizon drift.
The underreaction hypothesis is at odds with the notion ofthe efficient market theory that the stock market incorporatesall relevant information quickly and completely as it becomesavailable. One argument that can reconcile this conflicting evi-dence is, again, the potential of non-completion of the announcedrepurchase program. The market underreacts to announcement ofrepurchase programs because the market does not necessarily viewthe announcement as a firm commitment to actually repurchasethe shares. To the extent that the market does not fully incorpo-rate the effect of the repurchase announcement in a short period,the residual value of the announcement would be revealed over alonger time period.
Another argument to explain the long-term abnormal return isimprovements in operation performance in the context of the freecash flow theory. Jensen’s (1986, 1988) theory predicts that man-agers of firms with cash flow in excess of profitable investment
opportunities will have a tendency to waste it on perquisites orunprofitable investments. The agency hypothesis links investmentto cash flows by hypothesizing that managers of these firms areassumed to attach greater value to perquisites and firm size thanto the benefits of paying excess cash flow out to shareholders individends or stock buybacks. Thus, the key to Jensen’s argumentis that firms are likely to waste free cash flow on unproductiveinvestments and that shareholders benefit from anything (includ-ing repurchases) that prevents these wasteful expenditures. Sharerepurchases use up excess funds, divert funds from internal invest-ments, or cause the firm to incur debt, which can explain positivestock performance. Studies suggest that repurchase activity maybe associated with free cash flows (for example, see Grullon &Michaely, 2004; Nohel & Tarhan, 1998).
Finally, earlier studies state that both size and book-to-marketvalue of equity ratio (BE/ME) provide significant explanatorypower for subsequent market performance, and that the post-announcement abnormal performance is mainly driven by smalland high BE/ME stocks in their samples. The findings are not sup-ported in this study’s sample: positive abnormal returns appearacross different size and BE/ME portfolios. I find no evidence thatpositive performance is concentrated in firms with small size andhigh BE/ME. The Fama–French (1993) three-factor model mighthave accounted for the size effect and the BE/ME effect.
In conclusion, identifying potential flaws in methodology, thisstudy seeks to elucidate contrary findings of previous studies. Pos-itive and significant results support the argument of this studythat the sample should be further screened into meaningful groupsin order to obtain accurate results. Future studies should be con-ducted to shed further insight into the causes of long-run abnormalperformance of repurchasing firms.
References
Barber, B., & Lyon, J. (1997). Detecting long-run abnormal stock returns: The empir-ical power and specification of test statistics. Journal of Financial Economics, 43,341–372.
Billett, M. T., & Qian, Y. (2008). Are overconfident managers born or made? Evi-dence of self-attribution bias from frequent acquirers. Management Science, 54,1037–1051.
Bradford, B. M. (2008). Open-market common stock repurchases and subsequentmarket performance. The Journal of Business and Economic Studies, 14, 45–61.
Brav, A. (2000). Inference in long-horizon event studies: A Bayesian approach withapplication to initial public offerings. The Journal of Finance, 55, 1979–2016.
Brav, A., Harvey, J. G. C., & Michaely, R. (2005). Payout policy in the 21st century.Journal of Financial Economics, 77, 483–527.
Chan, K., Ikenberry, D., & Lee, I. (2004). Economic sources of gains in stock repur-chases. Journal of Financial and Quantitative Analysis, 39, 461–479.
Chan, K., Ikenberry, D., & Lee, I. (2007). Do managers time the market? Evidence foropen-market share repurchases. Journal of Banking and Finance, 31, 2673–2694.
Comment, R., & Jarrell, G. A. (1991). The relative signaling power of Dutch-auctionand fixed-price self-tender offers and open-market share purchases. Journal ofFinance, 46, 1243–1271.
Dann, L. Y. (1981). Common stock repurchases: An analysis of returns to bondholdersand stockholders. Journal of Financial Economics, 9, 113–138.
Dittmar, A. (2000). Why do firms repurchase stocks? Journal of Business, 73, 331–355.Dittmar, A. K., & Dittmar, R. F. (2008). The timing of financing decisions: An exam-
ination of the correlation in financing waves. Journal of Financial Economics, 90,59–83.
Fama, E. (1998). Market efficiency, long-term returns, and behavioral finance. Journalof Financial Economics, 49, 283–306.
Fama, E., & French, K. (1992). The cross-section of expected returns. Journal ofFinance, 47, pp. 427–405.
Fama, E., & French, K. (1993). Common risk factors in the returns on stock and bonds.Journal of Financial Economics, 33, 3–56.
Fuller, K., Netter, J., & Stegemoller, M. (2002). What do returns to acquiring firmstell us? Evidence from firms that make many acquisitions. Journal of Finance, 57,1763–1793.
Ginglinger, E., & Hamon, J. (2007). Actual share repurchases, timing and liquidity.Journal of Banking and Finance, 31, 915–938.
Grullon, G., & Michaely, R. (2002). Dividends, share repurchases, and the substitutionhypothesis. Journal of Finance, 57, 1649–1684.
Grullon, G., & Michaely, R. (2004). The information content of share repurchaseprograms. Journal of Finance, 59, 651–680.

Author's personal copy
K.C. Yook / The Quarterly Review of Economics and Finance 50 (2010) 323–331 331
Ikenberry, D. L., & Ramnath, S. (2002). Underreaction to self-selected news events:The case of stock splits. Review of Financial Studies, 15, 489–526.
Ikenberry, D., & Vermaelen, T. (1996). The option to repurchase stock. FinancialManagement, 25, 9–24.
Ikenberry, D., Lakonishok, J., & Vermaelen, T. (1995). Market underreaction to openmarket share repurchases. Journal of Financial Economics, 39, 181–208.
Ikenberry, D., Lakonishok, J., & Vermaelen, T. (2000). Stock repurchases in Canada:Performance and strategic trading. Journal of Finance, 55, 2373–2397.
Jagannathan, M., & Stephens, C. P. (2003). Motives for multiple open-market repur-chase programs. Financial Management, 32, 71–91.
Jagannathan, M., Stephens, C. P., & Weisbach, M. S. (2000). Financial flexibility andthe choice between dividends and stock repurchases. Journal of Financial Eco-nomics, 57, 355–384.
Jensen, M. C. (1986). Agency costs of free cash flow, corporate finance and takeovers.America Economic Review, 76, 323–329.
Jensen, M. C. (1988). Takeover: Their causes and consequences. Journal of EconomicPerspectives, 2, 137–154.
Kothari, S. P., & Warner, J. B. (1997). Measuring long-horizon security price perfor-mance. Journal of Financial Economics, 43, 301–340.
Lakonishok, J., & Vermaelen, T. (1990). Anomalous price behavior around repurchasetender offers. Journal of Finance, 45, 455–477.
Lie, E. (2005). Operating performance following open market share repurchaseannouncements. Journal of Accounting and Economics, 39, 411–436.
Louis, H., & White, H. (2007). Do managers intentionally use repurchase tender offersto signal private information? Evidence from firm financial reporting behavior.Journal of Financial Economics, 85, 205–233.
Lyon, J., Barber, B., & Tsai, C. (1999). Improved methods for tests of long-run abnormalstock returns. Journal of Finance, 54, 165–201.
Mitchell, M., & Stafford, E. (2000). Managerial decision and long-term stock priceperformance. Journal of Business, 73, 287–329.
Nohel, T., & Tarhan, V. (1998). Share repurchase and firm performance: New evi-dence on the agency costs of free cash flow. Journal of Financial Economics, 49,187–222.
Oswald, D., & Young, S. (2004). What role taxes and regulation? A second look atopen market share buyback activity in the UK. Journal of Business Finance andAccounting, 31(1/2), 257–292.
Skinner, D. J. (2008). The evolving relation between earnings, dividends, and stockrepurchases. Journal of Financial Economics, 87, 582–609.
Stephens, C., & Weisbach, M. (1998). Actual share reacquisitions in open-marketrepurchase programs. Journal of Finance, 53, 313–333.
Vermaelen, T. (1981). Common stock repurchases and market signaling. Journal ofFinancial Economics, 9, 139–183.