PhD Thesis - RUN
280
Setembro, 2014 Helena Isabel Caseiro Rego Gomes Licenciada em Engenharia do Ambiente (Ramo Ambiente), Mestre em Ciência e Sistemas de Informação Geográfica Coupling electrokinetics and iron nanoparticles for the remediation of contaminated soils Dissertação para obtenção do Grau de Doutor em Ambiente Orientador: Professora Doutora Alexandra de Jesus Branco Ribeiro, Professora Associada com Agregação, Faculdade de Ciências e Tecnologia da Universidade Nova de Lisboa Co-orientador: Doutora Célia Maria Dias Ferreira, Investigadora do Centro de Estudos de Recursos Naturais, Ambiente e Sociedade, Escola Superior Agrária de Coimbra Júri: Presidente: Prof. Doutor Fernando José Pires Santana Arguentes: Prof. Doutor Knud Henrik Hansen Prof. Doutor Marco Diogo Richter Gomes da Silva Vogais: Prof. Doutor José Miguel Rodriguez Maroto Prof. Doutora Alexandra de Jesus Branco Ribeiro Prof. Doutora Maria Margarida Cruz Godinho Ribau Teixeira
-
Upload
khangminh22 -
Category
Documents
-
view
3 -
download
0
Transcript of PhD Thesis - RUN

Setembro, 2014
Helena Isabel Caseiro Rego Gomes
Licenciada em Engenharia do Ambiente (Ramo Ambiente), Mestre em Ciência e Sistemas de Informação Geográfica
Coupling electrokinetics and iron nanoparticles for the remediation of contaminated soils
Dissertação para obtenção do Grau de Doutor em Ambiente
Orientador: Professora Doutora Alexandra de Jesus Branco Ribeiro, Professora Associada com Agregação, Faculdade de Ciências e Tecnologia da Universidade Nova de Lisboa
Co-orientador: Doutora Célia Maria Dias Ferreira, Investigadora do Centro de Estudos de Recursos Naturais, Ambiente e Sociedade, Escola Superior Agrária de Coimbra
Júri:
Presidente: Prof. Doutor Fernando José Pires Santana Arguentes: Prof. Doutor Knud Henrik Hansen
Prof. Doutor Marco Diogo Richter Gomes da Silva
Vogais: Prof. Doutor José Miguel Rodriguez Maroto Prof. Doutora Alexandra de Jesus Branco Ribeiro Prof. Doutora Maria Margarida Cruz Godinho Ribau Teixeira


Coupling electrokinetics and iron nanoparticles for the remediation of contaminated soils
Copyright © Helena Isabel Caseiro Rego Gomes, Faculdade de Ciências e Tecnologia, Universidade
Nova de Lisboa.
A Faculdade de Ciências e Tecnologia e a Universidade Nova de Lisboa têm o direito, perpétuo e sem
limites geográficos, de arquivar e publicar esta dissertação através de exemplares impressos
reproduzidos em papel ou de forma digital, ou por qualquer outro meio conhecido ou que venha a
ser inventado, e de a divulgar através de repositórios científicos e de admitir a sua cópia e
distribuição com objectivos educacionais ou de investigação, não comerciais, desde que seja dado
crédito ao autor e editor. Os direitos de cópia dos artigos apresentados na segunda parte desta
dissertação foram transferidos para editoras e estes artigos são reproduzidos sob permissão dos
editors originais e sujeiros às restrições de cópia impostos pelos mesmos.


“All my life through, the new sights of nature made me rejoice like a child.”
― Marie Curie
To my mother
who always told me to
be strong and never, never, give up


i
Preface
This dissertation is submitted as partial fulfillment of the requirements for the Doctoral Degree in
Environment and includes the results of my Ph.D. study carried out from September 2011 to June
2014 in the Faculty of Sciences and Technology from the New University of Lisbon, with stays abroad
as visiting researcher in the Department of Civil and Environmental Engineering, Lehigh University,
Bethlehem, PA, USA (September 2011-‐August 2012); in the Department of Civil Engineering,
Technical University of Denmark (DTU), Lyngby, Denmark (September-‐December 2013), and in the
Department of Chemical Engineering, Málaga University, Málaga, Spain (January-‐March 2014).
The dissertation is organized as follows:
Part I – provides all the summarized information regarding the problem statement, motivation and
the objectives of the work, compiles the major findings of the experimental work and
examines some limitations, outlines the main conclusions and identifies future areas of
research.
Part II – includes all the publications in international peer reviewed journals done for this Ph.D.
study, as an integral component of the dissertation:
• Gomes, H. I., Dias-‐Ferreira, C., & A. B. Ribeiro (2012). Electrokinetic remediation of
organochlorines in soil: Enhancement techniques and integration with other remediation
technologies. Chemosphere, 87: 1077-‐1090.
• Gomes, H. I.; Ferreira, C.D., Ribeiro, A. B. & S. Pamukcu (2012). Electrokinetic enhanced
transport of zero valent iron nanoparticles for chromium (VI) reduction in soils. Chemical
Engineering Transactions, 28: 139-‐144.
• Gomes, H. I., Dias-‐Ferreira, C., & A. B. Ribeiro (2013). Overview of in situ and ex situ
remediation technologies for PCB-‐contaminated soils and sediments and obstacles for full-‐
scale application. Science of the Total Environment, 445-‐446: 237-‐260.
• Gomes, H. I.; Ferreira, C. D., Ribeiro, A. B. & S. Pamukcu (2013). Enhanced transport and
transformation of zerovalent nanoiron in clay using direct electric current, Water, Air, & Soil
Pollution, 224: 1-‐12.

ii
• Gomes, H. I.; Dias-‐Ferreira, C.; Ribeiro, A. B. & S. Pamukcu (2014). Influence of electrolyte
and voltage on the direct current enhanced transport of iron nanoparticles in clay.
Chemosphere, 99: 171-‐179.
• Gomes, H. I.; Fan, G. P.; Mateus, E. P.; Dias-‐Ferreira, C. & A. B. Ribeiro (2014). Assessment of
combined electro-‐nanoremediation of molinate contaminated soil. Science of the Total
Environment, 493: 178-‐184.
• Gomes, H. I.; Dias-‐Ferreira, C.; Ottosen, L. M. & A. B. Ribeiro (2014). Electroremediation of
PCB contaminated soil with iron nanoparticles: performance of a new electrodialytic setup.
Submitted.
• Gomes, H. I., Dias-‐Ferreira, C., Ottosen, L. M., & Ribeiro, A. B. (2014). Electrodialytic
remediation of polychlorinated biphenyls contaminated soil with iron nanoparticles and two
different surfactants. Journal of Colloid and Interface Science, 433, 189-‐195.
• Gomes, H. I.; Dias-‐Ferreira, C.; Ottosen, L. M. & A. B. Ribeiro (2014). Enhanced electrokinetic
techniques for remediation of different PCB polluted soils. Submitted.
• Gomes, H. I.; Maroto, J. M. R.; Dias-‐Ferreira, C.; Ribeiro, A. B. & S. Pamukcu (2014).
Numerical prediction of diffusion and electric field-‐induced iron nanoparticle transport.
Submitted.
I hereby declare that, as the first author of the above mentioned manuscripts, I provided the major
contribution to the research and experimental work developed, to the results interpretation and the
preparation of these publications submitted during the Ph.D. project. The copyright of the
publications was transferred to the editors, and these articles are reproduced with permission of the
original publishers and subject to copy restrictions imposed by them.

iii
Acknowledgments
“Let us be grateful to the people who make us happy;
they are the charming gardeners who make our souls blossom.”
― Marcel Proust
First of all, I would like to express my gratitude and my friendship to my advisers, Alexandra Ribeiro
and Célia Ferreira, for believing in me and include me in their research projects, as well as for their
continuous support, lending me objective and helpful advice. Thank you so much! A special word of
thanks to Alexandra Ribeiro – that accompanied me in different periods of my career path – for her
friendship and for being such a kind mentor.
I had the opportunity to work with top research groups around the world and I would like to thank:
Ì Sibel Pamukcu, Reena Amatya Shrestha, Alla Miroshnik, Rebekah Brosky, Ehsan Ghazanfari and
Yi Don, from the Department of Civil and Environmental Engineering – Lehigh University, USA;
Ì Lisbeth M. Ottosen, Gunvor Kirkelund, Ebba Schnell, Louise Gammeltoft, Tian Ran Sun, Wan
Chen, Sabrina Madsen and Louise Birkemose from the Department of Civil Engineering –
Technical University of Denmark (DTU), Denmark;
Ì José Miguel Rodríguez-‐Maroto, Francisco García Herruzo, César Goméz-‐Lahoz, Carlos Vereda
Alonso, María Villen, Ana García Rubio, Gema Amaya Santos, Irene Sanchéz-‐Trujillo, Ana Belén
Muñoz and Brahim Arhoun from the Department of Chemical Engineering – Málaga University,
Spain;
for being so welcoming and friendly, for providing me good conditions to carry my work and for
sharing their experience and knowledge. I want to express my sincere appreciation for their help and
availability. It was my pleasure to meet you and work with you all!
I am grateful for the help from Fan Guangping from the Institute of Soil Science, Chinese Academy of
Sciences that during her exchange program in Portugal worked with me in the experiments with
molinate contaminated soil.
I would like to thank Eduardo Mateus for his help in setting up the GC/MS and all the support on the
analytical determinations, as well as the lively discussions of methods and results. Many thanks to
Paula Guedes and Nazaré Couto for being always there – I knew I could count on you girls!

iv
Thank you so much Helena Silva (NanoDC project) for all the help in the PCB analytical work! I would
also like to thank Emílio Rosales for the brainstorming/discussion on the nanoparticles reactions and
transport, for helping me in the setup of some experiments, as well as for all the support during my
stay in Coimbra. Jorge Varejão and Sandra Santos from ESAC are also acknowledged for providing
work conditions and support in the lab at Coimbra.
I would like to thank Thomas Hougaard for the indication of the site for sampling PCB contaminated
soil near Copenhagen, as well as for the discussion on field scale projects using electrokinetics.
I have no words to thank Júlio for being my close companion and for all the support in these last
years that have been so hard for him. I would also like to thank all my friends, for being by my side
and accompany me in this journey. And, last but not least, I would like to thank to my parents and
sister for being a constant source of encouragement.
The Department of Civil and Environmental Engineering at Lehigh University is acknowledged for the
funding of equipment development, testing and analysis in the study of the enhanced transport of
the iron nanoparticles. Also the Department of Civil Engineering from the Technical University of
Denmark (DTU) and the Department of Chemical Engineering from Málaga University are
acknowledged for receiving me and providing all the conditions needed for my research.
This work has been funded by the European Regional Development Fund (ERDF) through COMPETE –
Operational Programme for Competitiveness Factors (OPCF), by Portuguese National funds through
the “FCT -‐ Fundação para a Ciência e a Tecnologia” under project «PTDC/AGR-‐AAM/101643/2008
NanoDC», by the research grant SFRH/BD/76070/2011, and by FP7-‐PEOPLE-‐IRSES-‐2010-‐269289-‐
ELECTROACROSS.
v
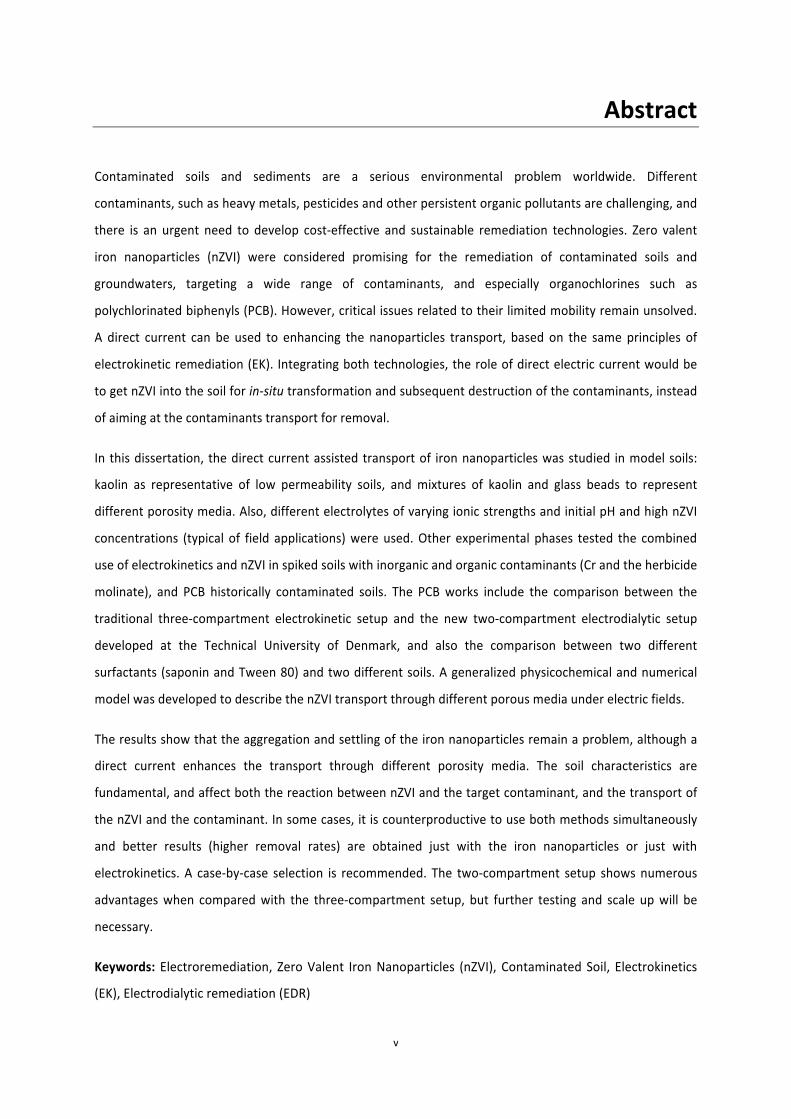
Abstract
Contaminated soils and sediments are a serious environmental problem worldwide. Different
contaminants, such as heavy metals, pesticides and other persistent organic pollutants are challenging, and
there is an urgent need to develop cost-‐effective and sustainable remediation technologies. Zero valent
iron nanoparticles (nZVI) were considered promising for the remediation of contaminated soils and
groundwaters, targeting a wide range of contaminants, and especially organochlorines such as
polychlorinated biphenyls (PCB). However, critical issues related to their limited mobility remain unsolved.
A direct current can be used to enhancing the nanoparticles transport, based on the same principles of
electrokinetic remediation (EK). Integrating both technologies, the role of direct electric current would be
to get nZVI into the soil for in-‐situ transformation and subsequent destruction of the contaminants, instead
of aiming at the contaminants transport for removal.
In this dissertation, the direct current assisted transport of iron nanoparticles was studied in model soils:
kaolin as representative of low permeability soils, and mixtures of kaolin and glass beads to represent
different porosity media. Also, different electrolytes of varying ionic strengths and initial pH and high nZVI
concentrations (typical of field applications) were used. Other experimental phases tested the combined
use of electrokinetics and nZVI in spiked soils with inorganic and organic contaminants (Cr and the herbicide
molinate), and PCB historically contaminated soils. The PCB works include the comparison between the
traditional three-‐compartment electrokinetic setup and the new two-‐compartment electrodialytic setup
developed at the Technical University of Denmark, and also the comparison between two different
surfactants (saponin and Tween 80) and two different soils. A generalized physicochemical and numerical
model was developed to describe the nZVI transport through different porous media under electric fields.
The results show that the aggregation and settling of the iron nanoparticles remain a problem, although a
direct current enhances the transport through different porosity media. The soil characteristics are
fundamental, and affect both the reaction between nZVI and the target contaminant, and the transport of
the nZVI and the contaminant. In some cases, it is counterproductive to use both methods simultaneously
and better results (higher removal rates) are obtained just with the iron nanoparticles or just with
electrokinetics. A case-‐by-‐case selection is recommended. The two-‐compartment setup shows numerous
advantages when compared with the three-‐compartment setup, but further testing and scale up will be
necessary.
Keywords: Electroremediation, Zero Valent Iron Nanoparticles (nZVI), Contaminated Soil, Electrokinetics
(EK), Electrodialytic remediation (EDR)


vii
Resumo
A contaminação de solos e sedimentos representa um problema ambiental grave à escala mundial. Diferentes
contaminantes – metais pesados, pesticidas e poluentes orgânicos persistentes – constituem um desafio e é
necessário desenvolver urgentemente tecnologias de remediação sustentáveis e com uma boa relação custo-‐
eficácia. As nanopartículas de ferro zero valente (nZVI) foram consideradas promissoras para a remediação de
solos e águas subterrâneas, abrangendo uma vasta gama de contaminantes, especialmente compostos
organoclorados como os bifenis policlorados (PCB). Contudo, a sua reduzida mobilidade em solos é limitante. A
corrente contínua pode ser utilizada para potenciar o transporte das nanopartículas com base nos mesmos
princípios do método electrocinético (EK). Integrando as duas tecnologias, o papel da corrente eléctrica seria
transportar as nanopartículas no solo para transformação in situ e posterior destruição dos contaminantes, em
vez da sua remoção.
Nesta tese foi estudado o transporte das nanopartículas sob ação da corrente contínua em solos modelo:
caulinite como representante de solos com baixa permeabilidade e misturas de caulinite e esferas de vido para
materiais com diferentes porosidades. Foram usados diferentes electrólitos, com distintas forças iónicas e pH
inicial, a par de nZVI com concentrações típicas de aplicação no terreno. Outras fases experimentais testaram o
uso combinado dos dois métodos em solos contaminados intencionalmente com crómio e com o herbicida
molinato e em contaminações antigas de solos com PCB. Nestes últimos foram comparadas a configuração
tradicional da célula electrocinética (três compartimentos) com uma célula electrodialítica de dois
compartimentos, desenvolvida na Universidade Técnica da Dinamarca (DTU). Foram também comparados dois
solos diferentes e dois surfactantes (saponina e Tween 80). Um modelo numérico e físicoquímico foi
desenvolvido para descrever o transporte das nZVI nos meios de diferentes porosidades.
Os resultados mostram que a agregação e a sedimentação das nZVI permanece um problema, embora a
corrente contínua melhore o seu transporte nos meios de diferentes porosidades. As características do solo são
fundamentais e afetam, tanto a reação entre nZVI e o contaminante alvo, como o transporte das nZVI e de
contaminantes. Em alguns casos, não há vantagem em usar ambos os métodos simultaneamente, dado que são
obtidos melhores resultados (maiores taxas de remoção) apenas com as nZVI ou com o método electrocinético.
É recomendável uma seleção caso-‐a-‐caso. A configuração de dois compartimentos mostra inúmeras vantagens
relativamente à configuração tradicional, mas é necessário realizar mais testes a maior escala.
Palavras-‐chave: Electrorremediação, Nanopartículas de Ferro Zero Valente, Solo Contaminado, Método
Electrocinético, Remediação Electrodialítica


ix
Acronyms, Abbreviations and Notations
AAS Atomic absorption spectroscopy
ANOVA Analysis of variance
BZ Ballschmiter and Zell
CAT Cation exchange membrane
CMC Carboxymethyl cellulose
CTAB Cetyltrimethylammonium bromide
DC Direct current
DCE Dichloroethene
DTU Technical University of Denmark
ED Electrodialytic
EK Electrokinetic
EOF Electroosmotic flow
EP Electrophoretic cell
EU European Union
GC Gas chromatography
GC/MS Gas chromatography/mass spectrometry
HCB Hexachlorobenzene
ICP Inductively coupled plasma-‐atomic emission spectrometry
IUPAC International Union of Pure and Applied Chemistry
nZVI Zero valent iron nanoparticles
ORP Oxidation reduction potential
PAA Polyacrilyc acid
PAH Polycyclic aromatic hydrocarbons
PAP Sodium polyaspartate
PBDE Polybrominated diphenyl ethers
PCB Polychlorinated biphenyls
PCE Perchloroethylene
PCP Pentachlorophenol
POP Persistent organic pollutant
PRB Permeable reactive barriers

x
PV3A Polyvinyl alcohol-‐co-‐vinyl acetate-‐co-‐itaconic acid
SDS Sodium dodecyl sulfonate
SPE Solid phase extraction
TCE Trichloroethene
TEF Toxic equivalency factor
TNT Trinitrotoluene
UN United Nations
USA United States of America
USEPA United States Environmental Protection Agency
VC Vinyl chloride
VOC Volatile organic compounds
WHO World Health Organization
ZVI Zero valent iron
Model notations
A cross-‐sectional area (cm2)
c concentration (mol cm-‐3)
D* effective diffusion coefficient
E redox potential (V)
E0 standard redox potential (V)
F Faraday constant
I current intensity
ke electroosmotic permeability coefficient
N mass flux (mol cm2 s-‐1)
Q reaction quotient
R ideal gas constant
R reaction rate
T temperature (K), assuming a constant room temperature of 25ºC
t time
U* effective electrophoretic mobility
V volume (cm3)
z ionic charge
Greek letters
electrical potential
η Faradaic efficiency
φ

xi
Contents
Preface ............................................................................................................................................................. i
Acknowledgments .......................................................................................................................................... iii
Abstract ........................................................................................................................................................... v
Resumo ......................................................................................................................................................... vii
Acronyms, Abbreviations and Notations ....................................................................................................... ix
Contents ......................................................................................................................................................... xi
List of Figures ............................................................................................................................................... xiii
List of Tables ................................................................................................................................................. xv
Part I
1. Introduction ................................................................................................................................................ 1
1.1 Problem Statement ............................................................................................................................... 1
1.1.1 Soil contamination ......................................................................................................................... 1
1.1.1.1 Heavy metals .......................................................................................................................... 2
1.1.1.2 Pesticides ................................................................................................................................ 3
1.1.1.3 Persistent organic pollutants and polychlorinated biphenyls ................................................ 4
1.1.2 Technologies for PCB contaminated soils and sediments ............................................................. 6
1.1.3 Zero valent iron nanoparticles (nZVI) ............................................................................................ 7
1.1.4 Electrokinetic remediation .......................................................................................................... 12
1.1.5 Coupling EK and nZVI ................................................................................................................... 15
1.2 Motivation and Objectives .................................................................................................................. 17
1.3 Original contribution ........................................................................................................................... 17
1.4 Dissertation outline and content ........................................................................................................ 19
2. Research methodology ............................................................................................................................. 21
3. Major findings from the experimental work ............................................................................................. 27
3.1 Expeditious methods for nZVI detection ............................................................................................ 27
3.2 Direct current assisted transport of zero valent iron nanoparticles ................................................... 29
3.2.1 Different porosity matrices .......................................................................................................... 29
3.2.2 Different ionic strength electrolytes ............................................................................................ 31
3.3 Electroremediation of contaminated soils with nZVI ......................................................................... 36
3.3.1 Chromium (VI) ............................................................................................................................. 36
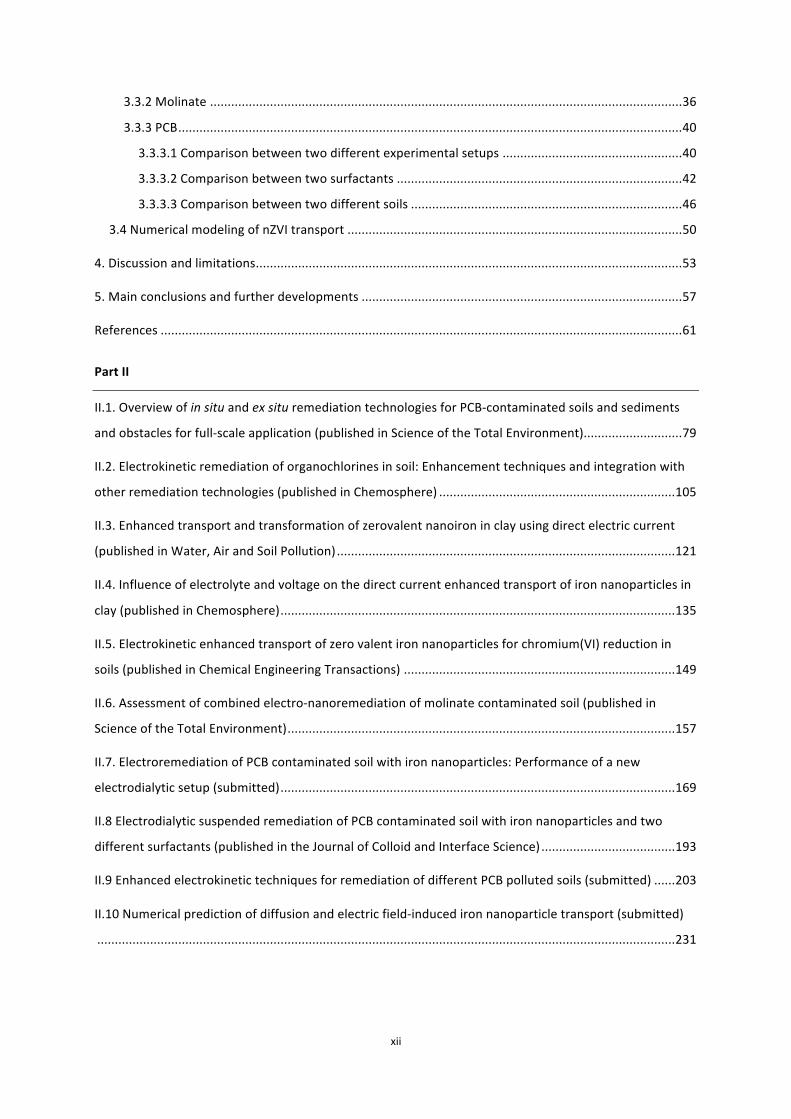
xii
3.3.2 Molinate ...................................................................................................................................... 36
3.3.3 PCB ............................................................................................................................................... 40
3.3.3.1 Comparison between two different experimental setups ................................................... 40
3.3.3.2 Comparison between two surfactants ................................................................................. 42
3.3.3.3 Comparison between two different soils ............................................................................. 46
3.4 Numerical modeling of nZVI transport ............................................................................................... 50
4. Discussion and limitations ......................................................................................................................... 53
5. Main conclusions and further developments ........................................................................................... 57
References .................................................................................................................................................... 61
Part II
II.1. Overview of in situ and ex situ remediation technologies for PCB-‐contaminated soils and sediments
and obstacles for full-‐scale application (published in Science of the Total Environment) ............................ 79
II.2. Electrokinetic remediation of organochlorines in soil: Enhancement techniques and integration with
other remediation technologies (published in Chemosphere) ................................................................... 105
II.3. Enhanced transport and transformation of zerovalent nanoiron in clay using direct electric current
(published in Water, Air and Soil Pollution) ................................................................................................ 121
II.4. Influence of electrolyte and voltage on the direct current enhanced transport of iron nanoparticles in
clay (published in Chemosphere) ................................................................................................................ 135
II.5. Electrokinetic enhanced transport of zero valent iron nanoparticles for chromium(VI) reduction in
soils (published in Chemical Engineering Transactions) ............................................................................. 149
II.6. Assessment of combined electro-‐nanoremediation of molinate contaminated soil (published in
Science of the Total Environment) .............................................................................................................. 157
II.7. Electroremediation of PCB contaminated soil with iron nanoparticles: Performance of a new
electrodialytic setup (submitted) ................................................................................................................ 169
II.8 Electrodialytic suspended remediation of PCB contaminated soil with iron nanoparticles and two
different surfactants (published in the Journal of Colloid and Interface Science) ...................................... 193
II.9 Enhanced electrokinetic techniques for remediation of different PCB polluted soils (submitted) ...... 203
II.10 Numerical prediction of diffusion and electric field-‐induced iron nanoparticle transport (submitted)
.................................................................................................................................................................... 231

xiii
List of Figures
Figure 1.1 Overview of contaminants affecting soil and groundwater in Europe as reported in 2011. . 3
Figure 1.2. Chemical structure of PCB. The possible positions of chlorine atoms on the benzene rings
are denoted by numbers assigned to the carbon atoms. ............................................................... 4
Figure 1.3. Different technologies for nZVI injection: (a) layout of a typical nanoparticle injection well;
(b) injection targeting mobile contaminants, and (c) targeting immobile contaminants. ............. 9
Figure 1.4. Dechlorination of PCB by zero valent iron nanoparticles. ................................................... 11
Figure 1.5. Schematic representation of the main phenomena occurring in electrokinetics. .............. 12
Figure 1.6. Timeline of the main pilot and full-‐scale applications of electrokinetics. ........................... 14
Figure 2.1. Identification of the four main phases in the methodology used. ...................................... 21 Figure 2.2. Different variables and conditions considered in the experiments for the study of iron
nanoparticles transport in model soils, under the influence of the direct current. ..................... 22
Figure 2.3. Different variables and conditions considered in the experiments coupling electrokinetics
and zero valent iron nanoparticles in contaminated soils. ........................................................... 23
Figure 2.4. Electrophoretic cell used in the nZVI transport and the Cr(VI) experiments. ..................... 26
Figure 2.5. Modified EK cell for the molinate experiments with nZVI injection reservoir. ................... 26
Figure 2.6. Three compartment EK setup used with PCB contaminated soil. ....................................... 26
Figure 2.7. Two compartment ED setup used with PCB contaminated soil. ......................................... 26
Figure 3.1. ORP values measured in the PAA-‐nZVI suspensions with 0.001 M and 0.1 M NaCl. .......... 28
Figure 3.2. Additional total iron (mg kg-‐1) in soil sections compared with the initial soil concentration
using different porous media in the enhanced transport and diffusion experiments. ................ 29
Figure 3.3. Pourbaix diagram with the values measured during 48 h in the electrodes embedded in
the electrophoretic cell. ............................................................................................................... 31 Figure 3.4. Additional total iron (mg kg-‐1) in soil sections compared with the initial soil concentration
using different electrolytes and voltages in the enhanced transport and diffusion experiments:
a) Results using 1 mM NaCl with 0, 5 and 10 V; b) 1 mM NaOH using 0 and 5 V; c) 0.1 M Na2SO3
using 0 and 5 V and d) 0.05 M CaCl2 using 0 and 5 V. .................................................................. 32
Figure 3.5. Variation of ORP in the kaolin medium in the a) enhanced transport, b) diffusion and c)
control experiments using 0.05 M CaCl2 as electrolyte and 5 V. The plots were obtained by
interpolation (kriging) of the ORP values measured in each electrode (E1-‐E5) over time. .......... 34

xiv
Figure 3.6. Pourbaix diagram with the values measured at 48 h in the electrodes embedded in the
electrophoretic cell: a) assisted current enhanced transport and b) diffusion tests. .................. 35
Figure 3.7. Post-‐treatment average distribution of total iron to total chromium ratio in the clay. ..... 36
Figure 3.8. Iron enrichment (g kg-‐1) in soil sections (compared with initial soil concentration: 18 g kg-‐1
in Soil S1 and 0.9 g kg-‐1 in Soil S2) in experiments A-‐. .................................................................. 38
Figure 3.9. Average mass balance of iron after the experiments. Average recovery of iron was 86%. 39
Figure 3.10. Average concentration of PCB congeners (PCB28, 52, 65, 101, 138, 153, 180, 204 and
209) in soil before and after the experiments, using the three-‐compartment cell and the two-‐
compartment cell. ........................................................................................................................ 41
Figure 3.11. Evolution of pH in the soil suspension during the experiments using the two-‐
compartment ED setup. ............................................................................................................... 42
Figure 3.12. Average concentration of PCB congeners (PCB28, 52, 65, 101, 138, 153, 180, 204 and
209) in soil before and after the electrodialytic experiments using saponin and Tween 80. ...... 43
Figure 3.13. Possible dechlorination pathways proposed for PCB138. ................................................. 44
Figure 3.14. Possible dechlorination pathways proposed for PCB180. ................................................. 45
Figure 3.15. Average concentration of PCB congeners (PCB28, 52, 65, 101, 138, 153, 180, 204 and
209) in the tested soils before and after the experiments using the two-‐compartment cell. ..... 48
Figure 3.16. Comparison of the mass of iron (%) found at the end of the experiments, with the setups
tested: A) three-‐compartment EK setup, and B) two-‐compartment ED setup. .......................... 49
Figure 3.17. Comparison between the experimental and model results regarding nZVI diffusive
transport in kaolin with 1 mM NaCl. ............................................................................................ 50
Figure 3.18. Comparison between the experimental and model results regarding nZVI assisted
transport (under electric fields) in glass beads with 1 mM NaCl. ................................................. 51
Figure 3.19. Comparison between the experimental (dots) and model results (lines) for the pH
evolution in the anolyte and the catholyte during the experiments with kaolin and CaCl2
(0.05 M). ....................................................................................................................................... 51

xv
List of Tables
Table 1.1. Molecular formula, name, number of isomers, IUPAC number, molecular mass, percentage
of chlorine and number of isomers identified. ............................................................................... 5
Table 1.2. Studies on the use of several types of zero valent iron nanoparticles for remediation,
targeting different contaminants in different matrices. ................................................................ 7
Table 1.3. Coupling of electrokinetic remediation and zero valent iron nanoparticles in bench-‐scale
experiments. ................................................................................................................................. 16
Table 2.1. Summary of the experimental conditions. ........................................................................... 25
Table 3.1. Physical and chemical characteristics of the soils. ............................................................... 47


Part I


1
1. Introduction
1.1 Problem Statement
1.1.1 Soil contamination
Soil contamination is a major environmental issue worldwide, with more than three million
potentially contaminated sites [1]. According to the latest data from the European Commission, an
estimation points to 2.5 million potentially contaminated sites in Europe of which about 14%
(340,000 sites) are probably contaminated and need remediation [2]. In the United States of America
(USA), there are now 1,739 Superfund sites [3] and more than 450,000 brownfields [4] . Developing
countries like China and India have also to deal with this environmental problem, due to rapid
industrialization and economic growth [5-‐10].
In North America and Europe, many countries have a legal framework to classify and deal with
contaminated soils [11, 12]. However, in most countries, the scale of the problem is difficult to assess
as “contaminated land” or “site contamination” are often subjectively or poorly defined [13]. In
Portugal, a specific regulatory framework for contaminated land management is still in development.
References to soil protection can be found scattered throughout the European Union (EU) regulatory
structure, establishing instruments and measures that have a direct or indirect impact on soil quality
[12], and also addressing prevention and control of polluting activities in waste management,
chemicals and industrial emissions [14]. The EU Thematic Strategy for Soil Protection identifies
erosion, organic matter decline, salinization, compaction, landslides, contamination, sealing and
biodiversity loss as the major threats to soils [15]. Still, the long-‐awaited binding EU Soil Directive has
been pending for eight years, without effective results. In 2013, the withdrawal of the Soil
Framework Directive proposal was proposed (MEMO/13/833, from 02/10/2013), thus opening the
way for another initiative in the next mandate of the European Commission.
1

2
Water and air quality are of immediate concern for most people because we all breathe and drink
several times a day, but the importance of soil is more difficult to grasp for an average citizen or
politician. Nevertheless, soil is a non-‐renewable natural resource at a human life span with many
important functions and services such as: (i) biomass production, including agriculture and forestry;
(ii) storing, filtering and transforming nutrients, substances and water; (iii) biodiversity pool for
habitats, species and genes; (iv) physical and cultural environment for humans and human activities;
(v) source of raw materials; (vi) carbon pool; (vii) archive of geological and archeological heritage
[16]. Soil is “the biogeochemical engine of Earth’s life support system”, providing us food, forage,
fiber and fuel [17]. The importance of soil as a sink of CO2 and consequently slowing climate change
was highlighted in a recent study published on Nature [18].
Soil contamination is a result of anthropogenic activities, especially after the Industrial Revolution,
and can be caused by both diffuse and local sources. It is usually defined by increased concentrations
of acidifying contaminants (e.g. SO2, NOx), metals (e.g. cadmium, chromium, copper, lead, mercury),
metalloids such as arsenic, and organic compounds, such as pesticides, herbicides, polycyclic
aromatic hydrocarbons (PAH), and polychlorinated biphenyls (PCB). The main sources of soil
contaminants are mining and smelting; fossil fuel combustion; sewage sludge; process and
manufacturing industries (specifically metallurgical, electronics and chemical); waste disposal; the
land spreading of fertilizers, fungicides and other agricultural materials; atmospheric deposition from
traffic and waste incineration; the spillage of liquids such as solvents or oil; and practices of irrigation
with contaminated waters [19]. Contaminated soils can be simultaneously source and sink for
pollution as, once introduced, pollutants may accumulate for a long time. Although soil
contamination has been recognized since the 1960s, less than a tenth of potentially contaminated
sites globally have been remediated, due to the complex and challenging nature of both surface and
subsurface contamination, as well as the cost and technical difficulty of dealing with contaminant
mixtures, recalcitrant and persistent pollutants [13].
1.1.1.1 Heavy metals
Heavy metals, a wide concept that includes any metal or metalloid of environmental concern, occur
naturally at trace levels in the soil environment, as a result from the pedogenetic processes of
weathering of rock materials. Due to anthropogenic influence, most soils may accumulate one or
more of the heavy metals above defined background values, high enough to cause risks to human
health, plants, animals and ecosystems, or other media, such as water and air. In Europe, heavy
metals are the predominant contaminants, both in soil and groundwater (Figure 1.1).

3
Figure 1.1 Overview of contaminants affecting soil and groundwater in Europe as reported in 2011 [2].
Large quantities of chromium have been discharged into the environment, mainly to soils and
groundwater, due to improper disposal and leakage in industrial activities (ore refining, production of
steel and alloys, metal plating, tannery, wood preservation and pigmentation). Chromium is one of
the most frequent metal soil contaminants and is one of the top 20 contaminants on the Superfund
priority list of hazardous substances for the past 15 years [20].
Oxidation states of Cr range from -‐4 to +6, but only the +3 (III) and +6 (VI) states are stable under
most natural environments. These two oxidation states are different in charge, physicochemical
properties, as well as chemical and biochemical reactivity [21]. Cr(VI) is extremely mobile in the
environment and is toxic to humans, animals, plants, and microorganisms. Because of its significant
mobility in the subsurface environment, the potential risk of groundwater contamination is high.
Cr(III), on the other hand, is less toxic, immobile, and readily precipitates as Cr(OH)3 [22]. Cr(III) is also
considered to be a trace element essential for the proper functioning of living organisms [23].
1.1.1.2 Pesticides
Pesticides are substances used to protect plants from pests, such as weeds, plant diseases or insects.
Target pests can be insects, plant pathogens, weeds, mollusks, birds, mammals, fish, nematodes, and
microorganisms. A pesticide is usually a chemical or biological agent that deters, incapacitates, kills,
or otherwise discourages pests. Despite the benefits in the crop protection, the extensive use of
pesticides and their characteristics can lead to potential toxicity to humans and damage in the
ecosystems. According to the Stockholm Convention on persistent organic pollutants (POP), 14 of the
persistent organic chemicals are pesticides [24].

4
The widespread use of pesticides in intensive agriculture leads to soil and groundwater
contamination. One of the pesticides that causes environmental concern is molinate (S-‐ethyl N,N-‐
hexamethylene-‐1-‐carbamate), often applied annually to flooded fields during rice seeding to control
the overgrowth of weeds [25]. In 2013, there were 165.5 million hectares of rice paddies worldwide
[26]. Molinate can be found in natural surface and ground waters and also in wastewaters [27] due
to its high water solubility, as well as in soils and sediments near rice paddies [25, 28, 29].
1.1.1.3 Persistent organic pollutants and polychlorinated biphenyls
Soil contamination with persistent organic pollutants is particularly alarming. The classification as
POP arises from the United Nations (UN) Stockholm Convention in 2001, due to accumulated
evidence of the potential toxicity of these chemicals based on in vitro or in vivo assays [17]. These
pollutants are synthetic organic compounds resistant to environmental degradation through
chemical, biological, and photolytic processes, which make them persist in the environment,
transport through long-‐range distances and reach remote areas where they have never been used,
bioaccumulate in human and animal tissue, and biomagnificate in food chains [30-‐32]. Soil plays an
important role in the global fate and distribution of POP, as an effective sink for these chemicals due
to its large retention capacity for hydrophobic compounds [33].
Polychlorinated biphenyls (PCB) are a group of synthetic aromatic compounds that comprise two
benzene rings connected at the C-‐1 carbon, with the general formula C12H10-‐xClx. Each ring can have
up to 5 chlorines in the ortho, meta, or para positions (Figure 1.2), ranging from mono-‐ to
decachlorobiphenyl (Table 1.1), totalizing 209 structural arrangements (congeners) differing in
chlorine number and position and exhibiting unique chemical properties. Ballschmiter and Zell (BZ),
in 1980, introduced a system in which congeners were arranged in ascending numerical order based
on the number of chlorine atoms and their position on the biphenyl structure. The BZ system was
recognized by the International Union of Pure and Applied Chemistry (IUPAC) and is the generally
accepted notation [34].
Figure 1.2. Chemical structure of PCB. The possible positions of chlorine atoms
on the benzene rings are denoted by numbers assigned to the carbon atoms.
2ortho
3
4
5 6
2' 3'
4'
5'6'
meta
para
meta ortho

5
Table 1.1. Molecular formula, name, number of isomers, IUPAC number, molecular mass, percentage of
chlorine and number of isomers identified [35].
Molecular Formula
Name: Chlorobiphenyl
No. of Isomers
Ballschmiter and Zell (BZ) No.
Molecular Mass
% of Chlorine
No. of Isomers identified
C12H9Cl Mono 3 1-‐3 188.65 18.79 3
C12H8Cl2 Di 12 4-‐15 233.10 31.77 12
C12H7Cl3 Tri 24 16-‐39 257.54 41.30 23
C12H6Cl4 Tetra 42 40-‐81 291.99 48.65 41
C12H5Cl5 Penta 46 82-‐127 326.43 54.30 39
C12H4Cl6 Hexa 42 128-‐169 360.88 58.93 31
C12H3Cl7 Hepta 24 170-‐193 395.32 62.77 18
C12H2Cl8 Octa 12 194-‐205 429.77 65.98 11
C12HCl9 Nona 3 206-‐208 464.21 68.73 3
C12Cl10 Deca 1 209 498.66 71.10 1
Manufactured by subjecting biphenyl to chlorine, commercial PCB typically came in a mixture of
many congeners, classified by the amount of chlorine by weight present. For instance, Aroclor 1260,
marketed by Monsanto from 1930 to 1977, contained 60% wt. of chlorine [36]. Other commercial
mixtures of different congeners were Clophen (Bayer, Germany), Kanechlor (Kanegafuchi, Japan),
Santotherm (Mitsubishi, Japan), Phenoclor and Pyralene (Prodolec, France) [37, 38]. PCB were used
for industrial application in closed systems: lubricants (industrial oils), dielectric fluids in electrical
equipment such as transformers, capacitors, heat transfer and hydraulic systems [39-‐42]. They were
also employed in open uses, such as pesticide extenders, sealants, carbonless copy paper, lubricants,
paints, adhesives, plastics, flame retardants and dedusting agents on roads [43-‐46]. Other uses, in
partially open systems, include: heat transfer fluids; hydraulic fluid in lifting equipment, trucks and
high-‐pressure pumps; vacuum pumps; voltage regulators; liquid filled electrical cables and liquid
filled circuit breakers [40, 43, 47, 48]. Recently, PCB congeners (namely PCB11 or 3,3'-‐
dichlorobiphenyl) were detected in azo and phthalocyanine pigments, commonly used in paint and
also in inks, textiles, paper, cosmetics, leather, plastics, food and other materials [49, 50], as by-‐
products (inadvertently produced) of industrial synthetic process of paint pigments [49].
PCB pose a real human health threat through numerous exposure pathways [51]. Of the 209
different types of PCBs, 13 exhibit a dioxin-‐like toxicity [24]. The Toxic Equivalency Factor (TEF)
defined by the World Health Organization (WHO) for PCB varies between 10-‐5 for 2,3',4,4',5,5'-‐
hexachlorobiphenyl and 0.1 for 3,3',4,4',5-‐pentachlorobiphenyl. The non-‐dioxin-‐like PCB and their
metabolites do not interact substantially with the aryl hydrocarbon receptor and may act through

6
different pathways than the dioxin-‐like chemicals, so their effects are not accounted for in TEF [52].
Adverse effects associated to the exposure of PCB comprise damage to the immune system, liver,
skin irritation (acne), reproductive system, gastrointestinal tract and thyroid gland [53-‐55]. Research
has also shown that PCB can cause severe neurological problems in children, including impairment of
cognitive and motor abilities and can be transmitted from mother to child during breastfeeding [54].
PCB are listed as probable human carcinogens [24]. Occurrences of PCB toxic effects in invertebrates,
fish, birds and other animals are also well documented [47, 56].
In the 1970s, several countries limited PCB use due to the concerns on human toxicity and later, in
1985, the European Community heavily restricted the use and marketing of PCB. Nevertheless, PCB
production was estimated around 1.2 and 2 million t, with some of the most detailed data indicating
a total global production of approximately 1.3 million t between 1929 and 1993 [57]. Of this
cumulative global production, previsions point to 440 to 92,000 t emitted into the environment [57,
58]. According to Ockenden et al. [59], most of the PCB manufactured/used (perhaps > 70%) have
not yet entered the environmental pool because they are still associated with diffusive source
materials. Around 10% of the total produced PCB [60] is accumulated in the geosphere because of
their low volatility, low solubility in water and high affinity for particulates, both biotic and abiotic
[36, 60, 61].
Under the UN Stockholm Convention, the parties (currently 179) have to eliminate the use of PCB in
equipment (e.g. transformers and capacitors) by 2025 and to ensure the environmentally sound
management of PCB waste (including contaminated soils) by 2028 [24].
1.1.2 Technologies for PCB contaminated soils and sediments
The extent of PCB contamination in soils and sediments worldwide is unknown. In the USA, 25% of
the Superfund Sites (total number of 433 sites) have PCB contaminated soils or sediments [62],
whereas in Canada there are 338 sites according to the Federal Contaminated Sites Inventory [63]. In
European countries, an estimate points towards 272,000 contaminated sites with chlorinated
hydrocarbons but a total quantification of PCB contaminated sites is missing [2]. Additionally to the
local contamination near industrial sites, an inventory on atmospheric deposition in background
surface soil estimates a PCB global soil burden of 21,000 t [64].
For this Ph.D. dissertation, the state of the art of the technologies for in situ and ex situ remediation
of PCB-‐contaminated soils and sediments was reviewed (Section II.1), including laboratory, pilot and
full-‐scale case studies [65]. The main emergent remediation technologies were described and their

7
current status was evaluated, assessing major advantages and also potential obstacles to their full-‐
scale application (Table 6, Section II.1). Although there are promising results in bench-‐scale studies,
most technologies are still in the initial stage of development. Further research and scale up are
needed for the progress of cost-‐effective and sustainable alternatives for PCB remediation. After this
review, recent studies include the electrokinetically enhanced persulfate oxidation of PCB in
contaminated soils with [66] and without surfactant [67]; the phytoremediation by alfalfa, tall fescue,
single, and mixed plants cultivation [68]; and the use of biosurfactant on combined chemical-‐
biological treatment [69]. In none of those studies was clearly demonstrated the method efficiency
for full-‐scale implementation. There is a critical need for a cost-‐effective and sustainable technology
for the remediation of PCB contaminated soils and sediments, as the most common solutions are
“dig and dump” and “dig and incinerate”.
1.1.3 Zero valent iron nanoparticles (nZVI)
Permeable reactive barriers (PRB) filled with granular zero valent iron (ZVI) have been successfully
used for groundwater remediation for twenty years [70], targeting both organic (methanes, ethanes,
ethenes, propanes, aromatics) and inorganic (trace metals and anions) contaminants. In 1996, Lehigh
University researchers developed a method to synthesize zero valent iron nanoparticles (nZVI) using
sodium borohydride as reductant [71, 72]. Since then, in a growing number of studies and
publications, nZVI were used (both as reductant and as oxidant), with several modifications, focusing
in different organic and inorganic contaminants, in different matrices (Table 1.2).
Table 1.2. Studies on the use of several types of zero valent iron nanoparticles for remediation, targeting
different contaminants in different matrices.
Target Contaminant Type of nZVI Matrix Ref. 1-‐(2-‐chlorobenzoyl)-‐3-‐(4-‐chlorophenyl) Bare Water/Methanol solution [73] Amoxicillin and ampicillin Bare Aqueous solutions [74] As (III) Bare Aqueous solutions [75] Atrazine Bare and bimetallic nanoparticles Fe/Pd Aqueous solutions and soil
slurry [76]
Cd2+ Bare Aqueous solutions [77] Chloramphenicol Bimetallic Fe/Ag nanoparticles Aqueous solutions [78] Chlorinated ethanes Bare Water/Methanol solution [79] Chlorinated ethenes and heavy metals Bimetallic Fe/Ni Simulated groundwater [80] Cr(VI) and Pb(II) Bare and supported Ferragel
nanoparticles Aqueous solutions [81]
Cr(VI), Pb(II), TcO4-‐ Polymer resin supported nZVI Aqueous solutions [82] γ -‐hexachlorocyclohexane (γ-‐HCH) CMC stabilized Fe/Pd bimetallic
nanoparticles Spiked soil slurry [83]
Hexachlorobenzene Bare and bimetallic Fe/Pd Aqueous solutions [84] Hexachlorobenzene Bare Aqueous solutions [85] Hexachlorocyclohexanes Bare Contaminated groundwater [86] Hexahydro-‐1,3,5-‐trinitro-‐1,3,5-‐triazine Bare and CMC and PAA stabilized nZVI Aqueous solutions [87]
Ibuprofen “Green” nanoparticlesa Aqueous solutions and sandy soil [88]

8
Target Contaminant Type of nZVI Matrix Ref. Lindane Bare Aqueous solutions [89]
Lindane Bare and CMC, PAP and PAA coated nZVI Water/Methanol solution [90]
Malathion Bare Spiked soil slurry [91] Methylene blue and methyl orange dyes
“Green” nanoparticlesb Aqueous solutions [92]
Metronidazole Polyvinylpyrrolidone stabilized nanoparticle
Aqueous solutions [93]
Molinate Bare Aqueous solutions [94] Nitrates Bare Aqueous solutions [95] PCB Bare Water/Methanol solution [96] PCB Bare Soil [97] PCE, TCE, cis-‐DCE and VC and several chlorinated aromatic compounds
Bimetallic nanoparticles (Pd/Fe, Pd/Zn, Pt/Fe, Ni/Fe) Aqueous solutions [72]
Pentachlorophenol Lactate-‐modified nZVI Spiked soils [98] Polybrominated diphenyl ethers (PBDEs) Bare Aqueous solutions [99]
Pyrene Bare Spiked soil [100] TCE Bare Aqueous solutions [101]
TCE Sodium carboxymethyl cellulose (CMC) stabilized bimetallic Fe/Pd Water/Methanol solution [102]
TCE and PCB Bare and Bimetallic Fe/Pd Aqueous and water/methanol solution [71]
TCE and PCB Starch-‐stabilized bimetallic Fe/Pd Aqueous solutions [103] Trichloroethene and other chlorinated hydrocarbons
Bimetallic Fe/Pd Groundwater (field application)
[104]
Trichloroethylene CMC stabilized Fe/Pd bimetallic nanoparticles
Aqueous solutions and 2 different soils slurries
[105]
Trinitrotoluene (TNT) Bare Aqueous solutions and soils slurries [106]
Uranium Bare Liquid waste effluent [107] VOC Bare Groundwater
(field application) [108]
a Green nZVI were produced using natural extracts (black tea, grapes, and vine leaves). b Green nZVI were produced using extracts of green tea leaves.
Iron nanoparticles have some specific advantages, such as high reactivity for a wide range of
contaminants, lower degradation times when compared to the granular ZVI, generation of less toxic
intermediate products, and also the possibility of injection in the form of aqueous slurries to treat
contaminated soils and groundwaters (Figure 1.3). The growing use of these nanomaterials in pilot
and full-‐scale applications in the last decade is expressive. According to the United States
Environmental Protection Agency (USEPA), in November 2011, there were 36 projects at pilot and
full-‐scale (11 were Superfund sites), including private, state and federal cleanup projects [109]. There
were 15 pilot tests in Europe [110] and full scale applications in Italy, Germany, Czech Republic and
Slovakia [111]. Most of them target soil and groundwater contamination with volatile organic
compounds (perchloroethylene – PCE, trichloroethylene – TCE and corresponding daughter
products); perchlorate; PCB and other organochlorines, as well as diesel products in sandy or silty
sandy soils. There are also applications in glacial till soils and unconsolidated sediments [109].
9
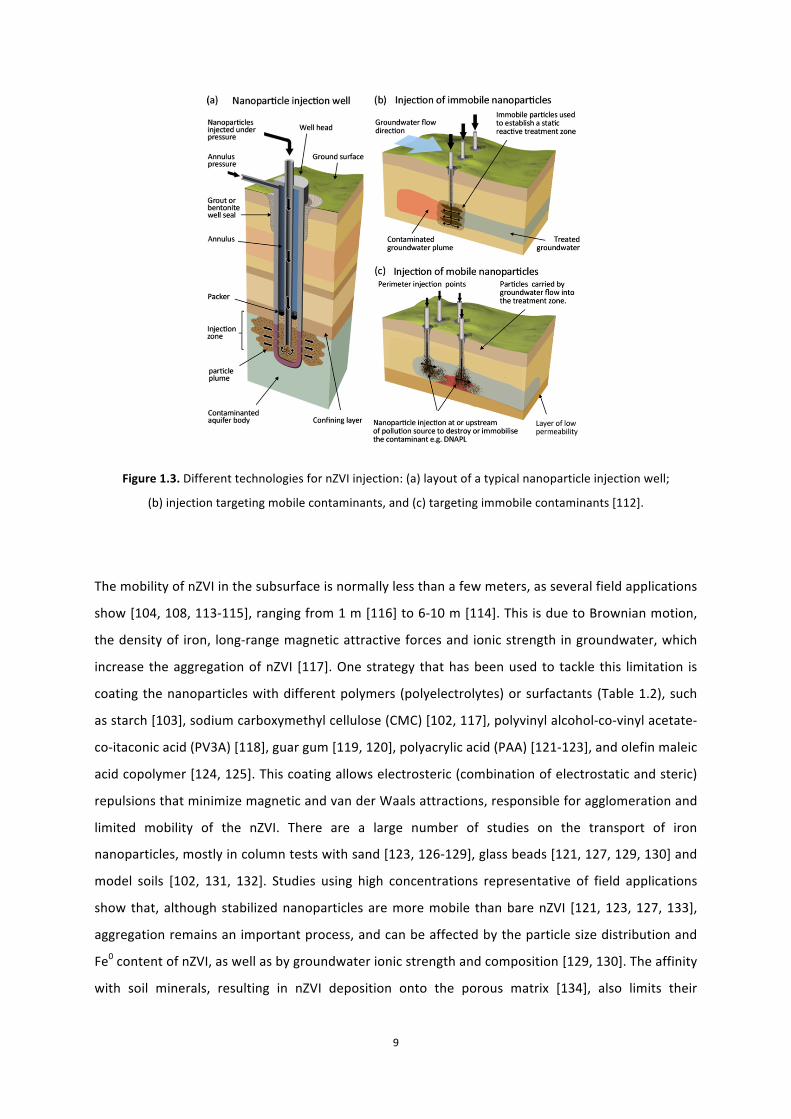
Figure 1.3. Different technologies for nZVI injection: (a) layout of a typical nanoparticle injection well;
(b) injection targeting mobile contaminants, and (c) targeting immobile contaminants [112].
The mobility of nZVI in the subsurface is normally less than a few meters, as several field applications
show [104, 108, 113-‐115], ranging from 1 m [116] to 6-‐10 m [114]. This is due to Brownian motion,
the density of iron, long-‐range magnetic attractive forces and ionic strength in groundwater, which
increase the aggregation of nZVI [117]. One strategy that has been used to tackle this limitation is
coating the nanoparticles with different polymers (polyelectrolytes) or surfactants (Table 1.2), such
as starch [103], sodium carboxymethyl cellulose (CMC) [102, 117], polyvinyl alcohol-‐co-‐vinyl acetate-‐
co-‐itaconic acid (PV3A) [118], guar gum [119, 120], polyacrylic acid (PAA) [121-‐123], and olefin maleic
acid copolymer [124, 125]. This coating allows electrosteric (combination of electrostatic and steric)
repulsions that minimize magnetic and van der Waals attractions, responsible for agglomeration and
limited mobility of the nZVI. There are a large number of studies on the transport of iron
nanoparticles, mostly in column tests with sand [123, 126-‐129], glass beads [121, 127, 129, 130] and
model soils [102, 131, 132]. Studies using high concentrations representative of field applications
show that, although stabilized nanoparticles are more mobile than bare nZVI [121, 123, 127, 133],
aggregation remains an important process, and can be affected by the particle size distribution and
Fe0 content of nZVI, as well as by groundwater ionic strength and composition [129, 130]. The affinity
with soil minerals, resulting in nZVI deposition onto the porous matrix [134], also limits their

10
mobility. The main factors that influence nZVI adsorption onto soil and aquifer materials are: i)
surface chemistry of soil and the nanoparticles; ii) groundwater chemistry (ionic strength, pH, organic
matter content); iii) hydrodynamic conditions (pore size, porosity, flow velocity, and degree of mixing
and turbulence) [135].
Another nZVI limitation is the shorter lifetime compared to granular zero valent iron, due to high
consumption via undesired reactions, i.e. corrosion in aqueous media, with Fe0 being oxidized to Fe2+
(fast process) and Fe3+ (slower process) [134]. Rapid corrosion occurs in the presence of dissolved
oxygen [eq. (1.1)], and then Fe2+ could be further oxidated by H+ [eq. (1.2)] with the precipitation of
the less soluble ferric Fe3+ hydroxides (rust). Besides, corrosion can also occur under anaerobic
conditions with water as the oxidant [eq. (1.3)], generating molecular hydrogen [136]:
2Fe0(s) + 4H+(aq) + O2 (aq) 2Fe2+(aq) + 2H2O(l) (1.1)
4Fe2+(aq) + 4H+(aq) + O2(aq) 4Fe3+(aq) + 2H2O(l) (1.2)
Fe0(s) + 2H2O(l) Fe2+(aq) + H2(g) + 2OH-‐(aq) (1.3)
The reaction of nZVI with inorganic contaminants is controlled by the redox potential of the inorganic
species [137]: if it is significantly higher than the redox potential of Fe0, the compound is removed by
reduction, and subsequent precipitation or co-‐precipitation; if it is significantly lower, then the
reduction is not possible, and the compound can be eliminated only via adsorption on the iron
particles; if the redox potential is moderately higher, a concurrence of reduction and
(co)precipitation could be observed. A comprehensive review on nZVI reactivity was published in
O’Carroll et al. [137] and by Yan et al. [138]. O'Carroll et al. [137] classified the predominant nZVI
removal mechanism for the most common inorganic contaminants into the following categories:
I. Reduction: Cr, As, Cu, U, Pb, Ni, Se, Co, Pd, Pt, Hg, Ag;
II. Adsorption: Cr, As, U, Pb, Ni, Se, Co, Cd, Zn, Ba;
III. Oxidation/reoxidation: As, U, Se, Pb;
IV. Co-‐precipitation: Cr, As, Ni, Se;
V. Precipitation: Cu, Pb, Cd, Co, Zn.
Zero valent iron nanoparticles were considered a promising alternative for PCB degradation in
aqueous solutions [71, 96, 139] because they can promote reductive dechlorination (Figure 1.4), with
a multi-‐step removal of chlorine atoms in different pathways, which can occur in parallel or
sequentially. However, a 95% dechlorination in historically contaminated soils was only achieved at

11
high temperatures (300 oC) [97]. Another recent study reported 81.5% and 53.4% PCB removal from
soils from an e-‐waste recycling area in batch tests with 12 days duration, using the Fe/Pd bimetallic
nanoparticles, compared with 67.4% and 48.3% using bare nZVI [140]. Until now, the efficiency of
PCB dechlorination in soils and soil slurries is limited when compared with aqueous solutions, due to
competing reactions occurring and also to the strong PCB adsorption to soil organic matter.
Figure 1.4. Dechlorination of PCB by zero valent iron nanoparticles
(adapted from Wang and Zhang [71] and Yan et al. [138]).
Most of the benefits of using nZVI are based on short-‐term considerations, and there are large data
and knowledge gaps within almost all aspects of environmental exposure and effect assessment (i.e.
potential for persistency, bioaccumulation, toxicity) in which further research is needed [141]. The
potential risks and environmental impacts associated with the use of nZVI have been studied, but
contradictory results can be found in the literature [142-‐147]. Besides that most toxicity studies are
limited, due to the use of a relatively high dose of nZVI, and to the absence of an environmental
background matrix [138]. According to Grieger et al. [141], the current and traditional environmental
risk assessment approaches are not applicable and there is an urgent need to develop analytical
methods to identify and quantify nanomaterials in environmental samples and complex matrices
[148, 149], despite the recent developments using techniques like field-‐flow fractionation,
ultrafiltration and nanofiltration, size-‐exclusion chromatography, capillary electrophoresis,
hydrodynamic chromatography, isoelectric focusing, and inductively coupled plasma-‐mass
spectroscopy [150-‐152].

12
1.1.4 Electrokinetic remediation
Electrokinetic (EK) remediation, also called electrokinetics, electroremediation or electroreclamation,
is a solid technology that has been successfully used since the late 1980s to treat contaminated soils,
specially low permeability soils [153-‐157]. Electrokinetics can be defined as the application or
induction of a low-‐level direct current on the order of mA cm-‐1 of cross-‐sectional area between the
electrodes or an electric potential difference about few V cm-‐1 across a soil mass containing fluid or a
high fluid content slurry/suspension, causing or caused by the motion of electricity, charged soil
and/or fluid particles [158]. In this method, the current act as the “cleaning agent”, generating
transport processes (as electroosmosis, electromigration and electrophoresis) and electrochemical
reactions (electrolysis and electrodeposition) [155] as showed in Figure 1.5.
Figure 1.5. Schematic representation of the main phenomena occurring in electrokinetics.
Early EK models assumed that electroosmosis (field-‐induced convection of fluid through a porous
medium towards the positive or negative electrode depending on the overall surface charge of the
porous material) was the only significant transport process [159]. This approach was inadequate for
explaining the movement of ionic species (ions and ionic complexes) in the aqueous pore solution,
which mainly depends on electromigration (field-‐induced transport of ions in an electrolyte towards
the electrode of opposite charge). The electromigration flux is determined by the ionic mobility,
tortuosity, porosity of the material, and charge of the ions [155]. In the case of colloidal suspended
charged particles (colloids, clay particles, and organic particles), electrophoresis is the prime
transport process. Diffusion is the movement of the ionic species in soil solution caused by

13
concentration gradients formed by the electrically induced mass transport. Diffusion is often ignored
when studying EK as the ionic mobility of a species is much higher than its diffusion coefficient [155].
Electrochemical reactions are also important in electroremediation. Electrolysis reactions prevail at
the electrodes, due to the oxidation occurring at the anode and the reduction at the cathode,
resulting in water electrolysis, generating an acid front from the anode, whereas reduction at the
cathode produces an alkaline front:
2H2O -‐ 4e-‐ O2# + 4H+ E0 = -‐ 1.229 V (anode) (1.4)
2H2O + 2e-‐ H2# + 2OH-‐ E0 = -‐ 0.828 V (cathode) (1.5)
Secondary reactions may occur depending on the concentration of available species, like metals Me,
for example [155]:
H+ + e-‐ ½ H2# (1.6)
Men++ ne-‐ Me (1.7)
Me(OH)n(s) + ne-‐ Me + nOH-‐ (1.8)
Electrodialytic soil remediation (EDR) is a remediation method developed for removing heavy metals
from polluted soil, based on the combination of the electrokinetic movement of ions in soil with the
principle of electrodialysis [160]. Electrodialytic remediation of solid waste products started in 1992
at the Technical University of Denmark (DTU) and was patented in 1995 (PCT/DK95/00209). EDR was
originally applied to moist and consolidated soil for in situ treatment. Later, a faster and continuous
process was developed [161-‐163]: the soil is suspended in a solution (most often water) and stirred,
primarily to use ex situ. This method was used successfully for the remediation of heavy metals
contaminated soils, both in soil mass containing fluid [157] or a high fluid content slurry/suspension
[161-‐163], for the cleanup of different contaminated matrices like mine tailings, different types of fly
ashes, sewage sludge, freshwater sediments and harbor sediments [164-‐170]. Recently, a new
development in EDR is the two-‐compartment electrodialytic setup also developed [171] at DTU, in
which the anode is placed directly in the compartment in which the soil or the contaminated matrix
is suspended and stirred simultaneously.
The removal of heavy metals from soils is one of the most studied processes in electroremediation
[172]. Despite the success at bench scale, there are limited full-‐scale applications for soil remediation
(Figure 1.6). In the last years, numerous research teams developed methods to increase
electrokinetics removal efficiency, such as pH control [173, 174], enhancement solutions [175],
desorbing agents [176], surfactants [177], pulse [178, 179] and alternating [180] current.

14
Figure 1.6. Timeline of the main pilot and full-‐scale applications of electrokinetics [159, 172, 181-‐185].
For this Ph.D. study, Gomes et al. [186] made a literature review of the experimental work carried
out to improve organochlorines electroremediation from contaminated soils, both with
enhancement solutions or using other remediation technologies simultaneously (Section II.2). The
main conclusions indicate that it is not possible to clearly state which technique is the best, as
experimental approaches and contaminants are different. Also, removal efficiencies in spiked
kaolinite are much higher than in real contaminated soils, showing the influence of the

15
organochlorines chemical properties, especially their low water solubility and sorption to soil
particles, as well as other factors like aging of the contamination [186].
When the referred review was made, EK had never been used to extract PCB from soils. Since then, a
study on spiked soils reported an 87% removal efficiency for PCB just with EK [187]. Still this paper
fails to explain this removal, because no quantification of PCB in the anolyte and the catholyte was
made, nor degradation processes were identified or proposed. Recently, two studies tested the
electrokinetically enhanced persulfate oxidation of PCB in spiked soils [67] and in contaminated soils
using also a surfactant [66]. In the first study, the highest level of PCB oxidation, 78%, was achieved
in spiked kaolin with temperature activated persulfate in 7 days [67]. These results could not be
replicated in the glacial till soil (with only 14% oxidation), probably due to the high buffering capacity,
non-‐homogeneous mineral content and high organic content [67]. In the second study, the
surfactant used was Igepal CA720 and zero valent iron (added in the cathode reservoir) was the
persulfate activator [66]. The highest PCB degradation rate was 38% in the treatment without
activator. The authors found that the use of iron as persulfate activator was ineffective as it
consumed most of persulfate and inhibited its transport into the cell.
1.1.5 Coupling EK and nZVI
The primary goal of soil remediation is achieving the required risk reduction for regulatory
compliance or liability reduction at minimal cost [188]. According to Rao et al. [188], the use of
treatment trains or integration of remediation technologies that, when coupled together work in a
synergistic manner, minimizes the cost of achieving risk-‐based endpoints. The general principle of
treatment trains is the use of a combination of techniques, simultaneously or in succession, to
enhance treatment performance in a quicker, more efficient, and cost effective way. In some cases, a
combination of two technologies might result in more efficient risk reduction, e.g. coupling abiotic
and biotic transformations. In other cases, a sequential application of successively less aggressive
technologies might be the best approach, e.g. thermal treatment, followed by less aggressive
engineered bioremediation, then monitored natural attenuation [188].
Some case studies include combining hydraulic flushing and the electrokinetic treatment for the
simultaneous removal of PAH and heavy metals [189], electrokinetic-‐enhanced bioaugmentation for
remediation of clays contaminated with chlorinated solvents [190], hydraulic pressure injection of
electrolyte to enhance electrokinetics for the remediation of pentachlorophenol (PCP) contaminated
soil [191], electrochemical Fenton oxidation for the remediation of hexachlorobenzene (HCB)

16
contaminated soil [192-‐195], coupling surfactants/cosolvents with oxidants for enhanced dense non-‐
aqueous phase liquid removal [196].
Electrokinetic remediation and zero valent iron nanoparticles were used in conjunction, both to
enhance the transport of iron nanoparticles in low permeability fine-‐grain soils, and to degrade
organic contaminants (Table 1.3). The simultaneous use of both remediation techniques (EK and
nZVI) allows the contaminant removal from soil (traditional outcome in EK) and also its degradation
by nZVI, whose transport is enhanced by the direct current, both by electrophoresis and
electroosmosis.
Table 1.3. Coupling of electrokinetic remediation and zero valent iron nanoparticles in bench-‐scale
experiments (modified from [186]).
Matrix Target contaminant
Duration of test(s) Electrolyte
Voltage gradient (V cm-‐1)
% contaminant removal
best results Ref.
White Georgia kaolin clay -‐ 46 h 0.2 M NaCl 0.25 -‐ [197]
Loamy sand -‐ 6 d Simulated groundwater 1.0 -‐ [132] Spiked soil KNO3 6 d Simulated groundwater 1.0 99 [198] Spiked kaolin PCP 427 h; 960 h Deionized water 1.0 55 [199] Spiked silica sand PCE 100 h 0.01 M Na2CO3 1.0 76 [200] 40/60 or 100/200 sands -‐ 10 d 0.007 or 0.02 M NaCl 0.55; 1.30 -‐ [201]
Spiked sandy soil TCE 10 d Simulated groundwater 1.0 70 [202] Coarse and fine sand -‐ 48 h Simulated groundwater 0.25; 0.5 -‐ [203]
Spiked turf PCP 8 d; 14 d 0.025 M Na2SO4 and 0.025 M Na2CO3
6.0 70 [204]
Contaminated soil PCB 14 d 0.01 M NaNO3 1.0 ⟶ 2.0 20 [205] Boom clay -‐ 160 h; 360 h 0.01 M NaCl 4.0 -‐ [206]
Fan et al. [205] were the first to combine EK and nZVI for remediation of PCB historically
contaminated soil. Brij35-‐xanthan gum stabilized Fe/Pd bimetallic nanoparticles obtained the highest
PCB removal efficiency, both in batch experiments and EK tests, with removal rates of about 50% and
20%, respectively. This limited removal is due to the strong adsorption of PCB to soils. The other
surfactants tested (sodium dodecyl benzene sulfonate – SDBS and rhamnolipid) showed even lower
PCB removal in the EK experiments.

17
1.2 Motivation and Objectives
There is an important need to develop new solutions for the remediation of persistent organic
pollutants in contaminated soils and sediments, both due to their ecotoxicity and the regulatory
obligations to soundly dispose or eliminate these contaminants. The common solutions of “dig and
dump” and “dig and incinerate” are expensive and need to be replaced by sustainable alternatives.
The main research objective of this Ph.D. study was to find out if coupling electrokinetics and zero
valent iron nanoparticles could be an efficient method for treating contaminated soils (with inorganic
and organic contaminants), and which enhancement methods could be more useful and cost-‐
effective. Chromium and two types of organic contaminants – the herbicide molinate and PCB – were
considered for the experimental phase, at bench scale. Another important goal was to develop a
deeper understanding of the mechanisms underlying the coupling of these two remediation
techniques, namely the assisted direct current transport of iron nanoparticles, both through
experiments and modeling.
Other objectives were:
• Development and testing a methodological and analytical approach for determining the fate
of iron nanoparticles in the soil;
• Analysis of the mobility, reactivity and functional life-‐time of zero valent iron nanoparticles in
the soil;
• Identification of the dechlorination pathways of PCB congeners by nZVI.
1.3 Original contribution
This dissertation presents several contributions targeting the aforementioned objectives and
including some existing knowledge gaps. Regarding the direct current assisted transport of iron
nanoparticles, it specifically considered the following:
• The assisted transport was tested here with high concentrations, typical of field applications,
which represent more realistic experimental conditions than with diluted concentrations
[197]. At high particle concentration (1-‐6 g L-‐1) there is a higher agglomeration [128], so it is
important to assess if a direct current can also enhance the nZVI transport in these
conditions.

18
• Previous studies have only considered the nZVI transport in sand and clay [197, 201, 203].
Different porosity media (with mixtures of glass beads and kaolin clay) were tested as model
soils and as an approach to more complex matrices.
• The influence of different electrolytes and the ionic strength in the assisted direct current
transport was studied for the first time. Both factors also contribute to nZVI agglomeration
and settling, hindering the transport of these nanoparticles.
• The modeling of the assisted transport only included the electrophoretic transport [201,
203]. The model now developed, and validated with the experimental data, includes all the
transport processes – diffusion, electromigration of ions, electrophoresis and electroosmosis.
For the simultaneous use of electrokinetics and zero valent iron nanoparticles several innovations
were also implemented:
• The conjunction of EK and nZVI was tested, for the first time, for chromium (VI) and molinate
contaminated soils.
• In the experiments with EK and nZVI, diffusion experiments were always performed as
control, to measure the effective improvement when using both methods. In previous
studies [198-‐200, 202, 204-‐205], this issue was overlooked, only considering the
effectiveness of both methods together.
• The suspended electrodialytic remediation of PCB contaminated soils was tested for the first
time. Regarding organic contaminants, it was only tested before for polycyclic aromatic
hydrocarbons (PAH) [207].
• The two-‐compartment electrodialytic setup developed at DTU [171] together with the
addition of iron nanoparticles was tested and compared with the traditional three-‐
compartment electrokinetic setup.
• Enhancement methods, like the use of surfactants, were also tested for the first time, when
using the two-‐compartment electrodialytic setup. Two different surfactants (saponin and
Tween 80) were assessed as enhancement methods.

19
1.4 Dissertation outline and content
After this introductory chapter, Section 2 presents a synthesis of the experimental approaches
implemented to reach the objectives. Section 3 shows the major findings from the experimental
work presented in detail in the Part II of the dissertation, namely II.3 to II.10, focusing on the direct
current assisted nZVI transport in different porous media and with different electrolytes, the
electroremediation with nZVI of Cr (VI), molinate and PCB contaminated soils. The main findings of
the numeric modeling of nZVI direct current assisted transport are also presented in this Section. The
discussion and limitations of the experimental work done is presented in Section 4. Finally, Section 5
summarizes the overall conclusions and identifies areas for future research.
Part II of the dissertation includes all the publications in peer-‐reviewed journals (published and
submitted) that were developed during the Ph.D. study. As Part I is a summary of the publications
presented in Part II, some overlap and repetition are inevitable.


21
2. Research methodology
The general methodology followed in this Ph.D. study is illustrated in Figure 2.1. The works started
with a comprehensive state of the art review (phase 1, Figure 2.1) on the enhancement methods and
technologies used in conjunction with electrokinetics for the remediation of organochlorines in soil
(Section II.1), and on the technologies for in situ and ex situ remediation of PCB contaminated soils
and sediments (Section II.2). The experimental work comprises phase 2 and 3, detailed in Figure 2.2
and 2.3, respectively, and also in Table 2.1. Finally, phase 4 is the numerical modeling of the nZVI
transport under electric fields.
The direct current assisted transport of iron nanoparticles (phase 2) was tested in model soils –
kaolin clay, as a low permeability medium, and different percentages of kaolin and glass beads for
different porosity media – in a modified electrophoretic cell (Figure 2.4). Various electrolytes with
different ionic strengths were used in the experiments. The applied voltage gradient was another
variable considered in this phase and two different values were tested.
Figure 2.1. Identification of the four main phases in the methodology used.
2
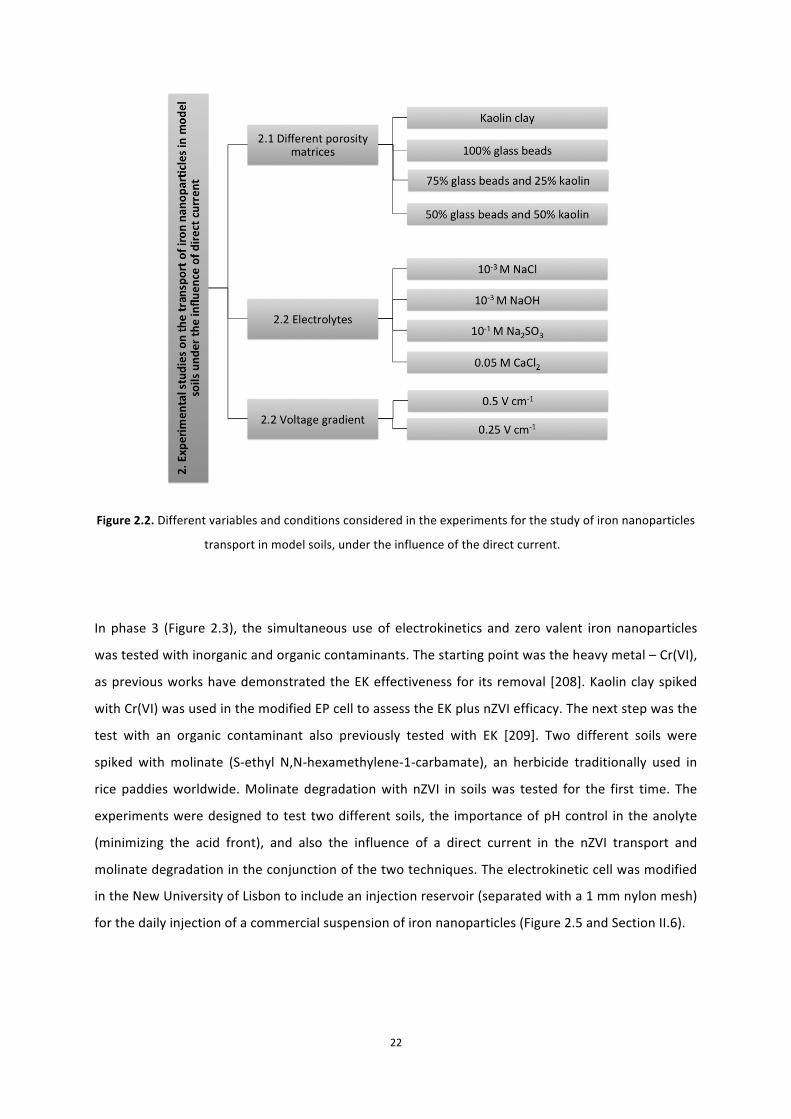
22
Figure 2.2. Different variables and conditions considered in the experiments for the study of iron nanoparticles
transport in model soils, under the influence of the direct current.
In phase 3 (Figure 2.3), the simultaneous use of electrokinetics and zero valent iron nanoparticles
was tested with inorganic and organic contaminants. The starting point was the heavy metal – Cr(VI),
as previous works have demonstrated the EK effectiveness for its removal [208]. Kaolin clay spiked
with Cr(VI) was used in the modified EP cell to assess the EK plus nZVI efficacy. The next step was the
test with an organic contaminant also previously tested with EK [209]. Two different soils were
spiked with molinate (S-‐ethyl N,N-‐hexamethylene-‐1-‐carbamate), an herbicide traditionally used in
rice paddies worldwide. Molinate degradation with nZVI in soils was tested for the first time. The
experiments were designed to test two different soils, the importance of pH control in the anolyte
(minimizing the acid front), and also the influence of a direct current in the nZVI transport and
molinate degradation in the conjunction of the two techniques. The electrokinetic cell was modified
in the New University of Lisbon to include an injection reservoir (separated with a 1 mm nylon mesh)
for the daily injection of a commercial suspension of iron nanoparticles (Figure 2.5 and Section II.6).

23
The most recalcitrant contaminants – PCB – were the last to be tested. The experiments also tested
two different contaminated soils (Figure 2.3 and Table 2.1). Soil 1 was provided by a hazardous waste
operator in Portugal and is a mixture of contaminated soils from industrial sites with transformers
oils spills. Soil 2 was sampled in a decommissioned school, in Hovedstaden (Capital Region of
Denmark), and the PCB resulted from the weathering of the windows joint sealants. In these
experiments, two different setups were tested: the traditional three-‐compartment electrokinetic
setup (Figure 2.6) and the two-‐compartment electrodialytic setup (Figure 2.7) developed at the
Technical University of Denmark [171]. The enhancing/desorption effects of two different surfactants
(Tween 80 and saponin) when using electro-‐nano remediation were also assessed.
Figure 2.3. Different variables and conditions considered in the experiments coupling electrokinetics and zero
valent iron nanoparticles in contaminated soils.
The modeling of the iron nanoparticles transport (phase 4) is the combination of two strongly
coupled modules: one for the transport process and the other for chemical equilibrium calculations.
The model consists in the Nernst–Planck coupled system of equations, which accounts for the mass

24
balance equation of ionic species in a fluid medium, when diffusion and electromigration are
considered in the ions transport process. In the case of nZVI (with negative charge), diffusion and
electrophoretic terms have been considered. In both cases, also the electroosmotic flow was
included in the equation. Regarding the chemical equilibrium, only the water chemical equilibrium
and the electrochemical reactions at the electrodes were considered.
The transport processes of nZVI take place in a domain that consists of the modified electrophoretic
cell (Figure 2.4) with a square tray (20 cm x 20 cm) containing a layer of solid (kaolin and/or glass
beads) saturated with electrolyte, and the anode and cathode compartments filled with the same
electrolyte solutions. The model operates in two steps, first simulating the process kinetic by
integrating forward in time one-‐dimensional transport equations, including electrochemical reactions
in the electrodes, and, after that, reestablishing the chemical equilibriums before the next step of
integration.

25
Table 2.1. Summary of the experimental conditions.
Phase Number of experiments Matrix Duration
(d)
Electrolyte (anolyte and catholyte)
pH control (in the electrolytes)
Voltage gradient (V cm-‐1)
PAA-‐nZVI added (g) Control experiments Experimental cell Section
2.1 10
Kaolin clay 100 % glass beads 75 % glass beads and 25 % kaolin 50 % glass beads and 50 % kaolin
2
10-‐3 M NaCl
None 0.25 0.008 Diffusion (no current) Current without nZVI
Modified electrophoretic cell II.3
2.2 14 Kaolin clay 2
10-‐3 M NaCl 10-‐3 M NaOH 10-‐1 M Na2SO3 0.05 M CaCl2
None 0.25 and 0.5 0.008
Diffusion (no current) Current without nZVI
Modified electrophoretic cell II.4
3.1 3 Kaolin clay 1 10-‐3 M NaCl None 0.25 Diffusion (no current) Current without nZVI
Modified electrophoretic cell II.5
3.2 5 Spiked soils (sandy and loamy sand) 6 10-‐2 M NaNO3
2 experiments with NaOH 1M added to
anolyte ~ 5* 1.150
Diffusion (no current) pH control
Modified cylindrical cell with injection reservoir near to
anode II.6
3.3.1 6 PCB historically contaminated soil (loamy sand)
5, 10, 20 and 45 10-‐2 M NaCl HCl 5M added to the
catholyte in the ED setup 2 2.990;
2.300 and 4.6000
Diffusion (no current) Setup
Cylindrical cell Three-‐compartment cell and
Two-‐compartment cell II.7
3.3.2 6 PCB historically contaminated soil (loamy sand)
5 10-‐2 M NaCl HCl 5M added to the catholyte in the ED setup
1 2.300 Diffusion (no current) Current without nZVI Type of surfactant
Two-‐compartment cell II.8
3.3.3 15 PCB historically contaminated soils (loamy sand and silt loam)
5 10-‐2 M NaCl HCl 5M added to the catholyte in some
experiments
2 (EK) 1 (ED)
2.990 and 2.300
Diffusion (no current) Current without nZVI
Setup
Cylindrical cell Three-‐compartment cell and
Two-‐compartment cell II.9
* Experiments with constant current density of 2.5 mA cm-‐1.
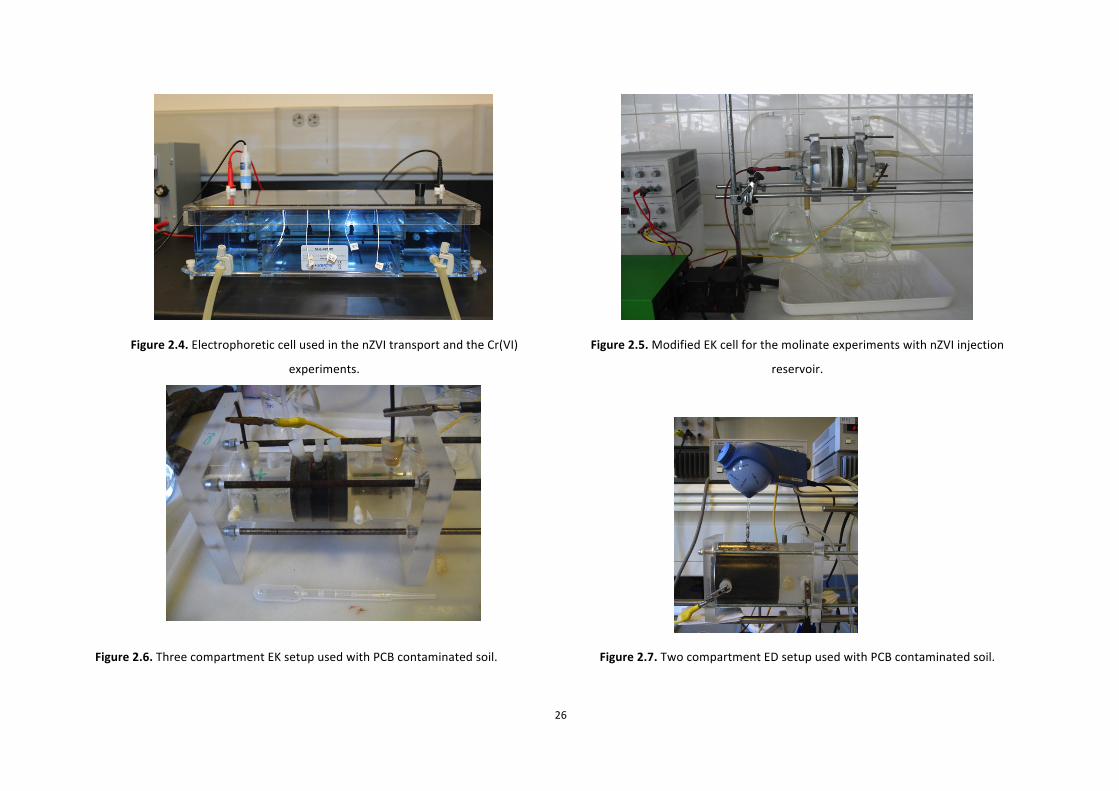
26
Figure 2.4. Electrophoretic cell used in the nZVI transport and the Cr(VI)
experiments.
Figure 2.5. Modified EK cell for the molinate experiments with nZVI injection
reservoir.
Figure 2.6. Three compartment EK setup used with PCB contaminated soil. Figure 2.7. Two compartment ED setup used with PCB contaminated soil.

27
3. Major findings from the experimental work
3.1 Expeditious methods for nZVI detection
A methodological and analytical approach for determining the fate of nZVI in the soil was developed
and tested (Section II.3) before starting the nZVI direct current assisted transport experiments. The
approach was based in the measurement of parameters such as pH, electrical conductivity, and
oxidation-‐reduction potential (ORP). The selection of these parameters was related with field
observations in groundwaters after nZVI injection, in which ORP values decreased from about −100
to −400 mV [210], and pH and conductivity increased [211]. The measurements were made in
suspensions of different concentrations of PAA-‐nZVI, prepared with deionized water, 0.1 M and
0.001 M NaCl solutions, at fixed times. The data obtained was used to generate calibration curves of
relative nZVI concentration.
In the tested suspensions, there was no clear fit for the pH calibration curves, as the pH values
measured at different concentrations of PAA-‐nZVI were identical, and did not show meaningful
changes in time (Figure 3, Section II.3). The PAA-‐nZVI concentrations in deionized water showed
good fits to the linear regression analysis for conductivity, except for the measurements made at
12 h. However, when NaCl is added, the salt conductivity completely masked the nZVI presence and
there was no change in conductivity with increasing concentrations of PAA-‐nZVI. Hence, the
conductivity could not be used as an expedite method to evaluate the distribution trends of the iron
nanoparticles in the enhanced transport experiments.
As ORP measurements have been widely used as an indirect method to assess the results of injection
of nZVI for groundwater remediation [104, 108, 212], it was expected that these values could be
used as a reliable indicator of nZVI concentration in the transport experiments. It was challenging to
3

28
obtain stable values of the ORP for the suspensions tested, with some readings taking more than 30
min. The results showed that ORP decreased with increasing concentration of nZVI. The relationships
between these variables were highly nonlinear, suggesting a complex response function that cannot
be reliably used as a calibration curve (Figure 3.1).
Figure 3.1. ORP values measured in the PAA-‐nZVI suspensions with 0.001 M and 0.1 M NaCl.
Although for nZVI concentrations lower than 0.1 g L-‐1 there is an approximately linear relationship
(with R2 > 0.90), at higher concentrations, the ORP becomes relatively independent of the nZVI
concentration. Both observations are consistent with the results of Shi et al. [213] that used rotating
disk electrodes in nZVI suspensions to assess the effects of nanoparticles on ORP. These researchers
found that the response of ORP electrodes to suspensions of nZVI is not a simple function of iron
nanoparticles concentration. At high concentrations of nZVI, ORP is dominated by direct interaction
between the electrode and the nanoparticles, but this response is nonlinear and saturates with
increased coverage of the electrode surface with adsorbed particles [213]. At low nZVI
concentrations, in aqueous suspensions, the measured ORP is a mixture of contributions that
includes adsorbed nZVI and the dissolved H2 and the Fe(II) species that arise from corrosion of nZVI
[213]. Therefore, the changes in ORP at low concentrations of nZVI (< 0.1 g L-‐1) may be a viable
method to track the relative spatial and temporal distribution of nZVI in controlled experiments.
-‐750
-‐600
-‐450
-‐300
-‐150
0
150
300
0.0001 0.01 1 100
ORP
(mV)
nZVI concentraEon (g L-‐1) -‐ logaritmic scale
0.001 M NaCl
0h
4h
12h
24h
48h
-‐750
-‐600
-‐450
-‐300
-‐150
0
150
300
0.0001 0.01 1 100
ORP
(mV)
nZVI concentraEon (g L-‐1) -‐ logaritmic scale
0.1 M NaCl
0h
4h
12h
24h
48h

29
3.2 Direct current assisted transport of zero valent iron nanoparticles
3.2.1 Different porosity matrices
The direct current assisted transport of zero valent iron nanoparticles in different porosity media was
investigated in Section II.3 and compared with diffusion. In general, higher concentrations of iron
across the test bed (in samples over the auxiliary electrodes E1-‐E5) were measured when a direct
current was applied (Figure 3.2), indicating that the nZVI transport was enhanced.
Figure 3.2. Additional total iron (mg kg-‐1) in soil sections compared with the initial soil concentration using
different porous media in the enhanced transport and diffusion experiments.
In all the experiments with glass beads there was a well-‐defined peak of concentration at E3 (i.e.,
practically the injection point). This was probably due to the nZVI aggregation, or to the fast
corrosion of the iron nanoparticles, or to both phenomena. It has been previously shown that at high
particle concentrations (1-‐6 g L-‐1) nZVI have a higher tendency for agglomeration [128]. When nZVI
aggregate and form clusters larger than the soil pores, their transport becomes restricted [214].
Changes to the nZVI mobility can be due to volumetric expansion with corrosion (eq. 1.1 and 1.3).
0
50
100
150
200
E1 E2 E3 E4 E5
Total Fe (m
g kg
-‐1)
100% glass beads
Enhanced transport
Diffusion
0
50
100
150
200
E1 E2 E3 E4 E5
Total Fe (m
g kg
-‐1)
50% glass beads + 50% kaolin
Enhanced transport
Diffusion
0
50
100
150
200
E1 E2 E3 E4 E5
Total Fe (m
g kg
.1)
75% glass beads + 25 % kaolin
Enhanced transport
Diffusion
0
50
100
150
200
E1 E2 E3 E4 E5
Total Fe (m
g kg
-‐1)
100% kaolin
Enhanced transport
Diffusion

30
The volume of corrosion products (Fe hydroxide or oxide) is larger than that of the original metal
(Fe0) and these products are likely to contribute to porosity loss, promoting simultaneously particle
agglomeration [135].
PAA-‐nZVI did not move into the aqueous phase in the electrode chambers, except for the cathode
chamber in the enhanced transport tests with 100% kaolin (final concentration of 0.43 mg L-‐1) and
100% glass beads (0.74 mg L-‐1 in the anode compartment and 0.09 mg L-‐1 in the cathode). This
indicates that the electroosmotic flow (EOF) was possibly dominant in transporting nZVI in pure clay,
whereas electrophoresis was the main mechanism to transport nZVI in surface neutral glass beads. In
mixed samples, it appears that the EOF and electrophoresis compete, resulting in the prolonged
presence of iron in the pores and potential capture on the clay surfaces. Other experimental results
showed that there was greater deposition of nZVI onto clay minerals compared to similar sized silica
fines due to charge heterogeneity on clay mineral surfaces [215].
The pH and ORP conditions measured during the experiments were favorable to the nZVI oxidation.
Also, the initial conditions were not advantageous to the mobility of PAA-‐nZVI, because low pH (such
as the kaolin pH = 4.97) increases deposition of nZVI in clay, as well as nZVI aggregation [215]. The
typical profile in electrokinetic treatments of a pH front increasing from the anode to the cathode
was not observed in the media in the experiments, which can be attributed to the low values of
current density applied, or to the absence of the physical conditions for fast transport of H+ and OH-‐
from the electrode compartments into the media. Only in the experimental setups with 100% glass
beads was noticed the effect on pH from the injection of the PAA-‐nZVI, particularly in E2, E3 and E4,
in which pH values higher than 8 were measured.
The use of Pourbaix (Eh-‐pH) diagrams, as an indication of the dominance of particular Fe species at
the recorded Eh and pH measurements, allowed observing that all data from diffusion tests form a
cluster that corresponds to the formation of Fe2O3 under oxidizing conditions (passivity region)
(Figure 3.3). Regarding the experiments with direct current enhanced transport of PAA-‐nZVI, the
values measured above E1 and E2 electrodes (i.e., nearest to the anode), during the first 6-‐7 h of the
experiments match the Fe2+ area (corrosion region). There is a distinct cluster of values measured in
the glass beads bed, in which pH values were much higher than in other experiments. Predictions
from these stability diagrams are only accurate when the system approaches thermodynamic
equilibrium in aqueous solutions, however, the results are consistent with the visual observations of
the iron injected in the cell, since only after one hour it was clearly visible that the iron nanoparticles
had started to present an orange color, typical of its oxidation.

31
Figure 3.3. Pourbaix diagram with the values measured during 48 h in the electrodes
embedded in the electrophoretic cell.
3.2.2 Different ionic strength electrolytes
The main objective of this study was to assess if low direct current can enhance the nZVI transport at
concentrations typical of field applications, in clay rich soils, varying the electrolyte ionic strength and
voltage (Section II.4). As in the previous experiments, kaolin clay represented a low permeability
medium. The experimental setup adopted allowed monitoring the oxidation-‐reduction potential and
pH values variation in the kaolin, during short-‐term experiments, estimating the temporal and spatial
distribution of the iron oxidation states, and hence the reactivity of the nanoparticles.
Similarly to the previous experiments (Section 3.2.1), higher iron concentrations were measured
when a direct current was applied (Figure 3.4), indicating an enhancement of nZVI transport over
diffusion in kaolin clay. A 25% increase in the average concentration was observed. The Fe
concentrations obtained in the enhanced transport tests were statistically different from the
diffusion tests at a 0.05 level of significance [one-‐way ANOVA, F(1,38) = 5.04, p = 0.03].
Simultaneously, statistic models with variables pH, ORP, electrode location and voltage did not
return any of these variables to be significant to explain this variance. No significant differences were
found in the diffusion experiments for the tested electrolytes [one-‐way ANOVA, F(3,16) = 0.60,
p = 0.62].

32
The electrolyte 1 mM NaOH presented the highest differences in the experiments with and without
direct current, as well as higher iron concentrations near the cathode in relation with the other
electrolytes (Figure 3.5). The experiments using Na2SO3 and CaCl2 showed limited enhancement in
PAA-‐nZVI transport when compared with diffusion. The higher ionic strength of these electrolytes
may have contributed to lower nanoparticles stability, increasing their agglomeration and limiting
the transport. Recent studies in columns showed that the addition of salts (more than 0.5 mM L-‐1
CaCl2), can decrease nZVI mobility, and changes in pH to values below six can inhibit mobility at all
[216]. Also, the higher ionic strength and the divalent cation Ca2+ can have affected the kaolin by
reducing the diffuse double layer of the clay particles, and consequently the electroosmotic
transport.
Figure 3.4. Additional total iron (mg kg-‐1) in soil sections compared with the initial soil concentration using
different electrolytes and voltages in the enhanced transport and diffusion experiments: a) Results using 1 mM
NaCl with 0, 5 and 10 V; b) 1 mM NaOH using 0 and 5 V; c) 0.1 M Na2SO3 using 0 and 5 V and d) 0.05 M CaCl2
using 0 and 5 V.
The increase in the applied voltage resulted in an increase in the transport of nZVI towards the
cathode side locations (E4 and E5) for the NaCl electrolyte clay sample, as well as in an even larger
0
50
100
150
200
0.20 0.35 0.50 0.65 0.80
Fe (m
g kg
-‐1)
Normalized distance from anode
1 mM NaCl -‐ Enhanced transport 5 V 1 mM NaCl -‐ Enhanced transport 10 V 1 mM NaCl -‐ Diffusion
a)
E1 E2 E3 E4 E5
0
50
100
150
200
0.20 0.35 0.50 0.65 0.80
Fe (m
g kg
-‐1)
Normalized distance from anode
1 mM NaOH -‐ Enhanced transport 5 V 1 mM NaOH -‐ Diffusion b)
E1 E2 E3 E4 E5
0
50
100
150
200
0.20 0.35 0.50 0.65 0.80
Fe (m
g kg
-‐1)
Normalized distance from anode
c) 0.1 M Na2SO3 -‐ Enhanced transport 5 V 0.1 M Na2SO 3 -‐ Diffusion
E1 E2 E3 E4 E5
0
50
100
150
200
0.20 0.35 0.50 0.65 0.80
Fe (m
g kg
-‐1)
Normalized distance from anode
d) 0.05 M CaCl2 -‐ Enhanced transport 5 V 0.05 M CaCl2 -‐ Diffusion
E1 E2 E3 E4 E5

33
increase in transport towards the anode. This transport is mainly due to electrophoresis, due to the
negative charge of the nZVI polymer coating, whereas the movement towards the cathode is due to
electroosmosis. The concentrations of total Fe measured in the 10 V test in E4 and E5 are around 1.5
times higher than in the 5 V test, possibly due to an increase in the electroosmotic advection with
voltage. Yang et al. [198] considered electroosmosis as the most relevant mechanism for Pd/Fe
bimetallic nanoparticles transport under direct electric current. Electroosmotic flow measurements
were not made in these experiments, but the results show the need for additional research to assess
the electroosmotic advection of iron nanoparticles in clays. Other researchers observed that the
enhancement in transport of nZVI from the cathode to the anode, compared to diffusion, was
proportional to the applied current [201, 203]. In those studies, electrophoresis was the predominant
transport mechanism, because the tested soils were fine-‐grained sands. In clay systems, apparently,
electroosmotic advection may be strong enough to counteract electrophoresis, reducing the overall
migration rate of nZVI toward the anolyte. However, if the pH is low, the polarity of the surface
charge may become inverted and electroosmosis towards the anode will occur. Potentially
electroosmosis towards the anode could have happened in the experiments with CaCl2, with pH
values close and below the pHiep 2.5 for the clay.
In all the experiments, and similarly to the results of the experiments with different porosity
materials, PAA-‐nZVI accumulation was visible around the injection location. First of all, this is due to
the generally slow dispersion from an injection point in this kind of porous media. Second, the
accumulation was also attributed to the aggregation of the iron nanoparticles or to their corrosion,
or to both, as mentioned in 3.2.1.
The ORP values measured in the clay during the experiments are well above typical values associated
with nZVI in groundwater in field applications (-‐ 100 mV) [104, 108, 139, 217], and those needed for
reductive dechlorination, but are consistent with other studies on nZVI enhanced transport in clay
[197, 214]. The nZVI effect on clay ORP is minor when compared with groundwater. The temporal
and spatial evolution of ORP from the tests with 0.05 M CaCl2 in the pore fluid is plotted in Figure 3.5.
For this electrolyte (with the higher ionic strength), the influence of nZVI in ORP is less important
than with NaCl (Figure 3, Section II.4), and the evolution shows the general trend of oxidizing to
reducing conditions from the anode toward the cathode (E1 to E5). This trend is due to the oxidation
occurring in the anode and the reduction in the cathode, resulting in water electrolysis according to
the equations 1.4 and 1.5 (see Section 1.1.4).

34
Figure 3.5. Variation of ORP in the kaolin medium in the a) enhanced transport, b) diffusion and c) control
experiments using 0.05 M CaCl2 as electrolyte and 5 V. The plots were obtained by interpolation (kriging) of the
ORP values measured in each electrode (E1-‐E5) over time.
In general, higher voltages corresponded to lower ORP values (with or without nanoparticles), with
exception of the experiments with NaOH, in which the inverse occurred. Higher ORP values were
obtained with CaCl2. The statistical analysis carried out in Section II.4 showed that only the factors
“Voltage”, “Electrolyte” and “nZVI” were significant and showed an interaction that could explain
most of the ORP variability (ω2 = 0.62). Independently, the factor more significant was “Electrolyte”
(ω2 = 0.12). These results show the importance of the electrolyte and the respective ionic strength in
the variation of the oxidation-‐reduction potential and how to interpret it for effectiveness of nZVI
transport.
Also in these experiments, initial pH measured in the clay was favorable for nZVI oxidation, varying
from 4.23±0.13 to 4.77±0.28, except for the electrolytes Na2SO3 (6.66±0.28) and CaCl2 (3.73±0.28)
that presented the highest and lowest pH values. Slight acidification of the kaolin at E1 and E2 (near
the anode) after 24 h and 30 h, respectively, was noted in all the EK tests. The electrolyte that
showed the most variation in the pH values was Na2SO3, especially near the injection point of PAA-‐
nZVI (E2 and E3), between 6 h and 32 h. A similar trend was observed in the diffusion tests with
Na2SO3. This was attributed to the oxidation of SO32-‐ to SO4
2-‐ generating acid. The statistical analysis
of pH data presented in Section II.4 showed that also for pH, the type of electrolyte could explain

35
most of the pH variability (ω2 = 0.64). Thus, the electrolyte (and its ionic strength) is the most
important factor in the pH variation during the experiments.
The Pourbaix (Eh-‐pH) diagrams for the Fe oxidation states in these experiments (Figure 3.6) are
similar to the ones obtained in the different porous media (Figure 3.3), with the most oxidizing
conditions occurring with CaCl2 and the most reducing conditions with NaOH. In the diffusion
experiments, there is a cluster that corresponds to the formation of Fe2O3 under oxidizing conditions
(passivity region), with small differences between the electrolytes tested. Comparing the diagrams a)
and b) (Figure 3.6), the effect of the direct current in the kaolin pH and redox conditions is
discernible, as well as its influence on the distribution of the iron oxidation states.
Figure 3.6. Pourbaix diagram with the values measured at 48 h in the electrodes embedded in the
electrophoretic cell: a) assisted current enhanced transport and b) diffusion tests.

36
3.3 Electroremediation of contaminated soils with nZVI
3.3.1 Chromium (VI)
Short duration experiments with K2Cr2O7 spiked kaolin were performed in the modified
electrophoretic cell used for the assisted current transport experiments (Section II.5). At the end of
24 h treatment, no iron or chromium was detected in either the anolyte or the catholyte in all the
experiments. The Fe/Cr ratio distribution in soil remained relatively uniform (Figure 3.7) in the
electrodes E1 to E5, throughout the cell as observed by Pamukcu et al. [208]. This is attributed to
retarded chromium transport and uniform distribution of the excess iron across the thin cross-‐
section of the kaolin during treatment.
Figure 3.7. Post-‐treatment average distribution of total iron to
total chromium ratio in the clay.
Comparing the ratio between Cr(VI) and total chromium concentrations along the electrodes, it is
apparent that less chromium is on this oxidation state, when direct current is used. In this case,
across the soil, at the end of 24 h, an average of 62 % of chromium is transformed into the less toxic
and less mobile oxidation state Cr(III). Results also show that PAA-‐nZVI transport is enhanced with
direct current, as more Fe2+ was found compared with diffusion. The high value in E3 is consistent
with the visual observation of nZVI transport as well.
3.3.2 Molinate
Molinate degradation with nZVI in spiked soils was tested for the first time, both in degradation tests
and also combining electrokinetics with nZVI (Section II.6). In aqueous solutions, molinate
degradation occurs via an oxidative pathway that requires oxygen and the formation of hydrogen
peroxide and hydroxyl radical [94]. After the degradation tests, comparing the molinate final amount
in the experiments with and without nanoparticles (one-‐way analysis of variance – ANOVA), we

37
found a significant difference for the concentrations of molinate in soils (p < 0.01). This supports the
hypothesis that the iron nanoparticles degraded the molinate added to the tested soils.
Regarding the nZVI transport, the aqueous solution in the anode compartment always presented
higher Fe concentrations than in the cathode compartment. This is related with the cell
configuration, as the injection reservoir is near the anode. The highest iron concentration was found
in the anode compartment in the diffusion experiments. Comparing the two different soils tested,
more iron was found in the anolyte with soil S1 (sandy soil) when compared with soil S2 (loamy soil
with high organic matter content). The sandy soil S1 allowed a faster transport of the iron
nanoparticles, due to its high pore volume [218]. Adsorption phenomena [105] in soil particles and
humic acid accumulation on the nZVI surface [219] most likely hinder iron transport, and this can also
contribute to the lower iron concentrations in the anolyte in experiments with soil S2, when
compared to those with soil S1 under similar conditions.
In the experiments with direct current, lower amounts of Fe were measured in the anolyte than in
the diffusion experiments. Even though nanoparticles have a negative surface charge due to the
polymer (PAA) coating, and thus would be potentially transported towards the anode by
electrophoresis, electroosmotic flow generally occurs in the opposite direction (towards the
cathode), and may hinder transport towards the anode, explaining the low concentrations found in
the anolyte when a direct current was applied. In the experiment with pH control in the anolyte (soil
S2), in average, ten times more iron was found in the anolyte than in experiment without pH control
(soil S2), possibly because in the later the advance of the acid front (H+) oxidizes nanoparticles
(Fe0⟶ Fe2+), and the resulting positively charged iron ion is transported towards the cathode. Still
only small amounts of iron were measured in the catholyte in all experiments, probably because
there was not enough time to reach the cathode compartment. The statistical analysis showed that
the observed variance can be explained, at a 0.05 level, by the type of soil (S1 and S2) and the
electric current (0 and 10 mA). The pH control was not significant.
In addition to iron in the electrolyte, its presence in the soil was also analyzed and compared to the
initial content. Iron enrichment in the different soil sections is shown in Figure 3.8. The highest iron
concentration in the soil in experiment A may be explained by the change of the soil charge with the
advance of the acid front from the anode end due to the absence of pH control. In these conditions,
ions of H+ may adsorb to soil particles and increase the zeta-‐potential, resulting in an augmented
adsorption of the PAA-‐coated iron nanoparticles. Most of the iron was always in the sections
immediately after the injection reservoir. The section near the cathode (Section 5) presented the
lowest amounts of additional iron (Figure 3.8), what is consistent with the concentrations found in

38
the catholyte. This means that the iron accumulates in the nearest sections to the injection point.
Nevertheless, no major differences existed in the three samples in the middle section (top, central
and bottom) in experiments B, C and D, with relative standard deviation (RSD) of 9%, 6% and 5%,
respectively; whereas in experiments A and E was higher (22% and 37%). There was no iron
accumulation or deposition in the bottom part of this section (section 3), when compared to the
central and top samples.
Figure 3.8. Iron enrichment (g kg-‐1) in soil sections (compared with initial soil concentration: 18 g kg-‐1 in Soil S1
and 0.9 g kg-‐1 in Soil S2) in experiments A-‐E. Section 1: between the anode compartment and the injection
reservoir; Section 2: central soil section after the injection reservoir, top; Section 3: central soil section after the
injection reservoir, bottom; Section 4: central soil section after the injection reservoir, center; Section 5:
between the central soil section and the cathode compartment.
The mass balance of the iron shows that most of it stays in the injection reservoir of the cell,
followed by the sum found in the soil and the passive membranes (Figure 3.9). This balance indicates
a low mobility of the iron nanoparticles inside the experimental electrokinetic cell, most likely due to
aggregation and sedimentation as also showed in other experimental setups with columns [128, 129,
220].

39
Figure 3.9. Average mass balance of iron after the experiments. Average recovery of iron was 86%.
The results confirm the transport of molinate towards the cathode with EK, as the experimental data
and modeling by Ribeiro et al. [209] demonstrated. However, in the diffusion experiments, with both
soils, more molinate was found in the anode side and in the compartment, than in the cathode, due
to direct contact between molinate-‐spiked soil and the anode compartment. At the cathode side, the
placement of a non-‐contaminated soil layer hinders the diffusive transport of molinate to the
cathode compartment (see Figure 1, Section II.6). Another important factor is the strong adsorption
of molinate in soils with high organic matter content [221] and this explains the 10-‐fold decrease in
molinate in the anolyte of experiment D (soil S2, sandy-‐loam, 12.8% organic matter) when compared
with experiment E (soil S1, sandy, 0.4% organic matter).
The soil type was statistically significant to explain the molinate variance in the electrolyte.
Comparing the data of all experiments, the direct current and pH control were not statistically
significant (p = 0.05) to explain molinate concentrations in the aqueous phase. When a direct current
was applied (experiments A, B and C), the amount of molinate in the anolyte decreases, and molinate
appears in soil section 5 (initially clean) near the cathode. This shows the electrokinetic transport of
molinate towards the cathode. Once again, the higher amount of molinate in soil S2 (experiment C)
compared with soil S1 (experiment B) can be explained by adsorption to soil organic matter, resulting
in lower molinate removal efficiencies in these experiments (around 70% in B vs. almost 90% in C).
The cumulative amounts of molinate found in the electrolytes (anolyte and catholyte) were less than
6% the initial amount in the soil. In previous studies with EK but without nanoparticles [222], around
60% of the molinate was found in the catholyte, less than 2% in the anolyte and a maximum of 9%
was found in soil. These differences support the hypothesis that there was molinate degradation by
Aqueous soluqon 0.6%
Membranes 10.6%
Soil 33.7%
Injecqon reservoir 54.4%
Losses 0.7%

40
nZVI in the experiments as, in identical conditions, fewer molinate was found in the electrolytes
(catholyte).
The results now obtained show no enhancement in molinate degradation when both EK and nZVI are
used, contrary to what was found for nitrates [198], dinitrotoluene [214] and PCP [204]. Although in
those studies no diffusion tests were made (to assess the degradation only with nZVI), the
degradation of those contaminants is dependent on reduction reactions, whereas molinate is
degraded by nano Fe0 via an oxidative pathway with hydroxyl radicals [94]. This requires desorption
of molinate and higher contact times than the common reductive pathway. In our experiments, the
diffusion tests were more effective for soil S2, most likely because EK, by transporting the molinate
out of the system faster, reduced the contact times with iron nanoparticles.
3.3.3 PCB
3.3.3.1 Comparison between two different experimental setups
The combined electro-‐nano remediation of PCB contaminated soils was tested in two different
experimental setups – both developed at the Technical University of Denmark (DTU). In the
electrodialytic (ED) two-‐compartment cell, the soil is suspended and stirred simultaneously with the
addition of nZVI vs. a conventional three-‐compartment electrokinetic (EK) cell (Section II.7).
The two-‐compartment ED setup shows PCB removal percentages of 83% with and 29% without direct
current (Figure 3.10). These results are higher than in previous studies with EK [205] and batch tests
without current [140]. The suspension and stirring of the soil can enhance the PCB dechlorination by
nZVI, due to an increase in desorption from soil or to a higher contact and reaction between nZVI and
PCB, or to both. In the traditional three-‐compartment EK setup, the iron has to be transported across
the compacted saturated soil to reach the contaminants. Previous studies show that even a low
proportion of carbonate minerals may cause an increase in the deposition of PAA-‐nZVI particles and
aggregates, due to the lower negative surface charge [223]. As the soil used in the experiments has
high carbonate content (18%), the limited dechlorination (12-‐58%) observed is probably related to
the iron precipitation with the carbonates (Figure 3.10).
In both setups, there are chemical reactions that deplete the Fe0 reductant power (eq. 1.1 – 1.3) and
the presence of transformer oil was found to adversely affect the PCB degradation [224].
A higher PCB removal is obtained in the ED setup compared with the traditional electrokinetic setup,
despite the introduction of H+ (resultant of hydrolysis in the anode) and the atmospheric O2 dissolved
by the slurry stirring that oxidize Fe0.
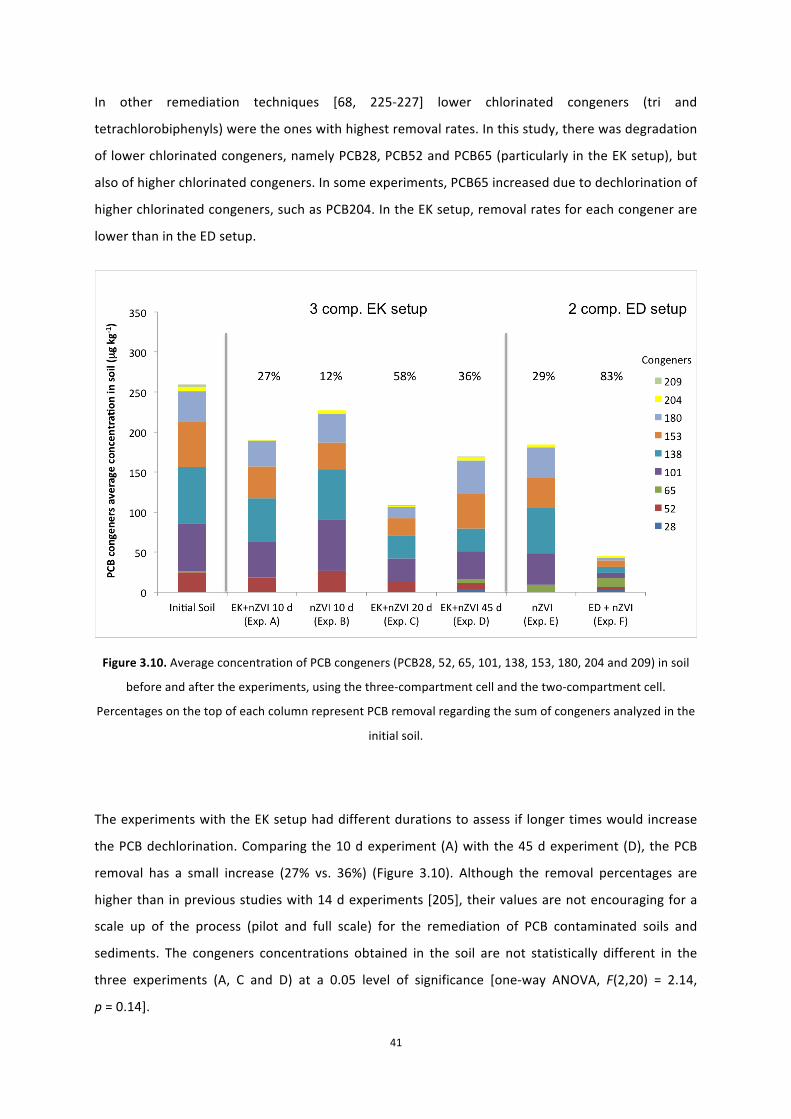
41
In other remediation techniques [68, 225-‐227] lower chlorinated congeners (tri and
tetrachlorobiphenyls) were the ones with highest removal rates. In this study, there was degradation
of lower chlorinated congeners, namely PCB28, PCB52 and PCB65 (particularly in the EK setup), but
also of higher chlorinated congeners. In some experiments, PCB65 increased due to dechlorination of
higher chlorinated congeners, such as PCB204. In the EK setup, removal rates for each congener are
lower than in the ED setup.
Figure 3.10. Average concentration of PCB congeners (PCB28, 52, 65, 101, 138, 153, 180, 204 and 209) in soil
before and after the experiments, using the three-‐compartment cell and the two-‐compartment cell.
Percentages on the top of each column represent PCB removal regarding the sum of congeners analyzed in the
initial soil.
The experiments with the EK setup had different durations to assess if longer times would increase
the PCB dechlorination. Comparing the 10 d experiment (A) with the 45 d experiment (D), the PCB
removal has a small increase (27% vs. 36%) (Figure 3.10). Although the removal percentages are
higher than in previous studies with 14 d experiments [205], their values are not encouraging for a
scale up of the process (pilot and full scale) for the remediation of PCB contaminated soils and
sediments. The congeners concentrations obtained in the soil are not statistically different in the
three experiments (A, C and D) at a 0.05 level of significance [one-‐way ANOVA, F(2,20) = 2.14,
p = 0.14].

42
Direct current can be used to enhance nZVI transport in different porous matrices or model soils
[218, 228] but, in the ED setup, the contact between the nanoparticles and the contaminated soil is
ensured by the stirring, so the current may not be needed for the PCB dechlorination. However,
results show that the experiment with direct current (Exp. F) had a higher PCB removal rate (83%)
than the experiment just with the iron nanoparticles (Exp. E) (29%), due to the high pH and buffer
capacity of the soil tested (Figure 3.11). In the experiment without current (Exp. E), the soil
suspension with nZVI kept a constant alkaline pH, which promotes the passivation of the iron
nanoparticles. In the experiment with current (Exp. F), water electrolysis produces H+ in the anode,
thus lowering the pH. A slightly acidic pH (4.90–5.10) increases the dechlorination rate of PCB by nZVI
and nZVI/Pd [229].
Figure 3.11. Evolution of pH in the soil suspension during the experiments using the
two-‐compartment ED setup.
3.3.3.2 Comparison between two surfactants
In Section II.8, two different surfactants (saponin and Tween 80) were tested to enhance PCB
desorption and removal efficiency from a contaminated soil. A two-‐compartment ED setup in which
the soil was stirred in a slurry with 1% surfactant, 10 mL of nZVI commercial suspension, and a
voltage gradient of 1 V cm-‐1.
The results show that, in the tested conditions, saponin allowed to obtain higher PCB removal from
soil (Figure 3.12) when compared with Tween 80. The most efficient removal (76%) was obtained
with 1% saponin, 10 mL nZVI and a voltage gradient of 1 V cm-‐1 (Exp. A). The lowest removal was
obtained with 1% Tween 80 and nZVI (8% removal), without application of a direct current. This
removal is consistent with previous studies that showed that Tween 80 was one of the surfactants
0
2
4
6
8
10
12
14
0 20 40 60 80 100 120
pH so
il suspen
sion
Time (h)
nZVI
ED+nZVI Injection of nZVI

43
with the least efficient degradation of 1-‐(2-‐chloro-‐benzoyl)-‐3-‐(4-‐chlorophenyl) urea by nZVI, when
compared with Triton X-‐100, Tween 20, sodium dodecyl sulfonate (SDS), and
cetyltrimethylammonium bromide (CTAB), probably due to the effect of the hydrophobic chain
length [230].
Figure 3.12. Average concentration of PCB congeners (PCB28, 52, 65, 101, 138, 153, 180, 204 and 209) in soil
before and after the electrodialytic experiments using saponin and Tween 80. Percentages on the top of each
column represent PCB removal regarding the sum of congeners analyzed in the initial soil.
Surfactants increase the rates of desorption of hydrophobic compounds from soil and transfer the
target contaminants into aqueous micelles through solubilization. However, surfactants have also
affinity for PCB and nZVI surface sites and can influence their interactions, namely they can affect the
degradation of PCB through various mechanisms, such as enhanced solubilization, enhanced
sorption, competitive sorption, and electron transfer mediation [230]. PCB dechlorination by nZVI,
like other reductive reactions, is a surface-‐mediated reaction [231], heterogeneous in nature,
involving adsorption of the contaminants at the iron surface before breaking of carbon–chlorine
bonds [138]. The adsorbed polyelectrolyte used to stabilize nZVI suspensions decreased
dechlorination activity of nZVI, by either blocking available reactive surface sites or else, by a
combination of site blocking and inhibited mass transfer of chlorinated organic compounds in bulk
solution to the nanoparticle surface [133, 232]. Cationic and non-‐ionic surfactants were also found to
inhibit the trichloroethylene degradation by CMC stabilized nZVI [105].

44
Usually lower chlorinated congeners (tri and tetrachlorobiphenyls) are the ones with highest removal
rates from contaminated soils [68, 225-‐227]. In this work, beside lower chlorinated congeners, also
higher chlorinated congeners (penta, hexa, hepta and octachlorobiphenyl) showed removal
percentages between 9 and 96% (average value 44%). The results also present an increase in the
concentration of PCB52 (Exp. D and E), PCB65 (Exp. A and F) and PCB101 (Exp. B and E), due to
dechlorination of higher chlorinated congeners. The congeners with higher removal rates were
PCB138 (Exp. C and F), PCB153 (Exp. A, B and D), and PCB180 (Exp. A). Previously, Chen et al. [140]
identified the PCB153 dechlorination pathways by nZVI. Figures 3.13 and 3.14 show the proposed
dechlorination pathways for PCB138 and PCB180, considering that nZVI reactivity decreases
according to the chlorine position in the following order: ortho < para < meta [225, 233].
Figure 3.13. Possible dechlorination pathways proposed for PCB138.

45
Figure 3.14. Possible dechlorination pathways proposed for PCB180.
In the aqueous samples (soil filtrate and catholyte), most of the PCB congeners were below the
detection limit. PCB have low water solubility (0.0027-‐0.42 ng L-‐1) and are hydrophobic [234]. In the
soil filtrate, we could measure PCB only in two samples. Experiment B had 0.08 ng L-‐1 of PCB153 and
Experiment D presented 3.81 ng L-‐1 of PCB101. These concentrations, higher than the typical
solubility range, are due to the surfactants. In the catholyte samples, some congeners were also
found, mostly lower chlorinated congeners (PCB28), but also penta, hexa and heptachlorobiphenyls.

46
These congeners are identified only in the experiments with current, probably due to
electrophoresis.
Comparing the energy consumption of the experiments, calculated according to Sun et al. [235],
Tween 80 has higher energy consumption when compared with saponin (1.6 Wh g-‐1 soil and
4.1 Wh g-‐1 in Exp. D and F, and 1.2 Wh g-‐1 and 0.7 Wh g-‐1 in Exp. A and C, respectively). Added to the
low removal percentages, this also contributes to show that Tween 80 is not a suitable surfactant to
use with PCB, despite the good results obtained for PAH with this method [207].
Results show that the experiments with direct current have higher removal percentages that the
ones without current. The PCB congeners concentrations using saponin with and without current
(Exp. A and B) are statistically different at a 0.05 level of significance [one-‐way ANOVA, F(1,9) = 5.61,
p = 0.04]. This means that electric current also contributes to PCB dechlorination, and this can be
done in two different ways. In the experiments without current, the soil suspension with nZVI kept a
constant alkaline pH (Figure 5, Section II.8), which promotes the passivation of the iron nanoparticles
and prevents PCB dechlorination. Another possibility is the PCB electrocatalytic hydrodechlorination
– the production of H+ and the presence of current can promote the Cl removal from PCB generating
HCl [236, 237]. The electrocatalytic hydrodechlorination has been demonstrated with specially
engineered foam electrodes, in solvent/surfactant-‐aided solutions and can possibly be also occurring
in this two-‐compartment electrodialytic setup. Further research is needed to evaluate the
importance of this dechlorination process.
The pH of the suspended slurry also affects the surfactant behavior, influencing the micelle
aggregation and hydrophobicity. At high pH, the net charge on the head groups of saponin molecule
will increase, causing electrostatic repulsion between the head groups, which tends to increase the
critical micelle concentration (CMC) values, reducing the solubilization capabilities of saponin [238].
Also, the solubilization of heavy metals by the electrodialytic process (like Cd2+ and Zn2+) and a lower
pH (until pH 4) decrease the CMC value of saponin solution and enhance its solubilization properties
[238]. With Tween 80, the pH increase had a positive effect on surface tension and the micelles are
more stable at higher pH (up to 10) [239].
3.3.3.3 Comparison between two different soils
Two different soils (Table 3.1), historically contaminated with PCB, were used in experiments using
both the three-‐compartment EK setup and the two-‐compartment ED setup (Section II.9). Soil 1 was
provided by a hazardous waste operator in Portugal and is a mixture of contaminated soils from
industrial sites with transformers oils spills. Soil 2 is a surface soil sampled in a decommissioned

47
school in Hovedstaden (Capital Region of Denmark), and the PCB resulted from the weathering of the
windows joint sealants used in 1955-‐1977 [240].
Table 3.1. Physical and chemical characteristics of the soils.
Parameter Soil 1 Soil 2 Particles distribution (%) Coarse sand (200 < Ø < 2000 μm) 19.1 3.2 Fine sand (20 < Ø < 200 μm) 67.3 69.6 Silt (2 < Ø < 20 μm) 12.7 23.6 Clay (Ø < 2 μm) 0.9 3.6 Textural classification Loamy sand Silt loam
pH (H2O) 12.2 8.20 Conductivity (mS cm-‐1) 18.76 0.221
Exchangeable cations (cmol(c) kg-‐1)
Ca2+ 83.75 259.14 Mg2+ 3.2 9.75 K+ 26.88 7.36 Na+ 9.37 8.34 Sum of exchangeable cations (cmol(c) kg
-‐1) 123.2 284.59
Calcium carbonate (%) 18.0 1.3 Organic matter (%) 16.46 0.57 PCBsa (µg kg-‐1) 258 ± 24 156 ± 2 Metalsb (mg kg-‐1) Al 20980 ± 590 4952± 71 As 9 ± 2 0.6 ± 0.97 Cd 0.7 ± 0.1 0.4 ± 0.04 Cr 52 ± 3 2.5 ± 0.04 Cu 142± 95 10 ± 0.3 Fe 13162 ± 301 6773± 97 Ni 32± 1 6 ± 0.3 Pb 45± 3 25 ± 0.9 Zn 2155 ± 40 135 ± 0.1
a Sum of PCB 52, 65, 101, 138, 153, 180, 204 and 209 b Acid digestion with HNO3 according to the Danish Standard DS259.
The results of PCB removal at the end of the experiments using the two-‐compartment cell are
different according to soil type. Soil 1 has the higher PCB removal without saponin, only with direct
current, stirring and nZVI (83%). In soil 2, the highest removal was obtained only with nZVI and
saponin. No significant differences were found in the ED experiments for soil 2 [one-‐way ANOVA,
F(3,20) = 0.69, p = 0.57], although the experiment without saponin (Exp. K) showed a lower removal
rate. In general, the best results were obtained with soil 1, with an average removal between 21% to
96% for the congeners analyzed, while for soil 2, the average congener removal was between 6% and
68%. The highest removal percentage in Soil 1 can be related to the pH of the soil slurry during the
experiments. The initial soil pH and carbonate content allowed to maintain the pH between 6 and 7

48
for about half the time of the experiment. In the experiments with Soil 2, the pH values turn acidic
faster (~30 h after the beginning of the experiment), and this contributes to the corrosion of the iron
nanoparticles. This is also consistent with the higher PCB removal obtained in Soil 2 without the
direct current, and consequently, without acidification of the soil slurry.
Figure 3.15. Average concentration of PCB congeners (PCB28, 52, 65, 101, 138, 153, 180, 204 and 209) in the
tested soils before and after the experiments using the two-‐compartment cell. Percentages on the top of each
column represent PCB removal regarding the sum of congeners analyzed in the initial soils.
The removal efficiencies in both soils with the three-‐compartment electrokinetic setup are much
lower (Section II.9), despite the longer duration of the experiments. The highest removal rate was
obtained in the experiment with saponin in the anode compartment. The diffusion experiment in soil
1 with the EK setup showed no PCB dechlorination. The highest removal rate in soil 2 corresponds to
the experiment without direct current, only the injection of iron nanoparticles. The use of saponin
with soil 2 does not show any enhancement compared to the other experiments.
In the ED setup, the soil suspension pH during the experiments had lower values in soil 2 compared
with soil 1, which is related with the lower initial pH value and lower carbonates content. The pH

49
values in soil 2 reached 2.91-‐3.35, which correspond to less favorable conditions to PCB
dechlorination due to the corrosion of zero valent iron. In all the experiments where nZVI was added,
higher pH values were measured in the suspension. Also, in the experiments without direct current
the pH values showed very little variation.
Figure 3.16 (A and B) shows the comparison between the mass of iron found in each component of
the tested cells, respectively, at the end of the experiments. Previous studies showed that in the
traditional three-‐compartment cell, most of the nZVI aggregate and settle in the injection
compartment [214, 218, 228, 241], thus not reaching the contaminated soil. The suspended
electrodialytic remediation assures that nZVI are mixed with the soil and most of the iron is found
there at the end of the experiments.
Figure 3.16. Comparison of the mass of iron (%) found at the end of the experiments, with the setups tested:
A) three-‐compartment cell, and B) two-‐compartment cell.
0% 20% 40% 60% 80% 100%
A
B
C
L
M
N
O
Fe
Expe
rimen
t (3-‐comp. cell)
Injecqon reservoir Membranes
Electrodes
Electrolyte
Soil
A
0% 20% 40% 60% 80% 100%
D
E
F
G
H
I
J
K
Fe
Expe
rimen
t (2-‐comp. cell)
Injecqon reservoir CAT membrane Electrodes
Electrolyte
Soil
B

50
3.4 Numerical modeling of nZVI transport
In Section II.10, a generalized physicochemical and numerical model was developed to describe the
nZVI transport through different porosity media, under electric fields. The model aims to be
sufficiently detailed to describe the main processes, and also a predictive tool for the nZVI transport.
The model consists in the Nernst–Planck coupled system of equations, which accounts for the mass
balance equation of ionic species in a fluid medium when diffusion and electromigration are
considered in the ions transport process. In the case of charged particles of nZVI, diffusion and
electrophoretic terms have been taken into account. In both cases, also the electroosmotic flow has
included in the equation. Therefore, the flux of any chemical species or charged particles i moving
from a volume element of the system can be expressed as [242]:
φφ ∇−∇−∇−= iei*ii
*ii ckcUcDN (3.1)
where ci is the molar concentration, Di* is the effective diffusion coefficient, φ is the electrical
potential, ke is the electroosmotic permeability coefficient and Ui* , is the effective electrophoretic
mobility for nZVI charged particles or ionic mobility, estimated by the Einstein–Nernst relation for
ions.
Two kinds of reactions, electrochemical and chemical, were also included. The rate of generation
term is not included in the continuity equation for the porous medium cells, given the assumption
that the only electrochemical reactions, which need to be taken into account in the system, are the
reduction and oxidation of water on the electrodes (eq. 1.4 and 1.5, Section 1.1.4).
The results show a good fit between the modeled and experimental results (Figures 3.17 – 3.19),
both for the iron masses in the solid matrix and the pH values in the anode and cathode
compartment.
Figure 3.17. Comparison between the experimental and model results regarding nZVI diffusive transport in
kaolin with 1 mM NaCl.
0
10
20
30
40
50
60
70
80
90
1 2 3 4 5 6 7 8 9 10 11 12 13 14 15 16 17 18 19 20L (cm)
nZVI
(mg/
kg)
ExpModel

51
Figure 3.18. Comparison between the experimental and model results regarding nZVI assisted transport (under
electric fields) in glass beads with 1 mM NaCl.
Figure 3.19. Comparison between the experimental (dots) and model results (lines) for the pH evolution in the
anolyte and the catholyte during the experiments with kaolin and CaCl2 (0.05 M).
The model allowed detecting that, in some cases, an important fraction of the nZVI particles tends to
aggregate when their concentration is high relative to the available pore volume, becoming an
immobile “iron cake” in the injection spot, but the results also indicate that aggregated mass clearly
diminishes in the presence of a direct current.
0
5
10
15
20
25
30
35
40
45
1 2 3 4 5 6 7 8 9 10 11 12 13 14 15 16 17 18 19 20L (cm)
nZVI
(mg/
kg)
ExpModel
0.0
2.0
4.0
6.0
8.0
10.0
12.0
14.0
0.0 0.5 1.0 1.5 2.0 2.5Time (d)
pH


53
4. Discussion and limitations
The experimental work done (Part II, Sections II.3 to II.9) has given some insight on the direct current
assisted transport of iron nanoparticles, and also on the simultaneous use of electrokinetics and nZVI
on contaminated soils. However, there are some limitations to the experimental setups that need to
be discussed.
One of the most important limitations is the fact that currently there is no analytical method for
quantification and characterization of nanoparticles in complex matrices, such as soil. So it is
impracticable to distinguish between the natural occurring iron in the soil (one of the most common
elements in Earth’s crust) and the manufactured nanoparticles. Literature reviews on the analytical
methods show the limitations of the current techniques [148, 243, 244]. Also, it is complex to isolate
and assess the integrity of nanoparticles (and their polymer coatings), their agglomeration and their
degree of oxidation or passivation after being mixed in a complex matrix. The iron extraction method
used in the experiments (sodium dithionite-‐citrate-‐bicarbonate method) was selected as the most
suitable after comparison with more aggressive methods, based on acid digestion. Those methods
would not have allowed quantifying the small amount of nano iron added when compared with the
iron background content in the soil. The Pourbaix diagrams were used as an approximation, but they
are relevant only for a system at equilibrium and at low concentrations.
The experiments on assisted direct current were performed in a modified electrophoretic cell that
does not allow measuring the electroosmotic flow. As in clays this transport is important, this is a
critical limitation of the experiments. Recent works on the nZVI transport in clays (Boom clay) [206]
confirmed the transport of nZVI by electro-‐osmotic advection, with an electro-‐osmotic conductivity
in the range (0.5-‐1.0)·∙10-‐10 m2V-‐1s-‐1. However, the presence of nZVI decreased electro-‐osmotic
4

54
conductivities by almost half and affected geochemical conditions of the system, inducing sharper pH
profiles and enhancing cation exchange in the clay [206].
In the experimental setup for the transport experiments, the modified electrophoretic cell was
closed, but there was a layer of air above the clay, which contributed for the corrosion of iron
nanoparticles and could have affected their transport. The intermittent measurement of pH and ORP
at fixed times implied that the power had to be turned off for short periods of time, which can cause
a disturbance of the applied direct field and this effect was not considered. Other design limitation is
related with the effectiveness of the compressed fiberglass wool pads for the passage of current and
migrating ions, namely H+ and OH-‐ from the electrode compartments into the media. The wool pads
showed high resistance and low surface area in contact with the matrix. In the other tested setups,
there was a larger area of soil in direct contact with the passive membranes or the CAT membrane,
and the current values measured were much higher. More accurate information about the iron
transport could have been obtained if the injection location was sampled and the iron measured in
order to close the mass balance. Another important limitation is the lack of representativeness of
thin layers of model soils for further extrapolation for real soils and full-‐scale applications.
The successful results obtained in kaolin or model soils cannot always be directly transferred to
spiked soils or to soils sampled at polluted sites. This is due to the variety of adsorption sites (organic
and inorganic) for contaminants present in soils not being present in kaolin, and also to the aging of
contamination. So, experiments with real soils and historically contaminated soils, from bench to
pilot and full scale are needed to assess the results.
Regarding the molinate experiments, it is important to remark that spiked soils behave differently
than historically contaminated soils, and further tests would be needed to confirm if only nZVI would
be enough to ensure the soil remediation. The cell design in these experiments favored transport to
the anode compartment due to the shorter distance. The testing of different injection locations
would have allowed obtaining more information about nZVI transport. The determination of
hydrogen peroxide during the experiments would confirm the oxidative degradation pathway of
molinate by nZVI in soil. Also, the measurement of soil pH at the end of the molinate experiments
could have justified the possible explanation of surface changes in the soil, and the consequent
increase in nZVI adsorption.
In the PCB experiments, only some congeners were analyzed and more detail would be required to
fully implement the technique. The identification of the congeners using GC/MS would provide some
additional information about the dechlorination pathways occurring in all the tested conditions: only

55
nZVI, nZVI plus EK, nZVI plus ED, with and without the surfactants. Desorption tests and batch
degradation tests, with and without surfactant, would allow assessing the best surfactant to enhance
PCB desorption, without inhibiting nZVI promoted dechlorination.
The environmental impacts of nanoremediation were not addressed in this dissertation. As
mentioned in Section 1.1.3, there are large knowledge gaps concerning the effects of manufactured
nanoparticles in ecosystems, their persistence, bioaccumulation, and long-‐term behavior. Results in
the literature are contradictory and inconclusive [142-‐147] and there is limited information under
field conditions [146]. It was also demonstrated that the iron nanoparticles reactivity interferes with
assay conditions and interpretation of effects in a microbial community in a natural soil [245]. The
ways in which nanomaterials exert toxic effects on the environment have not been conclusively
defined yet, with two different hypothesis currently accepted as possible: i) the free ion activity
model (the toxicity of nanomaterials is caused by metal ions released from nanoparticles); and ii) the
biotic ligand model, which also considers the participation of abiotic and biotic ligands [246].
The current need for sustainable remediation practices is becoming a new imperative, with
important implications for regulators, liability owners, consultants, contractors, and technology
vendors [247]. The assessment of secondary environmental impacts (e.g., life-‐cycle greenhouse gas
emissions, air pollution, energy consumption, and waste production) from remediation operations
can be made using different tools, ranging from simple (qualitative) to more quantitative (multi-‐
criteria and fully monetized cost-‐benefit analysis) [248]. The use of tools like Life Cycle Assessment
(LCA) approach should be considered for comparing the different remediation alternatives, namely
the use of combined EK and nZVI with traditional remediation technologies, and even with the “do
nothing” alternative.


57
5. Main conclusions and further developments
The dimension of the soil contamination problem worldwide is serious and new technologies are
needed to tackle with mix contaminations and persistent organic pollutants, usually the most
challenging ones. Simultaneously, there is a need to move towards more sustainable solutions and a
trend to combine, or use successively, already proven technologies. Nanoremediation is
controversial and an exciting research field, opening new possibilities for dealing with complicated
contaminants and locations, but also has potential environmental impacts associated.
The characteristics that led to a widespread use of PCB, in various industrial and domestic
applications, do present a challenge for the remediation of contaminated soils and sediments.
Following PCB entrance into the soil environment, they rapidly adsorb to mineral and organic matter
(solid phases). The ability to desorb these contaminants determines, in most cases, the effectiveness
of the remediation technologies. Currently, there is no cost-‐effective alternative to landfilling and
incineration of PCB contaminated soils. Also, there is no single, portable technology that is applicable
to both ex situ and in situ remediation of PCB in contaminated soils and sediments. Each case is
unique and several factors must be considered. The success of the treatment is dependent on proper
selection, design, and adjustment of the remediation technology, based on the congeners present,
soils properties and the system performance. The combined use of remediation technologies and the
so-‐called “treatment trains” is a promising approach for persistent contaminants. Although
electrokinetic remediation has been used extensively, it was only recently tested to extract PCB from
soils, used in conjunction with iron nanoparticles and sodium persulfate, with limited results that did
not encourage the scale up of the process.
5

58
The main research objective of this Ph.D. study was to find out if coupling electrokinetics and zero
valent iron nanoparticles could be an efficient method for treating contaminated soils (with inorganic
and organic contaminants), and which enhancement methods could be more useful and cost-‐
effective. The results of the experimental work allow outlining the following conclusions:
• Electrokinetics and nZVI can be used together successfully for soil remediation, but a case-‐
by-‐case analysis is recommended, as the results depend on the contaminant, type of soil and
ionic strength of the aqueous phase.
• It is important to test contaminants degradation with nZVI not only in aqueous solutions, but
also in matrices increasingly more complex, such as synthetic groundwaters, real
groundwaters, model soils and real soils. The degradation results in soils, like the ones
obtained for molinate, are much weaker and more time demanding than in deionized water.
• The aggregation and settling of the iron nanoparticles still remain a problem, although direct
current can enhance the transport through different porosity media. The suspended
electrodialytic remediation ensures that nZVI are uniformly mixed with the soil, eliminating
the problem of the accumulation of the iron in the injection reservoir, as occurred in the
three-‐compartment cell.
• The results show that the soil characteristics are critical and affect the reaction between nZVI
and the target contaminant, as well as the iron and the contaminant transport.
• In some cases, it is counterproductive to use both methods simultaneously and better results
(higher removal rates) are obtained just with the iron nanoparticles or just with
electrokinetics. A case-‐by-‐case selection is recommended.
• The use of surfactants as an enhancement method of electrokinetic coupled with nZVI needs
to be carefully assessed, to minimize the inhibitory effect of the surfactants on iron
nanoparticles reactivity. Combining surfactant and nZVI originated less successful
remediation than combining surfactant and electrodialytic remediation. The use of
surfactants as enhancements may be a poor choice in many contamination case studies.
• Tween 80 has higher energy consumption when compared with saponin in the two-‐
compartment electrodialytic setup. Associated to the low removal percentages, this also
contributes to sustain that Tween 80 is not a suitable surfactant to use with PCB
contaminated soils and electrodialytic remediation.

59
• The two-‐compartment electrodialytic setup allows PCB dechlorination from contaminated
soil ex situ at a higher rate, in a shorter time, with lower nZVI consumption, and with the use
of half of the voltage gradient when compared with the traditional EK setup. In addition,
there is no need to treat and dispose of the anolyte.
• The model allowed detecting that, in some cases, an important fraction of the iron
nanoparticles tends to aggregate and to form a large and immobile agglomerate, when their
concentration is high relative to the available pore volume. However, the results also indicate
that aggregated mass clearly diminishes in the presence of a direct current.
Other important goals were to develop a deeper understanding of the mechanisms of the assisted
direct current transport of iron nanoparticles, and the development and testing of a methodological
and analytical approach for determining the fate of iron nanoparticles in the soil. The experimental
work supported drawing the following conclusions:
• The use of a direct current enhanced the nZVI transport in the kaolin, using high
concentrations typical of field applications. However, the iron concentration variability could
not be explained by pH, ORP, voltage and electrolyte. In the variation of pH and ORP during
the experiments, the electrolyte and its ionic strength proved to be significant, and thus have
affected aggregation and fast oxidation of the particles.
• The changes in ORP at low concentrations of nZVI (< 0.1 g L-‐1) may be a viable method to
track the relative spatial and temporal distribution of nZVI in controlled experiments.
There are still many knowledge gaps regarding the combined use of electrokinetics and zero valent
iron nanoparticles. Some of the most important are:
• The need to develop a method (quick, portable and inexpensive) to identify and quantify iron
nanoparticles (and other metals nanoparticles) in soil and other complex matrices.
• The aging of nanoparticles and the polymer coatings in a living environment such as soil is an
interesting area of research.
• Further work is necessary for a comprehensive treatise of the behavior of nZVI in clay rich
soils under electric field, to assess the electroosmotic advection of iron nanoparticles.

60
• Scale up of the two-‐compartment cell and testing with other soils (with higher PCB
concentrations) to evaluate the viability of the method to compete with the traditional
alternatives for PCB contaminated soils treatment (“dig and dump” and “dig and incinerate”).
• Assessment of the possibility of recycling the iron nanoparticles used in the two-‐
compartment ED setup, and transported in the ionic form to the catholyte, through a new
step in the process before recirculation, with the addition of a strong reductant such as
sodium borohydride.
• Further research on potential side effects during treatment (such as anodic precipitation,
oxidation of the conditioning agent, and generation of gases e.g., Cl2) for the scale-‐up of the
ED process.
• Further research is needed to quantify the effect of the electrodechlorination and
hydrodechlorination of PCB using the two-‐compartment cell setup, in order to optimize the
combined process as the results showed that the use of a direct current allowed the highest
PCB removal rates.
• An important emerging field will also be the assessment of the ecotoxicological and
environmental impacts of the application of iron nanoparticles, also considering long-‐term
effects of the use of nanotechnologies.
• The assessment of the sustainability of nanoremediation, through a Life Cycle Assessment,
when compared with other current technologies.

61
References
[1] B. Singh, R. Naidu, Cleaning contaminated environment: A growing challenge, Biodegradation, 23 (2012) 785-‐786.
[2] G.P. Marc van Liedekerke, Sabine Rabl-‐Berger, Mark Kibblewhite, Geertrui Louwagie, Progress in the Management of Contaminated Sites in Europe, Report EUR 26376 EN. Institute for Environment and Sustainability. Joint Research Center. European Commission, Luxembourg, 2014.
[3] USEPA, Superfund -‐ Cleaning up the Nation's Hazardous Wastes Sites, United States Environmental Protection Agency, http://www.epa.gov/superfund/, Accessed the 12th June 2014, 2014.
[4] USEPA, Brownfields and Land Revitalization, United States Environmental Protection Agency, http://www.epa.gov/brownfields/basic_info.htm, Accessed the 12th June 2014, 2014.
[5] Q.Y. Cai, C.H. Mo, Q.T. Wu, A. Katsoyiannis, Q.Y. Zeng, The status of soil contamination by semivolatile organic chemicals (SVOCs) in China: A review, Sci. Total Environ., 389 (2008) 209-‐224.
[6] S. Khan, Q. Cao, Y.M. Zheng, Y.Z. Huang, Y.G. Zhu, Health risks of heavy metals in contaminated soils and food crops irrigated with wastewater in Beijing, China, Environ. Poll., 152 (2008) 686-‐692.
[7] L. Niu, F. Yang, C. Xu, H. Yang, W. Liu, Status of metal accumulation in farmland soils across China: From distribution to risk assessment, Environ. Poll., 176 (2013) 55-‐62.
[8] Z. Li, Z. Ma, T.J. van der Kuijp, Z. Yuan, L. Huang, A review of soil heavy metal pollution from mines in China: Pollution and health risk assessment, Sci. Total Environ., 468–469 (2014) 843-‐853.
[9] S. Srinivasa Gowd, M. Ramakrishna Reddy, P.K. Govil, Assessment of heavy metal contamination in soils at Jajmau (Kanpur) and Unnao industrial areas of the Ganga Plain, Uttar Pradesh, India, J. Hazard. Mater., 174 (2010) 113-‐121.
[10] A. Eguchi, T. Isobe, K. Ramu, N.M. Tue, A. Sudaryanto, G. Devanathan, P.H. Viet, R.S. Tana, S. Takahashi, A. Subramanian, S. Tanabe, Soil contamination by brominated flame retardants in open waste dumping sites in Asian developing countries, Chemosphere, 90 (2013) 2365-‐2371.
[11] A.A. Jennings, Analysis of worldwide regulatory guidance values for the most commonly regulated elemental surface soil contamination, J. Environ.Manag., 118 (2013) 72-‐95.
[12] S.M. Rodrigues, M.E. Pereira, E.F. da Silva, A.S. Hursthouse, A.C. Duarte, A review of regulatory decisions for environmental protection: Part I — Challenges in the implementation of national soil policies, Environ. Int., 35 (2009) 202-‐213.
[13] R. Naidu, Recent advances in contaminated site remediation, Water Air Soil Poll., 224 (2013) 1-‐11.
[14] WHO, Contaminated Sites and Health, R. Pasetto, P. Martin-‐Olmedo, M. Martuzzi (Eds.), World Health Organization Regional Office for Europe, 2013, 92 pp.
[15] European Comission, Thematic Strategy for Soil Protection. COM(2006)231, Brussels, Belgium, 2006.

62
[16] European Comission, Proposal for a Directive of the European Parliament and of the Council establishing a framework for the protection of soil and amending Directive 2004/35/EC, COM/2006/0232, 2006.
[17] L. Valentín, A. Nousiainen, A. Mikkonen, Introduction to organic contaminants in soil: Concepts and risks, in: T. Vicent, G. Caminal, E. Eljarrat, D. Barceló (Eds.) Emerging Organic Contaminants in Sludges: Analysis, Fate and Biological Treatment, Springer-‐Verlag, Berlin Heidelberg, 2013, pp. 1-‐30.
[18] C. Averill, B.L. Turner, A.C. Finzi, Mycorrhiza-‐mediated competition between plants and decomposers drives soil carbon storage, Nature, 505 (2014): 543-‐545.
[19] S.M. Rodrigues, M.E. Pereira, E.F. da Silva, A.S. Hursthouse, A.C. Duarte, A review of regulatory decisions for environmental protection: Part II-‐The case-‐study of contaminated land management in Portugal, Environ. Int., 35 (2009) 214-‐225.
[20] M. Chrysochoou, C.P. Johnston, G. Dahal, A comparative evaluation of hexavalent chromium treatment in contaminated soil by calcium polysulfide and green-‐tea nanoscale zero-‐valent iron, J. Hazard. Mater., 201–202 (2012) 33–42.
[21] D. Bagchi, S.J. Stohs, B.W. Downs, M. Bagchi, H.G. Preuss, Cytotoxicity and oxidative mechanisms of different forms of chromium, Toxicol., 180 (2002) 5-‐22.
[22] R. Singh, V. Misra, R.P. Singh, Synthesis, characterization and role of zero-‐valent iron nanoparticle in removal of hexavalent chromium from chromium-‐spiked soil, J. Nanopart. Res., 13 (2011) 4063-‐4073.
[23] J. Kotaś, Z. Stasicka, Chromium occurrence in the environment and methods of its speciation, Environ. Poll., 107 (2000) 263-‐283.
[24] UN, Stockholm Convention on Persistent Organic Pollutants, Geneva, 2001, http://chm.pops.int/Convention/tabid/54/language/en-‐GB/Default.aspx, Accessed 23rd May 2014
[25] M. Castro, A.C. Silva-‐Ferreira, C.M. Manaia, O.C. Nunes, A case study of molinate application in a Portuguese rice field: herbicide dissipation and proposal of a clean-‐up methodology, Chemosphere, 59 (2005) 1059-‐1065.
[26] FAO, Rice Market Monitor, Trade and Markets Division. Food and Agriculture Organization of the United Nations, 2013.
[27] M. Köck-‐Schulmeyer, M. Villagrasa, M. López de Alda, R. Céspedes-‐Sánchez, F. Ventura, D. Barceló, Occurrence and behavior of pesticides in wastewater treatment plants and their environmental impact, Sci. Total Environ., 458–460 (2013) 466-‐476.
[28] M.J. Cerejeira, P. Viana, S. Batista, T. Pereira, E. Silva, M.J. Valério, A. Silva, M. Ferreira, A.M. Silva-‐Fernandes, Pesticides in Portuguese surface and ground waters, Water Res., 37 (2003) 1055-‐1063.
[29] A. Hildebrandt, S. Lacorte, D. Barceló, Assessment of priority pesticides, degradation products, and pesticide adjuvants in groundwaters and top soils from agricultural areas of the Ebro river basin, Anal. Bioanal. Chem., 387 (2007) 1459-‐1468.
[30] M. Koblizkova, P. Ruzicková, P. Cupr, J. Komprda, I. Holoubek, J. Klánová, Soil burdens of persistent organic pollutants: Their levels, fate and risks. Part IV, Quantification of volatilization fluxes of organochlorine pesticides and polychlorinated biphenyls from contaminated soil surfaces, Environ. Sci. Technol., 43 (2009) 3588-‐3595.

63
[31] L. Nizzetto, M. Macleod, K. Borgå, A. Cabrerizo, J. Dachs, A.D. Guardo, D. Ghirardello, K.M. Hansen, A. Jarvis, A. Lindroth, B. Ludwig, D. Monteith, J.A. Perlinger, M. Scheringer, L. Schwendenmann, K.T. Semple, L.Y. Wick, G. Zhang, K.C. Jones, Past, present, and future controls on levels of persistent organic pollutants in the global environment, Environ. Sci. Technol., 44 (2010) 6526-‐6531.
[32] S.G. Donaldson, J.V. Oostdam, C. Tikhonov, M. Feeley, B. Armstrong, P. Ayotte, O. Boucher, W. Bowers, L. Chan, F. Dallaire, R. Dallaire, É. Dewailly, J. Edwards, G.M. Egeland, J. Fontaine, C. Furgal, T. Leech, E. Loring, G. Muckle, T. Nancarrow, D. Pereg, P. Plusquellec, M. Potyrala, O. Receveur, R.G. Sheare, Environmental contaminants and human health in the Canadian Arctic, Sci. Total Environ., 408 (2010) 5165–5234.
[33] I. Holoubek, L. Dušek, M. Sáňka, J. Hofman, P. Čupr, J. Jarkovský, J. Zbíral, J. Klánová, Soil burdens of persistent organic pollutants – Their levels, fate and risk. Part I. Variation of concentration ranges according to different soil uses and locations, Environ. Poll., 157 (2009) 3207-‐3217.
[34] J. Maervoet, A. Covaci, P. Schepens, C.D. Sandau, R.J. Letcher, A reassessment of the nomenclature of polychlorinated biphenyl (PCB) metabolites, Environ. Health. Perspect., 112 (2003) 291.
[35] H. Fiedler, Polychlorinated biphenyls (PCBs): Uses and environmental releases, United Nations Environmental Programmee. Procedings of the Subregional Awareness Raising Workshop on Persistent Organic Pollutants (POPs), Bangkok, Thailand, 25-‐28 November 1997. http://www.chem.unep.ch/pops/POPs_Inc/proceedings/bangkok/FIEDLER1.html
[36] H.K. Yak, B.W. Wenclawiak, I.F. Cheng, J.G. Doyle, C.M. Wai, Reductive dechlorination of polychlorinated biphenyls by zerovalent iron in subcritical water, Environ. Sci. Technol., 33 (1999) 1307-‐1310.
[37] K. Breivik, A. Sweetman, J.M. Pacyna, K.C. Jones, Towards a global historical emission inventory for selected PCB congeners — A mass balance approach 1. Global production and consumption, Sci.Total Environ. 290 (2002) 181-‐198.
[38] J. Diaz-‐Ferrero, M.C. Rodriguez-‐Larena, L. Comellas, B. Jimhnez, Bioanalytical methods applied to endocrine disrupting polychlorinated biphenyls, polychlorinated dibenzo-‐pdioxins and polychlorinated dibenzofurans. A review, Trend. Anal. Chem., 16 (1997) 563-‐573.
[39] J. Borja, D.M. Taleon, J. Auresenia, S. Gallardo, Polychlorinated biphenyls and their biodegradation, Process Biochem., 40 (2005) 1999-‐2013.
[40] M.D. Erickson, R.G. Kaley, Applications of polychlorinated biphenyls, Environ. Sci. Poll. Res., 18 (2011) 135-‐151.
[41] J. Kas, J. Burkhard, K. Demnerová, J. Kost'ál, T. Macek, M. Macková, J. Pazlarová, Perspectives in biodegradation of alkanes and PCBs, Pure Appl. Chem., 69 (1997) 2357-‐2369.
[42] UNEP, PCB Transformers and Capacitors From Management to Reclassification and Disposal, UNEP Chemicals, United Nations Environmental Programme, Geneva, Switzerland, 2002.
[43] ATSDR, Toxicological Profile for Polychlorinated Biphenyls (PCBs), in, Agency for Toxic Substances and Disease Registry. U.S. Department of Health and Human Services Atlanta, 2000.
[44] M.L. Diamond, L. Melymuk, S.A. Csiszar, M. Robson, Estimation of PCB stocks, emissions, and urban fate: Will our policies reduce concentrations and exposure?, Environ. Sci. Technol., 44 (2010) 2777-‐2783.

64
[45] M. Kohler, J. Tremp, M. Zennegg, C. Seiler, S. Minder-‐Kohler, M. Beck, P. Lienemann, L. Wegmann, P. Schmid, Joint sealants: An overlooked diffuse source of polychlorinated biphenyls in buildings, Environ. Sci. Technol., 39 (2005) 1967-‐1973.
[46] E. Priha, S. Hellman, J. Sorvari, PCB contamination from polysulphide sealants in residential areas -‐ Exposure and risk assessment, Chemosphere, 59 (2005) 537-‐543.
[47] R. Eisler, A.A. Belisle, Planar PCB Hazards to Fish, Wildlife, and Invertebrates: a synoptic review, Patuxent Wildlife Research Center. U.S. National Biological Service, Laurel, 1996.
[48] K. Furukawa, H. Fujihara, Microbial Degradation of Polychlorinated Biphenyls: Biochemical and Molecular Features, J. Biosci. Bioeng., 105 (2008) 433-‐449.
[49] D. Hu, K.C. Hornbuckle, Inadvertent polychlorinated biphenyls in commercial paint pigments, Environ. Sci. Technol., 44 (2010) 2822-‐2827.
[50] L.A. Rodenburg, J. Guo, S. Du, G.J. Cavallo, Evidence for unique and ubiquitous environmental sources of 3,3 '-‐dichlorobiphenyl (PCB 11), Environ. Sci. Technol., 44 (2010) 2816-‐2821.
[51] A. Mikszewski, Emerging Technologies for the In Situ Remediation of PCB-‐Contaminated Soils and Sediments: Bioremediation and Nanoscale Zero-‐Valent Iron, U.S. Environmental Protection Agency, Office of Solid Waste and Emergency Response. Office of Superfund Remediation and Technology Innovation Program, Washington, DC, 2004, pp. 26.
[52] CDC, Fourth National Report on Human Exposure to Environmental Chemicals, Department of Health and Human Services. Centers for Disease Control and Prevention Atlanta, GA, USA, 2009, pp. 519.
[53] ATSDR, Toxicological Profiles, in, Agency for Toxic Substances and Disease Registry. U.S. Department of Health and Human Services, Atlanta, Georgia, 2011.
[54] O.M. Faroon, L.S. Keith, C. Smith, Simon, C.T.D. Rosa, Polychlorinated Biphenyls: Human Health Aspects, World Health Organization, Report published under the joint sponsorship of the United Nations Environment Programme, the International Labour Organization, and the World Health Organization, and produced within the framework of the Inter-‐Organization Programme for the Sound Management of Chemicals, Geneva, 2003.
[55] G.H. Xing, J.K.Y. Chan, A.O.W. Leung, S.C. Wu, M.H. Wong, Environmental impact and human exposure to PCBs in Guiyu, an electronic waste recycling site in China, Environ. Int., 35 (2009) 76-‐82.
[56] R. Eisler, Planar PCB Hazards to Fish, Wildlife, and Invertebrates: a synoptic review, Patuxent Wildlife Research Center. U.S. Fish and Wildlife Service, Laurel, 1986.
[57] K. Breivik, A. Sweetman, J.M. Pacyna, K.C. Jones, Towards a global historical emission inventory for selected PCB congeners — A mass balance approach 3. An update, Sci. Total Environ. 377 (2007) 296–307.
[58] K. Breivik, A. Sweetman, J.M. Pacyna, K.C. Jones, Towards a global historical emission inventory for selected PCB congeners — A mass balance approach 2. Emissions, Sci. Total Environ. 290 (2002) 199–224.
[59] W.A. Ockenden, K. Breivik, S.N. Meijer, E. Steinnes, A.J. Sweetman, K.C. Jones, The global re-‐cycling of persistent organic pollutants is strongly retarded by soils, Environ. Poll., 121 (2003) 75-‐80.
[60] C. Schmidt, How PCBs are like grasshoppers, Environ. Sci. Technol., 44 (2010) 2752.

65
[61] A.C. Alder, M.M. Haggblom, S.R. Oppenheimer, L.Y. Young, Reductive dechlorination of polychlorinated biphenyls in anaerobic sediments, Environ. Sci. Technol., 27 (1993) 530-‐538.
[62] USEPA, Search Superfund Site Information, United States Environmental Protection Agency, http://cumulis.epa.gov/supercpad/cursites/srchsites.cfm, Accessed the 15th June 2014, 2014.
[63] TBS-‐SCT, Contaminants & Media, Federal Contaminated Sites Inventory. Treasury Board of Canada Secretariat, http://www.tbs-‐sct.gc.ca/fcsi-‐rscf/cm-‐eng.aspx?clear=1, Accessed the 27th February 2014, 2014.
[64] S.N. Meijer, W.A. Ockenden, A. Sweetman, K. Breivik, J.O. Grimalt, K.C. Jones, Global distribution and budget of PCBs and HCB in background surface soils: Implications for sources and environmental processes, Environ. Sci. Technol., 37 (2003) 667-‐672.
[65] H.I. Gomes, C. Dias-‐Ferreira, A.B. Ribeiro, Overview of in situ and ex situ remediation technologies for PCB-‐contaminated soils and sediments and obstacles for full-‐scale application, Sci. Total Environ., 445-‐446 (2013) 237-‐260.
[66] G. Fan, L. Cang, G. Fang, D. Zhou, Surfactant and oxidant enhanced electrokinetic remediation of a PCBs polluted soil, Sep. Purif. Technol., 123 (2014) 106-‐113.
[67] Y. Yukselen-‐Aksoy, K.R. Reddy, Effect of soil composition on electrokinetically enhanced persulfate oxidation of polychlorobiphenyls, Electrochim. Acta, 86 (2012) 164-‐169.
[68] Y. Li, F. Liang, Y. Zhu, F. Wang, Phytoremediation of a PCB-‐contaminated soil by alfalfa and tall fescue single and mixed plants cultivation, J. Soil Sediment., 13 (2013) 925-‐931.
[69] M. Viisimaa, O. Karpenko, V. Novikov, M. Trapido, A. Goi, Influence of biosurfactant on combined chemical-‐biological treatment of PCB-‐contaminated soil, Chem. Eng. J., 220 (2013) 352-‐359.
[70] USEPA, Permeable Reactive Barriers, Permeable Treatment Zones, and Application of Zero-‐Valent Iron: Overview, Technology Innovation and Field Services Division, Washington, DC, 2011.
[71] C.B. Wang, W. Zhang, Synthesizing nanoscale iron particles for rapid and complete dechlorination of TCE and PCBs, Environ. Sci. Technol., 31 (1997) 2154-‐2156.
[72] W. Zhang, C.B. Wang, H.L. Lien, Treatment of chlorinated organic contaminants with nanoscale bimetallic particles, Catal. Today, 40 (1998) 387-‐395.
[73] H. Lin, S. Hou, G. Xie, Z. Yao, Q. Zhou, Degradation of 1-‐(2-‐chlorobenzoyl)-‐3-‐(4-‐chlorophenyl) urea by nanoscale zerovalent iron under aerobic and anaerobic conditions, J. Environ. Sci. Health A, 47 (2012) 2270-‐2276.
[74] A. Ghauch, A. Tuqan, H.A. Assi, Antibiotic removal from water: Elimination of amoxicillin and ampicillin by microscale and nanoscale iron particles, Environ. Poll., 157 (2009) 1626-‐1635.
[75] S.R. Kanel, B. Manning, L. Charlet, H. Choi, Removal of arsenic (III) from groundwater by nanoscale zero-‐valent iron, Environ. Sci. Technol., 39 (2005) 1291-‐1298.
[76] T. Satapanajaru, P. Anurakpongsatorn, P. Pengthamkeerati, H. Boparai, Remediation of atrazine-‐contaminated soil and water by nano zerovalent iron, Water Air Soil Poll., 192 (2008) 349-‐359.
[77] H.K. Boparai, M. Joseph, D.M. O'Carroll, Cadmium (Cd2+) removal by nano zerovalent iron: surface analysis, effects of solution chemistry and surface complexation modeling, Environ. Sci. Poll. Res., (2013) 1-‐12.

66
[78] K. Singh, A. Singh, S. Gupta, P. Rai, Modeling and optimization of reductive degradation of chloramphenicol in aqueous solution by zero-‐valent bimetallic nanoparticles, Environ. Sci. Poll. Res., 19 (2012) 2063-‐2078.
[79] H. Song, E.R. Carraway, Reduction of chlorinated ethanes by nanosized zero-‐valent iron: Kinetics, pathways, and effects of reaction conditions, Environ. Sci. Technol., 39 (2005) 6237-‐6245.
[80] J. Dries, L. Bastiaens, D. Springael, S.N. Agathos, L. Diels, Combined removal of chlorinated ethenes and heavy metals by zerovalent iron in batch and continuous flow column systems, Environ. Sci. Technol., 39 (2005) 8460-‐8465.
[81] S.M. Ponder, J.G. Darab, T.E. Mallouk, Remediation of Cr(VI) and Pb(II) aqueous solutions using supported, nanoscale zero-‐valent iron, Environ. Sci. Technol., 34 (2000) 2564-‐2569.
[82] S.M. Ponder, J.G. Darab, J. Bucher, D. Caulder, I. Craig, L. Davis, N. Edelstein, W. Lukens, H. Nitsche, L. Rao, D.K. Shuh, T.E. Mallouk, Surface chemistry and electrochemistry of supported zerovalent iron nanoparticles in the remediation of aqueous metal contaminants, Chem. Mater., 13 (2001) 479-‐486.
[83] R. Singh, V. Misra, M.K.R. Mudiam, L.K.S. Chauhan, R.P. Singh, Degradation of HCH spiked soil using stabilized Pd/Fe0 bimetallic nanoparticles: Pathways, kinetics and effect of reaction conditions, J. Hazard. Mat., 237-‐238 (2012) 355-‐364.
[84] Y. Shih, Y. Chen, M. Chen, Y. Tai, C. Tso, Dechlorination of hexachlorobenzene by using nanoscale Fe and nanoscale Pd/Fe bimetallic particles, Colloids Surf. A, 332 (2009) 84-‐89.
[85] Y. Shih, C. Hsu, Y. Su, Reduction of hexachlorobenzene by nanoscale zero-‐valent iron: Kinetics, pH effect, and degradation mechanism, Sep. Purif. Technol., 76 (2011) 268-‐274.
[86] D.W. Elliott, H.L. Lien, W. Zhang, Zerovalent iron nanoparticles for treatment of ground water contaminated by hexachlorocyclohexanes, J. Environ. Qual., 37 (2008) 2192–2201.
[87] G. Naja, A. Halasz, S. Thiboutot, G. Ampleman, J. Hawari, Degradation of hexahydro-‐1,3,5-‐trinitro-‐1,3,5-‐triazine (RDX) using zerovalent iron nanoparticles, Environ. Sci. Technol., 42 (2008) 4364-‐4370.
[88] S. Machado, W. Stawiński, P. Slonina, A.R. Pinto, J.P. Grosso, H.P.A. Nouws, J.T. Albergaria, C. Delerue-‐Matos, Application of green zero-‐valent iron nanoparticles to the remediation of soils contaminated with ibuprofen, Sci. Total Environ., 461-‐462 (2013) 323-‐329.
[89] D.W. Elliott, H.L. Lien, W.X. Zhang, Degradation of lindane by zero-‐valent iron nanoparticles, J. Environ. Eng., 135 (2009) 317-‐324.
[90] I. San Román, M.L. Alonso, L. Bartolomé, A. Galdames, E. Goiti, M. Ocejo, M. Moragues, R.M. Alonso, J.L. Vilas, Relevance study of bare and coated zero valent iron nanoparticles for lindane degradation from its by-‐product monitorization, Chemosphere, 93 (2013) 1324-‐1332.
[91] R.K. Singhal, B. Gangadhar, H. Basu, V. Manisha, G.R.K. Naidu, A.V.R. Reddy, Remediation of malathion contaminated soil using zero valent iron nano-‐particles, Am. J. Anal. Chem., 3 (2012) 76-‐82.
[92] T. Shahwan, S. Abu Sirriah, M. Nairat, E. Boyaci, A.E. Erofülu, T.B. Scott, K.R. Hallam, Green synthesis of iron nanoparticles and their application as a Fenton-‐like catalyst for the degradation of aqueous cationic and anionic dyes, Chem. Eng. J., 172 (2011) 258-‐266.

67
[93] Z. Fang, J. Chen, X. Qiu, X. Qiu, W. Cheng, L. Zhu, Effective removal of antibiotic metronidazole from water by nanoscale zero-‐valent iron particles, Desalination, 268 (2011) 60-‐67.
[94] S.H. Joo, A.J. Feitz, T.D. Waite, Oxidative degradation of the carbothioate herbicide, molinate, using nanoscale zero-‐valent iron, Environ. Sci. Technol., 38 (2004) 2242-‐2247.
[95] S. Choe, Y.Y. Chang, K.Y. Hwang, J. Khim, Kinetics of reductive denitrification by nanoscale zero-‐valent iron, Chemosphere, 41 (2000) 1307-‐1311.
[96] G. Lowry, K. Johnson, Congener-‐specific dechlorination of dissolved PCBs by microscale and nanoscale zerovalent iron in a water/methanol solution, Environ. Sci. Technol., 38 (2004) 5208-‐5216.
[97] P. Varanasi, A. Fullana, S. Sidhu, Remediation of PCB contaminated soils using iron nano-‐particles, Chemosphere, 66 (2007) 1031–1038.
[98] K. Darko-‐Kagya, A.P. Khodadoust, K.R. Reddy, Reactivity of aluminum lactate-‐modified nanoscale iron particles with pentachlorophenol in soils, Environ. Eng. Sci., 27 (2010) 861-‐869.
[99] Y. Shih, Y. Tai, Reaction of decabrominated diphenyl ether by zerovalent iron nanoparticles, Chemosphere, 78 (2010) 1200-‐1206.
[100] M.C. Chang, H.Y. Kang, Remediation of pyrene-‐contaminated soil by synthesized nanoscale zero-‐valent iron particles, J. Environ. Sci. Health A, 44 (2009) 576-‐582.
[101] J.L. Chen, S.R. Al-‐Abed, J.A. Ryan, Z. Li, Effects of pH on dechlorination of trichloroethylene by zero-‐valent iron, J. Hazard. Mater., 83 (2001) 243-‐254.
[102] F. He, D. Zhao, J. Liu, C.B. Roberts, Stabilization of Fe-‐Pd nanoparticles with sodium carboxymethyl cellulose for enhanced transport and dechlorination of trichloroethylene in soil and groundwater, Ind. Eng. Chem. Res., 46 (2007) 29-‐34.
[103] F. He, D. Zhao, Preparation and characterization of a new class of starch-‐stabilized bimetallic nanoparticles for degradation of chlorinated hydrocarbons in water, Environ. Sci. Technol., 39 (2005) 3314-‐3320.
[104] D.W. Elliott, W. Zhang, Field assessment of nanoscale bimetallic particles for groundwater treatment, Environ. Sci. Technol., 35 (2001) 4922-‐4926.
[105] M. Zhang, F. He, D. Zhao, X. Hao, Degradation of soil-‐sorbed trichloroethylene by stabilized zero valent iron nanoparticles: Effects of sorption, surfactants, and natural organic matter, Water Res. 45 (2011) 2401-‐2414.
[106] W. Jiamjitrpanich, C. Polprasert, P. Parkpian, R.D. Delaune, A. Jugsujinda, Environmental factors influencing remediation of TNT-‐contaminated water and soil with nanoscale zero-‐valent iron particles, J. Environ. Sci. Health A, 45 (2010) 263-‐274.
[107] M. Dickinson, T.B. Scott, The application of zero-‐valent iron nanoparticles for the remediation of a uranium-‐contaminated waste effluent, J. Hazard. Mater., 178 (2010) 171–179.
[108] K.W. Henn, D.W. Waddill, Utilization of nanoscale zero-‐valent iron for source remediation — A case study, Remediation, 16 (2006) 57-‐77.
[109] USEPA, Fact sheet on selected sites using or testing nanoparticles for remediation, United States Environmental Protection Agency, http://cluin.org/products/nanozvi/, 2011, Accessed 3 April 2012.

68
[110] N.C. Mueller, J. Braun, J. Bruns, M. Černík, P. Rissing, D. Rickerby, B. Nowack, Application of nanoscale zero valent iron (NZVI) for groundwater remediation in Europe, Env. Sci. Poll. Res., 19 (2012) 550-‐558.
[111] D. Rejeski, T. Kuiken, P. Polischuk, E. Pauwels, Nanoremediation Map, Project on Emerging Nanotechnologies, http://www.nanotechproject.org/inventories/remediation_map/, Accessed 5th March 2014, 2014.
[112] R.A. Crane, T.B. Scott, Nanoscale zero-‐valent iron: Future prospects for an emerging water treatment technology, J. Hazard. Mater., 211-‐212 (2012) 112-‐125.
[113] J. Quinn, C. Geiger, C. Clausen, K. Brooks, C. Coon, S. O'Hara, T. Krug, D. Major, W.S. Yoon, A. Gavaskar, T. Holdsworth, Field demonstration of DNAPL dehalogenation using emulsified zero-‐valent iron, Environ. Sci. Technol., 39 (2005) 1309-‐1318.
[114] W. Zhang, D.W. Elliott, Applications of iron nanoparticles for groundwater remediation, Remediation, (2006) 7-‐21.
[115] C. Su, R.W. Puls, T.A. Krug, M.T. Watling, S.K. O'Hara, J.W. Quinn, N.E. Ruiz, A two and half-‐year-‐performance evaluation of a field test on treatment of source zone tetrachloroethene and its chlorinated daughter products using emulsified zero valent iron nanoparticles, Water Res., 46 (2012) 5071-‐5084.
[116] C.M. Kocur, A.I. Chowdhury, N. Sakulchaicharoen, H.K. Boparai, K.P. Weber, P. Sharma, M.M. Krol, L.M. Austrins, C. Peace, B.E. Sleep, D.M. O'Carroll, Characterization of nZVI mobility in a field scale test, Environ. Sci. Technol., 48 (2014) 2862-‐2869.
[117] T. Phenrat, N. Saleh, K. Sirk, R.D. Tilton, G.V. Lowry, Aggregation and sedimentation of aqueous nanoscale zerovalent iron dispersions, Environ. Sci. Technol., 41 (2007) 284-‐290.
[118] Y.P. Sun, X.Q. Li, W.X. Zhang, H.P. Wang, A method for the preparation of stable dispersion of zero-‐valent iron nanoparticles, Colloid Surface A, 308 (2007) 60–66.
[119] A. Tiraferri, K.L. Chen, R. Sethi, M. Elimelech, Reduced aggregation and sedimentation of zero-‐valent iron nanoparticles in the presence of guar gum, J. Colloid Interface Sci., 324 (2008) 71–79
[120] A. Tiraferri, R. Sethi, Enhanced transport of zerovalent iron nanoparticles in saturated porous media by guar gum, J. Nanopart. Res., 11 (2009) 635-‐645.
[121] P. Jiemvarangkul, W.X. Zhang, H.L. Lien, Enhanced transport of polyelectrolyte stabilized nanoscale zero-‐valent iron (nZVI) in porous media, Chem. Eng. J., 170 (2011) 482-‐491.
[122] Y.H. Lin, H.H. Tseng, M.Y. Wey, M.D. Lin, Characteristics, morphology, and stabilization mechanism of PAA250K-‐stabilized bimetal nanoparticles, Colloid Surface A, 349 (2009) 137-‐144.
[123] T. Raychoudhury, G. Naja, S. Ghoshal, Assessment of transport of two polyelectrolyte-‐stabilized zero-‐valent iron nanoparticles in porous media, J. Contam. Hydrol., 118 (2010) 143-‐151.
[124] T. Phenrat, A. Cihan, H.J. Kim, M. Mital, T. Illangasekare, G.V. Lowry, Transport and deposition of polymer-‐modified Fe0 nanoparticles in 2-‐D heterogeneous porous media: Effects of particle concentration, Fe0 content, and coatings, Environ. Sci. Technol., 44 (2010) 9086-‐9083.
[125] T. Phenrat, F. Fagerlund, T. Illangasekare, G.V. Lowry, R.D. Tilton, Polymer-‐modified Fe0 nanoparticles target entrapped NAPL in two dimensional porous media: Effect of particle

69
concentration, NAPL saturation, and injection strategy, Environ. Sci. Technol., 45 (2011) 6102-‐6109.
[126] B.W. Hydutsky, E.J. Mack, B.B. Beckerman, J.M. Skluzacek, T.E. Mallouk, Optimization of nano-‐ and microiron transport through sand columns using polyelectrolyte mixtures, Environ. Sci. Technol., 41 (2007) 6418-‐6424.
[127] S. Kanel, D. Nepal, B. Manning, H. Choi, Transport of surface-‐modified iron nanoparticle in porous media and application to arsenic(III) remediation, J. Nanopart. Res., 9 (2007) 725-‐735.
[128] T. Phenrat, H.J. Kim, F. Fagerlund, T. Illangasekare, R.D. Tilton, G.V. Lowry, Particle size distribution, concentration, and magnetic attraction affect transport of polymer-‐modified Fe0 nanoparticles in sand columns, Environ. Sci. Technol., 43 (2009) 5079-‐5085.
[129] N. Saleh, H.J. Kim, T. Phenrat, K. Matyjaszewski, R.D. Tilton, G.V. Lowry, Ionic strength and composition affect the mobility of surface-‐modified Fe0 nanoparticles in water-‐saturated sand columns, Environ. Sci. Technol., 42 (2008) 3349-‐3355.
[130] Y.H. Lin, H.H. Tseng, M.Y. Wey, M.D. Lin, Characteristics of two types of stabilized nano zero-‐valent iron and transport in porous media, Sci. Total Environ., 408 (2010) 2260-‐2267.
[131] B. Schrick, B.W. Hydutsky, J.L. Blough, T.E. Mallouk, Delivery vehicles for zerovalent metal nanoparticles in soil and groundwater, Chem. Mater., 16 (2004) 2187–2193.
[132] G.C.C. Yang, H.C. Tu, C.H. Hung, Stability of nanoiron slurries and their transport in the subsurface environment, Sep. Purif. Technol. 58 (2007) 166-‐172.
[133] T. Phenrat, Y. Liu, R.D. Tilton, G.V. Lowry, Adsorbed polyelectrolyte coatings decrease Fe0
nanoparticle reactivity with TCE in water: conceptual model and mechanisms, Environ. Sci. Technol., 43 (2009) 1507-‐1514.
[134] T. Tosco, M.P. Papini, C.C. Viggi, R. Sethi, Nanoscale zerovalent iron particles for groundwater remediation: a review, J. Clean. Prod., 77 (2014) 10-‐21.
[135] C. Noubactep, S. Caré, R. Crane, Nanoscale metallic iron for environmental remediation: Prospects and limitations, Water Air Soil Poll., 223 (2012) 1363-‐1382.
[136] W. Zhang, Nanoscale iron particles for environmental remediation: an overview, J. Nanopart. Res., 5 (2003) 323-‐332.
[137] D. O’Carroll, B. Sleep, M. Krol, H. Boparai, C. Kocur, Nanoscale zero valent iron and bimetallic particles for contaminated site remediation, Adv. Water Resour., 51 (2013) 104-‐122
[138] W. Yan, H.L. Lien, B.E. Koel, W. Zhang, Iron nanoparticles for environmental clean-‐up: Recent developments and future outlook, Environ. Sci. Process. Impact., 15 (2013) 63-‐77.
[139] F. He, D. Zhao, C. Paul, Field assessment of carboxymethyl cellulose stabilized iron nanoparticles for in situ destruction of chlorinated solvents in source zones, Water Res., 44 (2010) 2360–2370.
[140] X. Chen, X. Yao, C. Yu, X. Su, C. Shen, C. Chen, R. Huang, X. Xu, Hydrodechlorination of polychlorinated biphenyls in contaminated soil from an e-‐waste recycling area, using nanoscale zerovalent iron and Pd/Fe bimetallic nanoparticles, Environ. Sci. Poll. Res., 21 (2014) 1-‐10.
[141] K.D. Grieger, A. Fjordbøge, N.B. Hartmann, E. Eriksson, P.L. Bjerg, A. Baun, Environmental benefits and risks of zero-‐valent iron nanoparticles (nZVI) for in situ remediation: Risk mitigation or trade-‐off?, J. Cont. Hydrol., 118 (2010) 165-‐183.

70
[142] Y.S. El-‐Temsah, E.J. Joner, Effects of nano-‐sized zero-‐valent iron (nZVI) on DDT degradation in soil and its toxicity to collembola and ostracods, Chemosphere, 92 (2013) 131–137.
[143] C. Fajardo, M.L. Saccà, M. Martinez-‐Gomariz, G. Costa, M. Nande, M. Martin, Transcriptional and proteomic stress responses of a soil bacterium Bacillus cereus to nanosized zero-‐valent iron (nZVI) particles, Chemosphere, 93 (2013) 1077–1083.
[144] A.A. Keller, K. Garner, R.J. Miller, H.S. Lenihan, Toxicity of nano-‐zero valent iron to freshwater and marine organisms, PLoS ONE, 7 (2012) e43983.
[145] M. Saccà, C. Fajardo, M. Nande, M. Martín, Effects of nano zero-‐valent iron on Klebsiella oxytoca and stress response, Microb. Ecol., (2013) 1-‐7.
[146] R. Dinesh, M. Anandaraj, V. Srinivasan, S. Hamza, Engineered nanoparticles in the soil and their potential implications to microbial activity, Geoderma, 173-‐174 (2012) 19-‐27.
[147] R.J. Barnes, C.J. van der Gast, O. Riba, L.E. Lehtovirta, J.I. Prosser, P.J. Dobson, I.P. Thompson, The impact of zero-‐valent iron nanoparticles on a river water bacterial community, J. Hazard. Mater., 184 (2010) 73-‐80.
[148] K. Tiede, A.B.A. Boxall, S.P. Tear, J. Lewis, H. David, M. Hassellov, Detection and characterization of engineered nanoparticles in food and the environment, Food Addit. Contam., 25 (2008) 795-‐821.
[149] B. Pan, B. Xing, Applications and implications of manufactured nanoparticles in soils: A review, Eur. J. Soil Sci., 63 (2012) 437-‐456.
[150] H. Zänker, A. Schierz, Engineered nanoparticles and their identification among natural nanoparticles, Annu. Rev. Anal. Chem., 5 (2012) 107-‐132.
[151] I.C. Regelink, L. Weng, G.F. Koopmans, W.H. Van Riemsdijk, Asymmetric flow field-‐flow fractionation as a new approach to analyse iron-‐(hydr) oxide nanoparticles in soil extracts, Geoderma, 202 (2013) 134-‐141.
[152] G.Z. Tsogas, D.L. Giokas, A.G. Vlessidis, Ultra-‐trace determination of silver, gold and iron oxide nanoparticles by micelle mediated preconcentration / selective back-‐extraction coupled with flow injection chemiluminescence detection, Anal. Chem., 86 (2014) 3484-‐3492.
[153] R. Lageman, W. Pool, G.A. Seffinga, Electro-‐Reclamation, Chem.Ind., 18 (1989) 585-‐590.
[154] S. Pamukcu, J.K. Wittle, Electrokinetic removal of selected heavy metals from soil, Environ. Prog., 11 (1992) 241-‐250.
[155] Y.B. Acar, A.N. Alshawabkeh, Principles of Electrokinetic Remediation, Environ. Sci. Technol., 27 (1993) 2638-‐2647.
[156] R.F. Probstein, R.E. Hicks., Removal of contaminants from soil by electric fields, Science, 260 (1993) 498–530.
[157] L.M. Ottosen, H.K. Hansen, S. Laursen, A. Villumsen, Electrodialytic remediation of soil polluted with copper from wood preservation Industry, Environ. Sci. Technol., 31 (1997) 1711-‐1715.
[158] T. R. Sun, Effect of pulse current on energy consumption and removal of heavy metals during electrodialytic soil remediation, Ph.D Thesis, Technical University of Denmark, 2013.
[159] M.M. Page, C.L. Page, Electroremediation of contaminated soils, J. Environ. Eng., 128 (2002) 208-‐219.

71
[160] L.M. Ottosen, H.K. Hansen, S. Laursen, A. Villumsen, Electrodialytic remediation of soil polluted with copper from wood preservation industry, Environ. Sci. Technol., 31 (1997) 1711-‐1715.
[161] P.E. Jensen, L.M. Ottosen, C. Ferreira, Electrodialytic remediation of soil fines (<63 μm) in suspension—Influence of current strength and L/S, Electrochim. Acta, 52 (2007) 3412-‐3419.
[162] L.M. Ottosen, P.E. Jensen, H.K. Hansen, A. Ribeiro, B. Allard, Electrodialytic remediation of soil slurry–Removal of Cu, Cr, and As, Sep. Sci. Technol., 44 (2009) 2245-‐2268.
[163] L. Ottosen, P. Jensen, G. Kirkelund, H. Hansen, Electrodialytic remediation of different heavy metal-‐polluted soils in suspension, Water Air Soil Poll., 224 (2013) 1-‐10.
[164] A.B. Ribeiro, E.P. Mateus, L.M. Ottosen, G. Bech-‐Nielsen, Electrodialytic removal of Cu, Cr and As from chromated copper arsenate-‐treated timber waste, Environ. Sci. Technol., 34 (2000) 784-‐788.
[165] H.K. Hansen, A. Rojo, L.M. Ottosen, Electrodialytic remediation of copper mine tailings, J. Hazard. Mater., 117 (2005) 179-‐183.
[166] L.M. Ottosen, A.T. Lima, A.J. Pedersen, A.B. Ribeiro, Electrodialytic extraction of Cu, Pb and Cl from municipal solid waste incineration fly ash suspended in water, J. Chem. Technol. Biotechnol., 81 (2006) 553-‐559.
[167] L.M. Ottosen, A.J. Pedersen, H.K. Hansen, A.B. Ribeiro, Screening the possibility for removing cadmium and other heavy metals from wastewater sludge and bio-‐ashes by an electrodialytic method, Electrochim. Acta, 52 (2007) 3420-‐3426.
[168] G.M. Kirkelund, L.M. Ottosen, A. Villumsen, Electrodialytic remediation of harbour sediment in suspension—Evaluation of effects induced by changes in stirring velocity and current density on heavy metal removal and pH, J. Hazard. Mater., 169 (2009) 685-‐690.
[169] P.E. Jensen, C.M.D. Ferreira, H.K. Hansen, J.U. Rype, L.M. Ottosen, A. Villumsen, Electroremediation of air pollution control residues in a continuous reactor, J. App. Electrochem., 40 (2010) 1173–1181
[170] M. Pazos, G.M. Kirkelund, L.M. Ottosen, Electrodialytic treatment for metal removal from sewage sludge ash from fluidized bed combustion, J. Hazard. Mater., 176 (2010) 1073-‐1078.
[171] L.M. Ottosen, P.E. Jensen, G.M. Kirkelund, B. Ebbers, Electrodialytic separation of heavy metals from particulate material. Patent application EPC 13183278.4-‐1352, 2013.
[172] J. Virkutyte, M. Sillanpaa, P. Latostenmaa, Electrokinetic soil remediation -‐ Critical overview, Sci. Total Environ., 289 (2002) 97-‐121.
[173] H.H. Lee, J.W. Yang, A new method to control electrolytes pH by circulation system in electrokinetic soil remediation, J. Hazard. Mater., 77 (2000) 227-‐240.
[174] R.E. Saichek, K.R. Reddy, Effect of pH control at the anode for the electrokinetic removal of phenanthrene from kaolin soil, Chemosphere, 21 (2003) 273-‐287.
[175] L.M. Ottosen, A.J. Pedersen, A.B. Ribeiro, H.K. Hansen, Case study on the strategy and application of enhancement solutions to improve remediation of soils contaminated with Cu, Pb and Zn by means of electrodialysis, Eng. Geol., 77 (2005) 317-‐329.
[176] G.M. Nystroem, A.J. Pedersen, L.M. Ottosen, A. Villumsen, The use of desorbing agents in electrodialytic remediation of harbour sediment, Sci. Total Environ., 357 (2006) 25-‐37.

72
[177] R.E. Saichek, K.R. Reddy, Effects of system variables on surfactant enhanced electrokinetic removal of polycyclic aromatic hydrocarbons from clayey soils, Environ. Technol., 24 (2003) 503-‐515.
[178] H.K. Hansen, A. Rojo, Testing pulsed electric fields in electroremediation of copper mine tailings, Electrochim. Acta, 52 (2007) 3399-‐3405.
[179] T.R. Sun, L.M. Ottosen, Effects of pulse current on energy consumption and removal of heavy metals during electrodialytic soil remediation, Electrochim. Acta, 86 (2012) 28-‐35.
[180] A. Rojo, H.K. Hansen, M. Cubillos, Electrokinetic remediation using pulsed sinusoidal electric field, Electrochim. Acta, 86 (2012) 124-‐129.
[181] R. Lageman, R.L. Clarke, W. Pool, Electro-‐reclamation, a versatile soil remediation solution, Eng. Geol., 77 (2005) 191-‐201.
[182] L.M. Ottosen, I.V. Christensen, I. Rörig-‐Dalgård, P.E. Jensen, H.K. Hansen, Utilization of electromigration in civil and environmental engineering—Processes, transport rates and matrix changes, J. Environ. Sci. Health A, 43 (2008) 795-‐809.
[183] A.T. Yeung, Milestone developments, myths, and future directions of electrokinetic remediation, Sep. Purif. Technol., 79 (2011) 124–132.
[184] A.N. Alshawabkeh, Electrokinetic soil remediation: Challenges and opportunities, Sep. Sci. Technol., 44 (2009) 2171–2187.
[185] W.S. Kim, G.Y. Park, D.H. Kim, H.B. Jung, S.H. Ko, K. Baek, In situ field scale electrokinetic remediation of multi-‐metals contaminated paddy soil: Influence of electrode configuration, Electrochim. Acta, 86 (2012) 89-‐95.
[186] H.I. Gomes, C. Dias-‐Ferreira, A.B. Ribeiro, Electrokinetic remediation of organochlorines in soil: Enhancement techniques and integration with other remediation technologies, Chemosphere, 87 (2012) 1077-‐1090.
[187] I. Istrate, D. Cocarta, S. Neamtu, T. Cirlioru, The treatment of PCB polluted soil -‐ The approach based on the application of electrochemical treatment, Water Air Soil Poll., 224 (2013) 1-‐14.
[188] P.S.C. Rao, J.W. Jawitz, C.G. Enfield, R.W. Falta, M.D. Annable, A.L. Wood, Technology integration for contaminated site remediation: Clean-‐up goals and performance criteria, Groundwater Quality: Natural and Enhanced Restoration of Groundwater Pollutions 2001 Proceedings, Sheffield, UK, 2001, pp. 571-‐578.
[189] K.R. Reddy, C. Cameselle, P. Ala, Integrated electrokinetic-‐soil flushing to remove mixed organic and metal contaminants, J. App. Electrochem., 40 (2010) 1269–1279.
[190] X. Mao, J. Wang, A. Ciblak, E.E. Cox, C. Riis, M. Terkelsen, D.B. Gent, A.N. Alshawabkeh, Electrokinetic-‐enhanced bioaugmentation for remediation of chlorinated solvents contaminated clay, J. Hazard. Mater., 213-‐214 (2012) 311-‐317.
[191] J. Huang, W. Liao, S. Lai, R. Yang, Use of hydraulic pressure–improved electrokinetic technique to enhance the efficiencies of the remediation of PCP-‐contaminated soil, J. Environ. Eng., 139 (2013) 1213-‐1221.
[192] A. Oonnittan, R.A. Shrestha, M. Sillanpää, Removal of hexachlorobenzene from soil by electrokinetically enhanced chemical oxidation, J. Hazard. Mater., 162 (2009) 989-‐993.

73
[193] A. Oonnittan, R.A. Shrestha, M. Sillanpää, Effect of cyclodextrin on the remediation of hexachlorobenzene in soil by electrokinetic Fenton process, Sep. Purif. Technol., 64 (2009) 314-‐320.
[194] A. Oonnittan, P. Isosaari, M. Sillanpää, Oxidant availability in soil and its effect on HCB removal during electrokinetic Fenton process, Sep. Purif. Technol., 76 (2010) 146-‐150.
[195] A. Oonnittan, P. Isosaari, M. Sillanpää, Effect of polarity reversal on hexachlorobenzene removal during electrokinetic Fenton process, J. Environ. Eng., 139 (2013) 1228-‐1232.
[196] P.J. Dugan, R.L. Siegrist, M.L. Crimi, Coupling surfactants/cosolvents with oxidants for enhanced DNAPL removal: A review, Remediation, 20 (2010) 27-‐49.
[197] S. Pamukcu, L. Hannum, J.K. Wittle, Delivery and activation of nano-‐iron by DC electric field, J. Environ. Sci. Health A, 43 (2008) 934-‐944.
[198] G.C.C. Yang, C.H. Hung, H.C. Tu, Electrokinetically enhanced removal and degradation of nitrate in the subsurface using nanosized Pd/Fe slurry, J. Environ. Sci. Health A, 43 (2008) 945-‐951.
[199] K.R. Reddy, M.R. Karri, Electrokinetic delivery of nanoiron amended with surfactant and cosolvent in contaminated soil, Proceedings of the International Conference on Waste 8 Engineering and Management, May 2008, Hong Kong, 2008.
[200] S.S. Chen, Y.C. Huang, T.Y. Kuo, The remediation of perchloroethylene contaminated groundwater by nanoscale iron reactive barrier integrated with surfactant and electrokinetics, Ground Water Monit. R., 30 (2010) 90–98.
[201] E.H. Jones, D.A. Reynolds, A.L. Wood, D.G. Thomas, Use of electrophoresis for transporting nano-‐iron in porous media, Ground Water, 49 (2010) 172-‐183.
[202] G.C.C. Yang, Y.I. Chang, Integration of emulsified nanoiron injection with the electrokinetic process for remediation of trichloroethylene in saturated soil, Sep. Purif. Technol., 79 (2011) 278–284.
[203] A.I.A. Chowdhury, D.M. O'Carroll, Y. Xu, B.E. Sleep, Electrophoresis enhanced transport of nano-‐scale zero valent iron, Adv. Water Resour., 40 (2012) 71-‐82.
[204] S. Yuan, H. Long, W. Xie, P. Liao, M. Tong, Electrokinetic transport of CMC-‐stabilized Pd/Fe nanoparticles for the remediation of PCP-‐contaminated soil, Geoderma, 185-‐186 (2012) 18-‐25.
[205] G. Fan, L. Cang, W. Qin, C. Zhou, H.I. Gomes, D. Zhou, Surfactants-‐enhanced electrokinetic transport of xanthan gum stabilized nano Pd/Fe for the remediation of PCBs contaminated soils, Sep. Purif. Technol., 114 (2013) 64-‐72.
[206] E. Rosales, J.P.G. Loch, C. Dias-‐Ferreira, Electro-‐osmotic transport of nano zero-‐valent iron in Boom Clay, Electrochim. Acta, 127 (2014) 27-‐33.
[207] A.T. Lima, L.M. Ottosen, K. Heister, J.P.G. Loch, Assessing PAH removal from clayey soil by means of electro-‐osmosis and electrodialysis, Sci. Total Environ., 435–436 (2012) 1-‐6.
[208] S. Pamukcu, A. Weeks, J.K. Wittle, Enhanced reduction of Cr(VI) by direct electric current in a contaminted clay, Environ. Sci. Technol., 38 (2004) 1236-‐1241.
[209] A.B. Ribeiro, E.P. Mateus, J.M. Rodríguez-‐Maroto, Removal of organic contaminants from soils by an electrokinetic process: The case of molinate and bentazone. Experimental and modeling, Sep. Purif. Technol., 79 (2011) 193-‐203.

74
[210] Y.T. Wei, S.C. Wu, C.M. Chou, C.H. Che, S.M. Tsai, H.L. Lien, Influence of nanoscale zero-‐valent iron on geochemical properties of groundwater and vinyl chloride degradation: A field case study, Water Res., 44 (2010) 131-‐140.
[211] J.B. Michael, V. Ramesh, G. Florin, Status of nZVI technology: Lessons learned from North American and international implementations, C. Geiger, K. Carvalho-‐Knighton (Eds.) Environmental Applications of Nanoscale and Microscale Reactive Metal Particles, American Chemical Society Symposium Series, 2009, pp. 219-‐232.
[212] S. O’Hara, T. Krug, J. Quinn, C. Clausen, C. Geiger, Field and laboratory evaluation of the treatment of DNAPL source zones using emulsified zero-‐valent iron, Remediation, 16 (2006) 35-‐56.
[213] Z. Shi, J.T. Nurmi, P.G. Tratnyek, Effects of nano zero-‐valent iron on oxidation-‐reduction potential, Environ. Sci. Technol., 45 (2011) 1586-‐1592.
[214] K.R. Reddy, K. Darko-‐Kagy, C. Cameselle, Electrokinetic-‐enhanced transport of lactate-‐modified nanoscale iron particles for degradation of dinitrotoluene in clayey soils, Sep. Purif. Technol., 79 (2011) 230-‐237.
[215] H.J. Kim, T. Phenrat, R.D. Tilton, G.V. Lowry, Effect of kaolinite, silica fines and pH on transport of polymer-‐modified zero valent iron nano-‐particles in heterogeneous porous media, J. Colloid Interface Sci., 370 (2012) 1-‐10.
[216] J. Busch, T. Meißner, A. Potthoff, S.E. Oswald, Transport of carbon colloid supported nanoscale zero-‐valent iron in saturated porous media, J. Contam. Hydrol., 164 (2014) 25-‐34.
[217] C. Su, R.W. Puls, T.A. Krug, M.T. Watling, S.K. O'Hara, J.W. Quinn, N.E. Ruiz, Travel distance and transformation of injected emulsified zerovalent iron nanoparticles in the subsurface during two and half years, Water Res., 47 (2013) 4095-‐4106.
[218] H.I. Gomes, C. Dias-‐Ferreira, A.B. Ribeiro, S. Pamukcu, Enhanced transport and transformation of zerovalent nanoiron in clay using direct electric current, Water Air Soil Poll., 224 (2013) 1-‐12.
[219] D.G. Kim, Y.H. Hwang, H.S. Shin, S.O. Ko, Deactivation of nanoscale zero-‐valent iron by humic acid and by retention in water, Environ. Technol., 34 (2013) 1-‐11.
[220] C.M. Kocur, D.M. O'Carroll, B.E. Sleep, Impact of nZVI stability on mobility in porous media, J. Contam. Hydrol., 145 (2013) 17-‐25.
[221] C.A. Alister, M.A. Araya, M. Kogan, Adsorption and desorption variability of four herbicides used in paddy rice production, J. Environ. Sci. Health B, 46 (2010) 62-‐68.
[222] J.C.S. Santos, Electrokinetic remediation of rice field soils contaminated by molinate, Master degree in Environmental Engineering, Faculdade de Ciências e Tecnologia, Universidade Nova de Lisboa, 2008, 97 pp.
[223] S. Laumann, V. Micić, G.V. Lowry, T. Hofmann, Carbonate minerals in porous media decrease mobility of polyacrylic acid modified zero-‐valent iron nanoparticles used for groundwater remediation, Environ. Poll., 179 (2013) 53-‐60.
[224] Y. Chang, G. Achari, C. Langford, Effect of cocontaminants on the remediation of PCB-‐impacted soils by hydrogen peroxide, Pract. Period. Hazard. Toxic Radioact. Waste Manag., 14 (2010) 266-‐268.

75
[225] B.Z. Wu, H.Y. Chen, S.J. Wang, C.M. Wai, W. Liao, K. Chiu, Reductive dechlorination for remediation of polychlorinated biphenyls, Chemosphere, 88 (2012) 757-‐768.
[226] G.K. Vasilyeva, E.R. Strijakova, S.N. Nikolaeva, A.T. Lebedev, P.J. Shea, Dynamics of PCB removal and detoxification in historically contaminated soils amended with activated carbon, Environ. Poll., 158 (2010) 770–777.
[227] B. Beckingham, U. Ghosh, Field-‐scale reduction of PCB bioavailability with activated carbon amendment to river sediments, Environ. Sci. Technol., 45 (2011) 10567-‐10574.
[228] H.I. Gomes, C. Dias-‐Ferreira, A.B. Ribeiro, S. Pamukcu, Influence of electrolyte and voltage on the direct current enhanced transport of iron nanoparticles in clay, Chemosphere, 99 (2014) 171-‐179.
[229] Y. Wang, D. Zhou, Y. Wang, L. Wang, L. Cang, Automatic pH control system enhances the dechlorination of 2,4,4ʹ′-‐trichlorobiphenyl and extracted PCBs from contaminated soil by nanoscale Fe0 and Pd/Fe0, Environ. Sci. Poll. Res., 19 (2012) 448-‐457.
[230] Q. Zhou, H. Lin, Influence of surfactants on degradation of 1-‐(2-‐chlorobenzoyl)-‐3-‐(4-‐chlorophenyl) urea by nanoscale zerovalent iron, CLEAN, 41 (2013) 128-‐133.
[231] E.J. Weber, Iron-‐mediated reductive transformations: Investigation of reaction mechanism, Environ. Sci. Technol., 30 (1996) 716-‐719.
[232] F. He, D. Zhao, Hydrodechlorination of trichloroethene using stabilized Fe-‐Pd nanoparticles: Reaction mechanism and effects of stabilizers, catalysts and reaction conditions, App. Catal. B, 84 (2008) 533-‐540.
[233] N.E. Korte, O.R. West, L. Liang, B. Gu, J.L. Zutman, Q. Fernando, The effect of solvent concentration on the use of palladized-‐iron for the step-‐wise dechlorination of polychlorinated biphenyls in soil extracts, Waste Manag., 22 (2002) 343-‐349.
[234] M.D. Erickson, Analytical Chemistry of PCBs, CRC Press, Boca Raton, Florida, 1997, 688 pp.
[235] T.R. Sun, L.M. Ottosen, P.E. Jensen, G.M. Kirkelund, Electrodialytic remediation of suspended soil – Comparison of two different soil fractions, J. Hazard. Mater., 203–204 (2012) 229-‐235.
[236] B. Yang, G. Yu, J. Huang, Electrocatalytic hydrodechlorination of 2,4,5-‐trichlorobiphenyl on a palladium-‐modified nickel foam cathode, Environ. Sci. Technol., 41 (2007) 7503-‐7508.
[237] B. Yang, G. Yu, D. Shuai, Electrocatalytic hydrodechlorination of 4-‐chlorobiphenyl in aqueous solution using palladized nickel foam cathode, Chemosphere, 67 (2007) 1361-‐1367.
[238] W. Zhou, J. Yang, L. Lou, L. Zhu, Solubilization properties of polycyclic aromatic hydrocarbons by saponin, a plant-‐derived biosurfactant, Environ. Poll., 159 (2011) 1198-‐1204.
[239] O. Iglesias, M.A. Sanromán, M. Pazos, Surfactant-‐enhanced solubilization and simultaneous degradation of phenanthrene in marine sediment by electro-‐Fenton treatment, Ind. Eng. Chem. Res., 53 (2014) 2917-‐2923.
[240] S.F. Jensen, PCB in Soil. The Contamination of PCB in Selected Locations around Roskilde and Copenhagen, The International Basic Studies in Natural Science, Roskilde University, Denmark, 2009, 29 pp.
[241] H.I. Gomes, G. Fan, E.P. Mateus, C. Dias-‐Ferreira, A.B. Ribeiro, Assessment of combined electro-‐nanoremediation of molinate contaminated soil, Sci. Total Environ., 493 (2014) 178-‐184.

76
[242] J.M. Paz-‐García, B. Johannesson, L.M. Ottosen, A.B. Ribeiro, J.M. Rodríguez-‐Maroto, Computing multi-‐species chemical equilibrium with an algorithm based on the reaction extents, Comp, Chem. Eng., 58 (2013) 135-‐143.
[243] M. Farré, J. Sanchís, D. Barceló, Analysis and assessment of the occurrence, the fate and the behavior of nanomaterials in the environment, TrAC Trends Anal. Chem., 30 (2011) 517-‐527.
[244] B.F. Silva, S. Pérez, P. Gardinalli, R.K. Singhal, A.A. Mozeto, D. Barceló, Analytical chemistry of metallic nanoparticles in natural environments, TrAC Trends Anal. Chem., 30 (2011) 528-‐540.
[245] L.G. Cullen, E.L. Tilston, G.R. Mitchell, C.D. Collins, L.J. Shaw, Assessing the impact of nano-‐ and micro-‐scale zerovalent iron particles on soil microbial activities: Particle reactivity interferes with assay conditions and interpretation of genuine microbial effects, Chemosphere, 82 (2011) 1675-‐1682.
[246] I. Jośko, P. Oleszczuk, Manufactured nanomaterials: The connection between environmental fate and toxicity, Crit. Review. Environ. Sci. Technol., 43 (2013) 2581-‐2616.
[247] D. Hou, A. Al-‐Tabbaa, Sustainability: A new imperative in contaminated land remediation, Environ. Sci. Policy, 39 (2014) 25-‐34.
[248] J.N. Smith, G. Kerrison, Benchmarking of decision-‐support tools used for tiered sustainable remediation appraisal, Water Air Soil Poll., 224 (2013) 1-‐11.

77
Part II


79
II.1. Overview of in situ and ex situ remediation technologies for PCB-‐
contaminated soils and sediments and obstacles for full-‐scale application
(published in Science of the Total Environment)


Author's personal copy
Review
Overview of in situ and ex situ remediation technologies for PCB-contaminated soilsand sediments and obstacles for full-scale application
Helena I. Gomes a,b,⁎, Celia Dias-Ferreira b, Alexandra B. Ribeiro a
a CENSE — Center for Environmental and Sustainability Research, Departamento de Ciências e Engenharia do Ambiente, Faculdade de Ciências e Tecnologia, Universidade Nova de Lisboa,2829-516 Caparica, Portugalb CERNAS — Research Center for Natural Resources, Environment and Society, Campus da Escola Superior Agrária de Coimbra, Bencanta, 3040-316 Coimbra, Portugal
H I G H L I G H T S
Remediation technologies for PCB in contaminated soils and sediments Review of in situ and ex situ remediation technologies Historical overview of full-scale applications for PCB contaminated sites Assessment of full-scale applications of emerging technologies
a b s t r a c ta r t i c l e i n f o
Article history:Received 3 October 2012Received in revised form 28 November 2012Accepted 28 November 2012Available online xxxx
Keywords:Polychlorinated biphenyls (PCB)Remediation technologiesIn situEx situContaminated soils and sediments
Polychlorinated biphenyls (PCB) are persistent organic pollutants used worldwide between the 1930s and1980s. Although their use has been heavily restricted, PCB can be found in contaminated soils and sediments.The most frequent remediation solutions adopted are “dig and dump” and “dig and incinerate”, but there arecurrently new methods that could be more sustainable alternatives. This paper takes a look into the remedi-ation options available for PCB-contaminated soils and sediments, differentiating between biological, chem-ical, physical and thermal methods. The use of combined technologies was also reviewed. Most of them arestill in an initial development stage and further research in different implementation issues is needed.There is no single technology that is the solution for PCB contamination problem. The successful remediationof a site will depend on proper selection, design and adjustment of the technology or combined technologiesto the site characteristics.
© 2012 Elsevier B.V. All rights reserved.
Contents
1. Introduction . . . . . . . . . . . . . . . . . . . . . . . . . . . . . . . . . . . . . . . . . . . . . . . . . . . . . . . . . . . . . 2382. Full-scale applications of PCB remediation technologies in soil and sediments . . . . . . . . . . . . . . . . . . . . . . . . . . . . . . . 2383. Emerging technologies for PCB remediation . . . . . . . . . . . . . . . . . . . . . . . . . . . . . . . . . . . . . . . . . . . . . . 238
3.1. In situ technologies . . . . . . . . . . . . . . . . . . . . . . . . . . . . . . . . . . . . . . . . . . . . . . . . . . . . . . 2383.1.1. Biological treatment . . . . . . . . . . . . . . . . . . . . . . . . . . . . . . . . . . . . . . . . . . . . . . . . . . 2383.1.2. Natural attenuation . . . . . . . . . . . . . . . . . . . . . . . . . . . . . . . . . . . . . . . . . . . . . . . . . . 2413.1.3. Physical methods — capping . . . . . . . . . . . . . . . . . . . . . . . . . . . . . . . . . . . . . . . . . . . . . . 2413.1.4. Thermal treatment — microwave energy . . . . . . . . . . . . . . . . . . . . . . . . . . . . . . . . . . . . . . . . 251
3.2. Ex situ technologies . . . . . . . . . . . . . . . . . . . . . . . . . . . . . . . . . . . . . . . . . . . . . . . . . . . . . . 2533.2.1. Biological treatment — landfarming . . . . . . . . . . . . . . . . . . . . . . . . . . . . . . . . . . . . . . . . . . . 2533.2.2. Thermal treatment — thermal desorption . . . . . . . . . . . . . . . . . . . . . . . . . . . . . . . . . . . . . . . . 2533.2.3. Chemical treatment — base-catalyzed decomposition . . . . . . . . . . . . . . . . . . . . . . . . . . . . . . . . . . 254
3.3. Both in situ and ex situ technologies — chemical methods . . . . . . . . . . . . . . . . . . . . . . . . . . . . . . . . . . . . 2543.3.1. Reductive dechlorination . . . . . . . . . . . . . . . . . . . . . . . . . . . . . . . . . . . . . . . . . . . . . . . . 2543.3.2. Oxidation . . . . . . . . . . . . . . . . . . . . . . . . . . . . . . . . . . . . . . . . . . . . . . . . . . . . . . . 255
Science of the Total Environment 445–446 (2013) 237–260
⁎ Corresponding author at: CENSE— Center for Environmental and Sustainability Research, Departamento de Ciências e Engenharia do Ambiente, Faculdade de Ciências e Tecnologia,Universidade Nova de Lisboa, 2829-516 Caparica, Portugal. Tel.: +351 212948300; fax: +351 212948554.
E-mail address: [email protected] (H.I. Gomes).
0048-9697/$ – see front matter © 2012 Elsevier B.V. All rights reserved.http://dx.doi.org/10.1016/j.scitotenv.2012.11.098
Contents lists available at SciVerse ScienceDirect
Science of the Total Environment
j ourna l homepage: www.e lsev ie r .com/ locate /sc i totenv
81

Author's personal copy
3.3.3. Solvent extraction . . . . . . . . . . . . . . . . . . . . . . . . . . . . . . . . . . . . . . . . . . . . . . . . . . . 2553.4. Combined technologies . . . . . . . . . . . . . . . . . . . . . . . . . . . . . . . . . . . . . . . . . . . . . . . . . . . . . 256
4. Assessment for full-scale implementation . . . . . . . . . . . . . . . . . . . . . . . . . . . . . . . . . . . . . . . . . . . . . . . . 2565. Conclusions . . . . . . . . . . . . . . . . . . . . . . . . . . . . . . . . . . . . . . . . . . . . . . . . . . . . . . . . . . . . . . 257Acknowledgments . . . . . . . . . . . . . . . . . . . . . . . . . . . . . . . . . . . . . . . . . . . . . . . . . . . . . . . . . . . . . 257References . . . . . . . . . . . . . . . . . . . . . . . . . . . . . . . . . . . . . . . . . . . . . . . . . . . . . . . . . . . . . . . . . 257
1. Introduction
Polychlorinated biphenyls (PCB) are a group of anthropogenicchemicals, classified as persistent organic pollutants (POP) by theStockholm Convention (adopted in 2001). PCB were commerciallyproduced worldwide on a large scale between the 1930s and 1980s.In the late 1960s, some dimension poisonings occurred. In one indus-trial incident over 14,000 persons became ill in Yusho, Japan, fromingesting PCB-contaminated rice oil and, even today, there are still ef-fects in those populations (Masuda et al., 1998; Todaka et al., 2007).In the 1970s, several countries limited PCB use due to severe concernson their human toxicity. It was only in 1985 that the European Com-munity heavily restricted the use and marketing of PCB.
The disposal of these xenobiotics is a global problem (Haluska etal., 1995). The uptake of PCB-contaminated sediments by biota atthe water-sediment interface can introduce PCB into the food chain(Grittini et al., 1995). PCB move according to the “grasshopper effect”,volatilizing from soil to air in warmweather and falling to earth milesaway as temperatures cool (Schmidt, 2010). They have been detectedin virtually all environmental media (indoor and outdoor air, surfaceand groundwater, sediments, soil and food) and also in living organ-isms and in human milk and blood (Donaldson et al., 2010; Hopf etal., 2009; Mikszewski, 2004; Xing et al., 2009).
The extent of PCB contamination worldwide is unknown. In theUnited States, 350 of the 1290 Superfund Sites are contaminated withPCB (USEPA, 2011a), whereas in Canada there are 148 sites accordingto the Federal Contaminated Sites Inventory (TBS-SCT, 2011). InEuropean countries, an estimate points towards 242,000 contaminatedsites of which 2.4% are contaminated with chlorinated hydrocarbons(EEA, 2007). An inventory on atmospheric deposition in backgroundsurface soil, estimates a global soil total PCB burden of 21,000 t(Meijer et al., 2003). In many countries (e.g. UK, Australia, USA), thethreshold concentration for contaminated soil varies between 10and 50 mg kg−1, but in some cases it can be as low as 0.5 mg kg−1
(CCME, 1999; EPA, 2009; UKEPA, 2004; USEPA, 2012a).Cleanup of soils contaminated by PCB has been a challenging task
for decades. The most frequent soil remediation technologies used are“dig and dump” and also “dig and incinerate”. In sediments, dredgingfollowed by dewatering, treatment and/or landfilling are mainly used,but these solutions are disruptive and unsustainable (Agarwal et al.,2007). Cost effective and more sustainable alternatives are neededto safely remove PCB from the environment.
Several reviewswere published on the remediation technologies forPCB, such as aerobic and anaerobic biodegradation (Abramowicz, 1995;Tiedje et al., 1993), phytoremediation (Mackova et al., 2006; Van Akenet al., 2010) and thermal, oxidative and reductive methods (Alonso etal., 2002; Gorbunova et al., 2010; Rahuman et al., 2000; Wu et al.,2012; Zanaveskin and Aver'yanov, 1998). These reviews are focusedonly on a limited number of techniques, and sometimes apply to the de-struction of PCB in their pure form, in oils and in different solutions. Thecurrent work comprises a comprehensive, up-to-date and integratedreview of remediation technologies for in situ and ex situ remediationof PCB-contaminated soils and sediments, including the most recenttechniques not yet appearing in other sectorial reviews. It also includesa review on full-scale applications of remediation technologies in PCBcontaminated soil and sediments. The main emergent remediation
technologies are described and their current status is evaluated,assessing the main factors related with their full-scale application.
2. Full-scale applications of PCB remediation technologies in soiland sediments
Table 1 shows full-scale applications of remediation technologiesused in historical sites contaminated with PCB for which informationis available. A summary is presented mentioning site, media, date,total volume and associated costs, when available. Most of the sitesare related with massive industrial contamination, due to decades ofactivity, discharge of effluents, waste disposal or accidental spills. Someof the remedial processes in important rivers in the USA (HudsonRiver, Housatonic River, New Bedford Harbor, etc.) are still ongoing,involving enormous costs.
The most common solutions to PCB contaminated soils and sedi-ments are removal for incineration or disposal in an offsite landfill. Inthe USA, due to regulatory demands (40 CFR 761), incineration is oneof themost used remediation technologies since it ismandatory forma-terials containing over 500 ppm PCB. These solutions are unsustainableand considerable research was made to find new remediation tech-nologies that could be used for these persistent organic pollutants,as presented in the next section. However very limited experience atpilot and field scale application is available.
3. Emerging technologies for PCB remediation
In this section, some of the latest developments in technologies forremediation of PCB contaminated soils and sediments are presented,classified by in situ and ex situ methods, differencing biological, phys-ical, chemical and thermal methods, and also natural attenuation andcombined technologies. A classification for the technologies describedis proposed in Fig. 1.
3.1. In situ technologies
3.1.1. Biological treatment
3.1.1.1. Bioremediation. Microbial degradation of PCB is known tooccur via two main routes: anaerobic and aerobic. Highly chlorinatedPCB congeners can be dechlorinated under anaerobic conditions toform lower chlorinated congeners,which aremore susceptible to aerobicdegradation (Abramowicz, 1995; Furukawa and Fujihara, 2008; Wrightet al., 1996), also known as the biphenyl degradation pathway (Mageeet al., 2008). This involves O2 insertion at adjacent unsubstituted carbonsin the less chlorinated ring of the structure, followed by ring cleavage toform a chlorinated benzoate (Wright et al., 1996).
3.1.1.1.1. Anaerobic dechlorination. Anaerobic biodegradation ofPCB contaminated sediments (freshwater — pond, lake and river;estuarine and marine) has been studied by several research teamsand involves PCB reduction and replacement of chlorine by hydrogen(Alder et al., 1993; Brown et al., 1987; Chen et al., 2001; Natarajan etal., 1997; Quensen et al., 1988, 1990; Ye et al., 1992, 1995; Wu et al.,1998). Bedard and Quensen (1995) postulated that there are at leastsix separable pathways to dechlorinate PCB: M, Q, H, H′, N and P. LaterWiegel and Wu (2000) identified two more, LP and T (Fig. 2).
238 H.I. Gomes et al. / Science of the Total Environment 445–446 (2013) 237–260
82

Author's personal copy
Microbiologically mediated dechlorination of PCB typically removesmeta and/or para chlorines to generate primarily ortho-substitutedmono- through tetrachlorobiphenyls (Wiegel and Wu, 2000). Themost extensive dechlorination occurs when process Mworks in combi-nation with process Q. This activity, known as C dechlorination, attacksmeta and para chlorines, resulting in exclusively ortho substituted con-geners (Zwiernik et al., 1998), non-dioxin-like and that do not readilybioaccumulate.
The first experimental demonstration of a biologically mediatedortho-dechlorination of PCB was done with microorganisms elutedfrom sediments contaminated with hydrocarbon oil and Aroclorfrom Woods Pond, Massachusetts (Van Dort et al., 1997). SustainedPCB ortho dechlorination by bacterial enrichment cultures in the ab-sence of soil or sediments was also demonstrated (Cutter et al., 1998).Rodenburg et al. (2010) showed that anaerobic bacteria in sewers, land-fills and contaminated groundwater also dechlorinate PCB — the firstconvincing evidence occurring outside aquatic sediments. Recently,Fogel et al. (2012) refer that a sediment-free PCB-degrading culturewas developed. It contains a strain ofDehalococcoides and can grow rap-idly in groundwater and artificial media if fed with trichlorobenzene,retaining the ability to degrade PCB (Fogel et al., 2012). This can be animportant step in developing PCB bioremediation technologies.
Table 2 summarizes the experiments and the main findings in theliterature regarding anaerobic dechlorination and the pathways involved.It also lists experimental conditions, congeners targeted, amount and typeof substrate, temperature, pH, incubation time and amendments.
In short, five major factors determine the extent and route of PCBdechlorination: (i) the microbial populations present, (ii) the position(ortho, meta, or para) of the chlorine relative to the opposite phenylring, (iii) the surrounding chlorine configuration, (iv) the chlorine
configuration on the opposite ring, and (v) the incubation condition(Furukawa and Fujihara, 2008; Wiegel and Wu, 2000). The first ofthose factors is influenced by environmental conditions such as avail-ability of carbon sources, hydrogen or other electron donors, the pres-ence or absence of electron acceptors other than PCB, temperatureand pH (Borja et al., 2005; Wiegel and Wu, 2000).
Althoughmost of the researchers isolated cultures from contaminatedsediments (river or estuarine), they have used spiked substrates, whichrepresent more controlled conditions. However, successful resultsobtained with spiked matrices cannot always be transferred directlyto contaminated soils and sediments, both at bench or full-scale, dueto the sorption of PCB. The low biodegradability of PCB is due to slowrates of desorption from organic matter in soil and sediments. Both bio-availability and bioactivity limit the rate and extent of PCB degradationand these decrease with increasing chlorination degree (Liu et al.,2007a). However this reduced bioavailability can also be used forremediation purposes, since immobilization of these compounds re-duces the potential environmental harm, favoring solutions like moni-tored natural attenuation.
3.1.1.1.2. Aerobic biodegradation. The lightly chlorinated PCB con-geners resulting from the dechlorination of higher chlorinated onescan be substrates for aerobic bacteria. Oxidative degradation of PCBconsists in the breakdown to chlorobenzoic acid and its further degra-dation (Borja et al., 2005). PCB can be aerobically degraded also bycometabolism, either by bacteria or bywhiterot fungi (e.g. Phanerochaetechrysosporium). Earthworms were also used to enhance the dispersal ofthe bioaugmented PCB-degrading microorganisms (Singer et al., 2001).
Vasilyeva et al. (2010) treated a histosol and an alluvial soil historicallycontaminatedwith PCB (4190 and1585 mg kg−1, respectively; primarilytri-, tetra- and pentachlorinated congeners) through bioremediation
Table 1Summary of full-scale applications for remediation of PCB contaminated soils and sediments.
Site Medium Total volume Technology Date Cost References
Shiawassee River, MI, USA Soils andsediments
1341 m3 (soils)1216 m3
(sediments)
Excavation, dredging andlandfilling
1981–1982,2004–2005
13,558,000 USD USEPA, 2009; Zarullet al. (1999)
LaSalle Electrical Utilities, IL, USA Soils 17,782 m3
51,225 m3Excavation and incineration 1983–1985
1994NA USEPA (2012b)
Re-Solve, Inc., MA, USA Soils 12,233 m3
2294 m3Excavation and landfillingExcavation and chemicaloxidation on site
1985–19861992–1994
NA USEPA (2012b)
Douglassville Disposal, PA, USA Soils NA Excavation and incineration 1989 13,400,000 USD USEPA (2012b)New Bedford Harbor, MA, USA Sediments 152,911 m3 Dredging and landfilling
Dredging and landfilling,pilot cap
1994–1995,2004–2005ongoing
NA USEPA (2012b)
Florida Steel Corporation, FL, USA Soil 28,747 m3 Excavation, incineration andlandfilling
1987–19881995–1996
NA Dávila et al. (1993)USEPA (2012b)
General Electric Co. (Spokane Shop)WA, USA
Soil NA In situ vitrification andasphalt cap
1991–1999 NA GE (2008)
Rose Township Dump Superfund SiteHolly, MI, USA
Soil 34,000 t Excavation and incineration 1992–1993 12,000,000 USD USEPA (2012b)
Hamilton Harbor, Canada Sediment 10,000 m3 Capping 1992–1995 650,000 USD Zarull et al. (1999)Maumee River, OH, USA Sediment 6100 m3 Dredging and landfilling 1994–1998 5,000,000 USD Zarull et al. (1999)Manistique River, MI, USA Sediment 44,100 m3 Dredging and landfilling 1994–2000 50,000,000 USD TEI (2002)Communications manufacturingfacility in South West England, UK
Soil 1200 m3 Thermal desorption 1996 NA Norris et al. (1999)
River Raisin, MI, USA Sediment 20,000 m3 Dredging and landfilling 1997 6,000,000 USD Zarull et al. (1999)Military radar station, Canadian Arctic Soil 20,000 m3 Excavation, incineration
(>50 ppm) and landfilling(b50 ppm)
1999–2006 64,750,000 USD Kalinovich et al.(2008)
Illegal dumping of PCB capacitorsin Kobe, Japan
Soil 68 m3 Solvent extraction 2002–2003 NA Takigami et al. (2008)
North Adams, MA, USA Soil 7646 m3 Excavation and landfilling na 850,000 USD AbscopeEnvironmental (2012)
Industrial area, Aviles, Asturias, Spain Soil 10,000 m3 Thermal desorption 2003 NA TPSTEC (2012)GE-Pittsfield/Housatonic River Site,MA, USA
Soils andsediments
183,875 m3 Excavation, dredging andlandfilling
2000–2015 NA USEPA (2012)
Hudson River PCB Superfund Site,NY, USA
Sediments 2,000,000 m3 Dredging and landfilling 2009–2012 500,000,000 USD USEPA (2012b)
NA — not available.
239H.I. Gomes et al. / Science of the Total Environment 445–446 (2013) 237–260
83

Author's personal copy
enhanced with activated carbon, during a 39-month experiment undernear natural conditions. The results showed that the tri- and some ofthe tetrachlorinated congenerswere degraded and that the activated car-bon reduced PCB bioavailability without slowing degradation (Vasilyevaet al., 2010).
Table 3 summarizes the studies and main findings regarding PCBaerobic degradation, following an identical structure to Table 2 andlisting some of the most important conditions tested. The experimen-tal results show that biodegradability is highly dependent on thenumber of chlorines (decreases with increased number) and their posi-tions, and also highly strain dependent (Furukawa and Fujihara, 2008).PCB congeners with chlorines on only one biphenyl ring are degradedmore easily and PCB with chlorine at position 2,6- or 2,2′- (doubleortho-substituted congeners) are poorly degraded (Furukawa andFujihara, 2008).
3.1.1.2. Phytoremediation. Phytoremediation is based on the use ofplants to extract, sequester, and/or detoxify pollutants from contaminat-ed soil (Meagher, 2000; Raskin et al., 1997). In the case of PCB threemainmechanisms are involved: i) uptake from soil (phytoextraction) and ac-cumulation in stems and leaves tissues, ii) phytodegradation (enzymatictransformation) and iii) rhizoremediation (plant enhancement of themicrobial activity in the root zone, improving bioremediation, by therelease of secondary metabolites, such as sugars, amino acids, organicacids, various exsudates and microbial growth factors) (Van Aken et al.,2010).
Table 4 presents a summary on themain studies on phytoremediationof PCB contaminated soils, similar to the previous tables and highlighting
the experimental conditions andmain conclusions. Some of these studiesonly focused on PCB's final concentration in the soil neglecting the accu-mulation of PCB in roots and shoots of the plants. One of the main con-cerns regarding phytoremediation is crop disposal after phytoextractionand the issues associated with pollution transfer from the biomassdisposal.
Although PCB contaminated soils can be phytoremediated, PCB areonly taken up and degraded by plants and associated bacteria slowly infield trials, resulting in incomplete treatment and potential release oftoxic metabolites into the environment (Van Aken et al., 2010). To im-prove phytoremediation effectiveness, bacterial genes involved in themetabolism of PCB, such as biphenyl dioxygenases, have been intro-duced into higher plants, following a strategy similar to the developmentof transgenic crops, and bacteria have also been genetically modified toimprove biodegradation and tomaintain stable relationshipswith plants(Sylvestre, 2012; Van Aken et al., 2010). Transgenic plants for PCBphytoremediation have been produced, but none have reached commer-cial existence and in some countries (e.g. European Union) cultivation oftransgenic plants is still associated to perceived risks for ecosystems(Maestri and Marmiroli, 2011), due to the potential for inserted geneticmaterial to be transferred to indigenous populations (Gerhardt et al.,2009). According to Marmiroli and McCutcheon (2003) the main obsta-cles to the use of genetically engineered plants in phytoremediation areincreased costs for maintenance and monitoring of installations, andalso waste disposal in view of strict regulations. The biomass producedduring the phytoremediation of contaminated sites could be economi-cally valorized in the form of bioenergy (biogas, biofuels and combus-tion for energy production and heating), representing an important
Fig. 1. Classification of remediation technologies for remediation of PCB-contaminated soils and sediments.
240 H.I. Gomes et al. / Science of the Total Environment 445–446 (2013) 237–260
84

Author's personal copy
environmental co-benefit. Gomes (2012) identified the challengesand opportunities associated with the use of phytoremediation forbioenergy production.
3.1.2. Natural attenuationDuring natural attenuation pollutants are transformed to less harm-
ful forms or immobilized by a wide range of processes that include bio-degradation; dispersion; dilution; sorption; volatilization; radioactivedecay; and chemical or biological stabilization, transformation, or de-struction of contaminants (Brown et al., 2007; Declercq et al., 2012;Megharaj et al., 2011; USEPA, 1999). In sediments, natural attenuationcan take place through two primary pathways: burial of contaminatedbed by clean sediments (natural capping) and transformation via bio-degradation, immobilization, dilution, or volatilization (Agarwal et al.,2007). All these processes reduce bioavailability, thereby reducing theenvironmental impact.
Monitored natural attenuation (MNA) is a technique used to mon-itor the progress of natural attenuation processes. It may be used withother remediation technologies as a finishing option or as the onlyremediation technique if the rate of contaminant degradation is fastenough to protect human health and the environment.
The interest in applying MNA as a treatment approach in contami-nated sediments arose after extensive studies on reductive dechlorina-tion of PCB in numerous locations, including the Hudson River (NY,USA), Silver Lake (MA, USA), Sheboygan River (WI, USA), WaukeganHarbor (IL, USA), NewBedfordHarbor (MA, USA), andAcushnet Estuary(MA, USA) (Bedard and Quensen, 1995; Pakdeesusuk et al., 2003). Insome of these sites, it was decided to dredge the contaminated sedi-ment (Table 1), but in Lake Hartwell MNAwas selected as the remedial
option, predicting that ongoing deposition of clean sedimentwould capthe PCB-contaminated material and thereby isolate it from the foodchain (Pakdeesusuk et al., 2003). Two decades after, field results showevidence of in situ reductive dechlorination and also that the effective-ness of the natural attenuation is site-specific and is occurringwith var-iable degree of success, being lower in the most contaminated regions(Sivey and Lee, 2007).
Kaštánek et al. (1999) reported the occurrence of PCB natural at-tenuation in an industrial site contaminated with a PCB mixturewith tri- and tetrachlorinated congeners in a soil with a long historyof contamination (approx. 20 years). Data showed that under condi-tions prevailing in the field, only small changes in the compositionof PCB congeners had occurred, namely some biodegradation of thelighter congeners occurred in the oxygenated surficial soil layers(Kaštánek et al., 1999).
The lines of evidence that should be considered to support the useof MNA at sediment sites were identified by Magar and Wenning(2006) and Magar et al. (2009), and include assessing chemical trans-formation, reduction in the contaminant's bioavailability and mobili-ty, physical isolation and dispersion.
3.1.3. Physical methods — cappingCapping involves isolating a contaminated sediment bed with a
clean layer or “cap” commonly consisting of sand, gravel, silt orcrushed rock debris. Passive caps, made of unreactive material, main-ly rely on containment rather than treatment. The cap cuts down bio-availability of contaminants by physically separating sediments fromthe aquatic environment, confining bioturbation to the top clean layerand limiting the possibility of re-suspension of contaminated sediments
Cl
Cl
Cl
Cl
Cl
Cl
2,2',3,4,4',5'-hexachlorobiphenyl
Pathway M Flanked and unflanked meta
Cl
Cl
Cl
Cl
Pathway Q Flanked and unflanked para, meta of 2,3-
Pathway H'Flanked para, meta of 2,3- and 2,3,4-
Pathway H Flanked para, doubly flanked meta
Cl
Cl
Cl
Cl
Cl
Cl
Cl
Cl
Cl
Cl
Cl
Pathway P Flanked para
Cl Cl
Cl
Cl
Pathway NFlanked meta
Cl
Cl
Cl
Cl
Pathway LPFlanked and unflankedpara
Cl Cl
Cl
Cl
Fig. 2. Example of the microbial dechlorination pathways identified by Bedard and Quensen (1995) and Wiegel and Wu (2000) applied to PCB 138 (2,2′,3,4,4′5′-hexachlorobiphenyl).“Flanked” signifies an adjacent chlorine. Beside the pathways presented there is also the T pathway that removes flanked meta chlorine of 2,3,4,5- in hepta- and octachlorobiphenyls.
241H.I. Gomes et al. / Science of the Total Environment 445–446 (2013) 237–260
85

Author's personal copy
Table 2Summary of experimental conditions and main findings of studies on anaerobic dechlorination.
PCB (commercial nameor congeners)
Substrate amountused
Temp. (°C) pH Incubationperiod
Amendments Observations Dechlorination pathway Main findings Reference
Aroclors 1242, 1248,1254 and 1260
5 μL g−1 of sediment 25 – 24 weeks – The rate of dechlorinationwas similar for Aroclors1242 and 1248, but theextent decreased withincreasing degrees ofchlorination.
C (occurred in the metaand para positions)
Two PCB-dechlorinatingpopulations may exist inthe Hudson River sediments.
Quensen et al.(1990)
Aroclor1242 10 g of PCB-free drysediment and 10 mLof inoculum
37 – 12 w 10 mL of reduced anaerobicmineral medium, 100 μL of a10% autoclaved solution ofcysteine, and 80 μL of 10%(wt/vol) Aroclor 1242
Different sterilizationtechniques were tested:heating at 80 or 85 °C for15 min, treatment with50% ethanol for 1 h, andtreatment with thecombination of heat andethanol
Pattern C and M Anaerobic spore formersresponsible for thereductive dechlorination ofPCB. Microorganismssurviving the heat andethanol treatmentspreferentially remove metachlorines, whilemicroorganisms lost fromthe enrichment mainlycontribute to the paradechlorination activity.
Ye et al. (1992)
Aroclor 1242 and 1260 35% (v/v) sedimentinoculum in mineralsalts medium spikedwith 100 ppm Aroclor1242 in freshwatersediments and400 ppm Aroclor1260 for estuarinesediments
– – 11 m A fatty acid mixture withacetate, 0.85 mM; propionate,1.37 mM, butyrate, 0.57 mM;hexanoic acid, 0.43 mM wasadded as a carbon source.
Two different reducingconditions wereestablished, methanogenicand sulfidogenic
No ortho dechlorination wasobserved, nor complete PCBdechlorination
Slow degradation process.No activities were detectedunder sulfate-reducingconditions with any of thesediments.
Alder et al.(1993)
2,3,4- and 2,3,4,2′,4′,5′-chlorobiphenyl
5 g of sediment in20 mL of riversediments spikedwith different PCBconcentrations
Room temp. – 7.5 m Cystine sulfide (0.025%) – – Dechlorination may not beable to occur in areas withlow ambient PCB levelsbecause it isconcentration-dependent.
Sokol et al.(1995)
2,3,5,6-chlorinatedbiphenyl(CB), 2,3,5-CB, and2,3,6-CB
Baltimore Harborsediments(20% [vol/vol])
30 – 154 d Modified basal mediumNa2CO3, 3.0 g L−1; Na2HPO4,0.6 g L−1; NH4Cl, 0.5 g L−1;cysteine-HCl•H2O, 0.25 g L−1;Na2S •9H2O, 0.25 g L−1;resazurin, 0.001. 1% (vol/vol)each of vitamin and traceelement solutions was added.
Estuarine salt medium andmarine salt medium werealso used in the tests
Ortho dechlorination wasobserved
Ortho dechlorinationoccurred when marine orestuarine conditions werepresent. In contrast,freshwater sedimentsincubated under the sameconditions exhibited onlymeta and para dechlorinations.
Berkaw et al.(1996)
Aroclor 1242 and 1248 1 kg of contaminatedriver sediment
Room temp.(20 to 22 °C)and 12 °C
– 32 w Addition of wood powder asnutrient source.
A set of 2 L bench-scaleglass columns weredesigned and constructedas microcosms.
Absence of ortho andoccurrence of meta and paradechlorination (M pathway).
The rate of dechlorinationwas slightly higher atambient temperature.
Natarajan et al.(1997)
Aroclor 1242 2:3 (vol:vol)sediments andmineral medium240 mL sedimentsslurry
Room temp.(23–26 °C)
– 92 d A humic acid extract wasprepared using upper HudsonRiver sediment that did notcontain PCB and was added tothe cultures
Mineral medium reducedwith 0.1% L-cysteinehydrochloride. Twobacterial antibiotics,vancomycin and nisin,were added as stocksolutions.
M and Q The additions of 2,3,6-CBand 2,4,6-CB to PCB-contaminated upperHudson River sedimentslurries stimulate theproduction of reductivedechlorination.
Williams(1997)
242H.I.G
omes
etal./
Scienceofthe
TotalEnvironment
445–446
(2013)237
–260
86

Author's personal copy
PCB (commercial nameor congeners)
Substrate amountused
Temp. (°C) pH Incubationperiod
Amendments Observations Dechlorination pathway Main findings Reference
Aroclor 1260 0.15 g of sediment(dry weight) per mL
4 to 66 °C 6.9–7.2
1 y 2346-CB (350 μM of slurry) The dechlorination wasselective and progressedwith the incubation time.
Pathways N at 8 to 30 °C,P at 12 to 34 °C, LP at 18 to30 °C, and T at 50 to 60 °C
The extent and pattern ofdechlorination weretemperature dependent.Changes in incubationtemperature alone(i.e., raising it aboveambient temperature)cannot be used to initiatedehalogenation ofPCB in these sediments.
Wu et al.(1997b)
2,3,4,6-Tetrachlorobiphenyl
0.15 g of sediment(dry weight) per mL
4, 8, 12, 15,18, 20, 22,25, 27, 30,34, 37, 40,45, 50, 55,60, and66 °C
6.5–6.8
1 y 2346-CB (350 μM of slurry) Seven discretedechlorinationreactions were observed,four of which occurred inboth sediments. These were2,3,4,6-CB→2,4,6-CB,2,3,4,6-CB→2,3,6-CB,2,4,6-CB→2,6-CB, and2,3,6-CB→2,6-CB.
At most temperatures, metadechlorination of 2,3,4,6-CBto 2,4,6-CB almost completelydominated
Dechlorination wasrestricted to ~15 to 30 °Cand temperature affectedlag time. Paradechlorination dominatedat 20 °C, and orthodechlorination dominatedat 15 °C, but at 18 and 22 to30 °C the relativedominance of ortho versuspara dechlorination varied.Field temperatures play asignificant role indechlorination.
Wu et al.(1997a)
Aroclor 1254 50 mL riversediments slurry
Room temp.(21–23 °C)
7.0 24 w Glucose and methanol wereadded as substrates at0.1 mg L−1 and 0.02 mg L−1
Anaerobic phosphatebuffered basal (PBB)medium.
The dechlorination pathwayobserved is different fromthe ones reported earlier.
70% of the PCB weredechlorinated withoutaccumulation of anyspecific PCB congeners.
Natarajan et al.(1998)
Aroclor 1260 0.06 g [dry weight]of sediment per mLof estuarine mediumwithout sulfate
30 – 6 m 800 ppm Aroclor 1260 withand without the addition of350 μM 2,3,4,5-CB or2,3,5,6-CB
PCB dechlorination is morestable, when sediments arestored anaerobically atroom temperature (20 to22 °C) than at 4 °C.
Pathway N The addition of single PCBcongeners (2,3,4,5-CB and2,3,5,6-CB) stimulates metaand ortho dechlorination ofAroclor 1260.
Wu et al.(1998)
Aroclor 1242 Slurries with 2 g ofair-dried cleanupstream HudsonRiver sediment and3 mL of reducedanaerobic minimalmedia
22 – 35 w Unamended control, anautoclaved plus FeSO4
(10 mM) control, and thefollowing treatments: FeSO4
(10 and 20 mM), Na2SO4
(10 mM), FeCl2 (10 mM),FeSO4 (10 mM) plus Na2MoO4
(3.7 mM), and Na2SO4
(10 mM) plus PbCl2 (10 mM).
Only the M dechlorinationprocess occurred in theunamended treatment.
Pathways M, Q, C FeSO4 provides twomutually beneficial effects:i) sulfate stimulates growthof sulfate reducingorganisms responsible forPCB dechlorination, ii) Fe2+
reduces sulfidebioavailability by formingthe insoluble precipitateFeS. Ferrous sulfate couldbe used to overcome factorslimiting both the extent ofin situ dechlorination aswell as the implementationof sequentialanaerobic/aerobicbiotreatment systems.
Zwiernik et al.(1998)
Aroclor 1260 30 or 15 mL of slurryprepared with wetsediment (2 vol)combined with pondwater (3 vol)
Room temp.(22–25 °C)
7.0 240 d HalobenzoatesBrominated AromaticCompounds
None of the fluorinated orchlorinated benzoatesprimed PCB dechlorination,but several brominated andiodinated benzoatesinitiated this activity
Pathways N, P Halogenated aromaticcompounds that are notstructural analogs to PCBcan prime PCBdechlorination.
Deweerd andBedard (1999)
(continued on next page)
243H.I.G
omes
etal./
Scienceofthe
TotalEnvironment
445–446
(2013)237
–260
87

Author's personal copy
Table 2 (continued)
PCB (commercial nameor congeners)
Substrate amountused
Temp. (°C) pH Incubationperiod
Amendments Observations Dechlorination pathway Main findings Reference
2 CB; 3 CB, 4 CB, 2-3 CB;2-4 CB, 3-3 CB, 4-4 CB,34 CB; 345 CB, 25-3CB; 25-4 CB; 34-2 CB;35-4 CB, 25-34 CB;34-34 CB; 345-4CB; 345-34 CB; 345-345 CB
Spiked estuarinesediment slurries(30 mL) containing10% solids (wt./v)
Roomtemp.(23–25 °C)
7.2 2 y Surfactant Tween 20(0.05%, v/v)
Sulfidogenic conditions Para dechlorination of 4-CB,34-CB and 345-CB and metadechlorination of 25-CB and35-CB Pathways Q and M
Dechlorination of coplanarand non-planar congenersbegan with para chlorineremoval. All para chlorinesfrom the mono-, di-, andtrichlorobiphenyl groupscould be removed bysediment slurries.
Kuo et al.(1999)
2,3,5,6-CB; 2,3,4,5-CB;2,3,4,5,6-CB
5 g sediment spikedwith PCB in 45 mLmineral medium
20304050
6.07.08.09.0
108 d 20 mM sodium acetate;20 mM sodium pyruvate;20 mM sodium lactacte;20 mM MnO; 20 mM FeCl2;20 mM NaHCO3; 20 mMNa2SO4; 20 mM NaNO3.
Tests were made in sterilecontrol, sediment-freeculture sediment; sedimentcontaining culture.
Meta, para and orthodechlorination
Optimal conditions fordechlorination were 30 °Cand pH 7. Methanogen andsulfate-reducing bacteriawere involved in thedechlorination.
Chang et al.(2001)
Arochlor 1242 5 g dry weight ofriver sediment in50 mL water, spikedwith PCB
Roomtemp.
– 8 weeks – Synthetic mineral medium.Moisture level of 95%, 70%,45% and 15%.
– The maximum level ofdechlorination was lower atreduced moisture contents.Dechlorination is closelylinked to populationgrowth.
Cho et al.(2001)
Arochlor 1248 2.5%(w/v) lakesediment — 20 mLslurry spiked withPCB
– – 40 weeks Dried algal powder (2%, w/w) The addition ofsupplementary organiccarbon did not change thedechlorination pattern.
– Sediments characteristicsor organic carbon contentdid not play a role in theselection of dechlorinatingpopulations
Kim and Rhee(2001)
Aroclor 1248 PCB-spikedsediments (20 g dryweight) were madeinto slurries by theaddition of 90 mL ofreduced St. LawrenceRiver water in100-mL serum vials
Roomtemp.
– 400 d Sediments were spiked withAroclor 1248 at 14concentrations, ranging from3.44 to 687 nmol (g ofsediment)−1 on a dry weightbasis.
The time course ofdechlorination showed aninitial lag period, followedby dechlorination, and thena plateau with no furtherconcentration decreasethrough the remainder of a58-week incubation period.
No ortho dechlorinationwas detected
No dechlorination wasobserved at Aroclorconcentrations below40 ppm. The thresholdvalues and the specificdechlorination rates maynot be universallyapplicable to allcontaminated sedimentsbecause they may also be afunction of physical,chemical, and biologicalfactors (sedimentcomposition, age ofcontamination, and/orsediment microbialcommunity).
Cho et al. (2003)
Aroclor 1016 and 1254 50 mL of sedimentslurry (containing5.0–5.5 g ofsediment, dry wt)
22–24 7 260 d 500 μg g−1 (sedimentdry wt). Aroclor 1254
It was observed formationof methane due tobiodegradation f acetone —
solvent used for Aroclor1254.
Pathway M Lake Hartwell sediments inthe vicinity of the highestlevels of PCB contaminationcontain microbialcommunities capable ofmediating meta and paradechlorination.
Pakdeesusuket al. (2003)
244H.I.G
omes
etal./
Scienceofthe
TotalEnvironment
445–446
(2013)237
–260
88

Author's personal copy
PCB (commercial nameor congeners)
Substrate amountused
Temp. (°C) pH Incubationperiod
Amendments Observations Dechlorination pathway Main findings Reference
2,3,4-CB; 2,2′,3,3′,4,5,6-CB
80 mL syntheticwastewaterconsisting of a basalmedium to which atrace elementsolution with 3 gmicrobial granules
34±2 7.2 150 d Propionate, butyrate, andmethanol were added as thecarbon/electron sources.
Anaerobic granulesobtained from commercialbioreactors [upflowanaerobic sludgeblanket (UASB)].
Pattern M Variation of the carbon/electron source had noeffect on the dechlorinationpathway. The extents andrates of dechlorinationwere highest for ethanoland formate and lowest forpyruvate. The authorsconsider that the observedPCB dechlorination isenzymatic.
Nollet et al.(2005)
Aroclor 1260 50 mL sulfide-free,bicarbonate-bufferedmineral medium
22–24 7.0 154 d Selenite, tungstate, vitamins(including vitamin B12), atrace element solution (SL9),and 0.01% yeast extract
The sediment-free JN mixedcultures were establishedfrom microcosms of Aroclor1260-contaminatedsediment.
Pattern N Dehalococcoides bacteriamay play a major role in thein situ dechlorination ofcommercial PCB mixtures.
Bedard et al.(2007)
PCB 28PCB 53PCB 101PCB 138PCB 153PCB 180
3.5 L of wasteactivated sludge(WAS) spiked withan equivalentamount of 0.5 mgPCB kg−1 dw
Termophilicconditions(55 °C) andmesophilicconditions(35 °C)
6.3 26 d – Sewage sludge anaerobicdigestion
– Total PCB removalefficiency was 59.4–83.5%under thermophilicconditions and 33.0–58.0%under mesophilicconditions.
El-Hadj et al.(2007)
Aroclor 1248 2.5% (w/v) sedimentwith syntheticmineral medium
Roomtemp.
– 36 w50 w
50 μg rhamnolipidbiosurfactant g−1 sediment
Since the PCB thresholdconcentration for theinoculum in the firstexperiment was lower than40 ppm, anotherexperiment was conductedusing sediments with lowerPCB concentrations, 10, 20,and 30 ppm.
Meta dechlorination waspredominant.
There was no significantdifference in the extent ofdechlorination betweensurfactant-free and -amended sediments.Surfactant did not changethe congener specificity orbroaden the congenerspectrum fordechlorination at PCBconcentrations below40 ppm.
Kim et al.(2008)
2,3,4,5-CB 1 g dry sediment and100 mL of ananaerobic media tapwater 0.0021 g L−1
NaNO3, 0.014 g L−1
cysteine, 0.042 g L−1
NaHCO3, and0.001 g L−1
resazurin
10 and 25 6.0–7.1
11, 17and 20 m
0.024 g cysteine 0.02 g Fe0
per g dry sedimentequivalent; 0.06, 0.1, 0.14, 0.4,and 0.4 g Fe0
50 mM sodium azide (sterilecontrols)
Bioaugmentation with10 mL of culture fromRaisin River sediment.
– Dechlorination was eitherminimal or absent in thesediments amended withFe0 and incubated at either10 or 25 °C, suggesting thatH2 was not an appropriateelectron donor for thedechlorinating organismspresent. Bioaugmentationsuccessfully stimulated PCBdechlorination in all thesediments within 20 d.
Winchell andNovak (2008)
(continued on next page)
245H.I.G
omes
etal./
Scienceofthe
TotalEnvironment
445–446
(2013)237
–260
89

Author's personal copy
Table 2 (continued)
PCB (commercial nameor congeners)
Substrate amountused
Temp. (°C) pH Incubationperiod
Amendments Observations Dechlorination pathway Main findings Reference
Aroclors 1248, 1254,and 1260
200 mL AnacosiaRiver site sediment
26 – 415 d A mixture of electron donors;alternate halogenatedelectron acceptorstetrachlorobenzene (TeCB),pentachloro-nitrobenzene(PCNB), or PCB116;bio-augmentation with amixed culture containingD. ethenogenes strain 195; andPCNB plus bioaugmentation
Analysis of Chloroflexi 16SrRNA genes showed thatTeCB and PCNB increasednative Dehalococcoides spp.from the Pinellas subgroup;however this increase wascorrelated to enhanceddechlorination of lowconcentration weatheredPCB only in PCNB-amendedmicrocosms.
Identification of the exactdechlorination pathway wasnot the primary objective ofthe study.
Dechlorination of lowconcentration weatheredPCB were significantlyenhanced in AnacostiaRiver sediment microcosmsreceiving bioaugmentation,PCNB and PCNB plusbioaugmentation,compared to othertreatments receivingelectron donor only TeCB,or PCB116
Kruminset al. (2009)
245-2′4′5′hexachlorobiphenyl
Sediments (10 mL,containing 7 g drysediment)
102540
– 250 d 5 mM FeSO4
22.5 mM peptone on acarbon basis2.5 mM each of acetate,propionate, and butyrate
PCB removal was alsostudied in differentsediment layers applyingdialysis equilibrators in thefield for 4 months.
Dechlorination was notaffected by amendmentswith FeSO4, electron donors,or alternating anaerobic–aerobic conditions inthese sediments.
PCB stability in fieldconditions could be mainlyattributed to (a) elevatedredox status and (b) lowtemperature conditions inthe sediments. Identifiedseveral predominantgroups that are involved inthe stepwisedecomposition of organicmatter to acetate and H2,which are substrates fordechlorinators such asDehalococcoides.
D'Angelo andNunez (2010)
3,4,4′,5-tetrachlorobiphenyl,3,3′,4,4′,5-pentachlorobiphenyl,and 3,3′,4,4′,5,5′ -hexachlorobiphenyl
Sediment slurries(20% solids, wt/vol)
25 7.6 350 d (i) acetate and lactate, finalconcentration 5 mM each,and yeast extract (1 g L−1)and ferrous sulfate (finalconcentration 20 mM) and(ii) filtered site wateramended with ferrous sulfate(final concentration 20 mM)
No PCB were detected inthe site water and originalsediment.
Para dechlorination occurredprior to meta dechlorinationduring reductivedechlorination of3,4,4′,5-tetrachlorobiphenyland 3,3′,4,4′,5-pentachlorobiphenyl.
PCB concentration haseffects on biodegradationand the succession ofdechlorinatingmicroorganisms. Bacteria orphylotypes with the abilityto exclusively dechlorinateflanked and unflanked metachlorine, and bacteriaexclusively dechlorinatedouble flanked, singleflanked, and un- flankedpara chlorine werereported.
Ho and Liu(2011)
246H.I.G
omes
etal./
Scienceofthe
TotalEnvironment
445–446
(2013)237
–260
90

Author's personal copy
Table 3Summary of experimental conditions and main findings of studies on aerobic degradation.
PCB (commercialname orcongeners)
Substrate amountused
Temp. (°C) pH Incubationperiod
Amendments Observations Main findings Reference
Aroclor 1242 andAroclor 1260
18 g dry wt. spikedsoil
28 – 120 d In order tomaintain a highconcentration ofviable cells andconstant soilmoisture (20%),soils werereinoculatedonce a week.
500 mL of acultivation medium:glucose, 0.5 g L−1;peptone, 0.5 g L−1;KH2PO4, 0.5 g L−1
(i) the survival of the inoculated straindoes not correlate with the degradation ofPCB congeners; (ii) there are higherdifferences between degradation of PCB indifferent soil types than between sterileand nonsterile soils and (iii) efficiency ofAlcaligenes xylosoxidans is much higher inliquid media than in soils. This indicatesthat the degradation of PCB is probablyrelated to the soil sorption of the PCBcongeners. Degradation is faster in the soilscontaining an intermediate amount oforganic carbon with a high portion of totaland aromatic carbon in humic acid
Haluska etal. (1995)
Fenclor 42 Model soil spikedwith1 g kg−1 Fenclor 4287.5 g soil in 0.5 Lof distilled water
20±2 – 140 d 4 g/kg biphenyl,aerobic bacterialco-culture ECO3(108 CFU mL−1);addition ofhumic sub-stances 1.5 and3.0% (w/w)
The authors testedthe soil and thebiologically activeslurry microcosmsfor ecotoxicity withthe plant Lepidiunsativum and theanimal Folsomiacandida.
The presence of humic substancesinfluenced significantly the activity of thespecialized biomass and thebiodegradation of PCB
Fava andPiccolo(2002)
Aroclor 1242 1 g ofPCB-contaminatedsoil, 10 mL of thephosphate-bufferedmineral saltsmedium
25±2 – 4 m – The mixed culture ofPCB-degrading bac-teria was acquiredfrom New YorkState Center forHazardous WastesManagement(Buffalo, NY, USA).
The presence of biphenyl as cosubstratewas the most important factor affectingPCB biodegradation. The biodegradationoccurred as a first-order process, and itproved most effective in respect todichlorinated biphenyls (100% removal),followed by trichlorinated (92%) andtetrachlorinated biphenyls (24%).
Manzano etal. (2003)
Delor 103 100 mL of SIRAN,100 mL of mineralmedium, traceelements andbiphenyl
– – 3 w – Pseudomonas sp. 2was isolated fromPCB-contaminatedsoil in the CzechRepublic
The immobilized cells of Pseudomonas sp. 2were able to degrade all the tested tri- andtetrachlorobiphenyls
Komancováet al.(2003)
Aroclors 1242,1248, and 1260
1 kg ofcontaminated soilwas combined with1500 g of clean soiland 500 g of sterilesand.200 g of the mixedsoil were used.
28 – 6 m Chicken manure,chicken manureplus 1000 ppmbiphenyl, kenaf,and kenaf pluswhite rot fungus(Phanerochaetechrysosporium).
Total PetroleumHydrocarbons werealso analyzed
The chicken manure amended treatmentsshowed faster degradation in the first 45 dcompared to the other treatments. Addingbiphenyl or white rot fungus to enhancedegradation does not seem to enhancedegradation of the lower chlorinated PCB.The results suggest that if the soil isprovided adequate moisture and mixing,the concentration of lower chlorinated PCBcan be readily decreased.
Borazjaniet al.(2005)
PCB50 and Aroclor1248
10 g of marinesediments wasadded in SMS me-dium (100 mL).
30 – 15 d SMS medium(45 mL)supplementedwith biphenyl(0.7 g−1)
Seawater mineralsalts (SMS)medium,supplemented withbiphenyl as the solecarbon source.
All enrichment cultures degradeddichlorobiphenyls, while their capabilitiesto degrade congeners with three and foursubstituted chlorines varied greatly. Sixisolates belonging to the genusRhodococcus exhibited substantialPCB-degrading activity.
Kolar et al.(2007)
PCB congenerspresent in thesoil were mostlytri-, tetra- andpenta-chlorinated,plus smallamounts ofdi-, hexa- andhepta-
1 kg dry weight ofhistoricallycontaminated soils
Outdoortemperature(Russia)
– 39 m 0, 2, or 7% (w/w)Granular (GAC)and 0, 0.5, or 3.5%(w/w) powdered(PAC) activatedcarbons
Phytotoxicity wasdetermined fromgermination ofclover seeds.
The tri- and some of the tetrachlorinatedcongeners were degraded during thethree-year experiments. Amending thesoils with GAC or PAC sharply reduced PCBbioavailability without slowing degrada-tion processes.
Vasilyevaet al.(2010)
PCB-Congener-Mix 200 g of soil(dry weight) werespiked with400 μg kg−1
PCB-Congener-Mix.
28 7.0 30 d 10% or 20% (v:w)of S. melilotisuspensionculture(3×10⁸ cfumL−1)
The authorsperformed restingcell assay andidentification ofmetabolicintermediates
After 6 d, the percent biodegradation of2,4,4′-TCB was 77.4% compared with thecontrol. The main intermediate wasidentified as2-hydroxy-6-oxo-6-phenylhex-2,4-dienoicacid (HOPDA). Inoculation with S. melilotigreatly enhanced the degradation of targetPCB mixtures in the soil.
Tu et al.(2011a,b)
247H.I. Gomes et al. / Science of the Total Environment 445–446 (2013) 237–260
91

Author's personal copy
Table 4Summary of experimental conditions and main findings of studies on phytoremediation.
PCB (commercialname orcongeners)
Plants used Experimental conditions Durationof thestudy
Observations Main findings Reference
Aroclor 1242,1248, 1254and 1260
Medicago sativa L. Containers packed with 350 g ofhistorically contaminated soilwere planted with alfalfa(Medicago sativa L.) andaugmented with its symbioticN2-fixing host rhizobium(Sinorhizobium meliloti, strainA-025).
270 days The plants never reachedmaturity and some died duringthe experimental period.Bioaugmentation of the soil hada negative effect on plantgrowth and health, through theincrease of the hardness of thesoil.
The depletion, loss or change inPCB levels may be attributed toeither direct or indirectbiotransformation,biotranslocation and adsorptionof PCB due to the presence ofalfalfa and/or rhizobial inocula-tion. Either possibility under-scores the possibility of usingplant-rhizobacterialassociations.
Mehmannavazet al. (2002)
Aroclor 1242 Brassica nigra Greenhouse study with spikedsoil (100 mg kg−1) augmentedwith PCB-degrading bacteria,inducers (carvone and salicylicacid), surfactant (sorbitantrioleate), minimal salts medi-um in a 20-cm high soil column,or a combination of theseelements.
9 weeks Results from bioaugmentedtreatments suggested that plantroots allow increased inoculumpenetration, enabling greatersubsurface PCB removal.
Brassica nigra directlycontributed to accelerated PCBremoval by increased oxygendiffusion, amendment infiltra-tion, and microbial enrichment.
Singer et al.(2003)
Aroclor 1248 Medicago sativa L.,Lathyrus sylvestris L.Lespedeza cuneataDum.-Cours., Panicumclandestinum L. Phalarisarundinacea L.Panicum virgatum L.Festuca arundinaceaSchreb.
Spiked soil (100 mg kg−1)Growth chamber temperatureswere maintained at 25/16 °C,and the light regime was 16/8 h day/night cycle, withphotosynthetic photon flux rateof 400–500 μmol m−2 s−1 frommetal halide bulbs. The relativehumidity in the chambers wasset at 65±5%.
4 months Planting with Phalarisarundinacea and Panicumvirgatum resulted in a 70% and61%, respectively,biodegradation of the initial PCBlevels.
Aroclor 1248 biodegradation insoil seems to be positivelyinfluenced by the presence ofplants and plant–bacteriainteractions.
Chekol et al.(2004)
Aroclor 1260 Festuca arundinacea,Glycine max, Medicagosativa, Phalarisarundinacea, Loliummultiflorum, Carexnormalis, Cucurbitapepo ssp. pepo
Greenhouse experiments withweathered soil controlled forPCB volatilization through theuse of a vented enclosure and byisolating the soils with parafilm.
8 weeks Concentrations of PCB in planttissues were greater in the rootsthan the shoots. Tetra- to hexa-chlorobiphenyls contribute themost to plant shoots, whilehepta- and octa-chlorbiphenylscontributed to roots.
Plants (in particular C. pepovarieties) were able to extractPCB from soil and translocatethem from their roots to theirshoots.
Zeeb et al.(2006)
Aroclor 1254/1260
Cucurbita pepo ssp pepocv. Howden, Carexnormalis, Festucaarundinacea
Pilot-scale field trial at ahistorically contaminated fieldsite (mean concentration of46 μg g−1; range of0.6–200 μg g−1) total PCB. Thesoil was amended withfertilizer, an inorganic bulkingagent (perlite), and a minimalamount of top soil to achievesuitable growing conditions forthe plants without diluting theexisting PCB concentrations.
10 weeks Sedge (Carex normalis)exhibited the highest PCB con-centrations in both roots andshoots, followed by pumpkin(C. pepo) and then tall fescue(F. arundinacea).
This was a successful scale-up ofprevious greenhouse studies. Allthree plant species remain via-ble candidates for possible PCBphytoextraction. Intercroppingof the species might provide thebest characteristics of all.
WhitfieldÄslund et al.(2007)
Aroclor 1254/1260
Cucurbita pepo ssp pepocv.
Pilot-scale field trial at the samesite. The soil was amended withfertilizer, a 6-12-12 mixture(C-I-L Tomato Food fromCanadian Tire), at therecommended rate of140 g m−2. Following theapplication of fertilizer, soilplots were thoroughlyhomogenized by rototilling.
10 weeks Plant stem and leaf PCB con-centrations were observed toincrease significantly from theconcentrations reported in theprevious year (5.7 and3.9 μg g−1, respectively) whilethe total biomass produced aswell as soil and plant root PCBconcentrations did not change.The lower stems of some plantsexhibited PCB concentrations ashigh as 43 μg g−1, resulting inbioaccumulation factors (whereBAFplant part=[PCB]plant part/[PCB]soil) for parts of the plantshoot as high as 2.
PCB transfer to pumpkin plantswas primarily via root uptakeand translocation. Increasedplanting density was observedto significantly decrease bothplant biomass and plant stemPCB concentrations (to7.7 μg g−1), but did not changeplant root PCB concentrations.
WhitfieldÄslund et al.(2008)
Crude oilenriched withbenzo(a)pyrene,Arochlor 1221,Arochlor 1248and Arochlor1262
Zostera marina Spiked sediment was placed inseawater-supplied outdoorponds and planted with eelgrassturf consisting of shoots andbelowground root- rhizomemats.
60 weeks The fraction of PCBs removedwas somewhat greater andmore statistically significant inthe middle layer containingmost eelgrass plant roots thanin the top or bottom layer.
Total PCBs declined by 60% inthe presence of plants whilenone were removed in theunplanted sediment. PCB aretranslocated from the roots tothe shoots and thus could enterthe food chain via aquaticorganisms feeding on eelgrassleaves.
Huesemann etal. (2009)
248 H.I. Gomes et al. / Science of the Total Environment 445–446 (2013) 237–260
92

Author's personal copy
Table 4 (continued)
PCB (commercialname orcongeners)
Plants used Experimental conditions Durationof thestudy
Observations Main findings Reference
PCB congeners28, 52, 101,118, 138, 153,180
Brassica napus L. Greenhouse experiment withtwo different spiked soils
75 days Plants exhibited several foldhigher concentrations of thesum of PCB congeners in rootsthan in shoots.
Depletion of PCB in the rhizo-sphere was significantly higherin the soil with lower organicmatter content. Plant exsudatesand microbial processes in-volved have a positive effect onreduction of PCB concentrationmainly in the rhizosphere.
Javorská et al.(2009)
Aroclor 1242 and1260
Nicotiana tabacum,Solanum nigrum, Salixsp., Medicago sativa,Silybum marianum,Armoracia rusticana,Morus rubra and Zeamays
Different experimental setups:microcosms (pots and bucketsin indoor and outdoor systems),and field plots were establishedat the site.
10 years After the year 1999, thistle(Silybum marianum) was nolonger used, despite its goodgrowth, as PCB removal resultsdid not differ from those ofcontrol soil.
There is a variation inperformance of different plantspecies, changing from year toyear as effect of differentweatherconditions, but obtained PCBconversions were comparablebetween laboratory and field in-vestigations and in vegetated soilbetter than in control.
Mackova et al.(2009)
Mixedcontamination:HCH, DDT andPCB
Raphanus sativus Pilot scale study in a historicallycontaminated site. Triplicateplots of 1 m2 were prepared.Contaminated soil for the testfield was plowed to a depth of20 cm and treated withcommercial NPK fertilizer (11%NH4
+, 7% K+, 11% phosphates,15% sulfates, 100 g per squaremeter).
6 months Root bioconcentration factor(BCF) values were constant andnot correlated to log KOW. Anegative correlation betweenBCF and log KOW was found foredible bulbs.
Uptake from air was moresignificant for shoots than theone from soil.
Mikes et al.(2009)
Mixedcontamination:PCB and heavymetals(e-waste site)
Oryza sativa,Medicagosativa L., Loliumperenne L.and Festuca arundinacea
Greenhouse phytoremediationexperiment. The soil wasfertilized with 1.64 g of KH2PO3
and 2.28 g of NH4NO3 perkilogram dry weight of soil.Randomlymethylated-β-cyclodextrins(RAMEB) was supplementedwith RAMEB crystals at a finalconcentration of 3.0% (w/w onair-dried soil basis).
120 days Higher PCB removal percent-ages of 25.6–28.5% in rhizo-sphere soil were observedcompared with those of thenon-rhizosphere (10.4–16.9%)and unplanted controls (7.3%).The average PCB removal per-centages of four plant speciesincreased from 26.9% to 37.1% inthe rhizosphere soil with addi-tion of RAMEB.
All the plant candidates werefeasible for phytoremediation ofPCB polluted soil. Addition ofRAMEB increased the PCB bio-availability and stimulated themicrobial communities leadingto the enhanced PCBdegradation.
Shen et al.(2009)
PCBcontaminationfrom a formertransformerand electronicwastestripping andrecycling site
Medicago sativa L. Pilot study with two treatmentsset up in a randomized blockdesign: (1) soil withoutplanting as a control (CK), and(2) soil planted with alfalfa (P).Each treatment was replicatedfour times, and each plot was1.8 m long by 1.8 m wide insize. The soil was pretreatedwith lime.
2 years Alfalfa significantly decreasedthe initial soil PCB concentra-tions by 31.4% and 78.4%.
Alfalfa significantly increasedsoil dehydrogenase and FDAesterase activities and soil bac-terial diversity. SomePCB-degrading bacteria such asChloroflexi sp. may have con-tributed to therhizoremediation of PCB.
Tu et al.(2011b)
PCBcontaminationfrom a formertransformerand electronicwastestripping andrecycling site
Medicago sativa L.,Lolium perenne L.,Festuca arundinaceaand Oryza sativa
Two sets of greenhouseexperiments. Glucose, biphenyland three surfactants(TritonX-100, randomlymethylated- β -cyclodextrinsand β-cyclodextrin) were usedto enhance thephytoremediation process.
120 days All the planted treatments had asignificantly higher PCB removalpercentage (ranging from 25.6 to28.5%) compared to theunplanted control pots (7.3%).
Lolium perenne enhanced withβ-cyclodextrin showed the bestPCB removal. Results suggestedthat PCB removal was mainlycontributed by microbial degra-dation rather than plant uptakeor abiotic dissipation
Chen Y. et al.(2010)
Mixture ofAroclors 1254/1260Aroclor 1248
Amaranthus retroflexusAmbrosia artemisifoliaBrassica nigraCirsium vulgareDaucus carotaEchinochloa crusgalliLythrum salicariaPolygonum persicariaSetaria virisSolidago canadensisSoncus asperSymphyotrichumericoidesSymphyotrichumnovae-angliaeVicia craccaChrysanthemumleucanthemum
2 industrial sites with historiccontamination (31 μg g−1 and4.7 μg g−1); pilot plots in situ
3 years Minimal soil quality may haveaffected plant growth. V. craccaat the Etobicoke site, andP. persicaria at the Lindsay siteachieved shoot BAFs >1.
All species accumulated PCB intheir root and shoot tissues. Theplants studied showed potentialfor the phytoremediation ofPCB, considering theoreticaldensity values. Variations inenvironmental conditions suchas precipitation and tempera-ture likely affected plantgrowth, and thus potentially theplant tissue concentrations. Thevariation in these results high-lights the necessity ofconducting field research ratherthan just controlledexperiments.
Ficko et al.(2010)
(continued on next page)
249H.I. Gomes et al. / Science of the Total Environment 445–446 (2013) 237–260
93

Author's personal copy
Table 4 (continued)
PCB (commercialname orcongeners)
Plants used Experimental conditions Durationof thestudy
Observations Main findings Reference
PCBcontaminationfrom a formertransformerand electronicwaste strippingand recyclingsite
Medicago sativa L. Pilot plots in situ with 20cement quadrats (1.2 mlong×1.2 m wide×1.0 mdeep). Inoculum of the AM fun-gus Glomus caledonium 90036and Rhizobium cultures wereadded to the soil.
180 days Inoculation with R. meliloti hada greater effect thanG. caledonium on the yieldparameters. When alfalfa wasinoculated with both, shoot androot dry biomass and rootnodule dry weight weresignificantly greater comparedwith those inoculated with onlyG. caledonium or uninoculatedplants (pb0.05).
Planting with alfalfasignificantly reduced soil PCBconcentrations compared withthe control. Soil PCB concentra-tions were lowest in the dualinoculation treatment. Syner-gistic interactions betweenfungi and plants may have greatpotential to enhancephytoremediation.
Teng et al.(2010)
PCBcontaminationfrom a formerindustrial site
Cucurbita pepo ssp. PepoBidens cernuaChenopodium albumDaucus carotaPlantago majorRumex crispus
Greenhouse experiment with a12-h photoperiod and a settemperature of 25 °C. Soilmoisture was monitored on adaily basis, and containers werewatered as necessary.
51 to171 days
Plants from both the controlgroup and the root exudategroup extracted a combinedtotal of ~1.2% PCB from soil.
First report of significantchanges in the PCBphytoextraction ability of mul-tiple plant species due to thepresence of root exudates. Rootexudates of C. pepo ssp. pepo canaffect the uptake and transportof contaminants within specificplant species.
Ficko et al.(2011)
Mixedcontamination:PCB, PAH andheavy metals
Salix miyabeana 2 pilot studies in a Canadianformer oil refinery
4 months High mortality rates wereobtained when trying to reachdeeper layers through longrooted willow rods, probablydue to prolonged submersionperiods (i.e. anoxia) or plantsensitivity to certain pollutantsor a combination of the two.
PCB concentration decreaseddeep in the soil. Tissue analysisrevealed no traces of organicpollutants in the plants.
Guidi et al.(2011)
Mixedcontamination:PCB (Delor 106or Aroclor1260) and PAH
Zea mays_L, Helianthusannuu, Populus nigra xP. maximowiczii Salix xsmithiana
Pilot study in a former wasteincinerator site. The plants weretreated ordinarily (watering,weeding) and fertilized byaddition of 30 g m−1 NH4NO3
for each of the vegetationperiods.
2 years Maize and sunflower rootsaccumulated the mostconsiderable amount ofcongeners No 138, 153 and 180.
Zea mays_L and Helianthusannuu accumulated hexa- andheptachlorobiphenyl congenersmore than tri-, tetra-, andpentachlorobiphenyl congeners.
Kacálková andTlustoš (2011)
Mix of PCBcongeners(8, 9, 10, 18,28, 44, 52, 66,77, 81, 95, 97,105, 118, 149,153 and 169)
Salix alaxensis and Piceaglauca
Microcosm setup: 10 g of PCBspiked soil moistened with400 μL sterile water. For planttreatments, 1 g crushed fineroots (willow or spruce) wasadded to individualmicrocosms.
180 days Soils treated with willow root orbiphenyl showed significantlygreater losses (pb0.05) inseveral PCB congeners beyondwhat was observed in untreatedsoils.
S. alaxensis may be an effectiveplant for rhizoremediation byaltering microbial communitystructure, enhancing the loss ofsome PCB congeners and re-ducing the toxicity of the soilenvironment.
Slater et al.(2011)
Mix of PCBcongeners(15, 28, 47)
Zea mays Hydroponic experiment. Thephotoperiod was set 14 h d−1 ata light intensity of250 μmol m−2 s−1 provided bysupplementary illumination.The day/night temperatureregime was 25 °C/20 °C and therelative humidity wasmaintained 60–70%.
216 h Metabolites were detected,suggesting the existence of invivo metabolism of PCB.
A significantly positivecorrelation was found betweenlog RCF (root concentrationfactor) and log Kow, suggesting acontrol role of their partitioningin plant uptake.
Wang et al.(2011)
Mixedcontamination:PCB,hydrocarbonsand heavymetals
Populus nigra Pilot study. The size of each ofthe two field plots wasapproximately 0.25 ha. One ofthe plots was amended withhorse manure (HM).
1 year An increase in dehydrogenaseactivity was observed in theHM+P compared to the HMtreatment. Finally, preliminaryprotein SDS-PAGE results havepermitted the identification ofproteins that have been recov-ered in the HM+P soil withrespect to the HM.
The decrease of both inorganic(metals) and organic (TPH andPCB) contaminants in theamended soil shows theeffectiveness of thephytoremediation system.
Doni et al.(2012)
Mix of PCBcongeners(total PCBconcentration110 mg kg−1).
Nicotiana tabacumSolanum nigrum
Nine different microcosms wereconstructed using 300 g ofcontaminated soil, two differentplant species (tobacco andnightshade) and variousbacterial strains (strains ofPseudomonas spp. andOchrobactrum sp. strain KH-6).
3 months Nightshade absorbs higheramount of PCB, but tobacco cantransfer PCB to leaves and stemmore efficiently. This is impor-tant because plants containingPCB are harvested whereasroots can be disrupted duringthe harvest and can remain inthe soil.
The combination of tobacco andPseudomonas sp. KG3 leads tothe best biodegradation results
Kurzawova etal. (2012)
250 H.I. Gomes et al. / Science of the Total Environment 445–446 (2013) 237–260
94

Author's personal copy
(Agarwal et al., 2007). Eek et al. (2008) used a laboratory microcosm todemonstrate that the flux of PCB is reduced by 99%when using a 10 cmcapping layer. In PCB contaminated soils asphalt caps were used(Table 1).
Caps can also be modified by additives that actively immobilizePCB or destroy them. One example is activated carbon, whichaccording to Cho et al. (2007) may provide enhanced immobilizationby strongly partitioning PCB onto its surface. The concept has beentested in a pilot study in Hunters Point Shipyard, in San Francisco,USA (Cho et al., 2009, 2012) in which activated carbon added to thecapping layer (3.7% dry wt.) decreased the transfer of PCB from sedi-ments into the aquatic media by up to 73%, during a 5-year span. Amore elaborate reactive cap/barrier was proposed by Choi et al.(2009) consisting of pellets of reactive activated carbon (RAC) withzero-valent iron coated with palladium, contained between thingeo-textile membranes. These caps can be installed horizontally atthe bottom of estuaries and river banks or alternatively, the RAC canbe directly mixed with the PCB-contaminated matrix for sequestra-tion of PCB upon desorption into the aqueous phase, or set-up as apermeable reactive barrier for flow-through groundwater treatment(Choi et al., 2009).
The use of biochar (carbon rich by-product of the thermal decompo-sition of organic matter under low oxygen concentrations) to reducePCB bioavailability has been tested in historically contaminated soils,showing a maximum of 89% reduction in PCB root concentration inphytoextractor Cucurbita pepo ssp. (Denyes et al., 2012). Other recentstudy found that biochars had high adsorption affinity for PCB andalso that the presence of humic acids and metal cations increased PCB
sorption (Wang et al., 2013). Two comprehensive reviews on thebiochars' potential for use in contaminated soils (Beesley et al., 2011)and on the carbonaceous materials (activated carbon and biochar) foruse in sediments (Rakowska et al., 2012) can be found in the literature.
3.1.4. Thermal treatment — microwave energyMicrowave energy can be used for soil remediation, since most
soil constituents are transparent to microwave and thus the appliedenergy is concentrated on contaminants and pore water. Dependingon the types of contaminants, soil properties, and the addition of mi-crowave absorbers, the microwave energy may remove or immobilizecontaminants through various mechanisms such as thermal desorp-tion, destruction, and vitrification (Wu, 2008).
A series of studies on the decomposition of hexachlorobenzene(HCB), pentachlorophenol (PCP), PCB, and polycyclic aromatic hydro-carbons (PAH) using microwave energy were developed with a modi-fied aluminum bomb that allows the circulation of air around a quartzinsert, preventing the hot-spot problem (Abramovitch et al., 1998,1999a,b). The decomposition of 2,2′,5,5′-tetrachlorobiphenyl in soilwas remarkable, ranging from 97.9% (using Cu2O/10 N NaOH) to87.7% (using Al/10 N NaOH) (Abramovitch et al., 1998). In these exper-iments very small samples (from 1 to 6 g of soil) were used and theauthors mention no aging of the spiking.
Other tests were conductedwith graphite andmetal rods. The use ofgraphite powder led to much less decomposition of 2,2′,4,4′,5,5′-hexachlorobiphenyl (47.2%) in soil; however, complete decompositionwas achieved for most of the other PCB (Abramovitch et al., 1999b).Based on the determination of the decomposed products, the possible
Table 4 (continued)
PCB (commercialname orcongeners)
Plants used Experimental conditions Durationof thestudy
Observations Main findings Reference
Mixedcontamination:Cd, Cu and PCB
Sedum plumbizincicolaElsholtzia splendensMedicago sativaHouttuynia cordata
Real contaminated soil wasused in a glasshouseexperiment and a fieldmicrocosm experiment withdifferent intercroppingcombinations. In the 2nd yearsome plots of soil wereamended with lime.
2 years Adding lime to unplanted soilpromoted a decrease in PCB of25.2%.
M. sativa monoculture, M. sativaintercropped with E. splendens,M. sativa with E. splendens andS. plumbizincicola, and M. sativawith S. plumbizincicola (all withlime) showed declines in PCB of7.6, 20.1, 47.7, and 42.8%,respectively, compared to thecontrol soil with lime.
Wu et al.(2012)
Table 5Summary of studies on reductive dechlorination of PCB.
PCB (commercial name or congeners) Catalyst Breakdown products Temperature Reference
Aroclor 1260 and Aroclor 1254 0.05% w/w palladium/ironbimetallic system
Biphenyl Ambient Grittini et al. (1995)
Mix of PCB congeners Carbon-supported catalysts(Pd/C, Rh/C)
Biphenyl and phenylcyclohexane b82 °C Ukisu et al. (1996)
Aroclor 1254 Zero valent iron nanoparticles(nZVI)
Biphenyl Ambient Wang and Zhang (1997)
Aroclor 1260 Zero valent iron with sub-criticalwater
Mix of lower chlorinatedcongeners
250 °C Yak et al. (1999)
Aroclor 1254 Zero valent lead and copper withsub-critical water
Biphenyl 350 °C Kubátová et al. (2003)
2,2′-dichlorobiphenyl; 2,4′-dichlorobiphenyl;2,3,4-trichlorobiphenyl;2,2′,3,5′-tetrachlorobiphenyl;2,2′,4,5′-tetrachlorobiphenyl;3,3′,4,4′-tetrachlorobiphenyl;
Microscale and nanoscale zero valent ironin a water/methanol solution
Mix of lower chlorinatedcongeners
Ambient Lowry and Johnson(2004)
Mono- and dichlorobiphenyls Raney Ni–Al alloy in a dilute aqueousalkaline solution
Biphenyl and/orphenylcyclohexane
Ambient Liu et al. (2009)
Transformer oil with PCB 57.6% wt Ni on SiO2–Al2O3 Mix of congeners 150–300° Veriansyah et al. (2009)Aroclor 1242 and Concentrated (nondiluted)used PCB from a capacitator
Palladium on carbon (Pd/C) andtriethylamine as electron donor
Tri and tetrabiphenyls (averagechlorine numbers: 3.42)
Ambient Monguchi et al. (2010)
2,2′,3,5,5′,6-hexachlorobiphenyl Mg powder, carboxylic acid and alcoholsolvents
Biphenyl Ambient Maloney et al. (2011)
2-chlorobiphenyl Bimetallic Pd/Al particles Biphenyl Ambient Yang et al. (2011)
251H.I. Gomes et al. / Science of the Total Environment 445–446 (2013) 237–260
95

Author's personal copy
Table 6Comparative analysis of remediation technologies for contaminated soils and sediments.
Technology Developmentstage
Fieldtesting
Costindication
Clean uptime
Effectiveness SocialAcceptability
Major advantages Possible disadvantages
In situ methods
Biological treatmentBioremediation Initial stage Limited Low to
moderateaLong Variable Moderate Natural process. Improves the
overall quality and texture of soils.Different technologies areavailable and enhancements canbe made to improve efficiency:addition of nutrients nitrogen,phosphorus, ammonium chloride,supplementary carbon sources(sugars, organic acids, glutamateand so on), oxygen (peroxide),primers (polybrominatedbiphenyl), and by analogenrichment (adding biphenyl); byaugmentation of the indigenouspopulation with exogenouscultured inoculums (establishedPCB degraders).
The rate of PCB removal may beorders of magnitude slower innature than as established in thelaboratory because of mass trans-fer limitations leading to reducedmetabolic availability, shortage ofone or more crucial nutrients,preferential metabolism of othereasy-to-digest substrates, pres-ence of microbial predators andtoxins, and other environmentalfactors that can drastically con-strain the microbial metabolism.Very sensitive to temperature,moisture content, the geology/morphology of the site and thecongeners to be remediated. Po-tential for inhibition of biologicalprocesses owing to the heavymetals and other toxic com-pounds found in real contaminat-ed soils and sediments. Inability ofintroduced microbes to grow tosufficient depths to reachcontaminants.
Phytoremediation Practicalstage
Substantial Low tomoderateb
Long Variable High Natural process. Improves theoverall quality and texture of soils.Plants provide groundcover andminimize soil erosion. There is nosize restriction for sites. Highpublic acceptance.
Bioaccumulation depends on soilsproperties, including organiccarbon content, soil pH andnutrient levels. Plant stress factorscan affect efficiency; highconcentrations of contaminantsinhibit plant growth. Plantdisposal needs to be assessed toprevent pollution transfer.
Naturalattenuation
Practicalstage
Substantial Low Long Variable High Natural biological, physical andchemical processes. It can becarried out with little or no sitedisruption.
Intensive and long lastingmonitoring process is necessary. Itoften requires more time toachieve cleanup goals than otherconventional remediationmethods. It is difficult to predictwith high reliability theperformance of naturalattenuation.
Physical methods(capping)
Practicalstage
Substantial Moderateto Highc
Noindicationpossible
Noindicationpossible
High This technology relies oncontainment, rather thantreatment, of the contaminatedmedia to limit risk. In sediments, itis suitable for sites with low tomoderate natural hydrodynamicsand navigational traffic andfine-grained cohesive sediments.The use of active/reactive caps canbe promising.
There is no guarantee of thedestruction of the contaminant. Itis necessary to define standards todetermine cap deployment,optimal cap thickness, assessingerosion resistance of the cap, andshielding requirements to stormevents.
Thermal treatmentMicrowaveenergy
Initial stage None High Fast Moderate Moderate Compared to other thermaltreatments, it has shorter heatingtime, selective heating, betterprocess control, and no directcontact of heated materials.
Limited to the length of theconductor rods and the depth ofthe water layer, which may absorband dissipate microwave energy.Humus and bacterial coloniesshould be reintroduced for therestoration of soils. Occurrence ofthe hotspot phenomenon, whichis a type of thermal instability thatresults in higher-energy exposureand an increased heating rate insome regions.
252 H.I. Gomes et al. / Science of the Total Environment 445–446 (2013) 237–260
96

Author's personal copy
mechanisms of PCB decomposition using microwave energy seemed tobe self-condensation, dechlorination, oxidation, reduction, hydration,and fragmentation (Wu, 2008).
Microwave-generated steam technology showed promising resultson laboratory-scale experiments (Di et al., 2002). Evaporation wasidentified as the dominant mechanism, moreover, increased solubilityof PCB into the heated aqueous phase contributed to their removalfrom the bound phase (Wu, 2008).
The removal of three PCB in contaminated soil (all above 95%) in-dicates that MnO2 in combination with microwave irradiation can bea promising technology (Huang et al., 2010).
3.2. Ex situ technologies
3.2.1. Biological treatment — landfarmingLandfarming is a bioremediation treatment process performed ex
situ in biotreatment cells. Contaminated soils, sediments, or sludgesare incorporated into the soil surface and periodically turned over toaerate the mixture.
A pilot-scale land biotreatment was tested with 1500 kg (dryweight) of sediment from industrial lagoons containing waste oils and
wastewater from industry operations with PCB mixed with 1500 kg ofclean sand (medium to fine grade) (Ghosh et al., 2000). Results showedthat the noncoplanar PCB congeners, which are more leachable due totheir lower hydrophobicity, are less degraded during landfarming. Inthe presence of an oil phase, reductions in total PCB may not lead to re-ductions in aqueous PCB availability (Ghosh et al., 2000).
In anothermulti-year pilot-scale land treatment project for PAH andPCB, ~1 m3 sludge/sediment materials containing industrial wastewere placed in a land treatment unit. The results showed that completebiostabilization can be achieved when reversibly sorbed PAH and PCBare biodegraded, while irreversibly sequestrated PAH and PCB remainin soil particles and therefore present no threat to human health andthe environment (Liu et al., 2007b).
It was also demonstrated that PCB degradation in land treatmentwas caused by a combination of photolysis, volatilization and biodeg-radation mechanisms, rather than by any single process (Tang andMyers, 2002).
3.2.2. Thermal treatment — thermal desorptionThermal desorption is an environmental remediation technology
that utilizes heat to increase the volatility of contaminants for removal
Table 6 (continued)
Technology Developmentstage
Fieldtesting
Costindication
Clean uptime
Effectiveness SocialAcceptability
Major advantages Possible disadvantages
Ex situ methods
Biological treatmentLandfarming Practical
stageLimited Moderate Fast Variable Moderate Biological process. Amendments
can be added to speed thedegradation of the contaminants.Can be effective on organiccontaminants with slowdegradation rates
Need to control soil conditions tooptimize the rate of contaminantdegradation. Large amount ofspace is required. High energyconsumption during aeration.Dust control is an importantfactor, especially during tilling andother material handlingoperations. Runoff collectionfacilities must be constructed andmonitored.
Thermal treatmentThermaldesorption
Practicalstage
Substantial High Fast High Moderate The efficiency of desorption can begreater than 99%. It is insensitiveto contaminant concentrationlevels in the soil.
Special equipment and conditionscan be necessary to preventformation of dioxins and furans.The presence of water reduces itseffectiveness. As well, a high clayor silt content hinders the process.
Both in situ and ex situ methods
Chemical methodsDechorination Initial stage Limited High Fast High Moderate Destroy the PCB molecule but do
not break down the biphenylstructure of the molecule. Onlythe chlorine atoms which give thePCB molecule chemical and bio-logical stability are removed.Rapid treatment time.
Cost of metals and catalysts(needs for stoichiometric or anexcess amount of transitionmetal). Dechlorination is limitedby desorption of PCB and require aprolonged contact. Complete de-chlorination cannot be achieved insome cases. Harsh reaction condi-tions (elevated temperatures, forinstance) are needed. Ironnanoparticles degradation is fasterthan PCB. nZVI nanoparticles canbe passivated. Concerns aboutecotoxicologic effects ofnanoparticles.
Solvent extraction Initial stage Limited High Fast Moderate Moderate The solvent can be treated toremove and concentrate thecontaminants. The treated solventcan then be reused again in theextraction step.
Large volume of effluent, whichare not easily detoxified throughconventional or advancedbiological treatments.
Capping methods in soils have usually moderate costs (between 25 and 127 USD per m3).a Enhanced bioremediation through bioestimulation and bioaugmentation have higher costs.b Phytoremediation costs depend on the plants used, soil amendments, annual maintenance.c Reactive caps are more expensive than neutral ones.
253H.I. Gomes et al. / Science of the Total Environment 445–446 (2013) 237–260
97

Author's personal copy
from the solid matrix (typically soil, sludge or filter cake). Low temper-ature thermal desorption at around 400 °C is used for the treatment oflow and middle distillate organic contaminants such as solvents, gaso-line, diesel and lubricating oils (Norris et al., 1999). The contaminatedmaterial is continuously fed through a rotary kiln where it is heated totemperatures sufficient to evaporate/combust the contaminants, effec-tively stripping them from the soil. The volatilized contaminants arethen either collected or thermally destroyed. A thermal desorption sys-tem therefore has two major components: the desorber itself and theoff-gas treatment system (USEPA, 1992). The condensed liquid fromcooling the off-gas is separated into organic and aqueous fractions.The organic fraction is removed from the site and depending on its com-position, either recycled as a supplemental fuel or destroyed in a fixedbase incinerator. The water is either disposed of or used to cool thetreated solids and prevent dusting.
Low temperature thermal desorptionwas found to be themost effec-tive and commercially attractive solution for field application in a SouthWest England case study of a 20 ha telecommunications manufacturingfacility contaminated with Aroclor 1254 (up to 1300 mg kg−1) (Norriset al., 1999). Experiments showed that thermal desorption resulted in48–70% decomposition of PCB in sediments, but on the other hand leadto unwanted formation of dibenzofurans (PCDFs) (Sato et al., 2010).
3.2.3. Chemical treatment — base-catalyzed decompositionBase-catalyzed decomposition (BCD) is a catalytic hydrogenation
process in which atoms of chlorine are removed from moleculesand replaced by hydrogen atoms. Contaminated soil is mixed with so-dium bicarbonate or sodium hydroxide and a carrier oil, which actsboth as suspension medium and hydrogen donor. The mixture isthen heated to about 200–400 °C in a rotary reactor, destroying sig-nificant fractions of the PCB by promoting the hydrogenation of bond-ed chlorines with hydrogen split off from the carrier/donor oil (Hu etal., 2011).
After preliminary studies with PCB in oil solutions (Kawahara andMichalakos, 1997; Taniguchi et al., 1996), a two stage pilot plant was de-veloped to use base-catalyzed decomposition in contaminated soils withrelatively low (32–72 mg kg−1) and intermediate (350–530 mg kg−1)PCB concentrations (Taniguchi et al., 1998). High PCB removals wereachieved with temperatures >300 °C and reactor retention time of1 h and it was found that the optimum reaction temperature was330 °C and optimum NaHCO3 dosage was 3% (Taniguchi et al., 1998).The need for treating exhaust gas was also identified.
In the USA there is an actual remediation case in a technology transferreport: Production Base CatalyzedDecomposition Process Guam,MarianaIslands (NFESC, 1997), where sodium bicarbonate is used to catalyze theprocess by desorbing and decomposing PCB at 400 °C. Life Cycle Analysis(LCA) showed that environmental impact of BCDwas lower than InfraredHigh Temperature Incineration (Hu et al., 2011).
3.3. Both in situ and ex situ technologies — chemical methods
Extensive research has been conducted on chemical treatment ofPCB's solutions and oils. This section focuses on soils and sedimentschemical remediation technologies and includes three processes: re-ductive dechlorination, oxidation and solvent extraction.
3.3.1. Reductive dechlorinationReductive dechlorination successively removes chlorine atoms from
PCB generating biphenyl, according to the general chemical equation(Wu et al., 2012):
C12H 10mð ÞC1m þ nH2→C12H 10mþnð ÞC1mn þ nHC1; m≧n: ð1Þ
This dechlorination can be achieved using catalysts, a reducing agentsuch as zero-valent iron or a base, as detailed in the following sections.
3.3.1.1. Catalytic hydrodechlorination. Catalytic hydrodechlorination ofPCB is usually performed with transition metals (e.g. Ni or Pd) and H2
as heterogeneous catalysts and reducing agents (Table 5), respective-ly, in aqueous or organic solvents.
In contaminated soils, PCB were degraded using Samarium II (Sm)iodide, in the presence of hexamethylphosphoramide in tetrahydro-furan (Jackman et al., 1999). Results at bench-scale showed that Smcatalyzed hydrogenolytic dechlorination of highly chlorinated PCB,generating biphenyl, mono- and dichlorinated biphenyls from Aroclor1242 in a short timescale, under mild conditions (ambient tempera-ture; inert atmosphere) and with low energy requirements. At a hy-drogen pressure of 0.69 MPa or a stream of hydrogen at 338–343°Kwith stirring, Ehsan et al. (2003) used Pd/γ-Al2O3 for hydrogenolysis(hydrodechlorination and hydrogenation) of PCB in soil/sediment.Dechlorination was virtually complete, provided that excess catalystwas added to samples with higher PCB loadings prior to reaction, oth-erwise some partial hydrogenation of biphenyl was observed (Ehsanet al., 2003).
Researchwith Pd/Mg bimetals in clays showed that PCB dechlorina-tion was governed by its desorption, hence the addition of 10–25% eth-anol improved the performance (Agarwal et al., 2009). In the samestudy, the surfactant TritonX-100 effectively desorbed PCB from histor-ically contaminated sediments, but dechlorination was not observed.Investigating possible causes, researchers found that (i) Pd/Mg effec-tiveness was limited by the complex PCB distribution in historicallycontaminated sediments and (ii) sulfide concentration (20 mg L−1)in sediments was poisoning Pd, compromising its reactivity (Agarwalet al., 2009). These results show that real contaminated matrices arefar more complicated to dechlorinate than only PCB solutions.
Korte et al. (2002) tested the application of palladized iron (Pd/Fe)to dechlorinate PCB at ambient temperature in soil extracts and ob-served the complete conversion to biphenyl. Dechlorination occurredin a step-wise fashion with the meta-chlorines being more reactivethan ortho-chlorines and with no apparent interferences from asphaltand other miscellaneous debris in the soil (Korte et al., 2002).
3.3.1.2. Fe-based reductive dechlorination. Adifferent approach is the useof zero-valent iron nanoparticles (nZVI). Zero-valent iron (millimetricparticles) has been used in the remediation of contaminated aquifers inpermeable reactive barriers (PRB) for about 20 years (USEPA, 2011b).This metal acts as a reducing agent to transform contaminants, beingconsumed in the process, unlike catalysts (Comba et al., 2011). Withthe development of nanotechnology, highly reactive nZVI due to theirlarge surface area were tested successfully for the transformation anddetoxification of a wide variety of environmental contaminants, suchas chlorinated organic solvents, organochlorine pesticides and PCB ingroundwater (Wang and Zhang, 1997; Zhang, 2003). Although previousdata (Table 5) showed promising results in PCB dechlorination, a fieldassessment of in situ injection of carboxymethyl cellulose stabilizednZVI, in California, showed that, after two weeks, nZVI had exhaustedtheir reducing power (He et al., 2010). However, the injection of nZVIand the abiotic reductive dechlorination process appeared to haveboosted a long-term in situ biological dechlorination thereafter (He etal., 2010). A reduction of 87% of PCB 1242 concentration was evident inone of the monitoring wells.
Other researchers have successfully dechlorinated PCB in contam-inated soils using nZVI (Varanasi et al., 2007). However, for achievingthe minimum total PCB destruction efficiency of 95% high tempera-tures (300 °C) were used. Factors like pH can play a very importantrole in PCB dechlorination by nZVI and it was shown that a weaklyacid pH can increase the dechlorination rate (Wang et al., 2012).
Recently, a new approach to combine two different nanomaterials –activated carbon that adsorbs organic pollutants and nZVI thatdechlorinate PCB – was made through a low-cost composite usingpinewood sawdust and ferric chloride as starting materials inone-step synthesis (Liu and Zhang, 2010). This composite exhibited
254 H.I. Gomes et al. / Science of the Total Environment 445–446 (2013) 237–260
98

Author's personal copy
an efficient dechlorination of PCB at room temperature, and thedechlorinated products could be completely adsorbed (Liu and Zhang,2010). However, this porous carbon nZVI was only tested in aqueoussolutions and not in real contaminated soils or sediments.
3.3.1.3. Sodium dispersion. In the sodium dispersion processes, sodiumsalts are added to the contaminated media and react with the chlorineatoms in the PCB, to form sodium chloride and biphenyl. A sample ofsoil from a controlled landfill, after being submitted to a high energymilling technique, was treated with powdered NaBH4, obtainingcomplete abatement with a starting PCB concentration of about2600 mg kg−1 (Aresta et al., 2003). Results showed that the efficiencyof PCB extraction depended on the soil's specific surface and thatboron is found as boric acid in the soil and is unrecoverable (Aresta etal., 2003). Although boric acid can occur naturally in soils, boric acidand its sodium borate salts are active ingredients in pesticides usedagainst insects, algae, fungi and weeds and high soil levels of elementalboron are toxic to plants, so attention should be paid to this issue whenusing this method. The pathways and products of the degradation ofPCB by the sodium dispersion method were systematized by Noma etal. (2007) for nine congeners.
Reductions with Na/NH3 were used to dechlorinate PCB at bench-scale with diffusion controlled rates, at room temperature, in both dryNH3 andwith the addition of water (Pittman and He, 2002). This meth-odwas able to dechlorinate PCB generating sodiumchloride, at ambienttemperature and at fast rates (Pittman and He, 2002). According to thesame authors, other advantages are i) it works in soils (even clay soils),ii) liquid ammonia handling technology is well known and iii) removal,recovery and recycling of NH3 from soils are easy due to its low boilingpoint (−33 °C) (Pittman and He, 2002). However it is a very aggressivemethod for soils and in acidic sites results in NH4
+ retention. Theamount of retention depends upon the number and strength of acidfunctions in the soil and the stripping temperature that can regenerateNH3. Soil pH adjustment after treatment may also be employed(Pittman and He, 2002), given that pH increases to 9 or above. The ad-dition of NH3 to soil produces high osmotic potential, affects negativelythe populations of soil microorganisms and solubilizes the organicmat-ter in soil. All these environmental impacts should be considered beforeusing this technique both in situ and ex situ.
3.3.1.4. Photocatalytic dechlorination. Bench-scale studies have demon-strated that solar radiation can be effectively used to dechlorinate PCB(Aroclor 1254) to biphenyl in 2-propanol in the presence of a traceamount of phenothiazine (Hawari et al., 1992). Other researchershave tested radiolytic (electron beam) and photolytic (ultraviolet, UV)dechlorination of PCB in a marine sediment (Poster et al., 2003). Sedi-ments have been mixed with aqueous alcohol solutions and irradiatedwith an electron beam or photolyzed. In the electron beam irradiatedsamples, the concentrations of 29 PCB congeners decreased with irradi-ation dose. Photolysis leads to about 60% dechlorination, but only afteradding triethylamine (Poster et al., 2003).
The results of bench-scale studies on photocatalytic dechlorinationunder visible light employing methylene blue (MB) and triethylaminein acetonitrile/water, show that PCB-138 can be efficiently dechlorinated(Izadifard et al., 2010). It was also found that the red region of the light isresponsible for the reduction of MB and the UVA-blue region for thedechlorination process. If thermal reducing agents were used instead ofamines, it would be possible to dechlorinate PCB with light-emittingdiode with an output in the ultraviolet A region (Izadifard et al., 2010).
3.3.2. OxidationAccording to Hong et al. (2008), an ozonation technique that incor-
porated rapid, successive cycles of pressurization (690 kPa) and depres-surization, was more effective than conventional ozonation treatment.Near complete or complete removal of PCB could be achieved withinshorter ozonation time. This efficiency was due to soil aggregate
fracturing upon pressure cycles that exposed the contaminants, aswell as by the confluence of PCB and O3 at the gas–liquid interface inthe presence of microbubbles. According to Hong et al. (2008) the tech-nique is expected to accelerate O3 treatment of a wide range of organiccontaminants, and itmay provide treatment to dredged and stored con-taminated sediment as well as in situ treatment of excavated soil, in-creasing the medium's utilization or disposal options. This technologywas already tested at pilot scale with an in situ sediment ozonator(Hong, 2008).
The use of catalyzed H2O2 propagations (CHP; modified Fenton'sreagent) was also tested for PCB remediation. This process is basedon traditional Fenton's reagent, a laboratory procedure where dilutedH2O2 is slowly added to a solution of excess iron (II) to generatehydroxyl radical (OH•), a strong, relatively nonspecific oxidant(Ahmad et al., 2011). Recent studies at bench-scale with two contami-nated soils from Superfund Sites showed that PCB-contaminated soilscould be effectively treated using aggressive CHP conditions (Ahmadet al., 2011).
The effectiveness of persulfate oxidation for the destruction oftetrachlorobiphenyl as a representative PCB, in spiked subsurface soilswas evaluated by Yukselen-Aksoy et al. (2010). Kaolin and glacial tillsoils were selected as representative soils; spiked with 50 mg PCB perdry kg of soil and dried for 10 d before the experiments. To achieveeffective destruction of PCB temperature and high pH were used as ac-tivators (Yukselen-Aksoy et al., 2010).
3.3.3. Solvent extractionSolvent extraction uses an organic solvent as an extractant to sep-
arate contaminants from soil or sediments. The organic solvent is usu-ally mixed with the contaminated media in an extraction unit, whenthe technology is used ex situ. The extracted solution is then passedthrough a separator, where the contaminants and extractant are sep-arated from the soil or sediment. In situ, solvent extraction can also becalled soil flushing.
Experiments at bench and semi-pilot scale with binary solventmixture of alkanes and alcohols yielded 90% extraction efficienciesfor PCB (Nam et al., 2001). However this extraction has to be coupledto chemical dehalogenation or radiolytic degradation (γ-ray irradia-tion) to ensure PCB degradation. The residual organics in the solventmixture were removed with activated carbon, and the solvent wasrecycled for subsequent soil extractions (Nam et al., 2001).
Majid et al. (2002) tested a two-stage extraction process, with aseries of three wash steps incorporated into the solid–liquid separa-tion operation using a mixture of hexane with 5% acetone. The resultsshowed an efficiency of 95.4% in the removal of Aroclor 1016 (Majidet al., 2002).
Solvent extraction has also proven to be successful in a full case inKobe, Japan, where an illegal dumping of PCB capacitors was discov-ered, leaving about 68 m3 (92 t) of soil contaminated with approxi-mately 6.6 kg of PCB (Takigami et al., 2008). Solvent extractiontechnology, carried out in 2002–2003, using isopropyl alcohol,remedied the soil on site with a removal efficiency of 98.6% (Takigamiet al., 2008).
Bench-scale research has also proved that liquefied dimethylether (DME) can be effectively used to extract PCB (99%) and water(97%) from contaminated sediment, and DME can be recovered fromthe extract and easily reused (Oshita et al., 2010). This technology hasthe advantage of simultaneously dewatering and decontaminatingsediments. Experimental results showed that higher chlorinated PCB(hexachlorobiphenyls) could be extractedmore easily than lower chlo-rinated PCB (di to pentachlorobiphenyls) (Oshita et al., 2010).
When using solvent extraction in situ special care should be takenin the delivery, flow control and recovering of the flushing fluid, toavoid the dispersion of the contaminants or the solvents into theenvironment and the potential environmental impacts associated.
255H.I. Gomes et al. / Science of the Total Environment 445–446 (2013) 237–260
99

Author's personal copy
3.4. Combined technologies
To enhance the cost effectiveness of a contaminated site remedia-tion, the combination of different technologies is an approach thathas been increasingly used lately. This can be done with complemen-tary or separate technologies used sequentially. In the literature,several bench-case studies can be found, such as using surfactantwashing of PCB and aerobic biodegradation (Layton et al., 1998), mi-crowave energy and granular activated carbon (Liu and Yu, 2006),thermal desorption technique and catalytic hydrogenation (Arestaet al., 2008), soya lecithin based soil washing process and photocata-lytic treatment of resulting effluents (Occulti et al., 2008), polymerbeads (thermoplastic polymer Hytrel™) followed by biodegradationof the extracted PCB in a solid–liquid two-phase partitioning bioreac-tor (Rehmann and Daugulis, 2008), supercritical fluid carbon dioxideextraction with polymer-stabilized palladium nanoparticles (Wangand Chiu, 2009), Pd coated iron and an aerobic bacterium (He et al.,2009), zero-valent metals and hydrogenation catalysts (DeVor et al.,2009), chemical and photodegradation, more specifically H2O2 incombination with sunlight irradiation (Dasary et al., 2010), electro-catalytic dechlorination with a palladium loaded carbon nanotubescathode (S. Chen et al., 2010), microwave-irradiated manganese diox-ide (Huang et al., 2010), multiwalled carbon nanotubes coupled withβ-cyclodextrin (Shao et al., 2010), microwave irradiation and chemicaldechlorination (Liu et al., 2011a), biosurfactants and bioremediation(Liu et al., 2011b); soil washing and TiO2 photocatalytic degradation(Zhu et al., 2012) or persulfate oxidation enhanced with electrokinetics(Yukselen-Aksoy and Reddy, 2012). These studies show promising re-sults, but no pilot scale or field application has been developed so far.
4. Assessment for full-scale implementation
The technologies previously described, although aiming to destroyor transform PCB, operate in very different ways and consequentlyhave different clean up times, costs, breakdown products and envi-ronmental impacts. Their effectiveness is also site specific, sinceeach technology depends on the contaminants (in most cases, a mixof organic and inorganic pollutants and, even if the contamination isonly due to PCB different mixes of congeners), the aging of the con-tamination, the type of soil and geomorphologic conditions andother environmental factors (like mobility of the contaminants orsorption to soil particles). Generally biological treatments as bioreme-diation, phytoremediation and natural attenuation, are long-termprocesses, but have lower costs and environmental impacts thanchemical, physical or thermal treatments, as well as higher public accep-tance. Their effectiveness is also less predictable. Life Cycle Assessmenthas shown that bioremediation has less impact than incineration forPCB contaminated soils, with the lowest environmental footprint beingfor electric aeration, especially in terms of global warming and depletionof abiotic resources (Busset et al., 2012). At equal distances between thepolluted sites and the treatment plant, bioremediation had fewer im-pacts than incineration in eight out of 13 categories. The impact on globalwarmingwas nine times greater for incineration producing 6.5×10⁵ and7.2×104 kg eq. CO2, respectively (Busset et al., 2012).
The technologies based in natural degradation processes are moresuitable for matrices with low contaminant concentrations, since thesurvival of the degrading organisms (microorganisms or plants), eventhe best adapted ones, can be affected by the toxicity associated tohighly contaminated sites (Megharaj et al., 2011; Perelo, 2010; Reinet al., 2007). In the case of PCB, the congeners on site and their bio-availability, via desorption, can strongly limit the biological treatmentapplication. PCB with fewer chlorine atoms are more susceptible tocomplete aerobic mineralization and higher chlorine content corre-sponds to recalcitrant behavior. However, these highly chlorinatedmol-ecules may be partially degraded through the reductive dechlorination,obtaining congeners containing 2 to 3 atoms of chlorine as major
metabolites. The successful results on PCB dechlorination obtained atbench-scale cannot be replicated at full-scale, due to mass transferlimitations (that lead to reduced bioavailability), shortage of essentialnutrients, presence of microbial predators and toxins and other envi-ronmental factors (e.g. temperature, moisture content, pH). A generalpredictive model applicable to all field conditions is obviously veryhard to implement. Importantfindingsweremade related to the under-standing of the dechlorination patterns and identification of the speciesand enzymatic processes involved, but more research is needed at pilotand full-scales to optimize their application and select the enhance-ments that can bemade, in terms of bioaugmentation or biostimulationand also about the use of transgenic species.
Biological treatments can be easily combined with other remedi-ation methods. For example, the coupling of phytoextraction withother soil treatments in the so-called “treatment trains” (use ofmultipletechnologies either sequentially or concurrently) is gaining interest;what may be especially useful in cases where mixed contaminantsrequire the use of more than one technique to effectively remediatesites (Marchiol et al., 2004).
Regarding phytoremediation, the ideal plant should possess multipletraits: fast growing, high biomass, deep roots, easy to harvest and shouldtolerate (and accumulate) contaminants in their aerial and harvestableparts. For organic pollutants like PCB, it is important to use plants that en-hance phytodegradation, instead of phytoextraction and accumulation,given the concerns about pollution transfer, regarding crop disposal,and the risk of accumulation in the trophic chain. If the produced bio-mass from phytoremediation projects could be valorized, for exampleas bioenergy, then one main drawback (the long required remediationtime) becomes less important and slower-working phytoremediationschemes, based on gradual attenuation of the contaminants rather thanshort-term forced extraction, could be envisaged. Further research isneeded on the potential environmental impacts of the use of transgenicplants for PCB phytoremediation.
Natural attenuation, based on biological, physical and chemical pro-cesses, is very challenging to predict with a high reliability in itsoutcome, so it always implies long-term monitoring. To assess this re-mediationmethod, the source controlmust be documented and a statis-tically significant decline in contaminant concentration, bioavailability,and biological recovery should be demonstrated. The development ofa reliable model to predict future soil or sediment quality is also re-quired in most situations. Natural attenuation cannot be used in siteswhere ecological and human risks are high, due to the long time associ-ated with the natural processes occurring at the site.
Regarding physical methods, in general, reactive caps may bemore suitable than passive caps for highly contaminated sites thatcarry a risk of imminent exposure (Agarwal et al., 2007). The activat-ed carbon surface in reactive caps may act as a substrate on whichmicrobiota grows, increasing biodegradation of PCB in sediments(Agarwal et al., 2007). The high affinity of organics to such materialmay also cause a capillary effect, leading to possible extraction andsequestration of organics from deeper sediments (Agarwal et al.,2007; Choi et al., 2009). Other authors defend that this high adsorp-tion capacity and capillary effect of activated carbon might facilitatedesorption of PCB from a stable sediment matrix into the liquidphase (Choi et al., 2009). This technologymight not be an ultimate so-lution because slight changes in the capping environment can causethe erosion of the capping layer and re-suspension of the sequesteredPCB (Choi et al., 2009). Capping is more expensive than bioremedia-tion or natural attenuation, with increasing costs for reactive caps.The re-suspension of contaminated sediments and the temporary in-crease of contaminants concentration in the water column associatedwith the capping placement are important factors to be considered.
Chemical treatments are usually faster and can treat contaminantsat higher concentrations, but are more expensive and aggressive tothe soil (due to the use of high temperatures, strong acid and alkali).PCB desorption and contact with the reactants can also be limiting
256 H.I. Gomes et al. / Science of the Total Environment 445–446 (2013) 237–260
100

Author's personal copy
factors. The presence of competing substrates, dissolved solids,dissolved oxygen, etc. will also affect PCB dechlorination or oxidationrate. In the case of solvent extraction, a major drawback is the gener-ation of liquid effluent that requires advanced treatment due to thepresence of contaminants.
One of the major disadvantages of thermal treatment is that pollu-tion is transferred from one media (soil) to the other (gas) and there-fore it is essential to destroy volatilized substances in the gas phase toprevent pollution transfer and the formation of dioxins and furans.The high-energy requirement (that correspond to higher costs) need-ed to increase the soil temperature from ambient levels to 400 °C isan important disadvantage.
In their current stage of development, photocatalytic dechlorinationtechnologies are limited in their practical application. A combinationof excavating/dredging and subsequent treatment by means of suchmethods, especially with relatively expensive and potentially toxicadditives, would be considered only in very special cases. The use oflime for pH adjustment and substitution of benign substances (such asascorbate) for the alcohol and the amine couldmake radiation or photo-chemical processing into a competitive technology (Poster et al., 2003).
Microwave energy for in situ remediation is limited to the lengthof the conductor rods and the depth of the water layer, whichmay ab-sorb and dissipate the energy. This treatment is also aggressive to thesoil and can lead to hotspot phenomena (higher-energy exposure andan increased heating rate in some regions).
Ultimately, the selection of the technology to use in each site willbe based on its cost-effectiveness and social acceptability, as well asto the ecological and health risks associated with the site. Recently,the adoption of combined or sequential remediation technologieshas been studied and progress can be made in this area.
Table 6 summarizes the most important advantages and disadvan-tages of the technologies described in Section 3. Available informationfrom the literature was systematized/grouped into 6 main parameters,considered by the authors as the most relevant: current developmentstage and field testing, an indication of associated costs, clean-up time,effectiveness and social acceptance. Most applications are still in aninitial stage of development, with most studies and research carriedout at bench-scale. Some technologies are in practical stage—were test-ed at pilot or field scale. In the column “field testing”more informationis provided about the degree of existent experience in field application,considering three qualitative levels: none, limited (b10 case studies)and substantial (>10 case studies). The column “cost” provides a qual-itative indication of the total cost directly associatedwith the treatmenttechnology application (capital, operation and maintenance), also con-sidering three levels: low (b25 USD per m3), moderate (between 25and 127 USD per m3) and high (>127 USD per m3). The cost assess-ment for the remediation technologies was based in compilations ofreal costs of soil and sediment remediation available in the literature(Khan et al., 2004;McDade et al., 2005; Summersgill, 2006). Also a qual-itative indication of remediation time (fast — from months to 2 years,moderate— from 2 to 10 years, long— decades), effectiveness (as a de-gree of PCB destruction) and social acceptance is presented in Table 6.The main advantages and disadvantages of the technology applicationare presented in the last two columns. In both, the dominant featuresare related to technical issues or to environmental concerns.
5. Conclusions
The characteristics that led to a widespread use of PCB in differentindustrial and domestic applications do present a challenge for the re-mediation of contaminated soils and sediments. Following PCB entranceinto the soil environment, they rapidly sorp tomineral and organicmat-ter (solid phases). The ability to desorb these contaminants determines,in most cases, the effectiveness of the remediation technologies.Promising resultswere obtained in studies at bench-scale, in controlledlaboratorial conditions. Most technologies are still in an initial stage of
development and further research in several implementation issues isneeded. More field data and pilot scale experiments are essential to as-sess the effectiveness of these technologies. There is no single, portabletechnology that is applicable to both ex situ and in situ remediation ofPCB in contaminated soils and sediments. Each case is unique and sev-eral factors must be considered. The successful treatment of a site de-pends on proper selection, design, and adjustment of the remediationtechnology, based on the congeners present, soils properties and onthe performance of the system. More recently, the combined use of re-mediation technologies and the so-called treatment trains is a promis-ing approach for persistent contaminants.
Acknowledgments
This work has been funded by the European Regional DevelopmentFund (ERDF) through COMPETE – Operational Programme for Compet-itiveness Factors (OPCF), by the Portuguese National funds through“FCT — Fundação para a Ciência e a Tecnologia” under project “PTDC/AGR-AAM/101643/2008 NanoDC”, by the research grant SFRH/BD/76070/2011 and by FP7-PEOPLE-IRSES-2010-269289-ELECTROACROSSproject.
References
Abramovitch RA, Huang BZ, Davis M, Peters L. Decomposition of PCB's and otherpolychlorinated aromatics in soil using microwave energy. Chemosphere 1998;37:1427–36.
Abramovitch RA, Huang BZ, Abramovitch DA, Song JG. In situ decomposition of PCBs insoil using microwave energy. Chemosphere 1999a;38:2227–36.
Abramovitch RA, Huang BZ, Abramovitch DA, Song JG. In situ decomposition of PAHs insoil and desorption of organic solvents using microwave energy. Chemosphere1999b;39:81–7.
Abramowicz DA. Aerobic and anaerobic PCB biodegradation in the environment. EnvironHealth Perspect 1995;103:97–9.
Abscope Environmental Inc. North Adams, MA: remediation of PCB soils. http://www.abscope.com/a5108.php, 2012. [Accessed the 12th November 2012].
Agarwal S, Al-Abed SR, Dionysiou DD. In situ technologies for reclamation of PCB-contaminated sediments: current challenges and research thrust areas. J EnvironEng 2007;133:1075–8.
Agarwal S, Al-Abed SR, Dionysiou DD. A feasibility study on Pd/Mg application in histor-ically contaminated sediments and PCB spiked substrates. J Hazard Mater 2009;172:1156–62.
Ahmad M, Simon MA, Sherrin A, Tuccillo ME, Ullman JL, Teel AL, et al. Treatment ofpolychlorinated biphenyls in two surface soils using catalyzed H2O2 propagations.Chemosphere 2011;84:855–62.
Alder AC, Haggblom MM, Oppenheimer SR, Young LY. Reductive dechlorination ofpolychlorinated biphenyls in anaerobic sediments. Environ Sci Technol 1993;27:530–8.
Alonso F, Beletskaya IP, Yus M. Metal-mediated reductive hydrodehalogenation oforganic halides. Chem Rev 2002;102:4009–92.
Aresta M, Caramuscio P, De Stefano L, Pastore T. Solid state dehalogenation of PCBs incontaminated soil using NaBH4. Waste Manag 2003;23:315–9.
ArestaM, Dibenedetto A, Fragale C, Giannoccaro P, Pastore C, Zammiello D, et al. Thermal de-sorption of polychlorobiphenyls from contaminated soils and their hydrodechlorinationusing Pd- and Rh-supported catalysts. Chemosphere 2008;70:1052–8.
Bedard DL, Quensen JF. Microbial reductive dechlorination of polychlorinated biphe-nyls. In: Young LY, Cerniglia CE, editors. Microbial transformation and degradationof toxic organic chemicals. New York: Wiley-Liss; 1995. p. 127–216.
Bedard DL, Ritalahti KM, Loffler FE. The Dehalococcoides population in sediment-freemixed cultures metabolically dechlorinates the commercial polychlorinated biphe-nyl mixture Aroclor 1260. Appl Environ Microbiol 2007;73:2513–21.
Beesley L, Moreno-Jiménez E, Gomez-Eyles JL, Harris E, Robinson B, Sizmur T. A reviewof biochars' potential role in the remediation, revegetation and restoration ofcontaminated soils. Environ Pollut 2011;159:3269–82.
Berkaw M, Sowers KR, May HD. Anaerobic ortho dechlorination of polychlorinatedbiphenyls by estuarine sediments from Baltimore Harbor. Appl Environ Microbiol1996;62:2534–9.
Borazjani H, Wiltcher D, Diehl S. Bioremediation of polychlorinated biphenyl andpetroleum contaminated soil. In: LyonWG, Hong JJ, Reddy RK, editors. Proceedingsof the International Conference on Environmental Science and Technology. NewOrleans, USA: American Science Press; 2005. p. 502–7.
Borja J, Taleon DM, Auresenia J, Gallardo S. Polychlorinated biphenyls and their biodeg-radation. Process Biochem 2005;40:1999–2013.
Brown JF, Wagner RE, Feng H, Carnahan JC, May RJ. Environmental dechlorination ofPCBs. Environ Toxicol Chem 1987;6:579–93.
Brown RA, Wilson JT, Ferrey M. Monitored natural attenuation forum: the case forabiotic MNA. Remediation 2007;17:127–37.
257H.I. Gomes et al. / Science of the Total Environment 445–446 (2013) 237–260
101

Author's personal copy
Busset G, Sangely M, Montrejaud-Vignoles M, Thannberger L, Sablayrolles C. Life cycleassessment of polychlorinated biphenyl contaminated soil remediation processes.Int J Life Cycle Assess 2012;17:325–36.
CCME. Canadian soil quality guidelines for the protection of environmental and humanhealth. Total PCBs. Canadian environmental quality guidelines. Canadian Council ofMinisters of Environment; 1999.
Chang BV, Liu WG, Yuan SY. Microbial dechlorination of three PCB congeners in riversediment. Chemosphere 2001;45:849–56.
Chekol T, Vough LR, Chaney RL. Phytoremediation of polychlorinated biphenyl-contaminated soils: the rhizosphere effect. Environ Int 2004;30:799–804.
Chen IM, Chang FC, Hsu MF, Wang YS. Comparisons of PCBs dechlorination occurrencesin various contaminated sediments. Chemosphere 2001;43:649–54.
Chen S, Qin ZL, Quan X, Zhang YB, Zhao HM. Electrocatalytic dechlorination of2,4,5-trichlorobiphenyl using an aligned carbon nanotubes electrode depositedwith palladium nanoparticles. Chin Sci Bull 2010;55:358–64.
Chen Y, Tang X, Cheema SA, Liu W, Shen C. β-cyclodextrin enhanced phytoremediationof aged PCBs-contaminated soil from e-waste recycling area. J Environ Monit 2010;12:1482–9.
Cho YC, Kwo OS, Sokol RC, Bethoney CM, Rhee GY. Microbial PCB dechlorination indredged sediments and the effect of moisture. Chemosphere 2001;43:1119–26.
Cho YC, Sokol RC, Frohnhoefer RC, Yullrhee G. Reductive dechlorination of polychlorinatedbiphenyls: threshold concentration and dechlorination kinetics of individual congenersin Aroclor 1248. Environ Sci Technol 2003;37:5651–6.
Cho YM, Smithenry DW, Ghosh U, Kennedy AJ, Millward RN, Bridges TS, et al. Fieldmethods for amending marine sediment with activated carbon and assessingtreatment effectiveness. Mar Environ Res 2007;64:541–55.
Cho YM, Ghosh U, Kennedy AJ, Grossman A, Ray G, Tomaszewski JE, et al. Field applicationof activated carbon amendment for in-situ stabilization of polychlorinated biphenylsin marine sediment. Environ Sci Technol 2009;43:3815–23.
Cho YM, Werner D, Choi Y, Luthy RG. Long-term monitoring and modeling of the masstransfer of polychlorinated biphenyls in sediment following pilot-scale in-situamendment with activated carbon. J Contam Hydrol 2012;129–130:25–37.
Choi H, Al-Abed SR, Agarwal S. Catalytic role of palladium and relative reactivity ofsubstituted chlorines during adsorption and treatment of PCBs on reactive activat-ed carbon. Environ Sci Technol 2009;43:488–93.
Comba S, Di Molfetta A, Sethi R. A comparison between field applications of nano-,micro-, andmillimetric zero-valent iron for the remediation of contaminated aquifers.Water Air Soil Pollut 2011;215:595–607.
Cutter L, Sowers KR, May HD. Microbial dechlorination of 2,3,5,6-tetrachlorobiphenylunder anaerobic conditions in the absence of soil or sediment. Appl EnvironMicrobiol 1998;64:2966–9.
D'Angelo E, Nunez A. Effect of environmental conditions on polychlorinated biphenyltransformations and bacterial communities in a river sediment. J Soils Sediment2010;10:1186–99.
Dasary SSR, Saloni J, Fletcher A, Anjaneyulu Y, Yu H. Photodegradation of selected PCBsin the presence of nano-TiO2 as catalyst and H2O2 as an oxidant. Int J Environ ResPublic Health 2010;7:3987–4001.
Dávila B, Whitford KW, Saylor ES. Technology alternatives for the remediation ofPCB-contaminated soil and sediment. Office of Research and Development. Officeof Solid Waste and Emergency Response. US Environmental Protection Agency;1993.
Declercq I, Cappuyns V, Duclos Y. Monitored natural attenuation (MNA) of contaminatedsoils: state of the art in Europe — a critical evaluation. Sci Total Environ 2012;426:393–405.
Denyes MJ, Langlois VrS, Rutter A, Zeeb BA. The use of biochar to reduce soil PCB bio-availability to Cucurbita pepo and Eisenia fetida. Sci Total Environ 2012;437:76–82.
DeVor R, Carvalho-Knighton K, Aitken B, Maloney P, Holland E, Talalaj L, et al. Mecha-nism of the degradation of individual PCB congeners using mechanically alloyedMg/Pd in methanol. Chemosphere 2009;76:761–6.
Deweerd KA, Bedard DL. Use of halogenated benzoates and other halogenated aromaticcompounds to stimulate the microbial dechlorination of PCBs. Environ Sci Technol1999;33:2057–63.
Di P, Chang DPY, Dwyer HA. Modeling of polychlorinated biphenyl removal from con-taminated soil using steam. Environ Sci Technol 2002;36:1845–50.
Donaldson SG, Oostdam JV, Tikhonov C, Feeley M, Armstrong B, Ayotte P, et al. Environ-mental contaminants and human health in the Canadian Arctic. Sci Total Environ2010;408:5165–234.
Doni S, Macci C, Peruzzi E, Arenella M, Ceccanti B, Masciandaro G. In situ phytoremediationof a soil historically contaminated by metals, hydrocarbons and polychlorobiphenyls.J Environ Monit 2012;14:1383–90.
EEA. Progress in management of contaminated sites. European Environment Agency,Report CSI 015. Copenhagen, Denmark, 2007.
Eek E, Cornelissen G, Kibsgaard A, Breedveld GD. Diffusion of PAH and PCB from con-taminated sediments with and without mineral capping; measurement andmodelling. Chemosphere 2008;71:1629–38.
Ehsan S, Prasher SO, Marshall WD. Estimates of total polychlorinated biphenyl (PCB)compounds in soils/sediments by hydrogenolysis to dicyclohexyl. J Environ Monit2003;5:644–8.
El-Hadj TB, Dosta J, Torres R, Mata-Álvarez J. PCB and AOX removal in mesophilic andthermophilic sewage sludge digestion. Biochem Eng J 2007;36:281–7.
EPA. Industrial waste resource guidelines. Environment protection (industrial wasteresource) regulations 2009. Environmental Protection Agency Victoria; 2009[Publication IWRG643.1. September].
Fava F, Piccolo A. Effects of humic substances on the bioavailability and aerobic biodeg-radation of polychlorinated biphenyls in a model soil. Biotechnol Bioeng 2002;77:204–11.
Ficko SA, Rutter A, Zeeb BA. Potential for phytoextraction of PCBs from contaminatedsoils using weeds. Sci Total Environ 2010;408:3469–76.
Ficko S, Rutter A, Zeeb B. Effect of pumpkin root exudates on ex situ polychlorinatedbiphenyl (PCB) phytoextraction by pumpkin and weed species. Environ Sci PollutRes 2011;18:1536–43.
Fogel S, Findlay M, Smoler D. PCB biodegradation by a sediment-dree Dehalococcoidesculture grown on trichlorobenzenes. Poster. Battelle Conference — Remediationof Chlorinated and Recalcitrant Compounds, Monterey, California, 12-14 May,2012; 2012.
Furukawa K, Fujihara H. Microbial degradation of polychlorinated biphenyls: biochemicaland molecular features. J Biosci Bioeng 2008;105:433–49.
GE. Periodic review available to the public. General Electric Spokane Site, 4323 EastMission Avenue, Spokane, Spokane County, Washington, Facility Site ID 630; 2008.
Gerhardt KE, Huang X-D, Glick BR, Greenberg BM. Phytoremediation and rhizoremediationof organic soil contaminants: potential and challenges. Plant Sci 2009;176:20–30.
Ghosh U,Weber AS, Jensen JN, Smith JR. Relationship between PCB desorption equilibrium,kinetics, and availability during land biotreatment. Environ Sci Technol 2000;34:2542–8.
Gomes HI. Phytoremediation for bioenergy: challenges and opportunities. EnvironTechnol Rev 2012:1–8.
Gorbunova TI, Saloutin VI, Chupakhin ON. Chemical methods of transformation ofpolychlorobiphenyls. Russ Chem Rev 2010;79:511–30.
Grittini C, Malcomson M, Fernando Q, Korte N. Rapid dechlorination of polychorinatedbiphenyls on the surface of a Pd/Fe bimetallic system. Environ Sci Technol1995;29:2898–900.
Guidi W, Kadri H, Labrecque M. Establishment techniques to using willow forphytoremediation on a former oil refinery in southern Quebec: achievementsand constraints. Chem Ecol 2011;28:49–64.
Haluska L, Baranciková G, Baláz S, Dercová K, Vrana B, Paz-Weisshaar M, et al. Degrada-tion of PCB in different soils by inoculated Alcaligenes xylosoxidans. Sci Total Environ1995;175:275–85.
Hawari J, Demeter A, Samson R. Sensitized photolysis of polychlorobiphenys in alkaline2-propanol: dechlorination of Aroclor 1254 in soil samples by solar radiation.Environ Sci Technol 1992;26:2022–7.
He N, Li P, Zhou Y, Fan S, Ren W. Degradation of pentachlorobiphenyl by a sequentialtreatment using Pd coated iron and an aerobic bacterium (H1). Chemosphere2009;76:1491–7.
He F, Zhao D, Paul C. Field assessment of carboxymethyl cellulose stabilized ironnanoparticles for in situ destruction of chlorinated solvents in source zones.Water Res 2010;44:2360–70.
Ho CH, Liu SM. Effect of coplanar PCB concentration on dechlorinating microbial commu-nities and dechlorination in estuarine sediments. Chemosphere 2011;82:48–55.
Hong A. In situ sediment ozonator for remediation of PCB, PAH, DDT and other recalci-trant chemicals. Salt Lake City, UT: NOAA/UNH Cooperative Institute for Coastaland Estuarine Environmental Technology (CICEET); 2008.
Hong PKA, Nakra S, Kao CMJ, Hayes DF. Pressure-assisted ozonation of PCB and PAHcontaminated sediments. Chemosphere 2008;72:1757–64.
Hopf NB, Ruder AM, Succop P. Background levels of polychlorinated biphenyls in theU.S. population. Sci Total Environ 2009;407:6109–19.
Hu X, Zhu J, Ding Q. Environmental life-cycle comparisons of two polychlorinatedbiphenyl remediation technologies: incineration and base catalyzed decomposition.J Hazard Mater 2011;191:258–68.
Huang G, Zhao L, Dong Y, Zhang Q. Remediation of soils contaminated with polychlorinatedbiphenyls by microwave-irradiated manganese dioxide. J Hazard Mater 2010;186:128–32.
HuesemannMH,Hausmann TS, Fortman TJ, ThomRM, CullinanV. In situ phytoremediationof PAH- and PCB-contaminated marine sediments with eelgrass (Zostera marina).Ecol Eng 2009;35:1395–404.
Izadifard M, Langford CH, Achari G. Photocatalytic dechlorination of PCB 138 usingleuco-methylene blue and visible light; reaction conditions and mechanisms.J Hazard Mater 2010;181:393–8.
Jackman SA, Knowles CJ, Robinson GK. SACRED — a novel catalytic process for theenvironmental remediation of polychlorinated biphenyls (PCBs). Chemosphere1999;38:1889–900.
Javorská H, Tlustoš P, Kaliszová R. Degradation of polychlorinated biphenyls in therhizosphere of rape, Brassica napus L. Bull Environ Contam Toxicol 2009;82:727–31.
Kacálková L, Tlustoš P. The uptake of persistent organic pollutants by plants. Cent Eur JBiol 2011;6:223–35.
Kalinovich I, Rutter A, Poland JS, Cairns G, Rowe RK. Remediation of PCB contaminatedsoils in the Canadian Arctic: excavation and surface PRB technology. Sci Total Environ2008;407:53–66.
Kaštánek F, Demnerová K, Pazlarová J, Burkhard J, Maléterová Y. Biodegradation ofpolychlorinated biphenyls and volatile chlorinated hydrocarbons in contaminatedsoils and ground water in field condition. Int Biodeter Biodegr 1999;44:39–47.
Kawahara FK, Michalakos PM. Base-catalyzed destruction of PCBs — new donors, newtransfer agents/catalysts. Ind Eng Chem Res 1997;36:1580–5.
Khan FI, Husain T, Hejazi R. An overview and analysis of site remediation technologies.J Environ Manage 2004;71:95-122.
Kim J, Rhee GY. Reductive dechlorination of polychlorinated biphenyls as affected bysediment characteristics. Chemosphere 2001;44:1413–20.
Kim J, Frohnhoefer RC, Cho YC, Cho W, Rhee GY. Reductive dechlorination of low con-centration polychlorinated byphenyls as affected by a rhamnolipid biosurfactant.J Microb Biotechnol 2008;18:1564–71.
Kolar AB, Hrsak D, Fingler S, Cetkovic H, Petric I, Kolic NU. PCB-degrading potentialof aerobic bacteria enriched from marine sediments. Int Biodeterior Biodegrad2007;60:16–24.
258 H.I. Gomes et al. / Science of the Total Environment 445–446 (2013) 237–260
102

Author's personal copy
Komancová M, Jurcová I, Kochánková L, Burkhard J. Metabolic pathways ofpolychlorinated biphenyls degradation by Pseudomonas sp. 2. Chemosphere2003;50:537–43.
Korte NE, West OR, Liang L, Gu B, Zutman JL, Fernando Q. The effect of solvent concentra-tion on the use of palladized-iron for the step-wise dechlorination of polychlorinatedbiphenyls in soil extracts. Waste Manag 2002;22:343–9.
Krumins V, Park JW, Son EK, Rodenburg LA, Kerkhof LJ, Haggblom MM, et al. PCBdechlorination enhancement in Anacostia river sediment microcosms. Water Res2009;43:4549–58.
Kubátová A, Herman J, Steckler TS, Veil M, Miller DJ, Klunder EB, et al. Subcritical(hot/liquid) water dechlorination of PCBs (Aroclor 1254) with metal additivesand in waste paint. Environ Sci Technol 2003;37:5757–62.
Kuo CE, Liu SM, Liu C. Biodegradation of coplanar polychlorinated biphenyls by anaer-obic microorganisms from estuarine sediments. Chemosphere 1999;39:1445–58.
Kurzawova V, Stursa P, Uhlik O, Norkova K, Strohalm M, Lipov J, et al. Plant/microorganisminteractions in bioremediation of polychlorinated biphenyl-contaminated soil. NewBiotechnol 2012;30:15–22.
Layton AC, Lajoie CA, Easter JP, Muccini M, Sayler GS. An integrated surfactant solubili-zation and PCB bioremediation process for soils. Biorem J 1998;2:43–56.
Liu X, Yu G. Combined effect of microwave and activated carbon on the remediation ofpolychlorinated biphenyl-contaminated soil. Chemosphere 2006;63:228–35.
Liu Z, Zhang FS. Nano-zerovalent iron contained porous carbons developed from wastebiomass for the adsorption and dechlorination of PCBs. Bioresour Technol 2010;101:2562–4.
Liu L, Tindall JA, Friedel MJ. Biodegradation of PAHs and PCBs in soils and sludges.Water Air Soil Pollut 2007a;181:281–96.
Liu Y, Phenrat T, Lowry GV. Effect of TCE concentration and dissolved groundwater sol-utes on nZVI-promoted TCE dechlorination and H2 evolution. Environ Sci Technol2007b;41:7881–7.
Liu GB, Tashiro M, Thiemann T. A facile method for the dechlorination of mono- anddichlorobiphenyls using Raney Ni–Al alloy in dilute aqueous solutions of alkalihydroxides or alkali metal carbonates. Tetrahedron 2009;65:2497–505.
Liu X, Zhao W, Sun K, Zhang G, Zhao Y. Dechlorination of PCBs in the simulative trans-former oil by microwave-hydrothermal reaction with zero-valent iron involved.Chemosphere 2011a;82:773–7.
Liu Y, Ma M, Shi Z. Application of Rhamnolipid biosurfactant for removing polychlorinatedbiphenyls from contaminated soil. Adv Mater Res 2011b;233–235:608–13.
Lowry G, Johnson K. Congener-specific dechlorination of dissolved PCBs by microscaleand nanoscale zerovalent iron in a water/methanol solution. Environ Sci Technol2004;38:5208–16.
Mackova M, Barriault D, Francova K, Sylvestre M, Möder M, Vrchotova B, et al.Phytoremediation of polychlorinated biphenyls. In: Mackova M, Downling DN,Macek T, editors. Phytoremediation rhizoremediation. Dordrecht, The Netherlands:Springer; 2006. p. 143–67.
Mackova M, Prouzova P, Stursa P, Ryslava E, Uhlik O, Beranova K, et al. Phyto/rhizoremediation studies using long-term PCB-contaminated soil. Environ Sci PollutRes 2009;16:817–29.
Maestri E, Marmiroli N. Transgenic plants for phytoremediation. Int J Phytoremediation2011;13:264–79.
Magar VS, Wenning RJ. The role of monitored natural recovery in sediment remediation.Integr Environ Assess Manag 2006;2:66–74.
Magar VS, Chadwick DB, Bridges TS, Fuchsman PC, Conder JM, Dekker TJ, et al. Monitorednatural recovery at contaminated sediment sites. Technical Guide. ENVIRON Interna-tional Corp, ESTCP Project ER-0622, ADA512822, Arlington, VA, USA; 2009.
Magee KD, Michael A, Ullah H, Dutta SK. Dechlorination of PCB in the presence of plantnitrate reductase. Environ Toxicol Pharmacol 2008;25:144–7.
Majid A, Argue S, Sparks BD. Removal of Aroclor 1016 from contaminated soil bysolvent extraction soil agglomeration process. J Environ Eng Sci 2002;1:59–64.
Maloney P, DeVor R, Novaes-Card S, Saitta E, Quinn J, Clausen CA, et al. Dechlorinationof polychlorinated biphenyls using magnesium and acidified alcohols. J HazardMater 2011;187:235–40.
ManzanoMA, Perales JA, Sales D, Quiroga JM. Enhancement of aerobic microbial degrada-tion of polychlorinated biphenyl in soil microcosms. Environ Toxicol Chem 2003;22:699–705.
Marchiol L, Assolari S, Sacco P, Zerbi G. Phytoextraction of heavy metals by canola(Brassica napus) and radish (Raphanus sativus) grown on multicontaminated soil.Environ Pollut 2004;132:21–7.
Marmiroli N, McCutcheon SC. Making phytoremediation a successful technology. In:Mc-Cutcheon SC, Schnoor JL, editors. Phytoremediation: transformation andcontrol of contaminants. Hoboken (NJ): Wiley-Interscience, Inc.; 2003. p. 75-107.
Masuda Y, Schecter A, Papke O. Concentrations of PCBs, PCDFs and PCDDs in the bloodof Yusho patients and their toxic equivalent contribution. Chemosphere 1998;31:1773–80.
McDade JM, McGuire TM, Newell CJ. Analysis of DNAPL source-depletion costs at 36field sites. Remediation 2005;15:9-18.
Meagher RB. Phytoremediation of toxic elemental and organic pollutants. Curr OpinPlant Biol 2000;3:153–62.
Megharaj M, Ramakrishnan B, Venkateswarlu K, Sethunathan N, Naidu R. Bioremediationapproaches for organic pollutants: a critical perspective. Environ Int 2011;37:1362–75.
Mehmannavaz R, Prasher SO, Ahmad D. Rhizospheric effects of alfalfa on biotransfor-mation of polychlorinated biphenyls in a contaminated soil augmented withSinorhizobium meliloti. Process Biochem 2002;37:955–63.
Meijer SN, Ockenden WA, Sweetman A, Breivik K, Grimalt JO, Jones KC. Global distribu-tion and budget of PCBs and HCB in background surface soils: implications forsources and environmental processes. Environ Sci Technol 2003;37:667–72.
Mikes O, Cupr P, Trapp S, Klanova J. Uptake of polychlorinated biphenyls and organo-chlorine pesticides from soil and air into radishes (Raphanus sativus). EnvironPollut 2009;157:488–96.
Mikszewski A. Emerging technologies for the in situ remediation of PCB-contaminated soilsand sediments: bioremediation and nanoscale zero-valent iron. Washington, DC: U.S.Environmental Protection Agency, Office of Solid Waste and Emergency Response.Office of Superfund Remediation and Technology Innovation Program; 2004. p. 26.
Monguchi Y, Ishihara S, Ido A, Niikawa M, Kamiya K, Sawama Y, et al. Pilot-plant studyof the PCB degradation at ambient temperature and pressure. Org Process Res Dev2010;14:1140–6.
Nam P, Kapila S, Liu Q, Tumiatti W, Porciani A, Flanigan V. Solvent extraction andtandem dechlorination for decontamination of soil. Chemosphere 2001;43:485–91.
Natarajan MR, Nye J, Wu WM, Wang H, Jain MK. Reductive dechlorination of PCBcontaminated Raisin river sediments by anaerobic microbial granules. BiotechnolBioeng 1997;55:182–90.
Natarajan MR, Wu WM, Wang H, Bhatnagar L, Jain MK. Dechlorination of spiked PCBsin lake sediment by anaerobic microbial granules. Water Res 1998;32:3013–20.
Naval Facilities Engineering Service Center. Technology transfer report: productionbase catalyzed decomposition process Guam, Mariana Islands. Technical ReportTR-2075-ENV; 1997. [October].
Nollet H, Putte IV, Raskin L, Verstraete W. Carbon/electron source dependence ofpolychlorinated biphenyl dechlorination pathways for anaerobic granules.Chemosphere 2005;58:299–310.
Noma Y, Mitsuhara Y, Matsuyama K, Sakai S-i. Pathways and products of the degrada-tion of PCBs by the sodium dispersion method. Chemosphere 2007;68:871–9.
Norris G, Al-Dhahir Z, Birnstingl J, Plant SJ, Cui S, Mayell P. A case study of the manage-ment and remediation of soil contaminated with polychlorinated biphenyls. EngGeol 1999;53:177–85.
Occulti F, Roda GC, Berselli S, Fava F. Sustainable decontamination of an actual-siteaged PCB-polluted soil through a biosurfactant-based washing followed by a pho-tocatalytic treatment. Biotechnol Bioeng 2008;99:1525–34.
Oshita K, Takaoka M, Kitade S, Takeda N, Kanda H, Makino H, et al. Extraction of PCBsand water from river sediment using liquefied dimethyl ether as an extractant.Chemosphere 2010;78:1148–54.
Pakdeesusuk U, Freedman DL, Lee CM, Coates JT. Reductive dechlorination ofpolychlorinated biphenyls in sediment from the twelve mile creek arm of LakeHartwell, South Carolina, USA. Environ Toxicol Chem 2003;22:1214–20.
Perelo LW. Review: in situ and bioremediation of organic pollutants in aquatic sediments.J Hazard Mater 2010;177:81–9.
Pittman Jr CU, He J. Dechlorination of PCBs, CAHs, herbicides and pesticides neat and insoils at 25°C using Na/NH3. J Hazard Mater 2002;92:51–62.
Poster DL, Chaychian M, Neta P, Huie RE, Silverman J, Al-Sheikhly M. Degradation ofPCBs in a marine sediment treated with ionizing and UV radiation. Environ SciTechnol 2003;37:3808–15.
Quensen JF, Tiedje JM, Boyd SA. Reductive dechlorination of polychlorinated biphenylsby anaerobic microorganisms from sediments. Science 1988;42:752–4.
Quensen JF, Boyd SA, Tiedje JM. Dechlorination of four commercial polychlorinatedbiphenyls mistures (Aroclors) by anaerobic microorganisms from sediments.Appl Environ Microbiol 1990;56:2360–9.
Rahuman M, Pistone L, Trifiro F, Miertus S. Destruction technologies for polychlorinatedbiphenyls (PCBs). ICS-UNIDO Publications, Proceedings of Expert Group Meetingson POPs and Pesticides Contamination; 2000.
Rakowska MI, Kupryianchyk D, Harmsen J, Grotenhuis T, Koelmans AA. In situ remedi-ation of contaminated sediments using carbonaceous materials. Environ ToxicolChem 2012;31:693–704.
Raskin l, Smith RD, Salt DE. Phytoremediation of metals: using plants to remove pollutantsfrom the environment. Curr Opin Biotechnol 1997;8:221–6.
Rehmann L, Daugulis AJ. Biodegradation of PCBs in two-phase partitioning bioreactorsfollowing solid extraction from soil. Biotechnol Bioeng 2008;99:1273–80.
Rein A, Fernqvist MM, Mayer P, Trapp S, Bittens M, Karlson UG. Degradation of PCBcongeners by bacterial strains. Appl Microbiol Biotechnol 2007;77:469–81.
Rodenburg LA, Du S, Fennell DE, Cavallo GJ. Evidence for unique and ubiquitousenvironmental sources of 3,3′-dichlorobiphenyl (PCB 11). Environ Sci Technol2010;44:2816–21.
Sato T, Todoroki T, Shimoda K, Terada A, Hosomi M. Behavior of PCDDs/PCDFs in reme-diation of PCBs-contaminated sediments by thermal desorption. Chemosphere2010;80:184–9.
Schmidt C. How PCBs are like grasshoppers. Environ Sci Technol 2010;44:2752.Shao D, Sheng G, Chen C,Wang X, NagatsuM. Removal of polychlorinated biphenyls from
aqueous solutions using β-cyclodextrin grafted multiwalled carbon nanotubes.Chemosphere 2010;79:679–85.
Shen C, Tang X, Cheema SA, Zhang C, Khan MI, Liang F, et al. Enhanced phytoremediationpotential of polychlorinated biphenyl contaminated soil from e-waste recycling areain the presence of randomly methylated-β-cyclodextrins. J Hazard Mater 2009;172:1671–6.
Singer AC, Jury W, Luepromchai E, Yahng CS, Crowley DE. Contribution of earthwormsto PCB bioremediation. Soil Biol Biochem 2001;33:765–76.
Singer AC, Smith D, Jury WA, Hathuc K, Crowley DE. Impact of the plant rhizosphereand augmentation on remediation of polychlorinated biphenyl contaminatedsoil. Environ Toxicol Chem 2003;22:1998–2004.
Sivey JD, Lee CM. Polychlorinated biphenyl contamination trends in Lake Hartwell, SouthCarolina (USA): sediment recovery profiles spanning two decades. Chemosphere2007;66:1821–8.
Slater H, Gouin T, Leigh MB. Assessing the potential for rhizoremediation of PCBcontaminated soils in northern regions using native tree species. Chemosphere2011;84:199–206.
259H.I. Gomes et al. / Science of the Total Environment 445–446 (2013) 237–260
103

Author's personal copy
Sokol RC, Bethoney CM, Rhee GY. Effect of PCB concentration on reductive dechlorinationand dechlorination potential in natural sediments. Water Res 1995;29:45–8.
Summersgill M. Remediation technology costs in the UK & Europe; drivers and changesfrom 2001 to 2005. In: Telford T, editor. Proceedings of the 5th InternationalGeoEnviro Conference, June 2006, Cardiff; 2006.
Sylvestre M. Prospects for using combined engineered bacterial enzymes and plantsystems to rhizoremediate polychlorinated biphenyls. Environ Microbiol 2012.http://dx.doi.org/10.1111/1462-2920.12007.
Takigami H, Etoh T, Nishio T, Sakai S. Chemical and bioassay monitoring of PCB-contaminated soil remediation using solvent extraction technology. J EnvironMonitor 2008;10:198–205.
Tang NH, Myers TE. PCB removal from contaminated dredged material. Chemosphere2002;46:477–84.
Taniguchi S, Hosomi M, Murakami A, Iimura S, Usukura K, Ozawa S. Chemical decom-position of toxic organic chlorine compounds. Chemosphere 1996;32:199–202.
Taniguchi S, Miyamura A, Ebihara A, Hosomi M, Murakami A. Treatment of PCB-contaminated soil in a pilot-scale continuous decomposition system. Chemosphere1998;37:2315–26.
TBS-SCT. Contaminants & media, federal contaminated sites inventory. Treasury Boardof Canada Secretariat; 2011.
TEI. Remedial Action Plan Update Manistique River and Harbor Area of Concern. ProjectNo. W023452Manistique, Michigan: Great Lakes Commission and Department ofEnvironmental Quality, Triade Engineering Inc. and Terrafirma EnvironmentalInc.; 2002.
Teng Y, Luo Y, Sun X, Tu C, Xu L, Liu W, et al. Influence of arbuscular Mycorrhiza andRhizobium on phytoremediation by alfalfa of an agricultural soil contaminatedwith weathered PCBs: a field study. Int J Phytoremediation 2010;12:516–33.
Tiedje JM, Quensen JF, Chee-Sanford J, Schimel JP, Boyd SA. Microbial reductive dechlo-rination of PCBs. Biodegradation 1993;4:231–40.
Todaka T, Hirakawa H, Hori T, Tobiishi K, Iida T, Furue M. Concentrations ofpolychlorinated dibenzo-p-dioxins, polychlorinated dibenzofurans, and non-orthoand mono-ortho polychlorinated biphenyls in blood of Yusho patients. Chemosphere2007;66:1983–9.
TPSTEC. PCB's in Spain — Arcelor. http://www.tpstech.com/references/176. [Accessedthe 12th November 2012].
Tu C, Teng Y, Luo Y, Li X, Sun X, Li Z, et al. Potential for biodegradation of polychlorinatedbiphenyls (PCBs) by Sinorhizobium meliloti. J Hazard Mater 2011a;186:1438–44.
Tu C, Teng Y, Luo Y, Sun X, Deng S, Li Z, et al. PCB removal, soil enzyme activities, andmicrobial community structures during the phytoremediation by alfalfa in fieldsoils. J Soils Sediment 2011b;11:649–56.
UKEPA. Framework for the classification of contaminated soils as hazardous waste.United Kingdom Environmental Protection Agency; 2004.
Ukisu Y, Iimura S, Uchida R. Catalytic dechlorination of polychlorinated biphenyls withcarbon-supported noble metal catalysts under mild conditions. Chemosphere1996;33:1523–30.
USEPA. Low-temperature thermal treatment technology: applications analysis report.Cincinnati, OH: U.S. EPA, Office of Research and Development; 1992 [EPA/540/AR-92/019].
USEPA. OSWER Directive 9200.4-17P — use of monitored natural attenuation atsuperfund, RCRA corrective action, and underground storage tank sites. Washington,DC: Office of Solid Waste and Emergency Response; 1999.
USEPA. Five-year review report for Shiawassee River Site, Howell, Michigan. Region 5,Chicago. Illinois: United States Environmental Protection Agency; 2009.
USEPA. Search Superfund Site Information. http://cumulis.epa.gov/supercpad/cursites/srchsites.cfm, 2011. [Accessed 29 April 2011].
USEPA. Permeable reactive barriers, permeable treatment zones, and application ofzero-valent iron: overview. Washington, DC: Technology Innovation and Field Ser-vices Division; 2011b [http://www.clu-in.org/techfocus/default.focus/sec/Permeable_Reactive_Barriers%2C_Permeable_Treatment_Zones%2C_and_Application_of_Zero-Valent_Iron/cat/Overview/. Accessed 24 September 2012].
USEPA. PCB regulations at 40 CFR Part 761. United States Environmental ProtectionAgency. Toxic Substances Control Act; 2012a.
USEPA. Superfund Site Information. http://www.epa.gov/superfund/sites/, 2012. [Accessed12 November 2012].
Van Aken B, Correa PA, Schnoor JL. Phytoremediation of polychlorinated biphenyls:new trends and promises. Environ Sci Technol 2010;44:2767–76.
Van Dort HM, Smullen LA, May RJ, Bedard DL. Priming microbial meta-dechlorinationof polychlorinated biphenyls that have persisted in Housatonic River sedimentsfor decades. Environ Sci Technol 1997;31:3300–7.
Varanasi P, Fullana A, Sidhu S. Remediation of PCB contaminated soils using ironnano-particles. Chemosphere 2007;66:1031–8.
Vasilyeva GK, Strijakova ER, Nikolaeva SN, Lebedev AT, Shea PJ. Dynamics of PCB removaland detoxification in historically contaminated soils amended with activated carbon.Environ Pollut 2010;158:770–7.
Veriansyah B, Choi HM, Lee YW, Kang JW, Kim JD, Kim J. Continuous catalytichydrodechlorination of polychlorinated biphenyls (PCBs) in transformer oil. J EnvironSci Health A 2009;44:1538–44.
Wang JS, Chiu K. Destruction of pentachlorobiphenyl in soil by supercritical CO(2) ex-traction coupled with polymer-stabilized palladium nanoparticles. Chemosphere2009;75:629–33.
Wang CB, Zhang W. Synthesizing nanoscale iron particles for rapid and completedechlorination of TCE and PCBs. Environ Sci Technol 1997;31:2154–6.
Wang S, Zhang S, Huang H, Zhao M, Lv J. Uptake, translocation and metabolism ofpolybrominated diphenyl ethers (PBDEs) and polychlorinated biphenyls (PCBs)in maize (Zea mays L.). Chemosphere 2011;85:379–85.
Wang Y, Zhou D, Wang Y, Wang L, Cang L. Automatic pH control system enhances thedechlorination of 2,4,4′-trichlorobiphenyl and extracted PCBs from contaminatedsoil by nanoscale Fe0 and Pd/Fe0. Environ Sci Pollut Res 2012;19:448–57.
Wang Y, Wang L, Fang G, Herath HMSK, Wang Y, Cang L, et al. Enhanced PCBs sorptionon biochars as affected by environmental factors: humic acid and metal cations.Environ Pollut 2013;172:86–93.
Whitfield Äslund ML, Zeeb BA, Rutter A, Reimer KJ. In situ phytoextraction ofpolychlorinated biphenyl — (PCB)contaminated soil. Sci Total Environ 2007;374:1-12.
Whitfield Äslund ML, Rutter A, Reimer KJ, Zeeb BA. The effects of repeated planting,planting density, and specific transfer pathways on PCB uptake by Cucurbita pepogrown in field conditions. Sci Total Environ 2008;405:14–25.
Wiegel J, Wu Q. Microbial reductive dehalogenation of polychlorinated biphenyls.FEMS Microbiol Ecol 2000;32:1-15.
Williams WA. Stimulation and enrichment of two microbial polychlorinated biphenylreductive dechlorination activities. Chemosphere 1997;34:655–69.
Winchell LJ, Novak PJ. Enhancing polychlorinated biphenyl dechlorination in fresh watersediment with biostimulation and bioaugmentation. Chemosphere 2008;71:176–82.
Wright MA, Knowles CJ, Stratford J, Jackman SA, Robinson GK. The dechlorination anddegradation of Aroclor 1242. Int Biodeter Biodegr 1996;38:61–7.
Wu TN. Environmental perspectives of microwave applications as remedial alternatives:review. Pract Period Hazard Toxic Radioact Waste Manage 2008;12:102–15.
Wu Q, Bedard DL, Wiegel J. Effect of incubation temperature on the route of microbialreductive dechlorination of 2,3,4,6-tetrachlorobiphenyl in polychlorinated biphenyl(PCB)-contaminated and PCB-free freshwater sediments. Appl Environ Microbiol1997a;63:2836–43.
Wu Q, Bedard DL, Wiegel J. Temperature determines the pattern of anaerobic microbialdechlorination of Aroclor 1260 primed by 2,3,4,6-tetrachlorobiphenyl in woodspond sediment. Appl Environ Microbiol 1997b;63:4818–25.
Wu Q, Sowers KR, May HD. Microbial reductive dechlorination of Aroclor 1260 inanaerobic slurries of estuarine sediments. Appl Environ Microbiol 1998;64:1052–8.
Wu L, Li Z, Han C, Liu L, Teng Y, Sun X, et al. Phytoremediation of soil contaminatedwith cadmium, copper and polychlorinated biphenyls. Int J Phytoremediation2012;14:570–84.
Xing GH, Chan JKY, Leung AOW, Wu SC, Wong MH. Environmental impact and humanexposure to PCBs in Guiyu, an electronic waste recycling site in China. Environ Int2009;35:76–82.
Yak HK, Wenclawiak BW, Cheng IF, Doyle JG, Wai CM. Reductive dechlorination ofpolychlorinated biphenyls by zerovalent iron in subcritical water. Environ SciTechnol 1999;33:1307–10.
Yang B, Deng S, Yu G, Zhang H, Wu J, Zhuo Q. Bimetallic Pd/Al particles for highly effi-cient hydrodechlorination of 2-chlorobiphenyl in acidic aqueous solution. J HazardMater 2011;189:76–83.
Ye D, Quensen JF, Tiedje JM, Boyd SA. Anaerobic dechlorination of polychlorobiphenyls(Aroclor 1242) by pasteurized and ethanol-treated microorganisms from sediments.Appl Environ Microbiol 1992;58:1110–4.
Ye D, Quensen JF, Tiedje JM, Boyd SA. Evidence for para dechlorination ofpolychlorobiphenyls by methanogenic bacteria. Appl Environ Microbiol 1995;61:2166–71.
Yukselen-Aksoy Y, Reddy KR. Effect of soil composition on electrokinetically enhancedpersulfate oxidation of polychlorobiphenyls. Electrochim Acta 2012. http://dx.doi.org/10.1016/j.electacta.2012.03.049.
Yukselen-Aksoy Y, Khodadoust AP, Reddy KR. Destruction of PCB 44 in spiked subsurfacesoils using activated persulfate oxidation. Water Air Soil Pollut 2010;209:419–27.
Zanaveskin LN, Aver'yanov VA. Polychlorobiphenyls: problems of the pollution of theenvironment and technological neutralization methods. Russ Chem Rev 1998;67:713–24.
Zarull M, Hartig J, Maynard L. Ecological benefits of contaminated sediment remediationin the Great Lakes Basin. Sediment Priority Action Committee, Great Lakes WaterQuality Board; 1999 [www.ijc.org. Accessed 12 November 2012].
Zeeb BA, Amphlett JS, Rutter A, Reimer KJ. Potential for phytoremediation of polychlorinatedbiphenyl-(PCB)-contaminated soil. Int J Phytoremediation 2006;8:199–221.
Zhang W. Nanoscale iron particles for environmental remediation: an overview.J Nanopart Res 2003;5:323–32.
Zhu X, Zhou D, Wang Y, Cang L, Fang G, Fan J. Remediation of polychlorinated biphenyl-contaminated soil by soil washing and subsequent TiO2 photocatalytic degradation.J Soils Sediment 2012. http://dx.doi.org/10.1007/s11368-012-0556-3.
Zwiernik MJ, Quensen JF, Boyd SA. FeSO4 amendments stimulate extensive anaerobicPCB dechlorination. Environ Sci Technol 1998;32:3360–5.
260 H.I. Gomes et al. / Science of the Total Environment 445–446 (2013) 237–260
104

105
II.2. Electrokinetic remediation of organochlorines in soil: Enhancement
techniques and integration with other remediation technologies
(published in Chemosphere)


Author's personal copy
Review
Electrokinetic remediation of organochlorines in soil: Enhancement techniquesand integration with other remediation technologies
Helena I. Gomes a,⇑, Celia Dias-Ferreira b, Alexandra B. Ribeiro a
a CENSE, Departamento de Ciências e Engenharia do Ambiente, Faculdade de Ciências e Tecnologia, Universidade Nova de Lisboa, 2829-516 Caparica, Portugalb CERNAS, Departamento de Ambiente, Escola Superior Agrária de Coimbra, Bencanta, 3040-316 Coimbra, Portugal
a r t i c l e i n f o
Article history:Received 4 December 2011Received in revised form 7 February 2012Accepted 10 February 2012Available online 3 March 2012
Keywords:Soil remediationElectroremediationEnhanced electrokineticsCoupled technologiesOrganochlorines
a b s t r a c t
Electrokinetic remediation has been increasingly used in soils and other matrices for numerous contam-inants such as inorganic, organic, radionuclides, explosives and their mixtures. Several strategies weretested to improve this technology effectiveness, namely techniques to solubilize contaminants, controlsoil pH and also couple electrokinetics with other remediation technologies. This review focus in theexperimental work carried out in organochlorines soil electroremediation, aiming to systemize usefulinformation to researchers in this field. It is not possible to clearly state what technique is the best, sinceexperimental approaches and targeted contaminants are different. Further research is needed in theapplication of some of the reviewed techniques. Also a number of technical and environmental issues willrequire evaluation for full-scale application. Removal efficiencies reported in real contaminated soils aremuch lower than the ones obtained with spiked kaolinite, showing the influence of other factors likeaging of the contamination and adsorption to soil particles, resulting in important challenges when trans-ferring technologies into the field.
2012 Elsevier Ltd. All rights reserved.
Contents
1. Introduction . . . . . . . . . . . . . . . . . . . . . . . . . . . . . . . . . . . . . . . . . . . . . . . . . . . . . . . . . . . . . . . . . . . . . . . . . . . . . . . . . . . . . . . . . . . . . . . . . . . . . . . . 10782. Organochlorines . . . . . . . . . . . . . . . . . . . . . . . . . . . . . . . . . . . . . . . . . . . . . . . . . . . . . . . . . . . . . . . . . . . . . . . . . . . . . . . . . . . . . . . . . . . . . . . . . . . . . 10783. Electrokinetic remediation of organochlorine polluted soil. . . . . . . . . . . . . . . . . . . . . . . . . . . . . . . . . . . . . . . . . . . . . . . . . . . . . . . . . . . . . . . . . . . 10784. Enhanced electrokinetics . . . . . . . . . . . . . . . . . . . . . . . . . . . . . . . . . . . . . . . . . . . . . . . . . . . . . . . . . . . . . . . . . . . . . . . . . . . . . . . . . . . . . . . . . . . . . . 1080
4.1. Techniques to solubilize contaminants . . . . . . . . . . . . . . . . . . . . . . . . . . . . . . . . . . . . . . . . . . . . . . . . . . . . . . . . . . . . . . . . . . . . . . . . . . . . . 10804.1.1. Surfactants . . . . . . . . . . . . . . . . . . . . . . . . . . . . . . . . . . . . . . . . . . . . . . . . . . . . . . . . . . . . . . . . . . . . . . . . . . . . . . . . . . . . . . . . . . . . 10804.1.2. Cyclodextrins . . . . . . . . . . . . . . . . . . . . . . . . . . . . . . . . . . . . . . . . . . . . . . . . . . . . . . . . . . . . . . . . . . . . . . . . . . . . . . . . . . . . . . . . . . 10814.1.3. Sequential use of enhancement solutions . . . . . . . . . . . . . . . . . . . . . . . . . . . . . . . . . . . . . . . . . . . . . . . . . . . . . . . . . . . . . . . . . . . . 1081
4.2. Soil pH control. . . . . . . . . . . . . . . . . . . . . . . . . . . . . . . . . . . . . . . . . . . . . . . . . . . . . . . . . . . . . . . . . . . . . . . . . . . . . . . . . . . . . . . . . . . . . . . . . 10814.3. Comparative analysis and discussion. . . . . . . . . . . . . . . . . . . . . . . . . . . . . . . . . . . . . . . . . . . . . . . . . . . . . . . . . . . . . . . . . . . . . . . . . . . . . . . 1082
5. Coupling with other remediation technologies . . . . . . . . . . . . . . . . . . . . . . . . . . . . . . . . . . . . . . . . . . . . . . . . . . . . . . . . . . . . . . . . . . . . . . . . . . . . 10825.1. Oxidation/reduction . . . . . . . . . . . . . . . . . . . . . . . . . . . . . . . . . . . . . . . . . . . . . . . . . . . . . . . . . . . . . . . . . . . . . . . . . . . . . . . . . . . . . . . . . . . . 10825.2. Bioremediation . . . . . . . . . . . . . . . . . . . . . . . . . . . . . . . . . . . . . . . . . . . . . . . . . . . . . . . . . . . . . . . . . . . . . . . . . . . . . . . . . . . . . . . . . . . . . . . . 10845.3. Permeable reactive barriers . . . . . . . . . . . . . . . . . . . . . . . . . . . . . . . . . . . . . . . . . . . . . . . . . . . . . . . . . . . . . . . . . . . . . . . . . . . . . . . . . . . . . . 1084
5.3.1. Zero valent iron PRB. . . . . . . . . . . . . . . . . . . . . . . . . . . . . . . . . . . . . . . . . . . . . . . . . . . . . . . . . . . . . . . . . . . . . . . . . . . . . . . . . . . . . 10845.3.2. Lasagna process . . . . . . . . . . . . . . . . . . . . . . . . . . . . . . . . . . . . . . . . . . . . . . . . . . . . . . . . . . . . . . . . . . . . . . . . . . . . . . . . . . . . . . . . 10855.3.3. PRBs of different reactive media . . . . . . . . . . . . . . . . . . . . . . . . . . . . . . . . . . . . . . . . . . . . . . . . . . . . . . . . . . . . . . . . . . . . . . . . . . . 1085
5.4. Zero valent iron nanoparticles . . . . . . . . . . . . . . . . . . . . . . . . . . . . . . . . . . . . . . . . . . . . . . . . . . . . . . . . . . . . . . . . . . . . . . . . . . . . . . . . . . . . 10855.5. Phytoremediation . . . . . . . . . . . . . . . . . . . . . . . . . . . . . . . . . . . . . . . . . . . . . . . . . . . . . . . . . . . . . . . . . . . . . . . . . . . . . . . . . . . . . . . . . . . . . . 10865.6. Ultrasonication . . . . . . . . . . . . . . . . . . . . . . . . . . . . . . . . . . . . . . . . . . . . . . . . . . . . . . . . . . . . . . . . . . . . . . . . . . . . . . . . . . . . . . . . . . . . . . . . 10865.7. Full scale applications . . . . . . . . . . . . . . . . . . . . . . . . . . . . . . . . . . . . . . . . . . . . . . . . . . . . . . . . . . . . . . . . . . . . . . . . . . . . . . . . . . . . . . . . . . . 10865.8. Comparative analysis and discussion. . . . . . . . . . . . . . . . . . . . . . . . . . . . . . . . . . . . . . . . . . . . . . . . . . . . . . . . . . . . . . . . . . . . . . . . . . . . . . . 1087
6. Conclusions. . . . . . . . . . . . . . . . . . . . . . . . . . . . . . . . . . . . . . . . . . . . . . . . . . . . . . . . . . . . . . . . . . . . . . . . . . . . . . . . . . . . . . . . . . . . . . . . . . . . . . . . . 1087
0045-6535/$ - see front matter 2012 Elsevier Ltd. All rights reserved.doi:10.1016/j.chemosphere.2012.02.037
⇑ Corresponding author. Tel.: +351 212948300; fax: +351 212948554.E-mail address: [email protected] (H.I. Gomes).
Chemosphere 87 (2012) 1077–1090
Contents lists available at SciVerse ScienceDirect
Chemosphere
journal homepage: www.elsevier .com/locate /chemosphere
107

Author's personal copy
Acknowledgments . . . . . . . . . . . . . . . . . . . . . . . . . . . . . . . . . . . . . . . . . . . . . . . . . . . . . . . . . . . . . . . . . . . . . . . . . . . . . . . . . . . . . . . . . . . . . . . . . . . 1087References . . . . . . . . . . . . . . . . . . . . . . . . . . . . . . . . . . . . . . . . . . . . . . . . . . . . . . . . . . . . . . . . . . . . . . . . . . . . . . . . . . . . . . . . . . . . . . . . . . . . . . . . . 1087
1. Introduction
Soil contamination is a major environmental issue worldwide,as a result of mining, agricultural, industrial and urban activitiesover the past two centuries. In European countries, an estimatepoints towards 242000 contaminated sites of which 2.4% are con-taminated with organochlorines (EEA, 2007), a group of toxic com-pounds mostly used as refrigerants, industrial solvents, lubricants,dielectric and dry cleaning fluids, and pesticides.
Electrokinetic (EK) remediation is a technology that alreadyproved its value, especially in contaminated fine-grain soils. Themethod uses a low-level direct current as the ‘‘cleaning agent’’, sev-eral transport mechanisms (electroosmosis, electromigration andelectrophoresis) and electrochemical reactions (electrolysis andelectrodeposition) are induced (Acar and Alshawabkeh, 1993). Someof its advantages are close control over the direction of movement ofwater and dissolved contaminants, retention of contaminants with-in a confined zone, and low power consumption (Page and Page,2002). A major advantage is the possibility of treating low perme-ability soils, inaccessible for other remediation techniques. The gen-eral principle of the EK process is presented elsewhere and severalauthors have critically reviewed its historic developments, state ofknowledge and future directions (Yeung et al., 1997; Kim et al.,2002, 2011; Page and Page, 2002; Virkutyte et al., 2002;Alshawabkeh et al., 2004; Ribeiro and Rodríguez-Maroto, 2006;Wick et al., 2007; Yeung, 2008, 2011; Alshawabkeh, 2009).
Since the late 1980s, EK remediation has been successfully usedto treat different types of soils (Lageman et al., 1989; Pamukcu andWittle, 1992; Acar and Alshawabkeh, 1993; Probstein and Hicks,1993; Ottosen et al., 1997; Ribeiro and Mexia, 1997) and wastematerials (Ribeiro et al., 2000; Hansen et al., 2001, 2007; Ferreiraet al., 2005; Nystroem et al., 2005; Wang et al., 2007; Ottosenet al., 2008; Jensen et al., 2010). Although EK removal of heavymetals from soils is one of the most studied processes (Virkutyteet al., 2002), this method has also been applied to organic contam-inants such as phenol (Acar et al., 1995), chlorinated solvents(Rabbi et al., 2000; Rohrs et al., 2002), petroleum hydrocarbons(Park et al., 2005; Murillo-Rivera et al., 2009), herbicides (Ribeiroet al., 2005, 2011), creosote (Mateus et al., 2010), calmagite(Agarwal et al., 2008) and polycyclic aromatic hydrocarbons(PAHs) (Maini et al., 2000; Niqui-Arroyo et al., 2006; Alcántaraet al., 2008, 2010; Lima et al., 2011). A review on electroremedia-tion of PAH contaminated soils was made by Pazos et al. (2010),covering the use of solubilizing agents and hybrid technologiesand another review on hydrophobic organics can be found inSaichek and Reddy (2005a).
The EK effectiveness may be diminished by sorption of contam-inants on soil particle surfaces and several effects induced by theH2 and OH generated at the electrodes. Various enhancementtechniques have been developed and a review and classificationwas made by Yeung and Gu (2011). This article will focus on theexperimental work done in the organochlorines electroremedia-tion and the enhancement techniques and/or coupled technologiesapplied, using that classification (Yeung and Gu, 2011). It aims tocompile in a systematic way the experimental work available inthe literature. After a brief review of chemical properties of orga-nochlorines (Section 2), EK remediation of organochlorine pollutedsoil is evaluated in Section 3. Section 4 presents several enhance-ment techniques and a comparative analysis, while Section 5 isdedicated to the coupling of EK with other technologies. Section6 presents the conclusions.
2. Organochlorines
Chlorinated organic compounds (COCs) are originated by thesubstitution of one or more hydrogen in aliphatic and aromatichydrocarbons, and their derivatives, by chlorine. This class of com-pounds has a wide set of applications in industry, agriculture ordomestic activities. Many organochlorines are endocrine disrup-tors; show carcinogenic effects, and have been listed as priority pol-lutants by the US Environmental Protection Agency (USEPA). Whenreleased into the environment, these compounds are chemicallystable and difficult to destroy, and can be transported in both airand water. COCs are eventually deposited in soils and sedimentsdue to their hydrophobicity (Hanberg, 1996; Moermond, 2007;ATSDR, 2011) and they become long-term sources of these contam-inants, posing threats to human health and ecosystems (Reible andThibodeaux, 1999; Oostdam et al., 2005; Lu and Yuan, 2009).
Organochlorines can be divided in different families ofcompounds such as chlorinated aliphatic hydrocarbons (CAHs),chlorophenols (CPs), chlorobenzenes (CBs), polychlorinated biphe-nyls (PCBs), organochlorine pesticides (OPs), chlorofluorocarbons(CFCs), polychlorinated dibenzodioxins (PCDDs) or dioxins andpolychlorinated dibenzofurans (PCDFs) or furans. The last threefamilies were excluded in this review, since they originate primar-ily atmospheric pollution problems. Table 1 presents a summary ofthe essential information about the families included in this review.
3. Electrokinetic remediation of organochlorine polluted soil
In the literature, EK application on organochlorines was notstudied as intensively as other organics, like PAH. In the organochl-orines families, CP are the most studied due to their polarity.Bench-scale tests with spiked kaolin showed high removal ratefor chlorophenol (85%), after only 140 min of treatment (1200V m1, 10 mA and pH 9) (Cong et al., 2005), which can beexplained by the spiking method, since the researchers injectedthe contaminant and simultaneously the electric field was applied.It was found that pH could significantly affect the migration, beingeasier to remove CP at higher pH, and that the soil was remediatedby both EK and electrochemical degradation (Cong et al., 2005).
In another study with kaolinite and humic acid kaolinite com-plexes spiked with 2,6-dichlorophenol (DCP) or 3-(3,4-dichloro-phenyl)-1,1-dimethylurea (diuron), results showed that DCP waspartially oxidized during the treatment, as revealed by the pres-ence of benzoquinone, a product of DCP oxidation, in the catholyteand the clay (Polcaro et al., 2007). In the presence of humic acids,the removal efficiency of diuron decreased from 90% to 35%, whiletime increased from 50 h to 160 h. Regarding DCP this effect waslower: removal from kaolinite (without organic matter) reached90% after 110 h, while from kaolinite modified by humic acid itwas only 80% after 160 h (Polcaro et al., 2007). These results haveimportant implications for application in real soils, since orga-nochlorines tend to strongly adsorb the soil organic matter andtherefore their extraction using non-enhanced EK will probablyfail. Therefore it is not surprising that Lu and Yuan (2009) foundthat the removal of CB from soils was inefficient and that forKaragunduz (2009) the sorption and desorption capabilities of OPlimited the success of electro-osmotic transport.
Another study showed pentachlorophenol (PCP) removal effi-ciencies of 40–95% by electroosmotic flow (EOF) after 500 h inlow permeability clayey soil spiked with 100 mg kg1 PCP (Reddy
1078 H.I. Gomes et al. / Chemosphere 87 (2012) 1077–1090
108

Author's personal copy
Tab
le1
Esse
ntia
lin
form
atio
non
the
fam
ilies
ofch
lori
nate
dhy
droc
arbo
ns.
Fam
ily
Ch
emic
alst
ruct
ure
(gen
eral
form
ula
)C
omm
onu
ses
Exam
ples
Not
es
Ch
lori
nat
edal
iph
atic
hyd
roca
rbon
s(C
AH
s)O
rgan
icso
lven
ts(d
egre
asin
gin
indu
stri
essu
chas
:dr
ycl
ean
ing,
elec
tron
ics,
indu
stri
alm
anu
fact
uri
ng
and
equ
ipm
ent
mai
nte
nan
ce)
–Pe
rch
lore
thyl
ene
(PC
E)–
Den
se,n
on-a
queo
us,
phas
eli
quid
(DN
APL
)co
nta
min
ants
–Tr
ich
loro
eth
ylen
e(T
CE)
–In
crea
sin
gly
dete
cted
inso
il,g
rou
ndw
ater
and
sedi
men
ts–
Tric
hlo
roet
han
e(T
CA
)
Ch
loro
phen
ols
(CPs
)Pr
eser
vati
veag
ents
for
woo
d,pa
ints
,veg
etab
lefi
bers
and
leat
her
;di
sin
fect
ants
,her
bici
des,
fun
gici
des,
inse
ctic
ides
and
asin
term
edia
tes
inth
epr
odu
ctio
nof
phar
mac
euti
cals
and
dyes
–M
onoc
hlo
roph
enol
–Ph
enol
sw
ith
one
tofi
vech
lori
ne
atom
sad
ded
onth
ebe
nze
ne
rin
g,co
mpr
isin
g19
con
gen
ers
–3-
Ch
loro
phen
ol–
Pen
tach
loro
phen
ol(P
CP)
Ch
loro
ben
zen
es(C
Bs)
Mon
o-C
Bis
use
das
aso
lven
tfo
rso
me
pest
icid
efo
rmu
lati
ons,
asa
degr
ease
r,an
da
sou
rce
ofot
her
chem
ical
s.H
exac
hlo
robe
nze
ne
(HC
B)
has
been
use
ddi
rect
lyin
the
man
ufa
ctu
reof
pyro
tech
nic
s,tr
acer
bull
ets,
and
asa
flu
xin
gag
ent
inth
em
anu
fact
ure
ofal
um
inu
man
dal
soas
afu
nci
gide
–M
onoc
hor
oben
zen
e–
12D
iffe
ren
tco
nge
ner
s
–H
exac
hlo
robe
nze
ne
(HC
B)
–In
term
edia
tes
inth
esy
nth
esis
ofpe
stic
ides
and
oth
erch
emic
als
Poly
chlo
rin
ated
biph
enyl
s(P
CB
s)C
ompo
nen
tsin
elec
tric
alan
dh
ydra
uli
ceq
uip
men
tsu
chas
tran
sfor
mer
s,ca
paci
tors
,hea
ttr
ansf
ersy
stem
s.PC
Bs
hav
eal
sobe
enu
sed
aspe
stic
ide
exte
nde
rs,s
eala
nts
,car
bon
less
copy
pape
r,lu
bric
ants
(in
dust
rial
oils
),pa
ints
,adh
esiv
es,p
last
ics,
flam
ere
tard
ants
and
dedu
stin
gag
ents
toco
ntr
oldu
ston
road
s.
–2,
4-D
ich
loro
biph
enyl
–Ea
chbe
nze
ne
rin
gca
nh
ave
up
to5
chlo
rin
esu
bsti
tuen
tsin
the
orth
o,m
eta,
orpa
rapo
siti
ons
–2,
3,30
,40 -
Tetr
ach
loro
biph
enyl
–20
9C
onge
ner
sra
ngi
ng
from
mon
o-to
deca
chlo
robi
phen
ylth
atar
eve
rype
rsis
ten
tto
degr
adat
ion
and
haz
ardo
us
toth
ebi
osph
ere
–D
ecac
hlo
rodi
phen
yl
Org
anoc
hlo
rin
epe
stic
ides
(OPs
)N
oge
ner
alst
ruct
ure
Inse
ctic
ides
,fu
ngi
cide
s,bi
ocid
es–
Ald
rin
–Th
em
ost
freq
uen
tly
repo
rted
chlo
rin
ated
pest
icid
esar
ep,
p0-D
DE,
p,p0
-DD
T,di
eldr
inan
dm
irex
Each
pest
icid
eis
diff
eren
t–
DD
T–
Die
ldri
n–
Endr
in–
Hep
tach
lor
–M
irex
–Ta
xoph
ene
–Li
nda
ne
–2,
4-D
–2,
4,5-
T
H.I. Gomes et al. / Chemosphere 87 (2012) 1077–1090 1079
109

Author's personal copy
et al., 2011b). The direct reductive process at the electrodes wasalso observed.
In a systematic analysis of the factors affecting electroremedia-tion of CAHs, CPs and CBs made by Lu and Yuan (2009), the sorp-tion/desorption behavior of organochlorines on the interface ofsoil and pore solution, their aqueous solubilities and soil pH wereidentified as the most important factors. More hydrophobic com-pounds tend to adsorb and bind strongly to the soil, so electro-remediation efficiencies are lower.
4. Enhanced electrokinetics
Enhancement techniques currently used in EK are mainlydirected toward maintaining or bringing contaminants into solutionby addition of enhancement solutions and controlling pH (Ottosenet al., 2005). This section presents some of the most commontechniques.
4.1. Techniques to solubilize contaminants
4.1.1. SurfactantsFor organic contaminants, surfactants are commonly used as
flushing solutions to substantially increase desorption andsolubilization, through micellisation and surface tension reduction
(Saichek and Reddy, 2004). Several reviews on the use of surfac-tants for soil washing can be found in the literature (Mulliganet al., 2001; Wang and Mulligan, 2004), with more emphasisrecently in biosurfactants, due to their biodegradability and lowtoxicity (Mulligan, 2009). Surfactants adsorb to soils and alter theirsurface properties affecting EOF and sorption of hydrophobicorganics. Depending on the type of surfactants, micelles and theorganic contaminants within may be transported toward the anodeor cathode (Karagunduz, 2009). Table 2 summarizes some experi-mental results on the use of surfactants for enhanced EK. It is notpossible to directly compare these results, since experimentalapproaches are different (contaminants, surfactants used and typeof soil), but it is clear that both real contaminated soils and sedi-ments have lower efficiencies than spiked kaolin.
Experimental results indicate that anionic surfactants producenegative f (zeta) potentials (Kaya and Yukselen, 2005). However,since anionic surfactant micelles have electrophoretic mobility,the electromigration of micelles and, therefore, organochlorines,toward the anode becomes an important driving force. Cationicsurfactants have limited applications to EK due to their stronginteractions with the soil matrix (Karagunduz, 2009) and caneven retard the movement of contaminants (Ranjan et al., 2006).
Regarding organochlorines, only a nonionic surfactant, Tween80, and an anionic surfactant, SDBS were tested to enhance EK
Table 2Use of surfactants in bench-scale electrokinetic remediation of organic contaminants.
Target contaminant Matrix Surfactant % Removal bestresults
Reference
1,2,3,4-Tetrachlorobenzene (TeCB), 1,2,4,5-tetrachlorobenzene (i-TeCB),and 1,2,3-trichlorobenzene (TCB)
Spiked kaolin CDC 70–80 Yuan et al.(2007)
Benzo[a]pyrene Spiked kaolin Brij 35 76 Gómez et al.(2009)
Chlorobenzene (CB) and trichloroethylene (TCE) Spiked soil Triton X-100, OS-20ALM 85 Kolosov et al.(2001)
Diesel Spiked sand Sodium dodecyl sulfate(SDS)
– Kim and Lee(1999)
DDT Spiked soil Tween 80 and SDBS 13 Karagunduzet al. (2007)
Ethylbenzene Spiked soil SDS 98 Yuan and Weng(2004)
PANNOX 110Gasoil Spiked soil Citric acid 87 Gonzini et al.
(2010)Heavy metals and PAHs Marine
contaminatedsediments
Tween 80 62–84 formetals18 forPAH
Colacicco et al.(2010)
Hexachlorobenzene Spiked kaolin Tween 80 and b-cyclodextrin
80 Yuan et al.(2006)
Mixture of benzene, toluene, ethylbenzene, xylenes [BTEX] and threeselected polycyclic hydrocarbons [PAHs]
Spiked clay Cetyltrimethylammoniumbromide (CTAB)
97 Ranjan et al.(2006)
PAH (fluoranthene, pyrene, and benzanthracene) Spiked kaolin Tween 80 40 Alcántara et al.(2010)
PAH (16 priority PAH) Contaminated soil(P100 years)
Tween 80 30 Lima et al.(2011)
Naphthalene and 2,4-dinitrotoluene (2,4-DNT) Spiked soil CMCD 83 and 89 Jiradecha et al.(2006)
Phenanthrene Spiked kaolin HPCD 75 Ko et al. (2000)Phenanthrene Spiked kaolinite APG 98 Yang et al.
(2005)Calfax 16L-35
Phenanthrene Spiked kaolin andsand
Igepal CA-720 90 Saichek andReddy (2005b)
Phenanthrene Spiked kaolin APG 75 Park et al.(2007)
Brij 30SDS
Phenanthrene Spiked soil Triton X-100 rhamnolipid 30 Chang et al.(2009)
Phenanthrene and nickel Spiked kaolin HPCD – Maturi andReddy (2006)
Lubricant oil and zinc Contaminated soil Tergitol 45 Park et al.(2009)
1080 H.I. Gomes et al. / Chemosphere 87 (2012) 1077–1090
110

Author's personal copy
remediation of DDT (Karagunduz et al., 2007). It was found thatboth had similar solubilization potentials for that contaminant.
The potential success of surfactants depends on their type, soilproperties and other factors (i.e., pH, presence of other cations,etc.). It is recommended that the f potential of soils is determinedbefore using EK in order to maximize the efficiency of the tech-nique (Kaya and Yukselen, 2005). It was also found that the pHcontrol in the cathode maximized EOF and the surfactant en-hanced EK (Alcántara et al., 2010).
4.1.2. CyclodextrinsCyclodextrins are considered advantageous over regular surfac-
tants due to their nontoxicity, biodegradability and low sorptionto the solid phase at a wide range of pH values (Maturi and Reddy,2006).
The effect of b-cyclodextrin (b-CD) on EK removal of multiple CB,including 1,2,3,4-tetrachlorobenzene (TeCB), 1,2,4,5-tetrachloro-benzene (i-TeCB), and 1,2,3-trichlorobenzene (TCB) in contami-nated clay soils was studied by Yuan et al. (2007). The addition ofb-CD was not recommended, since the inclusion compounds formedwere less soluble than CB and their formation reduced the aqueoussolubility of CB and led to the partial immobilization of CB desorbedfrom soil (Yuan et al., 2007).
Different conclusions were obtained in another study, wheretwo solubilizing agents, ethanol and methyl-b-cyclodextrin(MCD), were compared in terms of either EK parameters orenhancement of hexachlorobenzene (HCB) movement in realcontaminated sediments (Wan et al., 2009). Although the test with50% ethanol exhibited the highest performance, researchers ob-served that ethanol had a more negative effect on cumulativeEOF than MCD. They concluded that MCD could perform betterthan ethanol for a long-term field application, given the reliableEOF and chemical stability (Wan et al., 2009). The authors alsorefer in situ degradation of HCB in regions near the cathode andthe direct electrochemical degradation of HCB at the electrodes.
In a pilot test with real aged sediments contaminated with HCBand Zn, hydroxypropyl-b-cyclodextrin (HPCD) was successfullypenetrated across sediments by electroosmosis (Li et al., 2009,2010b). However, the researchers concluded that thesimultaneous removal of HOCs and heavy metals was rather diffi-cult in relatively large-scale treatment and other enhancementswere needed for metals removal.
4.1.3. Sequential use of enhancement solutionsThe sequential use of the extractants is also a way to enhance
EK, although no literature was found on organochlorines. Khodad-oust et al. (2004) found that 5% Tween 80 followed by 1 M citricacid or 1 M citric acid followed by 5% Igepal CA-720 were effectivefor the removal of both nickel and phenanthrene from spiked kao-lin. Removal of both PAHs and heavy metals in a silty sand soil col-lected from a polluted former manufactured gas plant wasenhanced with 0.2 M EDTA flushing in two stages (without andwith voltage gradient, 1 V cm1), followed by 5% Igepal flushingalso in two stages (Reddy et al., 2010). Removal efficiencies variedbetween 20% and 80% and showed that a carefully designedsequential hydraulic flushing scheme, with chelants and surfac-tants, is needed for the removal of mixed contaminations.
Since in most field applications mixed contaminations are usu-ally found, it is important to study the sequential use of enhance-ment solutions to improve removal efficiency, minimizing alsopossible interferences and negative environmental impacts.
4.2. Soil pH control
Both theoretical and experimental analysis showed that pHregulation is an effective method for enhancing electroremedia-Ta
ble
3Co
mpa
riso
nof
enha
ncem
ent
met
hods
for
orga
noch
lori
nes
elec
tror
emed
iati
on.
Enh
ance
men
tm
eth
odC
urr
ent
stat
us
Org
anoc
hlo
rin
este
sted
Maj
orad
van
tage
sPo
ssib
ledi
sadv
anta
ges
Surf
acta
nts
Test
eda
DD
T(K
arag
un
duz,
2009
)Lo
wer
the
surf
ace
ten
sion
ofa
liqu
id.E
nh
ance
con
tam
inan
tsso
lubi
lity
Succ
ess
ofsu
rfac
tan
tsde
pen
dson
thei
rty
pean
dot
her
envi
ron
men
tal
fact
ors
Cyc
lode
xtri
ns
Test
eda
TeC
B,i
-TeC
B,T
CB
(Yu
anet
al.,
2007
),H
CB
(Yu
anet
al.,
2006
;Li
etal
.,20
09,2
010b
)C
hem
ical
stab
ilit
yan
dre
liab
leel
ectr
oosm
otic
flow
Incl
usi
onco
mpo
un
dsbe
twee
nco
mpl
exin
gag
ents
and
orga
noc
hlo
rin
esm
aybe
less
solu
ble
Sequ
enti
alu
seof
enh
ance
men
tso
luti
ons
Not
test
ed–
Mor
eef
fect
ive
onm
ixed
con
tam
inat
ion
s.C
anco
mbi
ne
the
use
ofch
elan
ts,s
urf
acta
nts
and
com
plex
ing
agen
tsV
aria
ble
–de
pen
don
the
enh
ance
men
tso
luti
onu
sed.
Poss
ible
inte
rfer
ence
sbe
twee
nen
han
cem
ent
solu
tion
s
Soil
pHco
ntr
olTe
sted
a2,
4-D
CP
(Lu
oet
al.,
2005
a),P
CE,
TCE,
carb
onte
trac
hlo
ride
and
chlo
rofo
rm(C
han
get
al.,
2006
),PC
P(R
eddy
etal
.,20
11b,
c)M
ain
tain
anol
yte
and
cath
olyt
epH
wit
hin
appr
opri
ate
ran
ges
Var
iabl
e–
depe
nd
onth
em
eth
odu
sed
toco
ntr
olpH
.Th
ead
diti
onof
som
eac
ids
may
pose
envi
ronm
enta
lis
sues
aB
ench
-sca
lete
sts.
H.I. Gomes et al. / Chemosphere 87 (2012) 1077–1090 1081
111

Author's personal copy
tion (Mishchuk et al., 2007; Lysenko and Mishchuk, 2009). Differ-ent strategies are used to control soil pH, like electrode condition-ing (Puppala et al., 1997; Saichek and Reddy, 2003; Baek et al.,2009), electrolyte circulation or circulation-enhanced electrokinet-ics (Lee and Yang, 2000; Chang and Liao, 2006), non-uniform elec-trokinetics (Luo et al., 2005a), ion exchange membranes or barriers(Ottosen and Hansen, 1992; Kim et al., 2005; Virkutyte and Sillan-paa, 2007), polarity exchange technique (Pazos et al., 2006) andapproaching anodes (Shen et al., 2007).
In experimental tests with tetrachloroethylene (PCE), trichloro-ethylene (TCE), carbon tetrachloride and chloroform, a buffer solu-tion of CH3COONa and a working-solution circulation system toneutralize the pH were used (Chang et al., 2006). A removal effi-ciency ranging from 85% to 98% was obtained after 2 weeks oftreatment. This EK process produced a roughly stable EOF rate(180 mL d1), pH (around 6.0), and current density (0.26–0.27 mA cm2). The mobility of chlorinated solvents in soils in-creased with its water solubility, i.e., chloroform > carbon tetra-chloride > TCE > PCE (Chang et al., 2006).
Researchers also showed that non-uniform electrokinetics (gen-erated by tubular electrodes) could accelerate the desorption andmovement of phenol and 2,4-DCP in spiked unsaturated soils(Luo et al., 2005a).
In another study, the highest degradation of PCP (78%) was ob-tained with 2 V cm1 voltage gradient and recirculation applica-tion (Reddy et al., 2011c). The pH control allowed PCP transportto the cathode where it underwent direct electrochemical reduc-tive dechlorination.
No literature was found in the use of ion exchange membranesfor organochlorines electroremediation.
4.3. Comparative analysis and discussion
Table 3 presents a comparative analysis of the techniques usedto enhance EK, identifying if the technique has already been tested,which were the organochlorines targeted, major advantages andpossible disadvantages associated.
Regarding enhancement techniques, CB were the most studiedorganochlorines, followed by OP and CAH. None of thesetechniques has been tested on CP or PCB. It is not possible to clearlystate what enhancement technique is the best, since experimentalapproaches differed. Results with real contaminated soils orsediments showed much lower EK efficiency, reflecting theinfluence of other factors like aging of the contamination andadsorption to soil particles, especially to organic matter.
Some of the techniques have not been tested for organochlo-rines so more research is needed. Given that EK efficiencies arelow with hydrophobic compounds, it is important to developnew methods to improve those efficiencies.
5. Coupling with other remediation technologies
The mobilizing potential of EK can be coupled to othertechnologies in order to maximize contaminant removal in acost-effectiveness perspective. Several studies at bench-scale havebeen made on this area. Table 4 summarizes the possibilities ofintegrating remediation technologies for organic contaminants,whereas Table 5 details on organochlorines. These integratedtechnologies will be further detailed in the next sections.
5.1. Oxidation/reduction
Chemical oxidation typically involves reduction/oxidationreactions that chemically convert hazardous contaminants intononhazardous or less toxic compounds that are more stable, lessmobile or inert. The most common oxidants are ozone, hydrogenperoxide, hypochlorites, chlorine, chlorine dioxide, potassiumpermanganate and Fenton’s reagent (hydrogen peroxide and iron)(USEPA, 2011).
Combining EK with chemical oxidation was tested by severalresearchers, namely for phenanthrene spiked soil with Fenton’sreagent (Kim et al., 2006), phenol spiked kaolin with KMnO4
(Thepsithar and Roberts, 2006) and diesel contaminated soils withH2O2 (Tsai et al., 2010). Reviews on the coupling of these
Table 4Combination of electrokinetic remediation and other methods for removal of organic contaminants in bench-scale experiments.
Target contaminant Matrix Enhancement method %Removal
Reference
Acid dye (acid blue 25) Spiked kaolin Electrokinetics and electrochemical oxidation 89 Lee et al. (2009)Benzo[a]pyrene Spiked kaolin Electrokinetics and liquid electrochemical oxidation 76 Gómez et al. (2009)Chrysene Spiked kaolin Ultrasonic electrokinetic (EK-US) and AC-electrokinetic
(EK-AC)54 Shrestha et al. (2009)
Creosote Contaminated clay soil Electrokinetics and chemical (Fenton) oxidation 35 Isosaari et al. (2007)Creosote Two creosote-polluted clay soils
and an agricultural soilElectrokinetic bioremediation 53 Niqui-Arroyo and
Ortega-Calvo (2007)Dinitrotoluene Spiked kaolin Electrokinetics and bare nanoscale iron particles (NIPs)
and lactate modified NIP (LM-NIP)30–65 Reddy et al. (2011a)
Petroleum hydrocarbons Spiked soil Electrokinetic bioremediation 45 Li et al. (2010a)Nickel and phenanthrene Spiked kaolin Electrokinetics and chemical (Fenton) oxidation – Reddy and Karri (2008a)Phenanthrene Spiked kaolin Electrokinetically enhanced soil flushing – Saichek and Reddy
(2003)Phenanthrene Spiked sandy soil Electrokinetics and chemical (Fenton) oxidation 82 Park et al. (2005)Phenanthrene Contaminated clay soil Electrokinetic bioremediation – Niqui-Arroyo et al.
(2006)Phenanthrene Spiked kaolin and Hadong clay Electrokinetics and chemical (Fenton) oxidation – Kim et al. (2006)Phenanthrene Spiked Hadong clay soil Electrokinetics and chemical (Fenton) oxidation with
stabilizers– Kim et al. (2007)
Phenanthrene Spiked kaolin Electrokinetics and chemical oxidation 95 Alcántara et al. (2008)Phenanthrene Spiked Hadong clay Electrokinetics and chemical (Fenton) oxidation – Kim et al. (2009)Phenanthrene Alginate beads Electrokinetic bioremediation – Shi et al. (2008a)Phenol Spiked sandy loam Electrokinetic bioremediation 58 Luo et al. (2006)Total petroleum
hydrocarbon-diesel(TPH-D)
Contaminated soil Electrokinetics and Fenton chemical oxidation 97 Tsai et al. (2010)
1082 H.I. Gomes et al. / Chemosphere 87 (2012) 1077–1090
112

Author's personal copy
Tabl
e5
Coup
ling
ofel
ectr
okin
etic
rem
edia
tion
and
othe
rte
chno
logi
esfo
rre
mov
alof
orga
noch
lori
nes
inbe
nch-
scal
eex
peri
men
ts.
Targ
etco
nta
min
ant
Mat
rix
Com
bin
edte
chn
olog
ies
Du
rati
onof
test
(s)
Proc
ess
flu
idV
olta
gegr
adie
nt
(Vcm
1)
%R
emov
albe
stre
sult
sR
efer
ence
An
ode
Cat
hod
e
2,4-
Dic
hlo
roph
enox
yace
tic
acid
(2,4
-D)
Spik
edso
ilB
iore
med
iati
onan
del
ectr
okin
etic
s4;
22d
0.2
MN
a 2H
PO4
4M
CH
3C
OO
H1.
7539
Jack
man
etal
.(20
01)
0.5
MN
a 2H
PO4
0.5
MH
NO
3
Tric
hlo
roet
hyl
ene
(TC
E)Sp
iked
soil
Elec
trok
inet
ics
and
Fen
ton
oxid
atio
n10
dH
2O
2(<
4000
mg
L1)
Dei
oniz
edw
ater
1.0
89Y
ang
and
Liu
(200
1)Pe
rch
loro
eth
ylen
eSp
iked
soil
Elec
trok
inet
ics
and
zero
-val
ent
met
als
(iro
nan
dzi
nc)
10d
0.01
MN
a 2C
O3
0.01
MN
a 2C
O3
1.0
90C
han
gan
dC
hen
g(2
006)
TCE
and
Cd
Spik
edK
impo
clay
Elec
trok
inet
ics
and
perm
eabl
ere
acti
veba
rrie
r20
0h
Dei
oniz
edw
ater
Dei
oniz
edw
ater
2.0
90an
d70
Ch
un
gan
dLe
e(2
007)
Pen
tach
loro
phen
olSp
iked
kaol
inEl
ectr
okin
etic
san
dN
anop
arti
cles
ofze
rova
len
tir
on(N
IP)
427
h5
gL
1N
IP,5
gL
1N
IPin
,H
2O
1.0
45–5
5R
eddy
and
Kar
ri(2
008b
)96
0h
5%Ig
epal
CA
720
960
h5
gL
1N
IPin
5%Et
han
olPe
nta
chlo
roph
enol
Spik
edso
ilB
iore
med
iati
onan
dre
vers
efi
eld
elec
trok
inet
ics
36;
95d
H2O
H2O
+H
2SO
41.
0–
Har
bott
leet
al.(
2009
)H
exac
hlo
robe
nze
ne
(HC
B)
Spik
edka
olin
Elec
trok
inet
ics
and
Fen
ton
chem
ical
oxid
atio
n15
dH
2O
2so
luti
ons
(30%
,15%
and
5%)
–0.
6776
Oon
nit
tan
etal
.(20
09a)
1%(b
yw
eigh
t)b
-cyc
lode
xtri
nso
luti
ons
Hex
ach
loro
ben
zen
e(H
CB
)Sp
iked
kaol
inEl
ectr
okin
etic
san
dFe
nto
nch
emic
alox
idat
ion
15d
Ferr
ous
sulf
ate
solu
tion
wit
h1%
(by
wei
ght)
b-c
yclo
dext
rin
solu
tion
sD
eion
ized
wat
er1.
064
Oon
nit
tan
etal
.(20
09b)
Aft
er48
hw
hen
curr
ent
deve
lope
d,15
%H
2O
2w
asad
ded
Hex
ach
loro
ben
zen
e(H
CB
),ph
enan
thre
ne
(PH
E)an
dfl
uor
anth
ene
(FLU
)
Spik
edka
olin
Ult
raso
nic
ally
enh
ance
del
ectr
okin
etic
s10
;15
d0.
01M
NaO
H0.
01M
Na 2
CO
3H
2O
1.5
70–8
3Ph
amet
al.
(200
9)
82–9
682
–97
2,4-
Dic
hlo
roph
enol
and
Cd
Spik
edsa
ndy
loam
Act
ivat
edba
mbo
och
arco
al(a
dsor
ben
t)an
ddi
ffer
ent
peri
odic
pola
rity
-rev
ersa
ls10
.5d
0.01
MK
NO
30.
01M
KN
O3
1.0
76of
Cd
and
55of
2,4-
DC
PM
aet
al.
(201
0)
Hex
ach
loro
ben
zen
e(H
CB
)Sp
iked
kaol
inEl
ectr
okin
etic
san
dFe
nto
nch
emic
alox
idat
ion
10;
20d
10–1
2%H
2O
2H
2O
2+
FeSO
4H
2O
1.5–
2.0
57O
onn
itta
net
al.(
2010
)H
exac
hlo
robe
nze
ne
(HC
B)
Spik
edso
ilEl
ectr
okin
etic
san
dm
icro
scal
ePd
/Fe
PRB
enh
ance
dw
ith
surf
acta
nt
5;10
dTX
-100
solu
tion
at10
mM
(50
cmc)
0.02
5M
Na 2
SO4
solu
tion
264
Wan
etal
.(2
010)
Pen
tach
loro
phen
ol(P
CP)
Spik
edso
ilEl
ectr
okin
etic
san
dPd
/Fe
perm
eabl
ere
acti
veba
rrie
r5–
15d
0.02
5M
Na 2
CO
30.
025
MN
a 2SO
4
2.0
49Li
etal
.(2
011)
Tric
hlo
roet
hyl
ene
(TC
E)Sp
iked
san
dyso
ilEl
ectr
okin
etic
san
dFe
nto
nox
idat
ion
wit
hin
ject
ion
ofn
anos
cale
Fe3O
4
7–14
d1.
0–10
.0g
L1
Na 2
S 2O
81.
0–10
.0g
L1
Na 2
S 2O
8
1.0
100
Yan
gan
dY
eh(2
011)
0.21
7g
ofn
anos
cale
Fe3O
4
H.I. Gomes et al. / Chemosphere 87 (2012) 1077–1090 1083
113

Author's personal copy
techniques can be found in Yang (2009),Yeung and Gu (2011) andYap et al. (2011).
Regarding organochlorines, the results of experiments carriedout on HCB spiked kaolin, showed 57% contaminant removal(Oonnittan et al., 2010). There was no pH dependence in the range2.9–5 and the results revealed the importance of efficient oxidantdelivery methods in the treatment duration reduction (Oonnittanet al., 2010).
Research made on in situ EK-Fenton process for oxidation of TCEshowed that graphite electrodes were superior to stainless steelelectrodes. It was also found that the soil with a higher organicmatter content resulted in a lower treatment efficiency (Yangand Liu, 2001). The cost analysis indicated that the EK-Fenton pro-cess is very cost-effective (Yang and Liu, 2001).
A different approach is the use of electrically induced reductionor EIR. It involves feeding an electric current through electrodesand creating favorable conditions for redox reactions to occur inthe matrix, without the migration of contaminants (Jin andFallgren, 2010). The applied electric potential is substantially lowerthan those used in EK process. This was tested in clay spiked withTCE, using weak electric potentials of 6, 9, and 12 V m1. The re-sults showed that up to 97% of TCE was depleted. Correspondingincreases in chloride concentrations were observed indicating areductive dechlorination pathway (Jin and Fallgren, 2010).
Yang and Yeh (2011) evaluated the effectiveness of EK en-hanced persulfate oxidation for destruction of TCE in a spiked san-dy clay soil. Experimental results showed that EK greatly enhancesthe transport of injected persulfate from the anode to the cathodethrough EOF, aiding in situ chemical oxidation of TCE. Such a cou-pled process was found to be capable of effective destruction ofTCE in the soil and electrode compartments (Yang and Yeh, 2011).
5.2. Bioremediation
Bioremediation uses microorganisms (e.g. yeast, fungi or bacte-ria) to degrade organic contaminants in soil, sludge and solidseither excavated or in situ. The microorganisms break down con-taminants by using them as a carbon source or cometabolizingthem with a food source.
Combining EK with bioremediation can be done with thepurpose of improving biodegradation by promoting transport ofnutrients such as nitrogen and phosphorus, and electron acceptors(Elektorowicz and Boeva, 1996; Lee et al., 2006; Wu et al., 2007;Lohner et al., 2008a,b; Ottosen et al., 2008; Schmidt et al., 2008;Xu et al., 2010). EK has also the potential to enhance bioremedia-tion of organic contaminants through control and movement ofboth contaminant and bacteria (DeFlaun and Condee, 1997; Lahlouet al., 2000; Wick et al., 2004; Olszanowski and Piechowiak, 2006;Shi et al., 2008b,c; Rocha et al., 2009), facilitating greater interac-tion and hence contaminant bioavailability (Wick et al., 2007).Enhancement techniques like bidirectional operation (Luo et al.,2005b) and an electrode matrix and a rotational operation modeshowed increases in the bioremediation rate of phenol (Luo et al.,2006). Reviews on the combination of bioremediation and EK canbe found in Wick (2009) and in Lohner et al. (2009).
Regarding organochlorines, it was found that constant electriccurrents caused large pH and moisture content changes due towater electrolysis and electroosmotic effects, with negativeimpacts on biodegradation parameters (enzyme activity andcontaminant mineralization) of PCP (Harbottle et al., 2009).Regularly reversed electric currents caused little change in pHand moisture content and led to more rapid contaminant mineral-ization, lower soil contaminant concentration and increased soilenzyme activity (except for soil immediately adjacent to theanode) (Harbottle et al., 2009).
The EK injection of benzoic acid cometabolite to enhance thebiodegradation of TCE was tested by Rabbi et al. (2000). Resultsshowed that EK biodegradation of TCE in clays may be practical,in particular for sites where traditional pump and treat technologyare ineffective.
There is some controversy about the impact of the electric fieldin the soils microbial communities. Some authors defend that theelectric field, if suitably applied, will not influence the compositionand physiology of microbial communities and hence not affecttheir potential to biodegrade contaminants (Wick et al., 2010).Other authors defend the contrary (Lear et al., 2007; Tiehm et al.,2009). A better awareness of the interactions between EKprocesses and microbial communities is needed.
5.3. Permeable reactive barriers
A permeable reactive barrier (PRB) is an in situ remediationmethod that combines a passive chemical or biological treatmentzone with subsurface fluid flow management. Treatment mediamay include zero-valent iron (Fe0), chelators, sorbents and alsobacteria to address a wide variety of ground-water contaminants.The contaminants are either degraded or retained in the barriermaterial, which may need to be replaced periodically.
A review on coupling EK and permeable reactive barriers can befound in Weng (2009), where the potential for in situ application ofthese remediation technologies and its ability to remove reactivecontaminants from low-permeability soil were recognized. Themain advantage of this integration is that it does not only removeorganochlorines from soil, but also convert these pollutants intoless toxic compounds through dechlorination.
5.3.1. Zero valent iron PRBThe mechanisms of TCE degradation in groundwater with elec-
trokinetics coupled with a zero valent iron (ZVI) PRB were investi-gated by Moon et al. (2005). Their results indicate that the rate ofreductive dechlorination of TCE was improved up to six times ofthat of a ZVI PRB alone. The most effective configuration of elec-trode and ZVI PRB for TCE removal was with the cathode installedat the hydraulic down-gradient (Moon et al., 2005).
In other research, a bench-scale flow-through Fe0 reactor col-umn with direct current was tested to increase the efficiency inTCE dechlorination (Roh et al., 2000). The tests were made withreal contaminated groundwater and the results showed that thecombination is highly effective in enhancing the rate of TCEdechlorination, cutting by tenfold the half-life time (Roh et al.,2000).
Chang and Cheng (2006) combined the EK process with zero va-lent metal (ZVM) to remediate PCE contaminated soils. ZVM in-stalled positions tested were: (i) around 5.0 cm away from theanode, (ii) in middle area and (iii) around 5.0 cm away from thecathode. The removal efficiency reached 99% and 90% in thepore-water and soil, respectively, after 10 d of treatment. Thezero-valent zinc performed better the PCE degradation than ZVI(Chang and Cheng, 2006).
A permeable reactive barrier filled with reactive Pd/Fe particleswas installed between anode and cathode to test the dechlorina-tion of PCP coupled with electrokinetics (Li et al., 2011). The mech-anism for PCP removal was the EK movement of PCP into the PRBcompartment, the complete dechlorination of PCP to phenol by Pd/Fe and the subsequent removal of phenol by electroosmosis (Liet al., 2011).
In other bench-scale research, surfactant-enhanced electroki-netics was coupled with a PRB composed of microscale Pd/Fe totreat a HCB spiked soil (Wan et al., 2010). A nonionic surfactant,Triton X-100, was used as the solubility-enhancing agent. Resultsshowed that the HCB removal was generally increased by a factor
1084 H.I. Gomes et al. / Chemosphere 87 (2012) 1077–1090
114

Author's personal copy
of 4 by EK coupled with PRB compared with EK alone (60% vs. 13%).In the EK–PRB system, HCB was removed from soil through severalsequential processes: the movement driven by EOF in the anode,the complete adsorption/degradation by the Pd/Fe particles andthe consequent movement by EOF and probable electrochemicalreactions in the cathode (Wan et al., 2010).
5.3.2. Lasagna processA different approach is proposed in an in situ electroremediation
technology called Lasagna™ (Ho et al., 1995; Ho et al., 1997,1999a,b) because of the layering of electrodes and treatment zonesfor sorption, immobilization and/or degradation of contaminants.It was used for cleaning up TCE contaminated low-permeabilitysoils. TCE in the soils was transported into carbon containing treat-ment zones where it was trapped. Over 98% of TCE was removedfrom the contaminated soils, with most samples showing a re-moval of over 99% (Ho et al., 1999a). Field scale applications haveshown good results in remediation of TCE contaminated clay soilsafter 2-year operation (Athmer, 2004). This technology was alsoapplied to 2,4-dichlorophenoxyacetic acid (2,4-D) at bench-scale(Jackman et al., 2001). Under a current density of 0.89 A m2, thecontaminant moved towards a microorganism active treatmentzone (Burkholderia spp. RASC c2), where it was biodegraded. Re-sults showed that it is possible to move an organic contaminantinto a biodegradative zone for mineralization in situ.
5.3.3. PRBs of different reactive mediaIn a bench-scale study, TCE and Cd were successfully removed
from spiked Kimpo clay, using atomizing slag (composites ofCaO, FeO and Fe2O3) as an inexpensive PRB material coupled withelectrokinetics (Chung and Lee, 2007). Experimental resultsshowed the TCE concentrations of effluent solution through thePRB material were much lower than those of EK remediation alone.Some of the TCE passing through the PRB was dechlorinated by theatomizing slag, as shown by the chloride concentrations measured(Chung and Lee, 2007).
A surfactant assisted EK remediation (SAEK) process coupledwith carbon nanotubes (CNTs) barrier has been investigated for1,2-dichlorobenzene (DCB) removal (Yuan et al., 2009). The best re-sult (up to 76%) was achieved with sodium dodecyl sulfate (SDS) asprocessing fluid. The authors observed that removal of DCB wasmainly contributed by surface sorption on CNT rather than by EK(Yuan et al., 2009).
5.4. Zero valent iron nanoparticles
Research has shown that zero valent iron nanoparticles (nZVIs)are very effective for the transformation and detoxification of awide variety of common environmental contaminants such aschlorinated organic solvents, OP and PCBs (Zhang, 2003). Nanopar-ticles are traditionally injected under pressure and/or by gravity tothe contaminated plume where treatment is needed. However, thetransport of nZVI is normally limited by their aggregation and set-tlement (Tiraferri et al., 2008; Reddy and Karri, 2009; Tiraferri andSethi, 2009; Jiemvarangkul et al., 2011). The mobility of nZVI willbe less than a few meters under almost all conditions, so the pos-sibility of enhancing its transport through EK is very interesting.There is also a lot of potential in the application of nZVI to orga-nochlorines, given their high reactivity and the fact that it effec-tively dechlorinates these compounds into less toxic and morebiodegradable ones (He, 2007; Shih et al., 2009; Zhang et al.,2011). Table 6 summarizes the bench-scale experiments madewith EK and nZVI.
Reddy and Karri (2009) studied the enhanced delivery of nZVIamended with surfactant or cosolvent under different electricpotentials for the remediation of a low permeable kaolin soilspiked with PCP (1000 mg kg1 of dry soil). Results revealed thatthe iron concentrations in the soil increased with higher voltagegradient (2 V cm1) and operating duration (938 h). The transportof nZVI was limited by their aggregation, settlement and partialoxidation within the anode. PCP was partially reduced (40–50%)in all the experiments (Reddy and Karri, 2009).
Table 6Coupling of electrokinetic remediation and zero valent iron nanoparticles in bench-scale experiments.
Concentration and type of nZVI Matrix Targetcontaminant
Durationof test(s)
Electrolyte Voltagegradient(V cm1)
%Removalbestresults
Reference
5.0 mL of the diluted PV3A coated nZVI solution (460 mg L1) WhiteGeorgiakaoliniteclay
– 46 h 0.2 M NaCl 0.1 – Pamukcuet al.(2008)
Daily addition of 20 mL nZVI (1 vol.% of PAA-modified nano ironslurry) with a Fe concentration of 2.5 g L1 to the anode reservoir
Loamysand
– 6 d Simulatedgroundwater
1.0 – Yanget al.(2007)
20 mL d1 of PAA-modified Pd/Fe bimetallic nanoparticles slurry(4 g L1)
Spiked soil KNO3 6 d Simulatedgroundwater
1.0 99 Yanget al.(2008)
5 g L1 nZVI in 5% Igepal CA720 and 5 g L1 nZVI in 5% ethanol at theanode
Spikedkaolin
PCP 427;960 h
Deionizedwater
1.0 55 Reddyand Karri(2008b)
44.62 g of bare nZVI and 51,27 g in 120 mg L1 of Tween 80 Spikedsilica sand
PCE 100 h 0.01 M ofNa2CO3
1.0 76 Chenet al.(2010)
0.5 g L1 nZVI dispersed in 2% or 5% weight PAA 40/60 or100/200sands
– 10 d 7 or 20 mMof NaCl
0.55 and1.30
– Joneset al.(2010)
Nano iron dose = 0.75 g L1 into the anode reservoir (in test 1) orcathode reservoir (in test 2). Nano iron with a pulp density of87 wt.% was added to the mixture of 10 wt.% of soybean oil and3 wt.% of mixed surfactants (Span 80 and Tween 40) for thepreparation of emulsified nano scale zero valent iron
Spikedsandy soil
TCE 10 d Simulatedgroundwater
1.0 70 Yang andChang(2011)
H.I. Gomes et al. / Chemosphere 87 (2012) 1077–1090 1085
115

Author's personal copy
Chen et al. (2010) used nZVI with surfactant and EK for theremediation of PCE. Experiments were performed in a glass sand-box to simulate the transport and degradation of PCE in the aquifer.The results revealed that the PCE concentrations at the bottomlayer were higher than those at the mid and upper layers, and thatthe surfactant Tween 80 mobilized PCE in the aquifer. The degrada-tion tests showed that nZVI activity could be promoted by EK.Chlorinated byproducts were not detected, so PCE was completelydechlorinated (Chen et al., 2010).
More recently, Reddy et al. (2011a) also studied the transportand reactivity of bare nanoscale iron particles (NIPs) and lactatemodified NIP (LM-NIP) in kaolin spiked with dinitrotoluene(DNT) under applied electric potential. The highest DNT degrada-tion was achieved using LM-NIP and attributed to both NIP andEK. Their conclusions indicate that EK can enhance the deliveryof nanoscale iron particles in low permeability soils (Reddy et al.,2011a).
Yang and Yeh (2011) also tested the injection of emulsifiednanoscale zero valent iron (ENZVI) and EK remediation for treat-ment of a TCE spiked sandy soil. EK enhanced the transport of EN-ZVI in the porous media and EOF played a key role in removing TCEfrom the soil matrix to the cathode reservoir.
5.5. Phytoremediation
The coupling of EK and phytoremediation was used mainly forheavy metals: Cd, Cu and As (O’Connor et al., 2003), Pb and As(Lim et al., 2004); Cu and Zn (Zhou et al., 2007); Zn, Pb, Cu andCd (Aboughalma et al., 2008); Cd, Cu, Pb and Zn (Cang et al.,2011); Cd, Zn and Pb (Bi et al., 2011). An analysis on benefits andconstraints of the combination of these two remediation tech-niques was made by Bedmar et al. (2009) and it is an improved toolfor soil remediation under certain conditions such as low quanti-ties of heavy metals and when it is needed to restore soil functions.
Several studies on phytoremediation of organochlorine pesti-cides (Chuluun et al., 2009), chlorinated solvents (RTDF, 2005)and TCE (Meagher, 2000; Newman and Reynolds, 2004) are avail-able. A review on recent advances in phytoremediation for thetreatment of PCBs, including the development of transgenic plantsand associated bacteria, was published by Aken et al. (2010).
However, no reference was found in the literature on the use ofboth techniques on organic contaminants and more precisely onorganochlorines.
5.6. Ultrasonication
High power ultrasound relies on the phenomenon of cavitationto destroy contaminants such as PCBs, PAH and organochlorineswhich adsorb to the surface of soil particles, because of their inher-ent hydrophobicity (Collings et al., 2006).
Chung and Kamon (2005) obtained removal efficiencies in EKand ultrasonic process which were increased in 3.4% for Pb and5.9% for phenanthrene when compared with simple EK process.Similar tests were made to study and to compare the combining ef-fects of these two methods on the removal of the three persistentorganic pollutants HCB, phenanthrene and fluoranthene fromspiked kaolin (Pham et al., 2009). Two pair tests were conductedinto two experiments with different initial low (10 mg kg1) andhigh (500 mg kg1) concentrations. Results showed that, generally,EK-US have higher EOF, higher current and better performancethan EK alone. However, ultrasonic enhancement can increasethe removal rate only up to about 10% more. Among the threePOPs, HCB was the most difficult to treat because of its very stablestructure, while the other two PAHs were easier to remove (Phamet al., 2009). Removal efficiency decreased with increasing initialconcentration (Pham et al., 2009).
5.7. Full scale applications
Several full scale projects developed by Geokinetics’ and HMT’swere described by Lageman et al. (2005). Since contaminated sitescontain often a mixture of both inorganic and organic components,a combination of techniques was used: (i) EK recovery of inorganiccontamination and electroheated recovery of organic contamina-tion in combination with soil vapor extraction and low flowgroundwater extraction; (ii) electroheated and EK enhanced bio-degradation in combination with addition of nutrients and electrondonors or acceptors and (iii) EK containment and remediation ofpolluted sites and groundwater plumes (Lageman et al., 2005).
Table 7Current status, major advantages and possible disadvantages of coupling electrokinetics with other remediation technologies for organochlorines removal or treatment.
Remediationtechnologycoupled with EK
Currentstatus
Organochlorines tested Major advantages Possible disadvantages
Oxidation/reduction
Testeda HCB (Oonnittan et al., 2010), TCE (Yang and Liu,2001)
Destruction of organiccontaminants by oxidation.Applicability to mixedcontaminations
Depend on the oxidant/reductant used.Intermediate anions generated can changethe electrical current intensity
Bioremediation Testeda TCE (Rabbi et al., 2000), PCP (Harbottle et al.,2009)
Improve biodegradation withtransport of nutrients and electrondonnors
Adverse effect on microbial communitiesin soils
Permeablereactivebarrier (PRB)
Testeda,b TCE (Ho et al., 1999a,b; Roh et al., 2000; Moonet al., 2005; Chung and Lee, 2007); PCE (Changand Cheng, 2006), PCP (Li et al., 2011)
In situ application for low permeablesoils. Enhanced transport ofcontaminants towards the PRB
pH gradient generated by EK may affectsorption and degradation in the PRB
Zero valent ironnanoparticles(nZVIs)
Testeda TCE (Yang and Yeh, 2011), PCP (Reddy and Karri,2009), PCE (Chen et al., 2010)
Reduction of chlorinatedcompounds in situ. Enhanced nZVImobility with electric fields
Need to protect nZVI from oxidation priorto contact with contaminant. Toxicity ofintermediate compounds.
Phytoremediation Nottested
– Enhance bioavailability andtransport of contaminants to shootsand roots of plants
EK can affect plant growth (biomassproduction)
Ultrasonication Testeda HCB (Pham et al., 2009) Increase the volume flow rate andremoval efficiencies
Performance depends on the chemicalstability of contaminants
a Bench-scale tests.b Field application.
1086 H.I. Gomes et al. / Chemosphere 87 (2012) 1077–1090
116

Author's personal copy
In another case study, the site of a former silver factory in theNetherlands, severely polluted with chlorinated solvents, was trea-ted by electro-bioreclamation: heating soil and groundwater in thesource areas, combined with soil vapor extraction and low-yieldgroundwater pumping, and enhancing biodegradation in thegroundwater plume area. Two years of heating and 2.5 years ofbiodegradation resulted in near-complete removal of the contam-inants (Lageman and Godschalk, 2007).
5.8. Comparative analysis and discussion
A comparative analysis of EK coupled with other remediationtechnologies is presented in Table 7, identifying the technology, ifit has been tested or not, the organochlorines tested, and majoradvantages and possible disadvantages. Comparing with enhance-ment techniques, more research has been made on coupling electro-kinetics with other technologies, and even full-scale applicationswere tested. It is not possible to compare directly the differenttechnologies integrated with EK, since different experimental ap-proaches were used and the way these technologies act on contam-inants is also different. Further research is needed on technologieslike phytoremediation and to expand these applications to otherorganochlorine families, like PCBs for example, since most of thestudies were targeting CAH, CB and CP.
6. Conclusions
The main factors influencing the effectiveness of remediationtechnologies are the chemical properties of organochlorines,specifically their low water solubility and sorption to soil particles.To use EK remediation in these compounds, enhancement tech-niques and the integration with other technologies are needed,both to remove contaminants and to increase dechlorination.
Most of the research works analyzed are based on spikedkaolinite or model soils and the successful results obtained cannotalways be transferred directly to spiked soils or to soils sampled atpolluted sites. This is due to the variety of adsorption sites for orga-nochlorines present in homogeneous soils (organic and inorganic)not being present in kaolinite and also to the aging of contamina-tion. The relative rareness of data available for real contaminatedsoils may reflect the challenges involved in transferring technologyinto the field.
Further research is needed since technical and environmentalissues will require a careful evaluation for further full-scale imple-mentation. These include controlling side effects during treatment(such as anodic precipitation, oxidation of the conditioning agentand generation of toxic gases e.g., Cl2), as well as evaluating the po-tential ecotoxicological effects of the surfactants, co-solvents, oxi-dants or reductants used.
Although EK remediation has been used quite extensively, it hasnever been used to extract PCBs from soils neither enhanced norcoupled EK with other technologies. According to the latest re-search developments, there is a great potential to use electrokinet-ics coupled with nZVI to remediate PCBs and other organochlorinescontaminated soils and sediments.
Acknowledgments
This work has been funded by the European Regional Develop-ment Fund (ERDF) through COMPETE – Operational Programme forCompetitiveness Factors (OPCF), by Portuguese National fundsthrough ‘‘FCT – Fundação para a Ciência e a Tecnologia’’ underProject «PTDC/AGR AAM/101643/2008 NanoDC» and by FP7-PEO-PLE-IRSES-2010-269289-ELECTROACROSS.
References
Aboughalma, H., Bi, R., Schlaak, M., 2008. Electrokinetic enhancement onphytoremediation in Zn, Pb, Cu and Cd contaminated soil using potato plants.J. Environ. Sci. Health, A 43, 926–933.
Acar, Y.B., Alshawabkeh, A.N., 1993. Principles of electrokinetic remediation.Environ. Sci. Technol. 27, 2638–2647.
Acar, Y.B., Gale, R.J., Alshawabkeh, A.N., Marks, R.E., Puppula, S., Bricka, M., Parker, R.,1995. Electrokinetic remediation: basics and technology status. J. Hazard.Mater. 40, 117–137.
Agarwal, S., Cluxton, P., Kemper, M., Dionysiou, D.D., Al-Abed, S.R., 2008. Assessmentof the functionality of a pilot-scale reactor and its potential for electrochemicaldegradation of calmagite, a sulfonated azo-dye. Chemosphere 73, 837–843.
Aken, B.V., Correa, P.A., Schnoor, J.L., 2010. Phytoremediation of polychlorinatedbiphenyls: new trends and promises. Environ. Sci. Technol. 44, 2767–2776.
Alcántara, T., Pazos, M., Cameselle, C., Sanromán, M.A., 2008. Electrochemicalremediation of phenanthrene from contaminated kaolinite. Environ. Geochem.Health 30, 89–94.
Alcántara, M.T., Gómez, J., Pazos, M., Sanromán, M.A., 2010. Electrokineticremediation of PAH mixtures from kaolin. J. Hazard. Mater. 179, 1156–1160.
Alshawabkeh, A.N., 2009. Electrokinetic soil remediation: challenges andopportunities. Sep. Sci. Technol. 44, 2171–2187.
Alshawabkeh, A.N., Sheahan, T.C., Wu, X., 2004. Coupling of electrochemical andmechanical processes in soils under DC fields. Mech. Mater. 36, 453–465.
Athmer, C., 2004. In-situ remediation of TCE in clayey soils. Soil Sediment Contam.13, 381–390.
ATSDR, 2011. Toxicological Profiles. Agency for Toxic Substances and DiseaseRegistry. US Department of Health and Human Services, Atlanta, Georgia.
Baek, K., Kim, D.-H., Park, S.-W., Ryu, B.-G., Bajargal, T., Yang, J.-S., 2009. Electrolyteconditioning-enhanced electrokinetic remediation of arsenic-contaminatedmine tailing. J. Hazard. Mater. 161, 457–462.
Bedmar, M.C.L., Pérez-Sanz, A., Martínez-Iñigo, M.J., Benito, A.P., 2009. Influence ofcoupled electrokinetic – phytoremediation on soil remediation. In: Reddy, K.R.,Cameselle, C. (Eds.), Electrochemical Remediation Technologies for PollutedSoils, Sediments and Groundwater. John Wiley & Sons, Inc., Hoboken, NewJersey, pp. 417–433.
Bi, R., Schlaak, M., Siefert, E., Lord, R., Connolly, H., 2011. Influence of electrical fields(AC and DC) on phytoremediation of metal polluted soils with rapeseed(Brassica napus) and tobacco (Nicotiana tabacum). Chemosphere 83, 318–326.
Cang, L., Wang, Q.Y., Zhou, D.M., Xu, H., 2011. Effects of electrokinetic-assistedphytoremediation of a multiple-metal contaminated soil on soil metalbioavailability and uptake by Indian mustard. Sep. Purif. Technol. 79, 246–253.
Chang, J.-H., Cheng, S.-F., 2006. The remediation performance of a specificelectrokinetics integrated with zero-valent metals for perchloroethylenecontaminated soils. J. Hazard. Mater. B 131, 153–162.
Chang, J.-H., Liao, Y.-C., 2006. The effect of critical operational parameters on thecirculation-enhanced electrokinetics. J. Hazard. Mater. B 129, 186–193.
Chang, J.-H., Qiang, Z., Huang, C.-P., 2006. Remediation and stimulation of selectedchlorinated organic solvents in unsaturated soil by a specific enhancedelectrokinetics. Colloids Surf., A 287, 86–93.
Chang, J.-H., Qiang, Z., Huang, C.-P., Ellis, A.V., 2009. Phenanthrene removal inunsaturated soils treated by electrokinetics with different surfactants—TritonX-100 and rhamnolipid. Colloids Surf., A 348, 157–163.
Chen, S.-S., Huang, Y.-C., Kuo, T.-Y., 2010. The remediation of perchloroethylenecontaminated groundwater by nanoscale iron reactive barrier integrated withsurfactant and electrokinetics. Ground Water Monit. R 30, 90–98.
Chuluun, B., Iamchaturapatr, J., Rhee, J.S., 2009. Phytoremediation oforganophosphorus and organochlorine pesticides by Acorus gramineus.Environ. Eng. Res. 14, 226–236.
Chung, H.I., Kamon, M., 2005. Ultrasonically enhanced electrokinetic remediationfor removal of Pb and phenanthrene in contaminated soils. Eng. Geol. 77, 233–242.
Chung, H.I., Lee, M., 2007. A new method for remedial treatment of contaminatedclayey soils by electrokinetics coupled with permeable reactive barriers.Electrochim. Acta 52, 3427–3431.
Colacicco, A., Gioannis, G.D., Muntoni, A., Pettinao, E., Polettini, A., Pomi, R., 2010.Enhanced electrokinetic treatment of marine sediments contaminated by heavymetals and PAHs. Chemosphere 81, 46–56.
Collings, A.F., Farmer, A.D., Gwan, P.B., Pintos, A.P.S., Leo, C.J., 2006. Processingcontaminated soils and sediments by high power ultrasound. Miner. Eng. 19,450–453.
Cong, Y., Ye, Q., Wu, Z., 2005. Electrokinetic behaviour of chlorinated phenols in soiland their electrochemical degradation. Process Saf. Environ. 83, 178–183.
DeFlaun, M.F., Condee, C.W., 1997. Electrokinetic transport of bacteria. J. Hazard.Mater. 55, 263–277.
EEA, 2007. Progress in Management of Contaminated Sites. European EnvironmentAgency, Report CSI 015. Copenhagen, Denmark.
Elektorowicz, M., Boeva, V., 1996. Electrokinetic supply of nutrients in soilbioremediation. Environ. Technol. 17, 1339–1349.
Ferreira, C., Ribeiro, A., Ottosen, L., 2005. Effect of major constituents of MSW fly ashduring electrodialytic remediation of heavy metals. Sep. Sci. Technol. 40, 2007–2019.
Gómez, J., Alcántara, M.T., Pazos, M., Sanromán, M.A., 2009. A two-stage processusing electrokinetic remediation and electrochemical degradation for treatingbenzo[a]pyrene spiked kaolin. Chemosphere 74, 1516–1521.
H.I. Gomes et al. / Chemosphere 87 (2012) 1077–1090 1087
117

Author's personal copy
Gonzini, O., Plaza, A., Palma, L.D., Lobo, M.C., 2010. Electrokinetic remediation ofgasoil contaminated soil enhanced by rhamnolipid. J. Appl. Electrochem. 40,1239–1248.
Hanberg, A., 1996. Toxicology of environmentally persistent chlorinated organiccompounds. Pure Appl. Chem. 68, 1791–1799.
Hansen, H.K., Ottosen, L.M., Pedersen, A.J., Villumsen, A., 2001. Speciation andmobility of cadmium in straw and wood combustion fly ash. Chemosphere 45,123–128.
Hansen, H.K., Ribeiro, A.B., Mateus, E.P., Ottosen, L.M., 2007. Diagnostic analysis ofelectrodialysis in mine tailing materials. Electrochim. Acta 52, 3406–3411.
Harbottle, M.J., Lear, G., Sills, G.C., Thompson, I.P., 2009. Enhanced biodegradation ofpentachlorophenol in unsaturated soil using reversed field electrokinetics. J.Environ. Manage. 90, 1893–1900.
He, F., 2007. Preparation, Characterization, and Applications of Polysaccharide-Stabilized Metal Nanoparticles for Remediation of Chlorinated Solvents in Soilsand Groundwater. PhD thesis. Auburn University, Auburn, Alabama, p. 277.
Ho, S.V., Sheridan, P.W., Athmer, C.J., Heitkamp, M.A., Brackin, J.M., Weber, D.,Brodsky, P.H., 1995. Integrated in situ soil remediation technology: the Lasagnaprocess. Environ. Sci. Technol. 29, 2528–2534.
Ho, S.V., Athmer, C.J., Sheridan, P.W., Shapiro, A.P., 1997. Scale-up aspects of the‘‘Lasagna’’ process for in situ soil decontamination. J. Hazard. Mater. 55, 39–60.
Ho, S.V., Athmer, C., Sheridan, P.W., Hughes, B.M., Orth, R., McKenzie, D., Brodsky,P.H., Shapiro, A., Thornton, R., Salvo, J., Schultz, D., Landis, R., Griffith, R.,Shoemaker, S., 1999a. The Lasagna technology for in situ soil remediation. 1.Small field test. Environ. Sci. Technol. 33, 1086–1091.
Ho, S.V., Athmer, C., Sheridan, P.W., Hughes, B.M., Orth, R., McKenzie, D., Brodsky,P.H., Shapiro, A., Sivavec, T.M., Salvo, J., Schultz, D., Landis, R., Griffith, R.,Shoemaker, S., 1999b. The Lasagna technology for in situ soil remediation. 2.Large field test. Environ. Sci. Technol. 33, 1092–1099.
Isosaari, P., Piskonen, R., Ojala, P., Voipio, S., Eilola, K., Lehmus, E., Itavaara, M., 2007.Integration of electrokinetics and chemical oxidation for the remediation ofcreosote-contaminated clay. J. Hazard. Mater. 144, 538–548.
Jackman, S.A., Maini, G., Sharman, A.K., Sunderland, G., Knowles, C.J., 2001.Electrokinetic movement and biodegradation of 2,4-dichlorophenoxyaceticacid in silt soil. Biotechnol. Bioeng. 74, 40–48.
Jensen, P.E., Ferreira, C.M.D., Hansen, H.K., Rype, J.-U., Ottosen, L.M., Villumsen, A.,2010. Electroremediation of air pollution control residues in a continuousreactor. J. Appl. Electrochem. 40, 1173–1181.
Jiemvarangkul, P., Zhang, W.X., Lien, H.L., 2011. Enhanced transport ofpolyelectrolyte stabilized nanoscale zero-valent iron (nZVI) in porous media.Chem. Eng. J. 170, 482–491.
Jin, S., Fallgren, P.H., 2010. Electrically induced reduction of trichloroethene in clay.J. Hazard. Mater. 173, 200–204.
Jiradecha, C., Urgun-Demirtas, M., Pagilla, K., 2006. Enhanced electrokineticdissolution of naphthalene and 2,4-DNT from contaminated soils. J. Hazard.Mater. 136, 61–67.
Jones, E.H., Reynolds, D.A., Wood, A.L., Thomas, D.G., 2010. Use of electrophoresis fortransporting nano-iron in porous media. Ground Water 49, 172–183.
Karagunduz, A., 2009. Electrokinetic transport of chlorinated organic pesticides. In:Reddy, K.R., Cameselle, C. (Eds.), Electrochemical Remediation Technologies forPolluted Soils, Sediments and Groundwater. John Wiley & Sons, Inc., Hoboken,New Jersey, pp. 235–248.
Karagunduz, A., Gezer, A., Karasuloglu, G., 2007. Surfactant enhanced electrokineticremediation of DDT from soils. Sci. Total Environ. 385, 1–11.
Kaya, A., Yukselen, Y., 2005. Zeta potential of soils with surfactants and its relevanceto electrokinetic remediation. J. Hazard. Mater. B 120, 119–126.
Khodadoust, A.P., Reddy, K.R., Maturi, K., 2004. Removal of nickel and phenanthrenefrom kaolin soil using different extractants. Environ. Eng. Sci. 21, 691–704.
Kim, J., Lee, K., 1999. Effects of electric field directions on surfactant enhancedelectrokinetic remediation of diesel-contaminated sand column. J. Environ. Sci.Health, A 34, 863–877.
Kim, S.-S., Han, S.-J., Cho, Y.-S., 2002. Electrokinetic remediation strategyconsidering ground strata: a review. Geosci. J. 6, 57–75.
Kim, W.-S., Kim, S.-O., Kim, K.-W., 2005. Enhanced electrokinetic extraction of heavymetals from soils assisted by ion exchange membranes. J. Hazard. Mater. B 118,93–102.
Kim, J.-H., Han, S.-J., Kim, S.-S., Yang, J.-W., 2006. Effect of soil chemical propertieson the remediation of phenanthrene-contaminated soil by electrokinetic-Fenton process. Chemosphere 63, 1667–1676.
Kim, J.H., Kim, S.S., Yang, J.W., 2007. Role of stabilizers for treatment of clayey soilcontaminated with phenanthrene through electrokinetic-Fenton process—someexperimental evidences. Electrochim. Acta 53, 1663–1670.
Kim, J.-H., Kim, J.Y., Kim, S.-S., 2009. Effect of H2SO4 and HCl in the anode purgingsolution for the electrokinetic-Fenton remediation of soil contaminated withphenanthrene. J. Environ. Sci. Health, A 44, 1111–1119.
Kim, B.-K., Baek, K., Ko, S.-H., Yang, J.-W., 2011. Research and field experiences onelectrokinetic remediation in South Korea. Sep. Purif. Technol. 79, 116–123.
Ko, S.-O., Schlautman, M.A., Carraway, E.R., 2000. Cyclodextrin-enhancedelectrokinetic removal of phenanthrene from a model clay soil. Environ. Sci.Technol. 4, 1535–1541.
Kolosov, A.Y., Popov, K.I., Shabanova, N.A., Artem’eva, A.A., Kogut, B.M., Frid, A.S.,Zel’venskii, V.Y., Urinovich, E.M., 2001. Electrokinetic removal of hydrophobicorganic compounds from soil. Russ. J. Appl. Chem. 74, 631–635.
Lageman, R., Godschalk, M.S., 2007. Electro-bioreclamation: a combination of in situremediation techniques proves successful at a site in Zeist, the Netherlands.Electrochim. Acta 52, 3449–3453.
Lageman, R., Pool, W., Seffinga, G.A., 1989. Electro-reclamation. Chem. Ind. 18, 585–590.
Lageman, R., Clarke, R.L., Pool, W., 2005. Electro-reclamation, a versatile soilremediation solution. Eng. Geol. 77, 191–201.
Lahlou, M., Harms, H., Springael, D., Ortega-Calvo, J.-J., 2000. Influence of soilcomponents on the transport of polycyclic aromatic hydrocarbon-degradingbacteria through saturated porous media. Environ. Sci. Technol. 34, 3649–3656.
Lear, G., Harbottle, M.J., Sills, G., Knowles, C.J., Semple, K.T., Thompson, I.P., 2007.Impact of electrokinetic remediation on microbial communities within PCPcontaminated soil. Environ. Pollut. 146, 139–146.
Lee, H.-H., Yang, J.-W., 2000. A new method to control electrolytes pH by circulationsystem in electrokinetic soil remediation. J. Hazard. Mater. B 77, 227–240.
Lee, G., Ro, H., Lee, S., Lee, S., 2006. Electrokinetically enhanced transport of organicand inorganic phosphorus in a low permeability soil. Geosci. J. 10, 85–89.
Lee, Y.J., Han, H., Kim, S.H., Yang, J.W., 2009. Combination of electrokineticseparation and electrochemical oxidation for acid dye removal from soil. Sep.Sci. Technol. 44, 2455–2469.
Li, T., Yuan, S., Wan, J., Lin, L., Long, H., Wu, X., Lu, X., 2009. Pilot-scale electrokineticmovement of HCB and Zn in real contaminated sediments enhanced withhydroxypropyl-b-cyclodextrin. Chemosphere 76, 1226–1232.
Li, T., Guo, S., Wu, B., Li, F., Niu, Z., 2010a. Effect of electric intensity on the microbialdegradation of petroleum pollutants in soil. J. Environ. Sci. 22, 1381–1386.
Li, T., Yuan, S., Wan, J., Lu, X., 2010b. Hydroxypropyl-beta-cyclodextrin enhancedelectrokinetic remediation of sediment contaminated with HCB and heavymetals. J. Hazard. Mater. 176, 306–312.
Li, Z., Yuan, S., Wan, J., Long, H., Tong, M., 2011. A combination of electrokinetics andPd/Fe PRB for the remediation of pentachlorophenol-contaminated soil. J.Contam. Hydrol. 124, 99–107.
Lim, J.-M., Salido, A.L., Butcher, D.J., 2004. Phytoremediation of lead usingIndian mustard (Brassica juncea) with EDTA and electrodics. Microchem. J.76, 3–9.
Lima, A.T., Kleingeld, P.J., Heister, K., Loch, J.P.G., 2011. Removal of PAHs fromcontaminated clayey soil by means of electro-osmosis. Sep. Purif. Technol. 79,221–229.
Lohner, S.T., Katzoreck, D., Tiehm, A., 2008a. Electromigration of microbial electronacceptors and nutrients: (I) transport in synthetic media. J. Environ. Sci. Health,A 43, 913–921.
Lohner, S.T., Katzoreck, D., Tiehm, A., 2008b. Electromigration of microbial electronacceptors and nutrients: (II) transport in groundwater. J. Environ. Sci. Health, A43, 922–925.
Lohner, S.T., Tiehm, A., Jackman, S.A., Carter, P., 2009. Coupling electrokinetics to thebioremediation of organic contaminants: applied aspects. In: Reddy, K.R.,Cameselle, C. (Eds.), Electrochemical Remediation Technologies for PollutedSoils, Sediments and Groundwater. John Wiley & Sons, Inc., Hoboken, NewJersey, pp. 389–416.
Lu, X., Yuan, S., 2009. Electrokinetic removal of chlorinated organic compounds. In:Reddy, K.R., Cameselle, C. (Eds.), Electrochemical Remediation Technologies forPolluted Soils, Sediments and Groundwater. John Wiley & Sons, Inc., Hoboken,New Jersey, pp. 219–234.
Luo, Q., Zhang, X., Wang, H., Qian, Y., 2005a. Mobilization of phenol anddichlorophenol in unsaturated soils by non-uniform electrokinetics.Chemosphere 59, 1289–1298.
Luo, Q., Zhang, X., Wang, H., Qian, Y., 2005b. The use of non-uniform electrokineticsto enhance in situ bioremediation of phenol-contaminated soil. J. Hazard.Mater. B 121, 187–194.
Luo, Q., Wang, H., Zhang, X., Fan, X., Qian, Y., 2006. In situ bioelectrokineticremediation of phenol-contaminated soil by use of an electrode matrix and arotational operation mode. Chemosphere 64, 415–422.
Lysenko, L.L., Mishchuk, N.A., 2009. Electrohydrodynamic method of pH regulationat soil decontamination. Colloids Surf., A 333, 59–66.
Ma, J.W., Wang, F.Y., Huang, Z.H., Wang, H., 2010. Simultaneous removal of 2,4-dichlorophenol and Cd from soils by electrokinetic remediation combined withactivated bamboo charcoal. J. Hazard. Mater. 176, 715–720.
Maini, G., Sharman, A.K., Knowles, C.J., Sunderland, G., Jackman, S.A., 2000.Electrokinetic remediation of metals and organics from historicallycontaminated soil. J. Chem. Technol. Biotechnol. 75, 657–664.
Mateus, E.P., Zrostlíková, J., Silva, M.D.R.G.d., Ribeiro, A.B., Marriott, P.J., 2010.Electrokinetic removal of creosote from treated timber waste: a comprehensivegas chromatographic view. J. Appl. Electrochem. 40 (0), 1183–1193.
Maturi, K., Reddy, K.R., 2006. Simultaneous removal of organic compounds andheavy metals from soils by electrokinetic remediation with a modifiedcyclodextrin. Chemosphere 63, 1022–1031.
Meagher, R.B., 2000. Phytoremediation of toxic elemental and organic pollutants.Curr. Opin. Plant Biol. 3, 153–162.
Mishchuk, N., Kornilovich, B., Klishchenko, R., 2007. PH regulation as a method ofintensification of soil electroremediation. Colloids Surf., A 306, 171–179.
Moermond, C.T.A., 2007. Bioaccumulation of Persistent Organic Pollutants fromFloodplain Lake Sediments: Linking Models to Measurements. WageningenUniversity, Wageningen, The Netherlands.
Moon, J.-W., Moon, H.-S., Kim, H., Roh, Y., 2005. Remediation of TCE-contaminatedgroundwater using zero valent iron and direct current: experimental resultsand electron competition model. Environ. Geol. 48, 805–817.
Mulligan, C.N., 2009. Recent advances in the environmental applications ofbiosurfactants. Curr. Opin. Colloid Int. 14, 372–378.
Mulligan, C.N., Yong, R.N., Gibbs, B.F., 2001. Surfactant-enhanced remediation ofcontaminated soil: a review. Eng. Geol. 60, 371–380.
1088 H.I. Gomes et al. / Chemosphere 87 (2012) 1077–1090
118

Author's personal copy
Murillo-Rivera, B., Labastida, I., Barron, J., Oropeza-Guzman, M.T., Gonzalez, I.,Teutli-Leon, M.M.M., 2009. Influence of anolyte and catholyte composition onTPHs removal from low permeability soil by electrokinetic reclamation.Electrochim. Acta 54, 2119–2124.
Newman, L.A., Reynolds, C.M., 2004. Phytodegradation of organic compounds. Curr.Opin. Biotechnol. 15, 225–230.
Niqui-Arroyo, J.-L., Ortega-Calvo, J.-J., 2007. Integrating biodegradation andelectroosmosis for the enhanced removal of polycyclic aromatic hydrocarbonsfrom creosote-polluted soils. J. Environ. Qual. 36, 1444–1451.
Niqui-Arroyo, J.-L., Bueno-Montes, M., Posada-Baquero, R., Ortega-Calvo, J.-J., 2006.Electrokinetic enhancement of phenanthrene biodegradation in creosote-polluted clay soil. Environ. Pollut. 142, 326–332.
Nystroem, G.M., Ottosen, L., Villumsen, A., 2005. Electrodialytic removal of Cu, Zn,Pb and Cd from harbour sediment: influences of changing experimentalconditions. Environ. Sci. Technol. 38, 2906–2911.
O’Connor, C.S., Lepp, N.W., Edwards, R., Sunderland, G., 2003. The combined use ofelectrokinetic remediation and phytoremediation to decontaminate metal-polluted soils: a laboratory-scale feasibility. Environ. Monit. Assess. 84, 141–158.
Olszanowski, A., Piechowiak, K., 2006. The use of an electric field to enhancebacterial movement and hydrocarbon biodegradation in soils. Polish J. Environ.Stud. 15, 303–309.
Oonnittan, A., Shrestha, R.A., Sillanpää, M., 2009a. Effect of cyclodextrin on theremediation of hexachlorobenzene in soil by electrokinetic Fenton process. Sep.Purif. Technol. 64, 314–320.
Oonnittan, A., Shrestha, R.A., Sillanpää, M., 2009b. Removal of hexachlorobenzenefrom soil by electrokinetically enhanced chemical oxidation. J. Hazard. Mater.162, 989–993.
Oonnittan, A., Isosaari, P., Sillanpää, M., 2010. Oxidant availability in soil and itseffect on HCB removal during electrokinetic Fenton process. Sep. Purif. Technol.76, 146–150.
Oostdam, J.V., Donaldson, S.G., Feeley, M., Arnold, D., Ayotte, P., Bondy, G., Chan, L.,Dewaily, E., Furgal, C.M., Kuhnlein, H., Loring, E., Muckle, G., Myles, E., Receveur,O., Tracy, B., Gill, U., Kalhok, S., 2005. Human health implications ofenvironmental contaminants in Artic Canada: a review. Sci. Total Environ.351–352, 165–246.
Ottosen, L.M., Hansen, H.K., 1992. Electrokinetic Cleaning of Heavy Metal PollutedSoil. Internal Report. Technical University of Denmark, Denmark. p. 9.
Ottosen, L.M., Hansen, H.K., Laursen, S., Villumsen, A., 1997. Electrodialyticremediation of soil polluted with copper from wood preservation industry.Environ. Sci. Technol. 31, 1711–1715.
Ottosen, L.M., Pedersen, A.J., Ribeiro, A.B., Hansen, H.K., 2005. Case study on thestrategy and application of enhancement solutions to improve remediation ofsoils contaminated with Cu, Pb and Zn by means of electrodialysis. Eng. Geol.77, 317–329.
Ottosen, L.M., Christensen, I.V., Rörig-Dalgård, I., Jensen, P.E., Hansen, H.K., 2008.Utilization of electromigration in civil and environmental engineering –processes, transport rates and matrix changes. J. Environ. Sci. Health, A 43,795–809.
Page, M.M., Page, C.L., 2002. Electroremediation of contaminated soils. J. Environ.Eng. – ASCE 128, 208–219.
Pamukcu, S., Wittle, J.K., 1992. Electrokinetic removal of selected heavy metals fromsoil. Environ. Prog. 11, 241–250.
Pamukcu, S., Hannum, L., Wittle, J.K., 2008. Delivery and activation of nano-iron byDC electric field. J. Environ. Sci. Health, A 43, 934–944.
Park, J.-Y., Kim, S.-J., Lee, Y.-J., Baek, K., Yang, J.-W., 2005. EK-Fenton process forremoval of phenanthrene in a two-dimensional soil system. Eng. Geol. 77, 217–224.
Park, J.-Y., Lee, H.-H., Kim, S.-J., Lee, Y.-J., Yang, J.-W., 2007. Surfactant-enhancedelectrokinetic removal of phenanthrene from kaolinite. J. Hazard. Mater. 140,230–236.
Park, S.-W., Lee, J.-Y., Yang, J.-S., Kim, K.-J., Baek, K., 2009. Electrokinetic remediationof contaminated soil with waste-lubricant oils and zinc. J. Hazard. Mater. 169,1168–1172.
Pazos, M., Sanromán, M.A., Cameselle, C., 2006. Improvement in electrokineticremediation of heavy metal spiked kaolin with the polarity exchange technique.Chemosphere 62, 817–822.
Pazos, M., Rosales, E., Alcántara, T., Gómez, J., Sanromán, M.A., 2010.Decontamination of soils containing PAHs by electroremediation: a review. J.Hazard. Mater. 177, 1–11.
Pham, T.D., Shrestha, R.A., Virkutyte, J., Sillanpää, M., 2009. Combinedultrasonication and electrokinetic remediation for persistent organic removalfrom contaminated kaolin. Electrochim. Acta 54, 1403–1407.
Polcaro, A.M., Vacca, A., Mascia, M., Palmas, S., 2007. Electrokinetic removal of 2,6-dichlorophenol and diuron from kaolinite and humic acid–clay system. J.Hazard. Mater. 148, 505–512.
Probstein, R.F., Hicks, R.E., 1993. Removal of contaminants from soil by electricfields. Science 260, 498–530.
Puppala, S.K., Alshawabkeh, A.N., Acar, Y.B., Gale, R.J., Bricka, M., 1997. Enhancedelectrokinetic remediation of high sorption capacity soil. J. Hazard. Mater. 55,203–220.
Rabbi, M.F., Clark, B., Gale, R.J., Ozsu-Acar, E., Pardue, J., Jackson, A., 2000. In situ TCEbioremediation study using electrokinetic cometabolite injection. WasteManage. (Oxford) 20, 279–286.
Ranjan, R.S., Qian, Y., Krishnapillai, M., 2006. Effects of electrokinetics and cationicsurfactant cetyltrimethylammonium bromide [CTAB] on the hydrocarbonremoval and retention from contaminated soils. Environ. Technol. 27, 767–776.
Reddy, K., Karri, M.R., 2008a. Effect of oxidant dosage on integrated electrochemicalremediation of contaminant mixtures in soils. J. Environ. Sci. Health, A 43, 881–893.
Reddy, K.R., Karri, M.R., 2008b. Electrokinetic delivery of nanoiron amended withsurfactant and cosolvent in contaminated soil. In: International Conference onWaste Engineering and Management, Hong Kong.
Reddy, K.R., Karri, M.R., 2009. Effect of electric potential on nanoiron particlesdelivery for pentachlorophenol remediation in low permeability soil. In:Hamza, M., Shahien, M., El-Mossallamy, Y. (Ed.), Proceedings of the 17thInternational Conference on Soil Mechanics and Geotechnical Engineering: TheAcademia and Practice of Geotechnical Engineering, Alexandria, Egypt, pp.2312–2315.
Reddy, K.R., Cameselle, C., Ala, P., 2010. Integrated electrokinetic-soil flushing toremove mixed organic and metal contaminants. J. Appl. Electrochem. 40, 1269–1279.
Reddy, K.R., Darko-Kagy, K., Cameselle, C., 2011a. Electrokinetic-enhanced transportof lactate-modified nanoscale iron particles for degradation of dinitrotoluene inclayey soils. Sep. Purif. Technol. 79, 230–237.
Reddy, K.R., Darko-Kagya, K., Al-Hamdan, A.Z., 2011b. Electrokinetic remediation ofchlorinated aromatic and nitroaromatic organic contaminants in clay soil.Environ. Eng. Sci. 28, 405–413.
Reddy, K.R., Darko-Kagya, K., Al-Hamdan, A.Z., 2011c. Electrokinetic remediation ofpentachlorophenol contaminated clay soil. Water, Air, Soil Pollut. 221, 35–44.
Reible, D.D., Thibodeaux, L.J., 1999. Using Natural Processes to Define ExposureFrom Sediments. Risk Based Approach to the Evaluation and Management ofContaminated Sediments, Sediment Management Work Group Technical Paper.
Ribeiro, A.B., Mexia, J.T., 1997. A dynamic model for the electrokinetic removal ofcopper from polluted soil. J. Hazard. Mater. 56, 257–271.
Ribeiro, A.B., Rodríguez-Maroto, J.M., 2006. Electroremediation of heavy metal-contaminated soils. Processes and applications. In: Prasad, M.N.V., Sajwan, K.S.,Naidu, R. (Eds.), Trace Elements in the Environment: Biogeochemistry,Biotechnology and Bioremediation. Taylor & Francis, CRC Press, Florida, USA,pp. 341–368.
Ribeiro, A.B., Mateus, E.P., Ottosen, L.M., Bech-Nielsen, G., 2000. Electrodialyticremoval of Cu, Cr and As from chromated copper arsenate-treated timber waste.Environ. Sci. Technol. 34, 784–788.
Ribeiro, A.B., Rodríguez-Maroto, J.M., Mateus, E.P., Gomes, H., 2005. Removal oforganic contaminants from soils by an electrokinetic process: the case ofatrazine. Experimental and modeling. Chemosphere 59, 1229–1239.
Ribeiro, A.B., Mateus, E.P., Rodríguez-Maroto, J.-M., 2011. Removal of organiccontaminants from soils by an electrokinetic process: the case of molinate andbentazone. Experimental and modeling. Sep. Purif. Technol. 79, 193–203.
Rocha, U.N.D., Tótola, M.R., Pessoa, D.M.M., Júnior, J.T.A., Neves, J.C., Borges, A.C.,2009. Mobilisation of bacteria in a fine-grained residual soil by electrophoresis.J. Hazard. Mater. 161, 485–491.
Roh, Y., Lee, S.Y., Elless, M.P., Moon, H.-S., 2000. Electro-enhanced remediation oftrichloroethene-contaminated groundwater using zero-valent iron. J. Environ.Sci. Health, A 35, 1061–1076.
Rohrs, J., Ludwig, G., Rahner, D., 2002. Electrochemically induced reactions in soils –a new approach to the in-situ remediation of contaminated soils? Part 2:remediation experiments with a natural soil containing highly chlorinatedhydrocarbons. Electrochim. Acta 47, 1405–1414.
RTDF, 2005. Evaluation of Phytoremediation for Management of ChlorinatedSolvents in Soil and Groundwater. The Remediation TechnologiesDevelopment Forum, Phytoremediation of Organics Action Team, ChlorinatedSolvents Workgroup, United States Environmental Protection Agency.
Saichek, R.E., Reddy, K.R., 2003. Effect of pH control at the anode for theelectrokinetic removal of phenanthrene from kaolin soil. Chemosphere 21,273–287.
Saichek, R.E., Reddy, K.R., 2004. Evaluation of surfactants/cosolvents for desorption/solubilization of phenanthrene in clayey soils. Int. J. Environ. Stud. 61, 587–604.
Saichek, R.E., Reddy, K.R., 2005a. Electrokinetically enhanced remediation ofhydrophobic organic compounds in soils: a review. Crit. Rev. Environ. Sci.Technol. 35, 115–192.
Saichek, R.E., Reddy, K.R., 2005b. Surfactant-enhanced electrokinetic remediation ofpolycyclic aromatic hydrocarbons in heterogeneous subsurface environments. J.Environ. Eng. Sci. 4, 327–339.
Schmidt, C.A.B., Barbosa, M.C., Almeida, M.d.S.S.d., 2008. A laboratory feasibilitystudy on electrokinetic injection of nutrients on an organic, tropical, clayey soil.J. Hazard. Mater. 143, 655–661.
Shen, Z., Chen, X., Jia, J., Qu, L., Wang, W., 2007. Comparison of electrokinetic soilremediation methods using one fixed anode and approaching anodes. Environ.Pollut. 150, 193–199.
Shi, L., Harms, H., Wick, L.Y., 2008a. EOF stimulates the release of alginate-boundphenanthrene. Environ. Sci. Technol. 42, 2105–2110.
Shi, L., Muller, S., Harms, H., Wick, L.Y., 2008b. Effect of electrokinetic transport onthe vulnerability of PAH-degrading bacteria in a model aquifer. Environ.Geochem. Health 30, 177–182.
Shi, L., Muller, S., Harms, H., Wick, L.Y., 2008c. Factors influencing the electrokineticdispersion of PAH-degrading bacteria in a laboratory model aquifer. Appl.Microbiol. Biotechnol. 80, 507–515.
H.I. Gomes et al. / Chemosphere 87 (2012) 1077–1090 1089
119

Author's personal copy
Shih, Y.-H., Chen, Y.-C., Chen, M.-Y., Tai, Y.-T., Tso, C.-P., 2009. Dechlorination ofhexachlorobenzene by using nanoscale Fe and nanoscale Pd/Fe bimetallicparticles. Colloids Surf., A 332, 84–89.
Shrestha, R.A., Pham, T.D., Sillanpää, M., 2009. Remediation of chrysene fromcontaminated soil by enhanced electrokinetics. Int. J. Electrochem. Sci. 4, 1387–1394.
Thepsithar, P., Roberts, E.P.L., 2006. Removal of phenol from contaminated kaolinusing electrokinetically enhanced in situ chemical oxidation. Environ. Sci.Technol. 40, 6098–6103.
Tiehm, A., Lohner, S.T., Augenstein, T., 2009. Effects of direct electric current andelectrode reactions on vinyl chloride degrading microorganisms. Electrochim.Acta 54, 3453–3459.
Tiraferri, A., Sethi, R., 2009. Enhanced transport of zerovalent iron nanoparticles insaturated porous media by guar gum. J. Nanopart. Res. 11, 635–645.
Tiraferri, A., Chen, K.L., Sethi, R., Elimelech, M., 2008. Reduced aggregation andsedimentation of zero-valent iron nanoparticles in the presence of guar gum. J.Colloid Interface Sci 324, 71–79.
Tsai, T.-T., Sah, J., Kao, C.-M., 2010. Application of iron electrode corrosion enhancedelectrokinetic-Fenton oxidation to remediate diesel contaminated soils: alaboratory feasibility study. J. Hydrol. 380, 4–13.
USEPA, 2011. In Situ Oxidation: Overview. Technology Innovation and Field ServicesDivision, Washington, DC.
Virkutyte, J., Sillanpaa, M., 2007. The hindering effect of experimental strategies onadvancement of alkaline front and during electrokinetic lake sedimenttreatment. J. Hazard. Mater. 143, 673–681.
Virkutyte, J., Sillanpaa, M., Latostenmaa, P., 2002. Electrokinetic soil remediation –critical overview. Sci. Total Environ. 289, 97–121.
Wan, J., Yuan, S., Chen, J., Li, T., Lin, L., Lu, X., 2009. Solubility-enhancedelectrokinetic movement of hexachlorobenzene in sediments: a comparisonof cosolvent and cyclodextrin. J. Hazard. Mater. 166, 221–226.
Wan, J., Li, Z., Lu, X., Yuan, S., 2010. Remediation of a hexachlorobenzene-contaminated soil by surfactant-enhanced electrokinetics coupled withmicroscale Pd/Fe PRB. J. Hazard. Mater. 184, 184–190.
Wang, S., Mulligan, C.N., 2004. An evaluation of surfactant foam technology inremediation of contaminated soil. Chemosphere 53, 1079–1089.
Wang, J.-Y., Huang, X.-J., Kao, J.C.M., Stabnikova, O., 2007. Simultaneousremoval of organic contaminants and heavy metals from kaolin using anupward electrokinetic soil remediation process. J. Hazard. Mater. 144,292–299.
Weng, C.-H., 2009. Coupled electrokinetic–permeable reactive barriers. In: Reddy,K.R., Cameselle, C. (Eds.), Electrochemical Remediation Technologies forPolluted Soils, Sediments and Groundwater. John Wiley & Sons, Inc., Hoboken,New Jersey, pp. 483–504.
Wick, L.Y., 2009. Coupling electrokinetics to the bioremediation of organiccontaminants: principles and fundamental interactions. In: Reddy, K.R.,Cameselle, C. (Eds.), Electrochemical Remediation Technologies for PollutedSoils, Sediments and Groundwater. John Wiley & Sons, Inc., Hoboken, NewJersey, pp. 369–388.
Wick, L.Y., Mattle, P.A., Wattiau, P., Harms, H., 2004. Electrokinetic transport of PAH-degrading bacteria in model aquifers and soil. Environ. Sci. Technol. 38, 4596–4602.
Wick, L.Y., Shi, L., Harms, H., 2007. Electro-bioremediation of hydrophobic organicsoil-contaminants: a review of fundamental interactions. Electrochim. Acta 52,3441–3448.
Wick, L.Y., Buchholz, F., Fetzer, I., Kleinsteuber, S., Härtig, C., Shi, L., Miltner, A.,Harms, H., Pucci, G.N., 2010. Responses of soil microbial communities to weakelectric fields. Sci. Total Environ. 408, 4886–4893.
Wu, X., Alshawabkeh, A.N., Gent, D.B., Larson, S.L., Davis, J.L., 2007. Lactate transportin soil by DC Fields. J. Geotech. Geoenviron. 133, 1587–1596.
Xu, W., Wang, C., Liu, H., Zhang, Z., Sun, H., 2010. A laboratory feasibility study on anew electrokinetic nutrient injection pattern and bioremediation ofphenanthrene in a clayey soil. J. Hazard. Mater. 184, 798–804.
Yang, G.C.C., 2009. Electrokinetic – chemical oxidation/reduction. In: Reddy, K.R.,Cameselle, C. (Eds.), Electrochemical Remediation Technologies for PollutedSoils, Sediments and Groundwater. John Wiley & Sons, Inc., Hoboken, NewJersey, pp. 439–462.
Yang, G.C.C., Chang, Y.-I., 2011. Integration of emulsified nanoiron injection with theelectrokinetic process for remediation of trichloroethylene in saturated soil.Sep. Purif. Technol. 79, 278–284.
Yang, G.C.C., Liu, C.-Y., 2001. Remediation of TCE contaminated soils by in situ EK-Fenton process. J. Hazard. Mater. B 85, 317–331.
Yang, G.C.C., Yeh, C.-F., 2011. Enhanced nano-Fe3O4=S2O28 oxidation of
trichloroethylene in a clayey soil by electrokinetic. Sep. Purif. Technol. 79,264–271.
Yang, J.-W., Lee, Y.-J., Park, J.-Y., Kim, S.-J., Lee, J.-Y., 2005. Application of APG andCalfax 16L–35 on surfactant-enhanced electrokinetic removal of phenanthrenefrom kaolinite. Eng. Geol. 77, 243–251.
Yang, G.C.C., Tu, H.-C., Hung, C.-H., 2007. Stability of nanoiron slurries and theirtransport in the subsurface environment. Sep. Purif. Technol. 58, 166–172.
Yang, G.C.C., Hung, C.-H., Tu, H.-C., 2008. Electrokinetically enhanced removal anddegradation of nitrate in the subsurface using nanosized Pd/Fe slurry. J. Environ.Sci. Health, A 43, 945–951.
Yap, C.L., Gan, S., Ng, H.K., 2011. Fenton based remediation of polycyclic aromatichydrocarbons-contaminated soils. Chemosphere 83, 1414–1430.
Yeung, A., 2008. Electrokinetics for soil remediation. In: Yeung, A.T., Lo, I.M.C. (Eds.),Proceedings of the Ninth International Symposium on EnvironmentalGeotechnology and Global Sustainable Development, Hong Kong, 1–4 June2008, pp. 16–25.
Yeung, A.T., 2011. Milestone developments, myths, and future directions ofelectrokinetic remediation. Sep. Purif. Technol. 79, 124–132.
Yeung, A.T., Gu, Y.-Y., 2011. A review on techniques to enhance electrochemicalremediation of contaminated soils. J. Hazard. Mater. 195, 11–29.
Yeung, A.T., Hsu, C.-N., Menon, R.M., 1997. Physicochemical soil-contaminantinteractions during electrokinetic extraction. J. Hazard. Mater. 55, 221–237.
Yuan, C., Weng, C.-H., 2004. Remediating ethylbenzene-contaminated clayey soil bya surfactant-aided electrokinetic (SAEK) process. Chemosphere 57, 225–232.
Yuan, S., Tian, M., Lu, X., 2006. Electrokinetic movement of hexachlorobenzene inclayed soils enhanced by Tween 80 and b-cyclodextrin. J. Hazard. Mater. 137,1218–1225.
Yuan, S.-H., Wan, J.-Z., Lu, X.-H., 2007. Electrokinetic movement of multiplechlorobenzenes in contaminated soils in the presence of b-cyclodextrin. J.Environ. Sci. 19, 968–976.
Yuan, C., Hung, C.-H., Huang, W.-L., 2009. Enhancement with carbon nanotubebarrier on 1,2-dichlorobenzene removal from soil by surfactant-assistedelectrokinetic (SAEK) process – the effect of processing fluid. Sep. Sci.Technol. 44, 2284–2303.
Zhang, W.-X., 2003. Nanoscale iron particles for environmental remediation: anoverview. J. Nanopart. Res. 5, 323–332.
Zhang, M., He, F., Zhao, D., Hao, X., 2011. Degradation of soil-sorbedtrichloroethylene by stabilized zero valent iron nanoparticles: effects ofsorption, surfactants, and natural organic matter. Water Res. 45, 2401–2414.
Zhou, D.-M., Chen, H.-F., Cang, L., Wang, Y.-J., 2007. Ryegrass uptake of soil Cu/Zninduced by EDTA/EDDS together with a vertical direct-current electrical field.Chemosphere 67, 1671–1676.
1090 H.I. Gomes et al. / Chemosphere 87 (2012) 1077–1090
120

121
II.3. Enhanced transport and transformation of zerovalent nanoiron in
clay using direct electric current
(published in Water, Air and Soil Pollution)


Enhanced Transport and Transformation of ZerovalentNanoiron in Clay Using Direct Electric Current
Helena I. Gomes & Celia Dias-Ferreira &
Alexandra B. Ribeiro & Sibel Pamukcu
Received: 16 August 2012 /Accepted: 27 March 2013# Springer Science+Business Media Dordrecht 2013
Abstract One of the major obstacles to zerovalentiron nanoparticles (nZVI) application in soil andgroundwater remediation is the limited transport, espe-cially in low-permeability soils. In this study, directcurrent (constant potential of 5.0 V) was used to en-hance polymer-coated nZVI mobility in different po-rous media, including a bed of glass beads and kaolinclay. The tests were conducted using a modified elec-trophoretic cell and with nZVI concentrations typicalof field applications (4 g L−1). Experimental resultsindicate that the use of direct current can enhance thetransport of the polymer-modified nanoparticles whencompared with natural diffusion in low permeability or
surface neutral porous medium. The applied electricfield appeared to enhance the oxidation–reduction po-tential, creating a synergistic effect of nZVI usage withelectrokinetics. Aggregation of the nanoparticles, ob-served near the injection point, remained unresolved.
Keywords Zerovalent iron nanoparticles (nZVI) .
Enhanced transport . Direct current . Electrokinetics .
Electrochemical treatment
1 Introduction
Zerovalent iron nanoparticles (nZVI) are a convenient andemergent remediation technology that could provide cost-effective solutions to soil and groundwater contamination(USEPA 2011). These nanoparticles have large surfaceareas for rapid uptake and transformation of a large numberof environmental contaminants (Masciangioli and Zhang2003; Li et al. 2006). Nanoparticles provide more flexibil-ity for in situ applications than granular iron and canremain reactive for extended periods of time (>4–8 weeks)(Zhang 2003), showing characteristics of both iron oxides(sorbent) and metallic iron (reductant) (Sun et al. 2006). Infield applications, the nanoparticle–water slurry has beeninjected under pressure and/or by gravity into the contam-inated plume where treatment is needed; alternatively,nZVI can be transported by the flow of groundwater.However, in low porosity clay-rich media, it is challengingto achieve a uniform distribution of the slurry for effectiveremediation. Moreover, due to the relatively high ionicstrength of most groundwater, favorable for colloidal
Water Air Soil Pollut (2013) 224:1710DOI 10.1007/s11270-013-1710-2
Guest Editors: R Naidu, Euan Smith, MH Wong, MegharajMallavarapu, Nanthi Bolan, Albert Juhasz, and Enzo Lombi
This article is part of the Topical Collection on Remediation ofSite Contamination
H. I. Gomes (*) : S. PamukcuDepartment of Civil and Environmental Engineering, FritzEngineering Laboratory, Lehigh University, 13 E. PackerAvenue, Bethlehem, PA 18015-4729, USAe-mail: [email protected]
H. I. Gomes :A. B. RibeiroCENSE, Departamento de Ciências e Engenharia doAmbiente, Faculdade de Ciências e Tecnologia,Universidade Nova de Lisboa, 2829-516 Caparica, Portugal
H. I. Gomes : C. Dias-FerreiraInstituto Politécnico de Coimbra, CERNAS – ResearchCenter for Natural Resources, Environment and Society,Campus da Escola Superior Agrária de Coimbra, Bencanta,3040-316 Coimbra, Portugal
123

aggregation, bare nZVI has very limited mobility in thesubsurface (Phenrat et al. 2007; Yang et al. 2007; Kanelet al. 2008; Bennett et al. 2010; He et al. 2010; Combaet al. 2011).
It is possible to use electric fields to effectively movenanoparticles through the soil. Some work has alreadybeen done to test this possibility, such as the oneconducted by Pamukcu et al. (2008), in whichpolymer-coated nanoparticles were transported in kaolinby electrophoresis. Jones et al. (2010) also found thatnZVI could be transported through fine-grained sandwith rates comparable to those predicted by electroki-netic (EK) theory. More recently, modified or emulsifiednZVI have been tested together with EK to treatdinitrotoluene (Reddy et al. 2011), trichloroethylene(Yang and Yeh 2011), and pentachlorophenol (Reddyand Karri 2009; Yuan et al. 2012) in spiked kaolin.Experiments with coarse and fine sand and sodiumcarboxymethyl cellulose stabilized nZVI showed thatthe electrophoretic enhancement in transport comparedto diffusion was proportional to the applied current(Chowdhury et al. 2012).
The work presented here shows the advantages ofdirect electric current to overcome nZVI transport lim-itation while enhancing its activation in low permeabil-ity soils. Integrating both technologies, the role ofdirect electric current would be quite the opposite ofthe traditional one; instead of aiming at getting thecontaminants out, it is used to get nZVI into the soilfor in situ transformation and subsequent destruction ofthe contaminants. Bench-scale EK experiments in amodified electrophoretic cell were performed to inves-tigate if the direct current enhances the transport andtransformation of polymer-coated nZVI (Lin et al.2010; Jiemvarangkul et al. 2011). A methodologicaland analytical approach including expeditious tech-niques to measure pH, electrical conductivity, oxida-tion–reduction potential (ORP), and iron content fordetermining the fate of nZVI in the soil was alsodeveloped and tested.
2 Experimental
2.1 Chemicals
Deionized (DI) water purged with ultra purified gradenitrogen gas (N2) was used in all experiments. Thepurging was continued for at least 1 h so that the
dissolved oxygen would fall to a level below 20 %.nZVI were prepared though the reduction of FeSO4
7H2O (Fisher Chemicals) by sodium borohydride(HydrifinTM). The polymer coating of the nanoparticleswas done using two different methods. For high con-centration suspensions, bare nanoparticles were pre-pared and coated with polyacrylic acid, sodiumsalt—PAA Mw ∼2,100 (Polysciences, Inc.) at 30 %following Jiemvarangkul et al. (2011). For the transportexperiments, the freshly prepared suspension had a con-centration of 4 g L−1 of nZVI, made using the one-stepprocedure described by Kanel et al. (2008). The particlesize distribution of the nanoparticles had a mean valueof particle diameter 62.66±39.6 nm and the median sizewas 60.2 nm (Jiemvarangkul 2012).
The electrolyte solution of 1 mM NaCl (SigmaUltra) used in the electrode chambers was deoxygen-ated with N2 for a minimum of 1 h before use.
2.2 Expedite Methods
Suspensions of different concentrations of PAA-nZVI(0, 0.0001, 0.001, 0.01, 0.1, 0.2, 0.5, 1, 2.5, 5, 10, 10,and 50 g L−1) were prepared with 0.1 and 0.001 Msolutions of NaCl with deionized water. Initially, theORP, pH, and conductivity of these PAA-nZVI sus-pensions were measured with OAKTON bench-topmeters at time steps of 0, 4, 12, 24, and 48 h. This datawas used to generate calibration curves of relativenZVI concentration and reactivity. All the measure-ment probes (pH, conductivity, and ORP) wererecalibrated before each measurement.
2.3 Electrophoretic Cell
A commercially available electrophoretic cell (EP)(Econo-Submarine Gel Unit, model SGE-020), originallydesigned for molecular separation, was modified to un-dertake these experiments (Fig. 1). The cell is a rectan-gular translucent box with a square (20 cm×20 cm) sam-ple tray. There are two liquid chambers on each side ofthe sample tray (to hold the electrolyte reservoirs) and alid that covers the whole apparatus. The standard cell isequipped with platinum working electrodes. Auxiliaryelectrodes and a reference electrode were added to thesystem for this experiment. The modified EP cell alloweddirect measurement of the redox potential (ORP) in thetest medium by use of 0.25-mm diameter platinum wireelectrodes (auxiliary electrodes) fixed in the base plate of
1710, Page 2 of 12 Water Air Soil Pollut (2013) 224:1710
124

the sample tray at equal intervals (3 cm) with conductiveglue. Redox potential measurements were made in thewire electrodes, using an Ag/AgCl reference electrode(Accumet) with 4.0 M KCl solution (Fig. 1). The auxil-iary electrodes were labeled as E1–E5 starting from theanode electrode side of the tray (Fig. 1). An OAKTONpH probe (model WD-35805-18) was used for pH mea-surements in the test medium. Compressed fiberglasswool pads saturated and immersed in the electrolytesolutions on both sides of the tray were used to helptransport the migrating ions from the electrolyte into thetest medium and vice versa. The levels of the electrolyteliquids in the anode and cathode chambers were keptslightly below that of the test medium in the sample trayto avoid flooding, hence prevent preferential transport ofnZVI through a water pool at the top. The experimentalsetup also includes a power supply, wiring, and amultimeter (Fluke 179).
2.4 Direct Current Enhanced Transport Experiments
Different porosity and surface reactivity test media,ranging from glass beads (with diameter less than1 mm, previously sieved) to white Georgia kaoliniteclay (>2 μm) were used in the enhanced transportexperiments. Table 1 shows the various parameters ofthe experiments conducted in this study. A kaolin clay,previously characterized by Pamukcu et al. (2004), wasused in this study. It was prepared to a final watercontent of 60 %, and the mixture had bulk mass densityof 1.63 g cm−3 (Pamukcu et al. 2004).
The final pastes with different percentages of kaolinand glass beads were transferred to the tray of theelectrophoretic cell and spread uniformly over the wireelectrodes to an approximate thickness of 2 mm. PAA-nZVI were delivered using a syringe to inject 2 mL ofits homogenized suspension through a tube and spread-ing it into a precut channel into the clay paste betweenthe electrode ports E2 and E3 (Fig. 1).
A constant potential of 5.0 V was applied across theworking electrodes for 48 h. This low potential wasselected to remain within the linear range of the powersupply used and also to prevent excessive gas genera-tion. The constant potential of 5 V resulted in a currentdensity in the range of 1.12 to 7.24×10⁻⁴ mA cm−2. Thecell was kept in a dark location to prevent iron photo-oxidation. Two sets of control experiments wereconducted for each mixture under the same conditions,one without direct current application, and another withcurrent but without the injection of PAA-nZVI.
Measurements were taken periodically at the follow-ing times: 0.25, 0.50, 0.75, 1, 2, 3, 5, 6, 7, 10, 12, 15, 24,27, 32, 36, and 48 h. At each measurement, time volt-age, current, ORP, and pHweremonitored. At the end ofeach test, aqueous samples were collected from theelectrode chambers, and composite solid samples werecollected above the auxiliary wire electrodes E1-E5. ThenZVI injection point was not sampled. The solid andaqueous samples were analyzed for total iron and fer-rous iron concentrations. The iron was extracted fromthe matrix with the sodium dithionite-citrate-bicarbonate method (Mehra and Jackson 1960). Theiron analyses were conducted using a PerkinElmer
Fig. 1 Schematic diagramof the modified electropho-retic cell test setup
Water Air Soil Pollut (2013) 224:1710 Page 3 of 12, 1710
125

AAnalyst 200 flame atomic absorption spectroscopyand a Hach DR 2800 spectrophotometer (UV).
3 Results and Discussion
3.1 Expedited Methods
The PAA-nZVI concentrations in DI water showed goodfits to the linear regression analysis for conductivity for all,except for the measurements made at 12 h (Fig. 2). Thesecurves did not change with the concentration of PAA-nZVI for either of the two concentrations of NaCl (0.001and 0.1 M) in the suspension because the conductivity ofNaCl completely masked the nZVI present. Hence, theconductivity could not be used as an expedite method toassess the distribution trends of the iron nanoparticles inthe enhanced transport experiments.
There was no clear fit for the pH calibration curves inany of the tested suspensions, as the pH valuesmeasuredat different concentrations of PAA-nZVI were identicaland did not show meaningful changes in time (Fig. 3).
Since ORP measurements have been widely used asan indirect method to assess the results of injection ofnZVI for groundwater remediation (Elliott and Zhang2001; Henn and Waddill 2006; O’Hara et al. 2006), itwas expected that these values could be used as areliable indicator of nZVI concentration in the transport
experiments. It was challenging to obtain stable valuesof the ORP for the suspensions tested, with some read-ings taking more than 30 min. The results showed thatORP decreased with increasing concentration of nZVI.The relationships between these variables were highlynonlinear, suggesting a complex response function thatcannot be used reliably as a calibration curve (Fig. 4).
Examining the ORP variations in Fig. 4, the results fornZVI concentrations lower than 0.1 g L−1 suggest anapproximately linear relationship (with R2>0.90), consis-tent with a Nernstian dependence of this parameter onnZVI concentration. However, at higher concentrations,the ORP becomes relatively independent of the nZVIconcentration. Both observations are consistent with theresults of Shi et al. (2011) that used rotating disk electrodesin nZVI suspensions to assess the effects of nanoparticlesonORP. These researchers found that the response of ORPelectrodes to suspensions of nZVI is not a simple functionof iron nanoparticles concentration. At high concentrationsof nZVI, ORP is dominated by direct interaction betweenthe electrode and the nanoparticles, but this response isnonlinear and saturates with increased coverage of theelectrode surface with adsorbed particles (Shi et al.2011). At low nZVI concentrations, in aqueous suspen-sions, the measured ORP is a mixture of contributions thatincludes adsorbed nZVI and the dissolved H2 and the Fe
II
species that arise from corrosion of nZVI (Shi et al. 2011).Hence, the changes in ORP at low concentrations of nZVI
Table 1 Enhanced transport experimental program and conditions
Test Matrix Moisture PAAnZVI Average Average NotesNumber content added voltage current
(%) (mL) (V) (mA)
1 Kaolin 60 2 5.043 0.27 Enhanced transport of nZVI
2 Kaolin 60 2 – – Diffusion control test
3 Kaolin 60 – 4.918 0.24 Control test without nZVI
4 50 % glass beads 30 2 5.022 0.13 Enhanced transport
and 50 % kaolin of nZVI
5 50 % glass beads 30 2 – – Diffusion control
and 50 % kaolin test
6 75 % glass beads 30 2 5.097 0.10 Enhanced transport
and 25 % kaolin of nZVI
7 75 % glass beads 30 2 – – Diffusion control
and 25 % kaolin test
8 100 % glass beads 20 2 5.110 0.27 Enhanced transport of nZVI
9 100 % glass beads 20 2 – – Diffusion control test
10 100 % glass beads 20 – 5.248 0 10 Control test without nZVI
1710, Page 4 of 12 Water Air Soil Pollut (2013) 224:1710
126

127

after 15 h. In contrast, the presence of clay introduces adelay in ORP reduction possibly due to competingprocesses with iron reactivity such as sorption andelectroosmotic transport of nZVI.
In the diffusion control experiments, the ORP valuesmeasured in all the electrodes (E1 to E5) showed littlevariation and are characteristic of oxidizing conditions(Fig. 6). In the glass beads experiment, the influence ofthe PAA-nZVI injection in both E2 and E3 is evidentwith a difference of more than 100 mV when comparedto E1 and E4. In the experiments that included kaolin,
this drop in ORP was not significant. Compared to thespatial and temporal distribution of ORP in the diffusiontests, the electric field enhance the spending of the nZVIthrough faster transport and activation, while presenceof clay delay both processes.
3.2.2 pH
The initial pH in the different experiments varied from4.05 to 4.85 when kaolin was present and from 5.40 to
Fig. 4 ORP values mea-sured in the PAA-nZVI so-lution with 0.1 M NaCl
Fig. 5 ORP values measured at the auxiliary electrodes during the enhanced transport of nZVI tests in the different porous materials
1710, Page 6 of 12 Water Air Soil Pollut (2013) 224:1710

7.19 in the experiments with 100 % glass beads(Fig. 7). This pH is favorable to the nZVI oxidation.Other researchers have observed that low pH increasesdeposition of nZVI in clay, as well as nZVI aggregation(Kim et al. 2012). Therefore, the initial conditions inthe matrix were not advantageous to the mobility ofPAA-nZVI. The pH values measured during the exper-iments showed some fluctuation, with values between3 and 5.52, when some percentage of kaolin existed inthe matrix. The typical profile of a pH front increasingfrom the anode to the cathode in electrokinetic treat-ments was not observed in these tests (Fig. 7). Thisoutcome can be attributed to the low values of currentdensity applied, the absence of the physical conditionsfor fast transport of H+ and OH− from the electrodecompartments into the media, and possibly the pres-ence of iron that kept the pH low at the cathode side.Only in the experimental setups with 100 % glassbeads was the effect on pH from the injection of thePAA-nZVI noticed, particularly in E2, E3, and E4,where pH values higher than 8 were measured.
Normally, due to the electrolysis of water in theelectrode compartments that produce H+ ions at theanode and OH− ions at the cathode, the final solutionpH values would approach values around 2 and 12,respectively. The values observed in the experiments(Fig. 8) varied between 2.71 and 11.03 and are
consistent with those electrochemical reactions of wa-ter electrolysis. In the diffusion experiments, a smalldecrease in the pH in both anode and cathode compart-ment was observed. A possible explanation is the in-crease in H+ in solution due to the oxidation of Fe0.
3.2.3 Iron-Enhanced Transport
Since PAA-coated nanoparticles have negative zetapotential and tend to electrophoretically transport to-wards the anode (Yang et al. 2008), some of the earlierpreliminary experiments were conducted with the in-jection point located near the cathode (results notshown). In those experiments, it was observed thatthe electroosmotic flow (EOF) was counterbalancingthe electrophoretic transport of the nZVI. This is con-sistent with the predictions of Jones et al. (2010) thatthe EOF rates will increase, due to the large apparentzeta potentials existent in natural clays, counteractingelectrophoresis and reducing the overall migration rateof nZVI when compared with diffusion. Other re-searchers also tested different injection points in elec-trokinetic experiments to enhance nZVI transport.Experimental results showed that the cathode reservoirwas the most unsuitable injection spot, due to thealkaline environment that promotes the formation ofiron oxides at the surface on nZVI (Yang et al. 2008;
Fig. 6 ORP values measured in the electrodes during the diffusion tests in the different porous materials
Water Air Soil Pollut (2013) 224:1710 Page 7 of 12, 1710

Yang and Yeh 2011). On the other hand, it was alsofound that corrosion on nZVI was higher when injectedin the anode compartment, due to increased dissolvedoxygen and lower pH (Chang and Cheng 2006;
Chowdhury et al. 2012). Based on the observations ofthe preliminary tests conducted and the results avail-able in the literature, the injection point used in theexperiments was selected in the central area of the EP
Fig. 7 Variation of pH in the matrices tested during the experiments
Fig. 8 Variation of pH in the cathode and anode compartments during the enhanced transport experiments
1710, Page 8 of 12 Water Air Soil Pollut (2013) 224:1710

cell (between E2 and E3), to avoid rapid corrosion ofthe nZVI by extreme pH conditions and be able todiscern the controlling transport mechanism of thenanoparticles (i.e., electrophoresis towards the anodeor electroosmosis towards the cathode).
Figure 9 shows the total iron distribution in theelectrophoretic cell at the end of the experiments andcompares the direct current enhanced transport withdiffusion. In general, there are higher concentrationsof iron across the test bed when direct current is ap-plied. It is also clear that higher concentrations near thecathode (E5) are only obtained when the matrix hashigher percentage of kaolin, reflecting the importanceof EOF. In all the experiments with glass beads, there isa very well-defined peak of concentration at E3 (i.e.,practically the injection point). This is potentially dueto the aggregation or fast corrosion of the ironnanoparticles, or to both phenomena. It has been pre-viously shown that at high particle concentrations (1–6 g L−1), there is a higher tendency for agglomeration(Phenrat et al. 2009). When nZVI aggregate and formagglomerations larger than the soil pores, their trans-port becomes restricted (Reddy et al. 2011). There canalso be changes to the mobility of nZVI due to volu-metric expansion with corrosion. The volume of cor-rosion products (Fe hydroxide or oxide) is larger than
that of the original metal (Fe0), and these products arelikely to contribute to porosity loss and also promoteparticle agglomeration (Noubactep et al. 2012).
According to Bahranowski et al. (1993), Fe may bepresent in kaolinite as a part of its structure or asseparate Fe-rich phases. Usually, both types of contam-ination, referred to as “structural” and “nonstructural”,or “free” iron, coexist in kaolinite. In the former case,Fe may either substitute for Al in the octahedralgibbsite [Al(OH)3] sheet or Si in the tetrahedral Si-Oskeleton. In the latter, it belongs to separate Fe-rich phasessuch as Fe-bearing micas or iron oxides/oxyhydroxides(Bahranowski et al. 1993). The lower concentrations ofFe in the experiment with 100 % of glass beads whencompared to those with kaolin might be explained by Feimpurities present in the kaolin. In fact, the blank sampleswith the same percentages of kaolin and glass beadsshowed background iron concentrations directly propor-tional to the percentage of kaolin present in the matrix.
It was also observed that PAA-nZVI did not moveinto the water phase in the electrode chambers, exceptfor the cathode chamber in the enhanced transport testswith 100 % kaolin (final concentration of 0.43 mg L−1)and 100 % glass beads (0.74 mg L−1 in the anode com-partment and 0.09 mg L−1 in the cathode). This indicatesthat EOF was dominant in transporting nZVI in pure clay,
Fig. 9 Total iron distribution on the electrophoretic cell
Water Air Soil Pollut (2013) 224:1710 Page 9 of 12, 1710
131

while electrophoresis was the only mechanism to transportnZVI in surface neutral glass beads. In mixed samples, itappears that EOF and electrophoresis competes,resulting in prolonged presence of iron in the poresand potential capture on the clay surfaces. Other exper-imental results showed that there was greater depositionof nZVI onto clay minerals compared to similar sizedsilica fines due to charge heterogeneity on clay mineralsurfaces (Kim et al. 2012).
3.2.4 Iron Oxidation State
All oxidation–reduction potentials measured in theelectrodes across the electrophoretic cell werereferenced to the normal hydrogen electrode bysubtracting the potential of the Ag/AgCl referenceelectrode. These values combined with pH valuesallowed the construction of a Pourbaix (Eh–pH) dia-gram, showing the potential oxidation states of the iron(Fig. 10). Since predictions from stability diagrams areonly accuratewhen the system approaches thermodynamicequilibrium in aqueous solutions, the plot is only intendedto give an indication of the dominance of particular Fespecies at the recorded Eh and pH measurements. In thisdiagram, all data from diffusion tests form a cluster thatcorresponds to the formation of Fe2O3 under oxidizing
conditions (passivity region). Regarding the experimentswith direct current enhanced transport of PAA-nZVI, thevalues measured above E1 and E2 electrodes (i.e., nearestto the anode), during the first 6–7 h of the experiments,match the Fe2+ area (corrosion region). There is a verydistinct cluster of values measured in the glass beads bed,where pH values were much higher than in other experi-ments. These results are consistent with the visual obser-vations of the iron injected in the cell, since only after 1 h, itwas clearly visible that iron nanoparticles had started topresent an orange color, typical of its oxidation.
4 Conclusions
In this study, very low current densities were used toenhance the transport of polymer-coated iron nanoparticlesin different porous media, using high nZVI concentrationstypical of field applications. Because of these conditions,some aggregation of the nanoparticles was observed, par-ticularly near the injection point. Higher currents should betested with these concentrations to check if the enhance-ment in transport compared to diffusion is proportional tothe applied current as reported by other researchers. Theexperimental results show that the electrical field applied toclay-rich media enhances the ORP creating a synergistic
Fe2O3 (s)
Fe(OH)2 (s)
Fe3+
Fe2+
O2
H2O
H2O
H2
Fe(s)
-1.6
-1.4
-1.2
-1.0
-0.8
-0.6
-0.4
-0.2
0.0
0.2
0.4
0.6
0.8
1.0
1.2
1.4
1.6
0 2 4 6 8 10 12 14
Eh
(V
)
pH
P = 1 atm Fe = 0.1 M
EK Enhanced transport - 100 % glass beads
Diffusion - 100% glass beads
EK Enhanced transport - 75% glass beads
Diffusion - 75% glass beads
EK enhanced transport - 50 % glass beads
Diffusion - 50% glass beads
EK enhanced transport 100% kaolin
Diffusion - 100% kaolin
Fig. 10 Pourbaix diagram with the values measured during 48 h in the electrodes embedded in the electrophoretic cell
1710, Page 10 of 12 Water Air Soil Pollut (2013) 224:1710
132

effect of nZVI usage with electrokinetics, delaying itscorrosion reaction. This effect was also observed in earlierstudies, where the ORP enhancement was attributed to thepolarization of the diffuse double layer of the clay media.
The transport of polymer-stabilized iron nanoparticlescan be enhanced by the direct current, in low permeabilityclay soils, where EOF can be effective in distributing theparticles as well as electrophoretic mobility of the parti-cles themselves. Further work is necessary for compre-hensive treatise of the behavior of nZVI in clay-rich soilsunder direct current applications, namely the measuringof the EOF.
Acknowledgments This work has been funded by the Euro-pean Regional Development Fund (ERDF) throughCOMPETE—Operational Program for Competitiveness Factors(OPCF), by Portuguese National funds through “FCT—Fundaçãopara a Ciência e a Tecnologia” under project «PTDC/AGR-AAM/101643/2008 NanoDC», by the research grant SFRH/BD/76070 /2011 , by FP7-PEOPLE-IRSES-2010-269289-ELECTROACROSS and by RIARTAS-Red Iberoamericana deaprovechamiento de residuos industriales para el tratamiento de suelosy aguas contaminadas, Programa Iberoamericano de Ciencia yTecnología para el Desarrollo (Cyted). The Department of Civil andEnvironmental Engineering at Lehigh University is acknowledged,where all the equipment development, testing, and analysis for thiswork were funded. Dan Zeroka is kindly acknowledged for theelectrophoretic cell modification.
References
Bahranowski, K., Serwicka, E. M., Stoch, L., & Srycharski, P.(1993). On the possibility of removal of nonstructural ironfrom kaolinite-group minerals. Clay Minerals, 28, 379–391.
Bennett, P., He, F., Zhao, D., Aiken, B., & Feldman, L. (2010). Insitu testing of metallic iron nanoparticle mobility and reac-tivity in a shallow granular aquifer. Journal of ContaminantHydrology, 116(1–4), 35–46.
Chang, J.-H., & Cheng, S.-F. (2006). The remediation perfor-mance of a specific electrokinetics integrated withzerovalent metals for perchloroethylene-contaminatedsoils. Journal of Hazardous Materials B, 131, 153–162.
Chowdhury, A. I. A., O’Carroll, D. M., Xu, Y., & Sleep, B. E.(2012). Electrophoresis enhanced transport of nanoscalezerovalent iron. Advances in Water Resources, 40, 71–82.
Comba, S., Di Molfetta, A., & Sethi, R. (2011). A comparisonbetween field applications of nano-, micro-, and millimetriczerovalent iron for the remediation of contaminated aqui-fers. Water, Air, & Soil Pollution, 215(1), 595–607.
Elliott, D. W., & Zhang, W. (2001). Field assessment of nano-scale bimetallic particles for groundwater treatment.Environmental Science & Technology, 35, 4922–4926.
He, F., Zhao, D., & Paul, C. (2010). Field assessment ofcarboxymethyl cellulose stabilized iron nanoparticles for
in situ destruction of chlorinated solvents in source zones.Water Research, 44, 2360–2370.
Henn, K. W., & Waddill, D. W. (2006). Utilization of nanoscalezerovalent iron for source remediation—A case study.Remediation, 16(2), 57–77.
Jiemvarangkul, P. (2012). Nanoparticles for Nonaqueous-phase liquids(NAPLs)Remediation,Dissertation presented to theGraduate andResearch Committee of Lehigh University for the Degree ofDoctor of Philosophy in Environmental Engineering.
Jiemvarangkul, P., Zhang, W. X., & Lien, H. L. (2011).Enhanced transport of polyelectrolyte stabilized nanoscalezerovalent iron (nZVI) in porous media. ChemicalEngineering Journal, 170(2–3), 482–491.
Jones, E. H., Reynolds, D. A., Wood, A. L., & Thomas, D. G.(2010). Use of electrophoresis for transporting nano-iron inporous media. Ground Water, 49(2), 172–183.
Kanel, S. R., Goswami, R. R., Clement, T. P., Barnett, M. O., &Zhao, D. (2008). Two-dimensional transport characteristicsof surface stabilized zerovalent iron nanoparticles in porousmedia. Environmental Science & Technology, 42, 896–900.
Kim, H.-J., Phenrat, T., Tilton, R. D., & Lowry, G. V. (2012).Effect of kaolinite, silica fines, and pH on transport ofpolymer-modified zerovalent iron nanoparticles in hetero-geneous porous media. Journal of Colloid and InterfaceScience, 370(1), 1–10.
Li, X., Elliott, D. W., & Zhang, W. (2006). Zerovalent ironnanoparticles for abatement of environmental pollutants:materials and engineering aspects. Critical Reviews inSolid State and Materials Sciences, 31(4), 111–122.
Lin, Y.-H., Tseng, H.-H., Wey, M.-Y., & Lin, M.-D. (2010).Characteristics of two types of stabilized nano zerovalentiron and transport in porous media. Science of the TotalEnvironment, 408(10), 2260–2267.
Masciangioli, T., & Zhang, W. (2003). Environmental technolo-gies at the nanoscale. Environmental Science & Technology,37(5), 102A–108A.
Mehra, O. P., & Jackson, M. L. (1960). Iron oxide removal fromsoils and clays by a dithionite–citrate system buffered withsodium bicarbonate. Clays and Clay Minerals, 7, 317–327.
Noubactep, C., Caré, S., & Crane, R. (2012). Nanoscale metalliciron for environmental remediation: prospects and limita-tions. Water, Air, & Soil Pollution, 223(3), 1363–1382.
O’Hara, S., Krug, T., Quinn, J., Clausen, C., & Geiger, C. (2006).Field and laboratory evaluation of the treatment of DNAPLsource zones using emulsif ied zerovalent iron.Remediation, 16(2), 35–56.
Pamukcu, S., Weeks, A., & Wittle, J. K. (2004). Enhanced reduc-tion of Cr(VI) by direct electric current in a contaminted clay.Environmental Science & Technology, 38, 1236–1241.
Pamukcu, S., Hannum, L., & Wittle, J. K. (2008). Delivery andactivation of nano-iron by DC electric field. Journal ofEnvironmental Science and Health, Part A, 43(8), 934–944.
Phenrat, T., Saleh, N., Sirk, K., Tilton, R. D., & Lowry, G. V.(2007). Aggregation and sedimentation of aqueous nano-scale zerovalent iron dispersions. Environmental Science &Technology, 41, 284–290.
Phenrat, T., Kim, H.-J., Fagerlund, F., Illangasekare, T., Tilton,R. D., & Lowry, G. V. (2009). Particle size distribution,concentration, and magnetic attraction affect transport ofpolymer-modified Fe0 nanoparticles in sand columns.Environmental Science & Technology, 43, 5079–5085.
Water Air Soil Pollut (2013) 224:1710 Page 11 of 12, 1710
133

Reddy, K. R., & Karri, M. R. Effect of electric potential onnanoiron particles delivery for pentachlorophenol remedia-tion in low permeability soil. In M. Hamza et al. (Ed.),Proceedings of the 17th International Conference on SoilMechanics and Geotechnical Engineering: The Academiaand Practice of Geotechnical Engineering, Alexandria,Egypt, 5–9 October 2009, 2312–2315.
Reddy, K. R., Darko-Kagy, K., & Cameselle, C. (2011).Electrokinetic-enhanced transport of lactate-modified nanoscaleiron particles for degradation of dinitrotoluene in clayey soils.Separation and Purification Technology, 79(2), 230–237.
Shi, Z., Nurmi, J. T., & Tratnyek, P. G. (2011). Effects of nanozerovalent iron on oxidation-reduction potential.Environmental Science and Technology, 45, 1586–1592.
Sun, Y.-P., Li, X., Cao, J., Zhang, W., & Wang, H. P. (2006).Characterization of zerovalent iron nanoparticles. Advancesin Colloid and Interface Science, 120, 47–56.
USEPA (2011). Fact sheet on selected sites using or testingnanoparticles for remediation. United States Environmental
Protection Agency. http://cluin.org/products/nanozvi/. Accessed3 April 2012
Yang, G. C. C., & Yeh, C.-F. (2011). Enhanced nano-Fe3O4/S2O8
2− oxidation of trichloroethylene in a clay-ey soil by electrokinetic. Separation and PurificationTechnology, 79, 264–271.
Yang, G. C. C., Tu, H.-C., & Hung, C.-H. (2007). Stability ofnanoiron slurries and their transport in the subsurface environ-ment. Separation and Purification Technology, 58, 166–172.
Yang, G. C. C., Hung, C.-H., & Tu, H.-C. (2008). Electrokineticallyenhanced removal and degradation of nitrate in the subsurfaceusing nanosized Pd/Fe slurry. Journal of EnvironmentalScience and Health, Part A, 43(8), 945–951.
Yuan, S., Long, H., Xie,W., Liao, P.,&Tong,M. (2012). Electrokinetictransport of CMC-stabilized Pd/Fe nanoparticles for the remedia-tion of PCP-contaminated soil. Geoderma, 185–186, 18–25.
Zhang, W. (2003). Nanoscale iron particles for environmental re-mediation: an overview. Journal of Nanoparticle Research, 5,323–332.
1710, Page 12 of 12 Water Air Soil Pollut (2013) 224:1710
134

135
II.4. Influence of electrolyte and voltage on the direct current enhanced
transport of iron nanoparticles in clay (published in Chemosphere)


Chemosphere 99 (2014) 171–179
Contents lists available at ScienceDirect
Chemosphere
journal homepage: www.elsevier .com/locate /chemosphere
Influence of electrolyte and voltage on the direct current enhancedtransport of iron nanoparticles in clay
0045-6535/$ - see front matter 2013 Elsevier Ltd. All rights reserved.http://dx.doi.org/10.1016/j.chemosphere.2013.10.065
⇑ Corresponding author at: Department of Civil and Environmental Engi-neering, Fritz Engineering Laboratory, Lehigh University, 13 E. Packer Avenue,Bethlehem, PA 18015-4729, USA. Tel.: +351 212948300; fax: +351 212948554.
E-mail address: [email protected] (H.I. Gomes).
137
Helena I. Gomes a,b,c,⇑, Celia Dias-Ferreira c, Alexandra B. Ribeiro b, Sibel Pamukcu a
a Department of Civil and Environmental Engineering, Fritz Engineering Laboratory, Lehigh University, 13 E. Packer Avenue, Bethlehem, PA 18015-4729, USAb CENSE, Departamento de Ciências e Engenharia do Ambiente, Faculdade de Ciências e Tecnologia, Universidade Nova de Lisboa, 2829-516 Caparica, Portugalc CERNAS – Research Center for Natural Resources, Environment and Society, Escola Superior Agrária de Coimbra, Instituto Politécnico de Coimbra, Bencanta,3045-601 Coimbra, Portugal
h i g h l i g h t s
Direct current can enhance iron nanoparticles transport in clay by 25%. Oxidizing conditions and higher ionic strength limit nZVI enhanced transport. Ionic strength was significant, promoting nanoparticles aggregation and oxidation.
a r t i c l e i n f o
Article history:Received 19 June 2013Received in revised form 19 October 2013Accepted 25 October 2013Available online 16 November 2013
Keywords:Zero valent iron nanoparticles (nZVI)Oxidation–reduction potential (ORP)Electrokinetics (EK)ElectrolyteVoltage
a b s t r a c t
Zero valent iron nanoparticles (nZVI) transport for soil and groundwater remediation is slowed down orhalted by aggregation or fast depletion in the soil pores. Direct electric current can enhance the transportof nZVI in low permeability soils. However operational factors, including pH, oxidation–reduction potential(ORP), voltage and ionic strength of the electrolyte can play an important role in the treatmenteffectiveness. Experiments were conducted to enhance polymer coated nZVI mobility in a model low per-meability soil medium (kaolin clay) using low direct current. Different electrolytes of varying ionicstrengths and initial pH and high nZVI concentrations were applied. Results showed that the nZVI transportis enhanced by direct current, even considering concentrations typical of field application that favornanoparticle aggregation. However, the factors considered (pH, ORP, voltage and electrolyte) failed toexplain the iron concentration variation. The electrolyte and its ionic strength proved to be significantfor pH and ORP measured during the experiments, and therefore will affect aggregation and fast oxidationof the particles.
2013 Elsevier Ltd. All rights reserved.
1. Introduction
Zero valent iron nanoparticles (nZVI) are considered an emergentsolution for in situ soil and groundwater remediation due to theirhigh specific surface area and reactivity and because they target avast number of contaminants, from organochlorines to heavy metals(Masciangioli and Zhang, 2003; Zhang, 2003; Zhang and Elliott,2006). The growing use of nZVI in pilot and full-scale applicationsin the last decade is notable (USEPA, 2011; Mueller et al., 2012; Rej-eski et al., 2012). However, one of the major limitations is the effec-tive long distance transport without aggregation and loss of theirreactivity – the mobility of nZVI in the subsurface is normally lessthan a few meters (Bennett et al., 2010; He et al., 2010; Comba
et al., 2011; Su et al., 2013). Coated nanoparticles are more mobilethan bare nZVI (He et al., 2007; Phenrat et al., 2007; Sun et al.,2007; Kanel et al., 2008; Tiraferri et al., 2008; Lin et al., 2009; Phenratet al., 2009; Tiraferri and Sethi, 2009; Phenrat et al., 2010; Ray-choudhury et al., 2010; Jiemvarangkul et al., 2011; Phenrat et al.,2011), but aggregation remains and can be determined by the parti-cle size distribution and Fe0 content of nZVI, as well as by soil waterionic strength and composition (Saleh et al., 2008; Lin et al., 2010).
Electrokinetic (EK) remediation is a well-known technologywith demonstrated results, especially in low permeabilityfine-grain soils. Direct current can enhance the transport of ironnanoparticles in sands (Jones et al., 2010; Chowdhury et al.,2012) and clay (Pamukcu et al., 2008) and improve the remediationeffectiveness for different contaminants (Yang et al., 2008; Reddyet al., 2011; Gomes et al., 2012a,b; Yuan et al., 2012; Fan et al.,2013). The primary mechanisms for the nZVI enhanced transportare: electrophoresis, towards the anode, and electroosmoticadvection, towards the cathode. In sands, with lower surface

Fig. 1. Schematic diagram of the modified electrophoretic cell test setup.
172 H.I. Gomes et al. / Chemosphere 99 (2014) 171–179
charge, electrophoresis dominates, while in clays, electroosmosiscan be the most important transport mechanism, counteractingelectrophoresis. The existing studies tested low nZVI concentra-tions and overlooked parameters such as ionic strength, pH,oxidation–reduction potential (ORP) and electric field strength thatcan influence the nZVI transport, given that the external supply ofelectric energy can enhance favorable oxidation–reduction reac-tions in clay-electrolyte systems (Pamukcu, 2009).
The main objective of the current study was to assess if low di-rect current can enhance the transport of high nZVI concentrations,typical of field applications, in clay rich soils varying the electrolyteionic strength and voltage. We used kaolin clay to represent a lowpermeability medium, and an experimental setup that allowed usto study the variation in the oxidation–reduction potential andpH values in the kaolin during short-term experiments, and esti-mate the temporal and spatial distribution of the iron oxidationstates and hence the reactivity of the nanoparticles.
2. Material and methods
2.1. Chemicals
Before synthesis of the iron nanoparticles, deionized (DI) waterwas purged with ultra-purified grade nitrogen gas (N2) for 1 h sothat dissolved oxygen would fall to a level below 20%. Iron nano-particles were prepared reducing FeSO47H2O (MP Biomedicals),dissolved in a polyacrylic acid, sodium salt – (PAA) Mw 2100(Polysciences, Inc.) solution, by sodium borohydride (Hydrifin™),using the procedure described by Kanel et al. (2008). The PAA–nZVIsuspensions were freshly prepared before each experiment andhad a concentration of 4 g L1 of nZVI. The particle size distributionof the nanoparticles had a mean value of particle diameter62.66 ± 39.6 nm and the median size was 60.2 nm, based on acount of 420 particles in TEM images.
All chemicals were reagent grade (NaCl, NaOH, Na2SO3, sodiumcitrate dihydrate – HOC(COONa)(CH2COONa)22H2O from SigmaAldrich, CaCl2 from Fisher Science Education, NaHCO3 fromResearch Organics, and Na2S2O35H2O from Amresco ProPure).Water was purified from deionized water in a Barnstead NANO-pure system (18 MX cm). In all the tests, the electrolyte solutionswere deoxygenated with ultra-purified grade nitrogen gas (N2)for a minimum of 1 h before each use.
2.2. Enhanced transport experiments
2.2.1. Electrophoretic cellA commercially available electrophoretic cell (EP) (Econo-Sub-
marine Gel Unit, model SGE-020), originally designed for molecularseparation, was modified to undertake these experiments (Fig. 1).The cell is a rectangular translucent box 10 cm height, 40 cm longand 23 cm width, with a square (20 cm 20 cm) sample tray and alid that covers the whole apparatus. The left and right sides of thesample tray have a liquid chamber (to hold the anolyte and thecatholyte, respectively) with platinum working electrodes.
The modified EP cell allowed direct measurement of the redoxpotential (ORP) in the clay during the experiments, using auxiliaryplatinum wire electrodes (0.25 mm diameter; 99.9% metals basis,Alfa Aesar) fixed at the base surface of the sample tray at equalintervals (3 cm) with conductive glue. These measurements weremade using an Ag/AgCl reference electrode (Accumet) with 4.0 MKCl solution. The auxiliary electrodes were labeled E1 to E5 start-ing from the anode side (Fig. 1). An OAKTON pH probe (ModelWD-35805-18) was used for measuring pH in the kaolin on theelectrodes E1–E5.
In all experiments, both anolyte and catholyte compartmentswere filled with the same electrolyte solutions (volume of
13
650 mL each), keeping the level slightly below the clay surfaceand preventing preferential transport of nZVI through a water poolon top of the kaolin. Compressed fiberglass wool pads, saturatedand immersed in the electrolyte solution, helped transport themigrating ions from the electrolyte into the clay and vice versa.The experimental set-up included a power supply, wiring and amulti-meter (Fluke 179).
2.2.2. Experimental conditionsTable 1 shows the experimental conditions used in this study.
High-purity (china grade, EMD Chemicals) colloidal kaolinite claywith a nominal particle size of 2 lm, pH 4.97 and with125.24 ± 13 mg kg1 of extractable iron was used to prepare thetest medium. The final water content of the test clay was 60%(by dry weight, before placing it the EP cell) with a mass densityof 1.63 g cm3. The pHiep of this clay is 2.5 (Brosky and Pamukcu,2013). A more detailed characterization of the kaolin used can befound in Pamukcu et al. (2004). The kaolin mixture was transferredto the tray of the electrophoretic cell and spread uniformly over thewire electrodes to a thickness of 5 mm (200 cm3).
Two sets of control experiments were conducted for each mix-ture under the same conditions, one without direct current butwith PAA–nZVI, and another with current but without PAA–nZVI.In the experiments with current, a constant potential was appliedfor 48 h. Table 1 presents the average values of the actual voltageand current measured during the tests. The potentials of 5 V and10 V resulted in average current densities of 1.12 104 to7.24 104 mA cm2, respectively. The cell was kept in a darklocation to prevent iron photo-oxidation.
The nanoparticle suspension was delivered in the electropho-retic cell using a syringe to inject 2 mL through a tube, whichallowed the suspension dispersion into a pre-cut shallow channelin the clay between the auxiliary electrodes E2 and E3 (Fig. 1).The nZVI injection location in the electrophoretic cell was selectedin the central area of the clay bed (between E2 and E3) to avoidinterference of extreme pH conditions generated in the electrodecompartments. Results available in the literature show that theinjection of nanoparticles either at the cathode (Yang et al., 2008;Yang and Wu, 2011) or the anode (Chang and Cheng, 2006;Chowdhury et al., 2012) promote the passivation or corrosion ofthe nZVI, respectively. Recently, a central injection position wasused for stabilized nano Pd/Fe for the remediation of pentachloro-phenol-contaminated soil (Yuan et al., 2012) with improvedresults. As such, a central position of nZVI injection was adoptedin this study.
Measurements were taken periodically at 0.25 h, 0.50 h, 0.75 h,1 h, 2 h, 3 h, 5 h, 6 h, 7 h, 10 h, 12 h, 15 h, 24 h, 27 h, 32 h, 36 h and
8
Table 1Enhanced transport experimental program and conditions.
Test number Electrolyte PAA–nZVI added (mL) Average voltage (V) Average current (mA) Notes
1 0.001 M NaCl 2 5.04 0.27 Enhanced transport of nZVI2 0.001 M NaCl 2 – – Diffusion control test3 0.001 M NaCl – 4.92 0.04 Control test without nZVI4 0.001 M NaCl 2 10.38 0.82 Enhanced transport of nZVI5 0.001 M NaCl – 9.99 0.62 Control test without nZVI6 0.001 M NaOH 2 5.26 0.13 Enhanced transport of nZVI7 0.001 M NaOH – 5.35 0.24 Control test without nZVI8 0.001 M NaOH 2 – – Diffusion control test9 0.1 M Na2SO3 2 5.33 1.63 Enhanced transport of nZVI10 0.1 M Na2SO3 2 – – Diffusion control test11 0.1 M Na2SO3 – 5.33 1.56 Control test without nZVI12 0.05 M CaCl2 2 5.05 5.04 Enhanced transport of nZVI13 0.05 M CaCl2 2 – – Diffusion control test14 0.05 M CaCl2 – 5.10 5.37 Control test without nZVI
H.I. Gomes et al. / Chemosphere 99 (2014) 171–179 173
48 h. At each time the voltage, current, ORP and pH were measuredacross the working and auxiliary electrodes. At the end of each test,aqueous samples were collected from the electrolyte chambers,and composite soil samples were collected above the auxiliary wireelectrodes E1–E5, avoiding the nZVI injection point. The soil andaqueous samples were analyzed for total iron and ferrous iron con-centrations. The iron was extracted from the test medium with thesodium dithionite-citrate-bicarbonate (DCB) method (Mehra andJackson, 1960). The iron analyses were conducted using a Perkin–Elmer AAnalyst 200 flame atomic absorption spectroscopy (AAS)and a Hach DR 2800 spectrophotometer (UV).
3. Results and discussion
3.1. Enhanced transport of iron nanoparticles
In general, higher iron concentrations were measured whendirect current was applied (Fig. 2), indicating an enhancement ofnZVI transport over diffusion in kaolin clay. An average concentra-tion increase of 25% was observed when using high concentrations
Fig. 2. Additional total iron (mg kg1) in soil sections compared with the initial soil condiffusion experiments: (a) Results using 1 mM NaCl with 0, 5 and 10 V; (b) 1 mM NaOH us
139
of nZVI, typical of field applications. The Fe concentrationsobtained in the enhanced transport tests are statistically differentfrom the diffusion tests at a 0.05 level of significance [one-wayANOVA, F(1,38) = 5.04, p = 0.03]. Use of statistic models, withvariables of pH, ORP, electrode location and voltage to explain thisvariability, did not return any of these variables to be significant.No differences were found in the diffusion experiments for thetested electrolytes [one-way ANOVA, F(3,16) = 0.60, p = 0.62].
The enhanced transport with 1 mM NaOH presents higherdifferences when compared with diffusion, as well as higher ironconcentrations near the cathode in relation with the other electro-lytes (Fig. 2). The experiments with higher currents, 1.5 and5.5 mA, using Na2SO3 and CaCl2 as electrolytes respectively,showed limited enhancement in PAA–nZVI transport whencompared with diffusion. The higher ionic strength of these elec-trolytes may have contributed to lower nanoparticles stability,increasing their agglomeration and limiting the transport. Also,the higher ionic strength and the divalent cation Ca2+ will haveaffected the clay by reducing the diffuse double layer of the clayparticles. This will reduce the electroosmotic transport.
centration using different electrolytes and voltages in the enhanced transport anding 0 and 5 V; (c) 0.1 M Na2SO3 using 0 and 5 V and (d) 0.05 M CaCl2 using 0 and 5 V.

Fig. 3. Variation of ORP in the kaolin medium in the (a) enhanced transport (Test 1), (b) diffusion (Test 2) and c) control (Test 3) experiments using 1 mM NaCl as electrolyteand 5 V. The plots were obtained by interpolation (kriging) of the ORP values measured in each electrode (E1–E5) over time.
174 H.I. Gomes et al. / Chemosphere 99 (2014) 171–179
The increase in the applied voltage resulted in an increase in thetransport of nZVI towards the cathode side locations (E4 and E5)for the NaCl electrolyte clay sample, as well as in an even larger in-crease in transport towards the anode side. This transport towardsthe anode is mainly due to electrophoresis, due to the negativecharge of the nZVI polymer coating, while the movement towardsthe cathode is due to electroosmosis. The concentrations of total Femeasured in the 10 V test in E4 and E5 are approximately 1.5 timeshigher than in the 5 V test, possibly due to an increase in the elec-troosmotic advection with voltage. Yang et al. (2008) consideredelectroosmosis as the most relevant mechanism for Pd/Fe bimetal-lic nanoparticles transport under direct electric current. Electroos-motic flow measurements were not made in the experimentsreported here, but the results indicate the need for additionalresearch to assess the electroosmotic advection in nZVI enhancedtransport in clays.
Other researchers observed that the enhancement in transportof nZVI from the cathode to the anode, compared to diffusion,was proportional to the applied current (Jones et al., 2010;Chowdhury et al., 2012). In those studies, electrophoresis wasthe predominant transport mechanism, because the test soils werefine-grained sands. In clay systems it appears that electroosmoticadvection may be strong enough to counteract electrophoresis,reducing the overall migration rate of nZVI toward the anolyte.However, if the pH is low, the polarity of the surface charge maybecome inverted and electroosmosis towards the anode will occur.Potentially electroosmosis towards the anode could havehappened in the experiments with CaCl2, as we measure pH valuesclose and bellow the pHiep 2.5 for the clay.
Electroosmotic flow (EOF) can be reduced to zero if the pH iskept at the isoelectric point, pHiep for the clay. The specific value
of pHiep varies temporally and spatially during electrokinetic treat-ment as the ionic strength and the ionic species in bulk solutionchange. Such changes could also alter the nZVI zeta potentialmaking it less stable and leading to lower transportation rates(Hydutsky et al., 2007; Jones et al., 2010).
In the aqueous samples, only in Experiment 4 (1 mM NaCl at10 V) a noticeable iron was measured in the anolyte (0.09 mgL1). The post-test concentrations of Fe2+ measured in the soiland aqueous samples were low in comparison to the total ironhence they were not plotted.
Release of electrons from nZVI to the reaction system mightenhance the transmission of electric current. However, contraryto this expectation and to reports in other studies (Yang and Chang,2011), the experiments with nZVI did not show an increase in theelectric current density. There was no statistical difference in thecurrent densities measured in the enhanced transport experimentsand the control without nZVI at the p < 0.05 level [one-wayANOVA, F(1,138) = 1.05, p = 0.31].
In all the experiments, PAA–nZVI accumulation was visiblearound the injection location. First of all, this is due to the generallyslow dispersion from an injection point in this kind of porous med-ia. This was also attributed to the aggregation of the iron nanopar-ticles or to their corrosion, or to both. At high particleconcentration (1–6 g L1) there is higher agglomeration (Phenratet al., 2009). When nZVI particles aggregate they become largerthan the soil pores, restricting their transport through soil (Reddyet al., 2011). Mobility changes will also take place due to nZVIvolumetric expansion with corrosion. The volume of corrosionproducts (Fe hydroxide or oxide) is larger than the original metal(Fe0) and these products are likely to contribute to porosity lossand increase particle agglomeration (Noubactep et al., 2012).

H.I. Gomes et al. / Chemosphere 99 (2014) 171–179 175
3.2. Oxidation–reduction potential
When direct current is applied, the ORP values show the generaltrend of oxidizing to reducing conditions from the anode towardthe cathode (E1 to E5), respectively. This trend is due to the oxida-tion occurring in the anode and the reduction in the cathode,resulting in water electrolysis according to the followingequations:
2H2O 4e ! O2 " þ 4Hþ E0 ¼ 1:229 ðanodeÞ ð1Þ
2H2Oþ 2e ! H2 " þ 2OH E0 ¼ 0:828 ðcathodeÞ ð2Þ
The temporal and spatial evolution of ORP from the tests with0.001 M NaCl in the pore fluid is plotted in Fig. 3. As observed, agradual decrease of ORP takes place in the diffusion specimen asthe nZVI diffuses away from the injection location between E2and E3 and undergoes oxidation from exposure to air and water(Fig. 3b). In the EK tests without nZVI, the ORP dropped fasterand further than that in the diffusion test. In these tests, typicallythe electrode nearest to cathode, E5, registered the largest decreasein ORP within the first 12 h, after which it remained approximatelyconstant (Fig. 3c). This is consistent with evolving ORP in EKtreatment of clays, which possess low ionic strength low electricalconductivity of pore water hence expanded electric double layer,initially. Under such circumstances the applied electrical fieldreduces ORP of the system by collapsing the expanded double layer(Pamukcu et al., 2008; Cirtiu et al., 2011; Brosky and Pamukcu,2013), as observed by the temporal evolution of ORP from its initialvalues in Fig. 3c. Diffuse double layer (DDL) processes of clay havebeen already suggested to be involved in the in situ conversion ofheavy metal soil contaminants to potentially less toxic forms byapplication of an external direct current to a clay-electrolyte sys-tem (Pamukcu et al., 2008). The applied current flows throughthe higher conductivity bulk liquid, as well as the lower conductiv-ity DDL of the clay particles. Due to the large difference in theconductivity of these two charge conduits, an electrochemical po-tential difference develops across the DDL, compressing it (Bard
Table 2ANOVA test for determining the significance difference between levels of a variable in OR
Sum of squares df
ORPBetween ‘‘Electrode’’ groups 0.331 4Within ‘‘Electrode’’ groups 38.626 1165Total 38.957 1169
Between ‘‘Voltage’’ groups 3.195 2Within ‘‘Voltage’’ groups 35.762 1167Total 38.957 1169
Between ‘‘Electrolyte’’ groups 27.959 3Within ‘‘Electrolyte’’ groups 10.998 1166Total 38.957 1169
Between ‘‘nZVI’’ groups 0.238 1Within ‘‘nZVI’’ groups 38.719 1168Total 38.957 1169
pHBetween ‘‘Electrode’’ groups 1,467 4Within ‘‘Electrode’’ groups 575685 715Total 577152 719
Between ‘‘Voltage’’ groups 24.440 2Within ‘‘Voltage’’ groups 552.712 717Total 577.152 719
Between ‘‘Electrolyte’’ groups 372.027 3Within ‘‘Electrolyte’’ groups 205.124 716Total 577.152 719
Bold—significant, p-value inferior to 0.05.
141
and Faulkner, 2001). The clay DDL essentially becomes a micro-capacitor and the charge accumulated in the DDL is passed throughit to the electrolyte solution. As the intensity of the electricalcharge increases across the DDL, a cathodic current runs outwardreducing the oxidation states of the available heavy metal constit-uents in the electrolyte solution near the DDL, thereby reducingthe ORP of the clay-electrolyte system.
The ORP values measured in the clay are well above typicalvalues associated with nZVI in groundwater in field applications(100 mV) (Elliott and Zhang, 2001; Henn and Waddill, 2006; Heet al., 2010; Su et al., 2013), and those needed for reductive dechlo-rination, but are consistent with other studies on nZVI enhancedtransport in clay (Pamukcu et al., 2008; Reddy et al., 2011). Theeffect of nZVI on clay ORP is smaller than in water. Others worksshowed also that the interpretation of ORP when using nZVI iscomplicated, because the platinum wire electrode response, atlow nZVI concentrations, is a mixed potential reflecting contribu-tions from dissolved Fe2+ and H2, as well as deposited and (possi-bly) suspended nanoparticulate iron (Shi et al., 2011). At highconcentrations of nZVI, ORP is dominated by direct interactionbetween the electrode and the nanoparticles, but this response isnonlinear and saturates with increased coverage of the electrodesurface with adsorbed particles (Shi et al., 2011).
The ORP for the enhanced transport drops more than those ofthe control cases at all electrode locations, stronger near thecathode than near the anode, for the first 12 h of the test. Soon afterthe 12 h period, the ORP shifts back up to or slightly above thecontrol values at all electrode locations. These results are consis-tent with the ones reported by Pamukcu et al. (2008) that observedlowered values of ORP in the first six hours of the experiments,after which the values increased above the average ORP distribu-tion for the control tests. The nZVI life span was estimated as8.8 h for a nanoparticle with 25 nm diameter (Noubactep et al.,2012). The first 6-h reduction in ORP reported in the previous work(Pamukcu et al., 2008), and the 12-h reduction in ORP reported inhere are likely due to the average available life span of the nano-particles during their transport. The difference in the time of ORP
P and pH measurements on the auxiliary electrodes (E1–E5).
Mean square F p-Value
0.083 2.494 0.0410.033
1.597 52.123 <0.0010.031
9.320 988.101 <0.0010.009
0.238 7.170 0.0080.033
0.367 0.456 0.7680.805
0.771 15.852 <0.00112.220
124.009 432.862 <0.0010.286

Fig. 4. Variation of pH in the kaolin medium in the (a) enhanced transport (Test 6), (b) diffusion (Test 8) using 1 mM NaOH as electrolyte and (c) enhanced transport (Test 12),experiments, (d) diffusion (Test 13) using 0.05 M CaCl2 as electrolyte, (e) enhanced transport (Test 9), experiments and (f) diffusion (Test 10) using 0.1 M Na2SO3as electrolyte.The plots were obtained by interpolation (kriging) of the pH values measured in each electrode (E1-E5) over time.
176 H.I. Gomes et al. / Chemosphere 99 (2014) 171–179
reduction period can be attributed to different starting nZVIconcentrations, the former being significantly lower, at 5.0 mL of460 mg L1 nZVI than the latter one, at 2.0 mL of 4000 mg L1.
The ORP values were used to determine which factors had thehigher level of significance: ‘‘Electrode’’ – the auxiliary electrodes
E1 to E5; ‘‘Voltage’’ – 0 in the diffusion tests, 5 V and 10 V;‘‘Electrolyte’’ – 1 mM NaCl, 1 mM NaOH, 0.1 M Na2SO3, 0.05 MCaCl2; ‘‘nZVI’’ – test with and without nZVI. An analysis of variance(ANOVA) was carried out to identify which ordinal or nominal fac-tors presented significant differences between levels (Table 2). This

Fig. 5. Pourbaix diagram with the values measured at 48 h in the electrodesembedded in the electrophoretic cell: (a) assisted current enhanced transport and(b) diffusion tests.
H.I. Gomes et al. / Chemosphere 99 (2014) 171–179 177
was followed by Bonferroni multiple comparison method, in orderto determine differences between levels of the same significantvariable (Supplementary information, Table 1). All tested factorswere statistically different (Table 2), but post hoc comparisonsusing the Bonferroni test showed that there was no statisticaldifference between the electrodes E1 to E5 (Supplementary infor-mation, Table 1). A multifactorial ANOVA with only the significantfactors ‘‘Voltage’’, ‘‘Electrolyte’’ and ‘‘nZVI’’ showed an interactionbetween the three factors that could explain most of the ORPvariability (x2 = 0.62). Independently, the factor more significantlywas ‘‘Electrolyte’’ (x2 = 0.12). In general, higher voltages corre-sponded to lower ORP values (with or without nanoparticles), withexception of the experiments with NaOH, where the inverseoccurred. Higher ORP values were obtained with CaCl2. Takentogether these results show the importance of the electrolyte andthe respective ionic strength in the variation of the oxidation–reduction potential and how to interpret it for effectiveness of nZVItransport.
3.3. pH
The electrolyte and kaolin mixtures’ initial pH varied from4.23 ± 0.13 to 4.77 ± 0.28, except with the electrolytes Na2SO3
(6.66 ± 0.28) and CaCl2 (3.73 ± 0.28) that presented the highestand lowest pH values, respectively. The initial acidic pH measuredin the clay was favorable for nZVI oxidation. Also, other researchershave observed that low pH increased deposition of nZVI in clay, aswell as nZVI aggregation (Kim et al., 2012). Hence the clay initialconditions were unfavorable for PAA–nZVI mobility.
The anolyte and catholyte pH values measured were consistentwith the electrochemical reactions of water electrolysis, whichproduce H+ ions at the anode and OH ions in the cathode. The finalsolution pH values approached 2 in the anolyte and 12 in the cath-olyte. The lowest pH values were observed with CaCl2 as electro-lyte that also displayed the highest current measured (>5 mA).When Na2SO3 was used as electrolyte, the anolyte pH dropped 3units between 27 h and 32 h, both in the enhanced transportexperiment and in the control without PAA–nZVI, probably dueto the exhaustion of the buffer capacity of the electrolyte solution.No statistical difference was found in the anolyte and catholyte pHwhen comparing the enhanced transport tests with the controlwithout nZVI at the p < 0.05 level [one-way ANOVA,F(1,318) = 0.03, p = 0.86], which is consistent with the iron concen-trations bellow the detection limits found in most of the electro-lytes samples.
Similar to ORP trends, a higher variation of pH was observed athigher voltage gradients in the first 12 h of the experiments. Acid-ification of the kaolin at E1 and E2 (near the anode) after 24 h and30 h, respectively, was noted in all the EK tests. When NaOH wasused, both with and without current, the pH values remainednearly neutral initially and stabilized at 5 within the first 12 h(Fig. 4). The electrolyte that showed most variation in the pH val-ues was Na2SO3, especially near the injection point of PAA–nZVI(E2 and E3), between 6 h and 32 h. A similar trend was observedin the diffusion tests with Na2SO3 as the electrolyte. This wasattributed to the oxidation of SO2
3 to SO24 generating acid. The
other diffusion tests showed little variation in the pH values.Table 2 shows the results of the ANOVA for the pH values,
considering the variables ‘‘Electrode’’, ‘‘Voltage’’ and ‘‘Electrolyte’’,to identify which variables presented significant differences.Contrary to the ORP values, no statistical difference was foundbetween pH values in the auxiliary electrodes E1-E5, but both‘‘Voltage’’ and ‘‘Electrolyte’’ show significant difference. Post hoccomparisons using the Bonferroni test for the significant variablesindicate that the pH values measured with ‘‘Voltage’’ = 10 V weresignificantly different from the diffusion tests (0 V) and 5 V tests,
but no difference was found between 0 and 5 V (Supplementaryinformation, Table 2). Regarding the ‘‘Electrolyte’’ (Supplementaryinformation, Table 2), all the differences between the tested elec-trolytes were significant. A two-way ANOVA considering the fac-tors ‘‘Voltage’’ and ‘‘Electrolyte’’ showed that the interactionbetween the two was not significant and that ‘‘Electrolyte’’ couldexplain most of the pH variability (x2 = 0.64). Taken together,these results suggest that the electrolyte and its ionic strength isthe most important factor in the pH variation during theexperiments.
3.4. Iron oxidation state
The oxidation–reduction potentials measured in the electrodesE1 to E5 in the enhanced transport and diffusion experiments werereferenced to the normal hydrogen electrode by subtracting thepotential of the Ag/AgCl reference electrode (200 mV, at 25 C,4 M KCl). These values combined with pH values allowed theirintroduction into Pourbaix (Eh-pH) diagrams for the Fe oxidationstates (Fig. 5). Because predictions from stability diagrams are onlyaccurate when the system approaches thermodynamic equilibriumin aqueous solutions, the plots are intended to give relativeapproximate dominance of Fe species at the recorded Eh and pHvalues.
Regarding the experiments with direct current enhanced trans-port of PAA–nZVI the values are distinct for each electrolyte, withthe most oxidizing conditions occurring with CaCl2 and the mostreducing conditions with NaOH. This is in agreement with thePAA–nZVI enhanced transport results. Fig. 5b presents the datafrom the diffusion tests showing a cluster that correspond to the

178 H.I. Gomes et al. / Chemosphere 99 (2014) 171–179
formation of Fe2O3 under oxidizing conditions (passivity region),with small differences between the electrolytes tested. From thecomparison of the two diagrams, the effect of the direct currentin the kaolin pH and redox conditions is discernible in its influenceon the distribution of the iron oxidation states. The data shows usthe difference between what is likely in each system if equilibriumwould be reached.
4. Conclusions
The use of direct current enhanced the nZVI transport in thekaolin, using high concentrations, typical of field applications.However, the iron concentration variability could not be explainedby pH, ORP, voltage and electrolyte. In the variation of pH and ORPduring the experiments, the electrolyte and its ionic strengthproved to be significant, and thus will have affected aggregationand fast oxidation of the particles. Clear distinctions were observedin ORP distribution between electrically enhanced transport, diffu-sion and control tests. The data showed larger variability, both inspace and time, in ORP measurements in enhanced transportexperiments, which therefore can be explored further as a field in-dex in assessing temporal and spatial efficacy of nZVI nanoparticlestransport.
Although real soil contamination cases are complex, the nZVInanoparticles are often targeted to neutralize specific contami-nants of significant concentrations in the subsurface soils. Largechanges in certain field parameters, such as ORP, relative to theirbackground values can be an important index to monitor withina treatment area to determine the efficacy of nZVI and the fre-quency and distribution of soil sampling for laboratory testing.Furthermore, the results of the experiments of electrically en-hanced transport of nZVI nanoparticles in a thin layer of pure clayreported here gave us fundamental insights about the criticalparameters and governing issues for this enhancement in clay richsoils, which can be used in predictive models.
Acknowledgments
This work has been funded by FP7-PEOPLE-IRSES-2010-269289-ELECTROACROSS, by Portuguese National funds through‘‘FCT – Fundação para a Ciência e a Tecnologia’’ under projectPTDC/AGR-AAM/101643/2008 NanoDC and by the research grantSFRH/BD/76070/2011. The Department of Civil and EnvironmentalEngineering at Lehigh University is acknowledged where all theequipment development, testing and analysis were funded.
Appendix A. Supplementary material
Supplementary data associated with this article can be found, inthe online version, at http://dx.doi.org/10.1016/j.chemosphere.2013.10.065.
References
Bard, A.J., Faulkner, L.R., 2001. Electrochemical Methods: Fundamentals andApplications. Wiley, New York.
Bennett, P., He, F., Zhao, D., Aiken, B., Feldman, L., 2010. In situ testing of metalliciron nanoparticle mobility and reactivity in a shallow granular aquifer. J.Contam. Hydrol. 116, 35–46.
Brosky, R.T. and Pamukcu, S., 2013. Role of DDL processes during electrolyticreduction of Cu(II) in a low oxygen environment. J. Hazard. Mater. <http://dx.doi.org/10.1016/j.jhazmat.2013.09.032>.
Chang, J.H., Cheng, S.F., 2006. The remediation performance of a specificelectrokinetics integrated with zero-valent metals for perchloroethylenecontaminated soils. J. Hazard. Mater. B 131, 153–162.
Chowdhury, A.I.A., O’Carroll, D.M., Xu, Y., Sleep, B.E., 2012. Electrophoresisenhanced transport of nano-scale zero valent iron. Adv. Water Resour. 40,71–82.
14
Cirtiu, C.M., Raychoudhury, T., Ghoshal, S., Moores, A., 2011. Systematic comparisonof the size, surface characteristics and colloidal stability of zero valent ironnanoparticles pre- and post-grafted with common polymers. Colloid Surface A390, 95–104.
Comba, S., Di Molfetta, A., Sethi, R., 2011. A comparison between field applicationsof nano-, micro-, and millimetric zero-valent iron for the remediation ofcontaminated aquifers. Water Air Soil Poll. 215, 595–607.
Elliott, D.W., Zhang, W., 2001. Field assessment of nanoscale bimetallic particles forgroundwater treatment. Environ. Sci. Technol. 35, 4922–4926.
Fan, G., Cang, L., Qin, W., Zhou, C., Gomes, H.I., Zhou, D., 2013. Surfactants-enhancedelectrokinetic transport of xanthan gum stabilized nano Pd/Fe for theremediation of PCBs contaminated soils. Sep. Purif. Technol. <http://dx.doi.org/10.1016/j.seppur.2013.1004.1030>.
Gomes, H.I., Dias-Ferreira, C., Ribeiro, A.B., 2012a. Electrokinetic remediation oforganochlorines in soil: Enhancement techniques and integration with otherremediation technologies. Chemosphere 87, 1077–1090.
Gomes, H.I., Dias-Ferreira, C., Ribeiro, A.B., Pamukcu, S., 2012b. Electrokineticenhanced transport of zero valent iron nanoparticles for chromium (VI)reduction in soils. Chem. Eng. Trans. 28, 139–144.
He, F., Zhao, D., Liu, J., Roberts, C.B., 2007. Stabilization of Fe–Pd nanoparticles withsodium carboxymethyl cellulose for enhanced transport and dechlorination oftrichloroethylene in soil and groundwater. Ind. Eng. Chem. Res. 46, 29–34.
He, F., Zhao, D., Paul, C., 2010. Field assessment of carboxymethyl cellulosestabilized iron nanoparticles for in situ destruction of chlorinated solvents insource zones. Water Res. 44, 2360–2370.
Henn, K.W., Waddill, D.W., 2006. Utilization of nanoscale zero-valent iron for sourceremediation—A case study. Remediation 16, 57–77.
Hydutsky, B.W., Mack, E.J., Beckerman, B.B., Skluzacek, J.M., Mallouk, T.E., 2007.Optimization of nano- and microiron transport through sand columns usingpolyelectrolyte mixtures. Environ. Sci. Technol. 41, 6418–6424.
Jiemvarangkul, P., Zhang, W.X., Lien, H.L., 2011. Enhanced transport ofpolyelectrolyte stabilized nanoscale zero-valent iron (nZVI) in porous media.Chem. Eng. J. 170, 482–491.
Jones, E.H., Reynolds, D.A., Wood, A.L., Thomas, D.G., 2010. Use of electrophoresis fortransporting nano-iron in porous media. Ground Water 49, 172–183.
Kanel, S.R., Goswami, R.R., Clement, T.P., Barnett, M.O., Zhao, D., 2008. Twodimensional transport characteristics of surface stabilized zero-valent ironnanoparticles in porous media. Environ. Sci. Technol. 42, 896–900.
Kim, H.J., Phenrat, T., Tilton, R.D., Lowry, G.V., 2012. Effect of kaolinite, silica finesand pH on transport of polymer-modified zero valent iron nano-particles inheterogeneous porous media. J. Colloid Interface Sci. 370, 1–10.
Lin, Y.H., Tseng, H.H., Wey, M.Y., Lin, M.D., 2009. Characteristics, morphology, andstabilization mechanism of PAA250k-stabilized bimetal nanoparticles. ColloidSurface A 349, 137–144.
Lin, Y.H., Tseng, H.H., Wey, M.Y., Lin, M.D., 2010. Characteristics of two types ofstabilized nano zero-valent iron and transport in porous media. Sci. TotalEnviron. 408, 2260–2267.
Masciangioli, T., Zhang, W., 2003. Environmental technologies at the nanoscale.Environ. Sci. Technol. 37, 102A–108A.
Mehra, O.P., Jackson, M.L., 1960. Iron oxide removal from soils and clays by adithionite–citrate system buffered with sodium bicarbonate. Clays Clay Miner.7, 317–327.
Mueller, N.C., Braun, Jr., Bruns, J., Cerník, M., Rissing, P., Rickerby, D., Nowack, B.,2012. Application of nanoscale zero valent iron (nZVI) for groundwaterremediation in Europe. Environ. Sci. Pollut. R 19, 550–558.
Noubactep, C., Caré, S., Crane, R., 2012. Nanoscale metallic iron for environmentalremediation: prospects and limitations. Water Air Soil Poll. 223, 1363–1382.
Pamukcu, S., 2009. Electrochemical transport and transformations. In: Reddy, K.R.,Cameselle, C. (Eds.), Electrochemical Remediation Technologies for PollutedSoils, Sediments and Groundwater. John Wiley & Sons, Inc., Hoboken, NewJersey, pp. 29–64.
Pamukcu, S., Hannum, L., Wittle, J.K., 2008. Delivery and activation of nano-iron byDC electric field. J. Environ. Sci. Health A 43, 934–944.
Pamukcu, S., Weeks, A., Wittle, J.K., 2004. Enhanced reduction of Cr(VI) by directelectric current in a contaminated clay. Environ. Sci. Technol. 38, 1236–1241.
Phenrat, T., Cihan, A., Kim, H.-J., Mital, M., Illangasekare, T., Lowry, G.V., 2010.Transport and deposition of polymer-modified Fe0 nanoparticles in 2-Dheterogeneous porous media: effects of particle concentration, Fe0 content,and coatings. Environ. Sci. Technol. 44. 9086-9083.
Phenrat, T., Fagerlund, F., Illangasekare, T., Lowry, G.V., Tilton, R.D., 2011. Polymer-modified Fe0 nanoparticles target entrapped NAPL in two dimensional porousmedia: effect of particle concentration, NAPL saturation, and injection strategy.Environ. Sci. Technol. 45, 6102–6109.
Phenrat, T., Kim, H.J., Fagerlund, F., Illangasekare, T., Tilton, R.D., Lowry, G.V., 2009.Particle size distribution, concentration, and magnetic attraction affecttransport of polymer-modified Fe0 nanoparticles in sand columns. Environ.Sci. Technol. 43, 5079–5085.
Phenrat, T., Saleh, N., Sirk, K., Tilton, R.D., Lowry, G.V., 2007. Aggregation andsedimentation of aqueous nanoscale zerovalent iron dispersions. Environ. Sci.Technol. 41, 284–290.
Raychoudhury, T., Naja, G., Ghoshal, S., 2010. Assessment of transport of twopolyelectrolyte-stabilized zero-valent iron nanoparticles in porous media. J.Contam. Hydrol. 118, 143–151.
Reddy, K.R., Darko-Kagy, K., Cameselle, C., 2011. Electrokinetic-enhanced transportof lactate-modified nanoscale iron particles for degradation of dinitrotoluene inclayey soils. Separ. Purif. Technol. 79, 230–237.
4

H.I. Gomes et al. / Chemosphere 99 (2014) 171–179 179
Rejeski, D., Kuiken, T., Polischuk, P., Pauwels, E., 2012. Nanoremediation map.Project on Emerging Nanotechnologies. <http://www.nanotechproject.org/inventories/remediation_map/>. (3 April 2012).
Saleh, N., Kim, H.-J., Phenrat, T., Matyjaszewski, K., Tilton, R.D., Lowry, G.V., 2008.Ionic strength and composition affect the mobility of surface-modified Fe0
nanoparticles in water-saturated sand columns. Environ. Sci. Technol. 42, 3349–3355.
Shi, Z., Nurmi, J.T., Tratnyek, P.G., 2011. Effects of nano zero-valent iron onoxidation–reduction potential. Environ. Sci. Technol. 45, 1586–1592.
Su, C., Puls, R.W., Krug, T.A., Watling, M.T., O’Hara, S.K., Quinn, J.W., Ruiz, N.E., 2013.Travel distance and transformation of injected emulsified zero valent ironnanoparticles in the subsurface during two and half years. Water Res. <http://dx.doi.org/10.1016/j.watres.2012.1012.1042>.
Sun, Y.P., Li, X.Q., Zhang, W.X., Wang, H.P., 2007. A method for the preparation ofstable dispersion of zero-valent iron nanoparticles. Colloid Surface A 308, 60–66.
Tiraferri, A., Chen, K.L., Sethi, R., Elimelech, M., 2008. Reduced aggregation andsedimentation of zero-valent iron nanoparticles in the presence of guar gum. J.Colloid Interface Sci. 324, 71–79.
Tiraferri, A., Sethi, R., 2009. Enhanced transport of zerovalent iron nanoparticles insaturated porous media by guar gum. J. Nanopart. Res. 11, 635–645.
145
USEPA, 2011. Fact sheet on selected sites using or testing nanoparticles forremediation. United States Environmental Protection Agency. <http://cluin.org/products/nanozvi/>. (accessed 3 April 2012).
Yang, G.C.C., Chang, Y.I., 2011. Integration of emulsified nanoiron injection with theelectrokinetic process for remediation of trichloroethylene in saturated soil.Sep. Purif. Technol. 79, 278–284.
Yang, G.C.C., Hung, C.H., Tu, H.C., 2008. Electrokinetically enhanced removal anddegradation of nitrate in the subsurface using nanosized Pd/Fe slurry. J. Environ.Sci. Health A 43, 945–951.
Yang, G.C.C., Wu, M.Y., 2011. Injection of nanoscale Fe3O4 slurry coupled with theelectrokinetic process for remediation of NO3 in saturated soil: remediationperformance and reaction behavior. Separ. Purif. Technol. 79, 272–277.
Yuan, S., Long, H., Xie, W., Liao, P., Tong, M., 2012. Electrokinetic transport of CMC-stabilized Pd/Fe nanoparticles for the remediation of PCP-contaminated soil.Geoderma 185–186, 18–25.
Zhang, W., 2003. Nanoscale iron particles for environmental remediation: anoverview. J. Nanopart. Res. 5, 323–332.
Zhang, W., Elliott, D.W., 2006. Applications of iron nanoparticles for groundwaterremediation. Remediation, 7–21.

146

Supplementary Information
Table 1. Multiple comparisons test using Bonferroni method, with ORP as dependent variable, for “Electrode”, “Voltage” and “Electrolyte”. Post hoc tests were not performed for “nZVI” because there are fewer than three groups.
(I) (J) Electrode Mean Difference (I-J)
Std. Error Sig. 95% Confidence Interval
Lower Bound Upper Bound
Electrode
E1
E2 0.031 0.017 0.657 -0.016 0.078 E3 0.014 0.017 1.000 -0.034 0.061 E4 -0.005 0.017 1.000 -0.052 0.043 E5 0.038 0.017 0.233 -0.009 0.086
E2
E1 -0.031 0.017 0.657 -0.078 0.016 E3 -0.017 0.017 1.000 -0.065 0.030 E4 -0.036 0.017 0.336 -0.083 0.012 E5 0.007 0.017 1.000 -0.040 0.055
E3
E1 -0.014 0.017 1.000 -0.061 0.034 E2 0.017 0.017 1.000 -0.030 0.065 E4 -0.018 0.017 1.000 -0.066 0.029 E5 0.025 0.017 1.000 -0.023 0.072
E4
E1 0.005 0.017 1.000 -0.043 0.052 E2 0.036 0.017 0.336 -0.012 0.083 E3 0.018 0.017 1.000 -0.029 0.066 E5 0.043 0.017 0.107 -0.004 0.090
E5
E1 -0.038 0.017 0.233 -0.086 0.009 E2 -0.007 0.017 1.000 -0.055 0.040 E3 -0.025 0.017 1.000 -0.072 0.023 E4 -0.043 0.017 0.107 -0.090 0.004
Voltage
5 -0.004 0.012 1.000 -0.032 0.025 0 10 0.146* 0.017 < 0.001 0.106 0.185 0 0.004 0.012 1.000 -0.025 0.032 5 10 0.149* 0.015 < 0.001 0.113 0.185 0 -0.146* 0.017 < 0.001 -0.185 -0.106 10 5 -0.149* 0.011 < 0.001 -0.185 -0.113
NaOH -0.081* 0.008 < 0.001 -0.102 -0.061 NaCl Na2SO3 0.134* 0.008 < 0.001 0.114 0.155 CaCl2 -0.320* 0.008 < 0.001 -0.341 -0.300 NaCl 0.081* 0.008 < 0.001 0.061 0.102 Electrolyte NaOH Na2SO3 0.216* 0.009 < 0.001 0.193 0.239 CaCl2 -0.239* 0.009 < 0.001 -0.262 -0.216 NaCl -0.134* 0.008 < 0.001 -0.155 -0.114 Na2SO3 NaOH -0.216* 0.009 < 0.001 -0.239 -0.193 CaCl2 -0.454* 0.009 < 0.001 -0.477 -0.431 NaCl 0.320* 0.008 < 0.001 0.300 0.341 CaCl2 NaOH 0.239* 0.009 < 0.001 0.216 0.262 Na2SO3 0.454* 0.009 < 0.001 0.431 0.477
*. The mean difference is significant at the 0.05 level. Bold—significant, p-value inferior to 0.05. Italic—high similarity, p-value equal to 1.
147

Table 2. Multiple comparisons test using Bonferroni method, with pH as dependent
variable, for “Voltage” and “Electrolyte”.
(I) (J)
Mean Difference (I-J)
Std. Error Sig. 95% Confidence Interval
Lower Bound Upper Bound
Voltage
0 5 -0.013 0.069 1.000 -0.180 0.154
10 0.579* 0.110 < 0.001 0.316 0.843
5 0 0.013 0.069 1.000 -0.154 0.180
10 0.592* 0.110 < 0.001 0.329 0.856
10 0 -0.579* 0.110 < 0.001 -0.843 -0.316
5 -0.592* 0.110 < 0.001 -0.856 -0.329 NaOH -0.655* 0.546 < 0.001 -0.799 -0.510 NaCl Na2SO3 -1.520* 0.055 < 0.001 -1.664 -1.375 CaCl2 0.477* 0.055 < 0.001 0.333 0.622 NaCl 0.655* 0.055 < 0.001 0.510 0.799 Electrolyte NaOH Na2SO3 -0.865* 0.060 < 0.001 -1.023 -0.706 CaCl2 1.132* 0.055 < 0.001 0.974 1.290 NaCl 1.520* 0.055 < 0.001 1.375 1.664 Na2SO3 NaOH 0.865* 0.060 < 0.001 0.706 1.023 CaCl2 1.997* 0.060 < 0.001 1.838 1.155 NaCl -0.477* 0.055 < 0.001 -0.622 -0.333 CaCl2 NaOH -1.132* 0.060 < 0.001 -1.290 -0.974 Na2SO3 -1.997* 0.060 < 0.001 -2.155 -1.838
*. The mean difference is significant at the 0.05 level. Bold—significant, p-value inferior to 0.05. Italic—high similarity, p-value equal to 1.
148

149
II.5. Electrokinetic enhanced transport of zero valent iron nanoparticles for
chromium(VI) reduction in soils
(published in Chemical Engineering Transactions)


CHEMICAL ENGINEERING TRANSACTIONS VOL. 28, 2012
A publication of
The Italian Association
of Chemical Engineering Online at: www.aidic.it/cet
Guest Editor: Carlo Merli
Copyright © 2012, AIDIC Servizi S.r.l.,
ISBN 978-88-95608-19-8; ISSN 1974-9791
Electrokinetic Enhanced Transport of Zero Valent Iron Nanoparticles for Chromium(VI) Reduction in Soils
Helena I. Gomesa,b*, Celia Dias-Ferreirac, Alexandra B. Ribeirob, Sibel Pamukcua aDepartment of Civil and Environmental Engineering, Fritz Engineering Laboratory, 13 E. Packer Avenue, Lehigh University, Bethlehem, PA 18015-4729, USA bCENSE, Departamento de Ciências e Engenharia do Ambiente, Faculdade de Ciências e Tecnologia, Universidade Nova de Lisboa, 2829-516 Caparica, Portugal cCERNAS, Departamento de Ambiente, Escola Superior Agrária de Coimbra, Bencanta, 3040-316 Coimbra, Portugal [email protected]
Zero valent iron nanoparticles (nZVI) are a promising technology that could provide cost-effective solutions to soil and groundwater remediation. However, transport of nZVI is normally limited by their aggregation and settling, and with mobility being normally less than a few meters.The main research objective of this study is to find out if coupling electrokinetics and reactive iron nanoparticles can be an effective method for treating chromium contaminated clay soils. Direct current was used to enhance poly(acrylic acid), sodium salt (PAA) coated iron nanoparticles (PAA-nZVI) mobility in Cr(VI) spiked kaolin.A commercially available electrophoretic cell was modified for these experiments and equipped with internal auxiliary electrodes that allow to measure the redox potential directly in the clay. A constant potential of 5.0 V wasapplied across the test bed. Experimental results show that electrokinetics can enhance the delivery of nanoscale iron particles for the reduction of hexavalent chromium to the less toxic trivalent chromium. Direct current enhanced nZVI transport up to 74 % when compared with diffusion, maximum value found when comparing iron concentrations ratios. Activation of nZVI was also observed with a decrease in the redox potential of 531 mV, in average, after the injection point.
1. Introduction Large quantities of chromium have been discharged into the environment, mainly to soils and groundwater, due to improper disposal and leakagein industrial activities (ore refining, production of steel and alloys, metal plating, tannery, wood preservation and pigmentation). Chromium is one of the most frequent metal soil contaminants and is one of the top 20 contaminants on the Superfund priority list of hazardous substances for the past 15 years(Chrysochoouet al., 2011). Oxidation states ofCr range from -4 to +6, but only the +3 (III) and +6 (VI) states are stable under most natural environments. These twooxidation states are drasticallydifferent in charge, physicochemical properties as well as chemical and biochemical reactivity (Bagchiet al., 2002). Cr(VI) is extremely mobile in the environment and is toxic to humans, animals, plants, and microorganisms. Because of its significant mobility in the subsurface environment, the potential risk of groundwater contamination is high. Cr(III), on the other hand, is less toxic, immobile, and readily precipitates as Cr(OH)3(Singhet al.,
151

2011).Cr(III) is also considered to be a trace element essential for the proper functioning of living organisms(Kotaś and Stasicka, 2000). Several researchers have already demonstrated, at bench-scale, that nZVI could be used to promote reduction of Cr(VI) to Cr(III) in groundwater (Ponderet al., 2000; Melitaset al., 2001; Drieset al., 2005) and also in soils (Xu and Zhao, 2007; Francoet al., 2009; Chrysochoouet al., 2011; Singhet al., 2011, 2012).Experimental results from X-ray photoelectron spectroscopy and X-ray absorption spectroscopy showed that nano Fe0 reduces Cr(VI) and corrodes to form lepidocrocite[a product of Fe(II) oxidation - γFeOOH] which then acts as a substrate for precipitation of Cr(OH)3 and/or CrxFe1-x(OH)3 (Manninget al., 2007). Fe0 is ultimately oxidized to Fe(III), which precipitates as ferric hydroxides, while Cr(VI) is reduced to Cr(III).The net reactions of Cr(VI) reduction with Fe(0) and coprecipitation of Cr(III) and Fe(III) are as follows(Qianet al., 2008), involving also indirect reduction by Fe(II) according to the reactions (3) and (4)(Chrysochoouet al., 2011):
CrO42− + Fe0 + 8H+ → Fe3+ + Cr3+ + 4H2O (1)
(1-x)Fe3+ +(x)Cr3+ +2H2O → 2Fe(1− x)CrxOOH (s) + 3H+ (2)
where x can vary from 0 to 1.
2HCrO4− + 3Fe0 + 14H+ → 3Fe2+ + 2Cr3+ + 8H2O (3)
Fe0 +2H+ → Fe2+ + H2 (4)
3Fe2+ + CrO42− + 16H+ → 3Fe3+ + Cr3+ + 8H2O (5)
In field applications, nZVI are traditionally injected under pressure and/or by gravity. However, transport of nZVI is normally limited by their aggregation and settling (Phenratet al., 2007), with mobility in the subsurface being normally less than a few meters as several field applications show(Bennettet al., 2010; Combaet al., 2010; Heet al., 2010). Some strategies have been developed to tackle this limitation, such as coating of the nanoparticles with different polymers (Sunet al., 2007; Yanget al., 2007; Phenratet al., 2008; Tiraferriet al., 2008). Electrokinetics can be used to deliver and activate nZVI in low permeability soils (Pamukcuet al., 2008; Reddyet al., 2011; Yang and Chang, 2011). The electrokinetic process can also provide the electrical supply of energy to drive favorable reduction-oxidation reactions. Pamukcu et al.(2004) demonstrated the feasibility of in situ reduction of Cr(VI) to Cr(III) by introducing ferrous iron Fe2+ to the contaminated soil electrokinetically. This study aims to analyze if coupling electrokinetics and reactive iron nanoparticles can also be an effective method for treating chromium contaminated soils.
2. Materials and methods 2.1 Electrophoretic cell A commercially available electrophoretic (EP) (Econo-SubmarineGel Unit, model SGE-020) cell was modified to undertake these experiments (Figure 1). The cell is a rectangular translucent box with a square (20 cm x 20 cm) sample tray. There are two liquid chambers on each side of the sample tray (to hold the electrolyte) and a lid that covers the whole apparatus. The standard cell is equipped with platinum working electrodes and both auxiliary electrodes and a reference electrode were added for this experiment. This modified EP cell allowed direct measurement of the redox potential (ORP) in the soil by use of 0.25 mm diameter platinum wire electrodes fixed in the base plate of the sample tray at equal intervals (3 cm) with conductive glue. ORP measurements were made in the wire electrodes, using a Ag/AgCl reference electrode and a device attached to a low resistance multimeter to facilitate the accurate measurement of soil redox potential (Rabenhorst, 2009) (Figure 1). These electrodes were labeled as E1-E5 starting from the anode end (Figure 1). Compressed fiberglass wool pads were used on both sides to help transport the migrating ions from the electrolyte into the clay and vice versa. The levels of the liquids in the anode and cathode chambers were kept slightly below that of the clay in the sample tray to avoid flooding of the soil cell with excess liquid and any preferential transport of nZVI through water pool at the top.
152

Figure 1: Schematic diagram of the modified electrophoretic cell test setup.
2.2 Chemicals Zero valent iron nanoparticles (nZVI) were prepared with the reduction of ferric chloride (Alfa Aesar) by sodium borohydride(HydrifinTM)and after were stabilized by poly(acrylic acid), sodium salt (PAA) (Polysciences, Inc) following the method described inJiemvarangkulet al.(2011). A solution with a concentration of 10 g L-1 of nZVI and 30 % (w/w) of PAA was prepared. All stock solutions were made from ACS reagent grade materials and distilled de-ionized water. The electrolyte solution used in the electrode chambers, 0.001 M NaCl (Sigma Ultra) was deoxygenated with ultra purified grade nitrogen gas (N2) for a minimum of 1 h before use.The molar concentration of the potassium dichromate(Aldrich Chemical) solution was 0.005 M.
2.3 Enhanced transport experiments The chromium spiked clay was prepared by adding K2Cr2O7 stock solution to 140 g of white Georgia kaolinite clay, whose properties were described by Pamukcu et al. (2004). The final water content was 60 % by dry weight and the mixture had a density of 1.63 g cm-3 (Pamukcuet al., 2004). The paste was transferred into the tray and spread uniformly over the wireelectrodes to a thickness of 2 mm. PAA-nZVI were delivered using a pipette to add 0.250 mL solution and spreading it into a pre-cut groove into the clay on the anode side, between E1 and E2 (Figure 1). An acrylic cover (2 mm thick) was then placed over to ensure that the clay saturation is maintained under a thin layer of water, butPAA-nZVI transport in the system occurred through the clay layer only. A constant potential of 5.0 V was applied across the working electrodes for 24 h.This low potential was selected to remainwithin the linear range of the power supply used and alsoprevent excessive gas generation. The24-h duration was selected to allow adequate time for uniformdistribution of iron in the clay based on previously demonstrated results (Pamukcu and Wittle, 1992).The cell was kept in a dark location to prevent iron photo-oxidation. Two control experiments were conducted in the same conditions, without direct current and with current and without nZVI. Measurements were taken periodically at the following times: 0.25, 0.50, 0.75, 1, 2, 3, 5, 7, 12, 15, 20 and 24 h. At each measurement time voltage, current, ORP, pH and temperature were monitored. At the end of each test, water samples were collected from the electrode chambers, and soil samples were collected in three equidistant locations above the electrodes. The grove where nZVI was injected was not sampled. The soil and water samples were analyzed for total chromium, hexavalent chromium, total iron and ferrous iron concentrations, and pH.All soil and liquid samples were collected, preserved, extracted, and diluted in accordance with the U.S. EPA guidelines (3050B, 3060A,7196A)or standard methods (APHA, 1992). The iron and chromium analysis were conducted using a Perkin-ElmerAAnalyst200flame atomic absorption spectroscopy (AA) and a Hach DR 2800 spectrophotometer (UV).
153

Figure 2: Distribution of ORPin the clay with and without direct current transport and without nZVI.
3. Results and discussion 3.1 Redox potential measurements The redox measurements in soil show the trend of oxidizing to reducing conditions from the anode toward the cathode when the direct current is applied over time in 24 h (Figure 2). When PAA-nZVI was injected between E1 and E2, it caused decrease in the ORP values of 523 mV within the first hour of transport, showing that there is an activation of the nanoparticles as observed by Pamukcu et al. (2008). In the diffusion test, the ORP values maintained a nearly constant value, around 0.222 V, showing no activation of the nZVI. In the experiments where direct current was applied, thecurrent density was2.7x 10-4 mA cm-2after about 1 h of treatment when no nanoparticles where injected,and1.3 x 10-3 mA cm-2 with PAA-nZVI. This shows the increase in the electrical conductivity when PAA-nZVI are used, causing additional current carriers be introduced into the system with the ensuing reactions.
3.2 Chromium and iron distributions At the end of 24h treatment, no iron or chromium was detected in both the anolyte and the catholyte in all the experiments. The Fe/Cr ratio distribution in soil remained relatively uniform (Figure 3)in the electrodes E1 to E5, throughout the cell as observed by Pamukcu et al. (2004). This is attributed to retarded chromium transport and uniform distribution of the excess iron across the thin cross-section of the kaolin during treatment.
Figure 3: Post-treatment average distribution of total iron to total chromium ratio in the clay.
Figure 4: Average mass fraction distribution of Cr(VI) and total chromium measured for each electrode location.
154

Figure 5: Average mass fraction distribution of Fe2+ and total iron measured for each electrode location.
Figure 6: 2D spatial distribution of the % [Fe2+]/[Fe] observed in the soil comparing the diffusion and DC assisted transport tests of nZVI.
Comparing the ratio between Cr(VI) and total chromium concentrations along the electrodes (Figure 4), it is apparent that less chromium is on this oxidation state, when direct current is used. In this case, across the soil, at the end of 24 h, an average of 62 % of chromium is transformed into the less toxic and less mobile oxidation state Cr(III). Results also show that PAA-nZVI transport is enhanced with direct current, as more Fe2+ was found compared with diffusion (Figure 5).The high value in E3 is consistent with the visual observation of nZVI transport as well. Figure 6 shows the 2-dimensional spatial distribution of the [Fe2+]/[Fe] percentage between the diffusion and enhanced transport. The overall transformation of Fe to Fe(II) is more than doubled in the enhanced transport case (Figure 5), but the spatial distribution of the species achieved at the end of 24 h is not as uniform as that of the diffusion (Figure 6).
4. Conclusions
According to the experimental results, it can be concluded that the integration of electrokinetics with nZVI is very promisingin the cleanup of Cr contaminated soil, enhancing the transport of PAA-nZVI and reducing the target contaminant, even with very low current density. ORP distribution and its temporal variation throughout the tests showed that the electrical field enhances the ORP, creating a synergistic effect of nZVI usage with electrokinetics. The results show that PAA-nZVI can be transported by electric fieldseven in low permeability clay soils, preventing common issues of agglomeration and settlement, while accelerating in situ destruction or immobilization of some contaminating compounds. However, further tests should be done, especially with higher amounts of soil and soils with high surface activity. More detailed analysis of the iron speciation; the competition between the different oxidants present in the media and the stoichiometry should also be considered.
Acknowledgments
This work has been funded by the European Regional Development Fund (ERDF) through COMPETE – Operational Programme for Competitiveness Factors (OPCF), by Portuguese National funds through “FCT - Fundaçãopara a Ciência e a Tecnologia” under project «PTDC/AGR AAM/101643/2008 NanoDC», by the research grant SFRH/BD/76070/2011 and by FP7-PEOPLE-IRSES-2010-269289-ELECTROACROSS. DanZerokais kindly acknowledged for the electrophoretic cell modification and the construction of the device to increase resistance.
References
APHA, 1992, Standard Methods for the Examination of Water and Wastewater, American Public Health Association, Washington, DC, USA.
Bagchi D., Stohs S.J., Downs B.W., Bagchi M., Preuss H.G., 2002, Cytotoxicity and oxidative mechanisms of different forms of chromium, Toxicology 180, 5-22.
155

Bennett P., He F., Zhao D., Aiken B., Feldman L., 2010, In situ testing of metallic iron nanoparticle mobility and reactivity in a shallow granular aquifer, J. Contam. Hydrol. 116, 35-46.
Chrysochoou M., Johnston C.P., Dahal G., 2011, A comparative evaluation of hexavalent chromium treatment in contaminated soil by calcium polysulfide and green-tea nanoscale zero-valent iron, J. Hazard. Mater.DOI:10.1016/j.jhazmat.2011.1011.1003.
Comba S., Molfetta A.D., Sethi R., 2010, A comparison between field applications of nano-, micro-, and millimetric zero-valent iron for the remediation of contaminated aquifers, Water Air Soil Pollut., 215, 595-607.
Dries J., Bastiaens L., Springael D., Agathos S.N., Diels L., 2005, Combined removal of chlorinated ethenes and heavy metals by zerovalent iron in batch and continuous flow column systems, Environ. Sci.Technol. 39, 8460-8465.
Franco D.V., Silva L.M., Jardim W.F., 2009,Reduction of hexavalent chromium in soil and ground water using zero-valent iron under batch and semi-batch conditions, Water Air Soil Pollut. 197, 49-60.
He F., Zhao D., Paul C., 2010, Field assessment of carboxymethyl cellulose stabilized iron nanoparticles for in situ destruction of chlorinated solvents in source zones, Water Res. 44, 2360-2370.
Jiemvarangkul P., Zhang W.X., Lien H.L., 2011, Enhanced transport of polyelectrolyte stabilized nanoscale zero-valent iron (nZVI) in porous media, Chem. Eng. J. 170, 482-491.
Kotaś J., Stasicka, Z., 2000. Chromium occurrence in the environment and methods of its speciation, Environ. Pollut. 107, 263-283.
Manning B.A., Kiser J.R., Kwon H., Kanel S.R., 2007, Spectroscopic investigation of Cr(III)- and Cr(VI)- treated nanoscale zerovalent iron, Environ. Sci. Technol. 41, 586-593.
Melitas N., Chuffe-Moscoso O., Farrell J., 2001,Kinetics of soluble chromium removal from contaminated water by zerovalent iron media: Corrosion inhibition and passive oxide effects,Environ. Sci. Technol. 35, 3948-3953.
Pamukcu S., Hannum L., Wittle J.K., 2008, Delivery and activation of nano-iron by DC electric field,J. Environ.Sci. Health A 43, 934-944.
Pamukcu S., Weeks A., Wittle J.K., 2004, Enhanced reduction of Cr(VI) by direct electric current in a contaminted clay,Environ. Sci. Technol.38, 1236-1241.
Pamukcu S., Wittle J.K., 1992, Electrokinetic removal of selected heavy metals from soil, Environ. Prog. 11, 241-250.
Phenrat T., Saleh N., Sirk K., Kim H.-J., Tilton R.D., Lowry G.V., 2008, Stabilization of aqueous nanoscale zerovalent iron dispersions by anionic polyelectrolytes: Adsorbed anionic polyelectrolyte layer properties and their effect on aggregation and sedimentation, J. Nanopart. Res. 10, 795–814.
Phenrat T., Saleh N., Sirk K., Tilton R.D., Lowry G.V., 2007, Aggregation and sedimentation of aqueous nanoscale zerovalent iron dispersions, Environ. Sci. Technol. 41, 284-290.
Ponder S.M., Darab J.G., Mallouk T.E., 2000. Remediation of Cr(VI) and Pb(II) aqueous solutions using supported, nanoscale zero-valent iron,Environ. Sci. Technol. 34, 2564-2569.
Qian H., Wu Y., Liu Y., Xu X., 2008. Kinetics of hexavalent chromium reduction by iron metal, Front. Environ. Sci. Engin. China 2, 51-56.
Rabenhorst M.C., 2009, Making soil oxidation–reduction potential measurements using multimeters, Soil Sci. Soc. Am. J. 73, 2198-2201.
Reddy K.R., Darko-Kagy K., Cameselle C., 2011, Electrokinetic-enhanced transport of lactate-modified nanoscale iron particles for degradation of dinitrotoluene in clayey soils, Sep. Purif. Technol. 79, 230-237.
Singh R., Misra V., Singh R.P., 2011, Synthesis, characterization and role of zero-valent iron nanoparticle in removal of hexavalent chromium from chromium-spiked soil, J. Nanopart. Res. 13, 4063-4073.
Singh R., Misra V., Singh R.P., 2012, Removal of Cr(VI) by nanoscale zero-valent iron (nZVI) from soil contaminated with tannery wastes, Bull. Environ. Contam. Toxicol.88(2), 210-214.
Sun Y.-P., Li X.-Q., Zhang W.-X., Wang H.P., 2007, A method for the preparation of stable dispersion of zero-valent iron nanoparticles, Colloid. Surface. A 308, 60–66.
Tiraferri A., Chen K.L., Sethi R., Elimelech M., 2008, Reduced aggregation and sedimentation of zero-valent iron nanoparticles in the presence of guar gum, J. Colloid Interf. Sci. 324, 71–79.
Xu Y., Zhao D., 2007, Reductive immobilization of chromate in water and soil using stabilized iron nanoparticles, Water Res. 41, 2101-2108.
Yang G.C.C., Chang Y.-I., 2011, Integration of emulsified nanoiron injection with the electrokinetic process for remediation of trichloroethylene in saturated soil, Sep. Purif. Technol. 79, 278–284.
Yang G.C.C., Tu H.-C., Hung C.-H., 2007, Stability of nanoiron slurries and their transport in the subsurface environment, Sep. Purif. Technol. 58 166-172.
156

157
II.6. Assessment of combined electro-‐nanoremediation of molinate
contaminated soil (published in Science of the Total Environment)


Science of the Total Environment 493 (2014) 178–184
Contents lists available at ScienceDirect
Science of the Total Environment
j ourna l homepage: www.e lsev ie r .com/ locate /sc i totenv
Assessment of combined electro–nanoremediation of molinatecontaminated soil
Helena I. Gomes a,c,⁎, Guangping Fan a,b, Eduardo P. Mateus a, Celia Dias-Ferreira c, Alexandra B. Ribeiro a
a CENSE, Departamento de Ciências e Engenharia do Ambiente, Faculdade de Ciências e Tecnologia, Universidade Nova de Lisboa, 2829-516 Caparica, Portugalb Key Laboratory of Soil Environment and Pollution Remediation, Institute of Soil Science, Chinese Academy of Sciences (ISSCAS), East Beijing Road, Nanjing 210008, Chinac CERNAS — Research Center for Natural Resources, Environment and Society, Escola Superior Agraria de Coimbra, Instituto Politecnico de Coimbra, Bencanta, 3045-601 Coimbra, Portugal
H I G H L I G H T S
• Molinate is degraded in soil by zero valent iron nanoparticles (nZVI).• Higher contact time of nZVI with soil facilitates molinate degradation.• Soil type was the most significant factor influencing iron and molinate transport.• When using nZVI and EK molinate is not only transported to catholyte, but also degraded.
⁎ Corresponding author at: CENSE, DepartamentoAmbiente, Faculdade de Ciências e Tecnologia, UniversidCaparica, Portugal. Tel.: +351 212948300; fax: +351 212
E-mail address: [email protected] (H.I. Gomes).
http://dx.doi.org/10.1016/j.scitotenv.2014.05.1120048-9697/© 2014 Elsevier B.V. All rights reserved.
a b s t r a c t
a r t i c l e i n f oArticle history:Received 21 March 2014Received in revised form 23 May 2014Accepted 25 May 2014Available online xxxx
Editor: Kevin V. Thomas
Keywords:HerbicideNanoremediationElectrokineticsContaminated soilZero valent iron nanoparticles (nZVI)
Molinate is a pesticide widely used, both in space and time, for weed control in rice paddies. Due to its watersolubility and affinity to organic matter, it is a contaminant of concern in ground and surface waters, soils andsediments. Previous works have showed that molinate can be removed from soils through electrokinetic (EK)remediation.In this work, molinate degradation by zero valent iron nanoparticles (nZVI) was tested in soils for the first time.Soil is a highly complex matrix, and pollutant partitioning between soil and water and its degradation rates indifferent matrices is quite challenging. A system combining nZVI and EK was also set up in order to study thenanoparticles and molinate transport, as well as molinate degradation.Results showed that molinate could be degraded by nZVI in soils, even though the process is more timedemanding and degradation percentages are lower than in an aqueous solution. This shows the importanceof testing contaminant degradation, not only in aqueous solutions, but also in the soil-sorbed fraction. It wasalso found that soil type was the most significant factor influencing iron and molinate transport. The mainadvantage of the simultaneous use of both methods is the molinate degradation instead of its accumulationin the catholyte.
© 2014 Elsevier B.V. All rights reserved.
1. Introduction
Thewidespreaduse of pesticides in intensive agriculture leads to soiland groundwater contamination. One of the pesticides that causesenvironmental concern is molinate (S-ethyl N,N-hexamethylene-1-carbamate), often applied annually to flooded fields during riceseeding to control the overgrowth of weeds (Castro et al., 2005). In2013, there were 165.5 million hectares of rice paddies worldwide(FAO, 2013). Molinate can be found in natural surface and groundwaters and also in wastewaters (Köck-Schulmeyer et al., 2013) due
de Ciências e Engenharia doade Nova de Lisboa, 2829-516948554.
15
to its high water solubility (Table 1), as well as in soils and sedimentsnear rice paddies (Castro et al., 2005; Cerejeira et al., 2003;Hildebrandt et al., 2007).
Zero valent iron nanoparticles (nZVI) degraded different pesticidesin aqueous solutions, such as atrazine (Bezbaruah et al., 2009; Joo andZhao, 2008; Satapanajaru et al., 2008), lindane (Elliott et al., 2009; Jooand Zhao, 2008), chloroacetanilide (Alachlor) (Bezbaruah et al., 2009)and molinate (Feitz et al., 2005), and remediated soils contaminatedwith pesticides such as malathion (Singhal et al., 2012), dinoseb(Satapanajaru et al., 2009), and chlorpyrifos (Reddy et al., 2013). Mostof the research with iron nanoparticles analyzed the contaminant deg-radation in aqueous media, showing high degradation rates, includingmolinate degradation by nZVI through an oxidative process (Feitzet al., 2005; Joo et al., 2004). However, only a limited number of studieshave assessed nanoparticle performance for soil-sorbed contaminants
9

Table 1Chemical and physical properties of molinate.Mabury et al., 1996
Chemical name Molinate
CAS No. 2212-67-1Structure
Molecular formula C9H17NOSBoiling point 202 °C (10 mm Hg)Density 1.06Water solubility 800–912 mg L−1
Half-life 21 daysKoc 190 mL g−1 OClog Kow 3.21
179H.I. Gomes et al. / Science of the Total Environment 493 (2014) 178–184
(Singh et al., 2012; Zhang et al., 2011), and as far as our knowledgeconcerns, no previous study was done for soil-sorbed molinate.
The combination of electrokinetic remediation (EK) and nZVI allowsthe enhancement of the transport of iron nanoparticles in low perme-ability fine-grain soils (Chowdhury et al., 2012; Gomes et al., 2013;Gomes et al., 2014; Jones et al., 2010; Pamukcu et al., 2008; Rosaleset al., 2014) and degradation of organic contaminants (Fan et al.,2013; Reddy et al., 2011; Yang and Chang, 2011; Yuan et al., 2012).With the simultaneous use of both remediation techniques (EK andnZVI), the contaminant is not only removed from soil (traditionaloutcome in EK), but also it is additionally degraded by nZVI, whosetransport can also be enhanced by electric direct current. Electrokineticscan successfully remove molinate from soils to the catholyte due toelectroosmotic transport as showed by Ribeiro et al. (2011), both byexperimental work and modeling.
This work studies for the first time the degradation of molinate insoil using nZVI. It also assesses the integration of nZVI and electro-kinetics to enhance the nanoparticles and molinate transport anddegradation in two different soils.
2. Materials and methods
2.1. Soils
We used two different soils: S1 (sandy), sampled near a sanitarylandfill at Valadares, Vale de Milhaço, Portugal, and S2 (sandy loamwith higher organic matter content), sampled in an industrial park, incentral Portugal. Table 2 presents some of their physical and chemicalcharacteristics.
2.2. Chemicals and solvents
Molinate standards were of Pestanal grade, obtained from Riedel-deHaën (Seelze, Germany). The technical molinate (95%) used in the
Table 2Physical and chemical characteristics of the soils used.
Parameter S1 S2
Textural classification Sandy Sandy loamOrganic matter (g kg−1) 4 128.3pH (H2O) 5.9 6.1pH (KCl) 4.5 5.4Exchangeable cations (cmol(c) kg−1)
Ca2+ 0.34 16.18Mg2+ 0.05 3.98K+ 0.05 0.70Na+ 0.04 0.18
Sum of exchangeable cations (cmol(c) kg−1) 0.48 21.04Cation exchange capacity (cmol(c) kg−1) 1.39 23.38Saturation (%) 35 90
160
experiments was from Herbex (Sintra, Portugal). The solvents used inthe present study were from Riedel-de Haën (Seelze, Germany),Panreac (Barcelona, Spain), Carlo Erba (Milan, Italy) and Merck(Darmstadt, Germany). Acetone was of Gradient Grade, hexane wasof Pestanal grade, diethyl ether was of ACS grade, methanol was ofHPLC grade and dichloromethane was of SupraSolv grade. Thewater was distilled and purified with a Milli-Q plus system fromMillipore (Bedford, MA, USA). The iron nanoparticles were in aslurry-stabilized suspension (NANOFER 25S, NANO IRON, s.r.o.,Rajhrad, Czech Republic) negatively charged due to the coatingwith polyacrylic acid (PAA), with an average particle size of 50 nm,an average surface area of 20–25 m2 g−1, a narrow particle sizedistribution of 20–100 nm and a high iron content in the range of80–90 wt.%.
2.3. Degradation tests
Both soils were spiked with technical molinate to obtain a final con-centration of 290 mg kg−1. After air-drying, 1 g of soil and 25mL of de-ionized water and 200 μL of nZVI slurry (final concentration 1.0 g L−1
Fe) were placed in glass vials with a screw cap, in duplicate, under aer-obic conditions, as themolinate degradation is an oxidative process (Jooet al., 2004). Blank samples were prepared as control, using the samespiked soil andwithout nZVI, for all the tested times. These soil suspen-sions were shaken in an orbital shaker (Bunsen A0 400) at 200 rpm at25 ± 2 °C. After 24 h, the samples were centrifuged for 10 min at7500 rpm (Sorvall RC5C Plus centrifuge). The supernatant was then re-moved and extracted through Solid Phase Extraction (SPE) using StrataX cartridges (200 mg/3 mL; Phenomenex Torrance, CA, USA) on avacuum rack. The molinate in the soil was extracted by 10 mL hexaneafter 20 min sonication (Bandelin Sonorex Super RK 102H). The hexaneextract was filtered through a 0.45 μm syringe Acrodisc PTFE filter (PallGelman Sciences, Ann Arbor, MI, USA) and concentrated under a gentlestream of nitrogen until 1.0 mL before analysis.
2.4. Electrokinetic experiments
2.4.1. Electrokinetic cellThe EK experiments were carried out in a laboratorial cell modified
at the New University of Lisbon. The cell is divided into three compart-ments, consisting of two electrode compartments (L=7.46 cm, internaldiameter = 8 cm) and a central one (L = 4 cm, internal diameter =8 cm), in which the soil, saturated with deionized water, is placed(Fig. 1). This central compartment, made of Plexiglas, was equipped
Fig. 1. Schematic representation of the laboratory cell. Legend: ① Anode compartment;② reservoir for the iron nanoparticles injection;③ cathode compartment. The separationbetween the soil and the compartments containing liquids was made through passivemembranes (filter paper).

180 H.I. Gomes et al. / Science of the Total Environment 493 (2014) 178–184
with an injection reservoir (L = 1 cm) for the iron nanoparticles, sepa-ratedwith a 1mmnylonmesh and a low speed filter paper. A set of fivecellulose filters, previously tested and known to work as passive mem-branes (Whatman filter paper), were used to separate the soil from theelectrolytes. The soil section near the cathode is a non-spiked S1 soil inorder to assess the molinate transport towards the cathode (Fig. 1). Apower supply (Hewlett Packard E3612A, Palo Alto, USA) was used tomaintain a constant DC and the voltage drop was monitored (KiottoKT 1000H multimeter). The electrodes were platinized titanium bars,with an L = 5 cm and a diameter of 3 mm (Bergsøe Anti CorrosionA/S, Herfoelge, Denmark). The fresh electrolyte was a 10−2 MNaNO3 solution, with pH 7.0, and a peristaltic pump (Watson-Marlow 503 U/R, Watson-Marlow Pumps Group, Falmouth,Cornwall, UK) distributed it to the electrode compartments. In all ex-periments, the electrolytes were collected into flasks and sampleswere analyzed.
2.4.2. Experimental conditionsFive different laboratory experiments (A–E) were carried out,
according to the experimental conditions presented in Table 3. Thevariables considered were: i) the type of soil (two different soils withdifferent textures, cation exchange capacities and organic matter con-tents), ii) pH control as an EK enhancementmethod, and iii) the absenceof current as control experiments. No pH control experiment was madewith soil S1 because its characteristics (sandy texture, low cation ex-change capacity and low organic matter content) facilitate bothmolinate and nZVI transport.
The electrolyte used, in both anode and cathode compartments, was10−2 M NaNO3, with a flow rate of 1 mL min−1. All experiments lasted6 days (~145 h). A daily injection of 1 mL nZVI slurry — NANOFER 25Swas made at the same time, after 10 min sonication, performing atotal of 5mL injected in each experiment. Electrolyte samples (catholyteand anolyte) were collected daily during the experiments, and their pHand volume were registered. At the end of each experiment, the totalsoil in the cell was sectioned into three “slices” and the center onewas further divided into three (down, center and top) for iron andmolinate analyses. Subsamples were collected for humidity measure-ments. In experiments B and C, pH control was performed in theanolyte, through the manual addition of NaOH 1 M, in order to keepthe pH neutral (~7).
2.5. Iron analysis
The iron was extracted from soil by the sodium dithionite–citrate–bicarbonate (DCB) method (Mehra and Jackson, 1960) and from theelectrokinetic cell and the membranes with concentrated hydrochloricacid. The iron analyses were made using an Inductively CoupledPlasma-Atomic Emission Spectrometer (ICP) on a Horiba Jobin-Yvonequipment.
2.6. Molinate analysis
2.6.1. Aqueous samples: electrolyte solutionsThe extraction of the molinate present in the electrolyte solutions
was performed by SPE, using Strata X cartridges (500 mg/6 mL;Phenomenex, Torrance, CA, USA). The SPE cartridges were conditioned
Table 3Summary of experimental conditions. The electrolyte used was 10−2 M NaNO3 and the durati
Exp. Soil Current (mA) Soil— dry weight (g)
A S2 10 321.46B S1 10 381.41C S2 10 344.31D S2 0 251.89E S1 0 387.42
16
by washing with 2 × 3 mL of methanol, followed by 2 × 3 mL of Milli-Qwater. The pHof the anolyte and catholyte daily sampleswas adjustedto values between 5 and 7, adding HCl or NaOH, before extraction. Theaqueous samples were passed through the cartridge approximately ata flow-rate of 10 mL min−1 by applying a moderate vacuum. Afterthat, the cartridgeswerewashedwithwater and dried for approximate-ly 1 min by vacuum. The analytes trapped in the cartridges were elutedsequentially with 2 × 2 mL of dichloromethane. The sample extractswere concentrated under a gentle stream of nitrogen to 1 mL. The sam-ples were transferred to a vial and kept at−20 °C until GC analysis.
2.6.2. Solid samples: soils and passive membranesSolid samples were extracted three times by sonication using 50 mL
of methanol for 10 min to assure molinate maximum recovery. All theextracts were collected, as one and concentrated to 10 mL using 250and 50 mL pear-shaped evaporating flasks on a rotary evaporator,Büchi RE 111 (35 °C/moderate vacuum). The concentrated extractswere transferred to a KudernaDanish concentrator tube and evaporatedto approximately 5 mL. In order to remove the particulate matter, theextracts were filtered through 0.5 μm glass microfiber filters (MFV-5,47 mm; Filter-Lab, Barcelona, Spain), prior to the concentration step,and through 0.2 μm syringe Chromafil PTFE filters (Macherey-Nagel,Duren, Germany) prior to the evaporation step.
2.6.3. Gas chromatography (GC)Molinate analyses were performed by gas chromatography/
mass spectrometry (GC/MS) on a HP5890 series II GC coupled toa HP5972 MSD (Hewlett-Packard, Palo Alto, California, USA). Thecolumn used was a ZB-5 (5%-phenyl 95%-dimethylpolysiloxane)with 30 m × 0.25 mm i.d. and 0.25 μm film thickness (Phenomenex,Torrance, CA, USA).
The oven temperature was programmed starting at 80 °C for 2 min,increased to 100 °C at a rate of 4 °C min−1 and then increased from8 °Cmin−1 to 250 °C, where it holds for 5min. Heliumwas used as car-rier gas at a flow rate of 1.0 mL min−1. The injector was in a split/splitless mode set at 250 °C. The injections of 1.00 μL were performedat a splitless mode (1 min) using an HP7673 autosampler (Hewlett-Packard, Palo Alto, California, USA).
The mass spectrometer was operated in the electron ionizationmode (EI, 70 eV). The interface temperature was set at 280 °C and theEI source was set at 176 °C. Molinate analysis was carried out by fullscan for identification (scan range 40–300 amu) and selected ionmonitoring (SIM) for quantitative analysis using the base peak ofmolinate. The HP5972 MSD was tuned before analysis using PFTBA(perfluorotributylamine) as the tuning standard. The data was regis-tered and analyzed using ChemStation software (G1701BA, VersionB.01.00).
3. Results and discussion
3.1. Degradation tests
For both soils, the molinate concentrations in the supernatant aresimilar with and without iron nanoparticles. We would expect to findalso identical concentrations in soils, but that does not occur (Fig. 2),with molinate concentrations in soil being residual when iron
on of the experiments was 6 days.
Molinate added to soil (mg) pH control
51.2 No55.8 NaOH 1 M added to anolyte52.7 NaOH 1 M added to anolyte52.6 No52.6 No
1

Control Supernatant
Control Soil
Supernatant
Soil
0
0.2
0.4
0.6
0.8
1
1.2
Soil 1 Soil 2
C/C
0
Soils
Fig. 2. Molinate concentrations in the soil and supernatant after 24 h, with and withoutnZVI (control) in S1 sandy soil and S2 sandy-loam soil. Initial molinate concentration insoil was 290 mg kg−1. Data plotted as mean of duplicates, error bars indicate standarddeviation.
0
2
4
6
8
10
12
14
16
18
0 25 50 75 100 125 150
Cum
ulat
ive
Fe (
mg)
Time (h)
E
B
a
0
1
2
3
4
5
6
7
8
9
0 25 50 75 100 125 150C
umul
ativ
e Fe
(m
g)
Time (h)
D
C
A
b
Fig. 3. Cumulative amounts of total iron (mg) in the anolyte solutions during the experi-ments. a) Experiments with soil 1 (sandy soil): B (EK with pH control) and E (diffusion);b) experiments with soil 2 (sandy loamwith high organicmatter content): A (EKwithoutpH control), C (EK with pH control) and D (diffusion). In the cathode compartment, ironwas detected in very low concentrations and in most of the samples was below thedetection limit.
181H.I. Gomes et al. / Science of the Total Environment 493 (2014) 178–184
nanoparticles are used. Comparing the molinate final amount in theexperiments with and without nanoparticles (one-way analysis ofvariance—ANOVA), we found a significant difference for the concentra-tions of molinate in soils (p b 0.01). This supports the hypothesis thatthe iron nanoparticles degraded molinate added to the soil.
Molinate degradation occurs via an oxidative pathway that requiresoxygen and the formation of hydrogen peroxide and hydroxyl radical(Joo et al., 2004). The degradation in an aqueous solution can shift themolinate equilibriumbetweenwater and soil, facilitatingmolinate desorp-tion from soil, and its subsequent degradation while in solution. We canalso hypothesize that part of molinate degradation occurred during thecentrifugation and the extraction of the soil samples. Iron nanoparticleswere removed from the aqueous solution and were visible in the solidphase — here they remained in contact with the soil for about 30 to45min andmolinate degradation could occur. Iron nanoparticles, becausethey are very strong reducing agents, are traditionally used for dechlorina-tion of organochlorines (Elliott et al., 2008; Liu et al., 2005; Lowry andJohnson, 2004;Wang and Zhang, 1997). In reduction, the reaction occursin the surface of the nanoparticles (Masciangioli and Zhang, 2003; Yanet al., 2013).However, in the oxidative pathway, the reaction is dependenton the formation of hydrogen peroxide and the hydroxyl radical, and onlyoccurs in aerobic media, being consequently favored in the supernatantwhere molinate can more easily react with the hydroxyl radical.
A lower recovery of molinate was found in soil S2 (55± 15%), whencompared to recovery in soil S1 (76 ± 17%), what may be related to itshigher soluble organic matter content that, probably, overloaded theSPE columns that presented a dark brown color after the extraction.Potential losses due to hydrolysis, biodegradation, photolysis and evap-oration processes (Köck-Schulmeyer et al., 2013) can also contribute tothis low recovery.
Fig. 4. Iron enrichment (g kg−1) in soil sections (compared to initial soil concentration:18.43 g kg−1 in soil S1 and 0.85 g kg−1 in soil S2) in experiments A–E. Section 1: betweenthe anode compartment and the injection reservoir; Section 2: central soil section after theinjection reservoir, top; Section 3: central soil section after the injection reservoir, bottom;Section 4: central soil section after the injection reservoir, center; and Section 5: betweenthe central soil section and the cathode compartment.
3.2. Electrokinetic experiments
3.2.1. Transport of iron nanoparticlesIn all experiments, the aqueous solution in the anode compartment
presented higher Fe concentrations than the one in the cathodecompartment. In themajority of the catholyte samples, the iron concen-trations were below the detection limit (100% of the samples in exper-iment A, 43% in experiment B, 86% in experiment C and 57% inexperiment D, Table S2 in the Supplementary materials).
We measured the highest iron concentrations in the aqueous solu-tions in the diffusion experiments (D and E) and more specifically inthe anode compartment, due to the lower distance from the injectionreservoir (only 1 cm, Figs. 1 and 3). A strong orange color and nanopar-ticle sedimentation in the anode compartmentwere visible in these dif-fusion experiments, which explain the peaks in the last segment of thecumulative Fe curves (Fig. 3). This sedimentation did not occur in thecathode. Concerning the variable soil, we measured near the double of
162
iron (16.24 mg vs. 8.38 mg) in the anolyte in experiment E (soil S1,sandy soil) when compared with experiment D (soil S2, loamy soilwith high organic matter content). Similarly, more iron was found atthe anolyte for experiment B (soil S1) than experiment C (soil S2). Thedifference in the soils texture contributes to this difference in transport.The sandy soil S1 will allow a faster transport of the iron nanoparticles,due to its higher pore volume (Gomes et al., 2013). Adsorption phenom-ena (Zhang et al., 2011) in soil particles and humic acid accumulation onthe nZVI surface (Kim et al., 2013)most likely hinder iron transport andthis can also contribute to the lower iron concentrations in the anolyte

Aqueoussolution
0.6%
Membranes10.6%
Soil33.7%
Injectionreservoir54.4%
Losses0.7%
a
b
Fig. 5. a) Averagemass balance of iron after the experiments. Average recovery of ironwas86%. b) Photo of the experimental cell showing the iron accumulation in the injectionreservoir.
182 H.I. Gomes et al. / Science of the Total Environment 493 (2014) 178–184
in experiments with soil S2, when compared to those with soil S1 undersimilar operational conditions (Figs. 3 and 4).
In the experiments with direct current (A, B and C), lower amountsof Fe were measured in the anolyte than in the diffusion experiments(D and E). Even though nanoparticles have a negative surface chargedue to the polymer (PAA) coating, being expected to be electrophoreti-cally transported towards the anode, electroosmotic flow generally oc-curs in the opposite direction (towards the cathode), and may hindertransport towards the anode, explaining lower concentrations foundin the anolyte when direct current was applied. In the experimentwith pH control (Exp. C, soil S2) 10 times more iron was, in average,found in the anolyte than in experiment A without pH control (soilS2), possibly because in this last case the advance of the acid front(H+) oxidizes nanoparticles (Fe0 → Fe2+), and the resulting positivelycharged iron ion is transported towards the cathode. However, onlyvery small amounts of iron were measured in the catholyte in allexperiments, probably because there was not enough time to reachthe cathode compartment.
Comparing the amount of iron added and the remaining iron in theinjection reservoir by the end of the experiments, the higher mobiliza-tion rate (1 − Cf ∕ C0 × 100) was obtained for experiment B (72%),followed by C (70%), E (62%), D (47%) and A (29%). The experimentswith pH control (B and C) show an identical mobilization rate.
An analysis of variance (ANOVA)with the iron concentrations in theaqueous phase showed that the observed variance can be explained, at a0.05 level, by the type of soil (S1 and S2) and the electric current (0 and10 mA) (Table S1, Supplementary materials). The pH control was notsignificant to explain this variance.
In addition to iron in the electrolyte, its presence in the soil was alsoanalyzed and compared to the initial content. Iron enrichment in thedifferent soil slices is shown in Fig. 4. Experiment A hadmore additionaliron in the soil (Fig. 4), followed by experiments D, C, B and E. Thishigher iron concentration in the soil in experiment A may be explainedby the change of the soil charge with the advance of the acid front fromthe anode enddue to the absence of pH control. In these conditions, ionsof H+ may adsorb to soil particles and increase the zeta-potentialresulting in an increased adsorption of the PAA-coated iron nanoparti-cles. In all experiments,most of the ironwas in the sections immediatelyafter the injection reservoir. The section near the cathode (Section 5)presented the lowest amounts of additional iron (Fig. 4), what is consis-tent with the concentrations found in the catholyte. This means that theiron accumulates in the nearest sections to the injection point. Neverthe-less, no major differences existed in the three samples in the middle sec-tion (top, central and bottom) in experiments B, C and D, with a relativestandard deviation (RSD) of 9%, 6% and 5%, respectively; while in experi-ments A and E the relative standard deviation was higher (22% and 37%).There was no iron accumulation or deposition in the bottom part of thissection (Section 3), when compared to the central and top samples.
The mass balance of the iron shows that most of it stays in the injec-tion reservoir of the cell, followed by the sum found in the soil and thepassive membranes (Fig. 5). This balance indicates a low mobility ofthe iron nanoparticles inside the experimental electrokinetic cell, mostlikely due to aggregation and sedimentation as also showed in other ex-perimental setupswith columns (Kocur et al., 2013; Phenrat et al., 2009;Saleh et al., 2008).
3.2.2. Transport and degradation of molinateOur results confirm the transport of molinate towards the cathode
with EK (Fig. 6), as the experimental data and modeling by Ribeiroet al. (2011) showed. In the diffusion experiments (D and E) moremolinate is found in the anode than in the cathode due to direct contactbetweenmolinate-spiked soil and the anode compartment, while at thecathode side a non-contaminated soil layer is placed adjacent to thecathode compartment (Figs. 1 and 6), hindering the appearance ofmolinate in the catholyte. Table 4 presents the electroosmotic transportof molinate towards the cathode, the diffusion towards the anode, the
16
final content in the soils and its removal rate. Removal rate includesmolinate transport from the soil and molinate degradation, calculatedas the percentage of the quotient between the difference of the initialand final concentrations, and the initial concentration.
Previous studies have showed the strong adsorption of molinate insoils with high organic matter content (Alister et al., 2010) and this ex-plains the 10-fold decrease in molinate in the anolyte of experiment D(soil S2, sandy-loam, 12.8% organic matter) when compared to experi-ment E (soil S1, sandy, 0.4% organic matter) (Fig. 7).
The soil type is statistically significant to explain the molinate vari-ance in the electrolyte (Table S1, Supplementary materials). Comparingthe data of all experiments, the direct current and pH control are notstatistically significant (p = 0.05) to explain molinate concentrationsin the aqueous phase.
When an electric current is applied (experiments A, B, and C) theamount of molinate in the anolyte decreases and molinate appears insoil section 5 (initially clean) near the cathode (Fig. 7). This shows theelectrokinetic transport of molinate towards the cathode. Once again,the higher amount of molinate in soil S2 (experiment C) compared tosoil S1 (experiment B) can be explained by adsorption to soil organicmatter, resulting in lower molinate removal efficiencies in these exper-iments (around 70% in B versus almost 90% in C).
The cumulative amounts of molinate found in the electrolyte(anolyte and catholyte) are less than 6% the initial amount in the soil(Table 4). In previous studies with EK but without nanoparticles(Santos, 2008), approximately 60% of the molinate was found in thecatholyte, less than 2% was found in the anolyte and a maximum of 9%was found in soil. These differences support the hypothesis that therewas molinate degradation by nZVI in our experiments as, in identicalconditions, fewer molinate was found in the electrolytes (catholyte).
The results now obtained show no enhancement in molinate degra-dationwhen both EK and nZVI are used, contrary towhat was found for
3

0
1
2
3
4
5
0 25 50 75 100 125 150
Cum
ulat
ive
mol
inat
e (m
g)
Time (h)
E - Anolyte
B - Catholyte
a
0
0.25
0.5
0.75
1
0 25 50 75 100 125 150
Cum
ulat
ive
mol
inat
e (m
g)
Time (h)
A - Catholyte
C - Catholyte
D - Anolyte
b
Fig. 6.Cumulative amounts ofmolinate (mg) in the anolyte and catholyte solutions duringthe experiments. a) Experiments with soil 1 (sandy soil): B (EK with pH control) and E(diffusion); b) experiments with soil 2 (sandy loam with high organic matter content):A (EK without pH control), C (EK with pH control) and D (diffusion). In the diffusion ex-periments (D and E) higher molinate content was found in the anolyte due to the directcontact with the spiked soil.
Fig. 7. Mass of molinate in different compartments by the end of the experiments.
183H.I. Gomes et al. / Science of the Total Environment 493 (2014) 178–184
nitrates (Yang et al., 2008), dinitrotoluene (Reddy et al., 2011) and pen-tachlorophenol (Yuan et al., 2012). Although in those studies no diffu-sion tests were made, we must remark that the degradation rates aredependent on reduction reactions and molinate is degraded by nano-Fe0 via an oxidative pathway with hydroxyl radicals (Joo et al., 2004),not via the most common reductive pathway. This requires desorptionof molinate and higher contact times than the reductive pathway. Inour experiments, the diffusion tests were more effective for soil S2,most likely because EK, by transporting the molinate out of the systemfaster, reduced the contact times with iron nanoparticles. For soil S1with lower resistance for molinate mobility, the applied direct currentis not significant for its removal.
4. Conclusions
Results show that molinate degradation by zero valent iron nano-particles via an oxidative pathway can also occur in soils. The soil-sorbed molinate degradation results show the importance of testingcontaminant degradation with nZVI not only in aqueous solutions, but
Table 4Molinate removal rate.
Experiment Soil Initial content in soils (mg) Transported to the anode (mg)
A S2 51.2 0.004B S1 55.8 1.323C S2 52.7 0.003D S2 52.6 0.349E S1 52.6 4.540
164
also in matrices increasingly more complex, such as synthetic ground-waters, real groundwaters, model soils and real soils. The degradationresults in soils nowobtained aremuch lower andmore timedemandingthan in deionized water.
Soil type was the most significant variable for iron and molinatetransport. In the tested conditions, iron moves preferentially to anodeand molinate to cathode. Diffusion was the transport mechanism thatyielded higher Fe concentrations in the anolyte. In the EK experiments,electrophoretic transport of iron nanoparticles was counteracted byelectroosmosis (higher in soil S2). For these experimental conditions,direct current was a significant variable to explain iron concentrationsin the aqueous solutions, but it was not significant for molinate. In thetested conditions, there was no advantage in using the electric currentto enhance the iron nanoparticle transport. We also observed limitedmobility of the iron nanoparticles, with an average of 54% of the nano-particles remaining in the injection reservoir.
Fe0 nanoparticles and electrokinetics can degrade and removemolinate from soils, respectively. With electrokinetics, molinate can beremoved from soil to an aqueous solution, and with nZVI molinate canbe degraded in situ. The major advantage of the simultaneous use ofboth methods is the molinate degradation instead of its accumulationin the catholyte.
Acknowledgments
This work has been funded by FP7-PEOPLE-IRSES-2010-269289-ELECTROACROSS, by the Portuguese National funds through “Fundaçãopara a Ciência e a Tecnologia” under projects PTDC/ECM/111860/2009and PTDC/AGR-AAM/101643/2008 and by the research grant SFRH/BD/76070/2011. Carla Rodrigues from REQUIMTE is acknowledged forthe ICP analysis, and NANO IRON, s.r.o. is acknowledged for kindly pro-viding the NANOFER 25S samples.
Appendix A. Supplementary data
Supplementary data to this article can be found online at http://dx.doi.org/10.1016/j.scitotenv.2014.05.112.
Transported to the cathode (mg) Final content in soils (mg) Removal rate (%)
0.237 10.46 72.31.886 1.01 89.90.125 9.22 71.20.003 0.74 97.50.044 0.00 91.3

184 H.I. Gomes et al. / Science of the Total Environment 493 (2014) 178–184
References
Alister CA, Araya MA, Kogan M. Adsorption and desorption variability of four herbicidesused in paddy rice production. J Environ Sci Health B 2010;46:62–8.
Bezbaruah AN, Thompson JM, Chisholm BJ. Remediation of alachlor and atrazine contam-inated water with zero-valent iron nanoparticles. J Environ Sci Health B 2009;44:518–24.
Castro M, AnC Silva-Ferreira, ClM Manaia, Nunes OC. A case study of molinate applicationin a Portuguese rice field: herbicide dissipation and proposal of a clean-upmethodol-ogy. Chemosphere 2005;59:1059–65.
Cerejeira MJ, Viana P, Batista S, Pereira T, Silva E, Valério MJ, et al. Pesticides in Portuguesesurface and ground waters. Water Res 2003;37:1055–63.
Chowdhury AIA, O'Carroll DM, Xu Y, Sleep BE. Electrophoresis enhanced transport ofnano-scale zero valent iron. Adv Water Res 2012;40:71–82.
Elliott DW, Lien H-L, Zhang W. Zerovalent iron nanoparticles for treatment of groundwater contaminated by hexachlorocyclohexanes. J Environ Qual 2008;37:2192–201.
Elliott DW, Lien HL, ZhangWX. Degradation of lindane by zero-valent iron nanoparticles. JEnviron Eng 2009;135:317–24.
Fan G, Cang L, Qin W, Zhou C, Gomes HI, Zhou D. Surfactants-enhanced electrokinetictransport of xanthan gum stabilized nano Pd/Fe for the remediation of PCBs contam-inated soils. Sep Purif Technol 2013;114:64–72.
FAO. Rice market monitor. XVI (3), XVI (3)Trade and Markets Division. Food and Agricul-ture Organization of the United Nations; 2013.
Feitz AJ, Joo SH, Guan J, Sun Q, Sedlak DL, DavidWaite T. Oxidative transformation of con-taminants using colloidal zero-valent iron. Colloid Surf A 2005;265:88–94.
Gomes H, Dias-Ferreira C, Ribeiro A, Pamukcu S. Enhanced transport and transformationof zerovalent nanoiron in clay using direct electric current.Water Air Soil Pollut 2013;224:1–12.
Gomes HI, Dias-Ferreira C, Ribeiro AB, Pamukcu S. Influence of electrolyte and voltage onthe direct current enhanced transport of iron nanoparticles in clay. Chemosphere2014;99:171–9.
Hildebrandt A, Lacorte S, Barceló D. Assessment of priority pesticides, degradation prod-ucts, and pesticide adjuvants in groundwaters and top soils from agricultural areasof the Ebro river basin. Anal Bioanal Chem 2007;387:1459–68.
Jones EH, Reynolds DA, Wood AL, Thomas DG. Use of electrophoresis for transportingnano-iron in porous media. Ground Water 2010;49:172–83.
Joo SH, Zhao D. Destruction of lindane and atrazine using stabilized iron nanoparticlesunder aerobic and anaerobic conditions: effects of catalyst and stabilizer.Chemosphere 2008;70:418–25.
Joo SH, Feitz AJ, Waite TD. Oxidative degradation of the carbothioate herbicide, molinate,using nanoscale zero-valent iron. Environ Sci Technol 2004;38:2242–7.
Kim D-G, Hwang Y-H, Shin H-S, Ko S-O. Deactivation of nanoscale zero-valent iron byhumic acid and by retention in water. Environ Technol 2013;34:1–11.
Köck-Schulmeyer M, Villagrasa M, López de Alda M, Céspedes-Sánchez R, Ventura F,Barceló D. Occurrence and behavior of pesticides in wastewater treatment plantsand their environmental impact. Sci Total Environ 2013;458–460:466–76.
Kocur CM, O'Carroll DM, Sleep BE. Impact of nZVI stability on mobility in porous media. JContam Hydrol 2013;145:17–25.
Liu Y, Majetich SA, Tilton RD, Sholl DS, Lowry GV. TCE dechlorination rates, pathways, andefficiency of nanoscale iron particles with different properties. Environ Sci Technol2005;39:1338–45.
Lowry G, Johnson K. Congener-specific dechlorination of dissolved PCBs by microscaleand nanoscale zerovalent iron in a water/methanol solution. Environ Sci Technol2004;38:5208–16.
Mabury SA, Cox JS, Crosby DG. Environmental fate of rice pesticides in California. In: WareG, editor. Reviews of environmental contamination and toxicology, 147. New York:Springer; 1996. p. 71–117.
16
Masciangioli T, Zhang W. Environmental technologies at the nanoscale. Environ SciTechnol 2003;37:102A–8A.
Mehra OP, JacksonML. Iron oxide removal from soils and clays by a dithionite–citrate sys-tem buffered with sodium bicarbonate. Clays Clay Minerals 1960;7:317–27.
Pamukcu S, Hannum L,Wittle JK. Delivery and activation of nano-iron by DC electric field.J Environ Sci Health A 2008;43:934–44.
Phenrat T, Kim H-J, Fagerlund F, Illangasekare T, Tilton RD, Lowry GV. Particle size distri-bution, concentration, and magnetic attraction affect transport of polymer-modifiedFe0 nanoparticles in sand columns. Environ Sci Technol 2009;43:5079–85.
Reddy KR, Darko-Kagy K, Cameselle C. Electrokinetic-enhanced transport of lactate-modified nanoscale iron particles for degradation of dinitrotoluene in clayey soils.Sep Purif Technol 2011;79:230–7.
Reddy AVB, Madhavi V, Reddy KG, Madhavi G. Remediation of chlorpyrifos-contaminatedsoils by laboratory-synthesized zero-valent nano iron particles: effect of pH and alu-minium salts. J Chem 2013;2013:1–7.
Ribeiro AB, Mateus EP, Rodríguez-Maroto J-M. Removal of organic contaminants fromsoils by an electrokinetic process: the case of molinate and bentazone. Exp modelSep Purif Technol 2011;79:193–203.
Rosales E, Loch JPG, Dias-Ferreira C. Electro-osmotic transport of nano zero-valent iron inBoom Clay. Electrochim Acta 2014;127:27–33.
Saleh N, Kim H-J, Phenrat T, Matyjaszewski K, Tilton RD, Lowry GV. Ionic strength andcomposition affect the mobility of surface-modified Fe0 nanoparticles in water-saturated sand columns. Environ Sci Technol 2008;42:3349–55.
Santos JCS. Electrokinetic remediation of rice field soils contaminated by molinate.Dissertação de Mestrado Faculdade de Ciências e Tecnologia da Universidade Novade Lisboa; 2008 [97 pp.].
Satapanajaru T, Anurakpongsatorn P, Pengthamkeerati P, Boparai H. Remediation ofatrazine-contaminated soil and water by nano zerovalent iron. Water Air Soil Pollut2008;192:349–59.
Satapanajaru T, Onanong S, Comfort SD, Snow DD, Cassada DA, Harris C. Remediatingdinoseb-contaminated soil with zerovalent iron. J Hazard Mater 2009;168:930–7.
Singh R, Misra V, Mudiam MKR, Chauhan LKS, Singh RP. Degradation of HCH spiked soilusing stabilized Pd/Fe0 bimetallic nanoparticles: pathways, kinetics and effect of reac-tion conditions. J Hazard Mater 2012;237–238:355–64.
Singhal RK, Gangadhar B, Basu H,Manisha V, Naidu GRK, Reddy AVR. Remediation ofmal-athion contaminated soil using zero valent iron nano-particles. Am J Anal Chem2012;3:76–82.
Wang C-B, ZhangW. Synthesizing nanoscale iron particles for rapid and complete dechlo-rination of TCE and PCBs. Environ Sci Technol 1997;31:2154–6.
Yan W, Lien H-L, Koel BE, Zhang W-x. Iron nanoparticles for environmental clean-up: re-cent developments and future outlook. Environ Sci Process Impacts 2013;15:63–77.
Yang GCC, Chang Y-I. Integration of emulsified nanoiron injection with the electrokineticprocess for remediation of trichloroethylene in saturated soil. Sep Purif Technol 2011;79:278–84.
Yang GCC, Hung C-H, Tu H-C. Electrokinetically enhanced removal and degradation of ni-trate in the subsurface using nanosized Pd/Fe slurry. J Environ Sci Health A 2008;43:945–51.
Yuan S, Long H, Xie W, Liao P, Tong M. Electrokinetic transport of CMC-stabilized Pd/Fenanoparticles for the remediation of PCP-contaminated soil. Geoderma 2012;185–186:18–25.
Zhang M, He F, Zhao D, Hao X. Degradation of soil-sorbed trichloroethylene by stabilizedzero valent iron nanoparticles: effects of sorption, surfactants, and natural organicmatter. Water Res 2011;45:2401–14.
5

166

Assessment of combined electro-nano remediation of molinate
contaminated soil Helena I. Gomes1,3, Guangping Fan1,2, Eduardo P. Mateus1, Celia Dias-Ferreira3,
Alexandra B. Ribeiro1
1CENSE, Departamento de Ciências e Engenharia do Ambiente, Faculdade de Ciências e Tecnologia, Universidade Nova de
Lisboa, 2829-516 Caparica, Portugal
2Key Laboratory of Soil Environment and Pollution Remediation, Institute of Soil Science, Chinese Academy of Sciences
(ISSCAS), East Beijing Road, Nanjing 210008, China
3 CERNAS – Research Center for Natural Resources, Environment and Society, Escola Superior Agraria de Coimbra, Instituto
Politecnico de Coimbra, Bencanta, 3045-601 Coimbra, Portugal
* Corresponding author. Tel. +351 212948300, Fax. +351 212948554. E-mail address: [email protected] (Helena I. Gomes)
Table S1. Analysis of variance (ANOVA) test for determining the significance difference between
levels of a variable in the electrolyte concentration for iron and molinate. Variable “Soil”
represents the two different soils tested, “Current” represents the EK and diffusion tests and
“pH Control” the addition (or not) of NaOH in the anode compartment.
Sum of squares df Mean square F p-value
Total iron concentration Between “Soil” groups Within “Soil” groups Total
3.487 6.978
10.465
1 29 30
3.487 0.241
14.491 0.001
Between “Current” groups Within “Current” groups Total
3.849 6.617
10.465
1 29 30
3.849 0.228
16.867 < 0.001
Between “pH control” groups Within “pH control” groups Total
0.753 9.713
10.465
1 29 30
0.753 0.335
2.247 0.145
Molinate concentration Between “Soil” groups Within “Soil” groups Total
60417.964 24774.974 85192.937
1 28 29
60417.964 884.820
68.283 < 0.001
Between “Current” groups Within “Current” groups Total
60417.964 24774.974 85192.937
1 28 29
5148.731 2858.722
1.801 0.190
Between “pH control” groups Within “pH control” groups Total
363.603 84829.334 85192.937
1 28 29
363.603 3029.619 0.120 0.732
Bold—significant, p-value inferior to 0.05 Post hoc tests were not performed because there are fewer than three groups.
167

Table S2. Cumulative amounts of total iron (mg) in the catholyte solutions in the experiments.
Experiment Soil Iron found in the catholyte (mg) A S2 Bellow detection limit (<0.003) B S1 1.17 C S2 0.004 D S2 0.03 E S1 0.04
168

169
II.7. Electroremediation of PCB contaminated soil with iron nanoparticles:
Performance of a new electrodialytic setup (submitted)


1 2 3 4 5 6 7 8 9 10 11 12 13 14 15 16 17 18 19 20 21 22 23 24 25 26 27 28 29 30 31 32 33 34 35 36 37 38 39 40 41 42 43 44 45 46 47 48 49 50 51 52 53 54 55 56 57 58 59 60 61 62 63 64 65
1
Electroremediation of PCB contaminated soil with iron nanoparticles:
performance of a new electrodialytic setup
Helena I. Gomes1,2,3
, Celia Dias-Ferreira2, Lisbeth M. Ottosen
3, Alexandra B. Ribeiro
1
1CENSE, Departamento de Ciências e Engenharia do Ambiente, Faculdade de Ciências e
Tecnologia, Universidade Nova de Lisboa, 2829-516 Caparica, Portugal
2 CERNAS – Research Center for Natural Resources, Environment and Society, Escola Superior
Agraria de Coimbra, Instituto Politecnico de Coimbra, Bencanta, 3045-601 Coimbra, Portugal
3 Department of Civil Engineering, Technical University of Denmark, Brovej, Building 118, DK
2800 Kgs. Lyngby, Denmark
* Corresponding author. Tel. +351 212948300, Fax. +351 212948554. E-mail address:
[email protected] (Helena I. Gomes)
*Manuscript (clean version)Click here to download Manuscript (clean version): ShortCommunication_160614.docx Click here to view linked References
171

1 2 3 4 5 6 7 8 9 10 11 12 13 14 15 16 17 18 19 20 21 22 23 24 25 26 27 28 29 30 31 32 33 34 35 36 37 38 39 40 41 42 43 44 45 46 47 48 49 50 51 52 53 54 55 56 57 58 59 60 61 62 63 64 65
2
Abstract
Contaminated soils and sediments with polychlorinated biphenyls (PCB) are an important
environmental problem due to the persistence of these synthetic aromatic compounds and to the
lack of a cost-effective and sustainable remediation technology. In this work we compared an
electrodialytic setup developed at the Technical University of Denmark (DTU), in which the soil
is suspended and stirred simultaneously with the addition of zero valent iron nanoparticles
(nZVI), with the conventional electrokinetic (EK) setup. The electrodialytic setup showed
several advantages, such as a higher PCB dechlorination in contaminated soil, in a shorter time,
with lower nZVI consumption, and with the use of half of the voltage gradient when compared
with the traditional EK setup.
Highlights
Suspended electrodialytic remediation with nZVI was tested for PCB for the 1st time
Higher PCB removal (83%) was achieved with suspended EDR in comparison to EK
Shorter times and less nanoparticles were needed using the electrodialytic setup
Higher chlorinated congeners were also degraded
Direct current enhanced dechlorination in the EK setup through pH conditions
The EDR setup with nZVI is competitive compared with incineration and landfilling
Keywords
Electrokinetics, electrodialytic remediation, nZVI, polychlorinated biphenyls, PCB
172

1 2 3 4 5 6 7 8 9 10 11 12 13 14 15 16 17 18 19 20 21 22 23 24 25 26 27 28 29 30 31 32 33 34 35 36 37 38 39 40 41 42 43 44 45 46 47 48 49 50 51 52 53 54 55 56 57 58 59 60 61 62 63 64 65
3
1. Introduction
Polychlorinated biphenyls (PCB) are a family of 209 congeners, classified as persistent
organic pollutants (POP), carcinogenic and recalcitrant, which strongly adsorb to soils and
sediments. Despite the environmental concern regarding PCB ecotoxicity and accumulation in
the food chain, there is no quantification of the total volumes of PCB contaminated soils and
sediments worldwide. Recently, Gomes et al. (2013a) reviewed in situ and ex situ remediation
technologies available for PCB-contaminated soils and sediments, and identified the urgent need
to find cost effective and more sustainable alternatives than the commonly adopted ―dig and
dump‖ and ―dig and incinerate‖.
Electroremediation of contaminated soils is a group of technologies that has evolved over
the last decades with the incorporation of enhancement techniques and the combination with
other remediation technologies (Gomes et al., 2012), targeting a wide range of contaminants.
Electrodialytic remediation (EDR) – a method based on the combination of the electrokinetic
movement of ions in soil with the principle of electrodialysis (Ottosen et al., 1997) – was used
successfully in different matrices such as mine tailings (Hansen et al., 2007; Rojo et al., 2006),
soils (Hansen et al., 1997; Ottosen et al., 2009), different types of fly ashes (Ferreira et al., 2005;
Ferreira et al., 2002; Jensen et al., 2010), sewage sludge (Pazos et al., 2010), freshwater
sediments and harbor sediments (Kirkelund et al., 2009; Nystroem et al., 2005). Electrodialytic
remediation of suspended soil has proven to be a faster process to be used ex situ for the removal
of heavy metals (Jensen et al., 2007; Ottosen et al., 2013a; Ottosen et al., 2009; Sun et al., 2012),
but it was never tested for PCB, only for polycyclic aromatic hydrocarbons (PAH) (Lima et al.,
2012).
173

1 2 3 4 5 6 7 8 9 10 11 12 13 14 15 16 17 18 19 20 21 22 23 24 25 26 27 28 29 30 31 32 33 34 35 36 37 38 39 40 41 42 43 44 45 46 47 48 49 50 51 52 53 54 55 56 57 58 59 60 61 62 63 64 65
4
Zero valent iron nanoparticles (nZVI) were considered a promising alternative for PCB
dechlorination in aqueous solutions (He et al., 2010; Lowry and Johnson, 2004; Wang and
Zhang, 1997; Zhuang et al., 2011). In general, the dechlorination can be expressed by the
following reaction (Zhang et al., 1998):
CxHyClz + zH++ zFe
0 CxHy+z + zFe
2++ zCl
-
(1)
in which iron acts as a reductant (electron donor) for the removal of chlorine. This reaction is
similar to the process occurring during iron corrosion, with the beneficial effects of transforming
chlorinated pollutants. Still a 95% PCB dechlorination in soils was just achieved at high
temperatures (300ºC) (Varanasi et al., 2007). In field applications, nZVI can be injected in the
aquifers through injection wells, or incorporated to topsoil to adsorb or degrade pollutants (Crane
and Scott, 2012). Results in aquifers show that nZVI have limited mobility, ranging from 1 m
(Kocur et al., 2014) to 6-10 m (Zhang and Elliott, 2006). One of the methods tested to enhance
nZVI mobility was the use of direct current (DC) (Gomes et al., 2013b; Jones et al., 2010;
Pamukcu et al., 2008; Yang et al., 2007), using the same principles of electrokinetic remediation
(EK). Electroremediation and nZVI were combined by Fan et al. (2013) and they obtained a PCB
removal rate from soils of only 20% using Fe/Pd bimetallic nanoparticles in conjunction with EK
after 14 d. Another study reported 82 and 53% PCB removal from soils in batch tests with 12 d
duration, using the Pd/Fe bimetallic nanoparticles, compared with 67 and 48% using nZVI (Chen
et al., 2014). In this work, we tested the two-compartment electrodialytic setup developed at the
Technical University of Denmark (DTU) (Ottosen et al., 2013b), in which the soil is suspended
and stirred simultaneously in combination with the addition of nZVI. The main objectives were
to: i) assess the effectiveness for the dechlorination of PCB by nZVI of the new two-
174

1 2 3 4 5 6 7 8 9 10 11 12 13 14 15 16 17 18 19 20 21 22 23 24 25 26 27 28 29 30 31 32 33 34 35 36 37 38 39 40 41 42 43 44 45 46 47 48 49 50 51 52 53 54 55 56 57 58 59 60 61 62 63 64 65
5
compartment electrodialytic setup in comparison with the traditional three-compartment
electrokinetic setup; ii) test if longer EK experiments with nZVI could result in an increased
PCB dechlorination; and to iii) evaluate the need of using direct electric current in the reactor
with suspended soil and nZVI.
2. Materials and Methods
2.1. Chemicals and solvents
PCB standards were analytical grade, obtained from Fluka, Sigma-Aldrich (PCB 28, 52,
101, 138, 153, 180 and 209) and Ultrascientific (PCB 30; PCB 65 and PCB 204). The solvents
hexane and acetone were Pestinorm (VWR BDH Prolabo). Hydrochloric (37.6%), nitric (65%)
and sulfuric (95-07%) acids were tracemetal. Anhydrous Na2SO4, KMnO4, NaCl, and silica gel
(silicic acid) were lab grade. Silica gel was cleaned up before use according to the USEPA
method 3630C. The water was deionized with a Milli-Q plus system from Millipore (Bedford,
MA, USA). A slurry-stabilized suspension of zero valent iron nanoparticles (NANOFER 25S,
NANO IRON, s.r.o., Rajhrad, Czech Republic) was used in the experiments, with 50 nm average
particles size, an average surface area of 20-25 m2
g-1
, a particle size distribution of 20-100 nm
and iron content in the range of 80-90 wt. %.
2.2 Soil characterization
The contaminated soil used in the experiments was provided by a hazardous waste
operator in Portugal and is a mixture of contaminated soils from industrial sites with
transformers oils spills. The soil characterization methods used were described in Jensen et al.
(Jensen et al., 2007). The elemental analysis were made using Inductively Coupled Plasma-
Atomic Emission Spectrometer (ICP) on an Agilent ICP-OES Varian 720-ES equipment. Table 1
presents the physical and chemical characteristics of the soil used in the experiments. The soil
175

1 2 3 4 5 6 7 8 9 10 11 12 13 14 15 16 17 18 19 20 21 22 23 24 25 26 27 28 29 30 31 32 33 34 35 36 37 38 39 40 41 42 43 44 45 46 47 48 49 50 51 52 53 54 55 56 57 58 59 60 61 62 63 64 65
6
was homogenized, air dried and sieved, and only the particles with size < 2 mm were used in the
electroremediation experiments.
2.3 PCB analysis
The soil samples were extracted according to the USEPA method 3550C, and the extracts
were then cleaned following the USEPA methods 3665A and 3630C. The PCB congeners were
analyzed by gas chromatography (GC) on an HP with ECD detector, HP 6890 Series (Hewlett-
Packard, Palo Alto, California, USA). The column used was a TRB–5–MS with 30 m × 0.25 mm
i.d. and 0.25 µm film thickness (Phenomenex, Torrance, CA, USA). The oven temperature was
programmed starting at 70ºC for 2 min, increased to 150ºC at a rate of 25ºC min−1
and then
increased 4ºC min−1
to 200ºC, 8ºC min−1
to 280ºC where it holds for 4 min and finally 10ºC
min−1
to 300ºC, where it holds for 2 min. Pure nitrogen was used as the carrier gas. The injector
was splitless set at 260°C. The injections of 1.00 μl were performed manually.
2.4 Electroremediation experiments
The electroremediation experiments were carried out in two different laboratorial
cylindrical Plexiglas-cells developed at DTU. The electrokinetic cell (EK) is divided into three
compartments, consisting of two electrode compartments (L = 5 cm, internal diameter Ø = 4 cm)
and a central one subdivided in three (L = 1.5 cm each, total of 4.5 cm, Ø = 4 cm), in which the
saturated soil (deionized water) is placed, as well as the zero valent iron nanoparticles [Figure 1
a)]. Cellulose filters (passive membranes) were used to assure the separation between the soil
and electrolytes, and the soil and the iron nanoparticles.
In the electrodialytic cell (ED), there is one compartment (L = 10 cm, Ø = 8 cm) where
the anode, the soil slurry (with a liquid solid ratio of 5) and the plastic-flaps attached to a glass-
stick stirrer (Lab-egg Bie&Bernsten, Denmark, ~350 rpm) are placed. A cation exchange
176

1 2 3 4 5 6 7 8 9 10 11 12 13 14 15 16 17 18 19 20 21 22 23 24 25 26 27 28 29 30 31 32 33 34 35 36 37 38 39 40 41 42 43 44 45 46 47 48 49 50 51 52 53 54 55 56 57 58 59 60 61 62 63 64 65
7
membrane (CAT, GE Water & Process Technologies Bvba - ED, Cation, CR67, MKIII, Blank)
separates this compartment from the one (L = 5 cm, Ø = 8 cm) where the cathode is placed
[Figure 1 b)]. In this setup, catholytes were recirculated by mechanical pumps (Plastomec
magnet pump, model P05) between the chamber and glass bottle.
In both setups, a power supply (Hewlett Packard E3612A, Palo Alto, USA) was used to
maintain a constant voltage and the current was monitored (Fluke 179 multimeter). The working
electrodes were platinized titanium bars, with a diameter of 3 mm and a length of 5 cm in the 3
compartments setup and 10 cm in the 2 compartments setup (Permascand®).
Six different laboratory experiments (A–F) were carried out, according to the
experimental conditions presented in Table 2. The iron nanoparticles were placed in the center of
both cells. In the electrokinetic set-up (experiments A, B, C and D), the central reservoir was
filled at the beginning of the experiments with nZVI. In C more nZVI was added (2 mL) in days
7 and 9. In the electrodialytic setup (experiments E and F), two injections of 5 mL nZVI were
made at 24 and 48 h. The electrolyte used in all experiments was 10-2
M NaCl. In the
electrodialytic setup, the catholyte pH was manually maintained around 2 by the periodic
addition of HCl 5M.
The current between working electrodes, the pH in the soil suspension and in the
electrolytes were measured every 24 h. In the ED setup, at the end of the experiment the
suspension from the central compartment was filtered though qualitative filter paper overnight.
In the EK setup, samples from the anode and the cathode side were considered separately.
Subsamples were collected for humidity measurements. For both setups, the soil was air-dried
and crushed lightly in a mortar before the PCB extraction and pH measurements.
177

1 2 3 4 5 6 7 8 9 10 11 12 13 14 15 16 17 18 19 20 21 22 23 24 25 26 27 28 29 30 31 32 33 34 35 36 37 38 39 40 41 42 43 44 45 46 47 48 49 50 51 52 53 54 55 56 57 58 59 60 61 62 63 64 65
8
3. Results and Discussion
3.1 Comparison between the two experimental setups
The two-compartment electrodialytic setup shows PCB removal percentages of 83% with
and 29% without direct current, as shown in Figure 2. These results are higher than in previous
studies with EK (Fan et al., 2013) and batch tests without current (Chen et al., 2014). The
suspension and stirring of the soil can enhance the PCB dechlorination by nZVI, due to an
increase in desorption from soil and/or to a higher contact and reaction between nZVI and PCB.
In the traditional three-compartment electrokinetic setup, the iron has to be transported across the
compacted saturated soil to reach the contaminants. Even a low proportion of carbonate minerals
may cause an increase in the deposition of PAA-nZVI particles and aggregates, due to a weaker
negative surface charge (Laumann et al., 2013). As the soil used in the experiments has high
carbonate content (18%), the limited dechlorination observed (12-58%) (Figure 2) can be due to
this soil characteristic.
In both setups, there are chemical reactions that deplete the Fe0 reductant power:
2Fe0
(s) + 4H+
(aq) + O2 (aq) 2Fe2+
(aq) + 2H2O(l) (2)
Fe0
(s) + 2H2O(l) Fe2+
(aq) + H2(g) + 2OH-(aq) (3)
Fe2+
(aq) + CO32-
(aq) FeCO3(s) (4)
Also, the presence of transformer oil was found to adversely affect the PCB degradation (Chang
et al., 2010). Despite the introduction of H+ (resultant of hydrolysis in the anode) and the
atmospheric O2 dissolved by the slurry stirring that oxidize Fe0, a higher PCB removal is
obtained in the ED setup compared with the traditional electrokinetic setup.
In other remediation techniques (Beckingham and Ghosh, 2011; Li et al., 2013;
Vasilyeva et al., 2010; Wu et al., 2012) lower chlorinated congeners (tri and
178

1 2 3 4 5 6 7 8 9 10 11 12 13 14 15 16 17 18 19 20 21 22 23 24 25 26 27 28 29 30 31 32 33 34 35 36 37 38 39 40 41 42 43 44 45 46 47 48 49 50 51 52 53 54 55 56 57 58 59 60 61 62 63 64 65
9
tetrachlorobiphenyls) were the ones with highest removal rates. In this study lower chlorinated
congeners were degraded, namely PCB28, PCB52 and PCB65 (particularly in the EK setup), but
higher chlorinated congeners were also degraded (Experiment F). In some experiments PCB65
increased due to dechlorination of higher chlorinated congeners, such as PCB204. In the EK
setup removal rates for each congener are lower than in the ED setup.
3.2 Different duration experiments
The experiments with the electrokinetic setup had different durations to assess if longer
times would increase the PCB dechlorination. Comparing the 10 d experiment (A) with the 45 d
experiment (D), the PCB removal has a small increase (27% vs. 36%) (Figure 2). Although the
removal percentages are higher than in previous studies with 14 d experiments (Fan et al., 2013),
their values are not encouraging for a scale up of the process (pilot and full scale) for the
remediation of PCB contaminated soils and sediments. The higher dechlorination rate in
experiment C is related with the additional nZVI injected at days 7 and 9, not with the exposure
duration. The congeners concentrations obtained in the soil are not statistically different in the
three experiments (A, C and D) at a 0.05 level of significance [one-way ANOVA, F(2,20) =
2.14, p = 0.14].
3.3 Experiments without direct current
Direct current can be used to enhance nZVI transport in different porous matrices or
model soils (Gomes et al., 2013b; Gomes et al., 2014), but, in the electrodialytic setup, the
contact between the nanoparticles and the contaminated soil is ensured by the stirring so the
current may not be needed for the PCB dechlorination. However, results show that the
experiment with direct current (exp. F) had a much higher PCB removal rate (83%) than the
experiment just with the iron nanoparticles (exp. E) (29%), due to the high pH and buffer
179
1 2 3 4 5 6 7 8 9 10 11 12 13 14 15 16 17 18 19 20 21 22 23 24 25 26 27 28 29 30 31 32 33 34 35 36 37 38 39 40 41 42 43 44 45 46 47 48 49 50 51 52 53 54 55 56 57 58 59 60 61 62 63 64 65
10
capacity of the soil tested (Table 1 and Figure 3). In the experiment without current (exp. E), the
soil suspension with nZVI kept a constant alkaline pH, which promotes the passivation of the
iron nanoparticles. In the experiment with current (exp. F) water electrolysis produces H+ in the
anode, thus lowering the pH. A slightly acidic pH (4.90–5.10) increases the dechlorination rate
of PCB by nZVI and nZVI/Pd (Wang et al., 2012).
The sum of energy and nZVI costs (operation costs for a full-scale reactor) for the
remediation of a cubic meter of PCB contaminated soil using the two compartments cell
electrodialytic setup is about 72 €, considering the average cost of energy in the European Union
(EUROSTAT 2011). If we are only dealing with organic contaminants that can be completely
degraded, there is no need to treat and dispose the anolyte after separation from the solids. Even
adding the excavation and transport costs, this solution is competitive when compared with the
off-site incineration average costs (885 €/m3) and off-site landfilling costs (231 €/m
3)
(Summersgill, 2006).
4. Conclusions
The two-compartment electrodialytic setup tested in this work allows PCB dechlorination
from contaminated soil ex situ at a higher rate, in a shorter time, with lower nZVI consumption,
and with the use of half of the voltage gradient when compared with the traditional EK setup. In
addition, there is no need to treat and dispose of the anolyte.
The results show that the soil characteristics are important and affect the reaction
between nZVI and the target contaminant, especially pH and carbonate content. Direct current
can enhance dechlorination in the two compartments electrodialytic setup.
180

1 2 3 4 5 6 7 8 9 10 11 12 13 14 15 16 17 18 19 20 21 22 23 24 25 26 27 28 29 30 31 32 33 34 35 36 37 38 39 40 41 42 43 44 45 46 47 48 49 50 51 52 53 54 55 56 57 58 59 60 61 62 63 64 65
11
Acknowledgments
This work has been funded by the European Regional Development Fund (ERDF) through
COMPETE – Operational Programme for Competitiveness Factors (OPCF), by Portuguese
National funds through ―FCT - Fundação para a Ciência e a Tecnologia‖ under project
«PTDC/AGR-AAM/101643/2008 NanoDC», by FP7-PEOPLE-IRSES-2010-269289-
ELECTROACROSS and by the research grant SFRH/BD/76070/2011. Prof. Jorge Varejão and
Helena Silva are acknowledged for GC analysis and Sabrina Madsen for ICP analysis. NANO
IRON, s.r.o. kindly provided NANOFER 25S samples.
References
Beckingham B, Ghosh U. Field-scale reduction of PCB bioavailability with activated carbon
amendment to river sediments. Environ. Sci. Technol. 2011; 45: 10567-10574.
Chang Y, Achari G, Langford C. Effect of cocontaminants on the remediation of PCB-impacted
soils by hydrogen peroxide. Pract. Period. Hazard. Toxic Radioact. Waste Manag. 2010;
14: 266-268.
Chen X, Yao X, Yu C, Su X, Shen C, Chen C, et al. Hydrodechlorination of polychlorinated
biphenyls in contaminated soil from an e-waste recycling area, using nanoscale
zerovalent iron and Pd/Fe bimetallic nanoparticles. Environ. Sci. Poll. Res. 2014: 1-10.
Crane RA, Scott TB. Nanoscale zero-valent iron: Future prospects for an emerging water
treatment technology. J. Hazard. Mat. 2012; 211-212: 112-125.
Fan G, Cang L, Qin W, Zhou C, Gomes HI, Zhou D. Surfactants-enhanced electrokinetic
transport of xanthan gum stabilized nano Pd/Fe for the remediation of PCBs
contaminated soils. Sep. Purif. Technol. 2013; 114: 64-72.
181

1 2 3 4 5 6 7 8 9 10 11 12 13 14 15 16 17 18 19 20 21 22 23 24 25 26 27 28 29 30 31 32 33 34 35 36 37 38 39 40 41 42 43 44 45 46 47 48 49 50 51 52 53 54 55 56 57 58 59 60 61 62 63 64 65
12
Ferreira C, Ribeiro A, Ottosen L. Effect of major constituents of MSW fly ash during
electrodialytic remediation of heavy metals. Sep. Sci. Technol. 2005; 40: 2007-2019.
Ferreira C, Ribeiro AB, Ottosen LM. Study of different assisting agents for the removal of heavy
metals from MSW fly ashes. In: Almorza D, Brebbia CA, Sales D, Popov V, editors.
Waste Management and the Environment. WIT Press, UK, 2002, pp. 171-179.
Gomes HI, Dias-Ferreira C, Ribeiro AB. Electrokinetic remediation of organochlorines in soil:
Enhancement techniques and integration with other remediation technologies.
Chemosphere 2012; 87: 1077-1090.
Gomes HI, Dias-Ferreira C, Ribeiro AB. Overview of in situ and ex situ remediation
technologies for PCB-contaminated soils and sediments and obstacles for full-scale
application. Sci. Total Environ. 2013a; 445-446: 237-260.
Gomes HI, Dias-Ferreira C, Ribeiro AB, Pamukcu S. Enhanced transport and transformation of
zerovalent nanoiron in clay using direct electric current. Water Air Soil Poll. 2013b; 224:
1-12.
Gomes HI, Dias-Ferreira C, Ribeiro AB, Pamukcu S. Influence of electrolyte and voltage on the
direct current enhanced transport of iron nanoparticles in clay. Chemosphere 2014; 99:
171-179.
Hansen HK, Ottosen LM, Kliem BK, Villumsen A. Electrodialytic remediation of soils polluted
with Cu, Cr, Hg, Pb and Zn. J. Chem.Technol. Biotechnol. 1997; 70: 67-73.
Hansen HK, Ribeiro AB, Mateus EP, Ottosen LM. Diagnostic analysis of electrodialysis in mine
tailing materials. Electrochim. Acta 2007; 52: 3406-3411.
182

1 2 3 4 5 6 7 8 9 10 11 12 13 14 15 16 17 18 19 20 21 22 23 24 25 26 27 28 29 30 31 32 33 34 35 36 37 38 39 40 41 42 43 44 45 46 47 48 49 50 51 52 53 54 55 56 57 58 59 60 61 62 63 64 65
13
He F, Zhao D, Paul C. Field assessment of carboxymethyl cellulose stabilized iron nanoparticles
for in situ destruction of chlorinated solvents in source zones. Water Res. 2010; 44:
2360–2370.
Jensen PE, Ferreira CMD, Hansen HK, Rype JU, Ottosen LM, Villumsen A. Electroremediation
of air pollution control residues in a continuous reactor. J. App. Electrochem. 2010; 40:
1173–1181
Jensen PE, Ottosen LM, Ferreira C. Electrodialytic remediation of soil fines (<63 μm) in
suspension—Influence of current strength and L/S. Electrochim. Acta 2007; 52: 3412-
3419.
Jones EH, Reynolds DA, Wood AL, Thomas DG. Use of Electrophoresis for transporting nano-
iron in porous media. Ground Water 2010; 49: 172-183.
Kirkelund GM, Ottosen LM, Villumsen A. Electrodialytic remediation of harbour sediment in
suspension—Evaluation of effects induced by changes in stirring velocity and current
density on heavy metal removal and pH. J. Hazard. Mater. 2009; 169: 685-690.
Kocur CM, Chowdhury AI, Sakulchaicharoen N, Boparai HK, Weber KP, Sharma P, et al.
Characterization of nZVI mobility in a field scale test. Environ. Sci. Technol. 2014: DOI:
10.1021/es4044209.
Laumann S, Micić V, Lowry GV, Hofmann T. Carbonate minerals in porous media decrease
mobility of polyacrylic acid modified zero-valent iron nanoparticles used for groundwater
remediation. Environ. Poll. 2013; 179: 53-60.
Li Y, Liang F, Zhu Y, Wang F. Phytoremediation of a PCB-contaminated soil by alfalfa and tall
fescue single and mixed plants cultivation. J. Soil Sedim. 2013; 13: 925-931.
183

1 2 3 4 5 6 7 8 9 10 11 12 13 14 15 16 17 18 19 20 21 22 23 24 25 26 27 28 29 30 31 32 33 34 35 36 37 38 39 40 41 42 43 44 45 46 47 48 49 50 51 52 53 54 55 56 57 58 59 60 61 62 63 64 65
14
Lima AT, Ottosen LM, Heister K, Loch JPG. Assessing PAH removal from clayey soil by means
of electro-osmosis and electrodialysis. Sci. Total Environ. 2012; 435–436: 1-6.
Lowry G, Johnson K. Congener-specific dechlorination of dissolved PCBs by microscale and
nanoscale zerovalent iron in a water/methanol solution. Environ. Sci. Technol. 2004; 38:
5208-5216.
Nystroem GM, Ottosen L, Villumsen A. Electrodyalitic removal of Cu, Zn, Pb and Cd from
harbour sediment: Influences of changing experimental conditions. Environ. Sci.
Technol. 2005; 38: 2906-2911.
Ottosen L, Jensen P, Kirkelund G, Hansen H. Electrodialytic remediation of different heavy
metal-polluted soils in suspension. Water Air Soil Poll. 2013a; 224: 1-10.
Ottosen LM, Hansen HK, Laursen S, Villumsen A. Electrodialytic remediation of soil polluted
with copper from wood preservation industry. Environ. Sci. Technol. 1997; 31: 1711-
1715.
Ottosen LM, Jensen PE, Hansen HK, Ribeiro A, Allard B. Electrodialytic remediation of soil
slurry–removal of Cu, Cr, and As. Sep. Sci. Technol. 2009; 44: 2245-2268.
Ottosen LM, Jensen PE, Kirkelund GM, Ebbers B. Electrodialytic separation of heavy metals
from particulate material. Patent application EPC 13183278.4-1352, 2013b.
Pamukcu S, Hannum L, Wittle JK. Delivery and activation of nano-iron by DC electric field. J.
Environ. Sci. Health A 2008; 43: 934-944.
Pazos M, Kirkelund GM, Ottosen LM. Electrodialytic treatment for metal removal from sewage
sludge ash from fluidized bed combustion. J. Hazard. Mater. 2010; 176: 1073-1078.
Rojo A, Hansen HK, Ottosen LM. Electrodialytic remediation of copper mine tailings:
Comparing different operational conditions. Miner. Eng. 2006; 19: 500-504.
184

1 2 3 4 5 6 7 8 9 10 11 12 13 14 15 16 17 18 19 20 21 22 23 24 25 26 27 28 29 30 31 32 33 34 35 36 37 38 39 40 41 42 43 44 45 46 47 48 49 50 51 52 53 54 55 56 57 58 59 60 61 62 63 64 65
15
Summersgill M. Remediation technology costs in the UK & Europe; Drivers and changes from
2001 to 2005. In: Telford T, editor. Proceedings of the 5th
International GeoEnviro
Conference, June 2006, Cardiff, 2006.
Sun TR, Ottosen LM, Jensen PE, Kirkelund GM. Electrodialytic remediation of suspended soil –
Comparison of two different soil fractions. J. Hazard. Mater. 2012; 203–204: 229-235.
Varanasi P, Fullana A, Sidhu S. Remediation of PCB contaminated soils using iron nano-
particles. Chemosphere 2007; 66: 1031–1038.
Vasilyeva GK, Strijakova ER, Nikolaeva SN, Lebedev AT, Shea PJ. Dynamics of PCB removal
and detoxification in historically contaminated soils amended with activated carbon.
Environ. Poll. 2010; 158: 770–777.
Wang CB, Zhang W. Synthesizing nanoscale iron particles for rapid and complete dechlorination
of TCE and PCBs. Environ. Sci. Technol. 1997; 31: 2154-2156.
Wang Y, Zhou D, Wang Y, Wang L, Cang L. Automatic pH control system enhances the
dechlorination of 2,4,4'-trichlorobiphenyl and extracted PCBs from contaminated soil by
nanoscale Fe0 and Pd/Fe
0. Environ. Sci. Poll. Res. 2012; 19: 448-457.
Wu BZ, Chen HY, Wang SJ, Wai CM, Liao W, Chiu K. Reductive dechlorination for
remediation of polychlorinated biphenyls. Chemosphere 2012; 88: 757-768.
Yang GCC, Tu HC, Hung CH. Stability of nanoiron slurries and their transport in the subsurface
environment. Sep. Purif. Technol. 2007; 58 166-172.
Zhang W, Elliott DW. Applications of iron nanoparticles for groundwater remediation.
Remediation 2006: 7-21.
Zhang W, Wang CB, Lien HL. Treatment of chlorinated organic contaminants with nanoscale
bimetallic particles. Catal. Today 1998; 40: 387-395.
185

1 2 3 4 5 6 7 8 9 10 11 12 13 14 15 16 17 18 19 20 21 22 23 24 25 26 27 28 29 30 31 32 33 34 35 36 37 38 39 40 41 42 43 44 45 46 47 48 49 50 51 52 53 54 55 56 57 58 59 60 61 62 63 64 65
16
Zhuang Y, Ahn S, Seyfferth AL, Masue-Slowey Y, Fendorf S, Luthy RG. Dehalogenation of
polybrominated diphenyl ethers and polychlorinated biphenyl by bimetallic, impregnated,
and nanoscale zerovalent iron. Environ. Sci. Technol. 2011; 45: 4896-4903.
186

Table 1. Physical and chemical characteristics of the soil.
Parameter
Soil particles (%)
Coarse sand (200 < Ø < 2000 μm) 19.1
Fine sand (20 < Ø < 200 μm) 67.3
Silt (2 < Ø < 20 μm) 12.7
Clay (Ø < 2 μm) 0.9
Textural classification Loamy sand
pH (H2O) 12.2
Conductivity (mS cm-1
) 18.76
Exchangeable cations (cmol(c) kg-1
)
Ca2+
83.75
Mg2+
3.2
K+
26.88
Na+
9.37
Sum of exchangeable cations (cmol(c) kg-1
) 123.2
Calcium carbonate (%) 18.0
Organic matter (%) 16.46
Total PCBa (µg kg
-1) 258 ± 24
Metalsb (mg kg
-1)
Al 20980 ± 590
As 8.6 ± 2.0
Cd 0.68 ± 0.14
Cr 51.66 ± 2.69
Cu 141.73 ± 94.62
Fe 13162 ± 301
Ni 31.98 ± 1.26
Pb 45.43 ± 3.31
Zn 2155 ± 40 a Sum of PCB 28, 30, 52, 65, 101, 138, 153, 180, 204 and 209
b Acid digestion with HNO3 according to the Danish Standard DS259.
TableClick here to download Table: Tables.docx
187

Table 2. Summary of experimental conditions.
Exp. nZVI (mL) Type of injection Voltage
(V cm-1)
Soil (g, dry
weight) Duration (d)
A 13 Unique (in the beginning of experiment) 2 65.30 10
B 13 Unique (in the beginning of experiment) 0 49.84 10
C 20 Repeated (additional iron in days 7 and 9) 2 67.50 20 D 13 Unique (in the beginning of experiment) 2 69.94 45
E 10 2 injections of 5 mL at 24 and 48 h 0 50.01 5
F 10 2 injections of 5 mL at 24 and 48 h 1 50.05 5
188

Figure 2. Average concentration of PCB congeners (PCB28, 52, 65, 101, 138, 153, 180, 204 and 209) in soil before and after the experiments using the 3-compartment electrokinetic setup and the 2-compartment electrodialytic setup. Percentages on the top of each column represent PCB removal regarding the sum of congeners analyzed in the initial soil.

Figure 3. Evolution of pH in the soil suspension during the experiments using the two-compartment ED setup.
0
2
4
6
8
10
12
14
0 20 40 60 80 100 120
pH so
il su
spen
sion
Time (h)
nZVI
ED+nZVI Injection of nZVI
191


193
II.8 Electrodialytic suspended remediation of PCB contaminated soil with
iron nanoparticles and two different surfactants
(published in the Journal of Colloid and Interface Science)


Journal of Colloid and Interface Science 433 (2014) 189–195
Contents lists available at ScienceDirect
Journal of Colloid and Interface Science
www.elsevier .com/locate / jc is
Electrodialytic remediation of polychlorinated biphenyls contaminatedsoil with iron nanoparticles and two different surfactants
http://dx.doi.org/10.1016/j.jcis.2014.07.0220021-9797/ 2014 Elsevier Inc. All rights reserved.
⇑ Corresponding author at: CENSE – Center for Environmental and SustainabilityResearch, Departamento de Ciências e Engenharia do Ambiente, Faculdade deCiências e Tecnologia, Universidade Nova de Lisboa, 2829-516 Caparica, Portugal.Fax: +351 212948554.
E-mail address: [email protected] (H.I. Gomes).
195
Helena I. Gomes a,b,c,⇑, Celia Dias-Ferreira b, Lisbeth M. Ottosen c, Alexandra B. Ribeiro a
a CENSE – Center for Environmental and Sustainability Research, Departamento de Ciências e Engenharia do Ambiente, Faculdade de Ciências e Tecnologia,Universidade Nova de Lisboa, 2829-516 Caparica, Portugalb CERNAS – Research Center for Natural Resources, Environment and Society, Escola Superior Agraria de Coimbra, Instituto Politecnico de Coimbra, Bencanta,3045-601 Coimbra, Portugalc Department of Civil Engineering, Technical University of Denmark, Brovej, Building 118, DK 2800 Kgs. Lyngby, Denmark
a r t i c l e i n f o
Article history:Received 16 May 2014Accepted 17 July 2014Available online 1 August 2014
Keywords:Electrodialytic remediationnZVISurfactantsSaponinTween 80PCB
a b s t r a c t
Polychlorinated biphenyls (PCB) are persistent organic pollutants (POP) that strongly adsorb in soils andsediments. There is a need to develop new and cost-effective solutions for the remediation of PCB con-taminated soils. The suspended electrodialytic remediation combined with zero valent iron nanoparticles(nZVI) could be a competitive alternative to the commonly adapted solutions of incineration or landfill-ing. Surfactants can enhance the PCB desorption, dechlorination, and the contaminated soil cleanup.
In this work, two different surfactants (saponin and Tween 80) were tested to enhance PCB desorptionand removal from a soil sampled at a polluted site, in a two-compartment cell where the soil was stirredin a slurry with 1% surfactant, 10 mL of nZVI commercial suspension, and a voltage gradient of 1 V cm1.
The highest PCB removal was obtained with saponin. Higher chlorinated PCB congeners (penta, hexa,hepta and octachlorobiphenyl) showed removal percentages between 9% and 96%, and the congenerswith highest removal were PCB138, PCB153 and PCB180. The use of low level direct current enhancedPCB removal, especially with saponin. Electrodechlorination of PCB with surfactants and nZVI showedencouraging tendencies and a base is thus formed for further optimization towards a new method forremediation of PCB polluted soils.
2014 Elsevier Inc. All rights reserved.
1. Introduction
Soil contamination with persistent organic pollutants, such aspolychlorinated biphenyls (PCB), is an important environmentalproblem, due to their persistence, chemical stability and strongadsorption to soils that inhibits their extraction and degradation,and also to the risks associated with human health and ecosystems[1,2]. An inclusive state of the art review on the technologies avail-able for PCB contaminated soils and sediments showed the advanta-ges and disadvantages of the existing methods, and highlighted theneed to find cost-effective and sustainable alternatives [3]. One pos-sible solution to cope with recalcitrant contaminants such as PCB canbe the integration of remediation technologies that, when coupledtogether (simultaneously or in succession, in the so called ‘‘treatmenttrains’’), work in a synergistic manner, minimizing the remediation
costs for achieving risk-based endpoints, in a quicker and moreefficient way than employing single technologies [4].
Zero valent iron nanoparticles (nZVI) are strong reductants thatcan dechlorinate PCB in aqueous solutions [5–7], but revealed lim-ited results in soils so far [8,9]. Pd/Fe bimetallic nanoparticles,when combined with electrokinetic remediation (EK), resulted inonly 20% PCB removal after 14 days with historically contaminatedsoil [10]. The electrodialytic remediation of suspended soil in con-junction with nZVI enabled a 83% PCB removal in just 5 days [11].
Electroremediation is a group of evolving technologies thatstarted in the 1990s, now targeting a wide range of contaminants,and have lately incorporated enhancement techniques and thecombination with other technologies [12]. The use of surfactantsfor enhancing electrokinetic remediation of contaminated soil withorganochlorines and mixed contaminations was reviewed byGomes et al. [12] and Cameselle et al. [13]. Surfactants improvesolubilization and desorption behavior of hydrophobic organiccompounds, increasing their availability in contaminated environ-ments [14,15], which can boost the remediation technologies effi-cacy. Different surfactants have already been tested, but beyondtheir desorption properties, they should also be environmental

Table 1Properties of the nonionic surfactants used in the experiments.
Trade name Molecular weight Molecular structure CMC – Critical micelle concentration (mg L1)
Saponin 1650 42.6 [18]
Tween 80 1310 40 [28]
Table 3Physical and chemical characteristics of the soil.
Parameter
Particle size distribution (%)Coarse sand (200 < Ø < 2000 lm) 19.1Fine sand (20 < Ø < 200 lm) 67.3Silt (2 < Ø < 20 lm) 12.7Clay (Ø < 2 lm) 0.9
Textural classification Loamy sand
pH (H2O) 12.2Conductivity (mS cm1) 18.76
Exchangeable cations (cmol(c) kg1)Ca2+ 83.75Mg2+ 3.2K+ 26.88Na+ 9.37
Sum of exchangeable cations (cmol(c) kg1) 123.2
Calcium carbonate (%) 18.0
190 H.I. Gomes et al. / Journal of Colloid and Interface Science 433 (2014) 189–195
friendly substances [16] and minimize the inhibitory effect of thesurfactants on iron nanoparticles reactivity [10,17]. Saponin is a rep-resentative non-ionic plant-derived biosurfactant that can efficientlyincrease desorption and degradation of PCB in contaminated soils[18,19]. Tween 80, a nonionic surfactant used in the food industry,was tested for enhanced EK remediation of dichlorodiphenyltrichlo-roethane (DDT) [20], hexachlorobenzene [21], perchloroethylene[22], and polycyclic aromatic hydrocarbons (PAH) [23,24]. Both sur-factants were also tested simultaneously and individually for theelectro-Fenton degradation of phenanthrene in marine sediment[25]. The electrodialytic remediation of PAH with Tween 80 in spikedand contaminated soils was also tested by Lima et al. [26].
In this work, we tested two different surfactants (saponin andTween 80) to enhance the electroremediation of PCB contaminatedsoil in the two-compartment electrodialytic (ED) setup developedat the Technical University of Denmark (DTU) [27], in which thesoil is suspended and stirred simultaneously in combination withthe addition of nZVI. The main objectives were to: (i) comparethe effectiveness of the two surfactants for increasing PCB desorp-tion and the subsequent dechlorination; (ii) evaluate the need ofusing direct electric current in the reactor with suspended soiland nZVI; (iii) assess the potential inhibitory effect of the surfac-tant in the nZVI reactivity.
2. Materials and methods
2.1. Chemicals and solvents
PCB standards were analytical grade, obtained from Fluka,Sigma–Aldrich (PCB 28, 52, 101, 138, 153, 180 and 209) and Ultra-scientific (PCB 30; PCB 65 and PCB 204). The solvents hexane andacetone were Pestinorm (VWR BDH Prolabo). The surfactantsTween 80 (Sigma Aldrich) and saponin (GPR Rectapur) were labgrade (Table 1). Hydrochloric (37.6%), nitric (65%) and sulfuric(95–97%) acids were trace metal grade. Anhydrous Na2SO4, KMnO4,
Table 2Characterization of the zero valent iron nanoparticles used in the experiments,according to the supplier information.
Product Name NANOFER 25S (NANO IRON, s.r.o.)
Stabilizer Polyacrylic acid (PAA)pH 11–12Suspension density 1.15–1.25 g cm3 (20 C)Average particles size 50 nmParticle size distribution 20–100 nmAverage surface area 20–25 m2 g1
Iron content 80–90 wt.%
19
NaCl, and silica gel (silicic acid) were lab grade. Silica gel wascleaned up before use according to the USEPA method 3630C.The water was deionized with a Milli-Q plus system from Millipore(Bedford, MA, USA). A nZVI slurry-stabilized suspension (NANOFER25S, NANO IRON, s.r.o., Rajhrad, Czeck Republic) was used in theexperiments (Table 2).
2.2. Soil characterization
The contaminated soil used in the experiments was provided bya hazardous waste operator in Portugal and is a mixture of contam-inated soils from industrial sites with transformers oils spills.Table 3 presents the physical and chemical characteristics of thesoil used in the experiments. The soil was homogenized, air driedand sieved, and only the particles with size <2 mm were used inthe experiments.
Organic matter (%) 16.46
Total PCBa (lg kg1) 258 ± 24
Metalsb (mg kg1)Al 20,980 ± 590As 9 ± 2Cd 0.7 ± 0.1Cr 52 ± 3Cu 142 ± 95Fe 13,162 ± 301Ni 32 ± 1Pb 45 ± 3Zn 2155 ± 40
a Sum of PCB28, 30, 52, 65, 101, 138, 153, 180, 204 and 209.b Acid digestion with HNO3 according to the Danish Standard DS259.
6

H.I. Gomes et al. / Journal of Colloid and Interface Science 433 (2014) 189–195 191
2.3. PCB analysis
The soil samples extraction followed the USEPA method 3550C,in which 10 g of soil was extracted with 3 30 mL of acetone–hex-ane (1:1) in a glass vial by ultrasonication (20 kHz) for 60 min.After vacuum filtration and concentration, the extracts were thencleaned following the USEPA methods 3665A and 3630C. Aqueoussamples (soil filtrate and catholyte) were extracted according to
Fig. 1. Schematic representation of the experimental electrodialytic (ED) setup. Thesoil slurry had a liquid solid ratio of 5 and was made with 1% solution of the testedsurfactant (saponin and Tween 80). CAT = cation exchange membrane. In the cell,the electrodes are not aligned, but parallel.
Table 4Summary of experimental conditions.
Exp. Voltage (V cm1) Surfactant nZVI (mL) Soil (g, dry weight)
A 1 1% saponin 5 + 5 50.00B 0 1% saponin 5 + 5 50.03C 1 1% saponin 0 50.01D 1 1% Tween 80 5 + 5 50.04E 0 1% Tween 80 5 + 5 50.01F 1 1% Tween 80 0 50.01
Fig. 2. Average concentration of PCB congeners (PCB28, 52, 65, 101, 138, 153, 180, 204Tween 80. Percentages on the top of each column represent PCB removal regarding the
197
the method used by Lowry and Johnson [5], after adjusting thepH of the acid samples to pH 7 by NaOH addition.
The PCB congeners were analyzed by gas chromatography (GC)on a HP with ECD detector, HP 6890 Series (Hewlett–Packard, PaloAlto, California, USA). The column used was a TRB–5–MS with30 m 0.25 mm i.d. and 0.25 lm film thickness (Phenomenex,Torrance, CA, USA). The oven temperature was programmed start-ing at 70 C for 2 min, increased to 150 C at a rate of 25 C min1
and then increased 4 C min1 to 200 C, 8 C min1 to 280 Cwhere it holds for 4 min and finally 10 C min1 to 300 C, whereit holds for 2 min. Pure nitrogen was used as the carrier gas. Theinjector was splitless set at 260 C. The injections of 1.00 ll weremade manually.
2.4. Electroremediation experiments
The electroremediation experiments were carried out in anelectrodialytic cell (ED) developed at DTU. The ED laboratorialcylindrical Plexiglas-cell has one compartment (L = 10 cm,Ø = 8 cm) where the anode, the soil slurry (with a liquid solid ratioof 5; 1% of surfactant solution added) and the plastic-flaps attachedto a glass-stick stirrer (Lab-egg Bie&Bernsten, Denmark,350 rpm)are placed. A cation exchange membrane (CAT, GE Water & ProcessTechnologies Bvba – ED, Cation, CR67, MKIII, Blank) separates thiscompartment from the one (L = 5 cm, Ø = 8 cm) where the cathodeis placed (Fig. 1). Catholytes were recirculated by mechanicalpumps (Plastomec magnet pump, model P05) between the cham-ber and glass bottle. A power supply (Hewlett Packard E3612A,Palo Alto, USA) was used to maintain a constant voltage and thecurrent was monitored (Fluke 179 multimeter). The working elec-trodes were platinized titanium bars, with a 3 mm diameter and alength of 10 cm (Permascand).
Six different experiments (A–F) were carried out during 5 days.Experimental conditions are presented in Table 4. The iron nano-particles (5 mL) were injected at 24 and 48 h, totalizing 10 mL ofNANOFER 25S slurry. The electrolyte used in the cathode compart-ment was 102 M NaCl. The catholyte pH was manually main-tained around 2 by the periodic addition of 5 M HCl to preventexcessive pH rise in the catholyte, except in experiments B and E.
The current between working electrodes (presented in the Sup-plementary Materials), the pH in the soil suspension and the elec-trolytes were measured every 24 h. At the end of the experiments,
and 209) in soil before and after the electrodialytic experiments using saponin andsum of congeners analyzed in the initial soil.

192 H.I. Gomes et al. / Journal of Colloid and Interface Science 433 (2014) 189–195
the contents of Fe in the different parts of the cell (membranes,soil, solutions, and electrodes) were determined. The contents ofFe in the CAT membranes and at the electrodes were measuredafter extraction in 1 M HNO3 and 5 M HNO3, respectively. The sus-pension from the central compartment was filtered through filterpaper overnight. The soil was dried and slightly crushed in a mor-tar before the PCB extraction and pH were measured. The iron wasextracted from soil by the sodium dithionite–citrate–bicarbonate(DCB) method [29]. The iron analyses were made using InductivelyCoupled Plasma-Atomic Emission Spectrometer (ICP) on an AgilentICP-OES Varian 720-ES equipment.
3. Results and discussion
3.1. Comparison of the two surfactants
The results show that, in the tested conditions, saponin allowedto obtain higher PCB removal from soil (Fig. 2) when comparedwith Tween 80. The most efficient removal (76%) was obtainedwith 1% saponin, 10 mL nZVI and a voltage gradient of 1 V cm1
(Exp. A). The lowest removal was obtained with 1% Tween 80and nZVI (8% removal), without application of direct current. Thisremoval is consistent with previous studies that showed thatTween 80 was one of the surfactants with the least efficient degra-dation of 1-(2-chloro-benzoyl)-3-(4-chlorophenyl) urea by nZVI,when compared with Triton X-100, Tween 20, sodium dodecyl sul-fonate (SDS), and cetyltrimethylammonium bromide (CTAB), prob-ably due to the effect of the hydrophobic chain length [30].
Fig. 3. Possible dechlorination pat
19
Surfactants increase the rates of desorption of hydrophobiccompounds from soil and transfer the target contaminants intoaqueous micelles through solubilization. However, these surfac-tants have also affinity for PCB and nZVI surface sites and can influ-ence their interactions. Thus, surfactants can affect the degradationof PCB through various mechanisms, such as enhanced solubiliza-tion, enhanced sorption, competitive sorption, and electron trans-fer mediation [30]. PCB dechlorination by nZVI, like otherreductive reactions, is a surface-mediated reaction [31], heteroge-neous in nature, involving adsorption of the contaminants at theiron surface prior to breaking of carbon–chlorine bonds [32]. Itwas shown that the adsorbed polyelectrolyte used to stabilize nZVIsuspensions decreased dechlorination activity of nZVI, by eitherblocking available reactive surface sites or else by a combinationof site blocking and inhibited mass transfer of chlorinated organiccompounds in bulk solution to the nanoparticle surface [33,34].Cationic and non-ionic surfactants were also found to inhibit thetrichloroethylene degradation by carboxymethyl cellulose stabi-lized nZVI [17]. The possibility of using non-stabilized micro zerovalent iron in this setup should be further investigated as it avoidsthese inhibition problems.
Usually lower chlorinated congeners (tri and tetrachlorobiphe-nyls) are the ones with highest removal rates from contaminatedsoils [35–38]. In this work, beside lower chlorinated congeners,also higher chlorinated congeners (penta, hexa, hepta and octa-chlorobiphenyl) showed removal percentages between 9% and96% (average value 44%). We also observed an increase in the con-centration of PCB52 (4% in Exp. D and 11% in Exp. E), PCB65 (tentimes more in Exp. A and 128% in Exp. F) and PCB101 (2% in Exp.
hways proposed for PCB138.
8

H.I. Gomes et al. / Journal of Colloid and Interface Science 433 (2014) 189–195 193
B and 4% in Exp. E), due to dechlorination of higher chlorinatedcongeners. The congeners with higher removal rates werePCB138 (Exp. C and F), PCB153 (Exp. A, B and D), and PCB180(Exp. A). Chen et al. [9] identified the PCB153 dechlorination path-ways by nZVI. Figs. 3 and 4 show the proposed dechlorinationpathways for PCB138 and PCB180, considering that nZVI reactivitydecreases according to the chlorine position in the following order:ortho < para < meta [36,39].
In the aqueous samples (soil filtrate and catholyte), most of thePCB congeners were below the detection limit. PCB have very lowwater solubility (0.0027–0.42 ng L1) and are very hydrophobic[40]. In the soil filtrate, we could measure PCB only in two samples.Experiment B had 0.08 ng L1 of PCB153 and Experiment D pre-sented 3.81 ng L1 of PCB101. These concentrations, higher thanthe typical solubility range, are due to the surfactants. In the cath-olyte samples (Table S1, Supplementary Material), some congenerswere also found, mostly lower chlorinated congeners (PCB28), butalso penta, hexa and heptachlorobiphenyls. These congeners areidentified only in the experiments with applied current, probablydue to the electrophoresis.
Although in the suspended electrodialytic setup, there arechemical reactions that deplete the Fe0 reductant power:
Fig. 4. Possible dechlorination pat
199
2Fe0ðsÞ þ 4HþðaqÞ þ O2ðaqÞ ! 2Fe2þ
ðaqÞ þ 2H2OðlÞ ð1Þ
Fe0ðsÞ þ 2H2OðlÞ ! Fe2þ
ðaqÞ þH2ðgÞ þ 2OHðaqÞ ð2Þthere is also water electrolysis occurring in the electrodes, and sec-ondary reactions with metals Me [41]:
2H2O 4e ! O2ðgÞ þ 4Hþ E0 ¼ 1:229 V ðanodeÞ ð3Þ
2H2Oþ 2e ! H2ðgÞ þ 2OH E0 ¼ 0:828 V ðcathodeÞ ð4Þ
Mnþe þ ne !Me ð5Þ
MeðOHÞnðsÞ þ ne ! Me þ nOH ð6ÞThe water electrolysis reactions (3) and (4) are responsible for
the generation of an acid front from the anode and an alkaline frontfrom the cathode, due to the pH values obtained (2 at the anolyteand 12 at the catholyte). The H+ generated at the anode can solubi-lize transition metals such as Fe and Ni from soil, that can degradePCB via catalytic hydrodechlorination with H2 successively remov-ing chlorine atoms from PCB generating biphenyl, according to thegeneral chemical equation [36]:
hways proposed for PCB180.

0
2
4
6
8
10
12
14
0 20 40 60 80 100 120
pH s
oil s
uspe
nsio
n
Time (h)
ED+nZVI+saponin (Exp. A)
nZVI+saponin (Exp. B)
ED+saponin (Exp. C)
ED+nZVI+Tween80 (Exp. D)
nZVI+Tween80 (Exp. E)
ED+Tween80 (Exp. F)
Fig. 5. Soil suspension pH evolution during the experiments.
Table 6Mass of iron (mg) in each cell component after the end of the experiments.
Exp. Injection reservoir Cation exchange membrane Electrodes Electrolyte (filtrate + catholyte) Soil
A 7.3 37.3 23.7 215 1307B 4.1 6.6 – 0.5 1181C 0.6 1.0 0.4 1.2 353D 6.1 19.4 64.7 127 2299E 2.5 2.4 – 0.2 1121F 1.1 8.4 0.3 99.2 417
194 H.I. Gomes et al. / Journal of Colloid and Interface Science 433 (2014) 189–195
C12Hð10mÞClm þ nH2 ! C12Hð10mþnÞClmn þ nHCl; m=n ð7ÞAlthough this hydrodechlorination was studied in aqueous or
organic solvents, in the tested setup, there are all the needed con-ditions for it to occur.
Comparing the energy consumption of the experiments, calcu-lated according to Sun et al. [42], we note that Tween 80 has higherenergy consumption when compared with saponin (1.6 W h g1
soil and 4.1 W h g1 in Exp. D and F, and 1.2 W h g1 soil and0.7 W h g1 in Exp. A and C, respectively). Added to the lowremoval percentages, this also contributes to show that Tween80 is not a suitable surfactant to use with PCB, despite the goodresults obtained for PAH with this method [26].
3.2. Experiments without current
Results show that the experiments with direct current havehigher removal percentages than the ones without current. ThePCB congeners concentrations using saponin with and without cur-rent (Exp. A and B) are statistically different at a 0.05 level of sig-nificance [one-way ANOVA, F(1,9) = 5.61, p = 0.04]. Theoretically,only the mixture of the nanoparticles with the soil slurry shouldbe enough to promote PCB dechlorination, but there are much bet-ter results when a direct current is applied. This means that electriccurrent also contributes to PCB dechlorination, and this can bedone in two different ways. The first is by lowering the pH dueto water electrolysis at the anode: a slightly acidic pH (4.90–5.10) increases the dechlorination rate of PCB by nZVI [43], whilean alkaline pH (as occurs in the experiments without current –Fig. 5) promotes the passivation of the iron nanoparticles and pre-vents PCB dechlorination. The fact that the electric current wasable to lower pH (Fig. 5), despite the high buffering capacity of thissoil, shows the potential of the technique and the tested setup. Thesecond way is related with the PCB electrocatalytic hydrodechlori-nation – the production of H+ and the presence of current can pro-mote the Cl removal from PCB, generating HCl [44,45]. Theelectrocatalytic hydrodechlorination has been demonstrated withspecially engineered foam electrodes, in solvent/surfactant-aided
20
solutions and can possibly be also occurring in this two-compart-ment electrodialytic setup. Further research is needed to evaluatethe importance of this dechlorination process, to assess how iron(natural and manufactured) and other metals act as catalysts.
The pH of the suspended slurry also affects the surfactantbehavior, influencing the micelle aggregation and hydrophobicity.At high pH, the net charge on the head groups of saponin moleculewill increase, causing electrostatic repulsion between the headgroups, which tends to increase the critical micelle concentration(CMC) values, reducing the solubilization capabilities of saponin[46]. Also, the solubilization of heavy metals by the electrodialyticprocess (like Cd2+ and Zn2+) and a lower pH (until pH 4) decreasethe CMC value of saponin solution and enhance its solubilizationproperties [46]. With Tween 80, the pH increase had a positiveeffect on surface tension and the micelles are more stable at higherpH (up to 10) [25].
Table 6 shows the mass of iron found in each component of thecell at the end of the experiments. Previous studies showed that inthe traditional electrokinetic setups most of the nZVI aggregateand settle in the injection compartment [47–49], thus not reachingthe contaminated soil. The suspended electrodialytic remediationassures that nZVI are mixed with the soil and most of the iron isfound there at the end of the experiments.
4. Conclusions
The work combined three different remediation components forPCB contaminated soil: Surfactant, nZVI and electrodialysis. Twosurfactants were tested (saponin and Tween 80). Saponin showedthe best results, but both surfactants presented a similar behavior(higher PCB removal rates with direct current and iron nanoparti-cles). Combining surfactant and nZVI gave less successful remedi-ation than combining surfactant and ED. The best result wasthough obtained when all three components were combined. Withsaponin, 76% PCB was removed in 5 days. Further research isneeded to quantify the effect of the electrodechlorination and hyd-rodechlorination of PCB using this two-compartment electrodia-
0

H.I. Gomes et al. / Journal of Colloid and Interface Science 433 (2014) 189–195 195
lytic setup in order to optimize the combined process, as theresults showed that the use of direct current allowed the highestPCB removal rates.
Acknowledgments
This work was funded by the European Regional DevelopmentFund (ERDF) through COMPETE – Operational Programme for Com-petitiveness Factors (OPCF), by Portuguese National funds through‘‘FCT – Fundação para a Ciência e a Tecnologia’’ under Project«PTDC/AGR-AAM/101643/2008 NanoDC», by FP7-PEOPLE-IRSES-2010-269289-ELECTROACROSS and by the research Grant SFRH/BD/76070/2011. Prof. Jorge Varejão and Helena Silva are acknowl-edged for GC analysis and Sabrina Madsen for ICP analysis. NANOIRON, s.r.o. kindly provided NANOFER 25S samples.
Appendix A. Supplementary material
Supplementary data associated with this article can be found, inthe online version, at http://dx.doi.org/10.1016/j.jcis.2014.07.022.
References
[1] L. Nizzetto, M. Macleod, K. Borgå, A. Cabrerizo, J. Dachs, A.D. Guardo, D.Ghirardello, K.M. Hansen, A. Jarvis, A. Lindroth, B. Ludwig, D. Monteith, J.A.Perlinger, M. Scheringer, L. Schwendenmann, K.T. Semple, L.Y. Wick, G. Zhang,K.C. Jones, Environ. Sci. Technol. 44 (2010) 6526–6531.
[2] B. Wang, J. Huang, S. Deng, X. Yang, G. Yu, Front. Environ. Sci. Eng. 6 (2012) 2–16.
[3] H.I. Gomes, C. Dias-Ferreira, A.B. Ribeiro, Sci. Total Environ. 445–446 (2013)237–260.
[4] P.S.C. Rao, J.W. Jawitz, C.G. Enfield, R.W. Falta, M.D. Annable, A.L. Wood,Technology integration for contaminated site remediation: clean-up goals andperformance criteria, in: Groundwater Quality: Natural and EnhancedRestoration of Groundwater Pollutions 2001 Proceedings, Sheffield, UK, 2001,pp. 571–578.
[5] G. Lowry, K. Johnson, Environ. Sci. Technol. 38 (2004) 5208–5216.[6] C.B. Wang, W. Zhang, Environ. Sci. Technol. 31 (1997) 2154–2156.[7] F. He, D. Zhao, C. Paul, Water Res. 44 (2010) 2360–2370.[8] P. Varanasi, A. Fullana, S. Sidhu, Chemosphere 66 (2007) 1031–1038.[9] X. Chen, X. Yao, C. Yu, X. Su, C. Shen, C. Chen, R. Huang, X. Xu, Environ. Sci.
Pollut. Res. (2014) 1–10.[10] G. Fan, L. Cang, W. Qin, C. Zhou, H.I. Gomes, D. Zhou, Sep. Purif. Technol. 114
(2013) 64–72.[11] H.I. Gomes, C. Dias-Ferreira, L.M. Ottosen, A.B. Ribeiro, Electroremediation of
PCB contaminated soil with iron nanoparticles: performance of a newelectrodialytic setup (submitted for publication).
[12] H.I. Gomes, C. Dias-Ferreira, A.B. Ribeiro, Chemosphere 87 (2012) 1077–1090.[13] C. Cameselle, S. Gouveia, D.E. Akretche, B. Belhadj, Advances in electrokinetic
remediation for the removal of organic contaminants in soils, in: M.N. Rashed(Ed.), Soils, Organic Pollutants – Monitoring, Risk and Treatment, 2013.
201
<http://www.intechopen.com/books/organic-pollutants-monitoring-risk-and-treatment/advances-in-electrokinetic-remediation-for-the-removal-of-organic-contaminants-in-soils>.
[14] M. Viisimaa, O. Karpenko, V. Novikov, M. Trapido, A. Goi, Chem. Eng. J. 220(2013) 352–359.
[15] C.N. Mulligan, R.N. Yong, B.F. Gibbs, Eng. Geol. 60 (2001) 371–380.[16] C.N. Mulligan, Curr. Opin. Colloid Interface Sci. 14 (2009) 372–378.[17] M. Zhang, F. He, D. Zhao, X. Hao, Water Res. 45 (2011) 2401–2414.[18] M. Cao, Y. Hu, Q. Sun, L. Wang, J. Chen, X. Lu, Environ. Pollut. 174 (2013) 93–99.[19] H. Xia, X. Chi, Z. Yan, W. Cheng, Bioresour. Technol. 100 (2009) 4649–4653.[20] A. Karagunduz, A. Gezer, G. Karasuloglu, Sci. Total Environ. 385 (2007) 1–11.[21] S. Yuan, M. Tian, X. Lu, J. Hazard. Mater. 137 (2006) 1218–1225.[22] S.S. Chen, Y.C. Huang, T.Y. Kuo, Ground Water Monitor. Remed. 30 (2010) 90–
98.[23] A.T. Lima, P.J. Kleingeld, K. Heister, J.P.G. Loch, Sep. Purif. Technol. 79 (2011)
221–229.[24] M.T. Alcántara, J. Gómez, M. Pazos, M.A. Sanromán, J. Hazard. Mater. 179
(2010) 1156–1160.[25] O. Iglesias, M.A. Sanromán, M. Pazos, Ind. Eng. Chem. Res. 53 (2014) 2917–
2923.[26] A.T. Lima, L.M. Ottosen, K. Heister, J.P.G. Loch, Sci. Total Environ. 435–436
(2012) 1–6.[27] L.M. Ottosen, P.E. Jensen, G.M. Kirkelund, B. Ebbers, Electrodialytic Separation
of Heavy Metals from Particulate Material, Patent Application EPC13183278.4-1352, 2013.
[28] W. Zhou, X. Wang, C. Chen, L. Zhu, Colloids Surf., A 425 (2013) 122–128.[29] O.P. Mehra, M.L. Jackson, Clays Clay Miner. 7 (1960) 317–327.[30] Q. Zhou, H. Lin, CLEAN 41 (2013) 128–133.[31] E.J. Weber, Environ. Sci. Technol. 30 (1996) 716–719.[32] W. Yan, H.L. Lien, B.E. Koel, W. Zhang, Environ. Sci. Process. Impacts 15 (2013)
63–77.[33] F. He, D. Zhao, Appl. Catal., B 84 (2008) 533–540.[34] T. Phenrat, Y. Liu, R.D. Tilton, G.V. Lowry, Environ. Sci. Technol. 43 (2009)
1507–1514.[35] Y. Li, F. Liang, Y. Zhu, F. Wang, J. Soils Sed. 13 (2013) 925–931.[36] B.Z. Wu, H.Y. Chen, S.J. Wang, C.M. Wai, W. Liao, K. Chiu, Chemosphere 88
(2012) 757–768.[37] G.K. Vasilyeva, E.R. Strijakova, S.N. Nikolaeva, A.T. Lebedev, P.J. Shea, Environ.
Pollut. 158 (2010) 770–777.[38] B. Beckingham, U. Ghosh, Environ. Sci. Technol. 45 (2011) 10567–10574.[39] N.E. Korte, O.R. West, L. Liang, B. Gu, J.L. Zutman, Q. Fernando, Waste Manage.
22 (2002) 343–349.[40] M.D. Erickson, Analytical Chemistry of PCBs, CRC Press, Boca Raton, Florida,
1997.[41] Y.B. Acar, A.N. Alshawabkeh, Environ. Sci. Technol. 27 (1993) 2638–2647.[42] T.R. Sun, L.M. Ottosen, P.E. Jensen, G.M. Kirkelund, J. Hazard. Mater. 203–204
(2012) 229–235.[43] Y. Wang, D. Zhou, Y. Wang, L. Wang, L. Cang, Environ. Sci. Pollut. Res. 19 (2012)
448–457.[44] B. Yang, G. Yu, J. Huang, Environ. Sci. Technol. 41 (2007) 7503–7508.[45] B. Yang, G. Yu, D. Shuai, Chemosphere 67 (2007) 1361–1367.[46] W. Zhou, J. Yang, L. Lou, L. Zhu, Environ. Pollut. 159 (2011) 1198–1204.[47] H.I. Gomes, C. Dias-Ferreira, A.B. Ribeiro, S. Pamukcu, Chemosphere 99 (2014)
171–179.[48] H.I. Gomes, C. Dias-Ferreira, A.B. Ribeiro, S. Pamukcu, Water, Air, Soil Pollut.
224 (2013) 1–12.[49] K.R. Reddy, K. Darko-Kagy, C. Cameselle, Sep. Purif. Technol. 79 (2011) 230–
237.


203
II.9 Enhanced electrokinetic techniques for remediation of different PCB
polluted soils (submitted)


1
Enhanced electrokinetic techniques for remediation of different PCB 1
polluted soils 2
3
Helena I. Gomes1,2,3
, Celia Dias-Ferreira2, Lisbeth M. Ottosen
3, Alexandra B. Ribeiro
1 4
5
1CENSE - Center for Environmental and Sustainability Research, Departamento de Ciências 6
e Engenharia do Ambiente, Faculdade de Ciências e Tecnologia, Universidade Nova de 7
Lisboa, 2829-516 Caparica, Portugal 8
2CERNAS – Research Center for Natural Resources, Environment and Society, Escola 9
Superior Agraria de Coimbra, Instituto Politecnico de Coimbra, Bencanta, 3045-601 10
Coimbra, Portugal 11
3Department of Civil Engineering, Technical University of Denmark, Brovej, Building 118, 12
DK 2800 Kgs. Lyngby, Denmark 13
* Corresponding author. Tel. +351 212948300, Fax. +351 212948554. E-mail address: 14
[email protected] (Helena I. Gomes) 15
16
17
ManuscriptClick here to view linked References
205

2
Abstract 18
Polychlorinated biphenyls (PCB) are carcinogenic and persistent organic pollutants 19
that accumulate in soils and sediments. Currently, there is no cost-effective and sustainable 20
remediation technology for these contaminants. In this work, a new combination of 21
electrodialytic remediation and zero valent iron particles in a two-compartment cell is tested 22
and compared to a more conventional combination of electrokinetic remediation and nZVI in 23
a three-compartment cell. In the new two-compartment cell, the soil is suspended and stirred 24
simultaneously with the addition of zero valent iron nanoparticles. Remediation experiments 25
are made with two different historically PCB contaminated soils, which differ in both soil 26
composition and contamination source. Soil 1 is a mix of soils with spills of transformer oils, 27
while Soil 2 is a superficial soil from a decommissioned school where PCB were used as 28
windows sealants. Remediation of Soil 1 (with highest pH, carbonate content, organic matter 29
and PCB concentrations) obtained the maximum 83% and 60% PCB removal with the two-30
compartment and the three-compartment cell, respectively. The highest removal with Soil 2 31
were 58% and 45%, in the two-compartment and the three-compartment cell, respectively, in 32
the experiments without direct current. The pH of the soil suspension in the two-compartment 33
treatment appears to be a determining factor for the PCB dechlorination, and this cell allowed 34
a uniform distribution of the nanoparticles in the soil, while there was iron accumulation in 35
the injection reservoir in the three-compartment cell. 36
37
38
206

3
1. Introduction 39
Electrokinetic (EKR) and electrodialytic (EDR) remediation are reliable technologies, 40
successfully used, both at laboratorial and pilot scale, for the removal of organic and 41
inorganic contaminants from different matrices, like soils, sediments, mine tailings, wastes 42
and ashes [1-8]. In both methods, a low level direct current is responsible for the transport of 43
contaminants through different mechanisms (electroosmosis, electromigration and 44
electrophoresis), and additionally induces electrochemical reactions (electrolysis and 45
electrodeposition) [9]. The use of electrokinetics in soil has evolved to include distinct 46
enhancement techniques and the combination with other technologies [10]. Common 47
problems in EKR remediation, such as the nonlinear and transient geochemical changes in 48
the soil, were coped by treating a suspension of soils with uniform stirring in electrodialytic 49
remediation, which allowed increasing the remediation rate [11-13]. A two-compartment 50
electrodialytic setup recently developed at the Technical University of Denmark [14] is a step 51
forward, showing additional advantages like a direct acidification of the matrix without 52
strong acids, and it is not necessary to dispose the anolyte. 53
Polychlorinated biphenyls (PCB) were classified as persistent organic pollutants 54
(POP) by the United Nations Stockholm Convention. There is a need to find cost effective 55
and more sustainable remediation alternatives for PCB-contaminated soils and sediments 56
[15]. Zero valent iron nanoparticles (nZVI) were used with success for PCB dechlorination in 57
aqueous solutions [16-18], but revealed limited results in soils so far [19, 20]. Pd/Fe 58
bimetallic nanoparticles, when combined with EKR, resulted in only 20% PCB removal after 59
14 days with historically contaminated soil [21]. Very recently, the new two-compartment 60
cell was successfully used for POP in conjunction with nZVI. This combination enabled a 61
83% PCB removal in just 5 days, which is much higher than the reported 27% removal in 10 62
days as the best result so far with EKR/nZVI [22]. 63
207

4
The effects of soil composition on electroremediation are described in several studies. 64
Especially the soil buffer capacity and the carbonate content, which can neutralize the acid 65
front generated at the anode, is an important soil parameter, as the acidification aids many of 66
the remediation processes [23-29]. Soil texture is also relevant for electroremediation [12, 27] 67
and nZVI transport in EKR/nZVI [30, 31], as the soil particles distribution and their charge 68
affect the transport mechanisms. The soil cation exchange capacity is also important, as it 69
allows the soil to immobilize significant quantities of heavy metal ions [32]. The organic 70
matter content can strongly influence the sorption/desorption of contaminants and it was also 71
shown to affect the electroosmotic properties and ionic modification of soils [33]. In the 72
present work, two electroremediation techniques, EKR and EDR, are compared 73
experimentally for remediation of two different historically PCB contaminated soils. The 74
differences between the techniques other than the design of the reactor are the use of ion-75
selective membranes for EDR while EKR uses passive membranes. In both setups the 76
remediation was enhanced with a surfactant (saponin) and nZVI, as suggested beneficial in 77
Gomes et al. [22]. The main objective was to assess the influence of soil composition on 78
these enhanced electroremediation techniques. 79
2. Materials and Methods 80
2.1. Chemicals and solvents 81
PCB standards were analytical grade, obtained from Fluka, Sigma-Aldrich (PCB28, 82
52, 101, 138, 153, 180 and 209) and Ultrascientific (PCB30; PCB65 and PCB204). The 83
solvents hexane and acetone were Pestinorm (VWR BDH Prolabo). Saponin (GPR Rectapur) 84
was the lab grade surfactant used to enhance PCB desorption. Hydrochloric (37.6%), nitric 85
(65%) and sulfuric (95-07%) acids were tracemetal. Anhydrous Na2SO4, KMnO4, NaCl, and 86
silica gel (silicic acid) were lab grade. Silica gel was cleaned up before use according to the 87
USEPA method 3630C. The water was deionized with a Milli-Q plus system from Millipore 88
208

5
(Bedford, MA, USA). A nZVI slurry-stabilized suspension (NANOFER 25S, NANO IRON, 89
s.r.o., Rajhrad, Czeck Republic) was used in the experiments (Table S1, Suplementary 90
Information). 91
2.2 Soil characterization 92
Two different soils, historically contaminated with PCB, were used for the 93
experiments. Soil 1 was provided by a hazardous waste operator in Portugal and is a mixture 94
of contaminated soils from industrial sites with transformers oils spills. Soil 2 is a surface soil 95
sampled in a decommissioned school in Hovedstaden (Capital Region of Denmark), and the 96
PCB resulted from the weathering of the windows joint sealants used in 1955-1977 [34]. 97
The soil characterization methods used were described in Jensen et al. [11]. The initial 98
soils were analyzed for Al, As, Cd, Cr, Cu, Fe, Ni, Pb, Zn using Inductively Coupled Plasma-99
Atomic Emission Spectrometer (ICP) on an Agilent ICP-OES Varian 720-ES equipment. Soil 100
texture was determined by laser diffraction with a Malvern Mastersizer 2000. The soil was 101
homogenized, air dried and sieved, and only the particles with size < 2 mm were used in the 102
experiments. 103
For PCB analysis, the soil extraction method used was the USEPA method 3550C, in 104
which 10 g of soil was extracted with 3 × 30 mL of acetone-hexane (1:1) in a glass vial by 105
ultrasonication (20 kHz) for 60 min. After vacuum filtration and concentration, the extracts 106
were cleaned following the USEPA methods 3665A and 3630C. Aqueous samples (soil 107
filtrate and catholyte) were extracted according to the method used by Lowry and Johnson 108
[16], after adjusting the pH of the acid samples to pH 7 by NaOH addition. The PCB 109
congeners were analyzed by gas chromatography (GC) on a HP with ECD detector, HP 6890 110
Series (Hewlett-Packard, Palo Alto, California, USA). The column used was a TRB–5–MS 111
with 30 m × 0.25 mm i.d. and 0.25 µm film thickness (Phenomenex, Torrance, CA, USA). 112
The oven temperature was programmed starting at 70ºC for 2 min, increased to 150ºC at a 113
209

6
rate of 25ºC min−1
and then increased 4ºC min−1
to 200ºC, 8ºC min−1
to 280ºC where it holds 114
for 4 min and finally 10ºC min−1
to 300ºC, where it holds for 2 min. Pure nitrogen was used 115
as the carrier gas. The injector was splitless set at 260°C. The injections of 1.00 µl were 116
performed manually. 117
2.3 Electroremediation experiments 118
The electroremediation experiments were carried out in two different laboratorial 119
cylindrical Plexiglas-cells. The EKR cell was divided into three compartments: of two 120
electrode compartments (L = 5 cm, internal diameter Ø = 4 cm) and a central compartment. 121
The central compartment subdivided in three parts (L = 1.5 cm each, total of 4.5 cm, Ø = 4 122
cm). The nZVI was placed in the middle part and the soil in the other two [Figure 1 a)]. The 123
soil was saturated with deionized water before the experiments. Cellulose filters (passive 124
membranes) were used to assure the separation between the soil and electrolytes, and the soil 125
and the nZVI. 126
The EDR cell had two compartments [Figure 1 b)]. In one compartment (L = 10 cm, 127
Ø = 8 cm) the anode was placed directly into the soil slurry and a plastic-flaps attached to a 128
glass-stick overhead stirrer (Lab-egg Bie&Bernsten, Denmark, ~350 rpm) maintained the soil 129
in suspension during the treatment. The soil slurry was made with 1% saponin solution (with 130
a liquid solid ratio of 5). Saponin is a representative plant-derived biosurfactant that can 131
efficiently increase desorption and degradation of PCB in contaminated soils [35, 36]. A 132
cation-exchange membrane (CAT, GE Water & Process Technologies Bvba - ED, Cation, 133
CR67, MKIII, Blank) separates this compartment from the cathode compartment (L = 5 cm, 134
Ø = 8 cm) [Figure 1 b)]. The catholyte was recirculated by mechanical pumps (Plastomec 135
magnet pump, model P05) between the chamber and a glass bottle. 136
137
210

a)
b)
211

8
In both setups, a power supply (Hewlett Packard E3612A, Palo Alto, USA) was used 144
to maintain a constant voltage and the current was monitored (Fluke 179 multimeter). The 145
working electrodes were platinized titanium bars, with a diameter of 3 mm and a length of 146
5 cm in the three compartments cell and 10 cm in the two compartments cell (Permascand®). 147
Results from 10 new laboratory experiments are given in the present paper. For 148
completeness of the investigation, results from five previously reported experiments are 149
included. The experimental conditions are given in Table 1. As seen, experiments were made 150
with different combinations of (i) applied electric field, (ii) surfactant and (iii) nZVI. To 151
study the combined effect, experiments were made with all combinations with two techniques 152
and one experiment where all three techniques are combined. The experiments with 153
enhancement methods for the EKR include the use of saponin in the anode compartment 154
(Exp. B and O ), and also the pH control in the catholyte (Exp. M). 155
The electrolyte used was 10-2
M NaCl. In the two-chamber setup, the catholyte pH 156
was manually maintained around 2 by the addition of HCl 5M. The nZVI were placed in the 157
center of both cells, consisting of two injections of 5 mL at 24 and 48 h in the two-158
compartment cell, and different injections in the three-compartment cell (Table 1). 159
The electric current between working electrodes, the pH in the soil suspension and in 160
the electrolytes were measured every 24 h. In the two-compartment cell, at the end of the 161
experiments, the suspension from the central compartment was filtered by gravity through 162
filter paper. In the three-compartment cell, samples from the anode and the cathode side were 163
collected separately. Subsamples were collected for humidity measurements. For both setups, 164
the soil was air-dried and crushed slightly in a mortar before the PCB extraction and pH 165
measurements. At the end of the experiments, the Fe contents in the different parts of the cell 166
(membranes, soil, solutions, and electrodes) were determined. The contents of Fe in the CAT 167
membranes and at the electrodes were measured after extraction in 1 M HNO3 and 5 M 168
212

9
HNO3, respectively. The Fe was extracted from soil by the sodium dithionite-citrate-169
bicarbonate method [37] and from the passive membranes with concentrated HCl. 170
171
Table 1 – Summary of experimental conditions. In the two-compartment cell, the soil slurry had a liquid solid 172
ratio of 5. 173
Exp. nZVI
(mL) Type of injection
Exp.
Setup
Voltage
(V cm-1
)
Soil (g, dry
weight) Soil
Duration
(d)
Observations
A 13 Unique (in the beginning
of experiment)
3 comp.
cell 2 65.30 1 10 (1)
B 13 Unique (in the beginning
of experiment)
3 comp.
cell. 2 46.69 1 10
1% saponin
solution in
the anode
compartment
C 13 Unique (in the beginning
of experiment)
3 comp.
cell 0 49.84 1 10 No current
D 10 2 injections of 5 mL at
24 and 48 h
2 comp.
cell 1 69.94 1 45
1% saponin
solution (2)
E 10 2 injections of 5 mL at
24 and 48 h
2 comp.
cell 0 50.01 1 5
1% saponin
solution (2)
F 10 2 injections of 5 mL at
24 and 48 h
2 comp.
cell 1 50.05 1 5
No surfactant
(1)
G 0 2 injections of 5 mL at
24 and 48 h
2 comp.
cell 1 50.01 1 5
1% saponin
solution, no
nZVI (2)
H 10 2 injections of 5 mL at
24 and 48 h
2 comp.
cell 1 50.02 2 5
1% saponin
solution
I 10 2 injections of 5 mL at
24 and 48 h
2 comp.
cell 0 50.02 2 5
1% saponin
solution, no
current
J 0 2 injections of 5 mL at
24 and 48 h
2 comp.
cell 1 50.05 2 5
K 10 2 injections of 5 mL at
24 and 48 h
2 comp.
cell 1 50.00 2 5 No surfactant
L 13 Unique (in the beginning
of experiment)
3 comp.
cell 2 53.89 2 10
M 13 Unique (in the beginning
of experiment)
3 comp.
cell 2 55.20 2 10
pH control in
the cathode
N 13 Unique (in the beginning
of experiment)
3 comp.
cell 0 52.62 2 10 No current
O 13 Unique (in the beginning
of experiment)
3 comp.
cell 2 56.59 2 10
1% saponin
solution in
the anode
compartment
(1) Data reported in [22]; (2) Data reported in [38] 174
175
176
213

10
3. Results and Discussion 177
3.1 Soils characterization 178
Table 2 presents the results from the soil characterization. Both soils are alkaline, but 179
Soil 1 has the highest pH value. As a carbonate rich soil has a pH around 7-8 [39], this 180
alkaline pH can be due to the presence of strong basis of industrial origin. Soil 1 is a mixture 181
of industrial contaminated soils, so it is also possible to have ashes from coal fired boilers or 182
power plants, rich in calcium oxide (CaO), which readily dissolves in water to form Ca(OH)2 183
[40]. Comparing the soils, Soil 1 has a higher conductivity, higher organic matter content and 184
higher metal concentrations. The high organic matter content in Soil 1 is probably related to 185
the presence of transformer oils, as the soil origin and intense smell corroborate. Soil 2, on 186
the other hand, has a higher sum of exchangeable cations. The PCB congeners concentrations 187
are also different – Soil 1 has the highest PCB concentrations (sum of congeners PCB52, 65, 188
101, 138, 153, 180, 204 and 209) and also the highest concentrations of metals. The PCB 189
concentrations measured in the soils are above the guidance values for total PCB in Denmark, 190
although only some congeners were measured. In Denmark, the limit for soil quality is 191
0.02 mg kg-1
total PCB and if the concentration exceeds 50 mg kg-1,
the soil is classified as 192
hazardous waste [34]. In other countries (e.g. UK, Australia, USA), the threshold 193
concentration for the total PCB concentration in contaminated soil varies between 194
10-50 mg kg-1
[41-43]. 195
196
197
214

11
Table 2 – Physical and chemical characteristics of the soils. 198
Parameter Soil 1 Soil 2
Particles distribution (%)
Coarse sand (200 < Ø < 2000 μm) 19.1 3.2
Fine sand (20 < Ø < 200 μm) 67.3 69.6
Silt (2 < Ø < 20 μm) 12.7 23.6
Clay (Ø < 2 μm) 0.9 3.6
Textural classification Loamy sand Silty loam
pH (H2O) 12.2 8.20
Conductivity (mS cm-1
) 18.76 0.221
Exchangeable cations (cmol(c) kg-1
)
Ca2+
83.75 259.14
Mg2+
3.2 9.75
K+
26.88 7.36
Na+
9.37 8.34
Sum of exchangeable cations (cmol(c) kg-1
) 123.2 284.59
Calcium carbonate (%) 18.0 1.3
Organic matter (%) 16.46 0.57
PCBsa (µg kg
-1) 258 ± 24 156 ± 2
Metalsb (mg kg
-1)
Al 20980 ± 590 4952± 71
As 9 ± 2 0.6 ± 0.97
Cd 0.7 ± 0.1 0.4 ± 0.04
Cr 52 ± 3 2.5 ± 0.04
Cu 142± 95 10 ± 0.3
Fe 13162 ± 301 6773± 97
Ni 32± 1 6 ± 0.3
Pb 45± 3 25 ± 0.9
Zn 2155 ± 40 135 ± 0.1 a Sum of PCB 52, 65, 101, 138, 153, 180, 204 and 209 199
b Acid digestion with HNO3 according to the Danish Standard DS259. 200
201
3.2 PCB dechlorination 202
Figure 2 shows the total PCB removal at the end of the experiments using the two-203
compartment cell. The results are different according to soil type. In general, the best results 204
were obtained with Soil 1. The highest removal percentage in Soil 1 can be related to the pH 205
of the soil slurry during the experiments (Figure 4). The initial soil pH and carbonate content 206
allowed to maintain the pH between 6 and 7 for about half the time of the experiment. In the 207
experiments with Soil 2, the pH values turn acidic faster (~30 h after the beginning of the 208
experiment), and this contributes to the nZVI corrosion. This is also consistent with the 209
higher PCB removal obtained in Soil 2 without the direct current, and consequently, without 210
acidification of the soil slurry. 211
215

12
212 Figure 2 – Average concentration of PCB congeners (PCB28, 52, 65, 101, 138, 153, 180, 204 and 209) in Soils 213
1 and 2 before and after the experiments using the two-compartment cell. Percentages on the top of each column 214
represent PCB removal regarding the sum of congeners analyzed in the initial soils. 215
216
Soil 1 has the higher PCB removal without the saponin, only with direct current, 217
stirring and nZVI (83%). In Soil 2, the highest removal was obtained in the experiment I, 218
only with nZVI and saponin. No significant differences were found in the EDR experiments 219
for Soil 2 [one-way ANOVA, F(3,20) = 0.69, p = 0.57], although the experiment without the 220
saponin (Exp. K) showed a lower removal percentage. Saponin, as a surfactant, should 221
increase PCB desorption from soil, probably some interference with the nZVI dechlorination 222
occurred. The dechlorination activity of nZVI decrease due to the polyelectrolyte coating, 223
due to blocking of the available reactive surface sites, or by a combination of site blocking 224
and inhibited mass transfer of chlorinated organic compounds in bulk solution to the 225
nanoparticle surface [44, 45]. The pH of the suspended slurry also affects the surfactant 226
behavior, influencing the micelle aggregation and their hydrophobicity. At high pH, the net 227
216
13
charge on the head groups of saponin molecule will increase, causing electrostatic repulsion 228
between the head groups, which tends to increase the critical micelle concentration (CMC) 229
values, reducing the solubilization capabilities of saponin [46]. 230
The removal efficiencies in both soils with the three-compartment cell are much 231
lower (Figure 3) than with the 2-compartment cell despite the longer duration of the 232
experiments (Table 1). In Soil 1, the average PCB removal percentages were 26%, 60% and -233
34% for experiments A, B and C, respectively. The highest removal rate was obtained in the 234
experiment with saponin in the anode compartment. The diffusion experiment in Soil 1 with 235
the two compartments cell showed no PCB dechlorination. In Soil 2 (Figure 3B), the average 236
removal percentages were 33%, 30%, 45% and 28% for experiments L, M, N and O, 237
respectively. The highest removal percentage in Soil 2 corresponds to the experiment without 238
direct current, only the nZVI injection. The use of saponin with Soil 2 (Exp. O) does not 239
show any enhancement compared to the other experiments with that soil. Regarding the 240
aqueous samples, only in experiments A, D, E and G some congeners were detected, due to 241
the high PCB hydrophobicity and strong adsorption to soils. 242
Comparing the soil samples in the three-compartment cell (Figure 3), from the anode 243
and cathode sides, in Soil 2, lower PCB concentrations are found in the cathode side, which 244
can be related with the electroosmotic flow. While in Soil 1 no electroosmotic flow was 245
observed, in experiments L, M and O it was 84, 36 and 78 mL (total of the 10 d), 246
respectively. The experiment with pH control in the catholyte did not show any enhancement 247
in PCB dechlorination when compared with the others, for Soil 2. 248
217

14
249
250
Figure 3 – Average concentration of PCB congeners (PCB28, 52, 65, 101, 138, 153, 180, 204 and 209) in the 251
soils before and after the experiments using the three-compartment cell in soil 1 (plot A) and soil 2 (plot B). 252
Each letter represents one the experiment. The symbol (+) indicates the soil sample of the anode side while (-) 253
indicates the soil sample from the cathode side. In the experiments without current (Exp. C and N), (+) indicates 254
the soil sample of the left side of the cell while (-) indicates the soil sample from the right side. 255
256
0
50
100
150
200
250
300
350
400
Initial soil
(Soil 1)
A(+) A(-) B(+) B(-) C(+) C(-)
Av
era
ge
PC
B c
on
gen
ers
con
cen
tra
tio
n i
n s
oil
(mg
kg
-1)
Soil sample
209
204
180
153
138
101
65
52
28
A
0
20
40
60
80
100
120
140
160
180
Initial Soil
(Soil 2)
L (+) L(-) M(+) M(-) N(+) N(-) O(+) O(-)
Av
era
ge
PC
B c
on
gen
ers
con
cen
tra
tio
n i
n s
oil
(mg
kg
-1)
Soil sample
209
204
180
153
138
101
65
52
28
B
218

15
Soil is an heterogeneous medium and its spatial variability is not confined to field 257
conditions, there is also variability among the samples and the intrinsic variability of the 258
sample [47]. This variability can help explain some of the results, like the differences in the 259
PCB removal between experiments D and E, for example, as well as the negative removal 260
percentages obtained with the three compartments cell. 261
3.3 pH variation 262
In the two-compartment cell, the soil suspension pH during the experiments had lower 263
values in Soil 2 compared to Soil 1, which is related to the lower initial pH and lower 264
carbonates content (Figure 4). Although a slightly acidic pH (4.90–5.10) increases the PCB 265
removal by nZVI and nZVI/Pd in aqueous solutions [48], the pH values in Soil 2 reached 266
2.91-3.35, which correspond to less favorable conditions to PCB dechlorination due to the 267
nZVI corrosion. In all the experiments with nZVI, we observed higher pH values in the 268
suspension. Without direct current the pH values showed very little variation. 269
270 Figure 4 – Comparison of the pH evolution in the soil suspension in the two-compartment cell during the 271
experiments. 272
273
0
2
4
6
8
10
12
0 50 100 150
pH
Time (h)
Soil1: EDR+nZVI+Saponin
Soil1: nZVI + Saponin
Soil1: EDR+ nZVI
Soil1: EDR+saponin
Soil2: nZVI+saponin
Soil2:EDR+nZVI+saponin
Soil2: EDR+nZVI
Soil2: EDR+saponin
219

16
Soil 1, with high buffer capacity, presents higher pH values in the soils at the end of 274
the experiments than Soil 2 in both cells (Table S2, Supplementary information), with 275
minimal changes in the three-compartment cell (Exp. A, B and C). Soil 2, in the three-276
compartment cell, shows the traditional profile of the migration of the acid and alkaline 277
fronts, from the anode and the cathode, respectively. Experiment M, with pH control at the 278
catholyte, shows a neutral pH in the soil near that compartment. Experiment C and N show 279
the effect of the nZVI in the soil pH, without direct current, but only diffusive transport. In 280
the two-compartment cell, pH values are also higher for Soil 1 compared with Soil 2, due to 281
the higher initial pH. The lower pH value obtained for soil 1 was 5.70, much higher than 3.27 282
in Soil 2 (Exp. K). 283
284
3.4 Iron content 285
Figure 5 (A and B) shows the comparison between the mass of iron found in each 286
component of the three- and two-compartment cells, respectively, at the end of the 287
experiments. Previous studies showed that in the traditional three-compartment cell, most of 288
the nZVI aggregate and settle in the injection compartment [31, 49-51], thus not reaching the 289
contaminated soil. The suspended electrodialytic remediation assures that nZVI are mixed 290
with the soil, and most of the iron is found there at the end of the experiments. 291
220

17
292
293
Figure 5 – Comparison of the mass of iron (%) found at the end of the experiments, with the setups tested: A) 294
three compartments cell, and B) two compartments cell. 295
296
297
0% 20% 40% 60% 80% 100%
A
B
C
L
M
N
O
Fe
Exp
erim
ent
(th
ree c
om
pa
rtm
ents
cell
) Injection reservoir
Membranes
Electrodes
Electrolyte
Soil
A
0% 20% 40% 60% 80% 100%
D
E
F
G
H
I
J
K
Fe
Exp
erim
ent
(tw
o c
om
pa
rtm
ents
cell
)
Injection reservoir
CAT membrane
Electrodes
Electrolyte
Soil
B
221

18
4. Conclusions 298
The work compared two different historically contaminated soils and two different 299
cells with different enhancements. Higher PCB removal percentages were obtained for Soil 1 300
(loamy sand with highest pH, carbonate content, organic matter and PCB concentrations) 301
with the electrodialytic two-compartment cell, while for Soil 2 (silty loam with highest sum 302
of exchangeable cations) only the nZVI addition in the three compartments cell allowed to 303
obtain the highest removal percentage. The use of enhancement techniques such as 304
surfactants (saponin) and pH control did not improve the PCB removal. 305
The use of the two-compartment cell allowed a uniform distribution of iron 306
nanoparticles through the soil, while in the three-compartments cell, there was accumulation 307
in the injection reservoir. 308
The results show that the soil characteristics, like pH and buffer capacity, are 309
important and affect the reaction between nZVI and the target contaminant. 310
311
Acknowledgments 312
This work was funded by the European Regional Development Fund (ERDF) through 313
COMPETE – Operational Programme for Competitiveness Factors (OPCF), by Portuguese 314
National funds through ―FCT - Fundação para a Ciência e a Tecnologia‖ under project 315
«PTDC/AGR-AAM/101643/2008 NanoDC», by FP7-PEOPLE-IRSES-2010-269289-316
ELECTROACROSS and by the research grant SFRH/BD/76070/2011. Prof. Jorge Varejão 317
and Helena Silva are acknowledged for GC analysis and Sabrina Madsen for ICP analysis. 318
NANO IRON, s.r.o. kindly provided NANOFER 25S samples. 319
320
222

19
References 321
[1] A.B. Ribeiro, E.P. Mateus, L.M. Ottosen, G. Bech-Nielsen, Electrodialytic removal of 322
Cu, Cr and As from chromated copper arsenate-treated timber waste, Environ. Sci. 323
Technol., 34 (2000) 784-788. 324
[2] A.B. Ribeiro, J.M. Rodríguez-Maroto, Electroremediation of heavy metal-contaminated 325
soils. Processes and applications, in: M.N.V. Prasad, K.S. Sajwan, R. Naidu (Eds.) Trace 326
Elements in the Environment: Biogeochemistry, Biotechnology and Bioremediation, 327
Taylor & Francis, CRC Press, Florida, USA, 2006, pp. 341-368. 328
[3] L.M. Ottosen, A.T. Lima, A.J. Pedersen, A.B. Ribeiro, Electrodialytic extraction of Cu, 329
Pb and Cl from municipal solid waste incineration fly ash suspended in water, J. Chem. 330
Technol. Biotechnol., 81 (2006) 553-559. 331
[4] L.M. Ottosen, P.E. Jensen, H.K. Hansen, A. Ribeiro, B. Allard, Electrodialytic 332
remediation of soil slurry – Removal of Cu, Cr, and As, Sep. Sci. Technol., 44 (2009) 333
2245-2268. 334
[5] L.M. Ottosen, I.V. Christensen, I. Rörig-Dalgård, P.E. Jensen, H.K. Hansen, Utilization 335
of electromigration in civil and environmental engineering—Processes, transport rates 336
and matrix changes, J. Environ. Sci. Health A, 43 (2008) 795-809. 337
[6] A.B. Ribeiro, J.M. Rodríguez-Maroto, E.P. Mateus, H. Gomes, Removal of organic 338
contaminants from soils by an electrokinetic process: The case of atrazine. Experimental 339
and modeling, Chemosphere, 59 (2005) 1229–1239. 340
[7] A.B. Ribeiro, E.P. Mateus, J.-M. Rodríguez-Maroto, Removal of organic contaminants 341
from soils by an electrokinetic process: The case of molinate and bentazone. 342
Experimental and modeling, Sep. Purif .Technol., 79 (2011) 193-203. 343
[8] C. Ferreira, A. Ribeiro, L. Ottosen, Effect of major constituents of MSW fly ash during 344
electrodialytic remediation of heavy metals, Sep. Sci. Technol., 40 (2005) 2007-2019. 345
223

20
[9] Y.B. Acar, A.N. Alshawabkeh, Principles of electrokinetic remediation, Environ. Sci. 346
Technol., 27 (1993) 2638-2647. 347
[10] H.I. Gomes, C. Dias-Ferreira, A.B. Ribeiro, Electrokinetic remediation of 348
organochlorines in soil: Enhancement techniques and integration with other remediation 349
technologies, Chemosphere, 87 (2012) 1077-1090. 350
[11] P.E. Jensen, L.M. Ottosen, C. Ferreira, Electrodialytic remediation of soil fines 351
(<63 μm) in suspension—Influence of current strength and L/S, Electrochim. Acta, 52 352
(2007) 3412-3419. 353
[12] T.R. Sun, L.M. Ottosen, P.E. Jensen, G.M. Kirkelund, Electrodialytic remediation of 354
suspended soil – Comparison of two different soil fractions, J. Hazard. Mater., 203–204 355
(2012) 229-235. 356
[13] L. Ottosen, P. Jensen, G. Kirkelund, H. Hansen, Electrodialytic remediation of different 357
heavy metal-polluted soils in suspension, Water Air Soil Poll., 224 (2013) 1-10. 358
[14] L.M. Ottosen, P.E. Jensen, G.M. Kirkelund, B. Ebbers, Electrodialytic separation of 359
heavy metals from particulate material. Patent application EPC 13183278.4-1352, 2013. 360
[15] H.I. Gomes, C. Dias-Ferreira, A.B. Ribeiro, Overview of in situ and ex situ remediation 361
technologies for PCB-contaminated soils and sediments and obstacles for full-scale 362
application, Sci. Total Environ., 445-446 (2013) 237-260. 363
[16] G. Lowry, K. Johnson, Congener-specific dechlorination of dissolved PCBs by 364
microscale and nanoscale zerovalent iron in a water/methanol solution, Environ. Sci. 365
Technol., 38 (2004) 5208-5216. 366
[17] C.B. Wang, W. Zhang, Synthesizing nanoscale iron particles for rapid and complete 367
dechlorination of TCE and PCBs, Environ. Sci. Technol., 31 (1997) 2154-2156. 368
224

21
[18] F. He, D. Zhao, C. Paul, Field assessment of carboxymethyl cellulose stabilized iron 369
nanoparticles for in situ destruction of chlorinated solvents in source zones, Water Res., 370
44 (2010) 2360–2370. 371
[19] P. Varanasi, A. Fullana, S. Sidhu, Remediation of PCB contaminated soils using iron 372
nano-particles, Chemosphere, 66 (2007) 1031–1038. 373
[20] X. Chen, X. Yao, C. Yu, X. Su, C. Shen, C. Chen, R. Huang, X. Xu, 374
Hydrodechlorination of polychlorinated biphenyls in contaminated soil from an e-waste 375
recycling area, using nanoscale zerovalent iron and Pd/Fe bimetallic nanoparticles, 376
Environ. Sci. Poll. Res., (2014) 1-10. 377
[21] G. Fan, L. Cang, W. Qin, C. Zhou, H.I. Gomes, D. Zhou, Surfactants-enhanced 378
electrokinetic transport of xanthan gum stabilized nano Pd/Fe for the remediation of 379
PCBs contaminated soils, Sep. Purif. Technol., 114 (2013) 64-72. 380
[22] H.I. Gomes, C. Dias-Ferreira, L.M. Ottosen, A.B. Ribeiro, Electroremediation of PCB 381
contaminated soil with iron nanoparticles: Performance of a new electrodialytic setup. 382
Submitted. 383
[23] K.R. Reddy, U.S. Parupudi, S.N. Devulapalli, C.Y. Xu, Effects of soil composition on 384
the removal of chromium by electrokinetics, J. Hazard. Mater., 55 (1997) 135-158. 385
[24] J.H. Kim, S.J. Han, S.S. Kim, J.W. Yang, Effect of soil chemical properties on the 386
remediation of phenanthrene-contaminated soil by electrokinetic-Fenton process, 387
Chemosphere, 63 (2006) 1667-1676. 388
[25] V.R. Ouhadi, R.N. Yong, N. Shariatmadari, S. Saeidijam, A.R. Goodarzi, M. Safari-389
Zanjani, Impact of carbonate on the efficiency of heavy metal removal from kaolinite 390
soil by the electrokinetic soil remediation method, J. Hazard. Mater., 173 (2010) 87-94. 391
[26] K. Reddy, R. Saichek, Effect of soil type on electrokinetic removal of phenanthrene 392
using surfactants and cosolvents, J. Environ. Eng., 129 (2003) 336-346. 393
225

22
[27] E. Mena, J. Villaseñor, P. Cañizares, M.A. Rodrigo, Influence of soil texture on the 394
electrokinetic transport of diesel-degrading microorganisms, J. Environ. Sci. Health A, 395
46 (2011) 914-919. 396
[28] C. Cameselle, K.R. Reddy, Development and enhancement of electro-osmotic flow for 397
the removal of contaminants from soils, Electrochim. Acta, 86 (2012) 10-22. 398
[29] L.M. Ottosen, H.K. Hansen, A.B. Ribeiro, A. Villumsen, Removal of Cu, Pb and Zn in 399
an applied electric field in calcareous and non-calcareous soils, J. Hazard. Mater., 85 400
(2001) 291-299. 401
[30] G.C.C. Yang, Y.I. Chang, Integration of emulsified nanoiron injection with the 402
electrokinetic process for remediation of trichloroethylene in saturated soil, Sep. Purif. 403
Technol., 79 (2011) 278–284. 404
[31] H.I. Gomes, C. Dias-Ferreira, A.B. Ribeiro, S. Pamukcu, Enhanced transport and 405
transformation of zerovalent nanoiron in clay using direct electric current, Water Air Soil 406
Poll., 224 (2013) 1-12. 407
[32] R. Lageman, W. Pool, Experiences with field applications of electrokinetic remediation, 408
in: K.R. Reddy, C. Cameselle (Eds.) Electrochemical Remediation Technologies for 409
Polluted soils, Sediments and Groundwater, John Wiley & Sons, Inc., Hoboken, New 410
Jersey, 2009, pp. 697-717. 411
[33] A. Asadi, B.K. Huat, M. Hanafi, T. Mohamed, N. Shariatmadari, Role of organic matter 412
on electroosmotic properties and ionic modification of organic soils, Geosciences J., 13 413
(2009) 175-181. 414
[34] S.F. Jensen, PCB in Soil. The Contamination of PCB in Selected Locations around 415
Roskilde and Copenhagen, Report, Roskilde University, Denmark, 2009. 416
226

23
[35] M. Cao, Y. Hu, Q. Sun, L. Wang, J. Chen, X. Lu, Enhanced desorption of PCB and trace 417
metal elements (Pb and Cu) from contaminated soils by saponin and EDDS mixed 418
solution, Environ. Poll., 174 (2013) 93-99. 419
[36] H. Xia, X. Chi, Z. Yan, W. Cheng, Enhancing plant uptake of polychlorinated biphenyls 420
and cadmium using tea saponin, Biores. Technol., 100 (2009) 4649-4653. 421
[37] O.P. Mehra, M.L. Jackson, Iron oxide removal from soils and clays by a dithionite-422
citrate system buffered with sodium bicarbonate, Clays Clay Miner., 7 (1960) 317-327. 423
[38] H.I. Gomes, C. Dias-Ferreira, L.M. Ottosen, A.B. Ribeiro, Electrodialytic remediation of 424
PCB contaminated soil with iron nanoparticles and two different surfactants. Submitted 425
[39] L. Ottosen, H. Hansen, P. Jensen, Relation between pH and desorption of Cu, Cr, Zn, 426
and Pb from industrially polluted soils, Water Air Soil Poll., 201 (2009) 295-304. 427
[40] A. Lopareva-Pohu, B. Pourrut, C. Waterlot, G. Garçon, G. Bidar, C. Pruvot, P. Shirali, 428
F. Douay, Assessment of fly ash-aided phytostabilisation of highly contaminated soils 429
after an 8-year field trial: Part 1. Influence on soil parameters and metal extractability, 430
Sci. Total Environ., 409 (2011) 647-654. 431
[41] CCME, Canadian Soil Quality Guidelines for the Protection of Environmental and 432
Human Health. Total PCBs. Canadian Environmental Quality Guidelines. Canadian 433
Council of Ministers of Environment, 1999. 434
[42] EPA, Industrial Waste Resource Guidelines. Environment Protection (Industrial Waste 435
Resource) Regulations 2009. Publication IWRG643.1. Environmental Protection Agency 436
Victoria, Australia, 2009. 437
[43] USEPA, PCB regulations at 40 CFR Part 761. United States Environmental Protection 438
Agency. Toxic Substances Control Act, 2012. 439
227

24
[44] F. He, D. Zhao, Hydrodechlorination of trichloroethene using stabilized Fe-Pd 440
nanoparticles: Reaction mechanism and effects of stabilizers, catalysts and reaction 441
conditions, App. Catal. B, 84 (2008) 533-540. 442
[45] T. Phenrat, Y. Liu, R.D. Tilton, G.V. Lowry, Adsorbed polyelectrolyte coatings decrease 443
Fe0 nanoparticle reactivity with TCE in water: Conceptual model and mechanisms, 444
Environ. Sci. Technol., 43 (2009) 1507-1514. 445
[46] W. Zhou, J. Yang, L. Lou, L. Zhu, Solubilization properties of polycyclic aromatic 446
hydrocarbons by saponin, a plant-derived biosurfactant, Environ. Pollut., 159 (2011) 447
1198-1204. 448
[47] B. Yaron, R. Prost, R. Calvet, Soil Pollution Processes and Dynamics. New York 449
Springer-Verlag Berlin Heidelberg, 1996. 450
[48] Y. Wang, D. Zhou, Y. Wang, L. Wang, L. Cang, Automatic pH control system enhances 451
the dechlorination of 2,4,4'-trichlorobiphenyl and extracted PCBs from contaminated soil 452
by nanoscale Fe0 and Pd/Fe
0, Environ. Sci. Pollut. Res., 19 (2012) 448-457. 453
[49] H.I. Gomes, C. Dias-Ferreira, A.B. Ribeiro, S. Pamukcu, Influence of electrolyte and 454
voltage on the direct current enhanced transport of iron nanoparticles in clay, 455
Chemosphere, 99 (2014) 171-179. 456
[50] K.R. Reddy, K. Darko-Kagy, C. Cameselle, Electrokinetic-enhanced transport of lactate-457
modified nanoscale iron particles for degradation of dinitrotoluene in clayey soils, Sep. 458
Purif. Technol., 79 (2011) 230-237. 459
[51] H.I. Gomes, G. Fan, E.P. Mateus, C. Dias-Ferreira, A.B. Ribeiro, Assessment of 460
combined electro–nanoremediation of molinate contaminated soil, Sci. Total Environ., 461
493 (2014) 178-184. 462
463
228

Enhanced electrokinetic techniques for remediation of different PCB polluted soils
Supplementary information
Helena I. Gomes1,2,3, Celia Dias-Ferreira2, Lisbeth M. Ottosen3, Alexandra B. Ribeiro1
1CENSE - Center for Environmental and Sustainability Research, Departamento de Ciências e Engenharia do Ambiente, Faculdade de Ciências e Tecnologia, Universidade Nova de Lisboa, 2829-516 Caparica, Portugal 2CERNAS – Research Center for Natural Resources, Environment and Society, Escola Superior Agraria de Coimbra, Instituto Politecnico de Coimbra, Bencanta, 3045-601 Coimbra, Portugal 3Department of Civil Engineering, Technical University of Denmark, Brovej, Building 118, DK 2800 Kgs. Lyngby, Denmark * Corresponding author. Tel. +351 212948300, Fax. +351 212948554. E-mail address: [email protected] (Helena I. Gomes)
Table S1 – Characterization of the zero valent iron nanoparticles used in the experiments, according to the supplier information.
Product Name NANOFER 25S (NANO IRON, s.r.o.) Stabilizer Polyacrylic acid (PAA) pH 11-12 Density 1.15 – 1.25 g cm-3 (20°C) Average particles size 50 nm Particle size distribution 20-100 nm Average surface area 20-25 m2 g-1 Iron content 80-90 wt. %
Table S2 – Soil pH at the end of the experiments. Initial soil pH is 12.2 for Soil 1 and
8.20 for Soil 2. Three-compartment cell Two-compartment cell
Exp. Anode side Cathode side Exp. Soil pH A 11.28 12.18 D 8.49 B 11.37 12.06 E 9.72 C 12.25 12.07 F 5.70 L 5.23 11.57 G 7.69 M 3.61 7.58 H 3.05 N 9.63 9.54 I 8.01 O 5.55 11.72 J 2.96 K 2.37
229

230

231
II.10 Numerical prediction of diffusion and electric field-‐induced iron
nanoparticle transport (submitted)


1 2 3 4 5 6 7 8 9 10 11 12 13 14 15 16 17 18 19 20 21 22 23 24 25 26 27 28 29 30 31 32 33 34 35 36 37 38 39 40 41 42 43 44 45 46 47 48 49 50 51 52 53 54 55 56 57 58 59 60 61 62 63 64 65
1
Numerical prediction of diffusion and electric field-induced iron
nanoparticle transport
Helena I. Gomesa,d, José Miguel Rodríguez-Marotob,1, Alexandra B. Ribeiroa, Sibel
Pamukcuc,1, Celia Dias-Ferreirad
a CENSE, Departamento de Ciências e Engenharia do Ambiente, Faculdade de Ciências e
Tecnologia, Universidade Nova de Lisboa, 2829-516 Caparica, Portugal
b Department of Chemical Engineering, University of Málaga, Campus de Teatinos, 29071-
Málaga, Spain
c Department of Civil and Environmental Engineering, Fritz Engineering Laboratory, 13 E.
Packer Avenue, Lehigh University, Bethlehem, PA 18015-4729, USA
d CERNAS – Research Center for Natural Resources, Environment and Society, Escola
Superior Agraria de Coimbra, Instituto Politecnico de Coimbra, Bencanta, 3045-601
Coimbra, Portugal
* Corresponding author. Tel. +351 212948300, Fax. +351 212948554. E-mail address:
[email protected] (Helena I. Gomes)
1 ISE member
*Manuscript (including Abstract)Click here to view linked References
233
1 2 3 4 5 6 7 8 9 10 11 12 13 14 15 16 17 18 19 20 21 22 23 24 25 26 27 28 29 30 31 32 33 34 35 36 37 38 39 40 41 42 43 44 45 46 47 48 49 50 51 52 53 54 55 56 57 58 59 60 61 62 63 64 65
2
Abstract
Zero valent iron nanoparticles (nZVI) are considered very promising for the
remediation of contaminated soils and groundwaters. However, an important issue related to
their limited mobility remains unsolved. Direct current can be used to enhance the
nanoparticles transport, based on the same principles of electrokinetic remediation. In this
work, a generalized physicochemical model was developed and solved numerically to
describe the nZVI transport through porous media under electric field, and with different
electrolytes (with different ionic strengths). The model consists of the Nernst–Planck coupled
system of equations, which accounts for the mass balance of ionic species in a fluid medium,
when both the diffusion and electromigration of the ions are considered. The diffusion and
electrophoretic transport of the negatively charged nZVI particles were also considered in the
system. The contribution of electroosmotic flow to the overall mass transport was included in
the model for all cases. The nZVI effective mobility values in the porous medium are very
low (10-7-10-4 cm2 V-1 s-1), due to the counterbalance between the positive electroosmotic
flow and the electrophoretic transport of the negatively charged nanoparticles. The higher the
nZVI concentration is in the matrix, the higher the aggregation; therefore, low concentration
of nZVI suspensions must be used for successful field application.
234

1 2 3 4 5 6 7 8 9 10 11 12 13 14 15 16 17 18 19 20 21 22 23 24 25 26 27 28 29 30 31 32 33 34 35 36 37 38 39 40 41 42 43 44 45 46 47 48 49 50 51 52 53 54 55 56 57 58 59 60 61 62 63 64 65
3
Highlights
x Numerical model describes the nZVI transport by diffusion and under electric fields
x Data from different porosity media and electrolytes were used to validate the model
x Diffusion, electromigration, electrophoresis and electroosmosis were considered
x Aggregation of nZVI particles due to high suspension concentrations
x Electrophoretic transport of the nZVI is counteracted by electroosmosis
Keywords
Electrokinetics; nZVI; porous media; electrolytes; Nernst–Planck equations
235

1 2 3 4 5 6 7 8 9 10 11 12 13 14 15 16 17 18 19 20 21 22 23 24 25 26 27 28 29 30 31 32 33 34 35 36 37 38 39 40 41 42 43 44 45 46 47 48 49 50 51 52 53 54 55 56 57 58 59 60 61 62 63 64 65
4
1. Introduction
Zero valent iron was used successfully for soil and groundwater remediation in
permeable reactive barriers for more than two decades [1-3]. With the development of
advanced nanotechnologies since late nineties, due to their size and reactivity that allowed an
easy injection, zero valent iron nanoparticles (nZVI) were considered a promising step
forward in soil and groundwater clean-up, particularly targeting organochlorines [4-8]. The
nZVI transport in porous media was studied in column tests with sand [9-16], glass beads
[17-19] and model soils [20, 21]. These studies showed that nZVI has a tendency to
aggregate quickly and settle in the pores, primarily due to magnetic attractive forces [22].
Results from field scale applications [23-27] confirm this limited mobility, ranging from 1 m
[28] to 6-10 m [26], depending on soil characteristics, test operations, and injection velocities
[29].
One of the methods tested to overcome poor nZVI mobility was the use of direct
current (DC) [16, 30-34], using the same principles of electrokinetic remediation (EKR). In
this method, low-level direct current is the “cleaning agent”, inducing different transport
mechanisms (electroosmosis, electromigration and electrophoresis) and electrochemical
reactions (electrolysis and electrodeposition) in contaminated soils [35]. Direct comparison of
the results provided in previous studies on nZVI enhanced transport with direct current is
limited due to the differences in experimental setups, soils or other solid media used, types of
iron nanoparticles, injection places (i.e., directly in the soil, anode or cathode compartments),
magnitude and duration of the voltage gradients applied. In general electrophoretic transport
of the particles was shown to be predominant in sandy soil [33, 36, 37], while electro-osmotic
transport appeared more important in kaolin clay and loamy sand soil [16, 32]. The available
analytical models of the nanoparticle transport in literature include only the electrophoretic
effect that mostly takes place in sands [33, 37].
236

1 2 3 4 5 6 7 8 9 10 11 12 13 14 15 16 17 18 19 20 21 22 23 24 25 26 27 28 29 30 31 32 33 34 35 36 37 38 39 40 41 42 43 44 45 46 47 48 49 50 51 52 53 54 55 56 57 58 59 60 61 62 63 64 65
5
In this work, a generalized physicochemical model has been developed to describe the
electrically induced transport of nZVI particles through different types of porous media of
varying porosity and surface reactivity. The model is sufficiently detailed, including the
fundamental processes, and its numerical solution offers a reliable prediction of the nZVI
transport. Experimental data using different porosity media and different pore fluid
electrolytes were used to validate the model [30, 31].
2. Model Description
The analytical model operates in two steps: first the kinetic process is simulated by
integrating forward in time the one-dimensional transport equations, including the
electrochemical reactions at the electrodes; then the chemical equilibriums are reestablished
before the next step of integration. This is done because chemical equilibriums are considered
instantaneous when compared with the transport time.
2.1. General description of experiments used to validate model
The experimental data used for the validation of the model have been published
previously by Gomes et al [30, 31], where the experimental conditions are described in detail.
The experiments were designed so that the transport of nZVI took place in the domain of a
layer of porous solid (kaolin and/or glass beads) saturated with an electrolyte.
237

1 2 3 4 5 6 7 8 9 10 11 12 13 14 15 16 17 18 19 20 21 22 23 24 25 26 27 28 29 30 31 32 33 34 35 36 37 38 39 40 41 42 43 44 45 46 47 48 49 50 51 52 53 54 55 56 57 58 59 60 61 62 63 64 65
6
Figure 1. Modified electrophoretic cell used in the experiments [30, 31]. E1 to E5 are
auxiliary platinum electrodes and represent the locations of the solid samples for iron
quantification.
The experiments were conducted in a modified electrophoretic cell (Econo-Submarine
Gel Unit, model SGE-020) as shown in Figure 1. The cell is a rectangular translucent box
10 cm height, 40 cm long and 23 cm width, with a square (20 cm x 20 cm) sample tray and a
lid that covers the whole apparatus. Two liquid chambers hold the anolyte and the catholyte
and platinum working electrodes on either side of the sample tray (Figure 1). In all
experiments, both the anolyte and catholyte compartments were filled with the same
electrolyte solution (volume of 650 mL each, Table 1) as that used to saturate the porous
specimen. The level of the solutions in the side compartments was kept slightly below the
specimen surface, thus preventing preferential transport of nZVI through a liquid pool over
the specimen. Compressed fiberglass wool pads, saturated and immersed in the electrolyte
solution, helped transport the migrating ions from the solution into the specimen and vice
versa. Different porosity and surface reactivity test media, ranging from glass beads (with
238

1 2 3 4 5 6 7 8 9 10 11 12 13 14 15 16 17 18 19 20 21 22 23 24 25 26 27 28 29 30 31 32 33 34 35 36 37 38 39 40 41 42 43 44 45 46 47 48 49 50 51 52 53 54 55 56 57 58 59 60 61 62 63 64 65
7
particle diameter less than 1 mm, previously sieved) to white Georgia kaolinite clay (> 2 μm)
were used in the transport experiments (Table 1). The PAA-nZVI suspensions were freshly
prepared before each experiment and had a concentration of 4 g L-1 of nZVI. The particle size
distribution of the nanoparticles had a mean particle diameter value of 62.66±39.6 nm and the
median size was 60.2 nm, based on a count of 420 particles in TEM images [30, 31]. Two
sets of control experiments were conducted for each mixture under the same conditions, one
without direct current but with PAA-nZVI, and another with current but without PAA-nZVI.
In the experiments with current, a constant potential was applied for 48 h. The cell was kept
in a dark location to prevent iron photo-oxidation. The nanoparticle suspension was delivered
in the electrophoretic cell using a syringe to inject 2 mL through a tube, which allowed the
suspension disperse into a pre-cut shallow channel in the porous specimen between the
auxiliary electrodes E2 and E3.
2.2. Governing equations
The mass conservation equation for ith species in a jth volume element, including
electrochemical reactions, is described by:
(1)
where Vj is volume of water in jth cell (cm3), cij is the concentration of ith species (ions and
nZVI) in the aqueous phase of the jth volume element (mol cm-3), t is the time, Ni, j-1 and Ni, j
the mass flux of ith species from (j-1)th into jth element volume and from jth into (j+1)th
volume element (mol cm2 s-1), A cross-sectional area of the domain (cm2), and Ri the reaction
rate for i species. With respect to the chemical reactions, only the chemical equilibria and the
electrochemical reactions at the electrodes are considered.
jij,ij,iij
j VRANNdtdc
V ¸¹
ᬩ
§1
239

1 2 3 4 5 6 7 8 9 10 11 12 13 14 15 16 17 18 19 20 21 22 23 24 25 26 27 28 29 30 31 32 33 34 35 36 37 38 39 40 41 42 43 44 45 46 47 48 49 50 51 52 53 54 55 56 57 58 59 60 61 62 63 64 65
8
The model consists of a coupled system of Nernst–Planck equations, which accounts
for the mass balance of the ionic species in a fluid medium, when diffusion and
electromigration are considered in the transport process. In the case of charged nZVI (i.e., the
nanoparticles are stabilized with polyacrylic acid – PAA, which gives them the negative
charge), diffusion and electrophoretic terms have to be taken into account. The
electroosmotic flow is included in all cases.
Therefore, the flux of any chemical species or charged particles i from a jth volume
element of the system can be expressed as:
(2)
where (sub index j is omitted), ci is the molar concentration, Di* is the effective diffusion
coefficient, and is the electrical potential, ke is the electroosmotic permeability
coefficient and Ui*, is the effective electrophoretic mobility for nZVI charged particles or
effective ionic mobility, estimated by the Einstein–Nernst relation for ions [38]:
(3)
where R is the ideal gas constant, F is the Faraday constant, zi is the ionic charge of the
species and T is the temperature (K), assuming a constant room temperature of 25 ºC. The
value of the electroosmotic permeability usually is in a very tight range of 10−5 to
10−4 cm2 s−1 V−1 [39]. Electroosmotic permeability and mobility can be combined into a new
effective mobility in the porous medium, Ui**:
(4)
The mass balance equations for nZVI and the ionic species are integrated over the one-
dimensional region limited by the electrodes compartments in order to obtain the
concentration profile for a given set of experimental conditions. Due to the negative charge of
II iei*ii
*ii ckcUcDN
I
RTFzDU i
*i*
i
e*i
**i kUU
240

1 2 3 4 5 6 7 8 9 10 11 12 13 14 15 16 17 18 19 20 21 22 23 24 25 26 27 28 29 30 31 32 33 34 35 36 37 38 39 40 41 42 43 44 45 46 47 48 49 50 51 52 53 54 55 56 57 58 59 60 61 62 63 64 65
9
polyacrylic acid coated nZVI, the sign of electrophoretic term is negative, whereas the
electroosmotic term is positive, resulting in a low value for the effective mobility.
Table 1 shows the experimental conditions and parameters used in solution of the
model to simulate the experimental tests. The nZVI effective diffusion coefficient values in
Table 1 were obtained from fitting the experimental results, that varied between 0.5 × 10⁻⁵
and 5.9 × 10⁻⁵ cm2 s-1. The electrophoretic mobility (EPM) of PAA-nZVI was obtained from
experimental measures for the different particle suspensions using Laser Doppler
Velocimetry in a ZetaSizer Nano ZS, Malvern (Southborough, MA). Stock suspensions of
PAA-nZVI were diluted to 2 g L-1 to obtain measurements for the electrolytes used in the
transport tests.
241

1 2 3 4 5 6 7 8 9 10 11 12 13 14 15 16 17 18 19 20 21 22 23 24 25 26 27 28 29 30 31 32 33 34 35 36 37 38 39 40 41 42 43 44 45 46 47 48 49 50 51 52 53 54 55 56 57 58 59 60 61 62 63 64 65
10
Table 1. Parameters used in modeling to simulate the experimental tests
Solid layer length, L: 20 cm Solid layer Area, A: 10 cm2 or 4 cm2 Number of volume elements used to represented solid column, N: 20 Electrode compartment volume, V0 and VN+1: 650 cm3 η = 1 Δt: 5 seconds Initial mass of nZVI injected in the system: 0.008 g (2 mL of 4 g L-1 solution) Electric Potential: 5 V (Experiments 5 to 11) and 10 V (Experiment 12)
Diffusion control tests
Test number
Layer thickness (mm) Matrix Porosity Electrolyte
1 5 100% Kaolin 0.65 NaCl (0.001M) 5.9 10-5 - 1.7 10-4
2 2 50% glass beads and 50% kaolin 0.57 NaCl
(0.001M) 4.6 10-5 - 1.5 10-4
3 2 75% glass beads and 25% kaolin 0.35 NaCl
(0.001M) 3.9 10-5 - 0.9 10-4
4 2 100% glass beads 0.20 NaCl (0.001M) 1.8 10-5 - 0.5 10-4
Enhanced transport tests
Test number
Layer thickness (mm)
Matrix Porosity Electrolyte
5 5 100% Kaolin 0.65 NaCl (0.001M)
1.6 10-5 - 1.1 10-4
6 2 50% glass beads and 50 % kaolin
0.57 NaCl (0.001M)
2.8 10-5 2.4 10-5
7 2 75% glass beads and 25% kaolin
0.35 NaCl (0.001M)
1.4 10-5 2.1 10-6
8 2 100% glass beads 0.20 NaCl (0.001M)
4.6 10-6 8 10-6
9 5 100% Kaolin 0.65 NaOH (0.001M)
1.7 10-5 4.7 10-5
10 5 100% Kaolin 0.65 CaCl2 (0.05M) 4.8 10-5 -9.7 10-7
11 5 100% Kaolin 0.65 Na2SO3 (0.1M)
3.3 10-5 1.8 10-4
12 5 100% Kaolin 0.65 NaCl (0.001M)
2.3 10-5 - 5.7 10-5
12 scmD*nZVI 112 sVcmU*nZVI
12 scmD*nZVI 112 sVcmU*nZVI
242

1 2 3 4 5 6 7 8 9 10 11 12 13 14 15 16 17 18 19 20 21 22 23 24 25 26 27 28 29 30 31 32 33 34 35 36 37 38 39 40 41 42 43 44 45 46 47 48 49 50 51 52 53 54 55 56 57 58 59 60 61 62 63 64 65
11
2.3. Electrochemical reactions
The rate of generation term is not included in the continuity equation for the porous
specimen because we assume that the main chemical reactions that need to be considered are
the electrochemical reduction and oxidation of water at the electrodes. The other
electrochemical reactions had to be taken into account only in experiments 10 and 11, as
explained in the following paragraphs. Nernst equation is used to calculate the redox
potential for each electrochemical half reaction, as:
(5)
where Q is the reaction quotient, defined as the product of the activities of the chemical
species to the power of their stoichiometric coefficients, for non-equilibrium conditions. In
the special case that the reaction is at equilibrium, the reaction quotient is equal to the
equilibrium constant. υ in this case is the stoichiometric coefficient of the electrons in the
redox equation, i.e. the number of electrons exchanged during the oxidation or reaction
process. E (V) is the redox potential in the reduction sense and E0 (V) is the standard redox
potential, which is measured under standard conditions which are 25 ºC, 1 M concentration
for each ion participating in the reaction, a partial pressure of 1 atm is assigned for each gas
that is part of the reaction and metals in their pure state [40].
At the cathode, cations Na+ and Ca2+ are attracted, but the redox potential of alkali
and alkaline earth metals is too high to be competitive to that of water in aqueous media.
Consequently, it seems reasonable to assume that only water reduction is taking place at the
cathode. Thus, the only electrochemical half-reaction at the cathode is:
(6)
On the other hand, anions are attracted to the anode, where oxidation reactions occur. In the
most of experiments (5 to 9 and 12) only water oxidation is expected. In contrast, the
QlnF
RTEEX
0
V8280222 022 .EgasHaqOHeOH o
243

1 2 3 4 5 6 7 8 9 10 11 12 13 14 15 16 17 18 19 20 21 22 23 24 25 26 27 28 29 30 31 32 33 34 35 36 37 38 39 40 41 42 43 44 45 46 47 48 49 50 51 52 53 54 55 56 57 58 59 60 61 62 63 64 65
12
oxidation of ions Cl− (0.1 M) in experiment 10 and of ions SO3= (0.1 M) in experiment 11
could compete with the water oxidation at the anode. Therefore, the possible half-reactions at
the anode is given by equation (7) for experiments 5 to 9 and 12; by equations (7) and (8) for
experiment 10; and by equations (7) and (9) for experiment 11:
(7)
(8)
(9)
Although a slight smell to chlorine was detected in experiment 10, the calculations revealed
that even in the most favourable conditions (pH < 1) the fraction of current used for chloride
oxidation is negligible. On the contrary, the sulphite oxidation predominates at the anode in
the experiment 11.
The electrochemical reactions were included in the mass balance equations of anode
and cathode compartments as given in equations (10) and (11) for all the experiments, with
the exception of experiment 11 which also included the equations (12) and (13):
(10)
(11)
(12)
(13)
where V0 and VN+1 are the volumes of electrolyte in the anodic and cathodic compartments,
c10 and c2N+1, H+ and OH- concentrations generated there by electrochemical reactions, c40
and c120, SO3= and SO4
= concentrations at the anodic compartment corresponding to the mass
V2291442 022 .EegasOaqHOH o
om V360122 0
2 .EeClCl
om V936022 0
243 .EOHeSOOHSO
KFI
dtdcV
ER
¸¹·
¨©§ 10
0
KFI
dtdcV
ER
NN ¸
¹·
¨©§
12
1
KzFI
dtdcV
ER ¸
¹·
¨©§ 40
0
KzFI
dtdcV
ER ¸
¹·
¨©§ 120
0
244

1 2 3 4 5 6 7 8 9 10 11 12 13 14 15 16 17 18 19 20 21 22 23 24 25 26 27 28 29 30 31 32 33 34 35 36 37 38 39 40 41 42 43 44 45 46 47 48 49 50 51 52 53 54 55 56 57 58 59 60 61 62 63 64 65
13
> @> @ > @
10
3
3133 10132 ·.
HCO
HCOKCOHHCO
mo
of sulfite and sulfate consumed and generated by oxidation respectively, I is the current
intensity, F, the Faraday’s constant and η the Faradic efficiency.
2.4. Chemical equilibria
Once the transport calculations are completed at each time step, the value of
concentration corresponding to the chemical equilibrium of every species is calculated from
the last value obtained from the transport. Therefore, in every volume element a system of
non-linear equations given by the mass balances, the electrical neutrality condition, and the
equilibrium mass action equations were solved.
The extremely rapid reactions between protons and hydroxyls to form water and
reverse must be taken into account in all the experiments. The chemical equilibrium of water
is:
om > @> @ 14
2 10 OH·HKOHOHH w (14)
In the experiments using NaCl (0.001 M) as electrolyte, as no equilibrium process
affects Cl- and Na+, the conservation equations for them are trivial. In contrast, additional
equilibrium equations are necessary for the experiments 9, 10 and 11, using NaOH
(0.001 M), CaCl2 (0.05 M) and Na2SO3 (0.1 M) as electrolytes, respectively. The exchanges
between the atmospheric CO2 and the electrolyte were also considered in the simulations:
(15)
(16)
(17)
(18)
> @
> @ > @16
23
322323 10842 ·.
HCO
COHKCOHHCO
mo
> @> @> @
1432 10271
m
o ·.Na
HNaOHKNaOHHOHNa
> @> @ > @ 618
3
3433 .
NaCO
NaCOKNaCONaCO
mo
245

1 2 3 4 5 6 7 8 9 10 11 12 13 14 15 16 17 18 19 20 21 22 23 24 25 26 27 28 29 30 31 32 33 34 35 36 37 38 39 40 41 42 43 44 45 46 47 48 49 50 51 52 53 54 55 56 57 58 59 60 61 62 63 64 65
14
The only effect expected of Ca2+ ion is its precipitation as Ca(OH)2 due to the high
pH present in the cathodic zone.
(19)
In fact, in this experiment, a white precipitate was observed at the cathode compartment as
predicted by the model calculations.
In the case of sulfite, several equilibrium equations were taken into account:
(20)
(21)
(22)
(23)
(24)
(25)
3. Results and Discussion
The model reproduces satisfactorily the nZVI concentration profiles in the porous
media, as well as the anodic and cathodic pH values over time.
Model and experimental results for nZVI concentrations profiles in the various porous
specimens at the end of the 48 h diffusion control tests are presented in Figure 2. It was
detected that, in some cases, an important fraction of the nZVI tends to aggregate when the
om > @> @ 622
022 100252 ·.OHCaKOHCaOHCa
> @> @ > @
7
3
3133 10551
m
o ·.HSO
HSOKHSOHSO
> @
> @ > @9
23
322323 10112 ·.
HSO
SOHKSOHHSO
mo
> @> @> @
1432 10271
m
o ·.Na
HNaOHKNaOHHOHNa
> @> @ > @ 766
3
3433 .
NaSO
NaSOKNaSONaSO
mo
> @> @ > @
1522
3
252
525223 1041722
m
o ·.HSO
OSKOSOHHSO
> @> @ > @ 7297
4
4644 .
HSO
HSOKSOHHSO
mo
246

1 2 3 4 5 6 7 8 9 10 11 12 13 14 15 16 17 18 19 20 21 22 23 24 25 26 27 28 29 30 31 32 33 34 35 36 37 38 39 40 41 42 43 44 45 46 47 48 49 50 51 52 53 54 55 56 57 58 59 60 61 62 63 64 65
15
concentration is high relative to the available pore volume, becoming immobile. In fact, in
experiments 2 and 4 only about 19% and 8% of the injected nZVI remained mobile over the
experiment, respectively. At high iron nanoparticle concentration (1-6 g L-1) there is higher
agglomeration [11]. Also, when iron nanoparticles aggregate they become larger than the
pores, restricting their transport through the matrix [41].
1) 100% Kaolin
2) 50% glass beads and 50% kaolin
3) 75% glass beads and 25% kaolin
4) 100% glass beads
Figure 2. Iron concentrations across the electrophoretic cell in the diffusion control tests for
the porous media tested (Experiments 1 to 4).
Model and experimental results for nZVI concentrations profiles and pH at the anode
and cathode over time in enhanced transport tests are presented in Figures 3 and 4. As can be
seen, the concentration of nZVI away from the injection point is higher than in the
experiments without current, in all the cases. This result shows that the current enhances
nZVI transport by preventing or hindering the nZVI aggregation at the injection location. In
0
10
20
30
40
50
60
70
80
90
1 2 3 4 5 6 7 8 9 10 11 12 13 14 15 16 17 18 19 20L (cm)
nZVI
(mg/
kg)
ExpModel
0
5
10
15
20
25
30
35
40
1 2 3 4 5 6 7 8 9 10 11 12 13 14 15 16 17 18 19 20L (cm)
nZVI
(mg/
kg)
ExpModel
0
10
20
30
40
50
60
70
80
1 2 3 4 5 6 7 8 9 10 11 12 13 14 15 16 17 18 19 20L (cm)
nZVI
(mg/
kg)
ExpModel
0
1
2
3
4
5
6
7
8
9
1 2 3 4 5 6 7 8 9 10 11 12 13 14 15 16 17 18 19 20L (cm)
nZVI
(mg/
kg)
ExpModel
247

1 2 3 4 5 6 7 8 9 10 11 12 13 14 15 16 17 18 19 20 21 22 23 24 25 26 27 28 29 30 31 32 33 34 35 36 37 38 39 40 41 42 43 44 45 46 47 48 49 50 51 52 53 54 55 56 57 58 59 60 61 62 63 64 65
16
Figure 5, the mobile mass of nZVI vs. pore volume is shown for the nZVI transport without
and with current. In all cases, the mobile mass is higher in the experiments with current.
The model predicts very low effective mobility values in the porous medium (Ui**) as
showed in Table 1 as a consequence of the opposing transport directions between the
electroosmotic advection and the electrophoretic migration of the negatively charged
nanoparticles. This effect manifests itself as higher concentrations close to the injection point
in most of experiments. Thus, if the nanoparticles could be stabilized with a surface modifier
to give them a positive charge, the nZVI effective mobility could potentially be increased.
Nevertheless the probability of the positively charged particles be attracted onto the soil
particle surfaces, particularly clays, could increase. Also the use of stabilizers without charge
could enhance the electroosmotic transport of the iron nanoparticles.
The ionic strength of the electrolyte was also determinant in the transport of the
nanoparticles – the higher the ionic strength of the electrolyte the lower the transport, what
should also be considered for field applications with contaminated groundwaters with high
concentrations of salts and metals. The distance covered by iron nanoparticles when using
0.001 M NaCl as the electrolyte is approximately the double when compared with 0.05 M
CaCl2 and 0.1 M Na2SO3.
Figure 6 shows the model predictions of the transport distance covered by the iron
nanoparticles using different electrolytes and porous media, with and without current. It is
clearly distinct the enhancement of the nZVI transport when current in applied, especially in
the kaolin clay. When using only kaolin clay and direct current the distance covered by iron
nanoparticles is almost the double of diffusion only.
248

1 2 3 4 5 6 7 8 9 10 11 12 13 14 15 16 17 18 19 20 21 22 23 24 25 26 27 28 29 30 31 32 33 34 35 36 37 38 39 40 41 42 43 44 45 46 47 48 49 50 51 52 53 54 55 56 57 58 59 60 61 62 63 64 65
17
Exp. 5 a)
Exp. 5 b)
Exp. 6 a)
Exp. 6 b)
Exp. 7 a)
Exp. 7 b)
Exp. 8 a)
Exp. 8 b)
Figure 3. Enhanced transport tests: a) iron concentrations in the solid matrix and b) pH
variation in the anolyte (yellow squares and red line) and catholyte (blue circles and line).
0
20
40
60
80
100
120
140
160
180
1 2 3 4 5 6 7 8 9 10 11 12 13 14 15 16 17 18 19 20L (cm)
nZVI
(mg/
kg)
ExpModel
0.0
2.0
4.0
6.0
8.0
10.0
12.0
14.0
0.0 0.5 1.0 1.5 2.0 2.5Time (d)
pH
020406080
100120140160180200
1 2 3 4 5 6 7 8 9 10 11 12 13 14 15 16 17 18 19 20L (cm)
nZVI
(mg/
kg)
Exp
Model
0.0
2.0
4.0
6.0
8.0
10.0
12.0
14.0
0.0 0.5 1.0 1.5 2.0 2.5Time (d)
pH
0
20
40
60
80
100
120
140
160
1 2 3 4 5 6 7 8 9 10 11 12 13 14 15 16 17 18 19 20L (cm)
nZVI
(mg/
kg)
ExpModel
0.0
2.0
4.0
6.0
8.0
10.0
12.0
14.0
0.0 0.5 1.0 1.5 2.0 2.5Time (d)
pH
0
5
10
15
20
25
30
35
40
45
1 2 3 4 5 6 7 8 9 10 11 12 13 14 15 16 17 18 19 20L (cm)
nZVI
(mg/
kg)
ExpModel
0.0
2.0
4.0
6.0
8.0
10.0
12.0
14.0
0.0 0.5 1.0 1.5 2.0 2.5Time (d)
pH
249

1 2 3 4 5 6 7 8 9 10 11 12 13 14 15 16 17 18 19 20 21 22 23 24 25 26 27 28 29 30 31 32 33 34 35 36 37 38 39 40 41 42 43 44 45 46 47 48 49 50 51 52 53 54 55 56 57 58 59 60 61 62 63 64 65
18
Exp. 9 a)
Exp. 9 b)
Exp. 10 a)
Exp. 10 b)
Exp. 11 a)
Exp. 11 b)
Exp. 12 a)
Exp. 12 b)
Figure 4. Enhanced transport tests: a) iron concentrations in the solid matrix and b) pH
variation in the anolyte (yellow squares and red line) and catholyte (blue circles and line).
0
20
40
60
80
100
120
140
160
180
1 2 3 4 5 6 7 8 9 10 11 12 13 14 15 16 17 18 19 20L (cm)
nZVI
(mg/
kg)
ExpModel
0.0
2.0
4.0
6.0
8.0
10.0
12.0
14.0
0.0 0.5 1.0 1.5 2.0 2.5Time (d)
pH
0
20
40
60
80
100
120
1 2 3 4 5 6 7 8 9 10 11 12 13 14 15 16 17 18 19 20L (cm)
nZVI
(mg/
kg)
ExpModel
0.0
2.0
4.0
6.0
8.0
10.0
12.0
14.0
0.0 0.5 1.0 1.5 2.0 2.5Time (d)
pH
0
20
40
60
80
100
120
1 2 3 4 5 6 7 8 9 10 11 12 13 14 15 16 17 18 19 20L (cm)
mg/
kg
Exp
Serie2
0.0
2.0
4.0
6.0
8.0
10.0
12.0
14.0
0.0 0.5 1.0 1.5 2.0 2.5Time (d)
pH
0
20
40
60
80
100
120
140
1 2 3 4 5 6 7 8 9 10 11 12 13 14 15 16 17 18 19 20L (cm)
nZVI
(mg/
kg)
ExpModel
0.0
2.0
4.0
6.0
8.0
10.0
12.0
14.0
0.0 0.5 1.0 1.5 2.0 2.5Time (d)
pH
250

1 2 3 4 5 6 7 8 9 10 11 12 13 14 15 16 17 18 19 20 21 22 23 24 25 26 27 28 29 30 31 32 33 34 35 36 37 38 39 40 41 42 43 44 45 46 47 48 49 50 51 52 53 54 55 56 57 58 59 60 61 62 63 64 65
19
Figure 5. Mobile mass of nZVI in the diffusion and enhanced transport experiments.
Figure 6. Prediction of the distances covered by nanoparticles in the different porosity media
with and without current.
0123456789
0 25 50 75 100 125 150
Pore Volume (cm3)
Mob
ile M
ass
(mg)
DiffusionEnhanced
251
1 2 3 4 5 6 7 8 9 10 11 12 13 14 15 16 17 18 19 20 21 22 23 24 25 26 27 28 29 30 31 32 33 34 35 36 37 38 39 40 41 42 43 44 45 46 47 48 49 50 51 52 53 54 55 56 57 58 59 60 61 62 63 64 65
20
4. Conclusions
The use of polymers which increase the repulsion between nanoparticles (inhibiting
aggregation) and between nanoparticles and surfaces (inhibiting attachment) aims at
enhancing the dispersibility and transport of nZVI through the porous medium. However,
despite the use of polyacrylic acid to modify the surface, an important aggregation of nZVI is
observed in the experiments when the particles are allowed to diffuse into porous medium
from an injection point. The higher the nZVI concentration is in the matrix, the higher the
aggregation; therefore, low concentrations suspensions must be used for successful field
application.
The use of electrical current to transport the nanoparticles prevents or hinders the
nZVI particle aggregation, increasing their mobility. However, opposing directions of
electrophoretic transport of negatively charged particles and the electroosmotic advection still
produces low nZVI transport that could be improved by reversing the charge of the iron
nanoparticle surface or by using neutrally charged nanoparticles that could be transported by
electroosmotic advection. A detailed physicochemical model which included advective,
diffusive and electrophoretic transport, electrolyte specific electrochemical reactions, as well
as mass balances, was developed and solved. The model predictions agreed well with the
experimental findings of the nZVI distribution in various porous systems, as well as the pH
evolution in the anolyte and catholyte in the enhanced transport and diffusion tests.
252

1 2 3 4 5 6 7 8 9 10 11 12 13 14 15 16 17 18 19 20 21 22 23 24 25 26 27 28 29 30 31 32 33 34 35 36 37 38 39 40 41 42 43 44 45 46 47 48 49 50 51 52 53 54 55 56 57 58 59 60 61 62 63 64 65
21
Acknowledgments
This work has been funded by the research grant SFRH/BD/76070/2011, by project
PTDC/AGR-AAM/101643/2008 NanoDC under Portuguese National funds through
“Fundação para a Ciência e a Tecnologia” and by FP7-PEOPLE-IRSES-2010-269289-
ELECTROACROSS. The Department of Civil and Environmental Engineering at Lehigh
University is acknowledged for the funding of equipment development, testing and analysis
of the nZVI transport experiments.
References
[1] USEPA, Permeable Reactive Barrier Technologies for Contaminant Remediation,
Technical Innovation Office. Office of Solid Waste and Emergency Response U. S.
Environmental Protection Agency Washington DC, National Risk Management Research
Laboratory Office of Research and Development, U. S. Environmental Protection Agency
Cincinnati, Ohio 1998.
[2] S. Comba, A. Di Molfetta, R. Sethi, Water Air Soil Poll., 215 (2011) 595-607.
[3] J.M. Rodríguez-Maroto, F. García-Herruzo, A. García-Rubio, C. Gómez-Lahoz, C.
Vereda-Alonso, Chemosphere, 74 (2009) 804-809.
[4] C.B. Wang, W. Zhang, Environ. Sci. Technol., 31 (1997) 2154-2156.
[5] W. Zhang, C. B. Wang, H.L. Lien, Catal. Today, 40 (1998) 387-395.
[6] J. Dries, L. Bastiaens, D. Springael, S.N. Agathos, L. Diels, Environ. Sci. Technol., 39
(2005) 8460-8465.
[7] Y. Liu, H. Choi, D. Dionysiou, G.V. Lowry, Chem. Mat., 17 (2005) 5315-5322.
[8] H. Song, E.R. Carraway, Environ. Sci. Technol., 39 (2005) 6237-6245.
[9] B.W. Hydutsky, E.J. Mack, B.B. Beckerman, J.M. Skluzacek, T.E. Mallouk, Environ. Sci.
Technol., 41 (2007) 6418-6424.
[10] S. Kanel, D. Nepal, B. Manning, H. Choi, J. Nanopart. Res., 9 (2007) 725-735.
253
1 2 3 4 5 6 7 8 9 10 11 12 13 14 15 16 17 18 19 20 21 22 23 24 25 26 27 28 29 30 31 32 33 34 35 36 37 38 39 40 41 42 43 44 45 46 47 48 49 50 51 52 53 54 55 56 57 58 59 60 61 62 63 64 65
22
[11] T. Phenrat, H.J. Kim, F. Fagerlund, T. Illangasekare, R.D. Tilton, G.V. Lowry, Environ.
Sci. Technol., 43 (2009) 5079-5085.
[12] T. Raychoudhury, G. Naja, S. Ghoshal, J. Contam. Hydrol., 118 (2010) 143-151.
[13] T. Raychoudhury, N. Tufenkji, S. Ghoshal, Water Res., 46 (2012) 1735-1744.
[14] T. Raychoudhury, N. Tufenkji, S. Ghoshal, Water Res., 50 (2014) 80-89.
[15] N. Saleh, H. Kim, T. Phenrat, K. Matyjaszewski, R.D. Tilton, G.V. Lowry, Environ. Sci.
Technol., 42 (2008) 3349-3355.
[16] G.C.C. Yang, H.C. Tu, C.H. Hung, Sep. Purif. Technol. 58 (2007) 166-172.
[17] P. Jiemvarangkul, W.X. Zhang, H.L. Lien, Chem. Eng. J., 170 (2011) 482-491.
[18] S.R. Kanel, R.R. Goswami, T.P. Clement, M.O. Barnett, D. Zhao, Environ. Sci.
Technol., 42 (2008) 896-900.
[19] Y.H. Lin, H.H. Tseng, M.Y. Wey, M.D. Lin, Sci. Total Environ., 408 (2010) 2260-2267.
[20] F. He, D. Zhao, J. Liu, C.B. Roberts, Ind. Eng. Chem. Res., 46 (2007) 29-34.
[21] B. Schrick, B.W. Hydutsky, J.L. Blough, T.E. Mallouk, Chem. Mater., 16 (2004) 2187–
2193.
[22] T. Phenrat, N. Saleh, K. Sirk, R.D. Tilton, G.V. Lowry, Environ. Sci. Technol., 41
(2007) 284-290.
[23] D.W. Elliott, W. Zhang, Environ. Sci. Technol., 35 (2001) 4922-4926.
[24] J. Quinn, C. Geiger, C. Clausen, K. Brooks, C. Coon, S. O'Hara, T. Krug, D. Major, W.-
S. Yoon, A. Gavaskar, T. Holdsworth, Environ. Sci. Technol., 39 (2005) 1309-1318.
[25] K.W. Henn, D.W. Waddill, Remediation, 16 (2006) 57-77.
[26] W. Zhang, D.W. Elliott, Remediation, (2006) 7-21.
[27] C. Su, R.W. Puls, T.A. Krug, M.T. Watling, S.K. O'Hara, J.W. Quinn, N.E. Ruiz, Water
Res., 46 (2012) 5071-5084.
254

1 2 3 4 5 6 7 8 9 10 11 12 13 14 15 16 17 18 19 20 21 22 23 24 25 26 27 28 29 30 31 32 33 34 35 36 37 38 39 40 41 42 43 44 45 46 47 48 49 50 51 52 53 54 55 56 57 58 59 60 61 62 63 64 65
23
[28] C.M. Kocur, A.I. Chowdhury, N. Sakulchaicharoen, H.K. Boparai, K.P. Weber, P.
Sharma, M.M. Krol, L.M. Austrins, C. Peace, B.E. Sleep, D.M. O'Carroll, Environ. Sci.
Technol., (2014) DOI: 10.1021/es4044209.
[29] M.M. Krol, A.J. Oleniuk, C.M. Kocur, B.E. Sleep, P. Bennett, X. Zhong, D.M.
O'Carroll, Environ. Sci. Technol., 47 (2013) 7332-7340.
[30] H.I. Gomes, C. Dias-Ferreira, A.B. Ribeiro, S. Pamukcu, Water Air Soil Poll., 224
(2013) 1-12.
[31] H.I. Gomes, C. Dias-Ferreira, A.B. Ribeiro, S. Pamukcu, Chemosphere, 99 (2014) 171-
179.
[32] S. Pamukcu, L. Hannum, J.K. Wittle, J. Environ. Sci. Health A, 43 (2008) 934-944.
[33] E.H. Jones, D.A. Reynolds, A.L. Wood, D.G. Thomas, Ground Water, 49 (2010) 172-
183.
[34] E. Rosales, J.P.G. Loch, C. Dias-Ferreira, Electrochim. Acta, 127 (2014) 27-33.
[35] Y.B. Acar, A.N. Alshawabkeh, Environ. Sci. Technol., 27 (1993) 2638-2647.
[36] G.C.C. Yang, C.-H. Hung, H.-C. Tu, J. Environ. Sci. Health A, 43 (2008) 945-951.
[37] A.I.A. Chowdhury, D.M. O'Carroll, Y. Xu, B.E. Sleep, Adv. Water Resour., 40 (2012)
71-82.
[38] J. Newman, Electrochemical Systems, Prentice Hall, Englewood Cliffs, 1991.
[39] J.K. Mitchell, Fundamentals of Soil Behavior, 2nd ed. ed., John Wiley & Sons, New
York, 1993.
[40] R. Chang, J. Overby, General Chemistry – The Essential Concepts, McGraw-Hill, New
York, 2011.
[41] K.R. Reddy, K. Darko-Kagy, C. Cameselle, Sep. Purif. Technol., 79 (2011) 230-237.
255

1 2 3 4 5 6 7 8 9 10 11 12 13 14 15 16 17 18 19 20 21 22 23 24 25 26 27 28 29 30 31 32 33 34 35 36 37 38 39 40 41 42 43 44 45 46 47 48 49 50 51 52 53 54 55 56 57 58 59 60 61 62 63 64 65
24
Appendix A. Nomenclature
A cross-sectional area (cm2)
c concentration (mol cm-3)
D* effective diffusion coefficient
E redox potential (V)
E0 standard redox potential (V)
F Faraday constant
I current intensity
ke electroosmotic permeability coefficient
N mass flux (mol cm2 s-1)
Q reaction quotient
R ideal gas constant
R reaction rate
T temperature (K), assuming a constant room temperature of 25ºC
t time
U* effective electrophoretic mobility
V volume (cm3)
z ionic charge
Greek letters
electrical potential
η Faradaic efficiency
Subscripts
i species
j cell
I
256