Short-Run Costs and Output Decisions
31
© 2007 Prentice Hall Business Publishing Principles of Economics 8e by Case and Fair Prepared by: Fernando & Yvonn Quijano 8 Chapter Short-Run Costs and Output Decisions
-
Upload
khangminh22 -
Category
Documents
-
view
4 -
download
0
Transcript of Short-Run Costs and Output Decisions

© 2007 Prentice Hall Business Publishing Principles of Economics 8e by Case and Fair
Prepared by:
Fernando & Yvonn Quijano
8 Chapter
Short-Run Costs
and Output Decisions

C
HA
PT
ER
8:
Sh
ort
-Ru
n C
ost
s an
d
O
utp
ut
Dec
isio
ns
© 2007 Prentice Hall Business Publishing Principles of Economics 8e by Case and Fair 2 of 31
Chapter Outline
8 Short-Run Costs
and Output Decisions
Costs in the Short Run
Fixed Costs
Variable Costs
Total Costs
Short-Run Costs: A Review
Output Decisions: Revenues,
Costs, and Profit Maximization
Total Revenue (TR) and Marginal
Revenue (MR)
Comparing Costs and Revenues
to Maximize Profit
The Short-Run Supply Curve
Looking Ahead

C
HA
PT
ER
8:
Sh
ort
-Ru
n C
ost
s an
d
O
utp
ut
Dec
isio
ns
© 2007 Prentice Hall Business Publishing Principles of Economics 8e by Case and Fair 3 of 31
SHORT-RUN COSTS AND OUTPUT DECISIONS
You have seen that firms in perfectly competitive industries
make three specific decisions.
FIGURE 8.1 Decisions Facing Firms
DECISIONS are based on INFORMATION
1. The quantity of output to
supply
1. The price of output
2. How to produce that
output (which technique
to use)
2. Techniques of production
available*
3. The quantity of each
input to demand
3. The price of inputs*
*Determines production costs

C
HA
PT
ER
8:
Sh
ort
-Ru
n C
ost
s an
d
O
utp
ut
Dec
isio
ns
© 2007 Prentice Hall Business Publishing Principles of Economics 8e by Case and Fair 4 of 31
COSTS IN THE SHORT RUN
fixed cost Any cost that does not depend
on the firm’s level of output. These costs
are incurred even if the firm is producing
nothing. There are no fixed costs in the
long run.
variable cost A cost that depends on the
level of production chosen.
total cost (TC) Fixed costs plus variable
costs.

C
HA
PT
ER
8:
Sh
ort
-Ru
n C
ost
s an
d
O
utp
ut
Dec
isio
ns
© 2007 Prentice Hall Business Publishing Principles of Economics 8e by Case and Fair 5 of 31
COSTS IN THE SHORT RUN
total fixed costs (TFC) or overhead The
total of all costs that do not change with
output, even if output is zero.
Total Fixed Cost (TFC)
FIXED COSTS
TABLE 8.1 Short-Run Fixed Cost (Total and
Average) of a Hypothetical Firm
(1)
Q
(2)
TFC
(3)
AFC (TFC/Q)
0
1
2
3
4
5
$1,000
$1,000
$1,000
$1,000
$1,000
$1,000
$
1,000
500
333
250
200
Firms have no control over fixed costs in the short run. For this reason, fixed costs are
sometimes called sunk costs.

C
HA
PT
ER
8:
Sh
ort
-Ru
n C
ost
s an
d
O
utp
ut
Dec
isio
ns
© 2007 Prentice Hall Business Publishing Principles of Economics 8e by Case and Fair 6 of 31
COSTS IN THE SHORT RUN
sunk costs Another name for fixed costs
in the short run because firms have no
choice but to pay them.
average fixed cost (AFC) Total fixed cost
divided by the number of units of output; a
per-unit measure of fixed costs.
Average Fixed Cost (AFC)
q
TFCAFC

C
HA
PT
ER
8:
Sh
ort
-Ru
n C
ost
s an
d
O
utp
ut
Dec
isio
ns
© 2007 Prentice Hall Business Publishing Principles of Economics 8e by Case and Fair 7 of 31
COSTS IN THE SHORT RUN
spreading overhead The process of
dividing total fixed costs by more units of
output. Average fixed cost declines as
quantity rises.
FIGURE 8.2 Short-Run Fixed Cost (Total and Average) of a Hypothetical Firm

C
HA
PT
ER
8:
Sh
ort
-Ru
n C
ost
s an
d
O
utp
ut
Dec
isio
ns
© 2007 Prentice Hall Business Publishing Principles of Economics 8e by Case and Fair 8 of 31
COSTS IN THE SHORT RUN
total variable cost (TVC) The total of all
costs that vary with output in the short run.
Total Variable Cost (TVC)
VARIABLE COSTS
total variable cost curve A graph that
shows the relationship between total
variable cost and the level of a firm’s
output.

C
HA
PT
ER
8:
Sh
ort
-Ru
n C
ost
s an
d
O
utp
ut
Dec
isio
ns
© 2007 Prentice Hall Business Publishing Principles of Economics 8e by Case and Fair 9 of 31
COSTS IN THE SHORT RUN
(9 x $2) + (6 x $1) = $24
(6 x $2) + (14 x $1) = $26
6
14
9
6
A
B
3 Units of
output
(7 x $2) + (6 x $1) = $20
(4 x $2) + (10 x $1) = $18
6
10
7
4
A
B
2 Units of
output
4
6
(4 x $2) + (4 x $1) = $12
(2 x $2) + (6 x $1) = $10
4
2
A
B
1 Unit of
output
TOTAL VARIABLE COST
ASSUMING PK = $2, PL = $1
TVC = (K x PK) + (L x PL)
USING
TECHNIQUE
UNITS OF INPUT
REQUIRED
(PRODUCTION FUNCTION)
K L
PRODUCE
TABLE 8.2 Derivation of Total Variable Cost Schedule from Technology and Factor Prices

C
HA
PT
ER
8:
Sh
ort
-Ru
n C
ost
s an
d
O
utp
ut
Dec
isio
ns
© 2007 Prentice Hall Business Publishing Principles of Economics 8e by Case and Fair 10 of 31
COSTS IN THE SHORT RUN
The total variable cost curve embodies information about both factor, or input, prices and
technology. It shows the cost of production using the best available technique at each output
level given current factor prices.
FIGURE 8.3 Total Variable Cost Curve

C
HA
PT
ER
8:
Sh
ort
-Ru
n C
ost
s an
d
O
utp
ut
Dec
isio
ns
© 2007 Prentice Hall Business Publishing Principles of Economics 8e by Case and Fair 11 of 31
COSTS IN THE SHORT RUN
Marginal Cost (MC)
marginal cost (MC) The increase in total
cost that results from producing one more
unit of output. Marginal costs reflect
changes in variable costs.

C
HA
PT
ER
8:
Sh
ort
-Ru
n C
ost
s an
d
O
utp
ut
Dec
isio
ns
© 2007 Prentice Hall Business Publishing Principles of Economics 8e by Case and Fair 12 of 31
COSTS IN THE SHORT RUN
Although the easiest way to derive marginal cost is to look at total variable cost and subtract,
do not lose sight of the fact that when a firm increases its output level, it hires or demands
more inputs. Marginal cost measures the additional cost of inputs required to produce each
successive unit of output.
TABLE 8.3 Derivation of Marginal Cost from Total Variable Cost
UNITS OF OUTPUT TOTAL VARIABLE COSTS ($) MARGINAL COSTS ($)
0
1
2
3
0
10
18
24
0
10
8
6

C
HA
PT
ER
8:
Sh
ort
-Ru
n C
ost
s an
d
O
utp
ut
Dec
isio
ns
© 2007 Prentice Hall Business Publishing Principles of Economics 8e by Case and Fair 13 of 31
COSTS IN THE SHORT RUN
The Shape of the Marginal Cost Curve in the
Short Run
FIGURE 8.4 Declining Marginal Product Implies That
Marginal Cost Will Eventually Rise with Output

C
HA
PT
ER
8:
Sh
ort
-Ru
n C
ost
s an
d
O
utp
ut
Dec
isio
ns
© 2007 Prentice Hall Business Publishing Principles of Economics 8e by Case and Fair 14 of 31
COSTS IN THE SHORT RUN
When an independent
accountant works until late at
night, he faces diminishing
returns. The marginal cost of
his time increases.
In the short run, every firm is constrained by some fixed input that (1) leads to diminishing
returns to variable inputs and (2) limits its capacity to produce. As a firm approaches that
capacity, it becomes increasingly costly to produce successively higher levels of output.
Marginal costs ultimately increase with output in the short run.

C
HA
PT
ER
8:
Sh
ort
-Ru
n C
ost
s an
d
O
utp
ut
Dec
isio
ns
© 2007 Prentice Hall Business Publishing Principles of Economics 8e by Case and Fair 15 of 31
COSTS IN THE SHORT RUN
Graphing Total Variable Costs and Marginal Costs
FIGURE 8.5 Total Variable Cost and Marginal
Cost for a Typical Firm
MCTVCTVC
q
TVCTVC
1Δ of slope

C
HA
PT
ER
8:
Sh
ort
-Ru
n C
ost
s an
d
O
utp
ut
Dec
isio
ns
© 2007 Prentice Hall Business Publishing Principles of Economics 8e by Case and Fair 16 of 31
COSTS IN THE SHORT RUN
Average Variable Cost (AVC)
q
TVCAVC
average variable cost (AVC) Total variable
cost divided by the number of units of output.

C
HA
PT
ER
8:
Sh
ort
-Ru
n C
ost
s an
d
O
utp
ut
Dec
isio
ns
© 2007 Prentice Hall Business Publishing Principles of Economics 8e by Case and Fair 17 of 31
COSTS IN THE SHORT RUN
Marginal cost is the cost of one additional unit. Average variable cost is the total variable
cost divided by the total number of units produced.
TABLE 8.4 Short-Run Costs of a Hypothetical Firm
(1)
q
(2)
TVC
(3)
MC
( TVC)
(4)
AVC
(TVC/q)
(5)
TFC
(6)
TC
(TVC + TFC)
(7)
AFC
(TFC/q)
(8)
ATC
(TC/q or AFC + AVC)
0 $ 0 $ $ $ 1,000 $ 1,000 $ $
1 10 10 10 1,000 1,010 1,000 1,010
2 18 8 9 1,000 1,018 500 509
3 24 6 8 1,000 1,024 333 341
4 32 8 8 1,000 1,032 250 258
5 42 10 8.4 1,000 1,042 200 208.4
500 8,000 20 16 1,000 9,000 2 18

C
HA
PT
ER
8:
Sh
ort
-Ru
n C
ost
s an
d
O
utp
ut
Dec
isio
ns
© 2007 Prentice Hall Business Publishing Principles of Economics 8e by Case and Fair 18 of 31
COSTS IN THE SHORT RUN
Marginal cost intersects average variable cost at the lowest, or minimum, point of AVC.
Graphing Average Variable Costs and Marginal
Costs
FIGURE 8.6 More Short-Run Costs

C
HA
PT
ER
8:
Sh
ort
-Ru
n C
ost
s an
d
O
utp
ut
Dec
isio
ns
© 2007 Prentice Hall Business Publishing Principles of Economics 8e by Case and Fair 19 of 31
COSTS IN THE SHORT RUN
FIGURE 8.7 Total Cost = Total Fixed Cost + Total Variable Cost
TOTAL COSTS

C
HA
PT
ER
8:
Sh
ort
-Ru
n C
ost
s an
d
O
utp
ut
Dec
isio
ns
© 2007 Prentice Hall Business Publishing Principles of Economics 8e by Case and Fair 20 of 31
COSTS IN THE SHORT RUN
average total cost (ATC) Total cost
divided by the number of units of output.
Average Total Cost (ATC)
q
TCATC
AVCAFC ATC

C
HA
PT
ER
8:
Sh
ort
-Ru
n C
ost
s an
d
O
utp
ut
Dec
isio
ns
© 2007 Prentice Hall Business Publishing Principles of Economics 8e by Case and Fair 21 of 31
COSTS IN THE SHORT RUN
FIGURE 8.8 Average Total Cost = Average
Variable Cost + Average
Fixed Cost

C
HA
PT
ER
8:
Sh
ort
-Ru
n C
ost
s an
d
O
utp
ut
Dec
isio
ns
© 2007 Prentice Hall Business Publishing Principles of Economics 8e by Case and Fair 22 of 31
COSTS IN THE SHORT RUN
The Relationship Between Average Total Cost
and Marginal Cost
If marginal cost is below average total cost, average total cost will decline toward marginal
cost. If marginal cost is above average total cost, average total cost will increase. As a
result, marginal cost intersects average total cost at ATC’s minimum point, for the same
reason that it intersects the average variable cost curve at its minimum point.
The relationship between average total cost and
marginal cost is exactly the same as the relationship
between average variable cost and marginal cost.

C
HA
PT
ER
8:
Sh
ort
-Ru
n C
ost
s an
d
O
utp
ut
Dec
isio
ns
© 2007 Prentice Hall Business Publishing Principles of Economics 8e by Case and Fair 23 of 31
COSTS IN THE SHORT RUN
SHORT-RUN COSTS: A REVIEW
TABLE 8.5 A Summary of Cost Concepts
TERM DEFINITION EQUATION
Accounting costs Out-of-pocket costs or costs as an accountant would
define them. Sometimes referred to as explicit costs.
Economic costs Costs that include the full opportunity costs of all inputs.
These include what are often called implicit costs.
Total fixed costs Costs that do not depend on the quantity of output
produced. These must be paid even if output is zero.
TFC
Total variable costs Costs that vary with the level of output. TVC
Total cost The total economic cost of all the inputs used by a
firm in production.
TC = TFC + TVC
Average fixed costs Fixed costs per unit of output. AFC = TFC/q
Average variable costs Variable costs per unit of output. AVC = TVC/q
Average total costs Total costs per unit of output. ATC = TC/q ATC = AFC + AVC
Marginal costs The increase in total cost that results from
producing one additional unit of output.
MC = TC/ q
C
HA
PT
ER
8:
Sh
ort
-Ru
n C
ost
s an
d
O
utp
ut
Dec
isio
ns
© 2007 Prentice Hall Business Publishing Principles of Economics 8e by Case and Fair 24 of 31
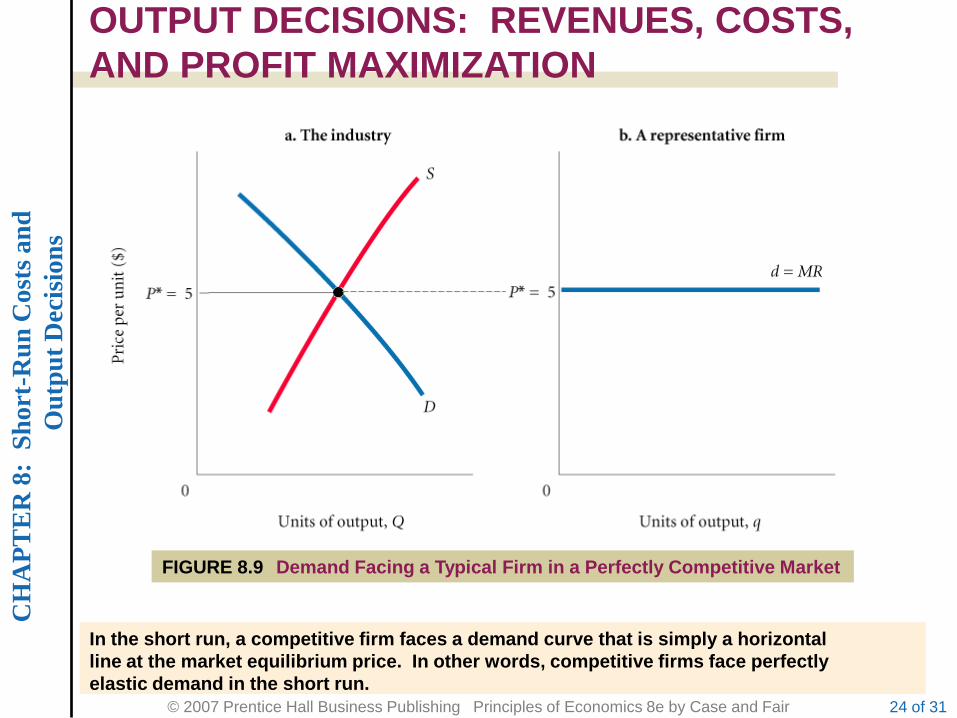
OUTPUT DECISIONS: REVENUES, COSTS,
AND PROFIT MAXIMIZATION
FIGURE 8.9 Demand Facing a Typical Firm in a Perfectly Competitive Market
In the short run, a competitive firm faces a demand curve that is simply a horizontal
line at the market equilibrium price. In other words, competitive firms face perfectly
elastic demand in the short run.

C
HA
PT
ER
8:
Sh
ort
-Ru
n C
ost
s an
d
O
utp
ut
Dec
isio
ns
© 2007 Prentice Hall Business Publishing Principles of Economics 8e by Case and Fair 25 of 31
OUTPUT DECISIONS: REVENUES, COSTS,
AND PROFIT MAXIMIZATION
TOTAL REVENUE (TR) AND MARGINAL
REVENUE (MR)
P x qTR
quantity x pricerevenue total
total revenue (TR) The total amount that
a firm takes in from the sale of its product:
the price per unit times the quantity of
output the firm decides to produce (P x q).
marginal revenue (MR) The additional
revenue that a firm takes in when it
increases output by one additional unit. In
perfect competition, P = MR.

C
HA
PT
ER
8:
Sh
ort
-Ru
n C
ost
s an
d
O
utp
ut
Dec
isio
ns
© 2007 Prentice Hall Business Publishing Principles of Economics 8e by Case and Fair 26 of 31
OUTPUT DECISIONS: REVENUES, COSTS,
AND PROFIT MAXIMIZATION
COMPARING COSTS AND REVENUES TO
MAXIMIZE PROFIT
The Profit-Maximizing Level of Output
FIGURE 8.10 The Profit-Maximizing Level of Output for a Perfectly Competitive Firm

C
HA
PT
ER
8:
Sh
ort
-Ru
n C
ost
s an
d
O
utp
ut
Dec
isio
ns
© 2007 Prentice Hall Business Publishing Principles of Economics 8e by Case and Fair 27 of 31
OUTPUT DECISIONS: REVENUES, COSTS,
AND PROFIT MAXIMIZATION
As long as marginal revenue is greater than marginal cost, even though the difference
between the two is getting smaller, added output means added profit. Whenever marginal
revenue exceeds marginal cost, the revenue gained by increasing output by one unit per
period exceeds the cost incurred by doing so.
The profit-maximizing perfectly competitive firm will produce up to the point where
the price of its output is just equal to short-run marginal cost—the level of output at
which P* = MC.
The profit-maximizing output level for all firms is the output level where MR = MC.

C
HA
PT
ER
8:
Sh
ort
-Ru
n C
ost
s an
d
O
utp
ut
Dec
isio
ns
© 2007 Prentice Hall Business Publishing Principles of Economics 8e by Case and Fair 28 of 31
OUTPUT DECISIONS: REVENUES, COSTS,
AND PROFIT MAXIMIZATION
A Numerical Example
TABLE 8.6 Profit Analysis for a Simple Firm
(1)
q
(2)
TFC
(3)
TVC
(4)
MC
(5)
P = MR
(6)
TR
(P x q)
(7)
TC
(TFC + TVC)
(8)
PROFIT
(TR TC)
0 $ 10 $ 0 $ $ 15 $ 0 $ 10 $ -10
1 10 10 10 15 15 20 -5
2 10 15 5 15 30 25 5
3 10 20 5 15 45 30 15
4 10 30 10 15 60 40 20
5 10 50 20 15 75 60 15
6 10 80 30 15 90 90 0

C
HA
PT
ER
8:
Sh
ort
-Ru
n C
ost
s an
d
O
utp
ut
Dec
isio
ns
© 2007 Prentice Hall Business Publishing Principles of Economics 8e by Case and Fair 29 of 31
OUTPUT DECISIONS: REVENUES, COSTS,
AND PROFIT MAXIMIZATION
THE SHORT-RUN SUPPLY CURVE
FIGURE 8.11 Marginal Cost Is the Supply Curve of a Perfectly Competitive Firm
The marginal cost curve of a competitive firm is the firm’s short-run supply curve.

C
HA
PT
ER
8:
Sh
ort
-Ru
n C
ost
s an
d
O
utp
ut
Dec
isio
ns
© 2007 Prentice Hall Business Publishing Principles of Economics 8e by Case and Fair 30 of 31
LOOKING AHEAD
Keep in mind that the marginal cost curve carries
information about both input prices and technology.
In the next chapter, we turn to the long run.

C
HA
PT
ER
8:
Sh
ort
-Ru
n C
ost
s an
d
O
utp
ut
Dec
isio
ns
© 2007 Prentice Hall Business Publishing Principles of Economics 8e by Case and Fair 31 of 31
average fixed cost (AFC)
average total cost (ATC)
average variable cost (AVC)
fixed cost
marginal cost (MC)
marginal revenue (MR)
spreading overhead
sunk costs
total cost (TC)
total fixed costs (TFC), or
overhead
total revenue (TR)
total variable cost (TVC)
REVIEW TERMS AND CONCEPTS
total variable cost curve
variable cost
1. TC = TFC + TVC
2. AFC = TFC/q
3. Slope of TVC = MC
4. AVC = TVC/q
5. ATC = TC/q = AFC + AVC
6. TR = P x q
7. Profit-maximizing level of output
for all firms: MR = MC
8. Profit-maximizing level of output
for perfectly competitive firms:
P = MC