What caused the Asian currency and financial crisis?
69
What caused the Asian currency and financial crisis? Giancarlo Corsetti a , Paolo Pesenti b,* , Nouriel Roubini c a Yale University, New Haven, USA and University of Bologna, Bologna, Italy b Federal Reserve Bank of New York, New York, USA and NBER, Cambridge, MA, USA c Department of Economics, MEC 7-83, New York University, Leonard N. Stern School of Business, 44 West 4th Street, New York, NY 10012, USA Received 26 October 1998; received in revised form 27 April 1999; accepted 7 May 1999 Abstract The paper explores the view that the Asian currency and financial crises in 1997 and 1998 reflected structural and policy distortions in the countries of the region, even if market overreaction and herding caused the plunge of exchange rates, asset prices and economic activity to be more severe than warranted by the initial weak economic conditions. The first part of the paper provides an overview of economic fundamentals in Asia on the eve of the crisis, with emphasis on current account imbalances, quantity and quality of financial ‘overlending’, banking problems, and composition, maturity and size of capital inflows. The second part of the paper presents a reconstruction of the Asian crisis from the antecedents in 1995–1996 to the recent developments in early 1999 in parallel with a survey of the debate on the strategies to recover from the crisis, the role of international intervention, and the costs and benefits of capital controls. # 1999 Elsevier Science B.V. All rights reserved. JEL classification: F31; F33; F34; F36; G15; G18 Keywords: Asia; Moral hazard; Balance of payment crisis; Banking crisis; Speculative attacks; Capital controls; Crisis management 1. Introduction What were the causes of the Asian economic, currency and financial crises of 1997– 1998? Two main hypotheses and interpretations have emerged in the aftermath of the crisis. Japan and the World Economy 11 (1999) 305–373 * Corresponding author. Tel.: +1-212-720-5493; fax: +1-212-720-68331 E-mail address: [email protected] (P. Pesenti) 0922-1425/99/$ – see front matter # 1999 Elsevier Science B.V. All rights reserved. PII:S0922-1425(99)00019-5
-
Upload
khangminh22 -
Category
Documents
-
view
5 -
download
0
Transcript of What caused the Asian currency and financial crisis?

What caused the Asian currency and ®nancial crisis?
Giancarlo Corsettia, Paolo Pesentib,*, Nouriel Roubinic
aYale University, New Haven, USA and University of Bologna, Bologna, ItalybFederal Reserve Bank of New York, New York, USA and NBER, Cambridge, MA, USA
cDepartment of Economics, MEC 7-83, New York University, Leonard N. Stern School of Business,
44 West 4th Street, New York, NY 10012, USA
Received 26 October 1998; received in revised form 27 April 1999; accepted 7 May 1999
Abstract
The paper explores the view that the Asian currency and ®nancial crises in 1997 and 1998
re¯ected structural and policy distortions in the countries of the region, even if market overreaction
and herding caused the plunge of exchange rates, asset prices and economic activity to be more
severe than warranted by the initial weak economic conditions. The ®rst part of the paper provides
an overview of economic fundamentals in Asia on the eve of the crisis, with emphasis on current
account imbalances, quantity and quality of ®nancial `overlending', banking problems, and
composition, maturity and size of capital in¯ows. The second part of the paper presents a
reconstruction of the Asian crisis from the antecedents in 1995±1996 to the recent developments in
early 1999 in parallel with a survey of the debate on the strategies to recover from the crisis, the role
of international intervention, and the costs and bene®ts of capital controls. # 1999 Elsevier Science
B.V. All rights reserved.
JEL classification: F31; F33; F34; F36; G15; G18
Keywords: Asia; Moral hazard; Balance of payment crisis; Banking crisis; Speculative attacks; Capital controls;
Crisis management
1. Introduction
What were the causes of the Asian economic, currency and ®nancial crises of 1997±
1998? Two main hypotheses and interpretations have emerged in the aftermath of the crisis.
Japan and the World Economy
11 (1999) 305±373
* Corresponding author. Tel.: +1-212-720-5493; fax: +1-212-720-68331
E-mail address: [email protected] (P. Pesenti)
0922-1425/99/$ ± see front matter # 1999 Elsevier Science B.V. All rights reserved.
PII: S 0 9 2 2 - 1 4 2 5 ( 9 9 ) 0 0 0 1 9 - 5

According to one view, sudden shifts in market expectations and con®dence were the key
sources of the initial ®nancial turmoil, its propagation over time and regional contagion.
While the macroeconomic performance of some countries had worsened in the mid 1990s,
the extent and depth of the 1997±1998 crisis should not be attributed to a deterioration in
fundamentals, but rather to panic on the part of domestic and international investors,
somewhat reinforced by the faulty policy response of the International Monetary Fund
(IMF) and the international ®nancial community.1
According to the other view Ð advanced in this paper Ð the crisis re¯ected structural
and policy distortions in the countries of the region. Fundamental imbalances triggered the
currency and ®nancial crisis in 1997, even if, once the crisis started, market overreaction
and herding caused the plunge of exchange rates, asset prices and economic activity to be
more severe than warranted by the initial weak economic conditions. A synthetic overview
of our interpretation is provided in Section 2, while Sections 3±5 present a systematic
assessment of the sources of economic tension at the root of the Asian crisis. This is based
on the analysis of the available empirical evidence for the following countries: South
Korea, Indonesia, Malaysia, Philippines, Thailand, Singapore, Hong Kong, China and
Taiwan. Macroeconomic imbalances in these countries are assessed within a broad
overview of structural factors: current account de®cits and foreign indebtedness, growth
and in¯ation rates, savings and investment ratios, budget de®cits, real exchange rates,
foreign reserves, corporate sector investment, measures of debt and pro®tability, indexes of
excessive bank lending, indicators of credit growth and ®nancial fragility, monetary
stances, debt-service ratios, dynamics and composition of capital in¯ows and out¯ows,
and political instability.
The rest of the paper is structured as follows. Section 6 presents a construction of the
Asian meltdown, from the period leading to the crisis to its eruption in 1997, and discusses
policy responses, contagion effects, and the role of Japan. In Section 7 we provide an
overview of the debate on policy strategies to recover from the crisis, with particular
emphasis on the role played by the IMF. Section 8 singles out the key points in the current
debate about the reform of the international ®nancial system and the desirability of free
capital mobility. Section 9 focuses on the most recent evolution of the Asian meltdown into
a global turmoil in the summer of 1998 and the recovery of early 1999.
2. At the root of the Asian crisis
Central to a full understanding of the roots of the Asian crisis is the multifaceted
evidence on the structure of incentives under which the corporate and ®nancial sectors
operated in the region, in the context of regulatory inadequacies and close links between
public and private institutions.2 The moral hazard problem in Asia magni®ed the ®nancial
vulnerability of the region during the process of ®nancial markets liberalization in the
1 See Radelet and Sachs (1998) for the most comprehensive exposition of this view.2 This section is based on Corsetti et al. (1999). A partial list of recent analyses of the Asian crisis includes
Alba et al. (1998), Corden (1998), Dornbusch (1998a), Feldstein (1998), Goldstein (1998), IMF (1998), and
Radelet and Sachs (1998). A large number of contributions on the crisis are available online on Nouriel
Roubini's Asian Crisis Homepage at www.stern.nyu.edu/nroubini/asia/AsiaHomepage.html.
306 G. Corsetti et al. / Japan and the World Economy 11 (1999) 305±373

1990s, exposing its fragility vis-aÁ-vis the macroeconomic and ®nancial shocks that
occurred in the period 1995±1997. The problem exhibited three different, yet strictly
interrelated dimensions at the corporate, ®nancial, and international level.3
At the corporate level, political pressures to maintain high rates of economic growth had
led to a long tradition of public guarantees to private projects, some of which were
effectively undertaken under government control, directly subsidized, or supported by
policies of directed credit to favored ®rms and/or industries.4 Even in the absence of
explicit promises of `bail-out', the production plans and strategies of the corporate sector
largely overlooked costs and riskiness of the underlying investment projects.5 With
®nancial and industrial policy enmeshed within a widespread business sector network
of personal and political favoritism, and with governments that appeared willing to
intervene in favor of troubled ®rms, markets operated under the impression that the return
on investment was somewhat `insured' against adverse shocks.
Such pressures and beliefs represented the underpinnings of a sustained process of
capital accumulation,6 resulting into persistent and sizable current account de®cits.7 While
common wisdom holds that borrowing from abroad to ®nance domestic investment should
not raise concerns about external solvency Ð it could actually be the optimal course of
action for undercapitalized economies with good investment opportunities Ð the evidence
for the Asian countries in the mid-1990s highlights that the pro®tability of new investment
projects was low. For instance, in Korea, 20 of the largest 30 conglomerates displayed in
1996 a rate of return on invested capital below the cost of capital. In 1997, before the crisis,
as many as seven of the 30 largest conglomerates could be considered effectively
bankrupt.8
Investment rates and capital in¯ows in Asia remained high even after the negative
signals sent by the indicators of pro®tability. In part, this occurred because the interest rate
fall in industrial countries (especially in Japan) lowered the cost of capital for ®rms and
motivated large ®nancial ¯ows into the Asian countries. However, the crucial factor
underlying the sustained investment rates was the ®nancial side of the moral hazard
problem in Asia, leading national banks to borrow excessively from abroad and lend
excessively at home.9 Financial intermediation played a key role in channelling funds
toward projects that were marginally if not outright unpro®table from a social point of
view.
The literature has focused on a long list of structural distortions in the pre-crisis Asian
®nancial and banking sectors: lax supervision and weak regulation; low capital adequacy
ratios; lack of incentive-compatible deposit insurance schemes; insuf®cient expertise in the
regulatory institutions; distorted incentives for project selection and monitoring; outright
3 The role of moral hazard in the onset of the Asian crisis has been stressed by a number of authors. See e.g.,
Krugman (1998a), Greenspan (1998) and Fischer (1998b).4 IMF (1997).5 See Pomerleano (1998) for a thorough assessment of the corporate roots of the financial crisis in Asia.6 See Section 3.4.7 See Section 3.1.8 See e.g., OECD (1988) for the analysis of the Korean case.9 See Section 4.
G. Corsetti et al. / Japan and the World Economy 11 (1999) 305±373 307

corrupt lending practices; non-market criteria of credit allocation, according to a model of
relationship banking that emphasizes semi-monopolistic relations between banks and
®rms, somehow downplaying price signals. All of these factors contributed to the build-up
of severe weaknesses in the undercapitalized ®nancial system, whose most visible
manifestation was eventually a growing share of non-performing loans.10
The adverse consequences of these distortions were crucially magni®ed by the rapid
process of capital account liberalization and ®nancial market deregulation in the region
during the 1990s, which increased the supply-elasticity of funds from abroad.11 The
extensive liberalization of capital markets was consistent with the policy goal of providing
a large supply of low-cost funds to national ®nancial institutions and the domestic
corporate sector. The same goal motivated exchange rate policies aimed at reducing
the volatility of the domestic currency in terms of the US dollar, thus lowering the risk
premium on dollar-denominated debt.
The international dimension of the moral hazard problem hinged upon the behavior of
international banks, which over the period leading to the crisis had lent large amounts of
funds to the region's domestic intermediaries, with apparent neglect of the standards for
sound risk assessment.12 Underlying such overlending syndrome may have been the
presumption that short-term interbank cross-border liabilities would be effectively guar-
anteed by either a direct government intervention in favor of the ®nancial debtors, or by an
indirect bail-out through IMF support programs. A very large fraction of foreign debt
accumulation was in the form of bank-related short-term, unhedged, foreign-currency
denominated liabilities: by the end of 1996, a share of short-term liabilities in total
liabilities above 50 percent was the norm in the region. Moreover, the ratio of short-term
external liabilities to foreign reserves Ð a widely used indicator of ®nancial fragility Ð
was above 100 percent in Korea, Indonesia and Thailand.13
The core implication of moral hazard is that an adverse shock to pro®tability does not
induce ®nancial intermediaries to be more cautious in lending and to follow ®nancial
strategies reducing the overall riskiness of their portfolios. Quite the opposite, in the face of
negative circumstances the anticipation of a future bail-out provides a strong incentive to
take on even more risk Ð that is, as Krugman (1998a) writes, `̀ to play a game of heads I
win, tails the taxpayer loses.'' In this respect, a number of country-speci®c and global
shocks contributed to severely deteriorate the overall economic outlook in the Asian
region, exacerbating the distortions already in place.
In particular, the long period of stagnation of the Japanese economy in the 1990s led to a
signi®cant export slowdown from the Asian countries; in the months preceding the
eruption of the crisis, the hopes for a Japanese recovery were shattered by a sudden
decline in economic activity in this country. Sector-speci®c shocks such as the fall in the
demand for semi-conductors in 1996, and adverse terms of trade ¯uctuations also contri-
buted to the worsening of the trade balances in the region between 1996 and 1997.
The sharp appreciation of the US dollar relative to the Japanese yen and the European
currencies since the second half of 1995 led to deteriorating cost-competitiveness in most
10 See Goldstein (1998).11 See e.g., McKinnon and Pill (1996).12 See e.g. Stiglitz (1998).13 See Section 5.
308 G. Corsetti et al. / Japan and the World Economy 11 (1999) 305±373

Asian countries whose currencies were effectively pegged to the dollar.14 Based on
standard real exchange rate measures, many Asian currencies appreciated in the 1990s,
although the degree of real appreciation was not as large as in previous episodes of
currency collapses (such as Mexico in 1994) and the dynamics of the real exchange rate
was asymmetric across countries: by 1997 the extent of real appreciation was evident in
Malaysia and the Philippines, while in South Korea, Thailand and Indonesia, real exchange
rate indicators had not moved signi®cantly relative to 1990. In general, competitive
pressures were enhanced by the increasing weight of China in total export from the
region.15
As a result of the cumulative effects of the ®nancial and real imbalances considered
above, by 1997 the Asian countries appeared quite vulnerable to ®nancial crises, either
related to sudden switches in market con®dence and sentiment, or driven by deteriorating
expectations about the poor state of fundamentals. In 1997, the drop of the real estate and
stock marketsÐwhere sustained speculative trends were in part fueled by foreign capital
in¯ows Ð led to the emergence of wide losses and outright defaults in the corporate and
®nancial sectors. Policy uncertainty stemming from the lack of commitment to structural
reforms by the domestic authorities worsened the overall climate. From the summer of
1997 onward, rapid reversals of ®nancial capital in¯ows led to the collapse of regional
currencies amidst domestic and international investors panic.16
3. Current account imbalances and macroeconomic fundamentals
3.1. The evidence
We start our study of the Asian crisis by assessing the evidence on current account
imbalances in the region over the 1990s. The potential role of current account de®cits as a
source of disruptive tensions in the ®nancial markets has been repeatedly emphasized in the
literature.17 On the anniversary of the Mexican ®nancial crisis, Lawrence Summers, the US
Deputy Treasury Secretary, wrote in The Economist that `̀ close attention should be paid to
14 Expectations of a monetary contraction in the US in the summer of 1997 ma have also played a role in
precipitating the crisis.15 Whether cost-competitiveness deteriorated in the rest of the region after the 50 percent devaluation of the
Chinese currency in 1994 is still a matter of debate. The thesis that `̀ a large part of China's recent export success
reflects the devaluation that occurred in January 1994'' and that this `cheap-currency policy' was `̀ one of the
factors provoking the crisis in Southeast Asia'' has been espoused in a Financial Times editorial (17 September,
1997) and echoed in the popular press (see for instance The Economist, 22 November, 1997, or Business Times,
17 March, 1998). Recent studies (IMF (1997), Liu et al. (1998) and Fernald et al. (1998)) dismiss the thesis on
the basis of several factors, most notably the fact that by 1993 about 80 percent of Chinese transactions were
already settled at the swap market rate, not the official rate, so that the official exchange rate devaluation
influenced only about 20 percent of the foreign exchange transactions.16 For a reconstruction of the crisis, see Section 6 and IMF (1997, 98).17 A number of recent contributions on financial and balance of payments crises provide a discussion of the
issues introduced in this Section±among others see Dornbusch et al. (1995), Milesi (1996a, b, c), Mishkin
(1996), Kaminsky et al. (1998) and Roubini and Wachtel (1998). Among recent studies focusing on the large-
scale speculative episodes in the 1990s before the Asian crisis, see Eichengreen and Wyplosz (1993) and Buiter
et al. (1998a, b) on the European Monetary Systyem crisis of 1992±1993, and Sachs et al. (1996) on the Mexican
peso crisis of 1994.
G. Corsetti et al. / Japan and the World Economy 11 (1999) 305±373 309

any current account de®cit in excess of 5 percent of GDP, particularly if it is ®nanced in a
way that could lead to rapid reversals''.18 By this standard, a number of countries in our
sample provided reasons for concern.
As shown in Tables 1 and 2, several Asian countries whose currencies collapsed in 1997
had experienced somewhat sizable current account de®cits in the 1990s. In the two Tables
we show two measures of the current account (as a share of GDP), one based on national
income account (NIA) and the other based on balance of payments data; in the discussion
we will mostly rely on the NIA data.19
The two countries with the largest and most persistent current account imbalances in our
sample were Thailand and Malaysia, both of which experienced de®cits for over a decade.
Based on NIA data, the current account in Thailand was over 6 percent of GDP virtually in
Table 1
Current account, NIA definition (% of GDP)a
1990 1991 1992 1993 1994 1995 1996 1997
Korea ÿ1.2 ÿ3.2 ÿ1.7 ÿ0.2 ÿ1.5 ÿ1.9 ÿ4.8 ÿ1.9
Indonesia ÿ4.4 ÿ4.4 ÿ2.5 ÿ0.8 ÿ1.5 ÿ4.3 ÿ3.3 ÿ3.6
Malaysia ÿ2.3 ÿ14.0 ÿ3.4 ÿ10.1 ÿ6.6 ÿ8.9 ÿ3.7 ÿ3.5
Philippines ÿ6.3 ÿ2.5 ÿ3.2 ÿ6.7 ÿ3.7 ÿ5.1 ÿ4.7 ÿ6.1
Singapore 9.5 12.4 12.4 8.5 18.1 18.0 16.3 13.9
Thailand ÿ8.7 ÿ8.0 ÿ6.2 ÿ5.7 ÿ6.4 ÿ8.4 ÿ8.5 ÿ2.4
Hong Kong 8.4 6.6 5.3 8.1 2.0 ÿ3.0 ÿ2.4 ÿ3.8
China 3.0 3.1 1.1 ÿ2.2 1.2 0.0 0.5 3.6
Taiwan 7.4 6.9 4.0 3.5 3.1 3.1 4.7 3.2
a Note: The source of all the data in these tables is the international financial statistics of the International
Monetary Fund (unless otherwise noted). The data for Taiwan are from various sources (Economist Intelligence
unit reports, IMF's december 1997 world economic outlook and asian development bank). The data for
Singapore for 1997 are from the economist intelligence unit country report, 2nd quarter 1998.
Table 2
Current account, BOP definition (% of GDP)
1990 1991 1992 1993 1994 1995 1996 1997
Korea ÿ0.7 ÿ2.8 ÿ1.3 0.3 ÿ1.0 ÿ1.9 ÿ4.8 ÿ1.9
Indonesia ÿ2.8 ÿ3.7 ÿ2.2 ÿ1.3 ÿ1.6 ÿ3.2 ÿ3.4 ÿ2.2
Malaysia ÿ2.0 ÿ8.7 ÿ3.7 ÿ4.7 ÿ6.2 ÿ8.4 ÿ4.9 ÿ4.9
Philippines ÿ6.1 ÿ2.3 ÿ1.9 ÿ5.6 ÿ4.6 ÿ2.7 ÿ4.8 ÿ5.2
Singapore 8.3 11.3 11.4 7.6 16.1 16.8 15.7 15.4
Thailand ÿ8.5 ÿ7.7 ÿ5.7 ÿ5.1 ÿ5.6 ÿ8.1 ÿ8.1 ÿ1.9
China 3.1 3.3 1.3 ÿ1.9 1.3 0.2 0.9 3.2
Taiwan 6.8 6.9 4.0 3.2 2.7 2.1 4.1 2.7
18 The Economist 23 December, 1995±5 January, 1996, pp. 46±48.19 While the two series should in principle be equivalent, quantitative differences can arise because of
inconsistencies in the data collection processes.
310 G. Corsetti et al. / Japan and the World Economy 11 (1999) 305±373

each year in the 1990s, and approached 9 percent of GDP in 1995 and 1996. Similarly large
numbers were observed in Malaysia, where the de®cit was above 10 percent of GDP in
1993, while slowly falling to 3.7 percent of GDP in 1996. The Philippines also experienced
long-term imbalances in having a de®cit around or above 5 percent of GDP for 4 years and
lastingly high in the remaining years.
Indonesia started the decade with a large imbalance (over 4 percent of GDP in 1990±
1991) but the de®cit shrank in 1992 and 1993. Later, the current account imbalance
widened again, reaching 3±4 percent of GDP in 1995±1996. In Korea, the current account
de®cit was low in the early 1990s (1±3 percent of GDP) and virtually negligible in 1993.
However, since 1993 the imbalance grew very fast, approaching 5 percent of GDP in 1996.
As can be seen from Table 3, these current account imbalances stemmed primarily from
large trade de®cits, with a relatively small role played by net factor payments to the rest of
the world.
Of the remaining countries, Hong Kong started the decade with large current account
surpluses, averaging over 7 percent of GDP between 1990 and 1993. Things worsened
signi®cantly after 1993. In 1994 the surplus shrank to 2 percent of GDP, and went into a
de®cit of more than 2 percent of GDP in 1995 and 1996. In Singapore, very large current
account surpluses were observed throughout the 1990s, averaging about 10 percent of GDP
in 1990±1993 and increasing to about 16 percent of GDP in 1994±1996. In China, the
current account was in surplus (1.5 percent of GDP) in 1990±1992, but turned into a 2
percent de®cit in 1993. After 1993, the current account experienced a modest surplus
averaging 1 percent of GDP. Finally, Taiwan's current account was consistently in surplus
in the 1990s, with the 1996 ®gure showing a large surplus of over 4.5 percent of
GDP.
Data on the current account positions provide some preliminary evidence that the
currency crises may have been associated with an external competitiveness problem. In
fact, as a group the countries that came under attack in 1997 appear to have been those
with large current account de®cits throughout the 1990s; in 1997 the appreciation of the US
dollar relative to the currencies of the high-de®cit countries Thailand, Malaysia, Philip-
pines, Korea and Indonesia reached 78, 52, 52, 107 and 151 percent, respectively.
Instead, countries with smaller de®cits or actual surpluses did not suffer comparable
depreciations. China had stable currency values in 1997 (a depreciation of 2 percent). The
Table 3
Trade balance, BOP definition (% of GDP)
1990 1991 1992 1993 1994 1995 1996 1997
Korea ÿ0.8 ÿ3.0 ÿ1.4 0.1 ÿ1.2 ÿ1.6 ÿ4.4 ÿ1.4
Indonesia 1.7 0.9 1.8 1.5 0.7 ÿ0.8 ÿ1.1 0.2
Malaysia 2.1 ÿ3.7 1.4 ÿ0.1 ÿ1.6 ÿ3.8 0.6
Philippines ÿ5.7 ÿ3.0 ÿ4.3 ÿ8.5 ÿ9.0 ÿ8.8 ÿ9.4 ÿ12.3
Singapore 6.8 10.6 9.3 8.1 14.9 15.4 13.6 12.6
Thailand ÿ7.8 ÿ6.9 ÿ4.7 ÿ4.6 ÿ5.2 ÿ7.1 ÿ6.7 0.1
China 2.8 2.9 1.0 ÿ1.9 1.4 1.7 2.1 4.4
Taiwan 4.7 4.4 1.7 1.6 1.7 1.6 3.5 2.4
G. Corsetti et al. / Japan and the World Economy 11 (1999) 305±373 311

Hong Kong parity against the US dollar was aggressively and successfully defended
against heavy attacks during the year. While the exchange rates of Singapore and Taiwan
were affected by the regional crisis, the rate of depreciation in these two countries Ð about
18 percent over the year Ð was well below that of the crisis countries. Moreover, the
depreciations in Singapore and Taiwan were orderly, and were not characterized by
episodes of speculative frenzy and ®nancial panic such as the ones associated with the
currency crises in the rest of the region.
In sum, while the correlation between currency depreciation and externalimbalances by
group of countries in the 1990s need not imply causation, prima facie evidence suggests
that current account problems may have played a role in the dynamics of the Asian
meltdown.
3.2. Solvency, resource balance gaps, and sustainability
Assessing the sustainability of current account imbalances is not an easy task. In fact, no
compelling criterion exists to determine when current account de®cits Ð and the resulting
accumulation of net foreign liabilities Ð reach `excessive' proportions, thus triggering
devaluation expectations, speculative out¯ows, and ®nancial crises.
The standard theoretical criterion for assessing current account imbalances is the notion
of solvency: a country is solvent to the extent that the discounted value of the expected
stock of its foreign debt in the in®nitely distant future is non-positive. In other words, a
country that is accumulating foreign debt at a rate that is faster than the real cost of
borrowing, cannot expect to be able to do so forever.
In practice, the solvency criterion is not particularly stringent, because the intertemporal
budget constraint of a country imposes only very mild restrictions on the evolution of a
country's current account and foreign debt. Any path of the current account such that the
present discounted value of the current and future trade surpluses is equal to the current
external debt position is consistent with solvency. A country could run very large and
persistent current account de®cits and remain solvent, as long as it can generate trade
surpluses (of the appropriate size) at some time in the future.20
Since the theoretical notion of solvency is rather loose, policy analysts tend to resort to
more practical criteria. A popular `test' of solvency in practical terms is a non-increasing
foreign debt to GDP ratio. It can be easily shown that, under the realistic assumption that in
the long run the interest rate exceeds the growth rate of output, a stable debt to GDP ratio is
a suf®cient condition for solvency. Based on this condition, then, the criterion of solvency
can be made operational by calculating the so-called `resource balance gap' Ð in a country
where the debt to GDP ratio is growing, this gap is the difference between the current trade
balance and the trade surplus required to stabilize the debt to GDP ratio in the long run.21
20 For an updated textbook treatment of solvency see Chapter 2 of Obstfeld and Rogoff (1996).21 To obtain unbiased estimates, the resource balance gap should be computed by considering only the
structural component of the current trade deficit. However, in the case of high-growth countries, it is reasonable
not to assign a large weight to cyclical factors. In our estimates below, we take the 1996 trade deficit as being
entirely structural.
312 G. Corsetti et al. / Japan and the World Economy 11 (1999) 305±373

The gap will be larger for countries with a large trade de®cit to GDP ratio, a large debt to
GDP ratio, or a large differential between the real interest rate and the growth rate of the
economy.22
To calculate the `resource balance gap', one needs to make assumptions about the long-
run differential between the real interest rate and the growth rate of the economy. There
exist compelling reasons Ð both at the theoretical and empirical level Ð to argue that such
a differential is positive in a steady state, regardless of whether negative values are
observed in the short run. A 1 percent differential between the real interest rate and output
growth is a conservative but realistic assumption.
On the basis of the above assumptions, the trade balance adjustment required to stabilize
the foreign debt to GDP ratio at the 1996 value are shown below. All ®gures are in
percentage of GDP.
Korea 4.4 percent
Thailand 6.9 percent
Indonesia 3.3 percent
Philippines 6.5 percent
Malaysia 2.3 percent
The table shows that resource gaps were quite large already in 1996. It is worth
emphasizing that we would obtain even larger ®gures by increasing the permanent interest
rate-growth differential above 1 percent, or by using the 1997 ®gures for foreign debt to
GDP. Our calculation is in fact carried out relative to the 1996 (end of the year) stock of
foreign debt, rather than the larger 1997 ®gure Ð making our estimates of the resource
balance gap appropriate to assess the pre-crisis imbalances, but very conservative when
applied to the post-crisis scenario, since the 1996 ®gures do not re¯ect the signi®cant
devaluation-induced increase in the external burden of the countries.
A more thorough assessment of the evidence on current account de®cits focuses on the
notion of sustainability of the external imbalances. To specify the meaning of `sustain-
ability' in the context of our analysis consider a country running a current account de®cit
and accumulating foreign debt relative to its GDP, so that solvency requires the country to
run trade surpluses at some point in the future. We consider a path of current account
de®cits and foreign debt accumulation sustainable when the reversal in the trade balance
consistent with solvency can be expected to materialize without a sharp change in current
policies and/or an external crisis.23
The notion of sustainability raises complex macroeconomic and political-economy
issues in the analysis of external imbalances. For instance, sustainability can be related to
22 Formally, start from the current account identity Bt�1 � �1� r�BtÿTt (where B is the net debt position of
the country and T is the trade balance) and divides both the sides by current GDP, denoted Yt . Assuming that
GDP grows at the constant rate g, so that Yt�1=Yt � 1� g percent , the previous expression can be rewritten as
�1� g�bt�1 � �1� r�btÿ� t,where b � B=Y and � � T=Y . For the debt to GDP ratio to be constant in the long
run at some level b, the trade balance surplus (as a fraction of GDP) must be equal to �rÿg�b. The resource
balance gap is the difference between the above trade surplus and the currently observed trade balance (both as
percentages of GDP).23 An external crisis could come in the form of a currency crisis Ð a run on the central bank's foreign
exchange reserves and/or a rapid depreciation of the exchange rate Ð or a foreign debt crisis Ð the inability to
obtain further international financing, or to meet repayments, or an actual default on debt obligations.
G. Corsetti et al. / Japan and the World Economy 11 (1999) 305±373 313
both the country's `willingness to pay', and the creditors `willingness to lend'. Willingness
to pay can become an issue when a country is potentially solvent but, as Milesi-Ferretti and
Razin write, `̀ it is not politically feasible to divert output from domestic to external use to
service the debt''.24 Creditors' willingness to lend on current terms is a maintained
assumption in the theoretical solvency criterion, but such presumption may not be realistic
if, for any reason, foreign creditors come to believe that the country will renege on its
liabilities; acting under this presumption, they will require a higher default premium, or
stop lending altogether.25
However, rather than providing a unifying theoretical framework for the study of
external imbalances, the approach based on the notion of sustainability is primarily focused
on the empirical analysis of macroeconomic performances during crisis episodes, in order
to determine under which conditions sharp trade balance reversals are more likely to occur.
In this light, we now turn to the assessment of current account imbalances in the context of
an overview of macroeconomic fundamentals in the Asian region: GDP growth, private and
public savings rate, in¯ation, and the degree of openness.
3.3. Output growth
The historical experience of the 1980 debt crisis suggests that there are several practical
reasons why large current account de®cits may be perceived as sustainable when current
and expected economic growth is high. For a given current account de®cit to GDP ratio,
higher growth rates imply a slower dynamics of the foreign debt to GDP ratio, and enhance
the country's ability to service its external debt. In addition, high (actual and expected)
GDP growth may re¯ect sustained capital accumulation rates driven by expectations of
high pro®tability, and high growth might also explain a transitory decline in the saving rate,
in anticipation of higher future income. If this is the case, current account imbalances
Table 4
GDP growth
1991 1992 1993 1994 1995 1996 1997
Korea 9.1 5.1 5.8 8.6 8.9 7.1 5.5
Indonesia 7.0 6.5 6.5 15.9 8.2 8.0 4.7
Malaysia 8.5 7.8 8.4 9.2 9.5 8.6 7.8
Philippines ÿ0.6 0.3 2.1 4.4 4.8 5.8 9.7
Singapore 7.3 6.3 10.4 10.1 8.8 7.3 7.6
Thailand 8.2 8.1 8.4 8.9 8.8 5.5 ÿ0.4
Hong Kong 5.0 6.2 6.2 5.5 3.9 5.0 5.3
China 9.2 14.2 12.1 12.7 10.6 9.5 8.8
Taiwan 7.6 6.8 6.3 6.5 6.0 5.7 6.8
24 Milesi et al. (1996a, p. 1).25 Since the current account is the sum of the trade balance and net factor incomes and transfers from abroad,
sustainability is also affected by the relative weight of these components. For a given level of current account
deficit, sustainability may be more problematic if the trade deficit is large, as opposed to large negative flow of
net factor payments from abroad. A trade deficit may indicate structural competitiveness problems, while a large
and negative flow of net foreign income represents the historica remnant of past foreign indebtedness.
314 G. Corsetti et al. / Japan and the World Economy 11 (1999) 305±373

driven by a transitory fall in private savings should not be a concern, since future income
growth will lead to increased future savings.
Table 4 presents the growth data in our sample of Asian countries in the 1990s. The overall
picture is quite clear: in all countries, GDP growth rates were remarkably high in the 1990s.
Growth rates averaging more than 7 percent of GDP (sometimes closer to 10 percent) were the
norm.Theexceptionis thePhilippines,wheregrowthrateswere lowin theearly1990s,butstill
averaged 5 percent after 1994. Only in 1996 did most countries in the region experience a
marginal slowdown in growth; for example, the growth rate in Korea fell from 8.9 percent of
GDP in 1995 to 7.1 percent in 1996. Accepting the traditional view that a large current account
de®cit is likely tobesustainablewhengrowthishigh, theAsiancountriesdidnotappeartohave
a sustainability problem. The key question, however, is whether or not the traditional view
provides reliable indications for the diagnosis of the Asian crisis.
Historical experience suggests in fact a more complex picture in which, paradoxically,
high economic growth may make an economy more vulnerable to a crisis.26 For instance,
high growth rates may induce overly-optimistic beliefs that the economic expansion will
persist unabated in the future. Such expectations can then drive both a consumption and
investment boom, as well as large capital in¯ows that make it easy to ®nance the increasing
demand. In such circumstances, an external shock that leads to a sudden change in
expectations can cause a rapid reversal of capital ¯ows and trigger a currency crash.27
In the speci®c case of the 1997±1998 crisis, this argument is strictly related to the debate
on the causes of the Asian `economic miracle'. The issue in that debate is the extent to
which output growth in Asia was due to total factor productivity (TFP) growth, as opposed
to growth in the availability of inputs, re¯ecting increasing rates of investment and labor
participation in the region. Krugman (1994) popularized the controversial view Ð
originally advanced by Young (1992) Ð that the contribution of TFP to output growth
in Asia was less sizable than commonly believed, suggesting that the very rapid growth that
Asia experienced in the past decades could not be sustainable in the long run, as
employment growth and investment were eventually bound to decline.
Such an interpretive scheme cannot explain the sudden crash of the Asian economies in
1997, since it only predicts a slowdown of growth. Yet, it does point out that, in the period
leading up to the crisis, extrapolating the high rates of growth of the 1990s into the future
was not necessarily warranted by fundamentals. To the extent that savings and investment
decisions were based on unrealistic expectations about long-run output perspectives, the
observed high rates of growth may have contributed to downplaying the riskiness and costs
of a strategy of excessive reliance on foreign capital and current account imbalances.
3.4. Investment rates, efficiency and profitability
Other criteria of current account sustainability focus on the intertemporal decisions
underlying a current account de®cit. Since the current account is equal to the difference
26 The traditional view does not fit, for instance, the cases of Chile in 1979±1981 and Mexico in 1977±1981,
whereas average real GDP growth rates in the years preceding the crisis were above 7 percent.27 Rigobon (1998) develops a model where excessive optimism leads to excessive capital inflows in `good'
times and rapid reversals and market overreaction in `bad' times.
G. Corsetti et al. / Japan and the World Economy 11 (1999) 305±373 315

between national saving and investment, a de®cit can emerge from either a fall in saving or
an increase in investment. Conventional wisdom holds that borrowing from abroad is less
`dangerous' for sustainability if it ®nances new investment (leading to increased productive
capacity and to higher future export receipts) rather than consumption (which implies
lower saving). For these reasons, a current account de®cit that is accompanied by a fall in
saving rates is regarded as more problematic than a de®cit accompanied by rising
investment rates.
Underlying such `conventional' conclusions, however, is the implicit assumption that
the return on investment is at least as high as the cost of the borrowed funds. Also implicit is
the assumption that high investment rates contribute to the enhancement of productive
capacity in the traded sector. If the investment boom is con®ned to the non-traded sector
(commercial and residential construction, as well as inward-oriented services), in terms of
sustainability analysis the contribution of such investment projects to future trade
surpluses±thus to the ability of the country to repay its external debt obligations±is limited
to their indirect impact on the productivity of the traded sector. The two `implicit'
assumptions above need not hold in the Asian case.
Evidence on investment rates in Asian countries is shown in Table 5 (corresponding data on
saving ratios are presented below). Unlike the Latin American countries that experienced
currency and ®nancial crises in the recent past, the Asian countries were characterized by very
highratesofinvestment throughout the1990s . Inmostcountries theserateswerewellabove30
percent of GDP (and in some cases above 40 percent of GDP), with the exceptions of the
Philippines and Taiwan, that show rates in the 20±25 percent range.
One may of course wonder whether aggregate measures of investment above 40 percent
of GDP truly represented the real magnitude of productive capital accumulation in these
economies. On the basis of anecdotal evidence, it has been argued in fact that the of®cial
investment rate measures were likely to be upward biased, as several forms of `investment'
in the Asian economies may have simply been a disguised form of consumption.28
Table 5
Investment rates (% of GDP)
1990 1991 1992 1993 1994 1995 1996 1997
Korea 36.9 38.9 36.6 35.1 36.1 37.1 38.4 35.0
Indonesia 36.2 35.5 35.9 29.5 31.1 31.9 30.8 31.6
Malaysia 31.3 37.6 33.5 37.8 40.4 43.5 41.5 42.8
Philippines 24.2 20.2 21.3 24.0 24.1 22.2 24.0 24.8
Singapore 35.9 34.2 36.0 37.7 32.7 33.1 35.1 37.4
Thailand 41.1 42.8 40.0 39.9 40.3 41.6 41.7 35.0
Hong Kong 27.4 27.2 28.5 27.5 31.9 34.9 32.4 35.1
China 34.7 34.8 36.2 43.5 40.9 40.2 38.7 37.6
Taiwan 23.1 23.3 24.9 25.2 23.9 23.7 21.2 22.2
28 As suggested by the head of research in a Thai brokerage house: `̀ there is in practice no clear divide
between investment and consumption in Thailand...'' For example, one very clear example of overinvestment has
been in five-star or equivalent hotels. Every family business empire feels it has to have one, and to out-do its
friends or enemies in outfitting it luxuriously. This is just an aspect of that I call `conspicuous investment'.
316 G. Corsetti et al. / Japan and the World Economy 11 (1999) 305±373

More generally, there are several reasons why such high investment rates should have been
regarded with concern with regards to current account sustainability. Evidence on the
pro®tability of the investment projects is provided by a standard measure of investment
ef®ciency, the ICOR or `incremental capital output ratio' de®ned as the ratio between the
investment rate and the rate of output growth. As bad investments might have been
concentrated in some sectors of the economy (such as real estate and some manufacturing
sectors), an aggregate measure such as the ICOR does not provide information about the
variabilityofratesofreturnacrosssectors.Butasameasureofoverall investmentef®ciency, its
level and changes over time provide a broad estimate of the productivity of capital.
Table 6 presents two sets of data, one for the 1987±1992 period and the other for the
1993±1996 period. The data for both the periods suggest that investment ef®ciency is
generally high in the Asian region. However, with the exception of Indonesia and the
Philippines, the ICOR had increased sharply in the 1993±1996 period relative to the 1987±
1992, suggesting that the ef®ciency of investments was already falling in the 4 years prior
to the 1997 crisis.
In the case of Korea, evidence of low pro®tability is also available at the ®rm level. In
this country, the 1997 crisis was primarily triggered by a series of bankruptcies of large
conglomerates (chaebols) which had borrowed heavily to ®nance their investment projects.
In 1997, and before the currency crisis hit Korea, as many as seven of the top 30
conglomerates failed .29 The extent of the ®nancial problems of the chaebols is presented in
Table 7 Ð outlining the assets, liabilities, sales, net pro®ts and debt-equity ratios for 30
chaebols at the end of 1996. The table shows that the average debt-equity ratio for the 30
chaebols was 333 percent (the comparable ®gure for the US is close to 100 percent). Those
chaebols that went bankrupt or had severe ®nancial problems in 1997, tended to have even
larger debt-equity ratios. In the case of Sammi (bankrupt in March), the ratio was a
staggering 3, 245 percent, while in the case of the Jinro group the ratio was 8, 598 percent.
Table 6
Incremental capital output ratio (ICOR)a
1987±1992 1993±1996
Korea 3.8 4.9
Indonesia 4.0 3.8
Malaysia 3.7 4.8
Philippines 6.0 5.5
Singapore 3.6 4.0
Thailand 3.4 5.1
Hong Kong 3.7 6.1
China 3.1 2.9
Taiwan 2.4 3.9
a Source: J.P. Morgan and authors' calculation.
29 See OECD (1988) and Section 6.2 below. The shaky conditions of Korean groups had been exhaustively
analyzed by the specialized press before the eruption of the crisis: as an example, see `̀ 20 of top 30 groups show
poor management performance,'' The Korea Herald, 7 October, 1997. We thank Seung Jung Lee for surveying
the available information.
G. Corsetti et al. / Japan and the World Economy 11 (1999) 305±373 317

The table also shows that pro®tability, as measured by net pro®ts, was very low (or outright
negative in the case of 13 out of 30 companies).
Table 8 shows the return on invested capital (ROIC) in the 1992±1996 period for ®ve of
the bankrupt ®rms. With a prime rate in local currency that before the crisis was as high as
Table 7
Financial conditions of top 30 Korean chaebol at the end of 1996 (in hundred million won and %)a
Chaebol Total assets Debt Sales Net profit Debt/equity ratio
Samsung 508.6 370.4 601.1 1.8 268.2
Hyundai 531.8 433.2 680.1 1.8 439.1
Daewoo 342.1 263.8 382.5 3.6 337.3
LG 370.7 287.7 466.7 3.6 346.5
Hanjin 139.0 117.9 87.0 ÿ1.9 556.9
Kia 141.6 118.9 121.0 ÿ1.3 523.6
Ssangyong 158.1 127.0 194.5 ÿ1.0 409.0
Sunkyong 227.3 180.4 266.1 2.9 385.0
Hanhwa 109.7 97.2 96.9 ÿ1.8 778.2
Daelim 57.9 45.9 48.3 0.1 380.1
Kumho 74.0 61.2 44.4 ÿ0.2 477.9
Doosan 64.0 55.9 40.5 ÿ1.1 692.3
Halla 66.3 63.2 52.9 0.2 2067.6
Sammi 25.2 25.9 14.9 ÿ2.5 3245.0
Hyosung 41.2 32.5 54.8 0.4 373.2
Hanil 26.3 22.3 13.0 ÿ1.2 563.2
Donga Construction 62.9 49.1 38.9 0.4 355.0
Kohap 36.5 31.2 25.2 0.3 589.5
Jinro 39.4 39.0 14.8 ÿ1.6 8598.7
Dongguk Jaekank 37.0 25.4 30.7 0.9 210.4
Lotte 77.5 51.0 71.9 0.5 191.2
Kolon 38.0 28.9 41.3 0.2 316.5
Haitai 34.0 29.5 27.2 0.4 658.3
Sinho Jaeji 21.3 17.7 12.2 ÿ0.1 489.5
Anam Industrial 26.4 21.8 19.8 0.1 478.1
Dongguk Muyok 16.2 13.6 10.7 ÿ0.2 587.9
New Core 28.0 25.9 18.3 0.2 1224.0
Bongil 20.3 18.3 8.7 ÿ0.9 920.5
Hansol 47.9 37.1 25.5 ÿ0.1 343.2
Hansin Kongyong 13.3 11.5 10.6 0.0 648.8
a Source: Chosun Ilbo, 29 November, 1997.
Table 8
Profitability of Korean chaebols. ROIC in 1992±1996a
Chaebol 1992±1996 (%) 1996 (%)
Hanbo 3.0 1.7
Sammi 2.9 3.2
Jinro 2.7 1.9
Kia 18.9 8.7
Dainong 6.8 5.5
a Source: LG Economic Research Institute.
318 G. Corsetti et al. / Japan and the World Economy 11 (1999) 305±373

12 percent, the ROIC for these ®rms was well below the cost of the capital in the 1992±
1996 period (with the exception of Kia) as well as in 1996 (without exceptions). In the
cases of Hanbo, Sammi and Jinro, the ®rst chaebols to collapse in 1997, the ROIC at the end
of 1996 was as low as 1.7 percent, 3.2 percent and 1.9 percent respectively.30 Figures on
pro®tability Ð over the 1990s Ð were particularly low for the conglomerates that went
bankrupt in 1997, and according to the evidence available during the ®rst half of 1997, the
ROIC was below the cost of capital for 20 out of the top 30 chaebols . Evidence on the low
pro®tability of investment was also provided by the Interest Coverage Rate (ICR)±which
compares cash ¯ow earned with interest payments due over a particular period: 11 out of
the 30 top chaebols had an ICR below 1, meaning that earnings were below interest
payments.31
In Korea, most investment projects by the chaebols were concentrated in the manu-
facturing sector. However, in other countries overinvestment and overcapacity problems
were concentrated instead in the non-traded sector. The low pro®tability of these invest-
ment projects can be assessed by looking at the data on Central Business District vacancy
rates and rental yields presented in Table 9. As the table shows, before the onset of the
crisis, rental yields on of®ce buildings were already quite low, re¯ecting the very high
prices of real estate. In mid 1997, they were as low as 3.5 percent in Hong Kong and 3.9
percent in Singapore. The rental yields for other countries were higher but the ®gures for
June 1997 are partly arti®cial, because they are based on pre-downturn expected vacancy
rates.32
Table 9
Central business district office vacancy rates and rental yieldsa
Vacancy rates Rental yield
1997 (%) 1998±1999 (%)June±1997 (%)
Seoul 9.50
Jakarta 10.0 20.0 7.20
Kuala Lumpur 3.0 20.0 5.80
Manila 1.0 3.0 9.30
Singapore 8.0 12.0 3.90
Bangkok 15.0 20.0 6.80
Hong Kong 6.0 10.0 3.50
Shanghai 30.0 40.0 8.00
Taipei 4.80
a Source: J.P. Morgan `Asian Financial Markets', January 1998. 1997 figures for vacancy rates are estimates;
1998±1999 figures are forecasts.
30 OECD (1988) points out that the return on capital of industrial companies in Korea were below the pre-tax
cost of debt between 1987 and 1995. Data disaggregated by sector show that only the steel industry realized
profits in excess of debt charges in the 1993±1995 period.31 See `Essence of Korean corporate crisis', Korean Economic Briefing, 23 October, 1997. For a recent
analysis of corporate performances in the pre-crisis Asian region see Pomerleano (1998).32 In 1997 the highest vacancy rates were in Bangkok (15 percent), Jakarta (10 percent) and Shanghai (30
percent).
G. Corsetti et al. / Japan and the World Economy 11 (1999) 305±373 319
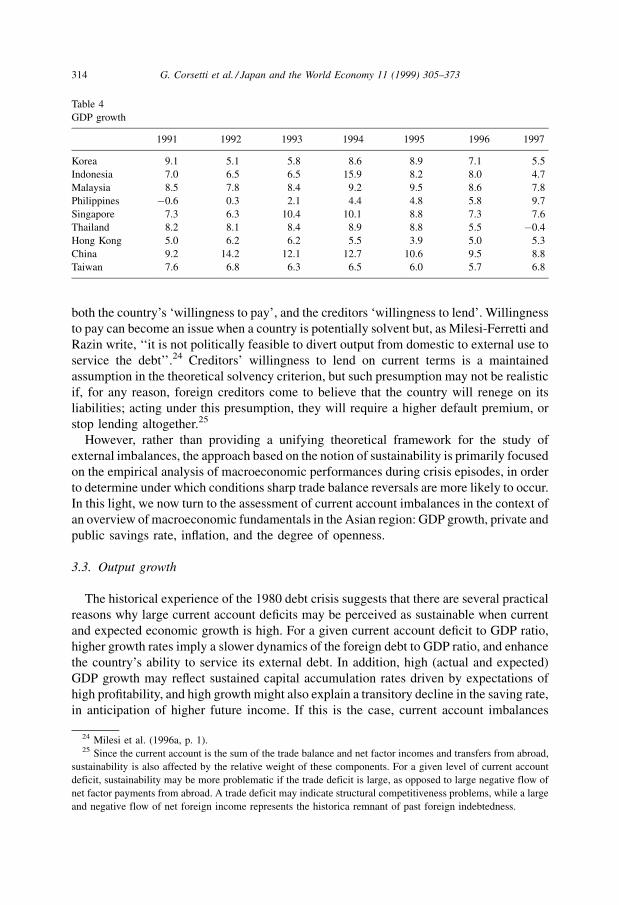
From a different viewpoint, evidence consistent with speculative overinvestment in land
and real estate is provided by data on stock market prices, which in many countries rose
more rapidly in the property sector than in the other sectors over the 1990±1996 period.
Similarly, when national stock markets collapsed in 1997,33 the percentage drop was much
sharper in the property sector than for the overall market. Data on overall stock market
indices in local currency are presented in Table 10, while Table 11 presents similar data for
stock price indices for the property/real estate sector Ð all data are end-of-year ®gures.
3.5. Private and public savings
In parallel with the assessment of investment rates, the analysis of the dynamics of
private and public savings can shed light on the sustainability of the underlying current
account imbalances. A fall in national savings caused by lower public savings (a higher
budget de®cit) is seen typically as more disruptive than a fall in private savings.34 The
conventional underpinning of this view is that a fall in private savings is more likely to be a
Table 10
Stock market prices indexes
1990 1991 1992 1993 1994 1995 1996 1997
Korea 696 610 678 866 1027 882 651 376
Indonesia 417 247 274 588 469 513 637 401
Malaysia 505 556 643 1275 971 995 1237 594
Philippines 651 1151 1256 3196 2785 2594 3170 1869
Singapore 1154 1490 1524 2425 2239 2266 2216 1529
Thailand 612 711 893 1682 1360 1280 831 372
Hong Kong 3024 4297 5512 11888 8191 10073 13451 10722
Taiwan 4350 4600 3377 6070 7111 5158 6933 8187
Table 11
Stock market prices indexes (property sector)
1990 1991 1992 1993 1994 1995 1996 1997
Indonesia 119 66 214 140 112 143 40
Malaysia 113 113 126 369 240 199 294 64
Philippines 32 34 39 81 80 87 119 59
Singapore 230 280 250 541 548 614 648 357
Thailand 74 82 168 367 232 192 99 7
Hong Kong 312 453 554 1392 862 1070 1682 941
Taiwan 61 71 57 137 109 59 55 55
33 Note that in several countries stock prices had already peaked before 1996 and stock markets were falling
even before the 1997 crash.34 It is worth recalling that, at a theoretical level, budget deficits can cause current account deficits even in
economies in which Ricadian equivalence holds. For instance, it is well known that, in a Ricardian world, a
transitory increase in government spending leads to both a budget deficit and a current account deficit. When
taxes are distortionary and the government follows a tax-smoothing rule, transitory negative output shocks will
also cause both a budget deficit and a current account deficit.
320 G. Corsetti et al. / Japan and the World Economy 11 (1999) 305±373

transitory phenomenon,35 while an increase in public sector de®cits often represents a
persistent change which results in an irreversible build-up of foreign debt.
The issue of understanding the role of public versus private saving in a current account
crisis is however far from settled, as there are historical examples that are clearly at odds
with the interpretive pattern just described. For example, in the Chilean 1977±1981 case, a
crisis occurred in spite of the fact that the ®scal balance was in surplus. In the more recent
Mexican episode, the deterioration of the current account in the years preceding the 1994
crisis was largely due to a fall in private savings and a boom in private consumption. Such
behavior was fueled by overly-optimistic expectations about future growth, in an environ-
ment in which the liberalization of domestic capital markets loosened liquidity con-
straints Ð suggesting that current account de®cits driven by a fall in private saving rates
may be a matter of concern even if such a fall can be interpreted as the result of rational
consumption/saving decisions.
Data on saving rates in Asia are reported in Table 12, and somewhat represent the mirror
of the investment rates in Table 5. Asian countries were characterized by very high savings
rates throughout the 1990s Ð in many cases above 30 percent of GDP and in some cases
above 40 percent. The lowest rates are recorded for the Philippines, where the saving rate
¯uctuated between 17 percent and 20 percent, Indonesia, where the saving rate fell below
30 percent (to a 28 percent average) after 1992, and Malaysia, where the saving rate was
below 30 percent until 1993. Looking at the data before the crisis, there is little evidence of
public dissaving Ð so that the current account imbalances do not appear to be the result of
increased public sector de®cits . Table 13 shows that in most countries the ®scal balance of
the central government was either in surplus or a small de®cit. In 1996, only China and
Taiwan displayed a central government de®cit (about 1 percent of GDP).
The absence of ®scal imbalances in the years preceding the crisis, however, should not
be interpreted as pervasive evidence against the ®scal roots of the Asian crisis. As we
document below, and we model formally in Corsetti et al. (1999), the pre-crisis years were
a period of excessive credit growth in the banking system, leading to a large stock of non-
Table 12
Saving rates (% of GDP)
1990 1991 1992 1993 1994 1995 1996 1997
Korea 35.69 35.74 34.88 34.91 34.60 35.14 33.60 33.06
Indonesia 31.75 31.10 33.41 28.66 29.52 27.65 27.50 27.98
Malaysia 29.07 23.24 30.06 27.70 33.81 34.65 37.81 39.34
Philippines 17.85 17.76 18.16 17.29 20.32 17.16 19.35 18.77
Singapore 45.32 46.56 48.35 46.17 50.82 51.05 51.33 51.30
Thailand 32.33 34.83 33.73 34.26 33.89 33.25 33.22 32.64
Hong Kong 35.85 33.78 33.76 35.67 33.83 31.94 29.95 31.33
China 37.77 37.84 37.26 41.29 42.04 40.22 39.25 41.15
Taiwan 30.50 30.26 28.93 28.68 26.99 26.70 25.92 25.43
35 A transitory fall in private savings (corresponding to a transitory increase in consumption) is determined by
expectations of higher future GDP growth raising permanent income. The transitory fall in savings today will be
offset by higher savings in the future, when the anticipated increase in income actually materializes.
G. Corsetti et al. / Japan and the World Economy 11 (1999) 305±373 321

performing loans and the eventual collapse of several ®nancial institutions. By early 1998,
the overall cost of `cleaning up the ®nancial sector' Ð as put by the First Deputy Managing
Director of the IMF Stanley Fischer Ð was realistically expected to amount to 15 percent
of GDP for several Asian economies.36 Ultimately, the restructuring of the ®nancial sector
poses a severe burden on the ®scal balances of the affected countries. In terms of our
analysis of current account sustainability, such costs represented an implicit ®scal liability
for the Asian countries. Such a liability was not re¯ected by data on public de®cits until the
eruption of the crisis, but affected the sustainability of the pre-crisis current account
imbalances since it contributed to generate expectations of drastic policy changes (a ®scal
reform required to ®nance the costs of ®nancial bail-outs) or currency devaluations (as a
result of higher recourse to seignioragerevenues).
3.6. Inflation
In¯ation is also important in the analysis of current account and external debt sustain-
ability. When currency values are ®xed or semi-®xed, and domestic in¯ation is above
foreign in¯ation, a real currency appreciation leads to decreasing cost-competitiveness,
eventually undermining the credibility of the peg. In particular, high in¯ation rates may
signal poor macroeconomic policy and/or sizable ®scal imbalances, generating the need for
seigniorage revenue. In either case, high in¯ation signals that the ®xed or semi-®xed
exchange rate regime is potentially exposed to speculative attacks.
Table 14 presents the data on in¯ation in our sample of Asian countries in the 1990s. The
overall picture is quite clear: in all the countries, in¯ation rates were relatively low in the
1990s . The only exceptions were the Philippines where in¯ation was close to 20 percent in
1990±1991(but falling to 8 percent by 1996), Hong Kong with an in¯ation rate of 11
percent in 1991 but falling to 6 percent by 1996 and China where the in¯ation rate was
above 10 percent in the 1993±1995 period (averaging 18 percent per year) but falling to 8
percent in 1996 and to 3 percent in 1997.
However, in terms of our sustainability analysis the picture is considerably more
complex. The banking and ®nancial sector problems experienced by several Asian
Table 13
Government fiscal balances (% of GDP)
1990 1991 1992 1993 1994 1995 1996 1997
Korea ÿ0.68 ÿ1.63 ÿ0.50 0.64 0.32 0.30 0.46 0.25
Indonesia 0.43 0.45 ÿ0.44 0.64 1.03 2.44 1.26 0.00
Malaysia ÿ3.10 ÿ2.10 ÿ0.89 0.23 2.44 0.89 0.76 2.52
Philippines ÿ3.47 ÿ2.10 ÿ1.16 ÿ1.46 1.04 0.57 0.28 0.06
Singapore 10.53 8.58 12.35 15.67 11.93 13.07 14.10 9.52
Thailand 4.59 4.79 2.90 2.13 1.89 2.94 0.97 ÿ0.32
China ÿ0.79 ÿ1.09 ÿ0.97 ÿ0.85 ÿ1.22 ÿ1.00 ÿ0.82 ÿ0.75
Taiwan 1.85 ÿ2.18 ÿ5.34 ÿ3.88 ÿ1.73 ÿ1.09 ÿ1.34 ÿ1.68
36 Fischer (1998b). By early 1999, the most recent unofficial estimates of the financial restructuring costs
have increased to the 20±30 percent range.
322 G. Corsetti et al. / Japan and the World Economy 11 (1999) 305±373

countries over the 1990s raised considerable doubts about their ability to keep in¯ation low
in the near future. Speci®cally, these doubts were related to the possibility that the
consequences of the banking sector bail-outs might prompt an increasing use of seignio-
rage, and would require infusions of liquidity to prevent systemic runs. For these reasons,
the nominal depreciations of Asian currencies in 1997 were consistent with the expected
in¯ationary consequences of banking and ®nancial bail-outs. Ex-post data seem to con®rm
this view: injections of liquidity into the banking system have occurred in several countries,
such as Indonesia and Malaysia, and in¯ationary pressures have emerged in Asia, either
explicitly (Indonesia) or masked by tight price controls (Malaysia).
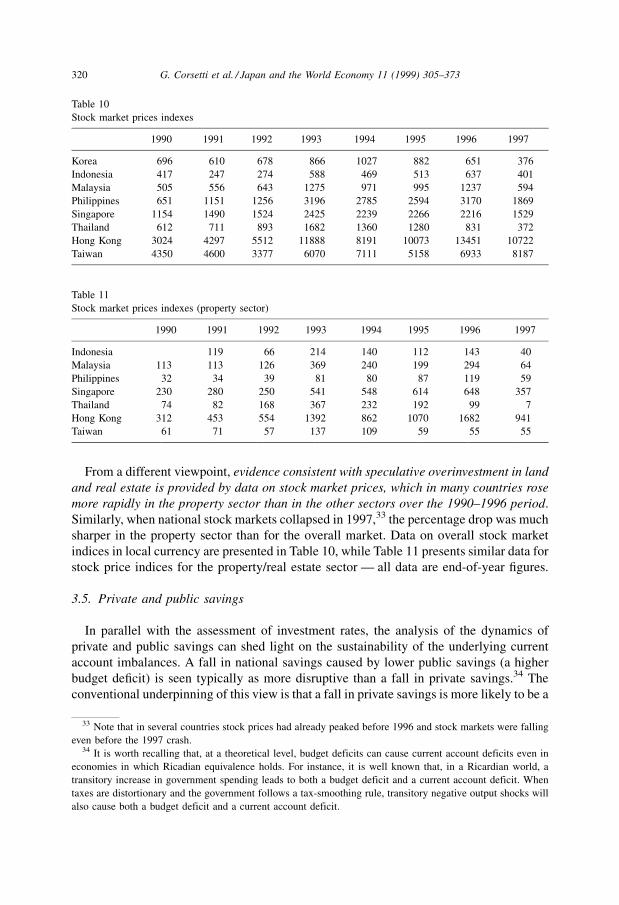
3.7. Openness
Economies that are relatively open are considered less likely to face sustainability
problems, for two reasons. First, a large export sector (generating foreign currency
receipts) strengthens the country's ability to service its debt obligation. Second, the
economic and political costs of a crisis are relatively large, as the interdependence of
the economy with the rest of the world is high. Since the costs of a cut-off from
international capital markets and disrupted trade credit may be quite severe, the country
is more likely to be willing to honor its liabilities. Yet, greater openness also makes the
country more vulnerable to terms of trade shocks and to restrictive trade policies in other
countries.
Table 15 reports the ratio of the average of exports and imports to GDP, as measures of
the degree of openness of the countries under study. As the table shows, most Asian
countries were considerably open. The degree of openness is the lowest in Indonesia
(around 26±27 percent). The measures are in the 30±40 percent range in Korea, the
Philippines and Thailand, close to 50 percent in Taiwan, above 80 percent in Malaysia, and
above 100 percent in the city-states of Hong Kong and Singapore. It is worth recalling here
that signi®cant negative terms of trade shocks were experienced by several East Asian
countries in 1996 with the fall in price of some of their main exports (semi-conductors and
other manufactured goods).
Table 14
Inflation rate
1991 1992 1993 1994 1995 1996 1997
Korea 9.30 6.22 4.82 6.24 4.41 4.96 4.45
Indonesia 9.40 7.59 9.60 12.56 8.95 6.64 11.62
Malaysia 4.40 4.69 3.57 3.71 5.28 3.56 2.66
Philippines 18.70 8.93 7.58 9.06 8.11 8.41 5.01
Singapore 3.40 2.32 2.27 3.05 1.79 1.32 2.00
Thailand 5.70 4.07 3.36 5.19 5.69 5.85 5.61
Hong Kong 11.60 9.32 8.52 8.16 8.59 6.30 5.83
China 3.50 6.30 14.60 24.20 16.90 8.30 2.80
Taiwan 3.63 4.50 2.87 4.09 3.75 3.01 0.90
G. Corsetti et al. / Japan and the World Economy 11 (1999) 305±373 323
3.8. Real exchange rate appreciation
Virtually all the analyses of crisis episodes emphasize that a signi®cant real exchange
rate appreciation may be associated with a loss of competitiveness and a structural
worsening of the trade balance, thus jeopardizing the sustainability of the current account.
What was the role of real exchange rate ¯uctuations in the aggregate demand boom and
external balance deterioration observed in the Asian countries prior to the crisis? To what
extent were the current imbalances caused by a misalignment in exchange rates? The
evidence is somewhat mixed, as the degree of real appreciation over the 1990s differed
widely across Asian countries.
Data on nominal exchange rates in the 1990s are presented in Table 16. In Malaysia, the
currency moved in a 10 percent range of 2.7±2.5 ringgit to the US dollar for most of the
period spanned by 1990 and the beginning of 1997. In Thailand the baht was effectively
®xed between 25.2 and 25.6 to the dollar from 1990 until 1997. And in the Philippines
during 1990±1995, the peso/dollar rate ¯uctuated between 24 and 28, but was effectively
®xed at 26.2 from the spring of 1995 until the beginning of 1997.
Other countries followed a somewhat more ¯exible exchange rate policy. In Korea, the
won depreciated in nominal terms between 1990 and the beginning of 1993 (from 700 to
almost 800 won per dollar). Between 1993 and mid-1996, it was quoted within a very
narrow range of 800±770, and then it depreciated again, reaching 884 won per US dollar by
the end of 1996. The Indonesian policy can be described as real exchange rate targeting,
Table 15
Openness ((Exports + imports)/2 as a % of GDP)
1990 1991 1992 1993 1994 1995 1996 1997
Korea 30.04 29.38 29.38 29.04 30.47 33.59 34.36 38.48
Indonesia 26.30 27.18 28.23 25.26 25.94 26.98 26.13 28.22
Malaysia 75.23 86.52 76.64 87.72 92.15 97.42 91.50 93.55
Philippines 30.40 31.09 31.58 35.58 36.98 40.26 44.90 54.20
Thailand 37.76 39.24 38.98 39.69 40.99 44.88 42.19 46.69
Hong Kong 129.93 135.28 140.37 137.18 138.92 151.67 142.28 132.68
Taiwan 44.27 45.14 42.34 43.29 43.16 47.80 46.63 48.07
Table 16
Nominal Exchange Rate (to the US dollar). Period average
1990 1991 1992 1993 1994 1995 1996 1997 1997f
Korea 707.76 733.35 780.65 802.67 803.45 771.27 804.45 951.29 1695.00
Indonesia 1842.80 1950.30 2029.90 2087.10 2160.80 2248.60 2342.30 2909.40 4650.00
Malaysia 2.70 2.75 2.55 2.57 2.62 2.50 2.52 2.81 3.89
Philippines 24.31 27.48 25.51 27.12 26.42 25.71 26.22 29.47 39.98
Singapore 1.81 1.73 1.63 1.62 1.53 1.42 1.41 1.48 1.68
Thailand 25.59 25.52 25.40 25.32 25.15 24.91 25.34 31.36 47.25
Hong Kong 7.79 7.77 7.74 7.74 7.73 7.74 7.73 7.74 7.75
China 4.78 5.32 5.51 5.76 8.62 8.35 8.31 8.29 8.28
Taiwan 26.89 26.82 25.16 26.39 26.46 26.49 27.46 28.70 32.64
324 G. Corsetti et al. / Japan and the World Economy 11 (1999) 305±373
with the nominal rupiah/dollar rate falling from 1900 in 1990 to 2400 by the beginning of
1997.
Taiwan also followed a policy of real exchange rate targeting, allowing its currency to
fall from a rate of 24 New Taiwan dollars per US dollar in 1990 to a rate of 27.8 by the end
of 1996. And in Singapore, the currency actually appreciated in nominal terms, from a
1990 rate of 1.7 to a rate of 1.4 by the end of 1996. Finally, in China where in¯ation was in
double ®gures in the early 1990s, the currency was allowed to depreciate modestly between
1990 and 1993 but was drastically devalued by around 50 percent in 1994 (substantially
bridging the gap between the of®cial rate and the swap market rate, at which about 80
percent of Chinese transactions were settled). Since then, the currency has remained stable
with a slight drift towards nominal appreciation.
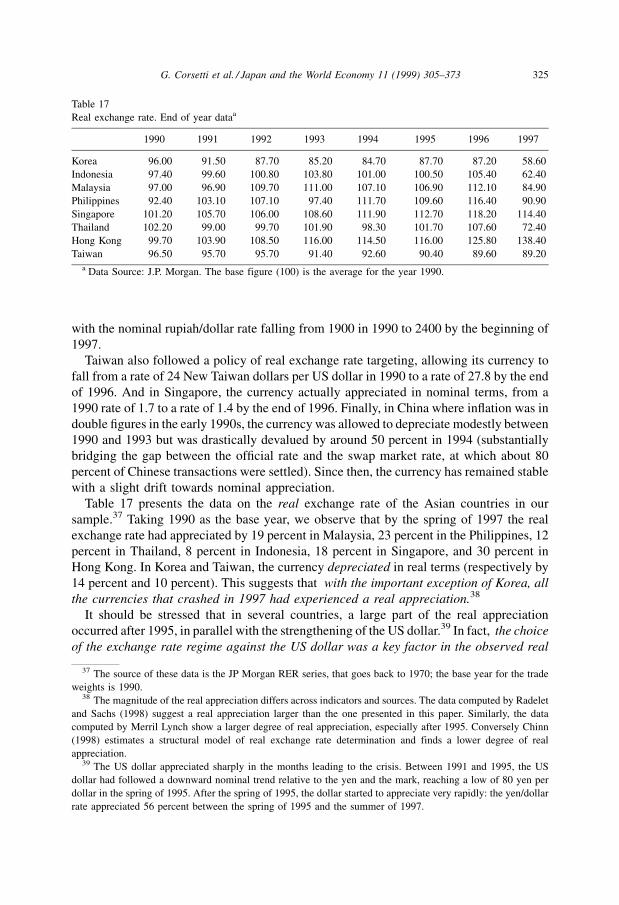
Table 17 presents the data on the real exchange rate of the Asian countries in our
sample.37 Taking 1990 as the base year, we observe that by the spring of 1997 the real
exchange rate had appreciated by 19 percent in Malaysia, 23 percent in the Philippines, 12
percent in Thailand, 8 percent in Indonesia, 18 percent in Singapore, and 30 percent in
Hong Kong. In Korea and Taiwan, the currency depreciated in real terms (respectively by
14 percent and 10 percent). This suggests that with the important exception of Korea, all
the currencies that crashed in 1997 had experienced a real appreciation.38
It should be stressed that in several countries, a large part of the real appreciation
occurred after 1995, in parallel with the strengthening of the US dollar.39 In fact, the choice
of the exchange rate regime against the US dollar was a key factor in the observed real
Table 17
Real exchange rate. End of year dataa
1990 1991 1992 1993 1994 1995 1996 1997
Korea 96.00 91.50 87.70 85.20 84.70 87.70 87.20 58.60
Indonesia 97.40 99.60 100.80 103.80 101.00 100.50 105.40 62.40
Malaysia 97.00 96.90 109.70 111.00 107.10 106.90 112.10 84.90
Philippines 92.40 103.10 107.10 97.40 111.70 109.60 116.40 90.90
Singapore 101.20 105.70 106.00 108.60 111.90 112.70 118.20 114.40
Thailand 102.20 99.00 99.70 101.90 98.30 101.70 107.60 72.40
Hong Kong 99.70 103.90 108.50 116.00 114.50 116.00 125.80 138.40
Taiwan 96.50 95.70 95.70 91.40 92.60 90.40 89.60 89.20
a Data Source: J.P. Morgan. The base figure (100) is the average for the year 1990.
37 The source of these data is the JP Morgan RER series, that goes back to 1970; the base year for the trade
weights is 1990.38 The magnitude of the real appreciation differs across indicators and sources. The data computed by Radelet
and Sachs (1998) suggest a real appreciation larger than the one presented in this paper. Similarly, the data
computed by Merril Lynch show a larger degree of real appreciation, especially after 1995. Conversely Chinn
(1998) estimates a structural model of real exchange rate determination and finds a lower degree of real
appreciation.39 The US dollar appreciated sharply in the months leading to the crisis. Between 1991 and 1995, the US
dollar had followed a downward nominal trend relative to the yen and the mark, reaching a low of 80 yen per
dollar in the spring of 1995. After the spring of 1995, the dollar started to appreciate very rapidly: the yen/dollar
rate appreciated 56 percent between the spring of 1995 and the summer of 1997.
G. Corsetti et al. / Japan and the World Economy 11 (1999) 305±373 325
exchange rate appreciation .40 Countries with more rigid policy rules experienced a much
larger real appreciation. Conversely, countries such as Korea and Taiwan that followed a
more ¯exible exchange rate regime experienced a real depreciation. Note that Indonesia,
which followed a regime closer to real exchange rate targeting, faced a smaller real
appreciation than Thailand, Malaysia, Hong Kong and the Philippines±countries that
focused more closely on exchange rate stability.
The data also suggest that, in general, an exchange rate appreciation was correlated
with a worsening of the current account Ð countries with appreciating currencies gen-
erally experienced a larger deterioration of the current account, while countries such as
China and Taiwan that had experienced a real depreciation exhibited current account
surpluses. The decision to maintain a stable currency led to large capital in¯ows, attracted
by favorable interest rate differentials and expectations of low exchange rate risk. The
resulting strong real appreciation helped build the region's large and growing current
account imbalances. The exception was, once again, Korea, which displayed current
account de®cits together with a currency that depreciated in real terms over the 1990s.
Is it possible that the observed movements in relative prices re¯ected a change in the
equilibrium real exchange rate, rather than a misalignment? First, high rates of productivity
in the tradables sector relative to the non-traded sectors may lead to real appreciation, along
the lines of the Balassa±Samuelson model.41 Second, even when the Balassa-Samuelson
argument does not apply, models of exchange rate-based stabilization programs suggest
that the typical investment and consumption booms that follow a successful in¯ation
stabilization program may lead to both an increase in the relative price of non-traded to
traded goods (a real appreciation), and a worsening of the current account Ð see Rebelo
and Vegh (1995) and Calvo and Vegh (1998).42
The question of whether the real appreciation observed in Asia was the result of a
misaligned exchange rate or an equilibrium real appreciation is open, but there are reasons
to be skeptical of explanations that rely too much on a change in the equilibrium exchange
rate. First, evidence for a Balassa±Samuelson effect in Asia is slim. Second, the Asian
countries do not ®t the story of an exchange rate-based stabilization starting from high
in¯ation. One of the key reasons why many Asian countries pursued a policy of an effective
40 Only Hong Kong had actually a currency board with the parity tied to that of the US dollar. Other countries
were formally pegging their exchange rate to a basket of currencies; however, the effective weight of the US
dollar in the basket was so high that their policies could be characterized as an implicit peg to the US currency.41 The Balassa-Samuelson model argues that technological progress is faster in the tradables sector than in the
nontradables sector, and that this productivity bias is more pronounced in high-income countries. In the latter,
the high productivity of the tradables sector pushes wages upward; competition among firms in the labor market
forces producers in the nontradables sector to pay higher wages; prices in the nontradables sector must therefore
increase to guarantee that producers of nontradables are able to meet the higher wages. As a consequence, CPIs
in rich countries are high relative to those in poor countries after adjusting for exchange rates. Moreover, the
CPI-based real exchange rates of fast-growing countries appreciate relative to slow-growing countries. For a
comprehensive survey of the literature on the Balassa±Samuelson model see Froot and Rogoff (1995).42 Strictly speaking, the exchange rate stabilization models presented in the literature do not provide an
equilibrium explanation of the stylized facts on real appreciation and current account deficits after a
stabilization. Their numerical simulations show that a good fit of the data requires the introduction of some form
of price/wage inertia (see Rebelo and Vegh (1995)). But this inertia is consistent with the view that a real
appreciation represents a misalignment relative to fundamental values.
326 G. Corsetti et al. / Japan and the World Economy 11 (1999) 305±373

peg against the dollar was to facilitate external ®nancing of domestic projects. The cost
of borrowing fell because a credible peg led to a reduction of the currency risk premium
charged by international investors. This policy was consistent with a strategy of sustaining
high investment rates, which were supposed to translate into high rates of productivity
and output growth. Most crucially, the loss in competitiveness (i.e. the increase in
the relative price of exports) experienced by the Asian countries that pegged their
currencies to the US dollar was particularly relevant when the value of the dollar soared
after mid-1995.
It is worth emphasizing that movements in the real exchange rates are not necessarily
dependable measures of changes in external competitiveness, since this can also suffer
from shocks that do not translate in a relative price increase. The misalignment of Asian
currencies was exacerbated by a number of these shocks. First, the long period of
stagnation within the Japanese economy led to a signi®cant slowdown of export growth for
its Asian trading partners. Close to the onset of the crisis, the abortive Japanese recovery of
1996 was overshadowed by a decline in activity in 1997, triggered by the introduction of a
consumption tax in April 1997. Second, the increasing weight of China in total exports
from the region enhanced competitive pressures in many Asian countries Ð an argument
that holds regardless of whether such pressures were magni®ed or not by the devaluation of
the Chinese currency in 1994. Third, as mentioned above, sector-speci®c shocks such as
the fall in the demand for semi-conductors in 1996, together with deteriorating terms of
trade for several countries in the region, caused a further signi®cant slowdown in export
growth in 1996±1997. And ®nally, expectations of a US monetary tightening in the summer
of 1997 may have also played a role in precipitating the crisis.
3.9. Political instability and policy uncertainty
The threat of a change in regime or a regime that is not committed to sound
macroeconomic policies can reduce the willingness of the international ®nancial com-
munity to provide current account ®nancing. So a deterioration in expectations about the
political and ®nancial environment can contribute to a balance of payments and exchange
rate crisis, especially when economic fundamentals are not very comforting. Such shifts in
expectations can occur quickly and without warning. Moreover, political instability may
lead to larger budget de®cits that, in an open economy, may lead to larger current account
de®cits.43
In this regard, there was plenty of political instability in Asia. Focusing on 1997 alone:
the cabinet reshuf¯es, and eventual government collapse in Thailand; the ranting by
Malaysian Prime Minister Mahathir against `rogue speculators' and international `mor-
ons'; the elections in Indonesia, the tensions, the reiterated bad news about the health of the
Indonesian president Suharto, and his policy reversals; the presidential campaign in Korea
and the contradictory signals sent by then candidate (and eventually President elect) Kim
43 For a formal model of how political instability may exacerbate a fiscal and current account deficit, see
Corsetti and Roubini (1997). For a systematic study of political influences on macroeconomic policy, see
Alesina et al. (1997).
G. Corsetti et al. / Japan and the World Economy 11 (1999) 305±373 327

Dae Jung; the threat of labor unrest in the region; were all the factors that added to the
seriousness of the crisis and triggered the domestic and foreign investors' ¯ight.
Throughout the crisis, market expectations re¯ected and reacted to political and policy
uncertainty in the region. The ®rst round of the IMF plans were signed but not seriously
implemented by governments. Regardless of whether the initial IMF plans were appro-
priate, 44 it is clear that governments failed to enforce even the most sensible components
of such plans. In Indonesia, a corrupt and authoritarian regime effectively ignored most of
its agreed-upon commitments until the severe deterioration of macro conditions led to a
fully ¯edged collapse and the free fall of the rupiah. The currency board `saga' following
the second IMF plan and the continued resistance of the Indonesian governments to macro
and structural reforms were important elements of the ®nancial demise experienced by
Indonesia. For the case of Korea, there were serious doubts about the implementation of the
®rst IMF plan, given the coming elections in December and the broad policy uncertainty
associated with that event. In Thailand, it was only with a new government truly committed
to economic reforms that the value of the baht stabilized, and even appreciated relative to
the lows reached in December.
4. The role of the financial system
The previous section has highlighted a number of country-speci®c and global factors
that determined the current account imbalances observed in Asia on the eve of the crisis,
and undermined their sustainability. In this Section, we argue that the key to a compre-
hensive interpretation of the events leading to the Asian meltdown of 1997 is the analysis of
the structure of incentives under which not only the corporate but also the banking and
®nancial sectors operated in the region.
The links between balance of payments crises and banking crises in emerging economies
represent a recurrent theme in the policy literature, and they have been (re)emphasized in a
number of recent studies.45 For instance, the origins of the 1994 Mexican crisis and its
impact on other countries in the region have been traced to, inter alia, an excessive build-up
of bank credit and a lending `boom' that represented the outcome of ®nancial market
liberalization.46 Jeffrey Sachs has presented an early analysis of the role of excessive
lending driven by `moral hazard' incentives:
`̀ Throughout Latin America, Central Europe and South-East Asia, banks have been
deregulated and privatized in recent years, allowing them much greater latitude to
borrow from abroad. Banks and near-banks Ð such as Thailand's now notorious
financial trusts become intermediaries for channeling foreign capital into the
domestic economy. The trouble is that the newly liberalized banks and near-banks
often operate under highly distorted incentives. Under-capitalized banks have
incentives to borrow abroad and invest domestically with reckless abandon. If the
lending works out, the bankers make money. If the lending fails, the depositors and
44 See the discussion in Section 7.45 See e.g., Kaminsky and Reinhart (1997), Goldfajn and Valdes (1997).46 See in particular Sachs et al. (1996).
328 G. Corsetti et al. / Japan and the World Economy 11 (1999) 305±373

creditors stand to lose money, but the bank's owners bear little risk themselves
because they have little capital tied up in the bank. Even the depositors and the foreign
creditors may be secure from risk, if the government bails them out in the case of bank
failure''.47
In the overview that follows, we provide evidence on the degree and extent of `over-
lending' in Asia, and comment upon its consequences and implications for the unraveling
of the 1997±1998 crises.
4.1. The evidence on financial `overlending': quantity...
Evidence on the lending boom in the 1990s is provided by the data on the growth of bank
credit to the private sector (Table 18) and the ratio of private sector lending to GDP (Table
19). Also, as in Sachs et al. (1996), in Table 20 we provide a synthetic measure of the
lending boom by calculating the rate of growth of bank lending as a percentage of GDP
ratio in the 1990s. The IMF distinguishes between `deposit money banks', `other banking
institutions' and `other ®nancial intermediaries', but information about the latter two
categories is missing for many countries. We therefore focus our analysis on `deposit
money banks' and refer to other intermediaries when data are available.48
The ratio of private sector lending to GDP shows an upward trend in all the countries in
our sample. Between 1990 and 1996, the magnitude of the lending boom was largest in the
Philippines (151 percent), Thailand (58 percent) and Malaysia (31 percent). It is also large
but more modest in Korea, Singapore, Hong Kong and Indonesia. And the measure was the
smallest in China (7 percent). For a comparison with Mexico and the `Tequila effect'
Table 18
Bank lending to private sector (% growth)
1991 1992 1993 1994 1995 1996 1997
Korea 20.78 12.55 12.94 20.08 15.45 20.01 21.95
Indonesia 17.82 12.29 25.48 22.97 22.57 21.45 46.42
Malaysia 20.58 10.79 10.80 16.04 30.65 25.77 26.96
Philippines 7.33 24.66 40.74 26.52 45.39 48.72 28.79
Singapore 12.41 9.77 15.15 15.25 20.26 15.82 12.68
Thailand 20.45 20.52 24.03 30.26 23.76 14.63 19.80
Hong Kong 10.17 20.15 19.94 10.99 15.75 20.10
China 19.76 20.84 43.52 24.58 24.23 24.68 20.96
Taiwan 21.25 28.70 19.46 16.18 10.00 6.00 8.92
47 Financial Times, 30 July, 1997. Along the same lines, a celebrated early analysis of the emergence of a
financial crisis in an emerging economy is provided by DõÂaz-Alejandro (1985). Corsetti et al. (1999) formalize
these insights in the context of the analysis of the Asian collapse.48 For a general assessment of the moral hazard argument in Asia, one should consider that financial
deregulation led to the emergence of new non-bank financial intermediaries (such as the finance companies in
Thailand), and that these companies often played a key part in the lending boom. Unfortunately, detailed data on
lending by all financial intermediaries are not available.
G. Corsetti et al. / Japan and the World Economy 11 (1999) 305±373 329

countries, between 1990 and 1994 the lending boom in Mexico, Argentina and Brazil was
116, 57 and 68 percent, respectively.49
How do our results on the lending boom change when we consider available data on
lending by `other banking institutions' and `non-bank ®nancial institutions'? In the case of
Korea, the measure of lending growth is not altered signi®cantly. For Malaysia, data on
`other banking institutions' are available only for the 1992±1995 period, while data on
`non-bank ®nancial institutions' are available only for the 1990±1994 period. The growth
rate of credit from such institutions appears to be similar to that of commercial banks. In the
Philippines lending by `other banking institutions' was more modest than lending by
commercial banks, but the overall lending by such institutions was a small fraction (about
10 percent) of bank lending.
In Singapore, the credit growth of `other banking institutions' and non-banks was very
close to that of commercial banks, so that the overall lending boom pattern is con®rmed by
this extension of the analysis. In Thailand, the lending boom was signi®cantly larger for
®nance and securities companies than for banks (133 percent as opposed to 51 percent);
moreover, the non-bank share of lending to the private sector was quite signi®cant (about
33 percent of bank lending). So, Thailand is the only country in the sample where lending
to the private sector is very different if we add the `other banking' and `non-bank ®nancial
institutions' ®gures. Data for `other banking' and `non-bank ®nancial institutions' are not
available for Hong Kong, China and Taiwan.
Table 19
Bank lending to private sector (% of GDP)
1990 1991 1992 1993 1994 1995 1996 1997
Korea 52.54 52.81 53.34 54.21 56.84 57.04 61.81 69.79
Indonesia 49.67 50.32 49.45 48.90 51.88 53.48 55.42 69.23
Malaysia 71.36 75.29 74.72 74.06 74.61 84.80 93.39 106.91
Philippines 19.17 17.76 20.44 26.37 29.06 37.52 48.98 56.53
Singapore 82.20 83.34 85.06 84.14 84.21 90.75 95.96 100.29
Thailand 64.30 67.70 72.24 80.01 91.00 97.62 101.94 116.33
Hong Kong 141.84 134.20 140.02 149.00 155.24 162.36 174.24
China 85.51 87.87 86.17 95.49 87.12 85.83 91.65 101.07
Taiwan 100.41 108.99 126.43 137.23 146.89 149.49 146.05 146.23
Table 20
Lending boom measure (rate of growth between 1990 and 1996 of the ratio between the claims on the private
sector of the deposit money banks and nominal GDP)
Korea 11% Singapore 17%
Indonesia 10% Thailand 58%
Malaysia 31% Hong Kong 26%
Philippines 151% China 7%
49 These figures on Latin America are from Sachs et al. (1996). Note that they use a slightly different
definition of lending boom, as they consider total lending to the private sector by both banks and the central
bank. The difference between the two definition is is not significant, as in most countries central bank credit to
the private sector is very modest.
330 G. Corsetti et al. / Japan and the World Economy 11 (1999) 305±373

In summary, the evidence suggests a sustained lending boom in the Philippines,
Thailand and Malaysia. Note that these were also the ®rst countries to be hit by currency
speculation in 1997.
4.2. ...and quality
The growth rate of the lending to GDP ratio gives an indication of the quantity of loans.
But one of the main problems faced by the countries in our sample is that many loans made
by banks and non-banks were of low quality, ®nancing investment of dubious pro®tability
or speculative purchases of existing ®nancial assets. In the investment Section above, we
have already shown evidence suggesting overinvestment in risky and poorly performing
projects. We can now add to the picture evidence on the quality of pre-crisis lending, by
looking at the proportion of non-performing loans to total loans. Since the 1997 crisis may
have crippled otherwise healthy loans, it is appropriate to refer exclusively to data on non-
performing loans at the onset of the crisis.
As reported in Table 21, the pre-crisis share of non-performing loans as a proportion of
total lending can be estimated at 13 percent for Thailand, 13 percent for Indonesia, 8
percent for Korea, 10 percent for Malaysia, 14 percent for the Philippines and 4 percent for
Singapore. The estimated share is 3±4 percent for Hong Kong and Taiwan, and 14 percent
for China.50 Although the reliability of these estimates varies across countries, the ®gures
show a strong correlation between the amount of bad loans and the extent of the currency
crises.
We stress the impact of the real estate sector crisis on the ®nancial position of the
banking sector. Table 22 presents end-1997 estimates of property exposure, collateral
valuation, non-performing loans and capital of local banks, all as a share of total assets.
Property exposure is estimated to be very high in Hong Kong, Malaysia, Singapore and
Thailand, while it is relatively low in the Philippines and Korea (where the bad loans were
concentrated in manufacturing ®rms). By the end of 1997, non performing loans of local
banks were the highest in Indonesia (11 percent), South Korea (16 percent) and Thailand
(15 percent). As the table shows, they are expected to increase sharply in 1998 in all the
Asian countries, and become especially problematic in Indonesia, South Korea, Thailand
and Malaysia. In these four countries, banks were also severely under-capitalized, with
capital to asset ratios as low as 6±8 percent. Note that, at the end of 1997, this ratio was
Table 21
Non-performing loans (as proportion of otal lending in 1996)a
Korea 8% Thailand 13%
Indonesia 13% Hong Kong 3%
Malaysia 10% China 14%
Philippines 14% Taiwan 4%
Singapore 4%
a Source: 1997 BIS annual report; Jardine Fleming
50 See Corsetti et al. (1999) for details.
G. Corsetti et al. / Japan and the World Economy 11 (1999) 305±373 331

already below the share of non-performing loans, a share that is expected to worsen in the
current year.
The table clari®es the links between high shares of bad loans, an excessive exposure to
the property sector, and overly-optimistic estimates of the loans' collateral. In the four
countries with the most severe problems, the of®cial collateral valuations were in the range
of 80±100 percent of assets.51 Asset de¯ation and the sharp drop in the value of the
collateral, especially real estate, triggered the irreversible surge in the shares of non-
performing loans.
4.3. Banking problems, financial deregulation, and institutional deficiencies
In the Asian region, with bond and equity markets relatively underdeveloped, most
®nancial intermediation occurred through the banking system. This meant that the capital
in¯ows ®nancing the region's large current account de®cits were largely intermediated by
local banks. Speci®cally, domestic banks borrowed from foreign banks and then, in turn,
lent on to domestic ®rms, so that when the domestic ®rms experienced ®nancial dif®culties,
domestic banks were faced with non-performing domestic assets and short-term foreign-
currency liabilities.
Such `overborrowing' and `overlending' syndromes within the undercapitalized banking
systems were the outcome of severe institutional and policy de®ciencies. There is indeed
overwhelming evidence that the Asian banking and ®nancial systems were very fragile±
poorly supervised, poorly regulated, and in a shaky condition even before the onset of the
crisis. In Thailand, regulation of commercial banks limited their credit expansion, but
®nancial liberalization in the 1990s led to the emergence of other largely unregulated non-
bank intermediaries that could circumvent credit limits. Moreover, Thai policies provided
strong tax-incentives to offshore borrowing. In the 1990s, Thai ®nance companies sharply
accelerated their lending to the real estate and property sector, mainly ®nanced with
borrowing from foreign ®nancial institutions.
In Korea the ®nancial system was in a severe crisis because of excessive lending to large
traded-sector conglomerates, a number of which went bankrupt before the currency crisis
Table 22
Banking system exposure to risk. (% of assets at the end of 1997)a
Property Collateral Non-performing loans Capital
Exposure (%) Valuation (%) 1997 (%) 1998 (%) Ratio (%)
Korea 15±25 80±100 16 22.5 6±10
Indonesia 25±30 80±100 11 20.0 8±10
Malaysia 30±40 80±100 7.5 15.0 8±14
Philippines 15±20 70±80 5.5 7.0 15±18
Singapore 30±40 70±80 2.0 3.5 18±22
Thailand 30±40 80±100 15 25 6±10
Hong Kong 40±55 50±70 1.5 3 15±20
a Source: J.P. Morgan `Asian Financial Markets', January 1998.
51 The source is J.P. Morgan.
332 G. Corsetti et al. / Japan and the World Economy 11 (1999) 305±373

hit in late 1997. It should be noted that, in several cases, private banks in Korea were
effectively controlled by chaebols, giving those conglomerates privileged access to credit
and exacerbating the moral hazard problem.
In Indonesia, although of®cial prudential requirements for domestic banks were in line
with the Basle Committee recommendations, compliance and enforcement were low.
According to central bank statistics, from a total of 240 banks in April 1996, 15 did not
meet the required 8 percent capital adequacy ratio, 41 did not comply with the legal
spending limit, and 12 out of 77 licensed foreign exchange banks did not meet the rules on
net overnight positions.
While in the 1980s the banking system had been dominated by ®ve large state-owned
banks, accounting for 80±90 percent of all the bank credit, in the 1990s Ð following a
wide-ranging series of reforms in 1988/1989 Ð the private banking sector grew rapidly,
surpassing the state sector by 1994. Overall, banks accounted for almost two-thirds of the
total corporate ®nance, while the stock markets provided one third. Rapid growth within
this deregulated system, along with the struggle for market shares, resulted in a system
containing an excessive number of small undercapitalized banks (a problem pointed out by
IMF economists in November 1996, and also highlighted by Standard and Poors in January
1996), which was vulnerable to poorly chosen or fraudulent lending.52
Rather than shutting down ailing banks Ð only one, Bank Summa in 1992, had ever
been liquidated Ð the Indonesian government's preferred course of action was to encou-
rage mergers, or other forms of support.53 With such government support in prospect, the
incentives of small undercapitalized banks were clearly biased toward riskier projects. The
asset quality of state banks was even worse than that of private banks, due to their even
greater con®dence in government support (the Finance Ministry announced in 1994 that it
would not permit a state bank to default on its obligations), or to their greater susceptibility
to government direction in their lending patterns. At end of 1995, state banks had an
average non-performing debt level of 17 percent, compared to 5 percent for the private
sector as a whole.
Until 1995, Malaysia's banking problems were not as serious as Indonesia's, but there is
evidence of excessive lending in highly risky projects, which escalated in 1996 and early
1997. Recognizing that Malaysia had too many small banks to be internationally
competitive, Bank Negara had been steadily urging consolidation of the banking sector.
In 1996 the proportion of non-performing loans to total credits dropped to 3.9 percent from
5.5 percent in 1995, due to recoveries associated both with economic growth and write-
offs. But 1996 witnessed an overall increase in bank lending by 27.6 percent, with a sharp
switch from lending to the manufacturing sector to lending for equity purchases: growth in
52 The most spectacular case of poor lending emerged with the rescue of Bank Bapindo, a government
development bank, which had built up a overwhelming portfolio of non-performing loans, and had lent US $420
million to an obscure businessman who absconded after being jailed with other Bapindo officials for corruption.
Similarly, Lippo Bank faced a bank run in November 1995, following reports that it had not disclosed its
exposure to sister companies in the Lippo group companies that had been involved in highly speculative real
estate ventures. The bank was rescued by a group of private banks which agreed to provide short-term liquidity.53 In April 1996, Bank Negara Indonesia was told to `nurse' two ailing banks closely affiliated with Suharto's
family Bank Yama, owned by President Suharto's eldest daughter, and Bank Pacific, run by the daughter of the
founder of the state-run oil monopoly Pertamina.
G. Corsetti et al. / Japan and the World Economy 11 (1999) 305±373 333

lending to the manufacturing sector fell to 14 percent in 1996 (from 30.7 percent in 1995),
while growth in lending for share purchases accelerated to 20.1 percent (from 4 percent in
1995).
By the end of 1996, the banking system's exposure to the property sector and equities
stood at 42.6 percent of total credits, compared to 21 percent for manufacturing ®nance.
Over the year, the increased availability of loans drove up asset prices, with the price of up-
market properties in major Malaysian cities growing by 25 percent in 1996. Property and
equity ®nancing continued to rise rapidly in early 1997. The Malaysian central bank
eventually intervened to slow the growth of lending for real estate speculation and equity
purchases, but these actions were too little, too late. Only on March 1997 did Bank Negara
announce ceilings on lending to the property sector and for purchases of stocks and shares.
5. Imbalances in foreign debt accumulation and management
5.1. The foreign debt burden and the role of short-term external debt
An otherwise solvent country may suffer a short-run liquidity problem when the
available stock of reserves is low relative to the overall burden of external debt service
(interest payments plus the renewal of loans coming to maturity). Liquidity problems
emerge when panicking external creditors Ð perhaps in response to rapid devaluation Ð
become unwilling to roll over existing short-term credits. So, if a large fraction of a
country's external liabilities are short-term, a crisis may take the form of a pure liquidity
shortfall Ð the inability by a country to roll-over its short-term liabilities. The experience
of Mexico with its short-term public debt (Tesobonos) in 1994±1995, and of several Asian
countries with private external liabilities in 1997 provides striking examples of liquidity
problems.54
Comparable estimates of the debt-service burden and the external liabilities of the Asian
countries are available from three sources. The ®rst is the World Bank, which provides
annual estimates of the external debt of developing countries.55 The second source consists
of two series of data published by the BIS. One BIS series56 is published quarterly and
presents data on the liabilities and assets of domestic agents (both domestic banks and non-
banking institutions, i.e., private ®rms and other large public sector agents) towards the BIS
reporting banks. The other BIS series57 is published every 6 months and contains
54 At a theoretical level, a number of recent analyses emphasize that a relatively large share of short-term debt
makes the occurrence of self-fulfilling debt crises more likely (see Cole and Kehoe (1996) and Sachs et al.
(1996)).55 The World Bank data on long-term debt are quite precise but its estimates of short-term debt, especially the
external liabilities of the banking system, are less reliable. Moreover, the World Bank measure of the debt-
servicing ratio has serious shortcomings as it includes interest payments on all foreign debt but principal
payments only for long-term debt so the roll-over of short term liabilities that was an essential issue in the 1997
Asian crisis is not considered. Also, the annual World Bank data are published with considerable delay (usually
1 year and often 2 years).56 These are the data in the BIS publication International banking and financial market developments.57 This is the BIS publication The maturity, sectoral and nationality distribution of international bank
lending.
334 G. Corsetti et al. / Japan and the World Economy 11 (1999) 305±373

consolidated data on liabilities toward BIS banks, including their maturity±allowing for a
precise measure of short-term lending from BIS reporting banks to a particular developing
country. Finally, the OECD also collects yearly data on the external liabilities of
developing countries.58
If we use the estimates developed by the World Bank, it is hard to notice any serious
problems for the countries hit by the crisis. As can be seen from Table 23, the debt-to-GDP
ratio for many of these countries was relatively low and growing only modestly, or else
high but actually falling during the 1990s. In Korea, the ratio was around 14 percent
between 1990 and 1995. It was relatively high in Indonesia in 1991 (68 percent), falling to
57 percent by 1996; in Malaysia, it gravitated around 40 percent since 1993. In the
Philippines, the ratio fell from a high 69 percent of GDP in 1991 to 53 percent in 1995. In
Thailand, it barely moved from 33 percent of GDP in 1990 until 1996, while in Singapore
and Taiwan external debt was practically non-existent.59 The ratio for China grew from 14
percent in 1990 to 18 percent in 1994 but still remained relatively low.
World Bank ®gures also suggest that the share of short-term debt was relatively modest,
albeit growing (see Table 24): about 25 percent in Korea in 1994; 25 percent in Indonesia in
1996, up from 16 percent in 1990; 28 percent in Malaysia in 1996, up from 12 percent in
1990; 19 percent in the Philippines in 1996; 41 percent in Thailand in 1996 (although it was
over 70 percent in 1995) and 20 percent in China in 1996. As for the debt service ratio, the
World Bank estimates for the Asian countries in our sample are also quite low, as they do
not include the roll-over of short-term liabilities. The debt service ratio is de®ned as the
interest on all debt plus the principal to be repaid on long-term debt as a share of total
Table 23
Foreign debt, world bank data (as a % of GDP)a
1990 1991 1992 1993 1994 1995 1996
Korea 13.79 13.51 14.34 14.18 14.32 23.80 28.40
Indonesia 65.89 68.21 68.74 56.44 60.96 61.54 56.74
Malaysia 35.80 35.48 34.51 40.74 40.40 39.31 40.06
Philippines 69.02 71.45 62.29 66.09 62.42 53.21 49.75
Singapore 11.23 11.07 9.47 9.45 10.79 9.84 10.74
Thailand 32.80 38.38 37.51 34.10 33.31 33.78 50.05
Hong Kong 16.80 14.84 14.99 14.35 18.38 16.60 15.44
China 14.26 14.84 14.99 14.35 18.38 16.60 15.44
Taiwan 11.04 10.73 9.37 10.44 10.87 10.40 10.07
a Note: The source for Tables 23±27 is the Global Development Finance (GDF) report of the World Bank and
IMF-IFS. The data for Hong Kong, Singapore, Taiwan in Tables 23, 24 and 26, 27 are from the Asian
development bank. The data for Korea in 1995 and 1996 (in italics) are from OECD, external debt statistics.
58 The OECD estimates of long-term debt are comparable to those of the World Bank; however, the OECD
estimates of short-term liabilities are closer to those provided by the BIS.59 Data on Singapore, Hong Kong and Taiwan are from the Asian Development Bank, since these countries
are not considered as developing by the World Bank, and therefore, are not included in the debt tables provided
by this institution. Since 1996, the World Bank also stopped reporting data on Korea, after this country was
promoted to the status of developed OECD country. In Tables 23±27, the source for Korean data in 1995 and
1996 (in italics) is the OECD; the lack of homogeneity between the World Bank and the OECD estimates is
transparent.
G. Corsetti et al. / Japan and the World Economy 11 (1999) 305±373 335
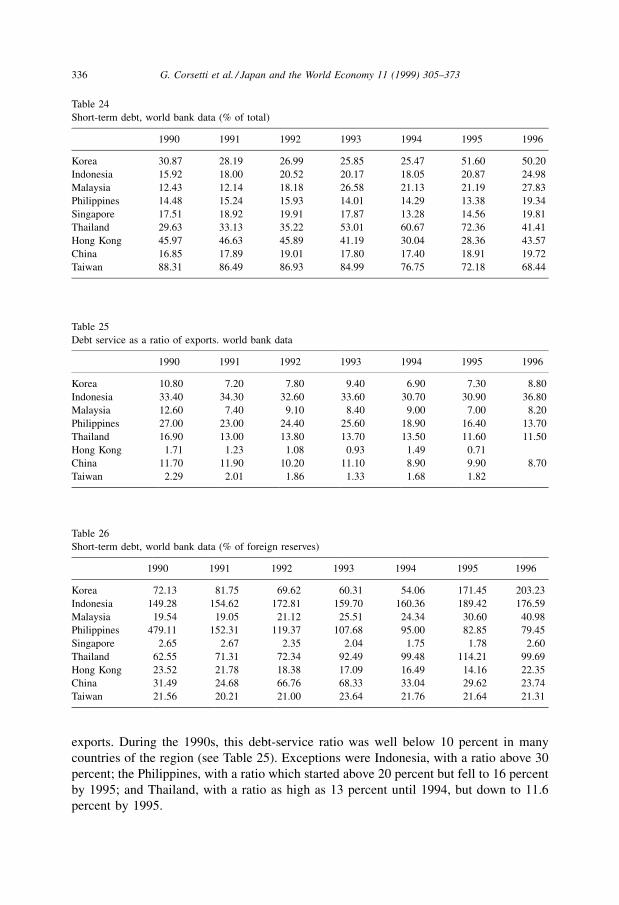
exports. During the 1990s, this debt-service ratio was well below 10 percent in many
countries of the region (see Table 25). Exceptions were Indonesia, with a ratio above 30
percent; the Philippines, with a ratio which started above 20 percent but fell to 16 percent
by 1995; and Thailand, with a ratio as high as 13 percent until 1994, but down to 11.6
percent by 1995.
Table 24
Short-term debt, world bank data (% of total)
1990 1991 1992 1993 1994 1995 1996
Korea 30.87 28.19 26.99 25.85 25.47 51.60 50.20
Indonesia 15.92 18.00 20.52 20.17 18.05 20.87 24.98
Malaysia 12.43 12.14 18.18 26.58 21.13 21.19 27.83
Philippines 14.48 15.24 15.93 14.01 14.29 13.38 19.34
Singapore 17.51 18.92 19.91 17.87 13.28 14.56 19.81
Thailand 29.63 33.13 35.22 53.01 60.67 72.36 41.41
Hong Kong 45.97 46.63 45.89 41.19 30.04 28.36 43.57
China 16.85 17.89 19.01 17.80 17.40 18.91 19.72
Taiwan 88.31 86.49 86.93 84.99 76.75 72.18 68.44
Table 25
Debt service as a ratio of exports. world bank data
1990 1991 1992 1993 1994 1995 1996
Korea 10.80 7.20 7.80 9.40 6.90 7.30 8.80
Indonesia 33.40 34.30 32.60 33.60 30.70 30.90 36.80
Malaysia 12.60 7.40 9.10 8.40 9.00 7.00 8.20
Philippines 27.00 23.00 24.40 25.60 18.90 16.40 13.70
Thailand 16.90 13.00 13.80 13.70 13.50 11.60 11.50
Hong Kong 1.71 1.23 1.08 0.93 1.49 0.71
China 11.70 11.90 10.20 11.10 8.90 9.90 8.70
Taiwan 2.29 2.01 1.86 1.33 1.68 1.82
Table 26
Short-term debt, world bank data (% of foreign reserves)
1990 1991 1992 1993 1994 1995 1996
Korea 72.13 81.75 69.62 60.31 54.06 171.45 203.23
Indonesia 149.28 154.62 172.81 159.70 160.36 189.42 176.59
Malaysia 19.54 19.05 21.12 25.51 24.34 30.60 40.98
Philippines 479.11 152.31 119.37 107.68 95.00 82.85 79.45
Singapore 2.65 2.67 2.35 2.04 1.75 1.78 2.60
Thailand 62.55 71.31 72.34 92.49 99.48 114.21 99.69
Hong Kong 23.52 21.78 18.38 17.09 16.49 14.16 22.35
China 31.49 24.68 66.76 68.33 33.04 29.62 23.74
Taiwan 21.56 20.21 21.00 23.64 21.76 21.64 21.31
336 G. Corsetti et al. / Japan and the World Economy 11 (1999) 305±373

The picture looks somewhat more troubling if we consider the ratio of short-term debt to
foreign reserves, and the ratio of debt-service plus short-term debt to foreign reserves. If a
liquidity crisis occurs, foreign reserves must be large enough to cover a country's debt
service obligations (including the roll-over of short-term debt). The ®gures corresponding
to the two ratios described above are presented in Tables 26 and 27. By the latest available
data (1996 for all the countries except Korea, for which data refer to 1994), these ratios
were: 54 and 85 percent for Korea; 177 and 294 percent in Indonesia; 41 and 69 percent in
Malaysia; 79 and 137 percent in the Philippines; 100 and 123 percent in Thailand; 24 and
38 percent in China.
We look next at the quarterly BIS data on the external assets and liabilities of domestic
banks and non-banks towards BIS reporting banks. Table 28 presents the data on a country-
by-country basis, while Table 29 reports the ratio of total liabilities to GDP for all countries
in the sample. First, by comparing Tables 23 and 29, we note that for Korea and Thailand
foreign liabilities of domestic agents towards BIS banks are larger than the World Bank
estimates of total foreign debt. This observation suggests that the World Bank estimates,
especially those of domestic agents' liabilities towards foreign banks, may be seriously
biased downward.
The second point to note is that, in most countries, foreign liabilities towards BIS
reporting banks are liabilities of domestic banks, as opposed to liabilities of the
corporate or public non-bank sector. For example, by the second quarter of 1997, about
77 percent of all the Korean liabilities towards BIS banks concerned domestic banks. This
con®rms our previous observation that a large fraction of Asian borrowing from foreign
banks was intermediated by the domestic banking system. In mid-1997 the ratio of
intermediation handled by domestic banks was 77 percent for Malaysia 69 percent for the
Philippines, 86 percent for Thailand, and 78 percent for China. The only country with
signi®cant external borrowing by non-banks was Indonesia, where the ratio for banks was
39 percent.
It is worth pointing out that the banking share of total liabilities is quite different if we
use the second set of data published by the BIS, as presented in Table 30. According to the
latter ®gures, in mid-1997 the banks' liabilities represented 44 percent of the total in Korea,
38 percent in Thailand, 21 percent in Indonesia, 36 percent in Malaysia, 62 percent in
Table 27
Debt service plus short-term debt, world bank data (% of foreign reserves ).
1990 1991 1992 1993 1994 1995 1996
Korea 127.43 125.90 110.35 105.66 84.90 204.93 243.31
Indonesia 282.92 278.75 292.03 284.79 277.95 309.18 294.17
Malaysia 63.96 45.87 45.55 42.37 48.73 55.92 69.33
Philippines 867.64 256.99 217.08 212.60 171.98 166.60 137.06
Thailand 102.35 99.34 101.34 120.28 126.54 138.13 122.62
Hong Kong 30.51 26.87 22.82 20.64 22.02 16.82
China 55.34 43.70 108.55 113.74 54.08 49.61 38.46
Taiwan 23.92 22.29 23.08 25.21 23.69 24.20
G. Corsetti et al. / Japan and the World Economy 11 (1999) 305±373 337

Table 28
Foreign Liabilities and Assets (toward BIS Reporting Banks) (US $ billion)a
1993 1994 1995 1996 1997 1997-Q1 1997-Q2 1997-Q4
Korea
Foreign liabilities 45.22 60.97 83.26 109.15 103.78 113.42 118.25 104.71
Foreign assets 15.20 20.54 25.10 29.07 41.28 33.04 35.87 41.79
Net liabilities 30.02 40.43 58.16 80.08 62.50 80.39 82.38 62.92
Foreign liabilities (non-banks) 10.59 13.49 17.91 24.07 25.18 25.98 26.53 25.40
Foreign assets (non-banks) 1.45 2.29 3.58 3.47 2.24 3.42 3.06 2.28
Net liabilities 9.14 11.20 14.33 20.61 22.94 22.57 23.46 23.13
Foreign liabilities (banks) 34.63 47.49 65.35 85.08 78.60 87.44 91.72 79.31
Foreign assets (banks) 13.75 18.25 21.52 25.61 39.04 29.62 32.80 39.52
Net liabilities 20.88 29.24 43.83 59.47 39.56 57.82 58.92 39.79
Indonesia
Foreign liabilities 37.20 41.62 48.93 57.85 62.76 59.65 62.44 63.58
Foreign assets 12.58 10.39 11.48 13.64 11.55 12.75 11.20 11.92
Net liabilities 24.63 31.23 37.45 44.21 51.21 46.91 51.24 51.66
Foreign liabilities (non-banks) 22.23 24.57 27.93 34.36 38.70 36.17 37.62 39.35
Foreign assets (non-banks) 3.61 2.47 2.56 2.68 3.32 2.90 2.71 3.37
Net liabilities
Foreign liabilities (banks) 14.97 17.05 21.00 23.49 24.07 23.48 24.82 24.23
Foreign assets (banks) 8.97 7.92 8.93 10.97 8.23 9.85 8.49 8.55
Net liabilities 6.00 9.13 12.08 12.52 15.84 13.63 16.33 15.68
Malaysia
Foreign liabilities 16.02 14.48 18.76 25.91 29.08 31.23 33.00 29.47
Foreign assets 19.24 10.32 13.03 17.49 13.07 18.88 17.47 13.93
Net liabilities -3.21 4.15 5.72 8.41 16.01 12.35 15.53 15.54
Foreign liabilities (non-banks) 4.26 3.91 5.54 6.92 6.46 7.06 7.50 6.70
Foreign assets (non-banks) 1.94 2.12 2.58 2.75 3.46 3.49 3.03 3.51
Net liabilities 2.31 1.79 2.96 4.17 3.00 3.57 4.47 3.20
Foreign liabilities (banks) 11.77 10.57 13.22 18.99 22.62 24.17 25.50 22.76
Foreign assets (banks) 17.29 8.21 10.46 14.74 9.61 15.39 14.44 10.42
Net liabilities ÿ5.53 2.36 2.76 4.25 13.01 8.78 11.06 12.35
Philippines
Foreign liabilities 6.61 6.54 8.07 13.51 16.61 15.11 17.02 16.79
Foreign assets 5.81 6.75 7.34 7.84 9.70 8.59 7.68 9.84
Net liabilities 0.80 ÿ0.21 0.73 5.67 6.91 6.52 9.34 6.96
Foreign liabilities (non-banks) 3.37 2.84 3.12 4.15 6.34 4.82 5.24 6.42
Foreign assets (non-banks) 2.96 3.22 3.31 3.06 3.14 3.15 3.30 3.17
Net liabilities 0.42 ÿ0.37 ÿ0.19 1.09 3.20 1.68 1.94 3.25
Foreign liabilities (banks) 3.24 3.70 4.95 9.36 10.27 10.28 11.78 10.37
Foreign assets (banks) 2.85 3.53 4.03 4.78 6.56 5.45 4.38 6.67
Net liabilities 0.39 0.17 0.92 4.58 3.72 4.84 7.40 3.71
Singapore
Foreign liabilities 233.39 248.00 282.03 287.24 295.83 293.41 306.89 310.24
Foreign assets 155.02 153.43 170.26 177.83 214.65 193.06 202.33 219.64
Net liabilities 78.37 94.57 111.77 109.42 81.18 100.35 104.56 90.59
Foreign liabilities (non-banks) 3.73 4.05 5.65 6.71 8.01 8.22 8.41 8.13
Foreign assets (non-banks) 9.56 10.88 12.07 13.62 14.16 13.72 13.77 14.38
Net liabilities ÿ5.82 ÿ6.83 ÿ6.43 ÿ6.91 ÿ6.16 ÿ5.50 ÿ5.36 ÿ6.26
338 G. Corsetti et al. / Japan and the World Economy 11 (1999) 305±373

Table 28 (Continued )a
1993 1994 1995 1996 1997 1997-Q1 1997-Q2 1997-Q4
Foreign liabilities (banks) 229.66 243.95 276.38 280.53 287.82 285.18 298.49 302.11
Foreign assets (banks) 145.47 142.55 158.19 164.21 200.49 179.34 188.56 205.26
Net liabilities 84.19 101.40 118.19 116.32 87.33 105.85 109.92 96.85
Thailand
Foreign liabilities 34.73 54.44 92.18 99.27 79.66 99.82 99.54 81.82
Foreign assets 5.01 7.04 11.81 9.00 9.81 10.09 8.78 9.95
Net liabilities 29.72 47.40 80.37 90.27 69.84 89.73 90.76 71.86
Foreign liabilities (non-banks) 9.14 9.81 12.56 14.13 12.00 13.84 13.50 12.23
Foreign assets (non-banks) 1.63 1.84 2.13 1.90 2.06 1.91 2.02 2.09
Net liabilities 7.50 7.97 10.43 12.22 9.94 11.92 11.49 10.14
Foreign liabilities (banks) 25.59 44.63 79.62 85.15 67.66 85.98 86.04 69.59
Foreign assets (banks) 3.38 5.20 9.68 7.10 7.75 8.17 6.76 7.86
Net liabilities 22.22 39.43 69.94 78.05 59.90 77.81 79.28 61.73
Hong Kong
Foreign liabilities 412.99 493.96 513.04 469.96 469.58 480.55 502.90 499.74
Foreign assets 290.01 345.19 329.74 284.37 294.76 302.24 296.81 302.72
Net liabilities 122.98 148.77 183.31 185.60 174.83 178.31 206.09 197.02
Foreign liabilities (non-banks) 19.61 17.90 22.58 26.73 20.69 25.48 26.10 21.44
Foreign assets (non-banks) 49.41 53.08 54.28 60.47 64.34 63.02 63.53 65.04
Net liabilities ÿ29.80 ÿ35.18 ÿ31.70 ÿ33.74 ÿ43.66 ÿ37.54 ÿ37.43 ÿ43.60
Foreign liabilities (banks) 393.38 476.06 490.46 443.24 448.90 455.08 476.79 478.31
Foreign assets (banks) 240.60 292.11 275.46 223.90 230.42 239.22 233.27 237.68
Net liabilities 152.78 183.95 215.00 219.34 218.48 215.86 243.52 240.63
China
Foreign liabilities 48.59 56.46 67.06 79.75 90.08 82.18 86.33 91.20
Foreign assets 49.16 59.95 57.43 66.54 66.40 64.58 64.99 67.04
Net liabilities ÿ0.57 ÿ3.49 9.63 13.21 23.68 17.60 21.34 24.15
Foreign liabilities (non-banks) 13.30 15.18 16.10 17.88 18.12 17.95 18.90 18.36
Foreign assets (non-banks) 2.50 2.73 2.92 3.00 3.79 3.70 3.98 3.86
Net liabilities 10.81 12.46 13.17 14.88 14.33 14.26 14.93 14.51
Foreign liabilities (banks) 35.29 41.28 50.96 61.87 71.96 64.22 67.43 72.83
Foreign assets (banks) 46.67 57.23 54.51 63.54 62.60 60.88 61.01 63.19
Net liabilities ÿ11.38 ÿ15.94 ÿ3.54 ÿ1.67 9.36 3.34 6.42 9.65
Taiwan
Foreign liabilities 22.13 22.79 22.43 24.69 25.23 22.66
Foreign assets 36.03 37.48 36.46 37.37 36.23 37.27
Net liabilities ÿ13.90 ÿ14.69 ÿ14.04 ÿ12.68 ÿ11.00 ÿ14.61
Foreign liabilities (non-banks) 2.51 2.97 3.13 3.53 3.19 3.19
Foreign assets (non-banks) 7.28 8.22 9.03 8.30 8.34 9.10
Net liabilities ÿ4.77 ÿ5.25 ÿ5.90 ÿ4.77 ÿ5.15 ÿ5.92
Foreign liabilities (banks) 19.63 19.82 19.29 21.16 22.04 19.47
Foreign assets (banks) 28.76 29.27 27.44 29.07 27.89 28.16
Net liabilities ÿ9.13 ÿ9.44 ÿ8.14 ÿ7.91 ÿ5.85 ÿ8.69
a Source: Bank for International Settlements (BIS): International Banking and Financial Market
Developments.
G. Corsetti et al. / Japan and the World Economy 11 (1999) 305±373 339
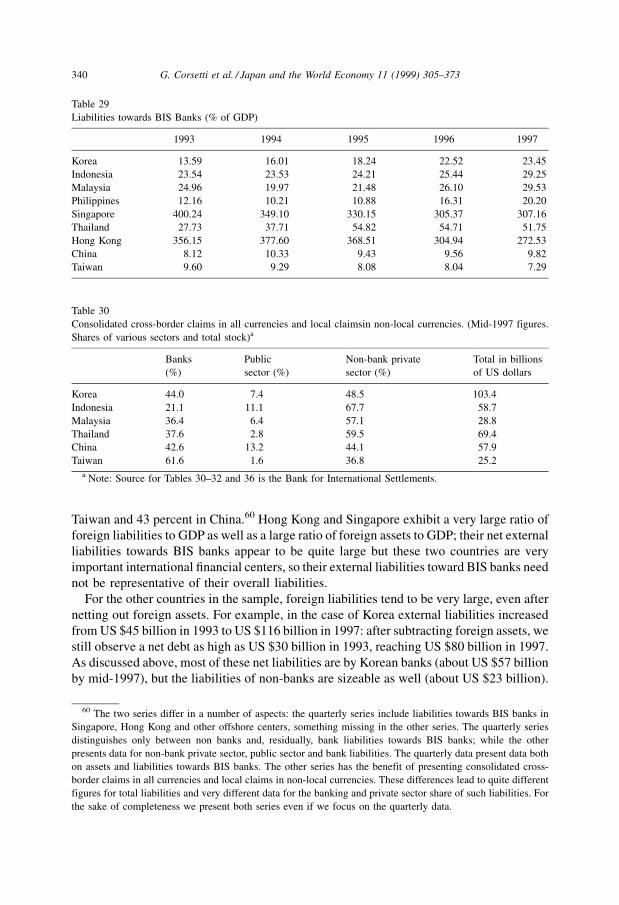
Taiwan and 43 percent in China.60 Hong Kong and Singapore exhibit a very large ratio of
foreign liabilities to GDP as well as a large ratio of foreign assets to GDP; their net external
liabilities towards BIS banks appear to be quite large but these two countries are very
important international ®nancial centers, so their external liabilities toward BIS banks need
not be representative of their overall liabilities.
For the other countries in the sample, foreign liabilities tend to be very large, even after
netting out foreign assets. For example, in the case of Korea external liabilities increased
from US $45 billion in 1993 to US $116 billion in 1997: after subtracting foreign assets, we
still observe a net debt as high as US $30 billion in 1993, reaching US $80 billion in 1997.
As discussed above, most of these net liabilities are by Korean banks (about US $57 billion
by mid-1997), but the liabilities of non-banks are sizeable as well (about US $23 billion).
Table 29
Liabilities towards BIS Banks (% of GDP)
1993 1994 1995 1996 1997
Korea 13.59 16.01 18.24 22.52 23.45
Indonesia 23.54 23.53 24.21 25.44 29.25
Malaysia 24.96 19.97 21.48 26.10 29.53
Philippines 12.16 10.21 10.88 16.31 20.20
Singapore 400.24 349.10 330.15 305.37 307.16
Thailand 27.73 37.71 54.82 54.71 51.75
Hong Kong 356.15 377.60 368.51 304.94 272.53
China 8.12 10.33 9.43 9.56 9.82
Taiwan 9.60 9.29 8.08 8.04 7.29
Table 30
Consolidated cross-border claims in all currencies and local claimsin non-local currencies. (Mid-1997 figures.
Shares of various sectors and total stock)a
Banks
(%)
Public
sector (%)
Non-bank private
sector (%)
Total in billions
of US dollars
Korea 44.0 7.4 48.5 103.4
Indonesia 21.1 11.1 67.7 58.7
Malaysia 36.4 6.4 57.1 28.8
Thailand 37.6 2.8 59.5 69.4
China 42.6 13.2 44.1 57.9
Taiwan 61.6 1.6 36.8 25.2
a Note: Source for Tables 30±32 and 36 is the Bank for International Settlements.
60 The two series differ in a number of aspects: the quarterly series include liabilities towards BIS banks in
Singapore, Hong Kong and other offshore centers, something missing in the other series. The quarterly series
distinguishes only between non banks and, residually, bank liabilities towards BIS banks; while the other
presents data for non-bank private sector, public sector and bank liabilities. The quarterly data present data both
on assets and liabilities towards BIS banks. The other series has the benefit of presenting consolidated cross-
border claims in all currencies and local claims in non-local currencies. These differences lead to quite different
figures for total liabilities and very different data for the banking and private sector share of such liabilities. For
the sake of completeness we present both series even if we focus on the quarterly data.
340 G. Corsetti et al. / Japan and the World Economy 11 (1999) 305±373
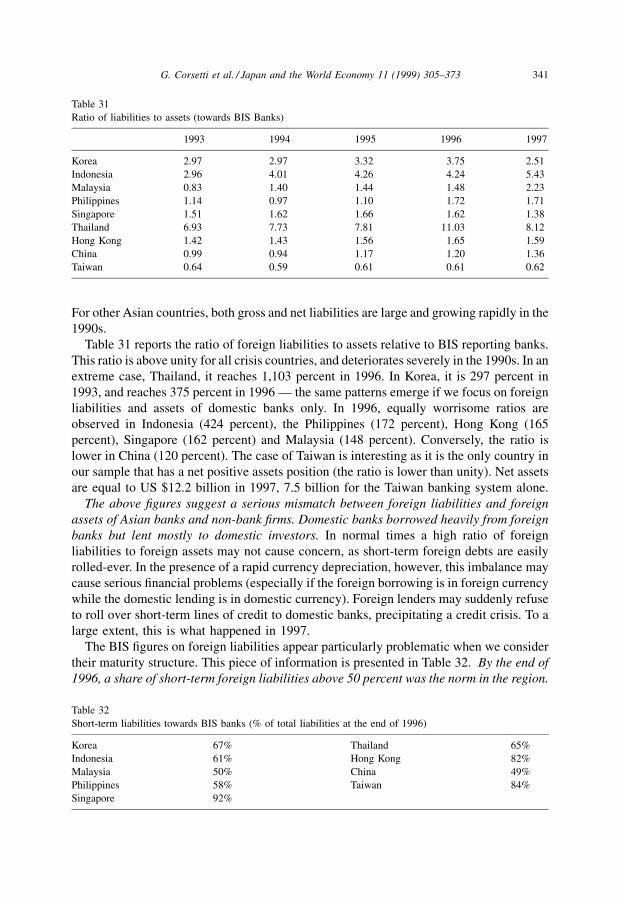
For other Asian countries, both gross and net liabilities are large and growing rapidly in the
1990s.
Table 31 reports the ratio of foreign liabilities to assets relative to BIS reporting banks.
This ratio is above unity for all crisis countries, and deteriorates severely in the 1990s. In an
extreme case, Thailand, it reaches 1,103 percent in 1996. In Korea, it is 297 percent in
1993, and reaches 375 percent in 1996 Ð the same patterns emerge if we focus on foreign
liabilities and assets of domestic banks only. In 1996, equally worrisome ratios are
observed in Indonesia (424 percent), the Philippines (172 percent), Hong Kong (165
percent), Singapore (162 percent) and Malaysia (148 percent). Conversely, the ratio is
lower in China (120 percent). The case of Taiwan is interesting as it is the only country in
our sample that has a net positive assets position (the ratio is lower than unity). Net assets
are equal to US $12.2 billion in 1997, 7.5 billion for the Taiwan banking system alone.
The above ®gures suggest a serious mismatch between foreign liabilities and foreign
assets of Asian banks and non-bank ®rms. Domestic banks borrowed heavily from foreign
banks but lent mostly to domestic investors. In normal times a high ratio of foreign
liabilities to foreign assets may not cause concern, as short-term foreign debts are easily
rolled-ever. In the presence of a rapid currency depreciation, however, this imbalance may
cause serious ®nancial problems (especially if the foreign borrowing is in foreign currency
while the domestic lending is in domestic currency). Foreign lenders may suddenly refuse
to roll over short-term lines of credit to domestic banks, precipitating a credit crisis. To a
large extent, this is what happened in 1997.
The BIS ®gures on foreign liabilities appear particularly problematic when we consider
their maturity structure. This piece of information is presented in Table 32. By the end of
1996, a share of short-term foreign liabilities above 50 percent was the norm in the region.
Table 31
Ratio of liabilities to assets (towards BIS Banks)
1993 1994 1995 1996 1997
Korea 2.97 2.97 3.32 3.75 2.51
Indonesia 2.96 4.01 4.26 4.24 5.43
Malaysia 0.83 1.40 1.44 1.48 2.23
Philippines 1.14 0.97 1.10 1.72 1.71
Singapore 1.51 1.62 1.66 1.62 1.38
Thailand 6.93 7.73 7.81 11.03 8.12
Hong Kong 1.42 1.43 1.56 1.65 1.59
China 0.99 0.94 1.17 1.20 1.36
Taiwan 0.64 0.59 0.61 0.61 0.62
Table 32
Short-term liabilities towards BIS banks (% of total liabilities at the end of 1996)
Korea 67% Thailand 65%
Indonesia 61% Hong Kong 82%
Malaysia 50% China 49%
Philippines 58% Taiwan 84%
Singapore 92%
G. Corsetti et al. / Japan and the World Economy 11 (1999) 305±373 341

The percentage of loans with a maturity of up to one year was 67 percent in Korea, 65
percent in Thailand, 61 percent in Indonesia, 50 percent in Malaysia, 58 percent in the
Philippines, 49 percent in China, 84 percent in Taiwan, 82 percent in Hong Kong and 92
percent in Singapore. Of the latter three countries, however, Taiwan was a net creditor,
while the data for Hong Kong and Singapore re¯ect the role of these countries as large
®nancial and intermediation centers.
5.2. Foreign exchange reserves
The existence of large foreign exchange reserves facilitates the ®nancing of a current
account de®cit, and enhances the credibility of a ®xed exchange rate policy. Foreign
exchange reserves and a small external debt burden reduce the risk of external crises, and
enable a country to ®nance a current account de®cit at lower costs. The real rate paid (in
hard currency terms) on the country's debt is an indication of the market's evaluation of the
country's ability to sustain a current account de®cit.
A traditional measure of the adequacy of foreign exchange reserves is the stock of
reserves in months of imports (of goods and services) Ð this measure is reported in Table
33. As rapid out¯ows of speculative money have become a more important source of
foreign exchange pressure than trade imbalances, the above indicator is no longer regarded
as a good measure of reserve adequacy. A better indicator of adequacy is the ratio of money
assets to foreign reserves, since in the event of an exchange rate crisis or panic, all liquid
money assets can potentially be converted into foreign exchange. Calvo (1998) suggests
the ratio of a broad measure of liquid monetary assets to foreign reserves, for instanceÐas
in Sachs et al. (1996) Ð the ratio of M2 to foreign reserves.61
Tables 34 and 35 report both the ratio of M1 to foreign reserves (M1/FX) and the ratio of
M2 to foreign reserves (M2/FX). For the purpose of comparison, it is worth recalling that,
just before the Mexican peso crisis (November 1994), M2/FX was equal to 9.1 in Mexico,
and equal to 3.6 in both Brazil and Argentina Ð the two countries that were most affected
by the `tequila effect'.
Table 33
Foreign reserves (in months of imports)
1990 1991 1992 1993 1994 1995 1996 1997
Korea 2.34 1.83 2.23 2.53 2.63 2.52 2.32 1.42
Indonesia 3.24 3.53 3.62 3.60 3.24 2.94 3.64 3.26
Malaysia 3.68 2.98 4.71 5.64 4.53 3.29 3.59 2.73
Philippines 0.75 2.63 2.93 2.59 2.81 2.33 2.95 1.79
Thailand 4.49 5.03 5.35 5.64 5.65 5.35 5.53 4.40
Hong Kong 3.13 3.04 3.04 3.33 3.27 3.10 3.47 4.80
Taiwan 12.99 12.86 11.28 10.64 10.90 8.90 8.68 7.56
61 Also see Radelet and Sachs (1998) and Chang and Velasco (1998c). A problem in interpreting the evidence
is that the ratio of M2 to GDP varies a great deal across countries, depending on the development of the banking
system and the level of financial intermediation. The M2 to reserves ratio may be high because banking
intermediaries are relatively more developed.
342 G. Corsetti et al. / Japan and the World Economy 11 (1999) 305±373
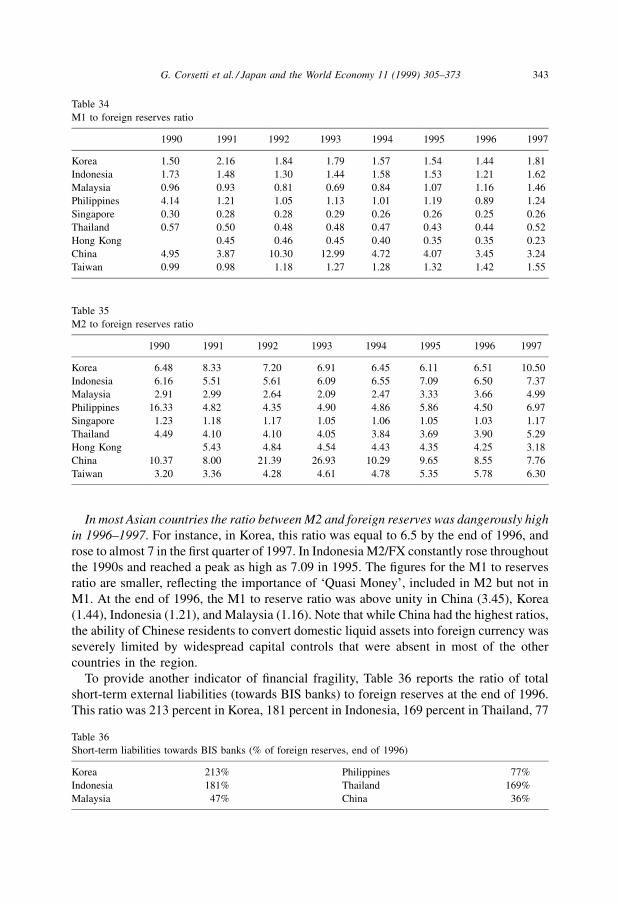
In most Asian countries the ratio between M2 and foreign reserves was dangerously high
in 1996±1997. For instance, in Korea, this ratio was equal to 6.5 by the end of 1996, and
rose to almost 7 in the ®rst quarter of 1997. In Indonesia M2/FX constantly rose throughout
the 1990s and reached a peak as high as 7.09 in 1995. The ®gures for the M1 to reserves
ratio are smaller, re¯ecting the importance of `Quasi Money', included in M2 but not in
M1. At the end of 1996, the M1 to reserve ratio was above unity in China (3.45), Korea
(1.44), Indonesia (1.21), and Malaysia (1.16). Note that while China had the highest ratios,
the ability of Chinese residents to convert domestic liquid assets into foreign currency was
severely limited by widespread capital controls that were absent in most of the other
countries in the region.
To provide another indicator of ®nancial fragility, Table 36 reports the ratio of total
short-term external liabilities (towards BIS banks) to foreign reserves at the end of 1996.
This ratio was 213 percent in Korea, 181 percent in Indonesia, 169 percent in Thailand, 77
Table 34
M1 to foreign reserves ratio
1990 1991 1992 1993 1994 1995 1996 1997
Korea 1.50 2.16 1.84 1.79 1.57 1.54 1.44 1.81
Indonesia 1.73 1.48 1.30 1.44 1.58 1.53 1.21 1.62
Malaysia 0.96 0.93 0.81 0.69 0.84 1.07 1.16 1.46
Philippines 4.14 1.21 1.05 1.13 1.01 1.19 0.89 1.24
Singapore 0.30 0.28 0.28 0.29 0.26 0.26 0.25 0.26
Thailand 0.57 0.50 0.48 0.48 0.47 0.43 0.44 0.52
Hong Kong 0.45 0.46 0.45 0.40 0.35 0.35 0.23
China 4.95 3.87 10.30 12.99 4.72 4.07 3.45 3.24
Taiwan 0.99 0.98 1.18 1.27 1.28 1.32 1.42 1.55
Table 35
M2 to foreign reserves ratio
1990 1991 1992 1993 1994 1995 1996 1997
Korea 6.48 8.33 7.20 6.91 6.45 6.11 6.51 10.50
Indonesia 6.16 5.51 5.61 6.09 6.55 7.09 6.50 7.37
Malaysia 2.91 2.99 2.64 2.09 2.47 3.33 3.66 4.99
Philippines 16.33 4.82 4.35 4.90 4.86 5.86 4.50 6.97
Singapore 1.23 1.18 1.17 1.05 1.06 1.05 1.03 1.17
Thailand 4.49 4.10 4.10 4.05 3.84 3.69 3.90 5.29
Hong Kong 5.43 4.84 4.54 4.43 4.35 4.25 3.18
China 10.37 8.00 21.39 26.93 10.29 9.65 8.55 7.76
Taiwan 3.20 3.36 4.28 4.61 4.78 5.35 5.78 6.30
Table 36
Short-term liabilities towards BIS banks (% of foreign reserves, end of 1996)
Korea 213% Philippines 77%
Indonesia 181% Thailand 169%
Malaysia 47% China 36%
G. Corsetti et al. / Japan and the World Economy 11 (1999) 305±373 343

percent in the Philippines, 47 percent in Malaysia and 36 percent in China. These ®gures
mean that, by the end of 1996, in the event of a liquidity crisis with BIS banks no longer
willing to roll-over short-term loans, foreign reserves in Korea, Indonesia and Thailand
were insuf®cient to cover short term liabilities, let alone to service interest payments and to
repay the principal on long-term debt coming to maturity in the period. When we add
interest and long-term principal repayment, the Philippines and Malaysia would have also
found it impossible to meet their external obligations.62
5.3. Composition and size of the capital inflows
As noted above, current account sustainability is enhanced when the de®cit is
largely ®nanced by foreign direct investment (FDI), relative to a de®cit mainly ®nanced
by short-term ¯ows that may be reversed if market conditions and sentiments change. In¯ows
from of®cial creditors are more stable and less subject to sharp reversals in the short-run than
those from private creditors; loans from foreign banks are less volatile than portfolio in¯ows
(bonds and non-FDI equity investments). External sustainability also depends on the currency
composition of a country's foreign liabilities. Borrowing in foreign currency is generally
associated with greater capital in¯ows at a lower interest rate than issuing debt denominated in
domesticcurrency(sinceriskaverse investorsconcernedabout in¯ationandexchangeraterisk
prefer foreign-currency denominated assets). However debt denominated in foreign currency
may end up exacerbating an exchange rate crisis, as the depreciation of the local currency
increases the real burden of foreign debt.63
Table 37 shows the extent to which Asia's current account imbalances were ®nanced
with non-debt creating long-term FDI ¯ows. There is a wide range of experiences. Some
countries such as Korea and Thailand ®nanced only a small and falling fraction of their
current account de®cits with long-term FDI. By 1996, this fraction was 10 percent for
Korea and 16 percent for Thailand. Other countries relied much more on FDI±in
Indonesia, FDI in¯ows were 60±90 percent of the current account de®cit between
1992 and 1995, whereas in Malaysia the ratio was well above 100 percent in 1992±
1993, but then fell to about 90 percent in 1994±1995. In the Philippines, the ratio was quite
Table 37
Contribution of inward FDI to current account financing (% of current account deficit)
1990 1991 1992 1993 1994 1995 1996 1997
Korea 45.16 14.19 18.43 ÿ59.39 20.92 20.88 10.11 34.82
Indonesia 36.58 34.79 63.92 95.16 75.54 67.58 80.83 97.11
Malaysia 268.05 95.58 239.18 180.13 98.27 90.10 110.84 139.28
Philippines 19.67 52.61 22.80 41.05 53.93 74.65 38.38 29.12
Thailand 33.57 26.60 33.52 28.35 16.90 15.26 15.90 103.84
62 The OECD data confirm the above analysis of the growth of short-term debt.63 In the experience of Mexico in 1995, the depreciation of the peso in the presence of a large amount of
short-term dollar denominated Tesobonos generated a liquidity crisis that almost turn into a default crisis.
344 G. Corsetti et al. / Japan and the World Economy 11 (1999) 305±373
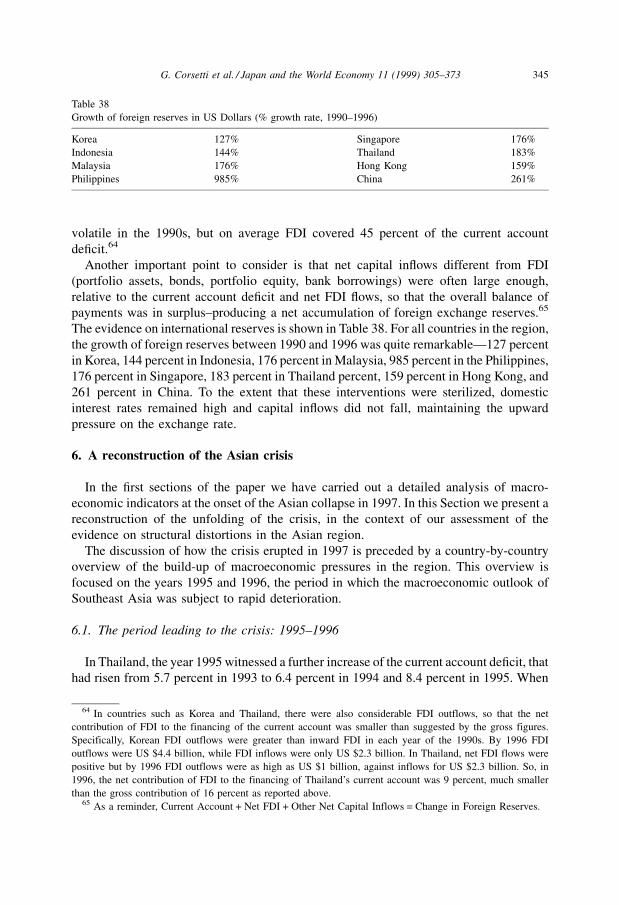
volatile in the 1990s, but on average FDI covered 45 percent of the current account
de®cit.64
Another important point to consider is that net capital in¯ows different from FDI
(portfolio assets, bonds, portfolio equity, bank borrowings) were often large enough,
relative to the current account de®cit and net FDI ¯ows, so that the overall balance of
payments was in surplus±producing a net accumulation of foreign exchange reserves.65
The evidence on international reserves is shown in Table 38. For all countries in the region,
the growth of foreign reserves between 1990 and 1996 was quite remarkableÐ127 percent
in Korea, 144 percent in Indonesia, 176 percent in Malaysia, 985 percent in the Philippines,
176 percent in Singapore, 183 percent in Thailand percent, 159 percent in Hong Kong, and
261 percent in China. To the extent that these interventions were sterilized, domestic
interest rates remained high and capital in¯ows did not fall, maintaining the upward
pressure on the exchange rate.
6. A reconstruction of the Asian crisis
In the ®rst sections of the paper we have carried out a detailed analysis of macro-
economic indicators at the onset of the Asian collapse in 1997. In this Section we present a
reconstruction of the unfolding of the crisis, in the context of our assessment of the
evidence on structural distortions in the Asian region.
The discussion of how the crisis erupted in 1997 is preceded by a country-by-country
overview of the build-up of macroeconomic pressures in the region. This overview is
focused on the years 1995 and 1996, the period in which the macroeconomic outlook of
Southeast Asia was subject to rapid deterioration.
6.1. The period leading to the crisis: 1995±1996
In Thailand, the year 1995 witnessed a further increase of the current account de®cit, that
had risen from 5.7 percent in 1993 to 6.4 percent in 1994 and 8.4 percent in 1995. When
Table 38
Growth of foreign reserves in US Dollars (% growth rate, 1990±1996)
Korea 127% Singapore 176%
Indonesia 144% Thailand 183%
Malaysia 176% Hong Kong 159%
Philippines 985% China 261%
64 In countries such as Korea and Thailand, there were also considerable FDI outflows, so that the net
contribution of FDI to the financing of the current account was smaller than suggested by the gross figures.
Specifically, Korean FDI outflows were greater than inward FDI in each year of the 1990s. By 1996 FDI
outflows were US $4.4 billion, while FDI inflows were only US $2.3 billion. In Thailand, net FDI flows were
positive but by 1996 FDI outflows were as high as US $1 billion, against inflows for US $2.3 billion. So, in
1996, the net contribution of FDI to the financing of Thailand's current account was 9 percent, much smaller
than the gross contribution of 16 percent as reported above.65 As a reminder, Current Account + Net FDI + Other Net Capital Inflows = Change in Foreign Reserves.
G. Corsetti et al. / Japan and the World Economy 11 (1999) 305±373 345

GDP growth slowed down in 1996, the current account fell even further, up to 8.5 percent
of GDP. By the end of 1996, the macroeconomic conditions of Thailand appeared to be
very shaky: large external de®cits, increasing short-term foreign indebtedness, fragile
®nancial conditions of corporate ®rms and ®nance companies that had borrowed heavily
from abroad to ®nance the speculative boom in real estate and equity investments. It is
worth stressing that the Thai baht had already come under attack in November and
December 1996.
In Indonesia, an acceleration of growth in 1995 brought along worrisome signs of
overheating: the in¯ation rate remained high, while the country's trade surplus suffered a
sharp drop. The government response was initially very timid: a mildly de¯ationary budget
and a modest tightening of monetary policy. The Bank of Indonesia (BI) raised interest
rates throughout 1995, and increased reserve requirements for commercial banks from 2 to
3 percent in January 1996. In September 1996, the BI announced that the reserve
requirements would further increase to 5 percent in April 1997. The bank also intensi®ed
its efforts to moderate the expansion of bank credit by resorting to moral persuasion.
Like many other Asian countries in a similar situation, the BI faced an awkward
balancing act: it was aiming at dampening domestic demand, but was reluctant to increase
domestic interest rates signi®cantly, in the fear that higher rates would fuel further capital
in¯ows and appreciate the currency. In an effort to reduce the effects of a monetary
contraction on capital in¯ows, the BI widened the rupiah's trading band from 2 to 3 percent
around the daily mid-rate, hoping that the additional trading risk of holding the rupiah
would offset the incentive to invest in domestic assets provided by the higher interest rates.
The band was further widened from 3 to 5 percent in June 1996, and again from 5 to 8
percent in September 1996. But the broader bands did little to discourage capital in¯ows, as
expectations of higher interest rates pushed the rupiah upward on each of these occasions.
Apart from these moves, the government's only other response was a promise to increase
its efforts to improve the ef®ciency and competitiveness of the export sector. This promise
was met with widespread skepticism, especially when assessed in the light of a number of
actual high-pro®le initiatives that the government undertook in the period.66 These
initiatives raised serious doubts on the government's willingness to address the country's
pressing economic problems, and, according to a private Hong Kong survey of expatriate
businessmen in March 1997, earned Indonesia the dubious honor of the `most corrupt
country in Asia'.
66 In February 1996, for instance, the heavily indebted Asri Petroleum group established under controversial
circumstances by a group of prominent local businessmen including Suharto's son, Bambang Trihatmodjo was
given significant tariff support, fueling worries of increased costs for downstream producers. In the same month,
Suharto inaugurated a National Automobile Program, in which qualified `pioneer' firms would be exempt from
sales tax and tariffs on imported components. The only firm to qualify was an obscure company owned by
Suharto's youngest son Hutomo (Tommy) Mandala Putra, which had entered into an agreement with the Korean
firm Kia, but had yet to produce a single car. To make the true intention of the government even clearer, it was
announced that the exemptions would not be extended to any other car manufacturer for a period of 3 years, even
if these met the qualification criteria. By the same token, when in December 1995 the ASEAN Free Trade Area
deadline for trade liberalization was brought forward to 2003, Suharto insisted on a list of exemptions for goods
such as cloves, rice, wheat flour, and sugar, most of which were supplied by lucrative monopolies owned by
Suharto's family or their close associates.
346 G. Corsetti et al. / Japan and the World Economy 11 (1999) 305±373

The current account de®cit had widened between 1993 and 1995 also in Malaysia,
reaching 8.8 percent GDP in 1995. Notably, in 1994 and 1995 foreign direct investment
failed to cover the full amount of the de®cit. In 1995 there was a surge in public investment,
which grew by 25 percent because of a series of large infrastructure projects designed to
facilitate Prime Minister Mahathir's goal of earning Malaysia the status of industrialized
country by 2020 (`Vision 2020'). The government dismissed concerns that such a goal was
placing too great a burden on the country's resources and skills, pointing at the low CPI
growth rates as evidence that the economy was not overheated. In contrast with this of®cial
view, a number of commentators stressed that Malaysia was an open economy with
effective price controls on items that were heavily weighted in the CPI basket. In this case,
overheating would be more likely to translate into a deterioration of the trade balance,
rather than an increase of the price level. And the trade balance was indeed deteriorating,
moving from a virtual balance in 1993 to a de®cit as high as 3.75 percent of GDP in 1995.
Efforts by members of the government to slow expenditure on these projects were
actively blocked by the Prime Minister, who appeared to view the projects as symbolic of
the government's resolve. With little help on the ®scal side, the Malaysian central bank,
Bank Negara (BN), implemented a number of restrictive measures. It placed administrative
controls on consumer lending for cars and houses in October 1995, and tightened reserve
requirements on Malaysian banks. Furthermore, BN cautiously took advantage of any
weakening in the ringgit to raise interest rates. Like Indonesia, the bank tried to walk a ®ne
line, hoping to restrain domestic demand without repeating the experience of 1992/1993, in
which BN halted a rush of speculative in¯ows by introducing restrictions and penalties on
domestic ringgit accounts and short-term debt instruments held by non-residents. Most of
these measures had been dismantled by 1995.
By the end of 1996, concern about overheating had eased. Despite the high rate of public
investment, growth had marginally slowed down from 8.2 to 8 percent. To a large extent,
this slowdown re¯ected a marked drop in the rate of export growth, which fell from 20.9
percent in 1995 to 7.3 percent in 1996. But the most important change that materialized
toward the end of 1996 was in the market sentiment towards Malaysia as an investment
opportunity Ð foreign fund managers had come to the conclusion that Malaysian interest
rates were too attractive to be ignored. In 1996, short-term capital in¯ows surged to M
$11.3 billion, compared to an in¯ow of M $2.4 billion in 1995 and an out¯ow of M $8.4
billion in 1994. Malaysia also experienced an overall increase in bank lending as high as
27.6 percent, with a sharp switch from lending to the manufacturing sector to lending for
equity purchases. The availability of property loans drove up asset prices: over the year, the
price of up-market properties in major Malaysian cities grew by 25 percent.
Korea experienced a serious deterioration of the macroeconomic conditions already in
1995±1996. The current account de®cit dramatically widened from 1.5 percent of GDP in
1994 to 4.8 percent in 1996, leading to an unprecedented accumulation of short-term
foreign debt. Export growth fell sharply, especially after negative terms of trade shocks hit
the economy in 1996. The 1996 growth rate of industrial production halved relative to the
previous year. On average, the pro®tability of the large Korean chaebols, characterized by
very high debt/equity ratios, was low and falling. The ®nancial conditions of the
conglomerates and their creditor banks were shaky, raising the possibility of widespread
bankruptcies; re¯ecting such weaknesses, the stock market fell sharply in the 2-year period
G. Corsetti et al. / Japan and the World Economy 11 (1999) 305±373 347

1995±1996, down by 36 percent relative to the 1994 peak. The won also weakened during
1996.
Relative to the other countries in the region, macroeconomic conditions were more solid
in the Philippines. Years of structural and macro reforms under IMF supervision had put
this economy on a sustainable growth path, albeit lower than some of the neighbors. The
government had privatized or was in the process of privatizing the national airline
company, the electric power systems, and banks and water supplies. The government's
budget was in surplus. Bad bank loans were at a rate of only 3.4 percent by the end of 1996.
Nevertheless, the current account de®cit was large, and the currency had signi®cantly
appreciated in real terms. A very rapid lending boom to the private sector had fueled
investment in risky projects, as well as a speculative boom in the property sector.
6.2. Financial distress in the first half of 1997
By early 1997, macroeconomic conditions had seriously deteriorated in most of the
region. We have already mentioned that, in the 1990s, ®nance companies in Thailand
experienced an explosive growth of lending to the real estate and property sector, mostly
®nanced by borrowing from foreign ®nancial institutions. Troubled ®nancial institutions
were receiving of®cial backing. For instance, in the ®rst quarter of 1997 the central bank's
Financial Institutions Development Fund (FIDF) had lent over US $8 billion, 17.5 percent
of which to Finance One Ð at the time, the largest ®nance company in the country Ð
alone.
It should be noted here that this public intervention implied a very large injection of
liquidity in the economic system. After a Thai company (Somprasong) missed payments on
foreign debt in February 1997, the Thai government on March 10 of®cially stated its
intention to buy US $3.9 billion in bad property debt from ®nancial institutions (a promise
that, as discussed below, was then to be reneged upon in June).
A closer look at the government management of the bankruptcy crisis allows us to assess
the role of moral hazard and government bail-out guarantees in facilitating the accumula-
tion of foreign loans by domestic ®nancial institutions. Although most of the evidence is
anecdotal, the analysis of a few cases can shed light on more general behavioral patterns.
The best known is the case of Finance One. Few months before its collapse, ING Bank in
Thailand had approved a loan to the company as part of a US $160 million syndication led
by the World Bank's International Finance Corporation. According to ING sources,
concerns about the viability of Finance One were simply dismissed by the Bank of
Thailand, which made explicit reference to a promise of bail-out in case the company had
®nancial problems.67
Despite the government-declared intentions to intervene in defense of Finance One, the
task of saving this company was particularly dif®cult and demanding. As reported by the
Financial Times, `̀ nearly two-thirds of the company's loans were in three problem areas±
property, hire purchase and stock margin lending. As interest rates rose and the economy
67 As quoted in the Financial Times, 1/12/1998, Jan Cherim, Country Manager for ING Bank in Thailand,
said: `̀ Every time we saw the Bank of Thailand they would tell us `Finance One is OK, we're backing it all the
way'. When they did not you had to question just about everything they had ever told you''.
348 G. Corsetti et al. / Japan and the World Economy 11 (1999) 305±373

slowed, Finance One's non-performing loans doubled in 1996, then doubled again in the
®rst quarter of 1997. Meanwhile, the terms of Finance One's assets and liabilities were the
most mismatched of any of the top 10 ®nance companies. It held substantial stakes in
several smaller ®nance and securities companies which themselves were even more
vulnerable to the dual pressures of high interest rates and a falling stock market.''
On 23 May the government made an attempt to save Finance One via a merger with
another ®nancial institution. As this attempt failed and the company became effectively
bankrupt, the FIDF stepped in and of®cially promised to buy new shares in Finance One. It
was only 1 month later, in June, that the public commitment to support Finance One, or any
troubled company, was of®cially abandoned. What happened in June?
Reportedly, on 25 June (the same day when information was leaked that the government
would stop supporting Finance One) the new ®nance minister `discovered' that the stock of
international reserves effectively available was a tiny fraction of that of®cially stated.
During the spring, US $28 billion out of US $30 billion in international reserves had been
committed in the course of forward market interventions to defend the value of the baht.
The government suddenly realized that the overall costs of defending both the domestic
value of the ®nancial ®rms and the external value of the currency were overwhelming and
unsustainable, given the available ®scal and quasi-®scal resources.68
The strong speculative attack on the baht that followed forced Thailand to let the
currency ¯oat on 2 July, a key date in the chronology of the Asian crisis. However, the
domestic ®nancial turmoil was just at its beginning. On 5 August, when the Thai baht had
already depreciated by 20 percent, Thailand unveiled a plan to revamp the ®nance sector as
part of a more general plan agreed upon with the IMF. At that time, the central bank
suspended 48 ®nance ®rms that were already effectively bankrupt. Eventually, 56 ®nance
companies went bankrupt and were forced to close.
Despite the timing of the bankruptcy, it should be stressed that a large number of these
Thai ®nancial institutions were bankrupt well before the currency crisis, when the sharp
depreciation driven by `investors' panic' increased the burden of their foreign liabilities. In
particular, the ®nance companies were very heavily exposed to real estate loans. On
average, 40 percent of the loan portfolio of the ®nance companies was in the real estate
sector, as opposed to the 25 percent exposure in real estate for the commercial banks.
It should be noted that the collapse of the real estate bubble was an important factor in the
weakening of the ®nancial conditions of the ®nance companies. While the peak of the real
estate bubble was in 1993 (see Table 11), the full crisis of the ®nance companies did not
erupt until 1997 for a number of reasons. First, it took a while for the downturn in real estate
to signi®cantly increase the share of non-performing loans by the ®nance companies.
Second, poor supervision and regulatory forbearance allowed such companies to hide their
®nancial problems for a while: bad loans classi®cation was inadequate, capital adequacy
standards were not enforced and regulation was rather lax. Third, while many ®nance
companies were at risk even before the baht collapse, the currency fall pushed into explicit
insolvency those companies that had heavily borrowed in foreign currency.
68 Although the press already reported the intention to suspend operation in support of Finance One on 25
June, it was only 2 days later that this intention translated into an official position of the central bank. On 27
June, Finance One and other 15 cash-strapped finance companies were ordered to submit merger or
consolidation plans.
G. Corsetti et al. / Japan and the World Economy 11 (1999) 305±373 349

By the same token, the beginning of the Korean crisis took place well before the
speculative attack on the won in late October and the ®nancial panic' that developed in
November and December. In early 1997, Korea was shaken by a series of bankruptcies of
its large conglomerates, the aforementioned chaebols, which had heavily borrowed in
previous years to ®nance their grand investment projects. The macroeconomic indicators in
early 1997 fully re¯ected the extent of this crisis: the current account de®cit was increasing,
export growth was falling, and industrial production growth rates were way below previous
levels.69
During 1997, Korea suffered a bankruptcy crisis shaking the large domestic conglom-
erate sector.70 As a general pattern, the chaebols that went bankrupt or had severe ®nancial
problems in 1997 had above average debt-equity ratios.71 The string of bankruptcies and
®nancial distress that affected the Korean corporate sector in 1997 translated into serious
®nancial dif®culties for the banking system, hitting especially the merchant banks. These
banks had heavily intermediated external funds, borrowing in foreign currency and lending
to domestic chaebols in domestic currency.
As opposed to Korea, the heart of ®nancial dif®culties in Malaysia was the real estate
sector. Facing a booming speculative bubble in real estate and equity lending, Bank
Negara waited very long±perhaps too long±before intervening. It was only on March
1997, that BN announced ceilings on lending to the property sector and for purchases
of stocks and shares.72 Yet the Bank added that it would be amenable to delays in the
submission of these plans and stressed that it was not asking banks to call in credits.
The impact of these measures on the KLCI stock exchange index (which is heavily
weighted toward property and ®nancial shares) was immediate, and caused foreign
investors, led by US fund managers, to start selling their stocks. Within a week of the
announcement, the index had dropped 6.6 percent, and was 17.2 percent lower than
69 The severity of the crisis in early 1997 was already apparent in press accounts of Korea's economic
outlook. For example, as early as February 1997, the New York Times reported: `South Korea is now gripped by a
deep unease about its future. Economic growth is slowing, the stock market is near a 4-year low, the Korean won
has sunk to its lowest exchange rate against the dollar in a decade, and the trade deficit has more than doubled in
the last year. Banks are hobbled by bad debt, businesses strangled in red tape, and wages are soaring, weakening
industrial competitiveness. Suddenly, it seems to Koreans, the era of fast growth is ending, endangering hopes
that their country will make the leap from industrialization to a high-technology economy on a par with the
United States and Japan. The sense of crisis has been punctuated by two events in the last month the nationwide
strike in reaction to a new labor law that threatens job security, and the stunning collapse of Hanbo Steel,
flagship of the nation's 14th largest conglomerate, under nearly $6 billion in debt and a cloud of corruption.
`Most people don't think it's a cycle but that structurally something is wrong,' said Kim Pyung Koo, a professor
of economics at Sogang University in Seoul.''70 The string of bankruptcies started in January 1997 when Hanbo Steel, the 14th largest chaebol, sought court
receivership. Hanbo steel was soon followed by Sammi Steel, the main firm of Korea's 26th largest
conglomerate, that also sought court receivership in March. In April, the Jinro Group, the 19th largest
conglomerate, defaulted on some liabilities to financial institutions. In July, it was the turn of the Kia group, the
8th largest chaebol, that failed to pay US $370 million worth of liabilities and was put under protection.71 See Section 3.4.72 Effective from 1 April new lending to these sectors was not to exceed 15 percent of total lending for
commercial banks, and 30 percent from merchant banks. Also, all the banks were required to limit the
proportion of their outstanding loans to the property sector to 20 percent (not including low-cost housing,
infrastructure, and industrial buildings and factories). They were given until 15 April to submit detailed plans as
to how this would be achieved.
350 G. Corsetti et al. / Japan and the World Economy 11 (1999) 305±373

the peak of 25 February. By 15 May, as the assault on the Thai baht took hold, the KLCI
had fallen to a 16-month low.
In Indonesia, despite the structural problems outlined above, signs of overheating did
abate in 1996 leading the BI to cut rates by 0.5 percent in December 1996, and again by 0.5
percent in March 1997, in the hope to moderate the in¯ow of capital, to ease the debt
burden on struggling Indonesian ®rms, and to foster exports. In the meantime, however,
Indonesian companies kept borrowing very heavily in international capital markets. As late
as 24 December a report indicated that total Indonesian debt was likely to be closer to US
$200 billion, almost twice as much as the government's of®cial ®gure, US $117 billion.
This report estimated that the government data ignored the bulk of short-term off-shore
borrowings. International ®nancial markets and institutions suddenly learned that the full
extent of total foreign borrowing by the Indonesian corporate sector was underestimated by
US $67 billion.
6.3. The policy response to the 1997 currency crises
Re¯ecting the macroeconomic conditions in the region, national stock markets started to
drop and currencies came under speculative pressures in the ®rst months of 1997. The ®rst
currency to come under attack in the spring was the Thai baht, the currency of the country
with the shakiest economic fundamentals. Once the baht started to depreciate in July 1997,
the currencies that came under speculative pressure were those of countries with economic
fundamentals and export structure similar to the ones of Thailand. These countries were
Malaysia, Indonesia and the Philippines. By the end of July, the baht had fallen by 25
percent relative to the beginning of the year, the rupiah by 9 percent, the ringgit by 4
percent, and the peso by 10 percent. In August, the baht fell further, depreciating by 34
percent relative to its January value; by the end of August, relative to the beginning of 1997
the rupiah had fallen by 27 percent , the ringgit by 17 percent and the peso by 14 percent.
The scenario of contagious devaluations, with a fall of one currency inducing further
plunges of other ones, continued in September. After another round of currency adjustment
in this month, the baht was 42 below its January level, the rupiah 37 percent below, the
ringgit 26 percent below and the peso 29 percent below.
The key to understanding the sharp devaluations of these currencies during the summer
is the conduct of monetary policies before the crisis and after the ®rst round of deprecia-
tions. The ®rst reaction by monetary authorities to speculative pressures in the foreign
exchange market was to avoid a signi®cant monetary contraction and a signi®cant increase
in domestic interest rates. So, in response to speculative pressures in the spring, Thailand
and the other countries in the region at ®rst sterilized their intervention in the spot and
forward markets. Once such a strategy turned out to be ineffective, Thailand tried to
discourage capital out¯ows with the introduction of limited capital controls aimed at
segmenting the onshore and offshore markets,73 while leaving the domestic monetary
stance untouched. Needless to say, under such circumstances, controls could do very little
to stop the speculative ¯ows.
73 Later in the spring, Malaysia introduced limits on swaps by nonresidents not related to commercial
transactions. See IMF (1997).
G. Corsetti et al. / Japan and the World Economy 11 (1999) 305±373 351

The stance of monetary policy in the region remained quite loose well into the crisis.
Despite the initial round of sharp depreciations, for many weeks national monetary
authorities were determined not to let domestic interest rates increase. It is only when
the fall of the currencies accelerated after the end of the summer that a serious monetary
tightening started to be implemented. Notably, Malaysia waited until early December,
when the ringgit had already fallen by over 40 percent, to change its of®cial monetary
stance and renounce its policy of low interest rates.
A policy of low rates in the presence of strong speculative attacks on the currency in
Thailand, Malaysia, Indonesia and the Philippines, can only be understood in the light of
the fragile ®nancial conditions that we discussed in the previous sections. Central banks
were held back by the concern that high interest rates would worsen and compromise the
®nancial conditions of highly indebted banks, ®nancial institutions and corporations. An
interest rate increase would have led to a further slowdown in output growth. Given the
fragility of both the banking system and the corporate sector, a monetary tightening would
have led to a credit squeeze, corporate and banking bankruptcies, and further negative effects
on the level of economic activity. Well before the onset of the crisis, several governments were
engaged inanextensivepolicy ofbailing out®nancial institutions.Such apolicy wasby itself a
source of monetary creation,74 and in any case a bail-out strategy was hardly consistent with a
contractionary monetary stance that would have only pushed more ®rms into ®nancial
dif®culties, and increased the ®scal bill of the government.
Arelatively loosemonetarypolicywith thegoalofpreventingfurther®nancialproblemsfor
®rms and banks was of course a very risky strategy. As it turned out, it eventually induced a
continuous spiral of currency depreciations that dramatically increased the real burden of the
foreign-currency liabilities. The depreciation jeopardized the very ®nancial viability of
®nancial and non-®nancial ®rms which a loose monetary policy was meant to preserve, while
increasing the cost of bail-out well beyond the ®scal means of these countries.
Only after the currencies had fallen considerably and after the increase in real external
liabilities had pushed a signi®cant fraction of ®rms into ®nancial dif®culties did the
monetary authorities switch to tight monetary and credit conditions. However, the impact
of such a late tightening turned out to be negative. Instead of restoring market con®dence,
the monetary contraction induced a credit squeeze that increased the amount of bad loans,
exacerbated the ®nancial problems of banks and ®rms, and had a sharp de¯ationary effect
on the level of real economic activity.
6.4. Policy spillovers and contagion effects
By the end of the summer, the combined effective devaluation of about 30 percent in 3
months for the currencies of Thailand, Indonesia, the Philippines and Malaysia had a strong
negative impact on the other currencies in the region. For instance, the Singaporean
currency that was formally on a ¯oat started to depreciate on the wheel of the sharp
deterioration of the ringgit Ð the currency of its close neighbor and trading partner
Malaysia. By the end of September, the Singaporean currency had lost 8 percent of its value
relative to the beginning of 1997.
74 For instance, in Thailand, liquidity injections surpassed US $8 billion in the first quarter of 1997.
352 G. Corsetti et al. / Japan and the World Economy 11 (1999) 305±373

The speculative pressure in October ®rst affected Taiwan, then Hong Kong, but not the
Korean won. Since during the 1990s the won had depreciated by about 15 percent in real
terms (relative to its 1990 level), Korea had suffered less from the devaluations in the
region, in comparison to Singapore and Taiwan. Most importantly, the won had been on a
gently declining path in 1996 and had lost another 8 percent of its value between the
beginning of 1997 and the end of September.
Things were different for Taiwan. Initially, the Taiwanese currency seemed to be
unaffected by the crisis for three reasons: ®rst, relative to the ASEAN-4 countries, the
composition of its exports was more oriented towards high value-added high-tech goods;
second, the country was running a current account surplus and had large foreign exchange
reserves; third, the Taiwanese dollar had been allowed to depreciate in real terms during the
1990s. However, the market's mood changed in October. Concerns about the loss of
competitiveness in Taiwan had already grown stronger as the magnitude of the depreciation
of the other currencies in the region kept increasing through September. The key factor was
however the decision by Singapore to allow a depreciation of its currency. Since the
composition of Singaporean exports is very close to that of Taiwan Ð the two countries
producing similar high-tech commodities75 Ð the Singaporean move was perceived as an
important threat to the competitive position of Taiwan. By early October, the Taiwanese
currency was subject to severe speculative pressures.
In principle, Taiwan had enough reserves to engage in an extensive defense of its
exchange rate parity Ð its stock of foreign reserves was over US $100 billion. None-
theless, in mid-October, the Taiwanese authorities preferred to let the currency ¯oat, as
they saw no point in defending a parity that in the previous months had signi®cantly
appreciated in real terms relative to the currencies of ®ve regional competitors. After the
switch to a ¯oat, the Taiwanese currency lost 5 percent of its value (by 20 October).
The devaluation of the Taiwanese dollar generated expectations that Hong Kong would
follow the example of Taiwan, changing its ®xed peg to the US dollar. Several considera-
tions could justify a depreciation of the Hong Kong dollar. First, during the 1990s the Hong
Kong dollar had appreciated by over 30 percent in real terms, and the trade balance had
exhibited a large structural de®cit since 1995. Second, by late October the average
depreciation of Thailand, Malaysia, Indonesia and Philippines had approached 40 percent.
Despite the differences in the export mix of these countries relative to Hong Kong, such a
large change in relative prices was indeed applying further competitive pressures on Hong
Kong. Third, both Singapore and Taiwan had depreciated their currencies, and the export
mix of these countries was very close to that of Hong Kong.76 Finally, the reuni®cation with
China over the summer had introduced an element of political risk. On the basis of the
75 In 1997, the percentage shares of semiconductors and some related capital goods (industries 200±216) in
total exports of Asian countries to the US were: 19 (Greater China), 54 (Korea), 83 (Singapore), 57 (Taiwan), 10
(Indonesia), 61 (Malaysia), 54 (Philippines), 37 (Thailand). During the same year, the percentage shares of
apparel, footwear and household goods (industries 400±420) were: 69 (Greater China), 19 (Korea), 5
(Singapore), 27 (Taiwan), 53 (Indonesia), 28 (Malaysia), 32 (Philippines), 39 (Thailand). See Fernald et al.,
(1998) for an analysis of these data.76 Market comments at the time expressed clearly how the fall of the Taiwan dollar would have had
contagious repercussions. As put by John Bender, vice president at HSBC James Capel, `̀ the biggest thing to
scare Hong Kong was the devaluation in Taiwan''.
G. Corsetti et al. / Japan and the World Economy 11 (1999) 305±373 353

above considerations, the contagious speculative attack against the Hong Kong dollar in
late October should not be interpreted as a form of irrational speculation. The currency of
Hong Kong was overvalued, and there were several fundamental reasons to expect a
correction.
Another serious misperception of the Hong Kong experience is the idea that the
successful defense of the parity was due to the presence of a currency board. The Hong
Kong success in avoiding a collapse of its currency under the strong speculative attack of
October had less to do with the fact that the country had a currency board, and more to do
with the fact that the monetary authorities were willing to drastically increase short-term
interest rates. Due to very severe monetary tightening, these rates reached extremely high
peaks in both nominal and real terms, preventing an escalation of the capital out¯ow, and
eventually convincing international markets about the credibility of the Hong Kong
commitment to keep its exchange rate parity ®xed.
We observed above that while the currency crisis was spreading throughout the region,77
the Korean won had been spared from speculative pressures. By the end of October, a
policy of gradual adjustment in the parity had led the won to a very contained depreciation
of 14 percent relative to December 1996 (only 8.4 percent since July). This implied that,
relative to the currencies of Thailand, Indonesia, Malaysia and the Philippines, the won had
appreciated by 37, 36, 20 and 15 percent, respectively. Moreover, Singapore and Taiwan
(which competed directly with Korea in a wide range of export products) had allowed their
currencies to depreciate more substantially than the won; this had put Korea Ð a country in
a serious economic crisis since the middle of 1996, as discussed in the previous Ð sections
at a rather severe competitive loss.
In November the won plunged, depreciating by 25 percent during the month (corre-
sponding to a 39 percent depreciation over the year). This rapid fall did not only worsen the
domestic ®nancial crisis, but eventually led to the arrangement of a US $60 billion IMF-led
rescue package in early December. As Korea was the largest economy in the region, it
negatively affected the external position of all the other countries in the region. Another
round of depreciations followed: the collapse of the Korean currency in November and
December was matched by a continuous decline of the Taiwanese and Singaporean dollar,
and a further drop in the value of the currencies of Thailand, Malaysia, Indonesia and the
Philippines.
Once the real burden of the gross borrowing by banks and non-banks was worsened by
the depreciation of the currency, and some ®nancial institutions went bankrupt, foreign
banks that had heavily lent to Korean banks started to refuse to roll-over their loans, loans
that would have been automatically renewed in normal times. The unwillingness of foreign
banks to roll-over normal lines of credit in the face of a high perceived risk of bankruptcy
made the prospect of loan default more likely, according to a well-known pattern of self-
ful®lling expectations.78 The ®nancial panic that ensued in December led to a 40 percent
77 By the end of October 1997, the Thai baht had depreciated relative to the US dollar by 55 percent, the
Indonesian rupiah by 54 percent, the Malaysian ringgit by 34 percent, the Philippines peso by 33 percent.
Relative to the beginning of the year, also, the Taiwan dollar had depreciated by 11.8 percent (10.4 percent since
July) and the Singapore dollar by 12.5 percent (10 percent since July).78 See e.g. Chang and Velasco (1998a, b), in which the classic Diamond and Dybvig (1983) framework is
applied to the study of financial crises in emerging economies.
354 G. Corsetti et al. / Japan and the World Economy 11 (1999) 305±373

currency collapse in just a week. The situation calmed down only at the end of December
1997 when the American, European and Japanese banks jointly agreed to negotiate an
orderly renewal of short-term loans and the major creditor countries decided to anticipate
the disbursement of a fraction of the bail-out package approved by the IMF in early
December.
A case in part similar to the Korean one was that of Indonesia in January 1998. In this
month, the continued plunge of the Indonesian currency together with the refusal by
foreign lenders to roll over short-term debts rendered domestic borrowers unable to service
their foreign debt. Indonesia then imposed an effective moratorium on the service of the
liabilities of its corporate sector. The problem of arranging an orderly roll-over of liabilities
was much more complicated in Indonesia than in South Korea. In Korea, most of the short-
term BIS loans were concentrated to a limited number of domestic ®nancial institutions.
Thus, the small number of concerned parties made the dif®cult problem of negotiating the
roll-over of loans (and/or their transformation into medium term loans) relatively manage-
able. In Indonesia, instead, the negotiation represented a much more daunting task, as it
involved a very large number of domestic ®rms that had borrowed directly from BIS banks
and/or in international debt markets.
6.5. The role of Japan
What was the role of Japan, the leading regional economy, in the crisis? At the beginning
of 1996 it appeared that the economy was recovering after 5 years of near zero growth, but
with the increase in the consumption tax in April 1997 Japan fell into another economic
recession: the level of activity actually declined in the second and third quarters. Clearly,
the economic weakness in Japan contributed to the crisis in terms of a reduced demand for
imports from the region. As Japanese authorities kept monetary policy loose and interest
rates extremely low, the continued depreciation of the yen relative to the US dollar since the
middle of 1995 exacerbated the exchange rate tensions in the region, and in 1997 caused a
steep real appreciation of the Asian currencies that were pegged to the dollar. The crisis
®nally exploded in the summer, when the dollar went through what seemed an unstoppable
rise and the yen continued its decline.
It is important to stress that Japanese banks, already in fragile conditions after the burst
of the 1980s asset bubble and weakened by a stagnant economy in the 1990s, had heavily
lent to other Asian economies; given the very low interest rates in Japan, large scale lending
to the fast-growing East Asian countries was stimulated by the higher returns available
outside Japan. As the Japanese crisis deepened in 1997, many of these banks suffered
capital losses and were required to re-balance their loan portfolio in adherence to capital
adequacy standards. Since the capital adequacy requirement is higher for international than
for national lending, many banks chose to recall foreign loans and contain the magnitude of
the domestic lending squeeze. At the same time, however, banks and ®rms in South East
Asia that had borrowed from Japan were hit by the currency shocks: the ®nancial outlook of
Japanese banks and securities ®rms correspondingly deteriorated.
Compared to the role of the US in Mexican crisis of 1994±1995 (when the US, the major
regional economic power, was in a strong cyclical upswing), undoubtedly the weakness of
Japan in 1997 exacerbated poor economic fundamentals in Asia and worsened the
G. Corsetti et al. / Japan and the World Economy 11 (1999) 305±373 355
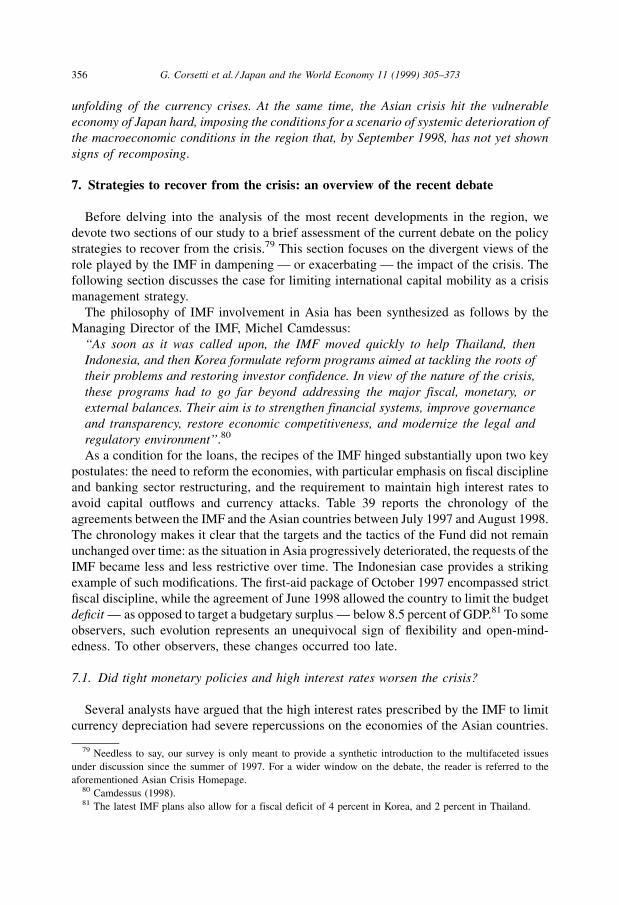
unfolding of the currency crises. At the same time, the Asian crisis hit the vulnerable
economy of Japan hard, imposing the conditions for a scenario of systemic deterioration of
the macroeconomic conditions in the region that, by September 1998, has not yet shown
signs of recomposing.
7. Strategies to recover from the crisis: an overview of the recent debate
Before delving into the analysis of the most recent developments in the region, we
devote two sections of our study to a brief assessment of the current debate on the policy
strategies to recover from the crisis.79 This section focuses on the divergent views of the
role played by the IMF in dampening Ð or exacerbating Ð the impact of the crisis. The
following section discusses the case for limiting international capital mobility as a crisis
management strategy.
The philosophy of IMF involvement in Asia has been synthesized as follows by the
Managing Director of the IMF, Michel Camdessus:
`̀ As soon as it was called upon, the IMF moved quickly to help Thailand, then
Indonesia, and then Korea formulate reform programs aimed at tackling the roots of
their problems and restoring investor confidence. In view of the nature of the crisis,
these programs had to go far beyond addressing the major fiscal, monetary, or
external balances. Their aim is to strengthen financial systems, improve governance
and transparency, restore economic competitiveness, and modernize the legal and
regulatory environment''.80
As a condition for the loans, the recipes of the IMF hinged substantially upon two key
postulates: the need to reform the economies, with particular emphasis on ®scal discipline
and banking sector restructuring, and the requirement to maintain high interest rates to
avoid capital out¯ows and currency attacks. Table 39 reports the chronology of the
agreements between the IMF and the Asian countries between July 1997 and August 1998.
The chronology makes it clear that the targets and the tactics of the Fund did not remain
unchanged over time: as the situation in Asia progressively deteriorated, the requests of the
IMF became less and less restrictive over time. The Indonesian case provides a striking
example of such modi®cations. The ®rst-aid package of October 1997 encompassed strict
®scal discipline, while the agreement of June 1998 allowed the country to limit the budget
de®cit Ð as opposed to target a budgetary surplus Ð below 8.5 percent of GDP.81 To some
observers, such evolution represents an unequivocal sign of ¯exibility and open-mind-
edness. To other observers, these changes occurred too late.
7.1. Did tight monetary policies and high interest rates worsen the crisis?
Several analysts have argued that the high interest rates prescribed by the IMF to limit
currency depreciation had severe repercussions on the economies of the Asian countries.
79 Needless to say, our survey is only meant to provide a synthetic introduction to the multifaceted issues
under discussion since the summer of 1997. For a wider window on the debate, the reader is referred to the
aforementioned Asian Crisis Homepage.80 Camdessus (1998).81 The latest IMF plans also allow for a fiscal deficit of 4 percent in Korea, and 2 percent in Thailand.
356 G. Corsetti et al. / Japan and the World Economy 11 (1999) 305±373

Table 39
Chronology of IMF Intervention in Asia
7/2/1997 Thailand announces a managed float of the baht and IMF negotiations begin.
7/14/1997 The Philippines extends and augments its existing IMF-supported program of 1997,
and arranges a stand-by facility in 1998. IMF offers Philippines US $1.1 billion loan package.
8/20/1997 IMF approves a US $3.9 billion credit for Thailand. The plan assumes a positive growth of 2.5
percent in 1997 and 3.5 percent in 1998; and calls for maintaining gross official reserves at the
equivalent of 4.2 months of imports in 1997 and 4.4 months in 1998; limiting the end-period rate
of inflation to 9.5 percent in 1997 and 5 percent in 1998; targeting a small overall fiscal surplus
by 1998 through an increase in the rate of the value-added-tax (VAT), and selective expenditure
cuts; initiating a credible and up-front restructuring of the financial sector, focused on the
identification and closure of unviable financial institution (56 finance companies).
10/8/1997 Indonesian government agrees to request help from IMF.
10/31/1998 The International Monetary Fund announces a $23 billion multilateral financial package
involving the World Bank and Asian Development Bank to help Indonesia stabilize its financial
system.
11/5/1997 The IMF approves a US $10 billion stand-by credit for Indonesia and releases a disbursement of
US $3 billion. Measures include financial sector restructuring, with the closure of 16 insolvent
banks; structural reforms to enhance economic efficiency and transparency, with the
liberalization of foreign trade and investment, the dismantling of monopolies, and privatization;
stabilizing the rupiah through a tight monetary policy; implementing fiscal measures equivalent
to 1% of GDP in 1997/1998, and 2% in 1998/1999, to yield a 1% of GDP surplus in both the
years.
11/21/1997 Korea requests IMF assistance.
11/25/1997 In light of a larger-than-expected depreciation of the baht, a second IMF package for Thailand is
approved. The new plan includes additional measures to maintain the targeted fiscal surplus of
1% of GDP, the establishment of a timetable for financial sector restructuring, and plans to
protect the weaker sectors of society.
12/4/1997 IMF approves a US $21 billion stand-by credit for Korea, and releases a disbursement of US
$5.6 billion. The initial program assumes GDP growth in 1998 of 2.5% and features
comprehensive financial sector restructuring, including central bank independence, strong
market and supervisory discipline, and the suspension of 9 insolvent merchant banks. Fiscal
measures equivalent to 2% of GDP make room for the cost of financial restructuring,
consistently with a balanced budget target. The plan calls for efforts to dismantle the non-
transparent and inefficient ties among government banks and business; for the implementation
of trade and capital account liberalization measures, as well as of labor market reforms; for the
publication and dissemination of key economic and financial data.
12/8/1997 Disbursement of US $810 million to Thailand.
12/16/1997 Korean government allows won to float.
12/18/1997 Disbursement of US $3.5 billion to Korea.
12/24/1997 Korea issues a letter of intent pointing at the need for an acceleration of the program as
the situation deteriorates. The plan includes further monetary tightening, the abolition of
the daily exchange rate band, the lifting of all capital account restrictions. Financial sector
reform and market liberalization, as well as trade liberalization, are expedited. The IMF also
announces that a debt rescheduling by international commercial banks is critical to Korea's
recovery.
12/30/1997 Disbursement of US $2 billion to Korea.
1/15/1998 Disbursement of US $2 billion to Korea.
1/15/1998 A second package for Indonesia is agreed upon. The plan allows for a relaxation of the previous
fiscal targets, that is now a budget deficit equal to 1% of GDP. Previous IMF conditions not
fulfilled but reiterated in the second package include: dismantling of government monopolies,
postponing infrastructure projects, and closing insolvent banks.
1/16/1998 International lenders agree on plan to officially roll over Korea's short-term debt.
G. Corsetti et al. / Japan and the World Economy 11 (1999) 305±373 357

According to the critics of the IMF recipes, interest rates hikes were not effective in
slowing down currency depreciation, but rather worsened the extent of the crisis by leading
to widespread banking and corporate bankruptcies. The effects of these policies have been
described in terms of a vicious circle: the credit crunch imparted severe ®nancial losses to
otherwise solvent companies; the widespread fall in pro®tability translated into higher
levels of non-performing loans and credit risk, exacerbating the crisis-induced recessions
and, in turn, causing a further contraction in the supply of credit.
Table 39 (Continued )
2/7/1998 Korea agrees to third IMF program. GDP growth projections are lowered to 1%. The letter of
intent includes additional measures to target fiscal deficit to 1% of GDP, increasing the amount
of financial instruments available to foreign investors, and broadening the financial sector
reform strategy to accommodate stabilization of short-term debt payments.
2/17/1998 Disbursement of US $2 billion to Korea.
2/24/1998 The Thai plan is further modified. The fiscal policy target is adjusted from a surplus of 1% of
GDP to a deficit of 2% of GDP.
3/4/1998 Disbursement of US $270 million to Thailand.
4/10/1998 Indonesia issues a Supplementary Memorandum of Economic and Financial Policies on
additional measures. These include a strong monetary policies, accelerated bank restructuring, a
comprehensive agenda of structural reforms. The IMF allows Indonesia to continue its fuel and
power subsidies. In the light of the failure of the first two packages, the IMF will resort to a
stricter enforcement of provisions.
5/2/1998 Korean authorities update the program of economic reforms. Growth forecasts for 1998 are
further revised downward to -2%. The letter of intent includes the accommodation of a larger
fiscal deficit of about 2% of GDP in 1998, measures to strengthen and expand the social safety
net, the loosening of restrictions on foreign exchange transactions, and the formation of an
appraisal committee to evaluate recapitalization plans by undercapitalized banks.
5/4/1998 Disbursement of US $1 billion to Indonesia.
5/26/1998 Fourth IMF program agreed to by Thailand. The main priority is to prevent any further slow-
down of the economy and foster an early recovery. The modified program calls for cautious and
gradual reductions of interest rates, higher monetary growth rates, a looser fiscal deficit target at
3% of GDP, and accelerated corporate debt restructuring with financial sector reforms.
5/29/1998 Disbursement of US $2 billion to Korea
6/10/11998 Disbursement of US $135 million to Thailand.
6/24/1998 Additional IMF reforms agreed to by Indonesia in light of changing political climate and
worsening economic situation. Provisions include an increase in social expenditures (7.5% of
GDP), a budget deficit target at 8.5% of GDP, the closure, merging or recapitalization of weak
banks, and the establishment of a bankruptcy system.
7/15/1998 Disbursement of US $1 billion to Indonesia. The IMF increases financing by US $1.4 billion.
7/15/1998 A new letter of intent by Korea announces a further easing of macroeconomic policies. The
letter includes the accommodation of a larger fiscal deficit for 1998 (5% of GDP), and measures
to bolster the social expenditure program.
7/29/1998 The Indonesian government requests the cancellation of the existing arrangement with the IMF
and its replacement with a new extended arrangement, including new measures on bank and
corporate restructuring and improvements in the distribution system.
8/25/1998 Disbursement of US $1 billion to Indonesia. The IMF approves an extended facility with a
longer repayment period.
8/25/1998 The Thai program is modified to incorporate a more comprehensive approach to bank and
corporate restructuring. The fiscal deficit target is still at 3% of GDP, for both 1998 and 1999,
but this target excludes the costs of financial sector restructuring.
8/25/1998 IMF disburses US $1 billion to Korea.
358 G. Corsetti et al. / Japan and the World Economy 11 (1999) 305±373

In the light of these considerations, the appropriate policy response to the crisis should
have been one of loose money and low interest rates Ð the same strategy adopted by Japan
to deal with its internal crisis. According to an extreme version of this argument, during the
crisis there were conditions for a currency/interest rate `Laffer curve': a fall Ð not a
rise Ð of the interest rates would have strengthened the economy and restored con®dence,
causing the Asian currencies to appreciate.
The above criticisms, however, have been challenged on a key issue. Loose monetary
policies in the early stages of a currency crisis contribute to exacerbate the extent of the
depreciation, increasing the burden of foreign currency-denominated liabilities issued by
banks and ®rms. In the presence of large external net liabilities, a monetary expansion
could actually produce ®nancial distress and bankruptcies, setting in motion the same
vicious circle described above.82 Consistent with this argument is the view that the severity
of the Asian crisis could in part be attributed to the unwillingness of the governments to
undertake the appropriate restrictive measures at the right time: the aforementioned case of
low interest rate policies in Malaysia after the runs on the Thai baht is a ®tting example. By
the same token, Japan's policy response to its internal crisis could not be considered
suitable for other Asian countries. As Japan is a large net foreign creditor with sizable
current account surpluses, the effects of a weaker yen on the Japanese economy are
qualitatively and quantitatively different from the effects of low interest rates and exchange
rate depreciation in countries with a large external debt denominated in foreign currency.
As regards the `Laffer curve' argument, it is Ð in the words of Paul Krugman Ð `̀ as silly
as it sounds''.83
While the appropriate interest rate policy at the onset of the crisis is still subject to a
widespread debate, at the time of this writing Ð and in the light of the large recessions
experiencedbytheAsianeconomiesin1998 Ð mostobserversseemtoagreethathighinterest
rates maintained beyond an `emergency scenario' can have destabilizing consequences.
Indeed, by the summer of 1998 interest rates in the East Asian region have signi®cantly fallen
and, in Korea and Thailand, they are now back to pre-crisis levels. Yet, these countries are
currently exhibiting a credit crunch which does not appear to be related to the level of interest
rates; rather, it has more to do with the inability of ®nancially distressed banks to lend to a
corporate sector laboring under the weight of a severe debt overhang.
7.2. Did the IMF plans require unnecessary fiscal adjustments?
Several commentators have argued that the ®scal policy requirements included in the
IMF plans were unnecessarily Ð and harmfully Ð strict. At the onset of the crisis, the
Asian countries under attack were running low budget de®cits or ®scal surpluses, and were
characterized by relatively low ratios of public debt to GDP, unlike the typical interlocutors
of the IMF in past crisis episodes. Excessively tight ®scal discipline made the crisis-
induced recession worse.
In support of the `discipline' view, it has been contended that loose ®scal policies at the
onset of the crisis would have raised doubts about the policy-makers' commitment to
82 A loose monetary policy could of course also ignite inflationary expectations.83 Krugman (1998b).
G. Corsetti et al. / Japan and the World Economy 11 (1999) 305±373 359

reduce the outstanding current account imbalances, jeopardizing the credibility of their
plans. Also, as pointed out in Section 3 above, while ®scal de®cits and debt were typically
low before the crisis, in several Asian countries the projected ®scal costs of post-crisis
®nancial bail-outs are estimated to be in the range of 20±30 percent of GDP. As these extra
public liabilities translate into a permanent increase in the interest bill paid by Asian
governments of 2±4 percent of GDP per year, ®scal balances must be appropriately
adjusted. In this respect, the IMF has reiterated that, on a country-by-country basis, ®scal
plans were targeted to raise the necessary revenues to meet these extra interest costs.
Quoting a speech by Stanley Fischer in January 1998,
`̀ the fiscal programs vary from country to country. In each case, the IMF asked for a
fiscal adjustment that would cover the carrying costs of financial sector restructur-
ing Ð the full cost of which is being spread over many years Ð and to help restore a
sustainable balance of payments. In Thailand, this translated into an initial fiscal
adjustment of 3 percent of GDP; in Korea, 1 1/2 percent of GDP; and in Indonesia, 1
percent of GDP, much of which will be achieved by reducing public investment in
projects with low economic returns''.84
One year after the eruption of the Thai crisis, some observers shared the view that the
IMF may have been too slow in revising its approach to ®scal policy in the crisis countries.
It was only when the recessions rapidly materialized in the course of 1998 that the IMF
progressively loosened its ®scal conditions to allow for cyclically-adjusted ®scal de®cits.
However, it should be acknowledged that over the entire year of 1998, news about the size
and depth of the recessionary effects of the crisis came as a shocking surprise not only to
the Asian governments and the IMF, but also to a vast majority of country analysts.
7.3. Did the IMF `stick to its knitting'?
The breadth of the restructuring efforts required by the IMF have raised a concern that
the Fund has been playing an excessively intrusive role in domestic affairs. The criticism
that, by including in the programs a number of structural elements, the IMF was moving
beyond its traditional macro-adjustment related areas of competence (monetary and ®scal
tasks) was ®rst made by Martin Feldstein.85 Similar arguments were echoed by regional
commentators, resentful of what they perceived as an imposition of major structural
reforms (in areas as heterogeneous as ®nancial and labor markets, competition policy, trade
relations) and an interference with the jurisdiction of a sovereign government.
The main counter-arguments were spelled out by Stanley Fischer in his reply to
Feldstein.86 To the extent that the Asian meltdown was attributable to structural problems
rather than the traditional macroeconomic imbalances, an effective rescue strategy was
bound to address the issues at the very core of the crisis. IMF lending to the Asian region
would serve no purpose if the weaknesses of the ®nancial sector (ranging from poor bank
supervision and regulation to murky relations among governments, banks and corpora-
tions) were not removed by the appropriate structural reforms. Similarly, the insistence on
84 Fischer (1998a).85 Feldstein (1998).86 Fischer (1998c).
360 G. Corsetti et al. / Japan and the World Economy 11 (1999) 305±373

good governance and the avoidance of `crony capitalism' represented a precondition to
avoid future crises, as halfhearted reform efforts would not help to re-establish market
con®dence. Fischer concluded that
`̀ the basic approach of the IMF to these crises has been appropriate±not perfect, to be
sure, but far better than if the structural elements had been ignored or the fund had not
been involved''.87
7.4. Did plans to close insolvent banks lead to runs on solvent banks?
The possibility that IMF plans to close insolvent banks led to runs on ®nancially healthy
banks has been pointed out, among others, by Jeffrey Sachs. In his comments on the ®rst
IMF plan for Indonesia, which called for the closing of 16 banks, Sachs stated:
`̀ In my view, although it's a minority opinion, the IMF did a lot of confidence-
reducing measures. In particular, I blame the IMF for abruptly closing financial
institutions throughout Asia, sending a remarkably abrupt, unprepared and danger-
ous signal [...] that you had better take your money out or you might lose it''.88
The advocates of the opposite view point out that the IMF was not at fault if measures of
prevention of bank runsÐsuch as incentive-compatible deposit insurance schemesÐwere
not in place in Indonesia. Moreover, when the IMF requirement partly back®red and an
unexpected run occurred, President Suharto's government bore responsibility for failing to
enact promised reforms in exchange for the $40 billion international rescue effort. In
support of this view is the fact that the requirements imposed on Indonesia by the IMF,
including the closing of insolvent banks, were similar to those demanded of Thailand and
Korea; yet, neither country experienced bank runs of the same magnitude as those hitting
Indonesia. It has also been argued that, in the Indonesian case, more rather than less should
have been done: as early as September 1997, widely circulated documents listed more than
16 Indonesian banks experiencing ®nancial dif®culties. Instead, the prompt reopening of a
closed bank owned by one of President Suharto's sons contributed to reducing the
con®dence of the public on the overall rescue plan.
7.5. Did IMF intervention enhance world-wide moral hazard?
Many authors have expressed concern with the possibility that IMF-led rescue packages
may risk a moral hazard. This is because expectations of a bail-out can lead investors and
creditors to refrain from effectively monitoring their investment and lending strategies.
Also, of®cials in debtor countries may pursue excessively risky courses of action, leaving a
country more vulnerable to sudden shocks to fundamentals and shifts in market sentiment.
While the residents of the country hit by a crisis suffer because of the crisis-induced
recession, to the extent that the creditors are bailed-out they do not bear a fair share of the
burden of the crisis.
Unquestionably, the risks of creating moral hazard will be thoroughly assessed within
the future debate on international policy design and crisis prevention in emerging markets.
87 Ib., p.106.88 `̀ To stop the money panic'', interview with Jeffrey Sachs, Asiaweek, 13 February, 1998.
G. Corsetti et al. / Japan and the World Economy 11 (1999) 305±373 361

Yet, several objections have been voiced against a simplistic reading of the problem. First,
there is no direct evidence that the surge in capital ¯ows to Asia after 1995 were related to
expectations of international bail-outs in the aftermath of the Mexican rescue package. The
second objection regards the issue of who bears the costs of the crisis. The IMF has
repeatedly pointed out that a majority of private creditors, especially bond-holders and
equity investors, took a huge hit during the crisis. By the end of 1997, foreign equity
investors had nearly lost three quarters of their equity holdings in some Asian markets.
Nonetheless, commercial banks were to some extent spared; for instance, foreign banks
operating in Korea demanded public guarantees on bank loans as a precondition for rolling
over the existing loans, without forgiving any amounts due,89 a point highlighted by Litan
(1998).
The third objection goes against the argument that countries which rely on international
support when things go out of control will follow unsound policies. As put by Fischer,
`̀ countries try to avoid going to the fund; policy makers whose countries end up in trouble
generally do not survive politically. In this regard, attaching conditions to assistance gives
policy makers incentives to do the right thing''.90
A fourth, and more substantial point, is that moral hazard may be the lesser evil, as the
alternative response to a crisis Ð to leave countries and creditors to sort out their debts Ð
may have much more dramatic and distortionary consequences. The lessons from the
interwar period and the 1980s point out that such a strategy requires complex negotiations
over a long period of time, during which access to international markets is curtailed and
long-term growth drastically lowered. Also, the experience of the 1990s suggests that
highly interdependent economies can be subject to the rapid transmission and the
`contagious' spread of speculative waves and ®nancial panic across regions. In this
scenario, a delay in taming a local crisis through the appropriate program of international
assistance Ð and the failure to promptly restore market con®dence Ð would greatly
increase the chances of a systemic chain reaction across countries.
8. The Asian crisis and the debate on capital controls
Vis-aÁ-vis the persistent and pervasive nature of the current crisis, the terms of the current
debate have progressively encompassed such items as the reform of multilateral institu-
tions, the future of economic and ®nancial cooperation and, most importantly, the
desirability of deregulation and liberalization of international capital markets. The crucial
question in this debate is whether exchange controls and limited capital mobility should
become elements of an overall strategy of international crisis management and global
restructuring.91
In order to discuss this topic, one needs to distinguish among three related issues: (a) the
case for controls on short-term capital in¯ows; (b) the case for controls on capital out¯ows
89 To be sure, some of the banks have added modestly to their loan reserves to account for possible future
write-offs, while claiming to be charging interest rates that do not fully reflect the risk of the loans rolled over.90 Fischer (1998c, p.106).91 For an overview of the debate since the Halifax Summit of 1995 see Kenen (1996).
362 G. Corsetti et al. / Japan and the World Economy 11 (1999) 305±373

in the event of a crisis; and (c) the optimal speed and sequencing of capital account
liberalization.
Regarding the ®rst issue, it has been argued that restrictions on short-term in¯ows may
be part of an appropriate policy strategy to prevent a crisis, as they discourage volatile
short-term portfolio investment, and therefore, insulate the country from the disruptive
effects of sudden reversals in market sentiment. The experiences with capital controls on
short-term in¯ows of Chile,92Colombia and Slovenia are often mentioned in support of this
view.
Restrictions on short-term capital in¯ows may take the form of cross-border controls on
bank lending and borrowing only, or be extended to all short-term ¯ows. The case for
controls on short-term cross-border interbank ¯ows is less controversial than the alter-
native. It is usually couched in terms of prudential banking standards, rather than in terms
of restrictions on capital ¯ows. The case for regulating interbank lending and borrowing
hinges upon the evidence on the disruptive effects of highly volatile ¯ows, such as the case
when creditor banks suddenly refused to renew their loans to ®rms and banks in Korea,
Thailand and Indonesia.
In principle, restrictions and controls on interbank ¯ows could be percent imposed on
either lending banks or borrowing banks. Regarding the former possibility, it should be
stressed that, under the current Basle capital adequacy standards, lending banks have a
clear incentive to supply short-term, rather than long-term loans to banks in emerging
markets. This is because risk weights are lower on short-term than long term bank loans.
After the Asian crisis, there is a growing consensus in favor of changing these standards, so
as to penalize short-term bank lending to emerging markets through a revision of risk
weights (this is currently undergoing as part of the BIS review of the capital adequacy
standards).
As regards restrictions on the borrower side, the consensus view is that effective
prudential regulation of banks in emerging economies requires higher reserve requirement
ratios on liabilities representing cross-border interbank loans and deposits. Note that, as
highlighted from our discussion, possible restrictions on short-term cross border banks
¯ows are debated within the context of prudential regulation and supervision of ®nancial
institutions.
The case for broader controls on all short-term capital in¯ows (including also portfolio
investments and equities) is more controversial. The main argument in its favor is that
controls on interbank ¯ows may not be suf®cient to shield a country from the high volatility
of `hot money' ¯ows. To the extent that also corporate ®rms respond to distorted incentives
leading them to excessive borrowing, controls on corporate foreign liabilities, especially
short-term, may be warranted. In the recent experience of Asia, for example, during the
1990s corporate ®rms directly undertook risky cross-border borrowing on a large scale. In
Indonesia corporate borrowing was massive, over $70 billion, and much larger than foreign
borrowing by banks. The scale of corporate borrowing was very large also in the other
crisis countries.
The available empirical evidence from Chile and other countries that have imposed
controls on a broad range of short-term capital in¯ows is mixed. Controls do appear to
92 For an assessment of the Chilean experience, see Massad (1998).
G. Corsetti et al. / Japan and the World Economy 11 (1999) 305±373 363

affect the composition of in¯ows (in favor of long-term loans and FDI) but do not appear to
affect the overall volume of in¯ows. Moreover, controls become less effective over time,
because of evasion and leakages (especially via trade credits). Finally, there is some
evidence that the Chilean controls have favored large corporations over small and medium
ones. It has been argued that the apparent success of Chile in avoiding major currency
crises should be attributed to an effective prudential regulation and supervision of the
®nancial system, more than to the presence of controls on short-term in¯ows. In this
respect, it is worth emphasizing that, during the recent ®nancial turmoil, Chile Ð along
with Colombia and Brazil Ð did actually phase-out controls, with the goal of stimulating
much needed capital in¯ows, and reduce the pressure on the currency.
The case for controls on capital out¯ows, especially in the aftermath of a currency crisis,
appears much more controversial in the ongoing academic and policy debate.93 The logic
of the argument in favor of out¯ow controls is laid out by Krugman (1998c). The economic
recovery in Asia is hampered by high interest rates, but, under perfect capital mobility, a
reduction in these rates would further depreciate the exchange rate. For countries with a
high stock of liabilities denominated in foreign currency, a depreciation would then be
recessionary, via the increasing burden of foreign debt. Controls on capital ¯ows allow
domestic policy makers to break the links between interest rates and exchange rates, so that
interest rates can be lowered without incurring the cost of a currency devaluation. Krugman
stresses the effectiveness of capital controls with the following provocative characteriza-
tion of the successful performance of the Chinese economy in 1997±1998
`̀ think about China right now: a country whose crony capitalism makes Thailand look
like Switzerland and whose bankers make Suharto's son look like J.P. Morgan. Why
hasn't China been nearly as badly hit as its neighbors? Because it has been able to
cut, not raise, interest rates in this crisis, despite maintaining a fixed exchange rate;
and the reason it is able to do that is that it has an inconvertible currency, a.k.a.
exchange controls. Those controls are often evaded, and they are the source of lots of
corruption, but they still give China a degree of policy leeway that the rest of Asia
desperately wishes it had''.94
Is the short-run relief that capital controls give to policy makers offset by their long-run
costs (higher in¯ation, higher risk-premium, ef®ciency costs due to a distorted allocation
etc.)? Some authors argue that there is no compelling empirical evidence that countries
which implement capital account convertibility are systematically associated with better
macroeconomic performances in the long run. For instance, Rodrik (1998) has recently
93 By the fall of 1998, a number of countries were assessing the costs and benefits of the recourse to capital
controls as a strategy to mitigate the extent of a crisis. At the beginning of September 1998, the Malaysian
central bank announced the introduction of capital controls, requiring official approval for repatriation and
withdrawal of ringgits from external accounts, imposing that all settlements of exports and imports be made in
foreign currency, limiting the sale and purchase of ringgit-denominated financial assets to transactions through
authorized depository institutions, and restricting the export of foreign currency by resident travellers. More
drastic controls were introduced in Russia following the 17 August decision to devalue the ruble.94 In a subsequent `open letter to Prime Minister Mahathir', Krugman suggests four `guiding principles' for
an exchange controls policy to succeed: first, the actual implementation of controls should aim to disrupt
ordinary business as little as possible; second, the distortions they impose on the economy should not be
overlooked; third, currency controls should not be used to defend an over-valued currency; fourth, controls must
serve as an aid to reform, not an alternative.
364 G. Corsetti et al. / Japan and the World Economy 11 (1999) 305±373

shown that, in a large sample of countries, `̀ the data provide no evidence that countries
without capital controls have grown faster, invested more, or experienced lower in¯ation.
Capital controls are essentially uncorrelated with long-term performance once we control
for other determinants.''95
Advocates of theoppositeview highlight several argumentsagainst such controls oncapital
out¯ows. First, imposing capital controls and limiting capital mobility Ð they argue Ð is no
`solution' to the structural problems underlying the Asian crisis. Rather, policy interventions
should aim at making the ®nancial system sound, well regulated and effectively supervised.96
The second argument is based on the experience with capital controls in Latin America in the
aftermath of the 1980s debt crisis, which was quite dismal. Controls tended to be ineffective, a
tool of ®nancial repression associated with negative real interest rates. For these reasons, they
eventually led to more, rather than less, capital ¯ight.
The third argument stresses the role of `political risk' in international ®nancial
instability. While the implementation of capital controls may help ®ghting a crisis and
buy time to organize a policy response to speculative ¯ows, the anticipation (or the
possibility) of controls may actually accelerate the crisis. In this respect, the fact that some
countries impose controls may lead to a perverse international contagion on other
countries. The news of capital controls imposed by Russia and Malaysia in August
1998 was arguably an important factor in the contagious spread of ®nancial panic to
Latin America and other emerging markets.
Finally, capital controls are not implemented and managed by the ideally `benevolent'
policy makers of the economic theory, but by governments that are potential sources of
distortions and moral hazard. This implies the possibility of a political use (or misuse) of
such controls, the risk of creating incentives to rent-seeking, and the temptation to use
controls to avoid and or delay necessary reforms.
While the arguments in favor of capital controls, especially during a crisis, are
controversial, the views on the third issue presented above, the optimal speed and
sequencing of capital account liberalization, re¯ect a widespread and explicit consensus.
This consensus view (even expressed formally within the G-7 group and the IMF97)
stresses that, while a progressive liberalization of the capital account may be warranted
over time, policy makers should be very careful about doing it in a gradual and orderly way.
As long as ®nancial systems are weak, poorly regulated and subject to political distortions,
a hasty rush to capital account liberalization may be unwise and produce destabilizing
effects. The bene®ts of free capital ¯ows are numerous and, provided that ®nancial systems
are strong, the arguments in favor of free capital mobility are compelling. In the transition
to a system with desirable characteristics, however, capital account liberalization will have
to be cautious, gradual and carefully managed. The transition process will have to prevent
large foreign debt accumulation, excessive borrowing and lending, and a mismatch in the
maturities and currency denomination of assets and liabilities of ®nancial institutions and
corporate ®rms, which have proven to be so destabilizing in many recent and less recent
episodes of ®nancial and currency crises.
95 Rodrik (1998), p.61.96 See e.g., Dornbusch (1998b).97 See e.g. Camdessus (1998).
G. Corsetti et al. / Japan and the World Economy 11 (1999) 305±373 365

9. East Asia and the world economy in 1998±1999
9.1. From regional crisis to global turmoil in the summer of 1998
In the summer of 1998, what had been until then a severe regional economic crisis in
East Asia turned into a devastating global turmoil enveloping a large group of emerging
markets and spreading even to the US (and other OECD) capital markets. During 1998,
forecasts of the economic slowdown in the crisis countries were steadily revised down-
ward. The economic recession in East Asia spread from the crisis countries (Korea,
Indonesia, Thailand and Malaysia) to Hong Kong, Singapore, the Philippines and Taiwan.
The Indian subcontinent was fragile, Pakistan in particular having serious external balance
and debt problems. More crucially, the economic conditions in Japan, the prominent
economy in the region, deteriorated in 1998, and this country was in need of dif®cult
banking and structural reforms, let alone an effective macroeconomic policy to recover
from the long period of stagnation.98 In the middle of 1998 policy failures leading to a
further weakening of the yen risked to undermine the stability of the currencies of China
and Hong Kong and threatened to trigger a further round of stag¯ationary competitive
devaluations in the entire Asian region.
Economic fundamentals remained strong in the US but by the fall of 1998 there was clear
evidence of a worldwide growth slowdown. The IMF's growth forecast for world output,
2.0 percent (in the October 1998 World Economic Outlook), represented a precipitous drop
from the 4.3 percent rate anticipated one year before in October 1997. Expected growth in
the Western Hemisphere was 2.3 percent, down from 5.1 percent. The estimated 2.0
percent world growth rate was comparable to that observed during previous world
recessions, such as 1974±1975, 1980±1983, and 1990±1991. Apart from the South-East
Asia countries, Japan's economy was expected to decline by 2.5 percent, while Russia was
expected to contract by 6 percent in 1998.
Moreover, commodities prices fell sharply in 1997±1998 per effect of the global
economic slowdown. In Latin America falling oil prices hit Mexico and Venezuela,
falling copper prices hurt Chile and Peru, while falling agricultural prices affected
Argentina. Advanced industrial countries were not spared either. Commodity prices
played a crucial role in the depreciations of the currencies of Canada, Australia and
New Zealand; given their tight trade links with East Asia, the latter was headed towards a
recession.
Russia experienced a severe economic crisis following the August 1998 collapse of the
ruble and the decisions to unilaterally reschedule the domestic-currency public debt and
impose capital controls. The crisis in Russia led to rapid worldwide contagion and affected
currencies and stock markets in Latin America, increasing the risk of a continental crisis in
the summer and fall of 1998. Currency speculation in 1998 did not even spare the Northern
98 In this respect, James Tobin wrote: `̀ Considering the damage Japan's disastrous macroeconomic
performance has done to the Asian and world economies along with the apparent inability of the Japanese to
enjoy spending money on themselves, perhaps the Japanese government should unilaterally transfer bundles of
yen to other Asian countries and poor countries everywhere for development projects and relief of poverty,
requiring that these yen be spent in Japan'' (The Straits Times, 18 July, 1998).
366 G. Corsetti et al. / Japan and the World Economy 11 (1999) 305±373

European countries which were not perspective members of the European Monetary
Union.
Contagion was exacerbated by a concern that a devaluation in Brazil could lead to
currency devaluations in Venezuela, Argentina, Chile, Colombia and Mexico. While Latin
American economies were structurally stronger than Russia, investors became increasingly
averse to risk. In August 1998, emerging market spreads over Treasuries (about 1500 basis
points) were close to the peaks reached during the 1995 Mexican peso crisis. The appetite
for risk of international investors sharply fell, making room for a major portfolio
reshuf¯ing from emerging markets towards safe-haven assets and from stocks towards
liquidity.
The contagion from Russia to Latin America affected capital markets even in the US and
Europe. The losses incurred by ®nancial institutions Ð the near collapse of Long Term
Capital Management (LTCM) representing a paradigmatic case Ð led to a serious liquidity
squeeze in US capital markets; such liquidity shock sharply increased the spreads (over US
Treasuries) of a broad range of private bonds, even high-grade corporate bonds. By
September 1998, the risks of a global recession in 1999 had signi®cantly increased.
However, the conditions in international and domestic ®nancial markets improved sub-
stantially in October and November 1998 following a series of positive policy develop-
ments.
9.2. Fundamental causes of contagion in 1998
While episodes of international contagion are not fully understood, there were many
reasons underlying the spread of the crisis from Russia to Brazil, and from emerging to
advanced economies; similarly, there were many fundamental factors behind the recovery
of con®dence in international ®nancial markets in October and November.
Consider for instance why the Russian crisis was rapidly transmitted to Brazil, Latin
America, other emerging markets and the US capital markets. There were a number of
`news' and fundamental `shocks' that emerged after the August 17 Russian policy
decisions. First, investors realized that the availability of liquid resources by the IMF
was now curtailed, and feared a greater reluctance to use them unconditionally to bail out
countries in crisis. Second, Russia, the country that had been considered the best example
of a too-big-to-fail country, went into a crisis because of its policy shortcomings and indeed
was not bailed out. Third, Russia implemented an unexpectedly large devaluation, as well
as an effective unilateral default on its domestic debt that surprised international investors
and led to a sharp increase in their aversion to risk.
Fourth, Russia imposed severe capital controls entailing large extra losses for investors
that had used forward contracts to hedge their GKOs positions; at the same time Malaysia
introduced drastic capital controls. These two episodes led to concerns that many more
emerging markets would also impose such controls. Fifth, investors overstated the
perceived similarities, in terms of macro conditions, between Brazil and Russia, thus
overlooking structural differences within the highly heterogeneous group of `emerging'
economies. Finally, the Russian default and its spillovers to emerging markets caused large
losses for a large number of ®nancial institutions and highly leveraged hedge funds; the
ensuing margin calls exacerbated the rush to dump emerging markets assets and trans-
G. Corsetti et al. / Japan and the World Economy 11 (1999) 305±373 367

mitted the contagion to US capital markets. The LTCM episode revealed the vulnerability
of some G-7 ®nancial institutions to the global turmoil.
9.3. Recovery of investors' confidence in October±November 1998
While the crisis in August and September raised concerns about a global ®nancial
meltdown, a number of important developments restored investors and market participants'
con®dence in October and November. The emerging markets sovereign spreads over
Treasuries fell from 1500 basis points to 1100 basis points; spreads over Treasuries of US
corporate bonds also fell signi®cantly; and stock markets recovered in the US, Latin
America, Asia and the rest of the emerging markets.
What can help explain such recovery of con®dence? First, the US Fed reduced interest
rates twice, once unexpectedly, signaling a strong commitment to prevent both a global and
a domestic crisis, as well as to minimize the risks of a liquidity crisis in the US. Second, the
US Fed rate cut was followed by a series of interest rate reductions in Japan, Canada, six
European countries and 20 other countries around the world. Third, the US Congress
passed the US $18 billion IMF refunding legislation, opening the way for US $80 billion of
new money to the IMF. Fourth, the strong G-7 commitment to support Brazil and design a
large stabilization package to help this country (eventually announced on November 13)
contributed to prevent economic turmoil in Latin America.
Fifth, the passage of bank reform legislation in Japan and the expectation of a
supplementary ®scal package helped the Asian asset markets to recover. Sixth, the sharp
increase in the value of the yen reduced the risks of a China devaluation that would have led
to another round of competitive devaluations in Asia. Seventh, the rescue of LTCM
prevented the systemic effects that could have resulted from its collapse. Eighth, in a series
of speeches the US President Clinton presented a number of policy proposals to deal with
the crisis, including an emergency fund within the IMF in support of countries with good
economic fundamentals subject to speculative pressures, measures to accelerate the
restructuring of banks and corporations in Asia, increases in multilateral banks' support
of social safety nets in crisis countries and increases in trade ®nancing for the affected
countries. Ninth, the G-7 communiques of 30 October reaf®rmed the commitment to
implement speci®c measures to contain current and future crises, following the guidelines
on the reform of the international ®nancial architecture presented in three reports of the G-
22 group published in October.
9.4. The 1998 recession in Asia: the role of corporate, banking and financial distress
Some of the crisis countries, notably Indonesia, Korea and Thailand, experienced a harsh
economic contraction throughout 1998. Many corporations had little access to working
capital and were burdened by a massive stock of liabilities. Corporate debt-to-equity ratios
that were already high before the crisis grew higher, up to levels that could hardly be
deemed sustainable (400 percent in Thailand, over 500 percent in Korea, an even higher
ratio for Indonesia).
Banks came under extreme stress and many ®nancial institutions were effectively
bankrupt. Partly as the result of high interest rates (which increase the rate of non-
368 G. Corsetti et al. / Japan and the World Economy 11 (1999) 305±373

performing loans) and partly due to the attempt to recapitalize ®nancial intermediaries at a
rapid pace, the net worth of the banking system of Korea, Thailand and Indonesia
drastically deteriorated. It should be emphasized that, in terms of actual disbursement,
of®cial ®nancial assistance was signi®cantly lower than announced and reported by
newspaper headlines. Financial means from of®cial sources did not fully alleviate the
liquidity squeeze in capital markets.
In such context of ®nancial distress and debt overhang, banks severely cut credit to
®rms. In some cases, this was a decisive factor in inducing bankruptcy of corporations
that in all likelihood would have been solvent in normal conditions. Contractions in
trade credit were particularly painful, as such cuts undermine the ®rms' ability to
import intermediate inputs, and to produce and export domestic goods. An important
indicator supporting this statement is the fact that, in spite of massive real depreciations,
the exports from the crisis countries had not signi®cantly increased in volume until the
middle of 1998.
The credit crunch for corporate ®rms was exacerbated by the fact that in East Asia bank
loans were a prevalent source of ®nancing for ®rms. With banks and other ®nancial
institutions in severe ®nancial distress, short-term lending (for working capital purposes)
and long-term lending by banks and non-bank ®nancial institutions were drastically
reduced, thus worsening the credit squeeze of the corporate sector. While a banking
crisis was also experienced by Mexico in 1995 following the collapse of the Peso, the
nature of the banking crisis was different in East Asia from Mexico. In Mexico, the lending
boom was concentrated in the household sector, with many households heavily borrowing
from banks (often in foreign currency) to ®nance the consumption of durable goods and
household services. Thus, the peso crush and the ensuing economic recession led to
®nancial distress among heavily leveraged households. The inability of the latter to service
their debt led to the collapse of many ®nancial institutions. Relative to the case of East
Asia, corporate bankruptcies were less important in triggering the ®nancial distress of the
®nancial sector. Conversely, in Asia the distress of the ®nancial institutions was mainly
triggered by the ®nancial and debt-servicing problems of the corporate sector.
Over the summer of 1998, interest rates in Asia had signi®cantly fallen relative to the
peaks of the crisis, and in Korea they came back to pre-crisis levels. In spite of this, the
credit crunch was still severe in most countries: while the price of credit had been falling,
banks that were effectively bankrupt or experienced ®nancial distress were unwilling to
lend to corporate ®rms suffering from debt overhang, so that loans were still drastically
rationed. In such a situation, capital controls leading to lower interest rates would have
done little to ease the credit crunch, and it is far from clear whether they would have helped
to remove structural impediments to recovery.
While the need for a more decisive expansionary policy was widely recognized, several
observers emphasized that an effective way to help the Asian countries to start producing
and exporting again would consist of an accelerated debt restructuring process. The goals
of this process were to recapitalize banks, reduce corporate debt overhang, and provide
®rms with debt moratoria and new priority ®nancing of working capital and trade. In this
regard, it can be argued that a gradual, voluntary and market-based work-out of foreign and
domestic debts was not the most effective strategy to address this issue, since a market-
based process of debt restructuring risked be too slow. A long process could increase the
G. Corsetti et al. / Japan and the World Economy 11 (1999) 305±373 369

number of otherwise solvent ®rms that became insolvent, and therefore worsen the collapse
of economic activity.
Suggestions for a comprehensive approach to bank and corporate restructuring, includ-
ing a more active role of governments, were widely debated. An accelerated restructuring
of the banking system could be accomplished in a number of alternative ways. Banks that
were undercapitalized but still solvent had to be recapitalized, either with capital injections
from domestic and/or foreign investors or through capital injections by the government. In
the case of institutions that were clearly insolvent or borderline insolvent, the governments
had to intervene directly, eventually deciding among possible alternative actions: to
recapitalize them in order to sell them to (domestic and/or international) private investors,
to merge them with stronger institutions, or to close them down in order to sell their assets.
Korea, Indonesia, Thailand and Malaysia tried out many different approaches to bank
capitalization, with a different mix of private and public participation. These included
recapitalization (mostly via foreign injections of new equity), closure and mergers with
other ®nancial institutions. Accelerated disposal of bad loans, proper loan classi®cation
and provisioning for bad loans were all elements of an accelerated bank restructuring
strategy.
9.5. Economic recovery in East Asia and the world economy in 1999
The positive policy developments between September and November 1998, together
with a strong economic performance of the US economy in the latter part of 1998, led to a
rapid recovery of con®dence among investors and a progressive recovery of economic
prospects in East Asia. In East Asia the macroeconomic adjustment, the implementation of
structural reforms, the beginning of bank and corporate restructuring, and the relaxation of
monetary and ®scal policies led to the ®rst tentative signs of economic recovery in a
number of countries.
The ®rst signs that the crisis was bottoming out came from ®nancial variables: currencies
that had sharply depreciated (the Korean won, the Thai baht and even the Indonesian
rupiah), started to appreciate. Next, nominal and real interest rates moved towards pre-
crisis levels. In Korea and Thailand, spreads on sovereign bonds also fell to pre-crisis
levels, following the recovery of con®dence by international investors. The easing in
monetary policy and expectations of a ®nancial clean-up of banks and ®rms next led to a
strong improvement in the stock markets. The turnaround in real variables took longer, but,
by the spring of 1999, there were signs of economic recovery in most of the crisis-af¯icted
countries. In Korea, Thailand and Malaysia, industrial production and GDP started to
recover and GDP was expected to show positive growth in 1999. Signs of economic
recovery were also evident in the rest of East Asia, including Hong Kong, Singapore and
the Philippines. In Indonesia, however, the recovery was still limited to ®nancial variables
and the recession had not yet bottomed out Ð due to serious policy and political
uncertainties and the delay in the bank and corporate restructuring processes.
By the spring of 1999 the risks of a worldwide recession appeared signi®cantly
diminished relative to the concerns emerged in the fall of 1998. The IMF presented a
more optimistic outlook for the world economy in the May 1999 World Economic Outlook,
even though the prospects for Europe and Latin America had worsened relative to forecasts
370 G. Corsetti et al. / Japan and the World Economy 11 (1999) 305±373

in 1998. Weaknesses in Germany, Italy and other European Union countries (partly caused
by the loss of export demand triggered by the recession in East Asia) clouded the
expectations for European growth, while the Brazilian devaluation in January 1999 and
the partial contagion to Latin America increased the likelihood of a signi®cant growth
slowdown in the region. However, while to some extent contagion was experienced in Latin
America following the Brazilian devaluation, it was much less virulent than the one
following the Russian collapse in August 1998. The reduction in overall investors' leverage
and the intervention of the IMF after the devaluation of the Brazilian real limited the
possibility of international contagion, with emerging market spreads sharply falling in
March and April after the strong spike that followed the fall of the real.
In other regions of the world business cycle conditions had improved. The expected
slowdown in US growth failed to materialize in the fourth quarter of 1998 and ®rst
quarter of 1999. The recovery of non-Japan Asia was signi®cant, China was still
experiencing solid growth and, even in Japan signi®cant policy changes (loose monetary
policy, ®scal expansion, bank and corporate restructuring) suggested that the economy may
be close to bottoming out. Also, in transition economies in Europe growth prospects
appeared improving while the severity of the Russian recession appeared to be partially
contained. By May 1999, an increasing number of observers suggested that the 2-year
global crisis that had started with the devaluation of the Thai baht in July 1997 might be
over.
Acknowledgements
We thank two anonymous referees, Ignazio Visco, and the seminar participants at the
NBER IFM Program Meeting, March 1998, the CEPR-World Bank Conference on
`Financial Crises: Contagion and Market Volatility', May 1998, the University of
Washington, and the Bank of Italy for helpful comments on the earlier drafts of this
paper. We also thank Michele Cavallo, Scott Nicholson and Andrew Tif®n for excellent
research assistance. Giancarlo Corsetti acknowledges ®nancial support from MURST. The
views expressed here are those of the authors, and do not necessarily re¯ect those of the
Federal Reserve Bank of New York, or any other institution with which the authors are
af®liated.
References
Alba, P., Bhattacharya, A., Claessens, S., Ghosh, S., Hernandez, L., 1998. Volatility and contagion in a
financially-integrated world: Lessons from East Asia's recent experience, paper presented at the PAFTAD 24
Conference Asia Pacific Financial Liberalization and Reform, Chiangmai, Thailand, 20±22 May.
Alesina, A., Roubini, N., Cohen; G., 1997. Political Cycles and The Macroeconomy. MIT Press, Cambridge,
MA.
Buiter, W., Corsetti, G., Pesenti, P., 1998a. Financial markets and European monetary cooperation. The Lessons
of the 1992±1993 Exchange Rate Mechanism Crisis. Cambridge University Press, Cambridge, UK.
Buiter, W., Corsetti, G., Pesenti, P., 1998b. Interpreting the ERM crisis: country-specific and systemic issues.
Princeton Studies in International Finance No. 84, International Finance Section, Princeton University,
Princeton.
G. Corsetti et al. / Japan and the World Economy 11 (1999) 305±373 371

Calvo, G., 1998. Varieties of capital market crises, In: Calvo, G.E., King, M. (Eds.), The Debt Burden and Its
Consequences for Monetary Policy. Macmillan, London, forthcoming.
Calvo, G., Vegh, C., 1998. Inflation stabilization and balance of payments crises in developing countries. In:
Taylor, J., Woodford, M. (Eds.), Handbook of Macroeconomics. North-Holland, Amsterdam, forthcoming.
Camdessus, M., 1998. The IMF's role in today's globalized world. Address to the IMF-Bundesbank Symposium,
Frankfurt, Germany, 2 July.
Chang, R., Velasco, A., 1998a. Financial fragility and the exchange rate regime. National Bureau of Economic
Research Working Paper No. 6469.
Chang, R., Velasco, A., 1998b. Financial crises in emerging markets: a canonical model, National Bureau of
Economic Research Working Paper No. 6606.
Chang, R., Velasco, A., 1998c. The Asian liquidity crisis. National Bureau of Economic Research, Working
Paper No. 6796.
Chinn, M., 1998. Before the fall: were East Asian currencies overvalued? National Bureau of Economic
Research Working Paper No. 6491.
Cole, H., Kehoe, K., 1996. A self-fulfilling model of Mexico's 1994±1995 debt crisis. Journal of International
Economics 41, 309±330.
Corden, W.M., 1998. The Asian crisis: Is there a way out?, Institute of Southeast Asian Studies, Singapore.
Corsetti, G., Pesenti, P., Roubini, N., 1999. Paper tigers? A model of the Asian crisis. European Economic
Review, forthcoming.
Corsetti, G., Roubini, N., 1997. Politically motivated fiscal deficits: policy issues in closed and open economies.
Economics Politics, pp. 27±55.
Diamond, D.W., Dybvig, P., 1983. Banks runs, deposit insurance, and liquidity. Journal of Political Economy 91,
401±419.
DõÂaz-Alejandro, C.F., 1985. Good-bye financial repression, hello financial crash, Journal of Development
Economics 19, reprinted. In: Velasco, A. (Ed.), Trade, Development and The World Economy. Selected
essays of Carlos DõÁaz-Alejandro, Blackwell, Oxford, UK, 1988.
Dornbusch, R., 1998a. Asian crisis themes. Mimeo, MIT.
Dornbusch, R., 1998b. Capital controls: an idea whose time is past, In: Fischer, S. et al. (Eds.), Should the IMF
pursue capital-account liberalization?, Essays in International Finance No. 207 International Finance
Section, Princeton University, Princeton.
Dornbusch, R., Goldfajn, I., Valdes, R.O., 1995. Currency crises and collapses. Brookings Papers on Economic
Activity 1, 219±270.
Eichengreen, B., Wyplosz, C., 1993. The unstable EMS. Brookings Papers on Economic Activity 1, 51±143.
Feldstein, M., 1998. Refocusing the IMF, Foreign Affairs 77, 2.
Fernald, J., Edison, H., Loungani, P., 1998. Was China the first domino? Assessing links between China and the
rest of emerging Asia. Federal Reserve Board, International Finance Discussion Paper No. 604.
Fischer, S., 1998a. The Asian crisis: a view from the IMF. Address at the Midwinter Conference of the Bankers
Association for Foreign Trade, Washington, DC, 22 January.
Fischer, S., 1998b. The IMF and the Asian crisis, Forum Funds Lecture at UCLA, Los Angeles, March 20.
Fischer, S., 1998c. In defense of the IMF, Specialized tools for a specialized task Foreign Affairs, 77, 4.
Froot, K., Rogoff, K., 1995. Perspectives on PPP and long-run real exchange rates, In: Grossman, G., Rogoff, K.,
(Eds.), Handbook of International Economics, Vol. III. Elsevier, Amsterdam, pp. 1647±1688.
Goldfajn, I., Valdes, R.O., 1997. Capital flows and the twin crises: the role of liquidity. International Monetary
Fund Working Paper 1997/1987, July.
Goldstein, M., 1998. The Asian financial crisis: causes, cures, and systemic implications, Policy Analyses in
International Economics No. 55, Washington, DC: Institute for International Economics.
Greenspan, A., 1998. Remarks before the 34th Annual Conference on Bank Structure and Competition, Federal
Reserve Bank of Chicago, 7 May.
International Monetary Fund, 1997. World economic outlook. Interim assessment. International Monetary Fund,
Washington, DC.
International Monetary Fund, 1998. World economic outlook. International Monetary Fund, Washington,
DC.
Kaminsky, G., Lizondo, S., Reinhart, C.M., 1998. Leading indicators of currency crises, IMF Staff Papers.
372 G. Corsetti et al. / Japan and the World Economy 11 (1999) 305±373

Kaminsky, G., Reinhart, C.M., 1997. The twin crises: the causes of banking and balance-of-payments problems,
Mimeo, Federal Reserve Board.
Kenen, P.B., 1996. From Halifax to Lyons: what has been done about crisis management? Essays in International
Finance No. 200, International Finance Section. Princeton University, October.
Krugman, P., 1994. The myth of Asia's miracle, Foreign Affairs, November/December.
Krugman, P., 1998a. What happened to Asia? Mimeo, MIT, Cambridge, MA.
Krugman, P., 1998b. Will Asia bounce back? Speech for Credit Suisse First Boston, Hong Kong, March.
Krugman, P., 1998c. Saving Asia: it's time to get radical. Fortune Investor, September 7.
Litan, R.E., 1998. A three-step remedy for Asia's financial flu. Brookings Policy Brief No. 30.
Liu, L., Noland, M., Robinson, S., Wang, Z., 1998. Asian competitive devaluations, Institute for International
Economics Working Paper pp. 92±98.
Massad, C., 1998. The liberalization of the capital account: Chile in the 1990s, In: Fischer, S. , Should the IMF
pursue capital-account liberalization?, Essays in International Finance No. 207, International Finance
Section, Princeton University, Pinceton, NJ.
McKinnon, R., Pill, H., 1996. Credible liberalization and international capital flows: the `overborrowing
syndrome'. In Ito, T., Kruger, A.O. (Eds.), Financial Deregulation and Integration in East Asia, The
University of Chicago Press, Chicago.
Milesi, F., Maria, G., Razin, A., 1996a. Sustainability of persistent current account deficits, National Bureau of
Economic Research Working Paper No. 5467.
Milesi, F., Maria, G., Razin, A., 1996b. Current account sustainability: selected East Asian and Latin American
experiences, National Bureau of Economic Research Working Paper No. 5791.
Milesi, F., Maria, G., Razin, A., 1996c. Current account sustainability. Princeton Studies in International Finance
No. 81, International Finance Section, Princeton University, Princeton, NJ.
Mishkin, F.S., 1996. Understanding financial crises: a developing country perspective. National Bureau of
Economic Research Working Paper No. 5600.
Obstfeld, M., Rogoff, K., 1996. Foundations of International Macroeconomics. MIT Press, Cambridge, MA.
OECD, 1988. Economic Survey of Korea 1997±1998. OECD Paris.
Pomerleano, M., 1998. The East Asia crisis and corporate finances ± The untold micro story, Emerging Markets
Quarterly, forthcoming.
Radelet, S., Sachs, J., 1998. The onset of the East Asian financial crisis, National Bureau of Economic Research
Working Paper No. 6680.
Rebelo, S., Vegh, C., 1995. Real Effects of Exchange-Rate-Based Stabilization Programs: An Analysis of
Competing Theories, in NBER Macroeconomics Annual, MIT Press, Cambridge, MA.
Rigobon, R., 1998. Informational speculative attacks: good news is no news, mimeo, MIT, Cambridge, MA.
Rodrik, D., 1998. Who needs capital-account convertibility? In: Fischer S., Should the IMF pursue capital-
account liberalization? Essays in International Finance No. 207, International Finance Section, Princeton
University, Princeton, NJ.
Roubini, N., Wachtel, P., 1998 Current account sustainability in transition economies. National Bureau of
Economic Research Working Paper No. 6468.
Sachs, J., Tornell, A., Velasco, A., 1996. Financial crises in emerging markets: the lessons of 1995, Brookings
Papers on Economic Activity 1 pp. 147±217.
Stiglitz, J., 1998. The role of international financial institutions in the current global economy. Address to the
Chicago Council on Foreign Relations. Chicago, 27 February.
Young, A., 1992. A tale of two cities: factor accumulation and technical change in Hong Kong and Singapore, In
NBER Macroeconomics Annual, MIT Press, Cambridge, MA.
G. Corsetti et al. / Japan and the World Economy 11 (1999) 305±373 373