Currency circulation
49
Modelling Currency Demand in India: An Empirical Study CONTENTS Acknowledgements Executive Summary 1. Introduction 2. Currency Demand – Cross-country Evidence and Review of Literature 2.1 Determinants of Currency Demand: Cross-country Evidence 2.2 Modelling Currency Transactions Demand 2.3 Modelling Currency Demand for Hoarding 2.4 Modelling Financial Innovations and the Implications for Currency Demand 2.5 Demand for Currency and the Underground Economy 2.6 Select Country Studies 2.7 Denomination-wise Demand for Currency 2.8 Denominational Currency Demand Forecasting and Inflation 3. Currency Circulation in India – Aggregate Analysis 3.1 Opportunity Cost of Holding Currency 3.2 Factors Influencing Per Capita Currency 3.3 Conclusion 4. Currency in Circulation – Denomination-wise Analysis 4.1 Currency Denomination and Inflation: Implications for User of Currency 4.2 Conclusion 5. Modelling Demand for Currency at the Aggregate Level 5.1 Modelling Currency in Circulation 5.2 Unit Root Tests - Annual Data 5.3 Cointegration Analysis 5.4 Cointegration analysis for quarterly data 6. Modelling Denomination-wise Circulation of Currency 7. Conclusion and Some Suggestions References DRG studies Series
-
Upload
independent -
Category
Documents
-
view
3 -
download
0
Transcript of Currency circulation

Modelling Currency Demand in India: An Empirical Study
CONTENTSAcknowledgementsExecutive Summary
1. Introduction
2. Currency Demand – Cross-country Evidence and Review of Literature2.1 Determinants of Currency Demand: Cross-country Evidence2.2 Modelling Currency Transactions Demand2.3 Modelling Currency Demand for Hoarding2.4 Modelling Financial Innovations and the Implications for Currency Demand2.5 Demand for Currency and the Underground Economy
2.6 Select Country Studies2.7 Denomination-wise Demand for Currency2.8 Denominational Currency Demand Forecasting and Inflation3. Currency Circulation in India – Aggregate Analysis3.1 Opportunity Cost of Holding Currency
3.2 Factors Influencing Per Capita Currency3.3 Conclusion4. Currency in Circulation – Denomination-wise Analysis4.1 Currency Denomination and Inflation: Implications for User of Currency4.2 Conclusion5. Modelling Demand for Currency at the Aggregate Level5.1 Modelling Currency in Circulation5.2 Unit Root Tests - Annual Data5.3 Cointegration Analysis5.4 Cointegration analysis for quarterly data6. Modelling Denomination-wise Circulation of Currency7. Conclusion and Some Suggestions
References
DRG studies Series

Development Research Group (DRG) has been constituted in Reserve Bank of India in itsDepartment of Economic and Policy Research. Its objective is to undertake quick andeffective policy-oriented research backed by strong analytical and empirical basis, onsubjects of current interest. The DRG studies are the outcome of collaborative effortsbetween experts from outside Reserve Bank of India and the pool of research talentwithin the Bank. These studies are released for wider circulation with a view togenerating constructive discussion among the professional economists and policymakers.
Responsibility for the views expressed and for the accuracy of statements contained inthe contributions rests with the author(s).
There is no objection to the material published herein being reproduced, provided anacknowledgement for the source is made.
DRG Studies are published in RBI web site only and no printed copies are available.
DirectorDevelopment Research Group
Acknowledgements
Prof. Nachane expresses his gratitude to Dr. Amlendu Dubey (currently AssistantProfessor, IIM-Indore) for helping the authors with his computational expertise and toDr. Partha Ray (Professor, IIM-Kolkata) for many helpful comments.
The detailed comments of an anonymous referee were very valuable in the revision of anearlier version of this monograph and these are gratefully acknowledged.
We are extremely thankful to the Reserve Bank of India for giving us the opportunityto work on this subject. We have received unstinted support from all past Directorsand other members of the DRG, DEPR of the Reserve Bank in the preparation of thismonograph. Our thanks in particular are due to Dr. Nishita Raje and Shri S.Arunachalaramanan.
Finally, we are also grateful for the useful comments received from the participantsof an internal seminar of the Bank where an earlier version of the study waspresented.
Needless to say, we retain full responsibility for any shortcomings and (what we hopewould be venial) failings.
EXECUTIVE SUMMARY

The main objective of this study was to examine the evolving determinants of currencydemand in the Indian context and develop a suitable framework for modelling currencydemand at the aggregate level as well as for the denominational composition.
The study presents an extensive survey of literature on various aspects of currencydemand from the central bank’s perspective of currency management. The review of theliterature focuses on the international evidence due to paucity of studies in theIndian context. The study has identified various factors influencing currency demandin India and analysed the behaviour and characteristics of currency circulation andits relationships with the major determinants such as output growth, consumption,inflation, interest rates and growing usage of non-cash payment instruments. It hasexamined the relationships between currency circulation and various explanatoryvariables and established existence of co-integrating relationships in a vector errorcorrection model (VECM) framework for aggregate currency demand as well as for variouscurrency groups.
The modelling of the demand for currency at the aggregate level for both annual andquarterly frequencies has allowed examination of the long-term behaviour as well asshort-term dynamics. In view of considerable volatility of circulation of individualdenominations and limitations relating to the availability of quarterly data, thestudy has identified suitable denomination groups of banknotes that are amenable tothe development of similar models based on annual data.
Some of the important findings of the study are:
At the aggregate level, currency circulation has increased at a faster pace incomparison to the growth in nominal GDP. Despite the emergence of variousalternatives to cash-based transactions, currency retains its pre-dominance.
The increase in currency, broad money and household financial saving in relationto GDP is reflective of the transition of a low income underdeveloped economytowards an economy characterized by increasing monetisation andcommercialisation.
During the past four decades, there has been a significant change in thecomposition of currency circulation across denominations. The average value of acurrency note (for denominations of Rs.10 and above) increased nearly eight-foldwhile there was a 18 fold rise in the price level. Thus, the average value of anote did not keep pace with inflation.
The trends in currency circulation at individual denomination level showconsiderable fluctuations, which rendered econometric modelling complex. Itsanalysis needs further refinement to take into account other factors, such ascurrency substitutes for payment (such as credit/debit cards, internet bankingand cheque payments).
There exists a co-integrating relationship between currency circulation, GDP,WPI and deposit rates based on annual data. The income elasticity of currencywas found to be somewhat higher in comparison to the long-term elasticityobserved in similar studies for advanced countries.
The study has also established co-integrating relationships between differentgroups of currency notes with per capita GDP, WPI and other explanatoryvariables, although the findings were not very robust.

A few limitations of the study arose from the non-availability of relevant datapertaining to, inter alia, the distribution pattern of the size of currency basedtransactions, the shadow economy and the regional dimensions of currency demand.
The study also makes a few suggestions for future improvements in the framework forcurrency analysis in India as under:
Efforts may be made to design a system to capture the magnitude of mismatchesbetween the demand and supply of currency in the economy.
A system of regular surveys to elicit information on public behaviour andpreference for various denominations of currency may be useful. Also, changes inthe micro level determinants of currency requirement, especially for smallerdenominations, such as transport tariff structure, etc. may be considered.
Estimation of regional demand for currency could be attempted though the datarequirements for such an exercise would be formidable.
Modelling Currency Demand in India: An Empirical Study
D M Nachane, A B Chakraborty, A K Mitra and Sanjib Bordoloi1
1. Introduction
Currency is an integral component of modern civilization. In historical times,currency began as coins of precious metals. In modern usage, the term “currency”embraces both coins and banknotes (with the former constituting a progressivelydwindling share). In spite of the emergence of many alternate substitutes, it stillretains its importance in the payments mechanism as the “ultimate mode of settlement”apart from its historical role as the oldest form of circulation media. While theoriginal motives for currency holdings were mainly for conducting transactions(transactions motive) and as a store of value for contingencies (precautionarymotive), with the continuous evolution of the financial system, other motives haveemerged. Thus as Keynes so graphically depicted in the General Theory (1936), thespeculative demand for currency plays a critical role in prolonging depressions, whileas pointed out later by Cagan (1956) in hyperinflations the velocity of currencycirculation can reach truly astounding magnitudes. Finally, the unchecked growth ofthe “shadow economy” in the latter half of the 20th century has created a new sourceof demand for currency, as a medium of circulation which leaves no trail. Given itsimportant role in everyday economic life, the potential for dislocation associatedwith its mismanagement can be serious, and several episodes in history bear ampletestimony to the severity of such disruptions.
Recognizing the important role that currency plays in the smooth functioning of aneconomy, its management has in modern times (say mid-19th century onwards) been vestedwith the central bank of a country, in the expectation that such an arrangement willlead to a standardization of the currency and prevent its “debasing” either by privatemerchants or by governments. The Bank Charter Act (1844) for example, made the Bank ofEngland the sole issuer of new banknotes, which were to be backed by 100 per cent goldreserves. Similarly, the Preamble to the Reserve Bank of India Act 1934 specifies thecentral bank’s objective as regulating “the issue of Bank notes and the keeping of

reserves with a view to securing monetary stability in India …” Thus currencymanagement, which was originally the primary function of a central bank, stillcontinues to be one of its major functions.
From the point of view of central banks, currency derives its importance from beingthe narrowest monetary aggregate and with the central bank exercising full controlover its supply. The central bank is entrusted with the responsibility of ensuringthat the aggregate supply as well as the denominational structure closely correspondsto what is demanded by residents. Hence the need for paying close attention to thefactors that influence currency demand by households, firms, financial intermediaries,the government sector and (to some extent) the external sector. In India, Reserve Bankis entrusted with the responsibility of currency management. The Reserve Bankendeavours to ensure the availability of adequate quantities of reasonably goodquality notes and coins to meet the demand for cash transactions in the country. Tothis end, Reserve Bank has set up a nation-wide network comprising Issue Offices anddesignated bank branches and State Government Treasuries known as currency chests forissue and distribution of currency notes and coins. Currency management activitiesinclude planning for printing/minting capacity for notes/coins, arrangements for issueand distribution of notes, disposal of soiled notes returned by the public fromcirculation and so on.
As noted above, the demand for currency primarily relates to transactions demand, i.e.,the need to carry out cash transactions in both the official and unofficial sectors.Besides the transactions demand, a part of currency, being the most liquid form ofmoney, is also held by the public and the firms as a precautionary measure. Currencycan very often be “hoarded” especially in the unofficial sector. Currency circulationis influenced by a host of factors primarily among them being the per capita incomelevels of people, prices of goods and services, opportunity cost of holding cash vis-à-vis other forms of money, financial innovations leading up to alternative non-cashmeans of payment (e.g. smart cards, debit cards, credit cards, etc.), degree ofmonetization, extent of financial inclusion and the size of the underground economy.With continuous changes in macroeconomic parameters, not only does the demand for theaggregate value of currency undergo changes, its composition also shifts towardshigher denominations. Estimation of the evolving demand for currency in the economyand understanding its relationship with various macroeconomic parameters is anessential element in the planning of the issue and distribution of currency.Notwithstanding this importance, the literature on modelling currency demand functionsconstitutes a very small fraction of the literature on estimating money demandfunctions. The current study has been undertaken with the motivation of attempting tofill this lacuna in the Indian context.
Estimation of demand for different denominations of notes and coins in the short termand long term has a crucial bearing on various macroeconomic activities. Short term(less than 1 year) estimates of currency in circulation are useful to track theseasonal variation and unexpected but transitory rise/fall in the requirement ofcurrency. Medium term (1 to 2 years) forecasts are useful for planning annualrequirement of fresh notes and coins. Long term demand (5 to 10 years) is required forcapacity planning of the note presses and mints and has to take into account thepossibility of changes in the denomination structure.
There has been a phenomenal growth in both the value and volume of currencycirculation over the years. The value of currency in circulation rose from `172 crore
in March 1935 when the Reserve Bank was established, to over `9,35,000 crore in March2011.2During the same period, the number of notes in circulation has gone up from 124million pieces to over 64,000 million pieces. Historically, there has been a markedpreference for cash in India, notwithstanding the growth in banking and use of chequesand the more recent developments in alternate non-cash forms of payment such ascredit/debit cards and electronic fund transfers. The long term annual growth rate ofcurrency circulation has in fact gone up from around 12 per cent during 1971-81 to 14per cent during 1981-91 and nearly 15 per cent in the last decade. In a vast countrylike India with its wide geographical spread, predominance of cash as a mode ofpayment and a high degree of regional variation in income, expenditure and spendingpatterns, management of currency is undoubtedly a challenging task.
An efficient system for management of currency needs to be based on a prior knowledgeof not only the future demand for the total value of currency but also for the demandfor various denominations of banknotes and coins. In an ideal scenario, given the sizedistribution of cash transactions in the economy within a specified time frame, thetotal value of currency and its denominational composition should match the currencyneeds to carry out those transactions without significant mismatches at thedenomination level. Further, the gradual shift in the denominational composition overtime needs to be captured so as to optimize the total volume of currency required tomeet the demand in terms of value.
Generally, the denominational structure of currency comprises 4 to 5 coin categoriesin the lower denomination and 5 to 6 note categories in the higher denomination.Considering that the lower denomination currencies are used for small valuetransactions, which account for a major part of the cash transactions, thesedenominations have a greater degree of velocity of circulation. This is why the lowerdenomination currencies are issued in the form of coins having a much longer life thannotes. In the short and medium term, the structure of denominations may not undergochange and, therefore, the estimation problem essentially relates to determining thevalue and volume of requirement of the existing denominations. However, in the longterm, the issues such as introduction of new higher denomination notes, discontinuanceof low denomination coins and coinisation of lower denomination notes etc assumeimportance and require careful attention in keeping with the objective of managing thevolume of currency in circulation. The long, medium and short term demand estimatesserve a useful purpose in planning the network and infrastructure for issue,distribution and servicing of the notes and coins.
The main objective of this study is to examine the evolving determinants of currencydemand at aggregate level as well as for various denominations. The Indian economy hasundergone significant structural transformation, especially in the last two decadessince the onset of economic reforms. While economic growth has accelerated andconsequently per capita income has gone up at a faster pace as compared with the 1970sand 1980s, inflation dynamics has also changed and in the wake of deregulation,interest rate cycles have emerged with their own cyclical impacts on currency demand.More importantly, there has been significant advancement in the field of non-cashpayment systems, presumably an important factor in containing the need for cash.
The study focuses on two distinct but related aspects of currency demand viz. aggregatecurrency demand and denomination-wise currency demand. For aggregate currency demand,we attempt both annual and quarterly models, while in the case of denomination-wisedemand, our focus is on notes and the absence of quarterly data means that only an

annual exercise can be undertaken. As is well known, the task of modelling currencydemand is quite challenging as currency holdings are remarkably volatile (at least inthe short run), lending a measure of instability to currency demand functions.Additionally, the lack of high frequency data in the Indian case means that some ofthe more advanced econometric techniques like VARs have to be used with a measure ofcaution. In this study, our primary reliance has been on VECMs (Vector ErrorCorrection Models) with an attempt to identify equilibrium cointegratingrelationships.
While a number of candidate variables could affect aggregate currency demand, the fivemost commonly used are (i) national income or private consumption (to account fortransactions demand), (ii) inflation (to account for the “carrying costs” of currencyholdings), (iii) interest rates (opportunity cost of holding currency), (iv) financialinnovations (ATMS, credit cards, etc), and (v) the size of the underground economy.Use of cash for the underground economy is also a well known phenomenon and, as such,the size and share of black economy also impacts currency demand, especially of higherdenominations. However, by its very nature, the size of the shadow/underground economyis difficult to estimate and good proxies are hard to come by. Some authors haveattempted to include various proxies for the shadow economy such as the tax-GDP ratio(e.g. Dotsey (1988)) or “bad behaviour” variables (Drehmann and Goodhart (2000)).However, since a substantial portion of the “black money” is held abroad in foreigncurrency or domestically in precious metals or real estate, the link between currencydemanded and the size of the shadow economy is likely to be a highly tenuous one. Somuch of the literature usually ignores this aspect, in spite of its obvious importancefor a country like India. Hence the shadow economy does not figure in our formalanalysis. In our analysis of currency demand, we did not distinguish between thecurrency needs of the formal and the underground economy, as data on the latter isvirtually non-existent. In line with the general approach, we then concentrate on thefirst three candidate variables using dummy variables to capture the effect offinancial innovations. The econometric results that we obtain are quite promisingespecially those based on the quarterly models estimated over 1996-97 to 2010-11.
We also attempt to model the denomination-wise components of currency demand. One ofthe important assumptions in estimating currency demand is that authorities’ currencysupply adequately reflects underlying demand conditions. While this assumption isreasonable for aggregate currency demand, at the disaggregated level the validity ofthis assumption depends on whether different denominations are supplied without anyrestriction to the people or the denomination-mix of the currency supplied are subjectto the need to contain overall volume. Following the lead from the receivedliterature, we group the different denominations into “small”, “medium” and “large”categories. For each of these, separate cointegration models are postulated. Since thecategories are substitutable at the margin, we attempt to supplement these separatemodels with a simultaneous equation SURE (Seemingly Unrelated Regression Equations)model. Once again we find that the econometric results are in consonance with whattheory leads us to expect.
The empirical exercises have been carried out for annual data for the period 1971 to2011. While data on aggregate currency circulation are published on monthly basis,denomination-wise data are published on annual basis (March end). The denomination-mixof currency has undergone considerable change during these four decades. While highdenomination notes (`1000, `5000 and`10000) were demonetised in 1978, subsequently,the `500 note was introduced in 1987, which started being issued in substantial

quantity since 1996 and `1000 was reintroduced in 2000. The denominationaldistribution of currency has evolved significantly. `1,`2 and `5 notes have beenprogressively coinised since 1990salthough both notes and coins in these denominationsco-existed for several years, which also complicated the estimation problem.
The scheme of presentation is as follows. In chapter 2, some international evidenceand a review of literature on demand for currency has been presented. The discussionis mostly oriented towards international research as, surprisingly, there have notbeen many published studies on currency demand in India. Chapter 3 provides adescriptive analysis of the evolution of currency circulation in India and discussesthe trend in currency-GDP ratio, its relationship with growth, inflation, interestrates and so on. In chapter 4, an overview of the trends in denomination-wise currencycirculation is presented. Chapter 5 deals with the problem of modelling currencydemand at aggregate level and chapter 6 throws some light on the problem of estimatingcirculation of different denomination-groups. Chapter 7 concludes with some policysuggestions for currency management.
In the preparation of this monograph, we have received unstinted support from all pastDirectors and other members of the DRG, DEPR of the Reserve Bank. Our thanks inparticular are due to Dr. Nishita Raje and Shri S. Arunachalaramanan. We are alsograteful to Dr. Amlendu Dubey (currently Assistant Professor, IIM-Indore) for helpingus with his computational expertise, and to Dr. Partha Ray (Professor, IIM-Kolkata)for many helpful comments. The detailed comments of an anonymous referee were veryvaluable in the revision of an earlier version of this monograph and these aregratefully acknowledged. Needless to say, we retain full responsibility for anyshortcomings and (what we hope would be venial) failings.
2: Currency Demand – Cross-country Evidence and Review of Literature
Internationally, there is a substantial literature that analyses various aspects ofcurrency demand from the point of view of currency management. Many of these studiesfocus on modelling aggregate currency demand taking into account macroeconomicfactors, payment mechanisms, local behavioural factors and (especially in the case ofthe US and Euro area) foreign demand for domestic currency. Studies devoted toestimating demand at denominational levels are, by contrast, relatively few. In India,however, there is surprisingly a paucity of studies on modelling currency demand. Thischapter presents a survey of literature along with a broad overview from a cross-country perspective of the various issues that have a bearing on currency demand.
2.1 Determinants of Currency Demand: Cross-country Evidence
Currency represents a unique combination of liquidity, security and privacy. Cross-country studies of the demand for currency aim to analyze how differences in economicactivity levels, opportunity costs of holding currency (as reflected in interest rateand inflation differentials) and financial innovations in carrying out transactionsaffect currency demand. They also mirror differences in national taxation systems, theimportance of the informal economy as well as heterogeneous payment habits, which arelikely to be related to the different structure of banknote denominations and cashless

payment instruments (Fischer, et al, 2004). Additionally, differences in the demand forcurrency may result from the foreign demand for some of the currencies.
As noted in Chapter 1, the key determinants of the demand for currency are thetransactions motive and the desire to have a liquid medium for storing value. Domestictransaction balances that comprise cash are used to purchase goods and services andhence have a direct relationship with transactions in the real economy. By not leavinga paper footprint, cash transactions permit anonymity and hence constitute a preferredmedium of transactions in the shadow economy – either for transactions of contrabandproducts or to evade taxes, e.g., in the housing sector.
Cash hoarding may be characterized essentially as the holding of currency as a storeof value.3 As in the case of transactions demand for currency, there are two forms ofhoarding: one associated with the official economy and the other associated with theblack/shadow/underground economy. The advantage of using currency as an instrument forstore of value is its liquidity and anonymity, the latter factor being particularlyimportant in the case of the black economy. Currency tends to be used for hoarding inthe official economy when the income on alternative assets, costs of currency storage ina locker and the risk of loss (via theft, soilage and most importantly inflation) issmaller than the transactions costs associated with portfolio transformation.
Somewhat surprisingly, over the years, currency has retained its importance, even inadvanced economies, notwithstanding the introduction of more efficient paymentinstruments, such as the cheque book facility and electronic modes of payment, such asEFT, credit and debit cards, and the setting up of ATMs, and instruments that serve asalternate stores of value. The aggregate currency demand, measured in terms of theratio of stock of currency outstanding to GDP, was decreasing for most countriesthroughout the 1970’s and much of the 1980’s. However, it flattened out since thenreflecting, in part, successful stabilization of inflation during the period of GreatModeration (Amromin and Chakravarti, 2009). Overall, the 1990s and 2000s (at lease fornon-Euro OECD countries) may be said to be characterized by stable currency-GDP ratios(Table 2.1).
Table 2.1: Currency-GDP Ratio: Cross-country Evidence(per cent)
Year USA Euro Area Japan UK Indonesia Thailand India2001 5.9 4.1 14.7 2.5 5.5 9.5 11.62002 6.1 5.4 16.3 2.5 5.4 10.3 12.12003 6.2 6.0 16.6 2.5 5.6 10.7 12.52004 6.1 6.6 16.5 2.3 5.5 11.0 12.42005 6.0 7.2 16.7 2.4 5.2 10.6 12.72006 5.9 7.6 16.6 2.4 5.3 9.9 12.82007 5.6 7.8 16.7 2.6 5.6 9.9 12.92008 5.9 8.6 17.1 2.7 5.3 10.2 13.12009 6.4 9.3 18.2 3.1 5.0 11.1 13.02010 6.5 9.5 18.1 3.1 5.0 11.0 13.0Source: International Financial Statistics, IMF and RBI.

There is, however, substantial cross-country heterogeneity. In the US, currency-GDPratio remained stable around 6 per cent in the last decade, whereas in Euro area, itwent up gradually to over 9 per cent in 2010. Prior to introduction of common currencyin the Euro area, the ratio of currency in circulation to private consumption declinedfrom 10.0 per cent in 1980 to 8.0 per cent in 2001 (Fischer, 2004). Among the Euroarea countries, the ratio of currency in circulation to private consumption variedfrom 3.9 per cent in Finland to 13.1 per cent in Spain in 2001. Further, suchheterogeneity does not disappear over time. For example, the currency-GDP ratio in theUK remained in a narrow range of 2.3-3.1 per cent during 2001-10. In contrast, thisratio for Japan rose from 14.7 per cent to 18.1 per cent over the same period, fueledpartly by the extremely low or negative inflation environment.
In many emerging market economies, especially in India, there has been a secularincrease in currency demand in relation to GDP, partly reflecting increasingmonetisation and commercialisation of the economy while the introduction of electronicmodes of transactions has been relatively recent and is yet to be reflected in alowered currency demand. In India, the decadal average currency-GDP ratio hoveredaround 10 per cent in the 1970s, 1980s and 1990s, but increased to over 13 per cent inthe last decade. Notably, currency to private consumption ratio also has gone upsubstantially from 12.6 per cent in the 80s to 14.8 per cent in the 90s to 19.1 percent in the last decade, despite rapid spread of non-cash payment modes. It is worthnoting that these aggregate measures are, however, unable to distinguish between thestore of value and payment functions of the currency.
Currency demand, as noted above, depends on country specific circumstances. Economic,technological, cultural and sociological factors that influence currency demand differacross countries. The cross-country variations in growth, inflation and interestrates, the rate of direct and indirect taxes, the share of informal and undergroundeconomy in the overall economic activity and the organization of economic activity(viz., dominance of retail vis-à-vis large-scale business), regulation of various modes ofpayment, proportion of migrant workers, the nature of currency (‘soft’ or ‘hard’),etc. are among the important explanatory economic factors. The extent and type offinancial innovations also impact currency demand. The growing acceptance of cashsubstitutes, viz., electronic modes of payment and use of credit/debit cards,particularly in the developed countries has not, however, necessarily resulted in anoffsetting reduction in the total stock of currency outstanding. Variations in annualgrowth of currency in circulation (in value terms) over time and across countries inthe last decade may be seen in Table 2.2. In the recent years, currency growth hasbeen low in Japan and moderate in the US and Euro area. On the other hand, it wasrelatively higher in India, Indonesia and Thailand.
Table 2.2: Currency in Circulation: Annual Growth Rate(per cent)
USA Euro Area Japan UK Indonesia Thailand India
2002 6.9 37.5 8.9 3.3 7.8 14.1 12.62003 5.4 14.7 1.9 6.8 14.6 13.8 15.82004 4.3 14.8 1.4 -1.9 12.6 12.3 12.72005 5.4 12.6 1.6 8.0 14.2 5.4 16.5

2006 3.3 11.0 0.7 7.1 23.3 2.7 17.32007 1.1 7.7 1.8 13.2 23.6 8.9 17.22008 7.3 12.6 0.2 7.1 19.8 9.7 17.02009 4.7 5.7 -0.6 8.8 5.5 8.9 15.72010 6.1 4.2 1.6 4.6 14.2 10.8 18.8Source: International Financial Statistics, IMF and RBI.
The degree of monetisation, however, as reflected in the currency to broad moneysupply ratio has been quite stable in both mature and emerging market economies(including India) in the recent years (Table 2.3).
Table 2.3: Currency- Broad Money Ratio(per cent)
USA Euro Area Japan UK Indonesia Thailand India2001 8.1 5.2 7.2 2.7 7.5 16.72002 8.3 6.8 7.8 2.6 8.4 16.42003 8.3 7.3 7.9 2.6 9.0 16.32004 8.2 7.9 7.9 2.4 12.3 9.6 16.42005 8.0 8.2 8.0 2.3 12.0 9.5 15.82006 7.6 8.3 8.2 2.2 12.9 9.0 15.22007 6.9 8.0 8.2 2.2 13.4 9.2 14.72008 6.8 8.3 8.2 2.0 13.9 9.3 14.42009 7.2 8.8 8.0 2.8 13.0 9.5 14.32010 7.8 9.0 8.0 2.8 12.9 9.5 14.6Source: International Financial Statistics, IMF, ECB and RBI.
2.2 Modelling Currency Transactions Demand
According to Roseman (2010), domestic demand for currency in the US is largely basedon the use of currency for transactions and is influenced primarily by income levels,prices of goods and services, the availability of alternative payment methods, and theopportunity cost of holding currency in lieu of an interest-bearing asset. Consumersfrequently use smaller-denomination notes for small transactions and alternativepayment methods (for example, debit and credit cards) for larger purchases. Incontrast, foreign demand for US currency is influenced primarily by the political andeconomic uncertainties associated with certain foreign currencies, which contrast withthe U.S. dollar's historically relatively high degree of stability. Because U.S.currency is held abroad primarily as savings, foreigners tend to hold high-denomination notes.
Doyle (2000) estimated the overseas demand for US dollars based on data for 1960-1996using a cointegrating framework between real currency balance, interest rates andretail sales. The dynamic OLS method was adopted. The exercise was carried out for theUS as also several other countries, which were likely to hold US dollar cash balances.The estimation results showed that in case ofmost countries, for aggregate currency

demand, coefficients were positive for retail sales and negative for interest ratesand both were significant. When currency data were split into large and smalldenominations, the signs flipped for small denominations. The study also foundevidence that the equations were stable for the period 1960-1996.
In the European context, there has been a large number of studies for estimatingcurrency demand. Nenovsky and Hristov (2000) model transactions demand for currency asfollows:
In contrast to the general models of demand for money, where the demand is estimatedin real terms, demand for banknotes and coins is estimated in nominal terms. Underthese conditions, in order to estimate the influence of price level on demand forcurrency, inflation rate (measured via the consumer price index) is added as anexplanatory variable (Nenovsky and Hristov, 2000). Usually, household money expenses -rather than money income - is more closely connected with demand for currency incirculation (Boeschoten, W., 1992). Attanasio et al (2002) estimated the demand for money inItaly between 1989 and 1995 using a dataset of detailed information about householdsand firms. The study found that demand for money by households was significant withrespect to elasticity of consumption and interest rate.
2.3 Modelling Currency Demand for Hoarding
There are a limited number of studies that have examined currency demand for thepurpose of hoarding. In fact, hoarding does not fit well into any theoreticalframework for currency demand4. Thus, the Baumol-Tobin inventory approach whereindividuals try to minimise the transactions and opportunity cost of holding cash,does not provide any room for hoarding. Nevertheless, studies related to hoarding ofcurrency show a large proportion of aggregate currency held as hoards. In view ofextreme liquidity of currency, it is an attractive form of precautionary balances ifthe cost of transferring alternative financial assets into cash proves to beprohibitive (Van Hove and Vuchelen, 1996). The desire for secrecy may be based onlegitimate motives (Anderson, 1977), although it is more likely to be associated withtax evasion or other illegitimate activities.
When currency is used as a store of value, there can be a strong elasticity of thedemand for cash with respect to interest rates (and, in open economies, exchangerates). Holders may even economize on transaction cash balances when interest ratesrise.The most commonly used method for modelling hoarding demand for currency is theage of bank notes or the lifetime method. Under this method, the average life ofvarious denominations of bank notes serves as an indicator of currency usage fortransactions/hoarding, with a relatively high note life of a particular denomination

indicating lower intensity of use (for transactions purposes), and a greater use forhoarding. The life-time method has been a popular method for estimating the volume ofhoarded banknotes. Studies of this genre assume that smaller denomination currenciesare used only for transactions and assuming that the average life of smalldenomination notes is the normal average life of the banknotes, the percentage ofnotes of a higher denomination used for hoarding is calculated. The average life ofdenominations is defined as the average period between the banknotes’ issue anddestruction.
Kippers (2004), Boeschoten and Fase (1992) and Boeschoten (1992), report on severalstudies regarding the hoarding of bank notes. In these studies, the hoardingpercentage of banknotes in the Netherlands was estimated to be around 50 per cent, andeven 70-80 per cent for the then existing highest denomination (1000 - guilder banknote). They used two methods to arrive at these estimates, viz. a comparison of thereturn rates of bank notes to return rates of bank notes that are mainly used fortransaction purposes. Also, they compare the average life of bank notes to a benchmarklife of non-hoarded bank notes. Boeschoten (1992) extends this analysis to 13 othercountries. The highest hoarding percentages were found in the countries with thehighest denominations (the Netherlands, Switzerland and Germany). One drawback of thismethod is its lack of precision power since over time, there can be changes both inthe treatment of banknotes as well as in the replacement procedures of central banks.
2.4 Modelling Financial Innovations and the Implications for Currency Demand
There have been rapid financial innovations, in both advanced economies and EMEs,especially in the last two decades, which have had implications for currency demand.In advanced economies, while cheques never became prominent in retail expenditure torival the use of cash, the use of electronic payment media like debit and credit cardspermitting electronic fund transfer at point of sale (EFT-POS) has successfullychallenged currency as an alternate transaction medium (Markose and Loke, 2002). Theusage of credit and debit cards in transactions depends, however, on the ratio offirms that accepts such payment, which varies across countries.
Unlike EFT-POS that reduce currency demand, the impact of ATMs on currency demand isambiguous. The expansion of ATM networks by banks has enhanced the convenience yieldof cash and reduced shoe leather costs by increasing accessibility to cash closer to pointof sale. For the first time, historically, this has reduced the transaction costs ofuse of cash while making payments. The lowering of the transaction costs enableseconomic agents to reduce their outstanding transaction balances (in terms of Baumol’smodel). At the same time, the cost effectiveness of ATM cash dispensation has enabledcash to maintain its competitiveness vis-à-vis EFT-POS instruments such as credit cardsand debit cards (Markos and Loke, 2002). Furthermore, the increase in the number ofATMs impacts directly the volume of banknotes in circulation due to a growing need ofgreater volumes of banknotes to be kept as reserves in ATMs. Interestingly, in somecountries such as Bulgaria, this effect occurs in certain specific denominations whichare used for the ATMs (Nenovsky and Hristov, 2000).
In one of the early studies dealing with various forms of financial transactions,Akhand and Milbourne (1986) used credit card usage as an alternate transaction mediumin a model of money demand. The study concluded that credit cards allow agents to holdless in money balances and more in bonds as postulated in the standard Baumol-Tobinmodel. Various studies have pointed to different conclusions on the role of currency

in the presence of alternative payment instruments. While a few studies havehypothesised the demise of currency as a medium of exchange in view of EFT-POSinstruments, other studies have noted that on both theoretical and empirical grounds,cash use is likely to persist for the foreseeable future because of the costcompetitiveness of ATM networked cash to the consumer relative to electronic POS cardsubstitutes.
In estimating the effect of payment cards on money demand, a log-linear money demandspecification of the form y = f (X, r, Card) is assumed as a theoretical starting pointwhere, y typically represents the log of currency in circulation, X an appropriate scalevariable like income or wealth and r represents a measure of the opportunity cost ofmoney holdings. Card typically contains several variables measuring payment card“intensity”, usually approximated by the number of outstanding payment cards, thenumber of EFT-POS terminals or the number of ATMs and number and volume oftransactions conducted via ATMs. A study by Drehmann et. al. (2002) analyzed a panel of 16OECD countries and separately studied the impact of credit card usage on the demandfor small and large denominations. They also find that the number of POS terminals andATMs have significant effects on cash demand.
2.5 Demand for Currency and the Underground Economy
Many of the studies in the literature on currency demand for non-transactions purposesrelate to the role of currency in facilitating underground economic activity. Attemptsat estimating the shadow economy through the currency in circulation have a longhistory (Cagan, P., 1956 and P. Gutman, 1977). In the standard view, the importance ofcurrency stems from its special characteristics, such as anonymity and secrecy ascurrency, unlike other means of payments, does not leave a paper/byte trail. Goodhart(1989) noted that “… much of such demand probably relates to nefarious activities, the‘black economy’, gambling, prostitution and drugs, where anonymity of currency isprized; indeed a large portion of outstanding notes is never caught in surveys.”
Faced with the alternatives of (i) paying tax on legitimate income/profits and earninginterest by placing the surplus with banks as deposits on the one hand and (ii) payingno tax and holding assets in the form of currency hoards on the other, there can be astrong incentive for tax evasion by hoarding currency especially for shorter periods.Firms operating in the underground might be inclined to hold large amounts of money inthe form of currency, either because they have no access to the legal credit market(Martino, 1981) or because they are waiting to have their black profits laundered.Further, the illegally acquired income – as opposed to unreported but otherwiselegally earned income – has to stay unreported and the accumulation of currency can,therefore, be meaningful for those engaged in illegal activities.
A crude method of estimating the change in the size of the informal economy over timeis to study the change in cash to deposit ratio using monetary approach (trend of thecash ratio) (Gutman 1977, Feige 1979, Tanzi 1983). This method involves several strongassumptions (e.g. constant cash-deposit ratio in the official sector) and the resultsare, therefore, not very reliable (Porter and Bayer 1984, Lafleche 1994).
In the more sophisticated method used by Tanzi (1983), the cash to M2 ratio has beenregressed on the tax rate, income, interest rate and the ratio of wages and salariesto national income, where the average weighted tax rate (direct and indirect taxes)was used as a proxy for the shadow economy. The Tanzi method has been widely used in

developed and developing countries. As per this method, the coefficient of the taxrate gives the effect of cash holdings in the underground economy on the cash toM2 ratio. By re-estimating the model assuming taxes to be zero, the difference betweenthe two estimates of the demand for currency is the proxy for the shadow economy. Thesecond step in Tanzi’s method is based on the assumption of the constant velocity ofcirculation in the shadow economy and in the official economy. Based on the aboveassumption, the shadow economy is quantified and compared with the official GDP(Schneider and Enste, 2000). Surely, Tanzi’s method involves strong and implausibleassumption, viz., any rise in tax above zero shifts income into the informal sector.Tanzi’s estimates are also biased since his method does not allow for the use ofcurrency as a means of hoarding. The hypothesis of the equal velocity of currency inthe shadow and in the official economy is a major weakness of the approach tomeasuring the underground economy through the currency in circulation (Thomas, 1999).Porter and Bayer (1989) using different methods have challenged Tanzi’s findings (of15-20 per cent currency absorbed in the underground economy).
2.6 Select Country Studies
We now present the findings of a few country-specific studies.
New Zealand
A study on forecasting currency demand by the Reserve Bank of New Zealand (RBNZ) wasmotivated by the need to comprehend the sudden unanticipated increase in demand forcurrency at a time when spectacular progress in the application of electronictechnology in the retail payments area was occurring, particularly in terms of numberand spread of automated teller machines (ATMs) and electronic funds transfer at pointof sale (EFT-POS) (Vincenzo et al, 1997). Contrary to the anticipated fall in currencydemand, there was a rise as ATMs made currency accessible to the public round theclock.
The RBNZ study used two approaches - currency demand function approach and an ARIMAmodel-based approach. The first approach is a standard money demand function based onthe transactions- and portfolio demand for currency. The study revealed that seasonalARIMA models proved superior to a structural demand function in forecasting the demandfor currency, particularly over short-term horizons. In particular, the moving averagemethod, which was found to provide the most accurate forecast, was successfullyincorporated in the RBNZ’s currency forecasting exercise.
European Union Countries
The extent to which payment cards are actually used vary widely among the countries ofthe EU with Finland, for example, displaying very advanced usage while Greece, Italy,Spain and Austria all show modest usage. At the aggregate level, the declining ratioof currency in circulation to M1/M3 since 1980s reflects the increased use of cashlesspayment instruments. Also, in some countries such as France, Belgium and Netherlands,there are legal regulations that enforce the use of cashless payments. In countries inthe European Union, payment cards can substitute for cash payments as they are mainlyused for small and medium-value purchases (Fischer et al, 2004).
There have been several studies on currency demand for European Union countries thatinvestigate the effect of non-cash payment instruments. Markose and Loke (2002)observed that among the early developers of EFT-POS networks viz. USA, Denmark, Canada,France and Finland, the latter three have experienced a resurgence of ATM cash usesince the mid-1990s. This is despite an overall trend towards an increasing proportionof card-financed to cash purchases (Humphreys et al., 1996, and Markose and Loke, 2000).
That credit/debit cards/ATMshave a strong offsetting effect on transactions demand forcurrency was found in Finland (Viren, 1992), and Netherlands (Boeschoten, 1992).5 Incase of Finland, however (along with Canada and France), there was a resurgence of ATMcash since the mid-1990s (Markose and Loke, 2002). In case of Italian households,estimation results based on a money demand equation indicate that ATM users holdsignificantly lower cash balances than non-users (Attanasio, Jappelli and Guiso,2002). In Austria, individuals who access POS terminals for payments and ATMs hold 20per cent and 18 per cent less purse cash, respectively (Stix, 2004). However, due tothe relatively small share of frequent users, aggregate purse cash demand was not verystrongly affected by EFT-POS payments. In case of Belgium and Iceland, it was foundthat the cost efficiency of the cash payment system is low compared to a paymentsystem based on cards (De Grauweet al., 2000). Using Baumol-Tobin cash balancesapproach, it was observed that at low interest rates, the interest rate elasticity forcash-cards substitution varies directly with the density of card network (Markose andLoke, 2000).
A study spanning the period 1960-99 for Belgium (a period representing the transition,from pure cash based society to a technology based payment system) estimated a moneydemand function for retail transactions through cointegration analysis. In addition tostandard variables (GDP and interest rate), variables like bankcards (credit/debitcards, electronic purses), points of sale that accept cards and ATMs were included tostudy currency substitution (Rinaldi, 2001). Real per capita currency holdings(defined as per capita currency with the public, i.e. outside the banking system)corrected for the share used for hoarding purposes was used as the dependent variable.The variables y, X, r and Card were shown to be non-stationary and co-integrated. Inthis long-run equilibrium relationship, the number of EFTPOS terminals, credit anddebit cards and the number of ATMs showed a negative impact on currency incirculation. Rinaldi (2001) also estimated an error-correction model (ECM) in whichthe number of ATMs was found to have a positive short-run effect on currency demand.While economic theory defines the long run equilibrium, the short term dynamicadjustment process is determined from the data under an ECM framework. The studyconcludes that currency demand increased following an increase in ATM in Belgium andthat E-money has taken off much slower than expected in European Union countries as awhole implying that payment habits of consumers and traders take time to adapt, sothat high cost currency provision would most likely continue for quite some time.
Using a dataset comprising 11,945 payments in France made from March to May 2005,Bounie and Francois (2006) attempted to assess the role of transaction characteristicsin the choice of payment instruments - cash, check or bank card - at the POS bycharacterizing the probability of a transaction being paid by one of theseinstruments. Controlling for individual characteristics, their main results were: i)a differentiated effect of the transaction size regarding payment instruments; and ii)a specializationeffect between payment instruments according to the type of goods/servicespurchased and the place of spending.

A panel study for ten European countries found strong evidence of a substitutioneffect between cash and cards, ATMs and POS terminals (Snellman, Vesala and Humphrey,2001). Gompertz S-curve analysis that accounts for product-cycle nonlinearities wasapplied. The study used estimated elasticity to derive the S-shaped learning curve andgenerate forecasts through extrapolating the curve. The development of infrastructurefacilitating the new technologies had a bearing on the process of substitution. Thus,cash transactions accounted for about 60 per cent of the value of point-of-salepayments in countries with a mature card payment network, like Belgium, Finland,France and Denmark. On the other hand, Germany, UK and Italy were slow in cashsubstitution with cash rate use at 95 per cent. In countries with a high cash share atthe POS and relatively immature card payment networks, the aggregate cash share wassignificantly higher but projected to slowly decrease due to the impact of paymentcards.
In Finland, the use of cards, especially debit cards, has increased substantially. Forexample, in 1984, some 80 per cent of total purchases (in value terms) were made withcash, whereas by 2002 the corresponding figure had dropped below 50 per cent. A studyon cash substitution in Finland showed rapid saturation with the use of cash remaininghigh in retail payments and was forecast not to fall below 65 per cent during the nextten years (Snellman and Vesala, 1999). However, another study found that the errorcorrection model and its special-case partial adjustment model, coupled withindependent explanatory variables, seem to do a better job than the learning curvemodels for explaining electronification of payment methods in Finland (Jyrkönen,2004). A forecast based on the former indicates that electronification would lower thecash-share of total value of point-of-sale payments over time.
United States
Before the passage of the Federal Reserve Act of 1913, which established the Fed, thesupply of currency in circulation was inelastic and did not respond to seasonal andcyclical changes in demand (Federal Reserve Bulletin, September 2001). The Congresspassed the Federal Reserve Act to remedy this problem, which mandated an elasticcurrency that would expand and contract in response to public demand. The FederalReserve Act also authorises the Federal Reserve to issue Federal Reserve notes todepository institutions through the Federal Reserve Banks. The Federal Reserve Boardprepares and submits an annual order to the Bureau of Engraving and Printing (BEP).The order is based on the Federal Reserve System’s estimate of the amount of currencythat would be demanded by the public in the following year and reflects the estimatedchanges in currency usage and destruction rates of unfit currency.
The estimation of demand for currency is the joint responsibility of the staff of theFederal Reserve Banks and the Federal Reserve Board. Each Federal Reserve Bank takesinto account local economic and environmental conditions that affect demand forcurrency. Environmental conditions have varying impact on physical appearance andlongevity of bank notes. These conditions are taken into account in each district todetermine the amount of currency needed to satisfy the daily payment requirements ofthe public and to maintain a safety stock to meet natural contingencies that mightdisrupt normal distribution channels. Board staff members study Federal Reserve datato reconcile variations and evaluate trends, consider the amount of currency held invaults at the BEP and at the Reserve Banks, and calculate overall growth rates of netpayments and currency destruction rates. Board staff members compare their currency

demand estimates with Federal Reserve Bank forecasts and reconcile differences until aconsensus print order is approved by the Board.
Another study (Judson and Porter (2004)) estimates US currency demand based onregional currency demands using a panel dataset covering the 37 Federal Reserve CashOffices over 25 years from 1974 to 1998. The study finds strong support for thetransaction specification, in which currency depends on a transaction measure andnominal interest rate.6 This result is generally robust to the inclusion of a widevariety of additional economic and demographic variables. Beyond the traditionaltransaction terms, seven other variables stand out in the specifications: the agedistribution of the population, bankruptcies, crime, employment, housing permits andstarts, and transfer payments. It also shows that international currency demand wasgenerally an important influence during the period; when its influence is disregarded,the findings are considerably muted.
Studies using US household survey data concluded that credit cards allow households toreduce their transactions and precautionary demand for money (Duca and Whitesel, 1995and Blanchflower et. al. 1998). The studies followed a cross-section approach andanalysed the effect of credit cards on the demand for various balances at banks (likechecking balances). There are similar studies in respect of other countries such asBulgaria, Malaysia and Turkey.
2.7 Denomination-wise Demand for Currency
The aggregate demand for currency fails to account for the fact that differentdenominations of currencies may be affected by distinct sets of factors/variables andthe aggregate picture could be somewhat misleading for planning the supply ofcurrencies of various denominations if the impact (actual and potential) of thevarious factors differentially impacting the various denominations are not considered.Thus, larger denominations may be in demand for use in ATMs and for the purpose ofhoarding. Smaller denominations, on the other hand, tend to be used more fortransactions.
In this regard, a few studies have pursued the distinction between differentdenominations, especially large and small denomination bills, and different holdinggroups.7 These studies show that the currency denominations in Euro/OECD countries arelinked to the per capita GDP in terms of purchasing power parity (PPP). Thus, lowvalue legacy banknotes were particularly important in Greece and Portugal. Second,continued high inflation, which leads to a decline in the purchasing power of abanknote, also leads to an increased concentration among the higher denominations, ifthere is no change in the denomination structure over the period. Third, countriesthat have high value banknotes in real terms become attractive for hoarding andforeign demand. High value banknote in real terms may be viewed as indicative of lowpast inflation (since denomination of currencies is not frequently changed). Lowerinflation makes such currencies attractive for hoarding. Fourth, the demand for high-value banknotes is relatively strong among non-residents.
Thus, in the Euro-area, whereas the transactions motive was seen to dominate thedemand for low-value currencies, the demand for large-value bank notes, which arewell-suited as a store of value, was found to be positively affected by a fall in theopportunity costs of holding currency (Fischer et al, 2004). Hence, currencies were usedfor hoarding purposes in those countries where the inflation rate was low. This is

seen from the fact that in countries where the average annual inflation during 1970-98was high, the average legacy value of a banknote (i.e. the total value of banknotes incirculation divided by the number of banknotes in circulation), converted to Euro, waslow in 2000. Thus, an increase in inflation increases transactions demand for lowerdenomination currencies, but reduces hoarding demand for larger denominationcurrencies and also tends to reduce the average real value of a bank note and usuallycauses concentration of fresh printing of notes of various denominations at the largerend (in the absence of introduction of higher denominations) (Fischer et al, 2004).Their results point towards lower levels of transaction balances used within the euroarea of around 25 per cent to 35 per cent of total currency.
A study using panel estimation techniques to analyze the change in transactionaldemand for various currency denominations resulting from improvements in paymenttechnology in 13 OECD countries from 1988 to 2003, classified currencies into threetypes: small, medium and large denominations (Amromin and Chakravorti (2009)). Thestudy observed that ATMs typically dispense medium denomination currencies and foundevidence that greater penetration of ATMs (signifying lower transaction costs incurredin a visit to ATM) has, on net, reduced the demand for the ATM dispensed notes.Second, they found that currency demand varies directly with the share of smallmerchants (self-employed) in an economy. This effect is primarily observed throughdemand for small denomination currency, suggesting that high fixed costs of installingelectronic payments terminals and not illicit activity influence cash demand by smallmerchants. It follows that demand for small denomination currency decreases withgreater debit card usage and with greater retail market consolidation. Third, thedemand for small (as also large) denomination currency is positively associated withthe extensiveness of the banking network. Fourth, the demand for larger denominationnotes is affected by the short-term interest rate, but not by the adoption of point-of-sale (POS) debit card terminals. This suggests that these denomination notes areessentially used for non transactional purposes. On the other hand, short-terminterest rate has little effect on the demand for small denomination currencies.
Structural Model - Bundesbank
The Bundesbank has developed a Structural model (vector error correction model) todetermine the contribution made by various determinants to the volume of banknotes incirculation (Deutsche Bundesbank, 2009). The analysis was carried out based onclassification of the bank notes on three criteria, viz., small denominations (€5 to €20and DM5 to DM50), medium denominations (€50 and €100 as well as of DM100 and DM200)and large denominations (€200 and €500 as well as DM500 and DM1,000). Cash consumption- considered to be those subcategories of private consumption that are largely settledin cash - was counted among the determinants of cash demand. The opportunity cost ofholding cash was taken into account via the interest rate level. The complete interestrate range is incorporated into the analysis as a shift parameter from an estimatedyield curve to represent the generally prevailing interest rate level.
Empirically, as expected, it was found that the small and medium denominations wereused for transactions purpose in Germany as reflected in cash consumption. The largedenominations (where the non-resident motives seem to be important) appeared to beunaffected by this factor, but were affected via a long-term impact of the houseprices in the euro area, whose dynamics are determined mainly by the real estatemarket outside Germany and also via private consumption in the euro area excludingGermany. Additionally, demand from non-euro-area countries emerged as important in the

long term for all denominations. Moreover, an influence of the shadow economy onbanknote demand could not be ruled out for any of the three banknote categories.Finally, opportunity costs in the form of the interest rate level seemed to be ofrelevance only for the small denominations. Alternative means of payment, too,evidently influence only the small denominations. Alternative payment media determinethe fluctuations around the long-term equilibrium, which is defined by cashconsumption, demand from non-residents, and interest rates. The cash changeoverdummies show a highly significant influence in all the specifications.
Statistical Models on Currency Distribution - D-metric approach
In the D-Metric model (Payne and Morgan, 1981), the independent variable of overridingimportance in determining the most efficient sequence of values of notes and coins inuse is the amount of the average day's pay (D) for the country in question. In orderto achieve an optimal system, it is necessary, according to the D-Metric approach,that the minimum coin denomination has a value of about D/5000, that the maximum notedenomination has a value of about 5D, and that the note-coin boundary (between thehighest-value coin and the lowest-value note) is between D/20 and D/50.
2.8 Denominational Currency Demand Forecasting and Inflation
Inflation affects the aggregate value of currency in circulation as also thedenomination shares. On the one hand, inflation raises nominal income and hence thetransactions demand for currency (in nominal terms). On the other hand, by raising theopportunity cost of holding currency as a store of value, inflation may result in ashift in the allocation of the consumer’s portfolio away from currency, whose returnis inversely related to the rate of inflation.
Inflation has implications from the point of view of currency management by a centralbank. As inflation erodes the purchasing power of a currency, the optimal level ofvarious denominations of currency keeps changing, Under inflationary circumstances,the central bank needs to continuously alter the denominations of currency (as well asquantity of currency in any given denomination) to facilitate efficient cashtransactions with smaller denominations going out of circulation and largerdenominations taking their place. First, the existing denominational structure may notbe suited to effect a straightforward response. Second, each denomination has adifferent volume. Although there have been studies to correlate note-coin volumes anddenominational structure with a wide range of economic-demographic variables, theywere not really amenable to yield a coherent theory of currency structure (see Payneand Morgan (1981)). Currency management, therefore, remains a matter of pragmaticadjustments combined with some form of trend analysis.
2.9 Currency Demand in India
The Reserve Bank estimates the quantum of banknotes that needs to be printed, based onthe requirement for meeting the demand for banknotes based on various factors likeinflation, GDP growth, replacement of soiled banknotes and reserve stock requirements.Further, the Reserve Bank also estimates the quantity of banknotes that are likely tobe needed denomination-wise and accordingly, places indents with the various printingpresses. Banknotes received from banks and currency chests are examined and those fit

for circulation are reissued and the others (soiled and mutilated) are destroyed so asto maintain the quality of banknotes in circulation.
There have been very few published studies on currency demand in India conductedoutside the Reserve Bank. One of the major studies worth mentioning is that byCoondoo8 et al. This study aimed at regression models for aggregate value of currency incirculation using explanatory variables such as income, per capita income, prices,interest rate, etc. Thereafter, a simulation approach was employed for estimating thedenomination-wise composition. In the absence of data on the distribution of cashtransactions, a parametric distribution (e.g. Lognormal) model was assumed for sizedistribution of cash transactions and random samples were drawn from the assumeddistribution. A rule was formulated to determine the number of different denominationsneeded to carry out the transactions and the required currency composition for eachsample of cash transactions were obtained and averaged across the samples. Theresulting denominational composition of currency was matched with the actual aggregatecirculation for determining the appropriate parameters of the underlying distribution.
3: Currency Circulation in India – Aggregate Analysis
Among the important determinants of the demand for currency, as we have seen above,the following deserve special attention: (i) volume of transactions demand arising inthe formal economy; (ii) transactions demand arising from the underground economy;(iii) precautionary, prudential and speculative demand; (iv) the type and pace offinancial innovation and (v) use by other countries (in case of India, primarily Nepaland Bhutan). The focus of this chapter is on reviewing the broad trends in currencydemand in India over the last four decades reflecting changes in the macroeconomicscenario and financial factors.
As regards the transactions demand for currency in the formal sector, it is expectedthat with the development of alternative modes of payment (cheques, electronic modesof payment), shift in the GDP composition from agriculture to services, spread of bankbranches, and increased ATMs network reducing transaction costs, there would be adecline in the transactions demand for currency with the public, in relation toaggregate output (GDP)/private final consumption expenditure, and financial saving ofhouseholds. On the other hand, progressive monetisation of the economy, reducedopportunity cost of holding currency with the secular decline in inflation, hightaxation rates, wider ATM network rendering easy access to cash and increase inunderground economy transactions would most likely lead to an increase in thetransactions and hoarding demand for currency.
While there has been considerable variability in the annual growth rates of currencyin circulation (in value terms) during the last four decades (1971-2011), the decadalaverage growth has been surprisingly stable. After an average annual growth of 11.2per cent during the 1970s, currency exhibited a near trend growth of around 15 percent during the 1980s, 1990s and 2000s Nominal GDP growth, however, declined sharplyduring the 2000s to 12.8 per cent from around 15 per cent during the 1980s and 1990s.The decline in the rate of growth of nominal GDP during the 2000s mainly reflecteddeceleration in average inflation (till 2009) even as real GDP growth accelerated(Table 3.1).
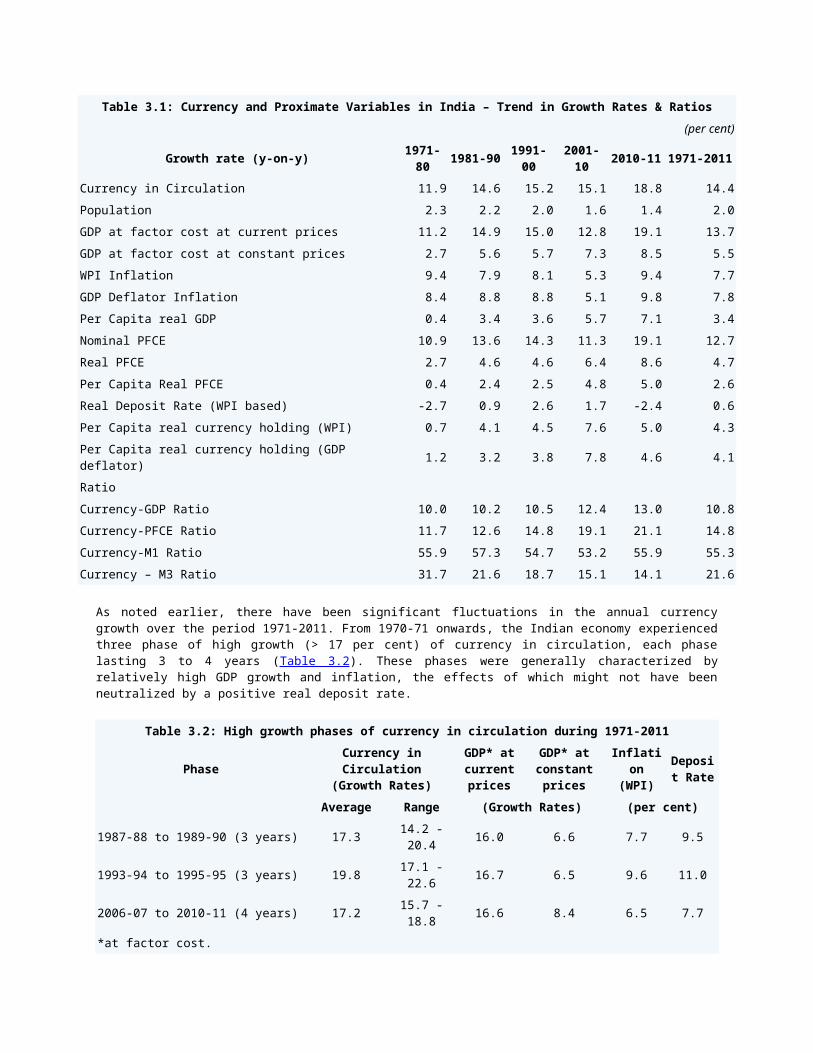
Table 3.1: Currency and Proximate Variables in India – Trend in Growth Rates & Ratios(per cent)
Growth rate (y-on-y) 1971-80 1981-90 1991-
002001-10 2010-11 1971-2011
Currency in Circulation 11.9 14.6 15.2 15.1 18.8 14.4Population 2.3 2.2 2.0 1.6 1.4 2.0GDP at factor cost at current prices 11.2 14.9 15.0 12.8 19.1 13.7GDP at factor cost at constant prices 2.7 5.6 5.7 7.3 8.5 5.5WPI Inflation 9.4 7.9 8.1 5.3 9.4 7.7GDP Deflator Inflation 8.4 8.8 8.8 5.1 9.8 7.8Per Capita real GDP 0.4 3.4 3.6 5.7 7.1 3.4Nominal PFCE 10.9 13.6 14.3 11.3 19.1 12.7Real PFCE 2.7 4.6 4.6 6.4 8.6 4.7Per Capita Real PFCE 0.4 2.4 2.5 4.8 5.0 2.6Real Deposit Rate (WPI based) -2.7 0.9 2.6 1.7 -2.4 0.6Per Capita real currency holding (WPI) 0.7 4.1 4.5 7.6 5.0 4.3Per Capita real currency holding (GDP deflator) 1.2 3.2 3.8 7.8 4.6 4.1
RatioCurrency-GDP Ratio 10.0 10.2 10.5 12.4 13.0 10.8Currency-PFCE Ratio 11.7 12.6 14.8 19.1 21.1 14.8Currency-M1 Ratio 55.9 57.3 54.7 53.2 55.9 55.3Currency – M3 Ratio 31.7 21.6 18.7 15.1 14.1 21.6
As noted earlier, there have been significant fluctuations in the annual currencygrowth over the period 1971-2011. From 1970-71 onwards, the Indian economy experiencedthree phase of high growth (> 17 per cent) of currency in circulation, each phaselasting 3 to 4 years (Table 3.2). These phases were generally characterized byrelatively high GDP growth and inflation, the effects of which might not have beenneutralized by a positive real deposit rate.
Table 3.2: High growth phases of currency in circulation during 1971-2011
PhaseCurrency inCirculation
(Growth Rates)
GDP* atcurrentprices
GDP* atconstantprices
Inflation
(WPI)
Deposit Rate
Average Range (Growth Rates) (per cent)
1987-88 to 1989-90 (3 years) 17.3 14.2 -20.4 16.0 6.6 7.7 9.5
1993-94 to 1995-95 (3 years) 19.8 17.1 -22.6 16.7 6.5 9.6 11.0
2006-07 to 2010-11 (4 years) 17.2 15.7 -18.8 16.6 8.4 6.5 7.7
*at factor cost.

On the other hand, there was some evidence of significant slowdown in currencycirculation (< 10 per cent) in at least four years during this period (Table 3.3). Alower growth in currency in circulation in these years indicates, in general, a lowerGDP growth and lower inflation.
Table 3.3: Low growth phases of currency circulation during 1971-2011
YearCurrency
Circulation
GDP*currentprices
GDP* constant prices(Annual Growth
Rates)
Inflation(year–on-year %)
DepositRate(percent) (Annual Growth Rates) current yr next yr current
yr next yr
1971-72 9.9 6.4 1.0 -0.3 5.6 10.1 6.01974-75 1.6 17.7 1.2 9.0 25.2 -1.1 7.41975-76 5.3 6.2 9.0 1.2 -1.1 2.1 8.01981-82 7.7 17.1 5.6 2.9 9.2 4.1 8.5*at factor cost
On a decadal average basis, the currency-GDP ratio remained stable during 1970s to1990s at around 10.5 per cent. Reflecting the deceleration in nominal GDP growth andstable currency growth during 2000s, the currency-GDP ratio increased in recent yearsto an average of 12.4 per cent during 2001-10. Apart from this fact, there could beseveral additional reasons for this increase. First, the decline in inflation couldhave lowered the opportunity cost of holding currency contributing to the increase (inthe currency-GDP ratio). Secondly, the opportunity cost of holding currency also fellbecause of a decline in the real rate of return on bank deposits during the 2000sreflecting the sharper fall in nominal deposit rates vis-à-vis that of the inflation rateas compared with the previous decade. Thirdly, growth in consumption expenditurelevels in both rural and urban sectors (as reflected in the NSSO data) may have led tosome increase in currency holding among the poorer section of society. Fourthly, animprovement in the supply position of currency via the pro-active currency- managementpolicy pursued by the Reserve Bank in recent years might have also been a contributingfactor. Finally, the availability of ATMs by providing relatively easy access tocurrency could also have increased its demand as in the case of European countries.
The year to year movements in currency-GDP ratio (Chart 3.1) reveal an increasingtrend, particularly since mid-1990s. The rise in the Currency-GDP ratio has,interestingly, occurred at about the same time that there have been developments inalternative modes of payments, a marked increase in the proportion of services to GDP,increased opportunity cost and lower transactions costs of holding currency (higherrate of return from bank deposits and a rise in the number of ATMs, respectively).However, the ratio has started showing a decline in the last three years.

The ratio of currency in circulation to private final consumption expenditure(PFCEdom) in India has increased from 11.5 per cent in 1970-71 to 23.8 per cent in2008-09 (Chart 3.2). Since Cu/GDP = Cu/PFCEdom * PFCEdom/GDP, the sharp increase inCu/PFCEdom was only partially offset by the decline in PFCEdom/GDP (with commensurateincrease in the saving rate) resulting in a modest increase in currency/GDP ratioduring the 2000s.9 It may also be indicated that during the periods of high inflation,there was a decline in the ratio from 12.1 per cent in 1972-73 to 9.8 per cent in1974-75 and again from 12.5 per cent in 1979-80 to 11.1 per cent in 1981-82. Thisdecline could be attributed to the inability of the authorities to keep pace withinflation during years of high inflation while printing currency notes, therebyresulting in a decline in real currency growth.

3.1 Opportunity Cost of Holding Currency
Judging by the rate of return on average commercial bank term deposits (of maturity 1-3 years), the opportunity cost of holding currency went up from the 1970s till 1990s.Subsequently, however, the real deposit rate declined in the last decade. As averageinflation declined from over 9 per cent during 1970s to about 8 per cent during 1980sand 1990s and further to just over 5 per cent in the last decade, the opportunity costof holding currency decelerated with the reduction in inflation and decline in realdeposit rate.
Other factors having a bearing on currency demand include: significant changes in thesectoral distribution of income in favour of services and away from agriculture, andgreater availability of alternative modes of payment (including credit cards).
3.2 Factors Influencing Per Capita Currency
The increase in the rate of growth of real per capita currency holding from 0.7 percent in 1970s to 7.4 per cent in 2000s occurred in two phases and reflected two setsof factors. In the first phase, there was a sharp increase in the rate of growth ofreal per capita currency holding from 0.7 per cent in 1970s to 4.0 per cent -4.5 percent during 1980s/1990s. This reflected the increase in the growth rate of (aggregatenominal) currency in circulation from 11.6 per cent in 1970s to around 15 per cent in1980s/1990s while population growth and inflation remained broadly stable. During2000s again, there was a spurt in per capital real currency growth to 7.4 per cent.This time, however, nominal aggregate currency growth remained stable at around 15 percent and the growth in per capita real currency holding reflected deceleration in bothpopulation growth and inflation.
3.3 Conclusion

At the aggregate level, the supply of currency has increased at a faster pace incomparison to growth in nominal GDP. Over the same period, however, broad money hasincreased at an even faster pace than currency reflecting household savings in banktime deposits. Overall financial saving of households have also increased at a fasterpace than currency and GDP, as an increasingly larger proportion of the populaceemerged from mere subsistence on a day-to-day basis. The increase in currency, broadmoney and household financial saving in relation to GDP is reflective of thetransition of a low income underdeveloped economy towards an economy characterized byincreasing monetisation and commercialisation of the economy. Rise in literacy andincome level coupled with the spread of bank branches in a growing market economy hasled to a bank based financial intermediation system. India’s financial sectordevelopment has yet to mature as in developed economies towards financialdisintermediation. Despite the emergence of various alternatives to cash-basedtransactions (credit/debit cards, cheques, internet-based payments, etc.), currencyretains its pre-dominance as the use of currency substitutes is associated with asignificantly higher level of literacy, awareness and income than prevailingcurrently. The use of currency as a mode of transaction is also encouraged bygovernment social sector expenditure as this contributes to increase in cash basedtransactions, particularly in rural areas. From the supply side, the pursuit of aclean note policy during the 2000s has contributed to the increased availability ofcurrency notes as against the use of fewer notes with resultant higher velocity andforced longevity in the earlier decades. Further, as we shall see in the next section,the denomination-wise distribution of currency notes has not been sufficiently alteredto compensate for the rise in income/consumption and inflation.
4: Currency in Circulation – Denomination-wise Analysis
Changes in the underlying structure of household and firm-level denomination-wisedemand for currency (by value) are attributable to a multiplicity of factors. Whilethe most significant factors in this regard could be the rate of inflation and changein real GDP, other factors having a bearing could be: changes in the distribution ofincome across individuals and sectors, extent of monetisation of the economy,availability of alternative modes of payment, changing motives for holdingcurrency, etc. Ideally, the projections of supply of currency of various denominationsneed to take into account these various factors so as to match the underlying demandby consumers for the various denominations.
Apart from its dependence on the underlying demand, the supply of currencydenomination-wise can be effectively constrained by the availability of productionfacilities. Specifically, production capacity of printing presses, distributionnetworks, security concerns and administrative lags, can all in conjunction serve todelay the process of introduction of higher denomination notes. Public preferences forcertain denominations arising from ease of use and distribution of cash transactionsmay also influence the demand-supply position at denominational level. One consequenceof the existence of demand-supply mismatches in the denominational distribution ofcurrency is that when a desired denomination is not available in sufficient volume, itmay have to be substituted with the nearest available denomination. For example, onemay have to use two `10 notes instead of one `20 note for a transaction worth `20. Theuse of combinations of various denominations of currencies, therefore, does notnecessarily always reveal the ‘true’ preference of users. Hence, using data on
denomination-wise structure of currency for modelling currency demand, particularly,at the disaggregated level, may be fraught with serious difficulties for statisticalestimation. In India, for example, although currency supply can be assumed to meet theunderlying demand at the aggregate level, the same may not be the case when weconsider the trend in the various denomination-wise shares of currency. In case ofsupply-demand mismatches, the velocity of circulation of banknotes goes up resultingin quicker soiling and reduction of life of notes. The deterioration in the quality ofnotes is likely to be reflected in the quantity of soiled notes returned by the publicto the issuing authority, which can be a useful variable to watch for estimating issuerequirement of notes.
In what follows, we shall see how the supply of currency denominations (in relativeterms, i.e. in relation to the aggregate value of currency in circulation) has changedover the years in India. Since annual data on different denominations are availablesince 1970-71, our study focuses on the period 1970-71 to 2010-11. Secondly, we shallsee how the share of the value of the various currency denominations has changed toreflect changes in the price level – as captured by the wholesale price index (WPI).
There has been a significant change in the distribution of currency (supply) acrossdenominations, during the past four decades (1970-71 to 2010-11) (Chart 4.1). Besides,new currencies were introduced to reflect the changing payment pattern, viz., `20(1972-73), `50 (1975-76), `500 (1987-88) and `1000 (2000-01).10 It is important toexamine as to what extent the changing proportion of various currency denominationsreflects the underlying demand for currency denominations. Some important changes inthe denominational composition of currency are as follows:
1970s: With the introduction of notes of `20 denomination in 1972-73 and `50denomination in 1975-76, there was a migration to these denominations from the smallerdenominations.
1980s: There was a significant migration from the smaller denominations (`20 & below)to `50 and from `100 to `500 – the latter introduced in 1987-88
1990s: There was a significant migration from the smaller denominations (`50 & below)to `100 and from `100 to `500, resulting in a significant increase in the shareof `500 denomination note followed by other denominations.
2000s: After remaining relatively unchanged in the previous decades, the share of `100denomination declined significantly in 2000s with the introduction of `1000denomination in 2000-01 and the increasing share of `500 denomination.
Chart 4.1 Trends in denominational share in aggregate currency (by value)
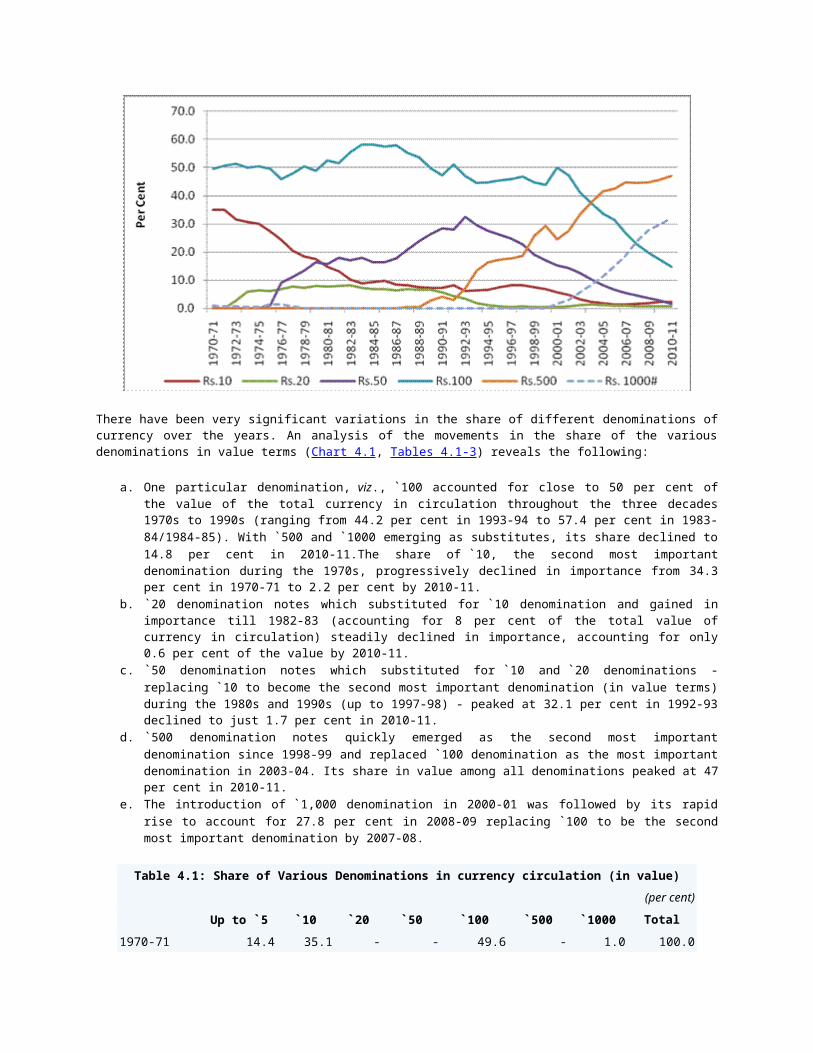
There have been very significant variations in the share of different denominations ofcurrency over the years. An analysis of the movements in the share of the variousdenominations in value terms (Chart 4.1, Tables 4.1-3) reveals the following:
a. One particular denomination, viz., `100 accounted for close to 50 per cent ofthe value of the total currency in circulation throughout the three decades1970s to 1990s (ranging from 44.2 per cent in 1993-94 to 57.4 per cent in 1983-84/1984-85). With `500 and `1000 emerging as substitutes, its share declined to14.8 per cent in 2010-11.The share of `10, the second most importantdenomination during the 1970s, progressively declined in importance from 34.3per cent in 1970-71 to 2.2 per cent by 2010-11.
b. `20 denomination notes which substituted for `10 denomination and gained inimportance till 1982-83 (accounting for 8 per cent of the total value ofcurrency in circulation) steadily declined in importance, accounting for only0.6 per cent of the value by 2010-11.
c. `50 denomination notes which substituted for `10 and `20 denominations -replacing `10 to become the second most important denomination (in value terms)during the 1980s and 1990s (up to 1997-98) - peaked at 32.1 per cent in 1992-93declined to just 1.7 per cent in 2010-11.
d. `500 denomination notes quickly emerged as the second most importantdenomination since 1998-99 and replaced `100 denomination as the most importantdenomination in 2003-04. Its share in value among all denominations peaked at 47per cent in 2010-11.
e. The introduction of `1,000 denomination in 2000-01 was followed by its rapidrise to account for 27.8 per cent in 2008-09 replacing `100 to be the secondmost important denomination by 2007-08.
Table 4.1: Share of Various Denominations in currency circulation (in value) (per cent)
Up to `5 `10 `20 `50 `100 `500 `1000 Total1970-71 14.4 35.1 - - 49.6 - 1.0 100.0

1980-81 9.1 14.9 7.7 15.7 52.6 - - 100.01990-91 7.1 7.3 5.7 28.5 47.3 4.2 - 100.02000-01 2.6 5.7 0.5 15.2 49.9 24.5 1.7 100.02010-11 1.6 2.2 0.6 1.7 14.8 47.0 32.0 100.0
Table 4.2: Share of Small (up to `10), Medium (`20 and `50) andLarge
(`100 and above) Denomination Notes in Currency Circulation(per cent)
Up to `10 `20 and `50 `100 & above1970-71 49.4 0.0 50.61980-81 24.0 23.4 52.61990-91 14.3 34.2 51.52000-01 8.3 15.6 76.12010-11 3.9 2.3 93.8Note: Notes of `20, `50, `500 and `1000 were introduced in 1972-73, 1975-76, 1986-87 and 2000-01, respectively.
Table 4.3: Peak Year for Currency Share of Various Denominations(per cent)
`1 – `5 `10 `20 `50 `100 `500 `100014.4 35.1 8.1 32.5 58.3 47.0 32.0
(1970-71) (1970-71) (1982-83) (1992-93) (1983-84) (2010-11) (2010-11)
Coins in Circulation:
Despite the introduction of coins of `2 and `5 denominations in 1990-91 and 1986-87,respectively, the proportion of value of coins (small coins, `1, `2 and `5) incurrency in circulation progressively declined from 4.0 per cent in 1970-71 to closeto 1 per cent in 2010-11with the corresponding increase in the proportion of value ofnotes.
4.1 Currency Denomination and Inflation: Implications for User of Currency
It is expected that the denomination-wise distribution of the supply of currency wouldchange over time to reflect the impact of inflation on currency demand, ceteris paribus. Inthis regard, it is observed that during 1970-71–2010-11, the average value of acurrency note (for denominations of `10 and above) increased nearly eight-foldfrom `214 to `174.3. During the same period, there was a 18 fold rise in the pricelevel (measured by WPI). That the average value of a currency note did not keep pacewith inflation is evident from Chart 4.2.

Clearly, the evolving denominational distribution of currency notes, even with theintroduction of higher denomination notes (`500 and `1,000) was not commensurate withthe underlying demand for the various denominations necessitated by the inflationpath. The implication is that a consumer would need to carry a much larger number ofcurrency notes than was the case earlier to purchase the same volume of goods andservices. This was particularly evident during the high inflation phases (1973-74 to1975-76, 1980-81 to 1981-82, and 1991-92 to 1995-96), as the denominationaldistribution of currency did not keep pace with inflation. It was only during theyears of low inflation (16 out of 38, including the ten recent years 1998-99 to 2007-08), that the value of a currency note rose at a rate higher than that of inflation.During 1998-99 to 2007-08, the rise in the average value of currency note wasfacilitated by the sharp rise in the volume of `500 denomination notes andintroduction of `1,000 denomination notes. Thus, the 2000s is the only decade when theaverage value of currency increased at a faster rate than inflation (Table 4.4).
Table 4.4: Movements in GDP and WPI (1970-71 to 2010-11) with 1970-71 = 100
YearGDP
deflator*
WPI* DecadeGDP
deflator (per cent)
WPI (percent)
Average Value ofcurrency
(% increase)Notes only Notes & Coins
1970-71 100.0 100.0 - - - - -1980-81 227.7 257.6 1970s 8.4 9.4 6.1 5.31990-91 524.3 510.0 1980s 8.8 7.9 4.3 3.1
2000-01 1,138.8 1,073.8 1990s 8.8 8.1 8.6 7.0
2010-11 1,990.0 1,832.2 2000s 5.5 5.6 10.2 8.0
*Derived from GDP at factor cost and WPI with base 2004-05=100.

Assuming that the underlying size distribution of cash transactions in real termsremains the same, the share of a particular currency denomination should change withinflation over the years, as the higher denomination currency takes up the ‘role’ ofthe lower denomination for effecting transactions. Under this hypothetical assumption,as WPI increased ten-fold between 1971 and 2001, the ‘role’ of `10 & `100denominations in 1970-71 would be performed respectively by `100 and `1000denominations in 2000-01. However, the share of `100 and `1000 in 2001 was not quitethe same as that of `10 and `100 in 1971. This could introduce some distortion in thesupply-demand balance at denominational level.
However, in reality it is expected that the growth in the average value of currencywould not only reflect inflation but, in addition, the increase in per capita realincome over time (the latter as a proxy for the trend in the real value oftransactions). Accordingly, the real value of an average currency note (defined as theratio of total value to total volume of notes) should rise over time. In India, thereverse has been the case till 1998-99. Thereafter, the real average value of a notewent up with increase in `500 and`1000 notes; however, it is showing some decline inthe recent period (Charts 4.3 and 4.4). Since inflation rate exceeded the growth inthe average value of a note, there has been a decline in the average real value of acurrency note of `10 and above (Base: 1971-72) from `21.6 in 1971-72 to `5.8 in 1997-98 before a modest rise to `8.9 in 2008-09.
Chart 4.3 Trends in average value of notes in real terms

There could be several different factors behind such trends in the denominationalpattern of currency circulation. First, note printing in India was dependent on theproduction capacity of the two government presses at Nashik and Dewas till the settingup of two more note presses in Mysore and Salboni in 1995-96. As such, there weresupply constraints on meeting the growing demand of notes, which resulted in importingnotes in the 1990s. The situation improved significantly from late 1990s and theReserve Bank adopted a Clean Note Policy in 1999. Second, the use of alternative paymentchannels such as cheques, credit/debit cards and internet banking has been spreadingover the years. These are not only more efficient instruments than paper currency butalso leave paper/electronic trails facilitating tax audit. Usually, such paymentmechanisms act as partial substitutes for high value currency. Third, the possibilityof use of high denomination notes for black economy transactions and thedemonetisation of `1000 and higher denomination notes in 1978 to curbhoarding/circulation of black money might have had a role to play in postponing theintroduction of new higher denomination notes for some time.
4.2 Conclusion
In this chapter, we have attempted to present the main trends in the denomination-wisecomposition of Indian currency over the past few decades. Some of the standarddeterminants of this composition such as inflation and per capita GDP have also beenexamined. However, the analysis needs further refinement to take into account otherfactors, such as the underground economy and currency substitutes for payment (such ascredit/debit cards, internet banking and cheque payments). The non-availability ofreliable and adequate data on these factors is, however, a major hurdle to such anextensive analysis.
5: Modelling Demand for Currency at the Aggregate Level
In this chapter, various formal approaches to estimation of aggregate currency demandin India are explored against the backdrop of the somewhat descriptive analysispresented in the previous sections. While nominal GDP and private final consumption

expenditure reflect the income effect on the demand for currency, the opportunity andtransactions costs reflect the substitution effect on the demand for currency. Thecombined impact of the income and substitution effects and their changes over timehave implications for currency demand for transactions in the formal sector – both atthe aggregate and per capita levels. In what follows, we try to capture the effect ofthese factors on aggregate currency demand.
Econometric analysis to explain the role of the various factors in determining themovements in currency demand has to contend with several challenges. First, currencyusage patterns can vary significantly across the country due to the vast geographicalspread and socio-economic heterogeneity, which has an impact on the cash transactionand currency usage patterns. Second, the penetration of non-cash payment mechanismsvary considerably as between rural and urban areas. Third, incidence of inflationacross different income groups could be different thereby impacting their currencyrequirements differently. This confronts the researcher with formidable challenges asregion-wise, sector-wise or income category-wise data on most variables is notavailable either in a time series or in a cross section format. These empiricaldifficulties are partially counterbalanced by two mitigating factors. Firstly, Indiais a moderate inflation country, unlike many Latin American and African countries,which have faced prolonged periods of hyper inflation in the past. Secondly, in viewof low levels of financial literacy, payment habits of the population tend to evolvegradually over time. Both these factors impart some stability to the various currencydemand equations. This encourages us to investigate some broad approaches to currencyestimation which have met with a reasonable degree of success internationally.
5.1 Modelling Currency in Circulation
We distinguish between two concepts of currency viz. Currency with the Public (CWP) andCurrency in circulation (CIC). Currency in circulation is the sum of (i) notes incirculation which is the principal liability of the Reserve Bank under Section 22 ofthe Reserve Bank of India Act, 1934 and (ii) government’s currency liabilities to thepublic comprising rupee coins and small coins. Currency in circulation comprisescurrency with the public (i.e. currency outside the banking system) and cash in handwith banks (i.e. banking system excluding the Reserve Bank). Two sets of results arepresented for each of the two measures of currency one for annual data (1989-90 to2010-11) and the other for quarterly data. Since official quarterly data on GDP areavailable only from 1996 onwards, the period of analysis for quarterly model was takenas 1996-97:Q1 to 2010-11:Q4. All the data are collected from the Database managed bythe Reserve Bank and those obtained from other external databases such as Datastream.
There seems to be no explicit theoretical model available for modelling the microfoundations of currency demand. The theoretical model of Rogoff (1998) for moneydemand has been extended by Fischer et al (2004) to currency demand and leads to aspecification of currency demand in real terms. A real specification as is well knownrests on the homogeneity postulate with respect to prices. While perhaps acceptablefor money demand, the homogeneity postulate might be too restrictive in the case of acurrency demand equation. Hence, in what follows, we model for currencyin nominal terms, using WPI (or inflation) as a regressor variable to account for theprice effect.
5.2 Unit Root Tests - Annual Data

Our preliminary analysis with data over the period 1986-87 to 2010-11, showed evidenceof a structural break in 1989-90 and hence the period of analysis for our model wasselected as 1989-90 to 2010-11. Table 5.1 shows the results of our unit root testingexercise. Unfortunately, the unit root tests present some conflicting evidence. Whileboth tests indicate that all variables have a unit root in levels, only the ADF testindicates that all series are stationary after first-differencing. Recalling that inthe Zivot-Andrews test, the null hypothesis is that the series has a unit root withstructural break(s) against the alternative hypothesis that they are stationary withbreak(s), the right panel of the table under the Zivot-Andrews columns must be takento imply that except for Log (CIC) and Log (CWP), the first differences of the otherseries might possibly contain unit roots i.e. the original series are I(2) rather thanI(1). This possibility could be difficult to accommodate in a cointegration exercisebased on a small sample such as ours. We therefore prefer to proceed towards thecointegration exercise by accepting the ADF results.
Table 5.1: Test for Stationarity (Unit Root test) - Augmented Dickey-Fuller Test
Variable
At level First Difference
Concl.ADF
Zivot-AndrewsADF
Zivot-AndrewsModel A:Intercept
Model B:Trend
Model C:Both
Model A:Intercept
Model B:Trend
Model C:Both
Log(CWP) -2.08 -3.38(1999-00)
-2.10(2007-08)
-2.53(1993-94) -3.98** -5.00**
(1997-98)-4.16
(2003-04)-5.29*
(1999-00) I(1)
Log(CIC) -2.01 -3.13(1993-94)
-3.12(2005-06)
-3.17(2002-03) -3.95** -5.04**
(1997-98)-4.10
(2003-04)-5.32*
(1999-00) I(1)
Log(GDP) -0.48 -2.00(2005-06)
-3.77(2004-05)
-3.76(2002-03) -3.71** -4.69
(2005-06)-4.31
(2003-04)-4.88
(2000-01) I(1)
Log(WPI) -1.15 -4.08(1991-92)
-4.41(1995-96)
-4.41(1994-95) -4.24** -4.49
(1996-97)-2.47
(2003-04)-3.20
(1996-97) I(1)
Avg_Deposit11 -1.96 -3.68(2001-02)
-2.39(1992-93)
-2.98(2001-02) -3.99** -4.58
(2005-06)-3.70
(2003-04)-4.60
(2006-07) I(1)
Note: The Critical Values for the ADF test at 5 per cent level is -3.65. The Critical values for the Zivot-Andrews test under Model A, Model B and Model C at 5 per cent level are -4.80, -4.42 and -5.08, respectively.* denotes significance at 5 per cent level.** denotes significance at 1 per cent level.
5.3 Cointegration Analysis
(a) Modelling Currency in Circulation (Annual data)
In line with the previous discussion, we select the following 4 variables for thecointegration exercise, viz. Currency in Circulation (CIC), Real GDP, WPI and AverageDeposit rate (Avg_Deposit). Estimation of cointegration was carried out over thesample period from 1989-90 to 2010-11 for the above variables (Table 5.2).
The Johansen Trace Statistics test indicates the existence of one cointegrationrelationship between the variables. The Maximum Eigenvalue test indicates existence of

a single cointegration relationship at around 7 per cent level of significance (Table5.3).
Table 5.2: Cointegration Rank Test (Trace)HypothesizedNo. of CE(s) Eigenvalue Trace
Statistic0.05
Critical Value Prob.
None * 0.70 54.65 47.86 0.01At most 1 0.56 28.26 29.80 0.07At most 2 0.22 10.30 15.49 0.26At most 3 0.20 4.80 3.84 0.03
Trace test indicates 1 cointegrating equation(s) at the 0.05 level
Table 5.3: Cointegration Rank Test (Maximum Eigenvalue)HypothesizedNo. of CE(s) Eigenvalue Max-Eigen
Statistic0.05
Critical Value Prob.
None** 0.70 26.39 27.58 0.07At most 1 0.56 17.95 21.132 0.13At most 2 0.22 5.51 14.26 0.68At most 3 0.20 4.80 3.84 0.03
Max-eigenvalue test indicates 1 cointegrating equation(s) at the 0.1 level
The estimate of the long-run equilibrium relationship (co-integrating vector) is:
The income elasticity of currency (demanded for circulation) at 1.38 is quite high incomparison to the long-term elasticity obtained for advanced countries. Fischer etal (2004), for example obtain an elasticity of 1.05 for the Euro Area. Correspondingly,the elasticity with respect to the interest rate variable is much lower (see Fischer etal (2004), p. 34). This could reflect the fact that India is under-banked but couldalso indicate that a part of the growth in GDP in recent years might have found itsway into the underground economy. Needless to say, this fact needs to be investigatedmuch more closely before arriving at any firm conclusions. The negative sign found inthe Deposit Rate indicate an increase in the deposit rate will lead to a fall in theCIC in the long run.
The estimate of the short-run dynamic equation is:

The error correction term in the short-run dynamic equation is found to besignificant. From the dynamic equation it can be interpreted that approximately 67 percent of the error will be corrected in the next year. The positive signs found withthe GDP and WPI indicates that an increase in the GDP growth and inflation leads to anincrease in the growth in the CIC. In contrast, an increase in the deposit rate isexpected to cause a fall in the CIC growth.
The incorporation of the Cheque Clearance variable, in value terms, was found to haveled to non-stationarity in the error term and hence was not considered in the finalequation. Additionally, the inclusion of both urbanization and cheque clearancevariables erodes the significance of the deposit variable. Hence, we thought that thechoice of variables for further analysis should be restricted to the three standardvariables GDP, WPI and deposit rate. Several authors have used real Private FinalConsumption Expenditure (PFCE) as a scale variable instead of real GDP in the currencydemand studies. Unfortunately, in the Indian case, quarterly historical data on PFCEis not available for a long time. Since our interest is in estimating both annual andquarterly models and comparing the results, the variable GDP was used in preference toPFCE.
(b) Modelling Currency with the Public (CWP) (Annual data)
Let us now turn our attention to the other major currency component viz., Currency withthe Public (CWP). The methodology followed is similar to the one employed formodelling CIC. The estimation of cointegration was carried out over the sample periodfrom 1989-90 to 2010-11using the variables – CWP, Real GDP, WPI and Average DepositRate. The Trace Statistics test indicates the existence of one cointegratingrelationship between the variables. The Maximum Eigenvalue test indicates existence ofa single cointegrating relationship at around 6 per cent level of significance.
The cointegration exercise was conducted within the standard Johansen-Juseliusframework. Since the data show evidence of a linear trend, we use the cointegrationmodel in which the cointegrating vector includes an (unrestricted) intercept. Theresults of the Rank and Maximum eigenvalue tests are presented in (Tables5.4 and 5.5).
Table 5.4: Cointegration Rank Test (Trace)
HypothesizedNo. of CE(s) Eigenvalue Trace
Statistic
0.05CriticalValue
Prob.
None * 0.71 55.14 47.86 0.01At most 1 0.55 28.16 29.80 0.08At most 2 0.23 10.49 15.49 0.25At most 3 0.20 4.85 3.84 0.03
Trace test indicates 1 cointegrating equation(s) at the 0.05 level
Table 5.5: Cointegration Rank Test (Maximum Eigenvalue)HypothesizedNo. of CE(s)
Eigenvalue Max-EigenStatistic
0.05Critical
Prob.
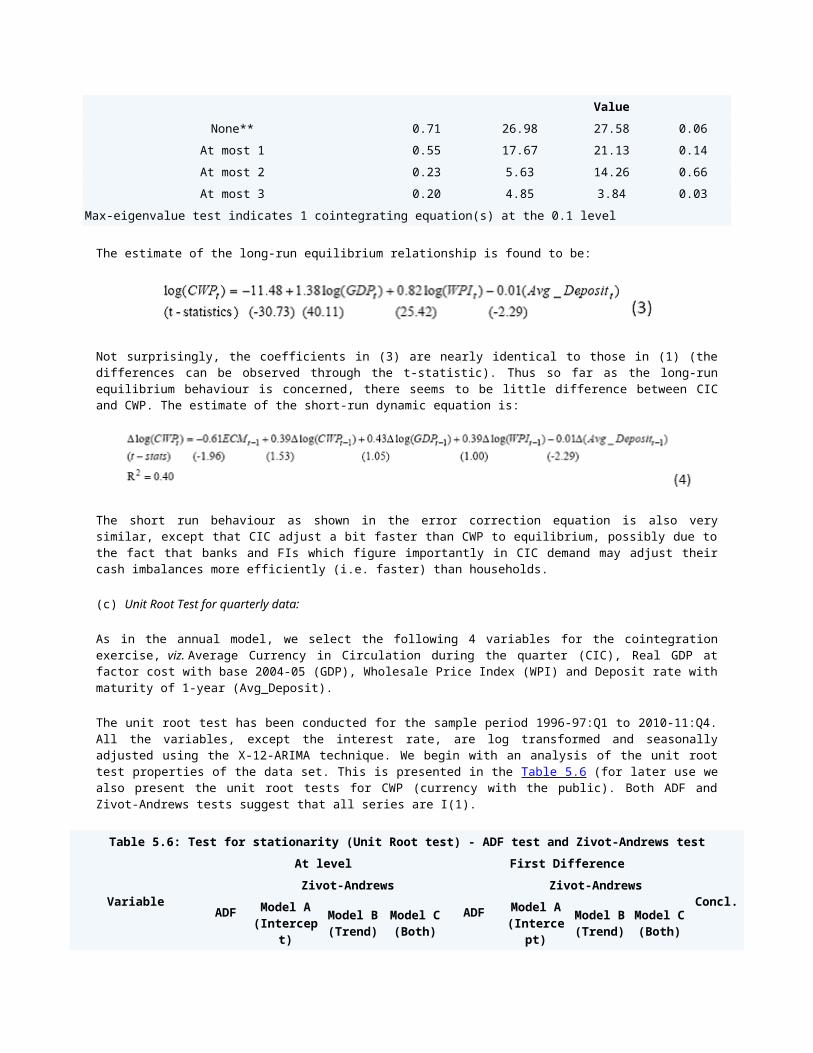
ValueNone** 0.71 26.98 27.58 0.06
At most 1 0.55 17.67 21.13 0.14At most 2 0.23 5.63 14.26 0.66At most 3 0.20 4.85 3.84 0.03
Max-eigenvalue test indicates 1 cointegrating equation(s) at the 0.1 level
The estimate of the long-run equilibrium relationship is found to be:
Not surprisingly, the coefficients in (3) are nearly identical to those in (1) (thedifferences can be observed through the t-statistic). Thus so far as the long-runequilibrium behaviour is concerned, there seems to be little difference between CICand CWP. The estimate of the short-run dynamic equation is:
The short run behaviour as shown in the error correction equation is also verysimilar, except that CIC adjust a bit faster than CWP to equilibrium, possibly due tothe fact that banks and FIs which figure importantly in CIC demand may adjust theircash imbalances more efficiently (i.e. faster) than households.
(c) Unit Root Test for quarterly data:
As in the annual model, we select the following 4 variables for the cointegrationexercise, viz. Average Currency in Circulation during the quarter (CIC), Real GDP atfactor cost with base 2004-05 (GDP), Wholesale Price Index (WPI) and Deposit rate withmaturity of 1-year (Avg_Deposit).
The unit root test has been conducted for the sample period 1996-97:Q1 to 2010-11:Q4.All the variables, except the interest rate, are log transformed and seasonallyadjusted using the X-12-ARIMA technique. We begin with an analysis of the unit roottest properties of the data set. This is presented in the Table 5.6 (for later use wealso present the unit root tests for CWP (currency with the public). Both ADF andZivot-Andrews tests suggest that all series are I(1).
Table 5.6: Test for stationarity (Unit Root test) - ADF test and Zivot-Andrews test
Variable
At level First Difference
Concl.ADF
Zivot-Andrews
ADF
Zivot-AndrewsModel A
(Intercept)
Model B(Trend)
Model C(Both)
Model A(Interce
pt)
Model B(Trend)
Model C(Both)

Log(CWP) -0.35 -2.66 -3.55 -3.50 -5.86* -5.41* -4.56* -5.76* I(1)Log(CIC) -0.25 -2.50 -3.68 -3.59 -5.87* -5.41* -4.45* -5.82* I(1)Log(GDP) -1.80 -3.41 -4.00 -4.25 -9.37* -6.90* -5.90* -6.82* I(1)Log(PFCE) -1.09 -2.70 -4.75** -5.00 -10.52* -5.77* -5.19* -5.91* I(1)Log(WPI) -0.02 -2.40 -3.60 -3.57 -5.24* -6.49* -6.90* -7.28* I(1)Avg_Deposit -1.10 -2.77 -3.34 -3.63 -7.33* -5.40* -4.84* -5.22* I(1)Critical value at5% -3.49 -4.80 -4.42 -5.08 -2.91 -4.80 -4.42 -5.08
* denotes significance at 5 per cent level. ** denotes significance at 1 per cent level.
5.4 Cointegration analysis for quarterly data:
While the annual model analyzed above is certainly useful for examining long-termcurrency demand, policymakers often need a shorter focus for planning theirstrategies. Hence, most of the available literature in this area has paid closeattention to modelling quarterly currency demand behaviour. In India, the officialquarterly GDP series commences only from 1996-97:Q1 Hence our quarterly modellingexercise spans the period 1996-97:Q1 to 2010-11:Q4.
The cointegration exercise was once again conducted within the standard Johansen-Juselius framework.
(a) Modelling Currency in Circulation (CIC) (Quarterly data)
The cointegration exercise was conducted over the sample period over the sampleperiod1996-97:Q1 to 2010-11:Q4 using the variables – CIC, GDP at factor cost atconstant prices (denoted as GDP below), WPI and Average Deposit Rate. Further a dummyvariable has been used to capture the impact the electronic mode of payments. Thedummy variables take a value ‘0’ from 1996-97:Q1 to 2006-07:Q4 and a value ‘1’ from2007-08:Q1 to 2010-11:Q4.
The Johansen Trace Statistics and the Maximum Eigenvalue test unanimously indicate theexistence of one cointegrating relationship between the variables (Tables5.7 and 5.8).
Table 5.7: Unrestricted Cointegration Rank Test (Trace)
HypothesizedNo. of CE(s) Eigenvalue Trace
Statistic
0.05CriticalValue
Prob.
None * 0.44 59.62 47.86 0.00At most 1 0.27 26.53 29.80 0.11At most 2 0.07 8.19 15.49 0.44At most 3 0.06 3.72 3.84 0.05
Trace test indicates 1 cointegrating equation(s) at the 0.05 level.
Table 5.8: Unrestricted Cointegration Rank Test (Maximum Eigenvalue)

HypothesizedNo. of CE(s) Eigenvalue Max-Eigen
Statistic
0.05CriticalValue
Prob.
None * 0.44 33.09 27.58 0.01At most 1 0.27 18.34 21.13 0.12At most 2 0.07 4.47 14.26 0.81At most 3 0.06 3.73 3.84 0.05
Max-eigenvalue test indicates 1 cointegrating equation(s) at the 0.05 level
The estimate of the long-run equilibrium relationship is found to be,
The elasticity of GDP and WPI on CWP in the long run is estimated to be at 0.76 percent and 1.56 per cent respectively. The negative sign found in the Deposit Rateindicate an increase in the deposit rate will lead to a fall in the CWP in the longrun.
The estimates for the quarterly model differ considerably from the correspondingannual estimates (see equation (1)). The income elasticity of nominal cash balances inthe quarterly case is much less than in the annual case while the opposite is true ofthe price elasticity. We have not been able to come up with a fully satisfactoryexplanation for this anomaly. One suggested interpretation could be that currencybalances respond relatively sluggishly to changes in real income (so that thequarterly income elasticity is less than the annual elasticity) while a rise in pricesleads to an “overshooting” of currency demand in the quarter which reverts to itsnormal level in the course of one year. Another reason could be that the annualexercise is based on a rather small sample and hence the estimates may be lessreliable than in the case of the quarterly model. The estimate of the short-rundynamic equation is (the insignificant variables are not incorporated in theequation):
The error correction term in the short-run dynamic equation is found to besignificant. From the dynamic equation it can be interpreted that approximately 11 percent of the error will be corrected in the next quarter that is consistent with the 67per cent found with the annual data. The introduction of electronic mode oftransaction has been found to have significantly impact on the growth of CIC. Thenegative coefficient found with the dummy indicates that increase in the electronicmode of payments cause a fall in the CIC growth.
(b) Modelling Currency with the Public (CWP) (Quarterly data)

We now turn our attention to the other major currency component viz. Currency with thePublic (CWP).The estimation of cointegration was carried out over the sample period1996-97:Q1 to 2010-11:Q4 using the variables – CWP, Real GDP, WPI and Average DepositRate. Once again, a dummy variable is used to capture the impact of the electronicmode of payments. The results of the Johansen Rank and Maximum Eigenvalue Tests arepresented in tables 5.9 - 5.10.
Table 5.9: Cointegration Rank Test (Trace)
HypothesizedNo. of CE(s) Eigenvalue Trace
Statistic
0.05CriticalValue
Prob.
None * 0.43 58.47 47.86 0.00At most 1 0.27 26.34 29.80 0.12At most 2 0.07 8.04 15.49 0.46At most 3 0.06 3.62 3.84 0.06
Trace test indicates 1 cointegrating equation(s) at the 0.05 level
Table 5.10: Cointegration Rank Test (Maximum Eigenvalue)
HypothesizedNo. of CE(s) Eigenvalue Max-Eigen
Statistic
0.05CriticalValue
Prob.
None * 0.43 32.13 27.58 0.01At most 1 0.27 18.29 21.13 0.12At most 2 0.07 4.42 14.26 0.81At most 3 0.06 3.62 3.84 0.06
Max-eigenvalue test indicates 1 cointegration equation(s) at the 0.05 level
Both Tests recommend a single cointegration vector.The estimate of the long-run equilibrium relationship is:
The estimates for CWP differ only marginally from those obtained in the case of CIC.The elasticity of GDP and WPI on CWP in the long run is estimated to be at 0.82 percent and 1.47 per cent respectively. The negative sign found in the Deposit Rate is asexpected. The estimate of the short-run dynamic equation is:
The error correction term in the short-run dynamic equation is found to besignificant. From the dynamic equation it can be interpreted that approximately 11 per

cent of the error will be corrected in the next quarter which is consistent with the61 per cent found in the annual model. The introduction of electronic mode oftransaction has been found to have a significant negative impact on the growth of CWPin line with our a priori expectations.
6: Modelling Denomination-wise Circulation of Currency
As noted in the previous chapters, the trends in circulation of individualdenominations in India exhibit considerable fluctuations, making the denomination-wisedata less amenable to time series modelling. In mature economies, by contrast, withreasonable stability in growth and inflation, denomination-wise trends are expected tobe relatively smoother. This property helps estimation of individual denominationsusing time series/econometric methods. However, even in advanced economies, the trendsin circulation of different denominations show some interactions in general.
The main difficulty in modelling denomination-wise currency stems from the fact thatthe motives for use of different denominations, viz., small, medium and large varyconsiderably. As small and medium denominations are used mainly for cash transactions,their demand is more likely to be influenced by income or consumption variables. Onthe other hand, large denomination notes are likely to be used as a store of valueand, as such, are more likely to be influenced by the opportunity cost of holdingbanknotes viz. risk-free interest rates on bank deposits.
We attempt to estimate the overall factors determining the demand for various types ofcurrency denominations. For this purpose, we classify notes/coins up to `20as small denominations, `50 and `100 as medium denominations and `500 and `1000as largedenominations. In order to capture the demand for these three groups, we haveexplored the existence of cointegrating relationship between per capita currencycirculation of each of these groups with GDP, inflation and deposit rate.Additionally, we have also tried to model the real per capita currency circulation foreach of these groups. Because denomination wise data is available in India only on anannual basis, the cointegration exercise was restricted to annual data from 1970-71 to2010-11.
Definition of Variables
Per_Small_Note = Per Capita Nominal Small Currency in Circulation (`1, `2, `5, `10and `20)
Per_Medium_Note = Per Capita Nominal Medium Currency in Circulation (`50 and `100)
Per_Large_Note = Per Capita Nominal Large Currency in Circulation (`500 and ` 1000)
PC_GDP = Per Capita GDP at factor cost at constant prices
Avg_Deposit = Average Deposit Rate
WPI = WPI at base 2004-05

Cheque = Value of cheque clearance in ` crore
The results are as follows:
(i) Annual Co-integrating model for Per Capita Nominal Small Currency inCirculation (1970-71 to 2010-11)
Based on the Trace and Maximum Eigenvalue statistics, a single cointegration vector issuggested. This is presented below
With the short-run dynamic equation given by
The cointegrating equation confirms our prior hypothesis that small denomination notes(being used primarily for transactions purposes) should respond positively to changesin (per capita) real GDP. The perverse sign on the deposit rate in the cointegratingequation may simply be indicative of the fact that in the long run equilibrium thereis no demand for small notes as a store of value.
(ii) Annual Co-integrating model for Per Capita Nominal Medium Currency inCirculation (1970-71 to 2010-11)
Once again, the Johansen technique suggests a single cointegration equation which ispresented below.
The negative sign found with the PC_GDP in the long-run indicates that with risingincome levels, people may prefer to make transaction through alternative paymentmechanisms. This inference is strengthened by the negative sign on cheque clearance inthe following short-run dynamic equation:

(iii) Co-integrating model for Per Capita Nominal Large Currency in Circulation
In view of the fact that one of the major constituents of large currencygroup, viz., `500 was introduced in 1987, the model for the large currency incirculation has been estimated over the sample period from 1990-91 to 2010-11. TheJohansen technique suggests existence of cointegration relationship.
The long-run relation is
The short run dynamic equation is,
While the cointegration exercises above are useful in analysing the long-termequilibrium movements of the banknotes of various denominations, they fail to accountfor one important fact viz. the interrelatedness (i.e. substitution at the margin)between banknotes of different denominations. This drawback may be overcome byresorting to the SURE (seemingly unrelated regression equations) method, whichsatisfactorily accounts for such substitution possibilities. However this advantagehas to be weighed against the fact that the SURE models are unable to distinguishbetween the long-run equilibrium and the short-run dynamics (as is the case withcointegration analysis). We now turn our attention to estimating the SURE model. Forthis purpose, the share of each denomination group (small, medium and large as definedabove) in the aggregate currency in circulation (in value terms) has been used as thedependent variables. Following standard SURE methodology, the shares of two suchgroups (small and medium) have been considered explicitly in the model, with the shareof the third group emerging as a residual ( so as to avoid singularity problems). Theset of explanatory variables comprises:
(i) per capita GDP, (ii) WPI and (iii) Average Deposit Rate.

Once again the model considered is an annual model defined over 1990-91 to 2010-11.The results of the SURE model are presented below:
It may be seen that per capita GDP is significant in all the three regressions. Pricelevel is found to have significant impact on the medium denomination group only. Thesign of WPI coefficients is positive for the medium denomination groups and negativefor the other two groups indicating that with inflation there could be a shift inshares to medium denomination group. On the other hand, with increase in per capitaincome, share of small and medium denomination groups goes down and the share of largegroup increases to a large extent. Interestingly, increase in interest rate leads toincrease in the share of small and medium denominations, but decreases the share oflarge denomination group.
Chapter 7: Conclusion and Some Suggestions
This project was undertaken with a view to developing a suitable framework formodelling currency demand in India at the aggregate level as well as for thedenominational composition. In the modelling exercise, the importance, dimensions andcomplexity of currency management, which is a core function of the Reserve Bank, werewell recognised. Further, various aspects of currency planning, such as, factorsinfluencing the short-term and long-term demand for currency and issues relating todenomination-wise distribution of currency were kept in view.
The main tasks were identification of the broad approach, formulation of the problems,review of available literature, collection of data, empirical analysis for developmentof estimation models and analysis of results. The starting point of the study was toidentify the factors that influence the demand for currency and carry out a review ofthe available literature, international as well as in the Indian context and tooutline an approach suited to the Indian economy. In this regard, a number of researchpapers pertaining to currency demand in the US, select European countries and theEurozone were reviewed.

As a prelude to the modelling exercise, a preliminary analysis of the behaviour andcharacteristics of the currency circulation in India over the years and therelationships such as cross correlations, partial correlation structures, etc., withthe probable candidate variables for modelling the demand for currency was undertaken.The variables, inter alia, included output, consumption, inflation and interest ratevariables directly affecting growth and composition of currency, currencysubstitutes / non-cash payment instruments, etc.
On the basis of the descriptive data analysis, various possible model formulationswere experimented with both for (i) estimation of the total value of notes and coinsin circulation as well as (ii) their denominational composition. The estimation of theaggregate currency demand was relatively straightforward and could be undertaken bothat the annual and quarterly frequencies, permitting an examination of the short-termdynamics (from the quarterly model) as well as picking up the long-term trends (fromthe annual model). Estimation of denomination-wise demand for currency, by contrast,posed considerable problems both at the conceptual and empirical level. Theintroduction of new denominations and the high degree of variability in thecirculation of individual denominations, meant that certain adjacent denominations hadto be grouped together. Denomination-wise data on currency usage was available only ona yearly basis and hence only a annual model could be attempted. Several importantdeterminants of denomination-wise demand such as shadow economy transactions, regionaldistribution of incomes and the distribution pattern of the size of transactionsremain masked and hence could not be incorporated into the analysis. Within thelimitations imposed by these constraints, we have attempted to build models whichreplicate the data reasonably well.
There are several limitations to the study, most of them arising from the non-availability of relevant data. The shadow economy, being a zone of ignorance for theanalyst, means that a critical determinant of currency demand does not figure in theanalysis at all. Secondly, regional aspects are extremely important in determining thedistribution of currency across the country. Once again the absence of regional dataon private consumption expenditure, cheque clearance, etc. is a formidable obstacle inany endeavour to understand the regional determinants of currency demand. Finally, inspite of our best efforts, we have not been able to obtain a data base spanning asufficient number of observations to repose a strong confidence in the reportedestimates. The annual data series exhibits a major structural break in 1988-89, whilethe quarterly data base extends only as far back as 1996-97. Within these limitations,however, we feel that our results have thrown up some interesting conclusions, withimportant implications for policy.
Given the critical importance of currency management, it would be worthwhile to make afew suggestions for future improvements in the framework for currency analysis inIndia based on our experience with this exercise. First, in an ideal set up, it isdesirable to ensure currency supply to meet the demand at both aggregate anddenominational level. Considering that some demand supply mismatches are inescapablein the real world, efforts may be made to design a system to capture the magnitude ofsuch mismatches. A direct method for this would be to systematically maintain data oncurrency demanded and currency supplied at the points of issue and distribution. Inaddition, an indirect method to capture such information would be through study ofsoiled notes - in circulation and returned from circulation. The degree of soilagewould serve as an indicator of the demand-supply distortion. Second, keeping in viewthe international experience, a system of regular surveys to elicit information on

public behaviour and preference for various denominations of currency may be useful.Also, changes in the micro level determinants of currency requirement, especially forsmaller denominations, such as transport tariff structure, etc. may be considered.Thirdly, it may be important to attempt estimation of regional demand for currency,though the data requirements for such an exercise would be formidable.
Currency management in India, given the vastness, geographical and socio-economicheterogeneity and a host of other factors is a very challenging task. It isnevertheless hoped that the findings of this study, subject to the various caveats wehave entered at the appropriate places would contribute in a reasonable measure to theanalytical framework underlying this process.
References
1. Akhand, H.&R. Milbourne (1986) , ‘Credit Cards and Aggregate MoneyDemand’, Journal of Macroeconomics, Elsevier, vol. 8(4), pp. 471-478.
2. Amromin, G. and S. Chakravorti (2009), ‘Whither Loose Change? The DiminishingDemand for Small Denomination Currency’, Journal of Money, Credit and Banking, Vol. 41,Issue 2-3, March, pp.315-335.
3. Anderson, P. (1977) , ‘Currency in Use and in Hoards’, Federal Reserve Bank ofBoston, New England Economic Review,March/ April, pp. 21 – 30.
4. Attanasio, O. P., T. Jappelli and L.Guiso (2002), ‘The Demand for Money,Financial Innovation and the Welfare Cost of Inflation: An Analysis withHousehold Data’, Journal of Political Economy, 110(2), pp.317-351.
5. Bounie, D. and A. Francois, (2006), ‘Cash, Check or Bank Card? The Effects ofTransaction Characteristics on the Use of Payment Instruments’, Telecom ParisEconomics and Social Sciences Working Paper No. ESS-06-05, March.
6. Boeschoten W. C. (1992), ‘Currency Use and Payment Patterns: Financial andMonetary Policy Studies’, Vol. 23, Kluwer Academic Publishers: Dodrecht, TheNetherlands.
7. Boeschoten, W. C. and M.G.Fase (1992), ‘The Demand for Large Bank Notes’, Journalof Money, Credit and Banking, Vol.24, No.3, pp.319-337.
8. Blanchflower D. G., D.S. Evans and A.J. Oswald (1998), ‘Credit Cards andConsumers’ NERA Working Paper.
9. Cagan, P. (1956), ’The Monetary Dynamics of Hyperinflation‘ in M. Friedman(ed), Studies in the Quantity Theory of Money,University of Chicago Press, Chicago, p.25-117.
10. De Grauwe, P., Buyst, E., Rinaldi, L. (2000), ‘The Costs of Cash and CardsCompared: The Cases of Iceland and Belgium’,Working Paper, Katholieke Universiteit Leuven,February 2000.
11. Deutsche Bundesbank (2009), ‘The Development and Determinants of Euro Currencyin Circulation in Germany’, Deutsche Bundesbank Monthly Report, June 2009, pp. 45-58.
12. Dotsey, M. (1988), ‘The Demand for Currency in the United States’, Journal ofMoney, Credit, and Banking, Vol. 20, No. 1, 22-40.
13. Doyle, Brian M. (2000), ‘Here Dollars, Dollars.... Estimating Currency Demandand Worldwide Currency Substitution’, Board of Governors of the Federal ReserveSystem, International Finance Discussion Papers (IFDP),No.657http://www.federalreserve.gov/pubs/ifdp/2000/657/ifdp657.pdf.
14. Drehman, M. and C. Goodhart (2000), ‘Is Cash becoming Technologically Outmodedor Does it Remain Necessary to Facilitate “Bad Behaviour” ? An Empirical

Investigation into the Determinants of Cash Holdings’, LSE Financial Markets Group,Discussion Paper 358, September.
15. Drehmann M., C. Goodhart and M. Krueger (2002), ‘The Challenges Facing CurrencyUsage: Will the Traditional Transaction Medium be Able to Resist Competitionfrom the New Technologies?’Economic Policy, 34, Spring, pp.195-227.
16. Duca J. V. and W.C. Whitesell (1995), ‘Credit Cards and Money Demand: A Cross-Sectional Study’, Journal of Money, Credit and Banking, Vol. 27, No. 2 (May), pp.604-623.
17. Feige, E.L. (1979), ‘How Big is the Irregular Economy?’, Challenge (November-December): pp.5-13.
18. Fischer, B., P. Kohler and F. Seitz (2004), ‘The Demand for Euro AreaCurrencies: Past, Present and Future’, European Central Bank Working Paper No.330, April.
19. Goodhart, C. A. E. (1989), Money, Information and Uncertainty, Houndmills, Basingstokeand London, MacMillan, pp.381-382.
20. Gutman (1977), ‘The Subterranean Economy’, Financial Analysts Journal, Vol. 33, pp. 24-27.
21. Humphrey, D.B., Pulley, L.B., Vesala, J.M. (1996), ‘Cash, Paper, and ElectronicPayments: A Cross-Country Analysis’,Journal of Money, Creit and Banking, 28(4), pp. 914-939.
22. Kimball, R. C. (1981), ‘Trends in the Use of Currency’, New England EconomicReview’, Federal Reserve Bank of Boston, September/October, pp. 43–53.
23. Kippers, J. (2004), ‘Empirical Studies on Cash Payments’, ERIM Ph.D. Research inManagement 43, Erasmus University, Rotterdam.
24. Judson, R.A. and R.D. Porter (2004), ‘Currency Demand by Federal Reserve CashOffice: What do We Know?’, Journal of Economics and Business Vol. 56 No.4, July-August,pp. 273-285.
25. Jyrkönen, H. (2004), Less Cash on the Counter - Forecasting Finnish PaymentPreferences, Bank of Finland Research Discussion Paper No. 27, December 27.
26. Keynes, J.M. (1936), The General Theory of Employment, Interest and Money, Classic BooksAmerica (2009 edition).
27. Krueger, M. (2000), The Demand for Currency in Germany, SSRN WorkingPaper,http://papers.ssrn.com/sol3/papers.cfm?abstract_id=1118802.
28. Lafleche, T. (1994), The Demand for Currency and the Underground Economy’, Bankof Canada Review, Issue Autumn, pp. 39-58.
29. Markose, S. M and Y. J. Loke (2000) , ‘Changing Trends in Payment Systems forSelected G10 and EU Countries 1990-1998’, International Correspondent Banking ReviewYearbook 2000/2001. Euromoney Publications.
30. Markose, S. M and Y. J. Loke (2002), ‘Can Cash Hold Its Own? International Comparisons:Theory And Evidence’, University Of Essex, April
31. Martino, A. (1981), ‘Measuring Italy’s Underground Economy’, Policy Review, Marchpp.87-106.
32. Nenovsky, N. and K. Hristov (2000), ‘Currency Circulation after Currency BoardIntroduction in Bulgaria (Transactions Demand, Hoarding, ShadowEconomy)’, Bulgarian National Bank Discussion Papers DP/13/2000, October.
33. Payne, L. C. and H. M. Morgan (1981), ‘UK Currency Needs in the 1980s’, TheBanker, 131, 4, April 1981, pp. 45–53.
34. Porter, R.D. and A.S. Bayer (1984), ‘A Monetary Perspective on UndergroundEconomic Activity in the United States’,Federal Reserve Bulletin 70, March, pp177-188.
35. Porter, R.D. and A.S. Bayer (1989), ‘Monetary Perspective on UndergroundEconomic Activity in the United States’ in E.L. Feige (ed) The Underground Economy:Tax Evasion and Information Distortion, Cambridge University Press., pp. 129-157.
36. Porter, R.D. and Judson, R. (1996), ‘The Location of U.S. Currency: How Much isAbroad?’ Federal Reserve Bulletin, 82(10), pp. 883-903.

37. Reserve Bank of Australia Bulletin (1997), Measuring Profits from Currency Issue, July38. Rinaldi, L. (2001), Payment Cards and Money Demand in Belgium, July
(http://www.econ.kuleuven.ac.be/ew/academic/intecon/Rinaldi/Dps0116.pdf).39. Rogoff, K. (1998), Blessing or Curse? Foreign and Underground Demand for Euro
Notes, Economic Policy, 13, pp. 263-303.40. Roseman, Louise L. (2010), The State of U.S. Coins and Currency, US Federal Reserve
Testimony, July.41. Schneider, F. & D. Enste, 2000, ‘Shadow Economies Around the World - Size,
Causes, and Consequences’, IMF Working Papers 00/26, International Monetary Fund.42. Snellman J. and J. Vesala (1999), ‘Changing Payment Pattern in Finland: Cash
Substitution and Electrification’, Bank of Finland Discussion Papers, 8/ 99, Helsinki.43. Snellman J., J. Vesala and D. Humphrey (2001), ‘Substitution of Noncash Payment
Instruments for Cash in Europe’,Journal of Financial Services Research, April-June, 19(2-3), 131-45.
44. Stix, H. (2004), ‘How do Debit Cards affect Cash Demand? Survey DataEvidence’, Empirica, Vol. 31(2), pp. 93–115.
45. Summer, S.B. (1990), ‘The Transaction and Hoarding Demand forCurrency’, Quarterly Review of Economics and Business, Vol. 30, pp. 75-89.
46. Tanzi, V. (1980), ’The Underground Economy in the United States: Estimates andImplications‘, Banco Nazionale Del Lavoro Quarterly Review (December) 135: pp.428-453.
47. Thomas, J.J., (1999), ‘Quantifying the Black Economy: ‘Measurement withoutTheory’ Yet Again ?’, Economic Journal,109(456), pp.381-389
48. Van Hove, L. and J. Vuchelen (1996), ‘Who Needs High Denomination EuroBanknotes? A Note on the Proposed Denominational Structure of the Euro’, RivistaInternazionale di Scienze Economiche e Commerciali, 43(4), pp. 791-803.
49. Vincenzo, C. and P. Misich (1997), ‘Forecasting the Demand for Currency’, ReserveBank of New Zealand Bulletin, Vol. 60, No.1.
50. Virén, M. (1992), ‘Financial Innovation and Currency Demand: Some NewEvidence’, Empirical Economics, 17, pp. 451-461.
51. ...... (1993), ‘Large Banknotes Dominate Currency Demand’, Bank of FinlandBulletin 3/1993, pp. 8-13.
1Dr D. M. Nachane is Prof. Emeritus & Former Director, IGIDR. A B Chakraborty is Officer-in-Charge,Department of Statistics and Information Management (DSIM). A K Mitra and Sanjib Bordoloi are Directorin Monetary Policy Department and Assistant Adviser in DSIM, respectively. The views expressed in thisStudy are those of the authors and not of the institution to which they belong.
2RBI Annual Report 2010-11, Chapter on Currency Management.
3On grounds of efficiency, high denomination banknotes are most likely to be used for hoarding.
4These studies include Anderson (1977), Kimball (1981) and Sumner (1990) for the US and Boeschoten andFase (1992) for the Netherlands, Van Hove and Vuchelen (1996) for Belgium and Krueger (2000) forGermany.
5Based on household survey data, Boeschoten concluded that frequent debit card payments and ATMwithdrawals reduce average cash holdings by 15 per cent and 18 per cent, respectively. Further, theadoption of debitable accounts and guaranteed cheques were responsible for 40 per cent of the fall incurrency ratio between 1965 and 1975 in the Netherlands. However, this trend reversed from 1975 to 1990indicating an increased role for banknotes as a store of value.

6The conclusion holds for aggregate currency demand as well as separately for large denominations and US$20 bills.
7These studies include: De Nederlandsche Bank (1994), and Boeschoten and Fase (1992), for theNetherlands; Virén, (1993) for Finland and Drehmannet al., 2002, Porter and Judson (1996) and Amromin andChakravorti (2009) for several OECD countries.
8Unpublished Note
9There is a cross-country difference between the ratios of currency in circulation to privateconsumption. For e.g., among Euro area countries, the ratio varied from 3.9 per cent (in case ofFinland) to 13.1 per cent (in case of Spain) in 2001 and from 3.8-16.9 per cent in 1980. However, forthe Euro area as a whole, the ratio remained relatively stable between 1980 and 2000, at a level ofaround 9-10 per cent.
10`1000 and notes of higher denomination were demonetised in 1978, since higher denomination notes werebeing used for hoarding purposes and for carrying out illegal transactions, generating black income andwealth. Henceforth, changes in the denomination-wise proportion of currency (in value terms) largelyreflected the changes in the preferences for carrying out transactions. Inflation also lowers theimportance of using currency for hoarding purpose. In India, the reluctance to introduce higherdenomination notes, even when warranted by inflation (as we shall see below) be explained by theauthorities’ desire to control use of currency for hoarding purposes.
11One year deposit rate