
FOREIGN VERSUS DOMESTIC CURRENCY D£BT FINANCING ...
177
FOREIGN VERSUS DOMESTIC CURRENCY D£BT FINANCING by KENNETH MOON, B.B.A., M.S. A DISSERTATION IN BUSINESS ADMINISTRATION Submitted to the Graduate Faculty of Texas Tech University in Partial Fulfillment of the Requirements for the Degree of DOCTOR OF PHILOSOPHY Approved December, 1997
-
Upload
khangminh22 -
Category
Documents
-
view
3 -
download
0
Transcript of FOREIGN VERSUS DOMESTIC CURRENCY D£BT FINANCING ...

FOREIGN VERSUS DOMESTIC CURRENCY
D£BT FINANCING
by
KENNETH MOON, B.B.A., M.S.
A DISSERTATION
IN
BUSINESS ADMINISTRATION
Submitted to the Graduate Faculty of Texas Tech University in
Partial Fulfillment of the Requirements for
the Degree of
DOCTOR OF PHILOSOPHY
Approved
December, 1997

^B
i c:
Copyright © 1994, Kenneth P. Moon

TABLE OF CONTENTS
LIST OF TABLES jv
LIST OF FIGURES xi
CHAPTER
I. INTRODUCTION I
II. DOMESTIC FIRM VALUE AND THE
DEBT DENOMINATION DECISION 8
Introduction 8
Reviewof Existing Literature 9
Summary and Motivation for Additional Research 24
III. THEORETICAL UNDERPINNINGS 27
Introduction 27
A Generalized Analysis 28
Intemational Equilibrium Redefined 38
Summary 42
IV. EMPIRICAL DESIGN AND DATA DESCRIPTION . . . . 44
Introduction 44
Event Methodology Test Statistic 45
Data Description and Empirical Design 49
Summary 56
11

V. SAMPLING PROCEDURES AND EMPIRICAL ANAI ^ SES . 57
Introduction ^7
Sampling Procedure X
Empirical Analysis 64
Data Evaluation 64
Event Methodology Results 68
One-Way AXOVA Results 72
Paired T-Test Results 78
Additional Empirical Analyses 81
Summary 90
VI. SUMMARY AND CONCLUSIONS 93
ENDNOTES 100
BIBLIOGRAPHY 103
APPENDICES
A. SUMMARY STATISTICS 106
B. EVENT METHODOLOGY RESULTS 120
C. ONE-WAY ANOVA RESULTS 126
D. PAIRED T-TEST RESULTS 134
E. MATURITY CONTROL ANALYSES 139
F. FOREIGN CURRENCY ANALYSES 159
111

LIST OF TABLES
4.1 Data Grouping for Hypotheses Testing 51
4.1 Hypothesized Signs for the Relationships Given in Table 4.1 55
5.1 Announcement Regime Groupings 67
5.2 Hypothesized Signs for the Relationships Given in Table 5.1 . 67
5.3 Group Sample Size Summary 68
5.4 Kmskal-Wallis Chi-Square Statistics Based on the Prediction Error Differences 78
A.l Summary statistics foreign currency debt issues
(full sample) 107
A.2 Summary statistics domestic currency debt issues . . . . 108
A.3 Summary statistics foreign currency debt issues (matched sample) 109
A.4 Summary statistics firms announcing debt issues (both domestic and foreign) 110
A.5 Industry representation summary for the firms
included in the matched sample I l l
A.6 Domestic and foreign corporate tax rates 112
A.7 ARIMA results (autocorrelation check for white noise) . . 113
B. 1 Event methodology results for the matched foreign and domestic samples using both the CRSP Value and Equal Weighted return series 121
B.2 Event methodology results using the CRSP Value Weighted return series for the foreign announcement sample with the observations segmented into their respective inflation/tax regime groupings 122
i \

B.3
B.4
B.5
C.l
C.2
C.3
Event methodology results using the CRSP Equal Weighted return series for the foreign announcement sample with the observations segmented into their respecti\ e inflation/tax regime groupings
Non-parametric event methodology results using the CRSP Value and Equal Weighted return series for the foreign announcement sample with the observations segmented into their respective inflation/tax regime groupings .
Small sample non-parametric event methodology results using the CRSP Value and Equal Weighted return series for the foreign announcement sample with the observations segmented into their respective inflation/tax regime groupings
Day "-1" and day "0" prediction error one-way ANOVA results using the CRSP Value Weighted return series for the data segmented into their respective inflation/tax regime groupings
Day "-1" and day "0" prediction error one-way ANOVA results using the CRSP Equal Weighted return series for the data segmented into their respective inflation/tax regime groupings
Cumulative two-day prediction error one-way ANOVA results using both the CRSP Value and Equal Weighted return series for the data segmented into their respective inflation/tax regime groupings
12 J
124
125
127
128
129
C.4 Foreign minus domestic prediction error differences day "-1" and day "0" one-way ANOVA resuhs using the CRSP Value Weighted return series for the data segmented into their respective inflation/tax regime groupings 130
C.5 Foreign minus domestic prediction error differences day "-1" and day "0" one-way ANOVA results using the CRSP Equal Weighted return series for the data segmented into their respective inflation/tax regime groupings 131
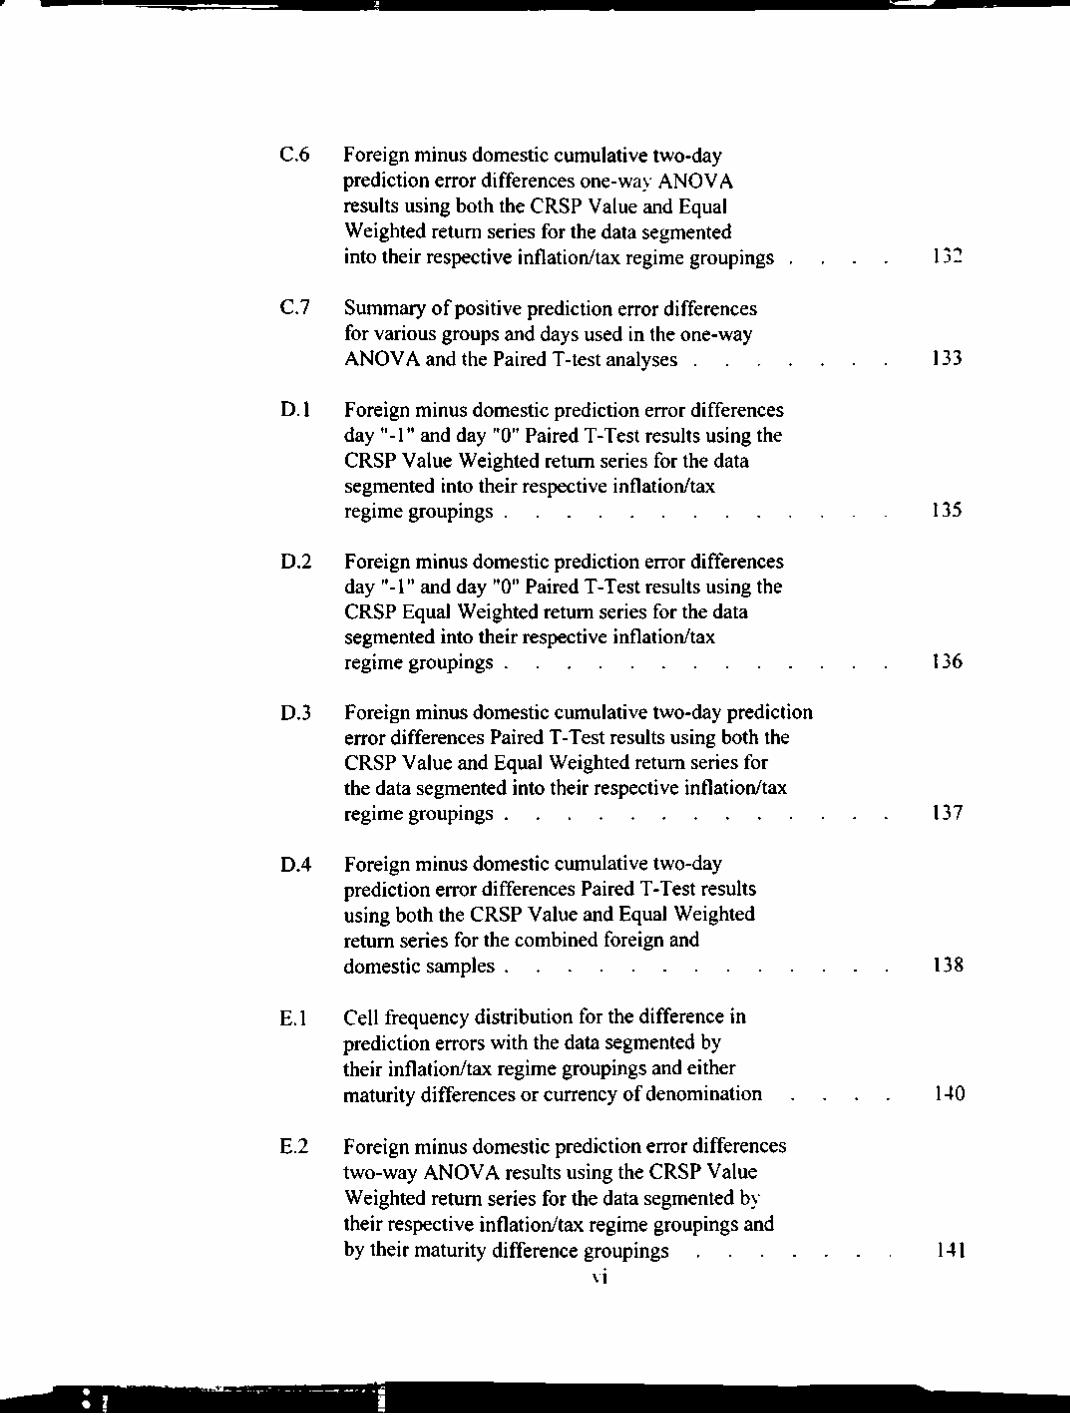
C.6 Foreign minus domestic cumulative two-day prediction error differences one-way ANOVA results using both the CRSP Value and Equal Weighted return series for the data segmented into their respective inflation/tax regime groupings . . . 132
C.7 Summary of positive prediction error differences for various groups and days used in the one-way ANOVA and the Paired T-test analyses 133
D. 1 Foreign minus domestic prediction error differences day "-1" and day "0" Paired T-Test results using the CRSP Value Weighted return series for the data segmented into their respective inflation/tax regime groupings 135
D.2 Foreign minus domestic prediction error differences day "-1" and day "0" Paired T-Test results using the CRSP Equal Weighted return series for the data segmented into their respective inflation/tax regime groupings 136
D.3 Foreign minus domestic cumulative two-day prediction error differences Paired T-Test results using both the CRSP Value and Equal Weighted return series for the data segmented into their respective inflation/tax regime groupings 137
D.4 Foreign minus domestic cumulative two-day prediction error differences Paired T-Test results using both the CRSP Value and Equal Weighted return series for the combined foreign and domestic samples 138
E. 1 Cell frequency distribution for the difference in prediction errors with the data segmented by their inflation/tax regime groupings and either maturity differences or currency of denomination . . . . 140
E.2 Foreign minus domestic prediction error differences two-way ANOVA resuhs using the CRSP Value Weighted return series for the data segmented b>' their respective inflation/tax regime groupings and by their maturity difference groupings 141
vi

E.3
E.4
E.5
E.6
Foreign minus domestic prediction error differences two-way ANOVA results using the CRSP Equal Weighted return series for the data segmented by their respective inflation/tax regime groupings and by their maturity difference groupings
Foreign minus domestic prediction error differences two-way ANOVA results using the CRSP Value Weighted return series for the collapsed data segmented by their respective inflation/tax regime groupings and by their maturity difference groupings
Foreign minus domestic prediction error differences two-way ANOVA results using the CRSP Equal Weighted return series for the collapsed data segmented by their respective inflation/tax regime groupings and by their maturity difference groupings
Foreign minus domestic prediction error differences two-way ANOVA results using the CRSP Value Weighted return series for the data segmented by their respective inflation/tax regime groupings and by their maturity difference groupings (Groups 4, 5, 8. 9 and Maturity Groups 1 & 4)
142
143
144
145
E.7 Foreign minus domestic prediction error differences two-way ANOVA results using the CRSP Equal Weighted return series for the data segmented by their respective inflation/tax regime groupings and by their maturity difference groupings (Groups 4. 5. 8, 9 and Maturity Groups 1 & 4) 146
E.8 Foreign minus domestic prediction error differences day "-1" and day "0" one-way ANOVA results using the CRSP Value Weighted return series for the data segmented by their respective inflation/tax regime groupings and by their maturity difference groupings (Groups 3. 4, 5, 7. 8, 9 and Maturity Group 1) 147
vii

E.9
E.IO
Foreign minus domestic prediction error differences day "-1" and day "0" one-way ANOVA results using the CRSP Equal Weighted return series for the data segmented by their respectiv e inflation/tax regime groupings and by their maturity difference groupings (Groups 3, 4. 5.1, 8, 9 and Maturity Group 1)
Foreign minus domestic cumulativ e two-day prediction error differences one-way ANOVA results using both the CRSP Value and Equal Weighted return series for the data segmented by their respectiv e inflationytax regime groupings and by their maturity difference groupings (Groups 3. 4, 5. 7. 8, 9 and Maturity Group 1)
148
149
E. 11 Foreign minus domestic prediction error differences day "-1" and day "0" one-way ANOVA results using the CRSP Value Weighted return series for the data segmented by their respective inflation/tax regime groupings and by their maturity difference groupings (Groups 1. 4. 5, 8, 9 and Maturity' Group 4) . 150
E. 12 Foreign minus domestic prediction error differences day "-1" and day "0" one-way ANOVA results using the CRSP Equal Weighted return series for the data segmented by their respective inflation/tax regime groupings and by their maturity difference groupings (Groups 1. 4. 5, 8, 9 and Maturity Group 4) . 151
E.13 Foreign minus domestic cumulative two-day prediction error differences one-way ANOVA results using both the CRSP Value and Equal Weighted return series for the data segmented by their respectiv e inflation/tax regime groupings and by their maturitv difference grouping (Groups 1. 4. 5. 8. 9 and Maturity Group 4) 152
E. 14 Foreign minus domestic prediction error differences day "-1" and day "0" one-way ANOV.A. results using the CRSP Value \\ eighted return series for the inflation/tax regime group 9 across all maturitv difference groupings 53
V l l l

E.15
E.16
E.17
E.18
E.19
F.l
Foreign minus domestic prediction error differences day "-1" and day "0" one-way ANOVA results using the CRSP Equal Weighted retum series for the inflation/tax regime group 9 across all maturity difference groupings
Foreign minus domestic cumulative two-day prediction error differences one-way ANOVA results using both the CRSP Value and Equal Weighted retum series for the inflation/tax regime group 9 across all maturity difference groupings
Foreign minus domestic prediction error differences day " - 1 " and day "0" one-way ANOVA results using the CRSP Value Weighted retum series for the collapsed data segmented by their respective inflation/tax regime groupings for the observations with a difference in maturity < 17| years
Foreign minus domestic prediction error differences day " - 1 " and day "0" one-way ANOVA results using the CRSP Equal Weighted retum series for the collapsed data segmented by their respective inflation/tax regime groupings for the observations with a difference in maturity < |7| years
Foreign minus domestic cumulative two-day prediction error differences one-way ANOVA results using both the CRSP Value and Equal Weighted retum series for the collapsed data segmented by their respective inflation/tax regime groupings for the observations with a difference in maturity < |7| years
Foreign minus domestic prediction error differences day "-1" and cumulative two-day one-way ANOVA resuhs using the CRSP Value Weighted retum series for the data segmented by their currency of denomination (Currency Groups AUS C$ DM SFR STG YEN) . .
154
155
156
157
158
160
IX
wHfaiig

m
F.2 Foreign minus domestic prediction error differences day "-1" and cumulative two-day one-way ANOV.A results using the CRSP Equal Weighted retum series for the data segmented b\ their currencv of denomination (Currency Groups AUS CS DM SFR STG YEN) . .
F.3 Foreign minus domestic prediction error differences day "-1" and cumulative two-day one-way ANOVA results using the CRSP Value Weighted retum series for the data segmented by their inflation/tax regime groups and currency of denomination (Inflation/Tax Regime Groups 1, 3. 4. 7. 9 and Currency Group SFR)
161
162
F.4 Foreign minus domestic prediction error differences day "-1" and cumulative two-day one-vvav ANOVA results using the CRSP Equal Weighted retum series for the data segmented by their inflation/tax regime groups and currency of denomination (Inflation/Tax Regime Groups 1, 3. 4. 7, 9 and Currency Group SFR) 163
F.5 Foreign minus domestic prediction error differences day "-1" and cumulative two-day one-way ANOVA results using the CRSP Value Weighted retum series for the data segmented by their inflation/tax regime groups and currency of denomination (Inflation/Tax Regime Group 9 and Currency Groups SFR & YEN) 164
F.6 Foreign minus domestic prediction error differences day "-1" and cumulative two-day one-way ANOV.A. results using the CRSP Equal Weighted retum series for the data segmented bv- their inflation/tax regime groups and currencv of denomination (Inflation/Tax Regime Group 9 and Currency Groups SFR & YEN) 165
X

LIST OF FIGURES
3.1 Exchange Adjusted After-Tax Retum Differential . . . . 33
3.2 Generalized Exchange Adjusted After-Tax Retum Differential . 34
A.l Monthly Inflation Rates U.S. Versus Canada 114
A.2 Monthly Inflation Rates U.S. Versus France 115
A.3 Monthly Inflation Rates U.S. Versus Germany 116
A.4 Monthly Inflation Rates U.S. Versus Japan 117
A.5 Monthly Inflation Rates U.S. Versus Switzerland . . 118
A.6 Monthlv Inflation Rates U.S. Versus U.K 119
XI

CHAPTER I
INTRODUCTION
The issue concerning the use of foreign versus domestic currency denominated
debt in a firm's capital stmcture is unresolved. Specifically, there exist in the literature
conflicting conclusions regarding whether a domestic firm may enhance its value by
using foreign currency debt, rather than domestic currency debt. Further, no attempt has
yet been made to empirically evaluate the problem.
The question is first addressed in a no tax environment where Senbet [1979]
concludes that foreign currency debt offers no advantage relative to domestic currency
debt, assuming Interest Rate Parity (IRP) and Relative Purchasing Power Paritv (RPPP)
hold. Next, taxes are introduced into the analysis. Here, Lee and Zechner [1984]
conclude that a domestic firm may enhance its value by issuing foreign currency debt,
even when IRP and RPPP hold. Contrary to this conclusion, Hodder and Senbet [1990]
argue that the presence of intemational tax arbitrage by multinational firms will render
the currency of denomination decision irrelevant.
Three primary areas of concern are identified based on the theories examined in
Chapter II. First, the models put forth thus far only consider situations where the
domestic inflation rate is positive while assuming the foreign inflation rate is equal to
zero, given that there is no difference in national tax rates, or where national tax rates
differ while the national inflation rates are assumed to equal zero. Accordingly, the
analysis needs to be extended to consider whether the simultaneous presence of both
differential positive inflation rates and differential national tax rates alter the conclusions
drawn thus far. Second, it is assumed throughout the existing literature that the
introduction of taxes only affects how national interest rates are defined, but does not
alter the traditional RPPP mechanism. This assumption leads to an inherent
inconsistency among the IRP condition, the RPPP mechanism and the Modified Fisher
Effect. Hence, h is argued that international, as well as national, conditions must be
modified to incorporate taxes such that a stable equilibrium may be achieved. Finally,
1

because no specific empirical test related to the stock price reaction for foreign currencv
debt offers (relative to domestic debt offers) exists, it is deemed necessarv that such an
analysis be conducted to determine which (if any) of the theoretical arguments are
supported by the data.
Chapter III begins by extending the analyses reviewed in Chapter II into a more
general setting. The primary concern discussed in Chapter III is whether the conclusions
drawn are altered by the simultaneous existence of both differential national inflation
rates and differential national tax rates. Specifically, Lee and Zechner conclude that a
domestic firm may enhance its value by issuing foreign currency debt when either the
domestic tax rate exceeds the foreign tax rate in the absence of differential inflation rates
or when the domestic inflation rate is positive given equal national tax rates. In contrast,
Hodder and Senbet conclude that the presence of intemational tax arbitrage by
multinational firms will render the currency of denomination decision irrelevant for
domestic non-multinational firms under the scenarios explored by Lee and Zechner. Will
these results be materially altered when both differential inflation and tax rates are present
in the analysis?
Based on the concern discussed above, it is shown that once all factors are
incorporated into the analysis, the national tax rate differential must be proportional to the
national inflation rate differential for an equilibrium to be achieved. In other words, for
there to be no difference in the exchange adjusted real after-tax cost of foreign borrowing
relative to domestic borrowing, the inflation rate differential must be proportionally offset
by the tax rate differential. This result leads to the conclusion that the intemational parity
conditions should be modified such that a stable equilibrium may be achieved.
The counter-intuitive result that tax rate differentials must be proportional to
inflation rate differentials leads to a re-examination of the traditional intemational parity
conditions in the presence of taxes. It is argued that, if national interest rates equilibrate
on a real after-tax basis as defined according to Darby [1975], then an intemational parity
should also be established on a real after-tax basis rather than the traditional real before-
tax equilibrium setting. The resuhs of this analysis imply that the Modified Fisher Effect

(which incorporates taxes within countries, but still invokes the traditional Relative
Purchasing Power Parity) according to Darby is inconsistent with the traditional
Intemational Fisher Effect. The inconsistency stems from the fact that national markets
are assumed to equilibrate on a real after-tax basis, while the intemational market is
assumed to equilibrate on a real before-tax basis. Accordingly, a new intemational
equilibrium, referred to as the Intemational Darby Effect, is derived where all markets
equilibrate on a real after-tax basis. The chapter concludes with a summary of the
analyses explored, and highlights the need for an empirical investigation of the issues at
hand.
Chapter IV begins with a description of the methodology that will be emploved in
the empirical analysis of the issues explored. The primary theoretical argument of
concem centers on how firm value will change with respect to a change in debt.
Specifically, is the value-debt relationship significantly different for a foreign versus a
domestic currency debt offer? To this end, it is deemed appropriate to employ an ev ent
study methodology that measures a firm's abnormal stock price as it relates to the
announcement of a debt offer. This type of methodology will provide the necessarv
information to compare stock price reactions for foreign debt offers relativ e to domestic
debt offers.
Next, the hypotheses implied by the research previously discussed will be
developed. In this section of the chapter, the null hypothesis for each scenario will be
that there is no significant differential effect on stock price for foreign debt offers relafive
to domestic debt offers. This debt denomination irrelev ancv proposition is based on the
Intemational Darby Effect (IDE) developed in Chapter 111. In the development of the
IDE h was assumed that the real after-tax costs of debt were equal across countries.
Based on this assumption, there should be no observable difference in stock price
reactions for foreign debt offers relative to domestic debt offers. Several altemative
hypotheses will be constmcted based on the scenario in quesfion. For example (as argued
by Lee and Zechner). there should be a positive relationship between firm value and
foreign debt offers under certain circumstances.
D

A brief description of the data to be used in this study is combined with the
discussions regarding the methodological design and the dev elopment of the testable
hypotheses. In addition, several areas of concem related to other factors that may lead to
an observable difference between debt offers are addressed. For instance, previous
research by Kidwell, Marr and Thompson [1985, 1986] argues that there may be an
advantage to borrowing in the Eurobond market relative to the U.S. domestic market.
This possible advantage stems from the observation by these authors that there exists a
persistent lower cost of borrowing in the Eurobond market relative to the U.S. domestic
debt market. In a similar vein, another area of concem deals with the Relative Purchasing
Power Parity assumpfion invoked in the arguments discussed in Chapters II and III.
Specifically, should debt offer announcements be categorized according to inflation
differentials, or according to expected currency movements as reflected in the exchange
rate markets? Finally, the chapter concludes with a summary of the issues discussed.
The discussion regarding the data collection process, the empirical design and test
results appears in Chapter V. As explained in Chapter IV. the main empirical tests
employ an event study methodology. Given the new intemational equilibrium condition
derived in Chapter III, the null hypothesis is defined as no statistical difference in stock
price reaction for a foreign debt offer versus a domestic debt offer.
The initial step in the data collection process involved identifying domestic firms
announcing a proposed foreign currency debt offer. The data for this initial step is
provided by the Securities Data Company for the years 1985 through 1993. After
screening the data following standard event study techniques, 115 foreign debt offers by
56 domestic based firms remained. These offers are then matched with domestic debt
offers in an effort to provide a control sample. The final samples consist of 78 foreign
and 78 domestic debt offers by 45 and 65 firms, respectiv ely.
Following the debt announcement identification phase, data are collected relating
to national inflation and tax rates for the countries in question. As described above, Lee
and Zechner posit foreign debt and firm value relationships only for specific inflation and
tax rate regimes. Therefore, it is necessary to categorize each foreign debt announcement
4

•.^^^iset
into its respective inflation and tax differential setting. Data related to national inflation
rates are from the International Financial Statistics Yearbook, and tax rate information
from the Prentice Hall publication Corporate Taxes a Worldwide Summary.
The empirical phase of the analysis has three primarv tests based on an ev ent
study methodology following Brown and Wamer [1985]. The first set of tests examine
whether any observable significance exists for either sample overall. The second set of
tests evaluates the foreign announcements after accounting for the inflation and tax rate
regime categorizations. The final primary empirical results attempt to discem an>
observable significant difference in stock price reaction for foreign debt offers relativ e to
domestic offers. Additionally, a fourth set of tests examines the relativ e difference in
stock price reactions after accounfing for differences in maturity for the "matched"
foreign and domestic offers. This analysis is deemed necessarv due to a lack of data that
would have enabled an initial control for this variable. In general, there is no conclusiv e
evidence to contradict the notion that firms should be indifferent to the currency
denomination decision as implied by the newly derived Intemational Darby Effect.
Once all data were collected and organized, an event methodology following
Brown and Wamer was used to compute the prediction errors associated with each debt
offer announcement. This segment of the analysis produced a negativ ely significant
result for the firms in group nine, in contrast to Lee and Zechner's theory. Group nine
relates to the foreign debt offer announcements under the inflation/tax regime where the
domestic tax and inflation rates exceed their foreign counterpart. According to Lee and
Zechner, this group should produce a positive sign due to an added tax shield benefit
from borrowing in an appreciating foreign currency. A potential rational for the result
found related to an increase in firm risk via the foreign currency exposure.
The second level of tests employed the prediction errors as the response variables
in a one-way ANOVA analysis. These tests were performed in an effort to increase the
efficiency of the results given the small sample sizes. Here, the results were similar to
those of the event methodology in that only group nine was found to be negativ ely
significant. The final phase of the primary empirical analysis focused on identifying anv

observable difference in prediction errors for the foreign announcements relative to the
domestic announcements.
In this last set of primary empirical tests, an ANOVA procedure and a matched
pairs t-test procedure were used, where the difference in prediction errors (for each group)
was the response variable. Further, the comparable non-parametric Kmskal-Wallis and
Wilcoxon Signed-Ranks tests were also employed in this analv sis. Overall, only the
difference in prediction errors for group seven on day "-1" appeared as significantly
positiv e. Group seven refers to those foreign debt announcements for which the domestic
inflation rate exceed its foreign counterpart, assuming no difference in tax rates. This
was one of the specific groups Lee and Zechner argued would be positive due to an added
tax shield benefit associated with borrowing in an appreciating foreign currencv.
Howev er, it was proposed that a negatively significant result related to the domestic
announcements might be behind the apparent positively significant difference in
prediction errors. This argument is based on the fact that this group was not significant
when the foreign prediction errors were examined independentlv of the domestic
prediction errors.
The empirical analyses also included a section related to an examination
controlling for differences in maturity between the foreign and domestic debt
announcements. This analysis was included because such a control was not possible in
the original sampling procedures given the limited amount of data available. Controlling
for differences in maturity did not provide any significant change in the results reported
in the prior sections. It was found, as before, that only group nine persisted as a
significant result. One possible explanation for this result was that a large sub-categorv'
of group nine related to observ ations for which the domestic maturity exceed the foreign
maturity. However, there were no other major changes in significance for the other
groups related to this maturity difference classification. The fact that only group nine
showed persistent significance may indicate that this significance was the result of three
outliers contained in this group. Unfortunately, no logical reason related to these outliers
could be identified.

In conclusion, there are a few significant results based on the analyses related
solely to the examination of prediction errors for foreign debt offer announcements and
based on the analyses comparing the foreign and domestic prediction errors. Further, an
additional analysis controlling for differences in maturity between the foreign and
domestic sample provided no new information. The overall results provide little ev idence
to reject (if at all) the null hypotheses based on the newly derived intemational
equilibrium given in Chapter III.
This dissertation constitutes an examination of the theoretical arguments
presented in the literature related to the issue concerning whether domestic firm value
may be enhanced via the use of foreign currency debt. Additionally, this research adds to
the existing literature in three ways. First, the existing literature is extended into a more
generalized (and perhaps more realistic) setting. Second, a new intemational debt market
equilibrium condition is derived, where all markets are assumed to equilibrate on a real
after-tax basis. And finally, an event study methodology is employed to empirically
examine the theoretical issues explored herein.

-9 y*?^^5i| mm
CHAPTER II
DOMESTIC FIRM VALUE AND THE DEBT
DENOMINATION DECISION
Introduction
This chapter examines the existing literature that explores the impact of using
foreign versus domestic currency denominated debt on firm value. The issue conceming
the use of foreign versus domestic currency denominated debt in a firm's capital stmcture
is unresolved. Specifically, the issue centers on conflicting conclusions regarding
whether a domestic firm may enhance its value by using foreign currency debt rather than
domestic currency debt.
The question is first addressed in a no tax environment where Senbet [1979]
concludes that foreign currency debt offers no advantage relative to domestic currency
debt, assuming Interest Rate Parity (IRP) and Relative Purchasing Power Parit> (RPPP)
hold. Next, taxes are introduced into the analysis. Here, Lee and Zechner [1984]
conclude that a domestic firm may enhance its value by issuing foreign currency debt,
even when IRP and RPPP hold. Contrary to this conclusion, Hodder and Senbet [1990]
argue that the presence of intemational tax arbitrage by multinational firms will render
the currency of denomination decision irrelevant.
This chapter concludes with a discussion highlighting the need for additional
research in this area. Three primary areas of concem are identified. First, the models put
forth thus far only consider situations where the domestic inflation rate is positiv e. while
assuming the foreign inflation rate is equal to zero and there is no difference in national
tax rates, or where national tax rates differ while the national inflation rates are assumed
to equal zero. Accordingly, the analysis needs to be extended to consider whether the
simultaneous presence of both differential positive inflation rates and differential national
tax rates alter the conclusions drawn thus far. Second, it is assumed throughout the
existing literature that the introduction of taxes onlv affects how national interest rates are
defined, but does not alter the traditional RPPP mechanism. This assumption leads to an
8

inherent inconsistency among the IRP condition, the RPPP mechanism and the .Modified
Fisher Effect. Hence, it is argued that national, as well as intemational. conditions must
be modified to incorporate taxes such that a stable equilibrium may be achieved. Finall>.
because no empirical analysis exists regarding the questions at hand, it is deemed
necessary that such an analysis be conducted to determine which (if any) of the
theoretical arguments are supported by the data.
Review of Existing Literature
de Faro and Jucker [1973] are among the first to explore a relafionship enabling
one to compare the effecfive nominal cost of domestic currency borrowing versus that of
foreign currency borrowing. They explore this relationship in a restrictive environment
in which they ignore the impact of taxes and assume a one period certainty model. In this
setting, the effecfive nominal cost of domesfic borrowing should equal the exchange
adjusted cost of foreign currency borrowing. This relationship is expressed as:
i,={l + i,)(l + e)-l (2.1)
Where i is the effective nominal cost of domestic currency borrowing. The effective
nominal cost of foreign borrowing in foreign currency terms is if. And, e is the change in
the value of the foreign currency e = 5, SQ
\
(SQ and s, represent the domestic currency
per unit of foreign currency exchange rates at the beginning and end of period,
respectively). The relationship expressed in equation (2.1) may be referred to as an
Interest Rate Parity (IRP) condition, in that any difference in the stated nominal interest
rates should be offset by the change in relative currency values.' Specifically, the change
in the exchange rate, e, should equal the geometric difference in the effective nominal
interest rates between the two countries defined as:

-\ = e (2.2)
de Faro and Jucker use the condition given in equation (2.1) or equation (2.2) to
show that a firm should borrow domestically if / - (1 + / )(l + ) ~ 1 • and vice versa.
Thus, if the change in the exchange rate did not offset the difference between the two
stated nominal interest rates, then it would be beneficial to borrow in the foreign
currency. For example, if i = if and e was negative, then (on an exchange adjusted basis)
foreign currency borrowing by a domestic firm would be less costly than domestic
currency borrowing. Hence, in the absence of taxes there could be a cost advantage for a
domestic firm to borrow in a weakening currency. This type of formulation for
evaluating effective borrowing costs establishes the basis for further examination once
other factors such as differential inflation rates, differential tax rates, and exchange risks
are introduced into the model.
Recognizing that s, is not known with certainty at the beginning of the period,
Senbet [1979] expands on this basic relationship by developing an intemational asset
pricing model that allows for this exchange rate uncertainty. Assuming that Relative
Purchasing Power Parity (RPPP) and that Interest Rate Parity hold, Senbet argues that
when taxes are equal to zero the value of a purely domestic firm will be unaffected bv the
use of foreign currency leverage in its capital structure." Further, he shows that the firm
value relationship for a purely domestic firm using foreign currency debt compared to a
purely domestic unlevered firm collapses to the traditional Modigliani and Miller [1958.
1963] setting.
10

Senbet's conclusions can be demonstrated using the following analysis.
For a given firm define:
X = the firm's domestic currency cash flow before payments to debt holders and
before corporate tax at (t = 1).
B = the face value of domestic currency debt.
Bf = the face value of foreign currency debt,
ij = the nominal retum on domestic currency debt,
r = the nominal^ retum on equity in the domestic country,
if = the nominal retum on foreign currency debt,
r f = the nominal retum on equity in the foreign country,
tj = the domestic corporate tax rate,
tf = the foreign corporate tax rate.
The value of a domestic firm at (t = 0) may then be expressed as:
V = B
1 + r + S X-B-t. X-B + B
1 + /., l + r. (2.3)
Following DeAngelo and Masulis [1980b], if the first derivative of V with respect
to B in equation (2.3) is positive, then firms would supply only debt; if the derivative is
negativ e, firms would supply only equity. An interior equilibrium can be achieved only
if there are positive suppliers of both debt and equity. This will be the case if the first
derivative of V with respect to B in equation (2.3) is zero. Differentiating equation (2.3)
with respect to B and setting this equal to zero giv es:
\
rl' _ 1
rB~ \ + i.
l-t. 1-1 + / dJ
1 + /-, = 0 (2.4:
11
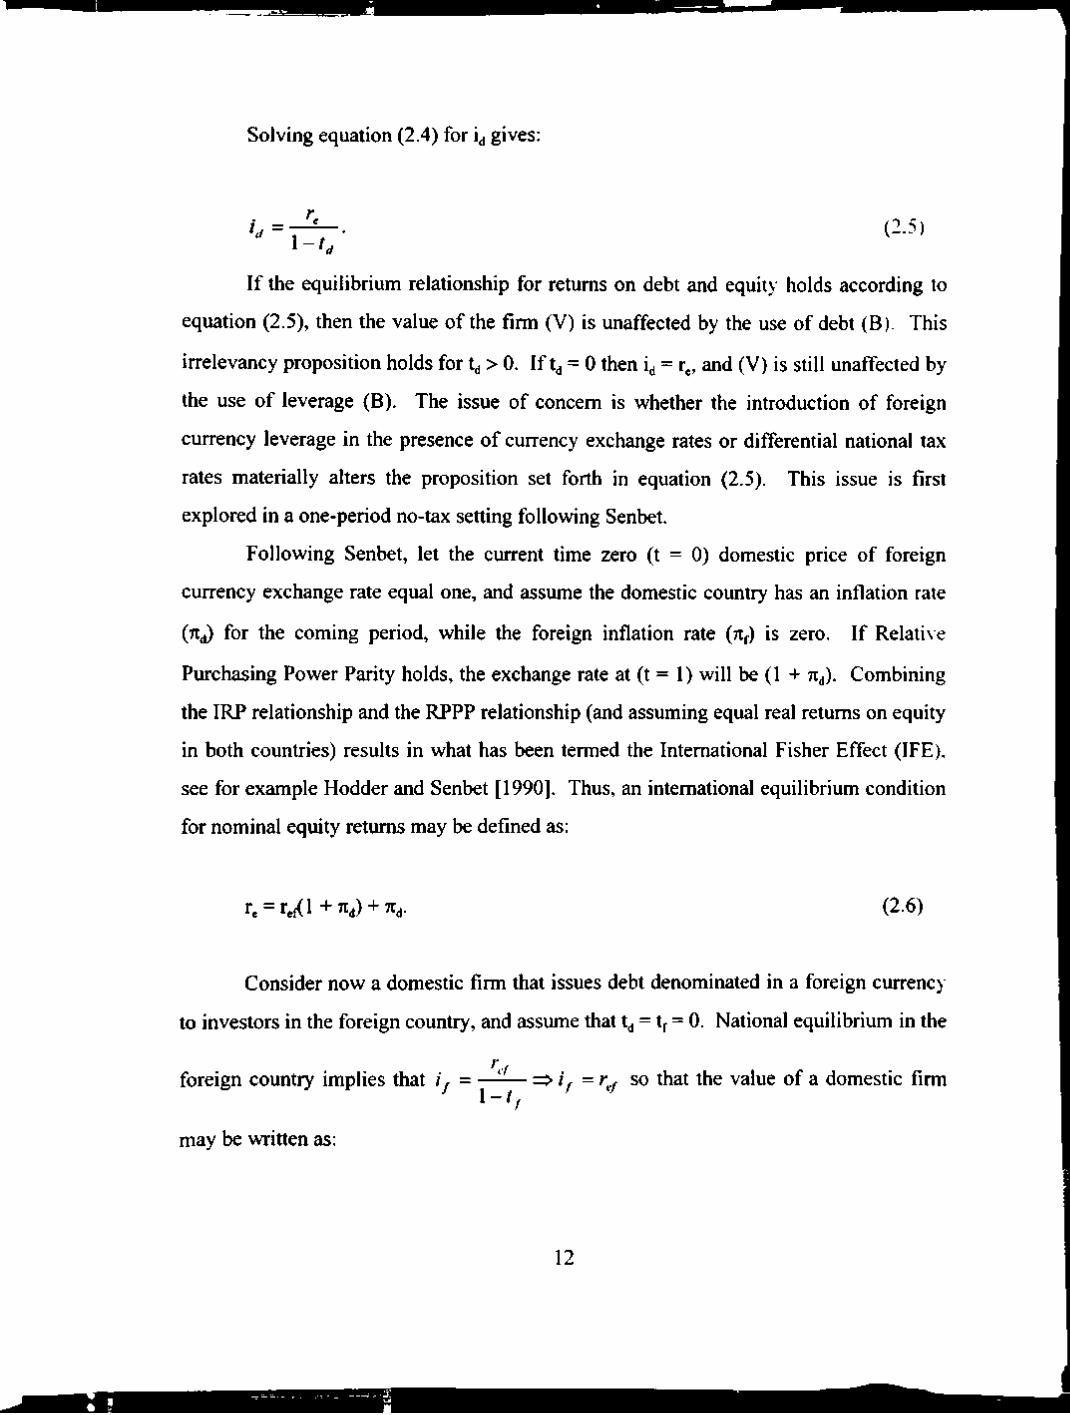
Solving equation (2.4) for i gives:
h = 1 - / . (2.5)
If the equilibrium relationship for retums on debt and equity holds according to
equation (2.5), then the value of the firm (V) is unaffected by the use of debt (B). This
irrelevancy proposition holds for t > 0. If t = 0 then i = r„ and (V) is still unaffected by
the use of leverage (B). The issue of concem is whether the introduction of foreign
currency leverage in the presence of currency exchange rates or differential national tax
rates materially alters the proposifion set forth in equation (2.5). This issue is first
explored in a one-period no-tax setting following Senbet.
Following Senbet, let the current time zero (t = 0) domestic price of foreign
currency exchange rate equal one, and assume the domestic country has an inflation rate
(TTJ) for the coming period, while the foreign inflation rate (TTJ) is zero. If Relativ e
Purchasing Power Parity holds, the exchange rate at (t = 1) will be (1 + TT ). Combining
the IRP relationship and the RPPP relationship (and assuming equal real retums on equity
in both countries) results in what has been termed the Intemational Fisher Effect (IFE),
see for example Hodder and Senbet [1990]. Thus, an intemational equilibrium condition
for nominal equity retums may be defined as:
h = hl^ +7rd) + 7rd- (2.6)
Consider now a domestic firm that issues debt denominated in a foreign currency
to investors in the foreign country, and assume that t = tf = 0. National equilibrium in the
foreign country implies that / c/
/ \-t if = r^j so that the value of a domestic firm
may be written as:
12

«LUH
V = 5 \ + r e/
+ \X- B. (1 + .T, )} —-^—^ . (2 .7)
The first term on the right-hand side of equation (2.7) is the present value of
foreign debt. The terms within the outer brackets denote the end of period (t = 1) amount
paid to the firm's equity holders denominated in domestic currency terms. The last term
is the equilibrium discount rate for equity income.^
Differentiating (2.7) for V with respect to Bf giv es:
3' cB,
(1 + ^ .)
l+'-e/ ^+^e/{^ + ^'^d)+^'^c = 0. (2.8)
and the value of the firm is unaffected by the use of foreign currency lev erage. In the
absence of taxes (assuming RPPP and IRP hold) the value of a domestic firm is
unaffected bv the use of either domestic or foreign currency debt.
The leverage irrelevancy argument demonstrated above may also be explored
using a format following deFaro and Jucker. The assumption of IRP for equity retums,
and the RPPP assumption are defined as. respectivelv:
^e={'^ + ^vf )(1 + ) - 1. and (2.9)
e = {\ + 7ij) (2.10)
Combining (2.9) and (2.10) gives:
fe=[^ + r^f\^^^d)-^ = r,f{\ + ^,) + ^j (2.11)
13

With tj = tf = 0, national equilibria imply that i = r and that if = r f. These conditions
imply that the following condition holds for the relative costs of debt:
i,=if(\ + ;r,) + 7rj=[\ + if){\-^e)~\ (2.12)
Accordingly, there is no cost advantage for a domestic firm to issue foreign
currency debt because any difference in the stated nominal interest rates is offset by the
change in the exchange rate. This intemational irrelevancy proposition is feasible in the
absence of taxes because Interest Rate Parity. Relative Purchasing Power Parity and the
Intemational Fisher Effect are shown to be consistent with one another. The following
discussion explores literature that attempts to incorporate taxes into this analysis.
Lee and Zechner extend the above analysis to include domestic and foreign
corporate taxes. Their arguments center on the scenarios where t = tf > 0 and TTJ > Tif = 0,
and where t 9 tf and TI = 7if > 0. They conclude that with equal corporate taxes between
countries there may be an advantage to issuing foreign debt when TTJ > Tif = 0, and that
there may be an advantage to issuing foreign debt with TT = TTf = 0 when t > tf. Hence, in
the presence of either differential national inflation rates or differential national tax rates,
a Miller [1977] equilibrium cannot be attained for a domestic firm that issues foreign
currency debt. This result is obtained even though a Miller equilibrium exists within each
country for firms that issue home currency debt.
Lee and Zechner's first conclusion can be demonstrated by incorporating taxes in
equations (2.7) and (2.8). For TI > Tif = 0 and t = tf > 0 equafions (2.7) and (2.8) may be
rewritten as:
14

.-giiBiLi
(2.7)
V = B,
1 + ef
1-r.
+ < X-B,{\-^7r,)-t^ X-B,{\ + .T,) + B,
1 + /L_ l - r
l + r.,(l + .Tj + .T
and
cB. 1 + '<t/^
(l + .T,)( l-r , ) + /, / \
ef 1 +
l + ''./(l + ^J+^. 1- / .
(2.8')
Lee and Zechner argue that for TTJ > 0 the value of equation (2.8') will alwav s be
positive. The advantage of foreign debt in this case is because the firm can deduct from
its taxable income the foreign exchange loss on the foreign debt principal repayment. If
Relativ e Purchasing Power Parity holds and t = tf > 0, then a situation where TIJ is greater
than Tif = 0 will result in a tax deductible foreign exchange loss for a domestic firm that
issues foreign currency debt. In other words, higher domestic inflation relativ e to foreign
inflation results in an appreciation of the foreign currency, which leads to a tax deductible
foreign exchange loss for the firm upon repayment of Bf.
To see this result more clearly, the total deductible debt expense of foreign debt in
domestic terms may be decomposed as follows:
5,(1+ ;r,) B.
1 + 1-r
B. -B,
1 + \-t.
+ KjBf (2.13)
15

The term within brackets represents a tax-deductible interest expense to the firm but
taxable income to the foreign lender. The last term (Ti Bf) is a compensation for the
inflation in the domestic country. Assuming RPPP holds, this term will be documented
as a tax deductible foreign exchange loss for the firm. This compensation for domestic
inflation will not be taxed on a personal level in the foreign countr>' because the foreign
investors' required interest income is equal to the bracketed terms in equation (2.13).
Since foreign investors (in this setting) are lending in their home country currency for
which there is no inflation or exchange exposure, the\ do not require any compensation
for inflation or foreign exchange. Hence, foreign investors only require a real rate of
retum grossed-up for their tax liability.
To examine Lee and Zechner's second conclusion thev ignore anv inflation
differential between countries (or that n^ = iif = 0). This helps to isolate the affect of
different tax rates across countries. It is assumed bv Lee and Zechner that real rates of
retum on equity are initiallv equal across countries (r . = r f). and that national equilibria
imply that i = TJ{\ - t j and if = TJ{\ - tf). The value of a domestic firm issuing foreign
currency debt may be expressed as:
V = B.
+ s 1 +
1 - ^
X-B.-t. X-Bf + B /
1 + \-t
\ + r. (2.14)
Differenfiafing (2.14) with respect to Bf gives:
cB, 1 +
1-r
1-0+^. 1
1+ '^ i-t f
l + r„ (2.15)
16

If tj = tf, then equation (2.15) reduces to equation (2.4). and the gain from foreign
currency leverage is equal to that of domestic currency leverage. Further, if t ^ i. = 0.
then — = = 0. cB cBf
On the other hand, when t > tf the value of equation (2.15) is positive, and the
domestic firm can increase its value by issuing foreign currency debt even in the absence
of changes m the exchange rate. For example, when t > tf = 0 equafion (2.15) reduces to:
r l '
cB f {'' 1 U+/-J
r 0 ] 1(1+'-,)'J
>0. (2.15')
In this simplified situafion the foreign equilibrium interest rate is not grossed up b> (1 - tf)
since tf = 0; however, domestic firms can still offset their interest expense against the
positive domestic tax rate, t . Hence, domestic firms would gain by issuing foreign debt
versus domestic debt.
The arguments bv Lee and Zechner can also be demonstrated using an analysis
following work by BenZion and Weinblatt [1984]. BenZion and Weinblatt examine the
relationship among the Relative Purchasing Power Parity, Interest Rate Parity, and what
they refer to as the Modified Fisher Effect in the presence of taxes. Thev argue that, in the
presence of taxes, the simultaneous coexistence of these three phenomena is inconsistent.'
BenZion and Weinblatt's analvsis compares these relationships in a "no-tax"
world to that of a more realistic setting that allows for taxation of interest income. In a
taxless world (assuming a constant before-tax real rate in the domestic and foreign
country equal to r^' and r*'. respectively), IRP, RPPP, and the simple (within countr>')
Fisher Effects are defined (respectivelv) as:^
0 + ' . ) - ( i + ^ ) ^ - (2.16)
17

^ = ( 1 + ^ . ) (2.17)
/• f =r)', and • / ' /
(2.18a)
i d = 0 * ' ( l + ^ d ) + ^d- (2.18b)
By substituting (2.17), (2.18a) and (2.18b) into (2.16). BenZion and Weinblatt
show that IRP, RPPP and the within country Fisher Effects are consistent in the sense that
before-tax real rates of retum are equal across countries. This substitution results in:
+{'-i'(i+^.)+'^<'}]=[i+{'-/'(i+'^.)+'^^}]'°'-ht hi (2.16')
BenZion and Weinblatt assume that the introduction of taxes into the analysis will not
affect the RPPP mechanism, but that taxes will modify the relationships in the other
equations.
With the introduction of taxes, the simple Fisher Effect no longer holds, and must
be modified as suggested by Darby [1975], Fedlstein [1976], or Tanzi [1976]. Assuming
constant real after-tax domestic and foreign interest rates {rf and r^', respectively), the
nominal foreign and domestic interest rates may be defined as, respectively:
'/ = ^f' (l + ;r ,) + /r /
( ' - ' . )
and (2.18'a)
."'
h = 0 + .) + 7r.
O-o) (2.18'b)
18

BenZion and Weinblatt set % = 0, and argue that the capital market equilibrium is
affected by the existence of taxes. Thus, the Modified Interest Rate Parity condition in
after-tax terms may be defined as:
•^3Rn
^.(1-^) = (1-V 1 - 1 (1-^.) (2.16")
Under IRP, the difference between these retums should be equal to zero, defined as:
' . ( i -o)- (->©-' 0-o)=o (2.16'")
BenZion and Weinblatt argue that the equality in (2.16'"), which held under IRP,
may not necessarily hold once RPPP is invoked because it is assumed that taxes do not
affect the RPPP mechanism. Invoking RPPP, and substituting equations (2.17), (2.18'a)
with TTf = 0 and (2.18'b) into the left-hand side of (2.16'") results in:
(1-0-.al \
1 + 7
( • - ' . ) .
( i + ^ . ) - i (i-o)<o (2.19)
Assuming r" = r"' = f", and re-arranging terms yields:
al (' + ' </)-
(1 + J(1-^.) > (2.19')
Since equation (2.19') is not necessarily equal to zero as suggested by equation
(2.16'"), BenZion and Weinblatt conclude that the Interest Rate Parity condition is not
19
,.fi^ i ^ » a w *•<

compatible with the revised Fisher Effect and/or the Relative Purchasing Power Parity
mechanism.
When tj = tf > 0 and TT > % = 0 equation (2.19') reduces to the following
inequality:
^dtd > 0. (2.19")
The term given in (2.19") represents the after-tax cost differential for domestic versus
foreign currency borrowing by a domestic firm. In other words, the after-tax cost of
domestic borrowing exceeds its foreign counterpart by the term given in (2.19"). This
result is consistent with that derived by Lee and Zechner shown in equation (2.13). As in
Lee and Zechner's analysis, a domestic firm benefits from issuing foreign currency debt
because foreign investors do not require compensation for exchange rate gains or losses.
Accordingly, the firm derives the full benefit of the exchange loss tax shield given in
(2.19").
When Tij = Tif = 0 and t tf equation (2.19') reduces to:
.«' 1- ( 1 - 0 ) > 0
< (2.19'")
From (2.19'"), it is clear that when t > tf the after-tax cost of domestic borrowing by a
domestic firm exceeds the after-tax domestic cost of foreign currency borrowing. Again,
this result is consistent with that derived by Lee and Zechner.
Thus far, the analyses explored have resulted in an opposite conclusion regarding
the use of foreign currency debt with or without the presence of taxes. Specifically, de
Faro and Jucker, and Senbet, would argue that (ignoring taxes) there is no gain from
issuing foreign currency debt assuming that Interest Rate Parity and/or Relative
purchasing Power Parity hold. Further, if IRP and/or RPPP did not hold, then it could be
20

beneficial to borrow in a weakening foreign currency. Contrary to this result, Lee and
Zechner (and BenZion and Weinblatt) would argue that a firm should borrow in a
strengthening foreign currency in the presence of taxes. This result is obtained e\ en
when IRP and RPPP are assumed to hold. In addhion to the above analv ses. the issue
conceming the possible incremental affect of foreign versus domestic currency borrowing
on firm value is examined by Hodder and Senbet.
Hodder and Senbet re-examine the scenarios discussed by Lee and Zechner, and
they conclude that an intemational equilibrium that renders capital stmcture irrelevant
will prevail in the presence of intemational tax arbitrage. Hodder and Senbet first
examine the case where TT = Tif = 0 and t ^ tf. Specifically, they argue that when t > t,
the solution implied by Lee and Zechner is for domestic firms to be entirelv foreign
levered. However, this solution ignores the ability of firms to engage in a tax arbitrage.
The argument put forth by Hodder and Senbet supposes a domestic based
multinational that owns a foreign levered subsidiary. In this setting, it would be to the
domestic parents" advantage to issue domestic debt and give the foreign subsidiary an
equity infusion used to repay its debt, which results in a firm-wide tax savings due to the
higher domestic tax shield. Alternatively, a foreign parent that owns a domestic
subsidiary may engage in a similar capital restmcturing so as to realign its debt stmcture
into the country that offers a higher tax shield. These types of tax shield realignments
would result in an intemational equilibrium rendering foreign leverage irrelevant for ev en
non-multinational domestic firms.
The capital realignment process described by Hodder and Senbet is supported by
Madura and Fosberg [1990]. Madura and Fosberg examine the effect of differing
national tax rates on the net present v alue of foreign investments and conclude that the
firm should borrow in the country that offers the highest tax shield adv antage. How ev er.
Liu and Hsueh [1993] point out that previous conclusions regarding the effect of taxes on
the currency of denomination decision for multinationals ignore the impact of foreign tax
credits (FTCs) for repatriated foreign earnings. They argue that when a domestic parent
has full utilization of FTCs or is able to use excess FTCs to offset other foreign source
21 ^

income (as long as the domestic tax rate is greater than zero) foreign financing ah\avs
ensures a higher expected net present value. Apparently, the issue conceming
multinational tax shield realignments that render foreign leverage irrelevant for domestic
non-multinationals is an empirical issue, which may be discemed by examining the
incremental effect of foreign versus domestic debt announcements on firm value.
Hodder and Senbet move on to re-examine the case where t = tf and TTJ > Tif = 0.
Here, the analysis focuses on whether the IFE holds for both equity and debt retums
simultaneously. As before, they assume real retums on equity are equal across countries
and define the nominal equity retum relationship according to the IFE as:
r, = r,f(l +7rd) + 7rd. (2.20)
Next, they consider whether an intemational analog of the "Darby Effect" dismpts
the IFE for interest rates on debt. They begin by examining the after-tax receipts to a
marginal investor in the foreign country. The after-tax receipts from a foreign and
domestic currency loan are defined as. respectively:
ij(l-tf), and (2.21)
lilA 1 0-/) (2.22)
Equating (2.21) and (2.22) yields:
if(l-tf) = (1 + ^ . )
(1-0 (2.23)
11

Hodder and Senbet argue that when we allow for progressive income taxes on debt
retums and do not restrict investors to lending only in their home currency, equation
(2.23) may be re-written as:
i, =if{l + 7Cj) + 7r,. (2.23')
The resuh derived in (2.23') stems from the assumption that the (1 - tf) term on either side
of equation (2.23) simply cancel each other out. Thus, they conclude that the IFE
relationship holds for both equity and debt retums simultaneously, even with the
introduction of taxes. This conclusion is obviously in direct contrast to the result derived
following Lee and Zechner, and BenZion and Weinblatt.
Hodder and Senbet do point out that even when IFE holds in both markets, the
existence of taxes leads to a difference in what they term the "effective real tax rate" for
each country. They define the nominal tax shield for a domestic firm borrowing in the
domestic currency as t^ij, or in real terms as X^\J{\ + n^). Further, the real interest rate on
domestic debt is equal to (i - n^l{\ + TT ). Thus they derive an effective real tax rate
(7^^) for domestic borrowing by a domestic firm by equating the following:
^d
( :
V l + TT^
tdh
l + TT, (2.24)
Hence,
T'^ =t ^d 'd
\K,-^dJ (2.25)
Similarly, the effective real tax rate for foreign borrowing bv a domestic firm is
shown to equal the expression given in equation (2.25). Since 7if = 0, the effectiv e real
23

tax rate in the foreign country for local or domestic currency borrowing equals tf. Hence,
the supply side conditions for domestic firms and foreign firms issuing debt in either
currency is expressed as. respectively:
h = l-Tf , and (2.26)
h = ef
\-t (2.27)
Obviously, (when TIJ > 0 and t = tf) equations (2.26) and (2.27) cannot hold
simultaneously. Hodder and Senbet argue that the existence of equal nominal tax rates
across countries combined with the introduction of differential inflation rates between
countries does not dismpt the IFE. Instead, this setting results in a difference between the
effective real tax rates, which reduces to the no inflation different tax rate scenario, except
that the difference in tax rates is in real terms rather than nominal. Accordingly, a similar
type of tax shield realignment renders foreign leverage decisions irrelevant for non-
multinational domestic firms. Again, this is an empirical issue.
Summarv and Motivation for Additional Research
The literature reviewed in this chapter has focused on the theoretical implications
of introducing taxes into an intemational equilibrium setting with and without the
existence of domestic inflation. The arguments begin in a no tax regime following
deFaro and Jucker, where the prescription is to borrow in the weakening currency in order
to gain a possible cost advantage. Next. Senbet invokes Interest Rate and Relative
Purchasing Power Parity, and concludes that the v alue of a purely domesfic firm will be
unaffected by the use of foreign leverage in its capital stmcture assuming taxes are
ignored. The introduction of taxes by Lee and Zechner. and BenZion and Weinblatt.
leads to the following conclusions: (1) ignoring the impact of exchange rate changes
24

(i.e.. 71 = %= 0), domestic firms can benefit from the issuance of foreign currencv debt
when the domestic tax rate exceeds the foreign tax rate; and (2) assuming national tax
rates are equal, domestic firms can benefit from the issuance of foreign currencv debt
when the domestic inflation rate exceeds the foreign inflation rate (i.e.. TT > Ttf = 0).
The arguments developed by these latter two papers is contradicted in the work bv
Hodder and Senbet. Here h is argued that the presence of intemational tax arbitrage bv
multinational firms renders foreign currency borrowing decisions irrelevant for non-
multinational domestic firms. This tax shield realignment process is supported bv
Madura and Fosberg in that firms should borrow in the country that offers the highest tax
shield advantage in order to maximize foreign projects' net present values. However. Liu
and Hsueh point out that these conclusions ignore the foreign tax credit provisions. Once
these provisions are recognized, the firm should always borrow in the foreign currency in
order to maximize foreign projects' net present values.
The need for additional research stems from three areas of concem that are not
adequately addressed in the existing literature. First, none of the arguments put forth thus
far have attempted to analyze the situation where both positive differential national
inflation rates and differential national tax rates exist simultaneously. Do the conclusions
drawn in each of the restricted settings examined thus far extend into a more generalized
setting where all variables are considered simultaneously? This issue is further explored
in the following chapter. Second, the cmx of the existing arguments centers on how the
introduction of taxes will alter within country retum relationships and/or how taxes will
alter traditional intemational parity conditions. In general, it is assumed that taxes affect
the interest rate relationships w ithin each country, but do not alter the traditional Relativ e
Purchasing Power Parity mechanism. Following these conditions, two primary
conclusions are drawn. The simultaneous existence of RPPP, IRP and the Modified
Fisher Effect is found to be inconsistent. This result leads Lee and Zechner, and BenZion
and Weinblatt, to conclude that domestic firm value may be enhanced bv the use of
foreign currency debt. Second, the simultaneous existence of RPPP, IRP and the
Modified Fisher Effect is found to be consistent. From this, Hodder and Senbet argue
25

that domestic firms will be indifferent between the use of foreign currency debt and
domestic currency debt in the presence of intemational tax arbitrage opportunities.
The next chapter of this dissertation re-examines how the introduction of taxes
affects national interest rates and traditional intemational parity conditions. An
intemational equilibrium is derived assuming national interest rates are defined according
to Darby. This revised equilibrium condition is termed the Intemational Darby Effect
(IDE). It is argued that under the IDE setting the tax shield advantage from foreign
exchange gains for domestic firms vanishes. This result is derived by recognizing that
differential inflation rates as well as nominal interest rates are grossed-up for taxes. The
conclusions drawn from this setting support the view that the traditional RPPP is
inconsistent with the Modified Fisher Effect as defined by Darby, which is in contrast to
the argument put forth by Hodder and Senbet.
The final area of concem regards the fact that the existing literature has examined
the issues of concem at the theoretical level, but not in an empirical setting. Further, the
existence of competing theories clearly sets the stage for an empirical investigation.
Accordingly, the combination of competing theories and the lack of an empirical analysis
provide ample motivation for further research in this area.
This chapter has provided a review of the existing literature as it relates to the
impact of taxes on traditional intemational equilibrium settings. Further, it has
established a need for more investigation into this issue in the form of a theoretical as
well as an empirical analysis. The following chapter re-examines the theoretical
underpinnings that are cmcial to the analysis at hand. Chapter IV develops the empirical
methodology to be employed in this study, examines the relevant concems involved with
empirically tesfing the issue, and provides a brief descripfion of the data to be used.
26

m
CHAPTER 111
THEORETICAL UNDERPINNINGS
Introduction
This chapter begins by extending the analyses reviewed in the prev ious chapter
into a more general setting. Of primary concem is whether the conclusions drawn are
altered by the simultaneous existence of both differential national inflation rates and
differential national tax rates. Specifically, Lee and Zechner conclude that a domestic
firm may enhance its value by issuing foreign currency debt when either the domestic tax
rate exceeds the foreign tax rate in the absence of differential inflation rates, or when the
domestic inflation rate is positive given equal national tax rates. In contrast, Hodder and
Senbet conclude that the presence of intemational tax arbitrage by multinational firms
will render the currency of denomination decision irrelevant for domestic non-
multinational firms under the scenarios explored by Lee and Zechner. Will these results
be materially altered when both differential inflation and tax rates are present in the
analysis?
Based on the concem discussed above, it is shown that once all factors are
incorporated into the analysis the national tax rate differential must be proportional to the
national inflation rate differential for an equilibrium to be achieved. In other words, for
there to be no difference in the real after-tax cost of domestic borrowing relative to
foreign borrowing, the inflation rate differential must be proportionally offset by the tax
rate differential. This result leads to the conclusion that the intemational parity
conditions should be modified such that a stable equilibrium may be achieved.
The counter-intuitive result that tax rate differentials must be proportional to
inflation rate differentials leads to a re-examination of the traditional intemational paritv
conditions in the presence of taxes. It is argued that if national interest rates equilibrate
on a real after-tax basis as defined according to Darbv, then an intemational parity should
also be established on a real after-tax basis rather than the traditional real before-tax
equilibrium setting. The results of this analysis imply that the Modified Fisher Effect
27

according to Darby is inconsistent with the traditional Intemational Fisher Effect. The
inconsistency stems from the fact that national markets are assumed to equilibrate on a
real after-tax basis, while the intemational market is assumed to equilibrate on a real
before-tax basis. Accordingly, a new intemational equilibrium, referred to as the
Intemational Darby Effect, is derived where all markets equilibrate on a real after-tax
basis. The chapter concludes with a summary of the analyses explored, and highlights the
need for an empirical investigation of the issues at hand.
A Generalized Analvsis
The most tractable method to expand the analysis so that all factors may be
incorporated is to follow a simplified version of the analysis by BenZion and Weinblatt.
This approach basically involves comparing the real after-tax retum from a domestic debt
issue to that of a foreign debt issue from the perspective of a domestic investor. Based on
this analysis, inferences may be drawn regarding the relative real after-tax cost of
borrowing by a domestic firm. This analysis will be conducted following the
assumptions made by Lee and Zechner, and BenZion and Weinblatt, except that both
inflation differentials and tax differentials are present in the model.
As explained in the previous chapter. Interest Rate Parity (IRP), Relative
Purchasing Power Parity (RPPP), and the Modified (within country) Fisher Effects are
defined, respectively, as:
^d =^f + (3.1)
= TT.-TT., (3.2)
,^.!^:±^,and ^"(1-0
(3.3)
h = r;'^n,
(1-0 (3.4)
28

Where s, and SQ are the beginning and end-of-period exchange rates; ij and if are the
domestic and foreign before-tax nominal interest rates, respectively. TTJ and 7tf are the
domestic and foreign inflation rates, respectively, rj" and r^' are the domestic and
foreign real after-tax rates, respectively. And, the domestic tax rate is tj. while the
foreign tax rate is tf.
Following an analysis similar to that employed by BenZion and Weinblatt, the
Modified Interest Rate Parity condition in real after-tax terms may be defined as:
id{}-td)-^d = - 0
( l - ' . ) - ' ^ . (3.5)
Under IRP, the difference between these retums should be equal to zero. Substituting rj*
for the term on the left hand side of equation (3.5), and setting the difference equal to zero
yields:
.(" ^i
^0
{l-t,) + ;r,=0 (3.6)
Substituting the definition of if given in equation (3.4) and invoking RPPP (which is
assumed to be unaffected by taxes) gives:
al , _
+ 7ij-;r, ( l - 0 ) + ;r, =0
Assuming rj" = r"' = r ' and rearranging terms yields:
( r - + ; r , ) + h{^d-^f) = ^
(3.6')
(3.6")
29

Equations (3.6') and (3.6") represent the real after-tax retum (cost) from domestic debt
minus the exchange adjusted real after-tax retum (cost) from foreign debt, assuming
RPPP holds. In order for equafion (3.6') or (3.6") to equal zero, the following relationship
between the tax and inflation differentials must hold:
( l - r , ) ~ [r^'^^f] (3.7)
Based on the result derived in equation (3.7), it is evident that there must be some
type of relationship between national inflational rate differentials and national tax rate
differentials in order to achieve an equilibrium. Specifically, the intemational debt
market is in equilibrium when there is no difference in the exchange adjusted real after
tax cost of debt as given in equation (3.6"). An equilibrium condition will hold only
when the intemational tax rate relationship is proportionally offset by the intemational
inflation rate relationship. For example, when t = tf, it may be inferred from equation
(3.7) that Tij must equal Tif in equilibrium; or, when TT = 7if, t must equal tf. This result is
counter-intuitive in that national tax and inflation rates should be independent exogenous
variables, even in equilibrium. The conclusions inferred from the results derived in this
section lead to the argument that the intemational equilibrating process needs to be re
examined. The following section provides such an examination. Before the intemational
equilibrating process is re-examined, it may be helpful to further examine the above
analysis, since the altemative hypotheses for the subsequent empirical investigation will
be based on the above results.
From the result derived in equation (3.7), the relationship between domestic firm
value and the use of foreign leverage may be explored for several possible scenarios.
First, the simple scenarios explored in the previous chapter where either TT = Tif = 0 and tj
^ tf, or Tij 9 TTf = 0 and t = tf, will be re-affirmed. For equation (3.6") to be positive. which
30
- - % * . : •

implies that domestic borrowing is more costly than foreign borrowing in exchange
adjusted real after-tax terms, the following inequality must be true:
(3.8)
Altematively, for equation (3.6") to be negative, which implies that domestic
borrowing is cheaper than foreign borrowing in after-tax real terms, the following
inequality must be tme:
i^-'^) ^ I/"{''-'-"f) ( ' - ' / ) {'•"^-f)
(3.9)
Thus (as before) if n^ = Ttf, then it must be tme that (1-0) = 1 (which implies
that tj = tf) for there to be no advantage from the use of foreign debt. Clearlv. if TI = 7if =
0 and tj > tf (a situation explored by Lee and Zechner), then the inequality in (3.8) holds
and foreign borrowing will enhance firm value. Further, if t = tf and TI > 7tf = 0,
inequality (3.8) again holds tme. These results re-affirm the conclusions reached bv Lee
and Zechner.
The other scenarios that hav e determinant results are for the situations where t >
tf and Tij > TTf, and where t < tf and TT < % When t > tf and n^ > Uf. inequality (3.8) will
hold and equation (3.6") will be positive. Conversely, when t < tf and TT < Tif, inequality
(3.9) will hold and equation (3.6") will be negative. The situations where t > tf and n^ <
71,, or where t < tf and TI > Tif, are not necessarily determinant; however, the inequalities
given in (3.8) and (3.9) help to set boundary condhions for the effect of foreign leverage
on firm value. For example, if TIJ = .05, Tif = .03 and t = .3. then tf may be derived given
31

r '. Assuming r ' = .02, tf may be solved for as: (1-.3)
= 1 + (.05-.03)
such that tf ( l - r ^ ) " (.02- .03)
must equal .375 in order for the real after-tax costs of domestic and foreign debt to be
equal. For this same example, if tf < .375, equafion (3.6") would be poshive implying
that foreign borrowing would enhance firm value. Altematively, if tf > .375 the opposite
result would hold tme. Further, If TT increase to .07, then tf must be approximately equal
to -435. These simple examples demonstrate that in order to attain a real after-tax
equilibrium for the cost of domestic debt relative to the exchange adjusted cost of foreign
debt, there must be some type of relationship between national tax differentials and
national inflation differentials as defined in equation (3.7).
In an attempt to provide a more intuitive understanding of the relationship given
in equation (3.6") several scenarios are graphically depicted below. For all figures it is
assumed that r ' equals 3%. Figures (3.1a) and (3.1b) graph the retum relationship given
in equation (3.6") for a scenario explored by Lee and Zechner. It is assumed that TI = Tif,
td = 34%, and 19% < tf < 49%. Figure (3.1a) assumes that TI = Tif = 0. It is clear that the
relationship agmed by Lee and Zechner is supported by the graph depicted in Figure
(3.1a). However, the relationship depicted in Figure (3.1b) (with TT = 7if = 5%) is
opposite to the result argued by Lee and Zechner. Specifically, with equal negative
inflation differentials foreign borrowing becomes more expensive relative to domestic
borrowing when t > tf. It is clear that Lee and Zechner's analysis failed to account for
possible negative inflation rates.
32

r^rmsfs
(a)7id = 7Cf=0%
Grai* of Equation (3.6") with t j = 34% and 7td = JCf=0
0.60% T
15.00%
-1.00%
(b)7td = 7Cf=-5%
Graph of Equation (3.6") with U = 34% and Jtj = «f = - 5 %
15.00%
Figure 3.1 Exchange Adjusted After-Tax Retum Differential
33
^

Figures (3.2a) through (3.2f) graphically depict equafion (3.6") for several other
possible scenarios. For each figure td is fixed at 34% and n^ is fixed; however, the level
of 7id changes across graphs from 0% to 60%. Further, tf varies from 19% to 49% for each
graph, and Tif varies about Tid in order to maintain a constant inflation differential across
graphs. It is quite evident that the retum relationship given in equation (3.6") becomes
more complex once all variables are mcorporated mto the model. In addition, the
difference in borrowing costs is dependent not only on the rate differentials, but also the
level of the rates. For example, for a tax differential of 9% [(td = 34%) minus (tf = 25%)]
and an inflation differential of 9% the difference in borrowing costs varies throughout the
graphs.
(a) TCd = 0% and -15% < Tif < 15%
Graph of Equation (3.6") with tj = 34% and JCd = 0%
Inflation Differential
• 15.00% -15.00% -9.00% 3.00% 3.00%
Tax Differential
ED-12.00%-10.00% • -4.00%~2.00% • 4.00%-6.00%
H-10.00%-8.00% D-2.00%-0.00% • 6.00%-8.00%
D -8.00%~6.00% • 0.00%-2.00% D8.00%-10.00%
n-6.00%-4,00% D2.00yo-4.00%
Figure 3.2 Generalized Exchange Adjusted After-Tax Retum Differential
34

(b) Tid = 2% and -13% < 7Cf < 17%
Graph of Equation (3.6") with tj = 34% and It J = 2%
Inflation Differential
-15.00% -9.00% 3.00% 3.00%
Tax Differential
13-12.00%-10.00% • -4.00%-2.00% • 4.00%-6.00%
H-10.00%-8.00% n-2.00%-0.00% • 6.00%-8.00%
n-8.00%"6.00% • 0.00%-2.00% D 8.00%-10.00%
n-6 .00%-4 .00% n2.00%-4.00%
D i f f e r e n t i a 1
(c) TCd = 5% and -10% < TCf < 20%
Graph of Equation (3.6") with U = 34% and Ttd = 5%
15.00% 9.00%
3.00%
Inflation Differential '
-9.00%
9.00% ^' .15.00% 'f-^^ .3.00% 3 00% -15.00% -9 00/ i Tax Differential
-12.00% 00%
D i f f e r e 0 t i a 1
Q-12.00%-10.00% B- lO.00%-8 .00% n-8.00%"6.00% a -6 .0 0%-4 .00% • - 4 . 0 0 % - 2 . 0 0 %
• -2.00%-0.00% •0 .00%-2 .00% a2.00%-4.00% •4 .00%-6 .00% •6 .00%-8 .00%
Figure 3.2 Continued
35

m
(d) jtd = 1 5 % and 0% < jtf < 30%
Graph of Equation (3.6") with U = 34% and ltd = 15%
Inflation Differential
10.00%
5.00%
0.00%
5.00%
-10.00%
D i f
R f e e t r u e r n n t
i a I
15.00%
-15.00% ~ : ^ c - - r - - — • ^^^^^^ 3.00O/. 9.00% 15.00%
-15.00% -9 00% Tax DifTercntial
E3-15.00%-10.00% a-10.00%-5.00% n-5.00%-0.00% nO.00%-5.00% •5.00%-10.00%
(e) TCd = 30% and 15% < TCf < 45%
Graph of Equation (3.6") with td = 34% and Xd = 30%
Inflation Differential
O-20.00%-! 5.00%
• -5.00%-0.00%
-15.00% -15.00%
on„,/ -3.00% 3.00% -9.00% j ^ x DifferenHal
l-15.00%-10.00<'o
l0.00%-5.00%
D-10.00%-5.00%
a5.00%-10.00%
Figure 3.2 Continued
36

m
(t) TCd = 60% and 4 5 % < TCf < 75%
Graph of Equation (3.6") with X^ = 34%
and ltd = 60%
15.00%
Inflation E)ifferential
-15.00% -15.00% -900*/-
-3.00% 3.00%
30.00%
9.00% 15.00%
Tax Ehfferential
El -30.00%-25.00% n-15.00%~10.00% • 0.00%-5.00%
H-25.00%-20.00% • -10.00%-5.00% • 5.00%-10.00%
n-20.0O%~15.00% • -5.00%-0.00% • 10.00%-] 5.00%
Figure 3.2 Continued
The conclusions inferred from the above analysis, which follows from the
assumptions by Lee and Zechner, and BenZion and Weinblatt, are counter-intuitive and
make very little economic sense. Specifically, there is no intuitive economic rationale for
why national tax rate differentials should be related to national inflation rate differentials
in order to achieve equilibrium. However, this result may be the reached via arbitrage
arguments. In any event, one would presume that tax rates as well as inflation rates
should be independent exogenous variables in defining equilibrium conditions. The
primary shortcoming of the above analysis is that it simultaneously assumes national
interest rates equilibrate on a real after-tax basis as per Darby, while an intemational
parity is achieved by equilibrating rates on a real before-tax basis. It is argued here that
these simultaneous assumptions lead to an inherent inconsistency that forces a
relationship between national tax rate and national inflation rate differentials. It is argued
37

that the intemational equilibrium setting should be re-evaluated so that a condition may
be derived that does not depend on a relationship such as the one in the above analv sis.
Intemational Equilibrium Redefined
The issue conceming whether foreign versus domestic currency debt financing
may enhance firm value centers on how the introduction of taxes affects the traditional
intemational equilibrium setting. To date, the literature has attempted to introduce taxes
via the so called Intemational Fisher Effect. It is argued in this section that once taxes are
introduced Fisher [1930] should be redefined according to the theory put forth by Darby
within each country, as well as across countries.^ The major shortcoming of the theories
discussed thus far is that interest rates within each country are redefined according to
Darby, while the intemational market is assumed to still equilibrate according to the
Intemational Fisher Effect. The following analysis highlights the inconsistency of
introducing taxes via the Intemational Fisher Effect, and offers an altemative
intemational equilibrium setting.
The Intemational Fisher Effect may be derived by first assuming that interest rates
within each country are defined according to Fisher such that:^
id = f'd' + ^d . and (3.10)
h = ''f' + ^ / (3.11)
Where all variables are defined as before. Further, rj" and r^/ represent the domestic
and foreign before-tax real rates of retum, respectively. The second necessary
assumption in deriving the IFE is that the before-tax real rates of retum are equal across
countries, which implies that the following equality should hold tme:
Id - T^d - If - TTf. (3.12)
38

From this assumption, it may be shown that the difference in before-tax nominal rates
across countries is equal to:
Id - If - TTj - TCf, (3.13)
or that the nominal before-tax retum relationship should be:
1H = if + 71. - Tif. (3.14)
The result shown in equation (3.14) is analogous to what has been termed the
Intemational Fisher Effect in the literature reviewed in the previous chapter. There is.
however, one distinguishing characteristic between the IFE given in equation (3.14) and
what has been termed the IFE in earlier work. Specifically, the condition derived in
equation (3.14) did not explicitly involve a combination of IRP. RPPP and the within
country Fisher Effects. Instead, (3.14) is derived from two simple assumptions: (1)
national interest rates are defined as per Fisher; and (2) before-tax real rates of retum are
equal across countries. Hence, it is not explicitly necessary that IRP and/or RPPP hold.
However, the Intemational Fisher Effect is consistent with Interest Rate Paritv. assuming
Relative Purchasing Power Parity holds.
The derivation of the IFE as given above allows for a closer examination of how
each country's national equilibrium (as defined by Darby) relates to traditional
intemational exchange rate parity conditions. As will become clear, once taxes are
introduced into the analysis, the across country before-tax nominal interest rate
relationship is no longer consistent with the traditional intemational exchange rate parity
conditions.
Following Darby, the domestic and foreign before-tax nominal interest rates mav
be defined, respectively, as:
39

,-^.^^:±^,and 1-r
/ / = r;+;r.
\-t f
(3.15)
(3.16)
Where rf and r^' represent the domestic and foreign after-tax real rates, respectively.
Following the IFE derivation above, a similar before-tax nominal retum relationship
across countries may be derived as follows. Assuming that the after-tax real rates of
retum are equal across countries, the following equality should hold tme:
id{^-fd)-^d=if{^-ff)-^f (3.17)
Adding TT to both sides of (3.17) and dividing through by (1 - t ) gives the before-tax
nominal retum relationship as:
h =h I, -7 r + —. r-O-O (1-0)
(3.18)
Clearly, the result derived in equation (3.18) is not consistent with the traditional
Relative Purchasing Power Parity mechanism. From this result, it is argued that the
analyses reviewed in the previous chapter contain an inherent inconsistency due to a
failure to recognize that both the interest rate relationships and the exchange rate
relationship should be adjusted for taxes in order to attain a stable equilibrium
relationship. Further, the relationship between national tax rates and national inflation
rates implied by the earlier analyses is no longer necessary.
As is evident from equation (3.18), regardless of the relationship between tax rates
and inflation rates, a stable equilibrium that renders the debt denomination decision
irrelevant may be achieved. This is tme because the nominal retum relationship given in
40

equation (3.18) incorporates both factors in an independent exogenous fashion. Thus, if
the nominal before-tax relationship is as defined by equation (3.18), then there is no cost
advantage to foreign debt on an exchange adjusted real after-tax basis.
One further insight is possible from the analysis of this section. It was argued bv
Hodder and Senbet that the IFE held simultaneously for both equity and debt retums in
the presence of taxes. This conclusion was reached by assuming that the after-tax
nominal retum relationship for debt retums reduced to a form similar to that given in
equation (3.14) above. However (in the presence of taxes), the appropriate before-tax
nominal retum relationship should be as defined in equafion (3.18). Equation (3.18) on
an after-tax basis reduces to:
Jd{^-fd) = if{^-ff) + ^d-^f (3.19)
Based on the result given in equation (3.19), it is argued that the results obtained
by Hodder and Senbet also failed to recognize the tme impact of taxes. Specificallv.
although it may be algebraically correct to simply cancel the term (1 -tf) from both sides of
equation (2.23). as Hodder and Senbet did, this cancellation may not be theoretically
correct. This cancellation is theoretically inappropriate because it ignores the impact of
taxes in deriving the before-tax nominal return relationship as given in equation (3.18).
Although no attempt has been made to specifically relate the Intemational Darby
Effect to the exchange rate as has been done for the Intemational Fisher Effect, equation
(3.19) may provide some insight. The traditional RPPP condition implies that the
exchange rate should be approximatelv equal to the inflation differential between
countries. This result is shown to be consistent with the IFE, which describes the
relationship for the before-tax nominal interest rates across countries. From equation
(3.19), it may be discemed that the inflation differentials should equal the after-tax
nominal retum relationship across countries. Thus, the modification implied by the IDE
41

.< - 'a * * i»^
is that Relative Purchasing Power Parity should be referred to as a nominal after-tax
relationship rather than a nominal before-tax relationship.
Summarv
Previous work examining the relationship between firm value and the currencv of
denomination for debt issues resulted in competing conclusions. Specifically, Lee and
Zechner conclude that a firm may enhance its value by issuing foreign denominated debt
in two instances. Firm value will be enhanced via a foreign currency debt issue when the
domestic tax rate (t ) exceeds the foreign tax rate (tf) in the absences of differential
national inflation rates. Second, firm value will be enhanced via a foreign currency debt
issue in the presence of equal national tax rates when the domestic inflation rate (Ttj)
exceeds the foreign inflation rate (Tif), which was assumed to be zero. These results are
supported by the work of BenZion and Weinblatt, where it is shown that the real after-tax
cost of domestic debt exceeded its foreign counterpart under the scenarios explored bv
Lee and Zechner.
In contrast to the above results, Hodder and Senbet argue that the process of
intemational tax arbitrage by multinational firms will render the currency of
denomination decision irrelevant for domestic non-multinational firms. This result was
obtained for the situation where firms were faced with differential national tax rates in the
absence of differential national inflation rates. Further, Hodder and Senbet argue that the
Intemational Fisher Effect is not dismpted when inflation rates differ in the presence of
equal tax rates. Accordingly, they argue that this scenario reduces to the different tax rate
no inflation setting where intemational tax arbitrage once again renders the currency of
denomination decision irrelevant.
The analyses developed in this chapter help to demonstrate that the conclusions
based on the simplified scenarios are not as obvious once other possible situations are
explored, and that a stable equilibrium may be achiev ed once all markets equilibrate on
an after-tax real basis. Specifically, once other situations such as a lower domestic tax
rate coupled with a higher foreign inflation rate are explored, the effect of foreign
42

currency debt on firm value is no longer necessarily determinant. Additionally, when
negative inflation rates enter into the analysis, the results may change. The primarv area
of concem, which became evident from this analysis, relates to the observation that
earlier research relied on an implicit assumption that national tax rate differentials must
be related to national inflation rate differentials, such that a real after-tax equilibrium mav
be achieved. This implich assumption was shown to be the result of modeling that
incorporated taxes in the national markets via Darby, while simultaneouslv' assuming that
the IFE held. In other words, earlier work attempted to force an equilibrium setting in
which national markets equilibrated on a real after-tax basis, while the intemational
market equilibrated on a real before-tax basis.
The realization of the inherent inconsistency discussed above led to a re
examination of the intemational equilibrating process. From this, a new intemational
equilibrium setting was derived and termed the Intemational Darby Effect (IDE). The
IDE setting eliminates the inconsistency found in earlier work bv assuming that all
markets, both national and intemational. equilibrate on a real after-tax basis. Further, in
this setting the currency of denomination decision is irrelevant because by definition real
after-tax exchange adjusted retums are equal.
In summary, it is argued that an empirical investigation is warranted based on the
contradictory conclusions of earlier research and the new irrelevancy proposition set forth
in this chapter. The primary issue of concem regards how domestic firm value may be
affected by the use of foreign versus domestic currency debt. In this v ein. the following
chapter describes an event study methodologv' that will be employed in an attempt to
differentiate among the arguments put forth to this point.
43

.<---«»*;
CHAPTER IV
EMPIRICAL DESIGN AND DATA DESCRIPTION
Introduction
This chapter begins with a description of the methodology to be employed in the
empirical analysis of the issues explored. The primary theoretical argument of concem
centers on how firm value will change with respect to a change in foreign versus
domestic debt. Specifically, is the value - debt relationship significantly different for a
foreign versus a domestic currency debt offer? To this end, it is deemed appropriate to
employ an event study methodology that measures a firm's abnormal stock price reaction
as it relates to the announcement of a debt offer. This type of methodology will provide
the necessary information to compare stock price reactions for foreign debt offers relativ e
to domestic debt offers.
Next, the hypotheses implied by the research previously discussed will be
developed. In this section, the null hypothesis for each scenario will be that there is no
significant differential affect on stock price for foreign debt offers relative to domestic
debt offers. This debt denomination irrelevancy proposition is based on the Intemational
Darby Effect (IDE) developed in Chapter III. In the development of the IDE it was
assumed that the real after-tax costs of debt were equal across countries. Based on this
assumption, there should be no observable difference in stock price reactions for foreign
debt offers relative to domestic debt offers. Several altemative hypotheses will be
constmcted based on the specific scenario in question. For example, as argued by Lee
and Zechner, there should be a positive relationship between firm value and foreign debt
offers under certain circumstances. Specifically, according to Lee and Zechner domestic
firm value may be enhanced if the firm issues foreign currency debt when either the
domestic tax rate (t ) exceeds the foreign tax rate (tf) given no inflation difference, or
when the domestic inflation rate (TT ) exceeds the foreign inflation rate (TT,) given no tax
rate difference. This potential value enhancement, as explained in earlier chapters, is
44

m/mitmm^i^tmmm
derived from the added tax shield benefit when foreign debt is issued in a strengthening
currency.
A brief description of the data to be used in this study is combined with the
discussions regarding the methodological design and the development of the testable
hypotheses. In addition, several areas of concem related to other factors that may lead to
an observable difference between debt offers are addressed. For instance, previous
research by Kidwell, Marr and Thompson [1985, 1986] argues that there may be an
advantage to borrowing in the Eurobond market relative to the U.S. domestic market.
This advantage is related to a belief by U.S. firms that they can borrow at a lower interest
cost overseas. Kidwell, Marr and Thompson point out that lower interest cost may stem
from several areas. First, since Eurobonds are bearer bonds, individual holders of these
bonds are not identified to the taxing authorities. Therefore, it is possible to avoid paying
taxes on these bonds, and hence, one would require a lower rate of retum relative to a
bond for which taxable income is identifiable. Second, movements in exchange rates
may lead to a lower cost of funds overseas. This is so because holders of Eurobonds may
not be investing in their native currency and may realize capital appreciation related to
strengthening in the currency of the Eurobond. In a similar vein, another area of concem
deals with the Relative Purchasing Power Parity assumption invoked in the arguments
discussed in earlier chapters. Specifically, should debt offer announcements be
categorized according to inflation differentials, or according to expected currency
movements as reflected in the exchange rate markets? Finally, the chapter concludes
with a summary of the issues discussed.
Event Methodologv Test Statistic
Although other methodologies might possibly be employed to examine the
relationship between firm value and foreign versus domestic debt issues, it is argued that
an event study methodology will be most appropriate. This argument is based on the
following observations. First, although it has been demonstrated that the cmcial
underlying factors that may lead to advantages from foreign currency borrowing stem
45

from how national and intemational markets equilibrate, it is unclear whether a foreign
currency borrowing advantage created by a disequilibrium condition will translate into an
increase in firm value. In other words, a test that supports the argument that foreign debt
is cheaper, on average, than domestic debt does not imply that investors recognize this
finding in terms of higher stock prices (or increased firm value). Stockholders may not
react favorably, or less adversely, because they may view debt the same regardless of its
currency denomination or its associated cost.
Second, contrary to the inability to infer conclusions regarding firm value via a
market integration analysis, it may be possible to infer conclusions in the other direction.
Specifically, if it is found that there is no differential effect on firm value from foreign
versus domestic currency debt offers, one possible explanation is that intemational debt
markets are integrated and that foreign currency debt serves as a substitute for domestic
debt. The final, and perhaps most compelling, motivation for an event study
methodology stems from the arguments put forth by the theories reviewed. The primary
theoretical argument of concem regards how firm value is affected by (or related to)
foreign versus domestic currency debt financing. Hence, it is argued that the most
appropriate method to examine the theories is one that is directly related to the reaction of
firm value (stock price) for a given debt offer.
The basic methodology to be employed follows the event study methodology
examined by Brown and Wamer [1980, 1985]. Following Brown and Wamer [1985], the
market model is used to measure the abnormal stock retums around the announcement of
the financing events. For the analysis at hand, there will be two announcements. The
first announcement is that of a foreign currency debt offer, and the second is the
announcement of a similar type domestic debt offer occurring within a specified period
prior to or following the foreign debt offer aimouncement. The actual announcement is
defined as the date of the first report of the debt offering in either the London Financial
Times or the Wall Street Journal. The market model will be estimated on a dailv basis
for the period that begins 120 trading days before and ending 120 days following the
event (announcement date). Additionally, the estimation procedure will exclude the 41
46

days centered around the event date so that the abnormal retums are not captured in the
market model. Thus, a Beta estimate is obtained using a 200-day period excluding the
time frame centered around the event window.
Following Brown and Wamer, the abnormal stock retum or prediction error (PE)
for firm j over day t is defined as:
PE,=R,-{a^^^fi^R„„). (4.1)
Where Rj, is the rate of retum for security j over period t; R , is the rate of retum on both
the CRSP equal and value weighted market index over period t. And, a j and /3^ are the
ordinary least squares estimates of firm j's market model parameters. Since there are two
different announcements, equation (4.1) will be used for each. Accordingly, DPEj, will be
used to denote the prediction error related to a domestic debt offer for firm j over period t,
where as FPEj, will be used to denote the prediction error related to a foreign currency
debt offer for firm i ^ j over period t.
The development of a test statistic is still an issue of concem in the literature.
Specifically, James [1987], and Brown and Wamer employ a standardized average
prediction error, which was explored by Brown and Wamer. However, the computation
of a Z-statistic based on this method and its related asymptotic properties depend on two
assumptions. The first assumption is that the individual prediction errors are cross-
sectionally independent. This is followed by the assumption that the average
standardized prediction error equals zero. This second assumption assures that the Z-
statistic is asymptotically distributed unit normal. As an altemative to this parametric
statistic, Corrado [1989] evaluates a new non-parametric rank test that may be employed
for abnormal security-price performance in event studies. The primary advantages of this
new procedure are that it is better specified under the null hypothesis, more powerful
under the altemative hypothesis and does not require symmetry in cross-sectional excess
retums distributions for correct specification. Corrado and Zivney [1992] argue that this
47

MHk
non-parametric rank test dominates both the parametric procedure employed by James
and another non-parametric sign test which they evaluated. In this study, the statistic
used by Brown and Wamer will be employed; however, the non-parametric rank test
statistic may be used if there are significant violations of the parametric assumptions.
Following James and other researchers, the parametric statistic is based on the
calculation of a cumulative two-day announcement period abnormal retum. This statistic
is computed by summing the prediction errors for day "-1" and day "0". Where day "0"
represents the date for which the announcement first appears in either the Financial
Times or the Wall Street Journal. It is argued that this procedure incorporates the
possibility that the announcement may have occurred in the middle of a trading day and
thus reported with a one-day lag. Following Brown and Wamer, the prediction error test
statistic for any event day is defined as:
P E t / S(PEt)
(4.2)
where
1 ^ ^^'=^F^''' (4.3)
t=-21 t=120/-
^ ^ ^ =l=Lr -'') s.r -'')J/ '' (4.4)
PE = 1 / t=-21 t=120 V
- ^ Z PEt+ Z PEt . 200Vt=-120 t=21 ^
(4.5)
And, the two-day test statistic is defined as:
48
^ . 1

MMMiM
t = - l (4.6)
is^(PE.)^
The test statistic is considered unit normal in the absence of abnormal performance. The
null hypothesis to be tested is that the mean cumulative two-day prediction error is equal
to zero, and thus concems the average affect of an event on retums to the shareholders.
The test statistic (equation 4.6) is the ratio of the cumulative two-day mean prediction
error to its estimated standard deviation; the standard deviation is estimated from the
time-series of mean excess retums.
Data Description and Empirical Design
The primary step in the analysis is to identify domestic firms that have offered
foreign currency debt. This initial sample will be from data provided by the Securities
Data Company, which identified 278 foreign debt offers by domestic based firms (or their
domestic subsidiaries) for the period January 1983 through June 1993. Once firms for
which a foreign currency debt offer exists are identified, the next step will be to identify
similar type domestic currency debt offers that occur within a specified time period
relative to the foreign debt offer announcement. Ideally, the foreign and domestic debt
offers will occur on the same day. As will become evident in the subsequent discussion,
it is necessary to identify domestic debt offers that occur under the same tax and inflation
scenario as the foreign debt offer. The domestic debt offers will be identified from data
provided by the Securities and Exchange Commission (SEC) filings tape.
In the collection of the debt offer data, several areas of concem regarding the
characteristics of the debt offer may lead to various stock price reactions. For example,
James groups debt offers by stated (or intended) purpose, type of borrowing (public
versus private) and maturity in an attempt to isolate the impact of the variable of concem.
Although there are various arguments put forth by Merton (1974), Ho and Singer (1982)
and Easterbrook (1984) regarding the possible affect of maturity on security retums,
49

James finds little or no evidence to support such arguments. Specifically, James' results
reveal no statistically significant relation between stock price reaction and the maturity of
the offering. However, if large differences in maturity exist, this variable will be taken
into consideration. In the analyses to follow, the primary concem focuses on controlling
for the inflation/tax regime for a given "pair" of debt offers. Additionally, an effort will
be made to identify debt offers that are as similar as possible except for their currenc) of
denomination. This particular issue will be explored further in the following chapter.
Characteristics of the debt offers, such as intended purpose, exchange on which it trades
(if any), convertibility, and maturity will come from either Moody's Bond Survey,
Standard and Poor's Bond Record or Disclosure.
The first phase of the analysis will be to compute the abnormal excess retums for
each debt offer. The stock retum data will come from the Center for Research on
Security Prices (CRSP) daily retum file, which will also be used in the market model
retum calculation mentioned earlier. Next, the data will be grouped into domestic and
foreign debt offers, respectively, and the test statistics that correspond to each group will
be calculated. This phase will allow for an initial test as to whether there is a difference
(on average) in abnormal retums for foreign versus domestic currency debt offers.
The next phase of the analysis will center on testing the specific hypotheses
implied by the theoretical arguments discussed thus far. In all cases, the null hypothesis
(HQ) is no expected differential effect on firm value (stock price) from the use of foreign
versus domestic debt (i.e. ^ dV
). In order to examine the altemative hypotheses it dB dBf
will be necessary to further group the data into categories according to the relationship of
the factors involved. Specifically, Lee and Zechner argue that the value of a domestic
firm may be enhanced by the use of foreign currency leverage under two specific
scenarios. In order to test these altemative hypotheses, it will be necessary to identify
foreign debt offers that were made under the scenarios described by Lee and Zechner.
The proposed scenario groupings are given in Table 4.1.
50
•K.aessg:s--^-:

Ill jiUJi, m
Table 4.1
Data Grouping for Hypotheses Testing
TCd = TCf
TCd < TCf
T C d > 7 C f
td = tf
H,
H4
H7
td<tf
H2
H5
Hs
t d > t f
H3
H6
H,
The groupings given in Table 4.1 provide a means by which the various
altemative hypotheses may be tested. Of primary concem are the scenarios described and
examined by Lee and Zechner, and Hodder and Senbet. Specifically, Lee and Zechner
argue that domestic firm value may be enhanced by the use of foreign versus domestic
debt in two specific situations. The scenario where the domestic tax rate (t ) exceeds the
foreign tax rate (tf) assuming no difference in inflation rates across countries relates to the
altemative hypothesis (H3) given in Table 4.1. Hypothesis (H7) in Table 4.1 relates to the
situation where domestic firm value may be enhanced via the use of foreign debt when
the domestic inflafion rate (TC ) exceeds the foreign inflation rate (TCf), given no difference
in tax rates. From these scenarios, the first set of specific tests to be examined is as
follows:
H. dV dV
dB dB f
dV dV ^3- -i;r < ——, for td > tf and TCd = TCf.
oB oB,
dV dV H7: -7:^ < ^; ;^, for td" tf and TCd > TCf.
dB dB f
51
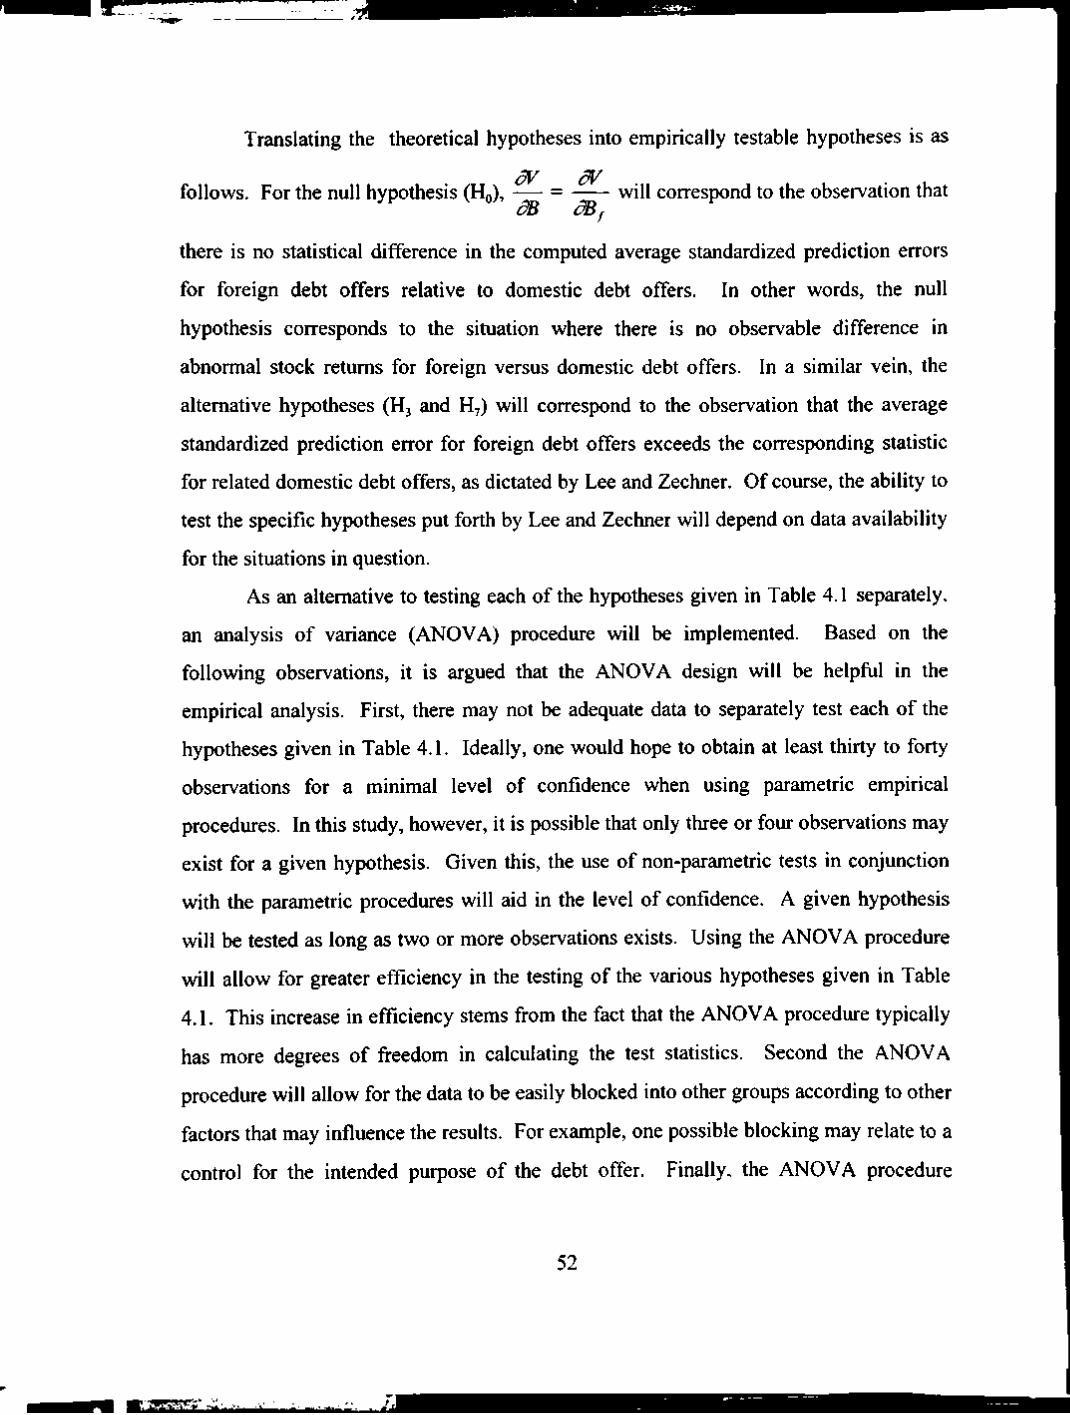
.<;ri***--
Translating the theoretical hypotheses into empirically testable hypotheses is as
follows. For the null hypothesis (HQ), dV dV
dB dB, will correspond to the observation that
there is no statistical difference in the computed average standardized prediction errors
for foreign debt offers relative to domestic debt offers. In other words, the null
hypothesis corresponds to the situation where there is no observable difference in
abnormal stock retums for foreign versus domestic debt offers. In a similar vein, the
alternative hypotheses (H3 and H7) will correspond to the observation that the average
standardized prediction error for foreign debt offers exceeds the corresponding statistic
for related domestic debt offers, as dictated by Lee and Zechner. Of course, the ability to
test the specific hypotheses put forth by Lee and Zechner will depend on data availability
for the situations in question.
As an altemative to testing each of the hypotheses given in Table 4.1 separately,
an analysis of variance (ANOVA) procedure will be implemented. Based on the
following observations, it is argued that the ANOVA design will be helpful in the
empirical analysis. First, there may not be adequate data to separately test each of the
hypotheses given in Table 4.1. Ideally, one would hope to obtain at least thirty to forty
observations for a minimal level of confidence when using parametric empirical
procedures. In this study, however, it is possible that only three or four observations may
exist for a given hypothesis. Given this, the use of non-parametric tests in conjunction
with the parametric procedures will aid in the level of confidence. A given hypothesis
will be tested as long as two or more observations exists. Using the ANOVA procedure
will allow for greater efficiency in the tesfing of the various hypotheses given in Table
4.1. This increase in efficiency stems from the fact that the ANOVA procedure typically
has more degrees of freedom in calculating the test statistics. Second the ANOVA
procedure will allow for the data to be easily blocked into other groups according to other
factors that may influence the results. For example, one possible blocking may relate to a
control for the intended purpose of the debt offer. Finally, the ANOVA procedure
52
. J ^ . J . ; ^ . - -V . . • j ' T-Al^^ ' i i ; . .—^: i . .-• • • ^ . „ : -

provides an easy and efficient means for testing whether a significant difference exists in
prediction errors between foreign and domestic debt offers.
The ANOVA procedure employed consists of a simple one-way .A.XOV.A design
where the treatment variable represents the different combine inflation/tax regimes. For
instances, rather than test each hypothesis independently (and all possible combinations)
the one-vvav .A.NOV.A. allows for a test of a joint hvpothesis regarding all the sample
means simultaneously. The specific hvpothesis to be tested under the ANOVA design is:
H. H, =H, = H, = . . .=H, = 0. and
H, Not all Hj (i = 1, .... 9) are equal.
.A.S was demonstrated in Chapter III, several other implicit results were derived
based on the assumptions invoked in earlier research. Specifically, an implied
equilibrium relationship for tax and inflation differentials was derived and given in
equation (3.7). Recall from Chapter III that equation (3.7) was giv en as:
{i-t,) [r-..,) (4.7)
Equation (4.7) was derived following the work of BenZion and Weinblatt, and
generalizes their result bv including both domestic and foreign inflation and tax rates.
This relationship shows that an equilibrium condition will hold only when the
intemational tax rate relationship is proportionally offset by the intemational inflation
rate relationship. For example, when tj = t . it may be inferred from equation (4.7) that TI
must equal TT, in equilibrium; or. when Tid ^ t- d must equal tf. From this result, a priori
hv potheses may be inferred for sev eral other situations. For example, when tj = tf and TIJ
< 71, equation (4.7) implies that the use of foreign debt will be detrimental to domestic
53

'mv*irji»ii •^M'l 111
firm value. Similarly, the situation where td > tf and TIJ > TI, was shown to be consistent
with the conclusion that firm value may be enhanced bv the use of foreign debt. Finallv.
when td < tf and Tid ^ f equation (4.7) will be negative, implying that domestic firm v alue
will be diminished by the use of foreign currency debt. Accordinglv. the follow ing signs
are hypothesized for H,, H, and H9 given in Table 4.1:
3" rl' ^ H,: -7^ > — ^ . for td = tf and Tid < f-
dB dB f
3' 3' H : — > , for td < tf and TIJ < Tif.
dB dB f
3' dV Ho: — < , for td > tf and Tid ^ r-
dB dB f
There are other possible tests also related to the generalized results derived in the
previous chapter; however, the predicted positive or negative effect will depend on the
specific relationship of the variables in question as given in the boundary conditions of
equations (3.8) and (3.9). Hence, it is not possible to a priori sign these hypotheses
without first categorizing them according to the boundary conditions set forth. Table 4.2
below gives a summary of the specific a priori signs related to the hypotheses given in
Table 4.1.
54

• n i l I I I -.-l:.va*iw
Table 4.2
Hypothesized Signs for the Relationships Given in Table 4.1
Tid = Tif
Tid < Tif
Tid > Tif
td = tf
^ _ dV _ dV
' dB dB,
,, dV dV H4 = — >
dB dB, ,, dV dV H7 = — <
dB dB,
t d < t f
,, dV dV H, = — >
- dB dB, ,^ dV dV H, = — >
dB dB,
H8 = ?
td>t f
H 3 = ^ ^ ' < ^ ' ' ' dB dBf
H6 = ?
,, 3' 3' H9 = — <
dB dB,
One final area of concem relates to the possibility that different bond markets may
offer relative costs advantages in addition to the currency of denomination. Specifically,
research by Kidwell, Marr and Thompson indicates that borrowing in the Eurobond
market may be cheaper, on average, than borrowing in the U.S. domestic market. As
explained earlier, this interest cost savings may stem from tax concems or currency gains.
Based on this finding, it may be necessary to further group (or block) the data by the
market on which it trades in order to control for other factors that may lead to a rejection
of the null hypothesis. This portion of the analysis may segment the data such that: (1)
foreign currency Eurobond issues may be compared to domestically traded dollar issues;
(2) foreign currency Eurobonds may be compared to Eurodollar bonds; or (3) foreign
non-Euromarket bonds may be compared to Eurodollar and/or domestic dollar bonds. It
is argued that these types of potential groupings may help to eliminate other possible
extraneous variables that may bias the results.'^
The data grouping and the implied testable hypotheses discussed above rely on
the assumption that Relative Purchasing Power Parity (RPPP) holds. The value
enhancement nature of a foreign debt offer as described in the literature basicallv stems
from the added tax shield afforded from exchange losses. In other words, under the
RPPP assumption, the situation where Tid ^ f is equivalent to a situation where the
55
^ifej'-;

- « i » — « * * — • - ! ? » «
foreign currency is expected to strengthen. In addition to grouping the data by inflation
differentials, a secondary analysis will be conducted where the data are grouped by the
expected change in foreign currency value as indicated in the exchange rate market. This
added analysis will aid in controlling for the misclassification of debt offer groupings
when the RPPP assumption may be violated.
Summarv
This chapter has provided a preview of the empirical methodology to be used in
the subsequent empirical analyses. It has been argued that an event study methodology
will best serve to differentiate among the theoretical arguments put forth. Specifically, it
has been hypothesized that domestic firm value may be enhanced by the use of foreign
versus domestic currency debt. Based on these conclusions, it is argued that an event
study methodology that measures abnormal stock price reactions as they relate to various
debt offers will be an appropriate empirical methodology. The event study methodology
to be employed will follow previous work by Brown and Wamer. From this
methodology, the calculated prediction errors will also be used in an ANOVA model,
which incorporates the tax and inflation factors.
Several areas of concem related to control factors were also briefly discussed.
Two specific concems have been mentioned in addition to traditional debt study control
factors. First, the possible cost advantages related to the market on which an issue is
offered, in addition to its currency of denomination, may need to be controlled for.
Second, the validity of the Relative Purchasing Power Parity condition needs to be
accounted for. Specifically, it may be necessary to categorize debt offers according to
information in the exchange rate market rather than according to inflation differentials if
RPPP is consistently violated. The empirical analysis may lead to a better understanding
of how firms actually behave, which may provide some insight as to which direction
future research should proceed.
56

"*-f!«
CHAPTER V
SAMPLESIG PROCEDURES AND EMPIRICAL ANALYSES
Introduction
This chapter begins with a discussion regarding the data collection process.
Following this, the actual empirical design and specific test results are examined. As
explained in Chapter IV, the main empirical tests employ an event study methodology.
Given the new intemational equilibrium condition derived in Chapter III, the null
hypothesis is defined as no statistical difference in stock price reaction for a foreign debt
offer versus a domestic debt offer.
The initial step in the data collection process involved identifying domestic firms
announcing a proposed foreign currency debt offer. The data for this initial step is
provided by the Securities Data Company for the years 1985 through 1993. After
screening the data according to standard event study techniques (discussed later in this
chapter), 115 foreign debt offers by 56 domestic based firms remained. These offers are
then matched with domestic debt offers in an effort to provide a control sample. The
final samples consist of 78 foreign and 78 domestic debt offers by 45 and 65 firms,
respectively.
Following the debt announcement identification phase, data are collected relating
to national inflation and tax rates for the countries in question. As described in earlier
chapters, Lee and Zechner posit foreign debt and firm value relationships only for
specific inflation and tax rate regimes. Therefore, it is necessary to categorize each
foreign debt announcement into its respective inflation and tax differential setting. Data
related to monthly national inflation rates are from the International Financial Statistics
Yearbook, and tax rate information is from the Prentice Hall publication Corporate Taxes
a Worldwide Summary.
The empirical phase of the analysis has three primary parametric and non-
parametric tests based on an event study methodology following Brown and Wamer
57

• ' IP*W9<w4^*^iW^"^Wi«(l
[1985]. The first set of tests examine whether any observable significance exists for
either sample. The second set of tests evaluate the foreign announcements after
accounting for the inflation and tax rate regime categorizations. The third primary
empirical resuhs attempt to discem any observable significant difference in stock price
reaction for foreign debt offers relative to domestic offers. A final set of additional tests
include a closer examination of different maturity classifications and different currencies.
These additional analyses are included because large maturity differences (between a
given foreign and domestic debt announcement) do exist and because all yen
announcements appear in a single inflation/tax regime category. In general, there is no
conclusive evidence to contradict the notion that firms should be indifferent to the
currency denomination decision as implied by the newly derived Intemational Darby
Effect.
Sampling Procedure
As mentioned in Chapter IV, the first step in the sampling procedure is to identify
all foreign currency debt issues by domestic firms. This data is provided by the
Securities Data Company. The initial sample consists of all (278) foreign currency debt
issues for the sample period January 1985 to June 1993.'^ Following Dann and
Mikkelson [1984], Eckbo [1986] and James, the initial sample had to meet several
selection criteria. The standard event study criteria employed in this dissertation are as
follows:
1. The issuing company's daily common stock retums around the
announcement period and for the estimation period are included in the
Center for Research in Security Prices (CRSP) NYSE daily retum file.
2. An announcement of the proposed debt offering is identifiable in either the
Wall Street Journal or the London Financial Times.
3. No other securities were offered within thirty days preceding or following
the identified debt offer announcement date, and no other firm-specific
announcements appear within this same window. This condition w as met by
58

WP^"^^»^-
searching for any other firm specific announcements in both the Wall Street
Journal and the London Financial Times for the relevant time-frame.
The final sample consists of 115 public announcements of forthcoming foreign currency
debt offers by 56 firms. Table A.l provides summary statistics for the foreign currencv
debt offers to be used in the subsequent analyses.
Referring to Table A. 1, there were 115 foreign currency debt offers that met the
above sample selection criteria. These offers were dispersed among nine foreign
currencies, and ranged in size from $23.5 to $198 million. The average maturitv was 8.2
years, with an average coupon rate of 7.95%. Of the 115 offers, there were 38 in Swiss
francs (SFR), 20 in German marks (DM), 19 in Japanese yen (YEN), 6 in Canadian
dollars (C$), 13 in British pounds (STG), 1 in New Zealand dollars (NZ), 10 in
Australian dollars (AUS), 3 in French francs (FF), and 5 in Italian lira (LIR).
The next step in the data collection process involved obtaining information related
to proposed domestic debt offers by U.S. public corporations. The inclusion of
announcement information related to domestic debt offers is necessary to make inferences
regarding whether the prediction errors based on the foreign currency debt offers are
significantly different from the prediction errors related to the announcement of domestic
debt offers. The theory presented in this dissertation relates firm value to either a foreign
currency or a domestic currency debt offer. Therefore, in addition to the analyses of
foreign currency debt offers, an examination of the announcement of proposed domestic
debt offers is also included in the analyses. In essence, the domestic sample is included
in the analyses as a control sample. Summary statistics for the domestic debt offers are
presented in Table A.2.
The domestic debt offer sample is designed to control for extraneous factors
which may inhibit the power of the statistical inferences to be made. Specifically, this
sample consists of U.S. firms that announced a proposed domestic debt offer within one
month of the foreign currency debt announcement for a particular industr>'. In other
words, each announcement of a foreign currency debt offer was matched with the
announcement of a proposed domestic debt offer that occurred within one month of the
59

foreign announcement for a firm in the same general industry classification (e.g., the
announcement for a Swiss franc offer by General Motors on March 15, 1986 would be
matched with the announcement of a proposed U.S. debt offer by Ford Motor
Corporafion occurring within one month of March 15, 1986). Based on this procedure
(explained below), 78 of the 115 foreign debt aimouncements were matched to domestic
announcements for the same sample period.
The specific data collection process for the proposed domestic debt offer
announcements is as follows: '
1. All domestic debt offer registrations for the sample period January 1985 to
June 1993 were identified. This data was obtain using the Securhies and
Exchange Commission Registration Offering Statistics data tape.'^
2. The domestic debt registration announcements obtained in step (1) were
next grouped by month and then arranged by their primary-business two-
digit SIC codes.
3. The domestic debt announcements were then matched with the
corresponding foreign currency debt announcements. The matching was
first by time, then by the two-digit SIC code, such that each foreign debt
offer announcement was "matched" with same-time (within one-month)
domestic announcements by firms in the same general industry. Note, after
the initial screening process for each sample, each firm appears only once
within a given time-frame window.
4. The final sampling step attempted to control for other possible extraneous
factors, in addition to the time-frame and the SIC control. Here, an effort
was made to "match" each foreign offer with a domestic debt offer as similar
as possible except for their currency of denomination. Accordingly,
domestic offers with marked differences to their foreign counterpart were
excluded. For example, an effort was made to not match a convertible
foreign currency issue with a non-convertible domestic issue.
60

^m
Unfortunately, differences in maturity could not always be controlled for
given the restricted sample size.'^
Summary statistics for the "matched" domestic offers and the foreign currency
offers are given in Tables A.2 and A.3, respectively. For the domestic announcements,
there were 78 observations by 65 different firms ranging in size from $21.25 to $205
million with an average maturity of 17.47 years and an average coupon rate of 9.90%.
The final (matched) foreign currency announcement sample consists of 78 offers by 45
firms for the period 1/85 through 6/93. All nine original currencies are reflected in this
sample. Further, the average maturity is 8.6 years with an average coupon rate of 7.56%.
An industry breakdown of the firms contain in the "matched" sample is given in Table
A.5. There are 21 industries represented in the sample, ranging from oil & gas extraction
to motion pictures.
One caveat regarding the nature of the two samples collected needs to be pointed
out. The announcements related to the foreign currency sample, in most cases, represent
the date an actual debt offer was announced to the market. Conversely, the
announcements related to the domestic sample represent the SEC registration date for a
proposed debt offer. Given the differences in the regulations regarding domestic and
foreign offers (required SEC registration versus no SEC registration, respectively), at
least two identifiable announcement dates are available for the domestic sample. The
first date represents the announcement of an SEC registration regarding a proposed debt
offer. The second date represents the announcement of an actual debt offer under the
terms of the preceding SEC registration.
In this study, the announcement date used for the domestic sample represents the
SEC registration date (or the date this announcement first appears in either the Wall Street
Journal or the London Financial Times). This choice of date may influence the results
given the fact that the "announcement" dates used for each sample do not represent the
exact same event. In other words, the foreign announcement reflects an actual debt offer,
where as the domestic reflects a proposed debt offer. It is argued, however, that this
choice of dates is appropriate because the dates represent the earliest announcement of a
61

fsm . « » ! » " '
given firm's intention to borrow, be it an actual borrowing or a proposed actual
borrowing. And, this "first" announcement is what should be relevant to investors.
The matching by time and industry (described above) for the domestic sample is
used for the following reasons. The time matching is deemed necessary based on the
specific propositions put forth by the theories examined in this dissertation. Specifically,
Lee and Zechner argue that domestic firm value will be enhanced via a foreign currency
debt offer only in specific instances, namely when either the domestic inflation rate
exceeds the foreign inflation rate given tax rates are equal across countries or when the
domestic tax rate exceeds the foreign tax rate given the inflation rates are equal across
countries. In an attempt to isolate the possible affects of various inflation differential and
tax differential regimes, each foreign debt announcement is accordingly matched in time
with a domestic debt announcement. In other words, the analyses examine the relative
prediction errors occurring during the same inflation and tax settings. This time matching
will help to eliminate added variation that may enter into the analysis due to changing
inflation rates, tax rates and overall economic conditions.
Second, the industry matching is deemed necessary because only other firm-
specific announcements, and not industry-specific effects, were controlled for in the
sample of the foreign debt announcements. Since the prediction errors are based on the
market model which only controls for overall market movements, there may be industry
specific effects that are not captured in this model. It is accordingly argued that grouping
firms by industries across samples may help to alleviate any added variability that may
enter the analysis due to an industry event not captured in the market model.
Finally, several previous empirical studies have indicated a potentially different
reaction in stock retums based on the type of debt offer announced. For example, James
shows a significant positive reaction to the announcement of bank loans, a varying
reaction to straight public debt (depending on the stated intended purpose), and a
marginally different reaction for offers with maturities less than ten years relative to those
with maturities greater than ten years. Additionally, Eckbo, and Darm and Mikkelson,
show a significant difference in stock price reaction based on whether the debt offer is
62

i .U*.Ui»" l i„ lirntMn" I J IM
convertible versus non-convertible. Based on these previous findings, the data collection
procedures employed in this dissertation were constmcted to control for a potential
increase in sample variability related to specific debt offer characteristics. In realitv,
however, complete information regarding a specific aimouncement was not alwavs
available on the announcement date. Of the 78 announcements included in this study, 25
debt registrations provided no information regarding maturity and coupon rate. All
registration announcements indicated whether the issue would be convertible and the
dollar amount of the registration. Firm size characteristics for both the foreign sample
and the domestic sample appear in Table A.4.
Once the samples of both foreign and domestic currency debt announcements
were identified, the next step in the sampling procedure involved the collection of
necessary inflation, tax and exchange rate data for the currencies in question. Inflation
and exchange rate data were obtain from the International Financial Statistics Yearbook
for the years 1985 through 1993.'^ These figures were crossed referenced with the data
published in the Federal Reserve Bulletin for the same time period. Graphs of the U.S
and foreign country monthly inflation rates are displayed in figures A.l through A.6.'^
The necessary national corporate tax rates for the period 1985 through 1993 were
obtained from the Prentice Hall publication Corporate Taxes a Worldwide Summary.
The corporate tax rates used in this dissertation appear in Table A.6, by country and year.
The tax rates given in Table A.6 represent a "best" estimate of a specific country's
maximum marginal corporate tax rate. Obviously, not everv' country has a similar tax
system. For example, in Canada there are different tax rates for manufacturing firms
relative to non-manufacturing. Japan and Germanv distinguish between distributed and
undistributed profits, and tax each portion at a different rate. One of the most complex
tax systems of the countries included in this study is that of Switzerland. In Switzerland,
a firm is taxed according to its communal and cantonal location, and then a modest
federal tax of 3% or 4% is levied. In Switzeriand, however, a maximum tax rate of 35%
is used as a general mle according to the worldwide corporate tax summarv. This 35%
63
• • " % —

tax rate mle remained unchanged throughout the sample period, as per information
provided by the aforementioned Prentice Hall publication.
The question of which corporate tax rate to use for each country is alleviated
somewhat in this study due to how the rates are to be employed. The only need for tax
rates in the analyses of this dissertation is to classify the foreign currency debt offers into
their respective tax and inflation rate regimes as argued in previous chapters. It is argued,
accordingly, that obtaining a precise total maximum corporate tax rate is unnecessary.
The importance is related to identifying whether the U.S corporate tax rate exceeds,
equals or is less than a specific foreign rate at a given time. Further, it is tme in the U.S..
as well as in Switzerland, that total corporate tax rates vary depending on a particular
firm's state of incorporation, yet (as in the theoretical papers examined in this
dissertation) no effort is made to include and/or account for the various state and local tax
rates.
This dissertation employs the maximum U.S. federal corporate tax rate and the
"best" estimate for its respective foreign counterparts. Recalling the arguments presented
in Chapter II related to the theory put forth by Lee and Zechner, it is assumed that a
Miller [1977] type equilibrium exists within each country, and that the firm in question is
a purely domestic firm. The combination of these two assumptions implies that the
relevant rate is each country's marginal corporate tax rate, and that other tax concems
such as foreign withholding taxes and foreign tax credits are not relevant to the analysis.
In fact, these other potential tax concems are indeed ignored in their analyses.
Empirical Analvsis
Data Evaluation
The first segment of the empirical analysis deals with testing various attributes
related to the data collected for this dissertation. First, the issue conceming the use of
inflation rates as a proxy for expected changes in exchange rates is addressed. Second,
the classification mles and summary statistics for the specific event study will be
64

discussed. Finally, other statistical issues relating to various testing assumptions will be
addressed as appropriate throughout the remainder of this chapter.
The first issue of concem centers on how to estimate the expected inflation
differential between the U.S. and a given country. It has been documented that U.S.
monthly inflation rates (as measured by changes in the Consumer Price Index) may
contain some non-random component, or may be serially dependent. Fama and Gibbons
[1984] provide a good review and comparison of competing inflation rate forecasts. The
observation of a non-random component in monthly inflation rates precludes the
possibility of invoking a simplifying assumption that expected inflation for a given month
equals the previous month's actual inflation. For purposes of this study, however, it is the
difference in inflation rates (domestic minus foreign) that is of importance. The question
of possible autocorrelation in monthly inflation rates is addressed in an inflation
differential format. Specifically, each of the monthly inflation differentials, U.S. rate
minus a given foreign rate, is tested for any possible autocorrelation stmcture.
An ARIMA procedure was employed to determine whether any autocorrelation in
the monthly inflation differential was present. Here, the monthly inflation rate is defined
CPL-CPL as the relative change in the monthly CPI,
^(t-i)
CPI as given in the International
( t - i )
Financial Statistics Yearbook for the years 1985-1993. The specific test examined each
of the monthly inflafion differential series for the entire sample period (1985-1993). For
example, the ARIMA procedure was used to determine whether any stmcture was present
in the series of the U.S. monthly inflation rate minus the foreign country monthly
inflation rate. This procedure was employed for each of the nine inflation series defined
as the U.S. monthly inflation rate minus a given foreign monthly inflation rate, except for
the Italian Lira. The Italian inflation data were incomplete, and only obtained for the one
observation used in the "matched" sample. Additionally, only quarterly inflation rates
were available for the New Zealand and Australian dollars. These currencies were
checked using a quarterly measure. The need for a test of nine series of data reflects the
fact that there were foreign debt offers in nine different currencies. The results of the
65

ARIMA procedures are reported in Table A.7. These results reflect an autocorrelation
check for white noise of lags one through six. If a given inflation differential series is a
random walk, then the first difference of this series should produce white noise. As is
evident from Table A.7, the test for white noise is not rejected for any series, except for
the Brhish pound which is marginally significant at the 10 percent (P-value of .083).
Finding little significant stmcture leads to the argument that it is appropriate to
assume that the expected inflafion differential equals the actual inflation differential, on
average. Therefore, given these results and invoking the Relative Purchasing Power
Parity (RPPP) assumption, the expected change in a country's currency value for a giv en
month is proxied by the actual inflation differential observed for the proceeding month.
For example, the inflation differential between the U.S. and Canada for Febmary 1985
was observed to be -.2%. This observation proxied for the expected change in the v alue
of the Canadian dollar during March 1985, which was observed to actually be -.25%.
Further, this use of inflation rates is consistent with the theoretical arguments explored in
previous chapters. Specifically, the models to be tested invoke Relative Purchasing
Power Parity and define the change in currency value as being equal to the difference in
expected inflation rates, domestic minus foreign.
As described in Chapters III and IV, the theories to be examined argue that
domestic firm value may be enhanced via a foreign currency debt offer relative to a
domestic debt offer only in specific instances. Consequently, the sample of foreign debt
offers and the "matched" sample of domestic debt offers are classified, or grouped,
according to their respective inflation and tax rate regimes. Table 5.1 provides a summary
of the regime groupings for the empirical analyses."
66
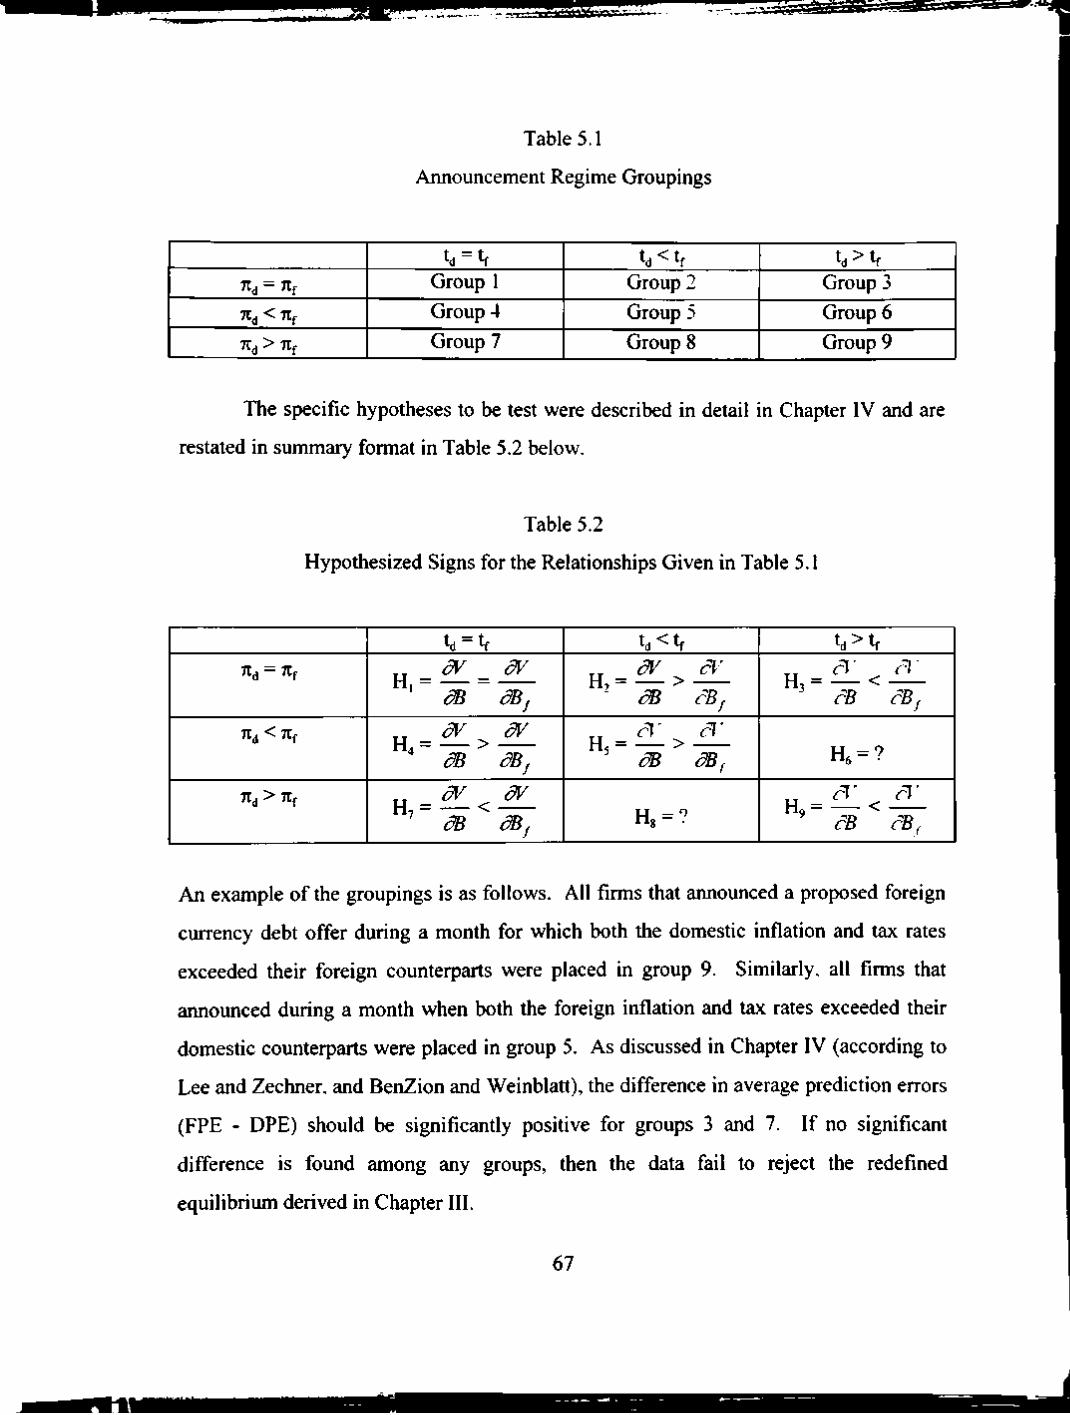
••tIMI«MHM»*ualM mm
Table 5.1
Announcement Regime Groupings
Tid = Tif
Tid < Tif
Tid > Tif
td = tf
Group 1
Group 4
Group 7
td<tf Group 2
Group 5
Group 8
t d > t f
Group 3
Group 6
Group 9
The specific hypotheses to be test were described in detail in Chapter IV and are
restated in summary format in Table 5.2 below.
Table 5.2
Hypothesized Signs for the Relationships Given in Table 5.1
Tid = Tif
Tid < Tif
Tid > Tif
td = tf
., _ dV _ dV
' dB dB,
^^ dV dV H4 = — >
dB dB, ,, dV dV H7 = — <
dB dB,
td<tf , , dV 3' H2 = — >
dB cB,
dB dBf
H = ' rig
t d > t f
cB cB,
H6=?
H,= - ^ ' < ^ ^ ' cB dBf
An example of the groupings is as follows. All firms that announced a proposed foreign
currency debt offer during a month for which both the domestic inflation and tax rates
exceeded their foreign counterparts were placed in group 9. Similarly, all firms that
aimounced during a month when both the foreign inflation and tax rates exceeded their
domesfic counterparts were placed in group 5. As discussed in Chapter IV (according to
Lee and Zechner, and BenZion and Weinblatt), the difference in average prediction errors
(FPE - DPE) should be significantly positive for groups 3 and 7. If no significant
difference is found among any groups, then the data fail to reject the redefined
equilibrium derived in Chapter III.
67

- "1 I t i r " •
The precise procedure for classifying the proposed debt offer announcements is as
follows. Every foreign currency announcement is classified by its respective inflation
and tax regime, using the given differentials for the month in which the announcement
occurred. For example, an announcement for a Canadian dollar offer in March 1990
would be classified according to the expected March inflation differential and the March
tax rate differential. Inflation and tax rate differentials, as per the theories, are defined as
domesfic minus foreign. Table 5.3 provides a summary of the number of observations in
each group based on this procedure.'^
Table 5.3
Group Sample Size Summary
Group
Size
1
6
2
2
3
10
4
8
5
11
6
1
7
6
8
14
9
20
Event Methodologv Results
The next phase of the empirical analv sis involved the use of an event studv
methodology to determine whether any significant results may be attributed to the debt
aimouncements in general and/or for the groupings discussed above. The methodology
employed follows that of Brown and Wamer. The prediction errors are estimated for day
"-1" , day "0" and the cumulative two-days (day "-1" to day "0") using a market model
excess retum calculation defined as:
PE,=R,- (a^-h ,&^R^,) (5.1)
68

• i i r l iwfr t i - .-. -^^ -•Dmatfc'*>i.->»<f^-:-.-f<:''.:';*.:''.*:f^-.ic<SfcflBB8B^^ti
As described in Chapter IV, a prediction error (PE) is calculated for both the domestic
sample (DPE) and the foreign sample (FPE). Following Brown and Wamer, the
prediction error test statistic for any event day is defined as:
P E t / S(PEt)'
(5.2)
where
1 N,
PE, = - Z P E j , N 1=1 •"
(5.3)
\( t=-21 i2 t=120/
S(PEt) = JI Z iPE t -PE + Z | P E t - P E l 1/199, (5.4)
PE = 1 / t=-21 t=120 '
TTTA Z PEt + Z PEt 200Xt=-120 t=21
(5.5)
And, the cumulative two-day test statistic is defined as:
t=-i
ZS^(PEt)
(5.6)
The test statistic is considered unit normal in the absence of abnormal performance.
Table B.l provides summary statistics for this procedure for both samples overall
based on both the CRSP value weighted retum series and the CRSP equal weighted
retum series. The domestic and foreign two-day prediction errors for the value weighted
retum series are .00139% and -.1615%, respectively. The results for the equal weighted
69

retum series are -.0524% (domestic) and -.2116% (foreign). As is evident from this table,
there are no significant stock price reactions, on average, to either a domestic or a foreign
proposed debt offer. This preliminary evidence is not inconsistent with the argument that
firms should be indifferent as to the currency debt denomination once the appropriate
intemational equilibrium condition is recognized.
Tables B.2 and B.3 highlight the results for only the foreign sample after each
announcement is categorized into its appropriate group. Again, there are no significant
observafions except for those related to group 9. Group 9 is significantlv negativ e under
both the value and equal weighted scenarios at the 10 and 5 percent levels, respectively.
The average prediction errors are -.7168% (value weighted) and -.7840% (equal
weighted) with respective Z values of-1.589 and -1.6937. There is no prior intuition as
to why this group is significantly negative. In contrast (based on arguments by Lee and
Zechner), one would suspect this result is exactly opposite what should be expected.
Group nine relates to the observations of foreign currency debt offers when both the
domestic tax and inflation rates exceed their foreign counterparts. In this setting, it may
be inferred from Lee and Zechner that there should be a positive reaction to the
announcement of a foreign debt offer given the added potential tax-shield benefit.'^
Given the relatively small sample sizes, especially when the data are segmented
into their respective inflation/tax regime groupings, a comparable non-parametric event-
methodology statistic is evaluated. Following Corrado [1989], this procedure involves
transforming each security's time series of market-model excess retums into their
respective ranks. Letting Kj, denote the rank of the excess retum, PEj„ in security i's time
series of excess retums, such that:
K,, = rank(PE,), t = -120, . . . , -21,-1,0,21, . . . , 120. (5.7)
The test statistic is then defined as:
70

—"- - - f
T = ^ Z ( K . o - 5 l ) / S ( K ) (5.8)
The standard deviation S(K) is calculated using the entire sample period, K,o
represents the two-day announcement retum and N represents the number of firms in the
sample. This procedure is employed for the cumulative two-day foreign prediction errors
in an effort to provide a comparable non-parametric event study procedure.
By design, each security's excess retum, PEj„ in security i's time series of excess
retums is converted into a two-day excess retum. These two-day excess retums are then
ranked accordingly. There are 202 days in the times series, including the two event days
for each firm. This number reduces to 101 two-day retums in the calculation. Following
Corrado, the average rank is V2 plus half the number of observed retums, or 51. The
ranking procedure transforms the distribution of security excess retums into a uniform
distribution across the possible rank values regardless of any asymmetr> in the original
distribution. Under the null hypothesis, the distribution of this statistic converges to a
standard normal variable.
Corrado points out that the statistic given above in equation (5.8) is well
calibrated for portfolios with as few as ten securities. However, he does suggest a small
sample adjustment to this statistic. The adjustment is defined as:
N
z i = l
T' = ZK.o/(m + l) (5.9)
Where KJQ and N are defined as above, and m is the total number of observed retums in
the estimafion and event periods, or 101. This statistic is distributed as the sum of N
uniform variables. Significance tables for this procedure are given by Buckle, Kraft and
van Eeden [1969]. Both statistics, equations (5.8 and 5.9), are used on the data once
categorized into their respective inflation/tax regime groups.
71
Results for the foreign sample groups one through nine based on the procedures
described in Corrado are reported in Tables B.4 and B.5. The statistics reported in Table
B.4 reflect the unadjusted calculation given in equation (5.8). For this test, no groups are
reported as significant. Using the small sample adjustment, groups 2 and 9 are
marginall) significant for the equal weighted reUun series. Group 9 has a reported
statistic of 8.1569. and is significant at the ten percent level (critical value of 8.3398).
Tests on the full foreign sample produced no significant results, and are not reported here.
To this point in the analysis, there is little overall evidence to support the
altemativ e theories exposed by previous research. In particular, there is no ev idence to
support the arguments proposed by either Lee and Zechner or BenZion and Weinblatt.
This is evident from the observation that neither group 3 or group 7 appear statistically
significant. It is noted though that a complete analv sis of the theories has not yet been
evaluated. The existing theories argue that domestic firm v alue ma> be enhanced by use
of foreign currency debt relative to the use of domestic debt. It is therefore argued that an
altemative test would be to determine whether there are anv significant differences in the
stock price reactions (on average) for proposed foreign debt offers versus proposed
domestic debt offers. This issue is examined more closely in the subsequent discussion
regarding the use of an ANOVA procedure and a paired t-test analysis.
One-Wav ANOVA Results
To begin, limited data av ailabilitv and the aforementioned sampling procedures
result in relativ ely small sample sizes. Additionally, great effort was put forth to "match"
the foreign and domestic observations such that potential extraneous variability mav be
minimized. In order to alleviate the potential problems associated with the small sample
size of each group, and also take advantage of the pseudo pairing of the observations, two
types of analyses are performed. First, a one-vvav ANO^^A procedure is employed to
help increase the efficiency of the analysis. The increase in efficiencv of the .\NO\'A
procedure stems from the greater degrees of freedom associated with this methodology.
Second, a paired t-test methodologv is used to take full advantage of the information
72

contained in the data. Both procedures are used to help increase the robustness of the
results by providing altemative tests of the specific hypotheses explored. Additionally,
the results from comparable non-parametric tests are also deemed necessary and included
given the small sample sizes.
The one-way ANOVA is stmctured as follows. A general ANOVA procedure
seeks to test the following hypotheses:
Hn: Ml = 1^2 = 1^3 = 1^4 = ^ 5 = 1^6 = l r (5.10)
H3: Not all Pi (i = 1 r) are equal. (5.11)
This generalized format is specifically related to the analysis at hand in the following
ways. The previously discussed simple event methodology was used to determine the
possible existence of a significant reaction to the announcement of a debt offer (foreign or
domestic). The one-way ANOVA procedure expands on this first set of tests by first
testing these same hypotheses in a more efficient manor, and then by testing to determine
the presence of a significant difference within and across the grouping classifications.
The two specific structures are as follows:
Hn Ml = M2 = MB = 1 4 = Ms = 1 6 = ••• = m = 0 (5.10a)
H, Not all Pi (i = 1, . . . ,9) equal zero. (5.11a)
Where, Pi refers to the average prediction error, on a given day (day "0", "-1" or
two-day), for either the foreign or domestic debt offer sample. The next
set of ANOVA tests examine the following set of hypotheses:
Ho: (MFI - MDI) = (MF2 - MD:) = (MF3 " MDB) = • • • = (MF9 " MDQ) = 0 (5.10b)
73

H
H3: Not all (ppi - PD,) (i " 1 9) equal zero. (5.11b)
Where. (MFI - MD.) represent the average difference in prediction errors (defined as
the foreign minus domestic prediction error).
Thus, the one-way ANOVA procedure allows for a simultaneous testing of whether anv
"group" of prediction errors is significantly different from zero. This methodology is
more efficient than using an individual t-testing procedure due to the increased degrees of
freedom.
Although sample size and testing efficiency are a major concem, a simple "joint'
t-test (given by the ANOVA procedure) may fail to take full advantage of the information
provided in the data. Specifically, according to statistical theorv'. paired data may contain
more information than randomly constmcted unpaired data due to the fact that the prior
represents data for which extraneous factors are controlled for. Given a paired set of data,
the more powerful procedure is a paired t-test. as opposed to a standard t-test (see for
example Aczel [1989], pages 289-301). .Although the data in this dissertation do not
represent tmly paired observations (i.e.. a before and after measurement on a single
variable), thev are paired in the sense that an effort was made to control for other
extraneous factors by isolating the observations in time and by industrv. etceteras.
Therefore, it is argued that a paired t-test procedure may aid in the interpretation of the
results by adding to their robustness relativ e to the ANOVA procedures described above.
There are two primary reasons for using an ANO\'A procedure in this study.
First, the procedure allows for greater efficiency in testing the significance of the v arious
groups. This aspect is deemed especially important considering the small sample sizes
observed in this dissertation. Secondly, the .\NOVA procedure provides a more
convenient format for testing whether a significant difference exists between the foreign
sample and the domestic sample once the grouping classifications are controlled for. To
this end. various ANOVA results are presented in Appendix C, and are discussed below.
74

There are three basic tests reported in Appendix C. In all cases, a Generalized
Linear Model (GLM) statistical procedure was used. This procedure is deemed
necessary, rather than a simple statistical ANOVA procedure, because the data represent
an unbalanced design due to the differences in sample sizes across groups. The GLM
procedure is the equivalent of an ANOVA procedure that allows for unequal sample
sizes. First, an ANOVA procedure is used to test for significance among and across
groups for day "-1" and day "0" separately. These results are presented for both the
CRSP value and CRSP equal weighted retum series in Tables C.l and C.2, respectively.
Second, similar results based on the two-day cumulative prediction errors are reported in
Table C.3. Finally, Tables C.4 through C.6 repeat the tests given in Tables C.l through
C.4, except these results pertain to the difference in prediction errors. As mentioned
earlier, the difference in prediction errors is defined as the foreign prediction error (FPE)
minus the domestic prediction error (DPE).
Tables C.l and C.2 provide results for the ANOVA procedure for day "-1" and
day "0". Here, the foreign prediction errors are classified to their respective groups and
group ten represents the overall domestic sample. Again, group nine is found to be
significantly negative at the ten percent level for both the value and equal weighted sets,
but is only significant for day minus one and not day zero. The significantl> negative
result for group nine implies that stock prices (on average) decline more than they should
according to the market model when a firm announces a foreign currency borrowing. The
observation that only day "-1" appears significant is consistent with the notion that the
average announcement for this group occurred in the middle of a trading day and was
reported with a one day lag, on day zero. The significant negative result found, however,
is inconsistent with the altemative arguments proposed by Lee and Zechner.
The ANOVA results for the cumulative two-day prediction errors, using both the
CRSP value and equal weighted retum series, are reported in Table C.3. These results are
consistent with those found using the event study methodology discussed earlier. Only
group 9 is significant, and negative, at the 10 and 5 percent levels for the value and equal
weighted sets, respectively. The value weighted average prediction error reported for
75

group 9 is -.7168% with a significant t-statistic of -1.88. The equal weighted value
reported is -.7840% and is significant at the five percent level, p-value of .0485. These
results are virtually the same as under the event study methodologv discussed earlier.
Comparing the event study results to those of the ANOVA results, no major
inconsistencies are apparent. Both empirical methods produce similar results, and there is
no new significant group given the added efficiency of the ANOVA procedure. Again,
there is no evidence (to this point) in support of the two altemative hypotheses posited by
Lee and Zechner, and BenZion and Weinblatt. Specifically, groups 3 and 7 hav e failed to
produce a significantly positive result, indicating no support for the argument that
domestic firms may enhance their value simply by issuing foreign rather than domestic
currency debt. In contrast, there is little evidence against the irrelevancv propositions set
forth under the new Intemational Darby Effect (IDE), as derived in Chapter III. The next
step in the empirical analysis addresses the question of whether the differences in the
average prediction errors, foreign minus domestic, produce any significant results.
It is argued that finding a significant result for any one of the groups discussed
thus far is not evidence that there is a significant difference in stock retum performance
for foreign versus domestic debt offers. In order to answer this question, it is necessarv to
actually test whether there are any significant results found when examining the av erage
difference in prediction errors. The difference in prediction errors is defined as the
foreign minus the domestic (FPE - DPE). Tables C.4 and C.5 are similar to Tables C.l
and C.2, except that the results in Tables C.4 and C.5 represent tests on the difference in
prediction errors for the "matched pairs" classified by group.
The value weighted retum series results are reported in Table C.4. As explained
earlier, Lee and Zechner's resuhs would imply that groups three, seven (and possibly
nine) should be significantly positive, and (it mav be inferred that) groups two, four and
five should be significantly negative. For the value weighted resuhs in Table C.4, there is
no significant observation. The only significant result appears for group seven on day
minus one (FPE-DPE = 1.3680%) using the equal weighted retum series, see Table C.5.
This result is marginally significant and positive at the 10 percent level, p-value of .0662.
76

In contrast, there are no significant results for the cumulative two-da> prediction errors
using either the value or equal weighted retum series, see Table C.6. .Additionallv. group
nine no longer appears as significantly negativ e. This lack of significance implies that
investors do not react differenfiy for a foreign v ersus a domestic debt offer, ev en though
the group nine foreign offers were found to be significant when examined independent of
the related domestic offers. The lack of significance for the difference in prediction
errors is consistent with the irrelevancy proposition set forth under the newly derived
Intemational Darby Effect.
Lee and Zechner argue that a domestic firm may enhance its value bv issuing
foreign currency debt under certain circumstances. Specificall), they posit that a
domestic firm's value is enhanced via an added tax-shield benefit if the firm issues
foreign currency debt when the domestic inflation rate (n^) exceeds the foreign inflation
rate (Tif), given no difference in national tax rates {i.e., (tj - tf) = 0 }. Altematively, a
domestic firm may gain a benefit if it issues foreign currency debt w hen the domestic tax
rate (td) exceeds the foreign tax rate (tf), given no difference in national inflation rates
{i.e., (Tid - f) ^ 0}. Group 7 represents the situation where Tid>Tif, and td = tf. Hence, the
observed positive significance related to group 7 is consistent with the argument that
domestic firm value may be enhanced via a foreign currency debt issue. In other words,
the firm's stock price (on average) reacted more positively given a foreign currency debt
offer relative to a domestic debt offer. Although this result may seem to be consistent
with Lee and Zechner's arguments, it hardly represents conclusive evidence in favor of
their theory. Specificall), this is the only significant result consistent with their theory
based on tests of sixty four different possible comparisons over the two-day prediction
error period.
The overall F values for the various ANOVA procedures are also included in
Tables C.l-C.6. These values are used to indicate whether a particular group's mean
prediction error differs from the grand mean of the entire sample. None of the F values is
significant, indicating that no individual group is. on average, different from all groups
combined. The comparable non-parametric Kmskal-Wallis statistics are reported below
77

"••"• •TT, '^ " ^
in summary format. These results also fail to indicate any overall significance for a
particular group relative to the entire sample.
Table 5.4
Kmskal-Wallis Chi-Square Statistics Based on the Prediction Error Differences
Day Value Weighted Equal Weighted
'0' II 1 1 I
Two-Day
2.1534
6.5665
1.5563
2.9862
6.4530
1.0043
Based on the results to this point, there is very little (if any) evidence to contradict
the theory derived in Chapter III. This new intemational equilibrium argument is taken
as the null hypothesis, in that there should be no observable significant difference in the
average prediction errors across samples. The next set of empirical tests employ a paired
t-test methodology.
Paired T-Test Results
Appendix D contains results related to a set of paired t-tests for the various groups
across the two-day retum period, and the corresponding Wilcoxon Signed-Rank test
statistics. As discussed previously, these tests are included in an effort to take full
advantage of the information contained in the data. The one-way ANOVA procedure
examined above helps to increase the efficiency of the test results, but may fail to extract
the full story given the "matched" nature of the data. Although the data are not tml>
paired, as explained earlier, it is argued that a paired t-test procedure may be an
appropriate extension of previous methods due to the measures taken in the sampling
procedure to control for extraneous variation. These tests are also included in the
78
analyses in an effort to compensate for a potential problem with unequal variances among
the groups examined. The ANOVA procedures given in Appendix C specificallv assume
that the variances are equal across the groups included in any given analysis. A v iolation
of this assumption may lead to an erroneous conclusion regarding the significance, or
lack there of for a particular group. Therefore, the use of a paired t-test procedure will
both help to extract more information and alleviate any potential bias from a violation of
the ANOVA equal variance assumption. Additionally, given the small sample sizes, a
comparable Wilcoxon Signed-Rank test is also performed on each respective pairing.
The resuhs reported in Tables D.l through D.3 are similar to those reported in
Appendix C except that here the results represent those related to paired t-tests. For each
group, a paired t-test and a Wilcoxon Signed-Rank test are reported. These tests remove
the ANOVA assumption that the variances are equal across groups, and test for a
significant difference in means within each group. The results using these procedures are
similar to those under the ANOVA analysis. Again, it is found that group seven is
marginally significant and positive for both the parametric and non-parametric results
based on the day "-1" value weighted series. The standard paired t-test is significant at
the ten percent level, with a p-value of .0749, see Table D.l. The Wilcoxon test produces
a T statistic of 1.9917, and is significant at the five percent level. No other group, even
for the cumulative two-day prediction error results, is found to be significantly different
from zero, see Tables D.l-D.3.
The paired t-test results that compare differences in the overall means for all da> s
(minus one, zero and cumulative two-day) are reported in Table C.4. The average
difference in cumulative two-day prediction errors (foreign minus domestic) is -.1592%
for the value weighted retum series, with a standard error of .2714 and a p-value of .5591.
The result for the cumulative two-day prediction error using the equal weighted series is
similar to that of the value weighted series. Here, the average difference in prediction
errors is -.1629%, a standard error of .2639 and a p-value of .5390. There is no evidence
under either the event or the paired t-test methodology to support a difference in ov erall
average prediction errors for foreign currency debt offer announcements versus domestic
79
-mmrn

^tiaa^imtgm
debt offer announcements. This result is consistent with a failure to reject the null
irrelevancy proposition developed in Chapter III.
The overall results reported in this dissertation provide little ev idence to support
the hypotheses proposed by Lee and Zechner. and BenZion and Weinblatt. Only the
difference in prediction errors for group seven were found to be significant, and
consistent, with their hypotheses. However, this result may actually be a by-product of a
seemingly negative result related to the domestic prediction errors for this group. The
results based solely on the foreign prediction errors produced no significant results for
this group. Specifically, Lee and Zechner argue that domestic firm value will be
enhanced via a foreign currency debt offer. There is no evidence consistent with this
argument. None of the results related to groups 3 and 7, based solely on the foreign
sample, produced a positive result. The only positive result potentially consistent with
Lee and Zechner's arguments is found when examining the difference in prediction errors.
This result ma) or may not support their hypotheses. In other words, finding the variable
(FPE - DPE) to be positive does not necessarily mean that the variable FPE is greater
than zero.
Although there are a few significant results based on the analyses related solely to
the examination of prediction errors for foreign debt offer announcements (and based on
the analyses comparing the foreign and domestic prediction errors), it is argued that there
is no conclusiv e evidence to support the altemativ e hypotheses. The overall results, to
this point, do not consistenfiy fail to reject (if at all) the null hypotheses based on the
newly deriv ed intemational equilibrium given in Chapter III. Further, the results do not
consistently support (if at all) the altemative hypotheses proposed by other researchers.
In other words, of the approximately two hundred and twentv tests performed (not
including the non-parametric results) to this point, only eight significant results are
reported. This translates into less than four percent of the tests producing a significant
result. Additionally, only three of these significant resuhs are consistent with the
arguments put forth by Lee and Zechner.
80

Additional Empirical Analvses
Further analyses of the data are warranted based on several observations. First, it
was not possible to consistently control for differences in maturity between the foreign
and domestic debt announcement samples. This is tme due to various reasons. One
reason is the fact that not all domestic shelf registrations were subsequently offered, and
therefore had no stated maturity. Additionally, the already small sample would be
considerably smaller if such controls were implemented, only 24 of the 78 "matched"
observations have similar maturities (an absolute difference of < 7 years). A second
observation warranting further analysis relates to the notion that group nine appears to be
an outlier group. Group nine is significantly negative in several tests, and this persistent
significance (coupled with potentially large maturity differences) lead to a need for closer
examination of this group. Finally, upon analyzing group nine, it was found that all 14
yen issues appear in this group. Accordingly, the natural question of whether a currency
effect is present will be addressed.
The first stage of the additional analyses attempts to isolate, or control for,
differences in maturity between the "matched" foreign and domestic offers. The
maximum maturity difference is 40 years, with a minimum difference of zero and an
average difference of 9.51 years. This analysis is conducted using several techniques. To
begin, an overall analysis is conducted for the entire "matched" sample using a two-way
ANOVA procedure. In this procedure, the two main-effects variables are the original
inflation/tax regime groupings (GRP) and a difference in maturity classification variable
(MATGRP). This analysis also includes an interaction variable denoted as
(GRP*MATGRP). The difference in maturity is defined as the foreign maturity minus
the domestic maturity for a given set of observations. The four classifications for the
maturity grouping variable (MATGRP) are as follows:
81

MATGRP
1
2
3
4
Maturitv Difference
Foreign < Domestic
Foreign > Domestic
Foreign = Domestic
Missing Domestic Value
Table E.l provides summary data related to the number of observations found in
the combined groupings, for example there are 11 observations in the original group nine
for which the domestic maturity exceeds its foreign counterpart. Overall, there are thirty
seven observafions in MATGRP 1, nine observations in MATGRP 2, seven in MATGRP
3, and twenty five in MATGRP 4. The two-way ANOVA results for the various event
days using the entire "matched" sample (n = 78) appear in Tables E.2 and E.3.
Tables E.2 and E.3 provide overall statistics related to the significance of each
main-effects variable and the interaction variable. No results are significant for the value
weighted retum series on any of the event days, see Table E.2. Based on the results in
Table E.3, it is noted that the interaction variable (GRP*MATGRP) appears significant at
the ten percent level for both the day "-1" and the cumulative two-day equal weighted
series. The respective day "-1" and cumulative two-day p-values are .0668 and .0845.
Additionally, the original grouping variable and the overall ANOVA model are
significant for day "-1". The p-value associated with the GRP effect is .0359, and the
overall model p-value is .0719. These results indicate that there may be a significant
effect related to the original inflation/tax regime groupings, once differences in maturities
are controlled for. However, inferences upon this conclusion are complicated by the fact
that a significant interaction exists between the original GRP variable and the new
MATGRP variable, defined as GRP*MATGRP.
One potential drawback related to an overall analysis is that a large number of
cells in the two-way ANOVA procedure using the entire sample are missing
observations, or have only one observation. Of the 36 cells given bv the two-way
analysis, 12 cells have no observations, and 9 cells have only one observation (see Table
82
- « . , i * * a ^ > « i ^ M .J2
E.l). Hence, a second general two-way ANOVA is conducted where the original groups
are collapsed according to their hypothesized signs following Lee and Zechner. That is.
the original inflation/tax regime groups are combined according to their hvpothesized
signs. Groups 2, 4 and 5 are combined, given their a-pirori negative sign. Groups 3, 7
and 9 are combine according to their hypothesized positiv e sign. Groups 6 and 8 are
combined due to the fact that their sign was indeterminate. And, group 1 remains in
isolation due to its hypothesized sign of zero. Collapsing the groups and then controlling
for maturity helps to alleviate the problem of insufficient data in 21 of 36 cells.
Tables E.4 and E.5 are similar to Tables E.2-E.3. except here the inflation/tax
regime groups are combined according to their hypothesized signs. The results are
similar to those for the complete two-way analysis, however, now some significance
appears for both the value and equal weighted retum series. The interaction variable
GRP*MATGRP is significant for both the day "-1" and the cumulative two-day results
using both return series. The value weighted interaction variable P-value is .0739 for day
"-1." and .0649 for the cumulative two-day results. The respective equal weighted P-
values are .0479 (day "-1"). and .0298 (two-day). The major difference between this
analysis and the "full" two-way analysis is that the original GRP variable is no longer
significant using either retum series. Although the collapsing procedure has helped to
reduce the number of cells with one or zero observations, the problem of missing
observations still exists. For the full analysis. 21 of 36 (58%) cells had onh one or no
observations. The collapsed groupings reduced this proportion to 6 of 16 cells, or 37.5%.
Given the result that the group collapsing only alleviated (but did not eliminate)
the missing variable concem, the fact that these collapsed groups are based on
hypothesized signs and the need to more closeh examine group nine, several other
analyses are conducted. These analyses include several two-way and one-way ANOVA
procedures for certain inflation/tax regime groups and maturity groups.'^ These anal) ses
allow for the complete elimination of missing cell values, and provide some insight as to
the nature of group nine.
83

Tables E.6 and E.7 provide the summary two-way ANOVA results for the
inflation/tax regime groups of 4, 5, 8 and 9 combined with the maturity groups 1 and 4.
This sub grouping is related to the fact that these particular combinations provide the
most available data as highlighted in Table E.l. Table E.6 provides the value weighted
retum series results, and Table E.7 is for the equal weighted retum series. Here, no
significant results are present for either series. This finding brings into question the
reliability of the significance found in the earlier two-way analyses because so many cells
were missing observations. Once the problem of missing observations is eliminated, no
significant resuhs appear. However, the insignificant resuhs in Tables E.6 and E.7 may
be due to the exclusion of the observations driving the earlier significant results. This
conclusion is questionable knowing that group nine is included in the current analysis. In
order to more closely examine the individual inflation/tax regime groupings, two one
way ANOVA's are included for various groups on only maturity group 1, and only on
maturity group 4. Additionally, an analysis of observations with similar differences in
maturity is also included.
Tables E.8 through E.IO provide the one-way ANOVA results, and the Kmskal-
Wallis results, for the inflation/tax regime groups (GRP) 3, 4, 5, 7, 8 and 9 (given that
maturity group (MATGRP) equals 1). The value weighted results for days "-1" and "0"
are given in Table E.8. The overall ANOVA model is significant at the ten percent level
for day "-1 ," having an F-value of 2.21 and a P-value of .0719. This result is contradicted
by the Kmskal-Wallis chi-square statistic of 8.3108, which is not significant. Both
groups 8 and 9 appear significantly negative at the five percent level with P-values of
.0308 and .0185, respectively.
The equal weighted retums series reults given in Table E.9 are similar to those for
the value weighted results. Only the day "-1" observations produce significance. The
overall ANOVA model is significant at the ten percent level, having a F-value of 2.29
and a P-value of .0633. Again, both groups 8 and 9 are significantiy negative at the fiv e
percent level. The only difference here is that the Kmskal-Wallis statistic of 9.5008 is
also marginally significant at the ten percent level (P-value of .0907). The two-day
84

iUMimmti
prediction error differences are given in Table E.IO. These results indicate that onh
group 9 is significant for both the value and equal weighted retum series. The associated
P-values are .0183 (value weighted) and .0118 (equal weighted).
The continued persistent significance of group 9 is intriguing. Here, group 9 is
significant when analyzing the difference in prediction errors, where as earlier anal) ses
only found group 9 significant when viewed independent of the "matched" domestic
observations (see Appendix C). On the surface, it would appear that the missing link in
the earlier analyses was a failure to control for differences in maturity. This observation
is made in light of the fact that foreign debt issues for group 9 are now significantly
different from domestic debt issues for group 9, not to mention the significant result
related to group 8. However, none of the other groups included in the analysis appear as
significant.
The next maturity difference classification containing the most information is that
related to domestic debt registrations for which no maturity information was provided,
defined as maturity group 4. As explain earlier, not all of the 78 domestic debt
registrations were subsequently offered. Therefore, these observations have no
information pertaining to a stated maturity. The one-way ANOVA (and Kmskal-Wallis)
results for the inflation/tax regime groups (GRP) 1, 4, 5, 8 and 9, given the maturity
group (MATGRP) equals 4, are presented in Tables E.ll through E.13. For this
particular analysis, no significant results are present.
The lack of significance may stem from a variety of reasons. One might be
inclined, however, to conclude that the maturity classification control variable may not be
as important as originally perceived, based on the resuhs given in Tables E.8 through
E.IO. The significant resuhs found earlier, especially for group 9. may be related to a few
large outliers. This inference is supported by the fact that the group 9 cumulative two-
day prediction error differences are almost twice as large as the next largest value, on
average (see Table E.IO). Conversely, the cumulafive two-day prediction error
differences for group 9 (given the maturity difference is group 4) are not markedlv
different from the other groups. In an attempt to more closely examine this issue, a one-
85

way ANOVA for group 9 across the different maturity classification groups is presented
in Tables E.l4 through E.16.
An examination of the results given in Tables E.l4 through E.16 indicates that
there may be a significant relationship between differences in maturity and differences in
prediction errors. This result is evident from the observation that both maturity groups 1
and 2 appear as significant for the day "-1" results using both the value and equal
weighted retum series. The value weighted retum series results are given in Table E.l4.
For day "-1," the MATGRP 1 average prediction error difference is -1.2612%, and is
significant at the one percent level (P-value of .0063). The MATGRP 2 average
prediction error difference (for this same day) is 1.3680%, and is significant at the ten
percent level (P-value of .0567). Similar results are found using the equal weighted
retum series, as seen in Table E.15. The MATGRP 1 estimate is -1.2817%, and is
significant at the five percent level (P-value of .0102). Similarly, the MATGRP 2
estimate is 1.4336%, and is significant at the ten percent level, having a P-value of .0607.
Only the MATGRP 1 cumulative two-day prediction error difference is significant. This
result is given in Table E.16. The value weighted cumulative two-day estimate is -
1.7680%, with a P-value of .0306. And, the equal weighted estimate is -1.8146% (P-
valueof.0229).
The resuhs in Tables E.l4 through E.16 help to shed light on contradictory results
found earlier. Recall that when group nine was examined solely on the basis of foreign
prediction errors, it was found to be significantly negative for all the day "-1" and
cumulative two-day resuhs (see Tables B.2-B.3 and C.l-C.3). In contrast, when group
nine was examined on the basis of the difference in prediction errors (relative to the
domestic sample), no significant results were found (see Tables C.4-C.6 and D.1-D.3).
This switch in significance may be a result of failing to initially control for differences in
maturity. Analyzing group nine across the difference in maturity groups shows that the
observations in MATGRP 1 (foreign maturity less than domestic maturity) may be
offsetting those in MATGRP 2 (foreign mattirity greater than domestic maturity).
86

B.-^A'
However, it is noted that including a control variable for differences in maturity did not
lead to a change in significance as related to the other groups included in this dissertation.
Evaluating MATGRP's 1 and 2 (for group 9) in isolation using a Wilcoxon
Signed-Ranks analysis reveals that these two maturit) groups may indeed offset each
other in the previous analyses. The value weighted da) "-1" W ilcoxon Signed-Ranks test
statistic for MATGRP 1 is -2.4006, and is significant at the five percent level (one
percent level using a one-tailed test). This same statistic for MATGRP 2 is 1.8257, and is
significant at the ten percent level (five percent using a one-tailed test). Combining
MATGRP's 1 and 2, and recalculating the Wilcoxon statistic yields an insignificant value
of 1.1360. Similar results are found evaluating the day "-1" equal weighted retum series.
Based on these results, it is argued that the original lack of significance for the prediction
error differences may be due to a failure to adequately control for differences in maturit)
(see Tables C.4-C.6 and D.l-D.3). Therefore, the original result of a significantly
negative foreign prediction error related to group nine may be due to the disproportionate
number of observations categorized in MATGRP 1. Of the 20 observation in group nine.
11 (55%) are in MATGRP 1.
One further analysis that will help to clarify the difference in maturity issue is an
analysis focusing on observations with minimal differences in maturity. If no significant
results are found using this analysis, it may be concluded that the results found above for
group nine are indeed driven by marked differences in maturity. This analysis entails a
one-way ANOVA procedure on the original inflation/tax regime groups collapsed
according to their hypothesized sign. Additionally, only observations with absolute
differences in maturity of less than, or equal to, 7 years are used in this analysis. This
maturity difference restriction results in 23 observations, excluding group one due to a
sample size of 1. The results of these tests are reported in Tables E.17 through E.19.
Here, no significant results are found. This lack of significance lends support to the
argument that it is indeed marked differences in maturit) leading to the observed
significance found earlier.
87

IIP
Upon examining group 9 with respect to the difference in maturity issue, it was
found that all 14 yen denominated debt announcements appear in the group 9 inflation/tax
regime. Accordingly, one final set of analyses addresses the question of whether the
specific currency of denomination influences the results. These analyses focus on the
various currencies with the most data available. As can be seen in Table E.l, the six
currencies with at least three observations are:
Currencv
AU
C$
DM
SFR
STG
YEN
# of Observations
3
3
15
30
7
14.
The first set of tests is a one-way ANOVA across the six currency groups listed
above. This analysis (and those below) only consider the day "-1" and cumulative two-
day prediction error differences, as these days contain the significant results found thus
far. Tables F.l and F.2 contain the results for the one-way analysis across the six
currencies listed above. As is evident from the results presented, no observations appear
significant for either of the days examined. Therefore, it is concluded that the currency of
denomination (examined in isolation) does not influence stock price reaction, on average,
to the announcement of a foreign currency debt offering. The next set of analyses
examines the original inflation/tax regime groupings for a given currency.
The results of a one-way ANOVA on the original groupings for the Swiss franc
(SFR) offerings are presented in Tables F.3 and F.4. The original inflation/tax regime
groups included are 1. 3, 4, 7 and 9. This choice of groups to include, and the use of the
SFR, is dictated by data availability (see Table E.l). There are 30 Swiss franc offers in
total. Groups 2. 5, 6 and 8 are excluded due to insufficient data. An examination of
88

Tables F.3 and F.4 shows that only those observations contained in the original group 9
appear significant. Group 9 is significant for both the value and equal weighted retum
series on day "-1." The value weighted estimate is -1.5117%, is significant at the ten
percent level and has a P-value of .0718. For the equal weighted series, the group 9
estimate is -1.7296% and is also significant at the ten percent level. These results are not
surprising considering the fact that three of the five observations in this group are from
the maturity group 1, found to be highly significant earlier. However, it can not be
concluded that a significant affect due to the choice of currency exists because the overall
prediction error differences for the SFR were found to be insignificant (see Tables F.l
and F.2).
The final set of tests relate to the fact that all 14 YEN denominated issues appear
in group 9. Tables F.5 and F.6 provide results for the one-way ANOVA analysis of
group 9 on the SFR and YEN. As expected, no significant results appear for the YEN
denominated issues. Again, the five group 9 SFR issues are found to be significant. All
evidence related to the currency of denomination issue points to a finding of no
significant relationship between stock price reaction and the choice of currency. The only
results found to be significant are the Swiss franc offers contained in group 9. However.
3 of the 5 observations in this subgroup are also in MATGRP 1. These observations
represent three of the ten largest negative prediction error differences overall.
This section of the empirical analysis focused on determining whether a
significant relationship exists for foreign currenc) debt announcements, once differences
in maturity between the foreign and domestic sample were controlled for. Additionally,
the analyses included a closer examination of group nine with respect to maturity
differences and currency denominations. This examination was warranted by the fact that
onh' group nine appeared significant overall in the analyses of the previous sections. The
results of this section are, in general, not conclusive. There appears to be no major
change in significance related to the various groups examined. Only group nine shows
significance, with or without a control for maturit) differences.
89

Summarv
This chapter contains specific descriptions regarding the data collection process,
and includes discussions relating to the actual empirical analyses conducted. The data
collection process involved first identifying announcements related to domestic firms
proposing a foreign currency debt offer. This procedure produced an initial sample of
278 foreign currency debt offer announcements. After screening the sample for
suitability of inclusion in the event study, 115 announcements by 56 firms remained.
These 115 foreign debt announcements were then matched with domestic debt offer
announcements by similar firms occurring within one month of the foreign offer.
The next segment related to the data collection concemed the gathering of
national inflation and tax rate information. The national monthly inflation figures for
each country were obtained from the International Financial Statistics Yearbook for the
years 1985 through 1993. This informafion was cross referenced with the inflation
information given in the Federal Reserve Bulletin for the same period. The foreign debt
announcements were grouped according to their respective expected inflation rate
differentials as given by the actual difference in the previous month's inflation rates.
These groupings were checked using expected changes in currency values since this is
what the difference in inflation rates served to proxy.
National tax rates for the countries in question were given by the Prentice Hall
publication Corporate Taxes a Worldwide Summary. The actual national tax rate used
for each country represented a "best" estimate of that country's maximum marginal
corporate tax rate. The theories examined deal specifically with purely domestic firms,
and assume that a Miller type equilibrium holds within each country. Therefore, the
appropriate tax rate employed was that country's marginal corporate tax rate.
Once all data were collected and organized, an event methodology following
Brown and Wamer was used to compute the prediction errors associated with each debt
offer announcement. The prediction errors were then used in the subsequent empirical
analyses. Three basic empirical tests were performed. First, an event methodology was
used to test whether any significant result appeared based on the overall samples and for
90

the foreign sample by group. This segment of the analysis produced a negatively
significant result for the firms in group nine, in contrast to Lee and Zechner's theor).
Group nine was identified as firm's that announced a foreign currency issue given that
both the domestic tax and inflation rates exceeded their foreign counterparts. A potential
rational for the result found related to an increase in firm risk via the foreign currency
exposure.
The second level of tests employed the prediction errors as the response variables
in a one-way ANOVA analysis. These test were performed in an effort to increase the
efficiency of the results given the small sample sizes. Here, the results vs ere similar to
those of the event methodology in that only group nine was found to be negativeh
significant. The final phase of the primary empirical analysis focused on identifying an)
observable difference in prediction errors for the foreign announcements relative to the
domestic announcements.
In this last set of empirical tests, an ANOVA procedure and a matched pairs t-test
procedure were used where the difference in prediction errors (for each group) was the
response variable. Overall, only the difference in prediction errors for group seven on
day minus one appeared to be significantly positive. However, it was proposed that a
negatively significant result related to the domestic announcements might be behind the
apparent positiveh significant difference in prediction errors.
In addition to the above parametric procedures, the non-parametric equivalent of
each test was also reported. This consisted of a Kmskal-Wallis chi-square test statistic in
conjunction with the ANOVA procedures, and a Wilcoxon Signed-Ranks test for the
paired t-test procedures. The non-parametric results were found to be consistent with
those reported under the parametric procedures.
The empirical analyses also included a section related to an examination
controlling for differences in maturity between the foreign and domestic debt
announcements. This analysis was included because such a control was not possible in
the original sampling procedures given the limited amount of data available. Controlling
for differences in maturity did not provide any significant change in the results reported
91

in the prior sections. It was found, as before, that only group nine persisted as a
significant result. One possible explanation for this result was that a large sub-categorv
of group nine related to observations for which the domestic maturity exceed the foreign
maturity. However, there were no other major changes in significance for the other
groups related to this maturity difference classification.
In conclusion, there are a few significant results based on the analyses related
solely to the examination of prediction errors for foreign debt offer announcements and
based on the analyses comparing the foreign and domestic prediction errors. It is
therefore argued that there is no conclusive evidence to support the altemative
hypotheses. The overall results provide little (if any) evidence to reject the null
hypotheses based on the newly derived intemational equilibrium given in Chapter III.
Further, there is no evidence in support of the altemative hypotheses proposed bv other
researchers. Specifically, of the explicit situations explored by Lee and Zechner, and
BenZion and Weinblatt, only two of the several hundred tests performed produced a
significant result. Consequently, it is concluded based on the empirical analyses in this
chapter that no evidence exists to reject the newly derived Intemational Darby Effect.
92

CHAPTER VI
SUMMARY AND CONCLUSIONS
The literature reviewed in this dissertation has focused on the theoretical
implications of introducing taxes into an intemational equilibrium setting with and
without the existence of domestic inflation. The arguments began in a no tax regime
following deFaro and Jucker, where the prescription was to borrow in the weakening
currency in order to gain a possible cost advantage. Next, Senbet invoked Interest Rate
and Relative Purchasing Power Parities, and concluded that the value of a purely
domestic firm will be unaffected by the use of foreign leverage in its capital structure
assuming taxes are ignored. The introduction of taxes by Lee and Zechner, and BenZion
and Weinblatt [1984], led to the following conclusions. Ignoring the impact of exchange
rate changes (i.e., TIJ = Tif = 0), domestic firms can benefit from the issuance of foreign
currency debt when the domestic tax rate exceeds the foreign tax rate. And. assuming
national tax rates are equal, domestic firms can benefit from the issuance of foreign
currency debt when the domestic inflation rate exceeds the foreign inflation rate (i.e.. TIJ >
Tlf=0).
The arguments developed by these latter two papers were contradicted in the work
by Hodder and Senbet. Here it was argued that the presence of intemational tax arbitrage
by multinational firms renders foreign currency borrowing decisions irrelevant for non-
multinational domestic firms. This tax shield realignment process was supported by
Madura and Fosberg in that firms should borrow in the country that offers the highest tax
shield advantage in order to maximize foreign projects' net present values. However. Liu
and Hsueh pointed out that these conclusions ignored the foreign tax credit provisions.
Once these provisions are recognized, the firm should always borrow in the foreign
currency in order to maximize foreign projects' net present values.
The need for additional research stems from three areas of concem that are not
adequately addressed in the existing literature. First, none of the arguments put forth thus
far have attempted to analyze the situation where both positive differential national
93

m
inflation rates and differential national tax rates exist simultaneously. Do the conclusions
drawn in each of the restricted settings examined thus far extend into a more generalized
setting where all variables are considered simultaneously? Second, the cmx of the
existing arguments centers on how the introduction of taxes will alter within country
retum relationships and/or how taxes will alter traditional intemational parity conditions.
In general, it has been assumed that taxes affect the interest rate relationships w ithin each
country, but do not alter the traditional Relative Purchasing Power Parity mechanism.
Following these conditions, two primary conclusions were drawn.
The simultaneous existence of RPPP, IRP and the Modified Fisher Effect was
found to be inconsistent. This result led Lee and Zechner, and BenZion and Weinblatt, to
conclude that domestic firm value may be enhanced by the use of foreign currency debt.
Second, the simultaneous existence of RPPP, IRP and the Modified Fisher Effect was
found to be consistent. From this, Hodder and Senbet argued that domestic firms will be
indifferent between the use of foreign currency debt and domestic currency debt in the
presence of intemational tax arbitrage opportunities.
Once the existing theories were explored, the focus of this dissertation moved on
to re-examine how the introduction of taxes affects national interest rates and traditional
intemational parity conditions. An intemational equilibrium was derived assuming
national interest rates are defined according to Darby. This revised equilibrium condition
was termed the Intemational Darby Effect (IDE). It was argued that under the IDE
setting the tax shield advantage from foreign exchange gains for domestic firms vanishes.
This result was derived by recognizing that differential inflation rates as well as nominal
interest rates should be grossed-up for taxes. The conclusions drawn from this setting
support the view that the traditional RPPP is inconsistent with the Modified Fisher Effect
as defined by Darby, which is in contrast to the argument put forth by Hodder and Senbet.
The final area of concem regards the fact that the existing literature has examined
the issues of concem at the theoretical level, but not in an empirical setting. Further, the
existence of competing theories clearly sets the stage for an empirical investigation.
94

Accordingly, the combination of competing theories and the lack of an empirical analysis
provide ample motivation for further research in this area.
The analyses developed in this dissertation help to demonstrate that the
conclusions based on the simplified scenarios are not as obvious once other possible
situations are explored, and that a stable equilibrium may be achieved once all markets
equilibrate on an after-tax real basis. Specifically, once other situations such as a lower
domestic tax rate coupled with a higher foreign inflation rate are explored, the effect of
foreign currency debt on firm value is no longer necessarily determinant. The primary
area of concem, which became evident from this analysis, relates to the observation that
earlier research relied on an implicit assumption that national tax rate differentials must
be related to national inflation rate differentials such that a real after-tax equilibrium may
be achieved. This implicit assumption was shown to be the result of modeling that
incorporated taxes in the national markets via Darby, while simultaneously assuming that
the IFE held. In other words, earlier work attempted to force an equilibrium setting in
which national markets equilibrated on a real after-tax basis, while the intemational
market equilibrated on a real before-tax basis.
The realization of the inherent inconsistency discussed above led to a re
examination of the intemational equilibrating process. From this, a new intemational
equilibrium setting was derived and termed the Intemational Darby Effect (IDE). The
IDE setting eliminates the inconsistency found in earlier work by assuming that all
markets, both national and intemational, equilibrate on a real after-tax basis. Further, in
this setting the currency of denomination decision is irrelevant because by definition real
after-tax exchange adjusted retums are equal.
The final portion of this dissertation contains specific descriptions regarding the
data collection process, and includes discussions relating to the actual empirical analyses
conducted. The data collection process involved first identifying announcements related
to domestic firms proposing a foreign currency debt offer. This procedure produced an
initial sample of 278 foreign currency debt offer announcements. After screening the
sample for suitability of inclusion in the event study. 115 announcements b) 56 firms
95

remained. These 115 foreign debt announcements were then matched w ith domestic debt
offer announcements by similar firms occurring within one month of the foreign offer.
The next segment related to the data collection concemed the gathering of
national inflation and tax rate information. The national monthly inflation figures for
each country were obtained from the International Financial Statistics Yearbook for the
years 1985 through 1993. This information was cross referenced with the inflation
information given in the Federal Reserve Bulletin for the same period. The foreign debt
announcements were grouped according to their respective expected inflation rate
differentials as given by the actual difference in the previous month's inflation rates.
These groupings were checked using expected changes in currency values since this is
what the difference in inflation rates served to proxy.
National tax rates for the countries in question were given by the Prentice Hall
publication Corporate Taxes a Worldwide Summary. The actual national tax rate used
for each country represented a "best" estimate of that country's maximum marginal
corporate tax rate. The theories examined deal specifically with purely domestic firms,
and assume that a Miller type equilibrium holds within each country. Therefore, the
appropriate tax rate employed was that country's marginal corporate tax rate.
Once all data were collected and organized, an event methodology following
Brown and Wamer was used to compute the prediction errors associated with each debt
offer aimouncement. The prediction errors were then used in the subsequent empirical
analyses. Three primary empirical tests were performed. First, an event methodology
was used to test whether any significant result appeared based on the overall samples and
for the foreign sample by group. This segment of the analysis produced a negativ ely
significant result for the firms in group nine, in contrast to Lee and Zechner's theory. A
potential rational for the result found related to an increase in firm risk via the foreign
currency exposure.
The second level of tests employed the prediction errors as the response variables
in a one-way ANOVA analysis. These test were performed in an effort to increase the
efficiency of the results given the small sample sizes. Here, the results were similar to
96

those of the event methodology in that only group nine was found to be negatively
significant. The final phase of the empirical anahsis focused on identifving an)
observable difference in prediction errors for the foreign announcements relative to the
domestic aimouncements.
In this last set of primary empirical tests, an ANOV.A. procedure and a matched
pairs t-test procedure were used were the difference in prediction errors (for each group)
was the response variable. Overall, only the difference in prediction errors for group
seven on day minus one appeared to be significantly positive. However, it was proposed
that a negativeh significant result related to the domestic announcements might be
behind the apparent positively significant difference in prediction errors.
In addition to the above parametric procedures, the non-parametric equivalent of
each test was also reported. This consisted of a Kmskal-Wallis chi-square test statistic in
conjunction with the ANOVA procedures, and a Wilcoxon Signed-Ranks test for the
paired t-test procedures. The non-parametric results were found to be consistent with
those reported under the parametric procedures.
The empirical analyses also included a section related to an examination
controlling for differences in maturity between the foreign and domestic debt
announcements. This analysis was included because such a control was not possible in
the original sampling procedures given the limited amount of data available. Controlling
for differences in maturity did not provide any significant change in the results reported
in the prior sections. It was found, as before, that onh group nine persisted as a
significant result. One possible explanation for this result was that a large sub-category
of group nine related to observations for which the domestic maturit) exceed the foreign
maturity. However, there were no other major changes in significance for the other
groups related to this maturit) difference classification. The fact that only group nine
showed persistent significance may indicate that this significance w as the result of three
outliers contained in this group. Unfortunately, no logical reason related to these outliers
could be identified.
97
In conclusion, there are a few significant results based on the anah ses related
solely to the examination of prediction errors for foreign debt offer announcements and
based on the analyses comparing the foreign and domestic prediction errors. However,
these significant results may be due to other unidentifiable factors besides those explored
by Lee and Zechner. It is therefore argued that there is no conclusiv e evidence to support
the specific hypotheses proposed by Lee and Zechner. Further, the overall results provide
little evidence to reject the null hypotheses based on the newly derived intemational
equilibrium given in Chapter III.
The primary drawback of the analysis conducted in this dissertation relates to the
availability of sufficient data needed to test the explicit hypotheses explored.
Specifically, the empirical (and theoretical) research presented in this dissertation focused
on the issue conceming foreign versus domestic currency borrowing and its impact on
domestic firm value. In other words, an attempt was made to discem any differential
stock price reaction for a foreign currency debt offer relative to a domestic debt offer. In
conducting this analysis, announcements of foreign currency borrowings by domestic
firms were subsequently "matched" with domestic debt announcements.
This matching procedure introduced two major problems. First, adequate
information related to a given debt offering was not always available. Second, attempting
to control for all possible differences between offers severely limited the amount of
useful data. Consequently, it was impossible to control for all possible differences among
the debt offers. The primary variables controlled for due to the hypotheses of interest,
and based on previous research, were the time-frame of the issue, the type of the issue (no
convertible securities are present in the sample), and the industry of the firm proposing
the offer. These three factors alone eliminated 37 of the 115 (32%) foreign currency debt
offer announcements.
Given the drawbacks associated with the specific construction of the anah sis
employed in this dissertation, one possible altemative would be to examine the real after
tax interest rate relationship across countries on a macro-economy level. This type of a
procedure would eliminate the restricted data problem present in the current analysis.
98

•cv!v v«'',!ii!i ' '-i'"-:"'"'"'" lii i'
However, a macro analysis based on general interest rate relationships would provide no
information with respect to shareholder reactions to the use of foreign currency debt
relative to domestic debt. Regardless of the type of analysis employed, there will ahva)s
be limitations, and one can only hope to provide a good thorough analysis given the
specific questions at hand.
99

ENDNOTES
'In a strict since, equation (2.1) is an "uncovered" Interest Rate Parity condition because the exchange position of foreign borrowing or lending is not "covered" b) an offsetting position in the forward exchange market. Henceforth, the condition giv en by equation (2.1) is simply referred to as Interest Rate Parity (IRP) because the models examined generally assume certainty, or that the exchange market is efficient.
"The RPPP theory argues that the percentage change in an exchange rate over the period will be equal to the geometric difference in the inflation rates between the two countries of concem. For example, if the expected domestic inflation rate was 5 percent while the expected foreign inflation rate was 2 percent, then the change in the exchange
'(1+.05) rate should be
(1+.02) - 1 >xlOO or 2.94%. In other words, the value of the foreign
currency should increase by 2.94% (relative to the domestic currency) to offset the relative change in purchasing power between the two countries.
In the analyses reviewed, the retum on equity is both real and nominal in the sense that some sections assume no inflation, while others assume a positive inflation rate. No effort is made to change the notation as the situation warrants. For all practical purposes and to be consistent with existing theories, the retum on equity is a nominal retum.
''Note that the firm has not issued foreign equit). The relationship in equation (2.7) is stated as such due to the RPPP and IRP assumptions.
^Howard and Johnson (1982) also recognize that the existence of taxes and inflation in an intemational setting may lead to a non-neutral it) in that one country's expected real interest rate might change. Hodder and Senbet (1990) argue that this inconsistency stems from an assumption that personal taxes on interest income are not progressive.
^Again it is assumed that Tif = 0. This allows for the RPPP to be expressed as it is in equation (2.17).
^For expositional ease, all derivations in this section assume continuous compounding so that complex cross-product terms may be ignored. Further, it is assumed that expected inflation equals actual inflation. Hence, no notation for expectations appear in the formulas.
^See also Feldstein (1976) or Tanzi (1976).
100

^Again, for expositional ease, all derivations in this section assume continuous compounding so that complex cross-product terms may be ignored Further, it is assumed that expected inflation equals actual inflation. Hence, no notation for expectations appear in the formulas.
10-The issue conceming which market the bond was offered in is deemed unimportant due to the fact that all but six of the foreign offers were made in the Eurobond market.
"The initial sample relates to U.S. domestic nonfinancial public corporations. Excluded from this sample are government agencies and debt offerings by the foreign subsidiaries of domestic firms. The theories explored in Chapters II and III focus on purely domestic firms, hence it is argued that only offerings by domestic based firms should be included in the analysis.
' All domestic debt offers had to meet the same selection criteria as their foreign counterpart. That is, once domestic offers within the same "window" were identified each was then screened for data availability and other firm-specific announcements.
' At the time of collection, the SEC data tape only contained information current as of the end of 1988. The remaining five years (1989-1993) of data were collected using the West Law database to identify SEC filing announcements in The Wall Street Journal.
'' Factors such as differences in maturity, straight debt versus convertible debt and public versus private offerings are taken into consideration, given the information was available, as differences in some of these factors may impact the results, see for example Dann and Mikkelson [1984], Eckbo [1986] and James [1987]. However, since the domestic data represent SEC registrations such information was not always provided at the time of registration. It follows that investors must react only to the information provided (i.e., the firm announcing a plan to offer debt).
'^Exchange rate data were collected to determine the classification accuracy using inflation rate differentials. Examination of the inflation rate differentials and exchange rates did not resuh in significant reclassification of the regimes under study. When observations were reclassified using actual changes in exchange rates, only 11 observations were classified to a new inflation/tax regime group. Therefore only inflation rate differentials, used to proxy for expected changes in currency values, were used to classify the debt offer announcements.
'^Inflation rates for New Zealand and Australia were only available on a quarterly basis, and do not appear in Appendix A. Inflation rates for Italy were incomplete, and only obtained for the necessary months.
101

^ 'I ff'mmv
' In an attempt to maximize the separation across groups, inflation rates v\ere considered equal unless the difference in rates exceeded +/- .5% and tax rates were considered equal unless the difference exceeded +/- 1%.
' Due to lack of observations, group 6 is not included in the subsequent empirical analyses. Group 2 is also excluded, except in the ANOVA procedures.
'^The data were examined for the presence of potentially influential outliers. This procedure involved analyzing the studentized residuals from dummy variable regression analyses comparable to the ANOVA procedures employed later. The analyses were conducted on both the FPE and the prediction error differences including and excluding a control for differences in maturity. Although two or three outliers were marginally significant for the day "-1" and cumulative two-day results, none were found to influence the results reported. Several measures of influence, including Cook's Distance and actual exclusion from the model, were used to analyze the potential affect of the identified outliers. The exclusion of the outliers did not lead to a change in the results reported, or a change in the inferences drawn, for either the overall sample or the individual groups examined.
^°Paired t-test and Wilcoxon Signed-Ranks test results similar to those in Appendix D did not yield results different from those reported in the one-way ANOVA procedures of this section, and are therefore not reported.
102

L-^TTTiTBifff' lti!E^.,^.:.:4.';'JViiffiM^..i^^-r-
BIBLIOGRAPHY
Aczel, Amir, (1989 ed.). Complete Business Statistics. Irwin, Boston.
BenZion, U. and J. Weinblatt, (1984), "Purchasing Power, Interest Rate Parities and the Modified Fisher Effect in Presence of Tax Agreements," Journal of Intemational Monev and Finance, 67-73.
Brown, S. J. and J. B. Wamer, (1980), "Measuring Security Price Performance," Joumal of Financial Economics, Vol. 8, No. 3, 205-258.
Brown, S. J. and J. B. Wamer, (1985), "Using Daily Stock Retums: The Case of Event Studies," Joumal of Financial Economics, Vol. 14, No. 1,3-31.
Buckle, N., C. Kraft and C. van Eeden, (1969), "An Approximation to the Wilcoxon-Mann-Whitney Distribution," American Statistical Association Joumal, 591-599.
Corrado, C. J., (1989), "A Non-parametric Test for Abnormal Security-Price Performance in Event Studies," Joumal of Financial Economics, Vol. 23, No. 2, 385-395.
Corrado, C. J. and T. L. Zivney, (1992), "The Specification and Power of the Sign Test in Event Study Hypothesis Test Using Daily Stock Retums," Joumal of Financial and Quantitative Analvsis, Vol. 27, No. 3, 465-478.
Dann, L. Y., and W. H. Mikkelson, (1984), "Convertible Debt Issuance, Capital Stmcture Change and Financing-Related Information," Joumal of Financial Economics, Vol. 13, No. 2. 157-186.
Darby, M. R., (1975), "The Financial and Tax Effects of Monetary Policy on Interest Rates," Economic Inquiry, 266-276.
DeAngelo, H. and R. W. Masulis, (1980), "Optimal Capital Structure Under Corporate and Personal Taxation," Joumal of Financial Economics, Vol. 8, No. 1. 3-29.
DeAngelo, H. and R. W. Masulis, (1980), "Leverage and Dividend Irrelevancy Under Corporate and Personal Taxation," Joumal of Finance, Vol. 35, No. 2, 453-467.
de Faro, C. and J. V. Jucker, (1973), "The Impact of Inflation and Devaluation on the Selection of an Intemational Borrowing Source," Joumal of Intemational Business Studies, 97-104.
Eaker, M. R., (1980), "Denomination Decision for Multinational Transactions," Financial Management, Vol. 9, No. 3, 23-29.
103

' J'wp/i
Easterbrook, F., (1984), "Two Agency-Cost Explanations of Dividends," American Economic Review, Vol. 74, No. 4, 650-660.
Eckbo, B.E., (1986), "Valuation Effects of Corporate Debt Offerings," Joumal of Financial Economics, Vol. 15, Nos. 1/2, 119-151.
Fama, E. F. and M. R. Gibbons, (1984), "A Comparison of Inflation Forecasts," Joumal of Monetary Economics. Vol. 13, No. 3, 327-348.
Feldstein, M., (1976), "Inflation, Income Taxes and the Rate of Interest: A Theoretical Analysis," American Economic Review, Vol. 66, No. 5, 809-820.
Fisher, I., (1907), The Rate of Interest: Its Nature, Determination, and Relation to Economic Phenomena. Macmillan, New York.
Fisher, L, (1930), The Theorv of Interest. Macmillan, New York.
Ho, T. S. Y. and R. Singer, (1982), "Bond Indenture Provisions and the Risk of Corporate Debt," Joumal of Financial Economics, Vol. 10, No. 4, 375-406.
Hodder, J. E. and L. W. Senbet, (1990), "Intemational Capital Stmcture Equilibrium," Joumal of Finance. Vol. 45, No. 5, 1495-1516.
Howard, D. H. and K. H. Johnson, (1982), "Interest Rates, Inflation, and Taxes: The Foreign Connection," Economics Letters, 181-184.
James, C , (1987), "Some Evidence on the Uniqueness of Bank Loans," Joumal of Financial Economics, Vol. 19, No. 2, 217-235.
Johnson, D., (1988), "The Currency of Denomination of Long-Term Debt in the Canadian Corporate Sector: An Empirical Analysis," Joumal of Intemational Monev and Finance, 77-90.
Kidwell, D. S., M. W. Marr, and G. R. Thompson, (1985). "Eurodollar Bonds: Altemative Financing for U.S. Companies," Financial Management, Vol. 14, No. 4, 18-27.
Kidwell, D. S., M. W. Marr, and G. R. Thompson, (1986), "Eurodollar Bonds, Altemative Financing for U.S. Companies: A Correction," Financial Management, 78-79.
Lee, M. H. and J. Zechner, (1984), "Debt, Taxes, and Intemational Equilibrium," Joumal of Intemational Monev and Finance, Vol. 3, No. 3, 343-355.
104
laiiii >'j 'qj^^!Pg?gl^^^^*

n i T M
Liu, Y. A. and L. P. Hsueh, (1993). "Tax Effect on the Debt Denomination Decision of Multinational Projects," Joumal of Intemational Business Studies, Vol. 24, No. 1. 145-154.
Madura, J. and R. H. Fosberg, (1990), "The Impact of Financing Sources on Multinational Projects," Joumal of Financial Research, Vol. 13, No. 1, 61-69.
Marr, W. and J. Trimble. (1988), "The Persistent Borrowing Advantage in Eurobonds: A Plausible Explanation," Joumal of Applied Corporate Finance. 65-70.
Merton, R., (1974), "On the Pricing of Corporate Debt: The Risk Structure of Interest Rates," Joumal of Finance. Vol. 29, No. 2, 449-465.
Miller, M. H., (1977). "Debt and Taxes," Joumal of Finance. Vol. 32. No. 2. 261-275.
Modigliani, F. and M. H. Miller, (1958), "The Cost of Capital, Corporate Finance and the Theory of Investment," American Economic Review, 261-297.
Modigliani, F. and M. H. Miller, (1963). "Corporate Income Taxes and the Cost of Capital: A Correction," American Economic Review, 433-443.
Senbet, L. W., (1979), "Intemational Capital Market Equilibrium and the Multinational Firm Financing and Investment Policies," Joumal of Financial and Quantitative Analvsis, Vol. 45, No. 5, 455-477.
Shapiro, A. C, (1984), "The Impact of Taxation on the Currency-of-Denomination Decision for Long-Term Foreign Borrowing and Lending," Joumal of Intemational Business Studies, Vol. 15, No. 1, 15-25.
Stephens, M. A., (1966), "Statistics Connected with the Uniform Distribution: Percentage Points and Application to Testing for Randomness of Directions," Biometrika, 235-240.
Tanzi, V., (1976), "Inflation, Indexation and Interest Income Taxation," Banca Nazionale del Lavoro Ouarterlv Review. 54-76.
Tanzi. V., (1980), "Inflationary Expectations, Economic Activity, Taxes and Interest Rates," American Economic Review, Vol. 70, No. 1, 12-21.
105

i — ' I T i l r I I'liTi
APPENDIX A
SUMMARY STATISTICS
106

•i-.'Ai'itBmt^viMtviTm.i
Table A.l
Summary statistics foreign currency debt issues
(full sample)
Number of Issues Number of Firms Number of Currencies'
115 56 9
Issue Characteristics
Maximum Size^ Minimum Size Mean Size Standard Deviation
$198.00 $23.50 $85.03 $37.22
Maximum Maturity Minimum Maturity Mean Maturity Standard Deviation
60. years 1.0 8.20 6.34
Maximum Coupon Rate Minimum Coupon Rate Mean Coupon Rate Standard Deviation
18.5% 0.0% 7.95% 3.27%
The breakdown by currency is AUS 10, C$ 6, DM 20, FF 3, LIR 5, NZ 1, SFR 38, STG 13, YEN 19
''Figures represent approximate U.S. dollar equivalent (in millions) converted at time of issue. Values were converted to U.S. dollars using the exchange rate given in the Wall Street Journal on the day of the announcement.
107

•^MCMOinuu- -"^•'•f'''!"!
Table A.2
Summary statistics domestic currency debt issues
Number of Issues^ Number of Firms
78 65
Issue Characteristics'"
Maximum Size Minimum Size Mean Size Standard Deviation
$205.00 $21.25 $67.82 $41.27
Maximum Maturity Minimum Maturity Mean Maturity Standard Deviation
31.0 years 3.0
17.47 8.54
Maximum Coupon Rate Minimum Coupon Rate Mean Coupon Rate Standard Deviation
17.00% 0.00% 9.90% 4.05%
The domestic observations used relate to the announcement of a SEC registration to offer a debt issue. Not all issues registered were subsequentiy offered. Of the 78 observations, 25 debt registrations were not subsequently offered. Accordingly, the sample characteristics given in this table are calculated using data related only to the debt issues actually offered at some point after the initial announcement (SEC registration) to offer was made. Hence, for the figures given N = 55.
''All Figures are in millions of U.S .dollars
108

fB mmtm I
Table A.3
Summary statistics foreign currency debt issues
(matched sample)
Number of Issues Number of Firms Number of Currencies^
Issue Characteristics''
78 45
9
Maximum Size Minimum Size Mean Size Standard Deviation
$198.00 $30.70 $88.05 $38.72
Maximum Maturity Minimum Maturity Mean Maturity Standard Deviation
60. years 2 8.6 7.3
Maximum Coupon Rate Minimum Coupon Rate Mean Coupon Rate Standard Deviation
18.50% 4.00% 7.56% 2.77%
The breakdown by currency is AUS 5, C$ 2, DM 15, FF 2, LIR 1, NZ 1, SFR 29. STG 7. YEN 14.
''Figures represent approximate U.S. dollar equivalent (in millions) converted at time of issue. Values were converted to U.S. dollars using the exchange rate given in the Wall Street Journal on the day of the announcement.
109
'mmtm'

m tnat^fi^m ' "'iii;';! fflfri'-iTT^^-iTTr-rr-^
Table A.4
Summary statistics firms announcing debt issues' (both domestic and foreign)
Full Foreign Sample
Maximum Firm Size'' Minimum Firm Size Mean Firm Size Standard Deviation
Matched Foreign Sample
Maximum Firm Size Minimum Firm Size Mean Firm Size Standard Deviation
Domestic Sample
Maximum Firm Size Minimum Firm Size Mean Firm Size Standard Deviation
n=115
$125,689,667 $358,947
$12,738,779 $19,893,639
n=78
$125,689,667 $358,947
$14,258,966 $22,893,152
n=78
$140,176,050 $277,329
$14,122,304 $22,847,129
'All figures in thousands of U.S. dollars.
''Firm size is calculated as the 3 year average of total assets including the year prior to and following the year of a specific debt issue announcement.
110

; ^ ^ t ; ^ . u i . i ^ j . . imiMfimtmVirm^^
Table A.5
Industry representation summary for the firms included in the matched sample'
SIC Code Industry Description Frequency
13 20 21 26 28 29 30 32 33 34 35 37 38 40 49 54 58 73 78 80 87
Oil & Gas Extraction 3 Food & Kindred Products 6 Tobacco Products 6 Paper & Allied Products 4 Chemicals & Allied Products 12 Petroleum Refining & Related Products 5 Rubber & Misc. Plastics Products 2 Stone, Clay, Glass, Concrete Products 2 Primary Metal Industries I Fabricated Metal, Transportation Equipment 2 Industrial/Commercial Machinery, Computer Equip. 2 Transportation Equipment 8 Measuring Industrial, Photo Goods, Watches 4 Railroad Transportation Electrical, Gas, Sanitary Services Food Stores Eating & Drinking Places Business Services Motion Pictures Health Services Engineering, Accounting, Research, Related Services
'Descriptions related to the various industry classification were taken from Standard & Poor's Compustat Services, Inc.
I l l

«'Vf*?I."»''>!'fi'!*-'.'i
Table A.6
Domestic and foreign corporate tax rates'
Country
Australia Canada France Germany Japan Italy New Zealand Switzerland'' United Kingdom United States
1985
46% 44 50 56 43.3 36 45 35 45 46
1986
49% 44 45 56 43.3 36 48 35 40 46
1987
49% 43 45 56 42 36 48 35 35 34
Year
1988
39% 41 42 56 42 36 28 35 35 34
1989
39% 40 42 50 37.5 36 28 35 35 34
1990
39% 39 42 50 37.5 36 33 35 34 34
1991
39% 38 34 50 37.5 36 33 35 34 34
1992
39% 38 34 50 37.5 36 33 35 33 34
1993
39% 38 33.33 50 37.5 36 33 35 33 34
'Tax rates used in this study represent the country's maximum corporate tax rate or the "typical" maximum tax rate. For example, Switzerland has a wide range of cantonal and communal tax rates, but defines 35% as the maximum "general-mle" tax rate applied to corporate profits.
''For Switzerland (as with the other countries), the 35% rate represents information obtained from the Prentice Hall publication Corporate Taxes A Worldwide Summary. According to this source, this rate remained unchanged for the sample period in question.
112
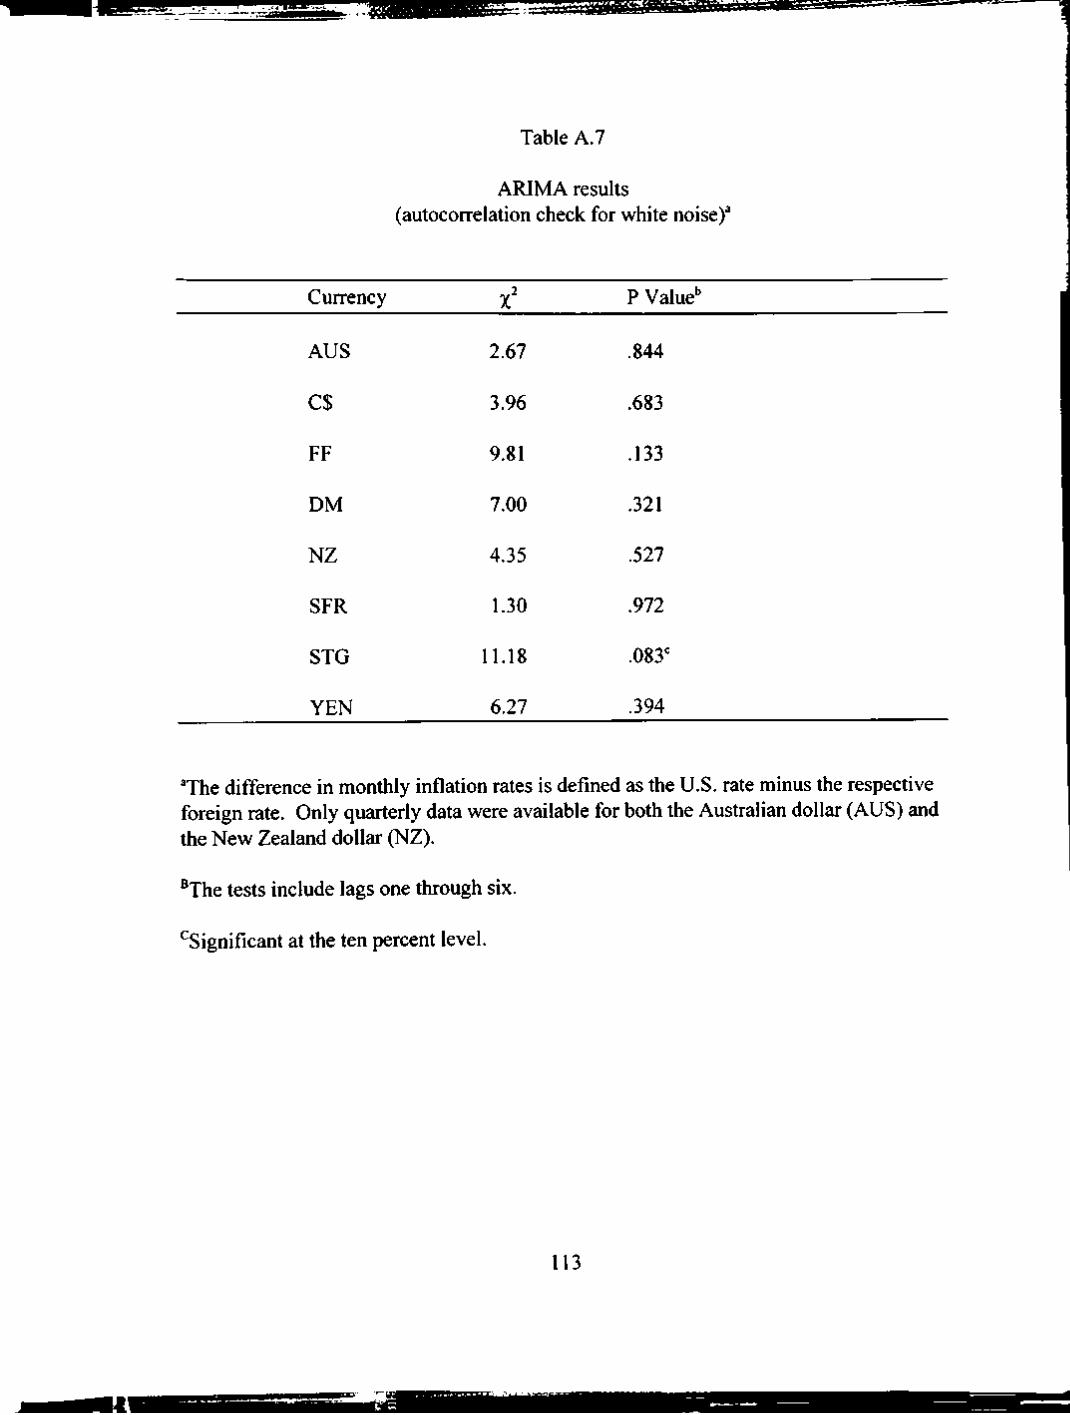
^ I B ^ 1
Table A.7
ARIMA results (autocorrelation check for white noise)'
Currency P Value"
AUS
c$
FF
DM
NZ
SFR
STG
YEN
2.67
3.96
9.81
7.00
4.35
1.30
11.18
6.27
.844
.683
.133
.321
.527
.972
.083 =
.394
'The difference in monthly inflation rates is defined as the U.S. rate minus the respective foreign rate. Only quarterly data were available for both the Australian dollar (AUS) and the New Zealand dollar (NZ).
^The tests include lags one through six.
^Significant at the ten percent level.
113

"TTTSB3S5 "'-'TOiWiiir-iiTiTmr
c/ v^ h= P CJ Q
114

.-'U^li^.r^
^ U, ^
D tt Q
••->
Q
</3
O
c
Vi 3
•5 ori o 1-5
<N
< •
ro
c3 fti c O *—> rr{
g.^
I
115
- U

"'• - •cfTi'f lMJH'" 'iWWT'-""'riiirMii I n'^
v ^ <^ $i-i c/ S ^ D Q Q
r*
<
>- l
3 ftn
uU
<u
nR
at
o
flat
i
c • — «
thly
c o
> .
rman
<u O 3 CO V H
>
oi •—:
H I
116
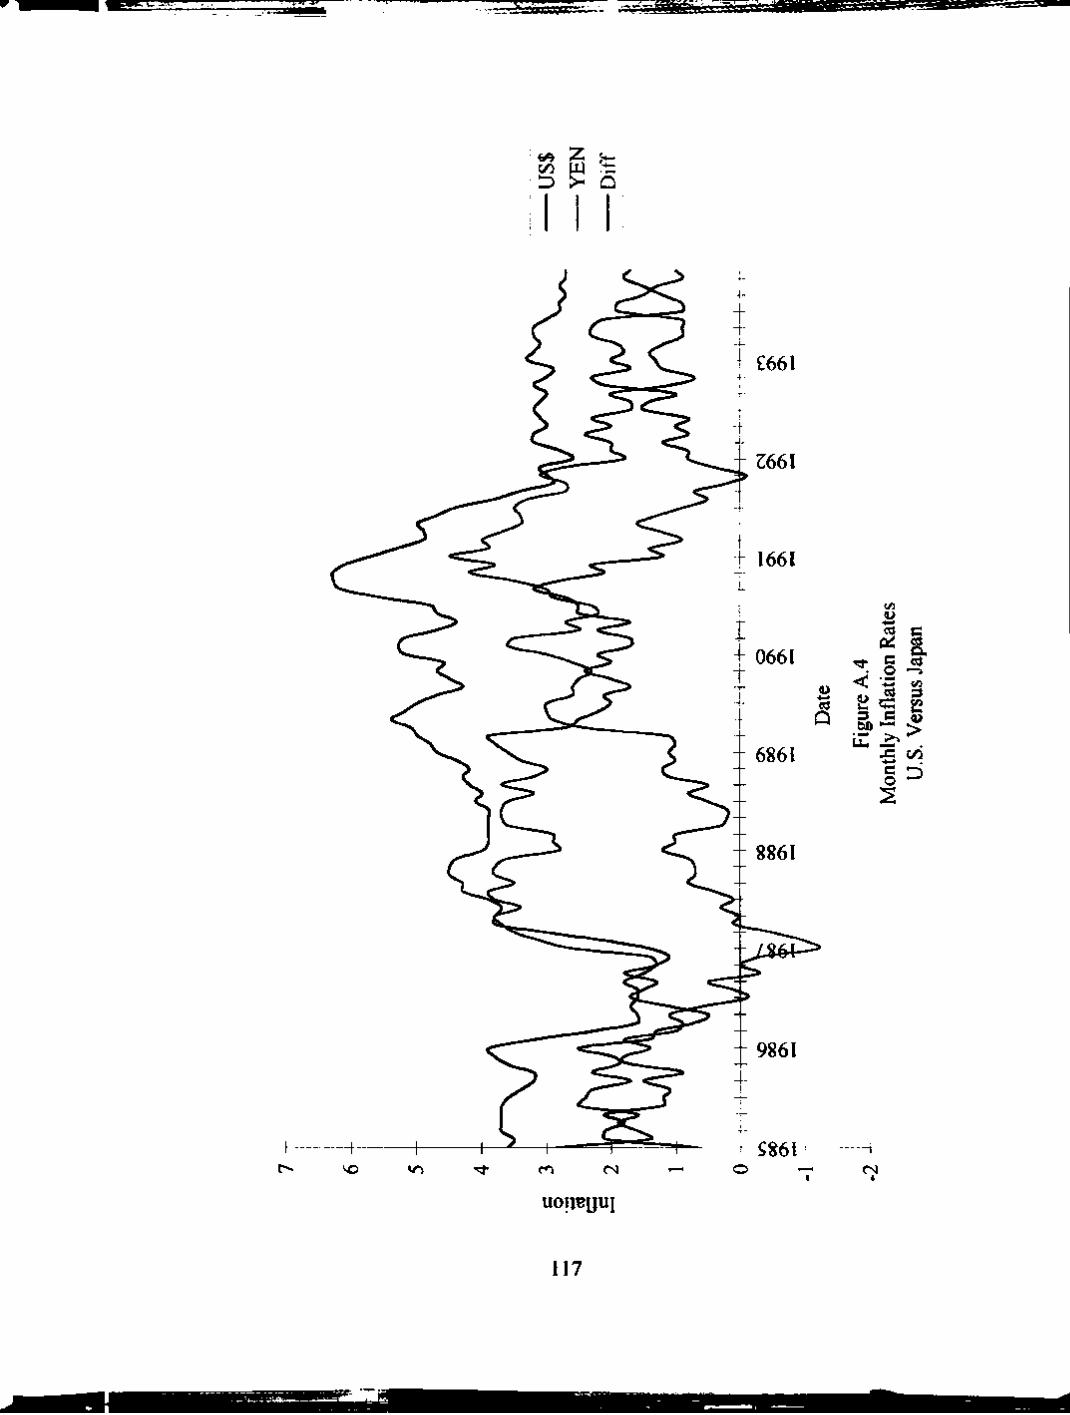
l-.-i., .1
V> Z ;. c/D m :t: D > Q
a> • • - . *
Q
• ^
<
Figu
Vi
-> e« oi c o ' • « - <
m q::
x ; +-»
o
c a . c3
^^ 1/2
rn Vi
(L> >
c/ ;:D
^-§861 I
117

TSPSjmr-wT'Tr- - tn^^S^Q^^^^^S^^^SdEe^^^ sjvr?
^ 0^ ^ 00 cZ T : D ^ Q
in
<
a u.
c/) U * - > C3
Q^
c o
^
> .
C o s
-o c <a U i
0) N
• ^ ^
1^
SUS
S
U i
>
00
D
118

It^ '3ti>^ W . J - • • • - . - " • ^ T n"'! ' 111 I |1HI i i l i ^ -
«^ O fe 00 H — D en Q
^
< •
a Pu
C/3
-» ea a: c o
q:: ^
hly
o
^
D C/5
3 C/5
>
00
O
oo
119
^ 1

.!K,V,iJ.»-«»'.M.^."'- Vi't A'-".^ ^fPyCg^"*.™
APPENDIX B
EVENT METHODOLOGY RESULTS
120

^SdJtfc'rf'iAkfirt^;-.
Table B.l
Event methodology results for the matched foreign and domestic samples using both the CRSP Value and Equal Weighted retum series
Panel A Value Weighted # Pos. Avg. PE S(PE) Test Statistic
Domestic Sample
Day -1 Day 0 Days 0-1
Foreign Sample
Day -1 Day 0 Days 0-1
Panel B Equal Weighted
37 36 38
35 37 39
-.0207% .022% .00139%
-.07% -.092% -.1615%
.1928
.1928
.2727
.1513
.1513
.2139
-.0174 .1141 .0051
-.4627 -.6081 -.7550
Domestic Sample
Day -1 Day 0 Days 0-1
Foreign Sample
Day -1 Day 0 Days 0-1
38 37 36
36 35 37
-.0203% -.032% -.0524%
-.047% -.164% -.2116%
.2023
.2023
.2860
.1586
.1586
.2242
-.1003 -.1582 -.1832
-.2963 -1.034 -.9438
121

^aiWfciMnr i- - ~ - '•'•^ I n i l I Til
Table B.2
Event methodology results using the CRSP Value Weighted retum series for the foreign announcement sample with the observations segmented into their
respective inflation/tax regime groupings'
Group''
1
3
4
5
7
8
9
#Pos.
5
6
6
4
3
6
9
Avg. PE
.6813%
.1966%
.3243%
-.3416%
-.1807%
.0383%
-.7168%
S(PE)
.8147
.6951
.5462
.4651
.6875
.5317
.4512
Test Statistic
.8362
.2828
.5937
-.7345
-.2628
.0720
-1.589 ^
n
6
10
8
11
6
14
20
'All calculations are for two day prediction errors.
^Groups 2 and 6 were excluded due to sample sizes of n=2 and n=l, respectively.
'Significant at the 10 percent level.
JO")
* , » ! » » • •

T:^VS.>-
Table B.3
Event methodology results using the CRSP Equal Weighted retum series for the foreign announcement sample with the observations segmented into their
respective inflation/tax regime groupings'
Group''
1
3
4
5
7
8
9
#Pos.
4
6
5
5
3
6
9
Avg. PE
.3544%
.0496%
.1435%
-.2437%
-.3359%
.2448%
-.7840%
S(PE)
.9214
.6918
.5903
.4958
.7570
.5866
.4629
Test Statistic
.3846
.0717
.2431
-.4915
.4437
.4173
-1.6937
n
6
10
8
11
6
14
20
'All calculations are for two day prediction errors.
''Groups 2 and 6 were excluded due to sample sizes of n=2 and n=l, respectively.
'Significant at the 5 percent level.
123

' "'-""!'• "iffri^-'B^TiiiT-
Table B.4
Non-parametric event methodology results using the CRSP Value and Equal Weighted retum series for the foreign announcement sample with the observations segmented into
their respective inflation/tax regime groupings'
Group^
Value Weighted Test Statistic
1.2049
-1.3341
.3344
.8099
-.6017
-.2358
.0752
-1.1653
Equal Weighted Test Statistic
.5294
-1.4306
.2548
.2464
-.3375
-.3456
.3999
-1.4632
n
6
2
10
8
11
6
14
20
1
2
3
4
5
7
8
9
'All calculations are for two day prediction errors.
^Group 6 was excluded due to sample size of n=l.
124

-^~- - '-r^ liriTiTTii ' ^'T^— •r-f-a.
Table B.5
Small sample non-parametric event methodology results using the CRSP Value and Equal Weighted retum series for the foreign announcement sample with the observations
segmented into their respective inflation/tax regime groupings'
Value Weighted Test Statistic'
Equal Weighted Test Statistic'
Group"
1
2
3
4
5
7
8
9
3.8725
.4510
5.2745
4.5686
5.0294
2.8333
7.0784
8.5098
n
3.3725
.4216'
5.2059
4.1667
5.2255
2.7549
7.4118
8.1569 ^
6
2
10
8
11
6
14
20
'All calculations are for two day prediction errors.
"Group 6 was excluded due to sample size of n=l.
The values given in the appropriate significance tables represent the lower tail of the distribution. Therefore, a smaller test statistic represents greater potential significance.
''Significant at the 10 percent level.
125

IfE w ^ ^ :*:««*«25ea6^K2«eBnw
APPENDIX C
ONE-WAY ANOVA RESULTS
126

T a b l e d
Day "-1" and day "0" prediction error one-way ANOVA results using the CRSP Value Weighted retum series
for the data segmented into their respective inflation/tax regime groupings'
Group"
Panel A Dav -1
1 2 3 4 5 7 8 9
10
Panel B Dav 0
1 2 3 4 5 7 8 9
10
Parameter Estimate(%)
.4474 -.0404 .2277 .6008
-.0065 .1294
-.2516 -.5194 -.0207
.2341 -.8535 -.0311 -.2765 -.3352 -.3099 .2900
-.1973 .0221
t Statistic
Overall F-Value .82
.85 -.04 .56
1.32 -.02 .25
-.73 -1.80
-.14
Overall F-Value .41
.43 -.90 -.07 -.58 -.83 -.56 .81
-.65 .14
P Value
P-Value .5887
.3966
.9647
.5773
.1894
.9867
.8060 -4663 .0736' .8872
P-Value .9141
.6711
.3718
.9419
.5626
.4106
.5740
.4219
.5136
.8850
'Groupd 10 relates to the full domestic sample as its own group with N = 78.
^Group 6 was excluded due to a sample size of n=l.
'Significant at the 10 percent level.
127
«-«aMinMR»i!0»*'

^^smm wm L'!L.l , | rr^SCSSSWSttttSfe^?
Table C.2
Day "-1" and day "0" prediction error one-way ANOVA results using the CRSP Equal Weighted retum series
for the data segmented into their respective inflation tax regime groupings'
Group"
Panel A Dav -1
1 2 3 4 5 7 8 9
10
Panel B Dav 0
1 2 3 4 5 7 8 9 10
Parameter Estimate(%)
.2993 -.3037 .0978 .6721 .2233 .1741
-.0927 -.5784 -.0203
.0549 -.8355 -.0410 -.5285 -.4669 -.5097 .3376
-.2056 -.0321
t Statistic
Overall F-Value .73
.54 -.32 .23
1.40 .55 .31
-.26 -1.91
-.13
Overall F-Value .63
.10 -.88 -.11
-1.11 -1.15
-.93 .94
-.68 -.21
P Value
P-Value .6829
.5890
.7515
.8197
.1624
.5853
.7532
.7982
.0580'
.8946
P-Value .7737
.9203
.3802
.9099
.2673
.2506
.3539
.3484
.4945
.8330
'Groupd 10 relates to the full domestic sample as its own group with N = 78.
"Group 6 was excluded due to a sample size of n=l.
'Significant at the 10 percent level.
128

I ^ W ^ aei w^ -. ,••• iT i . r . f -^^^i i" , - > ^ i ^ r - - » ' - - ^
Table C.3
Cumulative two-day prediction error one-wa) ANOVA results using both the CRSP Value and Equal Weighted retum series
for the data segmented into their respective inflation/tax regime groupings'
Group"
Panel A
1 2 3 4 5 7 8 9
10
Panel B
1 2 3 4 5 7 8 9
10
Parameter Esfimate(%)
Value Weighted
.6813 -.8940 .1966 .3243
-.3416 -.1807 .0383
-.7168 .0014
Equal Weighted
.3544 -1.1390
.0496
.1435 -.2437 -.3359 .2448
-.7840 -.0524
t Statistic
Overall F-Value .74
.98 -.74 .36 .54
-.66 -.26 -.08
-1.88 .01
Overall F-Value .65
.49 -.91 .09 .23
-.46 -.47 .52
-1.99 -.26
P Value
P-Value .6564
.3292
.4595
.7159
.5913
.5073
.7955
.9331
.0621'
.9942
P-Value .7510
.6229
.3620
.9292
.8181
.6471
.6412
.6039
.0485"
.7931
'Groupd 10 relates to the full domestic sample as its own group with N = 78.
"Group 6 was excluded due to a sample size of n=l.
'Significant at the 10 percent level.
''Significant at the 5 percent lev el.
129

7i?smrfs^
Table C.4
Foreign minus domestic prediction error differences day "-1" and day "0" one-way ANOVA results using the CRSP Value Weighted retum series
for the data segmented into their respective inflation/tax regime groupings'
Group"
Panel A
1 2 3 4 5 7 8 9
Panel B
1 2 3 4 5 7 8 9
Dav -1
Dav 0
Parameter Estimate(%)
.5305
.1226
.4146 ,4305 .0681
1.1179 -.5524 -.4692
-.1890 -.8115 -.2435 -.3160 -.3264 -.4916 .2556 .0357
t Statistic
Overall F-Value .89
.75
.10
.76
.71
.13 1.59
-1.20 -1.22
Overall F-Value .24
-.25 -.63 -.42 -.49 -.59 -.66 .52 .09
P Value
P-Value .5305
.4537
.9202 4496 .4824 .8962 .1168 .2348 .2277
P-Value .9811
.8009
.5322
.6749
.6265
.5556
.5123
.6026
.9307
'The difference in prediction errors is calculated as the foreign prediction error (FPE) minus the domestic prediction error (DPE).
"Group 6 was excluded due to a sample size of n=l.
130

Table C.5
Foreign minus domestic prediction error differences day "-1" and day "0" one-way ASOWA results using the CRSP Equal Weighted retum series
for the data segmented into their respective inflation/tax regime groupings'
Group"
Panel A Dav -1
I -)
4 5 7 8 9
Panel B Dav 0
1 0
->
4 5 7 8 9
Parameter Estimate(%)
.3432
.0301
.3440
.4897
.2441 1.3680 -.5849 -.4787
-.0911 -.7680 -.2515 -.5483 -.4859 -.4804 -.3623 .0606
t Statistic
Overall F-\'alue .97
-47 .02 .61 .77 .45
1.87 -1.22 -1.19
Overall F-Value .37
-.12 -.59 --43 -.84 -.87 -.64 .73 .15
P \'alue
P-Value .4648
.6410
.9811
.5465
.4430
.6534
.0662'
.2269
.2371
P-Value .9319
.9043
.5585
.6682
.4042
.3861
.5263
.4656
.8839
'The difference in prediction errors is calculated as the foreign prediction error (FPE) minus the domestic prediction error (DPE).
"Group 6 was excluded due to a sample size of n=l.
'Significant at the 10 percent lev el.
131

T'lVi'-^'V'ivrfii^yffiitniiPii'iii Tii'itfiiiiiiif 'i . TTw r v ^
Table C.6
Foreign minus domestic cumulative two-day prediction error differences one-way ANOVA results
using both the CRSP Value and Equal Weighted retum series for the data segmented into their respective inflation/tax regime groupings'
Group"
Panel A
1 2 3 4 5 7 8 9
Panel B
1 2 3 4 5 7 8 9
Parameter Estimate(%)
Value Weighted
.3413 -.6890 .1709 .1148
-.2583 .6262
-.2969 -.4336
Equal Weighted
.2521 -.7378 .0926
-.0584 -.2420 .8879
-.2228 -.4182
t Statistic
Overall F-Value .22
.35 -.41 .23 .14
-.36 .64
-.47 -.81
Overall F-Value .23
.25 -.42 .12
-.07 -.33 .89
-.34 -.76
P Value
P-Value .9858
.7274
.6845
.8217
.8922
.7209
.5229
.6433
.4196
P-Value .9839
.8023
.6723
.9054
.9466
.7448
.3791
.7353
.4490
'The difference in prediction errors is calculated as the foreign prediction error (FPE) minus the domestic prediction error (DPE).
"Group 6 was excluded due to a sample size of n=l.
132

Table C.7
Summary of positive prediction error differences for various groups and days used in the one-way ANOV.A and the Paired t-test analyses
Group' Da) -1
Panel A Value Weighted
1 1
H
4 5 7 8 9
Panel B Equal Weighted
1 1
"> J
4 5 7 8 9
4 6 1 2 4 10 6/8 4 11 5 6 6/14 6/20
3/6 1/2 3 10 4 8 6/11 5'6 6/14 7 20
67% 50 40 75 36 83 43 30
50% 50 30 50 55 83 43 35
0
3 6 0 2 5 10 2 8 8 11 3/6 8 14 12 20
3 6 12 510 2 8 4/11 2 6 7/14 12 20
50% 00 50 25 73 50 • 57 60
50% 50 50 25 36
50 60
Two-Day
3 6 1 2 5T0 4 8 411 3 6 7/14
10 20
3 6 0'2 6 10 4 8 5 11 3 6 6/14 9 20
50% 50 50 50 36 50 50 50
50% 00 60 50 45 50 43 45
'Group 6 was excluded due to a sample size of n=l

i f i ^ ^ ^ p w ^ l g UlUJ TiTrriiTii iiTFi sssa
APPENDIX D
PAIRED T-TEST RESULTS
134
aEQDSROSSa

T^r rraes^ipswiB- mj^mK'-f^^iv^tvmm^mmi^w^ii^^r-mis^z
Table D.l
Foreign minus domestic prediction error differences day "-1" and day "0" Paired t-test results
using the CRSP Value Weighted rettam series for the data segmented into their respective inflation/tax regime groupings'
Group"
Panel A Dav -1
1 2 3 4 5 7 8 9
Panel B Dav 0
1 2 3 4 5 7 8 9
Mean(%)
.5305
.1226
.4146
.4305
.0681 1.1179 -.5524 -.4692
-.1890 -.8115 -.2435 -.3160 -.3264 -.4916 .2556 .0357
Std. Error
.6360 1.4683 .6693 .3898 .4464 .4984 .5804 .3598
.4801
.7185
.4415
.4154
.6145
.7892
.4554
.5064
t Statistic
.8341
.0835
.6194 1.1045 .1525
2.2431 -.9517
-1.3042
-.3936 -1.1294 -.5515 -.7607 -.5312 -.6229 .5612 .0704
P Value
.4422
.9470
.5510
.3059
.8819
.0749'
.3586
.2077
.7101
.4614
.5947
.4717
.6069
.5607
.5842
.9446
Wilcoxon
.5241
.2000 -.4587 .9802 .1778 1.9917' -.7847
-1.3440
-.3145 -.6000 -.1529 -.7001 .5335 -.7338 .8475 .1120
n
6 0
10 8 11 6 14 20
6 0
10 8 11 6 14 20
'The difference in prediction errors is calculated as the foreign prediction error (FPE) minus the domestic prediction error (DPE).
"Group 6 was excluded due to a sample size of n=l.
'Significant at the 10 percent level.
' Significant at the 5 percent level.
135
'j.u i.u:j.mj>mM
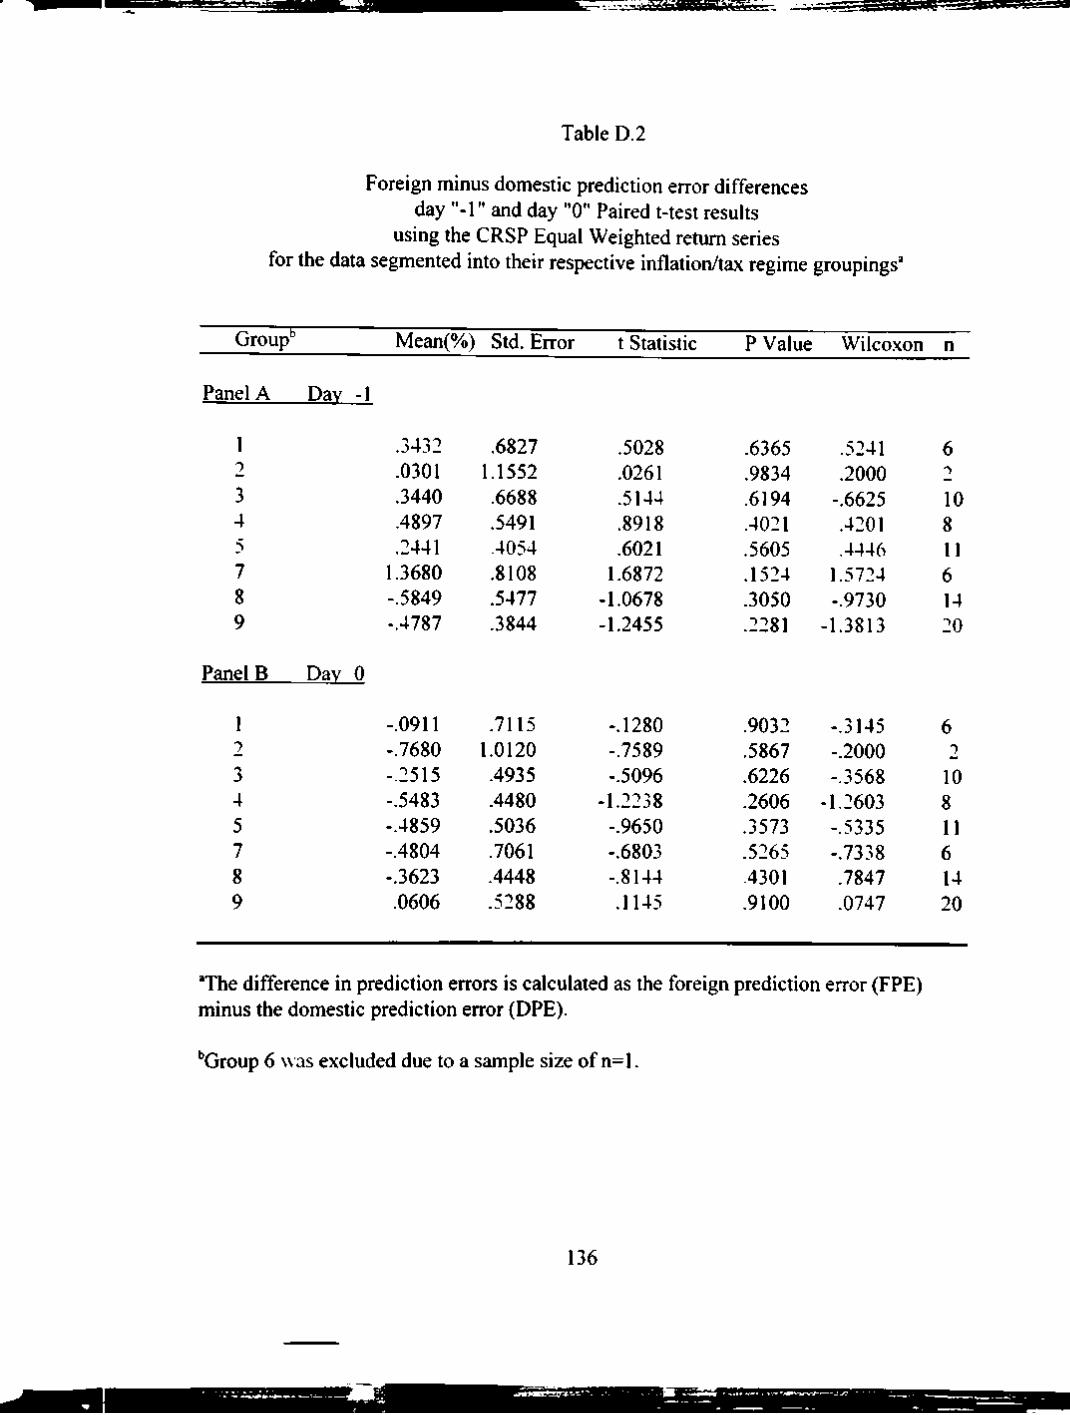
SCSCSK-."-"iS^iKKK
Table D.2
Foreign minus domestic prediction error differences day "-1" and day "0" Paired t-test resuhs
using the CRSP Equal Weighted rettim series for the data segmented into their respective inflation/tax regime groupings'
Group"
Panel A
1 2 3 4 5 7 8 9
Panel B
1 2
4 5 7 8 9
Dav -1
Dav 0
Mean(%)
.3432
.0301
.3440
.4897
.2441 1.3680 -.5849 -.4787
-.0911 -.7680 -.2515 -.5483 -.4859 -.4804 -.3623 .0606
Std. Error
.6827 1.1552 .6688 .5491 .4054 .8108 .5477 .3844
.7115 1.0120 .4935 .4480 .5036 .7061 .4448 .5288
t Statistic
.5028
.0261
.5144
.8918
.6021 1.6872 -1.0678 -1.2455
-.1280 -.7589 -.5096
-1.2238 -.9650 -.6803 -.8144 .1145
P Value
.6365
.9834
.6194
.4021
.5605
.1524
.3050
.2281
.9032
.5867
.6226
.2606
.3573
.5265
.4301
.9100
Wilcoxon
.5241
.2000 -.6625 .4201 .4446 1.5724 -.9730
-1.3813
-.3145 -.2000 -.3568
-1.2603 -.5335 -.7338 .7847 .0747
n
6 ")
10 8 11 6 14 20
6 2
10 8 11 6 14 20
'The difference in prediction errors is calculated as the foreign prediction error (FPE) minus the domestic prediction error (DPE).
"Group 6 was excluded due to a sample size of n=l.
136

rr'^fmf'imt m\mimr
Table D.3
Foreign minus domestic cumulative two-day prediction error differences Paired t-test results using both the CRSP Value and Equal Weighted retum series
for the data segmented into their respective inflation/tax regime groupings'
Group"
Panel A
1 2 3 4 5 7 8 9
Panel B
1 2 3 4 5 7 8 9
Mean(%)
Value Weighted
.3413 -.6890 .1709 .1148 -.2583 .6262 -.2969 -.4336
Equal Weighted
.2521 -.7378 .0926 -.0584 -.2420 .8879 -.2228 -.4182
Std. Error
.9719
.7501
.8414
.4366
.5211 1.1414 .6311 .6247
1.2529 .1435 .8914 .5382 .4589 1.1612 .6183 .6246
t Statistic
.3512 -.9185 .2031 .2630 -.4957 .5486 -.4704 -.6942
.2012 -5.1429 .1038 -.1085 -.5275 .7644 -.3603 -.6696
P Value
.7397
.5270
.8436
.8002
.6308
.6069
.6458
.4960
.8485
.1223
.9195
.9167
.6093
.4792
.7244
.5112
Wilcoxon
.1048 -.2000 .1529 .2801 -.7113 .5241 -.4708 -.5600
.1048 -.6000 .0510 .1400 -.8002 .7338 -.4080 -.6720
n
6 "»
10 8 11 6 14 20
6 2
10 8 11 6 14 20
'The difference in prediction errors is calculated as the foreign prediction error (FPE) minus the domestic prediction error (DPE).
"Group 6 was excluded due to a sample size of n=l.
137
>l»»li WiWtW* Wi

i,aatfi5»- •'»j>-> . . -.^ " i - ' - ^ j i _;.«P.>^.J. .. ^ ^uiiiv.,^.Pfnyff,,.-' • . . - ^ u . ^ ^ . - - , . . ^ ^
Table D.4
Foreign minus domestic cumulative two-day prediction error differences Paired t-test resuhs using both the CRSP Value and Equal Weighted retum series
for the combined foreign and domestic samples'
Day #Pos. Mean(%) Std. Error t Statistic P Value n=78
Panel A Value Weighted
Minus One 35 -.0271 .2119 -.1280 .8985
Zero 40 1320 .2019 -.6540 .5151
Two Day 36 -.1592 .2714 .5867 .5591
Panel B Equal Weighted
Minus One 34 -.0489 .2052 -.2386 .8120
Zero 36 -.1138 .1988 -.5728 .5685
Two Day 36 1629 .2639 -.6171 .5390
'The difference in prediction errors is calculated as the foreign prediction error (FPE) minus the domestic prediction error (DPE).
138

:^55SB3^^^I~
APPENDIX E
MATURITY CONTROL ANALYSES
139

BKfciLi.^
Table E.l
Cell frequency distribution for the difference in prediction errors with the data segmented by their inflation/tax regime groupings
and either maturity differences or currency of denomination
Maturity Group' 1 2 3 4 N
1 2
G
i-i
0
u
P
3 4 5 6 7 8 9
N
1 1 5 3 6 1 3 6 11
37
1 0 4 0 0 0 0 0 4
9
0 0 1 1 0 0 2 1 2
7
4 1 0 4 5 0 1 7 3
25
6 2 10 8 11 1 6 14 20
78
Currency Group AUS C$ DM FF LIR NZ SFR STG YEN N
1 2
G r 0
u
P
3 4 5 6 7 8 9
N
0 0 0 0 5 0 0 0 0
5
0 1 0 0 2 0 0 0 0
3
0 1 0 0 1 0 0 12 1
15
0 0 0 0 1 0 0 1 0
2
0 0 0 0 1 0 0 0 0
1
0 0 0 0 1 0 0 0 0
1
4 0 10 5 0 0 5 1 5
30
2 0 0 3 0 1 1 0 0
7
0 0 0 0 0 0 0 0 14
14
6 2 10 8 11 1 6 14 20
78
'As defined in the text, the maturity group variables relate to the difference in maturity for a given "matched" set of observations. Maturity difference is taken to be the foreign maturity minus the domestic. Group 1 is foreign < domestic, group 2 is foreign > domestic, group 3 is foreign = domestic, and group 4 is a missing domestic maturity value.
140
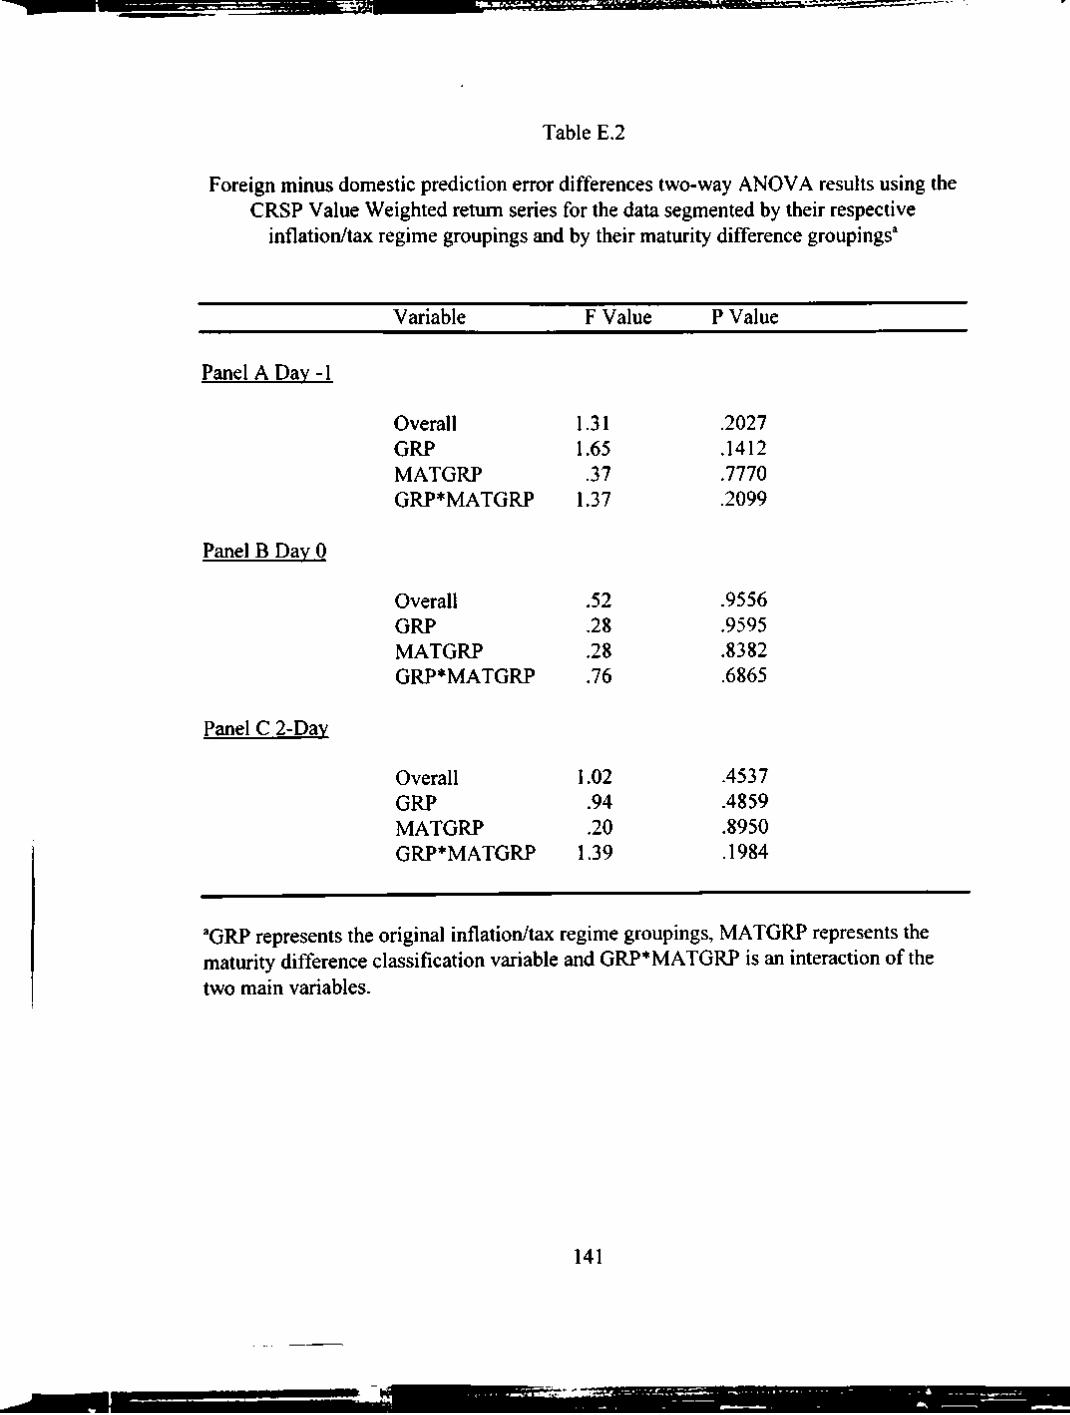
/ f^^'VAWK" iii;^.iJ(fiiiit-ifmT"wrimrIiTI? i
Table E.2
Foreign minus domestic prediction error differences two-way ANOVA results using the CRSP Value Weighted retum series for the data segmented by their respective
inflation/tax regime groupings and by their maturity difference groupings'
Variable F Value P Value
Panel A Dav -1
Panel B Dav 0
Panel C 2-Dav
Overall GRP MATGRP GRP*MATGRP
Overall GRP MATGRP GRP*MATGRP
Overall GRP MATGRP GRP*MATGRP
1.31 1.65 .37
1.37
.52
.28
.28
.76
1.02 .94 .20
1.39
.2027
.1412
.7770
.2099
.9556
.9595
.8382
.6865
.4537
.4859
.8950
.1984
'GRP represents the original inflation/tax regime groupings, MATGRP represents the maturity difference classification variable and GRP*MATGRP is an interaction of the two main variables.
141

..r^v—:T>v^^ :L,. L:ain'ii 'r ^
Table E.3
Foreign minus domestic prediction error differences two-way .ANOV.A results using the CRSP Equal U'eighted retum series for the data segmented b) their respectiv e
inflation/tax regime groupings and by their maturity difference groupings'
Variable F Value P Value
Panel A Dav -1
Panel B Dav 0
Panel C 2-Dav
Overall GRP MATGRP GRP*MATGRP
Overall GRP MATGRP GRP*MATGRP
Overall GRP MATGRP GRP*MATGRP
1.63 2.35
.48 1.83
.62
.59
.61
.87
1.24 J 0")
.30 1.74
.0719"
.0359'
.7099
.0668"
.8939
.7648
.6091
.5831
.2540
.3059
.8274
.0845'
'GRP represents the original inflation/tax regime groupings, MATGRP represents the maturity difference classification variable and GRP* MATGRP is an interaction of the two main variables.
"Significant at the ten percent level.
'Significant at the five percent level.
142
AaTJWfUfl

m '• •^•ImJaLi^cggr::^
Table E.4
Foreign minus domestic prediction error differences two-way ANOVA results using the CRSP Value Weighted retum series for the collapsed data segmented bv their respectiv e
inflation/tax regime groupings and by their maturity difference groupings'
Variable F Value P Value
Panel A Dav -1
Panel B Dav 0
Panel C 2-Dav
Overall GRP MATGRP GRP*MATGRP
Overall GRP MATGRP GRP*MATGRP
Overall GRP MATGRP GRP* MATGRP
1.83 .69 .88
2.03
.73
.76
.53 1.17
1.54 .93 .83
2.10
.0574'
.5593 -4575 .0739"
.7291
.5194
.6645
.3352
.1261
.4337
.4808
.0649"
'GRP represents the original inflation/tax regime groupings, MATGRP represents the maturity difference classification variable and GRP*MATGRP is an interaction of the two main variables. The collapsed data represent the original inflation/tax regime groupings combined according to their hypothesized sign.
'Significant at the ten percent level.
143

trxij?:-..-- i 3 : atosaaoKSi:—-- - : ryiriiii'i%i if- —r
Table E.5
Foreign minus domestic prediction error differences two-way ANOV.A results using the CRSP Equal Weighted retum series for the collapsed data segmented b) their respectiv e
inflation/tax regime groupings and by their maturity difference groupings'
Variable F Value P Value
Panel A Dav -1
Panel B Dav 0
-
Panel C 2-Dav
Overall GRP MATGRP GRP*MATGRP
Overall GRP MATGRP GRP*MATGRP
Overall GRP MATGRP GRP*MATGRP
1.90 .56
1.12 2.26
.91 1.00 .74
1.36
1.74 .85
1.19 2.52
.0465'
.6463
.3459
.0479'
.5509
.3979
.5306
.2453
.0740"
.4725
.3206
.0298'
'GRP represents the original inflation/tax regime groupings, MATGRP represents the maturity difference classification variable and GRP*MATGRP is an interaction of the two main variables. The collapsed data represent the original inflation/tax regime groupings combined according to their hypothesized sign.
^Significant at the ten percent level.
'Significant at the five percent level.
144

aasssQ •'^Jtfi'i ^ ^ H ^ ^ j c^Ebbcciafes
Table E.6
Foreign minus domestic prediction error differences two-way .ANGX'.A results using the CRSP Value Weighted retum series for the data segmented by their respective
inflation/tax regime groupings and by their maturity difference groupings (Groups 4. 5. 8, 9 and .Maturity Groups 1 & 4)'
Variable F Value P \'alue
Panel A Dav-1
Panel B Dav 0
Panel C 2-Dav
Overall GRP MATGRP GRP* MATGRP
Overall GRP MATGRP GRP*MATGRP
Overall GRP MATGRP GRP*MATGRP
1.66 1.12 .34
1.22
.25
.30
.00
.30
1.24 ")")
.21 1.15
.1422
.3550
.5638
.3146
.9765
.8261
.9836
.8281
.3054
.8852
.6481
.3417
'GRP represents the original inflation/tax regime groupings. MATGRP represents the maturity difference classification variable and GRP* MATGRP is an interaction of the two main variables. Group 1 is foreign < domestic, and group 4 represents a missing domestic maturitv value.
145

'•^ifraa ijJHrrTiuvi; ^M .v vn/ tf '- .•^^jsm^^jT^^^^^- ^rTo—.
Table E.7
Foreign minus domestic prediction error differences two-way ANOV.A results using the CRSP Equal Weighted retum series for the data segmented by their respective
inflation/tax regime groupings and by their maturity difference groupings (Groups 4, 5, 8, 9 and Maturity Groups 1 & 4)'
Variable F Value P Value
Panel A Dav -1
Panel B Dav 0
Panel C 2-Dav
Overall GRP MATGRP GRP* MATGRP
Overall GRP MATGRP GRP*MATGRP
Overall GRP MATGRP GRP*MATGRP
1.77 1.52 .22
1.23
.40
.64
.01
.29
1.44 1.52 .22
1.23
.1155
.2246
.6408
.3134
.9110
.5958
.9369
.8356
.2144
.8730
.7690
.2763
'GRP represents the original inflation/tax regime groupings, MATGRP represents the maturity difference classification variable and GRP*MATGRP is an interaction of the two main variables. Group 1 is foreign < domestic, and group 4 represents a missing domestic maturity value.
146
• \i mm
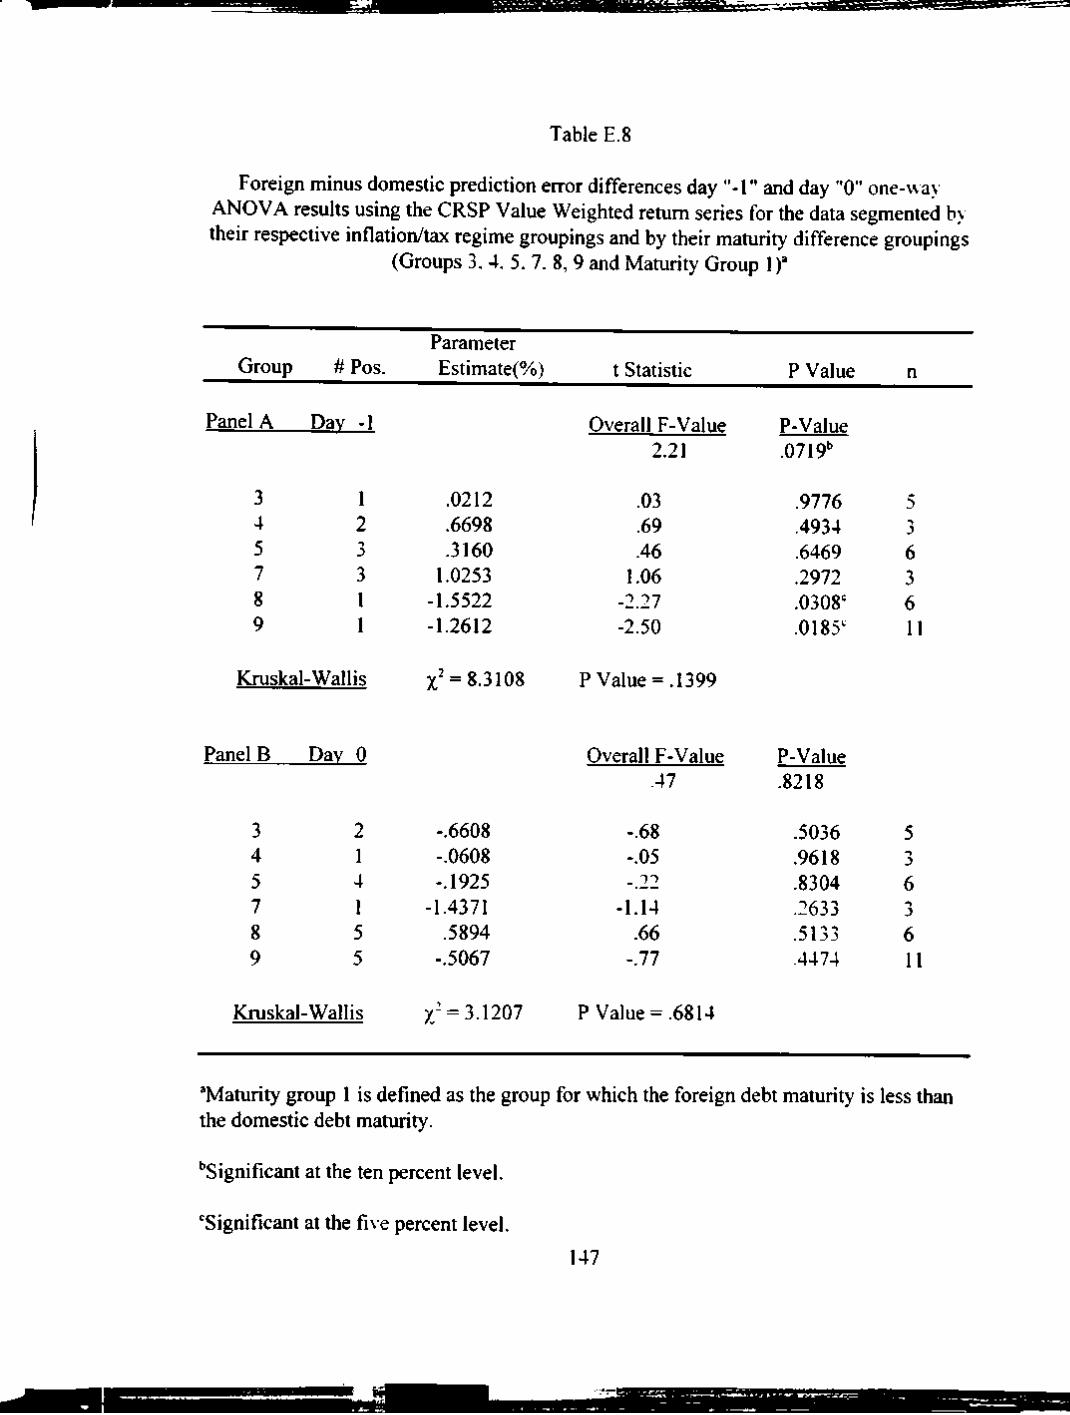
m'sSSina:
Table E.8
Foreign minus domestic prediction error differences day "-1" and day "0" one-wa) ANOVA results using the CRSP Value Weighted rettim series for the data segmented b) their respective inflation/tax regime groupings and by their maturity difference groupings
(Groups 3. 4. 5. 7. 8, 9 and Mamrity Group 1)'
Group
Panel A
3 4 5 7 8 9
#Pos.
Dav -1
1 2
3 1 1
Kmskal-Wallis
Panel B
3 4 5 7 8 9
Dav 0
2 1 4 1 5 5
Kmskal-Wallis
Parameter Estimate(%)
.0212
.6698
.3160 1.0253
-1.5522 -1.2612
X' = 8.3108
-.6608 -.0608 -.1925
-1.4371 .5894
-.5067
7/= 3.1207
t Statistic
Overall F-Value 2.21
.03
.69
.46 1.06
-2.27 -2.50
P Value = .1399
Overall F-Value .47
-.68 -.05 -.22
-1.14 .66
-.77
P Value = .6814
P Value
P-Value .0719"
.9776
.4934
.6469
.2972
.0308'
.0185^
P-Value .8218
.5036
.9618
.8304
.2633
.5133 -4474
n
5 -* J
6 3 6 11
5 ->
6 ->
6 11
'Maturity group 1 is defined as the group for which the foreign debt maturity is less than the domestic debt maturity.
"Significant at the ten percent level.
'Significant at the fiv e percent level.
147
mtf
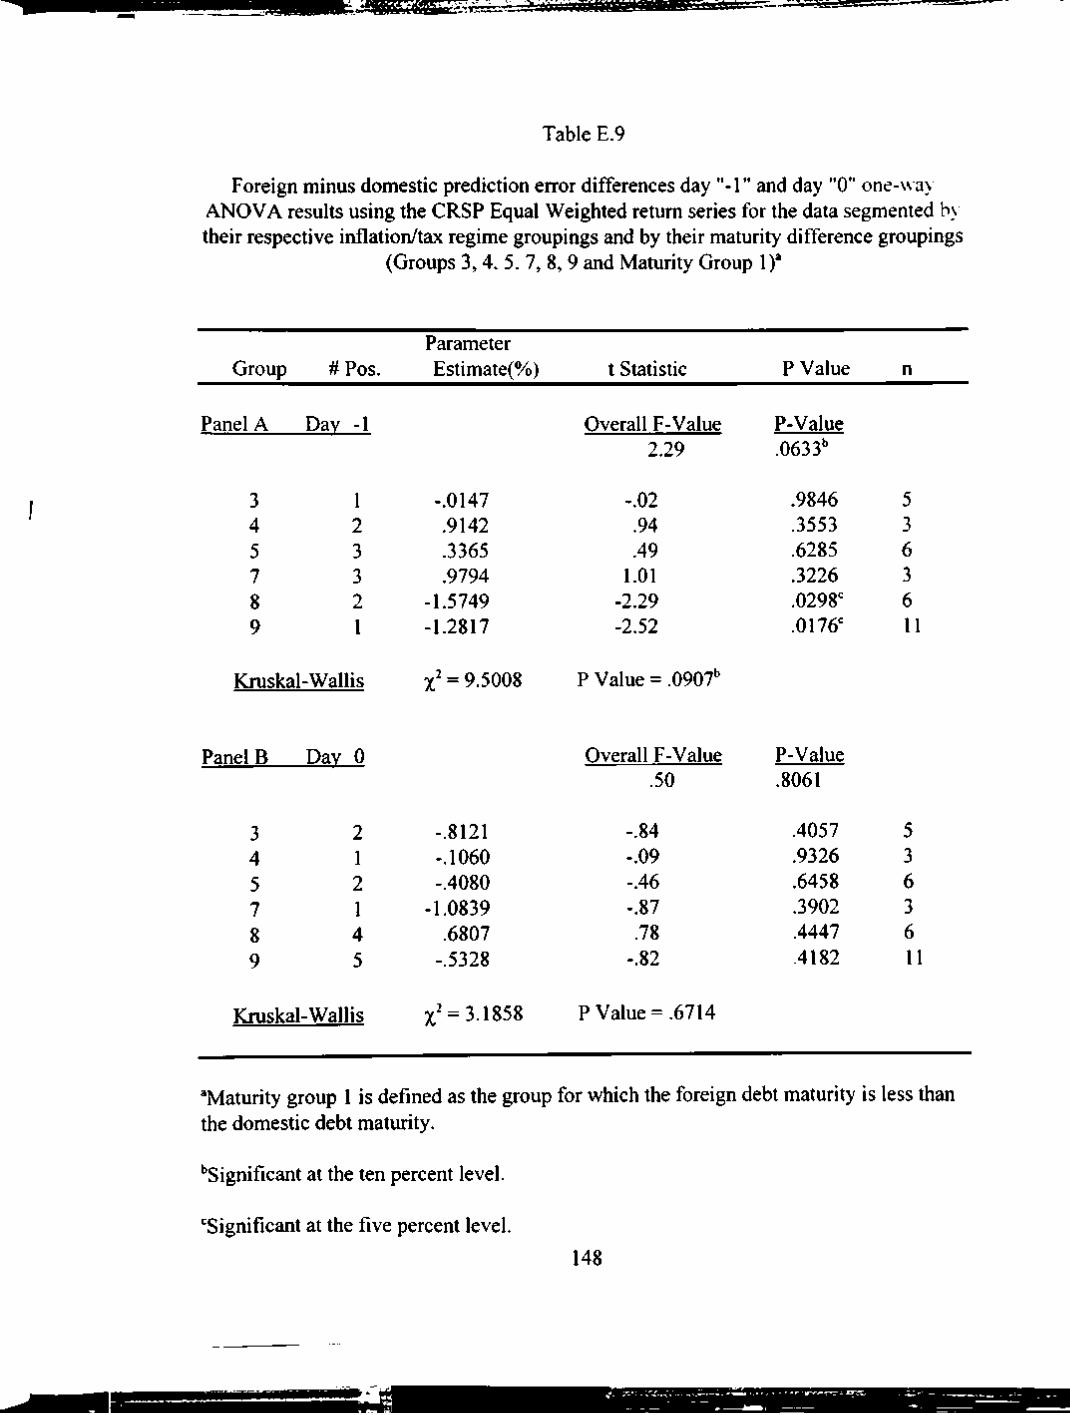
-VVt,-.'. ;Tf rVjilflrttfiHSffiflwr I • r ' ^-..r-.-^rinss
Table E.9
Foreign minus domestic prediction error differences day "-1" and day "0" one-wa) ANOVA results using the CRSP Equal Weighted retum series for the data segmented b) their respective inflation/tax regime groupings and by their maturity difference groupings
(Groups 3, 4, 5, 7, 8, 9 and Maturity Group 1)'
Group
Panel A
3 4 5 7 8 9
#Pos.
Dav -1
1 2 3 3 2 1
Kmskal-Wallis
Panel B
3 4 5 7 8 9
Dav 0
2 1 2 1 4 5
Kmskal-Wallis
Parameter Estimate(%)
-.0147 .9142 .3365 .9794
-1.5749 -1.2817
X' = 9.5008
-.8121 -.1060 -.4080
-1.0839 .6807
-.5328
X' = 3.1858
t Statistic
Overall F-Value 2.29
-.02 .94 .49
1.01 -2.29 -2.52
P Value = .0907"
Overall F-Value .50
-.84 -.09 -.46 -.87 .78
-.82
P Value = .6714
P Value
P-Value .0633"
.9846
.3553
.6285
.3226
.0298'
.0176'
P-Value .8061
.4057
.9326
.6458
.3902
.4447
.4182
n
5 3 6 3 6 11
5 3 6 3 6 11
'Maturity group 1 is defined as the group for which the foreign debt maturity is less than the domestic debt maturity.
"Significant at the ten percent level.
'Significant at the five percent level.
148
M H

Table E.IO
Foreign minus domestic cumulative two-day prediction error differences one-way ANOVA results using both the CRSP Value and Equal Weighted retum series
for the data segmented by their respective inflation/tax regime groupings and by their maturity difference groupings
(Groups 3. 4. 5. 7. 8, 9 and Maturity Group 1)'
Group
Panel A
3 4 5 7 8 9
#Pos. Parameter Estimate(%)
Value Weighted
2 2 H
1 2
Kmskal-Wallis
Panel B
3 4 5 7 8 9
Equal We
3 1
-> J
1 2 t J
Kmskal-Wallis
-.6399 .6096 .1237
-.4118 -.9629
-1.7680
X' = 3.5828
ighted
-.8265 .8085
-.0718 -.1041 -.8948
-1.8146
7/= 4.3152
t Statistic
Overall F-Value 1.33
-.61 .45 .13
-.30 -1.01 -2.50
P Value = .6109
Overall F-Value 1.55
-.83 .63 .08
-.08 -.98
-2.69
P Value = .5050
P Value
P-Value .2773
.5460
.6555
.8980
.7629
.3223
.0183"
P-Value .1983
.4151
.5358
.9378
.9362
.3350
.0118"
n
5 J)
6 J)
6 11
5 -% J
6 -> J
6 11
'Maturity group 1 is defined as the group for which the foreign debt maturity is less than the domestic debt maturity.
"Significant at the five percent level.
149
SBTSSSOBXn

' IN •iiThl'Tiji ii|iiV~r iiM'TiTrii
Table E.ll
Foreign minus domestic prediction error differences day " - 1 " and day "0" one-way ANOVA results using the CRSP Value Weighted retum series for the data segmented bv their respective inflation/tax regime groupings and b) their maturity difference groupings
(Groups 1. 4. 5. 8. 9 and Maturity Group 4)'
Group
Panel A
1 4 5 8 9
#Pos.
Dav -1
->
1 4 0
Kmskal-Wallis
Panel B
1 4 5 8 9
Dav 0
2 0 4 H
1
Kmskal-Wallis
Parameter Estimate(%)
.2409 -.0791 -.2292 -.0381 -.2636
X-= 1.5363
-.1722 -.3430 -.4872 .1829 .5296
7-= .90186
t Statistic
Overall F-Value .06
.32 -.10 -.34 -.07 -.30
P Value = .8202
Overall F-Value .32
-.26 -.51 -.82 .36 .69
P Value = .9243
P Value
P-Value .9967
.7544
.9181
.7393
.9477
.7668
P-\'alue .8948
.7996
.6140
.4257
.7215
.5012
n
4 4 5 7
4 4 5 7 J)
'Maturity group 4 is defined as the group for which the domestic maturity information was unavailable.
150
mm
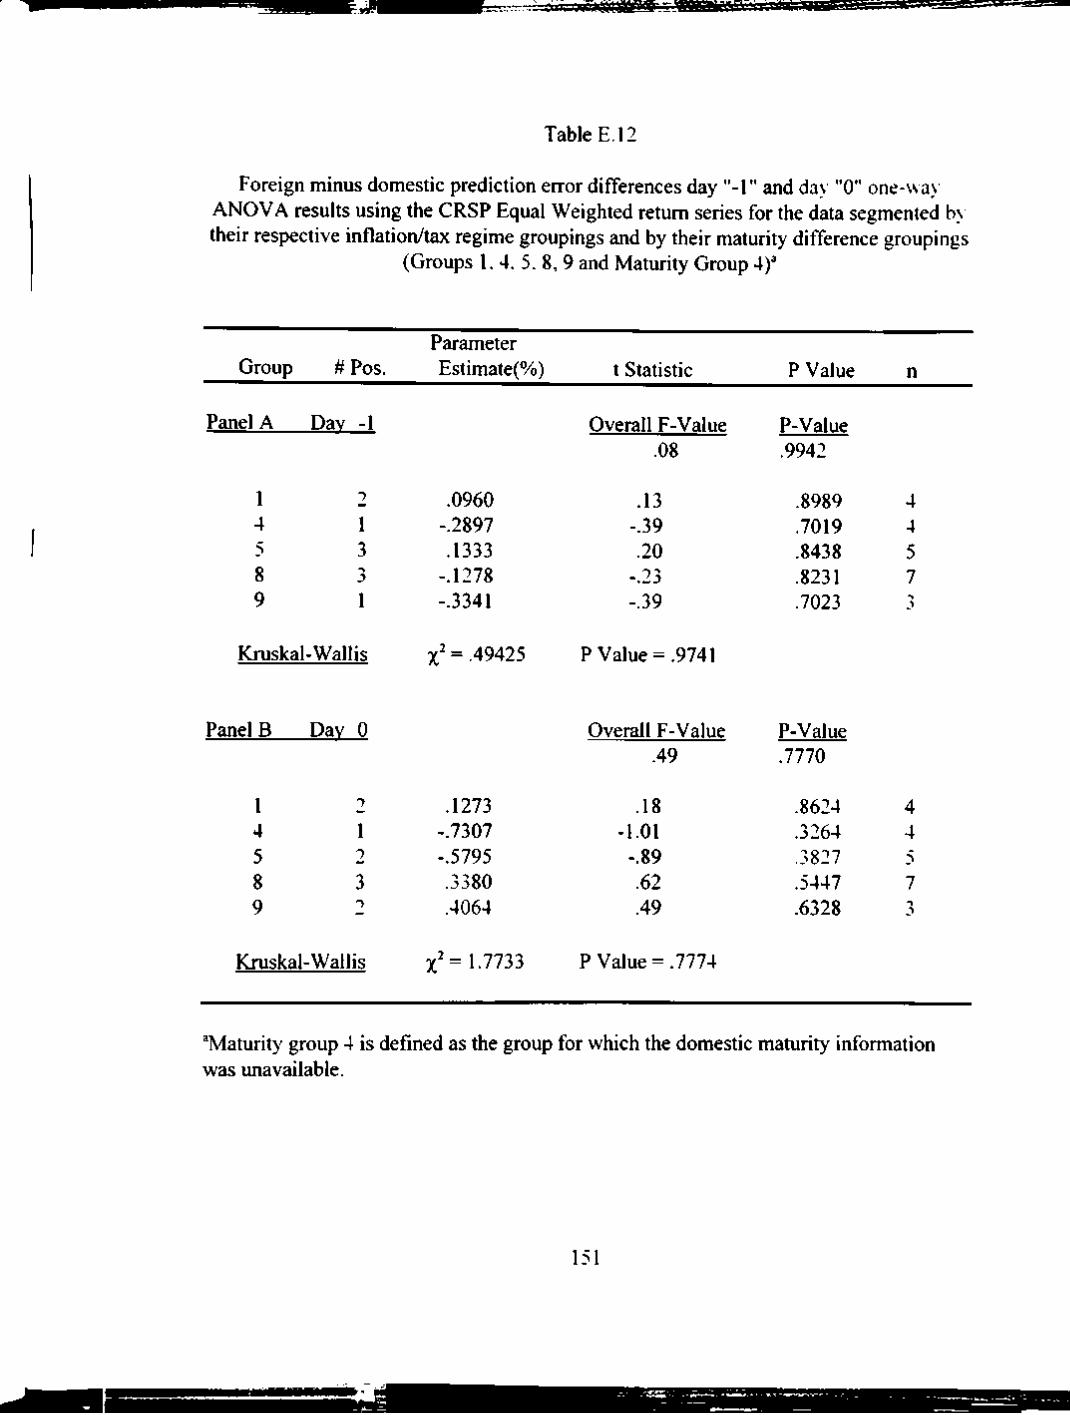
- M" I liTii HWfTif -wm,|iT^-11 I ' r -IIIviiTii I r i — i r
Table E.l2
Foreign minus domestic prediction error differences day "-1" and da) "0" one-way ANOVA results using the CRSP Equal Weighted retum series for the data segmented b\ their respective inflation/tax regime groupings and by their maturity difference groupings
(Groups 1. 4. 5. 8, 9 and Maturity Group 4)'
Group # Pos. Parameter Estimate(%) t Statistic P Value n
Panel A Dav -1
1 4 5 8 9
2 1
Kmskal-Wallis
Panel B Dav 0
1 4 5 8 9
2 1 2 3 -)
Kmskal-Wallis
.0960 -.2897 .1333 -.1278 -.3341
X' = .49425
.1273 -.7307 -.5795 .3380 .4064
X'= 1.7733
Overall F-Value .08
.13 -.39 .20
-.23 -.39
P Value = .9741
Overall F-Value .49
.18 -1.01 -.89 .62 .49
P Value = .7774
P-Value .9942
.8989
.7019
.8438
.8231
.7023
P-Value .7770
.8624
.3264
.3827
.5447
.6328
4 4 5 7 ->
4 4 5 7 J)
'Maturity group 4 is defined as the group for which the domestic maturity information was unavailable.
151

'• ^•'wiwWWi^'^ifr--^-''
Table E.13
Foreign minus domestic cumulative two-day prediction error differences one-way ANOVA results using both the CRSP Value and Equal Weighted retum series
for the data segmented by their respective inflation/tax regime groupings and b) their maturity difference grouping
(Groups 1. 4, 5, 8, 9 and Maturity Group 4)'
Group # Pos. Parameter Estimate(%) t Statistic P Value n
Panel A Value Weighted
1 4 5 8 9
Overall F-Value P-Value
2 1 1 4 2
.0686 -.4220 -.7166 .1448 .2662
Kmskal-Wallis x' = 1 -8058
Panel B Equal Weighted
.22
.08 -.46 -.88 .21 .25
P Value = .7714
Overall F-Value
.9490
.9408
.6487
.3906
.8358
.8030
P-Value
4 4 5 7 3
.29 .9131
1 2 4 1 5 2 8 3 9 1
Kmskal-Wallis
.2230% -1.0201% -.4464% .2103% .0722%
7" = 1.09^
.22 -1.03
-.50 .28 .06
P Value = .8952
.8247
.3175
.6211
.7824
.9504
4 4 5 7 3
'Maturity group 4 is defined as the group for which the domestic maturity information was unavailable.
152

[ iiTii Y v r i i j II II I iiiijiiii
Table E.l4
Foreign minus domestic prediction error differences da) "-1" and day "0" one-way .ANOVA results using the CRSP Value W eighted retum series
for the inflation/tax regime group 9 across all maturity difference groupings
Maturity Group # Pos.
Panel A
1 2 3 4
Dav -1
1 4 1 0
Kmskal-Wallis
Panel B
1 -)
3 4
Dav 0
5
2 2
Kmskal-\K'allis
Parameter Estimate(%)
-1.2612 1.3680 -.0967 -.2636
7- = 8.9368
-.5067 -.2119 2.7723
.5296
X' = 4.1786
t Statistic
Overall F-Value 3.55
-3.14 2.05 -.10 -.34
P Value = .0301"
Overall F-Value .98
-.76 -.19 1.77 .41
P Value = .2428
P Value
P-Value .0295^
.0063'
.0567^
.9195
.7362
P-Value .4449
.4584
.8505
.0953'
.6838
n
11 4 - »
-\ 21
11 4 ")
3
'Significant at the ten percent level.
'Significant at the five percent level.
'Significant at the one percent level.
53

.•Vitr.'.W.'.: VL ^ ^ I I M W I ' I I -
TableE.15
Foreign minus domestic prediction error differences day "-1" and day "0" one-way ANOVA results using the CRSP Equal Weighted remm series
for the inflation/tax regime group 9 across all maturity difference groupings
Maturity Group # Pos.
Parameter Estimate(%) t Statistic P Value n
Panel A Dav -1
1 2 3 4
Kmskal-Wallis
Panel B Dav 0
1 4 1 1
-1.2817 1.4336 -.1040 -.3341
,2 _ t = 8.4602
1 5 2 3 3 2 4 2
Kmskal-Wallis
-.5328 .0164
2.8943 .4064
X' = 3.8
Overall F-Value 3.13
-2.91 1.96 -.10 -.40
P Value = .0374"
Overall F-Value .95
-.76 .01
1.77 .30
P Value = .2742
P-Value .0443"
.0102"
.0670'
.9210
.6969
P-Value .4620
.4569
.9889
.0965'
.7653
11 4 2 3
11 4 2 3
'Significant at the ten percent level.
'Significant at the five percent level.
154

iTSC ^^^^^^msmbx
Table E.16
Foreign minus domestic cumulativ e two-day prediction error differences one-way ANOVA results using both the CRSP Value and Equal Weighted retum series
for the inflation/tax regime group 9 across all maturity difference groupings
Maturity Parameter Group # Pos. Estimate(%)
Panel A
1 2
4
\'alue Weighted
3 -1.7680 3 1.1561 2 2.6758 2 .2662
Kmskal-Wallis y' = 6.4225
Panel B
1 2 -
4
Equal Weighted
3 -1.8146 3 1.4496 2 2.7905 1 .0722
Kmskal-Wallis y' = 6.8448
t Statistic
Overall F-Value 1 ')')
-2.37 .94
1.53 .19
P Value = .0928'
Overall F-Value 2.63
-2.52 1.21 1.65 .05
P Value = .0770'
P \'alue
P-Value .1128
.0306"
.3635
.1454
.8544
P-Value .0731
.0229"
.2430
.1184
.9589
n
11 4
11 4
'Significant at the ten percent level.
''Significant at the fiv e percent level.
155

:.i •.*u ij • ' i i ' 'i ' I ' l l
Table E.17
Foreign minus domestic prediction error differences day "-1" and day "0" one-wa) ANOVA results using the CRSP Value Weighted retum series for the collapsed data
segmented by their respective inflation/tax regime groupings for the observations with a difference in maturity <\1\ years'
Group
Panel A
1 2 3
#Pos.
Dav -1
10 2
Kmskal-Wallis
Panel B
1 2 3
Dav 0
1 9 2
Kmskal-Wallis
Parameter Estimate(%)
-.7416 .4684
-1.0813
X' = .47536
-1.3514 .1288 .6206
X'= 1.9391
t Statistic
Overall F-Value 1.14
-.99 1.08
-1.12
P Value = .7885
Overall F-Value .95
-1.57 .26 .56
P Value = .3792
P Value
P-Value .3583
.3335
.2912
.2763
P-Value .4374
.1326
.7983
.5832
n
5 15 3
5 15 3
'The collapsed data represent the original inflation/tax regime groupings combined according to their hypothesized sign. The original Group 1 was excluded due to a sample size of n = 1.
156
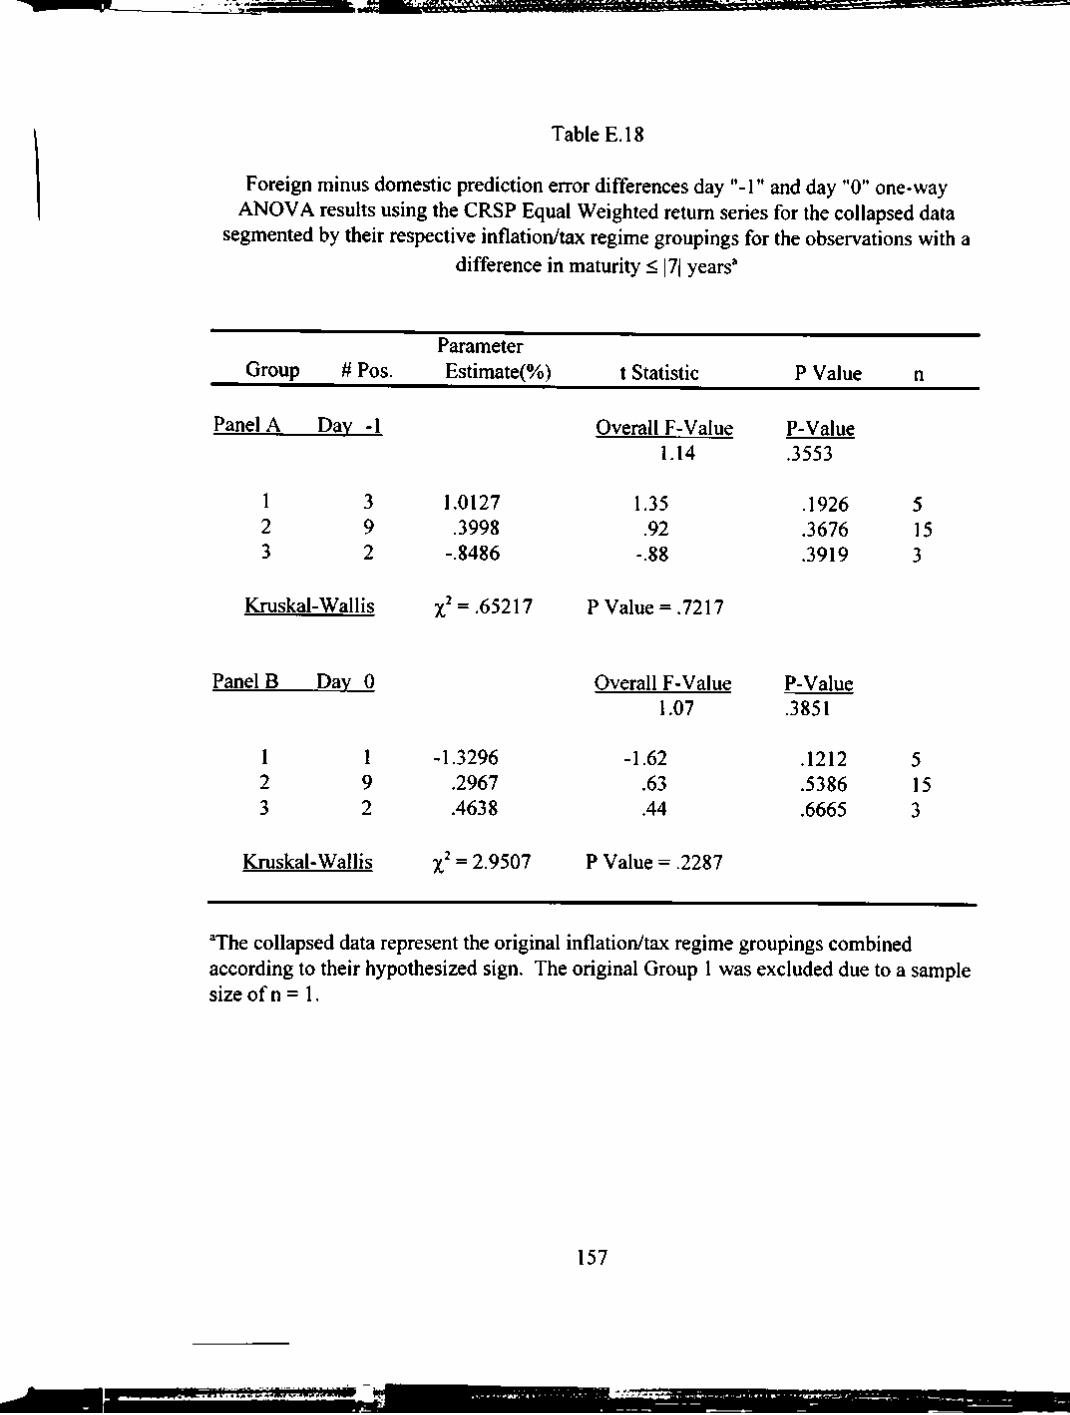
:m^ c;jpp«ci..w.v^.v^wi^P»trfvn/^>Hm-,-^Vinmir-,-rnFr^r-. -.-,- i,-riT^r - •-^
Table E.18
Foreign minus domestic prediction error differences day "-1" and day "0" one-way ANOVA resuhs using the CRSP Equal Weighted retum series for the collapsed data
segmented by their respective inflation/tax regime groupings for the observations with a difference in maturity < |7| years'
Group
Panel A
1 2 3
#Pos.
Dav -1
3 9 2
Kmskal-Wallis
Panel B
1 2 3
Dav 0
1 9 2
Kmskal-Wallis
Parameter Estimate(%)
1.0127 .3998
-.8486
X' =-65217
-1.3296 .2967 .4638
X' = 2.9507
t Statistic
Overall F-Value 1.14
1.35 .92
-.88
P Value = .7217
Overall F-Value 1.07
-1.62 .63 .44
P Value = .2287
P Value
P-Value .3553
.1926
.3676
.3919
P-Value .3851
.1212
.5386
.6665
n
5 15 3
5 15 3
'The collapsed data represent the original inflation/tax regime groupings combined according to their hypothesized sign. The original Group 1 was excluded due to a sample size ofn= 1.
157
:\rfi::'jJiifi:irm'ivmm

' ' ' I ' • " . " . I iTfiniiYi'irT III inVk •!! II
Table E.19
Foreign minus domestic cumulative two-day prediction error differences one-wa) ANOVA results using both the CRSP Value and Equal Weighted retum series for the
collapsed data segmented by their respective inflation/tax regime groupings for the observations with a difference in maturity < |7| ) ears^
Group
Panel A
1 2 3
Parameter # Pos. Estimate(%)
Value Weighted
2 -.6097 9 .5972 2 -.4604
Kmskal-Wallis 7^=1.2696
Panel B
1 2 3
Equal Weighted
2 -.3168 9 .6965 2 -.3850
Kmskal-Wallis 7-= .42319
t Statistic
Overall F-Value -47
-.58 .99
-.34
P Value = .5301
Overall F-Value .50
-.30 1.16 -.29
P Value = .8093
P Value
P-Value .7037
.5680
.3364
.7377
P-Value .6837
.7644
.2609
.7778
n
5 15 3
5 15 3
'The collapsed data represent the original inflation/tax regime groupings combined according to their hypothesized sign. The original Group 1 was excluded due to a sample size of n= 1.
158

—r±MC3aS»btKS»5 Pr-ih*!"-'-—
APPENDIX F
FOREIGN CURRENCY ANALYSES
159

riiihi «iiffffirwiMm7ii
Table F.l
Foreign minus domestic prediction error differences da) "-1" and cumulative two-day one-way ANOVA resuhs using the CRSP Value Weighted retum series
for the data segmented by their currency of denomination (Currency Groups AUS C$ DM SFR STG YEN)
Currency Group
Panel A
AUS C$ DM SFR STG YEN
#Pos.
Dav -1
2 1 7
16 4 5
Kmskal-Wallis
Panel B
AUS C$ DM SFR STG YEN
2-Dav
2 0 9
14 4 6
Kmskal-Wallis
Parameter Estimate(%)
.2495 -.0268 -.2141 .0937
-.3139 -.0375
X' = . 19634
-.0471 -1.3541
.0181
.0182 -.1355 -.5177
7-= 3.1078
t Statistic
Overall F-Value .09
.29 -.02 -.44 .27
-.44 -.07
P Value = .9992
Overall F-Value .27
-.04 -.97 .03 .04
-.15 -.80
P Value = .6834
P Value
P-Value .9971
.7704
.9806
.6645
.7884
.6640
.9415
P-Value .9509
.9656
.3376
.9770
.9674
.8830
.4279
n
5
15 30 7 14
5 -> J
15 30 7 14
'Only these six currency groups are included due to missing data for the FF, LIR and NZ (see Table E. 1 for a frequency distribution).
160

• - ----|;T--'^-riT-'l "1"
Table F.2
Foreign minus domestic prediction error differences day "-1" and cumulative two-day one-way ANOVA results using the CRSP Equal Weighted retum series
for the data segmented by their currency of denomination (Currency Groups AUS C$ DM SFR STG YEN)'
Currency Group
Panel A
AUS C$ DM SFR STG YEN
#Pos.
Dav -1
3 1 7
12 4 6
Kmskal-Wallis
Panel B
AUS C$ DM SFR STG YEN
2-Dav
4 0 7
14 4 6
Kmskal-Wallis
Parameter Estimate(%)
.4174
.0837 -.3090 .0525
-.1903 .0652
7" = .81777
.1258 -1.3774 -.0374 -.1112 .1212
-.3838
7" = 2.0363
t Statistic
Overall F-Value .12
.47
.07 -.61 .15
-.26 .12
P Value = .9759
Overall F-Value .22
.11 -.95 -.06 -.24 .13
-.57
P Value = .8441
P Value
P-Value .9940
.6363
.9414
.5444
.8840
.7986
.9015
P-Value .9690
.9111
.3454
.9541
.8091
.8988
.5693
n
5 -> J
15 30 7 14
5 ->
15 30 7 14
'Only these six currency groups are included due to missing data for the FF. LIR and NZ (see Table E. 1 for a frequency distribution).
161
1 1 ^ ^ erssBSTEws
IS^&I

Table F.3
Foreign minus domestic prediction error differences day "-1" and cumulative two-day one-way ANOV.A results using the CRSP Value Weighted retum series
for the data segmented by their inflation/tax regime groups and currency of denomination (Inflation/Tax Regime Groups 1. 3. 4. 7. 9 and Currency Group SFR)
Group
Panel A
1
4 7 9
#Pos.
Dav -1
3 4 4 4 1
Kmskal-Wallis
Panel B
1
4 7 9
2-Dav
2 5 2 2 - >
Kmskal-Wallis
Parameter Estimate(%)
.7562
.4146
.4174 1.0487
-1.5117
'/: = 5.8979
.7932
.1709 -.0297 .1120
-.3925
7/ = .30276
t Statistic
Overall F-Value 1.35
.84
.73
.52 1.31
-1.88
P Value = .2069
Overall F-Value .09
.57
.19 -.02 .09
-.31
P Value = .9896
P Value
P-Value .2765
.4078
.4722
.6078
.2038
.0718'
P-Value .9924
.5752
.8482
.9812
.9293
.7560
n
4 10 5 5 5
4 10 5 5 5
'Significant at the ten percent lev el
162
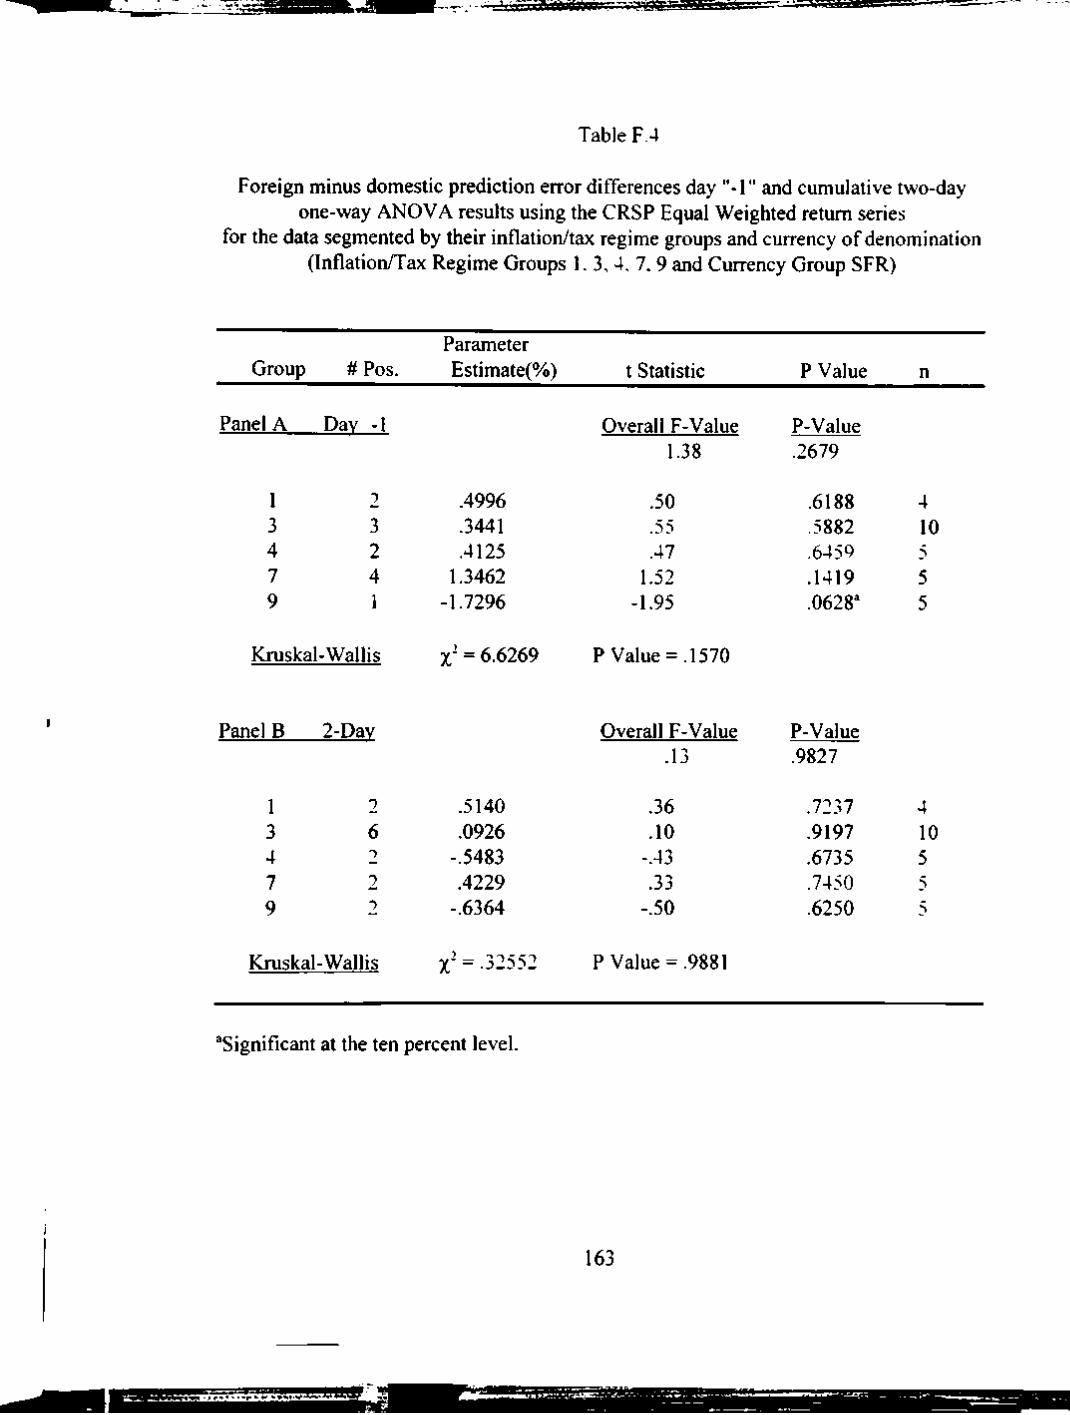
r.'JVjj|Tnrj*jfeee»ggcss^^
Table F.4
Foreign minus domestic prediction error differences day "-1" and cumulative two-day one-way ANOVA resuhs using the CRSP Equal Weighted retum series
for the data segmented by their inflation/tax regime groups and currency of denomination (Inflation/Tax Regime Groups 1. 3, 4. 7, 9 and Currency Group SFR)
Group
Panel A
1 3 4 7 9
#Pos.
Dav -1
2 3 2 4 1
Kmskal-Wallis
Panel B
1 3 4 7 9
2-Dav
2 6 2 2 2
Kmskal-Wallis
Parameter Estimate(%)
.4996
.3441
.4125 1.3462
-1.7296
yj = 6.6269
.5140
.0926 -.5483 .4229
-.6364
X- = .32552
t Statistic
Overall F-Value 1.38
.50
.55
.47 1.52
-1.95
P Value = .1570
Overall F-Value .13
.36
.10 -.43
- > ">
-.50
P Value = .9881
P Value
P-Value .2679
.6188
.5882
.6459
.1419
.0628'
P-Value .9827
.7237
.9197
.6735
.7450
.6250
n
4 10 5 5 5
4 10 5 5 5
'Significant at the ten percent level.
163

.*~1> L-—- rJXAu;.! .VJ.h.Utt'lffl
Table F.5
Foreign minus domestic prediction error differences da) "-1" and cumulative two-day one-way ANOVA results using the CRSP Value Weighted retum series
for the data segmented by their inflation/tax regime groups and currenc) of denomination (Inflation/Tax Regime Group 9 and Currency Groups SFR & YEN)
Currency Group # Pos.
Panel A Dav -1
SFR 1 YEN 5
Kmskal-Wallis
Panel B 2-Dav
SFR 3 YEN 6
Kmskal-Wallis
Parameter Estimate(%)
-1.5117 -.0375
r = 2.7771
-.3925 -.5177
X- = .07714
t Statistic
Overall F-Value 2.41
-2.19 -.09
P Value = .0956'
Overall F-Value .26
-.30 -.66
P Value = .7812
P Value
P-Value .1203
.0426"
.9286
P-Value .7733
.7691
.5192
n
5 14
5 14
'Significant at the ten percent level.
^Significant at the five percent level.
164

ttmU ..'.• j . : ^ ..V I..^tUAtt-iutillLOg-^- '^^^ ' '1 1 ' '"
Table F.6
Foreign minus domestic prediction error differences day "-1" and cumulative two-day one-way ANO\ A results using the CRSP Equal Weighted retum series
for the data segmented by their inflation/tax regime groups and currency of denomination (Inflation Tax Regime Group 9 and Currency Groups SFR & YEN)
Currency Group ~ Pos.
Parameter Estimate(°o) t Statistic P \'alue n
Panel A Dav -1 Overall F-Value 3.02
P-Value .0757'
SFR YEN
1 6
1.7296 .0652
•2.45 .15
.0253
.8789 14
Kmskal-Wallis 7/= 3.7800 P Value = .0519'
Panel B 2-Dav
SFR YEN
T
6
Kmskal-Wallis 7/
.6364
.3838
= 0
Overall F-Value .24
-.48 -.49
P Value =1.0000
P-Value .7928
.6353
.6322 14
'Significant at the ten percent lev el.
'Significant at the five percent level.
165