FOREIGN CURRENCY HEDGING ON GLOBAL EQUITY ...
20
WHITE PAPER FOREIGN CURRENCY HEDGING ON GLOBAL EQUITY PORTFOLIOS THIS DOCUMENT IS INTENDED FOR INSTITUTIONAL INVESTORS ONLY. IT SHOULD NOT BE DISTRIBUTED TO, OR USED BY, INDIVIDUAL INVESTORS.
-
Upload
khangminh22 -
Category
Documents
-
view
0 -
download
0
Transcript of FOREIGN CURRENCY HEDGING ON GLOBAL EQUITY ...
WHITE PAPER
FOREIGN CURRENCY HEDGING ON GLOBAL EQUITY PORTFOLIOS
THIS DOCUMENT IS INTENDED FOR INSTITUTIONAL INVESTORS ONLY. IT SHOULD NOT BE DISTRIBUTED TO, OR USED BY, INDIVIDUAL INVESTORS.

CONTENTS
Executive summary 1
1 Considering static passive hedge ratios 3
1.1 Variability of returns over different time horizons 5
1.2 Static hedging ‒ further considerations 6
2 Our dynamic hedging process 7
2.1 Dynamic hedging model structure 7
2.2 Estimating risk benefit 8
2.3 Expected return impact of hedging 9
2.4 Combining FX factors 11
3 Key performance outcomes 12
3.1 Dynamic hedge downside protection 14
4 Conclusion 16
EXECUTIVE SUMMARY
A recurring theme in international investment is whether or not to hedge foreign currency exposure, and if hedging, whether the process should be static, dynamic, one-size-fits all, or currency specific.
In this paper, we address each of these issues. Overall, we find that portfolios benefit from foreign exchange (FX) hedging. While a 100% static hedge across all FX exposures is a simple and popular approach that delivers reduced volatility, it assumes a set of relationships between currency and equity risk and return that do not generally hold true. Consequently, we find it to be sub-optimal.
From a total portfolio perspective, placing total portfolio risk and return at the core of our modelling, we have developed a process where risk and return characteristics are empirically estimated, rather than assumed. We identify a number of key factors that have historically improved the risk/return benefit of currency hedging and the associated impact on portfolio return. We also propose a systematic dynamic hedging framework which incorporates these factors in determining optimal forward-looking currency hedge ratios on a per-currency basis. Finally, we demonstrate the enhancement this approach offers versus conventional passive currency-hedging strategies.
INTRODUCTION
As investors increasingly allocate to globally diversified portfolios, currency movements have a greater bearing on the variability of returns. Consequently, managing currency risk becomes a critical strategic decision for investors.
In this paper, we consider the different options available to investors seeking to manage currency exposures. We also share our research findings on how best to manage such risks from a portfolio perspective. We argue that the most effective hedging approach should be dynamic in nature, and responsive to a number of key currency risk factors. These include interest-rate differentials, valuation and FX/equity co-movement. Finally, we demonstrate the benefits of this approach versus competing hedging strategies.
Foreign Currency Hedging on Global Equity Portfolios 1
In summary:
Hedging can improve outcomes – specifically reducing the variability of short-to-medium term returns and negative tail outcomes across all base currencies. Timing is important, and the benefits of hedging change through time. Over longer time frames, the efficacy of passive hedging can depend on a number of key factors, including currency trends, valuations and global interest-rate differentials.
We demonstrate that investors can improve the level and stability of portfolio risk-adjusted returns by incorporating these factors into a dynamic hedging framework versus static, passive hedging strategies.
2 Foreign Currency Hedging on Global Equity Portfolios
A SUMMARY OF INVESTORS' OPTIONSTo begin, let us outline the range of FX hedging options available to investors seeking to manage their currency exposures.
FX Strategy Overview
Passive Passive strategies aim to strip out any FX exposure from a body of assets by implementing a portfolio of hedging FX forwards. These passive hedges can range from a full 100% hedge of FX exposure, to fractional hedge ratios such as 50% or 33%, as deemed appropriate for the fund. The key consideration here is the degree of aversion to FX risk. The hedge may be applied equally across all foreign currency denominations, or by applying a variable hedge fraction to different currencies.
Active Active strategies seek to add alpha by forecasting returns and taking long/short positions dynamically across a range of currency pairs. Unlike passive strategies, they will, at times, take on additional FX risk (versus a broader portfolio), and do not simply reduce FX exposure. Return forecasts are typically driven by factors such as interest-rate differentials (carry), momentum and valuation.
Dynamic A dynamic hedge aims to maximise the expected risk-and-return impact of hedging by setting an optimal currency specific hedge ratio at each point in time. This is a hybrid approach, in that some of the classic FX factors typically used in an active currency programme are considered when determining the appropriate or inappropriate times to hedge.
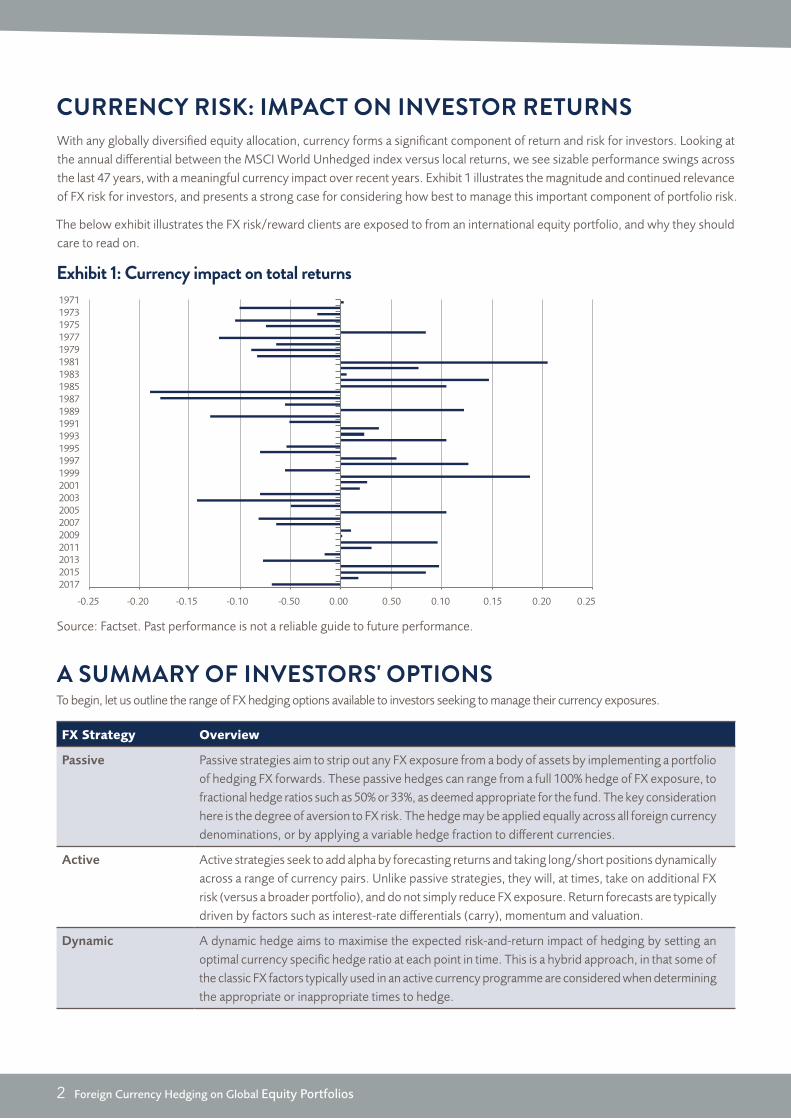
CURRENCY RISK: IMPACT ON INVESTOR RETURNSWith any globally diversified equity allocation, currency forms a significant component of return and risk for investors. Looking at the annual differential between the MSCI World Unhedged index versus local returns, we see sizable performance swings across the last 47 years, with a meaningful currency impact over recent years. Exhibit 1 illustrates the magnitude and continued relevance of FX risk for investors, and presents a strong case for considering how best to manage this important component of portfolio risk.
The below exhibit illustrates the FX risk/reward clients are exposed to from an international equity portfolio, and why they should care to read on.
Exhibit 1: Currency impact on total returns
Source: Factset. Past performance is not a reliable guide to future performance.
197119731975197719791981198319851987198919911993199519971999200120032005200720092011201320152017
-0.25 -0.20 -0.15 -0.10 -0.50 0.00 0.20 0.250.150.100.50
There is considerable debate on the optimal static hedge ratio for a book of assets with FX exposure. A range of well-regarded authors have come up with different answers, ranging from 0%¹, to near 100%². Theoretical arguments have been made from a ICAPM (“The International Capital Asset Pricing Model”) perspective (Fisher Black³,⁴) to put forward a universal hedge ratio, often cited at around 77%. In another study, 30%⁵ has been proposed as optimal for US pension plans where the impact of transaction costs is fully included.
To gauge the benefits of currency hedging at various degrees, we analysed the risk and return impact of a range of passive hedging strategies. Here, we considered an investor holding a global index portfolio tracking the MSCI World versus an unhedged benchmark over multiple time periods.
Foreign Currency Hedging on Global Equity Portfolios 3
Key insights:
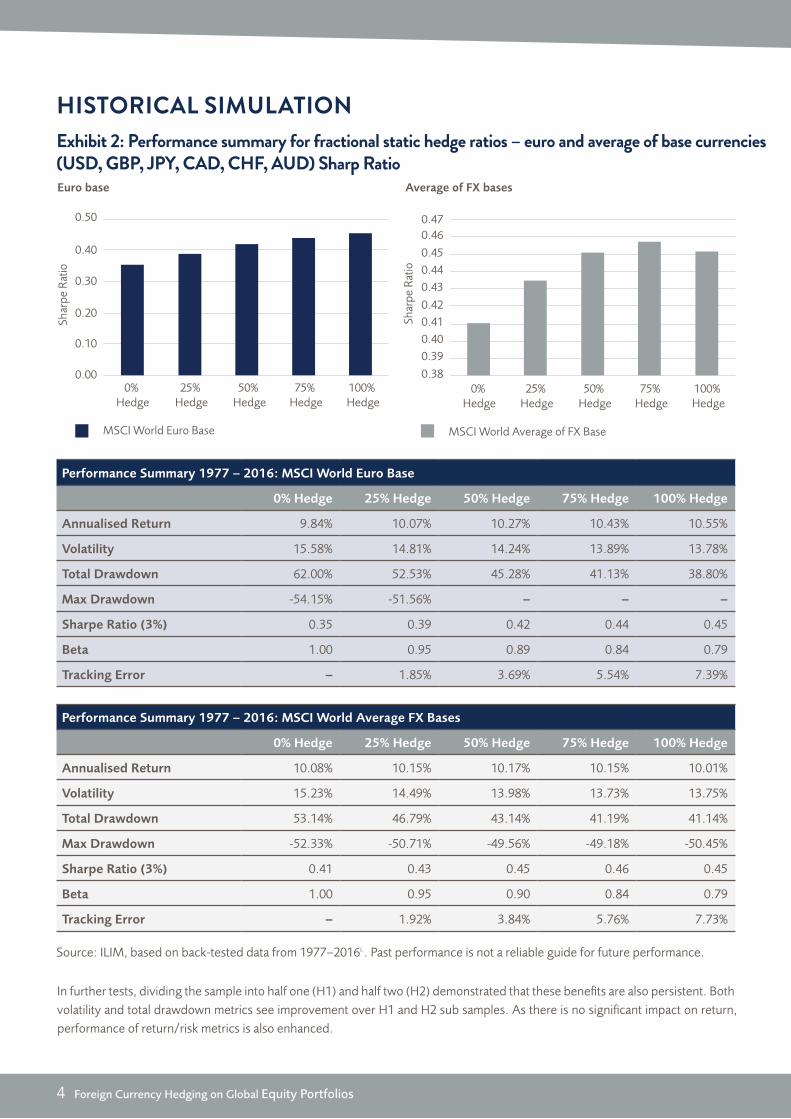
Static currency hedging meaningfully improves risk-adjusted return metrics across all bases. For the euro base, we see both positive return and risk impacts, while the average across all bases shows an improvement in volatility with negligible change in returns.
Total drawdown and beta statistics reduce with the increase in hedge ratio, with the greatest reduction at a 75–100% hedge.
Maximum drawdown/Sharpe ratios improve with the increase in hedging ratio. However, these benefits level off at higher hedging ratios – peaking at around the 75% hedge ratio level.
From an absolute return/risk perspective, we can assert that a relatively high hedging ratio of between 75%–100% appears optimal.
While the Euro (DEM)i historic experience is of particular interest to us, it represents the outcome from the perspective of just one base currency. To present a more complete picture of the performance of passive hedging strategies, our research examines the historic performance of a range of investor base currencies.
The tables overleaf set out the historic performance (1977–2016) of different hedge ratios as determined by a range of key risk and return metricsii. These tables show a euro base and an average across EURi, USD, JPY, GBP, AUD, CAD, and CHF. The results (allowing for transaction costs on hedging positions) evidenced by the average are generally very consistent across each of the sample bases.
PART 1: CONSIDERING STATIC PASSIVE HEDGE RATIOS
4 Foreign Currency Hedging on Global Equity Portfolios
HISTORICAL SIMULATIONExhibit 2: Performance summary for fractional static hedge ratios – euro and average of base currencies (USD, GBP, JPY, CAD, CHF, AUD) Sharp Ratio
In further tests, dividing the sample into half one (H1) and half two (H2) demonstrated that these benefits are also persistent. Both volatility and total drawdown metrics see improvement over H1 and H2 sub samples. As there is no significant impact on return, performance of return/risk metrics is also enhanced.
Source: ILIM, based on back-tested data from 1977–2016i.. Past performance is not a reliable guide for future performance.
Performance Summary 1977 ‒ 2016: MSCI World Euro Base
0% Hedge 25% Hedge 50% Hedge 75% Hedge 100% Hedge
Annualised Return 9.84% 10.07% 10.27% 10.43% 10.55%
Volatility 15.58% 14.81% 14.24% 13.89% 13.78%
Total Drawdown 62.00% 52.53% 45.28% 41.13% 38.80%
Max Drawdown -54.15% -51.56% ‒ ‒ ‒
Sharpe Ratio (3%) 0.35 0.39 0.42 0.44 0.45
Beta 1.00 0.95 0.89 0.84 0.79
Tracking Error ‒ 1.85% 3.69% 5.54% 7.39%
Performance Summary 1977 ‒ 2016: MSCI World Average FX Bases
0% Hedge 25% Hedge 50% Hedge 75% Hedge 100% Hedge
Annualised Return 10.08% 10.15% 10.17% 10.15% 10.01%
Volatility 15.23% 14.49% 13.98% 13.73% 13.75%
Total Drawdown 53.14% 46.79% 43.14% 41.19% 41.14%
Max Drawdown -52.33% -50.71% -49.56% -49.18% -50.45%
Sharpe Ratio (3%) 0.41 0.43 0.45 0.46 0.45
Beta 1.00 0.95 0.90 0.84 0.79
Tracking Error ‒ 1.92% 3.84% 5.76% 7.73%
0.10
0.00
0.20
0.30
0.40
0.50
0% Hedge
25% Hedge
50% Hedge
75% Hedge
100% Hedge
0.43
0.42
0.44
0.45
0.460.47
0.39
0.38
0.40
0.41
0% Hedge
25% Hedge
50% Hedge
75% Hedge
100% Hedge
MSCI World Euro Base MSCI World Average of FX Base
Shar
pe R
atio
Shar
pe R
atio
Euro base Average of FX bases
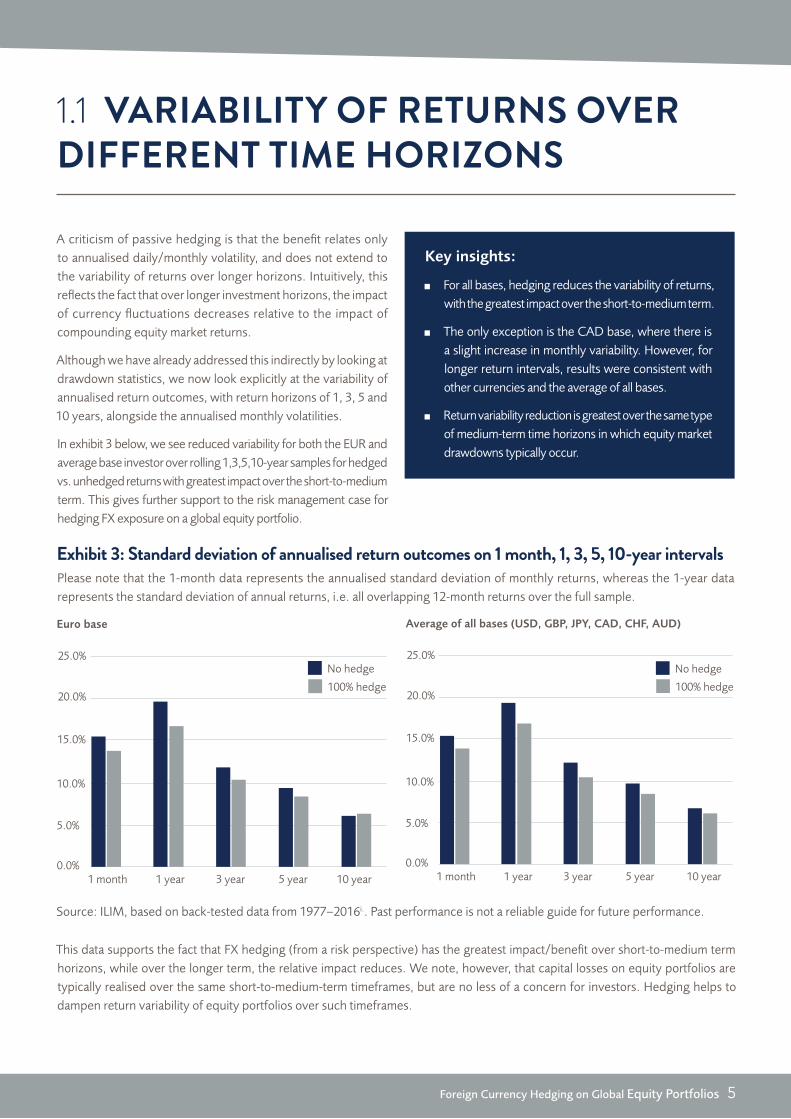
A criticism of passive hedging is that the benefit relates only to annualised daily/monthly volatility, and does not extend to the variability of returns over longer horizons. Intuitively, this reflects the fact that over longer investment horizons, the impact of currency fluctuations decreases relative to the impact of compounding equity market returns.
Although we have already addressed this indirectly by looking at drawdown statistics, we now look explicitly at the variability of annualised return outcomes, with return horizons of 1, 3, 5 and 10 years, alongside the annualised monthly volatilities.
In exhibit 3 below, we see reduced variability for both the EUR and average base investor over rolling 1,3,5,10-year samples for hedged vs. unhedged returns with greatest impact over the short-to-medium term. This gives further support to the risk management case for hedging FX exposure on a global equity portfolio.
1.1 VARIABILITY OF RETURNS OVER DIFFERENT TIME HORIZONS
Foreign Currency Hedging on Global Equity Portfolios 5
Key insights:
For all bases, hedging reduces the variability of returns, with the greatest impact over the short-to-medium term.
The only exception is the CAD base, where there is a slight increase in monthly variability. However, for longer return intervals, results were consistent with other currencies and the average of all bases.
Return variability reduction is greatest over the same type of medium-term time horizons in which equity market drawdowns typically occur.
Exhibit 3: Standard deviation of annualised return outcomes on 1 month, 1, 3, 5, 10-year intervalsPlease note that the 1-month data represents the annualised standard deviation of monthly returns, whereas the 1-year data represents the standard deviation of annual returns, i.e. all overlapping 12-month returns over the full sample.
Source: ILIM, based on back-tested data from 1977–2016i.. Past performance is not a reliable guide for future performance.
This data supports the fact that FX hedging (from a risk perspective) has the greatest impact/benefit over short-to-medium term horizons, while over the longer term, the relative impact reduces. We note, however, that capital losses on equity portfolios are typically realised over the same short-to-medium-term timeframes, but are no less of a concern for investors. Hedging helps to dampen return variability of equity portfolios over such timeframes.
Euro base
5.0%
0.0%
10.0%
15.0%
20.0%
25.0%
USD base
5.0%
0.0%
10.0%
15.0%
20.0%
1 month 1 year 3 year 5 year 10 year
No hedge
100% hedge
1 month 1 year 3 year 5 year 10 year
No hedge
100% hedge
CHF base
5.0%
0.0%
10.0%
15.0%
20.0%
25.0%
Average of all bases (USD, GBP, JPY, CAD, CHF, AUD)
5.0%
0.0%
10.0%
15.0%
20.0%
25.0%
1 month 1 year 3 year 5 year 10 year 1 month 1 year 3 year 5 year 10 year
No hedge
100% hedge
No hedge
100% hedge
6 Foreign Currency Hedging on Global Equity Portfolios
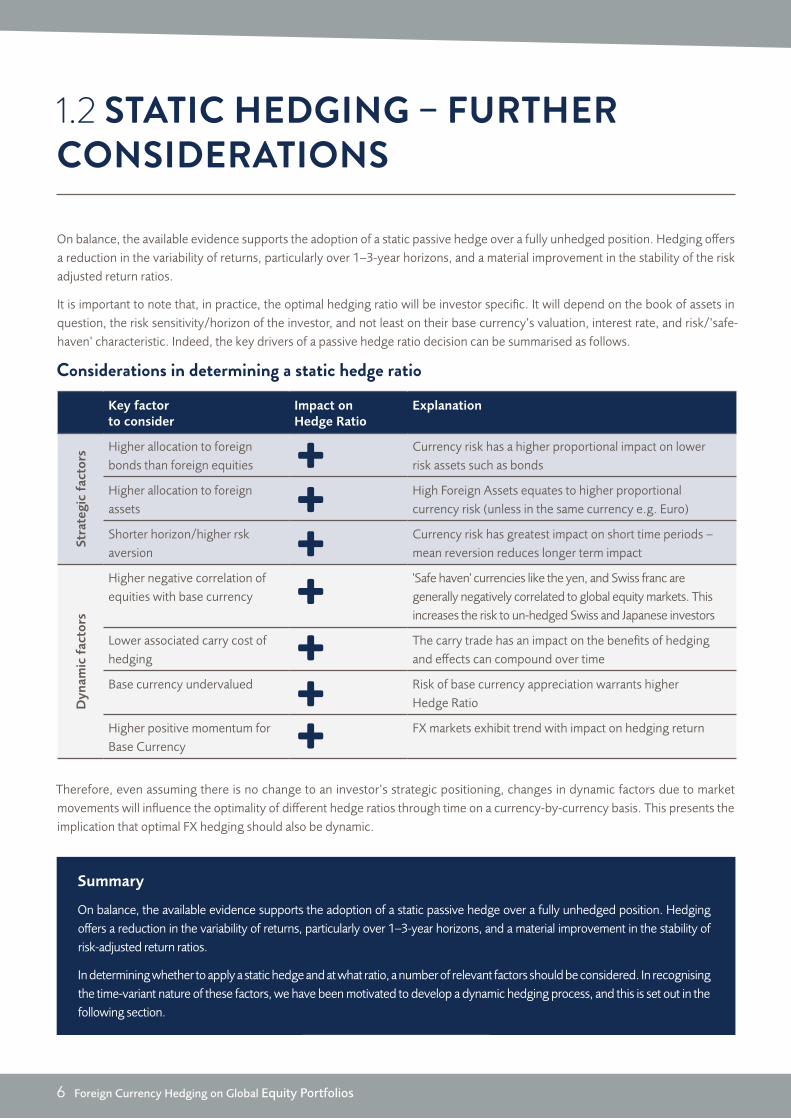
On balance, the available evidence supports the adoption of a static passive hedge over a fully unhedged position. Hedging offers a reduction in the variability of returns, particularly over 1–3-year horizons, and a material improvement in the stability of the risk adjusted return ratios.
It is important to note that, in practice, the optimal hedging ratio will be investor specific. It will depend on the book of assets in question, the risk sensitivity/horizon of the investor, and not least on their base currency’s valuation, interest rate, and risk/’safe-haven’ characteristic. Indeed, the key drivers of a passive hedge ratio decision can be summarised as follows.
1.2 STATIC HEDGING – FURTHER CONSIDERATIONS
Therefore, even assuming there is no change to an investor’s strategic positioning, changes in dynamic factors due to market movements will influence the optimality of different hedge ratios through time on a currency-by-currency basis. This presents the implication that optimal FX hedging should also be dynamic.
Key factor to consider
Impact on Hedge Ratio
Explanation
Stra
tegi
c fa
ctor
s Higher allocation to foreign bonds than foreign equities
Currency risk has a higher proportional impact on lower risk assets such as bonds
Higher allocation to foreign assets
High Foreign Assets equates to higher proportional currency risk (unless in the same currency e.g. Euro)
Shorter horizon/higher rsk aversion
Currency risk has greatest impact on short time periods ‒ mean reversion reduces longer term impact
Dyn
amic
fac
tors
Higher negative correlation of equities with base currency
'Safe haven' currencies like the yen, and Swiss franc are generally negatively correlated to global equity markets. This increases the risk to un-hedged Swiss and Japanese investors
Lower associated carry cost of hedging
The carry trade has an impact on the benefits of hedging and effects can compound over time
Base currency undervalued Risk of base currency appreciation warrants higher Hedge Ratio
Higher positive momentum for Base Currency
FX markets exhibit trend with impact on hedging return
Summary
On balance, the available evidence supports the adoption of a static passive hedge over a fully unhedged position. Hedging offers a reduction in the variability of returns, particularly over 1–3-year horizons, and a material improvement in the stability of risk-adjusted return ratios.
In determining whether to apply a static hedge and at what ratio, a number of relevant factors should be considered. In recognising the time-variant nature of these factors, we have been motivated to develop a dynamic hedging process, and this is set out in the following section.
Considerations in determining a static hedge ratio
Foreign Currency Hedging on Global Equity Portfolios 7
PART 2: OUR DYNAMIC HEDGING PROCESS
Recognising the importance of dynamic factors on an investors optimal hedge ratio, ILIM’s Quantitative Strategies Group (QSG) have developed a dynamic currency hedging process which seeks to improve risk-adjusted returns on a global equity portfolio through currency risk management. This process reduces nominal FX exposures to any foreign currency, so that the hedge ratio will be between 0–100% of the exposure in the physical equity portfolio. The hedge ratio is then set on a currency-by-currency basis, allowing a dynamic response to changes in the underlying drivers of risk and return.
An attractive feature of this approach is that it allows us to increase the overall portfolio’s exposure to FX return factor premia such as carry, valuation and momentum, while simultaneously reducing absolute risk. Consequently, a dynamic hedge represents a very appealing risk/return proposition for investors. It offers a potential gain in return with reduced absolute portfolio risk.
2.1 DYNAMIC HEDGING MODEL STRUCTURE
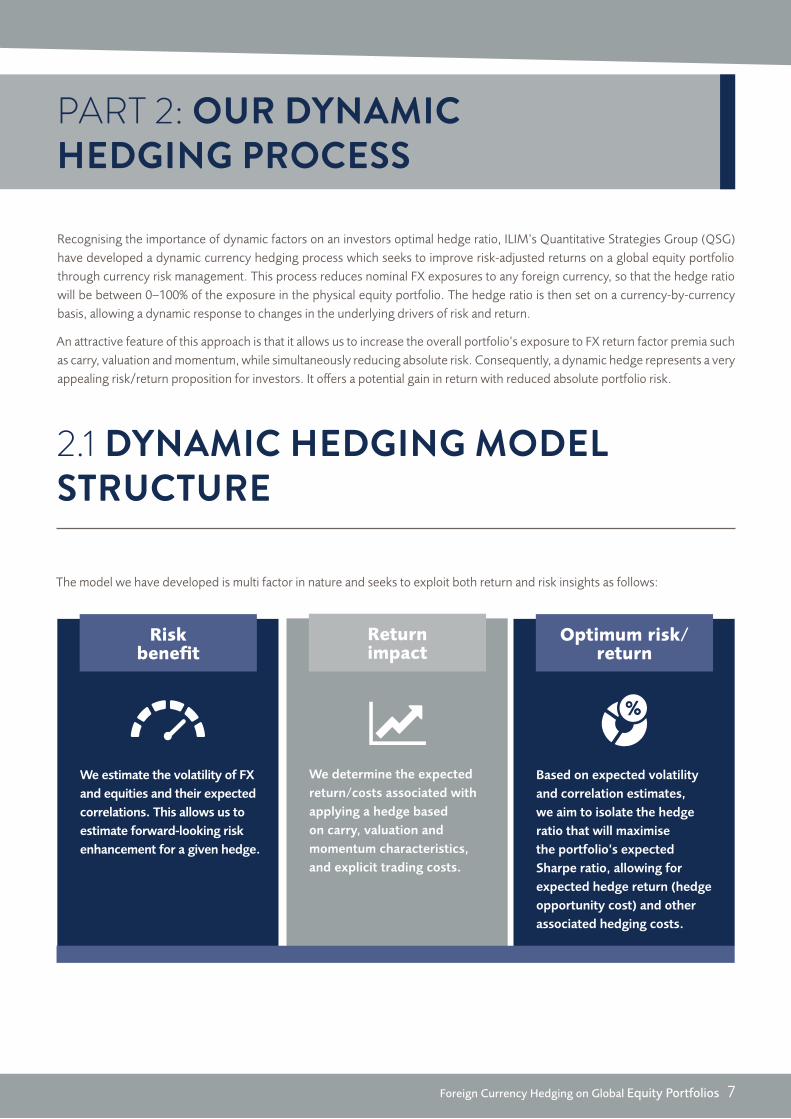
The model we have developed is multi factor in nature and seeks to exploit both return and risk insights as follows:
We estimate the volatility of FX and equities and their expected correlations. This allows us to estimate forward-looking risk enhancement for a given hedge.
Risk benefit
We determine the expected return/costs associated with applying a hedge based on carry, valuation and momentum characteristics, and explicit trading costs.
Return impact
Based on expected volatility and correlation estimates, we aim to isolate the hedge ratio that will maximise the portfolio’s expected Sharpe ratio, allowing for expected hedge return (hedge opportunity cost) and other associated hedging costs.
Optimum risk/return
8 Foreign Currency Hedging on Global Equity Portfolios
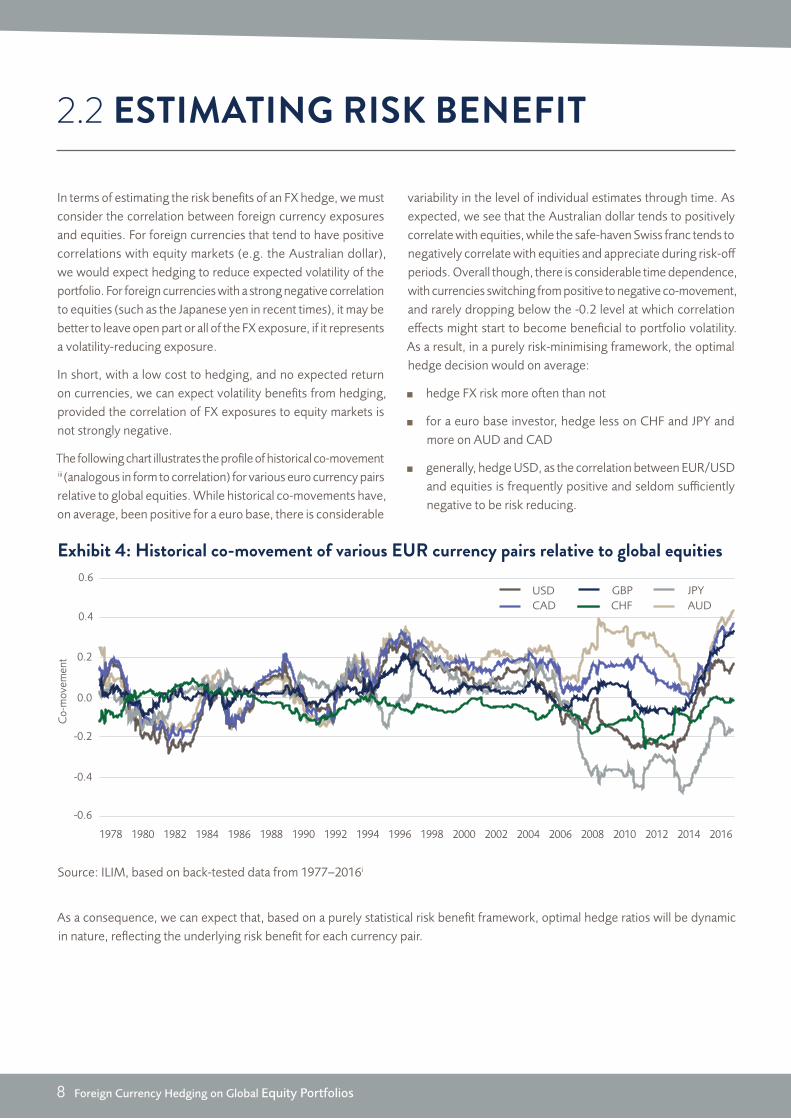
In terms of estimating the risk benefits of an FX hedge, we must consider the correlation between foreign currency exposures and equities. For foreign currencies that tend to have positive correlations with equity markets (e.g. the Australian dollar), we would expect hedging to reduce expected volatility of the portfolio. For foreign currencies with a strong negative correlation to equities (such as the Japanese yen in recent times), it may be better to leave open part or all of the FX exposure, if it represents a volatility-reducing exposure.
In short, with a low cost to hedging, and no expected return on currencies, we can expect volatility benefits from hedging, provided the correlation of FX exposures to equity markets is not strongly negative.
The following chart illustrates the profile of historical co-movement iii (analogous in form to correlation) for various euro currency pairs relative to global equities. While historical co-movements have, on average, been positive for a euro base, there is considerable
2.2 ESTIMATING RISK BENEFIT
variability in the level of individual estimates through time. As expected, we see that the Australian dollar tends to positively correlate with equities, while the safe-haven Swiss franc tends to negatively correlate with equities and appreciate during risk-off periods. Overall though, there is considerable time dependence, with currencies switching from positive to negative co-movement, and rarely dropping below the -0.2 level at which correlation effects might start to become beneficial to portfolio volatility. As a result, in a purely risk-minimising framework, the optimal hedge decision would on average:
hedge FX risk more often than not
for a euro base investor, hedge less on CHF and JPY and more on AUD and CAD
generally, hedge USD, as the correlation between EUR/USD and equities is frequently positive and seldom sufficiently negative to be risk reducing.
Exhibit 4: Historical co-movement of various EUR currency pairs relative to global equities
Source: ILIM, based on back-tested data from 1977–2016i
As a consequence, we can expect that, based on a purely statistical risk benefit framework, optimal hedge ratios will be dynamic in nature, reflecting the underlying risk benefit for each currency pair.
Co-
mov
emen
t
USDCAD
JPYGBPCHF AUD
1978 20161980 1982 1984 1986 1988 1990 2004 2008 20101992 1994 1996 1998 2000 2002 2006 2012 2014
-0.6
-0.4
-0.2
0.0
0.2
0.4
0.6

Foreign Currency Hedging on Global Equity Portfolios 9
Set against the potential risk benefit of hedging, we must consider the potential return impact (opportunity cost) of hedging foreign currency exposures. With regard to evaluating the expected return and cost of a hedging strategy, the key variable components are the:
cost of carry for a hedge programme,
valuation of the base currency,
underlying trend in foreign currency spot prices, and
transaction costs.
2.3 EXPECTED RETURN IMPACT OF HEDGING
A key factor in determining the merit of any hedging programme is the carry cost associated with hedging the foreign FX exposure.
If we wish to short a currency subject to higher domestic interest rates than our base currency, then over time, we can expect to pay the difference in the respective interest rates (or some portion thereof). While this points to an underlying inefficiency in FX markets, it is a well-documented and persistent effect, and comes through in our research. It can be demonstrated that Japanese-based investors would have paid a significant price in return (albeit with lower volatility) if they had chosen to hedge foreign exposures, given the low level of their base interest rate. Meanwhile, Australian investors would have received a large performance uplift (due to high domestic rates) if they had
CONSIDERING CARRY
Exhibit 5: Time evolution of carry from euro base for major currencies
chosen to hedge FX risk over the same time frame. Therefore, we should be less inclined to hedge if our base interest rate is low versus our foreign asset mix of interest rates, and hedge more if the situation is reversed.
The time evolution of carry from a euro base for the major currencies is shown below, and we can see it is both time dependant and currency specific. While we may be getting paid well to hedge JPY historically, there would have been carry headwinds to hedging GBP. The compressed yield environment following the Global Financial Crises means that carry has been a less significant driver, but we are starting to see a divergence in global developed interest rates once again.
Source: ILIM, based on back-tested data from 1977–2016i
1976 20161980 1984 1988 1992 1996 2000 2004 2008 2012
0.06
0.04
0.02
0
-0.02
-0.04
-0.06
-0.08
-0.10
-0.12
-0.14
GBP
USD
JPY
10 Foreign Currency Hedging on Global Equity Portfolios
MOMENTUMApplying a momentum factor is known to add value in many quant strategies, including FX alpha, and helps to avoid value traps where straight valuation readings are not responsive to new information impacting the market. Our research supports using a medium-term momentum signal based on 12-month returns with a linear fade. Shorter-term momentum is susceptible to excessive reversals, while longer-term momentum can lose persistence. Therefore, a medium-term signal demonstrates superior forecasting ability, allowing for transaction costs.
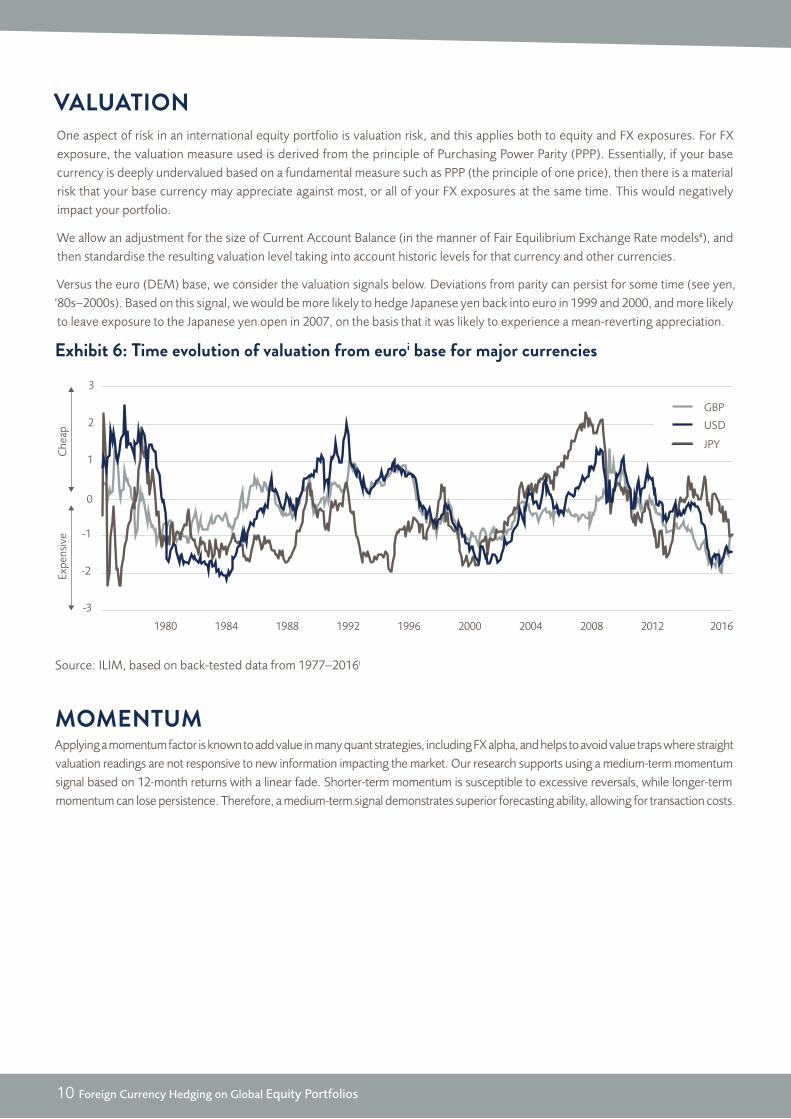
Exhibit 6: Time evolution of valuation from euroi base for major currencies
Source: ILIM, based on back-tested data from 1977–2016i
One aspect of risk in an international equity portfolio is valuation risk, and this applies both to equity and FX exposures. For FX exposure, the valuation measure used is derived from the principle of Purchasing Power Parity (PPP). Essentially, if your base currency is deeply undervalued based on a fundamental measure such as PPP (the principle of one price), then there is a material risk that your base currency may appreciate against most, or all of your FX exposures at the same time. This would negatively impact your portfolio.
We allow an adjustment for the size of Current Account Balance (in the manner of Fair Equilibrium Exchange Rate models⁶), and then standardise the resulting valuation level taking into account historic levels for that currency and other currencies.
Versus the euro (DEM) base, we consider the valuation signals below. Deviations from parity can persist for some time (see yen, ‘80s–2000s). Based on this signal, we would be more likely to hedge Japanese yen back into euro in 1999 and 2000, and more likely to leave exposure to the Japanese yen open in 2007, on the basis that it was likely to experience a mean-reverting appreciation.
VALUATION
3
2
1
0
-1
-2
-3
20161980 1984 1988 1992 1996 2000 2004 2008 2012
GBP
USD
JPY
Expe
nsiv
eC
heap
Foreign Currency Hedging on Global Equity Portfolios 11
2.4 COMBINING FX FACTORS
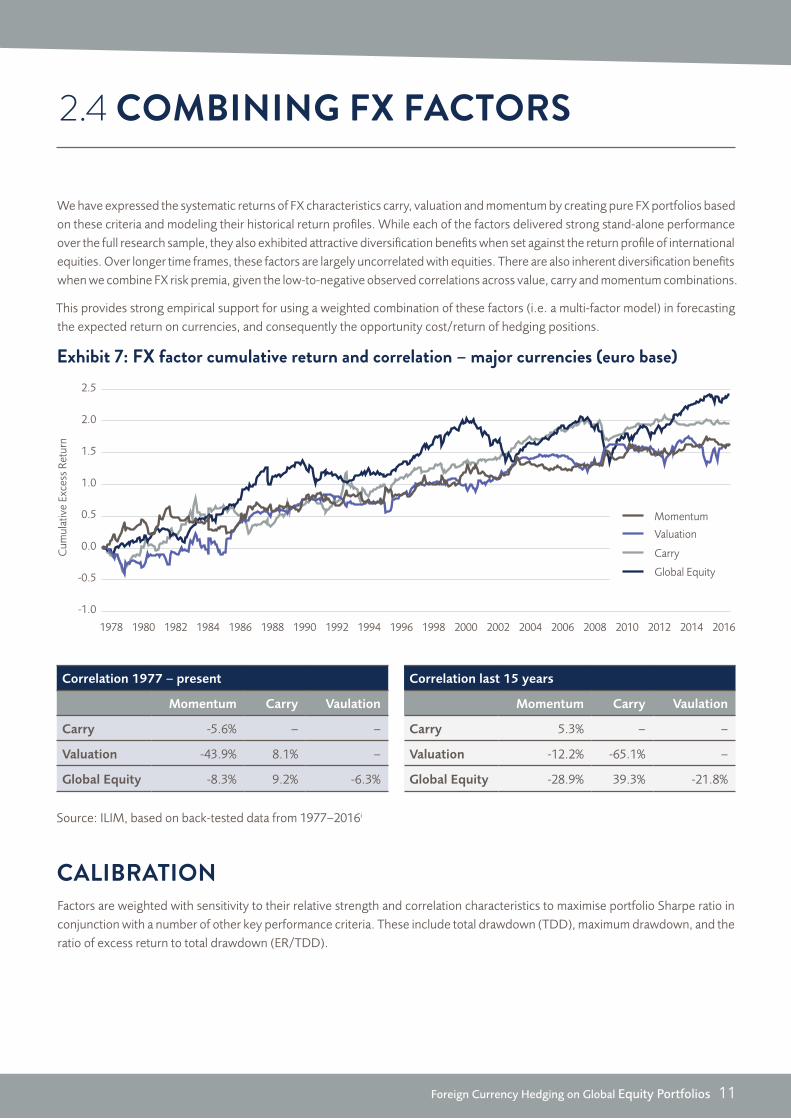
We have expressed the systematic returns of FX characteristics carry, valuation and momentum by creating pure FX portfolios based on these criteria and modeling their historical return profiles. While each of the factors delivered strong stand-alone performance over the full research sample, they also exhibited attractive diversification benefits when set against the return profile of international equities. Over longer time frames, these factors are largely uncorrelated with equities. There are also inherent diversification benefits when we combine FX risk premia, given the low-to-negative observed correlations across value, carry and momentum combinations.
This provides strong empirical support for using a weighted combination of these factors (i.e. a multi-factor model) in forecasting the expected return on currencies, and consequently the opportunity cost/return of hedging positions.
Exhibit 7: FX factor cumulative return and correlation – major currencies (euro base)
Source: ILIM, based on back-tested data from 1977–2016i
2.5
2.0
1.5
1.0
0.5
0.0
-0.5
-1.0
Cum
ulat
ive
Exce
ss R
etur
n
Momentum
Valuation
Carry
Global Equity
1978 20161980 1982 1984 1986 1988 1990 2004 2008 20101992 1994 1996 1998 2000 2002 2006 2012 2014
Correlation 1977 – present
Momentum Carry Vaulation
Carry -5.6% – –
Valuation -43.9% 8.1% –
Global Equity -8.3% 9.2% -6.3%
Correlation last 15 years
Momentum Carry Vaulation
Carry 5.3% – –
Valuation -12.2% -65.1% –
Global Equity -28.9% 39.3% -21.8%
Factors are weighted with sensitivity to their relative strength and correlation characteristics to maximise portfolio Sharpe ratio in conjunction with a number of other key performance criteria. These include total drawdown (TDD), maximum drawdown, and the ratio of excess return to total drawdown (ER/TDD).
CALIBRATION
12 Foreign Currency Hedging on Global Equity Portfolios
PART 3: KEY PERFORMANCE OUTCOMES
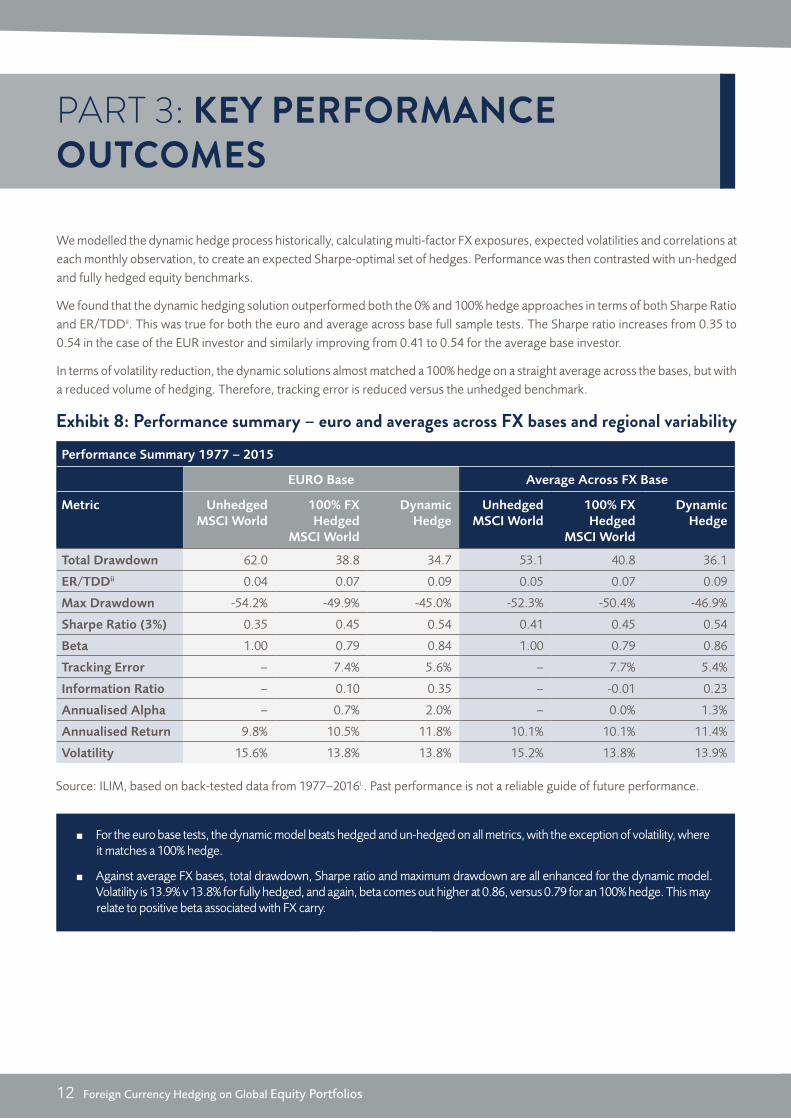
We modelled the dynamic hedge process historically, calculating multi-factor FX exposures, expected volatilities and correlations at each monthly observation, to create an expected Sharpe-optimal set of hedges. Performance was then contrasted with un-hedged and fully hedged equity benchmarks.
We found that the dynamic hedging solution outperformed both the 0% and 100% hedge approaches in terms of both Sharpe Ratio and ER/TDDii. This was true for both the euro and average across base full sample tests. The Sharpe ratio increases from 0.35 to 0.54 in the case of the EUR investor and similarly improving from 0.41 to 0.54 for the average base investor.
In terms of volatility reduction, the dynamic solutions almost matched a 100% hedge on a straight average across the bases, but with a reduced volume of hedging. Therefore, tracking error is reduced versus the unhedged benchmark.
Exhibit 8: Performance summary – euro and averages across FX bases and regional variability
Source: ILIM, based on back-tested data from 1977–2016i.. Past performance is not a reliable guide of future performance.
For the euro base tests, the dynamic model beats hedged and un-hedged on all metrics, with the exception of volatility, where it matches a 100% hedge.
Against average FX bases, total drawdown, Sharpe ratio and maximum drawdown are all enhanced for the dynamic model. Volatility is 13.9% v 13.8% for fully hedged, and again, beta comes out higher at 0.86, versus 0.79 for an 100% hedge. This may relate to positive beta associated with FX carry.
Performance Summary 1977 ‒ 2015
EURO Base Average Across FX Base
Metric Unhedged MSCI World
100% FX Hedged
MSCI World
Dynamic Hedge
Unhedged MSCI World
100% FX Hedged
MSCI World
Dynamic Hedge
Total Drawdown 62.0 38.8 34.7 53.1 40.8 36.1
ER/TDDii 0.04 0.07 0.09 0.05 0.07 0.09
Max Drawdown -54.2% -49.9% -45.0% -52.3% -50.4% -46.9%
Sharpe Ratio (3%) 0.35 0.45 0.54 0.41 0.45 0.54
Beta 1.00 0.79 0.84 1.00 0.79 0.86
Tracking Error ‒ 7.4% 5.6% ‒ 7.7% 5.4%
Information Ratio ‒ 0.10 0.35 ‒ -0.01 0.23
Annualised Alpha ‒ 0.7% 2.0% ‒ 0.0% 1.3%
Annualised Return 9.8% 10.5% 11.8% 10.1% 10.1% 11.4%
Volatility 15.6% 13.8% 13.8% 15.2% 13.8% 13.9%
Foreign Currency Hedging on Global Equity Portfolios 13
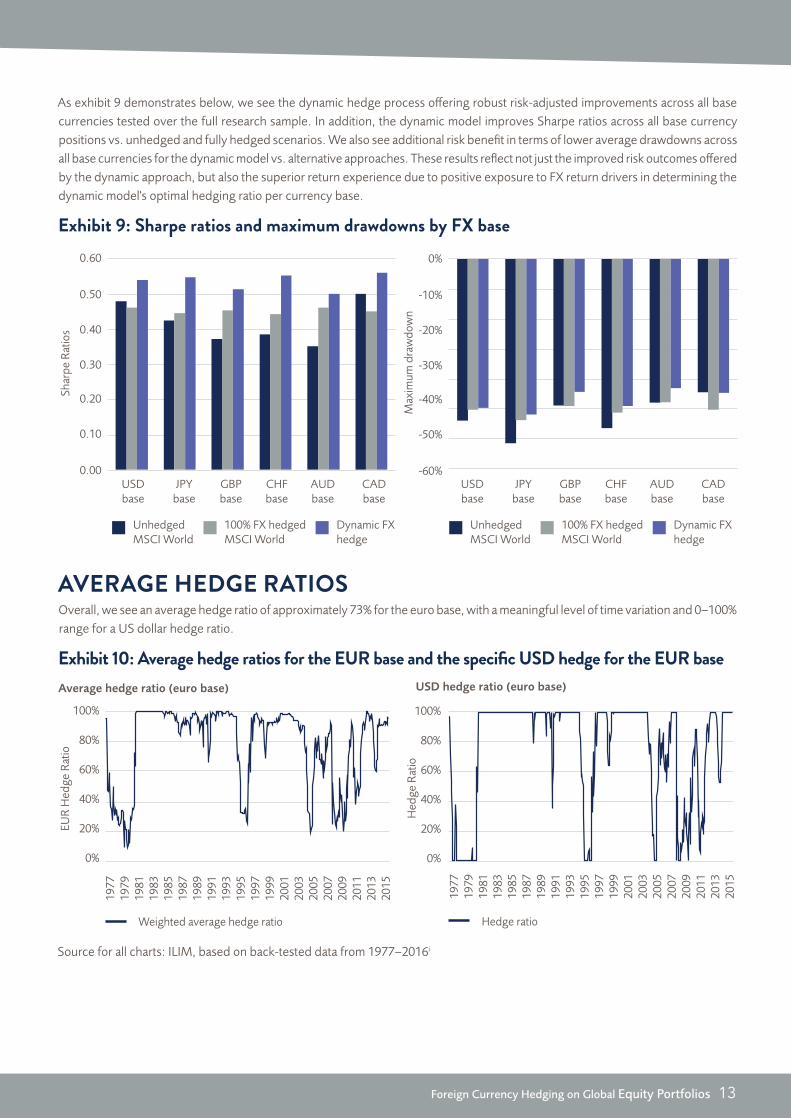
As exhibit 9 demonstrates below, we see the dynamic hedge process offering robust risk-adjusted improvements across all base currencies tested over the full research sample. In addition, the dynamic model improves Sharpe ratios across all base currency positions vs. unhedged and fully hedged scenarios. We also see additional risk benefit in terms of lower average drawdowns across all base currencies for the dynamic model vs. alternative approaches. These results reflect not just the improved risk outcomes offered by the dynamic approach, but also the superior return experience due to positive exposure to FX return drivers in determining the dynamic model's optimal hedging ratio per currency base.
Exhibit 9: Sharpe ratios and maximum drawdowns by FX base
UnhedgedMSCI World
100% FX hedgedMSCI World
Dynamic FX hedge
UnhedgedMSCI World
100% FX hedgedMSCI World
Dynamic FX hedge
0.00
0.10
0.20
0.30
0.40
0.50
0.60
-60%
-50%
-40%
-30%
-20%
-10%
0%
USDbase
JPYbase
GBPbase
CHFbase
AUDbase
CADbase
USDbase
JPYbase
GBPbase
CHFbase
AUDbase
CADbase
Shar
pe R
atio
s
Max
imum
dra
wdo
wn
AVERAGE HEDGE RATIOSOverall, we see an average hedge ratio of approximately 73% for the euro base, with a meaningful level of time variation and 0–100% range for a US dollar hedge ratio.
Exhibit 10: Average hedge ratios for the EUR base and the specific USD hedge for the EUR base
Source for all charts: ILIM, based on back-tested data from 1977–2016i
0%
20%
40%
60%
80%
100%
0%
20%
40%
60%
80%
100%
1977
1983
1979
1981
1985
1991
1987
1989
1993
1999
1995
1997
2001
2007
2003
2005
2013
2009
2011
2015
1977
1983
1979
1981
1985
1991
1987
1989
1993
1999
1995
1997
2001
2007
2003
2005
2013
2009
2011
2015
EUR
Hed
ge R
atio
Hed
ge R
atio
Weighted average hedge ratio Hedge ratio
Average hedge ratio (euro base) USD hedge ratio (euro base)
14 Foreign Currency Hedging on Global Equity Portfolios
3.1 DYNAMIC HEDGE DOWNSIDE PROTECTION
DISTRIBUTION OF 3-YEAR RETURN OUTCOMESExhibit 11: Distribution of 3-year return outcomes across all bases
0
50
100
150
200
250
300
-53
.6%
-47
.6%
-35
.7%
-41
.7%
-29
.8%
-23
.8%
-11
.9%
-17
.9%
-6.0
%
0.0
%
5.9
%
11
.9%
17
.9%
23
.8%
29
.8%
35
.7%
41
.7%
47
.6%
53
.6%
59
.5%
65
.5%
71
.4%
77
.4%
83
.4%
89
.3%
95
.3%
10
1.2
%
10
7.2
%
11
3.1
%
11
9.1
%
12
5.0
%
13
1.0
%
13
6.9
%
14
2.9
%
30
1.7
%
Negative 3-year return outcomesNo hedge
100% hedge
Dynamic hedge
Freq
uenc
y
Source: ILIM, based on back-tested data from 1977–2016i
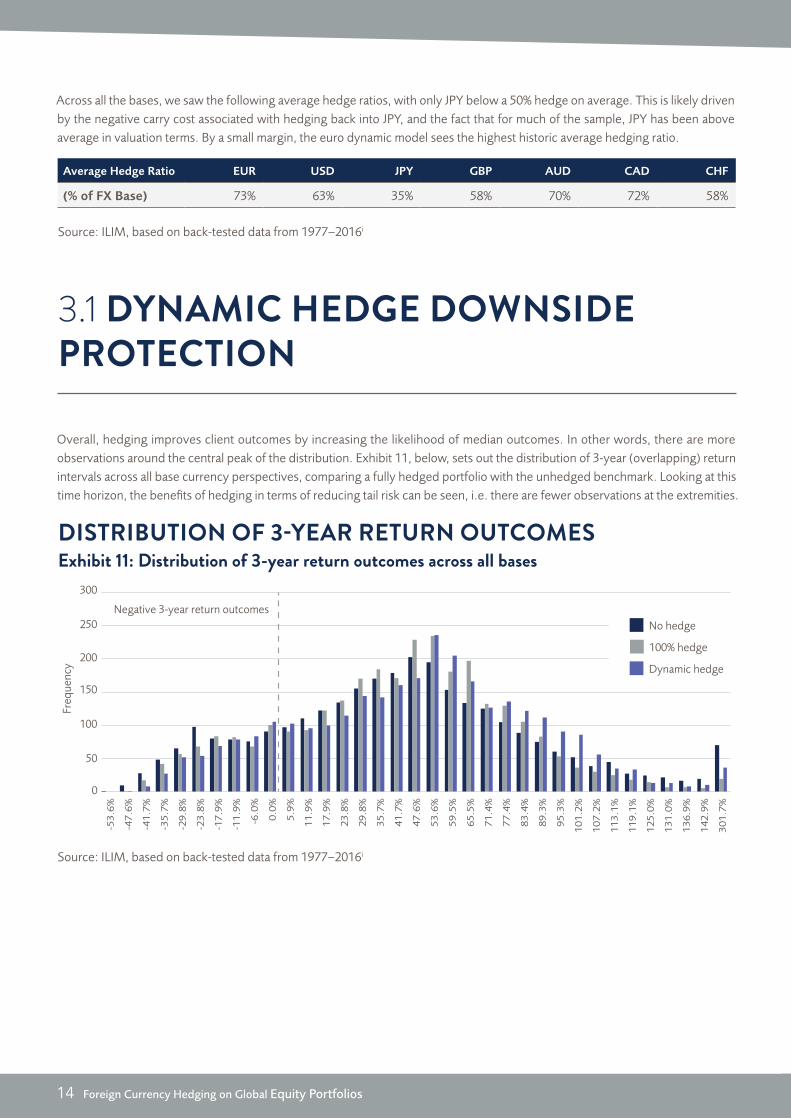
Overall, hedging improves client outcomes by increasing the likelihood of median outcomes. In other words, there are more observations around the central peak of the distribution. Exhibit 11, below, sets out the distribution of 3-year (overlapping) return intervals across all base currency perspectives, comparing a fully hedged portfolio with the unhedged benchmark. Looking at this time horizon, the benefits of hedging in terms of reducing tail risk can be seen, i.e. there are fewer observations at the extremities.
Average Hedge Ratio EUR USD JPY GBP AUD CAD CHF
(% of FX Base) 73% 63% 35% 58% 70% 72% 58%
Source: ILIM, based on back-tested data from 1977–2016i
Across all the bases, we saw the following average hedge ratios, with only JPY below a 50% hedge on average. This is likely driven by the negative carry cost associated with hedging back into JPY, and the fact that for much of the sample, JPY has been above average in valuation terms. By a small margin, the euro dynamic model sees the highest historic average hedging ratio.
Foreign Currency Hedging on Global Equity Portfolios 15
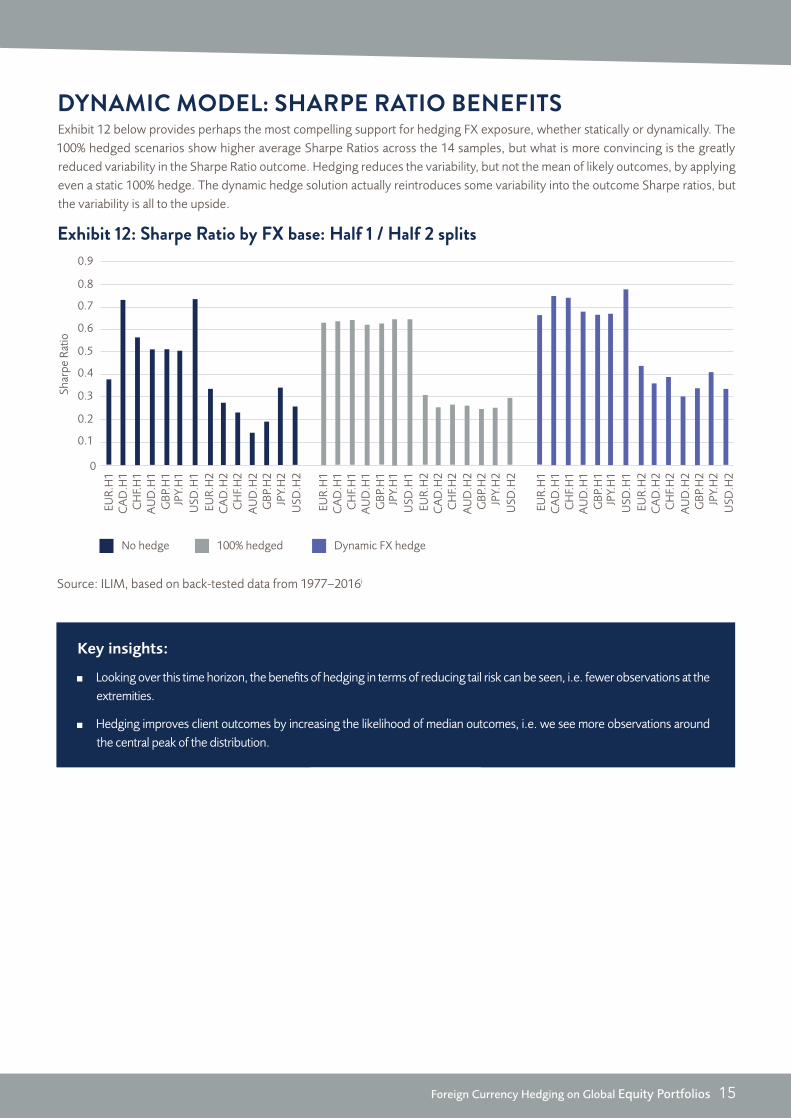
DYNAMIC MODEL: SHARPE RATIO BENEFITSExhibit 12 below provides perhaps the most compelling support for hedging FX exposure, whether statically or dynamically. The 100% hedged scenarios show higher average Sharpe Ratios across the 14 samples, but what is more convincing is the greatly reduced variability in the Sharpe Ratio outcome. Hedging reduces the variability, but not the mean of likely outcomes, by applying even a static 100% hedge. The dynamic hedge solution actually reintroduces some variability into the outcome Sharpe ratios, but the variability is all to the upside.
Exhibit 12: Sharpe Ratio by FX base: Half 1 / Half 2 splits
Source: ILIM, based on back-tested data from 1977–2016i
0
0.1
0.2
0.3
0.4
0.5
0.6
0.7
0.8
0.9
EUR.
H1
AU
D.H
1
CA
D.H
1C
HF.
H1
JPY.
H1
CA
D.H
2
USD
.H1
EUR.
H2
CH
F.H
2
JPY.
H2
AU
D.H
2G
BP.H
2
USD
.H2
GBP
.H1
EUR.
H1
AU
D.H
1
CA
D.H
1C
HF.
H1
JPY.
H1
CA
D.H
2
USD
.H1
EUR.
H2
CH
F.H
2
JPY.
H2
AU
D.H
2G
BP.H
2
USD
.H2
GBP
.H1
EUR.
H1
AU
D.H
1
CA
D.H
1C
HF.
H1
JPY.
H1
CA
D.H
2
USD
.H1
EUR.
H2
CH
F.H
2
JPY.
H2
AU
D.H
2G
BP.H
2
USD
.H2
GBP
.H1
No hedge 100% hedged Dynamic FX hedge
Shar
pe R
atio
Key insights:
Looking over this time horizon, the benefits of hedging in terms of reducing tail risk can be seen, i.e. fewer observations at the extremities.
Hedging improves client outcomes by increasing the likelihood of median outcomes, i.e. we see more observations around the central peak of the distribution.
16 Foreign Currency Hedging on Global Equity Portfolios
The evidence we have presented demonstrates that dynamic FX hedging is beneficial for those invested in a portfolio of global equities. We found this to be the case for all the major currencies, and generally consistent over different time periods.
The evidence we have presented demonstrates that dynamic FX hedging is beneficial for those invested in a portfolio of global equities. We found this to be the case for all the major currencies, and generally consistent over different time periods.
Our proposed value-additive process sets dynamic hedge ratios specific to each FX exposure, that are responsive to evolving correlations and betas. They are also responsive to expected return, risk, and cost for that exposure. The dynamic process comprehensively dominates both 0% and 100% hedge approaches.
While some of the benefits of the dynamic approach come from return enhancement derived from the factors of carry, value and momentum, and although these factors may now be weaker
drivers of returns than through the 70s, 80s and 90s, we note that the greatest downside protection was experienced in more recent times.
The dynamic hedge process delivers reduced return variability, superior sharp ratios and improved return/total drawdown looking across all FX bases. In absolute terms, hedging offers a win-win, with the potential for lower risk and enhanced return.
Overall, the dynamic hedging approach represents a very appealing risk/return proposition for investors versus either an unhedged or static FX hedge global equity portfolio/benchmark.The Dynamic Process offers both a potential gain in return from currency factor premia, while also benefiting from reduced absolute portfolio risk.
PART 4: CONCLUSION
Foreign Currency Hedging on Global Equity Portfolios 17
REFERENCES
1. Prajogi, Muralidhar and Wouden (2000), “An asset-liability analysis of the currency decision for pension portfolios”, Institutional Investor (Derivatives Quarterly), Winter, pp. 47-56
2. Larsen and Resnick (2000), “The optimal construction of international diversified equity portfolios hedged against exchange rate uncertainty”, European Financial Management, 6(4), pp. 479-514
3. Black (1989), “Universal Hedging: optimizing currency risk and reward in international portfolios”, Financial Analysts Journal, July/August, pp. 16-22
4. Black (1990), “Equilibrium exchange rate hedging”, Journal of Finance, 45, pp. 899-908
5. Braccia (1995), “An analysis of currency overlays for US pension plans”, Journal of Portfolio Management, Fall, pp. 88-93
6. Cline (2014), “Estimates of Fundamental Equilibrium Exchange Rates, May 2014”, Peterson Institute for International Economics, Policy Brief (PB14-16)
7. LeGraw (2015), “The Case for Not Currency Hedging Foreign Equity Investments: A U.S. Investor’s Perspective”, GMO White Paper
8. Jourovski (2011), “Currency Impact on Minimum Variance Portfolio”, UNIGESTION White Paper
i Comparison has been made of hedged and un-hedged MSCI World returns from seven major currency bases. Data is for the period 12/1977 to 06/2016. The standard MSCI World Local Return Index represents the aggregate of various local market returns. In practise we cannot directly match this return stream as we must either accept the impact of exchange rate moves on our returns, or we can hedge out FX risk and experience the impact of interest rate differentials in the form of FX-Carry. In practise a default, un-hedged investor will buy each market retaining exposure to FX moves between his base currency and the relevant foreign currency. Alternatively, an investor may choose to hedge his foreign currency exposure passively.
The Euro based returns for MSCI World, hedged and un-hedged, extend back to 1/1999, and prior to this are represented by MSCI World from a Deutschemark (DEM) base, and the hedged DEM returns are calculated by basis conversion using historic DEM/USD exchange rates and inter-bank rates.
ii Performance Metrics – One of our key risk measures is Total Drawdown (TDD) At any point in time a process is either at a new high(DD=0), or it is at a certain level of drawdown DD(t) versus its previous peak. Total Drawdown is this sum over time of DD(t). TDD is sometimes referred to as the Pain Index and so the ratio of Excess-Return to Total Drawdown, ER/TDD can be referred to as the Pain Ratio, analogous to the Sharpe Ratio where the Volatility risk measure is substituted with TDD.
iii We have looked at different ways of modelling the co-movement between FX and the Equity market. Overall the relationships we see are unstable, but there is some ability to forecast co-movement. The estimator used is based on historic weekly co-movement (the beta coefficient in a no-intercept regression), daily returns containing greater noise, and monthly requiring excess time window for estimation. This co-movement is analogous in form to correlation, but where the mean levels of return are not subtracted from the calculation, and the return horizon is longer in duration. This form, and weekly sampling is chosen to maximize explanatory power over 3-month forward co-movement, and an estimation process applied to determine an appropriate shrinkage factor representing the average level of realised versus lagged co-movement.
CONTACT US
PHONE: (01) 704 1200FAX: (01) 704 1918WEBSITE: www.ilim.comWRITE TO: Irish Life Investment Managers, Beresford Court, Beresford Place, Dublin 1
Irish Life Investment Managers is regulated by the Central Bank of Ireland. Irish Life Investment Managers Limited is registered as an Investment Adviser with the Securities and Exchange Commission (the “SEC”). Irish Life Investment Managers Limited holds an International Adviser Exemption in Manitoba and Ontario pursuant to NI 31-103. This material is for information only and does not constitute an offer or recommendation to buy or sell any investment and has not been prepared based on the financial needs or objectives of any particular person. It is intended for the use of institutional and other professional investors.
Source: MSCI. The MSCI information may only be used for your internal use, may not be reproduced or redisseminated in any form and may not be used as a basis for or a component of any financial instruments or products or indices. None of the MSCI information is intended to constitute investment advice or a recommendation to make (or refrain from making) any kind of investment decision and may not be relied upon as such. Historical data and analysis should not be taken as an indication or guarantee of any future performance, forecast or prediction. The MSCI information is provided on an “as is” basis and the user of this information assumes the entire risk of any use made of this information. MSCI, each of its affiliates and each other person involved in or related to compiling, computing or creating any MSCI information (collectively, the “MSCI Parties”) expressly disclaims all warranties (including, without limitation, any warranties of originality, accuracy, completeness, timeliness, non-infringement, merchantability and fitness for a particular purpose) with respect to this information. Without limiting any of the foregoing, in no event shall any MSCI Party have any liability for any direct, indirect, special, incidental, punitive, consequential (including, without limitation, lost profits) or any other damages. (www.msci.com)