The Effect of Holding Company Affiliation on Bank Risk and the 2008 Financial Crisis
37
Electronic copy available at: http://ssrn.com/abstract=1664105 Electronic copy available at: http://ssrn.com/abstract=1664105 The Effect of Holding Company Affiliation on Bank Risk and the 2008 Financial Crisis Edward R. Lawrence RB 207A, Department of Finance College of Business Administration Florida International University, Miami FL 33199, Tel: (305)348-0082 Email: [email protected] Fernando M. Patterson RB 208, Department of Finance College of Business Administration Florida International University, Miami FL 33199, Tel: (305)348-2680 Email: [email protected] Arun J. Prakash RB 202A, Department of Finance College of Business Administration Florida International University, Miami FL 33199, Tel: (305)348-2680 Email: [email protected]
-
Upload
independent -
Category
Documents
-
view
0 -
download
0
Transcript of The Effect of Holding Company Affiliation on Bank Risk and the 2008 Financial Crisis

Electronic copy available at: http://ssrn.com/abstract=1664105Electronic copy available at: http://ssrn.com/abstract=1664105
The Effect of Holding Company Affiliation on Bank Risk and the 2008 Financial Crisis
Edward R. Lawrence RB 207A, Department of Finance
College of Business Administration Florida International University, Miami FL 33199, Tel: (305)348-0082
Email: [email protected]
Fernando M. Patterson RB 208, Department of Finance
College of Business Administration Florida International University, Miami FL 33199, Tel: (305)348-2680
Email: [email protected]
Arun J. Prakash RB 202A, Department of Finance
College of Business Administration Florida International University, Miami FL 33199, Tel: (305)348-2680
Email: [email protected]

Electronic copy available at: http://ssrn.com/abstract=1664105Electronic copy available at: http://ssrn.com/abstract=1664105
The Effect of Holding Company Affiliation on Bank Risk and the 2008 Financial Crisis
Abstract
The 2008 financial crisis originated at banking institutions with a specific combination of high leverage, low liquidity, low capitalization and high exposure to subprime mortgage loans. We perform a comparative analysis of independent banks and holding company affiliated banks, and find that during the crisis holding company affiliation was related to a higher risk position in banks, characterized by riskier mortgage loans, higher leverage and lower liquidity and capitalization. Market measures of risk during this period, however, were not different for the different structures, indicating that the market did not price the additional risk contribution of affiliated banks to the main causes of the contagion.
JEL category: G20 G21
Keywords: Bank Risk, Bank Holding Company, Financial Crisis of 2008, Independent Banks, Holding Company Affiliation.

Electronic copy available at: http://ssrn.com/abstract=1664105Electronic copy available at: http://ssrn.com/abstract=1664105
The Effect of Holding Company Affiliation on Bank Risk and the 2008 Financial Crisis
1. Introduction
The financial crisis that erupted in September of 2008 had epic proportions, and led the
world economy into deep recession. In his testimony before The Financial Crisis Inquiry
Commission on April 7, 2010, former Chairman of the Federal Reserve Alan Greenspan
identified the global proliferation of securitized U.S. subprime mortgages as the immediate
trigger of the 2008 financial crisis1. He further attributed the root causes to financial institutions
that held a precarious combination of high leverage and low liquidity and capitalization.
Contagion arose when debt obligations arising from the high leveraged positions could not be
serviced by the low levels of capital in these institutions, which at the same time did not have
enough liquid assets to meet the capital deficiency. In this paper we focus on these central causes
of the financial crisis of 2008, and explore how bank structure contributed to the contagion.
Specifically, we isolate the effect of holding company affiliation on the overall risk position of
banks, as determined by the risk in the loan and security portfolios as well as the leverage,
liquidity and capital adequacy at these institutions.
We compare the holding company affiliated banks and unaffiliated (independent) banks
and find that the holding company affiliated banks have higher leverage than unaffiliated banks,
they take more risk in their lending and investments, hold lower liquidity, and have lower capital
adequacy ratios. In order to determine if the risk effect of holding company affiliation is priced
in the market, we further examine the publically traded institutions within our sample. First, we
1 www.fcic.gov/hearings/pdfs/2010-0407-Greenspan.pdf

ascertain that public banks demonstrate the same pattern of holding company risk effect found
for the entire sample. Then, we examine the stock behavior during the financial crisis period to
determine whether or not this effect was conveyed from the financial statements on to market
measures of risk, namely, the equity and asset betas, the stock volatility and the systematic and
unsystematic risks. We do not find any difference in the market measures of risk between the
public holding company of affiliated banks and public unaffiliated banks. It seems that the
market was both unaware of the higher risk and lower liquidity positions of holding company
affiliated banks, therefore, did not price these risks.
In a recent study Demyanyk and Van Hemert (2009) find that in the years leading to the
crisis, home mortgage loans deteriorated significantly in quality. Notably loans originated in
2006 show a higher delinquency rate and a higher foreclosure rate than loans originated in earlier
years. They also find that the poor quality of these loans was not confined to any particular
segment of the subprime mortgage market, such as adjustable-rate or low-documentation
mortgages. Brunnermeier (2009) attributes this decline in lending standards to the pre-crisis
trend towards an “originate and distribute” model, in which banks pooled and trenched their
loans, and then resold them via securitization. Additionally, Blanchard (2008) reports that
financial institutions financed their portfolios with less and less capital in the years before the
crisis in order to increase the return on that capital. Effectively banks found ways to reduce their
required capital and increase leverage, for example by moving assets off their balance sheets
through structured investment vehicles.
Some banks, however, are naturally more leveraged than others simply due to their
organizational structure. Holding company affiliated banks normally operate like independent
banks, except their interest must be reconciled with the parent company objectives, as well as the

interest of any sister subsidiary company. Because holding company affiliated banks tend to have
higher leverage than individual banks, we hypothesize that they generally take more risk in their
lending and investments, and hold lower liquidity and capital adequacy ratios. For public
companies, we anticipate this additional risk to reflect in a more volatile stock behavior. Hence,
we expect holding company affiliated banks to have had a greater contribution to the 2008
financial crisis. We are able to isolate the risk effect of holding company affiliation by
considering one-bank holding companies (OBHCs) in which the sole subsidiary is a commercial
bank. After controlling for other explanatory factors, such as firm size, geography and
regulation, we are able to attribute any resulting difference in the risk position of banks to their
association with a holding company.
The growing literature on the 2008 financial crisis focuses almost entirely on economy-
wide interpretations to the crisis. Cecchetti (2009) and Goodhart (2008) emphasize the effect of
government agencies response, with particular attention to the Federal Reserve actions.
Cardarelli, Elekdag and Lall (2009) compare and contrast the behavior of global financial
markets. Murphy (2008) and Chari, Lawrence, and Kehoe (2008) discuss the nature of the causes
of the crisis. Ivashina and Scharfstein (2010) provide a forensic analysis of bank lending
activities during the crisis. Our study adds to the developing literature in this topic by focusing
rather on firm-specific characteristics that justify the economic interpretations to the crisis given
in previous studies. Specifically we study whether holding company affiliation put commercial
banks at higher risk during the financial turmoil of 2008, and whether the market was receptive
to the effect of affiliation. Previous studies that have focused exclusively on bank holding
companies analyze the diversification and size effects at these institutions. Demsetz and Strahan
(1997), for example, decompose the stock return volatility of 150 bank holding companies

(BHCs) to measure holding company diversification. They find that the larger the BHC, the
better diversified it tends to be. By identifying several measures of firm-specific risk from the
BHCs financial statements they then find that the larger more diversified BHCs have similar
leverage, capital adequacy ratios, and asset composition as smaller less diversified BHCs. Their
findings suggest that whatever risk reduction benefits BHCs may obtain from diversification they
trade for a higher risk position. In their study, however, it is impossible to attribute the findings
to the effect of any particular institution within the conglomerate. To our knowledge, we are the
first to isolate the effect of bank holding company affiliation on the risk position of commercial
banks.
The increased leverage2 for OBHCs has the effect of increasing interest rate risk since
creditors demand higher interest rates to compensate for the higher default risk. It enables the
company, however, to multiply the profitability of subsidized debt proportional to the degree of
leverage. According to the moral hazard hypothesis associated with equity holders' limited
liability, equity holders have a strong incentive to increase risk because limited liability allows
them to capture all upside gains while sharing their losses with debt holders. Leverage has the
effect of raising this incentive, since debt holder’s stake in the company is directly proportional
to the debt to equity ratio. Equity holders use the capital and liquidity available to hold overall
riskier positions with the hope of achieving a higher return. In particular to our sampled period
this means that OBHCs are expected not only to engage in higher levels of home mortgage loans,
but also to have a higher percentage of them fall in the riskier, more lucrative subprime category.
They are at the same time expected to have higher levels of junior home liens, mortgage backed
2 In Appendix A, we explain the concept of higher leverage in affiliated banks through a simple balance sheet example.

securities (MBSs), and lower liquidity and capital adequacy ratios than unaffiliated banks, where
equity holders have higher stakes.
Our results confirm that OBHCs have indeed higher debt to equity ratios than unaffiliated
banks, and that during the financial crisis they held an overall riskier position marked by higher
levels of home mortgage lending as well as riskier mortgage loans, and lower liquidity and
capital adequacy ratios. The data on investment in securities show that OBHCs engaged in less
MBSs. Though unaffiliated banks had higher levels of MBSs, they also engaged to a greater
extent on the safer US Treasury securities. On the profitability side, the higher risk position of
OBHCs was in fact accompanied by significantly higher returns on assets and returns on equity.
This comes to no surprise; riskier loans have higher interest rates, which lead to higher profits.
During times of crisis, however, riskier loans can also lead to higher losses. We observed that
prior to the economic crisis OBHCs had low liquidity and capital ratios as well as higher total
loans to assets, implying that they were sacrificing their capital and liquidity to engage in more
lending. Though they experienced higher profits as a result, during the crisis their position
became more precarious.
We further analyze the risk positions of the public subsample of affiliated and
unaffiliated banks, and find that public OBHCs underwrite higher amounts of first and junior
home liens than public unaffiliated banks, and have a higher nonperforming percentage of them.
This difference, not seen in the full sample, comes as no surprise. There are many more owners
in stockholder controlled banks than in private equity holder banks.. A larger amount of owners
(shareholders) translates into a smaller stake for the owner manager of the bank. Thus in the
public subsample, the incentive to use the higher leverage in OBHCs to engage in riskier lending
is stronger than in the non public OBHCs. Our results confirm that OBHCs are less liquid and

less capitalized, and higher leveraged (debt to equity) and more profitable structures than
unaffiliated banks in the public subsample.
A consequential matter arises of whether or not the market captures the differences in risk
position between affiliated and unaffiliated banks. Beyond the clear evidence indicating that
public OBHCs have an overall riskier stance than public unaffiliated banks, the usual measures
of market risk fail to account for this difference. No measure of market risk, not even the asset
beta which is most influenced by the debt to equity ratio, show any significant difference
between the banking structures. We find that whether private or public, the effect of holding
company affiliation means a higher risk stance for banks, at least as measured through the
balance sheet. In the context of the financial crisis it means that holding company affiliation
significantly increased the contribution of banks to the root causes of the crisis. This effect,
however, did not translate into more volatile stocks for public OBHCs. The market’s
‘unawareness’ of their higher risk taking combined with higher profits provides a positive
feedback mechanism by which OBHCs actions were rewarded during the financial crisis. Our
study suggests that holding company affiliation is not properly priced by the market.
The remainder of the paper is organized as follows. In section 2 we discuss the relevant
literature. Details about the sample construction and variables of interest are in section 3. In
section 4 we present the methodology. Section 5 has the results. . We conclude with a discussion
in section 6 and a brief conclusion in section 7.
2. Literature Review and Hypothesis Formation
Structural changes in the financial industry during the last few decades reveal why it is
important to study the effect of holding company affiliation on banks. Amel (1996), reports that

in the year 1984 independent banks represented 19.1% of all banking organizations and held
$209.9 billion in deposits. In just ten years these numbers fell to 12.0% and $170.0 billion in
deposits. During the same period the number of one-bank holding companies grew from 16.5%
to 20.4% of all banking organizations, and their deposits from $467.7 to $523.0 billion. Similarly
multibank holding companies grew from 2.4% to 3.7% of all banking organizations, and their
deposits from $936.1 to $1689.6 billion. Janicki and Prescott (2006) study the changes in the size
distribution of banks from 1960 to 2005, and find that while the ten largest banks held 21% of
the banking industry’s assets in 1960, their share grew to nearly 60% by 2005. During this period
the number of independent banks fell sharply from 13,000 to less than 6,500. There has been a
steady change in the financial industry over time towards consolidation and larger size. It is clear
that the larger banking organizations have more of an impact on the financial markets. The
failure of any one of the ten largest depository institutions in the US during the financial crisis
would have bankrupted the FDIC. It would have taken several hundred small banks to do the
same. The effect of holding company affiliation on the financial markets is a less obvious matter,
however. In this study we are concerned with how affiliation influenced the risk position of
banks during the financial crisis, and how this influence specifically contributed to its root
causes.
The literature that explores differences in affiliated and unaffiliated banks is scanty and
outdated. Mayne (1977) compares selected measures of the performance of the banking affiliates
of multibank holding companies with nonaffiliated banks competing in the same local markets.
She studies a sample of 656 banks divided equally between independent banks and holding
company subsidiaries during 1969-1972. Her findings indicate that independent institutions
exhibit greater holdings of cash and low risk securities, and smaller percentage of residential

mortgage loans than affiliated banks. At the same time, independent banks appear to be less
profitable, presumably due to the assumption of lower risk, and commensurate lower return. We
build on Mayne’s multivariate approach in order to isolate the effect of the holding company
from that of other specified factors which influence bank risk position. Our study, however,
differs from Mayne’s in several important ways. For one thing, we restrict our sample to one-
bank holding companies with a commercial bank as its single subsidiary (OBHC). In this way we
are able to attribute the findings specifically to the effect of holding company affiliation, unlike
in Mayne’s study where other subsidiary companies make it impossible to isolate this effect.
Additionally the sheer sample size employed in our study constitutes almost the entire population
of OBHCs and nearly half of individual banks in the USA. Of the 3,097 affiliated banks and the
11,073 independent banks that existed in 1973, Mayne’s sample represents 10.6% of affiliated
banks and 2.9% of independent banks. Our sample, on the other hand, considers 91.6% of OBHC
and 48.5% of unaffiliated banks in existence at yearend 2008. Finally we consider, in addition to
financial statements measures of risk, market measures of risk by examining the stock behavior
of publically traded organizations within our sample.
We define our measures of risk appropriate for the time period studied. Demyanyk and
Van Hemert (2009) find that risk in financial institutions in the years leading to the financial
crisis was increasingly defined by the degree of low quality home mortgage loans. Hence our
objective becomes uncovering the relevant measures of low quality mortgage loans available in
the financial statements. While banks do not readily report the amount of ‘subprime’ mortgage
loans on their balance sheets, we measure risk in their mortgage loan portfolio through the
amount of nonperforming loans, and of junior home liens. Though an indirect measure of
‘subprime’, nonperforming home mortgage loans provide the best proxy of bad quality loans in

the financial statements. Junior home liens, on the other hand, are not presumed to reflect
‘subprime’ lending; however during times of crisis they can represent significantly riskier loans
over first liens. First home liens have payment priority over junior home liens in the event of
mortgage default. During a booming real estate market, banks can sell a foreclosed property at a
high enough price to cover both first and junior liens. However, during extreme real estate and
credit market contractions, like those experienced during 2008, a foreclosed property may barely
cover the first lien, and almost certainly not be sufficient to honor a junior lien. Hence, we use
junior home liens as a measure of risk in the loan portfolio. Consistent with the higher leverage
available to affiliated banks, and Blanchard (2008) findings that banks came into the financial
crisis with lower capital ratios than they had in years past, we formulate our first two research
hypotheses:
Hypothesis 1: Affiliated banks have higher amounts of nonperforming and junior mortgage loans
than unaffiliated banks.
Hypothesis 2: Affiliated banks have lower percentages of capital and liquid assets than
unaffiliated banks
We test these hypotheses by performing univariate and multivariate tests to compare the ratios of
nonperforming home mortgage loans and junior home liens to total loans, as well as the tier1 and
liquid assets to total assets ratios for the affiliated and nonaffiliated banks.
Our third hypothesis relates to the public institutions in our sample, and measures of
market risk used in a similar manner in previous literature. Maher (1997), for example, employs
a two-factor model of security returns to assess the inter-temporal risk position of bank holding
companies from 1976 to 1989. His primary measure of firm risk is the stock return variance,
which he finds to have gradually increased over time during the sampled period. We use the

stock variance as a measure of total firm risk, but further decompose it into the systematic and
unsystematic components. Additionally we employ the stock beta in order to measure the beta of
the assets in the balance sheet. Our third hypothesis describes our expectations on the market
measures of risk.
Hypothesis 3: Market measures of risk are higher for affiliated banks than for unaffiliated banks.
We test this hypothesis by performing the univariate as well as multivariate tests to compare the
stock and asset betas, as well as total, systematic and unsystematic risks between affiliated and
unaffiliated banks.
3. Sample and Data
In this study we use the Highline Financial3 database to obtain the financial statements of
all the banks is our sample. We identify 2649 OBHCs as having no nonbank, thrift or foreign
subsidiaries at yearend 2008. Entire investment (100%) of the holding companies’ investment is
in subsidiaries and is confirmed to be in a single commercial bank. We identify 2233
independent commercial banks.. The final total sample consists of 2426 OBHCs and 1085
unaffiliated banks, after banks with missing, unreported or otherwise unavailable dependent and
independent variables are removed. In the final sample 259 OBHCs have public holding
companies and private banks. Furthermore, 186 unaffiliated banks in the final sample are public.
Stock and market data is compiled using Bloomberg LP. Companies whose stock traded
continuously for at least 100 of the 104 weeks in the two year sample period are selected into the
final public sample set. Thus, in final sample we have 153 OBHCs and 116 unaffiliated banks.
3Highline Financial can be access at www.highlinefi.com. It provides financial statement data for US financial institutions.

We collect the 2008 end of year financial statements from Highline Financial for each
commercial bank in the sample. The dependent variables selected encompass the breakdown of
loans secured by real estate and their nonperformance, the security investments, and the liquidity,
leverage and capital adequacy of the banks. The independent variables selected control for firm
size, number of branches, local economic market (geography), and bank regulatory authority.
Additionally, weekly stock returns for 2007-2008 is collected from Bloomberg LP for the public
sample set. Betas are calculated through matched weekly S&P 500 index (SPX) returns. Total
stock risk is decomposed into systematic and unsystematic risks using the standard finance
equations.
4. Methodology
Univariate Analysis:
Our goal is to test if the ratios in the unaffiliated bank structure ( 1μ ) are different from
the ratios in the banks of OBHCs ( 2μ ). Hence we test the following null-hypothesis:
0: 210 =− μμH
To select the appropriate test we first test whether the population variances are
statistically equal or not using the Snedecor’s F-test. If the variances are found to be statistically
equal, we use the standard two independent sample t-test to test the equality of population
means4. If the variances are found to be statistically not equal, we use the two independent
sample t- test for equality of population means as proposed by Satterthwaite (1946). The test
4 For the test statistics and procedures to test the equality of two population variances and the equality of two population means when population variances are unknown but equal see any basic standard statistics textbook. Furthermore, the parametric tests require that the populations from which the samples are taken are normally distributed as well. However, we refrain from testing for normality as the sample sizes in our study are very large.

assumes that the two underlying populations are normally distributed with unequal but unknown
population variances, the appropriate two independent sample t-test requires the computation of
the t-statistic given by
21
2
22
1
21
2121
)(
)()(
ns
nsXXt
+
−−−=
μμ
If the null hypothesis is true, the t- statistic will have Student’s t-distribution with
Welch’s (1947) “modified” degrees of freedom given by
df =
2
22
22
1
21
21
2
2
22
1
21
)/()/(nns
nns
ns
ns
+
⎟⎟⎠
⎞⎜⎜⎝
⎛+
Where i and Si ( i = 1,2) respectively are the sample means and standard deviations of
the ith sample.
Multivariate Analysis:
Our multivariate analysis is inspired by Mayne’s (1977) study. Like Mayne, we also use
multiple linear regressions but improve upon by providing better control of the local economy in
which the banks compete, namely the county unemployment rate, the percent change in per-
capita income from 2007 to 2008, and whether or not the organization is in a metropolitan area
(See Thomson (1991)). Additionally, since our sample considers an important number of small
organizations, we also control for the number of branches. Essentially, we perform a cross
sectional multivariate regression analysis with selected variables of interest, which influences the
loan and security investment exposure to the real estate market as well as the leverage, liquidity,

capitalization and profitability. For each of the dependent variables, we run the following
regression model:
Dependent variable = α + β1*UR + β2*%ΔPCI + β3*MSA + β4*LogTA + β5*Charter
+ β6*Branches + β7*HC + ε (1)
The dependent variables are: home mortgage loans per total loans, first home liens per
total loans, junior home liens per total loans, total loans per total assets, nonperforming home
mortgage loans per total loans, nonperforming first home liens per total loans, nonperforming
junior home liens per total loans, nonperforming loans per total loans, US Treasury securities per
total securities, municipal securities per total securities, mortgage backed securities per total
securities, municipal securities per total securities, held to maturity securities per total securities,
total securities per total assets, liquid assets per total assets, tier 1 capital ratio, debt to equity
ratio, return on average asset, and return on average equity. Additionally for the public sample
we include the stock beta, stock return variance, systematic risk, unsystematic risk, and asset
beta.
The independent variables are: county unemployment rate (UR), percent change in per-
capita income from 2007 to 2008 (%ΔPCI), area type dummy variable (MSA = 1 for metro, 0 for
non-metro), log of total assets (logTA), regulatory authority (Charter = 1 for federal, 0 for state),
number of branches (Branches), holding company dummy variable (HC = 1 for OBHC, 0 for
independent bank).
The county unemployment rate, the percent change in per-capita income, and the MSA
dummy control for the local economic conditions. These measures have been widely used in
standard banking literature, (for example see Thomson (1991) and Mayne (1977)). In our study
these variables are key factors that affect the real estate market, and in turn the health of banks.

Higher unemployment and lower percent change in per-capita income can translate into higher
mortgage defaults. MSA type area, on the other hand, can make it easier (metropolitan areas) or
harder (micropolitan areas) for banks to increase the size of their home mortgage loan portfolios.
The size of a bank and the number of branches are other variables widely used to capture any
scale effects. They are particularly important in our study since typically independent banks tend
to be smaller than OBHC. Finally the regulatory authority controls for differences in the ‘ease’
by which banks are allowed to operate, given different stringency in the regulatory policy of
federal versus state regulators (Mayne (1977)). The HC dummy represents bank structure, and is
the primary variable of interest in this study.
An identical procedure of univariate and multivariate analysis is conducted for the public
subsample. In addition to comparing financial statement measures, however, we also test for
differences in the various market measures of risk. In principle, the risk embedded in the balance
sheet is captured by the beta of the assets. The asset beta corresponds to the weighted average of
the beta of the debt and the beta of the equity, as enumerated in equation 2 below. Though debt is
not risk-free, for simplicity we assume that it is insured or otherwise backed in its entirety by the
company assets. This assumption makes the debt beta equal zero, and allows us to measure the
asset beta through reduced equation 3. We obtain the equity beta for our public subsample of
unaffiliated banks and OBHCs, where the holding company is the public entity, through equation
4. Additional market measures of risk, such as stock total risk, systematic and unsystematic risk
are measured through equations 5, 6 and 7 respectively.
βassets = βdebt + βequity (2)
βassets = βequity (3)

βequity = (4)
Total stock risk = σi2 (5)
Systematic risk = (βequity)2 * σm2 (6)
Unsystematic risk = Total risk – Systematic risk (7)
Where σi2 is the variance of the stocks’ rates of return, and σm
2 is the variance of the market rates
of return.
5. Empirical Results
In Table 1 we present the univariate statistical tests for the full sample. In Panel A we
show the loan mix at unaffiliated and affiliated banks. We find that for both, total loans are more
than half of the total assets, and real estate loans are more than half of all loans, with OBHCs
offering more total loans to assets, but less real estate loans to total loans. OBHCs offer
significantly more first and junior home liens than unaffiliated banks. Panel B of Table 1 shows
that total nonperforming loans are a relatively small percentage of total loans, with unaffiliated
banks having significantly higher amounts of them. However, nonperforming loan differences
are mainly for construction and land development loans, home equity lines and loans secured by
nonfarm and nonresidential assets. Panel C of Table1 reveals that both OBHCs and unaffiliated
banks engage in security investments to a similar extent; for each, total securities represent about
a quarter of the total assets. OBHCs engage in significantly higher levels of municipal securities,
and have more total securities available for sale. Unaffiliated banks engage more in US Treasury,
MBSs and other debt securities, and also hold more of their total securities to maturity. Panel D
of Table 1 shows that OBHCs are larger in size and are more profitable; however they also hold

higher debt to equity ratios and lower liquid assets and tier 1 capital to total assets than
unaffiliated banks.
In Table 2 we present the full sample regression analysis on the variables of interest we
reported in Table 1. The HC Dummy coefficient indicates differences emanating from the type
of structure, either holding company affiliated or unaffiliated bank. In Panel A of Table 2 we find
positive and significant coefficients for home mortgage loans, first and junior liens and total
loans to assets, indicating that OBHCs engage in higher levels of these loans after controlling for
firm specific, geographical and regulatory differences. In Panel B we report the cross sectional
regression for the non performing loans and find a moderately significant and positive
coefficient for nonperforming home mortgage loans, indicating that the combined first and junior
lien loans are relatively worse in OBHCs. Total loans, however, generally underperform more at
unaffiliated banks, as indicated by the negative and moderately significant HC dummy
coefficient. In Panel C we notice significant differences across all security investment measures.
The negative HC dummy coefficient indicates higher levels of MBS, US Treasury securities,
securities held to maturity and total securities for unaffiliated banks, while OBHCs engage in
higher amounts of municipal securities. The cross sectional regression results in Panel D show
that OBHCs have significantly higher debt to equity ratios, higher return on assets (ROA), higher
return on equity (ROE), lower liquid asset and lower tier1 ratios. The results in Table 1 and 2
support our hypothesis 1 and 2 that affiliated banks have higher amounts of nonperforming and
junior mortgage loans than unaffiliated banks, and that affiliated banks have lower percentages
of capital and liquid assets than unaffiliated banks.
In Table 3 we present the univariate analysis of the public subsample of the unaffiliated
and the affiliated banks of OBHCs. Panel A shows that unaffiliated banks report moderately

higher levels of loans than OBHCs. Real estate loans constitute close to eighty percent of total
loans for both structures. Unaffiliated banks have higher levels of construction and land
development loans, while OBHCs report higher levels of home mortgage loans, both at the first
and junior levels. In Panel B we find higher construction and land development nonperforming
loans for the unaffiliated banks, while nonperforming first and junior home mortgage loans are
significantly higher at OBHCs. In Panel C we show that unaffiliated and the affiliated bank of
OBHCs have similar security mix; the only significant difference is in the municipal securities
where the bank affiliated to OBHCs hold more municipal securities. Lastly the results presented
in Panel D of Table 3 show that public OBHCs are larger and more profitable than public
unaffiliated banks. They also report lower liquid assets and tier 1 to total assets ratios, and higher
debt to equity ratios.
In Table 4 we present the similar regressions as Table 2 for the public subsample. In
Panel A we observe that while both structures engage in similar amounts of total loans, the
mortgage loan composition is substantially higher at OBHCs. Results in Panel B show that
affiliated banks of OBHCs experience higher amounts of nonperforming first and junior home
liens than their unaffiliated counterparts. Consistent with Mayne (1977), in Panel C we find that
public OBHCs engage in higher levels of municipal securities. Our results, however, show no
difference in the levels of MBS or total securities between affiliated and unaffiliated banks. In
Panel D, public OBHCs show the same pattern observed in the full sample regressions reported
in Panel D of Table 2, with lower liquid asset and tier 1 ratios and higher debt to equity, return
on average asset and return on average equity ratios than unaffiliated banks. Finally in Panel E
we find that none of the market measures of risk show any statistical difference between the two
banking structures.

6. Discussion
Our results indicate that OBHCs have higher debt to equity ratios than unaffiliated banks,
both in the overall sample and in the public subsample. High leverage is postulated by
economists like Alan Greenspan as having had a pivotal role in the aggregate risk of financial
markets during the 2008 crisis. , increased risk for banks meant engaging in subprime home
mortgage loans or in securities derived from them. These subprime mortgage loans had higher
probability of default, but higher interest, and therefore higher profits than their safer prime loan
counterparts. Our results clearly indicate that at OBHCs, where the leverage is higher, there were
many more home mortgage loans underwritten and underperforming than at unaffiliated banks,
where the leverage is lower.
We find that higher leverage for OBHCs was accompanied by lower liquid assets to total
assets and lower tier 1 to total assets ratios. This suggests that OBHCs did not manage their
higher loan portfolio risk by being better capitalized and liquid than unaffiliated banks. From
table 2 we can determine that they directed their attention instead to safer security investments,
particularly municipal securities. This is likely to explain why we find lower levels of MBS in
the banks of OBHCs. This particular combination of riskier home mortgage loans and safer
security investment proved profitable for OBHCs, as they experienced higher ROA and higher
ROE than unaffiliated banks, who preferentially engaged in more MBSs and managed their risk
through higher liquidity and capitalization.
The public subsample of OBHCs and unaffiliated banks show higher levels of leverage
and even sharper risk differences than the full sample of equivalents. Whereas for the full sample
there is a moderately significant difference in combined nonperforming home liens, public
OBHCs have higher levels of nonperforming first and junior liens than unaffiliated banks.

Furthermore there are no differences in MBSs investment. We observe significantly lower
liquidity and capital adequacy ratios for OBHCs. This suggests that the relative riskiness of
public OBHCs over public unaffiliated banks is larger than the difference in risk stance between
the non public structures. Nevertheless, the higher risk position of public OBHCs proved more
profitable than the relatively safer stance of unaffiliated banks, as measured by higher ROA and
ROE ratios. The market measures of risk did not incorporate the clearly defined risk and
profitability differences between the structures embedded in the balance sheet. The stock of
publically traded OBHCs is no more volatile than the stock of public unaffiliated banks. There
are no differences in the stock betas, and what is more surprising, no differences in the asset beta.
This is surprising indeed given the markedly different debt to equity ratios between the
structures, which is used to compute the asset beta. This asset beta is a proxy for the risk in the
assets that is ‘noticed’ by the market. Yet the market proved totally blind to the sharp differences
noted on the loan portfolios.
7. Conclusion
In this study we isolate the effect of holding company affiliation through sample
selection, and demonstrate that this effect translated into higher contribution of banks to the root
causes of the 2008 financial crisis. Affiliated banks used their higher leveraged positions to
engage in riskier home mortgage lending, sacrificing both liquidity and capital adequacy, the
combined effect of which were the primary reasons of the contagion. Besides this clear higher
contribution, the market did not deem OBHCs any riskier than unaffiliated banks.
In the context of the financial crisis it is important to determine if holding company
affiliation impacted the amounts of subprime mortgage loans underwritten at affiliated institution

versus unaffiliated ones. In this study we did not directly measure this amount, due to the general
unavailability of the specific nature of the home mortgage loans reported on the balance sheets.
Instead we use the percentage of nonperforming loans as a proxy for bad quality loans, though
we are careful not to refer to them as ‘subprime’. Instead, we identify ‘risky’ loans as being
either the nonperforming loans or the junior home liens. Our study could be taken further by
measuring subprime mortgage loans directly, though for our sample this data is not publically (or
freely) available yet. This, however, is a minor point rather than a limitation, considering that our
analysis enraptures more than risky loans and provides a general picture of the risk position of
OBHCs and unaffiliated banks.

REFERENCES
Amel, D., 1996. Trends in the structure of federally insured depository institutions: 1984-94.
Federal Reserve Bulletin January.
Blanchard, O., 2009. The crisis: basic mechanisms, and appropriate policies. International
Monetary Fund, Washington DC, Working Paper 80.
Brunnermeier, M., 2008. Deciphering the liquidity and credit crunch 2007-2008. Journal of
Economic Perspectives Forthcoming.
Cardarelli, R., Selim E., Subir L., 2009. Financial stress, downturns, and Recoveries.
Washington: International Monetary Fund forthcoming.
Cecchetti, S.G., 2009. Crisis and responses: the federal reserve in the early stages of the financial
crisis. Journal of Economic Perspectives 23, 51-75.
Chari, V.V., Lawrence J.C., Patrick J.K., 2008. Facts and myths about the financial crisis of
2008. Federal Reserve Bank of Minneapolis Working Paper no. 666.
Demsetz, R., Strahan, P., 1997. Diversification, size, and risk at bank holding companies. Journal
of Money Credit and Banking 29(3), 303-313.
Demyanyk, Y., Van Hemert, O., 2007. Understanding the subprime mortgage crisis. Stern
School of Business, New York University, Working Paper December 10.
Goodhart, C., 2008. The regulatory response to the financial crisis. LSE Financial Markets
Group Paper Series February.
Greenspan, A., 2010. Testimony before the financial crisis inquiry commission. April 7.
Ivashina, V., Scharfstein, D., 2010. Bank lending during the financial crisis of 2008. Harvard
Business School Working Paper.
Janicki, H., Prescott, E., 2006. Changes in the size distribution of U.S. banks: 1960-
2005.”Federal Reserve Bank of Richmond Economic Quarterly 92:4, 291-316.

Maher, M., 1997. Bank holding company risk from 1976-1989 with a two-factor model. The
Financial Review 32(2), 357-371.
Mayne, L.S., 1977. A comparative study of bank holding company affiliates and independent
banks, 1969-1972. Journal of Finance 32, 147-158.
Murphy, A., 2008. An analysis of the financial crisis of 2008: causes and solutions. Social
Science Research Network.
Thomson, J.B., 1991. Predicting bank failures in the 1980s. Federal Reserve Bank of Cleveland
Economic Review First Quarter, 9-20.

Appendix A: Leverage and Holding Company Affiliation
The concept of higher leverage in affiliated banks can be easily demonstrated through a
simple balance sheet example. Bank A shown below has $100 in assets. On the liability side the
assets are matched with $80 of debt and $20 of equity, which represents a debt to equity ratio of
4. A holding company owning bank A will report on their balance sheet $20 of assets,
corresponding to the equity of bank A. We assume that it has $5 of equity and that it has taken
$15 of debt to purchase the bank. The consolidated balance sheet of the one-bank holding
company consists of $95 of debt and $5 of equity, the equivalent of a debt to equity ratio of 19.
In this example we have assumed that the bank existed prior to the formation of the one-bank
holding company, in which case the minimum equity and debt assumed by the holding company
is the equity of the bank. Holding companies, however, are free to choose additional amounts of
debt, and do so regularly as the cost of capital is usually lower for them than for unaffiliated
banks.
Balance Sheet of Bank A:
Assets Liabilities + Equity
$100 Debt $80
Equity $20
Total $100 Total $100

Balance Sheet of Holding Company:
Assets Liabilities + Equity
$20 This is their investment in the Bank Debt $15
Equity $5
Total $20 Total $20
Consolidated Balance sheet of OBHC:
Assets Liabilities + Equity
$100 Debt $95
Equity $5
Total $100 Total $100

TABLE 1
Comparison of Affiliated Banks and Independent Banks: Univariate Analysis
The table shows the mean and standard deviation of selected balance sheet variables at yearend 2008 for the complete sample of unaffiliated and affiliated banks. Student’s t-test results are indicated by the asterisks; *, ** and *** denote significant differences between the samples means at the 10%, 5% and 1% level respectively. Panel A shows the real estate loan mix. Panel B describes the corresponding nonperforming amounts for the loans shown in Panel A. All loan variables are expressed as a percentage of gross loans and leases. Panel C shows selected security variables expressed as a percentage of total securities. Finally Panel D shows selected ratios that describe sample differences in size, liquidity, capitalization and profitability.
Panel A Unaffiliated Bank Bank of OBHC Loan Mix Mean S. Dev Mean S. Dev Loans Secured by Real Estate: 67.33% 0.2278 66.67% 0.1847 Construction & Land Development *** 10.88% 0.1213 7.98% 0.0920 Secured by Farmland *** 5.48% 0.0900 8.62% 0.0954 Secured by 1-4 Family Residential: *** 23.02% 0.1704 27.30% 0.1564 Home Equity Loans *** 2.82% 0.0461 2.38% 0.0378 Home Mortgage Loans: *** 20.20% 0.1680 24.92% 0.1523 Secured by First Liens *** 18.92% 0.1624 23.28% 0.1464 Secured by Junior Liens *** 1.28% 0.0218 1.63% 0.0217 Secured by 5+ Residential *** 2.36% 0.0542 1.56% 0.0305 Secured by Nonfarm, Nonresidential *** 25.59% 0.1853 21.20% 0.1394 Gross Domestic Loans & Leases/TA *** 62.96% 0.1904 65.40% 0.1515 #banks: 1085 2426
Panel B Unaffiliated Bank Bank of OBHC Nonperforming Loan Mix Mean S. Dev Mean S. Dev Loans Secured by Real Estate: ** 1.64% 0.0314 1.44% 0.0220 Construction & Land Development *** 0.79% 0.0241 0.53% 0.0149 Secured by Farmland 0.06% 0.0041 0.07% 0.0031 Secured by 1-4 Family Residential: 0.37% 0.0099 0.38% 0.0069 Home Equity Loans *** 0.04% 0.0023 0.02% 0.0008 Home Mortgage Loans: 0.34% 0.0095 0.36% 0.0068 Secured by First Liens 0.31% 0.0091 0.34% 0.0061 Secured by Junior Liens 0.02% 0.0012 0.03% 0.0016 Secured by 5+ Residential * 0.05% 0.0032 0.03% 0.0026 Secured by Nonfarm, Nonresidential *** 0.35% 0.0089 0.44% 0.0089 Gross Domestic Office Loans & Leases *** 2.17% 0.0451 1.86% 0.0240 #banks: 1085 2426

Panel C Unaffiliated Bank Bank of OBHC Security Investment Mix Mean S. Dev Mean S. Dev US Treasury Secs *** 3.73% 0.1489 2.01% 0.1062US Govt Agency Secs 42.59% 0.3410 41.75% 0.3190Municipal Secs *** 14.22% 0.2175 24.01% 0.2278Mortgage Backed Secs: *** 33.76% 0.3404 29.28% 0.2923 Secs Issue FNMA & FHLMC 6.19% 0.1563 7.04% 0.1468 Pass Through Secs *** 27.57% 0.3121 22.24% 0.2516Other Debt Secs ** 2.99% 0.0999 2.31% 0.0805Held-to-Maturity Secs *** 20.55% 0.3603 13.93% 0.2869Avail-for-Sale Secs *** 79.45% 0.3603 86.07% 0.2869 Securities/TA 22.14% 0.1709 22.02% 0.1409 #banks: 1085 2426
Panel D Unaffiliated Bank Bank of OBHC Selected Measures Mean S. Dev Mean S. Dev Log (TA) *** 4.93 0.4600 5.00 0.4014Liquid Assets/Total Assets *** 14.85% 0.1274 11.42% 0.0887Tier 1 Ratio *** 14.90% 0.1140 10.70% 0.0412Debt/Equity *** 36.63% 0.6567 45.76% 0.6436Return on Average Assets (ROA) *** -0.30% 0.0302 0.59% 0.0129Return on Average Equity (ROE) *** 0.06% 0.1704 5.90% 0.1178 #banks: 1085 2426

TABLE 2
Comparison of Affiliated Banks and Independent Banks: Cross Sectional Regression
The table presents the regression coefficients on selected variables as well as their significance on regressions ran on the entire sample of affiliated and unaffiliated banks. The independent variables are used to control for firm size, geography and regulatory authority. Panel A shows the breakdown of home mortgage loans into first and junior liens, and the total loans to total assets. Panel B describes the corresponding nonperforming amounts for the loans shown in Panel A. Panel C shows selected security investment variables. Finally Panel D shows regression results for variables that describe liquidity, capitalization and profitability. The variable of interest is the HC dummy, which takes value of 1 for affiliated banks, and of 0 for unaffiliated banks. *, ** and *** denote significant differences between the samples means at the 10%, 5% and 1% level respectively. The following acronyms are used: Mortgage (Mtg), Loans (Lns), Total Assets (TA), Nonperforming (NP), Securities (Secs), Mortgage backed securities (MBS), Held to maturity securities (HTM), Return on assets (ROA), and Return on equity (ROE).
Panel A Regression Coefficient Home Mtg
Lns First Liens Junior Liens Total Lns/TA
Independent Variable Intercept ***0.3335 ***0.3368 -0.0033 ***0.1556HC Dummy ***0.0453 ***0.0409 ***0.0044 ***0.0336Log (TA) ***-0.0452 ***-0.0478 **0.0025 ***0.0896MSA Type ***-0.0322 ***-0.0376 ***0.0053 ***0.0468%ΔPCI ***-0.2812 ***-0.2481 ***-0.0331 ***-0.17272008 UR ***1.9277 ***1.9277 3.69E-05 **0.3212Authority Charter ***0.0330 ***0.0307 **0.0022 ***-0.0586No Branches ***0.0026 ***0.0023 ***0.0003 -0.0003 R2 0.0976 0.1049 0.0523 0.1263
#Unaffiliated banks: 1085#OBHC banks: 2426

Panel B Regression Coefficient NP Home Mtg
Lns NP First Lns NP Junior
Lns NP Lns/Total
Lns Independent Variable Intercept 0.0002 0.0002 -4.9E-05 ***-0.0256HC Dummy *0.0005 0.0004 9.2E-05 *-0.0020Log (TA) 2.04E-05 -7.9E-06 2.83E-05 ***0.0090MSA Type 0.0004 0.0002 **0.0001 ***0.0040%ΔPCI **-0.0065 **-0.0057 -0.0008 **-0.02642008 UR ***0.0532 ***0.0513 0.0018 0.0373Authority Charter 0.0002 0.0002 -5.1E-05 *-0.0025No Branches -2E-05 -1.5E-05 -4.6E-06 **-0.0003 R2 0.0201 0.0209 0.0042 0.0274
#Unaffiliated banks: 1085#OBHC banks: 2426
Panel C Regression Coefficient US Treasury
Secs Municipal
Secs MBS HTM Total
Secs/TA Independent Variable
Intercept ***0.1149 0.0068 ***-0.3932 ***0.9705 ***0.2982HC Dummy ***-0.0151 ***0.0776 ***-0.0457 ***-0.0659 ***-0.0165Log (TA) **-0.0153 ***0.0363 ***0.1386 ***-0.1413 -0.0090MSA Type 0.0068 ***-0.0659 ***0.0426 ***-0.0358 ***-0.0516%ΔPCI -0.0093 0.1320 0.1744 ***-0.3897 ***0.27792008 UR -0.1332 -0.1822 0.3576 ***-0.8795 -0.2328Authority Charter -0.0002 -0.0065 -0.0056 -0.0136 ***0.0489No Branches 0.0004 0.0016 -0.0019 ***0.0073 *-0.0012 R2 0.0069 0.0627 0.0436 0.0404 0.0737
#Unaffiliated banks: 1085#OBHC banks: 2426

Panel D Regression Coefficient Liquid
Assets/TA Tier 1 Debt/Equity ROA ROE
Independent Variable
Intercept ***0.5980 ***0.3478 ***-1.8422 ***-0.0411 ***-0.1453HC Dummy ***-0.0297 ***-0.0349 ***0.0840 ***0.0055 ***0.0363Log (TA) ***-0.0888 ***-0.0425 ***0.4642 ***0.0096 ***0.0448MSA Type -0.0010 ***0.0133 *0.0415 ***-0.0090 ***-0.0647%ΔPCI -0.0298 ***-0.1165 -0.0454 ***0.0545 ***0.30362008 UR ***-0.2616 0.0797 -0.9957 ***-0.0944 ***-0.7867Authority Charter ***0.0176 *0.0058 ***-0.1141 0.0011 0.0067No Branches **0.0009 0.0003 ***-0.0117 **-0.0002 -0.0004 R2 0.1440 0.1154 0.0823 0.1280 0.1213
#Unaffiliated banks: 1085#OBHC banks: 2426

TABLE 3
Comparison of Public OBHCs and Public Independent Banks: Univariate Analysis
The table shows the mean and standard deviation of selected balance sheet variables at yearend 2008 for the public subsample of unaffiliated and affiliated banks, which are composed of a private bank and a public holding company. Student’s t-test results are indicated by the asterisks; *, ** and *** denote significant differences between the samples means at the 10%, 5% and 1% level respectively. Panel A shows the real estate loan mix. Panel B shows the nonperforming loan mix presented in Panel A. All loan variables are expressed as a percentage of gross loans and leases. Panel C shows selected security variables expressed as a percentage of total securities. Finally Panel D shows selected variables that describe sample differences in size, liquidity, capitalization and profitability.
Panel A Unaffiliated Bank Bank of OBHC Loan Mix Mean S. Dev Mean S. Dev Loans Secured by Real Estate: *** 75.58% 0.1256 79.71% 0.1111 Construction & Land Development *** 16.95% 0.1210 10.76% 0.1048 Secured by Farmland *** 0.87% 0.0187 1.99% 0.0362 Secured by 1-4 Family Residential: *** 17.72% 0.1375 32.71% 0.1859 Home Equity Loans 5.18% 0.0454 5.19% 0.0381 Home Mortgage Loans: *** 12.78% 0.1307 27.52% 0.1841 Secured by First Liens *** 10.88% 0.1218 24.32% 0.1665 Secured by Junior Liens *** 1.66% 0.0224 3.20% 0.0379 Secured by 5+ Residential 2.98% 0.0344 2.37% 0.0264 Secured by Nonfarm, Nonresidential *** 37.06% 0.1387 31.90% 0.1292 Gross Domestic Loans & Leases/TA * 73.87% 0.1208 71.18% 0.1215 # banks: 116 153
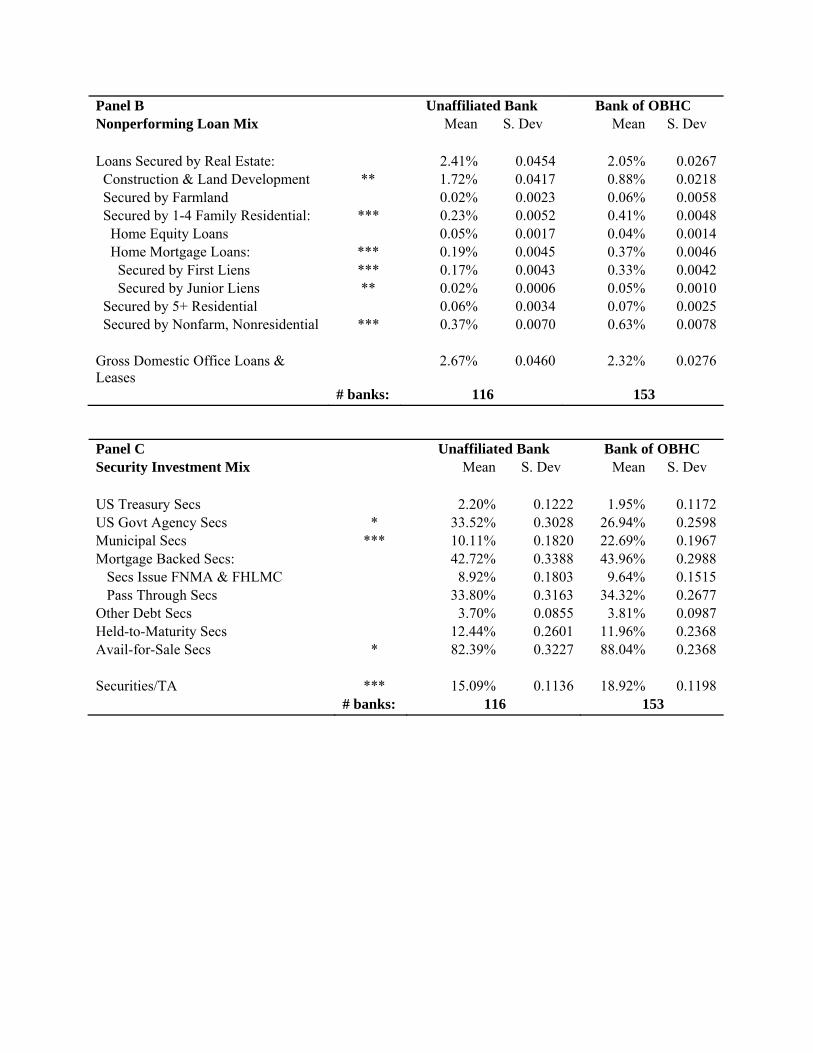
Panel B Unaffiliated Bank Bank of OBHC Nonperforming Loan Mix Mean S. Dev Mean S. Dev Loans Secured by Real Estate: 2.41% 0.0454 2.05% 0.0267 Construction & Land Development ** 1.72% 0.0417 0.88% 0.0218 Secured by Farmland 0.02% 0.0023 0.06% 0.0058 Secured by 1-4 Family Residential: *** 0.23% 0.0052 0.41% 0.0048 Home Equity Loans 0.05% 0.0017 0.04% 0.0014 Home Mortgage Loans: *** 0.19% 0.0045 0.37% 0.0046 Secured by First Liens *** 0.17% 0.0043 0.33% 0.0042 Secured by Junior Liens ** 0.02% 0.0006 0.05% 0.0010 Secured by 5+ Residential 0.06% 0.0034 0.07% 0.0025 Secured by Nonfarm, Nonresidential *** 0.37% 0.0070 0.63% 0.0078 Gross Domestic Office Loans & Leases
2.67% 0.0460 2.32% 0.0276
# banks: 116 153
Panel C Unaffiliated Bank Bank of OBHC Security Investment Mix Mean S. Dev Mean S. Dev US Treasury Secs 2.20% 0.1222 1.95% 0.1172US Govt Agency Secs * 33.52% 0.3028 26.94% 0.2598Municipal Secs *** 10.11% 0.1820 22.69% 0.1967Mortgage Backed Secs: 42.72% 0.3388 43.96% 0.2988 Secs Issue FNMA & FHLMC 8.92% 0.1803 9.64% 0.1515 Pass Through Secs 33.80% 0.3163 34.32% 0.2677Other Debt Secs 3.70% 0.0855 3.81% 0.0987Held-to-Maturity Secs 12.44% 0.2601 11.96% 0.2368Avail-for-Sale Secs * 82.39% 0.3227 88.04% 0.2368 Securities/TA *** 15.09% 0.1136 18.92% 0.1198 # banks: 116 153

Panel D Unaffiliated Bank Bank of OBHC Selected Measures Mean S. Dev Mean S. Dev Log (TA) *** 5.28 0.4070 5.50 0.3221Liquid Assets/Total Assets *** 9.81% 0.0687 7.41% 0.0519Tier 1 Ratio *** 12.74% 0.0530 9.20% 0.0215Debt/Equity *** 54.64% 0.5452 83.16% 0.7920Return on Average Assets (ROA) *** -0.65% 0.0182 0.16% 0.0121Return on Average Equity (ROE) *** -3.94% 0.1202 1.85% 0.1255 # banks: 116 153

TABLE 4
Comparison of Public OBHCs and Public Independent Banks: Cross Sectional Regression
The table shows the regression coefficients on variables of interest as well as their significance on regressions ran on the public subsample of affiliated and unaffiliated banks. The independent variables are used to control for firm size, geography and regulatory authority. Panel A shows the breakdown of home mortgage loans into first and junior liens, and the total loans to total assets. Panel B describes the corresponding nonperforming amounts for the loans shown in Panel A. Panel C shows selected security investments. Panel D shows regression results for variables that describe liquidity, capitalization and profitability. Panel E shows the regression results for variables describing market measures of risk. In all regressions the variable of interest is the HC dummy, which takes value of 1 for affiliated banks, and of 0 for unaffiliated banks. *, ** and *** denote significant differences between the samples means at the 10%, 5% and 1% level respectively. The following acronyms are used: Mortgage (Mtg), Loans (Lns), Total Assets (TA), Nonperforming (NP), Securities (Secs), Mortgage backed securities (MBS), Held to maturity securities (HTM), Return on assets (ROA), and Return on equity (ROE).
Panel A Regression Coefficient Home Mtg
Lns First Liens Junior Liens Total Lns/TA
Independent Variable Intercept 0.2778 0.2014 0.0495 ***1.1155HC Dummy ***0.0884 ***0.0777 ***0.0124 0.0129Log (TA) -0.0043 0.0052 -0.0055 ***-0.0717MSA Type ***-0.1008 ***-0.1057 0.0043 0.0273%ΔPCI ***1.8010 ***1.4261 ***0.3570 **-1.01412008 UR *-1.1183 -0.8162 *-0.2307 -0.1100Authority Charter **0.0500 **0.0452 0.0057 ***-0.0658No Branches 0.0007 0.0005 0.0002 0.0011 R2 0.3173 0.3212 0.1119 0.1392
#Unaffiliated banks: 116#OBHC banks: 153

Panel B Regression Coefficient NP Home Mtg
Lns NP First Lns NP Junior
Lns NP Lns/Total
Lns Independent Variable Intercept -0.0019 -0.0018 -8.7E-05 -0.0035HC Dummy **0.0015 **0.0013 *2.3E-04 -0.0018Log (TA) 0.0006 0.0005 6.6E-05 0.0042MSA Type -0.0005 -0.0006 1.3E-04 0.0003%ΔPCI 0.0021 -0.0032 *5.3E-03 -0.16582008 UR 0.0157 0.0200 -4.3E-03 0.1757Authority Charter -0.0005 -0.0006 7.6E-05 -0.0040No Branches 0.0000 0.0000 -3.3E-06 0.0000 R2 0.0574 0.0572 0.0427 0.0185
#Unaffiliated banks: 116#OBHC banks: 153
Panel C Regression Coefficient US Treasury
Secs Municipal
Secs MBS HTM Total
Secs/TA Independent Variable
Intercept -0.0609 **-0.5217 0.1702 0.2657 ***-0.3706HC Dummy 0.0005 ***0.0787 0.0184 0.0203 -0.0049Log (TA) 0.0184 ***0.1191 0.0436 -0.0246 ***0.0982MSA Type 0.0129 -0.0496 0.0083 0.0570 -0.0125%ΔPCI 0.1082 0.3614 -0.3258 *-1.4240 ***1.24392008 UR -0.3947 0.5462 0.5443 -0.9297 -0.0770Authority Charter -0.0196 0.0298 -0.0140 0.0296 ***0.0680No Branches -0.0003 -0.0004 -0.0016 0.0016 -0.0013 R2 0.0122 0.1567 0.0040 0.0344 0.1949
#Unaffiliated banks: 116#OBHC banks: 153

Panel D Regression Coefficient Liquid
Assets/TA Tier 1 Debt/Equity ROA ROE
Independent Variable
Intercept ***0.2280 ***0.3058 **-1.8636 ***-0.0575 ***-0.3872HC Dummy **-0.0210 ***-0.0291 **0.2235 **0.0042 *0.0286Log (TA) **-0.0272 ***-0.0355 ***0.5131 ***0.0110 ***0.0767MSA Type 0.0004 0.0101 -0.1290 -0.0026 -0.0186%ΔPCI -0.1156 -0.0065 -0.4645 *0.0961 *0.74882008 UR 0.1859 -0.0769 -1.5264 -0.0941 -0.8011Authority Charter **0.0195 **0.0113 *-0.1949 -0.0002 0.0061No Branches 0.0003 *0.0006 **-0.0112 -0.0001 -0.0004 R2 0.0794 0.2531 0.0990 0.1559 0.1235
#Unaffiliated banks: 116#OBHC banks: 153
Panel E Regression Coefficient Beta Var (Tot Risk) SYS Risk UNSYS Risk Asset Beta Independent Variable Intercept **-0.87247 ***0.012453 ***-0.00161 ***0.014066 -0.26328HC Dummy -0.0526 2.09E-05 -5.4E-05 7.49E-05 -0.02945Log (TA) ***0.203474 **-0.00189 ***0.000308 ***-0.0022 *0.075892MSA Type 0.006033 *0.001189 0.000115 *0.001075 0.014612%ΔPCI -1.3876 -0.01525 0.000603 -0.01585 -0.632922008 UR 0.119263 0.009215 0.000802 0.008412 -0.26138Authority Charter -0.07433 -0.00046 *-0.00012 -0.00034 *-0.05405No Branches *0.004002 4.56E-05 4.97E-06 4.07E-05 **0.003365 R2 0.122556 0.054334 0.136684 0.064849 0.083935
# Individual banks: 116 #One-bank shell HCs: 153