Monthly Report of Recent Economic and Financial ...
66
December 21, 2001 Bank of Japan Monthly Report of Recent Economic and Financial Developments December 2001 (English translation prepared by the Bank staff based on the Japanese original released on December 20, 2001)
-
Upload
khangminh22 -
Category
Documents
-
view
0 -
download
0
Transcript of Monthly Report of Recent Economic and Financial ...
December 21, 2001 Bank of Japan
Monthly Report ofRecent Economic and Financial Developments
December 2001
(English translation prepared by the Bank staff based on the Japanese original released on December 20, 2001)
1
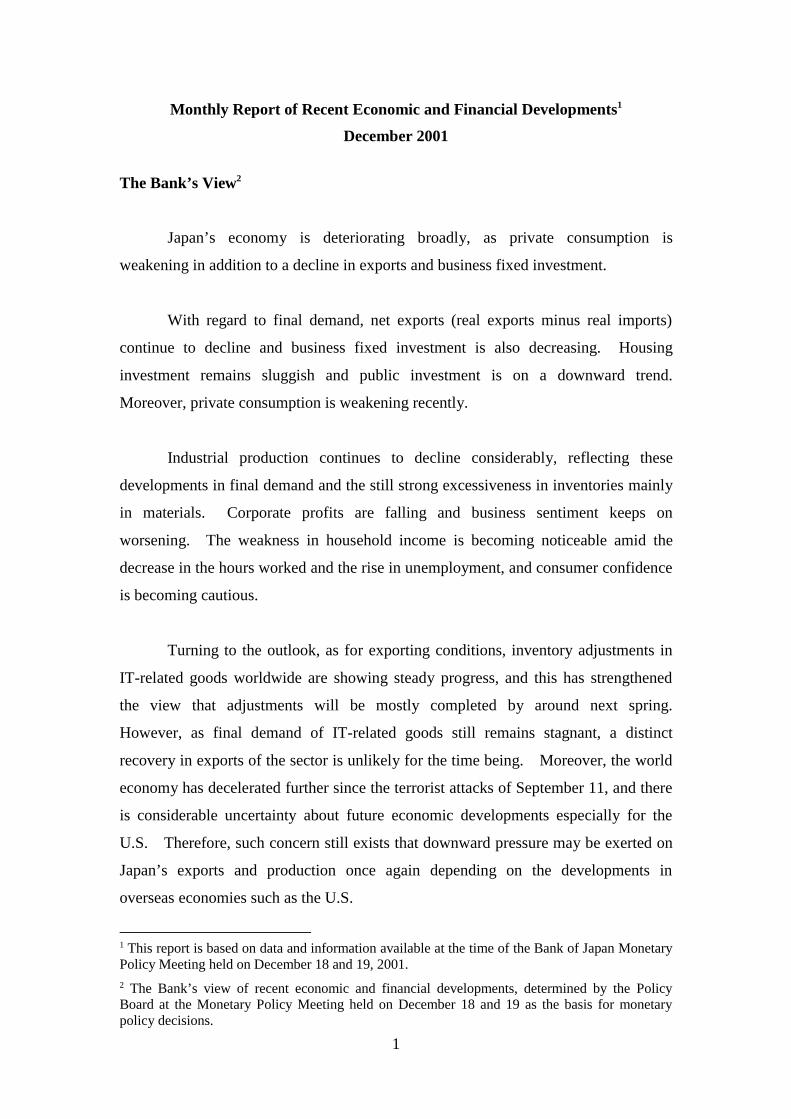
Monthly Report of Recent Economic and Financial Developments1
December 2001
The Bank’s View2
Japan’s economy is deteriorating broadly, as private consumption is
weakening in addition to a decline in exports and business fixed investment.
With regard to final demand, net exports (real exports minus real imports)
continue to decline and business fixed investment is also decreasing. Housing
investment remains sluggish and public investment is on a downward trend.
Moreover, private consumption is weakening recently.
Industrial production continues to decline considerably, reflecting these
developments in final demand and the still strong excessiveness in inventories mainly
in materials. Corporate profits are falling and business sentiment keeps on
worsening. The weakness in household income is becoming noticeable amid the
decrease in the hours worked and the rise in unemployment, and consumer confidence
is becoming cautious.
Turning to the outlook, as for exporting conditions, inventory adjustments in
IT-related goods worldwide are showing steady progress, and this has strengthened
the view that adjustments will be mostly completed by around next spring.
However, as final demand of IT-related goods still remains stagnant, a distinct
recovery in exports of the sector is unlikely for the time being. Moreover, the world
economy has decelerated further since the terrorist attacks of September 11, and there
is considerable uncertainty about future economic developments especially for the
U.S. Therefore, such concern still exists that downward pressure may be exerted on
Japan’s exports and production once again depending on the developments in
overseas economies such as the U.S.
1 This report is based on data and information available at the time of the Bank of Japan MonetaryPolicy Meeting held on December 18 and 19, 2001.2 The Bank’s view of recent economic and financial developments, determined by the PolicyBoard at the Monetary Policy Meeting held on December 18 and 19 as the basis for monetarypolicy decisions.
2
Meanwhile, with respect to domestic demand, business fixed investment is
expected to follow a downward trend amid the fall in corporate profits. Private
consumption will also continue to be weak along with deteriorating employment and
income conditions and the more cautious consumer sentiment. Government
spending is basically projected to follow a downward trend while domestic private
demand generally weakens on top of the uncertainty about exporting conditions.
Consequently, it may take quite a while for economic activity as a whole to stop
declining, even though the decrease in industrial production may moderate somewhat
in line with the progress in inventory adjustments such as of IT-related goods.
Overall, Japan’s economy will inevitably continue to deteriorate for a while.
In this situation, continuous attention should be paid to the risk of a negative impact
on the economy induced by developments in foreign and domestic financial markets.
With regard to prices, import prices continue to decline reflecting the
softening of international commodity prices. Domestic wholesale prices are
declining faster from the effects of the fall in crude oil prices in addition to the
continuous decreases in prices of electrical machinery and materials. Consumer
prices are weakening owing mainly to the decline in prices of imported products and
their substitutes. Corporate service prices continue to decrease.
As for the conditions surrounding price developments, crude oil prices remain
weak. Also, as the economy will continue to deteriorate, the balance between supply
and demand in the domestic market will increasingly exert downward pressure on
prices. Furthermore, in addition to the declining trend of machinery prices caused by
technological innovations, the decreases in the prices of goods and services reflecting
deregulation and the streamlining of distribution channels will continue to restrain
price developments. Overall, prices are expected to follow a gradual declining trend
for the time being. Moreover, given the high degree of uncertainty regarding future
economic developments, the possibility that weak demand will further intensify
downward pressure on prices warrants careful monitoring.
3
In the financial market, the overnight call rate is moving around zero percent
as the Bank of Japan provided ample liquidity to the money market by aiming at
maintaining the current account balances held at the Bank at above 6 trillion yen.
Interest rates on term instruments basically continue to be level. The Japan
premium remains negligible.
Yields on long-term government bonds are virtually flat, and are mainly
moving around 1.35 percent recently. As for the yield spreads between private
bonds (bank debentures and corporate bonds) and government bonds, while spreads
between bonds with relatively high credit ratings and government bonds remain
mostly unchanged, those between bonds with low credit ratings and government
bonds continue to expand slightly.
Stock prices are weakening recently.
In the foreign exchange market, the yen is currently being traded in the range
of 127 -129 yen to the U.S. dollar, moving around the lowest level for this year.
With regard to corporate finance, private banks appear to be more cautious in
extending loans to firms with high credit risks while they continue to be more active
in extending loans to blue-chip companies. The lending attitudes of financial
institutions as perceived by firms are becoming more cautious. In corporate bonds
and CP markets, the fund-raising conditions continue to be generally favorable
particularly for firms with high credit ratings, although the issuing environment for
those with low credit ratings is deteriorating.
Credit demand in the private sector is declining faster mainly because firms
are decreasing their business fixed investment while continuously reducing their
debts.
Amid these developments, private banks’ lending continues to decline at about
2 percent on a year-on-year basis. As for the amount outstanding of corporate bonds
issued, the year-on-year growth rate has been slowing due to a decrease in the
4
issuance of corporate bonds with low credit ratings. The year-on-year growth rate of
the amount outstanding of CP issued is declining recently, although the amount is still
well above the previous year’s level.
The growth rate of money stock (M2 + CDs) in November increased slightly
from the previous month owing to a rise in demand deposits.
Funding costs for firms continue to be at extremely low levels on the whole,
although market funding costs for some firms are rising.
Overall, the recent financial environment remains extremely easy in terms of
money market conditions and interest rate levels. However, the fund-raising
conditions of firms with high credit risks, especially of small firms, are becoming
severe as private banks and investors are becoming more cautious in taking credit
risks against the background of a growing number of corporate bankruptcies. Hence,
the developments in the behavior of financial institutions and corporate financing
need closer monitoring.
5
The Background
1. Japan’s Economy
Public investment is on a downward trend. The value of public works
contracted—a metric that reflects orders—has been at low levels, albeit some
fluctuations, and the actual implementation of those works has also been decreasing
(Chart 2). Public investment is basically expected to follow a declining trend.3
Real exports are on a downward trend, reflecting not only a slowdown in
overseas economies but also sluggish demand for IT-related goods (Charts 3[1] and
4). Real exports in October were almost flat vis-à-vis the level in the third quarter
due mainly to the increase in automobile-related exports to the U.S. Meanwhile,
exports of IT-related goods (telecommunications machinery and photo-copiers, and
computers) and capital goods and parts (semiconductor fabrication machines and
equipment, and industrial machinery) continued to decrease considerably.
Real imports are also on a declining trend while exports and production
keep on decreasing (Charts 3[1] and 5). Real imports in October increased slightly
compared to those in the third quarter, which recorded a substantial decline. By type
of goods, although imports of textile products from China surged, those of IT-related
goods such as PCs remained at low levels in October following the drop in the third
quarter.
Net exports (real exports minus real imports), in terms of the real trade
balance,4 decreased somewhat slowly in the third quarter as a result of the drop in real
imports, but expanded slightly in October once again (Chart 3[2]).
3 As the first supplementary budget for this fiscal year passed on November 16 puts emphasis onemployment measures, the spending on public investment, excluding expenditure related tonatural disaster relief, is limited. Thereafter, the government has launched the compilation of thesecond supplementary budget mainly composed of expenditures related to public works andfacilities. The passage and materialization of this budget would underpin public investment, butthe government, at the same time, has already decided to reduce 10 percent of public-investment-related-expenditures for the initial budget for fiscal 2002. Judged from available information atthis stage, public investment is basically expected to follow a declining trend even though it mayrise temporarily at some phases.
4 Strictly speaking, the real trade balance presented in Chart 3[2] differs from net exports on aGDP basis, but the changes in the real trade balance are broadly in line with those of net exports.(The real trade balance is on a customs-clearance basis and does not include trade in services,
6
Regarding the future environment for foreign trade, the real effective exchange
rate of the yen is depreciating recently (Chart 6-1[1]). As for overseas economies,
the synchronized deceleration in the U.S., East Asian, and European economies has
intensified further after the terrorist attacks of September 11, and many countries such
as the U.S. recorded negative growth in the third quarter (Chart 6-1[2]).
With regard to factors affecting Japan’s exports, since inventory adjustments
in IT-related goods worldwide from the start of this year are progressing gradually
(Chart 6-2), the view that the adjustments will be mostly completed by around next
spring has become dominant. Therefore, downward pressure on exports from this
aspect is expected to be alleviated in the future. However, since final demand of IT-
related goods still remains stagnant, a distinct recovery in exports of these goods is
unlikely for the time being. As for the circumstances surrounding exports other than
the IT-related sector (Chart 6-3), while U.S. private consumption is weakening mainly
from the deterioration in employment conditions, there is a concern that sales of
automobiles in the U.S. will drop in reaction to the upsurge in October-November
sales due to the zero-percent financing campaigns.5 Moreover, business fixed
investment in the U.S. continued to decline for IT-related equipment as well as other
equipment. Under this environment, the decline in exports is inevitable for the time
being; there exist even such risks that the downtrend may persist or even intensify
depending on the economic developments in the U.S.
Imports are also projected to follow a downward trend due to weakening
domestic demand, while exports and production are projected to continue declining
for the time being. In these circumstances, net exports are expected to keep on
decreasing for a while.6
while net exports of GDP statistics are on an ownership-transfer basis and include trade inservices.)
5 Sales of automobiles in the U.S. (Chart 6-3[2]), which had been following a mild downtrend,remained high in November (annualized rate of 18.26 million cars) after a conspicuous increase inOctober (21.62 million cars) owing to the most aggressive promotion ever done by U.S. vehiclemakers such as the zero-percent financing since the terrorist attacks.
6 The surplus of the nominal balance on goods and services (Chart 3[2]), which had been on adeclining trend since the start of 2000, is projected to expand for a while, due not only to theremarkable decrease in the number of people leaving for overseas since the terrorist attacks, butalso to the fall in crude oil prices.
7
Business fixed investment continues to decrease, particularly in
manufacturing, while corporate profits and the capacity utilization rate keep on
declining. As for investment-related indicators (Chart 7), business fixed investment,
according to the Financial Statements Statistics of Corporations by Industry,
Quarterly, decreased slightly in the third quarter following the first and second
quarters. Aggregate supply of capital goods7 (excluding transport equipment)—
which basically moves simultaneously with machinery investment—continued to
decline. Among leading indicators, machinery orders (private demand, excluding
shipbuilding and electric power equipment) plunged in October compared to the third
quarter. By industry, nonmanufacturing, which had been relatively firm, dropped in
October in addition to the continuous decline in manufacturing. Meanwhile,
construction starts (nonresidential) followed a downtrend since the start of the
previous fiscal year but are recently increasing somewhat mainly due to some large-
scale constructions related to redevelopment projects and public utility (such as
electricity and transportation) in nonmanufacturing.
With regard to the environment surrounding business fixed investment based
on the Bank of Japan’s Tankan—Short-term Economic Survey of Enterprises—of
December 2001, both manufacturing and nonmanufacturing firms made large
downward revisions for their current profit projections in the second half of this fiscal
year compared to the September Tankan, and this resulted in the significant decrease
in profits for fiscal 2001 overall (Chart 8). The worsening of profits was notable
particularly in manufacturing regardless of the scale of firm or whether firms belong
to the basic materials or processing industry. Under these projections, business
sentiment of firms is worsening further as a whole with some variation depending on
industries (Chart 9). As for corporate finance, the fall in corporate profits is
gradually affecting the financial position especially of manufacturing firms. In
addition, while the lending attitude of financial institutions perceived by firms still
7 In the Indices of Industrial Domestic Shipments and Imports, the aggregate supply by goods isshown by adding domestic shipments based on Indices of Industrial Production and the importvolume based on Foreign Trade Statistics. Charts 7-1(1) and 12-4 each shows the developmentsin aggregate supply of capital goods (excluding transport equipment) and consumer goods.Figures for the fourth quarter of 2001 (October) are calculated by the Bank of Japan using indicesof industrial shipments and real imports and exports.
8
significantly differ according to the scale of firm, the severity of corporate financing
for small firms is intensifying somewhat in general (Chart 10).
Turning to the outlook, business fixed investment is expected to follow a
declining trend while the fall in corporate profits is accentuated, judged from
investment plans and the weakness in leading indicators. According to business
fixed investment plans for fiscal 2001 reported in the December Tankan (Chart 11),
the investment plans of manufacturing firms recorded larger declines compared to that
of the September Tankan as those of large firms especially in the processing industry,
such as electrical machinery, were revised substantially downward. Meanwhile,
plans of nonmanufacturing firms were revised upward particularly in small firms.
Therefore, investment plans of all industries were basically the same as those of the
September Tankan (year-to-year percent change: -5.7 percent).
Private consumption is weakening recently, reflecting the increasingly harsh
employment and income conditions (Chart 12). With regard to sales indicators, sales
of department stores remained firm, particularly for accessories and foodstuffs, with
some fluctuations. On the other hand, sales of chain stores dropped in October
mainly for clothes while they continued to be sluggish. Sales of household electrical
appliances remained weak mostly due to stagnant sales of personal computers. In
addition, passenger car sales, which had been increasing with the introduction of new
models, turned to decline recently. Moreover, outlays for travel plunged as
individuals continued to refrain from travelling overseas after the terrorist attacks in
the U.S. Reflecting the developments in those indicators, indices of aggregated
sales8 turned to be below those of a year ago. Moreover, the level of aggregate
supply of consumer goods continued to be below that of the previous year since
domestic shipments were stagnant in addition to the modest increase in imports.
Meanwhile, according to the latest consumer survey (Chart 13[1]), consumers were
becoming more cautious due to the deterioration in employment conditions. Private
8 While various sales indicators show different movements, the indices of aggregated sales arecompiled by adding the weights of various sales indicators (including a few services consumption)to grasp the consumption trend from the supply side. For the detailed calculation method, seenotes in Chart 12-3.
9
consumption will continue to be lackluster, mainly reflecting employment and income
conditions.
Housing investment remains sluggish (Chart 14[1]). Construction starts fell
in October compared to the third quarter due to the drop in construction starts of built
for sale, which has a tendency to fluctuate, while those of owner-occupied houses
remained low (Chart 14[2]). Housing investment is likely to remain sluggish for the
time being amid the increasingly severe employment and income conditions of
households, even though construction starts of large condominiums are expected to
contribute as an underpinning factor.9
Reflecting these developments in final demand, industrial production
continues to decline considerably due mainly to the ongoing inventory adjustments
especially in materials (Chart 15). With regard to inventories (Chart 16), as
inventory adjustments seemed to be in progress along with large production cutbacks,
those of electronic parts among production goods declined noticeably. Moreover,
the further accumulation of inventories of other production goods such as iron and
steel has stopped, although the inventory levels still remain high. However, a strong
excessiveness persists while the inventory ratio continued to be high against the
background of sluggish final demand. Industrial production is expected to follow a
declining trend for some time, based on the projections for weak exports and domestic
demand, even though the pace of decline is likely to moderate somewhat in line with
the progress in inventory adjustments of IT-related goods and materials.10
As for employment and income conditions, with the economy deteriorating
broadly, the supply-demand condition in the labor market is easing further,
particularly in manufacturing, and household income is weakening more evidently
9 Construction starts of built for sale are underpinned by the more or less high-level sales ofcondominiums, especially in the Tokyo metropolitan area (Chart 14[3]).
10 According to the survey of production forecasts (-0.1 percent in November and +0.8 percent inDecember on a month-to-month basis), production in the fourth quarter is projected to diminish bya slight 2.3 percent on a quarter-to-quarter basis compared to the rate of decline of around 4percent from the start of this year. As for projections by industry (Chart 15[2]), transportequipment, which was on a rising trend, is projected to fall back and furthermore iron and steel areto undergo substantial production cutbacks. On the other hand, the rate of decline in electricalmachinery is expected to slow considerably.
10
(Chart 17). Among labor-market-related indicators (Charts 18 and 19), the
December Tankan indicated that the excessiveness of employment perceived by firms
increased further, mainly in manufacturing. The unemployment rate rose
considerably. Moreover, the ratio of job offers to applicants kept on declining, since
the number of job seekers recently surged while that of job offers continued to
decrease mainly in manufacturing. The number of regular employees (on a Monthly
Labour Survey basis at establishments with five employees or more) was basically
unchanged.
Meanwhile, as for nominal wages per employee, both overtime and regular
payments kept on declining, mainly reflecting the decrease in the hours worked (Chart
17[2]). Compensation of employees is projected to follow a downtrend for the time
being while the economy will continue to deteriorate.
2. Prices
Import prices on a yen basis decreased compared to levels three months earlier
reflecting the softening of international commodity prices such as in nonferrous
metals and crude oil (Chart 21).
Domestic wholesale prices are declining faster due mainly to the fall in crude
oil prices. In November, domestic wholesale prices (adjusted to exclude the effects
of seasonal changes in electricity rates11) continued to mark a larger decline compared
to levels three months earlier (Chart 22). This was because prices of petroleum
products dropped reflecting the fall in crude oil prices, while prices of machinery
(electrical machinery) and materials such as chemical and pulp, paper and related
products kept decreasing.
11 Industrial and commercial electric power consumption charges are set relatively high duringJuly-September, when the consumption volume increases substantially. To view the underlyingchanges in domestic wholesale prices, adjustments are made to exclude such factors that result in alarge seasonal fluctuation.
11
Corporate service prices are decreasing. In October, corporate service prices
(domestic supply-demand factors12) declined compared to levels three months earlier
(Chart 23). The decrease was mainly because prices of transportation (road freight
transportation and packing for freight) and temporary employment services were
lowered, in addition to the continued reduction in charges for leasing reflecting the
price decline in IT-related equipment, and the continuous decline in prices for
advertising services.
Consumer prices are weakening. In October, consumer prices (excluding
fresh food) declined compared to levels three months earlier mainly due to the
decreases in prices of clothes, reflecting the increases in imports of inexpensive
consumer goods (Charts 24 and 25). The overall year-to-year rate of decline in
October (excluding fresh food) diminished slightly compared to the previous month
owing to the rise in electricity charges in addition to the contraction of the year-to-
year decrease for personal computers. (The year-to-year change was -0.9 percent in
August, -0.8 percent in September, and -0.7 percent in October.13)
Regarding the conditions surrounding price developments, crude oil prices
remain weak (Chart 21[1]). Also, as the economy will continue to deteriorate, the
balance between supply and demand in the domestic market will increasingly exert
downward pressure on prices (Chart 26). Furthermore, in addition to the declining
trend of machinery prices caused by technological innovations, the decreases in prices
of goods and services reflecting deregulation and the streamlining of distribution
channels will continue to restrain price developments. Overall, prices are expected
to follow a gradual declining trend for the time being.
12 Corporate service prices (domestic supply-demand factors) only include items whose monthlyprice changes primarily reflect changes in domestic private demand. Specifically, items with thefollowing properties are removed from the overall CSPI: (1) regulated fees, (2) overseas factors,and (3) fees with a large monthly fluctuation that do not necessarily reflect short-term changes insupply-demand trends. For the detailed calculation, see the note in Chart 23.
13 Consumer prices including fresh food in October were basically the same as those excludingfresh food. (The year-to-year change was -0.7 percent in August, -0.8 percent in September, and-0.8 percent in October.)
12
3. Financial Developments
(1) Financial Markets
As for interest rate developments in short-term money markets (Charts 27[1]
and 28), the overnight call rate (uncollateralized) is moving around zero percent as the
Bank of Japan provided ample liquidity to the money market by aiming at maintaining
the current account balances held at the Bank at above 6 trillion yen (Chart 29).
As for interest rates on term instruments (Chart 28), three-month Euro-yen
rates (TIBOR) continue to be basically level. The Japan premium (Chart 31)
remains negligible.
Yields on ten-year government bonds (newly issued; Chart 27[2]) rose
somewhat temporarily as market participants view that the amount of government
bond issuance in the market has increased and the credit ratings of Japanese
government bonds were lowered, but are virtually flat and mainly moving around 1.35
percent recently. As for the yield spreads between government and private bonds
(bank debentures and corporate bonds; Charts 33 and 34), while spreads between
bonds with relatively high credit ratings and government bonds remain mostly
unchanged, those between bonds with low credit ratings and government bonds are
expanding slightly due to the more cautious views of investors toward taking credit
risks.
Stock prices (Chart 35[1]) are weakening recently. This is because while
stock prices are supported by the rise in expectations toward the economic recovery of
the U.S. and the depreciation of the yen, the credit risks of firms with poor business
performance have become evident.
In the foreign exchange market (Chart 36), the yen is currently being traded in
the range of 127-129 yen to the U.S. dollar, moving around the lowest level for this
year, reflecting market anxieties about corporate bankruptcies and the degrading of
Japanese government bonds.
13
(2) Monetary Aggregates and Corporate Finance
The growth rate of money stock (M2 + CDs; Chart 37) in November increased
slightly from the previous month owing to a rise in demand deposits. (The year-on-
year change was 3.3 percent in September, 3.0 percent in October, and 3.2 percent in
November.)
The year-on-year growth rate of monetary base (currency in circulation +
current account balances at the Bank of Japan; Chart 38) continues to be high at
around 14-15 percent mainly due to a large increase in the current account balances at
the Bank of Japan. (The year-on-year change was 14.2 percent in September, 14.3
percent in October, and 15.5 percent in November.)
As for the lending attitudes of private financial institutions, financial
institutions appear to be more cautious in extending loans to firms with high credit
risks, while they continue to be more active in extending loans to blue-chip
companies. The lending attitudes of financial institutions as perceived by firms are
becoming more cautious. In corporate bonds and CP markets, the fund-raising
conditions continue to be generally favorable particularly for firms with high credit
ratings, although the issuing environment for those with low credit ratings is
deteriorating.
Credit demand in the private sector is declining faster mainly because firms
are decreasing their business fixed investment while continuously reducing their
debts.
Amid these developments, lending by private banks (monthly average
outstanding balance basis; after adjustment for extraordinary factors;14 Chart 39),
consisting of city banks, long-term credit banks, trust banks, regional banks, and
regional banks II, continues to decline at about 2 percent on a year-on-year basis.
(The year-on-year change was -2.0 percent in September, -1.9 percent in October, and
-2.0 percent in November.) As for the amount outstanding of corporate bonds issued
14 The figures are adjusted for (1) fluctuations from the liquidation of loans, (2) fluctuations in theyen value of foreign currency-denominated loans due to changes in exchange rates, and (3)fluctuations from loan write-offs.
14
(Chart 40), the year-on-year growth rate has been slowing due to a decrease in the
issuance of corporate bonds with low credit ratings. The year-on-year growth rate of
the amount outstanding of CP issued is declining recently, although the amount is still
well above the previous year’s level.
Funding costs for firms continue to be at extremely low levels on the whole,
although market funding costs for some firms are rising. The average contracted
interest rates on new loans and discounts (Chart 42) continue to be more or less
unchanged. The long-term prime lending rate was raised by 0.2 percent to 1.85
percent on December 11. In the capital market, corporate bond issuance rates are
basically flat. CP issuance rates continue to be at extremely low levels as a whole.
In November, the number of corporate bankruptcies (Chart 43) remained high,
exceeding 1,800 cases.
Overall, the recent financial environment remains extremely easy in terms of
money market conditions and interest rate levels. However, the fund-raising
conditions of firms with high credit risks, especially of small firms, are becoming
severe as private banks and investors are becoming more cautious in taking credit
risks against the background of a growing number of corporate bankruptcies. Hence,
the developments in the behavior of financial institutions and corporate financing
need closer monitoring.
Charts
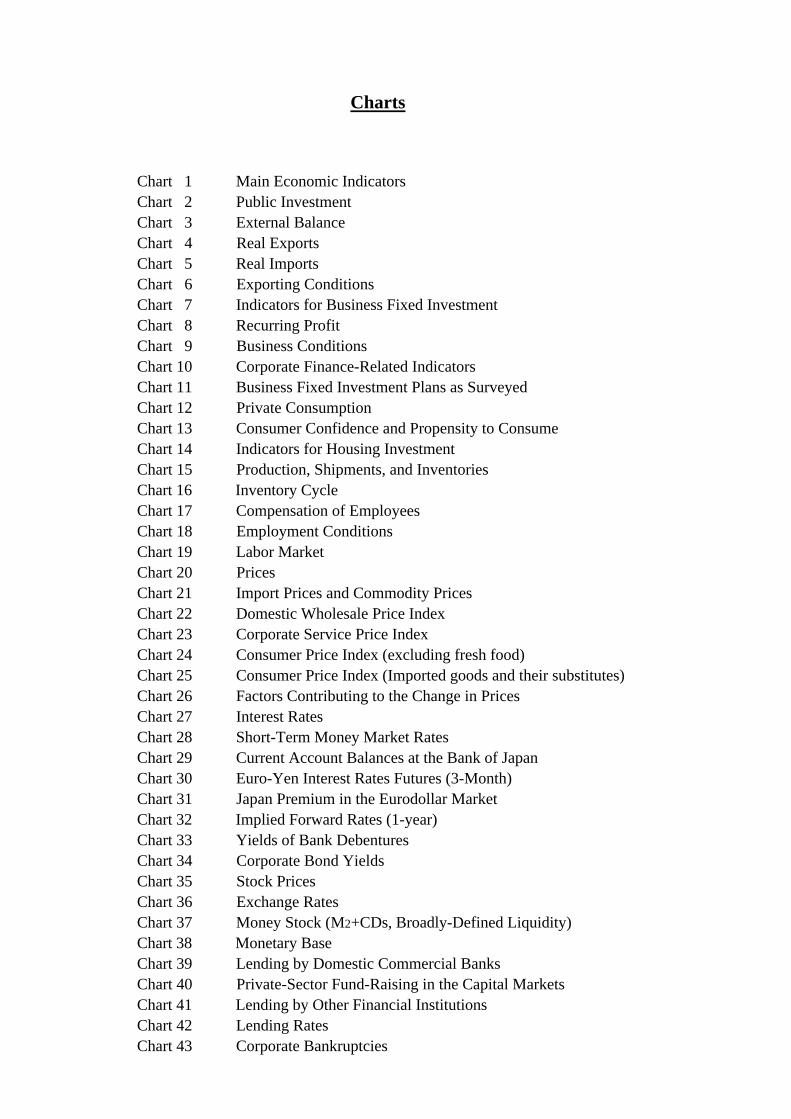
Chart 1 Main Economic IndicatorsChart 2 Public InvestmentChart 3 External BalanceChart 4 Real ExportsChart 5 Real ImportsChart 6 Exporting ConditionsChart 7 Indicators for Business Fixed InvestmentChart 8 Recurring ProfitChart 9 Business ConditionsChart 10 Corporate Finance-Related IndicatorsChart 11 Business Fixed Investment Plans as SurveyedChart 12 Private ConsumptionChart 13 Consumer Confidence and Propensity to ConsumeChart 14 Indicators for Housing InvestmentChart 15 Production, Shipments, and InventoriesChart 16 Inventory CycleChart 17 Compensation of EmployeesChart 18 Employment ConditionsChart 19 Labor MarketChart 20 PricesChart 21 Import Prices and Commodity PricesChart 22 Domestic Wholesale Price IndexChart 23 Corporate Service Price IndexChart 24 Consumer Price Index (excluding fresh food)Chart 25 Consumer Price Index (Imported goods and their substitutes) Chart 26 Factors Contributing to the Change in Prices Chart 27 Interest RatesChart 28 Short-Term Money Market RatesChart 29 Current Account Balances at the Bank of JapanChart 30 Euro-Yen Interest Rates Futures (3-Month)Chart 31 Japan Premium in the Eurodollar MarketChart 32 Implied Forward Rates (1-year)Chart 33 Yields of Bank DebenturesChart 34 Corporate Bond YieldsChart 35 Stock PricesChart 36 Exchange RatesChart 37 Money Stock (M2+CDs, Broadly-Defined Liquidity)Chart 38 Monetary BaseChart 39 Lending by Domestic Commercial BanksChart 40 Private-Sector Fund-Raising in the Capital MarketsChart 41 Lending by Other Financial InstitutionsChart 42 Lending RatesChart 43 Corporate Bankruptcies
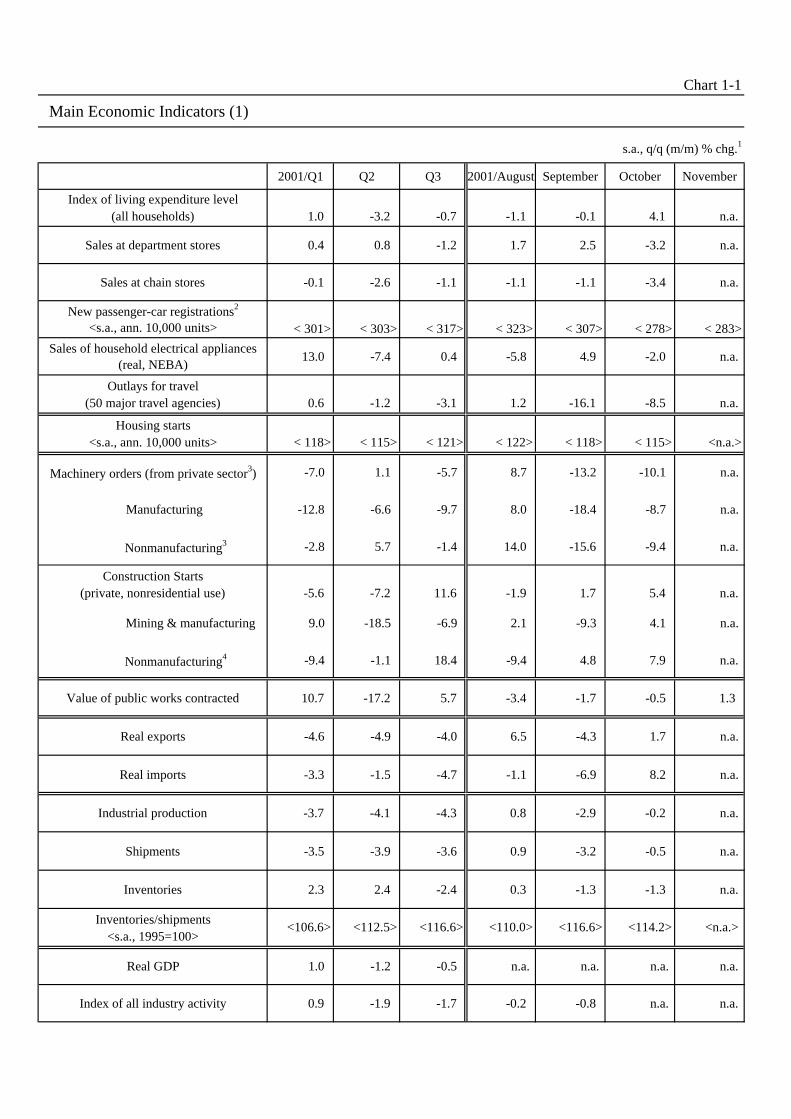
Chart 1-1
Main Economic Indicators (1)
s.a., q/q (m/m) % chg.1
2001/Q1 Q2 Q3 2001/August September October November
Index of living expenditure level (all households) 1.0 -3.2 -0.7 -1.1 -0.1 4.1 n.a.
Sales at department stores 0.4 0.8 -1.2 1.7 2.5 -3.2 n.a.
Sales at chain stores -0.1 -2.6 -1.1 -1.1 -1.1 -3.4 n.a.
New passenger-car registrations2
<s.a., ann. 10,000 units> < 301> < 303> < 317> < 323> < 307> < 278> < 283>
Sales of household electrical appliances(real, NEBA)
13.0 -7.4 0.4 -5.8 4.9 -2.0 n.a.
Outlays for travel(50 major travel agencies) 0.6 -1.2 -3.1 1.2 -16.1 -8.5 n.a.
Housing starts<s.a., ann. 10,000 units> < 118> < 115> < 121> < 122> < 118> < 115> <n.a.>
Machinery orders (from private sector3) -7.0 1.1 -5.7 8.7 -13.2 -10.1 n.a.
Manufacturing -12.8 -6.6 -9.7 8.0 -18.4 -8.7 n.a.
Nonmanufacturing3 -2.8 5.7 -1.4 14.0 -15.6 -9.4 n.a.
Construction Starts(private, nonresidential use) -5.6 -7.2 11.6 -1.9 1.7 5.4 n.a.
Mining & manufacturing 9.0 -18.5 -6.9 2.1 -9.3 4.1 n.a.
Nonmanufacturing4 -9.4 -1.1 18.4 -9.4 4.8 7.9 n.a.
Value of public works contracted 10.7 -17.2 5.7 -3.4 -1.7 -0.5 1.3
Real exports -4.6 -4.9 -4.0 6.5 -4.3 1.7 n.a.
Real imports -3.3 -1.5 -4.7 -1.1 -6.9 8.2 n.a.
Industrial production -3.7 -4.1 -4.3 0.8 -2.9 -0.2 n.a.
Shipments -3.5 -3.9 -3.6 0.9 -3.2 -0.5 n.a.
Inventories 2.3 2.4 -2.4 0.3 -1.3 -1.3 n.a.
Inventories/shipments<s.a., 1995=100>
Real GDP 1.0 -1.2 -0.5 n.a. n.a. n.a. n.a.
Index of all industry activity 0.9 -1.9 -1.7 -0.2 -0.8 n.a. n.a.
<116.6> <114.2> <n.a.> <106.6> <112.5> <116.6> <110.0>
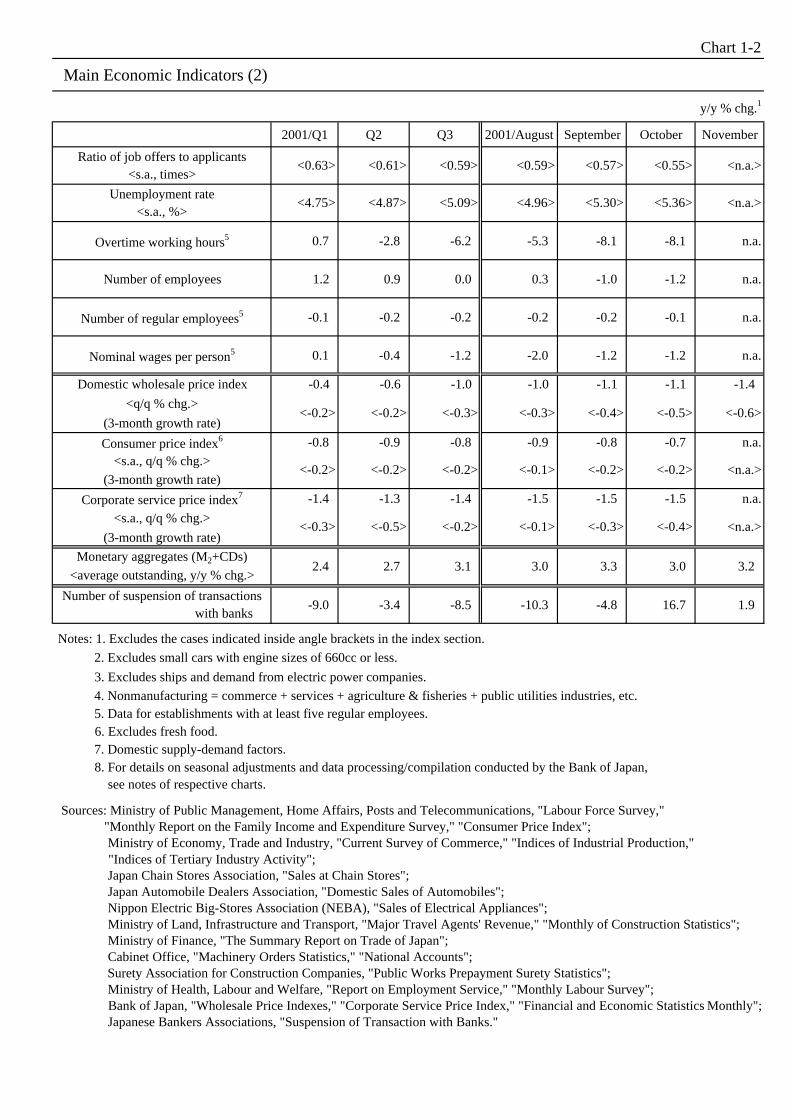
Chart 1-2
Main Economic Indicators (2)
y/y % chg.1
2001/Q1 Q2 Q3 2001/August September October November
Ratio of job offers to applicants<s.a., times>
Unemployment rate<s.a., %>
Overtime working hours5 0.7 -2.8 -6.2 -5.3 -8.1 -8.1 n.a.
Number of employees 1.2 0.9 0.0 0.3 -1.0 -1.2 n.a.
Number of regular employees5 -0.1 -0.2 -0.2 -0.2 -0.2 -0.1 n.a.
Nominal wages per person5 0.1 -0.4 -1.2 -2.0 -1.2 -1.2 n.a.
Domestic wholesale price index -0.4 -0.6 -1.0 -1.0 -1.1 -1.1 -1.4
<q/q % chg.>
(3-month growth rate)
Consumer price index6 -0.8 -0.9 -0.8 -0.9 -0.8 -0.7 n.a.
<s.a., q/q % chg.>
(3-month growth rate)
Corporate service price index7 -1.4 -1.3 -1.4 -1.5 -1.5 -1.5 n.a.
<s.a., q/q % chg.>
(3-month growth rate)
Monetary aggregates (M2+CDs)
<average outstanding, y/y % chg.>
Number of suspension of transactions with banks
Notes: 1. Excludes the cases indicated inside angle brackets in the index section.
2. Excludes small cars with engine sizes of 660cc or less.
3. Excludes ships and demand from electric power companies.
4. Nonmanufacturing = commerce + services + agriculture & fisheries + public utilities industries, etc. 5. Data for establishments with at least five regular employees. 6. Excludes fresh food. 7. Domestic supply-demand factors. 8. For details on seasonal adjustments and data processing/compilation conducted by the Bank of Japan, see notes of respective charts.
Sources: Ministry of Public Management, Home Affairs, Posts and Telecommunications, "Labour Force Survey," "Monthly Report on the Family Income and Expenditure Survey," "Consumer Price Index"; Ministry of Economy, Trade and Industry, "Current Survey of Commerce," "Indices of Industrial Production," "Indices of Tertiary Industry Activity"; Japan Chain Stores Association, "Sales at Chain Stores"; Japan Automobile Dealers Association, "Domestic Sales of Automobiles"; Nippon Electric Big-Stores Association (NEBA), "Sales of Electrical Appliances"; Ministry of Land, Infrastructure and Transport, "Major Travel Agents' Revenue," "Monthly of Construction Statistics"; Ministry of Finance, "The Summary Report on Trade of Japan"; Cabinet Office, "Machinery Orders Statistics," "National Accounts"; Surety Association for Construction Companies, "Public Works Prepayment Surety Statistics"; Ministry of Health, Labour and Welfare, "Report on Employment Service," "Monthly Labour Survey"; Bank of Japan, "Wholesale Price Indexes," "Corporate Service Price Index," "Financial and Economic Statistics Monthly"; Japanese Bankers Associations, "Suspension of Transaction with Banks."
<-0.3> <-0.4> <n.a.><-0.3> <-0.5> <-0.2> <-0.1>
<-0.4> <-0.5> <-0.6>
<-0.2> <-0.2> <-0.2> <-0.1> <-0.2> <-0.2> <n.a.>
<-0.2> <-0.2> <-0.3> <-0.3>
2.4 2.7 3.1 3.0 3.3 3.0 3.2
1.9 16.7 -4.8 -10.3 -8.5 -3.4 -9.0
<0.63> <0.61> <0.59> <0.59> <0.57> <0.55> <n.a.>
<n.a.><5.36><5.30><4.96><5.09><4.87><4.75>
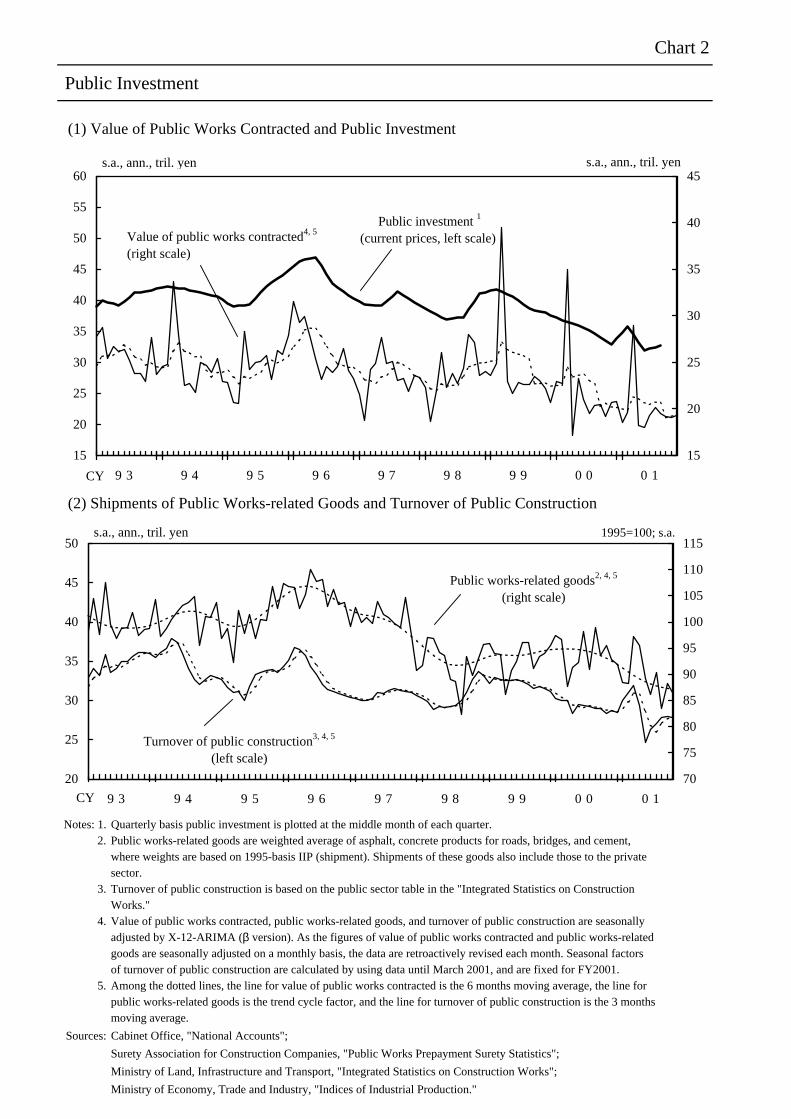
Chart 2
Public Investment
(1) Value of Public Works Contracted and Public Investment
(2) Shipments of Public Works-related Goods and Turnover of Public Construction
Notes: 1. Quarterly basis public investment is plotted at the middle month of each quarter. 2. Public works-related goods are weighted average of asphalt, concrete products for roads, bridges, and cement,
where weights are based on 1995-basis IIP (shipment). Shipments of these goods also include those to the privatesector.
3. Turnover of public construction is based on the public sector table in the "Integrated Statistics on ConstructionWorks."
4. Value of public works contracted, public works-related goods, and turnover of public construction are seasonallyadjusted by X-12-ARIMA (β version). As the figures of value of public works contracted and public works-relatedgoods are seasonally adjusted on a monthly basis, the data are retroactively revised each month. Seasonal factorsof turnover of public construction are calculated by using data until March 2001, and are fixed for FY2001.
5. Among the dotted lines, the line for value of public works contracted is the 6 months moving average, the line for public works-related goods is the trend cycle factor, and the line for turnover of public construction is the 3 monthsmoving average.
Sources: Cabinet Office, "National Accounts";
Surety Association for Construction Companies, "Public Works Prepayment Surety Statistics";
Ministry of Land, Infrastructure and Transport, "Integrated Statistics on Construction Works";
Ministry of Economy, Trade and Industry, "Indices of Industrial Production."
15
20
25
30
35
40
45
50
55
60
9 3 9 4 9 5 9 6 9 7 9 8 9 9 0 0 0 1
15
20
25
30
35
40
45s.a., ann., tril. yen
CY
s.a., ann., tril. yen
Value of public works contracted4, 5
(right scale)
Public investment 1
(current prices, left scale)
20
25
30
35
40
45
50
9 3 9 4 9 5 9 6 9 7 9 8 9 9 0 0 0 1
70
75
80
85
90
95
100
105
110
115
CY
s.a., ann., tril. yen 1995=100; s.a.
Public works-related goods2, 4, 5
(right scale)
Turnover of public construction3, 4, 5
(left scale)
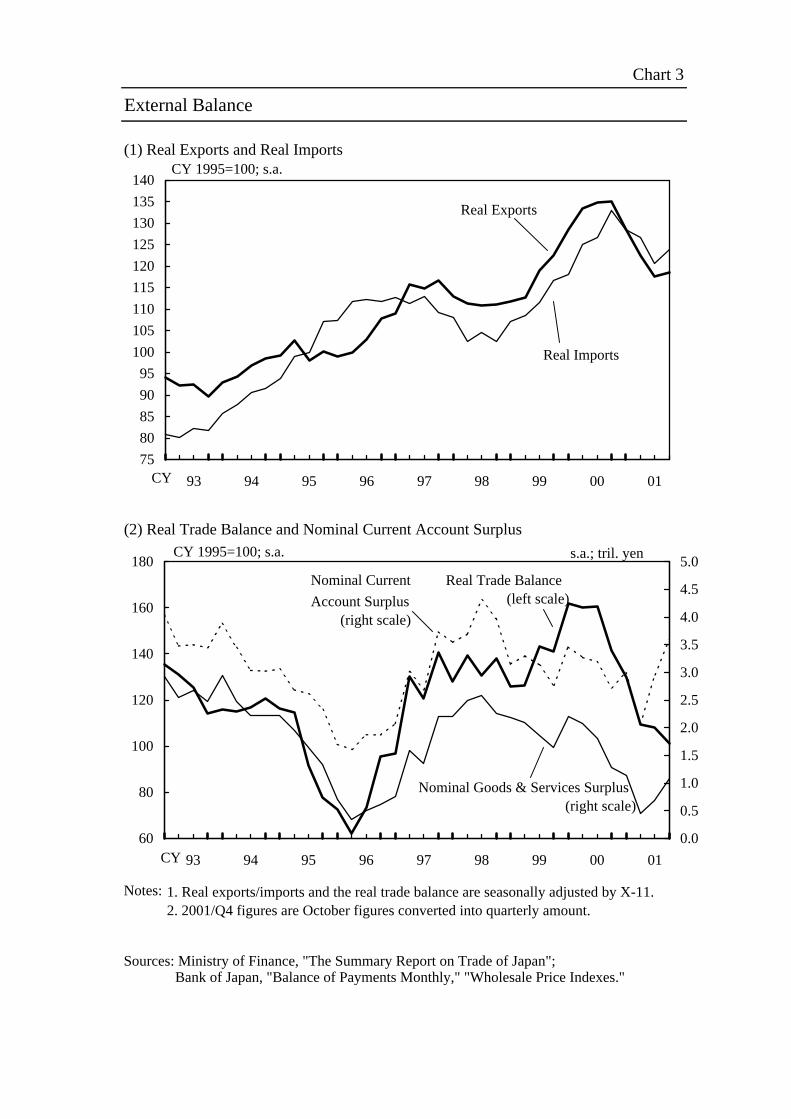
Chart 3
External Balance
(1) Real Exports and Real Imports
(2) Real Trade Balance and Nominal Current Account Surplus
Notes:
Sources: Ministry of Finance, "The Summary Report on Trade of Japan"; Bank of Japan, "Balance of Payments Monthly," "Wholesale Price Indexes."
75
80
85
90
95
100
105
110
115
120
125
130
135
140
93 94 95 96 97 98 99 00 01
CY 1995=100; s.a.
Real Exports 1
Real Imports 1
CY
60
80
100
120
140
160
180
93 94 95 96 97 98 99 00 01
0.0
0.5
1.0
1.5
2.0
2.5
3.0
3.5
4.0
4.5
5.0
CY
CY 1995=100; s.a. s.a.; tril. yen
Real Trade Balance 1
(left scale)Nominal Current
Account Surplus 2
(right scale)
Nominal Goods & Services Surplus 2
(right scale)
1. Real exports/imports and the real trade balance are seasonally adjusted by X-11.2. 2001/Q4 figures are October figures converted into quarterly amount.
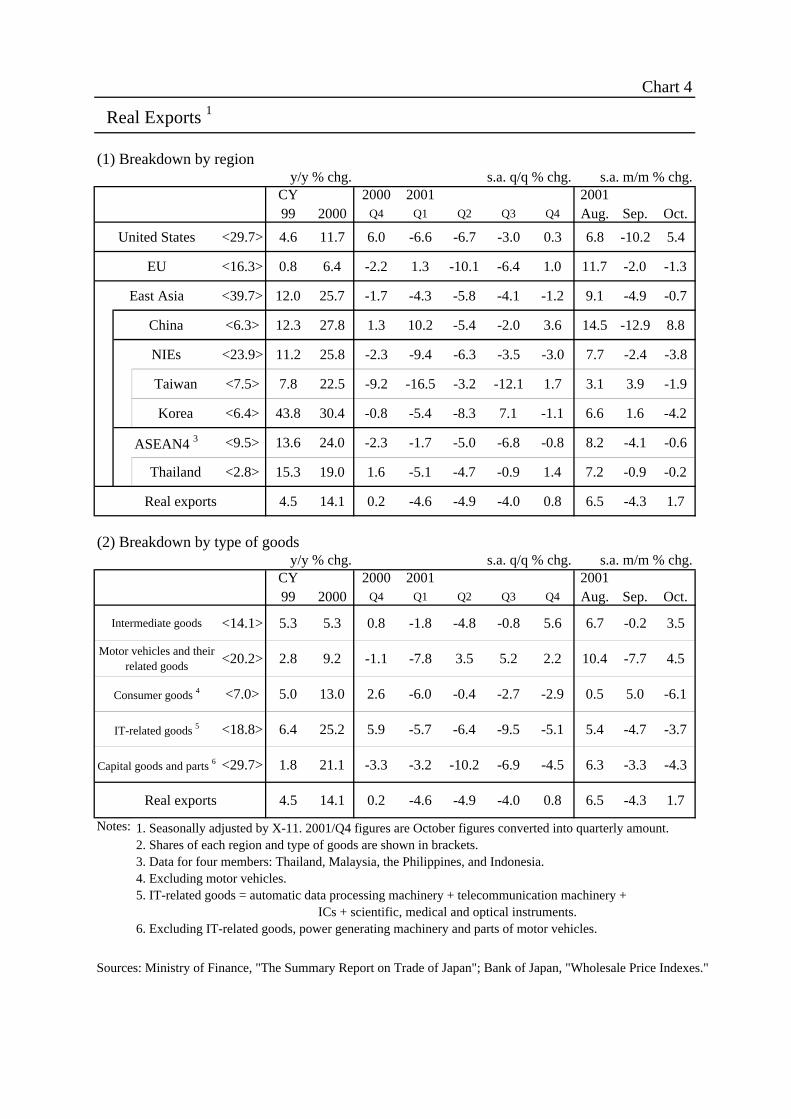
Chart 4
Real Exports 1
(1) Breakdown by regiony/y % chg. s.a. q/q % chg. s.a. m/m % chg.
CY 2000 2001 200199 2000 Q4 Q1 Q2 Q3 Q4 Aug. Sep. Oct.
United States <29.7> 4.6 11.7 6.0 -6.6 -6.7 -3.0 0.3 6.8 -10.2 5.4
EU <16.3> 0.8 6.4 -2.2 1.3 -10.1 -6.4 1.0 11.7 -2.0 -1.3
East Asia <39.7> 12.0 25.7 -1.7 -4.3 -5.8 -4.1 -1.2 9.1 -4.9 -0.7
China <6.3> 12.3 27.8 1.3 10.2 -5.4 -2.0 3.6 14.5 -12.9 8.8
NIEs <23.9> 11.2 25.8 -2.3 -9.4 -6.3 -3.5 -3.0 7.7 -2.4 -3.8
Taiwan <7.5> 7.8 22.5 -9.2 -16.5 -3.2 -12.1 1.7 3.1 3.9 -1.9
Korea <6.4> 43.8 30.4 -0.8 -5.4 -8.3 7.1 -1.1 6.6 1.6 -4.2
ASEAN4 3 <9.5> 13.6 24.0 -2.3 -1.7 -5.0 -6.8 -0.8 8.2 -4.1 -0.6
Thailand <2.8> 15.3 19.0 1.6 -5.1 -4.7 -0.9 1.4 7.2 -0.9 -0.2
Real exports 4.5 14.1 0.2 -4.6 -4.9 -4.0 0.8 6.5 -4.3 1.7
(2) Breakdown by type of goodsy/y % chg. s.a. q/q % chg. s.a. m/m % chg.
CY 2000 2001 0 0 0 2001 0 099 2000 Q4 Q1 Q2 Q3 Q4 Aug. Sep. Oct.
Intermediate goods <14.1> 5.3 5.3 0.8 -1.8 -4.8 -0.8 5.6 6.7 -0.2 3.5
Motor vehicles and theirrelated goods
<20.2> 2.8 9.2 -1.1 -7.8 3.5 5.2 2.2 10.4 -7.7 4.5
Consumer goods 4 <7.0> 5.0 13.0 2.6 -6.0 -0.4 -2.7 -2.9 0.5 5.0 -6.1
IT-related goods 5 <18.8> 6.4 25.2 5.9 -5.7 -6.4 -9.5 -5.1 5.4 -4.7 -3.7
Capital goods and parts 6 <29.7> 1.8 21.1 -3.3 -3.2 -10.2 -6.9 -4.5 6.3 -3.3 -4.3
Real exports 4.5 14.1 0.2 -4.6 -4.9 -4.0 0.8 6.5 -4.3 1.7
Notes:
Sources: Ministry of Finance, "The Summary Report on Trade of Japan"; Bank of Japan, "Wholesale Price Indexes."
1. Seasonally adjusted by X-11. 2001/Q4 figures are October figures converted into quarterly amount.2. Shares of each region and type of goods are shown in brackets.3. Data for four members: Thailand, Malaysia, the Philippines, and Indonesia.4. Excluding motor vehicles.5. IT-related goods = automatic data processing machinery + telecommunication machinery + ICs + scientific, medical and optical instruments.6. Excluding IT-related goods, power generating machinery and parts of motor vehicles.
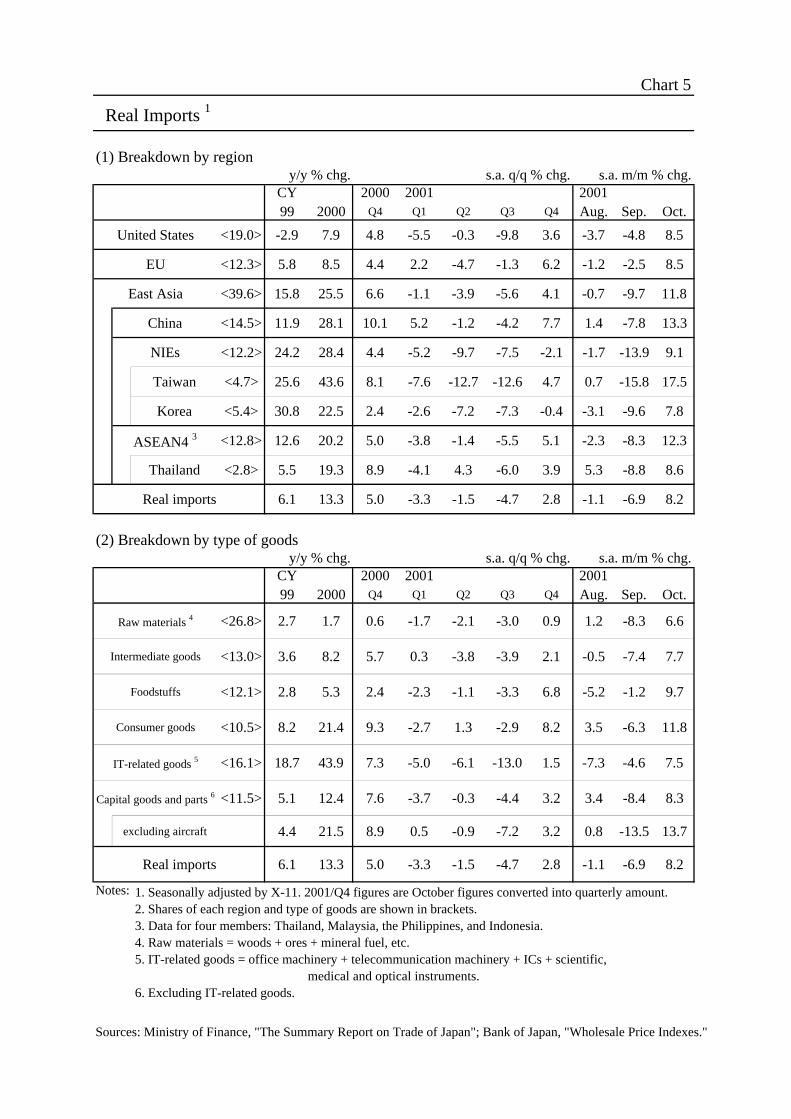
Chart 5
Real Imports 1
(1) Breakdown by regiony/y % chg. s.a. q/q % chg. s.a. m/m % chg.
CY 2000 2001 0 0 0 2001 0 099 2000 Q4 Q1 Q2 Q3 Q4 Aug. Sep. Oct.
United States <19.0> -2.9 7.9 4.8 -5.5 -0.3 -9.8 3.6 -3.7 -4.8 8.5
EU <12.3> 5.8 8.5 4.4 2.2 -4.7 -1.3 6.2 -1.2 -2.5 8.5
East Asia <39.6> 15.8 25.5 6.6 -1.1 -3.9 -5.6 4.1 -0.7 -9.7 11.8
China <14.5> 11.9 28.1 10.1 5.2 -1.2 -4.2 7.7 1.4 -7.8 13.3
NIEs <12.2> 24.2 28.4 4.4 -5.2 -9.7 -7.5 -2.1 -1.7 -13.9 9.1
Taiwan <4.7> 25.6 43.6 8.1 -7.6 -12.7 -12.6 4.7 0.7 -15.8 17.5
Korea <5.4> 30.8 22.5 2.4 -2.6 -7.2 -7.3 -0.4 -3.1 -9.6 7.8
ASEAN4 3 <12.8> 12.6 20.2 5.0 -3.8 -1.4 -5.5 5.1 -2.3 -8.3 12.3
Thailand <2.8> 5.5 19.3 8.9 -4.1 4.3 -6.0 3.9 5.3 -8.8 8.6
Real imports 6.1 13.3 5.0 -3.3 -1.5 -4.7 2.8 -1.1 -6.9 8.2
(2) Breakdown by type of goodsy/y % chg. s.a. q/q % chg. s.a. m/m % chg.
CY 2000 2001 0 0 0 2001 0 099 2000 Q4 Q1 Q2 Q3 Q4 Aug. Sep. Oct.
Raw materials 4 <26.8> 2.7 1.7 0.6 -1.7 -2.1 -3.0 0.9 1.2 -8.3 6.6
Intermediate goods <13.0> 3.6 8.2 5.7 0.3 -3.8 -3.9 2.1 -0.5 -7.4 7.7
Foodstuffs <12.1> 2.8 5.3 2.4 -2.3 -1.1 -3.3 6.8 -5.2 -1.2 9.7
Consumer goods <10.5> 8.2 21.4 9.3 -2.7 1.3 -2.9 8.2 3.5 -6.3 11.8
IT-related goods 5 <16.1> 18.7 43.9 7.3 -5.0 -6.1 -13.0 1.5 -7.3 -4.6 7.5
Capital goods and parts 6 <11.5> 5.1 12.4 7.6 -3.7 -0.3 -4.4 3.2 3.4 -8.4 8.3
excluding aircraft 4.4 21.5 8.9 0.5 -0.9 -7.2 3.2 0.8 -13.5 13.7
Real imports 6.1 13.3 5.0 -3.3 -1.5 -4.7 2.8 -1.1 -6.9 8.2
Notes:
Sources: Ministry of Finance, "The Summary Report on Trade of Japan"; Bank of Japan, "Wholesale Price Indexes."
1. Seasonally adjusted by X-11. 2001/Q4 figures are October figures converted into quarterly amount.2. Shares of each region and type of goods are shown in brackets.3. Data for four members: Thailand, Malaysia, the Philippines, and Indonesia.4. Raw materials = woods + ores + mineral fuel, etc.5. IT-related goods = office machinery + telecommunication machinery + ICs + scientific, medical and optical instruments.6. Excluding IT-related goods.
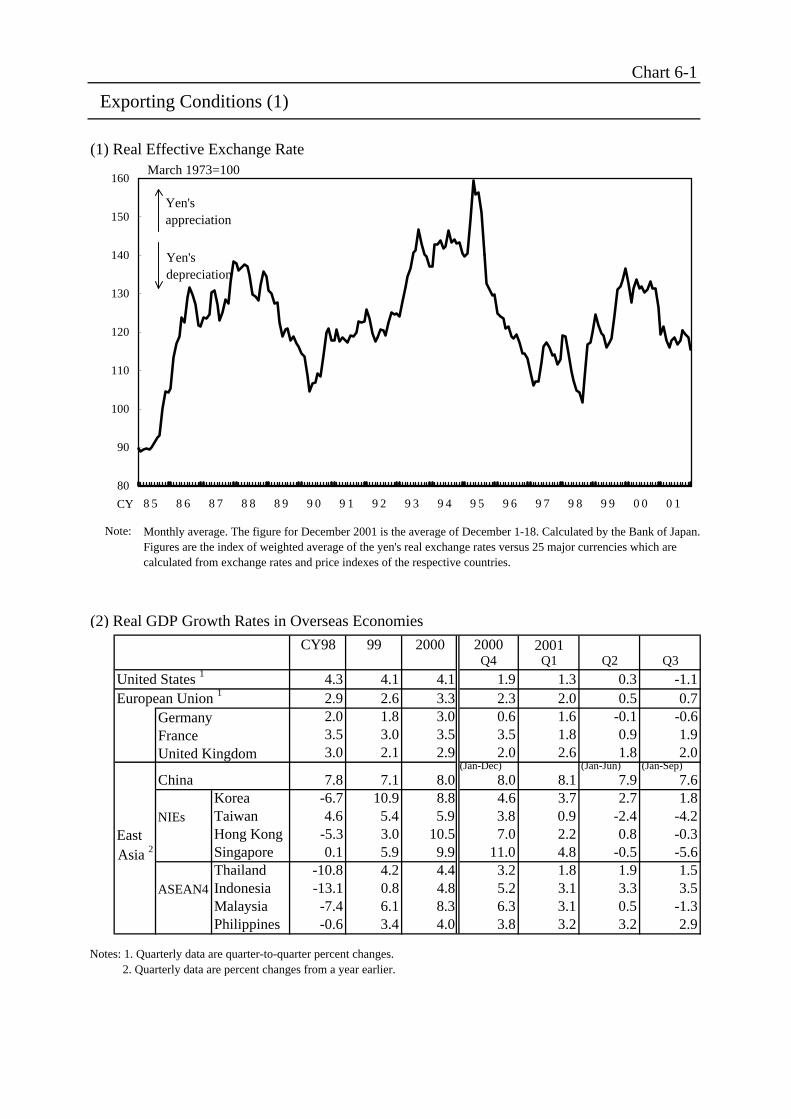
Chart 6-1
Exporting Conditions (1)
(1) Real Effective Exchange Rate 1
Note:
(2) Real GDP Growth Rates in Overseas Economies
CY98 99 2000 2000 2001Q4 Q1 Q2 Q3
United States 1 4.3 4.1 4.1 1.9 1.3 0.3 -1.1European Union 1 2.9 2.6 3.3 2.3 2.0 0.5 0.7
Germany 2.0 1.8 3.0 0.6 1.6 -0.1 -0.6France 3.5 3.0 3.5 3.5 1.8 0.9 1.9United Kingdom 3.0 2.1 2.9 2.0 2.6 1.8 2.0
(Jan-Dec) (Jan-Jun) (Jan-Sep)
China 7.8 7.1 8.0 8.0 8.1 7.9 7.6Korea -6.7 10.9 8.8 4.6 3.7 2.7 1.8
NIEs Taiwan 4.6 5.4 5.9 3.8 0.9 -2.4 -4.2East Hong Kong -5.3 3.0 10.5 7.0 2.2 0.8 -0.3
Asia 2 Singapore 0.1 5.9 9.9 11.0 4.8 -0.5 -5.6Thailand -10.8 4.2 4.4 3.2 1.8 1.9 1.5
ASEAN4 Indonesia -13.1 0.8 4.8 5.2 3.1 3.3 3.5Malaysia -7.4 6.1 8.3 6.3 3.1 0.5 -1.3Philippines -0.6 3.4 4.0 3.8 3.2 3.2 2.9
Notes: 1. Quarterly data are quarter-to-quarter percent changes. 2. Quarterly data are percent changes from a year earlier.
80
90
100
110
120
130
140
150
160
8 5 8 6 8 7 8 8 8 9 9 0 9 1 9 2 9 3 9 4 9 5 9 6 9 7 9 8 9 9 0 0 0 1
Yen'sappreciation
Yen'sdepreciation
March 1973=100
CY
Monthly average. The figure for December 2001 is the average of December 1-18. Calculated by the Bank of Japan. Figures are the index of weighted average of the yen's real exchange rates versus 25 major currencies which are calculated from exchange rates and price indexes of the respective countries.
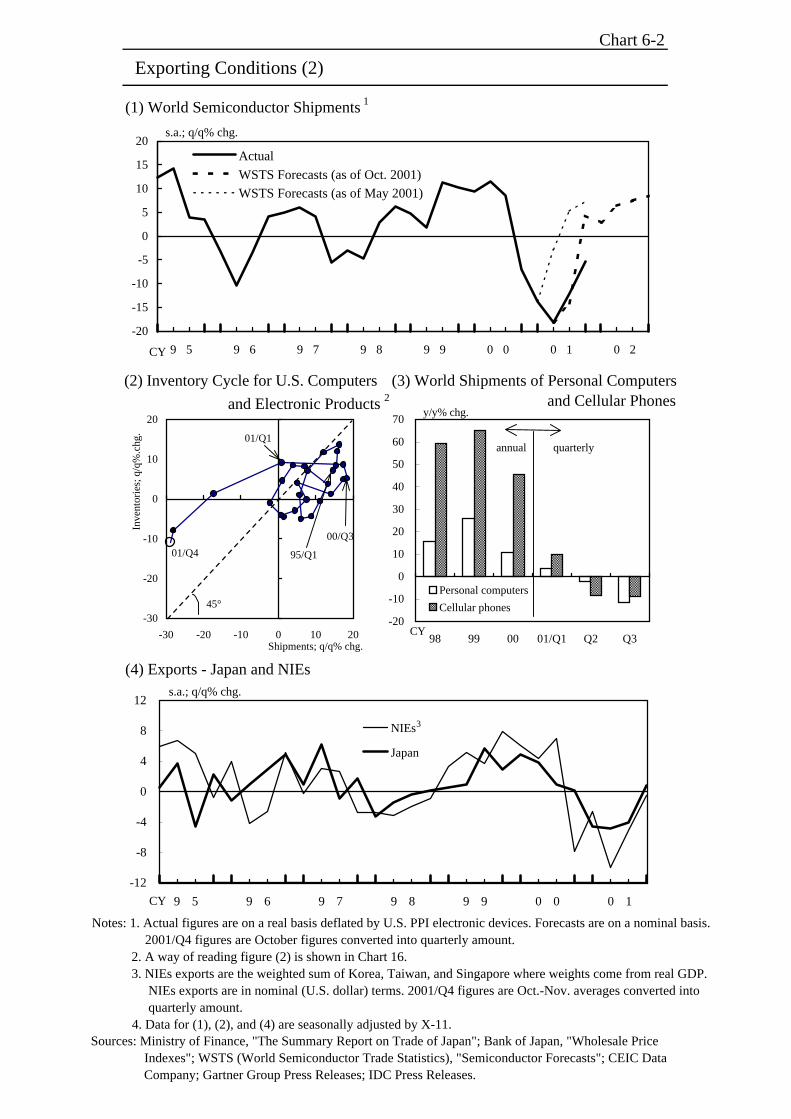
Chart 6-2
Exporting Conditions (2)
(1) World Semiconductor Shipments 1
(4) Exports - Japan and NIEs
-20
-15
-10
-5
0
5
10
15
20
9 5 9 6 9 7 9 8 9 9 0 0 0 1 0 2
Actual
WSTS Forecasts (as of Oct. 2001)
WSTS Forecasts (as of May 2001)
s.a.; q/q% chg.
CY
-12
-8
-4
0
4
8
12
9 5 9 6 9 7 9 8 9 9 0 0 0 1
NIEs
Japan
s.a.; q/q% chg.
CY
3
-20
-10
0
10
20
30
40
50
60
70
98 99 00 01/Q1 Q2 Q3
Personal computers
Cellular phones
CY
quarterlyannual
y/y% chg.
-30
-20
-10
0
10
20
-30 -20 -10 0 10 20
01/Q4
45°
01/Q1
00/Q3
95/Q1
Inve
ntor
ies;
q/q
%.c
hg.
Shipments; q/q% chg.
Notes: 1. Actual figures are on a real basis deflated by U.S. PPI electronic devices. Forecasts are on a nominal basis. 2001/Q4 figures are October figures converted into quarterly amount. 2. A way of reading figure (2) is shown in Chart 16. 3. NIEs exports are the weighted sum of Korea, Taiwan, and Singapore where weights come from real GDP. NIEs exports are in nominal (U.S. dollar) terms. 2001/Q4 figures are Oct.-Nov. averages converted into quarterly amount. 4. Data for (1), (2), and (4) are seasonally adjusted by X-11.Sources: Ministry of Finance, "The Summary Report on Trade of Japan"; Bank of Japan, "Wholesale Price Indexes"; WSTS (World Semiconductor Trade Statistics), "Semiconductor Forecasts"; CEIC Data Company; Gartner Group Press Releases; IDC Press Releases.
(2) Inventory Cycle for U.S. Computers
and Electronic Products 2
(3) World Shipments of Personal Computers and Cellular Phones
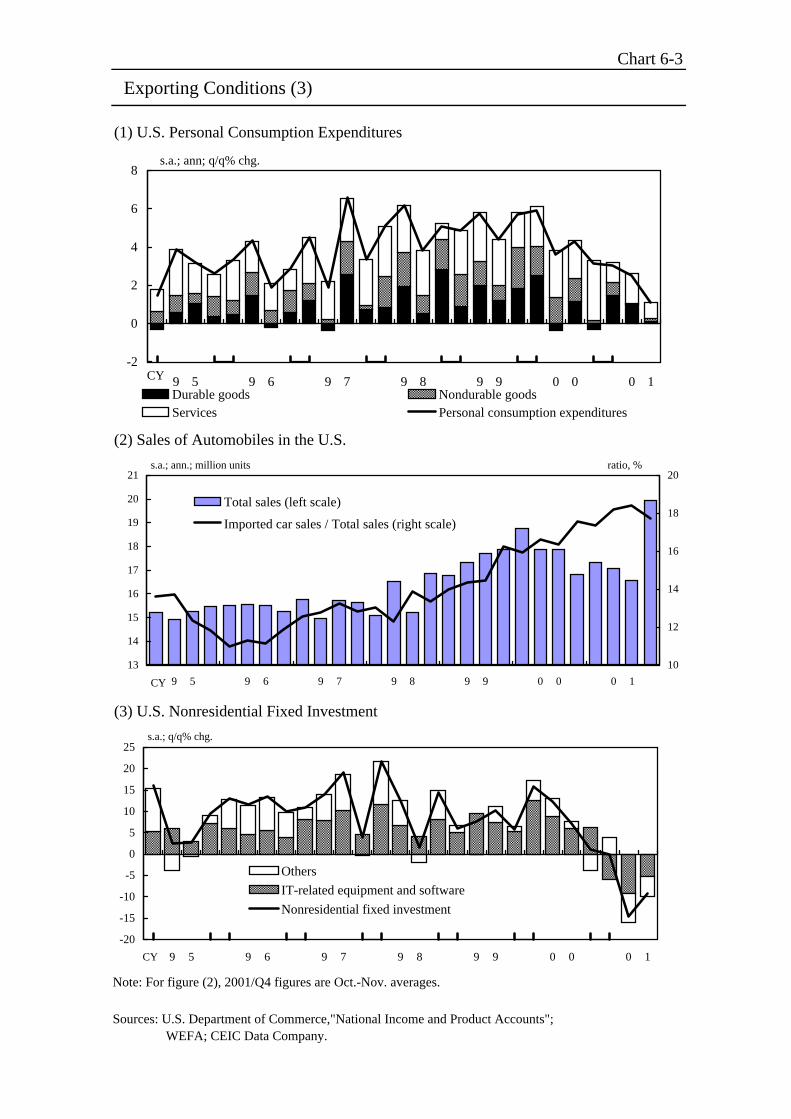
Chart 6-3
Exporting Conditions (3)
(1) U.S. Personal Consumption Expenditures
(2) Sales of Automobiles in the U.S.
(3) U.S. Nonresidential Fixed Investment
13
14
15
16
17
18
19
20
21
9 5 9 6 9 7 9 8 9 9 0 0 0 1
10
12
14
16
18
20
Total sales (left scale)
Imported car sales / Total sales (right scale)
s.a.; ann.; million units ratio, %
CY
Sources: U.S. Department of Commerce,"National Income and Product Accounts"; WEFA; CEIC Data Company.
-2
0
2
4
6
8
9 5 9 6 9 7 9 8 9 9 0 0 0 1Durable goods Nondurable goodsServices Personal consumption expenditures
s.a.; ann; q/q% chg.
CY
-20
-15
-10
-5
0
5
10
15
20
25
9 5 9 6 9 7 9 8 9 9 0 0 0 1
Others
IT-related equipment and software
Nonresidential fixed investment
s.a.; q/q% chg.
CY
Note: For figure (2), 2001/Q4 figures are Oct.-Nov. averages.
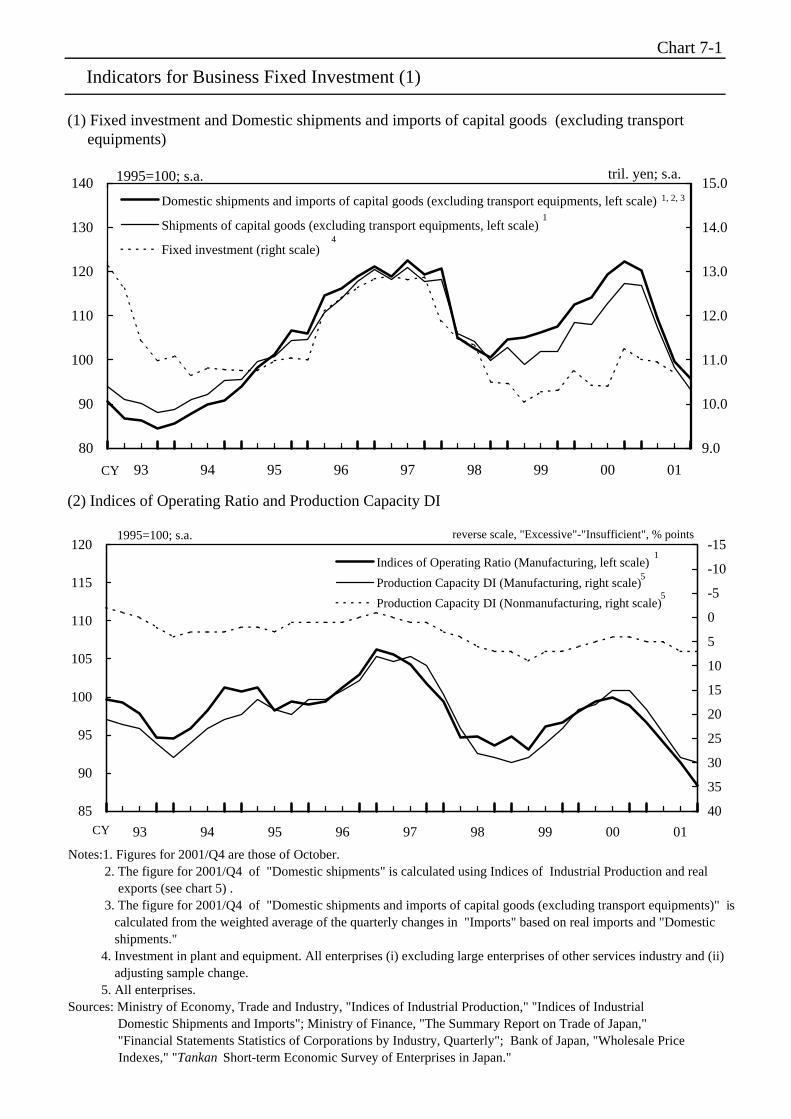
Chart 7-1
Indicators for Business Fixed Investment (1)
(1) Fixed investment and Domestic shipments and imports of capital goods (excluding transport equipments)
(2) Indices of Operating Ratio and Production Capacity DI
80
90
100
110
120
130
140
93 94 95 96 97 98 99 00 01
9.0
10.0
11.0
12.0
13.0
14.0
15.0Domestic shipments and imports of capital goods (excluding transport equipments, left scale)
Shipments of capital goods (excluding transport equipments, left scale)
Fixed investment (right scale)
1995=100; s.a.
CY
tril. yen; s.a.
1, 2, 3
1
4
85
90
95
100
105
110
115
120
93 94 95 96 97 98 99 00 01
-15
-10
-5
0
5
10
15
20
25
30
35
40
Indices of Operating Ratio (Manufacturing, left scale)
Production Capacity DI (Manufacturing, right scale)
Production Capacity DI (Nonmanufacturing, right scale)
CY
1995=100; s.a.
1
5
5
reverse scale, "Excessive"-"Insufficient", % points
Notes:1. Figures for 2001/Q4 are those of October. 2. The figure for 2001/Q4 of "Domestic shipments" is calculated using Indices of Industrial Production and real exports (see chart 5) . 3. The figure for 2001/Q4 of "Domestic shipments and imports of capital goods (excluding transport equipments)" is calculated from the weighted average of the quarterly changes in "Imports" based on real imports and "Domestic shipments." 4. Investment in plant and equipment. All enterprises (i) excluding large enterprises of other services industry and (ii) adjusting sample change. 5. All enterprises.Sources: Ministry of Economy, Trade and Industry, "Indices of Industrial Production," "Indices of Industrial Domestic Shipments and Imports"; Ministry of Finance, "The Summary Report on Trade of Japan," "Financial Statements Statistics of Corporations by Industry, Quarterly"; Bank of Japan, "Wholesale Price Indexes," "Tankan Short-term Economic Survey of Enterprises in Japan."
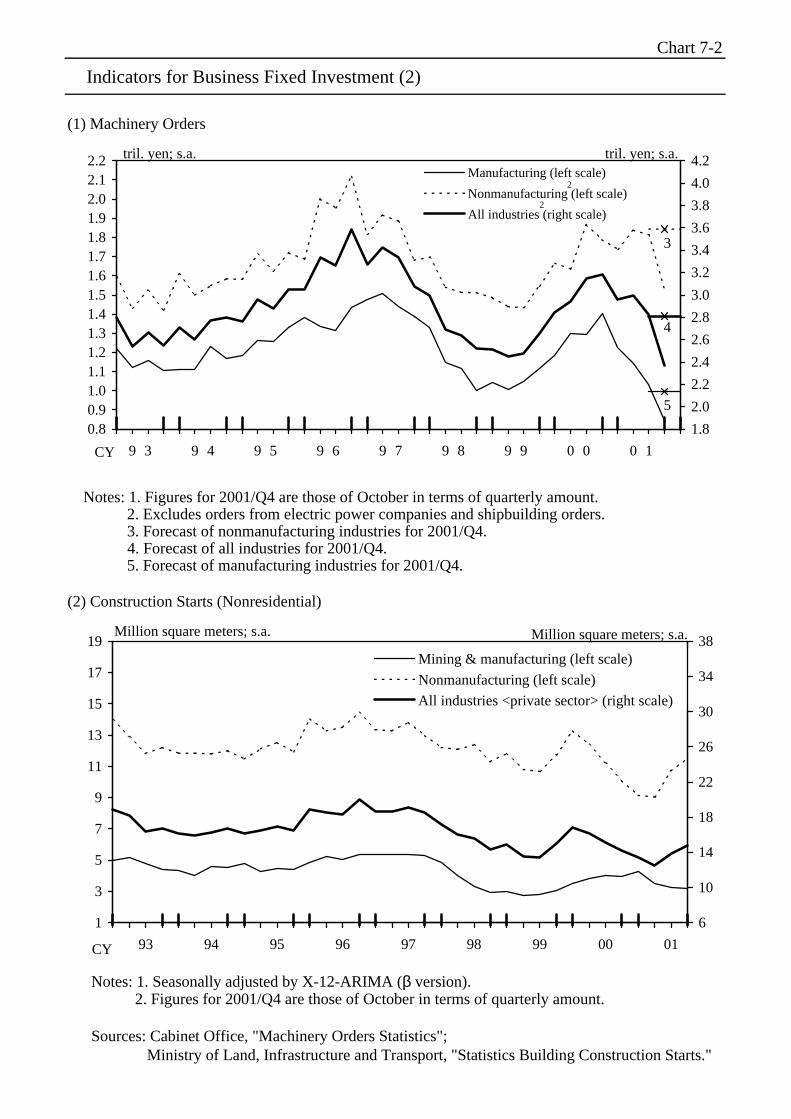
Chart 7-2
Indicators for Business Fixed Investment (2)
(1) Machinery Orders
Notes: 1. Figures for 2001/Q4 are those of October in terms of quarterly amount. 2. Excludes orders from electric power companies and shipbuilding orders. 3. Forecast of nonmanufacturing industries for 2001/Q4. 4. Forecast of all industries for 2001/Q4. 5. Forecast of manufacturing industries for 2001/Q4.
(2) Construction Starts (Nonresidential)
Notes: 1. Seasonally adjusted by X-12-ARIMA (β version). 2. Figures for 2001/Q4 are those of October in terms of quarterly amount.
Sources: Cabinet Office, "Machinery Orders Statistics"; Ministry of Land, Infrastructure and Transport, "Statistics Building Construction Starts."
0.80.91.01.11.21.31.41.51.61.71.81.92.02.12.2
9 3 9 4 9 5 9 6 9 7 9 8 9 9 0 0 0 1
1.8
2.0
2.2
2.4
2.6
2.8
3.0
3.2
3.4
3.6
3.8
4.0
4.2Manufacturing (left scale)
Nonmanufacturing (left scale)
All industries (right scale)
tril. yen; s.a. tril. yen; s.a.
3
5
4
2
2
CY
1
3
5
7
9
11
13
15
17
19
93 94 95 96 97 98 99 00 01
6
10
14
18
22
26
30
34
38Mining & manufacturing (left scale)
Nonmanufacturing (left scale)
All industries <private sector> (right scale)
CY
Million square meters; s.a. Million square meters; s.a.
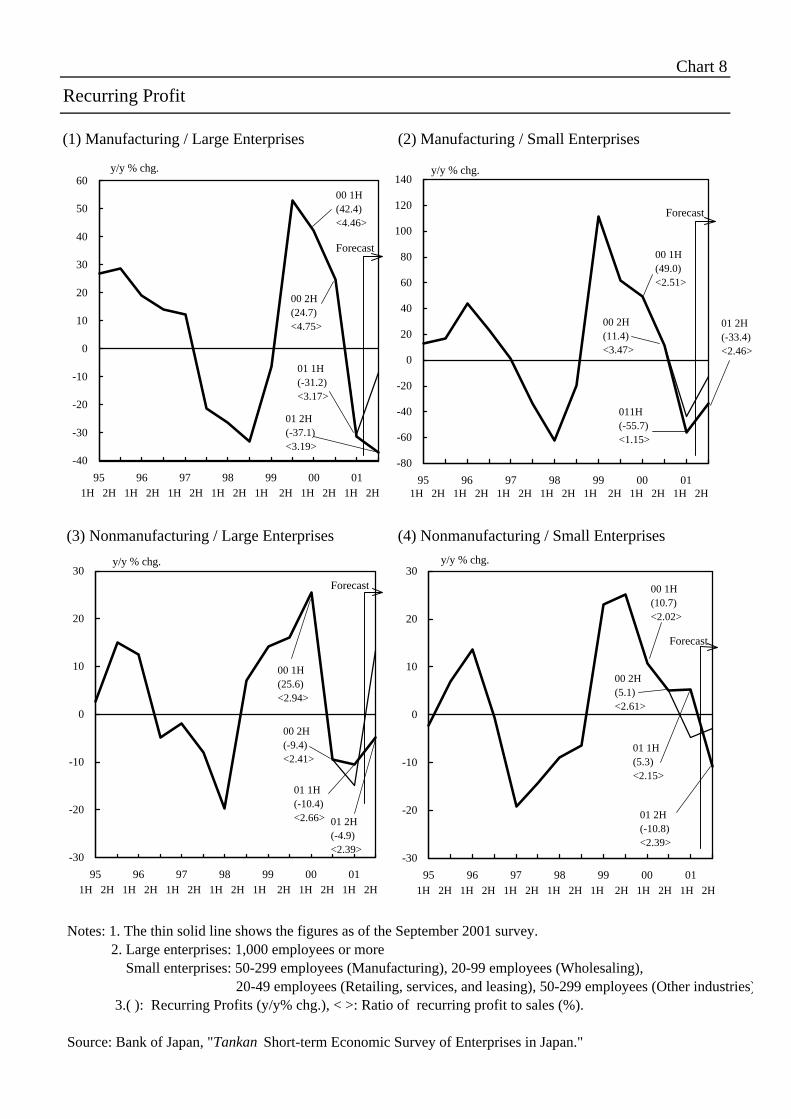
Chart 8
Recurring Profit
(1) Manufacturing / Large Enterprises (2) Manufacturing / Small Enterprises
(3) Nonmanufacturing / Large Enterprises (4) Nonmanufacturing / Small Enterprises
-40
-30
-20
-10
0
10
20
30
40
50
60
95 96 97 98 99 00 01
Forecast
y/y % chg.
1H 2H 1H 2H 1H 2H 1H 2H 1H 2H 1H 2H 1H 2H
01 2H(-37.1)<3.19>
01 1H(-31.2)<3.17>
00 2H(24.7)<4.75>
00 1H(42.4)<4.46>
-30
-20
-10
0
10
20
30
95 96 97 98 99 00 01
Forecast
y/y % chg.
01 2H(-4.9)<2.39>
01 1H(-10.4)<2.66>
00 2H(-9.4)<2.41>
00 1H(25.6)<2.94>
1H 2H 1H 2H 1H 2H 1H 2H 1H 2H 1H 2H 1H 2H
-80
-60
-40
-20
0
20
40
60
80
100
120
140
95 96 97 98 99 00 01
Forecast
y/y % chg.
011H(-55.7)<1.15>
00 2H(11.4)<3.47>
00 1H(49.0)<2.51>
1H 2H 1H 2H 1H 2H 1H 2H 1H 2H 1H 2H 1H 2H
-30
-20
-10
0
10
20
30
95 96 97 98 99 00 01
Forecast
y/y % chg.
01 2H(-10.8)<2.39>
01 1H(5.3)<2.15>
00 2H(5.1)<2.61>
00 1H(10.7)<2.02>
1H 2H 1H 2H 1H 2H 1H 2H 1H 2H 1H 2H 1H 2H
Notes: 1. The thin solid line shows the figures as of the September 2001 survey. 2. Large enterprises: 1,000 employees or more Small enterprises: 50-299 employees (Manufacturing), 20-99 employees (Wholesaling), 20-49 employees (Retailing, services, and leasing), 50-299 employees (Other industries) 3.( ): Recurring Profits (y/y% chg.), < >: Ratio of recurring profit to sales (%).
Source: Bank of Japan, "Tankan Short-term Economic Survey of Enterprises in Japan."
01 2H(-33.4)<2.46>
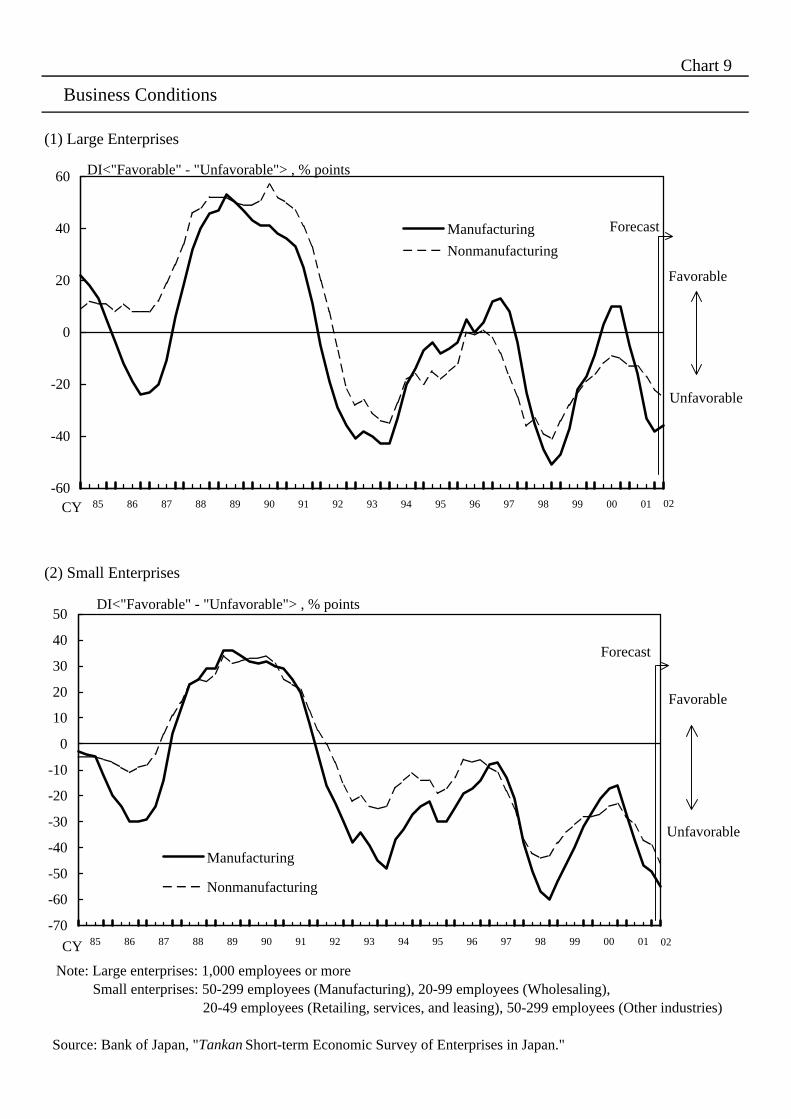
Chart 9
Business Conditions
(1) Large Enterprises
(2) Small Enterprises
Note: Large enterprises: 1,000 employees or more Small enterprises: 50-299 employees (Manufacturing), 20-99 employees (Wholesaling), 20-49 employees (Retailing, services, and leasing), 50-299 employees (Other industries)
Source: Bank of Japan, "TankanShort-term Economic Survey of Enterprises in Japan."
-60
-40
-20
0
20
40
60
85 86 87 88 89 90 91 92 93 94 95 96 97 98 99 00 01
Manufacturing
Nonmanufacturing
DI<"Favorable" - "Unfavorable"> , % points
Forecast
CY
-70
-60
-50
-40
-30
-20
-10
0
10
20
30
40
50
85 86 87 88 89 90 91 92 93 94 95 96 97 98 99 00 01
Manufacturing
Nonmanufacturing
DI<"Favorable" - "Unfavorable"> , % points
Forecast
CY
Favorable
Unfavorable
Favorable
Unfavorable
02
02
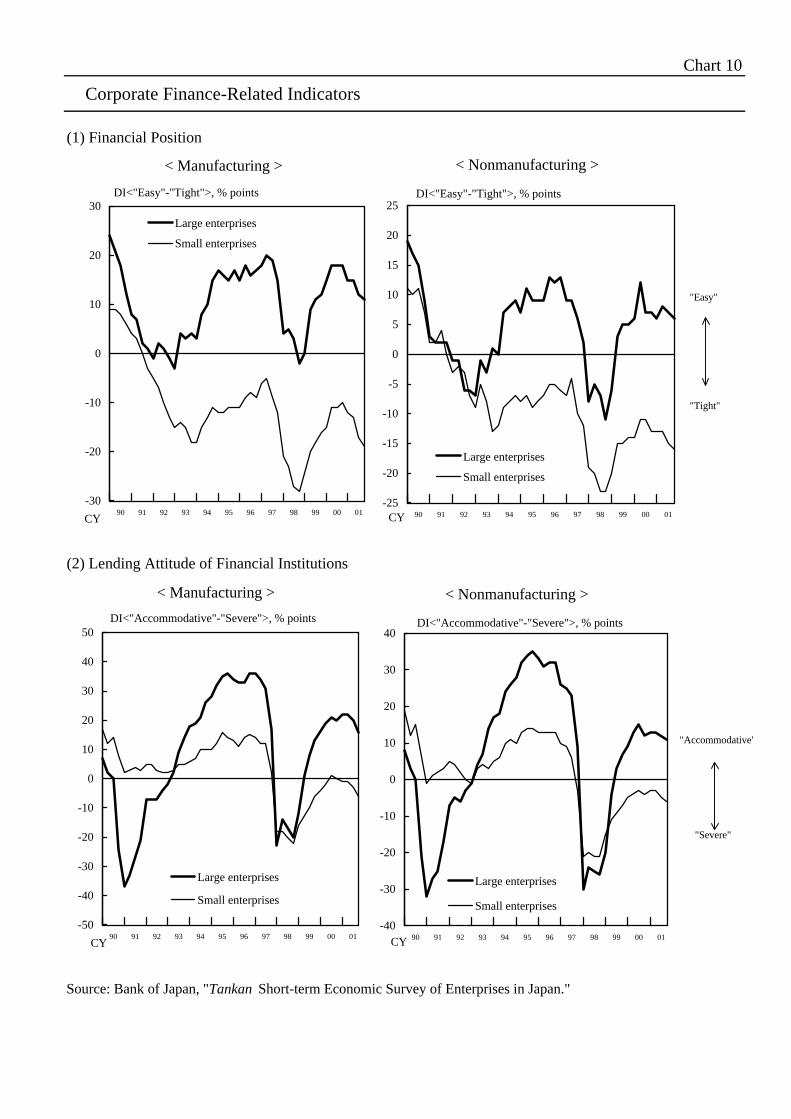
Chart 10
Corporate Finance-Related Indicators
(1) Financial Position
(2) Lending Attitude of Financial Institutions
Source: Bank of Japan, "Tankan Short-term Economic Survey of Enterprises in Japan."
-30
-20
-10
0
10
20
30
90 91 92 93 94 95 96 97 98 99 00 01
Large enterprises
Small enterprises
< Manufacturing >
CY-25
-20
-15
-10
-5
0
5
10
15
20
25
90 91 92 93 94 95 96 97 98 99 00 01
Large enterprises
Small enterprises
< Nonmanufacturing >
CY
DI<"Easy"-"Tight">, % points
-50
-40
-30
-20
-10
0
10
20
30
40
50
90 91 92 93 94 95 96 97 98 99 00 01
Large enterprises
Small enterprises
< Manufacturing >
CY
DI<"Accommodative"-"Severe">, % points
-40
-30
-20
-10
0
10
20
30
40
90 91 92 93 94 95 96 97 98 99 00 01
Large enterprises
Small enterprises
< Nonmanufacturing >
CY
DI<"Accommodative"-"Severe">, % points
"Easy"
"Tight"
"Accommodative"
"Severe"
DI<"Easy"-"Tight">, % points
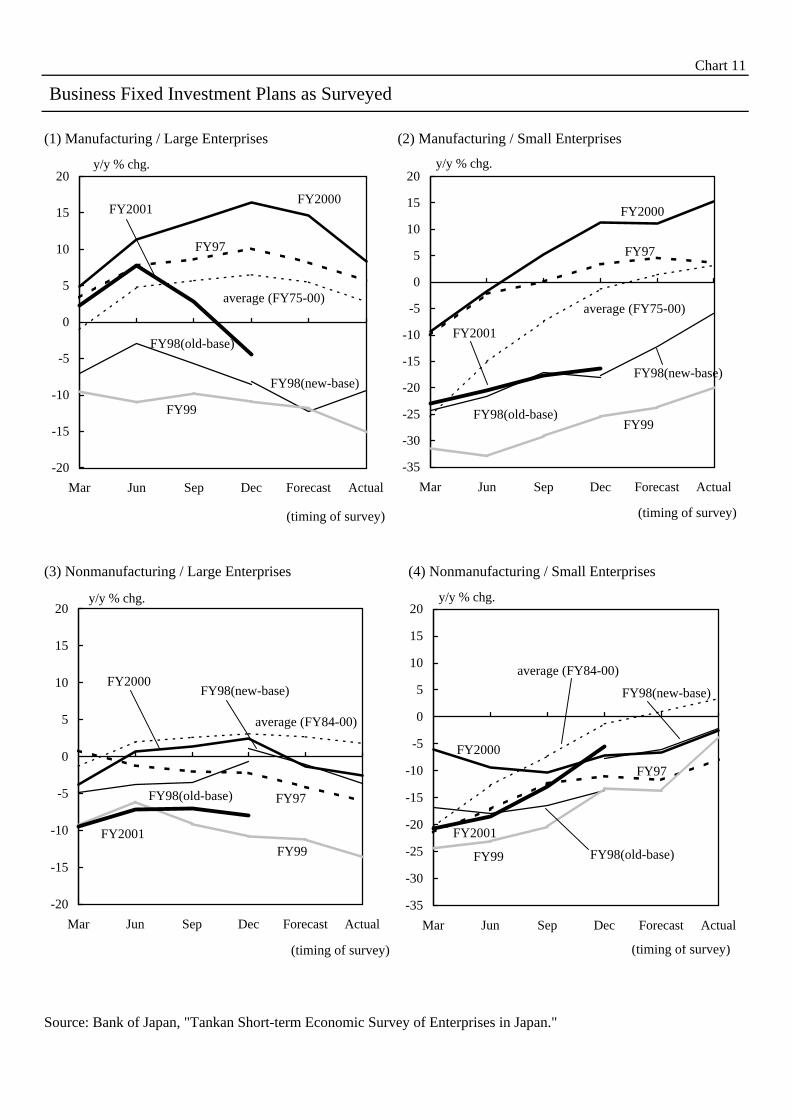
Chart 11
Business Fixed Investment Plans as Surveyed
(1) Manufacturing / Large Enterprises (2) Manufacturing / Small Enterprises
(3) Nonmanufacturing / Large Enterprises (4) Nonmanufacturing / Small Enterprises
Source: Bank of Japan, "Tankan Short-term Economic Survey of Enterprises in Japan."
(timing of survey) (timing of survey)
(timing of survey) (timing of survey)
-20
-15
-10
-5
0
5
10
15
20
Mar Jun Sep Dec Forecast Actual
y/y % chg.
average (FY75-00)
FY2000FY2001
FY97
FY98(old-base)
FY98(new-base)
FY99
-35
-30
-25
-20
-15
-10
-5
0
5
10
15
20
Mar Jun Sep Dec Forecast Actual
FY97
FY2000
FY2001
FY99
average (FY75-00)
FY98(old-base)
FY98(new-base)
y/y % chg.
-20
-15
-10
-5
0
5
10
15
20
Mar Jun Sep Dec Forecast Actual
FY2000
FY97
FY2001FY99
average (FY84-00)
y/y % chg.
FY98(old-base)
FY98(new-base)
-35
-30
-25
-20
-15
-10
-5
0
5
10
15
20
Mar Jun Sep Dec Forecast Actual
y/y % chg.
average (FY84-00)
FY2000
FY2001
FY99
FY98(new-base)
FY98(old-base)
FY97
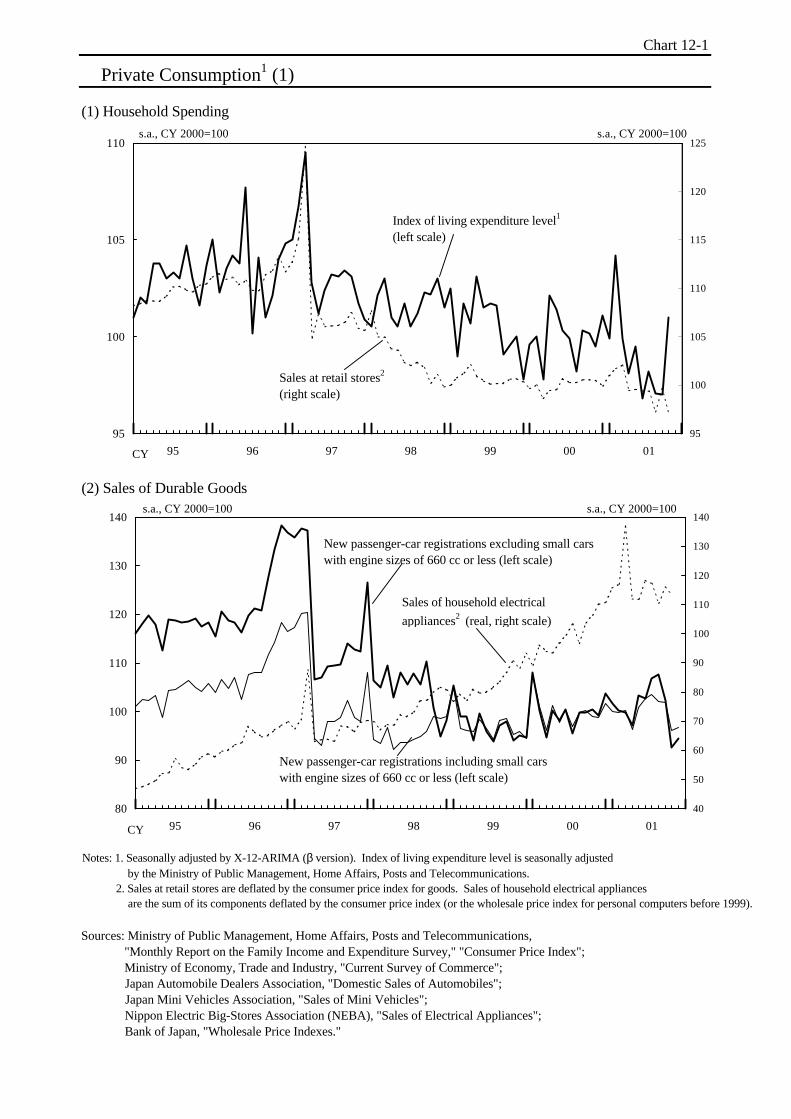
Chart 12-1
Private Consumption1 (1)
(1) Household Spending
(2) Sales of Durable Goods
Sources: Ministry of Public Management, Home Affairs, Posts and Telecommunications, "Monthly Report on the Family Income and Expenditure Survey," "Consumer Price Index"; Ministry of Economy, Trade and Industry, "Current Survey of Commerce"; Japan Automobile Dealers Association, "Domestic Sales of Automobiles"; Japan Mini Vehicles Association, "Sales of Mini Vehicles"; Nippon Electric Big-Stores Association (NEBA), "Sales of Electrical Appliances"; Bank of Japan, "Wholesale Price Indexes."
95
100
105
110
95 96 97 98 99 00 01
95
100
105
110
115
120
125s.a., CY 2000=100
CY
Index of living expenditure level1
(left scale)
Sales at retail stores2
(right scale)
s.a., CY 2000=100
80
90
100
110
120
130
140
95 96 97 98 99 00 01
40
50
60
70
80
90
100
110
120
130
140s.a., CY 2000=100 s.a., CY 2000=100
New passenger-car registrations excluding small carswith engine sizes of 660 cc or less (left scale)
New passenger-car registrations including small carswith engine sizes of 660 cc or less (left scale)
Sales of household electrical
appliances2 (real, right scale)
CY
Notes: 1. Seasonally adjusted by X-12-ARIMA (β version). Index of living expenditure level is seasonally adjusted by the Ministry of Public Management, Home Affairs, Posts and Telecommunications. 2. Sales at retail stores are deflated by the consumer price index for goods. Sales of household electrical appliances are the sum of its components deflated by the consumer price index (or the wholesale price index for personal computers before 1999).
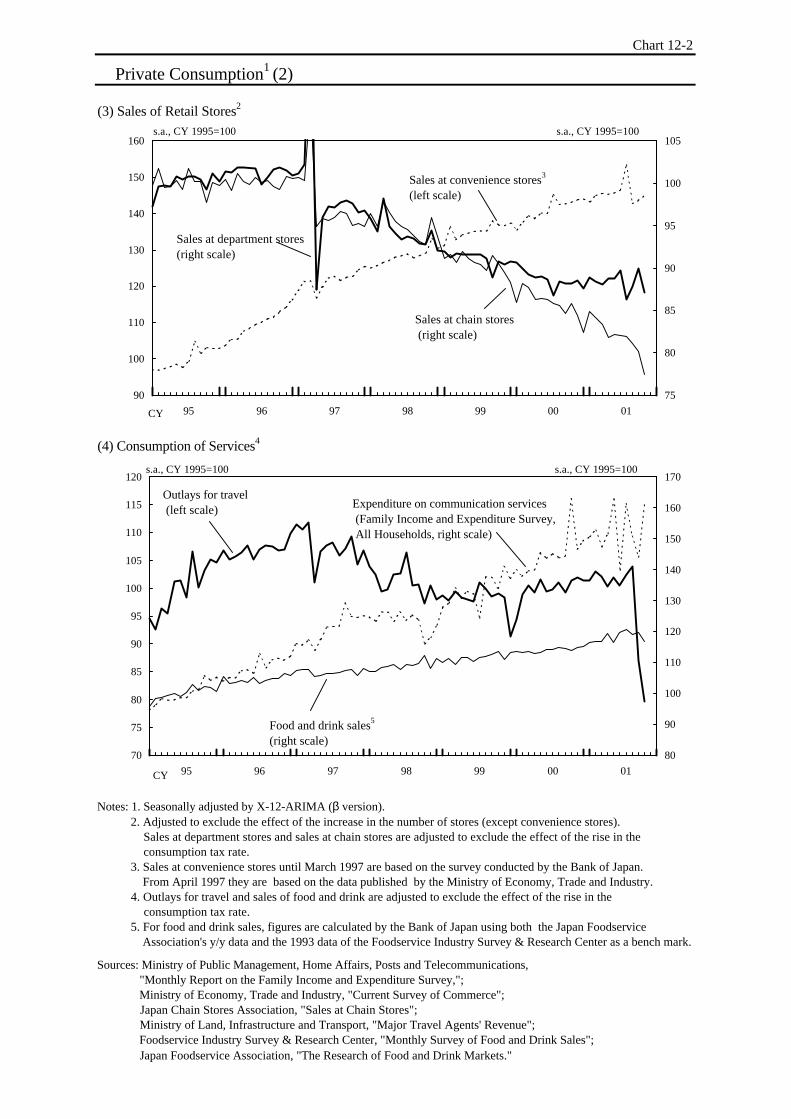
Chart 12-2
Private Consumption1 (2)
(3) Sales of Retail Stores2
(4) Consumption of Services4
Notes: 1. Seasonally adjusted by X-12-ARIMA (β version). 2. Adjusted to exclude the effect of the increase in the number of stores (except convenience stores). Sales at department stores and sales at chain stores are adjusted to exclude the effect of the rise in the consumption tax rate. 3. Sales at convenience stores until March 1997 are based on the survey conducted by the Bank of Japan. From April 1997 they are based on the data published by the Ministry of Economy, Trade and Industry. 4. Outlays for travel and sales of food and drink are adjusted to exclude the effect of the rise in the consumption tax rate. 5. For food and drink sales, figures are calculated by the Bank of Japan using both the Japan Foodservice Association's y/y data and the 1993 data of the Foodservice Industry Survey & Research Center as a bench mark.
Sources: Ministry of Public Management, Home Affairs, Posts and Telecommunications, "Monthly Report on the Family Income and Expenditure Survey,"; Ministry of Economy, Trade and Industry, "Current Survey of Commerce"; Japan Chain Stores Association, "Sales at Chain Stores"; Ministry of Land, Infrastructure and Transport, "Major Travel Agents' Revenue"; Foodservice Industry Survey & Research Center, "Monthly Survey of Food and Drink Sales"; Japan Foodservice Association, "The Research of Food and Drink Markets."
90
100
110
120
130
140
150
160
95 96 97 98 99 00 01
75
80
85
90
95
100
105s.a., CY 1995=100 s.a., CY 1995=100
CY
Sales at convenience stores3
(left scale)
Sales at chain stores (right scale)
Sales at department stores(right scale)
70
75
80
85
90
95
100
105
110
115
120
95 96 97 98 99 00 01
80
90
100
110
120
130
140
150
160
170s.a., CY 1995=100
CY
Food and drink sales5
(right scale)
Outlays for travel (left scale) Expenditure on communication services
(Family Income and Expenditure Survey, All Households, right scale)
s.a., CY 1995=100
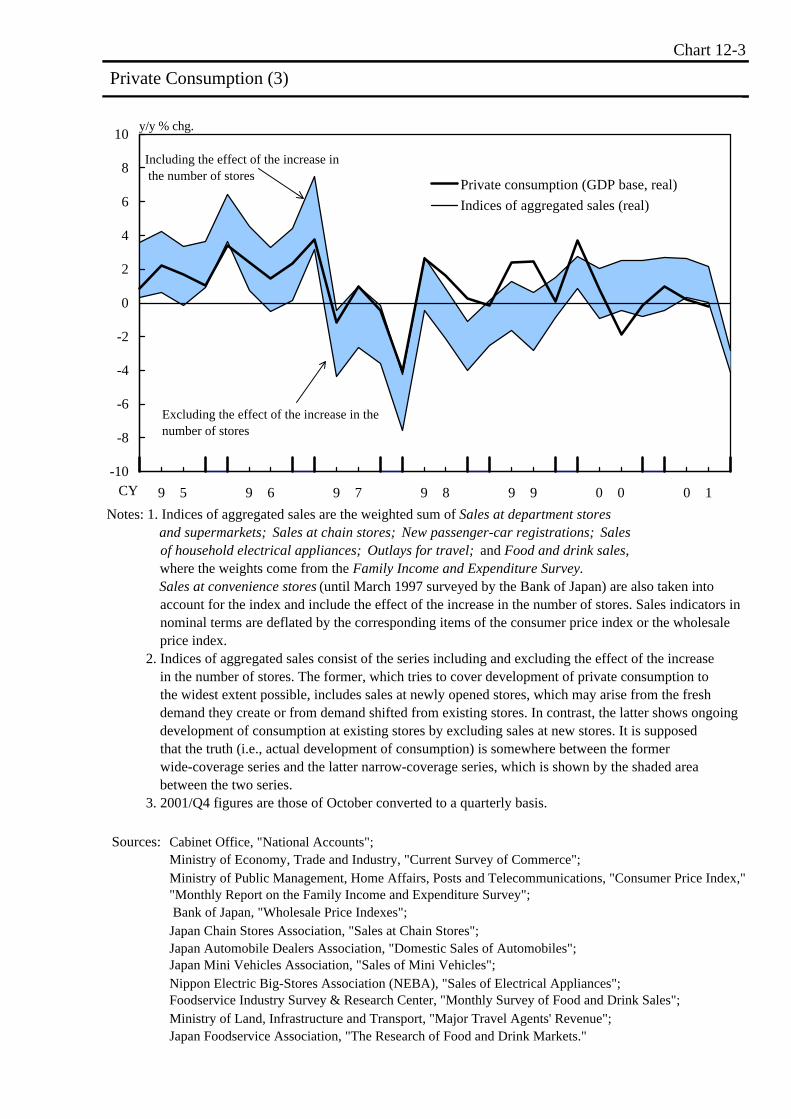
Chart 12-3
Sources: Cabinet Office, "National Accounts";Ministry of Economy, Trade and Industry, "Current Survey of Commerce"; Ministry of Public Management, Home Affairs, Posts and Telecommunications, "Consumer Price Index,""Monthly Report on the Family Income and Expenditure Survey"; Bank of Japan, "Wholesale Price Indexes";Japan Chain Stores Association, "Sales at Chain Stores"; Japan Automobile Dealers Association, "Domestic Sales of Automobiles";Japan Mini Vehicles Association, "Sales of Mini Vehicles";Nippon Electric Big-Stores Association (NEBA), "Sales of Electrical Appliances";Foodservice Industry Survey & Research Center, "Monthly Survey of Food and Drink Sales";Ministry of Land, Infrastructure and Transport, "Major Travel Agents' Revenue";Japan Foodservice Association, "The Research of Food and Drink Markets."
Private Consumption (3)
-10
-8
-6
-4
-2
0
2
4
6
8
10
9 5 9 6 9 7 9 8 9 9 0 0 0 1
Private consumption (GDP base, real)
Indices of aggregated sales (real)
y/y % chg.
Excluding the effect of the increase in thenumber of stores
CY
Including the effect of the increase in the number of stores
Notes: 1. Indices of aggregated sales are the weighted sum of Sales at department stores and supermarkets; Sales at chain stores; New passenger-car registrations; Sales of household electrical appliances; Outlays for travel; and Food and drink sales, where the weights come from the Family Income and Expenditure Survey. Sales at convenience stores(until March 1997 surveyed by the Bank of Japan) are also taken into account for the index and include the effect of the increase in the number of stores. Sales indicators in nominal terms are deflated by the corresponding items of the consumer price index or the wholesale price index. 2. Indices of aggregated sales consist of the series including and excluding the effect of the increase in the number of stores. The former, which tries to cover development of private consumption to the widest extent possible, includes sales at newly opened stores, which may arise from the fresh demand they create or from demand shifted from existing stores. In contrast, the latter shows ongoing development of consumption at existing stores by excluding sales at new stores. It is supposed that the truth (i.e., actual development of consumption) is somewhere between the former wide-coverage series and the latter narrow-coverage series, which is shown by the shaded area between the two series. 3. 2001/Q4 figures are those of October converted to a quarterly basis.
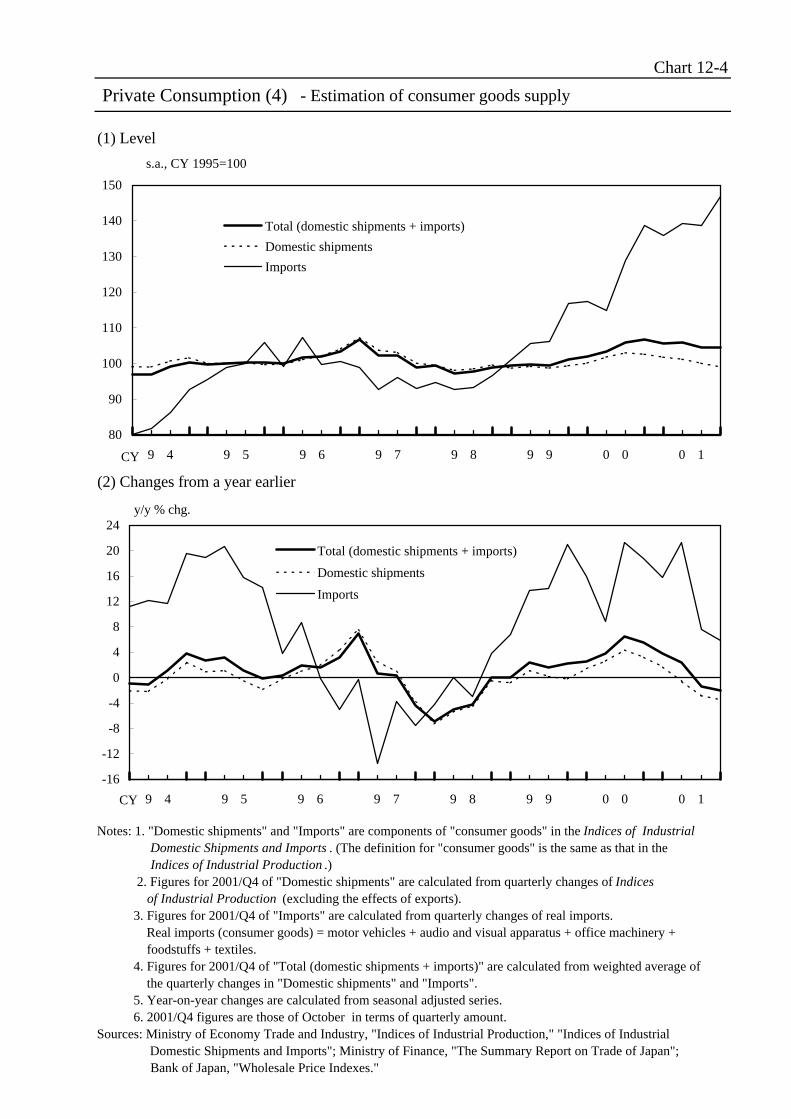
Chart 12-4
Private Consumption (4) - Estimation of consumer goods supply
(1) Level
(2) Changes from a year earlier
80
90
100
110
120
130
140
150
9 4 9 5 9 6 9 7 9 8 9 9 0 0 0 1
Total (domestic shipments + imports)
Domestic shipments
Imports
CY
s.a., CY 1995=100
-16
-12
-8
-4
0
4
8
12
16
20
24
9 4 9 5 9 6 9 7 9 8 9 9 0 0 0 1
Total (domestic shipments + imports)
Domestic shipments
Imports
y/y % chg.
CY
Notes: 1. "Domestic shipments" and "Imports" are components of "consumer goods" in the Indices of Industrial Domestic Shipments and Imports. (The definition for "consumer goods" is the same as that in the Indices of Industrial Production.) 2. Figures for 2001/Q4 of "Domestic shipments" are calculated from quarterly changes of Indices of Industrial Production (excluding the effects of exports). 3. Figures for 2001/Q4 of "Imports" are calculated from quarterly changes of real imports. Real imports (consumer goods) = motor vehicles + audio and visual apparatus + office machinery + foodstuffs + textiles. 4. Figures for 2001/Q4 of "Total (domestic shipments + imports)" are calculated from weighted average of the quarterly changes in "Domestic shipments" and "Imports". 5. Year-on-year changes are calculated from seasonal adjusted series. 6. 2001/Q4 figures are those of October in terms of quarterly amount.Sources: Ministry of Economy Trade and Industry, "Indices of Industrial Production," "Indices of Industrial Domestic Shipments and Imports"; Ministry of Finance, "The Summary Report on Trade of Japan"; Bank of Japan, "Wholesale Price Indexes."
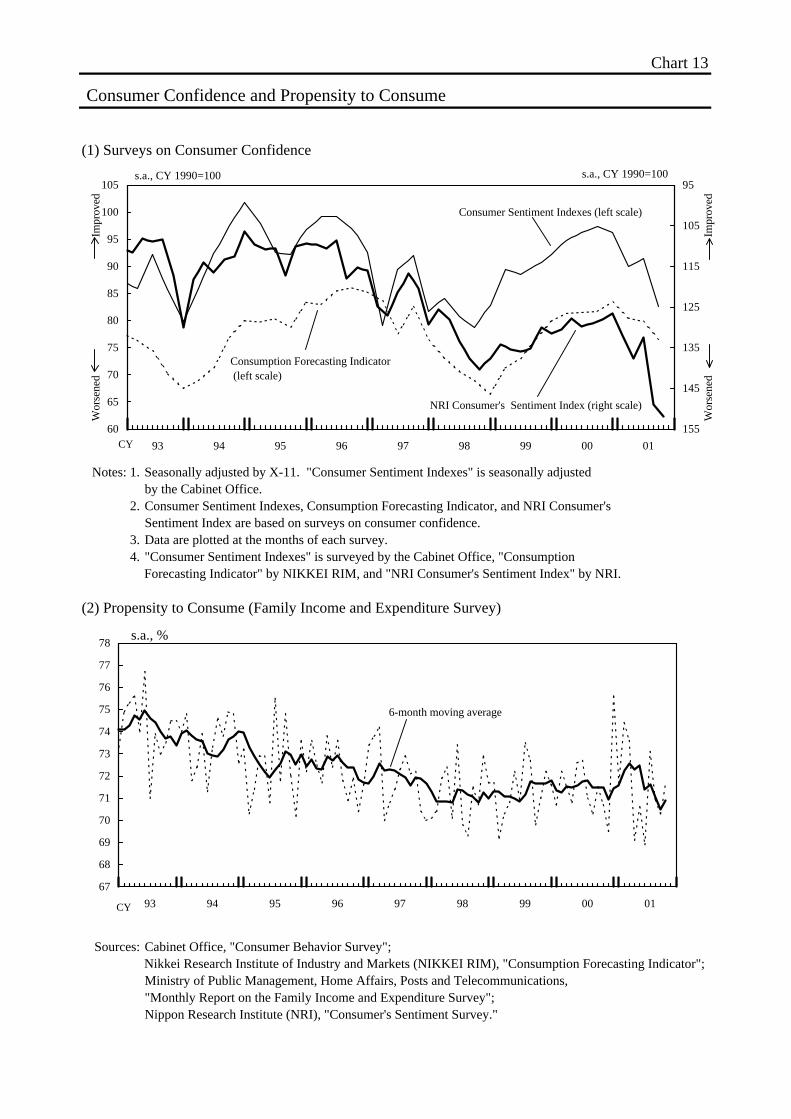
Chart 13
Consumer Confidence and Propensity to Consume
(1) Surveys on Consumer Confidence
Notes: 1. Seasonally adjusted by X-11. "Consumer Sentiment Indexes" is seasonally adjusted by the Cabinet Office.
2. Consumer Sentiment Indexes, Consumption Forecasting Indicator, and NRI Consumer's Sentiment Index are based on surveys on consumer confidence.
3. Data are plotted at the months of each survey.4. "Consumer Sentiment Indexes" is surveyed by the Cabinet Office, "Consumption
Forecasting Indicator" by NIKKEI RIM, and "NRI Consumer's Sentiment Index" by NRI.
(2) Propensity to Consume (Family Income and Expenditure Survey)
Sources: Cabinet Office, "Consumer Behavior Survey"; Nikkei Research Institute of Industry and Markets (NIKKEI RIM), "Consumption Forecasting Indicator";
Ministry of Public Management, Home Affairs, Posts and Telecommunications, "Monthly Report on the Family Income and Expenditure Survey";Nippon Research Institute (NRI), "Consumer's Sentiment Survey."
67
68
69
70
71
72
73
74
75
76
77
78
93 94 95 96 97 98 99 00 01
s.a., %
6-month moving average
60
65
70
75
80
85
90
95
100
105
93 94 95 96 97 98 99 00 01
95
105
115
125
135
145
155CY
Impr
oved
Impr
oved
Wor
sene
d
Wor
sene
d
Consumer Sentiment Indexes (left scale)
Consumption Forecasting Indicator (left scale)
s.a., CY 1990=100 s.a., CY 1990=100
NRI Consumer's Sentiment Index (right scale)
CY
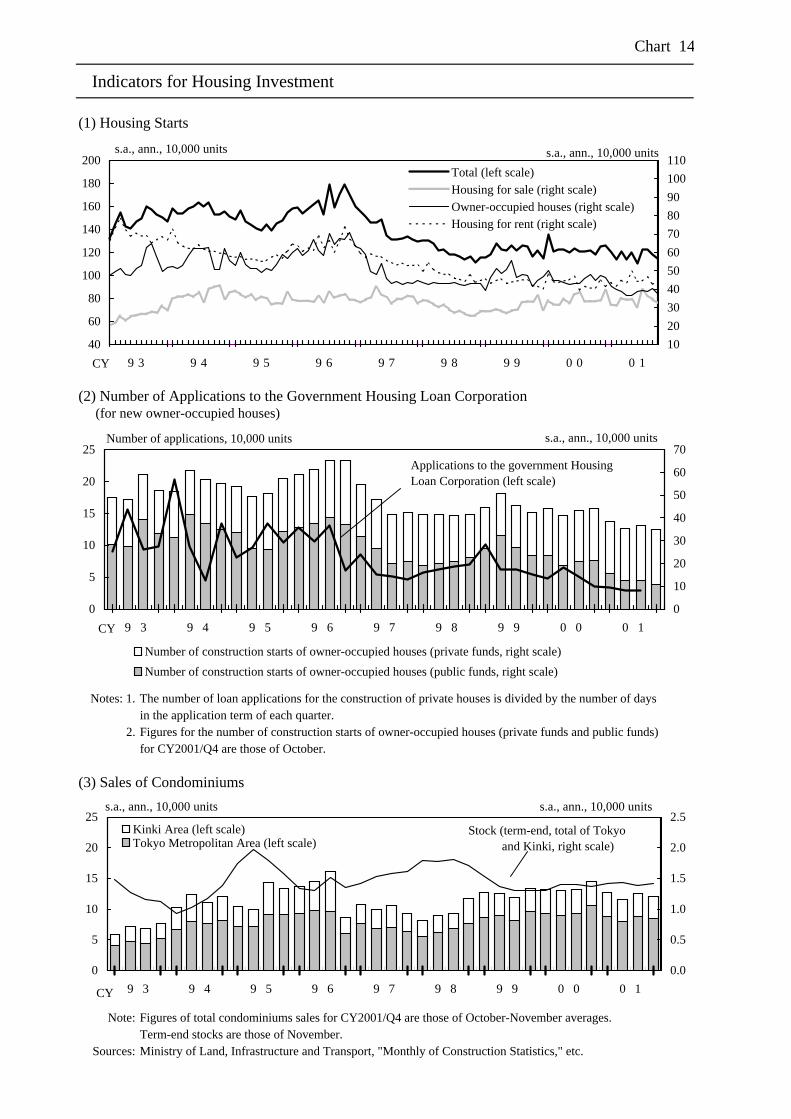
Chart 14
Indicators for Housing Investment
(1) Housing Starts
(2) Number of Applications to the Government Housing Loan Corporation (for new owner-occupied houses)
Notes: 1. The number of loan applications for the construction of private houses is divided by the number of daysin the application term of each quarter.
2. Figures for the number of construction starts of owner-occupied houses (private funds and public funds)for CY2001/Q4 are those of October.
(3) Sales of Condominiums
Note: Figures of total condominiums sales for CY2001/Q4 are those of October-November averages.Term-end stocks are those of November.
Sources: Ministry of Land, Infrastructure and Transport, "Monthly of Construction Statistics," etc.
40
60
80
100
120
140
160
180
200
9 3 9 4 9 5 9 6 9 7 9 8 9 9 0 0 0 1
10
20
30
40
50
60
70
80
90
100
110Total (left scale)Housing for sale (right scale)Owner-occupied houses (right scale)Housing for rent (right scale)
CY
s.a., ann., 10,000 units s.a., ann., 10,000 units
0
5
10
15
20
25
9 3 9 4 9 5 9 6 9 7 9 8 9 9 0 0 0 1
0
10
20
30
40
50
60
70
Number of construction starts of owner-occupied houses (private funds, right scale)
Number of construction starts of owner-occupied houses (public funds, right scale)
s.a., ann., 10,000 units
CY
Applications to the government HousingLoan Corporation (left scale)
Number of applications, 10,000 units
0
5
10
15
20
25
9 3 9 4 9 5 9 6 9 7 9 8 9 9 0 0 0 1
0.0
0.5
1.0
1.5
2.0
2.5Kinki Area (left scale)Tokyo Metropolitan Area (left scale)
s.a., ann., 10,000 units s.a., ann., 10,000 units
CY
Stock (term-end, total of Tokyo and Kinki, right scale)
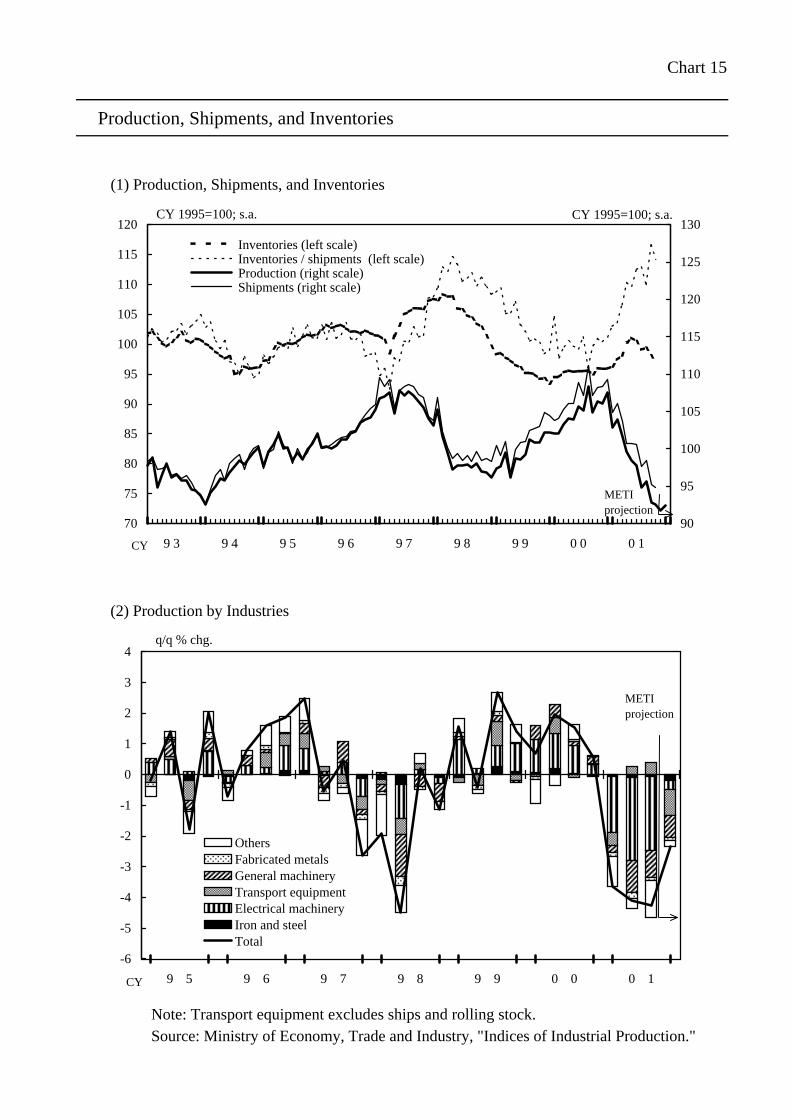
Chart 15
Production, Shipments, and Inventories
(1) Production, Shipments, and Inventories
(2) Production by Industries
Note: Transport equipment excludes ships and rolling stock.Source: Ministry of Economy, Trade and Industry, "Indices of Industrial Production."
-6
-5
-4
-3
-2
-1
0
1
2
3
4
9 5 9 6 9 7 9 8 9 9 0 0 0 1
OthersFabricated metalsGeneral machineryTransport equipmentElectrical machineryIron and steelTotal
METIprojection
CY
q/q % chg.
70
75
80
85
90
95
100
105
110
115
120
9 3 9 4 9 5 9 6 9 7 9 8 9 9 0 0 0 1
90
95
100
105
110
115
120
125
130
Inventories (left scale) Inventories / shipments (left scale) Production (right scale) Shipments (right scale)
METIprojection
CY
CY 1995=100; s.a. CY 1995=100; s.a.
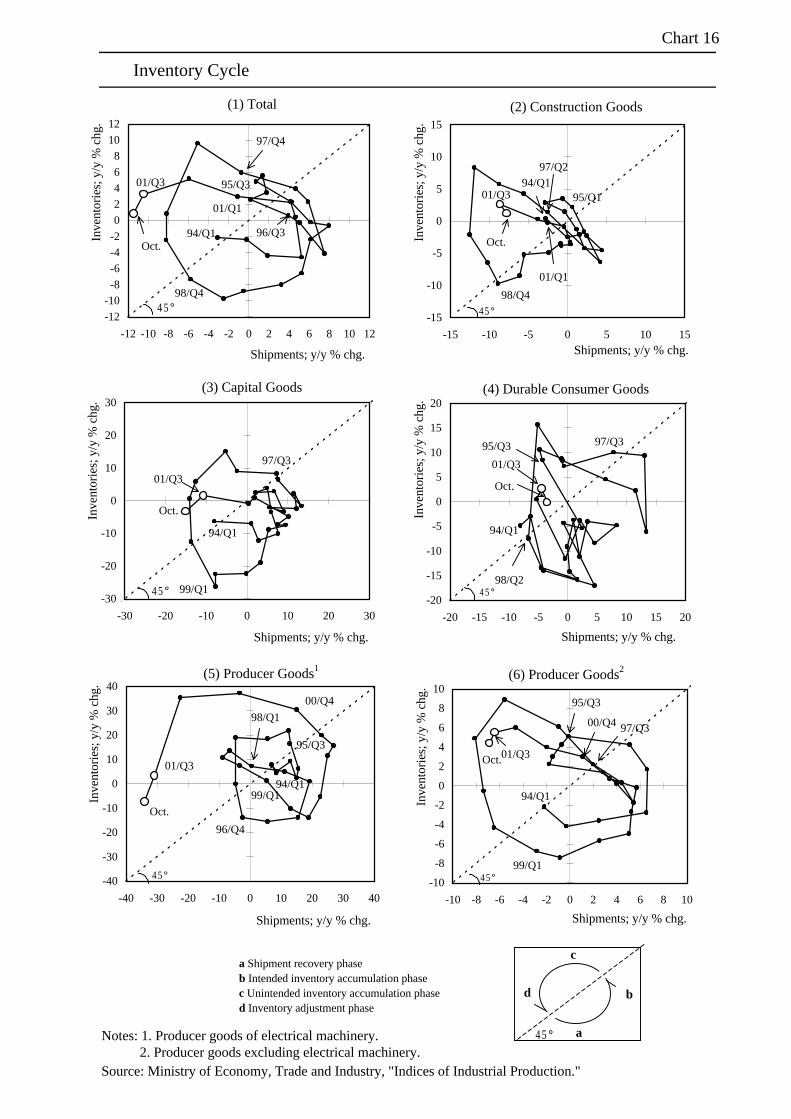
Chart 16
Inventory Cycle
Notes: 1. Producer goods of electrical machinery. 2. Producer goods excluding electrical machinery.Source: Ministry of Economy, Trade and Industry, "Indices of Industrial Production."
-20
-15
-10
-5
0
5
10
15
20
-20 -15 -10 -5 0 5 10 15 20
(4) Durable Consumer Goods
Shipments; y/y % chg.
Inve
ntor
ies;
y/y
% c
hg.
95/Q3
98/Q2
94/Q1
97/Q3
4 5°
01/Q3
Oct.
-12
-10-8
-6
-4-2
0
24
6
810
12
-12 -10 -8 -6 -4 -2 0 2 4 6 8 10 12
(1) Total
Shipments; y/y % chg.
Inve
ntor
ies;
y/y
% c
hg.
94/Q1
95/Q3
96/Q3
97/Q4
98/Q44 5°
01/Q1
Oct.
01/Q3
a Shipment recovery phaseb Intended inventory accumulation phasec Unintended inventory accumulation phased Inventory adjustment phase
c
d
a
b
-15
-10
-5
0
5
10
15
-15 -10 -5 0 5 10 15
(2) Construction Goods
Shipments; y/y % chg.
Inve
ntor
ies;
y/y
% c
hg.
95/Q194/Q1
97/Q2
45°98/Q4
01/Q1
Oct.
01/Q3
4 5°
-30
-20
-10
0
10
20
30
-30 -20 -10 0 10 20 30
(3) Capital Goods
Shipments; y/y % chg.
Inve
ntor
ies;
y/y
% c
hg.
94/Q1
97/Q3
99/Q14 5°
01/Q3
Oct.
-10
-8
-6
-4
-2
0
2
4
6
8
10
-10 -8 -6 -4 -2 0 2 4 6 8 10
(6) Producer Goods2
Shipments; y/y % chg.
Inve
ntor
ies;
y/y
% c
hg.
94/Q1
95/Q3
97/Q3
4 5°99/Q1
01/Q3
00/Q4
Oct.
-40
-30
-20
-10
0
10
20
30
40
-40 -30 -20 -10 0 10 20 30 40
(5) Producer Goods1
Shipments; y/y % chg.
Inve
ntor
ies;
y/y
% c
hg.
94/Q1
98/Q1
99/Q1
45°
01/Q3
00/Q4
Oct.
96/Q4
95/Q3
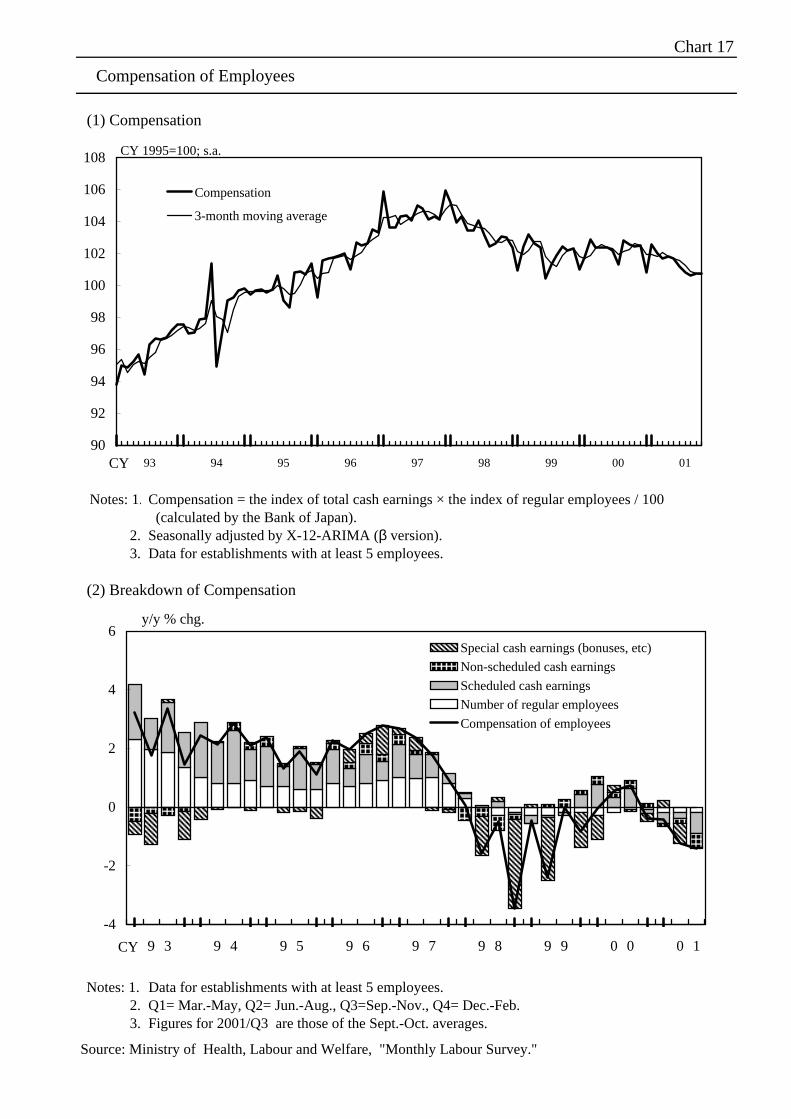
Chart 17
Compensation of Employees
(1) Compensation
Notes: 1. Compensation = the index of total cash earnings × the index of regular employees / 100 (calculated by the Bank of Japan).
2. Seasonally adjusted by X-12-ARIMA (β version). 3. Data for establishments with at least 5 employees.
(2) Breakdown of Compensation
Notes: 1. Data for establishments with at least 5 employees. 2. Q1= Mar.-May, Q2= Jun.-Aug., Q3=Sep.-Nov., Q4= Dec.-Feb. 3. Figures for 2001/Q3 are those of the Sept.-Oct. averages.
-4
-2
0
2
4
6
9 3 9 4 9 5 9 6 9 7 9 8 9 9 0 0 0 1
Special cash earnings (bonuses, etc)
Non-scheduled cash earnings
Scheduled cash earnings
Number of regular employees
Compensation of employees
y/y % chg.
CY
90
92
94
96
98
100
102
104
106
108
93 94 95 96 97 98 99 00 01
Compensation
3-month moving average
CY 1995=100; s.a.
CY
Source: Ministry of Health, Labour and Welfare, "Monthly Labour Survey."
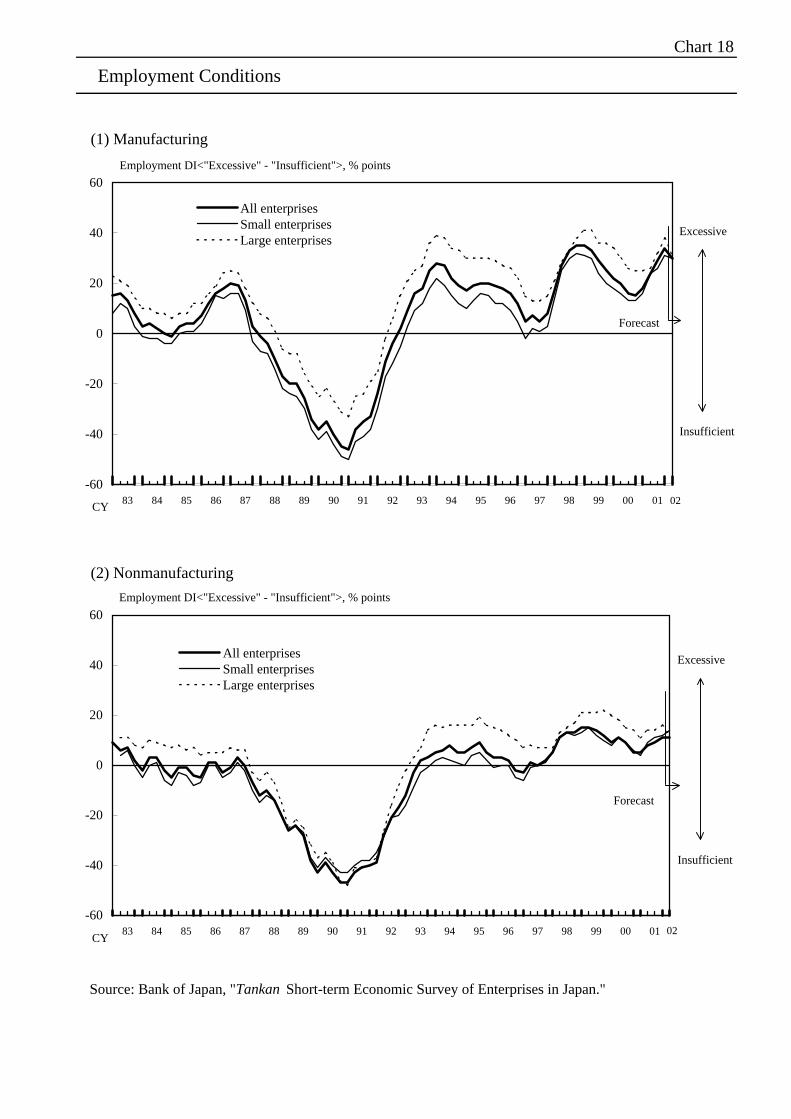
Chart 18
Employment Conditions
(1) Manufacturing
(2) Nonmanufacturing
Source: Bank of Japan, "Tankan Short-term Economic Survey of Enterprises in Japan."
-60
-40
-20
0
20
40
60
83 84 85 86 87 88 89 90 91 92 93 94 95 96 97 98 99 00 01
All enterprisesSmall enterprisesLarge enterprises
Employment DI<"Excessive" - "Insufficient">, % points
CY
Forecast
02
-60
-40
-20
0
20
40
60
83 84 85 86 87 88 89 90 91 92 93 94 95 96 97 98 99 00 01
All enterprisesSmall enterprisesLarge enterprises
Employment DI<"Excessive" - "Insufficient">, % points
CY
Forecast
02
Excessive
Insufficient
Excessive
Insufficient
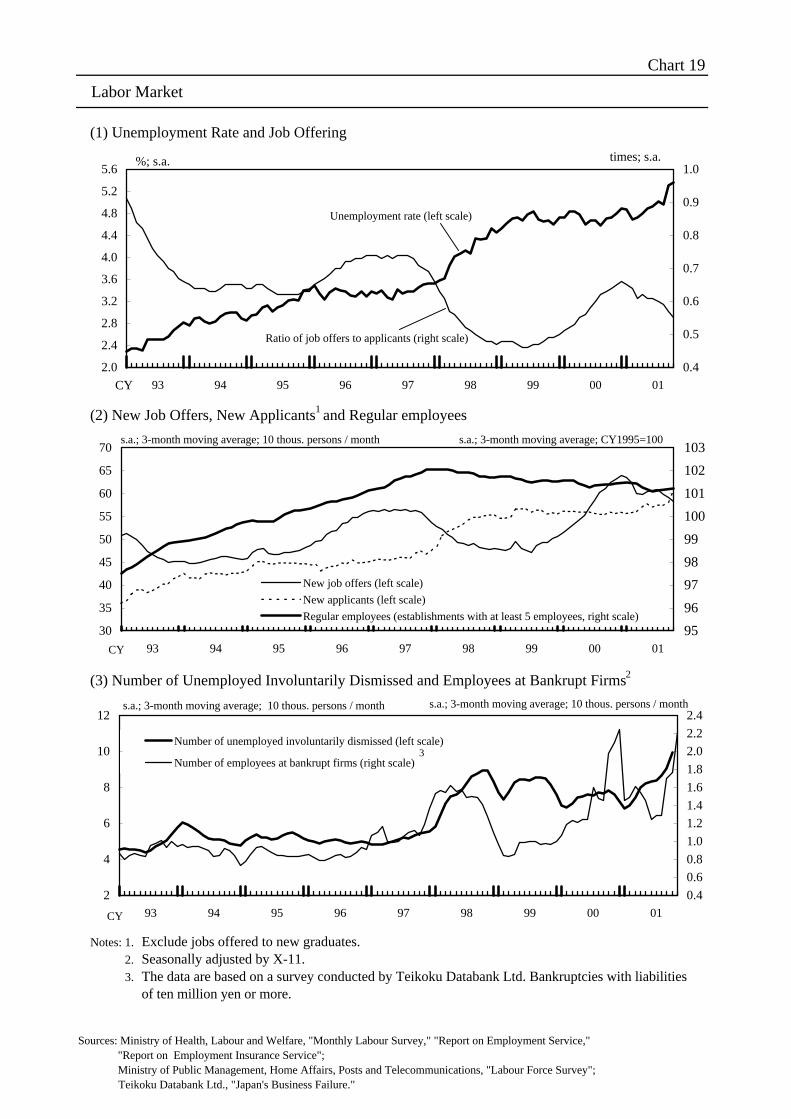
Chart 19
Labor Market
(1) Unemployment Rate and Job Offering
(2) New Job Offers, New Applicants1 and Regular employees
(3) Number of Unemployed Involuntarily Dismissed and Employees at Bankrupt Firms2
Notes: 1. Exclude jobs offered to new graduates. 2. Seasonally adjusted by X-11. 3. The data are based on a survey conducted by Teikoku Databank Ltd. Bankruptcies with liabilities
of ten million yen or more.
2.0
2.4
2.8
3.2
3.6
4.0
4.4
4.8
5.2
5.6
93 94 95 96 97 98 99 00 01
0.4
0.5
0.6
0.7
0.8
0.9
1.0%; s.a. times; s.a.
Unemployment rate (left scale)
Ratio of job offers to applicants (right scale)
CY
30
35
40
45
50
55
60
65
70
93 94 95 96 97 98 99 00 01
95
96
97
98
99
100
101
102
103
New job offers (left scale)
New applicants (left scale)
Regular employees (establishments with at least 5 employees, right scale)
CY
s.a.; 3-month moving average; 10 thous. persons / month s.a.; 3-month moving average; CY1995=100
2
4
6
8
10
12
93 94 95 96 97 98 99 00 01
0.4
0.6
0.8
1.0
1.2
1.4
1.6
1.8
2.0
2.2
2.4
Number of unemployed involuntarily dismissed (left scale)
Number of employees at bankrupt firms (right scale)
CY
s.a.; 3-month moving average; 10 thous. persons / month s.a.; 3-month moving average; 10 thous. persons / month
3
Sources: Ministry of Health, Labour and Welfare, "Monthly Labour Survey," "Report on Employment Service," "Report on Employment Insurance Service"; Ministry of Public Management, Home Affairs, Posts and Telecommunications, "Labour Force Survey"; Teikoku Databank Ltd., "Japan's Business Failure."
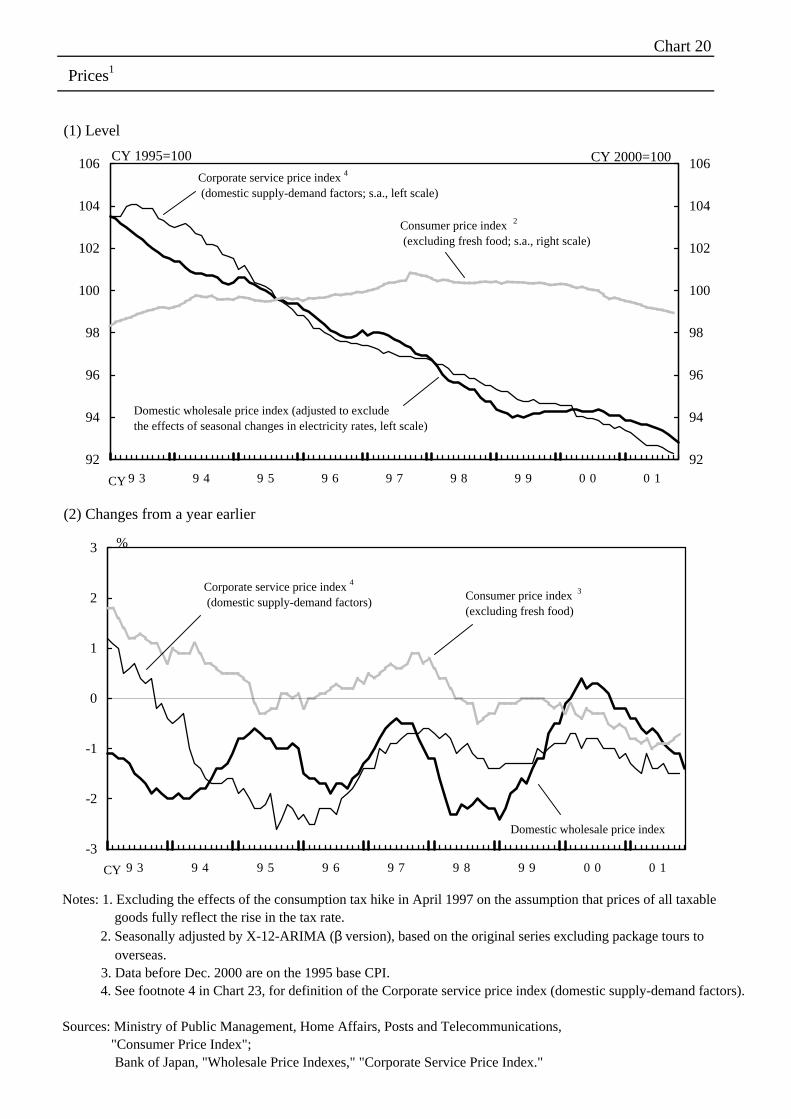
Chart 20
Prices1
(1) Level
(2) Changes from a year earlier
92
94
96
98
100
102
104
106
9 3 9 4 9 5 9 6 9 7 9 8 9 9 0 0 0 1
92
94
96
98
100
102
104
106
CY
Corporate service price index 4
(domestic supply-demand factors; s.a., left scale)
CY 1995=100
Domestic wholesale price index (adjusted to excludethe effects of seasonal changes in electricity rates, left scale)
Consumer price index 2
(excluding fresh food; s.a., right scale)
-3
-2
-1
0
1
2
3
9 3 9 4 9 5 9 6 9 7 9 8 9 9 0 0 0 1
Domestic wholesale price index
%
Corporate service price index 4
(domestic supply-demand factors) Consumer price index 3
(excluding fresh food)
CY
CY 2000=100
Notes: 1. Excluding the effects of the consumption tax hike in April 1997 on the assumption that prices of all taxable goods fully reflect the rise in the tax rate. 2. Seasonally adjusted by X-12-ARIMA (β version), based on the original series excluding package tours to overseas. 3. Data before Dec. 2000 are on the 1995 base CPI. 4. See footnote 4 in Chart 23, for definition of the Corporate service price index (domestic supply-demand factors). Sources: Ministry of Public Management, Home Affairs, Posts and Telecommunications, "Consumer Price Index"; Bank of Japan, "Wholesale Price Indexes," "Corporate Service Price Index."
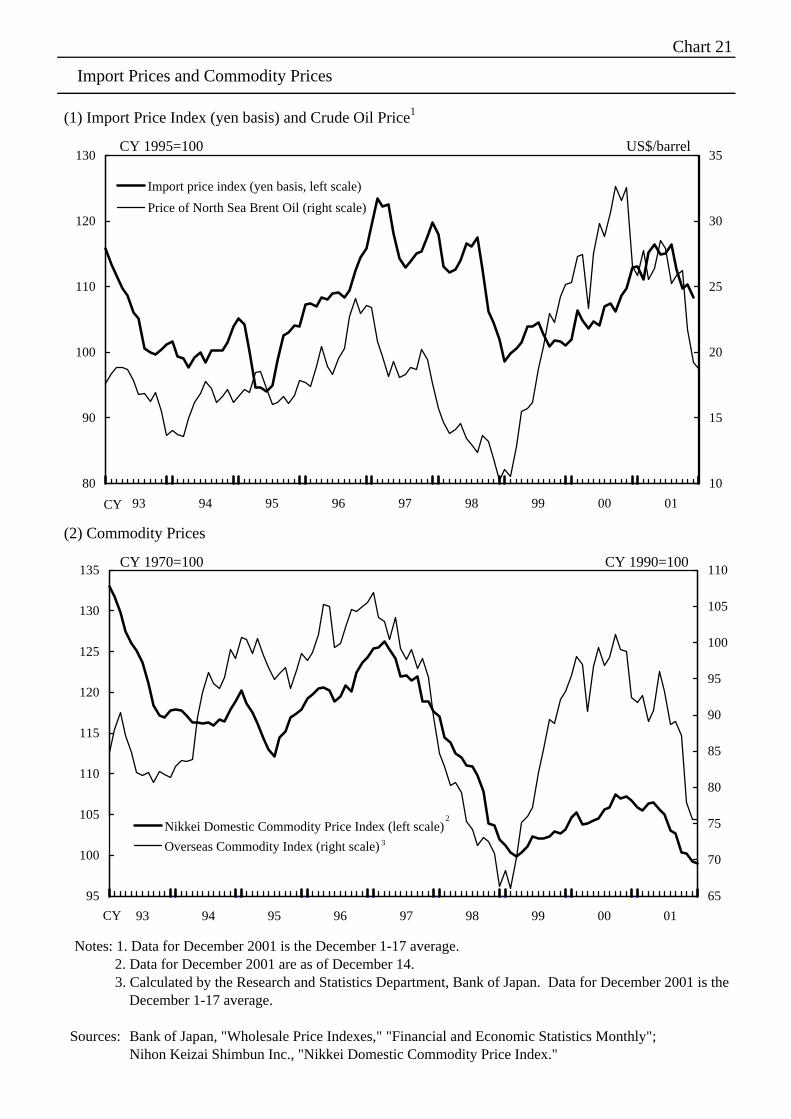
Chart 21
Import Prices and Commodity Prices
(1) Import Price Index (yen basis) and Crude Oil Price1
(2) Commodity Prices
Notes: 1. Data for December 2001 is the December 1-17 average. 2. Data for December 2001 are as of December 14. 3. Calculated by the Research and Statistics Department, Bank of Japan. Data for December 2001 is the December 1-17 average.
Sources: Bank of Japan, "Wholesale Price Indexes," "Financial and Economic Statistics Monthly"; Nihon Keizai Shimbun Inc., "Nikkei Domestic Commodity Price Index."
80
90
100
110
120
130
93 94 95 96 97 98 99 00 01
10
15
20
25
30
35
Import price index (yen basis, left scale)
Price of North Sea Brent Oil (right scale)
CY
CY 1995=100 US$/barrel
95
100
105
110
115
120
125
130
135
93 94 95 96 97 98 99 00 01
65
70
75
80
85
90
95
100
105
110
Nikkei Domestic Commodity Price Index (left scale)
Overseas Commodity Index (right scale)
CY
CY 1970=100 CY 1990=100
2
3
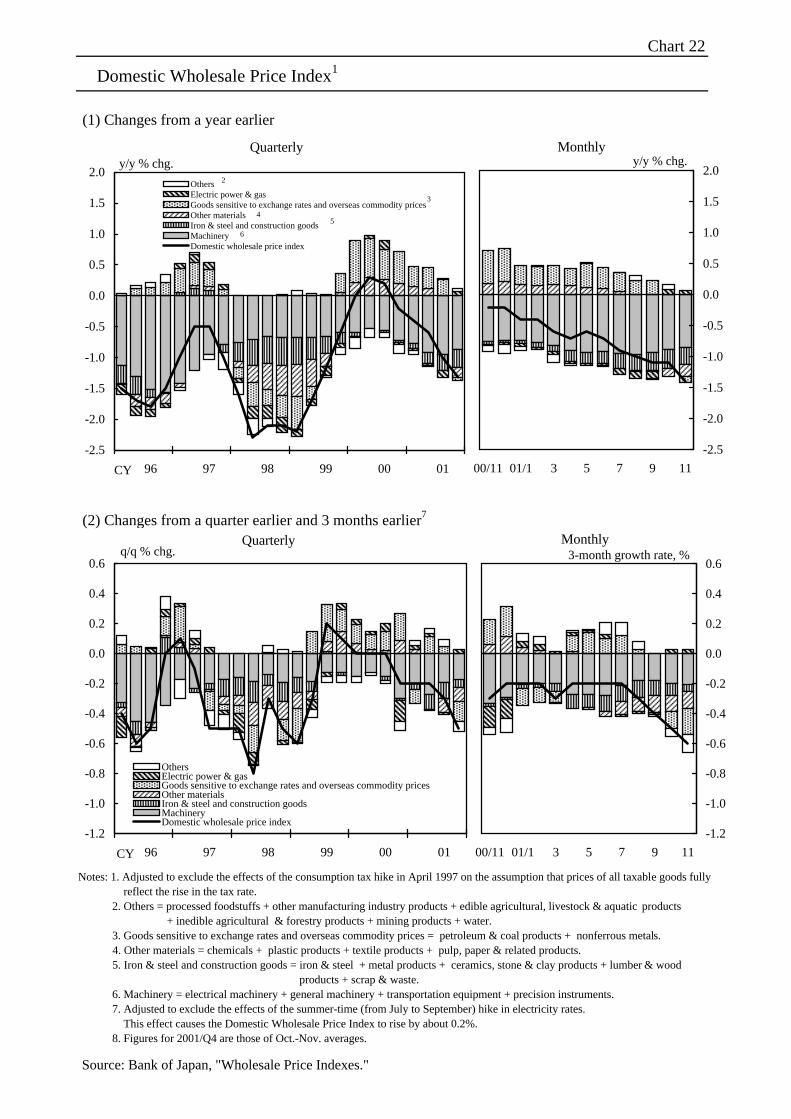
Chart 22
Domestic Wholesale Price Index1
(1) Changes from a year earlier
(2) Changes from a quarter earlier and 3 months earlier7
Source: Bank of Japan, "Wholesale Price Indexes."
-1.2
-1.0
-0.8
-0.6
-0.4
-0.2
0.0
0.2
0.4
0.6
96 97 98 99 00 01
OthersElectric power & gasGoods sensitive to exchange rates and overseas commodity pricesOther materialsIron & steel and construction goodsMachineryDomestic wholesale price index
CY
Notes: 1. Adjusted to exclude the effects of the consumption tax hike in April 1997 on the assumption that prices of all taxable goods fully reflect the rise in the tax rate. 2. Others = processed foodstuffs + other manufacturing industry products + edible agricultural, livestock & aquatic products + inedible agricultural & forestry products + mining products + water. 3. Goods sensitive to exchange rates and overseas commodity prices = petroleum & coal products + nonferrous metals. 4. Other materials = chemicals + plastic products + textile products + pulp, paper & related products. 5. Iron & steel and construction goods = iron & steel + metal products + ceramics, stone & clay products + lumber & wood products + scrap & waste. 6. Machinery = electrical machinery + general machinery + transportation equipment + precision instruments. 7. Adjusted to exclude the effects of the summer-time (from July to September) hike in electricity rates. This effect causes the Domestic Wholesale Price Index to rise by about 0.2%. 8. Figures for 2001/Q4 are those of Oct.-Nov. averages.
Quarterly
-2.5
-2.0
-1.5
-1.0
-0.5
0.0
0.5
1.0
1.5
2.0
96 97 98 99 00 01
OthersElectric power & gasGoods sensitive to exchange rates and overseas commodity pricesOther materialsIron & steel and construction goods MachineryDomestic wholesale price index
2
y/y % chg.
45
3
6
CY
-2.5
-2.0
-1.5
-1.0
-0.5
0.0
0.5
1.0
1.5
2.0
00/11 01/1 3 5 7 9 11
y/y % chg.Quarterly Monthly
-1.2
-1.0
-0.8
-0.6
-0.4
-0.2
0.0
0.2
0.4
0.6
00/11 01/1 3 5 7 9 11
3-month growth rate, %Monthly
q/q % chg.
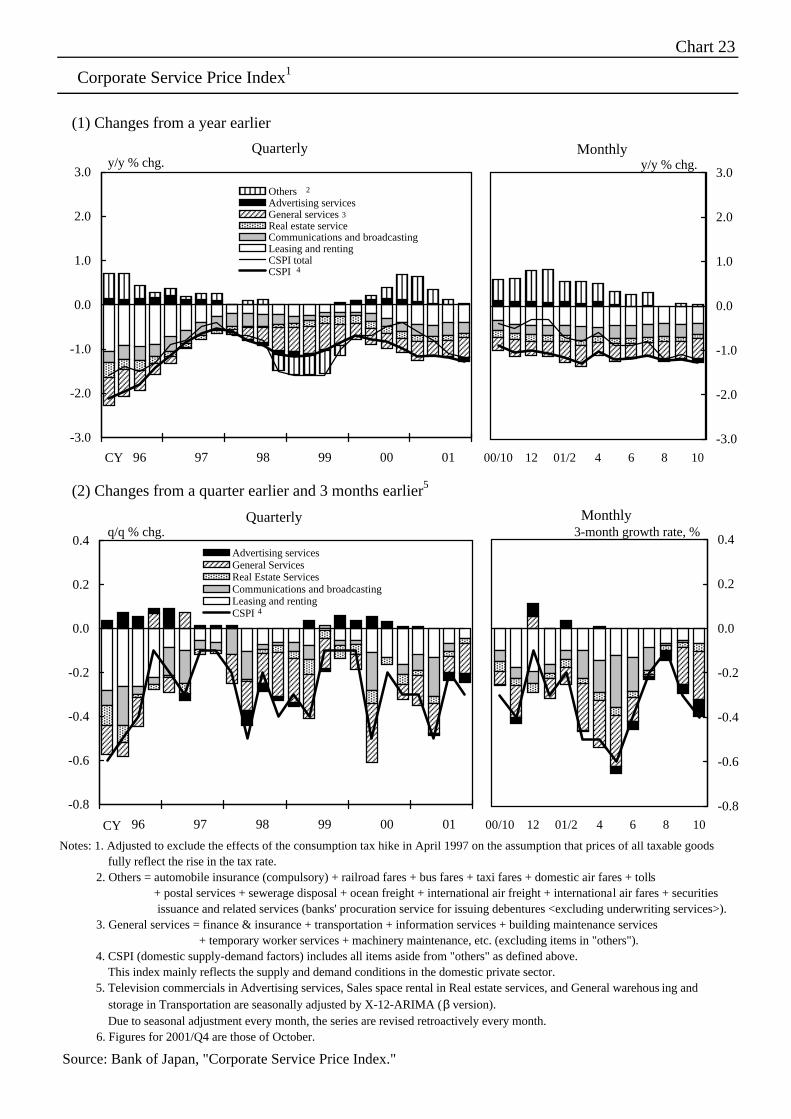
Chart 23
Corporate Service Price Index1
(1) Changes from a year earlier
(2) Changes from a quarter earlier and 3 months earlier5
Source: Bank of Japan, "Corporate Service Price Index."
Notes: 1. Adjusted to exclude the effects of the consumption tax hike in April 1997 on the assumption that prices of all taxable goods fully reflect the rise in the tax rate. 2. Others = automobile insurance (compulsory) + railroad fares + bus fares + taxi fares + domestic air fares + tolls + postal services + sewerage disposal + ocean freight + international air freight + international air fares + securities issuance and related services (banks' procuration service for issuing debentures <excluding underwriting services>). 3. General services = finance & insurance + transportation + information services + building maintenance services + temporary worker services + machinery maintenance, etc. (excluding items in "others"). 4. CSPI (domestic supply-demand factors) includes all items aside from "others" as defined above. This index mainly reflects the supply and demand conditions in the domestic private sector. 5. Television commercials in Advertising services, Sales space rental in Real estate services, and General warehousing and storage in Transportation are seasonally adjusted by X-12-ARIMA (β version). Due to seasonal adjustment every month, the series are revised retroactively every month. 6. Figures for 2001/Q4 are those of October.
-3.0
-2.0
-1.0
0.0
1.0
2.0
3.0
96 97 98 99 00 01
OthersAdvertising servicesGeneral services Real estate serviceCommunications and broadcastingLeasing and rentingCSPI totalCSPI
y/y % chg.
3
2
4
-0.8
-0.6
-0.4
-0.2
0.0
0.2
0.4
00/10 12 01/2 4 6 8 10
3-month growth rate, %
-3.0
-2.0
-1.0
0.0
1.0
2.0
3.0
00/10 12 01/2 4 6 8 10
y/y % chg.
Monthly
-0.8
-0.6
-0.4
-0.2
0.0
0.2
0.4
96 97 98 99 00 01
Advertising servicesGeneral ServicesReal Estate ServicesCommunications and broadcastingLeasing and rentingCSPI
q/q % chg.Quarterly
Quarterly Monthly
4
CY
CY
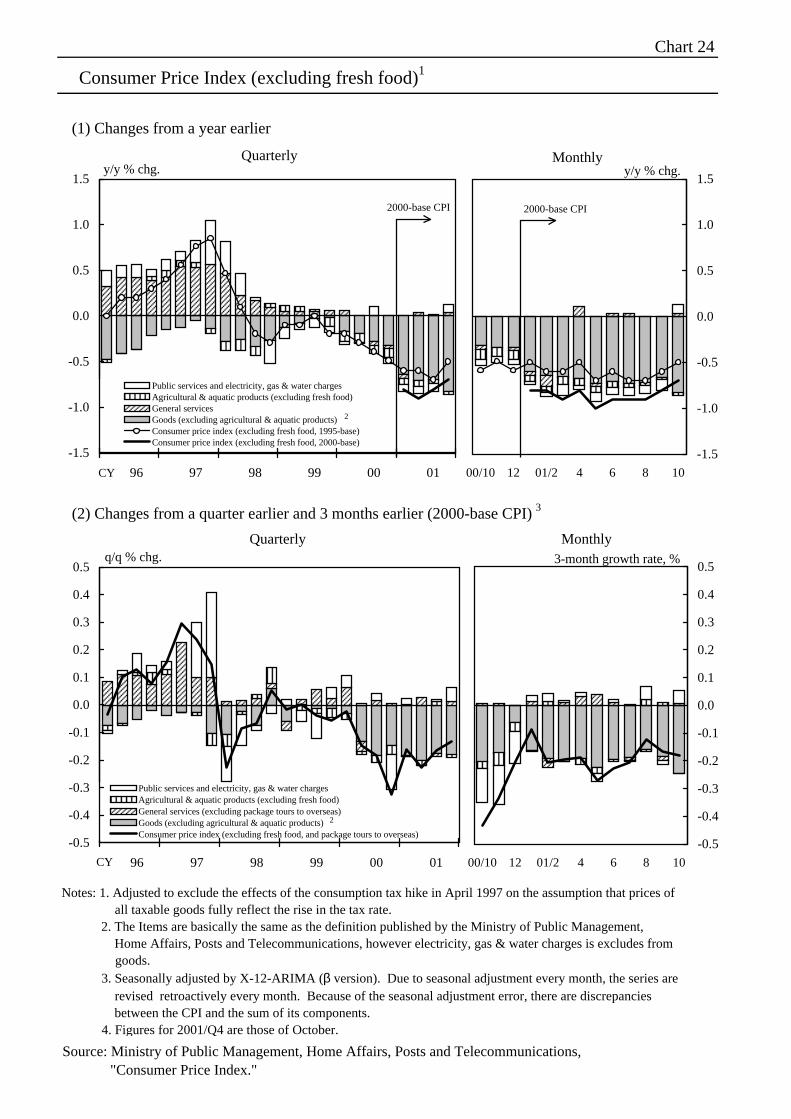
Chart 24
Consumer Price Index (excluding fresh food)1
(1) Changes from a year earlier
(2) Changes from a quarter earlier and 3 months earlier (2000-base CPI) 3
-1.5
-1.0
-0.5
0.0
0.5
1.0
1.5
96 97 98 99 00 01
Public services and electricity, gas & water chargesAgricultural & aquatic products (excluding fresh food)General servicesGoods (excluding agricultural & aquatic products)Consumer price index (excluding fresh food, 1995-base)Consumer price index (excluding fresh food, 2000-base)
CY
y/y % chg.
-1.5
-1.0
-0.5
0.0
0.5
1.0
1.5
00/10 12 01/2 4 6 8 10
y/y % chg.
Source: Ministry of Public Management, Home Affairs, Posts and Telecommunications, "Consumer Price Index."
-0.5
-0.4
-0.3
-0.2
-0.1
0.0
0.1
0.2
0.3
0.4
0.5
96 97 98 99 00 01
Public services and electricity, gas & water chargesAgricultural & aquatic products (excluding fresh food)General services (excluding package tours to overseas)Goods (excluding agricultural & aquatic products)Consumer price index (excluding fresh food, and package tours to overseas)
CY
q/q % chg.
-0.5
-0.4
-0.3
-0.2
-0.1
0.0
0.1
0.2
0.3
0.4
0.5
00/10 12 01/2 4 6 8 10
3-month growth rate, %
Quarterly Monthly
2000-base CPI
Quarterly
2
2
2000-base CPI
Notes: 1. Adjusted to exclude the effects of the consumption tax hike in April 1997 on the assumption that prices of all taxable goods fully reflect the rise in the tax rate. 2. The Items are basically the same as the definition published by the Ministry of Public Management, Home Affairs, Posts and Telecommunications, however electricity, gas & water charges is excludes from goods. 3. Seasonally adjusted by X-12-ARIMA (β version). Due to seasonal adjustment every month, the series are revised retroactively every month. Because of the seasonal adjustment error, there are discrepancies between the CPI and the sum of its components. 4. Figures for 2001/Q4 are those of October.
Monthly
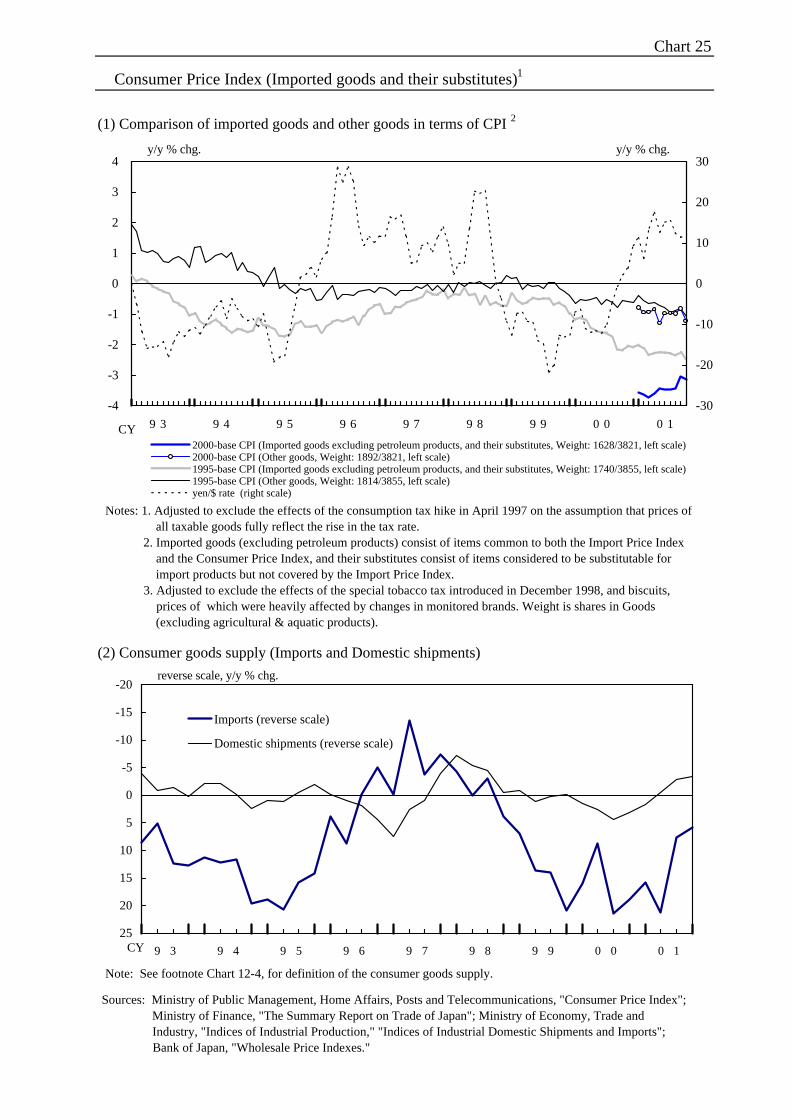
Chart 25
(1) Comparison of imported goods and other goods in terms of CPI 2
(2) Consumer goods supply (Imports and Domestic shipments)
Consumer Price Index (Imported goods and their substitutes)1
Sources: Ministry of Public Management, Home Affairs, Posts and Telecommunications, "Consumer Price Index"; Ministry of Finance, "The Summary Report on Trade of Japan"; Ministry of Economy, Trade and Industry, "Indices of Industrial Production," "Indices of Industrial Domestic Shipments and Imports"; Bank of Japan, "Wholesale Price Indexes."
Notes: 1. Adjusted to exclude the effects of the consumption tax hike in April 1997 on the assumption that prices of all taxable goods fully reflect the rise in the tax rate. 2. Imported goods (excluding petroleum products) consist of items common to both the Import Price Index and the Consumer Price Index, and their substitutes consist of items considered to be substitutable for import products but not covered by the Import Price Index. 3. Adjusted to exclude the effects of the special tobacco tax introduced in December 1998, and biscuits, prices of which were heavily affected by changes in monitored brands. Weight is shares in Goods (excluding agricultural & aquatic products).
-20
-15
-10
-5
0
5
10
15
20
25
9 3 9 4 9 5 9 6 9 7 9 8 9 9 0 0 0 1
Imports (reverse scale)
Domestic shipments (reverse scale)
reverse scale, y/y % chg.
CY
Note: See footnote Chart 12-4, for definition of the consumer goods supply.
-4
-3
-2
-1
0
1
2
3
4
9 3 9 4 9 5 9 6 9 7 9 8 9 9 0 0 0 1
-30
-20
-10
0
10
20
30
2000-base CPI (Imported goods excluding petroleum products, and their substitutes, Weight: 1628/3821, left scale)2000-base CPI (Other goods, Weight: 1892/3821, left scale)1995-base CPI (Imported goods excluding petroleum products, and their substitutes, Weight: 1740/3855, left scale)1995-base CPI (Other goods, Weight: 1814/3855, left scale)yen/$ rate (right scale)
y/y % chg. y/y % chg.
CY
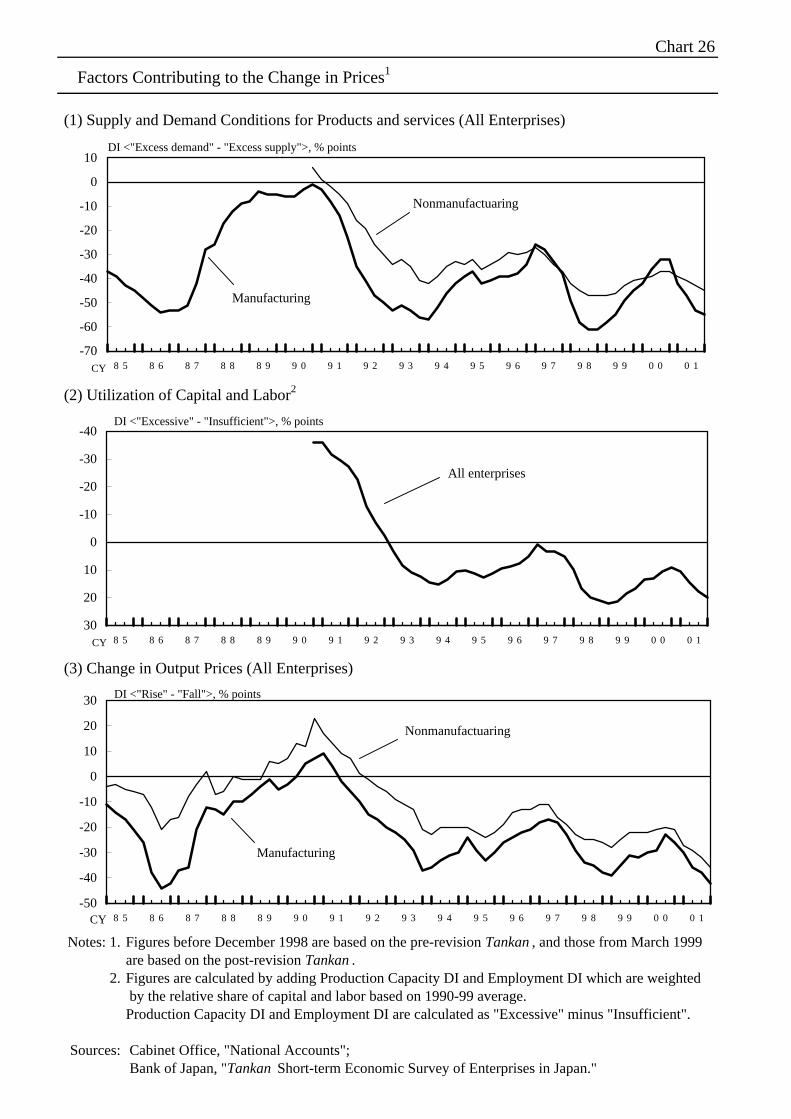
Chart 26
Factors Contributing to the Change in Prices1
(1) Supply and Demand Conditions for Products and services (All Enterprises)
(2) Utilization of Capital and Labor2
(3) Change in Output Prices (All Enterprises)
Notes: 1. Figures before December 1998 are based on the pre-revision Tankan, and those from March 1999are based on the post-revision Tankan.
2. Figures are calculated by adding Production Capacity DI and Employment DI which are weighted by the relative share of capital and labor based on 1990-99 average.Production Capacity DI and Employment DI are calculated as "Excessive" minus "Insufficient".
Sources: Cabinet Office, "National Accounts"; Bank of Japan, "Tankan Short-term Economic Survey of Enterprises in Japan."
-70
-60
-50
-40
-30
-20
-10
0
10
8 5 8 6 8 7 8 8 8 9 9 0 9 1 9 2 9 3 9 4 9 5 9 6 9 7 9 8 9 9 0 0 0 1
DI <"Excess demand" - "Excess supply">, % points
CY
-40
-30
-20
-10
0
10
20
308 5 8 6 8 7 8 8 8 9 9 0 9 1 9 2 9 3 9 4 9 5 9 6 9 7 9 8 9 9 0 0 0 1
All enterprises
CY
DI <"Excessive" - "Insufficient">, % points
-50
-40
-30
-20
-10
0
10
20
30
8 5 8 6 8 7 8 8 8 9 9 0 9 1 9 2 9 3 9 4 9 5 9 6 9 7 9 8 9 9 0 0 0 1
DI <"Rise" - "Fall">, % points
CY
Manufacturing
Nonmanufactuaring
Manufacturing
Nonmanufactuaring
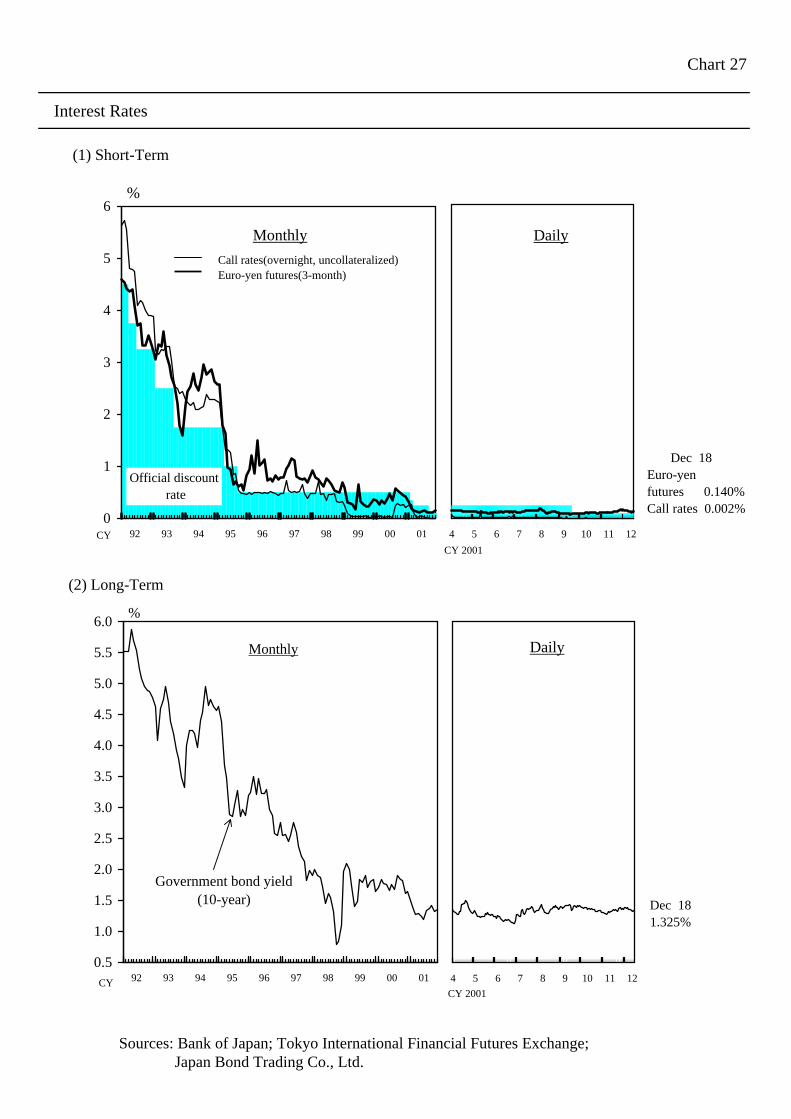
Chart 27
Interest Rates
(1) Short-Term
(2) Long-Term
Sources: Bank of Japan; Tokyo International Financial Futures Exchange; Japan Bond Trading Co., Ltd.
0.5
1.0
1.5
2.0
2.5
3.0
3.5
4.0
4.5
5.0
5.5
6.0
92 93 94 95 96 97 98 99 00 01
Government bond yield(10-year)
CY
%
Monthly
4 5 6 7 8 9 10 11 12
Dec 181.325%
Daily
0
1
2
3
4
5
6
92 93 94 95 96 97 98 99 00 01
%
Monthly
Official discount rate
Call rates(overnight, uncollateralized) Euro-yen futures(3-month)
CY 4 5 6 7 8 9 10 11 12
Daily
Dec 18Euro-yenfutures 0.140%Call rates 0.002%CD rates 0.11%
CY 2001
CY 2001
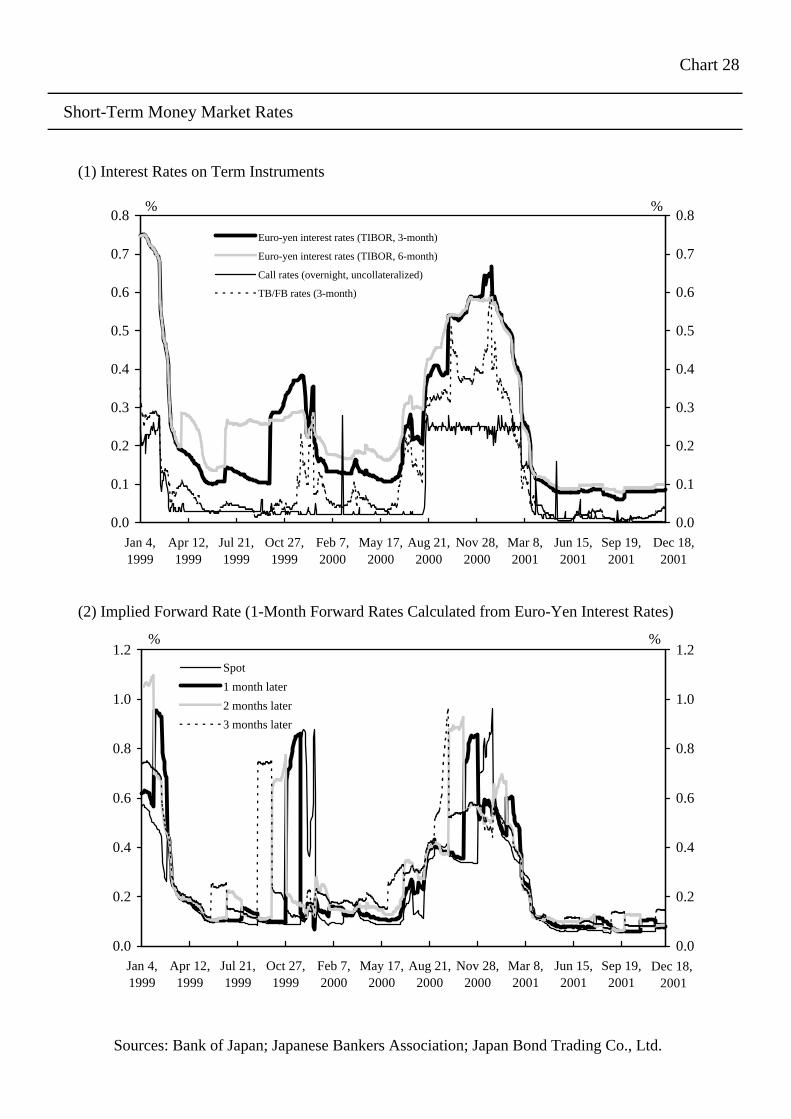
Chart 28
Short-Term Money Market Rates
(1) Interest Rates on Term Instruments
(2) Implied Forward Rate (1-Month Forward Rates Calculated from Euro-Yen Interest Rates)
Sources: Bank of Japan; Japanese Bankers Association; Japan Bond Trading Co., Ltd.
Dec 18,2001
0.0
0.1
0.2
0.3
0.4
0.5
0.6
0.7
0.8
Jan 4,1999
Apr 12,1999
Jul 21,1999
Oct 27,1999
Feb 7,2000
May 17,2000
Aug 21,2000
Nov 28,2000
Mar 8,2001
Jun 15,2001
Sep 19,2001
0.0
0.1
0.2
0.3
0.4
0.5
0.6
0.7
0.8
Euro-yen interest rates (TIBOR, 3-month)
Euro-yen interest rates (TIBOR, 6-month)
Call rates (overnight, uncollateralized)
TB/FB rates (3-month)
% %
Dec 18, 2001
0.0
0.2
0.4
0.6
0.8
1.0
1.2
Jan 4,1999
Apr 12,1999
Jul 21,1999
Oct 27,1999
Feb 7,2000
May 17,2000
Aug 21,2000
Nov 28,2000
Mar 8,2001
Jun 15,2001
Sep 19,2001
0.0
0.2
0.4
0.6
0.8
1.0
1.2Spot
1 month later
2 months later
3 months later
% %
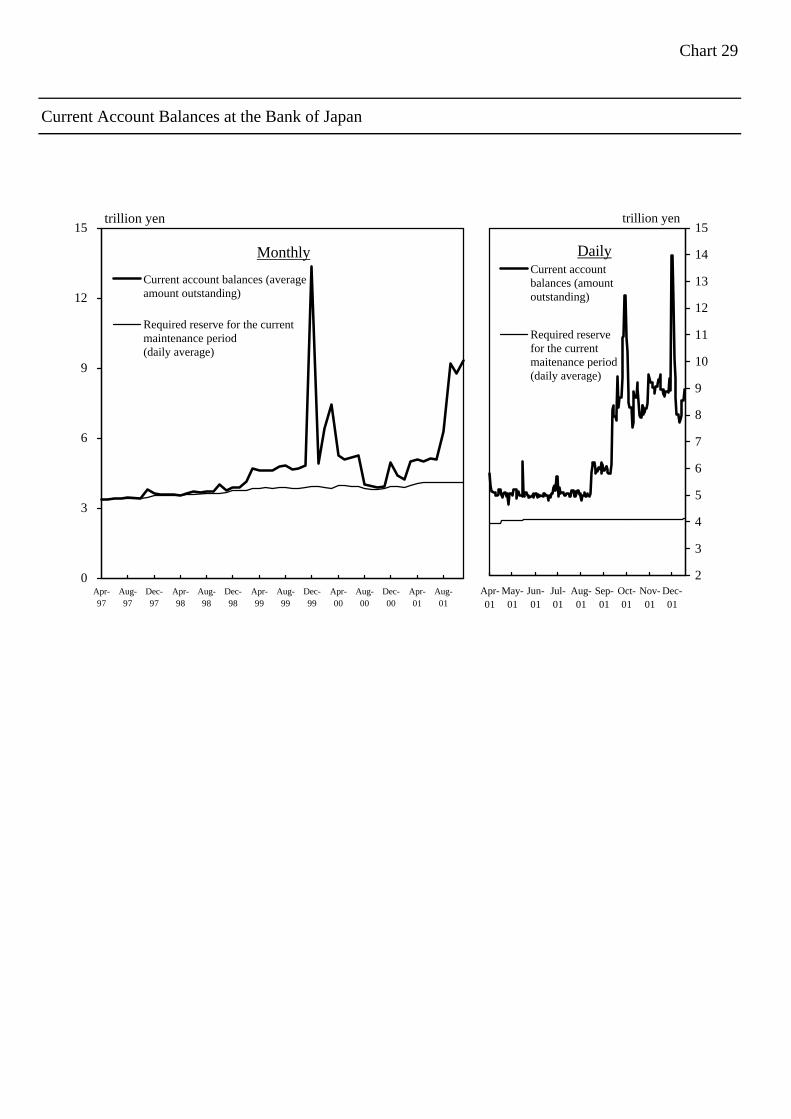
Chart 29
Current Account Balances at the Bank of Japan
0
3
6
9
12
15
Apr-97
Aug-97
Dec-97
Apr-98
Aug-98
Dec-98
Apr-99
Aug-99
Dec-99
Apr-00
Aug-00
Dec-00
Apr-01
Aug-01
Current account balances (averageamount outstanding)
Required reserve for the currentmaintenance period (daily average)
Monthly
trillion yen
Apr-01
May-01
Jun-01
Jul-01
Aug-01
Sep-01
Oct-01
Nov-01
Dec-01
2
3
4
5
6
7
8
9
10
11
12
13
14
15
Current accountbalances (amountoutstanding)
Required reserve for the current maitenance period (daily average)
Daily
trillion yen
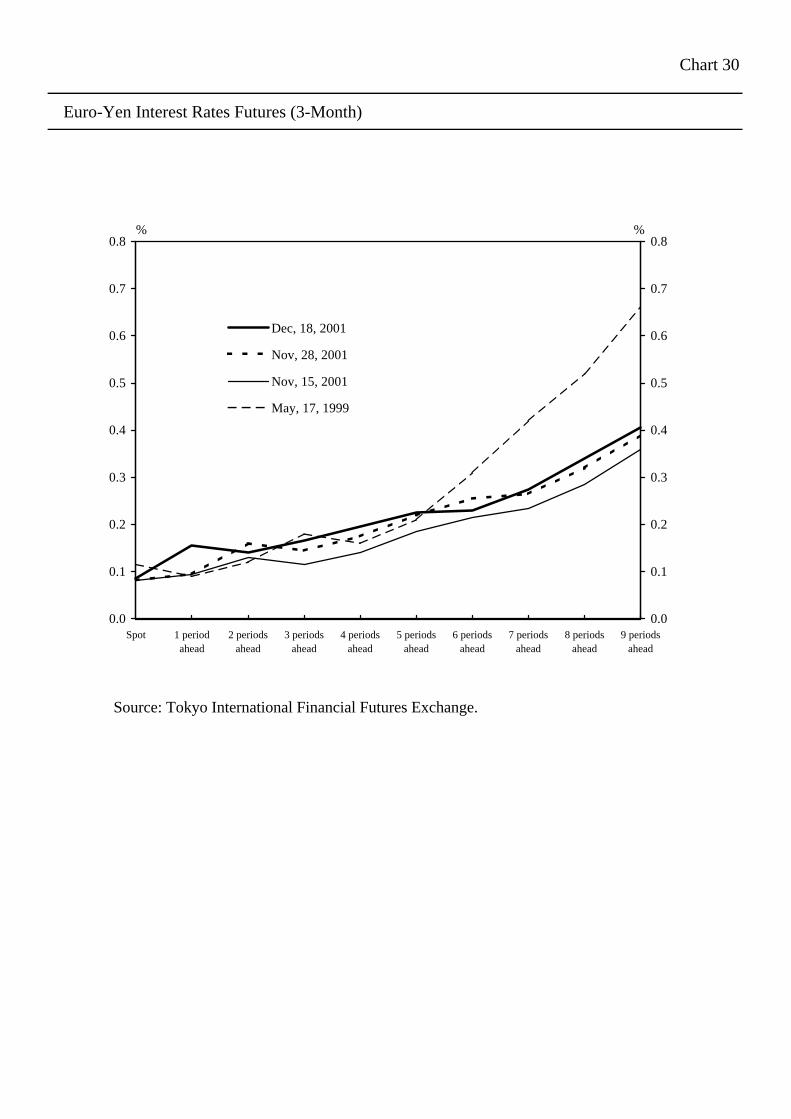
Chart 30
Euro-Yen Interest Rates Futures (3-Month)
Source: Tokyo International Financial Futures Exchange.
0.0
0.1
0.2
0.3
0.4
0.5
0.6
0.7
0.8
Spot 1 periodahead
2 periodsahead
3 periodsahead
4 periodsahead
5 periodsahead
6 periodsahead
7 periodsahead
8 periodsahead
9 periodsahead
0.0
0.1
0.2
0.3
0.4
0.5
0.6
0.7
0.8
Dec, 18, 2001
Nov, 28, 2001
Nov, 15, 2001
May, 17, 1999
% %
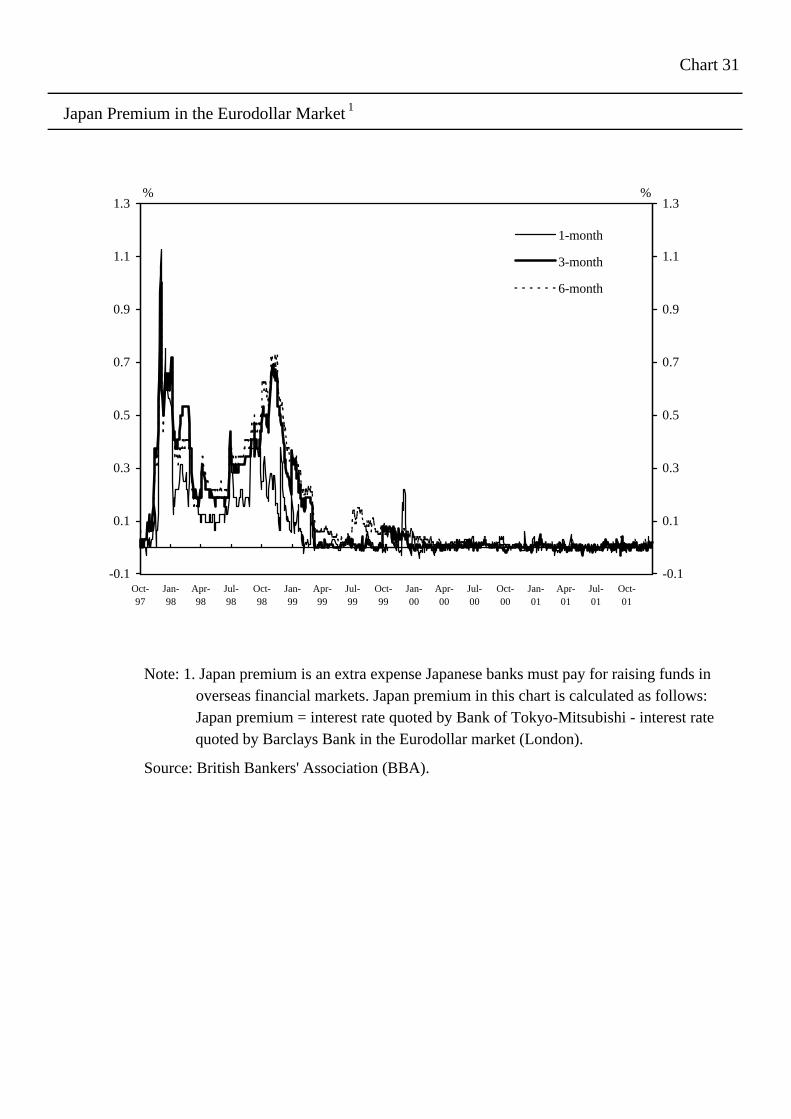
Chart 31
Japan Premium in the Eurodollar Market 1
Note: 1. Japan premium is an extra expense Japanese banks must pay for raising funds in overseas financial markets. Japan premium in this chart is calculated as follows: Japan premium = interest rate quoted by Bank of Tokyo-Mitsubishi - interest rate quoted by Barclays Bank in the Eurodollar market (London).
Source: British Bankers' Association (BBA).
-0.1
0.1
0.3
0.5
0.7
0.9
1.1
1.3
Oct-97
Jan-98
Apr-98
Jul-98
Oct-98
Jan-99
Apr-99
Jul-99
Oct-99
Jan-00
Apr-00
Jul-00
Oct-00
Jan-01
Apr-01
Jul-01
Oct-01
-0.1
0.1
0.3
0.5
0.7
0.9
1.1
1.3
1-month
3-month
6-month
% %
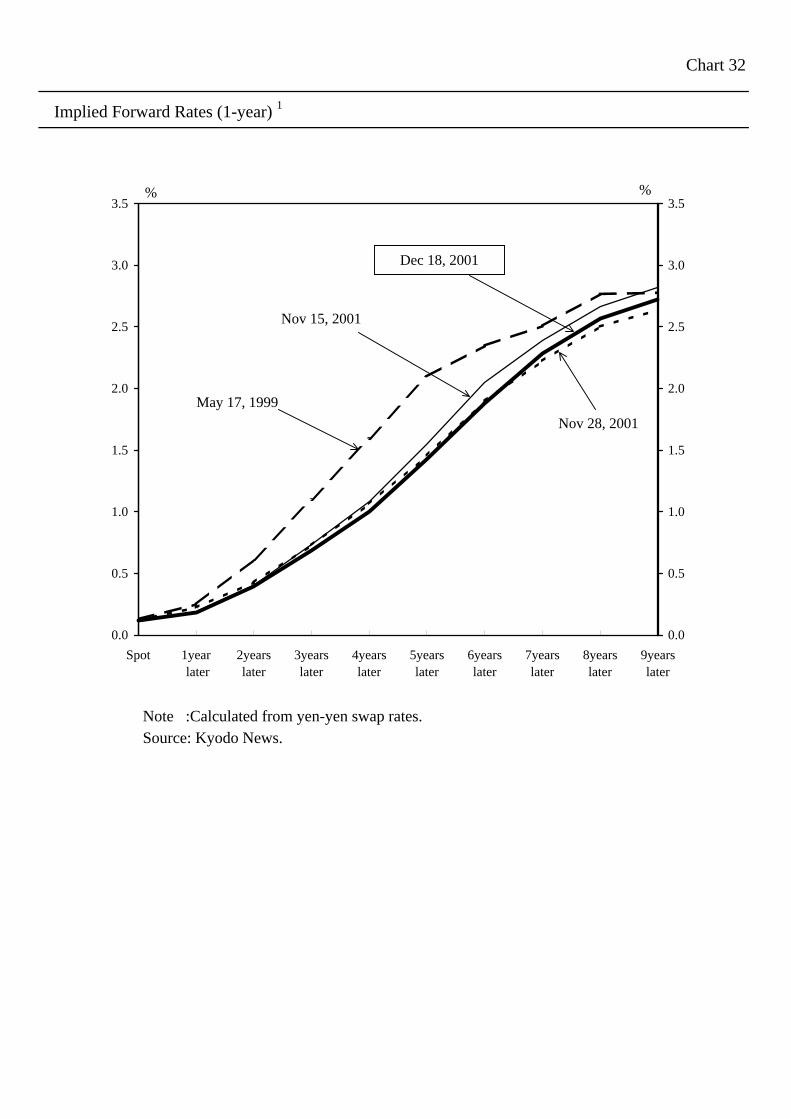
Chart 32
Implied Forward Rates (1-year) 1
Note :Calculated from yen-yen swap rates. Source: Kyodo News.
0.0
0.5
1.0
1.5
2.0
2.5
3.0
3.5
Spot 1year later
2yearslater
3yearslater
4yearslater
5yearslater
6yearslater
7yearslater
8yearslater
9yearslater
0.0
0.5
1.0
1.5
2.0
2.5
3.0
3.5%
May 17, 1999
Nov 28, 2001
%
Dec 18, 2001
Nov 15, 2001
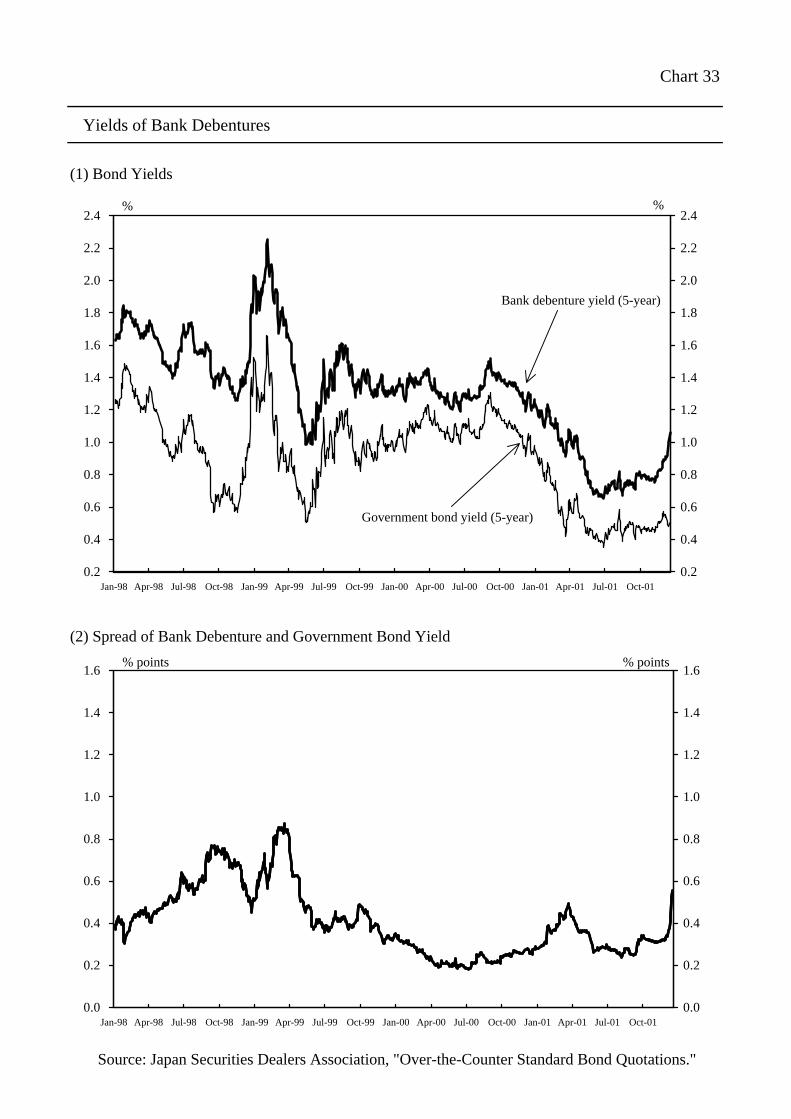
Chart 33
Yields of Bank Debentures
(1) Bond Yields
(2) Spread of Bank Debenture and Government Bond Yield
Source: Japan Securities Dealers Association, "Over-the-Counter Standard Bond Quotations."
0.2
0.4
0.6
0.8
1.0
1.2
1.4
1.6
1.8
2.0
2.2
2.4
Jan-98 Apr-98 Jul-98 Oct-98 Jan-99 Apr-99 Jul-99 Oct-99 Jan-00 Apr-00 Jul-00 Oct-00 Jan-01 Apr-01 Jul-01 Oct-010.2
0.4
0.6
0.8
1.0
1.2
1.4
1.6
1.8
2.0
2.2
2.4
Bank debenture yield (5-year)
Government bond yield (5-year)
%%
0.0
0.2
0.4
0.6
0.8
1.0
1.2
1.4
1.6
Jan-98 Apr-98 Jul-98 Oct-98 Jan-99 Apr-99 Jul-99 Oct-99 Jan-00 Apr-00 Jul-00 Oct-00 Jan-01 Apr-01 Jul-01 Oct-010.0
0.2
0.4
0.6
0.8
1.0
1.2
1.4
1.6% points % points
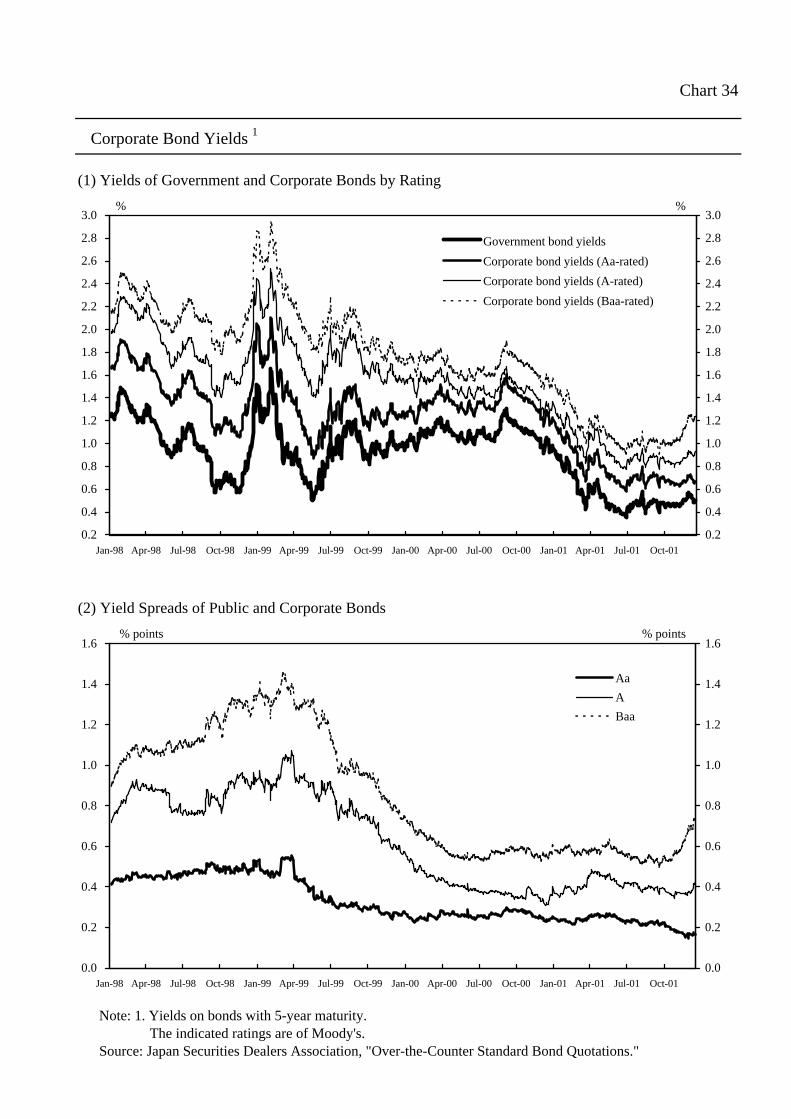
Chart 34
Corporate Bond Yields 1
(1) Yields of Government and Corporate Bonds by Rating
(2) Yield Spreads of Public and Corporate Bonds
Note: 1. Yields on bonds with 5-year maturity. The indicated ratings are of Moody's. Source: Japan Securities Dealers Association, "Over-the-Counter Standard Bond Quotations."
0.2
0.4
0.6
0.8
1.0
1.2
1.4
1.6
1.8
2.0
2.2
2.4
2.6
2.8
3.0
Jan-98 Apr-98 Jul-98 Oct-98 Jan-99 Apr-99 Jul-99 Oct-99 Jan-00 Apr-00 Jul-00 Oct-00 Jan-01 Apr-01 Jul-01 Oct-01
0.2
0.4
0.6
0.8
1.0
1.2
1.4
1.6
1.8
2.0
2.2
2.4
2.6
2.8
3.0
Government bond yields
Corporate bond yields (Aa-rated)
Corporate bond yields (A-rated)
Corporate bond yields (Baa-rated)
%%
0.0
0.2
0.4
0.6
0.8
1.0
1.2
1.4
1.6
Jan-98 Apr-98 Jul-98 Oct-98 Jan-99 Apr-99 Jul-99 Oct-99 Jan-00 Apr-00 Jul-00 Oct-00 Jan-01 Apr-01 Jul-01 Oct-01
0.0
0.2
0.4
0.6
0.8
1.0
1.2
1.4
1.6
Aa
A
Baa
% points % points
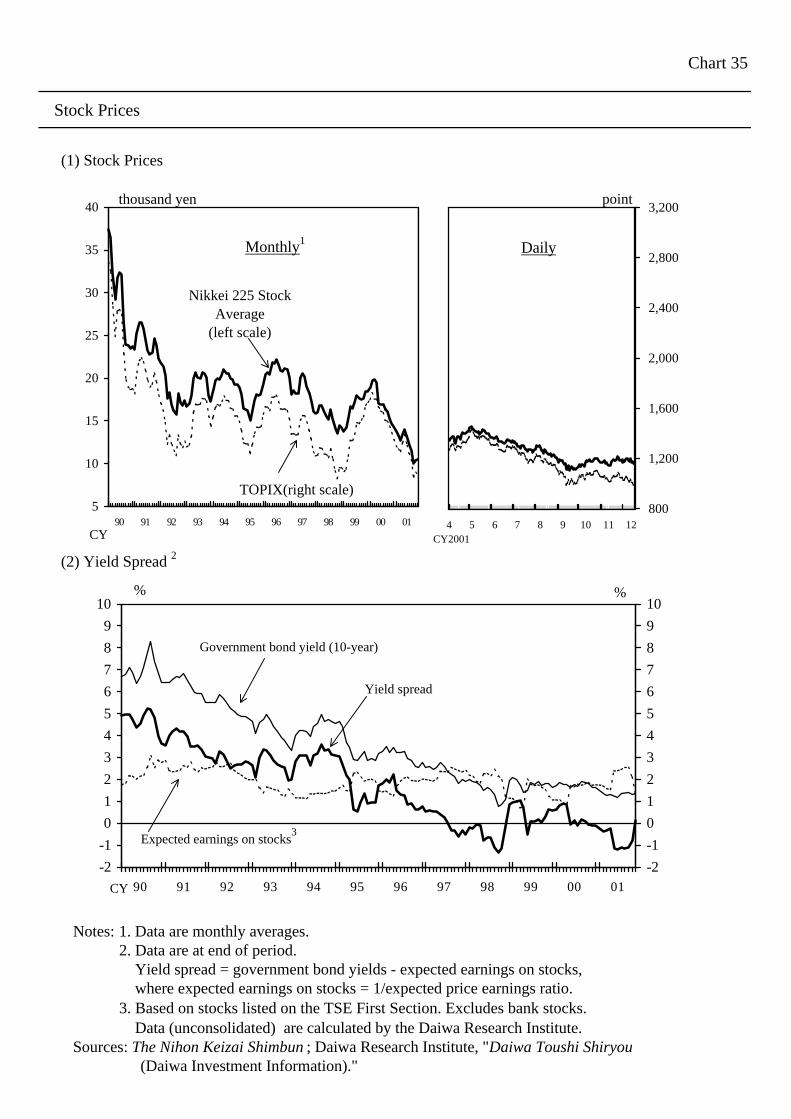
Chart 35
Stock Prices
(1) Stock Prices
(2) Yield Spread 2
Notes: 1. Data are monthly averages.2. Data are at end of period. Yield spread = government bond yields - expected earnings on stocks, where expected earnings on stocks = 1/expected price earnings ratio.3. Based on stocks listed on the TSE First Section. Excludes bank stocks. Data (unconsolidated) are calculated by the Daiwa Research Institute.
Sources: The Nihon Keizai Shimbun; Daiwa Research Institute, "Daiwa Toushi Shiryou (Daiwa Investment Information)."
5
10
15
20
25
30
35
40
90 91 92 93 94 95 96 97 98 99 00 01
thousand yen
Nikkei 225 StockAverage
(left scale)
CY
TOPIX(right scale)
4 5 6 7 8 9 10 11 12
800
1,200
1,600
2,000
2,400
2,800
3,200point
Daily
CY2001
Monthly1
-2
-1
0
1
2
3
4
5
6
7
8
9
10
90 91 92 93 94 95 96 97 98 99 00 01
-2
-1
0
1
2
3
4
5
6
7
8
9
10%%
Government bond yield (10-year)
Yield spread
Expected earnings on stocks3
CY
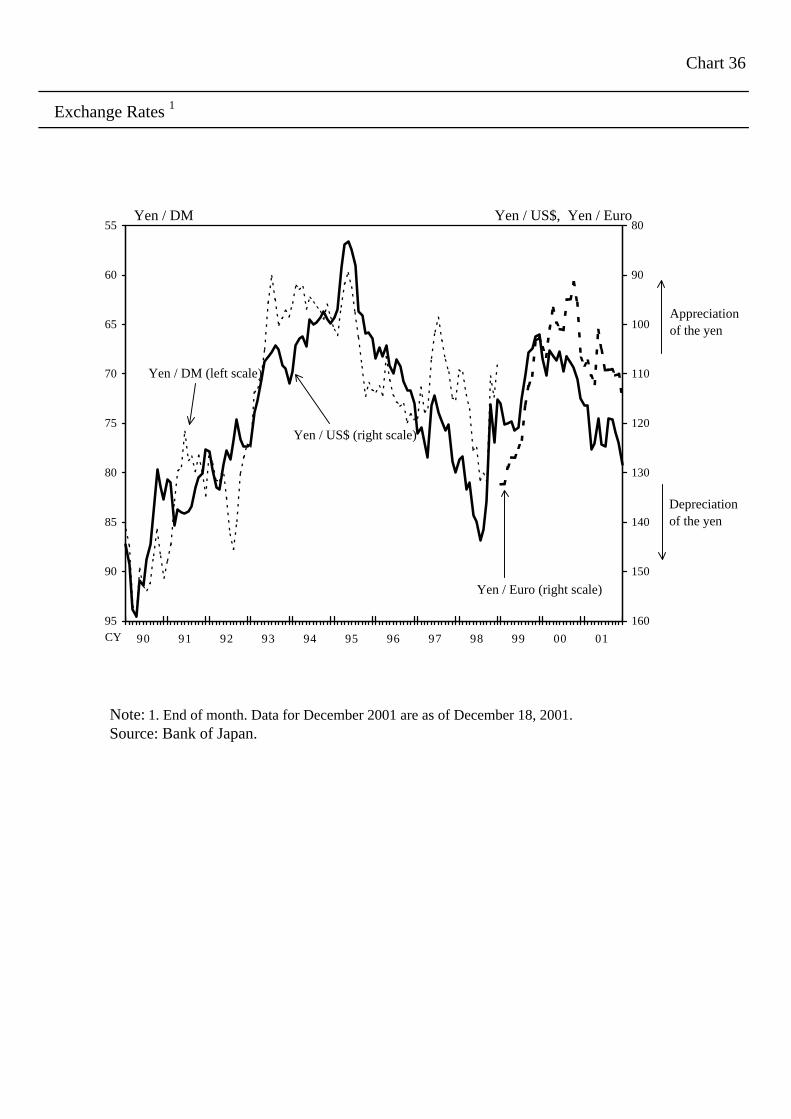
Chart 36
Exchange Rates 1
Note: 1. End of month. Data for December 2001 are as of December 18, 2001. Source: Bank of Japan.
55
60
65
70
75
80
85
90
95
90 91 92 93 94 95 96 97 98 99 00 01
80
90
100
110
120
130
140
150
160
Yen / US$, Yen / EuroYen / DM
Yen / US$ (right scale)
Yen / DM (left scale)
Appreciationof the yen
Depreciationof the yen
CY
Yen / Euro (right scale)
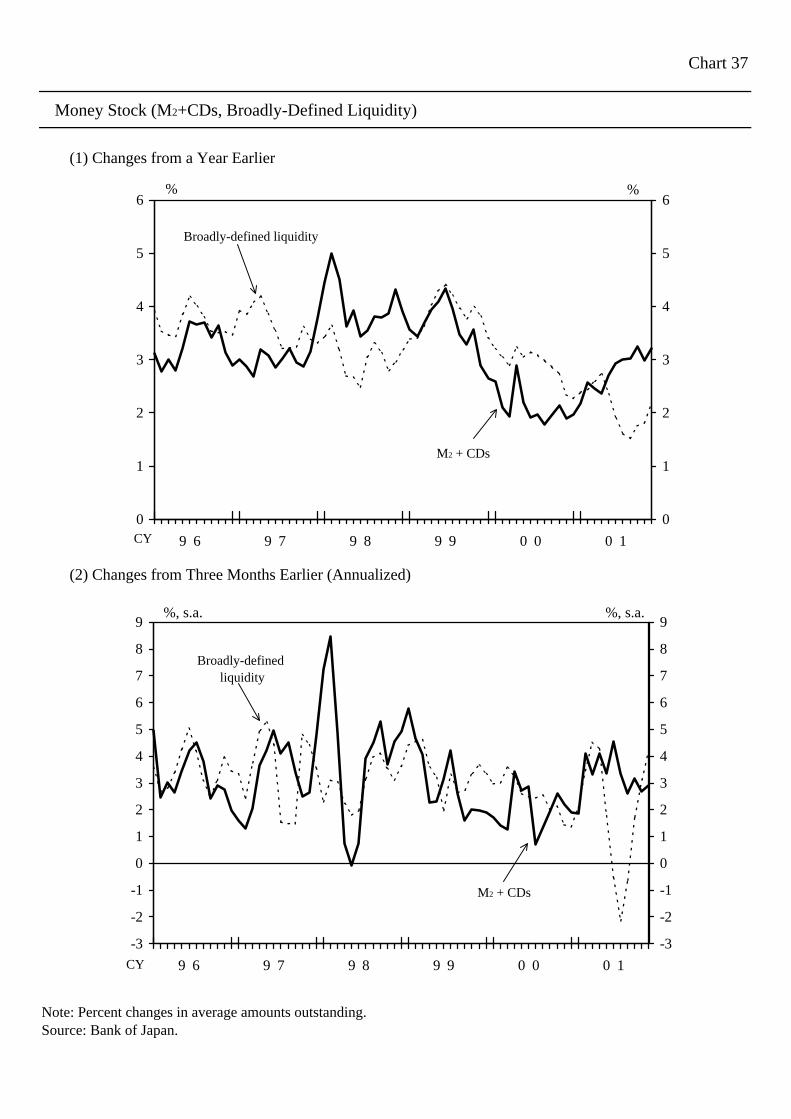
Chart 37
Money Stock (M2+CDs, Broadly-Defined Liquidity)
(1) Changes from a Year Earlier
(2) Changes from Three Months Earlier (Annualized)
Note: Percent changes in average amounts outstanding.Source: Bank of Japan.
0
1
2
3
4
5
6
9 6 9 7 9 8 9 9 0 0 0 1
0
1
2
3
4
5
6%
M2 + CDs
CY
%
Broadly-defined liquidity
-3
-2
-1
0
1
2
3
4
5
6
7
8
9
9 6 9 7 9 8 9 9 0 0 0 1
-3
-2
-1
0
1
2
3
4
5
6
7
8
9%, s.a.
M2 + CDs
CY
%, s.a.
Broadly-defined liquidity
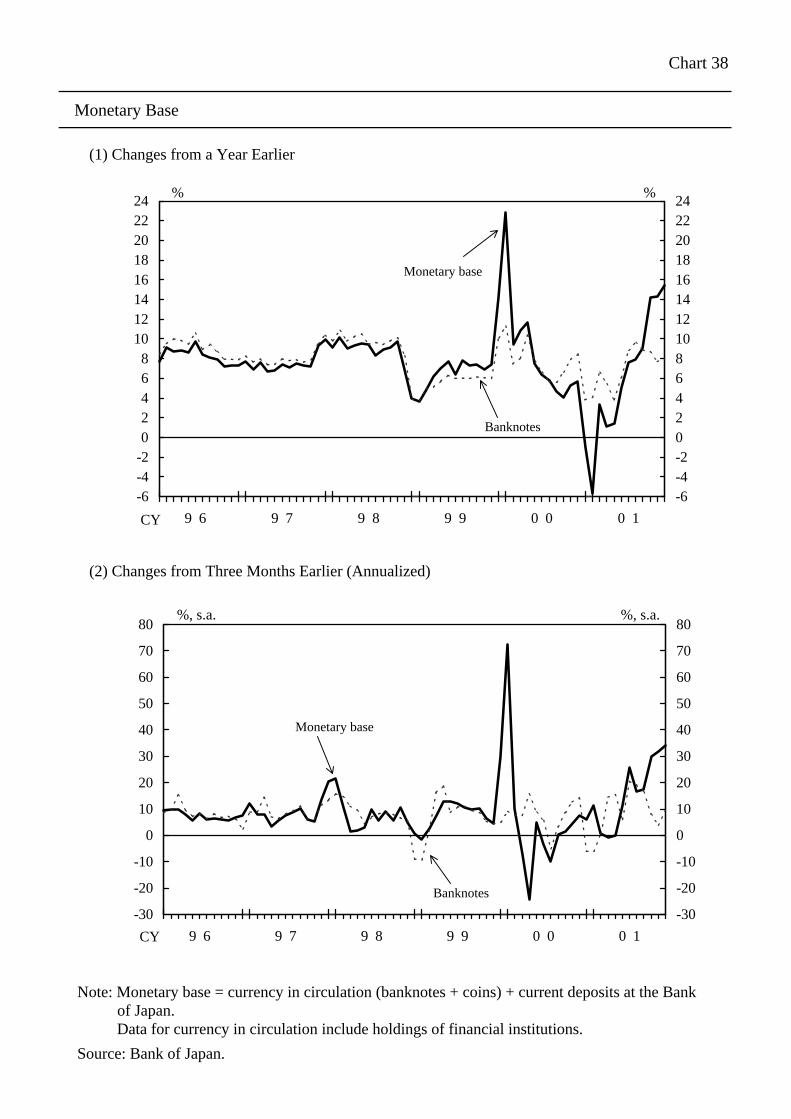
Chart 38
Monetary Base
(1) Changes from a Year Earlier
(2) Changes from Three Months Earlier (Annualized)
Note: Monetary base = currency in circulation (banknotes + coins) + current deposits at the Bank of Japan. Data for currency in circulation include holdings of financial institutions.
Source: Bank of Japan.
-6-4-202468
1012141618202224
9 6 9 7 9 8 9 9 0 0 0 1
-6-4-2024681012141618202224
% %
Monetary base
Banknotes
CY
-30
-20
-10
0
10
20
30
40
50
60
70
80
9 6 9 7 9 8 9 9 0 0 0 1
-30
-20
-10
0
10
20
30
40
50
60
70
80
CY
Monetary base
Banknotes
%, s.a. %, s.a.
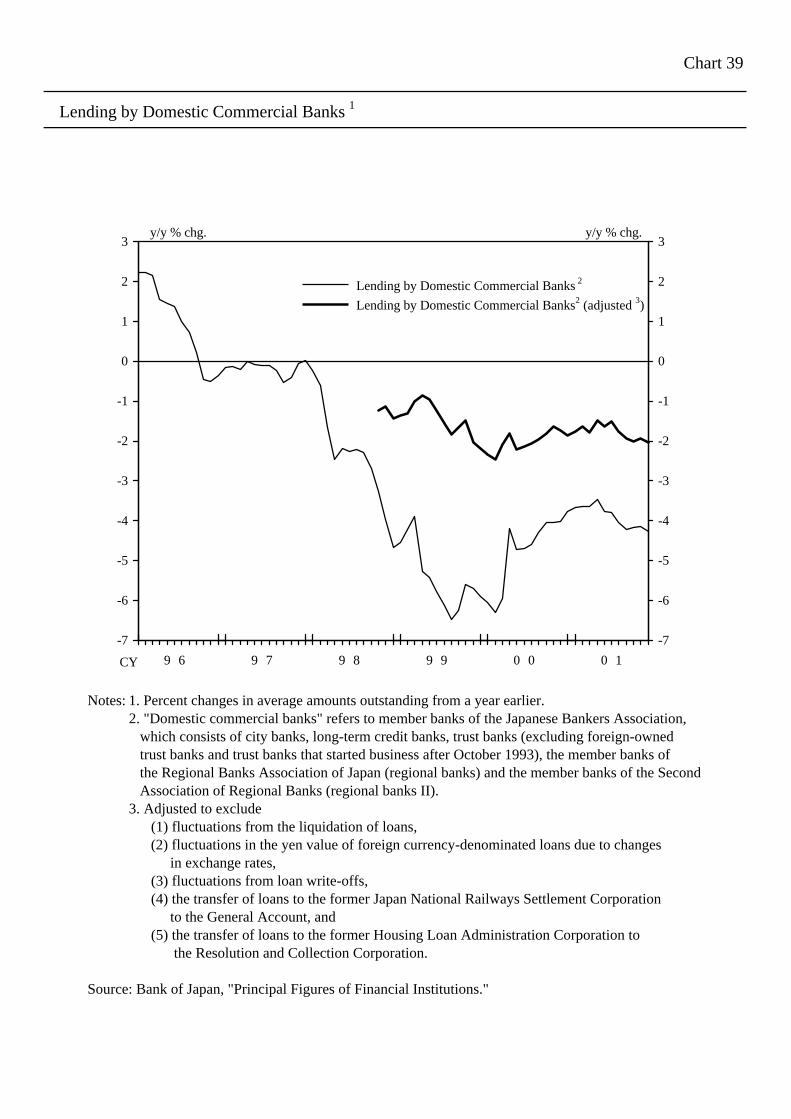
Chart 39
Lending by Domestic Commercial Banks 1
Notes: 1. Percent changes in average amounts outstanding from a year earlier.2. "Domestic commercial banks" refers to member banks of the Japanese Bankers Association, which consists of city banks, long-term credit banks, trust banks (excluding foreign-owned trust banks and trust banks that started business after October 1993), the member banks of the Regional Banks Association of Japan (regional banks) and the member banks of the Second Association of Regional Banks (regional banks II).3. Adjusted to exclude (1) fluctuations from the liquidation of loans, (2) fluctuations in the yen value of foreign currency-denominated loans due to changes
in exchange rates, (3) fluctuations from loan write-offs, (4) the transfer of loans to the former Japan National Railways Settlement Corporation
to the General Account, and (5) the transfer of loans to the former Housing Loan Administration Corporation to
the Resolution and Collection Corporation.
Source: Bank of Japan, "Principal Figures of Financial Institutions."
-7
-6
-5
-4
-3
-2
-1
0
1
2
3
9 6 9 7 9 8 9 9 0 0 0 1
-7
-6
-5
-4
-3
-2
-1
0
1
2
3y/y % chg. y/y % chg.
Lending by Domestic Commercial Banks 2
Lending by Domestic Commercial Banks2 (adjusted 3)
CY
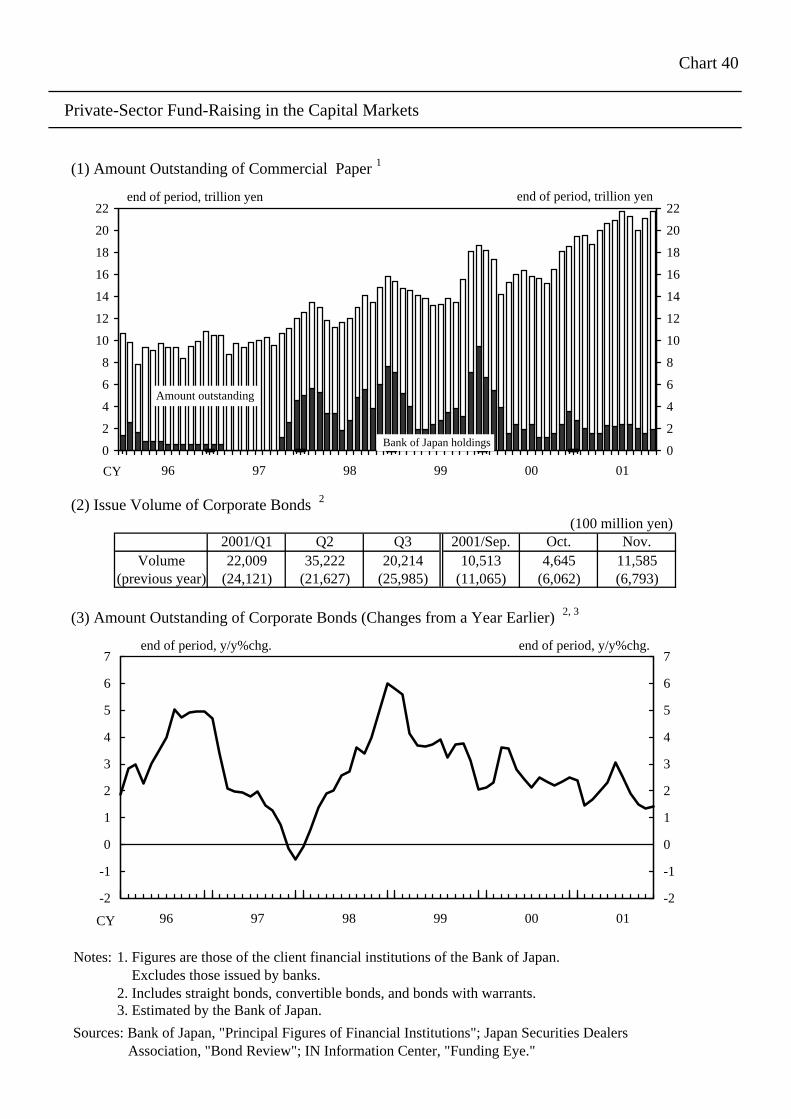
Chart 40
Private-Sector Fund-Raising in the Capital Markets
(1) Amount Outstanding of Commercial Paper 1
(2) Issue Volume of Corporate Bonds 2
(100 million yen)2001/Q1 Q2 Q3 2001/Sep. Oct. Nov.
Volume 22,009 35,222 20,214 10,513 4,645 11,585(previous year) (24,121) (21,627) (25,985) (11,065) (6,062) (6,793)
(3) Amount Outstanding of Corporate Bonds (Changes from a Year Earlier) 2, 3
Notes: 1. Figures are those of the client financial institutions of the Bank of Japan. Excludes those issued by banks.2. Includes straight bonds, convertible bonds, and bonds with warrants.3. Estimated by the Bank of Japan.
Sources: Bank of Japan, "Principal Figures of Financial Institutions"; Japan Securities Dealers Association, "Bond Review"; IN Information Center, "Funding Eye."
0
2
4
6
8
10
12
14
16
18
20
22
96 97 98 99 00 01
0
2
4
6
8
10
12
14
16
18
20
22end of period, trillion yen
CY
Bank of Japan holdings
end of period, trillion yen
Amount outstanding
-2
-1
0
1
2
3
4
5
6
7
96 97 98 99 00 01
-2
-1
0
1
2
3
4
5
6
7end of period, y/y%chg.
CY
end of period, y/y%chg.
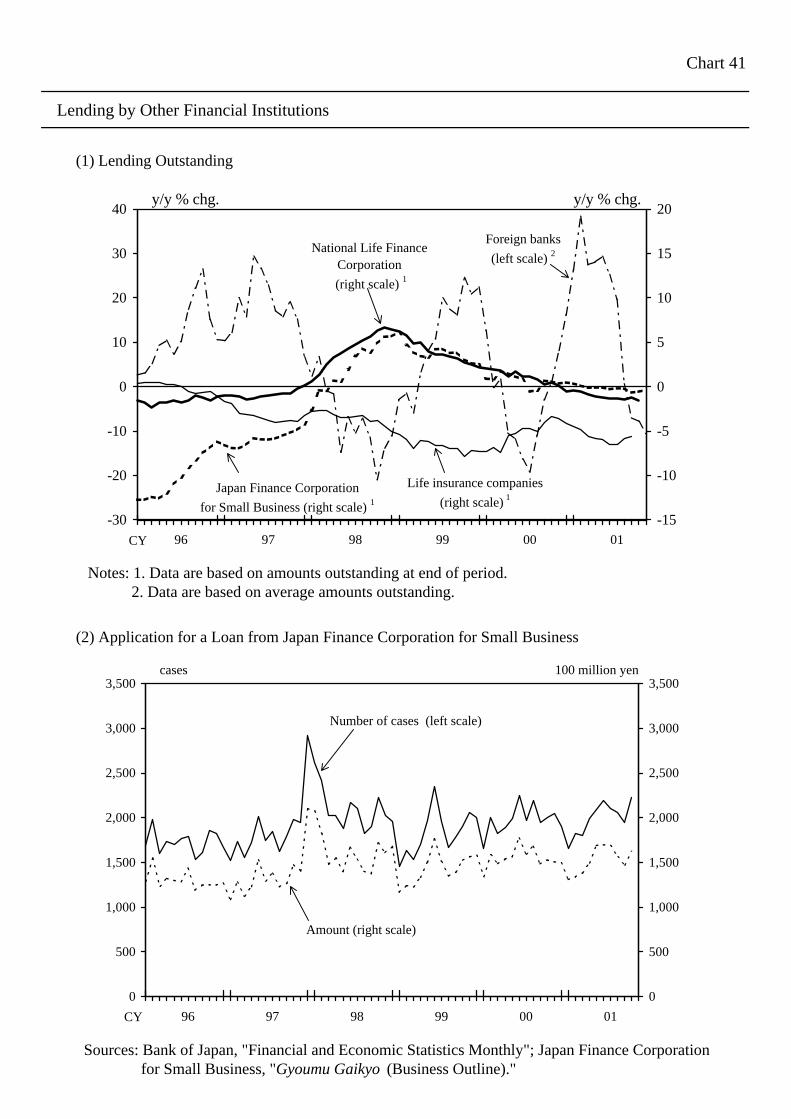
Chart 41
Lending by Other Financial Institutions
(1) Lending Outstanding
Notes: 1. Data are based on amounts outstanding at end of period. 2. Data are based on average amounts outstanding.
(2) Application for a Loan from Japan Finance Corporation for Small Business
Sources: Bank of Japan, "Financial and Economic Statistics Monthly"; Japan Finance Corporation for Small Business, "Gyoumu Gaikyo (Business Outline)."
-30
-20
-10
0
10
20
30
40
96 97 98 99 00 01
-15
-10
-5
0
5
10
15
20y/y % chg.
National Life FinanceCorporation
(right scale) 1
Japan Finance Corporation
for Small Business (right scale) 1
Foreign banks
(left scale) 2
Life insurance companies
(right scale) 1
y/y % chg.
CY
0
500
1,000
1,500
2,000
2,500
3,000
3,500
96 97 98 99 00 01
0
500
1,000
1,500
2,000
2,500
3,000
3,500cases
Amount (right scale)
Number of cases (left scale)
CY
100 million yen
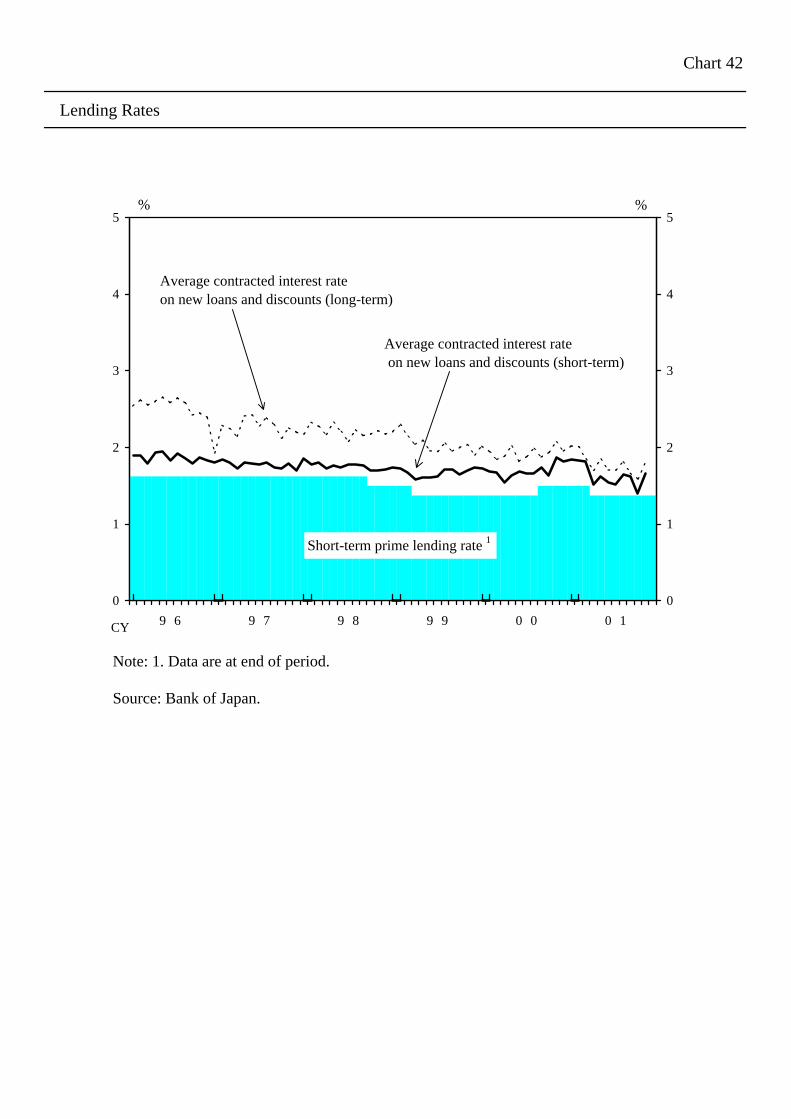
Chart 42
Lending Rates
Note: 1. Data are at end of period.
Source: Bank of Japan.
0
1
2
3
4
5
9 6 9 7 9 8 9 9 0 0 0 1
0
1
2
3
4
5% %
Average contracted interest rateon new loans and discounts (long-term)
Average contracted interest rate on new loans and discounts (short-term)
Short-term prime lending rate 1
CY
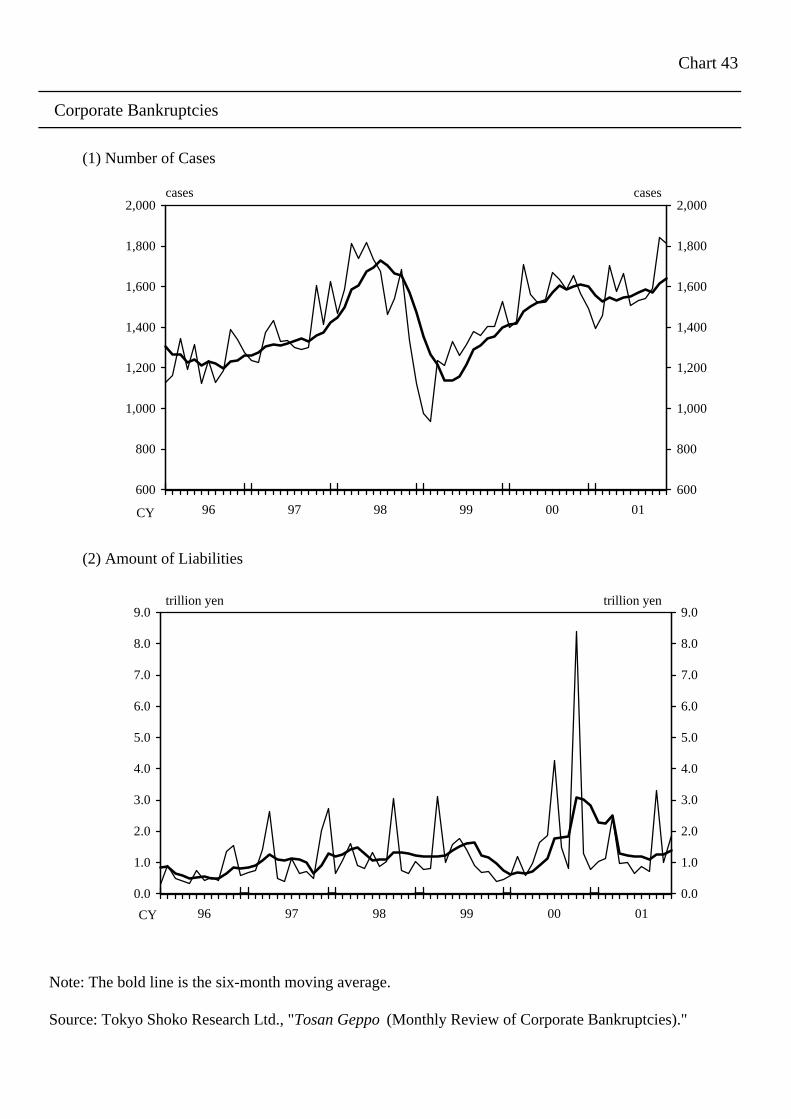
Chart 43
Corporate Bankruptcies
(1) Number of Cases
(2) Amount of Liabilities
Note: The bold line is the six-month moving average.
Source: Tokyo Shoko Research Ltd., "Tosan Geppo (Monthly Review of Corporate Bankruptcies)."
0.0
1.0
2.0
3.0
4.0
5.0
6.0
7.0
8.0
9.0
96 97 98 99 00 01
0.0
1.0
2.0
3.0
4.0
5.0
6.0
7.0
8.0
9.0trillion yen
CY
trillion yen
600
800
1,000
1,200
1,400
1,600
1,800
2,000
96 97 98 99 00 01
600
800
1,000
1,200
1,400
1,600
1,800
2,000cases
CY
cases