
Financial Development, Human Capital, and Economic Growth
58
Eastern Illinois University e Keep Masters eses Student eses & Publications 2016 Financial Development, Human Capital, and Economic Growth: A Cross Country Analysis Keshob Sharma Eastern Illinois University is research is a product of the graduate program in Economics at Eastern Illinois University. Find out more about the program. is is brought to you for free and open access by the Student eses & Publications at e Keep. It has been accepted for inclusion in Masters eses by an authorized administrator of e Keep. For more information, please contact [email protected]. Recommended Citation Sharma, Keshob, "Financial Development, Human Capital, and Economic Growth: A Cross Country Analysis" (2016). Masters eses. 2430. hps://thekeep.eiu.edu/theses/2430
-
Upload
khangminh22 -
Category
Documents
-
view
1 -
download
0
Transcript of Financial Development, Human Capital, and Economic Growth
Eastern Illinois UniversityThe Keep
Masters Theses Student Theses & Publications
2016
Financial Development, Human Capital, andEconomic Growth: A Cross Country AnalysisKeshob SharmaEastern Illinois UniversityThis research is a product of the graduate program in Economics at Eastern Illinois University. Find out moreabout the program.
This is brought to you for free and open access by the Student Theses & Publications at The Keep. It has been accepted for inclusion in Masters Thesesby an authorized administrator of The Keep. For more information, please contact [email protected].
Recommended CitationSharma, Keshob, "Financial Development, Human Capital, and Economic Growth: A Cross Country Analysis" (2016). Masters Theses.2430.https://thekeep.eiu.edu/theses/2430

The Graduate School~ E\51DZ,t'l' lllJNO!S CNIVERSJTY"'
Thesis Maintenance and Reproduction Certificate
FOR: Graduate Candidates Completing Theses in Partial Fulfillment of the Degree Graduate Faculty Advisors Directing the Theses
RE: Preservation, Reproduction, and Distribution of Thesis Research
Preserving, reproducing, and distributing thesis research is an important part of Booth Library's responsibility to provide access to scholarship. In order to further this goal, Booth Library makes all graduate theses completed as part of a degree program at Eastern Illinois University available for personal study, research, and other not-for-profit educational purposes. Under 17 U.S.C. § 108, the library may reproduce and distribute a copy without infringing on copyright; however, professional courtesy dictates that permission be requested from the author before doing so.
Your signatures affirm the following: • The graduate candidate is the author of this thesis. • The graduate candidate retains the copyright and intellectual property rights associated with the
original research, creative activity, and intellectual or artistic content of the thesis. • The graduate candidate certifies her/his compliance with federal copyright law (Title 17 of the U.
S. Code) and her/his right to authorize reproduction and distribution of all copyrighted materials included in this thesis.
• The graduate candidate in consultation with the faculty advisor grants Booth Library the nonexclusive, perpetual right to make copies of the thesis freely and publicly available without restriction, by means of any current or successive technology, including by not limited to photocopying, microfilm, digitization, or internet.
• The graduate candidate acknowledges that by depositing her/his thesis with Booth Library, her/his work is available for viewing by the public and may be borrowed through the library's circulation and interlibrary loan departments, or accessed electronically.
• The graduate candidate waives the confidentiality provisions of the Family Educational Rights and Privacy Act (FERPA) (20 U.S. C.§ 1232g; 34 CFRPart 99) with respect to the contents of the thesis and with respect to information concerning authorship of the thesis, including name and status as a student at Eastern Illinois University.
1 have conferred with my graduate faculty advisor. My signature below indicates that I have read and agree with the above statements, and hereby give my permission to allow Booth Library to reproduce and distribute my thesis. My adviser's signature indicates concurrence to reproduce and distribute the thesis.
Financial Development, Human Capital, and Economic Growth:
A Cross Country Analysis
(TITLE)
BY
Keshob Sharma
THESIS
SUBMITTED IN PARTIAL FULFILLMENT OF THE REQUIREMENTS FOR THE DEGREE OF
Master of Arts in Economics
IN THE GRADUATE SCHOOL, EASTERN ILLINOIS UNIVERSITY CHARLESTON, ILLINOIS
2016
YEAR
I HEREBY RECOMMEND THAT THIS THESIS BE ACCEPTED AS FULFILLING THIS PART OF THE GRADUATE DEGREE CITED ABOVE
Financial Development, Human Capital and Economic Growth: A Cross Country Analysis
Keshob Sharma [email protected] Department of Economics Eastern Illinois University
2016
Thesis Committee: Dr. Mukti P Upadhyay(Chair)
Dr. Ahmed S Abou-Zaid Dr. Ali R Moshtagh

Copyright© 2016 by Keshob Sharma
All rights reserved
Abstract
Taking a panel of 66 countries and employing panel data methodology, this stndy
examines the impact of financial development, human capital and their interaction on
economic growth. This study covers a period of 40 years from 1971 to 2010. To smooth
out the short-run fluctuations in the data for my growth study, I take 5-year non
overlapping averages of variables. As a proxy for fmancial development, I use private
credit by deposit money banks or liquid liabilities, as a percent of GDP. In turn, human
capital is represented by the percentage of population above 25 years of age with the
secondary level of education. Using conditioning information and interaction terms, this
stndy finds that financial development, as measured by credit to the private sector, and
human capital are positively significant in explaining growth whereas another measure of
financial development, liquid liabilities, is not significant in explaining growth.
Moreover, the interaction term is not significant in explaining growth. When I introduce
income dummies and region dummies, the results remain robust. The rate of convergence
and the degree of impact do vary across countries at different income levels and in
different regions. Another interesting result for my sample of countries is that human
capital has a positive significant impact on growth of countries that had a lower initial
level of human capital but not significant in countries that started out with a higher level
of human capital.

Acknowledgement
I would like to take this opportunity to thank all the people who supported me through
my graduate studies and my thesis. I am particularly thankful to Dr. Mukti P Upadhyay,
my supervisor for his immense guidance, patience and help in bringing this thesis in the
present form. Without his effort and encouragement, I could not have completed my
thesis and my degree on time. I am privileged to be under his tutelage.
I would also like to thank Dr. Ahmed S Abou-Zaid and Dr. Ali Moshtagh for their
help and suggestion in this thesis. Their encouragement and suggestions in completing
this thesis deserve my earnest gratitude. I also thank all my professors at Eastern Illinois
University for their support.
Thanks also go to my family members for supporting my education in USA.
Mununy, you are my inspiration, helping me to struggle against all odds and keeping me
thriving. I thank my better half and my son, for all the immeasurable sacrifice they have
made during my study.
Table of Contents
1. Introduction ................................................................................... 1
2. Literature Review ..................................................................................................... 5
3. Research Methodology and Data .......................................................... .14
3.1 Theoretical Framework ............................................................................. 15
3.2 Choice of Variables .................................................................. 16
3 .2.1 Dependent Variable ....................................................... 16
3.2.2 Financial Development .................................................... 16
3.2.3 Measures ofHuman Capital.. ............................................ l8
3.2.4 Interaction Term .............................................................. 19
3.2.5 Conditioning Information ................................................. 20
3.3 Selection of Countries .............................................................. 20
3 .4 Empirical Model.. .................................................................. 21
3 .4.1 Hypothesis ............................................................... 24
3 .4 .2 Panel Data Model.. ..................................................... 25
3.5 Data Source and Characteristics ................................................... 25
4. Results <md Discussions ...................................................................... 28
4.1 Stationarity Check .................................................................. 29
4.2 Correlation Matrix ................................................................. 30
4.3 Hausman Test for Fixed Effects and Random Effects ........................ 30
4.4 Results of Growth Regressions .................................................. .31
4.4.1 Results of Fixed Effects Growth Regression ............................ .31
4.4.2 Results of Random Effects GLS Regressions Including Income
Dummies ..................................................................... 34
4.4.3 Results of Random Effects GLS Regressions Including Region
Dununies .................................................................... 35
4.4.4 Regression on Countries with High Level and Low Level of Human
Capital in Early 1970's ...................................................... 38
5. Conclusion and Recommendations ........................................................ .40
Appendix ........................................................................................ .42
References ...................................................................................... .46
List of Tables
Table I: Smnmary Statistics ..................................................................... .27
Table 2: Levin-Lin-Chu Unit Root Test.. ................................................... 28
Table 3: Correlation Matrix ................................................................... 30
Table 4: Hausman Test for Fixed Effects and Random Effects ......................... .31
Table 5: Fixed Effects Regression Results on Real Per Capita GDP Growth Rate ... 32
Table 6: Random Effects GLS Regression Results on Real Per Capita Growth Rate
Including Dummies for Different Income Regions ............................ .35
Table 7: Random Effects GLS Regression Results of Real Per Capita Growth Rate with
Region Dummies ........................................................................ 37
Table 8: Random Effects GLS Regression of Countries with High and Low Human
Capital Level in 1970-1975 .......................................................... .39
Chapter 1
INTRODUCTION
Many studies have emphasized the importance of financial development and human
capital separately on economic growth. Studies show that both fmancial development and
human capital are positively related to growth. In recent studies, whether the presence of
a strong financial system leads to economic growth has been examined in many contexts
and most results show that it does lead to economic growth.
Studies started by King and Levine (1993) and followed by others have reached a
consensus that fmancial development leads to growth. A well-developed financial sector
(markets and institutions) mobilizes savings and manages risks. This helps channel
investment into most efficient sector of the economy.
Levine (2005) in his in-depth literature review confirms that a growing body of
evidence suggests that financial institutions (such as banks and insurance companies) and
financial markets (including stock markets, bond markets, and derivative markets) exert a
powerful influence on economic development and economic stability. A key step that
helps allocate resources, expands economic opportunities and fosters growth is completed
when banks screen borrowers and identify firms with the most promising prospects
(Cihak, Demeriguc-Kunt, Feyen and Levine, 2012).
Another important way in which finance fosters economic development is when
banks and securities markets mobilize savings from households to invest in promising
projects. Efficiency of corporations is boosted and waste and fraud by insiders is reduced
when financial institutions monitor the use of investments and scrutinize managerial
performance (Cihak eta!. 2012). Moreover, equity, bond and derivative markets help in
1
the diversification of risk. The problem arises when the financial system performs these
functions poorly. Ill functioning financial systems hinder economic growth, curtail
economic opportunities and destabilize economies.
Levine (2005) lists five broad functions provided by the financial systems:
produce information ex-ante about possible investments and allocate capital, monitor
investments and exert corporate governance after providing finance, facilitate the trading,
diversification and management of risks, mobilize and pool savings, and ease the
exchange of goods and services.
Human capital also contributes to economic growth. Countries differ substantially
in their stocks of human capital. Some countries have a high level of human capital while
others have a low level of human capital. A high level of financial development is
desirable for growth as found by previous studies. However, the impact of financial
development might not be the same in countries with different levels of human capital.
Countries with high human capital may benefit more from financial development
because countries with a large number of scientist and researchers may be able to make
an efficient use of opportunities, pool resources and start their own firms. Innovation and
technology, which are crucial for growth, can progress faster with greater research and
development. Therefore, both human capital and financial development can influence
growth.
Many studies have investigated the impact of financial development and human
capital on growth separately. The literature, however, seems to have largely ignored the
combined interactive impact of human capital on growth in cross-country studies
although financial development can impact growth through its interaction with human
2
capital. Low human capital can constrain innovation even if financial development
proceeds rapidly. Thus, there is a need to study the combined effects of financial
development and human capital on growth.
While studies on the interaction between human capital and financial
development on growth are sparse in cross country settings, Kendall (2012) examines
impact of interaction between financial development and human capital on growth in sub
national economies. His study takes disaggregated district level data of net national
product available from Reserve Bank of India (RBI) records.
In his disaggregated district level study, Kendall (2012) empirically tests how
financial development impacts growth in districts with different levels of human capital.
He finds that underdevelopment oflocal banking sector can hamper growth. Districts
with human capital above the median are able to overcome growth deficiency created by
low financial development. These districts perform better through development of the
less finance intensive sectors. Kendall's (2012) results suggest that financial development
and human capital are substitutes.
Some studies on financial development and growth, for example, Evans, Green,
and Murinde (2000), have considered human capital as a factor in growth but have
ignored the interaction between human capital and financial development. Barajas,
Chami and Y ousefi (20 13) use percentage of gross secondary enrollment as a control
variable in their cross-country study of finance and growth but fail to analyze the
interaction. Ahlin and Pang (2008) study the interaction between fmancial development
and corruption control and conclude that the two can be substitutes but do not consider
3
human capital. There is an obvious gap in the literature on the study of impact of human
capital and its interaction with financial development on growth.
This study is a partial attempt to fill the gap. It analyzes the impact on growth of
financial development, human capital, and their interaction. I also analyze whether there
is heterogeneity in growth rate across geographic regions. The study is based on a diverse
sample of66 countries with data spanning 40 years from 1970 to 2010 collapsed into
eight five-year periods per country.
This thesis is organized as follows: Chapter 2 provides a literature review of some
prominent studies in the field of financial development, human capital and growth,
Chapter 3 discusses the research methodology, model and data, including choice of
variables. Chapter 4 discusses the regression results in detail. Finally, a brief conclusion
and recommendations for future studies are presented in Chapter 5.
4
Chapter2
LITERATURE REVIEW
Many studies have investigated the impact of financial development on growth or the
effect of human capital on growth. Yet very few studies have examined the interaction of
financial development and human capital on growth. This section will provide a review
of the prominent studies in the field of financial development, human capital and
economic growth.
Levine (2005) reviews theoretical and empirical research on the connections
between financial system and economic growth. He finds that while subject to various
qualifications and countervailing views, the preponderance of evidence suggests that both
financial intermediaries and markets matter for growth and that reverse causality (growth
leading to financial development) is not the only accurate relationship. He further asserts
that better financial development eases external fmancial constraints facing firms, which
illuminates one mechanism through which financial development influences economic
growth.
Disagreement about the importance of fmance on economic growth is discussed
by Levine (2005) who finds two extremes in the literature: the one that rejects the role of
financial development on growth (Meiers and Seers, 1984) and Lucas (1988) and the one
that says that finance-growth nexus carmot be ignored without limiting our understanding
of economic growth (Schumpter, 1912; McKinnon, 1973).
One ofthe earliest studies is by Goldsmith (1969) who explores relationships
between financial development and the level of economic activity. He compiles data on
5
the financial intermediary assets as a share of economic output. He fmds correlation
between the two but does not take a stand on whether financial development causes
growth. While an early study in the field, it suffers from several problems according to
Levine (2005).
King and Levine (1993) build on Goldsmith's work by taking a sample of77
countries and controlling for other factors that seem to affect long run growth,. They
examine capital accumulation and productivity growth charmels, construct additional
measures of financial development, and analyze whether the level of capital accumulation
predicts long run growth. First, King and Levine (1993) examine financial depth for
which they take liquid liabilities of the financial system (currency plus demand deposits
and interest bearing liabilities of bank and non-bank financial institutions). Second, they
construct a variable that measures the relative degree in which central bank and
commercial banlc allocate credit. The authors believe that commercial banks are more
likely to provide the five different financial functions discussed earlier, and choose credit
to the private commercial sector by banks as a main indicator of financial development.
King and Levine (1993) consider three indicators of growth: the rate of real per
capita GDP growth, the rate of growth in the capital per person, and total productivity
growth which is also called the Solow residual. The results indicate that there is a strong
positive relationship between each financial development indicator and the three growth
indicators. They fmd that the initial level of financial development is a good predictor of
economic growth in subsequent years. Interestingly, King and Levine (1993) in a
different work confirm the findings of this paper.
6
La Porta, Lopez-de-Silanes, Shleifer and Vishny (1998) use legal systems as
exogenous factors that contribute to financial development. They study legal rules
protecting corporate shareholders and creditors and the origin of their rules. The authors
find that Common Law countries generally have the best legal protection of investors,
and the French civil law countries the worst, while German and Scandinavian civil law
countries are located around the middle on creditor protection. Since finance is based on
contracts, La Porta eta!. (1998) argue that laws that protect the rights of external
investors and enforce those rights effectively will be better at promoting financial
development. The studies following La Porta eta!. (1998) use legal origins as an
instrument for financial development.
La Porta et a!. (200 1) in yet another study examine the degree of public ownership
of banks around the world. The authors fmd that higher degree of public ownerships are
associated with lower levels of bank development and high levels of public ownerships
are associated with lower levels of development.
The studies by Levine (1998), and Levine, Loayza and Beck (2000) use the La
Porta measure of legal origin as an instrumental variable following La porta eta!. (1998).
Levine eta!. (2000) trace the effect oflegal origin to laws and then the effect oflaws to
financial development. This study uses two econometric techniques: generalized methods
of moments and a cross sectional instrumental variable estimator. GMM dynamic panel
estimators techniques are specifically designed to address the econometric problems
induced by unobserved country-specific effects and joint endogeneity of the explanatory
variables in lagged dependent variable models such as growth regressions. The authors
assemble a panel of 75 countries where the data are averaged over seven five-year
7
intervals from 1965 to 1995. They estimate the average growth rate of real per capita
GDP on the level of financial intermediation and a broad set of factors that act as
conditioning information. The authors employ system and difference GMM techniques
as well as cross-section estimators to analyze growth. Data for 71 countries are averaged
out to work with one observation per country in their cross-section study.
Levine, Loyayza and Beck (2000) use cross-section estimators as a consistency
check on their panel data model. The authors construct a new dataset to focus on the size
of the financial intermediation sector, whether the central bank or fmancial institutions
are conducting the financial intermediation, and focus on the extent to which the financial
sector funnels credit to the private sector. The authors discuss three sets of conditioning
factors: simple conditioning sets, policy conditioning set and the full conditioning
information and find financial development and growth are positively related under all
specifications and conditioning variables.
Several other studies come up with similar results looking at other exogenous
factors that contribute to the development of the country. Merton (1995) uses technology
as an exogenous factor and finds that advances in technology and in the theory of finance
have led to advances in financial intermediation.
Benhabib and Spiegel (200 I) examine the relationship between a variety of
financial development variables on the one hand and economic growth, investment, and
total factor productivity growth on the other. Again, indicators of financial development
are positively correlated both total factor productivity growth as well as investment.
Benhabib and Spiegal (2001) use a neoclassical growth model and an endogenous growth
model for estimating growth equations, where income is a function of labor, physical
8
capital and human capital. The initial growth is used to account for the countries'
distance from their respective steady states and the GMM technique is used to account for
the endogeneity of physical capital accumulation. For the depth of the financial sector,
Benhabib and Spiegal (2001 ), following King and Levine (1993), use (1) the ratio of
liquid liabilities of the financial sector to GDP to measure the depth of the financial
sector, (2) the ratio of the assets of deposit money banks to domestic assets of the entire
monetary system including the central bank, and (3) the banking system's private sector
credit as a percentage ofGDP. Benhabib and Spiegel (2001) find that two of the
measures of financial development indicate significant positive correlation with growth.
While these authors also find a positive role of financial development in encouraging
physical capital accumulation, their results do not turn out robust when country fixed
effects are included.
Levine and Zervos (1998) consider stock market development to assess its
relationship with economic growth, capital accumulation and TFP growth. The initial
level of stock market liquidity or of bank credit is positively correlated with future rates
of economic growth, capital accumulation and productivity growth. Once again, however,
the results are not robust.
Christopoulos and Tsionas (2004) investigate the long run relationship between
financial depth and economic growth via panel root tests and panel cointegration
analysis. They also use threshold cointegration tests, and dynamic panel data estimation
for a panel based vector error correction model. Using Johansen's procedure the authors
find a long run, but not a short run, relationship among variables. Their results concur
with King and Levine (1993) and Levine et a!. (2000) who find a unidirectional causality
9
among variables in the long run. Their results suggest that to promote growth through
financial development the focus should be on the long run rather than the short run.
Studies like that of Luintel and Khan (1999), however, find bidirectional causality
between financial development and economic growth in their sample of 10 countries,
which contradicts the results of Christopoulos and Tsionas (2004). The authors use
multivariate vector auto regression to examine long run causality. Their attempts to study
the finance-growth relationship through several different econometric techniques lead
them to favor the existence of a stable long-run relationship. This study is an early
attempt to model multivariate time series causality between financial development and
economic growth.
In a more recent study, Barajas, Chami andY ousefi (20 13) investigate the impact
of financial deepening across countries grouped by region, income level, and the type of
economy. For a measure of financial development they use private credit and stock
market turnover where the turnover is the ratio of the value of total shares traded to
market capitalization. Barajas, Charni and Yousefi (2013) use GMM dynamic panel
method to estimate the parameters to overcome two "deficiencies" ofthe OLS method,
namely omitted variable bias and reverse causality. The authors want to take advantage of
the time variation and adopt the plausible assumption that the explanatory variables are
weakly exogenous. However, to address the problem of bias the authors average all the
data over five non-overlapping periods. Their results contradict the assertions of robust
results claimed by previous authors. Barajas eta!. (2013) conclude that there is
heterogeneity in the impact of financial development on growth across regions, income
levels and the types of economy.
10
A few studies on financial development look at growth at local levels. For
example, Guiso, Sapienza and Zingales (2004) examine the effects of the difference in
local financial development within an integrated fmancial market ofltaly. Italy has had
an integrated fmancial system for the last 140 years from a political and regulatory point
of view. Using data from the Survey of Household Income and Wealth (SWIH)
conducted by the Bank of Italy and Italian Statistical Institute, Guiso et al. (2004) find
that an individual's odds of starting business increase by 33 percent if she moves from the
least financially developed region to the most financially developed region, particularly at
a relatively young age. They claim that local development enhances the probability that
an individual starts business, increases competition and promotes growth of firms.
Another local level study is conducted by Kendall (20 12) on India. Kendall finds
interestingly that human capital may decouple the dependence of growth on financial
development, based on disaggregated district level net domestic product data compiled by
the Reserve Bank of India and other variables from the Indian census. The author first
regresses deposits/NDP ratio on log(NDP) and takes the residual as a proxy for variation
in the banking capacity. Population density is used as another instrument for financial
development because of fixed cost associated with opening a new bank branch and the
ease of securing larger deposits and deeper credit penetration in more densely populated
areas. Results from the district level OLS growth regressions indicate the non-existence
of absolute convergence when control and state dummies are excluded. The results of
Kendall's (2012) 2SLS model indicate that the effect of financial development is robust
to the use of either instrument.
11
The study by Kendall (2012) has two important findings: underdevelopment of
local banking sector can hamper growth at the district level but higher human capital may
decouple this relationship. This study is one of the few that analyze the impact of
interaction between human capital and financial development on growth.
Ahlin and Pang (2008) develop a model in which low corruption and financial
development work as substitutes both facilitating productive projects. They note that the
question of substitutability or complementarity between these two factors is important. If
financial development and corruption are substitutes then aid targeted towards financial
system could best work in corrupt countries.
Ahlin and Pang (2008) run 2SLS using initial private credit as instruments. Unlike
La Porta et a! (1999), Levine et a!. (2000), and Aghion, Howitt and Mayer-Foulkes
(2004) who use legal origin as the instruments for finance, Ahlin and Pang(2012) use
initial private credit as an instrument. The reason is while growth may draw financial
sector along with it, yet its initial size is plausibly exogenous to the following forty years
of growth.
The authors find a high degree of substitutability between corruption control and
financial depth. A country at the 75th percentile of the data in both corruption and
financial development is seen to have grown 2.52 percentage points faster than a country
at the 25th percentile of these measures. Growth gains remain for improving the second
factor but gains are smaller the smaller the second factor. These very interesting results
are robust to specification differences.
One of the few studies that study impact of financial development in the context
of a model that includes human capital is by Evans, Green, and Murinde (2000) who
12
assemble data from 82 countries for 21 years from 1972 to 1992. Their findings show that
both financial development and hnman capital make a positive contribution toward the
growth process. Different from others, their model uses a translog production function
where financial indicators are M2/GDP and domestic credit to GDP and human capital is
proxied by primary and secondary school enrollments. Both money and human capital
are important contributors to growth. While the authors claim that the effects of hnman
capital or money cannot be studied in isolation which is likely to produce misleading
results, they fail to evaluate the interaction among factor inputs without denying such as a
possibility.
Abubakar, Kassim and Yusoff (20 15) explore the finance-growth nexus through
the channel ofhnman capital accumulation in the ECOWAS region. Using a panel
cointegration technique, DOLS, as well as fully modified least squares, the authors
conclude that financial development contribute significantly to economic growth of
ECOW AS both directly and through hnman capital development.
Abubakar, Kassim and Yusoff (2015) use, as do many others, the ratio of broad
money to GDP and ratio of bank credit to GDP, as indicators offmancial development.
Hnman capital is again measured by school enrollment at all levels, and the control
variables include trade openness, FDI, government expenditure and inflation. Employing
panel co integration techniques they estimate long run coefficients and perform panel
causality tests. Their results are more favorable to the use of bank credit (smaller effect
on growth) and domestic credit (bigger effect). Causality is unidirectional running from
GDP to broad money and from bank credit to GDP but bidirectional between domestic
13
credit and GDP and human capital and GDP. Interaction between human capital and
financial variables was not explored.
The variety of literature survey done here reveals that both financial development
and human capital are necessary for growth. Both factors are important determinants of
growth. An important thing that is missing in the literature is how Human capital and
Financial Development impact growth together. There is an obvious lack of extensive
literature emphasizing on the combined impact of financial development and growth.
It is necessary to know how financial development impacts growth in countries with
different level of human capital.
Conclusion: Countries across the world vary a great deal in the levels of human
capital and financial development. In the next section, my model will retain an interaction
term between these two important factors in growth. I will also examine how growth
rates vary across countries that are at different stages of development. Furthermore, I will
explore regional heterogeneity in the impact of financial development. One important
contribution to the existing literature would be to see whether Kendall's (20 12) micro
effects within a country would extend to a model for a large group of countries.
14

Chapter3
RESEARCH METHODOLOGY AND DATA
This chapter starts with a discussion of the theoretical framework that underlies my
model and that is informed by the relevant literature. The discussion is centered around
the role of financial development and human capital accumulation on economic growth.
This is followed by a description of data and the choice of variables which in tum
facilitates a discussion of my specific empirical model. Finally, I discuss the basic
characteristic of the data that is used in model estimation.
3.1 Theoretical Framework
This study takes the standard Solow (1956) neoclassical growth model with human
capital added as a factor of production. The per capita income of a country i in time
period t, Yit, will be a function of labor, Lit, physical capital Kif. The Cobb-Douglas
production function can be written as Y,, = A"L""K;/E:itwhere e"is the error term. Now
taking the log differences of the above equation and adding human capital, we get an
estimable form of the equation,
Yit = a"+aLit+ j3Kit + yHCiit + e" where y"= LogY"- LogYu-1
In the neoclassical model the initial income is also a determinant of the growth
rate because it determines the distance a country is in from its steady state. The greater
this distance the greater the predicted growth of per capita income through enhanced
capital formation (Benhabib and Spiegel, 2000). When initial level of income is included
in the model, the above model becomes:
Yit = au+aL"+ j3K" + yHCiit + Y.t-1 + eu, where yuis the growth rate.
15
When I include the control variables as suggested by the literature, I get a simple model
Growth=f(FinDev, HuCap, FinDev*HuCap, Yi-1. control variables)
3.2 Choice of Variables
3.2.1 Dependent Variable
The dependent variable in the model is growth rate of real per capita GDP. The World
Development Indicator (WDI) database of the World Bank reports growth rate of total
GDP at market values. The standard measure of per capita growth is just the difference of
the logarithms of real per capita GDP multiplied by 100.
3.2.2 Financial Development
Although there is substantial and sometimes contradictory evidence on the role of
financial development on economic growth, there is no unique measure of financial
development used in the literature that could be considered the best. Researchers have
relied on measures of the size of the banking industry as a proxy. This study considers
several measures used in the literature.
Cihak eta!. (2012) consider four characteristics of financial institutions and
markets: (a) the size of the financial institutions and markets (financial depth); (b) the
degree to which individuals can and do use financial institutions and markets (access); (c)
the efficiency of financial institutions and markets in providing financial services
(efficiency); and (d) the stability of financial institutions and markets (stability). These
four characteristics are measured both for financial institutions and financial markets that
also include equity and bond markets. This leads to a 4x2 matrix for indicators of
financial development. However, Cihak et a!. (20 12) admit that these four characteristics
individually might not capture fully all the features of financial systems. Financial depth
16
is not in itself a function of the financial system but rather a proxy of the overall extent of
services provided by the financial system.
For depth of financial institutions, Cihak eta!. (2012) favor ratio of credit to
private sector to GDP, and for depth offmancial markets they prefer stock market
capitalization plus outstanding domestic private debt securities as a percentage of GDP.
Access is measured by number of bank accounts per thousand adults (institutions) and
percent of market capitalization outside of the top 10 largest companies (markets).
Efficiency is indicated by net interest margin and turnover ratio respectively whereas for
stability the authors list z- score and volatility of stock price index. These are some of the
frequently used measures of financial systems in the literature although the authors also
provide a list of other measures for each characteristic of the financial development.
Many of the studies surveyed in the preceding chapter use a measure of broad
money (M2 or M3) as an indicator of financial development (King and Levine, 1993;
Abubakar et al., 2015). Other common measures used are ratio of domestic credit to
GDP, commercial bank credit to GDP, and liquid liabilities of the financial sector to GDP
(Benhabib and Spiegel, 2004; Evans, Green and Muride, 2000; and Ahlin and Pang,
2008). However, Luintel and Khan (1999) use the deposit, but not the currency, part of
M2 as a percentage of nominal GDP lagged one period. This may be a closer proxy to
financial development than M3 to GDP which, as claimed by Luintel and Khan (1999),
measures only monetization which in turn may not accurately indicate the size of the
financial sector in the developing countries.
In light of the need to arrive at the most relevant indicator of financial
development, this study will use three such measures: (a) private credit extended by
17
deposit money banks and other financial institutions as a percent of GDP, (b) ratio of
liquid liabilities to GDP expressed in percentage terms, and (c) domestic credit to the
private sector as a percentage of GDP.
Private credit advanced by the deposit money banks and other financial
institutions excludes credit issued to government agencies and public enterprises. It may
be a good representation of the depth of the financial system as it reflects the borrowing
needs of households and firms given market conditions (Beck and Levine, 1999).
Domestic credit to the private sector is a similar measure for the activity of financial
intermediaries except it comes from the balance sheet of the monetary system including
the central bank which in many developing countries can extend credit to the government
or public entities. This indicator was also used by Levine and Zervos (1998) and Levine
Lozaya and Beck (1999).
All the three variables used in this study are taken from the Global Financial
Development Database (GFDD) as available from the World Bank website. I expect the
financial development variable to have positive impact on growth.
3.2.3 Human Capital
One main purpose of this study is to find the impact of human capital on growth
rate distinct from the growth effect of financial development. Education data can indicate
aspects of human capital reasonably well. Kendall (2012) uses literacy rates for human
capital in the case ofindia. But literacy rates measure only basic educational
achievements and skills. In a diverse collection of countries using literacy rate would be
inappropriate; in developed countries for example a merely literate person would be near
the bottom of the distribution of the human capital.
18
Abubakar, Kassim and Yusoff (20 15) use human capital as measured by total
emollment ratio (primary, secondary and tertiary) taken from UNESCO statistics.
Benhabib and Spiegal (2001) use the logarithm of average years of schooling for adults
over 25 years of age.
My study takes human capital as the percentage of population age 25+ that has
completed secondary schooling. This data is obtained from the Barro-Lee dataset (2013).
The choice between stock measure (years of schooling) and flow measure ( emolhnents)
of human capital has also been debated in the literature. This study uses a stock measure
as indicated above. I expect that the human capital variable will have a significant
positive impact on growth.
3.2.4 Interaction
Financial development and human capital can independently influence economic growth.
But it is possible to hypothesize an interactive effect from these variables as well. As
human capital accumulation speeds up, individuals' risk taking ability may increase
which increases investment demand and demand for credit. A greater financial
development is more likely to facilitate investment through bank borrowings. Thus
combined effects of human capital and finance on growth may be greater than is
indicated by their individual contributions.
I create an interaction term between the measures of financial development and
human capital. Interaction terms can be created by taking the product of the total values
of the two variables. An alternative method would be to center the variables (i.e. take
differences from the respective means) and then take their product. Using the product of
19
level variables gave rise to severe multicollinearity of the interaction term with financial
development and human capital. The mean deviation approach avoids the problem and is
therefore my preferred method in this study.
3.2.5 Conditioning Information
Different conditioning information, i.e., control variables, is used in growth studies.
Levine, Loyaza and Beck (2000) use three sets of conditioning information: (a) The
simple conditioning information set, (b) the policy conditioning information set, and (c)
the full conditioning information set. The simple set includes the constant, the logarithm
of initial per capita GDP and initial educational attainment. The policy set includes the
simple set plus measures of government size, inflation, and openness to international
trade. The full conditioning information set includes the policy set plus measures of
political stability and ethnic diversity. This thesis uses the policy conditioning
information set.
Following standard practice, government size is measured by the general government
final consumption expenditure as a percentage of GDP, inflation by annual growth of
GDP implicit price deflator, and openness by the sum of exports and imports of goods
and services as a percentage of GDP (World Bank WDI).
3.3 Selection of Countries
My sample consists of 66 countries including those in the high income, upper middle
income, lower middle income, and low income groups. This classification follows Global
Financial Structure Database 2013 maintained by the World Bank.
Starting with all the countries available in World Development Indicators
Database, I dropped those that had a population of less than I million as a threshold. This
20
retained 145 countries. Lack of data for many of them, particularly for 1970s and part of
1980s, shrank the sample further to a panel of 66 countries in my study. The sample has
19 high income countries, 20 upper middle income countries, 19 lower middle income
countries, and 8 low income countries. These countries are from Middle East and North
Africa (6), Latin America and the Caribbean (15), Sub-Saharan Africa (17), high income
OECD (17), and South and Southeast Asia and the Pacific (II). Thus the diverse range
of countries in my sample from all income groups and all geographic regions easily
permits a study of differences across countries at various stages of development and from
different geographic areas. A comparative analysis of how financial development affects
growth is accomplished by creating regional and development stage dummies before
model estimation proceeds.
3.4 Empirical Model
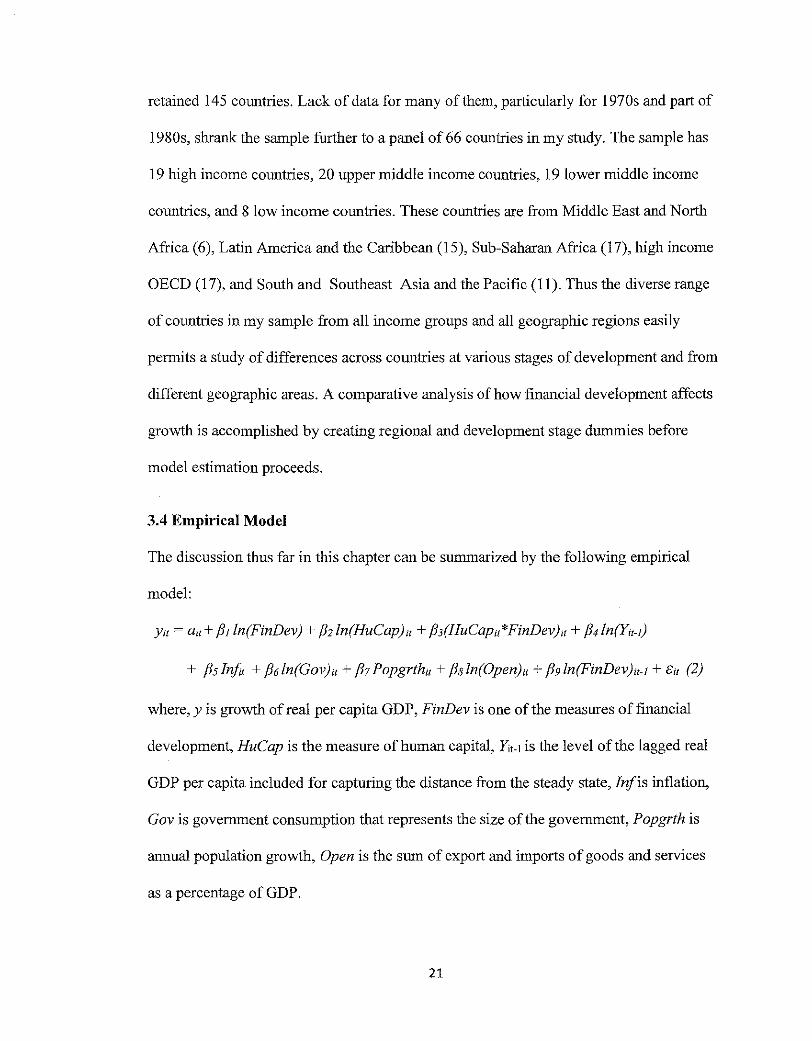
The discussion thus far in this chapter can be sunnnarized by the following empirical
model:
Yit =a"+ /h ln(FinDev) + j]] ln(HuCap)it + /h(HuCapit*FinDev)it + /h ln{Yit-I)
+ fh In/it + fJ6ln(Gov)it + f37 Popgrthit + fJsln(Open)it + jJ9ln(FinDev)it-I +Bit (2)
where, y is growth of real per capita GDP, FinDev is one of the measures of financial
development, HuCap is the measure of human capital, Yit-I is the level of the lagged real
GDP per capita included for capturing the distance from the steady state, Infis inflation,
Gov is government consumption that represents the size of the government, Popgrth is
annual population growth, Open is the sum of export and imports of goods and services
as a percentage of GDP.
21
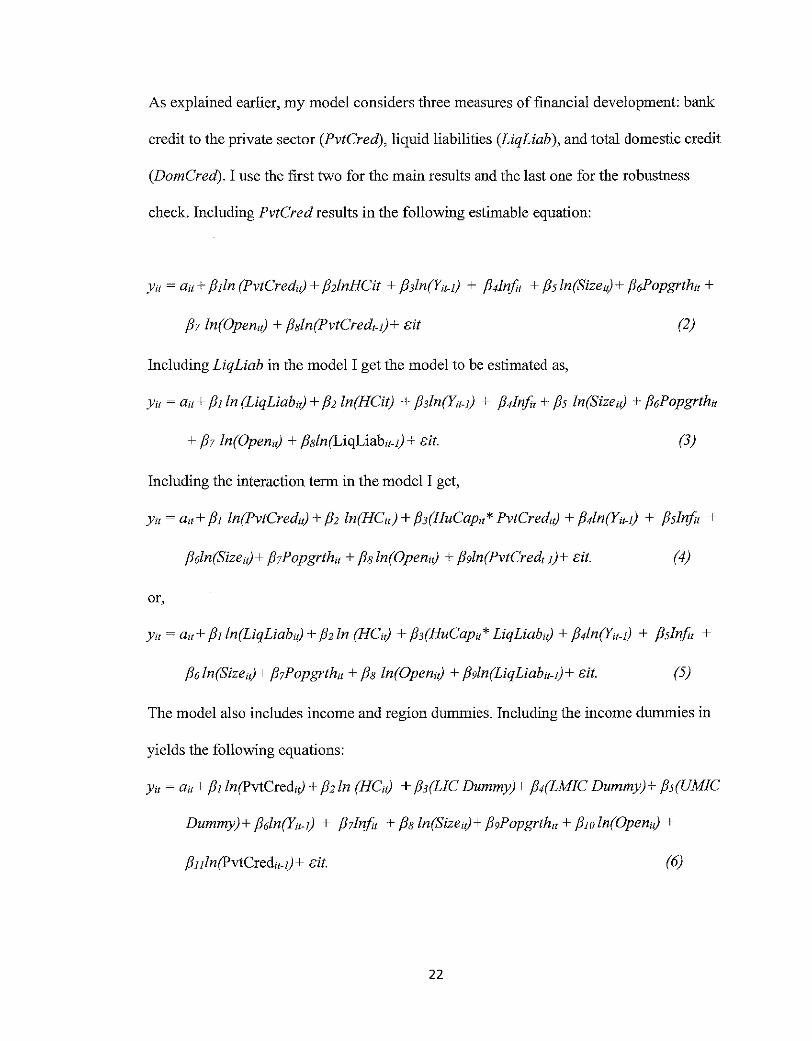
As explained earlier, my model considers three measures of financial development: bank
credit to the private sector (PvtCred), liquid liabilities (LiqLiab ), and total domestic credit
(DomCred). I use the first two for the main results and the last one for the robustness
check. Including PvtCred results in the following estimable equation:
j37 ln(Open,J + J3sln(PvtCred,.J)+ cit (2)
Including LiqLiab in the model I get the model to be estimated as,
Ytt ~ att + f31ln (LiqLiab,J + f32 ln(HCit) + f33ln{Ytt-I) + f34ln[t, + f35 ln(Size,J + f36Popgrthtt
+ f37 ln(Open,J + J3sln(LiqLiabtt-I) + eit. (3)
Including the interaction term in the model I get,
Ytt ~ att+ f31 ln(PvtCred,J + f32 ln(HCtt) + f33(HuCaptt* PvtCred,J + f34ln{Ytt-I) + f35lnju +
f3Gln(Size1J+ f31Popgrthu + J3sln(Open,J + f3gln(PvtCred,.J)+ eit. (4)
or,
Ytt ~ att+ f3Iln(LiqLiab,J + f32ln (HC,J + j33(HuCapu* LiqLiab,J + f34ln{Ytt-I) + f35Jn[t, +
f36ln(Size,J+ f31Popgrthtt + J3s ln(Open,J + f39ln(LiqLiabtt-I)+ eit. (5)
The model also includes income and region dummies. Including the income dummies in
yields the following equations:
Ytt ~ att+ j3Jln(PvtCred,J + f32ln (HC,J + f3J(LIC Dummy)+ j34(LMIC Dummy)+ j35(UMIC
Dummy)+ f36ln{Ytt-I) + f37!nji, + J3sln(Size,J+ j3gPopgrthtt + jJJOln(Open,J +
f3nln(PvtCredu-I)+ cit. (6)
22
Yit =au+ /31 (LiqLiab,J + /32HCu + /33(LIC Dummy)+ /34(LMIC Dummy)+ /3s(UMIC
Dummy)+ /36/n(Yu-1) + /37/nji, + f3sSizeu+ f3gPopgrthu + /3Jo0penu + f3nln(LiqLiab,_
1)+ eit. (7)
Yit =a"+ /31 (PvtCred,J + /32HCu + /33(HuCapu* PvtCred,J +f34(LIC Dummy)+ f3s(LMIC
Dummy)+ /36(UMIC Dummy)+ /37/n(Yu-1) + /3slnfu + /39 ln(Size,J+ f3wPopgrthu +
f3n ln(Open,J + j3n/n(PvtCredu-1)+ eit. (8)
yu =au+ /31 ln(LiqLiab,J + /32/n(HCtJ + /33(HuCapu* LiqLiab,J +f34(LJC Dummy)+
/3s(LMIC Dummy)+ /36(UMIC Dummy)+ /37/n(Yu-1) + J3slnji1 + j39ln(Size1J+
/31oPopgrthu + f3nln (Open,J + f3nln(LiqLiabt.J)+ eit. (9)
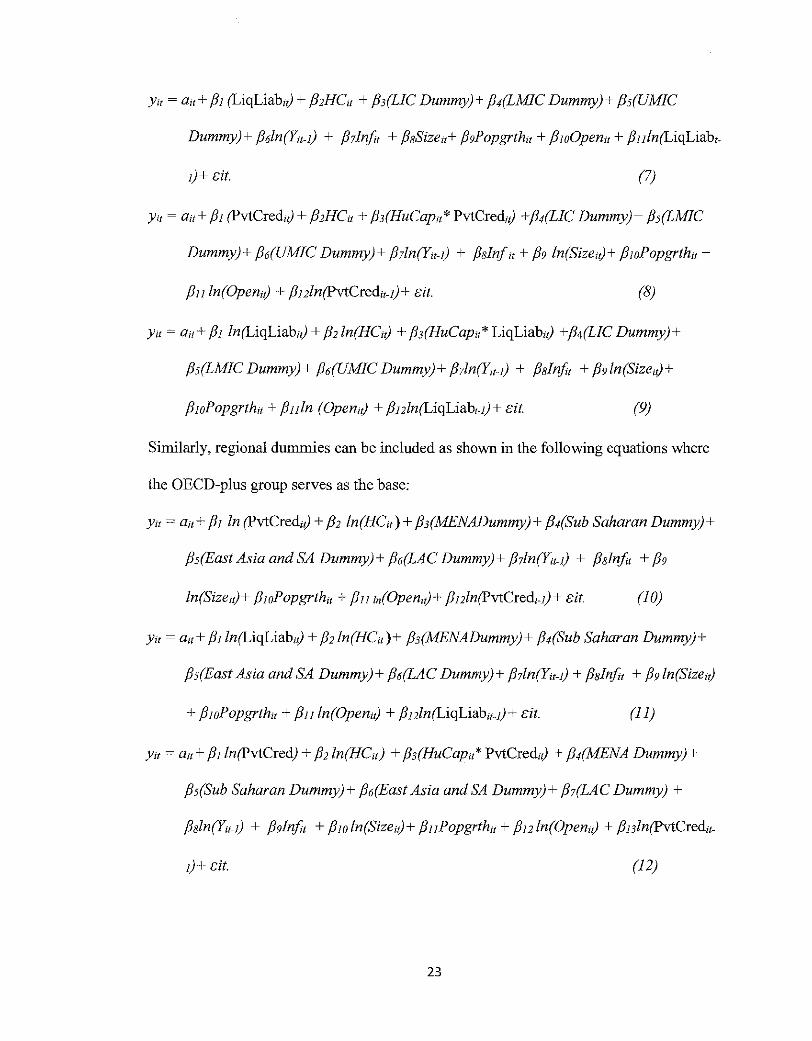
Similarly, regional dummies can be included as shown in the following equations where
the OECD-plus group serves as the base:
Ytt =au+ /31 In (PvtCred,J + /32 ln(HCu)+ /33(MENADummy)+ /34(Sub Saharan Dummy)+
/3s(East Asia and SA Dummy)+ /36(LAC Dummy)+ /37/n(Yu-1) + j3slnji, + /39
ln(Size,J+ j3wPopgrth,, + f3n zn(Open,J+ f3nln(PvtCred,.J)+ eit. (10)
yu =au+ /31 ln(LiqLiab,J + /32/n(HCu)+ j3J(MENADummy)+ /34(Sub Saharan Dummy)+
/3s(East Asia and SA Dummy)+ /36(LAC Dummy)+ /37/n(Yu-I) + J3slnfu + f3g/n(Size,J
+ /310Popgrthu + f3nln(Open,J + f3nln(LiqLiabu-I)+ eit. (II)
Ytt =au+ /31 ln(PvtCred) + /32/n(HCu) + /33(HuCapu* PvtCred,J + /34(MENA Dummy)+
j3 s(Sub Saharan Dummy)+ /36(East Asia and SA Dummy)+ j3 7(LA C Dummy) +
/3sln(Yu-I) + /39lnji, + /310 ln(Size,J+ f3nPopgrthu + f3nln(Open,J + f3nln(PvtCredu-
1)+ eit. (12)
23
y" ~au+ /JI ln(LiqLiab) + fJ2 (HCit)+ /JJ(HuCap* LiqLiab) + fJ4(MENADummy)+ fJs(Sub
Saharan Dummy)+ /J6(East Asia and SA Dummy)+ /J?(LAC Dummy) + fJsln{Yu-I) +
f39lnf + /Jio ln(Size)+ fJuPopgrth + fJnln(Open) +fJnln(LiqLiabr-I)+ <:it. (13)
3.4.1 Hypotheses
I expect that the financial development variable will have a positive impact on growth
because it eases the financial constraints that borrowers face leading to a more productive
economy. The human capital variable is also expected to have a significant positive
impact on growth. The lagged value of the log of the per capita real GDP is expected to
have a negative sign indicating that the countries are converging toward their respective
steady states. Population growth is expected to have a negative impact on growth per the
standard Solow model. Trade openness should have a positive coefficient because trading
with other countries helps a country to exploit comparative advantage. I expect the size of
the government to have a significant negative impact because as the government
consumption increases, gross capital formation is likely to decrease leading to slower
growth.
Financial development may also affect growth through its interaction with human
capital. Higher risk taking and perception and exploitation of profitable opportunities
tend to increase in countries with greater human capital accumulation. But turning ideas
into concrete projects requires fmance and investment made possible by financial
institutions through pooling of savers' resources. Thus, it is possible human capital and
financial development may affect growth in an interactive way. I expect the use of an
interaction term between these two variables will indicate their complementarity in
growth.
24
3.4.2 Panel Data Model
This research uses a panel data approach to find the relationship between growth and
other variables. Hsiao (2003) shows superiority of panel data analysis over country
specific OLS because of a large number of data points (N*T), increasing the degrees of
freedom and thus reducing the collinearity among explanatory variables. Cross section
data observed over many periods results in more reliable findings than a single year cross
section. Panel data model is also advantageous for its ability to account for country
specific effects unlike pooled OLS. Because of its greater merits I use the panel data
technique to estimate my model.
3.5 Data Sources and Descriptive Statistics
The data used in this study is taken mainly from the World Development Indicators
provided by the World Bank for most of the macro variables, the education data from the
Barro-Lee database, and financial development data from the World Financial
Development Structure Database that integrates data compiled earlier by several
researchers mainly at the World Bank.
The dataset covers the period from 1970 to 2010. That makes 40 observations for
each country. There are 66 countries in my sample. Starting with a total of 2640
observations (66 countries times 40 observations per country) I calculate the non
overlapping averages of 5 years for all the variables in order to smooth out business cycle
type fluctuations that would only introduce short term noise in my long-run study of
growth. Five-year averages for each variable then reduce the sample size to 528
observations consisting of 8 observations for each of 66 countries.
25
The summary statistics in Table 1 show the mean GDP per capita growth rate of
1.52 percent per year with a standard deviation of 2.32 percent. The minimum growth
rate is -8.05 and the maximum is 7.91 for the first period of 1971-75. The mean per
capita GDP (in 2005 constant dollars) is$ 9047.74 with a standard deviation of
$12432.05. The minimum per capita GDP is $144 for Burundi during 2001-05 and the
maximum per capita GDP is $67616 for Norway during 2006-10.
The mean rate of inflation is 40.78% with a standard deviation of272.96%. The
high mean is because of countries such as Nicaragua where inflation during the civil war
period of 1985-90 averaged 4828.7 percent. The mean, minimum and maximum values
of trade openness are 67.08, 9.33 and 400.20 percent ofGDP. Openness is least for India
for 1970-75 and highest for Singapore during 1995-2000.
My key explanatory variables are private credit, liquid liabilities, and human
capital. The mean values of the first two are 41.20 percent (with a standard deviation of
37.88 percent), and 45.40 (30.46), both as percentages of GDP. The mean of human
capital measured as a percentage of 25+ population with secondary schooling is 14.82
with a standard deviation of 12.18. The minimum is 0.17 for Niger for 1971-75 and the
maximum is 54.98 for Australia during 1995-2000. The summary statistics are presented
in Table 1 given below. The region-specific summary statistics are provided later in the
appendix section.
26
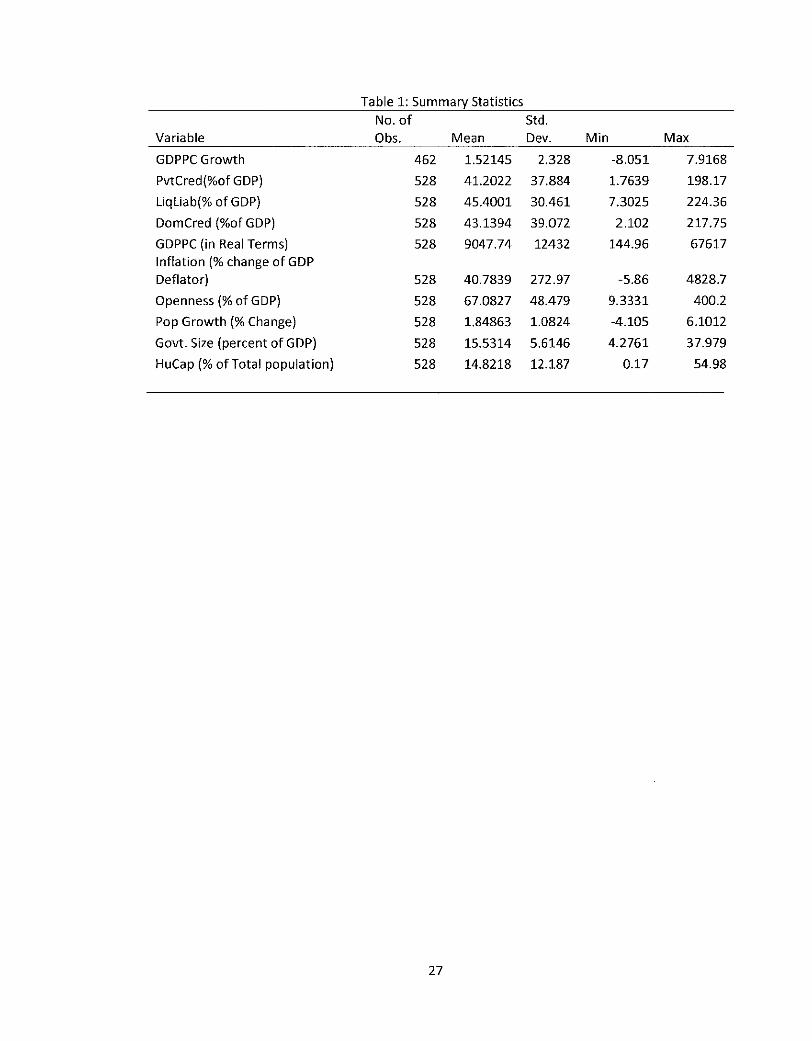
Table 1: Summary Statistics
No. of Std. Variable Obs. Mean Dev. Min Max
GOP PC Growth 462 1.52145 2.328 -8.051 7.9168
PvtCred(%of GOP) 528 41.2022 37.884 1.7639 198.17
Liqliab(% of GOP) 528 4S.4001 30.461 7.3025 224.36
DomCred (%of GOP) 528 43.1394 39.072 2.102 217.7S
GDPPC (in Real Terms) 528 9047.74 12432 144.96 67617 Inflation(% change of GOP Deflator) 528 40.7839 272.97 -5.86 4828.7
Openness(% of GOP) 528 67.0827 48.479 9.3331 400.2
Pop Growth(% Change) 528 1.84863 1.0824 -4.105 6.1012
Govt. Size (percent of GOP) 528 15.5314 5.6146 4.2761 37.979
HuCap (% ofTotal population) S28 14.8218 12.187 0.17 54.98
27
Chapter4
Results and Discussion
In this chapter I first present the results of the tests for stationarity of variables. This is
followed by addressing concerns about multicollinearity of the variables. The results of
the Hausman test for fixed effects and random effects are then discussed. Finally, once
the question of the right model is settled, I discuss my regression results.
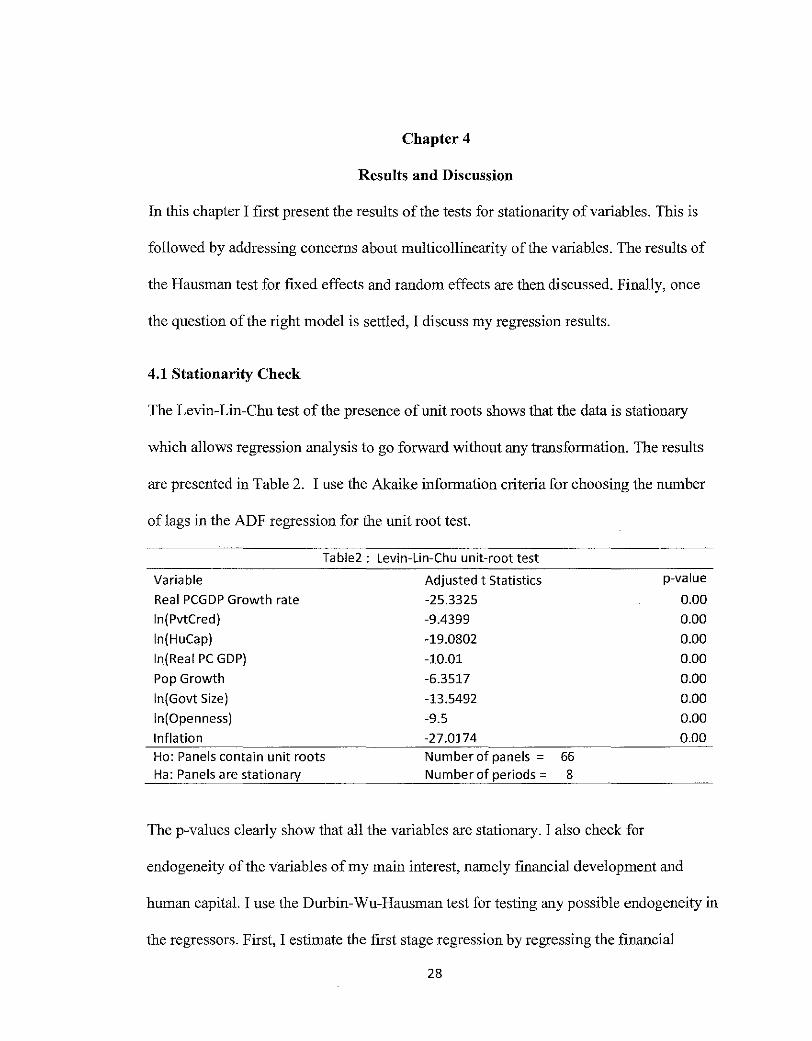
4.1 Stationarity Check
The Levin-Lin-Chu test of the presence of unit roots shows that the data is stationary
which allows regression analysis to go forward without any transformation. The results
are presented in Table 2. I use the Akaike information criteria for choosing the number
oflags in the ADF regression for the unit root test.
Table2 : Levin-Lin-Chu unit-root test
Variable Adjusted t Statistics p-value
Real PCGDP Growth rate -25.3325 0.00
ln(PvtCred) -9.4399 0.00
ln(HuCap) -19.0802 0.00
ln(Real PC GDP) -10.01 0.00
Pop Growth -6.3S17 0.00
In( Govt Size) -13.5492 0.00
ln(Openness) -9.5 0.00
Inflation -27.0174 0.00
Ho: Panels contain unit roots Number of panels = 66 Ha: Panels are stationary Number of periods = 8
The p-values clearly show that all the variables are stationary. I also check for
endogeneity of the variables of my main interest, namely financial development and
human capital. I use the Durbin-Wu-Hausman test for testing any possible endogeneity in
the regressors. First, I estimate the first stage regression by regressing the financial
28
development variable with the initial level of financial development and all other
regressors in the model and I obtain the residuals. Second, I run a regression including
the residual obtained from the first stage into the structural equation. I find that the
coefficient of the residuals in the structural equation is not significantly different to zero.
In fact, the coefficient of the residuals is omitted due to multicollinearity. This confirms
that the variable for financial development is exogenous in the model. The same applies
for the human capital variable. The Durbin-Wu-Hausman test for endogeniety confirms
that financial development and human capital are exogenous in the model.
4.2 Correlation Matrix
The correlation matrix in Table 3 shows that there is some problem of multicollinearity
among the variables. Private credit and domestic credit have a high level of collinearity
which has led to the removal of domestic credit and the use of private credit in my
regressions. Next, the interaction term between financial development and human capital
variable is highly correlated with both financial development and human capital. Thus the
interaction term used in the model is the product of mean deviations rather than the
product of the level values of the two variables. All the regression results discussed in
this chapter follow from the use of the centered interaction term. This fully addresses the
problem of multicollinearity.
29
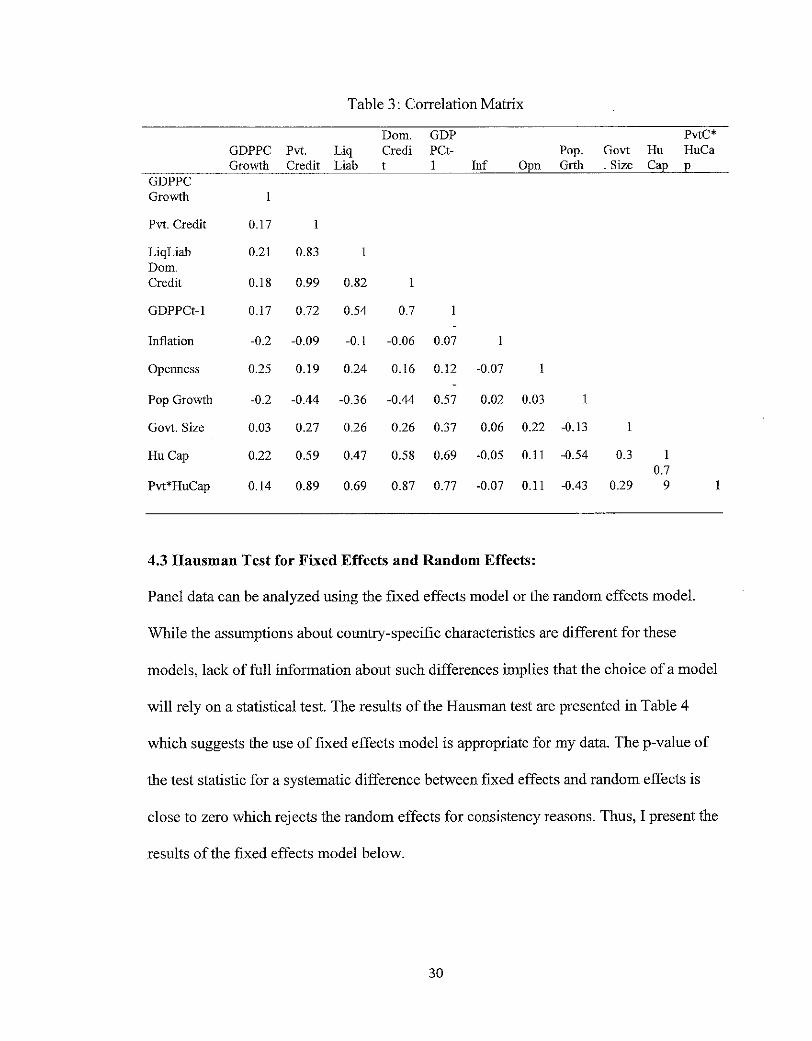
Table 3: Correlation Matrix
Dom. GDP PvtC* GDPPC Pvt. Liq Credi PCt- Pop. Govt Hu HuCa Growth Credit Liab t 1 Inf Ol'n Grth . Size Cal' E
GDPPC Growth
Pvt. Credit 0.17
LiqLiab 0.21 0.83 1 Dom. Credit 0.18 0.99 0.82 1
GDPPCt-1 0.17 0.72 0.54 0.7
Inflation -0.2 -0.09 -0.1 -0.06 0.07
Openness 0.25 0.19 0.24 0.16 0.12 -0.07
Pop Growth -0.2 -0.44 -0.36 -0.44 0.57 0.02 0.03
Govt. Size 0.03 0.27 0.26 0.26 0.37 0.06 0.22 -0.13 1
HuCap 0.22 0.59 0.47 0.58 0.69 -0.05 0.11 -0.54 0.3 1 0.7
Pvt*HuCap 0.14 0.89 0.69 0.87 0.77 -0.07 0.11 -0.43 0.29 9
4.3 Hausman Test for Fixed Effects and Random Effects:
Panel data can be analyzed using tbe fixed effects model or tbe random effects model.
While the assumptions about country-specific characteristics are different for these
models, lack of full information about such differences implies tbat the choice of a model
will rely on a statistical test. The results of tbe Hausman test are presented in Table 4
which suggests tbe use of fixed effects model is appropriate for my data. The p-value of
tbe test statistic for a systematic difference between fixed effects and random effects is
close to zero which rejects tbe random effects for consistency reasons. Thus, I present tbe
results of the fixed effects model below.
30

Table 4: Hausman Test for Fixed Effects and Random Effects
Ho: difference in coefficients not systematic
i(8) = (b-B)'[(V _b-V _BY'(-l)](b-B)= 109.86 Prob> x2 = 0.0000 (V _b-V _B is not positive definite)
However, one of the objectives of this research is to examine possible differences in the
relationships across country groups by income and geography. The fixed effects
estimation carmot produce the coefficients for any time invariant variables because of
their perfect multicollinearity with the constant term. Hence it will automatically drop the
country and income dummies and force the use of random effects in such cases. The
random effects model gives results for the Generalized Least Squares estimates by
including the coefficients for time invariant variables.
4.4 Results of Growth Regressions
4.4.1 Fixed Effects Growth Regression Results
Table 5 shows the results when the variable private credit or liquid liabilities is used in
the set of explanatory variables. These results appear in columns 1 and 2. Then, the
results for models with the respective interaction terms with human capital (PvtCred and
HuCap, or LiqLiab and HuCap) are shown in columns 3 and 4.
The results of fixed effects model show that private credit has a positive
significant impact on growth thus confirming that financial development has a role in the
growth of a country. The coefficient of log of private credit is at 0.605 indicates that a
one percent growth of private credit is associated with per capita income growth of 0.6
percentage point. More developed fmancial systems seem to charmel resources to
efficient projects which raise income.
31
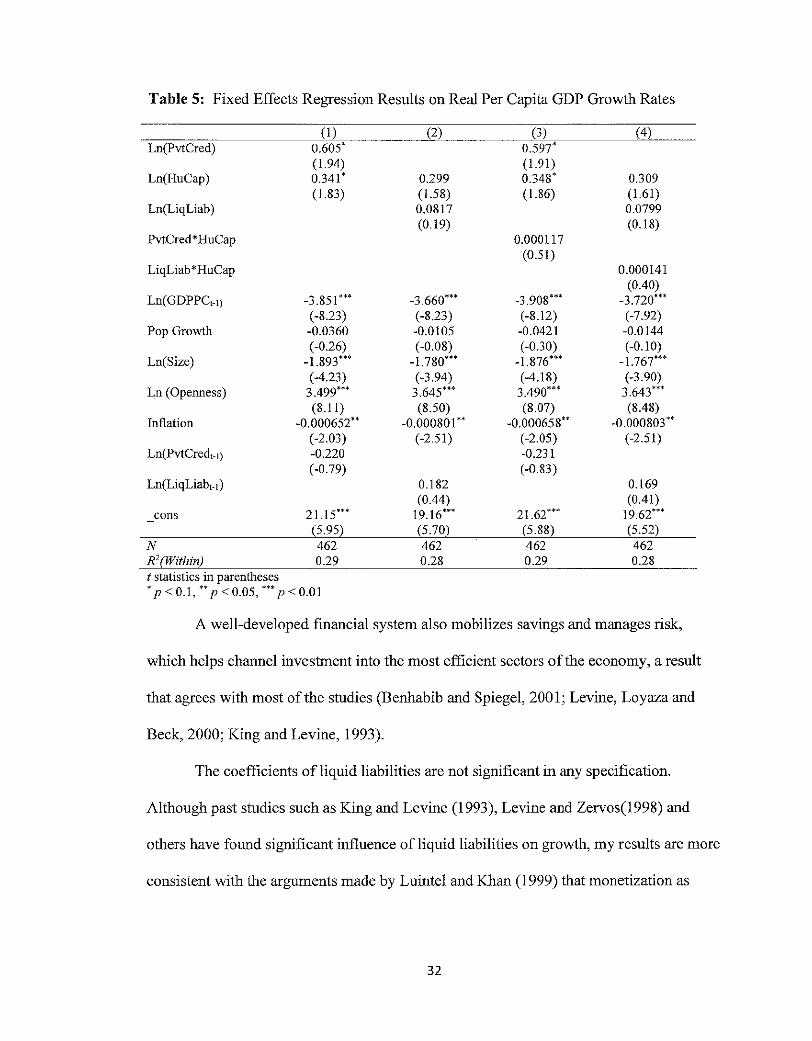
Table 5: Fixed Effects Regression Results on Real Per Capita GDP Growth Rates
(I) (2) (3) (4) Ln(PvtCred) 0.605' 0.597'
(1.94) (1.91) Ln(HuCap) 0.341' 0.299 0.348' 0.309
(1.83) (1.58) (1.86) (1.61) Ln(LiqLiab) 0.0817 0.0799
(0.19) (0.18) PvtCred*HuCap 0.000117
(0.51) LiqLiab*HuCap 0.000141
(0.40) Ln(GDPPC,_,) -3.851*** -3.660"' -3.908"' -3.720***
(-8.23) (-8.23) (-8.12) (-7.92) Pop Growth -0.0360 -0.0105 -0.0421 -0.0144
( -0.26) (-0.08) (-0.30) (-0.10) Ln(Size) -1.893"' -1.780'" -1.876*** -1.767***
( -4.23) (-3.94) (-4.18) (-3.90) Ln (Openness) 3.499*** 3.645*** 3.490"' 3.643***
(8.11) (8.50) (8.07) (8.48) Inflation -0.000652" -0.000801" -0.000658" -0.000803"
(-2.03) ( -2.51) (-2.05) ( -2.51) Ln(PvtCred,_,) -0.220 -0.231
(-0.79) (-0.83) Ln(LiqLiab,.,) 0.182 0.169
(0.44) (0.41) cons 21.15*** 19.16'" 21.62"' 19.62***
(5.95) (5.70) (5.88) (5.52) N 462 462 462 462 R2(Within) 0.29 0.28 0.29 0.28 t statistics in parentheses • p < 0.1, ** p < 0.05, *** p < 0.01
A well-developed fmancial system also mobilizes savings and manages risk,
which helps channel investment into the most efficient sectors of the economy, a result
that agrees with most of the studies (Benhabib and Spiegel, 200 l; Levine, Loyaza and
Beck, 2000; King and Levine, 1993).
The coefficients ofliquid liabilities are not significant in any specification.
Although past studies such as King and Levine (1993), Levine and Zervos(1998) and
others have found significant influence ofliquid liabilities on growth, my results are more
consistent with the arguments made by Luintel and Khan (1999) that monetization as
32
indicated by liquid liabilities does not necessarily mean growth in the credit issued to the
entrepreneurs and channeled to investments.
The coefficient of human capital is statistically significant for specifications (1)
and (3) and but not so for (2). Human capital expansion leads to innovation and
introduction of newer technology that can enhance growth. Results indicate that a one
percentage point increase in the population with a secondary level of education leads to a
0.34 percentage point increase in the growth rate. Innovation through human capital
strengthens growth of a country.
The interaction term is not significant in any of the four specifications. This
contradicts my hypothesis of a substantial interactive effect and that of Kendall (20 12)
who found significant interaction in the sub-regional economies oflndia.
The lagged per capita real GDP is highly significant across all specifications and
has the anticipated negative sign. This means that the nearer an economy was to its steady
state in the previous period, the lower will be the growth rate in the current period
holding other factors constant. The convergence predicts higher growth in response to
lower initial GDP per capita. Our results are in line with the results reported by Barro
( 1991) and hundreds of other studies.
Population growth is not significant in the model. The size of the government is
highly significant with a negative sign across all specifications. This implies that a rise in
government consumption is associated with slower growth. A one percent increase in
government consumption leads to approximately 1.8 percentage point decrease in growth
rate.
33
Openness is also significant in all the specifications. Openness is a driver of
growth. Results confirm that more open economies have higher per capita growth with a
rather large coefficient 3.49.
4.4.2 Results of Random Effects GLS Regressions Including Income Dummies
Table 6 gives the results of the regressions by including dummies for different income
groups with and without the interaction term when the high income group (HI C) serves as
the reference. The random effects GLS estimates show the results that are almost the
same as in Table 5, except that the coefficients of PvtCred are significant at a higher
level. Human capital and credit to the private sector are both significant but the
interaction term is again not significant. Other controls also have the same sign and
significance as shown earlier in Table 5, indicating the robustness of the model
specification.
The country group dummies are negative and highly significant. This suggests
that the rich HIC group, the base group, grows faster than all others after controlling for
all other variables. The LIC dummy has a coefficient of -8.1, LMIC a coefficient of -5.7,
and UMIC a coefficient of-3 .2. This means as we move from the lower income group to
the higher income group the coefficients are increasing. The implication that the growth
rate is higher as move up the development ladder shows that poorer countries will need to
focus more on factors that have the highest association with the growth rate instead of
hoping for naturally growing convergence with high income countries.
34
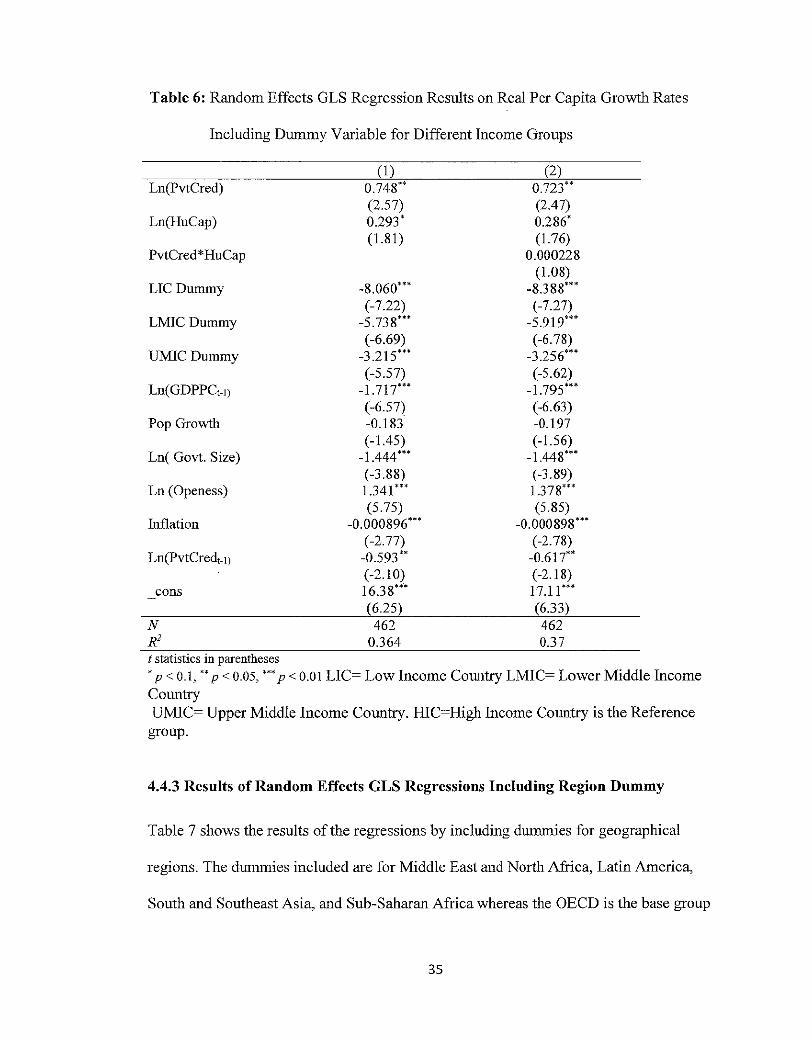
Table 6: Random Effects GLS Regression Results on Real Per Capita Growth Rates
Including Dummy Variable for Different Income Groups
(1) (2) Ln(PvtCred) 0.748" 0.723"
(2.57) (2.47) Ln(HuCap) 0.293' 0.286'
(1.81) (1.76) PvtCred *HuCap 0.000228
(1.08) LICDummy -8.060"' -8.388'"
(-7.22) (-7.27) LMICDummy -5.738"' -5.919'"
(-6.69) (-6. 78) UM!CDummy -3.215"' -3.256'"
(-5.57) (-5.62) Ln(GDPPCt-lJ -1.717'" -1.795'"
(-6.57) (-6.63) Pop Growth -0.183 -0.197
( -1.45) (-1.56) Ln( Govt. Size) -1.444 "' -1.448'"
( -3 .88) (-3.89) Ln (Openess) 1.341'" 1.378"'
(5.75) (5.85) Inflation -0.000896"' -0.000898"'
(-2.77) (-2.78) Ln(PvtCred,_, J -0.593" -0.617"
(-2.1 0) (-2.18) cons 16.38"' 17.11"'
6.25 6.33) N 462 462 R2 0.364 0.37 t statistics in parentheses
'p < 0.1, "p < 0.05, "'p < 0.01 LIC= Low Income Country LMIC= Lower Middle Income Country UMIC= Upper Middle Income Country. HIC=High Income Country is the Reference
group.
4.4.3 Results of Random Effects GLS Regressions Including Region Dummy
Table 7 shows the results of the regressions by including dummies for geographical
regions. The dummies included are for Middle East and North Africa, Latin America,
South and Southeast Asia, and Sub-Saharan Africa whereas the OECD is the base group
35
consisting of high income countries of Europe and North America and Australia. The
objective of these two tables is to see whether there is heterogeneity in growth rates
across regwns.
The results presented in Table 7 are similar to my previous results. The sign and
size of the coefficients of PvtCred and HuCap conform to the hypothesis of their positive
impact on growth. Holding other things constant, a I percent increase in the private credit
will lead to a 0.6 percentage point increase in the growth rate. Lagged GDP per capita is
negative indicating a trend toward convergence. Size of government, inflation, openness,
the lagged value of the private credit, and the region dummies are all significant and
match theoretical predictions. Growth in Sub-Saharan Africa is 3.3 percentage point
slower than the reference group. These coefficients for LAC, MENA, and Asia are -2.80
-1.92 and -1.98 respectively.
More importantly and unsurprisingly the interaction term between finance and
human capital again fails to acquire significance at any conventional level suggesting no
significant interaction between human capital and private credit in growth.
36
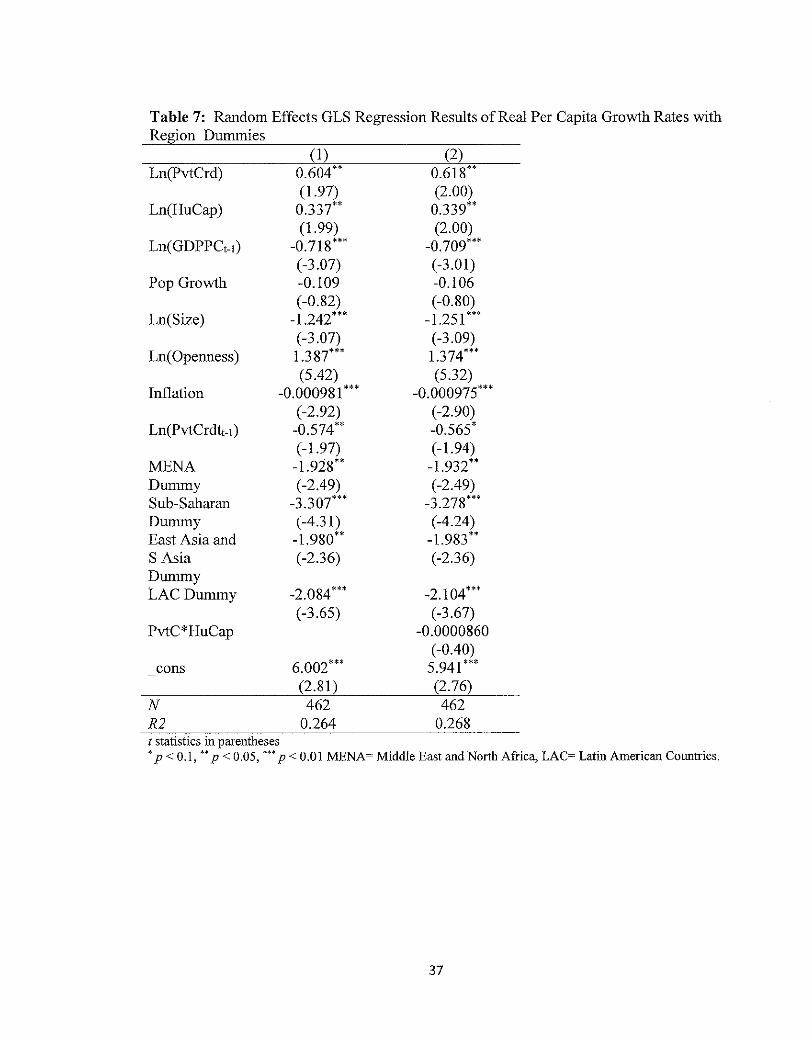
Table 7: Random Effects GLS Regression Results of Real Per Capita Growth Rates with Region Dummies
(I) (2) Ln(PvtCrd) 0.604" 0.618"
(1.97) (2.00) Ln(HuCap) 0.337" 0.339"
(1.99) (2.00) Ln(GDPPCt-1) -0.718'" -0.709'"
(-3.07) (-3.01) Pop Growth -0.109 -0.106
(-0.82) (-0.80) Ln(Size) -1.242'" -1.251 '"
(-3.07) (-3.09) Ln(Openness) 1.387'" 1.374'"
(5.42) (5.32) Inflation -0.000981 "' -0.000975"'
(-2.92) (-2.90) Ln(PvtCrdtt-1) -0.574" -0.565'
(-1.97) (-1.94) MENA -1.928" -1.932" Dummy (-2.49) (-2.49) Sub-Saharan -3.307'" -3.278"' Dummy (-4.31) (-4.24) East Asia and -1.980" -1.983" S Asia (-2.36) ( -2.36) Dummy LAC Dummy -2.084'" -2.104"'
(-3.65) (-3.67) PvtC*HuCap -0.0000860
(-0.40) cons 6.002'" 5.941'**
-(2.81) (2.76)
N 462 462 R2 0.264 0.268 t statistics in parentheses 'p < 0.1, "p < 0.05, '" p < 0.01 MENA~ Middle East and North Africa, LAC~ Latin American Conntries.
37

4.4.4 Regression on Countries with High Level and Low Level of Human Capital in
Early 1970's
In this section, I test whether growth remains the same in countries that had different
levels of human capital in the early 1970's. I group my countries according to the five
year average of human capital during 1971-1975. The median is now used to split my
sample into two groups: one with human capital in the initial period greater than the
median and the other with initial human capital less than the median. The two groups of
countries are therefore the group with the high initial human capital and one with the low
initial human capital.
Table 8 shows the results. The Hausman test here calls for the use of random
effects model. The coefficients of private credit are positive and significant at I 0 percent
level in all specifications. The introduction of initial human capital also shows that my
model is relatively robust to the use of different variables and specifications. The positive
impact of financial development on growth never goes insignificant. With respect to
human capital the model indicates significance ofthe variable in countries that started out
with a low level of human capital but not in those with a high level of initial human
capital. This also suggests that the positive and significant effect of human capital on
growth in earlier specifications could be attributed more to the countries that had a lower
level of human capital in the early 1970s.
Finally, regardless of specifications, the interaction between human capital and
financial development fails to provide any explanatory power to the model.
38
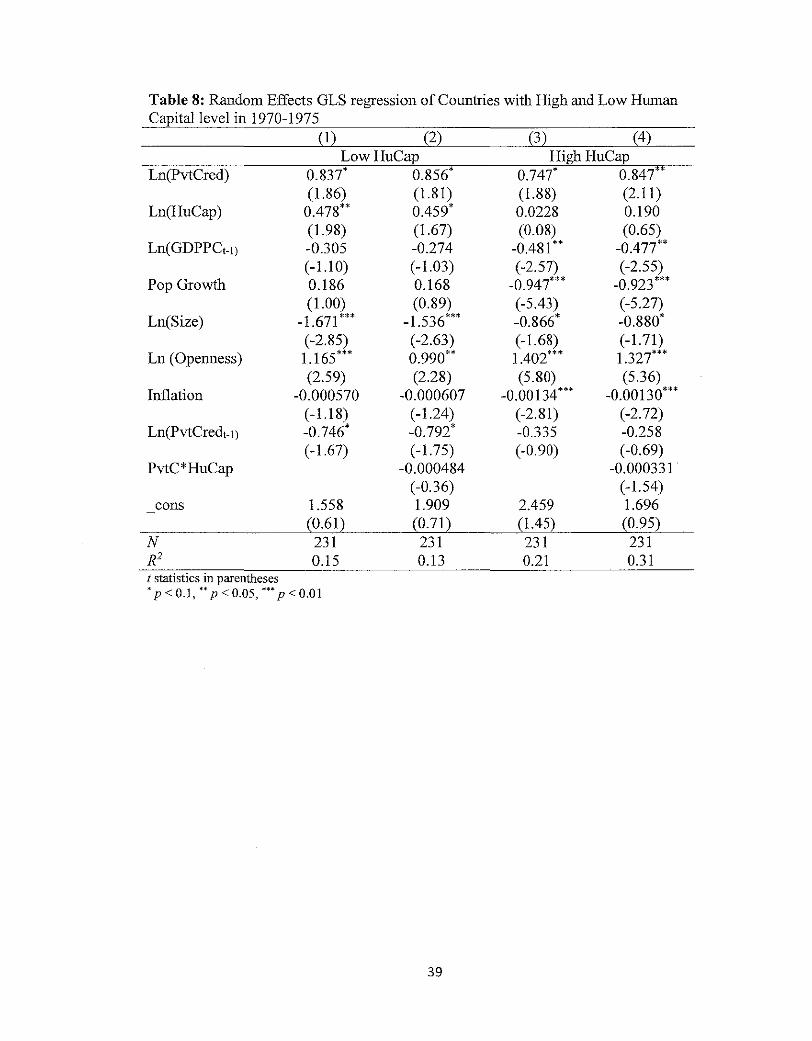
Table 8: Random Effects GLS regression of Countries with High and Low Human Capital level in 1970-1975
(1) (2) (3) (4) LowHuCap HighHuCap
Ln(PvtCred) 0.837' 0.856' 0.747' 0.847" (1.86) (1.81) (1.88) (2.11)
Ln(HuCap) 0.478" 0.459' 0.0228 0.190 (1.98) (1.67) (0.08) (0.65)
Ln(GDPPCt-1) -0.305 -0.274 -0.481 '* -0.477" ( -1.1 0) ( -1.03) (-2.57) (-2.55)
Pop Growth 0.186 0.168 -0.947'" -0.923'" (1.00) (0.89) (-5.43) (-5.27)
Ln(Size) -1.671 "* -1.536"' -0.866' -0.880' (-2.85) (-2.63) (-1.68) (-1.71)
Ln (Openness) 1.165"' 0.990" 1.402"* 1.327"* (2.59) (2.28) (5.80) (5.36)
Inflation -0.000570 -0.000607 -0.00134'" -0.00130'" (-1.18) (-1.24) (-2.81) (-2.72)
Ln(PvtCredt-1) -0.746' -0.792* -0.335 -0.258 (-1.67) ( -1.75) (-0.90) (-0.69)
PvtC*HuCap -0.000484 -0.000331" (-0.36) (-1.54)
cons 1.558 1.909 2.459 1.696 (0.61) (0.71) (1.45) (0.95)
N 231 231 231 231 R2 0.15 0.13 0.21 0.31 t statistics in parentheses • p<O.J, "p<0.05, "'p<O.OI
39
Chapter 5
CONCLUSION AND RECOMMENDATIONS
This thesis explores whether financial development contributes significantly to economic
growth. Its answer is in the affirmative as private credit and finance penetration are
positively associated with growth in a wide range of countries in my study. Results of the
model mostly remain robust to a wide range of specifications including types of panel
model, financial development indicators, regional dummies, development stage dummies,
and initial human capital. The implication is clear: policy makers could set a clear
objective to develop the financial sector of their countries. Financial institutions pool
savings and channel them to the most efficient entrepreneurs.
Human capital development is another important factor that seems to promote growth,
likely through a boost in researcb and innovation. But there is a caveat to tbis result. Human
capital is significant in explaining subsequent growth in countries that started out with a
relatively low level of human capital in the early 1970s. Many of the poor countries still
having low human capital can expect to have a higher payoff from a faster accumulation
of human capital. In contrast, countries with a larger stock of initial human capital may
not realize as high a return from further investments in this factor. Furthermore, human
capital does not seem to interact well with fmancial development to provide a greater
combined impact on growth than is available through their individual effects on growth.
Size of the government as measured by government consumption is negatively
associated with growth which suggests that a reduction in consumption expenditure in the
government budget tends to raise growth. This argument may be linked to relative
allocation of the budget between general administrations versus capital expenditure such
as on infrastructure.
40

Trade openness is positive and robust across all specifications in explaining
growth. Countries that are open with respect to international trade tend to grow at a faster
rate. This suggests that countries would benefit from dismantling barriers to international
trade in goods and services.
For future research and for addressing possible weaknesses in my study, it is
possible to increase the size of country sample beyond 66 perhaps by limiting the study to
1980s onward. It is not entirely clear, however, whether sample extension on the cross
sectional dimension would fully compensate the efficiency loss resulting from fewer time
series observations than are available in this study. Second, the measures of financial
development in this thesis only capture the depth of financial system. Yet, such other
aspects of financial development as access, efficiency and stability could also be
important. Third, human capital variable has also suffered from serious problems of
measurement in the literature. Measures such as secondary and higher level school
emollments and average years of schooling in the labor force could therefore be studied
for additional evidence on human capital's influence on growth. Finally, more rigorous
tests of endogeneity than performed in this research could be deployed to obtain clearer
results for the effects of both financial development and human capital accumulation.
41

References
Abubakar, A., Kassim, S. H., & Yusoff, M. B. (2015). Financial Development, Human
Capital Accumulation and Economic Growth: Empirical Evidence from the
Economic Community of West African States (ECOWAS). Procedia-Social and
Behavioral Sciences, 172, 96-103.
Aghion, P., Howitt, P., & Mayer-Foulkes, D. (2004). The effect of financial development
on convergence: Theory and evidence (No. wl0358). National Bureau of
Economic Research.
Ahlin, C., & Pang, J. (2008). Are financial development and corruption control
substitutes in promoting growth?. Journal of Development Economics, 86(2), 414-
433.
Barajas, M.A., Charni, M. R., & Yousefi, M. R. (2013). The finance and growth nexus
re-examined: Do all countries benefit equally? (No. 13-130). International
Monetary Fund.
Barra, R. J., & Lee, J. W. (2013). A new data set of educational attainment in the world,
1950-20 I 0. Journal of development economics, I 04, 184-198.
Beck, T., & Levine, R. (1999). A new database on financial development and
structure (Vol. 2146). World Bank Publications.
Benhabib, J., & Spiegel, M. M. (2000). The role of financial development in growth and
investment. Journal of economic growth, 5(4), 341-360.
42
Christopoulos, D. K., & Tsionas, E. G. (2004). Financial development and economic
growth: evidence from panel unit root and cointegration tests. Journal of
development Economics, 73(!), 55-74.
Cihak, M., Demirgiic-Kunt, A., Feyen, E., & Levine, R. (2013). Financial development in
205 economies, 1960 to 2010 (No. wl8946). National Bureau of Economic
Research.
Demetriades, P. 0., & Luintel, K. B. (1997). The direct costs of financial repression:
evidence from India. Review of Economics and Statistics, 79(2), 311-320.
Demirguc-Kunt, A., & Levine, R. (2009). Finance and inequality: Theory and
evidence (No. wl5275). National Bureau of Economic Research.
Evans, D., Green, C., & Murinde, V. (2000). The importance of human capital and
financial development in economic growth: new evidence using the trans log
production function. Institute for Development Policy and Management,
University of Manchester.
Goldsmith, R. W. (1959). Financial Structure and Development as a Subject for
International Comparative Study. In The Comparative Study of Economic Growth
and Structure (pp. 114-123). NBER.
Guiso, L., Sapienza, P., & Zingales, L. (2004). Does Local Financial Development
Matter?. The Quarterly Journal ofEconomics, 119(3), 929-969.
Guiso, L., Sapienza, P., & Zingales, L. (2009). Does local financial development
matter? (pp. 31-66). Physica-Verlag HD.
Hsiao, C., (2003), Analysis of Panel Data, second edition, Cambridge University Press.
43
Kendall, J. (2012). Local fmancial development and growth. Journal of Banking &
Finance, 36(5), 1548-1562.
La Porta, R. , F. Lopez-de-Silanes, A. Shleifer and R. W. Vishny (1998), "Law and
Finance", Journal of Political Economy, 106: 1113-1155.
La Porta, R., F. Lopez-de-Silanes and A. Shleifer (2002), "Government Ownership of
Commercial Banks", Journal of Finance, 57: 265-301.
La Porta, R., Lopez-de-Silanes, F., Shleifer, A., & Vishny, R. W. (2001). Law and
finance. In Corporate governance (pp. 26-68). Springer Berlin Heidelberg.
La Porta, R., Lopez-de-Silanes, F., Shleifer, A., & Vishny, R. (1999). The quality of
government. Journal of Law, Economics, and organization, 15(1), 222-279.
Levine, R. (1998). The legal environment, banks, and long-run economic growth. Journal
of money, credit and banking, 596-613.
Levine, R. (2005). Finance and growth: Theory and evidence. Handbook of economic
growth I, 865-934.
Levine, R., Loayza, N., & Beck, T. (2000). Financial intermediation and growth: causality
and causes. Journal of monetary Economics, 46(1), 31-77.
Levine, R., & Zervos, S. (1998). Stock markets, banks, and economic growth. American
economic review, 537-558.
Levine, R., Loayza, N., & Beck, T. (1999). Financial intermediation and growth:
causality and causes (Vol. 310). World Bank Publications.
Luintel, K. B., & Khan, M. (1999). A quantitative reassessment of the finance-growth
nexus: evidence from a multivariate V AR. Journal of development
economics, 60(2), 381-405.
44
Luintel, K. B., Khan, M., Arestis, P., & Theodoridis, K. (2008). Financial structure and
economic growth. Journal of Development Economics, 86(1), 181-200.
Lucas, R. E. (1988). On the mechanics of economic development. Journal of monetary
economics, 22(1 ), 3-42 ..
McKinnon, R.I. (1973). Money and capital in economic development. Brookings
Institution Press.
Merton, R. C. (1995). A functional perspective of financial interrnediation.Financial
management, 23-41.
Meier, Gerald M. & Seers, Dudley(1984) . Pioneers in development. New York: Oxford
U. Press
Solow, R. M. (1956). A contribution to the theory of economic growth. The quarterly
journal of economics, 65-94.
Seers, D., & Meier, G. (1984). Pioneers in Development. World Bank Report, (9948).
World Bank (2015). World Development Indicators. Washington, DC.
45
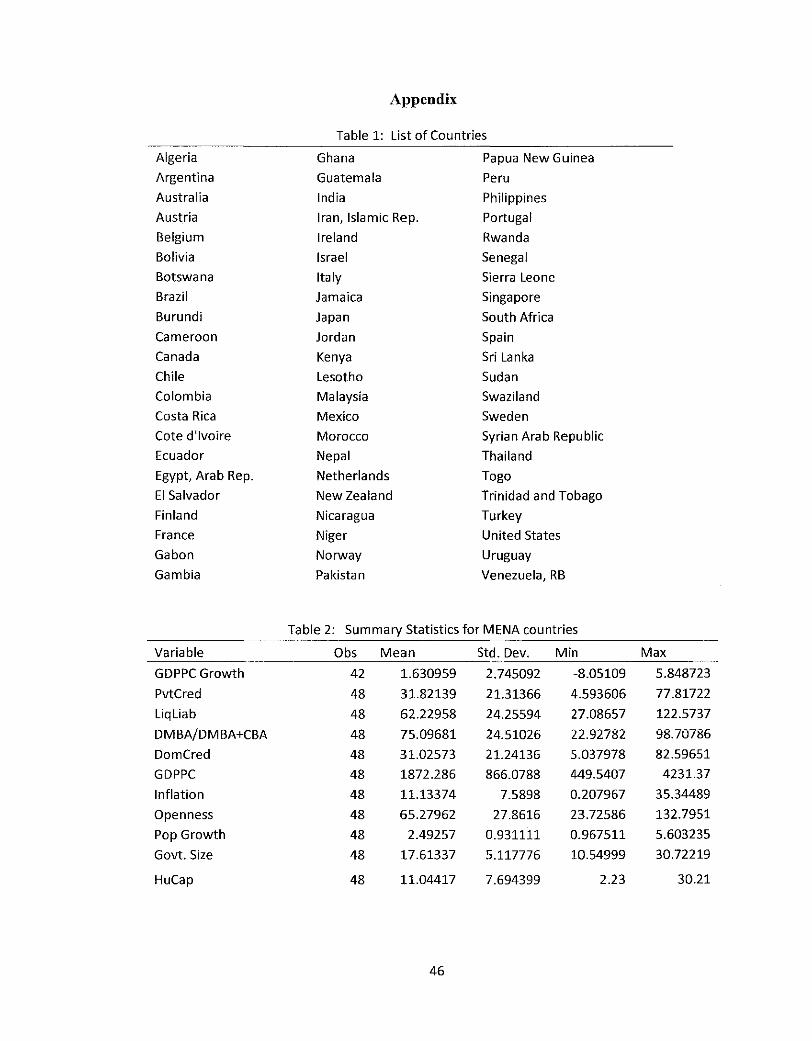
Appendix
Table 1: List of Countries
Algeria Ghana Papua New Guinea
Argentina Guatemala Peru
Australia India Philippines
Austria Iran, Islamic Rep. Portugal
Belgium Ireland Rwanda
Bolivia Israel Senegal
Botswana Italy Sierra Leone
Brazil Jamaica Singapore
Burundi Japan South Africa
Cameroon Jordan Spain
Canada Kenya Sri Lanka
Chile Lesotho Sudan
Colombia Malaysia Swaziland
Costa Rica Mexico Sweden
Cote d'lvoire Morocco Syrian Arab Republic
Ecuador Nepal Thailand
Egypt, Arab Rep. Netherlands Togo
El Salvador New Zealand Trinidad and Tobago
Finland Nicaragua Turkey
France Niger United States
Gabon Norway Uruguay
Gambia Pakistan Venezuela, RB
Table 2: Summary Statistics for MENA countries
Variable Obs Mean Std. Dev. Min Max
GDPPC Growth 42 1.630959 2.745092 -8.05109 5.848723
PvtCred 48 31.82139 21.31366 4.593606 77.81722
LiqLiab 48 62.22958 24.25594 27.08657 122.5737
DMBA/DMBA+CBA 48 75.09681 24.51026 22.92782 98.70786
DomCred 48 31.02573 21.24136 5.037978 82.59651
GDPPC 48 1872.286 866.0788 449.5407 4231.37
Inflation 48 11.13374 7.5898 0.207967 35.34489
Openness 48 65.27962 27.8616 23.72586 132.7951
Pop Growth 48 2.49257 0.931111 0.967511 5.603235
Govt. Size 48 17.61337 5.117776 10.54999 30.72219
HuCap 48 11.04417 7.694399 2.23 30.21
46
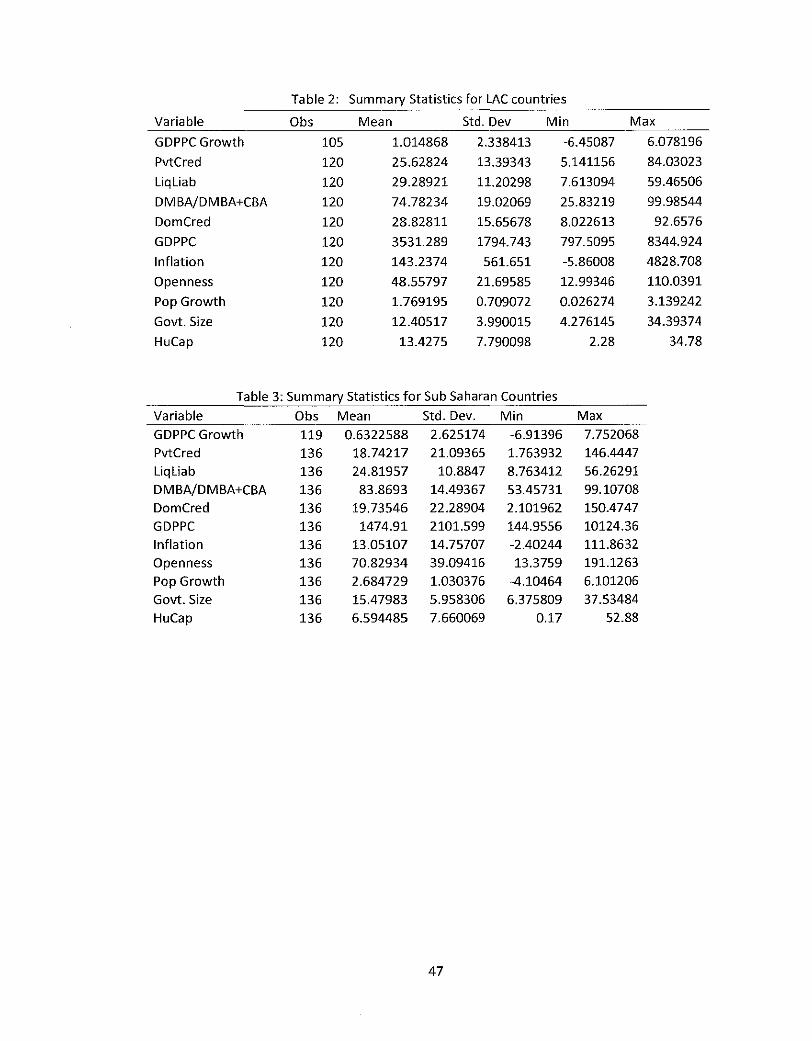
Table 2: Summary Statistics for LAC countries
Variable Obs Mean Std. Dev Min Max
GDPPC Growth 105 1.014868 2.338413 -6.45087 6.078196
PvtCred 120 25.62824 13.39343 5.141156 84.03023
LiqLiab 120 29.28921 11.20298 7.613094 59.46506
DMBA/DMBA+CBA 120 74.78234 19.02069 25.83219 99.98544
DomCred 120 28.82811 15.65678 8.022613 92.6576
GDPPC 120 3531.289 1794.743 797.5095 8344.924
Inflation 120 143.2374 561.651 -5.86008 4828.708
Openness 120 48.55797 21.69585 12.99346 110.0391
Pop Growth 120 1.769195 0.709072 0.026274 3.139242
Govt. Size 120 12.40517 3.990015 4.276145 34.39374
HuCap 120 13.4275 7.790098 2.28 34.78
Table 3: Summary Statistics for Sub Saharan Countries
Variable Obs Mean Std. Dev. Min Max
GDPPC Growth 119 0.6322588 2.625174 -6.91396 7.752068 PvtCred 136 18.74217 21.09365 1.763932 146.4447 LiqLiab 136 24.81957 10.8847 8.763412 56.26291 DMBA/DMBA+CBA 136 83.8693 14.49367 53.45731 99.10708 DomCred 136 19.73546 22.28904 2.101962 150.4747 GDPPC 136 1474.91 2101.599 144.9556 10124.36 Inflation 136 13.05107 14.75707 -2.40244 111.8632 Openness 136 70.82934 39.09416 13.3759 191.1263 Pop Growth 136 2.684729 1.030376 -4.10464 6.101206 Govt. Size 136 15.47983 5.958306 6.375809 37.53484
HuCap 136 6.594485 7.660069 0.17 52.88
47

Table 4: Countries with Human Capital Below and Above Median level in 1970-1975
Low Human Capital High Human Capital
Niger Pakistan India Ghana Kenya Iran, Islamic Rep. Burundi Costa Rica Nepal Portugal Rwanda Ecuador Sudan Malaysia Gambia Jordan
Togo Venezuela, RB
Botswana Singapore Senegal Bolivia Cote d'lvoire France Sierra Leone Uruguay Gabon South Africa Thailand Italy Papua New Guinea Peru
Cameroon Philippines Swaziland Argentina
Syrian Arab Republic Norway Brazil Belgium Algeria Chile
Egypt, Arab Rep. Finland Morocco Ireland Guatemala Japan
El Salvador Canada Mexico Sri Lanka Colombia Netherlands Turkey Austria Nicaragua Israel Jamaica New Zealand Lesotho Sweden Spain Australia Trinidad and Tobago United States
48