education expenditure, human capital an economic growth in ...
78
Institute of Sodal studies Graduate School of Development Studies EDUCATION EXPENDITURE, HUMAN CAPITAL AN ECONOMIC GROWTH IN UGANDA: TIME SERIES ANALYSIS (1962 - 2002) A Research Paper presented by: PETER JAMES EJOKUO OKUBAL (UGANDA) In Partial Fulfillment of the Requirements for Obtaining the Degree of: Master of Arts in Development Studies Specialization: ECONOMICS OF DEVELOPMENT Members of the Examining Committee: Drs. Jan van Heemst Dr. Arjun S. Bedi The Hague, December 2005
-
Upload
khangminh22 -
Category
Documents
-
view
0 -
download
0
Transcript of education expenditure, human capital an economic growth in ...
Institute of Sodal studies
Graduate School of Development Studies
EDUCATION EXPENDITURE, HUMAN CAPITAL AN ECONOMIC GROWTH IN UGANDA:
TIME SERIES ANALYSIS (1962 - 2002)
A Research Paper presented by:
PETER JAMES EJOKUO OKUBAL (UGANDA)
In Partial Fulfillment of the Requirements for Obtaining the Degree of:
Master of Arts in Development Studies Specialization:
ECONOMICS OF DEVELOPMENT
Members of the Examining Committee: Drs. Jan van Heemst
Dr. Arjun S. Bedi
The Hague, December 2005
This document represents part of the author's study programme while at the Institute of Social Studies; the views stated therein are those of the author and not necessarily those of the Institute.
Research papers and theses are not made available for outside circulation by the Institute.
Enquiries:
Postal Address: Institute of Social Studies P.O. Box 29776 2502 L T The Hague The Netherlands
Telephone: +31-70-4260 460 Telefax: +31 .. 704260 799 email: [email protected]
Location: Kortenaerkade 12 2518 AX The Hague The Netherlands

Dedication
To My Lovely Wife Violet Akurut


Acknowledgements
In every output there is always an input. lam highly indebted to the following for their
contribution towards this Research Paper;
My beloved Wife Violet Akurut for her encouragement, patience, love, and endurance
while I was away in the Netherlands. Jan Van Heemst My Supervisor, Academic
Counselor and Convener for his courageous advice and guidance while in ISS and for
insightful comments in shaping this research paper. My second Supervisor and lecturer
AIjun Bedi for the support during the research proposal and design write-ups and
comments on the first draft and subsequent drafts
The Lecturers of Department of Economics for their theoretical insights and Mmja Zubli
the ECD Programme Administrator for her effective and efficient work. Nuffic for the
funds. Uganda Bureau of Statistics (UBOS), Max Kipenji and Jacob Wanjala Musila for
the data. Sam Acodu and Nicholas Ochom for onward transmission of the data from
Uganda.
All ISS friends with special mention of Cornelius Ndolo Kimilu, Seraphine Alia, Grace
Tusiime, Moses Mbugua Mburu, Anthony Njui, Albert Musisi, Annet Mbabazi, Al Haji
Raji Ali and Retnon S. Chetty. You made my social life in ISS.
Lastly to My Mother, Brothers and Sisters for assistance to my family during my
absence.
11


Table of Contents
Dedication ............................................................................................................................ i Acknowledgements ........................................... '" ............................................................... ii Table of Contents ............................................................................................................... iii List of Tables ...................................................................................................................... v List Figures/Graphs ............................................................................................................. v List of Acronyms ............................................................................................................... vi Abstract ............................................................................................................................. vii CHAPTER ONE: INTRODUCTION ................................................................................. 1 1.1 Introduction ............................................................................................................. 1 1.2 The Statement of the Problem ................................................................................. 2 1.3 Justification of the research .................................................................................... 3 1.4 Research Methods ................................................................................................... 5 1.5 Research Objectives and Hypothesis ...................................................................... 6 1.6 Research Hypothesis ....................... , ....................................................................... 6 1.7 Limitations of the Study .......................................................................................... 6 1.8 Organisation of the Paper ........................................................................................ 6 CHAPTER TWO: OVERVIEW OF ECONOMIC SITUATION IN UGANDA .............. 7 2.0 Economic Performance of Uganda (1960's - 1986) ............................................... 7 2.1 Economic Reforms in Uganda (1987 - To Date) ................................................... 8 2.1.1 The Main Components of Economic Reforms in Uganda .................................. 8 2.1.1.1 Stabilisation ......................................................................................................... 9 2.1.1.2 Liberalisation of Markets and Structural Adjustment.. ....................................... 9 2.1.1.3 Public Expenditure Reform ................................................................................. 9 2.2 The Impact of Economic Reforms on Growth in Uganda ................................... 10 2.3 The Education System in Uganda ......................................................................... 12 2.4 Overview of the Education Sector and Reforms ................................................... 12 2.5 Trends in Expenditures in Education in Uganda (1962 - 2002) ........................... 13 2.6 Trends in Education Indicators (1962 - 2002) ..................................................... 14 2.7 Categories and Number of Education Institutions ................................................ 14 2.8 Average Years of Schooling ................................................................................. 15 2.9 Composition of Education Sector ......................................................................... 16 CHAPTER THREE: THEORETICAL AND ANALYTICAL FRAMEWORK ............ 17 3.0 Background ........................................................................................................... 17 3.0.1 The Concept of Human Capital ........................................................................ 17 3.0.2 Human Capital and Its Essence ......................................................................... 18 3.1 Measurement of Human capital ............................................................................ 19 3.2 Methods used in the Measurement of the impact of Human Capital on growth .. 20 3.2.1 Growth Accounting ........................................................................................... 20 3.2.2 The Rate of Return Analysis ............................................................................. 21 3.3 Main Criticisms of the Concept of Human Capital ............................................. 21 3.3.1 Conceptual and Theoretical Criticisms ............................................................. 22 3.3.2 The Methodological Criticisms ......................................................................... 23 3.4 Human Capital, Economic Growth and Growth Theories .................................... 24 3.4.1 Neoclassical Growth Theories and Human Capital .......................................... 24 3.4.1.1 Main Features of Neoclassical Production Function ........................................ 25 3.4.2 Endogenous Growth Models ............................................................................. 25 3.4.2.1 Introduction ....................................................................................................... 25 3.4.2.2 Main Features of the Endogenous Growth Models .......................................... 26 3.5 NGMs and EGMs and the Role of Human Capital: Theoretical Literature ......... 26
iii

3.6 Education Expenditure, Human Capital and Economic Growth: Empirical Evidence ............................................................................................................................ 28 CHAPTER FOUR: EMPRICAL ANALYSIS AND DISCUSSION ............................ 32 4.0 Introduction .......................................................................................................... 32 4.1 Education Expenditures, Human Capital and Economic Growth in Uganda (1962 - 2002) .............................................................................................................................. 32 4.2 Education Expenditure and Human Capital Stock (1962 - 2002): Simple statistical tests ................................................................................................................... 32 4.3 Human Capital and Economic Growth: Simple Statistical Tests ......................... 33 4.3.1 Human Capital Stock and Economic Growth in Uganda (1962 - 2002) .......... 33 4.4 Human Capital and Economic Growth: Econometric Test ................................... 34 4.4.1 Introduction ....................................................................................................... 34 4.5 The Econometric Model Specification ................................................................. 34 4.5.1 Theoretical Model ............................................................................................. 34 4.5.2 The Empirical Model ........................................................................................ 36 4.5.3 Variable Description and Sources ..................................................................... 37 4.6 Estimation of the Model and Interpretation of the Results ................................... 39 4.6.1 Estimation Method and Procedure .................................................................... 39 4.6.2 Stationarity, Cointegration, OLS regression and Error Correction Model ...... 40 4.6.2.1 Test for Stationarity Using the Augmented Dickey-Fuller Method ................. 40 4.6.2.2 Augmented Dickey Fuller Results for Unit root .............................................. 41 4.6.2.3 Engel and Granger Cointegration Test ............................................................ 42 4.6.2.3.1 Test for Cointegration with time trend, at lag 0 ............................................ 43 4.6.2.3.2 Test for Cointegration without time trend at lag 0 ........................................ 44 4.8 Error Correction Model. ........................................................................................ 45 4.8.1 Short Run estimates of the regression ............................................................... 46 4.9 Diagnostic Tests .................................................................................................... 46 4.10: Overall Conclusion .................................................................................................. 47 CHAPTER FIVE: SUMMARY, CONCLUSIONS AND POLICY IMPLICATIONS ... 48 5.0 Summary and Conclusion ..................................................................................... 48 5.2 Policy Recommendations ...................................................................................... 48 ANNEXES ........................................................................................................................ 50 Annex A: Summary statistics ............................................................................................ 50 Annex B: Graphical relationship between education expenditures and human capital.. .. 50 Annex C: Graphical relationship between human capital and Real GDP ........................ 52 Annex D: Graphical test for stationarity of the time series for Uganda ........................... 54 Annex E - 1: Stationarity Tests .................................................................................. 56 Annex E - 2: Testing For Co-Integration ................................................................... 57
iv

List of Tables
Table 1: GDP Growth, Private Investment and Inflation in Real terms: 1986/87-1999/00 .................................................................................................................................... 10
Table 2: Number ofInstitutions by Category (1965 - 2000) ............................................ 15 Table 3: Number of schools or institutions, ownership status, and percentage in urban
centres as at 2000 ....................................................................................................... 16 Table 4: Augmented Dickey - Fuller test for Unit root (1962 - 2002) ............................ 41 Table 5: Long run regression equation ............................................................................. 43 Table 6a: Dickey-Fuller Test for Unit Root.. .................................................................... 43 Table 6b: Asymptotic Critical Values for cointegration test with trend ........................... 44 Table 7a: Dickey-Fuller Test for Unit Root.. .................................................................... 44 Table 7b: Asymptotic Critical Values for cointegration test without trend ...................... 44 Table 8: Error Correction Model Estimates ...................................................................... 45 Table 9: Summary Statistics for period 1962 - 2002 ....................................................... 50
List Figures/Graphs
Figure 1: Education expenditure as percentage ofGDP 1962 - 2002 ............................... 13 Figure 2: Education expenditure in total government Expenditure (1962 - 2002) .......... 13 Figure 3: Trends in enrolment (1962 - 2002) ................................................................... 14 Graph 4: Average years of schooling 1962 - 2002 ........................................................... 15 Figure 5a: Education expenditures as percentage of GDP and average years of schooling
.................................................................................................................................... 50 Figure 5b: Education expenditures as percentage of GDP and adult literacy in Uganda. 51 Figure 5c: Education expenditures as percentage of GDP and education expenditure per
worker ......................................................................................................................... 51 Figure 5d: Education expenditures as percentage ofGDP and total enrolment in Uganda
.................................................................................................................................... 52 Figure 6a: Average years of schooling and economic growth in Uganda ........................ 52 Figure 6b: Adult literacy and economic growth in Uganda .............................................. 53 Figure 6c: Education expenditure per worker and economic growth in Uganda ............. 53 Figure 6d: Total enrolment as percent of total population and economic growth in Uganda
.................................................................................................................................... 54 Graph7a: Real GDP (1962 - 2002) in Uganda ................................................................. 54 Graph 7b: average years of schooling (1962 - 2002) ....................................................... 54 Graph 7c: Average education expenditure per worker ..................................................... 55 Graph 7d: Labour force as percent of total population ..................................................... 55 Graph 7e: Gross fixed capital formation as percentage ofGDP ....................................... 55 Graph 7f: M2 as percentage ofGDP (1962 - 2002) ......................................................... 56 Graph 7g: Trade as percentage ofGDP (1962 - 2002) .................................................... 56
v

ADF
"A" Level
BoU
CRS
EGMs
ECM
GDP
GFCF
IMF
IRS
ISS
MOE
MFPED
MTEF
M2
na
NTC
NGMs
OECD
"0" Level
OLS
PEAP
SAPs
SR
UBOS
UPE
UTC
UCC
WDI
VAR
List of Acronyms
Augmented Dickey Fuller Test
Advanced level of education
Bank of Uganda
Constant Returns to Scale
Endogenous Growth Models
Error Correction Model
Gross Domestic Product
Gross Fixed Capital Formation
International Monetary Fund
Increasing Returns to Scale
Institute of Social Studies
Ministry of Education
Ministry of Finance Planning and Economic Development
Medium Term Expenditure Framework
Broad Money
Not applicable
National Teachers' Colleges
Neoclassical Growth Models
Organisation for Development and Economic Cooperation
Ordinary Level of education
Ordinary Least Squares
Poverty Eradication Action Plan
Structural Adjustment Programmes
Short Run
Uganda Bureau of Statistics
Universal Primary Education
Uganda Technical Colleges
Uganda Colleges of Commerce
World Development Indicators
Vector Autoregressive Variable
vi

Abstract
Human capital has been seen by many as one of the key detenninants to economic
growth. However empirical studies on the role of human capital especially education to
economic growth have been contradictory.
In our paper we examine the question whether education expenditure translates in human
capital and hence economic growth in the case of Uganda using a time series technique.
Using descriptive statistics, cointegration, error correction model and regression analysis
we find that there is both a short run and long run impact of education expenditures on
economic growth in Uganda through human capital. In our study we examined the
average years of schooling as a proxy for human capital and found it to be positive and
statistically significant. In our empirical analysis we find that a one percent increase in
the average years of schooling, ceteris paribus would lead to 0.38% increase in real GDP
in the long run and 0.2% increase in real GDP in the short run.
vii

CHAPTER ONE: INTRODUCTION
1.1 Introduction
The role of human capital in the economic growth process is historic in nature. It builds
from the work of earlier economists such as Denison (1962), Schultz (1971), Blaug
(1972) and others that emphasised the role education as a means of human capital
formation. Several other studies on the relationship between human capital and economic
growth build on from this. Research on economic growth gained a lot of ground in the
1980's with the work of Romer (1986) and Lucas (1988). In these studies economic
growth, human capital and the role of human capital in economic growth took a centre
stage. However more recent empirical studies have found differing results for example
Barro (1991) and Gemmell (1996) find a strong relationship between human capital and
economic growth. However, Benhabib and Speigel (1994) and Devarajan et al (1996)
find weak or negative relationship between human capital and economic growth 1. The
relationship between human capital and economic growth is further complicated by the
fact that many factors affect the process of economic growth such as political stability,
trade policies, industrialisation policies, size of the labour force, investment in physical
capital, inflation, financial sector development among others (Tallman and Wang, 1994)
Many developing countries including Uganda have taken bold steps to develop their
human capital over a period of time, some as far back as independence to date. Besides,
most of these countries have gone through different periods ranging from political
stability, turmoil, structural adjustment and economic reforms. In the past close to two
decades alone, many Sub-Saharan African countries have undertaken larger structural
reforms in their countries which have had direct and implicit implications on human
capital formation. Uganda is one such example that has been characterised by rapid
economic growth in the 1960's, declining economic growth in the 1970's, recovery in the
early 1980's and reforms and rapid economic growth from mid 1980's to date. It is
worthwhile to study the effect of all these on the economic growth of a country like
Uganda and that is what this paper sets out to do with a specific focus on human capital
accumulation2.
1 Details in this subject win be discussed in chapter 3 2 Human capital is a broad concept that includes health, nutrition and education. In this paper we will take human capital to be synonymous with investment in education as proxied by average years of schooling. This is so because of the special focus and importance that the government of Uganda accorded to development of education in Uganda since independence therefore making it a crucial human capital

1.2 The Statement of the Problem
Ugandan economy has fluctuated over time with progressive growth in the early 1950's,
declining growth in the late 1950's and rejuvenated growth soon after independence
Okidi et aI, (2004) attributed to growth in agricultural sector and food processing
industries. After independence the growth rate of GDP was expanding at approximately
6.7 percent despite the population growth rate of 2.5 per cent per annum. This growth
was also reflected in the education sector which had flourished above all other countries
in the region (Odaet, 1990) due to the desire for manpower to fill the vacancies left by the
colonialists.
This growth was however, hampered during the rule of 1di Amin Dada (1971 - 1979).
The GDP fell at an annual rate of 2.6 percent coupled with an increasing population
growth rate of 2 percent per annum. Terms of trade deteriorated, infrastructure was
destroyed, monetary GDP declined by about 3 percent annually (Odaet, 1990). Odaet
noted that there was inflationary build up, money supply increased at an average rate of
about 30% between 1971 and 1981. Deficits expanded coupled by shrinkage in revenue
base especially from foreign trade. Public services and parastatals were not spared,
properties owned by Asians were expropriated and skilled and professional manpower
were expelled. This had profound effects on human capital accumulation. Odaet (1990)
also notes that funding to the education sector drastically declined. Education expenditure
as a percentage of total expenditure declined from 15 percent to 14 percent between 1971
and 1978. As a percentage of GDP the resources allocated to the education by the private
sector declined from 3.4 percent to 1.4 percent in 1978 as did the revenue base.
This experience had devastating effects on the entire economy, however, much more on
human capital stock. Thanks to the Government of Tanzania, in 1979, the dictatorial
regime was toppled. With support from the IMF and World Bank, the government of
Uganda undertook reconstruction and rehabilitation work in the early 1980's and late
1980's saw Uganda embark on radical economic reforms (Mutebile, 2000). These
reforms included stabilisation, liberalisation and budget reform. These reforms saw more
resources going to the social service sector especially education and health. This was part
of government policy and priorities outlined in the PEAP (1997) document.
indicator. Further we assume that an educated labour force is better at creating, implementing, and adopting new technologies, thereby generating growth.
2
The education sector was the key beneficiary of these reforms. As a share of GDP both
the recurrent and development expenditures increased about 3 fold in 13 years (1988/89-
1999/00) from about 1.1 to 3.1 percent (Mutebile, 2000). This led to large real per capita
education spending for the period 1988/89 - 1999/00. Given the fact the real GDP per
capita increased by about 41 percent during that period. The reforms are argued to have
increased real GDP growth rate averaging 6.3 percent per annum from 1986/87 to
1999/00(Mutebile, 2000)
Mutebile (2000) adds that Uganda has since sustained rapid and broadly based economic
growth since it began implementing adjustment policies in 1987. He states that despite
population growth rates averaging 2.9% per annum in this period, the sustained rates of
real GDP growth have raised per capita output at an average rate of3.3% per annum. The
size of the economy more than doubled in real terms and real per capita output also rose
by almost 53% during the same period (Mutebile, 2000).
This paper investigates whether increasing education expenditure did improve human
capital stock and human capital stock accumulation translated into economic growth in
Uganda. The research presupposes that there is a relationship between education
expenditure and human capital stock accumulation and that the accumulation in the
human capital stock translates into economic growth. The study spans from 1962 to 2002,
in order to capture the effects of periods of prosperity, turmoil and reform.
1.3 Justification of the research
Several studies reveal that there is a relationship between economic growth and poverty
reduction. Therefore at this point in time when all efforts are geared towards "making
poverty history" and aware that economic growth is one of the factors responsible for
poverty reduction, it is important to study the determinants of economic growth so as to
get an insight into what factors of economic growth can account for the rate of growth in
Uganda. There are several determinants of economic growth among which are rapid
physical and human capital investment. These two are cited as the factors behind rapid
economic growth among the Asian Tigers3 (Amankwah, 2004). Amankwah (2004) also
quotes Petri (2003) findings that high and rising endowments of human capital due to
Universal primary education and secondary education also generated increases in skills
3 Malaysia, Taiwan, Singapore, Thailand, Hong Kong 3
that triggered growth among the Asian tigers. This relationship will further be expounded
in Chapter 3 of this paper.
The focus of this paper is not to generally study the determinants of economic growth but
to specifically investigate the relationship between human capital stock accumulation and
economic growth. The study will follow other earlier studies especially three recent
studies by Musila and Belassi (2004), Amankwah (2004) and Tallman and Wang (1994).
Musila and Belassi (2004) studied the impact of education expenditures on economic
growth in Uganda while Amankwah (2004) studied the relationship between health and
education recurrent expenditures, human capital stock and economic growth in Ghana
and Tallman and Wang (1994) studied human capital and endogenous growth with
reference to Taiwan. All these studies used time series data analysis.
Our study intends to adopt a similar approach used by these studies but is distinguished
by the following features;
1. Time period: The Musila and Belassi (2004) study covered the period (1965 - 1999),
the Tallman and Wang (1994) study covered period (1965 - 1989) and the
Amankwah study covered the period (1970 - 2000). Our study will cover a longer
period (1962 - 2002) over and above the three cases.
2. Geographical focus: Like Musila and Belassi (2004) we focus on Uganda, the other
authors use other country cases.
3. The focus of the study: The Amankwah (2004), study used recurrent education and
health expenditures data as proxies of human capital, while Musila and Belassi
(2004) used average education expenditure per worker as a proxy for human capital
and Tallman and Wang (1994) used educational attainment as a proxy for human
capital. Our study uses both recurrent and development education expenditures not as
direct proxies for human capital but as a tool to establish whether there is a link
between education expenditures on human capital and instead of focusing on both
health and education like in the Amankwah (2004) case, we focus on only education
expenditures. As earlier stated, the study restricts the definition of human capital to
education because of the special focus and importance that the government of Uganda
accorded to development of education in Uganda since independence therefore
making it a crucial human capital indicator.
4
We differ from the Musila and Belassi (2004) in that our study uses average years of
schooling as a proxy for human capital instead of average education expenditure per
worker used by Musila and Belassi and we also use simple statistics (correlations and
scatter plots) to get an insight into the nature of relationship between education
expenditures and the average years of schooling not used by Musila and Belassi. The
econometric focus of the study is to examine the relationship between average years
of schooling4 and the changes in level of real GDP.
Tallman and Wang (1994) used the education attainment measure of the percentage
of the population that is 6 years and above that have completed primary education,
secondary education and tertiary education, whereas we take the average years of
schooling not used by their study.
4. Our study takes into account the potential effects the Amin era (1971 - 1980) on
human capital formation.
This study is very critical because there are several arguments presented for the rapid
economic growth in Uganda. This study will contribute to this debate by examining the
role of human capital on economic growth and explore whether it is a potential
explanation of the growth story in Uganda.
1.4 Research Methods
This study adopts a time series technique for the empirical study. It focuses on a single
poor but rapidly growing country case. The study uses descriptive statistics, simple
statistical tests, and econometric methods making use of the cointegration and error
correction model to investigate the relationship education expenditures and human capital
and human capital stock and economic growth (real GDP) over the period (1962 - 2002).
The study uses secondary data obtained mainly from various issues of Uganda Statistical
Abstracts (1960 - 2004) published by Uganda Bureau of Statistics (UBOS), IMF
Government Finance Statistics, IMF International Financial Statistics (2004), World
Bank Development Indicators (2004) and World Economic Outlook (September 2000 -
2004), Penn world tables 6.1. Reference is also made to various Ministries of finance and
education reports and strategies.
4 Here in referred to as human capital 5
The empirical part of the study begins by running correlations between expenditure on
education using scatter plots and simple correlations and human capital. The second part
of the study uses econometrics to estimate the relationship between human capital and
economic growth. It involves running a time series regression analysis making use of the
co-integration techniques and Error Correction Model
1.5 Research Objectives and Hypothesis
The obj ective of the study is to establish the link between the effects of changes in
education expenditure on human capital stock accumulation and human capital on
economic growth in Uganda using time-series data (1962 - 2002) and to generate policy
implications and recommendations for the government of Uganda
1.6 Research Hypothesis
There is a positive relationship between education expenditure and human capital stock
and human capital stock and economic growth (real GDP) in Uganda
1. 7 Limitations of the Study
The data may not be accurate since it has been collected from different sources. The
paper also uses proxies for human capital stock which may not be a true reflection of
human capital stock. However an effort has been made to ensure that the results depict
the study objectives and research questions
1.8 Organisation of the Paper
The rest of the paper is organized as follows Chapter 2 glVes an overview of the
economic situation in Uganda with focus on education system, historic trends in
economic growth, resource allocations, policy reforms and government policy over time.
Chapter 3 presents the analytical framework as well as relevant literature review both
theoretical and empirical for this study. Chapter 4 presents the theoretical and empirical
model and estimation of the relationship of the education expenditures and human capital
and human and economic growth. This chapter also includes the discussion of the
findings. Chapter 5 gives the conclusion, policy implications and recommendations of
the study
6
CHAPTER TWO: OVERVIEW OF ECONOMIC SITUATION IN UGANDA
2.0 Economic Performance of Uganda (1960's -1986)
The economic situation in Uganda has evolved over time with cotton as a major export
during colonial times, replaced by coffee in the 1950's. During this period the economy
registered substantial growth mostly in agriculture with a contribution from the fledgling
industrial sector, which emphasized food processing for export (Okidi, et aI, 2004). This
growth slowed in the late 1950s, as fluctuating world market conditions reduced export
earnings and Uganda experienced the political pressures of growing nationalist
movements that swept much of Africa as the countries fought for independence.
According to Odaet (1990) for the first five years following independence in 1962,
Uganda's economy resumed rapid growth, with GDP, including subsistence agriculture,
expanding approximately 6.7 percent per year. He notes that even with population growth
estimated at 2.5 percent per year, net economic growth of more than 4 percent suggested
that people's lives were improving. By the end of the 1960s, commercial agriculture
accounted for more than one-third of GDP. Industrial output had increased to nearly 9
percent of GDP, primarily as a result of new food processing industries. Tourism,
transportation, telecommunications, and wholesale and retail trade still contributed nearly
one-half of total output (Odaet, 1990)
Odaet (1990) also laments that although the government envisioned annual economic
growth rates of about 6 percent in the early 1970s, civil war and political instability
almost destroyed Uganda's once promising economy. He notes that GDP declined each
year from 1972 to 1976 and registered only slight improvement in 1977 when world
coffee prices increased. He notes that negative growth resumed, largely because the
government continued to expropriate business assets, decline in foreign investments,
inefficiency in public services and the parastatals, expropriation of Asian property and
erosion of the stock of professional and skilled manpower. He also observes that terms of
trade deteriorated which led to the fall of monetary GDP estimated at 3.1 percent per year
between 1971 and 1981. The decline in the monetised economy was accompanied by a
build up of inflationary pressure. This was coupled by scarcity of goods which steeply
increased money supply at an average rate of30 percent per year between 1971 and 1981,
fuelled by budgetary deficits, and shrunk the revenue base, particularly from foreign trade
(Odaet, 1990)
7
The economic and political destruction in the Amin years contributed to a record decline
in earnings by 14.8 percent between 1978 and 1980 (Odaet, 1990). Odaet (1999) notes
that when Amin fled from Uganda in 1979, the nation's GDP measured only about 80
percent of the 1970 level. Okidi et ai, (2004) state that industrial output declined sharply,
as equipment, spare parts, and raw materials became scarce. They note that from 1981 to
1983, the country experienced a welcome 17.3 percent growth rate, but most of this
success occurred in the agricultural sector. Little progress was made in manufacturing
and other productive sectors. Renewed political crisis led to negative growth rates of 4.2
percent in 1984, 1.5 percent in 1985, and 2.3 percent in 1986(Okidi et aI, 2004)
2.1 Economic Reforms in Uganda (1987 - To Date)
Growth in Uganda resumed in mid 1980's with GDP rising to about 4.3 percent above the
1986 average (Okidi, 2004). Okidi et aI, attribute this to security improvement and
resumption and expansion of production of factories that had stagnated. This modest rate
of growth increased in 1988, when GDP expansion measured 7.2 percent, with
substantial improvements in the manufacturing sector. In 1989 falling world market
prices for coffee reduced growth to 6.6 per cent and a further decline to 3.4 percent
growth occurred in 1990, in part because of drought, low coffee prices, and a decline in
manufacturing output (Okidi et aI, 2004) These changes in economic growth were
associated with radical economic reforms that Uganda embarked on in the late 1980's
after a long period of economic decline and civil strife. These reforms were driven by the
World Bank and IMF.
2.1.1 The Main Components of Economic Reforms in Uganda
Uganda was one of the sub-Saharan African countries that implemented the structural
adjustment and economic reform programmes with advice from the World Bank and IMF
on a sustained basis and managed to generate a robust growth (Musila and Belassi, 2004).
Musila and Belassi note that since 1995, the Ugandan government has increased the
shares of education and health in its budget and that this was accompanied by a
remarkable economic growths.
The economic reforms implemented in Uganda are in three main categories namely
stabilisation, liberalisation of Markets and Structural Adjustment and Public Expenditure
Reform.
5 This win be explained in the next section as we explore the effects of the reforms on Uganda's economy 8
2.1.1.1 Stabilisation
According to Mutebile (2000), Uganda implemented macroeconomic stabilisation
policies, mainly through strict control over public expenditure. He notes that in the 1970s
and 1980s Uganda suffered from severe macroeconomic imbalances, including high rates
of inflation and balance of payments deficits, because the growth of nominal aggregate
demand consistently outstripped the growth of real supply in the economy which he
attributes to printing of money to finance public sector deficits. Yet in an economy with a
very shallow financial sector, even relative modest Government deficits which are
financed by domestic credit creation can lead to a large percentage increase in money
supply, which fuels high rates of inflation. Macroeconomic stability was restored in 1993
only when Government imposed strict control over its own expenditures and maintained
fiscal discipline (Mutebile, 2000).
2.1.1.2 Liberalisation of Markets and Structural Adjustment
As earlier on stated by Odaet (1990), in the 1970s and 1980s the Ugandan economy was
subject to a plethora of controls which severely distorted resource allocation and
destroyed incentives for productive activity. These included according to Mutebile (2000)
the controls on coffee marketing together with the overvalued exchange rate which meant
that the farm gate prices which coffee farmers received for their coffee fell to levels
which made coffee production unprofitable. Mutebile (2000) notes that since the early
1990s Uganda has implemented reforms to liberalise markets in all key sectors of the
economy including the foreign exchange market, coffee marketing, financial markets and
the tax system. As a result external trade regime has also been liberalised with the
removal of an non tariff barriers to imports and the reduction and rationalisation of tariff
rates. In addition, Government has implemented a privatisation programme to divest
itself from commercial enterprises. The objective of these reforms was to improve the
efficiency of resource allocation and free up opportunities for private sector investment
(Mutebile, 2000).
2.1.1.3 Public Expenditure Reform
The government also pursued budgetary reforms which were aimed at improving the
efficiency of Government expenditure and prioritisation of government expenditures on
poverty eradication. This was done through introduction of a Medium Term Expenditure
Framework (MTEF) in which budgets are determined within a rolling three year
9
framework (Mutebile, 2000). This was aimed at concentrating government expenditures
on the provision of public goods and services that could not be provided by the market.
As a result public spending was directed to the priorities namely primary education,
primary health care, water and sanitation, rural roads and agricultural extension as set out
in the Poverty Eradication Action Plan (PEAP), 1997.
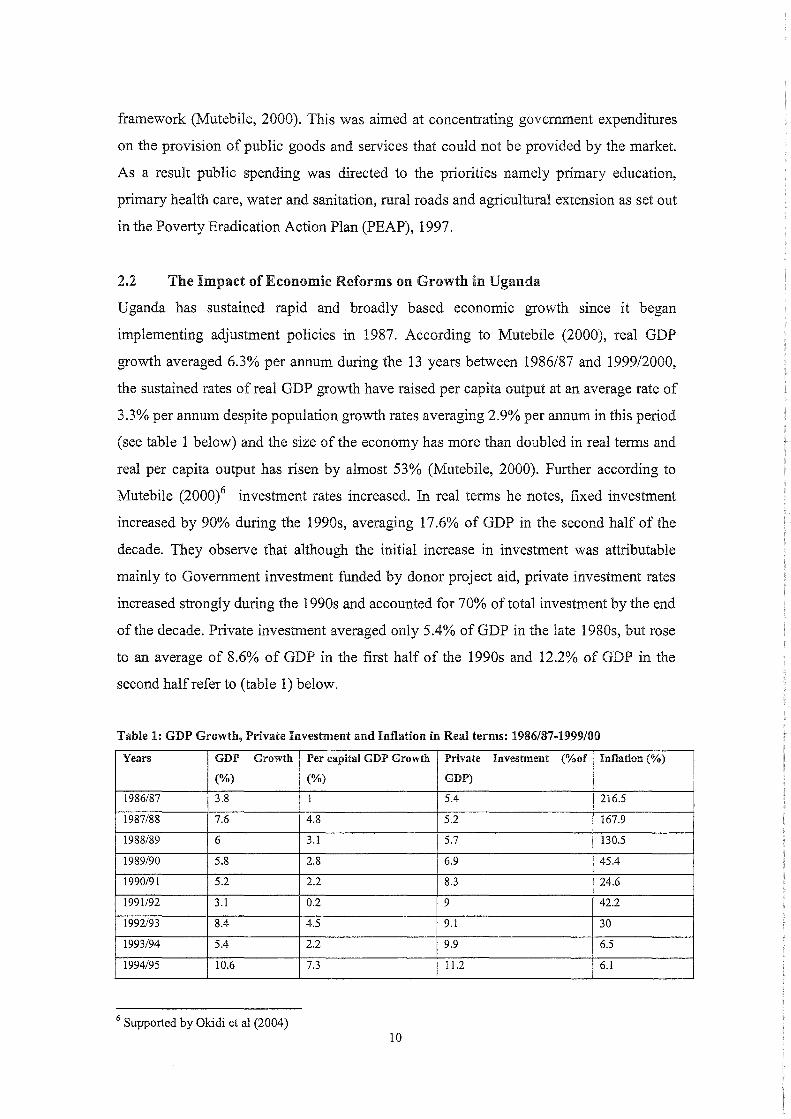
2.2 The Impact of Economic Reforms on Growth in Uganda
Uganda has sustained rapid and broadly based economic growth since it began
implementing adjustment policies in 1987. According to Mutebile (2000), real GDP
growth averaged 6.3% per annum during the 13 years between 1986/87 and 199912000,
the sustained rates of real GDP growth have raised per capita output at an average rate of
3.3% per annum despite population growth rates averaging 2.9% per annum in this period
(see table 1 below) and the size of the economy has more than doubled in real terms and
real per capita output has risen by almost 53% (Mutebile, 2000). Further according to
Mutebile (2000)6 investment rates increased. In real terms he notes, fixed investment
increased by 90% during the 1990s, averaging 17.6% of GDP in the second half of the
decade. They observe that although the initial increase in investment was attributable
mainly to Government investment funded by donor project aid, private investment rates
increased strongly during the 1990s and accounted for 70% of total investment by the end
of the decade. Private investment averaged only 5.4% of GDP in the late 1980s, but rose
to an average of 8.6% of GDP in the first half of the 1990s and 12.2% of GDP in the
second half refer to (table 1) below.
Table 1: GDP Growth, Private Investment and Inflation in Real terms: 1986/87-1999/00
Years GDP Growth Per capital GDP Growth Private Investment (%of Inflation (%)
(%) (%) GDP)
1986/87 3.8 1 5.4 216.5
1987/88 7.6 4.8 5.2 167.9
1988/89 6 3.1 5.7 130.5
1989/90 5.8 2.8 6.9 45.4
1990/91 5.2 2.2 8.3 24.6
1991192 3.1 0.2 9 42.2
1992/93 8.4 4.5 9.1 30
1993/94 5.4 2.2 9.9 6.5
1994/95 10.6 7.3 11.2 6.1
6 Supported by Okidi et a1 (2004) 10

Years GDP Growth Per capital GDP Growth Private Investment (%of Inflation (%)
(%) (%) GDP)
1995/96 7.8 4.7 12.5 7.5
1996/97 4.5 1.7 12.8 7.8
1997/98 5.4 2.7 11.5 5.8
1998/99 7.4 4.7 13 -0.2
1999/00 5.1 2.5 Not available 6.2
Source: MutebIle (2000)
The table above shows that the policy reforms which stabilised the economy and
liberalised markets· contributed to the increased private investment. We can also observe
from that table 1 that since 1992/93, when inflation was brought under control through
the restoration of budgetary discipline, consumer price inflation has averaged only 5.7%
per annum. Private investment rates jumped by about three percentage points of GDP,
with a relatively short lag of about two years after inflation rates had fallen, which
suggests that economic stabilisation can generate significant real gains.
Fox (2004), attributes the success of the reform process in Uganda to control of inflation
and continued macro stability; trade and agriculture marketing reforms to increase
producer prices at the farm gate, benefiting small holder farmers; improvements in public
security, the rule oflaw, and investment climate which made Uganda a better place to
invest than previously; effective political, administrative, and fiscal decentralization
which fostered a sustained focus on reaching the underserved in rural areas with public
services. Luck with weather and high coffee prices in the 1990s and very low levels of
civil unrest were part of the story as well, as were substantial and sustained foreign aid
inflows.
Mutebile (2000) is pessimistic that this explanation accounts only for the initial strong
recovery of the Ugandan economy in the late 1980s and the early 1990s, but not how the
economy has managed to sustain GDP growth rates throughout the 1990s. He attributes
the sustained growth rates, after the initial revival of the economy in the late 1980s, to
substantial increases in the quantity of factor inputs, such as fixed capital, and/or
improvements in the efficiency of resource allocation which boosted human capital stock
overtime. This is what this paper aims to explore. The role of human capital in explaining
sustained growth in Uganda
11

2.3 The Education System in Uganda
Education in Uganda dates back to 1890's. At independence from Britain in 1962,
education in Uganda was more advanced than in neighbouring countries Kenya,
Tanzania, Zaire and Rwanda (Odaet, 1990). Uganda has had two long term objectives in
the education system since independence (Odaet, 1990);
1. Primary school expansion towards universal primary education
2. The provision of sufficient manpower of the quality needed to meet the skill
requirements of the economy.
The implementation of these goals was severely hampered by the events in the 1970's,
which affected all the sectors of the economy, including the education system. The
education system suffered the effects of economic decline and political instability during
the 1970s and 1980s (Odaet, 1990). A recovery programme was adopted in 1982/84 to
reconstruct and rehabilitate the educational infrastructure where the government of
Uganda emphasized that education in Uganda was a foundation for economic growth and
central to the well being of the society as a whole7•
2.4 Overview of the Education Sector and Reforms
According to Aguti (2000), Uganda's education system has undergone tremendous
changes since 1979 when most institutions in the country had virtually collapsed. She
notes that the early 1980's, was devoted to the rehabilitation and expansion of schools
and between 1980 and 1985, education accounted for an average of only 15.6% of
recurrent government expenditure, reflecting its low priority at the time. However, since
1986 as observed by Nannyonjo, (2001), government expenditure on the education sector
has risen steadily, and as of 2000, accounted for up to a third of total government
discretionary recurrent budget. Nannyonjo, (2001) notes that between 1986 and 1996,
primary school enrolment rose modestly from 2.2 million to 2.7 million and with the
introduction of Universal Primary Education (UPE) in 1997, it jumped to 5.3 million, an
increase of 94% in just one year. By 2001, the number had risen to 6.9 million. This
development has not only transformed the entire education system in Uganda, it has also
presented many challenges for Government, while at the same time opening up
investment opportunities for the private sector Nannyonjo (2001) and Aguti (2000).
7 Odaet (1990): implementing educational policies in Uganda, World Bank Discussion Papers, Africa Technical Department Series; Washington D.C.
12

2.5 Trends in Expenditures in Education in Uganda (1962 - 2002)
Budgetary reforms in Uganda involved a progressive reallocation of budgetary resources
towards the education sector as illustrated in Graphs 1 and 2 which show the share of
education expenditure in GDP and total government expenditure over the period 1962 -
2002.
Figure 1: Education expenditure as percentage of GDP 1962 - 2002
Education Expenditure as percentage of GOP
l 7.00
S.OO
~ ~
i 4.00
! !_EdLJC Exp % GOP I
2.00
1.00
~//////////////////// Fiseal years
Source: Own computation from UBOS statistical abstracts (1960 - 2003), Uganda BaCkground to Budgets Issues (1976 -2003)
Graph 1 shows that there has been considerable increase in the share of education as a
percentage of total GDP over time. This is remarkable from the period 1986/87 to
2000101 which coincides with the period of economic reforms. A sharp increase was
registered period 1984/85 perhaps because this was a period of infra structural
rehabilitation after the devastation from the Amin government. The decline observed in
period 2001/02 could be due to general budget cuts by the government during that period.
Figure 2: Education expenditure in total government Expenditure (1962 - 2002)
Share of Education In Total Government Expenditure
)//////////////////// Flac.aly_rs
I-TQtal EdfTotal Gov(%) I
Source: Own computation from UBOS statistical abstracts (1960 - 2003), Uganda Background to Budgets Issues (1976 -2003)
Graph 2 indicates that the share of education expenditure in the total government
expenditure has not been stable overtime. It had has been cyclical in nature perhaps
l3

reflecting the history of the country that was associated with tunnoil, rehabilitation and
refonns and allocations of the budget for other purposes (changing government
priorities).
The interesting observation is that much as the share of education expenditure in the total
government expenditure is unstable overtime. The share of the education expenditure in
total GDP seemed to have been rising from the period 1986/1987 to 2000 with occasional
falls. The continued fall in 2001 to 2002 could be attributed to the general budget cuts in
all sectors by the government during this period.
2.6 Trends in Education Indicators (1962 - 2002)
School education has continued to expand since 1962 when Uganda gained its
independence from the British. The figure 3 gives enrolments in various institutions since
1962 to 2002.
Figure 3: Trends in enrolment (1962 - 2002)
Trends In total enrolment In total population
35
YCUU'.
Source: Own Computation from various statistical abstracts UBOS (1962 - 2002).
Graph 3 shows that enrolment in various education institutions has progressively grown
through out the study period including the period of tunnoil (1971 -1979), a steep
increase in enrolment is observed from 1995/96 to date which could be largely accounted
for by introduction of universal primary education in 1997, which accounts for about 7.2
million participants today.
2.7 Categories and Number of Education Institutions
There has been expansion in the educational institutions (between 1965 - 2000) in
Uganda as shown in table 2; except for Uganda Technical Colleges (UTCs), National
Teachers' Colleges (NTCs) and Uganda Colleges of Commerce (UCCs) whose roles
14
have been taken over by the University sector especially private Universities. Otherwise
the primary schools have expanded from 2,580 in 1965 to 12,480, technical schools from
6 to 58, teacher training colleges from 32 to 64, secondary schools from 66 to 1,892 and
universities from 1 to 9 in the period 1965 to 2000.
Table 2: Number ofInstitutions by Category (1965 - 2000)
Institution 1965 1970 1975 1980 1985 1990 1995 2000
Primary School 2,580 2,755 3,184 5,564 5,586 7,667 8,531 12,480
Technical schools 6 5 5 5 55 52 58 58
Teacher training 32 26 30 30 92 65 64 64
Secondary school 66 73 73 73 213 510 619 1,892
Technical Institutes 2 2 2 2 4 4 4 5
Uganda technical colleges na na na 5 5 5 5 5
National teachers colleges na na Na 10 10 10 10 10
Uganda commercial colleges na na na 5 5 5 5 5
Universities 1 1 1 1 1 3 7 9
Source: Own computation from various Statistical abstracts UBOS (1965 - 2002)
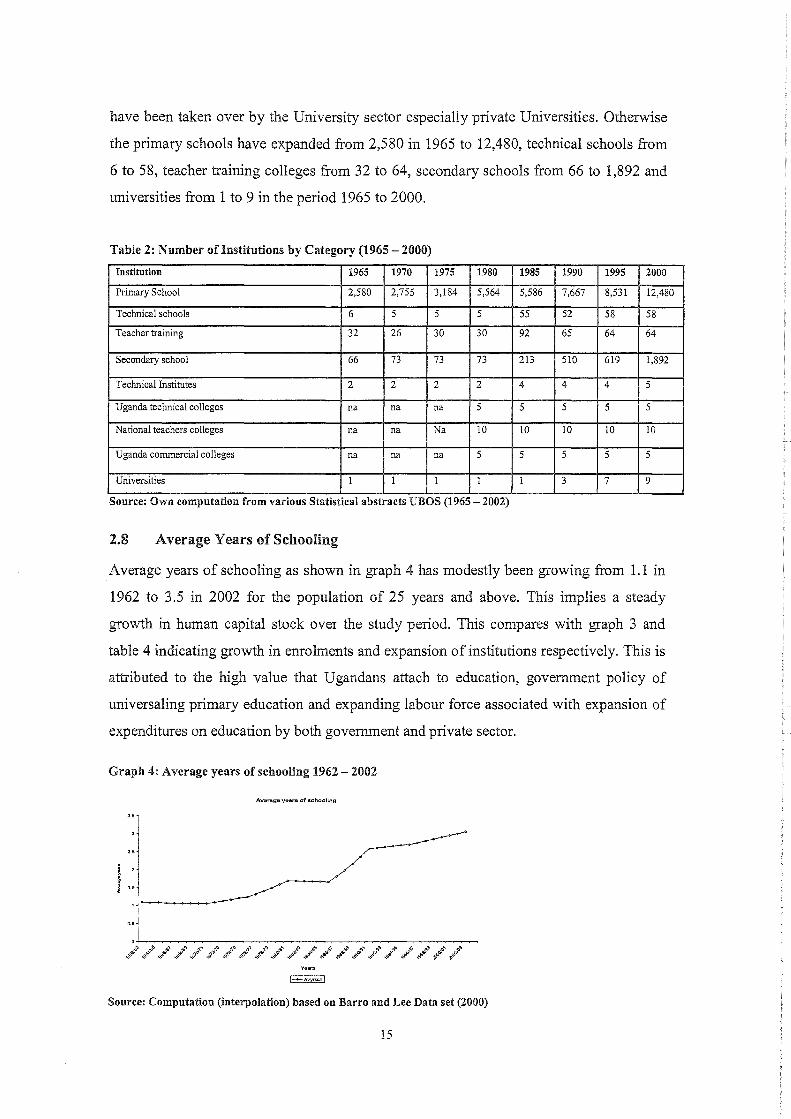
2.8 Average Years of Schooling
Average years of schooling as shown in graph 4 has modestly been growing from 1.1 in
1962 to 3.5 in 2002 for the population of 25 years and above. This implies a steady
growth in human capital stock over the study period. This compares with graph 3 and
table 4 indicating growth in enrolments and expansion of institutions respectively. This is
attributed to the high value that Ugandans attach to education, government policy of
universaling primary education and expanding labour force associated with expansion of
expenditures on education by both government and private sector.
Graph 4: Average years of schooling 1962 - 2002
i 2
~ ~ 1.5
AVe!'l!lge years of schooling
Source: Computation (interpolation) based on Barro and Lee Data set (2000)
15

2.9 Composition of Education Sector
Table 3: Number of schools or institutions, ownership status, and percentage in urban centres as at
2000
Education level Number Ownership % in urban
of Units centres
Private Government
Primary School 12,480 3,293 9,187 20.2
Technical and vocational' 73 35 38 62
Secondary Teacher training colleges 10 0 10 40
Secondary school 1,892 1,291 601 70
Primary teacher training 64 0 64 20
Universities 12 8 4 60
Total 14,531 4,627 9,904
Source: Own computation from Uganda statistical abstracts (various issues)
Table 3 compares the role and contribution of private sector to education provision and
delivery in Uganda with that of the government. The government because of the
Universal Primary Education (UPE) has heavily invested in primary schools owning
about 9,187 of 12,480 schools, while the private sector on the other hand has
complimented the government efforts by investing in secondary and University education
institutions. The private sector owns 1, 291 and 8 secondary schools and universities
respectively. However, most of these may not be affordable by rural poor since most of
them that is 70%, 60%, 62% of the secondary schools, universities and vocational
institutions are concentrated in the urban areas respectively. The government in its white
paper (1992) however, recommends that technical education should be accessible to all
who may not be able to access higher education.
This research seeks to examine the effects of these improvements in education on human
capital stock and economic growth in Uganda.
8 This includes Technical institutes, Uganda technical colleges, Uganda colleges of commerce, and technical schools 16
CHAPTER THREE: THEORETICAL AND ANALYTICAL FRAMEWORK
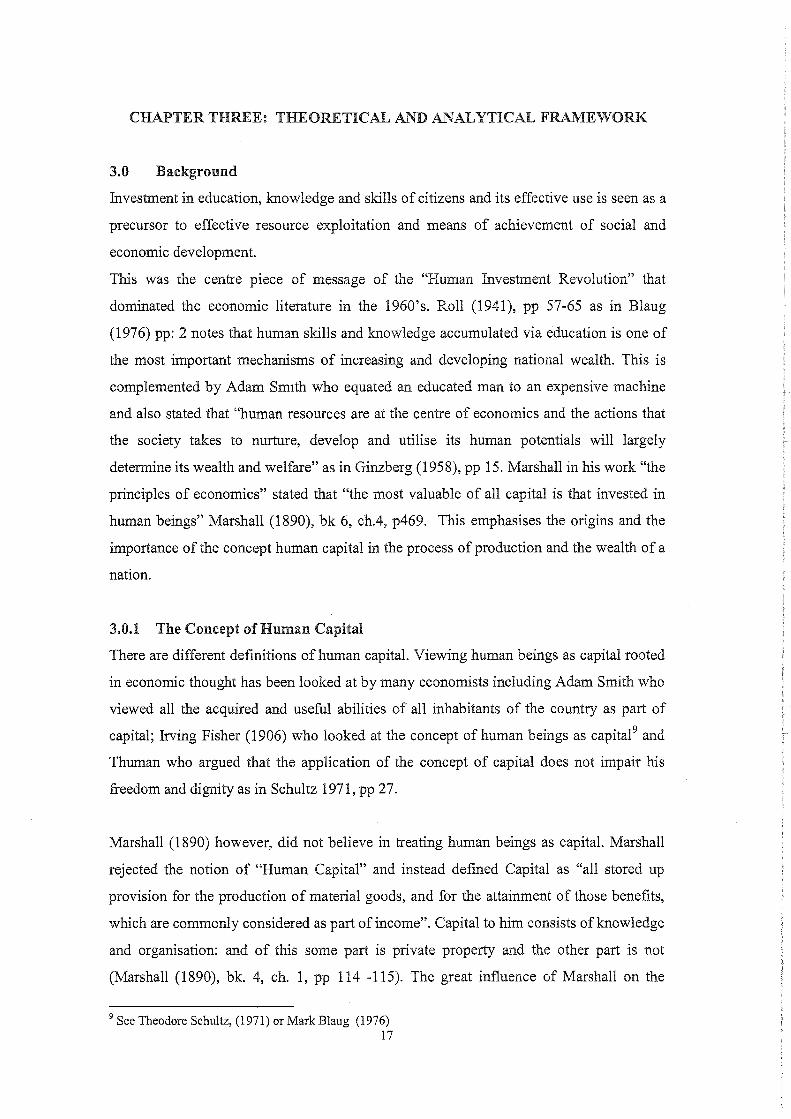
3.0 Background
Investment in education, knowledge and skills of citizens and its effective use is seen as a
precursor to effective resource exploitation and means of achievement of social and
economic development.
This was the centre piece of message of the "Human Investment Revolution" that
dominated the economic literature in the 1960's. Roll (1941), pp 57-65 as in Blaug
(1976) pp: 2 notes that human skills and knowledge accumulated via education is one of
the most important mechanisms of increasing and developing national wealth. This is
complemented by Adam Smith who equated an educated man to an expensive machine
and also stated that "human resources are at the centre of economics and the actions that
the society takes to nurture, develop and utilise its human potentials will largely
determine its wealth and welfare" as in Ginzberg (1958), pp 15. Marshall in his work "the
principles of economics" stated that "the most valuable of all capital is that invested in
human beings" Marshall (1890), bk 6, ch.4, p469. This emphasises the origins and the
importance of the concept human capital in the process of production and the wealth of a
nation.
3.0.1 The Concept of Human Capital
There are different definitions of human capital. Viewing human beings as capital rooted
in economic thought has been looked at by many economists including Adam Smith who
viewed all the acquired and useful abilities of all inhabitants of the country as part of
capital; Irving Fisher (1906) who looked at the concept of human beings as capital9 and
Thuman who argued that the application of the concept of capital does not impair his
freedom and dignity as in Schultz 1971, pp 27.
Marshall (1890) however, did not believe in treating human beings as capital. Marshall
rejected the notion of "Human Capital" and instead defined Capital as "all stored up
provision for the production of material goods, and for the attainment of those benefits,
which are commonly considered as part of income". Capital to him consists of knowledge
and organisation: and of this some part is private property and the other part is not
(Marshall (1890), bk. 4, ch. 1, pp 114 -115). The great influence of Marshall on the
9 See Theodore Schultz, (1971) or Mark Blaug (1976) 17
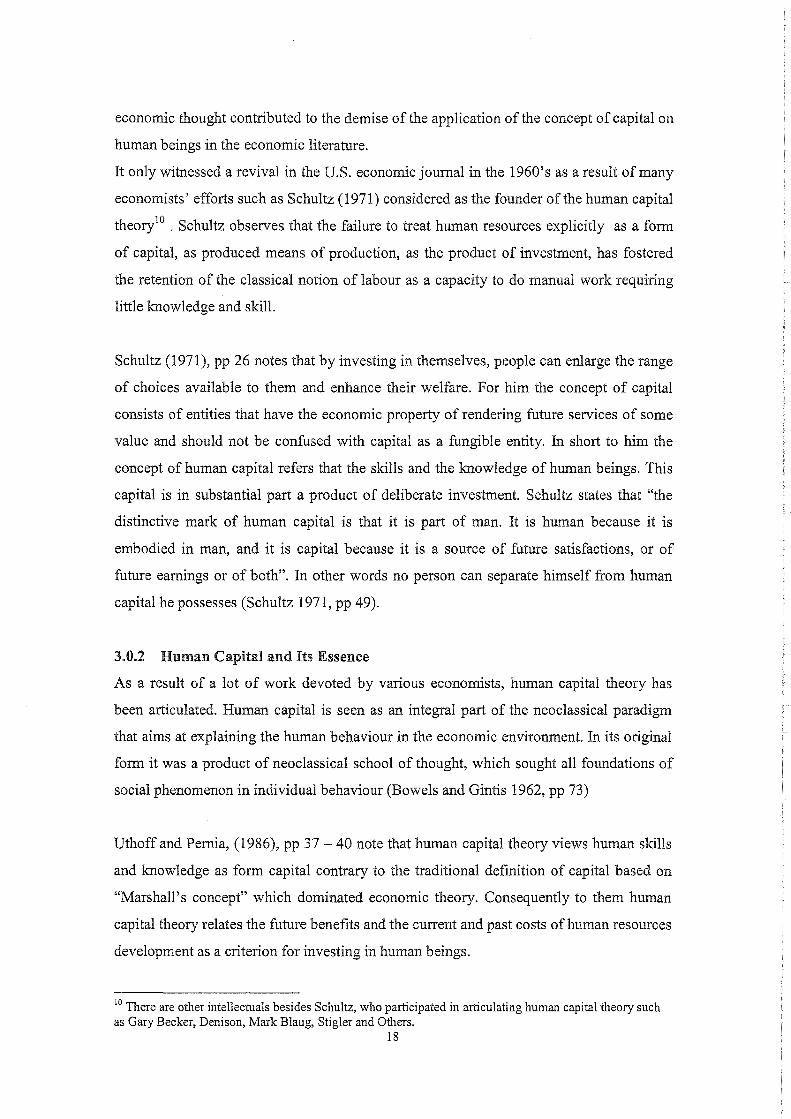
economic thought contributed to the demise of the application of the concept of capital on
human beings in the economic literature.
It only witnessed a revival in the U.S. economic journal in the 1960's as a result of many
economists' efforts such as Schultz (1971) considered as the founder of the human capital
theorylO . Schultz observes that the failure to treat human resources explicitly as a form
of capital, as produced means of production, as the product of investment, has fostered
the retention of the classical notion of labour as a capacity to do manual work requiring
little knowledge and skill.
Schultz (1971), pp 26 notes that by investing in themselves, people can enlarge the range
of choices available to them and enhance their welfare. For him the concept of capital
consists of entities that have the economic property of rendering future services of some
value and should not be confused with capital as a fungible entity. In short to him the
concept of human capital refers that the skills and the knowledge of human beings. This
capital is in substantial part a product of deliberate investment. Schultz states that "the
distinctive mark of human capital is that it is part of man. It is human because it is
embodied in man, and it is capital because it is a source of future satisfactions, or of
future earnings or of both". In other words no person can separate himself from human
capital he possesses (Schultz 1971, pp 49).
3.0.2 Human Capital and Its Essence
As a result of a lot of work devoted by various economists, human capital theory has
been articulated. Human capital is seen as an integral part of the neoclassical paradigm
that aims at explaining the human behaviour in the economic environment. In its original
form it was a product of neoclassical school of thought, which sought all foundations of
social phenomenon in individual behaviour (Bowels and Gintis 1962, pp 73)
Uthoff and Pernia, (1986), pp 37 - 40 note that human capital theory views human skills
and knowledge as form capital contrary to the traditional definition of capital based on
"Marshall's concept" which dominated economic theory. Consequently to them human
capital theory relates the future benefits and the current and past costs of human resources
development as a criterion for investing in human beings.
10 There are other intellectuals besides Schultz, who participated in articulating human capital theory such as Gary Becker, Denison, Mark Blaug, Stigler and Others.
18

The human capital concept was founded on some principal assumptions Schultz, (1971);
1. Rationality of persons in taking decisions of investment that enhances their
capabilities.
2. Earnings of a person depends on their productivity which depends on the level of
education and their experience
3. Differentials in earnings among persons can be attributed to their level of education
4. Allocation of investment resources to develop human capital should be on the basis of
the rate of return of these resources in comparison with other alternatives
The effect of human capital accumulation on productivity and income is used for analysis
at microeconomic and macro economic levels. At micro economic level, human capital
approach asserts that human capital formation through good health; education and
nutrition raise productivity of labour, which in turn influences economic activity and
societal well being (Schultz, (1992) pp 150-152). While at macroeconomic level, new
growth theories particularly endogenous growth models have been formulated relying on
the utilisation of the concept of human capital to explain the main determinates of growth
per capita income, such as the growth model by Romer (1986), Lucas (1988), and Barro
(1990, 1995).
3.1 Measurement of Human capital
Human capital can be measured in terms of education level, health and nutrition. As far
as education as a measure of human capital is concerned, several variables are used to
proxy for human capital. The quantity of education is measured by years of attainment at
various levels and the quality is gauged by scores on internationally comparable
examinations (Barro 1990). Other proxies include enrolment ratios, adult literacy and
education expenditures. For example Barro (1991), for 98 countries in the period 1960-
1985, studies the relationship between the growth rate of real per capita GDP and initial
human capital proxied by 1960 school-enrollment rates, Levine and Zervos (1993) uses
students enrolled in secondary schools, Martin and Xavier (1997) uses a combination of
various measures of education, Gemmell (1996) uses the measure of the workforce
derived from school enrollment rates and the labour force participation data, Tallman
and Wang (1994) use education attainment measure of the percentage of the population
that is 6 years and above that have completed primary education, secondary education
19

and tertiary education, Benhabib and Spiegel (1994); Temple (1999) use average years of
schooling. On the side of health the commonly used measure for human capital is the life
expectancy measure for example Gallup et al. (1998) draws their variables from Barro and
Lee (1993), and studies the relationship between initial levels of health and economic
growth, using life expectancy at birth as their basic measure of overall health of the
population. Nutrition is also occasionally used as an indicator of human capital. The next
section discusses the methods used to estimate the impact of human capital variables or
proxies on growth.
3.2 Methods used in the Measurement of the impact of Human Capital on
growth
There are two main methods of measuring the impact of human capital on growth;
1. The growth accounting area and
11. The rate of return analysis
3.2.1 Growth Accounting
Growth accounting is the main application of the neoclassical growth theory (Scott 1989,
pp 71). Its objective is to break down the growth rate of the aggregate output into
contributions from inputs, usually capital, labour and the level of technology (Barro and
sala - i-Martin (1995), pp 346). As stated by Hicks "growth accounting" traces its
origins to work done by Stigler (1947) Schmookler (1952), Kendreick (1961) among
others, but the definitive work remains that of Denison (1967, 1974, 1979) as in Hicks,
1980, pp 4).
In growth accounting the analysis generally starts from a neoclassical production function
in the style of the production function of Solow (1956). It equates the growth rate of
aggregate output to the growth rate of the total productivity of factors of production plus
a weighted average of the growth rates of two inputs.
There have been attempts to extend growth accounting to include factors like research
and development (Barro 1995, pp 346 - 351) but the inability of the conventional studies
via growth accounting to explain more than half of growth with help of factors such as
labour and capital led to the discovery of the role of human capital in economic growth
particularly after the "human investment revolution" in the late 1950's. Aukrust (1959)
20
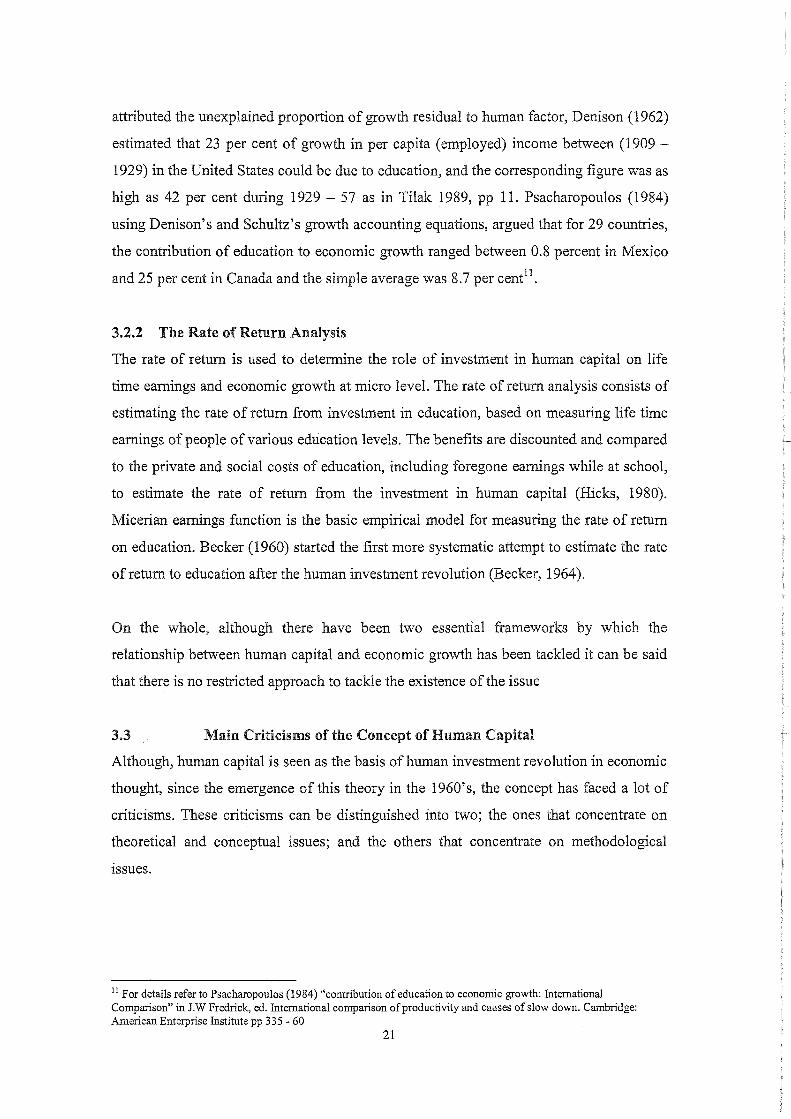
attributed the unexplained proportion of growth residual to human factor, Denison (1962)
estimated that 23 per cent of growth in per capita (employed) income between (1909 -
1929) in the United States could be due to education, and the corresponding figure was as
high as 42 per cent during 1929 - 57 as in Tilak 1989, pp 11. Psacharopoulos (1984)
using Denison's and Schultz's growth accounting equations, argued that for 29 countries,
the contribution of education to economic growth ranged between 0.8 percent in Mexico
and 25 per cent in Canada and the simple average was 8.7 per centll.
3.2.2 The Rate of Return Analysis
The rate of return is used to determine the role of investment in human capital on life
time earnings and economic growth at micro level. The rate of return analysis consists of
estimating the rate of return from investment in education, based on measuring life time
earnings of people of various education levels. The benefits are discounted and compared
to the private and social costs of education, including foregone earnings while at school,
to estimate the rate of return from the investment in human capital (Hicks, 1980).
Micerian earnings function is the basic empirical model for measuring the rate of return
on education. Becker (1960) started the first more systematic attempt to estimate the rate
of return to education after the human investment revolution (Becker, 1964).
On the whole, although there have been two essential frameworks by which the
relationship between human capital and economic growth has been tackled it can be said
that there is no restricted approach to tackle the existence of the issue
3.3 Main Criticisms of the Concept of Human Capital
Although, human capital is seen as the basis of human investment revolution in economic
thought, since the emergence of this theory in the 1960's, the concept has faced a lot of
criticisms. These criticisms can be distinguished into two; the ones that concentrate on
theoretical and conceptual issues; and the others that concentrate on methodological
issues.
11 For details refer to Psacharopoulos (1984) "contribution of education to economic growth: International Comparison" in J.W Fredrick, ed. International comparison of productivity and causes of slow down. Cambridge: American Enterprise Institute pp 335 - 60
21

3.3.1 Conceptual and Theoretical Criticisms
Shaffer (1961) argues that there is little to gain and much to loose by the universal
application of capital concept on man. He based this on the issue that investment in
human capital is different from investment in non human capital because at least part of
anyone direct expenditure for improvement of man is not investment as the term is
usually used i.e. it is taken for reasons other than the expectation of monetary return, it
has no impacts on the future output but in contrary satisfies wants directly (consumption
expenditure). To him it would remain a virtual impossibility to allocate a specific return
to a specific investment in man. He notes that if it was possible to compute the part of
man's income that results from a given investment in man expenditure, it would in most
instances still be advised from the view of social and economic welfare to utilise the
information thus obtained as exclusive or even the primary basis for policy formulation,
public or private" (Shaffer, 1961 pp 1026-1035).
The Marxists criticise the theory of human capital in that it does not take into account the
relevance of class and class conflict in its analysis because it restricts its analysis to the
exogenously given individual preferences, raw materials (individual abilities) and
alternative production technologies yet such issues as the wage structure, the individual
attributes valued in the labour market, and the social relations of the educational
processes can only be accounted for through an explicit class analysis. Marxists argue
that schooling may influence the rate of growth positively or negatively which goes
beyond human capitalist's notion of "labour quality" to its role in the extension and
reproduction of the wage - labour system, to its capacity to attenuate class conflict and
thereby to alter the rate of capital accumulation. The Marxists argue that the error in
human capital theory lies in its partial view of production and its abstraction from social
reproduction (Bowels and Gintis, 1975, pp75)
Welfarists have also criticised Human capital theory because of its strict application of
the economic yardstick of profitability to the analysis of human Capital development.
They argue that the process of human capital development through education and other
elements not only imparts vocationally useful knowledge and skills but also affects
attitudes, motivation and values, all of which determine the worker's productivity and
their participation in the process of development Uthoff and Pernia (1986), pp 48. They
further argue that this is at variance with the notion of the society welfare as also
22
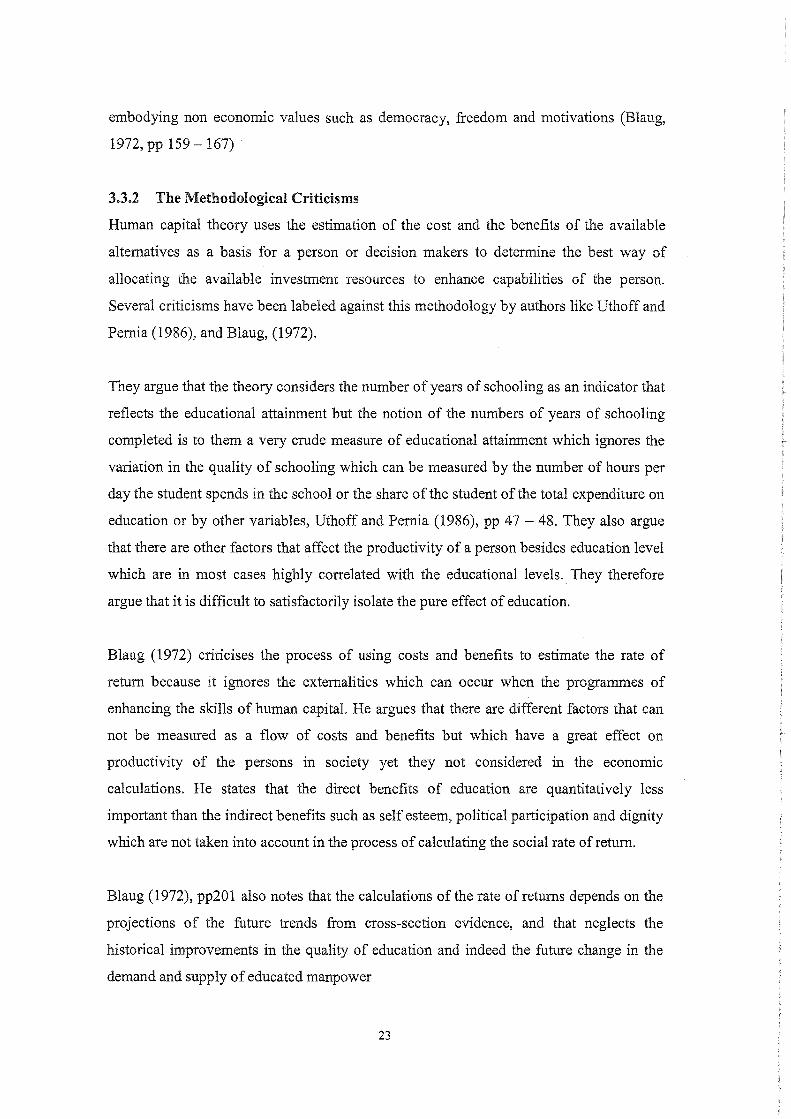
embodying non economic values such as democracy, freedom and motivations (Blaug,
1972, pp 159 - 167)
3.3.2 The Methodological Criticisms
Human capital theory uses the estimation of the cost and the benefits of the available
alternatives as a basis for a person or decision makers to determine the best way of
allocating the available investment resources to enhance capabilities of the person.
Several criticisms have been labeled against this methodology by authors like Uthoff and
Pernia (1986), and Blaug, (1972).
They argue that the theory considers the number of years of schooling as an indicator that
reflects the educational attainment but the notion of the numbers of years of schooling
completed is to them a very crude measure of educational attainment which ignores the
variation in the quality of schooling which can be measured by the number of hours per
day the student spends in the school or the share of the student of the total expenditure on
education or by other variables, Uthoff and Pernia (1986), pp 47 - 48. They also argue
that there are other factors that affect the productivity of a person besides education level
which are in most cases highly correlated with the educational levels. They therefore
argue that it is difficult to satisfactorily isolate the pure effect of education.
Blaug (1972) criticises the process of using costs and benefits to estimate the rate of
return because it ignores the externalities which can occur when the programmes of
enhancing the skills of human capital. He argues that there are different factors that can
not be measured as a flow of costs and benefits but which have a great effect on
productivity of the persons in society yet they not considered in the economic
calculations. He states that the direct benefits of education are quantitatively less
important than the indirect benefits such as self esteem, political participation and dignity
which are not taken into account in the process of calculating the social rate of return.
Blaug (1972), pp201 also notes that the calculations of the rate of returns depends on the
projections of the future trends from cross-section evidence, and that neglects the
historical improvements in the quality of education and indeed the future change in the
demand and supply of educated manpower
23
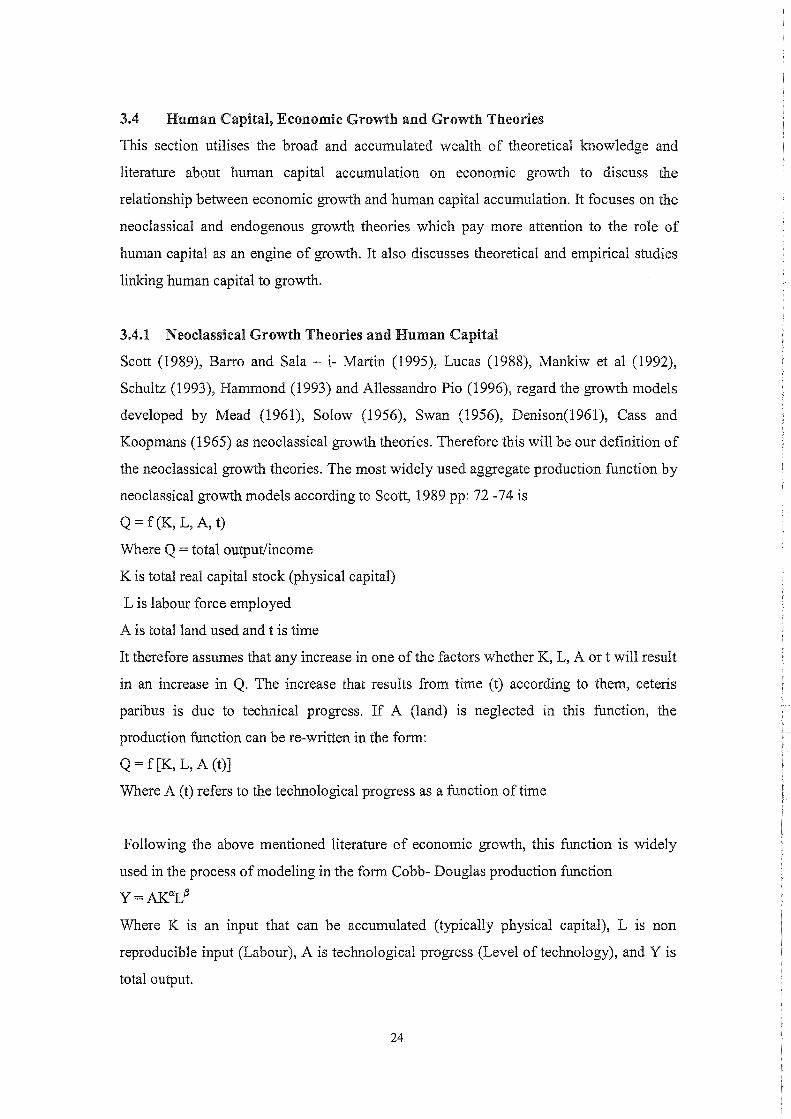
3.4 Human Capital, Economic Growth and Growth Theories
This section utilises the broad and accumulated wealth of theoretical knowledge and
literature about human capital accumulation on economic growth to discuss the
relationship between economic growth and human capital accumulation. It focuses on the
neoclassical and endogenous growth theories which pay more attention to the role of
human capital as an engine of growth. It also discusses theoretical and empirical studies
linking human capital to growth.
3.4.1 Neoclassical Growth Theories and Human Capital
Scott (1989), Barro and Sala - i- Martin (1995), Lucas (1988), Mankiw et al (1992),
Schultz (1993), Hammond (1993) and Allessandro Pio (1996), regard the growth models
developed by Mead (1961), Solow (1956), Swan (1956), Denison(1961), Cass and
Koopmans (1965) as neoclassical growth theories. Therefore this will be our definition of
the neoclassical growth theories. The most widely used aggregate production function by
neoclassical growth models according to Scott, 1989 pp: 72 -74 is
Q=f(K, L,A, t)
Where Q = total output/income
K is total real capital stock (physical capital)
L is labour force employed
A is total land used and t is time
It therefore assumes that any increase in one of the factors whether K, L, A or t will result
in an increase in Q. The increase that results from time (t) according to them, ceteris
paribus is due to technical progress. If A (land) is neglected in this function, the
production function can be re-written in the form:
Q = f[K, L, A (t)J
Where A (t) refers to the technological progress as a function of time
Following the above mentioned literature of economic growth, this function is widely
used in the process of modeling in the form Cobb- Douglas production function
Y=AK(XL.8
Where K is an input that can be accumulated (typically physical capital), L is non
reproducible input (Labour), A is technological progress (Level of technology), and Y is
total output.
24

3.4.1.1 Main Features of Neoclassical Production Function
The neoclassical production function assumes constant returns to scale, such that in the
absence of technical progress if the quantities of labour and capital have undergone an
increase of say 2 percent, then the output would increase in that proportion 12. Since the
model assumes that K and L are each homogenous, 2 percent more of K plus 2 percent of
L yields 2 percent more of every input that is already there in the production function.
This means that the marginal productivity of each input decreases as the stock of each
input increases 13 .
These properties of neoclassical production function reveal that the neoclassical growth
theories restrict the analysis of growth to the short run, Alessandro Pio (1996). The
neoclassical growth theories state that the long run growth rates, if they are not zero, are
determined by exogenous non economic factors such as population growth and the rate of
technical progress. Accordingly this implies that, any measures to promote growth can
only enhance short or medium term growth rates (Alessandro Pio 1996, pp 3 - 7). In
order to have positive per capita growth rates in the long run, the neoclassical growth
model states that the economy should get exogenously more productive over time.
3.4.2 Endogenous Growth Models
3.4.2.1 Introduction
The rebirth of the growth theory was in the 1980's beginning with the work of Romer
(1986); and Lucas (1988). Growth theory emerged with a new way of thinking which
contrasted the earlier neoclassical models which were driven by exogenous technological
progress and popUlation growth.
Romer and colleagues endogenise technological progress (Romer 1986, 1990), Human
capital (Lucas 1988), fertility (Becker, Murphy and Tamura, 1990) and even political
decisions resulting from political processes. Put differently the factors that were treated
historically in growth literature as exogenous become endogenous and the long run
growth determinates became determined within the growth model hence endogenous
models, Hammond and Rodriguez, (1993), pp 1- 7.
12 The Cobb-Douglas function used above can experience increasing returns to scale or decreasing returns to based on the summation of (jJ+cc)). If j3+cc) > 1 then there are increasing returns and if j3+cc) <1 then it experiences decreasing returns to scale. 13 This is clarified in many text books for details refer to Scott 1989, pp 75 and Barro and Sala - i- Martin 1995, pp 14 - 16
25
3.4.2.2 Main Features of the Endogenous Growth Models
The main features that distinguish endogenous growth models (EGMs) from the
neoclassical growth models (NGMs) especially in relation to the role of human capital
are based on the assumptions. The neoclassical growth models of Solow, Koopmans and
others relied on the Cobb - Douglas production function with constant returns to scale
(CRS) and decreasing returns to each of the inputs (cct {3 = 1, a<1 and (3<1) as in the
simple form Y = F (K, L), Y= A~ La, where a positive growth rate could not be
sustained in the absence of exogenous population growth or technical progress. While
population growth would provide the complementary factor such that off setting the
decreasing returns to the accumulation alone, technical progress would constantly shift
upwards the marginal productivity of capital, thus increasing output per capita
(Alessandro Pio (1996), pp 5-6).
However, the endogenous models have removed one or both of these assumptions and
can be distinguished in to two sets of endogenous growth models namely the endogenous
Growth Models with Constant Returns to Scale which introduces the concept of broad
capital (Alessandro Pio, 1996 pp 6-7), Barro and Sala - i- Martin (1995) and Robelo
(1990) and the endogenous Growth Models with Increasing Returns in the works for
example of Aulin (1992).
3.5 NGMs and EGMs and the Role of Human Capital: Theoretical Literature
This section reviews the various theoretical postulations by both the neoclassical and
endogenous growth theories on the role of human capital on economic growth.
As already discussed, the NGMs treat human capital as a homogenous factor in the
production function neglecting differences among human agents in skills and knowledge.
Additionally they treat technical progress as an exogenous factor whose determinates are
determined outside the model while EGMs on the hand have factored human capital as
essential input into the production function.
In 1986, Romer developed an equilibrium growth model of endogenous technical change
in which the engine of long run growth was seen as primarily the accumulation of
26
knowledge14• The Romer model assumed knowledge as an input in the production
function and the model offered an alternative view of long run prospects of growth. The
model postulated that in fully competitive equilibrium framework, per capita income can
grow without bound, possibly at a rate that is monotonically increasing over time in
which the rate of return of capital may increase rather than decrease with increases in the
capital stock as a result of externalities resulting from human investment (Romer 1986,
pp 1003 - 35).
Lucas (1988) likewise found out that neoclassical growth theory is unable to account for
observed diversity across countries given the over emphasis given to technology as a
major explanation for wide differences in income level and growth rates across countries,
Lucas (1986), pp 13 -17. As a result he considered two adaptations of the neoclassical
growth model in the style of Solow to include human capital with externalities in the
sense that average human capital affects worker's productivity (the internal effect of
human capital) in addition to the effect of his human capital. With this modification the
model predicts that the difference among countries can be maintained as differences of
the level of human capital among countries and in the second modification, Lucas (1988)
considered only human capital as having external effects in that the average level of
human capital also affects the productivity of other factors of production. Consequently,
with many commodities "with different levels of learning by doing" and with
international trade, it seems that producers do not take learning possibilities into account,
but only maximise their returns according to immediate comparative advantage which
result in very different paths of human capital formation via learning by doing.
This work of Lucas has very great influence on many of the subsequent works on growth
models with respect to the role of human capital as stated by Schultz (1992) "one
implication of Lucas' hypothesis was that human capital should be factored back into the
aggregate production function, an empirical practice that was never fully accepted in
growth theory literature in the 1960's" (Schultz, (1992), pp 146).
Stokey (1990) as in Behrman (1990) developed a model consistent with the East Asian
experience of rapid growth in trade, in education and rapid change of composition of
14 Infact his model relied on the idea of Kenneth Arrow on his model of "The economic implication of learning by doing" (1962)
27
output. She found out that the acquired level of human capital is the main source of
product quality where labour with higher level of human capital produces higher quality
products in contrary to those with low level of human capital that are unable to produce
higher quality products. She considered human capital as the essential factor in
determining the comparative advantage.
Barro and sala - i-Martin (1995) using a one sector model in form AK models, argued
that it is possible to have long run positive growth without exogenous technical progress
in contrary to the conventional neoclassical growth models. This resulted from the
adoption of the broad concept of capital that includes physical and human capital. Using
a two sector model of endogenous growth with special attention to the role of human
capital they stressed that "an economy would recover rapidly to a war that destroyed
primarily physical infrastructure but rebound on slowly from an epidemic that eliminate
mainly human capital" (Barro and sala - i-Martin 1995, pp 2000 -1)
3.6 Education Expenditure, Human Capital and Economic Growth: Empirical
Evidence
There is considerable evidence at the micro and macro levels that to support a link
between education expenditures and human capital and human capital and economic
growth. However, as shall be observed below, there are contradictions within these
studies both at micro and macro levels. This section therefore explores what other studies
have found out on these relationships.
At micro level, Bratsberg and Terrell (2002) find that immigrants from countries with
higher public expenditures per pupil receive higher U.S. wages. Card and Krueger (1992)
find that education quality positively influences wage rates. Krueger and Lindahl (2001),
find that there is robust evidence of private returns to schooling but less support for a
relationship between growth and changes in levels of schooling. Schultz (1992) and
Becker (1993) showed that investment in education had great influence on earnings.
Mincer (1974) as in Krueger and Lindahl (2001) showed the log of earnings is linearly
related to individuals' years of schooling, and the slope of this relationship is interpreted
as the rate of return to investment in schooling. This is supported Gary Becker (1964) and
Becker and Barry Chiswick (1966).
28
However, Krueger and Lindahl (2001) argue that the available micro evidence suggest
that the returns to education obtained for various reasons are ,more likely to be greater
than the conventionally estimated returns to schooling. They cite for example studies that
consider the effects of compulsory schooling or school-building projects (Kevin Lang
(1993), effects of school resources (Summers and Wolfe 1977; Krueger 1999); and
effects of preschool programmes (Rivkin, Hanushek, and Kain 1998) and raising incomes
(Barnett 1992), differences in student backgrounds (Entwisle, Alexander, and Olson
1997, Dale and Krueger 1998). All these have greater rates ofreturns as compared to the
conventional estimates for example by Mincer. This therefore implies that for several
reasons the returns to education vary according what variables are studied at micro level.
On the macro front, according to Krueger and Lindahl (2001), two issues have motivated
the use of aggregate data to estimate the effect of education on the growth rate of GDP.
They note that the relationship between education and growth in aggregate data can
generate insights into endogenous growth theories, and possibly allow one to discriminate
among alternative theories and that estimating relationships with aggregate data can
capture external returns to human capital that are missed in the micro econometric
literature.
According to Krueger and Lindahl (2001) the neoclassical growth model of Solow 1956
did not give any special role to human capital in the production of output while the
endogenous growth models assign a more central role to human capital. The role of
human capital in endogenous growth models can be divided into two broad categories
(Krueger and Lindahl (2001) namely; the broad concept of capital which assumes that
sustained growth is due to the accumulation of human capital over time (Uzawa 1965;
Lucas 1988) and the second category which attributes growth to the existing stock of
human capital, which generates innovations (Romer 1990) or improves a country's ability
to imitate and adapt new technology (Nelson and Phelps 1966) as in Krueger and Lindahl
(2001) .
Other studies at macro level include Cullison (1993) and Barro and Sala-i-Martin (1999)
who find a positive relationship between government education spending and growth.
Zhang and Casagrande (1998) find that education subsidies improve growth in a cross
section of developed and developing countries. Barro (1991) finds a positive correlation
between education expenditures and economic growth. Gemmell (1996) finds both the
29
levels of human capital and their growth rates to be important determinants of economic
growth. Musila and Belassi (2004) showed that education expenditure per worker had a
positive and significant impact on economic growth both in the long run and short run.
Gallup et al (1997) notes that a more efficient labour force through better education is
likely to increase productivity from a given resource base
Like in the micro front, other researchers find either weak or no evidence that education
or education expenditures enhance economic growth at macro level. Levine and Renelt
(1992) conclude that government education expenditures are not robustly correlated with
growth rates. Devarajan et al (1996) find negative correlations between the share
education expenditures in government budget and economic growth in most of their
estimates. Benhabib and Speigel (1994) find weak evidence of a relationship between
changes in educational attainment of the labour force and economic growth.
As seen above there is conflict both within the micro and macro evidence as far as the
role of education is concerned. The recent cross-country studies have found that
economic growth appears to be umelated to increases in educational attainment yet a
great deal of micro econometric evidence indicates high returns to human capital
investments in developing and developed countries alike. These contradictions may be
caused by several factors. Temple (1999) indicates that the correlation between increased
human capital and growth may sometimes be hidden in the cross-country data by a
number of unrepresentative observations.
The first paper to highlight the weak correlation between growth and increases in
educational attainment was Benhabib and Spiegel (1994). Another influential paper, by
Pritchett (1997), has emphasised a similar set of results but using a different dataset and
more extensive robustness testing. Some of the explanations to this conflict include
measurement error in the first-differenced education data (Krueger and Lindahl, 1998)
and the possibility that, in many developing countries, the highly educated are more
likely to work for the state than in the private sector (Pritchett, 1997). However, Temple
(1999) calls this explanation simplistic. He tresses this to one reason that simple cross
country regressions do not detect an effect of human capital because the effect could be
hidden by a small number of umepresentative countries, perhaps ones in which human
capital accumulation has had little or no effect. He found out that in a sample of 64
30
countries, there is clear evidence that output growth is positively correlated with the
change in educational attainment, even when one conditions on physical capital
accumulation. He therefore concludes that simple application of OLS is sometimes an
inappropriate way to estimate cross- country growth regressions, and results should
always be accompanied by a careful exploration of sample sensitivity, given the
likelihood of substantial parameter heterogeneity. He demonstrates the point using data
and specifications from Benhabib and Spiegel (1994).
Several other explanations showing the contradictions can be found in Krueger and
Lindahl (2001). They include among others measurement error, estimation over varying
time periods, effects of initial level of education and heterogeneous country effects of
education among others.
Our paper therefore in the next section uses macro economic data to estimate the effects
of education expenditure on human capital and human capital on economic growth (real
GDP) using the endogenous growth models based on Cobb Douglas aggregate production
function in Uganda
31

CHAPTER FOUR: EMPRICAL ANALYSIS AND DISCUSSION
4.0 Introduction
The main objective of this chapter is to show that accumulation in human capital stock
through increases in education expenditure can explain economic growth in Uganda. The
analysis employed in this chapter covers the period from 1962 to 2002. This period is
used in our study for the reason that most developing countries, including Uganda
devoted a lot of resources to human capital accumulation during the period 1960 - 1985
and the period from 1985 till now is deemed the crisis of human capital formation and
utilisation (Tallman and Wang, 1994). Further most developing countries including
Uganda are experiencing high levels of unemployment among educated people and
besides most of the developing countries have implemented SAPs because of debt crisis
and poor economic performance
4.1 Education Expenditures, Human Capital and Economic Growth in Uganda
(1962 - 2002)
This section employs simple statistical tests to try to establish the potential link between
education expenditures and human capital accumulation and Human capital and
economic growth in Uganda over the period 1962 to 2002.
4.2 Education Expenditure and Human Capital Stock (1962 - 2002): Simple
statistical tests
Here we attempt to establish the link between education expenditures and four different
potential proxies of human capital namely; average years of schooling, average education
expenditure per worker, adult literacy and total enrolment as percentage of total
population. The relationship is tested pair wise using scatter plots and simple correlations.
The education expenditures are expressed as a percentage ofGDP.
The scatter plots 5a to 5d(refer to annex 2) indicate a positive relationship between
growth in education expenditures as percentage of GDP and human capital accumulation
proxied by the four different indicators average years of schooling, adult literacy, average
education expenditure per worker and total enrolment as percentage of GDP in Uganda
for the period 1962 - 2002 and relatively speaking, the degree of association as indicated
by simple correlations coefficients (r) are 0.69 for average years of schooling (figure 5a),
0.67 for adult literacy (figure 5b), 0.96 for average education expenditures per worker
(figure 5c) and 0.62 for total enrolment as percentage of GDP (figure 5d) indicate that
32

there seems to be a positive association between the four variables with education
expenditure as percentage of GDP for the period 1962 - 2002 giving indications that
there is relationship between education expenditures and human capital accumulation. All
the four proxy variables are transformed into logarithms. The slopes of all the variables
investigated reflect that a unit change in education expenditures leads to considerable
changes in average years of schooling, adult literacy, emolment and average education
expenditures per worker. This conforms to theory in chapter three which postulates that
education expenditures are positively associated with human capital stock. For example a
number of papers have formalized this link between government education spending and
growth by building endogenous growth models where public education expenditures
directly influence human capital accumulation and consequently affect long-run growth.
Examples include Glomm and Ravikumar (1992, 1997, 1998), Eckstein and Zilcha
(1994), Kaganovich and Zilcha (1999), Cassou and Lansing (2001) and Blankeanu
(2003) as in Blankeanu and Simpson (2003). In other work, as cited in Blankeanu and
Simpson (2003), public expenditures have an indirect growth effect by encouraging
private investment. This feature is found, for example, in Zhang (1996), Milesi-Ferretti
and Roubini (1998), Hendricks (1999) and Brauninger and Vidal (1999).
4.3 Human Capital and Economic Growth: Simple Statistical Tests
4.3.1 Human Capital Stock and Economic Growth in Uganda (1962 - 2002)
A ware that there is an association between education expenditures and human capital
proxied by four different indicators, we conducted simple statistical tests to establish the
relationship between human capital variables discussed in section 4.2 above and
economic growth (real GDP). The results for these tests are shown in figures 6a to 6d in
annex 3.
The scatter plots 6a to 6d, (see annex 3) indicate that there is a positive relationship
between the level of human capital and the real GDP for the period 1962 - 2002
measured by the four proxies of human capital. In relative terms the degree of association
is also indicated by simple correlations coefficients (r) which are 0.87, 0.78, 0.42 and
0.80 for the average years of schooling, adult literacy, average education expenditure per
worker and total emolment as percentage of total population respectively and real GDP
for the period 1962 - 2002. In relation to the slopes we observe that unit changes in the
human capital indicators are positively associated with unit changes in real GDP. For
example a unit change in the average years of schooling leads to a 0.2 change in real
33
GDP as shown in annex C 6a above. These findings are therefore a pointer to what is
discussed in Chapter 3 of this paper where we observed that there is both a theoretical
and empirical evidence of the positive relationship between human capital stock and
economic growth. These shown by studies like Barro (1991), Barro and Sala - i-Martin
(1995), Zhang and Casagrande (1998) among others.
4.4 Human Capital and Economic Growth: Econometric Test
4.4.1 Introduction
This section uses econometrics to test the link between human capital accumulation and
economic growth in Uganda for the period 1962 - 2002.
After simple statistical test and getting indications of positive association between human
capital and growth we examine our hypothesis that human capital stock accumulation
leads to economic growth and argue that increase in education expenditures playa role in
motivating and supporting human capital accumulation and that the endogenous growth
in human capital in turn generates growth. However, we note despite the growing
literature, the results of existing cross-country studies present conflicting evidence so that
the explicit effect on output growth from human capital remains inconclusive.
This paper adopts a time series empirical strategy to investigate the importance of human
capital accumulation on economic growth but focusing on a single poor but rapidly
growing country. We use this framework based on arguments presented by Tallman and
Wang (1994);
1. Case study approach provides a more careful and an in-depth examination of
institutional and historical characteristics of a particular country
11. The use of the data set comprised of the most appropriate and high quality
measures unconstrained by the need for measurement consistency across
countries
111. A more detailed exposition of the dynamic evolution of the economy
4.5 The Econometric Model Specification
4.5.1 Theoretical Model
This paper uses the Cobb Douglas aggregate production function similar to the one used
by Aulin (1992), Tallman and Wang (1994) and Musila and Belassi (2004) albeit with
34

some modifications to establish the empirical link between human capital accumulation
and economic growth in Uganda. We used the aggregate production because we also
wanted to consider the traditional input measures of capital (K) and labour (L) in our
analysis
The aggregate production function takes the form of;
Yt = AKtIlHtY,
Where Yt is real income (i.e., real GDP),
Kt is physical capital,
Lt is the labour force
Ht is the total amount of human capital,
A is the technology parameter,
t is the observation subscript,
And ex, (3, and 'Yare parameters to be estimated.
Human capital in the Model is defined as follows:
Ht = StLt
Where St is the average years of schooling
(1)
(2)
In this study we estimate the relationship that increases in average years of schooling is
directly related to changes in the levels ofreal GDP. In section 4.2 we find that education
expenditures are highly associated with average years of schooling with a coefficient (R2)
of 0.69, therefore for our econometric analysis we use average years of schooling as our
proxy for human capital. This is based on the argument that education expenditures
contribute to improvement in the years of schooling (human capital) and human capital
stock leads to improvement in the levels ofreal GDP.
Substituting equation (2) into (1) gives;
Yt = AKt~OStr,
Where D = (3 + 'Y.
(3)
Like in the Musila and Belassi (2004) case we derive our econometric equation for our
empirical analysis from equation (3) above. Theory postulates that there is a positive
35
correlation between growth in output and increases in human capital stock. Our findings
are expected to conform to theory.
Given the fact that the relationship between output and the three inputs in Cobb -
Douglas production function above is non linear making it inconsistent with the use of
the Ordinary Least Squares (OLS) hence the variables for our model estimation are
transformed into natural logarithms to be compatible with the Ordinary Least Squares15.
As a result we obtain a linearised Cobb - Douglas function in the form In Yi = In {31 +
{321nX2i + {33lnX3i + Et (Gujarati, 2003 pp 224). In this form the model becomes linear in
the parameters {3o, {32, and {33 hence a linear regression model.
The transformations of the Cobb Douglas transforms the coefficients {32, {33 and others into
elasticity of output with respect to the specific inputs such as labour, capital and human
capital measured as a percentage change in output (Gujarati, 2003 pp 224). The
summation of fh. + {33 + {34 gives information on the rates of return i.e. the response of
output to a proportionate change in the inputs. Gujarati states that if this sum equals to 1,
then there are constant returns to scale, if it is greater than 1 there are increasing returns
to scale and less than one decreasing returns to scale (Gujarati, 2003 pp 224).
4.5.2 The Empirical Model
In this section we use Equation (3) in the theoretical model to enable us to relate
economic growth to human capital stock using logarithmic transformation. We also add
other variables deemed growth determinants in Ugandan Economy as shown in the model
specification (4) below. Like Musila and Belassi (2004) we do not restrict our model to
particular returns-to-scale on the parameters of the production but leave this to be sorted
by the data.
Our econometric model for empirical analysis is in log-linear form;
LOGRGDPt = a + cd..OGKt + oLOGLt + z LOGA VSCH t + mLOGm2GDPt +
hLOGOPENt + xDlt +€t (4)
Where:
LOGRGDP = 10g(Y) is the logarithm of output (real GDP);
LOGK = log (K) is the logarithm of gross fixed capital formation;
15 Also see Musila and Belassi (2004) and Amankwah (2004) 36
LOGL = log (L) is the logarithm of total labour force;
LOGA VSCH = log (A VSCH) is the logarithm of the average years of schooling
LOGM2GDP = log (M2GDP) is the logarithm of level of financial sector development
LOGOPEN = log (LOGOPEN) is the logarithm of total trade as percentage of GDP
(openness)
D!= (D!) is the dummy variable 1 controlling for period of political turmoil (1971-1980)
a, ex. 0, Z, m, h and x are the parameters to be estimated;
E is the error term; and
t is the observation subscript.
We examine the importance of human capital accumulation for economic growth in
Uganda in equation (4) using annual data spanning the period 1962 to 2002.
4.5.3 Variable Description and Sources
There are various determinates of economic growth and below we outline the ones we
deem relevant for our study.
Human capital measured in terms of education and health is of the determinants of
economic and given that the purpose of our study is to examine the contribution of
education (human capital accumulation) to economic growth we decide to examine the
contribution of education to economic growth (level of real GDP) in Uganda. We use the
average years of schooling as a proxy because it is seen as the ultimate outcome of any
education process. The data set for our analysis was obtained from the Barro and Lee
database (2000) for the variable of average years of schooling. The data was given in a
five year interval. Through interpolation were we able to obtain annual data. We expect a
positive relationship between the human capital stock accumulation and economic
growth.
Tallman and Wang (1994) point out that the financial system of a country is also known
to affect the level of economic growth. He cites Levin and Zervos, 1993 as arguing that
economies with more efficient financial systems are able to allocate more efficiently
savings to the best investments hence high productivity· and growth. Uganda has over
couple of years made considerable attempts to develop it financial sector, hence the need
in our study to establish whether there is a link between growth in the financial sectors
37
and economic growth in Uganda. We use M2 as a percentage of GDP to proxy for
financial sector activity in Uganda. The data was obtained from World Development
Indicators (2004).
Tallman and Wang (1994) also point out political instability as also impacting on
economic growth. It is believed that countries that experience more revolutions and coup
de tats grow more slowly than stable countries Levin and Zervos, 1993 as in Tallman and
Wang (1994). Gallup et al (1998) also find a strong negative relationship between
political instability and economic growth. In our Uganda case study we attempt to capture
the effects of political instability through a dummy variable spanning the period 1971 -
1980. We use it as an exogenous series that tries to capture the changes in the economy
that could have resulted from policies of Idi Amin Dada.
Government policies such as openness to the global economy also affect economic
growth. Gallup et al (1998) as in Tallman and Wang (1994), conclude that open
economies are in better position to import new technologies and ideas from the rest of the
world. In our study we also note over a period of time Uganda has adopted open policies
and many other major economic reforms. As a result we examine the effect of openness
to economic growth in Uganda. We capture the effect of openness using the trade
variable of imports plus exports as a percentage of real GDP per capita which is the total
trade as a percentage of GDP. We obtain the data for this variable from the Penn world
tables (2004).
Theory postulates that physical capital investment is critical for any growth process. We
therefore find it critical to have it factored in our empirical analysis. Physical capital
variable is captured by gross fixed capital formation (GFCF). The transformed data was
obtained from the data set used by Musila and Belassi (2004) and additional data for the
period (1962 - 1965 and 2000- 2002) was obtained from Uganda Bureau of statistics
(UBOS) statistical abstracts (1960 - 1965) and the World Development Indicators
(2004).
The Labour input variable (the total labour force) is theoretically a very critical factor in
economic growth and is included in our empirical analysis. The employment data was
also obtained from the Musila and Belassi (2004) data set and the additional for years
38

(1962 - 1964 and 2000 - 2002 was obtained from the Uganda Bureau of Statistics
(UBOS) statistical abstracts (1960 - 1965 and 2002-2004).
Education expenditures as percentage of GDP variable though not part of the estimation
equation is used for other simple tests to show the link between education expenditure
and human capital accumulation (average years of schooling and average education
expenditure per worker that are used as proxies for human capital) using simple
correlations and scatter plots see annex 2. The data for the variable was obtained from
various statistical abstracts of Uganda Bureau of Statistics (1960 - 2004); and Uganda
background to Budget issues (1976 - 1988).
One dummy variable is included in the model. Dummy 1 (1 = period 1971 - 1980 and 0
elsewhere) as an exogenous series intended to capture structural shifts in the economy as
a result of the policies of military regime of General Idi Amin.
The final variable used the Real GDP (total output) like in most of the growth studies
stands out as the dependent variable. The data was obtained from the UBOS various
statistical abstracts and the Musila and Belassi (2004) data set.
4.6 Estimation of the Model and Interpretation of the Results
4.6.1 Estimation Method and Procedure
Time series data is one of the common types of data used in empirical analysis. However,
as put forward by Gujarati (2003 pp 792), use of time series data poses a lot of challenges
to empirical analysis. According to Gujarati (2003) empirical work based on time series
data assumes that the underlying time series is stationary, which often is not the case. A
non stationary series according to Gujarati (2003, ppp798), is a situation whereby the
information about the macroeconomic variable under investigation will be useful only for
that time period and any prediction will not be of any practical value. It is therefore vital
to take this into consideration since estimating a regression model with non stationary
variables with the usual Ordinary Least Squares (OLS) techniques of regression analysis
may give biased estimates and may lead to misleading conclusions (Stock and Watson,
1988) as in Amankwah (2004). That is the marginal significance levels of standard
software packages for T and F tests would not be valid but make us accept the spurious
39

regression relationships (Amankwah, 2004). An important consideration therefore in
estimating the regression model as specified above by the OLS is to test for stationarity
of the included macroeconomic variables. That is, the mean, variance and auto -
covariance (at various lags) of the set of the macroeconomic time series should remain
the same no matter at what point we measure them. If this is to be the case, a particular
time series will tend to return to its mean (mean reversion) and its variance will generally
have a constant amplitude (Gujarati, 2003).
Non - stationary time's series is categorised into two as a guide for determining the
transformation method to be used in making them stationary16. These are;
1. Processes which consist of a deterministic function of time (deterministic trend)
and stochastic stationary process (trend stationary)
2. Time series whose first or higher difference is stationary (difference stationary)
One of the ways of dealing with the problem of non stationary series is to use the first
difference of each variable for the regression model. It is known that differencing
normally results into stationarity of the variables. However, Amankwah (2004) also notes
that differencing creates its own problems since "all information about potential long run
relationships between the levels of economic variables is lost" (Hendry, 1986, pp201).
MukheIjee et al (1998) recommends the test for cointegration of the set of the variables
as alternative solution. Cointegration analysis provides a way to conduct econometric
analysis of non stationary variables. Since this particular study uses time series data that
is historic in nature, we find it plausible to conduct tests for unit root and cointegration.
4.6.2 Stationarity, Cointegration, OLS regression and Error Correction Model
In this paper we use unit root test for stationarity, Engel - Granger test for cointegration
and then later estimate the long run and short run models to determine the relation
between human capital and economic growth.
4.6.2.1 Test for Stationarity Using the Augmented Dickey-Fuller Method
Before we test for unit root and cointegration, we can draw a graph for each variable
plotted against time to get first impressions about the data stationarity. We note that the
graphs (7a to 7g, see annex 4) indicate that most of the variables show a high level of
16 see Gujarati (2003) and Mukherjee et al (1998) 40

fluctuation over time. They do not show a stable trend, this gives the impression that they
are likely to be non-stationary.
The test for unit root for the time series for our variables was done using the Augmented
Dickey-Fuller (ADF) test (refer to Annex E - 1 for details of the procedure). We are
testing the null hypothesis that there is unit root (or the series is non stationary). We use
Stata 8 software. The results of the Augmented Dickey-Fuller test for unit root are
summarized in table 4.
Table 4: Augmented Dickey - Fuller test for Unit root (1962 - 2002)
Variables No of Without With No oflags 151 Diff 151 Diff with Conclusion
lags trend trend without trend trend
logrgdp 0 1.467 -1.235 0 -5.267*** -5.652*** 1(1)
logk 0 -0.469 -1.464 0 -6.888*** -6.979*** 1(1)
logl 0 -1.529 -2.641 0 -4.611 *** -4.515*** 1(1)
logavsch 0 1.428 -2.430 1 -2.555 -2.659* 1(1)
logmlgdp 0 -0.791 -1.381 0 -3.916** -3.876** 1(1)
logopen 0 -2.195 -2.030 0 -6.107*** -6.173*** 1(1)
logeducgdp 0 -2.986 2.934 0 -8.542*** -8.462*** 1(1)
Notes: *statlOnary at 10% slgmficance level, ** stationary at only 5% and 10% slgnlficance levels and *** mdlcates slgnlficance at all
levels of significance of 1 %, 5% and 10% respectively.
4.6.2.2 Augmented Dickey Fuller Results for Unit root
From table 4 above we observe that the computed t-statistics (with and without trends)
refer to columns 1 and 2, are less than the critical values. In this case we accept the null
Hypothesis that the series is non stationary for all the variables at levels. Tests for each of
all the variables based on first differences with and without time trend leads to the
conclusion that all the variables LOGRGDP (real GDP), LOGK (Physical capital), LOGL
(labour input), LOGM2GDP (financial sector development), LOGEDUCGDP (education
expenditure as percentage of GDP) and LOGOPEN (government policy of openness)
have no unit roots at 10% level of significance as shown in columns three and four. The
variable LOGA VSCH (average years of schooling) had no unit root only with a time
trend at lag one at 10% level of significance refer to column four. Our conclusion is that
our variables are integrated in the order of 1 (1)
Using the Breusch-Godfrey LM test for autocorrelation without trends, the computed chi
square is less than the critical chi-square at 10%, 5% and 1 % significance levels and 1
degree of freedom. Thus, the null hypothesis of no serial correlation can be accepted. 41

However, the test of autocorrelation by including trends show existence of
autocorrelation. The problem of autocorrelation in this case is unavoidable even if we
include lags until we run out of observations. This can be due to the fact that economic
time series could be trend stationary or difference stationary. Accordingly, including time
or trend variable in a regression model to 'detrend' the data is justified only for trend
stationary time series (Gujarti, 2003). Consequently, including time trend for difference
stationary results with variable or stochastic trend, as in the case of the results depicted in
Table 4, is inappropriate.
4.6.2.3 Engel and Granger Cointegration Test
After testing for stationarity of our series, we therefore test for cointegration of the
variables in our model to see whether there exists an equilibrium relationship between the
variables (see Annex E - 2 for details of the procedures). Regression of one time series
variable on one or more time series variable often can give spurious results (Wooldridge,
2003). One way of controlling this problem is by testing if the time series are
cointegrated. If a group of variables are individually integrated of order one, their linear
combination might be stationary. In this case the time series are said to be cointegrated
and suggests the existence oflong-run or equilibrium relationship between them.
On the other hand if the time series are non-stationary, it is not possible to generalize for
other periods. The series can be used only to study the behaviour of the time period under
consideration. For this reason, the knowledge that some variables are co integrated can
have a significant impact on the analysis of the short and long run dynamics of the
economic variables. Three general approaches are widely used for testing whether non
stationary economic time series are cointegrated. These are: Vector auto regressions
formulated by Johansen (1988, 91, & 95), single equation static regression due to Engle
and Granger (1987), and single equation error correction model (Thomas, 1999). And as
shown in the table 4 above that all our variables are non stationary and integrated in the
order of 1(1), we used Engel and Granger test for cointegration where we estimated an
OLS regression, obtained the residuals and used the ADF tests for cointegration. In the
Engle-Granger procedure the notion of cointegration applies when two series are I (1),
but a linear combination of them is I (0); in this case, the regression of one on the other is
not spurious, but instead tells us something about the long-run relationship between them.
Cointegration between two series also implies an error correction model for the short-
42
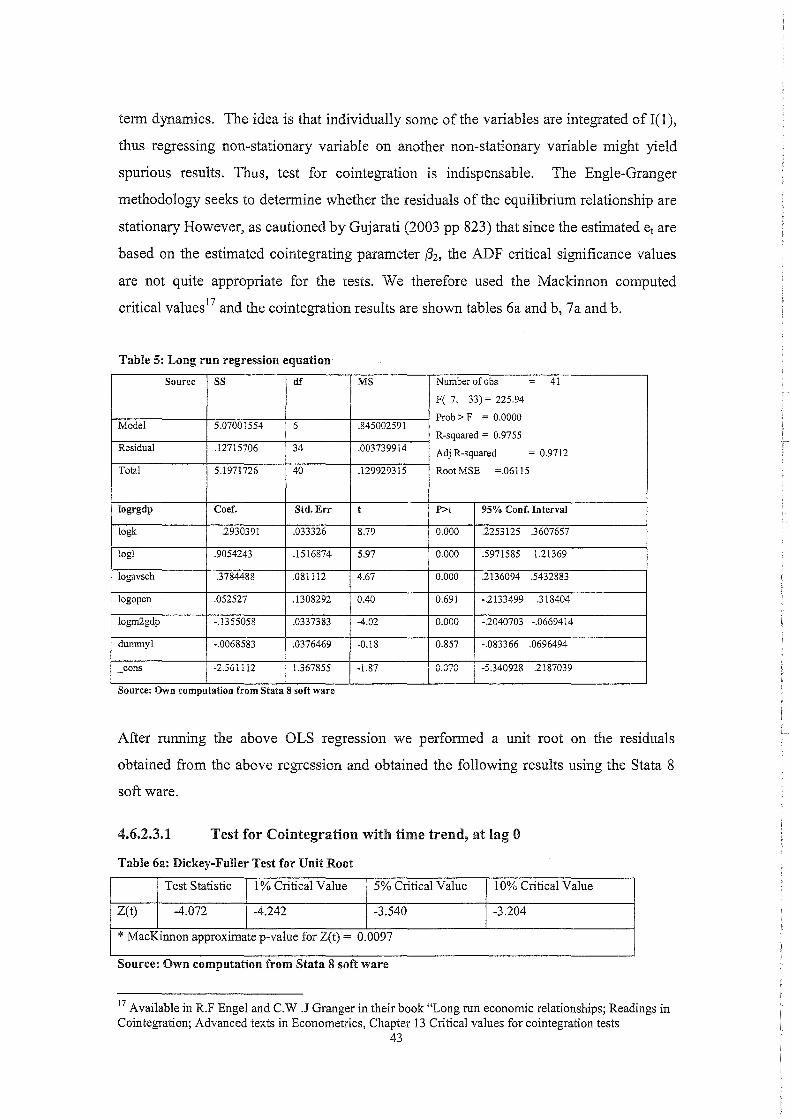
term dynamics. The idea is that individually some of the variables are integrated of 1(1),
thus regressing non..:stationary variable on another non-stationary variable might yield
spurious results. Thus, test for cointegration is indispensable. The Engle-Granger
methodology seeks to determine whether the residuals of the equilibrium relationship are
stationary However, as cautioned by Gujarati (2003 pp 823) that since the estimated et are
based on the estimated co integrating parameter f32, the ADF critical significance values
are not quite appropriate for the tests. We therefore used the Mackinnon computed
critical values17 and the cointegration results are shown tables 6a and b, 7a and b.
Table 5: Long run regression equation
Source SS df MS Number of obs - 41
F( 7, 33) = 225.94
Prob> F = 0.0000 Model 5.07001554 6 .845002591
R-squared = 0.9755 Residual .12715706 34 .003739914 Adj R-squared = 0.9712
Total 5.1971726 40 .129929315 RootMSE =.06115
logrgdp Coef. Std.Err t P>t 95% Conf. Interval
logk .2930391 .033326 8.79 0.000 .2253125 .3607657
logl .9054243 .1516874 5.97 0.000 .5971585 1.21369
logavsch .3784488 .081112 4.67 0.000 .2136094 .5432883
logopen .052527 .1308292 0.40 0.691 -.2133499 .318404
logm2gdp -.1355058 .0337383 -4.02 0.000 -.2040703 -.0669414
dummyl -.0068583 .0376469 -0.18 0.857 -.083366 .0696494
_cons -2.561112 1.367855 ' O~ ""'fA I:. '1Af\C\.,O ,,10"7(\'1('\ -LOI V.VfV -";.J"'!'V7L-O ."::'.lQ/V..J7
Source: Own computatIOn from Stata 8 soft ware
After running the above OLS regression we performed a unit root on the residuals
obtained from the above regression and obtained the following results using the Stata 8
soft ware.
4.6.2.3.1 Test for Cointegration with time trend, at lag 0
Table 6a: Dickey-Fuller Test for Unit Root
Test Statistic I % Critical Value 5% Critical Value 10% Critical Value
Z(t) -4.072 -4.242 -3.540 -3.204
* MacKinnon approximate p-value for Z(t) = 0.0097
Source: Own computation from Stata 8 soft ware
17 Available in R.F Engel and C. W .J Granger in their book "Long run economic relationships; Readings in Cointegration; Advanced texts in Econometrics, Chapter 13 Critical values for cointegration tests
43

As earlier on stated the critical values taken from Davidson and Mackinnon are
summarised below;
Table 6b: Asymptotic Critical Values for cointegration test with trend
Significance level 1% 5% 10%
Critical value -4.32 -3.78 -3.50
Source: Davidson and Mackinnon, 1993
4.6.2.3.2 Test for Cointegration without time trend at lag 0
Table 7a: Dickey-Fuller Test for Unit Root
Test Statistic 1 % Critical Value 5% Critical Value 10% Critical Value
Z(t) -4.l26 -3.648 -2.958 -2.612
* MacKinnon approximate p-value for Z(t) = 0.0013
Source: Own computation from Stata 8 soft ware
Table 7b: Asymptotic Critical Values for cointegration test without trend
Significance level 1% 5% 10%
Critical value -3.90 -3.34 -3.04
Source: Davidson and Mackinnon, 1993
From tables 6a and b, and 7a and b, the absolute values of the test statistics (4.072) table
6a and (4.126) table 7a are greater than the Engle-Granger 5% and 10% absolute critical
t-value (3.78 and 3.50) table 6b and (3.34 and 3.04) table 7b. Accordingly, it can be
concluded that the residuals from the re~lession are stationarj. Similarly, the computed
chi2 for autocorrelation 0.9215 is less than the critical chi2 value at 10%, 5% and 1%
level of significance. Thus, the null hypothesis that there is no serial correlation can be
accepted. The conclusion is that the residual is stationary. This implies the existence of
long-run or equilibrium relationship between the variables. By the same token, even
though the time series variables are individually non-stationary, they are cointegrated and
the regression is not spurious- it is meaningful to regress real GDP on the rest of the
explanatory variables LOGK, LOGL, LOGA VSCH, LOGM2GDP and LOGOPEN. The
reason is that the linear combination cancels out the stochastic trends in the time series
variables (Gujarati, 2003). Including time trend in the unit root test is subject to
autocorrelation due to the reasons explained above.
4.7 Long Run Estimates and Discussion of regression
44
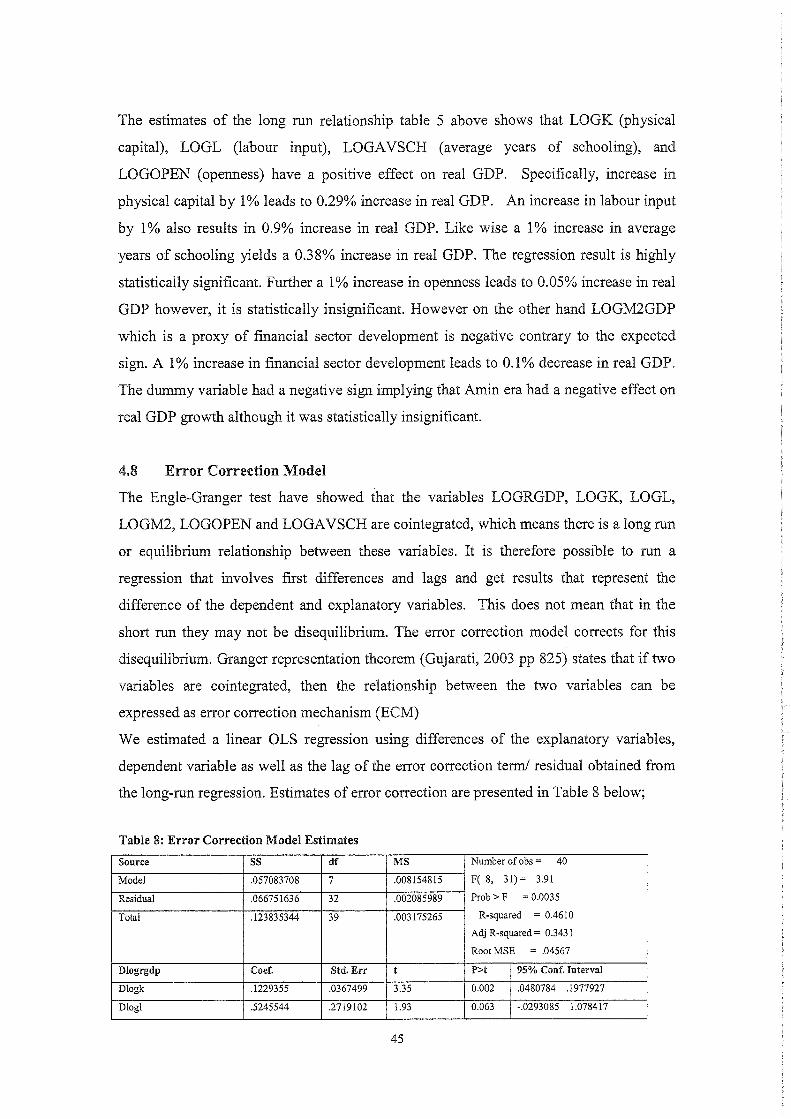
The estimates of the long run relationship table 5 above shows that LOGK (physical
capital), LOGL (labour input), LOGAVSCH (average years of schooling), and
LOGOPEN (openness) have a positive effect on real GDP. Specifically, increase in
physical capital by 1 % leads to 0.29% increase in real GDP. An increase in labour input
by 1% also results in 0.9% increase in real GDP. Like wise a 1% increase in average
years of schooling yields a 0.38% increase in real GDP. The regression result is highly
statistically significant. Further a 1% increase in openness leads to 0.05% increase in real
GDP however, it is statistically insignificant. However on the other hand LOGM2GDP
which is a proxy of financial sector development is negative contrary to the expected
sign. A 1% increase in financial sector development leads to 0.1% decrease in real GDP.
The dummy variable had a negative sign implying that Amin era had a negative effect on
real GDP growth although it was statistically insignificant.
4.8 Error Correction Model
The Engle-Granger test have showed that the variables LOGRGDP, LOGK, LOGL,
LOGM2, LOGOPEN and LOGA VSCH are cointegrated, which means there is a long run
or equilibrium relationship between these variables. It is therefore possible to run a
regression that involves first differences and lags and get results that represent the
difference of the dependent and explanatory variables. This does not mean that in the
short run they may not be disequilibrium. The error correction model corrects for this
disequilibrium. Granger representation theorem (Gujarati, 2003 pp 825) states that if two
variables are cointegrated, then the relationship between the two variables can be
expressed as error correction mechanism (ECM)
We estimated a linear OLS regression using differences of the explanatory variables,
dependent variable as well as the lag of the error correction term! residual obtained from
the long-run regression. Estimates of error correction are presented in Table 8 below;
Table 8: Error Correction Model Estimates
Source ss df MS Number of obs = 40
Model .057083708 7 .008154815 F( 8, 31)= 3.91
Residual .066751636 32 .002085989 Prob>F = 0.0035
Total .123835344 39 .003175265 R-squared = 0.4610
Adj R-squared = 0.3431
RootMSE = .04567
D10grgdp Coef. Std. Err t P>t 95% Conf. Interval
D10gk .1229355 .0367499 3.35 0.002 .0480784 .1977927
D10gl .5245544 .2719102 1.93 0.063 -.0293085 1.078417
45

Dlogavsch .2117372 .1296453 1.63 0.012 -.0523418 .4758161
D1ogopen .0221656 .0979171 -0.23 0.822 -.2216163 .1772851
D1ogm2gdp -.1338658 .0566502 -2.36 0.024 -.2492585 -.0184731
Ddummyl -.0003511 .0334757 -0.01 0.992 -.0685388 .0678367
ECMLl -.3859205 .1575991 -2.45 0.020 -.7069395 -.0649016
_cons .0212391 .0126193 1.68 0.102 -.0044656 .0469438
Source: Own computation from Stata 8 soft ware
4.8.1 Short Run estimates of the regression
From Table 8 above the effects of LOGK (physical capital), LOGL (labour input),
LOGAVSCH (average years of schooling), and LOGOPEN (openness) on real GDP are
still positive and statistically significant. We observe that a 1 % increase in physical
capital leads to 0.12% increase in real GDP, likewise a 1% increase in the labour input
generates a 0.5% increase in real GDP. Equally a 1% increase in average years of
schooling generates a 0.2% increase in real GDP. A 1 % increase in openness generates a
0.02% increase in real GDP though statistically insignificant. Again like in the long run
the financial development is negatively signed and statically significant. A 1 % increase
financial sector development generates 0.1% decrease in the real GDP. The dummy is
negatively signed indicating negative effects of the Amin regime in the real GDP but
statistically insignificant. The error correction term in Table 8 above is highly significant.
The speed of adjustment of the error correction term of -0.39 implies that the system
corrects its previous period level of disequilibrium by 39 % within a year. Equally, 39%
of previous year's real GDP disequilibrium from the long run will be corrected each year.
4.9 Diagnostic Tests
Three diagnostic tests are made based on the assumptions of the classical normal linear
regressions given in Gujarati (2003:65-81).
The data was found to be homoscedastic at 10% level of significance because the
computed Chi-square of 4.84 is less than the critical chi-square (6.63) at 1 degree of
freedom. The data also passed the normality test. Likewise there was no serial correlation
as the computed chi-square of 5.665 is less than the critical chi-square (6.63) at 1 degree
of freedom at 10 % level of significance. The error correction estimation given table 8
also passes all the diagnostic tests with Chi-square of 0.19 less than critical chi-square
3.84 at 1 degree of freedom indicating that the data was homoscedastic at 5% level of
significance. Like wise no serial correlation was detected because computed chi-square of
46

0.168 is less than the critical chi-square (3.84) at 1 degree of freedom at 5 % level of
significance.
4.10: Overall Conclusion
From both the SR model and the long run regression analysis we find a statistically
significant effect of human capital as measured by average years of schooling on
economic growth. We find that in the short run a one per cent increase in average years of
schooling leads to a 0.2 % increase in the real GDP like wise in the long run, a 1 %
increase in the average years of schooling leads to 0.38% increase in the real GDP. Our
findings are in line with other studies on this relationship such as Belassi and Musila
(2004), Barro (1991), Gemmel (1996) and many others who all found a positive
relationship between human capital and economic growth. It however differs from other
studies such as those by Benhabib and Spigiel (1994), Devarajan et al (1996) and Levine
and Renelt (1992) among others who found either weak or negative relationship between
human capital and growth.
47

CHAPTER FIVE: SUMMARY, CONCLUSIONS Al'lD POLICY IMPLICATIONS
5.0 Summary and Conclusion
This study set out to estimate the effects of changes in education expenditure on human
capital accumulation and human capital and economic growth using time series data
(1962 - 2002) using descriptive statistics, Co integration technique and Error Correction
Model.
Our study finds a very strong association of 0.69 (69%) between education expenditure
and average years of schooling see graph 5a in Annex B implying that education
expenditures are positively correlated with human capital stock. And based on our
econometric analysis we also found out that average years of schooling have a positive
and significant relationship with real GDP. The results indicate that human capital stock
proxied by average years of schooling is positively correlated to increase in real GDP in
Uganda. We conclude that a one percent increase in the average years of schooling,
ceteris paribus would lead to 0.36% increase in real GDP in the long run and 0.27%
increase in real GDP in the short run.
Other factors also such as investment in physical capital, labour input, and openness
contribute to increase in real GDP in Uganda.
The study therefore accepts the alternative hypothesis that there is a positive relationship
between in education expenditure and human capital stock proxied by average years of
schooling and human capital stock with economic growth (real GDP) as shown by the
preceding summary of the results.
5.2 Policy Recommendations
The government of Uganda's long term commitment to human capital stock
accumulation is worthwhile. The government policy of universal primary education,
prioritisation of resources to education and health sectors are therefore worthwhile
endeavours. We therefore recommend the following policy recommendations for
sustained rewards from investment in education.
The government should continue commit resources to education sector and expand access
to education sector. Issues around quality of education and delivery should also be taken
into account and this can be achieved through to pursuit of the policy of openness so that
48

it can be able catch up with the challenges of globalisation in terms of technology and
new ideas. Continued investment is also critical for Uganda's growth; therefore
implementation of sound macroeconomic policies currently in place should continue to
be maintained. This is also a basis of Foreign Direct Investment (FDI) which also
depends on openness and sound policy environment. Private investment and increased
role of the private sector in education should be promoted further since it has contributed
largely to expansion in education attainment in Uganda.
49
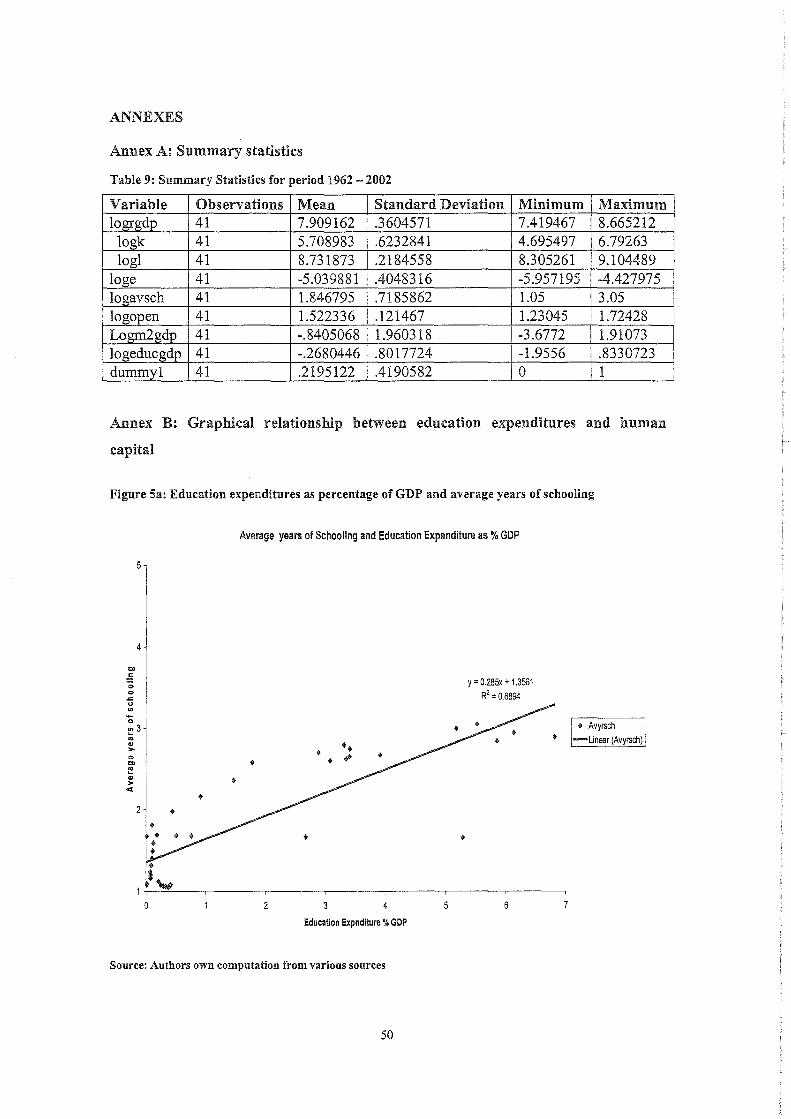
ANNEXES
Annex A: Summary statistics
Table 9: Summary Statistics for period 1962 - 2002
Variable Observations Mean Standard Deviation Minimum Maximum logrgdp 41 7.909162 .3604571 7.419467 8.665212
logk 41 5.708983 .6232841 4.695497 6.79263 logl 41 8.731873 .2184558 8.305261 9.104489
loge 41 -5.039881 .4048316 -5.957195 -4.427975 logavsch 41 1.846795 .7185862 1.05 3.05 logopen 41 1.522336 .121467 1.23045 1.72428 Logm2gdp 41 -.8405068 1.960318 -3.6772 1.91073 logeducgdp 41 -.2680446 .8017724 -1.9556 .8330723 dummy 1 41 .2195122 .4190582 0 1
Annex B: Graphical relationship between education expenditures and human
capital
Figure Sa: Education expenditures as percentage of GDP and average years of schooling
"" ~ C> ., .c u
'" -o
5
4
~3 ... '" ,., '" C>
~
'" > <C
2 •
•
..
Average years of Schooling and Education Expenditure as % GDP
y = 0.285x + 1.3561 R2= 0.6894
• Avyrsch .. -Linear (Avyrsch)
*~ 1~~---r------'-----~------'------r------'-----~
3 5 7
Education Expnditure % GDP
Source: Authors own computation from various sources
50

Figure 5b: Education expenditures as percentage of GDP and adult literacy in Uganda
Adult Literacy and Education Expenditure (Relationship)
80
70
80
~ .. S 50
"" " .., «
40
• •
30
! : ••
20+--------r------~--------,_------_.------~r_------._------_r------_,
0.00 1.00 2.00 3.00 4.00 5.00 6.00 7.00 8.00
Education Expenditure as percent of GOP
Source: Authors own computation from various sources
Figure 5c: Education expenditures as percentage of GDP and education expenditure per worker
~ .. "'"
18,000
1 16,000
14,000
~ 12,000 ~
" a.
~ 10,000 't:i c .. ~ 8,000 w c
.S! ~ 6,000
" 'C W
4,000
2,000
Education Expenditure(%GDP) and Education Expenditure per worker
3 4
Education Expendilure(%GDPj
• EDEXP PER WORKER -Linear (EDEXP PER WORKER)
Source: Authors own computation from various sources
51
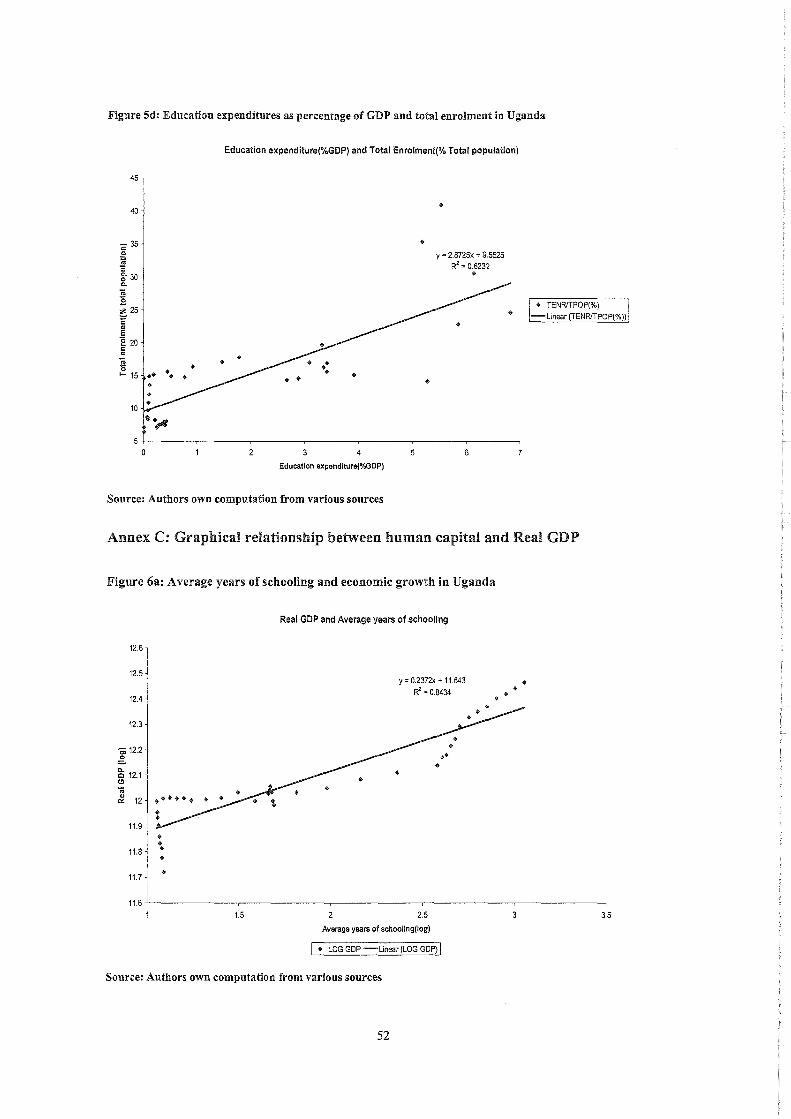
Figure 5d: Education expenditures as percentage of GDP and total enrolment in Uganda
45
40
,,35 .2 .. :; g- 30 Co
n; "0
Education expenditure(%GOP) and Total Enrolment(% Total population)
y = 2.8725x + 9.5525 R2 = 0.6232
•
• TENRfTPOP(%) ~25 c "
- Linear (TENRfTPOP(%))
E e 20 c " n; "0 ..... 15
10
3 4 5
Education expenditure(o/oGDP}
Source: Authors own computation from various sources
Annex C: Graphical relationship between human capital and Real GDP
Figure 6a: Average years of schooling and economic growth in Uganda
Real GOP and Average years of schooling
y = 0.2372x + 11.643 R' = 0.8434
2.5
Average years of schooling(log}
• LOG GOP -Linear (LOG GOP) I
Source: Authors own computation from various sources
52
••
3.5
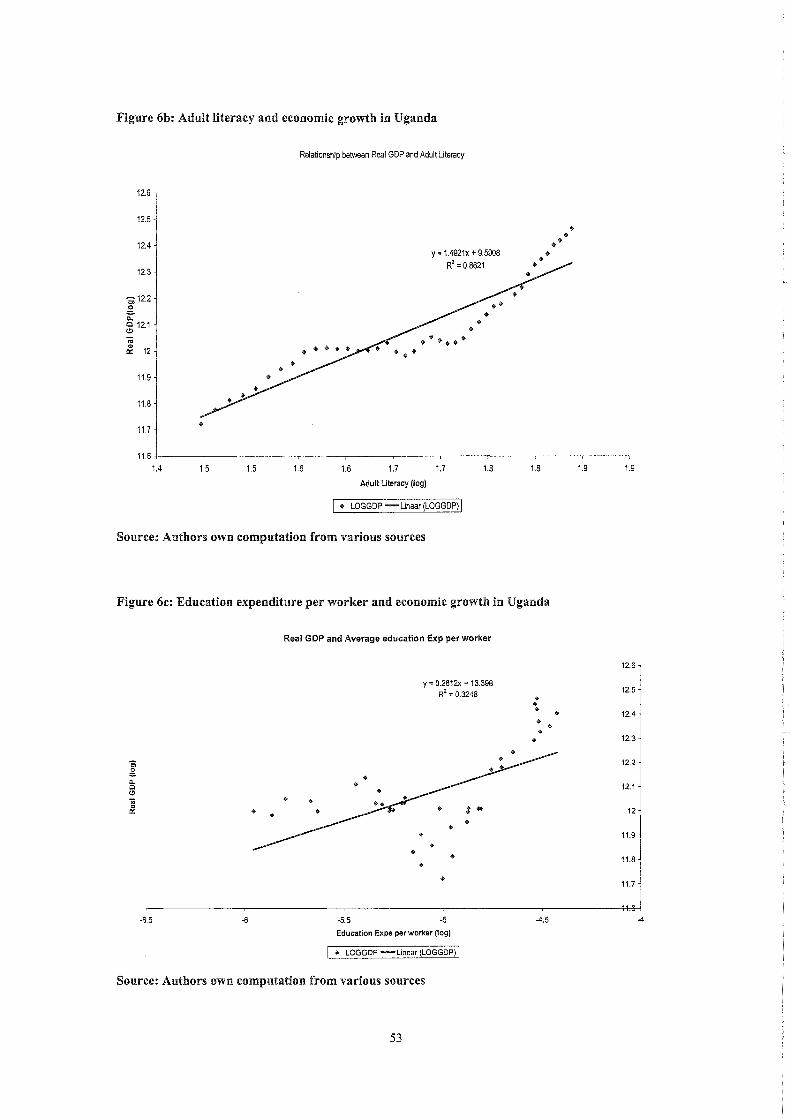
Figure 6b: Adult literacy and economic growth in Uganda
12.6
12.5
12.4
12.3
0; 12.2 .2 Q:" § 12.1 .. ~ 12
11.9
11.8
11.7 ..
Relationship between Real GOP and Adult Literacy
y = 1.4921x + 9.5908 R' =0.8621
• • • +
11.6+------,-------r------,-------r------,------~------T_----_.------_r----__.
1.4 1.5 1.5 1.6 1.6 1.7 1.7 1.8 1.8
Adult Literacy (log)
I • LOGGDP - Linear (LOGGDP) I
Source: Authors own computation from various sources
Figure 6c: Education expenditure per worker and economic growth in Uganda
-6.5 -6
Real GDP and Average education Exp per worker
-5.5
y = 0.2612x + 13.398 R2 = 0.3248
-5
Education Expe per worker (log)
.. LOGGDP -Linear (LOGGDP) I
Source: Authors own computation from various sources
53
.. .. .. .. .. ..
-4.5
1.9 1.9
12.6 -,
12.5
12.4
12.3
12.2
12.1
12
11.9
11.8
11.7
-4

Figure 6d: Total enrolment as percent oftotal population and economic growth in Uganda
12.6
12.5
12.'
12.3
! 12.2
~ 12.1
~ 12
11.9
11.8
11]
11.6 5.00000
Relationship between Real GOP and Total enrolment as percent of total population
5.50000
. . .
6.00000
y = 0.4914x + 9.0112 R2", 0.8698
6.50000
Total enrolment as percent of total Popn(log)
7.00000
Source: Authors own computation from various sources
7.50000
Annex D: Graphical test for stationarity of the time series for Uganda
Graph7a: Real GDP (1962 - 2002) in Uganda
Trend Raal GDP (Uganda) 1982 • 2002
/////////////////////
Source: Authors own computation from various sources
Graph 7b: average years of schooling (1962 - 2002)
Average years of schooling
3.5
2.5
i 2
f 15
0.5
;//////////////////// I_Avyrsch!
Source: Authors own computation from various sources
54
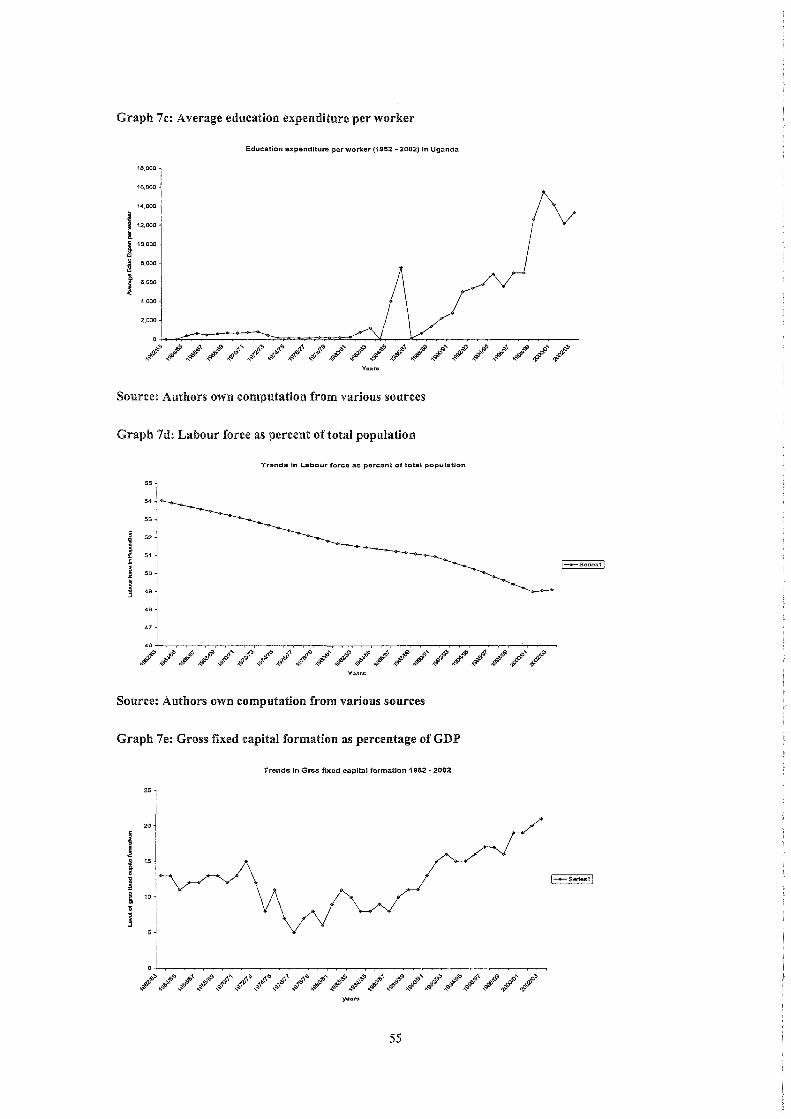
Graph 7c: Average education expenditure per worker
18,000
16,000
14,000
112.000 !. ! 10,000
~ 6.000
!l. j 6,000
4,000
2,000
Education expenditure per worker (1962 - 2002) in Uganda
Years
Source: Authors own computation from various sources
Graph 7d: Labour force as percent oftotai population
Trends in Labour force as percent of total population
55
54
53
52
51
50
49
48
47
Years
Source: Authors own computation from various sources
Graph 7e: Gross fixed capital formation as percentage ofGDP
Trends in Grss fixed capital formation 1962 .. 2002
years
55
I_Series11
I-+-Senes11

Source: Authors own computation from various sources
Graph 7f: M2 as percentage of GDP (1962 - 2002)
M2JGDP(1962 • 2002)
90
60
70
I 60
50
40
~ 30
20
10
Years
I_M2IGOP!
Source: Authors own computation from various sources
Graph 7g: Trade as percentage of GDP (1962 - 2002)
Totrade%GDP (Openness) 1962 - 2002
60 -------------,
50
10
) -+- Totracie%GDP Openness I
Source: Authors own computation from various sources
Annex E -1: Stationarity Tests
Gujarati (2003) presents three methods of stationarity tests namely; graphical analysis,
correlogram test and unit root test. Our study will apply graphical and unit root test
methods.
Graphical analysis method is meant to give a bird's eye view of the nature of the time
series data under study. Gujarati (2003) advises that before performing formal tests,
plotting the time series gives an initial clue whether the data is stationary or not. This is
because we may find high correlation coefficient (and high R2) and tend to conclude that
there is a causal relationship between the two variables. However, it is possible that two
variables trending consistently, say, upwards could be spuriously correlated and two
56

other variables trending in different directions could be truly and strongly correlated.
Thomas, (1990), notes that classical regression techniques applied to trending stochastic
time series variables with spurious correlations are likely to be invalid. Such techniques
are primarily designed to untrending or stationary, variables whose mean, variance and
covariance remain constant over time. On the other hand, a trending variable has mean
and variance that change over time (Thomas, 1990). Thus, before applying an ordinary
OLS regression, we have to test if the variables are stationary or non- stationary, also
known as testing for unit root.
Unit root test is the most widely used formal test for stationarity or non stationarity of
time series. A number of techniques have been prescribed to check for stationarity or unit
root such as the Phillips - Perron (PP) test, Perron - Break (PB) test, Dickey Fuller (DF)
test, and Augmented Dick Fuller (ADF) test. Our study uses the Augmented Dick Fuller
(ADF) test to test for the stationarity of our variables.
Annex E - 2: Testing For Co-Integration
We can estimate the equilibrium relationship between two variables Yt and Xt using the
Error Correction Model (ECM). However, the estimation of the ECM is based on the idea
that there exists an equilibrium relationship between the variables relevant to the model
(Gujarati, 2003). Thus, before we estimate the ECM, we need to test for the existence of
such equilibrium relationship. This is called the test for co integration. A series is said to
be integrated of order d if it has to be differenced d times before it becomes stationary.
Two time series are called cointegrated of order d,b denoted as CI(d,b) if the following
two conditions are satisfied. First both must be integrated of order d. Second, there
should exist a linear combination of both which is integrated of order b < d. A set of
variables are said to be co integrated if there exists some linear combination between them
which is in the order of 1(0) using the OLS regression. In other words, the test for
cointegration involves testing whether the residuals from an OLS regression between the
set of variables are stationary. If the residuals are stationary then the series are said to be
cointegrated. The levels of regression will then provide consistent estimates of the long
run relationship (Mukherjee (1998). We obtain our order of integration of our time series
by applying the Engel- Granger test for cointegration using Stata 8 soft ware.
57
BIBLIOGRAPHY 1. Aguti J. N., (1996), Makerere University External Degree Programme: The Dual
Afode Approach, Dissertation for MA Education and Development: Distance
Education, Institute of Education, University of London.
2. Aguti IN., (2000), Makerere University, Uganda In Reddy V. & Majulika S (2000)
The World of Open and Distance Learning Viva Books Private Limited, New Delhi.
P 255 - 280
3. And'res, J, 1. Hernando and J. D. Lo'pez-Salido, (1999), The Role of the Financial
System in the Growth-Inflation Link: The OECD Experience, Banco de Espana
Working Paper No. 9920.
4. Amankwah G. (2004); The relationship between Health and Education recurrent
expenditures, human capital stock and economic growth: The case of Ghana;
Research Paper Submitted to ISS in partial fulfilment of the requirements for Award
for MA in development studies, The Hague
5. Appleton, Simon (2000), "Education and health at the household level in sub-Saharan
Africa" paper prepared for the AERC collaborative research project on Explaining
African Economic Growth Performance, Centre for International Development,
Harvard University.
6. Appleton, Simon, Arne Bigsten and Damiano Kulundu Manda (1999), "Have returns
to education changed over time? Evidence from Kenya, 1978-1995", Centre for the
Study of African Economies Working Paper No. 1999/6, Centre for the Study of
African Economies, University of Oxford: Oxford.
7. Barro, R. J. (1990), Government Spending in a Simple Model of endogenous Growth.
Journal of Political Economy, XCVIII, S103-25.
8. Barro, R. l (1991), Economic Growth in a Cross-Section of Countries. Quarterly
Journal of Economics, 106(2), pp. 407-443.
9. Barro, R. land J. W. Lee. (1993), International Comparisons of Educational
Attainment. Journal of Monetary Economics, 32, pp. 363-94.
10. Barro, R. J. (1995), Determinants of Economic Growth, The MIT Press, London.
11. Barro, R., Sala-i-Martin, x., 1995. Economic Growth: MIT Press, Cambridge, MA.
12. Becker, G. S., K. M. Murphy and R. Tamura. (1990), Human Capital, Fertility and
Economic Growth. Journal of Political Economy, XCVIII, S12-37
13. Becker G. (1964), Human capital: A theoretical and Empirical Analysis, with Special
reference to education, New York: National Bureau of economic Research
58
14. Behrman J (1990), Human resource led development? "Review of issues and
evidence" Geneva, International Labour Organisation
15. Blaug, M (1972), An introduction to Economics of Education, London, Cox and
Wyman Ltd
16. Bowles, Sand Gintis H (1975), The problem with Human Capital Theory: A Marxian
Critique, Journal of American Economic Review, Vol 65, No 2 PP 75 - 83
17. Benhabib, J. and M. Speigel (1994), "The Role of Human Capital in Economic
Development: Evidence from Aggregate Cross-Country Data," Journal of Monetary
Economics vol. 34, pp. 143-173
18. Blis, M. and P. Klenow (2000), "Does Schooling Cause Growth?" American
Economic Review, vol. 90, pp. 1160-1183
19. Blankeanu, W.F., 2003, Public schooling, college subsidies and growth. Journal of
Economic Dynamics and Control.
20. Blankenau W.F, and Nicole B. Simpson (2003); Public education expenditures and
growth, Journal of Development Economics 73 (2004) 583- 605
21. Bratsberg, B., Terrel, D., 2002. School quality and returns to education of U.S.
immigrants. Economic Inquiry 40, 177- 198.
22. Cooper F. Odaet (1990), Implementing educational policies in Uganda; World Bank
Discussion papers Africa Technical department series, The World Bank, Washington
D.C
23. Card, D., Krueger, A., 1992. Does school quality matter? Returns to education and
the characteristics of public schools in the United States. Journal of Political
Economy 100,1 - 40.
24. Cassou, S., Lansing, K., 2001. Tax reform and public sector investment in human
capital. Manuscript.
25. Denison Edward. F.(1962), Education, Economic Growth and Gap information
Journal of Political Economy
26. E. Tumusiime - Mutebile (2000), Economic reform and their impact in Uganda,
lecture at the institute for economic studies, University of Iceland, institute of
economic studies, working paper series, and wOO: 13, Iceland.
27. Easterly, W., R. King., R. Levine and S. Rebelo. (1992), How Do National Polices
Affect Long-run Growth? A Research Agenda. World Bank Discussion Paper No.
164.
59
28. Eckstein, Z., Zilcha, 1., 1994. The effects of compulsory schooling on growth, income
distribution and welfare. Journal of Public Economics 53, 339-359.
29. Engel R.F and Granger C.W .J (1997) "Long run economic relationships; Readings in
Cointegration; Advanced texts in Econometrics, Chapter 13 Critical values for cointegration
tests
30. Gallup, J. L, 1. Sachs and A. D. Mellinger. (1998), Geography and Economic Growth.
Paper prepared for the Annual Bank Conference on Development Economics,
Washington, D. C., Apri120-21.
31. Gemmell, P. (1996), 'Rates of Return to Education: does the Conventional Pattern
Prevail in sub- Saharan Africa?', World Development, 24: 183-200.
32. Hausman. 1. A., (1978) Specification Tests in Econometrics. Econometrica,
Vo1.46(6).
33. Ginzberg, E, (1958), Human Resources: The Wealth of the Nation, New York; Simon
and Schuster
34. Glomm, G., Ravikumar, B., 1992. Public versus private investment in human capital:
endogenous growth and income inequality. Journal of Political Economy 100, 818-
834.
35. Grossman et al (1990), Trade Innovation and Growth, American Economic Review,
May 111- 120
36. Gujarati (2003), Basic Econometrics, 4th ed, McGraw-Hill International Editions.
37. Hendry, David F. (1986), Econometrics Modelling with Cointegration Variables: An
Overview, Oxford Bulletin of Econometrics and Statistics, August 48:20 - 212
38. Hammond, P and Rodriquez - Clare (1993), On Endogenising long run Growth; in
Andersen, T and Moene K (Eds) (1993), Endogenous growth, London: Blackwell
Publishers
39. Hanushek, E., 1986. The economics of schooling: production and efficiency of public
schools. Journal of Economic Literature 24, 1141-1177.
40. IMF report (1996), (1999)
41. Irving Fisher (1906), nature of capital and income, USA: The Macmillan Company
and smith Company
42. Krueger, A., Lindahl, M., 1998. Education For Growth: Why and For Whom?,
Princeton University, Manuscript.
43. Krueger, A., Lindahl, M., 2001. Education for growth: why and for whom? Journal of
Economic Literature 39, 1101- 1136.
60
44. Levine, R., Renelt, D., 1992. A sensitivity analysis of cross-country growth
regressions. American Economic Review 82, 942- 963.
45. Louise Fox (2004), Uganda Country Case Study: Field Visit Report and Lessons
Learned, The World Bank, Washington DC
46. Lucas, R., 1990. Supply-side economics: an analytical review. Oxford Economic
Papers 42,293- 316.
47. Levine, R. and S. Zervos. (1993), Looking at Facts: What We lrnow about Policy and
Growth from Cross-Country Analysis. World Bank Policy Research Papers, WPS
1115.
48. Lucas, R.E. (1988), On the Mechanics of Economic Development. Journal of
Monetary Economics, 22(1), pp. 3-42.
49. Marshall (1890), Principles of Economics, eighth edition, London: The Macmillan
Company
50. Musila and Belassi (2004), the Impact of Education Expenditures on Economic
Growth in Uganda: Evidence from Time Series Data, Journal of Developing Areas;
Vo138, Number 1, Fa112004 pp: 123 - 133
51. MukheIjee, C H et al (1998) Econometrics and Data analysis for Developing
countries, New York, Routledge, 98 - 338
52. Nannyonjo. J. (2001), The HIPC Debt Relief Initiative, Uganda's Social Sector
Reforms and Outcomes; Paper Prepared for Wider Development Conference: Debt
Relief, 17-18 August 2001, Maria Conference Centre, Helsinki
53. Nelson, R. R., and E. S. Phelps. (1966), Investment in Human, Technological
Diffusion, and Economic Growth. American Economic Review Proceedings, LVI, pp.
69-75.
54.0kidi et al (October 2004) "Operationalising Pro- Poor Growth" - A Country Case
Study on Uganda, A joint initiative of AFD, BMZ (GTZ, KfW Development Bank),
DFID, and the World Bank
55.0daet C. F., (1988), Uganda, In: T.N. Postlethwaite (Ed.), The Encyclopedia of
Comparative Education and National Systems of Education, Pergamon Press, Oxford,
681 -687
56. Pritchett, L., 1997. Where Has All the Education Gone?, The World
Bank,Washington DC, Policy Research Working Paper No. 1581.
57.
61
58. Psacharopoulos (1984) "contribution of education to economic growth: International
Comparison" in J. W Fredrick, ed. International comparison of productivity and
causes of slow down. Cambridge: American Enterprise Institute pp 335 - 60
59. Psacharopoulos, G. (1994), "Returns to investment in education: a global update."
World Development 22(9): 1325-1344.
60. Rebelo, S. (1990), Long Run Policy Analysis and Long Run Growth. NBER,
Working Paper No. 3325.
61. Republic of Uganda, (1992), Government White paper on The Education Policy
62. Review Commission Report on Education for National Integration and Development,
Republic of Uganda, Kampala.
63. Romer, P. (1986), Increasing Returns and Long-Run Growth. Journal of Political
Economy, 2, pp.485-490.
64. Romer, P. (1990), Endogenous Technological Change. Journal of Political Economy,
XCVIII, S71-S102.
65. Schultz, T (1971), Investment in Human Capital: The role of education and of
Research, New York: The free Press
66. Schultz Paul (1992), The role of education and Human Capital in economic
development: An empirical assessment; a paper presented at a conference on
economic growth in the world economy, institute, for Weltwirtswatcht, Keil
67. Scot (1989), Policy implication for a new view on economic growth, economic
journal, 622 - 632
68. Shaffer, H (1961), Investment in Human Capital: Comment, The American Economic
Review, Vol 51, pp 1026 - 35
69. Sala,-i-Martin, X., (1997), Regional Cohesion: Evidence and Theories of Regional
Growth and convergence. European Economic review, Vol. 40 pp. 1325-1352.
70. Tallman and Wang (1994), Human capital and endogenous growth: evidence from
Taiwan, Journal of Monetary economics 34(1994), 101 - 124
71. Temple, J., 2000. Growth regressions and what the textbooks don't tell you. Bulletin
of Economic Research 52, 181-205.
72. Temple, J., (1999), The New Growth Evidence," Journal of Economic Literature,
Vol. 37, pp.112-156.
73. Thomas, R.L (1990), Introductory Econometrics: Theory and Applications, 2nd ed.,
Longman.
62
74. Zhang, J., 1996. Optimal public investment in education and endogenous growth.
Scandinavian Journal of Economics 98, 387- 404.
63