
Economic Impact Statement - Venture Capital in Queensland
52
QUEENSLAND ECONOMIC DEVELOPMENT THROUGH AN INCREASE IN VENTURE CAPITAL INVESTMENT - A REVIEW OF THE FAILINGS IN THE CURRENT INDUSTRY, HOW TO FIX THOSE FAILINGS AND SET THE STATE'S ECONOMY APART FROM IT'S COMPETITORS ECONOMIC IMPACT STATEMENT JULY 2012
Transcript of Economic Impact Statement - Venture Capital in Queensland

QUEENSLAND ECONOMIC DEVELOPMENT
THROUGH AN INCREASE IN VENTURE CAPITAL
INVESTMENT - A REVIEW OF THE FAILINGS IN
THE CURRENT INDUSTRY, HOW TO FIX THOSE
FAILINGS AND SET THE STATE'S ECONOMY
APART FROM IT'S COMPETITORS
ECONOMIC
IMPACT STATEMENT
JULY 2012

QUEENSLAND ECONOMIC DEVELOPMENT
THROUGH AN INCREASE IN VENTURE CAPITAL
INVESTMENT - A REVIEW OF THE FAILINGS IN
THE CURRENT INDUSTRY, HOW TO FIX THOSE
FAILINGS AND SET THE STATE'S ECONOMY
APART FROM IT'S COMPETITORS
ECONOMIC
IMPACT STATEMENT
Prepared by
Darren Lelliott MBA MFP BComm
in conjunction with
Professor George Earl Dip QS, Grad Dip (PD), MSc (PM), PhD (QUT), AAIQS, FAIB,
MRICS, MAIPM, MAPI, MPIA, MUDIA, MULI Director Bond University Institute of Sustainable
Development; Bond University; Queensland, Australia

CONTENTS 1 INTRODUCTION 1
2 VENTURE CAPITAL’S DUAL OUTCOMES 2
2.1 Future State & National Development 2
2.1.1 Enabling Entrepreneurial Drivers 2
2.1.2 High Impact Investment 4
2.1.3 Venture capital-backed companies fast growing 4
2.1.4 Venture capital backed companies high employers 5
2.1.5 Economic Multiplier 6
2.2 Limited Partner (Investor) Returns 6
2.2.1 Historic Investment Performance 6
2.2.2 Return Expectations 7
3 QUEENSLAND’S VENTURE CAPITAL INDUSTRY 9
3.1 Venture Capital in Queensland 9
4 ATTRACTING BUSINESS TO QUEENSLAND 11
4.1.1 Requirements to Increase Venture Gravity 11
4.1.2 Universities 12
4.1.3 Government policy 12
4.1.4 Venture Funding (Risk Capital) 14
5 MAKING VENTURE CAPITAL A SUSTAINABLE INDUSTRY 15
5.1 Is venture capital management an art or science 15
5.2 Asset Return Range 15
5.3 Economic Equilibrium 16
5.3.1 Disjoint in Investment Beneficiaries 16
5.3.2 Time Lags 16
5.3.3 Achieving Equilibrium 17
5.4 An Argument of Scale 17
5.5 Sustainable Venture Capital Model 17
6 ACHIEVING OPTIMAL INDUSTRY SCALE 19
6.1 Domestic Superannuation Funds 19
6.1.1 Investment Allocations 20
6.1.2 Willingness to Invest 21
6.2 Offshore Fund of Funds 22
7 CONCLUSION & RECOMMENDATONS 23
7.1 Conclusion 23
7.1.1 A sustainable Queensland venture capital industry 23
7.1.2 Queensland’s Economic Benefits 24
7.1.3 Queensland's Employment Benefits 25

7.1.4 Queensland’s Innovation Corridor 25
7.2 Recommendations 26
7.2.1 Expansion of local venture capital industry 26
7.2.2 Develop a strategy for the ‘SEQ innovation corridor’ 27
7.2.3 Sponsor further research 27
7.2.4 Promotion to foreign investors & fund-of-funds 27
Annexure 1. Economic Development Loss Through Lack of Local Venture
Capital Management 28
Annexure 2. Lelliott’s Sustainable Venture Capital Model 31
8 GLOSSARY 46
9 REFERENCES 47
Venture Capital in Queensland: Economic Impact Statement
Copyright Bond University All Rights Reserved 2012 1
1 INTRODUCTION BY PROF GEORGE EARL
In my many years of activity in business and academia I have been presented with many new innovations and technologies which I had hoped to see developed through to commercial success.
Unfortunately, like most Australians, I had come to believe that while Australia is particularly good at innovation we are terrible at supporting the commercialisation of such innovations and that there was little I could do about it. My expectation was that between government policy and an underperforming venture capital industry we had little prospect of changing the status quo.
As such when Lelliott first made me aware of his theories with regard to "Economic Development Loss Through a Lack of Local Venture Capital Management" and the "Sustainable Venture Capital
Model" I had a renewed sense of optimism and felt that his theories warranted further consideration.
Economic development requires continuous business renewal, the leading industries of today did not exist yesterday and will themselves be replaced tomorrow. Venture capital is just one part of ensuring that renewal process occurs consistently over time and as such it is time we started to view the function of venture capital as another necessary and mainstream component of the
economic environment. It results in accelerated business growth and employment. The economic benefits of venture capital investment are such that they should be considered part of the economic imperative.
All levels of government understand this and support, in principle, the growth and development of an Australian venture capital industry, and yet the Australian venture capital industry remains weak, indeed concerns have been expressed that its illness may be terminal. The theories put forward by Lelliott go a long way in demonstrating that historic government policy attempts were almost certain to fail because the macro principles of industry have not been understood and as such policies have not dealt with imbalances in the macro issues.
In conjunction with Lelliott's theories I have prepared this Economic Impact Statement to explore aspects of the venture capital industry nationally and at the state level. While Lelliott's theories are incomplete and have not been subjected to extensive analysis or peer review at this time I include them, and in some regards use them as the cornerstone of my arguments, as they review existing data and propose a complete model that not only succinctly explains what is wrong with the current industry, but precisely how to fix the problems and develop a sustainable venture capital industry.
The ‘Sustainable Venture Capital Model’ is potentially a groundbreaking model for managing the entire industry and as such it is being made available for the first time in this paper and exclusively for the benefit of Queensland.
With the power of this new industry model there would exist a rare opportunity for Queensland to capitalise on the current retarded industry before the growth begins.
Applying a fresh and optimistic eye (as becomes possible with the insight of the ‘Sustainable Venture Capital Model’) it is possible to review how to make SEQ a location to attract innovative businesses (i.e. increasing the ‘venture gravity’) and then demonstrate just how this can, and
should be done, not as a Silicon Valley but an Australian corridor of innovation with unique Queensland characteristics.
All of these objectives may be achieved in a reasonable timeframe and will require little state or local government investment.
I am so convinced of the benefits that will arise out of an improved venture capital industry in Queensland that in conjunction with Messrs Graham Hart AM, Glendon Young and Darren Lelliott
we have formed Elcano Capital for the purpose of establishing venture capital funds to operate in line with the Sustainable Venture Capital Model.
George Earl

Venture Capital in Queensland: Economic Impact Statement
Copyright Bond University All Rights Reserved 2012 2
2 VENTURE CAPITAL’S DUAL OUTCOMES
There are two types of return potentially arising out of venture capital and an effective national venture capital industry;
1. the economic development impact; and 2. the actual financial return to investors of specific funds.
Unfortunately the history of the Australian venture capital industry might lead to the conclusion that these two returns have a significant negative correlation as economic benefits are high whilst actual investor returns have historically been low.
Investor returns need to be appropriate or else investors will not make future investments, as has
been demonstrated with the year-on-year decline in investment commitments to venture capital in Australia.
As will be shown Lelliott suggests that research indicates that there may be a simple mathematical explanation as to the poor historic returns from the Australian venture capital industry and it is not the size of our economy, a lack of skills in venture capital management or our entrepreneurs, or a lack of investment opportunities.
2.1 Future State & National Development
There is much postulation about a post-resources Australia and more specifically Queensland and while this may not occur for some time it is acknowledged that forethought on this proposition needs to occur now.
At different times in Queensland’s economic history there have been three main economic drivers, agriculture, resources and to a lesser extent manufacturing. However, what have always been underlying factors in any economic development are:
entrepreneurial endeavours; risk taking; starting ventures for profit; and innovation in products and services (either as new, modified or enhanced).
When Queensland winds-down its current resources activities what will its economy look like? Will it revert to agriculture, will the manufacturing industry be reinvigorated, will it still be resources but of a different kind, will there be a new “super industry” or will it be a state of many SME businesses across a wide spectrum without significant “super industries”?
No one knows which but no matter which it shall always require those economic drivers listed above.
2.1.1 Enabling Entrepreneurial Drivers
There is a lot of discussion as to how to best enhance or stimulate entrepreneurism, the legislative environment formulating the environment to nurture the entrepreneurial spirit, whilst still providing consumer protection, education and network opportunities.
The creation of or enhancement of an overall environment for entrepreneurism is beyond the scope
of this paper, however, in assuming such activity will occur then businesses will be established or current ones will seek to expand and in doing so most will require external funds. Funds, for this purpose, can be either debt or equity, but the access to such funding remains on an inverse relationship with the businesses stage of development and its profitability.

Venture Capital in Queensland: Economic Impact Statement
Copyright Bond University All Rights Reserved 2012 3
Figure 1: Profitability Vs Funding Relationship
The question of business funding is a well understood one and is best represented in the model represented below, Figure 2: Venture Capital Life Cycle. There are some variances to this model and the internet is starting to see some instances that vary from this model but those are exceptions and are a long way from representing a true change to the funding model.
This model is deceptive in that it appears to demonstrate that for each stage of the cycle there is funding available.
Figure 2: Venture Capital Life Cycle
As recently as late April 2012 Bill Shorten MP lead a trade mission to Israel to “attempt to understand how it is it that Israel-a country of 7.2 million people, a third of the size of Tasmania, sixty per cent desert, only sixty three years old, surrounded by enemies, with limited natural resources-produces more start-ups than large, peaceful and stable nations like Japan, India, Korea, Canada, the United Kingdom and Australia”i.
The head of the Productivity Commission, Gary Banks, has also spoken out as to the weakness of strategies to save employment through government hand-outs to the existing manufacturing sectorii; innovation is a key economic and performance driver for individual businesses. Australian Bureau of Statistics dataiii show that businesses that innovate are:
twice as likely to boost their productivity, 2½ times more likely to increase their contribution to their community,
2½ times more likely to put on staff, Four times more likely to increase the range of products or services they offer, and;

Venture Capital in Queensland: Economic Impact Statement
Copyright Bond University All Rights Reserved 2012 4
Five times more likely to target overseas markets.
Now more than ever, innovation is critical to lift productivity, economic growth, and employment through the creation of and invigoration of markets.
Venture capital is seen as crucial in innovation-driven economies as it provides significant funding for commercially high risk early-stage opportunities which may eventually redefine industries and sectors1, as has been identified as being an economic priority by the Liberal party with the Economic policyiv to “Enhance Australia’s venture capital market”.
2.1.2 High Impact Investment
The following is an internationally accepted definition of venture capital:
A venture capital fund provides more than just money to the company. Typically, the venture capital takes a seat on the board of directors and participates actively in company operations. This commitment often includes providing strategic counsel regarding development and production, making connections to aid sales and marketing efforts, and assisting in hiring key management. As part of this process, the venture capitalist also guides the company through multiple rounds of financing.
These elements – the patience, the hands on guidance, the willingness to take on risk and fail – make venture capital a unique asset class and may enable it to drive the Queensland economy faster and generate more jobs than other asset classes, as it does the U.S. economy. The significance of the U.S. venture capital industry has permitted it to historically set that economy apart from its international competitors.
Both the Canadian and U.S. governments use a measure of the number of billion dollar corporations per trillion dollars of GDP, as shown in Figure 3 below. On this scale Australia
presently rates well against Canada, both rate poorly against the U.S. However, in the last decade Canada has realised that without encouraging innovation, in part via substantial further venture capital investment, it stands to lose ground internationally, to the detriment of its economy. As such venture capital has been pursued as a national priority in Canada and the results are already extremely promising.
Figure 3: Firms with more than $1 billion market capitalisation per $ trillion GDP
Source: Elcano Capital; Australian figures are as per 2012 while US AND Canada are as per 2010; Bloomberg; Global Insight; McKinsey analysis.
2.1.3 Venture capital-backed companies fast growing
Over the past half century, venture-backed innovations have consistently spawned not only life-changing technologies but entire new industries. These include semiconductors, the internet, biotechnology, medical devices and clean technology, which in turn have spawned exciting
1 Allman K, Edler J, Georghiou L, Jones B, Miles I, Modivar O, Ramlogan R & Rigby J (2011) Measuring wider framework
conditions for successful innovation: A system’s review of UK and international innovation data, Index Report, NESTA, UK.
4
2^
2^
5
1
4
22
9
13
0 5 10 15 20 25
Total
Healthcare
Information Technology
US
Canada
Aust

Venture Capital in Queensland: Economic Impact Statement
Copyright Bond University All Rights Reserved 2012 5
subsectors of their own. Such evolutions create virtuous circles of innovation, job creation and revenue growth that benefit all Australians.
Venture-backed companies typically go on to fuel these new industries in terms of employment and revenue share. With their focus on innovation, high-growth potential and entrepreneurial spirit, these companies set themselves on a unique, positive trajectory that prevails long after the venture capitalist exits the investment.
Data gathered by the European Private Equity & Venture Capital Association2 shows that of the venture capital investees surveyed:
The post-investment period is characterised by large percentage increases in turnover; Most reporting companies reported an improved competitive position in terms of both market
share and profits;
Venture-backed companies deploy growth strategies to increase their sales in export markets; The venture capital investment enabled investee companies to create an average of 46 jobs
per company; Employees at all levels achieved higher levels of earnings and other forms of remuneration
following the investment; Almost three-quarters of seed/start-up companies could not have existed without venture
capital.
Anecdotal evidence in Australia indicates the same whereby because our venture capital industry is so weak by international standards so many of our innovative companies either fail or cease being Australian in order to survive.
2.1.4 Venture capital backed companies high employers
Evidence exists to suggest that venture capital backed companies are not only faster growing than their non-investee peers, but also that venture capital investment, at adequate levels, will result in almost 90% of investees increasing employee numbers.
For example while investment in venture-backed companies in the U.S. only equates to between 0.1% and 0.2% of U.S. GDP those companies employed 11% of the total U.S. private sector
workforce and generated revenue equal to 21% of U.S. GDP.
Looking forward, venture capital’s impact on the U.S. economy will likely grow even larger because
2 European Private Equity & Venture Capital Association (2002), Survey of the Economic and Social Impact of Venture Capital in Europe – Research Paper,
http://www.evca.eu/uploadedFiles/Home/Knowledge_Center/EVCA_Research/Economical_Impact/EconomicImpactofVentureCapital.pdf
could not have existed or
would have
developed more slowly
(94.5%)
would have developed in the same way
(4.7%)
would have developed
faster
(0.8%)
Without venture capital, my company.....
SOURCE: EVCA (2002)
Figure 4: Impact of the investment on the creation,
survival and growth of the company - all responding companies
Figure 5: Change in the total number of employees post
venture capital investment – all responding companies
Increase(89.70%)
Decrease(7.10%)
Same(3.10%)
SOURCE: EVCA (2002)

Venture Capital in Queensland: Economic Impact Statement
Copyright Bond University All Rights Reserved 2012 6
many of the fastest growing venture-backed companies in the U.S. today have yet to go public.
IHS Global Insightv research suggests that 92% of job growth for young companies occurs after their initial public offerings. This fact underscores the importance of IPO markets and of ensuring that our most innovative young companies can access the capital they need to grow.
Throughout its history, venture capital investment has built entire industry sectors by funding ground breaking innovations. From biotechnology to information technology to clean technology, thousands of start-ups have been brought to life, improving the way we live and work each day.
2.1.5 Economic Multiplier
Economic multipliers are difficult to determine and it would be even more difficult to accurately determine a multiplier effect from venture capital investment as such investment can be spread across a range of industries and at different stages in the growth of a business.
However, in the same manner that valuations of a business are impacted by its stage of business, i.e. the more advanced the business the higher its valuation per share, the effect of $1 of investment into a business in its ‘early stage’ will have far greater impact than the same $1 later, obviously this is demonstrated whereby $1M invested with Mark Zuckerberg when he was still in his dormitory at Harvard may have bought you 30% of his business then but only 1/100,000th% today.
Similarly your $1M may have been the difference between the survival of Mr Zuckerberg’s business and its resulting 1,500 employees then or not even paying for the CEO today.
For the purpose of this document the economic multiplier for an effective Australian venture capital industry investment is conservatively approximated to be 4 (assuming the innovation benefits outlined by the ABS and the EVCA data3).
As such the $120M of venture capital investment in 2010 should have a multiplied economic impact of no less than $480M.
2.2 Limited Partner (Investor) Returns
2.2.1 Historic Investment Performance
All over the world venture capital had its last set of ‘hey days’ in conjunction with the tech stock bubbles of 2001. Because the venture capital model got caught up in the tech bubble investment capital was easy, valuations were loose and the resulting losses were significant. It has taken the last ten years for those losses to work through the venture capital industry figures.
Table 16 is the last available recording of venture capital returns by AVCAL and demonstrates an industry average -5.4% IRR.
3 While ABS data demonstrates the employment, community contribution, productivity and export benefits of such innovative businesses it is difficult to determine a suitable macroeconomic or
partial multiplier3 for such investment (the ABS ceased production of Input-Output multipliers in its 98-99 publication3).
Table 16: Australian Private Equity Benchmarks - Cumulative Annualized IRR since
inception. Overall results as of June 30, 2008 for funds formed 1985-2007
Stage No. Avg Pooled Upper Median Lower DPI RVPI TVPI
Venture
Capital 37 -5.4 -1.4 3.3 -0.6 -14.8 0.29 0.66 0.95

Venture Capital in Queensland: Economic Impact Statement
Copyright Bond University All Rights Reserved 2012 7
Figure 6: Venture Capital Performance vs Investments: 1990-2008
Sources: National Venture Capital Association Yearbook 2009: Kauffman Foundation www.kauffman.org
Figure 6 and Figure 7 demonstrate the U.S. trend of venture capital investment performance against both investments made and committed capital. Note that due to the average 10 year cycle of venture capital funds and the escalation of investments up until the tech stock bubble bursting in 2001 many funds have not had to realise their investments or declare final IRRs until 2004
through to the present.
Figure 7: Venture Capital Performance vs. Committed Capital: 1990-2008 Sources: National Venture Capital Association Yearbook 2009: Kauffman Foundation www.kauffman.org
It is possible that by acknowledging the flaws of early venture capital investment strategies and having developed a relatively conservative investment strategy the industry may have already addressed those issues but will not see the result for several more years.
2.2.2 Return Expectations
The following table demonstrates expected investment returns across a sector. Returns are determined basically by the level of risk associated with that asset class.
Venture capital investment involves substantial risks due to many factors including, unproven products/services, unproven management, unproven markets for the product or service, the illiquid nature of the asset. As such it should have a commensurate return (within this graph as
represented by ‘Private equity’).
However, venture capital is not the same asset class as private equity as it involves a different investment strategy and generally invests at an earlier stage of investees than private equity and as such the expected return might better be represented at or above the emerging markets level of 14%.

Venture Capital in Queensland: Economic Impact Statement
Copyright Bond University All Rights Reserved 2012 8
Figure 8: Returns by asset class
Of course if an asset class is not making its appropriate risk assessed level of averaged return funds will cease to flow to that asset class. This has been demonstrated in Australia’s decline in venture capital investment.
FY 2010 saw investment of $150m into 14 funds, while FY 2011 shows a drop to $120m investment but between only 3 funds. It is difficult to draw too many conclusion just on this data because the average may have been, 2010 = $10.7M/Fund, 2011 = $40M/Fund, it could have been that because fewer funds were seeking capital in 2011 less was raised (unfortunately the data is not broken down to a sufficient level of detail to be better informed).
What we do know is that funding in 2010 was raised primarily for latter stage venture capital funds while earlier stage increased; Seed @ $40m up 162%, Early Stage @ $80m up 41%. As much as 50% of the capital raised in 2011 may have come from the Innovation Investment Fund of the federal government.
It is arguable that except for the acknowledged benefits to the economy Australia’s venture capital industry would have ceased to exist as there is no economic substantiation as to why investors should still be investing into this asset class on the basis of historic returns alone.
0 4 8 12 16
S&P 500
Barclays Agg
Real estate
Distressed debt
Hedge funds
Private equity
Emerging markets
Returns by asset class (%)
Venture Capital

Venture Capital in Queensland: Economic Impact Statement
Copyright Bond University All Rights Reserved 2012 9
3 QUEENSLAND’S VENTURE CAPITAL INDUSTRY
3.1 Venture Capital in Queensland
In researching the state of innovation and supporting innovation in Australia, particularly with regard to venture capital investment, Brisbane and Queensland barely rate a mention. Recently a rating of start-up ecosystemsvi was reported with Sydney ranked 21st and Melbourne 22nd. While this is a poor showing for those two cities the article was completely silent with regard to Brisbane and the fact it did not even make the rankings.
Now it seems Brisbane stands to fall further behind with Perth expanding its financial services sector and surpassing Brisbanevii.
However, Queensland has been assessed by McKinsey consultants as having a high degree of innovation momentum but a lack of diversity. In McKinsey’s assessment it outperforms, for potential in innovation, both Sydney and Melbourne.
Figure 9: McKinsey; Mapping innovation clusters
Source: McKinsey Digital, http://whatmatters.mckinseydigital.com/flash/innovation_clusters/
Figure 10, demonstrates an assumption that Queensland should not have its equitable share of investment as the text attaching to this diagram stated “The over-representation of Victoria and Queensland can be explained thus:
- Victoria has historically had prominent industrial and IT sectors; and - Queensland’s share is partly a reflection of its ‘Smart State’ initiatives”
Yet the data shows that Queensland, at 22% of PE investment is only marginal above its GSP
(19%) contribution to GDP and no greater than NSW’s 35% against GSP (32%) contribution to GDP. However, this representation is distorted as it includes private equity whereas Figure 20: Percentage distribution across states, demontrates the volume of venture capital investment against each states GSP contribution to GDP.

Venture Capital in Queensland: Economic Impact Statement
Copyright Bond University All Rights Reserved 2012 10
Figure 10: Private equity investment in Australia by state
SOURCE: PWC AVCAL (2006)
In order to capitalise on its innovation potential Queensland needs, among other things, access to venture capital investment.
Venture capital investment is low in Australia today but Queensland based innovative companies should expect to gain their share of this pool.
Lelliott argues, in his theory of "Economic Development Loss Through Lack of Local Venture Capital Management' Annexure 1, that Queensland isn't receiving it's fair entitlement for one very simple reason, that the amount of investment into a region has a strong correlation to the amount of venture capital management representation in that region.
As such it appears that because Queensland has low representation, while NSW and Victoria have high representation those states not only ensure they receive an adequate percentage of available venture capital investment but also receive that percentage that should otherwise have resided in under-represented states, such as Queensland.
The significance of his hypothesis is that it is not merely enough for a national effort to increase the amount of investment into venture capital where the current weighting of venture capital
management exists as this would simply mean that those states with the greater representation would assume even more investment funds and Queensland's investment deficit would become even greater. Therefore it is just as important to increase the percentage of venture capital management in Queensland as it is ensure greater amounts of venture capital investment.

Venture Capital in Queensland: Economic Impact Statement
Copyright Bond University All Rights Reserved 2012 11
4 ATTRACTING BUSINESS TO QUEENSLAND
Venture gravity is that condition whereby a geographic location has such appeal that new and existing ventures gravitate to that area. Yes Silicon Valley has the most venture gravity in the world but thus far it has proven impossible to duplicate a Silicon Valley elsewhere. But that does
not mean that other locations don’t have venture gravity.
All of the state capitals already have a degree of venture gravity as entrepreneurs are drawn from their regional locations to these urban hubs. However, it is possible to further increase South East Queensland’s venture gravity.
By increasing South East Queensland’s venture gravity ventures first from regional NSW and then
major NSW regional centres, followed by Sydney and Melbourne will flow to Queensland.
This flow of ventures, along with the growth of Queensland originated ventures, would be significant given the employment impact of venture capital funded ventures and other economic multiples of investment into those ventures. Furthermore, if Queensland is able to increase its venture gravity to a reasonable extent then it should also result in an inflow of venture capital investment, so much so that Queensland should become a net importer of venture capital investment and not the current and historic net exporter of investment funds for the development
and benefit of NSW and Victoria.
4.1.1 Requirements to Increase Venture Gravity
Research shows that most innovation hubs (that being a location that has significant venture gravity to have attracted a number of innovation ventures) start with a steady flow of early stage innovations – often generated by scientists or entrepreneurs at top-flight research universities,
government laboratories or existing start-ups.
The presence of at least one established, innovative, venture-backed anchor company that draws talent to the area and spins out entrepreneurs also help seed the ecosystem.
In addition to capital, these entrepreneurs need ongoing counsel from lawyers, accountants and other business professionals to get their ideas off the ground. Such support networks build up over time and provide start-ups and venture capitals with specialised services such as intellectual
property protection, IPO registration compliance and human resources support.
Encouragement from state and local government in the forms of favourable tax and investment policies, common-sense regulatory structures and funding of basic research provide a third essential component. Healthy infrastructure, which includes a strong transportation network, affordable housing, high-quality schools and a robust cultural scene, completes the system.
By assembling and pursuing these elements smartly, states and regions can establish favourable environments for venture-backed companies to grow and contribute to the local economy in meaningful ways. Enough of these elements exist in SEQ already so that its venture gravity could increase dramatically with the inclusion of more venture capital funds and fund managers.
Turner (2012) claims those elements necessary to duplicate the successes of Silicon Valley are as follows:
1. Strong research driven Universities (with endowments); 2. Globally experienced repeat entrepreneurs; 3. Sophisticated risk capital; 4. Social capital; 5. Knowledge sharing; 6. Tolerance of risk taking; 7. Creative destruction;
8. Constructive failure; 9. Positive aggregate returns; and 10. Supportive government policy.
Treasury and the Productivity Commission have undertaken studies as to the cause of 'clusters'4 such as Silicon Valley and how to duplicate these. It has been noted that in spite of numerous
4 Australian Treasury, Venture capital in Australia, p7

Venture Capital in Queensland: Economic Impact Statement
Copyright Bond University All Rights Reserved 2012 12
attempts around the world, including within the U.S. comparisons have not come close. As such it is not constructive to focus on a duplication but rather on what exists within Queensland, in particular South East Queensland, and within our culture and maximise the opportunities with those present constraints in mind.
Cultural characteristics:
Knowledge sharing; Tolerance of risk taking; Creative destruction; and Constructive failure.
Other characteristics:
Globally experienced repeat entrepreneurs; and Positive aggregate returns.
Organisational characteristics:
Strong research driven Universities (with endowments); Sophisticated risk capital (DESI and MESI [incl venture capital],
Social capital is included in this item); and Supportive government policy.
Once Turner's characteristics are rearranged, as above, and a more optimistic view is taken of the Australian scenario and the more quantitative aspects of our venture capital industry are considered then it is possible to argue as follows:
Cultural Characteristics - the cultural aspects of Australia are what they are and are what make Australia what it is today. Whilst there may be benefits economically in modifying some attitudes in accordance with Turner’s arguments it is not realistic to consider changing such in an organised way or on a short timeframe. As such it is more pragmatic to be aware of what exists and formulate expectations and a framework for innovation development within that framework, this most likely will never result in another Silicon Valley but does not mean we cannot get a whole lot more efficient in supporting innovation.
Other Characteristics – it is arguable that these characteristics are presently available and that the claim of a lack of entrepreneurial experience is a cultural cringe, or perhaps misallocating the present deficiencies in innovation support. Many of the top examples of successful
commercialisation of innovations involves first time entrepreneurs that have been supplemented by experienced management available either locally or brought in from another region. Australia has management expertise functioning both at home and abroad with many professional expatriates stating a willingness to return to Australia if opportunities exist.
Organisational Characteristics – these three elements are arguably the only ones that can be directly controlled and for which strategies developed. As such these three areas also receive the
greatest percentage of the blame. However, a less sceptical review of these three areas is likely to demonstrate a different scenario.
4.1.2 Universities
In Australia we have many excellent universities of both research and teaching focus and that many of our universities have proactively engaged in teaching of entrepreneurship and have active commercialisation units, but that they have not been able to successfully commercialise
predominantly for reasons of a lack of necessary risk capital.
Bond University is one such university and being Australia’s only private university it places a heavy emphasis on entrepreneurship and commercialisation. In spite of this commercialisation has continued to be a problem for Bond because of the lack of risk capital in Australia, and South East Queensland more specifically. Not only is risk capital insufficient but because of the disjoint between DESI and MESI there is no cohesive way to fuddle through the varying levels of funding
requirements in a manner that is conducive to establishing and continuously operating a professional commercialisation unit within the university.
It is for this reason Bond University is party to this research and has entered into a research partner relationship with Elcano Capital.
4.1.3 Government policy
While there will always be areas for improvement there have been many attempts within government policy, at both state and federal level, to encourage commercialisation and incentivise

Venture Capital in Queensland: Economic Impact Statement
Copyright Bond University All Rights Reserved 2012 13
entrepreneurship. However, research indicates that where government becomes too embroiled in venture capital decision making the result is often failure and as such government involvement in this most commercial of ventures should be to set policy in support of the function and leave all operational elements to venture capital managers.
To date the last two attempts by federal governments to incentivise and grow venture capital investment have failed as follows:
1. Pooled Development Funds – whilst appearing to have good taxation benefits on complying investments they utilised an Australian specific (non-universal) design. They have also proved overly restrictive and too cumbersome to manage and were superseded as a result; and
2. Venture Capital Act based Early Stage Venture Capital Limited Partnerships (ESVCLPs) and
Venture Capital Limited Partnerships (VCLPs) – the change to these venture capital Act based programs did see a conversion to a more universally accepted and understood structure for venture capital investment (although the State based Partnership Act ‘Incorporated Limited Partnership’ is cumbersome and poorly understood). Initially the complete taxation exemption of ESVCLPs seems attractive but unfortunately the same type of government interference with investment selection and management has rendered this structure almost unusable for ordinary venture capital funds. Furthermore, an apparent oversight in structuring the legislation5 renders the supposed taxation incentives potentially detrimental to Australian superannuation funds6. VCLPs have no taxation incentive inherent to themselves7 and are only of potential taxation benefit to venture capital managers.
A far simpler incentive structure which will not be inclusive of the government interference that historically renders the structures unusable is a simple taxation benefit to super funds as follows;
Up to X% 0.5% to 1.0%) of a super fund assets invested into a venture capital fund operated by an Australian domiciled venture capital firm (such a firm being a registered member with the venture capital industry association AVCAL), such fund being specifically limited to making investments into Australian domiciled ventures, shall have that contribution taxed at a beneficial rate of 10% and all income from the investments of that complying X% of fund assets taxed at the beneficial rate of 10%.
This represents a 33% saving in the tax on those contributions and their earnings and while that
may not appear as attractive as a complete tax exemption it would retain the following taxation structure that is lost under ‘complete tax exemption’:
1. Dividend franking offsets; 2. The ability to claim management and other fees and costs of making the investment; and 3. The ability to offset capital losses against capital gains.
This structure would be simple to design, implement and manage. The industry self-regulation through AVCAL membership would give the federal government a single point with which to negotiate as and when it felt modifications might be required to avoid abuse of the structure.
Use of this self-regulation would also ensure the commerciality of investment structures and not the historic attempts at overregulation apparent in the PDFs, ESVCLPs and VCLPs. Furthermore, it may be possible to address some of the key limitations of venture capital as an asset class, transparency, valuation methodology, illiquidity, by negotiating ‘best practice methodology’ in
these areas for AVCAL members8.
It is not envisaged that all super funds would place the full 1% into venture capital investments but sufficient investment should flow as to sustain the optimal industry investment range of 0.075% to 0.125% of GDP. Should the flow of funds become too great the federal government would have the ability to adjust flow by simply adjusting the percent of assets gaining the
5 An oversight the regulators, ATO and AusIndustry, only became aware of after being notified by Elcano Capital almost 5 years after implementation of the structure. 6 This limitation is not expected to have the same negative impact with regard to the ‘direct early stage investor’ strategy. 7 Any claimed taxation benefit is only an entitlement to foreign investors that are otherwise
entitled to the taxation benefits in their own right, rendering the claimed benefits illusory. 8 AVCAL already requires some of these ‘best practice’ methodologies of its corporate members.

Venture Capital in Queensland: Economic Impact Statement
Copyright Bond University All Rights Reserved 2012 14
entitlements.
4.1.4 Venture Funding (Risk Capital)
Venture financing refers to all forms of funding available to a venture in its early stages of development and operation but this research only with the ‘risk capital’ component, that being capital in exchange for an equitable interest in the venture.
In turn ‘risk capital’ is broken down to that ‘direct early stage investment’ (DESI) component and the ‘managed early stage investment’ (MESI) component.
While there are many variations to the norm DESI is provided earlier than MESI and serves a different function as MESI is expected to be inclusive of more guidance, introduction to networks, assistance with finding and selecting appropriate executives, etc.
4.1.4.1.1 Direct Early Stage Investment (DESI)
The private nature of the DESI market and the fact that because it has historically enjoyed no government assistance or incentive program means that data on this market is scarce and often unreliable. It also means that this market is difficult to find and inconsistent in its approach, quality and benefits.
An organised DESI market means investment networks, but being subscale results in poor quality of deal flow, and providing a fraction of the services claimed to be offered. This is not unique to Australia and Campbell (2003) states that as a result of UK angel networks being subscale “One well-known regional UK forum is described by one of its detractors as ‘infested with bankers, lawyers and accountants trying to sell their services’”. This description is anecdotally seen to be just as apt for the Australian market in businesses of ‘angel networks’ and most so-called ‘venture capital’ firms.
4.1.4.1.2 Managed Early Stage Investment (MESI)
This document is of course primarily dealing with MESI in the form of venture capital but it is worth reflecting here that whilst there are some levels of weakness in the other organisational characteristics necessary to create venture gravity the most significant fault lies in the near absence of MESI due to the low volume of investment into this sector and, as has been argued here, that even where there has been greater investment flow it may not have been adequate
from a pure mathematical balance of probabilities to sustain the industry.

Venture Capital in Queensland: Economic Impact Statement
Copyright Bond University All Rights Reserved 2012 15
5 MAKING VENTURE CAPITAL A SUSTAINABLE INDUSTRY
5.1 Is venture capital management an art or science
The question as to whether venture capital management is more science or an art has long waged and is not unique to this industry or to investment management in general.
At stake is the question of the value of the management and its ability to demand high financial rewards.
Another way of describing this argument is:
Which will deliver the greater likelihood of investment outperformance (i.e. a return above that expected for the asset class or above the average of other managers of that asset class) astute investment management decisions based primarily on qualitative assessments, or can strategies be formulated through quantitative analysis.
Of course the answer always requires a combination of the two but it appears that the venture capital management industry may have historically relied too heavily on the former, qualitative or art based approach.
The argument that maximised outcomes for venture capital, or other Direct Early Stage
Investment must rely almost entirely on the quality of the investment decision maker and manager appears correct when considering a single transaction (micro level assessment) because of the following parameters of the investment type:
limited available information on any potential investment; illiquidity of investment; and lack of available industry wide data for benchmarking.
However, at the broader fund or industry levels (macro level analysis) this seems at odds with the evidence.
This issue is important because just as a fund is highly unlikely to return adequate investment returns to LPs when it has a poor quality and inexperienced management team so too will that fund suffer poor returns when the macro level dynamics are wrong at either, or both, the fund or
industry levels.
Arguably this is self-evident whereby the Australian and other venture capital markets internationally, have either consistently performed below what should be the appropriate rate of investment return or been unable to sustain a healthy rate of return.
Today there continues to be lot of discussion as to the failing of the Australian venture capital industry but with almost all of this discussion remaining focused on the qualitative aspects such as
claims that the failures arise primarily from a lack of experience in venture capital management and the need for more education and government funded investment pools from which trainees can gain experience.
There is little doubt that such proposals will be beneficial but without addressing the quantitative issues they will have little positive effect.
Fluctuations in both the venture capital industries (macro level) comparative performance and
resulting inflows to the industry must be strong indicators that it is unsustainable in its current form.
5.2 Asset Return Range
In simple terms venture capital investment requires an appropriate yield from that investment and what is an appropriate yield is determined by where it sits with regard to the level of risk the
investor holds, e.g. likelihood of loss to some or all of that investment. As stated above on this scale venture capital should return approximately 14% on the basis of its Risk: Reward.
Each asset class rate of return expectation is really an average of the return from all investments within that asset class. But the actual rates will be within a band for this asset class (excludes those outside a mean variance determinant for the asset class).
For example Figure 8: Returns by asset class, provides an indicative averaged return rate for real
estate of approximately 8% but the range might be 6.5% to 9%. Where a particular

Venture Capital in Queensland: Economic Impact Statement
Copyright Bond University All Rights Reserved 2012 16
investment/fund or investment product from this asset class sits within this range will result from, among other things, the capability of the investment manager.
As such it is within an asset class range whereby the qualitative aspects should have the greatest impact, not in the ability to even get to this range. If this assumption is correct then it is possible to conclude it is the macro (quantitative) factors that must be failing our Australian venture capital industry.
5.3 Economic Equilibrium
There is generally stability and sustainability within an asset class return range because of the weight of investments within that asset class and the effect of economic equilibrium on that asset class.
If, for example, there were a sudden decrease in the volume of funds invested in the real estate asset class (i.e. a shift in the weight of the real estate market) then investment performance will move outside this range as prices will have gone up and therefore returns would also go up beyond the upper end of the return range.
This change in price occurs because there is, or has historically been, a constant element affecting the real estate asset class, demand driven by growth (of population and the economy).
However, upon seeing the above average returns going to this asset class new investors would pour into the class increasing the supply of projects and pushing prices, and as such investment returns, down. This fluctuation of the market with changes in supply and demand will continue until the market is again in a relative state of equilibrium. It is only when a market is in relative equilibrium that it is also relatively sustainable (equilibrium = sustainability).
The Australian venture capital asset class has not historically performed in this way. Investment
has flowed in with a cyclical motion seemingly more associated with super fund investment manager sentiment towards overall economic conditions and when the latest internationally backed Superperformer venture capital backed project most recently listed on the NASDAQ (2012 should therefore see an uptick in venture capital investment on the back of the Facebook payout to its venture capital backers).
The underlying element of demand driven by growth of the economy is just as relevant for the
venture capital asset class and that growth results in the opportunities for new ventures, resulting in a demand for venture investment but in spite of this the same pressure is not present to get and keep this asset class at equilibrium. There are two reasons that the forces of market equilibrium have not occurred over the venture capital asset class:
1. Disjoint between the investment beneficiaries; and 2. Significant time lags in the asset class.
5.3.1 Disjoint in Investment Beneficiaries
As noted above in 2 above there are two effective beneficiaries from venture capital investment; the economy and Limited Partners (investors).
But with such poor historic investment returns most Australian LPs have not enjoyed the expected benefits. Thus leaving only the economic benefits but the recipients of these benefits largely don’t financially contribute back to venture capital investment.
Australian governments, as guardians and monitors of our economy, do invest into venture capital (in recent years the federal government has been by far the largest investor but this comes with many limitations and potential disadvantages9) but this contribution is not adequate of itself.
The disjoint in beneficiaries exists today, but only because venture capital investors are not directly receiving adequate investment returns as per expectations this is primarily the result of the asset
class not getting up to scale and being sustained at an adequate scale of investment.
5.3.2 Time Lags
venture capital investments are both illiquid and opaque by nature. The result is that time lags are considerable from the point of investment until the point of investment returns. While the AVCAL
9 See Lerner - Boulevard of Broken Dreams.

Venture Capital in Queensland: Economic Impact Statement
Copyright Bond University All Rights Reserved 2012 17
valuation methodology goes some way to providing assurances of fair and reasonable progressive investment valuations the lack of transparency in the asset class and the lack of correlation between ongoing investment valuations against realisation values raises concerns that artificially inflated valuations cannot be relied upon during the life of a fund.
Therefore, it may be 10 years between making a venture capital investment and getting the investment feedback by way of declared dividends.
One way in which the issue of the transparency may be addressed is through a closer alignment between LPs and specific investments, such as by operating investment on a single investee basis. Elcano Capital has developed the unique capability of such direct alignment between one or more investors and a specific project through the tax incentivised federal government ESVCLP program and believes this will be better suited for the DESI strategy stated in 4.1.4 above.
5.3.3 Achieving Equilibrium
As stated above the available evidence, in conjunction with established economic theory, only leaves the conclusion that equilibrium has not yet been achieved as a balance of macro factors has not yet been achieved.
Surprisingly our research of existing international theory on macro level venture capital industry management has only demonstrated the lack of such theory.
5.4 An Argument of Scale
While this area still requires further research, both at the local and international levels, evidence indicates that scale plays an important role with regard to the likelihood of investment returns at the appropriate level.
Scale is relevant at all three levels of venture capital activity;
1. National Industry; 2. Manager and Fund; and 3. Transactions.
Due to the interrelationship between factors most likely to impact overall ratios of success or failure at all three levels, each level needs to achieve a minimum scale to be effective, i.e. have the greatest statistical likelihood of achieving overall success resulting in appropriate levels of investor returns.
From initial review of the available data (substantial further research is required before a conclusion could be made) it appears probable that in the same way that failing to achieve a minimum set of scales reduces the statistical likelihood of achieving appropriate rates of return so too does the rate of return reduce beyond a certain point, i.e. it appears that an optimal range
exists across all three levels described.
5.5 Sustainable Venture Capital Model
The 'Sustainable Venture Capital Model', Annexure 2, presents a model demonstrating the deficiencies with venture capital as a national industry and hypothesises that continuing the Australian venture capital industry as it has been is likely to not only destroy what there is of this vital industry but also hold Australia and Queensland back from performing at the economic levels they are capable of achieving.
It hypothesises that there is an optimal range at the three levels of venture capital:
1. Industry; 2. Fund; and 3. Transaction.
Where any one of these levels is outside the optimal range it has a destabilising effect which results in the asset class underperforming to such an extent as to threaten the ongoing existence of that asset class. The theory suggests that this is the current and historic position of the Australian and Queensland venture capital industries, but that by becoming aware of these issues we can start to modify policies and commitments to the sector for the purpose of making it self-sustaining.
By self-sustaining the model proposes that so long as the asset class is returning on investment

Venture Capital in Queensland: Economic Impact Statement
Copyright Bond University All Rights Reserved 2012 18
within an averaged range appropriate for its risk levels then this shall ensure a continuous flow of investment.
Venture Capital in Queensland: Economic Impact Statement
Copyright Bond University All Rights Reserved 2012 19
6 ACHIEVING OPTIMAL INDUSTRY SCALE
The Sustainable Venture Capital Model does not concern itself with the source of venture capital investment just the impacts. In assuming, for want of an alternative macro model to achieve a sustainable Australian venture capital industry, that the Sustainable Venture Capital Model is
correct and that the hypothesised optimal levels need to be achieved considerations must now be given as to the availability and sourcing of at least $850M worth of annual investment.
The three sources are as follows:
1. Domestic Managed superannuation funds, government and corporate investment (short-term);
2. Offshore fund-of-funds investment (medium-term); and 3. Domestic self-managed-super-funds (long-term).
6.1 Domestic Superannuation Funds
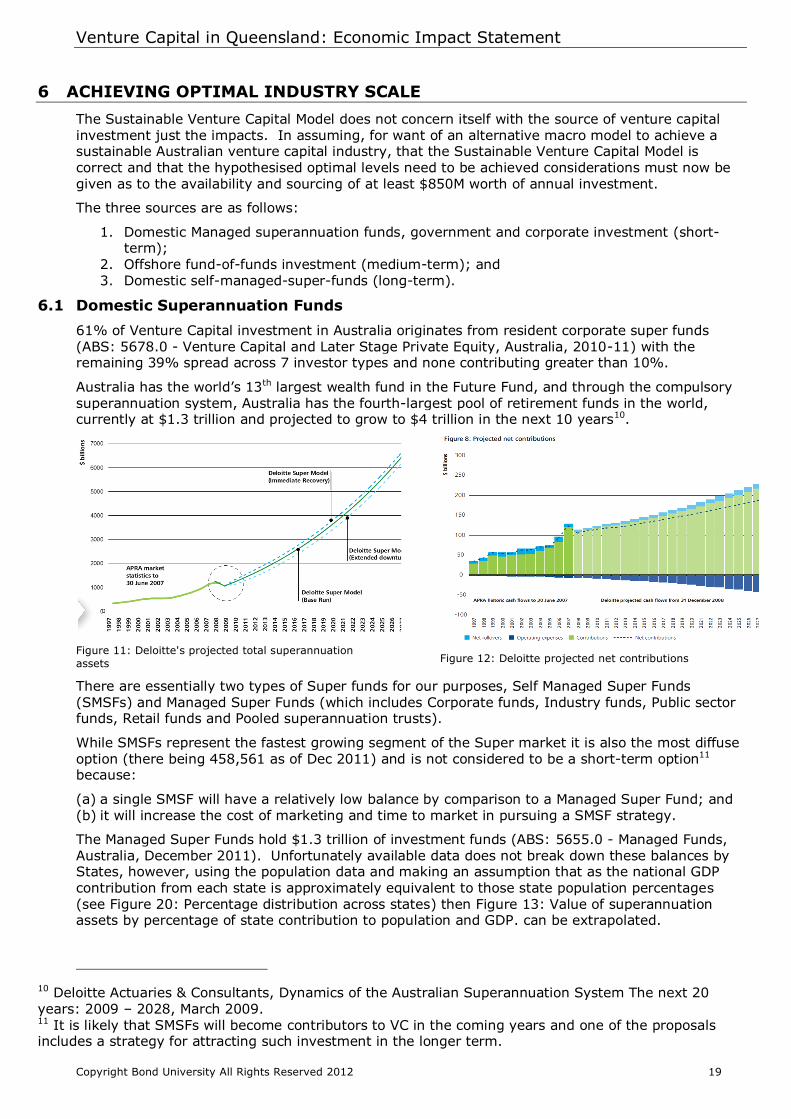
61% of Venture Capital investment in Australia originates from resident corporate super funds (ABS: 5678.0 - Venture Capital and Later Stage Private Equity, Australia, 2010-11) with the remaining 39% spread across 7 investor types and none contributing greater than 10%.
Australia has the world’s 13th largest wealth fund in the Future Fund, and through the compulsory superannuation system, Australia has the fourth-largest pool of retirement funds in the world, currently at $1.3 trillion and projected to grow to $4 trillion in the next 10 years10.
Figure 11: Deloitte's projected total superannuation
assets
Figure 12: Deloitte projected net contributions
There are essentially two types of Super funds for our purposes, Self Managed Super Funds
(SMSFs) and Managed Super Funds (which includes Corporate funds, Industry funds, Public sector funds, Retail funds and Pooled superannuation trusts).
While SMSFs represent the fastest growing segment of the Super market it is also the most diffuse option (there being 458,561 as of Dec 2011) and is not considered to be a short-term option11 because:
(a) a single SMSF will have a relatively low balance by comparison to a Managed Super Fund; and
(b) it will increase the cost of marketing and time to market in pursuing a SMSF strategy.
The Managed Super Funds hold $1.3 trillion of investment funds (ABS: 5655.0 - Managed Funds, Australia, December 2011). Unfortunately available data does not break down these balances by States, however, using the population data and making an assumption that as the national GDP contribution from each state is approximately equivalent to those state population percentages (see Figure 20: Percentage distribution across states) then Figure 13: Value of superannuation assets by percentage of state contribution to population and GDP. can be extrapolated.
10 Deloitte Actuaries & Consultants, Dynamics of the Australian Superannuation System The next 20 years: 2009 – 2028, March 2009. 11 It is likely that SMSFs will become contributors to VC in the coming years and one of the proposals includes a strategy for attracting such investment in the longer term.

Venture Capital in Queensland: Economic Impact Statement
Copyright Bond University All Rights Reserved 2012 20
Figure 13: Value of superannuation assets by percentage of state contribution to population and GDP.
Source: Elcano Capital
Therefore it is assumed that the component of Managed Super Funds originating from Queensland is $254Bn. It is also known that NSW and Vic are overweight in financial services companies and as such a heavy percentage of these Queensland originated Super funds are managed outside the state.
Figure 14: Assumption of Queensland Super Assets Managed Outside Queensland’ gives some figures for different percentages of Queensland originated funds managed outside this state. If
that is 60% then $101Bn worth of managed super funds are managed within Queensland.
6.1.1 Investment Allocations
Most Super fund trustees are risk averse when it comes to investment allocation strategies and while those trustees do not generally determine investment allocations they do provide the strategy for the consulting asset allocation advisers. Asset allocation advisers will use a range of theories in formulating their advice but the main one is Modern Portfolio theory, as developed by
Nobel laureate Harry Markowitz. In essence this is a mathematical model for maximising portfolio return at an accepted level of risk by combining a variety of asset classes with known (or assumed) risk measures.
What comprises the ideal asset mix is ‘elastic’ and will vary between any two asset consultants but as a general rule of thumb it is suggested that a small percentage (on average 5%) of a portfolio should be made up of ‘alternate assets’. It is a small allocation because investments in this
category carry high risks and potential rewards.
‘Alternate Assets’, in its broadest sense, comprises any investment that is not the standard listed equities, cash, fixed interest, property. Some unconventional investments may fall into this category and over the last ten years a lot of this allocation was taken up with derivatives and options products (falling under what was the boutique category of hedge fund investments) but otherwise is largely filled with Private Equity and lastly a small allocation to Venture Capital investments.
Frontier Investment Consulting claims to allocate around 3%of their investments to Australian private equity. Of that 3%, about 20% is typically allocated to venture capital12, or more directly meaning 0.6% of assets allocated to venture capital investment. While Chant West claims to allocate 2.5% of assets held by growth funds to alternate assets with 61% - 80% of this to PE funds (no details given for venture capital allocations from this).
12 http://investordaily.com.au/archive/13508.xml
StateSuperannuation (pension)
funds ($A M)
NSW 406,083
VIC 312,698
QLD 254,685
WA 130,459
SA 92,129
TAS 28,389
ACT 20,316
NT 12,799
1,257,557
% mgd outside Qld Residual mgd in Qld ($A M)
40% 152,811
50% 127,343
60% 101,874
Figure 14: Assumption of Queensland Super Assets
Managed Outside Queensland
Source: Elcano Capital

Venture Capital in Queensland: Economic Impact Statement
Copyright Bond University All Rights Reserved 2012 21
Figure 15: Achieving Optimal Scale through Queensland Super Funds Contributions
Source: Elcano Capital.
Figure 15 is a calculation of the impact of a strategy of 3% of Queensland originated super funds being directed towards PE investment and 20% of that allocation going towards venture capital investment.
Under these assumptions it is estimated that Queensland should presently have $1.1Bn worth of venture capital investment already and that it should have $290M of new investment each year.
Figure 15 assumes investment only from the managed component of super funds, as such once SMSF starts making contributions it will have a further profound impact in this area.
If we apply the assumed economic multiplier of 4x it represents approximately $1.2Bn worth of new state development investment, generated from within the state and without requiring any new
State government investment into this area.
If the asset allocation of 0.6% of inflowing managed super funds ($1.46Bn p.a.) did flow to venture capital investment then it would exceed the minimum of the optimal range ($850M p.a.). As such the managed super fund industry alone has more than the capacity to get the Australian venture capital market to its optimal investment range and as such better protect the ability of those funds gaining the investment return appropriate for the asset class, without considering the
flow on economic benefits to the economy and their individual fund members from having a vibrant economy based on more than one overwhelming source of national income, resources.
6.1.2 Willingness to Invest
At this time it is not possible to know whether the Super Fund trustees will be willing to invest into venture capital again, certainly investment had almost ceased after the 2001 tech bubble but it did grow again until 2008 when the GFC again saw a large drop in venture capital investment (ABS:
5678.0 - Venture Capital and Later Stage Private Equity, Australia, 2010-11).
Queensland based Super Funds may have historically either:
(c) Been reluctant to invest into Queensland based venture capital funds because of the lack of credible funds; or
(d) Not been approached to make allocations into Queensland based venture capital funds.
Brad Holzberger, QSuper chief investment officer put it succinctly when he pointed out that13 ‘much of the current asset allocation had not changed over the past 20 years, and that was mainly the result of herd behaviour, as none of the funds had been willing to divert too much from the industry average out of fear of falling periodically short of their peers’.
Media coverage of the state of depressed listed equities, both domestically and internationally, along with strong indicators that the real estate market will remain depressed for some time has
lead to many commentators claiming these markets could remain low for another decade. The Australian Financial Review has recently quoted Deutsche Bank strategist Tim Baker as pointing out that super fund "Cash holdings are very high and the share of super sitting in cash and deposits is 15 percent, whereas it used to be less than 10 percent"14.
13 http://investordaily.com.au/archive/13943.xml 14 The Australian Financial Review, Super rolling in cash, p 10, Thursday 12 July 2012.
%Mgd: 70% No.FirmsQld 5
%PE 3%
%VC: 20%
Column1 2012 2013 2014 2015 2016 2017 2018 2019 2020 2021 2022
$Billion 1,306 1,653 2,000 2,270 2,540 2,810 3,080 3,350 3,620 3,890 4,160
$Mgd 914 1,157 1,400 1,589 1,778 1,967 2,156 2,345 2,534 2,723 2,912
PE 27.42 34.71 42.00 47.67 53.34 59.01 64.68 70.35 76.02 81.69 87.36
VC 5.48 6.94 8.40 9.53 10.67 11.80 12.94 14.07 15.20 16.34 17.47
%Increase 27% 21% 14% 12% 11% 10% 9% 8% 7% 7%
$Increase 1.46 1.46 1.13 1.13 1.13 1.13 1.13 1.13 1.13 1.13
QldComponent 1.10 1.39 1.68 1.91 2.13 2.36 2.59 2.81 3.04 3.27 3.49
QldIncrease 0.29 0.29 0.23 0.23 0.23 0.23 0.23 0.23 0.23 0.23
Venture Capital in Queensland: Economic Impact Statement
Copyright Bond University All Rights Reserved 2012 22
6.2 Offshore Fund of Funds
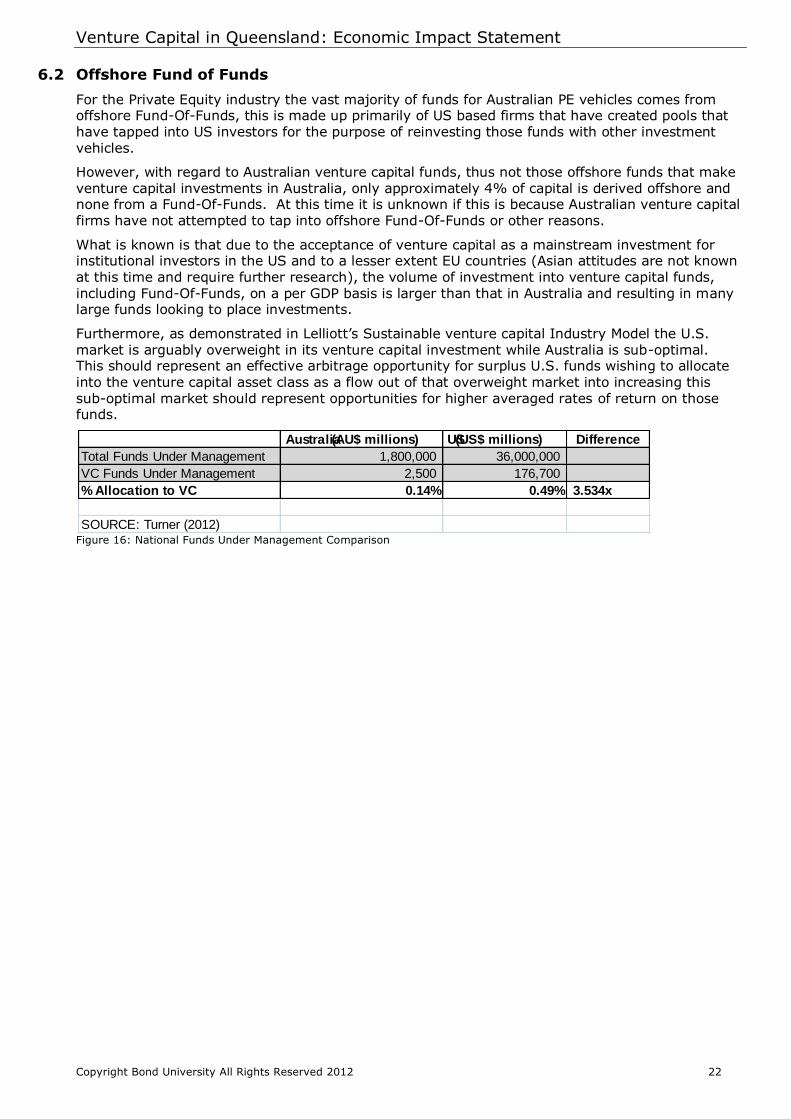
For the Private Equity industry the vast majority of funds for Australian PE vehicles comes from offshore Fund-Of-Funds, this is made up primarily of US based firms that have created pools that have tapped into US investors for the purpose of reinvesting those funds with other investment vehicles.
However, with regard to Australian venture capital funds, thus not those offshore funds that make venture capital investments in Australia, only approximately 4% of capital is derived offshore and none from a Fund-Of-Funds. At this time it is unknown if this is because Australian venture capital firms have not attempted to tap into offshore Fund-Of-Funds or other reasons.
What is known is that due to the acceptance of venture capital as a mainstream investment for institutional investors in the US and to a lesser extent EU countries (Asian attitudes are not known
at this time and require further research), the volume of investment into venture capital funds, including Fund-Of-Funds, on a per GDP basis is larger than that in Australia and resulting in many large funds looking to place investments.
Furthermore, as demonstrated in Lelliott’s Sustainable venture capital Industry Model the U.S. market is arguably overweight in its venture capital investment while Australia is sub-optimal. This should represent an effective arbitrage opportunity for surplus U.S. funds wishing to allocate
into the venture capital asset class as a flow out of that overweight market into increasing this sub-optimal market should represent opportunities for higher averaged rates of return on those funds.
Figure 16: National Funds Under Management Comparison
Australia(AU$ millions) US(US$ millions) Difference
Total Funds Under Management 1,800,000 36,000,000
VC Funds Under Management 2,500 176,700
% Allocation to VC 0.14% 0.49% 3.534x
SOURCE: Turner (2012)

Venture Capital in Queensland: Economic Impact Statement
Copyright Bond University All Rights Reserved 2012 23
7 CONCLUSION & RECOMMENDATONS
7.1 Conclusion
7.1.1 A sustainable Queensland venture capital industry
It is extraordinary to realise just how little comprehensive analysis has been conducted into
venture capital as an economic asset class. Little empirical data has been effectively compiled and analysed before now. Remarkable given just how significant an economic driver of wealth and employment this investment class is, or rather is known to be if operating effectively.
The Australian venture capital industry appears broken, it isn’t it is just poorly understood and therefore has historically been managed in ignorance. How can governments create effective policy to manage an industry it does not understand? How can investment managers create
effective investment management strategies over an asset class it only understands at the micro level? How can investors feel any reasonable certainty of investment returns? Of course the answer to all three questions is they cannot do so in ignorance and they have not as is self-evident.
Of course venture capital is not just an Australian phenomenon so how is it done differently in other markets? It appears there is little, if any, difference in the ignorance or its impact and that it
is most probable that those that have had better returns are doing so intuitively and just because of the sheer volume of available funds, as appears the case in the U.S.
But with an understanding and a useable industry model the veil of ignorance can be lifted and for the first time comparatively small markets, such as Australia, Queensland, Spain, Italy and others can establish national strategies and policies for their own industries. With this newly emerging post-information revolution economies will need to have strategies for constant renewal of its business base. Venture investment, including venture capital, is only a component of this but as has been seen historically in national case studies all over the world without effective access to venture investment nations renew their business base much slower, if at all and often follow developments made in other countries and don't lead such developments.
The ‘Sustainable Venture Capital Model’ may provide just such a model and has been made available exclusively to Queensland, at this time, as a blueprint so that this state can prepare itself by ensuring it has at least adequate venture capital management representation.
The opportunity exists because the model's developer, Lelliott, must conduct further data research, primary data collection, model development, testing and validation before being able to formally publish his ‘Sustainable Venture Capital Model’, which he expects to do as a doctoral thesis.
This model is intuitive in that when it is put forward the logic immediately strikes us. As it utilises economic principles substantiated in other contexts it reassures us of its relevance even before the
complete data set is available and testing is complete. In essence the simplicity of what Lelliott proposes may be summarised in the analogy that we need to 'prime-the-pump' before we will get an adequate flow of investment returns otherwise, as has been seen, no matter how we wind the motor little flow occurs.
With the ‘Sustainable Venture Capital Model’ for the first time getting this industry to sustainability may be relatively straight forward and is certainly achievable.
Straight forward because what the model states is required is to get and keep:
1. National venture capital investment within an optimal range - proposed as being 0.075% - 0.125% of GDP;
2. Each fund should be of an optimal size - proposed as being $100M to $300M; and 3. Fund average investment value in an optimal range - proposed as being $3.5M to $5.5M.
Achievable in Australia and Queensland because;

Venture Capital in Queensland: Economic Impact Statement
Copyright Bond University All Rights Reserved 2012 24
1. Domestic managed superannuation funds with a policy of 0.06% of assets to venture capital investment (5% to alternate assets incl 3% to PE & 20% of this to venture capital is 0.06% assets) = 0.125% GDP (Short-term strategy);
2. Offshore fund-of-funds redirecting investment out of overweight U.S. market & Israel to Australia should represent an arbitrage benefit until our local market achieves equilibrium (Medium-term strategy);
3. Self-managed-super-funds as Australia’s fastest growing asset pool may be encouraged to make small asset allocations to this asset class as suitable investment products become available (Long-term strategy).
It seems all of the indicators are there as to allow the reweighting towards venture capital, in accordance with the "Sustainable Venture Capital Model", over the next five years;
1. A macro model has been proposed which suggests that 'priming-the-pump' of this asset class will get it to a self-sustaining level;
2. The process of 'priming-the-pump' will take several years during which many aspects have to be better understood and managed. During that time it will take a leap of faith against what appears to be the evidence of a poor performing asset class. It would not be possible to take such a leap of faith during bouyant investment performances in mainstream asset classes; and
3. Due to poor investment performance in mainstream asset classes in recent years the percentage of funds in cash and deposits is high. As such it would be easier and less expensive for super funds to move a small allocation from cash to be available for venture capital investment.
7.1.2 Queensland’s Economic Benefits
Without venture capital funds based and managed in Queensland investment will continue to flow out of the state. Already NSW benefits not only from the super fund investments of Queensland but also from the venture capital investments it makes into NSW using Queensland originated super contributions. If the volume of national venture capital investment is to increase in accordance with the ‘Sustainable Venture Capital Model’ at the present level of state representation for venture capital managers Lelliott calculates the state would gain an estimated $22.29 Billion worth of economic benefit over the next ten years15.
15 Assumes 60% of Qld originated super contributions managed out of state as per Figure 14 and state increase in venture capital investment per Figure 15.
0.55
1.04 1.36
1.65 1.91
2.15 2.36
2.58 2.81
3.03 2.83
1.17
2.22
2.90
3.52
4.07
4.57
5.02
5.49
5.97
6.45
6.03
-
1.00
2.00
3.00
4.00
5.00
6.00
7.00
2013 2014 2015 2016 2017 2018 2019 2020 2021 2022
Value Losing 53% out of state
Value all in state
$Billion
$47.42 Billion
$22.29 Billion
Queensland's Lost Economic Benefit from future Venture Capital investment

Venture Capital in Queensland: Economic Impact Statement
Copyright Bond University All Rights Reserved 2012 25
Figure 17: Impact of under representation at full investment. Source: Elcano Capital
However, as Figure 17 demonstrates it should have received $47.42 Billion worth of economic benefit over that time period, this $25.13 Billion in economic benefit will be lost with most of it being absorbed by NSW and Victoria.
Instead of being a net exporter of investment to NSW and Victoria Queensland could and should become a net importer of investments from those states.
7.1.3 Queensland's Employment Benefits
As per European Private Equity & Venture Capital Association research16 it is estimated that 90% of investees will increase employee numbers by an average of 46 jobs post-investment. The following table, Figure 18: Employment Impact17, demonstrates the increase in employment if
allocations are made to Queensland based venture capital management firms in accordance with Figure 15: Achieving Optimal Scale through Queensland Super Funds Contributions.
Figure 18: Employment Impact Source: Elcano Capital
Figure 19: Cumulative Employee Numbers
Source: Elcano Capital
However, the majority of job growth (92%) is expected to occur once an investee IPOs and such increase is not included in this table.
7.1.4 Queensland’s Innovation Corridor
Previous investigations as to the creation of an Australian Silicon Valley may have been flawed in their thinking because of the lack of understanding of the venture capital industry and in disregarding existing cultural aspects. It is neither possible nor necessary to duplicate Silicon Valley and Queensland should not attempt to do so.
What is possible is the creation, or expansion of, an innovation corridor in SEQ by combining existing characteristics and a developed SEQ based venture investment industry.
16 See 2.1.3 and 2.1.4. 17 As calculated by Lelliott 2012.
2012 2013 2014 2015 2016 2017 2018 2019 2020 2021 2022
QldIncrease 0.29 0.29 0.23 0.23 0.23 0.23 0.23 0.23 0.23 0.23
No New Funds p.a. 3 3 2 2 2 2 2 2 2 2
New Investees 45 45 30 30 30 30 30 30 30 30
New Employees 1,863 1,863 1,242 1,242 1,242 1,242 1,242 1,242 1,242 1,242
Cumulative Employee No.s 1,863 3,726 4,968 6,210 7,452 8,694 9,936 11,178 12,420 13,662
13,662
6,955
0
2000
4000
6000
8000
10000
12000
14000
16000
2012 2013 2014 2015 2016 2017 2018 2019 2020 2021 2022
Cumulative Employees -under-represented state
Cumulative employees -fully represented state

Venture Capital in Queensland: Economic Impact Statement
Copyright Bond University All Rights Reserved 2012 26
Already Brisbane City Council, through the Lord Mayor's Economic Development Steering Committee has identified significant opportunities for the growth and development of Brisbane. The 'Brisbane's Unique Window of Opportunity' report lists among its five key objectives
'Productive Brisbane' and within this category 'Innovative Business and Digital Economy', which lists within its priority actions18 "7. Facilitate
innovation and support the growth of new business". Similarly the Gold Coast City Council is developing the Gold Coast Health and Knowledge Precinct, centred around the Griffith University campus and new Gold Coast Hospital. It is now considering expanding this initiative to the Gold Coast Knowledge
Corridor taking into account that corridor included in the 13 kilometre light rail corridor. Griffith University is also looking at expanding its own knowledge and innovation precincts between its Mount Gravatt campus and Gold Coast campus. Brisbane is now host to Australia's first Microsoft Innovation Centre, while also in this corridor is the Brisbane Technology
Park and the many innovative and technology driven businesses operating within this precinct.
It would seem the most significant missing element is the venture investment. This venture investment
requires a degree of consolidation and incentivisation of direct early stage investment and the expansion of the venture capital investment capability and pool of investable funds in this location.
For the first time it is possible to achieve both these aims utilising the Elcano Capital developed ‘stapled partnership units’ structure to take advantage of the complete tax exemption incentive scheme offered by the federal government (ESVCLP).
Use of the incentive scheme, coupled with the other elements of the ‘innovation corridor’ should encourage significant ‘direct early stage investment’ interest into the ‘innovation corridor’, thus providing enough consolidation of direct early stage investments to enhance the ‘SEQ innovation
corridor’.
Having the ‘direct early stage investment’ enhancements available to all19 venture capital participants in the ‘SEQ innovation corridor’ will further enhance the appeal of this location for the establishment of new venture capital funds or relocation of venture capital managers to this area.
Supporting or attracting venture capital firms to SEQ will result in an increase in its venture gravity
pulling businesses and employment from NSW and Victoria. All with little State or local government expenditure and as a long-term strategy.
7.2 Recommendations
7.2.1 Expansion of local venture capital industry
To initiate the development of the local venture capital industry support could be provided to Elcano Capital LP in its raising the first $100M venture capital fund for Queensland ‘early stage’
investment, the proposed fund to operate under principles established in the 'Sustainable Venture Capital Model'. Elcano Capital LP has been established by Messrs Graham Hart AM, Glendon Young, myself and is inclusive of Darren Lelliott as one of its Investment Managers.
Such support might take the form of:
18 Extracted from the "2012 - 2031 Brisbane Economic Development Plan". 19 Direct early stage investment data and relationships originating out of or directed through
Elcano's 'stapled partnership units' structure will be made available to Qld based venture capital managers and is not to be specific to or restricted to Elcano Capital projects.

Venture Capital in Queensland: Economic Impact Statement
Copyright Bond University All Rights Reserved 2012 27
a grant or assistance in a financial or accommodation form; an investment allocation made by the Queensland government, Brisbane City Council and
Gold Coast Council; introduction to relevant Queensland based superannuation fund trustees and their
executives; and providing a forum and venue for the presentation of the ‘Sustainable Venture Capital Model’
for the benefit of Queensland based superannuation funds.
Encouraging existing venture capital firms to establish their offices in SEQ or encouraging local professionals or professional firms to establish venture capital firms in SEQ.
This will likely result when it can be seen that Queensland based super fund managers, state and local government bodies and instrumentalities have a new attitude to making venture capital
investment allocations to Queensland venture capital funds, as such it will rely upon both education as to the returns when the asset class is at optimal levels and encouraging applicable parties to give priority to making investment into Queensland based venture capital funds.
7.2.2 Develop a strategy for the ‘SEQ innovation corridor’
The elements for the development of the SEQ innovation corridor exist, bar the local venture capital industry, but will need the support and involvement of those parties necessary for its
success. As such it is proposed that a development committee should be formed for the purpose of reviewing the potential for the development of such ‘innovation corridor’, making a recommendation as to the State government and affected councils proceeding with such a proposal and the manner of doing so.
Such a development committee may have the following structure:
Chair Deputy Premier & Minister for State Development, Hon Jeff Seeney MP;
Local government representative/s (Brisbane, Logan, Gold Coast); University representative; Senior member of the legal and/or accounting fraternity; Trustee from Queensland based super fund; Chairman of QIC; Research Officer - Mr Darren Lelliott .
7.2.3 Sponsor further research
Possibly through a role for Lelliott as the Research Officer attached to the ‘SEQ innovation corridor’ development committee further research could be supported in the following forms:
A research tour of foreign venture capital firms, regulating government agencies, investment managers and investors to conduct fact finding meetings, gather primary data
and establish direct relationships on behalf of the development committee, state and local government. To include the preparation and submission to the development committee of the findings.
Sponsor a request for the gathering of primary data from existing Australian and international venture capital managers.
Develop a strategy, in conjunction with ASIC and APRA, for Queensland venture capital firms to seek investment from self-managed-super-funds in the future. Compile a complete report and instructions to be presented to the development committee for such usage as determined by that committee.
7.2.4 Promotion to foreign investors & fund-of-funds
Through the use of existing Queensland consulates in the U.S., and elsewhere as appropriate, promote the benefits of the Queensland venture capital industry and the ability for those investors to gain the arbitrage benefit of a venture capital investment within the SEQ innovation corridor.
Promotion could also be undertaken by the development committee for the SEQ innovation corridor in conjunction with Lelliott’s research tour, or resulting from the contacts and relationships established by Lelliott on behalf of the development committee during his research tour.

Venture Capital in Queensland: Economic Impact Statement
Copyright Bond University All Rights Reserved 2012 28
State Population (M)
% Pop'n
GSP (million A$, 2010–11)
% GDP
NSW 7303.70 32.3% 419,895 31.8%
VIC 5624.10 24.9% 305,615 23.2%
QLD 4580.70 20.3% 251,616 19.1%
WA 2346.40 10.4% 187,117 14.2%
SA 1657.00 7.3% 86,323 6.5%
TAS 510.60 2.3% 23,738 1.8%
ACT 365.40 1.6% 29,473 2.2%
NT 230.20 1.0% 16,281 1.2%
Figure 20: Percentage distribution across states
Source: Elcano Capital
ANNEXURE 1. ECONOMIC DEVELOPMENT LOSS THROUGH LACK OF LOCAL
VENTURE CAPITAL MANAGEMENT
The following theory has been developed by Darren Lelliott and provided for inclusion in this Venture Capital in Queensland: Economic Impact Statement.
Queensland’s Entitlement
A simple calculation of state contribution to national population and GDP has been used to calculate what should be Queensland’s entitlement to venture capital investment in Australia.
As can be seen in Figure 20: Percentage distribution across states the population closely correlates with each state’s GSP contribution to GDP and that Queensland accounts for approximately 20% of both.
Queensland Under-Weight in venture capital management
A review of the Queensland based businesses operating in the Venture Capital and Private Equity spheres demonstrates that the local market is poorly represented having only 5% of all VCLPs and 6.3% of all AVCAL registered venture capital or PE firms (ESVCLPs have been discounted as neither
Queensland firm has any capital), the federal government’s Innovation Investment Fund (IIF) also reflects these numbers with only 1 fund, or 6% of funds that have been granted.
Therefore while Queensland contributes 20% of GDP it only represents approximately 6% of venture capital management.
Interstate Competition
NSW is heavily overweight with PE & venture capital firms accounting for almost 70% of the
%
ESVCLP % VCLP % AVCAL % IIF
NSW 32% 32% 40% 67% 67% 56%
VIC 25% 23% 40% 21% 21% 25%
QLD 20% 19% 20% 5% 6% 6%
WA 10% 14% 0% 2% 0% 13%
SA 7% 7% 0% 2% 4% 0%
TAS 2% 2% 0% 0% 0% 0%
ACT 2% 2% 0% 2% 1% 0%
NT 1% 1% 0% 0% 0% 0%
Venture Capital Mgmt
% Pop'n % GDPState
Figure 21: Proportional VC Management Representation. Source: Elcano Capital

Venture Capital in Queensland: Economic Impact Statement
Copyright Bond University All Rights Reserved 2012 29
numbers and 65% of recorded funds under management ($61.3Bn); Victoria is slightly underweight with approximately 21% of firms but overweight with 33.5% of funds ($31.5Bn), while Queensland is incredibly underweight in both firms, 6.3% and only 0.7% of funds ($0.6Bn).
Parity in this scenario, whereby with both the population and GSP statistics demonstrating 20% being Queensland’s input, would require the level of funding that should be based in Queensland at $18.83bn or a difference of $18.22bn. Or to put it another way the Queensland market for managing PE and venture capital investment funds should be 30 times larger than it currently is.
Figure 22: Distribution of investments in FY2011 (by location of company headquarters), as extracted from the AVCAL Yearbook 2011, would seem to again confirm that Queensland is also below parity for the placement of funds (of both a venture capital and PE nature), which also gives some confirmation of the assumption that parties in another location will give greatest focus on
their locale. Further, this is not a once off result as the last few years have had similar results for Queensland, last year being anomalous due to a single large investment in Queensland.
Impact of Underweight venture capital management
There is an inherent level of parochialism in all of us that will have some level of influence over our business decisions (including the decision to invest into one party rather than another when other matters are equal). Furthermore, almost everyone will choose the path of least resistance, that
being the easiest course of action still likely to provide the same outcome.
As such you can expect that parties based in another geographic location will focus the majority of their efforts in their location, and this is no less true of venture capital managers.
The correlation between state based venture capital management and the amount of venture capital investment retained in that state is significant, as demonstrated by Figure 22.
NSW, which is overweight in its share of venture capital management (approximately 65% of managers) and retains an overbalanced 45% of available venture capital investment although its national GDP contribution is 32%.
Figure 22: Distribution of investments in FY2011 (by location of company headquarters)
By contrast Victoria with 21% of venture capital managers retains 20% of venture capital investments and contributes 23% of GDP, effectively a parity position.
Those states having a lower percentage of venture capital managers than their GDP contribution all retain significantly lower percentages of venture capital investment;
Qld 6% Mgrs, 7% Investment, 19% GDP;
WA 0% Mgrs, 10% Investment, 14% GDP; SA 4% Mgrs, 3% Investment, 7% GDP; Others 1% Mgrs, 1% Investment, 5% GDP.
S.A. further demonstrates this correlation as its 4% venture capital Mgrs:7% GDP contribution has ensured that while it is still below its contributions in retaining 3% of venture capital investment its differential is lower than for other states.
To put this disparity into context for Queensland, in 2010 the extra 10% of investment represented
AMOUNT
(AUD millions)
%Total
$ No. Coys
% Total
Coys
Australia 3355.11 92.2% 119 79.3%
Victoria 1599.74 44.0% 29 19.3%
New South Wales 865.9 23.8% 42 28.0%
Western Australia 376.76 10.4% 14 9.3%
Queensland 279.84 7.7% 15 10.0%
South Australia 230.79 6.3% 16 10.7%
Other 2.07 0.1% 3 2.0%
New Zealand 215.08 5.9% 6 4.0%
US 36.02 1.0% 20 13.3%
Other 32.22 0.9% 5 3.3%
TOTAL INVESTMENT 3638.43 100% 150 100%
NOTE: States/Countries with fewer than three companies receiving
investments have been aggregated into "Other".

Venture Capital in Queensland: Economic Impact Statement
Copyright Bond University All Rights Reserved 2012 30
$51.9M (inclusive of PE investment) and with a multiplier of 4 this represents $207.6M worth of economic benefit the state has missed out on, most of that being picked up by NSW.
If Queensland is missing $200M a year in economic benefits today the situation will be significantly worse if the level of venture capital investment increases to the optimal range discussed below. For this reason Queensland should proactively seek to grow its venture capital management sector and encourage both domestic and foreign investment managers to utilise those venture capital managers.
There also exists the risk that whereby a lack of adequate representation across populations may lower investment returns in the over-represented regions as a disproportional rate of investment will go into a smaller population of opportunities, thus increasing the likelihood of investing into lesser investments in that geographic region. This is arguably evident in U.S. investment around
Silicon Valley, however because our venture capital industry is so subscale it is not considered applicable in Sydney at this time.
Figure 23: Investment in investee companies, by location of investee company head office
SOURCE: ABS (2011)20 & Elcano Capital analysis
20 Australian Bureau of Statistics, 2011, Venture Capital and Later Stage Private Equity, Australia, 2009-10, Cat No.56780, Table 11
45%
20%
9%
5%3%
1%
17%
0%
5%
10%
15%
20%
25%
30%
35%
40%
45%
50%
NSW Vic Qld WA SA Tas., ACT and NT
Overseas
1999-00 2000-01
2001-02 2002-03
2003-04 2004-05
2005-06 2006-07
2007-08 2008-09
2009-10
Percent of VC investment
32%
23%
19%
14%
7%5%
GSPshare ofGDP

Venture Capital in Queensland: Economic Impact Statement
Copyright Bond University All Rights Reserved 2012 31
ANNEXURE 2. LELLIOTT’S SUSTAINABLE VENTURE CAPITAL MODEL
This model, created by Darren Lelliott, a General Partner at Elcano Capital, is demonstrated in Figure 24: Sustainable Venture Capital Model below. Lelliott’s model breaks down venture capital industries into four (4) ranges (see Figure 24):
(A) Not Enough Oxygen – because investment funds are so scarce in the industry fund managers are attempting to spread those funds too thinly, as such the micro factors are so out of kilter that the risk of complete investment loss, thus low overall industry returns, is highly probable (micro factors);
(B) Sub-optimal range – many of the micro factors of A are rectified but at this level the statistical likelihood of missing the performing investments remains high and as such
industry returns are still below asset class appropriate returns (macro factors);
Figure 24: Sustainable Venture Capital Model
Source: Elcano Capital
(C) Equilibrium – both the micro and macro factors are in balance (allowing for standard systemic volatility issues) and the industry returns asset class appropriate rates of return;
and (D) Overweight – both micro and macro factors are corrupted as further investment flows in
(micro and macro factors).
-10%
-5%
0%
5%
10%
15%
20%
Lelliott's Sustainable VC Model
Industryscale
(% GDP)
IRR
OptimalReturnRange
OptimalScale
SuboptimalScale
Overweight

Venture Capital in Queensland: Economic Impact Statement
Copyright Bond University All Rights Reserved 2012 32
Figure 25: Four ranges of the Sustainable Venture Capital Model Source: Elcano Capital
It is necessary to include both micro and macro factors within an evaluation of a national model for sustainable venture capital industry as the effectiveness of that industry in achieving an asset class (i.e. Risk to Reward) appropriate level of return on investment is influenced by both.
LEVEL IMPACT OF BEING
SUB-OPTIMAL OVERWEIGHT
Industry (Macro factors)
As such a low percentage of the total possible Super-performer and/or Over-performing potential investments are being invested into (statistically) the overall industry Return On Investment (ROI) is
low while the probability of investing in the less or non-performing investments is high, thus the overall industry average ROI will be lower than the appropriate asset class ROI.
At this sub-optimal level of investment it is pure speculation that the occasional investment will be a
star performer but with speculation the macro level must statistical result in a poor overall result.
Because money is too prevalent all prices in the market have increased artificially, thus lowering industry ROI.
Fund (Macro & micro factors)
Where a fund operates at a sub-optimal level there will not be adequate Management Fee revenue to attract and retain the excellent quality venture capital management staff necessary to ensure consistent quality management and it is likely that
existing skills and management will change focus to more lucrative transactions and/or leave the industry entirely (e.g. the move from venture capital to PE in the 90s and 00s).
Competition for venture capital management skills is inflated and those managers will demand more than their appropriate value.
Furthermore, as funds find money too easily fund structures become lazy and benefits become skewed towards the venture capital managers rather than LPs.
-10%
-5%
0%
5%
10%
15%
20%
Lelliott's Sustainable VC Model
Industryscale
(% GDP)
IRR
OptimalReturnRange
OptimalScale
SuboptimalScale
Overweight
A - Not enough oxygen. (Micro factors out of balance)
B - Sub-optimal range (Micro factors may be right but macro factors out of
C - Equilibrium or the optimal range (both micro & macro factors are balanced)
D - Overweight (both micro & macro factors are corrupted)

Venture Capital in Queensland: Economic Impact Statement
Copyright Bond University All Rights Reserved 2012 33
Transaction21
(Micro factors)
As investment funds are scarce venture capital managers spread them very thinly over few investments. The resulting low level of investment per investee may have little long-term positive benefit to that investee as they will still not be able to grow as quickly as is otherwise possible but now
they are impeded in their growth by having external institutional investors on their register and in the board room (akin to boxing with one hand tied behind your back). Also if funds are not available or inadequate in a venture capital manager then the investee’s management team will have to seek
funding at a later stage and this removes their focus from the business and its growth.
Also the investee’s management may, after the initial investment, apply strategies and structures appropriate where further funding is available than where it will become constrained again and this
could (and often has) result in the complete business failure.
Too thinly applied investment funds could actually be more detrimental to an investee than no investment funds at all.
The investee’s main entrepreneur/s and management team are able to demand higher valuations (artificially because the whole market is overvalued) having a
tendency to constantly escalating valuations within the system.
With investment beyond the actual needs of the project (due to artificially inflated valuations)
such surplus funds have the tendency to remove some of the driving forces of the entrepreneurs and management team (otherwise said to remove the hunger) and may also result
slack and lazy financial controls. A lack of adequate financial controls can and does frequently result in the failure of businesses at all levels of growth and performance.
National Industry
The Sustainable Venture Capital Model states that there must be an optimal range of total investment into a venture capital market. This theory is premised on the proposition that where an industry has too low a level of investment then (sub-optimal) then the probability of selecting sufficient ‘winning’ investments from the available market is too great and therefore, statistically, the likelihood of under-performance to asset class expectations is significant.
In order to make estimation as to what would be the optimal range a set of benchmarks needs to be established. For this purpose the following assumptions are made:
1. that the model applies for markets which have approximately the same level of economic development (including available education);
2. that all possible members of the population of a market has relatively equal opportunity to undertake entrepreneurial activities (e.g. the society does not restrict the ability for females to undertake entrepreneurial activity);
3. that the culture of markets are reasonably aligned with regard to supporting and encouraging entrepreneurship (e.g. while the U.S. is arguably more willing to embrace entrepreneurship than Australia due to its culture towards business failure they are assumed to be reasonably aligned for this purpose);
4. that there shall be approximately the same percentage of entrepreneurial endeavour per
million population of all markets (see Figure 28: Project Per million population (0.10%/million));
5. that the GDP per capita is within a reasonable variance from each other market.
With these assumptions it is possible to utilise investment as a percentage of GDP as the universal measure of investment.
21 A Transaction is a single or a series of investments into a specific investee.

Venture Capital in Queensland: Economic Impact Statement
Copyright Bond University All Rights Reserved 2012 34
Figure 26: National venture capital investment comparisons Source: Elcano Capital
From Figure 26 it can be seen that Australia, at only 0.016% of GDP invested into venture capital is significantly below the average level of investment. However, if it is assumed that the Sustainable Venture Capital Model is correct then there are some other interesting observations to
be made from this table:
1. Italy and Spain, among the current European economic basket cases have investment levels even lower than Australia (although Spain’s level is only marginally lower than ours);
2. the U.S. has the world’s largest venture capital industry but its industry average return-on-investment is lower than that expected for the asset class. This is possibly indicative of the U.S. being overweight in venture capital investment as per the Sustainable Venture Capital
Model; and 3. Israel, recently held up as the venture capital model the world should be looking towards is
receiving the highest level of investment in the world (much of this is actually overflow from the U.S. market). This has been occurring for almost ten years but if the Sustainable Venture Capital Model is correct this would mean that Israel is overweight in venture capital investment and as such it is likely return-on-investment from this market will fall, possibly quite dramatically, in the next few years. Such a dramatic fall in returns could have
significant negative long-term impact on the industry.
Figure 27 provides a graphical representation as to how this optimal range may look. Note that the positioning of national venture capital industry returns on this scale are estimations only, at this time.
Rank Country/RegionGDP (millions of US$)
2010
Multiple
comparision
VC
Investment
2010 (US$
million)
Investment
Multiple
VC
Investment
as % GDP
1 United States 14,586,736 12.9 23,300 124.9 0.160%
2 China 5,815,501 5.1 4,005 21.5 0.069%
3 Japan 5,458,836 4.8 n/a n/a
4 Germany 3,391,641 3.0 937 5.0 0.028%
5 France 2,671,113 2.4 1,081 5.8 0.040%
6 United Kingdom 2,137,720 1.9 1,003 5.4 0.047%
7 Brazil 2,087,889 1.8 n/a n/a
8 Italy 2,060,965 1.8 65 0.3 0.003%
9 India 1,727,111 1.5 n/a n/a
10 Canada 1,566,030 1.4 1,100 5.9 0.070%
11 Russia 1,479,929 1.3 n/a n/a
12 Spain 1,407,405 1.2 139 0.7 0.010%
13 Australia 1,131,623 1 187 1 0.016%
39 Israel 217,333 0.2 525 2.82 0.242%
Note: A conversion of 2010 VC investment amount uses conversion rates as of 3rd May 2012.

Venture Capital in Queensland: Economic Impact Statement
Copyright Bond University All Rights Reserved 2012 35
Figure 27: Hypothetical positioning on Optimisation Graph
Source: Elcano Capital
Figure 28: Project Per million population (0.10%/million)
Source: Wikipedia, http://en.wikipedia.org/wiki/List_of_countries_by_population & Elcano Capital analysis.
The assumption of an optimal level of national investment does not rely solely on an argument of statistical probability but also aspects of economies of scale for the industry. That is aspects of the quality of venture capital management is expected to increase as more funds of greater value conducting more transactions are established and the support infrastructure (such as specialist lawyers, investment bankers and other exit strategy advisers) is likely to increase both in volume and competency.
Figure 28’ demonstrates an estimate of the total number of projects available in Australia annually utilising an assumption 0.10% of entrepreneurial projects per million population, 22,924.
VC Industry Optimisation Graph
Industryscale
Sub-optimalrange
Overweightrange
Optimalrange
IRRU.S.
0.16% GDP
Israel0.242%
GDP
Australia0.016%
GDP
Canada
0.070%
GDP
Country/Region Population Projects/Pop'n
United States 313,668,000 313,668
China 1,347,350,000 1,347,350
Japan 127,610,000 127,610
Germany 81,859,000 81,859
France 65,350,000 65,350
United Kingdom 62,262,000 62,262
Brazil 192,376,496 192,376
Italy 59,464,644 59,465
India 1,210,193,422 1,210,193
Canada 34,817,600 34,818
Russia 143,100,000 143,100
Spain 46,185,697 46,186
Australia 22,923,819 22,924
Israel 7,869,900 7,870

Venture Capital in Queensland: Economic Impact Statement
Copyright Bond University All Rights Reserved 2012 36
Figure 29: Current National Industry Source: Elcano Capital
Such an assumption might not be too broad in its scope as the number of applications to the venture capital industry exceed 10,000 each year and it is anecdotally thought that at least 50% of Australian projects don’t apply to our venture capital funds as they know how little venture capital support there is in this country (approximately 2% of applications gain investment).
Figure 29 is an initial model for further analysis of macro level industry probabilities (necessary to validate Lelliott’s Sustainable Venture Capital Model). This example assumes an industry standard
assumption that investments will fall into one of three categories equally, Complete Loss, Breakeven, and Overperformance. There is an assumption that a percentage of the available market is below a reasonable investment grade to substantiate venture capital investment at this time (50% is used here) and that of the total applications of the industry (approximately 10,500 currently) there is a substantial overlap of projects applying to multiple venture capital managers (33.3% assumed).
In Australia in the last year only 3 funds are recorded to have raised investment commitments of a combined $120M, in recent years funds have invested into an average of 4 investments but as these 3 are larger there is assumed to be 8 investments per fund. With this data and if the assumptions are reasonable (unknown without further primary data not presently available) then only 29.1% of the available market is applying for venture capital funding, each fund will receive 1,112 unique applications (which they will struggle to adequately assess given their resources), there will be only 24 investments made (0.21% of the available investment grade market), with
the 8 investments there is a 0.0005 probability of that fund selecting an Overperformer from the investment grade element of the market.
However, if the volume of venture capital investment increased to $850M p.a. and each fund was $100M - $150M (see 'Manager and Fund') and each transaction was the optimal size (see 'Transaction'), therefore 15 investments made per fund, there would be 120 investments made by the industry each year. Statistically this 96 investment increase might not appear significance in
its own right but the difference would be more significant as it is expected this would:
1. Draw more of the better quality projects to make application; and 2. Through improved skill in the industry and lower applications per fund (500 on increased
numbers) improve the ability to assess applications (thus decreasing the ‘Investment Grade’ percentage).
THE TOTAL MARKET FUNDS INVESTMENTS
Total Market Size: 22,900 No. active Funds in Industry: 3
Investment Grade (%): 50.0% Overlap in applications: 33.3%
Investment Grade (#): 11,450 Applications to active VC industry: 10,000 6,670 ex overlaps.
Investment Grade: 5,000 3,335 ex overlaps.
No. Investments made/active Fund: 4
No. Investments made by Industry: 12 1 Investee 1 13
FUND A 2 Investee 2 14
3 Investee 3 15
Overperforming Investments = 33.3% or 3813 ventures. 4 Investee 4 16
FUND B 5 17
Breakeven Investments = 33.3% or 3813 ventures. 6 18
Applications: 1,112
7 19
8 20
9 21
FUND C
Complete Loss Investments = 33.4% or 3824 ventures. 10 22
11 23
12 24

Venture Capital in Queensland: Economic Impact Statement
Copyright Bond University All Rights Reserved 2012 37
Figure 30: Optimal Australian Industry
Source: Elcano Capital
The result will be a significant improvement in the probability of an individual fund selecting Overperforming investments, and an equally significant overall industry improvement in performance and achieving the asset class appropriate return-on-investment, i.e. Equilibrium or Sustainability.
In determining an optimal level of investment many factors still need to be researched and little of the required data is publicly available. However, Lelliott estimates that it is likely the optimal level will be between 0.075% and 0.125% of GDP, meaning Australia should be investing no less than
$850M p.a. if it expects the venture capital industry to achieve its asset class appropriate return-on-investment.
Figure 31: Proposed Optimal National Investment Levels
Source: Elcano Capital
Overweight Markets
While an Overweight market has no bearing on the Australian situation at present it is worth addressing this issue. The argument for their being a minimum level of investment in a
sustainable asset class is premised largely on statistical reasoning, the more quality participants in the market the greater statistical likelihood of the selecting an adequate number of performing investments across the industry. These are the macro factors.
As such the logic should be linear (more money & participants in market the more Overperformers selected) until there is more money or participants in the market than there are investment grade projects.
However, Lelliott hypothesises that before this natural decline in returns will occur micro factors
THE TOTAL MARKET FUNDS INVESTMENTS
Total Market Size: 22,900 No. active Funds in Industry: 8
Investment Grade (%): 50.0% Overlap in applications: 33.3%
Investment Grade (#): 11,450 Applications to active VC industry: 12,000 8,004 ex overlaps.
Investment Grade: 6,000 4,002 ex overlaps.
No. Investments made/active Fund: 15
No. Investments made by Industry: 120 1 Investee 1 13 Investee 13
FUND A 2 Investee 2 14 Investee 14
3 Investee 3 15 Investee 15
Overperforming Investments = 33.3% or 3813 ventures. 4 Investee 4 16
FUND B 5 Investee 5 17
Breakeven Investments = 33.3% or 3813 ventures. 6 Investee 6 18
Applications: 500
7 Investee 7 19
8 Investee 8 20
9 Investee 9 21
FUND C
Complete Loss Investments = 33.4% or 3824 ventures. 10 Investee 10 22
11 Investee 11 23
12 Investee 12 24
Country/RegionGDP (millions of US$)
2010
Proposed Optimal
Scale ($ = 0.075%
GDP)
Proposed Optimal
Scale ($ = 0.125%
GDP)
United States 14,586,736 10,940 18,233
China 5,815,501 4,362 7,269
Japan 5,458,836 4,094 6,824
Germany 3,391,641 2,544 4,240
France 2,671,113 2,003 3,339
United Kingdom 2,137,720 1,603 2,672
Brazil 2,087,889 1,566 2,610
Italy 2,060,965 1,546 2,576
India 1,727,111 1,295 2,159
Canada 1,566,030 1,175 1,958
Russia 1,479,929 1,110 1,850
Spain 1,407,405 1,056 1,759
Australia 1,131,623 849 1,415
Israel 217,333 163 272

Venture Capital in Queensland: Economic Impact Statement
Copyright Bond University All Rights Reserved 2012 38
within each fund, venture capital manager and transaction will impact negatively on investment returns, thus bringing about a decline in investment returns long before they would have otherwise statistically occurred.
Figure 32:Venture Capital New and Follow-on Investment, 2005-06 to 2009–10 Source: ABS (2011) Venture capital and later stage private equity, Australia, 2009-10. cat. no. 5678.0
Manager and Fund
Sub-optimal Funds
There is a direct correlation between a fund being too small and its failing to achieve adequate return-on-investment for its LPs and that is its number and quality of resources.
Venture capital is an investment of high risk and while there may be quantitative measures to stabilise those risk impacts (the Sustainable Venture Capital Model), they will never supersede qualitative measures that come from experienced and professional resources. Quite simply if a fund is too small the manager will not have adequate fees to ensure it has, and maintains the resources necessary to maximise the portfolios risk mitigation through great investment management.

Venture Capital in Queensland: Economic Impact Statement
Copyright Bond University All Rights Reserved 2012 39
Figure 33: Proofing Table
Source: Elcano Capital
Figure 33 utilises a range of assumptions to derive patterns in both the Australian venture capital industry and individual funds as the percentage of GDP investment increases.
In calculating the “Over or Under reqd fees ($million)” it is assumed that LPs will want sought after professionals managing the investment and that there should be a dedicated Investment Manager
for every 4 investments made by a fund.
Figure 34: Parameters of calculations Source: Elcano Capital
Evidence suggests the need to reduce the number of investees per Investment Manager to 4 while increasing the amount per transaction, as such the ‘Proofing Table’ holds the number of Investees and Managers per fund back until more appropriate levels are achieved.
With current Australian fund balances there is not enough fee revenue to attract the calibre of Investment Manager to adequately measure and manage for portfolio risks ($80,000 p.a. short of requirement). However, the deficiency is even greater as with the present Australian average investment amount (less than $1M/investee) it assumes each underpaid or less than fully professional Investment Manager manages 6 investees. It is only due to the lack of fee revenue, resulting from the size of funds, that optimal Investment Manager/Investee and transaction sizes are not achievable.
It is not until a fund is approximately $100M that it has the fee revenue for the optimal Investment Manager/Investee balance, adequate transaction values and appropriately professional resources.
As such the Sustainable Venture Capital Model argues that the minimum fund size is $100M.
GDP% $Million/
Industry
No. of new
Funds in
Year
Average
$million
Invested/
Fund
No.
Investees
/Fund
Average
$million
Invested/
Investee
Mgmt Fee/
Fund p.a.
@ 2%
($million)
No. Inv
Mgrs
Approximate
reqd Mgmt
Fee p.a.
($million)
Over or under
reqd fees
($million)
No. of
applications
(ex overlaps)
0.003% 34 3 $ 11.32 8 $ 1.13 $ 0.23 1 $ 0.40 -$0.17 6,670
0.010% 113 6 $ 18.86 12 $ 1.26 $ 0.38 1 $ 0.45 -$0.07 6,836
0.016% 181 7 $ 25.87 12 $ 1.72 $ 0.52 2 $ 0.60 -$0.08 6,920
0.020% 226 7 $ 32.33 12 $ 2.16 $ 0.65 2 $ 0.70 -$0.05 6,920
0.030% 339 8 $ 42.44 12 $ 2.83 $ 0.85 2 $ 0.93 -$0.08 8,004
0.040% 453 8 $ 56.58 12 $ 3.77 $ 1.13 2 $ 1.02 $0.11 8,004
0.050% 566 8 $ 70.73 12 $ 4.72 $ 1.41 3 $ 1.38 $0.03 8,337
0.060% 679 8 $ 84.87 12 $ 5.66 $ 1.70 3 $ 1.46 $0.23 8,337
0.070% 792 8 $ 99.02 12 $ 6.60 $ 1.98 4 $ 1.87 $0.11 8,337
0.080% 905 9 $ 100.59 13 $ 6.19 $ 2.01 4 $ 1.89 $0.12 8,671
0.090% 1,018 9 $ 113.16 13 $ 6.96 $ 2.26 4 $ 1.96 $0.30 8,671
0.100% 1,132 10 $ 113.16 13 $ 6.96 $ 2.26 4 $ 1.96 $0.30 9,004
0.110% 1,245 10 $ 124.48 13 $ 7.66 $ 2.49 5 $ 2.33 $0.16 9,004
0.120% 1,358 11 $ 123.45 13 $ 7.60 $ 2.47 5 $ 2.33 $0.14 9,338
0.130% 1,471 11 $ 133.74 13 $ 8.23 $ 2.67 5 $ 2.38 $0.30 9,338
0.140% 1,584 12 $ 132.02 13 $ 8.12 $ 2.64 5 $ 2.37 $0.27 9,671
0.150% 1,697 12 $ 141.45 13 $ 8.70 $ 2.83 5 $ 2.41 $0.42 9,671
0.160% 1,811 12 $ 150.88 13 $ 9.29 $ 3.02 6 $ 2.78 $0.24 9,671
No. Investment Managers: 4 per $100M
Salary per Investment Mgr: 250,000$ Does not account for fund size as that comes from profit margin.
Operating Cost: 500,000$ for first $100M, then reduce by 30%/$100M
Diminishing operation rate: 30.00%
Profit Margin: 30.00%
Validated Mgmt Fee: 1,950,000$ per annum.
No. times Benchmark goes into Fund: 1
No. Investment Mgrs in Fund: 4
Total Investment Mgr salaries: 1,000,000$
Operating cost <= $100M Fund: 500,000$
Operating cost >= $101M, <= $200M Fund: -$
Operating cost >= $201M, <= $300M Fund: -$
Operating cost >= $301M, <= $400M Fund: -$
Operating cost >= $401M, <= $500M Fund: -$
Operating cost >= $501M: -$
Total operating costs: 500,000$
Profit: 450,000$
Income/Inv Mgr: 362,500.00$

Venture Capital in Queensland: Economic Impact Statement
Copyright Bond University All Rights Reserved 2012 40
Figure 35: Average GP fund size (CA $ million)
^SOURCE: Elcano Capital; Australian data is extrapolated using 2011 data from ABS and AVCAL SOURCE: McKinsey analysis based on data from Thomson Reuters, Thomson Financial, Funding Venture Capital, Deals for
High-Growth Companies in Canada
Overweight Funds
Just as an argument of Overweight Industry is not relevant to Australia in the near future it is worth reflecting on the risk of funds being too large and negative impact this has on asset class investment returns.
There is already some initial research from U.S. data that indicates, as per Figure 36, that an optimal scale exists and that it is possible to have too large a fund.
If Figure 33 is drawn out further it would logically conclude that one the appropriate Investment
Manager/Investee and Transaction Value are in balance then a fund could not be too big. Arguably this is not what occurs as a fund grows in size and that instead the ratios will again move out of balance with a lower Investment Manager/Investees ratio and higher Transaction Values.
As the Investment Manager/Investee ratio declines while fee revenue increases with fund size the result will be ever increasing incomes for the Investment Managers without any associated increase in performance. For example in the U.S. there is a degree of controversy surrounding many of the largest venture capital firms and their fee structures, general partner22 (GP) incomes verses fund performance.
Of concern is the fact these firms set their fee structure when they raised $100M funds23 and this was adequate to ensure all costs were met and Investment Managers paid appropriately (e.g. $250,000 p.a.). Now the same firm raises a $500M fund while charging the same fees, and whilst Investment Manager numbers have increased it is not to the same ratio. The result is that from a $500M fund’s $10M annual management fee the principals of the firm (most senior Investment Managers) are paying themselves >$1M p.a. salaries.
It is argued that these exorbitant salaries received with no regard to performance measures results in those firm principals being motivated to raising the next $500M fund at the expense of the performance of the current fund/s of that firm.
In a sub-optimal or optimal market this could not occur over the long-term as performance would
act to reduce the capability of the firm to raise future funds (the market effect of moving back to equilibrium) but in an overweight market, such as is argued the U.S. or Israel, the motivation of the investor is more concerned with placing funds and as such market factors are distorted and the market will not self-correct back to a state of equilibrium.
7.2.4.1.1 The effect of ‘large funds’
Also “Larger funds find it very difficult to do very small deals” (Campbell 2003) this is not only true
of venture capital funds but any type of fund manager. The impact of this limitation is both a distortion of the market and arguably the corruption of it.
Distortion as the vast majority of ‘early stage’ businesses from which maximum economic multiplication of investment is expected will constitute small deals and therefore large funds either
22 The general partner/s manage the VC fund and receive the fee income. 23 $100M being an entry level fund in the U.S.

Venture Capital in Queensland: Economic Impact Statement
Copyright Bond University All Rights Reserved 2012 41
cannot cope with a multitude of small deals and therefore don’t make any investment into this area (thus effectively removing major suppliers of funding to ‘early stage’ ventures).
Alternatively, particularly if it is within the funds mandate to make ‘early stage’ investments, they will try to increase the size of these deals for the sake of their own ability to manage those deals; this in turn will have the effect of corrupting the market through excessive valuations.
Figure 36: U.S. 20-year horizon IRR by size of fund Source: Thomson Reuters; Thomson Financial: Gilles Durufle
Transactions
Optimal transaction size is also important as too small an investment will mean that the investee will not be able to achieve its objectives.
Indeed too small an investment by venture capital managers may actually be more detrimental than not making the investment at all as it may result in;
1. continued slow growth in the investee; 2. further financial strain on the investee company and its management which may result in total
investee failure; 3. over expansion by investee management without adequate financial resources to sustain that
growth or to bear the timing mismatch between expenditure and increased returns; and 4. an inability of investee to source alternate investment.
The result of any or all of these could be complete investment failure, arguably as seen in the Australian context.
Conversely too large an investment will also have adverse impacts as follows:
1. buying into an investment at inflated values will decrease the profitability of that investment
and negatively impact upon venture capital returns; and 2. too much capital is, in most normal cases, not conducive to strict management and expenditure
by the investee management.
Sub-optimal transaction sizes across the venture capital sector will have a systemic flow-on effect as it will impact valuations across the entire venture capital sector.
22
29.1
38.4
26.8
17.5
10.2
0 10 20 30 40 50
$400+M
$300-400M
$200-300M
$100-200M
$50-100M
$0-50M

Venture Capital in Queensland: Economic Impact Statement
Copyright Bond University All Rights Reserved 2012 42
Figure 37: Average amount invested/company (AUD $ MILLION) ^SOURCE: Elcano Capital; Australian data is extrapolated using 2011 data from ABS and AVCAL
SOURCE: McKinsey analysis based on data from Thomson Reuters, Thomson Financial, Funding Venture Capital, Deals for High-Growth Companies in Canada
Figure 37 demonstrates the difference in per transaction average size between the U.S., Canada and Australia.
Evidence points to the U.S. venture capital industry as being over-scale, which has resulted in transaction sizes also being arguably over-scale, having the impact of artificially inflating investee
valuations. While Australian average investment sizes are at the opposite extreme being that they arguably are so low (therefore being significantly sub-optimal levels) as to render those investments possibly of greater detriment than benefit to investees and LPs.
The optimal range per transaction is likely to be closer to the Canadian model. Figure 38 is a model derived from the optimal fund, utilising optimal transaction sizes. As can be seen from the “Initial Investment” and “Average Follow-On Investment” tables the optimal average investment does not mean that each investee should receive the optimal average transaction, but rather that the fund should be of such size and structure so as to ensure that both the initial investments are sufficient and that follow-on investment will be available when and as it is required.
5.7
11.5
3.3 4.1
0.5 0.96
Early stage Late stage
U.S.
Canada
Australia

Venture Capital in Queensland: Economic Impact Statement
Copyright Bond University All Rights Reserved 2012 43
Figure 38: Optimal Fund Economics
Source: Elcano Capital LP
Variables SUMMARY
Fund size 100 Total Investments 81,500,004
$100,000,000 Total Mgmt Fees 18,000,000
Term 10 years Used Funds 99,500,004
Mgmt Fee:
Year 1 2.00% 2,000,000
Year 2 2.00% 2,000,000
Year 3 2.00% 2,000,000
Year 4 2.00% 2,000,000
Year 5 2.00% 2,000,000
Year 6 1.75% 1,750,000
Year 7 1.75% 1,750,000
Year 8 1.50% 1,500,000
Year 9 1.50% 1,500,000
Year 10 1.50% 1,500,000
18,000,000
Carry 20.00% of gains net of mgmt fees
Initial Investment
Concept stage: 1,000,000$
Trial stage: 2,500,000$
Revenue stage: 3,500,000$
Average Initial Investment 2,366,667$
Average Follow On Investment
Concept & trial stage investments 2,300,000$
Revenue stage investments 3,000,000$
Average Total Investment 5,006,667$ per Investment
Investments By Stage: 4 concept (26.7%)
7 trial (46.7%)
4 revenue (26.7%)
Total Deals 15
Initial Investments Per Year 3 Year 1
4 year 2
4 year 3
3 year 4
1 year 5
15
Investment Permance
Failed Investment 5 33.3%
Nil Gain Investment 5 33.3%
Positive Gain Investment 5 33.3%
15
Rounds Per Investment: 1 for Failed Investments
2 for Nil Gain Investment
3 for Positive •Gain Investment
4 for concept stage Positive •Gain Investment
Stage of investee Failed Investments Nil Gain Investment Positive •Gain Investment
Concept 2 1 1 Correct
Trial 2 2 3 Correct
Revenue 1 2 1 Correct
5 5 5
Average Return Multiple - for Failed Investments
1.25 for Nil Gain Investment
6.50 for Positive •Gain Investment
Average Holding Period (Yrs) 2.00 Failed Investment
6.00 concept
5.00 trial
4.00 revenue
Concept Trial Revenue
Initial 4 7 4 15
Follow-On I 2 5 3 10
Follow-On II 1 3 1 5
Follow-On III 1 1
Concept Trial Revenue
Initial 4,000,000 17,500,000 14,000,000 35,500,000
Follow-On I 4,600,000 11,500,000 9,000,000 25,100,000
Follow-On II 2,300,000 6,900,000 3,000,000 12,200,000
Follow-On III 2,300,000 2,300,000
13,200,000 35,900,000 26,000,000 75,100,000
Venture Capital Fund Model
Placement Stage
Funding
Round
Placement Stage
Funding
Round
For the Fund Size ($100,000,000) - Mgmt Fees ($18,000,000) / Average Total Investment ($5,006,667) per Investment = 16
transactions.

Venture Capital in Queensland: Economic Impact Statement
Copyright Bond University All Rights Reserved 2012 44
Figure 39: Optimal Fund Investment Summary
Source: Elcano Capital LP
Figure 39 provides an analysis of the optimal fund. Note that the assumptions are as per normal venture capital industry expectations, including investment performance being divided equally across failure, breakeven, and overperformance.
The following case studies (Figure 40) are all drawn from joint PWC AVCAL report24 as to the “Economic Impact of Private Equity and Venture Capital in Australia” and while the same case studies are held up as examples of success in other publications they are all actually contrary to the standard Australian venture capital investment because not one of them only received and was able to prosper on the current average investment amounts (see Figure 37).
Quite possibly these successful cases are further confirmation of the hypothesis that an optimal
range of transaction value exists, as it is probable that none of them would have survived at only the standard level of industry investment.
24 PriceWaterhouseCoopers and Australian Private Equity & Venture Capital Association Limited, Economic Impact of Private Equity and Venture Capital in Australia, 2006.
INVESTMENT SUMMARY
Total Fund: 100,000,000$
Total Invested Dollars: 81,500,004$
Total Management Fees: 18,000,000$
Average Investment: 5,433,334$
Total Proceeds on Investments: 447,500,000$
Total Gain on Investments: 365,999,996$
GROSS Multiple: 5.4x ($447.5M/$81.5M)
GROSS IRR: 61.9%
Multiple Incl Mgmt Fees: 4.4x ($366.0M/$81.5M)
Gain Incl Mgmt Fees: 347,999,996$
IRR Incl Mgmt Fees: 54.4%
Carried Interest Fees: $69,599,999 (20% of $348.0M)
NET Multiple: 3.4x ($278.4M/$81.5M)
NET IRR: 52.6%
ANALYSIS REPORT
Fund Size: 100,000,000$ Return On Investment ($): $278,399,997
Mgmt Fee Return On Investment (%): 278%
Value: 18,000,000$
% of fund: 18.0%
Av invested/Investment 5,433,334$
Investments
%
(Investments)
av investment
received
total investment
received
% total
investment
av duration
(yrs)
Concept stage 26.7% 3,300,000 13,200,001 16.2% 4.0
Trial stage 46.7% 6,114,286 42,800,002 52.5% 4.1
Revenue stage 26.7% 6,375,000 25,500,001 31.3% 3.5
81,500,004
Initial Investments Per Year
Year 1 3 20.0%
year 2 4 26.7%
year 3 4 26.7%
year 4 3 20.0%
year 5 1 6.7%
15
Investment Permance
Failed Investment 33%
Positive Gain Investment 33%
Nil Gain Investment 33%
100%
Stage
Initial
Investment
Follow-On
Investment
Av size of
follow-on inv
Exit
value
Concept 4,000,001 9,200,000 230.0% 46,500,000
Trial 17,500,002 25,300,000 144.6% 275,000,000
Revenue 14,000,001 11,500,000 82.1% 126,000,000

Venture Capital in Queensland: Economic Impact Statement
Copyright Bond University All Rights Reserved 2012 45
Figure 40: Successful Australian Early Stage Investments. Source: PWC & AVCAL
Further it is not enough to argue that perhaps other markets are frivolous with their investments as those markets outperform ours consistently.
Company (Success story) Investment Amount
Wizard Home Loans $25 million
Austal Limited $15 million
bCODE $5 million
CEA Technologies $11 million
Mincom $20 million
Dynamic Hearing $2M, $3M, $1.2M
G2 Microsystems $6M, $1.9M grant, $14M
Cap-XX US$1m, US$17m

Venture Capital in Queensland: Economic Impact Statement
Copyright Bond University All Rights Reserved 2012 46
8 GLOSSARY
'Investment Multiplier - The term investment multiplier refers to the concept that any increase in public or private investment spending has a more than proportionate positive impact on aggregate income and the general economy. The multiplier attempts to quantify the additional effects of a policy beyond those that are immediately
measurable. http://www.investopedia.com/terms/i/investment-multiplier.asp#ixzz1t8o27Ywo

Venture Capital in Queensland: Economic Impact Statement
Copyright Bond University All Rights Reserved 2012 47
9 REFERENCES
i Press Release, Australia-Israel Chamber of Commerce, Bill Shorten MP Trade Mission to Israel
Sunday 29 April – Saturday 5 May 2012, http://www.aicc.org.au/pages.cfm?id=90
ii Cara Waters, Productivity Commission boss says government hand-outs to manufacturing don’t save jobs, 29th March 2012, Business Spectator.
iii Australian Innovation System Report 2011, Australian Government Department of Innovation Industry, Science and Research, 2011
iv The Coalition’s plan for real action on Innovation, Industry, Science and Research,
http://www.liberal.org.au/~/media/Files/Policies%20and%20Media/Economy/Industry%20Policy.ashx
v http://www.ihs.com/products/global-insight/industry-analysis/financial/economic-analytics.aspx
vi Michelle Hammond, Sydney and Melbourne among world’s top 25 start-up ecosystems, 2012, smartcompany, http://www.smartcompany.com.au/start-up/049177-sydney-and-melbourne-
among-world-s-top-25-start-up-ecosystems.html?utm_source=SmartCompany&utm_campaign=90ced093a3-Friday_13_April_201213_04_2012&utm_medium=email, at 16 April 2012.
vii Peter Kerr and Jonathan Barrett, “Perth Lures the Money Men”, The Australian Financial Review, 22nd March 2012.
Joshua Lerner, Boulevard of Broken Dreams: Why Public Efforts to Boost Entrepreneurship and
Venture Capital Have Failed--and What to Do About It, Princeton University Press Princeton and Oxford, 2009.
http://www.businessweek.com/magazine/content/09_48/b4157080870431.htm – “How VC Lost its Way”;
http://www.theventurealley.com/vc-and-pe-funds/how-vc-funds-work---expenses-and-management-fees/ - “HOW VC FUNDS WORK - EXPENSES AND MANAGEMENT FEES”;
“Fastest-growing and fastest-shrinking industries, according to LinkedIn”, Joe McKendrick, March 8, 2012;
The Australian Financial Review, 9th March 2012, “Super funds question PE performance”.
Clean Technology Investment Program Direction No. 1 of 2012, - F2012L00575,
http://www.comlaw.gov.au/Details/F2012L00575
AVCAL 2011 Yearbook.
Figure 1 ‘Total funds raised’ table, extracted from the AVCAL 2011 Yearbook, “Australian Private Equity and
Venture Capital Activity Report – November 2011”
The Australian Financial Review, Peter Kerr and Jonathan Barrett, 22nd
March 2012, “Perth lures the money men”.
The Australian Financial Review, Jonathan Shapiro, 13th April 2012, “Funds offer share of their fortune”.
Michelle Hammond, Sydney and Melbourne among world’s top 25 start-up ecosystems, 2012, smartcompany, http://www.smartcompany.com.au/start-up/049177-sydney-and-melbourne-among-world-s-top-25-start-up-ecosystems.html?utm_source=SmartCompany&utm_campaign=90ced093a3-Friday_13_April_201213_04_2012&utm_medium=email, at 16 April 2012.
Universities Australia, Review of Venture Capital and Entrepreneurial Skills in Australia, 2012, Universities Australia, http://www.universitiesaustralia.edu.au/resources/705/1370 at 16 April 2012.

Venture Capital in Queensland: Economic Impact Statement
Copyright Bond University All Rights Reserved 2012 48
Deloitte Actuaries & Consultants, Dynamics of the Australian Superannuation System - The next 20 years: 2009 – 2028, March 2009.
Department of Employment, Economic Development and Innovation, Venture Capital Life Cycle, www.dtrdi.qld.gov.au.
Venture Impact: The Economic Importance of Venture Backed Companies to the U.S Edition 6. Economy, A joint study by the National Venture Capital Association and IHS Global Insight, http://www.nvca.org/index.php?option=com_content&view=article&id=255&Itemid=103, 2006
Australian Private Equity and Venture Capital Association Limited and PricewaterhouseCoopers, Economic Impact of Private Equity and Venture Capital in Australia, 2006
European Private Equity & Venture Capital Association, Survey of the Economic and Social Impact of Venture Capital in Europe =- Research Paper, June 2002.
European Private Equity & Venture Capital Association, EVCA Yearbook 2011.
Queensland Department of State Development, New Venture Funding in the USA – A report on the capital raising process in the USA for Queensland companies, August 2001.
Dominic Regan and Gene Tunny, Venture capital in Australia, Australian Treasury.
Adrian Turner, Blue Sky Mining - Building Australia's Next Billion Dollar Industries, Adrian Turner, 2012
P.A. Gompers & J. Lerner, The Venture Capital Cycle 2nd
Edn, MIT Press, 2004


