capitalism, ecological destruction and mainstream ... - CORE
Upload
imtfaridabadCategory
view
3download
0
Cover Page
Title of Paper : Developing venture capitalism in IndianEconomy:
Sector- wise
Principal Author : Dr. J.S. YadavAssistant Professor of CommerceGovt. College for Women, Gurawara, Rewari
(HARYANA)(Affiliated to M.D.University, Rohtak)Email: [email protected] No. +91-9416891097
Co-authors : 1. Dr. R.N. SangwanAssistant Professor of CommerceD.B.R.A. Govt. College, Kaithal,(Affiliated to Kurukeshtra University,
Kurukeshtra)Contract No. +91-9467643954
2. Dr. Narpal SinghAssociate Professor of Commerce,Ahir (P.G.) College, REWARI(Affiliated to M.D.University, Rohtak)
Developing venture capitalism in Indian Economy:Sector- wise
Abstract
In the last decade, due to liberalization of the Indian economy, venturecapitalists worldwide realized the vast potentials for investment in Indian industries dueto the significant advantages amongst others like cost efficiency, quality of humancapital, strategic geographic location etc. venture capital is privately raised externalequity capital and used to find early- stage firms with attractive prospects. This paper focuses on the venture capital as a new type of financial intermediary. Itlists the concepts of venture capital and regulatory frameworks within which it operatesin Indian economy. It also lists the registered number of Indian Venture Capital Funds(IVFC) & Foreign Venture Capital Investors (FVCIs) over the last decade and investmentsmade by IVCFs and FVCIs in various sectors of Indian economy i.e. IT;Telecommunications; Pharmaceutical; Biotechnology; Media/Entertainment; ServiceSector; Industrial Products; Real Estate etc. Last section consist conclusion. Key words:- Indian Venture Capital Fund; Foreign Venture Capital Investors; Sectors;Investments; Economy
Developing venture capitalism in Indian Economy:
Sector- wise
Introduction:- Venture capital (VC) investment performs the role of a
catalyst, speeding the ‘transformation of a developing economy into a
dynamic economy’ enabling it to face the growing competition brought about
due to globalization. A young private company that is not yet ready or
willing to tap the public financial markets may seek venture capital. VC
is a relatively new phenomenon on the Indian scene and has emerged as one
of the much talked about financing alternatives in India in the nineties
and now people talk of ‘venture capital industry’ or ‘venture capital
market’ comprising a large number of Venture Capital Funds (VCFs).
Meaning & Concept of Venture Capital:- Venture Capital means many things
to many people. According to Jane Koloski Morris, an editor of the
publication, Venture Economics, venture capital is “providing seed, start-

up and first stage financing” and also “funding the expansion of companies
that have already demonstrated their business potential but do not yet
have access to the public securities market or to credit oriented
institutional funding sources..” The European Venture Capital Association
describes it as risk finance for entrepreneurial growth oriented
companies. It is investment for the medium or long-term seeking to
maximize for both parties. It is a partnership with the entrepreneurs in
which the investor can add value to the company because of his knowledge,
experience and contact base. International Finance Corporation, Washington
D.C. 17C(W) defines VC as an equity or equity featured capital seeking
investment in new ideas, new companies, new products, new processes or new
services, that offer the potential of high returns on investment. It may
also include investment in turnaround situations. In India, the SEBI
defines Venture Capital Funds as ‘‘a fund established in the form of or
trust a Company having a dedicated pool of capital which raises moneys
through loan, donations, issue of securities or units as the case may be,
and makes or proposes to make investments in accordance with these
regulations”.
Origin and Growth of Venture Capital Industry in India
Venture capital is a new phenomenon, which emerged during the 1970s in
the U.S., in the early 1980s in the U.K., in the mid-1980s in Japan and
Canada and around 1987 in India. The concept of venture capital in India
was introduced by announcing in the long- Fiscal policy, presented in
parliament by Ministry of Finance (MoF) in Dec. 1985. The IFCI sponsored
in 1985 the Risk Capital Foundation (RCF) to give positive encouragement
to new entrepreneurs. In November 1988, guidelines were issued by the

(then) Controller of Capital Issues (CCI). These stipulated the framework
for the establishment and operation of funds/companies that could avail of
the fiscal benefits extended to them. In 1988, the Technical Development
and Information Corporation of India (TDICI, now ICICI ventures) was set
up, soon followed by Gujarat Venture Finance Limited. Both these
organizations were promoted by financial institutions. Among the Indian
banks, the subsidiaries of SBI and Canara bank have floated VCFs. ANZ
Grindlays Bank has set up India’s first private sector venture capital
fund, namely India Investment Fund. In 1991, as part of a large number of
financial reforms, the SEBI was created to regulate the stock market. The
formalization of the Indian VC community began in 1993 with the formation
of the Indian Venture Capital Association (IVCA) headquartered in
Bangalore. The prime mover for this was the TDICI. The IVCA is the nodal
centre for all venture activity in the country. In 1996, the SEBI
introduced guidelines, viz. SEBI (Venture Capital Funds) Regulations,
1996. Thereafter, in 2000 the SEBI announced the SEBI (Foreign Venture
Capital Investor) Regulations, 2000 enabling foreign VC and private equity
investors to register with the SEBI and avail of certain benefits. There
were 180 VCFs & 154 FVCIs registered with SEBI on 31st March, 2011.
Regulatory Framework of VC
Domestic and offshore VC funds investing in India are regulated by the
SEBI. The legal framework within which VC funds would be required to
operate broadly within the ambit of the following regulations:
- SEBI (Venture Capital Funds) Regulations, 1996;
- SEBI (Foreign Venture Capital Investor) Regulations, 2000;
SEBI (Venture Capital Funds) Regulations, 1996
In December 1996, the SEBI notified the SEBI VCF Regulations. These
regulations were further amended in time to time. Indian Venture Capital
Funds (VCFs), whether existing or newly organized, who wish to avail of
the tax benefits available to venture capital funds, must register with
the SEBI and comply with the provisions of the VCF Regulations? Under the
SEBI VCF Regulations, a domestic venture capital fund can be organized
either in the form of a trust or as a company. Though the guidelines do
not appear to make registration with file SEBI mandatory, the SEBI has
made its intention clear to regulate all domestic VCFs.
SEBI (Foreign Venture Capital Investor) Regulations, 2000;
In November, the SEBI notified the Securities and Exchange Board of India
(Foreign Venture Capital Investors) Regulations, 2000. These regulations
were further amended in time to time. According to these regulations,
"foreign venture capital investor" means an investor incorporated,
established outside India, is registered under these Regulations and
proposes to make investment in accordance with these Regulations. For the
purposes of seeking registration under these regulations, the applicant
shall make an application to the Board in Form A along with the
application fee. For the purposes of determining whether an applicant is
a fit and proper person the foreign venture capital investor, the Board
may take into account the criteria specified in Schedule II of the
Securities and Exchange Board of India (Intermediaries) Regulations, 2008.
If the Board is satisfied that the applicant is eligible for the grant of
certificate, it shall send intimation to the applicant. On receipt of
intimation, the applicant shall pay to the Board, the registration fee
specified in Part A of the Second Schedule in the manner specified in Part
B thereof. The Board shall on receipt of the registration fee grant a
certificate of registration in Form B.
Objective of the study: -
to examine contribution of VCFs and FVCIs in Indian economy
and which sector is dominating in the matter of pooling funds
from these.
to examine is there any significant difference investments
made by VCFs and FVCIs.
to examine is there any significant difference among various
segments of economy in the matter of pooling investments from
VCFs and FVCIs.
Collection of data and tools of analysis: -
The data required for the study relate information
pertaining to the registered number of VCFs and FVCIs and
investments made by them in various segments of Indian economy
for the study period i.e.2006 to 2011. The dates’ were obtained
from published annual reports of respective VCFs, Indian Venture
Capital Association (IVCA), SEBI and their web sites.The various
statistical techniques have been used for analyzing the data’s.
These include Trend Values (Yc), Annul Growth Rate (AGR),
percentage (%),ANOVA analysis, Chi-square test (χ2) etc. The uses
of all these techniques at different place have been made in the
light of nature and suitability of data available and requirement
of analysis.
HYPOTHESES OF THE STUDY

1. There is not any segment of economy which dominate in the
matter of attracting investments of VCFs and FVCIs.
2. There is no significant difference investment made by VCFs
and FVCIs.
3. There is no significant difference among various segments of
economy in the matter of pooling investments from VCFs and
FVCIs.
RESULTS AND INTERPRETATION
Table – 1 presents VCFs & FVCIs effectively registered over the period
2001 to 31st March 2011. It seems that the number of VCFs & FVCIs
effectively registered are increasing year after year in both groups (i.e.
VCFs & FVCIs) as witnessed by trend values. However, the annual growth rate
is highly fluctuating though positive. So, there is very likely-hood that
the number of VCFs and FVCIs registered will further increase in coming
years. It proves that the VCFs & FVCIs are becoming popular in country.
TABLE-1
No. of SEBI Registered Venture Capital Funds & Foreign Venture
Capital Investors
VCF FVCI
TOTALYear NO AGR Yc NO AGR Yc NO AGR Yc2001 35 41 1 -42 36 -12002 34 -2.86 71 2 100 -7 36 0 642003 43 26.47 101 6 200 29 49 36.11 1292004 45 4.65 131 9 50 64 54 10.20 195

2005 50 11.11 161 14 55.56 99 64 18.52 260
2006 80 60.00 191 39
178.5
7 134 119 85.94 325
2007 90 12.50 221 78
100.0
0 170 168 41.18 3902008 106 17.78 251 97 24.36 205 203 20.83 4552009 132 24.53 281 129 32.99 240 261 28.57 5212010 158 19.70 311 143 10.85 275 301 15.33 5862011 180 13.92 341 154 7.69 311 334 10.96 651
Source:- Compiled from www.sebi.gov.in
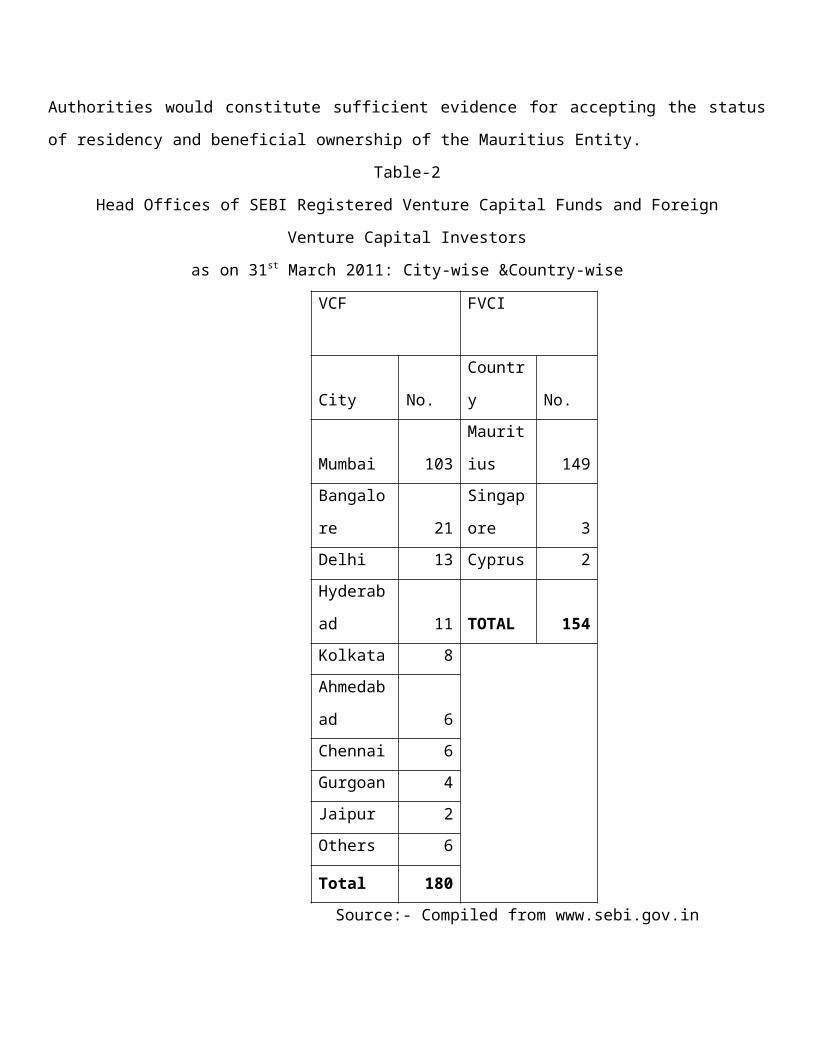
Table – 2 shows distribution of VCFs & FVCIs head offices city wise &
country wise. It appears that out of 180 VCFs’ Head Offices as many as 103
are in Mumbai followed by Banglore 21; Delhi 13; Hyderabad 11 respectively.
In other major cities the number is less than two digits.
So, it can be pointed out that the Head Offices of most of the VCFs
are concentrated in Mumbai city alone. Interestingly out of 154 FVCIs 149
belongs to Mauritius. Mauritius has generally been a preferred jurisdiction
for routing investment into India primarily because of the favorable Tax
Treaty between India and Mauritius which provides beneficial Tax Treatment
to Capital gains. As per the Tax Treaty, Capital Gain generated by a
resident on sale of shares would be liable to Tax only in Mauritius and not
in India. Mauritius does not however Tax on Capital Gain under its domestic
law. The popularity of Mauritius as an investment jurisdiction also stems
from the fast that the Indian Tax Authorities have clarified, via issue of
circular, that a Tax residency certificate issued by the Mauritius Revenue
Authorities would constitute sufficient evidence for accepting the status
of residency and beneficial ownership of the Mauritius Entity.
Table-2
Head Offices of SEBI Registered Venture Capital Funds and Foreign
Venture Capital Investors
as on 31st March 2011: City-wise &Country-wise
VCF FVCI
City No.
Countr
y No.
Mumbai 103
Maurit
ius 149Bangalo
re 21
Singap
ore 3Delhi 13 Cyprus 2Hyderab
ad 11 TOTAL 154Kolkata 8Ahmedab
ad 6Chennai 6Gurgoan 4Jaipur 2Others 6
Total 180 Source:- Compiled from www.sebi.gov.in
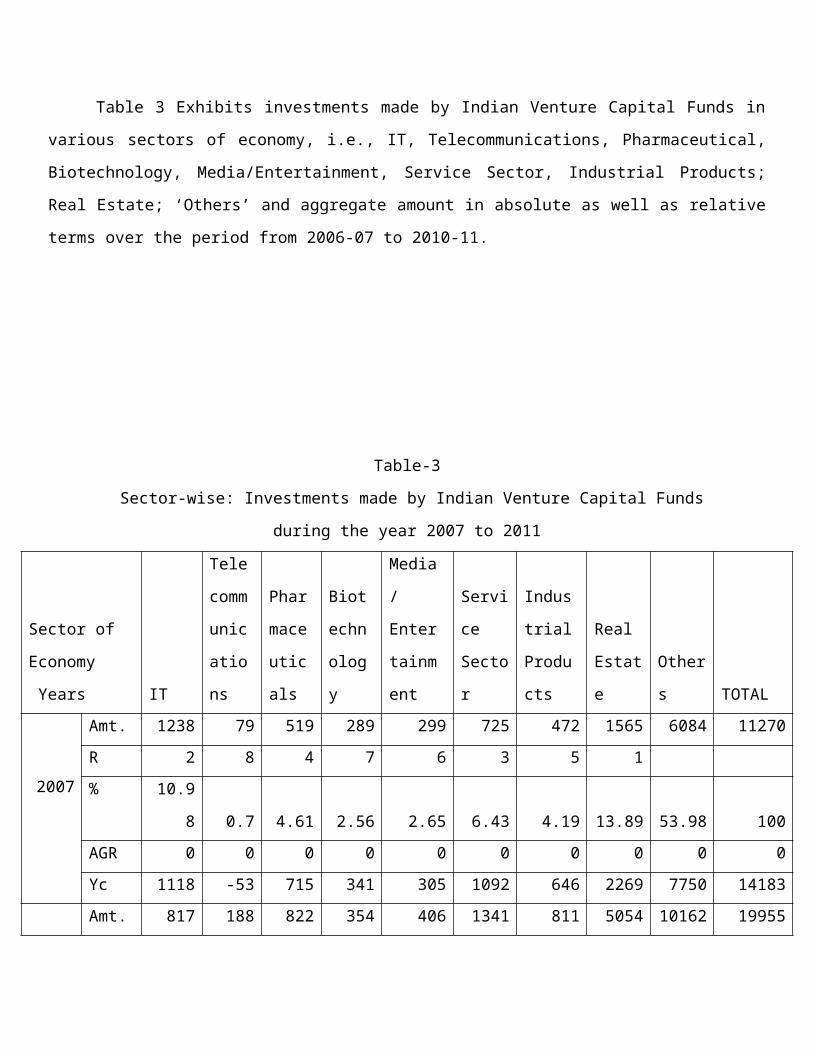
Table 3 Exhibits investments made by Indian Venture Capital Funds in
various sectors of economy, i.e., IT, Telecommunications, Pharmaceutical,
Biotechnology, Media/Entertainment, Service Sector, Industrial Products;
Real Estate; ‘Others’ and aggregate amount in absolute as well as relative
terms over the period from 2006-07 to 2010-11.
Table-3
Sector-wise: Investments made by Indian Venture Capital Funds
during the year 2007 to 2011
Sector of
Economy
Years IT
Tele
comm
unic
atio
ns
Phar
mace
utic
als
Biot
echn
olog
y
Media
/
Enter
tainm
ent
Servi
ce
Secto
r
Indus
trial
Produ
cts
Real
Estat
e
Other
s TOTAL
2007
Amt. 1238 79 519 289 299 725 472 1565 6084 11270R 2 8 4 7 6 3 5 1% 10.9
8 0.7 4.61 2.56 2.65 6.43 4.19 13.89 53.98 100AGR 0 0 0 0 0 0 0 0 0 0Yc 1118 -53 715 341 305 1092 646 2269 7750 14183Amt. 817 188 822 354 406 1341 811 5054 10162 19955

2008
R 4 8 3 7 6 2 5 1% 4.09 0.94 4.12 1.77 2.03 6.72 4.06 25.33 50.92 100AGR -
34.0
1
137.
97
58.3
8
22.4
9 35.79 84.97 71.82
222.9
4 67.03 77.06Yc 955 217 665 304 466 1168 738 4006 8832 17350
2009
Amt. 805 215 829 317 721 1770 1139 5242 11733 22771R 5 8 4 7 6 2 3 1% 3.54 0.94 3.64 1.39 3.17 7.77 5 23.02 51.53 100AGR
-
1.47
14.3
6 0.85
-
10.4
5 77.59 31.99 40.44 3.72 15.46 14.11Yc 791 486 615 267 626 1244 830 5743 9913 20517
2010
Amt. 533 858 450 187 802 1215 783 8155 10029 23012R 6 3 7 8 4 2 5 1% 2.32 3.73 1.96 0.81 3.49 5.28 3.4 35.44 43.58 100AGR -
33.7
9
299.
07
-
45.7
2
-
41.0
1 11.23
-
31.36
-
31.26 55.57
-
14.52 1.06Yc 628 756 566 229 787 1320 923 7480 10995 23684
2011
Amt. 564 1092 457 186 903 1168 947 8700 11559 25576R 6 3 7 8 5 2 4 1% 2.21 4.27 1.79 0.73 3.53 4.57 3.7 34.02 45.19 100AGR
5.82
27.2
7 1.56
-
0.53 12.59 -3.87 20.95 6.68 15.26 11.14Yc 465 1026 516 192 947 1396 1015 9217 12077 26851Amt. 3957 2432 3077 1333 3131 6219 4152 28716 49567 102584
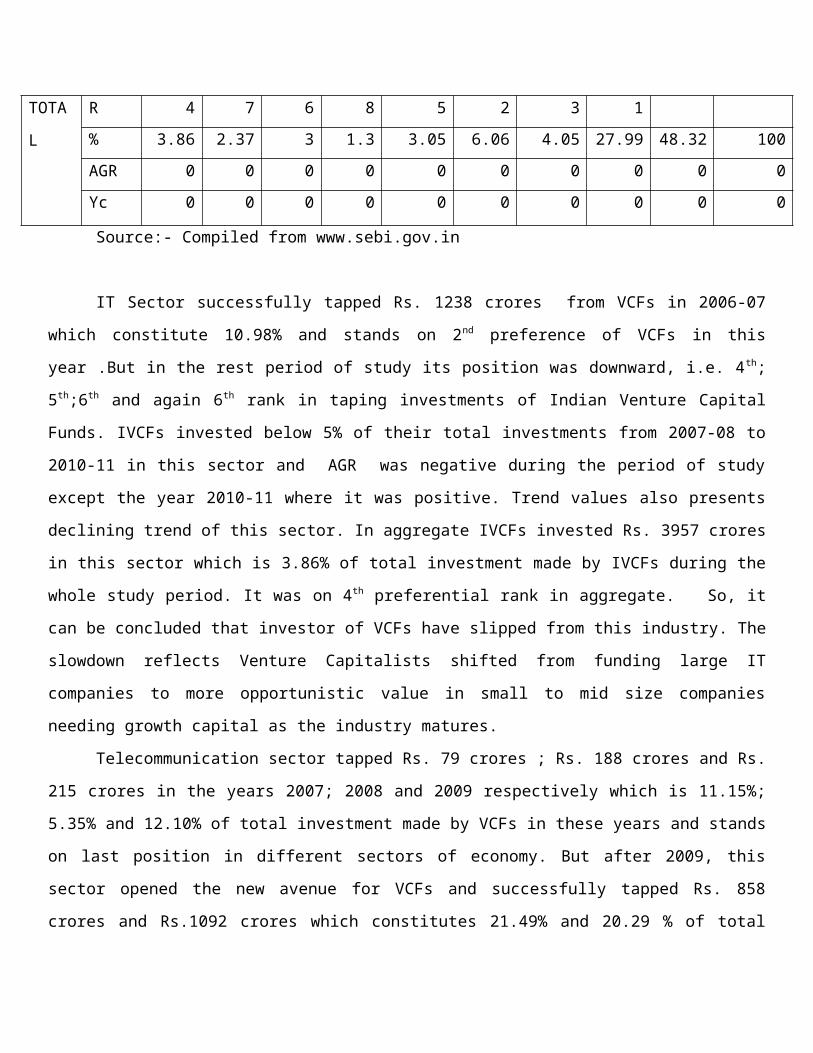
TOTA
L
R 4 7 6 8 5 2 3 1% 3.86 2.37 3 1.3 3.05 6.06 4.05 27.99 48.32 100AGR 0 0 0 0 0 0 0 0 0 0Yc 0 0 0 0 0 0 0 0 0 0
Source:- Compiled from www.sebi.gov.in
IT Sector successfully tapped Rs. 1238 crores from VCFs in 2006-07
which constitute 10.98% and stands on 2nd preference of VCFs in this
year .But in the rest period of study its position was downward, i.e. 4th;
5th;6th and again 6th rank in taping investments of Indian Venture Capital
Funds. IVCFs invested below 5% of their total investments from 2007-08 to
2010-11 in this sector and AGR was negative during the period of study
except the year 2010-11 where it was positive. Trend values also presents
declining trend of this sector. In aggregate IVCFs invested Rs. 3957 crores
in this sector which is 3.86% of total investment made by IVCFs during the
whole study period. It was on 4th preferential rank in aggregate. So, it
can be concluded that investor of VCFs have slipped from this industry. The
slowdown reflects Venture Capitalists shifted from funding large IT
companies to more opportunistic value in small to mid size companies
needing growth capital as the industry matures.
Telecommunication sector tapped Rs. 79 crores ; Rs. 188 crores and Rs.
215 crores in the years 2007; 2008 and 2009 respectively which is 11.15%;
5.35% and 12.10% of total investment made by VCFs in these years and stands
on last position in different sectors of economy. But after 2009, this
sector opened the new avenue for VCFs and successfully tapped Rs. 858
crores and Rs.1092 crores which constitutes 21.49% and 20.29 % of total
investment and this sector was given 3rd preferential rank by VCFs in these
years. Annual growth rate was fluctuating but positive during the study
period. Trend values also shows increasing trend for this sector. In
aggregate VCF investors invested total Rs. 2432 crores during the whole
study period and put it on 7th rank among all the eight sector of economy.
So, it can be concluded that in future, this sector will attract more VCFs
and will provide a fast growth for it.
Venture Capitalists invested Rs. 519 crores; Rs. 822 crores and Rs.
829 crores in Pharmaceuticals sector in 2007, 2008 and in the year 2009 by
putting it on 4th, 3rd and again 4th preferential rank which constitutes
4.61%, 4.12% and 3.64% of total investment made by VCFs during these years
respectively. After 2009 VCFs preferred this sector on 7th rank by
investing Rs. 450 crores and Rs. 457 crores in 2010 and 2011 which is below
2% of total investment during these two years. Its annual growth rate was
highly fluctuating and even negative also in study period. Trend values
also present negative trend of this sector. In aggregate, VCFs investors
put it on 6th preferential rank out of eight sectors by investing Rs. 3077
crores which is 3% of total investment made during the study period. It
proves that VCFs investors have shifted from funding large pharmaceuticals
companies to more profitable other sectors of economy from the year 2010.
Biotechnology sector was not opportunistic value investment for VCFs
and they put it on 7th rank in the years 2007, 2008, 2009 and on 8th rank in
the years 2010 and 2011. Investment made by VCFs in this sector was very
low ,i.e., 0.73% to 2.56% during the study period. Annual Growth Rate was
negative, except the year 2008 where it was positive. Trend values of this
sector were also negative. As a whole, Venture Capitalists put it on last

preferential rank for their investment by investing a little amount of
Rs.1333 crores in the period of study which is 1.3% of total investment of
last five years. So this sector needs to attract more VCFs for its growth
and contribution for economy by opening new avenues.
Media/Entertainment sector was on the 6th rank for investment purpose
of VCFs by investing Rs. 294 crores, Rs. 406 crores and Rs. 721 crores in
the years 2007, 2008, 2009 which is 2.65%, 2.03% and 3.17% respectively. In
2010 and 2011 this sector was more profitable for VCFs investors in
comparision to previous years, so they invested Rs. 802 crores and Rs. 903
crores which constitutes 3.49% and 3.53 % by putting it on 4th and 5th
preferential rank respectively. AGR of this sector was fluctuating but
positive during the study period. Trend value presents positive trend of
this sector. In aggregate, it was on 5th preferential rank of VCFs and
invested total Rs.3131 crores which is 3.05% of total investment made
during the last five years. So, it can be stated that this sector will
attract more and more investment of VCFs and grow in future.
Service sector successfully tapped Rs. 725 crores in 2007 which is
11.66% of total investment during this year and VCFs investor put it on 3rd
preferential rank. In the rest period of study, this sector was on second
preferential rank of Venture Capitalists and they invested 18.78% to 28.46%
in this sector from the year 2008 onwards. Its AGR was highly fluctuating
and even negative also in the years 2010 and 2011. But the trend value
presents positive trend for this sector. In aggregate, VCFs investors put
it on 2nd preferential rank by investing Rs.6219 crores which is 6.06% of
the whole investment made by VCFs during the study period. Investment made
by VCFs in service sector is more profitable in comparison to other sectors
of economy. So, it can be suggested that entrepreneur of this sector should
try for their positive growth rate. Interest of VCFs investors also
indicates that this sector of economy will grow more in future.
Venture Capitalists Invested in industrial product sector Rs.472
crores in 2007; Rs.811 crores in 2008 and Rs. 783 crores in 2010 putting on
5th preferential rank which were 11.37%, 19.53% and 18.56% respectively. In
2011, Rs.947 crores and in 2009 rs.1139 crores which were 22.43% and 27.43%
of total investments of VCFs putting on 4th and 3rd preferential rank
respectively. AGR was highly fluctuating and even negative in the year
2010. Trend values also present negative trend for this sector. In
aggregate of the study period it was on third rank by tapping Rs.4152
crores from VCFs which was 4.05% of total investment. So it can be stated
that position of this sector was not constant for investment made by VCFs.
Industries of this sector should try to maintain positive and progressive
growth rate by attracting more and more funds from VCFs so as to present a
positive trend. This is possible by adopting new techniques in their
products.
Real Estate sector was prominent in various sector of economy in the
matter of investments made by VCFs during the whole period of study. Its
share in total investment of VCFs was 13.89% in 2006 to 35.44% in 2011. Its
annual growth rate was fluctuating but positive during the study period.
Its growth also witnessed by increasing trend values. As a whole it was on
1st preferential rank by attracting Rs.28716 crores which constitutes 28%
of total investments of VCFs during the six years. So, position of this
sector proves that it is much profitable than other sectors for VCFs
investors.

In net cell, we can conclude that Real Estate was first preference of
Venture Capitalists followed by Service sector, industrial products, IT,
Media/Entertainment, Pharmaceuticals, Telecommunications and Bio-Technology
in the matter of investment. Hence, the hypothesis- there is no dominating
sector of economy in the matter of polling investment from VCFs rejected.
Table 4 shows investment made by FVCIs in different sectors of Indian
Economy, i.e. IT, Telecommunications; Pharmaceuticals; Bio-Technology;
Media/Entertainment; Service Sector; Industrial Products; Real Estate;
‘Others’ and aggregate amount of these sectors in absolute as well as
relative terms over the period of study. Information Technology was on 2nd
preferential rank during the period of study except the year 2010 where it
was on 3rd rank. This sector successfully pulled Rs.1098 crores, Rs.1443
crores, Rs.1837 crores, Rs. 3016 crores and Rs. 3436 crores from FVCIs
which constitutes 13.98%, 8.64%, 9.07% and 9.65% respectively during the
period of study. AGR was positive but fluctuating. Trend values show an
increasing trend. FVCI invested Rs. 10830 crores which was 9.3% of total
investment of study period and it was on 3rd preferential rank in
aggregate.
Table-4
Investments made by Foreign Venture Capital Investors during the
year 2007 to 2011: Sector-wise

Sector of
Economy
IT
Telec
ommun
icati
ons
Pharm
aceut
icals
Biote
chnol
ogy
Media
/
Enter
tainm
ent
Servi
ce
Secto
r
Indus
trial
Produ
cts
Real
Estat
e
Other
s TOTAL Years
2007
Amt. 1098 876 195 9 59 647 496 1292 3184 7856R 2 3 6 8 7 4 5 1% 13.9
8 11.15 2.48 0.11 0.75 8.24 6.31 16.45 40.53 100AGRYc 916 -4 259 0 -21 702 617 1356 5061 8886
2008
Amt. 1443 893 598 31 69 1090 748 2231 9602 16705R 2 4 6 8 7 3 5 1% 8.64 5.35 3.58 0.19 0.41 6.52 4.48 13.36 57.48 100AGR 31.4
2 1.94
206.6
7
244.4
4 16.95 68.47 50.81 72.68
201.5
7
112.6
4Yc 1541 1890 454 37 171 1048 752 1783 8411 16088
2009
Amt. 1837 2788 492 48 285 1293 1201 1431 13672 23047R 2 1 6 8 7 4 5 3% 7.97 12.1 2.13 0.21 1.24 5.61 5.21 6.21 59.32 100AGR
27.3
212.2
1
-
17.73 54.84
313.0
4 18.62 60.56
-
35.86 42.39 37.96Yc 2166 3785 649 73 364 1394 887 2210 11761 23289
2010
Amt. 3016 7145 985 140 701 2039 886 3107 15223 33242R 2 1 5 8 7 4 6 3% 9.07 21.49 2.96 0.42 2.11 6.13 2.67 9.35 45.79 100

AGR 64.1
8
156.2
8 100.2
191.6
7
145.9
6 57.7
-
26.23
117.1
2 11.34 44.24Yc 2791 5679 844 110 556 1741 1022 2636 15111 30490
2011
Amt. 3436 7221 976 139 705 1903 1102 2987 17124 35593R 2 1 6 8 7 4 5 3% 9.65 20.29 2.74 0.39 1.98 5.35 3.1 8.39 48.11 100AGR 13.9
3 1.06 -0.91 -0.71 0.57 -6.67 24.38 -3.86 12.49 7.07Yc
TOTA
L
Amt. 1083
0 18923 3246 367 1819 6972 4433 11048 58805
11644
3R 3 1 6 8 7 4 5 2% 9.3 16.25 2.79 0.32 1.56 5.99 3.81 9.49 50.5 100AGR 215.
19
162.0
6
232.5
8
164.0
3
158.0
1
266.3
7
302.2
7
269.8
7
243.4
1
227.1
5Yc 3416 7573 1039 147 749 2087 1157 3063 18461 37691
Source:- Compiled from www.sebi.gov.in
So, it can be concluded that FVCI investment increasing year by year
in this sector. It proves that this sector is more profitable in comparison
to other sectors. In future this sector will develop in Indian Economy with
foreign collaboration.
Telecommunication Sector was on first preferential rank of FVCI during
the period of study except 2007 and 2008. In these years, FVCI gave 3rd and
4th preferential rank by investing Rs.876 crores and Rs. 893 crores which
is 11.15% and 5.35% respectively. Its AGR was highly fluctuating, i.e.
1.06% in 2011 to 212.21% in 2009 but positive during the study period.

Trend values also presents increasing trends. FVCI invested Rs. 18923
crores which was 16.25% of total investments during the last six years. It
was on 1st preferential rank in aggregate. So, it proves that this sector
of economy is most profitable for FVCIs. It means, in future, it will grow
with foreign investment in Indian Economy.
Pharmaceuticals Sector, year-wise, was on 6th preferential rank of
FVCIs during the study period except the year 2010 where it was on 5th
rank. It attracted only 2.13% to 3.58% of yearly total investments. The
Annual growth rate was highly fluctuating and even negative also in the
years 2009 and 2011. Trend values shows increasing trends. In aggregate
FVCIs invested Rs. 3246 crores which constitute only 2.79%. So, this sector
should try to maintain its positive growth rate by attracting more and more
investments from FV Capitalists by opening new avenues in this sector.
Bio-Technology was in the bottom of preferential rank of FV
Capitalists among all the eight sectors. Least amount was invested was by
them in this sector which was below 0.42% of yearly investment. Annual
growth rate was highly fluctuating and even negative in the year 2011.
Trend values shows increasing trends. In aggregate, FVCIs invested Rs. 367
crores which was only 0.32% of total investment of last five years by
putting it on 8th rank. So, it can be stated that this sector was not
profitable for FV Capitalists and they shifted to other sectors for
investment purpose. Entrepreneurs of this sector should provide new
opportunities to attract more funds from FV Capitalists and try to maintain
their positive and constant growth rate in future.
Media/Entertainment Sector was also not popular among the FV
Capitalists during the study period. Though, its year wise investment was

increasing but under the ceiling of 2% except the year 2010 where it was
2.11%. This sector was on 7th preferential rank of FVCIs during the whole
study period. AGR of this sector was fluctuating but positive and trend
values also present an increasing trend which is a positive indication to
attract more funds from FVCIs in future. As a whole, FVCIs invested Rs.
1819 crores which constitutes only 1.56% of total investment made during
the study period. So, it can be concluded that this sector should open new
opportunities for FVCIs; otherwise they will shift to other sectors in
future.
Service Sector was on 4th preferential rank of FVCIs during the study
period except the year 2009 where it was on third rank. Although, this
sector was in the range of 5.35% to 8.24% of yearly investment of FVCIs.
AGR of this sector was not constant and it was negative in 2011. Trend
values present an increasing trend. This sector pooled Rs. 6972 crores from
FVCIs in the last five years which was 6% of their aggregate investments of
this period. So, it can be stated that entrepreneur of this sector should
try to maintain their positive and constant annual growth rate by pooling
more funds from FVCIs. This is possible only by opening new avenues.
In the matter of FVCIs investment; Industrial Products Sector was on
5th preferential rank in Indian Economy from 2007 to 2011except 2010where
it was on 6th rank. Percentage wise yearly investment of this sector was in
the range of 2.67 to 6.31. AGR was fluctuating and even negative in the
year 2010. Trend values show increasing trend of this sector. Foreign
Venture Capitalists invested Rs. 4433 cores by putting it on 5th rank which
constitutes only 3.81% of total investment of last five years. So, it can
be states that FVCIs have shifted their investments from this sector to

other sectors of economy. In future, entrepreneurs of this sector should
try to maintain their positive and progressive annual growth by attracting
more and more funds from FVCIs.
Real Estate pooled Rs. 1293 crores and Rs. 2231 crores which
constitutes 16.45% and 13.36% investments in the year 2007 and 2008. This
sector was on 1st preferential rank in these years but it was on 2nd rank in
2010 and 3rd rank in 2009 and 2011 by pooling Rs. 2210 crores, Rs.1431
crores and Rs. 2987 crores respectively. AGR of this sector was highly
fluctuating; i.e.( - 35.86%) to 117.12 %. The Trend values present an
increasing trend for this sector. In aggregate of past five years this
sector was on 2nd preferential rank by attracting Rs. 11048 crores from
FVCIs which constitute 9.49%. So it was proved that rank of this sector was
not constant like other sectors. Here; it should be noted that percentage-
wise investment of FVCI in this sector was decreasing yearly except the
year 2010. FVCIs have started shifting from this sector to other profitable
sector of Economy. To stop their shifting, entrepreneurs of this sector
should try to maintain their positive and progressive AGR by pooling more
funds.
In conclusion, it can be stated that telecommunication sector was
dominating in the matter of attracting FVCIs investments followed by Real
Estate, IT, Service Sector, Industrial Products, Pharmaceuticals,
Media/Entertainment and Biotechnology in aggregate of last five years. In
this case also hypothesis -1 rejected.
Table 5 shows total investment made by VCFs and FVCIs in different
sector of Indian Economy from 2007 to 2011 in absolute figures. To judge
the hypothesis:-

There is no significant difference in the matter of investment
made by VCF and FVCI
There is no significant difference in the various sectors of
economy for VCF and FVCI investment point of view.
For this purpose analysis of variance (ANOVA) table was prepared.
Value of correction Factor was 2665157041. Some of squares between VCFs and
FVCIs was 10670660.06; where sum of square between various sectors of
economy was 4492560464 and total sum of squares was 4852570019. Value of F
was 0.244 where the table value of F at 5% for v1=1 and v2=8 is 5.32. The
calculated value is less than the table value. Hence, the investments made
by VCFs and FVCIs in economy do not differ significantly. The Hypothesis,
there is no significant difference in the investment made by VCFs and FVCIs
is hold true.
TABLE-5
Sector-wise aggregate investment made by Indian Venture Capital
Funds and
Foreign Venture Capital Investors during the last five years
(2007-2011)
VF FVCIIT 3957 10830Telecommunicat
ions 2432 18923Pharmaceutical
s 3077 3246Biotechnology 1333 367

Media/
Entertainment 3131 1819Service Sector 6219 6972Industrial
Products 4152 4433Real Estate 28716 11048Others 49567 58805 Total 102584 116443
CORRECTION FACTOR=2665157041
SUM OF SQUARES BETWEEN VC &FVCI =10670660.06
SUM OF SQUARES BETWEEN ECONOMY SECTOR OF INVESTMENT = 4492560464
TOTAL SUM OF SQUARS=4852570019
ANALYSIS OF VARIANCE TABLE (ANOVA)
SOURCE OF VARIANCE
SUM OF
SQUARS v
MEAN
SUM OF
SQUARSBETWEEN VC &FVCI 10670660 1 10670660BETWEEN ECONOMY
SECTOR OF INVESTMEN
449256046
4 8
56157005
8
RESIDULE 349338895 8
43667361
.88TOTAL 485257001 17

9
F (VC &FVCI) = 10670660/43667361.88=0.244
F(SECTORS)=561570058/43667361.88=12.86
VALUE OF CHI SQURE TEST=24744.57 Where v=9
Investment point of view; the value of F for different sector of
economy was 12.860 where the table value of F at 5% level of significance
where v1=8, v2=8 is 3.44. The calculated value of F is more than the table
value. Hence the hypothesis, various sector of economy do not differ
significantly is rejected. This is also proved by χ2. Calculated value of
χ2 where v=9 is 24744.57 is greater than the table value (16.9). Hence the
Hypothesis was also rejected in χ2. Sector wise investments made by Indian
Venture Capitalists and Foreign Venture Investors have a significant
difference.
Conclusion:
In net cell we can conclude that VC is relatively a new phenomenon in
Indian economy and introduced by Ministry of Finance in long term fiscal
policy 1985. VCFs’ and FVCIs’ are becoming popular in country. Head offices
of most of VCFs’ are concentrated in Mumbai city alone. The Mauritius is
dominating country in Foreign Venture Capital Investors. In the matter of
investment made by VCFs’ real estate industry was dominating while in case
of FVCIs’ information technology industry was on top. From 2009 and onward
investment of FVCIs’ exceeds over VCFs’. In future, due to globalization;

new collaboration in the field of technology; entering young and dynamic
entrepreneurs, venture capital will grow very fast in India.
Notes and Refrences:
1. Bhalla V. K., ‘Management of Financial Services’ Anmol
Publication Pvt. Ltd. New Delhi, 2008. Pp. 702-704.
2. Manhor, R.: Venture Capital, the Management Accountant, February 1988.
3. Bijal Ajinkya and Shefali Goradia, ‘Venture Capitalism’ ASIA-
PADIFIC Tax Bulletin, November/December, 2002. Pp.378-389.
4. Bhattacharya, S.: Venture Capital Financing, Economic and Political
Weekly, November 25, 1989.
5. Shalin J. Parikh,’Venture Capital Funds are not ‘Non Banking
Financial Intermediaries’ The Chartered Accountant,
December-2002.Pp. 620-624.
6. Jagirdar, Rupal J.: Venture Capital - A Conceptual Error, Fortune India,
December 1-15, 1989.
7. Rafiq Dossani and Martin Kenney, ‘Creating Environment:
Developing Venture Capital in India’ BRIE Working Paper
143.June 6, 2002.
8. Black, B. & Gilson, R. (1998). Venture capital and the
structure of capital markets: Banks versus stock markets.
Journal of financial economics, 47, 243-277.
9. Brunner, H. (1995). Closing the technology gap. New Delhi:
Sage Publications.
10. Chandrasekhar, K., Dossani, R., & Singhvi, L. (1999). The
securities and exchange board of India’s report on venture
capital.
11. The SEBI (Venture Capital Fund) Regulation 1996 and its
amendments.
12. The SEBI (Foreign Venture Capital Investors) Regulation
2000 and its amendments.
13. Reddy G. Sudarsana: Financial Management, Himalya Publishing
House Pvt. Ltd., New Delhi, 2009.
14. www.indiavca.org/ivca20%Presentation_October 2007(pdf)
15. www.its-db.stanford.edu./pubs/12010/Dossani-kenney(pdf)
16. www.sebi.gov.in
17. www.wigt.in
Copyright © 2022 FDOKUMEN