
FINAL REPORT - Manufacturing in Queensland
340
h 2017 FINAL REPORT Manufacturing in Queensland
-
Upload
khangminh22 -
Category
Documents
-
view
8 -
download
0
Transcript of FINAL REPORT - Manufacturing in Queensland

h
2017
FINAL REPORT
Manufacturing in Queensland

h
© Queensland Productivity Commission 2017
The Queensland Productivity Commission supports and encourages the dissemination and exchange of information. However, copyright protects this document.
The Queensland Productivity Commission has no objection to this material being reproduced, made available online or electronically but only if it is recognised as the owner of the copyright and this material remains unaltered.
ABN: 18 872 336 955

Final Report: Manufacturing in Queensland
Queensland Productivity Commission i
Foreword Queensland enjoys the benefits of a healthy and diverse manufacturing sector despite an observable contraction. This contraction reflects a decline in manufacturing’s share of Australian and global gross domestic product. We consider that the Queensland government has opportunities to further improve the manufacturing environment.
Manufacturing is a significant contributor to Queensland’s economy. It generates approximately $20 billion in gross value added per year and employs around 168,000 workers.
In September 2016, the Queensland Government asked the Queensland Productivity Commission to conduct an inquiry into manufacturing to identify policies to improve the sector’s productivity and competitiveness.
This final report sets out a policy action plan to support a strong and diverse manufacturing sector.
The inquiry has found that policy settings can be shifted from predominantly sector-based programs towards broad-based reform of the business environment.
While many of the proposed reforms transcend the manufacturing sector and will require a sustained effort to implement, we believe that broad based reform will better address the key concerns of manufacturers in Queensland—energy, skills and training, tax, procurement, red tape and barriers to innovation, and benefit the wider Queensland economy.
The inquiry been aided by discussions and submissions from manufacturers, unions, peak business bodies, government agencies, academics and innovation experts. The Commission is grateful to all stakeholders who contributed to this inquiry.
The Commissioners would like to thank the staff who worked on this report—Kristy Bogaards, Richard Clarke, Peter Coombes, Matt Geck, Ann Jones and Steve Williams.
Kim Wood Bronwyn Fredericks Principal Commissioner Commissioner (Presiding Commissioner) 31 October 2017

Final Report: Manufacturing in Queensland
Queensland Productivity Commission ii
Contents Foreword i
Overview v
Recommendations xxii
1.0 Introduction 1 1.1 What is the inquiry about? 2
1.2 Our approach 3
1.3 Report structure 4
2.0 Manufacturing in Queensland 5
2.1 Introduction 7
2.2 Manufacturing in Queensland is diverse 7
2.3 Manufacturing remains significant, even though its share of Queensland’s economy is falling 11
2.4 Inter-industry linkages 18
2.5 Trade is important 22
2.6 Change is likely to continue 25
2.7 Productivity performance has been patchy 29
2.8 Conclusion 32
3.0 Pressures and prospects 33 3.1 Introduction 35
3.2 Significant factors that affect manufacturers 35
3.3 Prospects 44
3.4 Conclusion 50
4.0 Government policies and programs 51 4.1 A brief history of manufacturing policy 53
4.2 Current policy landscape 54
4.3 What is the role for government? 62
4.4 A way forward 68
Manufacturing: Policy Action Plan 70
5.0 Innovation 71 5.1 What is innovation? 73
5.2 Why is innovation important? 75
5.3 Innovation policy 80
5.4 Barriers to innovation 82

Final Report: Manufacturing in Queensland
Queensland Productivity Commission iii
5.5 There is scope to improve policy 102
6.0 Skills and training 109 6.1 Introduction 111
6.2 New and emerging technologies—changing workforce needs 111
6.3 Difficulties in attracting and retaining skilled workers 114
6.4 What is being done to address skills gaps and shortages? 124
6.5 What more could be done? 132
6.6 Conclusion 136
7.0 Reshoring 139 7.1 Globalisation, competition and the fragmentation of production 141
7.2 Reshoring 142
7.3 Which factors are driving the international reshoring movement? 142
7.4 How strong is the reshoring movement? 144
7.5 What are other countries doing to encourage reshoring? 149
7.6 Reshoring in Queensland 156
7.7 Conclusion 159
8.0 Regulation 161
8.1 Introduction 163
8.2 Existing regulation 163
8.3 Importance of an effective regulatory environment 168
8.4 Opportunities to reduce the regulatory burden on the manufacturing sector 170
8.5 A way forward 172
8.6 Conclusion 179
9.0 Structural adjustment 181 9.1 Structural change 183
9.2 Structural adjustment assistance 184
9.3 Queensland Government support measures 186
9.4 Future Queensland Government intervention 192
9.5 Conclusion 196
10.0 Framework policies 197
10.1 Introduction 199
10.2 Energy 199
10.3 Procurement policy 218
10.4 Investment attraction 230
10.5 State taxes 237

Final Report: Manufacturing in Queensland
Queensland Productivity Commission iv
10.6 Other issues 242
10.7 Conclusion 244
11.0 Implementation 245 11.1 The objective 247
11.2 How to get there 247
11.3 Timetable for reforms 254
11.4 Conclusion 255
Acronyms 257
Appendix A: Terms of reference 265 Inquiry into Queensland Manufacturing 266
Appendix B: Consultation 269
Submissions 270
Public forums 271
Roundtables 271
Consultations and visits 273
References 275

Final Report: Manufacturing in Queensland
Queensland Productivity Commission v
Overview In 2016, the Treasurer asked the Queensland Productivity Commission (the Commission) to investigate and report on manufacturing in Queensland—identifying policy options to improve the productivity and competitiveness of the sector.
This final report sets out the Commission's key findings and proposes a Manufacturing: Policy Action Plan, built on broad-based policy reform—to address cost pressures, increase productivity and improve government programs—and supported by effective implementation.
The Commission's approach The Commission operates under a public inquiry model. This provides for stakeholders to submit their evidence and views, and for the Commission's own analysis and recommendations to be publicly considered and tested. This helps the Commission to identify and explore issues to inform and strengthen its advice.
During the Manufacturing Inquiry, consultation took on various forms:
• discussions with around 100 stakeholders—meetings with manufacturing firms, government agencies, unions, industry associations and individuals, as well as undertaking site visits to manufacturing firms across Queensland
• 23 written submissions—13 in response to the issues paper and 10 in response to the draft report
• public forums in Brisbane, Ipswich, Townsville, Bundaberg and Gladstone
• roundtable discussions on innovation and structural adjustment, as well as participating in an industry-led discussion on the textile, clothing and footwear industry.
The Commission also considered other relevant reviews and programs, including the work undertaken by Jobs Queensland and the Advanced Manufacturing 10-Year Roadmap and Action Plan.
Key dates Issues paper released
9 November 2016
Initial consultation
late 2016 – February 2017
Release of the draft report
July 2017
Further consultation
July–September 2017
Final report submitted to the Government
31 October 2017
The Queensland Productivity Commission is an independent statutory body that provides independent advice on complex economic and regulatory issues.
The Commission has an advisory role and operates independently from the Queensland Government—its views, findings and recommendations are based on its own analysis and judgments.
After undertaking a public inquiry, the Commission provides a written report to the Treasurer who must provide a written response within six months. Following this, the Commission publishes the Final Report.
Further information on the Commission and its functions can be obtained from the Commission’s website www.qpc.qld.gov.au

Final Report: Manufacturing in Queensland
Queensland Productivity Commission vi
Manufacturing in Queensland This overview summarises the key findings and recommendations from the final report.
Although manufacturing is declining as a share of economic activity, it is a strong and diverse sector in Queensland, thriving where it can leverage comparative advantages, exploit niche markets or quickly deliver bespoke products.
Ultimately, manufacturing firms and their workers will drive competitiveness and growth in the sector. The Queensland Government can better support the manufacturing sector through broad-based policy reform—to address cost pressures, increase productivity and improve programs.
What is the inquiry about? Queensland's manufacturing sector is a significant source of employment and regional and economic activity within the state. Manufacturing links to:
• a wide range of domestic businesses as a supplier and purchaser of goods and services
• associated services such as applied research, engineering, industrial design, process improvement, logistics and client support
• communities as a key employer, particularly in some regional cities and towns
• export markets.
However, the sector's share of Queensland economic activity has almost halved since 1989–90.
There has been much debate about the changing nature of Queensland's manufacturing sector and its prospects. One view is that strong international competition and rising business costs will see a further shift away from manufacturing in Queensland.
Another is that greater access to global supply chains and markets, natural endowments and sophisticated service inputs provides rich opportunities.
Within this context, the Treasurer requested the Queensland Productivity Commission undertake an inquiry into the state's manufacturing sector to identify policies to improve the productivity and competitiveness of the sector.

Final Report: Manufacturing in Queensland
Queensland Productivity Commission vii
Manufacturing is a strong and diverse sector in Queensland
Manufacturing in 2015–16
$19.7 billion gross
value added
6.7% Queensland
economy
16,400 businesses
168,000 workers
(2016–17)
small business
(<20 staff)
medium business
(20–199 staff)
large business
(200 or more staff)
Manufacturing sales by industry subsector, 2015–16, Queensland

Final Report: Manufacturing in Queensland
Queensland Productivity Commission viii
The sector faces significant pressures High input costs
For manufacturers, input costs are the major determinant of production costs and product price. Many stakeholders expressed concerns about rising input costs, particularly energy and labour.
Growth in unit labour costs in Australia between 1998 and 2015 was the second highest of OECD countries.
Electricity prices in Queensland have increased by 4.9 per cent and gas prices by 3.4 per cent each year on average, between 1998–99 and 2016–17. As most firms are unable to diversify their energy source, this presents a significant commercial risk for energy-intensive manufacturers.
Recently, Rio Tinto’s Boyne Island aluminium smelter announced it would cut production and shed jobs in response to high wholesale electricity prices.
Difficulties maintaining workforce size and quality
Manufacturers in Queensland reported difficulties in attracting and retaining staff, particularly in regional areas. They also expressed concerns about the quality of skills at all levels. Some manufacturing firms and workers indicated education and training did not leave workers 'job-ready'—an issue that will be compounded further as new technology changes the nature of manufacturing jobs and forces workers to adapt and acquire new skills.
Strong domestic and international competition
Removing tariffs and other forms of protection on Australian manufactured goods has exposed the sector to greater international competition.
While many Queensland manufacturers have benefited from more open markets, trade barriers still exist. Many countries levy tariffs on imported products and some foreign governments provide direct financial assistance to key industries.
Changing consumption trends and new production technologies
An ageing population, increased urbanisation and rising demand from Asia are driving changes in consumer demand. As the market for new products has expanded, the demand for more traditional manufactured goods has diminished. This may compel some domestic firms to reassess what they are producing and consider alternative opportunities.
In general, manufacturing has become increasingly fragmented, specialised and globalised. It has transformed from a vertically integrated structure into one dominated by fragmented segments that are centrally coordinated. Modern manufacturing is characterised by global value chains comprising networks of businesses, workers and consumers.
Increasingly, emerging technologies are producing new products that are spurring a new industrial revolution, changing production processes and business models. Advanced manufacturing and automation of low-value production improve product quality and reduce the need for a large workforce.
Declining output—a state, national and global trend
Globally, between 1995 and 2014, manufacturing as a share of world gross domestic product fell 6.3 percentage points. Over the same period, it fell 4.4 percentage points in Queensland.
Between 2006–07 and 2010–11, manufacturing output in Queensland contracted by about 20 per cent. Since then, output has fluctuated.

Final Report: Manufacturing in Queensland
Queensland Productivity Commission ix
Real manufacturing output—Queensland and Australia
Despite these pressures, many Queensland manufacturing firms are prosperousAggregate industry data tend to mask the relative performance and prospects of subsectors and individual firms. For instance, several Queensland textiles, clothing and footwear firms are internationally competitive, despite significant rationalisation in their sector. Leading-edge technology, superior design or customisation, high levels of productivity and/or a focus on customer service are important factors.
Although some rationalisation and restructuring will continue, those manufacturers that can respond to challenges have a range of opportunities. Manufacturers, realising they need to adapt, have developed strengths, including:
• targeting niche markets, producing unique or customised products
• responding to fast changes in preferences by shortening the lead time from factory to retailer and customer
• using innovation to drive quality and efficiency
• bundling manufactured goods with services such as maintenance, financing, distribution and insurance, to add value for the customer
• leveraging their proximity to key raw materials and other comparative advantages.
There are many Queensland manufacturers who have leveraged these and other strengths to develop their competitive advantage (see Box 1 for a small sample of some of these firms).

Final Report: Manufacturing in Queensland
Queensland Productivity Commission x
Box 1: Manufacturers in Queensland
PACKER LEATHER
Established in 1891, Packer Leather is the last remaining leather tannery in Queensland. It is recognised worldwide for its locally sourced, high-performance kangaroo leathers, which provide superior strength and softness while being naturally thin. The fibre’s unique properties have allowed the company to establish a market niche for itself in fit-for-purpose products, including footwear, garments and gloves. While competitors now also produce kangaroo skins, Packer Leather has maintained its market lead with a reputation for quality and innovation, based on its exclusive tanning technologies that complement the natural characteristics of the leather. New technologies have enabled the company to produce with better moisture management, abrasion resistance, fire retardants and anti- microbial protection.
Packer Leather exports to 19 countries and supplies world-leading shoe brands. Prior to shipment, it tests products in its in-house laboratory to ensure they are fit for purpose and meet relevant international specifications. The company is committed to protecting the environment by using a renewable natural resource and meeting rigorous environmental standards that are independently audited. Technology, quality and exports have been the keys to the firm's survival and success.
It also uses solar power to reduce its energy consumption and recycles at least 40 per cent of the water used in production.
WATKINS STEEL
Watkins Steel is a family-owned steel manufacturer operating since 1968.
It specialises in structural steel and metalwork fabrications, serving the manufacturing, mining and construction industries. The company employs 70 staff to undertake steel detailing, fabricating, drafting, 3D scanning and design estimating and installation services.
It recognised a lack of accuracy was costly, both to itself (in the need to undertake reworks) and its customers (in downtime and lost production) and developed a unique end- to-end digital workflow for measurement, fabrication and installation.
Watkins Steel is currently exploring augmented reality as its next technology step.
By combining 3D technology with advanced robotics, it largely eliminated human error.
Its four-step linked process involves:
• 3D laser scan of the site to ensure accurate measurements
• 2D shop drawings and 3D modelling
• automated and precise steel fabrication using robotics
• a station set out for on-site installation.
Many of Watkins Steel’s employees who were previously tradesmen, such as boilermakers, have now been trained to operate new technology. While the business remains a steel fabrication and installation company at its core, the value-added benefits afforded to customers have allowed the company to provide specialist design and 3D laser scanning services.

Final Report: Manufacturing in Queensland
Queensland Productivity Commission xi
The Queensland Government can support the manufacturing sector through broad-based policy reform Manufacturing businesses and workers benefit from a broad suite of Queensland Government policies and programs.
Advance Queensland
Industry Accelerator program Knowledge Transfer Partnerships program
Platform Technology program Innovation Partnerships program
Ignite Ideas fund Commercialisation Partnership program
Business Development fund Industry Attraction fund
Growing Queensland’s Companies Queensland Startup Events and Activities fund
Advancing Small Business Queensland Strategy 2016–20
Mentoring for Growth program Small Business Digital Grants program
Accelerate Small Business Grants program Small Business Entrepreneur Grants program
Queensland Trade and Investment Strategy 2017–2022
Developing future leaders Strengthening regional businesses and economies
Improving the client experience Expanding international presence
Supporting businesses Promoting Queensland globally
Advancing Education: An Action Plan for Education in Queensland
The Schools of the Future STEM Strategy #codingcounts: A Plan for Coding and Robotics
Annual VET Investment Plan
Certificate 3 Guarantee User Choice program
Higher Levels Skills program VET in Schools
Foundation Skills Training
Jobs and Regional Growth Package
Made in Queensland Jobs and Regional Growth fund
Skilling Queenslanders for Work
Back to Work
Queensland Procurement Policy Queensland Charter for Local Content
Powering Queensland Plan
Cover cost of the Solar Bonus Scheme Return Swanbank E to service
Investigate restructure of government-owned gencos Deliver the Powering North Queensland Plan
50 per cent renewable energy target by 2030 Facilitate next wave of diversified renewable energy
Improve large-scale renewable project facilitation Establish Queensland Energy Security Taskforce
Implement Queensland Gas Action Plan Seek integrated national climate and energy policies
The Queensland Government also provides significant assistance to manufacturers through tax concessions that are available to all Queensland businesses.

Final Report: Manufacturing in Queensland
Queensland Productivity Commission xii
There is no magic bullet in terms of policy levers for the Queensland Government • Many of the underlying issues are outside the influence of government.
• The Australian Government controls key policies and the underlying policy instruments.
• 'Picking winners' has generally come at a cost to the community.
Manufacturing policy should not be used to promote a specific sector or firm as an end in itself. There is a long history of missteps and failures when governments have sought to do so, at a cost to the economy, community and, in many cases, the manufacturing sector (Box 2).
Box 2: Providing targeted assistance—caution required Governments often attempt to target specific industries or attract investment to increase employment and generate economic growth. However, empirical evidence and reported outcomes do not suggest any convincing link between governments targeting an industry and the performance of that industry.
History details some costly failures. For example: • The Queensland and Australian governments
provided assistance to the Australian Magnesium Corporation to establish the world's largest magnesium smelter near Rockhampton. Both governments foresaw large and beneficial impacts for employment (of up to 7,000 jobs) and investment ($4.5 billion). However, the project was not viable and work ceased in June 2003, with the Australian Government required to fulfil its loan guarantee of $90 million, and the Queensland Government losing $70 million to the project.
• The South Australian and Australian governments provided $100 million of assistance to Arrium's Whyalla steelworks. This included royalty concessions, procurement policies, and antidumping duties (before Arrium entered voluntary administration) and prospective financial assistance to upgrade infrastructure and improve energy efficiency and productivity (post-administration).
• At the national level, the Australian Government supported the Australian automobile manufacturing industry for more than a century. About $30 billion (2011–12 dollars) in net combined assistance provided to the industry between 1997 and 2012 failed to produce a sustainable manufacturing plant.
Internationally: • In the late 1950s, the Japanese Government
decided to subsidise petroleum and petrochemicals industries while at the same time hindering Sony's transistor technology venture because it was 'unpromising'.
• In the United States, the Obama administration had several high-profile failures from funding alternative energy companies, with total losses as of November 2014 estimated at US$2.2 billion.
• Many countries have tried to establish a semiconductor sector as a key industry. The McKinsey Global Institute identified countries that have attempted but failed to create a sustainable industry since the 1980s. These include Singapore (US$5–16 billion in subsidies), China (US$6–17 billion), Japan (US$19–54 billion), Germany (US$2–7 billion) and Malaysia (US$1–3 billion).
Government measures to facilitate a competitive industry are best directed at providing a favourable business environment. This means minimising impediments to efficiency and competitiveness, and ensuring government programs and procurement are effective. The manufacturing action plan sets out a broad-based program for reform.

Final Report: Manufacturing in Queensland
Queensland Productivity Commission xiii
Manufacturing: Policy Action Plan Where are we now?
Manufacturing in Queensland generates around $20 billion a year in gross value added for the Queensland economy. It employs 168,000 workers in 16,400 businesses. Manufacturers face pressure from high input costs and strong competition.
There are many government policies and programs for manufacturing. The sector is often unaware of government policies and what they aim to achieve. There is often limited information available to evaluate program effectiveness or value for money.
What’s the aim?
A competitive and productive manufacturing sector will best support economic growth and improve long term living standards in Queensland.
Government action should effectively and efficiently:
• target market and government failures
• simplify and consolidate programs
• focus on performance and results.
How to get there?
The Queensland Government can best achieve its objectives through three key actions:
1 Address cost pressures
• Avoid upward pressure on energy prices by ensuring energy policy and regulation are efficient (Recommendations 11 and 12).
• Create a competitive business environment through a more efficient tax system (Recommendation 16). • Reduce costs on business and improve regulatory outcomes by reducing red tape through stocktake
reviews (Recommendation 8).
2 Increase productivity
• Lift the pool of workers with the right skills by improving the VET framework with a focus on the right incentives to providers, students and businesses (Recommendations 6 and 7).
• Expand competition for procurement by simplifying the process and carefully implement the Queensland Procurement Policy 2017 (Recommendation 13).
• Support manufacturers, regions and workers, by improving adjustment assistance and removing barriers to labour mobility to assist workers to transition to new jobs (Recommendations 9 and 10).
3 Improve government programs
• Create a business environment to facilitate innovation (Recommendations 1 to 5). • Make it easier for businesses to locate and do business here by streamlining government processes and
offering comprehensive information to all businesses (Recommendation 14). • Avoid providing attraction incentives to individual firms, but if provided, transparently report the costs
and benefits (Recommendation 15). The Queensland Government should assign responsibility and authority to an appropriate body to implement the Manufacturing: Policy Action Plan (Recommendation 17).

Final Report: Manufacturing in Queensland
Queensland Productivity Commission xiv
An action plan built on broad-based policy reform will address the main concerns of the manufacturing sector and:
• avoid perverse outcomes associated with manufacturing-specific policies
• establish a clear policy with fewer programs that achieve more
• provide the greatest opportunity for manufacturing—and all Queensland businesses—to compete and grow.
Ensure policies and regulation do not place upward pressure on energy prices Energy markets are the focus of considerable policy attention, with several national reviews either recently completed or underway in addition to state-based studies. The Commission also completed an inquiry on electricity prices in 2016.
The challenge is to avoid policy or regulatory changes that place upward pressure on energy prices. The temptation to seek regulatory 'fixes' should be resisted. Such responses may distort or discourage commercial investment, leading to higher energy prices in the long term.
For electricity, the Queensland Government should prioritise:
• the Governance Review and Improvement Project, to develop policy and governance arrangements that maximise the efficiency of government-owned electricity network corporations' capital and operating expenditure
• additional policy options to limit any potential misuse of market power by government-owned generators in the wholesale electricity market
• its review of policy options to improve value for electricity customers in regional Queensland.
In the case of natural gas, LNG exports from Queensland are transforming Australia into the world’s second-largest gas exporter and the major gas supplier for East Asian markets. Local consumers are experiencing cost pressures as gas prices rise towards export parity. The Australian Energy Market Operator (AEMO) forecasts the delivered wholesale price of gas in Australia will increase by 48 per cent by 2036, with step changes in 2018 and 2023 as significant contracts expire.
Rising gas prices and uncertainty about future prices and availability can especially affect heavy users of natural gas that are trade-exposed and cannot switch to alternative energy sources.
Queensland manufacturing—with its significant metal, mineral, energy and chemical subsectors—is particularly exposed. AEMO projects that by 2021 gas consumed by large industrial users in Queensland will fall by 24.9 per cent (27.3 petajoules).
Some argue the case for gas to be reserved for local users, so they can access gas while being sheltered to some extent from higher prices. However, evidence shows reservation policies are ineffective and impose costs.
The most efficient solution to meet supply objectives of price, quality, reliability and security is likely to involve a combination of options. An approach that reduces regulatory impediments to supply will be challenging to deliver but is more likely to be effective in the long term. The Queensland Government has indicated it intends to release its gas action plan in 2017. This plan should remove barriers to supply by:
• paring back costs and removing impediments to gas exploration
• setting out a pathway to resolve land-use conflicts arising from gas activities (including through education and planning)
• increasing transparency to improve market efficiency.

Final Report: Manufacturing in Queensland
Queensland Productivity Commission xv
Reform the state tax system Queensland (like other states) relies on payroll tax, land tax on the unimproved value of land, transfer duties, insurance taxes and gambling duties. Payroll tax (28.7 per cent of total tax revenue in 2017–18) is the largest source of state taxation revenue, followed by transfer duty (24.0 per cent), motor vehicle registration fees (13.1 per cent), other duties (11.2 per cent), land tax (9.0 per cent) and gambling taxes and levies (8.9 per cent).
Competition between states has focused on taxation thresholds and exemptions as well as on tax levels. This has contributed to inefficient tax structures and concessions that can create distortions as people change their decisions to take advantage of concessions. Concessions also reduced revenue by an estimated almost $5.3 billion in 2016–17. Compliance costs, which are proportionately higher for small businesses, increase as tax systems become more complicated.
While there is limited evidence about the specific impacts of state taxes on manufacturing, there is consensus that state tax systems can be improved. Recent reviews provide a strong foundation for economy-wide, rather than sectoral, state reform but this has not yet happened.
Land tax has lower efficiency costs than other taxes, because if properly designed it has little impact on people’s decisions about working, saving or investing. In theory, payroll tax has low efficiency costs compared with other taxes but in practice the costs are higher because tax-free thresholds and other exemptions reduce the tax base.
There is a strong economic argument for Queensland to generate more revenue from land tax and, to a lesser extent, from payroll tax, as well as abolishing or reducing more distortionary taxes. Land and payroll tax rates could be set at lower levels by reducing or removing the exemptions and concessions that currently apply.
To maximise the net benefits, the reforms should have regard for the distributional and transitional impacts of changes.
Improve regulatory outcomes through targeted stocktakes Queensland manufacturers comply with multiple layers of regulation that can cut across different aspects of their activities and influence industry performance, productivity and competitiveness.
While it can be difficult to quantify the costs (or benefits) of regulation to Queensland manufacturing, the regulatory burden on firms and workers can be significant and is not declining.
This may include having unnecessarily complex and restrictive nature of some regulations; poor regulatory processes; and the 'cumulative effect' of complying with regulations across all levels of government.
Delivering high quality outcomes requires governments to ensure regulations are justified and well-designed. This is important for any new regulations. However, there is also is an opportunity to look more closely at the current stock of regulation—to ensure that policy delivery continues to match intent.
A regulatory stocktake is a comprehensive, systematic way to better understand how the existing regulatory framework affects Queensland manufacturers and workers.
As a starting point, the Commission has identified three priority subsectors—food, machinery and equipment, and chemicals manufacturing—for review. Focusing on these subsectors will provide the kind of information about regulatory burdens, the extent to which regulation is achieving intended outcomes, and ways in which to improve regulation, that would not be revealed by broader, sector-wide analysis.
Facilitate access to a quality workforce A diverse range of disciplines and levels of skill are required for Queensland manufacturers to succeed. Skilled workers strengthen the ability of manufacturers to innovate and grow—and firm, worker and industry outcomes will suffer unless existing skills gaps are addressed.

Final Report: Manufacturing in Queensland
Queensland Productivity Commission xvi
As the sector evolves, manufacturing firms and workers have found:
• New and emerging technologies are changing the tasks and activities undertaken and the associated skill sets required. This provides opportunities for some, but poses significant risks for others.
• It can be difficult to find, or replace, and retain skilled staff when:
− workers with desirable skills and talents do not seek manufacturing jobs
− the skills and qualifications profile of the manufacturing workforce does not align with current or anticipated needs.
These issues are not new—and are not unique to manufacturing. They reflect the challenges facing the Queensland economy as it shifts to more knowledge-intensive industries.
Efforts to improve workplace skills will benefit workers and firms, including those manufacturing businesses looking to move to more advanced processes with more highly skilled workers. In practice, addressing education and training issues is a shared task being undertaken at the state and national level across the school, vocational education and training (VET) and higher education levels.
A robust and flexible VET sector plays a key role, given the important role VET plays in skilling, upskilling and cross-skilling the manufacturing workforce.
The Queensland and Australian governments have implemented substantial VET reforms and continue to undertake significant VET reform initiatives. It is important to continue reform and development of VET in Queensland, including ensuring funding and regulatory arrangements that better serves students, business and the wider community.
Careful implementation of the new procurement policy Queensland Government departments spent more than $17 billion in 2016–17 on procuring supplies and services. The Commission has not found data on how much was spent on locally manufactured goods, but about 70 per cent of government expenditure is with local suppliers.
Some Queensland manufacturers are concerned procurement arrangements do not provide a level playing field for them to compete with interstate or overseas businesses. Small firms may be intimidated by complex or prescriptive tendering processes or have difficulty participating when government tenders aggregate procurement to create purchasing economies. Some stakeholders consider local suppliers should be given preferential treatment over those from interstate or overseas.
The government provides or supports services that help local businesses to participate in procurement processes. For example, Industry Capability Network Queensland (ICNQ), a not-for-profit organisation supported by the Queensland Government, helps to link project proponents with capable local suppliers. There is a sound rationale for such services, as enabling local firms to participate in procurement processes can improve value for money by increasing the number of potential suppliers.
There is less evidence for preferential procurement of local content as it may lead to the rejection of supply offers with the best quality–price combination, consequently increasing costs to Queensland taxpayers.
Moreover, procurement agencies are unlikely to have the sophisticated skills and information required to achieve the multiple objectives put forward by proponents of preferential procurement.
The Queensland Government introduced a new Queensland Procurement Policy (QPP) in September 2017, which focuses on 'putting Queenslanders first when securing value for money'. Under the policy, local suppliers
receive a local weighting of up to 30 per cent on any tender lodged for a significant procurement and at least one local or regional supplier and one other Queensland-based business must be invited to quote or tender for every procurement opportunity offered. The Department of Housing and Public Works will make resources available to support procurement agencies before the policy is fully implemented in March 2018.

Final Report: Manufacturing in Queensland
Queensland Productivity Commission xvii
To ensure that policies promoting opportunities for local suppliers do not add inefficient costs, the focus should be on those aspects of the policy that are likely to be unambiguously welfare enhancing. For example, removing impediments to local firms participating in procurement by:
• simplifying tendering requirements
• improving public sector procurement capability
• publishing a pipeline of supply opportunities.
Beyond this, government should ensure the QPP is implemented in the most cost-effective way, including by:
• providing guidance about how the local benefits test will be used to apply the value for money principle and minimise the addition to the cost of government procurement
• clarifying the definitions of 'local' and 'significant' in the new procurement policy
• minimising inconsistencies between the policy and the Australia New Zealand Government Procurement Agreement
• commencing monitoring and data collection so decision-makers and the Queensland community can better assess the impacts of the QPP.
Make it easy for business to relocate to Queensland and do business here Many factors influence business location decisions. Often, firms are mobile because important factors of production (such as raw materials or skilled labour) are available in many places. Governments compete for mobile investment through:
• investment facilitation, which can involve:
− providing information about legislative and regulatory requirements
− assisting with site identification
− identifying infrastructure and utility needs
− coordinating and brokering development approval processes
− assisting with business development programs
− introductions to industry networks
• investment assistance, through financial incentives that increase the return on investment in a specific location.
Multiple Queensland agencies, including Trade and Investment Queensland (TIQ) and the Department of State Development (DSD), as well as the Australian and local governments, provide facilitation services.
The Commission has not found a clear statement of the outcomes that investment facilitation is intended to achieve, and there is limited convincing evidence about its impacts and the effectiveness of current government expenditure on it. As services are provided without charge, some users may value them less than it costs taxpayers to provide them.
Reorganising facilitation activities towards addressing information barriers for all firms, rather than selected firms, is likely to produce greater benefits. In addition, gathering and publishing information about which government processes are most challenging for investors could identify opportunities for the government to simplify regulatory processes without undermining outcomes.

Final Report: Manufacturing in Queensland
Queensland Productivity Commission xviii
Box 3: Reshoring
Reshoring of manufacturing involves transferring an activity, commonly a production process, from an overseas location back to a country of origin.
Around the world, there has been a growing interest in reshoring as a corporate strategy and public policy objective, along with some high-profile cases of firms reshoring to the United States and United Kingdom.
However, the quantitative evidence on the extent and opportunities for reshoring overall is mixed. The employment gains from foreign direct investment in the United States have been steadily outstripping the number of jobs created by reshored production for some time.
Few firms have returned production to Queensland. It is likely the factors driving reshoring elsewhere—low energy costs, closer proximity to large domestic markets—are less relevant for Queensland manufacturers.
There is a lack of publicly available information on the effectiveness of government reshoring policies, both in terms of the direct benefits (such as the number of companies that repatriated production and the number of jobs created) and the cost of those policies.
Reshore UK, Britain's high-profile government initiative to reshore manufacturing production, closed in 2016.
On balance, the evidence suggests reshoring will occur if it is in the financial interest of the manufacturer. The primary role for government is to ensure firms have accurate and accessible information to make location decisions.
This would help to address the information barriers to firms locating in Queensland or relocating. It would also reduce and streamline regulation so there is a less complex and lower-cost system for potential investors to navigate.
Evidence suggests financial incentives to attract investment are unlikely to provide a net benefit to the Queensland community. However, if the government decides to provide a financial incentive, then these factors should be publicly reported:
• the criteria for allocating grants
• the number, names and size of firms assisted
• the value of assistance provided
• expected outcomes and an evaluation against those outcomes.
Set framework conditions to allow innovation to occur Innovation is a key driver of productivity and performance of many manufacturing firms. Most manufacturers are attempting to innovate, but success depends on their capacity to innovate as well as overcome external barriers.
Key concerns include:
• a lack of access to finance, especially for small and medium-size businesses

Final Report: Manufacturing in Queensland
Queensland Productivity Commission xix
• differences in leadership, management and entrepreneurship capabilities and capacity
• low levels of collaboration between businesses and universities and within business networks
• a disconnect between available skills and industry needs
• regulation that distorts business decisions.
Ultimately, businesses and the people within them will drive manufacturing innovation. Government also influences outcomes through taxation, education, training, energy policy, regulation, grants, subsidies and concessions. While some policies support innovation, other policies may impede it, often unintentionally.
The Queensland Government has over 50 innovation and entrepreneurship programs and activities as part of its Advance Queensland program. They are generally targeted at businesses and people broadly, rather than manufacturing exclusively. This is in addition to over 100 Australian Government innovation programs.
Innovation programs are difficult to design, measure and evaluate, complicating policy development. That said, not all programs appear to have a strong rationale and supporting evidence.
There is scope to better design and evaluate innovation programs by, for example, directly addressing barriers to innovation, rather than providing grants, and reducing the number of programs to do fewer things, but do them better.
Ensuring government programs are effective and efficient through design, implementation evaluation and monitoring Many government policies and programs across all levels of government affect manufacturers. These include broad framework policies (such as taxation and employment relations) as well as targeted policies such as grants and subsidies, and industry facilitation, and support programs to bolster research, increase collaboration and accelerate commercialisation.
In Queensland, manufacturers can access programs that support small business (Advancing Small Business Queensland Strategy), encourage innovation (Advance Queensland), improve education and training outcomes (Advancing Education and Annual VET Investment Plan) and support employment and regional growth (Jobs and Regional Growth Package).
Specific to manufacturing, the Queensland Government recently announced three key initiatives:
• Ten-year roadmaps and action plans have been developed for biofutures, mining equipment, technology and services and for advanced manufacturing, with implementation underway. Roadmaps for aerospace, biomedical and life sciences and defence are also being developed.
• An Industry and Manufacturing Advisory Group will help to develop and implement the 10-year plans.
• The Made in Queensland program provides funding to improve business capabilities and adopt innovative processes and technologies.
It is too early to assess the effectiveness of the new Queensland Government programs, however, good program design principles and feedback from stakeholders suggest some improvements can be made.
Although there is a sound basis for some programs, such as the positive spillovers generated by research and development (R&D), there is limited evidence to support others. Few have specific or measurable objectives for the community to judge their success.
Many manufacturing firms participating in this inquiry indicated they tend to avoid government programs based on a view the programs would not be useful, or the costs of navigating, applying for and complying with the program were too high compared with the expected benefits. Some firms were either not aware of the available programs or found it too difficult to find the program that suited their needs.

Final Report: Manufacturing in Queensland
Queensland Productivity Commission xx
Given the alternative uses for program funding, especially with tight fiscal conditions, it is imperative that government initiatives achieve what they are designed for. If program beneficiaries find the landscape too complex to access, and agencies are unable to transparently and easily demonstrate performance, there is a question as to whether the programs should continue to be pursued.
Good policy outcomes are also more likely where there is effective evaluation and monitoring to assess and identify opportunities for improvement and foster policy learning.
Assist workers to transition to new employment and remove barriers to labour mobility Structural change has been a prominent feature of Australia’s manufacturing industry after tariffs were removed on manufacturing imports in the 1980s and 1990s. While structural change ultimately results in a better use of the community's scarce resources, it can result in significant financial and social costs for workers, firms and communities as the economy transitions from industries in decline.
Queensland’s manufacturing sector is smaller and more diverse than in other states. Given this diversity, and a relative absence of sectors that were previously supported by high trade barriers, Queensland’s manufacturing sector has been less exposed to many of the structural shocks that have beset manufacturers elsewhere.
It is difficult to identify with certainty the Queensland industries or regions more likely to be affected by structural change and when problems may emerge. In the short term, those with the greatest exposure to risk would appear to be:
• energy-intensive industries where higher energy prices are continuing to erode their financial position and, ultimately, commercial sustainability
• communities or regions that rely heavily on a major business as a primary source of employment.
Over a longer-term horizon, technology, such as advanced manufacturing, will affect established firms in terms of the level of capital investment, the manner in which they produce, the amount of labour they employ, and their ability to compete with domestic and international rivals. It will also have an impact on workers in affected firms.
Between 2000 and 2012, governments around Australia spent more than $88 billion on structural adjustment programs. There are few publicly available reviews of how effective past adjustment assistance has been. However, analysis suggests the programs tended to have a high cost per job, insignificantly affected overall long-term regional employment trends, and did not enhance regional performance relative to other regions that lost a major employer but did not receive assistance.
As a result, although adjustment assistance has the potential to play a role in facilitating change and easing the adverse transitional impacts of adjustment, it needs to be justified, well-targeted and effective.
Where government adjustment assistance is warranted, these actions will likely have benefits:
• Directly target workers who face significant barriers to re-employment, such as older manufacturing workers with low or non-transferable skills.
• Before planned closures, extend non-financial assistance measures to affected workers to make them 'job-ready' and smooth the transition to alternative employment.
• Establish a longitudinal study of retrenched workers who received assistance, to determine which programs best led to permanent reemployment.
Geographic labour mobility is an important mechanism in adapting to labour market shocks associated with structural change. Labour mobility improves community wellbeing by enabling workers to move to locations where they are more productive and highly valued. This can increase employment and incomes across the state.

Final Report: Manufacturing in Queensland
Queensland Productivity Commission xxi
The Queensland Government should remove state-based barriers to geographic labour mobility, including:
• improving land-use planning processes to expedite the release of land for residential development that would otherwise limit the supply of housing
• removing unnecessary occupational and/or business licensing and ensure the remaining regulation is the minimum necessary to achieve consumer protection, safety or environment objectives
• reforming stamp duty to reduce the additional costs on property transfers.
The Queensland Government could also consider, as part of any structural adjustment package, the provision of financial support for relocation such as a one-off allowance and time-limited rental assistance.
The way forward
The key finding emerging from this inquiry is that manufacturing firms and their workers will drive competitiveness and growth in the sector. The Queensland Government can best support this outcome by reforming the business policy environment. The Commission has set out an action plan, comprising 16 recommended measures—to address cost pressures, increase productivity and improve government programs.
The Queensland Government should assign responsibility and authority for implementing this plan to a Minister or group of Ministers, who would:
• establish a clear commitment and timetable • specify and allocate tasks for implementing the plan • ensure that the tasks are carried out and achieve their intended results • develop measures to review performance of the plan • evaluate its effectiveness.

Final Report: Manufacturing in Queensland
Queensland Productivity Commission xxii
Recommendations Innovation Recommendation 1
Where programs are established on the basis of mitigating capital market failures, the Queensland Government should consider providing assistance through loans and equity investment rather than grants.
Recommendation 2
To improve management skills, the Queensland Government should, in conjunction with industry associations:
• identify management and leadership courses available to managers within established SMEs
• determine whether the current suite of courses effectively and efficiently deliver management skills (including accessibility and post-training performance)
• create a single portal for management, mentoring and leadership courses provided by government or with government support, and courses from other credible providers, to reduce search costs and improve access.
Recommendation 3
The Queensland Government should redesign innovation commercialisation programs to incentivise all businesses and universities to collaborate on commercialisation, rather than targeting business sizes, models, technologies, sectors or science priorities.
The Department of Science, Information Technology and Innovation should, in conjunction with industry associations, develop and provide information and case study resources on intellectual property and commercialisation to Queensland businesses, including for traditionally lower technology industries.
Recommendation 4
The Department of Science, Information Technology and Innovation should continue to collaborate with the Australian Bureau of Statistics and request the redesign and public release of state-based business innovation data. This data should include access to the Business Longitudinal Analysis Data Environment and Business Longitudinal Database and the Innovation in Australian Business publication.
Recommendation 5
To improve the efficacy of innovation policy, the Queensland Government should consolidate its more than 50 innovation and entrepreneurial programs and transparently report on its innovation policy. The consolidated set of programs should target three key areas—beneficial knowledge spillovers, access to information, and coordination problems.
For each program, the Queensland Government should publicly and transparently:
• develop a clear program logic targeting identified problems
• establish measurable objectives in relation to mitigating or offsetting the identified problems
• measure and monitor the program for performance from commencement

Final Report: Manufacturing in Queensland
Queensland Productivity Commission xxiii
• evaluate outcomes within three years and regularly thereafter, balancing precision with administrative and compliance costs. This evaluation should cover: administration costs; whether the program achieved its objectives (effectiveness); and whether the benefits exceeded the costs (efficiency).
Skills and training Recommendation 6
To better serve manufacturing firms, students and the wider economy, the Queensland Government should continue to reform and develop the VET framework, with a focus on the effectiveness and efficiency of the VET sector. The Queensland Government should:
• finalise its strategy for vocational education and training in Queensland (Advancing skills for the future), having regard to issues raised in response to the consultation draft
• implement the Queensland VET Quality Framework—and measure and report results
• ensure the regulatory and funding system:
− accommodates changing firm and worker needs, choice and thin markets
− establishes the right incentives for providers—including public and private sector providers—to provide relevant training in an effective and efficient way.
Recommendation 7
As a priority under the Queensland VET Quality Framework, the Department of Education and Training should implement a VET funding model based on government subsidy levels that:
• reflect the spillover benefits from VET to create the right price signals for an efficient and responsive VET sector
• provide the right level of support for training with a high proportion of public benefits and minimise incentives to provide/undertake training that has low or negative returns
• remove barriers to upskilling and retraining and choice of program and delivery modes
• transparently provide for equity-related matters, including for high-needs learners and access for rural or regional participants.
Regulation Recommendation 8
To improve regulatory outcomes, the Queensland Government should commission stocktakes of the regulations that affect:
• food manufacturers
• machinery and equipment manufacturers
• basic chemical and chemical products manufacturers.

Final Report: Manufacturing in Queensland
Queensland Productivity Commission xxiv
The three stocktakes should be undertaken sequentially by an independent body (such as the Better Regulation Taskforce or the Office of Best Practice Regulation) and completed as soon as possible.
The three stocktakes should identify priority areas for reform that will contribute to improved productivity for Queensland manufacturers as well as the wider Queensland economy. This includes areas where there is the most scope to:
• reduce unnecessary regulatory burden and pursue regulatory objectives in more efficient (least cost) ways
• better coordinate action across (Australian, state and local) governments to reduce unnecessary overlaps.
Structural adjustment Recommendation 9
To assist in the development of future structural adjustment policies, the Queensland Government should establish a longitudinal study of retrenched workers who previously received assistance, to identify those programs that have successfully resulted in permanent re-employment.
Recommendation 10
To minimise the social and economic costs associated with structural adjustment in the manufacturing sector, the Queensland Government should:
• provide early training assistance as required where there are planned firm closures
• remove regulatory barriers to labour mobility across regions in Queensland, particularly in relation to housing, occupational/business licensing and stamp duty, and consider, as part of any structural adjustment package, providing support for relocation in the form of a one-off allowance and time-limited rental assistance
• work with the Australian Manufacturing Workers' Union and other key industry stakeholders, including Jobs Queensland, to identify employment opportunities for older, low-skilled manufacturing workers who are displaced.
Framework policies Recommendation 11
To promote the long-term interest of electricity consumers, the Queensland Government should avoid policy or regulatory changes that impede the efficiency of the electricity market and place upward pressure on energy prices. It should:
• complete and implement the Governance Review and Improvement Project as a priority, to develop policy and governance arrangements that maximise the efficiency of government-owned electricity network corporations' capital and operating expenditure
• progress additional policy options to limit any potential misuse of market power by government-owned generators in the wholesale electricity market, particularly in relation to their rebidding strategies
• encourage manufacturers to pursue demand management opportunities with government-owned electricity network corporations
Final Report: Manufacturing in Queensland
Queensland Productivity Commission xxv
• conclude its review of policy options to improve value for electricity customers in regional Queensland as soon as possible.
Recommendation 12
To remove gas supply barriers while balancing the needs of landholders and environmental safeguards, the Queensland Government should structure its Gas Action Plan to:
• reduce the costs and impediments to gas exploration and development through, for example, measures to improve land release and tenure management, and cooperation between different mineral and energy regulators
• improve processes to resolve land-use conflicts arising from gas activities (including through providing better information and fair compensation to landholders and an evidence-based approach to regulation)
• increase transparency to improve market efficiency, through measures such as reporting on sector-wide performance and regulatory compliance.
Recommendation 13
Procurement policy should deliver the best price-quality outcome for the Queensland community. In implementing the Queensland Procurement Policy 2017, the Queensland Government should:
• remove impediments to local firms participating in procurement, including by:
− simplifying tendering requirements
− improving public sector procurement capability
− publishing a pipeline of supply opportunities
• develop guidelines for implementing the local benefits test that provide clear advice about how it will be used to apply the value for money principle
• clarify the definitions of 'local' and 'significant' and provide training to procurement agencies about the new framework
• seek to minimise inconsistencies between the policy and the Australia – New Zealand Government Procurement Agreement
• collect and publish information on procurement outcomes to assess the impact of the policy.
Recommendation 14
To ensure that the investment facilitation activities of government agencies, including Trade and Investment Queensland and the Department of State Development, maximise their contribution to investment in Queensland, the Queensland Government should assess the benefits from:
• producing and publishing costs and other relevant information for all firms to access in order to assist them in deciding whether to do business in Queensland
• establishing a single Queensland Government business advisory entity
• leveraging facilitation services to identify opportunities to improve government processes, programs and regulation so that there are fewer government requirements to navigate, at a lower cost.

Final Report: Manufacturing in Queensland
Queensland Productivity Commission xxvi
Recommendation 15
To ensure net benefits from investment attraction activities, the Queensland Government should avoid providing attraction incentives to individual firms or projects unless it can be demonstrated that there are likely spillovers that would otherwise not occur. If the Queensland Government does provide incentives, it should:
• publish the criteria for allocating grants to attract mobile investors
• provide assistance transparently, rather than through less transparent forms such as tax concessions
• link grants to measurable outputs
• publish the number, names and size of firms assisted, the value of assistance provided to each firm, and the details of contracts with individual firms
• report annually the expected outcomes and performance milestones agreed in the case of each grant and the performance of each project against these milestones.
Recommendation 16
To improve the business environment, the Queensland Government should establish a roadmap that sets out reform of the state tax system that:
• removes or reduces distortionary taxes (such as stamp duties and insurance levies) and moves towards less distortionary taxes (such as broad-based land taxes)
• has regard for the economic, distributional and transitional impacts of proposed changes, and considers whether all changes should be introduced at once or spread over time.
Implementation Recommendation 17
The Queensland Government should assign direct responsibility and authority to a Minister or group of Ministers to implement the Manufacturing: Policy Action Plan. The responsible body should:
• establish a clear commitment and timetable for implementing change
• further develop and coordinate implementation of the plan
• specify and allocate tasks for implementing the plan
• ensure that the plan is implemented and achieves intended results
• develop measures to review the performance of the plan
• evaluate its effectiveness.

Final Report: Manufacturing in Queensland
Queensland Productivity Commission 1
1.0 Introduction

Final Report: Manufacturing in Queensland
Queensland Productivity Commission 2
In September 2016, the Queensland Government asked the Queensland Productivity Commission to investigate and report on manufacturing in Queensland—identifying policy options to improve the productivity and competitiveness of the sector.
This final report sets out the Commission's key findings and recommendations and proposes a Manufacturing: Policy Action Plan, built on broad-based policy reform—to address cost pressures, increase productivity and improve government programs—and supported by effective implementation.
1.1 What is the inquiry about? Manufacturing is the physical or chemical transformation of materials, substances or components into new products. It generally transforms raw materials from agriculture, forestry, fishing and mining, and intermediate manufactured products into new products. In some cases, manufacturing firms use advanced technologies, such as robotics and 3D printing, to improve production processes and business models. These can be can be applied to both traditional low-tech products and high- tech products such as equipment or pharmaceuticals.
In 2015–16, manufacturing contributed $19.7 billion to the Queensland economy. It also has links to businesses and workers in the non-manufacturing sector, multiple communities and valuable export markets.
Over recent decades, there has been considerable debate on the changing role of manufacturing and its future prospects. There are two views:
• Strong international competition and rising business costs will see a further shift away from manufacturing.
• Greater access to global supply chains and markets, natural endowments and sophisticated service inputs provide rich opportunities for Queensland manufacturers.
A range of current Queensland Government programs and policies affect manufacturing. The government therefore wants to determine which policy settings will best support a competitive and productive sector.
Within this context, the Commission was asked to undertake an inquiry into Queensland’s manufacturing sector to investigate and report on:
• the role and changing nature of Queensland manufacturing, including its performance and potential
• the characteristics of competitive manufacturers with respect to innovation and productivity
• international reshoring initiatives
• changes to the regulatory framework to reduce the regulatory burden on manufacturers
• the effectiveness of current policy settings to facilitate performance, productivity and competitiveness.
The full terms of reference are provided in Appendix A.

Final Report: Manufacturing in Queensland
Queensland Productivity Commission 3
1.2 Our approach This inquiry identifies policy options to improve productivity and competitiveness in Queensland's manufacturing sector. These reflect the key factors driving manufacturing in Queensland—and any changes to existing policy settings that will enable firms and workers to build on existing capacities and capabilities or take advantage of emerging opportunities. The inquiry has considered those firms and workers with strengths that provide an ongoing competitive advantage, as well as those less able to adapt and reposition themselves in a changing market.
The Commission's approach to this inquiry has rested on three main components:
• assessing the size, nature and trends in Queensland manufacturing, drawing on Queensland and Australian data
• identifying challenges and prospects based on research, the feedback from consultation, and case study evidence
• setting out a plan for the Queensland Government to effectively support a competitive and productive sector.
The Commission operates under a public inquiry model. This provides for stakeholders to submit their evidence and views, and for the Commission's own analysis and recommendations to be publicly considered and tested. This helps the Commission to identify and explore issues to inform and strengthen its advice.
Consultation with stakeholders took on various forms:
• discussions with around 100 stakeholders—meeting with manufacturing firms, government agencies, unions, industry associations and individuals, as well as undertaking a range of site visits to small, medium and large manufacturers across Queensland
• 23 written submissions—13 in response to the issues paper and 10 in response to the draft report
• public forums in Brisbane, Ipswich, Townsville, Bundaberg and Gladstone
• roundtable discussions on innovation and structural adjustment, as well as participating in a subsector led discussion on the textile, clothing and footwear subsector
• The Commission also considered the work occurring in other reviews and programs, including the work undertaken by Jobs Queensland and the Advanced Manufacturing 10-Year Roadmap and Action Plan.
The Commission would like to thank all organisations and individuals who have contributed to this inquiry.
A full list of submissions and consultations is provided in Appendix B.

Final Report: Manufacturing in Queensland
Queensland Productivity Commission 4
1.3 Report structure The structure of this report is as follows:
Part A—Size, scope and nature of manufacturing in Queensland
Chapter two outlines manufacturing in Queensland, its characteristics and trends.
Chapter three investigates the pressures faced by Queensland manufacturers and potential prospects.
Chapter four provides an overview of existing government programs and discusses the role of the state government in enabling a productive and competitive manufacturing sector.
Part B—Options to improve productivity and competitiveness
Chapter five investigates barriers to innovation, innovation policy and options for reforming Queensland Government programs.
Chapter six analyses how skills and training influence the productivity and competitiveness of manufacturing, and how government can address skill challenges as part of broader reform to the education and training sector.
Chapter seven defines reshoring, examines the extent and possibilities for reshoring, and experience with international policy initiatives.
Chapter eight discusses regulation and opportunities to reduce red tape.
Chapter nine examines the drivers and impacts of structural change, and the characteristics of past and present government assistance measures.
Chapter ten reviews and identifies opportunities to improve broader framework policies—energy, government procurement, investment attraction, state taxes—that affect manufacturers in Queensland.
Chapter eleven examines implementation issues, including who is responsible and accountable for driving change, how performance is measured and timeframes for action.
Appendices A and B provide the terms of reference and a consultation record. A separate technical supplement provides supporting analysis and material.

Final Report: Manufacturing in Queensland
Queensland Productivity Commission 5
2.0 Manufacturing in Queensland

Final Report: Manufacturing in Queensland
Queensland Productivity Commission 6
The terms of reference ask the Commission to report on the composition, location, employment, structure and changes to manufacturing in Queensland. This chapter outlines characteristics of Queensland manufacturing, both now and over time, and considers its productivity performance.
Key points
1 Manufacturing is an important sector for Queensland. In 2015–16, it contributed $19.7 billion of gross value added, or 6.7 per cent of the state’s economy. The sector’s outputs are largely related to food production, minerals, metals, coal and petroleum processing, and the production of machinery and equipment, generally corresponding with Queensland’s natural strengths.
2 In 2016–17, the sector employed about 168,000 people (7.1 per cent of the workforce) and was the seventh-largest employing sector in Queensland. Manufacturing is spread across the state, but contributes the largest share of employment in Brisbane's outer suburbs and the Darling Downs Maranoa and Wide Bay regions.
3 The sector’s share of the economy fell by 4.4 percentage points between 1995 and 2014, less than the 6.3 percentage points reduction globally.
4 While the gross value added of Queensland manufacturing has fallen in real terms, nominal exports have increased by 28 per cent (5 per cent in real terms) since 2007–08. The food and beverages subsector has been the standout performer.
5 Labour productivity in Queensland manufacturing grew until 2007–08, but has declined since. Multifactor productivity has declined since its peak in 2001–02. The level of Australian manufacturing productivity is lower than for many developed nations. The productivity gap has also risen.

Final Report: Manufacturing in Queensland
Queensland Productivity Commission 7
2.1 Introduction This chapter describes the changing nature of Queensland manufacturing, its performance in providing employment and exports, and its role in advancing economic growth and productivity. While the analysis draws on published statistics, Box 2.1 illustrates that the complexity of modern manufacturing can make data comparisons difficult.
2.2 Manufacturing in Queensland is diverse ‘Manufacturing’ includes many activities that share common features but also significant differences.
2.2.1 Large differences in the size and nature of manufacturing activities
Figure 2.1 illustrates that there are large size differences between subsectors, as measured by sales and employment.1
Food product manufacturing was the largest subsector both by sales ($21 billion) and employment (47,800). Metal products ($8.4 billion in sales and 8,300 employees) and petroleum and coal products ($6.4 billion in sales and 1,000 employees) contributed the second and third most sales.
Although furniture/other product manufacturing and textile, leather, clothing and footwear made relatively small contributions to total sales ($1.3 and $0.9 billion, respectively), they had relatively high numbers of employees (6,000 and 4,700, respectively).
1 The Commission's industry classification levels equate: sector with ANZSIC industry division; subsector with ANZSIC subdivision, and industry with ANZSIC major group.
Box 2.1 Defining manufacturing: some boundary issues
The definition of manufacturing is an imperfect one, which can affect statistical trends.
Where services (such as accounting and IT) are undertaken within a manufacturing firm, it is counted as manufacturing activity. If those services are outsourced, it is recorded in the services sector.
About 17 per cent of the change in output as a proportion of the economy was estimated to be due to outsourcing of services in the 1980s and 1990s. As a result, long-term statistical trends may appear slightly more negative than trends are in reality. But, this trend plateaued in the 2000s and would explain little of recent manufacturing changes (Barnes et al. 2013, p. 221).
In addition, modern production does not always fall into traditional classifications. For example:
• Information technology spans traditional manufacturing of hardware as well as services such as software services, systems design and system management.
• The pharmaceutical industry encompasses research and development, testing, regulatory approval and marketing services in addition to traditional manufacturing.
Australian data, rather than Queensland data, are used in some sections of this report where Queensland data is not available, has a shorter time series or is not as disaggregated as Australian data.

Final Report: Manufacturing in Queensland
Queensland Productivity Commission 8
Food product manufacturing is by far the largest subsector, accounting for 29 per cent of total manufacturing sales and 30 per cent of employment. Beyond this, there are many smaller subsectors, some of which are even smaller than the larger individual food manufacturing industries.
Figure 2.1 Sales and employment by manufacturing subsector, Queensland, 2015–16
Note: Data are from the ABS Australian Industry publication. Estimates may differ from the labour force survey. Source: ABS 2017h.
More than 60 per cent of Queensland’s manufacturing sales are based on transforming natural endowments.2 However, this figure masks the underlying diversity of the sector, and even among the subsectors (Box 2.2), which exhibit different production processes, skill requirements, research intensity, and regulatory issues.
Sources: ABS 2000, 2006.
2 Subsectors that are assumed to be based on natural endowments are food, primary metal and metal, petroleum and coal, non-metallic mineral, beverages and tobacco, wood, and pulp and paper manufacturing.
Box 2.2 Manufacturing’s diverse industries
The food manufacturing subsector contains industries such as meat and meat products; seafood processing; dairy products; fruit and vegetable processing; grain mill and cereal products; bakery products; sugar and confectionary; milk bottling and pasteurising; fresh fish packaging (including oyster shucking, fish filleting). In 2016–17, the meat and meat products industry employed around 40 per cent of the people employed in food product manufacturing.
Other examples of the diversity of manufacturing activities include printing and related support activities; ready-mixed concrete production; grinding of lenses to prescription; electroplating, plating, metal heat treating, and polishing; tyre re-treading; leather tanning and dressing; wood preserving and treatment; fabricating signs and advertising displays; ship, boat, railway rolling stock and aircraft repair and maintenance.

Final Report: Manufacturing in Queensland
Queensland Productivity Commission 9
2.2.2 Different production processes
The variety of manufacturing activities is matched by diversity of capital and energy intensity, skill requirements, technology, and position in the supply chain.
Capital and labour intensities differ across subsectors. For example, in 2015-16 petroleum and coal products had the third largest sales revenue ($6.4 billion) but the third fewest employees (1,000). Furniture and other product manufacturing appears relatively labour intensive, with the third smallest sales revenue ($1.3 billion), but 6,000 employees.
Skill requirements also vary considerably (Figure 2.2). In 2011, food production—the largest employer in Queensland’s manufacturing sector—had the highest proportion of low-skilled workers, based on qualification levels, while the basic chemical and chemical products sector had the lowest.
Figure 2.2 Qualifications of Queensland manufacturing workers, 2011
Source: ABS 2011.
Energy intensity varies, with large differences between:
• energy-intensive industries such as non-ferrous metals, non-metallic minerals, and chemicals
• medium-intensity industries such as wood, paper and printing, and food, and
• less energy-intensive industries such as textile clothing and footwear, and machinery and equipment (Stanwix et al. 2015, p. 48).
The type, sophistication and pace of technological change vary across subsectors. Table 2.1 shows that research intensities also differ. New technologies such as 3D printers are used in metals manufacturing, and are extending into areas such as footwear.

Final Report: Manufacturing in Queensland
Queensland Productivity Commission 10
Manufacturing will also:
benefit from information-driven-intelligence arising from advanced analytics, big data, social technologies, greater connectivity through the ‘internet of things’, and the use of smart devices which monitor production machinery, supply chains, and products. (Office of Queensland Chief Scientist 2016a, p. 25)
As they spread, some new technologies reduce the brake that economies of scale impose on small economies and firms by creating ‘economies of scalelessness’ (The Economist, 2017, pp. 17-19).
Table 2.1 Expenditure on R&D as a percentage of gross value added, Australia, 2013–14
Expenditure ($000) Intensity
Machinery and equipment 2,128,409 11.2%
Petroleum, coal, chemical and rubber products 1,101,072 6.1%
Metal products 597,753 3.8%
Food, beverage and tobacco products 689,006 2.7%
Non-metallic mineral products 138,981 2.3%
Textile, clothing and other manufacturing 89,765 1.7%
Printing and recorded media 35,158 1.1%
Wood and paper products 64,098 1.0%
Total manufacturing 4,844,242 4.9% Sources: QPC calculations; ABS 2015b, 2017c.
2.2.3 Firm size and survival
Queensland manufacturers on average are larger than all Queensland businesses—6.7 per cent of manufacturing businesses are medium (20–199 employees) or large (200+ employees), compared with 2.6 per cent of all businesses that are medium-size or large.
Nevertheless, most manufacturing firms in Queensland are small. Table 2.2 shows that about half (48 per cent) have 1–19 employees, and 45 per cent are non-employing.
Australia's manufacturers tend to be relatively smaller than their international peers, with proportionally about half as many medium and large businesses as the OECD average (OECD 2016).
Table 2.2 Manufacturing: number of businesses by size of business, Queensland, June 2016
Non-employing
1–19 employees
20–199 employees
200+ employees
Total
Businesses, June 2016 7,431 7,834 1,006 86 16,351
Proportion of businesses 45.4% 47.9% 6.2% 0.5% 100.0% Source: ABS 2017b. Food manufacturing in Queensland has about 32 of the 86 large manufacturing businesses and a relatively high proportion of large and medium firms compared with other subsectors.

Final Report: Manufacturing in Queensland
Queensland Productivity Commission 11
Table 2.3 identifies the entry and exit rate of manufacturing business in Queensland. In 2015–16, the business exit rate was slightly lower for the manufacturing sector (11.8 per cent) than for all businesses across the state (12.7 per cent). Between 2012 and 2016, the survival rate of Queensland manufacturing businesses (62.5 per cent) was slightly better than the survival rates of all businesses, both in Queensland (60.2 per cent) and across the nation (62.1 per cent).
Table 2.3 Manufacturing business, entry and exit rate, Queensland, June 2016
Non-employing
1–19 employees
20–199 employees
200+ employees
Total
Entry rate 2015–16 14.6% 8.9% 1.8% 0.0% 11.3%
Exit rate 2015–16 17.5% 7.7% 4.7% 3.5% 11.8%
Survival rate (2012 to 2016) 49.2% 72.1% 84.9% 83.5% 62.5% Note: Entry rate refers to new businesses formed and exit rate refers to businesses that cease to exist, as a proportion of the stock of businesses. Survival rate is the proportion of businesses at the beginning of the period that are still going at the end of the period. Source: ABS 2017b.
2.3 Manufacturing remains significant, even though its share of Queensland’s economy is falling
2.3.1 Manufacturing’s falling share of the economy
Manufacturing grew very strongly in Australia until the early 1970s, to become its largest industry. Over the last 40 years, however, it has been the slowest growing industry in Australia, declining as a proportion of the economy. Similarly, manufacturing has been Queensland’s slowest growing industry over the last 25 years. Figure 2.3 shows that as a result, at the state and national level, manufacturing output has declined by 5.2 and 5.6 percentage points, respectively, as a share of output over the last 25 years.
Figure 2.3 Manufacturing gross value added (GVA) as a proportion of total GVA, Queensland and Australia
Sources: ABS 2016j, 2017c.

Final Report: Manufacturing in Queensland
Queensland Productivity Commission 12
The sector continued to grow until 2006-07, while its share of the economy fell. For example, between 1989–90 and 2006–07, manufacturing output expanded by around 4 per cent per year in real terms while the Queensland economy grew by 4.8 per cent per year. During this period, the sector grew more than twice as fast as Australian manufacturing (1.4 per cent per year) and faster than the Australian economy (3.3 per cent). Until 2007, manufacturing was generally Queensland’s largest sector. However, manufacturing output peaked at $25 billion in 2006-07, before falling in 2007–08 by around 1 per cent, while Australian output continued to grow.
The global financial crisis (GFC) and the resources boom impacted Queensland manufacturing particularly heavily (Figure 2.4). In 2008–09, it contracted more than any other Queensland industry, almost 14 per cent, and more than any other state’s manufacturing industry—the rest of Australia’s manufacturing industry decreased 2.8 per cent. The contraction continued for several years and by 2010–11 Queensland’s manufacturing had lost about a fifth of its output.
Figure 2.4 Real manufacturing output, Queensland and Australia (gross value added, chain volume measures)
Sources: ABS 2016j, 2017c.
Since then, Queensland manufacturing output has fluctuated. In 2015–16 it declined about 3.3 per cent to approximately the same level as 2010–11. By 2015–16, manufacturing output was $19.7 billion or 6.7 per cent of the Queensland economy.
During the GFC, global demand for many manufactured products fell. This, combined with a strengthening Australian dollar, made manufacturers less competitive. At the same time, the mining and construction industries that were competing with manufacturing for the same skills expanded, increasing labour costs. This period also saw rising electricity prices and, in later years, higher gas prices with the commencement of the LNG plants. Some of these pressures eased as the boom receded and the Australian dollar fell towards historical norms.
The Australian Performance of Manufacturing Index (PMI) in August 2017 indicated some recovery. It was the highest monthly result since 2002, and six of seven performance sub-indices also showed positive signs. This was the eleventh consecutive quarter of expansion (Ai Group 2017d).

Final Report: Manufacturing in Queensland
Queensland Productivity Commission 13
International trends
Globally, in most advanced nations, manufacturing’s share of the economy has also been declining.
In every international income group3, manufacturing has fallen as a proportion of GDP (Figure 2.5). Globally, between 1995 and 2014, manufacturing's share of world output fell 6.3 percentage points. Over the same period, it fell 4.4 percentage points in Queensland.
Figure 2.5 Manufacturing gross value added as a proportion of GDP
Source: World Bank 2017.
In developed countries, manufacturing’s share of total employment has declined for more than 40 years (Figure 2.6). Across the OECD, between 1993 and 2013, manufacturing as a proportion of employment fell 5.5 percentage points. Even in China, where manufacturing has grown significantly, the proportion of workers employed in manufacturing was lower in 2010 than in 1980.
Key reasons for the relative decline in manufacturing include:
• preference for services—people spend less of their additional income on manufactured products and more on services as their incomes increase
• technological changes—as products such as newspapers and recorded music have become available on line, demand for manufactured products has fallen
• shifting trade patterns—with growing exports of manufactured products from low-wage developing economies
• measurement error, due to services previously undertaken in manufacturing being outsourced (PC 2003, pp. 32–36).
3 Income group refers to a group of countries that are in the same per capita income range.

Final Report: Manufacturing in Queensland
Queensland Productivity Commission 14
Figure 2.6 Manufacturing as a proportion of total employment, selected countries
OECD 2015c.
2.3.2 The sector is a large employer
Manufacturing remains a large employer, particularly in some locations, and generates higher than average wages and salaries.
Workforce size and growth
Employment in Queensland manufacturing peaked at 190,000 in 2004–05. Between 1985–86 and 2007–08, employment grew by about 41 per cent (Figure 2.7). Employment has declined since 2007–08, but has stabilised at about 168,000 over the last three years, or 7.1 per cent of the workforce.
Manufacturing’s declining share of total employment has partly been caused by falling employment in the sector, combined with strong growth in other sectors (Figure 2.8). For many—particularly younger people with transferable skills—reduced opportunities in manufacturing have been offset by job opportunities elsewhere. However, this has not been the case across the board, with some workers facing significant challenges and costs to transition to new employment.

Final Report: Manufacturing in Queensland
Queensland Productivity Commission 15
Figure 2.7 Queensland manufacturing employment
Source: ABS 2017l. Figure 2.8 Queensland industry employment growth, 2007–08 to 2016–17
Source: ABS 2017l. While manufacturing employment in Queensland has declined, it has held up better than in other states (Figure 2.9). Queensland’s lower exposure to industries that were previously protected from imports, such as motor vehicles, and textile, leather, clothing and footwear may have helped.
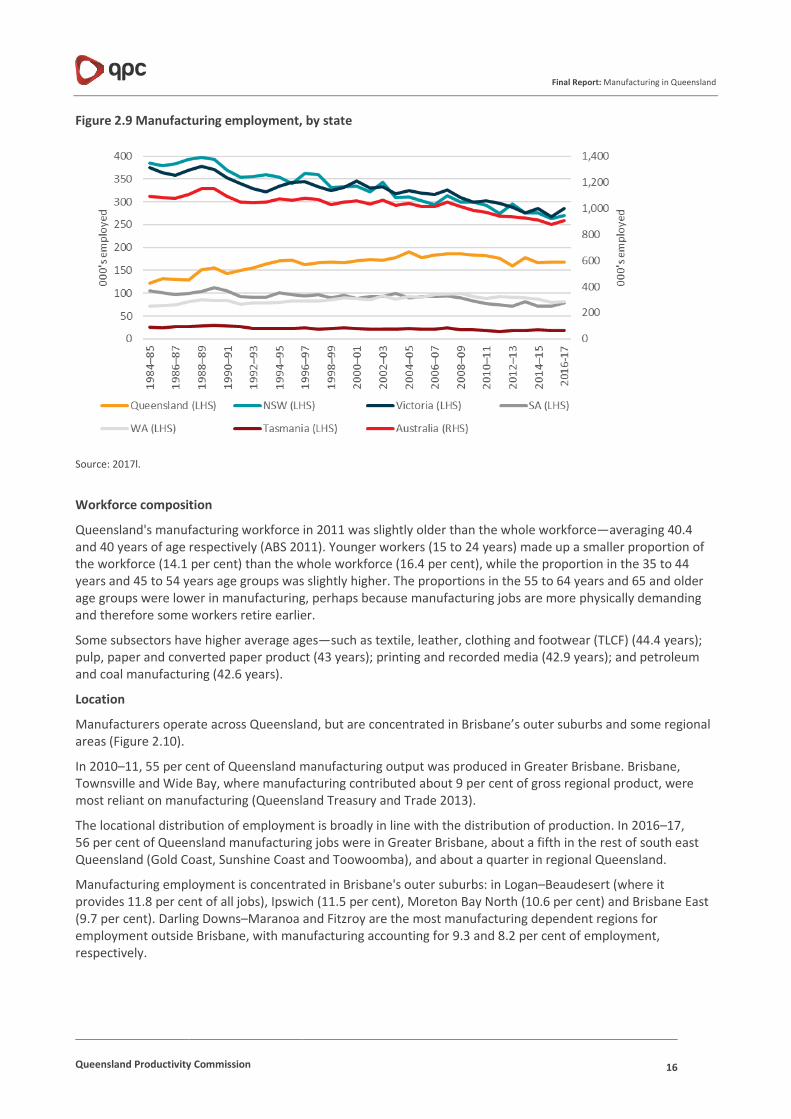
Final Report: Manufacturing in Queensland
Queensland Productivity Commission 16
Figure 2.9 Manufacturing employment, by state
Source: 2017l.
Workforce composition
Queensland's manufacturing workforce in 2011 was slightly older than the whole workforce—averaging 40.4 and 40 years of age respectively (ABS 2011). Younger workers (15 to 24 years) made up a smaller proportion of the workforce (14.1 per cent) than the whole workforce (16.4 per cent), while the proportion in the 35 to 44 years and 45 to 54 years age groups was slightly higher. The proportions in the 55 to 64 years and 65 and older age groups were lower in manufacturing, perhaps because manufacturing jobs are more physically demanding and therefore some workers retire earlier.
Some subsectors have higher average ages—such as textile, leather, clothing and footwear (TLCF) (44.4 years); pulp, paper and converted paper product (43 years); printing and recorded media (42.9 years); and petroleum and coal manufacturing (42.6 years).
Location
Manufacturers operate across Queensland, but are concentrated in Brisbane’s outer suburbs and some regional areas (Figure 2.10).
In 2010–11, 55 per cent of Queensland manufacturing output was produced in Greater Brisbane. Brisbane, Townsville and Wide Bay, where manufacturing contributed about 9 per cent of gross regional product, were most reliant on manufacturing (Queensland Treasury and Trade 2013).
The locational distribution of employment is broadly in line with the distribution of production. In 2016–17, 56 per cent of Queensland manufacturing jobs were in Greater Brisbane, about a fifth in the rest of south east Queensland (Gold Coast, Sunshine Coast and Toowoomba), and about a quarter in regional Queensland.
Manufacturing employment is concentrated in Brisbane's outer suburbs: in Logan–Beaudesert (where it provides 11.8 per cent of all jobs), Ipswich (11.5 per cent), Moreton Bay North (10.6 per cent) and Brisbane East (9.7 per cent). Darling Downs–Maranoa and Fitzroy are the most manufacturing dependent regions for employment outside Brisbane, with manufacturing accounting for 9.3 and 8.2 per cent of employment, respectively.

Final Report: Manufacturing in Queensland
Queensland Productivity Commission 17
Figure 2.10 Manufacturing employment by Queensland region, 2016–17
Note: Greater Brisbane includes Brisbane East, North, South, West and City, Ipswich, Logan and Morton Bay North and South. South east Queensland includes Greater Brisbane, Gold Coast, Sunshine Coast and Toowoomba. Regional Queensland includes Cairns, Darling Downs, Fitzroy, Mackay Outback, Townsville and Wide Bay. Source: ABS 2017l.
Wages and salaries
On average, manufacturing workers earned about $63,400 in wages and salaries in 2015–16, more than the average of $50,000 earned by private sector workers in Queensland. This is likely due to:
• some parts of the sector providing high income jobs—petroleum and coal product manufacturing has some of the nation’s highest earning employees ($139,000) (Figure 2.11)
• manufacturing workers being more likely to be full-time (86 per cent) than all workers in Queensland (69 per cent), and working more hours per week (37.4 hours) than employees generally (33.5 hours) (ABS 2017l).
• However, average manufacturing wages in Queensland were slightly below most other states in 2015–16.

Final Report: Manufacturing in Queensland
Queensland Productivity Commission 18
Figure 2.11 Total and average wages and salaries by subdivision, Queensland, 2015–16
Source: ABS 2017h.
2.4 Inter-industry linkages The terms of reference ask the Commission to report on manufacturing’s linkages with service industries.4
Manufacturing occupies a central position in the supply chain and therefore has a high level of linkages within the sector, to other sectors of the economy and to global markets. About 13 per cent of manufacturing production uses local intermediate manufactured products and services—more than double the proportion used by all industries.
Manufacturing is the largest sectorial user of agricultural and mining products and accounts for more than half of Australian industry use. However, as Table 2.4 demonstrates, the contribution of services sectors to manufacturing (22.1 per cent) is greater than the combined contribution of agriculture (10.1 per cent) and mining sectors (8.4 per cent).
The manufacturing sector is relatively more connected to international trade than most other sectors. A quarter of production is exported—more than twice as much as all industries. Imports contribute more to manufacturing output (16 per cent) than in any other sector.
4 These include direct effects, when manufacturers purchase inputs (such as accounting services) from the service sector, and the converse; indirect effects, when purchasing inputs leads a service provider to buy more from other service providers (for example, when an accountant buys services from a computer technician to meet the manufacturers' requirements).

Final Report: Manufacturing in Queensland
Queensland Productivity Commission 19
Today manufacturing encompasses many pre- and post-production services, including R&D, design, training, support, repairs, monitoring and analytics. As these services have been increasingly outsourced to specialised businesses, the proportion of manufacturing embodied in services purchases has increased:
• In 2014–15, services industries contributed $22.10 to every $100 of manufacturing output. This has increased since 2008–09, when it contributed $20.50, and 1994–95 when it contributed $19.80 (Barnes et al. 2013, p. 221). The contribution was highest in wood products and lowest in metal, textile and clothing.
• The increase in the purchase of services between 2008–09 and 2014–15 has been driven by increasing use of professional, scientific and technical services and financial and insurance services and increasing energy prices.
Table 2.5 illustrates that linkages with other sectors vary considerably within the manufacturing sector:
• Services contributed relatively more to wood, paper, furniture and other and chemical products manufacturing output (32.9 and 30.8 per cent) than to textile, clothing, leather and footwear (TCLF) and petroleum, coal, rubber and polymer manufacturing consume relatively less services (14.5 and 15.5 per cent).
• While some manufacturing subsectors consume a large amount of professional, scientific and technical services, others consume relatively little—7.5 per cent of machinery and equipment output was from professional, scientific and technical services, compared with only 0.7 per cent of TCLF output.
• Intermediate manufactured products contributed more to non-metallic mineral product manufacturing (16.2 per cent) than to petroleum, coal, rubber and polymer manufacturing (8.8 per cent).
Manufacturers may outsource part of their production process—usually a more labour-intensive stage—to a country with lower wage rates. Or, they may develop a niche in international production processes.
The changes in technology noted earlier, which are reducing the disadvantage of small scale, may create new opportunities for small Queensland manufacturers to become involved in global supply chains.

Final Report: Manufacturing in Queensland
Queensland Productivity Commission 20
Table 2.4 Input–output linkages of industries, Australia 2014–15
User
Agriculture Mining Manufacturing Utilities Construction Transport Wholesale Professional Acommodation & food
Total services
Supp
lier
Agriculture 16.9% 0.2% 10.1% 0.0% 0.2% 0.0% 0.4% 0.1% 1.8% 0.3%
Mining 0.3% 7.7% 8.4% 2.6% 0.9% 0.4% 0.9% 0.6% 0.4% 0.5%
Manufacturing 7.4% 4.5% 13.0% 1.7% 12.3% 5.9% 3.9% 1.4% 15.7% 4.6%
Utilities 2.3% 1.5% 2.3% 25.5% 0.7% 0.9% 0.8% 1.3% 2.6% 1.9%
Construction 3.0% 6.0% 0.8% 4.0% 29.9% 3.7% 2.7% 2.0% 1.5% 7.3%
Transport 2.9% 2.4% 4.7% 0.9% 2.3% 12.9% 8.4% 2.4% 1.8% 2.9%
Wholesale Trade 4.3% 2.0% 3.5% 0.9% 2.3% 2.1% 2.5% 1.2% 2.6% 1.7%
Professional, Scientific and Technical Services 2.4% 4.5% 3.3% 1.8% 4.7% 4.2% 5.5% 17.0% 1.1% 6.0%
Total services 23.1% 26.4% 22.1% 46.5% 48.2% 42.2% 39.4% 43.6% 26.8% 36.8%
Competing imports 6.6% 6.4% 16.0% 3.5% 7.4% 6.4% 5.5% 3.7% 5.2% 4.6%
Value Added 44.8% 54.8% 29.8% 45.4% 30.9% 44.5% 49.8% 50.3% 47.7% 52.7%
Australian Production 100.0% 100.0% 100.0% 100.0% 100.0% 100.0% 100.0% 100.0% 100.0% 100.0% Sources: QPC calculations; ABS 2017k.

Final Report: Manufacturing in Queensland
Queensland Productivity Commission 21
Table 2.5 Input–output linkages of manufacturing subsectors, Australia 2014–15
User
FBT TLCF WPFO PRM PCRP CP MP NMM ME
Total Manuf
Supp
lier
Agriculture 32.9% 11.9% 6.5% 0.0% 0.5% 1.7% 0.0% 0.0% 0.0% 10.1%
Mining 0.7% 0.2% 0.8% 0.3% 6.1% 4.2% 31.6% 8.4% 0.3% 8.4%
Manufacturing 14.3% 11.3% 15.2% 12.1% 8.8% 12.6% 11.5% 16.2% 13.7% 13.0%
Utilities 1.6% 2.2% 3.2% 2.4% 2.1% 3.1% 3.5% 2.9% 1.1% 2.3%
Construction 0.3% 0.3% 3.6% 0.9% 0.6% 0.5% 0.6% 1.0% 0.8% 0.8%
Transport 4.8% 2.2% 8.2% 3.1% 3.2% 7.0% 4.8% 6.7% 2.3% 4.7%
Wholesale Trade 3.4% 4.8% 4.6% 2.4% 1.6% 5.8% 2.0% 3.2% 5.5% 3.5%
Professional, Scientific and Technical Services 1.8% 0.7% 3.8% 5.9% 1.8% 4.8% 1.9% 4.8% 7.5% 3.3%
Total services 18.2% 14.5% 32.9% 22.9% 15.5% 30.8% 18.2% 30.3% 25.9% 22.1%
Competing imports 6.1% 14.2% 11.2% 10.7% 42.5% 16.8% 15.0% 10.7% 22.4% 16.0%
Value added 27.1% 46.2% 33.0% 53.8% 24.8% 33.5% 23.3% 33.9% 37.3% 29.8%
Australian production 100.0% 100.0% 100.0% 100.0% 100.0% 100.0% 100.0% 100.0% 100.0% 100.0% Notes: FBT is Food, beverage & tobacco products; TCO is Textile, clothing & other manufacturing; WPFO is Wood & paper products; PRM is Printing & recorded media; PCRP is Petroleum, coal, rubber & polymer products; CP is chemical products; NMM is Non-metallic mineral products; MP is Metal products; ME is Machinery & equipment manufacturing. Based on direct allocation of imports so that the percentages intermediate inputs refer only to domestically produced inputs. Imports refer to imported intermediate goods used by column (use) industry and can be products from any industry. Sources: QPC calculations; ABS 2017k.

Final Report: Manufacturing in Queensland
Queensland Productivity Commission 22
2.5 Trade is important Manufacturing’s involvement in international trade is significant and growing, although the extent and pattern of that involvement vary substantially across the sector.
2.5.1 Composition of exports and imports
In 2015–16, Queensland exported $17.4 billion of manufactured products (about 23 per cent of manufacturing sales) and imported about $32.2 billion.
Imports and exports of manufactures are growing:
• Exports have increased by 28 per cent in nominal terms (5 per cent real) since 2007–08, while the real gross value added of Queensland manufacturing fell (Figure 2.12). The proportion of manufactured goods produced domestically that is exported may have increased.5
• Imports are more volatile than exports, declining by about 9 per cent in real terms since 2012–13, but growing by 23 per cent since 2005–06.
Figure 2.12 Manufacturing imports and exports, real terms, Queensland
Notes: Import and export values have been deflated by the Brisbane CPI. Because industry subdivision price indices have not been used to deflate values, price changes for individual subsectors that differ from the Brisbane CPI affect the calculated import and export volumes. Prices are real for 2015-16. Sources: Queensland Government Statistician’s Office 2017a, 2017b; Queensland Treasury Unpublished data; ABS 2017g; QPC calculations. Four subsectors accounted for 97 per cent of manufacturing exports in 2015–16 (Figure 2.13):
• Food and beverages (largely meat, sugar processing and fruit and vegetable processing) contributed $9.1 billion (52.4 per cent of total exports of manufactures)
• Metals contributed $5 billion (28.6 per cent)
5 Proving this would require close examination of the data. For example, import and export data include goods that are imported to be re-exported with nothing (or very little) done to them in Australia. Including re-exports in the measures overstates export capability and exposure to competing imports. Also, domestic production data (sales and exports) attribute all activity to the sector of final sale, even if other industries, or imported inputs, have substantially contributed to the production of the relevant goods (PC 2003, p. 122).

Final Report: Manufacturing in Queensland
Queensland Productivity Commission 23
• Machinery and equipment contributed $1.8 billion (10.2 per cent)
• Petroleum, coal and chemicals contributed $950 million (5.5 per cent).
The remaining 11 subsectors contributed just 3 per cent of manufacturing exports in 2015–16, compared with 44 per cent of the sector’s sales.
Figure 2.13 Manufacturing exports, Queensland, 2015–16
Sources: Queensland Government Statistician’s Office 2017a; Queensland Treasury unpublished data.
Two subsectors dominate manufacturing imports to Queensland:
• Machinery and equipment products make up almost half (49 per cent) of the imports. This category includes motor vehicles and parts, which account for almost a quarter (22 per cent) of imports.
• Petroleum, coal, chemical and associated products, mostly refined petroleum, account for about a quarter of the value of imports.
2.5.2 Export growth6 and destination
Figure 2.14 shows that food and beverages exports have increased by 45 per cent (or about $2.8 billion) in real terms since 2007–08. Apart from the small ‘other manufacturing’ subsector, food and beverages was the only subsector that increased its exports over this period.
6 Growth rates are sensitive to the base year from which growth is measured. For example, exports of metal products declined by 23 per cent in real terms between 2007–08 and 2015–16. Yet exports of metals more than doubled in real terms between 1998–99 and their peak in 2007–08, and were 62 per cent above their 1998–99 level in 2015–16, despite the decline since 2007–08.

Final Report: Manufacturing in Queensland
Queensland Productivity Commission 24
Figure 2.14 Manufacturing exports by subsector, real terms, Queensland
Notes: Import and export values have been deflated by Brisbane CPI. Industry subdivision price indices have not been used to deflate export values, therefore individual price changes impact on export values. Prices are real for 2015-16. Sources: Queensland Government Statistician’s Office 2017a; Queensland Treasury Unpublished data; ABS 2017g; QPC calculations.
Figure 2.15 illustrates that China has become the Queensland manufacturing sector’s largest export market, increasing from $0.6 billion in 2005–06 to $2.7 billion in 2015–16. Other major export destinations include South Korea ($2.4 billion), Japan ($2.2 billion) and the United States ($2 billion).

Final Report: Manufacturing in Queensland
Queensland Productivity Commission 25
Figure 2.15 Top 10 manufacturing export destinations, nominal terms
Sources: Queensland Government Statistician’s Office 2017a; Queensland Treasury Unpublished data.
2.6 Change is likely to continue
2.6.1 Sector composition
Many factors affect industry performance—including changes in input costs, access to capital and appropriately skilled labour, market growth, consumer preferences, the strength of the Australian dollar, technological change, taxes, and regulations—and change the composition of the manufacturing sector over time.
Figure 2.16 shows that, since 1986–87:
• four subsectors (machinery and equipment; chemicals; food; and petroleum and coal) grew throughout all or most of the 30-year period.
• some subsectors generally grew until the mid-2000s but have declined over the last decade (printing and recorded media; wood; textile, leather, clothing and footwear; non-metallic mineral; polymer and rubber; metals; and transport equipment).

Final Report: Manufacturing in Queensland
Queensland Productivity Commission 26
Figure 2.16 Manufacturing employment by subsector, Queensland
Note: Unclassified manufacturing data has been prorated to manufacturing subsectors. Source: ABS 2017l.
Table 2.6 illustrates that between 1987–88 and 2007–08 metals, transport equipment, food, and machinery and equipment were the biggest contributors to growth of manufacturing employment. However, since that time, employment in metals, transport equipment and non-metallic minerals, wood product, polymer and rubber and printing has fallen.
Employment growth in machinery and equipment and chemicals manufacturing has partially offset the contraction in these subsectors.

Final Report: Manufacturing in Queensland
Queensland Productivity Commission 27
Table 2.6 Subsector contribution to Queensland manufacturing employment growth, before and after the global financial crisis
Between 1987–88 and 2007–08 Between 2007–08 and 2016–17
Growth % Growth 000s
Contribution to change
Growth % Growth 000s
Contribution to change
Food product manufacturing 26.5% 8.9 15.7% 0.3% 0.1 0.8%
Beverage and tobacco product manufacturing 72.1% 1.7 3.0% 9.8% 0.4 2.3%
Textile, leather, clothing and footwear manufacturing -16.9% -1.4 -2.4% -11.6% -0.8 -4.7%
Wood product 38.5% 2.5 4.3% -34.8% -3.1 -18.2%
Pulp, paper and converted paper product 17.8% 0.5 0.9% -31.1% -1.0 -5.9%
Printing and recorded media 28.2% 1.8 3.1% -31.1% -2.5 -14.6%
Petroleum and coal product 62.0% 0.6 1.1% -2.6% -0.0 -0.3%
Basic chemical and chemical product 169.1% 3.5 6.1% 40.1% 2.2 13.0%
Polymer product and rubber product 71.6% 3.1 5.4% -20.6% -1.5 -8.9%
Non-metallic mineral product 40.8% 3.5 6.2% -43.0% -5.3 -30.9%
Primary metal and metal product 142.0% 11.1 19.5% -27.6% -5.2 -30.7%
Fabricated metal product 3.3% 0.5 0.9% -0.8% -0.1 -0.7%
Transport equipment 94.4% 10.3 18.1% -27.3% -5.8 -34.2%
Machinery and equipment 93.8% 8.6 15.1% 22.4% 4.0 23.5%
Furniture and other 17.6% 1.9 3.4% 12.0% 1.5 9.1%
Total manufacturing 44.0% 57.1 100.0% -9.1% -17.0 -100.0% Note: Unclassified manufacturing data has been prorated to manufacturing subsectors. Sources: QPC calculations; ABS 2017l.

Final Report: Manufacturing in Queensland
Queensland Productivity Commission 28
At the industry level, there has been even more change than at the subsector level. However, the data is less reliable, and the direction of change varies considerably over time:
• Food product nfd7, furniture, meat and meat product, machinery and equipment nfd, basic non-ferrous metal, motor vehicle and motor vehicle part and basic non-ferrous metal product manufacturing together account for over 60 per cent of net increase in jobs over the last 30 years (ABS 2017l).
• Over the last 10 years, sugar and confectionery, food product nfd, beverage, professional and scientific equipment, specialised machinery and equipment, machinery and equipment nfd, metal container, pharmaceutical and medicinal product and cleaning compound and toiletry preparation manufacturing all contributed at least 1,000 jobs in a sector in overall employment decline.
2.6.2 Locational pressures
Changes in the sector’s size and composition change regional employment patterns. As demonstrated in Figure 2.17, between 2007–08 and 2016–17, the share of employment in manufacturing fell in most Queensland regions.
In Ipswich, Toowoomba, Moreton Bay South, Townsville and Wide Bay manufacturing as a proportion of total jobs has declined by 6.0, 4.7 and 4.1, 4 and 3.1 percentage points respectively. On the other hand, the share was either close to stable or increased in Brisbane West, Cairns, Darling Downs–Maranoa, Sunshine Coast and Fitzroy.
Figure 2.17 Manufacturing as a proportion of total employment by Queensland region
Source: ABS 2017l.
The majority of the manufacturing job losses between 2007–08 and 2016–17 were in Greater Brisbane (11,800 of the 17,000 fall in manufacturing employment).
7 Nfd is a residual classification, standing for not further defined. It is used when the ABS is unable to classify the data to a specific industry.

Final Report: Manufacturing in Queensland
Queensland Productivity Commission 29
2.7 Productivity performance has been patchy The manufacturing sector’s recent productivity performance has been influenced by changes in investment, employment and output. As discussed earlier, Queensland manufacturers experienced a burst of growth leading up to the GFC and falling output afterwards. Manufacturers invested heavily during the growth surge, and were slow to shed labour after output started to fall.
The combination of rising investment, steady employment and declining output led to lower productivity growth in Queensland than in other states. This occurred in the context of Australian manufacturing productivity that is lower than in most developed countries, and appears to be falling further behind.
2.7.1 Labour productivity
Through the second half of the 20th century, labour productivity in Australian manufacturing grew faster than in the total market sector8, although the gap in growth rates narrowed towards the end of the century (PC 2003, p. 161).
Figure 2.18 shows that between 1989–90 and 1999–2000 labour productivity in Queensland manufacturing grew at the same rate as manufacturing in the rest of the country, and in the Australian market sector. Labour productivity in Queensland manufacturing then grew much faster than elsewhere during a period of strong output growth until 2006–07, before falling by 18 percent over for the next three years, in line with the fall in output.
This severe contraction in productivity appears unique to Queensland manufacturing: labour productivity continued to increase after 2006–07 in the market sector and in manufacturing in the rest of Australia.
Figure 2.18 Labour productivity, Queensland and rest of Australia
Note: Labour inputs and labour productivity measured on an hours-worked-basis, with no adjustment for changes in labour quality. Sources: ABS 2016a, 2016b; QPC estimates.
8 The 12 market sector industries are agriculture, forestry and fishing, mining, manufacturing, electricity, gas, water and waste services, construction, retail trade, wholesale trade, transport, postal and warehousing, information, media and telecommunications, accommodation and food services, financial and insurance services and arts and recreation services.

Final Report: Manufacturing in Queensland
Queensland Productivity Commission 30
Since 2009–10, manufacturing labour productivity growth in Queensland has been volatile, around a growth rate below the rest of Australia.
A combination of increasing capital intensity and multifactor productivity (MFP)9 growth is likely to explain the long-term increases in labour productivity. The large drop after 2006–07 may have occurred because Queensland manufacturers maintained staffing levels for a time, even though output was dropping.
The causes of the greater volatility in Queensland manufacturing labour productivity than elsewhere since 2000–01 are not clear.
2.7.2 Multifactor productivity
Queensland manufacturing MFP has performed poorly for over a decade.
Figure 2.19 shows that measured MFP10 grew strongly from 1989–90 to 2001–02, but subsequently fell sharply until 2010–11. Over the same period, manufacturing MFP improved slightly in the rest of Australia.
Figure 2.19 Manufacturing MFP (experimental estimates), Queensland and rest of Australia
Notes: Rest of Australia (ROA) excludes Tasmania and the Northern Territory, as the ABS net capital stock estimates combine manufacturing and mining in these jurisdictions. Labour inputs are measured on an hours-worked-basis, with no quality adjustment. The capital input index is an index of manufacturing net capital stocks adjusted so that the combined Queensland and ROA index growth rates equal the growth rates in the national manufacturing capital services index. Sources: ABS 2016a, 2016b; QPC estimates.
The strong growth in investment after 2001–02 may explain some of this poor performance. Time lags between when capital investment is undertaken and the subsequent increases in output mean that measured productivity performance may depart from long-term trends, particularly when there are periods of particularly strong or weak investment.
The large increase in manufacturing’s capital stock after 2001–02 suggests the potential for MFP to grow strongly as output expands, and underutilised capital stock is used more fully. However, many investments were made before the GFC and the resources boom, and may have been based on excessively optimistic growth expectations. If that turns out to be the case, productivity growth will be subdued.
9 MFP reflects the general efficiency with which capital and labour are used together to produce outputs. 10 The MFP estimates are experimental estimates based on the recently published experimental estimates of net capital stocks produced by the ABS.

Final Report: Manufacturing in Queensland
Queensland Productivity Commission 31
The strength of the increase in Queensland MFP from 1999–2000 and its subsequent decline were also influenced by volatility in industry output, which coincided with the GFC. As Figure 2.20 illustrates, from 1999–2000 to 2006–07, industry output increased strongly, then declined afterwards, first contributing to, then detracting from, MFP growth.
Figure 2.20 Manufacturing MFP and component indexes, Queensland
Sources: ABS 2016j, 2016l, 2016m; QPC estimates.
2.7.3 International productivity comparisons
The Commission has not seen productivity comparisons of Queensland manufacturers with international peers. However, studies suggest that Australian manufacturing productivity is lower than in many advanced economies.11
• In 2005, Australian manufacturing MFP and labour productivity was the lowest in a sample of 20 comparable countries, except for the Czech Republic, Hungary, Portugal and Slovakia. Manufacturing MFP was 58 per cent of the United States level.
• Australia’s productivity gaps relative to the United States are higher in manufacturing than in other industries. Australian manufacturing labour productivity was 52 per cent of the United States level. In comparison, the MFP and labour productivity gaps for the Australian market sector compared with the United States were 25 and 32 per cent, respectively.
• In 2007, each manufacturing subsector in the United States had higher MFP than in Australia, except for coke, refined petroleum products and nuclear fuels. The gap has widened for almost all subsectors since 1997. Some gaps are very large, with United States MFP double that of the Australian MFP.
11 Shepherd & Prasada Rao 2002 and Dolman et al. 2007 both found that Australian manufacturing productivity was significantly below the technological frontier.

Final Report: Manufacturing in Queensland
Queensland Productivity Commission 32
2.8 Conclusion The manufacturing sector is diverse, significant, open for trading with the international economy, and continuously changing. Manufacturing accounts for about 7 per cent of Queensland’s workforce and its economy. The size of both has declined since 2007–08, coinciding with the GFC, but now appear to be stabilising. At the same time, productivity has declined and appears relatively low by international comparison.
However, Queensland manufacturing exports have increased, with some subsectors growing more than others, indicating some manufacturers have retained their competitiveness and are exploiting global opportunities.

Final Report: Manufacturing in Queensland
Queensland Productivity Commission 33
3.0 Pressures and prospects

Final Report: Manufacturing in Queensland
Queensland Productivity Commission 34
This chapter examines the external pressures on the manufacturing industry in Queensland, and discusses some characteristics that are likely to either emerge or continue to be relevant to the future success of the sector.
Key points
1 The manufacturing sector in Queensland has been facing a range of external pressures, including high input costs, particularly for energy and labour; strong domestic and international competition; new markets and changing consumer patterns; technological advancements; and difficulties in accessing appropriately skilled labour.
2 Energy and labour costs have been increasing:
• Between 1998-1999 to 2016-17, gas prices increased annually by 3.4 per cent and electricity prices by 4.9 per cent, on average.
• The growth in unit labour costs in Australia between 1998 and 2015 was the highest among OECD countries.
3 There are manufacturing success stories across industries and the state, rather than one standalone exemplary section of manufacturing in Queensland. Broad characteristics of successful manufacturing firms in Queensland emerge, nevertheless. These firms:
• identify and leverage sources of advantage
• provide rapid turnaround and bespoke orders
• target niche markets and global value chains
• focus on quality to move up the product value chain
• innovate to drive quality and efficiency
• combine manufactured goods with services to establish a local advantage.

Final Report: Manufacturing in Queensland
Queensland Productivity Commission 35
3.1 Introduction Queensland has many robust, competitive manufacturers that leverage natural resources, leading-edge technology, superior design or customisation, high levels of efficiency and/or a focus on customer service. However, the sector is facing a range of pressures including relatively high energy and labour costs, intense international competition, changing markets and challenges accessing skilled labour.
The diverse nature of manufacturing in Queensland and the strengths firms have developed in response to pressures mean that while it is possible to identify some of the broad opportunities emerging, there is no single pathway or subsector that provides a ‘blueprint’ for manufacturing success in the future.
3.2 Significant factors that affect manufacturers
3.2.1 Input costs
Australia is a relatively high-cost place for manufacturing.
The Boston Consulting Group Cost Competitiveness Index—which develops scores based on manufacturing wages, productivity, energy costs and currency exchange rates—ranked Australia as the worst-performing of the 25 economies analysed in 2014. Australia was also found to have lost ground in each of the cost competitive areas assessed since 2004:
The resources and infrastructure boom contributed to the loss of cost competitiveness in manufacturing by driving up wages and the Australian dollar and by drawing away capital. Manufacturing wages rose by 48 per cent over the past decade, and capital inflows from commodity exports caused Australia’s currency to appreciate by 21 per cent against the U.S. dollar. At the same time, overall manufacturing labour productivity fell 1 per cent in absolute terms over the ten-year period. (Sirkin et al. 2014, p. 12)
More recently, the Australian dollar has fallen in real terms and this is likely to have reduced some of the input price growth. However, many stakeholders have expressed their concerns about continued input price growth.
Manufacturers' input costs have changed over time. As a proportion of total costs, intermediate inputs12 have been rising, offset by small falls in labour and capital. Among intermediate inputs, the cost share of energy inputs has risen from 4.5 per cent in 1995–96 to over 8.5 per cent in 2014–15, while the share of services has also risen.
The impact of the high-cost environment on a manufacturer depends on several factors, including a firm’s exposure to particular input costs (Box 3.1) and its ability to pass on costs to buyers. Trade-exposed manufacturers are particularly vulnerable to input prices. When critical input costs, such as labour or energy, increase more rapidly than in competing countries, manufacturers in trade-exposed subsectors bear these increased costs through reduced profit margins (assuming manufacturers sell at internationally determined market prices). Sustained increases in input costs can render businesses uncompetitive.
12 Intermediate inputs aggregates energy, services and materials.

Final Report: Manufacturing in Queensland
Queensland Productivity Commission 36
Box 3.1 The manufacturing industry's cost structure: How much do input costs matter?
The Queensland manufacturing industry’s cost structure as at 2006–07 was:
• labour—15 per cent of total input costs (17 per cent nationally)
• capital—12 per cent of total input costs (11 per cent nationally)
• intermediate inputs (energy, materials and services)—72 per cent of total input costs (72 per cent nationally)
• taxes on production—1 per cent of total input cost. (Queensland Treasury and Trade 2012; ABS 2016m)
• Disaggregated data for intermediate inputs, or recent data for Queensland, is unavailable. However, a breakdown of input costs by subsector at the national level is provided below (Figure 3.1).
Figure 3.1 Manufacturing subsector costs as a proportion of total production costs, Australia, 2014–15
Note: Data labels for ‘taxes less subsidies’ are not shown. ‘Taxes less subsidies’ does not exceed 2.9 per cent of costs in any subsector. Disaggregated data for intermediate inputs, or recent data for Queensland, is unavailable. However, a breakdown of input costs by subsector at the national level is provided. Source: ABS 2017k.
69.6 74.9 60.0 52.1 67.7 70.6 46.0 78.6 66.1 63.9 65.7 69.9 89.1 60.6 69.4 55.4 59.6
18.0 15.3
15.3 28.2
20.6 18.4
37.2
3.1 15.3
22.0 18.7
26.8 7.8
26.3 24.5
28.0 26.2
10.9 8.8
22.2 16.8
10.2 9.9
14.7 15.5 17.5
12.4 14.0
2.0
2.3 11.4
4.6 15.1
12.4
0 20 40 60 80 100
Total Food
Beverage and tobacco Textile, leather, clothing and footwear
Wood Pulp, paper and converted paper
Printing Petroleum and coal
Chemical Polymer and rubber
Non-metallic mineralIron and steel
Non-ferous primary metals Fabricated metal
Transport equipment Machinery and equipment
Furniture and other
Proportion of costs %Intermediate Use Compensation of employees Returns to capital Taxes less subsidies

Final Report: Manufacturing in Queensland
Queensland Productivity Commission 37
Manufacturers’ input price growth has varied over time and the impact has varied across subsectors. In aggregate:
• From 1989–90 to 2016–17, the price of inputs to manufacturing rose by 2.4 per cent per annum on average.
• Input prices rose rapidly from 1998–99 to 2007–08 at an average rate of 3.6 per cent per annum (Figure 3.2). This was followed by subdued growth averaging 1.2 per cent per annum over the period 2007–08 to 2016–17.
Figure 3.2 Growth in manufacturing input prices, Australia
Notes: Growth rates calculated as average annual growth rates of each financial year. Input price trends exclude subsector labour and capital cost trends. Source: ABS 2017f. The impact of input price growth depends on how rapidly input prices were increasing relative to output prices. Some subsectors have experienced lower growth in output prices than in input prices, reducing profit margins per unit sold, particularly in metals, food, textile and furniture manufacturing.
3.2.2 Energy costs
From June 1999 to June 2017, the price of natural gas as an input to manufacturing increased by 3.4 per cent per annum on average. Electricity prices rose more markedly at 4.9 per cent per annum over the same period (Figure 3.3).
Many stakeholders have expressed concern about the rising price of electricity. CCIQ emphasised the importance of electricity for manufacturing:
In a recent CCIQ survey, 65% of businesses cited electricity price rises as a major or critical concern. Manufacturers use a diverse range of energy sources and the ability to secure long-term supply is a key factor in their decision-making on whether to invest in, grow, or close their business operations entirely. Mostly however, the provision of reliable and cost-effective electricity supply is vital to manufacturing businesses in Queensland continuing their operations. (CCIQ sub. 6, p. 18)
Similarly, the Department of State Development (DSD) identified rising resource and energy production costs as a key challenge for Queensland’s manufacturing businesses (DSD sub. 11, p. 2).

Final Report: Manufacturing in Queensland
Queensland Productivity Commission 38
Figure 3.3 Energy input costs in the manufacturing industry, Australia
Note: These energy input PPIs reflect changes in manufacturing input costs for purchases from the electricity supply and gas supply industries (ANZSIC industry codes 26 and 27, respectively). Source: ABS 2017f. The electricity futures market expects that wholesale electricity prices will fall in Queensland on average (until at least 2020) but remain above the historical spot price average (AEMO 2017a; AER 2017a).13 AEMO (2016) forecasts that the delivered wholesale price of gas in Australia will increase by 48 per cent by 2036.
3.2.3 Labour costs and quality
All else being equal, wage increases that are underpinned by labour productivity increases do not erode the international competitiveness of domestic manufacturers; however, this has not been the case in Australia.
National wages14 rose by more than 2.5 per cent per annum for all years from 1998–99 to 2013–14. Growth was more subdued in the last few years: 2.4 per cent in 2014–15; 2.1 per cent in 2015–16 and 2 per cent in 2016–17 (Figure 3.4) (ABS 2017n).15 This represents a 3.4 per cent increase per annum, on average, between 1998–99 and 2015–16.
In contrast, manufacturing labour productivity grew at only 1.4 per cent per annum, on average, between 1998–99 and 2015–16 (ABS 2016m).
Compared to a set of OECD countries (plus Taiwan), Australian manufacturing experienced the second-highest rate of growth in unit labour costs16 over the period 1998 to 2008 and the third-highest rate of growth over the period 2008 to 2015 (The Conference Board n.d.).17
13 Historical average is based on values between 1999 and 2016. 14 Calculated here using the Wage Price Index published by the ABS. 15 Wage price indexes by state and by industry are not available for Queensland. 16 Unit labour costs are defined as the cost of labour input required to produce one unit of output. 17 In contrast to this trend, real wage growth has slowed in recent years, reducing real cost growth to firms (Jacobs & Rush 2015 p. 12). Data is not yet available to determine the magnitude of this reduction in input cost growth on manufacturers. Conference board data beyond 2015 is unavailable.

Final Report: Manufacturing in Queensland
Queensland Productivity Commission 39
Figure 3.4 Manufacturing Wage Price Index, Australia
Notes: The Wage Price Index is based on total hourly rates of pay excluding bonuses. It includes all states and territories and both private and public wages. Source: ABS 2017n. Beyond the cost of labour, accessing appropriately skilled labour can be difficult. Both access to skilled labour and the changing nature of manufacturing jobs will likely create challenges for the Queensland manufacturing sector. Some stakeholders identified that accessing skilled workers was not always easy in Queensland. Moreover, significant scope exists to improve the quality of management in Australia’s manufacturing (AMGC 2017, p. 9; AMPR Team, p. 14).
3.2.4 Strong international competition
Over the last three decades, the Queensland manufacturing sector has faced increasing international competition.
The appreciation of the Australian dollar from 2000 to 2013 made it difficult for Queensland exporters to compete in international markets. The depreciation of the Australian dollar in recent years has provided some relief (Figure 3.5).
Nevertheless, Queensland’s manufacturers are operating in a global environment where:
• reduced trade barriers provide customers with more choice. At the same time, remaining barriers to trade and subsidies can prevent Queensland manufacturers from accessing some international markets
• information and communication technologies help mitigate problems associated with distance, allowing activities to be more dispersed while maintaining functional supply chains, making it easier for competition to enter domestic markets
• falling transportation costs from technological advances allow production to be moved to the lowest-cost regions
• the differences in costs between countries, particularly labour costs, make offshoring profitable (CEDA 2014, p. 33).
The Australian manufacturing sector is relatively trade-exposed. It faces about four times as much import competition as the broader market, with over 40 per cent of manufactured products imported (ABS 2017e).

Final Report: Manufacturing in Queensland
Queensland Productivity Commission 40
Figure 3.5 Real effective exchange rate, Australia
Notes: The RBA’s trade-weighted indices are calculated as a weighted geometric average of a basket of currencies chosen to account for at least 90 per cent of Australia’s two-way merchandise and services trade. Source: RBA 2017. The textile, leather, clothing and footwear (TLCF) subsector and the machinery and equipment manufacturing subsector face the greatest competition from imports (78.5 and 73.7 per cent of products consumed in Australia are imported, respectively). Metal manufacturing is the only Australian manufacturing subsector to export the majority of output (62.4 per cent) (ABS 2017k).
Queensland manufacturers will continue to face pressure from international manufacturers. Large international manufacturers are increasingly focusing on growth and expect to introduce new products and services, and enter new markets. For them, access to new markets (94 per cent of survey respondents) will be a driver of their international investments (KPMG 2016, p. 10).
3.2.5 Changing markets and consumer preferences
Consumer demand is changing (Table 3.1) through:
• rising demand from Asia, due to a growing middle class, with its associated spending power (Ernst & Young 2013, p. 8)
• a global aging population, which is shifting demand for certain products. The average consumer is slightly older, with growth among aging populations in developed markets outpacing growth of the younger demographic in emerging markets (Benson-Armer et al. 2015; ABS 2015a)
• growth in the urban consumer market, which is increasing demand for some products (such as electric vehicles) and reducing demand for products consumed in non-urban markets.

Final Report: Manufacturing in Queensland
Queensland Productivity Commission 41
Table 3.1 Identifiable market trends
New and emerging markets
Rising Asian middle class Global aging population Increased urbanisation
By 2025, 1.8 billion people will have joined the global middle class.
The global share of people aged 60 years or over increased from 9.2 per cent in 1990 to 11.7 per cent in 2013 and will reach 21.1 per cent by 2050.
In 2014, approximately 54 per cent of the world’s population lived in urban areas.
By 2030, Asia will form 66 per cent of the global middle class population and 59 per cent of middle class consumption, compared to 28 per cent and 23 per cent respectively in 2009.
The Australian population aged 65 years and over grew from 11.9 per cent in 1995 to 15 per cent in 2015.
This will increase to 66 per cent by 2050.
Sources: Manyika et al. 2012 p. 9; Pezzini 2012 p.1; United Nations 2013 pp. 38-40, 2014 p. 1; ABS 2015a. Other identifiable consumer trends include online shopping, the sharing economy, ‘ethical’ consumerism, overemployed consumers, a shift to pre-prepared food, health consciousness and customised and bespoke products.
Given the dynamic nature of preferences, simply aligning manufacturing processes and products to these emerging patterns may not result in a firm’s success. Nor do emerging consumer patterns necessarily negate the importance of traditional manufactured goods, many of which are likely to remain a consumer staple. Many other factors—beyond the product—also contribute to the success, or otherwise, of businesses.
3.2.6 A small and relatively remote market
Queensland’s relatively small market, in which the population is dispersed over a large and remote land mass, can make it difficult for manufacturers to achieve economies of scale, access markets and maintain growth.
Economies of scale may become less important over time, particularly as certain markets move away from a ‘mass production, mass consumption’ model and firms trade scale for flexibility and timeliness. However, even in this environment, scale can still be important. Due to the small size of local markets, scaling production is a challenge for Queensland manufacturers (Office of the Queensland Chief Scientist 2016a, p. 5).
Firms make location decisions based on multiple factors (Box 3.2). Proximity to market, market size and stability particularly affect the competitiveness of Queensland as a location for manufacturing. For example, locating close to markets may assist organisations to reduce freight costs, improve reliability of product delivery and understand and respond quickly to customers’ requirements (ESCIP Consortium 2014, pp. 6–7).

Final Report: Manufacturing in Queensland
Queensland Productivity Commission 42
Sources: Bartik 1985; Buettner & Ruf 2007; McIvor 2013; Bhatnagar & Sohal 2005; MacCarthy & Atthirawong 2003; McIvor 2013; Kamp 2007; ESCIP Consortium 2014; McQuaid et al. 2004; Hummels 2007; Berthelon & Freund 2004; Porter 1998; Liu et al. 2010; Frenkel et al. 2013; Tole & Koop 2011.
3.2.7 Integration with global value chains
Global value chains present opportunities, but integration can be difficult. A value chain is:
the full range of activities that firms and workers perform to bring a product from its conception to end use and beyond. This includes activities such as research and development (R&D), design, production, marketing, distribution and support to the final consumer. The activities that comprise a value chain can be contained within a single firm or divided among different firms. (Gereffi & Franandez-Stark 2016, p. 7)
A supply chain emphasises the manufacturing and distribution elements of activity, whereas the value chain includes other activities such as design, branding and customer service that add value but do not involve the physical transformation of the product (Frederick 2016).
The CSIRO in its Roadmap for Advanced Manufacturing identified supply chain transformation as one of five global megatrends that will substantially shift the social, economic, technological and environmental conditions that manufacturers operate in (CSIRO 2016, pp. 10–11). Transformations will see greater specialisation and collaboration in some markets, while in others technologies will enable vertical integration.
Boeing is an example of an entity that utilises global value chains to manufacture parts of its aircraft.
Boeing’s 787 Dreamliner sources its parts from nine countries around the world including Australia (Ro 2013). The high value of components can render shipping costs a relatively minor factor as a proportion of total costs, despite some parts being quite large and heavy.
Box 3.2 Factors influencing location decisions
Many studies have analysed the factors that affect location decisions.
Firms tend to base locational decisions on the rate of return they can achieve on an investment. The location decision is largely driven by economic factors based on a range of cost drivers, as well as social and political factors.
These factors include taxation and regulation; access to raw materials; freight costs; market proximity, size and growth; labour skills and costs; and the business operating environment.
In terms of government policy, the literature regularly cites corporate taxation as the strongest driver of production and investment location decisions.

Final Report: Manufacturing in Queensland
Queensland Productivity Commission 43
Some Queensland manufacturers have taken advantage of fragmented production by integrating with global value chains. However, on average, Australian manufacturers are thought to be poorly connected to global value chains (AMGC 2017, p. 49; CEDA 2014, p. 62).
3.2.8 Technological advancements
Technological advancements are changing the manufacturing landscape. Innovation and knowledge are increasingly determining the competitiveness, productivity and growth of manufacturing in developed countries (OECD 2012a, pp. 26-30).
Technology is advancing exponentially and this provides significant opportunity for Queensland manufacturers by reducing barriers to entry and the economies of scale necessary to compete. Small-scale local manufacturers, coupled with agile manufacturing ecosystems18, are building to order rather than building to stock, enabled through increasing the product speed to market (Hagel et al. 2015). These developments reduce the impact of Queensland’s remoteness on a manufacturer’s ability to compete on price and quality.
Business Insider has projected that the installation of Internet of Things (IoT)19 devices in global manufacturing will increase from 237 million in 2015 to 923 million in 2020 (Greenough 2016). More than a quarter of large international manufacturers have already invested in robotics, 3D printing or IoT. Most large international manufacturers are planning to invest in or are considering investing in advanced manufacturing (Figure 3.6).
Figure 3.6 Large international manufacturing businesses that anticipate investment in advanced manufacturing technologies over the next two years
Source: KPMG 2016, pp. 16, 17, 22.
Queensland manufacturers and their workers may not be well-prepared for the changes taking place globally and may lack capacity to adopt new technologies. Only 19 per cent of small and medium enterprises (SMEs) have some form of digital strategy, and ICT literacy in many SMEs is low (DSD 2016b, p. 9).
18 Manufacturing ecosystems comprise networks of manufacturers and other businesses that encourage collaboration and integration. 19 IoT is used to describe devices that are interconnected and communicate with each other through internet applications and technology.

Final Report: Manufacturing in Queensland
Queensland Productivity Commission 44
3.3 Prospects Firms are responding to these pressures in different ways. Those that have, or can, respond and adapt have a range of opportunities, but not all firms will be able to transition. Firms have developed strengths and are continuing to do so, by:
• identifying and leveraging sources of advantage—Queensland has many competitive and comparative advantages such as land, minerals and metal ores, access to Asian markets, strong institutions and an educated workforce
• providing rapid turnaround and bespoke orders—some customers will pay a premium to have a product that meets their specific requirements and/or can be delivered promptly
• focusing on quality to move up the product value chain—quality is cited by international consumers as a key reason they buy Australian products
• targeting niche markets and global value chains—specialising and developing unique products enables quality, reliability and efficiency
• using innovation to drive quality and efficiency—adopting advanced production processes and undertaking capital deepening20 can reduce costs and waste while concurrently improving quality
• combining manufactured goods with services—provides a greater opportunity to add value for the customer beyond products.
3.3.1 Manufacturers are identifying and leveraging sources of advantage
The advantages for manufacturing in Queensland are many and varied, but some stakeholders identified some common sources:
• an abundance of natural resources
• access to relatively low-cost, highly skilled workers
• proximity to growing export markets (such as India and China)
• infrastructure and supporting transport/logistical/telecommunication networks, including airports, ports and rail
• research capability and pre- and post-production activities (such as design, R&D, innovation and communications)
• liveability, amenity and an increasingly diverse population with extensive links throughout the region.
Queensland’s strengths have resulted in manufacturing outputs that are largely related to food production, minerals and metals processing and the production of machinery and equipment. These manufacturing subsectors, supported by the relative competitive and comparative advantages they enjoy, are likely to continue to produce the majority of the sector’s output for the foreseeable future. Although new manufacturing opportunities will arise, it is likely that firms in existing industries will continue to be a major contributor to growth.
20 Capital deepening is investing more in capital assets to increase the amount of capital per worker.

Final Report: Manufacturing in Queensland
Queensland Productivity Commission 45
3.3.2 Using innovation to drive quality and efficiency
Queensland manufacturers use technology and innovative production processes to deliver higher-quality products and value for money.
They are adopting advanced production processes and undertaking capital deepening, including through automation, to reduce costs and waste while concurrently improving quality. Similarly, adding value through process innovation can develop new products and markets. Watkins Steel and Sunny Queen Farms are examples of Queensland manufacturers innovating to drive quality and efficiency.
Case study: Watkins Steel
Watkins Steel is a Brisbane-based business that has been operating since 1968. It specialises in structural steel and metalwork fabrications with applications in construction, manufacturing and mining. The family-owned business employs over 70 staff who undertake steel detailing, fabricating, drafting, 3D scanning and design, estimating and installation services.
Watkins Steel management has adopted advanced process and production techniques, which has allowed it to innovate. Recognising that a lack of accuracy was costly, both to the business (in needing to undertake reworks) and its customers (in downtime and lost production), it developed a unique end-to-end digital workflow for measurement, fabrication and installation. By combining 3D technology with advanced robotics, it has largely eliminated human error in estimation, manufacturing and installation.
Its four-step linked process involves:
• taking a 3D laser scan of the site to ensure accuracy of measurement
• developing 2D shop drawings and undertaking 3D modelling
• automated and precise steel fabrication using robotics
• station set-out for on-site installation.
Watkins Steel has also started using augmented reality21 within its processes, discovering application possibilities in industry design, quality assurance, site layouts, fabrication, installation and design communication.
Utilising these advanced technologies, Watkins Steel is able to achieve near 100 per cent accuracy on every job. As a result, in 2015, it decreased operational expenditure by 40 per cent, increased employment by 10 per cent and ultimately increased net profit by 10 per cent.
Many of Watkins Steel’s employees who were previously tradesmen, such as boilermakers, have now been trained to operate new technology. While the business remains a steel fabrication and installation company at its core, the value-added benefits afforded to customers through the application of its 3D scanning technology and modelling software has allowed the company to provide specialist design and 3D laser scanning services. (Watkins Steel 2017)
21 Augmented reality is a technology that overlays a computer-generated image to a user’s view of the real world.
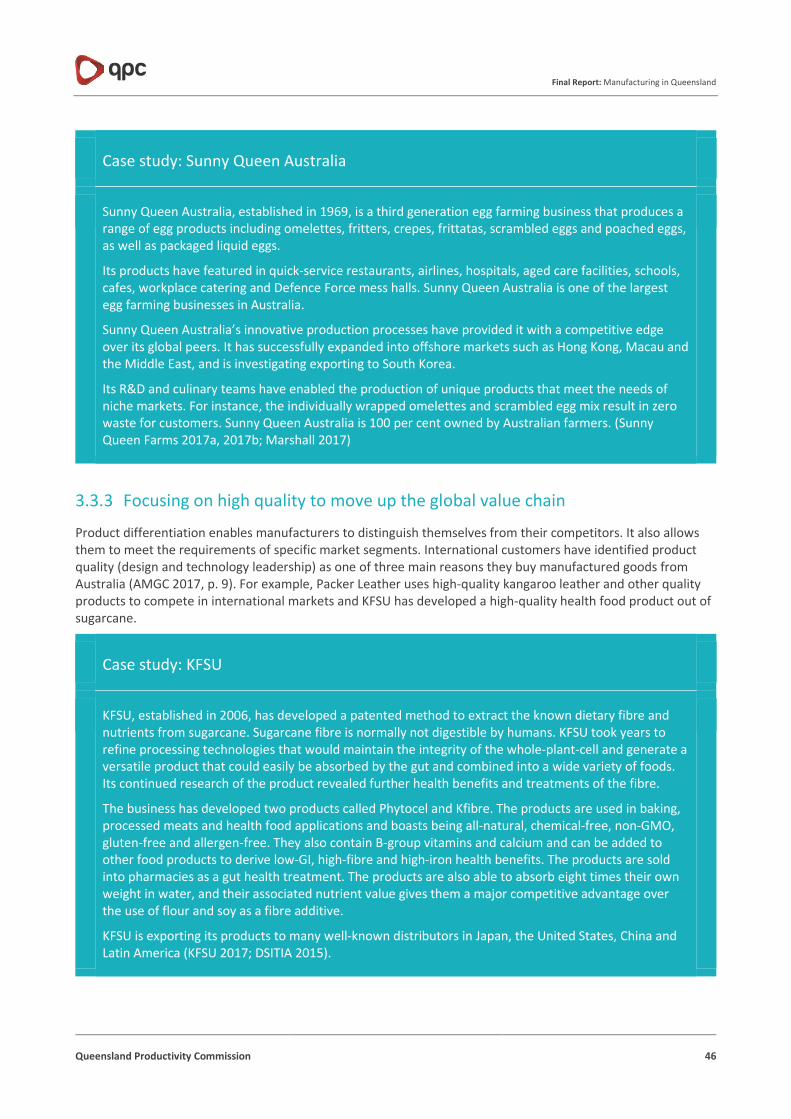
Final Report: Manufacturing in Queensland
Queensland Productivity Commission 46
Case study: Sunny Queen Australia
Sunny Queen Australia, established in 1969, is a third generation egg farming business that produces a range of egg products including omelettes, fritters, crepes, frittatas, scrambled eggs and poached eggs, as well as packaged liquid eggs.
Its products have featured in quick-service restaurants, airlines, hospitals, aged care facilities, schools, cafes, workplace catering and Defence Force mess halls. Sunny Queen Australia is one of the largest egg farming businesses in Australia.
Sunny Queen Australia’s innovative production processes have provided it with a competitive edge over its global peers. It has successfully expanded into offshore markets such as Hong Kong, Macau and the Middle East, and is investigating exporting to South Korea.
Its R&D and culinary teams have enabled the production of unique products that meet the needs of niche markets. For instance, the individually wrapped omelettes and scrambled egg mix result in zero waste for customers. Sunny Queen Australia is 100 per cent owned by Australian farmers. (Sunny Queen Farms 2017a, 2017b; Marshall 2017)
3.3.3 Focusing on high quality to move up the global value chain
Product differentiation enables manufacturers to distinguish themselves from their competitors. It also allows them to meet the requirements of specific market segments. International customers have identified product quality (design and technology leadership) as one of three main reasons they buy manufactured goods from Australia (AMGC 2017, p. 9). For example, Packer Leather uses high-quality kangaroo leather and other quality products to compete in international markets and KFSU has developed a high-quality health food product out of sugarcane.
Case study: KFSU
KFSU, established in 2006, has developed a patented method to extract the known dietary fibre and nutrients from sugarcane. Sugarcane fibre is normally not digestible by humans. KFSU took years to refine processing technologies that would maintain the integrity of the whole-plant-cell and generate a versatile product that could easily be absorbed by the gut and combined into a wide variety of foods. Its continued research of the product revealed further health benefits and treatments of the fibre.
The business has developed two products called Phytocel and Kfibre. The products are used in baking, processed meats and health food applications and boasts being all-natural, chemical-free, non-GMO, gluten-free and allergen-free. They also contain B-group vitamins and calcium and can be added to other food products to derive low-GI, high-fibre and high-iron health benefits. The products are sold into pharmacies as a gut health treatment. The products are also able to absorb eight times their own weight in water, and their associated nutrient value gives them a major competitive advantage over the use of flour and soy as a fibre additive.
KFSU is exporting its products to many well-known distributors in Japan, the United States, China and Latin America (KFSU 2017; DSITIA 2015).

Final Report: Manufacturing in Queensland
Queensland Productivity Commission 47
Case study: Packer Leather
Packer Leather was established in 1891 and is the last remaining leather tannery in Queensland.
To differentiate itself, Packer Leather began producing kangaroo skins, thereby carving out its own market niche. It is recognised worldwide for its locally sourced, high-performance kangaroo leathers, which provide superior strength and softness while being naturally thin. Through taking advantage of the properties of the leather's fibre, the company established a market niche for itself in fit-for-purpose products, including footwear, garments and gloves.
While competitors now also process kangaroo skins, Packer Leather has maintained itself as a market leader with a reputation for quality and innovation, based on its exclusive tanning technologies that complement the natural characteristics of the leather. Packer Leather produces waterproof, abrasive resistant, breathable, fire retardant, UV reflectant, anti-microbial and identifiable leather products.
The business exports to 19 countries and supplies world-leading sports shoe brands (Lee 2014). Domestically, Packer Leather supplies renowned brands such as Kookaburra Sport, RM Williams, Akubra, Sherrin, Rip-curl and Florsheim. Prior to shipment, its products are tested in the company’s in-house laboratory to ensure that they are fit for purpose and meet relevant international specifications. The company is committed to maintaining the environment, through its use of a renewable natural resource and by ensuring that it meets rigorous environmental standards that are subject to independent audit. It also makes use of solar power to reduce its energy consumption and recycles at least 40 per cent of the water used in production (Packer Leather 2017).
3.3.4 Providing rapid turnaround and bespoke orders
For some manufacturers, their competitive advantage stems from their ability to manufacture products quickly for customers who are willing to pay a higher price for expediency. This willingness to pay may mitigate high local-production costs, and a preference for customer involvement may advantage local producers, who can more easily provide this service.
While the removal of trade barriers has seen a contraction in traditionally protected industries, such as the TCF, some firms have remained competitive. Beaulieu Pacific is an example of a Queensland manufacturer whose focus on high quality and rapid turnaround has kept it competitive.

Final Report: Manufacturing in Queensland
Queensland Productivity Commission 48
Case study: Beaulieu Pacific
Beaulieu Pacific is a manufacturer of jacquard fabrics22 for commercial and residential use. The company has been weaving fabrics in Brisbane since 1989. The company is a wholesaler throughout Australia and New Zealand that is focused on:
• • high quality
• • flexibility and adaptability
• • exceptional customer service
• • minimising environmental impacts.
A team of 45 employees including specialist weavers, technicians and three in-house designers enables the company to quickly produce and take to market new products. The company can turn around new products within a couple of weeks, whilst the process allows for instantaneous customer feedback and input. Large international competitors, on the other hand, can take several months to develop and deliver the product required.
Beaulieu Pacific is part of Belgotex International and has a working relationship with Beaulieu Fabrics in Belgium, providing its customers with direct access to the latest European design and colour trends whilst enjoying the benefits of face-to-face interactions with a local Australian manufacturer (Beaulieu Pacific 2017).
3.3.5 Targeting global value chains and niche markets
Firms have developed competitive advantages by targeting niche markets and leveraging green/ethical branding or the high-tech, high-quality end of global value chains. The Australian Automotive Aftermarket Association illustrates how the automotive industry is contributing to global value chains.
22 Jacquard fabric features raised patterns that are woven (instead of printed) into the fabric.

Final Report: Manufacturing in Queensland
Queensland Productivity Commission 49
Case study: The Australian Automotive Aftermarket Association
The Australian Automotive Aftermarket Association represents manufacturers, distributors, wholesalers, importers and retailers of automotive parts, accessories and services.
Through collaboration, innovation, quality, flexibility and punctuality, manufacturers in Australia have earned an enviable international reputation. The industry produces suspension components, roof racks, tow bars, side steps, performance parts and other aftermarket products, which are sold both in Australia and overseas. The industry has focused on moving up the value chain, specialising in products with a technological advantage such as 4WD, high-performance and motorsport components. These are shipped and used around the globe as part of other businesses’ global value chains (AAAA sub. 10, p. 5). This has enabled many businesses to thrive despite the recent closures of large Australian car manufacturers.
Niche markets provide significant opportunities for Queensland manufacturers. For example, Full Circle Fibres reaches the niche market of customers who want to know the full production journey of their fabric products. This is done by attaching a record to its products so that customers can ‘create with a conscience,’ knowing exactly where their products are sourced and how. Full Circle Fibres manages and coordinates complex supply chains to maintain this high quality and traceability. The business is responding to growing demand for integrity in fabric products (Full Circle Fibres 2017).
Grove Juice, one of the largest Australian-owned fresh fruit juice processors headquartered in Brisbane, tests every batch in its lab to ensure its juice meets its stringent quality specifications. The juice is then distributed chilled throughout Grove Juice's cold-chain distribution network. This high-quality product has been popular both locally and internationally (Grove Juice 2017).
3.3.6 Combining manufactured goods with services to create a local advantage
Some manufacturers are expanding their product offering beyond the manufactured product to encompass associated services that add value. These associated services may include customisation, maintenance, replacement, sales, insurance, financing, distribution and more.
Increasingly, manufacturers are personalising their services and products. There is a shift towards mass customisation or personalisation, rather than mass production. For instance, stores are now offering personalised packaging for products. Similarly, new technology allows for the local printing of precision parts for repair and maintenance. This allows firms to provide a broader and more comprehensive product and service offering for their customers.
The Herston Health Precinct in Brisbane is an example of such customisation. The Precinct is dedicating two floors to be converted into a hub for medical engineers to collaborate, use 3D printers and undertake tissue engineering (Halverson 2017). This location places the facility close to patients who are likely to require these services.
Manufacturers are responding to customer's needs through customisation and personalisation. Surgical Engineering Queensland is a firm offering personalised product development and product service support for its customers. Surgical Engineering Queensland has been designing and manufacturing wheelchairs in Australia for over 35 years. The company makes everything from day wheelchairs to top-of-the-range racers and handcycles. All chairs are custom-made and fitted to individual specifications and preferences (Surgical Engineering 2017).

Final Report: Manufacturing in Queensland
Queensland Productivity Commission 50
3.4 Conclusion This chapter explores factors which place pressures on the competitiveness of the manufacturing industry and individual manufacturers in Queensland. These factors include high input costs; strong global competition; geographical constraints, new markets and changing consumer patterns; technological advancements; tax and regulation; and access to appropriately skilled labour.
Manufacturers are responding to these pressures in different ways—some, but not all, will embrace new opportunities. Many Queensland manufacturers are developing strengths through identifying and leveraging sources of advantage, producing unique, high-quality products, providing value for money through efficiency, and bundling manufactured goods with services.
There are many successful manufacturers across Queensland, with some operating in unexpected areas of manufacturing. However, not one standalone exemplary segment of manufacturing in Queensland has been identified—competitive manufacturers have shown up in many different subsectors. Competition has driven these manufacturers to identify and build their competitive strengths.

Final Report: Manufacturing in Queensland
Queensland Productivity Commission 51
4.0 Government policies and programs

Final Report: Manufacturing in Queensland
Queensland Productivity Commission 52
Government policies and programs influence outcomes in Queensland’s manufacturing sector—by shaping the general business environment and influencing firms’ and workers’ decisions.
This chapter provides an overview of the existing policies and programs that manufacturing businesses might use, have access to, or would otherwise be impacted by, and discusses what role the government can play in the manufacturing sector.
Key points
1 Manufacturers are affected by a broad range of government policies and programs across all levels of government. These policies are often not specifically directed at the manufacturing sector.
• Like all businesses, manufacturers are influenced by framework policies that shape the overall business operating environment and the economy more broadly.
• More targeted policies include grants or subsidies; trade barriers; industry facilitation and support programs; programs to bolster research, increase collaboration and accelerate commercialisation; and education and skills development programs.
2 It is difficult to assess whether existing policies and programs are effective or efficient.
• Many policies and programs are new (performance information is therefore limited or unavailable).
• Specific challenges may arise when programs are dealing with complex and dynamic processes, which can have lags between implementation and outcome.
• More generally, a lack of information on policy failures lends itself to a lack of balanced reviews on the effectiveness of policy programs.
3 The Queensland Government can influence the Queensland manufacturing sector’s future growth.
4 Getting the fundamental policy and program settings right is the best way to help all businesses and workers (including those in the manufacturing sector) to achieve their potential.
5 Direct intervention should be limited to policy problems that require a government response (that is, where the market clearly fails to produce the best outcome) and where a government response will improve outcomes (where benefits outweigh the costs).
6 The Queensland Government should be particularly cautious when attempting to develop new ‘strategic’ industries or sustain industries in decline. There is no convincing link between targeted government aid for an industry and the performance of that industry—and history details many costly failures.
7 Best-practice policy design, implementation and review will help focus Queensland Government efforts.

Final Report: Manufacturing in Queensland
Queensland Productivity Commission 53
4.1 A brief history of manufacturing policy Following federation in 1901, the Australian Government adopted an array of trade protection policies, in the form of tariffs, quotas and subsidies to support local industry. State governments supported trade barriers with regulatory restrictions on competition, and subsidised services and infrastructure.
By the 1970s and 1980s, there was growing evidence that trade barriers were making a significant contribution to Australia’s economic malaise and greater recognition that:
• as a small open economy, Australia is a price-taker for many goods and services, so must enable markets to work to ensure the most efficient allocation of resources
• government funding of social programs depended on having an efficient and productive economy (Banks 2005, p. 17).
What followed was a progressive opening of the Australian economy—and a marked fall in measured assistance to the manufacturing sector. The effective rate of assistance23 for manufacturing fell from around 35 per cent in 1970–71 to around 4 per cent in 2015–16 (Figure 4.1).
Figure 4.1 Effective rates of assistance to manufacturing and agriculture, 1970–71 to 2015–16
Note: Agriculture refers to selected agriculture activities up to and including the year 2000–01. From 2001–02, estimates refer to division A of the Australian and New Zealand Industrial Classification which covers agriculture, forestry, fishing and hunting activities. Source: PC 2017a, p. 35.
The opening of the Australian economy, together with other economic reforms, saw a significant rise in Australia’s per capita GDP ranking (Figure 4.2).
23 The effective rate of assistance measures the net combined assistance to a particular industry (including budgetary outlays, tax concessions and tariffs) in proportion to that industry’s unassisted net output (value added). It provides an indication of the extent to which assistance to an industry enables it to attract and hold economic resources relative to other sectors (PC 2017a, p. 30).

Final Report: Manufacturing in Queensland
Queensland Productivity Commission 54
Figure 4.2 Fall and rise of Australia’s economy, Australia’s international ranking in GDP per capita
Source: World Bank 2016a. The lowering of trade barriers has, however, precipitated an increase in other forms of intervention such as budgetary assistance through subsidies and tax concessions (including to support innovation), as well as government purchasing preferences and regional adjustment initiatives (PC 2016b, 2017a; QCA 2015a). Emerging influences seen domestically and abroad have put a renewed emphasis on reinvigorating manufacturing, including some calls for the return of measures that support, maintain or develop capabilities in key sectors, even where otherwise the sector would not be competitive.
4.2 Current policy landscape Policies and programs that impact manufacturing are delivered by all levels of government and include:
• framework policies that shape the overall business operating environment and the economy more broadly
• assistance that is more closely targeted, including grants, subsidies, and concessions.
In 2014–15, 15.5 per cent of manufacturing businesses in Australia received some type of government financial assistance. Except for ongoing funding, a larger share of manufacturing businesses reported receiving government financial assistance than the share of businesses generally (ABS 2016c). That said, it is likely that overall figures mask large variations between different manufacturing subsectors.
4.2.1 Australian Government policies and programs
In 2015–16, Australian manufacturers received an estimated $6.2 billion in net assistance (PC 2017a, p. vi), largely due to tariff protection, but also through industry programs and policies (Box 4.1). It is not possible to disaggregate how much assistance is provided to Queensland manufacturing businesses through these programs.
R&D tax incentive
The R&D tax incentive aims to encourage R&D activity that would not otherwise occur and to incentivise small companies to engage in R&D (Australian Government 2015). It allows eligible companies to receive a refundable tax offset for R&D activities. This offset can be as much as 43.5 per cent, when aggregated turnover is less than $20 million.

Final Report: Manufacturing in Queensland
Queensland Productivity Commission 55
Sources: PC 2017a, pp. 20, 26; AMGC 2016; Macfarlane 2015a, 2015b; Hunt 2016; Commonwealth of Australia 2017a, p. 129.
Export market grants and assistance
Export Market Development Grants (EMDGs) encourage small and medium-sized Australian businesses to develop export markets by reimbursing up to 50 per cent of eligible export promotion expenses. Each eligible applicant can receive the grant up to eight times (QCA 2015a). In addition, the Australian Trade and Investment Commission provides resources to navigate trade agreements online, and grants are available to assist with entering new export markets.
The Industry Innovation and Competitiveness Agenda
The Industry Innovation and Competitiveness Agenda has six key initiatives designed to promote industry innovation and competitiveness:
• encouraging employee share ownership
• reforming the vocational education and training (VET) sector
• promoting science, technology and mathematics skills in schools
• accepting international standards and risk assessments for certain product approvals
Box 4.1 Australian Government assistance to manufacturing
The Australian Government assists industry through an array of government programs, regulatory instruments and policies. Key policies and programs relevant to manufacturing include:
• import tariffs—which raise the price of imported products allowing competing domestic firms to charge higher prices including for food, beverages and tobacco (providing an estimated $2 billion of assistance), metal and fabricated products ($1 billion), petroleum, coal, chemical and rubber products ($0.6 billion)
• tax concessions (providing an estimated $446 million of assistance)—including the R&D tax offset that reimburses some of the costs of R&D to organisations through a tax offset
• Growth Fund (with $101 million of Australian government funding)—a partnership between government and industry to support employees, businesses and regions affected by the closure of Australia’s car manufacturing industry, including assisting automotive supply chain firms to add new products and customers and drive new non-automotive business activities
• Advanced Manufacturing Fund (with $101.5 million of Australian government funding)—to promote research and capital development for high-technology manufacturing businesses
• Industry Growth Centres—including establishing the Advanced Manufacturing Growth Centre (located in Victoria) to link manufacturers with global companies; identify future job and skills needs; develop an innovation pipeline; and identify regulatory reforms
• Innovative Manufacturing Cooperative Research Centre (with $40 million of Australian government funding)—to develop and support ‘manufacturing innovation’ in Australia
• numerous business grants available to manufacturing and free trade agreements.

Final Report: Manufacturing in Queensland
Queensland Productivity Commission 56
• enhancing the 457 and investor visa programs24
• establishing Industry Growth Centres (Box 4.2) (DIIS 2014, p. vii).
Source: DIIS 2017a.
Procurement policy
The Australian Government’s procurement rules require that all suppliers be treated equitably (based on their commercial, legal, technical and financial abilities) and not be discriminated against due to their size, degree of foreign affiliation or ownership, location or the origin of their goods and services (DoF 2017b, p. 13). The Australian Government does, however, seek to assist entities in identifying procurement opportunities. The Department of Defence’s Australian Industry Capability program, for example, helps Australian companies identify opportunities in supplying Australian Defence Force projects (Department of Defence 2017).
24 The Australian Government is undertaking substantial reform of the types of visas available, including abolishing the 457 visa and replacing it with a new Temporary Skill Shortage visa in March 2018 (DIBP 2017a).
Box 4.2 Industry Growth Centres
The Industry Growth Centres are designed to help industries transition into ‘smart, high value and export focused industries’. The Australian Government has allocated $250 million in funding over four years (2016–17 to 2019–20) to this initiative. It has established six growth centres around the following industry sector priorities:
Advanced Manufacturing Cyber Security Food and Agribusiness
Medical Technologies and Pharmaceuticals
Mining Equipment, Technology Services
Oil, Gas and Energy Resources
The growth centres are not-for-profit organisations—led by a board of industry experts—which have been tasked to:
• identify regulations that are unnecessary, overly burdensome and impede their ability to grow, and suggest possible reforms
• improve engagement between research and industry, and within industry, to achieve stronger coordination and collaboration of research and stronger commercialisation outcomes in the key growth sectors
• improve the capability of the key growth sectors to engage with international markets and access global supply chains
• identify ways to improve the management and workforce skills of key growth sectors.
Each centre has been tasked to set a long-term strategy for its sector in a Sector Competitiveness Plan, which outlines how to lift capability, boost productivity and skills, create jobs, reduce regulation and engage with international opportunities.

Final Report: Manufacturing in Queensland
Queensland Productivity Commission 57
4.2.2 Queensland Government policies and programs
The Queensland Government is seeking to ‘create jobs and a diverse economy’ through policies and programs that foster entrepreneurship and innovation; promote business investment and exports; deliver and facilitate productive infrastructure; grow human capital; optimise the use of land and natural resources; and lead an innovative, active and responsive public sector (Queensland Treasury 2017b, p. 8). Within this framework, the government is committed to growing manufacturing as a critical driver of innovation and productivity in the Queensland economy (DSD 2016a, p. 1).
Queensland manufacturing businesses and workers have access to a broad set of Queensland Government policies and programs (Figure 4.3) to support small business, encourage innovation and improve education and training outcomes. These include:
• the $420 million Advance Queensland initiative—aims to reinvigorate science and innovation to create the knowledge-based jobs, increase collaboration between research bodies and industry to translate ideas and research into commercial outcomes, and boost Queensland’s entrepreneurial culture
• the new Queensland Procurement Policy (QPP)—aims to prioritise Queensland businesses and support local jobs in regional communities, by applying a 'local benefits' test for all significant procurement and ensuring 'full, fair and reasonable opportunity' for Queensland suppliers, including local suppliers and small businesses
• the Queensland Trade and Investment Strategy 2017-22—seeks to position Queensland as an innovative and dynamic trading economy by building on Queensland’s existing strengths and further diversifying the economy; building export capabilities and fostering export opportunities; and attracting job-creating investment
• funding under the Annual VET Investment Plan—contributes to the cost of vocational education and training
• policies and programs designed to support employment and regional growth—such as the $177.5 million Back to Work Regional Employment package and elements of the $240 million Skilling Queenslanders for Work program (Queensland Treasury 2017b, p. 15).
The Queensland Government also provides significant assistance to manufacturers through tax concessions that are available to all Queensland businesses. The Queensland Competition Authority (QCA) estimated that from 2013–14 to 2017–18 the manufacturing sector would receive $946 million of payroll tax concessions, including $167 million for wages for apprentices and trainees (QCA 2015a, pp. 52, 56).
The uptake of Queensland Government programs by manufacturing businesses or workers is not available—neither is information on whether there are any particular benefits that might accrue to the manufacturing sector.
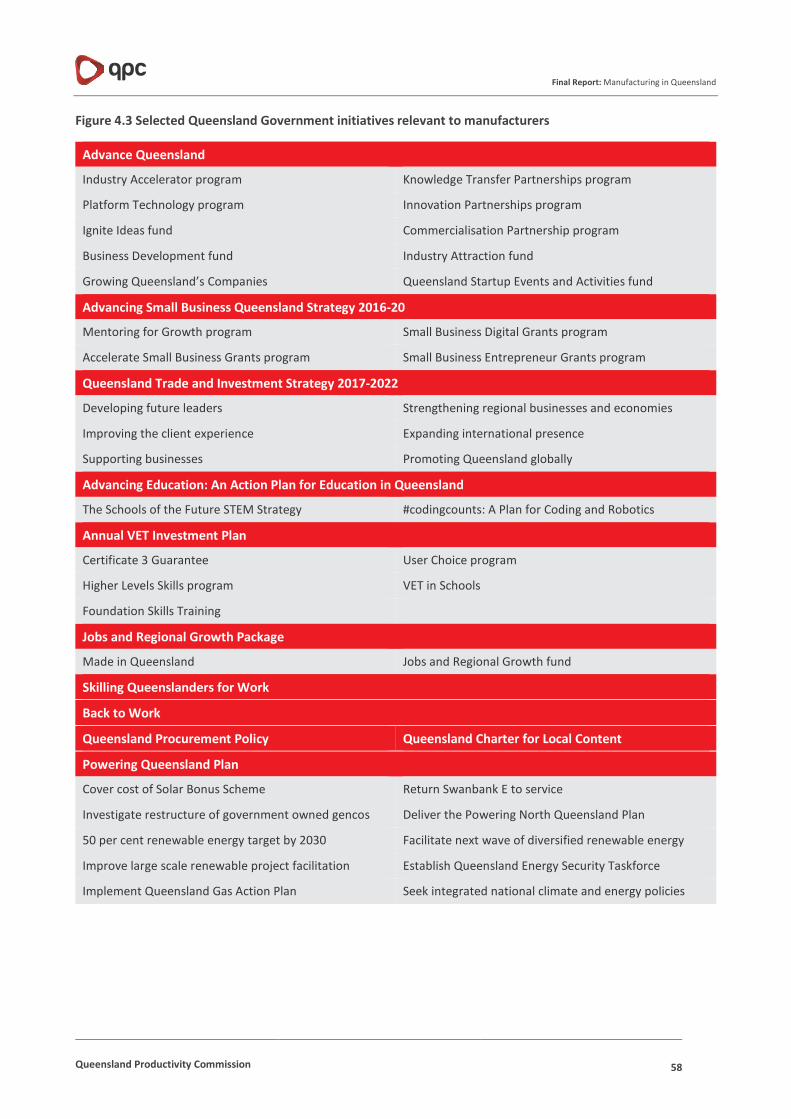
Final Report: Manufacturing in Queensland
Queensland Productivity Commission 58
Figure 4.3 Selected Queensland Government initiatives relevant to manufacturers
Advance Queensland
Industry Accelerator program Knowledge Transfer Partnerships program
Platform Technology program Innovation Partnerships program
Ignite Ideas fund Commercialisation Partnership program
Business Development fund Industry Attraction fund
Growing Queensland’s Companies Queensland Startup Events and Activities fund
Advancing Small Business Queensland Strategy 2016-20
Mentoring for Growth program Small Business Digital Grants program
Accelerate Small Business Grants program Small Business Entrepreneur Grants program
Queensland Trade and Investment Strategy 2017-2022
Developing future leaders Strengthening regional businesses and economies
Improving the client experience Expanding international presence
Supporting businesses Promoting Queensland globally
Advancing Education: An Action Plan for Education in Queensland
The Schools of the Future STEM Strategy #codingcounts: A Plan for Coding and Robotics
Annual VET Investment Plan
Certificate 3 Guarantee User Choice program
Higher Levels Skills program VET in Schools
Foundation Skills Training
Jobs and Regional Growth Package
Made in Queensland Jobs and Regional Growth fund
Skilling Queenslanders for Work
Back to Work
Queensland Procurement Policy Queensland Charter for Local Content
Powering Queensland Plan
Cover cost of Solar Bonus Scheme Return Swanbank E to service
Investigate restructure of government owned gencos Deliver the Powering North Queensland Plan
50 per cent renewable energy target by 2030 Facilitate next wave of diversified renewable energy
Improve large scale renewable project facilitation Establish Queensland Energy Security Taskforce
Implement Queensland Gas Action Plan Seek integrated national climate and energy policies

Final Report: Manufacturing in Queensland
Queensland Productivity Commission 59
Several agencies provided information to the Commission that suggest a positive contribution by their programs. For example:
• participants in the Mentoring for Growth program have consistently reported improvements in employment, turnover and gross profits of businesses involved in the program, more than what would be expected from businesses in general (DTESB 2017a)25
• in 2015–16, the VET Investment Plan provided $33.2 million for manufacturing-related apprenticeships and traineeships under the User Choice program and $14 million for manufacturing-related Certificate Level III and higher-level qualifications under the Certificate 3 Guarantee and Higher Levels Skills program (DET 2017a)26
• 23 of the 29 projects currently being managed through the Advance Queensland Industry Attraction fund are related to manufacturing (DSD 2017a)
• manufacturing firms have accessed Advance Queensland Initiatives, including for projects seeking to:
− translate incremental sheet forming to market (under the Innovation Partnerships program)
− use battery storage to extend product range and develop new markets in the energy industry (under the Knowledge Transfer Partnerships program)
− develop low-cost wireless sensors to monitor mining and sugar industry equipment (under the Knowledge Transfer Partnerships program) (DSITI 2017).
The Queensland Government also provides support and advice to firms, including manufacturers, looking to invest in, establish or expand operations in Queensland (Figure 4.4). This is provided by Trade and Investment Queensland (with a focus on international investors) and the Department of State Development (DSD) (with a focus on attracting interstate companies and projects to Queensland and assisting Queensland-based companies with expanding their existing operations) (DSD sub. 11, p. 9; DSD sub. DR2, p. 3; TIQ n.d.).
Figure 4.4 Examples of support services provided by government
DSD support is provided to projects that:
• will make a significant contribution to the Queensland economy
• require multiple approvals and active facilitation across governments and stakeholders
• are complex or sensitive
• respond to a recognised regional need (DSD sub. 11, pp. 9–10).
Under these arrangements, case managers address issues that may inhibit a project’s establishment or expansion; ensure a coordinated approach; and provide a diverse suite of skills and experience to assist clients (DSD sub. 11, p. 10).
25 The Commission was advised that around 40 per cent of businesses that register for Mentoring for Growth are manufacturing businesses (DTESB 2017a). 26 The year to date expenditures (as at December 2016) are $12.7 million for the User Choice program and $10.3 million for Certificate 3 Guarantee and Higher Levels Skills program (DET 2017a).

Final Report: Manufacturing in Queensland
Queensland Productivity Commission 60
DSD also supports local businesses to obtain full, fair and reasonable access to tender opportunities for government work (DSD sub. 11, p. 7). This includes assisting companies to build their capacity and capability to enter the supply chain, assisting buyers to find capable local suppliers, and ensuring legislative compliance (DSD sub. DR2, pp. 2–3).
The Queensland Trade and Investment Strategy provides for a new concierge and case management service, to assist firms to navigate government services related to investing in Queensland (Queensland Government 2017f, p. 39; DSD sub. DR2, p. 4).
4.2.3 A focus on manufacturing — targeted programs
The Queensland Government provides targeted programs and initiatives that are directly relevant to Queensland’s manufacturers. This can include packaging investment assistance and facilitation for specific firms or projects (including through offering financial support and grants, land and payroll tax concessions, and assistance in finding suitable land for the project concerned). For example, the Queensland Government has been working closely with the two companies shortlisted by the Australian Government for its Land 400 contract27, to secure Queensland as the location to build and maintain armoured vehicles (Lynham 2017e; Palaczszuk & Lynham 2017).
Advance Queensland 10-year roadmaps and action plans
DSD is working with industry to develop a series of 10-year industry roadmaps and action plans as part of the Advance Queensland program. The roadmaps and action plans seek to articulate a vision for, and shape the ongoing growth of, identified emerging and priority sectors (DSD 2017b).
To date, roadmaps and action plans have been developed for biofutures, mining equipment, technology and services and for advanced manufacturing (Box 4.3), with implementation underway.
A key element of the biofutures roadmap is the Biofutures Acceleration program, which aims to attract and support development of commercial-scale biorefinery projects in the state. Through this program, the Government announced it would provide financial assistance to fast-track development and construction of facilities in Mackay (Pitt & Lynham 2017), Dalby (Lynham 2017f) and Yarwun (Palaczszuk & Bailey 2017). The program was also used to support US biotechnology company Amyris’s recent decision to develop a biorefinery in regional Queensland (Palaczszuk 2017).
Roadmaps for aerospace, biomedical and life sciences and defence are also being developed (DSD 2017b).
Industry and Manufacturing Advisory Group (IMAG)
IMAG was established to help position Queensland manufacturing businesses to maximise domestic and international opportunities, including through the development and implementation of the 10-Year Advanced Manufacturing Roadmap and Action Plan (DSD 2017i).
27 Rheinmetall and BAE Systems

Final Report: Manufacturing in Queensland
Queensland Productivity Commission 61
Sources: DSD 2016a, 2017a; Pitt & Lynham 2016.
Made in Queensland (MIQ)
Made in Queensland (MIQ) provides $20 million in grant funding across two years to support small and medium-sized manufacturers in Queensland to become more internationally competitive and adopt innovative processes and technologies (DSD 2017a, 2017c).
The program requires manufacturing businesses to measure their business performance against international best practice and provide an action plan across a broad range of business capability areas to improve their international competitiveness (Figure 4.5).
28 These are community spaces offering public, shared access to high-end manufacturing equipment.
Box 4.3 10-Year Advanced Manufacturing Roadmap and Action Plan
The 10-Year Advanced Manufacturing Roadmap and Action Plan outlines ‘a path for the growth of advanced manufacturing, fostering the continued transition of existing manufacturers into world-class advanced manufacturers and creating high paid, sustainable jobs for Queenslanders’.
The focus is on supporting advanced manufacturers to expand their businesses and assisting traditional manufacturers to adopt advanced manufacturing approaches.
The plan identifies key areas of competitive strength and opportunity for advanced manufacturing in: aerospace; automotive and transport; biomedical and life sciences; defence; food and beverage processing; industrial biotechnology and bioproducts; mining equipment, technology and services; precision agriculture; and renewable energy.
It provides $7.6 million over three years (2016–17 to 2018–19) based around three strategies.
Increase productivity and international competitiveness
Target the adoption/adaption of innovative technologies and processes
Promotion and marketing (domestic and international)
It includes:
• $1.5 million program of workshops on robotics and digital business capability
• $0.55 million for hacker/maker spaces28 to connect manufacturers with ideas and innovations
• $0.7 million for workshops to encourage manufacturers to use design and engineering analysis software, new materials and advanced manufacturing techniques
• $0.9 million to improve manufacturers’ energy efficiency and produce stronger environmental outcomes
• $0.25 million to get more young people into manufacturing careers.

Final Report: Manufacturing in Queensland
Queensland Productivity Commission 62
Figure 4.5 Made in Queensland program business capability areas
An MIQ grant will reimburse up to 50 per cent of the cost of implementing business capability improvements.
Grants will range from $50,000 to $2.5 million (in matched funding on a dollar-for-dollar basis) with a maximum of four grants, to a total of $2.5 million for an individual business.
The project must focus on boosting productivity and international competitiveness, leading to improved commercial outcomes and contributing to the creation of high-skilled jobs.
Each grant will be under the supervision of a case manager who will monitor the business throughout the length of the project. Businesses must also provide an assessment of the results of the grant against the improvements identified in the benchmark report.
The MIQ program was announced as part of the 2016–17 Mid-Year Fiscal and Economic Review under the Jobs and Regional Growth package (Queensland Treasury 2016c). By May 2017, more than 160 Queensland manufacturing firms had completed the first stage of the program, with more than 20 being assessed for grants (Lynham 2017a).
4.2.4 Local government policies and programs
Local governments also run programs available to manufacturers. These include:
• providing grants and incentives for firms seeking to start, expand or locate the businesses
• investment attraction teams and business specialists to assist with starting a new business, expansion, relocating, seeking training, discussing plans, connecting with resources, networking, identifying local business growth opportunities, and complying with legislation
• establishing start-up hubs as co-working spaces for new businesses
• ‘buy local’ policies—where local councils identify and seek quotes from local business suppliers29
• trade mission events.
Variations of these programs are running in larger cities as well as some regional areas. Some of these policies overlap with the Australian and Queensland government policies.
4.3 What is the role for government? This inquiry has been asked to consider policy options to improve the productivity and competitiveness of the manufacturing sector in Queensland.30
Stakeholders generally saw a role for government in facilitating the ongoing growth of the manufacturing sector.
29 Subject to requirements under the Local Government Act 2009 and Local Government Regulations 2012 for councils to adhere to Sound Contracting Principles for the discharge of public money. 30 The question of whether, when and how governments should become involved in the manufacturing sector has been debated at length. See, for example, Pack and Saggi (2006).

Final Report: Manufacturing in Queensland
Queensland Productivity Commission 63
Most said governments should focus on the general business operating environment and leave the market and competitive forces to shape the development of the industry. A key priority was having access to affordable and reliable energy supply. Stakeholders also highlighted ‘burdensome regulatory requirements’ that can unnecessarily constrain business decisions, and the importance of comprehensive tax reform and delivering reliable infrastructure and transport networks.
Others, however, supported a more active government role in the sector—particularly in the areas of innovation, training and skills, and procurement—to better support businesses, workers and communities in a challenging and changing market.
It has become abundantly clear that the nature and complexity of the issues surrounding manufacturing’s transition to the new economy, requires a comprehensive whole-of government intervention, partnering with both business and unions. The question should no longer be whether governments should intervene, but how they should intervene. (AMWO sub. DR1, p. 7)
There is a role for government in supporting workforce transition associated with structural adjustment, both in specific industry and regional contexts and across the economy more broadly … support directed at supporting employees impacted by structural adjustment, be it through (re)training and/or broader measures, should be considered a high priority. (Jobs Queensland sub. DR7, p. 3)
In considering how the Queensland Government can best support the manufacturing sector, the Commission recognises that:
• manufacturing firms, workers and consumers—rather than government—drive the success of the sector, particularly when competition drives productivity growth in markets31
• the nature of many of the challenges facing manufacturers means these may be best addressed on a national level (Box 4.4).
Within this context, the fundamental role for government is to put in place a robust system of laws, policies and institutions to enable markets to work efficiently (including secure property rights, rule of law and core public services). For the Queensland Government, this means setting state policies that allow businesses, including manufacturers, to capitalise on existing strengths and opportunities. It also means working with the Australian Government and other states and territories to influence national reforms, and working with local governments to address local agendas.
Beyond this, there can be an ‘in-principle’ case to intervene in markets to protect against (or correct) market failures. For manufacturing, these failures primarily relate to:
• addressing knowledge spillovers—where firms are unable to capture privately the full returns from their own R&D, reducing incentives for the industry to undertake a socially optimal level of R&D
• overcoming information failures in the market—for example, when consumers have insufficient information to make optimal consumption decisions (for example, food safety).
Governments may become involved to address ‘systems failures’ that are a result of the complex interactions between institutions, enterprises and people. For example, the networks of firms, universities, research institutes and governments (and the people within them) support the flows of technology and information that are key to the innovative process. Governments also provide assistance to facilitate community adjustment and recovery in response to structural change, often on the grounds of equity or fairness.
31 Competitive pressures increase productivity by providing incentives for resources to be allocated to their highest value use (allocative efficiency); goods and services to be produced at least cost (productive efficiency); and innovation and investment to occur in a timely way to meet changes in consumer tastes and in productive opportunities (dynamic efficiency).

Final Report: Manufacturing in Queensland
Queensland Productivity Commission 64
Even where there is an in-principle case to intervene, governments should demonstrate this is likely to do more good than harm. Government intervention is not without costs and may create distortions that introduce new inefficiencies or have unintended impacts. Moreover, markets may, without intervention, move to a desirable solution over time, especially when they are experiencing fundamental change that provides a powerful stimulus (and opportunity) for firms to seek out new opportunities and improve business practices.
Sources: National Commission of Audit 2014; PC 2006.
Box 4.4 Whose responsibility? Assigning functions between levels of government
In principle, the appropriate level of government for a function should reflect:
• sovereignty—as far as practicable, each level of government should be sovereign in its own sphere, and activities should be allocated to one level of government only
• subsidiarity—as far as practicable, policy and service delivery should be devolved to the level of government closest to the ultimate clients, to allow programs to be tailored to meet community needs
• fiscal equivalency—those who benefit and those who bear the cost of a policy should coincide within a geographic boundary to avoid the over-or under-provision of programs.
While there might be no single ‘best’ model for assigning functions between governments, it is likely that policy oversight for the Australian Government will be appropriate where:
• there are significant interjurisdictional spillovers associated with the provision of a good or service at the sub-national level (for example, interstate transport systems)
• there are readily identifiable areas of shared or common interest or sizeable economies of scale and scope arising from central provision or organisation (for example, defence, and social welfare support)
• a diversity in rules or regulations is likely to give rise to high transaction costs with insufficient offsetting benefits (for example, regulation of companies, transport, the financial sector and trading provisions covering weights and measures)
• there is scope for mobility of capital and people across jurisdictions to undermine the fiscal strength of the sub-national level of government (for example, as arises with the income, capital gains and corporate tax bases or with welfare entitlements).

Final Report: Manufacturing in Queensland
Queensland Productivity Commission 65
Other reasons put forward in favour of intervening in the manufacturing sector are not strong. For example, providing:
• specific incentives for firms to locate operations in particular regions can support regional economies and regional development—but this is unlikely to lead to a net increase in output. It is more likely to simply shift economic activity between regions (often shifting resources away from more highly valued uses) with the benefits to a region often only existing until another region offers a bigger enticement
• a ‘boost’ to firms at the outset can help fledging businesses and infant industries to grow rapidly and become viable over time—but may not be effective in practice, in part because it relies on governments having a better long-term vision of the viability, or otherwise, of the industry than firms and consumers
• support to preserve a critical mass of manufacturing firms and capacity for manufacturing will protect the manufacturing base—but there is no evidence that economies with a certain level of manufacturing have a higher standard of living than those without it.
• support to ‘clusters’ of interconnected firms and institutions in particular precincts can help these precincts grow—but this is more likely to be a success when being part of the cluster is consistent with firm needs, not when governments attempt to artificially create them.
The history of missteps and (sometimes costly) failures from attempting to develop new ‘strategic’ industries or sustain industries in decline (Box 4.5) suggests that the Queensland Government should be particularly cautious when considering whether to establish these types of programs.
[D]irect support to ‘struggling’ firms has demonstrated little long term success, and iconic manufacturers and employers eventually exit. The cost to the taxpayers of delaying exit can be considerable, as was demonstrated with the automotive industry. There is also a cost to workers in that it delays their skill adaptation. (PC 2017a, p. 52)
In modern economies with global supply chains, businesses are mobile—those that require incentives and subsidies (not their comparative and competitive advantage) to invest or stay, will come to rely on those subsidies, and move on when they are reduced or withdrawn.
When government seeks to ‘pick winners’,32 this implicitly puts those group(s) not selected at a disadvantage. This is a concern when:
• it diverts resources away from higher value uses—ultimately imposing costs on consumers
• it distorts firms’ incentives and operational decisions—encouraging firms to focus their efforts on taking advantage of the assistance provided, potentially foreclosing market developments (through emerging technologies or new business models) that may turn out to be superior
• it unnecessarily delays otherwise beneficial structural change—by artificially protecting the position of existing firms (and workers)
• the process for developing policy:
− is not transparent—with the risk that the beneficiaries reflect the vested interests of those firms best equipped to lobby government (but with little basis for support)
− lacks accountability—where the people deciding the ‘winners’ do not experience the effects of errors
− fails to take account of the ‘bigger picture’—either because it is focused on more obvious, shorter-term gains or because it is intrinsically aligned with particular sectors.
32 Or in some cases ‘save losers’ to the extent that policies seek to protect industries or firms that would otherwise decline.

Final Report: Manufacturing in Queensland
Queensland Productivity Commission 66
Sources: QCA 2015a; Dinian 2015; The Economist 2010; PC 2017a.
33 On 1 September 2017, Arrium was sold to GFG Alliance.
Box 4.5 Providing targeted assistance—caution required
Governments often attempt to target specific industries or attract investment to increase employment and generate economic growth. However, the empirical evidence and reported outcomes provide, at best, mixed evidence of the success of these measures.
History details some costly failures. In Australia, these have included:
• The Queensland and Australian governments provided assistance to the Australian Magnesium Corporation to establish the world’s largest magnesium smelter near Rockhampton. Both governments foresaw large and beneficial impacts for employment (of up to 7,000 jobs) and investment ($4.5 billion). However, the project was not viable and work ceased in June 2003, with the Australian Government required to fulfil its loan guarantee of $90 million, and the Queensland Government losing $70 million to the project.
• The South Australian and Australian governments provided $100 million of assistance to Arrium's Whyalla steelworks.33 This included royalty concessions, procurement policies, and antidumping duties (before Arrium entered voluntary administration) and prospective financial assistance to upgrade infrastructure, and improve energy efficiency and productivity (post-administration).
• The Australian Government supported the Australian automobile manufacturing industry for more than a century. About $30 billion (2011–12 dollars) in net combined assistance to the industry between 1997 and 2012 failed to produce a sustainable manufacturing plant.
• The Australian Government provides screen-related tax offsets, Screen Australia funding, and one-off payments to international film producers to make movies in Australia. This assistance rose by $159.5 million in 2015-16—and now exceeds the annual assistance to the motor vehicle industry in any of the last four years.
Internationally:
• In the late 1950s, the Japanese Government decided to subsidise petroleum and petrochemicals industries—and not Sony’s transistor technology venture because it was ‘unpromising’.
• In the United States, the Obama administration had several high-profile failures from funding alternative energy companies, with total losses as of November 2014 estimated at US$2.2 billion.
• Many countries have tried to establish a semiconductor industry. The McKinsey Global Institute identified countries that have attempted, but failed, to create a sustainable industry since the 1980s. These include Singapore (US$5–16 billion in subsidies), China (US$6–17 billion), Japan (US$19–54 billion), Germany (US$2–7 billion) and Malaysia (US$1–3 billion).

Final Report: Manufacturing in Queensland
Queensland Productivity Commission 67
Policies that target specific industries or firms are more likely to ‘succeed’ when they align with competitive strengths. However, there is a risk that this assistance is essentially paying for activity that would have occurred anyway.34 In that case, the key question is why government intervention was required in the first place, and if it is provided, how it will generate significant additional benefits? This can be difficult to determine because it is hard to know what might have occurred in the absence of intervention.
A well-designed and robust policy framework (Box 4.6) is essential when trade-offs are required, to help focus Queensland Government efforts.
4.3.1 Findings about the role for government
Queensland manufacturers have access to a broad range of government policies and programs, across all levels of government. These policies and programs are generally not directed only at the manufacturing sector, but can nevertheless influence manufacturers’ business decisions and performance. More recently, governments (state, national and overseas) have looked to ‘revive’ manufacturing, through policies designed to support and develop their manufacturing sectors.
34 Which in effect is simply transferring taxpayers’ resources to increase the private profitability of particular firms.
Box 4.6 Good policy design principles for manufacturing
Good outcomes are more likely where policy is developed under a well-designed and robust framework that:
• identifies there is a sound basis for government action—that is, where there is a genuine policy problem of sufficient size and scope that government can address
• considers all feasible options for achieving policy objectives, and identifies the option that is most likely to:
− target the problem effectively—inducing socially valuable change that would not otherwise have occurred
− provide the right incentives and avoid unintended consequences—with a focus on limiting rent-seeking behaviour, limiting adverse interactions with other policies and facilitating (rather than impeding) otherwise beneficial structural change
− limit compliance burdens and be administratively efficient for government—avoiding duplication and inconsistency with other programs and policies
− maximise the net benefit to the Queensland community—having regard to all the expected benefits and costs (economic, social, compliance and administrative)
• provides for periodic evaluation to assess and identify opportunities for improvement and foster policy learning
• is transparent—with any funding or assistance provided, as well as the evidence base that underpins the government’s decision to provide it, made publicly available.

Final Report: Manufacturing in Queensland
Queensland Productivity Commission 68
Whether these programs and initiatives are effective—and whether they are the best option—will depend, among other things, on how they have been developed, designed and implemented. On this, DSD said the current Queensland government strategies, policies and programs have been:
appropriately developed, targeted and marketed in consultation with industry and other relevant stakeholders … this is being driven by the Advance Queensland initiative, which comprises a comprehensive suite of programs based on international evidence of best practice and collaboration between entrepreneurs, industry, universities and government. (DSD sub. 11, p. 9)
In particular, the Advance Manufacturing Roadmap is a 'strong policy base'—which was developed in consultation with industry, with expert input from IMAG, based on research into national and international policies and assistance measures (DSD sub. DR2, p. 1).
However, it has proved difficult for the Commission to assess the effectiveness of the Queensland Government’s current policy settings for manufacturing. Many of these programs are new, and limited or no information is available on their performance generally, or their impacts on manufacturing. There are also specific challenges to assessment when programs are dealing with complex processes, which can have lags between implementation and outcome, and which are part of a broader national (and sometimes international) policy framework.
While there is some evidence of potential benefits for Queensland manufacturers, the Commission was also told that some manufacturers:
• tend to avoid government programs or initiatives, given uncertainty around the nature and scope of assistance on offer
• are unaware of relevant government programs or initiatives available to them
• find it difficult to select programs to suits their needs, given the large number of programs available, and the duplication and inconsistencies (including across various levels of government).
Compliance and administration costs tend to be higher when there are many small programs. Moreover, to the extent that some of these programs do not have clearly defined policy objectives or include a plan to review effectiveness, they may not provide government with good value for money.
In addition, poor policy design and implementation can give rise to its own costs and problems, which need to be considered.35
4.4 A way forward The Queensland Government should focus its efforts on broad-based policy reform—minimising impediments to efficiency and competitiveness; ensuring the effective and efficient performance of government programs and procurement; and appropriately managing any adverse transitional impacts of adjustment.
Economy-wide policies, rather than sector-specific measures, are more likely to deliver sustainable industries not dependant on handouts. Effective economy-wide policies raise Queensland’s overall capability and provide the greatest opportunity for dynamic and innovative firms, including manufacturers, to prosper. Broad-based reform also reduces the risk of perverse outcomes often associated with sector-specific measures.
Good policy outcomes are also more likely where policy is designed using sound principles.
35 In the extreme, a program that in-principle could have yielded significant benefits may instead result in net social costs.

Final Report: Manufacturing in Queensland
Queensland Productivity Commission 69
The Queensland Government should be particularly cautious in attempting to promote the growth (or prevent the decline) of particular industries or firms. What may be good for one part of the economy may not be good for other parts, or the community more broadly. Where trade-offs exist, a careful consideration of all the expected benefits and costs is required. This can be technically demanding (requiring information about all benefits and costs) and politically challenging (particularly where there are calls to directly support certain firms or sectors).
The remainder of this report details a broad-based policy reform agenda to best support a competitive and productive manufacturing sector in Queensland. This Manufacturing: Policy Action Plan is based around three key actions—address cost pressures, increase productivity, improve government programs—and is supported by an implementation strategy that provides a clear allocation of responsibility and authority for implementing the recommendations and coordinating the plan.

Final Report: Manufacturing in Queensland
Queensland Productivity Commission 70
Manufacturing: Policy Action Plan Where are we now?
Manufacturing in Queensland generates around $20 billion a year in gross value added for the Queensland economy. It employs 168,000 workers in 16,400 businesses. Manufacturers face pressure from high input costs and strong competition.
There are many government policies and programs for manufacturing. The sector is often unaware of government policies and what they aim to achieve. There is often limited information available to evaluate program effectiveness or value for money.
What’s the aim?
A competitive and productive manufacturing sector will best support economic growth and improve long term living standards in Queensland.
Government action should effectively and efficiently:
• target market and government failures • simplify and consolidate programs • focus on performance and results.
How to get there?
The Queensland Government can best achieve its objectives through three key actions:
1 Address cost pressures
• Avoid upward pressure on energy prices by ensuring energy policy and regulation are efficient (Recommendations 11 and 12).
• Create a competitive business environment through a more efficient tax system (Recommendation 16). • Reduce costs on business and improve regulatory outcomes by reducing red tape through stocktake
reviews (Recommendation 8).
2 Increase productivity
• Lift the pool of workers with the right skills by improving the VET framework with a focus on the right incentives to providers, students and businesses (Recommendations 6 and 7).
• Expand competition for procurement by simplifying the process and carefully implement the Queensland Procurement Policy 2017 (Recommendation 13).
• Support manufacturers, regions and workers, by improving adjustment assistance and removing barriers to labour mobility to assist workers to transition to new jobs (Recommendations 9 and 10).
3 Improve government programs
• Create a business environment to facilitate innovation (Recommendations 1 to 5). • Make it easier for businesses to locate and do business here by streamlining government processes and
offering comprehensive information to all businesses (Recommendation 14). • Avoid providing attraction incentives to individual firms, but if provided, transparently report the costs
and benefits (Recommendation 15). The Queensland Government should assign responsibility and authority to an appropriate body to implement the Manufacturing: Policy Action Plan (Recommendation 17).
An action plan built on broad-based policy reform will address the main concerns of the manufacturing sector and: • avoid perverse outcomes associated with manufacturing-specific policies • establish a clear policy with fewer programs that achieve more • provide the greatest opportunity for manufacturing—and all Queensland businesses—to compete and
grow.

Final Report: Manufacturing in Queensland
Queensland Productivity Commission 71
5.0 Innovation

Final Report: Manufacturing in Queensland
Queensland Productivity Commission 72
In a global market, innovation is an important source of competitiveness and productivity improvement for Queensland manufacturers. This chapter investigates barriers to innovation, innovation policy and options for reforming Queensland Government programs.
Key points
1 Innovation is a key driver of productivity and economic welfare. Australia ranks towards the middle among developed countries in terms of innovation.
2 Manufacturing is a relatively innovative and R&D-intensive sector. The industry’s business expenditure on R&D as a proportion of GSP in Queensland (0.17 per cent) was lower than in other states and about half of that of Australia (0.31 per cent).
3 Sixty per cent of innovation-active manufacturers experience barriers to innovation. These include access to finance, skilled people, time costs, government regulations, standards and costs of development.
• Manufacturing businesses do not appear to face additional barriers to financing than other businesses.
• Entrepreneurship in Queensland manufacturing appears to be healthy. However, there may be some broader barriers in terms of culture and entrepreneurial skills.
• The standard of management capabilities in Australian manufacturing appears to be below that of global leaders. An improvement in management quality may improve innovation and productivity in the manufacturing industry.
• There appears to be little collaboration between Queensland manufacturers and universities. The reasons for this include experiential, cultural and information differences, poor incentives for universities to collaborate and the capability of businesses.
4 There are many innovation programs, provided by all levels of government. Most of the Queensland Government suite of programs have been implemented only recently, so it is too early to evaluate their effectiveness. However, there is scope to rationalise and redesign programs to do fewer things, but to be better.

Final Report: Manufacturing in Queensland
Queensland Productivity Commission 73
5.1 What is innovation? Innovation has been defined in many ways. Innovation occurs when businesses and people produce, disseminate and apply knowledge. The OECD defines innovation as:
the implementation of a new or significantly improved product (good or service), or process, a new marketing method, or a new organisational method in business practices, workplace organisation or external relations. (2005b, p. 46)
Innovation is not just the creation of new ideas but also their application. The minimum requirement for an innovation is that the process, product or method is new to the firm rather than the world. Once innovations are discovered the knowledge is transferred, finding applications in other processes, services and products.
Innovation is a term that applies to a broad range of activities. It applies equally to technological and non-technological changes that improve products, services or the functioning of businesses.
• For the manufacturing sector, innovation, including technology adoption and diffusion amongst firms, is increasingly discussed within the context of advanced manufacturing, ‘Industry 4.0’ or the fourth industrial revolution (Rüssman et al. 2015) (see Box 5.1).

Final Report: Manufacturing in Queensland
Queensland Productivity Commission 74
Sources: CSIRO 2016; International Federation of Robotics 2016; Greenough 2016.
Analysis for the OECD (2015b, p. 7) suggests innovation thrives in an environment characterised by a:
• skilled workforce
• sound business environment
• strong and efficient system for knowledge creation and diffusion
• set of policies encouraging innovation and entrepreneurship
• strong focus on governance and implementation.
Box 5.1 Advanced manufacturing and Industry 4.0
New technologies and processes are coalescing to change the way world manufactures. Many of the advances in technology are already in use, but the coming together of these technologies will optimise and automate production processes and change relationships between customers and suppliers, as well as people and machines. These technologies include:
Additive manufacturing involves 3D printing of successive layers of material to form products. It is currently mostly used for prototyping and individual components, but in the future it may allow customer-led designs, just-in-time production and smaller niche manufacturing.
Sensors measure or detect the properties of the surrounding environment. These sensors may be used as standalone to scan a site to manufacture a customised product to fit or may be embedded in materials to give ongoing information and data on manufacturing processes.
The internet of things (IoT) is a giant network of computers, phones, household appliances, vehicles and equipment. IoT is changing business models, digitally linking production and logistics, automating processes and gathering information to improve productivity.
Data analytics (often called big data) takes data generated from the IoT and sensors and turns it into useful information. This information may enable managers and workers to identify bottlenecks, wear and tear and maintenance requirements, improve quality control and safety and automate processes.
Robotics and automation in manufacturing is growing globally in response to demands for higher productivity, tighter tolerances, quality improvement, timeliness, miniaturisation and customisation.
Virtual reality is the creation of a virtual world which users can interact with or in. Augmented reality is the blending of the real and virtual worlds, by overlaying virtual information onto the real world. These two types of reality are currently being used for entertainment, but in the future will likely be used in manufacturing to improve efficiency, safety, and quality and consumer engagement.
Advanced materials are new or modified materials that have been engineered to enhance characteristics such as, strength, weight, conductivity and formability.

Final Report: Manufacturing in Queensland
Queensland Productivity Commission 75
5.2 Why is innovation important? Innovation is a key driver of productivity, competitiveness and economic output. It results in better products and services, customer benefits, greater efficiency for businesses and can solve social and environmental problems.
It can be argued that virtually all the economic growth that has occurred since the eighteenth century is ultimately attributable to innovation. (Baumol 2002, p. 13)
How effectively investment in skills, R&D and creative activity are transformed into knowledge and then into innovations is critical to business productivity.
The generation and application of technological and organisational knowledge (innovation) are the main drivers of firm-level productivity growth. (Gordon et al. 2015, p. 3)
For businesses, the fundamental role of innovation is to improve profitability—it is a means to an end, rather than an end in itself (BCA 2014, p. 5; Rassenfosse et al. 2011, p. 12). In response to challenges, businesses innovate to solve problems, improve productivity or create new products and services to differentiate and add value.
5.2.1 Relative performance
Innovation is challenging to measure and there is no single indicator of performance. Reports on innovation generally provide a range of indirect or partial indicators such as investment in R&D, patents, number of reported innovations and levels of education—often reflecting inputs rather than the quality and impact of innovations. There is limited data on many innovation indicators for Queensland, and so it is difficult to get an accurate picture of how well Queensland is performing. Australian statistics are reported where Queensland data is not available. On some indicators, Queensland and Australia lag leading nations.
Multi-factor productivity (MFP) is often used as proxy for the contribution of innovation to economic growth and, if measured well, it might be the most reasonable measure of innovation. However, it can be difficult to separate innovation from other impacts, such as capital over-investment and measurement errors. As detailed in Chapter 2, Queensland manufacturing MFP has declined since 2001–02, but this appears to reflect fluctuating output and capacity underutilisation, rather than a lack of innovation.
Relative to other high-income countries, Australia’s innovation performance is around the average (Cornell University et al. 2017, pp. xviii–xix).
Using a combination of indicators, the Global Innovation Index 2017 of 127 nations ranked Australia:
• 23rd for innovation (7th in the Asian region) (Table 5.1)
• 12th in innovation inputs but 30th in innovation outputs
• 76th for innovation efficiency, indicating that while the nation invests a lot of inputs into its innovation system, the outputs are relatively low.
The 2017 Bloomberg Innovation Index ranked Australia similarly—18th out of 78 nations.

Final Report: Manufacturing in Queensland
Queensland Productivity Commission 76
Table 5.1 International innovation rankings
Country Global Innovation Index 2017 (score)
Bloomberg Innovation Index 2017 (score)
Switzerland 1 (67.7) 4 (83.6)
Sweden 2 (63.8) 2 (84)
Netherlands 3 (63.4) 15 (75.2)
United States 4 (61.4) 9 (81.4)
United Kingdom 5 (60.9) 17 (74.5)
Denmark 6 (58.7) 8 (81.9)
Singapore 7 (58.7) 6 (83.2)
Finland 8 (58.5) 5 (83.3)
Germany 9 (58.4) 3 (83.9)
Ireland 10 (58.1) 16 (74.9)
South Korea 11 (57.7) 1 (89.0)
Luxembourg 12 (56.4) 34 (59.2)
Iceland 13 (55.8) 25 (65.3)
Japan 14 (54.7) 7 (82.6)
France 15 (54.2) 11 (81)
Hong Kong 16 (53.9) 35 (57.5)
Israel 17 (53.9) 10 (81.2)
Canada 18 (53.7) 20 (71.6)
Norway 19 (53.1) 14 (76.9)
Austria 20 (53.1) 12 (80.5)
New Zealand 21 (52.9) 19 (71.6)
China 22 (52.5) 21 (68.9)
Australia 23 (51.8) 18 (73.3)
Czech Republic 24 (51) 28 (62.7)
Estonia 25 (50.9) 33 (59.8) Sources: Cornell University et al. 2017; Jamrisko & Lu 2017. Across all four types of innovation (product or service, process, marketing, or organisational) manufacturing businesses in Australia are more likely to innovate than other businesses (Table 5.2). New products and services introduced by manufacturing businesses are more than twice as likely to be new to the world as those introduced by other businesses. However, organisational and marketing innovations introduced by manufacturers show a low degree of novelty.

Final Report: Manufacturing in Queensland
Queensland Productivity Commission 77
Table 5.2 Proportion of Australian businesses that introduced any innovation, by type and the degree of novelty of the innovation, 2014–15
Type of innovation
Type of business
Proportion of businesses that introduced any innovation (%)
Degree of novelty of the innovation (%)
New to the world
New to Australia
New to the industry
New to the business only
Products or services
Manufacturing 28.5 20.1 19.7 13.9 57.5
All businesses 19.3 8.4 7.4 12.9 74.5
Operational processes
Manufacturing 27.6 3.4 1.0 9.8 86.5
All businesses 15.6 2.5 3.9 9.4 85.8
Organisational processes
Manufacturing 23.8 0.1 0.5 4.3 95.6
All businesses 17.4 2.2 3.1 5.9 90.5
Marketing Methods
Manufacturing 19.6 0.1 0.1 3.3 96.7
All businesses 16.5 1.2 1.8 5.9 92.2 Source: ABS 2016g. Manufacturing is one of Queensland’s most innovative industries. The University of Queensland (UQ) 2013–14 Business School Innovation Survey estimated 77 per cent of Queensland manufacturers innovate (DSD sub. 11, p. 3). The survey also found innovation in businesses had risen relative to previous years and Queensland businesses were more likely to innovate than those in other states (Verreynne & Steen 2014, pp. 8–9).
Submissions to the inquiry and consultation revealed many Queensland manufacturers are innovating. For example, Cook Medical Australia manufactures some of the world’s most advanced endovascular grafts for the treatment of aortic aneurysms, and is one of the few companies that custom-makes these products to fit individual patient anatomies. The company has an Asia-Pacific New Technologies Team (ANTT) dedicated to finding medical technologies to address some of the key challenges facing healthcare systems. The ANTT interacts with inventors, universities, research institutes, startups and design contractors to evaluate ideas and new technologies that have potential for commercialisation (Cook Medical sub. 12; CCIQ sub. 6).
5.2.2 Research and development
Queensland expenditure on R&D as a proportion of GSP—about 1.6 per cent—is less than Australia’s (2.1 per cent) and is also below the OECD+ average (1.9 per cent).36 Queensland and Australia invest heavily in creating knowledge through basic research, but lag in commercialisation. Figure 5.1 shows higher education expenditure on R&D (HERD) as a proportion of GDP in Queensland and Australia is above the OECD+ average. However, business expenditure on R&D (BERD) as a proportion of GDP is below the OECD+ average.
Australia performs well in terms of creating academic knowledge, commensurate with a large investment. For example, Australia ranked 8th of 36 OECD+ nations in terms of academic publishing (Innovation and Science Australia 2016, p. xiii). The number of researchers per 1,000 workers in Australia (8.6) is similar to the OECD+ average (7.7), but the proportion of researchers working in businesses is relatively low (OECD 2015c).
36 OECD+ refers to a group of OECD countries plus non-OECD countries, such as China.

Final Report: Manufacturing in Queensland
Queensland Productivity Commission 78
Figure 5.1 Business expenditure on R&D (BERD) and higher education expenditure on R&D (HERD) as a proportion of GDP, 2013
Note: Queensland expenditure data refer to 2013–14. OECD countries’ expenditure data mostly refer to 2013; however, some data refer to 2011 and 2012 (including Australia, 2011). Sources: ABS 2015b, 2016e, 2016h; OECD 2015c; QPC calculations. Manufacturing is one of the most R&D-intensive sectors globally. Queensland has lower manufacturing BERD as a proportion of GSP (0.17 per cent) than all but two OECD countries—about half of Australia’s proportion and one-fifth of the OECD+ average (Figure 5.2).
Figure 5.2 Manufacturing business expenditure on R&D (BERD) as a proportion of GDP and manufacturing BERD as a proportion of total BERD, 2013
Note: Queensland expenditure data refer to 2013–14. OECD countries’ expenditure data mostly refer to 2013 data; however, some data refer to 2011 and 2012, including Australia (2011). Sources: OECD 2015c; ABS 2015b, 2016e, 2016h, 2016j; QPC calculations.

Final Report: Manufacturing in Queensland
Queensland Productivity Commission 79
Queensland manufacturers spent $532 million on R&D in 2013–14. Queensland spends relatively less on manufacturing R&D than other states, despite the sector making a similar contribution to GSP. This may partly reflect the nature of Queensland manufacturing, which is relatively more focused on processing primary products.
In Australian manufacturing, almost two-thirds (64 per cent) of R&D activity occurs inside large businesses (200 or more employees). Globally, original, frontier innovation is highly concentrated across a small number of large corporations:
In 2012, the 2000 leading R&D corporations and their network of 500 000 affiliates accounted for more than 90% of global business R&D and 66% of patent families filed at the largest five intellectual property offices worldwide. Within the top-2000, 250 multinationals accounted for 70% of R&D expenditure, 70% of patents, almost 80% of ICT-related patents, and 44% of trademarks filings. Most of their headquarters (55%) and affiliates (40%) were based in the United States and Japan. (OECD 2015c, p. 16)
Figure 5.3 shows that while Queensland’s total BERD is relatively low, it has risen substantially. In 2013–14, Queensland businesses spent about $2.7 billion on R&D, about 11 times more than it did a decade earlier. As a proportion of GSP, BERD has increased almost three-fold between 1993–94 and 2013–14, from about 0.3 per cent to almost 0.9 per cent.
Figure 5.3 Business expenditure on R&D, current prices, by Australian states and territories
Source: ABS 2015b.
Finding
Queensland invests a greater proportion of its output on higher education R&D than most other developed countries, but business still contributes the majority of R&D. While manufacturing is a relatively R&D-intensive industry globally, Queensland invests a relatively low amount in manufacturing R&D.

Final Report: Manufacturing in Queensland
Queensland Productivity Commission 80
5.3 Innovation policy Innovation policy has emerged as an amalgam of industry policy and knowledge and science policy. Since the 1980s, governments have changed the emphasis of industry policy towards improving innovation performance (QCA 2015a, p. 12). Innovation support accounted for 38 per cent of Australian Government industry assistance in 2012–13 (PC 2014b, p. 38).
5.3.1 The roles of government and business in innovation
Ultimately, businesses and the people within them will drive manufacturing innovation. Businesses have strong incentives to innovate. Where they succeed, innovation can be highly profitable and personally rewarding. However, a lack of innovation can render businesses uncompetitive, at substantial personal cost to those who own and work for them.
Competition and the profit motive are the dominant drivers of manufacturing innovation (ABS 2016g; ABS & PC 2011, pp. 1–2). In competitive markets, innovative businesses out-compete other businesses by achieving higher rates of growth in employment, profits and survival (Office of the Chief Economist 2016, p. 23).
There is a direct role for government in innovation, where it provides services, such as health and defence, including investing in R&D. Beyond this, the role of government is not to promote individual innovation, but to set framework conditions to allow innovation to occur (Carlsson 2015, p. 227).
5.3.2 Australian programs
The Australian Government has more substantial levers to deliberately or accidentally influence innovation than state governments. It has jurisdiction over universities and company taxes and is charged with regulating important parts of the market, including the financial system, corporations and competition laws.
The Australian Government has over 100 innovation policies, which focus on creating, transferring and applying knowledge. The majority of funding is directed towards private and public sector R&D (Innovation and Science Australia 2016, p. 30). Programs to improve knowledge transfer receive a smaller proportion of funding—that is, around 16 per cent.
In 2016–17, the Australian Government expected to spend around $10.3 billion on innovation- and science-related policies (Innovation and Science Australia 2016, p. 21). This equated to about 2.3 per cent of Australian Government expenditure (Australian Government 2016, p. 114). The largest government program to assist innovation was the R&D tax incentive, budgeted at $3.1 billion. In comparison, state and territory governments were projected to spend around $1.1 billion in 2016–17 (Innovation and Science Australia 2016, p. 23).
Many of the businesses said during consultation they found the R&D tax incentive to be the most useful innovation policy available in Australia.
5.3.3 Queensland programs
The Queensland Government broadly influences manufacturing innovation through policies including taxation, education, training, energy, regulation, grants, subsidies and concessions. While some policies support innovation, other policies may impede it, often unintentionally.
The Queensland Government has many innovation policies, programs and activities. They are generally targeted at businesses broadly, rather than manufacturing businesses exclusively.
There are at least 50 programs within the Advance Queensland policy suite aimed at increasing innovation or entrepreneurship. These programs are run by the Department of Science, Information Technology and Innovation (DSITI) the Department of State Development (DSD), the Department of Tourism, Events and Small Business (DTESB) and Queensland Treasury. In addition, these departments undertake other activities aimed at stimulating innovation, such as industry roadmaps.

Final Report: Manufacturing in Queensland
Queensland Productivity Commission 81
The Queensland Government’s primary innovation policy is the Advance Queensland initiative. The 2017–18 state budget includes initiatives to boost the Advance Queensland investment to $420 million over the next four years (Queensland Treasury 2017b, p. 24).
Advance Queensland represents a systems approach to enabling innovation in Queensland—by removing barriers or stimulating improvement in underperforming parts of the innovation system. DSD described advance Queensland as:
Investments … designed to bridge market and systems failures within key elements of innovation:
• inspire Queenslanders through programs to engage with science and technology, be entrepreneurial and take their ideas to the world
• discover new solutions to improve everyday lives through programs to foster current and future talent and enable researchers and industry to solve global challenges here in Queensland
• connect Queenslanders to world-leading local and international innovators through programs that encourage collaboration and build the entrepreneurial ecosystem
• invest in Queensland innovation through programs to encourage seed funding, venture capital and deal-flow, and foster emerging industries
• grow the competitiveness of our businesses, industries and regions through programs to accelerate growth and unlock new markets and opportunities. (DSD sub. DR2, p. 5)
Advance Queensland innovation programs more likely to be used by manufacturers include:
• Ignite Ideas Fund—assists SMEs to commercialise new or improved products, processes or services through grants of up to $250,000
• Knowledge Transfer Partnerships—helps SMEs to employ graduates to work on strategic innovation projects to improve collaboration and knowledge transfer. Grants of up to $50,000 are available for each project
• Innovation Partnerships—supports research organisations to undertake collaborative research projects with end-users that address industry needs, through grants of up to $1.5 million
• Commercialisation Partnership—provides access to Chinese incubators to access facilities and funding
• Industry Accelerators—pairs established businesses with industry accelerators to help commercialise ideas
• Platform Technology—provides funding for collaborative R&D towards development and use of enabling technologies, such as unmanned aerial vehicles (Queensland Government 2017a)
• Small Business Innovation Research—supports innovators to develop their ideas, by providing funding of up to $500,000 for feasibility and proof of concept (DSITI 2017).
• Advance Queensland offers the Business Development Fund, which aims to stimulate the venture capital industry and early stage businesses. The fund of up to $40 million co-invests equity funding with angel and venture capital investors. Projects funded to date include Brisbane-based electric vehicle charging manufacturer Tritium, which has received a $2.5 million investment (Pitt & Bailey 2017).
Through most stages of the early business or innovation process, government support is available from either the Australian Government or the Queensland Government, or from both. The Queensland Chief Scientist Office (2016, p. 67) notes there is some overlap between Advance Queensland and Australian Government programs. This is no accident—the programs share similar policy goals.

Final Report: Manufacturing in Queensland
Queensland Productivity Commission 82
5.4 Barriers to innovation Most manufacturers are attempting to innovate, but success depends on their capacity to innovate as well as overcome external barriers. The capacity of businesses to absorb and generate new innovations depends on:
• scale and access to resources
• access to finance
• access to knowledge
• the relevance of innovation to the firm’s business strategy
• entrepreneurial leadership
• management capability and structure
• workers’ skills, including science and research skills
• the extent to which the full value of the innovation can be captured by the firm
• government regulations and standards.
Sixty per cent of innovation-active37 Australian manufacturing businesses reported barriers to innovation. Manufacturers were slightly more likely to face barriers to innovation than other businesses. Australian manufacturing businesses reported that the greatest barriers to innovation are a lack of access to additional funds and a lack of skilled people (Figure 5.4).
Figure 5.4 Barriers to innovation for Australian businesses, 2014–15
Source: ABS 2016g. Lack of scale may impede some SMEs from having sufficient capabilities to undertake innovation and result in imperfect choices due to a lack of knowledge and the costs of gathering, assessing and processing information (Potts & Morrison 2009, p. 10–11).
37 Innovation-active businesses are those that had undertaken any innovative activity during the reference period, including introducing any type of innovation and/or developing or introducing innovation that is either still in progress or has been abandoned.

Final Report: Manufacturing in Queensland
Queensland Productivity Commission 83
Queensland manufacturing businesses tend to be smaller than those in other leading manufacturing nations (OECD 2016). As shown in Table 5.3, large manufacturing businesses are more likely to be engaged in innovation activity (79 per cent) than medium (71 per cent) or small (51 per cent) businesses. Larger firms have access to more resources as well as a greater diversity of resources, which can be redeployed to support innovation (ABS & PC 2011, p. 2; Rogers 2003).
Table 5.3 Proportion of manufacturing businesses innovating and experiencing a barrier to innovation, by firm size, Australia, 2014–15
Proportion of businesses innovating (%)
Proportion of businesses experiencing barriers to innovation (%)
All businesses Innovation-active businesses
Small (0–4 persons) 51.4 42.3 57.7
Small (5–19 persons) 51.7 45.6 61.2
Medium (20–199 persons) 71.0 55.5 63.8
Large (200 or more persons)
78.7 36.8 39.7
Total 54.1 45.0 59.6 Source: ABS 2016g. Innovation depends on access to knowledge and ideas or on the ability to create new ideas. As illustrated in Figure 5.5, internal sources are the most common origin of ideas and information for innovation in manufacturing firms (78 per cent of manufacturers). Upstream and downstream sources within the value chain and competitors are also important sources of ideas. Less than 1 per cent of manufacturing businesses consider governments and universities a source of ideas for innovation.
Figure 5.5 Sources of ideas or information for innovation, Australia, 2014–15
Source: ABS 2016g. There are a wide range of barriers to innovation. Some key barriers are discussed in other sections of this report, including skills and regulation, which are covered in Chapters 6 and 8 respectively.

Final Report: Manufacturing in Queensland
Queensland Productivity Commission 84
5.4.1 Access to finance
A lack of access to finance is a commonly cited barrier to innovation. ABS data suggests it is the biggest constraint on innovation for Australian manufacturing businesses. This constraint is more likely to affect small businesses (around 25 per cent) and medium businesses (19 per cent) than large businesses (10 per cent) (ABS 2016g).
Manufacturers in Queensland told the Commission that access to finance impacted on their ability to undertake innovation (QPC Innovation Roundtable; CCIQ sub. 6, p. 7). A 2017 survey estimated that 34 per cent of Queenslanders had an idea they thought had commercial potential but did not progress it—46 per cent cited finance as the barrier (Colmar Brunton 2017, p. 32).
Innovation can be resource-intensive and risky. To undertake it, businesses need access to funds, for activities such as investing in advanced manufacturing technologies and R&D.
Around 19 per cent of Australian manufacturing businesses sought debt or equity financing in 2014–15 (ABS 2016i). Most of these businesses (91 per cent) sought debt financing, and about a quarter (24 per cent) sought equity financing. Most businesses seeking debt financing obtained it (88 per cent), but just more than half of the manufacturing businesses seeking equity financing obtained it (52 per cent).
Factors that may influence manufacturers’ access to finance include:
• Queensland has a relatively small venture capital and private equity market compared with leading nations. Queensland accounts for only 9.3 per cent of the Australian venture capital market and 7.5 per cent of the Australian private equity market (Australian Private Equity & Venture Capital Association Limited 2016, p. 22).
• The greater physical capital requirements of manufacturers might delay returns on investment and deter some financiers (QPC Innovation Roundtable).
• Research suggests Australians have a relatively high preference towards short-term returns over long-term returns. When given the option of choosing between $3,400 this month or $3,800 next month, about 50 per cent of Australians would wait, compared with around 90 per cent of Germans (Wang et al. 2011, p. 17).
• Capital markets may not function perfectly in the presence of information asymmetry and risk and uncertainty (Freel 2000, p. 61). Financiers may lack the information to understand business innovation and discriminate between businesses.
Withers et al. (2015, p. 121) argued:
The most fundamental problem here arises because potential borrowers are not able to indicate their ‘quality’ to banks. This problem of information asymmetry identified by Nobel laureate George Akerlof is a major cause for market collapse and lost opportunities.
However, manufacturing businesses were more likely to seek financing and more likely to obtain both debt and equity financing than other businesses (ABS 2016i). The Australian financial system generally performs well compared to its international peers. A study by The World Bank ranked Australia 5th out of 190 nations for ease of getting credit (World Bank 2016b).
The Productivity Commission argued that there are no market failures impeding capital allocation to innovative firms:
Similar to conventional businesses, [failure to access finance] could be due to an array of reasons — for example, the business plan may be inadequate or unviable, or investors may view the risks to be too great — and of itself is not evidence that there are widespread market failures.

Final Report: Manufacturing in Queensland
Queensland Productivity Commission 85
On balance, there is not sufficient evidence to suggest that there are widespread, systemic problems around new businesses accessing finance in Australia. Nevertheless, there are opportunities to address regulations around crowd-sourced equity and employee share schemes with a view to giving more (and potentially lower cost) finance options to new businesses. (PC 2015b, p. 136)
Moreover, even if market failures exist, there is no evidence that governments would be able to solve such imperfections through superior information. Financial intermediaries have incentives and superior knowledge to solve such failures, by developing innovative models to provide capital to risky investments (Lacker 1994). Where governments intervene by providing loans or grants, without solving the underlying information problem, they may fund the same projects and largely crowd out private investment (QCA 2015a, p. 247).
Government programs to address access to finance
Many government programs aimed at improving access to finance provide direct grants and subsidies, rather than directly addressing access to finance. The benefits from grants are likely to mostly accrue directly to the recipient. It is possible that grants requiring partial or matched funding will allow private participants to do well, regardless of whether the investment generated an economic return or not. Government intervention does not remove the risk of adverse selection on the part of the financier or moral hazard on the part of entrepreneurs.
Where the argument or rationale for government intervention is capital market failures, loan or equity arrangements that provide a full return to government would be preferable. Programs involving repayment would be partially self-evaluating, because if it does not provide an adequate return, it cannot be said that markets have really failed (PC 2007, p. 55). Additionally, over the longer-term repayments would ensure more self-sufficient programs.
Advance Queensland's Business Development Fund is one example of a program that adheres to the above principles. It involves the Queensland government co-investing with venture capitalists and other investors. The Queensland Government has a path to sell its equity stake and recoup its investment. In the Commission's discussions with DSITI, it indicated it was looking at options to increase the use of conditional repayment.
The Business Development Fund is modelled on similar programs in New Zealand (NZVIF) and Israel (Yozma). The fund takes a ‘matching funds’ approach, to augment rather than replace existing venture capitalists. Yozma was particularly successful—the government initially invested $100 million and privatised the fund in 1998 after five years at a substantial gain. A decade later the funds that originally participated managed total funds of $2.9 billion (Lerner 2009).
Finding
For most businesses, access to finance is not a barrier. Manufacturing businesses do not appear to face additional barriers to financing than other businesses. There is some evidence that financing may impede the optimal allocation of capital to innovation activities. However, governments do not appear to have any information advantages that would enable them to solve these inefficiencies.

Final Report: Manufacturing in Queensland
Queensland Productivity Commission 86
The NZVIF has not been quite as successful. In operation since 2002, private venture capital investment had grown three-fold by 2009 (New Zealand Ministry of Economic Development 2009, p. 4). By 2016, the NZVIF achieved an annualised net internal rate of return of –1.5 per cent (NVIF 2017, p. 3). This return partly reflects policy design, whereby the upside of good investments is limited as partner funds have generous buyout options.
5.4.2 Entrepreneurship
Stakeholders identified entrepreneurship and management as key internal factors in firm innovation and productivity (DSD sub. 11, p. 6; CCIQ sub. 6, pp. 7–8; QPC Innovation Roundtable; Australian Sugar Milling Council sub. 5, p. 5).
Entrepreneurship is an important factor in innovation, bridging the gap between invention and commercialisation. An entrepreneur can be defined as a person with the vision to see an innovation and the ability to bring it to market.
In contrast to Australia’s relatively modest performances in innovation and competitiveness indexes, it performs quite well in entrepreneurship. The Global Entrepreneurship Index ranked Australia 7th globally (Global Entrepreneurship and Development Institute 2017, p. 24). Australia exhibits relatively high rates of business ownership and business formation, and generally positive attitudes to starting businesses (Innovation and Science Australia 2016, p. 77).
Analysis from the Office of the Chief Economist (2015a, p. 43) found that Australia:
has one of the highest proportions of start-ups and young firms among small businesses in the OECD. As is the case in many other advanced economies, we show that start-ups and young businesses contribute disproportionately to job creation in Australia. However, it is only a relatively small percentage of very high growth businesses that make up the bulk of this contribution.
There is evidence of increasing and healthy entrepreneurship within Queensland. The state’s Chief Entrepreneur said Queensland now had the second highest number of start-ups in Australia, with 19 per cent of the nation’s total (Norris 2017).
Queensland manufacturing exhibited lower entry and exit rates than other businesses, but still higher than most other OECD manufacturing sectors38 (ABS 2017b; OECD 2016, pp. 76–80). This suggests barriers to entry and exit are not particularly high in Queensland manufacturing. Innovation and Science Australia suggested business formation is not a problem:
Compared to other countries however, Australians are good at starting businesses but not good at growing them. (Innovation and Science Australia 2016, p. 77)
Even though Queensland appears to perform relatively well in terms of some entrepreneurship measures, entrepreneurial skills and culture have been suggested as potential barriers (see, for example, CCIQ 2015).
38 The OECD compares business entry and exit using an industry classification that also includes mining.
Recommendation 1
Where programs are established on the basis of mitigating capital market failures, the Queensland Government should consider providing assistance through loans and equity investment rather than grants.

Final Report: Manufacturing in Queensland
Queensland Productivity Commission 87
There is mixed evidence on how skilful Australian entrepreneurs are, and concerns exist about Australia’s cultural attitudes towards entrepreneurship (StartupAus 2015, p. 41; OECD 2012b; PC 2015b, pp. 268–70; Australian Venture Capital Association Ltd 2012, p. 31). Most Queenslanders (84 per cent) perceive entrepreneurship as a good career; however, most also thought that most entrepreneurs ultimately do not succeed (72 per cent) and that entrepreneurship is highly risky (56 per cent) (Colmar Brunton 2017, p. 34).
Entrepreneurial support networks
In recent years, a variety of entrepreneurial support networks have been developed to assist entrepreneurs:
• Incubators assist entrepreneurs and their new businesses through office services, mentoring, management and business advice, networking and sometimes financing. If successful, businesses grow in size and move out of the incubator into the surrounding economy and is replaced by new infant businesses.
• Accelerators provide similar services to incubators but focus on providing them once a business is beyond the very early start up stage. Accelerators help startups and early-stage businesses with seeking customers and investors, develop products, market test and rapidly commercialise.
• A hub is a co-working space for entrepreneurs and businesses at various life stages, which may also provide additional support services (PC 2015c pp. 56–59; Mazzarol 2015).
These support networks can focus on specific industries or activities, or they can have a broad mix of tenants—often the focus is on the early stage or startups. They may be provided by governments, universities, not-for-profits and businesses to improve skills and provide networking opportunities.
There is debate around how successful incubators are—the empirical evidence appears inconclusive. Researchers at the Kauffman Foundation analysed more than 35 reviews and found that there was no clear evidence that businesses launched inside incubators were more successful than those launched by entrepreneurs outside of incubators (Fetsch 2015). On the other hand, supporters point to spectacular successes such as Y-Combinator in Silicon Valley that helped AirBnB and DropBox. A report for NESTA (Dee et al. 2015, p. 37) noted that the lack of longitudinal data on such programs made analysis of the success of startups over time impossible on a systematic basis.
The Queensland Government is supporting the development of hubs for innovation and entrepreneurship across the state. Consultation with the recently launched Gold Coast Hub suggested that the funding provided brought forward the establishment of the hub. Funding from Advance Queensland has also been used to develop the Queensland Startup Precinct (Box 5.2).
Finding
Entrepreneurship in Queensland manufacturing appears to be healthy. However, there are some broader potential barriers related to culture and entrepreneurial skills.

Final Report: Manufacturing in Queensland
Queensland Productivity Commission 88
Sources: Queensland Government 2017e; River City Labs 2015; Trad 2017. Incubators may not be as effective tools for stimulating manufactured products as it is for digital services:
The emphasis on web-based digital technologies is unsurprising. This type of start-up is generally easily launched and scaled-up, with a relatively low level of technical complexity and a short time to market. By contrast more complex technologies such as biotech or advanced electronics require much greater capital investment and time to commercialise. (Mazzarol 2015)
However, startups and a range of entrepreneurial support networks are moving into the manufacturing space. In Melbourne, Monash university launched a Food Innovation Centre to accelerate innovation in food industries (Ferret 2017). On the Gold Coast, the Griffith Advanced Design and Manufacturing Institute is being formed—design, engineering, testing and some production activities will be located in the hub, while further production of the end products occurs in the spokes located within industry (Griffith University 2017).
Makerspaces and hackerspaces
Makerspaces, also called hackerspaces or fablabs (short for fabrication laboratories), provide opportunities for people to develop skills, collaborate and prototype new products. Makerspaces are facilities that are equipped with a variety of tools and machinery and people with a variety of skills (such as HSBNE (Hacker Space Brisbane), a non-for-profit community workshop and maker collective). Makerspaces can reduce barriers to entry through resource sharing, especially expensive equipment.
The Queensland Hackerspaces Grant program provides $450,000 over two years to support the establishment of new hackerspaces and support the expansion of existing Queensland hackerspaces (DSD 2017f). Some councils, such as the Brisbane City Council, also provide grants to help local non-profit community groups develop and improve facilities and services (Brisbane City Council n.d.).
Box 5.2 The Queensland Startup Precinct
The Queensland Startup Precinct (‘the Precinct’) is the state’s largest startup hub. It was founded in March 2017 with a $6 million State Government investment. The Precinct is housed in the repurposed TC Beirne building in the Fortitude Valley, and brings together Queensland entrepreneurs, startups, incubators and mentors in one central location.
The hub provides entrepreneurs with co-working spaces and access to support networks. It also offers events and meeting spaces, an investor and venture capital presence, access to professional services such as legal and accounting, and assistance for international entrepreneurs setting up in Queensland.
With digital and physical links to innovation centres and accelerators located elsewhere in the Queensland, the Precinct facilitates collaboration and innovation across the state.
Foundation tenants include River City Labs, CSIRO’s Data 61, eHealth Queensland, Softbank Technologies from Japan, Open Data Institute of Queensland, One Ventures, R&R Strategic, CyberLabs, Find-Me, Airway Medical Innovations, Myriad and the Office of the Queensland Chief Entrepreneur.
Most of the startups using the Precinct innovate using technology to deliver new or better services. However, a major Japanese drone manufacturer, Terra Drone, has also based its regional office there.

Final Report: Manufacturing in Queensland
Queensland Productivity Commission 89
5.4.3 Management practices
Differences in management skills and capabilities play a key role in firm productivity and innovation:
[W]orkplaces with more capable leaders are more innovative—regarding both incremental and radical innovation performance. (Gahan et al. 2016, p. 7)
A study benchmarking Australian manufacturing against 15 other countries on 18 management capabilities found Australian manufacturing managers performed around the global average, but lagged global leaders. The areas of greatest skills deficiency were in people management, especially rewarding and retaining top performers and installing a talent mindset. Australian managers were also found to be relatively further behind in setting goals and time horizons (AMPR Team 2009, pp. 14–22).
Better management capability in Australian manufacturing is positively associated with:
• the education attainment of management and employees, and organisational size
• more diffuse and multinational ownership (Agarwal et al. 2014, pp. 6497–6511).
Internationally, the level of product market competition has also been positively associated with superior management practices, by providing comparison opportunities, reducing economic rents and removing poor practices over time (Bloom & Van Reenen 2007).
Poor management performance is linked to low educational attainment. In general, Australian manufacturing managers have been found to have a relatively low level of tertiary qualifications (Green et al. 2012, p. 45).
Studies have identified deficiencies in management practices in some manufacturing businesses are limiting innovation (Cutler 2008, p. 6; Samson 2011, p. 2; Agarwal et al. 2014, pp. 6497–-6498). This suggests that if management could be improved across the manufacturing industry, sector-wide productivity and competitiveness would increase.
Consultation undertaken by DSD in developing their Advanced Manufacturing Roadmap also found management capability a performance issue in Queensland (DSD sub. DR2, p. 7).
Given the link between management skills and productivity and innovation, some studies advocate for government support to improve management skills (Green et al. 2012, p. 47; Bloom et al. 2007, p. 10). A collaborative report between the London School of Economics and McKinsey & Company found:
Governments can play their part in encouraging the take-up of good management behaviour. Doing so may be the single most cost-effective way of improving the performance of their economies. Strong competition and flexible labour markets both lead directly to improved management performance … Relentless improvement in educational standards is also essential. (Bloom et al. 2007, p. 10)
There is some evidence that improvements in management can be achieved as a result of industry action and practical evidence based recommendations. The Industry Skills Council found:
[T]he 28 Karpin Report recommendations [delivered in 1995] have proven over time to be robust and strongly related to organisational success. Market forces, rather than concerted action by Government, ensured that many of the recommendations found their way into practice within organisations and educational settings. (Samson 2011, p. 5)
While studies suggest management practices could be improved, there is the risk that what is considered better practice may turn out to be a fad or not add value (Agarwal et al. 2014, p. 6498; Abrahamson & Fairchild 1999). There is also the risk that managers will not have the time or not perceive sufficient value to invest their energy into a management education program.

Final Report: Manufacturing in Queensland
Queensland Productivity Commission 90
That said, there is a place for mentorship and education from experienced management practitioners. The success and proliferation of university business schools and other private courses suggest there is a supply of and demand for such services. There are also a range of free online courses through platforms such as Edx and Coursea, covering topics such as business fundamentals, supply chains, people management and leadership, from internationally recognised universities such as Harvard, MIT, Stanford, Duke University, UQ and University of London (Edx 2017; Coursera n.d.).
What is available to help managers improve their skills?
There is a wide variety of courses, workshops, seminars and programs available for managers and leaders looking to improve their skills. There are a range of providers of management education in Queensland, including business schools and their representative bodies, private business colleges, industry representative bodies, associations and institutes, the vocational education sector, management and professional development firms and Queensland and Australian Government sponsored programs.
The Queensland Government offers a range of workshops to help managers, especially with understanding government grants, procurement, taxes and regulation.
Programs provided by the Queensland Government include:
• Business Model Innovation Workshops (by Professor Goran Roos), which aim to enable manufacturers to re-think their business model; examine ways to create new revenue streams; explore business models that integrate complementary services; and turn these new ideas into action (DSD sub. DR2, p. 7)
• a Design in Manufacturing Seminar series to raise businesses’ awareness of the importance of design, showcase the benefits of incorporating design principles and practices in manufacturing and provide sources of advice and information that strengthen capability (DSD sub. DR2, p. 7)
• Mentoring for Growth, which offers eligible businesses access to a panel of between six to eight volunteer business experts. During a meeting of around 90 minutes, they offer insights, options and suggestions on overcoming business challenges relating to growth and innovation (DTESB 2017a)
• the Advance Queensland program, Growing Queensland’s Companies, which aims to teach CEOs and executive teams to lead, manage and grow their companies. The program, run by the Australian Centre for Business Growth, is informed by analysis of companies using real data. The Centre will track companies for at least three years after completing the program—this will enable the program to be evaluated for its effectiveness (Australian Centre for Business Growth 2017)
• other programs, such as Small Business in a Day; Evolve to Thrive Workshops; Monthly Mentor Chats; Innovate Queensland Pathways and Small Business Solutions
• TAFE Queensland offers a range of courses to develop business fundamentals, marketing and entrepreneurial skills (TAFE Queensland n.d.)
Finding
The standard of management capabilities in Australian manufacturing appears to be below that of global leaders, even though many managers and businesses are world class. An improvement in management quality could improve innovation and productivity in the manufacturing sector.

Final Report: Manufacturing in Queensland
Queensland Productivity Commission 91
• The Australian Government also provides a range of business management support services, including: Business Evaluation; Supply Chain Facilitation; Growth Services; Business Growth Grants; and Enterprise Connect (Australian Government 2017e).
As with entrepreneurship, governments may not be well placed to understand management deficiencies. Businesses and their managers are, in many cases, better placed than government bureaucracies to understand and address these deficiencies. There is some evidence that government programs can assist:
• Enterprise Connect was designed to provide business skills services to SMEs and bridge information gaps in accessing reliable information. In 2010, the PC found that the Enterprise Connect offered highly relevant business support services to SMEs (PC 2010, p. 247). Using a difference in differences analysis, one evaluation found that Enterprise Connect participation was associated with higher revenue and the benefits exceeded the costs of the program. However, the results might be subject to selection bias and cannot determine what would have happened in the absence of the program (Cully 2013).
• Mentoring for Growth has shown partial evidence—83 per cent of businesses mentored reported an increase of at least 10 per cent in either employment, turnover or gross profit (Queensland Government 2017q, p. 7).
Barriers preventing managers accessing further education are likely to be a lack of time, money and information barriers, to both know that education would be beneficial and to efficiently assess what would best suit their needs. Almost half of business owners (48 per cent) felt overwhelmed by the complexity of running a business and performing so many roles at once (NAB 2017, p. 6).
There are a large number of disparate providers of management and leadership training and mentoring. This is understandable, as the deficiencies and needs of managers vary. A single information point would allow managers to make better choices. It would also allow supporting public servants to better identify gaps and provide the right support.
Recommendation 2
To improve management skills, the Queensland Government should, in conjunction with industry associations:
• identify management and leadership courses available to managers within established SMEs
• determine whether the current suite of courses effectively and efficiently deliver management skills (including accessibility and post-training performance)
• create a single portal for management, mentoring and leadership courses provided by government or with government support, and courses from other credible providers, to reduce search costs and improve access.

Final Report: Manufacturing in Queensland
Queensland Productivity Commission 92
5.4.4 Commercialisation of public research and collaboration
Consultation suggested that business-to-university and business-to-business collaboration are important for Queensland manufacturing innovation (QPC Innovation Roundtable; CCIQ sub. 6, p. 8; AAAA sub. 10, pp. 4–5; AMWU sub. 9, pp. 6–8; TCF sub. 2, p. 3):
A business’s ability to collaborate is critical to accessing the skills and knowledge required to be competitive. Collaboration gives businesses access to new ideas, better information, and improved capabilities beyond that if a business operated in isolation. Businesses that collaborate perform better when compared with businesses that do not innovate or collaborate, with a significant majority of businesses reporting increases in productivity when collaborating with industry partners, academic institutions, or governments. (CCIQ sub. 6, p. 8)
Australian businesses and universities do not collaborate as much as their foreign peers, and this may impede knowledge transfer (PC 2016d, p. 475). Without collaboration between businesses and researchers, Queensland manufacturing may lack sufficient access to R&D. Universities are likely to hold a large amount of intellectual property (IP) that has commercial potential but has not been commercialised (QPC Innovation Roundtable).
Manufacturers tend to source their ideas and information for innovation from within their own business, their supply chain or competitors to a greater extent than other businesses. Less than 1 per cent of manufacturing businesses source ideas from universities or government. This is even lower than the proportion of all businesses who use these sources at 3 per cent. Around 2010, Australia appeared to have the least collaboration between businesses and universities and public research institutions of 33 OECD countries. While the data is somewhat dated and new policies have been introduced, recent ABS surveys suggest this type of collaboration remains low (ABS 2016g).
Large firms were about one-tenth as likely to collaborate as their global peers and SMEs were about one-third as likely (Figure 5.6). The lower collaboration for both SMEs and large businesses suggests the scale of Australian businesses is only a partial explanation.

Final Report: Manufacturing in Queensland
Queensland Productivity Commission 93
Figure 5.6 Businesses collaborating on innovation with higher education or public research institutions, by firm size, 2008–10
Note: For Australia, data refers to 2010–11 and includes product-, process-, marketing- and organisational-innovative firms (including ongoing or abandoned innovation activities). Recorded year and measurement of business size vary across nations. For example, South African data refer to 2005–07 and firms with 20 or more employees, with a minimum turnover between ZAR 3 million and ZAR 6 million, depending on the industry. Some caution should therefore be used in the interpretation. However, these difference are unlikely to impact the data for large firms. Source: OECD 2013a. Some key factors driving this outcome are:
• Many businesses say they lack the time or skills needed to collaborate with research institutions (Innovation and Science Australia 2016, p. 84). A NAB survey (2017, p. 4) found that most SMEs (57 per cent) struggle to find the time to think about their business at a macro level. SMEs felt they spent too much time working 'in' the business rather than 'on' the business.
• Some businesses are reluctant to base their competitive strategies on innovation and R&D, as it is by nature very uncertain. This uncertainty combined with financing, skills and time difficulties may deter some businesses from collaboration. Manufacturers may also lack information on the potential opportunities and benefits and the type of research and intellectual property that are available at universities.
• Funding for universities provides incentives to publish journal articles, but limited incentives for commercialising research or collaborating with businesses (QPC Innovation Roundtable; PWC 2015, p. 12). Some cultural elements within universities, including risk aversion, may impede innovation (Spike Innovation 2015, p. 18).

Final Report: Manufacturing in Queensland
Queensland Productivity Commission 94
• Australia has a relatively high number of PhDs, but relatively few are employed by businesses. There is a lack of mobility between public and private research (PC 2015b, p. 276).
• The research priorities of the private sector and public research institutions may not be well-aligned. For example, in 2010, businesses spent 52 per cent of R&D on engineering and 28 per cent on ICT, while universities only spent 9 per cent and 4 per cent respectively (PWC 2015, p. 8).
• Some universities may be too protective of their IP (PWC 2015, p. 12). It has also been suggested the technology transfer offices within universities may not function as well as they could (Mazzarol 2016; PC 2016d, p. 471).
While on average collaboration is low, a study by the AMGC found that for leading manufacturing firms, collaboration with universities or research institutes was the most commonly cited factor impacting technology development in med-tech firms and the second most for aerospace firms (AMGC 2017, 37).
Some manufacturers are making connections:
Our company is working closely with James Cook University to improve ourselves and bring new technologies forward. A lot of great research is done in our universities, but it ends at a piece of paper because the lack of forward thinking. (Townsville Engineering Industries sub. DR9, p. 3)
Universities are instituting initiatives to encourage research commercialisation. Queensland universities have established technology transfer organisations to help commercialise student and staff research and build industry links, including the UQ’s UniQuest (see Box 5.3), Queensland University of Technology’s BlueBox and James Cook University.
Sources: McKenna 2017; DIIS 2016a.
Box 5.3 UQ's Uniquest a commercialisation leader
UQ's UniQuest is one of the most successful research commercialisation organisations in Australia. It was set up in 1984 and has brought global successes like the cervical cancer vaccine Gardasil to market.
It has generated more than $15 billion in sales from the technologies it licenced. UQ has a heavy focus on not just research but also the business side of commercialising it. The university has more commercialisation staff than any other Australian public research organisation, apart from the CSIRO. The value of contracts signed by UniQuest in 2015 was $226 million (16 per cent of the national total of $1.4 billion) and again more than any other organisation except for the CSIRO.
UniQuest reinvests its revenues to commercialise more technologies and breakthroughs and often take equity in the companies it forms with investors. More than 80 startups have emerged from UQ since 2000, more than any other Australian research institution.
While some universities are doing well, as a total, Australian universities lag the US, UK, Canada and Israel in terms of licence, option or agreement income and the number of start-ups formed, relative to research expenditure.

Final Report: Manufacturing in Queensland
Queensland Productivity Commission 95
What is occurring internationally?
To bridge existing gaps, governments and the private sector have established numerous bodies and industry groups worldwide, designed to facilitate and undertake the following activities:
• knowledge transfer through R&D, IP development and consultation
• skills transfer through collaboration work programs
• access to resources by leasing of facilities, outsourcing and pooling resources including financing.
These activities enable businesses to develop innovations that they otherwise would not be able to. Institutions come in many forms and include research bodies, startup hubs, industry associations and government agencies.
The ideal institution bridges the gap between business, government and research organisations. These three types of organisations working together are commonly referred to as the Triple Helix (Ranga & Etzkowitz 2013). The United Kingdom’s (UK) Catapults (see Box 5.4) and the Fraunhofer Institutes in Germany are commonly viewed as exemplars of this approach. These organisations can draw on many examples of where they have assisted businesses to innovate, however, no study has been identified that evaluates the total costs and benefits of such organisations. This may be due to the difficulties in measurement.
Finding
While Queensland performs well in terms of research, the development or commercialisation of the research is lacking. There appears to be a relatively low level of collaboration between Queensland manufacturers and universities. Reasons may include experiential, cultural and information differences, poor incentives for universities to collaborate, and capability in businesses.

Final Report: Manufacturing in Queensland
Queensland Productivity Commission 96
Sources: De Silva & Andersen 2015; Hauser 2014. The Australian Government has introduced Industry Growth Centres modelled on the UK approach. Queensland participation in this program includes:
METS Ignited the growth centre for mining equipment, technology and services is based in Brisbane. Discussions are underway with the AMGC in regard to a collaborative approach to establishing an Advanced Manufacturing Growth Centre hub in Queensland. (DSD sub. DR2, p. 8)
There are a wide range of programs and initiatives in Australia aimed at bridging the gap
The Australian Government has greater levers and responsibility than state governments for ensuring that public research delivers socially optimal returns. The Australian Government has jurisdiction over universities, it sets the incentives and funding levels.
In 2015, the Australian Government announced policy measures to address the lack of connectivity between research and industry in Australia (Macfarlane 2015b; DIIS n.d.) including:
• developing a National Collaborative Research Infrastructure Strategy, including releasing a roadmap and requiring publicly funded research institutions to have published engagement plans (Australian Government 2017d, p. 13)
• reviewing the R&D tax incentive to place more emphasis on collaboration. The review recommended introducing a collaboration premium where R&D activity is undertaken with public research organisations; modifying the incentive to better ensure it induces additional activity; improving transparency by publishing additional data; and increasing the use of plain English examples and guidance (Ferris et al. 2016)
• launching a Productivity Commission inquiry into IP arrangements, which recommended Australian, state and territory governments implement an open access policy, whereby publicly funded research would be freely available within 12 months. The Australian Government has supported the recommendation as well as a range of others to improve user access to IP (DIIS 2017c)
Box 5.4 Catapult Centres
The UK has developed a program to assist knowledge transfer between, and the development of, manufacturers. The Catapult network consists of multiple centres with a focus on innovation and growth. Each Catapult has access to technical experts, equipment, and other resources required to realise and commercialise concepts.
The Catapults are designed to connect and are comprised of businesses, researchers, engineers and communities. Catapults act as neutral brokers of knowledge and relationships, linking entrepreneurs, businesses, investors and end-users to commercialise late-stage R&D. Over the past four years UK Catapults have generated over 3,000 academic and industrial collaborations.
The Catapults are funded from a mix of private and public sources. Each Catapult centre is an independent non-for-profit company, controlled by its own board and executive management team.
Each Catapult has its own technological specialisation, including: High Value Manufacturing; Cell and Gene Therapy; Compound Semiconductor Applications; Satellite Applications; Future Cities; Digital; Energy Systems; Medicines Discovery; and Transport Systems.
Catapults have also set up two skills centres, contributing to the training of 900 apprentices last year.

Final Report: Manufacturing in Queensland
Queensland Productivity Commission 97
• reducing information barriers in the system by developing an IP Toolkit, with model contracts and case studies, access to information on collaboration and commercialisation outcomes, and a Patent Analytics Hub
• requiring universities to list their patents generated from publicly funded research on a central platform. There are currently over 9,000 patents and inventions listed, including at least 1,260 from Queensland based universities (IP Australia 2017a)
• ensuring rules for competitive grants appropriately recognise industry-relevant expertise or research
• supporting programs aimed at helping commercialisation, including:
− Innovation Connections encourages SMEs (less than $20 million turnover) operating in one of the Industry Growth sectors, to access knowledge and engage researchers, through the CSIRO's SME Connect team advisors and matched funding grants of up to $50,000 (DIIS 2017b).
− The Accelerating Commercialisation program provides businesses with expert advice and matched funding of up to $1 million to help take to market products, processes and services (DIIS 2017b).
− Linkage Projects provides grants of $50,000 to $300,000 for collaborative projects between higher education researchers and government, business, industry and end-users (ARC 2017).
The Cooperative Research Centres (CRC) program is a long-running program to link public research and industry. In its 2017-18 budget, the Australian Government increased CRC funding (see Box 5.5) to support larger-scale advanced manufacturing research projects (Sinodinos 2017).
Sources: Miles 2015; The Allen Consulting Group 2012; IMRC 2017a, 2017b; Cooperative Research Centres Association 2016.
Box 5.5 Cooperative Research Centres
The Cooperative Research Centres (CRC) program was introduced by the Australian Government in 1990 to bridge the gap between research and industry. The program supports industry user-driven research through the formation of collaborative partnerships between businesses, industry associations, governments and research organisations.
Over 200 CRCs have been formed over the history of the program, across a wide range of specialist fields. Of the 31 CRCs current members of the CRC Association, three are based in Queensland (CRC Optimising Resource Extraction; CRC for Living with Autism; and Wound Management Innovation CRC).
The Innovative Manufacturing CRC (IMCRC) aims to improve the competitiveness, productivity and sustainability of Australian manufacturing firms, by driving digital and business model transformation and increasing the use of enabling technologies. The IMCRC is funded to run from 2016 to 2022, and has up to $40 million in available Australian Government money, to be matched with industry funding.
Several reviews have found evidence of CRCs benefitting industry. For example, the CRC for Advanced Composite Structures enabled Hawker de Havilland to propose designs for the Boeing 787 that reduced labour and materials costs and aircraft weight. Innovation by Hawker de Havilland won $4 billion of contracts over 25 years with Boeing to manufacture aircraft parts in Australia. One review found CRCs to be highly effective in linking researchers and businesses—estimating a 3:1 benefit to cost ratio.

Final Report: Manufacturing in Queensland
Queensland Productivity Commission 98
Queensland Government policies
While the Australian Government has jurisdiction over the university sector, state governments still have a role in minimising any state-based barriers to research and commercialisation. Under the Advance Queensland banner, incentives are provided to increase collaboration between business and researchers, including:
• The Queensland Biofutures Commercialisation Program provides grants of up to $250,000 for pilot projects and up to $1 million to scale-up and test new or improved technologies and processes for collaborative projects that align with the government's Biofutures Roadmap (Queensland Government 2017k).
• Sports Science Challenge supports the development of new products, technology or processes that benefit performance or participation in sport and requires partnering with a business or end-user (Queensland Government 2017r).
• Innovation Partnerships provide grants of up to $1.5 million to collaborations involving at least one business or non-for-profit and one research organisation where it aligns with Queensland Science and Research Priorities and Advance Queensland Roadmaps (Queensland Government 2017k).
• Clinical Genomics Services aims to build capability and support demonstration projects to accelerate the implementation of clinical genomics in Queensland to improve health outcomes (QGHA 2016).
• The Medical Research Commercialisation Fund was established in 2007. It invests in early-stage development and commercialisation opportunities emanating from medical research institutes, with the support of Australian, State and New Zealand Governments and superannuation funds (MCRF 2017).39
• Knowledge Transfer Partnerships aims to improve collaboration between universities and SMEs by providing grants of up to $50,000 to employ an honours, master of PhD graduate to work on an innovative project. Universities assist in selection of graduates and mentorship (Queensland Government 2017o).
• Research Fellowships supports PhD qualified researchers in undertaking research that aligns with Queensland Science and Research Priorities or applies research from business schools to support entrepreneurship in SMEs. Applications must involve a collaboration between industry or end-user and universities or research institutions (Queensland Government 2017p).
Sectoral-based programs require manufacturers to understand up to six government policy documents and then assess whether their project meets these priorities, rather than focusing on how they can best commercialise promising research or technology. Unnecessary criteria may restrict some worthy manufacturers applying and increase compliance costs and administrative costs. Complexity is also more likely to create larger barriers for smaller businesses. Such program distortions are likely to result in unnecessary confusion and increase compliance and administrative costs.
Sectoral-based programs also rely on 'picking winners' correctly. For example, 49 of 50 US states started major programs to stimulate bio-technology industries. Realistically only a handful were positioned to have a viable industry and so most funds were wasted. When these programs did support a promising firm, it often quickly moved to a more suitable region (Lerner 2009). If bio-industry projects are the best opportunities for commercialisation, a competent evaluation process will see them succeed in grant applications. If on the other hand, they are not, the distortion would not promote economic efficiency.
39 Governments fund innovation in areas where they are directly involved, such as health. In such instances, the rationale for sector specific programs can be higher.

Final Report: Manufacturing in Queensland
Queensland Productivity Commission 99
Low-technology manufacturers would also benefit from access to programs. Vanino, Roper & Becker (2017) in their analysis of the impacts of publicly funded R&D on UK firm performance found that while impacts in terms of turnover were greater for high-tech manufacturers than low-tech manufacturers, productivity impacts were lower. The impact for both measures was also greater in low-tech manufacturers than knowledge-intensive services and all firms.
There are at least four programs provided by the Queensland Government that provide incentives to researchers and industry to collaborate on commercialisation. Three programs have a narrow focus: bio-industry, clinical genomics and sports sciences. The fourth, Innovation Partnerships, is restricted to projects that address Queensland Science and Research Priorities or Advance Queensland Roadmaps.
5.4.5 Business networks
Collaboration within business networks can spread the cost of innovation, achieve economies of scale and reduce duplication. The Australian Department of Industry, Tourism and Resources found that, while controlling for other firm characteristics, collaboration was associated with a statistically significant increase in new-to-the-world innovations (Rassenfosse et al. 2011, p. 18).
However, Australian business-to-business collaboration appears limited. Only about 16 per cent of innovation-active manufacturers collaborate with another organisation (ABS 2016g). This is similar to other industries, where about 15 per cent collaborate. More than half of collaborators do so through joint marketing or distribution, followed by joint R&D and joint production.
Large innovation-active manufacturers appear to be much better at collaboration. Almost half of them (47 per cent) collaborate, in comparison with the far smaller percentage of SMEs that collaborate (12–19 per cent). Large manufacturers are the most likely to collaborate on R&D—five times more likely than all businesses.
Figure 5.7 illustrates that Australian businesses are poorly connected in global value chains. Australia’s large businesses ranked 24th out of 27 OECD+ countries and its SMEs 19th for international collaboration in 2010–12.
Recommendation 3
The Queensland Government should redesign innovation commercialisation programs to incentivise all businesses and universities to collaborate on commercialisation, rather than targeting business sizes, models, technologies, sectors or science priorities.
The Department of Science, Information Technology and Innovation should, in conjunction with industry associations, develop and provide information and case study resources on intellectual property and commercialisation to Queensland businesses, including for traditionally lower technology industries.

Final Report: Manufacturing in Queensland
Queensland Productivity Commission 100
Figure 5.7 Proportion of innovation active firms that collaborate with international partners, 2010–12
Source: OECD 2015c. The AAAA suggested collaboration is:
the key to developing new products and expanding into new markets and this can rarely be achieved by a stand-alone commercial entity. Governments and industry associations working together are the best method of bringing clusters of manufacturers together to pursue opportunities. (sub. 10, p. 5)
Clusters
Reasons for relatively low collaboration may include geographical isolation and a lack of scale and cross-cultural skills. Cultural attitudes to business may also play a role (QPC Innovation Roundtable).
Clusters are geographic concentrations of linked businesses and institutions in an industry, such as the aerospace industry in north Brisbane and the marine industry on the Gold Coast. These industries generally do not conform to traditional industry classifications and sometimes go unrecognised (Porter 1998).
Clusters enable knowledge diffusion, specialisation, economies of scale, improved coordination, and comparison, the sharing of infrastructure, agglomeration and innovation. Firms within clusters benefit from accessing the same supply chains, and sharing the same institutions, infrastructure and knowledge. As Porter (1998) said:
Clusters promote both competition and cooperation. Rivals compete intensely to win and retain customers. Without vigorous competition a cluster will fail. Yet there is also cooperation, much of it vertical involving companies in related industries and local institutions … A cluster allows each member to benefit as if it had greater scale or as if it had joined with others without sacrificing its flexibility.
DSD said that one of the potential barriers to cluster formation and networking was the relatively small size of Queensland manufacturers (DSD sub. DR2, p. 8). It suggested that government may have a role in investigating how to best organise, design, facilitate and support networks/clusters.

Final Report: Manufacturing in Queensland
Queensland Productivity Commission 101
The Caravan Trade & Industries Association of Queensland provided an example of how lack of access to clusters and networks due to geographic factors can impact businesses:
One particular Queensland based component manufacturer has directly changed the way caravans have been built in Australia and helped support the recent phenomenal growth in off-road caravan products. This particular business engineers and manufactures arguably the most advanced caravan suspension in the world, right here in Queensland. While their success has been outstanding, they face the ongoing geographical challenge of being removed from the main recreational vehicle manufacturing hub in Victoria and overseas. (sub. DR6, p. 1)
The OECD noted that:
economic clusters emerge most often where there is a critical mass of firms allowing economies of scale and scope, a strong science and technology base, and a culture conducive to innovation and entrepreneurship ... Many successful clusters have long historical roots and the emergence of new clusters takes time. (1999, p. 7)
Policies to establish a cluster in the absence of other factors contributing to competitiveness are unlikely to be effective. Wallsteen (2001), in evaluating technology parks in the United States, found counties with such parks had lower growth rates in high technology employment after foundation—suggesting a 'build it and they will come' approach does not necessarily work. Reviews suggest that more than half of attempts to artificially create manufacturing clusters fail, and as few as 10 per cent are significantly successful (Johnston 2003, p. 25).
Innovative industries and businesses have an innate tendency towards clustering (Rothwell et al. 2016, p. 35). New businesses often proliferate in existing clusters rather than in isolation, because a dense customer base makes opportunities more apparent and lowers risks, and an existing supply of inputs can be utilised.
Governments can assist promoting networks and collaboration through the right framework conditions, land-use planning and zoning and information dissemination. Clusters policy has generally involved encouraging the development of deep local network relationships between firms and supporting agencies and removing barriers that hinder the development of clusters in terms of numbers and types of firms (McDonald et al. 2007, p. 46).
The Property Council of Australia noted that property regulation effects supply and distribution chains:
Rapid technology innovation is disrupting the industrial property sector. An increase in demand for properties which can facilitate new automated technology is changing the face of industrial precincts. Building heights, car parking requirements, and hours of operation are all areas that will necessitate a shift in thinking from city planners over the coming years. (sub. DR5, p. 2)
The spatial organisation of cities and region are built up over decades or longer and as a result high fixed costs may impede quick changes in industrial property and clusters. Some manufacturers impose negative externalities through pollution on neighbours and therefore are separated from some other land uses. However, for most businesses (retail, commercial, and some light industrial), there are few adverse impacts associated with their location decisions and therefore few planning reasons why they should not be co-located in a business zone (PC 2011b, p. 352).

Final Report: Manufacturing in Queensland
Queensland Productivity Commission 102
5.5 There is scope to improve policy The main policy rationales for government intervention (see Chapter 4) in innovation are market and systems failures (knowledge spillovers, information and coordination problems). These provide a necessary but not sufficient rationale for government intervention. A sufficient case for intervention depends on establishing that the intervention is likely to provide net social or economic benefit.
The most commonly cited possible enabler of Queenslanders progressing ideas was information to inform people of the specific steps needed to develop the idea (47 per cent) (Colmar Brunton 2017, p. 33).
5.5.1 Policy design
It is too early to evaluate the success of most Advance Queensland programs. DSITI indicated that many of its programs are based on programs that have succeeded internationally and have been co-designed with local experts and industry. DSITI has also committed to monitor and evaluate the effectiveness of innovation programs using best international practices (DSITI 2017).
In their communications with the Commission, DSITI, DSD and DTESB identified objectives and monitoring and evaluation processes for some of their programs. Even so, based on the policy design principles outlined in Chapter 4, there is scope to improve the current suite of programs.
Some programs lack evidence of strong policy rationale. Few programs have specific or measurable public objectives for the community to judge their success. This may be because little of the supporting evidence for the programs is publicly released, rather than because of an absence of policy logic. Some programs appear to favour activities with a limited link to innovation (Box 5.6).
Finding
Australian manufacturers do not collaborate as much as their international peers. Greater collaboration between Queensland manufacturers would likely provide knowledge spillovers and improve innovation. Clusters cannot be reliably manufactured—they are built on firms acting in their own interests in choosing locations and interlinkages. State and local governments have the role of providing information and ensuring their planning and zoning systems do not impose barriers to optimal land use.

Final Report: Manufacturing in Queensland
Queensland Productivity Commission 103
Sources: Queensland Government 2017a, 2017b, 2017h; ABS 2017m; DoET 2016b. For many programs, there is limited publicly available evidence to suggest they will induce additional activity. For example, much government assistance to start-ups40 through measures such as incubators, accelerators, grants and tax concessions is based on the notion that high-growth businesses may generate positive network spillovers, agglomeration economies and virtuous cycles of entrepreneurship (PC 2015b, p. 253). A disproportionate amount of net employment and economic growth comes from a relatively small number of firms (Office of the Chief Economist 2015a, p. 51). It is not clear that these programs can distinguish between what is a small business and what is a high-growth startup.
Borras and Edquist (2016, p. 10) observed that often policy instruments are not designed with a problem in mind, identified and accurately analysed beforehand,p which can result in generic and insufficient rationales for intervention. This aligns with the Australian National Audit Office (2017, p. 24) observation that much of the evidence base supporting the Federal Government’s recent Innovation and Science Agenda was general in nature and lacked in depth analysis of the problems.
Many manufacturers indicated they are unaware of, or avoid programs. Many firms participating in this inquiry indicated they tend to avoid government programs based on a view they would not be useful, or the compliance costs of navigating, applying and complying with the program are too high compared with the expected benefits. Some firms were either not aware of the available programs or found it too difficult to find one that suited their needs.
There is a large number of programs and no public performance information. There may be a case for multiple programs to enable policy experimentation, particularly in complex areas such as innovation where barriers are diverse and it is difficult to know what will work. Yet, the large number of programs available reduces effectiveness, increases overlap and duplication (both within state programs and with Australian and local government programs) and impedes performance measurement. It may also undermine the process of eliminating ineffective policies, scaling effective policies and continuous improvement.
40 Start-ups are a very small proportion of new businesses that are highly entrepreneurial and innovative and have high growth potential (PC 2015b, p. 251).
Box 5.6 Advance Queensland—targeting innovation?
Sport Science Challenge—the objective is to enhance the competitiveness of our elite athletes and teams, including those preparing for the 2018 Commonwealth Games or the 2020 Olympic Games, and to promote healthy and active lifestyles. The fund has $300,000 and it is not clear what failures impede a socially optimal level of innovation in Australian sport.
Women’s Academic Fund—the objective was to support more women in STEM with funding for female researchers within the Queensland-based universities and other publicly-funded research organisations. The guidelines do not restrict the academic’s field of study to a STEM discipline, as the objective might suggest. Between August 2015 and 30 June 2017, more than $1.53 million was invested through the fund to directly support more than 150 women researchers to help them continue research while on maternity leave, or to help advance their careers by funding childcare or raising the profile of their research through presenting at national or international conferences. There is no established failure that the policy addresses. In 2016, women represented almost half of Australian university academic roles (46.4 per cent) and the workforce (46.8 per cent) under 65. (Applications to this Fund are now closed, and the program is now in its evaluation stage.)

Final Report: Manufacturing in Queensland
Queensland Productivity Commission 104
5.5.2 There are some impediments to effective policy evaluation
Evaluation and monitoring of innovation policies is important to allow ineffective programs to be discontinued or effective programs to be scaled up. Some innovation programs have been well-monitored and evaluated. However, in general, good evaluation is the exception rather than the rule.
Evaluation is integral to good policy design. As noted by the Office of the Chief Economist:
[W]e gain an understanding of what works and what doesn’t work and why, what is being done well and what is not, what should be pursued and what should not. This knowledge can improve the design and implementation of effective interventions. (2015b, p. 2)
A comprehensive evaluation of New Zealand innovation programs concluded that:
The direct economic and financial returns from most individual government programs aimed at supporting innovative research or business investments have been generally low. Although there have been some exceptions—i.e. specific projects which gone on to significant commercial investment—these have been far fewer in number and scale than initially envisaged. (New Zealand Ministry of Economic Development 2011, pp. 3–4)
Innovation and Science Australia found:
Whilst there are evaluations showing the success of several such programmes, there is a need for improved data in this area (innovation) to ensure the efficiency and effectiveness of all Australian Government interventions. (2016, p.xii)
Moreover, as Lenihan et al. (2007 p. 1) discuss:
[O]nly rarely, do we see the application of evaluation methodologies which address the effects of selection bias and incorporate appropriate counterfactual scenarios.
Other innovation agencies and policies have had issues with design and evaluation. In reviewing the design and monitoring of Australian Government innovation policy, ANAO (2017, p. 37) found that:
An evaluation framework was developed but not in a timely or fully effective manner ... While evaluation arrangements were progressively developed post-announcement, there were delays and issues associated with the identification of suitable performance measures and data sources.
There are difficulties in measuring the impact and effectiveness of innovation programs, including:
• It may take many years before data is available to perform statistically valid analysis.
• Necessary data is not always available or reliable.
• Difficulties can arise in attributing cause and effect.
• The scale of programs can be small and therefore may only have marginal impacts on macro variables and its impacts can be difficult to separate from other fluctuations in the economy.
Evaluation needs to assess whether programs have induced additional activity beyond what would have occurred without the program. For example, the Knowledge Transfer Partnerships (KTP) program is based on a UK program of the same name. An evaluation of the UK program by Warwick Economics & Development (WECD) (2015) found that approximately £7.5 to £8 of net additional GVA was generated for every £1 spent on the program. The benefit was derived by estimating the impact of KTP participants on productivity (measured through differences in wages and startup creation). The evaluation estimated that 75 per cent of participants achieved the same or better career results than if they had not participated in KTP. The study uses surveys to try to establish additionality by asking participants whether they think they would have attained the same skills or achieved the same results elsewhere.

Final Report: Manufacturing in Queensland
Queensland Productivity Commission 105
It is not clear is what caused the increase in wages of KTP participants. If the sample of KTP participants was completely random, it would be reasonable to assume KTP drove the increase in wages. If, on the other hand, KTP was better than average at selecting good graduates, some of the relative increase in wages would have been caused by the graduates' innate talents. The WECD study (2015) does not rely on a randomised control group to establish additionality.
The WECD study (2015) also uses some less contemporary approaches to economic analysis—applying a multiplier of 1.8 to the impacts on productivity and high growth businesses.41 It also appears to have ignored discount rates, despite upfront costs and benefits accruing over three decades. This does not suggest there are no benefits to the program, but it does illustrate the difficulties in analysing programs and that the impacts of this program are likely overstated.
DSD has said Advance Queensland programs will be evaluated at three levels: individual, clusters and macro (DSD sub. DR2, p. 5). It is good practice to identify review and evaluation practices and data sources and baselines in the design phase. A key impediment to this is the current a dearth of state-based metrics to measure innovation inputs and outputs, to ultimately inform proper evaluation.
The main ABS publications measuring innovation do not provide data at the state level, including the ABS's Business Longitudinal Analysis Data Environment and Business Longitudinal Database and Innovation in Australian Business publication. This make it difficult to measure many of the indicators the government is attempting to target. The Business Characteristics Survey, which is the basis of most ABS business innovation data, is not designed to provide state level estimates. While data on location is collected, it may be unreliable and does not account for businesses that operate in multiple states.
This is not just a problem for Queensland but also for other state governments, many of whom are also implementing innovation policies. Collecting such data nationally is likely to be more cost-effective than individual states collecting it themselves. DSITI indicated it has approached the ABS to gain access to state level data on innovation and is actively working to resolve the issue.
5.5.3 Transparency and consolidation
Large numbers of relatively small programs are likely to be less cost-effective, requiring a high proportion of funds to administer them. The greater the proportion of the funding spent on administration, the smaller the amount that businesses and researchers actually receive.
As the Queensland Competition Authority observed in relation to industry assistance:
Some assistance measures have very high delivery costs. While the cost of administering industry assistance measures averaged around 10 per cent for those budget-funded programs that record program administration costs, for a handful of programs, administration costs account for 50 per cent of total program cost, meaning for every dollar of assistance, a dollar is spent administering the program. For a small number of programs, the cost of establishing and administering the program was higher than the amount of assistance provided. (QCA 2015a, p. 59)
Evaluations of Finland's innovation agency Tekes showed program costs ranged between 2 and 25 per cent and varied depending on the type of program, number and average size of projects (economies of scale), the complexity of evaluation and other activities included (such as marketing and publication) (Finland Ministry of Employment and the Economy 2012, p. 127).
41 See for example Gretton 2013 on why multipliers tend to overestimate the economic impacts of policies.

Final Report: Manufacturing in Queensland
Queensland Productivity Commission 106
The importance of a transparent well-developed policy approach to innovation policy and the potential risks of failure are highlighted by Lerner (2009, p. 5):
When we look at the regions of the world that are, or are emerging as, the great hubs of entrepreneurial activity—places such as Silicon Valley, Singapore, Tel Aviv, Bangalore, and Guangdong and Zhejiang provinces—the stamp of the public sector is unmistakable. Enlightened government intervention played a key role in creating each of these regions. But for each effective government intervention, there have been dozens, even hundreds, of failures, where substantial public expenditures bore no fruit.
Transparent reporting on innovation would be in line with the Queensland Government's Open Data Policy Statement, which says that data is increasingly vital to solving real world problems and that it can bring benefit Queensland, including to:
Foster transparent, accountable, efficient, responsive and effective government
Support the design, delivery and assessment of better services for citizens and businesses
Improve the evidence-base for policy and programs
Provide major opportunities for innovation and underpin growth of the digital economy. (Queensland Government 2017n, p. 1)
With large amounts of public funds spent on innovation policy across all levels of government, there is a need for greater accountability. Much of it is in grants to individuals or private businesses. For many of the programs, the primary benefits are private rather than public. Therefore, it is important to transparently measure and provide evidence of the benefits, particularly the spillovers to the broader Queensland community.
The OECD recommended the consolidation of innovation programs and a more integrated whole-of-government approach, to increase innovation absorption and development and boost productivity (OECD 2017b, pp. 2–3).
The AMWU gave in principal support to the consolidation of innovation programs which had measurable objectives that are monitored and evaluated (AMWU sub DR1, p. 6).
The Caravan Trade & Industries Association of Queensland supported increasing effectiveness and reducing administration costs, consolidating and simplifying innovation programs and tracking, managing and measuring their performance (sub. DR6, p. 7).
Fewer programs—based on robust design that focuses on outcomes, measures benefits and is accompanied by transparent evaluation to demonstrate ‘what works’—are more likely to:
• establish a clear government plan for industry, which is understood by firms, workers and the community
• make it easier for manufacturing firms to access and participate, increasing the chance that the best firms can access programs, rather than firms that have the time and resources to navigate the system
• better achieve the government’s objectives and be able to demonstrate success (or if not successful, demonstrate how to improve programs or identify if resources would be better deployed elsewhere).

Final Report: Manufacturing in Queensland
Queensland Productivity Commission 107
Recommendation 4
The Department of Science, Information Technology and Innovation should continue to collaborate with the Australian Bureau of Statistics and request the redesign and public release of state-based business innovation data. This data should include access to the Business Longitudinal Analysis Data Environment and Business Longitudinal Database and the Innovation in Australian Business publication.
Recommendation 5
To improve the efficacy of innovation policy, the Queensland Government should consolidate its more than 50 innovation and entrepreneurial programs and transparently report on its innovation policy. The consolidated set of programs should target three key areas—beneficial knowledge spillovers, access to information, and coordination problems.
For each program, the Queensland Government should publicly and transparently:
• develop a clear program logic targeting identified problems
• establish measurable objectives in relation to mitigating or offsetting the identified problems
• measure and monitor the program for performance from commencement
• evaluate outcomes within three years and regularly thereafter, balancing precision with administrative and compliance costs. This evaluation should cover: administration costs; whether the program achieved its objectives (effectiveness); and whether the benefits exceeded the costs (efficiency).

Final Report: Manufacturing in Queensland
Queensland Productivity Commission 108

Final Report: Manufacturing in Queensland
Queensland Productivity Commission 109
6.0 Skills and training

Final Report: Manufacturing in Queensland
Queensland Productivity Commission 110
This chapter considers how workforce skills and training can influence the productivity and competitiveness of Queensland manufacturing.
It identifies challenges around skills and discusses how government can address these issues as part of broader reform to the education and training sector.
Key points
1 A skilled workforce is an important driver of growth and innovation for Queensland manufacturing.
2 New and emerging technologies are placing new demands on workers and businesses—changing tasks and activities and the associated skillsets required. This provides opportunities for some, but can also pose significant risks for others.
• Businesses must attract and retain workers with skillsets to meet changing needs.
• Workers must acquire new skills and quickly adapt in an environment where it is never certain which new technologies will develop next.
• For government, the challenge is to put in place sufficiently flexible policies and programs to accommodate a range of possible future needs.
3 Some manufacturers find it difficult to attract, retain or replace skilled workers, particularly in regional areas or niche markets. In part, this reflects:
• the perception there is ‘no future’ in manufacturing
• ongoing concerns with the level of basic skills (literacy, numeracy, problem solving)
• differences in the capability and capacity of workers ‘beyond the production line’ (STEM skills, leadership, management, entrepreneurship)
• an apparent disconnect between government, training providers and industry needs, particularly in relation to ‘job readiness’ as well as in identifying and providing for future skills needs.
4 Many of these issues are not unique to manufacturing. They reflect challenges facing the Queensland economy as it shifts to more knowledge-intensive industries and services.
5 A robust and flexible vocational education and training (VET) sector plays a key role in delivering an appropriately skilled manufacturing workforce.
6 The Queensland and Australian Governments have implemented substantial VET reforms and continue to undertake significant VET reform initiatives. Continued efforts to develop a VET system that better serves students, business and the wider community will benefit Queensland manufacturers and workers, as well as the broader economy.

Final Report: Manufacturing in Queensland
Queensland Productivity Commission 111
6.1 Introduction Manufacturing businesses require workers with a variety of skills to pursue different product-market strategies. In some cases, highly skilled staff with knowledge of specific disciplines are required to undertake technical and specific tasks. Businesses also need ‘capable’ workers with a base set of skills and the flexibility, creativity and ability to try new things.
The OECD emphasises the importance of:
a skilled workforce that can generate new ideas and technologies, bring them to the market, and adapt to technological changes across society. Skilled people generate knowledge that can be used to create and implement innovations, and skills are also crucial to help absorb new innovations throughout economy and society. (OECD 2015a, p. 47)
Stakeholders said Queensland manufacturing required a skilled workforce to succeed, and firm and industry outcomes would suffer unless existing skills gaps were addressed (Box 6.1).
This inquiry has identified specific concerns:
• new and emerging technologies that provide opportunities for the industry, but nevertheless place new demands on workers
• difficulties in finding (or replacing) and retaining skilled staff, that reflect:
− a perception problem—when workers (with desirable skills and talents) do not appear to be interested in manufacturing jobs
− workplace skills—where existing gaps and future concerns about workplace skills limit opportunities for firms and workers.
These issues are not new—and are not unique to manufacturing. Reflecting this, governments have put in place a program of reform to improve skills and training for firms and workers, including those involved in manufacturing. Continuing efforts to improve training and skills outcomes based on broad-based reform is most likely to address stakeholders' concerns—with the benefits from reform being incremental and realised over the medium to longer term.
6.2 New and emerging technologies—changing workforce needs New and emerging technologies are shaping the Queensland manufacturing industry—but uptake by industry, business and workers is highly context-dependent.
While many businesses have automated routine or repetitive tasks, some have fundamentally changed their processes and business models by using smart robotics, advanced machinery, additive manufacturing for complex tasks, and new technologies and advanced materials to improve products and processes. New businesses are also emerging to take advantage of new technologies.

Final Report: Manufacturing in Queensland
Queensland Productivity Commission 112
Box 6.1 Stakeholder views about skills in manufacturing
Stakeholders said having workers with diverse range of disciplines and levels of skill would enable Queensland manufacturers to succeed, noting:
Higher skill levels and genuine interaction across disciplines and specialisations will be a necessary precondition to Queensland securing a competitive advantage in global markets and capitalising on the opportunities of the future. (CCIQ sub.6, p. 8)
The key skills required for participation in global manufacturing supply chains includes: strong communication skills; the ability to collaborate effectively; knowledge of international practices and quality standards; and the ability to produce high-quality products. (DSD sub.11, p. 4)
But the true asset to Queensland’s economic future is the skill base retained within the manufacturing industry. It is these skills that drive innovation and support the commercialisation of those ideas, which in turn create new opportunities for growth. (Cook Medical Australia sub. 12, p. 3)
The skills set required by those employed in the Caravan Service & Repair and Manufacturing Sector of our industry is extremely diverse … a minimum of at least 40 individual trade skills are used each and every day. (CTIAC sub. DR6, pp. 4–5)
Others said firm and industry outcomes would suffer unless existing skills gaps were addressed:
One of the key barriers to manufacturing innovation is a lack of skilled people … industry and government should focus on building a stronger skills base which will increase productivity and competitiveness … (AMWU sub. 9, p. 6)
The development and delivery of manufacturing workers with skills that support good, high wage jobs for the future is essential. Reskilling must start now so that working people have the tools to transition into an advanced manufacturing economy. (AMWU sub. DR1, p. 4)
Stakeholders were generally concerned manufacturing skills would be lost and not replaced if the industry failed to grow. They said the decline in manufacturing:
is severely impacting the skills and knowledge base, which is critical to achieving the successful commercialisation of innovative new products … the skills necessary to pursue innovation-led advanced manufacturing opportunities are largely nurtured within wider manufacturing, making the two inextricably linked … (Cook Medical sub.12, p. 5)
These effects could be felt by manufacturing workers and businesses, as well as firms in other industries and the broader economy:
Many people initially trained in manufacturing move to other industries. Where will the engineers, technicians, welders, maintenance fitters and machinists come from to install and maintain our telecommunications, power stations, water plants, transport and defence systems? (Green & Roos 2012, p. 49)

Final Report: Manufacturing in Queensland
Queensland Productivity Commission 113
These developments place new demands on workers—changing the activities undertaken in many manufacturing firms, and the associated skill sets needed.42 The impacts in workplaces and on workers are well documented:
Recent decades have witnessed waves of obsolescence of skills as a result of wholesale replacements of technologies and their associated infrastructures. (Jones & Grimshaw 2012, p. 6)
Technology will change the way we work and the work we do; destroying existing jobs, creating new ones, transforming industries and internationalising labour at unprecedented levels … People most likely to prosper in tomorrow’s workforce will be protean—able to change, adapt to unfamiliar work, deploy versatile skills and learn new trades continuously as part of their working lives. (Williamson et al. 2015a, pp. 8, 19)
It is expected that the increasing automation of processes will reduce the labour intensity of manufacturing, significantly lowering the number of low-skilled roles:
Employment is likely to decrease in the manufacturing sector because productivity improvements generally exceed growth in demand, and rapid digitisation means firms require fewer workers even as they become more service oriented. (CEDA 2014, p. 33)
Autonomous machines and additive manufacturing are reducing the labour intensity of manufacturing, significantly lowering the number of low-skilled roles. (CSIRO 2016, p. 53)
The Australian Department of Employment (DoE) found the proportion of manufacturing workers employed as labourers, machinery operators and drivers across Australia has fallen from 40 per cent to 31 per cent during the past 20 years (DoE 2015a, p. 9).
Many manufacturers have redesigned and streamlined production lines while increasingly automating processes. Although some remaining job roles will require less technically skilled workers, these trends and innovations generally demand more skilled workers (Deloitte Development LLC and The Manufacturing Institute 2015, p. 6). Capabilities more difficult to automate such as the ‘deeply human’ characteristics of ethics, creativity and intuition will be more important and highly valued (CSIRO 2016, p. 53).
These effects are not expected to diminish over time:
One certainty about the economy and employment in the years ahead is they will continue to be shaped and affected by new and evolving technology … While the impact of technology on the workplace to date has been significant, it is likely to be dwarfed by new technologies that are emerging. (CEDA 2015, p. 39)
Stakeholders supported the view that new and emerging technologies are likely to increase the demand for workers who are capable of driving change and innovation (CCIQ sub. 6, p. 8; QPC Innovation Roundtable; TCF Roundtable; Brisbane Public Forum; Townsville Public Forum). This includes people with high levels of technical proficiency (engineering, production, technology) as well as entrepreneurship, design and creativity skills. Trade skills will remain important, but they are more likely to come in the form of skilled trade roles as opposed to lower-skilled work as was the case in traditional manufacturing (CCIQ sub. 6, p. 8; TCF Connect sub. 2, p. 2; QPC Innovation Roundtable; TCF Roundtable).
At the same time, workers with low or obsolete skills who are unable to readily acquire new skills will be increasingly exposed to unemployment or underemployment. The AMWU said:
asking a boilermaker to put on a lab coat tomorrow is an unrealistic proposition. (sub. 9, p. 3)
42 This includes new ways of doing things on the production line as well as new activities beyond the production line such as complex research, development and design work and value-adding post-production opportunities, through service and support.

Final Report: Manufacturing in Queensland
Queensland Productivity Commission 114
In this environment:
• manufacturing businesses need to attract and retain workers with the skillsets to meet changing needs
• manufacturing workers need to lift basic skills and/ or reskill or upskill to take on new tasks.
Stakeholders identified a tension between ‘generic’ or ‘adaptable’ skills and specialist technical skills, especially when there is uncertainty over what technologies will come ‘online’ and whether new skills will fit with these developments:
The growing trend of employers skilling workers for highly specific tasks is a dangerous one. This practice results in working people having too narrow a skillset which leaves them vulnerable in the manufacturing industry. Producing workers whose skills are tied to the narrow needs of an individual employer is counterproductive and contrary to the public interest. (AMWU sub. DR1, p. 4)
[S]killing workers specifically for highly specialised tasks can present risk, as this practice can result in elements of the workforce having too narrow a skill set that is limited in transferability. This can potentially create vulnerability for individuals in the manufacturing industry. While skills must be matched to the manufacturing jobs of the future, the skill sets should also be broad enough to promote longevity of employment within the industry for individuals and an adaptable workforce for the industry more broadly. (Jobs Queensland sub. DR7, p. 2)
As it is difficult to predict major technological changes far in advance, the ability to acquire new skills and adapt quickly is necessary:
Occupational obsolescence can be mitigated by ensuring that vocational training targets tomorrow’s jobs rather than yesterday’s, and by training people to be adaptable. (Williamson et al. 2015b, p. 20)
Lifelong learning is an essential part of both reacting to and fostering innovation. Learning and replenishing skills is necessary to respond to economic and technological change. (OECD 2015a, p. 57)
These tensions are not unique to manufacturing—and reflect the broader challenges the Queensland economy faces as it shifts to more knowledge-intensive industries and services.
6.3 Difficulties in attracting and retaining skilled workers Across Australia, 18 per cent of all manufacturing firms identified the lack of skilled persons within the firm and/or within the labour market as a barrier to general business activities or performance. This increases to 24 per cent for innovation-active manufacturing firms (ABS 2016d).
Finding
New and emerging technologies place new demands on workers, changing the tasks and activities undertaken in manufacturing, and the associated skills required. Increasing automation creates risks for workers with low or obsolete skills, or those workers unable to readily acquire new skills. The capabilities that are more difficult to automate will become more important and highly valued.

Final Report: Manufacturing in Queensland
Queensland Productivity Commission 115
Stakeholders said that although Queensland manufacturing offers opportunities for a wide variety of workers with a diverse range of skills, some businesses had difficulties in finding (or replacing) and retaining skilled manufacturing workers. This seemed to be a particular challenge for businesses that are:
• requiring (sometimes new) specialised skills for niche products (Packer Leather sub. 13, p. 3; TCF Connect sub. 2, p. 2; CTIAC, sub. DR6, pp. 4; TCF Roundtable; Brisbane Public Forum; MSA 2015a, p. 22)
• employing a larger share of older workers (who are heading towards retirement) and are:
− struggling to attract younger workers, and therefore rely on older workers to remain fully active and engaged in the workplace (TCF Connect sub. 2, p. 2; TCF Roundtable)
− seeking to move to more advanced manufacturing practices that require workers to develop different skillsets (DSD sub.11, p. 5)
• located in regional areas, where firms can often have difficulty recruiting labour with the appropriate entry level skills and there are more limited opportunities for training and development (Bundaberg Public Forum, Gladstone Public Forum; MSA 2015b, p. 14).
The general decline in manufacturing activity (and reduced demand for workers with related skills from the mining sector) has meant competition can be strong for available vacancies for some jobs. In 2015, the DoE found there were 23 applicants for each engineering trade43 vacancy on average in Queensland (of which 5.2 applicants were suitable), the highest recorded levels for the past eight years (DoE 2015b, p. 2). However, shortages still exist for some occupations or in some regional areas (Table 6.1).
6.3.1 A perception problem
The prospect of a stable career can be a powerful factor in attracting people to the manufacturing workforce and continuing to develop relevant skills and knowledge. Some stakeholders were concerned that workers were deterred from the manufacturing sector by the view that it had no future. The CCIQ said:
The consequences of this negative public perception include successful manufacturers encountering roadblocks when seeking to attract and retain talent … Queensland needs to build a renewed perception of its manufacturing industry, from one of steep declines and a bleak future, to that of a rejuvenated and active industry full of opportunity and promise. (sub. 6, p. 20)
The Queensland Government’s Advanced Manufacturing 10 Year Action Plan and Roadmap also highlighted the challenges around existing perceptions and understanding of the industry, noting:
Communities’ perception that the manufacturing (and by extension advanced manufacturing) sector is in decline is devaluing the importance of manufacturing to the economy and thereby reducing the industry’s ability to attract new businesses and apprentices into the sector. (DSD 2016a, p. 23)
Similar concerns have been raised at the national level. In its 2014 study into Australia’s manufacturing workforce, the (former) Australian Workforce and Productivity Agency44 said:
Public perceptions of manufacturing do not bear a close relationship to the contemporary emergence of creative, high-skilled and interdisciplinary manufacturing jobs. These perceptions are impacting the sector’s ability to attract skilled workers. (AWPA 2014, p. 25)
43 Engineering trades workers construct, repair and maintain vehicles and aircraft structures and systems and cut, shape, cast, join and finish metal, metal parts, subassemblies and precision instruments. At the last census, manufacturing was the largest employing industry of people in these occupations (44 per cent) (DoE 2015b). 44 The functions of Australian Workforce and Productivity Agency were transitioned into the Australian Department of Industry in July 2014 (DoET 2016a).

Final Report: Manufacturing in Queensland
Queensland Productivity Commission 116
Table 6.1 Department of Employment labour market ranking of selected occupations relevant to manufacturing in Queenslanda, 2016
Statusb Applicants per vacancy
Suitable applicants per vacancy
Metro Regional Sheetmetal trades
R 13.1 2.4 0.8 Overall, 77 per cent of vacancies were filled within four weeks of advertising, with lower numbers of applicants (and more suitable applicants) than in 2015. Around 85 per cent of all applicants were not qualified sheetmetal trades workers. Some lacked any trade qualifications while many were boilermakers who worked with heavier and thicker materials.
Structural steel and welding trades
NS 15.6 1.9 3.50 There were high fill rates across Queensland, with regional vacancies attracting high numbers of structural steel workers and welders previously employed in, or looking to exit, the mining industry.
Metal fitters and machinists
R 40.6 6.3 0.6 While metropolitan employers were generally able to fill vacancies for metal fitters and machinists from large fields of qualified applicants, regional employers were unable to fill most their vacancies. While advertised positions attracted around 40.6 applicants per vacancy, the number of qualified applicants per vacancy in metropolitan areas (38.3) was almost three times that of regional Queensland (13.6). Of those applicants who were qualified, 67 per cent were considered unsuitable, most commonly due to issues around experience and skills. Temporary skilled migration is a minor source of supply for metal fitters and machinists, with less than five workers in 2014–15 to 2015–16.
Butcher or smallgoods maker
S 8 1.6 1.8 Shortages of trade qualified butchers persist, with 20 per cent of employers reporting their vacancies failed to attract any applicants and 40 per cent having no suitable applicants respond. Unsuitable applicants do not have the required length or breadth of experience.
Cabinetmaker S 10.3 0.5 2.0 There is a state-wide shortage for cabinetmakers, with 67 per cent of all vacancies remaining unfilled four weeks after advertising. There was a 25 per cent fill rate for metropolitan vacancies. Unsuitable applicants were not qualified or lacked relevant skills and the necessary experience, including in operating industry-standard machinery.
Mechanical engineers
NS 139.4 190 63.5 Overall, 60 per cent of vacancies for mechanical engineers were filled within six weeks of advertising, with unfilled vacancies for very senior or specialist positions or suitable applicants declining the position.
a In Queensland, the manufacturing industry is a key employer of engineering trades workers (particularly sheet metal trades and structural steel and welding). Metal fitters and machinists, butchers, cabinetmakers and mechanical engineers are employed across several industries, including manufacturing. b NS—No shortage; S—Skill shortage (employers are unable to fill or have considerable difficulty filling vacancies, or significant specialised skill needs within that occupation, at current levels of remuneration and conditions of employment, and in reasonably accessible locations); R—Regional shortage. Sources: DoE 2015a, 2016b, 2016c, 2016d, 2016e, 2016f, 2016g, 2016h.

Final Report: Manufacturing in Queensland
Queensland Productivity Commission 117
CEDA said despite some ‘good news stories’, the media focus on closures, job losses, cutbacks, uncertainty and vulnerability paints a bleak picture. This influences young students contemplating their future study and career pathway; skilled workers looking for career development; and those already working in the sector and contemplating their future (CEDA 2014, p. 87).
The MSA said the overwhelming negativity is taking its toll:
Rather than an atmosphere of collaboration and innovation that are today’s business aspirations, it fosters a mindset of limitation and an aversion to risk. Without a more inspiring vision, manufacturing is at risk of becoming a self-fulfilling prophesy … Certainly manufacturing finds itself in a vicious circle in need of a circuit breaker. (MSA 2015a, p. 9)
This has an adverse impact on the potential desirability of manufacturing as a career:
While most Australians appear to believe it would be a good thing if more Australians worked in manufacturing, there doesn’t appear to be a strong desire among Australians for their own children to work in factory jobs. (Eslake in Wade 2017)
Reflecting this negativity, the Wallis Public Perceptions of Manufacturing Survey found only 29 per cent of Australians would recommend manufacturing as a career for young people. The survey identified the key disadvantages as low job security; repetitive and boring tasks; and potentially dirty and unsafe work environments (Wallis Consulting Group 2013, pp. 2, 27).
6.3.2 Workplace skills—existing gaps and future concerns
The qualifications profile of Australian manufacturing workers varies considerably (Figure 6.1).
Figure 6.1 Highest educational attainment—share of employment, Australia, 2016
Source: ABS 2016o.
Finding
The community’s perceptions and understanding of Queensland manufacturing affect the industry’s ability to attract and retain manufacturing workers (with desired skills and talents).

Final Report: Manufacturing in Queensland
Queensland Productivity Commission 118
Some subsectors of the industry have a highly educated and skilled workforce, particularly those with innovative and advanced manufacturing practices. For example, more than 85 per cent of staff at Patheon’s pharmaceutical manufacturing and development facility have tertiary qualifications (DSD 2016a, p. 19).
Many Australian manufacturing workers do not hold any formal post-school qualifications.
The majority of manufacturing workers who have attained a non-school qualification hold a certificate-level qualification, reflecting the importance of trade skills to manufacturing.
While some manufacturing workers also hold higher-level qualifications, manufacturing employs fewer university graduates than other industries.
Stakeholders said a diverse range of disciplines and levels of skill are required for Queensland manufacturers to succeed—but the skills and qualifications profile of the manufacturing workforce does not always align with current (or anticipated) needs (Box 6.1).
Some workers lack basic workplace skills
Basic workplace skills such as numeracy, literacy and problem-solving are important in all workplaces—and become crucial when processes become increasingly complex and higher-level technical competencies are needed.45
There are ongoing concerns that some manufacturing workers lack basic workplace skills. Information from the 2012 Programme for the International Assessment of Adult Competencies (PIAAC) shows the levels of numeracy, literacy and problem-solving skills in manufacturing in Australia are lower on average than in most other sectors.
More than half of manufacturing workers recorded low levels of proficiency for literacy46, numeracy47 and problem-solving48, and could be regarded as not meeting a ‘functional level’ to participate effectively at work or benefit fully from training. Technicians and trade workers, machinery operators and labourers generally had lower than average levels of proficiency numeracy, literacy and problem-solving skills than all employed persons (Table 6.2).
To the extent these results reflect Queensland outcomes49,this means many:
• Queensland manufacturing workers potentially forgo the individual benefits of literacy, numeracy and problem-solving skills—limiting their opportunities to reskill or upskill for new (potentially higher-level) roles
• Queensland manufacturers (and other businesses) potentially forgo the benefits of a workforce with a higher level of literacy, numeracy and problem-solving skills—with resultant adverse impacts (through poor completion of workplace documents, reworking, ineffective work teams and wasted materials) and limiting capacity to innovate, adapt and respond to new technologies, systems or work processes.
This is a particular concern for firms seeking to become high-skill, advanced manufacturing businesses with a focus on new technology, customer orientation and product innovation (MSA 2015c, pp. 7–10).
45 In these cases, basic skills extend beyond the entry-level skills required to obtain employment and enter the workforce. 46 Proficiency is ranked on a 1–5 scale. Workers with lower level proficiencies can locate a single piece of specific information, using basic vocabulary and sometimes the meanings of sentences and paragraphs (Level 1 and below) or make matches between the text and information requiring paraphrasing or low-level inferences (Level 2) (OECD 2013b, p. 2). 47 Proficiency is ranked on a 1–5 scale. Workers with lower level proficiencies can carry out simple processes such as counting, sorting, performing basic arithmetic (Level 1 and below), sometimes taking two or more steps (Level 2) (OECD 2013b, p. 2). 48 These workers can use familiar technology applications, such as email software or a web browser and generally use only one function to meet one explicit criterion without any categorical or inferential reasoning, or transforming of information (OECD 2013b, p. 2). 49 The average proficiency scores for Queensland manufacturing workers were lower than the Australian average for problem-solving, but higher than the Australian average for literacy and numeracy (ABS 2014).

Final Report: Manufacturing in Queensland
Queensland Productivity Commission 119
Table 6.2 Proportion of workers with low levels of proficiency in literacy, numeracy and problem-solving, Australia, 2012, per cent
Proportion of workers
Literacya
Numeracya Problem-solving in a technology-rich worldb
By industry
Manufacturing 51.2 59.1 77.5
By occupationc
Technicians and trades workers 47.7 54.4 75.0
Machinery operators and drivers 57.9 66.6 84.9
Labourers 62.3 68.3 85.3
All employed persons 38.3 48.4 65.8 a A low level of proficiency (literacy or numeracy) refers to a proficiency score of 2 or below (out of 5). b A low level of proficiency (problem solving) refers to a proficiency score of 1 or below (out of 3) as well as people who did not have the skills to undertake the assessment or opted out of the assessment. c Occupations that are relevant to manufacturing, but that also include workers who do not work in manufacturing. Source: ABS 2013. A shift away from STEM subjects and skills
Stakeholders said science, technology, engineering and mathematics (STEM) skills are essential for manufacturing firms seeking to move to more advanced technologies and skill-based technological manufacturing processes (CCIQ sub. 6, p. 8; Cook Medical sub. 12, p. 5).
The Australian Chief Scientist said STEM skills:
are the lifeblood of emerging knowledge-based industries—such as biotechnology, information and communications technology (ICT) and advanced manufacturing—and provide competitive advantage to established industries—such as agriculture, resources and healthcare … An education in STEM also fosters a range of generic and quantitative skills and ways of thinking that enable individuals to see and grasp opportunities. These capabilities—including deep knowledge of a subject, creativity, problem solving, critical thinking and communication skills—are relevant to an increasingly wide range of occupations. They will be part of the foundation of adaptive and nimble workplaces of the future. (Office of the Chief Scientist 2014, p. 7)
However, the low uptake (and capability and capacity) in STEM subjects at school is a key challenge to Queensland manufacturing businesses (DSD sub. 11, p. 2; Brisbane Public Forum; Ipswich Public Forum).
Over the past decade, there has been a fall in the number of students enrolling in STEM subjects at high school (and at university) (Office of the Queensland Chief Scientist 2017). Moreover, recent Programme for International Student Assessment (PISA) results50 show Queensland average scores for mathematical and scientific literacy are below the Australian average and are significantly lower than the ACT (the top-rating Australian jurisdiction) and Singapore (the top-rating country). Queensland’s score for mathematical literacy was also less than the OECD average (Table 6.3).
When students have limited interest or ability in STEM subjects at school, developing the relevant skills and knowledge to perform in technology- or knowledge-based workplaces can be difficult.
50 PISA is a triennial international survey directed by the OECD that aims to evaluate education systems worldwide by testing the skills and knowledge of 15-year-old students, focusing on the core school subjects of science, reading and mathematics (OECD 2017a).

Final Report: Manufacturing in Queensland
Queensland Productivity Commission 120
Table 6.3 PISA reading, mathematical and scientific literacy results, 2015
Reading literacy Mathematical literacy Scientific literacy
ACTa 516 505 527
Queensland 500 486 507
Australia 503 494 510
OECD average 493 490 493
Singaporeb 535 564 556 a The ACT was the highest-performing Australian jurisdiction for reading, mathematical and scientific literacy in 2015. b Singapore was the highest-performing country for reading, mathematical and scientific literacy in 2015. Source: Thomson et al. 2016, pp. 30, 32, 34. Significant differences in leadership, management and entrepreneurship capabilities
Stakeholders suggested developing leadership and management skills is a key priority, noting there can be significant differences in the capabilities and capacity of Queensland manufacturers.
The Advanced Manufacturing Growth Centre said while there is a large and talented cohort of managers in Australian manufacturing, there are fewer high-performing managers (and a larger tail of low-performing manufacturing companies) than in other successful countries (AMGC 2017, pp. 29, 69). The CSIRO (2016, p. 20) suggested this reflects the ‘family-owned’ nature of many manufacturing businesses, where those in leadership positions are less likely to have had sufficient external experience to learn novel or more sophisticated approaches to business planning and staff management.
MSA noted 80 per cent of its 2015 EScan survey respondents thought developing management skills was a high priority. It said:
Manufacturers often don’t have management skills and managers are brought in who don’t have manufacturing skills; indicating that current development pathways are not being used to properly prepare employees to move up the ranks … There is also a big gap in the development of supervisors and in the executive leadership training area. (MSA 2015a, pp. 16–17)
Similarly, entrepreneurs are essential to a firm's survival and growth in changing markets, where it is faced with challenging conditions. Entrepreneurs innovate, take risks, find new opportunities and develop new goods and services. They drive the birth, expansion, contraction and death of firms (and sectors). There are general concerns about Australia’s attitude to entrepreneurship and its reputation as a risk-averse culture, and about mixed international evidence as to how Australia performs in terms of entrepreneurial skills and capacity (Chapter 5).

Final Report: Manufacturing in Queensland
Queensland Productivity Commission 121
A disconnect between training programs and worker, firm and industry needs
A well-functioning education and training system will ensure a suitably trained workforce can meet the needs of the manufacturing industry, particularly given the sector’s diversity. Stakeholders highlighted the importance of education and training curricula that focus on the practical application skills to the everyday activities of a manufacturing workplace (CCIQ sub. DR4, p. 6; CTIAC sub. DR6, pp. 5–6; Townsville Public Forum). The CCIQ said the relationship between the manufacturing industry and the education and training system will be critical, and recommended promoting:
increased collaboration between industry and education providers to ensure training delivered and competencies achieved by graduates successfully meet the needs of the industry now and into the future. (CCIQ sub.6, p. 9)
Some manufacturing businesses suggested there is a disconnect between skills outcomes and industry needs, with many newly qualified workers (across all qualification levels) often not ‘job ready’, particularly for the more innovative parts of the manufacturing sector. Additional challenges lie in developing capabilities in regional areas (Australian Sugar Milling Council, sub. 5, p. 6; Bundaberg Public Forum; Townsville Public Forum) as well as changing social and learning expectations (Brisbane Public Forum; Ipswich Public Forum).
These concerns have been reported elsewhere. For example, the Australian DoE noted in its 2015 labour market ratings that Queensland employers were concerned about the quality of engineering trades training in Australia, with apprentices not receiving sufficient exposure to all facets of the trade (DoE 2015b, p. 5). Some employers were also concerned that newly trained applicants lacked soft skills (communication, team work) and resilience to challenging situations in the workplace (DoE 2016h).
The (former) Australian Workforce and Productivity Agency said that Australian manufacturing’s engagement with the higher education sector is ‘underdeveloped’ and its employment of tertiary graduates lags other countries with developed manufacturing sectors. Concerns have also been raised about current completion rates for apprentices and about encouraging university graduates into manufacturing (AWPA 2014, p. 26).
Vocational education and training
VET plays an important role in skilling, upskilling and cross-skilling the manufacturing workforce.
Finding
Some Queensland manufacturers are concerned with the existing levels of workplace skills in the manufacturing workforce, including:
• levels of basic skills—literacy, numeracy and problem-solving
• interest and ability in STEM subjects
• leadership, management and entrepreneurship.
Efforts to improve workplace skills will benefit workers and firms, including those manufacturing businesses looking to move to more advanced processes with more highly skilled workers.

Final Report: Manufacturing in Queensland
Queensland Productivity Commission 122
Some stakeholders were concerned VET course offerings did not meet worker, firm and industry needs—with recent graduates often not ‘job ready’. This reflected, in part, a concern over the quality of courses provided by some training providers, especially the heavy reliance on book-based or online content to deliver 'hands-on', practical skill sets. In addition, some stakeholders found technically proficient graduates often lacked desirable workplace skills, including problem-solving, thinking creatively or collaborating effectively with others.
The National Council for Vocational Education Research (NCVER) student outcomes survey reported student outcomes for Queensland VET graduates in engineering and related technologies have fallen since 2013, in some cases quite considerably (Table 6.4).
In 2016, Queensland graduates’ satisfaction with the courses undertaken and the impact of training on their employment prospects were generally lower than the Australian average. From 2012–2016, the proportion of manufacturing employers (Australia-wide) using the VET system to meet their training requirements fell slightly (from 61 per cent to 57.3 per cent) (NCVER 2015, p. 10). Of these, the proportion of manufacturing employers who were satisfied that vocational qualifications provided employees with the skills they required fell (from 78 per cent to 64.4 per cent) and is now less than overall industry outcomes. In contrast, the proportion of manufacturing employers who were satisfied that apprentices and trainees are obtaining the skills they require grew considerably (from 68.5 per cent to 82.8 per cent) to now be marginally higher than overall industry outcomes (NCVER 2015, p. 13).

Final Report: Manufacturing in Queensland
Queensland Productivity Commission 123
Table 6.4 NCVER National Student Outcomes Survey, VET graduate outcomes for students in engineering and related technologies, per cent
2012 2013 2014 2015 2016
Employed after training
Queensland 80.7 86.6 87.9 81.4 79.8
Australia 83.9 84.3 83.7 83.2 83.2
Fully or partly achieved main reason for undertaking training
Queensland 88.1 88.9 88.7 78.9 77.6
Australia 85.9 86.4 83.6 81.2 82.0
Satisfied with training
Queensland 87.8 87.8 88.2 85.8 85.3
Australia 90.4 87.3 87.7 84.6 85.1
At least one job-related benefit
Queensland 81.0 82.6 81.1 79.8 64.0
Australia 81.2 79.3 75.7 77.8 67.1
Training highly/somewhat relevant to job
Queensland 80.7 89.0 85.5 84.4 75.2
Australia 84.8 84.8 82.7 83.0 79.1 Source: NCVER 2016. Overall, the following key reasons were given for employer dissatisfaction (across all industries):
• Training was of a poor quality or low standard.
• The relevant skills were not taught.
• There was not enough focus on practical skills.
• Training is too general and not specific enough (NCVER 2015, p. 14).
These issues were also raised in the consultation process. CTIAC (sub. DR6, p. 4) said that while training courses have been available for the recreational vehicle industry, an all-encompassing training package had only recently been developed. Townsville Engineering Industries said:
[T]rades training must be restructured to service the future and be directed towards new areas aimed at new, innovative technology. The ways of 20, 30 or even 50 years ago are not going to service our future, and the curriculum in trades training needs modernising for the next 50 years. (TEI sub. DR9, p. 2)
This suggests more can be done to ensure courses better meet firm and industry needs.
Managing niche industries
The expected growth of niche industries (Chapter 3) creates additional challenges for education and training—because of the lack of a critical mass of people seeking training, courses get wound back or are not offered.

Final Report: Manufacturing in Queensland
Queensland Productivity Commission 124
The Commission has been told that some manufacturing businesses cannot source training to meet their workforce needs for specific skills (Packer Leather sub. 13, p. 3; TCF Connect sub. 2, p. 2; CTIAC sub. DR6, pp. 4–6; TCF Roundtable; Brisbane Public Forum) or in particular (mostly regional) areas. However, there is limited publicly available information about the nature, prevalence and consequences of this unmet demand.
Niche industries are inherently difficult for training providers to service. In some cases, low (and sometimes volatile) student numbers make courses financially unviable. The costs of delivering programs can also increase in regional and remote areas or where the student population has significant additional learning needs.
Improving options to better deal with training for niche markets is likely to become increasingly important as the nature of the manufacturing sector changes.
6.4 What is being done to address skills gaps and shortages? Skills gaps and shortages are being addressed by various mechanisms, over a range of timeframes (Figure 6.2).
Figure 6.2 Options to improve outcomes
Source: Adapted from VCEC 2009, p. 144.
Finding
The skills and qualifications profile of the manufacturing workforce is not fully aligned with occupational and employment needs now and in the future. This is a particular concern for VET, given the important role it plays in skilling, upskilling and cross-skilling the manufacturing workforce.

Final Report: Manufacturing in Queensland
Queensland Productivity Commission 125
6.4.1 Skilled migrants
In the short term, skilled migrant workers have been used to fill skills gaps. Queensland manufacturers said they would like to hire local workers, but the lack of relevant skills or interest in manufacturing jobs, particularly in some Queensland regions and industries, stop them from doing so. On that basis, migrant workers have become an important part of some textile and clothing, meat processing and high-skill biomedical workforces and are expected to remain an important source of skilled labour in the future.51
Migration issues are largely dealt with by the Australian Government through the Department of Immigration and Border Protection—and have been subject to substantial reform of the types of visas available, the targeted occupation lists and requirements and restrictions (DIBP 2017a, 2017b).
The Queensland Government can also influence outcomes through its State Migration Plan. The plan provides for the government to identify and sponsor points-tested applicants to fill local skills shortages in Queensland. The occupations identified in the Queensland Skilled Occupation Lists relevant to manufacturing include manufacturer; aeronautical or biomedical engineer; small engine mechanic; sheetmetal trades worker; fitter and turner; welder (first class); metal fabricator; aircraft maintenance engineer; and cabinet markers52 (BSMQ n.d.). It will be important for the Queensland Government to maintain its awareness of manufacturing skill needs over time when developing the occupational list.
6.4.2 Changing perceptions about Queensland’s manufacturing sector
Improving access to accurate and balanced information about Queensland’s manufacturing sector will go some way toward helping workers to better engage with the sector and understand the opportunities that might exist (Figure 6.3).
Figure 6.3 Potential benefits from better access to accurate and balanced information
Source: VCEC 2011, pp. 169–170.
51 A 2014 independent review into Integrity in the Subclass 457 Programme reported that, on average, more than 3500 subclass 457 visas were granted each year for workers going into Australian manufacturing between 2005 and 2014 (Azarias et al. 2014, p. 34). 52 These occupations do not apply to all visa categories, with some occupations only applicable for a provisional visa that allows nominated skilled workers to work and live in regional Queensland for four years (as a pathway to permanent residency) (BSMQ 2016, n.d.).
Correct unfounded perceptions
• Current opportunities
• Future prospects
Provide better information
• What to expect on the job
• Skills required
Reduce search costs
• Making contacts
• Relationships and networks
Finding
Skilled migration programs support the scope and size of the manufacturing workforce, especially where there are local skills shortages.

Final Report: Manufacturing in Queensland
Queensland Productivity Commission 126
Queensland manufacturers have a key responsibility for enhancing their own reputation, which will, in turn, promote the broader strengths of the sector and the opportunities available in the industry.
However, manufacturing businesses may undertake less than efficient amounts of sector-wide, reputation-building activities because they are unable to capture a sufficient level of benefits individually.
Accordingly, CSIRO (2016, p. 62) concluded the manufacturing ‘ecosystem’ (which includes industry bodies and government) can play a key role in changing perceptions of manufacturing.
This is already occurring in some parts of the sector. For example, in 2016 the Australian Advanced Manufacturing Council (AAMC) partnered with the Ai Group to produce a video and social media campaign to spread awareness about the advanced manufacturing industry and encourage students to enter it (AAMC & Ai Group 2016). The AAMC also showcases Australian advanced manufacturing companies on its website—providing case studies of successful manufacturing businesses, including Queensland businesses (AAMC 2016).
The government may complement industry initiatives, where it is clear a government response will improve outcomes. DSD provides information and advice about the manufacturing sector on its website. In addition, the Queensland Government’s Advanced Manufacturing 10-year Action Plan and Roadmap includes a promotion and marketing strategy, focusing on Queensland’s advanced manufacturing technologies and expertise as well as future career opportunities in advanced manufacturing (DSD 2016a). As a new program, it is too early to tell if, or how, the program is effective. Future review will be required to ensure future activity is directed where it will have the largest effect.
Finding
Queensland manufacturers (and their industry associations) have a key responsibility to provide accurate information about the strengths of the sector and the available opportunities. Governments may complement industry initiatives, where it is clear a government response will improve outcomes.

Final Report: Manufacturing in Queensland
Queensland Productivity Commission 127
6.4.3 Improving education and skills outcomes
Individuals can develop skills for the workplace in many ways (Figure 6.4).
Figure 6.4 Improving workplace skills
Manufacturers highlighted the importance of on-the-job training and vocational education and training (VET) for many firms.
This includes traineeships for workers new to the industry, additional training on firm-specific tasks and processes and upskilling and cross-skilling existing workers for new processes and roles.
It is likely that more people with post-school qualifications and skills will be required to provide the technical and leadership capabilities to drive further sector transformation.
Government policies and programs across all levels of government deal with education, training and skills matters relevant to manufacturing. In Queensland, the Department of Education and Training (DET) delivers services relating to:
• school education—supporting students to develop fundamental knowledge, skills and qualities needed and providing a pathway to further education
• training and skills—supporting training and skills outcomes, including through the VET Investment Plan, the Skilling Queenslanders for Work program and accredited and non-accredited adult community education programs.
The Australian Government also has a role supporting education (policies, funding and programs) and through the governance, regulation and support of the national VET system.
Schools
The Queensland Government’s action plan for education in Queensland, Advancing education, includes strategies to help prepare young people to lift education outcomes (DET 2016d). Strategies relevant to manufacturing include enhancing students’ capacity to learn, general literacy and numeracy and engaging young Queenslanders in STEM subjects (Box 6.2).

Final Report: Manufacturing in Queensland
Queensland Productivity Commission 128
Sources: DET 2016d, 2016f, 2016g. Some schools also provide students with real-world experience and information about manufacturing in Queensland through:
• trade training centres—facilities that support VET-approved training courses, including in aeroskills and aeronautics, marine technology and food processing
• the Manufacturing and Engineering Gateway to Industry Schools program—where secondary schools partner with local manufacturing and engineering firms to provide students and teachers with a better understanding of the nature of work and the skill sets required (DET 2016e).
The AMWU (sub. 9, p. 7) said expanding the Manufacturing and Engineering Gateway to Industry Schools program and integrating it into more schools (particularly in rural and regional areas) would be a useful way to guide young people into required skills fields as early as possible, and would help to create a lasting skills base for the future.
The Commission understands a new operating framework is being developed for the Manufacturing and Engineering Gateway to Industry Schools program to identify clear objectives and related measurable outputs and outcomes to enhance the program’s governance.
Box 6.2 Engaging students in STEM subjects
The Queensland Government’s Schools of the future STEM strategy seeks to encourage students to study science, technology, engineering and mathematics—including robotics and coding.
The Queensland Government’s 'Schools of the future #codingcounts' program supports students’ digital literacy and coding skills, while nurturing young innovators and creating young entrepreneurs.
Building teacher capability
• Professional learning forteachers in STEM
• Regionally-basedSTEM champions
• Access to specialistSTEM teachers
• Step into STEM TeachingScholarships
Students engage in STEM learning
• Entrepreneurs ofTomorrow program
• STEM programs for girls
• STEM programs forAboriginal and TorresStrait Islanders
• STEM Hub and CodingAcademy
Excellence in STEM learning
• Targeted initiatives to liftstudent performance inSTEM
• Implementing theAustralian Curriculum:Digital Technologies
• STEM-specificcurriculum resources
• STEM virtual academies

Final Report: Manufacturing in Queensland
Queensland Productivity Commission 129
VET
VET in Queensland is part of a national system (Table 6.5). Jobs Queensland noted:
[S]ystem reform must be considered in the context of these longstanding structural factors and take into consideration the roles and responsibilities of all of the key parties within the system. (Jobs Queensland sub, DR7, p. 2)
Table 6.5 VET in Australia—a shared responsibility
Australian Government responsibilities Shared responsibilities Queensland Government
responsibilities
Overseeing the Australian Qualifications Framework, including training package development
Managing advisory bodies to support the VET system including the Australian lndustry Skills Committee (AISC) and the VET Advisory Board
Regulating RTOs through the Australian Skills Quality Authority (ASQA)
Providing income contingent loans to students studying Diploma and above courses
Purchasing training including through the Industry Skills Fund
Providing funding to states and territories for skills delivery and workforce development
Determining national skills priorities
Setting national policy direction through the COAG Industry and Skills Council
Overseeing the National Centre for Vocational Education Research (NCVER)
Providing support and incentives to apprentices, trainees and their employers
Providing high quality, relevant consumer information
Engaging with industry on training product development and delivery
Operating the publicly funded, demand driven training market for delivery of priority qualifications
Providing targeted training to people who need extra assistance to skill or re-skill
Supporting public providers to operate effectively and provide high quality training
Engaging with industry through Jobs Queensland to seek advice on skills needs, workforce planning and the apprenticeship and traineeship system
Assisting consumers to resolve complaints and navigate the VET system through Queensland's Training Ombudsman
Regulating apprenticeships and traineeships
Providing incentives to address local, regional and state skills needs
Monitoring the market to ensure areas of emerging or unmet demand are addressed
Investing in training infrastructure Source: DET 2017c, p. 5.
Finding
Schools influence the size of the potential manufacturing workforce and its capacity and capability through influencing learning outcomes, in particular in STEM subjects, and by exposing students to manufacturing as a potential career option.

Final Report: Manufacturing in Queensland
Queensland Productivity Commission 130
In 2012, the Australian, state and territory governments committed to a National Partnership Agreement on Skills Reform, and set out goals and structures of intergovernmental VET funding and reform over five years (2012–17). In 2017, the Australian Government replaced funding under the agreement with the Skilling Australians Fund. The new arrangements provide an estimated $1.5 billion from 2017–18 to 2020–21, with matched funding from states and territories, to support up to 300,000 apprentices, trainees, and pre- and higher-level apprentices. States will need to bid for project funding with proposals that align with priorities and criteria set by the Australian Government (DoET 2017a).
The Queensland Government is finalising its strategy for vocational education and training, Advancing skills for the future, to set out its vision for VET to ensure 'Queenslanders are able to access—at any stage in their lifetime and career—high quality training that improves their life prospects and supports industry development and economic growth' (DET 2017c, p. 8). A consultation draft has been released (DET 2017c).53 It is based around the Queensland Government's VET Quality Framework (DET 2017f) and Annual VET Investment Plan (DET 2017h), having regard to the ongoing responsibilities of Jobs Queensland and the Queensland Training Ombudsman.
Ensuring quality VET outcomes
VET quality is a shared responsibility across governments, industry and the consumer market.
At the national level, the Australian Industry and Skills Committee (AISC) is responsible for ensuring national training packages are meeting the needs of industry. AISC prioritises the review and development of training packages in accordance with the National Schedule. It draws on advice provided by various industry reference committees (IRCs), including manufacturing sector IRCs, to identify the skills needed by employers and develop occupational skills standards and training packages (AISC 2017a, 2017b).
The Australian Skills Quality Authority (ASQA) regulates Australia’s training providers, courses and qualifications to ensure nationally approved quality standards are met. It also undertakes strategic reviews of training quality in areas where system risks have been identified (ASQA 2015a, 2015b).
At the state level, the Queensland Government regulates apprenticeships and traineeships under the Further Education and Training Act 2014. The Queensland VET Quality Framework details requirements for VET program design; supplier entry requirements; information and support; market performance and oversight; and compliance (DET 2017f). There is also a Queensland Training Ombudsman—an independent office that provides support to resolve training issues or complaints in relation to the VET system (Queensland Training Ombudsman 2017).
VET Funding
The Queensland Government’s Annual VET Investment Plan provides $768.9 million for VET in 2017–18 across three investment strategies:
• demand-driven funded training arrangements—through the User Choice, Certificate 3 Guarantee and Higher Level Skills programs
• funding rounds—through the Skilling Queenslander for Work program
• public provider grants—through grants to public providers to support their ongoing presence in the skills system and additional funding to subsidise student support services, regional support programs, foundation skills courses for disadvantaged learners, and second chance training opportunities as part of the Rescuing TAFE grant (DET 2017h).
Funded training programs are available across different skills types and levels, with the Queensland Training Subsidies List and the User Choice Price List identifying the qualifications and skill sets that attract a government subsidy.
53 Consultation on the draft closed in April 2017 (DET 2017g).

Final Report: Manufacturing in Queensland
Queensland Productivity Commission 131
The amount of subsidy the Queensland Government provides varies across qualifications, reflecting:
• the indicative course value—calculated as the funded hours for the qualification multiplied by a 'course rate' that considers the complexity of the training delivered, and other costs such as teacher or trainer costs, overheads and extra ordinary materials
• the 'relative priority' of the qualification for government investment— with lower-level qualifications (up to Certificate III) subsidised at higher rates, and those identified as a skills priority subsidised at the highest rates (DET 2016h).
In some cases, qualifications are managed under special arrangements, with additional restrictions applying to students (for example, requiring the student to be an existing worker in the industry or hold a particular qualification). Special restrictions can also apply to training organisations, such as where only pre-qualified suppliers specifically authorised by the department can deliver publicly funded training for those qualifications.
The Commission understands funding is reviewed by the department each year. In addition, industry can submit evidence to the department at any time to seek funding of new qualifications under the training lists or request a change to the government priority of currently funded qualification(s). The pricing model may be adjusted, on an ad hoc basis, to price thin markets at higher rates than otherwise to attract and retain a supplier in that qualification.
During 2016–17, investment was highest in skills related to the construction; community services; utilities; hospitality; and primary industry sectors, accounting for over 50 per cent of total investment (DET 2017h, p. 8).
Funding was also provided for manufacturing activities. In the first six months of 2016–17, the Queensland government provided $23 million funding for subsidised training places for manufacturing industries (Table 6.6).
Table 6.6 Estimated key VET expenditure for manufacturing activities, 2013–14 to 2016–17
Investment program 2013–14 2014–15 2015–16 2016–17a
User Choice ($millions)
Provides a public funding contribution towards the cost of training and assessment for apprentices and trainees.
45.3 38.1 33.2 12.7
Certificate 3 Guarantee and Higher Level Skills ($millions)b
Provides eligible individuals with a government subsided training place for a certificate III qualification or for certificate IV and above qualifications (higher level).
0.3 3.8 14.0 10.3
VET Revenue General ($millions) 5.6 2.5
VET in Schools (VETiS)c
Provides education and training for students while they are at secondary school that focuses on delivering skills and knowledge required for specific industries.
N/A N/A
a Year to date, as at December 2016. b The chief intent of VET Revenue General was to purchase training from public providers to address government skilling priorities. Over 2013–14 and 2014–15 VET Revenue General was replaced with other funding programs, including Certificate 3 Guarantee and Higher Level Skills. c VETiS activity funded by the VET budget will be managed through the Certificate 3 Guarantee. Sources: DET 2017a, 2016a.

Final Report: Manufacturing in Queensland
Queensland Productivity Commission 132
The Queensland Government provides incentives to employers to take on apprentices and trainees under the Skilling Queenslanders for Work program (DET 2017b). Since 2015, $135 million has been invested across the state to provide nationally recognised training, skills development and job opportunities to 28,033 disadvantaged Queenslanders (DET 2017h, p. 14). In 2017–18, $4.25 million will be available for local councils across Queensland for 340 new traineeships (under First Start) and up to $3 million for businesses who employ new trainees or apprentices in south east Queensland (under Work Start) (DET 2017d, 2017e).
There is also a 50 per cent payroll tax rebate for Queensland businesses seeking to employ apprentices and trainees, subject to eligibility thresholds (Queensland Government 2017i).
In the 2017–18 Budget, the Queensland Government provided $10 million over two years for a Regional Skills Adjustment Strategy to support unemployed individuals to develop skills for jobs in demand, jobs pathway planning and provide pathways to training at TAFE (Queensland Treasury 2017b, p. 25). It also provided $9 million over four years through the Regional Skills Investment Strategy to better target training on local opportunities available in regional areas (Queensland Government 2017c, p. 11).
The Queensland Government provides annual grants to TAFE Queensland to support its operation54—including $179.1 million in 2017–18 (DET 2017h, p. 18), up from $143.2 million in 2016–17 (DET 2016a, p. 13).
6.5 What more could be done? A skilled manufacturing workforce will be essential to support the growth of the industry and provide Queenslanders with access to high-skill and high-wage employment opportunities.
Some stakeholders were concerned that worker, firm and industry outcomes would suffer unless existing skills gaps were addressed. Options they identified to address these concerns include:
• Ensure that policy settings support the workforce to transition into different kinds of manufacturing work, including advanced forms of manufacturing (AMWU sub. DR1, p. 4; Jobs Queensland sub. DR7, p. 1).
• Promote increased collaboration between industry and education providers, to develop training programs that focus on:
− the practical application of skills to the everyday activities of a manufacturing workplace (CCIQ sub. 6, p. 9; CCIQ sub. DR4, p. 6; QPC Innovation Roundtable; TCF Roundtable; Brisbane Public Forum)
− incorporating new technologies to produce work-ready graduates (TCF Connect sub. 2, p. 2; TEI sub. DR9, p. 2)
54 The Queensland Government’s draft strategy, Advancing skills for the future, identifies the important role for TAFE Queensland in delivering key government priorities and in areas that cannot be met through market settings (Queensland Government 2017c, pp. 3, 4).
Finding
A robust and flexible VET sector is required to meet worker, firm and industry needs, including the need to deal efficiently with niche trades. VET is a shared responsibility across all governments. The Queensland Government influences outcomes through its funding arrangements, apprenticeship and traineeship regulation, and through public providers.

Final Report: Manufacturing in Queensland
Queensland Productivity Commission 133
− striking a balance between high skill specialisation and broad-based transferrable skills (AMWU, sub. DR1, p. 4; Jobs Queensland sub. DR7, p. 2)
• Better match the skills profile of manufacturing workers with emerging industry needs, including as the sectors transitions from broad-based to advanced manufacturing models (Jobs Queensland sub DR7, p. 2).
• Review the level of funding of training places to ensure it accounts for existing skills shortages and priorities (CTIAC sub. DR6, p. 6).
• Reduce unnecessary compliance costs on businesses and students in the VET system, while maintaining/ensuring high quality outcomes (CCIQ sub. DR4, p. 6; Jobs Queensland sub DR7, p. 2).
• Provide support for apprenticeships to make them more attractive and financially viable, including additional support for apprentices living away from home and for regional employers to take on apprentices (AMWU sub. 9, p. 7; ASMC sub. 5, p. 6; CCIQ sub. DR4, p. 6).
• Provide businesses with greater flexibility to bring in training expertise from ‘outside traditional education facilities’ by providing training funds directly to business (Packer Leather sub. 13, p. 3)
In practice, addressing education and training issues:
• is a shared task, so it is important to identify those factors that are within the power or capacity of firms and workers, and those that might be best dealt with by government action
• is part of broader reform effort already being undertaken at the state and national level
− The Queensland Government is already undertaking broader reform initiatives including through its Advancing Skills for the future strategy; the VET Quality Framework, Skilling Queenslanders for Work, Rescuing TAFE and the establishment of the Queensland Training Ombudsman55
− Jobs Queensland has provided a report to government on Queensland's apprenticeship and traineeship system and is consulting with industry to develop an Advanced Manufacturing Skills, Training and Workforce Development Strategy, as well as workforce plans for aerospace, defence and mining equipment, technology and services
• will take place in an evolving education and training landscape at school, VET and higher education levels
• is unlikely to realise results in the very immediate term but is likely to raise Queensland workers' overall capacities and capabilities.
6.5.1 Better education and skills outcomes
Better education and training outcomes will lift the capabilities and productivity of Queensland’s manufacturing workforce. Stakeholders have identified VET as a key priority.
The Queensland and Australian governments have implemented substantial VET reforms and continue to undertake significant VET reform initiatives. The nature and scope of these go beyond their direct application to manufacturing, and so are beyond the scope of this inquiry, but some key principles apply.
Ensuring quality VET outcomes
Ensuring quality VET outcomes helps to ensure VET graduates have the skills required by industry and firms, and workers have increased confidence in recognised VET qualifications.
55 A strategy for vocational education and training in Queensland, Advancing skills for the future, is being finalised.

Final Report: Manufacturing in Queensland
Queensland Productivity Commission 134
Quality assurance of training providers and training products occurs at the national level, through the AISC and ASQA. The Commission notes that some stakeholders thought that training packages do not reflect business reality and can take a long time to change—by which time they are already out of date.
The Queensland Government will also influence quality through its VET Quality Framework. The VET Quality Framework is a new program, so it is too early to evaluate its effectiveness. This reinforces the importance of reviewing and reporting outcomes.
Designing the system to better accommodate firms' and workers' needs
Having accurate and timely information about the skills manufacturing firms and workers need can help the VET system to better serve students, business and the wider community. Quality information helps:
• training providers to develop courses that will provide a mix of skills to meet worker and firm needs
• the government to set training priorities and make funding decisions to link the courses and funding offered with labour market conditions and state priorities.
However, gathering and assessing this information can be costly, and there can be a number of problems in practice (PC 2011a, pp. 73–74).
• The future demand for skills for some manufacturing activities is subject to considerable uncertainty—especially in a diverse (and potentially fragmented) sector with different firms having differing needs, over different timeframes, and potentially operating in different regional labour markets.
− Training for niche industries and thin markets is likely to become increasingly important as the nature of the manufacturing sector changes.
• Employers and students might be looking for different training outcomes—with students looking for transferable, rather than sector-specific (or firm-specific) skills.
The Jobs Queensland advice through the Advanced Manufacturing Skills, Training and Workforce Development Strategy56 is likely to be particularly relevant for Queensland manufacturing. It will identify the new skills required in advanced manufacturing; explore alternate training approaches for workers to improve their workplace readiness; and incorporate a stronger focus on training and education (DSD 2016a, p. 26; Jobs Queensland sub. DR7, p. 4). Progressing will provide greater clarity, focus and direction by identifying what needs to be done, how it can be done and, importantly, who is best placed to make this happen.
The VET system should deliver workers with relevant, adaptable skills in an effective and efficient manner. Such a system will:
• develop effective options to improve training outcomes for niche industries and regional and local areas (which are likely to become increasingly important as the nature of the manufacturing sector changes)
• balance training for specialist skills and tasks with adaptable skill sets through career-long learning (including VET and higher education subsidies and student support arrangements that influence when, where and how students undertake study and training)
• reduce unnecessary compliance costs on businesses and students. Regulation should provide adequate consumer protections in a least-cost way. Unnecessary costs discourage students from undertaking otherwise beneficial training and reduce firm support for their training efforts (including workplace apprenticeships and traineeships).
56 For advanced manufacturing, aerospace, defence and mining equipment, technology and services.

Final Report: Manufacturing in Queensland
Queensland Productivity Commission 135
Funding issues
In Queensland, funded training is provided through a subsidy (that reflects the government's investment priorities or importance of the training) and a co-contribution paid by the student57 or their employer (that is set by the training provider). Both provide signals about needs of the labour market and potential employment prospects—and so influence students' and trainings providers' decision-making.
The nature and scope of VET funding has impacts beyond the manufacturing sector. It is therefore appropriate to consider it as part of a broader review of VET funding and principles for determining price and fee arrangements.
That said, stakeholders identified that current arrangements can create barriers to upskilling and retraining and lead to overinvestment in training with low or no return and underinvestment in high-value training. Although the Commission has not made an assessment on the size and scope of these outcomes, the concerns raised in this inquiry suggest more can be done to ensure the funding arrangements will provide the right signals to students, business and RTOs to provide/undertake the right level and type of training.
In principle, government funding of VET can be warranted:
• on efficiency grounds—to address any shortfall in the level of VET that might occur when there are public benefits from VET that firms and workers cannot fully capture (and do not consider in their decision-making)
• on equity grounds—to improve access, participation and outcomes of students from disadvantaged groups or regions.
A greater focus on the efficiency and equity rationale in the design of funding, rather than cost and provider roles, may better meet the government's objectives and with fewer unintended consequences.
The right provider
In Queensland, VET can be provided by government-run TAFEs, private RTOs, universities, schools and community education providers; it can also be provided in workplaces.
Under the government's draft strategy for VET (Advancing skills for the future), private and public training providers play different roles in delivering training.
• TAFE Queensland is a ‘premium public provider’ of VET— delivering training for key government priorities (including engineering and automotive) and in areas that may not be met through market settings (including having a key role in meeting the training needs of disadvantaged learners, regions and local communities).
• Private providers give students choice in relation to training suppliers and courses (DET 2017c, p. 16)
Stakeholders generally recognised that a strong and sustainable public VET provider is valuable and necessary, and identified opportunities to improve TAFE Queensland’s capability and capacity—including refocusing its offerings to students and better utilising its buildings, property and assets.
Having a mix of providers, with appropriate resourcing and clearly defined roles and expectations around quality and delivery, helps to ensure that relevant training is offered and undertaken in an effective and efficient way. As TAFE Queensland is the largest training provider of publicly funded VET, ensuring that it delivers quality outcomes is a key priority. This includes recognising and understanding any additional obligations, costs or restrictions on TAFE Queensland that other providers do not face.
57 The Australian Government provides income-contingent loans (VET Student Loans) for some higher-level VET courses, with caps on the amounts students can borrow (DoET 2017b).

Final Report: Manufacturing in Queensland
Queensland Productivity Commission 136
6.6 Conclusion A diverse range of disciplines and levels of skill are required for Queensland manufacturers to succeed. Skilled workers strengthen the ability of manufacturers to innovate and grow, whereas a lack of skilled workers can constrain growth.
Specific concerns identified in this inquiry have been:
• new and emerging technologies that are placing new demands on workers and businesses, changing the tasks and activities undertaken and associated skill sets required. This provides opportunities for some, but significant risks for others
• difficulties in finding (or replacing) and retaining skilled staff because:
− workers (with desirable skills and talents) do not appear to be interested in manufacturing jobs
− there are existing gaps and future concerns about workplace skills that are limiting opportunities for firms and workers and that are not being addressed satisfactorily by the skills and training system, in particular VET.
These issues are not new and are not unique to manufacturing. They reflect the challenges to the Queensland economy as it shifts to more knowledge-intensive industries.
Reflecting this, governments have put in place a program of broader reform to improve skills and training outcomes for firms and workers, including those involved in manufacturing. It is important to continue with reform, including assessing the measurable impacts on labour markets and job outcomes. Ongoing, broad-based reform is most likely to address stakeholders' concerns—with the benefits to manufacturing training and skills outcomes being incremental and realised over the medium to longer term.
Recommendation 6
To better serve manufacturing firms, students and the wider economy, the Queensland Government should continue to reform and develop the VET framework, with a focus on the effectiveness and efficiency of the VET sector. The Queensland Government should:
• finalise its strategy for vocational education and training in Queensland (Advancing skills for the future), having regard to issues raised in response to the consultation draft
• implement the Queensland VET Quality Framework—and measure and report results
• ensure the regulatory and funding system:
− accommodates changing firm and worker needs, choice and thin markets
− establishes the right incentives for providers—including public and private sector providers—to provide relevant training in an effective and efficient way.

Final Report: Manufacturing in Queensland
Queensland Productivity Commission 137
Recommendation 7
As a priority under the Queensland VET Quality Framework, the Department of Education and Training should implement a VET funding model based on government subsidy levels that:
• reflect the spillover benefits from VET to create the right price signals for an efficient and responsive VET sector
• provide the right level of support for training with a high proportion of public benefits and minimise incentives to provide/undertake training that has low or negative returns
• remove barriers to upskilling and retraining and choice of program and delivery modes
• transparently provide for equity-related matters, including for high-needs learners and access for rural or regional participants.

Final Report: Manufacturing in Queensland
Queensland Productivity Commission 138

Final Report: Manufacturing in Queensland
Queensland Productivity Commission 139
7.0 Reshoring

Final Report: Manufacturing in Queensland
Queensland Productivity Commission 140
The terms of reference asks us to investigate the international experience with reshoring initiatives. This chapter defines reshoring and examines the extent and possibilities for reshoring, as well as the experience with international policy initiatives.
Key points
1 Reshoring refers to the reversal of a previous decision to offshore a business activity. In the manufacturing context, reshoring results in the transfer of an activity, usually a production process, from an overseas location back to a country of origin.
2 Interest has been growing in reshoring as a corporate strategy and public policy objective, with advocates stating that it creates jobs in the domestic manufacturing sector.
3 There have been some high-profile cases of firms reshoring to the United States and United Kingdom. However, the quantitative evidence on the extent and opportunities for reshoring overall is subdued. Foreign direct investment has created more manufacturing jobs than reshoring in the United States manufacturing sector.
4 Where reshoring is occurring, it is being driven by cost saving opportunities resulting from producing at home, and the growing commercial risks of managing a global supply chain.
5 Factors that are driving reshoring elsewhere—particularly narrowing labour and energy cost differentials—are less relevant in Queensland. Few firms have returned production to Queensland.
6 There is a lack of publicly available information on the effectiveness of government reshoring policies, in terms of the direct benefits (such as the number of companies which repatriated production and the number of jobs created) and the cost of those policies. Reshore UK, Britain's high-profile government initiative to reshore manufacturing, was closed in 2016.
7 On balance, the evidence suggests that reshoring will occur if it is in the financial interest of the manufacturer. The primary role for government is to ensure firms have accurate and accessible information to make decisions on where to produce.

Final Report: Manufacturing in Queensland
Queensland Productivity Commission 141
7.1 Globalisation, competition and the fragmentation of production Manufacturing firms have responded to the forces of globalisation by establishing production networks across firms, locations and countries, based on factor endowments and relative costs.
Sourcing inputs and services from overseas has allowed firms to secure cost savings through the economies of scale and scope provided by specialised suppliers.
In particular, offshoring has allowed domestic firms to reduce costs associated with:
• labour—one of the biggest cost components for a manufacturing business
• overheads—including energy costs, maintenance and other indirect labour expenses.
CCIQ identified input costs as a driver of offshoring in Queensland:
Manufacturers are being forced to pay twice as much for Australian gas as their competitors in Japan, meaning Queensland manufacturers are looking to take their business offshore to reduce their operational costs. (CCIQ sub. DR4, p. 3)
For industrialised countries, such as the United States, the United Kingdom and Australia, manufacturing firms have generally relocated the labour-intensive elements of production to low labour-cost locations overseas. This has been the case particularly for products produced in high volume. Capital- or skill-intensive production activities, such as high-end design and research and development (R&D), have tended to remain in the higher-cost and more knowledge-intensive domestic economies.
Offshoring has resulted in greater industrial efficiency. It has been a means for businesses to boost competitiveness, enabling them to cut costs, grow profits and enhance returns for shareholders. In addition, it has provided firms with exposure to new markets and delivered opportunities to develop new products.
For consumers, offshoring has resulted in a wider variety of cheaper products to choose from, and higher real incomes with which to purchase those goods.
However, as production has relocated, the practice has brought about a decline in output and employment in the manufacturing sector. Firms, no longer requiring a large ongoing labour force, have shed jobs. In Queensland, the AMWU observed that:
workers across [the] manufacturing industry have been deeply affected by the offshoring of jobs, high unemployment rates, redundancy and the shift towards multiple forms of precarious employment. (AMWU sub. DR1, p. 1)
Critics argue that:
[the] transfer of jobs to developing nations erodes the traditional advantage of [developed] nations in value added fields. (Grant 2005, p. 4)
Some fear that the country might be finding itself:
'in a race to the bottom' in terms of jobs, wages and … standard of living.' (BCA 2004, p. 3)58
Moreover, there are economic and social costs of structural adjustment (on the long-term unemployed and community) and potential impacts on innovation (when separating production from R&D results in the loss of engineering and other knowledge to the economy).
58 This is not the BCA's view, however.

Final Report: Manufacturing in Queensland
Queensland Productivity Commission 142
7.2 Reshoring Since the global financial crisis, there has been a growing interest in reshoring as a corporate strategy and policy objective. Headlines about large multinational firms repatriating production have increased the visibility of reshoring.
The action of reshoring refers to the reversal of a previous decision to offshore a business activity.59 In the manufacturing context, reshoring results in the transfer of an activity, usually a production process, from an overseas location back to a country of origin.
Reshoring does not necessarily result in the termination or repatriation of all previously offshored activities. A domestic firm may elect to continue to manufacture some proportion of its output overseas for purposes such as meeting demand in the foreign marketplace.
Proponents of reshoring maintain that it:
• creates jobs for skilled workers in the domestic economy, reducing unemployment and boosting economic growth
• revitalises an industry which has stagnated or been in decline
• reduces the total cost of production for manufacturers, improving their profitability
• strengthens innovation as production becomes more integrated with R&D
• streamlines the distribution of goods from factory to customer, reducing the time to market
• results in the production of higher-quality products for consumers.
7.3 Which factors are driving the international reshoring movement? The interest in reshoring from a corporate perspective is being driven by a gradual erosion of the production cost savings from offshoring. In addition, reshoring offers opportunities to reduce the commercial risks associated with managing a geographically dispersed supply chain.
7.3.1 Cost-related factors
Relative labour costs
Companies generally identify rising offshore labour costs and a narrowing of the labour cost differential with developing countries, particularly China, as a key reason for shifting production back onshore (The Economist 2013a, p. 1).
Figure 7.1 shows that between 2001 and 2015 real wages in China have risen annually on average by 11 per cent. Labour costs per unit of output are now around three times higher than in 2000 (Moser 2014, p. 1). By comparison, real wage growth in the major developed countries has been relatively lower for many years.
59 In media commentary and policy discussions, the terms reshoring, onshoring, inshoring and backshoring are often used interchangeably.

Final Report: Manufacturing in Queensland
Queensland Productivity Commission 143
Figure 7.1 Real wage growth in selected countries
Source: International Labour Organization 2015.
New technology and the relative price of capital
Emerging technologies have eroded some of the financial benefits of manufacturing in low-wage economies. Automation of low-value production reduces the need for a large workforce and commensurately lowers labour costs. This makes manufacturing in industrialised countries, where those technologies are available, relatively more attractive.
Recent estimates indicate that in the United States alone demand for 3D printers is expected to grow by more than 16 per cent per year between 2016 and 2020, largely due to reductions in capital cost and evolution of the technology. This is increasing the range of applications available to manufacturers (International Data Corporation 2016, p. 1), with implications for manufacturing business models, supply chains and the workforce (Srinivasan & Bassan 2012, p. 3).
In addition, the declining costs and improved capabilities of advanced robotics, which can operate alongside workers, will reduce the need for labour in more advanced domestic production (Boston Consulting Group 2015, p. 1).
The International Labour Organization recently forecast that over 50 per cent of all employees in Cambodia, Indonesia, the Philippines, Thailand and Vietnam are at high risk of displacement due to technology (Chang & Huynh 2016, p. 4). Similar prospects are likely to be faced by workers in China.
Other costs
In the United States, lower energy costs due to falling oil prices and the shale gas boom have significantly reduced the price of domestic gas. This has lowered costs of domestic production, particularly for energy-intensive firms such as those manufacturing petrochemicals, fertiliser and steel.

Final Report: Manufacturing in Queensland
Queensland Productivity Commission 144
Some transportation and cross-border transfer costs have risen over time and become increasingly volatile, adding to the complexity of managing the movement of components and final goods (Russell et al. 2014, p. 1). In addition to direct freight costs, there are also costs associated with insurance, the need to carry higher inventories and the potential for inventories to become obsolete, and greater operational travel requirements for management purposes.
7.3.2 International supply chain risks
Concerns around the quality, security and responsiveness of an international supply chain include:
• challenges monitoring and guaranteeing the quality of goods produced in foreign facilities
• vulnerability to disruptions to production due to civil or political unrest and extreme climate events
• risks associated with intellectual property (IP) theft, potentially resulting in lost revenue, competitive advantage and licensing opportunities
• longer lead times, reducing the ability to respond to fast changes in consumer preferences.
7.4 How strong is the reshoring movement? In 2011, the Boston Consulting Group (BCG) foreshadowed an emerging reshoring trend for manufacturing production around the world, and in the United States in particular, noting:
[The reallocation of global manufacturing] will become more pronounced over the next five years, especially as companies face decisions about where to add future capacity. (Sirkin et al. 2011, p. 4)
This view received further backing when BCG's 2013 annual survey of manufacturing executives found that most large companies had plans to move some production from China back to America, or were at least considering it (Barrentine & Whelan 2015, p. 1).
Well-publicised examples of large companies that have returned production to the United States over the past five years include:
• Caterpillar, which relocated production of equipment from Japan and Mexico, creating 2,100 machinery jobs in Texas and Georgia
• General Motors, which invested $185 million on a new plant in Tennessee in 2014, creating 3,000 jobs, to manufacture Cadillacs which were previously produced in Mexico. This relocation followed a deal with the union, allowing for greater pay flexibility
• Ford, which reshored 3,200 manufacturing jobs from Mexico and Spain to produce particular truck models and engines
Finding
Internationally, opportunities to reshore are being driven by cost savings from producing at home, and the growing commercial risks of managing a global supply chain.

Final Report: Manufacturing in Queensland
Queensland Productivity Commission 145
• General Electric, which added 2,656 jobs over four years in Kentucky, Texas and Ohio, manufacturing high-efficiency light bulbs, batteries and water heaters. The Kentucky plant was re-opened after a dormant period of 15 years
• Walmart, which has reshored almost 5,000 positions through its Made in America initiative. The company's goal is to purchase $250 million in American-manufactured goods for its stores in the 10-year period to 2023
• Apple, which invested $100 million and created 200 jobs, to produce its Mac Pro computer in the United States rather than China (American Manufacturers Association 2016; Yarrow 2013; Sligar 2016).
However, the extent to which an underlying trend exists, in the United States or elsewhere, is unclear.
As noted by the International Labour Organisation (ILO):
Re-shoring is a difficult phenomenon to measure both at the aggregate and firm level. The difficulties stem especially from the fact that it is challenging to attribute changes in investment and employment trends directly to [reshoring]. (International Labour Organization 2015, p. 2)
While it may be assumed that the basis for a company’s decision to close an overseas plant or reduce its foreign direct investment is profit, it is not always apparent. Data at the firm level is often confidential and no official statistics on offshoring or reshoring manufacturing trends are published (ISLI Supply Chain Forum Team 2015, p. 9).
As a result, key market data and commentary tend to be provided by the media, industry groups, consulting firms and other private sector organisations, making it difficult to estimate the extent of reshoring:
[D]espite reports on high-visible cases of reshoring, the quantitative evidence … is still fragmented and often of an anecdotal nature, making it very difficult to assess the importance and analyse the characteristics of the phenomenon. (De Backer et al. 2016, p. 11)
Moreover, there is often inconsistency in the data and findings provided by the different sources.
In the United States, the two most comprehensive and regular analyses of reshoring are provided by the Reshoring Initiative, a not-for-profit industry association, and AT Kearney, a global management consulting company.
The Reshoring Initiative found that in 2015 about 68,000 new jobs in the country were created following ‘reshored production’, bringing the total number of manufacturing jobs brought from offshore since 2010 to over 249,000 (Reshoring Initiative 2016a). This represents only a small fraction of the 12.4 million employees in the US manufacturing sector (Bureau of Labor Statistics 2017).
The Reshoring Initiative calculated that the United States has now gone from losing about 220,000 manufacturing jobs per year in net terms, from 2000 to 2007, to breaking even.
While this data appears to suggest a strong reshoring trend, AT Kearney cautioned:
[E]ven though manufacturing in the United States [is] on the upswing, the impact of reshoring [is] significantly less than what press reports and pundits would have had us believe. (Van den Bossche et al. 2015, p. 1)
Based on its own research and dataset, which contains around 700 records of reshoring cases, AT Kearney forecast that reshoring would continue to decline in 2015 (Figure 7.2) and noted:
[T]he reshoring phenomenon, once viewed by many as the leading edge of a decisive shift in global manufacturing, may actually have been just a one-off aberration. Indeed, the 2015 data confirms that offshoring seems only to be gathering steam, while the U.S. reshoring train that so many predicted has yet to leave the station. (Van den Bossche et al. 2015, p. 1)

Final Report: Manufacturing in Queensland
Queensland Productivity Commission 146
Figure 7.2 Published US reshoring cases
Source: Van den Bossche et al. 2015, p. 4.
AT Kearney is of the view that the Reshoring Initiative’s employment growth figures overstate the number of jobs reshored because they include the impact of foreign direct investment (FDI)—new jobs created by multinational firms that decided to increase their production capacity in the domestic market.
It points out:
[T]he data does not show that US companies are returning. In fact, it shows that foreign companies are coming. We don’t consider an FDI to be an example of ‘reshoring’, because the company was never here to begin with. (Callari 2016)
By removing the impact of FDI from the Reshoring Initiative’s data, as depicted in Figure 7.3 and Figure 7.4, the two sets of findings can be largely reconciled.
Figure 7.3 illustrates that that the employment gains from FDI in the United States have been steadily outstripping the number of jobs created by reshored production for some time.

Final Report: Manufacturing in Queensland
Queensland Productivity Commission 147
Figure 7.3 Reshoring and FDI job growth in the US, cumulative, adjusted
Source: Reshoring Initiative 2017.
Moreover, Figure 7.4 demonstrates that the number of jobs reshored annually to the United States has been declining since 2013.
Figure 7.4 Reshoring and FDI jobs added in the US, annual, adjusted
Source: Reshoring Initiative 2017. AT Kearney’s conclusion is consistent with the findings of other analysts. For example:
Over the past five years, there has been little evidence to suggest that reshoring has resulted in any significant change in the US economy. While peripheral evidence indicates growth in manufacturing, a large-scale push towards reshoring has not been apparent. (Haider 2015, p. 2)
Final Report: Manufacturing in Queensland
Queensland Productivity Commission 148
Our analysis suggests that there is no clear reshoring trend in the U.S. Companies do not appear to be abandoning overseas operations in droves; some are building new capacity in the U.S. and other countries to meet domestic demand. And the level of reshoring activity varies widely, depending on the industry involved. (Rice & Stefanelli 2014, p. 3)
Increasing FDI and a few prominent reshoring moves by multinationals provide some indication of a shift in the competitive landscape of US manufacturing. However, more evidence is required before we can conclude that the manufacturing pendulum has swung back toward the United States. (Majumdar & Hussain 2016)
An MIT study cast further doubt on the significance of reshoring, by revealing that, in most of the publicised cases for reshoring over the previous five to seven years:
[T]he companies involved plan to invest in US-based production capacity; they have not actually made the move. (Rice & Stefanelli 2014, p. 3)
Others have also expressed caution:
[T]he reshoring movement has to be kept in proportion. Most of the multinationals involved are bringing back only some of their production destined for the American market. Much of what they had moved over the past few decades remains overseas. And for many of the biggest firms the amount of work that they are still sending abroad outweighs the amount that they are bringing back onshore. (The Economist 2013a)
In the United Kingdom, there is only limited evidence of reshoring in the manufacturing sector.
In a 2013 survey of 500 SMEs, the Manufacturing Advisory Service (MAS) found that 15 per cent of those manufacturers surveyed had returned production to the UK (Groom 2013, p. 1). This is broadly consistent with the findings of Civitas, which could identify only 64 SMEs across the nation that had reshored (Gibson 2014, p. 5).
Similarly, EEF’s 2014 survey of the industry found that:
• One in six UK-based manufacturers had brought production back in-house in the three years to 2014, up from one in seven, when a similar study was carried out in 2009.
• A further six per cent were planning to reshore, either in-house or to a UK supplier, in the next three years (EEF 2014, p. 9).
Finding
In the United States, foreign direct investment appears to be creating more jobs in the manufacturing sector than reshoring.

Final Report: Manufacturing in Queensland
Queensland Productivity Commission 149
UK Trade & Investment60 (UKTI) was able to identify only 1,500 manufacturing jobs that had been created because of reshoring since 2011 (Ernst & Young 2015, p. 11). To put this into perspective, it was estimated that around £36 billion of UK manufacturing output was offshored between 1995 and 2011, equating to around 567,000 jobs (Ernst & Young 2015, p. 5).
7.5 What are other countries doing to encourage reshoring? Given the potential economic and financial benefits associated with reshoring, government and private sector organisations around the industrialised world have actively encouraged the activity. This section identifies examples from the United States, the United Kingdom and mainland Europe.
7.5.1 Government initiatives
In general, governments implement a range of policies to enhance the attractiveness of a country or region as a location for foreign investment. While not a stated policy objective, many of the initiatives that provide incentives to attract and retain business activity, are also likely to encourage domestic reshoring.
These policies generally focus on the provision of subsidies and tax concessions to reduce business costs, and measures to reduce information asymmetries for companies seeking to invest.
The policies and programs identified below have specified reshoring of manufacturing as a primary objective.
7.5.2 United States
Around the world, government support for the manufacturing reshoring movement has been strongest in the United States, particularly since the global financial crisis.
In 2012, the Obama Administration’s Blueprint for an America Built to Last (the blueprint) put forward a new fiscal framework to encourage the reshoring of manufacturing production. This framework included proposals to:
• establish a minimum tax on overseas profits to prevent other countries attracting American business by offering low tax rates
• eliminate the tax deduction that companies can claim for moving production offshore
• create a tax credit to cover moving expenses for companies closing production overseas and relocating to the United States
• lower tax rates for companies that manufacture in the United States, including doubling the tax deduction for high-tech manufacturers
• adopt a more rigorous approach to trade enforcement, including the creation of a new trade enforcement unit to pursue unfair trade practices in foreign countries, and the enhancement of trade inspections on imported goods
• make investments in logistics infrastructure to improve transportation (Compton 2012, p. 4).
Some of these fiscal proposals faced political obstacles and, as a result, not all were subsequently legislated.
60 UKTI was replaced by the Department for International Trade in July 2016.

Final Report: Manufacturing in Queensland
Queensland Productivity Commission 150
In 2012, to complement its reshoring efforts in the blueprint, the Obama Administration announced the Make it in America Challenge, providing $40 million in competitive grant funding from a range of federal agencies61 to encourage businesses to build, continue or expand their operations in the United States.
To be eligible for funding, projects needed to demonstrate an ability to encourage companies to bring work and jobs back home, foster more foreign direct investment or help train local workers to meet the needs of those businesses (Office of Public Affairs 2012).
Ten projects were successful in obtaining grants, including the PA Made Again Initiative (Box 7.1). However, the total grant money paid out by government agencies as part of the program appears to be only just over one-half of the amount initially budgeted for.62
Source: NIST 2013; Reshore2PA n.d. The Federal Government’s Department of Commerce offers services to encourage businesses to return production to the United States or expand their domestic operations. These include:
• the Assess Costs Everywhere (ACE) tool, providing online links to public and private resources and case studies, to assist manufacturers understand the costs of investing and sourcing in the United States
• the Manufacturing Extension Partnership (MEP), a public–private partnership between the federal government and various public and private entities, including state, university and non-profit organisations. It
61 Those agencies were the Department of Commerce’s Economic Development Administration (EDA), the Department of Labor’s Employment and Training Administration (DLETA), the Delta Regional Authority (DRA), and the National Institute of Standards and Technology – Manufacturing Extension Partnership (NIST–MEP). 62 $20.5 million was provided by the EDA, DLETA and DRA (Office of Public Affairs 2013) whilst NIST–MEP provided each of the 10 projects with $125,000 per year for three years (Manufacturing Extension Partnership 2014, p. 2).
Box 7.1 PA Made Again Initiative
The PA Made Again Initiative is operated by the SEDA–Council of Governments in Pennsylvania, and partners including the Northeastern Pennsylvania Industrial Resource Centre and the Pennsylvania Workforce Development Corporation. It received $2.2 million in grant funding from the Federal Government’s Make it in America Challenge to establish its activities.
PA Made Again is focused on creating and retaining manufacturing jobs in Pennsylvania by spurring direct foreign investment, encouraging firms to reshore, and encouraging those considering relocation to keep operations in the state, by:
• building well-connected networks of industrial clusters that foster efficiencies, collaboration and innovation between firms along supply chains and value streams
• fostering a collaborative environment between manufacturers, colleges and other research institutions that focuses on the development of new technologies, product development and process innovation
• building a strong pipeline of middle-skilled and highly-skilled manufacturing workers.
A key element of PA Made Again is Reshore2PA, a platform for connecting manufacturers that want to reshore parts and products to Pennsylvania with suppliers that can manufacture them. Manufacturers post reshoring requests online and Pennsylvania’s regional economic development partners scout potential suppliers and help make buyer–supplier connections.

Final Report: Manufacturing in Queensland
Queensland Productivity Commission 151
operates as a system of centres in each state, offering a wide range of services to enable small and medium businesses identify opportunities to grow and strengthen their competitiveness in the global marketplace
• SelectUSA, a government-wide program to encourage domestic business and foreign direct investment. The program works with large and small companies, assisting them to obtain information, connect to people and organisations at the local level, and navigate the federal regulatory system.
The Trump administration has committed to a policy platform of Making America Great Again, with job creation in the manufacturing sector, particularly through the reshoring of production, as a cornerstone of that platform.
On 23 January 2017, President Trump signed an executive order to:
withdraw the United States as a signatory to the Trans-Pacific Partnership [TPP], permanently withdraw the United States from TPP negotiations, and to begin pursuing, wherever possible, bilateral trade negotiations to promote American industry, protect American workers, and raise American wages. (The White House 2017, p. 1)
President Trump has also foreshadowed penalties for companies which shift operations overseas and the provision of a one-off tax holiday for corporate profits held offshore at a tax rate of 10 per cent (Trump 2016, pp. 1–2).
Local administrations and state governments also offer financial and other incentives to attract manufacturing employment to their region and promote reshoring (Branham 2014, p. 26). Many of these incentives take the form of tax abatements on income, loans or property and cash rebates (Reshoring Institute 2017a).
7.5.3 The United Kingdom
In 2014, the United Kingdom Government introduced a reshoring policy with the aim of strengthening local economies and the industrial base as a whole. At the World Economic Forum in January 2014, the then British Prime Minister proposed to make the UK a ‘Re-Shore Nation’, noting:
For years we have had UKTI out there helping our businesses to export and encouraging inward investment. Now I want to give that same dedicated specific support to helping businesses re-shore. (Cameron 2014, p. 1)
To facilitate this initiative, UKTI and the Manufacturing Advisory Service (MAS)63 launched Reshore UK, a comprehensive ‘one-stop shop’ to assist firms return production to the United Kingdom.
The Prime Minister considered that the service would ‘create jobs and [ensure] that hard-working people can reap the benefits of globalisation’ (Cable et al. 2014).
Reshore UK was designed to bring industry and government together to identify opportunities and unify available support to take advantage of business opportunities created by reshoring. The service was open to all SME UK businesses, and those overseas that could make a significant contribution to the economy.
MAS was to have a domestic focus, assisting:
businesses to be globally competitive and [ensuring] that there is capacity in the UK supply chain to take advantage of reshoring opportunities. (Cable et al. 2014)
UKTI was to complement MAS in using its global networks to attract foreign companies.
For firms considering reshoring, Reshore UK offered dedicated technical and strategic advice on a range of matters, including grants and other financial incentives, the identification of supply chain opportunities and development of business cases.
63 MAS was part of the Department for Business, Innovation and Skills. In 2014, it was incorporated within the Department’s Business Growth Service, which offered support to businesses with growth potential.

Final Report: Manufacturing in Queensland
Queensland Productivity Commission 152
For UK-based SMEs seeking to take advantage of new supply chain opportunities created by reshoring firms, the service provided them with:
• an objective assessment of market capability and assistance in developing a business strategy
• referral to reshoring organisations where their requirements could match those capabilities
• continued support in establishing the reshored supply chain (Solent Growth Hub n.d.).
Reshore UK was supported by the Government’s Advanced Manufacturing Supply Chain Initiative, a competitive £245 million fund, providing subsidies for capital investment, R&D expenditure and training for industrial projects involving collaboration across supply chains, including projects involving the reshoring of manufacturing. The initiative was expected to assist in developing local suppliers around the UK’s major manufacturers, in particular the automotive industry (De Backer et al. 2016, pp. 24–5).
Following the government's expenditure review in 2015, the Business Growth Service, which incorporated MAS, was closed, with:
all contractual commitments to be honoured, as long as all support and related activity is completed by 31 March 2016. (The National Archives 2016)
It appears that, at this time, the Reshore UK service also ceased.
DSD (sub. 11, p. 8) indicated that:
reshoring manufacturing operations [in the UK] faltered due to a lack of skills and capacity among ‘smaller’ manufacturers. The data also indicated the majority of manufacturers view reshoring as ‘irrelevant’ to their strategic and corporate intention (with uptake by remaining manufacturers being less than predicted).
There is no publicly available information which evaluates the effectiveness of Reshore UK. It is unclear how many companies it assisted and how many jobs were directly created.
Advice from the United Kingdom's Department of International Trade indicates that, while the government still supports businesses seeking to reshore to the United Kingdom, this support is not conducted under a specific program. Rather, assistance with reshoring business is provided as part of broader programs that encourage foreign direct investment and provide domestic company support.64
7.5.4 Europe
There has been some interest, albeit limited, in reshoring in Europe, which likely reflects Europe’s relatively high labour costs and a smaller shift on offshoring production in the first place compared to the United States or United Kingdom (The Economist 2013b, p. 1). In addition, offshoring by French, Spanish and Italian firms has tended to be held back by domestic political and social pressures (Margulescu & Margulescu 2014, p. 91).
At the supra-national level, European Union institutions have acknowledged and expressed support for reshoring initiatives. For example, backshoring is a goal of the European Parliament’s Renaissance of Industry for a Sustainable Europe Strategy (De Backer et al. 2016, p. 24). The European Commission, in its 2012 and 2014 Communications to the European Parliament, referred to reshoring in the context of arresting the decline of the manufacturing industry’s share of European GDP (Needham 2014, p. 6).
Most European governments do not have a specific policy on reshoring manufacturing. Only a few governments have (or have recently had) reshoring policies. While only limited detailed information is available, it appears that these countries have adopted their respective measures with different domestic policy objectives in mind (Box 7.2).
64 Email correspondence with the Head of the Contact Management Centre—Asia-Pacific, Department of International Trade.

Final Report: Manufacturing in Queensland
Queensland Productivity Commission 153
Box 7.2 Reshoring in Europe
In Germany, reshoring is being encouraged to further develop and strengthen the country’s manufacturing sector, consistent with Industrie 4.0, a strategic initiative to establish the nation as a lead market and provider of advanced manufacturing solutions. This initiative, undertaken as part of Germany’s broader High-Tech Strategy 2020, is founded upon the country’s:
• continued role as one of the world’s most innovative manufacturing sectors
• technological leadership in industrial production, research and development (Germany Trade and Investment 2017).
It is unclear whether the German Government is offering specific inducements to encourage companies to relocate production.
In France, the Government’s key policy initiative on reshoring is designed to:
complement [the Government’s other] policy measures which discourage offshoring by French companies. (De Backer et al. 2016, p. 6)
A 2013 government study, Relocalisations d’activités industrielles en France, found that three types of companies were engaged in reshoring, namely:
• major firms seeking access to the best international locations for high-value-added activities (tactical reshoring)
• medium-sized firms recognising the higher ‘hidden’ costs of offshoring (home reshoring)
• start-up companies which commenced operations in a low-wage country, and now had a stable customer base (development reshoring) (ISLI Supply Chain Forum Team 2015, p. 21).
To further encourage this activity, the Ministry for Industrial Renewal developed and released the Colbert 2.0 software platform, designed to identify the relative merits of producing domestically.
In Italy, government policies to encourage reshoring are not coordinated (Marchese 2015). Despite this, the Uni-Club moRE Reshoring, a research group of scholars from Italian universities, found evidence of 125 domestic firms returning production to the country (Battochi 2016).
Most of these firms are in the clothing, footwear and electronics industries, seeking greater quality control over their production and to capitalise on the marketing advantages of the ‘Made in Italy’ brand (Marchese 2015). In this context, many of the products are niche goods, being sold at the luxury end of the market.
Finding
There is a lack of publicly available information on the effectiveness of government reshoring policies, in terms of the direct benefits (such as the number of companies which repatriated production and the number of jobs created) and the cost of those policies.

Final Report: Manufacturing in Queensland
Queensland Productivity Commission 154
7.5.5 Private sector initiatives
In the United States and the United Kingdom, key private sector organisations have developed reshoring programs, to complement the public policy agenda (the United States) or undertake a function previously provided by government (the United Kingdom).
Reshoring Initiative
The Reshoring Initiative is an industry-led non-profit organisation in the United States with an objective of bringing four million manufacturing jobs back to the United States, and reducing the unemployment rate by four percentage points (Reshoring Initiative 2016b). The organisation works directly with:
• manufacturing companies to help them realise that local production can, in some cases, reduce the total cost of ownership of purchased parts and tooling
• suppliers, training them to effectively meet the needs of local customers and sell against lower-priced offshore competitors (Reshoring Initiative n.d.).
The Reshoring Initiative offers a range of free services to interested manufacturers and suppliers, including:
• an online software tool, the Total Cost of Ownership (TCO) estimator, to comprehensively assess the actual costs of offshore production (see Box 7.3 below)
• access to information and education on reshoring, foreign investment and workforce capabilities.
The Reshoring Initiative receives only limited assistance from government and relies on the financial support of sponsors and donations to operate.

Final Report: Manufacturing in Queensland
Queensland Productivity Commission 155
Sources: Moser 2016b, 2016d.
Reshoring Institute
The Reshoring Institute is a non-profit organisation providing information, research and support for companies trying to reshore their manufacturing services back to the United States. Based at the University of San Diego, and working in collaboration with the institution’s Supply Chain Management Institute, it provides a range of services, including site selection, identification of tax credits and other incentives, marketing, public relations, cost comparisons, locating potential employees and developing strategic partnerships. The organisation uses industry experts and student interns to support its research and consulting efforts (Reshoring Institute 2017b).
Return One Million Jobs Campaign
The Return One Million Jobs (ROMJ) campaign was created in early 2017 to bring one million jobs back to the United States from offshore. It is seeking to raise $20 million to fund a major data analytics project that will allow 100,000 identified companies in the United States, which presently offshore production and sources, to compare the costs of domestic production (Return One Million Jobs 2017).
ROMJ will provide advisory services to interested companies and work closely with the Reshoring Initiative and the Reshoring Institute.
Box 7.3 Total Cost of Ownership estimator
TCO is a general framework for evaluating the relative financial merits of alternative investment strategies. It involves identifying and aggregating the direct and indirect costs likely to be incurred over the life cycle of those investments.
Advocates of reshoring manufacturing use the Reshoring Initiative's online TCO estimator to demonstrate the financial benefits of a domestic sourcing strategy, compared with offshoring production. Calculations are based not only on the costs of manufacturing a component, subassembly or product, but include hidden and intangible costs associated with ‘doing business’ and the risks associated with reliance on global supply chains.
To provide a complete picture of total cost by source (or supplier), the TCO estimator accounts for all relevant cost factors. These include readily identifiable costs such as wages, freight and duty, travel expense and time, inventory carrying costs and currency changes.
It also assists in quantifying more subjective costs and risks such as those associated with intellectual property loss, the impact on product innovation from having manufacturing distant from engineering, losses from stock-outs due to long delivery times, and supply chain shocks or disruptions caused by natural disasters and political unrest.
• In the United States, the TCO estimator has been endorsed by the US Commerce Department, and is available free of charge for all users.
• Cranfield University in the United Kingdom has developed TCO-UK, a TCO estimator, based on the Reshoring Initiative's modelling framework, for use by British companies.

Final Report: Manufacturing in Queensland
Queensland Productivity Commission 156
Reshoring UK
GTMA, a UK-based trade association representing leading companies in precision engineering, rapid product development, tool making and other critical manufacturing related products and services, established Reshoring UK.
Reshoring UK is an initiative that brings together:
leading industrial engineering associations to assist manufacturers connect with trusted, accredited suppliers capable of delivering products and services that match their requirements. (Reshoring UK 2015, p. 1)
To enable this initiative, GTMA is working with nine other trade associations and two high-value manufacturing catapults to comprehensively map the entire UK engineering supply chain with a view to making this information available online.65
This information is designed to assist OEMs and tier one companies,66 particularly those bringing production back to the United Kingdom, to identify domestic companies to fill their supply chain or establish new ones. Key industries to benefit from the data include automotive, aerospace, rail, medical, energy and defence industries.
Reshoring UK receives no financial assistance from the government and is funded by members through a subscription service.
7.6 Reshoring in Queensland The evidence on reshoring in Australia, and Queensland in particular, is very limited. No information is available, either from a government or private source, which provides any history or documents the magnitude of the activity. Despite forecasts of impending growth in domestic reshoring activity (see, for example, Johnson 2016, p. 1), only a few individual cases have been publicly reported.
A recent example is Signet, a Brisbane-based packaging company, which has returned production to Australia through investment in new capital technology (Box 7.4).
65 This online database is available at http://www.reshoringuk.co.uk/find-a-company/. 66 A tier one company is the most important member of the supply chain, supplying components directly to the original equipment manufacturer that established the chain.

Final Report: Manufacturing in Queensland
Queensland Productivity Commission 157
Sources: Packaging News 2016; Norris 2016; Mallis 2016; Sligar 2016.
While it is highly likely that there are other instances of reshoring in Queensland, it appears that reshoring is not a significant trend in the state. This may be for several reasons, including that the factors that may elsewhere drive reshoring—particularly more competitive energy and labour costs—are not present here. Chapter 3 notes the poor cost performance of the broader manufacturing sector in Australia since 2004.
Taking all of this into account, it would be ‘overstating the case to call [reshoring] the future of Australian manufacturing’ (Sligar 2016).
7.6.2 Implications for the Queensland Government
The Queensland Government has a strong focus on job creation and the reshoring prospects for Queensland firms currently manufacturing overseas (Pitt 2017b, p. 1).
As noted previously, it is not certain that reshoring policies implemented overseas have been successful in meeting their objectives.
The link between United States Government policy and the number of jobs reshored in that country is not clear. Despite an initial surge, evidence suggests that actual reshoring has waned even as support measures have continued. Although it is difficult to be conclusive in the absence of a formal evaluation, it is possible that many of those companies that reshored would have done so in the absence of government incentives. Their decisions may have been driven by their own commercial or strategic imperatives, and influenced by market circumstances and opportunities at the time.
Box 7.4 Signet reshores manufacturing to Brisbane
Signet is a national supplier and manufacturer of packaging and industrial supplies, based in Brisbane, with locations throughout Australia. It is a family-owned company, which has been operating since 1968, now employing over 300 people to produce inks and aerosol paints, signs, labels, poly tubing and plastic films.
Signet has national contracts with all of Australia’s major retailers including Woolworths and Metcash, plus a number of Australia’s largest logistics companies including Toll, Ceva, TNT and DB Schenker.
It also services industrial businesses such as 3M and Ansell.
In 2016, the company invested $7 million to expand its factory and acquire a plastic extrusion machine that turns fingertip-size plastic pellets into sheets of stretch wrap. This has allowed the company to manufacture its own plastic packaging, previously shipped in from Asia, and nearly triple its domestic polyethylene capability for packaging and agricultural customers.
Signet’s chief executive officer, Jack Winson, cited the reasons for reshoring production as:
• the slow turnaround time associated with Asian imports, providing little flexibility with which to meet tight customer deadlines
• having the capability to control the manufacturing process to ensure products of a consistently high quality
• the lower Australian dollar.
Mr Winson also noted that the largely automated nature of advanced manufacturing had made local production more competitive.

Final Report: Manufacturing in Queensland
Queensland Productivity Commission 158
In the United Kingdom, Reshore UK was closed only two years after its introduction. This timing suggests that the unpublished outcomes did not meet the government’s expectations and would have been unlikely to do so in the future.
Similarly, where companies have reshored, no comprehensive analysis has been done as to the nature of the jobs after reshoring. The ILO notes the uncertainty in this regard:
Some argue that bringing back jobs … might mean creating higher quality jobs with better protection … others believe that any jobs that return will not necessarily be the same as those that previously left. (International Labour Organization 2015, p. 6)
In addition, whilst reshoring may provide profitable opportunities for firms, it may not necessarily generate the employment opportunities that could otherwise be expected. This is particularly the case with advanced manufacturing, where reshored production is undertaken in plants that are highly automated and make use of robotic technology. For example:
[A] robot-assisted [worker] in a reshored factory might do the work of several workers abroad without machine helpers. And the returned plant won’t have nearly as many workers as the original [domestic] manufacturer, simply because of increased efficiency from improved technology. (Walker 2016, p. 1)
In other words, new technology and advanced production processes ensure that less labour per unit is needed, than when more traditional manufacturing methods are used.
In this context, government policies to encourage reshoring may not result in many new jobs.
7.6.3 What can the Queensland Government do?
Overall, the Queensland Government should ensure that it implements policies that promote economic stability and foster a competitive commercial environment. Firms are attracted to invest where there are opportunities for profit and growth.
Reshoring will occur if it is in the financial interest of the manufacturer.
A company’s location decision is a complex one, and transformational change is likely to incur significant costs. In making a critical decision to modify their sourcing strategy and produce domestically, businesses need to be confident that the change will be profitable.
An assessment of the relative merits of offshoring and reshoring involves a comparison of quantitative and qualitative factors, including relative labour and input costs and logistics. Businesses need accurate information to enable an objective, comprehensive comparison.
The Queensland Government has a role in ensuring that the right information is available to allow firms to develop their own sourcing and production strategies. In this context, it can:
• identify which information that would enable firms to decide on reshoring production is not available in the market
• ascertain whether its suite of information offerings, including cost information, provided through the Department of State Development and Trade and Investment Queensland, addresses this gap
• ensure that this information is available to all firms in the market.
These information services can be provided to both domestic firms, who may be considering whether to reshore production, and new international investors. Investment facilitation is discussed further in Chapter 10.

Final Report: Manufacturing in Queensland
Queensland Productivity Commission 159
7.7 Conclusion Around the world there has been a growing interest in reshoring as a corporate strategy and public policy objective, along with some high-profile cases of firms reshoring to the United States and the United Kingdom in particular. However, the quantitative evidence on the extent and opportunities for reshoring overall are mixed. The employment gains from foreign direct investment in the United States have been steadily outstripping the number of jobs created by reshored production for some time.
This appears to have been the case domestically. Few firms have returned production to Queensland. It is likely that the factors driving reshoring elsewhere—low energy costs at home, closer proximity to large domestic markets—are less relevant for Queensland manufacturers.
There is a lack of publicly available information on the effectiveness of government reshoring policies, both in terms of the direct benefits (such as the number of companies that repatriated production and the number of jobs created) and the cost of those policies.
On balance, reshoring will occur if it is in the financial interest of the manufacturer. The primary roles for the Queensland Government are to maintain a stable and competitive commercial environment, and to ensure firms have accurate and accessible information to use when making location decisions.

Final Report: Manufacturing in Queensland
Queensland Productivity Commission 160

Final Report: Manufacturing in Queensland
Queensland Productivity Commission 161
8.0 Regulation

Final Report: Manufacturing in Queensland
Queensland Productivity Commission 162
This chapter considers how the regulatory framework affects Queensland manufacturers, and discusses the role of ongoing evaluation and review in managing the existing stock of regulations, to better meet government objectives and limit unnecessary costs for businesses and the community.
Key points
1 Queensland manufacturers have to comply with multiple layers of regulation that can cut across different aspects of their activities and influence industry performance, productivity and competitiveness.
2 Regulations that affect Queensland manufacturers include general business regulations (tax, superannuation, business reporting protection, product safety, industrial relations, workplace health and safety) as well as industry-specific regulations such as food safety.
3 The number and complexity of regulations affecting the manufacturing sector suggests that the cumulative burden of regulation on manufacturing firms and workers may be substantial. Stakeholders raised concerns about the 'red tape' associated with running their businesses (particularly taxation structures and superannuation compliance requirements, and employment and wage setting regulations).
4 It can be difficult to pinpoint a primary cause of regulatory burden, in part because of the diversity of the sector. However, key themes have emerged, relating to the unnecessarily complex and restrictive nature of some regulations; poor regulatory processes; and the 'cumulative effect' of complying with regulations across all levels of government.
5 These concerns are not new, and have been raised (along with others) in other reviews of the regulatory burden on manufacturers, or on businesses generally.
6 The challenge for government is to ensure that the regulatory framework is necessary (responding to an identified problem); effective (separately and jointly achieving objectives); and efficient (maximising the net benefit to the community). This requires governments to actively manage the stock and flow of regulation, and requires regulators to administer and enforce regulation well.
7 There is an opportunity to look more closely at the current stock of regulation that applies to particular subsectors of the manufacturing industry—and identify priority areas where regulation could be improved, consolidated or removed to raise productivity.

Final Report: Manufacturing in Queensland
Queensland Productivity Commission 163
8.1 Introduction Governments introduce regulations to improve economic, social and environmental outcomes, or to reduce undesirable outcomes. These benefits may not occur if left to markets to deliver.
Although regulations can bring benefits, they can also impose costs. A challenge for government is to ensure the regulatory framework achieves the government's regulatory objectives in a way that also supports productivity growth and competitiveness, and provides an overall benefit to the community.
Regulation, if implemented effectively, should carry the minimum cost for the benefit it provides … It should be managed according to the better outcomes it can provide the community and should not be considered solely as a burden imposed on that community relative to the net benefit it provides. (Regulatory Policy Framework Review Panel 2017, p. 19)
The Commission was asked to consider the regulatory framework for Queensland manufacturing, including changes that would reduce the regulatory burden on the sector. This has been difficult to assess, given the diversity of manufacturing firms and the different regulations that they must comply with, as well as challenges for manufacturers in distinguishing the costs of particular regulations—as distinct from the overall burden.
This chapter focuses on the impact of existing regulation on Queensland manufacturers, as raised by stakeholders during consultation.
It does not directly address other important elements of Queensland's regulatory framework such as the effectiveness of processes for adding, changing and removing regulation; the performance of regulators in administering and enforcing regulation; and the operation of Queensland regulation in the broader Australian framework. These matters have economy-wide impacts, and are beyond the scope of an inquiry into manufacturing.
8.2 Existing regulation Queensland manufacturers must comply with multiple layers of regulation that can cut across different aspects of their activities and influence industry performance, productivity and competitiveness (Table 8.1).
Much of the regulation affecting the Queensland manufacturing sector is set at a national level. As some manufacturing businesses are, or will be, increasingly globally interconnected through global supply chains, international regulation and standards are also important.
The Queensland Government, too, continues to have a significant regulatory role. For example, the Red Tape Reduction Advisory Council (RTRAC) (now part of the Queensland Small Business Advisory Council (QSBAC))67 found that a metal trade manufacturer in Queensland must comply with a minimum of 29 state codes of practice, licences and regulatory obligations, including environmental controls, disposal of trade waste, hazardous goods management, taxation, and registration requirements (RTRAC 2016, Appendix B, p. 5).
Often Queensland manufacturers must comply with regulations that do not directly target the manufacturing sector, but nevertheless are a potential source of burden to manufacturing businesses. These include general business obligations that reflect:
• a firm's structure or business model—including relating to taxation (income tax, goods and services tax, payroll tax); superannuation; financial reporting and business registration
• the nature of operations—including various consumer protection provisions; product safety obligations; industrial relations; workplace health and safety (WHS) requirements; transport frameworks; planning and environmental requirements.
67 The Better Regulation Taskforce (BRT), as a subcommittee of QSBAC, has taken over the work of the RTRAC (DTESB 2017b).

Final Report: Manufacturing in Queensland
Queensland Productivity Commission 164
Manufacturing businesses can also be subject to industry-specific regulations that are designed, implemented and enforced to change outcomes in an industry, or for an activity. The number and complexity of regulations increases when inputs come from multiple supply chains and source materials.
Table 8.1 Types of state and federal regulations applying to Queensland manufacturers
Australian Government Function Queensland Government National land transport regulatory frameworks
Shipping and maritime safety laws
International maritime codes and conventions
Competition and consumer law
Upstream supply activities Transport
Food safety
Workplace Health and Safety
Hazardous goods handling and transport
Environmental protection and biodiversity conservation
Financial sector (access to finance)
Acquisition of premises Land use and planning
Building code
Retail tenancy
Workplace Health and Safety Industrial relations
National pollutant inventory
National greenhouse and energy reporting
Immigration
Water access
Industrial, agricultural and veterinary chemicals
Trade measurement
Operations Workplace Health and Safety Food production safety
Manufacturing codes of practice and registration requirements
Machinery operations
Local government rates and charges
Land use and planning
Renewable energy legislation
Waste management
Biofuels mandate
Queensland electricity supply
Export certificates
National land transport regulatory frameworks
Shipping and maritime safety laws
International maritime codes and conventions
Competition and consumer law
Logistics and distribution Transport
Food production safety
Workplace Health and Safety
Building code
Local government rates and charges
Hazardous goods handling and transport
Product safety
Competition and consumer law
Marketing, sales, service
Product safety
Consumer protection
Corporation law
Redundancy provisions
Cessation of operations Contaminated sites
Land use and planning
Sources: QPC 2016c, p. 21; ASMC sub. 5, p. 6; CTIAC sub. DR6, p. 7.

Final Report: Manufacturing in Queensland
Queensland Productivity Commission 165
8.2.1 Impact on Queensland manufacturers
It is difficult to quantify the costs (or benefits) of regulation to Queensland manufacturing given its diversity. The information that is available is often limited to particular (subsector) activities.
In addition, many manufacturers—especially those involved in small business—can find it difficult to pinpoint particular concerns and identify and specify the associated costs. On this, the RTRAC said:
[M]any of these costs become less transparent over time as methods of operation are built upon a foundation, which includes existing regulation. As a consequence, business generally cannot quantify how regulation impacts their costs. The reason is that the costs are embedded in cost structures and become part of business as usual. (RTRAC 2016, p. 5)
The observed scope of the regulatory environment (through different agencies and levels of government) gives an indication of the size (and potential complexity) of regulatory arrangements. The information presented to this inquiry suggests that, at least anecdotally, 'red tape'68 associated with running Queensland manufacturing businesses can be significant and is not declining (Box 8.1).
For the most part, manufacturers raised concerns about regulations that apply to business generally rather than manufacturing specific regulation. Businesses pointed to Australian Government regulation (taxation and superannuation compliance requirements, employment and wage-setting regulations, industrial chemicals regulations) as imposing the greatest individual regulatory burden. They noted the significant time spent on understanding requirements and on undertaking the paperwork and other activities required to comply.
More generally, stakeholders suggested that:
• regulations have 'gone too far', putting restrictions on business beyond what would be required to achieve a policy objective
• regulations are overly complex and highly prescriptive, failing to take account of the needs of extremely diverse and dynamic workplaces
• domestic regulations are more complex or onerous than comparable overseas regimes, putting onshore manufacturers at a disadvantage
• uncertainty about the scope or impact of (new) regulations has stopped firms buying capital equipment or employing new staff
• poor regulatory processes have led to slow responses and unanticipated delays, mistakes and inconsistencies, and requirements for large amounts of information for 'no apparent reason'
• implementation issues can cause unnecessary compliance costs—including when businesses do not understand what is required, or when new obligations do not integrate with existing ones (even when the intent of the regulation is reasonable)
• the combined or cumulative burden of complying with many regulations across all levels of government is significant (even when individual regulations are manageable).
The evolving nature of some manufacturing processes is particularly important. Regulations that mandate particular solutions for compliance may prevent or delay lower-cost solutions that may become available as the industry develops.69 In some cases, business-to-business requirements (including for product quality) put greater demands on manufacturers than the existing regulations.
68 This includes regulations that restrict the activities of businesses or imposes compliance costs on businesses, to achieve social, economic and environmental outcomes. 69 They can also encourage a culture of 'demonstrating of compliance' rather than looking for solutions (CCIQ sub. 6, p. 16).

Final Report: Manufacturing in Queensland
Queensland Productivity Commission 166
Box 8.1 Concerns about the regulatory framework
The CCIQ said the regulatory framework adds a 'heavy cost burden' to Queensland manufacturers, with the industry 'hamstrung' by:
an inefficient and uncompetitive tax system, an inflexible workplace relations framework, prescriptive regulatory compliance requirements … the pendulum has swung too far towards a largely unnecessary and highly prescriptive regulatory framework. (sub. 6, pp. 15–16)
It described the administrative burden on manufacturing businesses:
Obtaining and renewing business and occupational licenses can be particularly burdensome … employers must invest valuable time away from their businesses to liaise with any number of government departments and submit multiple forms and documents; all the while fearful of an oversight and the risk of a financial penalty. Manufacturing businesses faced with these time consuming administrative activities become, in effect, the 'unpaid bookkeepers' for government. (sub. DR4, p. 1)
The CCIQ reported the view of a dairy manufacturer, which emphasised the industry is:
threatened by a culture of over-regulation that prevents innovative and/or entrepreneurial responses to problems or challenges that arise in the workplace and in the manufacturing industry more broadly. (sub. 6, p. 22)
Meat processors said compliance costs were 'hitting the sector very hard', with significant costs in quality assurance and internal and external auditing (Nolan in Goodwin 2017).
Cook Medical said the current regulatory environment hampers Queensland manufacturers' ability to compete globally and was the 'fundamental impediment' to keeping the sector a vibrant, economically viable and broad-based one (sub. 12, p. 4).
Stakeholders said that existing industrial relations arrangements lack flexibility and 'go too far' into the employer-employee relationship (CCIQ sub 6, p. 17; TCF Industry Roundtable, Brisbane Public Forum).
Packer Leather said over-regulation 'suffocates initiative and diminishes risk taking'. This includes 'extreme' environmental restrictions; requirements to recertify technologies already certified overseas; and slow planning and approval processes that put it at a competitive disadvantage (sub. 13, pp. 2–3).
Stakeholders pointed to a lack of alignment across levels of government:
A key issue for manufacturing businesses operating across multiple jurisdictions are the inconsistencies in requirements and regulations. (CCIQ sub. 6, p. 16)
It is not just State based regulation that requires review, but also Federal Legislation that is being interpreted differently in each state … One recreational vehicle may be subject to up to over 100 Australian Design Rules, Australian Standards and Regulations … to ensure a level playing field across all states, legislation must be interpreted and regulated consistently across all states. Better communication between all state regulators is required. (CTIAQ, sub. DR6, p. 7)
The Service Trades Council said plumbing and drainage and fire protection regulations do not properly reflect evolving building construction practices, which could pose significant health and safety risks (sub. 3, p. 2).

Final Report: Manufacturing in Queensland
Queensland Productivity Commission 167
These concerns are not new, and have been raised (along with others) in other reviews of the regulatory burden on manufacturers or on businesses generally. For example, similar concerns were raised in the RTRAC 2016 report on the regulatory burden of businesses in three industry sectors (light metal manufacturing, cafes and restaurants, and fruit growing) (Box 8.2).
Sources: RTRAC 2016; Queensland Government 2016c, pp. 3, 5; Queensland Government 2017m.
Box 8.2 Red Tape Reduction Advisory Council (RTRAC) 2016 report
The RTRAC was established in 2015 to advise the Queensland Government on opportunities to reform and streamline Government regulations that were of concern to Queensland businesses. This included providing recommendations to address regulatory issues across at least three industry sectors each year.
RTRAC’s 2016 report identified key sources of regulatory burden across three industry sectors—agriculture (fruit growing), manufacturing (light metals) and hospitality (cafes and restaurants):
• difficulties in navigating the legislation and regulations and understanding compliance obligations (Commonwealth and state)
• complex employment and wage setting regulations, including for business with non-standard workforce requirements
• administrative burden of paper-based application and renewal processes for licences, permits and notifications
• lack of flexibility and consistency in approach
• poor communication between regulatory agencies and businesses, leading to duplication in reporting and compliance
• poor communication of obligations and changes to regulations, particularly for WHS and industrial relations obligations
• overly prescriptive regulations that focus on processes and procedures rather than outcomes
• insufficient consideration of the level of risk posed by the activities.
It also identified additional regulatory issues for light metal manufacturers:
• significant costs in complying with the Australian standards and/or codes regarding manufacturing, including lengthy and complex approval processes
• duplication in product testing, registration and reporting requirements across regulatory agencies.
The Queensland Government has accepted, or supported for further investigation, the RTRAC recommendations for reform, noting that many could deliver benefits more broadly to small and medium businesses across all sectors of the economy.
The Better Regulation Taskforce (BRT), a subcommittee of the Queensland Small Business Advisory Council (QSBAC), has taken over the work of RTRAC including monitoring the progress of the recommendations made in its 2016 report. The first six-month update (on progress made up to February 2017) found implementation either completed, or on track.

Final Report: Manufacturing in Queensland
Queensland Productivity Commission 168
Similar concerns have also been raised by the Manufacturing Taskforce (Prime Minister's Taskforce on Manufacturing 2012), the VCEC's inquiry into Victoria's manufacturing industry (VCEC 2011) and the Productivity Commission's review of the regulatory burdens in manufacturing (PC 2008).
The CCIQ's Red Tape survey70 has consistently found that over 70 per cent of Queensland businesses experience a moderate to high impact from complying with government regulation. The 2017 survey found:
• More than half of businesses have seen an increase in the overall cost of compliance in the past two years.
• Nearly half of businesses consider that regulatory requirements have prevented them from growing their businesses or impacted their profitability.
• Taxation, workplace health and safety, and industrial relations are the red tape hotspots (CCIQ 2017 pp. 5–8).
8.3 Importance of an effective regulatory environment Regulation is an important tool to achieve policy objectives and respond to community needs.
In some cases, regulation seeks to support the operation of markets, so that they work more efficiently. This includes clarifying or establishing the overall institutional and legislative framework, property rights or processes for contract enforcement. Regulation can be introduced to protect against (or correct) a range of market failures. Other regulations seek to address social and equity objectives—including assisting vulnerable and disadvantaged people and the unemployed.
Good regulation can yield significant benefits—enhancing Queensland's ability to compete and prosper economically. For example, the Commission was told that effective biosecurity arrangements can help Australian food processors take advantage of Australia's 'clean green' reputation when seeking to access premium export markets. The CCIQ said:
[S]ome well-targeted regulation is necessary to facilitate a level playing field for businesses … (sub. 6, p. 16)
Overall, manufacturing businesses support compliance and regulatory frameworks that are flexible to allow businesses to be more responsive to market trends and economic conditions. (sub. 6, p. 16)
However excessive, ineffective or inefficient regulation can impose unnecessary costs on businesses and the community (Figure 8.1).
Figure 8.1 Costs of ineffective or inefficient regulation
70 The CCIQ conducts a biannual Red Tape Survey to understand the impact of red tape on Queensland businesses and track changes to the burden of regulatory compliance (CCIQ 2017).
Excessive compliance costs
• Additionalpaperwork burdens
• Additional costs tomeet obligations
Distort business decisions
• Divert resources tocompliance activities
• Less innovation
• Less investment
• Fewer jobs
Unnecessary costs to the community
• Higher prices
• Restrict choices
• Unintentionallydisadvantageparticular groups
• Burden only falls onthose who comply
Undermine confidence
• Business andcommunity lose respect for theregulations
• Significantnon-compliance

Final Report: Manufacturing in Queensland
Queensland Productivity Commission 169
The challenge for any government is to make sure regulation is:
• necessary—there is a convincing underlying problem that regulation seeks to rectify
• effective—regulations separately and jointly achieve their objectives
• efficient—regulation maximises the net benefit (benefits minus costs) to the community.
Regulation that delivers high-quality outcomes with minimum burden requires governments to ensure regulations are justified and well-designed.
This is not just important in the context of new regulations. There also needs to be a focus on the stock of existing regulation. Poor management of the flow or stock of regulation can lead to a 'rigid and conservative approach to regulation that imposes significant costs on the community' (RTRAC 2016, p. 5).
It also requires regulators to administer and enforce regulation effectively and efficiently.
Regulation is an inescapable part of doing business and the way it is implemented is often as important to business and to compliance outcomes as the content of the regulation itself … By exercising discretion and choosing judiciously how regulation should be implemented, a regulator can reduce costs for small businesses while maintaining or even improving compliance outcomes — a win-win for business and the community. (PC 2013a, p. iii)
8.3.1 Effective regulation in a diverse, evolving industry
During the consultation process, feedback on the impact of regulation on Queensland manufacturers (and their responses in complying with regulation) varied considerably, depending on the activities undertaken and the size of the business. For manufacturers operating in higher-risk areas (such as biotech, food processing and heavy machinery), compliance would be expected to form a central part of a firm's operation and decision-making. In contrast, for lower-risk businesses, regulatory compliance may be more peripheral to their core activities.
Stakeholders highlighted the importance of the regulatory framework being 'fit for purpose' when tasks and activities are diverse and changing, sometimes fundamentally. They said, that outdated or inappropriate regulation (that failed to take account of changing work practices and needs) can impose unnecessary burdens.
• Workplace relations was a significant issue for some firms, with the overly complex and highly prescriptive arrangements undermining the capacity of firms (particularly those with requirements for businesses with nonstandard workforce requirements) to run their business including taking on new staff (CCIQ sub. 6, p. 19; TCF Roundtable; Brisbane Public Forum).
• Packer Leather said that requiring technologies that are already certified, and in use, in comparable overseas markets to be 'recertified' in Australia reduces its competitiveness and ability to compete in a global market—by unnecessarily increasing the complexity and costs of it doing business and inhibiting its access to new technologies and scientific advances (Packer Leather sub. 13, p. 3).
Stakeholders said that regulations need to be evidence-based, and developed in consultation with industry to ensure they have the desired affect and avoid unintended consequences. On this, the Australian Sugar Milling Council (ASMC) noted that industries can be damaged when changes to regulations are 'politically driven'. It suggested that the 2015 amendments to the Queensland Sugar Industry Act 1999 (which changed the marketing arrangements of Queensland sugar and introduced pre-contract arbitration):
cost the industry millions of dollars in compliance response without generating any additional revenue … halted major capital projects worth hundreds of millions of dollars and has put future foreign investment in regional manufacturing at significant risk. (ASMC sub. 5, p. 5)

Final Report: Manufacturing in Queensland
Queensland Productivity Commission 170
8.3.2 A disproportionate impact on small businesses
Queensland manufacturers are mostly 'small' firms (employing 19 or less workers), with many of these operating with the owner as the primary person working in the business (Chapter 2). Small firms usually operate in a fundamentally different structure to larger businesses.
Given their nature and typical characteristics, Queensland's small manufacturing firms may 'feel the burden of regulation' more strongly than larger firms. For example, small firms might have relatively limited resources and specialist management functions to respond to regulation (or changes to regulations) and can face challenges in understanding and fulfilling compliance obligations. The CCIQ said:
Regulatory compliance burdens tend to be felt more severely by small businesses, as they often do not have the resources to undertake the breadth of compliance requirements compared to larger enterprises. (sub. 6, p. 16)
To the extent that compliance costs are largely 'fixed' (in that they do not vary with output)71, compliance exerts a disproportionately large burden on small firms. This is because it costs more for small businesses to fulfil their regulatory obligations (per unit) compared to larger businesses, with compliance costs absorbed less readily within their smaller revenue base.
Good regulation will be designed and implemented to address a policy problem in a least cost way, regardless of the size of the firm. This includes carefully considering ways to reduce the compliance cost burden on all firms, including small firms.
8.4 Opportunities to reduce the regulatory burden on the manufacturing sector
The Commission has been asked to identify changes to the regulatory framework that would reduce the regulatory burden on Queensland's manufacturing sector.
It has considered this issue in the following context:
• The regulatory framework that applies to the manufacturing sector is broad, with some regulations applying generally to manufacturers and other businesses and others applying only to parts of the sector.
• The stock of regulation in Queensland is large, with the Queensland Competition Authority estimating that Queensland had 50,443 pages of Acts and 21,993 pages of subordinate legislation in 2012 (QCA 2012, p. 35).72
• The Queensland Government is committed to addressing red tape and creating a balanced regulatory environment for Queensland businesses across all sectors of the economy, and has:
− established the RTRAC (now the BRT subcommittee of the QSBAC) to inform the development of policy options to reduce the regulatory burden faced by Queensland small business owners
− indicated it is on track to implement its response to the first RTRAC report
71 These can include implementation costs, such as when regulatory requirements are newly introduced or updated relating to new or updated plant or other physical infrastructure, IT systems and software, business restructuring, staff training and, in some cases, payment for external services to facilitate compliance (PC 2013a, p. 74). 72 While page counts can provide a broad indication of the aggregate regulatory burden, they can also be influenced by non-regulatory factors (such as format and layout) or efforts to make legislation easier to understand (that reduce the burden but may require more pages) (QCA 2013, pp. 3, 14).

Final Report: Manufacturing in Queensland
Queensland Productivity Commission 171
− directed the independent Office of Best Practice Regulation (now part of the Commission) to assist agencies to apply effective and rigorous regulatory impact analysis as part of standard policy development processes
− required that regulatory processes be consistent with the Council of Australian Governments (COAG) Best Practice Principles for Regulation Making (Box 8.3)
− released The Queensland Government Guide to Better Regulation in August 2016, as an administrative policy approved by the Treasurer, to assist agencies in developing regulation.
Source: COAG 2007, p.4. This inquiry has nevertheless identified concerns (see section 8.2) that, taken together, suggest that the regulatory system, as it relates to the manufacturing sector, is operating below its potential. The CCIQ said:
Government must focus on reining in business operating costs for manufacturers and burdensome regulatory requirements that inhibit growth and investment. (sub. 6, p. 15)
These concerns do not appear to be systematically different to those raised by other firms or in other industries.
Accordingly, the Commission considers that opportunities to reduce the regulatory burden on the manufacturing sector are best considered as part of broader regulatory reform. This includes improving the 'flow' of regulation through regulatory impact analysis so that new regulations are justified and well-designed. However, there is also the risk that the existing 'stock' of regulation may no longer be effective or necessary—reducing flexibility, innovation, competitiveness and productivity, and imposing unnecessary compliance costs to the manufacturing sector (and elsewhere). This reinforces the importance of effective evaluation and review.
Box 8.3 COAG Best Practice Principles for Regulation Making
COAG has agreed that all governments will ensure that regulatory processes in their jurisdiction are consistent with the following principles of best practice regulation.
• Establishing a case for action before addressing a problem.
• Considering a range of feasible policy options including self-regulatory, co-regulatory and non-regulatory approaches, and an assessment of their benefits and costs.
• Adopting the option that generates the greatest net benefit for the community.
• Ensuring, in accordance with the Competition Principles Agreement, legislation should not restrict competition unless it can be demonstrated that:
− the benefits of the restrictions to the community outweigh the costs; and
− the objectives of the regulation can only be achieved by restricting competition.
• Providing effective guidance to relevant regulators and regulated parties to ensure that the policy intent and expected compliance requirements of the regulation are clear.
• Ensuring that regulation remains relevant and effective over time.
• Consulting effectively with affected stakeholders at all stages of the regulatory cycle.
• Ensuring that government action is effective and proportional to the issue being addressed.

Final Report: Manufacturing in Queensland
Queensland Productivity Commission 172
8.4.1 Evaluation and review
The Commission supports the ongoing efforts of departments, agencies and regulators to monitor and evaluate the impact of regulations on businesses and communities, and identify and respond to emerging issues for improved regulatory practices. In Queensland:
• Section 54 of the Statutory Instruments Act 1992 requires that all subordinate legislation expire after 10 years, unless extended. This means agencies wanting to 'remake' regulation must demonstrate its continuing relevance, effectiveness and efficiency.
• Acts can require the government to undertake a review of legislation to evaluate whether it is effective and improvements are required (although there is no consistent approach to the expiry of primary legislation, like there is with subordinate legislation).
• Agencies, sometimes at the instruction of government, can determine that regulatory frameworks should be reviewed to ensure they remain current and fit for purpose.
• A Post Implementation Review to assess the impacts, effectiveness and continued relevance of a new regulation may be required where a regulatory proposal has been exempted from completing a Regulatory Impact Statement.
Formal large-scale reviews of regulation have been undertaken at the state and national level. More recent reviews have included trading hours in Queensland (Trading Hours Review Reference Group 2016); taxis and personalised transport in Queensland (OPT Review Taskforce 2016); and Australian Agriculture (PC 2016c).
Other options to improve regulatory outcomes include benchmarking studies73; and agency rules and administrative arrangements (Box 8.4), although the usefulness of these approaches depends on their ability to alter the underlying causes of the regulatory burden.
8.5 A way forward There are no easy answers to address the regulatory burden on Queensland's manufacturing sector. Improving outcomes will require (all levels of) government to actively manage the flow and stock of regulation—and ensure it is administered and enforced effectively and efficiently.
Delivering high quality outcomes requires governments to ensure regulations are justified and well-designed. This is important for any new regulations. However, there also needs to be a focus on the impacts of existing regulations—which reflect past policy objectives and business practices that may be less relevant now, and into the future. Periodic review helps to ensure regulations remain 'fit for purpose'—so that policy delivery continues to match intent.
8.5.1 A regulatory stocktake
A regulatory stocktake is a comprehensive, systematic way to better understand how the existing regulatory framework affects Queensland manufacturers and workers.74
73 Benchmarking studies compare regulation in different areas, to identify leading practices. Often the best comparators will be found in other jurisdictions, which means that state governments are unlikely to make extensive use of this approach. 74 This will supplement existing sunsetting reviews, which are important but tend to focus on a piece of subordinate legislation (and not the linkages between different regulation) and have timing driven by an imposed cycle (and not when there is evidence of regulations that are not working or are imposing an unnecessary burden).

Final Report: Manufacturing in Queensland
Queensland Productivity Commission 173
A regulatory stocktake could usefully identify:
• regulatory 'hotspots'—regulations that impose an unnecessary burden on manufacturers, with a focus on those that have a material impact on competitiveness and productivity
• circumstances where a lack of connectedness between regulations and regulators has resulted in duplication, inconsistency and unnecessary complexity
• the cumulative burden from multiple overlapping regulators or duplication when regulators do not coordinate (or consolidate) information collection, reporting or audit requirements
• options to improve outcomes and address issues identified.
A review would provide a better understanding of both the broad reach and economic impact of key regulations as well as the cumulative impact of individual regulatory requirements.
Public stocktakes are designed as a ‘discovery’ mechanism for unnecessary regulatory burdens. They are particularly suited to identifying areas imposing high compliance costs on business, including where the accumulation of regulation has compounded the costs of doing business. Public stocktakes have also been effective in throwing up challenging areas requiring more detailed examination, helping identify priorities for in-depth reviews. (PC 2011c, p. 76)
This information could feed into broader programs of regulatory reform that seek to explain observed outcomes and understand the logic of government involvement to suggest opportunities for improvement (Box 8.5). Case studies at a more detailed level could support this analysis.
Box 8.4 Agency rules and administrative arrangements
Agency rules and administrative arrangements have been suggested to improve regulatory outcomes.
• The New Zealand Productivity Commission has suggested that departments should be required to publish their regulation review strategies and review reports; the Treasury should articulate principles that would help departments to focus reviews where they have the largest anticipated benefits; there should be preliminary assessments to identify areas requiring attention; there should be targets that require departments to identify reviews expected to yield the largest benefits (NZPC 2014, pp. 392–3).
• Linking departmental performance in managing the stock of regulation to chief executive performance agreements.
• Providing more information about the stock of legislation and regulation, including historical data on the number of legislative instruments, and the number that have been reviewed, repealed or amended in each year. This would give some indication—albeit only a crude one—of how the burden of regulation is changing.
• Mandating 'one in, one out' rules or red tape reduction targets. While such rules can be used to galvanise action, their focus on red tape reduction can compromise other, more meaningful, reforms that promote good policy outcomes and reduce unnecessary regulation. They can also be difficult to sustain after the 'low-hanging fruit' has been picked (Regulatory Policy Framework Review Panel 2017, pp. 21–23).
• Reducing the period for sunsetting reviews of subordinate regulation below 10 years.

Final Report: Manufacturing in Queensland
Queensland Productivity Commission 174
Some stakeholders raised concerns about how to effectively implement a stocktake, noting that it should:
• not result in the reduction of regulation designed to keep working people safe, secure their conditions and wages at work or protect the environment (AMWU sub. DR 1, p. 5)
• not duplicate elements of existing reform processes, including through the RTRAC/BRT (DSD sub. DR2, p. 4)
• take account of any effects of identified regulations that go beyond manufacturing (PCA sub. DR5, p. 2).
Box 8.5 Extending the approach—regulator performance
The efficiency and effectiveness of regulation is driven, in no small way, by the way regulators administer and enforce regulation:
The efficiency of regulatory processes is a key determinant of the level of regulatory burden imposed on businesses … regulatory costs are exacerbated by the lack of flexibility and consistency of regulatory frameworks and processes. (RTRAC 2016, p. 14)
It is often the experience of regulation, i.e. how governments administer regulations, rather than what those regulations are, that can cause frustration or create problems for regulated parties and consumers. (Regulatory Policy Framework Review Panel 2017, p. 86)
The enforcement of regulations affects businesses at least as much as the policy of the regulation itself. Efficient enforcement can support compliance across the whole range of businesses, delivering targeted, effective interventions without unreasonable administrative cost to business. Inflexible or inefficient enforcement increases administrative burdens needlessly … (Hampton 2005, p. 1)
This means regulators' performance—whether good or bad—could have significant impacts on Queensland manufacturers' compliance costs and business decisions. Accordingly, an extension to the proposed approach would be to also review regulators' performance—to also consider how regulation is applied.
Measuring and reporting regulators' performance requires regulators to look at how they operate, the benefits achieved and any burden created. This helps identify what works well and where there are opportunities for modification, improvement or remediation. The increased transparency and accountability provide an incentive for organisations to lift performance and a way to demonstrate how it 'adds value.' It also gives business, the community and individuals confidence that regulators effectively and flexibly manage risk.
The performance of regulators is already monitored, measured and reported in some Australian jurisdictions. This includes the Australian Government's Regulatory Performance Framework (Australian Government 2014), Victoria's Statement of Expectations for regulators (Victorian Government 2017) and New South Wales' Quality Regulatory Services Initiative (New South Wales Government 2017).
The Queensland Government is developing a 'regulatory performance framework', to monitor the performance of regulatory agencies (Queensland Government 2017m, p. 14). The Commission provided advice to the Treasurer on potential models—recommending a flexible approach where regulators self-assess performance against key performance indicators and report annually, either as a standalone report or through existing reporting such as annual reports (QPC 2017a, pp. 44–53, 54–59).

Final Report: Manufacturing in Queensland
Queensland Productivity Commission 175
These issues are largely a matter of effective implementation. When managed well, a stocktake review can be a cost-effective way to identify priority areas where regulation could be improved, consolidated or removed.
Overall, the degree of influence of stocktake reviews depends on how they are managed … good process is crucial in building awareness and a constituency for change. (PC 2011c, p. B.17)
Key implementation issues are identifying the subsectors to be considered and determining the general approach. Both affect the breadth of the review; the volume of regulation that falls within scope; and ultimately the quality of information and ability to identify areas of concern.
Which subsectors?
The diversity of Queensland's manufacturing sector means that regulation is likely to affect different parts of the sector in different ways. Focusing on subsectors will provide the kind of information about regulatory burdens, the extent to which regulation is achieving intended outcomes, and ways in which to improve regulation, that would not be revealed by broader, sector-wide analysis.
There are 15 manufacturing subsectors, and reviewing all of them in detail is not likely to be feasible.75 It may be more useful to begin by reviewing the subsectors for which the benefits of reform appear likely to be largest, while recognising that it is not possible to know in advance which are the most prospective. The Commission has identified three priority areas, based on:
• stakeholders' views provided through submissions, individual meetings, and public forums—although the concerns raised were often about the general burden of regulation rather than about individual regulations (Box 8.1)
• its own desk-top analysis, using the Australian Business Licence and Information Service (ABLIS) to identify an indicative list of obligations which firms in seven of the largest subsectors would have to comply with.76 The Commission then applied, on a desk-top basis, a framework that has been widely used (for example, QCA 2013, pp. 111–112) to identify priority subsectors (Figure 8.2).
Figure 8.2 Identifying priorities for further investigation
75 In addition, because many of the regulations are general business obligations that will apply to all businesses, reviewing every subsector is unlikely to reveal new or fresh insights. 76 This typically indicated that there would be 50 or more obligations, imposed by the three levels of government.

Final Report: Manufacturing in Queensland
Queensland Productivity Commission 176
This analysis suggested three subsectors should be given priority (Figure 8.3). However, even at the subsector level the diversity of manufacturing activities, production processes and associated regulatory issues may still suggest that further disaggregation to focus on particular industries might be required to provide meaningful insights. The Commission notes the RTRAC's 2016 report identified key issues relating to the regulatory burden for light metal manufacturers.
Figure 8.3 Proposed subsector priorities and example industries
a In 2016–17, the meat and meat products industry employed around 40 per cent of the people employed in food product manufacturing. b Includes agricultural machinery and equipment, mining and construction machinery, and food processing machinery.
Food
Food product manufacturing is the largest manufacturing subsector.77 It is also the biggest exporter and one of the few subsectors that is growing. This suggests that regulation in this subsector has significant reach—so the gains from even small reductions in compliance costs for each business would be larger than equivalent reductions in other subsectors.
The ABLIS search suggested food manufacturers typically must comply with around 60 licensing, code of practice or legislative obligations, across all levels of government. Many of these are general business obligations (such as employment and industrial relations, workplace health and safety, and taxation). There are also industry-specific requirements, reflecting production under the Food Act 200678and Food Production (Safety) Act 2000. Safe Food Queensland administers Food Safety Schemes based upon nationally agreed standards that are incorporated into the Food Production (Safety) Regulation 2014. These apply to food production and processing activities associated with meat, dairy, eggs, seafood and horticulture. Each year, Safe Food Queensland issues and renews over 8,000 accreditations for processing activities under various Food Safety schemes. Over half of these related to processing and around one-third related to transport (SFQ 2016, pp. 6, 8–10). Safe Food also assesses and reports on compliance across accredited business. Safe Food reports consistently high rates of compliance—suggesting that businesses are aware of, provide for, and are committed to food safety (SFQ 2016, p. 16).
Although the inquiry was presented with some evidence that regulation can constrain food manufacturers' business decisions and compliance costs are high (Box 8.1), other estimates suggest the cost of food safety amount to approximately 1 per cent of the retail price (SFQ 2016, p. 14) and, in some cases, supply chain partners can have stricter quality and verification requirements than the regulated quality and safety standards. A stocktake would give insight into the broad scope of regulations that apply, to better understand where the largest burdens lie.
77 The food subsector is made up of many industries, some of which are themselves large. 78 Administered by Queensland Health and Local Government.
Food
• Meat and meat productsa
• Fruit and vegetableprocessing
Machinery and equipment
• Industrial machineryand equipmentb
• Automotive afterparts
Basic chemical and chemical products
• Medicinal andpharmaceutical products
• Industrial biotechnology

Final Report: Manufacturing in Queensland
Queensland Productivity Commission 177
Machinery and equipment
The machinery and equipment subsector is the sixth-largest subsector by sales and the third-largest by employment. It has significant links into key industries (through the production of agriculture and mining equipment, scientific equipment, medical and surgical equipment, and computer and electronic equipment) and a strong regional component. This suggests that regulation in this subsector has significant reach—including through any flow on effects to other key sectors and in regional economies.
The ABLIS search suggested machinery and equipment manufacturers must comply with around 50 obligations, across all levels of government. These are primarily general business obligations—there do not appear to be significant additional sector-specific requirements.
Machinery and equipment manufacturers often rely on being technically innovative. There is a growing awareness of the effects of regulation on innovation and entrepreneurship.
[M]ost empirical analyses find a negative relationship between regulatory restrictions and entrepreneurship … Given the challenges faced by entrepreneurs and firms, governments should take into account the effects of regulation on innovation and entrepreneurship in their decision making process. Also, entrepreneurial development and innovation policies may be nurtured by carefully designed regulatory strategies. (Moreno 2015, pp. 7–8)
The Queensland Mining Equipment, Technology and Services 10-Year Roadmap and Action Plan79 highlights the complex relationship between regulation and innovation. It argues that Australia's demanding environmental protection requirements and workplace safety regulations have encouraged Queensland's METS companies to become world leaders in developing products, processes and services to reduce the environmental impacts of operations and improve workplace safety systems (DSD 2017d, p. 8). However, METS companies have identified red tape and regulation as a significant cost that is higher than faced by some competitors.
The challenge is to maintain our position as a favourable place in which to establish new businesses in an increasingly competitive environment. (DSD 2017d, p.11)
The stocktake would provide insights into how regulation affects innovation in this sector, and whether there is scope for regulation to be more favourable for innovation without affecting regulatory outcomes. A key focus would be on identifying potentially duplicative or outdated regulations.
Basic chemical and chemical products
Basic chemical and chemical products manufacturing includes the production of basic chemicals and polymers, fertilisers and pesticides, pharmaceutical and medicinal products (for human or veterinary use).
Although the smallest subsector identified for review80, parts of the subsector have been identified as providing major opportunities for innovation, jobs and growth in Queensland in future. For example, the Queensland Biofutures 10 year Roadmap and Action Plan reports that Queensland's industrial biotechnology and bioproducts sector could contribute $1.8 billion to annual gross state product and support 6,640 full-time jobs in Queensland (DSD 2016g, p. 6). More broadly, chemicals and plastics are used widely in the economy.
The ABLIS search suggested chemicals manufacturers must comply with between 70 and 95 obligations. Many of these are general business obligations, along with some activity-based requirements. Where there are more industry-specific requirements, these reflect the nature of production (for example, relating to restricted medicines and poisons, or agricultural and veterinary chemical products, labelling of fertilisers). The various regulations include national and state requirements. This reinforces the benefit of identifying, at an industry level, where the burden lies, including possible interactions, inconsistencies and overlaps of regulations.
79 Mining and construction machinery manufacturing, which is an activity within the subsector, overlaps with activities in considered identified in the mining equipment, technology and services. 80 The basic chemical and chemical products sector is the fifth-largest subsector by sales, and seventh-largest by employment.

Final Report: Manufacturing in Queensland
Queensland Productivity Commission 178
Which approach?
Reviews of these subsectors are most likely to succeed where they:
• build on existing evaluations and reviews (when there have been any)—and not duplicate previous work
• are undertaken with an appropriate amount of independence—to help avoid conflicts of interest, encourage objectivity, and enable a broader perspective where regulations cut across several departments or levels of government
• are undertaken by an agency that is familiar with Queensland's existing regulatory frameworks, good regulatory practice and regulatory review (including cost–benefit analysis)
• have a clear objective—to identify priority areas for reform that will contribute to improved productivity for Queensland manufacturers as well as the wider Queensland economy
• have buy-in from the relevant government departments and agencies and from business and other stakeholders—and effective consultation strategies to allow for meaningful engagement
• publish their conclusions and recommendations in a timely and transparent way. This will build accountability for government, departments and agencies to 'follow through' and implement meaningful change.
To ensure adequate focus and resources, the reviews could be undertaken sequentially rather than simultaneously. The review of the food sector regulation is possibly the most significant. However, it is likely to be the most complicated. It may be prudent to begin with one of the other two reviews, so that the lessons learned can be applied to the review of the food subsector.
It is particularly important that the first review is successful, both for its direct benefits, and because that success would encourage other parts of manufacturing to participate in later reviews of other subsectors. The aim should be to create a 'virtuous cycle', in which a successful review encourages other subsectors to identify opportunities to improve their regulatory frameworks, which would help the government to identify the priorities for review after the first three reviews have been completed.
In addition, governance is important. The perceived independence of the review will influence its credibility and underpin stakeholder confidence and engagement in the process. Factors that promote independence include:
• conducting the review at arm’s length from government and from business—to reduce potential conflicts and take a broader perspective
• ensuring effective process, including consultation—to develop a strong evidence base to identify and explore issues
• making the outcomes of stocktakes transparent—to provide a level of accountability for government to ‘follow through’ and implement meaningful change.
This also requires adequate resourcing (staff, time and resources) to effectively engage with businesses, departments and agencies; identify areas of concern; and weigh up competing claims.
The BRT and the Office of Best Practice Regulation appear to be well-placed to undertake work of this nature, given their independence and familiarity with regulatory issues, the regulatory framework and good regulatory practice—but they would require adequate resourcing to do so.

Final Report: Manufacturing in Queensland
Queensland Productivity Commission 179
8.6 Conclusion An effective regulatory framework achieves the government's regulatory objectives in a way that also supports productivity growth and competitiveness and provides an overall benefit to the community.
It is difficult to quantify the costs (or benefits) of regulation to Queensland manufacturing, given the diversity of the sector. However, the information presented to this inquiry suggests the regulatory burden for Queensland manufacturers can be significant and is not declining. Key concerns are the unnecessarily complex and restrictive nature of some regulations; poor regulatory processes; and the 'cumulative effect' of complying with regulations across all levels of government.
A regulatory stocktake is a comprehensive, systematic way to better understand how the existing regulatory framework affects Queensland manufacturers. As a starting point, the Commission has identified three priority subsectors—food, machinery and equipment, and chemicals manufacturing—for review. Taking a targeted approach will provide sufficient focus and detail to identify areas where there is scope to improve outcomes (through immediate changes or in directing priorities for further review). Taking a sequential approach, having regard to the other elements of existing reform processes, is also important to ensure that review adds value, and builds on common themes and priorities and lessons learnt. Ensuring independence and transparency improves credibility and can help build stakeholder confidence and engagement in the process.
Recommendation 8
To improve regulatory outcomes, the Queensland Government should commission stocktakes of the regulations that affect:
• food manufacturers
• machinery and equipment manufacturers
• basic chemical and chemical products manufacturers.
The three stocktakes should be undertaken sequentially by an independent body (such as the Better Regulation Taskforce or the Office of Best Practice Regulation) and completed as soon as possible.
The three stocktakes should identify priority areas for reform that will contribute to improved productivity for Queensland manufacturers as well as the wider Queensland economy. This includes areas where there is the most scope to:
• reduce unnecessary regulatory burden and pursue regulatory objectives in more efficient (least cost) ways
• better coordinate action across (Australian, state and local) governments to reduce unnecessary overlaps.

Final Report: Manufacturing in Queensland
Queensland Productivity Commission 180

Final Report: Manufacturing in Queensland
Queensland Productivity Commission 181
9.0 Structural adjustment

Final Report: Manufacturing in Queensland
Queensland Productivity Commission 182
This chapter discusses the drivers and impacts of structural change, and the characteristics of past and present assistance measures. It also identifies likely future impacts on the manufacturing sector and potential policy challenges confronting government.
Key points
1 The forces driving structural change are diverse. They include globalisation, technology, economic shocks, consumer preferences, demographic factors and domestic government policy.
2 The majority of structural adjustment assistance is provided by the Australian Government. In the absence of these programs, the Queensland Government has generally relied on the provision of labour market assistance to affected workers.
3 In Queensland, high energy prices and new technologies are likely to drive structural change in the manufacturing sector.
4 Adjustment assistance may play an important role in facilitating change and easing the adverse transitional impacts of adjustment. Such assistance needs to be justified, well-targeted and facilitate rather than impede change.
5 Structural change may require workers to relocate to obtain alternative employment. Labour mobility for manufacturing workers is lower than for workers in other sectors.

Final Report: Manufacturing in Queensland
Queensland Productivity Commission 183
9.1 Structural change
9.1.1 What is structural change?
Structural change involves relatively large and long-lasting transformations in the composition of production in the economy. It reflects the aggregate responses of individuals and firms to changes in relative prices which, in turn, affects the allocation of resources among firms, industries and geographic areas.
Structural change is an ongoing characteristic of economic development. As the patterns of production and consumption change, resources are allocated to more high-value uses. In the process, new firms and industries emerge while others decline or disappear. Structural change occurs:
• within firms, as they respond to changes in the relative price of inputs, and implement new production processes through the adoption of new technology and management practices
• within industries, as competitive pressures favour one firm over another
• across sectors of the economy as domestic or global consumption patterns change or industries lose their comparative advantage (Downes & Stoeckel 2006, p. 12).
The process through which the economy transitions is referred to as structural adjustment. It relates to the period in which the factors of production—land, labour and capital—move between activities in search of higher returns. Depending upon the source of change, and the way individuals and firms respond, structural adjustment can occur gradually or relatively quickly.
9.1.2 Drivers of structural change
The factors that drive structural change are diverse.
As discussed in Chapter 3, globalisation and the increasing connectivity of economies have had a large impact on developed countries around the world. The emergence of China and other East Asian nations as major producers of goods has resulted in a proliferation of low cost imports, increasing the competitive pressures on domestic producers. These pressures have been reinforced by government policies of market liberalisation.
Domestic and international economic shocks can also generate structural change. The extent of change depends upon the nature of the shock, including its duration and severity. For example, the recent mining boom in Australia led to a large appreciation of the currency, which weighed heavily on trade-exposed sectors of the economy, including manufacturing and agriculture. It also diverted labour and capital from non-mining industries, forcing many firms to raise wages in an effort to retain workers.
Advances in technology, especially in relation to mechanisation, computerisation and telecommunications, have had significant impacts on domestic production and distribution processes. In particular, the wider application of robotics in industry has increased the range of functions that can be automated and resulted in the substitution of capital over labour.
In many developed economies, consumer preferences and demographic factors have produced structural shifts towards the services sector. In Australia, for example, as consumer incomes have risen over time, expenditure on leisure activities has increased more than proportionately. There has also been a growing demand for health care services, due in part to the country’s ageing population (Office of the Chief Economist 2014, pp. 86-7).
In addition to market forces, domestic government policies bring about structural change. Examples in Australia include deregulation of the dairy industry and the reduction in subsidies to the automotive manufacturing sector. Broader government regulation and policies—such as energy policy—can also have financial impacts on businesses.

Final Report: Manufacturing in Queensland
Queensland Productivity Commission 184
9.1.3 Benefits, transitional costs and distributional impacts
Overall, structural change normally brings benefits, with resources flowing to higher-value uses. These benefits can be reflected in lower prices, improved quality and a greater choice of goods and services for individuals and businesses. For communities, structural change can create employment opportunities and enhance economic growth.
The scale and scope of structural adjustment in Queensland has been less than in other states that had a heavy reliance on trade-protected industries. Adjustment also needs be placed in the context of employment opportunities elsewhere. Since 2000, the total number of employed workers in Queensland has grown by over 40,000 per year on average (ABS 2017d).
However, structural adjustment may bring significant disruption and economic and social costs for individuals, families and communities. It can also have distributional impacts.
For employees, the loss of work will likely prompt them to seek alternative employment. If, given their particular skills and experience, there are no jobs available locally, some may relocate to find work elsewhere. Others may reskill to take advantage of employment opportunities offered by local firms in different industries. Those who do not (or cannot) relocate or retrain, face the prospect of long-term unemployment. This can lead to a deterioration in skills, making it even more difficult to find work in the future.
At the industry level, structural change reduces the number and size of individual firms, and often the nature of their business. In the process, labour and capital are diverted to alternative activities. If the economic forces are sufficiently strong, an affected industry may cease to exist.
Communities, particularly at the regional level, can be heavily impacted where they rely on an affected firm or industry for economic opportunities. In the absence of prospects for alternative employment, the population is likely to decline. This could impact on the delivery of public services and maintenance of infrastructure. Financial returns to surviving businesses, including those businesses providing services to the region, are also likely to diminish.
In addition to the economic impacts, structural change may also adversely affect the health and wellbeing of workers and their families, and the social cohesion of the community. Townsville Engineering Industries (sub DR9, p. 2) noted that '[r]etrenching long term valued employees is hurtful and costly'.
9.2 Structural adjustment assistance In the past, government intervention has occurred where these impacts have been a direct consequence of policy reforms. However, governments have also provided assistance where structural change has been brought on by market forces—particularly where the transition period is protracted or where the burden of adjustment falls upon a particular region or industry.
Aither (2014, pp. 26–27) notes that the key objectives of government intervention include:
• overcoming distributional or equity impacts of change
• facilitating and incentivising adjustment to more quickly and efficiently realise economic benefits
• complying with legislative obligations that compel the payment of compensation in the event that policy change results in an economic loss for particular stakeholders, such as a loss of property rights
• buying off opposition to reform to make adjustment more politically acceptable
• avoiding adjustment altogether in the expectation that the forces driving change are temporary and do not reflect longer-term economic fundamentals.

Final Report: Manufacturing in Queensland
Queensland Productivity Commission 185
9.2.1 Scale of assistance
In a comprehensive study of structural adjustment assistance in Australia between 2000 and 2012, Beer (2015, pp. 23–24) observed that assistance programs:
constitute a large, and relatively costly, part of the Australian government’s engagement with industry and communities.
Key findings of this study included:
• There were 135 structural adjustment programs implemented between 2000 and 2012, with costs generally ranging in size from $5 million to $500 million.
• The total value of commitments was in excess of $88 billion, with most of the assistance provided by the Australian Government.
• While a diverse range of industries received assistance, some were in receipt of repeat adjustment packages.
Often, adjustment programs have yielded short-term support, but made adjustment more difficult later, requiring additional assistance to be provided. The Australian car industry is a good example.
Beer (2015, p. 24) noted an observation by the Productivity Commission that, across the nation, the manufacturing industry has been the recipient of the greatest level of assistance.
Box 9.1 highlights many of the more comprehensive structural adjustment programs provided to the sector since 2000.

Final Report: Manufacturing in Queensland
Queensland Productivity Commission 186
Source: Beer 2014. In many of these examples, the Australian Government established structural adjustment funds, with the purpose of supporting retrenched employees and promoting diversification in affected regions. Rather than create specific new policies, it augmented existing schemes, such as training programs and other forms of labour market assistance, and tailored them to the specific needs of affected workers (PC 2014a, p. 225).
9.3 Queensland Government support measures Since 2000, Queensland Government programs have been in place to:
• assist employees in finding alternative work
• restructure industry
Box 9.1 Manufacturing structural adjustment packages since 2000
The Australian Government has funded the majority of the following assistance measures:
• Textile Clothing and Footwear Structural Adjustment Package
• Textile Clothing and Footwear Strategic Investment Program Scheme
• Textile Clothing and Footwear Post-2005 Strategic Investment Program Scheme
• Automotive Industry Structural Adjustment Program
• Automotive Competitiveness and Investment Scheme
• Structural Adjustment Fund for South Australia
• South Australia Innovation and Investment Fund
• Innovation and Investment Fund for South Australia
• Geelong Investment and Innovation Fund
• Automotive Transformation Scheme
• Automotive New Markets Program
• Australian Paper’s Maryvale Pulp and Paper Mill
• Clothing and Household Textile Building Innovation Capability Scheme
• Textile, Clothing and Footwear Strategic Capability Program
• Textile, Clothing and Footwear Small Business Program
• Automotive Diversification Program
• Bluescope Steel Structural Adjustment Program
• Arrium Structural Adjustment Program
• Queensland Nickel Structural Adjustment Program

Final Report: Manufacturing in Queensland
Queensland Productivity Commission 187
• facilitate investment and provide broad economic opportunities in affected regions.
The Queensland Government also has a range of general employment programs (see Chapter 4).
9.3.1 Labour market assistance
For around a decade, the Queensland Government’s Worker Assistance Program (WAP) was its leading program to assist workers impacted by business closure.
WAP was established in 1999, as part of the Queensland Government’s Breaking the Unemployment Cycle budget initiative. It was an early intervention program to prevent workers who lost their jobs in large-scale retrenchments from becoming long-term unemployed. The key objective of WAP was to help workers who needed to increase or diversify their skills to secure another job.
WAP was available for rural and regional communities where 15 or more people were retrenched from an enterprise and, in larger cities, where 50 or more people were laid off (Braddy 1999).
Under the program, retrenched workers could receive financial assistance of up to $5,000 for training, job preparation, wage subsidy and relocation (Foley 2002a). An example of WAP and its support for affected workers is given in Box 9.2 below.
Sources: Barton 2002a; Barton 2002b; Foley 2002b; Webster 2004. In a review of Breaking the Unemployment Cycle, the Department of Employment and Training (2002, p. 45) found that, in the three years to 2002, WAP assisted 3,029 workers through 33 interventions, at a cost of $2.41 million ($796 per worker, on average). There is no publicly available data that examines the cost and levels of assistance across the entire life of the program.
Box 9.2 Lakes Creek Meatworks
The Lakes Creek abattoir, established in 1871, was for many years the largest employer in Rockhampton. At its peak, the facility employed around 2,000 out of a local population of around 50,000. In 2001, it was the second-biggest meat works in Australia, and provided work for 1,350 people. It was estimated to contribute $20 million in wages and $5 million in related goods and services annually to the local economy.
Following a long dispute over remuneration and conditions, the facility’s owner reduced the workforce in May 2002. It subsequently closed the abattoir entirely in September 2002, citing financial reasons. As part of the Queensland Government’s WAP, retrenched meatworkers were offered up to $2,000 in job preparation and training assistance. A specialist job provider was contracted to provide this individual career transition support. In addition, local support was provided by:
• Capricorn Training, which offered the use of their training facilities
• the Community Informatics Project, an initiative of Rockhampton City Council and Central Queensland University, which provided basic computer and internet training.
This assistance for affected workers was subsequently widened to include about 20 permanent employees of Tempo Cleaning Services, who were contracted to the meatworks.
For those workers able to secure employment at other abattoirs in Queensland, the $2,000 WAP funding was available to use for relocation expenses.

Final Report: Manufacturing in Queensland
Queensland Productivity Commission 188
The review foreshadowed modifications to the program to encourage more active participation and boost employment outcomes. These included:
a greater focus on participants developing return to work plans, providing training that more clearly articulates with these plans and a more focused period during which participants can receive assistance (six months as opposed to twelve months). (DET 2002, p. 46)
WAP was considered to have limited overlap with employment services offered by the Australian Government, given its early intervention focus.
During the global financial crisis, WAP was the main program providing assistance to displaced workers. In 2008, the government increased the annual provision for the program from $5 million to $10 million (Queensland Treasury 2008, p. 33).
This program is no longer offered by the Queensland Government.
In providing assistance for affected workers, the Queensland Government now works closely with the Australian Government to secure priority access to tailored employment services, offering amongst other things:
• help with job application preparation, interview skills and presentation techniques
• referrals to jobs in the local area and help with relocating for work
• targeted training that is suited to the skills that local employers need
• opportunities to connect to a range of other government initiatives, including the New Enterprise Incentive Scheme, which provides advice on starting a business.
The Queensland Nickel Structural Adjustment Program (Box 9.3) is a recent example of this type of assistance program.

Final Report: Manufacturing in Queensland
Queensland Productivity Commission 189
Sources: DoE 2016i; Lynham et.al. 2016; Cash 2016.
9.3.2 Industry restructuring assistance
Industry restructuring programs are designed to make industries as a whole more sustainable in light of prevailing economic conditions. They tend to be more common in primary industries, particularly agriculture, forestry and fisheries, which have been challenged by global market forces or other environmental factors.
In general, industry restructuring programs involve assistance measures to:
• improve the efficiency of producers so that they can adjust to lower market returns
• encourage unviable enterprises to exit the industry, or diversify into other activities.
A recent example of an industry restructuring program in Queensland is the East Coast Commercial Net Fishing Reduction Scheme (Box 9.4).
Box 9.3 Queensland Nickel Structural Adjustment Program
On 20 January 2016, the Australian Government announced a $500,000 adjustment program for Queensland Nickel employees who had lost their jobs.
Under the Queensland Nickel Structural Adjustment Program (QNSAP), retrenched workers were eligible for immediate access to Stream B assistance through jobactive, the national employment services network. Eligible workers also received a $2,000 credit for use by a jobactive provider for work-related items, post-placement support, professional services, targeted training and licences.
Stream B assistance provides workers with case management support and requires job service providers to play a more prominent role in preparing jobseekers for alternative employment.
Subsequently, on 10 March 2016, the Australian Government announced a further $1.9 million to assist retrenched workers and affected downstream suppliers.
At the same time (but separate to the QNSAP) the Queensland Government, working in conjunction with the Australian Departments of Employment and Human Services, mobilised a Rapid Response Team to connect workers with services, including:
• access to financial assistance
• information and support for job seekers
• training and career information
• support for supply chain businesses
• referral to advice on debt and bills
• access to mental health services.

Final Report: Manufacturing in Queensland
Queensland Productivity Commission 190
Source: DAF 2015.
9.3.3 Regional assistance programs
Regional assistance programs aim to attract new investment to regions and cushion any adverse impact of structural change. They encourage the entry of new businesses and the expansion of existing firms by improving infrastructure and programs.
In Queensland, the most recent example of a regional assistance program is the North Stradbroke Island Economic Transition Strategy, which was developed in response to a major government policy decision to cease sand mining on the island (Box 9.5).
Box 9.4 East Coast Commercial Net Fishing Reduction Scheme
In 2012, the Queensland Government committed $9 million to buy back commercial fishing licences along the eastern seaboard of Queensland. The aim of the buyback was to:
• reduce the commercial fishing pressure on resources
• reduce the impact of inshore netting on protected species
• improve economic conditions for commercial fishermen.
Between 2012 and 2014, the Queensland Government ran three buyback schemes, comprising voluntary competitive tenders, and fixed price and capped offers. In total, the scheme yielded 74 commercial fishing vessel licence packages, representing a 32 per cent reduction in large mesh netting authorities on the east coast of Queensland.

Final Report: Manufacturing in Queensland
Queensland Productivity Commission 191
Sources: DSD 2016e; Queensland Treasury 2016b; Finance and Administration Committee 2016.
Box 9.5 North Stradbroke Island Economic Transition Strategy
Mineral sands have been mined on North Stradbroke Island (NSI) since 1949. In May 2016, the Queensland Government legislated to phase out sand mining by 2019. A report by Deloitte Access Economics, commissioned by the government, previously found that closure of the industry would result in an annual direct job loss of 95 mining workers and an annual loss of direct economic activity on NSI of between $55 million and $86 million.
To support the NSI’s economic transition, the Queensland Government developed the North Stradbroke Island Economic Transition Strategy. The five-year strategy provides over $20 million in initiatives designed to diversify and expand the current tourism industry, expand education and training opportunities, and stimulate local business development and growth. Through this funding allocation and the initiatives proposed, the Queensland Government is seeking to facilitate co-investment with private sector stakeholders.
In addition to these measures, the Queensland Government allocated a further $5 million for the North Stradbroke Island Workers Assistance Scheme to assist affected workers to transition to alternative employment. The elements of the scheme include:
• job search support (up to $2,000 per worker)
• training and skills support (up to $2,000 per worker, as well as compensation for up to four weeks leave to undertake training while employed by the mining company, Sibelco)
• housing assistance and commuting subsidy (mortgage or rent assistance up to $5,000, and a commuting subsidy of up to $5,000 per worker who continue to reside on NSI)
• income supplementation for permanent workers who did not receive a redundancy and continue to reside on NSI
• dislocation assistance (varies based on length of eligible service)
• up to $4,000 per worker to eligible employers who engage an affected worker in permanent employment continuously for six months or more.
Finding
The majority of structural adjustment assistance is provided by the Australian Government. The Queensland Government has supported these Commonwealth initiatives and, where such initiatives have been absent, it has generally relied on the provision of labour market assistance to affected workers.

Final Report: Manufacturing in Queensland
Queensland Productivity Commission 192
9.4 Future Queensland Government intervention
9.4.1 Manufacturing and the nature of future structural change
The Queensland manufacturing sector has not experienced the effects of structural shocks and the forces of structural change forces as much as the manufacturing sector in other parts of the country has. This is because the sector in Queensland is so diverse and lacks the presence of major industries that are supported by trade barriers.
It is difficult to forecast with any degree of certainty the potential nature and extent of future structural change in Queensland’s manufacturing sector. Nonetheless, it is likely that:
• technology, such as advanced manufacturing, will have an impact on established firms, in terms of the level of capital investment, the manner in which they produce, the amount of labour they employ and their ability to compete with domestic and international rivals
• higher electricity and gas prices will erode the commercial sustainability of energy-intensive industries.
Baffour et al. (2016, p. 11) expect employment opportunities to decline from 2020 onward in particular for metal fitters and machinists, and structural steel and welding trade workers (boilermakers).
It is likely that manufacturing employment opportunities will also decline over time as the state transitions to a services economy.
9.4.2 Principles for future assistance measures
The Productivity Commission (2012, p. 24) observed that in the past the effectiveness of structural adjustment policies in retaining or creating employment has generally been limited, with regions receiving assistance not appearing to adjust better to structural change than their unassisted counterparts.
In general, this is consistent with the findings of Daley and Lancy (2011, p. 26) who also identified that structural adjustment programs:
• had a high cost per job created
• did not significantly affect overall long-term employment trends in the assisted regions.
Adjustment assistance is therefore typically best provided through the general welfare system. As stated by the Productivity Commission:
The social security and tax systems … will usually be the most appropriate vehicles for assisting the adjustment process and moderating adverse distributional impacts. (PC 2001, p. X)
These mechanisms provide assistance effectively and efficiently, and directly target those in need without unduly introducing inefficiencies in the market. They meet a simple equity objective in responding to structural adjustment.
However, the Productivity Commission (2001, p. X) also accepted that the general welfare system is not designed to handle all contingencies and that selective support may be appropriate, depending upon the circumstances.
In particular, more specific support measures may be warranted where adjustment costs are significant, concentrated and systematically different to those experienced by other firms or workers adjusting to change.
Accordingly, depending on the circumstances, there may be a role for the Queensland Government in providing assistance to facilitate community adjustment and recovery.

Final Report: Manufacturing in Queensland
Queensland Productivity Commission 193
In circumstances where a case for government support is identified, the Queensland Government should be guided by clear policy principles (Box 9.6) to ensure that assistance is suitably targeted and the measures effective.
Sources: QCA 2015a; OECD 2005a.
9.4.3 Policy challenges
In providing adjustment assistance to the manufacturing sector, the Queensland Government is likely to encounter a number of potential challenges in the design of an appropriate policy response.
Focus on what works
There appears to have been only limited monitoring and evaluation of the effectiveness of previous assistance measures. As a result, policymakers may have little guidance as to the relative merits of different forms of assistance and the manner in which they are best delivered.
Box 9.6 Structural adjustment principles
Clear objectives: the basis for any government intervention and the underlying policy objectives of any assistance package should be clear.
Focus on individuals and the community: assistance should be targeted at individuals and the community, rather than businesses. Affected employees generally find it difficult to diversify risk and are often poorly informed about risks when making employment decisions. Providing assistance directly to workers is less likely to impede efficiency-enhancing industry change.
Facilitation of adjustment: government assistance should facilitate adjustment and not be distortionary. It should not impede industry adjustment to market conditions.
Jurisdictional coordination: where relevant, there should be coordination between the Australian, Queensland and local governments in the content and delivery of adjustment assistance programs.
Time limit: the time period over which assistance is provided should be limited. Without this limitation, any incentive for innovation and efficiency-enhancing change is impaired.
Cost: the level of assistance should have regard to the costs to be met by government and the wider community.
Transparency: assistance measures should be delivered in a transparent manner.
Evaluation: assistance programs should be subject to regular assessment to determine that they are having their intended impact.
Finding
Adjustment assistance may be required to facilitate change and ease the adverse transitional impacts of adjustment. However, this assistance needs to be justified, well-targeted and facilitate, rather than impede, change.

Final Report: Manufacturing in Queensland
Queensland Productivity Commission 194
This underlines the importance of future assistance programs being monitored and reviewed so that policymakers can learn the lessons of past decisions.
Timing issues
Timing can be problematic when it comes to providing assistance for displaced workers. Often, affected employees are not able to access support measures and benefits until a firm has closed and they have been formally provided notification of retrenchment.
This delays the time until a worker is able to commence training or reskilling programs and, in turn, extends the period in which they could be without alternative work.
The Australian Manufacturing Workers' Union noted that it is in the best interests of employees that, where necessary, they are engaged in training programs as soon as practicable—even prior to them losing their job. This would assist in making them ‘job-ready’ as soon as possible and smoothing the transition to alternative employment (sub. DR1, p. 4).
The Australian Manufacturing Workers' Union also proposed that:
the Queensland Government [should create] a training scheme that funds employees to upgrade their skills during time of decreased work. (sub. 9, p. 4)
However, the Department of State Development considered that it is
virtually impossible to find out about "planned firm closures" in advance of the closure. (sub. DR2, p. 6)
Apart from planned firm closures, a greater emphasis on lifelong learning and ongoing skill development through a robust and effective education and training system is important (see Chapter 6).
Labour mobility
Manufacturing workers may face substantial barriers to re-employment, which will be exacerbated by barriers to labour mobility.
Geographic labour mobility is an important mechanism in adapting to shocks arising from structural change. It improves community wellbeing by enabling workers to move to locations where they are more productive and valued higher. This can increase employment and incomes across the state. However, where mobility is low, regional labour markets can be adversely impacted, unemployment is likely to be high, and there could be greater inequality in income and social conditions.
The Office of the Chief Economist (2014, p. 116) highlighted the low levels of geographic labour mobility among manufacturing workers, compared with workers from other sectors:
Manufacturing workers are generally less likely to relocate from one region to another than non-Manufacturing workers. This may inhibit structural change and, to some extent, explain why the decline in [manufacturing] has had a negative impact on regional labour markets.
Recommendation 9
To assist in the development of future structural adjustment policies, the Queensland Government should establish a longitudinal study of retrenched workers who previously received assistance, to identify those programs that have successfully resulted in permanent re-employment.

Final Report: Manufacturing in Queensland
Queensland Productivity Commission 195
Often labour immobility is driven by personal and lifestyle factors, such as a reluctance to leave family members, friends and the community. However, the Productivity Commission (2014a, pp. 169–190) found that relocation costs, housing affordability, working conditions and other administrative barriers may also play a part.
The Commission considers that the Queensland Government should remove state-based barriers to geographic labour mobility. In particular:
• improving land-use planning processes to expedite the release of land for residential development that would otherwise limit the supply of housing
• removing unnecessary occupational and/or business licensing, whilst ensuring the regulation that remains is the minimum necessary to achieve consumer protection, safety or environmental objectives
• reforming stamp duty to reduce the additional costs on property transfers.
To the extent that relocation costs represent a short-term financial barrier for manufacturing workers and their families, the Queensland Government could consider providing financial support in the form of a one-off relocation allowance and time-limited rental assistance.
Age issues
Adjustment is likely to be most difficult for older, lower-skilled manufacturing workers. Callan and Bowman (2015, p. 11) highlight the problems facing older workers with limited or non-transferable skills in finding a new job following retrenchment:
The probability of being re-employed is much lower for older lower-skilled displaced workers … More skilled and highly qualified workers typically have skills that are transferable to other sectors and they gain new jobs relatively easily. However, substantial challenges are faced by employees in industries where large proportions of the workforce are older, with lower skills, no formal qualification and associated lower literacy and numeracy skills.
Their continued participation in the labour market could even be threatened. In their review of mature-age unemployment in Australia, Spoehr, Barnett and Parnis (2009, p. 5) observed that:
many older workers who become unemployed do not intentionally retire but find this happens by default when they fail to find employment.
The government should target this cohort of affected workers as soon as practicable once retrenched to ensure that they have the best possible chance of securing meaningful employment.
Where training opportunities are offered, they should focus on developing specific skills that directly relate to the current and emerging needs of firms, rather than be more generic in nature.
There is also a case, however, to shift beyond the conventional policy approach of retraining—particularly given limited evidence of effectiveness—towards new pathways for older, lower-skilled workers, be it to alternative employment, other forms of work or retirement, whether partly or permanent.
The Commission considers that the Queensland Government should work with the Australian Manufacturing Workers’ Union and key industry associations to identify additional pathways for future employment of workers in the manufacturing sector, including older employees with more traditional skills. Jobs Queensland may be well-placed to support this work, given its:
• function to undertake statewide workforce planning and development initiatives
• ongoing research and analysis on the impact of structural adjustment on workforces within Queensland industries.

Final Report: Manufacturing in Queensland
Queensland Productivity Commission 196
9.5 Conclusion As markets evolve, the relative size and characteristics of industry change. In response, businesses, workers and communities must adapt and reposition themselves. During the adjustment period, there may be costs to various parties and regions of the economy.
The role of government in providing adjustment assistance remains a contentious issue. Any assistance the government chooses to provide needs to be justified, well-targeted and effective.
Recommendation 10
To minimise the social and economic costs associated with structural adjustment in the manufacturing sector, the Queensland Government should:
• provide early training assistance as required where there are planned firm closures
• remove regulatory barriers to labour mobility across regions in Queensland, particularly in relation to housing, occupational/business licensing and stamp duty, and consider, as part of any structural adjustment package, providing support for relocation in the form of a one-off allowance and time-limited rental assistance
• work with the Australian Manufacturing Workers' Union and other key industry stakeholders, including Jobs Queensland, to identify employment opportunities for older, low-skilled manufacturing workers who are displaced.

Final Report: Manufacturing in Queensland
Queensland Productivity Commission 197
10.0 Framework policies

Final Report: Manufacturing in Queensland
Queensland Productivity Commission 198
This chapter reviews opportunities to improve broader framework policies that affect manufacturers in Queensland.
Key points
1 Evidence presented to this inquiry suggests that economy-wide policies affect the sector more than sector-specific policies.
2 Rising electricity and gas prices are putting manufacturers (and other energy users) under pressure. The government should avoid hasty policy or regulatory changes that impede the efficiency of the national electricity market and place further pressure on energy prices. Stronger governance arrangements and greater competition would reduce pressure on electricity prices.
3 The Queensland Government’s Gas Action Plan should be developed in such a way that it:
• reduces the costs and remove impediments to gas exploration and development
• improves processes to resolve land-use conflicts arising from gas activities
• increases transparency to improve market efficiency.
4 Procurement preferences generally come at a cost to other businesses and lower household incomes. In implementing the Queensland Procurement Policy 2017, the government should:
• focus on removing impediments to local firms participating in procurement
• develop guidelines for implementing the local benefits test
• clarify the definitions of 'local' and 'significant'
• provide training about the new framework
• start to collect information for an evidence base
• embed evaluation within program development.
5 Trade facilitation services could be improved by addressing information barriers for all firms. In addition, gathering and publishing information about which government processes are most challenging for investors to ‘navigate’ could identify opportunities for government to simplify regulatory processes without undermining outcomes.
6 Financial incentives to attract investment are unlikely to provide a net benefit to the Queensland community. Where the government provides such incentives, it should report the size of the assistance; the number, names and size distribution of firms assisted; the reasons why assistance is provided; and the basis on which it is provided. The outcomes should be publicly evaluated and reported.
7 The government should reform the state tax system, placing less reliance on distortionary taxes and moving towards more efficient broader-based taxes. A shift to broad-based efficient taxes would allow those taxes to be set a lower rate (which is likely to benefit manufacturing overall) and more distortionary taxes to be removed.

Final Report: Manufacturing in Queensland
Queensland Productivity Commission 199
10.1 Introduction Policy measures can significantly affect manufacturing sector performance. Manufacturers supported the view that economy-wide policies affect the sector even more than sector-specific ones.
This chapter examines key framework policies. Sections 10.2, 10.3, 10.4 and 10.5 examine four policy areas that are particularly important to manufacturers:
• energy
• procurement
• investment facilitation and attraction
• state taxation.
Section 10.6 outlines other issues that manufacturers raised, including workplace relations, section 457 skilled migration visas and planning and zoning regulation. The discussion is less detailed because:
• the government is introducing significant initiatives in planning and zoning regulation, the effects of which cannot yet be evaluated
• the Australian Government is responsible for most aspects of workplace relations policy and skilled migration visas that stakeholders raised.
10.2 Energy Manufacturers stated that access to competitively priced and secure energy supply, together with policy certainty, would increase their international competitiveness and willingness to invest.
Submissions concentrated on electricity supply (see Box 10.1), but the Commission also heard concerns about rising gas prices.

Final Report: Manufacturing in Queensland
Queensland Productivity Commission 200
The head of the Australian Food and Grocery Council (AFGC) has commented that, nationally, rising energy costs are having a ‘massive impact’ on the industry, and are ‘going to make a difference between some businesses staying and going offshore’. The AFGC represents food, drink and grocery manufacturers (Heffernan 2017).
10.2.1 Electricity
Market pressures
Queensland is part of the national electricity market (NEM). The pressures on Queensland manufacturers from rising electricity prices, and their concerns about reliability and security, can be sourced to developments in the NEM and the surrounding policy framework. Similar concerns are being voiced across Australia.
Box 10.1 Stakeholder views on energy
CCIQ considered that:
Energy is the most significant input cost for Queensland manufacturing businesses. In a recent CCIQ survey, 65% of businesses cited electricity price rises as a major or critical concern. Manufacturers use a diverse range of energy sources and the ability to secure long-term supply is a key factor in their decision-making on whether to invest in, grow, or close their business operations entirely. Mostly, however, the provision of reliable and cost-effective electricity supply is vital to manufacturing businesses in Queensland continuing their operations. (sub. 6, p. 18)
Electricity prices have risen to be the number one issue facing all industries, with almost 55 per cent of Queensland manufacturers citing it as a major to critical concern. Almost a third of manufacturing businesses will reduce profits, while 25 per cent will pass their increasing costs on to consumers and a further 12 per cent will reduce staff numbers and 2 per cent will close their doors. The impacts electricity prices have on the manufacturing industry is devastating and has wider economic impact across Queensland. 23,800 Queensland jobs are at risk in the manufacturing sector if prices continue to increase. (sub. DR4, p. 3)
The Australian Sugar Milling Council noted that the lack of certainty in energy policy has already significantly impacted on investment in renewable generation, and that poor tariff structures discourage demand management. It said that 'associated policies relating to biofuels are under-developed' (sub. 5, pp. 3–4).
The Northern Iron and Brass Foundry found it difficult to remain viable with escalating electricity prices (sub. 1, p. 1).
Rio Tinto believed that Queensland’s ‘long history of industrial manufacturing of natural resources [is] underpinned by access to competitively priced energy, especially electricity. But this is now under serious threat’ (sub. 4, p. 1).
Rio Tinto also viewed that the Commission should 'advise on the extent to which the manufacturing sector is already being damaged by high prices and inefficiencies in the electricity and gas industry and the extent to which the initiatives announced and being considered are likely to be effective in supporting the sustainability of Queensland manufacturing' (sub. DR8, p. 1).

Final Report: Manufacturing in Queensland
Queensland Productivity Commission 201
The Australian Energy Regulator’s (AER) 2017 overview of the energy market suggests that the past 12 to 18 months have ‘been some of the most challenging … since the NEM was established in 1998’ (AER 2017b, p. 8). Contributors to tightening conditions in the electricity market include:
• rising peak grid demand for electricity, particularly in Queensland
• the retirement of coal-fired generators, following an influx of wind and solar generation
• gas-powered generation often setting dispatch prices, and gas generators responding to higher fuel costs by bidding into the market at higher prices
• uncertainty about energy and climate change policies affecting investor confidence. Apart from renewables, private investment in new plant has stalled, while governments have announced plans to invest, or to explore investment, in gas, pumped hydro and energy storage (AER 2017b, pp. 6, 8).
These conditions have led to a tightening supply–demand balance. AEMO’s analysis shows a:
heightened risk that the current NEM reliability standard will not be met, and confirms that for peak summer periods, targeted actions to provide additional firming capability are necessary to reduce risks of supply interruptions. (AEMO 2017f, p. 1)
Wholesale electricity prices increased across the NEM in 2015–16 and continued to generally increase during 2016–17, with the steepest increases occurring in South Australia, Queensland and New South Wales (AER 2017b, pp. 51-58).
The chair of the Australian Competition and Consumer Commission (ACCC), which is inquiring into the supply of retail electricity, observed:
There are many cases of firms facing a doubling or even tripling in electricity prices in their most recent offers over the last 12-24 months, as companies come off 3-5 year contracts. Often electricity is at least 5% of total costs, and firms that are in the traded goods sector cannot pass on these cost increases …
Many medium-sized food and non-food manufacturers have seen electricity prices increase by 20% recently or by 100% or more over the last five years. Some had only 1-2 offers for supply; some are so desperate they are buying directly from the spot market, or are considering doing so, which is extremely risky. (Sims 2017)
The market has been extremely volatile, for reasons that are complex and differ across regions. Futures prices indicate that wholesale prices in Queensland are expected to moderate from 2016–17 levels more than in other states, but remain above 2016 average spot prices (AER 2017b, pp. 51–58).
The Queensland Government’s role
The government has state and national policy responsibilities for electricity supply. It is a significant service provider through its shareholdings in Energy Queensland, Powerlink, CS Energy and Stanwell.
The government owns or controls 65 per cent of NEM-connected electricity generation in Queensland (through CS Energy and Stanwell) and the rest is privately owned. It owns 100 per cent of both electricity transmission (Powerlink Queensland) and distribution (Energy Queensland). Through Energy Queensland, it provides retail electricity services to most regional Queensland customers.
Many of the NEM’s governance and regulatory arrangements are set nationally. However, the government regulates retail pricing for some consumers, network reliability settings, derogations from nationally harmonised laws (for example, consumer protections), planning requirements in relation to electricity infrastructure, and safety requirements for electrical work and equipment (QPC 2016a, pp. 45, 78–79).

Final Report: Manufacturing in Queensland
Queensland Productivity Commission 202
Large electricity consumers have been able to choose their retailer since 1998 and residential and small business customers have done so since 2007, although competition has been largely restricted to south east Queensland, where retail electricity prices were deregulated on 1 July 2016. The Queensland Competition Authority (QCA) sets regulated retail tariffs for the rest of Queensland.
In July 2017, the Queensland Government announced its Powering Queensland Plan (Box 10.2), which:
sets out the Government’s strategy to guide the state through the short-term and long-term challenges occurring in the market. The plan aims to deliver stable energy prices, ensure long-term security of electricity supply, transition to a cleaner energy sector and create new investment and jobs. (DEWS 2017a)
Source: DEWS 2017a.
Box 10.2 The Queensland Government’s Powering Queensland Plan
The Powering Queensland Plan seeks to address the state’s current and future energy needs through the following series of initiatives:
• Provide electricity price relief by transferring to the Government the cost of the Solar Bonus Scheme, at an estimated cost of $770 million.
• Return Swanbank E gas-fired power station to service, to support the market over the summer period.
• Direct Stanwell Corporation to alter its bidding strategies to help put as much downward pressure on wholesale electricity prices as possible.
• Investigate the restructure of Government owned generators and the establishment of a ‘CleanCo’, to operate Queensland’s existing renewable and low emissions energy generation assets and develop new renewable energy projects.
• Deliver a $386 million Powering North Queensland Plan to strengthen and diversify the north’s energy supply and create a North Queensland clean energy hub.
• Confirm the Government’s commitment to a 50 per cent renewable energy target by 2030.
• Facilitate up to 400 megawatts of diversified renewable energy, including 100 megawatts of energy storage through a reverse auction.
• Improve large-scale renewable project facilitation, planning and network connections.
• Establish the Queensland Energy Security Taskforce, to develop an energy security plan for the state.
• Implement the Queensland Gas Action Plan and release over 450 square kilometres of new gas tenure for supply to the Australian market.
• Continue to advocate for stable, integrated national climate and energy policies.

Final Report: Manufacturing in Queensland
Queensland Productivity Commission 203
Policy reviews
The electricity policy framework in Queensland and nationally is undergoing significant review and change. Many reviews have been recently completed or are underway. A subset of these reviews is summarised below.81
Queensland Productivity Commission
The Commission reviewed solar feed-in pricing and electricity pricing in Queensland in 2016 (QPC 2016a, 2016b).
The electricity pricing inquiry (EPI) considered issues such as the competitive electricity market, efficiency and reliability, environmental outcomes and vulnerable customers. It identified the major drivers of price increases in Queensland had been escalating network costs and renewable energy schemes. The Commission found there to be no simple fix to rising electricity prices. Its 52 recommendations included:
• minimising or deferring future network capital expenditure through tariff and non- tariff demand management programs
• removing price regulation in south east Queensland’s retail electricity market
• Introducing additional measures to assist vulnerable customers.
The government accepted (or accepted in principle or in part) most recommendations (Queensland Government 2016e).
Finkel Review
The Independent Review of the Future Security, Reliability and Affordability of the National Electricity Market (Commonwealth of Australia 2017b) (the Finkel Review) focused on reliability, security and governance.
Box 10.3 summarises some of its 50 recommendations.
81 Additional reviews not discussed in this chapter include the Australian Energy Market Commission's (AEMC) review of system security and the AEMO's advice on dispatchable capability.

Final Report: Manufacturing in Queensland
Queensland Productivity Commission 204
Sources: Commonwealth of Australia 2017b; Blowers 2017a.
The COAG Energy Council (COAGEC) agreed on a timeline to implement 49 of the 50 recommendations, but did not support tasking the AEMC to develop design options for implementation of a Clean Energy Target. However, Queensland, Victoria, South Australia and the Australian Capital Territory will separately commission the AEMC to do further work in this area (COAGEC 2017).
In response to a request for advice from the Minister for Environment and Energy, the Energy Security Board has proposed the creation of a dual reliability and emissions guarantee, which will require retailers to meet their load obligations with a portfolio of resources that includes a minimum amount of flexible dispatchable capacity, at an emissions level consistent with Australia's international emissions reduction commitments.
Box 10.3 Key features of the Finkel Review
Reliability
• A Clean Energy Target would provide incentives to new low-emissions generators that produce electricity below a specified emissions intensity threshold.
• A Generator Reliability Obligation would require wind and solar generators in regions with a high proportion of intermittent generation to provide backup for some supply, through new storage or contracts with new dispatchable generators such as gas.
• Large generators would need to provide three years notice before leaving the market, to provide time for new generation to be installed.
Security
• Transmission companies would be required to provide and maintain a prescribed level of inertia in the system, to prevent rapid and damaging changes in frequency. Fossil fuel generators may be required to change their settings to control the frequency in the system.
• The Australian Energy Market Commission (AEMC) should report on rule changes to encourage distributed energy resource participation to provide services such as frequency and voltage control.
• A data collection framework should be developed to provide static and real-time data for all forms of distributed energy resources.
• The development of ‘demand response’ schemes would give consumers incentives to switch off and help smooth the load at peak times.
Governance
• An Energy Security Board (ESB), made up of an independent chair and vice-chair, as well as the heads of the three governing bodies (the AEMC, AEMO and the AER), would have primary responsibility for energy security and reliability and for implementing the review’s recommendations.
• The Council of Australia Governments (COAG) should agree to a new Australian Energy Market Agreement (AEMA), recommitting all parties to a nationally consistent approach to energy policy and requiring any party to notify the COAG Energy Council if they propose to take unilateral action that falls within the scope of the AEMA.

Final Report: Manufacturing in Queensland
Queensland Productivity Commission 205
The reliability guarantee would require retailers to hold forward contracts with dispatchable resources covering a predetermined percentage of their forecast peak load, based on the system-wide reliability standard determined by the AEMC. Retailers and large users would have incentives to enter into contracts with generation resources for a proportion of their energy obligations to be met by capacity that meets the dispatchability criteria established by AEMO. Compliance would be based on the actual output and the availability of dispatchable capacity, and the cost of any non-compliance would be based on the real-time spot price.
The emissions guarantee would require retailers and large users to meet their load requirements at a specified average emissions level. Retailers and generators would enter into contracts for the supply of energy at a certain emissions level. Because some retailers would not be able to meet the required emissions profile while others would overachieve, a secondary market would develop. Retailers would need to provide evidence to the AER that the mix of electricity supplied has met the emissions guarantee for their served load over the compliance period (Energy Security Board 2017).
Reviews of retail electricity
The Australian Government has directed the ACCC to inquire into the supply of retail electricity and the competitiveness of retail electricity prices. A preliminary report (ACCC 2017c) was released in October 2017, with the final report required by June 2018 (Morrison 2017).
The Victorian Government has established a review of electricity and gas retail markets in Victoria (Thwaites et al. 2017).
Moving forward
Wood et al. (2017) argue that the NEM is at a ‘fork in the road’, with three possible futures:
• a competitive market, with clear expectations for both emissions reduction and reliability
• a fundamental restructure, with alternative market structures and policies (such as a capacity market)
• a centrally planned approach, with a government-led program of investment, planning and coordination (Wood et al. 2017, p. 27).
One view is that there is a trend towards a central-planning approach:
Whether it is the Commonwealth with its proposed Snowy 2.0 scheme, South Australia’s plan to build a state-owned gas power station, or Queensland’s manipulation of wholesale prices, electricity is now government business. (Blowers 2017b)
It is too early to tell whether governments have moved from a competitive electricity market towards central planning. However, they are responding to strong pressures for early action to improve system security, reliability and affordability, which could push them towards more direct involvement. For example, Wood et al. (2017, p. 10) identify four recent state and Australian government announcements that appear to involve significant government investment in generation and to commit governments to investments prior to cost-benefit analysis. They suggest that such measures:
may further weaken the NEM and could lead to a spiral of government actions away from a reliance on market solutions and towards regulation and central planning and control. (Wood et al. 2017, p. 10)
They consider that this approach has considerable risks. For example:
A government-led program of investment, planning and coordination is likely to lock-in existing technologies at the expense of better solutions that may emerge in future. Investment risks and costs would be transferred to consumers and would be heavily reliant on forecasts (that are never quite right and often quite wrong). Over-investment would lead to higher costs, while under-investment would lead to supply shortfalls. (Wood et al. 2017, p. 27)

Final Report: Manufacturing in Queensland
Queensland Productivity Commission 206
While there are risks from rushed interventions, there are also risks of excessively delaying the benefits of worthwhile reform. Recent reviews make a strong case for changing the regulatory and governance framework within which the NEM operates, and set out how this can be done. Governments have accepted some recommendations and are considering others. The proposed changes are complicated and implementation will be challenging, with details still to be resolved and important decisions involving many stakeholders yet to be made. This will take time. But it can take too long if, as the Australian Productivity Commission (PC) notes has happened in the past, reform is frustrated by:
complex processes, constant and overlapping reviews, and a lack of agreement by relevant governments about either the reforms themselves or the need for more timely progress to a genuinely NEM-wide approach to energy regulation. (PC 2013b, p. 36)
Frustration with the slow pace of decisions through regular processes could encourage governments to seek quick ‘fixes’ through direct interventions that may weaken pressure on market participants to reduce costs and introduce more effective and efficient technology solutions. There is evidence that this is already happening, as governments have felt compelled to act because of significant past disruptions to an essential service. Should such changes become the norm, leading to less use of market processes in the NEM, this would ultimately be to the detriment of consumers, including energy-intensive manufacturing businesses.
The Finkel Review’s proposals to strengthen governance arrangements, to help energy market bodies to respond in a coordinated and timely way, are an important part of the overall reform program. While the Energy Security Board will drive implementation of reforms to the NEM, it is accountable to COAGEC—comprising energy and resources ministers—which remains responsible for coordinating the institutional arrangements and providing strategic direction. The review notes that ‘in recent times the commitment of governments to this national approach to energy policy has been tested’. It therefore proposes a new intergovernmental agreement to reaffirm governments’ commitment to the NEM and an integrated approach to energy and emissions reduction policy. It recognises that different levels of government have different priorities and pressures, but considers that securing the new agreement would ‘reinforce to governments the importance of taking a uniform national approach to energy markets’ (Commonwealth of Australia 2017b, p. 167).
In this regard, Queensland’s recently established Energy Security Task Force, which will provide advice on long-term market design for Queensland and the NEM while taking into account the outcomes of the Finkel Review, will play a particularly important role.
Specific actions
As noted earlier, the government has regulatory roles for electricity supply and is a significant service provider. It could take actions to make market processes work more effectively.
Wholesale market
Consistent with previous comments on the matter, the chairman of the ACCC recently stated that one of two main explanations for recent increases in wholesale electricity prices is:
changes in bidding patterns by the coal-fired generators that do not appear fully linked to increases in the cost of production. While such behaviour is clearly allowed under the rules, there is doubt about whether the rules ever envisaged a generation market as concentrated as what we now have. (Sims 2017)
The level of market concentration in Queensland's wholesale electricity market and strategic late bidding by the state's government-owned generators were raised by stakeholders in the EPI.
In considering a policy response, the aim is to achieve outcomes that would result from a competitive market. However, identifying and designing an effective policy response from available options is challenging. Options include:
• separating the government-owned generation portfolio into smaller entities, whereby competition limits the potential for market power abuse

Final Report: Manufacturing in Queensland
Queensland Productivity Commission 207
• additional market rules, such as the recent changes to the National Electricity Rules, and more comprehensive reporting obligations
• a code of conduct and independently audited report of rebidding behaviour, as recommended by the EPI.
Each option has advantages and disadvantages. For instance, ACIL Allen found that changes in the amount of capacity available to the market, due to mothballing or retirement, have more of an impact on market outcomes than changes in market concentration (QPC 2016a, p. 92). As a result, structural changes may not necessarily produce sufficient benefits to outweigh the costs. In addition, changes to market rules may reduce, but not overcome, use of market power and have compliance and monitoring costs.
The Commission notes that, as part of the Powering Queensland Plan, the Queensland Government is returning Swanbank E gas-fired power station to service to increase supply and reduce volatility in the wholesale market (DEWS 2017b, p. 1). The Government also committed to direct Stanwell Corporation to alter its bidding strategies to help put as much downward pressure on wholesale electricity prices as possible. It considers that this will:
counter some of the impacts being seen in the broader national electricity market that are resulting in higher wholesale prices and volatility during peak demand. (DEWS 2017a, p. 3)
Beyond this, the Queensland Government should identify and implement further effective policy, regulatory and shareholder responses to address market power in the generation market.
Network costs
Network costs have been the key driver of rising electricity prices over the past decade, accounting for 46 per cent of the increase in commercial and industrial electricity prices in the eastern states between 2007–08 and 2016–17 (Sims 2017).
CCIQ noted that the Powering Queensland Plan does not address network costs.
Further ways to reduce the costs for Queensland manufacturers would include optimising Energex and Ergon’s network assets and setting prices at efficient levels, 40% below existing levels. (sub. DR4, p. 4)
In the EPI, the Commission specifically recommended that the Queensland Government should not seek to revalue the regulated asset bases of Energex and Ergon Energy, or direct them to recover less than their maximum allowable revenue, for the purpose of reducing electricity prices. It considered that the costs of this policy would outweigh the benefits (QPC 2016a, p. 139).
However, consistent with the views of stakeholders in the EPI, the Commission considered there to be a role for the Queensland Government, as shareholder of the government-owned network businesses, to minimise future network price increases by:
• setting clear expectations about the efficient operation of government owned corporations, including efficient delivery of capital programs
• undertaking robust performance monitoring of their commercial and financial performance against efficiency and savings targets, including benchmarking against commercial comparators, where possible (QPC 2016a, p. 192).
To this end, the Commission recommended that the Queensland Government should:
• establish a common Statement of Corporate Intent framework
• engage external expertise to advise the Shareholding Minister in determining government-owned GOC performance targets

Final Report: Manufacturing in Queensland
Queensland Productivity Commission 208
• review the annual performance of the electricity GOCs with the Chairs, including
− the achievement of performance targets as advised by their Statements of Corporate Intent
− the Board and the Chief Executive Officer
• implement a robust performance management reporting framework
• ensure merit-based selection of non-executive directors includes a suitable mix of skills (QPC 2016a, p. 193).
In accepting these recommendations, the government indicated that it has engaged external expertise to provide advice on GOC performance targets and that a Governance Review and Improvement Project will seek to improve the accountability framework between Shareholding Ministers and the GOCs (Queensland Government 2016e, p. 9).
The Commission considers that the Queensland Government should ensure that the new governance arrangements put in place provide the GOCs with strong incentives to maximise the efficiency of their capital and operating expenditure, and thereby minimise the impact on future electricity prices for customers.
Greater demand-side participation
Demand-side participation initiatives are measures that improve the performance of network services, and often the efficiency of electricity consumption. For network businesses, these measures change the usage of the network, alleviating constraints particularly at times of peak demand, and avoiding the need for additional capital expenditure. For electricity customers, they have the potential to reduce electricity costs.
Network-related demand side participation measures include:
• setting efficient prices for use of the network, and providing technology to assist the customer to respond to those signals
• paying customers in return for the network being permitted to reduce customers' use at peak times
• contracting for network support with an embedded generator, which may be situated on a customer's site
• influencing a customer's pattern of use, either by adjusting the operation of their appliance, installing power correction factor equipment or connecting an energy storage device. (PricewaterhouseCoopers Australia 2012, p. iii).
In the EPI, the Commission recommended that Energex and Ergon Energy (distribution) should:
minimise or defer network capital expenditure by pursuing tariff and non-tariff demand management programs (including discounts and rebates) for customers who shift their load to off-peak periods, or are subject to interruptability of supply. (QPC 2016a, p. 147)
In its response to the EPI, the Queensland Government (2016e, p. 6) noted that both businesses have demand management plans in place to pursue initiatives to improve network utilisation.
The Commission considers that there may be opportunities for manufacturers to benefit from a demand management arrangement with their network service provider, particularly where their production schedules have sufficient operational flexibility. Where mutual benefits are available, manufacturing businesses should work with Energex and Ergon Energy to identify new opportunities and implement energy-efficient solutions.

Final Report: Manufacturing in Queensland
Queensland Productivity Commission 209
Retail prices in regional Queensland
South east Queensland's retail electricity market was deregulated in July 2016. However, in regional Queensland, competition is limited due to relatively high network costs and the government's uniform tariff policy (UTP). Most customers in regional Queensland continue to be supplied by Ergon Energy (Retail) under a standard contract at regulated (notified) prices, subsidised by the Queensland Government.
As the actual costs of supplying residential, small business and some large business customers are generally higher than notified prices, the application of the UTP benefits customers in regional Queensland. To cover the difference between notified prices and the costs that [Ergon Energy (Retail)] actually incurs, the Queensland Government pays [Ergon Energy (Retail)] a subsidy. (QCA 2017, p. iv)
This subsidy takes the form of a Community Service Obligation (CSO) payment.
The UTP acts as a barrier to competition in regional Queensland because other retailers are generally unable to compete with Ergon Energy (Retail's) subsidised prices.
In the EPI, the Commission recommended that, rather than provide the CSO to Ergon Energy (Retail), the Queensland Government should provide the CSO payment to Ergon Energy (distribution) and allow subsidised network prices to be made available to all retailers. It considered that a network CSO was:
the only efficient way to facilitate broad retail competition for regional Queenslanders while retaining the UTP. (QPC 2016a, p. 221)
The Commission believed that this policy would impose downward pressure on retail margins (and prices) and encourage retailers to develop new and innovative energy products and services. However, it recognised that a network CSO would impose a significant financial cost on the Queensland Government, and its introduction would need to be weighed against the productivity benefits likely to be realised.
More recently, the ACCC (2017, pp. 107-8) raised the possibility that higher regulated prices may be needed in the short term to attract new retailers to regional Queensland.
The Queensland Government indicated that it is undertaking further work to fully understand the options available to improve value for electricity customers in regional Queensland (Queensland Government 2016e, p. 11).
The Commission considers that the Queensland Government should conclude this work as quickly as possible.

Final Report: Manufacturing in Queensland
Queensland Productivity Commission 210
10.2.2 Natural gas
Natural gas is Australia’s third-largest energy resource after coal and uranium. Liquefied natural gas (LNG) exports from Queensland are transforming Australia into the world’s second-largest gas exporter and the major gas supplier to East Asian markets.
Rising gas prices
Recent reports by the ACCC (2017b), AEMO (2017c, 2017d), and the AER (2017b) analyse the significant domestic impacts of this transformation.
By 2020, gas for LNG exports could account for 73 per cent of total eastern and south eastern Australian natural gas demand for residential, commercial, industrial and electricity uses (AEMO 2017c, p. 11). Originally, the three LNG projects (Queensland Curtis LNG, Gladstone LNG and Australia Pacific LNG):
were expected to source much of their gas requirements from newly developed reserves in the Surat-Bowen Basin. But gas well development by Santos’ Gladstone LNG project has been slower than expected, disrupting the domestic market. Because the project lacks sufficient reserves to meet its LNG requirements, it is sourcing about half of its gas from elsewhere–much of it from the Cooper Basin in central Australia but also gas from Victorian production sources. (AER 2017b, p. 11)
The sharp increase in demand for LNG exports, accompanied by limited domestic supply of gas, has made the market more susceptible to outages and shocks.
Coinciding with the first winter of material LNG demand in 2016, spot prices increased from an average of $5.00 a gigajoule (GJ) across gas markets in April 2016 to an average of $12.00/GJ in July 2016. (AEMO 2017c, p. 22)
Offers of about $20 per gigajoule (GJ) have been quoted in 2017. With many long-term contracts expiring between 2016 and 2018, customers have reported difficulties securing new arrangements—with offers at sharply higher prices, for shorter durations, and on ‘take it or leave it’ terms (AER 2017b, pp. 13, 82).
Recommendation 11
To promote the long-term interest of electricity consumers, the Queensland Government should avoid policy or regulatory changes that impede the efficiency of the electricity market and place upward pressure on energy prices. It should:
• complete and implement the Governance Review and Improvement Project as a priority, to develop policy and governance arrangements that maximise the efficiency of government-owned electricity network corporations' capital and operating expenditure
• progress additional policy options to limit any potential misuse of market power by government-owned generators in the wholesale electricity market, particularly in relation to their rebidding strategies
• encourage manufacturers to pursue demand management opportunities with government-owned electricity network corporations
• conclude its review of policy options to improve value for electricity customers in regional Queensland as soon as possible.
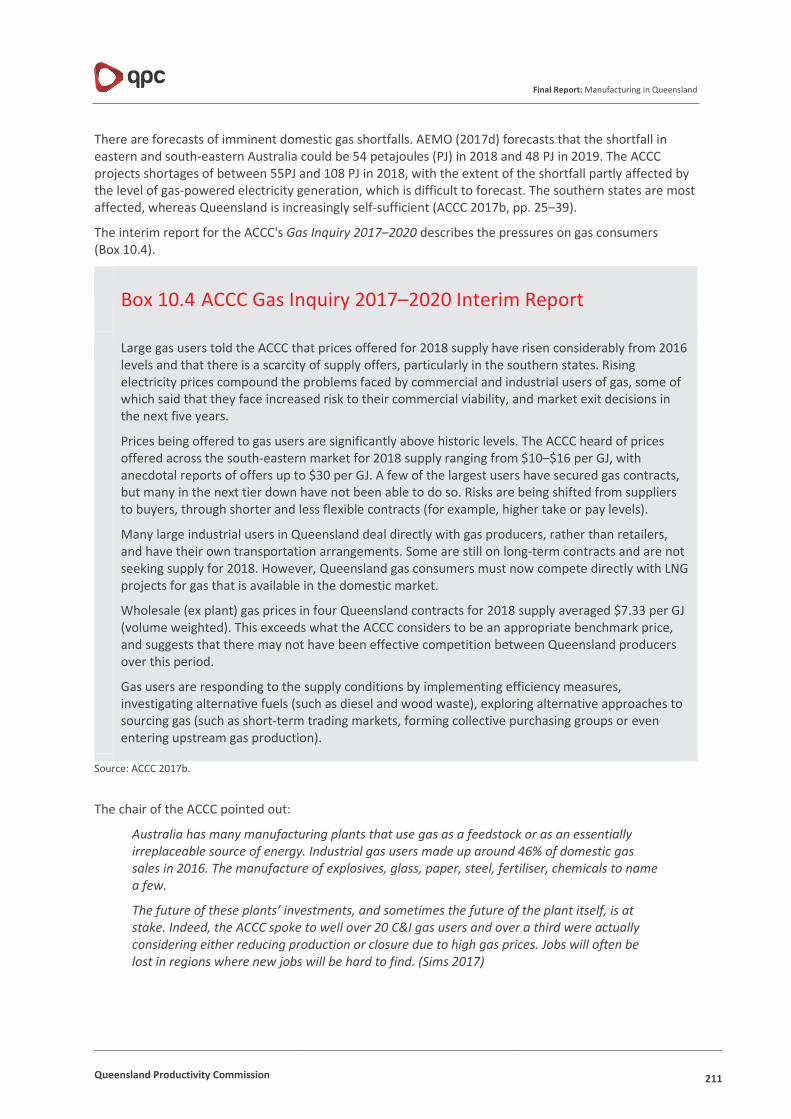
Final Report: Manufacturing in Queensland
Queensland Productivity Commission 211
There are forecasts of imminent domestic gas shortfalls. AEMO (2017d) forecasts that the shortfall in eastern and south-eastern Australia could be 54 petajoules (PJ) in 2018 and 48 PJ in 2019. The ACCC projects shortages of between 55PJ and 108 PJ in 2018, with the extent of the shortfall partly affected by the level of gas-powered electricity generation, which is difficult to forecast. The southern states are most affected, whereas Queensland is increasingly self-sufficient (ACCC 2017b, pp. 25–39).
The interim report for the ACCC's Gas Inquiry 2017–2020 describes the pressures on gas consumers (Box 10.4).
Source: ACCC 2017b.
The chair of the ACCC pointed out:
Australia has many manufacturing plants that use gas as a feedstock or as an essentially irreplaceable source of energy. Industrial gas users made up around 46% of domestic gas sales in 2016. The manufacture of explosives, glass, paper, steel, fertiliser, chemicals to name a few.
The future of these plants’ investments, and sometimes the future of the plant itself, is at stake. Indeed, the ACCC spoke to well over 20 C&I gas users and over a third were actually considering either reducing production or closure due to high gas prices. Jobs will often be lost in regions where new jobs will be hard to find. (Sims 2017)
Box 10.4 ACCC Gas Inquiry 2017–2020 Interim Report
Large gas users told the ACCC that prices offered for 2018 supply have risen considerably from 2016 levels and that there is a scarcity of supply offers, particularly in the southern states. Rising electricity prices compound the problems faced by commercial and industrial users of gas, some of which said that they face increased risk to their commercial viability, and market exit decisions in the next five years.
Prices being offered to gas users are significantly above historic levels. The ACCC heard of prices offered across the south-eastern market for 2018 supply ranging from $10–$16 per GJ, with anecdotal reports of offers up to $30 per GJ. A few of the largest users have secured gas contracts, but many in the next tier down have not been able to do so. Risks are being shifted from suppliers to buyers, through shorter and less flexible contracts (for example, higher take or pay levels).
Many large industrial users in Queensland deal directly with gas producers, rather than retailers, and have their own transportation arrangements. Some are still on long-term contracts and are not seeking supply for 2018. However, Queensland gas consumers must now compete directly with LNG projects for gas that is available in the domestic market.
Wholesale (ex plant) gas prices in four Queensland contracts for 2018 supply averaged $7.33 per GJ (volume weighted). This exceeds what the ACCC considers to be an appropriate benchmark price, and suggests that there may not have been effective competition between Queensland producers over this period.
Gas users are responding to the supply conditions by implementing efficiency measures, investigating alternative fuels (such as diesel and wood waste), exploring alternative approaches to sourcing gas (such as short-term trading markets, forming collective purchasing groups or even entering upstream gas production).

Final Report: Manufacturing in Queensland
Queensland Productivity Commission 212
Longer term, AEMO (2016, p. 7) forecasts that the delivered wholesale price of gas in Australia will increase by 48 per cent by 2036, driven mainly by rising domestic production costs, as new gas is sourced from higher-cost fields, combined with the effects of less domestic supply relative to demand. Step changes in wholesale prices are projected in 2018 and 2023, as large contracts end. AEMO forecasts retail prices (before inflation) to rise at 5.8 per cent for large industrial users in the short term, and then to stabilise, but there is considerable uncertainty around these projections owing to climate change policy, international market linkages and the spillover effects from uncertainty in electricity markets (AEMO 2016, pp. 26–28).
Impact on gas users
Industrial demand and gas-fired power generation account for most gas use in Queensland (AER 2017b, p. 67). Rising gas prices and uncertainty about future price movements and availability affect trade-exposed users of natural gas in the manufacturing sector that cannot switch to alternative energy sources. These users concentrate in two manufacturing subsectors, making up 60 per cent of large gas-using businesses surveyed by AEMO (2016, pp. 37-38):
• basic chemicals and chemical products (such as fertilisers, explosives and methanol)
• primary metal and metal products (such as alumina refineries, iron and steel mills, and smelters).
The largest industrial gas consumers in Queensland include Rio Tinto Alcan (Yarwun), Glencore (Mt Isa Mines), Incitec Pivot and Queensland Alumina Limited (DNRM 2016, p. 36).
Natural gas can comprise a large part of the operating cost of plants in these subsectors. For example, natural gas priced at $4 per GJ in 2013 made up 40 per cent of the operating cost of an ammonia-based fertiliser plant, increasing to about 60 per cent at a wholesale gas price of $8 per gigajoule (ACIL Allen Consulting 2013, p. 19). The alternative to purchasing gas for feedstock is to cease production and switch to imported products.
AEMO (2016, p. 38) expects the volume of gas consumed by large industrial users to fall in all states over the next 20 years, as firms reduce gas usage where possible and some gas-intensive businesses close. Gas consumption by large industrial users in Queensland is expected to fall 24.9 per cent (27.3 PJ) by 2021.
Between 2016 and 2036, Queensland consumption is projected to fall by 37 petajoules (33.8 per cent), compared with 3.5 petajoules in the rest of the country. The decline in Queensland consumption is more than 10 times the reduction in the rest of Australia, because it has a significant proportion of large industrial users of natural gas (AEMO 2016, pp. 37–38).
Higher energy prices also encourage residential and commercial users to change behaviour in the short term, and invest in energy efficiency in the long term, reducing gas consumption by residential and commercial customers in Queensland by 1.0 PJ (11.7 per cent) by 2036 (AEMO 2016, p. 35).
Addressing the immediate issues
The Australian Government introduced an Australian Domestic Gas Security Mechanism (ADGSM) on gas exports on 1 July 2017. Its objective is to:
ensure that there is sufficient supply of natural gas to meet the forecast needs of Australian consumers by requiring, if necessary, LNG projects which are drawing gas from the domestic market to limit exports or find offsetting sources of new gas. (DIIS 2017d)
The ADGSM:
• establishes a process for the Minister for Resources and Northern Australia to determine whether there will not be a sufficient supply of natural gas for Australian consumers in the forthcoming calendar year (a domestic shortfall year)
• prohibits exports of LNG during a domestic shortfall year, unless written permission has been granted by the Minister or an authorised officer
Final Report: Manufacturing in Queensland
Queensland Productivity Commission 213
• establishes a licensing regime, whereby the Minister or an authorised officer may grant export permissions to LNG exporters.82
The Australian Government has secured an agreement with the gas exporting companies that they will meet the forecast domestic shortfall in 2018 (Turnbull, Duke, King & Yujnovich 2017).
Some stakeholders have called for greater intervention, including domestic gas reservation. The available evidence does not support such an approach (see Box 10.5).
82 Details about the operation of the ADGSM are contained in the Customs (Prohibited Exports) (Operation of the Australian Domestic Gas Security Mechanism) Guidelines 2017). The overview provided above is taken from section 6 of the Guidelines.

Final Report: Manufacturing in Queensland
Queensland Productivity Commission 214
Box 10.5 Gas reservation for domestic use
The Australian Government has not promoted the approach of reserving gas reserves for the local market, which it criticised in a 2015 energy white paper, because it would:
act as a tax on the production of LNG … leading to fewer economic benefits that would not be offset by gains in other sectors of the economy … artificially low domestic prices do not encourage gas users to use gas more efficiently or encourage innovation in the use of alternative fuels and processes … The Australian Government believes that having diverse suppliers and encouraging additional supply are the best responses to high prices. (DIS 2015, p. 20)
The Queensland Government has also commented that:
market interventions such as reservation policies on existing tenures to improve domestic gas affordability and availability are not supported. (DNRM 2016, p. 12)
The Productivity Commission (PC) (2015a), ACCC (2016, pp. 7–8), and the Economic Regulation Authority of Western Australia (2014, p. 382) have criticised gas reservation policy and most economists (ESA 2017) surveyed recently about this issue oppose gas reservation, although that view is not universal:
A gas reservation policy … makes no sense as a solution. First, unless the government was going to make the policy retrospective, it would only apply to future gas developments. These will not occur until the current problem is history … [If the policy was applied retrospectively] gas sellers will have to bear the loss—a great example of sovereign risk. Second, even if there was a long-term problem, a reservation policy is a poor policy to help ensure the viability of businesses that have high demands for carbon intensive fuels like gas. (Professor Stephen King)
In the short run, however, some firms have committed to export volumes they do not have. This is temporarily forcing some local prices above the world prices as firms bid for volumes to export. It would be better if they bought gas on the world market to meet their offshore contracts rather than forcing local prices up unnecessarily. The short run spike has the potential to cause significant short-term damage especially to the manufacturing industry. Reserving gas for local uses will create a long- term distortion if it keeps domestic prices below world prices. (Professor Rodney Maddock)
Almost certainly, government choices of the reservation gas quantity for the domestic market will result in a mixture of large effective subsidies/taxes which misallocate gas resources. (Professor John Freebairn)
Dissenting views include:
[D]omestic reservations policy is very much a ‘second best’ compared with a much better designed domestic market combined with more appropriate resource rent taxation (or royalties) for onshore gas production, and more rational rules governing gas production. But since we don’t have any of those, the ‘second best’ may be the best available alternative. (Saul Eslake)
Energy policy in Australia is a mess. Prices don’t reflect economic or climatic costs. Availability of low cost gas would obviously improve the situation here, in particular allowing an adjustment away from coal. (Professor John Quiggin)
Final Report: Manufacturing in Queensland
Queensland Productivity Commission 215
Increasing the supply of gas
In the long term, increasing gas supply from existing and new fields, where commercially viable, will help to address gas market pressures. In its exploration program for 2017–18, the Queensland Government has released almost 18,000 km2 of land for petroleum and gas exploration in the Surat, Bowen, Eromanga and Adavale basins (Lynham, 2017g).
Finding, proving up and developing gas reserves requires significant investment over long periods, as the development of coal seam gas, for which exploration as a standalone resource commenced in Queensland in the late 1970s, demonstrates. Although the lead times for gas developments differ considerably83, even simple projects take years to reach the market and may operate for 20 or more years, making investors sensitive to the risk of swings in government policy.
Policy reviews have found that a multifaceted approach is needed to make gas markets work better by strengthening and more closely aligning incentives between different participants; improving regulation; and increasing transparency. The Queensland Government is pursuing this type of approach.
Finkel Review
The review focuses on interdependencies between gas and electricity markets, rather than on industrial uses of gas. It argues that gas markets need to be highly efficient if gas is to play an increasing role in affordable electricity supply. However, gas-fired generators are finding it difficult to secure firm gas supply contracts and are being forced to rely on the short-term trading market. At current prices, they may have an incentive to close or mothball plants and to sell their contracted gas.
While 4,900 MW of proposed gas-fired generation capacity has been announced (Commonwealth of Australia 2017b, p. 111), whether these projects are built will depend in part on whether they can access reliable and affordable gas supply. If gas-fired power generation is to play a significant role in the NEM, long-term gas supply certainty is essential.
To foster efficient gas markets that contribute to energy security and reliability.
Effective government policy and regulatory settings have a dual role. They should:
– Facilitate new investment and enable the development of Australia’s gas resources.
– Address community concern about the environmental and social impacts associated with unconventional gas extraction. (Commonwealth of Australia 2017b, p. 106)
Within this broad framework, the review concludes that:
• AEMO should have better oversight of gas supply contracts for gas-fired generators
• governments should work with communities and industry to enable safe exploration and production of unconventional gas, including ensuring that landowners receive fair compensation
• gas industry performance data should be transparent, clear and accessible (Commonwealth of Australia 2017b, p. 105).
Productivity Commission
The Productivity Commission proposed improvements to policy settings across the supply chain, arguing that the ‘rapid transformation of the eastern Australian gas market puts a premium on policies that would facilitate (rather than impede) adjustment’ (PC 2015a, p. 8).
83 Depending on factors such as: project scale and complexity; whether the project is greenfields or incremental; the presence or absence of supporting transport and other infrastructure; environmental and social considerations; and market conditions.

Final Report: Manufacturing in Queensland
Queensland Productivity Commission 216
The Productivity Commission’s proposals include:
• ensuring that the process for allocating the rights to explore for and produce gas allocates them to the parties that can undertake those activities most efficiently
• policies to resolve land use conflicts arising from gas activities, through a framework for managing land use issues that includes a compensation regime that helps to align relevant interests; developing template access agreements and negotiation guides for landholders; better engagement with affected communities; policies to deal with economic and amenity effects for local communities; and risk-reflective environmental insurance/assurance provided by gas companies for rehabilitation of adverse effects
• policies to ensure that gas transmission markets are operating efficiently
• avoiding policies to restrict exports (PC 2015a).
Improving the policy framework in Queensland
State and national policies both have important roles in securing the best outcomes from the transforming natural gas market. The ADGSM is aimed at addressing the impacts of short-term spikes in gas prices and does not replace measures for improving market functioning and strengthening incentives to increase long-term gas supply.
As part of this longer-term framework, in August 2016, COAGEC committed to a Gas Market Reform Package, which includes a new information disclosure and commercial arbitration framework for certain pipelines, transportation capacity trading-related reform, market transparency reforms, and wholesale gas market reforms (Commonwealth of Australia 2017b, p. 111).
In addition to its policy involvement through COAG, the Queensland Government has outlined 29 reform ideas to increase community trust of the gas sector, while removing barriers to gas supply through improving regulation, land release strategies, geoscientific data, investment attraction, technological innovation, and access to gas and gas infrastructure (Box 10.6). So far, these ideas have only been presented in a discussion paper, Queensland Gas Supply and Demand Action Plan, which was released in November 2016 (DNRM 2016, pp. 4–5). However, the government announced in its Powering Queensland Plan that it will implement a Queensland Gas Action Plan, which is likely to be based on the discussion paper.
The Queensland Government has also put forward proposals to the Australian Government, including:
• a jointly-funded study into infrastructure options
• addressing groundwater management
• guaranteed funding, possibly from the North Australia Infrastructure Facility, for viable options, such as new pipelines, that will deliver gas to the Australian market (Lynham 2017b).

Final Report: Manufacturing in Queensland
Queensland Productivity Commission 217
Source: DNRM 2016.
The Gas Action Plan—if based on the reform ideas that the Government has proposed and implemented effectively—could reduce regulatory impediments to gas supply while building community trust in the gas industry. An effective plan should seek to improve gas markets by strengthening and more closely aligning incentives between different participants to:
• avoid land use conflicts
• improve regulation by removing unnecessary costs but without damaging desired outcomes
• increase transparency to improve market efficiency.
This would help to achieve the aspirations set out in the discussion paper, of:
maximising the gas sector's potential, supplying gas to households and business users in sufficient quantities at affordable prices and being internationally competitive, while balancing the needs of landholders, local communities and traditional owners and maintaining environmental safeguards. (DNRM 2016, p. i)
Box 10.6 Queensland Gas Supply and Demand Action Plan
The Queensland Government’s discussion paper sets out 29 reform ideas organised into two areas:
• improving the industry’s ‘social licence’ to operate, through measures such as introducing a reporting system for sector-wide performance and regulatory compliance; improved complaints management; basin-wide community messaging before land release; and improving capability of local suppliers to the gas sector
• decreasing barriers to gas supply, through measures such as improving collaboration across regulatory functions; a basin and sub-basin–wide approach to exploration approvals; whole-of-government case/project management support for pre-exploration through to production; removing obstacles to economies of scale; streamlined lease application and approval processes; introducing a strategic exploration tenure lease framework; developing a Queensland exploration strategy; less prescriptive tenure work programs; and reforming pipeline trading arrangements.

Final Report: Manufacturing in Queensland
Queensland Productivity Commission 218
10.3 Procurement policy The Queensland Government spends large amounts on procuring supplies and services. Determining exact expenditure is difficult, but Queensland Treasury expects that about $17.4 billion was spent on ‘Goods and Services’ in 2016–17 (Queensland Treasury 2017b, p. 167). About 70 per cent of government expenditure is with local suppliers (IDC 2015, pp. i, 46).
Queensland manufacturers are keen to ensure that they can bid for this market. They have concerns that procurement processes do not provide a level playing field that enables them to compete with interstate or overseas businesses. Some manufacturers consider that local suppliers should be given preferential treatment.
10.3.1 Policy framework
Procurement policy operates within the legal framework set by the Financial Accountability Act 2009. Under section 61, achieving reasonable value for money is a legislative obligation for accountable officers. The Queensland Procurement Policy (QPP), administered by the Department of Housing and Public Works (DHPW), is the overarching policy framework.
The Queensland Government has signed the Australia–New Zealand Government Procurement Agreement and has agreed to observe the requirements of other bilateral agreements that the Australian Government has signed. The objective of the procurement rules within the agreements is to create and maintain a single government procurement market between partner countries (QCA 2015a, p. 311).
Queensland Procurement Policy
A new QPP (the QPP 2017) became effective in September 2017. Like its predecessor, it is based on six principles. There is common ground between the two sets of principles, except for the primary principle, which has changed from ' we drive value for money in our procurement', to 'putting Queenslanders first when securing value for money' (Box 10.7).
Recommendation 12
To remove gas supply barriers while balancing the needs of landholders and environmental safeguards, the Queensland Government should structure its Gas Action Plan to:
• reduce the costs and impediments to gas exploration and development through, for example, measures to improve land release and tenure management, and cooperation between different mineral and energy regulators
• improve processes to resolve land-use conflicts arising from gas activities (including through providing better information and fair compensation to landholders and an evidence-based approach to regulation)
• increase transparency to improve market efficiency, through measures such as reporting on sector-wide performance and regulatory compliance.

Final Report: Manufacturing in Queensland
Queensland Productivity Commission 219
Source: DHPW 2017.
Important features of the QPP 2017 are:
• Local suppliers84 receive a local weighting of up to 30 per cent on any tender lodged for a significant procurement.
• At least one local or regional supplier, and one other Queensland-based business, must be invited to quote or tender for every procurement opportunity offered.
• For significant infrastructure projects—$100 million and above—local subcontractors and manufacturers must be used where the local capability and capacity exists.
• Significant projects will be required, where possible, to spend 15 per cent on apprenticeships.
• Deliver a more visible pipeline of opportunities for every Queensland business.
• Reduce complexity to assist Queensland industry prepare for government tenders, and provide resources to help them tender.
• Exempt business from the pre-qualification system for building contracts and ICT projects under $1 million.
• Businesses tendering for government procurement contracts will need a permanent workforce in Queensland, offer fair wages, conditions and superannuation, and have good workplace health and safety records.
• A special compliance, coordination and referral unit will back up the QPP 2017 (Palaszczuk 2017b).
84 Local suppliers are suppliers that maintain a workforce whose usual place of residency is located within a 125 km radius of where the goods or services are to be supplied. If a suitable local supplier does not exist within 125 km, consideration will be given to suppliers within the local region. If a suitable supplier does not exist within the local region, consideration will be extended to suppliers within Queensland. If a suitable supplier does not exist within Queensland, consideration will be extended to suppliers within Australia (DHPW 2017a, p. 3).
Box 10.7 Six principles of Queensland's new procurement policy
Primary principle
1. Putting Queenslanders first when securing value for money
Secondary principles
2. Advancement of economic, environmental and social objectives
3. Integrity, probity and accountability
4. Leaders in procurement practice
5. Working together to achieve outcomes
6. Governance and planning.

Final Report: Manufacturing in Queensland
Queensland Productivity Commission 220
The Charter for Local Content
The Charter for Local Content (the Charter), administered by the Department of State Development (DSD), operates within the framework provided by the QPP. Its core objective is ‘maximising local content through greater participation of capable local industry in major government procurement activities’ (DSD 2016c, p. 1).
DSD considers that the Charter provides a framework for encouraging government agencies to apply best practice in local content procurement while minimising the compliance burden on government agencies and contractors, and ensuring a full, fair and reasonable opportunity for local suppliers.
The Charter applies to all government procurement (not just from manufacturers) above value thresholds that vary by location (as the value threshold is lower in regional Queensland) and by strategic significance, which is determined by factors such as the procurement’s impact on regional development or local industry’s competitiveness or value-adding activities (DSD 2016d, pp. 8–9).
10.3.2 The Commission's position in the draft report
The draft report, published before the QPP 2017, noted that submissions from the CCIQ (sub. 6, p. 20), the AMWU (sub. 9, p. 10) and TCF Connect (sub. 2, p. 2) supported preferential local purchasing.
The Commission concluded that preferential procurement can be at the expense of value for money. If it increases procurement cost, the government must reduce expenditure on other programs, which may affect other government objectives or employment elsewhere, or increase taxes or borrowing.
Where preferential procurement directly benefits some local producers, it may increase activity in the favoured industry while reducing it in others, although those who lose are less visible than those who gain. In such cases, the policy is effective in increasing activity in one industry, but ineffective in increasing economic activity overall. General equilibrium modelling, which identifies the indirect as well as direct effects of local content requirements, illustrates these economy-wide effects. Two examples, albeit not of manufacturing in Queensland, give a sense of these effects (Box 10.8).

Final Report: Manufacturing in Queensland
Queensland Productivity Commission 221
Sources: Stone, Messent & Flaig 2015, p. 9; QCA 2015a, pp. 335–37. The draft report also noted deficiencies in procurement organisation, data and capabilities (QAO 2016). Given these skill gaps, procurement agencies are unlikely to have the sophisticated skills and information required to achieve multiple objectives through procurement.
To avoid adverse effects of local content requirements while reducing unnecessary barriers to local firms bidding for government projects, the draft report favoured measures that enable them to participate in procurement processes—such as simplifying tendering processes and improving databases and procurement capabilities.
Box 10.8 Direct and indirect effects of local content requirement
For a scenario in which an additional $100 million of ICT product is sourced from Queensland rather than from the rest of Australia or overseas, at a cost of an additional 10 per cent, modelling shows that while the preferential purchasing boosts the ICT sector, activity in the economy is lower and production in every other sector (including manufacturing) falls. Queensland’s gross state product is $26 million lower in the long term. A relevant insight from this example is that, because the QPP is not focused solely on manufacturing, it will unleash pressures that could both shrink manufacturing and expand parts of it (in the case of preferential purchasing from manufacturers). The net impact on the sector is not certain.
International modelling of local content requirements (LCRs) that affect industry input decisions, undertaken for the OECD, provides evidence that the LCRs cause imports and exports to decline in every region. There is a loss in international competitiveness as measured by the reduction in exports in non-LCR affected sectors in imposing economies. Further, as LCR-affected sectors consume more domestic resources, other sectors are forced to reduce production, or increase imports, leading to a concentration of domestic economic activity. This undermines the growth and innovation opportunities that come from a diverse economy.
In all but one of the cases examined, the LCR-affected sectors increased the domestic price of their good. The increased prices in turn raise costs to producers further along the production chain, reducing the competitiveness of industries across the economy. The size of these efficiency losses in the market place is proportional to the additional domestic inputs required under the LCR.
Finding
Procurement policy that is not based on a single value for money objective can increase the cost to government of procurement. Such a policy can boost activity in favoured activities, but may reduce it in others by, for example, increasing their costs.

Final Report: Manufacturing in Queensland
Queensland Productivity Commission 222
The draft recommendation was that procurement policy should be based around a single objective—value for money—and that to increase local content the government should remove impediments to local firms participating in procurement, including by:
• simplifying tendering requirements, including the structure, breadth, scale and complexity of procurement contracts
• improving the capability of the public service to review and assess tenders
• providing clear advice to tenderers on the definition and method that will be used to apply the value for money principle
• to the extent possible, specifying contracts in terms of the desired outcomes rather than inputs
• publishing a pipeline of supply opportunities (QPC 2017b, p. 176).
10.3.3 Responses to the Commission's position in the draft report
The AMWU 'fundamentally disagrees' with the Commission's support for a new procurement model with value for money being its single objective, and considers that this recommendation conflicts with the government’s Buy Queensland procurement policy.
The AMWU has two main objections to the use of value for money in procurement. First, it ignores broader objectives such as job creation:
While cost is a factor, the true value of local investment that contributes to jobs, local business and the broader community will not be taken into account if our procurement proposition is to only consider value for money … Fundamentally, procurement must be a mechanism to influence broader strategic goals of government, namely the creation of secure jobs. While many detractors of government intervention will argue that local content targets are a form of protectionism, there is significant evidence to suggest that local procurement can be a strong driver of competitive industry in certain circumstances. Infant industries, including advanced manufacturing, must be supported until Queensland can establish the economies of scale to be truly competitive. If we are to grow the advanced manufacturing sector rapidly, the Queensland manufacturing industry requires a boost at the outset. (sub. DR1, pp. 2–3)
Townsville Engineering Industries argues similarly:
The questions of benefit to community and benefit to society never got the appropriate weighting in 'value for money' assessments. (sub. DR 9, p. 3)
DSD considers:
The Queensland Industry Participation Policy Act 2011 and the Queensland Charter for Local Content, together with the new QPP, work to maximise opportunities for local suppliers. Through the Queensland Charter for Local Content, DSD provides a robust approach to supporting major projects meeting the Charter thresholds, ensuring local suppliers are obtaining full, fair and reasonable access to tender opportunities and obtaining value for money for Queensland … This approach has demonstrated the success of the Queensland Government’s policies in achieving high levels of local content in project delivery and its commitment to supporting Queensland businesses and growing local jobs. (sub. DR2, p. 2)
Final Report: Manufacturing in Queensland
Queensland Productivity Commission 223
The AMWU's second criticism is that value for money ignores product quality:
true measures of labour productivity, including quality of product are being ignored under current procurement processes … In this same vein, weight must be placed on Queensland’s ability to produce high quality, fit for purpose products in conjunction with the benefit of boosting our local economy through the creation of good jobs and their inevitable positive flow on effects. This issue was most prominently demonstrated in the recent purchase of Queensland trains, which were built offshore, with numerous design faults including issues with windscreen visibility, braking systems, air-conditioning and disability access. Accordingly, government should establish a means of assessing value for money that accounts for the benefits of local procurement and content and assigns weightings. (sub. DR1, pp. 2–3)
International agreements
CCIQ emphasised the importance of honouring international agreements, pointing out that it:
has openly supported the QPP contingent on it continuing to comply with Australia’s international agreements and treaties. Under principle 3 of the QPP agencies will observe applicable legislation, policies and agreements. Such legislation and policies include the Queensland Industry Participation Policy Act 2011 and Queensland Charter for Local Content. Both acknowledge Queensland’s commitment to Commonwealth international agreements and treaties. (sub. DR4, p. 2)
The CCIQ's position may reflect concerns that other jurisdictions may respond in kind to the preferential aspects of the QPP 2017, which would make it more difficult for Queensland firms to access their markets. The Australian and New Zealand governments' criticisms of the policy indicate that the possibility of ‘tit-for-tat’ responses from other jurisdictions cannot be ignored (Viellaris 2017).
10.3.4 What does value for money mean?
Much of the debate on preferential procurement centres around the view that value for money equates to lowest price. However, value for money is a much broader concept that, just like all consumption choices, involves an assessment of price, quality and likelihood of whether the good or service will achieve the desired outcomes (Box 10.9). The lowest price procurement option will not necessarily be the best value for money. The cheapest option may bring with it, for example, more risk, lower quality, a shorter project life, or higher maintenance costs. A value for money assessment requires a whole-of-life perspective, which considers factors such as the availability of follow-up maintenance services.

Final Report: Manufacturing in Queensland
Queensland Productivity Commission 224
Sources: Department of Finance 2017; New South Wales Government nd; New Zealand Government Procurement 2015; UK Government 2017.
10.3.5 Implementing the QPP 2017
The QPP 2017 contains measures that will enable local suppliers to participate in procurement opportunities, such as requiring agencies to identify the procurement strategy most appropriate for delivering the best procurement option and publishing a forward procurement pipeline. It requires agencies to report on procurement benefits and to ensure that appropriate governance mechanisms are in place to maintain the integrity of the procurement decision-making process. It commits the government to building procurement capability. As discussed below, these aspects of the policy are arguably even more important now than was the case under the former procurement policy.
Box 10.9 Value for money
A common theme of different governments’ definitions of value for money is that it ‘does not necessarily mean selecting the lowest price but rather the best possible outcome for the total cost of ownership (over the whole-of-life of the goods, services or works)’.
The UK Government defines value for money as 'the best mix of quality and effectiveness for the least outlay over the period of use of the goods or services bought'. It points out that this should be achieved through competition, unless there are compelling reasons to the contrary.
The Australian Government requires that procurements should encourage competition and be non-discriminatory; they should also encourage appropriate engagement with risk. Procurement officials must consider the quality of the goods and services; the fitness for purpose of the proposal; the potential supplier’s relevant experience and performance history; flexibility of the proposal (including innovation and adaptability over the life cycle of the procurement); environmental sustainability of the proposed goods and services; and whole-of-life costs. Whole-of-life costs could include:
• the initial purchase price of the goods and services
• maintenance costs
• transition out costs
• licensing costs (when applicable)
• the cost of additional features procured after the initial procurement
• consumable and disposal costs.
The New South Wales Government defines value for money as the difference between the total benefit derived from a good or service and its total costs, when assessed over the period the goods or services are to be used. Three types of benefits and costs need to be considered:
• up front
• after purchase
• fitness-for-purpose (for example, consistency with government-wide procurement policies; capability of the good or service to meet the precise identified need; capacity of the supplier to deliver the good or service; flexibility and adaptability of the good or service over the life cycle of the procurement).

Final Report: Manufacturing in Queensland
Queensland Productivity Commission 225
DHPW will make resources available to support agencies in implementing the policy (DHPW 2017b). This section discusses issues DPHW could consider when developing these resources.
Applying the value for money principle under the QPP 2017
Under the principles in the QPP 2017, agencies must 'put Queenslanders first when securing value for money' (DHPW 2017a, p. 2).
Agencies must address four factors when assessing value for money:
• a local benefits test, to be conducted for all significant procurement where a weighting of up to 30 per cent may be applied
• advancement of relevant government objectives and the outcome being sought
• cost-related factors, including up-front price, whole-of-life costs and transaction costs associated with acquisition, use, holding, maintenance and disposal
• non-cost factors, such as fitness for purpose, quality, delivery, service, and support (DHPW 2017a, p. 3).
The local benefits test for all significant procurement, with a weighting of up to 30 per cent, raises challenging implementation issues. Local suppliers will have an incentive to argue that they need this premium, whether or not that is the case. Given the estimate that about 70 per cent of government expenditure is already with local suppliers (IDC 2015, pp. i, 46), the test could result in local suppliers being paid an unnecessary premium.
In the extreme case, if all local suppliers in 2016–17 had received a 30 per cent premium, the government would have paid about $3.5 billion more each year for the same local content.85 To minimise budgetary costs, the government should seek to apply a local benefits weighting only when it is needed to encourage additional local content, and to pay only the premium that is needed to encourage additional local supply. The following steps may contribute to achieving this.
First, procurement agencies should encourage competition between local suppliers. They should stress that the 30 per cent weighting is a maximum, which will not necessarily be applied. The proposed publication of a pipeline of work will increase local interest in bidding for government work. Other suggestions for encouraging competition include:
• simplifying the tender process (CCIQ, sub. 6, p. 20; IDC 2015, p. xiv)
• clarifying the definition and methodology for assessing value for money (CCIQ, sub. 6, p. 21; IDC 2015, p. xiv)
• improving agencies' understanding of the knowledge and information needs of procurement (CCIQ, sub. 6, p. 21)
• continually reviewing standard contracts to avoid unnecessary complexities.
Simplifying processes and clarifying definitions will be more challenging under the QPP 2017. However, doing this has probably become even more important. There is a risk that the additional information that local firms will need to provide to satisfy the conditions for the local content premium could reduce competition by discouraging them from bidding for government work.
The North Queensland Stadium project illustrates ways in which local firms can be encouraged to participate in government projects (Box 10.10).
85 Assuming the value of procurement is $17.4 billion per year and 70 per cent of this ($12.8 billion) is local, and the 30 per cent weighting is applied to all local purchases ($3.65 billion).

Final Report: Manufacturing in Queensland
Queensland Productivity Commission 226
Source: Information provided by DSD.
Second, for large projects, agencies should analyse likely indirect well as direct effects when they assess the impacts of the local benefits test.
Third, contracts awarded to local suppliers on the basis of their local content should enforce the delivery of that local content. For example, progress payments might be based on verification by suppliers that promised local content has been achieved. This will add to contract complexity and compliance costs, but will reduce the risk of additional payments being made without achieving the government's objective.
Fourth, the additional amount that procurement agencies have paid for local content, together with their assessment of the outcomes that have been achieved, should be published after contracts are awarded. This would be consistent with the QPP 2017 requirement to:
ensure all stages of the procurement process are defensible and appropriately documented relative to the value and risk associated with the procurement. Decisions will withstand public scrutiny and preserve confidence in the procurement process. (DHPW 2017a, p. 7)
Publishing the basis on which contracts have been awarded would:
• reveal the additional cost of achieving extra local content, enabling taxpayers to assess the value of this use of their taxes and governments to assess where additional local content can be secured most cheaply
• create competition between procurement agencies, which might compete over the extent to which they increase local content at a relatively low cost. There may be ways to use this to motivate procurement staff, for example, through performance pay
• assist in contract enforcement, if additional payments have been made in exchange for extra local content
Box 10.10 North Queensland Stadium: reducing the barriers to local suppliers
The $250 million North Queensland Stadium project is a joint initiative of the Queensland Government, Australian Government and Townsville City Council and is supported by both the National Rugby League (NRL) and the North Queensland Cowboys. The stadium forms part of the Townsville City Deal signed in December 2016.
The Department of State Development is delivering workshops, industry events and information material to assist North Queensland's local businesses to be competitive in positioning for work on the project. This includes a series of workshops to assist local businesses to understand where they fit in the extended project supply chain and to prepare effective capability statements to position for work on the project.
Networking events are also on offer to provide opportunities for local manufacturers, suppliers and contractors to connect with like-minded businesses to form supply partnerships. Industry Capability Network (ICN) Gateway express workshops are also available to provide practical guidance to businesses to directly register their interest in project work packages.
Managing contractor Watpac is proactively working with local industry to target at least 80 per cent of the hours spent building the 25,000 seat stadium will be provided by locals, and at least 80 per cent of the value of the project to be spent on local subcontractors and suppliers. Watpac is also aiming for 6.6 per cent of the construction workforce to be Aboriginal and Torres Strait Islander peoples.

Final Report: Manufacturing in Queensland
Queensland Productivity Commission 227
• help to maintain the integrity of procurement by providing information that probity auditors could use.
DHPW could provide guidance material that would help procurement agencies to assess the outcomes achieved from additional local content under the QPP 2017.
Collect baseline data
While the IDC has estimated that 70 per cent of government procurement is sourced locally (IDC 2015, pp. i, 46), the Commission has not seen more detailed published data about procurement patterns.
The QCA (2015a, p. 331) noted that DSD was beginning to collect data on how much impact the former QPP, combined with ICN Queensland86, was having on local content. However, DSD's ability to draw conclusions was limited by problems with identifying the counterfactual—that is, what would have happened in the absence of the policy. Indeed, it is even more difficult than this—what needs to be identified is how much the preferential aspect of the policy increases local content in addition to the aspects of the new policy that reduce unnecessary barriers to local content, such as simplifying tendering processes.
Notwithstanding these difficulties, it is important to establish a baseline against which policy impacts can be assessed. This could include analysing data on current procurement, to indicate, by product/service and geographical area, how much procurement is already sourced locally. Where this is small, the reasons could be analysed to show whether this is because there is no local supply capability, or whether local suppliers are available but not competitive. Evidence about the nature and extent of unwarranted barriers to local suppliers and how much this is discouraging local content would identify where to focus effort on reducing barriers. This evidence would help to indicate where the local benefit test may need to be applied, and would also provide the basis for subsequent evaluation.
The reporting requirements that the Department of Finance administers for Australian Government procurement (Department of Finance 2015) could provide a model for Queensland. This approach reports more than 30 data 'fields' for Australian government contracts. The data is publicly available, unless explicitly flagged as confidential.
Evaluate the policy
Good public policy practice involves post-implementation evaluation of public sector programs. The Queensland Government Program Evaluation Guidelines explain why this is important:
Evaluation is an essential part of the management and delivery of public sector programs. Well-designed evaluations are an essential tool for public sector agencies to strengthen efficiency of program delivery and to demonstrate the effectiveness of programs in generating outcomes.
Evaluations can provide useful information for program managers on whether a program is doing the right things in the right ways, and whether there are ways to improve program delivery. Evaluations can also provide information to the public sector as a whole to inform broader decisions on the best way to achieve desired outcomes and address identified needs. (Queensland Treasury 2014, p. 2)
The Guidelines point out that evaluation will be most effective when embedded within program development, and that, where possible, baseline data should be collected before program implementation. Effective application of the guidelines depends on the program having clearly defined and measurable objectives against which success can be assessed. Even the most rigorous evaluation process will fail if it is not clear what the program is trying to achieve and why (Queensland Treasury 2014, pp. 8–9).
86 ICN Queensland is a not-for-profit organisation supported by the Queensland Government, which identifies procurement opportunities for local industry.

Final Report: Manufacturing in Queensland
Queensland Productivity Commission 228
The seven-month period between the announcement of the QPP 2017 and its full implementation in March 2018 provides an opportunity for DHPW to embed evaluation within program development, consistent with the Queensland Government Program Evaluation Guidelines.
Clarify definitions
The definitions of 'local' and 'significant' could, respectively, constrain suppliers in regional Queensland from competing in south east Queensland and encourage local procurement of more risky projects. DHPW's resource material could explain whether these are intended outcomes of the QPP 2017.
The definition of 'local'
The definition of 'local' in the QPP 2017 implies that suppliers in regional Queensland will be unable to bid for government projects in south east Queensland, where there are likely to be capable local suppliers.
Local supplier means a supplier of goods or services that maintains a workforce whose usual place of residency (i.e. where they normally live, sleep and eat) is located within a 125 kilometre (km) radius of where the good or service is to be supplied. If a capable local supplier does not exist within the 125 kilometre radius, the radius should be extended progressively to the local region, then Queensland, then Australia, until a suitable supplier is identified. (DHPW 2017a, p.14)
DHPW should clarify whether it is the government's intention that Queensland suppliers whose workforces reside more than 125 kilometres from south east Queensland are restricted from supplying that market.
The definition will impose a significant compliance burden on firms, which will now need to collect, maintain and verify data about the 'usual' place of residence of their workforce. A geographical definition inevitably raises boundary issues, and will require judgements about whether a firm with less than 100 per cent of its staff living within 125 kilometres will qualify as local. If that is the case, agencies will then need advice about at what percentage a firm is no longer considered to be local, and whether they should apply the same benefits weighting to firms with different percentages of local employees. This advice would need to be made available to firms, so that they understand the basis on which they can bid for projects.
The definition of 'significant' procurement
The local benefits test applies to 'all significant procurement', which is defined as including:
goods and services identified by the agency as being high expenditure and/or for which there is a high degree of business risk (DHPW 2017a, p. 15).
However, in the case of infrastructure projects, using local contractors or manufacturers is only required, where possible, in projects worth $100 million and above (DHPW 2017a, p. 2). These two obligations imply that 'significant' indicates a project valued at more than $100 million in the case of an infrastructure project, but is defined by the agency in the case of other projects.
The definition of significant procurement involves high expenditure and/or high risk. This implies that if two projects of equivalent size do not involve 'high' expenditure, but one involves 'high' business risk, the high-risk project would be significant, and so would bring in the local benefits test, but the other would not. It seems counterintuitive to apply a higher local benefits weighting for riskier projects, unless it is considered that small local firms are more able to manage risk than suppliers from elsewhere in Queensland or Australia.
Minimise conflict with trade agreements
The Queensland Government has signed the Australia New Zealand Government Procurement Agreement, under which Australia and New Zealand are treated as a single market for government procurement (Box 10.11). In addition, Australia is currently seeking access to the World Trade Organisation (WTO) Agreement on Government Procurement.

Final Report: Manufacturing in Queensland
Queensland Productivity Commission 229
Source: Australia New Zealand Government Procurement Agreement 2013.
Other jurisdictions may react by applying their own local benefits tests, which would undermine the government's objective of increasing opportunities for Queensland-based firms. The government should consider how it can minimise the risk that other jurisdictions restrict competition from Queensland suppliers.
Build procurement capability
As noted above, the QAO has identified gaps in procurement capability. Under the QPP 2017, procurement will be even more complicated.
To deliver the policy commitment to building procurement capability, DHPW's resource material needs to be supported by training in matters such as:
• the definitions of 'value for money'; 'local' and 'significant', and how they are to be applied
• any other changes to procurement processes
• evaluation.
The proposed compliance, coordination and referral unit is one option for a central point of expertise within government to provide advice and training on procurement issues.
The government will also need to provide resources and training for firms that may bid for government contracts.
Box 10.11 The Australian and New Zealand Government Procurement Agreement
The objective of the ANZ Government Procurement Agreement is to create and maintain a single ANZ government procurement market to maximise opportunities for competitive ANZ suppliers and reduce costs of doing business for both government and industry.
This will be achieved by:
• ensuring the opportunity exists for ANZ suppliers to compete on an equal and transparent basis for government contracts in the Commonwealth of Australia Government, Australian States and Territories, and the New Zealand Government
• ensuring the absence of inter-state and trans-Tasman application of preference schemes and other forms of discrimination in government procurement, based on the place of origin of goods and services
• providing a mechanism for co-operation by the Parties in working towards achieving the greatest possible consistency in contractual, technical and performance standards and specifications, and simplicity and consistency in the application of procurement policies, practices and procedures
• ensuring that the Parties' application of electronic commerce methods to their procurement is consistent with this Agreement.

Final Report: Manufacturing in Queensland
Queensland Productivity Commission 230
10.4 Investment attraction Many factors influence business location decisions. Often, firms are mobile because factors of production (such as access to raw materials or skilled labour) are available in many places. Governments compete to attract mobile investments, primarily by developing effective business environments.
However, they also try to draw in investors through:
• investment facilitation, which can involve providing information about regulatory requirements; assisting with site identification; identifying infrastructure and utility needs; coordinating and brokering development approval processes; assisting with business development programs; and introductions to industry networks (VCEC 2011, p. 184)
• investment assistance, through financial incentives that increase the return on investment in a location.
The Queensland Government offers both investment facilitation and investment assistance.
Recommendation 13
Procurement policy should deliver the best price-quality outcome for the Queensland community. In implementing the Queensland Procurement Policy 2017, the Queensland Government should:
• remove impediments to local firms participating in procurement, including by:
− simplifying tendering requirements
− improving public sector procurement capability
− publishing a pipeline of supply opportunities
• develop guidelines for implementing the local benefits test that provide clear advice about how it will be used to apply the value for money principle
• clarify the definitions of 'local' and 'significant' and provide training to procurement agencies about the new framework
• seek to minimise inconsistencies between the policy and the Australia–New Zealand Government Procurement Agreement
• collect and publish information on procurement outcomes to assess the impact of the policy.

Final Report: Manufacturing in Queensland
Queensland Productivity Commission 231
10.4.1 Investment facilitation
The policy framework
DSD and Trade and Investment Queensland (TIQ) deliver investment facilitation services. DSD’s case management approach to investment facilitation includes:
• providing the business case information as to ‘Why Queensland’
• delivering information about project requirements, business costs, skills availability and other business investment drivers
• identifying suitable site options reflecting project requirements
• streamlined access to government services
• coordinating pre-lodgement meetings and giving advice about the development approval process, to expedite approvals and reduce red tape barriers
• providing advice and contacts or introductions to universities and service providers such as property groups, utilities, education and training organisations, raw materials suppliers and other organisations (sub. 11, p. 12).
TIQ is the Queensland Government’s dedicated global business agency:
TIQ’s vision is a prosperous Queensland — underpinned by diversified exports and high–value investments that create jobs and sustain a vibrant, innovative economy. [It] employs its global and regional office networks to identify export opportunities, promote Queensland exporters, target international investors and promote Queensland as an ideal destination offering diverse business opportunities. (TIQ 2017, p. 18)
TIQ is a primary driver in delivering the government’s five-year trade and investment strategy (Box 10.12).

Final Report: Manufacturing in Queensland
Queensland Productivity Commission 232
Source: Queensland Government 2017f.
The delivery of investment facilitation services is fragmented. In addition to DSD and TIQ, Business Queensland provides advice on starting, planning, and running a business, as well as on grants. The Office of Small Business, in the Department of Tourism, Major Events, Small Business and the Commonwealth Games is required to ‘position Queensland as the state for small business to start, grow and employ through the delivery of targeted programs and services' (Queensland Government 2017s). Many other business grant programs, such as those provided through Advance Queensland, also directly or indirectly provide investment facilitation services.
In addition to services provided by the Queensland Government agencies, services are also offered by the Australian Government (through Austrade), interstate trade offices, local governments, and private firms. For example, the members of Brisbane City Council’s investment attraction team specialise in the industrial sector, commercial property, tourism infrastructure, and technology and innovation (Brisbane City Council 2017).
Are investment facilitation services effective and efficient?
The effectiveness and efficiency of investment facilitation services is shown by the extent to which they achieve a specified output at least cost. Given TIQ’s objective of attracting and developing trade and investment opportunities, its output could be considered to be increased trade and investment.
TIQ’s 2016-17 annual report (2017, pp. 8–9) lists, among its 2016-17 highlights, that it:
• helped Queensland companies achieve 246 export deals and 27 inward investment deals
• facilitated 15 Premier- and Minister-led overseas trade and investment missions and hosted more than 50 international trade delegations
• provided export assistance to about 450 businesses in regional Queensland
• nominated 530 international business migrants and 1,100 skilled visa migrants, who are expected to inject about $1.25 billion into the Queensland economy.
Box 10.12 Queensland trade and investment strategy 2017–22
The strategy sets out a plan for cooperation between governments, business, educational institutions and local councils, which aims to use Queensland’s natural and acquired strengths to tap into opportunities created by expanding international markets. It has two aspirational targets:
• Increase Queensland’s share of national exports to 22 per cent and maintain that level through to 2022.
• Increase the number of investment outcomes facilitated by the Queensland Government by 20 per cent by 2022.
Priorities are to build on Queensland’s strengths, further diversify the economy, target key overseas markets, build the export capabilities of small and medium-sized businesses, increase international engagement, and promote investment in businesses, infrastructure and innovation. The strategy recognises the contribution of foreign investment to funding development and opening and securing markets and that trade and investment will remain significant sources of economic growth for Queensland.

Final Report: Manufacturing in Queensland
Queensland Productivity Commission 233
The report provides examples and case studies of companies that it has assisted, although it is difficult to determine whether its involvement tipped the balance in favour of projects proceeding or expanding, as a number of factors will normally be involved. TIQ measures its performance in contributing to exports and investment in terms of costs per investment and export lead and client satisfaction (TIQ 2017, pp. 27-28).
This means that it is difficult to assess whether the government funding of $34.6 million for TIQ (up from $30.6 million in 2015-16, due to TIQ's implementation of two whole-of-government strategies) (TIQ 2017, p.39), together with DSD’s expenditure, provides optimal value for money. This difficulty is exacerbated because facilitation services are frequently provided without charge, which limits the amount of information available about the value firms place on the services. When users pay nothing, some may value services less than it costs to provide them.
Could investment facilitation services be made more effective and efficient?
Although the target of services may differ (from small business to foreign investment), the services offered by TIQ, DSD, Business Queensland and the Office of Small Business and other grant programs appear to overlap. Local governments, other interstate trade offices and Austrade may also offer overlapping services. This could indicate scope through reorganisation to reduce costs without losing service quality.
DSD pointed out the following:
• Initiatives in the TIQ Strategy include establishing a new concierge service to manage trade and investment enquiries, a new case management service for investors, and a new case management network that will include DSD, through which the two agencies will be able to streamline and coordinate the provision of information and assistance.
• TIQ and DSD have been cooperatively developing web content and messaging, supported by other agencies (DSD sub. DR2, p. 4).
These initiatives are significant. However, given the government's large involvement in investment facilitation, the 'comprehensive review of Queensland’s international operations’ foreshadowed in the TIQ Strategy should consider the scope to improve investment facilitation services to:
• address at lower cost the primary information barriers and deficiencies to firms locating in Queensland. This would involve identifying information gaps and ensuring that information provided by Queensland Government agencies addresses these gaps effectively and efficiently
• consolidate investment facilitation into a single Queensland Government entity
• use facilitation services to identify opportunities to reform regulation and policy, so there is a less complex system for firms to navigate, and to enable them to do so at lower cost. For example, evidence that facilitation services focus on approval processes that firms find difficult to navigate may indicate opportunities to simplify them. This information could also be used in sunsetting reviews of regulation and in the regulatory stocktakes proposed in Chapter 8, to enable more focused analysis of opportunities to reduce the cost of regulation. TIQ and DSD could also build on this information to provide general advice to investors, helping them to identify the most appropriate supply network and determine whether elements of production are best made locally, regionally or globally (see Chapter 7).

Final Report: Manufacturing in Queensland
Queensland Productivity Commission 234
10.4.2 Investment assistance
Governments typically provide grants to encourage investment in projects that they anticipate would otherwise not proceed. Competition from other jurisdictions trying to attract the same projects, combined with political pressures to be seen to be assisting development, pressures governments to offer grants.
The Queensland Government provides both firm- and project-based investment assistance.
The Queensland Government provides assistance through investment grant programs (Table 10.1). The Industry Attraction Fund is the primary program described as being specifically for investment attraction. However, other funds also offer financial support to potential investors.
Recommendation 14
To ensure that the investment facilitation activities of government agencies, including Trade and Investment Queensland and the Department of State Development, maximise their contribution to investment in Queensland, the Queensland Government should assess the benefits from:
• producing and publishing costs and other relevant information for all firms to access in order to assist them in deciding whether to do business in Queensland
• establishing a single Queensland Government business advisory entity
• leveraging facilitation services to identify opportunities to improve government processes, programs and regulation so that there are fewer government requirements to navigate, at a lower cost.

Final Report: Manufacturing in Queensland
Queensland Productivity Commission 235
Table 10.1 Investment grant programs
Fund name Amount allocated
Purpose
Made in Queensland $20 million Supports the manufacturing sector to become more internationally competitive and adopt innovative processes and technologies. Offers matching grants to Queensland based manufacturers.
Business Development Fund
$40 million Provides a co-investment in Queensland businesses commercialising ground-breaking research or innovations. The fund's investment is a direct investment in the business. It is not a payment to the co-investor, a grant or a loan.
Platform Technology Program
$10 million Provides financial incentives to larger scale co-funded projects (minimum > $1 million) that accelerate the development and deployment of significant and highly collaborative industry-based platform technology projects.
Commercialisation Partnership Program
$480,000 Places Queensland innovators in Chinese incubators to collaborate, access facilities and accelerate commercial outcomes.
Industry Attraction Fund
$40 million Designed to attract businesses to Queensland, either to relocate or establish new projects in the state. Objectives include employment creation, regional growth and encouraging innovation.
Ignite Ideas Fund $16.5 million was spent in the first two rounds.
Supports the development of new or improved products, processes or services to secure investment, launch into global markets and grow business.
Small Business Innovation Research Pilot
Unknown–part of the Advance Queensland fund.
Provides commercial opportunities to innovators while solving Queensland Government challenges. At the end of the process, applicants have the possibility to secure a contract with a Queensland Government agency.
Sources: Lynham 2017d; Palaszczuk & Enoch 2016; Queensland Government 2017t.
What are the policy’s effects?
Little data is publicly available on the effects of investment grants. The Queensland Government Investment portal, which lists grant and funding programs, does not provide information about outcomes. DSD noted successful examples of investment attraction, such as Oji Fibre Solutions and Sunny Queen Eggs (sub. DR2, p. 5).
The absence of comprehensive information is not unusual. For example, the VCEC’s review of investment assistance in Victoria found little information about the effects of assistance. It commissioned a study of five large projects, which found that in only one case was government financial support a deciding factor. The VCEC concluded that:
whatever one’s position [on the conceptual arguments for and against investment attraction], there would seem little reason to provide assistance if it is not effective in encouraging additional investment. (VCEC 2011, p. 195)

Final Report: Manufacturing in Queensland
Queensland Productivity Commission 236
The case for government involvement in investment attraction is not convincing even though the pressures on governments to provide it are strong. Commentators such as the OECD, the Productivity Commission, the QCA and the VCEC have suggested that assistance may be justified when the investment is accompanied by spillovers. However, the use of this rationale can trigger rent-seeking behaviour. Spillovers are difficult to identify and anticipated benefits do not occur automatically (OECD 2011, p. 11).
Opponents of providing financial incentives to attract investment argue:
• Financial incentives are not usually large enough to affect location decision:
− Interstate bidding is a zero-sum game—shuffling resources between states rather than making the Australian community better off. If grants do lead to projects proceeding, because these projects depend on government support they may divert resources from other activities that would have generated a higher return.
• Grants’ opportunity costs—as the funds could have been used in other government programs or to reduce taxes—are usually ignored, and may exceed their value in investment attraction.
• States collectively would be better off if they stopped competing through grants, and they can do so through interstate agreement.
• Confidentiality about grant allocation discourages performance evaluation, and can undermine decision-making processes.
Improving policy
Notwithstanding the weak case for investment attraction, it is common practice and difficult for any state acting individually to cease. When assistance is provided, improving transparency can help improve outcomes:
Transparency … provides scrutiny of the assumptions and methods used to support assistance proposals, opportunities to test competing claims and ultimately a basis for the Queensland community to judge the success or failure of industry assistance. It can also lead to improvements in assistance design and implementation over time … Transparent policy development can help reduce the likelihood of policy failure. (QCA 2015a, p. 63)
DSD stated that there is a transparent and rigorous process for allocating grants (sub. DR2, p. 4). However, opportunities for improvement include:
• publishing the criteria for allocating grants, to make it more likely that they are allocated where they generate most value
• making the main criterion for assistance that the project is anticipated to generate spillovers (for example, through other businesses having access to new technology leading to productivity improvements) that would otherwise not have occurred, and with an expected value that exceeds the cost of the grant
• providing assistance in a transparent way, rather than through less transparent forms such as tax concessions
• spreading grant payments over time, and linking them to measurable outputs
• publishing indicators such as the number, names, and size distribution of firms assisted; the value of assistance provided to each firm; and the details of contracts with individual firms
• conducting performance assessment, to identify whether assistance is offering a net benefit to Queensland (QCA 2015a; VCEC 2011).

Final Report: Manufacturing in Queensland
Queensland Productivity Commission 237
Transparency would be further enhanced by reporting annually the expected outcomes and performance milestones agreed in the case of each grant and the performance of each project against these milestones. Over the longer term, the information could be used to evaluate grant programs.
10.5 State taxes
10.5.1 The policy framework
Revenue from state taxes is expected to contribute 23.8 per cent of Queensland Government revenue in 2017–18 (Figure 10.1).
Figure 10.1 Queensland Government revenue by source, 2017–18
Source: Queensland Treasury 2017b.
Recommendation 15
To ensure net benefits from investment attraction activities, the Queensland Government should avoid providing attraction incentives to individual firms or projects unless it can be demonstrated that there are likely spillovers that would otherwise not occur. If the government does provide incentives, it should:
• publish the criteria for allocating grants to attract mobile investors
• provide assistance transparently, rather than through less transparent forms such as tax concessions
• link grants to measurable outputs
• publish the number, names and size of firms assisted, the value of assistance provided to each firm, and the details of contracts with individual firms
• report annually the expected outcomes and performance milestones agreed in the case of each grant and the performance of each project against these milestones.

Final Report: Manufacturing in Queensland
Queensland Productivity Commission 238
Queensland has a history of being a ‘low tax state’. The government considers:
Maintaining the competitiveness of Queensland’s tax system provides a competitive advantage to business and moderates the tax burden for its citizens, and is therefore fundamental to the Government’s commitment to job creation and sustainable development. (Queensland Treasury 2017b, p. 84)
The amount of tax citizens pay is one measure of competitiveness. Treasury estimates that taxation per capita in Queensland will be $2,691 in 2017–18, which is $843 below the average of other jurisdictions.
Treasury reports two other measures87, which also indicate that Queensland taxes are competitive with other states. To maintain the state’s position, the government seeks to keep general government sector own-source revenue at or below 8.5 per cent of projected nominal gross state product on average across the forward estimates period (Queensland Treasury 2017b, pp. 84–5).
While levels of taxation contribute to Queensland’s attractiveness as a business location—provided that low taxes do not lead to inadequate government services—the way in which that revenue is raised also has significant impacts.
Queensland (like other states) relies on payroll tax, land tax, transfer duties, insurance taxes and gambling duties. Payroll tax (28.7 per cent of total tax revenue in 2017–18) is the largest source of state taxation revenue, followed by transfer duty (24.0 per cent), motor vehicle registration fees (13.1 per cent), other duties (11.2 per cent), land tax (9.0 per cent) and gambling taxes and levies (8.9 per cent) (Queensland Treasury 2017b, p. 83).
Competition between states has focused on taxation thresholds and exemptions as well as on tax levels. This has led to complex tax structures and concessions, and Queensland frequently has more generous tax concessions than other states. For example:
• As well as having the lowest payroll tax rate of all states and territories (New South Wales Treasury 2016), the exemption threshold of taxable wages of $1.1 million in Queensland is the highest of any mainland state. Taxable wages between $1.1 million and $5.5 million also obtain a partial deduction, with the deduction withdrawn at a rate of $1 in every $4 of taxable wages.
• The principal place of residence owned by individuals is exempt from land tax in Queensland, as in all states. Non-resident individuals become liable for land tax once the total taxable value of residential land exceeds $600,000, which is the highest threshold among Australian states (New South Wales Treasury 2016).
Queensland Treasury (2017b, p. 216) estimates that $5.264 billion of revenue was foregone in 2016–17 through concessional treatment of payroll tax, land tax, duties and gambling taxes. Payroll tax ($2.447 billion) was the biggest contributor, followed by land tax ($1.562 billion).
87 These measures are taxation revenue as a share of GSP and taxation effort, as measured by the Commonwealth Grants Commission. Taxation effort indicates the actual effort by a jurisdiction to raise tax revenue relative to the average effort of all states.

Final Report: Manufacturing in Queensland
Queensland Productivity Commission 239
10.5.2 Assessing state taxes
Taxes are typically assessed in terms of their administration costs, compliance costs, efficiency costs and equity.
Recent reviews of state tax systems (including QCA 2015a, 2015b; Australian Government 2015) found:
• Compliance costs increase as tax systems become more complicated.
• Compliance costs are regressive as they are proportionately higher for small businesses.
• Gambling taxes and insurance duties have the largest efficiency costs of state taxes and land taxes the lowest.
• Payroll tax, in theory, has low efficiency costs compared with other taxes, but in practice the costs are higher than some other taxes because exemptions reduce the base of the tax. Complying with their payroll tax obligations can be complex for firms.
• The efficiency costs of land tax, while lower than other taxes, are increased by exemptions and concessions.
10.5.3 Impacts on manufacturing
In 2015–16, 2,900 firms in the manufacturing sector paid $436 million in payroll tax (Office of State Revenue 2017). This was 12 per cent of payroll taxes collected in Queensland. Manufacturers also pay stamp duties and land taxes and indirectly insurance duties.
Manufacturers pay relatively more payroll tax per employee and per dollar spent on wages, than other selected industries88 (QPC calculations; Office of State Revenue 2017; ABS 2017h). Per employee, manufacturers pay about $2,700 in payroll tax, 72 per cent more than other industries. On average manufacturers pay a tax rate of 4.25 per cent on the wages they pay their employees. This is 33 per cent higher than in other industries.
This larger share may affect the distribution of activity between sectors. For example, modelling undertaken by the QCA (2015b, p. 184) examined a scenario in which industry assistance schemes in Queensland were discontinued and the savings used to reduce payroll taxes. Industries with a higher share of payroll tax relative to subsidies benefited most—as measured by changes to value added—from replacing industry assistance with lower rates of payroll tax. Of all sectors, the manufacturing sector expanded the most.
10.5.4 Improving taxation
The case for comprehensive reform
There is consensus that state tax systems can be substantially improved through comprehensive reform of the tax mix, towards more efficient taxes. The Goods and Services Tax (GST) was introduced in 2000 on the basis that the revenue raised would be distributed to the states in exchange for removing various inefficient duties, levies and taxes. Despite these significant changes, the ‘Australia’s Future Tax System’ review, published in 2010, proposed significant further reform of state taxes. This was followed by the Australian Government white paper on tax reform in 2015, which also commented on state taxation.
88 Selected industries include all activity, except for the financial services industry and the public sector.

Final Report: Manufacturing in Queensland
Queensland Productivity Commission 240
The 2010 review recommended that most stamp duties should be abolished and replaced with a broad-based land tax (Henry et al. 2010, p. 263). This is consistent with the view in the 2015 white paper that:
[S]tamp duties are some of the most inefficient taxes in Australia … they are levied selectively on activities or products and are taxed on total transaction value, rather than the ‘value added’ component. Such transaction taxes are more likely to discourage turnover of taxed goods, as taxpayers attempt to reduce or avoid paying tax. (Australian Government 2015, p. 145)
An additional benefit of removing stamp duties is that reducing the additional costs they impose on property transfers would assist labour mobility and structural adjustment, as discussed in Chapter 9.
Land tax is more efficient, because if properly designed it has little impact on decisions about working, saving or investing. Because land is immobile and fixed, an ideally designed land tax would result in a once-off reduction in the value of land but without reducing land supply (Australian Government 2015, p. 148). However, several features of current land taxes, particularly their narrow base, make them less efficient and fair than they could be (Henry et al. 2010, p. 262).
Payroll tax could in principle be one of the most efficient state taxes, because it is designed to tax the value added from labour, which is relatively immobile (Henry et al. 2010, p. 293). In practice, however, payroll tax is ‘less efficient and more complex than it could be because of tax-free thresholds and other exemptions, often introduced to reduce tax paid by groups such as small business’ (Australian Government 2015, p. 144). The thresholds increase tax payable by small firms that cross the threshold and so may either discourage growth or encourage firms to change their corporate form to avoid tax.
The QCA, in its review of industries assistance in Queensland, similarly concluded that:
there is a strong economic argument for Queensland and other state governments to undertake tax reforms which result in a significantly larger share of state revenues being generated by land tax and, potentially, payroll tax. (QCA 2015a, p. 200)
These three reviews have made the case for economy-wide, rather than sectoral, state tax reform. This is because a sectoral approach that looks at improving state taxes through, for example, a manufacturing lens could lead to changes that distort resource allocation away from higher valued uses in other sectors. Manufacturing-specific changes would also increase administrative complexity and compliance costs. Moreover, changes in taxes will have distributional consequences. A comprehensive approach to tax reform would create more opportunities to develop a package of changes that balance out some of the distributional impacts.
However, despite the strong conceptual underpinning for comprehensive reform of state taxes, it has not yet happened.
Australia's system of horizontal fiscal equalisation may be one reason why states, acting individually, have been slow to reform their tax systems. The Productivity Commission, which is currently conducting an inquiry into HFE as the basis for the distribution of GST revenue among the states and territories, has concluded:
For the most part, States considering tax reforms would generally not be deterred by the effects on GST redistribution. However, there are circumstances where the GST effects can be material — such as for a State undertaking large scale tax reform—and act as a significant disincentive to States implementing efficient tax policy. These disincentives are likely to be exacerbated where the State is a first mover on reform or where there is uncertainty about how significant tax changes will be assessed by the CGC. (PC 2017b, p. 100) 89
89 The Productivity Commission's draft report was released in October 2017.

Final Report: Manufacturing in Queensland
Queensland Productivity Commission 241
Part of the evidence supporting this draft finding is a reform 'cameo', involving a single state halving its average rate of stamp duty on property and replacing the lost revenue with a new broad-based tax on all residential land. Modelling suggests that Queensland could lose between $302 million and $920 million in GST payments if it made this change unilaterally, but would see modest increases in GST payments if this reform was introduced multilaterally (PC 2017b, p. 99).
A national or state-based approach
Given the case for states to reform their tax systems through replacing inefficient taxes with more efficient one, the next question is whether the Queensland Government should seek to improve its own tax system independently, in the absence of national reform.
A national approach has significant advantages.
• It would broaden the range of reform options. For example, the Australia’s Future Tax System review (Henry et al. 2010, p. 680) suggested that payroll tax should be replaced by a broad-based wages tax or by a cash flow tax. Because the states would lose some autonomy over tax revenue if payroll tax were absorbed into a new national cash flow tax and there would be practical limitations on using land tax to fund increases in expenditure, the review suggests that the states might need to seek a national tax base sharing arrangement in respect of personal income tax or company tax.
• Generally, Commonwealth policy instruments are more suited to addressing the distributional consequences of reforms (QCA 2015, p. 203).
• Productivity Commission modelling suggest that the redistribution of GST revenue may be less of a barrier when there is a multilateral approach across states (PC 2017b, p. 100).
• Some changes to state taxes—for example, abolishing stamp duties—might increase Australian Government revenues from personal or income tax. In this event, Australian Government involvement could strengthen state government incentives to pursue tax reform.
CCIQ supported a national approach:
The priority for Queensland manufacturers is for comprehensive tax reform that considers the taxation system holistically, with a focus on addressing the complexity of the system and reducing the reliance on income taxes in favour of consumption taxes like the Goods and Services Tax (GST), which will enable the removal of inefficient State taxes. … [It supports] the expansion of a GST, and the abolishment of inefficient state taxes such as payroll tax and stamp duties. (sub. 6, p. 15)
[T]ax reform should be comprehensive and take place at the national level, rather than tackle reform in a piecemeal fashion … Proper tax reform is required. A focus on removing distortionary taxes, reducing the complexity of the existing system and favouring the expansion of broad-based consumption taxes should be the key considerations for the reform agenda. (sub. DR4, p.4)
The Property Council of Australia also considered that a national approach is required to reform stamp duty, because:
proposing to replace it with a broad based land tax is not likely to be politically feasible. Therefore, to achieve stamp duty reform a broader tax reform discussion involving the Commonwealth Government is required. (sub. DR5, p. 2)
Meanwhile, the Council recommends the Government undertake a review of the current 'out-dated' land tax thresholds and remove the 2009 'temporary' land tax surcharge.
On the other hand, achieving national consensus is likely to be a slow process. Unless momentum builds for national tax reform, the Commission considers that the Queensland Government should proceed unilaterally, provided that the direction of change is consistent with the direction that national reform might ultimately take, and therefore makes national reform more, rather than less, likely.

Final Report: Manufacturing in Queensland
Queensland Productivity Commission 242
This approach would bring forward the benefits of a better tax system. For example, broadening the base of more efficient taxes would allow those taxes to be set a lower rate (which is likely to benefit manufacturing overall) as well as enabling the removal of more distortionary taxes, and by demonstrating the benefits of change could improve the prospects for national reform. It would also provide a platform for the Queensland Government to lead negotiations between state and federal governments for national reform.
While there is considerable agreement about the broad direction of reform, in designing the details of a reform package, the Queensland Government would need to have regard for matters such as:
• distributional impacts, recognising that the initial and final incidence of taxes may not be the same
• transitional impacts, such as the possible impacts on GST revenue or whether a change in tax structure creates adjustment costs for parts of the community
• trade-offs between assessment criteria (such as administration costs, compliance costs, efficiency costs and equity), which will not always point in the same direction
• whether changes should be introduced at one time, so that the benefits are achieved quickly, or spread over time, to reduce adjustment costs.
10.6 Other issues Stakeholders identified other economy-wide policy areas that are significant for manufacturers, including workplace relations, skilled immigration visas, urban planning and zoning, transport policy and infrastructure. Workplace relations, skilled immigration visas and urban planning and zoning are briefly discussed below.
10.6.1 Workplace relations
Workplace relations featured prominently in the Commission’s consultations. For example, CCIQ considered:
Workplace relations are one of the most significant issues facing Queensland businesses as it directly shapes their employment and operational arrangements, and influences their cost bases. The top five workplace relations issues for Queensland businesses are unfair dismissal, complexity of the system, penalty rates, wages, and lack of flexibility. (sub. 6, p. 17)
Recommendation 16
To improve the business environment, the Queensland Government should establish a roadmap that sets out reform of the state tax system that:
• removes or reduces distortionary taxes (such as stamp duties and insurance levies) and moves towards less distortionary taxes (such as broad-based land taxes)
• has regard for the economic, distributional and transitional impacts of proposed changes, and considers whether all changes should be introduced at once or spread over time.

Final Report: Manufacturing in Queensland
Queensland Productivity Commission 243
CCIQ supported embracing workplace flexibility:
We need a workplace relations system where the rights of employees are balanced against the rights of employers, with adequate protections in place to ensure the sustainability and fairness of the system … Enhanced wages and conditions need to be offset by delivering equal benefits to employers through higher efficiency or productivity improvements. (sub. 6, p. 17)
The Commission also heard concerns that legislative requirements for permanent part-time workers are inconsistent with employment patterns in industries that are seasonal or hire staff who work from home.
The Queensland Government’s jurisdiction in workplace relations is—with exceptions such as regulation of workplace health and safety—limited to local and state government employees, through the Industrial Relations Act 2016. Workplace relations for private sector employees are regulated through the Fair Works Act 2009 (Cwlth), which the Australian Government administers. Given the government’s limited role in workplace relations in the private sector, the Commission has not reviewed workplace relations.
The government is already reviewing workplace health and safety, one of the main areas for which it is responsible. The review, amongst other things, is examining Workplace Health and Safety Queensland’s (WHSQ) effectiveness. It covers WHSQ’s functions, including inspections, investigations, prosecutions, enforceable undertakings, research, strategy and policy development, information and education and awareness campaigns (Grace et al. 2017).
10.6.2 Section 457 skilled immigration visas
Stakeholders have expressed different views about section 457 skilled immigration visas. The AMWU considers that the government should strengthen regulation to ensure local workers are given priority for local work, and foreign workers are not exploited by local business in terms of pay, conditions and other workplace rights (sub. 9, pp. 4-5). Some businesses, on the other hand, consider that section 457 visas help them to fill skill gaps when there are local shortages.
Since these submissions were made, the Australian Government has abolished section 457 visas and replaced them with the Temporary Skill Shortage visa (DIPB 2017a, 2017b). It will be important to manufacturers that they continue to be able to fill skill gaps under the new system.
10.6.3 Urban planning and zoning
Urban planning and zoning regulation affects manufacturers indirectly—through impacts on urban form—and directly; for example, by influencing the supply of industrial land and infrastructure, and when projects require development approval.
Government also provides industrial land. Economic Development Queensland acquires, develops, manages and sells land to meet industry requirements, by bringing to market selected industrial land to help foster industry growth in Queensland, especially where there is a strategic outcome for the state.
CCIQ considered:
[T]he interaction between state and local government planning and development legislation, in addition to environmental and health requirements, is inhibiting decision-making. (sub. 6, p. 16)
CIQ supported introducing more streamlined state based law and policy in the area of planning and development, environmental regulation and health and safety (sub. 6, p. 16).
The Australian Sugar Milling Council (sub. 5, p. 3) noted that ‘conflict in land planning and competition for land from other forms of agriculture, urban expansion and industrial use can result in the fragmentation of cane land and efficiency and scale for milling operations’.

Final Report: Manufacturing in Queensland
Queensland Productivity Commission 244
The Property Council of Australia commented:
With Queensland competing nationally and globally for investment we must provide a competitive advantage for businesses to base themselves in Queensland. From an industrial land perspective, this means providing competitive land and development rates to ensure the upfront costs of establishing a business are not restrictive. To assist in keeping downward pressure on these costs and to remain competitive we need to ensure that we have an adequate supply of well-serviced industrial land, streamlined development assessment processes, along with a competitive infrastructure charges regime. (sub. DR 5, p. 5)
Queensland introduced a new planning system on July 2017, when the Planning Act 2016 came into effect. The government expects that the new system will improve:
• transparency and accountability, by imposing new requirements on councils and the government to publish reasons for decisions
• community consultation
• appeal rights
• the development assessment process, which will be simplified
• environmental, heritage and sustainability outcomes (DILGP 2016).
Given this substantial overhaul, it would be premature to comment on urban planning and zoning issues. However, it is good practice to evaluate the impacts of such major policy changes. Impacts on manufacturing should be included in the evaluation.
10.7 Conclusion Overall, the evidence presented to this inquiry suggests that economy-wide policies affect the sector more than sector-specific policies. Energy policy, procurement policy, investment attraction and facilitation policies, and state taxation policy significantly influence the prospects for Queensland manufacturing. Policy settings in these areas should not, however, be designed specifically for manufacturing, as this could disadvantage other sectors of the economy and reduce overall economic performance. However, good policy design in these four policy areas will help to provide an environment within which competitive manufacturers can build on their advantages, ameliorate weaknesses and take advantage of international opportunities.

Final Report: Manufacturing in Queensland
Queensland Productivity Commission 245
11.0 Implementation

Final Report: Manufacturing in Queensland
Queensland Productivity Commission 246
This chapter discusses how the Manufacturing: Policy Action Plan could most effectively be implemented.
Key points
1 This inquiry has concluded that the Queensland Government can best support the manufacturing sector through a broad-based policy action plan with three key themes:
• address cost pressures that could constrain viable businesses
• increase productivity, to enable firms to pay higher wages, provide more jobs, and provide more choices and/or lower prices to consumers
• improve government programs, to enhance their contribution to productivity.
2 This plan would address concerns that the sector has identified during the inquiry, improve key features of the Queensland business environment, adopt an economy-wide perspective and establish a clear policy framework with fewer programs that achieve more.
3 The plan's economy-wide benefits are one of its most attractive features. However, implementation would involve at least eight ministerial portfolios and many agencies, which poses a significant implementation challenge.
4 Several options could address this challenge. The key requirements are to:
• assign clear ministerial and agency responsibility to further develop and implement the plan, with adequate resourcing
• set timeframes, milestones and reporting to ensure the plan is implemented and is achieving intended results.

Final Report: Manufacturing in Queensland
Queensland Productivity Commission 247
11.1 The objective A competitive and productive manufacturing sector will support economic growth and improve long-term living standards in Queensland.
The Commission has found:
• Despite its declining share of the economy, Queensland manufacturing is strong and diverse, thriving where it leverages comparative advantages, exploits niche markets or quickly delivers bespoke products.
• Manufacturing firms and their workers drive competitiveness and growth.
• The Queensland Government can better support the manufacturing sector through broad-based policy reform—to address cost pressures, increase productivity and improve programs.
There are, however, no magic bullet policy levers for the government. In particular:
• Many underlying issues are beyond government influence.
• The Australian Government controls key policies and policy instruments.
• ‘Picking winners’ does not have a track record of success.
Rather, the policy goal should be to improve living standards, through government action that effectively and efficiently:
• targets market and government failures
• simplifies and consolidates programs
• focuses on performance and results.
11.2 How to get there
11.2.1 Have a clear plan
The Manufacturing: Policy Action Plan centres on three key themes:
• Address cost pressures that could constrain viable businesses.
• Increase productivity, which enables firms to pay higher wages, provide more jobs, and/or provide more choices and lower prices to consumers.
• Improve government programs, to enhance their contribution to improving productivity.
Chapters 5 to 10 set out the 16 recommendations to support the plan.
Address cost pressures
• Avoid upward pressure on energy prices by ensuring energy policy and regulation are efficient (Recommendations 11 and 12).
• Create a competitive business environment through a more efficient tax system (Recommendation 16).
• Reduce costs on business and improve regulatory outcomes by reducing red tape through stocktake reviews (Recommendation 8).
Final Report: Manufacturing in Queensland
Queensland Productivity Commission 248
Increase productivity
• Lift the pool of workers with the right skills by improving the VET framework with a focus on the right incentives to providers, students and businesses (Recommendations 6 and 7).
• Expand competition procurement by simplifying the process and carefully implement the Queensland Procurement Policy 2017 (Recommendation 13).
• Support manufacturers, regions and workers, by improving adjustment assistance and removing barriers to labour mobility to assist workers to transition to new jobs (Recommendations 9 and 10).
Improve government programs
• Create a business environment to facilitate innovation (Recommendations 1 to 5).
• Make it easier for businesses to locate and do business here by streamlining government processes and offering comprehensive information to all businesses (Recommendation 14).
• Avoid providing attraction incentives to individual firms, but, if provided, transparently report the costs and benefits (Recommendation 15).
The Queensland Government should assign responsibility and authority to an appropriate body to implement the Manufacturing: Policy Action Plan (Recommendation 17).
This plan is built on broad-based policy reform to improve the opportunities for manufacturers—and all Queensland businesses—to compete and grow and, through that, contribute to higher living standards for Queenslanders. Benefits of the plan are that it would:
• address the sector’s main concerns identified during the inquiry
• improve key features of the business environment, by reducing the upward pressure on input costs such as energy; increasing the sector’s access to the labour skills it needs; and creating a more effective regulatory and taxation environment
• adopt an economy-wide perspective, which avoids perverse outcomes associated with manufacturing-specific policies that might assist this sector at the expense of others
• establish a clear policy framework with fewer programs that achieve more.
The plan can, however, only secure these outcomes if it is implemented successfully.
11.2.2 Focus on implementation
The dilemma
The recommendations directly affect other sectors, as well as manufacturing. For instance, the recommendation to create a competitive business environment through a more efficient tax system is deliberately drafted in terms of creating a competitive business environment. This is because changes to the tax system need to be considered at the economy level rather than sector level to ensure overall benefit, and to account for transitional impacts.
The recommendations’ economy-wide implications mean that responsible ministers would look beyond manufacturing when considering how to implement them. To demonstrate this, Table 11.1 sets out a notional allocation of responsibilities between ministerial portfolios. It shows portfolio responsibilities for the recommendations, if they were allocated based on the ministerial responsibilities set out in the Directory of Queensland Ministers and Portfolios. At least eight ministers and seven departments—all with economy-wide responsibilities—could implement parts of the plan. In some cases, more than one minister could be notionally responsible for the same recommendation.

Final Report: Manufacturing in Queensland
Queensland Productivity Commission 249
Table 11.1 highlights the dilemma: implementing the plan so that it maximises its contribution to higher living standards requires allocating responsibility for implementing the recommendations to ministers obliged to consider economy-wide effects, rather than just impacts on manufacturing. However, recommendations from an inquiry that focuses on manufacturing may not be a high priority for these ministers. This could delay—perhaps indefinitely—implementation.
Table 11.1 Notional ministerial responsibilities for recommendations
Minister Relevant recommendation Relevant Ministerial responsibility
Relevant department
Treasurer and Minister for Trade and Investment
Recommendations 11–12: energy
Recommendation 16: tax system
Recommendation 8: red tape reduction
Recommendations 9-10: structural adjustment
Recommendation 14: investment facilitation
Recommendation 15: investment attraction
State budget and taxation Government owned enterprises Trade development and investment promotion
Treasury State Development
Minister for Energy, Biofuels and Water Supply
Recommendations 11–12: energy Energy and water utilities
Energy and Water Supply
Minister for Housing and Public Works
Recommendation 13: government procurement
Government purchasing
Housing and Public Works
Minister for Training and Skills
Recommendations 6–7: VET
Recommendations 9-10: structural adjustment
Vocational education and training, and workforce development
Education and Training
Minister for Employment and Industrial Relations
Recommendations 9-10: structural adjustment Employment policies and programs
Treasury
Minister for State Development
Recommendations 9-10: structural adjustment
Recommendation 14: investment facilitation
Recommendation 15: investment attraction
State development State Development
Minister for Local Government
Recommendations 9-10: structural adjustment
Local government Infrastructure, Local Government and Planning
Minister for Innovation, Science and the Digital Economy
Recommendations 1–5: innovation programs Innovation policy, strategy and programs,
Science, Information Technology and Innovation

Final Report: Manufacturing in Queensland
Queensland Productivity Commission 250
Overcoming the dilemma: allocate responsibility to a single ‘responsible body’
A prerequisite for resolving this dilemma is for the government to nominate a single point of accountability (a ‘responsible body’) for coordinating delivery of the plan.
The responsible body would be responsible for:
• specifying in detail the problem to be solved and the anticipated outcomes
• developing the recommendations into specific tasks
• allocating tasks to those best placed to deliver them
• establishing a timetable, milestones and sequencing of reforms
• resourcing those who are required to deliver the plan
• developing performance indicators and monitoring and reporting progress against them
• reallocating resources and tasks as needed when circumstances change or experience indicates some tasks are easier or more difficult than expected
• periodically evaluating the plan, to assess whether initiatives are achieving desired outcomes and identify unintended outcomes and opportunities for improvement.90
The responsible body—while retaining overall accountability—would probably delegate responsibility for each recommendation. There are two reasons for this. First, most recommendations are in separate policy areas (see Table 11.1). It may be sensible to develop separate work streams for these recommendations, while the responsible body remains accountable for ensuring that synergies between them are recognised. Second, some recommendations (for example, recommendations 9 and 10, on structural adjustment) require action by several government agencies. Implementing these recommendations would itself require a coordinated approach (Box 11.1).
Allocating specific tasks and responsibilities involves machinery of government considerations that are beyond the scope of the inquiry. Nevertheless, the Commission stresses that it is important that the government allocates overall responsibility for implementing the plan (to what we have called the ‘responsible body’), as this is the essential prerequisite for successful implementation.
90 A similar dilemma is found in regulatory reform. The OECD suggests that governments 'should consider assigning a specific Minister with political responsibility for maintaining and improving the operation of the whole-of-government policy on regulatory quality and to provide leadership and oversight of the regulatory governance process' (OECD 2012c, rec. 1.6). In 2008, 24 OECD jurisdictions reported that their governments had assigned responsibility for promoting government-wide progress on regulatory reform to a specific minister (OECD 2012c, p. 23).

Final Report: Manufacturing in Queensland
Queensland Productivity Commission 251
Ministerial responsibility
Options for the role of the responsible body include:
• a Minister for Manufacturing
• a senior minister (for example, the Minister for State Development)
• adding this role to the responsibilities of a relevant existing Cabinet subcommittee, which would be chaired by a minister, who could either be the Minister for Manufacturing or (more likely) a senior minister.
Box 11.1 Implementing structural adjustment recommendations
These recommendations include measures such as:
• initiating studies of retrenched workers
• applying structural adjustment principles across government
• removing or reducing barriers to adjustment, such as unnecessary occupational or business licensing; stamp duty on property transfers
• providing early training assistance.
Queensland ministerial portfolios with a stake in these recommendations include Treasury, Infrastructure and Planning, State Development, Training and Skills, Employment and Industrial Relations, and Local Government.
Implementing these recommendations could require:
• making a single point of ministerial and departmental responsibility accountable for achieving the outcome at which recommendations 9 and 10 are directed. Ensure that they have the necessary authority and resources. Develop protocols for addressing barriers outside the lead portfolio.
• establishing a coordinating group that spans departments, but without diluting accountability for delivery. This group would:
− identify measurable outputs that would achieve the outcome
− specify tasks (for example, analysing the size and causes of adjustment costs; identifying barriers to adjustment that the government can reduce and ranking them; assessing proposals and seeking funding; designing and implementing the best options)
− identify positions within departments to carry out these tasks, and ensure that they have the necessary skills, resources and authority
− develop a timetable and performance indicators at the task level and monitor performance against them; reallocate resources and tasks if necessary
− set up a process for evaluating whether policies have reduced adjustment costs as intended; use evaluations to identify other ways to reduce adjustment costs.

Final Report: Manufacturing in Queensland
Queensland Productivity Commission 252
Most submissions did not comment on this matter. However, the AMWU believes that there should be a Minister for Manufacturing:
The nature and complexity of the problem requires a comprehensive whole-of-government response, partnering with both business and unions, driven from a central point within government. Accordingly, the AMWU recommends the reestablishment of a ministerial portfolio for manufacturing in Queensland.
A Minister for Manufacturing would drive the following objectives:
• Coordinate with other relevant departments, stakeholders and existing government support structures to develop the “whole of government” plan for the future of manufacturing and oversee its implementation;
• Ensure the practical implementation of current and new Manufacturing Policy, including the Local Content Policy;
• Identify opportunities for future growth in the industry; and
• Play a pivotal role in the development of a comprehensive, long term Manufacturing transition plan for Queensland. (AMWU sub. 9, pp. 2–3)
Table 11.2 ranks the advantages and disadvantages of the three options against four criteria that would influence whether and how the plan is implemented. The criteria are whether the incumbents in each option would, because of their positions:
• focus on manufacturing, rather than have their attention diverted to other issues
• take a whole-of-government perspective, which takes account of the interests of manufacturing but without placing it ahead of other sectors
• have sufficient authority to ensure that proposals are developed and implemented, even when other ministers are primarily responsible for them
• have sufficient authority to maintain the government’s interest in manufacturing issues.
Table 11.2 Comparison of governance optionsa
Criteria Minister for Manufacturing
Senior Minister, with manufacturing as an additional responsibility.
Cabinet committee, with manufacturing as an additional responsibility.
Focus on manufacturing α α α α α α α α α α
Whole-of government perspective
α α α α α α α α α α
Authority to ensure proposals are implemented
α α α α α α α α α α
Capacity to maintain the government’s interest in manufacturing issues
α α α α α α α α
a The number of alphas indicates the extent to which a governance option satisfies each criterion.

Final Report: Manufacturing in Queensland
Queensland Productivity Commission 253
The government might use other frameworks for comparing these and other options, and allocating ministerial responsibilities is not a matter for the Commission. However, Table 11.2 illustrates that the way responsibility is allocated will have a large impact on the outcome. It is particularly important that the government ensures that the obligation to further develop and implement the plan is clearly allocated to a position that is provided with sufficient authority and resources to carry out this responsibility.
A Minister for Manufacturing would be most focused on the sector and on ensuring that the plan is implemented, but less inclined to take a whole-of-government perspective. Such a minister is likely to be a junior minister, with less capacity to encourage other ministers to implement proposals that are their responsibility and to encourage the government to remain focused on the manufacturing sector.
Table 11.2 suggests that adding manufacturing to a senior minister’s responsibilities would be a strong option if the four criteria are weighted equally and there are no other significant options or criteria. One risk with this option is that excluding other ministers would weaken their commitment to change.
Implications for agencies
Once the government has decided which minister or committee of ministers is to be responsible for delivering the plan, it will need to ensure that there is departmental support to develop and carry out the work program on behalf of the responsible minister. Establishing a Minister for Manufacturing would require more change to departmental arrangements than would the other options. Whichever option is chosen, several agencies would need to work together to implement the plan, and organisational arrangements would need to be implemented to enable this to take place.
11.2.3 Reporting back to the manufacturing sector
The Industry and Manufacturing Advisory Group (IMAG) is an arms-length body that advises the government about manufacturing issues (Box 11.2). An option would be to require the responsible body to report to IMAG on progress with implementing the plan. Public reporting to an external body that is independent of the government would help to reassure the sector that adequate attention is being given to plan delivery.
Source: DSD 2017i.
Box 11.2 Industry and Manufacturing Advisory Group
The Industry and Manufacturing Advisory Group (IMAG) supports Queensland’s manufacturing industry. The group will help position Queensland manufacturing businesses to maximise domestic and international opportunities.
The group assists with industry growth by concentrating on:
• changing demand and emerging opportunities
• productivity and competitiveness
• innovation and technology
• local content, business costs and regulation.
The Minister for State Development chairs the group, which includes six business leaders, two union representatives and one representative from a peak industry.

Final Report: Manufacturing in Queensland
Queensland Productivity Commission 254
11.3 Timetable for reforms The responsible body will need to develop an implementation plan with key accountabilities and milestones. Table 11.3 sets out some initial thoughts on recommendations that could be implemented immediately and those that would need to be developed over a longer period.
Table 11.3 Timing of implementation of recommendations
Recommendation Short-term implementation
Longer-term implementation
Recommendation 1–5: innovation programs Implement immediately
Recommendations 6–7: VET Continue reforms Continue reforms Recommendation 8: Reduce red tape through stocktake review
Begin first stocktake review in 2018
Commence second and third reviews as soon as the first review is completed Develop priorities for subsequent reviews before third review is completed
Recommendations 9–10: structural adjustment
Implement immediately
Recommendation 11: electricity Implement proposed governance improvements Conclude review of policy options for regional Queensland
Recommendation 12: natural gas Release gas action plan as soon as possible
Recommendation 13: government procurement
Before March 2018
Recommendation 14: investment facilitation
Commence assessment
Implement conclusions from the review within a year of the commencement of the review
Recommendation 15: investment assistance Implement immediately
Recommendation 16: taxation Implement tax system changes

Final Report: Manufacturing in Queensland
Queensland Productivity Commission 255
11.4 Conclusion The terms of reference point out that ‘it is essential that the State’s manufacturing businesses operate within a supportive business environment that encourages innovation, investment and growth’. The Manufacturing: Policy Action Plan sets out a blueprint that, if effectively implemented, would move Queensland much closer to having such a supportive business environment.
A distinctive feature of the plan is that its recommendations would improve the broad business environment, not just that part of it within which manufacturing operates. This means that the plan’s benefits are larger than they would be if they were restricted to manufacturing. However, the dispersion of these benefits, combined with the fact that they are spread across at least eight ministerial portfolios, poses an implementation challenge.
Several options could address this challenge. The key requirements are that the Queensland Government ensures that it is completely clear who is responsible and authorised to further develop and implement the proposed plan, and that they are adequately resourced.
Recommendation 17
The Queensland Government should assign direct responsibility and authority to a Minister or group of Ministers to implement the Manufacturing: Policy Action Plan. The responsible body should:
• establish a clear commitment and timetable for implementing change
• further develop and coordinate implementation of the plan
• specify and allocate tasks for implementing the plan
• ensure that the plan is implemented and achieves intended results
• develop measures to review the performance of the plan
• evaluate its effectiveness.

Final Report: Manufacturing in Queensland
Queensland Productivity Commission 256

Final Report: Manufacturing in Queensland
Queensland Productivity Commission 257
Acronyms

Final Report: Manufacturing in Queensland
Queensland Productivity Commission 258
Numbers
2D two-dimensional
3D three-dimensional
4WD four-wheel drive
A
AAAA Australian Automotive Aftermarket Association
ABLIS Australian Business Licence and Information Service
ABS Australian Bureau of Statistics
ACCC Australian Competition and Consumer Commission
ACE Assess Costs Everywhere (US analysis tool)
AEMO Australian Energy Market Operator
AER Australian Energy Regulator
AFGC Australian Food and Grocery Council
AISC Australian Industry and Skills Committee
AMWU Australian Manufacturing Workers' Union
ANTT Asia-Pacific New Technologies Team
ANZSIC Australia New Zealand Standard Industrial Classification
ASEAN Association of South East Asian Nations
ASMC Australian Sugar Milling Council
ASQA Australian Skills Quality Authority
B
BERD Business expenditure on research and development
BRT Better Regulation Taskforce
C
CCIQ Chamber of Commerce & Industry Queensland
CEDA Committee for Economic Development of Australia
COAG Council of Australian Governments
COAGEC Council of Australian Governments Energy Council

Final Report: Manufacturing in Queensland
Queensland Productivity Commission 259
CRC Cooperative Research Centres
CSIRO Commonwealth Scientific and Industrial Research Organisation
D
DET Department of Education and Training (Queensland)
DEWS Department of Energy and Water Supply (Queensland)
DHPW Department of Housing and Public Works (Queensland)
DILGP Department of Infrastructure, Local Government and Planning (Queensland)
DNRM Department of Natural Resources and Mines (Queensland)
DoE Department of Employment (Australian Government)
DR Draft report (Manufacturing in Queensland)
DSD Department of State Development (Queensland)
DSITI Department of Science, Information Technology and Innovation (Queensland)
DTESB Department of Tourism, Major Events, Small Business and the Commonwealth Games (Queensland)
DTMR Department of Transport and Main Roads (Queensland)
E
EPI Electricity pricing inquiry (by the QPC)
ESA Economic Society of Australia
ESB Energy Security Board
F
G
GDP Gross domestic product
GFC Global financial crisis
GJ Gigajoule
GITC Government Information Technology Contracting
GMO Genetically modified organisms
GOC Government-owned-corporation

Final Report: Manufacturing in Queensland
Queensland Productivity Commission 260
GSP Gross state product
GTMA Gauge and Toolmakers Association (UK)
GVA Gross value added
H
HERD Higher education expenditure on research and development
I
ICC Infrastructure Cabinet Committee
ICNQ Industry Capability Network Queensland
ICT Information and communication technology
IDC Interdepartmental Committee
IMAG Industry and Manufacturing Advisory Group
IO Input–output
IoT Internet of things
IP Intellectual property
IPO Infrastructure Portfolio Office
IRC Industry Reference Committee
ISA Innovation and Science Australia
IT Information technology
J
JQ Jobs Queensland
K
L
LCR Local content requirement
LNG Liquefied natural gas

Final Report: Manufacturing in Queensland
Queensland Productivity Commission 261
M
MACSM Ministerial Advisory Council on Skilled Migration
MAS Manufacturing Advisory Service (UK)
MEP Manufacturing Extension Partnership (US)
METS Mining Equipment Technology Services
MFP Multifactor productivity
MIQ Made in Queensland
MIT Massachusetts Institute of Technology
MSA Manufacturing Skills Australia
N
NCVER National Council for Vocational Education Research
NEM National Electricity Market
NKS Net Capital(K) Stock
NSI North Stradbroke Island
NSIETS North Stradbroke Island Economic Transition Strategy
NZPC New Zealand Productivity Commission
NZVIF New Zealand Venture Investment Fund
O
OECD Organisation for Economic Co-operation and Development
OPT Opportunities for personalised transport
P
PC Australian Productivity Commission
PIAAC Programme for the International Assessment of Adult Competencies
PISA Programme for International Student Assessment
PJ Petajoule
PMI Performance of Manufacturing Index

Final Report: Manufacturing in Queensland
Queensland Productivity Commission 262
Q
QAO Queensland Audit Office
QCA Queensland Competition Authority
QNSAP Queensland Nickel Structural Adjustment Programme
QPC Queensland Productivity Commission
QPP Queensland Procurement Policy
QSBAC Queensland Small Business Advisory Council
R
R&D Research and development
RBA Reserve Bank of Australia
ROA Rest of Australia
ROI Return on investment
RTO Registered training organisation
RTRAC Red Tape Reduction Advisory Council
S
SFQ Safe Food Queensland
SME Small and medium enterprise
STEM Science Technology Engineering and Mathematics
T
TAFE Technical and Further Education
TCF Textile, Clothing and Footwear
TCO Total cost of ownership
TIQ Trade and Investment Queensland
U
UKTI United Kingdom Trade and Investment

Final Report: Manufacturing in Queensland
Queensland Productivity Commission 263
V
VCEC Victorian Competition and Efficiency Commission
VET Vocational education and training
W
WAP Worker Assistance Program
WHS Workplace Health and Safety
WHSQ Workplace Health and Safety Queensland
WTO World Trade Organization
X
Y
Z

Final Report: Manufacturing in Queensland
Queensland Productivity Commission 264

Final Report: Manufacturing in Queensland
Queensland Productivity Commission 265
Appendix A: Terms of
reference

Final Report: Manufacturing in Queensland
Queensland Productivity Commission 266
Inquiry into Queensland Manufacturing In accordance with section 23 of the Queensland Productivity Commission Act 2015, I hereby direct the Commission to undertake an Inquiry into Queensland Manufacturing, including a review of international reshoring initiatives.
Background
Queensland’s manufacturing sector is a significant contributor to employment, as well as regional and economic growth within the State. In 2014-15, the industry contributed over $20 billion to the Queensland economy. Despite this significant contribution, manufacturing’s share of State output declined from around 12 per cent in 1989-90 to around 7 per cent in 2014-15.
While there are significant emerging opportunities, the manufacturing sector is also facing a number of challenges including business costs and regulation, skills shortages and strong emerging international competition. To remain competitive, the manufacturing sector will need to adapt and reposition itself to address these challenges and take advantage of emerging opportunities. This will include building the management and workforce skills and knowledge required to drive productivity and innovation.
Opportunities exist for the manufacturing sector to build on existing competitive advantages and advanced manufacturing niches, gain access to new domestic and international supply chains and other value-adding market opportunities, capitalise on export opportunities, apply advanced technologies, and foster a highly skilled manufacturing workforce. A reinvigorated manufacturing sector, using advanced manufacturing techniques in particular, has the potential to bring significant productivity gains and employment growth.
To achieve this, it is essential that the State’s manufacturing businesses operate within a supportive business environment that encourages innovation, investment and growth.
Scope
The objective of the Inquiry is to develop policy options to improve the productivity and competitiveness of the manufacturing sector in Queensland. In this regard, the Inquiry should focus on opportunities to maximise existing advantages, improve weaknesses and take advantage of emerging domestic and international opportunities.
In undertaking the Inquiry, the Commission should investigate and report on:
• the role of the manufacturing sector in advancing economic growth and productivity in Queensland
• the changing nature of Queensland manufacturing, including its composition, location, employment size and structure, and linkages with service industries and international supply chains
• the manufacturing sector’s performance and potential, including a focus on employment and exports
• the characteristics of a productive and competitive manufacturing sector (noting the diverse nature of manufacturing in Queensland), including a focus on innovation and skills utilisation to promote longer term productivity improvements
• opportunities to improve the performance, productivity and competitiveness of the Queensland manufacturing sector
• experience from other jurisdictions, including in respect of reshoring initiatives (for example, the reshoring initiative in the United Kingdom)
• the regulatory framework for manufacturing in Queensland, including changes that would reduce the regulatory burden on the manufacturing sector

Final Report: Manufacturing in Queensland
Queensland Productivity Commission 267
• the effectiveness of current policy settings for the manufacturing sector, and changes that would facilitate improved performance, productivity and competitiveness.
Public consultation
In accordance with section 25 of the Queensland Productivity Commission Act 2015, the Commission must undertake public consultation in relation to the Inquiry. This should include consultation with a diverse range of stakeholder groups including large and small manufacturers, key interest groups and affected parties, the Industry and Manufacturing Advisory Group, regulatory bodies, employee associations, government agencies, councils and research bodies.
Amended Reporting Timeframes as at 30 June 2017
The Commission is required to publish a Draft Report for consultation by 31 July 2017.
The Final Report must be provided to Government by 31 October 2017.

Final Report: Manufacturing in Queensland
Queensland Productivity Commission 268

Final Report: Manufacturing in Queensland
Queensland Productivity Commission 269
Appendix B: Consultation

Final Report: Manufacturing in Queensland
Queensland Productivity Commission 270
The public inquiry process provides for stakeholders to put forward their views and experiences and comment on the Commission's approach, findings and recommendations. In this inquiry, the Commission:
• received 23 written submissions—13 in response to the issues paper and 10 in response to the draft report
• held public forums in Brisbane, Ipswich, Townsville, Bundaberg and Gladstone
• convened roundtable discussions on innovation and structural adjustment, and participated in an industry-led discussion on the textile, clothing and footwear industry
• benefited from discussions with around 100 stakeholders—meeting with manufacturing firms, government agencies, unions, industry associations and individuals, as well as undertaking site visits to small, medium and large manufacturers across Queensland.
This appendix provides details on the Commission's consultation.
Submissions Individual or organisation Submission number a
Australian Manufacturing Workers' Union (AMWU) 9 DR1
Australian Automotive Aftermarket Association (AAAA) 10
Australian Sugar Milling Council (ASMC) 5
Caravan Trade & Industries Association of Queensland (CTIAC) DR6
Chamber of Commerce and Industry Queensland (CCIQ) 6 DR4
Cook Medical Australia 12
Department of State Development 11 DR2
Gladstone Industry Leadership Group (GILG) DR10
Jobs Queensland DR7
Northern Iron and Brass Foundry 1
Packer Leather 13
Property Council of Australia (PCA) DR5
Queensland University of Technology (QUT) 8
Rio Tinto Aluminium 4 DR8
Service Trades Council 3
TCF Connect 2
Townsville Engineering Industries Pty Ltd DR9
Transit Australia Group (Confidential) 7
Wide Bay Burnett Regional Organisation of Councils (WBBROC) DR3 a The first column refers to submissions made in response to the issues paper and the second column two refers to submissions made in response to the draft report. Submissions can be found on the Commission’s website.

Final Report: Manufacturing in Queensland
Queensland Productivity Commission 271
Public forums Brisbane (28 August 2017), 14 attendees
Ipswich (29 August 2017), 10 attendees
Townsville (1 September 2017), 2 attendees
Bundaberg (7 September 2017), 10 attendees
Gladstone (8 September 2017), 7 attendees
Roundtables The Commission held two roundtables during its consultations: on innovation and structural adjustment.
Innovation Roundtable—17 February 2017
Organisation Representative
Advanced Manufacturing Growth Centre (AMGC) Mr Michael Grogan, Director
Australian Industry (Ai Group) Mr Alex Stanojevic, Manager, Policy and Public Affairs
Australian 3D Manufacturing Association Mr Neil Sharwood, Operations Director
B&R Enclosures Pty Ltd Ms Chris Bridges-Taylor, General Manager
BlueMount Capital Dr Mark Rainbird, Managing Director
Chamber of Commerce and Industry Queensland (CCIQ)
Mr Stephen Tait, Chief Executive Officer
Department of Science, Information Technology and Innovation (DSITI)
Dr Jason Olsen
Department of State Development (DSITI) Ms Denise Johnston, Director, Regional Economic Programs Mr Bill Walker, Director, Advanced Manufacturing
Jobs Queensland Dr Caroline Smith, Executive Director
QMI Solutions Mr Gary Christian, Managing Director and Chief Executive Officer
Queensland University of Technology (QUT) Dr Henri Burgers, QUT Business School
University of Technology Sydney (UTS) Professor Roy Green, Dean of UTS Business School
University of Queensland (UQ) Professor Matthew Dargusch, Mechanical and Mining Engineering

Final Report: Manufacturing in Queensland
Queensland Productivity Commission 272
Structural Adjustment Roundtable—24 February 2017
Organisation Representative
Australian Industry (Ai Group) Mr Alex Stanojevic, Manager, Policy and Public Affairs
Australian Manufacturing Workers' Union (AMWU)
Mr Rohan Webb, State Secretary
Chamber of Commerce and Industry Queensland (CCIQ)
Ms Kate Whittle, State Manger (Advocacy)
Committee for Economic Development of Australia
Ms Kyl Murphy, State Director
Department of State Development Mr Richard Walker, Acting Executive Director (Economic Policy and Research) Mr Divu Halanaik, Director (Economic Research)
Jobs Queensland Dr Caroline Smith, Executive Director
Queensland Council of Social Services (QCOSS) Ms Laura Barnes, Senior Manager (Practice, Research and Policy)
Regional Australia Institute Mr Jack Archer, Chief Executive Officer
TAFE Queensland Mr Erik Salonen, Business Manager (Projects)
University of Queensland (UQ) Professor John Quiggin, Australian Laureate Fellow in Economics
The Commission also attended an industry-led roundtable held by the textile, clothing and footwear industry body, the Apparel and Textile Industry Group. This meeting was held on 2 February 2017 at TAFE Queensland’s Mt Gravatt Campus; participants are included below in the ‘Consultations and visits’ section.

Final Report: Manufacturing in Queensland
Queensland Productivity Commission 273
Consultations and visits Ai Group
Alvey Reels
Apparel and Textile Industry (ATI) Group
Australian Manufacturing Workers' Union
Australian Workers’ Union
B&R Enclosures
B&T Alloy Welding
Beaulieu Pacific
Burdekin Shire Council
CEA Fashion Incubator
Coar Engineering
Cook Medical
Department of Education and Training
Department of Energy and Water Supply
Department of Infrastructure, Local Government and Planning
Department of Science, Information Technology and Innovation
Department of State Development
Department of Tourism, Major Events, Small Business and the Commonwealth Games—Office of Small Business
Economic Development Queensland
Evolve
Full Circle Fibres
Grove Juice
Gold Coast Hub
HildeHeim Bridal Couture
HSBNE
Hutchinson Builders
IMAG Members group
JBS Australia - Primo
Jobs Queensland
KFSU
LBFR Creative
METS Ignited
Nu-Tek Engineering
Packer Leather
Patheon Biologics
QMI Solutions
QMN Manufacturing
Queensland Mining Maintenance
Queensland Treasury
Queensland University of Technology (QUT)
Raptis
SKOLA
Sun Metals
TAFE Queensland
Technical Fabric Services
The Trailer Shop
Trade and Investment Queensland
Watkins Steel
Xtreme Engineering

Final Report: Manufacturing in Queensland
Queensland Productivity Commission 274

Final Report: Manufacturing in Queensland
Queensland Productivity Commission 275
References

Final Report: Manufacturing in Queensland
Queensland Productivity Commission 276
AAMC (Australian Advanced Manufacturing Council) 2016, viewed 2 March 2017, at http://aamc.org.au/showcase/.
AAMC (Australian Advanced Manufacturing Council) & Ai Group (Australian Industry Group) 2016, Australian Manufacturing is Misunderstood, video, viewed 29 April 2017, at https://www.youtube.com/watch?v=WW7ZW9g9y_8.
Abrahamson, E & Fairchild, G 1999, ‘Management Fashion: Lifecycles, Triggers and Collective Learning Processes’, Administrative Science Quarterly, vol. 44, no. 4, p. 708.
ABS (Australian Bureau of Statistics) 2000, Manufacturing Industry, Queensland, 1999–00, cat. no. 8221.3, at http://www.abs.gov.au/AUSSTATS/[email protected]/Lookup/8221.3Data%20Cubes11999-2000.
− 2001, Year Book of Australia 2001, cat. 1301.0, at http://www.ausstats. abs.gov.au/ausstats/subscriber.nsf/0/7B268DE64F791420CA2569DF00012F05/$File/13010_2001.pdf.
− 2006, Australian and New Zealand Standard Industrial Classification 2006, cat no. 1292.0, at http://www.ausstats.abs.gov.au/ausstats/subscriber. nsf/0/19C21C5659BCAE73CA2574C8001474E4/$File/12920_2006.pdf.
− 2011, 2011 Census, at http://www.abs.gov.au/websitedbs/censushome.nsf/home/tablebuilder.
− 2013, Programme for the International Assessment of Adult Competencies, Australia, 2011–12, cat. no. 4228.0, table 10, at http://www.abs.gov.au/AUSSTATS/[email protected]/DetailsPage/4228.02011-12?OpenDocument.
− 2014, Programme for the International Assessment of Adult Competencies, Australia, 2011–12, cat. no. 4228.0, table 6, at http://www.abs.gov.au/AUSSTATS/[email protected]/DetailsPage/4228.02011-12?OpenDocument.
− 2015a, Australian Demographic Statistics, cat. no. 3101.0, at http://www.abs.gov.au/ausstats/[email protected]/ featurearticlesbyCatalogue/7A40A407211F35F4CA257A2200120EAA?OpenDocument.
− 2015b, Research and Experimental Development, Businesses, Australia 2013–14, cat. no. 8104.0, at http://www.abs.gov.au/ausstats%5Cabs@. nsf/0/17EF02A5029649E2CA257F990030EDFE?Opendocument.
− 2016a, Australian Industry 2014–15, cat. no. 8155.0, at http://www.abs.gov.au/AUSSTATS/[email protected]/DetailsPage/8155.02014-15?OpenDocument.
− 2016b, Australian National Accounts: State Accounts, 2015–16, cat. no. 5220.0, at http://www.abs.gov.au/AUSSTATS/[email protected]/DetailsPage/8155.02014-15.
− 2016c, Selected Characteristics of Australian Business, 2014–15, cat. no. 8167.0, table 3 Government financial assistance received, by employment size, by industry, at http://www.abs.gov.au/AUSSTATS/[email protected]/DetailsPage/8167.02014-15?OpenDocument.
− 2016d, Selected Characteristics of Australian Business, 2014-15, cat. no. 8167.0, table 1 Barriers to general business activities or performance, by innovation status, by employment size, by industry, at http://www.abs.gov.au/AUSSTATS/[email protected]/DetailsPage/8167.02014-15?OpenDocument.
− 2016e, Higher education resources devoted to research and experimental development (R&D), cat. no. 8111.0, at http://www.abs.gov.au/ausstats/[email protected]/mf/8111.0.
− 2016f, Australian Industry, 2014–15, cat. no. 8155.0, at http://www.abs.gov.au/ausstats/[email protected]/mf/8155.0.

Final Report: Manufacturing in Queensland
Queensland Productivity Commission 277
− 2016g, Innovation in Australian Business, 2014–15, at http://www.abs.gov.au/ausstats/[email protected]/mf/8158.0.
− 2016h, Research and Experimental Development, Government and Private Non-Profit Organisations, Australia, 2014–15, cat. no. 8109.0, at http://www.abs.gov.au/ausstats/[email protected]/mf/8109.0.
− 2016i, Selected Characteristics of Australian Business, 2014–15, cat. no. 8167.0, at http://www.abs.gov.au/AUSSTATS/[email protected]/Latestproducts/8167.0Main%20Features52014- 15?opendocument&tabname=Summary&prodno=8167.0&issue=2014-15&num=&view=.
− 2016j, Australian National Accounts: State Accounts, 2015–16, cat. no. 5220.0, at http://www.abs.gov.au/ausstats/[email protected]/mf/5220.0.
− 2016k, Labour Force, Australia, Detailed, Quarterly, cat. no. 6291.0.55.003, at http://www.abs.gov.au/ausstats/[email protected]/mf/6291.0.55.003.
− 2016l, Emphasising the State perspective: Experimental estimates of State capital stock, 2015–16, cat. no. 5220.0.55.005, at http://abs.gov.au/ausstats/[email protected]/mf/5220.0.55.005.
− 2016m, Estimates of Industry Multifactor Productivity, Australia, 2015–16, cat. no. 5260.0.55.002, at http://www.abs.gov.au/ausstats/[email protected]/mf/5260.0.55.002.
− 2016n, Wage Price Indexes, Cat. No. 6345.0, at http://www.abs.gov.au/ausstats/[email protected]/mf/6345.0.
− 2016o, Education and Work, Australia, cat. no. 6227.0, table 10, at http://www.abs.gov.au/AUSSTATS/[email protected]/DetailsPage/6227.0May%202016?OpenDocument.
− 2017a, Business Indicators, Australia, Dec 2016, cat. no. 5676.0, at http://www.abs.gov.au/AUSSTATS/[email protected]/DetailsPage/5676.0Dec%202016?OpenDocument.
− 2017b, Counts of Australian Businesses, including Entries and Exits, Jun 2012 to Jun 2016, cat. no. 8165.0, at http://www.abs.gov.au/ausstats/[email protected]/mf/8165.0.
− 2017c, Australian National Accounts: National Income, Expenditure and Product, Dec 2016, cat. no. 5206.0, at http://www.abs.gov.au/ausstats/[email protected]/mf/5206.0.
− 2017d, Labour Force, Australia, cat. no. 6202.0, Australian Bureau of Statistics, Canberra, at http://www.abs.gov.au/ausstats/[email protected]/mf/6202.0.
− 2017e, Input Output Tables, cat no. 5209.0.55.001, at http://www.abs.gov.au/ausstats/[email protected]/mf/5215.0.55.001.
− 2017f, Producer Price Indexes, Australia, cat. no. 6427.0, Canberra, at http://www.abs.gov.au/ausstats/[email protected]/mf/6427.0.
− 2017g, Consumer Price Index Australia, cat no. 6401.0, Canberra, at http://www.abs.gov.au/ausstats/[email protected]/mf/6401.0.
− 2017h, Australian Industry 2015–16, cat. no. 8155.0, at http://www.abs.gov.au/AUSSTATS/[email protected]/DetailsPage/8155.02015-16?OpenDocument.
− 2017i, Australian National Accounts: National Income, Expenditure and Product, cat. no. 5206.0, at http://www.abs.gov.au/ausstats/[email protected]/mf/5206.0.
− 2017j, Labour Force, Australia, May 2017, cat. no. 6202.0, at http://www.abs.gov.au/ausstats/[email protected]/mf/6202.0.

Final Report: Manufacturing in Queensland
Queensland Productivity Commission 278
− 2017k, Australian National Accounts: Input–Output Tables, 2014–15, at http://www.abs.gov.au/ AUSSTATS/[email protected]/Lookup/5209.0.55.001Main+Features12014-15?OpenDocument.
− 2017l, Labour Force, Australia, Detailed, Quarterly, May 2017, cat. no. 6291.0.55.003, at http://www.abs.gov.au/AUSSTATS/[email protected]/DetailsPage/6291.0.55.003May%202017?OpenDocument.
− 2017m Labour Force, Australia, Aug 2017, cat. no. 6202.0, at http://www.abs.gov.au/AUSSTATS/[email protected]/DetailsPage/6202.0Aug%202017?OpenDocument.
− ABS 2017n, Wage Price Index, Australia, Jun 2017, cat. no. 6345.0, at http://www.abs.gov.au/ausstats/[email protected]/mf/6345.0.
ABS (Australian Bureau of Statistics) & PC (Productivity Commission) 2011, Competition, Innovation and Productivity in Australian Businesses, Sep 2011, research paper, cat. no. 1351.0.55.035, viewed 4 November 2016, at http://www.ausstats.abs.gov.au/Ausstats/subscriber. nsf/0/896C28E59CC4B822CA2579050014C578/$File/1351055035_sep%202011.pdf.
ACCC (Australian Competition & Consumer Commission) 2016, Inquiry into the east coast gas market, April, at https://www.accc.gov.au/system/files/1074_Gas%20enquiry%20report_FA_21April.pdf.
− 2017a, ACCC to investigate and report on Australian gas market transparency, media release, 20 April, at https://www.accc.gov.au/media-release/accc-to-investigate-and-report-on-australian-gas-markets- and-market-transparency.
− 2017b, Gas Inquiry 2017–2020, interim report, September, at https://www.accc.gov.au/system/files/ACCC%20gas%20inquiry%20first%20interim%20report%20%20September%202017%20-%20FINAL.PDF.
− 2017c, Retail Electricity Pricing Inquiry, preliminary report, September, at https://www.accc.gov.au/system/files/ACCC%20Retail%20Electricity%20Pricing%20Inquiry%20-%20Preliminary%20Report%20-%2022%20September%202017.pdf.
ACIL Allen Consulting 2013, Australia’s Natural Gas Supply: An assessment of current policy issues and options, report prepared for the Australian Pipeline Industry Association, June, at http://www.acilallen.com.au/projects/3/energy/83/gas-policy-australias-natural-gas-supply-an-assessment- of-current-policy-issues-and-options.
AEMC (Australian Energy Market Commission) 2016, System Security Market Frameworks Review, interim report, December, at http://www.aemc.gov.au/getattachment/7d65d3c8-28f9-43b0-a9ca-5d7d27ee663d/Interim-report.aspx.
− 2017a, System Security Market Frameworks Review, final report, Sydney.
− 2017b, Delivering a more stable power system to keep the lights on, media release, 27 June, viewed 4 July 2017, at http://www.aemc.gov.au/News-Center/What-s-New/Announcements/DELIVERING-A- MORE-STABLE-POWER-SYSTEM-TO-KEEP-THE.
AEMO (Australian Energy Market Operator) 2016, National Gas Forecasting Report for Eastern and South- Eastern Australia, December, at https://www.aemo.com.au/-/media/Files/Gas/National_Planning_and_ Forecasting/NGFR/2016/2016-National-Gas-Forecasting-Report-NGFR-Final.pdf.
− 2017a, Data Dashboard, Average Price Tables, viewed 27 March 2017, at https://www.aemo.com.au/ Electricity/National-Electricity-Market-NEM/Data-dashboard#average-price-table.
− 2017b, Black System South Australia 28 September 2016, final report, March, at https://www.aemo. com.au/-/media/Files/Electricity/NEM/Market_Notices_and_Events/Power_System_Incident_ Reports/2017/Integrated-Final-Report-SA-Black-System-28-September-2016.pdf.
Final Report: Manufacturing in Queensland
Queensland Productivity Commission 279
− 2017c, Gas Statement of Opportunities for Eastern and South-Eastern Australia, March, at https://www.aemo.com.au/-/media/Files/Gas/National_Planning_and_Forecasting/GSOO/2017/2017- Gas-Statement-of-Opportunities.pdf.
− AEMO 2017d, Update to gas statement of opportunities, September, at https://www.aemo.com.au/-/media/Files/Gas/National_Planning_and_Forecasting/GSOO/2017/2017-Gas-Statement-of-Opportunities---Update.pdf.
− 2017e, Advice to Commonwealth Government on dispatchable capability, September, at https://www.aemo.com.au/- /media/Files/Media_Centre/2017/Advice-To-Commonwealth-Government-On-Dispatchable-Capability.PDF.
− AEMO 2017f, Electricity Statement of Opportunities for the National Electricity Market, September, at https://www.aemo.com.au/-/media/Files/Electricity/NEM/Planning_and_Forecasting/NEM_ESOO/2017/2017-Electricity-Statement-of-Opportunities.pdf
AER (Australian Energy Regulator) 2017a, Quarterly base futures prices, website, viewed 27 March 2017, at https://www.aer.gov.au/wholesale-markets/wholesale-statistics/quarterly-base-futures-prices.
− 2017b, State of the Energy Market May 2017, Australian Competition and Consumer Commission.
AMGC (Advanced Manufacturing Growth Centre) 2016, About Advancing Australian Manufacturing, viewed 13 February 2017, at https://www.amgc.org.au/Category?Action=View&Category_id=45#understanding.
− 2017, Advanced Manufacturing Growth Centre: Sector Competitiveness Plan 2017, viewed 17 January 2016, at https://www.amgc.org.au/Attachment?Action=Download&Attachment_id=15.
Agarwal, R, Brown, PJ, Green, R, Randhawa, K & Tan H 2014, ‘Management practices of Australian manufacturing firms: why are some firms more innovative?’, International Journal of Production Research, vol. 52, no. 21, pp. 6496–6517.
Ai Group (Australian Industry Group) 2017a, Energy Shock: No gas, No power, No future?, March, at http://cdn.aigroup.com.au/Reports/2017/Energy_shock_report_Feb2017.pdf.
− 2017b, Ai Group letter to PM and Opposition Leader on Energy Action / gas swaps, media release, 18 April, at https://www.aigroup.com.au/policy-and-research/mediacentre/releases/letter_to_PM_on_ Energy_18_April_2017/.
− 2017c, ‘Manufacturing growth slows in May’, Australian Performance of Manufacturing Index (PMI), May, at http://cdn.aigroup.com.au/Economic_Indicators/PMI/2017/PMI_May_2017_73568p.pdf.
− 2017d, ‘Manufacturing surges ahead in August’, Australian Performance of Manufacturing Index (PMI), August, at http://cdn.aigroup.com.au/Economic_Indicators/PMI/2017/PMI_Aug_2017_658923i.pdf.
AISC (Australian Industry and Skills Committee) 2017a, Industry Reference Committees, at https://www.aisc.net.au/content/irc-review.
− 2017b, National Schedule, at https://www.aisc.net.au/content/national-schedule.
Aither 2014, Structural adjustment in regional Australia: learning from experience, improving future responses, report prepared for RIRDC and RAI, at http://www.regionalaustralia.org.au/home/wp-content/ uploads/2016/11/Structural-Adjustment-in-Regional-Australia.pdf.

Final Report: Manufacturing in Queensland
Queensland Productivity Commission 280
Allcock, A 2016, ‘On the road to reshoring’, Machinery, vol. 14, no. November, pp. 14–16, at http://www.gtma. co.uk/wp-content/uploads/2017/01/On-The-Road-To-Reshoring.pdf.
Allen Consulting Group 2012, The economic, social and environmental impacts of the Cooperative Research Centres Program, final report, prepared for the Department of Industry, Innovation, Science, Research and Tertiary Education, at http://www.acilallen.com.au/cms_files/acgcrcprogramreview2012.pdf.
American Manufacturers Association 2016, ‘Top manufacturing companies being jobs back to the U.S.’, blog entry, posted 21 April, at http://www.ama50.com/american-manufacturing-blog/reshoring-american- manufacturing-jobs.
AMPR Team (Australian Management Practices Research Team) 2009, Management Matters in Australia: Just how productive are we?, Department of Innovation, Industry, Science and Research, at https://industry.gov. au/industry/OtherReportsandStudies/Documents/ManagementMattersinAustraliaReport.pdf
Anderson, F 2017, ‘Malcom Turnbull slaps export controls on recalcitrant gas exporters’, Australian Financial Review, 26 April, at http://www.afr.com/news/politics/malcolm-turnbull-slaps-export-controls-on- recalcitrant-gas-exporters-20170426-gvsuh4.
Andrews, D, Criscuolo, C & Gal, PN 2016, The best versus the rest: The global productivity slowdown, divergence across firms and the role of public policy, OECD productivity working paper no. 5, OECD Publishing, Paris.
ASQA (Australian Skills Quality Authority) 2015a, Agency Overview, at https://www.asqa.gov.au/about/agency-overview.
− 2015b, Strategic reviews, at https://www.asqa.gov.au/about/strategic-reviews.
Australian and New Zealand Government Procurement Agreement 2013, viewed 24 October 2017, at http://www.apcc.gov.au/ALLAPCC/2014%20NOV%20ANZGPA%20Sep%202013%20WEB%20VERSION.pdf.
Australian Centre for Business Growth 2017, Growing Queensland’s Companies, University of South Australia Business School, viewed 20 September 2017, at https://centreforbusinessgrowth.com/qld/.
Australian Government 2014, Regulator Performance Framework, viewed 26 September 2017, at https://cuttingredtape.gov.au/sites/default/files/documents/regulator_performance_framework.pdf.
− 2015, Re:think, Tax discussion paper, March, at http://bettertax.gov.au/files/2015/03/ TWP_combined-online.pdf.
− 2016, Budget Strategy and Outlook, Budget Paper No. 1 2016–17, at http://www.budget.gov.au/2016-17/content/bp1/html/.
− 2017a, Budget Measures, Budget Paper No. 2, at http://budget.gov.au/2017-18/content/bp2/download/bp2.pdf.
− 2017b, Growth Fund, at https://www.business.gov.au/assistance/growth-fund.
− 2017d, 2016 National Research Infrastructure Roadmap, at https://docs.education.gov.au/system/files/doc/other/ed16-0269_national_research_infrastructure_roadmap_report_internals_acc.pdf.
− 2017e, Business: Entrepreneurs Programme, viewed 2 October 2017, at https://www.business.gov.au/assistance/entrepreneurs-programme-summary.
Australian National Audit Office 2017, Design and Monitoring of the National Innovation and Science Agenda, report no. 10 2017–18, Canberra.
Australian Private Equity & Venture Capital Association Limited 2012, submission to Review of Venture Capital and Entrepreneurial Skills, at https://www.avcal.com.au/documents/item/516.

Final Report: Manufacturing in Queensland
Queensland Productivity Commission 281
Australian Private Equity & Venture Capital Association Limited 2016, 2016 Yearbook: Australian Private Equity and Venture Capital, November, at https://www.avcal.com.au/documents/item/1315.
ARC (Australian Research Council) 2017, Linkage Projects, Linkage Program, Australian Government, viewed 24 September 2017, at http://www.arc.gov.au/linkage-projects.
AWPA (Australian Workforce and Productivity Agency) 2014, Manufacturing workforce study, April, at https://docs.education.gov.au/system/files/doc/other/manufacturing-workforce-study-2014.pdf.
Azarias, J, Lambert, J, McDonald, P & Malyon, K 2014, Robust New Foundations: A Streamlined, Transparent and Responsive System for the 457 Programme, September, at https://www.border.gov.au/ ReportsandPublications/Documents/reviews-and-inquiries/streamlined-responsive-457-programme.pdf.
Baffour B, Povey J, Stevenson S, Bon J, Mangan J, Boreham P, Western & M & Chainey, C 2016, The Future of Manufacturing Jobs in Queensland, report prepared for the Australian Manufacturing Workers Union, Institute for Social Science Research, University of Queensland.
Banks, G 2005, Structural reform Australian-style: lessons for others?, presentation to the IMF, World Bank and OECD, 26–27 May, at http://www.pc.gov.au/news-media/speeches/cs20050601/cs20050601.pdf.
Barkworth, H 2014, ‘Six trends that will shape consumer behaviour this year’, Forbes, 4 February, viewed 1 September 2017, at http://www.forbes.com/sites/onmarketing/2014/02/04/six-trends-that-will-shape-consumer-behavior-this-year/#387219e77f84.
Barnes, P et al. 2013, Productivity in Manufacturing: Measurement and Interpretation, Productivity Commission, Canberra.
Barrentine, K & Whelan, A 2015, The reshoring option: Maybe its’s time, Deloitte CRG, at https://www2.deloitte.com/us/en/pages/advisory/articles/the-reshoring-option.html.
Bartik, TJ 1985, ‘Business Location Decisions in the United States: Estimates of the Effects of Unionization, Taxes, and Other Characteristics of States’, Journal of Business & Economics, vol. 3, no. 1, pp. 14–22.
Barton, T 2002a, State Government responds to abattoir closure, media release, Queensland Government, 2002a, Brisbane, 7 July, at http://statements.qld.gov.au/Statement/2002/7/31/state-government-responds-to-abattoir-closure.
− 2002b, Update on Immediate Response Centre—Rockhampton, media release, Queensland Government, Brisbane, 6 August, at http://statements.qld.gov.au/Statement/2002/8/6/update-on- immediate-response-centre--rockhampton.
Battochi, M 2016, ‘Italy is the second most popular reshoring destination’, San Francisco, Italy, at http://sanfranciscoitaly.com/day/2016/06/15/.
Baumol, WJ 2002, The Free-Market Innovation Machine: Analyzing the growth miracle of capitalism, Princeton University Press, Princeton NJ.
BCA (Business Council of Australia) 2004, Offshoring, global outsourcing and the Australian economy: Continuing Australia’s integration into the world economy, Melbourne.
− 2014, Building Australia’s competitive advantages, at http://www.bca.com.au/publications/building-australias-comparative-advantages.
Beaulieu Pacific 2017, Home, viewed 28 April 2017, at http://www.beaulieupacific.com.au/easyweb3/WEBID- 130742-ep_code-product-grp_id-94304-grp_name-Home.html.
Beer, A 2014, Regions and Structural Adjustment in Australia, presentation to the Regional Studies Association Conference, Izmir, Turkey, 15–18 June, at http://www.regionalstudies.org/uploads/Andrew_Beer_ PDF.pdf.

Final Report: Manufacturing in Queensland
Queensland Productivity Commission 282
− 2015, ‘Structural adjustment programmes and regional development in Australia’, Local Economy, vol. 30, no. 1, pp. 21–40.
Benson-Armer, R, Noble, S, & Thiel, A 2015, The consumer sector in 2030: Trends and questions to consider, viewed 1 October 2016, at http://www.mckinsey.com/industries/consumer-packaged-goods/our-insights/the- consumer-sector-in-2030-trends-and-questions-to-consider.
Berthelon, M & Freund, C 2004, On the Conservation of Distance in International Trade, World Bank Policy Research Department working paper no. 3293, World Bank Development Research Group, Washington DC.
Bhatnagar, R & Sohal, AS 2005, ‘Supply chain competitiveness: measuring the impact of location factors, uncertainty and manufacturing practices’, Technovation, vol. 25, pp. 443–56.
Bloom, N, Dorgan, S, Dowdy, J, Van Reenan, J 2007, Management Practice & Productivity: Why they matter, Centre for Economic Performance and McKinsey & Company, July, at http://cep.lse.ac.uk/management/ Management_Practice_and_Productivity.pdf.
Bloom, N & Van Reenen, J 2007, ‘Measuring and explaining management practices across firms and countries’, Quarterly Journal of Economics, vol. 122, no. 4, pp. 1351–1408.
Blowers, D 2017a, ‘The Finkel review: Finally, a sensible and solid footing for the electricity sector’, published at The Conversation, 9 June, viewed at https://grattan.edu.au/news/the-finkel-review-finally-a-sensible-and- solid-footing-for-the-electricity-sector/.
− 2017b, ‘The government’s new energy plans will leave investors less confident than ever’, published at The Conversation, 22 June, viewed at https://grattan.edu.au/news/the-governments-new-energy- plans-will-leave-investors-less-confident-than-ever/.
Borrás S & Edquist C 2016, Conceptual Underpinnings for Innovation Policy Design—Indicators and Instruments in Context, paper prepared for the OECD Blue Sky Conference III, Ghent, Belgium, 19–21 September 2016.
Boston Consulting Group 2015, ‘Reshoring of Manufacturing to the US Gains Momentum’, bcg.perspectives, December, at https://www.bcgperspectives.com/content/articles/lean-manufacturing-outsourcing-bpo- reshoring-manufacturing-us-gains-momentum/.
Braddy, P 1999, Beattie Government establishes worker assistance program to help retrenched employees avoid long-term unemployment, media release, Queensland Government, 14 September, at http://statements.qld.gov.au/Statement/1999/9/14/beattie-goverment-establishes-worker-assistance- program-to-help-retrenched-employees-avoid-longterm-unemployment.
Branham, M 2014, ‘”Made in the USA”: Reshoring brings manufacturing back’, Capitol Ideas, March/April, pp. 26–29, at http://www.csg.org/pubs/capitolideas/2014_mar_apr/2014_mar_apr_images/CIMarApr14.pdf.
Brisbane City Council 2017, Investment Attraction Team, viewed 10 May 2017, at http://www.choosebrisbane.com.au/invest/how-we-can-help/investment-attraction-team?sc_lang=en-au.
− n.d., Community grants, viewed 25 September 2017, at https://www.brisbane.qld.gov.au/community-safety/grants-awards/community-grants.
Brookings Institution 2004, Free trade in the new global economy: A discussion on the state of U.S. trade policy, transcript of a panel discussion, Brookings Institution briefing, Washington DC, 7 January, at www.brookings.edu/wp-content/uploads/2012/04/20040107.pdf.
BSMQ (Business and Skilled Migration Queensland) 2016, Skilled Visa Options, viewed 19 May 2017, at https://migration.qld.gov.au/skilled-visa-options/.

Final Report: Manufacturing in Queensland
Queensland Productivity Commission 283
− 2017, 'BSMQ Temporarily Suspends Queensland Skilled Visa Nomination for Subclass 190 & 489', BSMQ news page, 10 April, at https://migration.qld.gov.au/latest-news/bsmq-temporarily-suspends-queensland-skilled- visa-nomination-subclass-190-489/.
− n.d., Skilled Occupation Lists, Queensland Government, viewed 3 October 2017, at https://migration.qld.gov.au/skilled-occupation-lists/.
Buettner, T & Ruf, M 2007, ‘Tax incentives and the location of FDI: Evidence from a panel of German multinationals’, International Tax and Public Finance, vol. 14, no. 2, pp. 151–64.
Bureau of Labor Statistics 2017, Employment, hours and earnings from the Current Employment Statistics survey, United States Department of Labour, viewed 3 May 2017, at https://data.bls.gov/timeseries/ CES3000000001.
Bureau of Resources and Energy Economics 2014, An assessment of the key costs and benefits associated with the Ethanol Production Grants program, at https://industry.gov.au/Office-of-the-Chief-Economist/ Publications/Documents/other/asssessment-ethanol-production-grants-program.pdf.
Cable, V, Cameron, D, & Livingston, Lord 2014, New government support to encourage manufacturing production back to the UK, media release, UK Government, London, 24 January, at www.gov.uk/government/ news/new-government-support-to-encourage-manufacturing-production-back-to-the-uk.
Callan, V & Bowman, K 2015, Industry restructuring and job loss: Helping older workers get back into employment, NCVER, Adelaide.
Callari, J 2016, ‘Reshoring trend: Fading or Going Strong?’, Plastics Technology, 23 March, at http://www. ptonline.com/articles/reshoring-trend-fading-or-going-strong.
Cameron, D 2014, Speech to the World Economic Forum, Davos-Klosters, Switzerland, 24 January, at www.gov.uk/government/speeches/world-economic-forum-davos-2014-speech-by-david-cameron--2.
Carlsson, B 2015,‘Transparency of Innovation Policy’, in J Forssbaeck and L Oxelheim (eds), The Oxford Handbook of Economic and Institutional Transparency, Oxford University Press, pp. 219–38.
Cash, M 2016, Assistance for all Queensland Nickel workers, media release, Australian Government, 10 March, at https://ministers.employment.gov.au/cash/assistance-all-queensland-nickel-workers.
CEDA (Committee for Economic Development of Australia) 2014, Advanced Manufacturing: Beyond the production line, at http://adminpanel.ceda.com.au/FOLDERS/Service/Files/Documents/22092~Advanced- Manufacting.pdf.
− 2015, Australia’s future workforce?, at http://adminpanel.ceda.com.au/FOLDERS/Service/Files/ Documents/26792~Futureworkforce_June2015.pdf.
CCIQ (Chamber of Commerce and Industry Queensland) 2015, ‘CCIQ calls on governments to do more to inspire Qld entrepreneurs’, CCIQ news page, 23 February, at https://cciq.com.au/news/cciq-calls-on-governments-to-do-more-to-inspire-qld-entrepreneurs/.
− 2017, Red Tape Survey 2017, Government Red Tape: A Small Business Dilemma, at https://www.cciq.com.au/assets/Advocacy/Red-Tape/CCIQ-Red-Tape-Survey-2017-screen.pdf.
Center for International Development n.d., The Atlas of Economic Complexity, Harvard University, viewed 26 September 2017, at http://www.atlas.cid.harvard.edu.
Chang, J-H & Huynh, P 2016, ASEAN in transformation: The future of jobs at risk of automation, International Labour Office Bureau for Employers’ Activities, Working Paper no 9, International Labour Organization, July, at http://www.ilo.org/public/english/dialogue/actemp/downloads/publications/2016/ asean_in_transf_2016_r2_future.pdf.

Final Report: Manufacturing in Queensland
Queensland Productivity Commission 284
COAG (Council of Australian Governments) 2007, Best Practice Regulation: A guide for Ministerial Councils and National Standards Setting Bodies, at https://www.dpmc.gov.au/sites/default/files/publications/COAG_best_practice_guide_2007.pdf.
COAGEC (Council of Australian Governments Energy Council) 2017, Meeting Communique, 14 July, at http://www.coagenergycouncil.gov.au/sites/prod.energycouncil/files/publications/documents/12th%20COAG%20 Energy%20Council%20Communique%20V2.pdf.
Colmar Brunton 2017, Queenslanders’ perceptions and attitudes to innovation, report prepared for the Department of Science, Information Technology and Innovation, Queensland Government, at http://advance.qld.gov.au/our-vision/assets/public-perceptions-report/qld-public-perceptions-of-innovation-report.pdf.
Committee on Regional Development 2013, Comment on the report on reindustrialising Europe to promote competitiveness and sustainability, European Parliament, at http://www.europarl.europa.eu/sides/getDoc. do?type=REPORT&reference=A7-2013-0464&language=EN#title7.
Commonwealth of Australia 2016, Independent Review into the Future Security of the National Electricity Market, preliminary report, at http://www.environment.gov.au/system/files/resources/97a4f50c-24ac-4fe5- b3e5-5f93066543a4/files/independent-review-national-elec-market-prelim.pdf.
− 2017a, Budget 2017–18, Budget Measures, Budget Paper No. 2, at http://budget.gov.au/2017-18/content/bp2/download/bp2.pdf.
− 2017b, Independent Review into the future security of the National Electricity Market: Blueprint for the future, final report, Department of the Environment and Energy, viewed at https://www.energy.gov.au/sites/g/files/net3411/f/independent-review-future-nem-blueprint-for-the-future-2017.pdf.
Compton, M 2012, The Blueprint for an America built to last, blog entry, posted 24 January, The White House President Barack Obama, Washington DC, at https://obamawhitehouse.archives.gov/blog/2012/01/24/blueprint-america-built-last.
Cooperative Research Centres Association 2016, CRC Association Members, viewed 10 July 2017, at https:// crca.asn.au/members/.
Cornell University, INSEAD, & WIPO 2016, The Global Innovation Index 2016: Winning with Global Innovation, Ithaca, Fontainebleau and Geneva, at https://www.globalinnovationindex.org/gii-2016-report.
− 2017, The Global Innovation Index 2017: Innovation Feeding the World, Ithaca, Fontainebleau & Geneva, at https://www.globalinnovationindex.org/gii-2017-report.
Coursera n.d., Meet our Partners, at https://www.coursera.org/about/partners.
CSIRO (Commonwealth Scientific and Industrial Research Organisation) 2016, Advanced Manufacturing:A Roadmap for unlocking future growth opportunities for Australia, November, at https://www.csiro.au/en/ Do-business/Futures/Reports/Advanced-manufacturing-roadmap.
Cully M 2013, Evaluating the Impact of Enterprise Connect Core Services: An experimental study by the ABS, Department of Industry, Australian Government Statistical Forum, 30 October, Canberra.
Cutler, T (Chair: Panel for the Review of the National Innovation System) 2008, Venturous Australia: Building strength in innovation, report prepared for the Department of Innovation, Industry, Science and Research, at http://www.voced.edu.au/content/ngv%3A12472.
DAF (Department of Agriculture and Fisheries) 2015, Fisheries Queensland: East Coast Net Buy-Back Program, Queensland Government, Brisbane.
Daley, J & Lancy, A 2011, Investing in regions: Making a difference, Grattan Institute, May, Melbourne.

Final Report: Manufacturing in Queensland
Queensland Productivity Commission 285
De Backer, K, Menon, C, Desnoyers-James, I & Moussiegt, L 2016, Reshoring: Myth or Reality?, OECD Science, Technology and Industry Policy Paper no. 27, OECD Publishing, Paris, http://dx.doi. org/10.1787/5jm56frbm38s-en.
Dee N, Gill D, Weinberg C & McTavish S 2015, Startup Support Programmes: What’s the Difference, Nesta, at http://www.nesta.org.uk/sites/default/files/whats_the_diff_wv.pdf.
Deloitte Access Economics 2013, The economic impacts of a domestic gas reservation, report prepared for Australian Petroleum Production & Exploration Association Limited, October, at https://industry.gov.au/Energy/EnergyMarkets/Documents/GasMarketStudySubmissions/ AustralianPetroleumProductionExplorationAssociationAttachment2.pdf.
Deloitte Australia 2014, Positioning for prosperity? Catching the next wave, Building The Lucky Country series paper no. 3, viewed 24 August 2017, at https://www2.deloitte.com/au/en/pages/building-lucky-country/articles/positioning-for-prosperity.html#1.
Deloitte Development LLC & The Manufacturing Institute 2015, The skills gap in U.S. manufacturing 2015 and beyond, at https://www2.deloitte.com/content/dam/Deloitte/us/Documents/manufacturing/us-pip-the- manufacturing-institute-and-deloitte-skills-gap-in-manufacturing-study.pdf.
Deloitte LLP 2015, The Deloitte Consumer Review—Made-to-order: The rise of mass personalisation, viewed 1 September 2017, at https://www2.deloitte.com/content/dam/Deloitte/ch/Documents/consumer-business/ch-en-consumer-business-made-to-order-consumer-review.pdf.
Department of Defence 2017, Australian industry capability, Australian Government, at http://www.defence.gov.au/SPI/Industry/AIC.asp.
DET (Department of Employment and Training) 2002, Breaking the unemployment cycle: Initiative Review, Queensland Government, October, at http://www.voced.edu.au/content/ngv%3A24167.
DET (Department of Education and Training) 2016a, 2016–17 Annual VET Investment Plan, Queensland Government at https://training.qld.gov.au/site/docs-data/Documents/strategies/vetinvest/annual-vet- investment-plan.pdf.
− 2016b, Annual Report 2015–2016, Queensland Government, at https://det.qld.gov.au/det-publications/ reports/Documents/annual-report/annual-report-2015-16-signature.pdf.
− 2016c, Adult Community Education, Queensland Government, viewed 2 March 2017, at https://training.qld.gov.au/training/courses/ace.
− 2016d, Advancing education: An action plan for education in Queensland, Queensland Government, at http://advancingeducation.qld.gov.au/SiteCollectionDocuments/advancing-education-action-plan. pdf.
− 2016e, Manufacturing and Engineering, Queensland Government, at https://training.qld.gov.au/employers/gatewayschools/manufacturing-engineering.
− 2016f, A strategy for STEM in Queensland state schools, at http://advancingeducation.qld.gov.au/ SiteCollectionDocuments/schools-of-the-future-stem-strategy.pdf.
− 2016g, #codingcounts, Queensland Government, at http://advancingeducation.qld.gov.au/ SiteCollectionDocuments/coding-counts-supporting-plan.pdf.
− 2016h, Queensland Training Subsidies List, fact sheet, at https://training.qld.gov.au/site/docs-data/Documents/strategies/vetinvest/qld-training-subsidy-factsheet.pdf .
− 2017a, Response to Information Request from the QPC, provided 5 January 2017.
− 2017b, Skilling Queenslanders for Work, fact sheet, Queensland Government, at https://training.qld.gov.au/site/community-orgs/Documents/funded/sqw/sqw-fact-sheet.pdf.

Final Report: Manufacturing in Queensland
Queensland Productivity Commission 286
− 2017c, Advancing skills for the future: A strategy for vocational education and training in Queensland, draft report, Queensland Government, at https://training.qld.gov.au/site/docs-data/Documents/ strategies/advancing-skills/advancing-skills-draft-consultation.pdf.
− 2017d, Skilling Queenslanders for Work: First Start, Queensland Government, at https://training.qld. gov.au/site/community-orgs/Documents/funded/sqw/first-start-funding-guidelines.pdf.
− 2017e, Skilling Queenslanders for Work: Work Start, fact sheet, Queensland Government, at https://training.qld.gov.au/site/community-orgs/Documents/funded/sqw/work-start-factsheet.pdf.
− 2017f, Queensland VET Quality Framework: Promoting quality for Queensland’s VET investment, Queensland Government, May, at https://training.qld.gov.au/site/docs-data/Documents/ qualityframework/qld-vet-quality-framework.pdf.
− 2017g, Advancing skills for the future: a strategy for vocational education and training in Queensland, Queensland Government, viewed 10 October 2017, at https://training.qld.gov.au/docs-data/strategies/vet-strategy.
− 2017h, 2017–18 Annual VET Investment Plan, Queensland Government, viewed 3 October 2017, at https://training.qld.gov.au/site/docs-data/Documents/strategies/vetinvest/annual-vet-investment-plan.pdf.
Department of Environment, Land, Water and Planning 2017, Review of electricity and gas retail markets in Victoria: Terms of reference, Victoria State Government, viewed 4 July 2017, at https://www.energy.vic.gov. au/data/assets/pdf_file/0016/44413/Terms-of-Reference-revised-27012017.pdf.
Department of Finance 2015, Reporting requirements: Buying for the Australian Government, Australian Government, viewed 29 September 2017, at https://www.finance.gov.au/procurement/procurement-policy-and-guidance/buying/reporting-requirements/
− 2017 Commonwealth Procurement Rules, 1 March 2017, section 4—Value for money, viewed 6 October 2017, Australian Government, at http://www.finance.gov.au/procurement/procurement-policy-and-guidance/commonwealth-procurement-rules/march/value-for-money/.
Department of Industry, Innovation and Science 2014, Industry Innovation and Competitiveness Agenda, viewed 24 January 2017, available at https://www.industry.gov.au/industry/Pages/Industry-Innovation-and- Competitiveness-Agenda.aspx#header.
− 2017, Industry Growth Centres—Initiative summary, viewed 24 January 2017, available at https://www.industry.gov.au/industry/Industry-Growth-Centres/Pages/default.aspx.
Department of the Premier and Cabinet 2017, Directory of Queensland Ministers and Portfolios: Meet your Cabinet, Queensland Government, viewed 21 July 2017, at https://www.cabinet.qld.gov.au/ministers.aspx.
De Silva, M & Andersen, B 2015, Catapults contributing to Europe 2020: How to generate value by strategically engaging in EU activities, Big Innovation Centre, viewed 23 August 2017, at http://www.biginnovationcentre.com/media/uploads/pdf/1427374354_0357121001427374354.pdf.
DEWS (Department of Energy and Water Supply) 2017a, Powering Queensland Plan, Queensland Government, viewed 4 July 2017, at https://www.dews.qld.gov.au/ data/assets/pdf_file/.../powering-queensland-plan.pdf.
− 2017b, Stabilising electricity prices for Queensland consumers, Queensland Government, at https://www.dews.qld.gov.au/__data/assets/pdf_file/0005/1253831/stabilising-electricity-prices-for-qld-consumers.pdf.

Final Report: Manufacturing in Queensland
Queensland Productivity Commission 287
DHPW (Department of Housing and Public Works) 2015, Queensland Procurement Policy, at http://www.hpw.qld.gov.au/SiteCollectionDocuments/QLDProcurementPolicy.pdf.
− 2017a, Queensland Procurement Policy 2017, viewed 24 October 2017 at http://www.hpw.qld.gov.au/SiteCollectionDocuments/QLDProcurementPolicy.pdf.
− 2017b, Queensland Procurement Policy, viewed 25 October at http://www.hpw.qld.gov.au/Procurement/ProcurementStrategy/Policy/Pages/default.aspx.
DIBP (Department of Immigration and Border Protection) 2014, Reviewing the Skilled Migration and 400 Series Visa Programmes, Australian Government, discussion paper, Australian Government, September, at https://www.border.gov.au/ReportsandPublications/Documents/discussion-papers/skilled-migration-400- series.pdf.
− 2017a, Fact sheet two: Reforms to Australia’s temporary employer sponsored skilled migration programme—abolition and replacement of the 457 visa, Australian Government, at https://www.border.gov.au/WorkinginAustralia/Documents/reforms-australia-permanent-employer- sponsored-migration-programme.pdf.
− 2017b, Fact sheet one: Reforms to Australia’s temporary employer sponsored skilled migration programme—abolition and replacement of the 457 visa, Australian Government, at https://www.border.gov.au/WorkinginAustralia/Documents/abolition-replacement-457.pdf.
DIIS (Department of Industry, Innovation and Science) n.d., Boosting the Commercial Returns from Research, viewed 19 May 2017, at https://www.industry.gov.au/industry/IndustryInitiatives/Pages/Boosting-the- Commercial-Returns-from-Research.aspx.
− 2014, Industry Innovation and Competitiveness Agenda, viewed 24 January 2017, at https://www.industry.gov.au/industry/Pages/Industry-Innovation-and-Competitiveness-Agenda. aspx#header.
− 2016a, Innovation: Latest NSRC data, 2000–2015 NSCR unit record data, Australian Government, viewed 19 September 2017, at https://industry.gov.au/innovation/NSRC/Data/Pages/default.aspx.
− 2016b, Automotive Transformation Scheme (ATS), fact sheet, Australian Government viewed 24 October 2017, at https://www.business.gov.au/assistance/automotive-transformation-scheme.
− 2017a, Industry Growth Centres: Initiative summary, A new policy direction for Australia, viewed 24 January 2017, at https://www.industry.gov.au/industry/Industry-Growth-Centres/Pages/ default.aspx.
− 2017b, Business: AusIndustry Programme Summary, Australian Government, at https://www.business.gov.au/about/ausindustry-programme-summary.
− 2017c, Australian Government Response to the Productivity Commission Inquiry into Intellectual Property Arrangements, Australian Government, at https://www.industry.gov.au/innovation/Intellectual-Property/Documents/Government-Response-to-PC-Inquiry-into-IP.pdf.
− 2017d, Resources: The Australian Domestic Gas Security Mechanism, Australian Government, viewed 26 September 2017, at https://industry.gov.au/resource/UpstreamPetroleum/AustralianLiquefiedNaturalGas/Pages/Australian-Domestic-Gas-Security-Mechanism.aspx.
DILGP (Department of Infrastructure, Local Government and Planning) 2016, New planning laws, fact sheet, at http://www.dilgp.qld.gov.au/resources/planning/better-planning/benefits-of-new-system.pdf.
− 2017, Response to Information Request from the QPC, provided 10 January 2017.

Final Report: Manufacturing in Queensland
Queensland Productivity Commission 288
Dinan, S 2015, ‘Obama clean energy loans leave taxpayers in $2.2 billion hole’, The Washington Times, 27 April, viewed 24 April 2017, at http://www.washingtontimes.com/news/2015/apr/27/obama-backed-green- energy-failures-leave-taxpayers/.
DIS (Department of Industry and Science) 2015, 2015 Energy White Paper, April, Australian Government, at http://ewp.industry.gov.au/sites/prod.ewp/files/EnergyWhitePaper.pdf.
DNRM (Department of Natural Resources and Mines) 2016, Queensland gas supply and demand action plan, discussion paper, Australian Government, November, at https://www.dnrm.qld.gov.au/ data/assets/pdf_ file/0007/805552/gas-action-plan-5107-discussion-paper.pdf.
DoE (Department of Employment) 2015a, Industry Outlook: Manufacturing, Australian Government, at https://cica.org.au/wp-content/uploads/2015-Manufacturing-Industry-Outlook.pdf.
− 2015b, Labour Market Research—Engineering Trades Workers, Queensland, December 2015, Australian Government, at https://docs.employment.gov.au/system/files/doc/other/ engineeringtradesqld_2.pdf.
− 2016a, Labour Market Research – Engineering Trades, Australian Government, at https://docs.employment.gov.au/system/files/doc/other/ausengineeringtrades_0.pdf.
− 2016b, Skill Shortage List Queensland, Australian Government, at https://docs.employment.gov.au/system/files/doc/other/skillshortagelistqld_7.pdf.
− 2016c, Labour market rating—ANZSCO 3941-11 Cabinetmaker, Queensland, September 2016, Australian Government, at https://docs.employment.gov.au/system/files/doc/ other/394111cabinetmakerqld_2.pdf.
− 2016d, Labour market rating - ANZSCO 3512-11 Butcher or Smallgoods Maker, Queensland, December 2016, Australian Government, at https://docs.employment.gov.au/system/files/doc/other/351211butcherqld_0.pdf.
− 2016e, Labour market rating—ANZSCO 3232-11,12,14 Metal Fitters and Machinists, Queensland, December 2016, Australian Government, at https://docs.employment.gov.au/system/files/doc/other/3232metalfittersmachinqld.pdf.
− 2016f, Labour market rating—ANZSCO 3223-11-13 Structural Steel and Welding Trades Workers Queensland, December 2016, Australian Government, at https://docs.employment.gov.au/system/files/doc/other/3223structweldtradworkqld.pdf.
− 2016g, Labour market rating—ANZSCO 2335-12 Mechanical Engineer, Queensland, April 2016, Australian Government , at https://docs.employment.gov.au/system/files/doc/other/233512mechanicalenginqld_3.pdf.
− 2016h, Labour market rating—ANZSCO 3222-11 Sheetmetal Trades Workers, Queensland, December 2016, Australian Government, at https://docs.employment.gov.au/system/files/doc/other/322211sheetmetaltradqld.pdf.
− 2016i, Help for workers who have recently lost their jobs from Queensland Nickel, fact sheet, Australian Government, at https://docs.employment.gov.au/system/files/doc/other/updated_201609_-_qnsap_factsheet.pdf.
DoET (Department of Education and Training) 2016a, Former Australian Workforce and Productivity Agency (AWPA) publications, Australian Government, at https://www.education.gov.au/former-australian-workforce-and-productivity-agency-awpa-publications.
− 2016b, Selected Higher Education Statistics—2016 Staff data, Australian Government, at https://www.education.gov.au/selected-higher-education-statistics-2016-staff-data.

Final Report: Manufacturing in Queensland
Queensland Productivity Commission 289
− 2017a, Skilling Australians Fund, Australian Government, viewed 3 October 2017, at https://docs.education.gov.au/system/files/doc/other/skilling_australians_fund_fact_sheet_0.pdf.
− 2017b, VET Student Loans, Australian Government, viewed 10 October 2017, at https://www.education.gov.au/vet-student-loans.
DoF (Department of Finance) 2017a, Ministerial Advisory Council on Skilled Migration, at http://www.finance.gov.au/node/119141/.
− 2017b, Commonwealth Procurement Rules, Australian Government, 1 March, at https://www.finance. gov.au/sites/default/files/commonwealth-procurement-rules.pdf.
Dolman, B, Parham, D, & Zheng, S 2007, Can Australia match US productivity performance?, Productivity Commission Staff Working Paper, March, Canberra.
Downes, P & Stoeckel, A 2006, Drivers of structural change in the Australian economy, Centre for International Economics, December, Canberra and Sydney.
DSD (Department of State Development) 2016a, Queensland Advanced Manufacturing 10-Year Roadmap and Action Plan: Powering the Queensland economy, Queensland Government, December, at http://statedevelopment.qld.gov.au/ resources/plan/advanced-manufacturing/advanced-manufacturing-roadmap.pdf.
− 2016b, Queensland Advanced Manufacturing 10-year Roadmap, discussion paper, Queensland Government, February, viewed 29 August 2016, at http://www.statedevelopment.qld.gov.au/ resources/paper/qld-adv-manufacturing-roadmap-paper.pdf.
− 2016c, Queensland Charter for Local Content, Queensland Government, at http://statedevelopment. qld.gov.au/resources/policy/queensland-charter-for-local-content.pdf.
− 2016d, Queensland Charter for Local Content: Best Practice Guidelines for Agencies, Queensland Government, at http://statedevelopment.qld.gov.au/resources/guideline/queensland-charter-for- local-content-agencies.pdf.
− 2016e, North Stradbroke Island Economic Transition Strategy, Queensland Government, September, at http://www.statedevelopment.qld.gov.au/industry-development/north-stradbroke-island- economic-transition-strategy.html.
− 2016f, Sharing our stories: Queensland Charter for Local Content delivers for suppliers and the state’s economy, viewed 10 May 2017, Queensland Government, at http://statedevelopment.qld.gov.au/news- media-events/qclc-delivers-for-suppliers-and-states-economy.html.
− 2016g, Queensland Biofutures 10-Year Roadmap and Action Plan, Queensland Government, June, at http://www.statedevelopment.qld.gov.au/resources/plan/biofutures/biofutures-10yr-roadmap-actionplan.pdf.
− 2017a, Response to Information Request from the QPC, provided 30 January 2017 and 3 February 2017.
− 2017b, Industry roadmaps, Queensland Government, viewed 3 February, at http://statedevelopment.qld.gov.au/industry-development/industry-roadmaps.html.
− 2017c, Made in Queensland Program: Guidelines for applicants, Queensland Government, February, at http://www.statedevelopment.qld.gov.au/resources/guideline/eid/made-in-qld- program%20guidelines.pdf.

Final Report: Manufacturing in Queensland
Queensland Productivity Commission 290
− 2017d, Queensland Mining Equipment, Technology and Services 10-Year Roadmap and Action Plan, July, at https://www.statedevelopment.qld.gov.au/resources/plan/eid/mets-10-year-roadmap-and-action-plan.pdf.
− 2017e Queensland Mining Equipment, Technology and Services 10-Year Roadmap and Action Plan, July, at https://www.statedevelopment.qld.gov.au/resources/plan/eid/mets-10-year-roadmap-and-action-plan.pdf.
− 2017f, Queensland Hackerspaces Grant program, Queensland Government, viewed 25 September 2017, at https://statedevelopment.qld.gov.au/industry-development/hackerspaces-grant-program.html.
− 2017g, Property Queensland, Queensland Government, viewed 25 September 2017, at <https://www.statedevelopment.qld.gov.au/industry-development/property-queensland.html.
− 2017h, Queensland Government Land Transaction Policy, Queensland Government, viewed 25 September 2017, at http://www.statedevelopment.qld.gov.au/resources/glam-land-transaction-policy-dsd.pdf.
− 2017i, Industry and Manufacturing Advisory Group, Queensland Government, viewed 25 July 2017, at https://www.statedevelopment.qld.gov.au/industry-development/industry-and-manufacturing-advisory-group.html.
DSITI (Department of Science, Information Technology and Innovation) 2017a, Response to Information Request from the QPC, provided 25 January 2017.
− 2017b, comments on the QPC draft report: Manufacturing in Queensland, 21 September.
DSITIA (Department of Science, Information Technology, Innovation and the Arts) 2015, The Innovation Case Study Library: KFSU Ltd and Kfibre, Fibres of Innovation, Queensland Government, at https://publications.qld.gov.au/dataset/99172124-8fd6-4a63-a1a7-3a2759d1b5d9/resource/eb7eb507-b46e- 4ac9-b95a-b2f0f6641b87/download/kfsu.pdf.
DTESB (Department of Tourism, Major Events, Small Business and the Commonwealth Games) 2017a, Response to Information Request from the QPC, provided 10 January 2017.
− 2017b, Better Regulation Taskforce, Queensland Government, viewed 26 September 2017, at https://www.dtesb.qld.gov.au/small-business/better-regulation-taskforce.
Edx 2017, Schools and Partners, at https://www.edx.org/schools-partners.
EEF 2014, Backing Britain: A manufacturing base for the future, at www.eef.org.uk/campaigning/news-blogs-and-publications/publications/2014/sep/backing-britain-a- manufacturing-base-for-the-future.
Energy Security Board 2017, Energy Security Board (ESB) advice on a retailer reliability, emissions guarantee and affordability, letter to The Hon. Josh Frydenberg MP, 13 October, at http://www.coagenergycouncil.gov.au/sites/prod.energycouncil/files/publications/documents/Energy%20Security%20Board%20ADVICE....pdf.
Enoch, L 2017a, Co-working space fosters next generation of entrepreneurs, media release, 4 July, Queensland Government, Brisbane, at http://statements.qld.gov.au/Statement/2017/7/4/coworking-space- fosters-next-generation-of-entrepreneurs.
− 2017b, Business growth potential ignited by Palaszczuk Government Advance Queensland funding, media release, March 29, Queensland Government, Brisbane, at http://statements.qld.gov.au/ Statement/2017/3/29/business-growth-potential-ignited-by-palaszczuk-government-advance- queensland-funding.

Final Report: Manufacturing in Queensland
Queensland Productivity Commission 291
− 2017c, Palaszczuk Government funds innovative ‘smart-aid’ kit which could save lives, media release, July 10, Queensland Government, Brisbane, at http://statements.qld.gov.au/Statement/2017/7/10/ palaszczuk-government-funds-innovative-smartaid-kit-which-could-save-lives.
ERA (Economic Regulation Authority) Western Australia 2014, Inquiry into microeconomic reform in Western Australia, final report, Economic Regulation Authority, Perth.
ESA (The Economic Society of Australia) (Victoria Branch) 2017, Energy shortages—reserving Australian gas, Poll results, viewed 18 May, at https://business.monash.edu/economics-forum/polls/energy-shortages- reserving-australian-gas.
ESCIP Consortium 2014, Study on the relationship between the localisation of production, R&D and innovation activities, final report, prepared for the European Commission, European Competitiveness and Sustainable Industrial Policy Consortium, Rotterdam.
Ernst & Young 2013, Hitting the sweet spot: The growth of the middle class in emerging markets, viewed 1 June 2017, at http://www.ey.com/Publication/vwLUAssets/Hitting_the_sweet_spot/$FILE/Hitting_the_ sweet_spot.pdf.
− 2015, Reshoring manufacturing—time to seize the opportunity, Ernst & Young, London.
Ferret 2017, ‘Monash Uni, Chobani launch $3 million food incubator facility’, news page, 30 August, viewed 1 September 2017, at http://www.ferret.com.au/articles/news/monash-uni-chobani-launch-3-million-food-incubator-facility-n2529021.
Fetsch E 2015, ‘Are Incubators Beneficial to Emerging Businesses?’, Growthology blog post, 3 February, Kauffman Foundation, at http://www.kauffman.org/blogs/growthology/2015/03/are-incubators-beneficial-to-emerging-businesses.
Finance and Administration Committee 2016, North Stradbroke Island Protection and Sustainability and Other Acts Amendment Bill 2015 and North Stradbroke Island Protection and Sustainability (Renewal of Mining Leases) Amendment Bill 2015, Report no. 21, 55th Parliament, Brisbane, May, at https://www.parliament.qld.gov.au/documents/committees/FAC/2015/B12-NthStradbrokeIsl/B12-rpt-001-03May2016.pdf.
Finland Ministry of Employment and the Economy 2012, Evaluation of Tekes, final report, at https://www.technopolis-group.com/wp-content/uploads/2014/04/1570-TEKES-Evaluation-Final.pdf.
Foley, M 2002a, Budget provides safety net for retrenched workers, media release, Queensland Government, Brisbane, 18 June, at http://statements.qld.gov.au/Statement/2002/6/18/budget-provides-safety-net-for- retrenched-workers.
Foley, M 2002b, Retrenched Rocky meatworkers get government help, media release, Queensland Government, 21 August 21, at http://statements.qld.gov.au/Statement/2002/8/21/retrenched-rocky-meat- workers-get-government-help.
Frederick, S 2016, Concepts and Tools, viewed 4 November 2017, available at https://globalvaluechains.org/concept-tools.
Freel, M 2000, ‘Barriers to Product Innovation in Small Manufacturing Firms’, International Small Business Journal, vol. 18, no. 2, pp. 60–80.
Frenkel, A, Bendit, E, & Kaplan, S 2013, ‘Residential location choice of knowledge-workers: The role of amenities, workplace and lifestyle’, Cities, vol. 35, pp. 33–41.
Full Circle Fibres 2017, Create with Conscience, at http://fullcirclefibres.com/.
Gahan, P, Adamovic, M, Bevitt, A, Harley, B & Healy, J, Olsen, J & Theilacker, M 2016, Leadership at Work Do Australian leaders have what it takes?, Centre for Workplace Leadership, University of Melbourne, at http://www.workplaceleadership.com.au/sal/.

Final Report: Manufacturing in Queensland
Queensland Productivity Commission 292
Gereffi, G & Franandez-Stark, K 2016, Global value chain analysis: A primer, 2nd edn, Duke University, Centre on Globalization, Governance and Competitiveness, at http://www.cggc.duke.edu/pdfs/Duke_CGGC_Global_ Value_Chain_GVC_Analysis_Primer_2nd_Ed_2016.pdf.
Germany Trade and Investment 2017, Industrie 4.0, at https://industrie4.0.gtai.de/INDUSTRIE40/Navigation/EN/Topics/industrie-4-0.html.
Gibson, M 2014, Bringing manufacturing back: Is the tide of offshoring beginning to turn towards reshoring?, Civitas, London.
Global Entrepreneurship and Development Institute 2017, Global Entrepreneurship Index 2017, at https://thegedi.org/global-entrepreneurship-and-development-index/.
Goodwin S 2017, ‘The red tape costs are killing us all, says veteran processor’, The Land, 7 September, p. 7.
Gordon, J, Zhao, S, & Gretton, P 2015, On productivity: Concepts and measurement, Productivity Commission, Canberra, at http://www.pc.gov.au/research/supporting/concepts-measurement/concepts-and- measurement.pdf.
Grace, G 2017, Expert panel to put health and safety laws under spotlight, media release, Queensland Government, Brisbane, 5 April, at http://statements.qld.gov.au/Statement/2017/4/5/expert-panel-to-put- work-health-and-safety-laws-under-the-spotlight.
Grant, R 2005, Offshoring jobs: US and Australian debates, Parliament of Australia, Canberra.
Gray, J, Skowronski, K, Esenduran, G & Runtusanatham, M 2013, ‘The reshoring phenomenon: What supply chain academics ought to know and should know’, Journal of Supply Chain Management, vol. 49, no. 2, pp. 27–33.
Green, R & Roos, G 2012, Australia’s Manufacturing Future, discussion paper, prepared for the Prime Minister’s Manufacturing Taskforce, at https://www.uts.edu.au/sites/default/files/Australia’s_Manufacturing_Future.pdf.
Green, R, Toner, P, & Agarwal, R 2012, Understanding Productivity Australia’s Choice, University of Technology Sydney and McKell Institute.
Greenough, J 2016, ‘How the Internet of Things is revolutionizing manufacturing’, Business Insider, 12 October, at http://www.businessinsider.com/internet-of-things-in-manufacturing-2016-10/?r=AU&IR=T.
Gretton P 2013, On input–output tables: uses and abuses, Productivity Commission Staff Research Note.
Griffith University 2017, Griffith Advanced Design and Manufacturing Institute, fact sheet, at https://moregoldcoast.com.au/wp-content/uploads/2017/05/Gold-Coast-Health-and-Knowledge-Precinct_AdAM-Factsheet.pdf.
Groom, B 2013, ‘One in six UK manufacturers reverse offshoring in growing trend’, Financial Times, 25 November, at www.ft.com/content/7e736f90-539e-11e3-9250-00144feabdc0.
Grove Juice 2017, About, http://grovejuice.com.au/why-grove/.
Hagel, J, Brown JS, Kulasooriya, D, Giffi, CA & Chen, M 2015, ‘The future of manufacturing: Making things in a changing world’, Deloitte Insights, 31 March, viewed 10 July 2016, at http://dupress.deloitte.com/dup-us-en/industry/manufacturing/future-of-manufacturing-industry.html.
Haider, Z 2015, Reshoring: myth or reality?, IBISWorld, Los Angeles, at https://www.ibisworld.com/media/wp-content/uploads/2015/03/Reshoring-myth-or-reality.pdf.
Halverson, E 2017, ‘Brisbane’s Herston Health Precinct to gain 3D printing hub’, ABC online news, 24 March, viewed 27 March 2017, at http://www.abc.net.au/news/2017-03-24/herston-health-precinct-to-be-converted- to-3d-printing-hub/8383820.

Final Report: Manufacturing in Queensland
Queensland Productivity Commission 293
Hampton, P 2005, Reducing administrative burdens: effective inspection and enforcement, final report, HM Treasury, UK Government, viewed 19 September 2017, at http://news.bbc.co.uk/nol/shared/bsp/hi/pdfs/bud05hampton_150305_640.pdf.
Hauser, H 2014, Review of the Catapult network, Cambridge, UK, at https://catapult.org.uk/wp-content/uploads/2016/04/Hauser-Review-of-the-Catapult-network-2014.pdf.
Heffernan, M 2017, ‘Energy prices a threat to food manufacturers’, The Age, Melbourne, 3 July, p. 18.
Henry, K, Harmer, J, Piggot, J, Ridout, H & Smith, G 2010, Australia’s future tax system, final report to the Treasurer Australia’s Future Tax System Review Panel, at https://taxreview.treasury.gov.au/content/Content.aspx?doc=html/pubs_reports.htm.
HSBNE 2017, About us, viewed 25 September 2017, at http://hsbne.org/index.html#about.
Hummels, D 2007, ‘Transportation Costs and International Trade Over Time’, Journal of Economic Perspectives, vol. 21, no. 3, pp. 131–54.
Hunt, G 2016, $31.6 million for next generation manufacturing in South Australia and Victoria, media release, Australian Government, 25 August, viewed 13 February 2017, at http://minister.industry.gov.au/ministers/ hunt/media-releases/316-million-next-generation-manufacturing-south-australia-and-victoria.
IDC (Interdepartmental Committee) Queensland Government Procurement 2015, Review of Queensland Government Procurement, Department of Housing and Public Works, at http://www.hpw.qld.gov.au/SiteCollectionDocuments/ReviewQGProcurement.pdf.
IMCRC (Innovative Manufacturing CRC) 2017a, IMCRC Research Project Applications, viewed 10 July 2017, at http://www.imcrc.org/new-research-projects.html.
− 2017b, Innovative Manufacturing CRC, fact sheet, viewed 10 July 2017, at http://www.imcrc.org/ uploads/8/2/9/0/82902038/imcrc_fact_sheet_feb17.pdf.
Inklaar, R & Timmer, MP 2008, GGDC productivity level database: international comparison of output, inputs and productivity at the industry level, Groningen Growth and Development Centre, University of Groningen.
− 2014, ‘The relative price of services’, Review of Income and Wealth, vol. 60, no. 4, pp. 727–46.
Innovation and Science Australia 2016, Performance Review of the Australian Innovation, Science and Research System 2016, Commonwealth Government, Canberra, at https://industry.gov.au/Innovation-and- Science-Australia/Documents/ISA-system-review/Performance-Review-of-the-Australian-Innovation- Science-and-Research-System-ISA.pdf.
International Data Corporation 2016, New IDC forecast shows U.S. 3D printer shipments grew nearly 20% in 2015 with double-digit growth expected through 2020, media release, International Data Corporation, Framingham,13 June, at https://www.idc.com/getdoc.jsp?containerId=prUS41516716.
International Federation of Robotics 2016, World Robotics 2016 Industrial Robots, Executive Summary, at http://www.diag.uniroma1.it/~deluca/rob1_en/2016_WorldRobotics_ExecSummary_Industrial.pdf.
International Labour Organization 2015, Re-shoring in Europe: Trends and Policy Issues, International Labour Organization, Geneva, viewed 21 September 2016, at http://www.ilo.org/wcmsp5/groups/public/---europe/--- ro-geneva/---ilo-brussels/documents/genericdocument/wcms_408974.pdf.
IP Australia 2017a, SourceIP, Australian Government, viewed 22 September 2017, at https://sourceip.ipaustralia.gov.au/.
IP Australia 2017b, Patent Analytics Hub, Australian Government, viewed 22 September 2017, at https://www.ipaustralia.gov.au/tools-resources/patent-analytics-hub.
ISLI Supply Chain Forum Team 2015, White Paper: Planning the future supply chain together, Sourcing strategies: Re-shoring vs offshoring, Kedge Business School, Bordeaux.

Final Report: Manufacturing in Queensland
Queensland Productivity Commission 294
Jacobs, D & Rush, A 2015, ‘Why Is Wage Growth So Low?’, Reserve Bank of Australia Bulletin, viewed 13 September 2017, at https://www.rba.gov.au/publications/bulletin/2015/jun/pdf/bu-0615-2.pdf.
Jamrisko, M & Lu, W 2017, ‘Innovative Economies: Nordic nations dominate the top 15, while South Korea reigns supreme and Russia is dealt a huge blow’, Bloomberg, 17 January, at https://www.bloomberg.com/ news/articles/2017-01-17/sweden-gains-south-korea-reigns-as-world-s-most-innovative-economies.
JQ (Jobs Queensland) 2016, Positive Futures: Apprenticeships and Traineeships in Queensland, discussion paper, Queensland Government, at http://jobsqueensland.qld.gov.au/projects/apprenticeships-2-2/.
Johnson, A 2016, ‘Re-shoring tide is starting to turn’, Manufacturer’s Monthly, 27 October, at http://www.manmonthly.com.au/features/re-shoring-tide-starting-turn/.
Johnston, R 2003, Clusters: A Review, prepared for the Mapping Australia’s Science and Innovation System Taskforce, Department of Education, Science and Training, The Australian Centre for Innovation Limited.
Jones, B & Grimshaw, D 2012, The Effects of Policies for Training and Skills on Improving Innovation Capabilities in Firms, Nesta working paper no. 12/08. Manchester Institute of Innovation Research, University of Manchester, at https://www.nesta.org.uk/sites/default/files/the_effects_of_policies_for_training_and_ skills_on_improving_innovation_capabilities_in_firms.pdf.
Kamp, B 2007, Location Behaviour and Relationship Stability in International Business Networks: Evidence from the automotive industry, Routledge, London and New York.
KFSU 2017, Manufacturers, viewed 28 April 2017, at http://www.kfsu.net/au/manufacturers/manufacturers.
KPMG 2016, Global Manufacturing Outlook: Competing for growth in industrial manufacturing, viewed 19 May 2017, at https://home.kpmg.com/xx/en/home/campaigns/2016/05/kpmg-internationals-2016-global- manufacturing-outlook-competing-for-growth.html.
Kwo, KK 2017, Comparative Advantage and Competitive Advantage, viewed 22 March 2017, at https://www.scribd.com/document/148896773/Comparative-Advantage-and-Competitive-Advantage.
Lacker, JM 1994, ‘Does adverse selection justify government intervention in loan markets?’, Federal Reserve Bank of Richmond Economic Quarterly, vol. 80, no. 1, pp. 61–95.
Lee, T 2014, ‘Leaps & Bounds’, ABC Landline, 17 August, viewed 3 August 2017, at http://www.abc.net.au/landline/content/2014/s4068602.htm.
Lenihan H, Hart M & Roper S 2007, ‘Industrial policy evaluation: Theoretical foundations and empirical innovations: new wine in new bottles’, International Review of Applied Economics, vol. 21, no. 3, pp. 313–19.
Lerner J 2009, Boulevard of Broken Dreams: Why Public Efforts to Boost Entrepreneurship and Venture Capital have Failed—and What to do About it, Princeton University Press.
Liu, X, Lovely, M, & Ondrich, J 2010, ‘The location decisions of foreign investors in China: Untangling the effect of wages using a control function approach’, Review of Economics and Statistics, vol. 92, no. 1, pp. 160–66.
Lynham, A 2017a, Manufacturers line up for design tips, media release, Queensland Government, 23 May, at http://statements.qld.gov.au/Statement/2017/5/23/manufacturers-line-up-for-design-tips.
− 2017b, Queensland puts foot on the gas with Feds, media release, Queensland Government, 16 April, at http://statements.qld.gov.au/Statement/2017/4/16/queensland-puts-foot-on-the-gas-with-feds.
− 2017c, Qld fires on ahead with gas development, media release, Queensland Government, 15 May, at http://statements.qld.gov.au/Statement/2017/5/15/qld-fires-on-ahead-with-gas-development.

Final Report: Manufacturing in Queensland
Queensland Productivity Commission 295
− 2017d, Made in Queensland grants now on offer to manufacturers, media release, Queensland Government, 16 February, at http://statements.qld.gov.au/Statement/2017/2/16/made-in-queensland- grants-now-on-offer-to-manufacturers.
− 2017e, Qld hits shortlist for army vehicle project, media release, Queensland Government, 24 February, at http://statements.qld.gov.au/Statement/2017/2/24/qld-hits-shortlist-for-army-vehicle-project.
− 2017f, Biorefinery expansion fuels jobs, grain demand, media release, Queensland Government, 27 June, at http://statements.qld.gov.au/Statement/2017/6/27/biorefinery-expansion-fuels- jobs-grain-demand.
− Lynham 2017g, Exploration program drives gas supply, new-age mineral, media release, Queensland Government, 11 October, at http://statements.qld.gov.au/Statement/2017/10/11/exploration-program-drives-gas-supply-newage-minerals.
Lynham, A O’Rourke, C & Grace, G 2016, Rapid Response Team mobilised following Yabulu redundancies, media release, Queensland Government, 15 January, at http://statements.qld.gov.au/Statement/2016/1/15/ rapid-response-team-mobilised-following-yabulu-redundancies.
MacCarthy, BL & Atthirawong, W 2003, ‘Factors affecting location decisions in international operations—a Delphi study’, International Journal of Operations and Production Management, vol. 23, no. 7, pp. 794–818.
Macfarlane, I 2015a, $74M boost for minerals processing and manufacturing CRCs, media release, Australian Government, 26 May, viewed 13 February 2017, at http://minister.industry.gov.au/ministers/macfarlane/media- releases/74m-boost-minerals-processing-and-manufacturing-crcs.
− 2015b, Forging greater research industry links, media release, Australian Government, 26 May, at http://minister.industry.gov.au/ministers/macfarlane/media-releases/forging-greater-research- industry-links.
Majumdar, R & Hussain, A 2016, ‘Reshoring manufacturing jobs to the United States: Myth or reality? Behind the Numbers, May 2016’, Deloite University Press, 25 May, at https://dupress.deloitte.com/dup-us-en/ economy/behind-the-numbers/reshoring-manufacturing-jobs-to-united-states.html.
Mallis, A 2016, ‘Signet pulls manufacturing back to Aussie shores’, ProPrint, 12 July, at www.proprint.com.au/ News/390417,signet-pulls-manufacturing-back-to-aussie-shores.aspx.
Manufacturing Extension Partnership 2014, Make it in America Challenge Awards Report, National Institute of Standards and Technology, Washington DC, December, at https://www.nist.gov/document/miiareportpdf.
Manyika, J, Sinclair, J, Dobbs, R, Strube, G, Rassey, L, Mishcke, J, Remes, J, Roxburgh, C, George, K, O’Halloran, D & Ramaswamy, S 2012, Manufacturing the future: The next era of global growth and innovation, McKinsey Global Institute and McKinsey Operations Practice, viewed 12 December 2016, at http://www.mckinsey.com/business-functions/operations/our-insights/the-future-of-manufacturing.
Marchese, G 2015, ‘Made in Italy’s allure prominent among factors behind reshoring of production’, Italy Europe 24, 23 June, at http://www.italy24.ilsole24ore.com/art/business-and-economy/2015-06-22/made- italy-excellence-calls-back-home-the-manufacturing-100808.php?uuid=ACbUYfE.
Margulescu, S & Margulescu, E 2014, ‘Reshoring in manufacturing and services’, Global Economic Observer, vol. 2, no. 1, pp. 90–5.

Final Report: Manufacturing in Queensland
Queensland Productivity Commission 296
Marshall, A 2017, Sunny Queen cracks new value-added egg market niche, viewed 26 April 2017, at http://www.queenslandcountrylife.com.au/story/4476402/sunny-queen-cracks-new-value-added-egg- market-niche/?cs=4699.
Mazzarol, T 2015, 'Business incubators and start-up accelerators: Valuable assets or a waste of time and money?', The Conversation, 1 August, viewed 22 September 2017, at https://theconversation.com/business-incubators-and-start-up-accelerators-valuable-assets-or-a-waste-of-time-and-money-45551.
Mazzarol, T 2016, ‘Is commercialising Australia’s research an insurmountable challenge?’, The Conversation, 4 May, at https://theconversation.com/is-commercialising-australias-research-an-insurmountable- challenge-26276.
McDonald F, Huang Q, Tsagdis D & Tuselmann HJ 2007, ‘Is there evidence to support Porter-type cluster policies?’, Regional Studies, vol. 41, no. 1, pp. 39–49.
McGowan, MA & Andrews, D 2015, Skills Mismatch and Public Policy in OECD Countries, OECD, at https://www.oecd.org/eco/growth/Skill-mismatch-and-public-policy-in-OECD-countries.pdf.
McIvor, R 2013, ‘Understanding the manufacturing location decision: The case for the transaction cost and capability perspectives’, Journal of Supply Chain Management, vol. 49, no. 2, pp. 23–26, viewed 29 August 2016, at http://onlinelibrary.wiley.com/doi/10.1111/jscm.12010/epdf.
McKenna M 2017, 'UQ’s commercial arm setting up for profitable future', The Australian, 13 September, viewed 27 September 2017, at http://www.theaustralian.com.au/.
McQuaid, R, Greig, M, Smyth, A & Cooper, J 2004, The Importance of Transport in Business’ Location Decisions, Edinburgh Napier University, viewed 16 December 2016, at http://stopstanstedexpansion.com/ documents/sse10_appendix_9.pdf.
MCRF (Medical Research Commercialisation Fund) 2017, About us, viewed 24 September 2017, at http://www.mrcf.com.au/about-us.
Miles, DA 2015, Growth through Innovation and Collaboration: A Review of the Cooperative Research Centres Programme, report for the Minister for Industry and Science.
Moore, GA 2014, Crossing the chasm: marketing and selling disruptive products to mainstream customers, 3rd edn, Harper Business, New York.
Moreno AZ 2015, Regulation, Innovation, & Entrepreneurship: A Review of the Literature, Regulatory Insight, Regulatory Studies Centre, The George Washington University, viewed 27 September 2017, at https://regulatorystudies.columbian.gwu.edu/sites/regulatorystudies.columbian.gwu.edu/files/downloads/RegInsight_AMZM-regulation-and-Innv%26entrep-literature-review120815.pdf.
Morrison, S 2017, Inquiry into Retail Electricity Supply, Terms of Reference, Commonwealth of Australia, letter to the ACCC, 27 March, at https://www.accc.gov.au/system/files/27032017075228-0001.pdf.
Moser, H 2014, ‘How will China’s labor turmoil and rising wages impact reshoring?’, IndustryWeek, 14 May, at http://www.industryweek.com/ask-expert-reshoring/how-will-chinas-labor-turmoil-and-rising-wages- impact-reshoring.
− 2016a, About Us, Reshoring Initiative website, at http://reshorenow.org/about-us/.
− 2016b, Total Cost of Ownership Estimator, Reshoring Initiative website, at http://reshorenow.org/tco-estimator/.
− 2016c, ‘A deeper dive into total cost of ownership (TCO): Part 1’, Assembly, 1 December, at www.assemblymag.com/articles/93652-a-deeper-dive-into-total-cost-of-ownership-tco-part-1.
− 2016d, ‘Using TCO when buying or selling’, Assembly, 3 October, at www.assemblymag.com/ articles/93590-using-tco-when-buying-or-selling.

Final Report: Manufacturing in Queensland
Queensland Productivity Commission 297
MSA (Manufacturing Skills Australia) 2015a, Manufacturing: advancing the conversation, Environmental Scan 2015, at http://www.mskills.com.au/DownloadManager/downloads/MSA%20EScan%202015.pdf.
− 2015b, Submission to the Australian Government Department of Education and Training, Review of the 2016–17 Skilled Occupations List (SOL), at https://submissions.education.gov.au/forms/ archive/2015_16_sol/documents/Manufacturing%20Skills%20Australia.pdf.
− 2015c, Foundation Skills in the manufacturing industry, at http://www.mskills.com.au/downloads/ Foundation%20Skills%20in%20the%20manufacturing%20industry_March%202015.pdf.
National Commission of Audit 2014, Towards Responsible Government, Appendix to the Report of the National Commission of Audit, Volume 1, at http://www.ncoa.gov.au/report/docs/appendix_volume%201.pdf.
NAB (National Australia Bank) 2017, Moments that Matter, Chapter 1: Understanding Australian small to medium businesses, at http://business.nab.com.au/wp-content/uploads/2017/09/mtm-whitepaper-ipsos.pdf.
National Institute of Standards and Technology (NIST) 2013, The MEP Makes it in America: Details on the 10 Make it in America awards, 3 December, viewed 27 October 2017, at https://www.nist.gov/news-events/news/2013/12/mep-makes-it-america-details-10-make-it-america-awards.
NCVER (National Centre for Vocational Education Research) 2015, Employers’ use and views of the VET system 2015, at https://www.ncver.edu.au/ data/assets/file/0022/9427/2015-employers-use-and- views-2822.pdf.
NCVER (National Centre for Vocational Education Research) 2016, Government-funded student outcomes 2016 data slicer, 1 December, at https://www.ncver.edu.au/data/data/all-data/government-funded-student- outcomes-2016-data-slicer#.
Needham, C 2014, Reshoring of EU manufacturing, briefing 21 March, European Parliamentary Research Service, at www.europarl.europa.eu/EPRS/140791REV1-Reshoring-of-EU-manufacturing-FINAL.pdf.
New South Wales Government 2017, Quality Regulatory Services Initiative, 26 September, at https://www.finance.nsw.gov.au/better-regulation/quality-regulatory-services-initiative.
New South Wales Government n.d., ProcurePoint: Statement on Value for Money, at https://www.procurepoint.nsw.gov.au/policy-and-reform/nsw-government-procurement-information/statement-value-money.
New South Wales Treasury 2016, Interstate Comparison of Taxes 2015–16, research and information paper, New South Wales Government, at https://www.treasury.nsw.gov.au/sites/default/files/pdf/TRP16-01_ Interstate_Comparison_of_Taxes_2015-16_-_pdf.pdf.
New Zealand Government Procurement 2015, Government Rules of Sourcing, 3rd edn, New Zealand Government Procurement and Ministry of Business Innovation and Employment, Wellington, at http://www.procurement.govt.nz/procurement/pdf-library/agencies/rules-of-sourcing/procurement-government-rules-of-sourcing-v3.pdf.
New Zealand Ministry of Economic Development 2009, Evaluation of the Venture Investment Fund, at http://www.mbie.govt.nz/publications-research/publications/evaluation-of-government-programmes/vif-evaluation.pdf.
− 2011, Innovation Policies and Funding in New Zealand: How Effective are they?, at http://www.esg.co.nz/pub_files/Innovation%20Policies%20 &%20Funding%20Study%20[Part%20A]%20-%20Published%20Report.pdf.
https://www.nist.gov/news-events/news/2013/12/mep-makes-it-america-details-10-make-it-america-awards

Final Report: Manufacturing in Queensland
Queensland Productivity Commission 298
Nguyen, T & Hansell, D 2014, Firm Dynamics and Productivity Growth in Australian Manufacturing and Business Services, research paper, Australian Bureau of Statistics, cat. no. 1351.0.55.052, at http://www.ausstats.abs.gov.au/ausstats/subscriber. nsf/0/2E2F6F53A20300A1CA257D6C0019D9F4/$File/1351055052_oct%202014.pdf.
Norris, G 2016, ‘Brisbane company Signet has local manufacturing all wrapped up’, Courier Mail, 10 July, at http://www.couriermail.com.au/business/brisbane-company-signet-has-local-manufacturing-all-wrapped- up/news-story/dd527f7f5aa5e96b075af0314d564be5.
Norris, G 2017, ‘Queensland is now innovation hub, says state’s Chief Entrepreneur Mark Sowerby’, Courier Mail, 23 March, at http://www.couriermail.com.au/business/queensland-is-now-innovation-hub-says-states- chief-entrepreneur-mark-sowerby/news-story/8bfe7dec2719c02313d39e213bd5aaeb.
NZPC (New Zealand Productivity Commission) 2014, Regulatory institutions and practices, at http://www.productivity.govt.nz/sites/default/files/regulatory-institutions-and-practices-final-report.pdf.
NZVIF (New Zealand Venture Investment Fund) 2017, Investment Report For the Year to 30 June 2016, at http://www.nzvif.co.nz/assets/publications/NZVIF-Investment-Report-2017.pdf.
OECD (Organisation for Economic Co-operation and Development) 1999, Boosting Innovation: The Cluster Approach, OECD Publishing, Paris.
− 2005a, Trade and structural adjustment, OECD, at http://www.oecd.org/trade/tradedev/tradeandstructuraladjustment.htm.
− 2005b, Oslo Manual: The measurement of scientific and technological activities, European Commission Eurostat, available at 2005b.
− 2007, Glossary of Statistical Terms, at https://stats.oecd.org/glossary/.
− 2011, Attractiveness for Innovation: Location Factors for International Investment, Executive Summary, OECD Publishing, Paris, at http://www.oecd.org/sti/inno/47659507.pdf.
− 2012a, Australian Manufacturing in the Global Economy, final report, prepared for the Australian Government Department of Industry, Innovation, Science, Research and Tertiary Education, viewed 29 August 2016, at http://www.industry.gov.au/industry/OtherReportsandStudies/Documents/ OECD_Aus_Manufacturing.pdf.
− 2012b, Entrepreneurship at a Glance 2012, OECD Publishing, Paris, at http://www.oecd-ilibrary.org/ industry-and-services/entrepreneurship-at-a-glance-2012_entrepreneur_aag-2012-en.
− 2012c, Recommendation of the Council on Regulatory Policy and Governance, OECD, Paris.
− 2013a, ‘Firms collaborating on innovation with higher education or public research institutions, by firm size, 2008–10’, in OECD Science, Technology and Industry Scoreboard 2013, OECD Publishing, Paris, at http://www.oecd-ilibrary.org/science-and-technology/oecd-science-technology-and- industry-scoreboard-2013/firms-collaborating-on-innovation-with-higher-education-or-public- research-institutions-by-firm-size-2008-10_sti_scoreboard-2013-graph110-en.
− 2013b, Key Facts about the Survey of Adult Skills (PIAAC), at https://www.oecd.org/skills/piaac/ Key%20facts%20about%20the%20Survey%20of%20Adult%20Skills.pdf.
− 2015a, The Innovation Imperative: Contributing to Productivity, Growth and Well-Being, OECD Publishing, Paris, at https://www.oecd.org/publications/the-innovation-imperative-9789264239814-en.htm.

Final Report: Manufacturing in Queensland
Queensland Productivity Commission 299
− 2015b, OECD Innovation Strategy 2015: An Agenda for Policy Action, meeting of the OECD Council at Ministerial Level (OECD week), 3–4 June 2015, Paris, at https://www.oecd.org/sti/OECD-Innovation- Strategy-2015-CMIN2015-7.pdf.
− 2015c, OECD Science, Technology and Industry Scoreboard, OECD Publishing, Paris, at http://www.oecd-ilibrary.org/science-and-technology/oecd-science-technology-and-industry- scoreboard_20725345.
− 2016, Entrepreneurship at a Glance 2016, OECD Publishing, Paris, at http://dx.doi.org/10.1787/entrepreneur_aag-2016-en.
− 2017a, Programme for International Student Assessment (PISA), at https://www.oecd.org/pisa/aboutpisa/.
− 2017b, Economic Survey of Australia, at www.oecd.org/eco/surveys/economic-survey-australia.htm.
Office of Public Affairs 2012, Obama Administration announces $40 million initiative to challenge businesses to Make it in America, media release, United States Department of Commerce, Washington DC, 25 September, at http://2010-2014.commerce.gov/news/press-releases/2012/09/25/obama-administration- announces-40-million-initiative-challenge-busine.html.
− 2013, Obama Administration awards $20.5 million in Make it in America Challenge grants to spur business investment and job creation in the U.S., media release, 22 October, United States Department of Commerce, Washington DC, at https://www.commerce.gov/news/press-releases/2013/10/ obama-administration-awards-205-million-make-it-america-challenge-grants.
Office of the Chief Economist 2014, Australian Industry Report 2014, Australian Government Department of Industry, Canberra, at http://www.industry.gov.au/Office-of-the-Chief-Economist/Publications/Documents/ Australian-Industry-Report.pdf.
− 2015a, Australian Innovation System Report 2015, Department of Industry, Innovation and Science, Australian Government, Canberra, at https://www.industry.gov.au/Office-of-the-Chief-Economist/ Publications/Documents/Australian-Innovation-System/Australian-Innovation-System-Report-2015.pdf.
− 2015b, Evaluation Strategy 2015–2019, Department of Industry and Science, Australian Government, Canberra, at https://industry.gov.au/Office-of-the-Chief-Economist/Publications/Documents/ Evaluation-Strategy.pdf.
− 2016, Australian Innovation System Report 2016, Department of Industry, Innovation and Science, Australian Government, Canberra, at https://industry.gov.au/Office-of-the-Chief-Economist/ Publications/Documents/Australian-Innovation-System/2016-AIS-Report.pdf.
Office of the Chief Scientist 2014, Science, Technology, Engineering and Mathematics: Australia’s Future, Australian Government, Canberra, at http://www.chiefscientist.gov.au/wp-content/uploads/STEM_ AustraliasFuture_Sept2014_Web.pdf.
Office of the Queensland Chief Scientist 2016a, Advanced Manufacturing: Implications and opportunities for Queensland, Office of the Queensland Chief Scientist, Brisbane, at http://www.chiefscientist.qld.gov.au/ images/documents/chiefscientist/pubs/reports-other/advanced-manufacturing-2016.pdf.
− 2016b, Health of Queensland Science and Innovation 2016, Department of Science, Information Technology and Innovation, Queensland Government, Brisbane, at http://www.chiefscientist.qld.gov. au/images/documents/chiefscientist/pubs/reviews-audits/health-qld-science-2016.pdf.

Final Report: Manufacturing in Queensland
Queensland Productivity Commission 300
− 2017, STEM Education: The challenge for Queensland, Queensland Government, viewed 19 May 2017, at http://www.chiefscientist.qld.gov.au/stem-education/challenge-for-queensland.
OPT Review Taskforce 2016, Opportunities for Personalised Transport, viewed 19 May 2017, at https:// optreviewqld.com.au/about-the-review.
OSR (Office of State Revenue) 2017, confidential data provided to the Queensland Productivity Commission, 22 May.
Pack, H & Saggi, K 2006, ‘Is there a case for industrial policy? A critical survey’, World Bank Research Observer, vol. 21, no. 2, pp. 267–97.
Packaging News 2016, ‘Brisbane’s Signet to invest millions in plastics manufacturing’, Packaging News, 11 July, at www.packagingnews.com.au/news/brisbane-s-signet-to-invest-millions-in-plastics- manufacturing#comments.
Packer Leather 2017, Packer Leather—Performance Technologies, viewed 22 June 2017, at http:// packerleather.com/technologies/.
Palaszczuk, A 2017a, Biorefinery planned for regional Queensland, media release, Queensland Government, Brisbane, 21 June, at http://statements.qld.gov.au/Statement/2017/6/21/biorefinery-planned-for-regional- queensland.
Palaszczuk, A 2017b, "Buy Queensland" to boost business and jobs, media release, Queensland Government, Brisbane, 29 July, at http://statements.qld.gov.au/Statement/2017/7/29/buy-queensland-to-boost-business-and-jobs.
Palaszczuk, A & Bailey, M 2017, New Gladstone plant a boost for biofuel industry in Queensland, media release, Queensland Government, Brisbane, 1 June, at http://statements.qld.gov.au/Statement/2017/6/1/new- gladstone-plant-a-boost-for-biofuel-industry-in-queensland.
Palaszczuk, A & Enoch, L 2016, $405 million to accelerate Advance Queensland–making Queensland the national innovation leader, media release, Queensland Government, 13 June, at http://statements.qld.gov. au/Statement/2016/6/13/405-million-to-accelerate-advance-queensland--making-queensland-the-national- innovation-leader.
Palaszczuk, A & Lynham, A 2017, Premier evokes Maroon spirit to secure armoured vehicle contract for Qld, media release, Queensland Government, Brisbane, 5 July, at http://statements.qld.gov.au/ Statement/2017/7/5/premier-evokes-maroon-spirit-to-secure-armoured-vehicle-contract-for-qld.
PC (Productivity Commission) 2001, Structural Adjustment—Key Policy Issues, research paper, Canberra.
− 2003, Trends in Australian Manufacturing, research paper, Canberra.
− 2006, Productive Reform in a Federal System, Roundtable Proceedings, Canberra, 27–28 October 2005.
− 2007, Public Support for Science and Innovation, research report, Canberra.
− 2008, Annual Review of Regulatory Burdens on Business: Manufacturing and Distributive Trades, research report, Canberra.
− 2010, Contribution of the Not-for-Profit Sector, research report, Canberra.
− 2011a, Vocational Education and Training Workforce, research report, Canberra.
− 2011b, Performance Benchmarking of Australian Business regulation: Planning, Zoning and Development Assessments, research report, Canberra.
− 2011c, Identifying and Evaluating Regulation Reforms, research report, Canberra.
− 2012, Annual Report 2011–12, annual report series, Canberra.

Final Report: Manufacturing in Queensland
Queensland Productivity Commission 301
− 2013a, Regulator Engagement with Small Business, research report, Canberra.
− 2013b, Electricity network regulatory frameworks, inquiry report no. 62, Canberra.
− 2014a, Geographic Labour Mobility, research report, Canberra.
− 2014b, Trade & Assistance Review 2012–13, annual report series, Canberra.
− 2014c, Public infrastructure, inquiry report no. 71, May.
− 2015a, Examining barriers to more efficient gas markets, research paper, Canberra.
− 2015b, Business Set-Up, Transfer and Closure, inquiry report no. 75, Canberra.
− 2016a, Digital Disruption: What do governments need to do?, research paper, Productivity Commission, Canberra.
− 2016b, Trade and Assistance Review 2014–15, annual report series, Canberra.
− 2016c, Regulation of Australian Agriculture, inquiry report no. 79, Canberra.
− 2016d, Intellectual Property Arrangements, inquiry report no. 78, Canberra.
− 2017a, Trade & Assistance Review 2015–16, annual report series, Canberra.
− 2017b, Horizontal Fiscal Equalisation, Terms of Reference, Canberra, at http://www.pc.gov.au/inquiries/current/horizontal-fiscal-equalisation/terms-of-reference.
− 2017c, Rising protectionism: challenges, threats and opportunities for Australia, research paper, Canberra.
Pezzini, M 2012, ‘An emerging middle class’, OECD Observer, viewed 1 June 2017, at http://oecdobserver.org/news/fullstory.php/aid/3681/An_emerging_middle_class.html.
Pitt, C 2016, Queensland now even more competitive on tax and forecast to grow strongly, media release, 19 July, Queensland Government, viewed 13 September 2017, at http://statements.qld.gov.au/Statement/2016/7/19/queensland-now-even-more-competitive-on-tax-and-forecast-to-grow-strongly.
− 2017a, Innovative legaltech firm gets $500,000 funding boost, media release, Queensland Government, 5 May, at http://statements.qld.gov.au/Statement/2017/5/5/innovative-legaltech-firm-gets- 500000-funding-boost.
− 2017b, QPC draft report on manufacturing in Queensland, media release, Queensland Government, 20 July, at http://statements.qld.gov.au/Statement/2017/7/20/qpc-draft-report-on-manufacturing-in-queensland.
Pitt, C & Bailey M 2017, Brisbane-based manufacturer Tritium charges ahead while Qld launches new EV strategy, joint media release, 4 October, Queensland Government, at http://statements.qld.gov.au/Statement/2017/10/4/brisbanebased-manufacturer-tritium-charges-ahead-while-qld-launches-new-ev-strategy.
Pitt, C & Lynham, A 2016, $7.6M drives manufacturing transformation, media release, Queensland Government, 14 December, at http://statements.qld.gov.au/Statement/2016/12/14/76m-drives-manufacturing-transformation.
− 2017, Government injects $8.64 million into new biorefinery and jobs for Mackay, media release, Queensland Government, 9 June, at http://statements.qld.gov.au/Statement/2017/6/9/ government-injects-864-million-into-new-biorefinery-and-jobs-for-mackay.
Porter, ME 1998, ‘Clusters and the New Economics of Competition’, Harvard Business Review, November–December at https://hbr.org/1998/11/clusters-and-the-new-economics-of-competition.

Final Report: Manufacturing in Queensland
Queensland Productivity Commission 302
Potts, J & Morrison, K 2009, Nudging Innovation: Fifth generation innovation, behavioural constraints, and the role of creative business—considerations for the NESTA innovation vouchers pilot, NESTA, at https://www.nesta.org.uk/sites/default/files/nudging_innovation.pdf.
Prime Minister’s Taskforce on Manufacturing 2012, Prime Minister’s Manufacturing Taskforce: Report of the non-government members, Department of Industry, Innovation, Science, Research and Tertiary Education, Canberra.
PwC (PricewaterhouseCoopers Australia) 2012, Incentives for network driven DSP, prepared for the Energy Networks Association, at http://www.energynetworks.com.au/sites/default/files/incentives_for_network_driven_dsp.pdf.
− 2015, Innovate and Prosper: Ensuring Australia’s Future Competitiveness through University-Industry Collaboration, at https://www.atn.edu.au/siteassets/publications/atninnovateprosper.pdf.
QAO (Queensland Audit Office) 2016, Strategic procurement, Report 1: 2016–17, Queensland Government, at https://www.qao.qld.gov.au/sites/all/libraries/pdf.js/web/viewer.html?file=https%3A%2F%2Fwww.qao.qld.gov. au%2Fsites%2Fqao%2Ffiles%2Freports%2Fstrategic_procurement_report_1_2016-17.pdf.
QCA (Queensland Competition Authority) 2012, Queensland Legislation in Force on 23 March 2012: Page Count and Classification by Broad Function, information report, at http://www.qca.org.au/getattachment/ f515487f-9ef6-46fd-ac74-1befd2092c29/Information-Report-Queensland-Legislation-in-Force.aspx.
− 2013, Measuring and Reducing the Burden of Regulation, final report, viewed 26 September 2017, at http://www.qca.org.au/Other-Sectors/Red-Tape-Reduction/Regulatory-Impact-Statements/Regulatory-Impact-Statements/Reference-Material/OBPR-GOV-FinalReport-MRBR-0313-1.
− 2015a, Industry Assistance in Queensland, final report, vol. 1, at http://www.qca.org.au/ getattachment/9af6d9af-bb5b-4b35-882c-ea2021107c6c/Final-Report-Volume-1.aspx.
− 2015b, Industry Assistance in Queensland, final report, vol. 2, at http://www.qca.org.au/ getattachment/529fdbd7-0e44-4006-a73f-cd0542710fb1/Final-Report-Volume-2.aspx.
− 2017, Regulated retail electricity prices for 2017–18, final determination, at http://www.qca.org.au/getattachment/a3e8d208-8177-4d58-a677-f90ad6812c3d/QCA-2017-18-final-determination-of-regulated-elect.aspx.
QGHA (Queensland Genomics Health Alliance) 2016, Projects, viewed 24 September 2017, at https://www.qgha.org/project.
QPC (Queensland Productivity Commission) 2016a, Electricity Pricing Inquiry, final report, at http://www.qpc.qld.gov.au/files/uploads/2016/11/EPI-Final-Report.pdf.
− 2016b, Solar Feed-in Pricing in Queensland, final report, at http://www.qpc.qld.gov.au/files/ uploads/2016/12/DOC16-2388-Solar-Final-Report-FINAL2.pdf.
− 2016c, Manufacturing in Queensland, issues paper, at http://www.qpc.qld.gov.au/files/ uploads/2016/09/Manufacturing-Inquiry-Issues-Paper.pdf.
− 2016d, Productivity: Concepts, Measurement & Performance, research paper, at http://www.qpc.qld. gov.au/files/uploads/2016/12/Productivity-Concepts-Measurement-and-Performance-FINAL.pdf.
− 2017a, Red Tape Reduction Advisory Council Recommendations, regulatory advice, February, at https://qpc.blob.core.windows.net/wordpress/2017/06/Red-Tape-Reduction-Advisory-Council-QPC-Regulatory-Advice-Report-for-.._.pdf.

Final Report: Manufacturing in Queensland
Queensland Productivity Commission 303
− 2017b, Manufacturing in Queensland, draft report, at https://qpc.blob.core.windows.net/wordpress/2017/07/17_4232-QPC-Manufacturing-Report_21.pdf.
Queensland Government 2016a, The Queensland Government’s objectives for the community, at https://www.premiers.qld.gov.au/publications/categories/plans/community-objectives/assets/qld- government-community-objectives.pdf.
− 2016b, Queensland Budget 2016–17: Budget Strategy and Outlook, Budget Paper No.2, at https://s3- ap-southeast-2.amazonaws.com/s3-media-budget/pdfs/budget+papers/bp2/bp2-2016-17.pdf.
− 2016c, Red Tape Reduction Advisory Council Report: Queensland Government Response and Action Plan, at https://www.treasury.qld.gov.au/publications-resources/response-and-action-plan/rtrac- report-response-and-action-plan.pdf.
− 2016d, GITC review co-design, viewed 10 May 2017, at https://www.qld.gov.au/dsiti/gov-ict/buying-selling-ict/gitc-review/co-design/.
− 2016e, Queensland Government response to the Queensland Productivity Commission Electricity Pricing Inquiry, at https://www.dews.qld.gov.au/__data/assets/pdf_file/0005/939983/qps-response-outline.pdf.
− 2017a, Advance Queensland: Platform Technology Program, viewed 19 May 2017, at http://advance.qld.gov.au/industry/platform-technology-program.aspx.
− 2017b, Advance Queensland: Women’s Academic Fund, viewed 19 May 2017, at http://advance.qld.gov.au/uni-researchers/women-academic-fund.aspx.
− 2017c, Queensland State Budget 2017–18: Service delivery statements—Department of Education and Training, Budget Paper 5, Queensland Government, at https://s3.budget.qld.gov.au/budget/papers/5/ bp5-det-2017-18.pdf.
− 2017d, Advance Queensland: Industry Accelerator Program, viewed 4 July 2017, at http://advance.qld. gov.au/industry/industry-accelerator-program.aspx.
− 2017e, Advance Queensland: The Precinct, viewed 4 July 2017, at http://advance.qld.gov.au/ entrepreneurs-startups/the-precinct.aspx.
− 2017f, Queensland Trade and Investment Strategy 2017–2022, viewed at https://www.tiq.qld.gov.au/ download/business-interest/invest/trade-investment-strategy-TIQ.pdf.
− 2017g, Advance Queensland: Ignite Ideas Fund, viewed 11 July 2017, at http://advance.qld.gov.au/ industry/ignite-ideas-fund.aspx.
− 2017h, Advance Queensland: Women’s Academic Fund, viewed 4 July 2017, at http://advance.qld.gov. au/uni-researchers/women-academic-fund.aspx.
− 2017i, Business Queensland: Apprentice and trainee rebate for payroll tax, viewed 4 July 2017, at https://www.business.qld.gov.au/running- business/employing/payroll-tax/exemptions/apprentice- trainee-rebate.
− 2017j, Business Queensland: Food and beverage industry regulations and compliance, viewed 10 April 2017, at https://www.business.qld.gov.au/industries/hospitality-tourism-sport/food/food-beverage/regulations.
− 2017k, Advance Queensland: Biofutures Commercialisation Program, viewed 24 September 2017, at http://advance.qld.gov.au/industry/biofutures-commercialisation-program.aspx.
Final Report: Manufacturing in Queensland
Queensland Productivity Commission 304
− 2017l, Advance Queensland: Innovation Partnerships, viewed 24 September 2017, at http://advance.qld.gov.au/investors/innovation-partnerships.aspx.
− 2017m, Red Tape Reduction Advisory Council Report 2016: Six-month progress report, viewed 25 September 2017, at https://s3.treasury.qld.gov.au/files/rtrac-six-month-progress-report.pdf.
− 2017n, Queensland Government Open Data Policy Statement, Department of Science, Information Technology and Innovation, at https://www.qld.gov.au/data/qld-data-policy-statement.pdf.
− 2017o, Advance Queensland: Knowledge Transfer Partnerships Program, viewed 15 September 2017, at http://advance.qld.gov.au/small-business/knowledge-transfer-partnerships.aspx.
− 2017p, Advance Queensland: Research Fellowships 2017, viewed 15 September 2017, at http://advance.qld.gov.au/uni-researchers/research-fellowships.aspx.
− 2017q, Queensland Budget 2017–18 Service Delivery Statements: Department of Tourism, Major Events, Small Business and the Commonwealth Games, at https://s3.budget.qld.gov.au/budget/papers/5/bp5-dtesb-2017-18.pdf.
− 2017r, Advance Queensland: Sports Science Challenge, viewed 24 September 2017, at http://advance.qld.gov.au/industry/sport-science-challenge.aspx.
− 2017s, Office of Small Business Report 2016–17, Department of Tourism, Major Events, Small Business and the Commonwealth Games, viewed 9 October 2017, at https://publications.qld.gov.au/dataset/7c25b44d-ffd0-4b7a-aeb6-e9a6a2f7b136/resource/ff492653-7f0d-4d20-950b-6fbabec53ca6/download/osb7.pdf.
− 2017t, Advance Queensland: Industry, viewed 24 October 2017, at http://advance.qld.gov.au/industry.aspx.
Queensland Government Statistician’s Office 2017a, Trade data—overseas exports by industry (4-digit ANZSIC 1993 edition) and country of destination, Queensland and other states and territories, 1995–96 to 2015–16, Queensland Government, Brisbane, at http://www.qgso.qld.gov.au/products/tables/trade-data- overseas-exports-industry-anzsic/index.php.
− 2017b, Trade data—overseas imports by industry (4-digit ANZSIC 1993 edition) and country of origin, Queensland and other states and territories, 2005–06 to 2015–16, Queensland Government, Brisbane, at http://www.qgso.qld.gov.au/subjects/economy/trade/tables/trade- data-overseas-imports-industry-anzsic/index.php.
Queensland Leaders n.d., About Us, available at http://www.queenslandleaders.com.au/about-us/
Queensland Training Ombudsman 2017, Meet the Office of the Queensland Training Ombudsman, at http://trainingombudsman.qld.gov.au/about/.
Queensland Treasury 2008, State Budget 2008–09, Major economic statement: Mid year fiscal and economic review, Queensland Government, Brisbane, at https://www.treasury.qld.gov.au/publications-resources/mid- year-review/mid-year-review-2008-09.pdf.
− 2014, Queensland Government Program Evaluation Guidelines, Queensland Government, Brisbane, at https://s3.treasury.qld.gov.au/files/qld-government-program-evaluation-guidelines.pdf
− 2016a, unpublished Queensland Treasury research paper.
− 2016b, North Stradbroke Island Workers Assistance Scheme, Queensland Government, viewed 19 May 2017, at https://www.treasury.qld.gov.au/projects-infrastructure/initiatives/nsi/workers-assistance- scheme.php.

Final Report: Manufacturing in Queensland
Queensland Productivity Commission 305
− 2016c, Mid Year Fiscal and Economic Review, Queensland Government, Brisbane, viewed 19 May 2017, at https://www.treasury.qld.gov.au/publications-resources/mid-year-review/mid-year-review-2016-17.pdf.
− 2016d, Budget Strategy and Outlook 2016–17, viewed 19 May 2017 at http://budget.qld.gov.au/ budget-papers/
− 2017a, ‘Using Labour Force Statistics’, unpublished internal document.
− 2017b, Queensland State Budget 2017–18: Budget Strategy and Outlook, Budget Paper 2, viewed 4 July 2017, at https://budget.qld.gov.au/budget-papers/.
Queensland Treasury and Trade 2012, Queensland Industry Structure, 2006-07, Queensland Government, Brisbane, at http://www.qgso.qld.gov.au/products/reports/qld-industry-structure/qld-industry-structure-2006-07.pdf.
− 2013, Experimental Estimates of Gross Regional Product 2000–01, 2006–07 and 2010–11, Queensland Government, Brisbane, at http://www.qgso.qld.gov.au/products/reports/experimental-estimates-grp/ experimental-estimates-grp-2010-11.pdf.
Ranga, M & Etzkowitz, H 2013, ‘Triple helix systems: an analytical framework for innovation policy and practice in the knowledge society’, Industry and Higher Education, vol. 27, no. 4, pp. 237–62.
Rassenfosse, G, Jensen, P, & Webster, E 2011, Understanding Innovation: The Role of Policy Intervention, Intellectual Property Research Institute of Australia, Melbourne Institute of Applied Economic and Social Research, University of Melbourne.
RBA (Reserve Bank of Australia) 2017, Statistical Tables, viewed August 2017, at http://www.rba.gov.au/statistics/tables/.
Red Meat Industry 2008, Submission to the Productivity Commission, Annual Review of Regulatory Burdens on Business: Manufacturing and Distributive Trades, viewed 13 February 2017, at http://www.pc.gov.au/ inquiries/completed/regulatory-burdens/manufacturing/submissions/24_red_meat_industry/sub024.pdf.
Regulatory Policy Framework Review Panel 2017, Independent Review of the NSW Regulatory Policy Framework, draft report, viewed 19 September 2017, at http://www.dpc.nsw.gov.au/__data/assets/pdf_file/0007/185677/Regulatory_Policy_Framework_Review_-_Draft_report_for_consultation_vA3893728.pdf.
Reshore2PA n.d., About, viewed 27 October 2017, at http://www.reshore2pa.com/about/.
Reshoring Initiative 2016a, ‘Reshoring Initiative data report: Reshoring and FDI boost US manufacturing in 2015’, Reshoring Initiative, 28 March, at http://reshorenow.org/blog/reshoring-initiative-data-report- reshoring-and-fdi-boost-us-manufacturing-in-2015/.
− 2016b, ‘Objective of reshoring’, Reshoring Initiative, 1 July, at http://www.reshorenow.org/blog/objective-of-reshoring/.
− 2016c, ‘Reshoring Initiative goals and accomplishments’, Reshoring Initiative, 17 November, at http://reshorenow.org/blog/reshoring-initiative-goals-and-accomplishments/.
− 2017, Response to information request from QPC, provided 31 December.
− n.d., About us, at http://reshorenow.org/about-us/.
Reshoring Institute 2017a, State Economic Profiles, Reshoring Institute, at https://reshoringinstitute.org/ reshoring-knowledge-library/state-profiles/.
− 2017b, About the Reshoring Institute, at https://reshoringinstitute.org/about-the-reshoring-institute/.

Final Report: Manufacturing in Queensland
Queensland Productivity Commission 306
ReshoringUK 2015, Mapping the Engineering Supply Chain, at http://www.reshoringuk.co.uk/.
Return One Million Jobs 2017, ‘ROMJ and Reshoring Initiative cooperating to bring back one million jobs’, news, 27 April at https://www.returnonemillionjobs.com/single-post/2017/04/25/ROMJ-and-Reshoring- Initiative-Cooperating-to-Bring-Back-One-Million-Jobs.
Rice, J & Stefanelli, F 2014, ‘Reshoring: New Day, False Dawn, or Something Else?’, MIT Center for Transportation & Logistics, September, at http://ctl.mit.edu/sites/ctl.mit.edu/files/Reshoring%20article%20FINAL.pdf.
River City Labs 2015, River City Labs announces plans to double in size in Brisbane’s Fortitude Valley, media release, 16 November, at http://www.rivercitylabs.net/2015/11/river-city-labs-announces-plans-to-double-in- size-in-brisbanes-fortitude-valley/.
Ro, S 2013, ‘Boeing’s 787 Dreamliner is made of parts from all over the world’, Business Insider, 10 October, at http://www.businessinsider.com.au/boeing-787-dreamliner-structure-suppliers-2013-10.
Rogers, EM 2003, Diffusion of Innovations, 5th edn, Simon & Schuster, New York.
Rothwell, J, Lobo, J, Strumsky, D & Muro, M 2013, Patenting Prosperity: Invention and Economic Performance in the United States and its Metropolitan Areas, Brookings, at <https://www.brookings.edu/wp-content/ uploads/2016/06/patenting-prosperity-rothwell.pdf.
RTRAC (Red Tape Reduction Advisory Council) 2016, Red Tape Reduction Advisory Council Report, prepared for the Queensland Government, at https://publications.qld.gov.au/dataset/8587a82a-a7e5-4275-85ec-6d8dcaa865d8/resource/118ae348-b4a0- 44e6-8f07-f9eb8eea0dc3/download/final-rtrac-report-for-web.pdf.
Russell, D, Coyle, JJ, Ruamsook, K & Thomchick, EA 2014, ‘The real impact of high transportation costs’, CSCMP’s Supply Chain Quarterly, Quarter 1, at http://www.supplychainquarterly.com/topics/ Logistics/20140311-the-real-impact-of-high-transportation-costs/.
Rüssman, M, Lorenz, M, Gerbert, P, Waldner, M, Justus, J, Engel, P & Harnish, M 2015,’Industry 4.0: The Future of Productivity and Growth in Manufacturing Industries’, bcg.perspectives, Boston Consulting Group, 9 April, at https://www.bcgperspectives.com/content/articles/engineered_products_project_business_industry_40_future_productivity_growth_manufacturing_industries/#chapter1.
Samson, D 2011, Karpin Report Revisited: Leadership and Management Challenges in Australia, Innovation & Business Skills Australia, East Melbourne.
SFQ (Safe Food Queensland) 2016, Safe Food Production Queensland Business Plan 2016–2017, viewed 26 September 2017, at https://www.safefood.qld.gov.au/wp-content/uploads/2017/05/business-plan-20162017.pdf.
Shepherd, W & Prasada Rao, DS 2002, ‘A comparison of real output and productivity levels in Australian and United States manufacturing, 1970–95’, in A Maddison, DS Prasada Rao & WF Shepherd (eds), The Asian Economies in the Twentieth Century, Edward Elgar Publishing, Cheltenham, UK, pp. 53–81.
Sims, R 2017, Shining a light: Australia's gas and affordability problem, address to the National Press Club, 20 September, at https://www.accc.gov.au/speech/shining-a-light-australia%E2%80%99s-gas-and-electricity-affordability-problem.
Sinodinos, A 2017, New investment in advanced manufacturing and research infrastructure, media release, Australian Government, Canberra, 9 May, at http://www.minister.industry.gov.au/ministers/sinodinos/media- releases/new-investment-advanced-manufacturing-and-research-infrastructure.
Sirkin, H, Zinser, M, & Hohner, D 2011, Made in America, again: Why manufacturing will return to the U.S., Boston Consulting Group, Boston, at www.bcg.com/documents/file84471.pdf.

Final Report: Manufacturing in Queensland
Queensland Productivity Commission 307
Sirkin, H, Zinser, M & Rose, J 2014, ‘The Shifting Economics of Global Manufacturing: How Cost Competitiveness Is Changing Worldwide’, bcg.perspectives, Boston Consulting Group, August, at https://www.bcgperspectives.com/content/articles/lean_manufacturing_globalization_shifting_economics_ global_manufacturing/.
Sligar, D 2016, ‘Is onshoring the future of Australian manufacturing?’, Industry Update, 30 August, at www.industryupdate.com.au/article/onshoring-future-australian-manufacturing.
Smith R 2012, Economic Geography and Innovation Clusters, Department of Industry, Innovation, Science, Research and Tertiary Education, working paper 2012–01, Australian Government, Canberra.
Solent Growth Hub n.d., Reshore UK, viewed 19 May 2017, at http://www.solentgrowthhub.co.uk/export-for-growth/uk-trade-investment-ukti/reshore-uk.
Solomon, M, Russell-Bennett, R & Previte, J 2013, Consumer Behaviour: Buying, Having, Being, 3rd edn, Pearson Australia, Frenchs Forest, NSW.
Spike Innovation 2015, Boosting high-impact entrepreneurship in Australia: a role for universities, report prepared for the Office of the Chief Scientist, Australian Government, viewed 19 May 2017, at http://www.chiefscientist.gov.au/wp-content/uploads/Boosting-High-Impact-Entrepreneurship.pdf.
Spoehr, J, Barnett, K, & Parnis, E 2009, Experience works: The mature age employment challenge, discussion paper, prepared for National Seniors Australia, Australian Institute for Social Research, University of Adelaide.
Srinivasan, V & Bassan, J 2012, 3D printing and the future of manufacturing, CSC Leading Edge Forum, Tysons, Virginia, at https://assets1.csc.com/innovation/downloads/LEF_20123DPrinting.pdf.
Stanwix, G, Pham, P & Ball, A 2015, End-use energy intensity in Australia, Office of the Chief Economist, Department of Industry and Science, June.
StartupAus 2015, Crossroads 2015: An action plan to develop a vibrant tech startup ecosystem in Australia, at http://startupaus.org/wp-content/uploads/2015/04/Crossroads-2015.pdf.
Stone, S, Messent, J, & Flaig, D (2015), “Emerging Policy Issues: Localisation Barriers to Trade”, OECD Trade Policy Papers, No. 180, OECD Publishing, Paris, at http://dx.doi.org/10.1787/5js1m6v5qd5j-en.
Sunny Queen Farms 2017a, Sunny Queen Farms - About Us, viewed 26 April 2017, at http://www.sunnyqueen.com.au/about/.
Sunny Queen Farms 2017b, Sunny Queen Meal Solutions, viewed 28 April 2017, at http://www.sunnyqueenmealsolutions.com.au/our-customers/.
Surgical Engineering 2017, Surgical Engineering, website, at http://www.sureng.com.au/index.htm.
TAFE Queensland n.d., Practical Small Business Workshops, website, at https://business.tafeqld.edu.au/workshops.
The Conference Board n.d., ‘Manufacturing Productivity & Unit Labor Cost Trends: Data 1950–2015’, viewed 17 March 2017, at https://www.conference-board.org/ilcprogram/.
The Economist 2010, ‘Picking winners, saving losers’, 5 August, at http://www.economist.com/node/16741043/.
− 2013a, ‘Coming home’, in the special report: Reshoring manufacturing, 19 January, at www.economist.com/news/special-report/21569570-growing-number-american-companies-are- moving-their-manufacturing-back-united.
− 2013b, ‘Staying Put’, in the special report: Reshoring manufacturing ,19 January, at www.economist.com/news/special-report/21569567-european-jobs-are-not-coming-back-because- few-them-went-first-place-staying-put.
− 2017, ‘Additive manufacturing’, Briefing, July 1, pp. 17–19.

Final Report: Manufacturing in Queensland
Queensland Productivity Commission 308
The National Archives 2016, ‘As part of the Spending Review settlement the government has decided to wind down the national delivery of the Business Growth Service’, notice, viewed 19 May 2017, at http://webarchive. nationalarchives.gov.uk/20160105122946/http:/www.ga.businessgrowthservice.greatbusiness.gov.uk/.
The White House 2017, Presidential memorandum regarding withdrawal of the United States from the Trans- Pacific Partnership Negotiations and Agreement, media release, 23 January, United States Government, at https://www.whitehouse.gov/the-press-office/2017/01/23/presidential-memorandum-regarding-withdrawal- united-states-trans-pacific.
Thomson, S, De Bortoli, L, & Underwood, C 2016, PISA 2015: A first look at Australia’s results, Australian Council for Educational Research, at http://research.acer.edu.au/cgi/viewcontent. cgi?article=1021&context=ozpisa.
Thwaites, J, Faulkner, P & Mulder, M 2017, Independent review into the electricity and gas retail markets in Victoria, final report, August, at https://www.energy.vic.gov.au/__data/assets/pdf_file/0030/79266/Retail-Energy-Review-Final-Report.pdf.
TIQ (Trade & Investment Queensland) 2016, Annual Report 2015–16, Queensland Government, viewed 19 May 2017, at https://www.tiq.qld.gov.au/download/business-interest/about-tiq/annual-reports-strategic-plan/tiq- annual-report-2015-16-web.pdf.
− n.d., How we help investors, viewed 23 March 2017, at http://www.tiq.qld.gov.au/invest/how-we-help-investors/.
− 2017, Annual Report 2016-17, Queensland Government, viewed 29 October 2017, at https://www.tiq.qld.gov.au/connect/about-us/our-corporate-publications/annual-report-2016-17/.
Tole, L & Koop, G 2011, ‘Do environmental regulations affect the location decisions of multinational gold mining firms?’, Journal of Economic Geography, vol. 11, no. 1, pp. 151–77.
Trad, J 2017, Major Japanese drone company Terra Drone chooses Queensland for home, Media release, 27 January, Queensland Government, Brisbane, at http://statements.qld.gov.au/Statement/2017/1/27/major- japanese-drone-company-terra-drone-chooses-queensland-for-home.
Trading Hours Review Reference Group 2016, A Review of Queensland’s Trading (Allowable Hours) Act 1990, at https://www.treasury.qld.gov.au/fair-safe-work/industrial-relations/trading-hours-review/documents/ trading-hours-review-final-report.pdf.
Trump, D 2016, ‘Donald Trump’s contract with the American voter’, at https://assets.donaldjtrump.com/_landings/contract/O-TRU-102316-Contractv02.pdf.
Turnbull, M 2017, Putting Australian Workers First, media release, Australian Government, 18 April, at https://www.pm.gov.au/media/2017-04-18/putting-australian-workers-first.
Turnbull, M, Frydenberg J and Canavan, M 2017, Securing our energy future, joint media release, 20 June, at http://www.joshfrydenberg.com.au/siteData/uploadedData/171U1740_46edf49c-af81-4eaf-b7e7- a7470723e3d9.PDF.
Turnbull, M., Duke, R., King, W., and Yujnovich, Z, 2017, Heads of Agreement- the Australian East Coast Domestic Gas Supply Commitment, 3 October, at https://industry.gov.au/resource/UpstreamPetroleum/AustralianLiquefiedNaturalGas/Documents/Heads-of-Agreement-The-Australian-East-Coast-Domestic-Gas-Supply.pdf.
UK Government 2017, Public procurement policy, viewed 24 October 2017, at https://outlook.office365.com/owa/?realm=qpc.qld.gov.au&exsvurl=1&ll-cc=3081&modurl=0&path=/mail/inbox.

Final Report: Manufacturing in Queensland
Queensland Productivity Commission 309
United Nations 2013, World Population Ageing 2013, United Nations Department of Economic and Social Affairs Population Division, at http://www.un.org/en/development/desa/population/publications/pdf/ageing/ WorldPopulationAgeing2013.pdf.
− 2014, ‘World’s population increasingly urban with more than half living in urban areas’, Department of Economic and Social Affairs News, 10 July, at http://www.un.org/en/development/desa/news/population/world-urbanization-prospects-2014.html.
University of Queensland 2017, UQ Idea Hub: About the program, viewed 10 July, at https://ideahub.uq.edu.au/about.
Van den Bossche, P, Gupta, P, Gott, J & Levering, B 2015, U.S. reshoring: Over before it began?, AT Kearney, New York, at https://www.atkearney.com/documents/10192/7070019/US+Reshoring.pdf/14777afa-0c14- 460e-937b-11233be340b6.
Vanino, E, Roper, S & Becker, B 2017, Assessing the business performance effects of receiving publicly-funded science, research and innovation grants, research paper no. 61, Enterprise Research Centre.
VCEC (Victorian Competition and Efficiency Commission) 2011, Victorian Manufacturing: Meeting the Challenges, September, Melbourne.
Verreynne, M & Steen, J 2014, Queensland Business Innovation Survey 2014 Report, prepared for the Queensland Department of Science, Information Technology, Innovation and the Arts, University of Queensland Business School, at https://www.qld.gov.au/dsiti/assets/documents/qld-business-innovation-report-2014.pdf.
Victorian Government 2017, Statement of Expectations for regulators, 26 September, at http://www.dtf.vic.gov.au/Publications/Victoria-Economy-publications/Statement-of-Expectations-for-regulators.
Viellaris R 2017, ‘New Zealand could demand compensation over Buy Queensland First policy’, Courier Mail, 5 August, at http://www.couriermail.com.au/news/queensland/new-zealand-could-demand-compensation-over-buy-queensland-first-policy/news-story/1bcc8c794e72c563a172a25992c1f46c.
Wade, M & Ting, I 2017, ‘Australians almost united in their desire to manufacture more at home’, The Sydney Morning Herald, 6 February, at http://www.smh.com.au/federal-politics/political-news/the-one-political-view- that-unites-australians-20170203-gu54f4.html.
Walker, J 2016, ‘Re-shoring: How we’re starting to manufacture things again’, The Australian, 19 November, at http://www.theaustralian.com.au/news/nation/reshoring-how-were-starting-to-manufacture-things-again/ news-story/9e01db894860aeb5e9329e6cc75d2fd4.
Wallis Consulting Group 2013, Public Perceptions of Manufacturing, final report, prepared for Department of Industry, Innovation, Climate Change, Science, Research and Tertiary Education, at http://resources.news. com.au/files/2013/10/09/1226736/461973-131010-manufacturing.pdf.
Wallsten S 2001, The Role of Government in Regional High-Tech Development: The Effects of Science Parks and Public Venture Capital, SIEPR discussion paper no. 00–39, Stanford Institute for Economic Policy Research, Stanford University.
Wang, M, Rieger, M, & Hens, T 2011, How Time Preferences Differ: Evidence from 45 Countries, discussion paper no. 2011/18, Department of Finance and Management Science, Norwegian School of Economics.
Watkins Steel 2017, ‘Watkins Steel’, viewed 22 May 2017, at http://www.watkinssteel.com.au/about-us/.
Webster, B 2004, ‘”Here’s something to ease your pain”: Community and the response to Rockhampton’s Lakes Creek Meatworks crisis, 2002’, in proceedings of the 18th AIRAANZ conference, New economies: new industrial relations, Association of Industrial Relations Academics of Australia and New Zealand, Noosa, pp. 606–615.
Final Report: Manufacturing in Queensland
Queensland Productivity Commission 310
WECD (Warwick Economics and Development) 2015, KTP Programme: The Impacts of KTP Associates and Knowledge Base on the UK Economy, report prepared for Innovate UK, at https://www.gov.uk/government/uploads/system/uploads/attachment_data/file/467141/KTP_Report_July_2015__1-SEP-15_.pdf.
Williamson, RC, Raghnaill, MN, Douglas, K, & Sanchez, D 2015a, Technology and Australia’s Future: Findings and Implications, precis report, prepared for the Australian Council of Learned Academies, at http://www.acola.org.au/PDF/SAF05/SAF05_Precis_web_16Sept.pdf.
Williamson, RC, Raghnaill, MN, Douglas, K & Sanchez, D 2015b, Technology and Australia’s future: New technologies and their role in Australia’s security, cultural, democratic, social and economic systems, final report, prepared for the Australian Council of Learned Academies, at http://www.acola.org.au/PDF/SAF05/ SAF05_Report_web_17Sept.pdf.
Withers, G, Gupta, N, Curtis, L & Larkins, N 2015, Australia’s Comparative Advantage, final report, prepared for the Australian Council of Learned Academies, at http://www.acola.org.au/PDF/SAF01/SAF01%20full%20 lo%20res.pdf.
Wood, T, Blowers, D & Griffiths, K 2017, Powering through: How to restore confidence in the National Electricity Market, Grattan Institute, Melbourne.
World Bank 2016a, GDP Per Capita (constant 2010 US$), at http://data.worldbank.org/indicator/NY.GDP.PCAP.KD.
− 2016b, Doing Business: Economy Rankings, viewed 19 May 2017, at http://www.doingbusiness.org/rankings.
− 2017, Databank: World Development Indicators, viewed 19 May 2017, at http://databank.worldbank.org/data/reports.aspx?source=2&series=NV.IND.MANF.ZS&country=.
Yarrow, J 2013, ‘Here’s how many jobs Apple will bring to the US to make Macs’, Business Insider Australia, 13 February, at https://www.businessinsider.com.au/heres-how-many-jobs-apple-will-bring-to-the-us-to- make-macs-2013-2.

Queensland Productivity Commission
2

Queensland Productivity Commission
3