Financial Flows Reconciliation Report: – 2009 – 2011 Oil ...
Upload
khangminh22Category
view
5download
0
CASH FLOWS AND FINANCIALANALYSIS
In Chapter 1 we made the point that the orientation of finance is toward cash flows rather thanaccounting results. Because of the importance of cash flow, we need to understand the concept thor-oughly and be familiar with the construction of the statement of cash flows as one of a firm’s financialstatements. We’ll develop that understanding in the first half of this chapter.
Then we’ll turn our attention to financial analysis, a technique designed to get practical informationabout business operations out of financial statements. Before attacking either of these topics, however,we need a little background on financial information in general.
FINANCIAL INFORMATION—WHERE DOES ITCOME FROM, WHO USES IT, AND WHAT AREWE LOOKING FOR?The term “financial information” refers to the results of business operations stated in money terms. Theidea largely implies the material in financial statements but isn’t entirely limited to those documents.Financial information about a company is important because people inside and outside use it as a basisfor making decisions about the firm and their relationships with it.
Financial information is the responsibility of management. It is created by accountants within thecompany and reviewed by auditors, but neither accountants nor auditors guarantee its correctness.1
Financial Information—WhereDoes It Come From, WhoUses It, and What Are WeLooking For?
Users of Financial InformationSources of Financial InformationThe Orientation of Financial Analysis
The Statement of Cash FlowsHow the Statement of Cash Flows
Works—Preliminary ExamplesBusiness Cash FlowsConstructing the Statement
of Cash FlowsFree Cash Flows
Ratio AnalysisComparisonsCommon Size StatementsRatiosLiquidity RatiosAsset Management RatiosDebt Management RatiosProfitability RatiosMarket Value RatiosDu Pont EquationsUsing the Du Pont EquationsSources of Comparative InformationLimitations and Weaknesses of
Ratio Analysis
C H A P T E R O U T L I N E
3CH
AP
TE
R
1. Auditors make certain observations and tests which provide a reasonable level of assurance that statements are prepared inthe proper manner and that all relevant details are disclosed.

64 Part 1 Introduction to Financial Management
This creates a conflict of interest, because managements invariably want to portrayresults as favorably as possible. We’ll discuss this idea shortly.
Once prepared, financial information is published to a variety of audiences, whouse it to make decisions about the company. Let’s begin our study by looking at theseusers in a little more detail.
USERS OF FINANCIAL INFORMATIONFinancial statements are a report on the issuing company’s performance. The mainuser groups are investors, creditors, and management itself.
Investors and Financial AnalystsThe most important function of financial statements is to convey information to out-side investors. These are people or organizations that might be interested in buyingthe company’s stock or might be asked to lend it money. Lenders are concerned withthe firm’s stability and cash flows. The primary focus of stockholders is more likely tobe its prospects for growth.
Investors sometimes analyze financial statements themselves, but more often relyon the reports of financial analysts who usually work for large brokerage firms or otherfinancial institutions. Their job is to know as much about a particular company andits industry as an outsider can and to use that knowledge to predict the firm’s perform-ance. They then make recommendations about its investment value, includingwhether to buy or sell its stock and whether its debt is safe. Because of their pivotaladvisory role, financial analysts can be considered the main audience for investor-oriented information.
A major part of the analyst’s job is a careful study of the company’s recent finan-cial statements. It’s important to realize that published financial statements relate tothe past, and the analyst is interested in the future. However, the past factored bycurrent information is usually the best available indicator of the future. In this chap-ter we’ll have a look at the basic tools used by financial analysts and sophisticatedinvestors.
Vendors/CreditorsVendors asked to do business with the firm on credit are another important group ofstatement users. Because they’re advancing funds in the form of products and services,they tend to be interested in most of the same things that concern lenders. The mainissue is whether the firm is likely to have cash available to pay its debts in the imme-diate future.
ManagementThe final group of statement users is the firm’s own management. Financial results showsuccesses and failures in each of the many facets of running a business. Managementcan study those results to pinpoint relative strengths and weaknesses in operations.This process shows where to put effort to correct problems and improve performance.
SOURCES OF FINANCIAL INFORMATIONThe primary source of financial information about any publicly traded company is itsown annual report. Annual reports are required of companies that sell their stock tothe general public, and typically include several years of historical financial informa-tion along with a great deal of verbiage about the firm and its business.
Financial analystsinterpret informationabout companiesand make recom-mendations toinvestors.
A firm’s annual reportis the primary sourceof financial informa-tion about it.

Chapter 3 Cash Flows and Financial Analysis 65
The financial information in an annual report must be audited by an independentaccounting firm. That process doesn’t guarantee complete accuracy, but it usually givesa fair level of assurance that the numbers are presented with reasonable objectivityand in accordance with generally accepted accounting principles (GAAP). However,there’s a lot more latitude in the nature of the information presented in the verbiage.
In fact, there’s something of a problem with annual reports. They tend to portraypast performance and future prospects in a very favorable light. That is, they’re biasedtoward reporting that the firm has done as well as could be expected in the past yearand that it will do even better in the future. Reports tend to minimize or ignore mis-takes and failures, exaggerate successes, and build up future opportunities in unrealisti-cally optimistic terms.
The annual report is actually a report to stockholders prepared by the company’smanagement. But management works for the stockholders, so they are in effect writ-ing their own report cards. Naturally the result is biased in favor of the people run-ning the firm.
Along these lines, most annual reports have become advertising vehicles and areprepared to be very visually appealing. They’re done on glossy paper, in multicoloredinks, and are filled with professional quality photographs. They frequently look morelike upscale magazines than business documents.
All this isn’t necessarily bad as long as readers understand the biases and don’t takeeverything in reports as strictly true. Outright lies are rare, but the truth can be toldmore or less attractively, and annual reports tend to present things in a rosy glow.
Companies file a more businesslike document called the 10-K with the Securitiesand Exchange Commission each year. It gives more detailed information than theannual report. Most companies will send you an annual report and a 10-K for theasking.
Brokerage firms and investment advisory services provide reports on most largecompanies. These reports are the result of the work of their financial analysts.Brokerage firms provide the information free as a service to clients and prospectiveclients, while investment advisory services publish it for a fee. The best known advi-sory service is Value Line which provides information on approximately 1,700 stocks.Advisory services provide information to paid subscribers, but it is often available freein libraries.
Value Line’s September 2006 report on General Motors is shown in Figure 3.1.Study the layout of the information it contains for a few minutes. The chart at thetop shows the stock’s price performance for the last 10 years. Below that 10 to 15years of history are shown for a variety of financial line items. Notice that some itemsare stated on a per-share basis.
Moving down the page, there’s a short summary of the nature of the company’sbusiness followed by a verbal analysis of its current situation and prospects for thefuture. This section is the heart of the report. It tells investors what the analystthinks is likely to happen to GM’s business and by implication the price of itsstock.
At the time this report was written, General Motors was recovering from a periodof serious financial distress. The verbal report focused on the firm’s prospects for thefuture stressing its new products and a possible alliance with Nissan and Renault,Japanese and European auto manufacturers. The report ended with a comment thatan investment in the stock at that time was unlikely to yield big gains because GM’sshare price had risen substantially in the recent past leaving little room for furtherappreciation.
Annual reports tendto be biased in favorof management’sperformance.
Choose a companyfrom Nasdaq’s list athttp://dynamic.nasdaq.com/dynamic/nasdaq100activity.stmand look at its annualreport, usually foundunder InvestorRelations on the com-pany web sites.
http://

66 Part 1 Introduction to Financial Management
Figure 3.1 Value Line’s September 2006 Report on General Motors
Source: Reproduced with permission from Value Line.

Chapter 3 Cash Flows and Financial Analysis 67
The issues addressed in this descriptive section aren’t always purely financial. Theycan be about any area of business that’s crucial, such as markets, products, competition,or mergers. In other words, a lot of “financial information” isn’t exactly financial. Itmight be better described as marketing or strategic information. Keep in mind thatfinancial results are numerical representations of what is physically going on in a busi-ness. Thus, deciding whether a firm is a good financial investment begins with a judg-ment about how it’s doing in the market for its products. Notice that Value Line endsthe discussion by saying that it has a neutral opinion of the stock’s investment potential.
THE ORIENTATION OF FINANCIAL ANALYSISMuch of the information in the rest of this chapter may seem similar to material you’vestudied in accounting. However, our orientation is different here. In accounting we’re
The Devil Is in the Details . . .
Annual reports are a leading source of information for investors. But since they’re prepared bymanagement, they tend to be very favorably biased. The bias takes the form of exaggerating suc-cesses and downplaying problems and threats. An annual report of Microsoft, the world’s lead-ing software company, provides a good example.
In the late 1990s and early 2000s, Microsoft was under legal attack by the U.S. JusticeDepartment for alleged violation of the Sherman Act, a law that makes certain business behav-ior illegal if it reduces competition and puts the violator in a monopoly position. The federal gov-ernment and nineteen states sued Microsoft and demanded, among other things, that it bebroken up into two companies to compensate for the alleged anticompetitive effects of its pre-vious behavior.
During one year, the pending lawsuit was in the news constantly, and was undoubtedly amajor factor in the investment community’s perception of Microsoft stock. Indeed the threat itposed to the company’s future probably depressed its stock price considerably. It seems rea-sonable to expect that a professional analysis of the firm’s prospects would have included a thor-ough discussion of the lawsuit and an assessment of the likelihood that the firm would bedamaged by it.
Yet Microsoft’s annual report barely mentioned the suit, even though it was still pending whenthe report was issued. The litigation was given only six lines in the president’s discussion of resultswhich is read carefully by most serious investors. It was mentioned in somewhat more detail in thenotes to the financial statements where statements about pending litigation are required by law.But many investors don’t read the notes, which are similar to “the fine print” in a contract.
Companies defend their minimal mention of such lawsuits in annual reports saying that man-agement believes the suits are groundless, the companies will eventually win, and that investorstherefore shouldn’t worry about them. That’s the way this case turned out. In the end Microsoftwasn’t hurt by the suit. But while the outcomes of such suits are in doubt, aren’t investors enti-tled to fair and thorough disclosure of their risks, and a discussion of both management’s andthe other side’s arguments? Perhaps, but it would be unusual to find it in an annual report.
Source: Microsoft Corporation Annual Report 2000.
INS
IGH
TS R EAL APPLICATIONS

68 Part 1 Introduction to Financial Management
The Ethics of Presenting Financial Information
Recent financial results tend to be good predictors of future performance, so investors bid stockprices up or down based on the content of published financial statements. Earnings and earn-ings growth are especially important.
Financial statements are reputed to be objective representations of business performance.However, management has a good deal of control over them. That’s because there’s a lot of lat-itude and room for interpretation within the accounting guidelines that govern how statementsare put together. In other words, management can to some extent “engineer” the financialresults that are so crucial to investors and the prices they put on stocks.
At the same time, top managers have an incentive to hold up stock prices. High prices bene-fit existing shareholders, but more importantly, executive compensation is tied to stock price inways that make senior executives enormously wealthy when the price of their company’s sharesrises rapidly.
This creates a conflict of interest between management and investors. Top managementgets rich by manipulating reported financial performance to drive stock price up in the shortrun. But eventually the fact that results were artificially inflated is discovered, and shareprices fall rapidly. This has a devastating effect on investors, especially those who bought thestock near its peak.
This phenomenon has been recognized as a problem for many years and is reported in thefinancial press from time to time. Here are a few of the “tricks” major companies were engagedin starting in the late 1990s as reported in The Wall Street Journal. Notice that they “stretch” thetruth and muddy the predictive power of past financial results.
Continuing Operations When a company sells or closes a division, its future prospects shouldbe based on continuing operations which represent repeatable performance. But financial state-ments often make separating the results of sold units difficult, creating the impression thatwhat’s left is better than it is.
Unusual Activities Profits from activities outside of normal business should be displayed sepa-rately because they usually aren’t repeatable. For example, a manufacturing firm’s one-time gainon the sale of real estate shouldn’t be combined with profits from ongoing operations, becausethat’s likely to mislead investors into overvaluing the firm.
Restructuring Charges Restructuring means reorganizing to face changed business conditions,usually by getting smaller. It generally involves charges for severance pay and closing facilities.Companies show income before and after restructuring charges, expecting investors to valuefirms based on the higher income before the charge because restructurings are rare. But in the1990s, many companies restructured every few years. Doing that raises a question as to whetherthe charges are truly one-time events or just cover-ups for bad management.
The Calm before the Storm It’s important to realize that the investing community was aware ofthese arguably unethical practices but didn’t consider them too severe. Most people felt that
INS
IGH
TS ETHIC S

Chapter 3 Cash Flows and Financial Analysis 69
management might stretch the truth a little, but was basically honest. They also relied on theaudits done by public accounting firms, which had excellent reputations for integrity, to policecorporate reporting and keep statements from being misleading.
The Ethical Depths—A Major Loss of Confidence All that changed in the early 2000s when sev-eral large companies were discovered “cooking their books” to produce grossly misleadingfinancial statements. Practices included recording completely bogus transactions to pump uprevenue and profit and supporting operations with borrowed money that didn’t show up on thebalance sheet because the debt was held in shadowy “partnerships” with artificially createdbusinesses. While all this was going on, many of the top executives involved increased their indi-vidual wealth by hundreds of millions of dollars.
The most widely publicized cases were Enron, a leading player in energy; WorldCom, thetelecommunications giant that owned MCI; and Tyco, a firm that participates in a wide variety ofbusinesses. Enron and WorldCom actually went into bankruptcy. Stockholders in all three lost80% to 100% of their investments.
But perhaps the most startling result of the scandal was the role of public accountants. Notonly did they fail to prevent the deceptions allegedly perpetrated by managements, but theywere also accused of participating in the deceptions themselves. Arthur Andersen, Enron’s audi-tor and one of the world’s largest and most respected accounting firms, failed and disappearedentirely as a result of its role in the Enron debacle.
It seems that because accounting firms are paid by the companies they audit, they have aninterest in staying in the good graces of management. That creates a conflict of interest with theirresponsibility to the investing public. Allegations have also been made that some importantfinancial institutions, including investment banks and brokerage houses, contributed to thedeception.
The scandal led to a major review of financial reporting and auditing procedures by theaccounting profession as well as congressional legislation aimed at preventing a recurrance andpunishing knowing deception by senior executives. The legislation passed by Congress in 2001is known as the Sarbanes-Oxley Act. We’ll discuss it in some detail in Chapter 5.
The Ethical Picture in the Long Run The full effect of the revelations of the early 2000s won’t beunderstood for a long time. Today’s investors are certainly less willing to trust in the ethics of cor-porate executives and Wall Street analysts than they were in the past. But it isn’t certain thattheir skepticism will last. It may, but investors may also shrug it off in a few months or years andchalk up the experience to the frantic stock market boom of the 1990s.
Sources: Ken Brown, “Creative Accounting: How to Buff a Company” The Wall Street Journal (February 21, 2002): C1.
John R. Emshwiller and Rebecca Smith, “Murky Waters: A Primer on Enron Partnerships” The Wall StreetJournal (January 21, 2002): C1.
Aaron Elstein, “‘Unusual Expenses’ Raise Concerns” The Wall Street Journal (August 23, 2001): C1.
R. Smith and S. Lipin, “Are Companies Using Restructuring Costs to Fudge the Figures?” The Wall StreetJournal (January 30, 1996).

70 Part 1 Introduction to Financial Management
concerned with creating financial statements. In finance we’re concerned with usingthem to evaluate businesses and their prospects for the future. In particular, financialanalysis looks for problems, places where things aren’t as they seem, or where results indicatethe firm may be heading for trouble.
For example, a statement of cash flows might indicate that a firm borrowed a lot ofmoney last year. Accounting per se stops with the presentation of that fact along withinformation on the things money was spent on during the period. The financial ana-lyst, however, must go further and ask why the borrowing occurred and what itimplies for the future.
Perhaps the borrowing was to finance expansion into an exciting new venture.That might seem great, but the analyst wants to know if the firm will be able to sup-port the interest payments and whether the venture will need more borrowing laterbefore it starts to generate a profit. On the other hand, the borrowing might bebecause the firm isn’t collecting its receivables or is holding significant useless inven-tory. In that case, the analyst will want to know how the problem will be resolved andwhat its impact on long-run profitability will be.
Keep this orientation in mind. In finance our attitude is critical and investigative.
THE STATEMENT OF CASH FLOWSWe’ve made the point that income as reported in the income statement does notequal cash in the pocket of the business or its owner. Accounting income includesthings like depreciation, which is one of several artificial devices designed to makethe income statement a representation of the long-run condition of the enterprise.Businesses, however, are run with cold, hard cash on a day-to-day basis. Therefore,another statement is needed to give users information detailing the actual movementof cash in and out of the company. That document is the statement of cash flows. Itshows a reader where the firm’s money came from and what it was spent on during theperiod covered.
TerminologyA more formal name for the statement of cash flows is the statement of changes infinancial position, but people rarely use that awkward title. It comes from the factthat the balance sheet can be called the statement of financial position, and techni-cally the cash statement analyzes changes in the balance sheet. Common usageinvolves the words “cash flow” or “funds flow.” Sources and uses or sources and appli-cations of cash or funds are also ways of referring to what we will call the statement ofcash flows.
Cash statements report inflows and outflows of money. Inflows are usually repre-sented by positive numbers while outflows are negative. Negative numbers are shownin parentheses.
Where the Statement of Cash Flows Comes FromThe income statement and balance sheet emerge directly from closing the books. Thestatement of cash flows does not; it is constructed from the other two statements afterthey’re produced.
HOW THE STATEMENT OF CASH FLOWS WORKS—PRELIMINARY EXAMPLESThe best way to gain an understanding of the role of cash in financial statements is toappreciate how the statement of cash flows is put together from the balance sheet and
from the CFO
The orientation ofthe financial ana-lyst is critical andinvestigative.

Chapter 3 Cash Flows and Financial Analysis 71
income statement. The pages that follow will develop a working knowledge of theprinciples as well as the calculations involved.
It takes two balance sheets and an income statement to build a statement of cashflows for an accounting period. The income statement is from the period and the bal-ance sheets are as of its beginning and end. (A beginning balance sheet is the endingbalance sheet of the previous period.)
The cash statement analyzes where money has come from and gone to by doingtwo things. First, it takes net income for the period and adjusts it for some of theitems that make it different from the everyday concept of income as cash in one’spocket. Second, it takes the two consecutive balance sheets and analyzes the changesin everything the company has and everything it owes to determine how thosechanges have affected the cash balance.
Applying these ideas can be a little difficult if we jump right into a business exam-ple. It helps to first consider personal examples involving familiar assets and liabilities.We’ll begin with two such illustrations.
Buying a Car on CreditSuppose Joe Jones has after-tax income of $50,000 and spends $40,000 on normalliving expenses during a year. Also assume that at the beginning of the year he had abank balance of $10,000 and no other assets or liabilities. Further assume that duringthe year he bought a new car costing $30,000, financing $25,000 at the bank with acar loan. At the end of the year he has $15,000 in the bank.
The statement of cash flows lays out these transactions in a way that highlightswhere the cash comes from and goes to. The “where from” and “where to” are com-monly called sources and uses of cash, respectively. The statement goes on to demon-strate that the beginning balance in the bank plus the net cash flow equals the endingbalance in the bank.
The idea is illustrated conceptually as follows.
Cash income $ 50,000Cash used on living expenses (40,000)Net source of cash from income $10,000Source of cash from loan 25,000Use of cash to buy auto (30,000)Net inflow/(outflow) of cash $ 5,000
Beginning cash balance $10,000Net cash flow 5,000Ending cash balance $15,000
In this example the net source of cash from income is analogous to a business’s netincome adjusted for noncash items. This item is an important source of cash for Joe.
Joe used $30,000 to buy an automobile. In other words, he increased his assets by$30,000. In general, any time assets are increased, cash is used. Joe also received$25,000 from the bank when he took out the loan, which is a liability. In other words,he realized a source of cash of $25,000 by increasing his liabilities. In general, anyincrease in liabilities results in a source or inflow of cash.
It’s important to keep the car and the loan separate in your mind. In our personallives we tend to think of going into a car dealer with a down payment and coming outwith a car and loan payments all in one transaction. To understand the statement ofcash flows, you have to keep the asset (the car) and the liability (the loan) separate.

72 Part 1 Introduction to Financial Management
When he bought the car Joe didn’t just spend $5,000. He spent $30,000 and bor-rowed $25,000 at the same time.
Adding Joe’s sources (income and loan) and uses (car purchase) together we get hisnet cash flow. Assuming all his money is in the bank, the beginning balance plus thenet cash flow has to equal the ending balance. If it doesn’t, something is wrong withthe record keeping or accounting.
Here’s a slightly more complicated illustration.
Buying and Selling CarsSuppose at the beginning of a year Sally Smith has an expensive car with a currentmarket value of $20,000 and a $14,000 loan outstanding on it. At the same time herbank balance is $6,000. During the year she has after-tax income of $60,000 butspends $62,000 on living expenses. In an effort to economize, she sells her big car for$20,000 and buys a small economy model for $9,000 in cash (no loan). When shesells the old car she pays off the $14,000 loan on it. At the end of the year her bankbalance is $1,000. Sally’s cash flows look something like this.
Cash income $60,000Cash used on living expenses (62,000)Net source of cash from income2 $(2,000)Source of cash from selling old car $20,000Use of cash to buy new car (9,000)Net source from car investments 11,000Use of cash to pay off old car financing (14,000)Net inflow/(outflow) of cash $(5,000)
Beginning cash balance $6,000Net cash flow (5,000)Ending cash balance $1,000
In this case, Sally reduced her assets by selling the old car for $20,000. That sale was asource of cash. In general, when assets are reduced, the reduction is a source of cash.She also bought a new car, which was obviously an increase in her assets and a use ofcash.
Sally paid off her car loan using cash. In doing so she reduced a liability. In general,a liability reduction is a use of cash.
Notice that Sally’s net source of cash from income less expenses was negativesimply because she spent more than she made this year. That added to the fact thatshe spent more than she gained on the cars and loan together means she has a netnegative cash flow for the year. She accomplished that by pulling down her bankbalance. If she didn’t have any money in the bank, she could still have done it byborrowing. Then we would have shown an additional source due to an increase in aliability, the loan.
These examples help to illustrate the ideas involved in cash flow because we’re allfamiliar with automobiles as assets and loans as liabilities. Basically, cash flows stemfrom either income or changes in assets and liabilities.
2. Because income is usually positive and a source of cash, a loss is conventionally shown as a negativesource rather than as a use.

Chapter 3 Cash Flows and Financial Analysis 73
BUSINESS CASH FLOWSIn a business, income is represented by adjusting net income from the income state-ment for noncash items like depreciation. Assets and liabilities are conveniently listedon balance sheets as of the beginning and end of the year, so changes in each accountcan be calculated easily.
However, in a business context changes in balance sheet amounts get a little con-fusing when assets include things like accounts receivable and liabilities include itemslike accounts payable and accruals. It’s not as easy to see that an increase in receiv-ables is a use of cash as it is to understand that you need cash to buy a car. A decreasein accruals is also more difficult to fathom as a use of cash than is paying off a loan.
Cash Flow RulesIn practice we don’t have to worry about thinking through how cash flows in and outof every account. Four simple rules illustrated in the preceding examples can beapplied to any business’s financial statements. All we need to do to analyze cash is tokeep those rules in mind. The rules are that changes in balance sheet accounts resultin sources and uses of cash as follows.
Asset increase � Use
Asset decrease � Source
Liability increase � Source
Liability decrease � Use
Standard PresentationA business’s statement of cash flows is organized to show cash flows from three differ-ent kinds of activities: operating, investing, and financing.
Operating activities have to do with running the business on a day-to-day basis.
Investing activities occur when the firm buys (invests in) or sells things such asfixed assets that enable it to do business. Investing activities also include long-term purchases and sales of financial assets.3
Financing activities occur when the company borrows money, pays off loans, sellsstock, or pays dividends. They have to do with raising money and servicing theobligations that come along with it.
Graphic PortrayalsBefore tackling a numerical example, let’s fix these ideas in mind by looking at twographic representations of cash flow in a business.
Figure 3.2 shows how cash flows in and out of a company. Notice that operatingactivities have to do with the normal course of business and the current accounts ofthe balance sheet. Investing activities generally have to do with buying long-livedassets, either real or financial. Financing activities are concerned with debt andequity.
The statement ofcash flows presentsoperating, investing,and financing activi-ties separately.
3. The term “invest” generally means buying something that is expected to return more than its cost inthe future. When individuals say “invest” they usually mean buying a financial asset. However, wesometimes use the term with physical things (investing in a house) or even intangibles (investing in aneducation). When we talk about investment by companies we generally mean buying the equipmentused in doing business such as machinery, vehicles, and real estate.

74 Part 1 Introduction to Financial Management
Figure 3.3 is usually called the cash conversion cycle, but the term racetrack diagramis a little more colorful and tends to fix it in mind better. Starting at the bottom ofthe track, a business uses cash to purchase inventory and labor to produce a product.That product is sold, resulting in a receivable. When the receivable is collected, thefirm once again has cash in hand that it uses to buy more inventory and labor to pro-duce more product and so on.
In a sense the company is running around a racetrack, converting cash to productand product to cash. You can think of the firm continually doing this equipped withsome level of assets.
Given a level of assets, the firm goes around the track faster by making moresales in the period. Clearly the faster it can go around, the better off it is as long as
Cash to Vendors
InvestingActivities
PurchaseFixedAssets
OperatingActivities
Product
Cash toVendors
Cash toEmployees
Cash fromCustomers
Cash to IRS
FinancingActivities
StockEquity
Cashfrom/to
Stockholders
Cashfrom/toLenders
Bonds*Debt
Buy Inventory
Payable
Pay Wages
Accrual
Sale
Receivable
Loan
Dividends
Stock Price
Repayment
CASH
Pay Taxes*Interest expense is recorded in theincome statement and is therefore part of cash from operating activities.
Figure 3.2 Business Cash Flows
Product is con-verted into cash,which is trans-formed into moreproduct, creatingthe cash conversioncycle.

Chapter 3 Cash Flows and Financial Analysis 75
it doesn’t damage something else by going too fast. In other words, it’s important toget a lot of sales per dollar of assets employed in the business. That’s one of severalmeasures of success.
However, a firm that just runs around the track putting all its money back intoinventory wouldn’t be doing its owners much good. A successful business has to pullsomething out each time around to buy new assets for growth and to replace old onesthat wear out, to pay taxes, and for profit. Clearly, the larger the slice that can betaken out of cash flow each time around the track, the better off the firm is. This ideais simply profitability and is shown in the lower part of the figure.
Summarizing, the diagram illustrates that a business has to do two things for success:sell a lot for its level of assets and sell at a reasonable profit margin given its costs andexpenses.
Notice that the two things work against each other. The business can always sellmore if it charges less, but then it will have less profit. Conversely, a higher priceyields more profit but lower sales. We’ll come back to this idea toward the end of thechapter.
CONSTRUCTING THE STATEMENT OF CASH FLOWSNow we can look at putting together a statement of cash flows for a business. Thebest way to do that is to work through a numerical example.
The Belfry Company’s Cash FlowsConstructing a business cash flow statement requires balance sheets at the begin-ning and end of the period under consideration and an income statement for thatperiod.
Consider the following statements for the hypothetical Belfry Company in whichthe balance sheets are arranged vertically.
Receivable
Assets, Taxes, Profits...
SaleCash
Inventory
Labor
Figure 3.3
The CashConversionCycle—TheRacetrackDiagram

76 Part 1 Introduction to Financial Management
In addition to the information on these statements, we’ll assume the company soldstock for $800 during the year and paid a $500 dividend.
Notice that we’ve shown depreciation separately in the income statement for con-venience. Most presentations don’t do that. We’ll develop the statement of cash flowsfor Belfry one activity at a time.
Operating ActivitiesOperating activities are the things a company does on a day-to-day basis to conductits business. Typically they include buying inventory, producing and selling product,paying expenses and taxes, and collecting on credit sales. The focus of these activitiesis the production of net income, so we start the cash statement with that figure.
However, net income includes items that don’t represent cash flows in the currentperiod. Our next step is therefore to adjust those out. The result is called operating income.
In Belfry’s case, the only adjustment necessary to calculate operating income is toadd back depreciation, which was subtracted in the calculation of net income.
Net income $1,000Depreciation 500Operating income $1,500
Belfry CompanyBalance Sheet
For the period ended 12/31/x2
ASSETS12/31/X1 12/31/X2
Cash $1,000 $ 1,400Accounts receivable 3,000 2,900Inventory 2,000 3,200CURRENT ASSETS $6,000 $ 7,500
Fixed assetsGross $4,000 $ 6,000Accumulated deprec. (1,000) (1,500)Net $3,000 $ 4,500
TOTAL ASSETS $9,000 $12,000
LIABILITIES
Accounts payable $1,500 $ 2,100Accruals 500 400CURRENT LIABILITIES $2,000 $ 2,500
Long-terms debt $5,000 $ 6,200Equity 2,000 3,300TOTAL CAPITAL $ 7,000 $ 9,500
TOTAL LIABILITIESAND EQUITY $9,000 $12,000
Belfry CompanyIncome Statement
For the period ended 12/31/x2
Sales $10,000COGS 6,000Gross margin $ 4,000
Expense $ 1,600Depreciation 500EBIT $ 1,900Interest 400EBT $ 1,500Tax 500Net income $ 1,000
Operating activitiesinvolve the incomestatement and current balancesheet accounts.

Chapter 3 Cash Flows and Financial Analysis 77
Next we recognize that the money from operating transactions runs through thecurrent balance sheet accounts. Therefore changes in those accounts are part of oper-ating cash flow. We analyze the balances other than cash and classify the changes assources or uses of cash according to the cash flow rules. The cash account is handledseparately later.
In Belfry’s case, accounts receivable decreased from $3,000 to $2,900, providing a$100 source of cash because according to the second rule an asset decrease is a source.Similarly, inventory increased from $2,000 to $3,200 for a use of $1,200 according tothe first rule.
Apply the third and fourth rules to the changes in accounts payable and accruals toget the following sources and uses.
Account Source/(Use)
Receivables $ 100Inventory (1,200)Payables 600Accruals (100)
$ (600)
The sum of the current account changes and operating income is cash from operat-ing activities. The typical presentation is illustrated for Belfry as follows.
Net income $1,000Depreciation 500Net changes in current accounts (600)Cash from operating activities $ 900
Investing ActivitiesCash from investing activities is simple in this example. The only entry comes froman increase in Belfry’s fixed assets of $2,000. This is reflected by the increase in grossfixed assets from $4,000 to $6,000, which is a use of cash according to the first rule.
Notice that we use the gross fixed assets account for this calculation rather thanthe net. That’s because the net figure includes a reduction for accumulated deprecia-tion, the change in which is the other side of the entry that put depreciation on theincome statement. That depreciation is already included in the cash flow statement inthe operating section, and we don’t want to repeat it here.
Hence, cash from investing activities is
Purchase of fixed assets ($2,000)
Financing ActivitiesThere are three financing activities in this example. The first is an increase in long-term debt, a source according to the third rule. The company appears to have takenout another loan. The second is a sale of stock, and the third a dividend payment.The sale of stock results in an increase in equity, a liability,4 and is a source according
4. Equity is a “liability” of the company to its owners. We treat it as a liability with respect to the cashflow rules.
Investing activitiestypically includepurchasing fixedassets.
Financing activitiesdeal with the capi-tal accounts, long-term debt andequity.

78 Part 1 Introduction to Financial Management
to the third rule. The dividend payment is clearly a use of money. It reduces equityand is therefore a use according to the fourth rule.
Cash from financing activities is calculated as follows.
Increase in long-term debt $1,200Sale of stock 800Dividend paid (500)Cash from financing activities $1,500
The Equity and Cash AccountsNotice that we haven’t calculated the change in equity and classified it as a source ora use of cash. That’s because the procedure breaks that change into three parts andincludes them individually. Let’s lay the pieces out. The change in equity is the sumof net income and the sale of new stock less the dividend paid. These are as followsfor Belfry.
Net income $1,000Stock sale 800Dividend (500)Total change in equity $1,300
The stock sale and the dividend are included under financing activities, while theaddition of net income to equity shows up under operating activities.
Also notice that we haven’t done anything with the cash account. It’s been omit-ted because the cash flow total of the three activities we’ve presented so far mustequal the change in the cash account. That’s shown as a reconciliation at the end ofthe statement.
In Belfry’s case the sum of operating, investing, and financing activities is a posi-tive $400, so we have the following reconciliation.
Beginning cash balance $1,000Net cash flow 400Ending cash balance $1,400
The entire statement of cash flows for Belfry is shown on page 79.To summarize, the statement of cash flows takes information from the income
statement and balance sheet and displays it in a manner that highlights the move-ment of cash. No new information is created; what is already there is simplyrearranged in a way that’s more usable in the day-to-day running of the business.
ConclusionsIn this case, examination of the statement of cash flows leads to some concern aboutthe Belfry Company. The firm is quite profitable, earning 10% on sales, but still had toborrow substantially during the year. Clearly the fixed asset purchase had somethingto do with the additional funds required. One must ask whether that expenditurewas entirely necessary. Another concern is the sudden increase in inventory. Does itmean that some of the existing inventory isn’t good? If so, this could portend a bigloss.
You should always keep in mind the fact that it’s cash that really counts in business,not net income.

Chapter 3 Cash Flows and Financial Analysis 79
To drive that point home, let’s ask another question about Belfry. Notice thatduring the year it had to borrow an additional $1,200 from the bank. Would a bankhave been likely to extend that additional credit?
In fact, a bank might have been reluctant to advance more money to this company.Notice that the firm’s capital (long-term debt plus equity) is in the neighborhood of 70%debt. We’ll see later that such a high proportion of debt is beyond the comfort level of mostlenders. The bank could have refused further advances, putting the company in a cash bind.If that had caused Belfry to fail to make its payroll, the company could have been out ofbusiness overnight.
Yet Belfry is earning great profits in terms of net income, 10% of sales. Take thelesson to heart: A firm can go broke profitably. Small businesses do it all the time, andit happens to big companies with surprising frequency.
FREE CASH FLOWSFree cash flow refers to whether a firm generates cash beyond its own needs. Undernormal conditions, most firms generate positive cash flows from operating activities, butsome of those funds have to be used to maintain a long-run competitive position. Thelargest such nonoperating cash requirement is typically replacing worn-out fixed assets.
Free cash flow is defined as net cash flow less such requirements. It is essentially thecash available for distribution to common stockholders. If free cash flow is negative,the firm must either borrow or raise more equity capital to be viable in the long run.
The free cash flow concept is especially important when one company acquiresanother. The acquiring firm needs to know whether its new business will need cashinfusions after the acquisition or will generate funds that can be used elsewhere.
from the CFO
Belfry CompanyStatement of Cash Flows
For the period ended 12/31/x2
CASH FROM OPERATING ACTIVITIES
Net income $ 1,000Depreciation 500Net changes in current accounts (600)Cash from operating activities $ 900
CASH FROM INVESTING ACTIVITIESPurchase of fixed assets $(2,000)
CASH FROM FINANCING ACTIVITIESIncrease in long-term debt $ 1,200Sale of stock 800Dividend paid (500)Cash from financing activities $ 1,500
NET CASH FLOW $ 400
Beginning cash balance $ 1,000Net cash flow 400Ending cash balance $ 1,400
A firm that managescash poorly cango out of businesswhile making an accounting profit.
Cash generated be-yond reinvestmentneeds is free cashflow.

80 Part 1 Introduction to Financial Management
RATIO ANALYSISPeople who make judgments about businesses by reading financial statements havedeveloped some relatively standard methods with which they analyze information.The general technique is known as ratio analysis. Its use is virtually universal amongfinancial professionals. It is therefore important that you be familiar with the basictechnique and a few of the more commonly used ratios.
Ratio analysis involves taking sets of numbers out of the financial statements andforming ratios with them. The numbers are chosen so that each ratio has a particularmeaning to the operation of the business.
An example will make the idea clear. There’s a ratio that gives a quick indicationof whether the company will have the means to pay its bills during the next year. It’scalled the current ratio and is based on the definitions of current assets and currentliabilities.
Recall from Chapter 2 that the money coming into a firm from normal operationspasses through current assets. Similarly, outgoing money normally passes throughcurrent liabilities. Further, the definition of “current” is that cash will be generated orrequired within a year.
It’s clear that to remain solvent, a company must have at least as much moneycoming in as it has going out. This fact suggests that comparing the sizes of currentassets and current liabilities at a point in time will give an indication of whether oper-ating cash flows will be positive or negative in the near future. The current ratio doesjust that. It’s formed by dividing current assets by current liabilities, and must exceed1.0 or the firm can expect to run short of cash within the next year.5 The currentratio measures liquidity, which in this context refers to the company’s ability to payits bills in the short run.
Numerous ratios have been devised, each having a special significance like the cur-rent ratio. We’ll cover several of the most commonly used ratios in the remainder ofthis chapter.
COMPARISONSRatios by themselves have some value, but not nearly as much as they have whenthey’re compared with other similar figures. For example, a current ratio of 1.8 in aparticular business might seem all right by itself, but it could cause concern if compet-ing firms have current ratios in excess of 3.0. In such a case we would suspect thatsome characteristic of the business requires great liquidity, and the firm we are analyz-ing doesn’t have it.
Ratio analysis is usually conducted in the context of one or more of three com-parisons. Comparisons are made with respect to history, the competition, andbudget.
HistoryComparison with history means looking at a ratio next to the same figure calculatedfor the same organization in one or more immediately preceding accounting periods.The idea is to look for trends. If a firm’s current ratio is seen to be decreasing steadilyover a number of periods, the analyst would ask why.
5. The current ratio generally needs to be quite a bit greater than 1.0. If future inflows and outflows arejust equal, timing problems can be expected if the outflows come first.
Financial ratios areformed from sets offinancial statementfigures. Ratios highlight differentaspects ofperformance.
For a business, liquidity refers toits ability to pay itsbills in the shortrun.

Chapter 3 Cash Flows and Financial Analysis 81
The CompetitionThe performance of other companies in the same field is always a good yardstick forevaluating a firm’s performance. If a particular measure is substantially off what othersare doing, it’s a good idea to find out why. Industry average data are often availablethrough trade associations, government publications, banking publications, and thepublications of investment analysts.
BudgetMost businesses of any size develop financial plans for the future. We’ll study businessplanning in Chapter 4. For now it’s enough to understand that a plan involves a pro-jected set of financial statements from which ratios can be developed. When financialperformance is being evaluated, what the organization really did is always comparedwith what management said it would do in their plan (budget) for the period.Comparing planned and actual ratios highlights where management needs to put itsattention in running the business.
COMMON SIZE STATEMENTSThe first step in a financial analysis is usually the calculation of a set of ratios knownas common size statements. The common size income statement is the most fre-quently used. The idea can best be understood with an example.
Suppose we’re interested in comparing the financial performance of two companiesin the same line of business that are substantially different in size. For example, con-sider the income statements of Alpha and Beta.
Alpha Beta
Sales revenue $2,187,460 $150,845Cost of sales 1,203,103 72,406Gross margin $ 984,357 $ 78,439Expenses 505,303 39,974EBIT $ 479,054 $ 38,465Interest 131,248 15,386EBT $ 347,806 $ 23,079Tax 118,254 3,462Net income $ 229,552 $ 19,617
It’s hard to tell which company is doing a better job of controlling costs andexpenses by looking at the dollar figures because Alpha is so much larger thanBeta.
The comparison is made much easier by creating a common size statement for eachcompany to abstract away from absolute dollars and state things in relative terms. A common size income statement is formed by stating each line as a percentage ofrevenue. The percentages are usually stated to the first decimal place and displayednext to the dollar figures. Let’s look at the comparison of Alpha and Beta with the aidof common size statements.
Ratios are typicallycompared with similar figures fromhistory, the compe-tition, and budget.
A common sizeincome statementpresents each lineitem as a percent of revenue.

82 Part 1 Introduction to Financial Management
Alpha Beta
$ % $ %
Sales revenue $2,187,460 100.0 $150,845 100.0Cost of sales 1,203,103 55.0 72,406 48.0Gross margin $ 984,357 45.0 $ 78,439 52.0Expenses 505,303 23.1 39,974 26.5EBIT $ 479,054 21.9 $ 38,465 25.5Interest 131,248 6.0 15,386 10.2EBT $ 347,806 15.9 $ 23,079 15.3Tax 118,254 5.4 3,462 2.3Net income $ 229,552 10.5 $ 19,617 13.0
Each percentage figure below sales is a ratio of that line’s dollars to revenue dollars.The ratio of cost of sales (or cost of goods sold) to sales revenue is generally called thecost ratio, while expenses as a percentage of revenue can be called the expense ratio.Net income as a percentage of sales has a name of its own, return on sales, and is oneof the ratios we’ll look at later.
Comparing the two columns of ratios in our example, we can immediately see sig-nificant differences in the way the two companies are operating. Alpha’s cost is 55%of revenues while Beta’s is only 48%. This is unusual because one would expect thelarger company to have economies of scale in production that would make it moreefficient than the smaller firm.
Several explanations are possible. Alpha might have some production problems,Beta might be particularly good at what it does, or there may be a difference in whatthey’re making. In the last situation Alpha might be producing a simple bottom-of-the-line product that sells at a minimal markup while Beta might be making a fancycustomized version of the same thing that’s marked up much higher.
The point is that the common size analysis leads us to ask the right questions. It doesn’tgive us the answers, but it gets our investigation of problems started in the right direction.
Common size analysis is particularly useful in comparing a firm’s performance with itsown history. Unfavorable trends in cost or expense ratios from this year to last and the yearbefore are signals to management that should never be overlooked or taken lightly.
A set of common size statements is generally the first thing an analyst prepares whenstarting a project.
Common size balance sheets can also be constructed that state everything as a per-centage of total assets. They can be useful in determining whether a firm has rela-tively too much money tied up in inventory or receivables, or whether it uses moreequipment than it should.
RATIOSIn the following pages we’ll present some of the more commonly used ratios of finan-cial analysis. Each ratio is designed to illuminate some aspect of how the business isdoing. In each case we’ll illustrate how the ratio is calculated, discuss the rationalebehind its use, and explain what it’s telling the analyst.
Remember that ratios are most meaningful when used in comparisons. For thatreason it’s difficult to make a generalization about what a good or an acceptable valueis for any particular figure. For example, one of the ratios we’ll be talking about
from the CFO

Chapter 3 Cash Flows and Financial Analysis 83
measures how effectively the firm uses inventory. With respect to that ratio, a goodnumber for a manufacturing company would be terrible for a retailer.
After we’ve discussed each ratio, we’ll calculate its value for the Belfry Company,using the financial statement shown on page 76.
A Note on Average versus Ending ValuesNotice that we have a beginning and an ending balance sheet for the Belfry Company,which brings up a computational question. When a ratio calls for a balance sheet figure,should we use the beginning, the ending, or an average value?
The answer depends on what the ratio is measuring. If it pertains to a position orstatus at the end of the year, ending values are appropriate. On the other hand, if theratio measures an activity that goes on during the entire period, average balance sheetfigures better reflect performance. Beginning values alone are never appropriate.
The difference between average and ending values isn’t very important if the com-pany is relatively stable and account balances aren’t changing much. However, it canbe significant if the firm is growing or shrinking rapidly.
Sophisticated analysts always use average balances where appropriate. However, inorder to keep the computations in our illustrations and problems simple, we will con-sistently use ending balances. You should just be aware that the issue exists.
Categories of RatiosRatios can be categorized according to the kinds of issues they address. The ones we’lldiscuss fit into five classifications: liquidity, asset management, debt management,profitability, and market value.
Liquidity ratios indicate the firm’s ability to pay its bills in the short run. Asset man-agement ratios show how the company uses its resources to generate revenue and profitand to avoid cost. Debt management ratios show how effectively the firm uses otherpeople’s money and whether it’s using too much borrowed money. Profitability ratiosgive us several measures by which to assess the success of the whole venture inmaking money. Market value ratios give an indication of how investors feel about thecompany’s financial future.
LIQUIDITY RATIOSLiquidity ratios are of particular concern to lenders and suppliers who provide prod-ucts and services to the firm on credit. They want to be sure the company has theability to pay its debts.
The Current RatioThe current ratio is the primary measure of a company’s liquidity—that is, its abilityto meet its financial obligations in the near future. The calculation is
current ratio �current assets
current liabilities
The reasoning behind the ratio was discussed earlier as an example. If everythingcoming in the near future is a current asset today, and everything to be paid out in thenear future is a current liability today, then current assets should be substantially abovecurrent liabilities to ensure solvency. That means the current ratio has to exceed 1.0.In general, a figure greater than 1.5 or 2.0 is required for comfort.
Ratios fall into fivecategories: liquidity,asset management,debt management,profitability, andmarket value.
Liquidity ratiosmeasure the abilityto meet short-termfinancial obliga-tions.

84 Part 1 Introduction to Financial Management
Having said that, we should point out two anomalies that occur with respect tothis ratio. If you look at the balance sheets of large, sophisticated companies that aredoing well, you’ll often see current ratios in the neighborhood of 1.0. Does this meanthese firms are in danger of insolvency?
The answer is generally no in spite of the low current ratio. The reason is that thefirms are being managed very well. Holding current assets like receivables and inventoryties up money that could be used elsewhere. Hence, firms try to operate with as few cur-rent assets as possible. Companies which do that well can have relatively low currentratios if they have a line of credit with a bank to cover temporary cash shortages.
It’s also important to be aware that a high current ratio can be misleading. Inventoriesand receivables can be overstated, meaning some items in those accounts are valueless andwill never turn into cash. If those items remain on the balance sheet, they can result in aninflated current assets figure and a falsely comforting current ratio.
Belfry’s current ratio is
current ratio � � 3.0
The current ratio is a pure number and is generally not referred to in units of any kind.
The Quick Ratio or Acid TestThe quick ratio is conceptually similar to the current ratio. The calculation is
quick ratio �
The liquidity measure provided by the current ratio depends on the conversion of inven-tory to cash in a reasonable time. However, as we described in Chapter 2, inventory isparticularly subject to valuation problems and is often overstated. Inventory also takesmore time to convert to cash than other current items.
As a result of these problems, analysts look for a liquidity measure that does notdepend on inventory. The quick ratio simply takes it out of current assets in the cal-culation. The quick ratio is also called the acid test, which implies a particularlytough, discerning test.
Current assets sometimes contain minor items such as prepaid expenses that neverbecome cash; they, too, should be subtracted when calculating the quick ratio. InBelfry’s case we have
quick ratio � � 1.7
Like the current ratio, the quick ratio isn’t stated in any particular units.
ASSET MANAGEMENT RATIOSAsset management ratios address the fundamental efficiency with which a company isrun. They help an analyst understand the firm’s basic competitiveness.
The Average Collection Period (ACP)The average collection period (ACP) represents the average number of days the firmtakes to collect its receivables. That is, how long does it take to get paid on credit
$7,500 � $3,200$2,500
current assets � inventorycurrent liabilities
$7,500$2,500
from the CFO
The ACP measures thetime it takes to collecton credit sales.

Chapter 3 Cash Flows and Financial Analysis 85
sales? The ACP is also known as the DSO for days sales outstanding, or the receivablescycle. The ACP is stated in days and is calculated as follows.
ACP �
where average daily sales is sales/360. Multiplying the numerator and denominator by360 gives a more convenient formulation.
ACP �accounts receivable
� 360sales
It is common practice to use a 360-day year made up of twelve 30-day months inthese calculations.6
Clearly, the longer a firm takes to collect its money the worse off it is. Althoughthere are significant exceptions, most credit business is done on terms of 30 days.Frequently a discount is offered for faster payment on the order of 10 days.
Customers often stretch credit terms by paying a few days late, and sellers, who are anx-ious to keep their business, don’t complain over minor delays. That means it’s not unusual tosee ACPs of 35 to 45 days in the normal course of business in some industries. However, ifthe ACP exceeds the company’s terms of sale by more than 50%, there are probably seriouscredit problems.
Collection problems have several important implications. The most apparent is that thefirm may be granting credit to customers that lack either the ability or the intent to pay.Another possibility, however, is that customers are finding something wrong with the com-pany’s product. Customer dissatisfaction frequently results in a reluctance to pay the bill.
The proper interpretation of a high ACP is very important. Although the ACP representsan average collection period, a high figure doesn’t usually mean that the average customer ispaying excessively slowly. It may imply that while most receivables are being collected fairlypromptly, a few are very old, as much as six months or a year. These are unlikely ever to berealized in cash.
Remember from our discussion in Chapter 2 that management is sometimes reluc-tant to write off questionable receivables because doing so reduces profit. The result ofthat tendency is an overstated receivables account, which means that the firm’s bal-ance sheet is worth less than it purports to be.
Old receivables should be written off without delay or at least reserved through anaddition to the allowance for doubtful accounts.
The value of the receivables balance net of the allowance for doubtful accountsshould be used in the calculation. For Belfry we have the following ACP.
ACP � � 360 � 104.4 days
This is not a good result. Belfry clearly has a problem collecting money from at leastsome of its credit customers.
The Inventory TurnoverThe inventory turnover ratio is an attempt to measure whether the firm has excessfunds tied up in inventory. The ratio is calculated as follows.
inventory turnover � cost of goods sold
inventory
$2,900$10,000
accounts receivableaverage daily sales
from the CFO
6. The 360-day year is common, but so is the use of a 365-day year. We’ll use both conventions fromtime to time.

86 Part 1 Introduction to Financial Management
Holding inventory costs money. Inventory costs include interest, storage, insur-ance, and taxes. In addition, the more inventory a company holds, the more it has atrisk of spoiling and becoming obsolete. The inventory turnover measures how manytimes a year the firm uses up an average stock of goods. A higher turnover is better inthat it implies doing business with less tied up in inventory.
A low turnover figure can mean some old inventory is on the books that isn’t being used.What is being used may be turning over adequately, but some material can just be deadweight. Such old stock should be disposed of for whatever can be gotten for it.
Operating with too little inventory can create problems too. Excessively low inventorylevels cause stockouts—running out of raw material in the factory or not having the producta customer wants on hand. The result is work stoppages and lost sales. There is definitely aright amount of inventory somewhere between too much and too little. The inventoryturnover ratio helps to find it.
An alternate formulation of the inventory turnover ratio involves using sales inthe numerator rather than cost of goods sold. In practice the cost of goods sold formu-lation is preferred because cost and inventory are comparable numbers, whereas salesincludes expenses and profit. Either formulation can be used if comparisons are madeconsistently.
Belfry’s inventory turnover using cost of goods sold is
inventory turnover �(based on COGS)
The alternative formulation with sales in the numerator is
inventory turnover �(based on Sales)
Inventory turnover is a pure number, but it’s usually stated in units of “turns” or“times,” which are written as “�.”
Notice that in this example the results would be considerably different if an aver-age inventory balance was used in the denominator. That’s because inventorychanged a lot during the year.
Fixed Asset Turnover and Total Asset TurnoverFixed and total asset turnovers measure the relationship of the firm’s assets to a year’ssales.
fixed asset turnover �
total asset turnover �
A business can be thought of as using its assets in conjunction with the skills ofits employees to generate revenue and profit. These ratios show the relationshipbetween assets and sales. In general, a company that generates more sales with agiven level of assets does better than a firm that generates fewer sales with thesame assets.
The two ratios allow us to focus on either fixed or total assets. The total assetsratio tends to be more widely used. The ratio using fixed assets is appropriate in indus-tries where significant equipment is required to do business.
salestotal assets
salesfixed assets
$6,000� 1.9$3,200
$10,000� 3.1$3,200
from the CFO
Inventory turnovergives an indicationof the quality of inventory as well as how well it ismanaged.

Chapter 3 Cash Flows and Financial Analysis 87
These ratios are long-term measures of performance, which are of primary interestto equity investors and stock market analysts. Both asset values are stated net ofaccumulated depreciation. For the Belfry Company we have the following ratios.
fixed asset turnover � � 2.2
total asset turnover � � .83
The units here are generally stated as “times,” sometimes with the symbol “�.” Forexample, Belfry’s fixed asset turnover might be written as 2.2 � for “2.2 times.”
DEBT MANAGEMENT RATIOSDebt management deals with how the firm uses other people’s money to its ownadvantage. By “other people’s money” we mean borrowing as well as trade credit andother liabilities. In financial analysis, we’re primarily concerned that a company doesn’t use so much of these funds that it assumes excessive risk. This is an importantpoint. The problem with using other people’s money is that it requires future cashoutflows for interest and/or repayment. If a firm’s operations don’t supply enough cashfor those payments, it can get in big trouble.
TerminologyThe term debt in ratio analysis requires a little amplification. Some authorities use theword to mean any source of money other than equity. Applied to our examples thatdefinition means debt is the sum of long-term debt and current liabilities. Othersprefer to restrict the idea of debt to interest-bearing obligations, which are generallylong-term borrowings.
Theorists tend to prefer the first interpretation. They like to add current liabilitiesand long-term debt to arrive at a total debt figure for use in ratio analysis. Businesspeople,however, are more likely to limit the definition of debt to long-term, interest-bearingborrowing. Clearly this can lead to some confusion.
In this book, we’ll simply be careful to say exactly what we mean. We’ll call totaldebt the sum of current liabilities and long-term debt. Long-term debt will mean justthat, and we’ll take the word debt by itself to mean formal borrowing regardless ofterm. Where common usage is different we’ll explain.
The Debt RatioThe debt ratio uses the total debt concept and measures the relationship betweentotal debt and equity in supporting the firm’s assets. That is, it tells us how much ofthe firm’s assets are supported by other people’s money.
debt ratio � long-term debt � current liabilitiestotal assets
A high debt ratio is viewed as risky by investors, especially lenders. Debt managementratios are generally stated as percentages.
Belfry’s debt ratio is
debt ratio � $6,200 � $2,500� 72.5%$12,000
$10,000$12,000
$10,000$4,500

88 Part 1 Introduction to Financial Management
Debt to Equity RatioThe debt to equity ratio generally uses just long-term debt and is stated somewhat dif-ferently than other ratios.
debt to equity ratio � long-term debt : equity
This ratio is a measure of the mix of debt and equity within the firm’s total capital. Itis an important measure of risk, because a high level of debt can burden the incomestatement with excessive interest. This makes the firm’s profitability fragile in reces-sionary times. Interest is known as a fixed financial charge, and must be paid regard-less of whether or not revenues and profits are healthy. Hence in a business downturn,large interest charges can throw a company into a loss position quickly. The riskinessassociated with debt and interest is called financial risk.
This ratio is unusual in that it is commonly stated as a proportion rather than as a decimal or a percentage. For example, if capital of $100 includes debt of $33.33,conventional terminology would describe the debt to equity ratio as “one-third—two-thirds,” or “33/67.” If capital is two-thirds debt, we would say the ratio is “2 to 1debt to equity.”
For Belfry we have
debt to equity � $6,200 � $3,300
This would be stated as 1.9 � 1 (1.9 to 1) because $6,200/$3,300 � 1.9.
Times Interest Earned (TIE)TIE gets at the idea of burdening the income statement with interest more directly. Itmeasures the number of times interest can be paid out of earnings before interest andtaxes (EBIT).
TIE �
TIE is called a coverage ratio. For example, if EBIT is $100 and interest is $10, soTIE is 10, we would say that interest is covered 10 times. Clearly, the more timesearnings cover existing interest, the safer it is to lend the firm more money.
For the Belfry Company we have
TIE �$1,900
� 4.8$400
The appropriate unit is times.
Cash CoverageThere’s an obvious problem with the TIE ratio. Interest is a cash payment, but EBIT isnot exactly a source of cash. Rather, it’s an income statement subtotal that may beconsiderably different from cash flow. In other words, more or less cash than EBIT maybe available in any given year to pay interest. The problem can be partially solved byrecognizing that the biggest difference between EBIT and a comparable cash figure isdepreciation. It is subtracted as part of cost and expense in the calculation of EBIT.
A better approximation of coverage is available if we form another ratio withdepreciation added to EBIT in the numerator. This ratio is called cash coverage.
cash coverage � EBIT � depreciationinterest
EBITinterest
Fixed financialcharges like interestincrease a firm’s financial risk.
A high level of interest coverageimplies safety.

Chapter 3 Cash Flows and Financial Analysis 89
Belfry’s cash coverage is
cash coverage � $1,900 � $500� 6.0$400
Fixed Charge CoverageThe TIE and cash coverage ratios recognize interest as a fixed financing charge. Theterm “fixed” implies that interest must be paid regardless of business conditions,unlike dividends, which may be reduced if earnings are poor.
In recent years leasing has supplemented debt as a means of acquiring assets.Instead of borrowing to buy equipment, businesses lease the same equipment andmake lease instead of interest payments. We’ll discuss leasing in Chapter 7.
However, if a company’s leased equipment is necessary to stay in business, or if theleases are contractually noncancelable, the payments become fixed charges in thesense that they have to be paid regardless of conditions, just like interest.
We can adjust the TIE ratio to recognize this additional fixed charge. Because leasepayments have been subtracted along with other costs and expenses to come to EBIT,they must be added back in the numerator to arrive at a cash figure available to payall fixed charges. The same amounts must also be added to the denominator as fixedcharges equivalent to interest. The resulting ratio is known as fixed charge coverage.
fixed charge coverage �
Other fixed charges can be added to the numerator and denominator when appropriate.We’ll assume that the Belfry Company has $700 of lease payments within its cost
and expense figures. Its fixed charge coverage is then
fixed charge coverage � � 2.4
Debt management ratios are important to both creditors and stockholders.Creditors want to make sure funds are available to pay interest and principal, and aretherefore particularly interested in short-run coverage ratios. Stockholders are con-cerned about the impact of excessive debt and interest on long-term profitability.
PROFITABILITY RATIOSThe most fundamental measure of a business’s success is profit. Without profit thereare no dividends, and without dividends or the expectation of them, no one willinvest in stock.
Lenders don’t like profitless companies either. Firms that are losing money orbarely breaking even are perilously close to not being able to repay their loans.
Profitability ratios give us relative measures of the firm’s money-making success.That is, they gauge profits per dollar of sales made, assets employed, or equityinvested. They’re generally stated as percentages.
Return on Sales (ROS)Return on sales is also called the profit margin or net profit margin. It is simply netincome as a percentage of sales.
ROS �net income
sales
$1,900 � $700$400 � $700
EBIT � lease paymentsinterest � lease payments
Lease paymentsare fixed financialcharges similar tointerest.
ROS measures controlof the income state-ment: revenue, costand expense.

90 Part 1 Introduction to Financial Management
Notice that this ratio is the bottom line of the common size income statement. It is afundamental indication of the overall profitability of the business. It gives insight intomanagement’s ability to control the income statement items of revenue, cost, andexpense.
Belfry’s ROS is
ROS � � 10%
Return on Assets (ROA)A business uses assets and the skills of its people to earn a profit. ROA quantifies thesuccess of that effort with respect to assets by stating net income as a percentage oftotal assets.
ROA � net incometotal assets
ROA measures the overall ability of the firm to utilize the assets in which it hasinvested to earn a profit.
Belfry’s ROA is
ROA � � 8.3%
Return on Equity (ROE)ROE is the most fundamental profitability ratio. It states net income as a percentageof equity.
ROE = net incomeequity
ROE measures the firm’s ability to earn a return on the owners’ invested capital. Ittakes the ROA concept one step further by factoring in the effect of borrowed money.If the firm has substantial debt, ROE tends to be higher than ROA in good times andlower in bad times. If there is little or no debt, ROE and ROA are close to the same.We’ll talk about the effect of borrowed money, called leverage, in detail in Chapter 14.For Belfry we have
ROE � � 30.3%
MARKET VALUE RATIOSThe ratios we’ve discussed so far all pertain to the internal management of the firm.As such they are all more or less under the control of management. Another set ofratios compares certain financial statement figures to the value the stock marketplaces on the firm. These ratios are less controllable by management because the per-ceptions and attitudes of the investing public are imposed on the actions of the com-pany in arriving at market value. Management can influence those perceptions andattitudes, but it doesn’t control them.
The market value of a company is reflected in the price of its stock. Multiplying theper-share price by the number of shares outstanding leads to a value for the company asa whole. However, it is common practice to think in terms of per-share values.
$1,000$3,300
$1,000$12,000
$1,000$10,000
ROA adds the effec-tiveness of assetmanagement toROS.
ROE adds the effect of borrowing to ROA.

Chapter 3 Cash Flows and Financial Analysis 91
Price/Earnings RatioThis ratio compares the market price of the stock to the earnings per share calculatedfrom the latest income statement. Earnings per share is simply net income divided bythe number of shares of common stock outstanding. It is usually abbreviated as EPS,while the price/earnings ratio is referred to as the P/E ratio.
P/E ratio = stock priceEPS
The P/E ratio is very important in the stock market. Notice that it tells us howmuch investors are willing to pay for a dollar of the firm’s earnings. For example, if acompany’s P/E is 10 and earnings per share are $4.50, the stock is selling for $45.Stock market people would say, “The company is selling for 10 times earnings.”
Different companies carry different P/Es. Clearly, the higher the P/E the better,because a dollar of earnings translates into more shareholder wealth at higher P/Es.The most significant factor leading to a high P/E ratio is a high expected level ofgrowth by the company.
P/Es must be used with caution. A firm that is losing money doesn’t have a mean-ingful P/E. Further, if profits are very small but the stock has some value, the P/E canbe enormous. That isn’t meaningful either.
To calculate market value ratios for the Belfry Company, we need the number ofshares outstanding and the price of the stock. For the sake of illustration we’ll assumethat there are 300 shares valued at a price of $38 per share. Earnings per share is then
EPS � $1,000/300 � $3.33
and the P/E ratio is
P/E � � 11.4
Market to Book Value RatioA company’s book value is the total value of the equity on its balance sheet. That’sequal to the value of assets less liabilities to outsiders. Notice that it may be more orless than the amount the firm could actually realize by selling everything and payingoff its debts.
A healthy company is usually expected to have a market value in excess of its bookvalue. This is sometimes known as the going concern value of the firm. The idea isthat the combination of assets and people that creates an enterprise will generatefuture earnings that are worth more than the assets alone are worth today.
The market to book value ratio gets at this idea of excess value. Like P/E, it is gen-erally thought of in per-share terms. Market value per share is just the price of thestock, and book value per share is total equity divided by the number of shares out-standing. The calculation is
market to book value ratio =
The market to book value ratio is a broad indicator of what the market thinks of aparticular stock. A value below 1.0 indicates grave concern about the company’sfuture. Such a firm is said to be selling below book.
stock pricebook value per share
$38$3.33
The P/E ratio is anindication of the value the stock market places on a company.
A firm’s P/E is pri-marily a function ofits expectedgrowth.
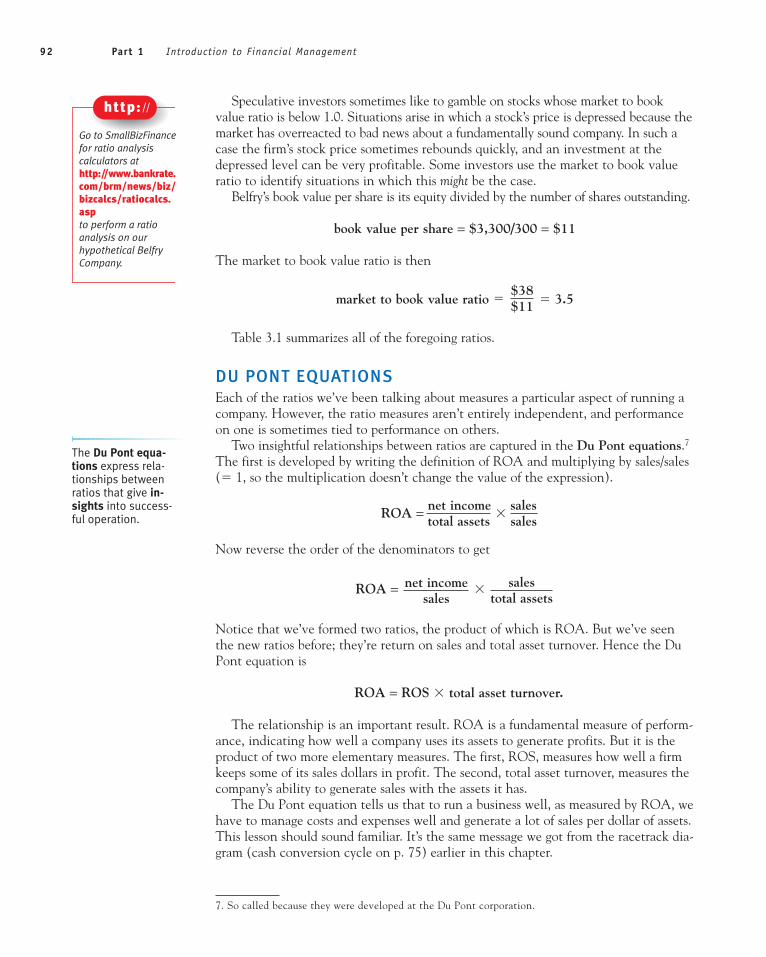
92 Part 1 Introduction to Financial Management
Speculative investors sometimes like to gamble on stocks whose market to bookvalue ratio is below 1.0. Situations arise in which a stock’s price is depressed because themarket has overreacted to bad news about a fundamentally sound company. In such acase the firm’s stock price sometimes rebounds quickly, and an investment at thedepressed level can be very profitable. Some investors use the market to book valueratio to identify situations in which this might be the case.
Belfry’s book value per share is its equity divided by the number of shares outstanding.
book value per share = $3,300/300 = $11
The market to book value ratio is then
market to book value ratio � � 3.5
Table 3.1 summarizes all of the foregoing ratios.
DU PONT EQUATIONSEach of the ratios we’ve been talking about measures a particular aspect of running acompany. However, the ratio measures aren’t entirely independent, and performanceon one is sometimes tied to performance on others.
Two insightful relationships between ratios are captured in the Du Pont equations.7
The first is developed by writing the definition of ROA and multiplying by sales/sales(� 1, so the multiplication doesn’t change the value of the expression).
ROA = net income �
salestotal assets sales
Now reverse the order of the denominators to get
ROA = �
Notice that we’ve formed two ratios, the product of which is ROA. But we’ve seenthe new ratios before; they’re return on sales and total asset turnover. Hence the DuPont equation is
ROA = ROS � total asset turnover.
The relationship is an important result. ROA is a fundamental measure of perform-ance, indicating how well a company uses its assets to generate profits. But it is theproduct of two more elementary measures. The first, ROS, measures how well a firmkeeps some of its sales dollars in profit. The second, total asset turnover, measures thecompany’s ability to generate sales with the assets it has.
The Du Pont equation tells us that to run a business well, as measured by ROA, wehave to manage costs and expenses well and generate a lot of sales per dollar of assets.This lesson should sound familiar. It’s the same message we got from the racetrack dia-gram (cash conversion cycle on p. 75) earlier in this chapter.
salestotal assets
net incomesales
$38$11
Go to SmallBizFinancefor ratio analysis calculators athttp://www.bankrate.com/brm/news/biz/bizcalcs/ratiocalcs.aspto perform a ratioanalysis on ourhypothetical BelfryCompany.
http://
7. So called because they were developed at the Du Pont corporation.
The Du Pont equa-tions express rela-tionships betweenratios that give in-sights into success-ful operation.
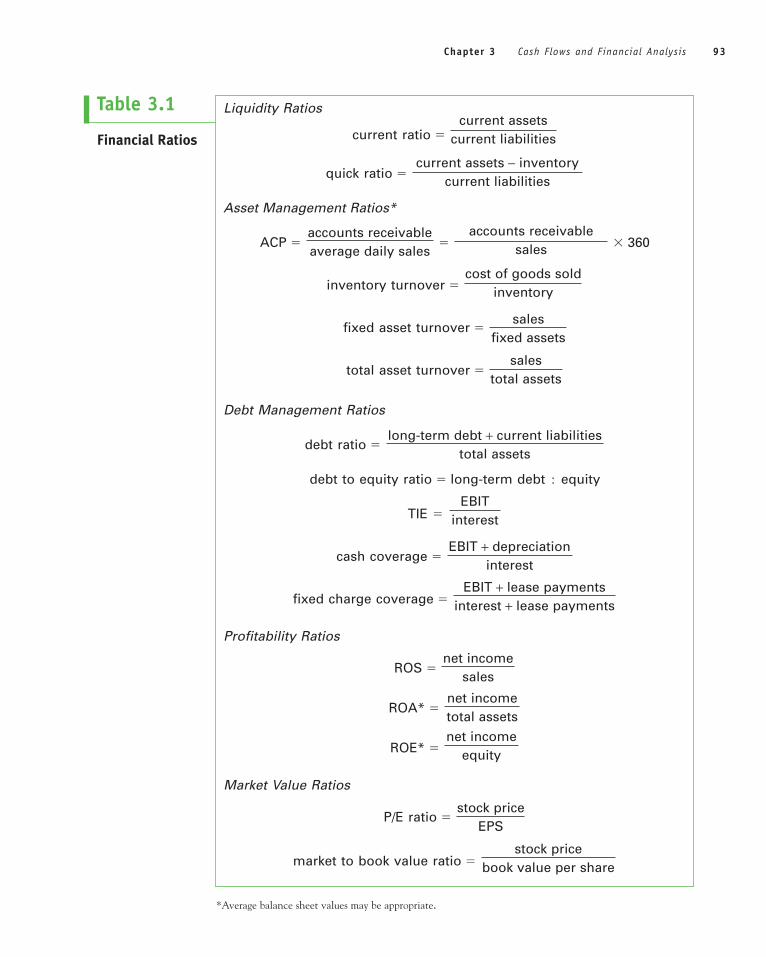
Chapter 3 Cash Flows and Financial Analysis 93
Table 3.1
Financial Ratios
*Average balance sheet values may be appropriate.
Liquidity Ratios
current ratio �
quick ratio �
Asset Management Ratios*
ACP � � � 360
inventory turnover �
fixed asset turnover �
total asset turnover �
Debt Management Ratios
debt ratio �
debt to equity ratio � long-term debt � equity
TIE �
cash coverage �
fixed charge coverage �
Profitability Ratios
ROS �
ROA* �
ROE* �
Market Value Ratios
P/E ratio �
market to book value ratio �stock price
book value per share
stock priceEPS
net incomeequity
net incometotal assets
net incomesales
EBIT + lease paymentsinterest + lease payments
EBIT + depreciationinterest
EBITinterest
long-term debt + current liabilitiestotal assets
salestotal assets
salesfixed assets
cost of goods soldinventory
accounts receivablesales
accounts receivableaverage daily sales
current assets − inventorycurrent liabilities
current assetscurrent liabilities

94 Part 1 Introduction to Financial Management
The extended Du Pont equation takes the idea one step further by expressing returnon equity (ROE) in terms of other ratios. We’ll develop that by writing the definitionof ROE and multiplying by sales/sales and by total assets/total assets.
ROE � � �
Now rearrange the denominators to get
ROE = � � total assets
equitysales
total assetsnet income
sales
total assetstotal assets
salessales
net incomeequity
Concepts in Financial Analysis: MVA and EVA®
In recent years the related ideas of market value added (MVA) and economic value added(EVA®) have become popular as gauges of business success. The concept behind both measuresis the creation of shareholder wealth. We’ll consider MVA first.
There are two ways to think about the value of a firm’s equity. The market value of equityis just stock price times the number of shares outstanding. At the same time the equity con-tributed by shareholders is reflected in the equity accounts on the company’s books (includ-ing retained earnings). If market value is greater than book value, some additional value hasbeen created by the company acting as an ongoing business. This extra is MVA. It’s the cumu-lative amount management has made for the stockholders over and above dividends sincethe inception of the firm.
Notice that MVA can be negative if the stock is selling below its book value. Conceptually MVAis similar to the market to book value ratio we discussed earlier. You should be able to see thata negative MVA is equivalent to a market to book ratio of less than 1.0.
The more exciting idea is EVA, economic value added. In theory it is the amount by which thefirm increases or decreases MVA in the current year.
Before defining EVA precisely, it’s important to notice something about traditional netincome. When we calculate net income we subtract interest from revenues along with other costsand expenses. You can think of interest as the cost the company pays for the use of its debt cap-ital. We do not, however, subtract a payment to stockholders for the use of equity capital.
That means financial analysis based on net income (EAT) recognizes the cost of debt (inter-est) but implicitly treats equity as a free source of capital. This presents a problem becauseequity capital does have a cost, basically the return demanded by stockholders on their invest-ments. Ignoring the cost of equity makes performance seem better than it is. For example, acompany with a small positive net income is profitable in an accounting sense but may be aneconomic failure because it doesn’t provide an adequate return to stockholders on their equityinvestments.
A better measure of overall performance than accounting net income would be produced ifwe modified the income statement to subtract the cost of both debt and equity capital insteadof just the interest cost of debt. This is exactly what EVA does using a concept called the cost ofcapital. We’ll study the cost of capital a great deal in a later chapter. For now it’s enough to
INS
IGH
TS PRACTICAL FINANCE

Chapter 3 Cash Flows and Financial Analysis 95
The last term is called the equity multiplier. We’ll explain it in a minute, but firstnotice that the ROE expression is the same as the ROA expression with the last termadded.
ROE = ROS � total asset turnover � equity multiplierROE = ROA � equity multiplier
The equity multiplier has to do with the idea of leverage, using borrowed moneyinstead of your own to work for you. Hence, the extended Du Pont equation says thatto measure performance in terms of ROE, we add the concept of leverage to perform-ance in terms of ROA.
understand that it’s a single, average “interest rate” that reflects the rate of return the businesspays to the suppliers of its capital, both debt and equity. That rate, stated on an after-tax basis,is the “cost” of the capital funds the firm uses.
EVA is defined as follows.
EVA � EBIT (1 � T) � (debt � equity)(cost of capital %)
where T is the tax rate.The first term on the right is EBIT adjusted to an after-tax basis by multiplying by (1�T). This
figure is what the firm’s after-tax earnings would be if there were no charges for the use of capi-tal, either debt or equity.
The second term on the right subtracts a charge for the use of capital. Debt � equity is totalcapital, so the cost of capital percentage times that sum is the dollar amount the firm pays forthe use of all of its capital. This term is like the traditional interest charge in the income state-ment except that it’s expanded to include a payment for equity. It’s an after-tax figure, becausethe cost of capital percentage is stated after tax.
Hence, EVA is after-tax earnings less an after-tax charge for all capital. But the charge for cap-ital is simply the minimum amount stockholders and bondholders demand for investing theirmoney. They could make that amount by putting it in any number of alternate investments.Hence, if EVA is positive, the firm is exceeding its investors’ expectations. That is, a positive EVAis an extra, an additional contribution to shareholders’ wealth made during the year.
This is a very important idea. If EVA is zero, the firm is just earning what investors expect anddemand, nothing more and nothing less. That’s adequate performance. On the other hand, ifEVA is positive, management is performing above expectations and contributing some additionalvalue to stockholders. A negative EVA, of course, means the firm is losing ground, making a neg-ative contribution to shareholder wealth.
EVA began to gain popularity about fifteen years ago and is one of the hottest ideas in financialmanagement today. More firms seem to be using it with each passing year. Several attribute majorgains in market value to a management focus on EVA rather than traditional net income. The EVA andMVA concepts were developed by Stern Stewart & Co., a financial consulting firm. Stern Stewartmaintains that its clients who use EVA—including Best Buy (consumer electronics), Guidant (med-ical products), and Noble Drilling (energy)—outperform their peers in the stock market.
Source: http://www.eva.com

96 Part 1 Introduction to Financial Management
To understand the equity multiplier, consider the right side of the balance sheet. Itlists all of the places where the firm’s money comes from: equity, debt, and other lia-bilities.8 These add to total assets because both sides of the balance sheet sum to thatfigure. Debt and other liabilities are other people’s money, while equity is the firm’sown money (its owners’). The equity multiplier is related to the proportion to whichthe firm is financed by other people’s money as opposed to owners’ money.
For example, suppose a firm has total assets of $100 and equity of $25. That meansthree quarters of its assets are financed by debt and/or liabilities ($75) and one quarter($25) is supported by equity. The equity multiplier is ($100/$25�) 4, and theextended Du Pont equation says that the firm’s ROE will be four times its ROAbecause of the use of other people’s money.
That’s very good if the business is making a profit and ROA is a positive number.For example, if ROA is 5%, ROE would be a healthy 20%. However, if times gettough, using other people’s money is generally bad news. Suppose the business startsto lose money and ROA is �5%. Unfortunately, the multiplier still works the sameway, and ROE will be �20%, a pretty dismal figure.
The extended Du Pont equation says something very important about running abusiness. The operation of the business itself is reflected in ROA. This means manag-ing customers, people, costs, expenses, and equipment. But that result, good or bad,can be multiplied by borrowing. In other words, the way you finance a business cangreatly exaggerate the results of nuts and bolts operations.
Write out the Du Pont equations for Belfry to verify the relationships.
USING THE DU PONT EQUATIONSComparing the Du Pont equations between a company and an industry average cangive some insights into how a firm is doing in relation to its competitors. For example,suppose we have the following data for Samson Inc. and its industry.
ROA � ROS � Total Asset Turnover
Samson Inc. 12% 6% 2�
Industry 15% 5% 3�
If Samson is trying to figure out why its ROA is below average, this display focusesattention in the right direction. It says that management of the income statementitems, like cost and expense, is a little better than average, but the use of assets togenerate sales, as measured by total asset turnover, is very poor in comparison to thecompetition.
The turnover problem is probably in one or both of two areas. Perhaps the com-pany has unnecessary or ineffective assets, such as overstated inventory or inefficientmachinery. Or maybe its promotional activities are not on target, so sales are lowerthan they should be. The job is now to find out what’s going on and fix the problem.
SOURCES OF COMPARATIVE INFORMATIONThe best competitive information for ratio analysis is generally an industry average.These averages are available in several places.
The Du Pont equa-tions can be used toisolate problems.
8. In our Belfry example other liabilities are simply current liabilities, but that’s not always the case.

Chapter 3 Cash Flows and Financial Analysis 97
Dun and Bradstreet (D&B) is a credit rating service. Vendors use D&B reports tomake decisions about whether or not to sell to customers on credit.
D&B maintains credit files on most businesses in the United States. The filesinclude financial information and comments on a firm’s past payment history asreported by other firms that have done business with it. D&B subscribers can orderreports on specific companies to help in making the credit decision.
D&B has summarized its data to provide industry average ratios for about 800 linesof business. The information is published in Industry Norms and Key Business Ratios.
The Risk Management Association is an association of bank lending officers. It pub-lishes summarized ratio information on 250 industries in Statement Studies.
The U.S. Commerce Department publishes the Quarterly Financial Report, whichcontains summarized ratio information for a large number of industries. Governmentreports on industry are usually organized by the Standard Industrial Classification(SIC) Code that provides a systematic segregation and cataloging of industrial activity.
Value Line and similar investment advisory services provide industry profiles as wellas reports on individual companies.
LIMITATIONS AND WEAKNESSES OF RATIO ANALYSISAlthough ratio analysis is a powerful tool, it has some significant shortcomings.Analysts have to be careful not to apply the techniques blindly to any set of state-ments they come across. Here are a few of the more significant problems.
Diversified companies, large firms with consolidated operations, create what is proba-bly the biggest analysis problem. Such companies often have divisions operating insignificantly different industries. The financial information they publish consolidatesthe results of those different operations into one set of statements. Because the inter-pretation of ratios is highly dependent on industry norms, this mixing of results fromdifferent businesses can greatly reduce the informative value of analysis.
Financial reporting standards set by the accounting profession for diversified busi-nesses require the disclosure of some segment information, but it is generally of limitedscope and use.
Window dressing refers to practices at year end that make balance sheets look betterthan they otherwise would through improvements that don’t last. Here’s a simple exam-ple. Imagine a firm with a current ratio that’s too low whose business is fundamentallysound so it can borrow long term. Suppose this company takes out a long-term loan afew days before the end of the year, holds the proceeds in cash, a current asset, over yearend, and repays the loan a few days later. It thus increases year-end current assets withno impact on current liabilities, thereby improving the reported current ratio.
Accounting principles allow a great deal of latitude in reporting. That means similarcompanies might report the same thing differently, making their financial results arti-ficially dissimilar. Depreciation is a good example. The choice between acceleratedand straight line depreciation is up to the firm, but the difference can double reporteddepreciation in a given period. That in turn can make a big percentage difference innet income between two essentially identical firms.
Inflation often distorts financial statements. Real estate purchased years ago, forexample, will be carried on the balance sheet at its original cost. Yet it may be worthmany times that amount in today’s market. During periods of rapid inflation, inven-tory, cost of goods sold, and depreciation can badly distort true results.
The interpretation of ratios isn’t always clear. Recall our discussion of the currentratio and inventory turnover.
The most important thing to remember with respect to these issues is that ratioanalysis doesn’t give answers; it helps you ask the right questions.
Visit these sites:D&B athttp://www.dnb.comand Value Line athttp://www.valueline.com
http://
Ratio analysis is not an exact sci-ence and requiresjudgment andexperienced inter-pretation.

98 Part 1 Introduction to Financial Management
QUE STIONS
1. List the main user groups of financial information. What are the reasons for theirinterest?
2. Where do analysts get financial information about companies? What are theirconcerns about the information?
3. Financial analysts are generally optimists who believe what they’re told. Right orwrong? Explain.
4. If a company’s cash account increases from the beginning to the end of the year,there’s more cash on hand so that must be a source of cash. Yet the cash accountis an asset, and the first cash flow rule says that an asset increase is a use of cash.Explain this apparent conflict.
5. Why don’t we calculate the difference in the equity account between the begin-ning and end of the year and consider that difference as a source or use of cash?Why do we similarly exclude the cash account?
6. What are free cash flows? Who is likely to be most interested in them? Why?
7. Outline the thinking behind ratio analysis in brief, general terms (a few lines;don’t go into each ratio individually).
8. Financial ratios don’t do you much good by themselves. Explain.
9. What is the reasoning behind using the current ratio as a measure of liquidity?
10. Why do we need the quick ratio when we have the current ratio?
11. A company’s terms are net 30 and the ACP is 35 days. Is that cause for alarm?Why or why not?
12. Discuss the different definitions of debt in ratio analysis.
13. Why do people view having too much debt as risky? If you were interested indetermining whether a company had too much debt, what measure would youuse? Why? How much debt do you think would generally be considered too much?
14. It can be argued that the TIE ratio doesn’t make much sense. Why? How would youchange the measure to be more meaningful? (Hint: Think in terms of cash flows.)
15. Can managers affect market value ratios?
16. Can a competent financial analyst always correctly assess a firm’s financial healthfrom publicly available information? Explain.
BUSINE SS ANALYSI S
1. The present format for the statement of cash flows is organized according to oper-ating activities, investing activities, and financing activities. That format has onlybeen in use since the late 1980s. The previous format first listed all sources andthen all uses of cash, giving a subtotal for each. Cash flow was then the differencebetween the two subtotals. What advantages or disadvantages do you see of thecurrent format in relation to the old one? Which would you prefer if you had achoice?
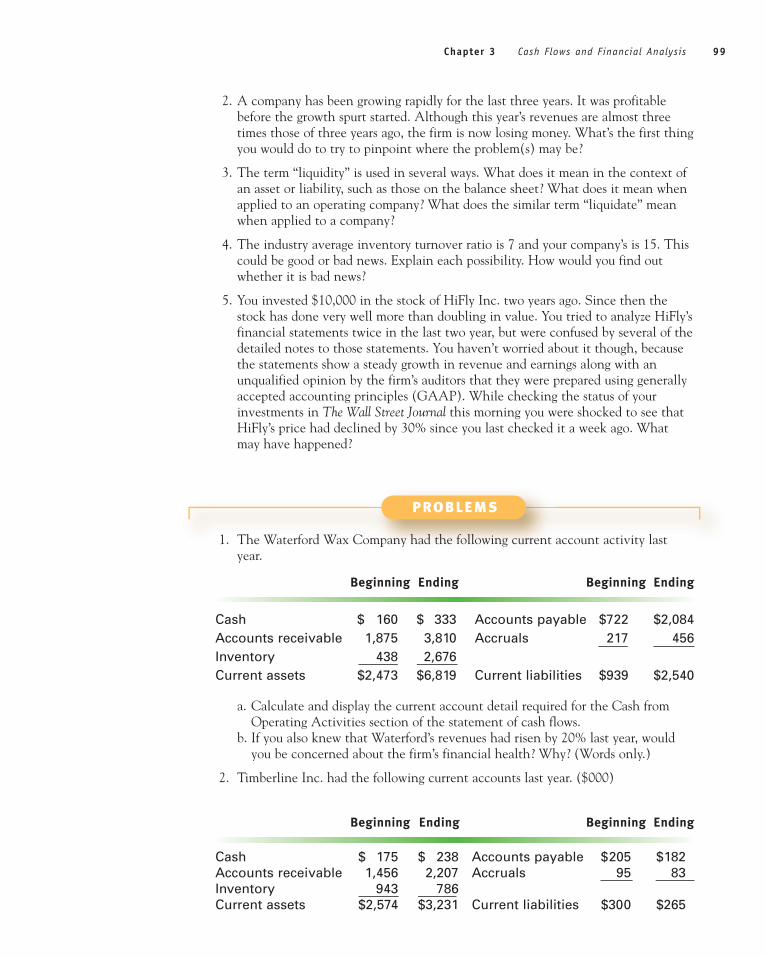
Chapter 3 Cash Flows and Financial Analysis 99
2. A company has been growing rapidly for the last three years. It was profitablebefore the growth spurt started. Although this year’s revenues are almost threetimes those of three years ago, the firm is now losing money. What’s the first thingyou would do to try to pinpoint where the problem(s) may be?
3. The term “liquidity” is used in several ways. What does it mean in the context ofan asset or liability, such as those on the balance sheet? What does it mean whenapplied to an operating company? What does the similar term “liquidate” meanwhen applied to a company?
4. The industry average inventory turnover ratio is 7 and your company’s is 15. Thiscould be good or bad news. Explain each possibility. How would you find outwhether it is bad news?
5. You invested $10,000 in the stock of HiFly Inc. two years ago. Since then thestock has done very well more than doubling in value. You tried to analyze HiFly’sfinancial statements twice in the last two year, but were confused by several of thedetailed notes to those statements. You haven’t worried about it though, becausethe statements show a steady growth in revenue and earnings along with anunqualified opinion by the firm’s auditors that they were prepared using generallyaccepted accounting principles (GAAP). While checking the status of yourinvestments in The Wall Street Journal this morning you were shocked to see thatHiFly’s price had declined by 30% since you last checked it a week ago. Whatmay have happened?
PROBLEMS
1. The Waterford Wax Company had the following current account activity lastyear.
Beginning Ending Beginning Ending
Cash $ 160 $ 333 Accounts payable $722 $2,084Accounts receivable 1,875 3,810 Accruals 217 456Inventory 438 2,676Current assets $2,473 $6,819 Current liabilities $939 $2,540
a. Calculate and display the current account detail required for the Cash fromOperating Activities section of the statement of cash flows.
b. If you also knew that Waterford’s revenues had risen by 20% last year, wouldyou be concerned about the firm’s financial health? Why? (Words only.)
2. Timberline Inc. had the following current accounts last year. ($000)
Beginning Ending Beginning Ending
Cash $ 175 $ 238 Accounts payable $205 $182Accounts receivable 1,456 2,207 Accruals 95 83Inventory 943 786Current assets $2,574 $3,231 Current liabilities $300 $265

100 Part 1 Introduction to Financial Management
In addition, the company had sales revenues of $9,453,000 and costs and expenses(including interest and tax) of $7,580,000. Depreciation of $1,462,000 is includedin the cost and expense figures.
Construct a statement showing Timberline’s Cash from Operating Activitiessection, including a detail of changes in balance sheet accounts.
3. Fred Klein started his own business recently. He began by depositing $5,000 of hisown money (equity) in a business account. Once he’d done that his balance sheetwas as follows.
Assets Liabilities and Equity
Cash $5,000 Equity $5,000Total $5,000 Total $5,000
During the next month, his first month of business, he completed the followingtransactions. (All payments were made with checks out of the bank account.)
• Purchased $2,500 worth of inventory, paying $1,500 down and owing thevendor the remainder.
• Used $500 of the inventory in making product.
• Paid employees’ wages of $1,100 on the last day of the month.
• Sold all the product made in the first month on credit for $3,000.
• Paid rent of $1,200.
a. Construct a balance sheet for Fred’s business at the end of its first month.(Hint: Fred’s business has only current assets, current liabilities, and anequity account. Calculate the ending balance in each of the currentaccounts from the information given. The ending equity account balancewill be the difference between the current assets and liabilities at monthend.)
b. Construct Fred’s income statement. (Hint: Fred’s revenue is the credit sale.His costs/expenses consist of the inventory used in product sold plus thethings other than inventory for which he wrote checks. Ignore taxes.)
c. Construct Fred’s statement of cash flows for the month. (Hint: Fred’s beginningbalance sheet has only two accounts, cash and equity, each with a $5,000 bal-ance. All other accounts open with zero balances.)
d. Is Fred’s business profitable in an accounting sense? In a cash flow sense?(Words only.)
e. Can the business fail while making a profit? How might that happen in thenext month or so? (Words only.)
4. The Blandings Home Construction Company purchased a new crane for $350,000this year. It sold the old crane for $80,000. At the time it had a net book value of$20,000. Assume any profit on the sale of old equipment is taxed at 25%. Thesewere the only transactions that affected investing activities this year. Constructthe Cash Flow from Investing Activities section of the statement of cash flows toconcisely convey the maximum information to readers of the company’s financialstatements.

Chapter 3 Cash Flows and Financial Analysis 101
5. Lansing Inc., a profitable food products manufacturer, has undertaken a majorexpansion that will be financed by new debt and equity issues as well as earnings.During the last year the company borrowed $5 million for a term of 30 years tofinance a new building to house the expanded operations. It also sold 60,000shares of $4 par value stock at $51 per share to pay for new equipment. It alsopaid off short-term loans that support inventory and receivables totaling $700,000as they came due and took out new short-term debt for the same purpose of$850,000, which was outstanding at year end. Lansing also made a scheduled pay-ment of $500,000 on an old long-term loan with which it had acquired produc-tion equipment several years ago. The payment included interest of $425,000.Finally the firm paid dividends of $2.50 per share on 700,000 shares of outstand-ing common stock. Calculate and display the Cash from Financing Activities sec-tion of Lansing’s statement of cash flows.
6. Fitch Inc.’s financial statements are as follows:
Fitch Inc.Income Statement
For the period ended12/31/x1 ($000)
Sales $40,506COGS 14,177Gross margin $26,329Expense 19,487EBIT $ 6,842Interest 180EBT $ 6,662Tax 2,265Net income $ 4,397
Fitch Inc.Balance Sheet
For the period ended 12/31/x1($000)
ASSETS12/31/X0 12/31/X1
Cash $ 2,165 $ 2,647Accounts receivable 4,832 5,614Inventory 3,217 2,843CURRENT ASSETS $10,214 $ 11,104
Fixed assetsGross $35,183 $39,456Accumulated deprec. (22,640) (24,852)Net $12,543 $14,604
Total assets $22,757 $25,708
LIABILITIESAccounts payable $ 1,642 $ 1,420Accruals 438 1,228CURRENT LIABILITIES $ 2,080 $ 2,648
Long-term debt $ 1,823 $ 409Equity 18,854 22,651TOTAL CAPITAL $20,677 $23,060TOTAL LIABILITIESAND EQUITY $22,757 $25,708
Fitch also sold stock for $2.5 million and paid dividends of $3.1 million. Nofixed assets were retired during the year. (Hint: That implies fixed asset purchases

102 Part 1 Introduction to Financial Management
and depreciation are the only changes in the gross fixed assets and accumulateddepreciation accounts.)
Construct Fitch’s statement of cash flows for 20X1.
7. Axtel Company has the following financial statements.
Axtel CompanyBalance Sheet
For the period ended 12/31/x1($000)
ASSETS 12/31/X0 12/31/X1
Cash $ 3,514 $ 2,875Accounts receivable 6,742 5,583Inventory 2,573 3,220CURRENT ASSETS $12,829 $11,678Fixed assets
Gross $22,478 $24,360Accumulated deprec. (12,147) (13,313)Net $10,331 $11,047
Total assets $23,160 $22,725
LIABILITIESAccounts payable $ 1,556 $ 1,702Accruals 268 408CURRENT LIABILITIES $ 1,824 $ 2,110Long-term debt $ 7,112 $ 6,002Equity 14,224 14,613TOTAL CAPITAL $21,336 $20,615TOTAL LIABILITIESAND EQUITY $23,160 $22,725
Axtel CompanyIncome Statement
For the period ended 12/31/x1($000)
Sales $36,227COGS 19,925Gross margin $16,302Expense 10,868EBIT $ 5,434Interest 713EBT $ 4,721Tax 1,605Net income $ 3,116
In addition, Axtel retired stock for $1,000,000 and paid a dividend of $1,727,000.Depreciation for the year was $1,166,000. Construct a statement of cash flows forAxtel for 20X1. (Hint: Retiring stock means buying it back from shareholders.Assume the purchase was made at book value, and treat it like a negative sale of stock.)
8. Calculate all of the ratios discussed in the chapter for Axtel Company of the pre-ceding problem. Assume Axtel had leasing costs of $7,267 in 20X1 and had1,268,000 shares of stock outstanding valued at $28.75 per share at year end.
9. The Seymour Corp. attempted to increase sales rapidly in 20X1 by offering a new,low-cost product line designed to appeal to credit customers in relatively poor

Chapter 3 Cash Flows and Financial Analysis 103
financial condition. The company sold no new stock during the year but paiddividends of $3,000,000. Depreciation for the year was $7,851,000, and no fixedassets were retired or sold. The firm had the following financial statements for20X1.
Seymour Corp.Balance Sheet
For the period ended 12/31/x1($000)
ASSETS12/31/X0 12/31/X1
Cash $ 2,745 $ 1,071Receivables 19,842 24,691Inventory 10,045 15,621CURRENT ASSETS $32,632 $41,383
Fixed assetsGross $80,128 $ 97,432Accum. deprec. (60,225) (68,076)Net $ 19,903 $29,356
Total assets $52,535 $70,739
LIABILITIES AND EQUITYAccts payable $ 3,114 $ 6,307Accruals 768 914CURRENT LIABILITIES $ 3,882 $ 7,221
Long-term debt $36,490 $48,128Equity 12,163 15,390TOTAL CAPITAL $48,653 $ 63,518
TOTAL LIABILITYAND EQUITY $52,535 $70,739
Seymour Corp.Income Statement
For the period ended 12/31/x1($000)
Revenue $88,765COGS 39,506Gross margin $49,259Expenses $34,568EBIT 14,691Interest 4,312EBT $10,379Tax 4,152EAT $ 6,227
a. Without preparing a statement of cash flows, examine the changes in each bal-ance sheet account and summarize in rough terms wehre Seymour got its cashand what it spent the money on. Include the sum of net income and deprecia-tion as a source of cash.
b. Construct a statement of cash flows for Seymour Corp. How does the informa-tion available from the statement compare with the results of your analysis in part a?
c. Does it look like Seymour may be headed for financial trouble? Explain thepossible implications of the new product and credit strategy on individualaccounts. (Hint: Consider the implications of two extreme scenarios; the newproduct is doing very well or very poorly.)

104 Part 1 Introduction to Financial Management
10. Slattery Industries reported the following financial information for 20X2:
Revenues $10.0 millionCosts & expenses (excluding depreciation) 8.0Depreciation 0.5Taxes 0.6Net income 0.9Fixed assets (gross) 10.0Working capital 4.0
The firm expects revenues costs, expenses (excluding depreciation), and workingcapital to grow at 10% per year for the next three years. It also expects to invest$2 million per year in fixed assets which includes replacing worn out equipmentand purchasing enough new equipment to support the projected growth andmaintain a competitive position. Assume depreciation is 5% of the gross fixedasset account, the tax rate is 40%, and that Slattery has no debt and thereforepays no interest.
a. Make a rough projection of cash flows for 20X3, 20X4, and 20X5 assuming nonew debt or equity is raised. Simply compute an income statement in each year,add depreciation, and subtract increases in working capital and fixed asset pur-chases.
b. Are your projections free cash flows?c. What do your projections imply for Slattery’s owners/managers?d. How would you evaluate Slattery’s ability to achieve this level of growth (as
measured by the increase in fixed assets)?
11. Linden Corp. has a 10% market share in its industry. Below are income state-ments ($millions) for Linden and for the industry.
Linden Industry
Sales $6,000 $64,000Cost of goods sold 3,200 33,650Gross margin $2,800 $30,350Expenses:
Sales and marketing $ 430 $ 3,850Engineering 225 2,650Finance and administration 650 4,560
Total expenses $1,305 $ 11,060
EBIT $1,495 $ 19,290Interest expense 230 4,500EBT $1,265 $14,790Tax 500 5,620Net income $ 765 $ 9,170
a. Develop common sized income statements for Linden and the industry as awhole.
b. What areas should management focus on to improve performance, and whatkind of issues should be examined or looked for in each area?

Chapter 3 Cash Flows and Financial Analysis 105
12. Norton Industries recorded total cost of goods sold for 20X2 of $6.5 million.Norton had the following inventory balances for the months indicated (end ofperiod balances):
In Millions In Millions
December 20X1 $1.20 July 20X2 $1.81 January 20X2 1.65 August 20X2 1.78February 20X2 1.70 September 20X2 1.26March 20X2 1.38 October 20X2 1.61April 20X2 1.66 November 20X2 1.63May 20X2 1.93 December 20X2 1.19June 20X2 1.41
a. Compute inventory turnover for Norton using the following methods to calcu-late the inventory figure:1. End of year2. Average of the beginning and end of year3. Average of the ends of quarters (use the five quarter ends)4. Average of the ends of months (use the 13 month ends)
b. Which method provides the most accurate picture of Norton’s inventory man-agement? Why?
c. Which method do you think Norton is currently using? Why?
13. Partridge Inc. sells about $45 million a year on credit. Good credit and collectionsperformance in the industry result in a 35-day ACP.
a. What is the maximum receivables balance Partridge can tolerate and stillreceive a good rating with respect to credit and collections?
b. If Partridge is now collecting an average receivable in 40 days, by how muchwill it have to lower the receivables balance to achieve a good rating?
14. Epsom Co. manufactures furniture and sells about $40 million a year at a grossmargin of 45%.
a. What is the maximum inventory level the firm can carry to maintain an inven-tory turnover (based on COGS) of 8.0?
b. If the inventory contains $1.2 million of obsolete and damaged goods thatdon’t turn over at all, how fast would the active inventory have to turn over toachieve an overall turnover rate of 8.0?
15. The Nelson Sheetmetal Company has current assets of $2.5 million and currentliabilities of $1.0 million. The firm is in need of additional inventory and has anopportunity to borrow money on a short-term note with which it can buy theneeded material. However, a previous financing agreement prohibits the companyfrom operating with a current ratio below 1.8. What is the maximum amount ofinventory Nelson can obtain in this manner? (Hint: The note and the inventoryare both current items of equal size on the balance sheet.)
16. Sweet Tooth Cookies, Inc. has the following ratios.
ROE = 15%Total Asset turnover = 1.2
ROS = 10%
What percentage of its assets are financed by equity?

106 Part 1 Introduction to Financial Management
17. The Paragon Company has sales of $2,000 with a cost ratio of 60%, current ratio of1.5, inventory turnover ratio (based on cost) of 3.0, and average collection period(ACP) of 45 days. Complete the following current section of the firm’s balance sheet.
Cash $ Accounts payable $ Accounts receivable Accruals 60Inventory
Current assets $ Current liabilities $ 750
18. You are given the following selected financial information for The Blatz Corporation.
Income Statement Balance Sheet
COGS $750 Cash $250Net income $160 Net fixed assets $850
Ratios
ROS 10%Current ratio 2.3Inventory turnover 6.0�
ACP 45 daysDebt ratio 49.12%
Calculate accounts receivable, inventory, current assets, current liabilities, debt,equity, ROA, and ROE.
19. Companies often use ratios as a basis for planning. The technique is to assume thebusiness being planned will achieve targeted levels of certain ratios and then cal-culate the financial statement amounts that will result in those ratios. The processalways starts with a dollar assumption about sales revenue. Forecast the balancesheet for Lambert Co. using the following projected information ($000). Roundall projections to the nearest thousand dollars.
Sales $10,000Cash $500Accruals $50Gross margin 45%ACP 42 daysInventory turns 7.0�
Total asset turnover 1.25�
Current ratio 2.0Debt � equity 1 � 3
ASSETS LIABILITIESCash Accounts payableAccounts receivable AccrualsInventory Current liabilities
Current assets DebtNet fixed assets EquityTotal assets Total liabilities & equity

Chapter 3 Cash Flows and Financial Analysis 107
20. Tribke Enterprises collected the following data from its financial reports for 20X3:
Stock price $18.37Inventory balance $300,000Expenses (excluding OGS) $1,120,000Shares outstanding 290,000Average issue price of shares $5.00Gross margin % 40%Interest rate 8%TIE ratio 8Inventory turnover 12�
Current ratio 1.5Quick ratio .75Fixed asset turnover 1.5
Complete the following abbreviated financial statements, and calculate per shareratios indicated. (Hint: Start by subtracting the formula for the quick ratio fromthat for the current ratio and equating that to the numerical difference.)
INCOME STATEMENT RevenueCOGSGMExpenseEBITInterestEBTTaxEAT
BALANCE SHEETCurrent assets Current liabilitiesFixed assets Long-term debt
Equity:Paid-in capital*Retained earnings
Total equityTotal assets Total liabilities & equity*Paid-in Capital � Common Stock � Paid-in Excess
RATIOSBook value per share Market value per share
21. (Refer to the INSIGHTS box on pages 94–95 before attempting this problem.Notice that the calculations called for here do not involve cost of capital.)William Edwards, Inc. (WEI) had one million shares of common stock outstand-ing on 12/31/20X0. The stock had been sold for an average of $8.00 per share andhad a market price of $13.25 per share on that date. WEI also had a balance of

108 Part 1 Introduction to Financial Management
$5.0 million in its retained earnings account on that date. The following projec-tion has been made for WEI’s next five years of operations:
Shares Average Stock PriceYear Net Income Dividends/Share Issued Issue Price 12/31
20X1 $700,000 $.20 None NA $13.7520X2 840,000 .22 50,000 $14.00 14.2520X3 750,000 .24 100,000 13.50 13.8020X4 900,000 .26 50,000 14.50 15.0020X5 860,000 .28 None NA 15.40
Compute the MVA as of 12/31/X0, and compute EVA®, the change in MVA, as aresult of each subsequent year’s activity. (Assume that all shares issued during anygiven year received the dividends declared that year.) Comment on management’sprojected performance over the five-year period. What would you do if you repre-sented a majority of the stockholders? Would the result have been different beforeMVA/EVA analysis?
22. Prahm & Associates had EBIT of $5M last year. The firm carried an averagedebt of $15M during the year on which it paid 8% interest. The company paidno dividends and sold no new stock. At the beginning of the year it had equity of$17M. The tax rate is 40%, and Prahm’s cost of capital is 11%. Calculate Prahm’sEVA® during the year, and comment on that performance relative to ROE. Makeyour calculations using average balances in the capital accounts.
23. The Hardigree Hamburger chain is a closely held corporation with 400,000shares of common stock outstanding. The owners would like to take the companypublic by issuing another 600,000 shares and selling them to the general public inan initial public offering (IPO). (IPOs are discussed in Chapter 5.). Benson’sBurgers is a similar chain that operates in another part of the country. Its stock ispublicly traded at a price earnings (P/E) ratio of 25. Hardigree had net income of$2,500,000 in 2006.a. How much is Hardigree likely to raise with its public offering?b. What will the public offering imply about the wealth of the current owners?
24. Comprehensive Problem. The Protek Company is a large manufacturer and dis-tributor of electronic components. Because of some successful new products mar-keted to manufacturers of personal computers, the firm has recently undergone aperiod of explosive growth, more than doubling its revenues during the last twoyears. However, the growth has been accompanied by a marked decline in prof-itability and a precipitous drop in the company’s stock price.
You are a financial consultant who has been retained to analyze the com-pany’s performance and find out what’s going wrong. Your investigative planinvolves conducting a series of in-depth interviews with management and doingsome independent research on the industry. However, before starting, you wantto focus your thinking to be sure you can ask the right questions. You’ll begin byanalyzing the firm’s financial statements over the last three years, which areshown below.
The following additional information is provided with the financial statements.Depreciation for 20X1, 20X2, and 20X3 was $200, $250, and $275 million,

Chapter 3 Cash Flows and Financial Analysis 109
Protek Company Income StatementsFor the periods ended 12/31
($000,000)
20X1 20X2 20X3Sales $1,578 $2,106 $3,265COGS 631 906 1,502Gross margin $ 947 $1,200 $1,763
ExpensesMarketing $ 316 $ 495 $ 882R&D 158 211 327Administration 126 179 294Total expenses $ 600 $ 885 $1,503
EBIT $ 347 $ 315 $ 260Interest 63 95 143EBT $ 284 $ 220 $ 117Tax 97 75 40EAT $ 187 $ 145 $ 77
Protek Company Balance SheetsFor the periods ended 12/31
($000,000)
20X1 20X2 20X3ASSETS
Cash $ 30 $ 40 $ 62Accounts receivable 175 351 590Inventory 90 151 300
Current assets $ 295 $ 542 $ 952Fixed assetsGross $1,565 $2,373 $2,718Accumulated depreciation (610) (860) (1,135)Net $ 955 $1,513 $1,583
Total assets $1,250 $2,055 $2,535
LIABILITIESAccounts payable $ 56 $ 81 $ 134Accruals 15 20 30
Current liabilities $ 71 $ 101 $ 164CapitalLong-term debt $ 630 $1,260 $1,600Equity 549 694 771
Total liabilities & equity $1,250 $2,055 $2,535

110 Part 1 Introduction to Financial Management
respectively. No stock was sold or repurchased, and, like many fast-growing com-panies, Protek paid no dividends. Assume the tax rate is a flat 34%, and the firmpays 10% interest on its debt.
a. Construct common size income statements for 20X1, 20X2, and 20X3. Analyzethe trend in each line. What appears to be happening? (Hints: Think in termsof both dollars and percentages. As the company grows, the absolute dollars ofcost and expense spending go up. What does it mean if the percentage of rev-enue represented by the expenditure increases as well? How much of anincrease in spending do you think a department could manage efficiently?Could pricing of Protek’s products have any effect?)
b. Construct statements of cash flows for 20X2 and 20X3. Where is the company’smoney going to and coming from? Make a comment about its free cash flowsduring the period. Is it likely to have positive or negative free cash flows in thefuture?
c. Calculate the indicated ratios for all three years. Analyze trends in each ratioand compare each with the industry average. What can you infer from thisinformation? Make specific statements about liquidity, asset management, espe-cially receivables and inventories, debt management, and profitability. Do notsimply say that ratios are higher or lower than the average or that they aregoing up or down. Think about what might be going on in the company andpropose reasons why the ratios are acting as they are. Use only ending balancesheet figures to calculate your ratios. Do certain specific problems tend to affectmore than one ratio? Which ones?
Industry Average 20x1 20x2 20x3
Current ratio 4.5Quick ratio 3.2ACP 42 daysInventory turnover 7.5�
Fixed asset turnover 1.6�
Total asset turnover 1.2�
Debt ratio 53%Debt � equity 1 � 1TIE 4.5ROS 9.0%ROA 10.8%ROE 22.8%Equity multiplier 2.1
d. Construct both Du Pont equations for Protek and the industry. What, if any-thing, do they tell us?
e. One hundred million shares of stock have been outstanding for the entireperiod. The price of Protek stock in 20X1, 20X2, and 20X3 was $39.27, $26.10,and $11.55, respectively. Calculate the firm’s earnings per share (EPS) and itsprice/earnings ratio (P/E). What’s happening to the P/E? To what things areinvestors likely to be reacting? How would a slowdown in personal computersales affect your reasoning?
f. Would you recommend Protek stock as an investment? Why might it be a verybad investment in the near future? Why might it be a very good one?

Chapter 3 Cash Flows and Financial Analysis 111
INTERNET PROBLEM
25. Learning about different companies is an important part of the financial manager’sjob. Go to http://www.annualreports.com, and search for the latest annual reportfor Merck & co., the pharmaceuticals manufacturer.
a. At the Merck site, click on pdf annualreport. Scroll down a short way and readthe Chairman’s Report. Was it a good year for the company? Why?
b. Check out the company’s income statement. By what percent did its saleschange from the prior year?
c. What do you think contributed to this change? Read what management has tosay by going to the sections in the report where management analyzes the com-pany’s financial condition.
COMPUTER PROBLEMS
26. At the close of 20X3, the financial statements of Northern Manufacturing were asfollows.
Northern ManufacturingIncome Statement
For the period ended 12/31/x3($000)
Sales $22,560COGS 11,506Gross margin $ 11,054Expense 5,332Depreciation 700EBIT $ 5,022Interest 1,180EBT $ 3,842Tax 1,537Net income $ 2,305
Northern ManufacturingBalance Sheet
For the period ended 12/31/x3($000)
ASSETS12/31/X1 12/31/X2
Cash $ 500 $ 200Accounts receivable 6,250 7,300Inventory 5,180 6,470CURRENT ASSETS $11,930 $13,970
Fixed assetsGross $ 7,500 $ 9,000Accumulated deprec. (2,400) (3,100)Net $ 5,100 $ 5,900
TOTAL ASSETS $ 17,030 $19,870
LIABILITIESAccounts payable $ 1,860 $ 2,210Accruals 850 220CURRENT LIABILITIES $ 2,710 $ 2,430
Long-term debt $11,320 $12,335Equity 3,000 5,105TOTAL CAPITAL $14,320 $17,440TOTAL LIABILITIESAND EQUITY $ 17,030 $19,870

112 Part 1 Introduction to Financial Management
In addition, Northern paid dividends of $1.2 million and sold new stock valued at$1.0 million in 20X3. Use the CASHFLO program to produce Northern’s state-ment of cash flows for 20X3.
27. Comparative historical financial statements for Northern Manufacturing of thepreceeding problem are as follows.
Northern ManufacturingIncome StatementsFor the years ended
($000)
12/31/X1 12/31/X2 12/31/X3Sales $17,850 $20,510 $22,560COGS 9,100 10,665 11,506Gross margin $ 8,750 $ 9,845 $11,054
Expense 5,180 5,702 5,332Depreciation 600 650 700EBIT $ 2,970 $ 3,493 $ 5,022Interest 800 910 1,180EBT $ 2,170 $ 2,583 $ 3,842Tax 868 1,033 1,537Net income $ 1,302 $ 1,550 $ 2,305
Dividends paid $ 650 $ 750 $ 1,200Stock sold 0 0 1,000Lease payments $ 500 $ 700 $ 800
Northern ManufacturingBalance Sheets
For the years ended($000)
ASSETS 12/31/X0 12/31/X1 12/31/X2 12/31/X3Cash $ 955 $ 980 $ 500 $ 200Accounts receivable 3,103 3,570 6,250 7,300Inventory 2,890 3,033 5,180 6,470CURRENT ASSETS $ 6,948 $ 7,583 $11,930 $13,970Fixed assets
Gross $ 5,800 $ 6,650 $ 7,500 $ 9,000Accumulated deprec. (1,150) (1,750) (2,400) (3,100)Net $ 4,650 $ 4,900 $ 5,100 $ 5,900
TOTAL ASSETS $11,598 $12,483 $17,030 $19,870

Chapter 3 Cash Flows and Financial Analysis 113
LIABILITIESAccounts payable $ 1,860 $ 1,650 $ 1,860 $ 2,210Accruals 385 742 850 220CURRENT LIABILITIES $ 2,245 $ 2,392 $ 2,710 $ 2,430Long-term debt $ 7,805 $ 7,891 $11,320 $12,335Equity 1,548 2,200 3,000 5,105TOTAL CAPITAL $ 9,353 $10,091 $14,320 $ 17,440
TOTAL LIABILITIES & EQUITY $11,598 $12,483 $ 17,030 $19,870Number of shares 300,000 300,000 315,000Stock price $ 78.12 $ 70.00 $ 65.88
a. Use the ANALYS program to prepare common size statements and a set of finan-cial ratios for each of the last three years.
b. Analyze the results of ANALYS for Northern Manufacturing. The firm has beenquite successful in terms of revenue and profit growth so far. Do the ratios revealany disturbing trends that might indicate future problems?
DEVELOPING SOFT WARE
28. Write a program to generate a statement of cash flows yourself. It isn’t as hard asyou might think.
First set up the income statement and two balance sheets on the spreadsheetjust as they appear in Problem 26. Let the amounts in individual accounts such asCash, A/R, Revenue, COGS, Interest, and Tax be input items, and let the pro-gram calculate all the totals and subtotals such as Current Assets, Total Assets,Gross Margin, and Net Income.
Next take a different area of the spreadsheet and set up the changes in the cur-rent accounts and the statement of cash flows shown below.
Take all of the items shown in lowercase xxx’s from the statements in the firstpart of your spreadsheet. Some will be single items like net income and deprecia-tion, but most will be differences between beginning and ending balances like theincrease or decrease in long-term debt or the change in receivables. Finally, pro-gram the spreadsheet to add up the subtotals where the uppercase XXX’s appearand display the reconciliation.
The trickiest part is keeping the signs straight in your subtractions for sourcesand uses.
Once you have your program written, test it with the inputs to the CASHFLOprogram and see if you get the same results.
29. Write your own analysis program to calculate a common size income statementand the ratios introduced in this chapter. To keep the exercise reasonably simple,just provide for one year of ratios and one common size statement.
Construct an input area in your spreadsheet in the form of an income statementand a balance sheet. Input the accounts and have the program calculate all totalsand subtotals. Define your common size income statement alongside the inputincome statement by dividing each input line item by revenue. Define your ratios inanother area drawing the numerators and denominators from the input statements.
Test your program using the 20X3 statements for Northern Manufacturing fromProblem 27. Compare your results with those of the ANALYS program.

THOMSON ONE Business School Edition
114 Part 1 Introduction to Financial Management
Northern ManufacturingSummary of Changes to Current Accounts
For the year ended 12/31/x3($000)
ACCOUNT SOURCE/(USE)Receivables $ xxxInventory xxxPayables xxxAccruals xxx
$XXX
Northern ManufacturingStatement of Cash Flows
For the year ended 12/31/x3($000)
CASH FROM OPERATING ACTIVITIESNet income $ x,xxxDepreciation xxxNet changes in current accounts xxxCash from operating activities $ XXX
CASH FROM INVESTING ACTIVITIESPurchase of fixed assets $ (x,xxx)
CASH FROM FINANCING ACTIVITIESIncrease (Decrease) in long-term debt $ x,xxxSale of stock xxxDividend paid (xxx)Cash from financing activities $ X,XXX
NET CASH FLOW $XXX
RECONCILIATIONBeginning cash balance $ x,xxxNet cash flow XXXEnding cash balance $ X,XXX
In this chapter we’ll use Thomson ONE to do some financial analysis of the companieswe overviewed in Chapter 1. Go to the text Web site at http://lasher.swlearning.com,select your book and click on the Thomson ONE button. Enter Thomson ONE—Business School Edition using the username and password you created when you regis-tered the serial number on your access card. Select a problem for this chapter, and you’llsee an expanded version that includes instructions on how to navigate within theThomson ONE system, as well as some additional explanation of the presentation format.

Chapter 3 Cash Flows and Financial Analysis 115
30. Take a piece of paper and set up a simple five-column chart. Write the followingratios in the left-most column.
PFM Ratio Name Thomson ONE ratio nameCurrent ratio Current RatioACP Receivables Days SalesTotal asset turnover Sales/Total AssetsReturn on Sales Net Income/SalesReturn on Assets Net Income/Total AssetsReturn on Equity Net Income/EquityTimes interest earned Times interest earnedP/E Ratio P/E
Now label the other four columns for the four companies we looked at in Chapter1: General Motors, Harley-Davidson, Starbucks, and Microsoft.
a. For each company go to the Thomson ONE page displaying three or more yearsof history for annual values of a broad range of financial ratios. Examine thetrend in each of the ratios we’ve listed and note its performance on your chart. Isperformance improving, declining, stable, or is there something strange going on?
b. Make another chart and write down the most recent ratios for each companyand compare them between companies.
Typically ratios within industries or types of industries are similar if companiesare performing similarly. For example, companies in heavy manufacturing tend tohave high levels of fixed assets (also called property, plant and equipment), whilecompanies producing services or intellectual products and retailers tend to havefewer fixed assets. That generally makes the total asset turnover figure lower formanufacturers like GM and Harley than for firms like Starbucks or Microsoft.
Do your ratios show the similarities we’ve just described? If not, go to theThomson ONE page displaying the financial statements themselves and look atdollar line items to see if you can find an explanation. Analyze each ratio.
c. How would you rank the four firms in terms of financial performance? Look atROS, ROA, ROE, and P/E. What economic or market factors might accountfor big differences in P/E?
d. Compare GM and Harley. They both make motor vehicles. Why is their finan-cial performance so different? (Hint: Think in terms of market and economicfactors that make the numbers what they are.)
31. Analyze the performance of each of the four companies we’ve been working withagainst its competition. This is called a peer analysis in Thomson ONE. Thesystem will show you a variety of ratios arrayed against their average value amonga group of competitors. It will also show the performance of individual competi-tors on the same ratios.
First note who the competitors are. Does the selection of competitors makesense to you? How is each of our companies doing against its competition?Conduct a thorough analysis. Don’t just say better or worse on particular ratios.Try to think of reasons why.
Copyright © 2022 FDOKUMEN