Public Finance & Illicit Financial Flows: Evidence and Agenda_Indonesia Case
21
Public Finance & Illicit Financial Flows: Evidence and Agenda Ah Maftuchan - Researcher at PRAKARSA – Jakarta, Indonesia Presentation in Session 2 of Reversing the Resource Curse Conference Accra, Ghana; August 25-27, 2013
-
Upload
independent -
Category
Documents
-
view
3 -
download
0
Transcript of Public Finance & Illicit Financial Flows: Evidence and Agenda_Indonesia Case
Public Finance & Illicit Financial Flows: Evidence and AgendaAh Maftuchan - Researcher at PRAKARSA – Jakarta, IndonesiaPresentation in Session 2 of Reversing the Resource Curse Conference Accra, Ghana; August 25-27, 2013
Outline•Introduction – financing development•Overview of illicit financial flows (IFFs)•Evidence of IFFs in global & selected area (Asia / Africa)
•Public financing and illicit financial flows relations & effect
•Research and advocacy agenda

Financing for development
• Development financing is one the heated topics in the debate of global development because it involves huge amount of money;
• Sources of development financing: domestic & foreign financing. Domestic financing (tax and non-tax revenues) and foreign financing (assistance/donations, foreign investment, international trade, foreign debt, remittance etc);
• If a poor country cannot finance their own development (because its national revenues is very small), others countries could give assistance/ODA in form of technical assistance or cash;
• ODA cannot be the only source of development financing because it is not sustainable and insignificant (especially for emerging countries). Therefore, mobilization of domestic resources is urgent.
Tax and Public Finance• Tax is one of the most heated issues in policy debates in many countries, and it has become a transnational issue;
• Domestic resources such as taxes and remittances of migrant workers are more significant for financing development (Greenhill and Prizzon, 2012);
• Taxes are the main revenues for the government. However, taxation often faces political pressure and illicit financial flows (tax evasion, money laundering, and secrecy jurisdictions), which are now perceived as important obstacles to development.
Illicit Financial Flows?• Illicit financial flows (IFFs) refer to money that is ‘illegally earned, transferred, or utilized. If it breaks laws in its origin, movement or use it merits the label’ (Global Financial Integrity / GFI);
• The money which are moved across borders originate from three major sources: corruption, criminal activity, and cross border tax evasion (Tax Justice Network, 2011);
• This money is strategically shifted from developing economies into the global shadow of financial system to facilitate kick-backs, bribery, and other forms of grand corruption, thereby making basic day-to-day services more expensive and less efficient (ASAP, 2012);
• Illicit financial flows is dirty business practices, an informal economy with a jurisdiction that facilitate the practices of tax evasion/avoidance, as exemplified by the existence of many countries categorized as tax havens (Fuest & Riedel, 2009).
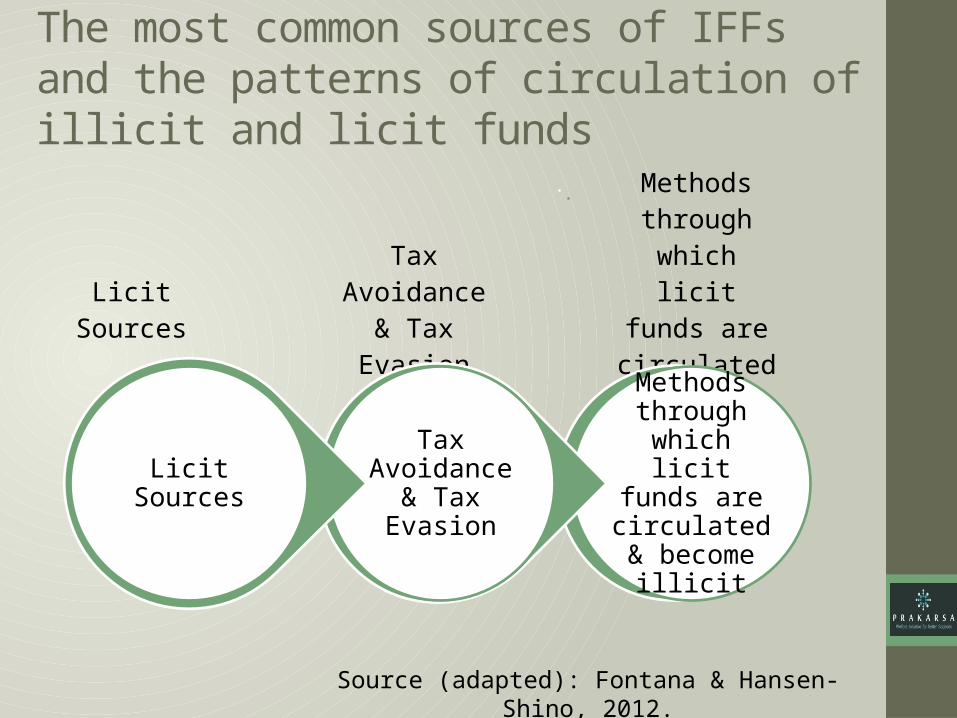
The most common sources of IFFs and the patterns of circulation of illicit and licit funds
Methods through which licit
funds are circulated & become illicit
Tax Avoidance & Tax
Evasion
Licit Sources
Methods through which licit
funds are circulated & become illicit
Tax Avoidance
& Tax Evasion
Licit Sources
Source (adapted): Fontana & Hansen-Shino, 2012.
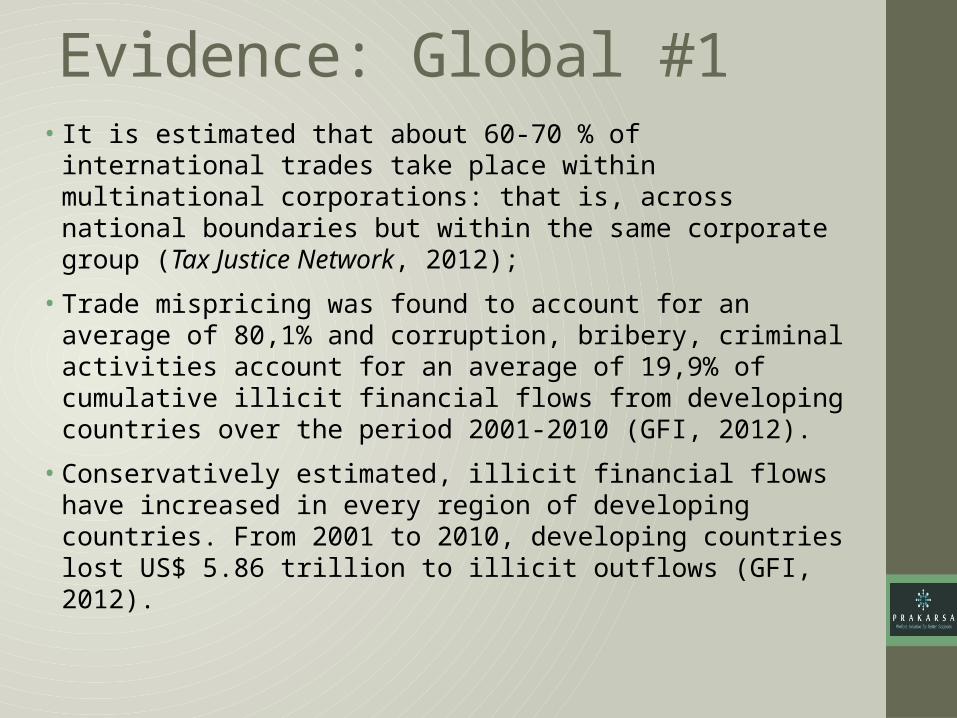
Evidence: Global #1 •It is estimated that about 60-70 % of international trades take place within multinational corporations: that is, across national boundaries but within the same corporate group (Tax Justice Network, 2012);
•Trade mispricing was found to account for an average of 80,1% and corruption, bribery, criminal activities account for an average of 19,9% of cumulative illicit financial flows from developing countries over the period 2001-2010 (GFI, 2012).
•Conservatively estimated, illicit financial flows have increased in every region of developing countries. From 2001 to 2010, developing countries lost US$ 5.86 trillion to illicit outflows (GFI, 2012).
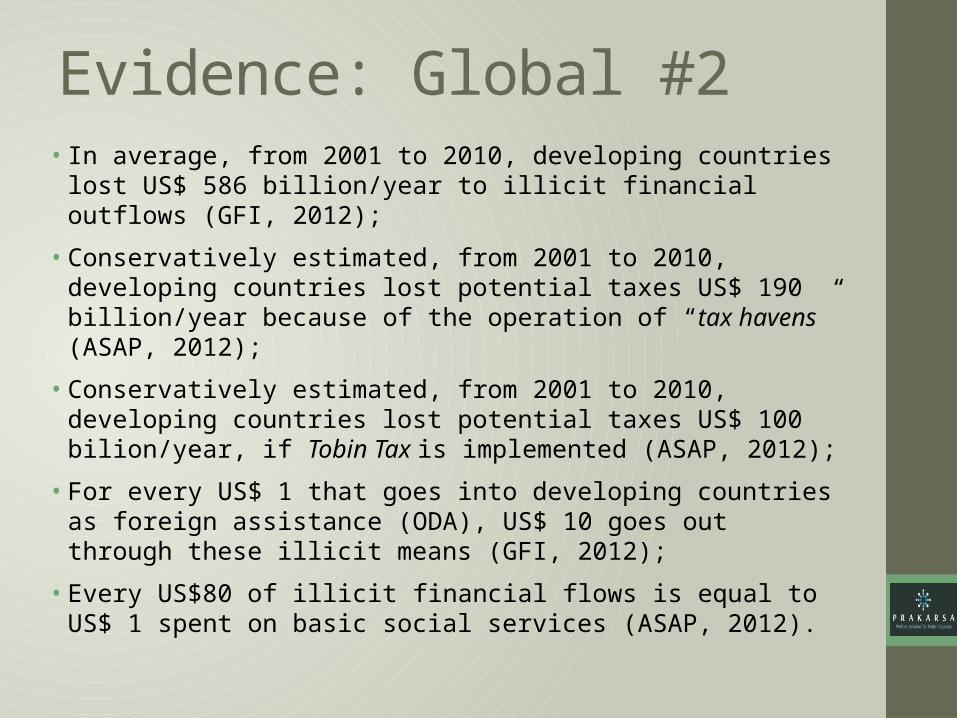
Evidence: Global #2 •In average, from 2001 to 2010, developing countries lost US$ 586 billion/year to illicit financial outflows (GFI, 2012);
•Conservatively estimated, from 2001 to 2010, developing countries lost potential taxes US$ 190 billion/year because of the operation of “tax havens” (ASAP, 2012);
•Conservatively estimated, from 2001 to 2010, developing countries lost potential taxes US$ 100 bilion/year, if Tobin Tax is implemented (ASAP, 2012);
•For every US$ 1 that goes into developing countries as foreign assistance (ODA), US$ 10 goes out through these illicit means (GFI, 2012);
•Every US$80 of illicit financial flows is equal to US$ 1 spent on basic social services (ASAP, 2012).
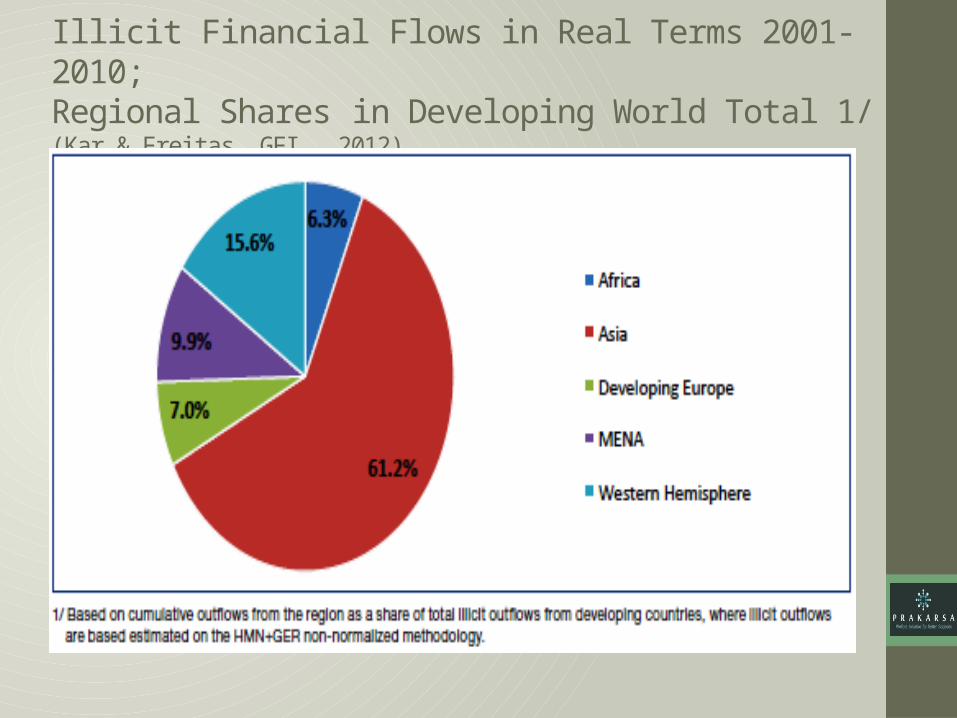
Illicit Financial Flows in Real Terms 2001-2010; Regional Shares in Developing World Total 1/ (Kar & Freitas, GFI, 2012)

IFFs of 33 Sub-Saharan African countries (1970 –2010): US$ 814 billion
Source: “Capital Flight from Sub-Saharan African Countries: Updated Estimates, 1970 – 2010” (JK. Boyce & L. Ndikumana,
2012)

Overview of Indonesia Tax System
Ministry of Finance of the Republic of Indonesia, 2012
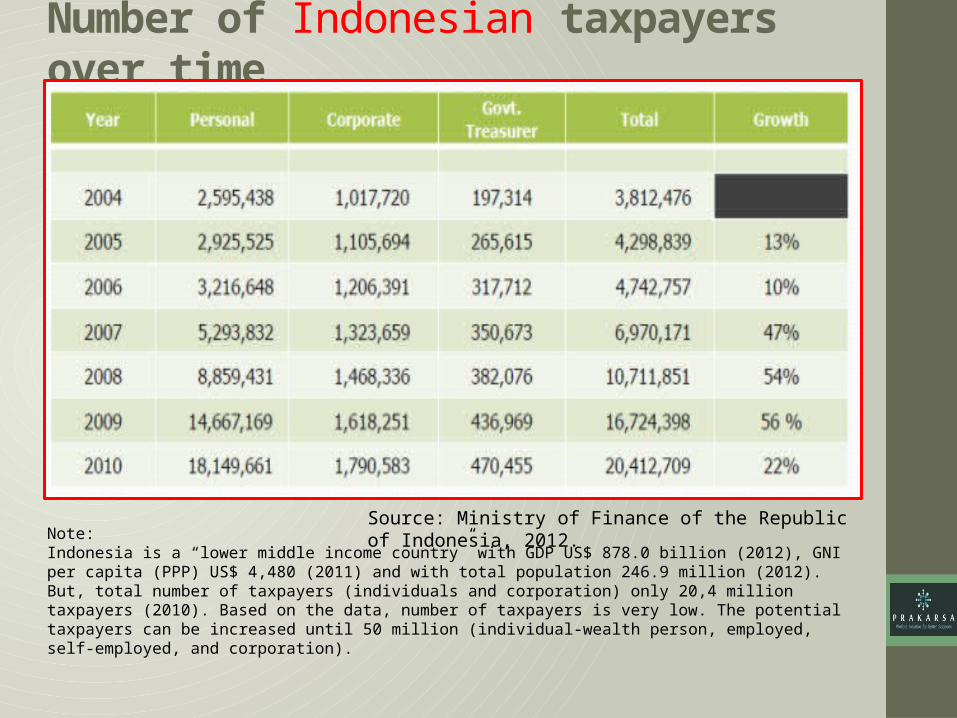
Number of Indonesian taxpayers over time
Note:Indonesia is a “lower middle income country” with GDP US$ 878.0 billion (2012), GNI per capita (PPP) US$ 4,480 (2011) and with total population 246.9 million (2012). But, total number of taxpayers (individuals and corporation) only 20,4 million taxpayers (2010). Based on the data, number of taxpayers is very low. The potential taxpayers can be increased until 50 million (individual-wealth person, employed, self-employed, and corporation).
Source: Ministry of Finance of the Republic of Indonesia, 2012.
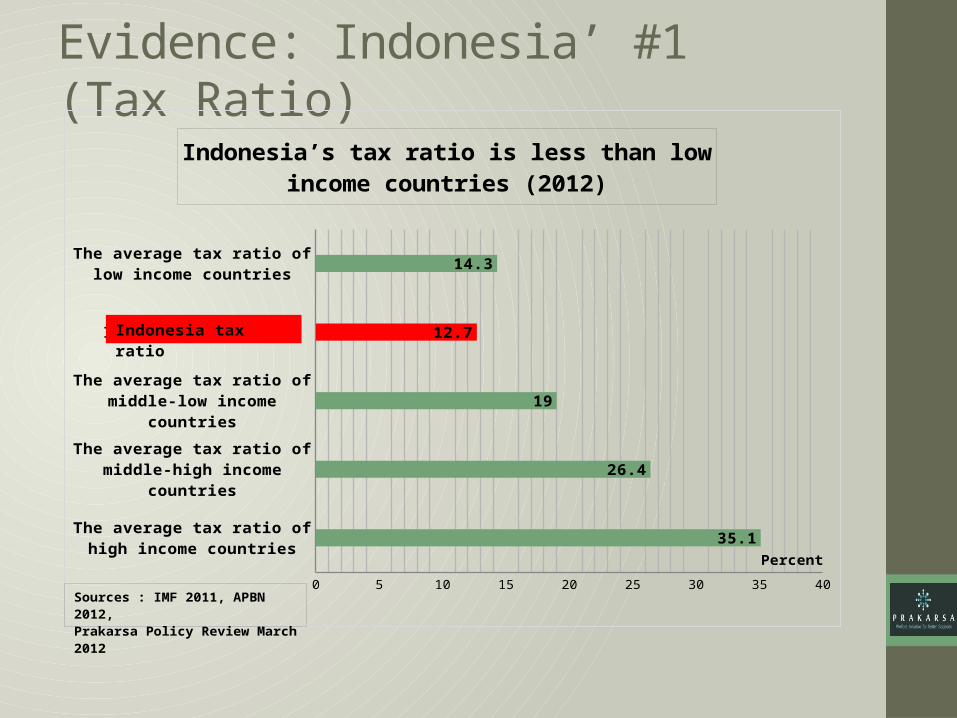
Evidence: Indonesia’ #1 (Tax Ratio)
The average tax ratio of high income countries
The average tax ratio of middle-high income
countries
The average tax ratio of middle-low income
countries
Indonesian tax ratio
The average tax ratio of low income countries
0 5 10 15 20 25 30 35 40
35.1
26.4
19
12.7
14.3
Indonesia’s tax ratio is less than low income countries (2012)
Percent
Indonesia tax ratio
Sources : IMF 2011, APBN 2012,Prakarsa Policy Review March 2012
Cont..•Indonesia is a member of G20 with the lowest tax ratio among the G20 members;
•Indonesia’s tax ratio (per-GDP) in the last five years has been less than 14% 2007 (12,4 %), 2008 (13,3 %), 2009 (11,0%), 2010 (11,3%), 2011 (11,8%), 2012 (12,7%);
•The Indonesia’s tax ratio shows that the government performance in collecting tax is not optimal. It also shows that there is no significant expansion of tax base and that the awareness of the people to pay tax is still low (Budiantoro & Prastowo, 2012).
Evidence: Indonesia’ #2•Self-employed individuals are not captured by the withholding system, and no systematic approach exists for assessing their tax liabilities as a substantial scope for broadening the tax base;
•Tax revenue does not reflect the principle of justice. Wealthy people contributing 1,2% of total tax reveneue and employees contributing 18,6% of total tax reveneue (2010);
•The wealthy individuals do not give significant contribution while the employees give more significant contribution.
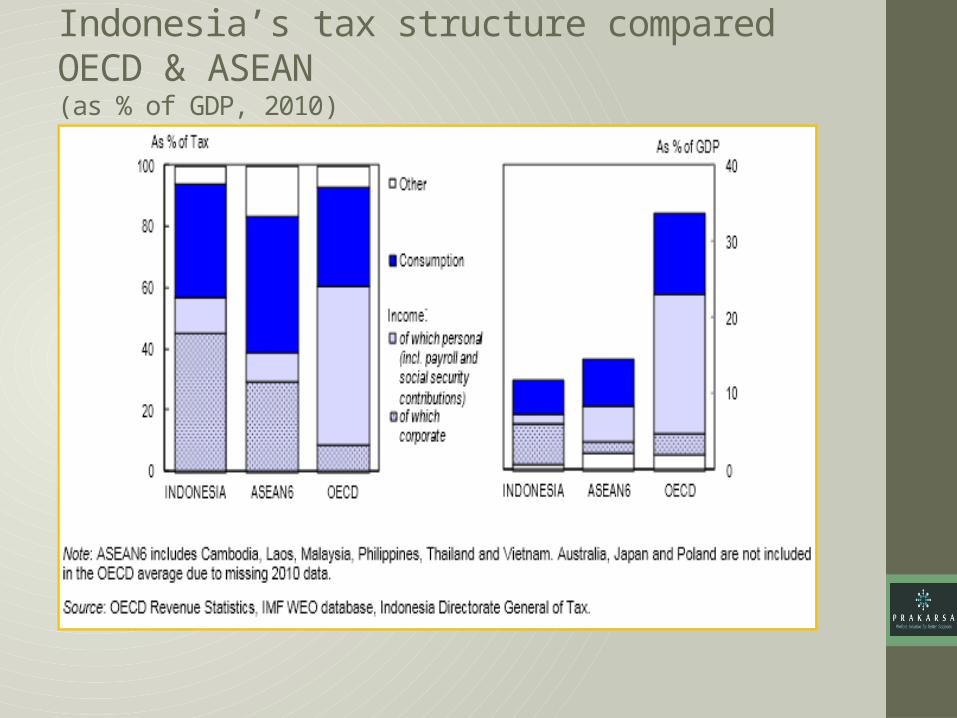
Indonesia’s tax structure compared OECD & ASEAN (as % of GDP, 2010)
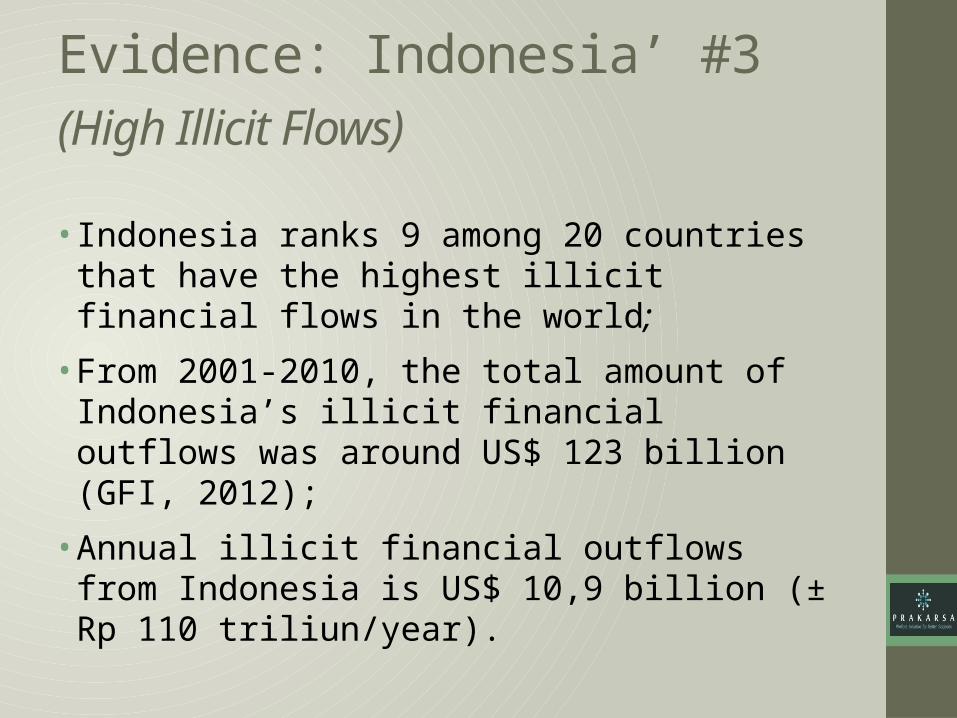
Evidence: Indonesia’ #3 (High Illicit Flows) •Indonesia ranks 9 among 20 countries that have the highest illicit financial flows in the world;
•From 2001-2010, the total amount of Indonesia’s illicit financial outflows was around US$ 123 billion (GFI, 2012);
•Annual illicit financial outflows from Indonesia is US$ 10,9 billion (± Rp 110 triliun/year).
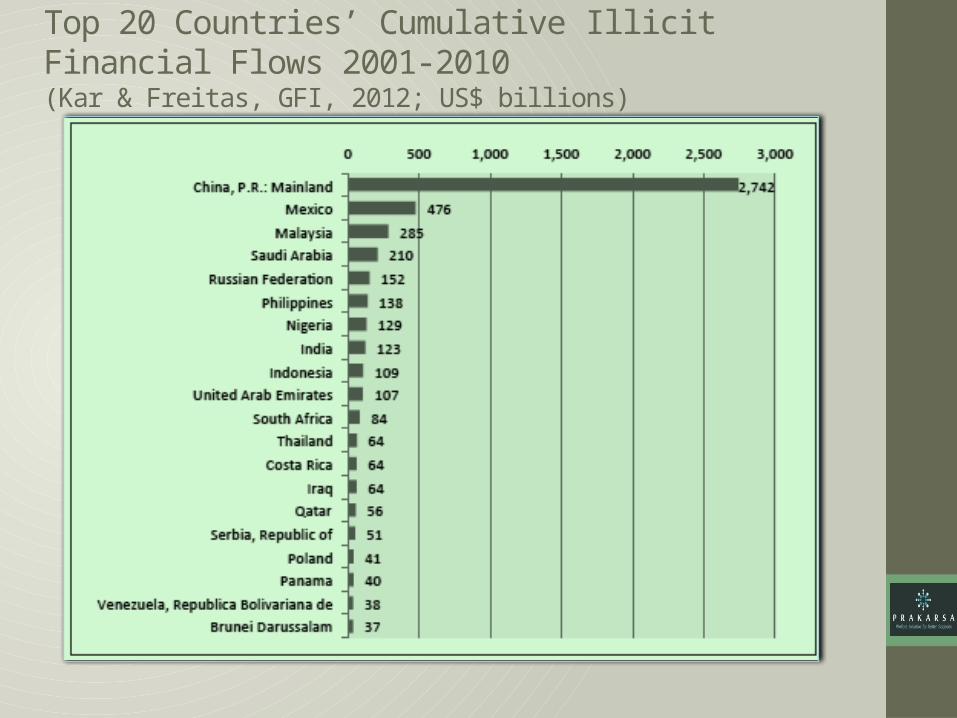
Top 20 Countries’ Cumulative Illicit Financial Flows 2001-2010(Kar & Freitas, GFI, 2012; US$ billions)
Effect of IFFs•The effect of illicit flows i.e.:
The amount of illicit flows exceed flows from aid to developing countries: lower revenues greater reliance on aid & loans;
Corruption probably accounts for a larger proportion of illicit flows coming out of the least-developed countries that are dependent on aid eroded tax base fewer public goods & services
Illicit flows have much greater negative economic impact, including on the functioning of the state in developing countries more financial ‘burden’ to legitimate business incentives to bribe or to evade;
Illicit flows are a central component of the world economy, and corruption cannot be fought effectively in developing countries without developed countries playing their part to stop the ‘illicit inflows’.
CSOs Proposed Agenda •consolidating CSOs working groups at the national, regional and global level to address tax issues;
•developing practical tools for research & advocacy on tax and IFFs;
•capacity building for CSOs and think-tank groups on research-monitoring-estimating IFFs country by country, regions and worldwide;
•developing global partnership between governments and CSOs to counter illicit flows as proposed in the Post 2015 development financing agenda;
•corporate accountability and transparency advocacy.
Finish
Thank you for your attentionAh Maftuchan
Social Policy & Governance SpecialistPerkumpulan Prakarsa
Komplek Rawa Bambu I Blok A No 8-E RT 010 RW 06Pasar Minggu | Jakarta Selatan | Indonesia | 12520
Phone: +62 21 7811-798 | Fax: +62 21 7811-897 | Mobile: +62 852 7777 4448 | E-mail: [email protected] |
[email protected] | Twitter: @AhMaftuchan | Website: theprakarsa.org/