Online markets for illicit drugs in Georgia - Civil.ge
17
CRRC Policy Bulletin METHODOLOGICAL ANNEX Online markets for illicit drugs in Georgia Tbilisi, Georgia September 2020
-
Upload
khangminh22 -
Category
Documents
-
view
1 -
download
0
Transcript of Online markets for illicit drugs in Georgia - Civil.ge
CRRC Policy Bulletin
METHODOLOGICAL ANNEX
Online markets for illicit drugs in
Georgia
Tbilisi, Georgia
September 2020
| i
1 Liziko Kavtaradze Street | Entrance III-IV, First Floor | 0179 Tbilisi | Georgia [email protected] | +995 32 250 52 90
crrc.org.ge | crrc-caucasus.blogspot.com | caucasusbarometer.org
About CRRC Georgia
CRRC-Georgia is a non-governmental, non-profit research organization, which collects, analyzes and
publishes policy relevant data on social, economic and political trends in Georgia. CRRC-Georgia, together
with CRRC-Armenia and CRRC-Azerbaijan, constitutes a network of research centers with the common
goal of strengthening social science research and public policy analysis in the South Caucasus.
Author
Ian Goodrich, Policy Analyst
Author contact: [email protected]
Acknowledgements
The author would like to thank to extend thanks to Ada Beselia, Mariam Ubilava and Natia Natenadze
from Alternative Georgia/Mandala for their early support to the project. Special thanks to Judith Aldridge
for her review, and to Jack Cunliffe and Patrick Shortis for their insights and assistance.
Funding
No specific funding was received for this work.
Rights and Permissions
© Caucasus Research Resource Centers, Georgia.
This document is copyrighted and may not be reproduced in part or full without express permission.
Source code for this document is made available via GitHub for replication and further analysis. Data
generated for the study may be used with attribution and without prior permission for research and non-
commercial purposes.
| ii
CRRC – Georgia September 2020
Online markets for illicit drugs in Georgia Methodological Annex
Table of contents List of tables .................................................................................................................................................. II
List of Figures ................................................................................................................................................ II
List of Acronyms ........................................................................................................................................... III
Introduction .................................................................................................................................................. 1
Differences with other studies .................................................................................................................. 1
The Data ........................................................................................................................................................ 2
Data Pipeline ................................................................................................................................................. 3
Web-Scraping ............................................................................................................................................ 3
Data Processing ......................................................................................................................................... 6
Substance Labelling ................................................................................................................................. 10
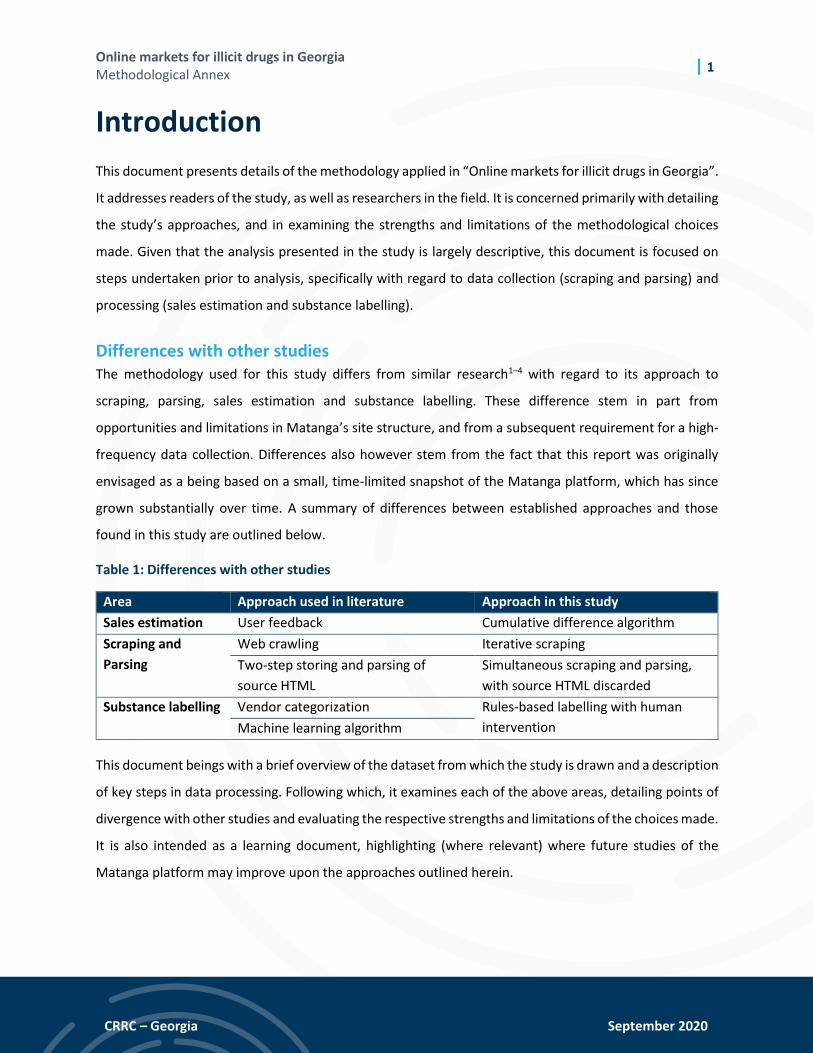
List of tables
Table 1: Differences with other studies ........................................................................................................ 1
Table 2: Summary of records collected during scraping ............................................................................... 2
List of Figures
Figure 1: Data pipeline .................................................................................................................................. 3
Figure 2: Frequency distribution of scrape counts ....................................................................................... 4
Figure 3: Screen capture from Matanga.guru............................................................................................... 8
Figure 4: Illustration of labelling process .................................................................................................... 11
Source code and data
Source code and data for replication and further analysis is available online at GitHub.

| iii
CRRC – Georgia September 2020
Online markets for illicit drugs in Georgia Methodological Annex
List of Acronyms
HTML Hypertext markup language
CSV Comma separated values
SQL Server query language
EUR European euro
BTC Bitcoin
RUB Russian ruble
MDMA 3,4-Methylenedioxymethamphetamine, a synthetic empathogen–entactogen and
stimulant. Known as ecstasy in tablet form.
| 1
CRRC – Georgia September 2020
Online markets for illicit drugs in Georgia Methodological Annex
Introduction
This document presents details of the methodology applied in “Online markets for illicit drugs in Georgia”.
It addresses readers of the study, as well as researchers in the field. It is concerned primarily with detailing
the study’s approaches, and in examining the strengths and limitations of the methodological choices
made. Given that the analysis presented in the study is largely descriptive, this document is focused on
steps undertaken prior to analysis, specifically with regard to data collection (scraping and parsing) and
processing (sales estimation and substance labelling).
Differences with other studies The methodology used for this study differs from similar research1–4 with regard to its approach to
scraping, parsing, sales estimation and substance labelling. These difference stem in part from
opportunities and limitations in Matanga’s site structure, and from a subsequent requirement for a high-
frequency data collection. Differences also however stem from the fact that this report was originally
envisaged as a being based on a small, time-limited snapshot of the Matanga platform, which has since
grown substantially over time. A summary of differences between established approaches and those
found in this study are outlined below.
Table 1: Differences with other studies
Area Approach used in literature Approach in this study
Sales estimation User feedback Cumulative difference algorithm
Scraping and
Parsing
Web crawling Iterative scraping
Two-step storing and parsing of
source HTML
Simultaneous scraping and parsing,
with source HTML discarded
Substance labelling Vendor categorization Rules-based labelling with human
intervention Machine learning algorithm
This document beings with a brief overview of the dataset from which the study is drawn and a description
of key steps in data processing. Following which, it examines each of the above areas, detailing points of
divergence with other studies and evaluating the respective strengths and limitations of the choices made.
It is also intended as a learning document, highlighting (where relevant) where future studies of the
Matanga platform may improve upon the approaches outlined herein.
| 2
CRRC – Georgia September 2020
Online markets for illicit drugs in Georgia Methodological Annex
The Data
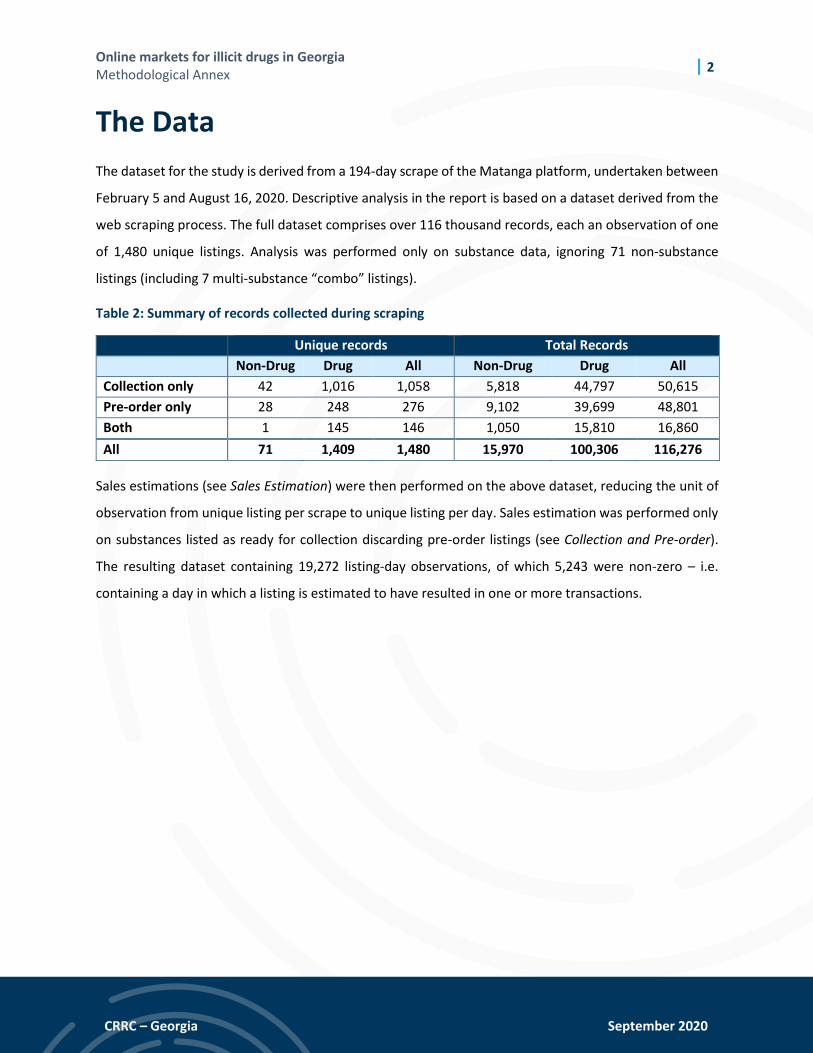
The dataset for the study is derived from a 194-day scrape of the Matanga platform, undertaken between
February 5 and August 16, 2020. Descriptive analysis in the report is based on a dataset derived from the
web scraping process. The full dataset comprises over 116 thousand records, each an observation of one
of 1,480 unique listings. Analysis was performed only on substance data, ignoring 71 non-substance
listings (including 7 multi-substance “combo” listings).
Table 2: Summary of records collected during scraping
Unique records Total Records Non-Drug Drug All Non-Drug Drug All
Collection only 42 1,016 1,058 5,818 44,797 50,615
Pre-order only 28 248 276 9,102 39,699 48,801
Both 1 145 146 1,050 15,810 16,860
All 71 1,409 1,480 15,970 100,306 116,276
Sales estimations (see Sales Estimation) were then performed on the above dataset, reducing the unit of
observation from unique listing per scrape to unique listing per day. Sales estimation was performed only
on substances listed as ready for collection discarding pre-order listings (see Collection and Pre-order).
The resulting dataset containing 19,272 listing-day observations, of which 5,243 were non-zero – i.e.
containing a day in which a listing is estimated to have resulted in one or more transactions.
| 3
CRRC – Georgia September 2020
Online markets for illicit drugs in Georgia Methodological Annex
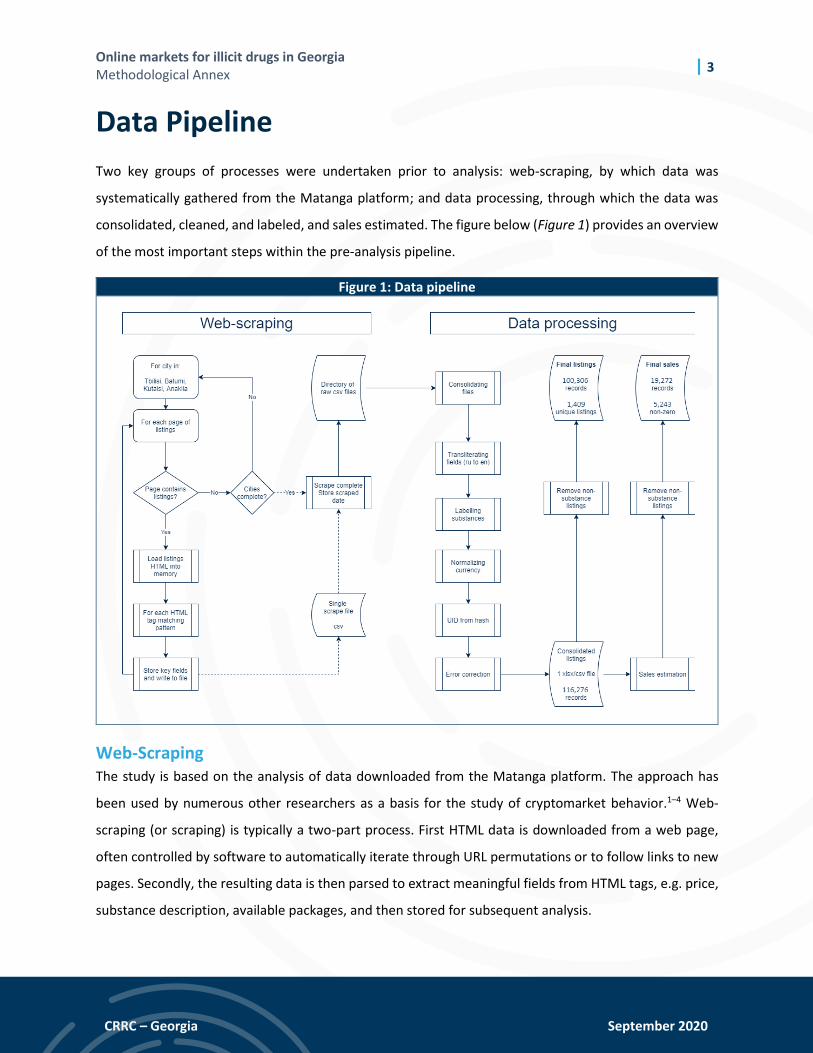
Data Pipeline
Two key groups of processes were undertaken prior to analysis: web-scraping, by which data was
systematically gathered from the Matanga platform; and data processing, through which the data was
consolidated, cleaned, and labeled, and sales estimated. The figure below (Figure 1) provides an overview
of the most important steps within the pre-analysis pipeline.
Figure 1: Data pipeline
Web-Scraping The study is based on the analysis of data downloaded from the Matanga platform. The approach has
been used by numerous other researchers as a basis for the study of cryptomarket behavior.1–4 Web-
scraping (or scraping) is typically a two-part process. First HTML data is downloaded from a web page,
often controlled by software to automatically iterate through URL permutations or to follow links to new
pages. Secondly, the resulting data is then parsed to extract meaningful fields from HTML tags, e.g. price,
substance description, available packages, and then stored for subsequent analysis.
| 4
CRRC – Georgia September 2020
Online markets for illicit drugs in Georgia Methodological Annex
Scraping
Scraping was conducted using Python, with a modified version of the Selenium web testing framework
used to access the site via Tor.5 Scraping was undertaken iteratively, drawing down responses for each
Georgian city and paging through results before ceasing upon an empty response (see Figure 1).
The scraper did not attempt to use site defined categories to label substances (see Substance Labelling),
which would have required another level of iteration, i.e. through each page for each category for each
city. This approach may have resulted in a simpler labelling process but would have also resulted in
significantly more requests to the site, increasing scrape duration, and the likelihood both of administrator
intervention and encountering a periodic server error.
The iterative approach outlined above stands in contrast to other studies which have used automatic link
following (crawling). The iterative approach was chosen for its simplicity and speed, and because a whole-
site scrape was not desired.
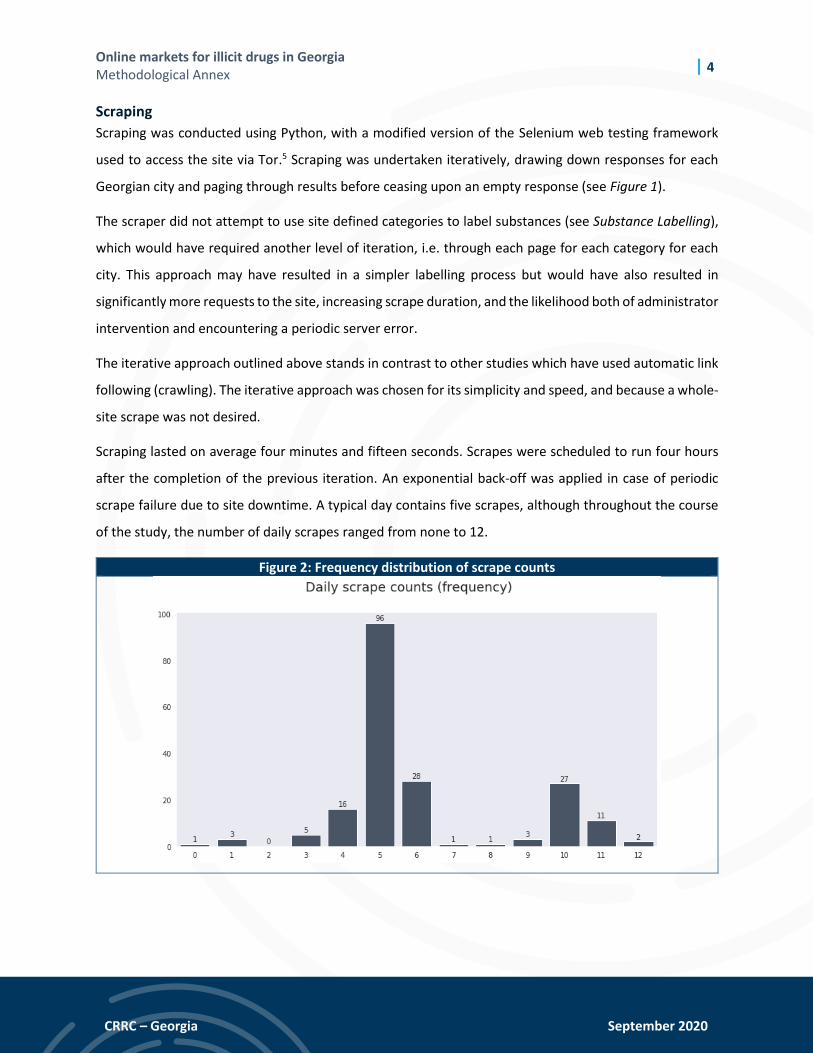
Scraping lasted on average four minutes and fifteen seconds. Scrapes were scheduled to run four hours
after the completion of the previous iteration. An exponential back-off was applied in case of periodic
scrape failure due to site downtime. A typical day contains five scrapes, although throughout the course
of the study, the number of daily scrapes ranged from none to 12.
Figure 2: Frequency distribution of scrape counts
| 5
CRRC – Georgia September 2020
Online markets for illicit drugs in Georgia Methodological Annex
Minor changes to scraper code were periodically required in response to changes in the site structure or
to circumvent anti-scraping mechanisms. Downward variation in scraping frequency resulted from
unanticipated downtime due to server errors or scraper maintenance. Only one day of complete
downtime was experienced, on June 4, 2020. Three further days saw only one scrape conducted: May 17,
July 19, and August 8.
Upward variation resulted from testing following maintenance. Additional scrapes were not discarded
following testing, given that the sales estimation algorithm’s cumulative structure results in higher
accuracy estimates through a lower likelihood of missing resupplies. This may have resulted in slightly
upward biased results on days with higher scrape volumes (see Estimation).
Parsing
Parsing was conducted using the Python library, BeautfiulSoup6 with the resulting output saved in CSV
format. Scraping and parsing were conducted simultaneously. In contrast to other studies, raw HTML was
discarded and not saved for further analysis. Storage of raw HTML is preferable, as it provides an
additional layer of replicability, and enables sophisticated debugging, and alternative approaches to
parsing to be applied retroactively. This approach does however entail overheads to scraping speed and
a requirement for large volume storage, particularly in the context of high frequency scraping.
The approach used in the study, whereby raw data was not saved, was informed by the fact that the study
was initially limited in scope, with a large-scale long-term data collection effort not anticipated. The
original research design foresaw a short-term scraping process, following which more robust scraping
infrastructure would be developed. Factors including the outbreak of the Covid-19 virus resulted in
updates to the scraper not being implemented, with the presented study based on the weaker one-stage
process.
Conclusions
Scraping practices worked well on the limited study sample (i.e. Georgian listings). The high speed of
scraping and low data requirements could potentially have translated into even higher frequency scraping
than was undertaken. This noted, the approach saw tradeoffs in data completeness, with records outside
of Georgia ignored. Furthermore, by ignoring self-categorization of substances, labelling was laborious
and potentially more error prone.
| 6
CRRC – Georgia September 2020
Online markets for illicit drugs in Georgia Methodological Annex
Raw HTML data was discarded after each scrape. Limitations on parsing replicability are to some extent
compensated for by the release of all source code and (parsed) data on GitHub.7 This noted, the approach
was taken resulted from convenience rather than design, and future studies of the Matanga process
should be built upon a system whereby HTML data can be collected for future analysis.
Furthermore, the use of the CSV file format for storage of parsed data became challenging to maintain
over time. CSV storage lacks many of the benefits of a robust database system (such as SQL), including
multi-user access, versioning, speed, and easy integration into other data pipelines.
Data Processing Data processing consisted of three core components: sales estimation, substance labelling, and data-
cleaning and normalization. This section briefly describes steps undertaken during the data cleaning and
normalization process, before undertaking a detailed treatment of sales estimation and labelling.
Data cleaning and normalization
Prior to analysis, the collected data was cleaned and normalized to ensure consistency of key fields and
to address a small number of errors identified through manual review. This process included standardizing
text fields into Latin script, normalizing currency in USD, creating unique listing identifiers, and manual
intervention in case of error.
Standardizing text
Descriptive text fields used to identify substances (see Substance Labelling) are presented by vendors in
a mixture of English, Russian and (in rare cases) Georgian languages – often using a mixture of languages
within a single listing. To simplify manual data review and the substance labelling process, all listings were
transliterated into Latin script prior to labelling.
Normalizing currency in United States Dollars
Listings are provided in at least two of a range of currencies, including US dollars (USD), Euros (EUR),
Russian Rubles (RUB) and Bitcoin (BTC). Interestingly no listings were given in Georgian lari (GEL). Prices
were standardized in USD, based on day-rate conversion from BTC where available and required (listings
in USD were not converted). In the rare case that BTC was not given, day-rate conversion from EUR was
used.
| 7
CRRC – Georgia September 2020
Online markets for illicit drugs in Georgia Methodological Annex
Unique identifier creation
Unique listing identifiers are not made available on the Matanga platform, presenting challenges in
tracking listings over time. This issue was addressed through the creation of unique hash values for listings
using Python’s built-in hash function after the completion of substance labelling. Hashes were based on a
tuple of the following fields: vendor code, city, transliterated free text description, substance labels
(including group and type), and quantity offered (e.g. 1 gram).
Error correction
In rare cases, manual intervention was undertaken to address an error found in a listing or substance
labelling. Specifically, one listing for a small quantity of cannabis saw the vendor present the USD value of
their listing as BTC. This error was easily identified, as conversion from BTC to USD gave the listing a value
in the hundreds of thousands of dollars. Errors in substance labelling were resolved as part of the
substance labelling workflow (see Figure 4).
Sales Estimation
The Matanga platforms differs in structure to other cryptomarkets examined in subject literature,
providing an opportunity for alternative approaches to sales estimation. The established standard for
identifying transactions in cryptomarket research uses user feedback as a proxy for sales. This approach
results out of necessity, as most platforms provide no information that can be used to reliably triangulate
transactions. For most cryptomarkets, users are encouraged, and often required, to leave feedback on
their purchases. Some customers, however, may be unwilling or neglect to do so. Various studies have
estimated the coverage rate of the feedback approach to be between 71 and 88 percent.1(p14).
In the case of the Matanga platform, three factors stemming from the site’s structure led to the feedback
approach not being used for this study. Firstly, and most importantly, Matanga listings provides vendor
stock data, noting the number of packages ready for collection (готовых) and for pre-order (предзаказ)
– see Collection and Pre-order, below. The presence of these two fields provides an opportunity for
alternative, and potentially more accurate approaches to transaction estimation. The second motivation
is that within the context of this specific site, the relationship between reviews and individual listings is
unclear, with different quantities of the same substance (e.g. 1 and 10 grams of cannabis) apparently
included in the same review set, complicating estimation. Finally, convenience was also a factor: access
to customer feedback is available only to logged-in users, with automated login complicated by a
CATCHPA, whereas individual listings (without reviews) may be accessed freely.
| 8
CRRC – Georgia September 2020
Online markets for illicit drugs in Georgia Methodological Annex
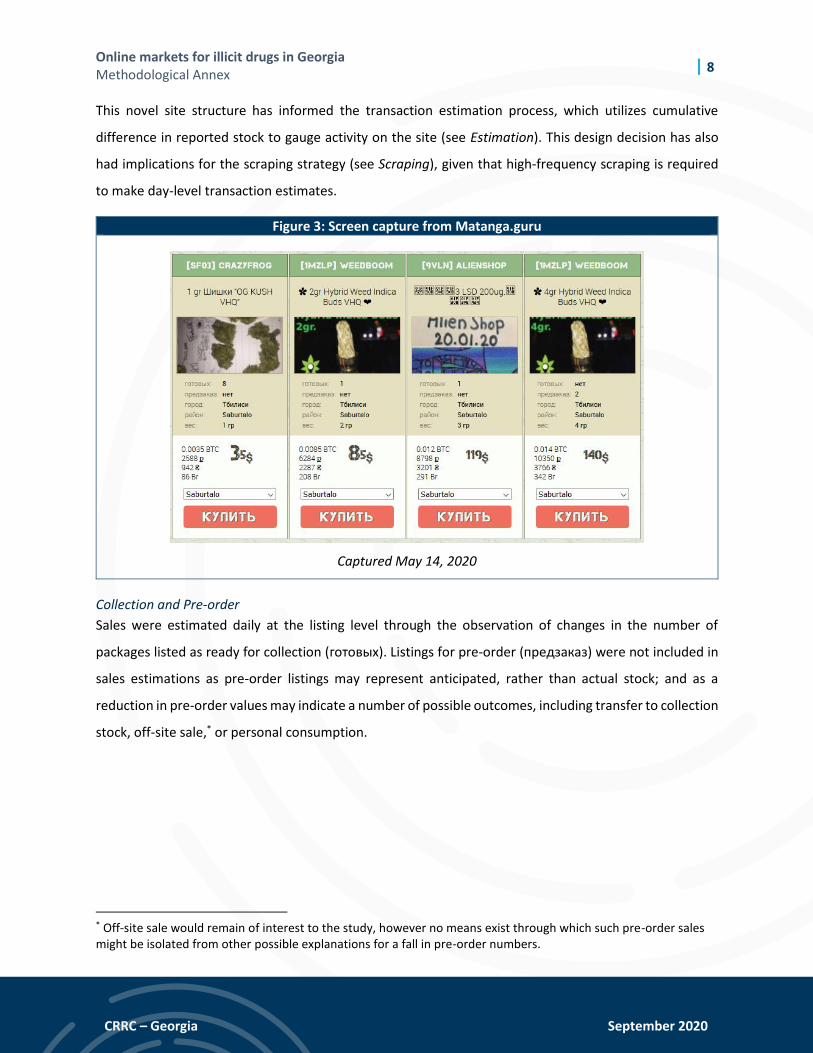
This novel site structure has informed the transaction estimation process, which utilizes cumulative
difference in reported stock to gauge activity on the site (see Estimation). This design decision has also
had implications for the scraping strategy (see Scraping), given that high-frequency scraping is required
to make day-level transaction estimates.
Figure 3: Screen capture from Matanga.guru
Captured May 14, 2020
Collection and Pre-order
Sales were estimated daily at the listing level through the observation of changes in the number of
packages listed as ready for collection (готовых). Listings for pre-order (предзаказ) were not included in
sales estimations as pre-order listings may represent anticipated, rather than actual stock; and as a
reduction in pre-order values may indicate a number of possible outcomes, including transfer to collection
stock, off-site sale,* or personal consumption.
* Off-site sale would remain of interest to the study, however no means exist through which such pre-order sales might be isolated from other possible explanations for a fall in pre-order numbers.
| 9
CRRC – Georgia September 2020
Online markets for illicit drugs in Georgia Methodological Annex
Pre-order only listings account for around a third of total unique listings and are typically four times larger
in average daily USD value than ready listings. This noted, when exploratory analysis of pre-sale
transactions was conducted using the sales estimation algorithm, total revenue from presale listings was
found to be negligible at less than 1% of ready sales. That such a small number of sales are registered
against pre-order listings also suggests that vendors may not update available quantities for pre-order
listings in the same way they do collection, which reinforced the decision to ignore presale listings during
estimation.
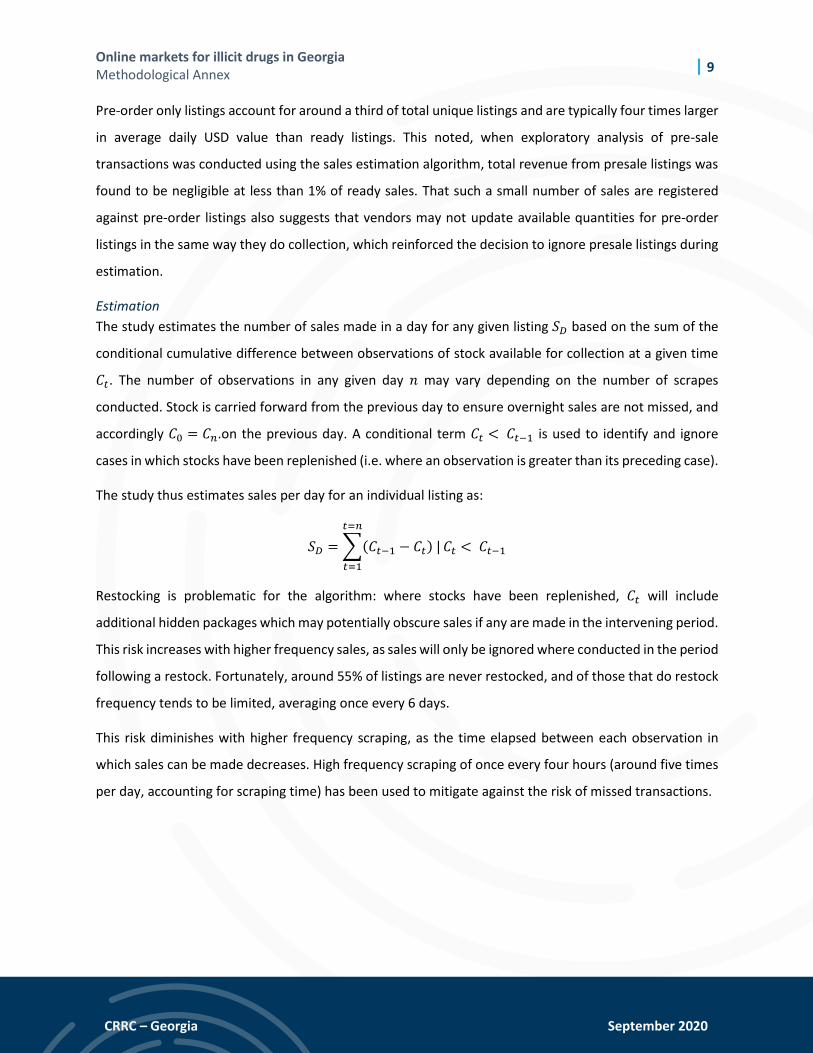
Estimation
The study estimates the number of sales made in a day for any given listing 𝑆𝐷 based on the sum of the
conditional cumulative difference between observations of stock available for collection at a given time
𝐶𝑡. The number of observations in any given day 𝑛 may vary depending on the number of scrapes
conducted. Stock is carried forward from the previous day to ensure overnight sales are not missed, and
accordingly 𝐶0 = 𝐶𝑛.on the previous day. A conditional term 𝐶𝑡 < 𝐶𝑡−1 is used to identify and ignore
cases in which stocks have been replenished (i.e. where an observation is greater than its preceding case).
The study thus estimates sales per day for an individual listing as:
𝑆𝐷 = ∑(𝐶𝑡−1 − 𝐶𝑡) |
𝑡=𝑛
𝑡=1
𝐶𝑡 < 𝐶𝑡−1
Restocking is problematic for the algorithm: where stocks have been replenished, 𝐶𝑡 will include
additional hidden packages which may potentially obscure sales if any are made in the intervening period.
This risk increases with higher frequency sales, as sales will only be ignored where conducted in the period
following a restock. Fortunately, around 55% of listings are never restocked, and of those that do restock
frequency tends to be limited, averaging once every 6 days.
This risk diminishes with higher frequency scraping, as the time elapsed between each observation in
which sales can be made decreases. High frequency scraping of once every four hours (around five times
per day, accounting for scraping time) has been used to mitigate against the risk of missed transactions.

| 10
CRRC – Georgia September 2020
Online markets for illicit drugs in Georgia Methodological Annex
Bivariate OLS regression analysis was conducted to test for scrape frequency bias in the estimation
algorithm. The estimation strategy has a small, but significant positive bias linked to scrape frequency:* –
i.e. days upon which larger numbers of scrapes have been conducted result in slightly increased sales
estimations. This may be anticipated in the context of presumed underestimation in lower scrape count
estimations and can be interpreted as a function of lower reliability for days with fewer scrapes.
Conclusions
This document presents a novel approach to sales estimation based on unique available data and
limitations on established approaches in the context of the Matanga platform. The approach applied is
likely more accurate than the use of user feedback for the Matanga platform specifically, given that
feedback is consolidated for multiple quantities of substances. This noted, it is likely also an
underestimation, and accordingly estimations should be considered as a floor.
Underestimation may occur as only presale listings have not been analysed, and as scraping may miss
transactions conducted between scrapes. The extent of underestimation is difficult to measure. In
exploratory analysis using the estimation algorithm, pre-order listings recorded negligible sales, however
the accuracy of quantities reported by vendors for pre-order may be poor. Missed sales following restock
may be less concerning given limited restock frequency and high scrape frequency. This noted, given that
scrape frequency has a positive relationship with estimated sales, some transactions are likely to have
been missed. Future studies may seek to increase scrape frequency to further mitigate against this
problem.
Substance Labelling Per-substance analysis is contingent on a strong classification scheme, with each listing tied to a particular
substance, a process which often requires translating unstructured free text into meaningful labels.
Researchers have approached substance labelling in a variety of ways, often predicated on the
information available on a site of interest.
All cryptomarkets provide some form of categorization of products offered, and where sufficient detail is
provided, self-categorization is adequate for substance labelling. Large datasets of well-labelled listings
have also been used to develop machine learning models for categorization, for example by Soska and
Christin (2015).4
* 𝐶𝐼 95% [0.053,0.117], 𝑝 ≤ 0.001, 𝑅2 = 0.005
| 11
CRRC – Georgia September 2020
Online markets for illicit drugs in Georgia Methodological Annex
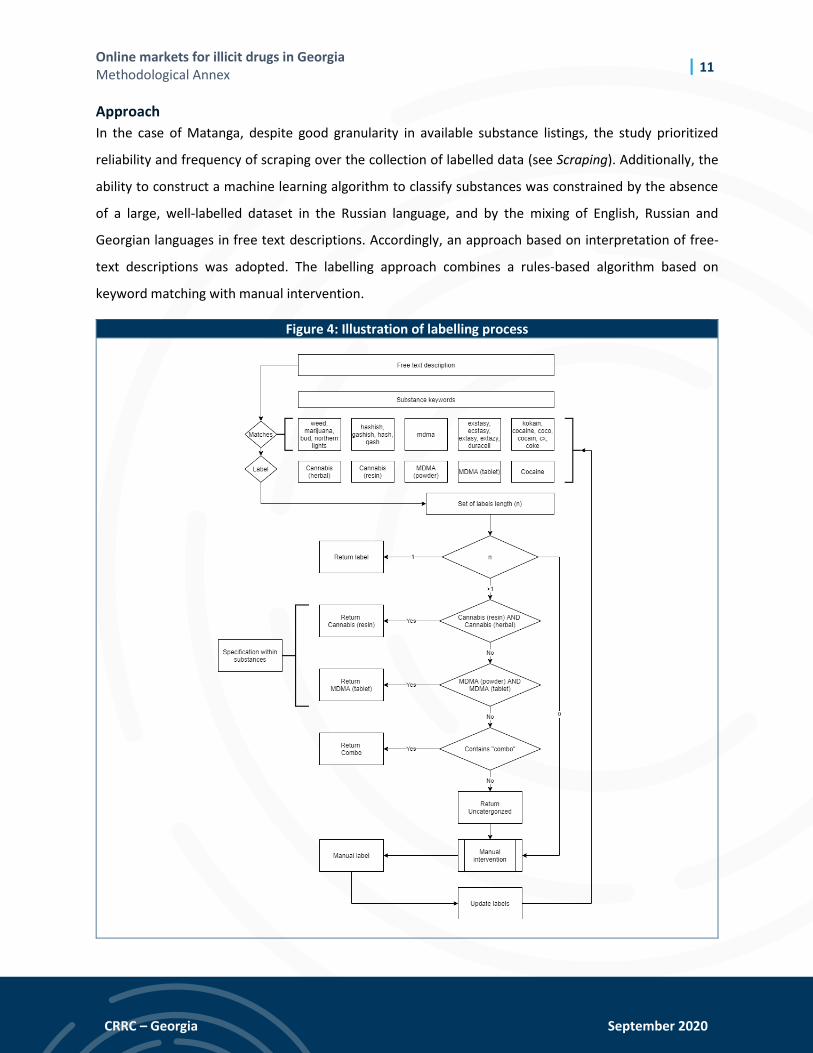
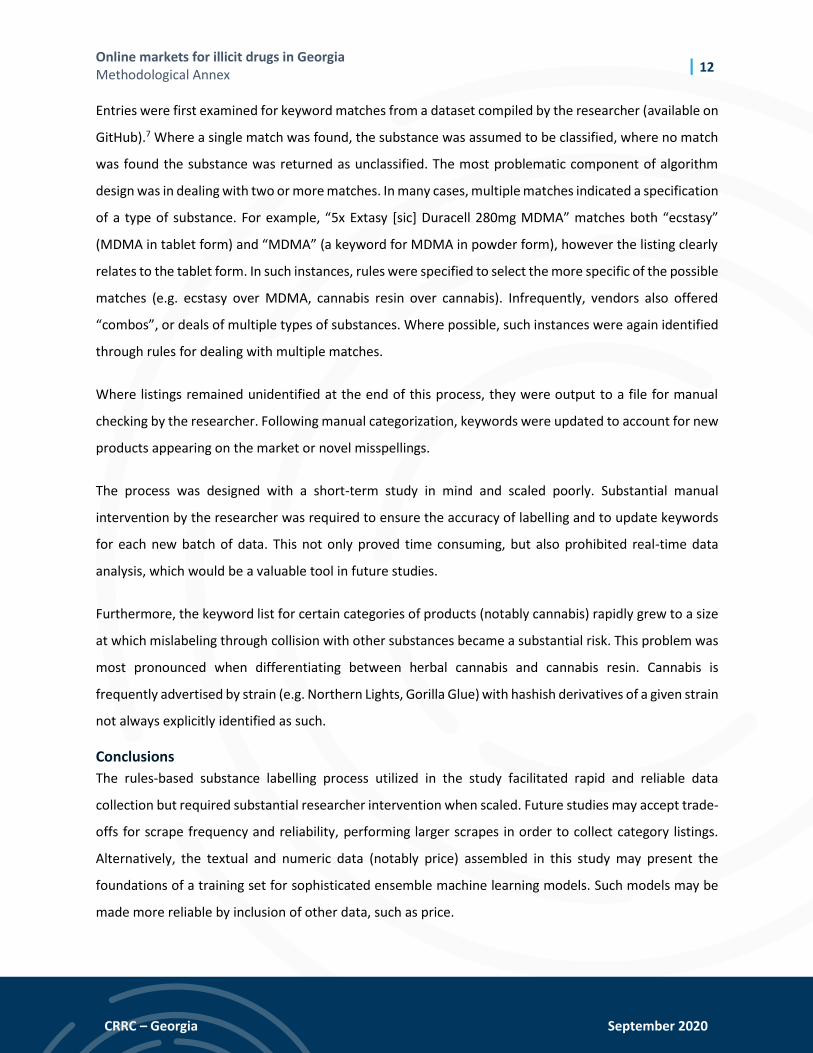
Approach
In the case of Matanga, despite good granularity in available substance listings, the study prioritized
reliability and frequency of scraping over the collection of labelled data (see Scraping). Additionally, the
ability to construct a machine learning algorithm to classify substances was constrained by the absence
of a large, well-labelled dataset in the Russian language, and by the mixing of English, Russian and
Georgian languages in free text descriptions. Accordingly, an approach based on interpretation of free-
text descriptions was adopted. The labelling approach combines a rules-based algorithm based on
keyword matching with manual intervention.
Figure 4: Illustration of labelling process
| 12
CRRC – Georgia September 2020
Online markets for illicit drugs in Georgia Methodological Annex
Entries were first examined for keyword matches from a dataset compiled by the researcher (available on
GitHub).7 Where a single match was found, the substance was assumed to be classified, where no match
was found the substance was returned as unclassified. The most problematic component of algorithm
design was in dealing with two or more matches. In many cases, multiple matches indicated a specification
of a type of substance. For example, “5x Extasy [sic] Duracell 280mg MDMA” matches both “ecstasy”
(MDMA in tablet form) and “MDMA” (a keyword for MDMA in powder form), however the listing clearly
relates to the tablet form. In such instances, rules were specified to select the more specific of the possible
matches (e.g. ecstasy over MDMA, cannabis resin over cannabis). Infrequently, vendors also offered
“combos”, or deals of multiple types of substances. Where possible, such instances were again identified
through rules for dealing with multiple matches.
Where listings remained unidentified at the end of this process, they were output to a file for manual
checking by the researcher. Following manual categorization, keywords were updated to account for new
products appearing on the market or novel misspellings.
The process was designed with a short-term study in mind and scaled poorly. Substantial manual
intervention by the researcher was required to ensure the accuracy of labelling and to update keywords
for each new batch of data. This not only proved time consuming, but also prohibited real-time data
analysis, which would be a valuable tool in future studies.
Furthermore, the keyword list for certain categories of products (notably cannabis) rapidly grew to a size
at which mislabeling through collision with other substances became a substantial risk. This problem was
most pronounced when differentiating between herbal cannabis and cannabis resin. Cannabis is
frequently advertised by strain (e.g. Northern Lights, Gorilla Glue) with hashish derivatives of a given strain
not always explicitly identified as such.
Conclusions
The rules-based substance labelling process utilized in the study facilitated rapid and reliable data
collection but required substantial researcher intervention when scaled. Future studies may accept trade-
offs for scrape frequency and reliability, performing larger scrapes in order to collect category listings.
Alternatively, the textual and numeric data (notably price) assembled in this study may present the
foundations of a training set for sophisticated ensemble machine learning models. Such models may be
made more reliable by inclusion of other data, such as price.
| 13
CRRC – Georgia September 2020
Online markets for illicit drugs in Georgia Methodological Annex
References
1. Kruithof K, Aldridge J, Hétu DD, Sim M, Dujso E, Hoorens S. Internet-Facilitated Drugs Trade: An Analysis of the Size, Scope and the Role of the Netherlands. WODC, Ministerie van Veiligheid en Justitie; 2016. Accessed June 20, 2020. https://www.rand.org/pubs/research_reports/RR1607.html
2. Aldridge J, Décary-Hétu D. Not an “Ebay for Drugs”: The Cryptomarket “Silk Road” as a Paradigm Shifting Criminal Innovation. Social Science Research Network; 2014. doi:10.2139/ssrn.2436643
3. Aldridge J, Décary-Hétu D. Hidden wholesale: The drug diffusing capacity of online drug cryptomarkets. International Journal of Drug Policy. 2016;35:7-15. doi:10.1016/j.drugpo.2016.04.020
4. Soska K, Christin N. Measuring the longitudinal evolution of the online anonymous marketplace ecosystem. In: 24th {USENIX} Security Symposium ({USENIX} Security 15). ; 2015:33-48.
5. Webfp/Tor-Browser-Selenium. webfp; 2020. Accessed August 6, 2020. https://github.com/webfp/tor-browser-selenium
6. Richardson L. Beautiful soup documentation. April. Published online 2007.
7. Goodrich I. Online Markets for Illicit Drugs in Georgia: Replication Code and Source Data. CRRC Georgia; 2020. https://github.com/crrcgeorgia/matanga