Georgia - UNECE
333
UNITED NATIONS Environmental Performance Reviews Third Review Georgia UNECE
-
Upload
khangminh22 -
Category
Documents
-
view
0 -
download
0
Transcript of Georgia - UNECE

UNITED NATIONS
Environmental Performance ReviewsThird Review
Georgia
UNECE

ECE/CEP/177
UNITED NATIONS ECONOMIC COMMISSION FOR EUROPE
ENVIRONMENTAL
PERFORMANCE REVIEWS
GEORGIA
Third Review
UNITED NATIONS
New York and Geneva, 2016
Environmental Performance Reviews Series No. 43
NOTE Symbols of United Nations documents are composed of capital letters combined with figures. Mention of such a symbol indicates a reference to a United Nations document. The designations employed and the presentation of the material in this publication do not imply the expression of any opinion whatsoever on the part of the Secretariat of the United Nations concerning the legal status of any country, territory, city or area, or of its authorities, or concerning the delimitation of its frontiers or boundaries. In particular, the boundaries shown on the maps do not imply official endorsement or acceptance by the United Nations. The United Nations issued the second Environmental Performance Review of Georgia (Environmental Performance Reviews Series No. 30) in 2010. This volume is issued in English only.
ECE/CEP/177
UNITED NATIONS PUBLICATION Sales E.16.II.E.3
ISBN 978-92-1-117101-3 e-ISBN 978-92-1-057683-3
ISSN 1020-4563
iii
Foreword
It is essential to monitor progress towards environmental sustainability and to evaluate how countries reconcile environmental and economic targets and meet their international environmental commitments. Through regular monitoring and evaluation, countries may more effectively stay ahead of emerging environmental issues, improve their environmental performance and be accountable to their citizens. The ECE Environmental Performance Review Programme provides valuable assistance to member States by regularly assessing their environmental performance so that they can take steps to improve their environmental management, integrate environmental considerations into economic sectors, increase the availability of information to the public and promote information exchange with other countries on policies and experiences. As we celebrate 20 years of ECE Environmental Performance Reviews, we are undertaking a process of reflection and evaluation of the review process itself. One thing is clear: it has been a valuable mechanism in evaluating the implementation of the extensive environmental legislation enacted and the numerous environment-related conventions ratified by ECE member States. All the countries of the region have further benefited from the discussions on the recommendations of the Environmental Performance Reviews, which entail the sharing of environmental data and knowledge and a frank exchange on best practices and lessons learned. Recently, new instruments, such as the 2030 Agenda for Sustainable Development and its Sustainable Development Goals (SDGs) and the Paris Agreement on Climate Change, have been negotiated and adopted to address sustainable development challenges. ECE peer review mechanisms, including the Environmental Performance Reviews, play an important role in assessing how well countries are addressing such challenges and meeting their commitments, both old and new. These mechanisms will also continue to provide an opportunity to evaluate whether policies are achieving results, whether there might be better ways to do so, and how to address any shortcomings. The third Environmental Performance Review of Georgia gathers together a wealth of information to build up a snapshot of the country’s environmental governance and performance — both in terms of achievements and shortcomings. I trust that this third review will serve as a powerful tool to support policymakers and representatives of civil society in their efforts to improve environmental management and to further promote sustainable development in Georgia. ECE wishes the Government of Georgia further success in carrying out the tasks involved in meeting its environmental objectives, including the implementation of the recommendations in the third review. I also hope that the lessons learned from the peer review process in Georgia will benefit other countries throughout the ECE region and facilitate the achievement and monitoring of the SDGs.
Christian Friis Bach
Executive Secretary Economic Commission for Europe


v
Preface This third Environmental Performance Review (EPR) of Georgia takes stock of progress made by the country in the management of its environment since it was peer reviewed for the second time in 2010, and assesses the implementation of the recommendations made in the second review. It covers issues of specific importance to the country related to legal and policy frameworks, the financing of environmental expenditures, greening the economy, air protection, water and waste management and biodiversity conservation. It also examines the efforts of Georgia to integrate environmental considerations in its policies in the agriculture, energy, industry, transport, forestry, tourism and health sectors. The review further provides a substantive and policy analysis of the country’s climate change adaptation and mitigation measures, and its participation in international mechanisms. The successes of Georgia in the achievement of most of the Millennium Development Goals are highlighted, as well as some remaining challenges. Governments are now discussing the implementation of the 2030 Agenda for Sustainable Development, as well as the follow-up and review of progress in the achievement of its Sustainable Development Goals (SDGs). This third review, together with its recommendations, should assist all national stakeholders in developing an aspirational national agenda for achieving these goals. The third EPR of Georgia began in March 2014 with a preparatory mission to agree on the structure of the report and establish a schedule for its completion. As decided, a team of international experts then took part in a review mission from 16 to 24 September 2014 as well as an update mission in May 2015. The draft report was submitted to Georgia for comments and to the ECE Expert Group on Environmental Performance Reviews for consideration in September 2015. During its meeting on 13 and 14 October 2015, the Expert Group discussed the draft report with expert representatives of the Government of Georgia, focusing on the conclusions and recommendations made by the international experts. The recommendations, with suggested amendments from the Expert Group, were then submitted to the Committee on Environmental Policy for a peer review at its twenty-first session on 29 October 2015. A high-level delegation from Georgia participated in the peer review and the Committee adopted the recommendations in this report. The Committee and the ECE secretariat are grateful to the Government of Georgia and its experts who worked with the international experts and contributed their knowledge and assistance. ECE would like to express its appreciation to the German Federal Ministry for Environment, Nature Conservation, Building and Nuclear Safety and the German Federal Environment Agency for their support by providing funds through the Advisory Assistance Programme, and also to Switzerland for their financial contribution. Sincere thanks also go to France, the Netherlands, Portugal, the United Nations Environment Programme (UNEP) and the Joint UNEP/Office for the Coordination of Humanitarian Affairs (OCHA) Environment Unit for having provided their experts, and to the United Nations Development Programme for their support of this review. ECE also takes the opportunity to thank Austria and the Netherlands for their general financial support to the EPR Programme and expresses its deep appreciation to Belarus, Estonia, Germany, Hungary, Sweden and Switzerland for having provided their experts for the ECE Expert Group on Environmental Performance Reviews, which undertook the expert review of this report.

vi
Team for the third EPR of Georgia, 2014

vii
LIST OF TEAM MEMBERS
Mr. Antoine Nunes ECE Team leader Mr. Yaroslav Bulych ECE Project coordinator Ms. Oksana Rott ECE Logistics coordinator Mr. Jyrki Hirvonen ECE Introduction Mr. Valeriu Mosanu ECE consultant Chapter 1 Ms. Angela Bularga ECE consultant Mr. Dieter Hesse ECE consultant Chapter 2 Mr. André Peeters Weem The Netherlands Chapter 3 Ms. Ana Katila Ribeiro Portugal Chapter 4 Mr. Juraj Farkas ECE consultant Chapter 5 Mr. Thierry Lucas UNEP Chapter 6 Ms. Irina Davis ECE consultant Chapter 7 Ms. Karin Morona Requia ECE Chapter 8 Ms. Elisabeth Clément ECE consultant Chapter 9 Mr. George Georgiadis ECE Chapter 10 Ms. Maria-Teresa Pisani ECE Chapter 11 Mr. Yaroslav Bulych ECE Chapter 12 Ms. Sylvie Eymard France Chapter 13 Mr. Rene Nijenhuis UNEP/OCHA Chapter 14
Information cut-off date: 29 October 2015 ECE Information Unit Palais des Nations CH-1211 Geneva 10 Switzerland
Tel.: +41 (0)22 917 44 44 Fax: +41 (0)22 917 05 05 E-mail: [email protected] Website: http://www.unece.org

viii
LIST OF NATIONAL TEAM MEMBERS Ministry of Environment and Natural Resources Protection
Mr. Gigla Agulashvili, Minister Mr. Elguja Khokrishvili, former Minister (2014-2015) Ms. Khatuna Gogaladze, former Minister (2012-2014) Mr. Teimuraz Murgulia, First Deputy Minister Ms. Maia Bitadze, Deputy Minister Mr. Besarion Abashidze, Deputy Minister Ms. Ekaterine Grigalava, Deputy Minister Ms. Nino Sharashidze, Former First Deputy Minister (2012-2014)
National coordinators
Ms. Nino Tkhilava, Head of Environmental Policy and International Relations Department Mr. Gizo Chelidze, Head of Sustainable Development and EU Integration Policy Division
National focal points Chapter 1
Mr. Gizo Chelidze, Ministry of Environment and Natural Resources Protection Chapter 2
Ms. Tamar Aladashvili, Ministry of Environment and Natural Resources Protection Ms. Tea Levidze, Ministry of Economy and Sustainable Development
Chapter 3
Ms. Ketevan Kordzakhia, Ministry of Environment and Natural Resources Protection
Chapter 4 Ms. Mariam Makarova, Ministry of Environment and Natural Resources Protection
Chapter 5
Ms. Tamar Loladze, Ministry of Environment and Natural Resources Protection Chapter 6
Mr. Karlo Amirgulashvili, Ministry of Environment and Natural Resources Protection Mr. Ioseb Kartsivadze, Ministry of Environment and Natural Resources Protection Ms. Tamar Kvantaliani, Ministry of Environment and Natural Resources Protection
Chapter 7
Ms. Salome Khachiauri, Ministry of Environment and Natural Resources Protection Ms. Marita Arabidze, Ministry of Energy
Chapter 8
Ms. Mariam Beruashvili, Ministry of Environment and Natural Resources Protection Ms. Tea Levidze, Ministry of Economy and Sustainable Development
ix Chapter 9
Ms. Maka Manjavidze, Ministry of Environment and Natural Resources Protection Mr. Jimsher Koshadze, Ministry of Agriculture
Chapter 10
Mr. Noe Megrelishvili, Ministry of Environment and Natural Resources Protection Ms. Ketevan Salukvadze, Ministry of Economy and Sustainable Development
Chapter 11
Mr. Karlo Amirgulashvili, Ministry of Environment and Natural Resources Protection Ms. Natia Iordanishvili, Ministry of Environment and Natural Resources Protection
Chapter 12
Ms. Mariam Tatarashvili, Ministry of Environment and Natural Resources Protection Chapter 13
Ms. Maia Javakhishvili, Ministry of Environment and Natural Resources Protection Ms. Nia Giuashvili, National Center for Disease Control and Public Health
Chapter 14
Ms. Irma Gurguliani, Ministry of Environment and Natural Resources Protection
LIST OF CONTRIBUTORS Ministry of Environment and Natural Resources Protection
Mr. Besarion Abashidze Ms. Maia Beradze Ms. Ana Berejiani Mr. Akaki Chalatashvili Mr. Alverd Chankseliani Ms. Nino Chikovani Ms. Lia Chelidze Mr. Besarion Datishvili Mr. Lasha Dzadzamia Ms. Antie Fischer Mr. Vasil Gedevanishvili Ms. Nino Gokhelashvili Ms. Natia Gobejishvili Ms. Nino Gvazava Ms. Khatia Jiquridze Ms. Nona Khelaia Mr. Grigol Lazrievi Mr. Kakha Lomashvili Ms. Mariam Matiashvili Mr. Giorgi Nabakhtiani Mr. Vakhtang Nozadze Ms. Nino Obolashvili Ms. Teona Qarchava Ms. Tamar Sharashidze Ms. Olga Shashkina Mr. Mirza Sulkhanishvili Ms. Nino Tandilashvili Mr. Dimitri Tatriashvili Mr. Grigor Tsotadze Ms. Kristine Vardanashvili Mr. Akaki Veltauri Ms. Nana Zamtaradze
x
Department of Environmental Supervision Ms. Maia Chkhobadze Ms. Elene Iakobidze Mr. Konstantine Khachapuridze Ms. Neli Korkotadze
LEPL National Environmental Agency
Ms. Salome Alania Ms. Marine Arabidze Ms. Tamar Bagratia Ms. Elena Bakradze Mr. Ramaz Chitanava Mr. Koba Gabadze Mr. Merab Gaprindashvili Mr. Irakli Gelashvili Mr. Gaga Gvaramia Mr. Vladimer Lazarishvili
LEPL National Forestry Agency
Mr. Davit Aladashvili Mr. Dimitri Glonti Mr. Tornike Gvazava Mr. Zurab Kelikhashvili Mr. Merab Sharabidze Mr. Levan Tabutsadze Mr. Vladimir Vashakidze
LEPL Agency of Protected Areas
Mr. Giorgi Bakuridze Mr. Vazha Cherkezishvili Mr. Anzor Gogotidze Mr. Rati Japaridze Mr. Lasha Moistsraphishvili Ms. Fikria Navguraidze Mr. Merab Pirosmanishvili Mr. Otar Tsamalaidze Ms. Khatuna Tsiklauri
LEPL Environmental Information and Education Centre
Mr. Paata Dvaladze Ms. Ia Papiashvili Ms. Nato Sultanishvili
Ministry of Agriculture
Ms. Maia Beruashvili Ms. Manana Gabruashvili Ms. Mariam Gelashvili Ms. Tamar Khmaladze Mr. Konstantine Khutsaidze Ms. Ekaterine Sanadze Ms. Teona Tsotskhalashvili
LEPL National Food Agency
Ms. Mariam Garashvili Ms. Mariam Gordadze Ms. Marina Gvinepadze

xi
Mr. Jambul Maglakelidze Mr. Nikoloz Meskhi Ms. Irma Tskvitinidze
Ministry of Economy and Sustainable Development
Mr. Otar Antia Mr. David Gigineishvili Ms. Lali Gogoberidze Ms. Gogita Gvenetadze Ms. Irma Kavtaradze Ms. Tea Levidze Ms. Ketevan Salukvadze
LEPL Civil Aviation Agency
Mr. Levan Karanadze LEPL Georgian National Tourism Administration
Mr. Revaz Geradze Mr. Vakhtang Kurtskhalia, Mr. Rusudan Machitidze
LEPL National Agency of State Property Mr. Zurab Tsikvadze
Ministry of Energy
Ms. Natalia Jamburia Ms. Ana Jejelava Mr. Jaba Jishkariani Mr. Davit Sharikadze Ms. Lizi Tadumadze Ms. Mariam Valishvili
Energy Development Fund Mr. Galaktion Buadze Mr. Levan Mosakhlishvili
Ministry of Finance
Ms. Natia Gulua Mr. Giorgi Kakauridze
Ministry of Internal Affairs
Mr. Levan Buiglishvili Ministry of Justice of Georgia LEPL National Agency of Public Registry
Ms. Ekaterina Meskhidze Ministry of Labor, Health and Social Affairs LEPL National Center for Disease Control and Public Health
Mr. Amiran Gamkrelidze Ministry of Regional Development and Infrastructure
Ms. Anna Rukhadze Mr. Georgi Tsakadze
LEPL Municipal Development Fund
Ms. Shalva Kokochashvili Mr. Davit Tabidze

xii
National Energy and Water Supply Regulatory Commission Ms. Mari Ioseliani Mr. Ivane Pirveli Mr. Giorgi Shengelia
National Statistics Office
Ms. Tatuli Dushuashvili Mr. Giorgi Kalakashvili Ms. Mzia Kereselidze Ms. Nino Kverghelidze Mr. Gogita Todradze
Parliament of Georgia The Committee of Environment Enforcement and Natural Resources
Mr. George Tsagareishvili Energy Efficiency Centre Georgia
Mr. George Abulashvili Strategic Research Centre for Caucasus Energy Safety
Mr. Ivane Cholokashvili Vakhushti Bagrationi Institute of Geography
Ms. Nana Bolashvili State Security and Crisis Management Council
Ms. Rusudan Kakhishvili Black Sea protection Convention Service
Mr. Irakli Chavchanidze Tbilisi Zoo
Mr. Zurab Gurielidze International community Delegation of the European Union to Georgia
Mr. Alvaro Ortega Aparicio Deutsche Gesellschaft für Internationale Zusammenarbeit (GIZ) GmbH
Mr. Christan Gönner Mr. Giorgi Kolbin
EU ENPI East Waste Governance Project
Mr. Irakli Legashvili ECE/FAO Forestry and Timber Section
Mr. Florian Steirer GIZ Sustainable Management of Biodiversity in the South Caucasus Project
Mr. Giorgi Lebanidze Ms. Mariam Urdia
xiii KfW
Ms. Nino Shanidze UNDP
Ms. Nino Antadze Ms. Nino Gvetadze Ms. Sophio Kakauridze Ms. Salome Lomadze Mr. Niels Scott Ms. Lali Tevzadze
UNDP Project “Sustainable Management of Pastures in Georgia”
Mr. Tornike Phulariani Non-governmental and other international and national organizations Caucasus Environmental NGO Network (CENN)
Mr. Kakha Bakhtadze Ms. Nana Janashia Ms. Nino Kheladze Ms. Nino Shavgulidze
Caucasus Nature Fund
Ms. Tea Barbakadze
Dedoplistskaro Agricultural and Environmental Association Mr. Gela Tetrauli
Eco-vision
Ms. Nino Sulkhanishvili ELKANA
Ms. Mariam Jorjadze EISD Centre RIO
Ms. Nato Kirvalidze Green Alternative
Mr. David Chipashvili Ms. Keti Gujaraidze Mr. Irakli Matcharashvili
Georgian Employers’ Association
Ms. Natela Khurtsidze Mr. Elguja Meladze Mr. Konstantine Nanobashvili
Georgia Red Cross Society Mr. Kakha Mamuladze
Greens Movement Georgia
Ms. Nino Chkhobadze Georgian Farmers Union
Mr. Raul Babunashvili

xiv
Michael Succow Foundation for the Protection of Nature Mr. Lutz Fahser
REC Caucasus
Ms. Sophiko Akhobadze Shepherds Association of Georgia
Mr. Beka Bonashvili Twinning project expert
Mr. Ralph Juelich Winrock International Georgia
Ms. Dana Kenney WWF Caucasus
Mr. Tamaz Gamkrelidze Ms. Ekaterine Kakabadze Mr. Ilia Osepashvili Mr. Nugzar Zazanashvili
Local authorities Mtskheta Municipality
Mr. Giorgi Eloshvili Mr. Badri Mamuchashvili
Tbilisi City Hall
Ms. Ani Bibliashvili Ms. Paata Jachvliani
Fire Brigade Tbilisi
Mr. Temur Giorgadze Dedoplistskaro Municipality
Mr. Nikoloz Janiashvili Other LTD Batumi Oil Terminal
Mr. Giorgi Kiladze Mr. Tengiz Gordeladze
LTD Rustavi “AZOTI”
Mr. Levan Burdiladze Mr. Teimuraz Tavberidze
Marneuli Food Factory LLC
Ms. Irina Gaprindashvili LTD United Water Supply Company
Mr. Ketevan Chomakhidze Mr. David Shukhoshvili
xv LTD Solid Waste Management Company
Mr. Vakhtang Baramia Ms. Medea Chachkhiani Mr. Levan Inashvili Ms. Ekaterine Mikanadze Mr. Giorgi Shukhoshvili
LTD Georgian Water and Power
Mr. Merab Kandelaki Mr. Vitali Shlapman
Heidelberg cement plant, Rustavi
Mr. Zaza Jijeishvili JSC Telasi Electricity Company
Mr. Misha Antadze Administration of Sea Ports Batumi, Poti, Supsa
Mr. Mamuka Akhaladze
xvi
Page
CONTENTS
Foreword .............................................................................................................................................................. iii Preface .................................................................................................................................................................. v List of team members ......................................................................................................................................... vii List of contributors .............................................................................................................................................. ix Key abbreviations ............................................................................................................................................ xxiii Signs and measures .......................................................................................................................................... xxiv
EXECUTIVE SUMMARY .......................................................................................................................... xxvii Introduction: ENVIRONMENTAL CONDITIONS AND PRESSURES
I.1 Geography and climate ............................................................................................................................... 1 I.2 Demographic and socioeconomic context .................................................................................................. 1 I.3 Key environmental trends ........................................................................................................................... 3 PART I ENVIRONMENTAL GOVERNANCE AND FINANCING Chapter 1: Legal, policy and institutional framework
1.1 Institutional framework ............................................................................................................................ 13 1.2 Policy framework ..................................................................................................................................... 20 1.3 Legal framework ...................................................................................................................................... 23 1.4 Regulatory instruments and procedures ................................................................................................... 25 1.5 Compliance assurance mechanisms.......................................................................................................... 30 1.6 Environmental information and data reporting ........................................................................................ 33 1.7 Conclusions and recommendations .......................................................................................................... 35 Chapter 2: Economic instruments and environmental expenditures for greening the economy
2.1 Economic instruments .............................................................................................................................. 39 2.2 Financial resources for environmental protection .................................................................................... 53 2.3 Conclusions and recommendations .......................................................................................................... 58 PART II MEDIA AND POLLUTION MANAGEMENT Chapter 3: Air protection
3.1 Trends in emission levels ......................................................................................................................... 63 3.2 Pressures ................................................................................................................................................... 64 3.3 Air quality ................................................................................................................................................. 66 3.4 Air monitoring .......................................................................................................................................... 67 3.5 Emission monitoring and reporting .......................................................................................................... 68 3.6 Legal, policy and institutional framework ................................................................................................ 68 3.7 Regulatory, economic and information measures .................................................................................... 70 3.8 Air-related global and regional agreements .............................................................................................. 71 3.9 Conclusions and recommendations .......................................................................................................... 72 Chapter 4: Water management
4.1 Management of water use and pollution prevention ................................................................................ 75 4.2 Water monitoring...................................................................................................................................... 79 4.3 River basin management .......................................................................................................................... 81

xvii
Page 4.4 Developments in water infrastructure systems and their management .................................................... 82 4.5 Legal, policy and institutional framework ................................................................................................ 83 4.6 Regulatory, economic, fiscal and information measures .......................................................................... 86 4.7 Water-related global, regional and bilateral agreements .......................................................................... 86 4.8 Conclusions and recommendations .......................................................................................................... 87 Chapter 5: Waste management
5.1 Trends in waste management ................................................................................................................... 89 5.2 Pressures from waste ................................................................................................................................ 94 5.3 Legal, policy and institutional framework ................................................................................................ 95 5.4 Regulatory, economic, fiscal and information instruments ...................................................................... 99 5.5 Waste-related global and regional agreements ....................................................................................... 100 5.6 International projects .............................................................................................................................. 101 5.7 Conclusions and recommendations ........................................................................................................ 102 Chapter 6: Biodiversity and protected areas
6.1 Trends in species and ecosystems .......................................................................................................... 103 6.2 Trends in development and management of protected areas and ecological networks .......................... 106 6.3 Pressures on species and ecosystems...................................................................................................... 106 6.4 Biodiversity monitoring .......................................................................................................................... 109 6.5 Legal, policy and institutional framework .............................................................................................. 110 6.6 Most important projects .......................................................................................................................... 112 6.7 Communication, education and public awareness-raising...................................................................... 112 6.8 Biodiversity-related global, regional and bilateral agreements .............................................................. 113 6.9 Conclusions and recommendations ........................................................................................................ 113 PART III Interaction of environment with selected sectors/issues Chapter 7: Energy and environment
7.1 Trends in energy balance ........................................................................................................................ 117 7.2 Environmental pressures ........................................................................................................................ 121 7.3 Energy intensity and efficiency by end use ............................................................................................ 124 7.4 Alternative sources of energy ................................................................................................................. 125 7.5 Legal, policy and institutional framework .............................................................................................. 126 7.6 Projects ................................................................................................................................................... 129 7.7 Energy sector development scenarios..................................................................................................... 129 7.8 Regulatory, economic, fiscal and information measures ........................................................................ 130 7.9 Energy-related global and regional agreements ..................................................................................... 131 7.10 Conclusions and recommendations ........................................................................................................ 132 Chapter 8: Industry and environment
8.1 Trends in industry development ............................................................................................................. 133 8.2 Environmental pressures and trends ....................................................................................................... 133 8.3 Integration of environmental considerations in industry ........................................................................ 139 8.4 Conclusions and recommendations ........................................................................................................ 144 Chapter 9: Agriculture and environment
9.1 Conditions and activities in agriculture .................................................................................................. 147 9.2 Pressures from agriculture ...................................................................................................................... 150 9.3 Legal, policy and institutional framework .............................................................................................. 152 9.4 Agriculture-related global and regional agreements .............................................................................. 156 9.5 Conclusions and recommendations ........................................................................................................ 156

xviii
Page Chapter 10: Transport and environment
10.1 Overview of transport sector and transport infrastructure ...................................................................... 159 10.2 Environmental pressures from different modes of transport and from transport infrastructure ............. 164 10.3 Emission and fuel standards for vehicles ............................................................................................... 167 10.4 Assessment of performance towards greening the transport sector ........................................................ 168 10.5 Conclusions and recommendations ........................................................................................................ 171 Chapter 11: Forestry and environment
11.1 Current situation ..................................................................................................................................... 175 11.2 Role and functions of forests .................................................................................................................. 179 11.3 Pressures from forestry ........................................................................................................................... 181 11.4 Forest monitoring ................................................................................................................................... 181 11.5 Assessment of environmental performance ............................................................................................ 181 11.6 Conclusions and recommendations ........................................................................................................ 187 Chapter 12: Tourism and environment
12.1 Current situation ..................................................................................................................................... 189 12.2 Development in tourism activities .......................................................................................................... 192 12.3 Pressures from tourism and tourist infrastructure ................................................................................... 195 12.4 Legal, policy and institutional framework .............................................................................................. 195 12.5 Projects ................................................................................................................................................... 198 12.6 Conclusions and recommendations ........................................................................................................ 199 Chapter 13: Health and environment
13.1 Status of human health ........................................................................................................................... 201 13.2 Health risks associated with environmental factors and environmental causes,
of morbidity and mortality ...................................................................................................................... 203 13.3 Legal policy and institutional framework ............................................................................................... 211 13.4 Conclusions and recommendations ........................................................................................................ 215 Chapter 14: Risk management of natural and technological/anthropogenic hazards
14.1 Current situation .................................................................................................................................... 219 14.2 Legal, policy and institutional framework .............................................................................................. 219 14.3 Related global and regional agreements ................................................................................................. 224 14.4 Conclusions and recommendations ........................................................................................................ 226 ANNEXES I Implementation of the recommendations in the second Environmental Performance Review .............. 231 II Participation of Georgia in multilateral environmental agreements ....................................................... 251 III Key data and indicators available for the review ................................................................................... 255 IV Millenium Development Goals indicators, 2008-2014 .......................................................................... 261 V List of major environment-related legislation ........................................................................................ 269 VI Results of the For Future Inland Transport Systems (ForFITS) tool ...................................................... 275 Sources ............................................................................................................................................................. 287
LIST OF TABLES
I.1 Foreign direct investment, 2008-2013, US$ million in current prices ....................................................... 3 I.2 Main sector emissions, 2008-2011, thousand tons of CO2-equivalent ....................................................... 4 I.3 Municipal wastewater discharge and treatment, 2008-2013, million m3 ................................................... 6

xix
Page I.4 Used pesticides, 2008-2011, 2013, tons ..................................................................................................... 7 1.1 Environmental impact permits, 2007 - 2014, number .............................................................................. 27 1.2 Natural resources licences ........................................................................................................................ 30 1.3 Sectoral structure of planned environmental inspection, 2010-2011, 2014 ............................................. 31 1.4 Detection of environmental offences in Georgia and imposed sanctions, 2010-2014 ............................. 32 1.5 Predominance of offences related to natural resources use, 2010-2014 ................................................... 32 2.1 Excise taxes on motor fuels, 2014 ............................................................................................................ 40 2.2 Revenues from road motor vehicle excise duties, 2010-2013, million lari .............................................. 40 2.3 Excise duty on imports of motor cars ....................................................................................................... 41 2.4 Water abstraction fees .............................................................................................................................. 46 2.5 Waste fees in Tbilisi ................................................................................................................................. 48 2.6 Household expenditures on public utility services, 2014, percentage of total expenditures .................... 49 2.7 Tariffs for water supply and sewerage, 2014 ........................................................................................... 50 2.8 Electricity tariffs for residential customers, tetri/kWh ............................................................................. 52 2.9 Budget of the Ministry of Environment and Natural Resources Protection, 2010-2014, million lari ...... 57 2.10 Government expenditures on environmental protection according to functional classification of
expenditures (COFOG), 2009–2013, million lari ..................................................................................... 57 2.11 General government environmental expenditure, 2009-2013, million lari .............................................. 57 3.1 Emissions of air pollutants, 2008-2013, tons ........................................................................................... 63 3.2 Emissions per sector, 2013, tons .............................................................................................................. 63 3.3 Emissions from agriculture, 2008-2013, tons ........................................................................................... 64 3.4 Emissions from energy, 2008-2013, tons ................................................................................................. 65 3.5 Emissions from industry, 2008-2013, tons ............................................................................................... 65 3.6 Emissions from transport, 2008-2013, tons .............................................................................................. 65 3.7 CDM projects ........................................................................................................................................... 72 4.1 Reservoirs, 2014 ....................................................................................................................................... 75 4.2 Methodology for calculation of environmental flow ................................................................................ 76 4.3 Estimated rate of population coverage of water supply systems, 2013 .................................................... 77 4.4 Waterborne diseases: number of outbreaks and number of cases ............................................................ 81 5.1 Average municipal waste composition ..................................................................................................... 89 5.2 Rustavi landfill balance, 2013, tons ......................................................................................................... 90 5.3 Types and volumes of waste according to the 2007 inventory ................................................................. 91 7.1 Energy balance, 2012 ............................................................................................................................. 118 7.2 Electricity balance, 2008-2014, GWh .................................................................................................... 120 7.3 Current HPP projects .............................................................................................................................. 121 8.1 Number of active industrial enterprises, by size and branch .................................................................. 134 9.1 Main field crops, 2008-2014, thousand ha ............................................................................................. 147 9.2 Evolution of livestock since 2004, thousand head ................................................................................. 147 9.3 Agricultural land use and tenure, 2012, thousand ha ............................................................................. 148 10.1 Share of transport and communication sector in GDP, 2007-2013, US$ million .................................. 159 10.2 Official development assistance, selected sectors, 2004-2012, disbursements,
constant 2012 US$ million ..................................................................................................................... 160 10.3 Georgia, LPI position, 2010, 2012, 2014 ............................................................................................... 161 10.4 Rail accidents, 2010-2014 ...................................................................................................................... 162 10.5 Annual capacity and number of passengers, 2006-2014 ........................................................................ 163 10.6 Aviation accidents, 2009-2014, number ................................................................................................. 163 10.7 Freight transportation, Georgian ports, 2009-2014, million tons ........................................................... 164 10.8 Key cargo transportation figures, 2004-2013 ......................................................................................... 166 10.9 Accidents in ports, 2005-2010 ................................................................................................................ 166 10.10 Road accidents. 2004-2014, number ...................................................................................................... 166 10.11 Causes of road accidents ........................................................................................................................ 167 10.12 Passengers, Tbilisi public transport , 2010-2014, number...................................................................... 169 10.13 Regulations and standards on fuel quality .............................................................................................. 169 11.1 Forest fires, 2008-2014, number ............................................................................................................ 177 11.2 Contribution of forestry to GDP, 2005, 2008-2013 ................................................................................ 178
xx
Page 12.1 Tourism types, 2013, per cent ................................................................................................................ 180 12.2 International arrivals, top 10 countries, 2012-2014 ................................................................................ 192 12.3 Main purpose of visit for international visitors, 2013 ............................................................................ 193 12.4 Share of tourism in GDP, 2008-2014, percentage .................................................................................. 194 12.5 Foreign currency revenues from incoming tourism, 2006-2013, US$ thousand .................................... 194 12.6 Main indicators of hotel activities, 2008-2013 ....................................................................................... 194 12.7 Tourist accommodation, 2013, per cent ................................................................................................. 194 12.8 Annual average number of employed by economic activity: hotels and restaurants, 2008-2014 .......... 194 12.9 Potential environmental risks from tourism ........................................................................................... 196 12.10 International tourism and the environment, 2008-2014 ......................................................................... 196 13.1 Selective infectious and parasitic diseases, 2011-2012, incidence per 100,000 population ................... 202 13.2 Incidence of selected diseases (new cases), 2002, 2010, 2012-2013, per 100,000 population .............. 203 13.3 Access to piped water, percentage .......................................................................................................... 206 13.4 Vaccination and immunization data, 2013-2014 .................................................................................... 215 14.1 Man-made emergencies, 2010-2013....................................................................................................... 220 14.2 Natural disasters, 2010-2013 .................................................................................................................. 220
LIST OF FIGURES
I.1 Air emissions, 2008=100 ............................................................................................................................ 4 I.2 Average concentrations of ammonia in the Kura River basin, 2013 .......................................................... 6 I.3 Land use in 2012, per cent .......................................................................................................................... 7 1.1 Organizational chart of the Ministry of Environment and Natural Resources Protection ........................ 15 1.2 Links between EIA and construction permit procedures in Georgia ........................................................ 27 3.1 Concentration of manganese oxides in Zestafoni, 2008-2012, mg/m3 ..................................................... 65 3.2 Yearly average concentration of TSP in selected cities, 2008-2012, mg/m3 ............................................ 66 3.3 Yearly average concentration of NO2 in selected cities, 2008-2012, mg/m3 ............................................ 67 4.1 Water consumption by user, excluding hydropower, 2012, million m3 ................................................... 75 4.2 Sources of total drinking water supply, 2011-2013, million m3/year ....................................................... 77 4.3 Discharges into surface waters, 2011–2013, million m3/year .................................................................. 78 4.4 National Food Agency samples, 2009–2014 ............................................................................................ 80 7.1 Total final energy consumption by sector, 2013, toe ............................................................................. 125 7.2 Trend of total final energy consumption (TFC), 2015-2020, Mtoe ........................................................ 125 8.1 Industrial production turnover, 2008-2013, billion lari .......................................................................... 134 8.2 Industry value added by branch, 2013, US$ million .............................................................................. 134 8.3 Industry air emissions, 2008-2012, tons ................................................................................................. 135 8.4 Total industry air emissions per sector value added,
2008-2012, kg/ 1,000 lari at constant 2005 prices .................................................................................. 135 8.5 Air emissions from stationary sources in selected regions, 2012, tons .................................................. 136 8.6 Industrial wastewater discharges by branch of industry, 2013, million m3/year .................................... 137 8.7 Accumulated industrial hazardous wastes by region, 2006, tons ........................................................... 139 9.1 Use of pesticides and fertilizers, kg/ha cultivated land, 2005-2013 ....................................................... 149 10.1 Transport infrastructure investment and maintenance, 2004-2011, per cent of GDP ............................ 160 10.2 Vehicles registered, 2004-2014, number ................................................................................................ 161 10.3 Number of registered vehicles by age, 2011 .......................................................................................... 170 11.1 Growing stock in forest by species, 2013, per cent ................................................................................ 176 11.2 Illegal logging, 2008-2014, m3 ............................................................................................................... 178 12.1 Visitors in protected areas, 2007-2014, number ..................................................................................... 191 12.2 International arrivals, 2007-2014, number ............................................................................................. 192 13.1 E. coli concentrations in recreational lakes of Tbilisi during the 2009 bathing season, cells/l .............. 208 VI.1 ForFITS schematic ................................................................................................................................. 276 VI.2 WTW CO2 emissions by mode in passenger under reference scenario, 2010-2030, ,
billion kg CO2/year ................................................................................................................................. 279 VI.3 WTW CO2 emissions by mode in freight transport under reference scenario,
2012-2030, billion kg CO2 ..................................................................................................................... 279
xxi
Page VI.4 Projected passenger kilometers under various scenarios: 2010-2030, billion pkm ................................ 283 VI.5 Projected ton kilometers (tkm) under various scenarios: 2010-2030, billion tkm .................................. 283 VI.6 Projected passenger transport energy use under various scenarios: 2010-2030, million toe.................. 284 VI.7 Projected freight transport energy use under various scenarios: 2010-2030, million toe ....................... 284 VI.8 Projected Well-To-Wheel CO2 emissions for transport under various scenarios,
2010-2030, billion kg ............................................................................................................................. 285
LIST OF MAPS
I.1 Map of Georgia .......................................................................................................................................... 9 6.1 Protected areas ........................................................................................................................................ 107 11.1 Distribution of forest area ....................................................................................................................... 175
LIST OF BOXES
1.1 Subnational governance: main actors and chronology of reforms ........................................................... 20 1.2 Second National Environmental Action Programme ............................................................................... 20 1.3 Strategic environmental assessment ......................................................................................................... 25 2.1 Supply of wood for the rural population .................................................................................................. 46 3.1 Estimate of total emissions of particulate matter caused by use of firewood ........................................... 67 5.1 Solid Waste Management Company of Georgia ...................................................................................... 93 7.1 Dariali Valley landslides ........................................................................................................................ 128 7.2 Sustainable Energy Action Plans ............................................................................................................ 128 8.1 Improvements in Heidelberg Cement Georgia ....................................................................................... 136 8.2 Environmental concerns during the rebuild of Rustavi Steel ................................................................. 136 8.3 Environmental issues in Zestafoni and Chiatura .................................................................................... 140 9.1 Grazing in the Vashlovani National Park ............................................................................................... 152 9.2 GIZ projects ............................................................................................................................................ 153 10.1 Public transport in Tbilisi ....................................................................................................................... 168 11.1 National Forest Concept for Georgia...................................................................................................... 184 11.2 Donors’ Coordination Matrix ................................................................................................................. 184 11.3 Legal and regulatory framework in support of sustainable forest management ..................................... 186 12.1 Touristic potential of Ajara .................................................................................................................... 190 12.2 Ski resorts in Georgia ............................................................................................................................. 190 12.3 Tusheti Protected Areas .......................................................................................................................... 191 12.4 Vashlovani Protected Areas ................................................................................................................... 191 12.5 2015 – a year of opportunities ................................................................................................................ 194 13.1 Environmental and human health risks associated with manganese mining and processing
in Chiatura .............................................................................................................................................. 204 13.2 Assessment of small-scale water supply systems in selected districts ................................................... 207 13.3 Water quality in Khamiskuri and Khorga ............................................................................................... 207 13.4 Studies on radon presence in Tbilisi ....................................................................................................... 210 13.5 Lead poisoning prevention week of action for Georgia ......................................................................... 210 14.1 Environmental emergency with potential international impacts at legacy waste site ............................ 225 14.2 Disaster risk reduction tools ................................................................................................................... 226
LIST OF PHOTOS I Tbilisi by night ........................................................................................................................................... 5 1.a Dartlo’s Sabtcheo. Tusheti Protected Areas ............................................................................................. 18 1.b Traditional Court. Tusheti Protected Areas .............................................................................................. 18 2 Bungalo for tourists in Vashlovani Protected Areas ................................................................................ 44 3 Pirikita Alazani River in Tusheti Protected Areas .................................................................................... 70 4 Sunset near Mtskheta ................................................................................................................................ 80 5 Landfills improvement ............................................................................................................................. 96

xxii
Page 6 Birds’ nests in Vashlovani Protected Areas ........................................................................................... 104 7 Solar panels and solar water heaters installed in Omalo, Tusheti Protected Areas ................................ 122 8 Traditional bread making in Georgia...................................................................................................... 141 9.a Pastures and hay fields in Tusheti Protected Areas ................................................................................ 154 9.b Vintage in Napareuli , Kakheti Region .................................................................................................. 154 10 Unpaved road in Vashlovani Protected Areas ........................................................................................ 162 11 Forests in Vashlovani Protected Areas ................................................................................................... 180 12.a Visitor’s centre in Tusheti Protected Areas ............................................................................................ 197 12.b Information stand in Tusheti Protected Areas ........................................................................................ 197 13 Recreational area in Caucasian part of Georgia ..................................................................................... 205 14 Rock fall in Vashlovani Protected Areas ................................................................................................ 223
PHOTO CREDITS Photos I, 1.a, 1.b, 2, 3, 4, 6, 7, 8, 9.a , 9.b, 10, 11, 12.a, 12.b, 13, 14 – Yaroslav Bulych Photo 5 – Juraj Farkas Cover page photos: Kazbegi (Sergo Edisherashvili), Lagodekhi (Mikheil Kavtaradze), Paliastomi Lake (David Natroshvili), Sataplia (Sero Edisherashvili)
xxiii
KEY ABBREVIATIONS APA Agency of Protected Areas AWSC Ajara Water Supply Company BAT best available techniques BTC Baku–Tbilisi–Ceyhan (Pipeline) CENN Caucasus Environmental NGO Network CFC chlorofluorocarbon DES Department of Environmental Supervision DRR disaster risk reduction EIA environmental impact assessment FDI foreign direct investment GEL Georgian lari (currency) GHG greenhouse gas GIZ Deutsche Gesellschaft für Internationale Zusammenarbeit GMO genetically modified organism GNERC Georgian National Energy and Water Supply Regulatory Commission HCFC hydrochlorofluorocarbon HPP hydropower plant IFI international financial institution INSARAG International Search and Rescue Advisory Group IWRM integrated water resources management LEDS low emission development strategy LEPL Legal Entity of Public Law MAC maximum allowable concentration MDGs Millennium Development Goals NCDCPH National Centre for Disease Control and Public Health NEA National Environmental Agency NEAP-2 second National Environmental Action Programme of Georgia 2012–2016 NFA National Forestry Agency NMVOC non-methane volatile organic compound OCHA United Nations Office for the Coordination of Humanitarian Affairs ODS ozone-depleting substance PCB polychlorinated biphenyl PRTR pollutant release and transfer register RBMP river basin management plan SCP South Caucasus Pipeline SEA strategic environmental assessment SWMCG Solid Waste Management Company of Georgia TEIA (Convention on the) Transboundary Effects of Industrial Accidents TPP thermal power plant TSP total suspended particles UNDAC United Nations Disaster Assessment and Coordination UNEP United Nations Environmental Programme UWSCG United Water Supply Company of Georgia VOC volatile organic compound WREP Western Route Export Pipeline
xxiv
SIGNS AND MEASURES
.. not available - nil or negligible . decimal point $ dollar cap capita eq. equivalent g gram Gg gigagram GWh gigawatt-hour ha hectare kg kilogram km kilometre km2 square kilometre km3 cubic kilometre kt kiloton kV kilovolt kW kilowatt kWh kilowatt-hour l litre m metre m2 square metre m3 cubic metre Mg Megagram MW megawatt PJ petajoule ppm parts per million t ton (1,000 kg) toe ton of oil equivalent TWh terawatt-hour
xxv
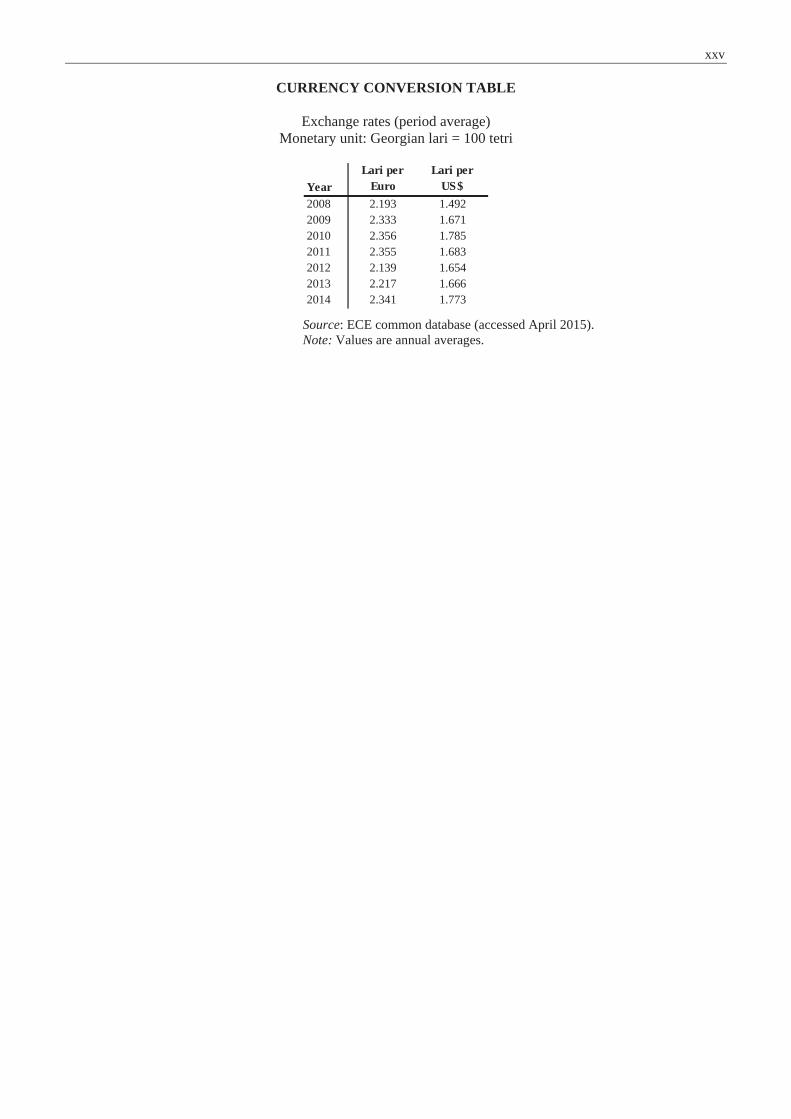
CURRENCY CONVERSION TABLE
Exchange rates (period average) Monetary unit: Georgian lari = 100 tetri
Source: ECE common database (accessed April 2015). Note: Values are annual averages.
YearLari per
EuroLari per
US$2008 2.193 1.4922009 2.333 1.6712010 2.356 1.7852011 2.355 1.6832012 2.139 1.6542013 2.217 1.6662014 2.341 1.773


xxvii
Executive summary
The second Environmental Performance Review (EPR) of Georgia was carried out in 2009. This third review intends to assess the progress made by Georgia in managing its environment since the second EPR and in addressing new environmental challenges.
Environmental conditions and pressures
Since 2008 the general trend of emissions of air pollution substances has been negative – almost all emissions have been on the rise. Nitrogen oxides emissions (NOx), converted to NO2, increased by 120.59 per cent from 18,534 tons in 2008 to 40,886 tons in 2013. There was also a 35.34 per cent increase in emissions of volatile organic compounds (VOCs), from 87,131 tons in 2008 to 117,926 tons in 2013.
The development of the SO2 and TSP diverged from the increasing pollution trend. Sulphur oxide (SO2) emissions decreased by 3.65 per cent between 2008 and 2013, from 9,873 tons to 9,513 tons. Emissions of total suspended particles (TSP) decreased by 21.47 per cent from 33,220 tons in 2008 to 26,080 tons in 2013.
In 2013, annual total freshwater abstraction was 30.2 billion m3. In 2013, 57 per cent of the drinking water came from groundwater sources and the rest was surface water. Although about 70 per cent of the urban population is connected to the sewerage system, only 26 per cent of their wastewater was treated in 2013. The rural population is not connected to wastewater systems and there are no wastewater data available.
Soil erosion is the critical threat to Georgian soils. Nearly 35 per cent of agricultural land is degraded as a result of water and wind erosion, which are affecting particularly the mountainous areas and crop fields, especially in eastern Georgia. Modern farming techniques for cultivating steep areas such as terraces and buffer strips are not commonly applied. Wind erosion and desertification have become a critical issue in eastern Georgia due to overgrazing and the recent decline in rainfall in the region.
Soil salinization is another big threat affecting the soils of eastern Georgia. Large-scale secondary soil salinization is due to the non-observance of irrigation rules and dates. In addition to soil salinization, Soil pollution also takes place in some industrial areas. Especially in the vicinity of metal mining sites, soils are affected by pollution with heavy metals through irrigation water and atmospheric deposition.
In Georgia, the use of fertilizers has fluctuated over the past 15 years. Due to sharp price increases, fertilizer use diminished to 2,500 tons a year in 2006, which translated to about eight kg per sown hectare. Since then, fertilizer use has increased massively. In 2013, total fertilizer use was 35,300 tons – about 136 kg per sown hectare.
Legal, policy and institutional framework
The country’s environmental sector underwent a profound reorganization in 2011, which was then reversed in 2013. This reorganization was the origin of a massive decrease of capacity at all levels of environmental governance. Institutional instability compounded with the Government’s focus on maximum deregulation affected the pace of planned environmental policy reforms and hindered implementation.
After a two-year period of functioning with a narrowed mandate, in 2013 the Ministry regained its former functions almost entirely, and re-established or established several key units. However, the previous depth and breadth of the Ministry’s presence at the subnational level was not re-established.
The process of EU association added more clarity in environmental policy objectives in Georgia. The Government put efforts into reconciling economic and environmental goals, though the former remain clearly predominant.
Environmental planning has progressed along several lines. After an aborted NEAP for 2008–2012, the development and adoption of the NEAP for 2012–2016 (NEAP-2) was an important landmark in environmental
xxviii Executive summary
policymaking in Georgia. Overall, both in terms of process organization and its outcome, NEAP-2 development has been well aligned with good international practice. The development of NEAP-3 has started in 2014.
There was no progress on developing a national sustainable development strategy. National action on the MDGs was monitored irregularly. The second MDG progress monitoring report was issued in September 2014, almost a decade after the first progress monitoring report. The assessment report is rather descriptive and does not review achievements in relation to national targets.
There has been little progress on revising environmental standards since 2010. Ambient standards are Soviet standards transposed into the Georgian law. Computer models used to derive emission standards for individual stationary sources are outdated. The development of general binding rules (technical regulations that may indicate emission standards for a specific sector) have stagnated.
There were some changes in product standards, in particular fuel quality regulation. Despite a gradual improvement, fuel quality standards continue to be below the international benchmarks (especially for sulphur), while the number of cars has been growing exponentially and their technical state has been degrading.
Georgia’s spatial planning system has significant gaps, especially in terms of implementation. Legislation is vague or incomplete. Mandates are not well defined in both a vertical and horizontal perspective. Land use categories are not sufficiently specific. Community tenure of land is not part of the legislation although it concerns most of the country’s pasture land. Information for planning remains scarce, especially data on land privatized prior to 2006 and its use category. Data sharing is limited and information management infrastructure obsolete.
In Georgia, an assessment of impacts is necessary for both new and existing facilities and infrastructure projects. EIA is performed on the basis of design documentation, while the acceptability of the proposed site for the planned development is not evaluated and an alternatives analysis is not undertaken.
The quality of EIA reports tends to be poor; some reports are missing essential elements. In its current design and functioning, the EIA procedure is far from compliance with international benchmarks. Its flaws concern the coverage of projects (i.e. EIA scope), organization and transparency of the procedure, clarity and enforceability of EIA conditions, and compliance with them. Public participation in this procedure is limited.
There is no mandatory environmental insurance in Georgia, despite the stipulation in the 1996 Law on Environmental Protection that activities that can cause severe environmental damage should be subject to it. Relevant normative acts, which would enact the mentioned requirement, have not been adopted.
The NEA has succeeded in improving environmental and hydrometeorological monitoring networks.Advancements have been most significant in relation to surface water monitoring, which was extended and comprises 69 monitoring points on 40 water bodies. In 2012–2013, seven automated stations measuring the degree of -radiation exposure were installed. Real time data received from the stations are gathered daily in the central office and published on the official website of the NEA. Soil and geological surveillance remain very limited. New forms for statistical reporting on water have been developed.
Economic instruments, environmental expenditures and investments for greening the economy
Since 2010 no new environmentally related economic instruments have been introduced. Although the Law on Environmental Protection provides for the establishment of eco-labels, there is as yet no legal framework for eco-labelling of products in Georgia.
The Law on Public Procurement does not consider environmental criteria in public sector procurement of goods and services. There is no information on the extent to which such considerations have been made on a voluntary basis during the past few years.
Georgia has made progress in improving its public sector budgetary and financial management frameworkpertaining to strategic budget planning, budget formulation and execution. As from 2010, the Basic Data and Directions document provides a medium-term budget framework.
Executive summary xxix
The management of environmental pollution does not rely on pollution charges to create economic incentives for reducing emissions of air and water pollutants to acceptable standards. The excise duties applied in Georgia appear, however, to be rather low for creating such incentives. In a similar vein, the excise duty levied on imports of motor vehicles creates wrong incentives by favouring the purchase of older vehicles, which are, in general, more polluting than newer cars.
Both the polluter-pays and user-pays principles are not followed in the water sector. There are no payments of fees for surface water abstraction. Fees for groundwater abstraction are low. Water supply and sewerage tariffs for households are quite low. Water supply tariffs are not cost reflective. A large proportion of households have no water meters and pay a flat fee per person.
Air protection
Currently, no information on critical loads from agriculture is available in Georgia. The most important pollutant released into the air by agricultural activities is ammonia (NH3). Until 2009, emissions from industrial sources have decreased. This was due to the termination of operations at several installations and the application of emission abatement measures at other installations.
National air quality standards are still based on maximum allowable concentrations and cannot be directly compared to the standards used by the World Health Organization or the EU. The air quality measurements are performed according to Georgian standards. Air quality monitoring is based on seven manual and one automatic monitoring stations that are operated by the NEA. Except of Tbilisi there is only one monitoring station in other four cities. The monitoring stations are mostly located in places with high levels of air pollution, near industrial blackspots or near traffic hotspots.
In 2004 Georgia abandoned a yearly, mandatory test of safety and roadworthiness for light duty vehicles.Without appropriate regulations and a mandatory annual test of safety, roadworthiness and exhaust emissions, it is not possible to ban the most polluting vehicles from the road.
Georgia has phased out the use of chlorofluorocarbons and halons. Georgia acceded to the Beijing Amendment in 2010. The country is in full compliance with control measures under the Montreal Protocol. The main ODSs (annex A and B of the Protocol) have been phased out two years prior to the requirement (2010).
Water management
Between 55 and 75 per cent of the water consumed by the total population has a groundwater origin. For rural communities the situation is different: in 2013, groundwater represented the major source (90 per cent) of drinking water. It is estimated that the population coverage of water supply systems (WSSs) was around 65 per cent in 2013.
While Georgia is rich in water resources, access to safe drinking water is still a problem in almost all regions.The water supply infrastructure in Georgia is in poor condition. The unsatisfactory sanitary and technical conditions existing in the water supply systems often lead to breakdowns, leading to losses of 40–60 per cent.
Municipal wastewater remains a major polluter of surface waters in Georgia: on average, 70 per cent of the urban population is served by collection systems but only 26 per cent of wastewater is treated. Currently, sewage collection systems exist in only 41 towns and urban centres but most of the municipal wastewater treatment plants (WWTPs) are inoperable. The exceptions are Gardabani WWTP, built in 1988, which only has mechanical pre-treatment, and the Sachkhere and Batumi WWTPs (operating since 2013), which have biological treatment.
In the last few years, the drinking water quality monitoring system has worsened substantially, due to the abolition, in 2006, of the Sanitary Supervision Service within the Health Ministry. The Service used to analyse more than 50,000 samples annually. However, since 2012, the situation has been gradually improving as the National Food Agency is strengthening its presence in the country with three regional laboratories. There has been an increase in the number of analyses performed since 2012.
xxx Executive summary
Currently, 19 automated hydrological stations and 12 manual stations are operational. The monitoring network for surface water quality has improved from 41 points in 2009 to 69 points in 2014, and at 32 rivers and 8 lakes. The number of monitored parameters was increased to 33.
The coverage rate of water supply in Tbilisi was already 100 per cent by 2008, but only 70 per cent of the population was served 24 h/day; 30 per cent of the population covered by the supply system had water for only three to four hours per day.
Waste management
Collection of municipal waste is provided only in urban areas, while rural areas remain unserved. It is estimated that about 70 per cent of generated municipal waste is collected by regular services and delivered to local disposal sites. Practically all collected waste is transported directly to disposal sites. Material recovery from municipal waste is not performed except in the sorting plant at Rustavi city landfill. Separate collection has not yet been introduced in Georgia.
Regular reporting on industrial waste was not required by legislation in Georgia before 2015. A more or less broad inventory was conducted only once, in 2007, with the help of UNDP, and included household, industrial, medical and biological waste. But the inventory is compromised by the non-existence of a waste classification system, which would allow identification of options for the treatment of identified waste. There is no comprehensive record of the amount of industrial solid wastes generated in Georgia, and thus, information on the exact amount produced is not available.
Management of health-care waste in Georgia is undergoing a transformation. Old practices, when waste from hospitals was dumped together with municipal waste, are being abandoned and a network of specialized incinerators for medical waste is emerging. The old system of health-care waste management, which is still used, is based on disposal of non-infectious waste in municipal landfills; infectious waste is sterilized and then disposed of, and anatomical waste is buried in cemeteries. The new system, which has been developed with the assistance of international donors, uses incinerators for the destruction of health-care waste.
The environment is affected by air, ground and surface water pollution from improperly constructed official municipal landfills. Most of the 63 official municipal landfills operational today do not have a groundwater protection barrier and a leachate collection/treatment system. Spontaneous, low-temperature combustion of waste occurs in landfills, emitting harmful substances including dioxins and furans into the air. These persistent organic pollutants (POPs) degrade slowly in the environment and are transported long distances by atmospheric flows.
An integrated waste management framework law did not exist in Georgia until 2015, despite there having been several attempts to adopt a waste law, in 2003, 2005 and 2010. A new legal act on waste management, the Waste Management Code, was adopted on 26 December 2014 and entered into force on 15th of January 2015.
Georgia has neither a waste management strategy nor a waste management policy. Targets and measures for waste management and for management of radioactive waste were defined in the National Environmental Action Programme 2012–2016 (NEAP-2).
Biodiversity and protected areas
Within Georgian flora, 4,130 species of vascular plants have been recorded. In 2014, the Caucasus plants Red List has been published and the assessment resulted in the first comprehensive list of plants endemic to the Caucasus region (about 2,950 species/subspecies).
The rich nature of Georgian flora is evident from its high level of endemism, with around 21 per cent of Georgian flora (up to 900 species) being endemic. Among these, around 600 (14 per cent of all species) are Caucasus endemics and 300 (9 per cent of all species) are endemic to Georgia.
There have been improvements in the management of protected areas since 2010. New protected areas have been established and the initiation of the Emerald Network was a step forward. As a result, the area of protected
Executive summary xxxi
areas increased from 494 050 ha (7.09 per cent of Georgia’s territory) to 600,668 ha (8.62 per cent of Georgia’s territory). In respect of geographical coverage of the country and representativeness of Georgian biomes, critical gaps still exist, in particular in the Central Caucasus Mountain Range.
No protected area network is yet developed in Georgia, and neither is there a spatial development plan in order to strengthen the existing protected areas and transform them into a network. Protected areas appear isolated and no actions are taken for establishing an interconnected protected area network. Nevertheless, a plan and steps to set up a protected area network exist.
Until 2010, hunting was allowed only on hunting farms and in certain areas of strict nature reserves, except for hunting of migratory birds, which was allowed everywhere except in settlements and some categories of protected areas. Today, there are 18 hunting farms (four more licenses have been issued to fishing farms) but they do not operate effectively and only some of them have approved extraction quotas.
The existing monitoring system in protected areas is insufficient. Biodiversity monitoring studies in protected areas are mainly conducted by university research departments and NGOs in the frameworks of projects.
Energy and environment
Georgia has very small proven oil and natural gas reserves. More than 70 per cent of primary energy supply is imported; fossil fuels make up more than 70 per cent of this. Current crude oil production is not high and most of the fields are heavily depleted. Plans call for boosting oil production to three million tons per year by 2020, and gas production to two billion m3 by the same date.
Georgia’s energy sector has experienced significant growth in recent years, from having annual electricity generation of 7,061 GWh in 2005 to reaching 10,059 GWh in 2013; it became a net exporter of electricity in 2007. Exports reached its peak in 2010 and then decreased sharply in the period 2011–2013, from 1,524 GWh in 2010 to 450 GWh in 2013. In 2013, electricity generated from HPPs amounted to 8,271 GWh (83 per cent of total generation) and from TPPs, 1,788 GWh (17 per cent).
Despite installed hydropower capacity of around 2,700 MW, only 1,600 MW (60 per cent) of hydropower capacity actually generates electricity. The rehabilitation of the remaining 1,100 MW installed capacity could bring around 2.2–2.5 TWh of additional hydroelectricity. This is the least costly way to expand generation capacity and is given priority by the Government. Many of these rehabilitations are already under way.
Local biofuels (mainly in the form of firewood) play an important role in primary energy supply. Its share in total energy consumption is about 20 per cent. Firewood is mainly consumed in rural areas for cooking and heating purposes. For these purposes, the average rural household consumes 5–15 m3 of firewood annually. Annual consumption of firewood has been estimated at 1 million m3. The consumption of firewood is very inefficient due to the widespread practice of using woodstoves of very low efficiency (35–40 per cent). Georgia has considerable potential for biomass utilization (3–4 TWh), given the share of forests and agriculture in the national estate.
The energy intensity of the Georgian economy is high and the amount of specific energy needed to produce goods and services in Georgia is 2–2.5 times higher than in Western countries. It is estimated that energy efficiency measures can provide up to 20 per cent of energy saving in the country, in particular up to 1 TWh of electricity, up to 250 m3 of natural gas and up to a million m3 of firewood.
Georgia uses 40–50 per cent more energy for heating per m2 of floor space than EU countries with the same climate. As a result, 80–90 per cent of the energy consumed in Georgia’s residential sector is used for space heating. In general, buildings in Georgia consume about 40–45 per cent of all energy for heating purposes. The problem is equally acute for residential, office and industrial buildings. In Tbilisi, the thermal resistance of buildings to heat losses is three to four times less than recommended for energy efficiency for the Tbilisi climate zone. Currently, there are no effective mandatory or indicative energy efficiency standards in the Building Code. The residential sector in Georgia has a huge energy efficiency potential, due to the high share of the residential sector in the energy balance.
xxxii Executive summary
Geothermal achievable potential is 3 TWh per year. Geothermal waters are currently used in Georgia for district heating, fishpond heating, agricultural drying, industrial applications and greenhouse heating. The nation’s geothermal resources are of the highest quality, containing minimal amounts of dissolved salts, which consequently reduces scaling during utilization.
The climatic conditions of Georgia are favourable for utilizing solar energy. The achievable potential of solar energy in Georgia is estimated at 60–120 GWh annually. Most regions of the country have 250–280 days of sunshine per year. Direct and global radiation reaches daily values of 3.5–5.3 kW/m² and an annual average of 1,550 kW/m². The potential of solar energy, however, is strongly seasonal and varies by a factor of more than four from mid-summer to mid-winter.
The technical potential of the major biomass sources in Georgia amounts to 12.5 TWh. The achievable potential is estimated at 3–4 TWh. This estimate does not incorporate the potential of farming energy crops. Apart from firewood, which is used for cooking and heating, and a few donor-supported biogas initiatives, the biofuel potential remains untapped.
Industry and environment
Pollution flows from industry are difficult to assess in terms of volume and composition, since only a few industrial enterprises carry out self-monitoring and self-reporting. Nevertheless, the data available indicate that air emissions and pollution of surface water, groundwater and soil due to industrial activities remain important issues in regions where manufacturing and mining enterprises are located (e.g., Bolnisi, Chiatura, Rustavi and Tbilisi).
Total air emissions from the industrial sector have increased remarkably, to 35,627 tons in 2012, after a drastic decrease in 2009 to 14,363 tons. This increase is mainly due to higher amounts of TSPs, but emissions of VOCs, NOx, CO and SOx have also shown a moderate increase in the same period.
The regions that rank as the most polluted due to air emissions from industry are Imereti, with its manganese and coal mining, metallurgical and ferroalloys industries, followed by Kvemo Kartli, with its copper/gold mining, metallurgical, chemical and cement production industries.
In 2013, industry water use accounted for 35 per cent of total water use, excluding hydropower generation.Industrial wastewater discharges have increased by a factor of 1.6 from 2011 to 2013. In 2013, 48 per cent of total industrial wastewater was not treated before discharge into surface water bodies.
There are no landfills for industrial waste in the country. Industrial wastes are disposed of at municipal waste landfills or, more often, at the site of the facility producing the waste. In general, environmental requirements are not observed, resulting in diffuse pollution of surface water and groundwater and soil. Industrial hazardous wastes and mining wastes, including old and present tailings containing heavy metals and other toxic substances, can be found in several regions of Georgia, but are mainly concentrated in the Imereti region (85 per cent) and Racha-Lechkhumi and Kvemo Svaneti regions (11 per cent).
Environmental management systems, such as the ISO 14001 series and EU Eco-Management and Audit Scheme (EMAS), are not common in Georgia. At present, only eight industrial enterprises in the country are ISO 14001 certified. Capacities on environmental management (mainly environmental economics, eco-innovation, assessment of environmental technologies) are lacking, as are incentives to improve performance. This is reflected in the low level of environmental compliance by the industrial and mining sectors.
Agriculture and environment
In 2013 agriculture share in GDP was 9.4 per cent, and 9.2 per cent in 2014. From an employment perspective, agriculture still remains a mainstay, as the population classified as employed in agriculture has remained fairly constant from 2000 (52.1 per cent) to 2013 (52 per cent).
Agricultural productivity of Georgia is low: between 2006 and 2012, the average wheat yield was 1.5 tons/ha and that of maize 2.2 tons/ha. The reasons for this are very small family farms, a low degree of

Executive summary xxxiii
entrepreneurship, the lack of cooperative development, limited educational opportunities (19 per cent of the agricultural labour force have training in agriculture) and the low use of agricultural inputs.
Large-scale breeding facilities (cattle and poultry) have closed down, resulting in the establishment of many small-scale facilities, and this has redistributed the emissions from a small number of large sources to a large number of small sources. The impacts of localized large emissions have been reduced. The cattle and pigs are held exclusively on private small farms and dispersed throughout the territory: in 2012, there was an average of about 1.5 cows and 0.25 pigs per farm, so that there is no manure management at the farm level.
Of the 3 million ha of agricultural land, 35 per cent is degraded because of erosion. Due to the climate and the topography, natural soil erosion takes place on quite a large scale in Georgia. Water erosion takes place in the western part of the country and is accelerated by overgrazing and the ploughing of steep slopes. Wind erosion takes place in the eastern part and is due to the destruction of the wind shelter belts (out of a total of 2,000 km, 1,800 km were logged for firewood) and overgrazing by large sheep flocks.
Irrigation and drainage systems deteriorated seriously in the past two decades, because there was no funding for their maintenance and rehabilitation. As a result, water losses lowered water availability, negatively affecting crop yields.
Transport and environment
The development of Georgia’s transport sector is determined to a large extent by its strategic position for energy imports by the EU from neighbouring Azerbaijan, and for east–west and north–south trade flows. In response to its strategic position as a transit country, Georgia has invested in important infrastructure projects to increase the effectiveness of its transport system.
Since 2004, the number of wheeled vehicles has increased three times, from 319,461 in 2004 to 1,021,261 in 2014. The steep increase is primarily due to the increase in road passenger transport with eight seats; which increased by 220 per cent from 256,153 in 2004 to 820,819 in 2014. About 531,000 vehicles, i.e. 70 per cent of the vehicle fleet, are older than 15 years.
Georgia has invested heavily in modernizing and upgrading its rail network since 2004. The rail network in 2004 was 1,565 km, 4 per cent of which was included in the Trans-Caucasian Corridor (TRACECA) rail corridor. Today, the network has reached 2,344 km.
The transport sector accounts for 87 per cent of CO, 70 per cent of NOx, 50 per cent of SO and 40 per cent of VOCs emissions in the country. According to NEAP-2, factors exacerbating the emission of air pollutants by the sector include the age, poor quality and high number of the vehicle fleet. Furthermore, even though most cars are imported from Europe, the catalytic converters are outdated, thus dramatically increasing the amount of emitted harmful substances.
In recent years, efforts have been made to promote public transport in Georgia. In recent years, it has received considerable investments. The underground system extends to a total of 57 km, corresponding to two lines and 22 stations. In 2012, aerial tram/cable car from Rike Park to Narikala Fortress was built. The funicular railway that runs up to Mtatsminda Mountain was opened in 1905 and was recently reconstructed.
From 1 January 2014, regulations and standards on fuel quality in force have become more strict. In particular, those concerning lead content standards in Georgia are as stringent as those in the EU. However, there is no inspection system in place to control the quality of fuel at the distribution points.
Despite the fact that the new standards for sulphur content are considerably more stringent than their predecessors, they remain a clear outlier from equivalent standards in the EU. In petrol, maximum sulphur concentrations in Georgia are 15 times higher than those allowed in the EU. In diesel, the same concentrations are 20 times higher than those allowed in the EU. Given the adverse environmental and health effects of sulphur emissions, this is an area of concern with considerable room for improvement.
xxxiv Executive summary
Forestry and environment
Forests occupy about 40 per cent of the territory of Georgia, a total of 2,822,500 ha, with an unequal distribution across the regions. Approximately 97 per cent are located on the slopes of the Greater and Smaller Caucasus Mountain ranges; the rest are found in the valleys of east Georgia and the Kolkheti lowlands.
The assessment of the total growing stock of Georgian forests is 455 million m3, of which 124 million m3 are coniferous and 312 million m3 broadleaved. The average growing stock per ha is 170 m3 and continues to be higher than the EU average of 150 m3 per ha. Regarding its net annual natural increment, this amounts to 1.8 m3
per ha per year.
In combination with unsustainable logging, excessive grazing is causing severe damage to forest ecosystems in the country. Overgrazing by livestock is a serious threat in certain locations near settlements, in winter pastures. Grazing is often shifted to nearby forests. Limited control from the state authorities, rural poverty, limited alternative livelihood opportunities, improper range management, and a lack of awareness of shepherds and livestock owners are considered to be main causes of overgrazing in the country. At present, there are no data on forest areas affected by overgrazing.
About 87.1 per cent of households in rural areas and 17.4 per cent of households in urban areas depend heavily on wood for cooking and heating. Most of the wood harvested in Georgia is used directly for fuelwood and comes from forests; however, trees from fruit orchards, gardens, windbreaks, etc. complement the supply. Fuelwood is mainly traded in informal markets and official recorded data do not properly reflect the fuelwood situation in the country.
Data and assessments on the status of Georgian forests are incomplete and based on a sample of inventory or satellite images over limited periods of time. A complete forest inventory dates back to 1997, and partial updates have only recently been initiated through temporary ground plots.
Tourism and environment
In the period 2005–2013, the tourism industry in Georgia demonstrated impressive growth. The number of international arrivals grew more than ninefold, from 560,021 in 2005 to 5,515,559 in 2014. In 2012, 2013 and 2014 the number of international arrivals was higher than the total population of the country.
The statistics for 2011–2014 demonstrate that the most popular season among international travellers is summer (35 per cent of all international arrivals). Eighty-eight per cent of all arrivals are from four neighbouring countries: Turkey, Azerbaijan, Armenia and the Russian Federation, in that order. An increasing trend is observed in the number of tourists from the Russian Federation. This was made possible by the visa liberalization process and the reintroduction of direct flights.
Tourism is an important sector in the Georgian economy. Approximately 59 per cent of Georgia’s service export revenue comes from tourism. Revenues consisting of international tourism receipts demonstrated an increasing trend, reaching US$1.79 billion in 2014. Tourism’s gross value added, as a proportion of GDP, increased to 6 per cent.
The number of hotels has more than doubled since 2008, from 353 to 836 in 2013. This growth was achieved thanks to private investments in the hotel industry. During the same period, the number of state-owned hotels decreased sixfold, from 30 in 2008 to 5 in 2013.
There is little information available on pressures from tourism and tourist infrastructure on the environment in Georgia. There are neither estimates of energy and resource use in tourism, no estimates of pressures from tourism on water resources in Georgia. Data on water consumption by tourists are not collected and consequently are not published in any reports such as statistical yearbooks.
Executive summary xxxv
Health and environment
The under-five mortality rate per 1,000 live births has been declining since 2000. It was estimated at 28.7 (per 1,000 live births) in the period 1990–1994, 24.9 in 2000 and 13.0 in 2013. This is still higher than that in the EU (5 per 1,000 live births) and the European region (9 per 1,000 live births).
During the last decade, the incidence of respiratory system diseases increased. The incidence rate is much higher in children (35,000 per 100,000 children in 2012) compared with the general population (12,000 per 100,000 population in 2012). The most widespread chronic respiratory diseases are asthma, respiratory allergic diseases and chronic obstructive pulmonary diseases. Tobacco smoke is the main cause of chronic pulmonary diseases. Air contamination in buildings, atmospheric air pollution, occupational dust and chemicals also constitute risk factors.
Each year from 9,000 to 11,000 people are dying in Georgia from diseases associated with tobacco use; among them, 3,000 are passive smokers. The prevalence of smoking in Georgia is one of the highest among countries in Europe.
In Georgia, there is a strong contrast between urban and rural areas in terms of the proportion of households with piped water supply (97 per cent in urban areas, 66 per cent in rural areas). In big cities, water supply performances increased due to the construction and optimization of water networks by companies.
In 2007 the surveillance, control and majority of services involved in sanitary surveillance were abolishedwithout an alternative structure or new legislation. Legislation related to environmental health was also cancelled or suspended. There is a lack of legislation and control of the authorities in several environmental health domains, for example, safe use of chemicals, waste management, industrial emissions, and outdoor and indoor air quality.
There is no plan or programme on environmental health. In 2003, a national environmental health action plan was elaborated but was never adopted. There is no children’s environment and health action plan in Georgia.
Risk management of natural and technological/anthropogenic hazards
Georgia is exposed to a wide variety of natural hazards, however they do not cause as many fatalities as technological disasters. Floods and debris- and mudflows contribute to most natural-disaster-related fatalities. The economic losses stemming from disasters are not consistently assessed and collected.
The 2014 Law on Civil Safety prescribes responsibilities for the Ministry of Internal Affairs, while many activities described in the Law are also mandated to the Ministry of Environment and Natural Resources Protection, such as monitoring, sampling and analysis following emergencies. However, the capacities within the Ministry of Environment and Natural Resources Protection are very limited to undertake these tasks. The Law requires the development of some 50 by-laws to harmonize existing legislation with that of the EU.
No national strategy for disaster risk management has been developed, although a thorough assessment of capacities for disaster risk reduction (DRR) has been undertaken on which a capacity-development plan could be based.
In 2014, Georgia undertook a DRR Capacity Assessment. It revealed that there is a high level of government willingness and potential to move from a reactive approach of disaster response to a more proactive DRR approach. It stated that technical, human and financial capacities exist; however, coordination, prioritization and systematization across all relevant sectors, governance levels and institutions are insufficient.
The response component of the disaster management system is well developed in Georgia. However, its engagement in international fora, including the United Nations Disaster Assessment and Coordination (UNDAC) teams, Environmental Emergency Response Network and International Search and Rescue Advisory Group (INSARAG) is limited.

1
Introduction
ENVIRONMENTAL CONDITIONS AND PRESSURES
I.1 Geography and climate Georgia has a land area of 69,700 km2 and is located in the mountainous South Caucasus region of Eurasia, which stretches from the Black Sea to the Caspian Sea. The country’s northern border runs roughly along the crest of the Greater Caucasus mountain range. In addition to this mountain range, Georgia is bounded by the Lesser Caucasus mountains to the south, while the Likhi mountain range divides the country into eastern and western halves. The western border of the country is formed by the 315-km-long Black Sea coastline. The topography of the country is very varied. Western Georgia’s landscape ranges from lowland marsh-forests, swamps and temperate rainforests to eternal snows and glaciers, while the eastern part of the country contains a small section of semi-arid plains. Forests cover around 40 per cent of Georgia’s territory, while the alpine/subalpine zone accounts for roughly 10 per cent of the land area. The Greater Caucasus mountain range moderates Georgia’s climate by preventing the penetration of colder air masses from the north, whereas the Lesser Caucasus mountains partially protect the region from the influence of dry and hot air masses from the south. The weather patterns are influenced by both dry Caspian air masses from the east and humid Black Sea air masses from the west. The division of the country by the Likhi mountain range causes the eastern and western parts of the country to have two different main climatic zones. Much of western Georgia lies within the northern periphery of the humid subtropical zone, with annual precipitation ranging from 1,000 to 4,000 mm. Eastern Georgia, with its transitional climate from humid subtropical to continental, has considerably lower annual precipitation, ranging from 400 to 1,600 mm. I.2 Demographic and socioeconomic context
Population The population indicators have changed very little since 2008. The total population increased by 2.32 per cent, from 4,382 million inhabitants in 2008 to
4,483 million in 2013. The crude birth rate, which was 12.9 in 2008, went up to 14.4 in 2009 but has since been in decline – the latest available figure, for 2013, was 12.9. The total fertility rate was the same, 1.7, in 2008 and in 2013. The average life expectancy of the population increased from 74.2 years in 2008 to 75.2 in 2013. In 2013, life expectancy for women was 79.4 years, about 4.9 months more than in 2008, while life expectancy for men was 70.8 years in 2013, 18 months longer than in 2008. The diminishing infant mortality rate, which declined from 17 deaths per 1,000 in 2008 to 11.1 deaths per 1,000 in 2013, was a very positive development, especially when compared with the general stability of the population trends. Little over half (53.1 per cent) of the Georgian population lives in towns. The capital and largest city is Tbilisi (population 1,175,000 in 2014). The other main cities are Kutaisi (pop. 197,000) and Batumi (pop. 161,200).
Economic and social development In 2004, Georgian gross domestic product (GDP) had amounted to 49.5 per cent compared to1990 level, and the Government launched an ultra-liberal deregulation and anti-corruption policy drive. The result was double-digit annual GDP growth in 2007, driven by high levels of foreign direct investment (FDI) and strong credit growth. Overall, during the period 2004–2007 the country’s economy expanded by 35 per cent. In 2008, the Georgian economy was hit by two separate shocks, the military conflict with the Russian Federation and the global financial crisis. Together these two shocks caused major disruption of the economy, although it is hard to analyse which one had the greater effect. In October the same year, US$4.5 billion in foreign aid was pledged to the rebuilding effort of the country after the war. The international aid, combined with the personal remittances of the Georgian diaspora – worth 10.3 per cent of GDP in 2009 – mitigated the effects of the war and financial crisis, but GDP still contracted by
2 Introduction
3.7 per cent in 2009. However, in 2010, GDP grew by 6.2 per cent and the robust growth continued by 7.2 per cent in 2011 and 6.4 per cent in 2012 – slowing down to 3.3 per cent in 2013. The shock year 2008 had its effect on other economic indicators but the rebound was also fast. Industrial production dropped by 10.6 per cent in 2009 but the downturn was short and industrial production was back to the 2008 level in 2010. FDI, on which the Government had placed high hopes for facilitating the recovery, never returned to the high levels of 2007. It contracted by 52.2 per cent from 2008 to 2009 and had strong annual fluctuations but reached only 60.2 per cent of the 2008 investment level in 2013. Unemployment has been relatively high throughout the review period. The average annual unemployment rate between 2008 and 2014 was 15.2 per cent. The latest available (2014) figure of 12.4 per cent was lower than the longer term average. According to the United Nations Statistics Division’s latest available Millennium Development Goals (MDGs) indicators, there was a drop in the poverty level during the review period. In 2008, 17.7 per cent of the population lived with income below the national poverty line; this figure had reduced to 14.8 per cent in 2012. Price levels have fluctuated greatly since 2008. Inflation, measured by the Consumer Price Index (CPI), which was at 10 per cent in 2008, plunged to 1.7 per cent in 2009 but jumped to 7.1 per cent and 8.5 per cent in 2010 and 2011, respectively. Thereafter, deflation took hold and there was a 0.9 per cent drop in 2012, while the latest available CPI figure, for 2013, was 0.5 per cent negative. The track record of Georgia’s economic performance in the international comparisons is ambiguous. The World Bank’s 2014 “Ease of Doing Business” analysis put Georgia in 8th place. The World Economic Forum’s 2014–2015 Global Competitiveness Report, which compares economic performance in a much broader way, placed Georgia in 69th place of the 148 countries compared. The World Economic Forum’s report indicated several areas where there was a need for improvement. These challenges were related to Georgia’s property rights in general and to the protection of both intellectual property rights and minority shareholders’ interests. In addition the report stated that, to improve its competitiveness, the country needs to improve its
higher education and workforce training and enhance the quality of the research institutions and the amount spent on research and development. Georgia belongs to the high human development country group in the United Nations Development Programme (UNDP)’s comparative Human Development Report. Georgia’s Human Development Index (HDI) score was 0.730 in 2008, which rose slightly to 0.744 in 2013, placing the country in 79th place of the 187 countries compared.
Gender Georgia has made progress in ensuring the implementation of the gender equality commitments laid out by the Convention on the Elimination of All Forms of Discrimination against Women (CEDAW). After adopting the Law on Gender Equality in March 2010, the Government developed a National Action Plan which was approved in May 2011. In addition, the Gender Equality Council of Parliament, which initially was a temporary advisory structure, was made a standing body in March 2010. Despite the progress made in recent years, women are still underrepresented at decision-making levels and disempowered economically. According to UNDP’s Gender Inequality Index, Georgia was ranked 71st of the 137 countries surveyed. It has been extremely uncommon and difficult for women to be elected to Parliament, the supreme legislative body of Georgia. In the period from the 1991 to 2008 elections, the proportion of women Members of Parliament never exceeded 10 per cent. In 2013, however, there was a slight increase in female representation when 12 per cent (18 of 150) of the elected Members of Parliament were women. The number of women in local self-governance bodies is very low. In 2008, women held 11.4 per cent of the local government seats and in 2013 this had increased to 12 per cent. Similar very low representation of women applies to the executive branch of the Government. In 2008, all 18 ministers were men. Female representation improved a little when, as of June 2013, three of 20 ministers were women. There seems to be equal opportunity by gender in education, according to the latest, 2013, figures. In primary and secondary education the enrolment ratio was 0.9 females to one male, while in tertiary education the ratio slightly favoured women at 1.2 females to one male.
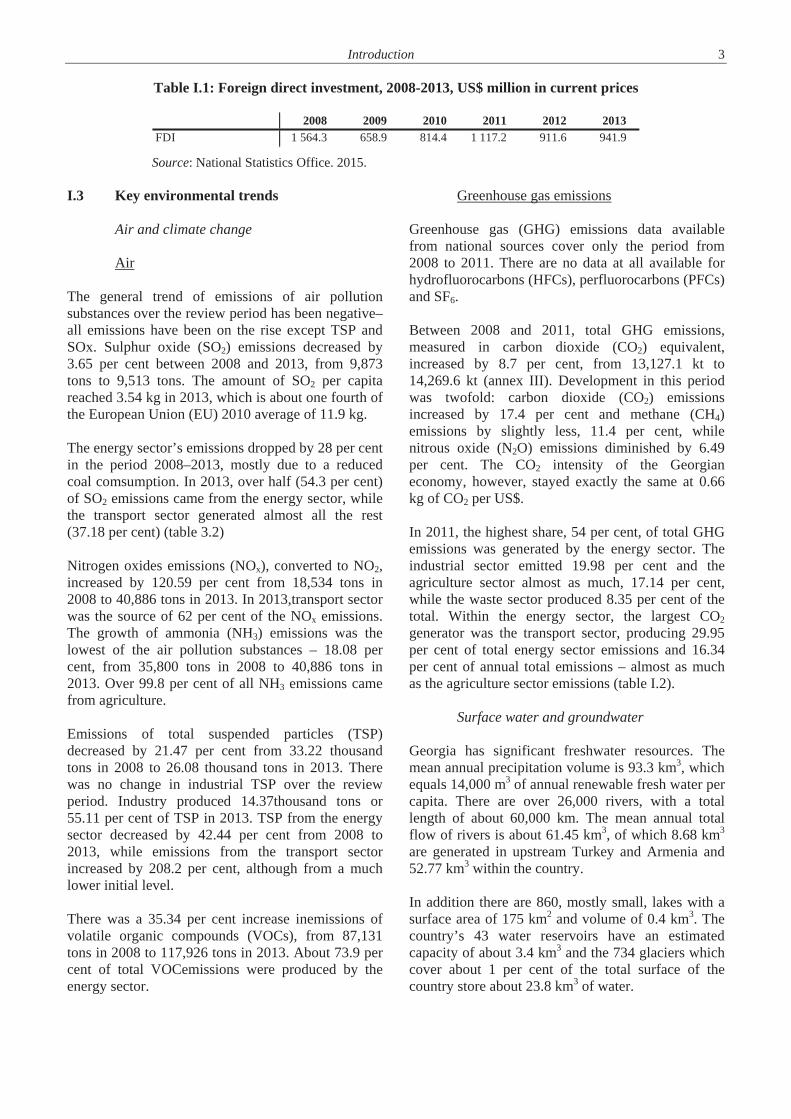
Introduction 3
Table I.1: Foreign direct investment, 2008-2013, US$ million in current prices
Source: National Statistics Office. 2015.
I.3 Key environmental trends
Air and climate change
Air The general trend of emissions of air pollution substances over the review period has been negative– all emissions have been on the rise except TSP and SOx. Sulphur oxide (SO2) emissions decreased by 3.65 per cent between 2008 and 2013, from 9,873 tons to 9,513 tons. The amount of SO2 per capita reached 3.54 kg in 2013, which is about one fourth of the European Union (EU) 2010 average of 11.9 kg. The energy sector’s emissions dropped by 28 per cent in the period 2008–2013, mostly due to a reduced coal comsumption. In 2013, over half (54.3 per cent) of SO2 emissions came from the energy sector, while the transport sector generated almost all the rest (37.18 per cent) (table 3.2) Nitrogen oxides emissions (NOx), converted to NO2, increased by 120.59 per cent from 18,534 tons in 2008 to 40,886 tons in 2013. In 2013,transport sector was the source of 62 per cent of the NOx emissions. The growth of ammonia (NH3) emissions was the lowest of the air pollution substances – 18.08 per cent, from 35,800 tons in 2008 to 40,886 tons in 2013. Over 99.8 per cent of all NH3 emissions came from agriculture. Emissions of total suspended particles (TSP) decreased by 21.47 per cent from 33.22 thousand tons in 2008 to 26.08 thousand tons in 2013. There was no change in industrial TSP over the review period. Industry produced 14.37thousand tons or 55.11 per cent of TSP in 2013. TSP from the energy sector decreased by 42.44 per cent from 2008 to 2013, while emissions from the transport sector increased by 208.2 per cent, although from a much lower initial level. There was a 35.34 per cent increase inemissions of volatile organic compounds (VOCs), from 87,131 tons in 2008 to 117,926 tons in 2013. About 73.9 per cent of total VOCemissions were produced by the energy sector.
Greenhouse gas emissions Greenhouse gas (GHG) emissions data available from national sources cover only the period from 2008 to 2011. There are no data at all available for hydrofluorocarbons (HFCs), perfluorocarbons (PFCs) and SF6. Between 2008 and 2011, total GHG emissions, measured in carbon dioxide (CO2) equivalent, increased by 8.7 per cent, from 13,127.1 kt to 14,269.6 kt (annex III). Development in this period was twofold: carbon dioxide (CO2) emissions increased by 17.4 per cent and methane (CH4) emissions by slightly less, 11.4 per cent, while nitrous oxide (N2O) emissions diminished by 6.49 per cent. The CO2 intensity of the Georgian economy, however, stayed exactly the same at 0.66 kg of CO2 per US$. In 2011, the highest share, 54 per cent, of total GHG emissions was generated by the energy sector. The industrial sector emitted 19.98 per cent and the agriculture sector almost as much, 17.14 per cent, while the waste sector produced 8.35 per cent of the total. Within the energy sector, the largest CO2 generator was the transport sector, producing 29.95 per cent of total energy sector emissions and 16.34 per cent of annual total emissions – almost as much as the agriculture sector emissions (table I.2).
Surface water and groundwater Georgia has significant freshwater resources. The mean annual precipitation volume is 93.3 km3, which equals 14,000 m3 of annual renewable fresh water per capita. There are over 26,000 rivers, with a total length of about 60,000 km. The mean annual total flow of rivers is about 61.45 km3, of which 8.68 km3 are generated in upstream Turkey and Armenia and 52.77 km3 within the country. In addition there are 860, mostly small, lakes with a surface area of 175 km2 and volume of 0.4 km3. The country’s 43 water reservoirs have an estimated capacity of about 3.4 km3 and the 734 glaciers which cover about 1 per cent of the total surface of the country store about 23.8 km3 of water.
2008 2009 2010 2011 2012 2013FDI 1 564.3 658.9 814.4 1 117.2 911.6 941.9
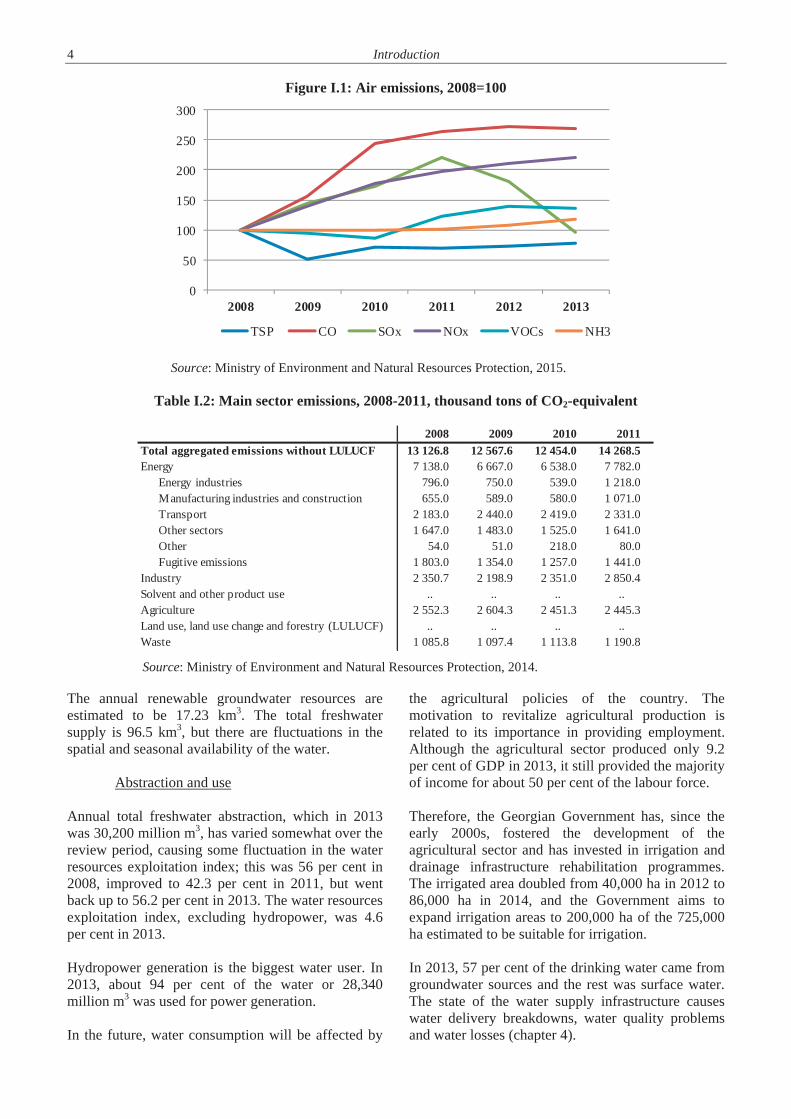
4 Introduction
Figure I.1: Air emissions, 2008=100
Source: Ministry of Environment and Natural Resources Protection, 2015.
Table I.2: Main sector emissions, 2008-2011, thousand tons of CO2-equivalent
Source: Ministry of Environment and Natural Resources Protection, 2014.
The annual renewable groundwater resources are estimated to be 17.23 km3. The total freshwater supply is 96.5 km3, but there are fluctuations in thespatial and seasonal availability of the water.
Abstraction and use
Annual total freshwater abstraction, which in 2013 was 30,200 million m3, has varied somewhat over the review period, causing some fluctuation in the water resources exploitation index; this was 56 per cent in 2008, improved to 42.3 per cent in 2011, but wentback up to 56.2 per cent in 2013. The water resources exploitation index, excluding hydropower, was 4.6 per cent in 2013.
Hydropower generation is the biggest water user. In 2013, about 94 per cent of the water or 28,340million m3 was used for power generation.
In the future, water consumption will be affected by
the agricultural policies of the country. The motivation to revitalize agricultural production isrelated to its importance in providing employment. Although the agricultural sector produced only 9.2 per cent of GDP in 2013, it still provided the majority of income for about 50 per cent of the labour force.
Therefore, the Georgian Government has, since theearly 2000s, fostered the development of theagricultural sector and has invested in irrigation and drainage infrastructure rehabilitation programmes.The irrigated area doubled from 40,000 ha in 2012 to86,000 ha in 2014, and the Government aims to expand irrigation areas to 200,000 ha of the 725,000 ha estimated to be suitable for irrigation.
In 2013, 57 per cent of the drinking water came from groundwater sources and the rest was surface water.The state of the water supply infrastructure causes water delivery breakdowns, water quality problems and water losses (chapter 4).
0
50
100
150
200
250
300
2008 2009 2010 2011 2012 2013
TSP CO SOx NOx VOCs NH3
2008 2009 2010 2011Total aggregated emissions without LULUCF 13 126.8 12 567.6 12 454.0 14 268.5Energy 7 138.0 6 667.0 6 538.0 7 782.0
Energy industries 796.0 750.0 539.0 1 218.0Manufacturing industries and construction 655.0 589.0 580.0 1 071.0Transport 2 183.0 2 440.0 2 419.0 2 331.0Other sectors 1 647.0 1 483.0 1 525.0 1 641.0Other 54.0 51.0 218.0 80.0Fugitive emissions 1 803.0 1 354.0 1 257.0 1 441.0
Industry 2 350.7 2 198.9 2 351.0 2 850.4Solvent and other product use .. .. .. ..Agriculture 2 552.3 2 604.3 2 451.3 2 445.3Land use, land use change and forestry (LULUCF) .. .. .. ..Waste 1 085.8 1 097.4 1 113.8 1 190.8
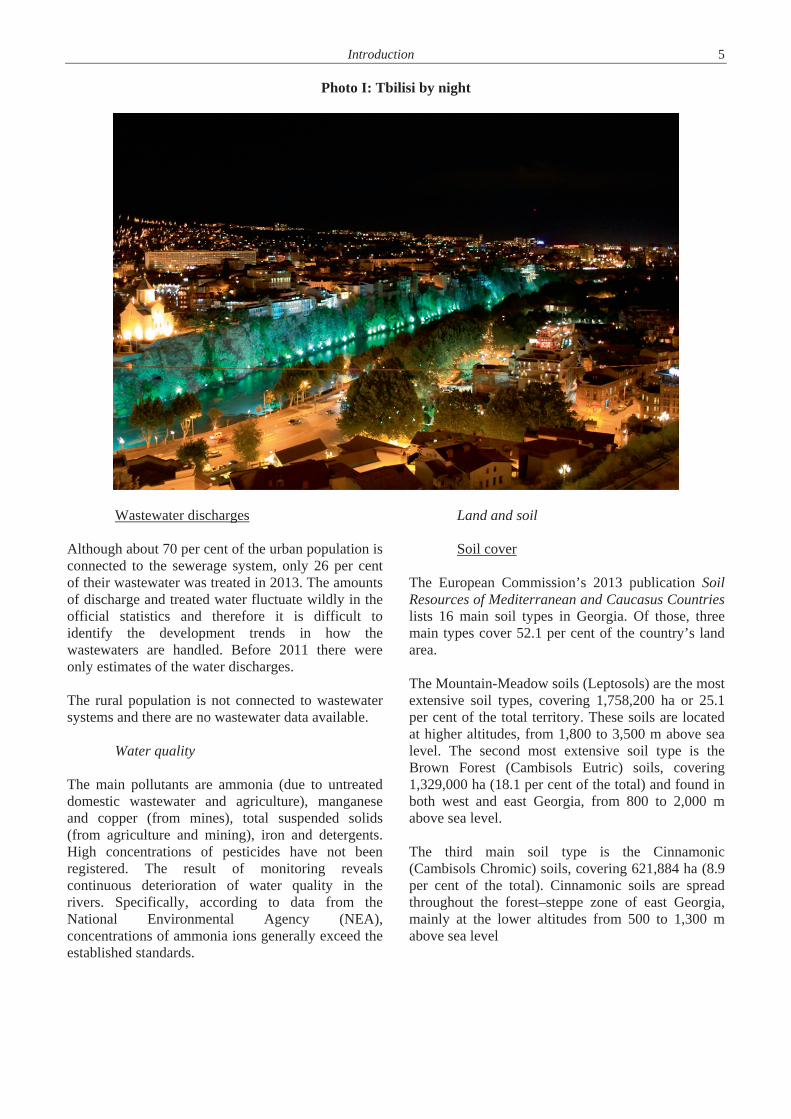
Introduction 5
Photo I: Tbilisi by night
Wastewater discharges
Although about 70 per cent of the urban population is connected to the sewerage system, only 26 per cent of their wastewater was treated in 2013. The amounts of discharge and treated water fluctuate wildly in the official statistics and therefore it is difficult to identify the development trends in how the wastewaters are handled. Before 2011 there were only estimates of the water discharges.
The rural population is not connected to wastewater systems and there are no wastewater data available.
Water quality
The main pollutants are ammonia (due to untreated domestic wastewater and agriculture), manganese and copper (from mines), total suspended solids (from agriculture and mining), iron and detergents. High concentrations of pesticides have not been registered. The result of monitoring reveals continuous deterioration of water quality in the rivers. Specifically, according to data from the National Environmental Agency (NEA), concentrations of ammonia ions generally exceed the established standards.
Land and soil
Soil cover
The European Commission’s 2013 publication Soil Resources of Mediterranean and Caucasus Countrieslists 16 main soil types in Georgia. Of those, three main types cover 52.1 per cent of the country’s land area.
The Mountain-Meadow soils (Leptosols) are the most extensive soil types, covering 1,758,200 ha or 25.1 per cent of the total territory. These soils are located at higher altitudes, from 1,800 to 3,500 m above sea level. The second most extensive soil type is the Brown Forest (Cambisols Eutric) soils, covering 1,329,000 ha (18.1 per cent of the total) and found in both west and east Georgia, from 800 to 2,000 m above sea level.
The third main soil type is the Cinnamonic (Cambisols Chromic) soils, covering 621,884 ha (8.9 per cent of the total). Cinnamonic soils are spread throughout the forest–steppe zone of east Georgia, mainly at the lower altitudes from 500 to 1,300 m above sea level
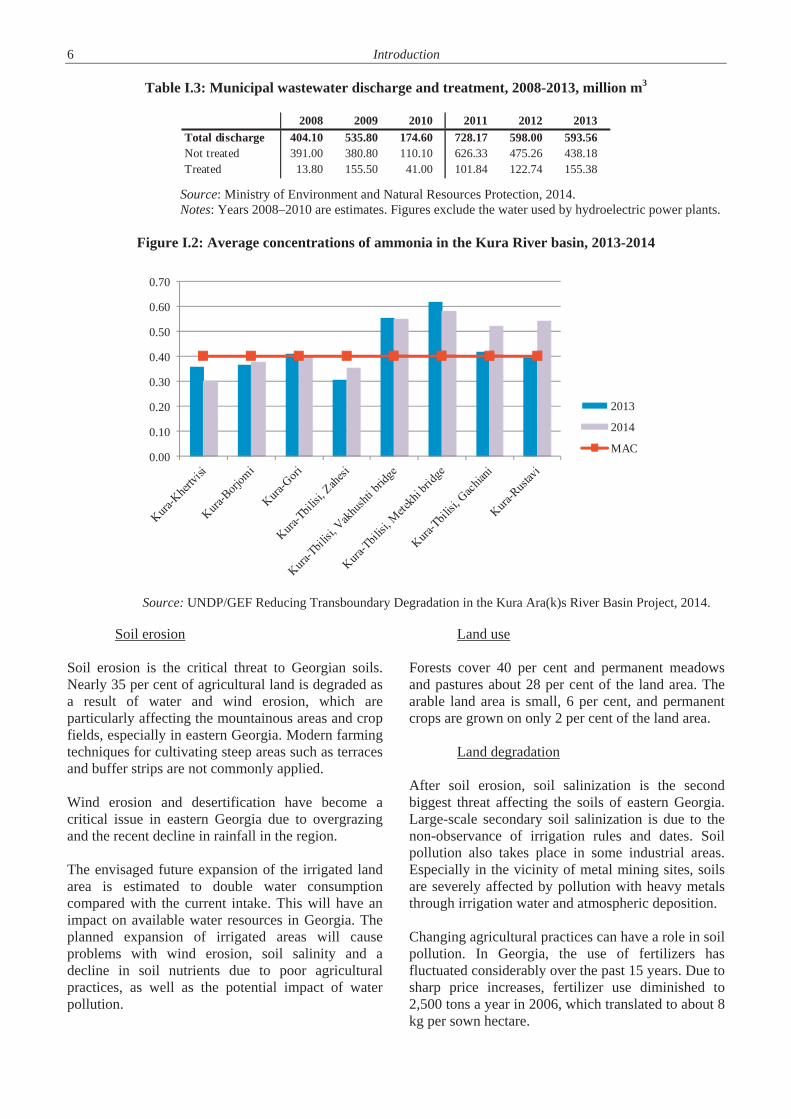
6 Introduction
Table I.3: Municipal wastewater discharge and treatment, 2008-2013, million m3
Source: Ministry of Environment and Natural Resources Protection, 2014. Notes: Years 2008–2010 are estimates. Figures exclude the water used by hydroelectric power plants.
Figure I.2: Average concentrations of ammonia in the Kura River basin, 2013-2014
Source: UNDP/GEF Reducing Transboundary Degradation in the Kura Ara(k)s River Basin Project, 2014.
Soil erosion
Soil erosion is the critical threat to Georgian soils. Nearly 35 per cent of agricultural land is degraded as a result of water and wind erosion, which are particularly affecting the mountainous areas and cropfields, especially in eastern Georgia. Modern farming techniques for cultivating steep areas such as terraces and buffer strips are not commonly applied.
Wind erosion and desertification have become a critical issue in eastern Georgia due to overgrazing and the recent decline in rainfall in the region.
The envisaged future expansion of the irrigated landarea is estimated to double water consumptioncompared with the current intake. This will have animpact on available water resources in Georgia. The planned expansion of irrigated areas will cause problems with wind erosion, soil salinity and a decline in soil nutrients due to poor agricultural practices, as well as the potential impact of waterpollution.
Land use
Forests cover 40 per cent and permanent meadowsand pastures about 28 per cent of the land area. The arable land area is small, 6 per cent, and permanentcrops are grown on only 2 per cent of the land area.
Land degradation
After soil erosion, soil salinization is the second biggest threat affecting the soils of eastern Georgia. Large-scale secondary soil salinization is due to the non-observance of irrigation rules and dates. Soil pollution also takes place in some industrial areas. Especially in the vicinity of metal mining sites, soils are severely affected by pollution with heavy metals through irrigation water and atmospheric deposition.
Changing agricultural practices can have a role in soil pollution. In Georgia, the use of fertilizers has fluctuated considerably over the past 15 years. Due to sharp price increases, fertilizer use diminished to2,500 tons a year in 2006, which translated to about 8 kg per sown hectare.
2008 2009 2010 2011 2012 2013Total discharge 404.10 535.80 174.60 728.17 598.00 593.56Not treated 391.00 380.80 110.10 626.33 475.26 438.18Treated 13.80 155.50 41.00 101.84 122.74 155.38
0.00
0.10
0.20
0.30
0.40
0.50
0.60
0.70
2013
2014
MAC
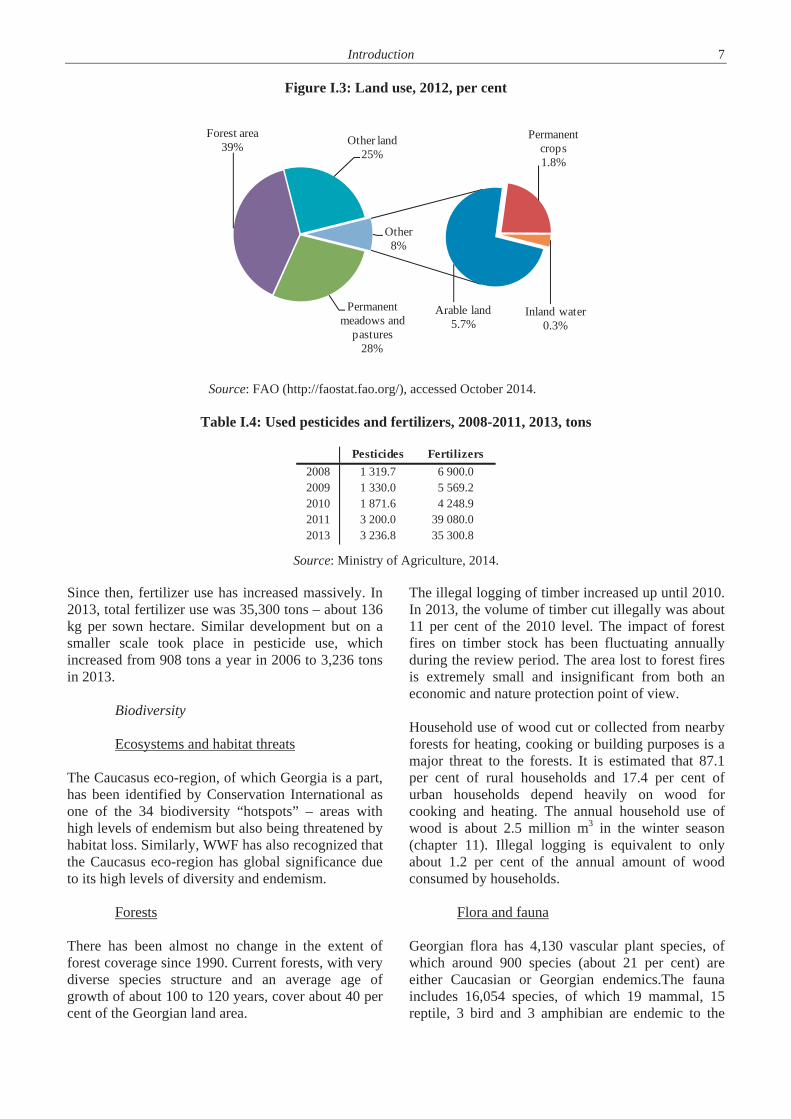
Introduction 7
Figure I.3: Land use, 2012, per cent
Source: FAO (http://faostat.fao.org/), accessed October 2014.
Table I.4: Used pesticides and fertilizers, 2008-2011, 2013, tons
Source: Ministry of Agriculture, 2014.
Since then, fertilizer use has increased massively. In 2013, total fertilizer use was 35,300 tons – about 136 kg per sown hectare. Similar development but on a smaller scale took place in pesticide use, which increased from 908 tons a year in 2006 to 3,236 tons in 2013.
Biodiversity
Ecosystems and habitat threats
The Caucasus eco-region, of which Georgia is a part, has been identified by Conservation International as one of the 34 biodiversity “hotspots” – areas withhigh levels of endemism but also being threatened by habitat loss. Similarly, WWF has also recognized that the Caucasus eco-region has global significance dueto its high levels of diversity and endemism.
Forests
There has been almost no change in the extent offorest coverage since 1990. Current forests, with verydiverse species structure and an average age of growth of about 100 to 120 years, cover about 40 per cent of the Georgian land area.
The illegal logging of timber increased up until 2010. In 2013, the volume of timber cut illegally was about 11 per cent of the 2010 level. The impact of forest fires on timber stock has been fluctuating annuallyduring the review period. The area lost to forest fires is extremely small and insignificant from both aneconomic and nature protection point of view.
Household use of wood cut or collected from nearbyforests for heating, cooking or building purposes is a major threat to the forests. It is estimated that 87.1 per cent of rural households and 17.4 per cent ofurban households depend heavily on wood forcooking and heating. The annual household use ofwood is about 2.5 million m3 in the winter season (chapter 11). Illegal logging is equivalent to only about 1.2 per cent of the annual amount of woodconsumed by households.
Flora and fauna
Georgian flora has 4,130 vascular plant species, of which around 900 species (about 21 per cent) are either Caucasian or Georgian endemics.The fauna includes 16,054 species, of which 19 mammal, 15 reptile, 3 bird and 3 amphibian are endemic to the
Arable land5.7%
Permanentcrops1.8%
Permanentmeadows and
pastures28%
Forest area39% Other land
25%
Inland water0.3%
Other8%
Pesticides Fertilizers2008 1 319.7 6 900.02009 1 330.0 5 569.22010 1 871.6 4 248.92011 3 200.0 39 080.02013 3 236.8 35 300.8

8 Introduction
Caucasian region and 1 species, the Adjarian lizard (Darevskia mixta), is endemic to Georgia. Currently, the national Red List includes 29 mammal, 35 bird, 14 fish, 11 reptile, 2 amphibian and 56 plant species. In addition, 44 vertebrates found in Georgia are globally endangered and included on the IUCN Red List as vulnerable (VU) or of a higher position of threat.
Protected areas
The size of the total protected area grew moderately, by 1.53 per cent, from 2008 to 2013. The national parks form the largest part (58 per cent) of the protected areas. In 2013, there were 10 national parks with a land area of 2,766.16 km2. The habitat and species management areas grew the most rapidly, by 8 per cent, but from a very small original size. Theprotected share of the country’s land area was 7.47 per cent in 2013.
Waste There is almost no waste data available because there is no regular systematic monitoring of waste generation or collection. In 2007, a waste inventory, which included household, industrial, medical and biological wastes, was conducted. Since that study, no comprehensive record of the wastes collected or produced is available. The estimation of municipal waste generation has been calculated based on approximate values of per capita generation, size of the population and other waste accumulation factors. municipal waste generation is estimated to be between 0.8 and 1
million tons annually (chapter 5). municipal waste is disposed of to 56 official sites, three of which are modern sanitary landfills. There is no data on industrial waste collected since the 2007 inventory. Industrial waste is disposed of in industrial premises. Since there is no legislation on industrial waste, it is quite likely that the majority of these disposal sites are unsatisfactory. Some smaller industries dispose of their non-hazardous waste at municipal disposal sites. There are no public treatment facilities for industrial or hazardous waste. Unused outdated pesticides are accumulated throughout the country at former chemical enterprise stock facilities and at former collective farm depots. Pesticides lie in the open air, causing soil, ground and surface water pollution. With the help of UNDP Georgia, template database forms were developed, linked to a GIS system, to record and locate obsolete pesticide and polychlorinated biphenyl (PCB) sites. However, the system has never been used and tested. There is no data on health-care waste. Current disposal of health-care waste is straightforward. Non-infectious health-care waste is disposed of in municipal landfills, while infectious waste is first sterilized before disposal. Anatomic waste is buried in cemeteries. As early as 2001, the Ministry of Labour, Health and Social Affairs published a detailed regulation for health-care waste management, which was based on the use of incinerators. The lack of financing has slowed down the full implementation of the regulation. Currently, there are 10 operational waste incinerators.
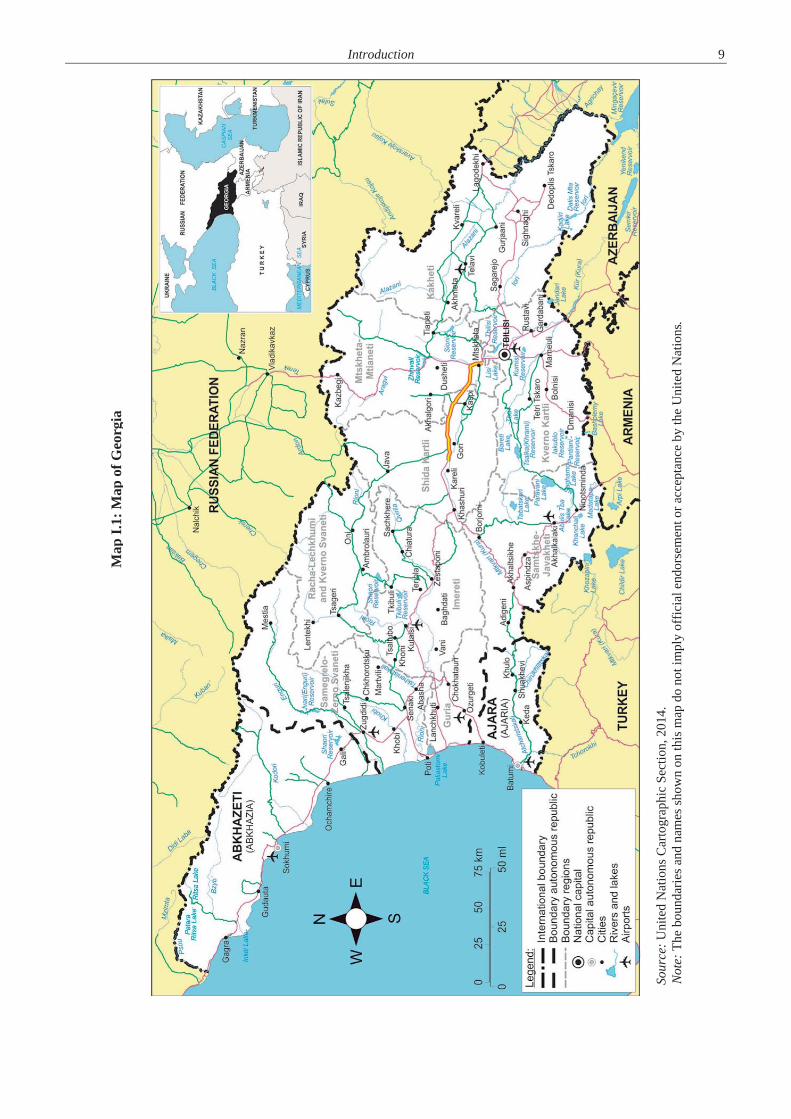
Introduction 9
Map
I.1:
Map
of G
eorg
ia
Sour
ce: U
nite
d N
atio
ns C
arto
grap
hic
Sect
ion,
201
4.
Not
e: T
he b
ound
arie
s and
nam
es sh
own
on th
is m
ap d
o no
t im
ply
offic
ial e
ndor
sem
ent o
r acc
epta
nce
by th
e U
nite
d N
atio
ns.

PART I: ENVIRONMENTAL GOVERNANCE AND FINANCING

13
Chapter 1
LEGAL, POLICY AND INSTITUTIONAL FRAMEWORK 1.1 Institutional framework The country’s environmental sector underwent a profound reorganization in 2011, which was then reversed in 2013. This reorganization was the origin of a massive washout of capacity at all levels of environmental governance. Institutional instability compounded with the Government’s focus on maximum deregulation affected the pace of planned environmental policy reforms and hindered implementation. The parliamentary elections of 2012 resulted in some refocusing on environmental goals and the launching of some reforms. Simultaneously, public administration has been evolving towards deconcentration of power – both vertically and horizontally. In this very dynamic context, understanding the role and interests of various actors is of capital importance for ensuring the success of reforms in the environmental sector.
Main environmental authority and its branches The Ministry of Environment and Natural Resources Protection is the main environmental authority in Georgia. Its current mandate is specified in a governmental decree of April 2013 and covers all aspects of pollution control and regulation of natural resources extraction (except oil and gas), use and protection. Several independent units (“legal entities of public law”, or LEPLs) report to the Ministry. Subnationally, there are units of the Ministry responsible for enforcement. In March 2011, the former Ministry of Environment Protection and Natural Resources was significantly downscaled. Some of its major functions were transferred to other government authorities. Thus, the former Ministry of Energy, transformed into the Ministry of Energy and Natural Resources, was mandated to manage the majority of Georgia’s natural capital and ensure radiological and nuclear protection. Land resources management was reduced to merely a land registration procedure and transferred to the National Agency of Public Registry under the Ministry of Justice. Subnational units of the Ministry were abolished without any transfer of responsibilities. The Environmental Inspectorate was abolished as well, and its functions were assigned to three different ministries: the Ministry of Energy and
Natural Resources, the Ministry of Internal Affairs and the reformed and renamed Ministry of Environment and Natural Resources Protection. The latter retained – though only temporarily – nine staff members responsible for the enforcement of pollution control regulations throughout the entire country. The reorganization was accompanied by an important turnover and loss of personnel. Resources previously invested in institutional development, be they from the state budget or donor grants, were thus lost. The authority previously gained by environmental inspectors within the regulated community has been degraded. Another two abolished bodies were the State Forestry Agency and the Investigation Department. The Agency of Protected Areas (APA) remained within the Ministry, though the plan was to place it under the authority of the Ministry of Economy and Sustainable Development. In 2011, the Ministry of Energy and Natural Resources established the short-lived Agency for Natural Resources. This self-financed LEPL, with its 1,200 staff members, was mandated to carry out regulatory, enforcement and asset management functions. The Ministry of Economy and Sustainable Development lost its mandate to organize auctions of licences for the use of natural resources, this function being transferred to the Agency. The scope of the Agency’s mandate was clearly trespassing limits of good governance. The Agency’s key objective was to maximize revenue from Georgia’s natural resources. A key step in this process was to restart forest leasing. This intention resulted in tensions between the Ministry of Energy and Natural Resources and non-governmental organizations (NGOs), given that the Government lacked a vision of how the environmental function of forests would be preserved if they were totally under private management. At the same time, the Agency made some positive changes, for example by establishing an electronic system to fight illegal logging. Even though the Ministry of Environment and Natural Resources Protection retained a lead role in the development and implementation of environmental policies, the 2011 reorganization was assessed negatively by the environmental community and Georgia’s donors. For a two-year period, the Ministry’s voice was heard only on issues of nature conservation. The Government by and large was

14 Part I: Environmental governance and financing
disregarding pollution control and weakened environmental safeguards. Environmental compliance merely disappeared from the Government’s radar screen. The process of regulatory development stagnated. Many economic decisions of a long-lasting and often irreversible character, principally on the hydropower sector’s development, were taken without due consideration of environmental implications. Peer pressure from international partners and NGOs, coupled with financial aid, have enabled the Ministry to at least sustain the process of environmental planning. This process focused on potentially influential policy documents, such as the second National Environmental Action Programme of Georgia 2012–2016 (NEAP-2) and the second National Biodiversity Strategy and Action Plan of Georgia 2014–2020 (NBSAP-2). After a two-year period of functioning with a narrowed mandate, in 2013 the Ministry regained its former functions almost entirely, and re-established or established several new key units (figure 1.1). Only the oil and gas sector’s regulation remained with the renamed Ministry of Energy, being performed by the State Agency of Oil and Gas. The Agency for Natural Resources was abolished. To match the institutional mandate with adequate financial resources, the budget of the Ministry of Environment and Natural Resources Protection was increased to the level of 2011 with some adjustment for inflation. The organizational structure of the new Ministry of Environment and Natural Resources Protection (figure 1.1) reflects Georgia’s environmental policy priorities relatively well, and does not exhibit blatant gaps or contradictions with good governance principles. All major functions and areas of environmental management are covered. Special units were established within the central body to address land management and natural hazards. Units responsible for nuclear safety and for forestry were re-established. The Ministry’s Department of Environmental Supervision (DES) is the key body that is mandated to verify compliance with regulatory requirements. It has two main units – the Division of Rapid Response and the Division of Inspection. This structure is mirrored by the Department’s eight units present in the regions. Marine pollution is controlled by the Black Sea Convention Service. A total of 348 people
work in the DES, of which 90 are inspectors (mostly involved in planned activities on nature protection and pollution control), while most of the others are rapid response personnel. There is some lack of clarity about the mandates of the DES and the Technical and Constructions Supervision Agency under the Ministry of Economy and Sustainable Development. Institutionally, the inspection authority was the most exposed to structural changes. In the period 2010–2014, three different institutions have had the role of the main competent authority in environmental inspection: Prior to 2011, the former Environmental
Inspectorate; In the period 2011–2013, the former Agency for
Natural Resources together with the Control Division of the Ministry of Environment and Natural Resources Protection; and
Since May 2013, the Ministry’s Department of Environmental Supervision (DES).
These organizational changes resulted in the loss of staff and capacity, and ultimately credibility and authority within the regulated community. Furthermore, part of institutional memory has been washed out, which is dangerous in an area that needs continuity, for example to fight recidivism effectively. The Ministry’s compliance assurance arm – the DES – was beefed up with additional staff and a network of eight regional offices. The Department’s lack of institutional independence may raise questions regarding political interference with enforcement decisions. The current model of enforcement, whereby non-compliance response is solely provided by the courts, makes this structural flaw of lesser concern. Environmental impact assessment (EIA) and permitting of industrial installations are performed by another department of the Ministry. In the forestry area, institutional separation is more robust: forestry policy development is done by a Ministry department while the management of forest resources pertains to a legally independent National Forestry Agency (NFA) (chapter 11). A total of 2,386 people work in the Ministry. However, the previous depth and breadth of the Ministry’s presence at the subnational level was not re-established.
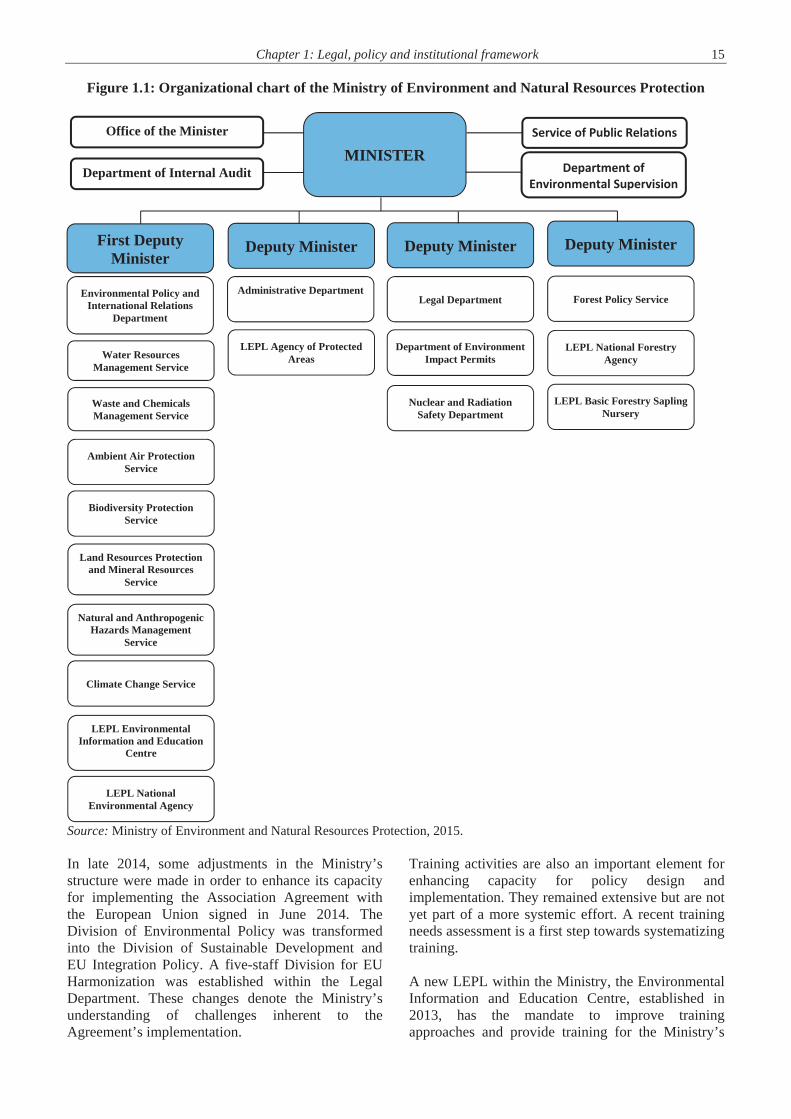
Chapter 1: Legal, policy and institutional framework 15
Figure 1.1: Organizational chart of the Ministry of Environment and Natural Resources Protection
Source: Ministry of Environment and Natural Resources Protection, 2015.
In late 2014, some adjustments in the Ministry’s structure were made in order to enhance its capacity for implementing the Association Agreement with the European Union signed in June 2014. The Division of Environmental Policy was transformed into the Division of Sustainable Development and EU Integration Policy. A five-staff Division for EU Harmonization was established within the Legal Department. These changes denote the Ministry’s understanding of challenges inherent to the Agreement’s implementation.
Training activities are also an important element for enhancing capacity for policy design and implementation. They remained extensive but are not yet part of a more systemic effort. A recent training needs assessment is a first step towards systematizing training.
A new LEPL within the Ministry, the Environmental Information and Education Centre, established in 2013, has the mandate to improve training approaches and provide training for the Ministry’s
MINISTER
First Deputy Minister
Service of Public RelationsOffice of the Minister
Department of Internal Audit
Deputy Minister Deputy Minister Deputy Minister
Environmental Policy and International Relations
Department
Administrative Department
LEPL Agency of Protected Areas
Legal Department
Climate Change Service
LEPL National Environmental Agency
Department of Environment Impact Permits
Waste and Chemicals Management Service
Forest Policy Service
Nuclear and Radiation Safety Department
LEPL National Forestry Agency
LEPL Basic Forestry Sapling Nursery
Biodiversity Protection Service
LEPL Environmental Information and Education
Centre
Natural and Anthropogenic Hazards Management
Service
Land Resources Protection and Mineral Resources
Service
Water Resources Management Service
Ambient Air Protection Service
Department ofEnvironmental Supervision

16 Part I: Environmental governance and financing
staff and other stakeholders. So far, the Centre has teamed up with ongoing donor projects to deliver training in two priority areas: environmental compliance assurance and forest management. More generally, the Ministry has continued to share its workload with donor-financed projects. This has helped to fill in its resource and capacity gaps. Interaction with such projects has been constructive.
Horizontal cooperation While the mandate of governmental actors involved in environmental management has been strengthened, the mechanisms of comprehensive horizontal cooperation have not yet followed this trend and have remained rather weak. At the same time, interaction on specific issues that require interagency cooperation has improved. Among other ministries engaged in environmental management in Georgia, the Ministry of Economy and Sustainable Development has the widest mandate. It includes functions and units that aim at promoting policy integration and coherence, and intragovernmental coordination. A major development was the creation of the Department of Sustainable Development (DSD) in 2010. Its activities have primarily focused on making the business case for green economy. Its staff comprises only three people. These resources seem totally insufficient if DSD is to facilitate work on the identification of national sustainable development goals (SDGs) and then coordinate and monitor their implementation. The Administration of the Government, namely the Department of Policy Analysis, Strategic Planning and Coordination, played a central role in monitoring the implementation of the MDGs. Through the Technical and Constructions Supervision Agency, the Ministry of Economy and Sustainable Development also plays an important role in the procedure of EIA and in industrial safety control. Besides macroeconomic and investment policies, the Ministry decides on transport, industrial and housing policies, including their environmental aspects. The Ministry is also involved in spatial planning. Between 2004 and 2010, the Ministry of Economy and Sustainable Development had in its subordination the country’s statistical authorities, whose role in environmental statistics was reduced during that period. In 2010, the National Statistics Office of Georgia (Geostat) was established as an
independent entity reporting directly to Parliament and being overseen by a management board. At present, Geostat does not yet collect environmental data. One staff member of Geostat is working on compiling and publishing environmental statistics provided by the Ministry of Environment and Natural Resources Protection. A memorandum of understanding (MoU) was signed in 2013 to improve the data flow between environmental and statistical authorities. The Ministry of Labour, Health and Social Affairs develops and approves environmental quality standards, including those for drinking water, surface waters, groundwater and coastal waters. According to the new Waste Management Code (2014) the Ministry, together with the Ministry of Environment and Natural Resources Protection, regulates and controls the management of health-care waste. The Ministry of Agriculture carries out supervision and state control over the irrigation systems, and soil quality assessment and soil conservation. Other competencies include the management, supervision and control of pesticides and certain hazardous chemicals as well as the management of animal waste. The Ministry is in charge of drinking water quality monitoring. The Ministry of Regional Development and Infrastructure is responsible for implementing regional development policy, including coordination and support of the development of water supply and sanitation systems. It is also in charge of the construction, operation and closure of non-hazardous waste landfills, as well as the construction and management of waste transfer stations. The Ministry of Finance and its Customs Service have a stake in the regulation of the transboundary movement of waste, CITES species, and nuclear and radiological materials (together with the Ministry of Environment and Natural Resources Protection). The Ministry of Internal Affairs has a role in implementing policies in the field of chemicals and radioactive and nuclear issues, as well as in the control of illegal movements of waste (through the Border Police). It also enforces the regulations on the mandatory technical control of vehicles. The Emergency Management Agency under the Ministry coordinates risk reduction, prevention and preparedness works across the country within its area of competency as well as activities for eliminating the consequences of natural and man-made disasters. Those works are shared with the
Chapter 1: Legal, policy and institutional framework 17 Ministry of Regional Development and Infrastructure, the Ministry of Agriculture and the municipalities.
In several cases, there are overlaps in mandates and a lack of clear delineation between the responsibilities of various actors. These include, for example, spatial planning, land, water and waste management, and biodiversity protection. In some areas, such as EIA and pollution control, a rebalancing of mandates is necessary, as they have been skewed to the detriment of environmental authorities. None of the sectoral ministries has a dedicated environmental unit. Awareness about the economic and social benefits of enhanced environmental management is still low among line ministries. To address this knowledge gap, a series of training events is planned in conjunction with the development of the country’s third National Environmental Action Programme (NEAP) and eventually during the identification of the national SDGs. Georgian authorities have not been able to make operational the National Commission on Sustainable Development (NCSD) since its official creation in April 2005. The NCSD has not convened even once. The Government, however, has not recognized that the NCSD has been totally dysfunctional, and has avoided terminating its existence on paper. The national policy dialogue on water resources management provides a good example of how various stakeholders can be involved in a results-oriented and evidence-based policymaking and law-making process. A similar approach is now being applied to design the key elements of the forestry policy reform. There are examples of ad hoc cooperation, such as meetings to discuss specific regulatory changes. Cooperation is also supported by establishing steering committees within national or regional-level donor projects. Cooperation with the legislative and judicial branches of the State is ongoing too, within mechanisms that are relatively well established. For example, the Ministry of Environment and Natural Resources Protection management regularly meets members of Parliament’s Environmental Protection and Natural Resources Committee to discuss draft laws and to jointly establish annual schedules of legislative activities. Also, cross-sectoral cooperation is promoted through joint meetings hosted in the Parliament. For example, in June 2014, a joint meeting of environmental and
agricultural committees, involving the respective two ministries, was organized to discuss the challenges and opportunities presented by European integration. Outside the environmental sector, two relevant bodies for coordinating public policies were established under the leadership of the Prime Minister: the Economic Council and the Government Commission of Georgia on EU Integration respectively in 2013 and in 2014,. The Council’s mission is to coordinate Georgia’s economic policy and strategy. The Commission is supposed to coordinate the line ministries’ activities toward integration into the EU, as well as to promote effective cooperation between Georgia and EU Member States.
Vertical cooperation Deepening of local self-governance constitutes an important change since the second EPR. A 2014 Local Self-Government Code gives more powers and financial resources to municipal authorities. Following the Code’s enactment, the number of actors at the subnational level increased, namely the number of cities having self-governing status is now 12 (from 5) and the number of self-governing municipalities is 71 (from 64 previously). The role of local authorities in the provision of environmental services, notably water supply and sanitation, was strengthened. In order to be able to overcome eventual fragmentation and lack of capacity in areas of their responsibility, for example as concerns waste management or water supply and sanitation, municipalities can form regional unions. The central authorities supervise the legislative activities by self-governance bodies and the implementation of delegated responsibilities. In this regard, the Ministry of Regional Development and Infrastructure plays a key role. The Local Self-Government Code has implications for natural resource tenure in Georgia. Municipal authorities acquired ownership of forests and water resources of local importance, land attached to facilities under municipal ownership and elements of cities’ green infrastructure, such as parks. There is a huge task ahead to translate this legislative provision into practice as the legal language remains rather general as concerns local authorities’ responsibilities and powers. Furthermore, it is unclear what environmental conditions apply to the assets that they manage and who will monitor and enforce their implementation.
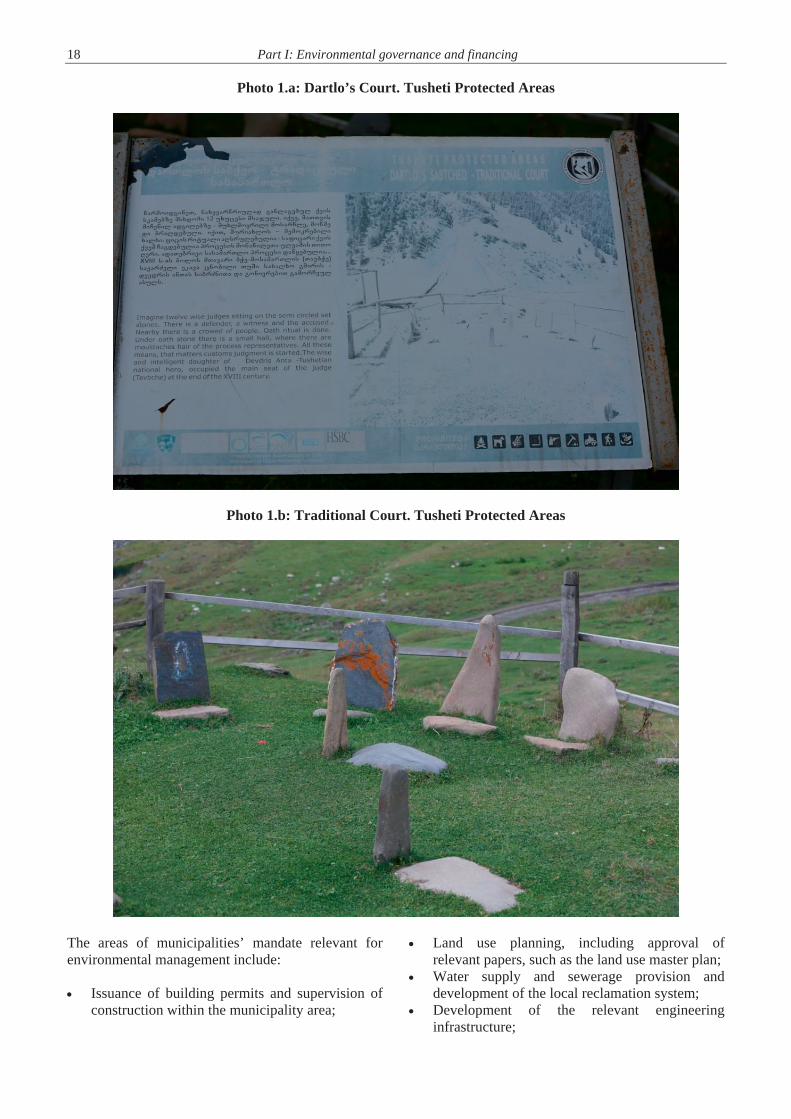
18 Part I: Environmental governance and financing
Photo 1.a: Dartlo’s Court. Tusheti Protected Areas
Photo 1.b: Traditional Court. Tusheti Protected Areas
The areas of municipalities’ mandate relevant for environmental management include:
Issuance of building permits and supervision of construction within the municipality area;
Land use planning, including approval of relevant papers, such as the land use master plan; Water supply and sewerage provision and development of the local reclamation system; Development of the relevant engineering infrastructure;
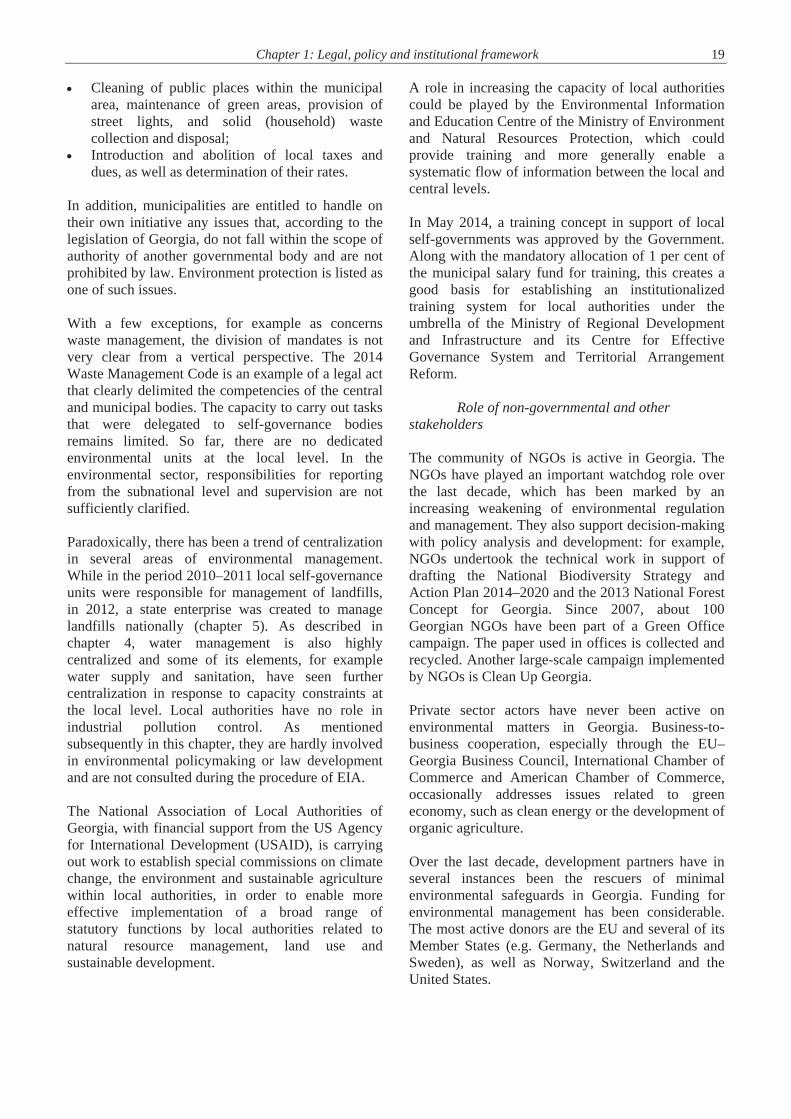
Chapter 1: Legal, policy and institutional framework 19 Cleaning of public places within the municipal
area, maintenance of green areas, provision of street lights, and solid (household) waste collection and disposal;
Introduction and abolition of local taxes and dues, as well as determination of their rates.
In addition, municipalities are entitled to handle on their own initiative any issues that, according to the legislation of Georgia, do not fall within the scope of authority of another governmental body and are not prohibited by law. Environment protection is listed as one of such issues. With a few exceptions, for example as concerns waste management, the division of mandates is not very clear from a vertical perspective. The 2014 Waste Management Code is an example of a legal act that clearly delimited the competencies of the central and municipal bodies. The capacity to carry out tasks that were delegated to self-governance bodies remains limited. So far, there are no dedicated environmental units at the local level. In the environmental sector, responsibilities for reporting from the subnational level and supervision are not sufficiently clarified. Paradoxically, there has been a trend of centralization in several areas of environmental management. While in the period 2010–2011 local self-governance units were responsible for management of landfills, in 2012, a state enterprise was created to manage landfills nationally (chapter 5). As described in chapter 4, water management is also highly centralized and some of its elements, for example water supply and sanitation, have seen further centralization in response to capacity constraints at the local level. Local authorities have no role in industrial pollution control. As mentioned subsequently in this chapter, they are hardly involved in environmental policymaking or law development and are not consulted during the procedure of EIA. The National Association of Local Authorities of Georgia, with financial support from the US Agency for International Development (USAID), is carrying out work to establish special commissions on climate change, the environment and sustainable agriculture within local authorities, in order to enable more effective implementation of a broad range of statutory functions by local authorities related to natural resource management, land use and sustainable development.
A role in increasing the capacity of local authorities could be played by the Environmental Information and Education Centre of the Ministry of Environment and Natural Resources Protection, which could provide training and more generally enable a systematic flow of information between the local and central levels. In May 2014, a training concept in support of local self-governments was approved by the Government. Along with the mandatory allocation of 1 per cent of the municipal salary fund for training, this creates a good basis for establishing an institutionalized training system for local authorities under the umbrella of the Ministry of Regional Development and Infrastructure and its Centre for Effective Governance System and Territorial Arrangement Reform.
Role of non-governmental and other stakeholders The community of NGOs is active in Georgia. The NGOs have played an important watchdog role over the last decade, which has been marked by an increasing weakening of environmental regulation and management. They also support decision-making with policy analysis and development: for example, NGOs undertook the technical work in support of drafting the National Biodiversity Strategy and Action Plan 2014–2020 and the 2013 National Forest Concept for Georgia. Since 2007, about 100 Georgian NGOs have been part of a Green Office campaign. The paper used in offices is collected and recycled. Another large-scale campaign implemented by NGOs is Clean Up Georgia. Private sector actors have never been active on environmental matters in Georgia. Business-to-business cooperation, especially through the EU–Georgia Business Council, International Chamber of Commerce and American Chamber of Commerce, occasionally addresses issues related to green economy, such as clean energy or the development of organic agriculture. Over the last decade, development partners have in several instances been the rescuers of minimal environmental safeguards in Georgia. Funding for environmental management has been considerable. The most active donors are the EU and several of its Member States (e.g. Germany, the Netherlands and Sweden), as well as Norway, Switzerland and the United States.

20 Part I: Environmental governance and financing
Box 1.1: Subnational governance: main actors and chronology of reforms
From a territorial-administrative perspective, Georgia consists of two autonomous republics (Ajara and Abkhazia), nine regions and the capital city, Tbilisi. Autonomous republics enjoy a higher degree of self-governance. Subnational authorities in Georgia are of two types: deconcentrated units of central authorities and local self-governance units. Deconcentrated units are present principally at the regional level. Municipalities are the key self-governance actors. The Council (or Assembly) is a representative body of local self-governance at the municipality level. The Council is elected for a four-year term. A mayor is elected directly by the voters. The Government has embarked on local self-governance reforms since 2006, when a new Organic Law on Local Self-Government was enacted. This Law consolidated the more than one thousand previously existing local self-governance units into 69 municipalities. The Law provided them with some autonomy vis-à-vis the central authorities, although their competencies and capacities remained limited. Following parliamentary elections in late 2012, the new Government decided to further enhance decentralization and strengthen regional governance. To this end, a new Local Self-Government Code was adopted by the Parliament in February 2014. Following the 2014 reform, consultation bodies of municipalities – regional consultation councils – are to be set up. They are to be chaired by the state trustees in the regions – the governors. The mayors as well as the chairs of relevant municipalities’ councils are ex officio members of the consultation councils. The councils shall convene quarterly and render consultative decisions. Their functions include: review of projects and programmes to be implemented by the State (submitted by the governor), review of the regional development strategies and development of recommendations for the state trustee. During 2013, the regional development strategies of eight Georgian regions were drafted. All seven strategies were officially approved by the Government in September 2013. Source: Based on UNDP Georgia (http://www.cosmopolitalians.eu/project-manager-open-georgian-nationals/).
Box 1.2: Second National Environmental Action Programme
The second National Environmental Action Programme (NEAP-2) identifies main environmental challenges and sets short- and medium-term goals. It is organized around 11 sectors, each covered in a separate chapter: 1) water resources; 2) ambient air; 3) waste and chemical substances; 4) Black Sea; 5) biodiversity and protected areas; 6) land resources; 7) forestry; 8) mineral resources; 9) disasters; 10) nuclear and radiation safety; 11) climate change. The selection of these sectors was based on a detailed analysis and stakeholder consultations. For each of them, the NEAP clarifies key problems and their origin, stakeholders, actions taken to date, national and international developments and the necessary regulatory framework. Actions that should be implemented, estimated costs and responsible parties are clearly stated. Potential financing sources and indicators of success (targets) are also identified. Besides national concerns, NEAP addresses a number of cross-border issues. 1.2 Policy framework As compared with 2010, there is more clarity in environmental policy objectives in Georgia, largely due to the process of EU association. The Government put efforts into reconciling economic and environmental goals, though the former remain clearly predominant.
Environmental policies Environmental planning has progressed along several lines. After an aborted NEAP for 2008–2012, the participative development and adoption of the NEAP for 2012–2016 (NEAP-2) is an important landmark in environmental policymaking in Georgia (box 1.2). Overall, both in terms of process organization and its outcome, NEAP-2 development has been well
aligned with good international practice. The development of NEAP-3 has started in 2014 with UNDP support. Several other planning documents were adopted covering specific areas, such as the National Biodiversity Strategy and Action Plan 2014–2020, the National Forest Concept for Georgia (2013) and the National Strategy and Action Plan on Environmental Education for Sustainable Development 2012–2014. The 2013 Meeting of the Parties to the Convention on Biological Diversity (CBD) in Montreal noted that Georgia has been an exemplary country in terms of its Strategy and Action Plan update. Climate change strategies were developed in 2013 for the Autonomous Republic of Ajara, and Tbilisi.
Chapter 1: Legal, policy and institutional framework 21 These documents, developed with technical assistance provided by Austria, Germany and the Netherlands, were adopted by either the Government or the Parliament. Several strategy papers are under development, including the Government Action Plan for the Reduction of Environment Pollution from the Transport Sector in Georgia, the second National Action Plan to Combat Desertification, and the Waste Management National Strategy and Waste Management National Action Plan. Though an integrated coastal zone management strategy for Georgia was developed in 2010, its approval is still pending. Strong impetus for implementation of the NEAP is likely to be given by the signature in 2014 of the EU Association Agreement. Among other matters, the Agreement defines areas for environmental cooperation and goals to be achieved within a clearly established timeframe. Legal alignment with the EU directives is the first step towards their implementation. Where deadlines for achieving full compliance were identified, they stretch until 2030, in some cases. A roadmap for the implementation was finalized in 2015. A government-wide monitoring framework was established. The Association Agreement addresses the following environmental issues: (i) environmental governance and integration of environment into other policy areas; (ii) air quality; (iii) water quality and resource management including marine environment; (iv) waste management; (v) nature protection; (vi) industrial pollution and industrial hazards; (vii) chemicals management; and (viii) climate action. Forestry is addressed only in the agreement on a Deep and Comprehensive Free Trade Area (DCFTA) that covers only the commercial use of forests. This gap is believed to be a consequence of the 2011 reorganization. In order to translate the Agreement into more specific actions, the Government adopts annual national action plans for the implementation of the Association Agreement, and National Action Plan for the Implementation of a Deep and Comprehensive Free Trade Area for 2014–2017. The two action plans are important tools for providing a predictable policy and legal framework that would enable smooth adaptation by the private sector. The process of alignment with EU environmental directives is expected to bring benefits, within and outside the environmental sector. For example, the total domestic benefits to Georgia from reduced air pollution was estimated at €98 million each year (in 2008 prices), equivalent to 0.5 per cent of annual GDP. The monetary values of the benefits relate to the year
2020, to which the assumed target of a 50 per cent emission reduction applies. It remains to be seen how this process will be managed in terms of costs. The Ministry of Environment and Natural Resources Protection, in cooperation with the EU, has developed the Roadmap for the implementation of the EU-Georgia Association Agreement (AA) on environment and climate action. This roadmap enables the Ministry to implement legal approximation, policy making and similar activities in line with the specific requirements of the environment and climate action chapters of the AA and their annexes as well as all relevant provisions of the DCFTA part. The roadmap address legislation changes required by the AA or DCFTA. The roadmap also covers some actions, which are not directly required by the AA, but will be very useful for the implementation of the agreement. Nine sector specific roadmaps have been produced in accordance with the structure of the AA, namely on: 1. Environmental governance; 2. Air quality protection; 3. Water quality and water resources management (including marine environment but excluding drinking water); 4. Waste management; 5. Nature protection (including Genetically Modified Organisms (GMO)), species trading and fisheries policy); 6. Industrial pollution and industrial hazards; 7. Chemicals management; 8. Climate action (which includes Ozone Depleting Substances (ODS)); and 9. Forestry management. Important lessons for the process of convergence with the EU legislation and practices can be extracted from the implementation of the EU–Georgia Action Plan (2007–2013). Environment was among the seven areas of EU–Georgia cooperation under this plan. Independent monitoring of the plan’s implementation was carried out by a coalition of NGOs, based on a transparent and regionally agreed methodology (Georgian authorities did not conduct similar monitoring, making comparison impossible). Its results show very meagre outcomes under the environmental area of the plan. The most underperforming elements include integration of environmental aspects into other sectors, reinforcement of EIA procedures, public information and participation, and adoption of environmental legislation in the water and waste sectors. Regress instead of progress was noted in relation to the objective of strengthening administrative structures and procedures.
22 Part I: Environmental governance and financing
Sustainable development policies There was no progress on developing a national sustainable development strategy. National action on the MDGs was monitored irregularly. The second MDG progress monitoring report was issued in September 2014, almost a decade after the first progress monitoring report. The report is built on the latest available data which mostly cover the period from 2000 to 2013. The assessment report is rather descriptive and does not review achievements in relation to national targets. Overall, there has been progress in achieving the MDGs. As concerns MDG 7 “Ensure Environmental Sustainability”, the 2014 progress monitoring report gives several examples of achievements, including the following: GHG emissions in 2011 have constituted 14.27
million t CO2-equivalent (about 29 per cent of the 1987 level); per capita GHG emissions (3.19 t CO2-eq.) diminished 2.9 times in the same period;
Legislation to control ozone-depleting substances (ODSs) has been established; Georgia is in full compliance with control measures under the Montreal Protocol;
In 2014, the extent of protected areas reached 8.62 per cent of the country’s territory.
Since 2013, the Government has been preparing a low emission development strategy (LEDS) with support from USAID. Since 2010, Georgia’s eight biggest cities (Tbilisi, Batumi, Kutaisi, Rustavi, Poti, Zugdidi, Gori and Telavi), representing about 80 per cent of the urban population, joined the EU climate initiative, the Covenant of Mayors, and committed themselves to reduce GHG emissions by 2020 by 20 per cent as compared with the business-as-usual scenario. These two processes, LEDS at the national level and the Covenant of Mayors at the local level, are synergistic.
Integration of environmental goals into development, sectoral and subnational strategies For almost a decade, the environmental agenda in Georgia was largely eclipsed by the Government’s strong focus on economic development. The first signs of change date back to 2010, when reflection on how the country’s economic and environmental goals could be reconciled started within the Ministry of Economy and Sustainable Development. This resulted in the national Green Growth Initiative that
established a clearing house mechanism for promoting investment in green projects and identified specific needs in four sectors that have been assessed as most promising from a green economy perspective. The pace of positive change has somewhat accelerated, together with adoption of the 2012 programme, For Strong, Democratic, United Georgia. This identifies environmental protection and rational use of natural resources as one of the Government’s priority areas. The programme was aligned with NEAP-2 priority sectors and actions. Resources for its implementation were identified in the Government’s medium-term budget planning document. In October 2014, the Ministry of Environment and Natural Resources Protection submitted a progress report on the programme’s environmental measures implementation to the Government. The extent of integration of environmental goals into the 2014 Socio-Economic Development Strategy of Georgia (“Georgia 2020”) is limited. This Strategy treats environmental issues mostly in relation to infrastructure development, stressing the need to lessen its impact on the environment and reduce risks of natural and anthropogenic hazards. The Strategy calls for adoption of sustainable management of the forestry sector that would decrease the costs of forest degradation and stimulate economic growth by improvement of ecosystem services. This document identifies international funding as the main source for climate change mitigation and adaptation in Georgia and for meeting the obligations under the United Nations global conventions. The latter approach sustains the practice of previous governments of relying on environmental financing by international donors. In late 2011, the Parliament approved a new national security strategy, the National Security Concept of Georgia, which replaced a similar document of 2005. This includes the goal of ensuring environmental security nationally and subnationally. The dialogue on integrating environmental and sectoral policies has been ongoing. Although the State Strategy Regional Development of Georgia 2010–2017 listed “environmental protection” among its five main strategic objectives, the Strategy’s first action programme (2011–2014) did not reflect the environmental objective in an adequate manner. The 2014 Regional Development Programme for 2015–2017 reflects a number of priority environmental goals, such as ambient air protection, developing water supply and sanitation, waste management and
Chapter 1: Legal, policy and institutional framework 23 implementing new mechanisms to reduce natural and anthropogenic hazards. Work is ongoing to integrate environmental goals into the draft agricultural development strategy (2015–2020). A challenge for Georgia is integrating energy and environmental policy goals. In this regard, the launch of work on the national Energy Policy and Strategy constitutes a window of opportunity to make such an integration meaningful. The Government started to enhance the national system of disaster risk reduction (DRR). An initial assessment identified areas where the country needs action and further assistance. This was followed by the participatory preparation of the National Plan of Action for Capacity Development in Disaster Risk Reduction. Environmental policy integration attempts are present at the subnational level. While local environmental action planning remains rudimentary, the regional strategies of development contain environmental goals. The majority of these strategies were adopted in 2013 and are now in the process of further elaboration through the development of action plans. Moreover, the Sustainable Energy Action Plan (SEAP) submitted by Tbilisi in March 2011 was already accepted after review by the EU’s Joint Research Centre. Rustavi, Gori and Batumi developed and submitted their SEAPs in the period 2012–2014 and await their acceptance. All SEAPs were approved by city councils.
Economic analysis of environmental policies Making the economic case for better environmental policies has become potentially easier due to analytical and capacity-building activities, implemented with support from international donors. This includes the assessment of benefits stemming from more ambitious environmental goals, conducted in 2011 as part of an international project covering all countries of the EU Neighbourhood. In 2013, Georgia volunteered to assess its natural capital with the ultimate objective of valuing it, including non-monetary values and the services provided by the country’s ecosystems. This ongoing pilot project is a joint effort of the Ministry of Environment and Natural Resources Protection, United Nations Environment Programme (UNEP) and WWF-Caucasus. It resulted in a scoping study that identified five core sectors of the Georgian economy for in-depth analysis: energy, tourism, agriculture, mining and forestry. Concomitantly, several Georgian experts were trained in cost–benefit
analysis. In 2014, the World Bank started work to value the economic implications of environmental performance in Georgia. Links among all these activities are not clear. 1.3 Legal framework The last decade of environmental law-making in Georgia can be generally characterized as the story of a gradual watering down of environmental safeguards and of relaxing or totally cutting off environmental procedures. It is also a history of sterile law development whereby legal documents were drafted without being approved. The most recent example is the Environmental Code of Georgia that absorbed resources and created false expectations without any end result. It is clear now that the development of this comprehensive legal act was an error, given the difficulty of reaching consensus on a text of such complexity. Failure to enact the Environmental Code left Georgia with all the previously existing gaps in its legal framework, most importantly as concerns environmental assessments and permitting, water resources management, forestry and waste management.
New environmental laws and plans for law development Environmental law-making since 2010 has been narrow in scope and has not addressed gaps in major policy areas. However, new laws were adopted as well as amendments: 2011 Amendment to the Law on the Creation and
Management of Imereted Caves Protected Areas – seven Nature Monuments and one Managed Reserve were added;
2011 Law on the Creation and Management of Javakheti Protected Area;
2012 – Change was made in the Law on the Status of Protected Areas and three new Nature Monuments were created;
2012 – Law on Machakhela National Park; 2012 Law on Nuclear and Radiation Safety; 2013 – Law on the Creation and Management of
Nature Monuments (16 new Nature Monuments were created);
2014 Law on the Creation and Management of Pshav-Xevsureti Protected Area;
2014 Law on Genetically Modified Organisms; 2014 Waste Management Code.
An important number of legal amendments arose from the environmental sector’s reorganization in 2011 and its reversal in 2013. This reorganization
24 Part I: Environmental governance and financing
was highly counterproductive by detracting law-making from priority areas. Lifting the ban on the hunting of endangered and red-listed species was a highly controversial legal amendment made in 2011 by the Ministry of Energy and Natural Resources. In response to harsh criticism from the NGO community, this amendment was abrogated in 2012. Unfortunately, its logic is not unique and is highly symptomatic of the will to extract money from the country’s natural capital within a short-term perspective without any clear understanding of what might be the consequences, including the economic consequences, of such decisions. Another example of controversial law-making dates back to 2012. Amendments to the environmental liability regime that were introduced at the initiative of the former Ministry of Energy and Natural Resources involved an ex-post exemption from liability for environmental violations in exchange for a one-off payment to the state budget. This legislative change was very much within the logic of the prevalence of economic goals over the environment. The intention was to conduct a sort of “paid amnesty” of past liability through special agreements with enterprises. Under such agreements, and in exchange for one-off payments to the state budget, the Government would not seek any further fines and damage compensation for environmental violations. While the Government pretended that this amendment was mostly targeted at small enterprises that lacked the financial resources to ensure full compliance and compensate for damage, it seems that the first agreement was concluded with one of the largest polluters in Georgia. NGOs expressed a very negative reaction to this change in the liability regime and made recourse to the Constitutional Court in order to reverse it. In 2013, the Constitutional Court ruled that the amendment to the law was unconstitutional. The amendment was repealed. In the same vein, on 6 July 2010, the Parliament adopted the Law on Changes and Amendments to the Forest Code of Georgia (No. 3346-rs). Several legal requirements that are crucial for sustainable forest management were abolished, including the requirements to keep a forest fund cadastre, conduct regular forest inventories, etc. New by-laws replaced the previous ones as part of this massive change in
forest management legislation. Further changes were introduced through the 2011 Law No. 4677-is. In particular, the definition of social cutting and electronic timber markers were introduced and the duration of forest lease licences was extended from 20 to 49 years. In 2011, the Government developed a draft legal act in the area of forest resources management that raised a lot of resistance from the NGO community. Work on this draft was not finalized and the draft seems to have been totally disregarded. Overall, about 200 statutory acts concerning the forestry sector were passed by the Parliament and executive bodies in the period 2009–2012. Currently, several draft laws are in the process of development, such as on environmental impact permitting, on water resources management and on forestry policy. There is no dedicated law on energy efficiency in Georgia. At present, the country has no primary legislation dedicated to renewable energy either, although aspects relevant to renewables exist in the energy legislation. In 2007, the Government received technical assistance to draft an energy efficiency law but no draft has been publicly released or submitted for consultation. More generally, international partners provide support for environmental law-making, although way too often law-drafting efforts remain infertile. The Ministry of Environment and Natural Resources Protection develops annual schedules of law drafting. In conjunction with the implementation of the EU Association Agreement, this practice is translated in the development of a multi-year environmental road map. The road map is based on the timetable set in the environmental chapter of the Association Agreement. This is increasing the predictability of law-making. Unpredictable legislation was named by the International Chamber of Commerce among the two key factors preventing business development in the country. Furthermore, the intensity of law-making does not allow the private sector actors in Georgia to adequately assess and respond to legislative changes and engage in meaningful dialogue.
Links to the framework and sectoral legislation While the effectiveness of environmental regulation depends upon integration with regulatory frameworks in other sectors, the degree of such integration remains weak in Georgia.

Chapter 1: Legal, policy and institutional framework 25
Box 1.3: Strategic environmental assessment
In 2014, the Ministry of Environment and Natural Resources Protection started to develop a new law on environmental impact permitting. This law will introduce the mandatory use of strategic environmental assessment (SEA) for plans and programmes. It will transpose into the national legislation the requirements of the Protocol on Strategic Environmental Assessment to the Espoo Convention on Environmental Impact Assessment in a Transboundary Context, and relevant EU legislation. The draft law will be submitted for adoption by mid-2015. Simultaneously, a pilot SEA will be prepared in relation to the draft national waste management plan. The first attempt to apply SEA on a pilot basis dates back to 2008 when the World Bank commissioned the development of a strategic evaluation of environmental impact inflicted by the Georgian energy sector. Apparently, this study was never endorsed by the Georgian authorities. The Ministry of Environment and Natural Resources Protection does not plan in advance its participation in the development of framework and sectoral laws and limits itself to providing inputs upon request. Timeframes for providing such inputs are often short. Given that many changes in the legal basis are to be expected in relation to the implementation of the EU Association Agreement, there is a window of opportunity for the Ministry of Environment and Natural Resources Protection to become more strategic and proactive.
Law-making process and use of regulatory
impact assessment Following the amendments made to the Parliament Regulation in 2012, the law-making process in Georgia was further harmonized with international benchmarks. These amendments constitute an important step towards using a fully fledged regulatory impact assessment. Principally, each legal draft submitted to the Parliament should be accompanied by an explanatory note. The note’s aim is to highlight costs and benefits of proposed regulatory changes and screen their concordance not only with national policy objectives but also with international good practice. Furthermore, the note should summarize the outcomes of stakeholder consultations and how feedback was addressed by law developers. Various actors are involved in the preparation of draft laws, including relevant units of the Ministry of Environment and Natural Resources Protection, international experts, and representatives of other ministries, the NGO community and academic circles. The involvement of local authorities and the private sector has traditionally been limited. A mandatory review by other ministries is part of the procedure and required prior to submitting the draft to the Parliament. Deadlines for commenting on legal drafts are commonly short, thus depriving many stakeholders from providing meaningful feedback. New legislation is published in electronic form: following a legal
change that entered into force on 1 January 2011, the official text of a law is considered its first publication on the website of the Legislative Herald of Georgia (https://matsne.gov.ge/en). 1.4 Regulatory instruments and procedures As early as 2004, some flaws in the design of environmental standards, assessment procedures and permitting were identified. Their reform unfortunately stagnated and the agenda for the future is likely to remain charged and difficult to promote.
Standards There has been no progress on revising environmental standards since 2010. Ambient standards are Soviet standards transposed into the Georgian law. Computer models used to derive emission standards for individual stationary sources are outdated. The development of general binding rules (technical regulations that may indicate emission standards for a specific sector) have stagnated. Industrial emissions and discharges by large facilities are regulated on a case-by-case basis through the environmental impact permits, which set emission limit values. Emission limits for polluted air/water are set on condition that concentrations of those pollutants in the receiving media do not exceed the maximum allowable concentrations (MACs) established for the ambient air or surface waters. Activities not subject to environmental impact permits have to comply with technical regulations, which establish general environmental requirements (including pollution emission norms) for smaller scale economic activities, usually on a sectoral basis. There were some changes in product standards, in particular fuel quality regulation. Despite a gradual improvement, fuel quality standards continue to be below the international benchmarks (especially for sulphur), while the number of cars has been growing exponentially and their technical state has been degrading. In 2011, amendments were made to a 2004 Government resolution that established fuel quality standards.

26 Part I: Environmental governance and financing
The key changes concerned sulphur. For the purpose to decrease emissions of sulphur dioxide, benzene and polycyclic aromatic hydrocarbons from vehicles, changes and amendments were made into corresponding orders of the Government. Based on these changes sulphur content in petrol was decreased three times and was no more than 50 mg/kg in 2015. To reach modern EU standard for petrol, final reduction of sulphur content is prescribed in 2017 (10 mg/kg). From 2016 content of benzene and polycyclic aromatic hydrocarbons will reach EU standards (1 per cent and 35 per cent). From 2016 sulphur content in diesel fuel will be no more than 150 mg/kg. For diesel, the limits were established at 300 and 200 mg/kg respectively. Georgian legislation provides for general product labelling standards, notably by the 2012 Law on Food Safety, Veterinary and Plant Production and the Governmental Resolution N441 on approval of additional requirements to product labelling, instituted by the Minister of Agriculture in 2013 and by the Law on Labeling of GMO and GMO products of feed and food intended for human consumption These regulations set standard requirements for labelling, such as name of the product, ingredients. At the same time, it must be mentioned that the provision on eco-labelling of products is set in the framework Law on Food Safety, Veterinary and Plant Production and the Governmental Resolution N 196 on Bioproduction Rules.
Spatial and land planning According to a 2012 assessment by the World Bank, Georgia’s spatial planning system has gaps, especially in terms of implementation. Legislation is vague or incomplete. Mandates are not well defined in both a vertical and horizontal perspective. Land use categories are not sufficiently specific. Community tenure of land is not part of the legislation although it concerns most of the country’s pasture land. Information for planning remains scarce, especially data on land privatized prior to 2006 and its use category. Data sharing is limited and information management infrastructure obsolete. The main competent authority in spatial planning – the Ministry of Economy and Sustainable Development’s Spatial Planning and Construction Policy Department – has not yet manifested strong leadership for enabling change. The Government is working on the general scheme of the spatial arrangement. The state commission working on the spatial arrangement scheme held its first sitting on April 2015. Its main goal is to elaborate the general scheme of the spatial arrangement – Georgia 2030.
The elaboaration of first draft version of the strategy is expected in the first half of 2016. An inter-agency working group is working on a draft law on national spatial data infrastructure, and the initial draft should be prepared in June. The implementation of spatial plans is slow, especially in small settlements. Master plans for the use and development of urban land exist for three of Georgia’s largest cities (Tbilisi, Batumi and Zugdidi) and for a small mountain resort town (Bakuriani). Zoning maps have also been drawn up for the cities of Batumi, Kobuleti, Poti, Kutaisi, Khashuri, Gori and Signagi. The rest of the country’s cities and towns still await plans. And while there is a law in place regarding planning and development of rural areas, there are no such development projects in the planning stages. An environment protection zone is specified among the functional zoning types in Georgia; however, slow implementation of spatial plans hampers the effective integration of environmental considerations into the process. A particular issue is capacity to integrate disaster risk assessment and management into spatial planning because of insufficient data on natural hazards, the lack of a national plan for natural disaster prevention measures and the lack of a mechanism for linking disaster risk spatial planning. In this context, the Atlas of Natural Hazards and Risks of Georgia developed by the Caucasus Environmental NGO Network (CENN) and the University of Twente, the Netherlands, in the framework of the project Institution Building for Natural Disaster Risk Reduction in Georgia, represents a useful tool for all stakeholders.
Environmental impact assessment
Domestic context In Georgia, an assessment of impacts is necessary for both new and existing facilities and infrastructure projects. Existing facilities are subject to EIA when substantial changes in the production process occur. The EIA is incorporated in the construction permitting procedure (figure 1.2). It is therefore the construction permitting authority (the Ministry of Economy and Sustainable Development or the local self-governance unit, as appropriate) which initially determines whether a proposed activity may fall under the EIA requirements in accordance with the 2007 Law on Environmental Impact Permit. Scoping is within the responsibility of the project developer, without the involvement of the environmental authorities.
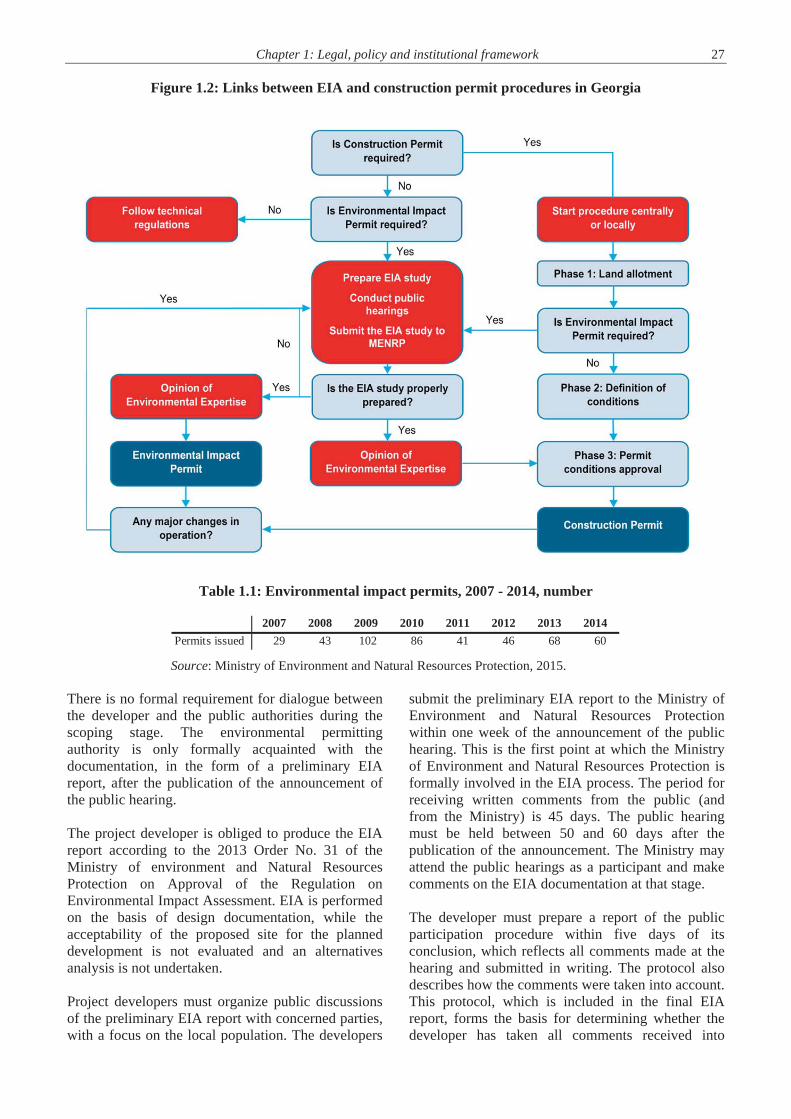
Chapter 1: Legal, policy and institutional framework 27
Figure 1.2: Links between EIA and construction permit procedures in Georgia
Table 1.1: Environmental impact permits, 2007 - 2014, number
Source: Ministry of Environment and Natural Resources Protection, 2015.
There is no formal requirement for dialogue betweenthe developer and the public authorities during the scoping stage. The environmental permitting authority is only formally acquainted with the documentation, in the form of a preliminary EIA report, after the publication of the announcement of the public hearing.
The project developer is obliged to produce the EIA report according to the 2013 Order No. 31 of the Ministry of environment and Natural Resources Protection on Approval of the Regulation onEnvironmental Impact Assessment. EIA is performedon the basis of design documentation, while theacceptability of the proposed site for the planned development is not evaluated and an alternatives analysis is not undertaken.
Project developers must organize public discussions of the preliminary EIA report with concerned parties, with a focus on the local population. The developers
submit the preliminary EIA report to the Ministry of Environment and Natural Resources Protection within one week of the announcement of the publichearing. This is the first point at which the Ministry of Environment and Natural Resources Protection isformally involved in the EIA process. The period for receiving written comments from the public (and from the Ministry) is 45 days. The public hearing must be held between 50 and 60 days after the publication of the announcement. The Ministry mayattend the public hearings as a participant and makecomments on the EIA documentation at that stage.
The developer must prepare a report of the public participation procedure within five days of its conclusion, which reflects all comments made at the hearing and submitted in writing. The protocol also describes how the comments were taken into account. This protocol, which is included in the final EIA report, forms the basis for determining whether the developer has taken all comments received into
2007 2008 2009 2010 2011 2012 2013 2014Permits issued 29 43 102 86 41 46 68 60
28 Part I: Environmental governance and financing
account in the final EIA report. After this stage, a review of the EIA report is performed by the competent authority (the Ministry’s Department of Environmental Impact Permit). The decision of the environmental authority in the process of environmental impact permitting comes as a result of a separate, but linked, ecological expertise procedure. This procedure results in a document with additional conditions that arise from the EIA review. Where required, a positive ecological expertise is a condition for granting a permit to commence activities. In the case of new facilities, these conditions become part of the construction permit. In the case of existing facilities, an environmental impact permit is issued in order to authorize project implementation under the conditions highlighted by the review procedure. The Department of Environmental Impact Permit establishes a council (commission) of experts for each ecological expertise procedure. The council includes staff members of the Ministry of Environment and Natural Resources Protection and its subordinate agencies, and may also include independent experts. The council reviews the EIA documentation for compliance with legal requirements, including the mandatory contents of the EIA report, a site map, the volume and types of emissions, and the outcome of the public participation procedure. The “Conclusions of Ecological Expertise” document prepared by the expert commission is then approved by the Minister. The decision can be positive or negative. In the period 2007 - 2014, 485 EIA reviews have been carried out. There were 11 negative decisions. The quality of EIA reports tends to be poor; some reports are missing essential elements. Insufficient quality of EIA reports could be partly related to the fact that currently there are no formal requirements that a private company must meet to provide EIA services. In practice, EIA reports include always the contact information and identity of the experts carrying it out. The responsibility for enforcing conditions in environmental impact permits and inspecting the facilities falls under the DES. Within the DES, a unit is responsible for enforcement of EIA requirements and environmental impact permit conditions. Despite the fact that the majority of inspections are unplanned and mostly are based on complaints, a list of planned inspections was developed in 2014 (2014 Order of the Minister of Environment and Natural Resources Protection, No. 81). The list of regulated objects comprises 119 objects.
In its current design and functioning, the EIA procedure is far from compliance with international benchmarks. Its flaws concern the coverage of projects (i.e. EIA scope), organization and transparency of the procedure, clarity and enforceability of EIA conditions, and compliance with them. Public participation in this procedure is limited. The environmental assessment of new projects, which are primarily authorized through the construction permit procedure, come too late in the process – after the stage of land allotment. In consequence, the benefits that it can bring in terms of optimal siting are lost. It means that alternatives assessed from an environmental point of view are limited to “no project” and some technical solutions, when several of them are possible. A discussion is now ongoing in Georgia to address this problem and dissociate the EIA procedure from the construction permit procedure. Initially, their bundling together was decided in order to enable the “one window” approach, thus reducing the number of administrative procedures that businesses would need to undergo. The application of the “one window” principle has the effect of placing the EIA permitting process in an inferior position to the construction permit: the project developer does not deal directly with the environmental authority until very late in the process. Placing the scoping phase under the sole responsibility of the developer, without any involvement of the public authorities, leads to poorer quality of the EIA reports and prevents public participation at this stage of the EIA procedure. There are exceptions from the EIA procedure. The list of activities subject to EIA does not include such activities/projects as, for instance, mining, nuclear power stations, the agricultural and food industries, the wood, paper, leather and textile industries, and certain types of infrastructural projects (these activities used to be subject to EIA until the adoption of the Law on Licences and Permits in 2005). Thus, the scope of EIA application neither complies with the respective EU directive nor Annex I of the Aarhus Convention. The 2007 Law on Environmental Impact Permit provides exemption from EIA. The activity can be exempted from EIA if the State interest requires launching the planned activity without delay and making timely decision on it. The 2006 Law on State Support to investments does not apply to construction permits. The ecological expertise of the EIA report must be conducted during a period of 10–15 (calendar) days following the submission of the EIA application to the environmental authority, which is too short for
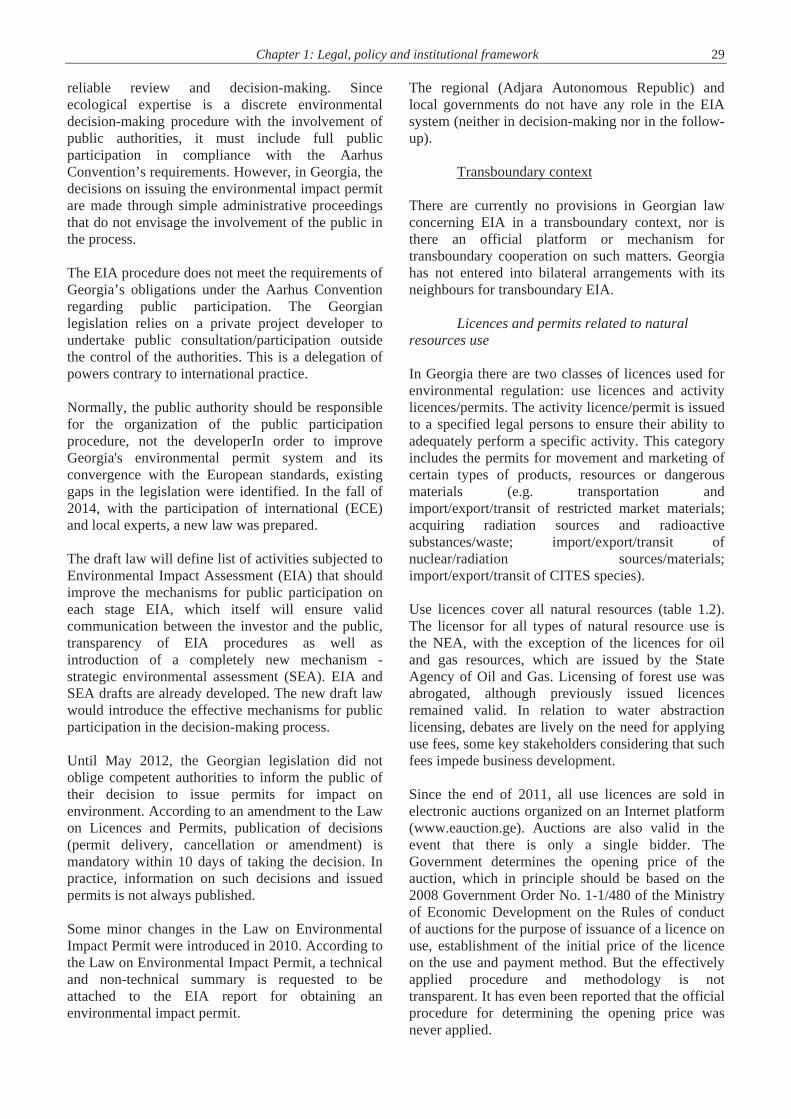
Chapter 1: Legal, policy and institutional framework 29 reliable review and decision-making. Since ecological expertise is a discrete environmental decision-making procedure with the involvement of public authorities, it must include full public participation in compliance with the Aarhus Convention’s requirements. However, in Georgia, the decisions on issuing the environmental impact permit are made through simple administrative proceedings that do not envisage the involvement of the public in the process. The EIA procedure does not meet the requirements of Georgia’s obligations under the Aarhus Convention regarding public participation. The Georgian legislation relies on a private project developer to undertake public consultation/participation outside the control of the authorities. This is a delegation of powers contrary to international practice. Normally, the public authority should be responsible for the organization of the public participation procedure, not the developerIn order to improve Georgia's environmental permit system and its convergence with the European standards, existing gaps in the legislation were identified. In the fall of 2014, with the participation of international (ECE) and local experts, a new law was prepared. The draft law will define list of activities subjected to Environmental Impact Assessment (EIA) that should improve the mechanisms for public participation on each stage EIA, which itself will ensure valid communication between the investor and the public, transparency of EIA procedures as well as introduction of a completely new mechanism - strategic environmental assessment (SEA). EIA and SEA drafts are already developed. The new draft law would introduce the effective mechanisms for public participation in the decision-making process. Until May 2012, the Georgian legislation did not oblige competent authorities to inform the public of their decision to issue permits for impact on environment. According to an amendment to the Law on Licences and Permits, publication of decisions (permit delivery, cancellation or amendment) is mandatory within 10 days of taking the decision. In practice, information on such decisions and issued permits is not always published. Some minor changes in the Law on Environmental Impact Permit were introduced in 2010. According to the Law on Environmental Impact Permit, a technical and non-technical summary is requested to be attached to the EIA report for obtaining an environmental impact permit.
The regional (Adjara Autonomous Republic) and local governments do not have any role in the EIA system (neither in decision-making nor in the follow-up).
Transboundary context There are currently no provisions in Georgian law concerning EIA in a transboundary context, nor is there an official platform or mechanism for transboundary cooperation on such matters. Georgia has not entered into bilateral arrangements with its neighbours for transboundary EIA.
Licences and permits related to natural resources use
In Georgia there are two classes of licences used for environmental regulation: use licences and activity licences/permits. The activity licence/permit is issued to a specified legal persons to ensure their ability to adequately perform a specific activity. This category includes the permits for movement and marketing of certain types of products, resources or dangerous materials (e.g. transportation and import/export/transit of restricted market materials; acquiring radiation sources and radioactive substances/waste; import/export/transit of nuclear/radiation sources/materials; import/export/transit of CITES species). Use licences cover all natural resources (table 1.2). The licensor for all types of natural resource use is the NEA, with the exception of the licences for oil and gas resources, which are issued by the State Agency of Oil and Gas. Licensing of forest use was abrogated, although previously issued licences remained valid. In relation to water abstraction licensing, debates are lively on the need for applying use fees, some key stakeholders considering that such fees impede business development. Since the end of 2011, all use licences are sold in electronic auctions organized on an Internet platform (www.eauction.ge). Auctions are also valid in the event that there is only a single bidder. The Government determines the opening price of the auction, which in principle should be based on the 2008 Government Order No. 1-1/480 of the Ministry of Economic Development on the Rules of conduct of auctions for the purpose of issuance of a licence on use, establishment of the initial price of the licence on the use and payment method. But the effectively applied procedure and methodology is not transparent. It has even been reported that the official procedure for determining the opening price was never applied.
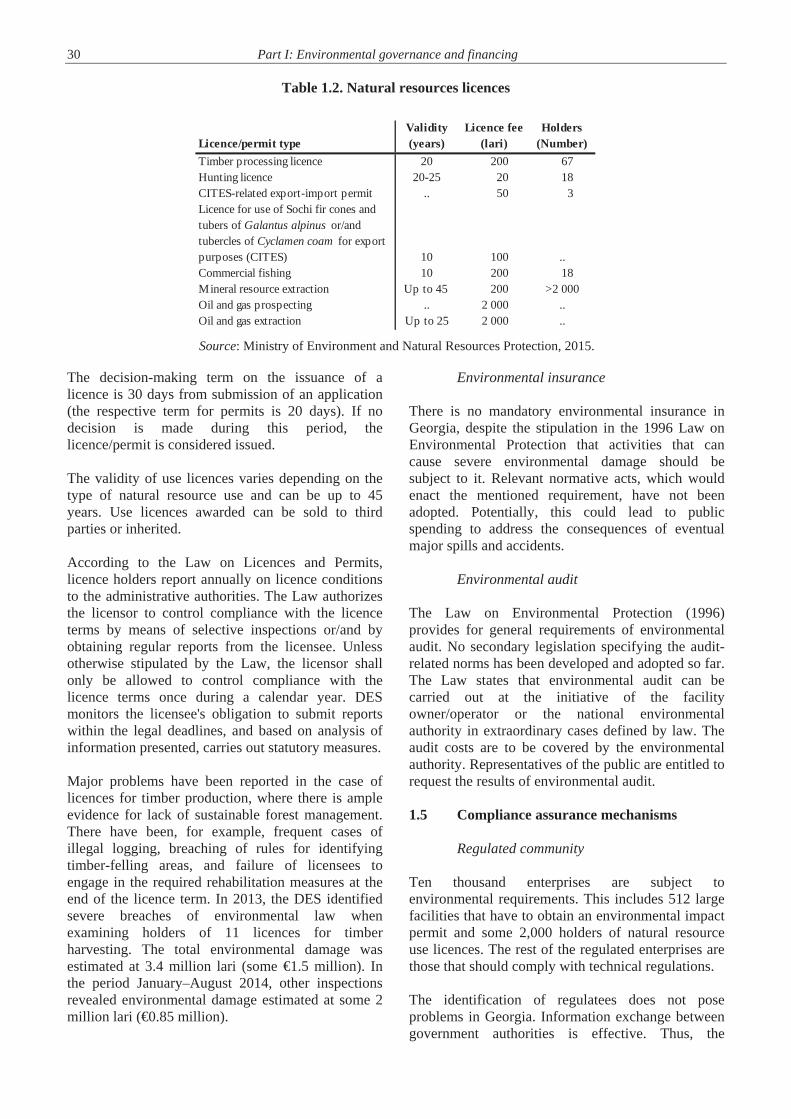
30 Part I: Environmental governance and financing
Table 1.2. Natural resources licences
Source: Ministry of Environment and Natural Resources Protection, 2015.
The decision-making term on the issuance of a licence is 30 days from submission of an application (the respective term for permits is 20 days). If no decision is made during this period, the licence/permit is considered issued. The validity of use licences varies depending on the type of natural resource use and can be up to 45 years. Use licences awarded can be sold to third parties or inherited. According to the Law on Licences and Permits, licence holders report annually on licence conditions to the administrative authorities. The Law authorizes the licensor to control compliance with the licence terms by means of selective inspections or/and by obtaining regular reports from the licensee. Unless otherwise stipulated by the Law, the licensor shall only be allowed to control compliance with the licence terms once during a calendar year. DES monitors the licensee's obligation to submit reports within the legal deadlines, and based on analysis of information presented, carries out statutory measures. Major problems have been reported in the case of licences for timber production, where there is ample evidence for lack of sustainable forest management. There have been, for example, frequent cases of illegal logging, breaching of rules for identifying timber-felling areas, and failure of licensees to engage in the required rehabilitation measures at the end of the licence term. In 2013, the DES identified severe breaches of environmental law when examining holders of 11 licences for timber harvesting. The total environmental damage was estimated at 3.4 million lari (some €1.5 million). In the period January–August 2014, other inspections revealed environmental damage estimated at some 2 million lari (€0.85 million).
Environmental insurance There is no mandatory environmental insurance in Georgia, despite the stipulation in the 1996 Law on Environmental Protection that activities that can cause severe environmental damage should be subject to it. Relevant normative acts, which would enact the mentioned requirement, have not been adopted. Potentially, this could lead to public spending to address the consequences of eventual major spills and accidents.
Environmental audit The Law on Environmental Protection (1996) provides for general requirements of environmental audit. No secondary legislation specifying the audit-related norms has been developed and adopted so far. The Law states that environmental audit can be carried out at the initiative of the facility owner/operator or the national environmental authority in extraordinary cases defined by law. The audit costs are to be covered by the environmental authority. Representatives of the public are entitled to request the results of environmental audit. 1.5 Compliance assurance mechanisms
Regulated community Ten thousand enterprises are subject to environmental requirements. This includes 512 large facilities that have to obtain an environmental impact permit and some 2,000 holders of natural resource use licences. The rest of the regulated enterprises are those that should comply with technical regulations. The identification of regulatees does not pose problems in Georgia. Information exchange between government authorities is effective. Thus, the
Licence/permit type Validity(years)
Licence fee (lari)
Holders(Number)
Timber processing licence 20 200 67Hunting licence 20-25 20 18CITES-related export-import permit .. 50 3Licence for use of Sochi fir cones and tubers of Galantus alpinus or/and tubercles of Cyclamen coam for export purposes (CITES) 10 100 ..Commercial fishing 10 200 18Mineral resource extraction Up to 45 200 >2 000Oil and gas prospecting .. 2 000 ..Oil and gas extraction Up to 25 2 000 ..

Chapter 1: Legal, policy and institutional framework 31 Analytical Division of the Department of Environmental Impact Permit regularly informs the DES about EIA reviews, issued environmental impact permits and their conditions. This information is provided in a timely manner to regional DES units. Similarly, the NEA provides information on holders of natural resource use licences and their conditions. Relations between the DES and the National Forestry Agency (NFA) and the Agency of Protected Areas (APA) are also constructive. There is ongoing cooperation with the Revenue Service and the Customs Service on issues of mutual interest. Information about regulatees and their compliance history is stored in a dedicated database. The ultimate goal is to make the database interactive and increase automated collection of data to the maximum.
Compliance monitoring Both government authorities and the regulated community have the task to monitor compliance. All holders of licences must establish a system of self-monitoring and report on the use of natural resources on an annual basis. Permit holders have a similar obligation if this is adequately stipulated in permit conditions. Some permits are not sufficiently well formulated and as a result regulated enterprises avoid both self-monitoring and self-reporting. General binding rules are not sufficiently clear regarding self-monitoring and self-reporting conditions, lowering the share of enterprises which establish such systems. In practice, only one third of, or even fewer, enterprises subject to sectoral technical regulations send in annual self-monitoring reports. Compliance monitoring by the DES continues to focus on administrative aspects because of two main factors: legislation that restricts technical controls to one per year (although several walk-through
inspections are permitted) and limited capacity. Sampling during inspections is of particular concern. Compliance monitoring is conducted based on the annual DES activity plan and in response to complaints. The intensity and scope of inspections are limited (table 1.3). In 2012 and 2013, no planned inspections were conducted at all. The reasons behind this are likely to include lack of capacity, although other factors may play a role. For 2014, planned inspections included a total of 119 regulatees, mainly in the mining and forestry sectors. During the first nine months of 2014 800 unscheduled site visits were conducted – main part of which was to verify the information provided by license-holders, as well as to check complaints. Much non-compliance is related to deficient or illegal natural resources use. A risk-based methodology of inspection planning has been under development for a few years: its finalization sees legal obstacles, for example the absence of the notion “high-risk facility” in the Georgian environmental legislation. Overall, compliance monitoring is overly driven by complaints and not sufficiently based on risk analysis. Most of the resources are dedicated to fighting illegal mining, logging and poaching. This detracts the DES from industrial pollution control; small and medium-sized enterprises receive little attention. Each inspection results in drawing up an act and report – first is mandatory, as for latter, it will be presented to DES along with inspection materials. Inspection materials, if they do not include commercial secrets, as well as the periodic reports prepared by DES, are considered as public information and are sent to interested parties imeddiately or within 10 days, per to Administrative Code. However, these reports are not regularly realeased to general public.
Table 1.3: Sectoral structure of planned environmental inspection, 2010-2011, 2014
Source: Ministry of Environment and Natural Resources Protection, 2015. Note: There were no planned inspections conducted in 2012 and 2013.
Planned inspections 2010 2011 2014Impact permit holders 30 16 15Enterprises under GBRs 8 0 0Mining licence holders 67 90 86Hunting farms 5 8 6Timber production licence holders 28 18 7State forest fund area 19 27 0Fishing special licence holders 0 6 2CITES licences 0 0 3
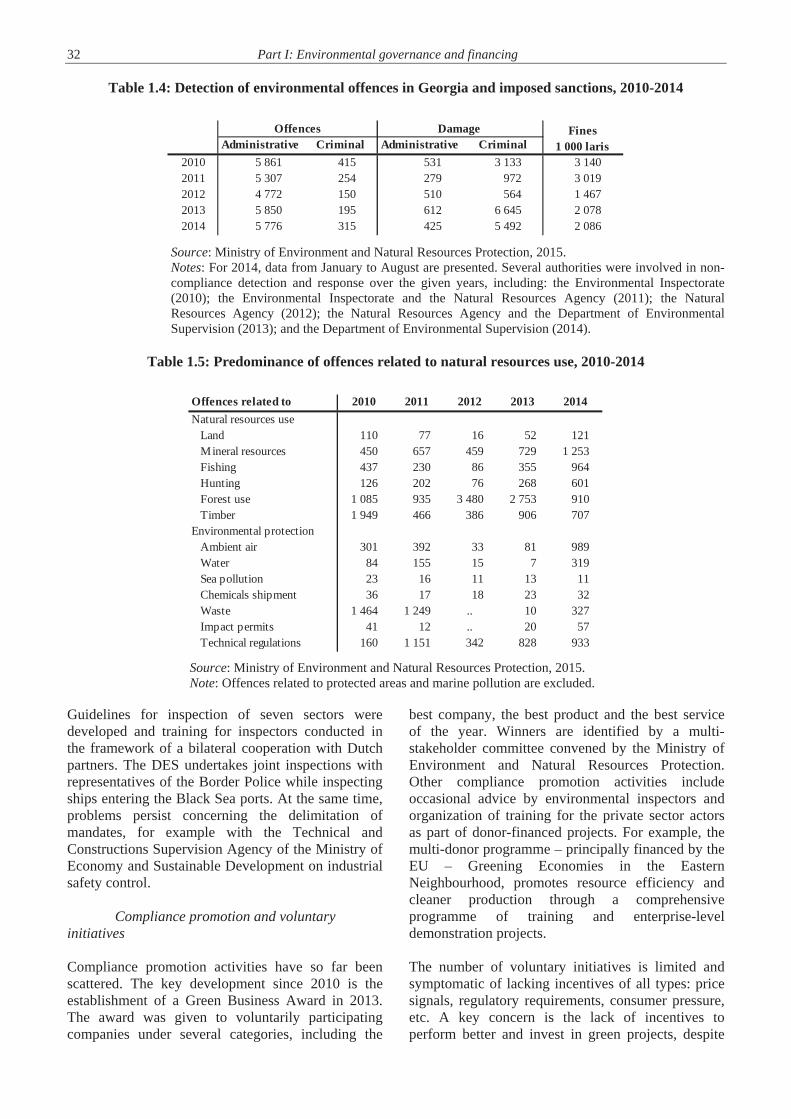
32 Part I: Environmental governance and financing
Table 1.4: Detection of environmental offences in Georgia and imposed sanctions, 2010-2014
Source: Ministry of Environment and Natural Resources Protection, 2015. Notes: For 2014, data from January to August are presented. Several authorities were involved in non-compliance detection and response over the given years, including: the Environmental Inspectorate (2010); the Environmental Inspectorate and the Natural Resources Agency (2011); the Natural Resources Agency (2012); the Natural Resources Agency and the Department of Environmental Supervision (2013); and the Department of Environmental Supervision (2014).
Table 1.5: Predominance of offences related to natural resources use, 2010-2014
Source: Ministry of Environment and Natural Resources Protection, 2015. Note: Offences related to protected areas and marine pollution are excluded.
Guidelines for inspection of seven sectors were developed and training for inspectors conducted in the framework of a bilateral cooperation with Dutch partners. The DES undertakes joint inspections with representatives of the Border Police while inspecting ships entering the Black Sea ports. At the same time, problems persist concerning the delimitation of mandates, for example with the Technical and Constructions Supervision Agency of the Ministry of Economy and Sustainable Development on industrial safety control.
Compliance promotion and voluntary
initiatives Compliance promotion activities have so far been scattered. The key development since 2010 is the establishment of a Green Business Award in 2013. The award was given to voluntarily participating companies under several categories, including the
best company, the best product and the best service of the year. Winners are identified by a multi-stakeholder committee convened by the Ministry of Environment and Natural Resources Protection. Other compliance promotion activities include occasional advice by environmental inspectors and organization of training for the private sector actors as part of donor-financed projects. For example, the multi-donor programme – principally financed by the EU – Greening Economies in the Eastern Neighbourhood, promotes resource efficiency and cleaner production through a comprehensive programme of training and enterprise-level demonstration projects. The number of voluntary initiatives is limited and symptomatic of lacking incentives of all types: price signals, regulatory requirements, consumer pressure, etc. A key concern is the lack of incentives to perform better and invest in green projects, despite
Administrative Criminal Administrative Criminal 2010 5 861 415 531 3 133 3 1402011 5 307 254 279 972 3 0192012 4 772 150 510 564 1 4672013 5 850 195 612 6 645 2 0782014 5 776 315 425 5 492 2 086
Offences Damage Fines1 000 laris
Offences related to 2010 2011 2012 2013 2014Natural resources use
Land 110 77 16 52 121Mineral resources 450 657 459 729 1 253Fishing 437 230 86 355 964Hunting 126 202 76 268 601Forest use 1 085 935 3 480 2 753 910Timber 1 949 466 386 906 707
Environmental protectionAmbient air 301 392 33 81 989Water 84 155 15 7 319Sea pollution 23 16 11 13 11Chemicals shipment 36 17 18 23 32Waste 1 464 1 249 .. 10 327Impact permits 41 12 .. 20 57Technical regulations 160 1 151 342 828 933

Chapter 1: Legal, policy and institutional framework 33 the availability of preferential credits. Small and medium-sized enterprises very often lack capacity even when interested in implementing environmental improvements. A new Agency for Business Support was established in 2014 and can play an important role in this regard. There are only eight ISO 14001 certified enterprises in Georgia (2013 data). This is comparable with other countries in the Caucasus but way behind the Baltic countries or countries in the Western Balkans. Membership in the United Nations’ Global Compact is slightly more extensive and includes 23 Georgian companies, business associations and NGOs. There have been no new Georgian members of the Global Compact since 2012.
Non-compliance response and liability The duty of sanctioning enterprises has been totally transferred to the courts even though environmental inspectors have the power to impose administrative sanctions. This model of enforcement is considered as more reassuring for the private sector at the current stage of development and may well change. The spectrum of legally mandated non-compliance responses is large but in practice they are limited to fines. The legal framework provides for an enforcement pyramid; for example, if the repetitive application of fines does not bring an enterprise back into compliance, its licence can be repealed. The total number of detected offences has been relatively stable over recent years, however, with a reduction in 2011–2012 that can be attributed to the institutional changes in environmental inspection. This correlated with a decrease in the amount of fines and damage compensation claims. The sectoral structure of offences is likely to illustrate inspection priority in checking compliance with natural resources use legislation. Illegal activities on forest use, mining, hunting and fishing were regularly tracked and sanctioned over recent years. On the other hand, the number of offences related to environmental protection showed an irregular pattern, with air, water and waste, for example, almost disappearing from the list of inspectors’ concerns in 2012–2013. The reasons for such fluctuations in the activity of inspections on pollution control are not clear. An element continuously generating tensions between the regulated community and regulators is the design of the environmental liability regime. The way the legislation defines liability shows a focus on
revenue rather than environmental performance. Companies that cause damage receive a demand to pay compensation calculated according to obsolete Soviet methodologies. These compensation payments are not earmarked and remediation is most often not being undertaken. As a result, the liability system ends up undermining the authority of regulators, who gain the image of revenue-seekers. Cases of closing or suspending the activity of industrial facilities as a result of inspections by the DES and following court decisions are very rare; for example, no such actions were taken in 2013–2014. A few sawmills working illegally or processing illegally obtained timber were sealed. Administrative decisions taken by the DES are subject to appeal. The absolute majority of criminal cases refer to illegal felling (about two thirds of all recorded offences) and poaching (one quarter of violations). In 2013, only one of 121 criminal cases sent to investigating bodies for further examination concerned industrial pollution (namely, undertaking an activity without an environmental impact permit); all the others related to violation of natural resources legislation. Data on enforcement action is scarce and fragmented. There is no systematic analysis of compliance monitoring data (collected by the DES) and enforcement data (collected by the courts). This undermines the evidence base for analysing the effectiveness of the regulatory management cycle. 1.6 Environmental information and data reporting The rehabilitation and modernization of the environmental monitoring network has progressed but data analysis remains the weakest link in the chain of information management. Information reporting has steadily improved, as witnessed by the production of a high-quality State of the Environment Report in 2010–2011. In order to improve the monitoring and reporting of environmental information, LEPL Center for Environmental Information and Education started to develop an environmental information management system. The system would include reports (air, water, waste), permits / licenses, timber and other resources. However, this long-term process would take several years before it will be fully operational. Nowadays only timber resources system is fully functional. It is expected that ambient air and maybe water management components would be ready by beginning of 2016.

34 Part I: Environmental governance and financing
The NEA has succeeded in improving environmental and hydrometeorological monitoring networks. Advancements have been in relation to surface water monitoring, which was extended and comprises 116 monitoring points on 63 water bodies. In order to further improve the reliability of water monitoring, the number of monitoring points needs to be increased to 150, according to joint estimates by local and international experts. The scope of water quality monitoring has improved: as of 2013, the NEA started to measure total nitrogen concentration in the major water bodies, and, as of 2014, total phosphorus. There are eight air quality monitoring stations in five cities (Tbilisi, Kutaisi, Batumi, Rustavi, Zestaphoni) and one country background EMEP station in Abastumani. Under the EU project “Air Quality Governance in ENPI Countries” were developed Action Plan for Improvement of the Air Quality Assessment System in Georgia. According to this document in the country air quality should assessed in the nine zones and one agglomeration (by 10 monitoring stations). In 2012–2013, seven automated stations measuring the degree of -radiation exposure were installed in several regions of Georgia. Real time data received from the stations are gathered daily in the central office and published on the official website of the NEA. Soil and geological surveillance remain very limited. New forms for statistical reporting on water have been developed. Environmental data collection from enterprises encounters difficulties. Only air emission must be reported to environmental authorities in a predefined format. Water use reporting is optional and many enterprises avoid reporting such information. Water pollution and waste reporting do not exist. A priority is amending questionnaires in the area of water management, and work on this is ongoing. Electronic reporting is possible and used by some 40 per cent of respondents. Legal changes to impose statistical reporting are now being considered. The National Statistical Office, Geostat, has enhanced its efforts and capacity to disseminate environmental information. Geostat does not collect environmental data directly: enterprises send their reports to the environmental authorities. Statistical authorities receive data in an aggregated form from the Ministry of Environment and Natural Resources Protection. After verification and validation, these data are published in annual environmental compendia, as well as in the National Statistical Yearbook that summarizes key trends across all sectors. Commonly, published time series cover up to 10 years. Since 2014, the annual environmental compendium is
available in English. Since 2012, the core set of environmental indicators is freely accessible in Excel format on Geostat’s web page. The MoU signed in 2014 between the Ministry of Environment and Natural Resources Protection and Geostat includes the schedule of data delivery across all media. Environmentally relevant information is collected through statistical surveys that target industry and agricultural units. For example, agricultural units are surveyed in relation to livestock numbers and the use of pesticides. As of 2014, questions concerning irrigation are also part of such unit surveys. Industry surveys have also evolved in a positive direction. For example, industrial units are surveyed about their production and use of renewable energy resources. Recourse to subsidies is also part of the surveys. In 2012, Geostat started to develop energy statistics. After a decade-long absence of a complete energy balance of the country (the last one was published in 2002), Geostat is ready to issue the National Energy Balance for 2013. State-of-the-environment reporting has seen progress. With some delay, the national report covering the period 2007–2009 was issued in December 2011. Its content follows ECE guidelines. The report seems to have made maximal use of the scarce environmental information available in Georgia. It is not clear, however, to what extent this report has been used in policymaking. A new report for 2010–2013 is under preparation. In 2014, a Government order mandated the procedure of its development and officially adopted the report’s structure. The report’s publication is scheduled for 2015. The use of environmental information as a decision-making tool remains limited, although policy planning does rely on data and analysis, as mentioned above. Policy evaluation is done irregularly on a case-by-case basis. A comprehensive review of policy effectiveness in the field of biodiversity protection, for example, was performed in conjunction with the work on updating the National Biodiversity Strategy and Action Plan. In most cases, however, implementation reviews are limited to an assessment of activities without linking policy action with environmental outcomes. Access to environmental information is insufficient: while citizens now have improved access to information on the state of the environment at the national level, disaggregated information that is most relevant to them is still lacking. Documentation related to EIA, permitting and compliance assurance can be obtained only upon request. The country has
Chapter 1: Legal, policy and institutional framework 35 conducted some work on planning the establishment of a national pollutant release and transfer register (PRTR) but failed to ensure implementation. The site of the Aarhus Centre, which offered valuable environmental information, was suspended in early 2013 due to establishment of LEPL the Centre for Environmental Information and Education on its basis. Consequently, information placed on its web-site will not be available until January 2016. The new web-ste is expected to be more user friendly and contains more information.
Environmental education The Georgian Government has strengthened its efforts to promote better environmental education and bring together activities that have been scattered to date. To this end, a working group has been created, aimed at coordinating formal and informal environmental education initiatives. This group also supported the implementation of the National Strategy and Action Plan on Environmental Education for Sustainable Development 2012–2014. Several important initiatives have been implemented. Thus, 2012 was proclaimed the Year of Environmental Education in Georgia. During this year, high-profile events occurred, most importantly a national Environmental Education Week and the international Tbilisi+35 Intergovernmental Conference on Environmental Education for Sustainable Development, organized in partnership with UNESCO and UNEP. In 2013, the “Teacher’s Guidebook to Environmental Education for Grades I–IX” was published as a joint undertaking of the Ministry of Environment and Natural Resources Protection, the Ministry of Education and Science, and UNDP Georgia. The National Centre for Teacher Professional Development under the Ministry of Education and Science has a training course for geography and biology teachers on “Environment and Sustainable Development”. A weekly environmental education TV show, “Ecovision”, has been broadcast since 2012. This is the first TV show for children in Georgia that places a particular emphasis on environmental and sustainable development issues. It aims to raise children’s and the general public’s awareness and promote relevent issues. Since 2009, every fall, Climate Week in Georgia is organized with the support of the EC Delegation.
Climate Week events aim at raising awareness about climate change. They include, for example, workshops and street rallies. 1.7 Conclusions and recommendations The Ministry of Environment and Natural Resources Protection’s presence at the subnational level is limited to forest management and compliance assurance. Local self-governance authorities do not yet have the capacity to take over. A lack of clarity about their environmental responsibilities may be a factor. At the same time, there are municipalities actively involved in environment-related activities. The challenge is thus upscaling local-level engagement from a few pioneer municipalities to the entire country. Even with a Ministry of Economy and Sustainable Development in place, the sustainable development agenda remains imperceptible on the government agenda and in terms of a wider policy dialogue with non-governmental stakeholders. With international processes on SDGs development entering their final phase, action on sustainability governance at the national level becomes urgent. Protracted efforts in the past to establish a National Council on Sustainable Development show that work on national SDGs requires a mechanism able to pull in all governmental and non-governmental stakeholders. Recommendation 1.1: The Government should clarify mandates regarding environmental governance and strengthen relevant cooperation mechanisms and capacity both horizontally and vertically by: (a) Making sure that environmental and
sustainable development issues are discussed by such coordination bodies as the Economic Council and the European Union Integration Commission;
(b) Strengthening the Ministry of Economy and Sustainable Development to enable it to facilitate effective dialogue on green economy and sustainable development goals;
(c) Assessing gaps in multi-level environmental governance and defining a clear action plan for enhancing the environmental management capacity of self-governance units;
(d) Encouraging the Ministry of Environment and Natural Resources Protection to continue regular communication with subnational authorities and provide training.
36 Part I: Environmental governance and financing
Recommendation 1.2: The Ministry of Environment and Natural Resources Protection should continue its efforts under the association process with the European Union, by further implementation of the Road Map for the implementation of the European Union-Georgia Association Agreement in the fields of environment and climate action. Modern environmental planning is taking root in Georgia. The second National Environmental Action Programme 2012–2016 outlines well the country’s policy goals. The National Biodiversity Strategy and Action Plan of Georgia 2014–2020 can be used as a benchmark for exemplary environmental planning. The next milestone in the area of environmental management is making all aspects of public planning more environmentally friendly and integrated, and translating the principle of sustainable development into specific goals. Recommendation 1.3 The Government should: (a) Finalize nationalization of sustainable
development goals, and make sure that future national development strategies put adequate focus on them as well as other environmental policy objectives;
(b) Make strategic environmental assessment mandatory at all levels;
(c) Integrate environmental and disaster risk management elements into spatial planning;
(d) Enhance involvement of the Ministry of Environment and Natural Resources Protection in the development of sectoral policies and law-making.
There is no single instrument of pollution prevention and control that works properly in Georgia, and there are persistent problems in EIA, permitting, compliance monitoring and enforcement. From the perspective of human health costs, but also of economic costs and opportunities more generally, this situation requires a comprehensive plan of action. Recommendation 1.4: The Government should improve the prevention and control of environmental degradation and pollution by: (a) Fully aligning the scope and procedure of
EIA and permitting with international pratices;
(b) Ensuring that the system of mandatory environmental insurance is effective, and
reorienting the environmental liability regime towards rehabilitation of the environment;
(c) Enhancing non-compliance detection through mandatory and more strictly enforced self-monitoring and self-reporting requirements, as well as more risk-based, technically focused inspections of facilities.
Incentives for business actors to achieve compliance are meagre in Georgia. Environmental compliance is poor, voluntary action is asthenic, and understanding of gains related to cleaner production and resource efficiency is low. Dialogue with private sector actors on environmental matters has started. Recommendation 1.5: The Ministry of Environment and Natural Resources Protection should promote resource efficiency and cleaner production, green business development and voluntary environmental initiatives by: (a) More systematically seeking the private
sector’s input into the development of environmental policies and the legal framework;
(b) Promoting knowledge of environmental requirements and raising awareness among the private sector;
(c) Encouraging companies to participate in international initiatives, e.g., Green Industry or the Global Reporting Initiative.
Georgia has improved its capacity to collect, analyse and present data. Problems remain, though. They include insufficiently developed monitoring networks; limited data management infrastructure, especially a lack of relational databases that are critical for the future use of “big data”; and the modest degree of information disclosure and availability online. Thus, legislation, policy and practice regarding access to environmental information does not meet requirements of the country’s obligations under the Aarhus Convention. Recommendation 1.6: The Ministry of Environment and Natural Resources Protection should improve environmental data analysis and disclosure and increase transparency of environmental decision-making more generally by: (a) Continue making administrative information,
such as environmental impact assessment reports, permits and licences, more transparent, clear and integrated;
(b) Providing access to information on environmental regulation and compliance

Chapter 1: Legal, policy and institutional framework 37
assurance activities, including penalties imposed by the courts;
(c) Making inspection reports and annual reports publicly available;
(d) Continuing efforts to optimize the monitoring network and further enhance capacity for data analysis;
(e) Enhancing the use of environmental information in decision-making;
(f) Fully aligning the legislation, policy and practice regarding access to environmental information with the international obligations of the country.
Recommendation 1.7: The National Statistics Office, together with the Ministry of Environment and Natural Resources Protection, should further improve environmental statistics, in particular through the application of the international System of Environmental-Economic
Accounting and the revised United Nations Framework for the Development of Environment Statistics. The Ministry of Environment and Natural Resources Protection established a NEAP 2012–2016, but there was no proper costing of the various envisaged measures, and there is hardly any information on its implementation. Overall government expenditures on environmental protection are low and insufficient to adequately address the major environmental problems in the country. Recommendation 1.8: The Ministry of Environment and Natural Resources Protection should prepare a draft national environmental action plan (NEAP) for 2017–2020 based on an assessment of the implementation of the NEAP 2012–2016, including the major obstacles encountered and the benefits realized.

39
Chapter 2
ECONOMIC INSTRUMENTS, ENVIRONMENTAL EXPENDITURES AND INVESTMENTS
FOR GREENING THE ECONOMY 2.1 Economic instruments Compared with the situation reviewed in 2010, no new environmentally related economic instruments have been introduced. The main legal base for the application of the polluter-pays and user-pays principles has remained the 1996 Law on Environmental Protection.
Pollution charges Georgia abolished pollution charges for emissions of air pollutants and the discharge of water pollutants in 2005. As regards air pollution, the main concern is emissions of pollutants from road transport vehicles (chapter 3). These can best be checked by stricter regulatory mechanisms and product charges on motor fuels and imported vehicles. As regards water pollution, among the major issues is the discharge of pollutants from industrial and municipal wastewater, where an appropriate policy mix of effective regulations and pollution charges could prove its worth.
Environmental insurance Environmental insurance schemes are not yet applied in Georgia (chapter 1).
Product-related economic instruments
Taxes on motor fuels Georgia levies excise duties on motor fuels, which are all imported. The tax base is the weight (in tons) of the vehicle, except for natural gas condensate (CNG) for which the tax rate is volume based (in 1,000 m3). The current tax rates are established in the 2010 Tax Code, which entered into force at the beginning of 2011. But tax rates have not been modified from the previous Tax Code, which was applied as from 2005. The only exception is the tax rate for CNG and other natural gas, which was reduced from 150 lari to 80 lari per 1,000 m3. There is, moreover, a new excise duty on biodiesel, which is the same as for standard diesel. The unchanged
excise rates on motor fuels contrast with cumulative consumer price inflation by some 50 per cent between 2005 and 2014. Duty rates for diesel are lower than the rate applied to petrol (gasoline). Comparison with excise tax rates in other European (i.e. EU) countries requires converting the tax base from tons to litres (for petrol, etc.) and from 1,000 m3 to gigajoules for CNG (table 2.1). This shows that excise taxes on motor fuels in Georgia are lower than the minimum rates applied by lower income countries in the EU (such as Bulgaria and Romania). Thus, the excise tax rate for unleaded petrol in Georgia corresponds to only 22 per cent (and in the case of diesel, 16.5 per cent) of the EU minimum rate. The corresponding proportion is somewhat higher for liquefied petroleum gas (LPG) (some 42 per cent) and CNG (35 per cent). Revenues from excises on domestic consumption of gasoline and diesel fuel corresponded to 0.6 per cent of GDP in 2013, which is relatively low in an international perspective. In Western Europe, this proportion is within a range of 1–2 per cent of GDP. The difference mainly reflects the low excise rates in Georgia (table 2.2).
Taxes on other energy products Georgia applies a uniform excise tax rate for specific energy products (gas oil, kerosene and LPG), independent of the type of purpose (propellant, industrial/commercial use, heating). The typical feature in many European countries is that the tax rate for use of these products as propellants is much higher than for other uses.
Taxes on motor vehicles There is no domestic motor vehicle production capacity in Georgia. All new and used motor vehicles are imported, and there are no import restrictions concerning their age or other criteria. Most vehicles are between 10 and 15 years old; there are, moreover, no mandatory vehicle inspections (chapters 3 and 10).
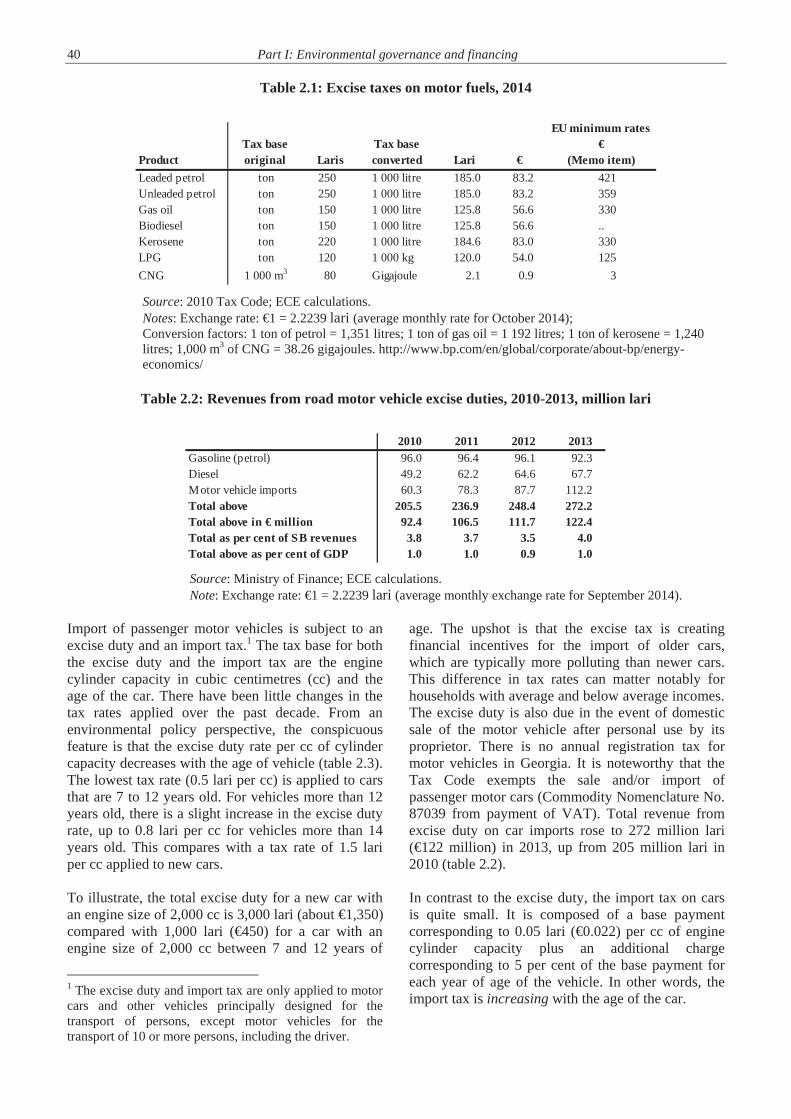
40 Part I: Environmental governance and financing
Table 2.1: Excise taxes on motor fuels, 2014
Source: 2010 Tax Code; ECE calculations. Notes: Exchange rate: €1 = 2.2239 lari (average monthly rate for October 2014); Conversion factors: 1 ton of petrol = 1,351 litres; 1 ton of gas oil = 1 192 litres; 1 ton of kerosene = 1,240 litres; 1,000 m3 of CNG = 38.26 gigajoules. http://www.bp.com/en/global/corporate/about-bp/energy-economics/
Table 2.2: Revenues from road motor vehicle excise duties, 2010-2013, million lari
Source: Ministry of Finance; ECE calculations. Note: Exchange rate: €1 = 2.2239 lari (average monthly exchange rate for September 2014).
Import of passenger motor vehicles is subject to an excise duty and an import tax.1 The tax base for both the excise duty and the import tax are the engine cylinder capacity in cubic centimetres (cc) and the age of the car. There have been little changes in the tax rates applied over the past decade. From an environmental policy perspective, the conspicuous feature is that the excise duty rate per cc of cylinder capacity decreases with the age of vehicle (table 2.3). The lowest tax rate (0.5 lari per cc) is applied to cars that are 7 to 12 years old. For vehicles more than 12 years old, there is a slight increase in the excise duty rate, up to 0.8 lari per cc for vehicles more than 14 years old. This compares with a tax rate of 1.5 lari per cc applied to new cars. To illustrate, the total excise duty for a new car with an engine size of 2,000 cc is 3,000 lari (about €1,350) compared with 1,000 lari (€450) for a car with an engine size of 2,000 cc between 7 and 12 years of
1 The excise duty and import tax are only applied to motor cars and other vehicles principally designed for the transport of persons, except motor vehicles for the transport of 10 or more persons, including the driver.
age. The upshot is that the excise tax is creating financial incentives for the import of older cars, which are typically more polluting than newer cars. This difference in tax rates can matter notably for households with average and below average incomes. The excise duty is also due in the event of domestic sale of the motor vehicle after personal use by its proprietor. There is no annual registration tax for motor vehicles in Georgia. It is noteworthy that the Tax Code exempts the sale and/or import of passenger motor cars (Commodity Nomenclature No. 87039 from payment of VAT). Total revenue from excise duty on car imports rose to 272 million lari (€122 million) in 2013, up from 205 million lari in 2010 (table 2.2). In contrast to the excise duty, the import tax on cars is quite small. It is composed of a base payment corresponding to 0.05 lari (€0.022) per cc of engine cylinder capacity plus an additional charge corresponding to 5 per cent of the base payment for each year of age of the vehicle. In other words, the import tax is increasing with the age of the car.
ProductTax base original Laris
Tax base converted Lari €
EU minimum rates €
(Memo item)Leaded petrol ton 250 1 000 litre 185.0 83.2 421Unleaded petrol ton 250 1 000 litre 185.0 83.2 359Gas oil ton 150 1 000 litre 125.8 56.6 330Biodiesel ton 150 1 000 litre 125.8 56.6 ..Kerosene ton 220 1 000 litre 184.6 83.0 330LPG ton 120 1 000 kg 120.0 54.0 125CNG 1 000 m3 80 Gigajoule 2.1 0.9 3
2010 2011 2012 2013Gasoline (petrol) 96.0 96.4 96.1 92.3Diesel 49.2 62.2 64.6 67.7Motor vehicle imports 60.3 78.3 87.7 112.2Total above 205.5 236.9 248.4 272.2Total above in € million 92.4 106.5 111.7 122.4Total as per cent of SB revenues 3.8 3.7 3.5 4.0Total above as per cent of GDP 1.0 1.0 0.9 1.0
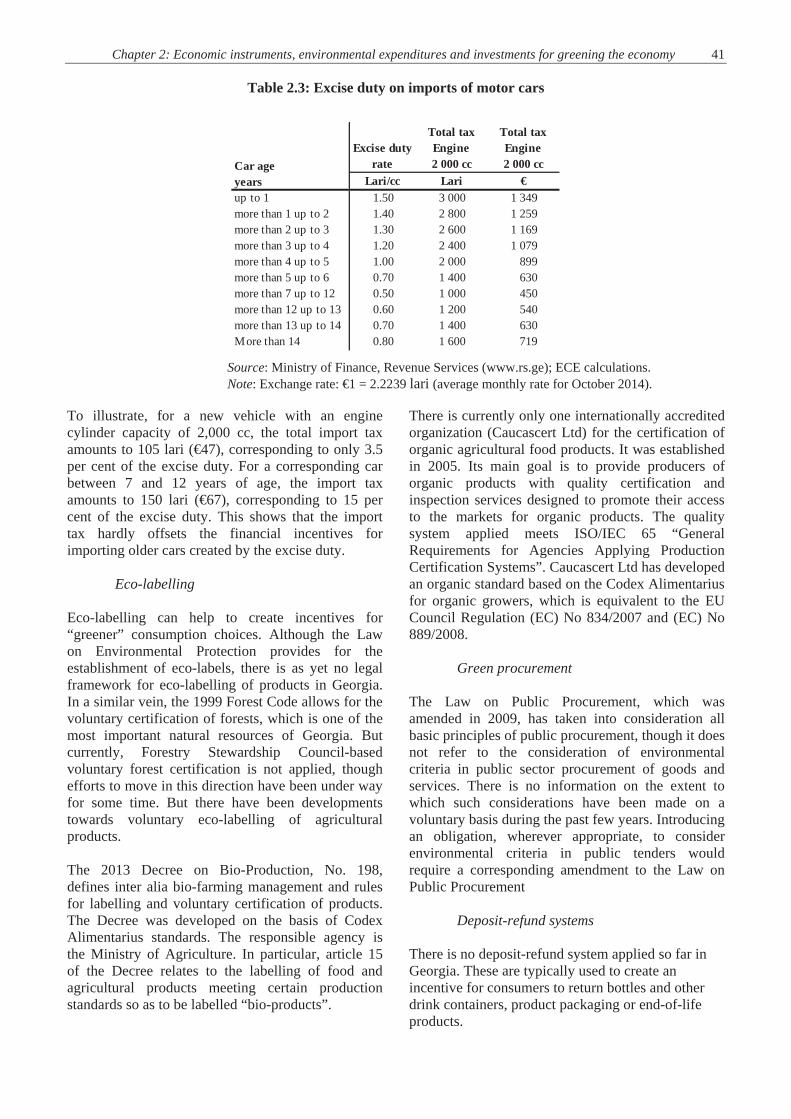
Chapter 2: Economic instruments, environmental expenditures and investments for greening the economy 41
Table 2.3: Excise duty on imports of motor cars
Source: Ministry of Finance, Revenue Services (www.rs.ge); ECE calculations. Note: Exchange rate: €1 = 2.2239 lari (average monthly rate for October 2014).
To illustrate, for a new vehicle with an engine cylinder capacity of 2,000 cc, the total import tax amounts to 105 lari (€47), corresponding to only 3.5 per cent of the excise duty. For a corresponding car between 7 and 12 years of age, the import tax amounts to 150 lari (€67), corresponding to 15 per cent of the excise duty. This shows that the import tax hardly offsets the financial incentives for importing older cars created by the excise duty.
Eco-labelling Eco-labelling can help to create incentives for “greener” consumption choices. Although the Law on Environmental Protection provides for the establishment of eco-labels, there is as yet no legal framework for eco-labelling of products in Georgia. In a similar vein, the 1999 Forest Code allows for the voluntary certification of forests, which is one of the most important natural resources of Georgia. But currently, Forestry Stewardship Council-based voluntary forest certification is not applied, though efforts to move in this direction have been under way for some time. But there have been developments towards voluntary eco-labelling of agricultural products. The 2013 Decree on Bio-Production, No. 198, defines inter alia bio-farming management and rules for labelling and voluntary certification of products. The Decree was developed on the basis of Codex Alimentarius standards. The responsible agency is the Ministry of Agriculture. In particular, article 15 of the Decree relates to the labelling of food and agricultural products meeting certain production standards so as to be labelled “bio-products”.
There is currently only one internationally accredited organization (Caucascert Ltd) for the certification of organic agricultural food products. It was established in 2005. Its main goal is to provide producers of organic products with quality certification and inspection services designed to promote their access to the markets for organic products. The quality system applied meets ISO/IEC 65 “General Requirements for Agencies Applying Production Certification Systems”. Caucascert Ltd has developed an organic standard based on the Codex Alimentarius for organic growers, which is equivalent to the EU Council Regulation (EC) No 834/2007 and (EC) No 889/2008.
Green procurement The Law on Public Procurement, which was amended in 2009, has taken into consideration all basic principles of public procurement, though it does not refer to the consideration of environmental criteria in public sector procurement of goods and services. There is no information on the extent to which such considerations have been made on a voluntary basis during the past few years. Introducing an obligation, wherever appropriate, to consider environmental criteria in public tenders would require a corresponding amendment to the Law on Public Procurement
Deposit-refund systems
There is no deposit-refund system applied so far in Georgia. These are typically used to create an incentive for consumers to return bottles and other drink containers, product packaging or end-of-life products.
Lari/cc Lari €up to 1 1.50 3 000 1 349more than 1 up to 2 1.40 2 800 1 259more than 2 up to 3 1.30 2 600 1 169more than 3 up to 4 1.20 2 400 1 079more than 4 up to 5 1.00 2 000 899more than 5 up to 6 0.70 1 400 630more than 7 up to 12 0.50 1 000 450more than 12 up to 13 0.60 1 200 540more than 13 up to 14 0.70 1 400 630More than 14 0.80 1 600 719
Excise duty rate
Total tax Engine 2 000 cc
Total tax Engine 2 000 ccCar age
years
42 Part I: Environmental governance and financing
Extended producer responsibility Georgia does not currently apply schemes that oblige producers (individually or collectively) to recover and recycle end-of-life products such as batteries, waste oil and motor vehicles. The draft waste management law and the associated draft waste management strategy envisage the application of the extended producer responsibility principle, i.e. that producers should be responsible for managing such waste streams, including waste electrical and electronic equipment – WEEE) (chapter 5). This should also create a more favourable environment for recycling activities, which are still very limited in Georgia.
Environmental subsidies The 1996 Law on Environmental Protection provides the possibility of promoting environmentally friendly behaviour by means of financial incentives (such as tax relief, soft government loans, product marketing schemes) for environmental projects and the use of second-hand materials and environmentally friendly (“green”) technologies. The corresponding details have to be settled in separate legislation. But there has been relatively limited use made of these instruments. Among the known examples is that imports of electric motor cars principally designed for the transport of persons under Combined Nomenclature Code No. 8703 (i.e. excluding motor cars for the transport of more than 10 persons, including the driver) are exempt from VAT and car excise duty. The 2004 Law on Fees for Use of Natural Resources stipulates that the fee for use of specific natural resources is reduced by 70 per cent for scientific and educational activities that promote the sustainable use of resources. The same holds for users of resources that are directly engaged in the recovery and reproduction of these resources. The Tax Code stipulates, moreover, that hunting farms are exempt from property tax for the land they occupy. This is to create incentives for the creation of hunting farms. There is no information about the use that has been made of these instruments. There are, moreover, tax incentives for investors who plan to invest in the construction of small (up to 10 MW) hydropower plants (HPPs) and associated imports of required technologies. But these incentives also apply for construction of large HPPs, which are more controversial because of the associated adverse environmental impacts. It is noteworthy that Georgia has a very liberal trade regime that exempts the large majority (95 per cent)
of goods from import duty. This applies notably to all types of machinery and equipment, including environmentally friendly technologies. But it applies also to the import (and domestic production) of chemical fertilizers and pesticides, which is not welcome from an environmental perspective.
Road user charges Georgia applies a toll for trucks and cargo transit transport. Drivers have to purchase a toll card, which costs 200 lari (€90) while passing through Georgian territory. The card can be purchased at the border or at specific selling points (petrol stations). There are no other direct road user charges. Excises on motor fuels and passenger motor vehicles may be considered as a substitute for user charges. But it is not clear to what extent the current revenues allow for recovery of the costs of construction and operation of the road network, including the social costs of wear and tear of roads due to motor vehicles – notably heavy trucks.
Land tax Issues concerning land ownership and land use are regulated, notably by the Law on Ownership of the Agricultural Lands (1996), the Law on Compensation for Using Agricultural Land for Non-agricultural Purposes and Related Damages (1997) and the Tax Code (2010). There is a property tax on agricultural and non-agricultural land, which is part of a larger set of property taxes. Property taxes are the only local tax in Georgia. The tax rate for agricultural land depends on the land category and the administrative-territorial unit. The basic tax rate for arable land ranges from 56 lari to 100 lari; the corresponding tax rate for grassland and pasture land ranges from 5 lari to 20 lari. The tax rate on non-agricultural land is 0.24 lari per m2, but local self-governments can adjust the tax rate by a territorial coefficient with a maximum value of 1.5. Persons who are engaged in the use of natural resources, based on a corresponding licence, have to pay a land tax with a maximum tax rate of 3 lari per ha. The land tax is a purely revenue-generating instrument and not designed to serve any environmental protection purpose. The use of privately owned agricultural lands for non-agricultural purposes (such as construction of buildings and operation of industrial companies, except facilities such as private homes used by the landowner themselves) is subject to payment of compensation by the interested party, amounting to 34,000 lari (€14,750) to 100,000 lari (€43,400) per
Chapter 2: Economic instruments, environmental expenditures and investments for greening the economy 43 ha, depending on the administrative-territorial unit. The corresponding change in designation is the responsibility of the National Agency of Public Registry within the Ministry of Justice. The Ministry of Environment and Natural Resources Protection is responsible for changing the designation of lands classified as recreational areas, as well as agricultural lands within the areas of Tbilisi and Batumi.
Payments for use of natural resources In Georgia there is a dual mechanism for taxation of natural resource use, namely auctions and specific resource extraction charges. The right to extract publicly owned natural resources such as minerals and timber is transferred to private parties by auctioning licences for user rights. This is an ex ante taxation before the actual resource extraction has begun. It is supplemented by an ex post collection of tax revenue related to the effective exploitation of natural resources. The latter taxes are levied per unit of specific resources extracted and are tantamount to a royalty. In the case of timber, they are also known as a stumpage fee. The 2005 Law on Licences and Permits regulates the transfer of user rights to a private party, and the 2004 Law on Fees for Use of Natural Resources regulates the royalty system. Revenues from auctions are allocated to the central government budget while revenues from royalties are allocated to the budgets of the local self-governments on whose territory the corresponding activities are taking place. The exception is revenue from charges for use of underground resources, which is allocated to the state budget. None of these revenues is earmarked for a specific purpose. Persons interested in participating in an auction have to transfer in advance a financial deposit that corresponds to 20 per cent of the opening price. Bidder losses financial deposit in two cases: if bidder transferred a financial deposit and does not participate in an auction; and in case of competition, if bidder won an auction but did not pay the full fee. In this case, the money is only reimbursed to a bidder who did not win the auction. An auction is also valid in the event that there is only a single bidder. There is no general assessment available concerning experience of the system of auctioning licences for use of the various natural resources in Georgia. A major issue is whether there have always been enough bidders to generate sufficient competition, because this is a necessary condition for ensuring that the Government gets its fair share in the resource extraction rent appropriated by the licence holder. The fact that in Georgia an auction is also valid when
there is only a single bidder suggests that the Government is neglecting this issue. Also, the fact that the financial deposit to be made is not reimbursed in the case of a participant not being awarded the licence will tend to thwart competition, given that resource products are, in general, large. Thus, to illustrate, financial deposits for timber extraction licences amounted to more than 1 million lari (€450,000) in recent years. There is therefore a large risk of collusion, given that firms may agree not to bid against each other in order not to lose the financial deposit. But they may, anyway, agree not to bid against each other in order to keep the licence prices low. Another issue on which there is little information is how (and if at all) the Government has been dealing with the divergence between the social and private costs of a public natural resource due to externalities, such as environmental damages, associated with the exploitation of the resource. Major problems have been reported in the case of licences for timber production, where there is ample evidence for lack of sustainable forest management. In a more general way, the problems encountered with forest use licences reflect to a large extent inadequate forest governance and regulation by the competent state authorities (chapter 11). Thus, the Government went ahead with the transfer of forest user rights to the private sector without first establishing an up-to-date forest inventory and forest management plans. The last national forest inventory was established in 1997 and is outdated. The upshot is that the Government has been offering licences for timber extraction although it had incomplete information on the volume and quality of resources it was selling. Instead, the establishment of an inventory of the relevant forest areas has been assigned to the holder of the licence, but only after the licence was issued. There has been a major case where one investor has sued the Government because the expected resource volumes indicated in the tender for the auction were far above the actual resources in the corresponding forest area. In the event, the principle of sustainable use of natural resources has not been adequately applied as regards licence terms, extraction quotas and other issues. In fact, government policy was mainly oriented towards short-term revenue maximization from extraction of resources while neglecting the importance of nature conservation and sustainability. It is only since 2013 that the issuance of forest use licences has been made dependent on the existence of a forest management plan – but not yet on an up-to-date forest inventory
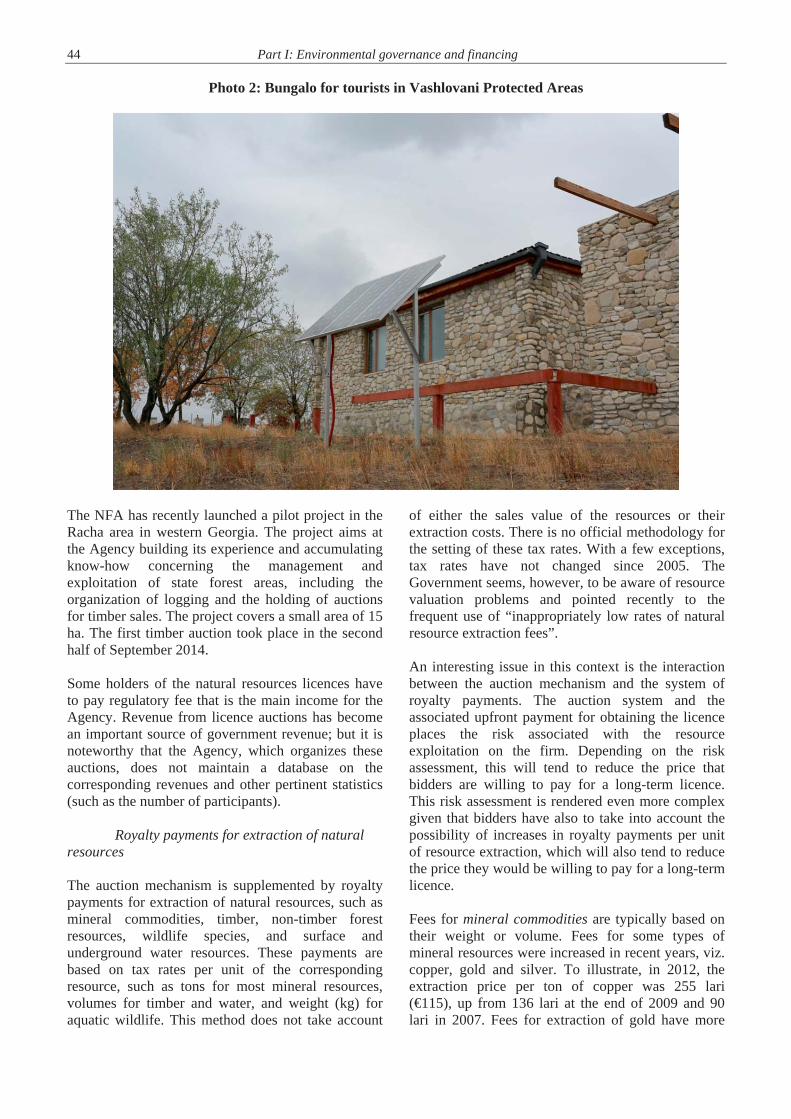
44 Part I: Environmental governance and financing
Photo 2: Bungalo for tourists in Vashlovani Protected Areas
The NFA has recently launched a pilot project in the Racha area in western Georgia. The project aims at the Agency building its experience and accumulating know-how concerning the management and exploitation of state forest areas, including the organization of logging and the holding of auctions for timber sales. The project covers a small area of 15 ha. The first timber auction took place in the second half of September 2014.
Some holders of the natural resources licences have to pay regulatory fee that is the main income for the Agency. Revenue from licence auctions has become an important source of government revenue; but it is noteworthy that the Agency, which organizes these auctions, does not maintain a database on the corresponding revenues and other pertinent statistics (such as the number of participants).
Royalty payments for extraction of natural resources
The auction mechanism is supplemented by royalty payments for extraction of natural resources, such as mineral commodities, timber, non-timber forest resources, wildlife species, and surface and underground water resources. These payments are based on tax rates per unit of the corresponding resource, such as tons for most mineral resources, volumes for timber and water, and weight (kg) for aquatic wildlife. This method does not take account
of either the sales value of the resources or their extraction costs. There is no official methodology for the setting of these tax rates. With a few exceptions, tax rates have not changed since 2005. The Government seems, however, to be aware of resource valuation problems and pointed recently to the frequent use of “inappropriately low rates of natural resource extraction fees”.
An interesting issue in this context is the interaction between the auction mechanism and the system of royalty payments. The auction system and the associated upfront payment for obtaining the licence places the risk associated with the resource exploitation on the firm. Depending on the risk assessment, this will tend to reduce the price that bidders are willing to pay for a long-term licence. This risk assessment is rendered even more complex given that bidders have also to take into account the possibility of increases in royalty payments per unit of resource extraction, which will also tend to reduce the price they would be willing to pay for a long-term licence.
Fees for mineral commodities are typically based on their weight or volume. Fees for some types of mineral resources were increased in recent years, viz. copper, gold and silver. To illustrate, in 2012, the extraction price per ton of copper was 255 lari (€115), up from 136 lari at the end of 2009 and 90 lari in 2007. Fees for extraction of gold have more

Chapter 2: Economic instruments, environmental expenditures and investments for greening the economy 45 than tripled in 2014 compared with the end of 2009. The price for silver has doubled over the same period. Fees for timber resources depend on the tree species and the wood quality category. Prices per m3 in the first quality category range from 102 lari (€46) down to 13 lari (some €6). These prices have not changed since 2009. As regards the use of non-timber forest resources (other than wildlife resources) only the extraction of species listed in the annexes to CITES (fir-tree cones, snowdrop bulbs and cyclamen tubers) is regulated based on the issuance of licences for export and specific extraction fees per kg. These fees, which were established at the end of 2006, have not changed since. The collection of other non-timber resources such as berries, wild fruits, mushrooms, nuts and medicinal plants is allowed by the Forest Code only for personal use but not for commercial purposes. There have been no user fees for the collection of these resources since 2010. Since then, this has been an unregulated area, and there is anecdotal evidence that these non-timber resources have been extensively collected for commercial purposes, including for export without payment of user fees. The local rural population has also been collecting these species and selling them in the informal market to generate additional income. There is a concern that among the collected species there are rare and endangered ones that are currently not legally protected. But information on the volumes of their collection and the impact on the state of the populations of these species is not available. Fees for surface water abstraction depend on the water body category, of which there are three. For each water body category, the Law on Fees for Use of Natural Resources establishes a base fee per m3. The effective charge rates for water abstraction by thermal and hydropower plants and for irrigation channels are expressed as a percentage of the base fee. The charge rate for water companies that ensure water supply for the population is set at only 0.0001 lari (0.0045 euro cents) per m3 (table 2.4). However, these fees have not been applied for the past decade, given an unresolved conflict between the Law on Fees for Use of Natural Resources, which stipulates the need for a licence for use of water resources, and the Law on Licences and Permits, which contains no
provisions for such a type of licence (or permit). The Government has been turning a blind eye to this issue of free surface water abstraction, possibly related to fears that water abstraction charges for HPPs could lead to higher electricity prices. In contrast, fees for abstraction of fresh groundwater have been applied, but they are very low. The abstraction fee for use of fresh groundwater by water companies for drinking water supply is 0.0001 lari per m3, the same rate as for abstraction of surface water. The fee for fresh groundwater abstraction for other commercial/industrial activities is 0.005 lari (€0.0022) per m3. These fees have not changed during the past decade. Revenues collected are allocated to the state budget. Groundwater use is regulated by the 1996 Law on Mineral Resources.
Irrigation tariffs The Government has increased efforts in recent years to revitalize irrigated agriculture, which is expected to become a major source of employment opportunities in the rural areas. Large parts of the irrigation system are dilapidated due to lack of maintenance and institutional weaknesses (chapter 9). Ensuring reliable supply of irrigation water will require considerable investments. These are being supported by increased state budget support and by international donors within the framework of the Irrigation and Land Market Development Project (backed by international donors the International Fund for Agricultural Development (IFAD), the World Bank and USAID), the Agricultural Support Project (backed by, notably, IFAD, the World Bank and USAID) and the Orio project organized by the Netherlands. In 2011, the Government transferred the setting of irrigation tariffs for primary water users to the Georgian National Energy and Water Supply Regulatory Commission (GNERC). Tariffs were established by GNERC in its 2011 Resolution No. 2 on Establishing Melioration Tariffs. In fact, this only “confirmed” the existing tariff levels (75 lari /ha/year), established in 2007. Current irrigation tariffs are not cost reflective. There is no official tariff setting methodology based on economic cost parameters. The tariff rate is also not adjusted according to the crops cultivated or the number of times irrigation water is supplied during a year. Tariffs do not provide any incentives for water consumption savings.
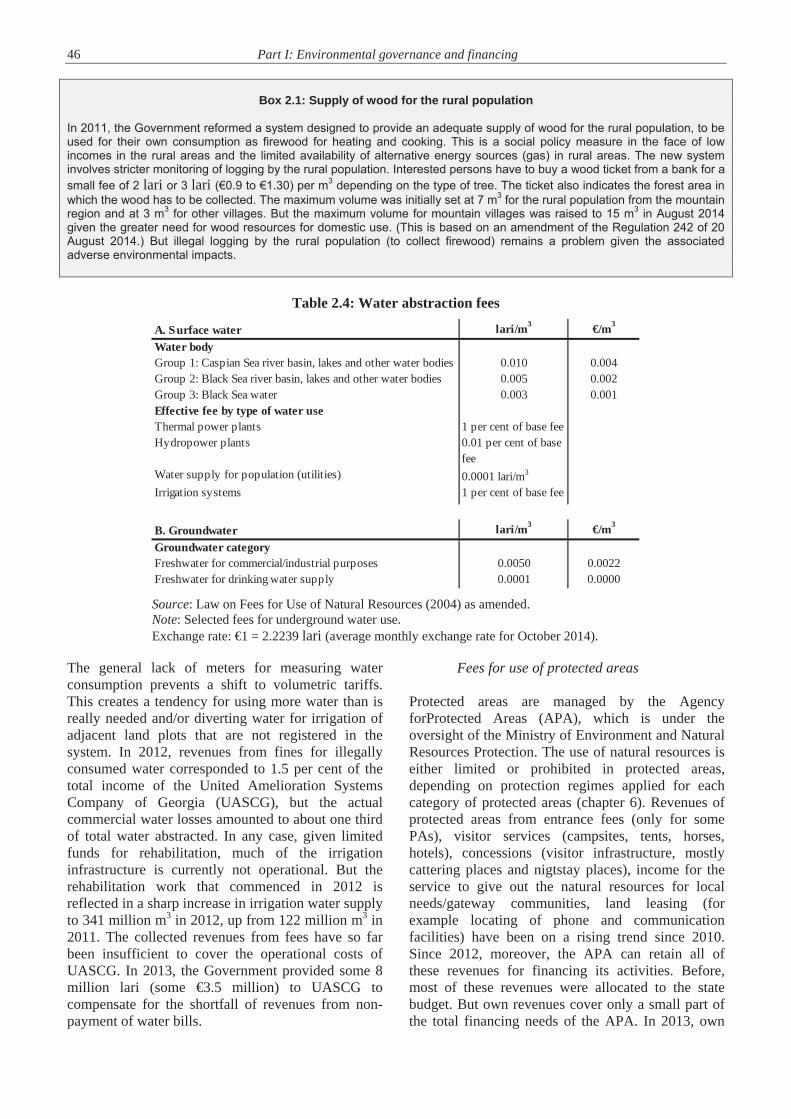
46 Part I: Environmental governance and financing
Box 2.1: Supply of wood for the rural population
In 2011, the Government reformed a system designed to provide an adequate supply of wood for the rural population, to be used for their own consumption as firewood for heating and cooking. This is a social policy measure in the face of low incomes in the rural areas and the limited availability of alternative energy sources (gas) in rural areas. The new system involves stricter monitoring of logging by the rural population. Interested persons have to buy a wood ticket from a bank for a small fee of 2 lari or 3 lari (€0.9 to €1.30) per m3 depending on the type of tree. The ticket also indicates the forest area in which the wood has to be collected. The maximum volume was initially set at 7 m3 for the rural population from the mountain region and at 3 m3 for other villages. But the maximum volume for mountain villages was raised to 15 m3 in August 2014 given the greater need for wood resources for domestic use. (This is based on an amendment of the Regulation 242 of 20 August 2014.) But illegal logging by the rural population (to collect firewood) remains a problem given the associated adverse environmental impacts.
Table 2.4: Water abstraction fees
Source: Law on Fees for Use of Natural Resources (2004) as amended. Note: Selected fees for underground water use. Exchange rate: €1 = 2.2239 lari (average monthly exchange rate for October 2014).
The general lack of meters for measuring water consumption prevents a shift to volumetric tariffs. This creates a tendency for using more water than is really needed and/or diverting water for irrigation of adjacent land plots that are not registered in the system. In 2012, revenues from fines for illegally consumed water corresponded to 1.5 per cent of the total income of the United Amelioration Systems Company of Georgia (UASCG), but the actual commercial water losses amounted to about one third of total water abstracted. In any case, given limited funds for rehabilitation, much of the irrigation infrastructure is currently not operational. But the rehabilitation work that commenced in 2012 is reflected in a sharp increase in irrigation water supply to 341 million m3 in 2012, up from 122 million m3 in 2011. The collected revenues from fees have so far been insufficient to cover the operational costs of UASCG. In 2013, the Government provided some 8 million lari (some €3.5 million) to UASCG to compensate for the shortfall of revenues from non-payment of water bills.
Fees for use of protected areas Protected areas are managed by the Agency forProtected Areas (APA), which is under the oversight of the Ministry of Environment and Natural Resources Protection. The use of natural resources is either limited or prohibited in protected areas, depending on protection regimes applied for each category of protected areas (chapter 6). Revenues of protected areas from entrance fees (only for some PAs), visitor services (campsites, tents, horses, hotels), concessions (visitor infrastructure, mostly cattering places and nigtstay places), income for the service to give out the natural resources for local needs/gateway communities, land leasing (for example locating of phone and communication facilities) have been on a rising trend since 2010. Since 2012, moreover, the APA can retain all of these revenues for financing its activities. Before, most of these revenues were allocated to the state budget. But own revenues cover only a small part of the total financing needs of the APA. In 2013, own
A. Surface water lari/m3 €/m3
Water bodyGroup 1: Caspian Sea river basin, lakes and other water bodies 0.010 0.004Group 2: Black Sea river basin, lakes and other water bodies 0.005 0.002Group 3: Black Sea water 0.003 0.001Effective fee by type of water useThermal power plants 1 per cent of base feeHydropower plants 0.01 per cent of base
feeWater supply for population (utilities) 0.0001 lari/m3
Irrigation systems 1 per cent of base fee
B. Groundwater lari/m3 €/m3
Groundwater categoryFreshwater for commercial/industrial purposes 0.0050 0.0022Freshwater for drinking water supply 0.0001 0.0000

Chapter 2: Economic instruments, environmental expenditures and investments for greening the economy 47 income from user charges amounted to 1.023 million lari, up from 0.13 million lari in 2010. Own income corresponded to some 20 per cent of the state budget allocation of the APA in 2013.
Charges for municipal waste management Local self-governments are responsible for the collection, transport and disposal of municipal waste. These services are provided by waste companies, which are 100 per cent owned by the corresponding municipalities. But the delivery of effective waste management services is still largely limited to major cities. In 2012, the Government established the Solid Waste Management Company of Georgia (SWMCG), which is responsible for the construction of new landfills and closure of existing landfills that do not meet the established environmental and health standards throughout Georgia. The activities of SWMCG cover all of Georgia, with the exception of Tbilisi and the Autonomous Republic of Ajara (chapter 5). SWMCG operates under the umbrella of the Ministry of Regional Development and Infrastructure. Charges for municipal waste services are regulated by local self-governments, subject to the observance of maximum charge rates established in the Law on Local Fees (1998). The current ceiling for private households is 3 lari (€1.35) per person per month. Most households, however, pay much less, namely some 0.45 lari (€0.20). The maximum charge rate for legal entities (enterprises, public institutions) has been set at 27 lari (€12) per m3. In practice, the effective waste charges for legal entities depend on the kind and scale of their activity. The typical measure applied for the scale of activity is the size (m2) of the business premises. But there are other measurement units as well, such as number of beds in hospitals, number of pupils in educational institutions and number of seats in restaurants. The system of waste charges does not provide any incentives for waste minimization given that it does not take into account volumes of waste generated. The dominant feature is that waste charges are not cost reflective. In any case, revenues from collection of waste bills are not retained by the municipal waste companies but allocated to the general municipal budget. This provides little incentive for waste companies to improve the efficiency of their operations.
In Tbilisi, municipal waste services are operated by the Tbilisi Service Group, a company that also manages the local landfill. Waste fees cover the collection, transport and discharge of waste at the landfill. Current charge rates for private households amount to 2.5 lari (€1.1) per person per month – the highest in the country and far above the country average. The local self-government has, however, set the maximum charge rate per household per month at 10 lari (€4.5) for social policy reasons. The current household tariff of 2.5 lari became effective in January 2011, up from the 1.2 lari that had been applied since 2008. But between July 2011 and May 2013, the local self-government applied an “innovative” waste tariff for private households, by linking the monthly waste collection fees to household electricity consumption. Each household had to pay 0.05 lari (€0.02) per kWh of electricity consumed each month, for waste collection. The new tariff system boosted local self-government revenues from waste collection services. They rose to some 4 million lari (€1.8 million) per month compared to some 1.5 million lari under the traditional tariff scheme. It is noteworthy that the local self-government budget financed a large part of the higher charges for low-income households and other socially vulnerable persons. But the local self-government had to abandon the new tariff system in May 2013, mainly because it was in conflict with the provision on maximum waste charge rates in the Law on Local Fees. As regards legal persons, the Tbilisi waste tariff scheme distinguishes 29 activity categories. To make sure that the waste fees per m2 do not exceed the legal monthly maximum, which is expressed as lari per m3, there are special waste conversion norms (expressed as m3/m2) for each kind of activity. There is, however, no cost-related justification for most of these differential tariffs. Waste tariffs for legal persons, moreover, have remained unchanged since 2007 (table 2.5). This compares with cumulative consumer price inflation of some 32 per cent in 2014 compared with 2007. Legal entities (but also natural persons) that deliver municipal waste directly to the Tbilisi landfill pay a gate fee that amounts to 35 lari per ton. There is a separate gate fee of 12 lari per ton for construction waste. For regular deliveries that exceed 100 tons per annum there are lower fees. But a lingering problem is the identification of hazardous waste among the disposed waste (chapter 5).
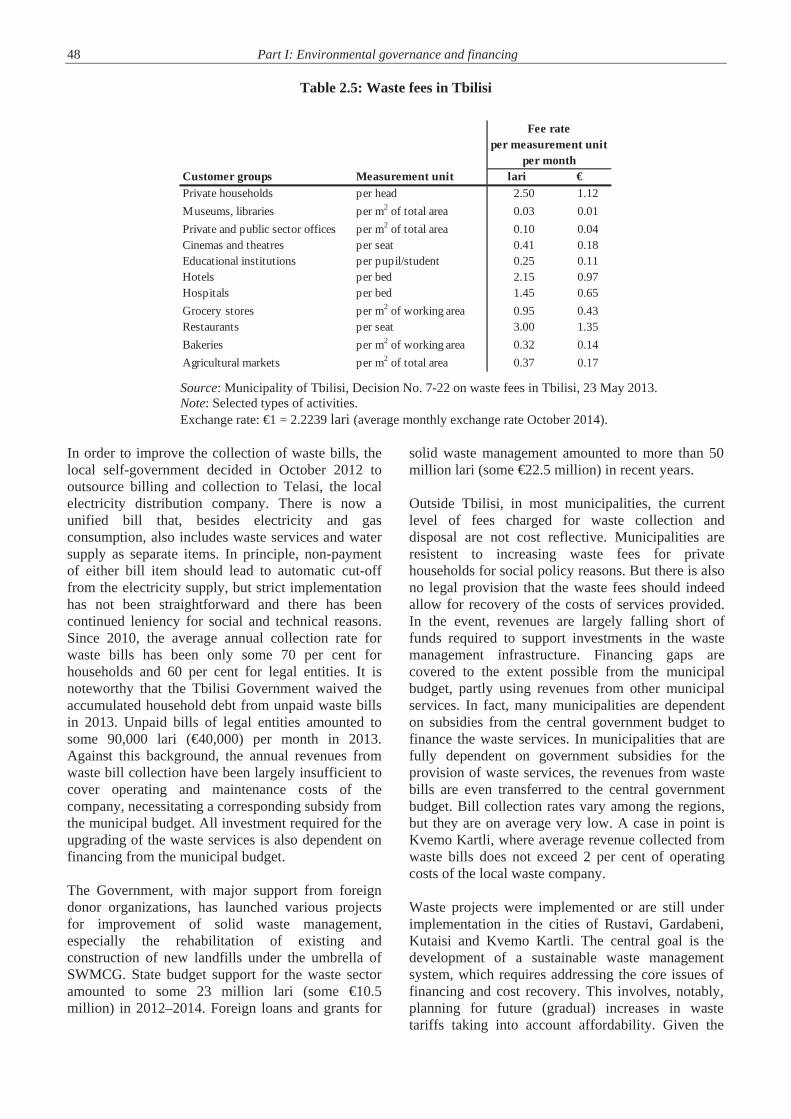
48 Part I: Environmental governance and financing
Table 2.5: Waste fees in Tbilisi
Source: Municipality of Tbilisi, Decision No. 7-22 on waste fees in Tbilisi, 23 May 2013. Note: Selected types of activities. Exchange rate: €1 = 2.2239 lari (average monthly exchange rate October 2014).
In order to improve the collection of waste bills, the local self-government decided in October 2012 to outsource billing and collection to Telasi, the local electricity distribution company. There is now a unified bill that, besides electricity and gas consumption, also includes waste services and water supply as separate items. In principle, non-payment of either bill item should lead to automatic cut-off from the electricity supply, but strict implementation has not been straightforward and there has been continued leniency for social and technical reasons. Since 2010, the average annual collection rate for waste bills has been only some 70 per cent for households and 60 per cent for legal entities. It is noteworthy that the Tbilisi Government waived the accumulated household debt from unpaid waste bills in 2013. Unpaid bills of legal entities amounted to some 90,000 lari (€40,000) per month in 2013. Against this background, the annual revenues from waste bill collection have been largely insufficient to cover operating and maintenance costs of the company, necessitating a corresponding subsidy from the municipal budget. All investment required for the upgrading of the waste services is also dependent on financing from the municipal budget. The Government, with major support from foreign donor organizations, has launched various projects for improvement of solid waste management, especially the rehabilitation of existing and construction of new landfills under the umbrella of SWMCG. State budget support for the waste sector amounted to some 23 million lari (some €10.5 million) in 2012–2014. Foreign loans and grants for
solid waste management amounted to more than 50 million lari (some €22.5 million) in recent years. Outside Tbilisi, in most municipalities, the current level of fees charged for waste collection and disposal are not cost reflective. Municipalities are resistent to increasing waste fees for private households for social policy reasons. But there is also no legal provision that the waste fees should indeed allow for recovery of the costs of services provided. In the event, revenues are largely falling short of funds required to support investments in the waste management infrastructure. Financing gaps are covered to the extent possible from the municipal budget, partly using revenues from other municipal services. In fact, many municipalities are dependent on subsidies from the central government budget to finance the waste services. In municipalities that are fully dependent on government subsidies for the provision of waste services, the revenues from waste bills are even transferred to the central government budget. Bill collection rates vary among the regions, but they are on average very low. A case in point is Kvemo Kartli, where average revenue collected from waste bills does not exceed 2 per cent of operating costs of the local waste company. Waste projects were implemented or are still under implementation in the cities of Rustavi, Gardabeni, Kutaisi and Kvemo Kartli. The central goal is the development of a sustainable waste management system, which requires addressing the core issues of financing and cost recovery. This involves, notably, planning for future (gradual) increases in waste tariffs taking into account affordability. Given the
Customer groups Measurement unit lari €Private households per head 2.50 1.12Museums, libraries per m2 of total area 0.03 0.01Private and public sector offices per m2 of total area 0.10 0.04Cinemas and theatres per seat 0.41 0.18Educational institutions per pupil/student 0.25 0.11Hotels per bed 2.15 0.97Hospitals per bed 1.45 0.65Grocery stores per m2 of working area 0.95 0.43Restaurants per seat 3.00 1.35Bakeries per m2 of working area 0.32 0.14Agricultural markets per m2 of total area 0.37 0.17
Fee rate per measurement unit
per month

Chapter 2: Economic instruments, environmental expenditures and investments for greening the economy 49 considerable investments required for upgrading the waste sector infrastructure, the Government has also been promoting the regionalization of municipal waste management based on inter-municipal cooperation, which allows for the benefits of economies of scale that help reduce unit operating and investment costs. The recent construction of a new sanitary landfill that serves Rustavi and Gardabani involved the introduction of waste recycling in Georgia based on waste sorting that separates certain materials (plastic, cellophane and cardboard) from the rest. Currently, only 3 per cent of total solid waste disposed at the landfill in Rustavi is recycled. Household budget surveys suggest that waste collection fees accounted, on average, for only 0.2 per cent of total household expenditures in 2014 (table 2.6), up from the tiny share of 0.1 per cent in 2010. This masks a somewhat higher share of 0.4 per cent for households in urban areas, whereas waste fees in rural areas are, on average, virtually non-existent. This suggests that average income earners can well afford higher waste fees.
Tariffs for water supply and sanitation services After sector reforms and consolidation during the period 2008–2010, water supply and sewerage services in Georgia are now provided mainly by the UWSCG, which covers 90 per cent of the country area and some 60 per cent of the total population. The other two major water companies are Georgia Water and Power (GWP), which services Tbilisi and Rustavi (some 32 per cent of the population) and the Batumi Water Company (BWC), which services the Ajara Autonomous Republic (some 8.5 per cent of the population). Tariff setting for water supply and sanitation services was moved from the local self-government level to GNERC as from 2008, based on the (amended) 2007 Law on Electricity and Natural Gas, No. 5466. A tariff methodology was adopted in August 2008 (2008 GNERC Resolution No. 18 on the Approval of the Methodology for Setting Water Use Tariffs). It also includes the requirement that household water consumption should be metered. A decision on maximum levels of water tariffs that can be charged by water companies was issued in August 2010 (2014 GNERC Resolution No. 17 on Adoption of Water Use Tariffs). These maximum levels are still in force (October 2014). The current tariff structure distinguishes two main consumer categories: residential consumers (private
households) and non-residential consumers (industry, commerce and public institutions). Households with meters pay a volumetric charge per m3 while those that do not have meters installed pay a flat fee per family member per month. All non-residential consumers are equipped with water meters and pay volumetric charges. Until September 2010, installation of water meters was voluntary for the population. The right of water companies to install meters for residential consumers was only established by 2010 GNERC Resolution No. 18. The percentage of households that are equipped with meters is still relatively low, though it has been increasing in recent years, reflecting the nationwide programme to install meters that was started in 2011. Among households serviced by the UWSCG, there are currently some 50 per cent with individual meters, compared with only 6.5 per cent in 2010. In Tbilisi, which is serviced by GWP, only some 20 per cent of households (mainly in private housing) are currently equipped with meters. The installation of meters in apartment blocks is scheduled to start in 2015.
Table 2.6: Household expenditures on public utility services, 2014, percentage of total
expenditures
Source: National Statistics Office, direct communication. Note: Results from household budget surveys. Data for expenditures on waste collection in rural areas are less reliable than other data.
The tariff structure is characterized by cross-subsidies from non-residential to residential consumers. Tariffs for water supply and sanitation combined for non-residential customers are more than eight times the tariff for households in the case of the UWSCG, and more than 16 times in the case of GWP (table 2.7). Tariffs for sewerage services in Georgia are much lower than drinking water tariffs for all customers, reflecting the low standards of sewerage services, if there are any at all. Thus, in the regions serviced by the UWSCG, only some 70 per cent of the urban population has access to piped water supply while only 15.5 per cent has access to a sewerage system. The current tariffs were established in December 2010, but only tariffs for metered households increased from those that had been applied since 2007.
Urban Rural TotalWaste collection 0.40 0.00 0.20Water supply 0.70 0.10 0.40Electricity 2.50 1.80 2.20Natural gas 2.50 0.60 1.70Total 6.10 2.45 4.50
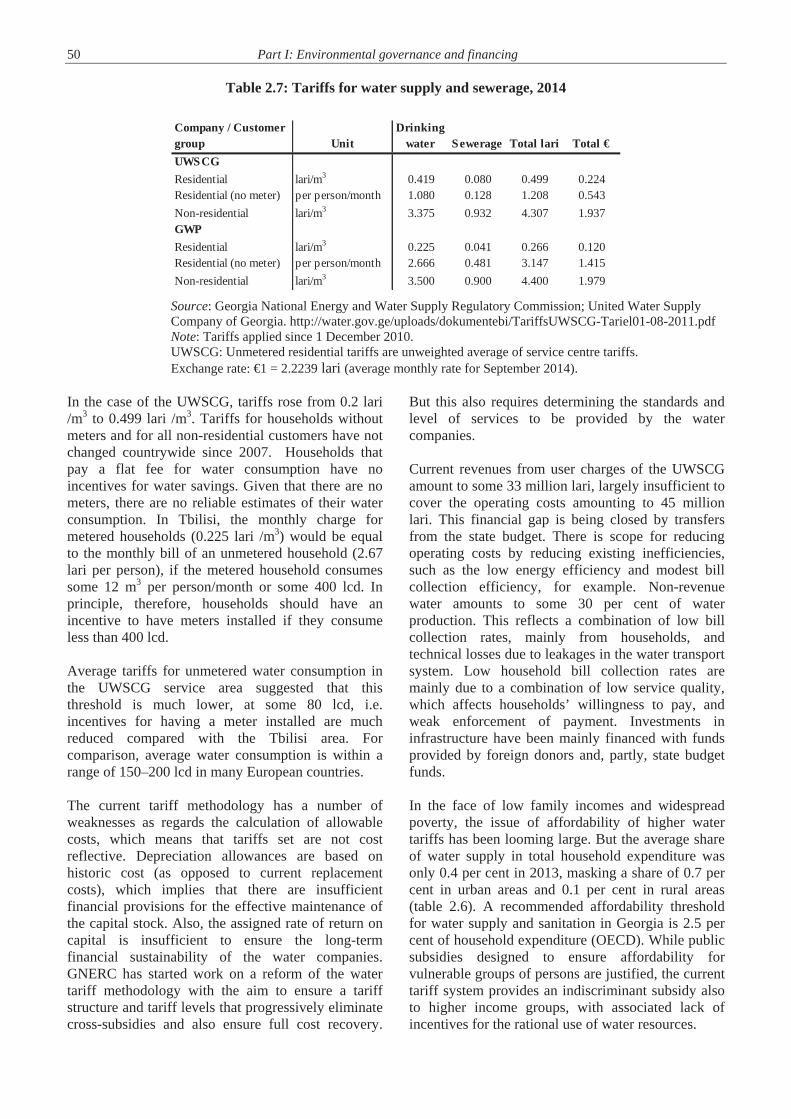
50 Part I: Environmental governance and financing
Table 2.7: Tariffs for water supply and sewerage, 2014
Source: Georgia National Energy and Water Supply Regulatory Commission; United Water Supply Company of Georgia. http://water.gov.ge/uploads/dokumentebi/TariffsUWSCG-Tariel01-08-2011.pdf Note: Tariffs applied since 1 December 2010. UWSCG: Unmetered residential tariffs are unweighted average of service centre tariffs. Exchange rate: €1 = 2.2239 lari (average monthly rate for September 2014).
In the case of the UWSCG, tariffs rose from 0.2 lari /m3 to 0.499 lari /m3. Tariffs for households without meters and for all non-residential customers have not changed countrywide since 2007. Households that pay a flat fee for water consumption have no incentives for water savings. Given that there are no meters, there are no reliable estimates of their water consumption. In Tbilisi, the monthly charge for metered households (0.225 lari /m3) would be equal to the monthly bill of an unmetered household (2.67 lari per person), if the metered household consumes some 12 m3 per person/month or some 400 lcd. In principle, therefore, households should have an incentive to have meters installed if they consume less than 400 lcd. Average tariffs for unmetered water consumption in the UWSCG service area suggested that this threshold is much lower, at some 80 lcd, i.e. incentives for having a meter installed are much reduced compared with the Tbilisi area. For comparison, average water consumption is within a range of 150–200 lcd in many European countries. The current tariff methodology has a number of weaknesses as regards the calculation of allowable costs, which means that tariffs set are not cost reflective. Depreciation allowances are based on historic cost (as opposed to current replacement costs), which implies that there are insufficient financial provisions for the effective maintenance of the capital stock. Also, the assigned rate of return on capital is insufficient to ensure the long-term financial sustainability of the water companies. GNERC has started work on a reform of the water tariff methodology with the aim to ensure a tariff structure and tariff levels that progressively eliminate cross-subsidies and also ensure full cost recovery.
But this also requires determining the standards and level of services to be provided by the water companies. Current revenues from user charges of the UWSCG amount to some 33 million lari, largely insufficient to cover the operating costs amounting to 45 million lari. This financial gap is being closed by transfers from the state budget. There is scope for reducing operating costs by reducing existing inefficiencies, such as the low energy efficiency and modest bill collection efficiency, for example. Non-revenue water amounts to some 30 per cent of water production. This reflects a combination of low bill collection rates, mainly from households, and technical losses due to leakages in the water transport system. Low household bill collection rates are mainly due to a combination of low service quality, which affects households’ willingness to pay, and weak enforcement of payment. Investments in infrastructure have been mainly financed with funds provided by foreign donors and, partly, state budget funds. In the face of low family incomes and widespread poverty, the issue of affordability of higher water tariffs has been looming large. But the average share of water supply in total household expenditure was only 0.4 per cent in 2013, masking a share of 0.7 per cent in urban areas and 0.1 per cent in rural areas (table 2.6). A recommended affordability threshold for water supply and sanitation in Georgia is 2.5 per cent of household expenditure (OECD). While public subsidies designed to ensure affordability for vulnerable groups of persons are justified, the current tariff system provides an indiscriminant subsidy also to higher income groups, with associated lack of incentives for the rational use of water resources.
Company / Customer group Unit
Drinking water Sewerage Total lari Total €
UWSCGResidential lari/m3 0.419 0.080 0.499 0.224Residential (no meter) per person/month 1.080 0.128 1.208 0.543Non-residential lari/m3 3.375 0.932 4.307 1.937GWPResidential lari/m3 0.225 0.041 0.266 0.120Residential (no meter) per person/month 2.666 0.481 3.147 1.415Non-residential lari/m3 3.500 0.900 4.400 1.979
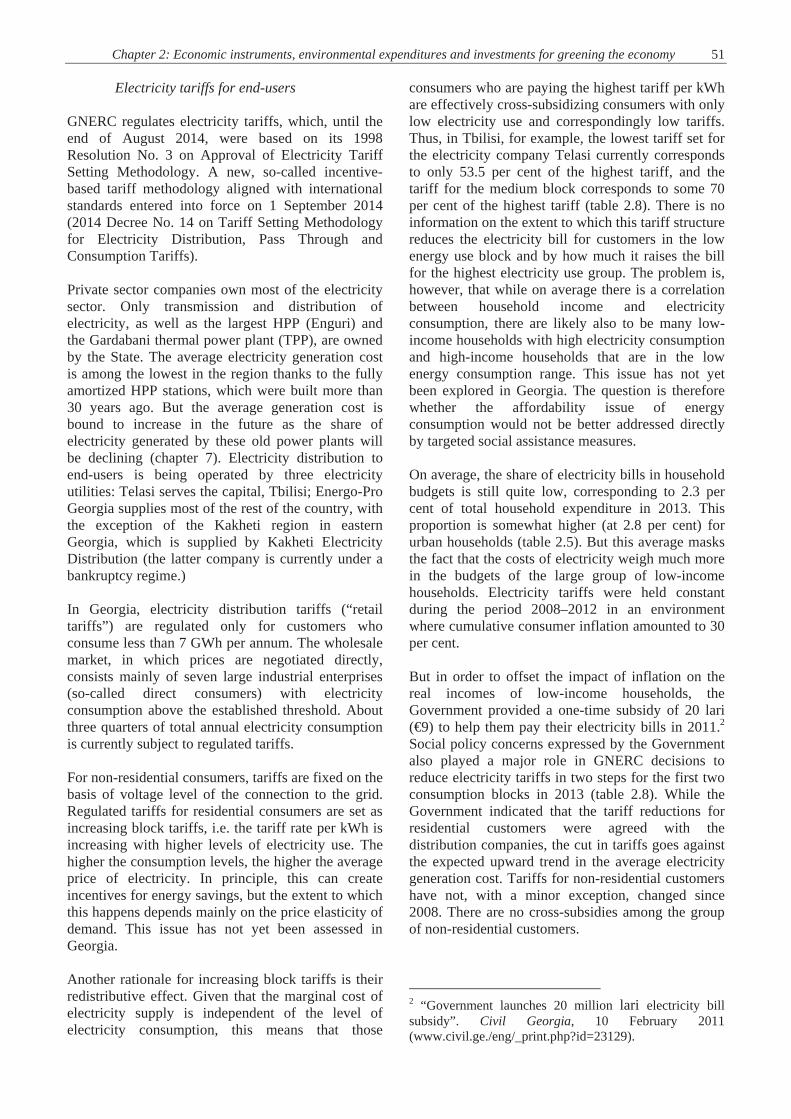
Chapter 2: Economic instruments, environmental expenditures and investments for greening the economy 51
Electricity tariffs for end-users GNERC regulates electricity tariffs, which, until the end of August 2014, were based on its 1998 Resolution No. 3 on Approval of Electricity Tariff Setting Methodology. A new, so-called incentive-based tariff methodology aligned with international standards entered into force on 1 September 2014 (2014 Decree No. 14 on Tariff Setting Methodology for Electricity Distribution, Pass Through and Consumption Tariffs). Private sector companies own most of the electricity sector. Only transmission and distribution of electricity, as well as the largest HPP (Enguri) and the Gardabani thermal power plant (TPP), are owned by the State. The average electricity generation cost is among the lowest in the region thanks to the fully amortized HPP stations, which were built more than 30 years ago. But the average generation cost is bound to increase in the future as the share of electricity generated by these old power plants will be declining (chapter 7). Electricity distribution to end-users is being operated by three electricity utilities: Telasi serves the capital, Tbilisi; Energo-Pro Georgia supplies most of the rest of the country, with the exception of the Kakheti region in eastern Georgia, which is supplied by Kakheti Electricity Distribution (the latter company is currently under a bankruptcy regime.) In Georgia, electricity distribution tariffs (“retail tariffs”) are regulated only for customers who consume less than 7 GWh per annum. The wholesale market, in which prices are negotiated directly, consists mainly of seven large industrial enterprises (so-called direct consumers) with electricity consumption above the established threshold. About three quarters of total annual electricity consumption is currently subject to regulated tariffs. For non-residential consumers, tariffs are fixed on the basis of voltage level of the connection to the grid. Regulated tariffs for residential consumers are set as increasing block tariffs, i.e. the tariff rate per kWh is increasing with higher levels of electricity use. The higher the consumption levels, the higher the average price of electricity. In principle, this can create incentives for energy savings, but the extent to which this happens depends mainly on the price elasticity of demand. This issue has not yet been assessed in Georgia. Another rationale for increasing block tariffs is their redistributive effect. Given that the marginal cost of electricity supply is independent of the level of electricity consumption, this means that those
consumers who are paying the highest tariff per kWh are effectively cross-subsidizing consumers with only low electricity use and correspondingly low tariffs. Thus, in Tbilisi, for example, the lowest tariff set for the electricity company Telasi currently corresponds to only 53.5 per cent of the highest tariff, and the tariff for the medium block corresponds to some 70 per cent of the highest tariff (table 2.8). There is no information on the extent to which this tariff structure reduces the electricity bill for customers in the low energy use block and by how much it raises the bill for the highest electricity use group. The problem is, however, that while on average there is a correlation between household income and electricity consumption, there are likely also to be many low-income households with high electricity consumption and high-income households that are in the low energy consumption range. This issue has not yet been explored in Georgia. The question is therefore whether the affordability issue of energy consumption would not be better addressed directly by targeted social assistance measures. On average, the share of electricity bills in household budgets is still quite low, corresponding to 2.3 per cent of total household expenditure in 2013. This proportion is somewhat higher (at 2.8 per cent) for urban households (table 2.5). But this average masks the fact that the costs of electricity weigh much more in the budgets of the large group of low-income households. Electricity tariffs were held constant during the period 2008–2012 in an environment where cumulative consumer inflation amounted to 30 per cent. But in order to offset the impact of inflation on the real incomes of low-income households, the Government provided a one-time subsidy of 20 lari (€9) to help them pay their electricity bills in 2011.2 Social policy concerns expressed by the Government also played a major role in GNERC decisions to reduce electricity tariffs in two steps for the first two consumption blocks in 2013 (table 2.8). While the Government indicated that the tariff reductions for residential customers were agreed with the distribution companies, the cut in tariffs goes against the expected upward trend in the average electricity generation cost. Tariffs for non-residential customers have not, with a minor exception, changed since 2008. There are no cross-subsidies among the group of non-residential customers.
2 “Government launches 20 million lari electricity bill subsidy”. Civil Georgia, 10 February 2011 (www.civil.ge./eng/_print.php?id=23129).
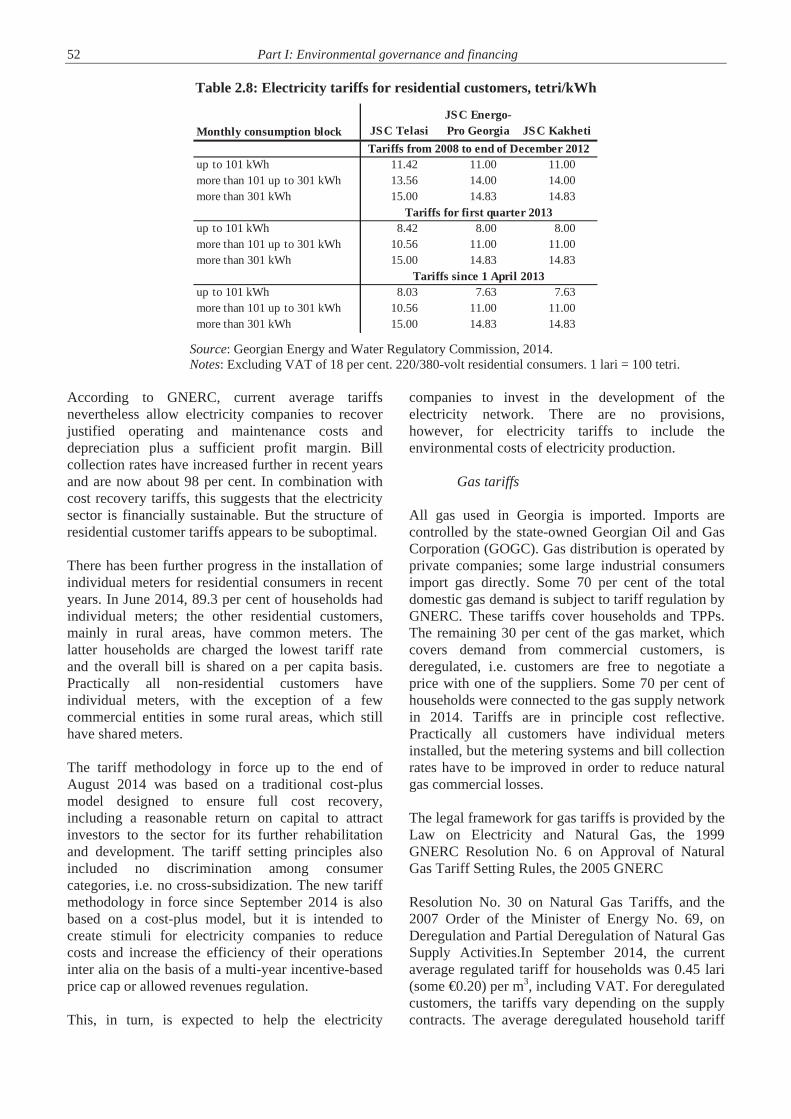
52 Part I: Environmental governance and financing
Table 2.8: Electricity tariffs for residential customers, tetri/kWh
Source: Georgian Energy and Water Regulatory Commission, 2014. Notes: Excluding VAT of 18 per cent. 220/380-volt residential consumers. 1 lari = 100 tetri.
According to GNERC, current average tariffs nevertheless allow electricity companies to recover justified operating and maintenance costs and depreciation plus a sufficient profit margin. Bill collection rates have increased further in recent years and are now about 98 per cent. In combination with cost recovery tariffs, this suggests that the electricity sector is financially sustainable. But the structure of residential customer tariffs appears to be suboptimal. There has been further progress in the installation of individual meters for residential consumers in recent years. In June 2014, 89.3 per cent of households had individual meters; the other residential customers, mainly in rural areas, have common meters. The latter households are charged the lowest tariff rate and the overall bill is shared on a per capita basis. Practically all non-residential customers have individual meters, with the exception of a few commercial entities in some rural areas, which still have shared meters. The tariff methodology in force up to the end of August 2014 was based on a traditional cost-plus model designed to ensure full cost recovery, including a reasonable return on capital to attract investors to the sector for its further rehabilitation and development. The tariff setting principles also included no discrimination among consumer categories, i.e. no cross-subsidization. The new tariff methodology in force since September 2014 is also based on a cost-plus model, but it is intended to create stimuli for electricity companies to reduce costs and increase the efficiency of their operations inter alia on the basis of a multi-year incentive-based price cap or allowed revenues regulation. This, in turn, is expected to help the electricity
companies to invest in the development of the electricity network. There are no provisions, however, for electricity tariffs to include the environmental costs of electricity production.
Gas tariffs All gas used in Georgia is imported. Imports are controlled by the state-owned Georgian Oil and Gas Corporation (GOGC). Gas distribution is operated by private companies; some large industrial consumers import gas directly. Some 70 per cent of the total domestic gas demand is subject to tariff regulation by GNERC. These tariffs cover households and TPPs. The remaining 30 per cent of the gas market, which covers demand from commercial customers, is deregulated, i.e. customers are free to negotiate a price with one of the suppliers. Some 70 per cent of households were connected to the gas supply network in 2014. Tariffs are in principle cost reflective. Practically all customers have individual meters installed, but the metering systems and bill collection rates have to be improved in order to reduce natural gas commercial losses. The legal framework for gas tariffs is provided by the Law on Electricity and Natural Gas, the 1999 GNERC Resolution No. 6 on Approval of Natural Gas Tariff Setting Rules, the 2005 GNERC Resolution No. 30 on Natural Gas Tariffs, and the 2007 Order of the Minister of Energy No. 69, on Deregulation and Partial Deregulation of Natural Gas Supply Activities.In September 2014, the current average regulated tariff for households was 0.45 lari (some €0.20) per m3, including VAT. For deregulated customers, the tariffs vary depending on the supply contracts. The average deregulated household tariff
Monthly consumption block JSC Telasi JSC Energo-Pro Georgia JSC Kakheti
up to 101 kWh 11.42 11.00 11.00more than 101 up to 301 kWh 13.56 14.00 14.00more than 301 kWh 15.00 14.83 14.83
up to 101 kWh 8.42 8.00 8.00more than 101 up to 301 kWh 10.56 11.00 11.00more than 301 kWh 15.00 14.83 14.83
up to 101 kWh 8.03 7.63 7.63more than 101 up to 301 kWh 10.56 11.00 11.00more than 301 kWh 15.00 14.83 14.83
Tariffs from 2008 to end of December 2012
Tariffs for first quarter 2013
Tariffs since 1 April 2013
Chapter 2: Economic instruments, environmental expenditures and investments for greening the economy 53 amounts to 0.53 lari (€0.23), including VAT. The lower tariff in the regulated market compared with the deregulated market reflects a deliberate policy of supplying “social gas” to households and TPPs.
Renewable energy tariffs Hydropower is the most important source of electricity in Georgia, and there is a very large undeveloped hydropower potential. But there is also wind and solar energy potential, which is still to be exploited (chapter 7). There is no primary legislation that addresses renewable energy and there is no special feed-in tariff regime for small hydropower and other sources of renewable energy. A recent amendment to the Law on Electricity and Natural Gas, however, created the possibility for the Electricity System Commercial Operator (ESCO) to buy hydropower produced by new HPPs at the long-term fixed tariff during winter months. The activities of all newly constructed HPPs, including small renewable projects, are deregulated and therefore fall outside the remit of GNERC. In the event, tariffs depend on the negotiation skills of the investors engaged in renewable projects. 2.2 Financial resources for environmental protection The three main sources of domestic environmental protection expenditures are the state (central government) budget, local self-government budgets, and foreign funds provided by international financial institutions (IFIs) and other international donors, as well as bilateral donors. Most of the domestic environmental expenditures have been made at local self-government level, but these are largely financed by transfers from the central government budget and foreign resources. There is no information on business sector expenditure on environmental protection.
Legal and institutional framework Georgia has made progress in improving its public sector budgetary and financial management framework pertaining to strategic budget planning, budget formulation and execution. As from 2010, the Basic Data and Directions (BDD) document provides a medium-term budget framework, which was established by the 2009 Budget Code. The BDD allocates multi-year budget ceilings based on government priorities that are established in the medium-term action plans of each ministry. The Government also adopted a plan for moving towards programme budgeting (10 March 2010 Government Decree No. 284 on Adoption of the Plan of
Establishing Programme Budgeting). Programme budgeting involves, notably, linking the costs of government activities within a given programme with outputs or outcomes measured by performance indicators. This is, however, a complex task and implementation remains a challenge. A marked feature of Georgia’s fiscal system is the low degree of fiscal decentralization. While each local self-government body has its own independent budget, the only own tax revenue source is the property tax, which is, however, centrally administrated. There are, moreover, a number of non-tax revenues such as administrative fines and fees for use of natural resources on the territory of a local self-government unit. The financial resources generated by the property tax and the other charges, however, are largely insufficient for financing the responsibilities (“competencies”) assigned to local self-government in the Local Self-Government Code. The upshot is that local self-government bodies are dependent on financial transfers from the central government budget for fulfilling these functions. These transfers have accounted, on average, for some 70 per cent of total local self-government revenues and outlays since 2010. Some of these transfers can be freely used by local self-governments (the so-called equalization grants), but other transfers are allocated for covering the costs of specific tasks delegated by the central government (“specific transfers”) or earmarked for implementation of specific projects such as rehabilitation of municipal infrastructure (“earmarked transfers”). Borrowing by local self-governments from commercial banks, moreover, is only possible with the consent of the central government and limited to short-term loans (3–6 months) for the financing of current expenditures, such as salaries. Loans are also available from the central government and the Municipal Development Fund (see below) but conditions for obtaining such loans are quite restrictive. To address these problems, in March 2013, the Government adopted a policy document, “The Main Principles of the Strategy on Decentralization and Self-Government Development”, which provides inter alia a preliminary framework for public financing of municipal and regional development. A new Local Self-Government Code was, moreover, adopted by Parliament in February 2014. It is designed to promote increased decentralization of public service delivery and the building of local institutional capacity as required for a more effective local self-government system. But the necessary legislative changes of the Budget Code have still to be decided on. The 2014 Local Self-Government

54 Part I: Environmental governance and financing
Code also foresees a reform of intergovernmental finances, notably involving the local administration of property taxes, introduction of shared taxes and a minimum “equalization transfer” from the central government to local self-government units, designed to ensure more balanced availability of resources for the financing of municipal services. The 2014 Code also stipulates the availability of capital transfers from the state budget for the financing of infrastructure projects. Local self-governments, moreover, have limited capacities with regard to the planning, budgeting and managing of municipal services to be provided to citizens. Municipal development strategies, including infrastructure investment plans, are largely absent. The planning and implementation of important municipal infrastructure projects is strongly dependent on central government capacities (financial and human) and foreign assistance. This is also reflected in the current centralization of management of municipal infrastructure projects in the water and waste sector in the Ministry of Regional Development and Infrastructure and its SWMCG, and in the UWSCG. In fact, the Ministry was established in 2009 with the mandate to coordinate the regional and local development process in Georgia. Another public institution involved in the financing of municipal infrastructure projects is the Municipal Development Fund, which was established in 1997 as an independent LEPL. It has the general mandate to strengthen the institutional and financial capacity of local self-government units. The Fund is the major national implementing agency of projects financed by foreign donors designed to improve municipal services and infrastructure, such as water supply and wastewater treatment systems, irrigation and drainage systems, local and regional roads, and small HPPs. The main sources of financing for these projects are IFIs (such as the Asian Development Bank [ADB], European Bank for Reconstruction and Development [EBRD], European Investment Bank [EIB] and World Bank) and bilateral donors (such as the German development bank KfW, the Millennium Challenge Corporation [MCC] and USAID, and Swedish International Development Cooperation [SIDA]). These international loans and grants are generally supplemented by state budget and local self-government funds. Among the main tasks of the Municipal Development Fund is to ensure the effective evaluation, prioritization and financing of projects. Since 2010, the Fund has had an Environmental Protection Analysis Division for the coordination of environmental issues associated with the planning and implementation of projects, such as
the conduct of EIA, the organization of public hearings and environmental monitoring during project implementation. Public–private partnerships (PPPs) for the provision of municipal utility services (water supply and sewerage, solid waste management) hardly exist in Georgia. The legal base for the involvement of PPPs in the provision of municipal infrastructure and municipal services is the 1994 Law on the Procedure for Granting Concessions to Foreign Countries and Companies. The Law appears, however, to be limited to concessions for natural resources and related leasing arrangements. An EBRD assessment of the legal framework for PPPs concludes that Georgia’s legislation is in low compliance with international standards and does not constitute a sufficiently solid basis for the development of PPPs. A potential source for supporting environment-related projects could also be the Partnership Fund. This fully state-owned investment fund was established in 2011. It has the mandate to manage the key national enterprises operating in the infrastructure sector (transport, energy and power). It owns 100 per cent of the shares of the joint stock companies Georgian Railways, Georgian Oil and Gas Corporation (GOGC), Georgian State Electrosystem (GSE) and Electricity System Commercial Operator (ESCO). The Government plans to reorganize the Partnership Fund to become an investment unit of a future Georgian sovereign fund. Another main mandate of the Fund is to develop private equity investments in economically viable projects. Key areas are energy, agriculture, manufacturing, real estate and tourism.
Policy framework National Environmental Action Programme
The Government has had difficulties as regards the development and implementation of a National Environmental Action Plan (NEAP). A first action plan (NEAP-1) was adopted for the period 2000–2004, but its implementation was not very successful given that it was not directly linked to the budget process to ensure availability of sufficient financial resources. A NEAP 2005–2008 was developed but not implemented. Efforts by the Ministry of Environment and Natural Resources Protection to have adopted a second NEAP, that was developed for 2008–2012, were also not successful. However, in January 2012, the Government adopted a second National Environmental Action Programme (NEAP-2) for the period 2012–2016. It is based on the 2012 Government Decree No. 127. Timeframes for
Chapter 2: Economic instruments, environmental expenditures and investments for greening the economy 55 achieving a large range of specific measures are identified as well as the broad cost categories (low, medium and high), potential financing sources (central and local self-government budgets, IFIs, foreign donors) and achievement indicators. To date, there has been no formal assessment of the progress made with implementation of NEAP-2. There is neither a specific cost estimate for the various individual measures envisaged nor an estimate of the overall financial resources that would be required to implement all these measures. There is also no costing of the various measures implemented so far within the framework of NEAP-2.
State Strategy Regional Development of Georgia The broad goal of the 2010 State Strategy Regional Development of Georgia 2010–2017, Government Resolution No. 172, is to create conducive conditions for regional economic development and the improvement of living standards. The Strategy defines medium-term priorities and objectives for a given region as well as the means for achieving them. The key objectives are to improve municipal and regional infrastructure services (water supply, water drainage, waste management, roads, etc.) and institutional capacity at the regional and local levels. Environmental protection is, in general, integrated into these regional strategies. Until 2014, the Government had developed regional development strategies for the period up to 2017 or 2021 for all nine regions (i.e. administrative-territorial units) of Georgia.
Socio-Economic Development Strategy of Georgia (“Georgia 2020”) The Government adopted the Socio-Economic Development Strategy of Georgia (“Georgia 2020”) in June 2014. The central objective of this national strategy is to promote economic growth with the aim to raise employment and the overall living standards of the population. A key target is to raise GDP per capita more than twofold in 2020 compared with 2013. The Strategy contains a range of measures to stimulate competitiveness in major economic sectors, notably in agriculture, designed to promote the growth of exports. The challenge will be to ensure the effective consideration and integration of environmental protection into this growth strategy.
Green economy initiatives Georgia does not have an official strategy for “greening” economic growth. Opportunities for fostering green growth exist in a large number of
areas, such as energy efficiency, material use efficiency, organic agriculture and the food industry, sustainable forest management and wood processing, transport of goods and persons, and eco-tourism. The areas of energy, transport and water management (e.g. the Black Sea) also provide opportunities for green regional and subregional activities. Among the main challenges are the mainstreaming of sustainable consumption and production (SCP) into national legislation and development plans, and the promotion of SEA and EIA as planning instruments. Government budgets alone cannot mobilize the resources required for financing the necessary “green investments”; rather, private finance has to play a key role. It is therefore important that there are effective incentives for promoting private sector investments. Also, the role of commercial banks in providing loans for green business investments has to be strengthened. So far, commercial banks have mainly offered specific environmental credit lines when supported by IFIs and donors. There are currently two government-owned funds in Georgia that aim to leverage private investment. The Georgian Energy Development Fund (GEDF) was established in 2010. It has the legal form of a joint stock company, but is currently fully state owned. It operates under the supervision of the Ministry of Energy. Its main assignment is to promote the development of the renewable energy investment projects (mainly hydropower) and attract potential investors. The state-owned Georgian Green Energy Development Company, which was created in 2011 and is operated under the supervision of the Georgian Oil and Gas Corporation (GOGC), was merged with the GEDF in 2012. Furthermore, there is a Renewable Energy Fund set up by KfW, which leverages investments in renewable energy infrastructure, notably hydropower, by enabling Georgian commercial banks to lend corresponding funds to domestic companies. Since 2013, Georgia has been a member of the Eastern Europe Energy Efficiency and Environment Partnership, which is a multi-donor fund that aims at promoting energy efficiency and environmental investment at local self-government level in EU Eastern Partnership countries. These funds are then used to leverage national funds and loans from IFIs, which include the EBRD, EIB, World Bank, Nordic Environment Finance Corporation and Nordic Investment Bank.Georgia is currently included in a multi-country EU programme, Greening Economies in the Eastern Neighbourhood (EaP GREEN), which also includes Armenia, Azerbaijan, Belarus, the Republic of Moldova and Ukraine. The programme aims at
56 Part I: Environmental governance and financing
promoting sustainable consumption and production patterns that help decouple economic growth from environmental degradation and natural resource depletion. The programme is being implemented by the Organisation for Economic Co-operation and Development (OECD), ECE, UNEP and the United Nations Industrial Development Organization (UNIDO) during the period 2013–2016. The European Commission, the four implementing organizations and other donors are financing the programme.
Government expenditures on environmental protection The temporary transfer of some functions and staff of the Ministry of Environment and Natural Resources Protection (use of natural resources, nuclear and radioactive regulations) to the correspondingly renamed Ministry of Energy and Natural Resources during 2011–2012 is reflected in the level of funds allocated to the Ministry of Environment and Natural Resources Protection during the period 2010–2014. In 2014, state budget allocations corresponded to 26.8 million lari (€12 million) or 0.4 per cent of total central government expenditure (table 2.9). Financial resources of the Ministry were, however, augmented by grants and other donor funds, nearly all of which were intended to support the Agency of Protected Areas (APA), an LEPL operating under the supervision of the Ministry of Environment and Natural Resources Protection. In 2013, donor funds to the APA, mainly for financing the operating costs of the protected area system, were only slightly lower than the allocated funds from the state budget. Another source of financial resources for the legal entities operating under the Ministry of Environment and Natural Resources Protection are own revenues from fees for various services provided. Thus, the APA’s own fees from visitor services and concessions have increased steadily since 2010, but they cover only a small part of the total resources required for managing the protected area system. In 2013, the APA had total resources of 11.7 million lari (some €5.3 million), of which own revenues accounted for only some 1.1 million lari or 10 per cent. Some 45 per cent of the total APA budget was accounted for by donor funds, the main contributor being the Caucasus Nature Fund. As regards the NEA, own revenues for forest-use-related charges amounted to 12.4 million lari (€5.6 million) in 2013, corresponding to 90.5 per cent of the total funds available to it. Own revenues, from
licence fees, accounted for nearly 40 per cent of the total budget of the NEA during the period 2011–2013. The Licence Department became part of NEA in 2013. In 2013 revenues from licences issuance constituted 87.9 per cent of the NEA’s total budget, while in 2014 - 96.6 per cent. All told, own revenues of its various legal entities accounted for some 37 per cent of the total funds available to the Ministry of Environment and Natural Resources Protection in 2013. But these aggregate total funds available to the Ministry corresponded to only 0.6 per cent of total central government expenditure. Total general government expenditure on environmental protection – based on the Classification of Functions of Government (COFOG) – corresponded to 1.6 per cent of total general government outlays in 2013, or 0.5 per cent of GDP (table 2.10). On average, more than 75 per cent of these expenditures occurred at the local self-government level. Still, environmental expenditures accounted for only 3.6 per cent of local self-government budgets in 2012. As noted above, it is earmarked transfers from the central government that actually finance the large bulk of these local self-government expenditures on environmental protection. On average, the bulk of general government expenditure on environmental protection has aimed at improving the municipal infrastructure for waste collection and disposal (some 60 per cent) and wastewater treatment (12 per cent). Another 18.5 per cent was allocated to protection of biodiversity and landscape (table 2.11). To a large extent, the government expenditures related to the rehabilitation of environmentally related municipal infrastructure are financed from a special budget line of the state budget, viz. a “Regional fund for implementing regional infrastructure projects”, which is administrated by the Ministry of Regional Development and Infrastructure. The projects financed from this “fund” include, notably, improvement of local and regional roads, rehabilitation of water supply infrastructure and other municipal infrastructure. The fund had an overall financial envelope of 449 million lari (€195 million) in 2013 and 297 million lari (€130 million) in 2012, which, however, also includes loans and grants provided by foreign donors. In a more general way, projects financed by the fund support the priorities defined in the State Strategy Regional Development of Georgia 2010–2017.

Chapter 2: Economic instruments, environmental expenditures and investments for greening the economy 57
Table 2.9: Budget of the Ministry of Environment and Natural Resources Protection, 2010-2014, million lari
Source: Ministry of Environment and Natural Resources Protection; ECE calculations.Note: Planned budget for 2014. Exchange rate: €1 = 2.2239 lari (average monthly rate for October 2014).
Table 2.10: Government expenditures on environmental protection according to functional classification
of expenditures (COFOG), 2009–2013, million lari
Source: Ministry of Finance; ECE calculations. Note: Exchange rate: €1 = 2.2239 lari (average monthly rate for October 2014).
Table 2.11: General government environmental expenditure, 2009-2013, million lari
Source: Ministry of Finance; ECE calculations. Notes: COFOG = Classification of Functions of Government. Exchange rate: €1 = 2.2239 lari (average monthly rate for October 2014).
As noted above, another public institution involved in municipal infrastructure projects is the Municipal Development Fund. In September 2014, the projects executed or under execution during the period 2009–2014 involved expenditures of some 280 million lari (€125 million) for water supply rehabilitation works financed by the EIB and ADB; the corresponding
amount for sewerage infrastructure was some 15.5 million lari (€6.7 million). The total value of projects implemented since 1997 amounts to more than US$1.2 billion. Most of these foreign donors’ projects are being managed using the donors’ own procedures as regards procurement, disbursements, audit and reporting, and they are not included in the
Budget sources 2010 2011 2012 2013 2014Allocations from state budget 28.2 13.7 16.0 21.2 26.8Own revenues of legal entities of public law (LEPLs) 1.5 3.8 15.7 16.0 15.0 Agency for Protected Areas 0.1 0.4 0.7 1.1 1.5 National Forestry Agency 0.0 1.9 13.7 12.4 4.9 Forestry Sapling 0.4 0.2 0.1 0.2 0.2 Env. Information and Education Centre 0.0 0.0 0.0 0.0 0.1 National Environmental Agency 0.9 1.3 1.2 2.2 8.3Total funds of Ministry 31.2 21.3 47.4 53.2 56.8Memorandum item:Total funds in € million 15.6 9.4 16.1 19.3 21.3State budget funds as per cent of total government expenditures 0.4 0.2 0.2 0.3 0.4Total funds as per cent of total government expenditures 0.5 0.3 0.5 0.6 0.6
Government sector 2009 2010 2011 2012 2013State budget 28.69 18.03 24.68 21.78 30.98Local government budget 86.31 106.00 86.13 66.73 109.20Total 115.00 124.03 110.81 88.51 140.21Memorandum itemsTotal in € million 51.71 55.77 49.82 39.80 63.04Total as per cent of general government expenditures 1.60 1.70 1.30 1.00 1.60Total as per cent of GDP 0.64 0.60 0.46 0.34 0.52
COFOG Code / Domain 2009 2010 2011 2012 20137051 Waste collection, recycling and disposal 61.84 75.76 63.47 33.91 75.147052 Wastewater management 15.07 13.71 11.94 14.32 15.667053 Pollution abatement 5.01 4.12 2.73 0.89 0.657054 Protection of biodiversity and landscape 12.85 19.10 21.44 26.16 27.547055 R&D in environmental protection 1.18 0.99 0.00 0.00 0.007056 Environmental protection n.e.c. 19.06 10.35 11.22 13.22 21.21705 Total 115.00 124.03 110.81 88.51 140.21705 Total in € million 51.71 55.77 49.82 39.80 63.04
58 Part I: Environmental governance and financing
state budget. Besides the Municipal Development Fund, implementation of these projects has also involved UWSCG and SWMCG. The Ministry of Environment and Natural Resources Protection (Division of International Relations) maintains a database on donor-funded environmental projects. The aggregate project values amounted to some €132 million in September 2014 (implementation period 2008–2017), of which some €75 million are grants. The Ministry of Environment and Natural Resources Protection organizes biannual donor coordination meetings designed to exchange information on ongoing and planned projects funded by external resources.
Carbon credits from Clean Development Mechanism projects Georgia is a non-Annex I party to the United Nations Framework Convention on Climate Change (UNFCCC) and participates in the Clean Development Mechanism (CDM) on a voluntary basis. Georgia has registered six projects (at September 2014), which generate certified emission reduction (CER) credits that can be sold in the international carbon market. Currently, the total amount of CER credits is projected to be some 14.9 million over the period up to 2020. Georgia’s CDM projects, which are not yet all operational, include the Enguri HPP rehabilitation project, which is supported by the EBRD and generates a large part of the projected CERs. 2.3 Conclusions and recommendations In Georgia, the management of environmental pollution does not rely on pollution charges to create economic incentives for reducing emissions of air and water pollutants to acceptable standards. Given the structural changes in the economy, the main preoccupation as regards air pollution is now the urban road transport sector. Excise duties on motor fuels, in combination with technical regulations, can be regarded as an instrument not only for reducing pollution associated with the use of motor vehicles but also to generate government revenue for financing the operation and maintenance of the road network. The excise duties applied in Georgia appear, however, to be rather low for creating such incentives. In a similar vein, the excise duty levied on imports of motor vehicles creates wrong incentives by favouring the purchase of older vehicles, which are, in general, more polluting than newer cars.
Recommendation 2.1: The Government should: (a) Consider reforming the system of excise
duties on imported motor vehicles to eliminate the financial incentives for purchasing older vehicles;
(b) Increase excise duty rates on motor fuels, including a surcharge to support improvement and maintenance of the road network.
In the water sector, the control of water contamination remains a major challenge, which could be effectively and efficiently addressed by combining the use of pollution charges with stringent water pollution standards. Moreover, charges for use of water are not creating incentives for rational use of water resources. In fact, there are no payments of fees for surface water abstraction, which notably benefits the HPPs. The fees applied for groundwater abstraction are very low. Tariffs for irrigation water are not volumetric but per ha of irrigated land and even irrespective of the crops. Water supply and sewerage tariffs for households are quite low, reflecting a considerable cross-subsidy from the business sector. Water supply tariffs are not cost reflective and revenues allow only partial recovery of operating and maintenance costs. A very large proportion of households have no water meters installed and pay a flat fee per person, i.e. there are no incentives at all for water savings. The upshot of all of the above is that both the polluter-pays and user-pays principles are not satisfied in the water sector. Recommendation 2.2: The Government, or, where appropriate, GNERC, should take measures designed to ensure the effective and (environmentally and financially) sustainable management of water resources, including: (a) Reintroduction of water pollution charges as
part of a more effective policy mix for achieving stringent water quality standards;
(b) Taking the necessary legal steps to introduce a system of payments for surface water abstraction for all user groups;
(c) Ensuring that charge rates for groundwater and irrigation water provide incentives for the rational use of water resources;
(d) Raising water supply and sewerage tariffs to levels that are cost reflective, taking into account issues of affordability for vulnerable persons;
(e) Extending the water meter installation programme to all households.

Chapter 2: Economic instruments, environmental expenditures and investments for greening the economy 59 Recommendation 2.3: The Government should implement a general metering programme for the use of irrigation water when upgrading the infrastructure of the irrigation sector. Major efforts are under way for the upgrading of the municipal waste management sector. Charges for municipal waste services are regulated by local self-governments subject to maximum charge rates established in the 1998 Law on Local Fees, which is outdated. All households benefit from very low tariffs, given that local self-governments treat waste management as a kind of social policy. Waste charges are not cost reflective. Revenues from collection of waste bills are not retained by the municipal waste companies but allocated to the general municipal budget. This provides little incentive for waste companies to improve the efficiency of their operations and for households to minimize waste. Modern instruments for waste management such as a deposit-refund system, extended producer responsibility or a tax on plastic bags have not been applied yet. Recommendation 2.4: The Government, in cooperation with local authorities, should: (a) Gradually optimize waste tariffs to cost-
reflective levels, taking into account affordability, while at the same time eliminating existing cross-subsidies between legal entities and private households;
(b) Improve collection rates for waste bills; (c) Provide municipal waste companies with
greater operational and financial autonomy based on annual performance contracts;
(d) Introduce modern waste management tools, e.g., deposit-refund systems.
Use of natural resources requires a licence, which is sold in auctions organized by the Government. The corresponding revenue is tantamount to a natural
resource use tax. This instrument is supplemented by a system of user charges – tantamount to a royalty – for the effective extraction of a given volume of natural resources. The question, however, is to what extent these instruments have allowed the Government to have a fair share in the natural resource rent accruing to the firms that are exploiting the natural resources. This depends on the degree of effective competition among bidders for licences and, notably in the case of a single auction participant, the setting of the starting price for such auctions. There is, moreover, a risk of collusion among firms given that the “losers” are not restituted the financial deposit they had to make. Auctions for licences have notably been used for transferring long-term forest use rights to private investors in the assumption that this would ensure adequate forest management and forest use. But experience in Georgia shows that this is not automatic and, instead, an adequate governance and regulatory framework is required. Recommendation 2.5: The Government should: (a) Consider reviewing the system of auctions for
the right to extract natural resources to ensure that competitive conditions maximize revenues for the State budget;
(b) Ensure that due account is taken of economic valuation criteria in the setting of opening prices for such auctions and the determination of user fees (royalties) for natural resource extraction;
(c) Support resource-exploiting enterprises in taking adequate measures to ensure that the external environmental costs of natural resource extraction are taken into consideration by the enterprise in its decision-making;
(d) Create an overall adequate governance and regulatory framework for natural resource extracting activities and ensure its enforcement.

PART II: MEDIA AND POLLUTION MANAGEMENT

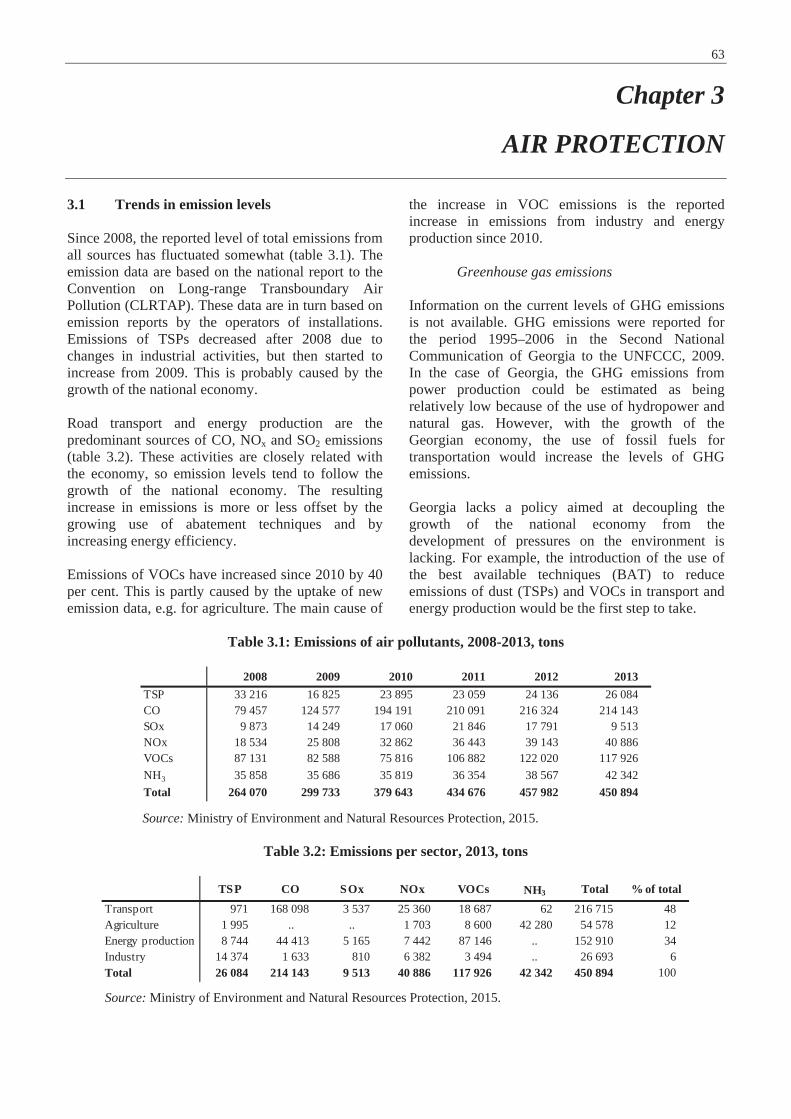
63
Chapter 3
AIR PROTECTION
3.1 Trends in emission levels Since 2008, the reported level of total emissions from all sources has fluctuated somewhat (table 3.1). The emission data are based on the national report to the Convention on Long-range Transboundary Air Pollution (CLRTAP). These data are in turn based on emission reports by the operators of installations. Emissions of TSPs decreased after 2008 due to changes in industrial activities, but then started to increase from 2009. This is probably caused by the growth of the national economy. Road transport and energy production are the predominant sources of CO, NOx and SO2 emissions (table 3.2). These activities are closely related with the economy, so emission levels tend to follow the growth of the national economy. The resulting increase in emissions is more or less offset by the growing use of abatement techniques and by increasing energy efficiency. Emissions of VOCs have increased since 2010 by 40 per cent. This is partly caused by the uptake of new emission data, e.g. for agriculture. The main cause of
the increase in VOC emissions is the reported increase in emissions from industry and energy production since 2010.
Greenhouse gas emissions Information on the current levels of GHG emissions is not available. GHG emissions were reported for the period 1995–2006 in the Second National Communication of Georgia to the UNFCCC, 2009. In the case of Georgia, the GHG emissions from power production could be estimated as being relatively low because of the use of hydropower and natural gas. However, with the growth of the Georgian economy, the use of fossil fuels for transportation would increase the levels of GHG emissions. Georgia lacks a policy aimed at decoupling the growth of the national economy from the development of pressures on the environment is lacking. For example, the introduction of the use of the best available techniques (BAT) to reduce emissions of dust (TSPs) and VOCs in transport and energy production would be the first step to take.
Table 3.1: Emissions of air pollutants, 2008-2013, tons
Source: Ministry of Environment and Natural Resources Protection, 2015.
Table 3.2: Emissions per sector, 2013, tons
Source: Ministry of Environment and Natural Resources Protection, 2015.
2008 2009 2010 2011 2012 2013TSP 33 216 16 825 23 895 23 059 24 136 26 084CO 79 457 124 577 194 191 210 091 216 324 214 143SOx 9 873 14 249 17 060 21 846 17 791 9 513NOx 18 534 25 808 32 862 36 443 39 143 40 886VOCs 87 131 82 588 75 816 106 882 122 020 117 926NH3 35 858 35 686 35 819 36 354 38 567 42 342Total 264 070 299 733 379 643 434 676 457 982 450 894
TSP CO SOx NOx VOCs NH3 Total % of total
Transport 971 168 098 3 537 25 360 18 687 62 216 715 48Agriculture 1 995 .. .. 1 703 8 600 42 280 54 578 12Energy production 8 744 44 413 5 165 7 442 87 146 .. 152 910 34Industry 14 374 1 633 810 6 382 3 494 .. 26 693 6Total 26 084 214 143 9 513 40 886 117 926 42 342 450 894 100

64 Part II: Media and pollution management 3.2 Pressures
Agriculture The most important pollutant to air by agricultural activities is ammonia (NH3) (table 3.3). Other pollutants from agriculture that can be relevant are pesticides, especially pesticides from old stocks. No data are available on the use of pesticides. Ammonia contributes to increased levels of reactive nitrogen in water and soil and is a precursor for the formation of secondary aerosol. The deposition of nitrogen can be assessed by comparing the calculated deposition to the maximum critical load for areas that have to be protected. These are forests or natural reserves that are susceptible to eutrophication due to increased levels of nitrogen.Currently, no information on critical loads from agriculture is available in Georgia.
Energy The production of electric power is mainly based on the use of hydropower and natural gas. The three most important fossil-fuel-fired power plants (JSC Energy Invest, LTD Mtkvari Energy and JSC Tbilsresi) are located in Gardabani, and consume natural gas. Those sources do not pollute locally because of their high stacks and use of natural gas as a fuel. A gas-fired power plant of 230 MW located close to Gardabani is meant to operational in 2015. General information about the dry low NOx gas turbine shows a NOx emission in the order of magnitude of 25 ppm. Combined with a predicted annual power production of 1.8 TWh, this would result in an estimated annual mass flow of about 1 kton NOx.
Industry Until 2009, emissions from industrial sources have decreased (table 3.5). This was due to the termination
of operations at several installations and the application of emission abatement measures at other installations. Dust filters have been installed at the cement plants in Rustavi and Kaspi to reduce emissions of particulate matter (PM) to a level that is in line with the European standards for BAT. The installation of these filters is the outcome of the policy towards environmental protection of the management of these plants (Heidelberg Cement Georgia) (chapter 8). Since 2009, industrial activities have recommenced, leading to an increase in emissions (figure 3.2). For several sites near industrial installations, information is available based on local air quality monitoring stations. According to the Report on the State of the Environment (SoE) for the period 2007–2009, the levels of air pollution exceeded national standards for air quality in Batumi, Kutaisi, Tbilisi and Zestafoni, for TSP, SO2, NO2 and MnO2. In Batumi, Kutaisi and Zestafoni, these exceedances are mainly caused by industrial activities. The highest exceedance was established in Zestafoni (figure 3.1). The levels of manganese oxides concentration, due to the local metallurgical plant, were more than five times higher than the maximum allowed concentrations (MACs). It is not clear whether actions have been undertaken to reduce the emissions of the industrial installations.
Transport Measurements performed under the existing, limited air quality monitoring system show that concentrations of most measured pollutants in specific locations can be higher than national MACs. In urban areas, these hotspots are for the most part caused by transport emissions. Transport is also the major source of emissions of CO, NOx and SO2 on a national level. Most emissions that are related to transportation, i.e. NOx, SO2 and NMVOCs, are steadily increasing (table 3.6).
Table 3.3: Emissions from agriculture, 2008-2013, tons
Source: Ministry of Environment and Natural Resources Protection, 2014.
2008 2009 2010 2011 2012 2013NH3 35 800 35 530 35 765 36 289 38 507 42 280NOx 1 350 1 525 1 324 1 144 1 309 1 703NMVOCs 7 495 7 271 7 427 7 658 7 958 8 600TSP 1 710 1 707 1 709 1 732 1 869 1 995PM 10 514 452 401 409 405 485PM 2.5 20 17 15 16 16 19Total 46 887 46 502 46 640 47 248 50 064 57 093
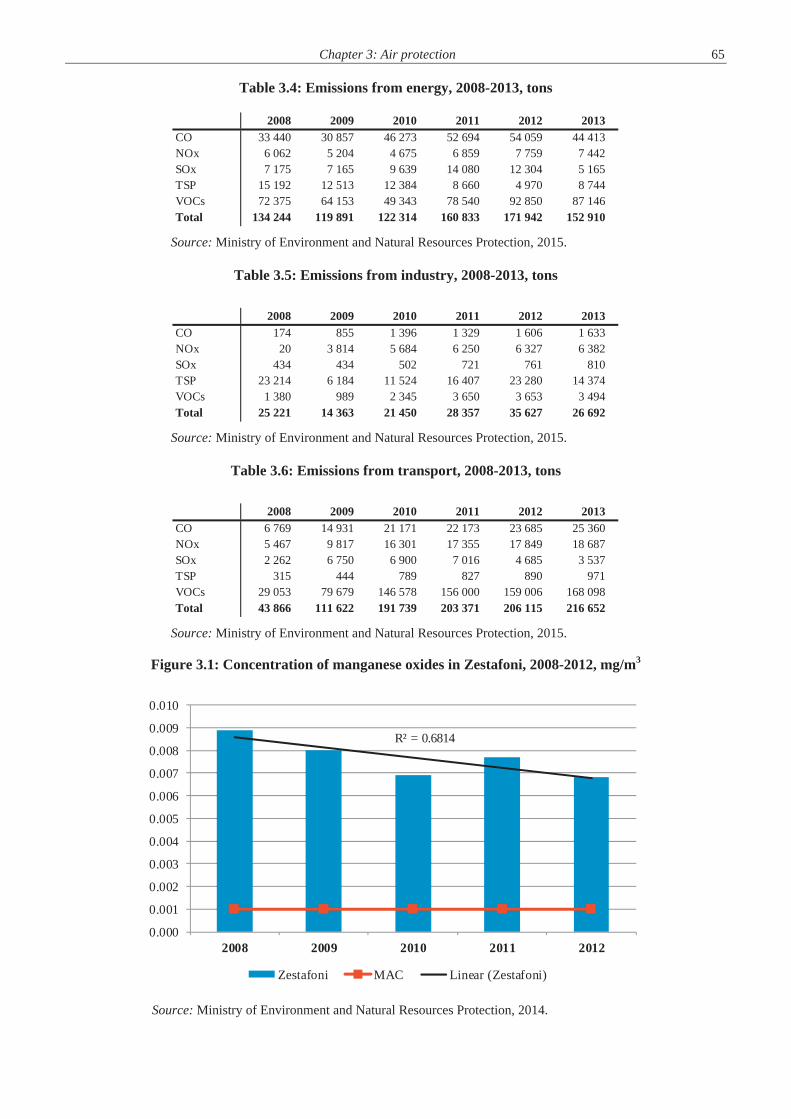
Chapter 3: Air protection 65
Table 3.4: Emissions from energy, 2008-2013, tons
Source: Ministry of Environment and Natural Resources Protection, 2015.
Table 3.5: Emissions from industry, 2008-2013, tons
Source: Ministry of Environment and Natural Resources Protection, 2015.
Table 3.6: Emissions from transport, 2008-2013, tons
Source: Ministry of Environment and Natural Resources Protection, 2015.
Figure 3.1: Concentration of manganese oxides in Zestafoni, 2008-2012, mg/m3
Source: Ministry of Environment and Natural Resources Protection, 2014.
2008 2009 2010 2011 2012 2013CO 33 440 30 857 46 273 52 694 54 059 44 413NOx 6 062 5 204 4 675 6 859 7 759 7 442SOx 7 175 7 165 9 639 14 080 12 304 5 165TSP 15 192 12 513 12 384 8 660 4 970 8 744VOCs 72 375 64 153 49 343 78 540 92 850 87 146Total 134 244 119 891 122 314 160 833 171 942 152 910
2008 2009 2010 2011 2012 2013CO 174 855 1 396 1 329 1 606 1 633NOx 20 3 814 5 684 6 250 6 327 6 382SOx 434 434 502 721 761 810TSP 23 214 6 184 11 524 16 407 23 280 14 374VOCs 1 380 989 2 345 3 650 3 653 3 494Total 25 221 14 363 21 450 28 357 35 627 26 692
2008 2009 2010 2011 2012 2013CO 6 769 14 931 21 171 22 173 23 685 25 360NOx 5 467 9 817 16 301 17 355 17 849 18 687SOx 2 262 6 750 6 900 7 016 4 685 3 537TSP 315 444 789 827 890 971VOCs 29 053 79 679 146 578 156 000 159 006 168 098Total 43 866 111 622 191 739 203 371 206 115 216 652
R² = 0.6814
0.000
0.001
0.002
0.003
0.004
0.005
0.006
0.007
0.008
0.009
0.010
2008 2009 2010 2011 2012
Zestafoni MAC Linear (Zestafoni)

66 Part II: Media and pollution management
Housing
Residential heating is a major source of air pollution during periods of cold in the winter. This is mainly related to the type of fuel used. In general, natural gas is used in urban areas. For financial reasons, however, wood or coal is used. Nowadays, in the country’s largest cities the share of wood used in public heating is minor and even smaller than that of coal.
Total yearly average wood consumption in Georgia is 230,000 tonnes. Additional emissions from the burning of wood will lead to an increase in levels of pollution. In rural areas this will have a low impact on air quality as the background levels of air pollution in rural areas are low. However, experience in Northern Europe shows that pollution levels in densely populated urban areas can rise to dangerous levels on cold days with low wind speeds.
3.3 Air quality
National air quality standards are still based on MACs and cannot be directly compared to the standards used by the World Health Organization or the EU. Air quality has been measured at eight monitoring stations located in hotspots (next to the main roads and industial facilities). As well, except of Tbilisi there is only one monitoring station in other four cities. Therefore, data from these stations do not represent air quality of whole city.
Air quality in these hotspots is worse than Georgian national air quality standards allow. The maximum allowed levels for dust (figure 3.2) and NO2 (figure 3.3) have exceeded the limits at all monitoring stations for the period 2008–2012. The high levels of pollution are caused by large industrial installations in Kutaisi and Zestafoni (although the latter registers close to the MAC for NO2). The high levels in Tbilisi and Batumi are caused by road traffic and sea-going vessels, respectively.
The concentration of lead has dropped below the national limit since 2008. Data on monthly averages of air pollution show that the pollution in Tbilisi is higher in summer and lower in winter. This would imply that the contribution of residential heating to air pollution is relatively low compared to the contribution of traffic.The current air quality in Tbilisi has an impact on public health.
Several studies have been undertaken by NGOs and foreign consultants to assess its impact. UNEP’s GEO-Cities report on Tbilisi (2011) references an environmental assessment study by AEA Technology (2002) that reported an estimated 450 cases of hospitalization in Tbilisi. Later studies by the Caucasus Environmental NGO Network (CENN) have shown that the total costs to society of the health impact of air pollution are much higher than the costs of reducing air pollution by road traffic. CENN estimates the health benefits of reducing emissions from road traffic to be 1 billion lari to 2 billion lari.
Figure 3.2: Yearly average concentration of TSP in selected cities, 2008-2012, mg/m3
Source: Ministry of Environment and Natural Resources Protection, 2014.
0.00
0.20
0.40
0.60
0.80
1.00
1.20
2008 2009 2010 2011 2012
Tbilisi Kutaisi Batumi Zestafoni MAC
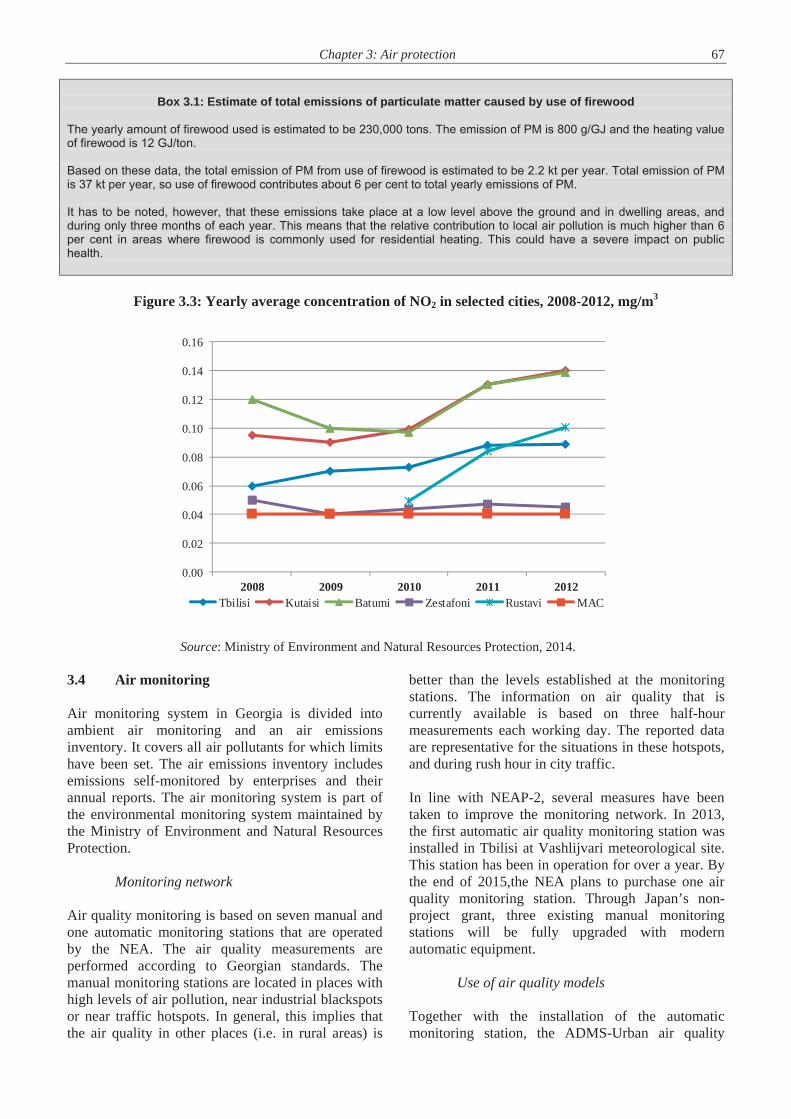
Chapter 3: Air protection 67
Box 3.1: Estimate of total emissions of particulate matter caused by use of firewood
The yearly amount of firewood used is estimated to be 230,000 tons. The emission of PM is 800 g/GJ and the heating valueof firewood is 12 GJ/ton.
Based on these data, the total emission of PM from use of firewood is estimated to be 2.2 kt per year. Total emission of PM is 37 kt per year, so use of firewood contributes about 6 per cent to total yearly emissions of PM.
It has to be noted, however, that these emissions take place at a low level above the ground and in dwelling areas, andduring only three months of each year. This means that the relative contribution to local air pollution is much higher than 6per cent in areas where firewood is commonly used for residential heating. This could have a severe impact on publichealth.
Figure 3.3: Yearly average concentration of NO2 in selected cities, 2008-2012, mg/m3
Source: Ministry of Environment and Natural Resources Protection, 2014.
3.4 Air monitoring
Air monitoring system in Georgia is divided intoambient air monitoring and an air emissions inventory. It covers all air pollutants for which limitshave been set. The air emissions inventory includesemissions self-monitored by enterprises and their annual reports. The air monitoring system is part of the environmental monitoring system maintained by the Ministry of Environment and Natural Resources Protection.
Monitoring network
Air quality monitoring is based on seven manual andone automatic monitoring stations that are operatedby the NEA. The air quality measurements are performed according to Georgian standards. The manual monitoring stations are located in places with high levels of air pollution, near industrial blackspots or near traffic hotspots. In general, this implies that the air quality in other places (i.e. in rural areas) is
better than the levels established at the monitoring stations. The information on air quality that iscurrently available is based on three half-hour measurements each working day. The reported data are representative for the situations in these hotspots, and during rush hour in city traffic.
In line with NEAP-2, several measures have beentaken to improve the monitoring network. In 2013,the first automatic air quality monitoring station was installed in Tbilisi at Vashlijvari meteorological site. This station has been in operation for over a year. By the end of 2015,the NEA plans to purchase one airquality monitoring station. Through Japan’s non-project grant, three existing manual monitoringstations will be fully upgraded with modernautomatic equipment.
Use of air quality models
Together with the installation of the automatic monitoring station, the ADMS-Urban air quality
0.00
0.02
0.04
0.06
0.08
0.10
0.12
0.14
0.16
2008 2009 2010 2011 2012Tbilisi Kutaisi Batumi Zestafoni Rustavi MAC
68 Part II: Media and pollution management
modelling tool was developed and implemented for Tbilisi and local staff trained to use it. It became available for use in 2013. Calculations using the ADMS-Urban model can be very useful for evaluating and predicting air quality, especially for predicting and controlling local hotspots. Since new information on traffic flow became avalaible from a new traffic light system in Tbilisi, it is planned to update the existing model and calibrate it based on measurement results. A new model for Batumi will be developed, based on the Thor model for predicting air quality. To make use of the current monitoring data, a relation has to be established between the measured levels of air pollution and the number of people exposed to these levels. An estimate can be made of the impact of current pollution levels on health. 3.5 Emission monitoring and reporting According to the Ambient Air Protection Law, each operator of stationary sources (from small to large enterprises) are obliged to submit information on their annual emissions (approximately 2,000 entities). These data are made available to other governmental institutions and the public. Self-monitoring is based on energy and mass balance calculations and not on actual emission measurements, as the equipment for this is either obsolete or non-existent. The forms are regularly sent to the Ministry of Environment and Natural Resources Protection or its regional agencies, which check the validity of the data within 15 days of their reception.Each stationary source in the country provides a specific document regarding the technical inventory, including information about emissions, to the Ministry of Environment and Natural Resources Protection for approval. Thus, the Ministry has detailed information about each industrial installation. For the large stationary sources, even more detailed information is available, as most of them have an environmental permit and therefore, individual emission limit values. This information is neither used in any national emissions inventory nor as an input for models to calculate air quality. 3.6 Legal, policy and institutional framework
Legal framework The 1999 Law on Ambient Air Protection continues to establishe a framework for the regulation of air pollution, including such measures as the establishment of air quality standards (values) and
monitoring. In many places the Law makes use (partially) of standards and procedures included in the EU’s environmental legislation (the following directives are quoted in the text: 70/220/EEC, 72/306/EEC, 88/77/EEC, 93/12/EC, 96/62/EC, 96/96/EC). The requirements of certain international legal acts are incorporated into the Law, including those of the Vienna Convention for the Protection of the Ozone Layer and its Montreal Protocol, the UNFCCC and CLRTAP. Since 2010 several by-laws on air protection have been issued: 2013 Order No. 408 of the Government on
Approval of the Method for Calculation of Emission Limits for Stationary Sources;
2013 Order No. 413 of the Government on the Approval of the Rules of Self-Monitoring and Reporting of Annual Emissions from Stationary Sources;
2013 Order No. 435 of the Government on instrumental method for determination of actual amounts of emissions into ambient air from stationary pollution source, standard list of emission measuring equipment, and methodology for calculation of actual amounts of emissions into ambient air from stationary pollution source according to technological processes;
2013 Order No. 484 of the Government on the Rules for Calculating Air Pollution Indices and Defining Values for Pollution Indices for Extremely Polluted, Significantly Polluted, Polluted and Unpolluted Settlements, Classified in Accordance with Pollution Levels;
2014 Order No. 8 of the Government on the Rules for ambient air protection during unfavourable weather conditions ;
2014 Order No. 21 of the Governmenton the operational rules for gas and dust trapping devices;
2014 Order No. 42 of the Government on Approval of the Rules for Emission Inventories from Stationary Sources;
2014 Order No. 116 of the Minister of Environment and Natural Resources Protection of Georgia on the Approval of the List of Settlements in Georgia, where the Values of Indexes of Ambient Air Pollution with Harmful Substances are Calculated Annually.
No specific legislation is in force aimed at reducing ammonia emissions from agriculture.

Chapter 3: Air protection 69
Institutional framework The Ministry of Environment and Natural Resources Protection is responsible for the management of ambient air quality. The Ministry implements the national environmental policy and is responsible for air emissions inventory and air quality monitoring. The latter is performed by the NEA. Environmental permits for stationary sources are issued by the Department of Environment Impact Permit of the Ministry. Enforcement is a task of the Department of Environmental Supervision, which is also a part of the Ministry. The Inspectorate does not have a formal position in the permitting process. The Inspectorate provides feedback to the Department of Environment Impact Permit on enforcement of permits. It has relevant knowledge on enforcement of permits and on the use of environmental standards in practice. This knowledge is important in the process of drafting of the permits. Institutional changes have been made to improve the control of industrial emissions. In 2013, there was a full restructuring and enhancement of the Environmental Inspectorate. Regional branches of the Inspectorate were established and the number of inspectors was considerably increased. To meet training needs, the Environmental Information and Education Centre was established as an LEPL under the Ministry in 2013. In 2013, with the financial support of a USAID Human and Institutional Capacity Development Project, the Centre developed four modules on the priority topics defined by the Department of Environment Impact Permit and training of trainers was conducted. In addition, with the support of the Netherlands, 12 employees of the Division were trained as trainers and attended a one-week study visit to the Netherlands. In 2014, 15 inspectors were trained in the inspection procedures based on the module developed by the Centre. It is envisaged to continue training activities, but ensuring professional development greatly depends on the availability of resources. Various state institutions are dealing with transport-related issues. The Parliament decides on the vehicle types that are subject to regular technical checks; the Government determines the MACs of automotive fuel quality standards. The Ministry of Internal Affairs enforces the regulation about the mandatory test of safety and roadworthiness of vehicles. The Ministry of Regional Development and Infrastructure
and municipalities are responsible for road construction and other infrastructure for transport. The Ministry of Economy and Sustainable Development, through its Land Transport Agency, ensures the development and adoption of technical regulations for the transport sector and, through its Transport Policy Department, implements overall transport policy in the country. Each local municipality makes decisions about public transport development or traffic optimization in its territory. In this structure, decisions regarding the transportation system that have an impact on air quality are taken on different levels and by separate institutions. It is not clear how the decisions by the authorities on different levels are coordinated.
Policy framework The two most relevant documents for air quality management are: The National Environmental Action Programme
2012–2016 (NEAP-2); The 2014 National Action Plan for the
Implementation of the Association Agreement. The long-term goal of NEAP-2 is to reach a level of air quality throughout Georgia that is safe for human health. For the period until 2016, short-term targets are set: Improve the existing air quality monitoring
network; Reduce industrial emissions by applying modern
energy saving technologies and enforcement of permits;
Reduce vehicle emissions. Several measures have been defined to reach these goals. To improve the monitoring network, the Ministry aims at installing several automated monitoring stations, implementing air quality modelling software and establishing public access to air quality information. The Environmental Information and Education Centre plans to start publishing air quality data in 2016. The enforcement of permits has been improved through training staff of the Ministry and the Inspectorate. Vehicle emissions have been reduced by renewal of the fleet of minibuses in Tbilisi. Meeting the national air quality standards is not specified as a target in NEAP-2.

70 Part II: Media and pollution management
Photo 3: Pirikita Alazani River in Tusheti Protected Areas
The National Action Plan for the Implementation of the Association Agreement presents a road map for development of legislation that is necessary for the implementation of many EU directives that are relevant for air quality management.
The main achievements under the framework of EU project “Air Quality Governance” are:
National Action Plan for Implementation of the EU Harmonization plan on air quality governance and meeting corresponding international obligations” was developed. The aim of this National Action Plan is to harmonize national legislation to EU legislation and fulfill requirements in the context of the EU-Georgia Association Agreement. National Action Plan was prepared for the ratification and fulfillment obligation of last three protocols (Gothenburg Protocol to Abate Acidification, Eutrophication and Ground-level Ozone, Protocol on Persistent Organic Pollutants and Protocol on Heavy Metals) of Convention on Long-range Transboundary Air Pollution which assists country in ratification and implementation process. Gap analysis was realized on air quality monitoring system and EU Standards corresponding air quality monitoring system development program was established. Based on above mentioned programme air quality
monitoring network gradual rehabilitation, automation and modernization will be implemented. Emissions from transport sector were calculated based on modern EU methodology (EMEP/EEA air emission inventory guidebook) using COPERT 4 software. Improved capacity in the field of air quality assessment/management and IPPC.
Policies aimed at reducing ammonia emissions and controlling GHG emissions are lacking.
3.7 Regulatory, economic and information measures
City planning and traffic management
One of Tbilisi’s MDGs is to ensure sustainable development, by integrating the principles of sustainable development into city policies and programmes. Improving air quality is one of the first targets. As traffic is the main cause of air pollution in Tbilisi, traffic management and developing public transport could be one of the areas in which to take measures. The municipality plans to replace old buses for public transport with new ones. This can have a positive impact on air quality in the centre of Tbilisi. No other plans to reduce traffic emissions, e.g. introducing low emission zones or promoting cycling in Tbilisi, are forecast.

Chapter 3: Air protection 71
Transport The most cost-effective measure to reduce emissions from transport is to prevent the use of vehicles with high emissions. In general, these are old vehicles, vehicles that need maintenance or vehicles that are operated in an improper way. The most effective way to improve public health is to ban these vehicles from densely populated areas such as city centres.Georgia used to have a system based on a yearly, mandatory test of safety and roadworthiness of all road-going vehicles. This system was abandoned in 2004 for light duty vehicles. Without appropriate regulations and a mandatory annual test of safety, roadworthiness and exhaust emissions, it is not possible to ban the most polluting vehicles from the road. Apart from the mandatory annual test, it is possible to take other measures aimed at removing the super polluters from the roads. This can be based on financial incentives, such as increasing taxes for more polluting vehicles. It can also involve the introduction of green zones from which dirty vehicles are banned. Next to these measures, it is necessary to raise public awareness of the relationship between pollution from road traffic and public health. Several measures were taken to reduce transport emissions. Tbilisi undertook a full renovation of the traffic light system. A centralized traffic management system has been introduced. After Tbilisi signed a new contract with the privately owned operator of the minibuses, a full renovation of the public minibus fleet took place. Old vans, serving as minibuses, were replaced by new minibuses with much lower emissions. One aerial tram/cable car was installed in Tbilisi and incorporated into the system of public transport. Apart from the measures taken by the national or local governments, air quality in Tbilisi has also improved because in the last 10 years an increasing number of vehicles have been using CNG (compressed natural gas) as a fuel. CNG is used for economic reasons. In the current situation, many taxis use CNG instead of diesel. As taxis are operated mainly in urban areas, this reduces overall emissions from traffic in Tbilisi.
Information The NEA reports the air quality data to the Ministry. Monthly reports on air quality have been made
available on the NEA’s website. A real-time internet connection is established with the automated monitoring station.
Development and implementation of environmental policy requires a sound knowledge of environmental sciences and a lot of information. This knowledge base for air quality management can be organized inside or outside the government. In the current situation in Georgia, many NGOs play an important role in the preparation and development of air quality management. NGOs perform studies, write reports, use environmental data to make inventories and prepare action plans for the Ministry. In this way, NGOs act as a source of knowledge for the Ministry. 3.8 Air-related global and regional agreements
United Nations Framework Convention on Climate Change As a non-Annex I country, Georgia does not have any quantitative commitment to reduce or limit GHG emissions under the Kyoto Protocol. Of three market mechanisms introduced by the Kyoto Protocol, Georgia participates in the Clean Development Mechanism (CDM). Six CDM projects are registered (Table 3.7). New CDM projects are not foreseen in the current situation, due to the very low prices of CO2 emission rights.
Convention for the Protection of the Ozone Layer As a party to the Vienna Convention for the Protection of the Ozone Layer, Georgia has phased out the use of chlorofluorocarbons and halons. Georgia acceded to the Beijing Amendment in 2010. Georgia is in a full compliance with control measures under the Montreal Protocol. The main ODSs (annex A and B of the Protocol) have been phased out two years prior to the requirement (2010). At this stage, the country is realizing its HCFC Phase-out Management Plan (HPMP), which will ensure smooth and efficient implementation of the international commitments. Since Georgia is not a producer of ODSs, its consumption mainly depends on import. Consequently, import is strictly limited by predefined quotas, following the requirements of the Montreal Protocol. An effective monitoring system on import of these substances is already in place.

72 Part II: Media and pollution management
Table 3.7: CDM projects
Source: Ministry of Energy, 2014.
Convention on Long-range Transboundary
Air Pollution Georgia has been a party to the Convention on Long-range Transboundary Air Pollution (CLRTAP) since 1999 and to the Protocol on Long-term Financing of the Cooperative Programme for Monitoring and Evaluation of the Long-range Transmission of Air Pollutants in Europe (EMEP) since 2013. Hence, under the framework of the EU project Air Quality Governance in ENPI East Countries, a National Action Plan was developed in order to ratify CLRTAP protocols and meet corresponding commitments. At the fifty-second session of the Convention’s Working Group on Strategies and Review (30 June–3 July 2014) Georgia indicated its plans to ratify the latest key protocols to the Convention – the Protocol to Abate Acidification, Eutrophication and Ground-level Ozone (Gothenburg Protocol), the Protocol on Persistent Organic Pollutants and the Protocol on Heavy Metals, by the end of 2019. Georgia regularly provides its Nomenclature For Reporting (NFR) tables to EMEP. The first Informative Inventory Reports (IIRs) was submitted in 2015 Georgia received support from the EU within the project Air Quality Governance in ENPI East Countries, which is being implemented in several countries of Eastern Europe and the Caucasus. Among other matters, the project aims to support Georgia in developing its air quality monitoring system.
Protocol on Pollutant Release and Transfer Registers Although Georgia signed the Protocol on Pollutant Release and Transfer Registers to the Convention on Access to Information, Public Participation in Decision-making and Access to Justice in Environmental Matters (Aarhus Convention) in 2003, the country has not ratified it. 3.9 Conclusions and recommendations Transportation is the most important source of air pollution in Tbilisi. Due to heavy traffic, transportation causes local hotspots near busy roads. In several places, air quality standards are exceeded. Georgia used to have a system of yearly, mandatory technical inspection of all road-going vehicles. This system was abandoned in 2004. Without a mandatory annual test of safety, roadworthiness and exhaust emissions, supported by relevant regulations, it is not possible to identify and then ban the most polluting vehicles from the road. The most cost-effective measure to reduce emissions from transport is to prevent the use of vehicles with high emissions – the super polluters. In general, these are old vehicles, vehicles that need maintenance or vehicles that are operated in an improper way. Banning old vehicles would improve public health in densely populated areas such as city centres. Often the population is not aware of the relationship between pollution from road traffic and human health.
Project Registered
Annual emission reduction tCO2-eq. CERs issued
Leak reduction in above-ground gas distribution equipment in the Kaz-Transgaz-Tbilisi gas distribution system, Tbilisi 21/09/2009 339 197 611 073Leak reduction in above-ground gas distribution equipment in Socar Georgia Gas gas distribution system 10/10/2012 166 496 ..Refurbishment of Enguri Hydro Power Plant 17/12/2012 581 715 134 727Adjaristskali HPP project 11/01/2012 530 340 ..Gudauri small HPP project 21/12/2012 22 891 ..Dariali Hydroelectric Power Project 17/05/2013 259 229 ..Total 1 899 868 745 800
Chapter 3: Air protection 73 Recommendation 3.1: The Government should: (a) Reintroduce the mandatory annual test of the
safety, roadworthiness and exhaust emissions of all vehicles, including an assessment of the emissions of each vehicle tested;
(b) Introduce and enforce regulations to restrict the use of the most polluting vehicles in urban areas;
(c) Regularly inform the population of the health effects of road transport pollution.
To develop and implement environmental policy, especially on air protection, requires knowledge of environmental sciences and a lot of information. This knowledge base for air quality management is lacking but can be organized inside or outside the governmental structures. Recommendation 3.2: The Ministry of Environment and Natural Resources Protection should: (a) Establish a mechanism for governmental
institutions, academia and NGOs to share knowledge and information about air quality management;
(b) Produce a yearly assessment report based on data on traffic, the vehicle fleet, fuel consumption, air quality monitoring and meteorology, as well as calculations from the air quality models used for Tbilisi and other cities in Georgia.
The legislative framework is outdated and does not reflect modern approaches, such as BAT. The laws dealing with air protection provide only general legal norms and often are not sufficiently developed. Metallurgical plants, mines and quarries, chemical plants, cement plants and power stations can have a severe impact on public health and occupational health. The implementation of BAT might be combined with other activities to overhaul or upgrade the existing installations to reduce costs for the operators. Recommendation 3.3: The Ministry of Environment and Natural Resources Protection should encourage the implementation of best available techniques (BAT) for emission abatement.
Traffic data and data about the vehicle fleet would allow the development of effective and efficient measures to reduce air pollution levels in cities. The Ministry of Internal Affairs has information on registered vehicles (number, age and model). In addition, the Ministry of Economy and Sustainable Development maintains data on transport volumes and modalities. These data, however, are not combined to make calculations or estimates of emissions by road transport. However, detailed information, such as fuel type and engine size, is available only for vehicles that have been imported since 2008. More detailed information on traffic and vehicles can be used to calculate emissions from mobile sources based on datasets about different aspects of mobile transport. Recommendation 3.4: The Ministry of Internal Affairs, in cooperation with the Ministry of Environment and Natural Resources Protection, the Ministry of Economy and Sustainable Development, the Ministry of Infrastructure and the municipality of Tbilisi, should develop a shared information system for providing data on traffic, infrastructure, vehicle emissions and air quality, and should make those data available to all stakeholders. The Department of Environment Impact Permit of the Ministry of Environment and Natural Resources Protection issues environmental permits for stationary sources, but without receiving feedback from the Environmental Inspectorate, which is also a part of the Ministry. Although the Inspectorate does not have a formal position in the permitting process, it has relevant knowledge on enforcement of permits and on the use of environmental standards by industry. This knowledge would be useful when drafting, and ultimately issuing, permits. Recommendation 3.5: The Ministry of Environment and Natural Resources Protection should ensure that the Department of Environmental Supervision provides feedback to the Department of Environment Impact Permit on the enforcement of permits and the use of environmental standards by industry.

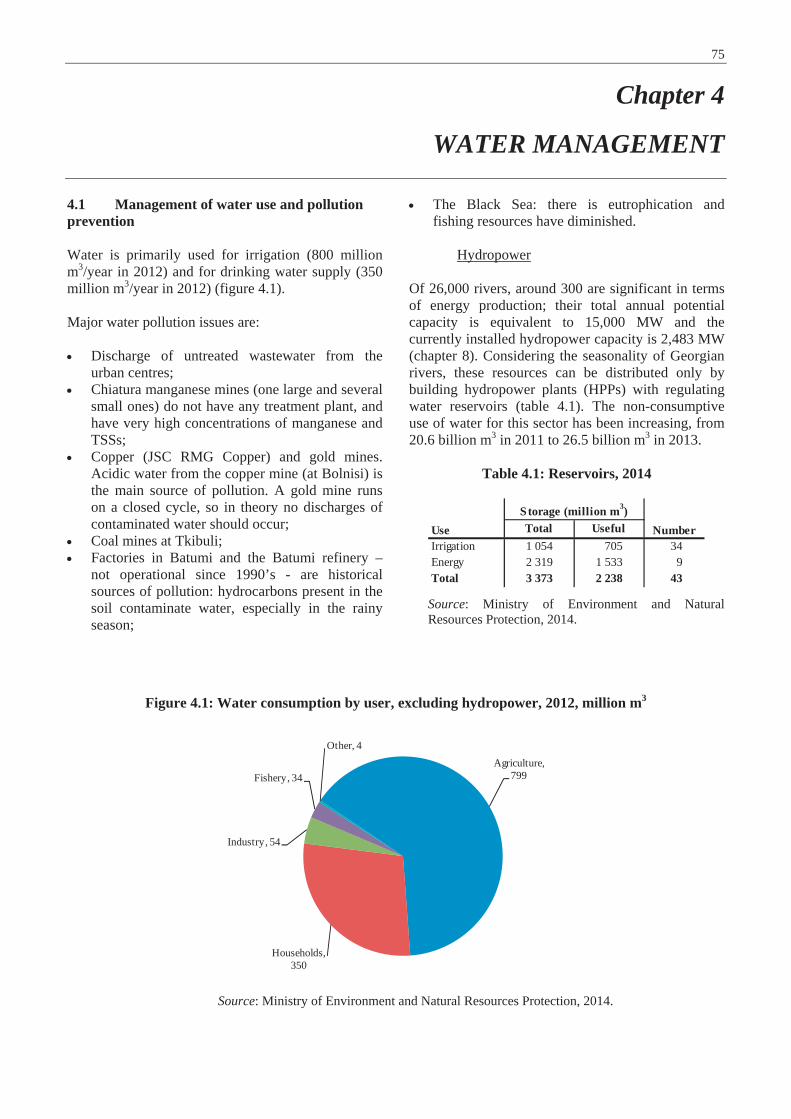
75
Chapter 4
WATER MANAGEMENT
4.1 Management of water use and pollution prevention
Water is primarily used for irrigation (800 million m3/year in 2012) and for drinking water supply (350 million m3/year in 2012) (figure 4.1).
Major water pollution issues are:
Discharge of untreated wastewater from the urban centres; Chiatura manganese mines (one large and severalsmall ones) do not have any treatment plant, and have very high concentrations of manganese and TSSs; Copper (JSC RMG Copper) and gold mines. Acidic water from the copper mine (at Bolnisi) is the main source of pollution. A gold mine runs on a closed cycle, so in theory no discharges of contaminated water should occur; Coal mines at Tkibuli; Factories in Batumi and the Batumi refinery – not operational since 1990’s - are historical sources of pollution: hydrocarbons present in the soil contaminate water, especially in the rainy season;
The Black Sea: there is eutrophication andfishing resources have diminished.
Hydropower
Of 26,000 rivers, around 300 are significant in terms of energy production; their total annual potentialcapacity is equivalent to 15,000 MW and the currently installed hydropower capacity is 2,483 MW (chapter 8). Considering the seasonality of Georgianrivers, these resources can be distributed only bybuilding hydropower plants (HPPs) with regulatingwater reservoirs (table 4.1). The non-consumptive use of water for this sector has been increasing, from20.6 billion m3 in 2011 to 26.5 billion m3 in 2013.
Table 4.1: Reservoirs, 2014
Source: Ministry of Environment and Natural Resources Protection, 2014.
Figure 4.1: Water consumption by user, excluding hydropower, 2012, million m3
Source: Ministry of Environment and Natural Resources Protection, 2014.
Total UsefulIrrigation 1 054 705 34Energy 2 319 1 533 9Total 3 373 2 238 43
Use NumberStorage (million m3)
Agriculture,799
Households,350
Industry, 54
Fishery, 34
Other, 4
76 Part II: Media and pollution management While HPPs are non-consumptive users, the majority of them impact on river flow, as they typically divert and/or impound water. Water demands for individual HPPs are conditioned by installed capacity, which is designed based on cost-effectiveness principles. Considering that it is planned to further expand hydropower generation, it is likely that maintaining adequate dynamic environmental flow, taking into account the seasonal needs of riverine ecosystems, cannot be ensured. As a result, it is expected that greater parts of the rivers could be subject to negative impact, especially in water biodiversity. The current Georgian legislation does not define the methodology for calculating the environmental flow. In practice two methodologies coexist: for the oldest dams the Soviet standards are applied, and for the most recent ones a more simplified methodology is adopted (table 4.2). The latter does not take into account the seasonal variability of the natural flow and its impact on water ecosystems. Two methodologies also coexist for the ecological devices for minimizing the impact on fish migration (as fish ladders and elevators), which are currently considered mandatory. Although the Ministry of Environment and Natural Resources Protection is responsible for monitoring these systems, there is no record as evidence of any checking, supervision and regulation being done.
Table 4.2: Methodology for calculation of environmental flow
Source: Ministry of Environment and Natural Resources Protection, 2014.
Agriculture
For irrigation purposes, some 34 dams have been built, with a total reservoir capacity of 1,054 million m3, of which 705 million m3 is useful (table 4.1). The irrigation potential in Georgia is estimated at 725,000 ha.
There has been a reduction of the irrigated and arable area, as well as abandonment of the land, due to: The increased cost of energy: the area has been
reduced to what can be irrigated by gravity; The degradation of the hydraulic infrastructures
(e.g. channels) due to the lack of maintenance. The water consumption for irrigation purposes was 156 million m3 in 2013. The most common irrigation method is flooding, with water losses over 50 per cent. The problems in this area are not only related to the underuse of the total capacity and the non-sustainable use of water, but also to pollutant emissions. Currently in Georgia, there are no studies on the impact of agriculture on the environment. However, there has been an increase in the use of fertilizers and pesticides (chapter 9 and figure 9.1). The main problems related to agriculture are linked to the unsustainable use of water for irrigation, with losses exceeding 50 per cent, and diffuse pollution caused by the drainage of the land. There are no contamination problems with phosphates and pesticides. However, nitrogen compounds levels (especially nitrates and ammonium) are above the limits set by law. The rivers are not eutrophic, but some lentic bodies of water are. With weak monitoring and supervision exercised, it is difficult to assess their origin – whether to agriculture and/or discharges of untreated domestic wastewater. No data or studies exist that would reveal the status and impact of this type of pollution. Between 55 and 75 per cent of the water consumed by the total population has a groundwater origin. For rural communities the situation is different: in 2013, groundwater represented the major source (90 per cent) of drinking water. It is estimated that the population coverage of water supply systems (WSSs) was around 65 per cent in 2013 (table 4.3). In March 2012, the Government reorganized the management of the national irrigation and drainage infrastructure by establishing the fully state-owned United Amelioration Systems Company of Georgia (UASCG), which operates under the newly created Melioration Policy Department within the Ministry of Agriculture. The creation of UASCG was the response to the failure of the previous system of irrigation systems management, which was established in 2007.
Flow Soviet period Post-Soviet
periodAverage 95 per cent of the
yearly average flow50 per cent of the yearly average flow
Minimum Min. Summer and Winter
10 per cent average flow
Base series 100 years 50 years
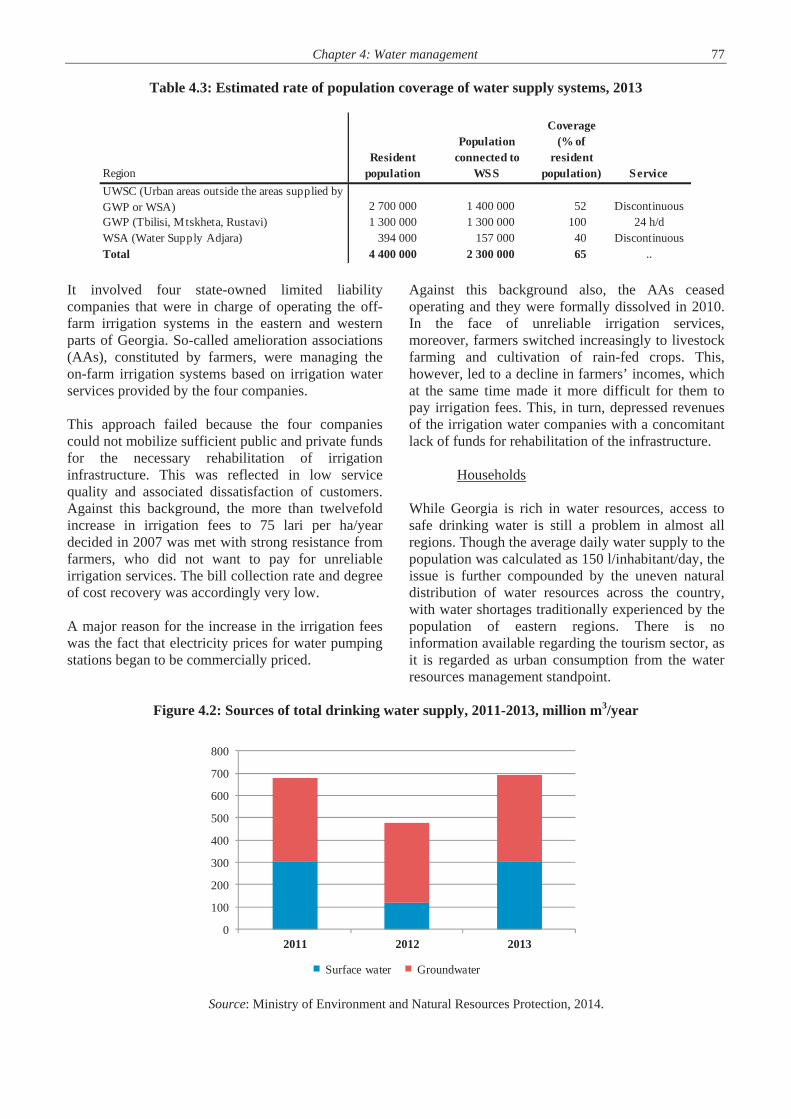
Chapter 4: Water management 77
Table 4.3: Estimated rate of population coverage of water supply systems, 2013
It involved four state-owned limited liabilitycompanies that were in charge of operating the off-farm irrigation systems in the eastern and westernparts of Georgia. So-called amelioration associations(AAs), constituted by farmers, were managing the on-farm irrigation systems based on irrigation water services provided by the four companies.
This approach failed because the four companies could not mobilize sufficient public and private funds for the necessary rehabilitation of irrigation infrastructure. This was reflected in low servicequality and associated dissatisfaction of customers.Against this background, the more than twelvefold increase in irrigation fees to 75 lari per ha/yeardecided in 2007 was met with strong resistance from farmers, who did not want to pay for unreliable irrigation services. The bill collection rate and degreeof cost recovery was accordingly very low.
A major reason for the increase in the irrigation fees was the fact that electricity prices for water pumpingstations began to be commercially priced.
Against this background also, the AAs ceasedoperating and they were formally dissolved in 2010.In the face of unreliable irrigation services,moreover, farmers switched increasingly to livestock farming and cultivation of rain-fed crops. This, however, led to a decline in farmers’ incomes, which at the same time made it more difficult for them to pay irrigation fees. This, in turn, depressed revenues of the irrigation water companies with a concomitantlack of funds for rehabilitation of the infrastructure.
Households
While Georgia is rich in water resources, access tosafe drinking water is still a problem in almost allregions. Though the average daily water supply to thepopulation was calculated as 150 l/inhabitant/day, the issue is further compounded by the uneven natural distribution of water resources across the country, with water shortages traditionally experienced by thepopulation of eastern regions. There is no information available regarding the tourism sector, as it is regarded as urban consumption from the waterresources management standpoint.
Figure 4.2: Sources of total drinking water supply, 2011-2013, million m3/year
Source: Ministry of Environment and Natural Resources Protection, 2014.
RegionResident
population
Populationconnected to
WSS
Coverage(% of
residentpopulation) Service
UWSC (Urban areas outside the areas supplied byGWP or WSA) 2 700 000 1 400 000 52 DiscontinuousGWP (Tbilisi, Mtskheta, Rustavi) 1 300 000 1 300 000 100 24 h/dWSA (Water Supply Adjara) 394 000 157 000 40 DiscontinuousTotal 4 400 000 2 300 000 65 ..
0
100
200
300
400
500
600
700
800
2011 2012 2013
Surface water Groundwater
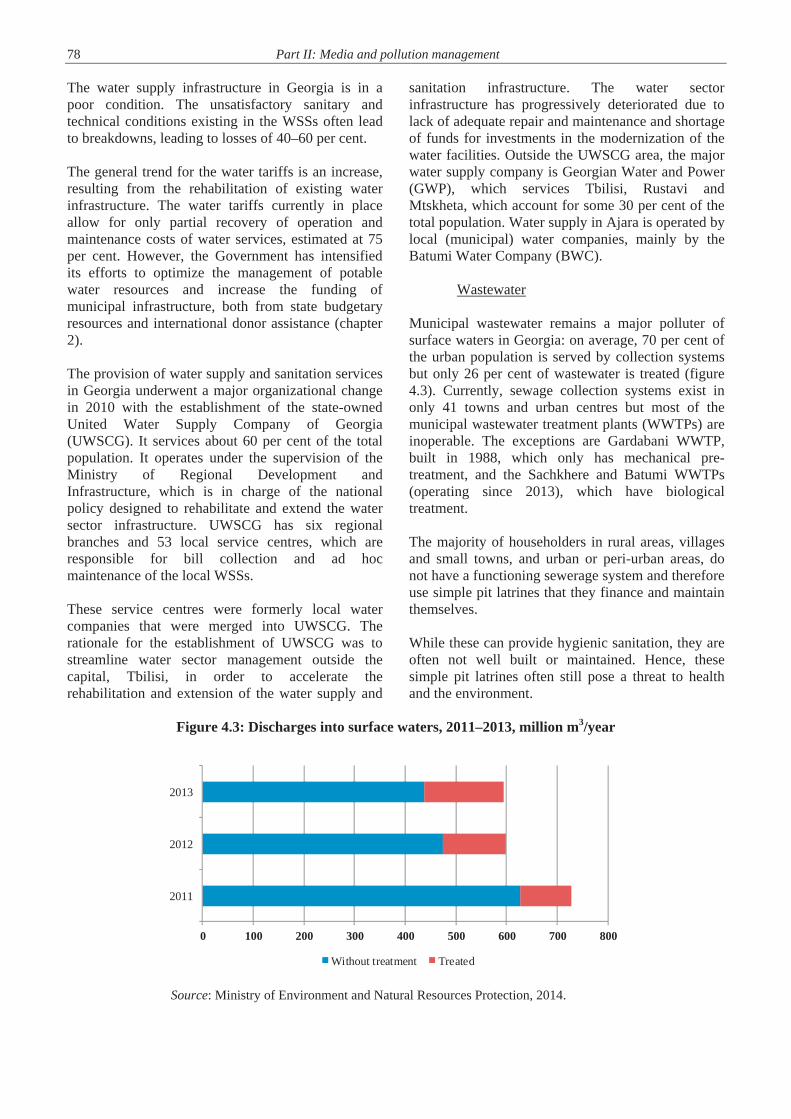
78 Part II: Media and pollution management
The water supply infrastructure in Georgia is in a poor condition. The unsatisfactory sanitary and technical conditions existing in the WSSs often lead to breakdowns, leading to losses of 40–60 per cent.
The general trend for the water tariffs is an increase, resulting from the rehabilitation of existing water infrastructure. The water tariffs currently in place allow for only partial recovery of operation and maintenance costs of water services, estimated at 75 per cent. However, the Government has intensified its efforts to optimize the management of potable water resources and increase the funding of municipal infrastructure, both from state budgetary resources and international donor assistance (chapter 2).
The provision of water supply and sanitation services in Georgia underwent a major organizational change in 2010 with the establishment of the state-owned United Water Supply Company of Georgia (UWSCG). It services about 60 per cent of the total population. It operates under the supervision of the Ministry of Regional Development and Infrastructure, which is in charge of the national policy designed to rehabilitate and extend the water sector infrastructure. UWSCG has six regional branches and 53 local service centres, which are responsible for bill collection and ad hoc maintenance of the local WSSs.
These service centres were formerly local water companies that were merged into UWSCG. The rationale for the establishment of UWSCG was to streamline water sector management outside the capital, Tbilisi, in order to accelerate the rehabilitation and extension of the water supply and
sanitation infrastructure. The water sector infrastructure has progressively deteriorated due to lack of adequate repair and maintenance and shortage of funds for investments in the modernization of the water facilities. Outside the UWSCG area, the major water supply company is Georgian Water and Power (GWP), which services Tbilisi, Rustavi and Mtskheta, which account for some 30 per cent of the total population. Water supply in Ajara is operated by local (municipal) water companies, mainly by the Batumi Water Company (BWC).
Wastewater
Municipal wastewater remains a major polluter of surface waters in Georgia: on average, 70 per cent of the urban population is served by collection systems but only 26 per cent of wastewater is treated (figure 4.3). Currently, sewage collection systems exist in only 41 towns and urban centres but most of the municipal wastewater treatment plants (WWTPs) are inoperable. The exceptions are Gardabani WWTP, built in 1988, which only has mechanical pre-treatment, and the Sachkhere and Batumi WWTPs (operating since 2013), which have biological treatment.
The majority of householders in rural areas, villages and small towns, and urban or peri-urban areas, do not have a functioning sewerage system and therefore use simple pit latrines that they finance and maintain themselves.
While these can provide hygienic sanitation, they are often not well built or maintained. Hence, these simple pit latrines often still pose a threat to health and the environment.
Figure 4.3: Discharges into surface waters, 2011–2013, million m3/year
Source: Ministry of Environment and Natural Resources Protection, 2014.
0 100 200 300 400 500 600 700 800
2011
2012
2013
Without treatment Treated
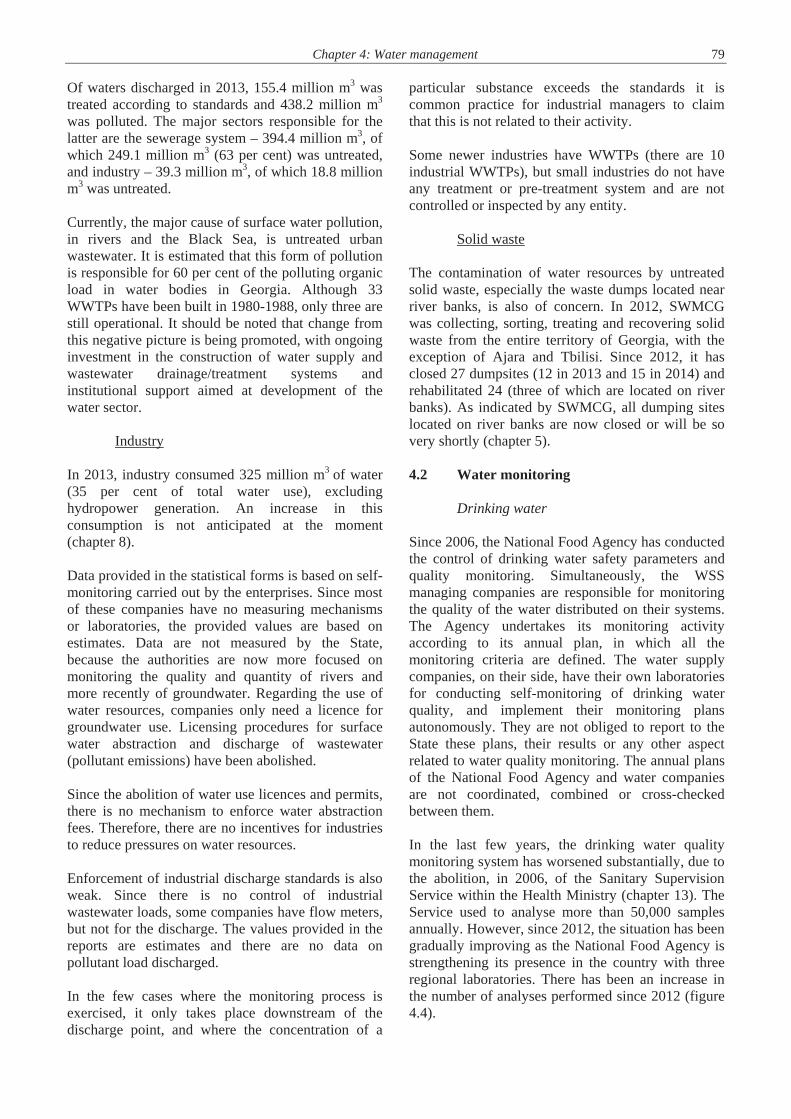
Chapter 4: Water management 79 Of waters discharged in 2013, 155.4 million m3 was treated according to standards and 438.2 million m3 was polluted. The major sectors responsible for the latter are the sewerage system – 394.4 million m3, of which 249.1 million m3 (63 per cent) was untreated, and industry – 39.3 million m3, of which 18.8 million m3 was untreated. Currently, the major cause of surface water pollution, in rivers and the Black Sea, is untreated urban wastewater. It is estimated that this form of pollution is responsible for 60 per cent of the polluting organic load in water bodies in Georgia. Although 33 WWTPs have been built in 1980-1988, only three are still operational. It should be noted that change from this negative picture is being promoted, with ongoing investment in the construction of water supply and wastewater drainage/treatment systems and institutional support aimed at development of the water sector.
Industry In 2013, industry consumed 325 million m3 of water (35 per cent of total water use), excluding hydropower generation. An increase in this consumption is not anticipated at the moment (chapter 8). Data provided in the statistical forms is based on self-monitoring carried out by the enterprises. Since most of these companies have no measuring mechanisms or laboratories, the provided values are based on estimates. Data are not measured by the State, because the authorities are now more focused on monitoring the quality and quantity of rivers and more recently of groundwater. Regarding the use of water resources, companies only need a licence for groundwater use. Licensing procedures for surface water abstraction and discharge of wastewater (pollutant emissions) have been abolished. Since the abolition of water use licences and permits, there is no mechanism to enforce water abstraction fees. Therefore, there are no incentives for industries to reduce pressures on water resources. Enforcement of industrial discharge standards is also weak. Since there is no control of industrial wastewater loads, some companies have flow meters, but not for the discharge. The values provided in the reports are estimates and there are no data on pollutant load discharged. In the few cases where the monitoring process is exercised, it only takes place downstream of the discharge point, and where the concentration of a
particular substance exceeds the standards it is common practice for industrial managers to claim that this is not related to their activity. Some newer industries have WWTPs (there are 10 industrial WWTPs), but small industries do not have any treatment or pre-treatment system and are not controlled or inspected by any entity.
Solid waste The contamination of water resources by untreated solid waste, especially the waste dumps located near river banks, is also of concern. In 2012, SWMCG was collecting, sorting, treating and recovering solid waste from the entire territory of Georgia, with the exception of Ajara and Tbilisi. Since 2012, it has closed 27 dumpsites (12 in 2013 and 15 in 2014) and rehabilitated 24 (three of which are located on river banks). As indicated by SWMCG, all dumping sites located on river banks are now closed or will be so very shortly (chapter 5). 4.2 Water monitoring
Drinking water Since 2006, the National Food Agency has conducted the control of drinking water safety parameters and quality monitoring. Simultaneously, the WSS managing companies are responsible for monitoring the quality of the water distributed on their systems. The Agency undertakes its monitoring activity according to its annual plan, in which all the monitoring criteria are defined. The water supply companies, on their side, have their own laboratories for conducting self-monitoring of drinking water quality, and implement their monitoring plans autonomously. They are not obliged to report to the State these plans, their results or any other aspect related to water quality monitoring. The annual plans of the National Food Agency and water companies are not coordinated, combined or cross-checked between them. In the last few years, the drinking water quality monitoring system has worsened substantially, due to the abolition, in 2006, of the Sanitary Supervision Service within the Health Ministry (chapter 13). The Service used to analyse more than 50,000 samples annually. However, since 2012, the situation has been gradually improving as the National Food Agency is strengthening its presence in the country with three regional laboratories. There has been an increase in the number of analyses performed since 2012 (figure 4.4).

80 Part II: Media and pollution management
Figure 4.4: National Food Agency samples, 2009–2014
Source: National Food Agency, 2014.
Photo 4: Sunset near Mtskheta
The National Food Agency collects the samples annually in different locations after water treatment and in the distribution network, and checks them against the parameters defined in the legislation. However, the frequency of sampling increases in the case of non-compliance and in outbreak situations. General procedures are given in the Order of the Minister of Agriculture N2-143 on the approval of risk assessment and communication procedures in the framework of risk analysis. The procedures in case of non-compliance and outbreaks are also defined.
According to the National Food Agency, the results of research show that the general condition regarding drinking water quality has been improved for the inhabitants of Kutaisi, Batumi, etc. However, the overall picture concerning the water distributed to the Georgian population is clearly a negative one.
Currently, the major problems concerning non-compliance with defined parameter guidelines occur in the WSSs of small towns. Of the nine outbreaks of waterborne diseases registered between 2007 and 2013 (table 4.4.), only one was related to a big city.
0
200
400
600
800
1 000
1 200
1 400
2009 2010 2011 2012 2013 2014
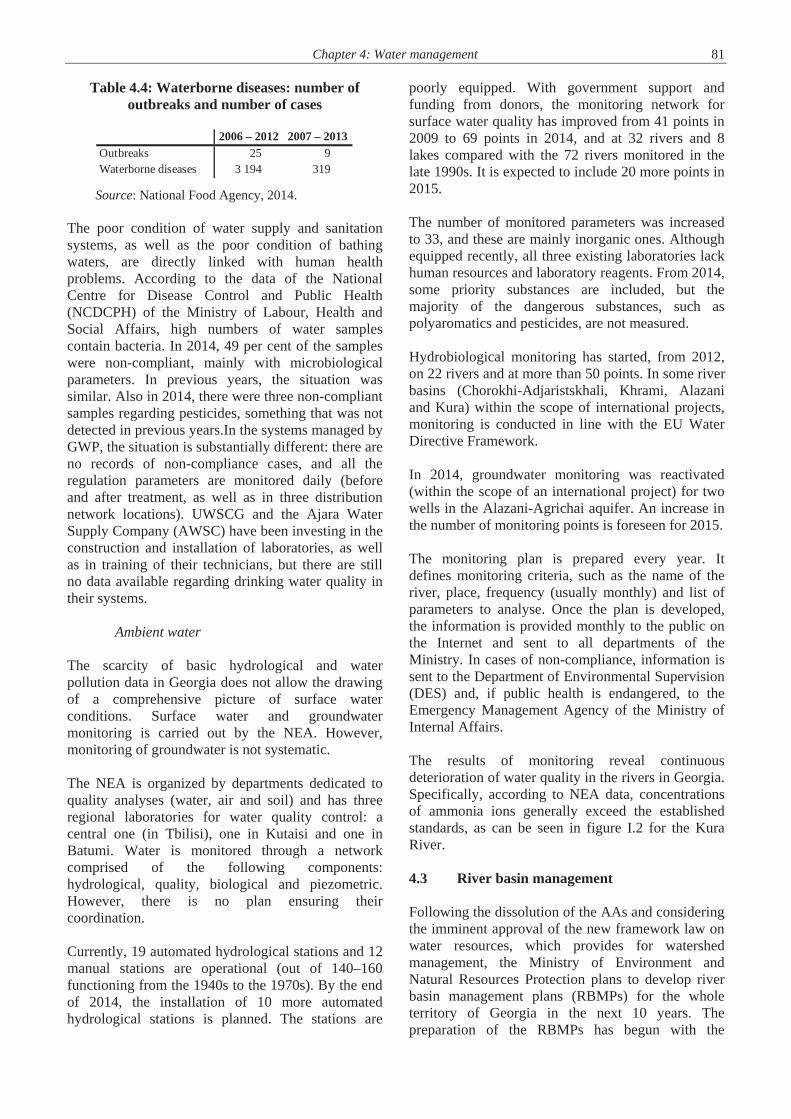
Chapter 4: Water management 81
Table 4.4: Waterborne diseases: number of outbreaks and number of cases
Source: National Food Agency, 2014.
The poor condition of water supply and sanitation systems, as well as the poor condition of bathing waters, are directly linked with human health problems. According to the data of the National Centre for Disease Control and Public Health (NCDCPH) of the Ministry of Labour, Health and Social Affairs, high numbers of water samples contain bacteria. In 2014, 49 per cent of the samples were non-compliant, mainly with microbiological parameters. In previous years, the situation was similar. Also in 2014, there were three non-compliant samples regarding pesticides, something that was not detected in previous years.In the systems managed by GWP, the situation is substantially different: there are no records of non-compliance cases, and all the regulation parameters are monitored daily (before and after treatment, as well as in three distribution network locations). UWSCG and the Ajara Water Supply Company (AWSC) have been investing in the construction and installation of laboratories, as well as in training of their technicians, but there are still no data available regarding drinking water quality in their systems.
Ambient water The scarcity of basic hydrological and water pollution data in Georgia does not allow the drawing of a comprehensive picture of surface water conditions. Surface water and groundwater monitoring is carried out by the NEA. However, monitoring of groundwater is not systematic. The NEA is organized by departments dedicated to quality analyses (water, air and soil) and has three regional laboratories for water quality control: a central one (in Tbilisi), one in Kutaisi and one in Batumi. Water is monitored through a network comprised of the following components: hydrological, quality, biological and piezometric. However, there is no plan ensuring their coordination. Currently, 19 automated hydrological stations and 12 manual stations are operational (out of 140–160 functioning from the 1940s to the 1970s). By the end of 2014, the installation of 10 more automated hydrological stations is planned. The stations are
poorly equipped. With government support and funding from donors, the monitoring network for surface water quality has improved from 41 points in 2009 to 69 points in 2014, and at 32 rivers and 8 lakes compared with the 72 rivers monitored in the late 1990s. It is expected to include 20 more points in 2015. The number of monitored parameters was increased to 33, and these are mainly inorganic ones. Although equipped recently, all three existing laboratories lack human resources and laboratory reagents. From 2014, some priority substances are included, but the majority of the dangerous substances, such as polyaromatics and pesticides, are not measured. Hydrobiological monitoring has started, from 2012, on 22 rivers and at more than 50 points. In some river basins (Chorokhi-Adjaristskhali, Khrami, Alazani and Kura) within the scope of international projects, monitoring is conducted in line with the EU Water Directive Framework. In 2014, groundwater monitoring was reactivated (within the scope of an international project) for two wells in the Alazani-Agrichai aquifer. An increase in the number of monitoring points is foreseen for 2015. The monitoring plan is prepared every year. It defines monitoring criteria, such as the name of the river, place, frequency (usually monthly) and list of parameters to analyse. Once the plan is developed, the information is provided monthly to the public on the Internet and sent to all departments of the Ministry. In cases of non-compliance, information is sent to the Department of Environmental Supervision (DES) and, if public health is endangered, to the Emergency Management Agency of the Ministry of Internal Affairs. The results of monitoring reveal continuous deterioration of water quality in the rivers in Georgia. Specifically, according to NEA data, concentrations of ammonia ions generally exceed the established standards, as can be seen in figure I.2 for the Kura River. 4.3 River basin management Following the dissolution of the AAs and considering the imminent approval of the new framework law on water resources, which provides for watershed management, the Ministry of Environment and Natural Resources Protection plans to develop river basin management plans (RBMPs) for the whole territory of Georgia in the next 10 years. The preparation of the RBMPs has begun with the
2006 – 2012 2007 – 2013Outbreaks 25 9Waterborne diseases 3 194 319
82 Part II: Media and pollution management
development of the EU-funded project River Basin Analysis in Chorokhi-Adjaristskali Pilot Basin. The Government’s strategy is based on replication of this study in other hydrographic basins. The environmental resources management system currently in place (licensing, standards setting, monitoring) is centralized. The Ministry of Environment and Natural Resources Protection intends to create new river basin management units for water resources management. There are no mechanisms to regulate, define priorities and establish rules for the allocation and distribution of water in the event of conflict. No conflicts between different water users in Georgia are reported. The Ministry of Environment and Natural Resources Protection is not informed about the existence of conflicts between water users and is not called to any negotiation meetings. The absence of policies for water use is especially worrisome if one takes into account that: (a) there are shortages of water (four times in four years), especially in the Yori River, which is important for irrigation, and (b) climate change, together with deforestation, has led to the intensification of the flow over shorter periods. 4.4 Developments in water infrastructure systems and their management
Water supply The coverage rate of water supply in Tbilisi was already 100 per cent by 2008, but only 70 per cent of the population was served 24 h/day; 30 per cent of the population covered by the supply system had water for only three to four hours per day. The main achievement of GWP has been to ensure that, since 2013, the entire population of Tbilisi has had constant water supply. The installation of water meters began in 2012, and has achieved considerable results: today, the billing rate is about 90 per cent for domestic customers and 100 per cent for others (industrial, commercial, etc.). About 50 km of the water distribution network is rehabilitated annually (a rate of 2.2 per cent per year), while in previous years it amounted to 18 km/year. It is estimated that around US$400 million is needed to fully rehabilitate the distribution network (of 2,300 km). The main purpose of the billing system practised is to recover the costs of operation and maintenance. But the rate charged in Tbilisi is not sufficient to cover
these costs, with the State subsidizing them (including funding the maintenance of the systems). It is for this reason that GWP reports that the company’s main problem is financial: the charged tariff does not allow for financing the works needed and there is no guarantee that the State would provide funding. Although Georgia is a country rich in water resources, there are many settlements without a water distribution system. As most of the systems were constructed in the 1950s, the lack of maintenance and rehabilitation of such systems has meant that they are inoperative or too degraded. Wishing to solve this problem, in 2012, the Government created UWSCG, which aims to ensure 100 per cent of the population is served by WSSs (24 h/day) and WWTPs, on a closed urban cycle. With financing from international donors and several development banks – the ADB, EIB, World Bank and EBRD – and co-financing from the Georgian Government, work is under way. Since 2010, the major achievements of UWSCG have been: Rehabilitation of WSSs in 21 cities and the
setting up of internal distribution networks in four cities;
Full or partial rehabilitation of WSSs in 17 cities, within the EIB financing;
Completion or commencement of several constructions and rehabilitations of WSSSs in seven secondary cities, with the financial support of the ADB.
Though UWSCG has made some effort in priority cities, rural sanitation currently receives little attention and few resources: there is a total absence of permanent water quality control in rural areas, and virtually no efforts to increase access to hygienic sanitation in rural areas, villages and small towns are under way or planned.
Sewerage system wastewater The main objectives of GWP in relation to wastewater treatment are: To implement the connections to the existing
manifolds, expanding the existing sewerage system (which has a total length of about 1,250 km). Prior to 2010, about 40 per cent of the flow of wastewater was discharged without treatment into the Kura River. Currently, over 80 per cent of the flow is directed to the WWTP Garbadani, while the remaining 20 per cent will be connected by the end of the year;
Chapter 4: Water management 83 To complete the rehabilitation of the WWTP
Garbadani: according to the contract signed with the Government in 2008, this should be achieved within 10 years. According to officials, the contract for the rehabilitation of the treatment plant that will serve Tbilisi, Rustavi and Mtskheta was initiated in 2014.
Since 2010, the major developments promoted by UWSCG have been as follows: in several cities new sewerage networks has been set up; in Poti a new WWTP with a maximum capacity of 5,500 m3/day was constructed for the new settlement of internally displaced peoples, but at present it is not functioning because the network is not yet in place; it is planned to construct treatment plants in eight cities, which will be concluded in 2018; sewerage networks have been rehabilitated and new networks have been set up in six regions, with a total length of 131.5 km.
Agriculture The irrigation system consists of 3,600 km of main channels, 3,100 km of primary and secondary distribution network and 25,000 km of internal network. Most of these infrastructures were built in the 1990s. The total irrigable area, 270,000 ha, is not currently being irrigated because there is no funding to rehabilitate the systems. Of this area, about 100,000 ha are irrigated using pumping systems, but the price of energy makes them impossible to use. The priority is therefore the rehabilitation of the entire irrigable area – only then can thought be given to its expansion. According to estimates of the Ministry of Agriculture, to recover the irrigation system on the area of 270,000 ha would require US$14 billion. The tariff system practised is insufficient to collect this value. Currently, a project financed by the World Bank is under way for the rehabilitation of four major irrigation and drainage systems. Work on rehabilitation of the main irrigation and drying systems has been conducted and some projects are under way on a regional basis. Electro-mechanical equipment in the pumping stations and water intakes, pipe canals, aqueducts and reservoir water engineering systems has been repaired. The main and supporting distribution canals have been repaired and cleaned. By the end of 2014, it was envisaged to irrigate 100,000 ha and drain 29,000 ha in the framework of the state programme “Modernization of Melioration Systems”. At present, 10 irrigation canals are being rehabilitated and during the coming years it is planned to rehabilitate 50 more.
4.5 Legal, policy and institutional framework Following the signing of the EU Association Agreement, Georgia foresees a period of 10 years in which to harmonize current legislation on water with the Water Framework Directive, in accordance with the following phasing: 1) harmonization of legislation; 2) monitoring and evaluation of the current situation; 3) classification of water bodies; and 4) preparation of the RBMP.
Legal framework On the whole, Georgia’s water-related legislation is inconsistent, contradictory and fragmented throughout the wide range of legal acts. There are several major laws and numerous sublegal acts regulating protection and management of water resources. The 1997 Water Law is the framework law regulating water resources, which defines the main issues related to protection and use of water. It defines the main principles of water policy (protection and rational use, supply of drinking water as a first priority, sustainability and prevention of harmful impacts), and guarantees the security of state interests in water protection. However, it does not fully cover all aspects of water management, including management of groundwater, which is regulated by the 1996 Law on Mineral Resources. The Water Law suffers from an unworkable character because of the nominal and questionable legal validity of most of its provisions. It mainly provides for protection and use of surface inland waters and practically leaves out the legal regulation of groundwater and coastal waters. Georgia’s legislation has continued its evolution since the adoption in 1997 of the Water Law; however, practically no effort has been made to ensure consistency of the latest water-related legislation to the basic principles and provisions of the Water Law. The 2005 Law on Licences and Permits altered the licensing and permitting system, abolishing numerous licences and permits, including in the water use sector. Nowadays, water abstraction and discharge is regulated by an environmental impact permit. In addition, abstraction of groundwater is regulated by a licence for use of mineral resources, and use of fish resources is regulated by a licence for fishing. Rules for issuance of an environmental impact permit are further defined by the 2007 Law on Environmental Impact Permit. Also, by-laws on technical environmental regulations define water

84 Part II: Media and pollution management
abstraction and discharge standards for activities not subject to an environmental impact permit. A major legislative change in Georgia’s environmental law was brought about with the 2004 Tax Code and 2005 Law on Licences and Permits. According to the Tax Code, taxes for environmental pollution (including water pollution) were abolished. The Law on Licences and Permits radically reduced the number of activities that were classified as environmentally sensitive and in need of management and oversight. The permitting system for surface water abstraction and for wastewater discharges, though in an initial version, was eliminated. Despite these fundamental changes, the Water Law has not been amended to bring it into conformity with the 2005 Law on Licences and Permits as well as to environmental and other sectorial laws that have been adopted since. In addition, current water-related legislation practically does not provide for comprehensive and clear regulation of such important and divergent topics as: water resources management; pollution prevention tools; ownership, possession and use rights with regard to water bodies; water cadastre; integration of water protection requirements and restrictions on land use and spatial development; and jurisdiction of regional and local self-governing bodies over waters. The draft of the new framework law on water resources was finalized by the end of 2014 and forwarded for inter-ministerial consultation. The draft law is supposed to fully embrace all aspects of integrated water resources management (IWRM). Since 2010, the following laws have been repealed: the 1997 Law on Land Melioration, regulating waters and water bodies used for melioration (agricultural) purposes; and the 2005 Law on State Control for Environment Protection. Georgia has committed to harmonizing its water-related legislation with that of the EU. The Government has already begun this process by establishing a time schedule to standardize national legislation with the EU directives related to water.
Policy framework Since 2010, and specifically for the water sector, no policies, strategies, guidelines, plans or programmes have been adopted. Development of the following strategic documents should, however, be emphasized:
Socio-Economic Development Strategy of Georgia (“Georgia 2020”): this document, apart from mentioning management by hydrographic river basin, defines overall strategic objectives (without establishing quantifiable indicators) for the supply and sanitation sector, for instance, to serve the entire population with continuous (24h) water supply and to rehabilitate drainage systems and treatment;
Second National Environmental Action Programme 2012–2016 (NEAP-2): this is a single strategic environmental document that addresses the water sector, devoting a chapter to water resources and another to the Black Sea;
State Strategy for Regional Development of Georgia 2010–2017: this document integrates a component concerning the strategy for the water supply and wastewater sanitation sectors. The aim of the development of municipal infrastructure is to establish a mechanism of effective management of infrastructure systems that provide different kinds of public services (water supply and water drainage, waste management, roads, etc.), for their further sustainable development.
There are no policies, strategies, mechanisms or systematic tools that promote efficient water use and the prevention of pollution by domestic consumption (reduced losses, public awareness campaigns). In general, there is no control of wastewater, as the licensing system, supervision and management is practically non-existent and management relies on emissions self-monitoring. There are no laws, policies or programmes that enable the management of water resources used in agriculture, the prevention of pollution caused by agricultural activity, promotion of the sustainable use of water, or the parsimonious use of pollutants, such as pesticides and fertilizers.
Institutional framework Water-management-related responsibilities in Georgia are divided among different state institutions, the key entity being the Ministry of Environment and Natural Resources Protection. Protection and management of surface and underground waters, as well as state control of environmental protection, lies within the competencies of this Ministry. Coordination of the development of water supply, sanitation systems and flood protection is undertaken by the Ministry of Regional Development and Infrastructure, while the

Chapter 4: Water management 85 management of drinking water quality is the responsibility of the Ministry of Agriculture. The Ministry of Labour, Health and Social Affairs develops environmental quality standards, including those for drinking water, bathing water, surface waters, groundwater and coastal waters. The tariffs for drinking water supply are set by the Georgian National Energy and Water Supply Regulatory Commission (GNERC).
Ministry of Environment and Natural Resources Protection Taking into account the institutional changes introduced in 2013, the following ministerial structures and instruments for pursuing the protection of water resources policy should be noted: The Water Resources Management Service is
responsible for water resources management; The Department of Environmental Impact Permit
is responsible for environmental licensing (chapter 1);
The Department of Environmental Supervision (DES) is responsible for inspection (of new units);
The NEA, ensuring the supply of information (chapter 1).
The Water Resources Management Service has seven employees and the following general functions: development of legislation, organization of river basin planning; ecological expertise for environmental permitting for surface water; and technical regulations and setting norms for surface water abstraction and wastewater discharge, collection, analysis and processing of statistical forms submitted annually by users of water resources (irrigation companies, hydroelectric and thermoelectric enterprises, industries) with data concerning the amount abstracted, and the destination, quantity and quality of discharged wastewater. Companies were previously obliged to submit the forms otherwise they would be fined; however, in 2008, that provision was abolished and the process became voluntary. The DES is responsible for pollution control checks and controls the fulfilment of the conditions imposed by the licence. Since its inception in 2013, it has conducted 500 inspections in 2013 and 800 in 2014. The costs of environmental damage are estimated based on the methodology established in the Guidance Rules for inspection proceedings that defines, among other things, formulae and cost per ton of pollution emitted. While it does perform
ad hoc inspections, its activities are well established in annual plans that define all aspects of inspections to be conducted, including their locations, frequencies and parameters. The DES has eight regional units, one being the Black Sea. Coordination with other relevant entities for environmental inspection activities are planned and defined, for example, the Police (if any criminal evidence exists) and the NEA (for samples). Extreme events (floods and droughts) are the responsibility of the Natural and Technological Hazards Management Service of the Ministry of Environment and Natural Resources Protection. It prepares annual reports identifying risks and defining measures (for local authorities) and recommendations for the Ministry of Regional Development and Infrastructure. These reports are also sent to all ministries and serve as the annual guide.
Other institutions The state-owned UASCG, created in 2008, includes 22 regional companies responsible for managing water irrigation and drainage, as well as collecting the fees from the systems’ users. However, there is no application of the polluter-pays principle, as the tariff is simply calculated according to the irrigated area. The rate, 75 lari /ha, is well below what the international criteria recommend (between 800 lari and 1,300 lari /ha) and only 50 per cent of the farmers pay this tariff. Management of the existing water supply and wastewater drainage systems is exercised by three companies, with different territorial interventions: UWSCG serves the country’s urban areas, with
the exception of Tbilisi, Mtskheta, Rustavi and the Autonomous Republic of Ajara;
GWP operates in Tbilisi, Mtskheta and Rustavi; Water Companies of the towns of Ajara are
responsible for water services in the Ajara Autonomic Republic.
The National Food Agency under the Ministry of Agriculture is responsible for driniking water monitoring. 4.6 Regulatory, economic, fiscal and information measures The absence of effective pollution prevention and water extraction control mechanisms is one of the major problems related to water resources in Georgia. There are no special permits for water extraction and use in Georgia. Both industrial discharge and water

86 Part II: Media and pollution management
extraction are regulated through an environmental impact permit process. The environmental impact permit system needs improvement. Currently, the process cannot adequately address all water quality- and quantity-related issues. The environmental impact permit does not address major industrial sectors responsible for high loads of nutrient-containing wastewater, such as food industries. Activities not subject to environmental impact permits have to comply with technical environmental regulations, which establish pollution discharge standards and provide for the approval of five-year water extraction projects by the Ministry of Environment and Natural Resources Protection. However, this standardized approach to discharge control does not account for differing background conditions, differing sensitivities of areas or the cumulative effect of several industries in a neighbourhood. The environmental permitting system is fully regulated by the 2007 Law on Environmental Impact Permit, which defines procedures and contains the list of activities subject to licensing. Once drafted and revised, an EIA is submitted to the Ministry of Environment and Natural Resources Protection for ecological expertise, and analysis involving experts from the Ministry and external experts, as appropriate. At this point, if they are concerned with issues related to environmental protection of water, the Water Resources Management Service is called on to intervene. One can say that, currently, in this procedure resides the main tool for sustainable management of water resources and prevention of water pollution in Georgia. Since 1997, the year in which the permitting system database was created, about 70 environmental permits have been issued per year, at an almost constant rate (500 in total). Most permits are issued to industries, construction materials factories and mines. The following activities are not subject to environmental permitting: Water abstraction and discharge of wastewater; Extraction of/exploration for minerals
(considered to be natural resource management); Groundwater abstraction (considered to be
natural resource management). The tariffs for drinking water supply are set by GNERC by its 2010 Resolution No. 17 on Adoption of Water Use Tariffs. Metering of drinking water
supply is in progress in the cities. Until September 2010, this was voluntary for the population. In compliance with GNERC’s 2010 Resolution No. 18, water distributing companies were given the right of individual metering of the population. Today in Tbilisi, about 20 per cent of consumers are provided with water meters; from 2015 onwards, it is planned to also cover individual apartments and not just entire buildings. In the Law on Licences and Permits, the list of economic activities subject to ecological expertise does not include agricultural and livestock farms, so in these cases the Ministry of Environment and Natural Resources Protection refers to the application of the technical environmental regulations. There is no entity or state legislation enabling the allocation/distribution of water among farmers – agricultural cooperatives, and others who played that role, were abolished in 2010, and the licensing system of farms (which defined the maximum use of water, and if this was exceeded, required the payment of fines) was also extinguished. 4.7 Water-related global, regional and bilateral agreements
Regional Multilateral Environmental Agreements
Convention on the Protection and Use of Transboundary Water Courses and International Lakes Georgia is not a party to the Convention on the Protection and Use of Transboundary Water Courses and International Lakes and to the London Protocol on Water and Health.
Convention on the Protection of the Black Sea Against Pollution (Bucharest Convention) It is estimated that only 2 per cent of the organic matter responsible for the eutrophication of the Black Sea comes from Georgia and therefore it is not considered a problematic issue. Regarding wastewater, the main cause of pollution in coastal areas is the discharge of untreated wastewater (and not agricultural, industrial or mining activities). Urban pollution has been intensifying with the increase of tourism activity in the region. To alleviate this situation, the Batumi WWTP was constructed and two other are planned in Ureki and Cobrileti. Regarding the Black Sea, the main developments since 2010 can be summarized as follows:
Chapter 4: Water management 87 Due to the fact that there were not enough
financial resources to develop a NEAP for the Black Sea, a specific chapter on the Black Sea was developed and included into the 2012 National Environmental Action Programme 2012–2016 (NEAP-2). The main problem is that most of the measures and objectives established in the NEAP were taken directly from the 2009 Strategic Action Plan for the Rehabilitation and Protection of the Black Sea (SAP);
Development since 2013 of the UNDP- and EU-funded project Environmental Monitoring in the Black Sea (EMBLAS), the objective of which is to strengthen the capacities of Georgia, the Russian Federation and Ukraine for biological and chemical monitoring of water quality in the Black Sea, in line with EU water-related legislation.
The implementation of the Convention requires the involvement of all departments of the Ministry responsible for the area of water resources management: the NEA – on quality monitoring, especially in the Batumi laboratory that exists to monitor chemical and biological parameters in the Black Sea; the Department of Environmental Impact Permit – with the ecological expertise to avoid or mitigate impacts of economic activities on the Black Sea; the DES, which has a special department for the supervision of the Convention based in Batumi (itinspects boats to check whether they are in accordance with international conventions, including MARPOL); and the member of the Commission of the Black Sea Convention from Georgia, which annually prepares progress reports and annual plans.
Bilateral cooperation With regard to international cooperation in the area of water resources, no agreements, international conventions or protocols have beensigned or ratified since 2010. It should be noted, however, that currently the Organization for Security and Co-operation in Europe (OSCE) and ECE support Georgia in facilitating the negotiation process on the agreement between Azerbaijan and Georgia on cooperation in the field of protection and sustainable use of the water resources of the Kura River basin. The preparation of the agreement was endorsed by two letters: one from the Minister of Environment and Natural Resources Protectionof Georgia and one from the Minister of Ecology and Natural Resources of Azerbaijan. The agreement seeks to resolve inter alia the issue of shared water from the Kura River for agricultural use – something that has become problematic for the Ministry of Agriculture considering the planned expansion of the agricultural
area in the east of the country. During the period 2010–2014, six bilateral consultations between Georgia and Azerbaijan took place with the objective of definingthe scope and structure of the future bilateral agreement on the shared water resources and developing a text for the agreement. Among international projects implemented or ongoing in Georgia in the field of cooperation on water resources management, the following should be highlighted: the National Policy Dialogue on Integrated Water Resources Management (IWRM) in Georgia was launched in September 2010, with the support of ECE, which focuses on three major topics: i) preparation of the national water law based on the IWRM principles; ii) setting targets for implementation of the ECE/WHO Protocol on Water and Health of the ECE Water Convention; and iii) transboundary water cooperation with neighbouring Azerbaijan. Review of the Georgian Legal and Institutional Water Framework and Recommendations for Implementation of EU Water Framework Directive Principles, including preparation of a national water law, was prepared in 2012. Development of regulations for watershed-based planning started in 2014. 4.8 Conclusions and recommendations Current water-related legislation practically does not provide for comprehensive and clear regulation of the water resources management. The absence of effective pollution prevention and water extraction control mechanisms is one of the major problems related to water resources in Georgia. There are no special permits for surface water abstraction and wastewater discharge. At present the Ministry of Environment and Natural Resources Protection is in the process of harmonization and approximation of the water legislation with that of EU. The draft of the new framework law on water resources was finalized by the end of 2014 and forwarded for inter-ministerial consultation. Recommendation 4.1: The Ministry of Environment and Natural Resources Protection should: (a) Finalize the drafting of a new law on water
resources management, taking into account the country’s commitments to introducing European Union-relevant regulations, and submit the draft for adoption;
(b) Develop by-laws regarding the quality criteria for surface water abstraction and wastewater discharge and re-establish the permit for these activities;

88 Part II: Media and pollution management
(c) Strengthen capacity of the existing units responsible for water resources management and administrative supervision;
(d) Establish basin management structures for defined river basin districts and ensure the coordination of actions for the development of river basin management plans.
With government support and funding from donors, the monitoring network for surface water quality has improved from 41 points in 2009 to 69 points in 2014. The number of monitored parameters was increased to 33. However all three existing laboratories of the National Environment Agency of the Ministry of Environment and Natural Resources Protection lack capacity and human resources. The scarcity of basic hydrological and surface and groundwater pollution data in Georgia does not allow drawing of a comprehensive picture of status of water bodies. Recommendation 4.2: The Ministry of Environment and Natural Resources Protection should: (a) Continue expansion of the surface water and
groundwater monitoring networks; (b) Strengthen the capacity of the National
Environment Agency, providing it with adequate funding, training and equipment and a sufficient number of professional staff.
Municipal wastewater remains a major polluter of surface waters in Georgia: on average, 70 per cent of
the urban population is served by collection systems but only 26 per cent of wastewater is treated. Currently, sewage collection systems exist in only 41 towns and urban centers, most of the municipal wastewater treatment plants (WWTPs) constructed in 1990-s are inoperable. Recommendation 4.3: The Ministry of Infrastructure and Regional Development should: (a) Assess the status of urban wastewater
collection and treatment; (b) Prepare technical and investment
programmes for the implementation of the urban wastewater treatment regulations, compatible with the relevant European Union directive, and allocate corresponding funds for that work in the budget.
There are no contamination problems with phosphates and pesticides from agricultural activities. However, nitrogen compounds levels in the surface water bodies are above the norms set by the national legislation. Recommendation 4.4: The Ministry of Agriculture should develop action plans and codes of good agricultural practice for nitrate-vulnerable zones in accordance with the requirements of European Union Directive 91/676/EEC concerning the protection of waters against pollution caused by nitrates from agricultural sources.

89
Chapter 5
WASTE MANAGEMENT
5.1 Trends in waste management
Municipal waste There was no legal requirement to collect data on types and amounts of municipal waste until 2015; thus, the amount of generated municipal waste can only be estimated from generation per capita and the total population of Georgia – between 0.8 million and 1 million tons of municipal waste per year, currently. Composition of municipal waste (table 5.1) was analysed in the regions of Tbilisi, Kvemo Kartli and Kutaisi, which is accepted as representative of the whole of Georgia. Table 5.1: Average municipal waste composition
Source: Draft national waste management plan, 2014.
Collection
Collection of municipal waste is provided only in urban areas, while rural areas remain unserved. It is estimated that about 70 per cent of generated municipal waste is collected by regular services and delivered to local disposal sites. Containers used for waste collection are mainly 1.1 m3 euro-containers and 240 litre plastic bins. These are located along main streets, enabling easy and fast collection. The number of containers is not sufficient and municipal waste has to be collected several times per day. The collection system covers all types of waste generated by citizens, services and markets. This results in local overfilling of containers, especially in the vicinity of city markets, which is creating additional workload for collection companies.
There are two other methods of waste collection, but their share is decreasing. In areas with difficult access, municipal waste is collected by the bell system, with residents called by the collection vehicle horn to bring out their waste. Bunker systems or refuse chutes in apartment blocks are being continuously phased out, because their operation is considered unhygienic and labour demanding. Waste collected in Tbilisi is first transported to a transfer station located at the base of the Tbilisi waste collection company. This is making waste collection more efficient and provides effective transport of waste to the Tbilisi landfill. Only two districts of Tbilisi, nearest to the landfill, are delivering waste to it directly. Practically all collected waste is transported directly to disposal sites. Material recovery from municipal waste is not performed, except in the sorting plant at Rustavi city landfill. Separate collection has not yet been introduced in Georgia. Waste is recovered for recycling mainly through informal activities. For example, in 2012, the private initiative COOP Georgia started introducing separate collection services to interested individuals and companies in Tbilisi. Recyclers are focusing on waste that has a market value. This is mainly PET bottles, scrap metal, glass and paper. There is capacity for processing recyclables in Georgia. JSC Mina Glass factory in Ksani has capacity of 28,000 tons/year; paper waste is processed in paper plants in Tbilisi and Tserovani. PET bottles are collected and compacted by several small companies, and then the plastic waste is exported.
Landfilling Disposal of municipal waste has improved by the implementation of a centralized approach to modernization of the operation of existing disposal sites, and by development of three modern sanitary landfills. This creates the necessary conditions for introducing new standards for municipal waste management. There are 63 existing large, official disposal sites in Georgia; of these, 52 are under the control of the
%Food 42.11Paper and cardboard 7.65Plastics 11.27Textiles, rubber, leather 4.46Garden green waste 14.63Wood 2.17Glass 3.66Metals 1.36Inert waste 12.38Hazardous materials 0.31
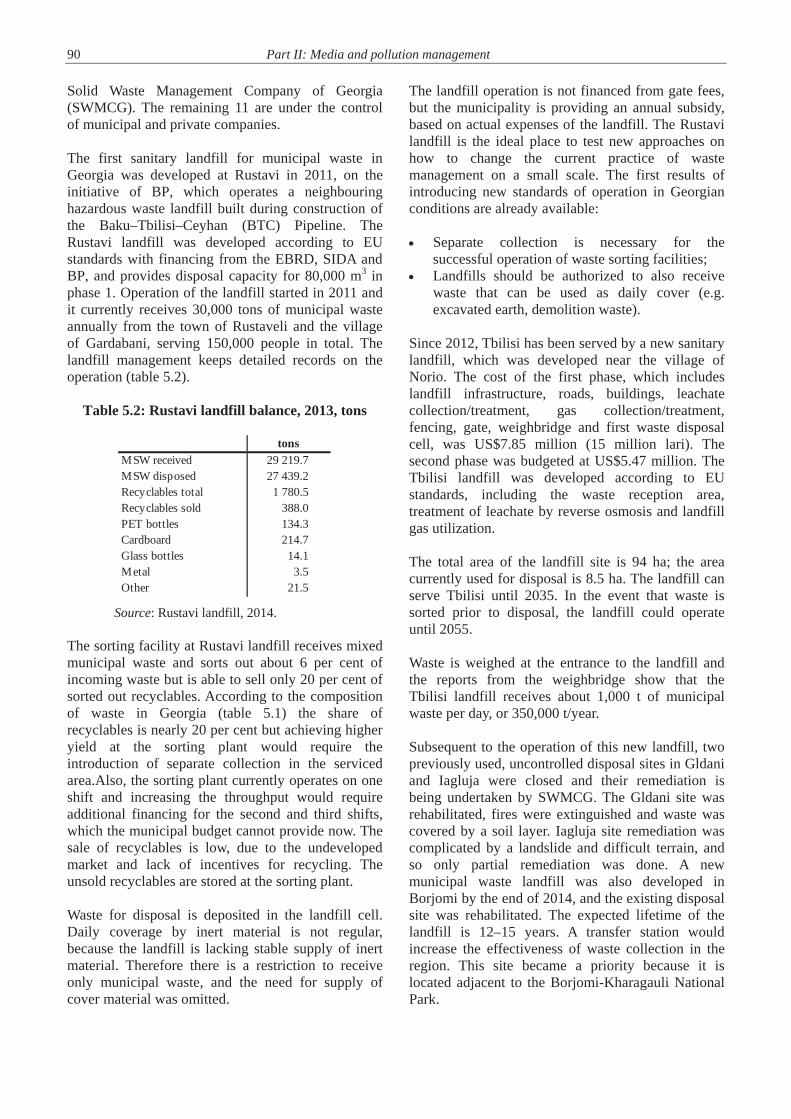
90 Part II: Media and pollution management
Solid Waste Management Company of Georgia (SWMCG). The remaining 11 are under the control of municipal and private companies. The first sanitary landfill for municipal waste in Georgia was developed at Rustavi in 2011, on the initiative of BP, which operates a neighbouring hazardous waste landfill built during construction of the Baku–Tbilisi–Ceyhan (BTC) Pipeline. The Rustavi landfill was developed according to EU standards with financing from the EBRD, SIDA and BP, and provides disposal capacity for 80,000 m3 in phase 1. Operation of the landfill started in 2011 and it currently receives 30,000 tons of municipal waste annually from the town of Rustaveli and the village of Gardabani, serving 150,000 people in total. The landfill management keeps detailed records on the operation (table 5.2).
Table 5.2: Rustavi landfill balance, 2013, tons
Source: Rustavi landfill, 2014.
The sorting facility at Rustavi landfill receives mixed municipal waste and sorts out about 6 per cent of incoming waste but is able to sell only 20 per cent of sorted out recyclables. According to the composition of waste in Georgia (table 5.1) the share of recyclables is nearly 20 per cent but achieving higher yield at the sorting plant would require the introduction of separate collection in the serviced area.Also, the sorting plant currently operates on one shift and increasing the throughput would require additional financing for the second and third shifts, which the municipal budget cannot provide now. The sale of recyclables is low, due to the undeveloped market and lack of incentives for recycling. The unsold recyclables are stored at the sorting plant. Waste for disposal is deposited in the landfill cell. Daily coverage by inert material is not regular, because the landfill is lacking stable supply of inert material. Therefore there is a restriction to receive only municipal waste, and the need for supply of cover material was omitted.
The landfill operation is not financed from gate fees, but the municipality is providing an annual subsidy, based on actual expenses of the landfill. The Rustavi landfill is the ideal place to test new approaches on how to change the current practice of waste management on a small scale. The first results of introducing new standards of operation in Georgian conditions are already available: Separate collection is necessary for the
successful operation of waste sorting facilities; Landfills should be authorized to also receive
waste that can be used as daily cover (e.g. excavated earth, demolition waste).
Since 2012, Tbilisi has been served by a new sanitary landfill, which was developed near the village of Norio. The cost of the first phase, which includes landfill infrastructure, roads, buildings, leachate collection/treatment, gas collection/treatment, fencing, gate, weighbridge and first waste disposal cell, was US$7.85 million (15 million lari). The second phase was budgeted at US$5.47 million. The Tbilisi landfill was developed according to EU standards, including the waste reception area, treatment of leachate by reverse osmosis and landfill gas utilization. The total area of the landfill site is 94 ha; the area currently used for disposal is 8.5 ha. The landfill can serve Tbilisi until 2035. In the event that waste is sorted prior to disposal, the landfill could operate until 2055. Waste is weighed at the entrance to the landfill and the reports from the weighbridge show that the Tbilisi landfill receives about 1,000 t of municipal waste per day, or 350,000 t/year. Subsequent to the operation of this new landfill, two previously used, uncontrolled disposal sites in Gldani and Iagluja were closed and their remediation is being undertaken by SWMCG. The Gldani site was rehabilitated, fires were extinguished and waste was covered by a soil layer. Iagluja site remediation was complicated by a landslide and difficult terrain, and so only partial remediation was done. A new municipal waste landfill was also developed in Borjomi by the end of 2014, and the existing disposal site was rehabilitated. The expected lifetime of the landfill is 12–15 years. A transfer station would increase the effectiveness of waste collection in the region. This site became a priority because it is located adjacent to the Borjomi-Kharagauli National Park.
tonsMSW received 29 219.7MSW disposed 27 439.2Recyclables total 1 780.5Recyclables sold 388.0PET bottles 134.3Cardboard 214.7Glass bottles 14.1Metal 3.5Other 21.5

Chapter 5: Waste management 91
Industrial waste Regular reporting on industrial waste is not required by legislation. A more or less broad inventory was conducted only once, in 2007, with the help of UNDP, and included household, industrial, medical and biological waste (table 5.3). But the inventory is compromised by the non-existence of a waste classification system, which would allow identification of options for the treatment of identified waste. There is no comprehensive record of the amount of industrial solid wastes generated in Georgia, and thus, information on the exact amount produced is not available. The main industrial regions in Georgia are Tbilisi, where about one third of industrial companies are concentrated, followed by Kvemo Kartli (Rustavi in particular), Imereti (Kutaisi in particular), Shida Kartli and Kakheti. The major waste generators are considered to be the mining industry (including coal extraction/processing), oil processing industries, and the ferrous and nonferrous metallurgy and manufacturing industries. The latter constitute the largest number of existing facilities and include, for example, varnish and paint production, food and drink factories and construction materials processing. Waste from large industrial facilities is disposed mainly on landfills at the industrial site itself or nearby, with a few legal/environmental requirements. It is considered that the majority of these on-site landfills are unsatisfactory. Some smaller industries dispose of their non-hazardous waste at municipal disposal sites. There are several facilities who treat some types of hazardous waste.
Accumulated hazardous wastes Hazardous waste that was generated in the past was not properly disposed of. Hazardous waste can be found at practically every abandoned factory. A systematic inventory of hazardous waste sites has not yet been carried out in Georgia. Lack of data allows only for known hotspots to be highlighted and additional polluted sites may be identified in the future. Attention is given to hazardous mining waste in the villages of Tsana and Uravi, where deposits of arsenic-containing waste from the operation of an arsenic extraction and enrichment facility are located. About 100,000 tons of arsenic waste was identified on these sites. The situation escalated in September 2013 when part of a barrel storage site was flooded and arsenic waste polluted the Tskhenistskali River. Two projects are targeting arsenic-containing mining waste in Georgia. They are aimed at assessment of the risks connected with these sites and will continue with development of two new disposal sites, one for hazardous and one for non-hazardous waste, which will result in elimination of the most direct threats of arsenic waste on the local population and environment. The amount of obsolete pesticides in Georgia is estimated at 3,583 tons. Most of these and other expired agrochemicals were accumulated and are deposited in the Iagluja storage site. It is estimated that about 2,800 tons of low chlorine pesticides are deposited on this site, which were not properly packed and the site was freely accessible.
Table 5.3: Types and volumes of waste according to the 2007 inventory
Source: Ministry of Environment and Natural Resources Protection. Report of Waste Inventory on the Territory of Georgia, 2007.
Material Mining and mineral processing wastes 11 777 300 tonsChemical industry and processing wastes 781 120 tonsAlcohol beverages and soft drinks industry wastes 45 000 tonsConstruction materials production wastes 35 700 tonsOil refineries and oil product consumption wastes 27 520 tonsFerrous and non-ferrous metal scrap 1 720 tonsOther organic and inorganic wastes 1 490 tonsGlass slivers 200 tonsPolyethylene and plastic wastes 12 tonsFluorescent lamps 68 100 piecesTimber processing wastes 19 600 m3

92 Part II: Media and pollution management The Global Environment Fund (GEF) project Disposal of POP Pesticides and Initial Steps for Containment of Dumped POP Pesticides in Georgia was implemented in 2012–2014. The project is aimed at repackaging disposed of pesticides, securing the site by fencing and minimizing environmental impacts from this site. After investigating the site, 230 tons of pesticides were sent to France and Belgium for destruction. This is an improvement for the Iagluja site, as this amount represents two thirds of the pesticides not mixed with soil. The project also provided training in handling these hazardous chemicals and will identify methods for final clean-up of the Iagluja site.
Health-care waste
Management of health-care waste in Georgia is undergoing a transformation. Old practice, when waste from hospitals was dumped together with municipal waste, is being abandoned and a network of specialized incinerators for medical waste is emerging. The system of collection of medical waste in Tbilisi is operated by a private company, Express Diagnostics Ltd, which also supplies equipment and material for hospitals. Anatomical waste is collected by a special company and buried in cemeteries. About 90 per cent of health-care facilities in Tbilisi are covered by a daily collection system. There are only limited data on health-care waste, although it is required to report them. A study based on WHO standards on health-care waste generation estimates annual amounts at 5,000–10,000 tons, of which 1,200–1,800 tons are considered hazardous. In Tbilisi, about 450 t/year are collected, but this study indicated that about 1,900 tons of health-care waste, of which 723 tons are hazardous, should be generated annually. The Ministry of Labour, Health and Social Affairs carries out surveillance of medical establishments but there are no clear provisions for overseeing health-care waste management. The old system of health-care waste management, which is still used, is based on disposal of non-infectious waste in municipal landfills; infectious waste is sterilized and then disposed of, and anatomical waste is buried in cemeteries. The new system, which has been developed with the assistance of international donors, uses incinerators for the destruction of health-care waste. Currently, 10 waste incinerators are in operation. The transition to the new system is supported by the Infectious Medical Waste Management Project, which is aimed
at implementation of a national infectious health-care waste management system, including an effective separation, transportation and treatment system based on the incineration technology. The project aims to install incinerators in the western and eastern parts of Georgia and to manage the infrastructure.
Radioactive waste Georgia is using radioactive sources only in research and production. Currently, the following radioactive sources may generate radioactive waste: Institutions which use radioactive sources for
radiography, research, carotage, etc. (mainly 137Cs, 60Co and 192 Ir);
RTG sources: irradiators type Gube-400, Stebel and Kolos (137Cs with activity 280 tBq), medical irradiators Rokus (60Co with activity of 50–75 tBq), Teragama (with activity 232 tBq);
Neutron sources for logging (241Am-Be, 210Po-Be, 239Pu-Be, 252Cf);
Nuclear materials intercepted during illicit trafficking;
Medical and research open sources; Three Reil High Measurement System devices; X-ray devices used mainly for medical and for
research purposes; Devices containing radioactive sources with
activity less than 5 mCi (e.g. smoke alarm detectors).
The Mtskheta nuclear research reactor IRT-M is being decommissioned. Decommissioning activities carried out in 2006–2007 were aimed at dismantling the primary and secondary cooling circuits, cryogenic and other auxiliary systems of the reactor, whose surface had been contaminated by the radioisotope Cobalt-60. All radioactive waste generated during the dismantling activity was safely moved to special storage built on the reactor site. The interim storage of radioactive substances began operation in 2007 (with the assistance of the United States) and provides for the safe storage of radioactive wastes. Georgia, in cooperation with international partners, especially the International Atomic Energy Agency (IAEA) and United States, carried out search-and-secure operations throughout the country. The operations started with aerial surveillance to search for orphan sources in the western part of Georgia. The last search-and-secure operation was carried out in May 2012 at former scientific research facilities located in western Georgia. Since the beginning of the campaign about 15 years ago, approximately 800 orphan sources have been found and secured.

Chapter 5: Waste management 93 The Saakadze radioactive disposal facility, a Radon type inherited from the Soviet era, was decommissioned in 1988, but was later used for storage of identified abandoned sources, until 1995. The next challenge is to upgrade the physical protection infrastructure of this radioactive waste disposal site. Numerous radioactive sources were placed on the site during Soviet times. The operations are being jointly supported by the Governments of the United Kingdom of Great Britain and Northern Ireland, and Georgia. The IAEA is supervising the process through its Nuclear Security Office. The first stage of enhancements to physical protection and infrastructure is scheduled to be finished in the middle of 2014.
Agricultural waste Agricultural production generates a broad range of residues from arable land farming and animal breeding. A large part of these residues can be utilized directly by farmers and the only unusable part is generated as waste.
Agricultural waste in Georgia is not monitored. Current amounts of waste are not subject to investigation, although attention is given to agrochemical wastes accumulated in the past. Agricultural waste is not considered a problem in the countryside, where there are mainly small family farms. However, if small farmers live within an area served by a municipal waste collection company, they often discard agricultural waste together with municipal waste. This is causing additional workload for waste collection services. The main source of waste generation from the agriculture sector arises from cattle and poultry breeding. The closure of several large-scale cattle and poultry breeding facilities resulted in many smaller scale facilities being established. This has distributed the waste generation from a small number of sources to a larger number of smaller sources. This has reduced the impact of waste generation from intensive agriculture facilities overall.
Box 5.1: Solid Waste Management Company of Georgia
Georgia has taken an innovative approach to modernization of existing disposal sites. The specialized Solid Waste Management Company of Georgia (SWMCG) was founded in 2013 and all large disposal sites were placed under its responsibility, except the disposal sites in Tbilisi, Rustavi and Ajara. The main advantage of this approach is the effective introduction of regionalization of waste disposal. The Government gained direct access to financing the modernization of, and/or itself modernizing, disposal sites. The traditional approach of assigning responsibility for disposal sites to municipalities often fails as municipalities give priority to their local interests and undermine government efforts to introduce a regional network of landfills. This risk has been avoided in Georgia. SWMCG is administratively under the control of the Ministry of Regional Development and Infrastructure and its operation and investments are financed from the state budget. The main tasks of the company are the gradual improvement of operational standards, introduction of a waste recording system and minimizing the environmental impact of its sites. The company will also play an important role in the development and operation of modern sanitary landfills and gradual closure of existing landfills by observing international standards after commissioning the new regional sanitary landfills. Of the 52 disposal sites transferred to the control of SWMCG, 13 were closed and upgrade plans were prepared for the other 39. Eight disposal sites were upgraded in 2013 and another 12 in 2014. This modernization included:
Establishing the landfill commissioning project; Topographic-geodetic works, topographic survey of the landfill site and engineering-geological study; Transferring wastes placed on the landfill to a designated area, compaction and covering with an inert layer; Construction of the entrance area with weighbridge and service rooms; Fencing and runoff and leachate control systems; Improvement of adjacent areas through riverbank protection works and collection of littered waste.
SWMCG is the key partner for international donors in development of new regional sanitary landfills. SIDA assisted in development of the SWMCG Action Plan and assessment of risks on landfills. This cooperation is planned to continue for the next three years. Cooperation with KfW targets the Imereti region, which will result in a new sanitary landfill in Kutaisi and development of a network of transfer stations. Cooperation with the EU resulted in the Kvemo Kartli waste management project, under which a regional waste management strategy was developed. Under preparation is cooperation with the Government of the Netherlands (ORIO) and with the EU programme INOGATE on utilization of landfill gas. Source: Ministry of Environment and Natural Resources Protection, Solid Waste Management Company of Georgia, 2014.

94 Part II: Media and pollution management
Construction waste Rapid urban development of Tbilisi and other cities results in high quantities of construction waste. There are no data on amounts of this waste, and estimates are not reliable as the volume of construction work is increasing on an annual basis. Uncontrolled dumping of construction waste by construction companies ended in 2006 when new legislation introduced high fines for illegal dumping. From November 2007 to November 2010, 2,571 cases of waste-related administrative violations were reported, of which the major share comprised cases of illegal disposal of construction waste. Now construction waste can be disposed of only in allocated sites. The site received approximately 330,000 tons of waste in 2005. Construction waste from small-scale developments and building renovations generated by individuals remains a problem. If citizens place construction waste in municipal waste containers, this leads to the failure of lifting and compaction systems on collection vehicles. Collection companies are willing to collect small amounts of construction waste for a charge, but citizens are not willing to pay and prefer placing construction waste near containers or near disposal sites, expecting collection free of charge.
Waste streams Handling of specific waste streams (such as packaging, oils, tyres, motor vehicles, batteries, accumulators, and electrical and electronic equipment) is not yet introduced in Georgia, because there was no nationwide governmental policy on waste management. It is expected that implementation of the new Waste Management Code will include preparation of strategies for specific waste streams and enable their separation from general waste. 5.2 Pressures from waste
Municipal waste The environment is affected by air, ground and surface water pollution from improperly constructed official municipal landfills. Most of the 63 official municipal landfills operational today do not have a groundwater protection barrier and a leachate collection/treatment system. Some of the landfills are located on riverbanks or water-tracing gorges, polluting surface water and groundwater. Due to
remediation measures implemented by SWMCG, some of these negative impacts have been reduced. Almost all municipal landfills operating today were constructed in Soviet times and they do not meet the current environmental requirements. Spontaneous, low-temperature combustion of wastes occurs in landfills, emitting harmful substances including dioxins and furans into the air. These POPs degrade slowly in the environment and are transported long distances by atmospheric flows. The littering of natural landscapes and cultural sites with household wastes dumped without control is noticeable in Georgia. This situation is problematic not only from the aesthetic and economic points of view but also for the risks of diseases and parasite proliferation it presents; both domestic and wild animals feed on the dumped litter that may poison them or result in accumulation of harmful substances in the tissues of the animals. The main reason for littering of the environment is the disintegration of the waste collection system. Presently, the regular collection of household waste is only carried out in big cities and district centres. In many settlements (especially villages), the residents solve the waste problem themselves by dumping the wastes in nearby ravines, along the roads or onto river banks. Eventually, these dumps are converted into small, uncontrolled disposal sites.
Industrial waste The environmental impact of industrial waste is known only in individual cases, because of the lack of systematic investigation of hotspots, waste classification and data collection. According to the generally accepted methodology, “source–pathway–target”, Georgia has information regarding targets expressed for water and air pollution, but clear assignment to source is missing. Identified pollution caused by arsenic waste from mining activities remained an issue in the Tskhenistskali River. The pollution of surface waters by wastes which were either accumulated in the past or are being currently produced and poorly managed, is of particular concern. Regarding pollution from facilities which are currently operational, the main areas of concern include the Kvirila River, polluted by wastes from a manganese recovery facility, and the Mashavera River and its tributaries, polluted by wastes from a polymetallic ore processing facility.

Chapter 5: Waste management 95 5.3 Legal, policy and institutional framework
Legal framework Despite there having been several attempts to adopt a waste law, in 2003, 2005 and 2010, an integrated waste management framework law does not exist in Georgia. A new law on waste management, the Waste Management Code, was adopted on 26 December 2014 and entered into force on 15th of January 2015. The 1996 Law on Environmental Protection contains general legal requirements on policy, planning, monitoring of waste management facilities and public awareness, which can be applied to waste management. It defines principles of environmental protection, including waste minimization, according to which, priority shall be given to technologies generating less waste and to recycling, which calls for the use of materials which can be easily reused or degraded biologically without harming the environment. This Law also enables the introduction of economic incentives supporting the use of BAT for waste minimization. It defines requirements for environmentally sound waste management. The waste generator is required to manage their waste according to standards of environmental protection and sanitary, hygienic and epidemiological standards. Disposal of industrial and municipal waste is permitted only on defined sites. Toxic, radioactive and other dangerous waste can be disposed of only in specially designated sites. The same article also forbids dumping waste into the sea or into watercourses and defines that a separate law regulates the import, export and transit of waste. Environmental requirements for commissioning a facility are defined in article 40, where it is stipulated that, if a facility generates hazardous waste, it must have fully operational equipment for treatment of hazardous waste. The 2007 Law on Environmental Impact Permit defines permitting of various activities, including waste management operations. This Law is supported by the 2007 Law on State Ecological Expertise. According to the 2011 amendment to the Law on Environmental Impact Permit, all already operational non-hazardous waste landfills had to obtain a permit before 1 January 2014. This legal obligation was not followed up to its full extent and its application was
postponed to 2016. New sanitary landfills have this permit and disposal sites under the control of SWMCG will obtain such a permit after their modernization has been completed. Landfills in most municipalities do not have an environmental impact permit. The main cause for this is the limited financial resources coupled with the lack of the requisite knowledge, skills and guidance in meeting the environmental requirements. The 1995 Law on Transit and Import of Waste within the Territory of Georgia is implementing requirements of the Basel Convention on the Control of Transboundary Movement of Hazardous Wastes and their Disposal. This Law bans the import of hazardous and radioactive waste to Georgia, but allows import of non-hazardous waste suitable for recycling in Georgia. Export of hazardous waste for recovery or disposal is not restricted. The rules on how collection of municipal waste must be performed and procedures for how service tariffs should be set and collected are defined in the 1996 Resolution of the Minister of Economy and Minister of Environment and Natural Resources No. 131-197 on the Rules for Removing Solid and Liquid Municipal Wastes. The 1998 Law on Pesticides and Agrochemicals regulates their production, import, trade and use, but – except regarding storage – it does not cover their disposal or destruction. The 2001 Regulation “On collection, storage and treatment of waste from health-care facilities” defined rules for management of health-care waste. This Regulation requires hospitals to have introduced a system of categorization of waste into five categories: general hospital waste, hazardous waste, highly hazardous waste, similar to industrial waste, and radioactive waste. However, its full implementation has not happened yet. The key reason is lack of suitable waste management facilities. Disposal sites selection and operation is defined in the 2003 Order of the Minister of Labour, Health Care and Social Protection No. 36/N on Sanitary Rules and Norms for Arranging and Operating Municipal Solid Waste Landfills. This Order bans disposal of selected wastes on a landfill and defines amounts of toxic industrial waste that can be disposed of on municipal disposal sites. The burning of waste on landfills is banned. It is required to control spontaneous fires.
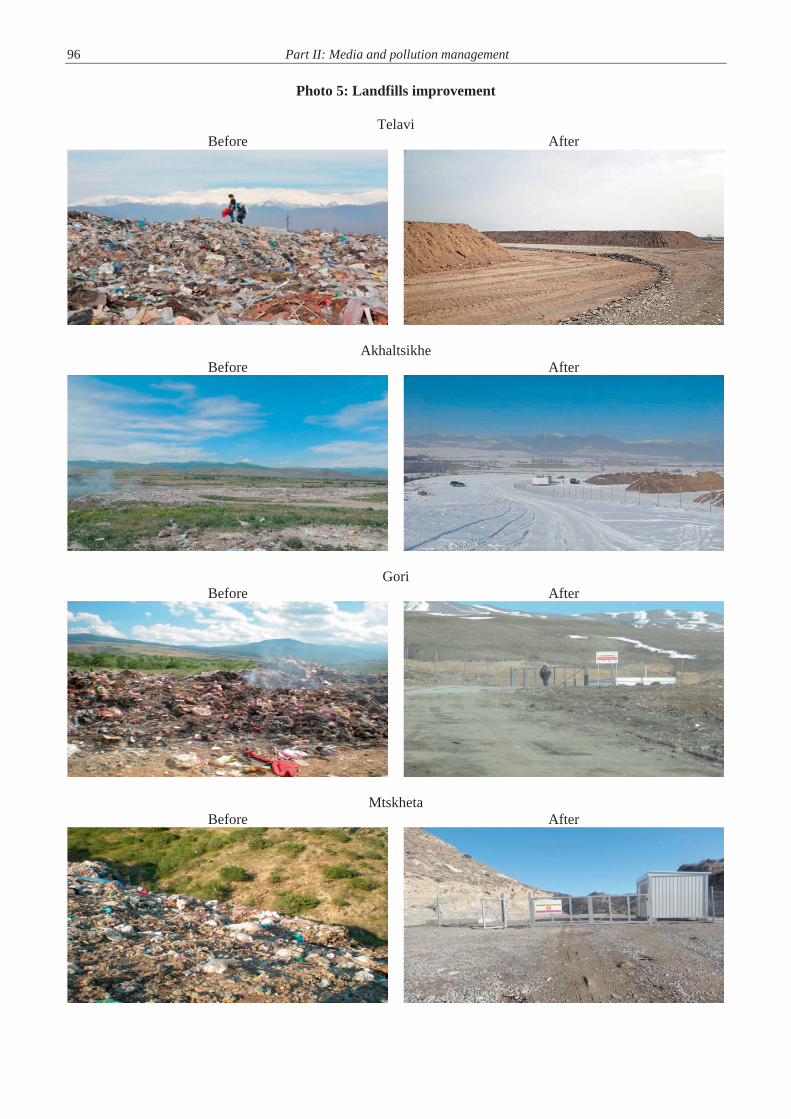
96 Part II: Media and pollution management
Photo 5: Landfills improvement
Telavi Before After
Akhaltsikhe Before After
Gori Before After
Mtskheta Before After
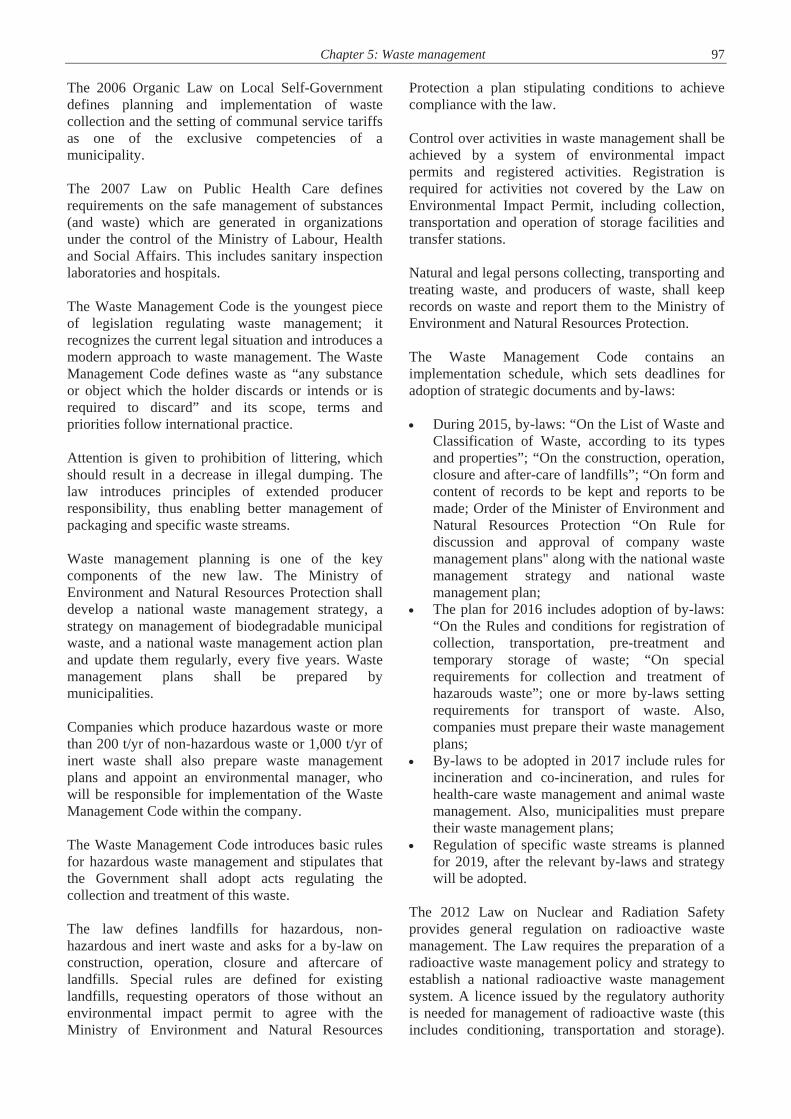
Chapter 5: Waste management 97 The 2006 Organic Law on Local Self-Government defines planning and implementation of waste collection and the setting of communal service tariffs as one of the exclusive competencies of a municipality. The 2007 Law on Public Health Care defines requirements on the safe management of substances (and waste) which are generated in organizations under the control of the Ministry of Labour, Health and Social Affairs. This includes sanitary inspection laboratories and hospitals. The Waste Management Code is the youngest piece of legislation regulating waste management; it recognizes the current legal situation and introduces a modern approach to waste management. The Waste Management Code defines waste as “any substance or object which the holder discards or intends or is required to discard” and its scope, terms and priorities follow international practice. Attention is given to prohibition of littering, which should result in a decrease in illegal dumping. The law introduces principles of extended producer responsibility, thus enabling better management of packaging and specific waste streams. Waste management planning is one of the key components of the new law. The Ministry of Environment and Natural Resources Protection shall develop a national waste management strategy, a strategy on management of biodegradable municipal waste, and a national waste management action plan and update them regularly, every five years. Waste management plans shall be prepared by municipalities. Companies which produce hazardous waste or more than 200 t/yr of non-hazardous waste or 1,000 t/yr of inert waste shall also prepare waste management plans and appoint an environmental manager, who will be responsible for implementation of the Waste Management Code within the company. The Waste Management Code introduces basic rules for hazardous waste management and stipulates that the Government shall adopt acts regulating the collection and treatment of this waste. The law defines landfills for hazardous, non-hazardous and inert waste and asks for a by-law on construction, operation, closure and aftercare of landfills. Special rules are defined for existing landfills, requesting operators of those without an environmental impact permit to agree with the Ministry of Environment and Natural Resources
Protection a plan stipulating conditions to achieve compliance with the law. Control over activities in waste management shall be achieved by a system of environmental impact permits and registered activities. Registration is required for activities not covered by the Law on Environmental Impact Permit, including collection, transportation and operation of storage facilities and transfer stations. Natural and legal persons collecting, transporting and treating waste, and producers of waste, shall keep records on waste and report them to the Ministry of Environment and Natural Resources Protection. The Waste Management Code contains an implementation schedule, which sets deadlines for adoption of strategic documents and by-laws: During 2015, by-laws: “On the List of Waste and
Classification of Waste, according to its types and properties”; “On the construction, operation, closure and after-care of landfills”; “On form and content of records to be kept and reports to be made; Order of the Minister of Environment and Natural Resources Protection “On Rule for discussion and approval of company waste management plans" along with the national waste management strategy and national waste management plan;
The plan for 2016 includes adoption of by-laws: “On the Rules and conditions for registration of collection, transportation, pre-treatment and temporary storage of waste; “On special requirements for collection and treatment of hazarouds waste”; one or more by-laws setting requirements for transport of waste. Also, companies must prepare their waste management plans;
By-laws to be adopted in 2017 include rules for incineration and co-incineration, and rules for health-care waste management and animal waste management. Also, municipalities must prepare their waste management plans;
Regulation of specific waste streams is planned for 2019, after the relevant by-laws and strategy will be adopted.
The 2012 Law on Nuclear and Radiation Safety provides general regulation on radioactive waste management. The Law requires the preparation of a radioactive waste management policy and strategy to establish a national radioactive waste management system. A licence issued by the regulatory authority is needed for management of radioactive waste (this includes conditioning, transportation and storage).
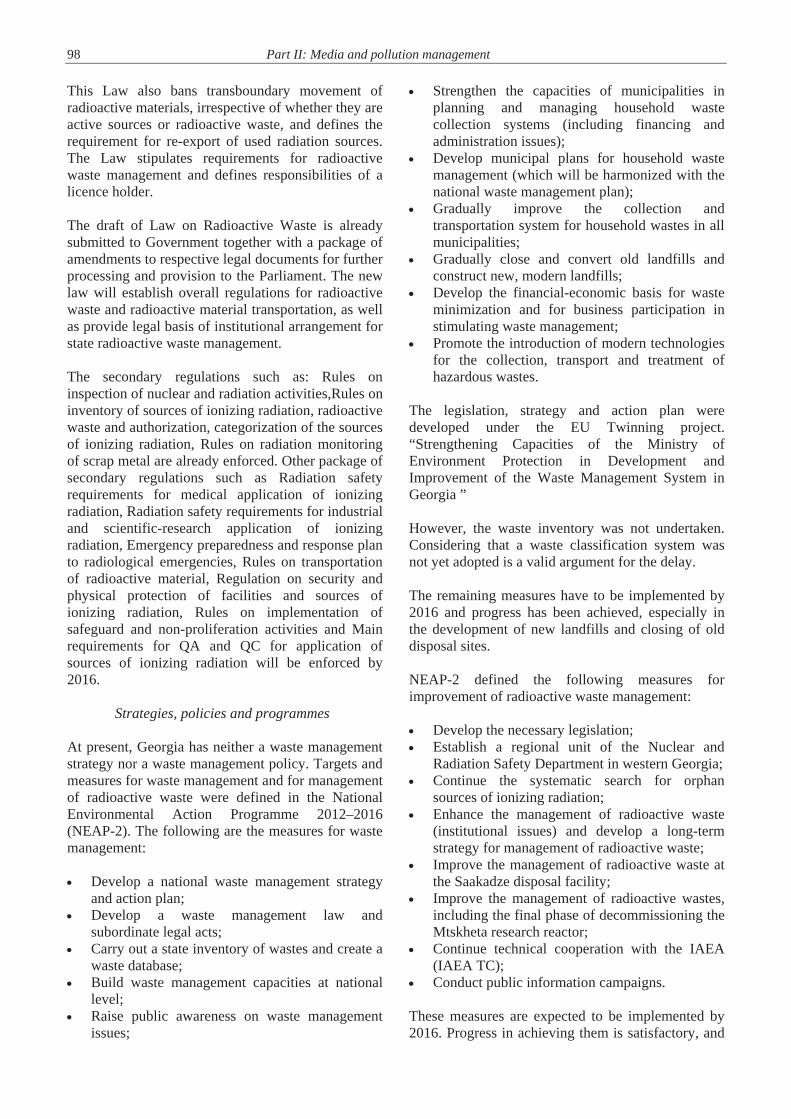
98 Part II: Media and pollution management
This Law also bans transboundary movement of radioactive materials, irrespective of whether they are active sources or radioactive waste, and defines the requirement for re-export of used radiation sources. The Law stipulates requirements for radioactive waste management and defines responsibilities of a licence holder. The draft of Law on Radioactive Waste is already submitted to Government together with a package of amendments to respective legal documents for further processing and provision to the Parliament. The new law will establish overall regulations for radioactive waste and radioactive material transportation, as well as provide legal basis of institutional arrangement for state radioactive waste management. The secondary regulations such as: Rules on inspection of nuclear and radiation activities,Rules on inventory of sources of ionizing radiation, radioactive waste and authorization, categorization of the sources of ionizing radiation, Rules on radiation monitoring of scrap metal are already enforced. Other package of secondary regulations such as Radiation safety requirements for medical application of ionizing radiation, Radiation safety requirements for industrial and scientific-research application of ionizing radiation, Emergency preparedness and response plan to radiological emergencies, Rules on transportation of radioactive material, Regulation on security and physical protection of facilities and sources of ionizing radiation, Rules on implementation of safeguard and non-proliferation activities and Main requirements for QA and QC for application of sources of ionizing radiation will be enforced by 2016.
Strategies, policies and programmes At present, Georgia has neither a waste management strategy nor a waste management policy. Targets and measures for waste management and for management of radioactive waste were defined in the National Environmental Action Programme 2012–2016 (NEAP-2). The following are the measures for waste management: Develop a national waste management strategy
and action plan; Develop a waste management law and
subordinate legal acts; Carry out a state inventory of wastes and create a
waste database; Build waste management capacities at national
level; Raise public awareness on waste management
issues;
Strengthen the capacities of municipalities in planning and managing household waste collection systems (including financing and administration issues);
Develop municipal plans for household waste management (which will be harmonized with the national waste management plan);
Gradually improve the collection and transportation system for household wastes in all municipalities;
Gradually close and convert old landfills and construct new, modern landfills;
Develop the financial-economic basis for waste minimization and for business participation in stimulating waste management;
Promote the introduction of modern technologies for the collection, transport and treatment of hazardous wastes.
The legislation, strategy and action plan were developed under the EU Twinning project. “Strengthening Capacities of the Ministry of Environment Protection in Development and Improvement of the Waste Management System in Georgia ” However, the waste inventory was not undertaken. Considering that a waste classification system was not yet adopted is a valid argument for the delay. The remaining measures have to be implemented by 2016 and progress has been achieved, especially in the development of new landfills and closing of old disposal sites. NEAP-2 defined the following measures for improvement of radioactive waste management: Develop the necessary legislation; Establish a regional unit of the Nuclear and
Radiation Safety Department in western Georgia; Continue the systematic search for orphan
sources of ionizing radiation; Enhance the management of radioactive waste
(institutional issues) and develop a long-term strategy for management of radioactive waste;
Improve the management of radioactive waste at the Saakadze disposal facility;
Improve the management of radioactive wastes, including the final phase of decommissioning the Mtskheta research reactor;
Continue technical cooperation with the IAEA (IAEA TC);
Conduct public information campaigns. These measures are expected to be implemented by 2016. Progress in achieving them is satisfactory, and
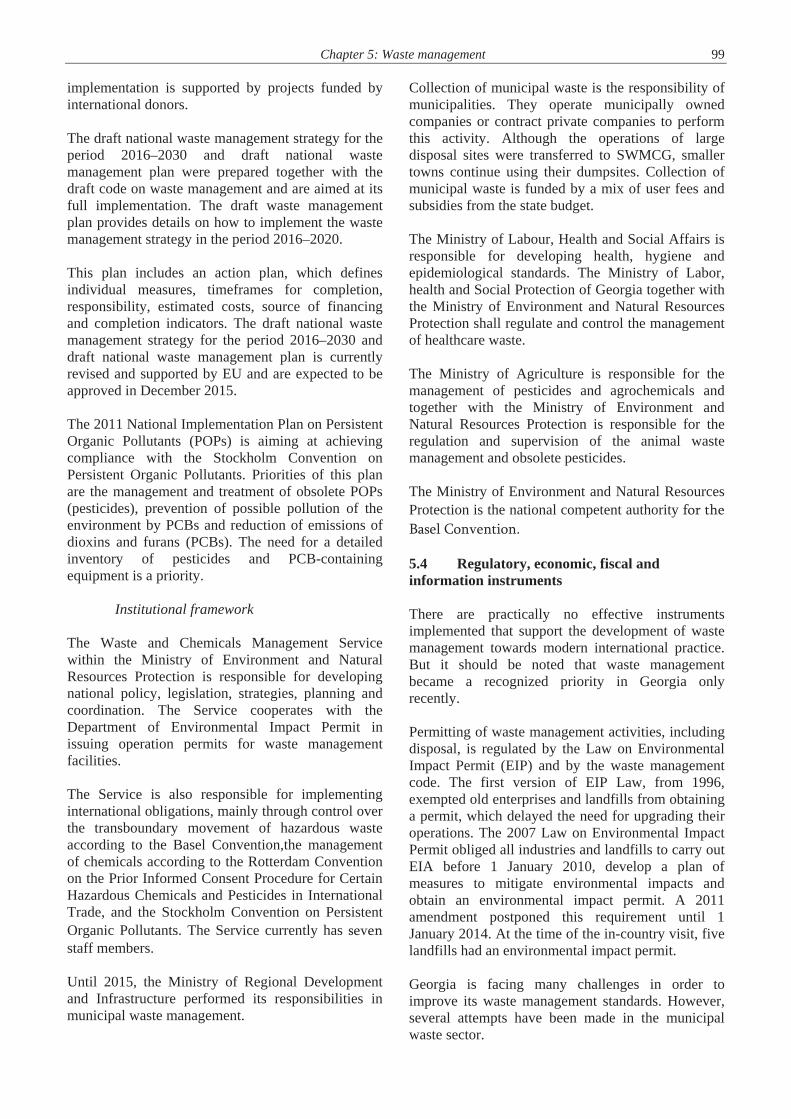
Chapter 5: Waste management 99 implementation is supported by projects funded by international donors. The draft national waste management strategy for the period 2016–2030 and draft national waste management plan were prepared together with the draft code on waste management and are aimed at its full implementation. The draft waste management plan provides details on how to implement the waste management strategy in the period 2016–2020. This plan includes an action plan, which defines individual measures, timeframes for completion, responsibility, estimated costs, source of financing and completion indicators. The draft national waste management strategy for the period 2016–2030 and draft national waste management plan is currently revised and supported by EU and are expected to be approved in December 2015. The 2011 National Implementation Plan on Persistent Organic Pollutants (POPs) is aiming at achieving compliance with the Stockholm Convention on Persistent Organic Pollutants. Priorities of this plan are the management and treatment of obsolete POPs (pesticides), prevention of possible pollution of the environment by PCBs and reduction of emissions of dioxins and furans (PCBs). The need for a detailed inventory of pesticides and PCB-containing equipment is a priority.
Institutional framework
The Waste and Chemicals Management Service within the Ministry of Environment and Natural Resources Protection is responsible for developing national policy, legislation, strategies, planning and coordination. The Service cooperates with the Department of Environmental Impact Permit in issuing operation permits for waste management facilities. The Service is also responsible for implementing international obligations, mainly through control over the transboundary movement of hazardous waste according to the Basel Convention,the management of chemicals according to the Rotterdam Convention on the Prior Informed Consent Procedure for Certain Hazardous Chemicals and Pesticides in International Trade, and the Stockholm Convention on Persistent Organic Pollutants. The Service currently has seven staff members. Until 2015, the Ministry of Regional Development and Infrastructure performed its responsibilities in municipal waste management.
Collection of municipal waste is the responsibility of municipalities. They operate municipally owned companies or contract private companies to perform this activity. Although the operations of large disposal sites were transferred to SWMCG, smaller towns continue using their dumpsites. Collection of municipal waste is funded by a mix of user fees and subsidies from the state budget. The Ministry of Labour, Health and Social Affairs is responsible for developing health, hygiene and epidemiological standards. The Ministry of Labor, health and Social Protection of Georgia together with the Ministry of Environment and Natural Resources Protection shall regulate and control the management of healthcare waste. The Ministry of Agriculture is responsible for the management of pesticides and agrochemicals and together with the Ministry of Environment and Natural Resources Protection is responsible for the regulation and supervision of the animal waste management and obsolete pesticides. The Ministry of Environment and Natural Resources Protection is the national competent authority for the Basel Convention. 5.4 Regulatory, economic, fiscal and information instruments There are practically no effective instruments implemented that support the development of waste management towards modern international practice. But it should be noted that waste management became a recognized priority in Georgia only recently. Permitting of waste management activities, including disposal, is regulated by the Law on Environmental Impact Permit (EIP) and by the waste management code. The first version of EIP Law, from 1996, exempted old enterprises and landfills from obtaining a permit, which delayed the need for upgrading their operations. The 2007 Law on Environmental Impact Permit obliged all industries and landfills to carry out EIA before 1 January 2010, develop a plan of measures to mitigate environmental impacts and obtain an environmental impact permit. A 2011 amendment postponed this requirement until 1 January 2014. At the time of the in-country visit, five landfills had an environmental impact permit. Georgia is facing many challenges in order to improve its waste management standards. However, several attempts have been made in the municipal waste sector.

100 Part II: Media and pollution management
The creation of SWMCG, which took control over large disposal sites, is an good example for the transformation of the waste management system. There are numerous benefits in centralizing modernization of disposal sites. First, clear ownership was created for all large disposal sites. Second, disposal site modernization may be very expensive and municipalities as owners can create strong opposition to changes, if funding is expected from municipal sources. And if funding is provided from the state budget to municipalities, there is a risk of ineffective use of these funds. Finally, this approach splits waste collection from disposal operation and such a set-up provides higher quality data on waste delivered for disposal. To improve the financing of waste management services, the Tbilisi Mayor tied waste fees to electricity bills in 2006. Subsequently, in July 2011, the traditional waste fee per person was replaced by a new waste fee of 0.05 lari per kWh. This waste fee was quite reasonable in a situation in which the exact population of Tbilisi is not known because of the number of migrant workers. However, the fee per kWh exceeded the maximum allowable fee of 3 lari per person per month and the waste-per-kWh component had to be abandoned; the Mayor returned to the per capita system of waste fees in June 2013. In the attempt to support development of private waste management services, municipalities are required to select a servicing company by tender. But the potential benefits of competition generated by a tender process are practically disabled due to municipal waste collection being limited to urban areas (which results in large variations in the size of serviced populations from town to town), the short contract period of one year (which does not allow financial planning in private companies), low user fees (which means cheap service is preferred over quality service) and municipalities’ potential preference for their “own” company. The main obstacle to defining effective measures for managing waste accumulated or generated in Georgia is the critical lack of reliable information. Environmental problems arising from inadequate waste-handling practice are thus approached as local issues, without planned, coordinated action on a national level. The network of landfills may be developed even without data on waste. Quantitative and qualitative data are not available to assess the potential for waste recycling, identify options for industrial waste treatment, prioritize industrial hotspots and remediate old disposal sites. Therefore, implementation of a system for waste data collection and waste classification is essential for proposing and
implementing effective measures for the management of waste and also evaluation of achieved results. 5.5 Waste-related global and regional agreements Georgia has joined the key global agreements on hazardous waste management, chemicals management and management of radioactive waste. Due to the geographic location of Georgia, there is a risk of illicit trafficking, and participation in global agreements helps to increase the safety of Georgian territory. Georgia became a party to the Basel Convention on the Control of Transboundary Movements of Hazardous Wastes and their Disposal in May 1999. Requirements of this Convention were implemented in the Georgian legal system through the Law on Transit and Import of Waste within the Territory of Georgia. Georgia became a party to the Stockholm Convention on Persistent Organic Pollutants in October 2006, and the Rotterdam Convention on the Prior Informed Consent Procedure for Certain Hazardous Chemicals and Pesticides in International Trade in February 2007. The Minamata Convention on Mercury is a global treaty to protect human health and the environment from the adverse effects of mercury. Georgia signed this Convention on 10 October 2013, but has not yet ratified it. Georgia joined the Treaty on the Non-Proliferation of Nuclear Weapons (NPT) as a non-nuclear state in March 1994. Georgia ratified an agreement with the IAEA on using the NPT-related safeguard agreements in April 2003. The Joint Convention on the Safety of Spent Fuel Management and on the Safety of Radioactive Waste Management came into force in Georgia in October 2009. Georgia presented its first national report in accordance with this Convention in 2011. Georgia expressed its political will to abide by rules defined by the Code of Conduct on the Safety and Security of Radioactive Sources, published by IAEA in January 2004, and its additional directives in 2012. 5.6 International projects International projects in waste management are focusing on the strengthening of legal and institutional structures for effective waste management and also provide direct investments in
Chapter 5: Waste management 101 the development of regional landfills, mining waste control and obsolete POPs management in Georgia. The recent EU twinning project Strengthening the Capacities of the Ministry of Environment and Natural Resources Protection in Development and Improvement of Waste Management System in Georgia resulted in development of a draft code on waste management, accompanied by a draft national waste management strategy and draft national waste management plan. The project also included training, awareness-raising and capacity-building. The project was implemented in the period 01-07-2011 – 30-06-2014 with a budget of €1.25 million The Environment and Security Initiative (ENVSEC) project Addressing Emergency Environment and Security Threats at the Arsenic Mining Site in Tsana, Georgia aimed to identify measures for the safe transportation and disposal of arsenic-containing waste materials and associated costs, including design of two containment facilities. The project was implemented during 2013 with a budget of €50,000. A parallel project, Arsenic-Containing Mining Waste in Georgia, is being implemented in the period 2011–2015, including site investigation, implementation of urgent remedial action and investigation of soil pollution in the Ambrolauri and Lentekhi districts. This project has a budget of €750,000. The Government of the Netherlands provided financing of €1.2 million for the project Development of a Sanitary Landfill for Household Waste in Borjomi, Georgia, in the period 2011–2014. The resulting sanitary landfill will bring about the closure of the existing dumpsite currently in operation and ensure disposal of waste in accordance with EU requirements for the next 12–15 years. The European Neighbourhood and Partnership Instrument (ENPI) East’s Waste Governance Project was implemented in the period 2010–2013 in the Kvemo Kartli region of Georgia. An inventory of waste disposal sites, 15-year waste management strategy and proposal for a waste classification system were prepared for this pilot region. The project was financed by the EU with a budget of €800,000. The project Survey and Strategic Assessment of Georgian Radwaste Disposal and Interim Storage Sites, supported by the European Commission, was aimed at investigation of site characteristics and preparing an inventory of radioactive waste stored in these facilities. This project also included development of a country strategy for handling
radioactive waste. This project was implemented in 2012–2013 with a budget of €858,000. The project Support to the Operators in the Preparation of Safety Assessment Reports for Georgian Radwaste Disposal and Interim Storage Sites was financially supported by the European Commission in the framework of the Instrument for Nuclear Safety Cooperation (INSC). Its main objective was the improvement of nuclear and radiation safety in Georgia by the execution of safety assessments for the interim consolidated storage facility (CSF) and the Saakadze disposal facility. The project was implemented in 2014 with an allocated budget of €500,000. The interim storage facility is still in operation, while the disposal facility had already been closed in 1995. The safety assessment of the disposal facility included an assessment of the potential radiological impact of the possible additional disposal of unused sealed radioactive sources and other radioactive waste at the Saakadze site GEF and UNEP implemented the project Disposal of POPs Pesticides and Initial Steps for Containment of Dumped POPs Pesticides in Georgia with a budget of US$3.14 million in the period 2012–2014. The objective of this project was to minimize releases of POPs from obsolete pesticide stockpiles in Georgia and create capacity in the management of the POPs pesticide stockpiles. Additionally, GEF and UNEP assist in the review and update of the national implementation plan for the Stockholm Convention on Persistent Organic Pollutants in Georgia (US$169,000 in the period 2014–2017), and Georgia participated in the international project Capacity Building on Obsolete and POPs Pesticides in Eastern European, Caucasus and Central Asian (EECCA) Countries in 2010–2013. The decommissioning of the nuclear reactor is supported by IAEA. The next phase of the project, GEO/90/12 Decommissioning of Auxiliary Systems of Nuclear Research Reactor, will focus on converting part of the reactor’s cryogenic station helium workshop into a radiologically safe state. With the project Waste Management Technologies in Regions, USAID supports central and local government authorities, local businesses and communities, and municipalities in designing an integrated waste management system in the Kakheti and Ajara regions. This project will be implemented in the period 2014–2018 with a budget US$4.8 million.
102 Part II: Media and pollution management
The project Infectious Healthcare Waste Management in Georgia, funded by the Government of the Netherlands, is implementing a modern system of managing waste from hospitals and providing incinerators in the western and eastern parts of Georgia. The project implementation period is 2011–2014, with a budget of €382,000. The Pilot Demonstration Project on ODS Waste Management and Disposal will examine options for destruction of these substances in Georgia in combination with obsolete POPs and pesticides, in the period 2014–2015. The project is funded by the Multilateral Fund for the Implementation of the Montreal Protocol with a budget of US$55,000. 5.7 Conclusions and recommendations Georgia has achieved progress in the management of municipal and radioactive waste. Management of industrial waste and investigation of historical waste did not improve since 2009. The critical step for further improvement of waste management is implementation of adopted waste legislation. Delays in adoption of these documents may cause a loss of the momentum gained through involvement of foreign donors in investing in waste infrastructure. Recommendation 5.1: The Ministry of Environment and Natural Resources Protection should continue implementation of the Waste Code through the adoption of by-laws on waste management, a national waste strategy and an action plan. The lack of reliable information on waste generation and methods of treatment and disposal is a drawback in efforts to improve waste management in Georgia. Measures, decisions and national priorities cannot be defined unless quantitative information on waste management is available.
Recommendation 5.2: The Ministry of Environment and Natural Resources Protection should implement a waste data information system based on the internationally recognized waste classification system. The involvement of enterprises active in Georgia in improvement of their waste management practice is not sufficiently investigated. They may fear an increase in operation costs and international companies may benefit from lower waste management standards. There is no discussion with them to identify problems in the introduction of higher waste management standards. Recommendation 5.3: The Ministry of Economy and Sustainable Development in cooperation with the Ministry of Environment and Natural Resources Protection should develop a system of extended producer responsibility and enforce it on enterprises, associations of entrepreneurs and other key players. The transformation of Georgian industries has resulted in deep structural changes and their impact on the environment is not known. Only a few hotspots have been identified. In addition, production practice may have resulted in environmental threats. Investigation and remediation of these sites will improve the quality of the environment in Georgia. Recommendation 5.4: The Ministry of Environment and Natural Resources Protection should: (a) Conduct an inventory of hazardous waste
hotspots and provide systematic monitoring and control of those hotspots;
(b) Carry out a feasibility study for a hazardous waste depository.
103
Chapter 6
BIODIVERSITY AND PROTECTED AREAS
6.1 Trends in species and ecosystems
Threatened species
The current status of most species is unknown, which makes it difficult to compare trends over time and plan conservation activities. There have been 16,054 fauna species recorded, 758 of which are chordates. In 2005, the Red List was compiled for the first time, resulting in the incorporation of 197 species of which 141 are animal species – 29 species of mammals, 35 birds and 11 reptiles – and 56 are plant species. The Red List is already out of date.
Within Georgian flora, 4,130 species of vascular plants have been recorded. In 2014, the Caucasus Red List of Plants has been published and the assessment resulted in the first comprehensive list of plants endemic to the Caucasus region (about 2,950 species/subspecies).
endangered or have disappeared. Of mammals, four species are extinct at the national level and five species are critically endangered (lynx, leopard, striped hyena, red deer and wild goat).
Intensive monitoring has been carried out in Vashlovani and Tusheti Protected Areas since 2010 for signs of the leopard (Panthera pardus); unfortunately, no signs have been found since 2003. Of the two species of tur – West Caucasian tur (Capra caucasica) and East Caucasian tur (Capra cylindricornis) – the West Caucasian tur has the smallest population size and is found in only a few areas of Georgia. Among ungulates, the rarest species is the wild goat (Capra aegagrus), found only in Tusheti Protected Areas with an estimated population size of 210. The red deer is found only in four protected areas (Lagodekhi Protected Areas, Gardabani Managed Reserve and Borjomi-Kharagauli National Park, Tusheti protected areas), as completely isolated populations. At present, nevertheless, there is a positive trend of a slight increase in the deer population in Lagodekhi Protected Areas and Borjomi-Kharagauli National Park. The total population size is believed to be about 500–578.
Certain species of large mammal require specific urgent conservation measures, in particular those species that have very small populations (e.g. red deer, leopard and bezoar goat). In addition, no measures are carried out to restore those species that have become extinct in the near past, including the goitered gazelle. The Bezoar Goat from Armenia was reintroduced. Also in the Black Sea, aquatory of Kolkheti NP research on large sea mammals had been conducted.
Endemic species
Only one fauna species is endemic to Georgia – the Adjarian lizard (Darevskia mixta). Of the Georgian mammals, 19 are Caucasus endemics and a relict species, endemic to the south-western Caucasus, in Georgia and Turkey, The Caucasian salamander (Mertensiella caucasica) . Of the birds, three are Caucasian endemics: Caucasian grouse (Tetrao mlokosiewiczi), Caucasian snowcock (Tetraogalus caspius) and Caucasian warbler (Phylloscopus lorenzi).
The rich nature of Georgian flora is evident from its high level of endemism, with around 21 per cent of Georgian flora (up to 900 species) being endemic. Among these, around 600 (14 per cent of all species) are Caucasus endemics and 300 (9 per cent of all species) are endemic to Georgia.
Invasive alien species
Anthropogenic introduction of alien species in the Black Sea, whether intentional or accidental, started in the 19th century, with the highest impact on the ecosystem in the 20th century. Until the mid-1970s, the Black Sea was characterized as a highly productive ecosystem at all trophic levels, but by the 1990s it had degraded to an ecosystem with a low biodiversity dominated by a “dead-end” gelatinous food web. A number of factors have resulted in great structural changes in the food web of the Black Sea: climate change, natural annual fluctuations, anthropogenic impacts including changes in river discharge quality resulting in a rise in eutrophication and pollution, overfishing, and the accidental introduction of exotic species from aquaculture projects.
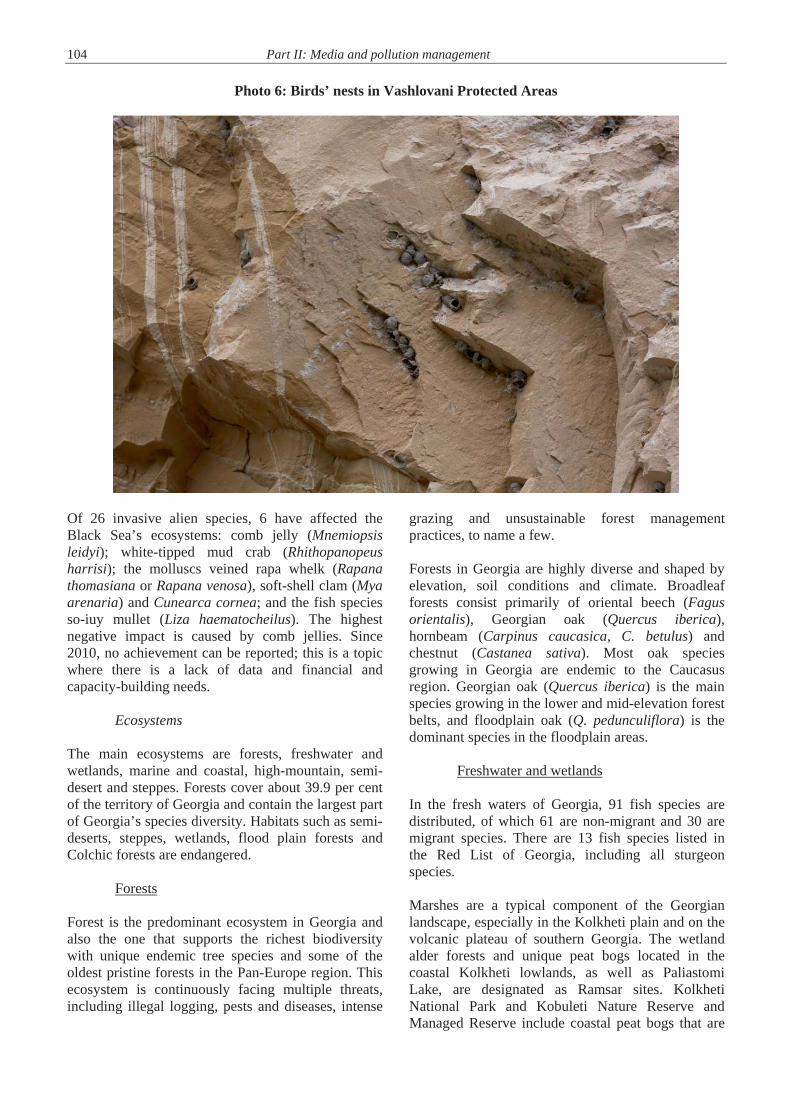
104 Part II: Media and pollution management
Photo 6: Birds’ nests in Vashlovani Protected Areas
Of 26 invasive alien species, 6 have affected the Black Sea’s ecosystems: comb jelly (Mnemiopsis leidyi); white-tipped mud crab (Rhithopanopeus harrisi); the molluscs veined rapa whelk (Rapana thomasiana or Rapana venosa), soft-shell clam (Mya arenaria) and Cunearca cornea; and the fish species so-iuy mullet (Liza haematocheilus). The highest negative impact is caused by comb jellies. Since 2010, no achievement can be reported; this is a topic where there is a lack of data and financial and capacity-building needs.
Ecosystems
The main ecosystems are forests, freshwater and wetlands, marine and coastal, high-mountain, semi-desert and steppes. Forests cover about 39.9 per cent of the territory of Georgia and contain the largest part of Georgia’s species diversity. Habitats such as semi-deserts, steppes, wetlands, flood plain forests and Colchic forests are endangered.
Forests
Forest is the predominant ecosystem in Georgia and also the one that supports the richest biodiversity with unique endemic tree species and some of the oldest pristine forests in the Pan-Europe region. This ecosystem is continuously facing multiple threats, including illegal logging, pests and diseases, intense
grazing and unsustainable forest management practices, to name a few.
Forests in Georgia are highly diverse and shaped by elevation, soil conditions and climate. Broadleaf forests consist primarily of oriental beech (Fagus orientalis), Georgian oak (Quercus iberica), hornbeam (Carpinus caucasica, C. betulus) and chestnut (Castanea sativa). Most oak species growing in Georgia are endemic to the Caucasus region. Georgian oak (Quercus iberica) is the main species growing in the lower and mid-elevation forest belts, and floodplain oak (Q. pedunculiflora) is the dominant species in the floodplain areas.
Freshwater and wetlands
In the fresh waters of Georgia, 91 fish species are distributed, of which 61 are non-migrant and 30 are migrant species. There are 13 fish species listed in the Red List of Georgia, including all sturgeon species.
Marshes are a typical component of the Georgian landscape, especially in the Kolkheti plain and on the volcanic plateau of southern Georgia. The wetland alder forests and unique peat bogs located in the coastal Kolkheti lowlands, as well as Paliastomi Lake, are designated as Ramsar sites. Kolkheti National Park and Kobuleti Nature Reserve and Managed Reserve include coastal peat bogs that are
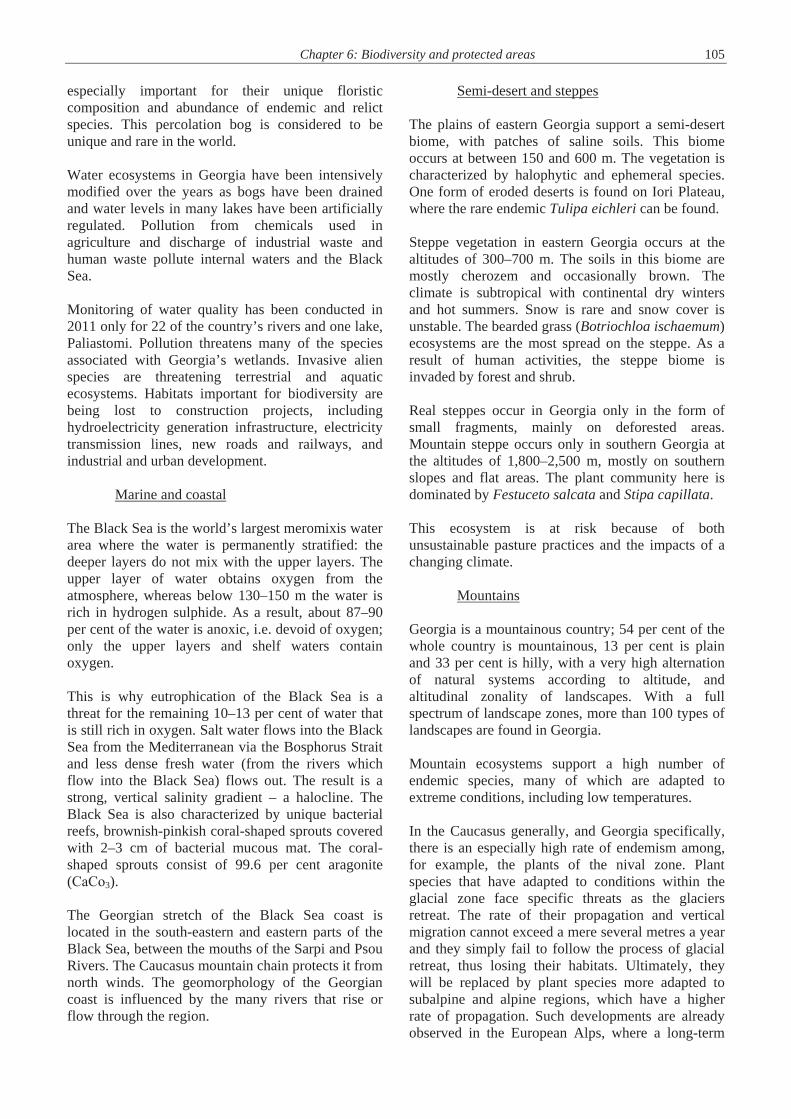
Chapter 6: Biodiversity and protected areas 105 especially important for their unique floristic composition and abundance of endemic and relict species. This percolation bog is considered to be unique and rare in the world. Water ecosystems in Georgia have been intensively modified over the years as bogs have been drained and water levels in many lakes have been artificially regulated. Pollution from chemicals used in agriculture and discharge of industrial waste and human waste pollute internal waters and the Black Sea. Monitoring of water quality has been conducted in 2011 only for 22 of the country’s rivers and one lake, Paliastomi. Pollution threatens many of the species associated with Georgia’s wetlands. Invasive alien species are threatening terrestrial and aquatic ecosystems. Habitats important for biodiversity are being lost to construction projects, including hydroelectricity generation infrastructure, electricity transmission lines, new roads and railways, and industrial and urban development.
Marine and coastal The Black Sea is the world’s largest meromixis water area where the water is permanently stratified: the deeper layers do not mix with the upper layers. The upper layer of water obtains oxygen from the atmosphere, whereas below 130–150 m the water is rich in hydrogen sulphide. As a result, about 87–90 per cent of the water is anoxic, i.e. devoid of oxygen; only the upper layers and shelf waters contain oxygen. This is why eutrophication of the Black Sea is a threat for the remaining 10–13 per cent of water that is still rich in oxygen. Salt water flows into the Black Sea from the Mediterranean via the Bosphorus Strait and less dense fresh water (from the rivers which flow into the Black Sea) flows out. The result is a strong, vertical salinity gradient – a halocline. The Black Sea is also characterized by unique bacterial reefs, brownish-pinkish coral-shaped sprouts covered with 2–3 cm of bacterial mucous mat. The coral-shaped sprouts consist of 99.6 per cent aragonite ( 3). The Georgian stretch of the Black Sea coast is located in the south-eastern and eastern parts of the Black Sea, between the mouths of the Sarpi and Psou Rivers. The Caucasus mountain chain protects it from north winds. The geomorphology of the Georgian coast is influenced by the many rivers that rise or flow through the region.
Semi-desert and steppes The plains of eastern Georgia support a semi-desert biome, with patches of saline soils. This biome occurs at between 150 and 600 m. The vegetation is characterized by halophytic and ephemeral species. One form of eroded deserts is found on Iori Plateau, where the rare endemic Tulipa eichleri can be found. Steppe vegetation in eastern Georgia occurs at the altitudes of 300–700 m. The soils in this biome are mostly cherozem and occasionally brown. The climate is subtropical with continental dry winters and hot summers. Snow is rare and snow cover is unstable. The bearded grass (Botriochloa ischaemum) ecosystems are the most spread on the steppe. As a result of human activities, the steppe biome is invaded by forest and shrub. Real steppes occur in Georgia only in the form of small fragments, mainly on deforested areas. Mountain steppe occurs only in southern Georgia at the altitudes of 1,800–2,500 m, mostly on southern slopes and flat areas. The plant community here is dominated by Festuceto salcata and Stipa capillata. This ecosystem is at risk because of both unsustainable pasture practices and the impacts of a changing climate.
Mountains Georgia is a mountainous country; 54 per cent of the whole country is mountainous, 13 per cent is plain and 33 per cent is hilly, with a very high alternation of natural systems according to altitude, and altitudinal zonality of landscapes. With a full spectrum of landscape zones, more than 100 types of landscapes are found in Georgia. Mountain ecosystems support a high number of endemic species, many of which are adapted to extreme conditions, including low temperatures. In the Caucasus generally, and Georgia specifically, there is an especially high rate of endemism among, for example, the plants of the nival zone. Plant species that have adapted to conditions within the glacial zone face specific threats as the glaciers retreat. The rate of their propagation and vertical migration cannot exceed a mere several metres a year and they simply fail to follow the process of glacial retreat, thus losing their habitats. Ultimately, they will be replaced by plant species more adapted to subalpine and alpine regions, which have a higher rate of propagation. Such developments are already observed in the European Alps, where a long-term

106 Part II: Media and pollution management
observation programme, GLORIA, monitors more than 60 sites. This research, launched in 2001, has shown that heat-tolerant species are actively occupying the sub-nival zone, where previously they were absent. Similar observations are now being carried out within the Caucasus mountains by Ilia State University and similar trends are being observed, raising real fears of extinctions among local endemic species. 6.2 Trends in development and management of protected areas and ecological networks There have been improvements in the management of protected areas since 2010. New protected areas have been established: Machakehla National Park (July 2012), Javakheti Protected Areas (in 2011, including Javakheti National Park and five managed reserves) and Pshav-khevsureti Protected Areas (in 2014 Pshav-khevsureti National Park, Asa Managed Reserve and Roshka Natural Monument), as well as 21 natural monuments. As a result, the area of protected areas increased from 494,050 ha (7.09 per cent of Georgia’s territory) to 600,668 ha (8.62 per cent of Georgia’s territory). In respect of geographical coverage of the country and representativeness of Georgian biomes, critical gaps still exist, in particular in the Central Caucasus mountain range (the regions of Svaneti, Raja, Lechkhumi and Khevsureti). Moreover, no protected area network is yet developed in Georgia, and neither is there a spatial development plan in order to strengthen the existing protected areas and transform them into a network. Protected areas appear isolated and no actions are taken for establishing an interconnected protected area network. Nevertheless, a plan and steps to set up a protected area network exist. The Caucasus Ecoregional Conservation Plan was adopted at the 11th Caucasus Biodiversity Council Meeting in March 2011. It provides for Georgia, as well as Armenia and Azerbaijan, a comprehensive ecological network map with corridor planning both within the country and with neighbouring countries. Also in this context, the initiation of the Emerald Network was a step forward. In the period 2009–2011, within the framework of the joint Council of Europe and EU Programme for the Development of the Emerald Network in Central and Eastern Europe and the South Caucasus, a scientific database and maps were prepared and 20 sites of special conservation interest with a total area of 596,475.63
ha were identified. However, of these 20 sites, the eight conservation areas so far identified and nominated are located within the borders of existing protected areas. Selecting sites of special conservation interest outside protected areas would bring added value. The political situation, lack of legislation outside protected areas and lack of capacity are preventing the establishment of a comprehensive protected area network in Georgia. In Kolkheti National Park, part of a Ramsar site was allocated for construction of the Kulevi terminal, and part of Kazbegi Protected Areas was allocated for construction of a hydroelectric power plant. The country’s drive for economic development, in particular the country’s hydroelectricity generation and regional development strategies, are preventing progress towards the development of the network. Efforts such as the identification and nomination of potential areas for inscription on the UNESCO World Heritage List – which were re-initiated in 2011 by WWF and the International Union for Conservation of Nature (IUCN) with support from the MAVA Foundation – as well as designation of Ramsar sites and UNESCO biosphere reserves, are positive steps in this direction. The Governement is planning to develop PA network through designation of PAs of Category V and VI connecting other categories I-IV to insure achievement of conservation goals in production landscape. 6.3 Pressures on species and ecosystems
Land uptake In the light of recent rapid economic growth, which started in 2004, the easing of EIA as well as ineffective law enforcement have negative impacts on species and habitats. According to the assessment conducted in preparation of the revision of the National Biodiversity Strategy and Action Plan, the recent revival of animal husbandry and agriculture, which coincide with economic growth, has resulted in the transformation of wild nature – wetlands have been drained and turned into agricultural lands. Current unsustainable agricultural practices have negative impacts on invertebrates, birds and small mammals and result in the reduction of biological diversity. Creating and maintaining small intact or managed lands between agricultural lands would prevent the above-mentioned problems.
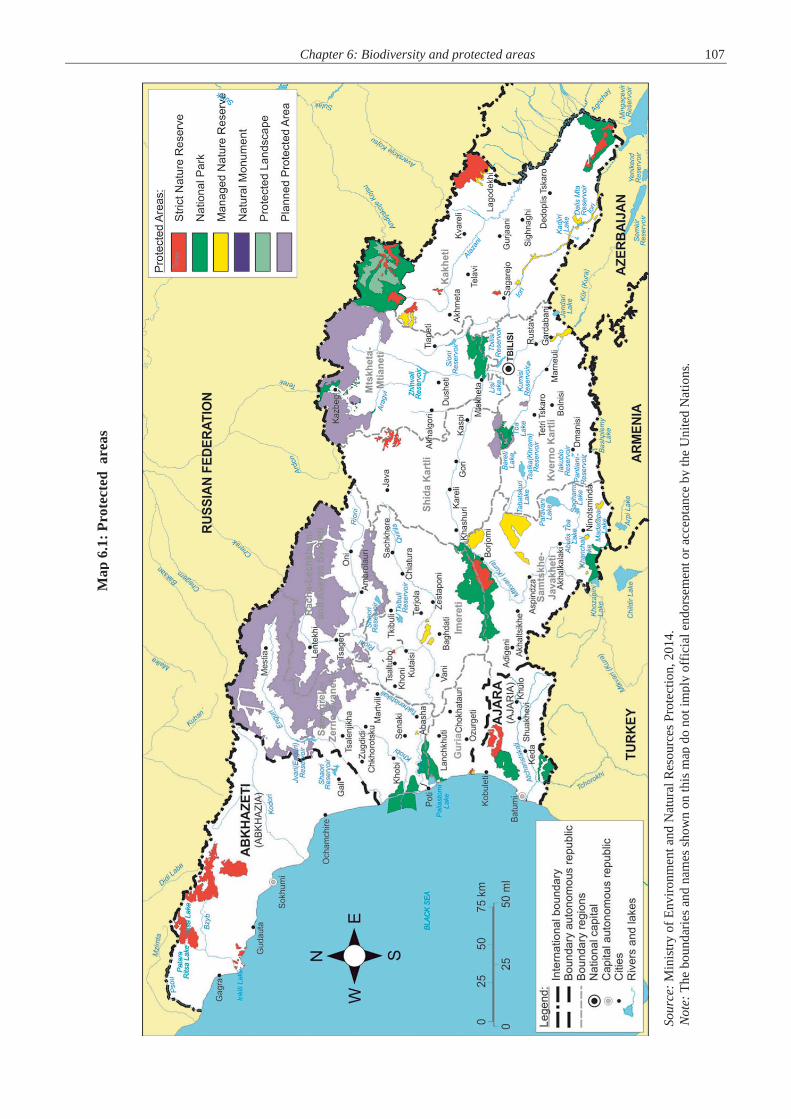
Chapter 6: Biodiversity and protected areas 107
Sour
ce: M
inis
try o
f Env
ironm
ent a
nd N
atur
al R
esou
rces
Pro
tect
ion,
201
4.
Not
e: T
he b
ound
arie
s and
nam
es sh
own
on th
is m
a p d
o no
t im
ply
offic
ial e
ndor
sem
ent o
r acc
epta
nce
by th
e U
nite
d N
atio
ns.
Ma p
6.1
: Pro
tect
ed a
reas
108 Part II: Media and pollution management
Habitat fragmentation and “man-made” barriers for migratory species Wetland ecosystems of both the Kolkheti lowlands and the Javakheti plateau are important habitats for migratory birds, with up to 300 species of birds having been registered in the Kolkheti protected territories and adjacent areas. A further 91 species have been registered at Javakheti lakes, many of them included on both the Georgian and IUCN Red Lists. The territory is a habitat for endangered species included on the Red List, among them Pelecanus onocrotalus, Pelecanus crispus, Ciconia ciconia, Ciconia nigra, Anser erythropus, Tadorna ferriginea, Marmaronetta angustirostris, Oxyura leucocephala and Grus grus. The Kolketi lowland (Lake Paliastomi and Black Sea coastal zone) and lakes of the Javakheti plateau are important wintering and resting areas for approximately 100 species of migratory birds. Many of them are included in the Convention on the Conservation of Migratory Species of Wild Animals (CMS – the Bonn Convention) and the Agreement on the Conservation of African-Eurasian Migratory Waterbirds (AEWA). Black Sea coastal waters and river mouths, particularly the Rioni delta, are habitats for sturgeons. These fish spawning grounds and migratory routes are not protected or managed sustainably, and infrastructure development projects, planned or existing hydropower plants, pollution of rivers or the coastal zone and extraction of sand and gravel are ongoing. These developments have damaging impacts on sturgeon populations.
Logging and deforestation Over the last two decades, illegal logging has been a problem in Georgia. Two major types of logging can be distinguished – for fuelwood and for construction timber. According to official estimates, the volume of illegal logging has declined in recent years (from 53,854 m3 in 2009 to 7,339 m3 in 2011); however, some experts believe that the actual volumes are much higher, mainly due to the high demand for fuelwood (chapter 11). The driver of logging for fuelwood is rural poverty. Many rural households cannot afford to purchase alternative energy resources such as liquified gas. Because of strict law enforcement on the one hand and improved natural gas supply to the villages on the other, the volumes of fuelwood harvesting have
been reduced. However, relatively remotely located villages in Georgia do not have gas supply. As a result, the demand for fuelwood is high and exceeds the annual increment of forests growing near these villages. The problem is aggravated by the lack of awareness about the ecological and socioeconomic consequences of illegal logging.
Collection of non-wood forest products The collection of non-wood forest products, e.g. early flowers of Staphylea colchica, bulbs of snowdrops (Galanthus spp.) and tubers of cyclamen (Cyclamen coum), seeds of Caucasian fir (Abies nordmanniana), is an activity for supporting the livelihoods of rural people. There are official data on the volumes of resources of Caucasian fir and snowdrops licensed for harvesting (300 tonnes of Caucasian fir cones, 13 million snowdrop bulbs); however, there is no reliable information about the real volumes of collection of these products. At present, one license was issued, however, it is outdated. Consequently, it is very difficult to assess the sustainability of collection of these products. According to the estimates of experts, there are no obvious signs of reduction in the volumes of these products.
Eutrophication Georgia’s contribution to eutrophication is marginal because it represents 1 per cent of nitrogen and phosphorus total deposits. Nonetheless, there is no legislation which takes full account of good international practices and principles in river water management, assigning specific responsibilities to the various institutions and for the different water usages. A river basin management planning approach is lacking, as opposed to a sectorial planning approach.
Desertification In Georgia, pastures are severely degraded due to overexploitation. Erosion processes are very intensive and this, together with desertification on winter pastures, poses threats to biodiversity and local agriculture. Sustainable pasture management has huge potential for the protection of biodiversity and local economic development.
Intensified agriculture In the Soviet period, Georgia became a country of industrial agriculture, where exports of agricultural products exceeded imports by 70 per cent. The sector was one of the factors behind the economic
Chapter 6: Biodiversity and protected areas 109 development of the country. With the breakdown of the Soviet Union and loss of traditional markets, the agricultural industry collapsed and the area of cultivated agricultural land fell by almost half. According to 2009 data, the percentage of the population living below the poverty line was one third higher in rural areas than in the cities. In terms of food security, small farmers and people residing in high mountainous regions belong to high-risk groups and are especially sensitive to threat.In the current unstable economic situation, food security is an issue for Georgia. Agriculture is one of the main priorities of the Strategic “10-Point Plan” of the Government for Modernization and Employment 2011–2015. According to this document, the Government is focused on development of primary and processing production in parallel with development of traditional household-based rural farming. Georgia’s agroecosystems are the economic basis of Georgian agriculture, while the local plant and animal landraces, as well as microorganisms and fungi that take part in food production, have not only cultural but also great economic and scientific value. Thus, and against the background of global climate change, the conservation and sustainable use of local agricultural biodiversity is of great importance for ensuring the country’s long-term food security.
Hunting Until 2010, hunting was allowed only on hunting farms and in certain areas of strict nature reserves, except for hunting of migratory birds, which was allowed everywhere except in settlements and some categories of protected areas. Today, there are 18 hunting farms (four more licences have been issued to fishing farms) but they do not operate effectively and only some of them have approved extraction quotas.
Fishing In recent decades, fishing by using illegal methods has caused the decline of fish stocks in Georgian rivers. It is thought that the trout has been affected the most. However, detailed study of this issue has not been carried out recently. Illegal fishing on the migration routes of species such as sturgeon, together with the dams constructed along those routes, is also a big problem for the survival of these species.
Tourism
While there are quick revenues to be generated from the tourism sector, various adverse impacts of tourism on ecosystems have been observed. Some of
these include habitat loss due to land encroachment, waste generation and water quality impacts. Moreover, some of these adverse effects from uncontrolled expansion in tourism may negatively impinge upon the tourist experience (e.g. untreated sewage affecting bathing water quality; soil erosion from off-road vehicles making pathways and roads impassable; the draining of coastal wetlands, which can increase the prevalence and intensity of storm events; unregulated waste disposal implying plastic litter in otherwise pristine nature spots).
Climate change As a result of research carried out in the framework of the 2009 Second National Communication of Georgia to the UNFCCC, conducted to assess vulnerability to climate change and develop adaptation measures, Dedoplistskaro Municipality, the territories of which are under the threat of desertification, has been selected as a “pilot region”. This municipality has been characterized historically by a dry climate and a tendency to land degradation. Recently, activation of a land degradation process caused by a rise in temperature and frequency of strong winds has been observed. Currently, irrigation systems and windbreak rehabilitation programmes are being implemented in the pilot region. In September 2013, a TEEB (Economics of Ecosystems and Biodiversity) scoping study was developed. It identifies five core sectors of the Georgian economy of high importance for future management of biodiversity: energy, tourism, agriculture, mining and forestry. The study highlights the substantial dependence of these driving forces of the economy on natural capital and the services it provides. Thus, the study is an important step forward in valuing natural capital, though it necessarily needs to be followed by a full TEEB national study to ensure the sustainability of the country’s commitment to demonstrating a strong relationship between the economy and environment, and the integration of the value of natural capital into national economic policies. 6.4 Biodiversity monitoring The existing monitoring system in protected areas is insufficient. This is due to the lack of funding to establish a modern monitoring system and to implement relevant measures (namely, training and monitoring capacity-building). There are vacant positions for natural resources experts and rangers in some protected areas due to the low salaries and sometimes difficult working conditions. Rangers regularly gather information that is compiled in the

110 Part II: Media and pollution management
annual Chronicle of Nature prepared by each protected area. Yet the methods for data collection do not comply with modern scientific approaches; a modern unified methodology is lacking. Biodiversity monitoring studies in protected areas are mainly conducted by university research departments and NGOs in the frameworks of projects. The Agency of Protected Areas (APA) has identified gaps in different aspects of protected area management, developed a list of research needs and submitted it to respective scientific and educational institutions. One monitoring mechanism recently introduced in some protected areas is photo traps. At present, the number of photo traps is insufficient to create a comprehensive picture, and in some protected areas there are no photo traps in place; in others, there is a lack of trained staff. Within the scope of the UNDP/GEF-funded project Facilitation of Financial Sustainability of the Georgian Protected Areas System (2009–2011), the Noah’s Ark Centre for the Recovery of Endangered Species (NACRES) developed a programme for monitoring tur and bezoar goat in Tusheti Protected Areas. With the support of CNF (Caucasus Nature Fund) umbrella species monitoring is underway in several Pas. 6.5 Legal, policy and institutional framework
Legal framework As a result of amendments made to the Law on Forestry Agency in 2010, hunting is allowed on the entire territory of the state forest fund; however, hunting was not initiated under these provisions because of the absence of relevant subordinate legislation. In September 2012, a Law on Making Amendments to Some Legislative Acts of Georgia introduced new regulations which posed a threat to Georgia’s biodiversity. There were several problematic issues: Extraction of endangered species for commercial
purposes; Hunting in protected areas, including in national
parks; Legalization of the possibility of destruction of
habitats of rare and endangered species; Abolition of a natural resource fee on the
extraction of Red List and other hunting species, as well as of compensation for environmental damage caused by illegal extraction.
After non-governmental and international organizations expressed concerns, several provisions were removed from the law, in particular, provisions allowing hunting in national parks and introducing a zero fee on the extraction of endangered species. As for allowing hunting of the species included in the Red List, quite ambiguous wording was added to the legislation. Although it does not directly state that hunting of endangered wild animals is permitted, according to the Government’s interpretation, commercial hunting of species included in the Red List is allowed. Restrictions included in the draft law are not enforced because there are no mechanisms to combat poaching (except in protected areas) or to control or monitor hunting. The Parliament also made amendments to other laws in order to abolish as many legal restrictions on hunting as possible. It is quite apparent that, in order to allow hunting in some reserves and national parks, a part of them may be transformed into managed reserves or other categories of protected areas. It is expected that new hunting regulations will further strengthen hunting pressure on biodiversity, because no mechanisms have been developed to control hunting. With respect to the collection of other non-wood forest products such as fruits, berries and mushrooms, the existing forest legislation allows collection of these products free of charge for personal consumption; however, no thresholds have been specified beyond which the collection of these products would be regarded as commercial. Furthermore, no payments or fees are envisaged by the present legislation for the collection of these products in commercial volumes. No annual quotas are defined, either. This might create risks of unsustainable extraction, especially for mushrooms. Also, there is still an imbalance between forest use and conservation, and since 2010, a number of drawbacks have particularly affected this ecosystem. In September 2012, the Ministry of Energy and Natural Resources introduced major changes to forest utilization rules, including the abolition of the document of origin, the electronic accounting of exploited resources, and increased the limits for fuelwood quantities of social cuts (for family use). The single positive signal since 2010 is the 2013 National Forest Concept for Georgia, the main goal of which is to establish a system of sustainable forest management that will ensure improvement of the
Chapter 6: Biodiversity and protected areas 111 quantitative and qualitative characteristics of Georgian forests, protection of biological diversity, effective use of the economic potential of forests taking into account their ecological value, public participation in forest management-related issues and fair distribution of derived benefits.
Policy framework The 2014–2020 National Biodiversity Strategy and Action Plan (NBSAP) is one of the most important preconditions of the country’s sustainable development. Among other matters, the 2012 National Environmental Action Programme 2012–2016 (NEAP-2) covers issues of biodiversity and identifies key priorities. The State Strategy Regional Development of Georgia 2010–2017 is dedicated to the development of agriculture and tourism, and ensuring environmental protection. The Strategy states that the goal of the State in the sustainable regional development process is to ensure a balance between environmental protection and the socioeconomic development interests of society, which will support the realization of the constitutional right of citizens to live in and benefit from a sound environment. The 2010 Comprehensive Strategy and Legislative Approximation Programme in Food Safety noted that the preservation of traditional methods of food production, processing and distribution is one of the main priorities of the Government. The Strategic “10-Point Plan” of the Government for Modernization and Employment 2011–2015 envisages the transfer of land into agricultural activities, which is important in respect of agricultural biodiversity; however, the Plan does not indicate measures to be taken to attain this target. The draft agriculture development strategy (2012–2020) dedicates a separate chapter to agricultural biodiversity. The strategy mentions that conservation and sustainable use of agricultural biodiversity have a special role in the development of agriculture. It also recognizes the role of local farmers and breeders in the conservation and improvement of genetic resources, though it does not specify the State’s obligations in respect of the conservation of agricultural biodiversity. The main focus in the Strategy is on activities aimed at developing soil protection and land-reclamation infrastructure. The Strategy does not highlight questions related to the development of organic agriculture, which is an
important issue for the green economy development initiative mentioned above. National conservation plans have been elaborated for numerous species; some of these programmes are being implemented (Caprinae, leopard), others did not progress since 2010 (striped hyena, Cervidae). It is important to develop conservation plans for other threatened species and, where necessary, to initiate captive breeding programmes for them. There are legal impediments to implementing species conservation plans. More specifically, none of the species conservation plans has a legal status; the species conservation plans prepared in recent years have only been endorsed by the relevant state agency – the Ministry of Environment and Natural Resources Protection. The Ministry of Environment and Natural Resources Protection adopted new regulations in order to develop protected area management plans in line with international standards, and by doing so is achieving greater effectiveness and taking into account the involvement of local communities. Currently four PAs have management plans, four are already elaborated and in the process of approvement (twinning) and seven of them are going to start. In Georgia, there are no governmental programmes to protect migratory birds, such as ex-situ conservation and reintroduction, aimed at monitoring water birds.
Institutional framework The Ministry of Environment and Natural Resources Protection is the key body of the executive authority in the biodiversity protection sphere. Its objectives and terms of reference directly or indirectly relating to biodiversity issues are: Biodiversity protection, restoration and
monitoring; Regulation of biodiversity components (i.e.
issuing permits for export, import, re-export and introduction of species, included in the annexes to the Convention on International Trade in Endangered Species of Wild Fauna and Flora [CITES], their parts and derivates);
General environmental issues; Environmental policy; Control, monitoring, environmental education
and awareness. The official functions of the Agency of Protected Areas (APA) include organizing monitoring and scientific research, and processing, storing and

112 Part II: Media and pollution management
distributing data about protected areas. Scientific research and monitoring of the ecosystems and species is conducted by the Agency and its territorial bodies, other public research institutions and NGOs, including in the framework of individual projects. The Agency is lacking both the financial resources – 33 per cent of its budget comes from donor contributions – and human resources to implement its work. In the forestry sector, combating illegal logging is complicated by frequent changes in legislation and limited capacities of and coordination among relevant state authorities. For effective protection of forests against illegal activities, it is essential to supply relevant law enforcement authorities with adequately qualified staff and advanced communication means. In 2011, the functions of the Environmental Inspectorate were transferred to the Monitoring Department of the Ministry of Energy and Natural Resources. Further changes are planned in this direction in the very near future. At present, the forest protection function is fulfilled by the rangers of the NFA under the Ministry of Environment and Natural Resources Protection. The average area under the control of one ranger is very high (up to 5,000 ha), which makes it difficult to protect forests effectively. 6.6 Most important projects The EU project Strengthening Management of Protected Areas of Georgia aims at achieving an effective nature conservation system in Georgia through improved management of Georgia’s protected areas. The main approach of the project is building the capacity of staff of the central apparatus of the APA and local park administrations. The project covers four pilot sites: Lagodekhi Protected Areas, Mtirala National Park, Imereti Caves Protected Areas and Ajameti Managed Reserve. Various projects are being implemented in protected areas for biodiversity monitoring: in Borjomi-Kharagauli, the administration is implementing a black grouse monitoring project, targeted at identification of black grouse population areas, their number and current ecological status; and the Institute of Zoology is conducting a study of “Biodiversity of dragonflies, semi-coleopterous, thin-winged and coleopterous species”. The NGO Biosphere is collaborating with the administration in a project to promote chamois conservation. Information on the number of the deer population is systematically gathered by administrations of the Lagodekhi and Borjomi-Kharagauli Protected Areas.
In 2009, NACRES implemented a project for brown bear conservation in Georgia, financially supported by the Dutch fund Alertis. The purpose of the project was to study brown bear ecology in Vashlovani State Reserve and National Park and to conduct monitoring of large predators (including bear, leopard, lynx and wolf). 6.7 Communication, education and public awareness-raising Institutionally, education at preschool level is administered by local governance bodies in Georgia. However, the Ministry of Education and Science in 2010 established “Learning and Development Standards” that can be followed by kindergartens. The standards were developed by the National Curriculum and Assessment Centre with the support of UNICEF and represent a set of learning and development outcomes in five areas (namely, health and physical development, cognitive development and general knowledge, attitudes towards learning, speech development and social-emotional development) for the age groups 0–1, 1–3, 3–5 and 5–6. The standards have a strong focus on environmental issues and include outcomes conducive to developing environmental awareness and a positive attitude towards the environment in children. Most of the topics aimed at environmental awareness in children fall under the cognitive development and general knowledge section of the standards, one of the subtopics of which (Nature and technology) is oriented towards children’s abilities “to learn about the physical environment and observe, investigate and test processes that have visible outcomes”. Environmental education, more exactly “knowledge of potential harms to and ways to protect and preserve natural habitats”, is one of the national goals for general education in Georgia (Governmental Decree No. 84 of 18 October 2004 on Approving National Goals of General Education). This states that “adolescents should know what natural habitat/environment they live in, what potential harm people may inflict on environment by their actions and how to preserve and protect natural habitats/the environment”. Environmental education (and, in particular, biodiversity education), as might be expected, is not identified as a separate subject block in the National Curriculum (the current National Curriculum 2011–2016 was adopted in 2011). The curriculum specifies learning outcomes related to environmental/biodiversity education in transparent priority competencies that are integrated in an inter-

Chapter 6: Biodiversity and protected areas 113 disciplinary manner and embedded in specific subjects at all three levels: primary, basic and general education. The National Curriculum identifies nine priority competencies that are integrated into different subjects taught at the general education level and aligned with the National Goals of General Education and Demand from the Society; possession of these competencies is decisive for “self-realization and finding one’s place in the modern world”. “Ecological literacy” is one of the above-mentioned transparent priorities. Ecological literacy means “developing a healthy attitude in people towards the environment, and that pupils should understand their personal responsibilities in relation to current phenomena and be able to participate in their protection and restoration”. 6.8 Biodiversity-related global, regional and bilateral agreements Georgia is a party to all of the major legally binding agreements relevant to biodiversity conservation and climate change and their related protocols, with the exception of the Nagoya Protocol on Access and Benefit Sharing to the Convention on Biological Diversity, International Treaty on Plant Genetic Resources for Food and Agriculture, Georgia is also a signatory to a number of relevant non-legally binding multilateral agreements. In October 2015, The Parliament of Georgia ratified the GMO Amendment to the Aarhus Convention. Georgia will deposit the instrument of ratification to the depositary. 6.9 Conclusions and recommendations A unified, well-equipped monitoring system using modern methodologies is lacking. By this is implied not only biodiversity monitoring, but monitoring of resource use by local communities in protected areas (e.g. wood- cutting, use of pasturelands), tourism development, cases of poaching and staff statistics. No regular monitoring of management efficiency of protected areas is carried out individually and at
system level using an internationally practised evaluation approach. Recommendation 6.1: The Ministry of Environment and Natural Resources Protection should develop and maintain a unified, well-equipped biodiversity monitoring system that is in line with international practise with regard to evaluation approaches and indicators. There is no protected area network yet developed in Georgia, and no spatial development plan in order to strengthen the existing protected areas and transform them into a network. With the establishment of an Emerald network, together with the designation of Ramsar sites, the identification and nomination of potential areas for inscription into the UNESCO World Heritage List and the Caucasus Ecoregional Conservation Plan, all elements are in place for establishing an interconnected protected area network, by applying national categories (I-VI) of PAs in order to have proper management body in place. Recommendation 6.2: The Ministry of Environment and Natural Resources Protection should develop and maintain a protected areas network. Although Georgia is a party to all of the major legally binding agreements relevant to biodiversity conservation, it is not a Party of the Nagoya Protocol on Access and Benefit Sharing to the Convention on Biological Diversity, International Treaty on Plant Genetic Resources for Food and Agriculture. Recommendation 6.3: As soon as appropriate capacities for implementation are available, the Government should ratify: (a) The Nagoya Protocol on Access to Genetic
Resources and the Fair and Equitable Sharing of Benefits Arising from their Utilization to the Convention on Biological Diversity,
(b) The International Treaty on Plant Genetic Resources for Food and Agriculture.


PART III: INTERACTION OF ENVIRONMENT WITH SELECTED SECTORS/ISSUES

117
Chapter 7
ENERGY AND ENVIRONMENT
7.1 Trends in energy balance The main energy sources in Georgia are natural gas, petroleum products, hydropower and biomass. Hydropower dominates Georgia’s electricity generation sector, while the national economy depends on imports for the bulk of its primary energy requirements due to the low level of domestic oil and gas resources and there being only a few coal deposits in the country. The national energy sector is composed of the natural gas transportation and distribution sectors, power generation plants, the Georgian State Electrosystem (GSE), up to 34 natural gas distribution companies and three large power distribution companies. More than 70 per cent of primary energy supply is imported; fossil fuels make up more than 70 per cent of this.
Hydrocarbons Reserves and production
Georgia has very small proven oil and natural gas reserves (oil – proven 1.42 million tons, probable - 5.22 million tons, possible – 21.137 million tons, natural gas – proven 16.385 million m3, probable – 13,771.847 million m3). At present, there are 16 oil fields, 1 oil/gas and 1 gas field, with reserves estimated at 45 million tons oil equivalent (Mtoe). Although Georgia has no proven large-scale oil and gas resources or production, it can generate revenues from oil and gas transit because of its geo-strategic location. Total crude oil production in Georgia was 47,900.21 tons, while natural gas production totalled 8.8 million m3 in 2013 (table 7.1). For domestic use, Georgia imports already refined oil products. Since 2003, import of refined oil products has increased and reached its peak in 2009, at about 961,454.1 tons. The Georgian economy is heavily dependent on imports (in 2013, the import/GDP ratio was 0.6). In 2013, the indicator of imports of goods and services was US$7,885 million, almost three times larger than the indicator of exports for the corresponding year. Unfortunately, the contribution of the energy sector to this gap is high. In 2013, the share of energy in total imported goods and services was 38 per cent;
about two thirds of gross energy demand was met with imported energy resources. The total primary energy supply (TPES) in Georgia decreased from a peak of 12,416 Mtoe in 1990 to 2,544 Mtoe in 2002. Since 2002, the primary energy supply increased, to 3,543 Mtoe in 2011. TPES is still far from the indicators of 1990. Coal, natural gas and oil products were the “big losers” since economic changes have forced many consumers to limit their consumption. Supply of coal has declined from approximately 896,000 tons of oil equivalent (ktoe) in 1990 to 13 ktoe in 2002, and increased slightly to 157 ktoe in 2011. Oil products followed the same trend with a consumption decrease from 3,186 ktoe in 1990 to 547 ktoe in 2008, then an increase to 1,009 ktoe in 2011. Energy supply of natural gas was 4,553 ktoe in 1990, 678 ktoe in 2002 and 1,507 ktoe in 2011. In 2012, the TPES in Georgia was 3,705.53 Mtoe (table 7.1). About 73 per cent of the supplied primary energy was imported, of which 60 per cent was natural gas and 35 per cent oil products. Total final consumption (TFC) was 3,155.27 Mtoe; 65 per cent of TFC constitutes oil and gas; 57 per cent of energy comes from electricity produced by hydropower stations, while 10 per cent of consumption is of fuelwood. Most of Georgia’s coal reserves are of bituminous coal (hard and brown) at three deposits (Tkibul-Shaori, Tkvarcheli and Akhalcikhe). The largest deposit is at Tkibuli (268 million tons of proven reserves and 700 million tons of potential reserves, 80 per cent of the country’s total). Indications are that coal deposits may be found elsewhere in the country, but exploration has been discontinued since the 1980s. Current crude oil production is not high and most of the fields are heavily depleted, requiring additional exploration or redevelopment by modern technologies in order to prove and tap any remaining potential. Plans call for boosting oil production to 3 million tons per year by 2020, and gas production to 2 bcm by the same date. Within the last five years, there has been a steady increase in coal production, reaching 189.5 ktoe in 2012.

118 Part III: Interaction of environment with selected sectors/issues T
able
7.1
: Ene
rgy
bala
nce,
201
2
Sour
ce: I
nter
natio
nal E
nerg
y A
genc
y, 2
014
Chapter 7: Energy and environment 119
Transit
The South Caucasus Pipeline (SCP) and the North–South Main Gas Pipeline (NSMP) transport natural gas from Azerbaijan through Georgia to Turkey, and the Baku–Tbilisi–Ceyhan (BTC) Pipeline and the Western Route Export Pipeline (WREP) transit crude oil from Azerbaijan through Georgia to the Mediterranean and Black Sea markets. The SCP began operating in 2007 and has the capacity to transport about 8 bcm of natural gas. According to BP, during the first nine months of 2014, the SCP’s daily average throughput was 17,412 million m3 of gas or 106,017 barrels of oil equivalent per day.
At full capacity, the NSMP can transport 12 bcm of natural gas. In 2007, gas transit volume was 3.2 bcm, which later increased to 6.6 bcm in 2008. However, from 2009 to 2012, gas transportation volume decreased steadily from 6.4 bcm to 5.2 bcm, but had risen again to 6.1 bcm in 2013. The average transit volume of natural gas was 5.8 bcm a year in the period 2009–2013.
The BTC Pipeline exports oil extracted from the Azeri-Chirag-Gunshli field to Ceyhan port in Turkey. The BTC is the second longest pipeline in the world. The total length of the pipeline is 1,768 km, with 229 km in Georgia. The pipeline has eight pumping stations, two of which are located in Georgia. The BTC Pipeline, commissioned in 2006, carries an average of 1 million barrels per day of crude oil. The WREP, also known as the Baku–Supsa Pipeline, is the first investment of the Georgian–British International Oil Consortium in Georgia; it has been in operation since 1999. From 2009 to 2013, oil transportation volume decreased from 317.2 million barrels a year to 278.9 million barrels a year; average transit volume of oil was 294.9 million barrels a year.
Crude oil and refined oil product shipments from Georgia’s Black Sea port of Batumi were down 24.4 per cent in the first 11 months of 2014, from a year earlier. The Batumi terminal, operated by Kazakh state energy company KazMunaiGas, shipped 3.914 million tons of oil and oil products during the 11 months, down from 5.178 million tons in the same period of 2013. The terminal shipped 5.63 million tons in 2013, up from 5.19 million in 2012.
Refineries According to the United States Energy Information Administration, there has been no refinery capacity in
Georgia since 2005. Therefore, Georgia exports its own crude oil abroad and imports refined oil for domestic needs. Georgia used to have three refineries: a 5.2 million tons per year refinery at Batumi, a 0.2 million tons per year refinery (a small topping plant) at Sartichala, and another small topping plant, run by Navtobi Ltd. During the 1990s, Batumi refinery worked only intermittently at 1–5 per cent of capacity, and operations were discontinued in 2001. In November 2014, the Government announced its intention to select an investor to develop a modern oil refinery with minimum capacity of 2 million tons of crude oil per annum on the coast of the Black Sea at Poti, on a build, operate and transfer basis.
Electricity sector
Georgia’s energy sector has experienced growth in recent years, from having annual electricity generation of 7,061 GWh in 2005 to reaching 10,059 GWh in 2013; it became a net exporter of electricity in 2007. Exports reached its peak in 2010 and then decreased sharply in the period 2011–2013, from 1,524 GWh in 2010 to 450 GWh in 2013 (table 7.2). In 2013, electricity generated from HPPs amounted to 8,271 GWh (83 per cent of total generation) and from TPPs, 1,788 GWh (17 per cent). Since 2006, electricity production from HPPs has increased by almost 40 per cent, while TPP production has decreased by 55 per cent. According to CEE Bankwatch Network, it is estimated that the total hydropower potential of Georgia is 80 TWh, of which the economically viable potential is thought to be 27 TWh. One of the objectives for developing and exploiting Georgia’s hydropower capacity is to export surplus electricity to neighbouring countries. New investments in the hydropower sector, together with both the rehabilitation of existing and development of new hydropower stations, have led to an increase in Georgian hydropower generation in the last decade. Progress has been made with the individual rehabilitation of small HPPs. In 2013, the total installed capacity of both hydro and thermal power plants in Georgia was 3,413.5MW, of which around 2,731 MW was covered by HPPs and the balance, 682 MW, by TPPs. Despite installed hydropower capacity of around 2,700 MW, only 1,600 MW (60 per cent) of hydropower capacity actually generates electricity.
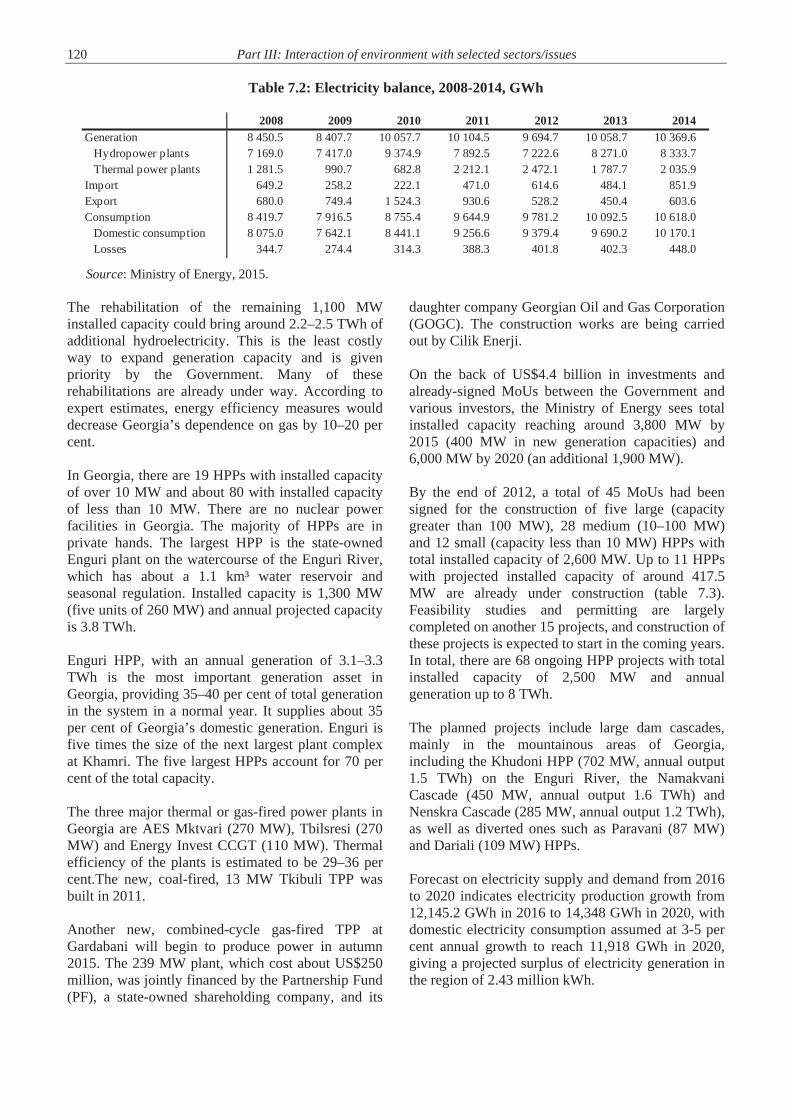
120 Part III: Interaction of environment with selected sectors/issues
Table 7.2: Electricity balance, 2008-2014, GWh
Source: Ministry of Energy, 2015.
The rehabilitation of the remaining 1,100 MW installed capacity could bring around 2.2–2.5 TWh of additional hydroelectricity. This is the least costly way to expand generation capacity and is given priority by the Government. Many of these rehabilitations are already under way. According to expert estimates, energy efficiency measures would decrease Georgia’s dependence on gas by 10–20 per cent. In Georgia, there are 19 HPPs with installed capacity of over 10 MW and about 80 with installed capacity of less than 10 MW. There are no nuclear power facilities in Georgia. The majority of HPPs are in private hands. The largest HPP is the state-owned Enguri plant on the watercourse of the Enguri River, which has about a 1.1 km³ water reservoir and seasonal regulation. Installed capacity is 1,300 MW (five units of 260 MW) and annual projected capacity is 3.8 TWh. Enguri HPP, with an annual generation of 3.1–3.3 TWh is the most important generation asset in Georgia, providing 35–40 per cent of total generation in the system in a normal year. It supplies about 35 per cent of Georgia’s domestic generation. Enguri is five times the size of the next largest plant complex at Khamri. The five largest HPPs account for 70 per cent of the total capacity. The three major thermal or gas-fired power plants in Georgia are AES Mktvari (270 MW), Tbilsresi (270 MW) and Energy Invest CCGT (110 MW). Thermal efficiency of the plants is estimated to be 29–36 per cent.The new, coal-fired, 13 MW Tkibuli TPP was built in 2011. Another new, combined-cycle gas-fired TPP at Gardabani will begin to produce power in autumn 2015. The 239 MW plant, which cost about US$250 million, was jointly financed by the Partnership Fund (PF), a state-owned shareholding company, and its
daughter company Georgian Oil and Gas Corporation (GOGC). The construction works are being carried out by Cilik Enerji. On the back of US$4.4 billion in investments and already-signed MoUs between the Government and various investors, the Ministry of Energy sees total installed capacity reaching around 3,800 MW by 2015 (400 MW in new generation capacities) and 6,000 MW by 2020 (an additional 1,900 MW). By the end of 2012, a total of 45 MoUs had been signed for the construction of five large (capacity greater than 100 MW), 28 medium (10–100 MW) and 12 small (capacity less than 10 MW) HPPs with total installed capacity of 2,600 MW. Up to 11 HPPs with projected installed capacity of around 417.5 MW are already under construction (table 7.3). Feasibility studies and permitting are largely completed on another 15 projects, and construction of these projects is expected to start in the coming years. In total, there are 68 ongoing HPP projects with total installed capacity of 2,500 MW and annual generation up to 8 TWh. The planned projects include large dam cascades, mainly in the mountainous areas of Georgia, including the Khudoni HPP (702 MW, annual output 1.5 TWh) on the Enguri River, the Namakvani Cascade (450 MW, annual output 1.6 TWh) and Nenskra Cascade (285 MW, annual output 1.2 TWh), as well as diverted ones such as Paravani (87 MW) and Dariali (109 MW) HPPs. Forecast on electricity supply and demand from 2016 to 2020 indicates electricity production growth from 12,145.2 GWh in 2016 to 14,348 GWh in 2020, with domestic electricity consumption assumed at 3-5 per cent annual growth to reach 11,918 GWh in 2020, giving a projected surplus of electricity generation in the region of 2.43 million kWh.
2008 2009 2010 2011 2012 2013 2014Generation 8 450.5 8 407.7 10 057.7 10 104.5 9 694.7 10 058.7 10 369.6
Hydropower plants 7 169.0 7 417.0 9 374.9 7 892.5 7 222.6 8 271.0 8 333.7Thermal power plants 1 281.5 990.7 682.8 2 212.1 2 472.1 1 787.7 2 035.9
Import 649.2 258.2 222.1 471.0 614.6 484.1 851.9Export 680.0 749.4 1 524.3 930.6 528.2 450.4 603.6Consumption 8 419.7 7 916.5 8 755.4 9 644.9 9 781.2 10 092.5 10 618.0
Domestic consumption 8 075.0 7 642.1 8 441.1 9 256.6 9 379.4 9 690.2 10 170.1Losses 344.7 274.4 314.3 388.3 401.8 402.3 448.0

Chapter 7: Energy and environment 121
Table 7.3: Current HPP projects
Source: Ministry of Energy, 2014.
In 2013, the Black Sea Transmission Network Project (BSTNP) added up to 300 km of high-voltage line across southern Georgia to connect the Georgian transmission grid to the Turkish grid. This allows Georgia to export an additional 700 MW of electricity to Turkey. The backbone of the transmission network is a 500 kV line connecting Georgia to the Russian Federation and Azerbaijan, and running through Tbilisi and northwest Georgia where the largest power plants (Enguri and Vardnili HPPs) are located.
Firewood
Local biofuels (mainly in the form of firewood) play an important role in primary energy supply. Its share in total energy consumption is about 20 per cent. Firewood is mainly consumed in rural areas for cooking and heating purposes. For these purposes, the average rural household consumes 5–15 m3 of firewood annually. According to data presented in the second National Environmental Action Programme (NEAP-2), annual consumption of firewood has been estimated at 1 million m3. The consumption of firewood is very inefficient due to the widespread practice of using woodstoves of very low efficiency (35–40 per cent). Georgia has considerable potential for biomass utilization (3–4 TWh), given the share of forests and agriculture in the national estate. In recent times, several projects supported by foreign investors have been implemented in Georgia, increasing electricity production, heating and pellet exports from biomass. However, rural Georgians’ heavy reliance on burning wood for fuel is having a devastating effect on forests across the country. The environmental impact includes landslides on deforested slopes, which damage thousands of homes.
A survey carried out by the Caucasus Environmental NGO Network, CENN, found that, in some areas of Georgia, more than 75 per cent of people relied on fuelwood for heating and cooking. Over the past 20 years, however, small, wood-burning stoves have become ubiquitous, as many Georgians, without access to natural gas or pressed for cash, have turned to the forests to heat their homes. 7.2 Environmental pressures
Extraction of energy sources There are no data and information on the environmental impact of fossil fuel extraction in Georgia. Worldwide practice demonstrates that all oil and gas industry activities have environmental effects: geological and geophysical surveys, drilling and production activities, accidental oil spills, decommissioning of installations, gas and oil transportation, and gas and oil processing. Existing mining can still cause environmental problems associated with this industry, in particular large-scale land use, an overburden of removal and disposal, disturbance of hydrology, acid mine drainage, fugitive dust and reclamation. These activities have an impact on the air, surface water and groundwater, soil, wildlife and human populations.
Transit of fossil fuels During a pipeline’s construction stage, aggregate extraction, blasting, using rock hammers, road construction, micro-tunneling and horizontal directional drilling could affect the geology and geomorphology. The environmental impacts of pipelines are mainly related to the risk of an oil or gas leak or spillage, and are location specific.
Hydro-electric Power Station Company MW
Year of exploitation
Dariali Darial-Energy (Georgia-USA) 100.0 2016Nabeghlavi Alliance Energy (Turkey) 1.9 2015Kirnati Achar Energy 2007 Ltd (Turkey) 36.6 2017Khelvachauri 1 Achar Energy 2007 Ltd (Turkey) 47.5 2017Okropilauri Alter Energy (Georgia) 1.8 2016Goginauri Alter Energy (Georgia) 1.8 2016Lukhuni 2 Rusmetali Ltd (Georgia) 12.0 2015Arakali Optimum Enerji Üretim A. (Turkey) 8.9 2017Abuli Optimum Enerji Üretim A. (Turkey) 22.2 2017Shuakhevi Clean Energy Invest/Tata Group (Norway/India) 175.0 2018Skhalta Clean Energy Invest/Tata Group (Norway/India) 9.8 2020
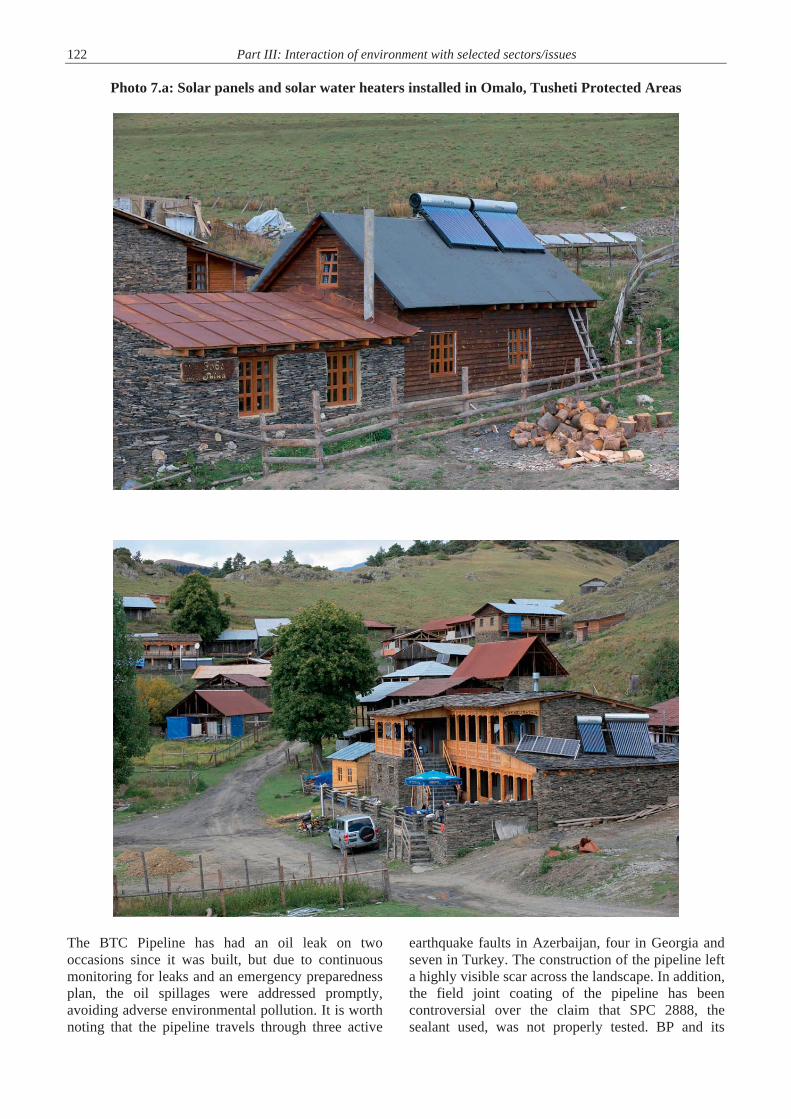
122 Part III: Interaction of environment with selected sectors/issues
Photo 7.a: Solar panels and solar water heaters installed in Omalo, Tusheti Protected Areas
The BTC Pipeline has had an oil leak on two occasions since it was built, but due to continuous monitoring for leaks and an emergency preparedness plan, the oil spillages were addressed promptly, avoiding adverse environmental pollution. It is worth noting that the pipeline travels through three active
earthquake faults in Azerbaijan, four in Georgia and seven in Turkey. The construction of the pipeline left a highly visible scar across the landscape. In addition, the field joint coating of the pipeline has been controversial over the claim that SPC 2888, the sealant used, was not properly tested. BP and its

Chapter 7: Energy and environment 123 contractors interrupted work until the problem was eliminated. The SCP and BTC Pipelines pass through the buffer zone of Borjomi National Park and the Borjomi-Kharaguli Nature Reserve.
Electricity production and transportation
Hydropower plants
Generation of hydroelectric power changes the river environment. The current Georgian legislation does not define the methodology for calculating the environmental flow. In practice, two methodologies coexist: for the oldest dams, the Soviet standards are applied, and for the most recent ones, a more simplified methodology is adopted (chapter 4). In addition, dams have cumulative impacts on water quality, natural flooding and species composition where a number of dams are sited on the same river. While hydropower is a renewable resource, it both depends on and impacts upon ecosystem services. It depends on a regular supply of water; both quality and quantity of freshwater is critical for the functioning of this sector. Some of the impacts of the hydropower sector include habitat loss, displacement of local communities and emissions. These impacts, however, are not always appropriately addressed in the current EIAs of HPPs. In the case of Khudoni HPP, the Netherlands Commission for Environmental Assessment has concluded that essential information is lacking in the environmental and social impact assessment (ESIA): social issues related to compensation, resettlement and cultural heritage; sediment load of the river and geo-hazards in relation to useful reservoir life; seismic risk; and broader costs and benefits for Georgia. The Commission also concluded that, if the above issues were addressed and were necessarily mitigated in an appropriate manner, the ratio between environmental and social impacts on the one hand, and generated power on the other, was relatively favourable for Khudoni HPP, which could act as a driver of regional conservation and development if compensation measures for loss of biodiversity and cultural heritage were implemented according to international best practice. As there are plans to construct more HPPs with reservoirs, it is worth noting that the formation of big water reservoirs can slow the water flow rate and increase water surface temperature because slower water absorbs more heat from the sun. It causes a more pronounced stratification effect – with the coldest water at the bottom and warmest on the surface. If the water released for power generation
purposes is coming from the bottom, where it is colder and consequently has less oxygen, it affects the river’s ecosystem and habitats downstream. Furthermore, the hydropower sector is not only dependent on forest ecosystems but also has impacts on these ecosystems. The construction of HPPs typically encroaches upon natural ecosystems due to damming, modifications to water flows (both location/direction and flow rates) and the building of roads and power lines. Moreover, nearly 47 per cent of the population lives in rural areas and those people are fully dependent on ecosystem services such as water purification, erosion prevention and fuelwood provisioning. Any reduction in the provisioning of these services would imply measurable concomitant losses in social welfare, e.g. the need to purchase substitutes for timber and non-timber forest products, or the costs implied by an increase in the frequency and/or severity of flooding events. Preliminary project plans and EIA reports suggest that the building of planned large-scale HPPs will cause losses through flooding.
Thermal power plants Burning fossil fuels in the TPPs can be a contributor to local particulate-matter (PM) pollution, acid rain. Environmental impacts of TPPs’ hazardous air pollutant emissions include acidification of the environment, bioaccumulation of toxic metals, contamination or rivers and lakes, and degradation of buildings and culturally important monuments. According to the Ministry of Environment and Natural Resources Protection, currently operating gas-fired power plants do not cause local air pollution due to the height of stacks and natural gas consumption. However, due to the fact that more coal-fired TPPs are currently in the pipeline, an increase in effects on the environment might be expected to take place in the future.
Power grids With more than 26,000 rivers, Georgia is rich in hydropower potential. However, the limited capacity of the country’s electricity transmission grid prevents this natural advantage from translating into major economic bene t. The Black Sea Energy Transmission System project aims to increase Georgia’s grid stability, reduce transmission losses and diversify supply sources. It should be noted that most of Georgia’s hydro resources are concentrated in western Georgia, while the eastern part of the country hosts the majority of large industrial enterprises, making an efficient transmission system critical for the stability of supply.
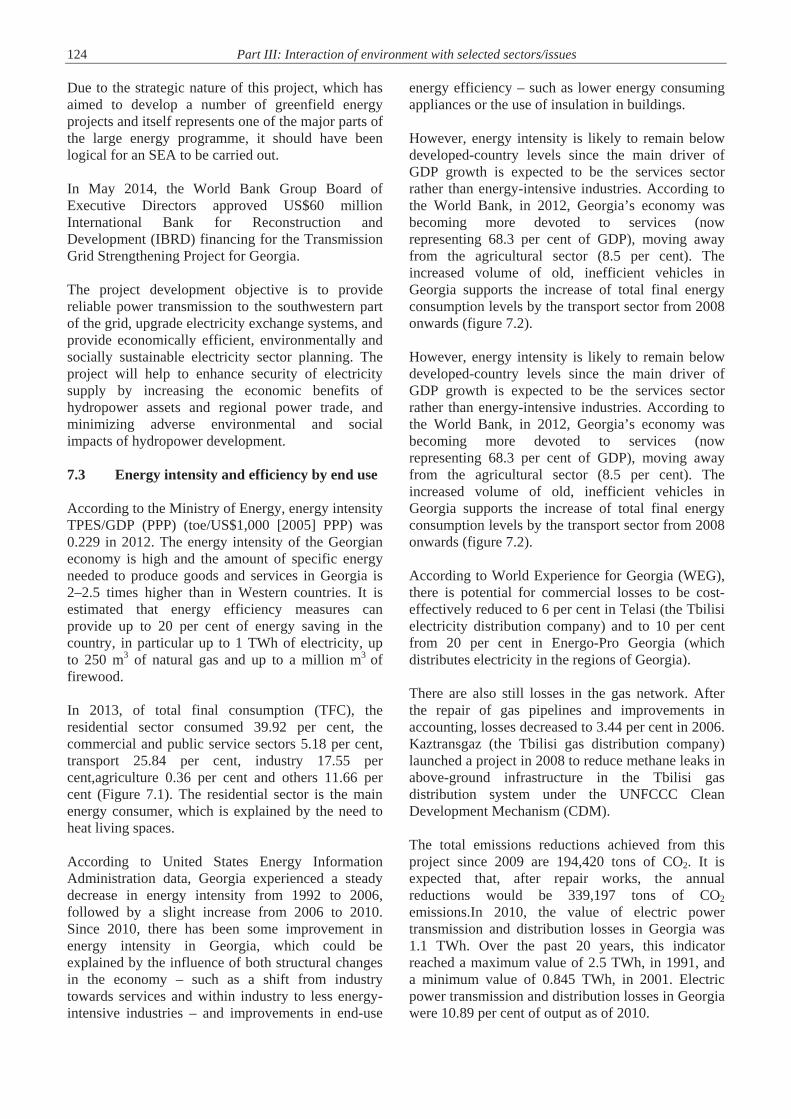
124 Part III: Interaction of environment with selected sectors/issues
Due to the strategic nature of this project, which has aimed to develop a number of greenfield energy projects and itself represents one of the major parts of the large energy programme, it should have been logical for an SEA to be carried out. In May 2014, the World Bank Group Board of Executive Directors approved US$60 million International Bank for Reconstruction and Development (IBRD) financing for the Transmission Grid Strengthening Project for Georgia. The project development objective is to provide reliable power transmission to the southwestern part of the grid, upgrade electricity exchange systems, and provide economically efficient, environmentally and socially sustainable electricity sector planning. The project will help to enhance security of electricity supply by increasing the economic benefits of hydropower assets and regional power trade, and minimizing adverse environmental and social impacts of hydropower development. 7.3 Energy intensity and efficiency by end use According to the Ministry of Energy, energy intensity TPES/GDP (PPP) (toe/US$1,000 [2005] PPP) was 0.229 in 2012. The energy intensity of the Georgian economy is high and the amount of specific energy needed to produce goods and services in Georgia is 2–2.5 times higher than in Western countries. It is estimated that energy efficiency measures can provide up to 20 per cent of energy saving in the country, in particular up to 1 TWh of electricity, up to 250 m3 of natural gas and up to a million m3 of firewood. In 2013, of total final consumption (TFC), the residential sector consumed 39.92 per cent, the commercial and public service sectors 5.18 per cent, transport 25.84 per cent, industry 17.55 per cent,agriculture 0.36 per cent and others 11.66 per cent (Figure 7.1). The residential sector is the main energy consumer, which is explained by the need to heat living spaces. According to United States Energy Information Administration data, Georgia experienced a steady decrease in energy intensity from 1992 to 2006, followed by a slight increase from 2006 to 2010. Since 2010, there has been some improvement in energy intensity in Georgia, which could be explained by the influence of both structural changes in the economy – such as a shift from industry towards services and within industry to less energy-intensive industries – and improvements in end-use
energy efficiency – such as lower energy consuming appliances or the use of insulation in buildings. However, energy intensity is likely to remain below developed-country levels since the main driver of GDP growth is expected to be the services sector rather than energy-intensive industries. According to the World Bank, in 2012, Georgia’s economy was becoming more devoted to services (now representing 68.3 per cent of GDP), moving away from the agricultural sector (8.5 per cent). The increased volume of old, inefficient vehicles in Georgia supports the increase of total final energy consumption levels by the transport sector from 2008 onwards (figure 7.2). However, energy intensity is likely to remain below developed-country levels since the main driver of GDP growth is expected to be the services sector rather than energy-intensive industries. According to the World Bank, in 2012, Georgia’s economy was becoming more devoted to services (now representing 68.3 per cent of GDP), moving away from the agricultural sector (8.5 per cent). The increased volume of old, inefficient vehicles in Georgia supports the increase of total final energy consumption levels by the transport sector from 2008 onwards (figure 7.2). According to World Experience for Georgia (WEG), there is potential for commercial losses to be cost-effectively reduced to 6 per cent in Telasi (the Tbilisi electricity distribution company) and to 10 per cent from 20 per cent in Energo-Pro Georgia (which distributes electricity in the regions of Georgia). There are also still losses in the gas network. After the repair of gas pipelines and improvements in accounting, losses decreased to 3.44 per cent in 2006. Kaztransgaz (the Tbilisi gas distribution company) launched a project in 2008 to reduce methane leaks in above-ground infrastructure in the Tbilisi gas distribution system under the UNFCCC Clean Development Mechanism (CDM). The total emissions reductions achieved from this project since 2009 are 194,420 tons of CO2. It is expected that, after repair works, the annual reductions would be 339,197 tons of CO2 emissions.In 2010, the value of electric power transmission and distribution losses in Georgia was 1.1 TWh. Over the past 20 years, this indicator reached a maximum value of 2.5 TWh, in 1991, and a minimum value of 0.845 TWh, in 2001. Electric power transmission and distribution losses in Georgia were 10.89 per cent of output as of 2010.

Chapter 7: Energy and environment 125
Figure 7.1: Total final energy consumption by sector, 2013, toe
Source: Ministry of Energy, 2015.
Figure 7.2: Trend of total final energy consumption (TFC), 2015-2020, Mtoe
Source: International Energy Agency (IEA), 2014.
The distribution of electricity in Georgia has become much more efficient in recent years. The technical and commercial losses in the sector have come down substantially. The collection rates have increased from 20 per cent in 2003 to 95 per cent in 2008.
Residential sector
Georgia uses 40–50 per cent more energy for heating per m2 of floor space than EU countries with the same climate. As a result, 80–90 per cent of the energy consumed in Georgia’s residential sector is used for space heating. In general, buildings in Georgia consume about 40–45 per cent of all energy for heating purposes.
The problem is equally acute for residential, office and industrial buildings. In Tbilisi, the thermal resistance of buildings to heat losses is three to four times less than recommended for energy efficiency for the Tbilisi climate zone. Currently, there are no effective mandatory or indicative energy efficiency standards in the Building Code. The residential sector in Georgia has a huge energy efficiency potential, due to the high share of the residential sector in the energy balance.
7.4 Alternative sources of energy
The solar and geothermal power potential is not given priority at the moment, but the Ministry of
Agriculture, 13 700
Services, 192 900 Others,
434 600
Industry, 654 100
Transport, 963 100
Households, 1 467 900
0
2
4
6
8
10
12
14
16
2015 2016 2017 2018 2019 2020
Electricity production Electricity forecast of domestic consumption
126 Part III: Interaction of environment with selected sectors/issues
Energy is aware of estimated potential in these types of energy. Currently, there are no legal acts or tax benefits supporting the development of alternative renewable sources of energy use in Georgia.
Geothermal Geothermal waters are currently used in Georgia for district heating, fishpond heating, agricultural drying, industrial applications and greenhouse heating. Total geothermal water reserves exceed 160,000 m3 per day. Eighty per cent of these resources are located in the western part of the country (reservoir formations are fractured karstic limestones of the Upper Cretaceous series in the sedimentary trough), but geothermal fields are also found in south-eastern Georgia. Geothermal water resources, available in 44 deposits across the entire country, are generated by 206 wells and four springs, ranging in temperature from 3°C –110°C. The nation’s geothermal resources are of the highest quality, containing minimal amounts of dissolved salts, which consequently reduces scaling during utilization. Geothermal achievable potential is 3 TWh per year.
Solar The climatic conditions of Georgia are favourable for utilizing solar energy. Most regions of the country have 250–280 days of sunshine per year. Direct and global radiation reaches daily values of 3.5–5.3 kW/m² and an annual average of 1,550 kW/m². The potential of solar energy, however, is strongly seasonal and varies by a factor of more than four from mid-summer to mid-winter. The achievable potential of solar energy in Georgia is estimated at 60–120 GWh annually. The use of solar energy in Georgia is still low, but during the last decade solar water heaters became increasingly popular. Although more than 70 per cent of this potential is realizable in the months of April through September, solar power can contribute to reducing energy dependence by almost completely replacing the need for gas currently used for hot water supply throughout the year. There are a number of specialized private companies doing the installation of solar systems. Most of the systems, however, are imported. A number of projects have been implemented in protected areas (Mtirala, Tusheti and Kintrishi Protected Areas) to provide the population and tourism facilities with solar-powered electricity and water heating.
Biomass Georgia has considerable potential biomass resources. It is conditioned by its geographical position and a favourable climate for growing forests and agricultural products. In some regions it is even possible to have two yields per year. Unfortunately, the current use of biomass in Georgia is rather inefficient and unsustainable. Firewood consumption is estimated at 1 million m³ per year, which covers almost 50 per cent of household energy demand. The technical potential of the major biomass sources in Georgia amounts to 12.5 TWh. The achievable potential is estimated at 3–4 TWh. This estimate does not incorporate the potential of farming energy crops. Apart from firewood, which is used for cooking and heating, and a few donor-supported biogas initiatives, the biofuel potential remains untapped.
Wind energy The potential of wind energy has been analysed by the Wind Energy Research Centre of Karenergo. However, the analysis did not address important parameters for the planning of wind energy projects, such as security and environmental protection. Based on the data in the Wind Energy Atlas, the technical potential of wind energy was assessed. The calculations have shown that about 2,000 MW of capacity and 5 TWh of energy per year can be obtained. The most suitable areas for wind power plants (WPPs) in Georgia are in the Caucasus high mountain zone, the highlands of southern Georgia (in the Javakheti region) and the southern section of the Black Sea coast. Areas and sites for wind farms of 30–630 MW have been identified. Many of these sites have a seasonal wind pattern yielding maximum output in winter. This would assist in meeting winter domestic energy demand and offset the drop in hydropower, leading to the reduction of dependence on imports in winter. In the summer of 2015, the first WPP in Georgia will start to function. The plant will be built near Gori and will be implemented by the Georgian Energy Development Fund (GEDF). Its capacity will be about 20 MW and investment value is between US$30 million and US$35 million. 7.5 Legal, policy and institutional framework
Legal framework The 1997 Law on Electricity and Natural Gas stipulates the establishment and functioning of the
Chapter 7: Energy and environment 127 energy regulator, the Georgian National Energy and Water Supply Regulatory Commission (GNERC). However, it only briefly mentions the need to promote improvements in the efficiency of energy generation, transmission, dispatching, distribution, import, export and consumption, as well as natural gas delivery, import, export, transportation, distribution and consumption. In 2008, the Government approved the regulation for construction of renewable energy sources in Georgia, “Renewable Energy 2008”. It was replaced with 2013 Resolution No. 214 “On Approval of the Terms and Conditions for Conduct of a Feasibility Study, Construction, Ownership and Operation of Power Plants which are in the 2013 List of Potential Power Plant Projects Approved by the Minister of Energy, Order No. 125”. It regulates and supports the construction of new renewables projects. The 2014 Minister of Energy Order No. 40 sets out the terms and conditions of the proposals about construction, ownership and operation of those HPPs that are not included in the List of Potential Power Plants in Georgia. Under article 2, Submission of proposals relating to HPPs, there is no requirement for an initial EIA, neither is there a requirement for an initial assessment of social issues and risks which would enable the conduct of preliminary screening of projects. The lack of this assessment makes it impossible to identify the challenges and management response to proceed with a more detailed project investigation. Currently, there is no energy efficiency law in place. The Ministry of Energy has developed energy policy document, which among other directions addresses energy efficiency issues. The Ministry is also developing new energy strategy document where promotion of energy efficiency and renewable energy will be broadly addressed. A new structural unit, Division of Energy Efficiency and Renewable Energy, was created in the Ministry and this unit, in cooperation with international organizations, works on promotion of energy efficiency and renewable energy projects. The legislation does not address the issue of involuntary resettlement caused by infrastructure projects. Contracts and memoranda with investors do not provide sufficient safeguards for citizens in terms of resettlement. Resettlement will be implemented in accordance with World Bank Standard 4.12.
Policy framework According to the 2006 Main Directions of State Policy in Georgian Power Sector, the principal
energy policy goal is to meet the energy needs of final customers securely through the diversification of energy sources, the achievement of economic independence and ensuring the sustainability of the sector. In the longer term, the policy goal for the power sector is to satisfy the demand for electricity from indigenous hydro resources, initially and seasonally with the help of imports and, eventually, by substituting them with thermal generation. The document also calls for: Improvement of energy efficiency in the
industrial and domestic spheres, creating a sound legislative basis and institutional framework for improvement of energy efficiency in the country;
Study and putting into operation measures necessary for the use of thermal and cogeneration systems, and renewable sources of energy.
Despite the key policy directions, currently, Georgia does not have an energy policy and/or strategy. The policy document fails to prioritize energy saving, implementation of energy efficiency measures, demand-side management and issues related to heating. It does not offer any concrete proposals to develop the sector in future. NEAP-2 does not contain a separate chapter dedicated to the energy sector and its environmental effects, although its potential effects were identified in chapters on water resources, forestry, natural disasters and air protection. It does not specify goals, targets and measures with regards to the energy sector. NEAP-2 has identified planned increases in the number of HPPs as a potential additional pressure on water resources and a contributor to an increase in the frequency and intensity of geological natural processes.
Institutional framework The Ministry of Energy sets out policies and is responsible for facilitating investment projects. The Ministry has a duty to provide the policy framework and legal means for the institutional development of the energy sector of Georgia. As of 2014, the Ministry has no formal sustainable energy executive agency within its responsibility or budget provision for the implementation of sustainable energy programmes. The Division for Energy Efficiency and Alternative Sources was established in the Ministry in 2013. Its main responsibilities include promotion of the programmes and projects supporting the development of energy efficiency and use of renewable energy resources, and CDM projects.
128 Part III: Interaction of environment with selected sectors/issues
Box 7.1: Dariali Valley landslides
According to Democracy & Freedom Watch, six people were killed in a landslide in Dariali Valley on 17 May 2014, and two more in a second landslide on 21 August. Both times, masses of mud blocked the only road connecting Georgia with the Russian Federation. While the disasters were not caused by the HPP construction, they do indicate the high geological instability of the area. In May 2014, just days before the first landslide, the EBRD approved a US$80 million loan for the development, construction and operation of the Dariali HPP, which is a part of a larger plan to develop the hydropower potential of the Tergi River and its tributaries. Geological experts, among them Prof. Otar Duduari, have warned (in September 2013) that the construction site has been chosen inadequately. More recently, Duduari stated that construction of an HPP anywhere in the Dariali Gorge would increase the risks of natural disasters. Green Alternative, a member of CEE Bankwatch Network, has for some time been warning of the high geological risks in the Dariali Gorge. The mountainous area is naturally prone to landslides and a major incident happens every other year. Furthermore, the project’s own EIA clearly identified the risks of landslides and mudflows and pointed out the need for mitigation measures and detailed geological surveillance. Concerns about this were expressed during public consultation but were not taken into account by the investor and construction of the HPP has begun without sufficient safeguards in place. The project was implemented by the company with international experience. Geological and seismic surveys were conducted. The project passed the examination (expertise) and obtained the building permit in accordance with Georgian Law. Source: CEE Bankwatch Network; Democracy & Freedom Watch, 2014.
Box 7.2: Sustainable Energy Action Plans
In 2010, Tbilisi signed the European Initiative Covenant of Mayors and committed to reduce CO2 emissions by 20 per cent by 2020. As a Covenant of Mayors signatory city, Tbilisi Municipality elaborated the Sustainable Energy Action Plan (SEAP) which envisages the implementation of energy efficiency measures in the building and infrastructure sectors. To date, installation of solar collectors in kindergartens has been implemented, providing 10,500 kWh savings. At present, Tbilisi Municipality does not have in place approved methodology for calculation and monitoring of the SEAP implementation process. Rustavi, Gori and Batumi developed and submitted their SEAPs in the period 2012–2014 and await their acceptance by the European Union. All SEAPs were approved by city councils. The Division is a national coordinator of the Covenant of Mayors and the EC-LEDS.The Ministry of Economy and Sustainable Development is responsible for and has priorities relating to the preparation of sustainable development strategy and issuing of construction permits for HPP development. The Georgian National Energy and Water Supply Regulatory Commission (GNERC), the independent regulator, establishes tariffs, licensing rules and standards, and resolves relations between customers and companies. It has the authority to grant licences and to regulate the activities of licensees, importers, exporters, and commercial system operators and suppliers within the electricity and natural gas sectors of Georgia. The Electricity System Commercial Operator (ESCO) is responsible for balancing the market and ensuring grid stability, conducting export/import operations to meet systemic needs and for emergency purposes, and creating and managing a unified database on the wholesale purchase and sale of
energy (including the creation and management of a unified reporting registry). The Georgian State Electrosystem (GSE), the transmission system owner and operator, is the only dispatch licensee. Its main function is technical control and supervision over the entire power system to ensure an uninterrupted and reliable power supply. It only has the right to purchase electricity to cover transmission losses. GSE also owns and operates part of the high-voltage transmission grid and interconnection lines with neighbouring countries. The National Statistics Office (Geostat) provides all the sector-specific data used for end-use sector energy analysis. The Georgian Energy Development Fund (GEDF) is a joint stock company established in 2010 by the Government in order to facilitate investment in and development of the country’s renewable energy sector. GEDF aims at development of renewable energy projects in Georgia and works mainly on development of hydro, wind and solar energy
Chapter 7: Energy and environment 129 projects. The company started a project for development of a WPP near Gori. This is the first attempt at introducing wind-power technology in Georgia. The non-governmental Energy Efficiency Centre (EEC) has been active since early 1998 in popularizing energy efficiency principles and raising the issue of energy efficiency in different sectors of the national economy. Although cooperation among ministries has improved since 2004, there is still not enough consideration given to the potential effects of energy sector development on other sectors of the economy. 7.6 Projects Since 2000, there have been a number of large-scale energy efficiency initiatives, research, promotion and pilot projects mainly supported by USAID and the European Commission through various programmes and projects, Georgia–Norway cooperation and some other donors. The activities include the assessment and promotion of energy efficiency and renewable energy potential, training of practitioners and certification of energy engineers, as well as implementation of various pilot projects in different parts of Georgia. The pilot projects addressed both the residential and non-residential sectors (industrial enterprises and public entities such as schools, hospitals and so on). One of the most active companies in Georgia is USAID-sponsored Winrock International, which is implementing a number of energy efficiency and renewable energy projects in urban and rural areas. The company manages the Enhancing Capacity for Low Emission Development Strategies (EC-LEDS) project in Georgia. In 2012, USAID and the Ministry of Environment and Natural Resources Protection signed an MoU that supports EC-LEDS and provides the framework for bilateral cooperation in Georgia. During the five years of the programme, EC-LEDS Clean Energy is expected to reduce GHG emissions in Georgia by at least 236,372.9 metric tons of CO2-equivalent, facilitate up to US$14 million in private sector investments in clean energy, and lead to energy savings of up to 315 GWh (the equivalent of approximately US$22 million). At 1 October 2013, Georgia’s Energy Efficiency Centre, in cooperation with 10 institutions from seven EU-ENP countries (Armenia, Austria, Belarus, Georgia, Germany, Hungary and Moldova) started a new 36-month project under the EU-funded ENER2i (Energy Research to Innovation: Reinforcing cooperation with ENP countries on bridging the gap
between energy research and energy innovation). The ENER2i project focuses on the need to find innovative and sustainable solutions to these challenges, directly addressing the gap between new energy research and European industry. Another USAID-sponsored company operating in Georgia, Advanced Engineering Associates International (AEAI), implemented an energy capacity project for enhancement of energy policy and promoted stakeholder dialogues on policy issues in the period 2008–2011. AEAI has also been providing energy education and training programmes. Six CDM projects have been registered and 745.8 certified emission reduction (CER) credits have already been issued for two projects, together constituting potential generation of 1,899,868 CERs. 7.7 Energy sector development scenarios The Government works to position the country as a future regional renewable energy hub.
Business-as-usual scenario The business-as-usual scenario implies developing 1,872 MW extra capacity through new small, medium and large-scale HPPs. Development is carried out on a case-by-case basis without any strategic planning for what seems to be a rather large number of HPPs, taking into consideration the fact that currently installed HPPs work at only 60 per cent of their capacity. The current large-scale and export-oriented energy model can be vulnerable to unfavourable changes in the political and economic environments of all potential trade partners: it can be affected by a decrease in electricity demand in Turkey as a result of a slowdown in economic growth, or a decrease in electricity prices in Turkey. The energy scenario is often not appropriate and effective in meeting basic needs in rural areas. This energy model gives rise to overreliance on one energy source for power generation, such as hydropower (where prolonged drought means empty reservoirs that dramatically reduce generating capacity), where large hydropower projects, the negative social and environmental impacts of which, are often not properly assessed prior to their construction. The absence of a national and/or strategic site allocation energy strategy, complemented by integrated water resources (or river basin) management plans for rivers and supported by the SEA process, makes it impossible to verify why

130 Part III: Interaction of environment with selected sectors/issues
projects are needed from a national energy demand and supply point of view, why hydropower is selected as the source of energy and where the hydropower dams should be located. Planned hydropower development has yet to be optimized to increase overall economic benefits and minimize adverse environmental and social impacts. Georgia has been developing hydropower sites on a case-by-case basis, focusing on the benefits and costs of each site, rather than an optimal development framework. At the same time, there has been a clear tendency to move Georgia’s economy towards heavy dependence on the large-scale exploitation of natural resources (forestry, agricultural land) without assessing the economic, environmental and social consequences of such an approach. Impacts on poor communities that rely heavily on natural resources for subsistence and income have been neglected.
Alternative scenario An alternative scenario may support alternative, small-scale decentralized energy projects which take account of the needs of local communities and the economic realities specific to Georgia. It might specifically address how access to energy can help lift people out of poverty, while facilitating the shift to an environmentally sustainable energy development path. It might aim to diversify the energy portfolio, to scale up investments in renewable energies and energy efficiency, and to refrain from investing in large hydroelectric projects, underlying that small hydropower dams are more sustainable and economically viable than large hydropower facilities. Alternative scenarios might ensure the sustainability of energy sector development if hydropower capacity growth is carried out though medium and small-scale HPP installations, complemented by alternative renewable energy resources for electricity generation and energy efficiency measures. Careful planning is required, based on robust statistical data outlining future demand and supply projections for the energy sector, where calculations for projected energy efficiency measures and potential energy conservation savings are factored into energy policy planning. Whereas increased power generation affects the environment, energy efficiency/savings measures support energy consumption without an environmental impact. It is suggested that an SEA process be carried out in parallel with any strategic energy development plan document. To facilitate sustainable development at the project level, application of the principles of the
Hydropower Sustainability Assessment Protocol, developed under the auspices of the International Hydropower Association (IHA), will ensure that the need for any HPP development, and the political, technical, social, financial and environmental risks associated with it, are integrated into the decision-making process at the early stages of the development. 7.8 Regulatory, economic, fiscal and information measures
Environmental impact assessment Georgia introduced a system of investment permitting called the “one window” approach, streamlining the permitting process and cutting down the number of authorities that permit applicants need to deal with. It also reduced the list of activities subject to EIA, shortened the timeframes for permitting and constrained public participation rights and procedures. As a result of the reforms, for new HPPs, the main permitting procedure is the construction permit. EIA is a part of the construction permitting process. The 2005 Law on Licences and Permits regulates environmental impact permits, which are necessary for HPP construction. Issuance of an environmental impact permit is contingent upon the conduct of an EIA describing the direct or indirect impacts of the planned activity on the environment. There are a number of issues observed with respect to the EIA process for HPP development: Construction of an HPP can start before an EIA
report is completed and environmental impact permit is issued, which undermines the whole EIA process;
Some EIA reports miss essential elements (e.g. no field study results), with mitigation measures being of a general nature;
Neither the Government nor the public is involved in the screening and scoping stages;
An important issue related to the development of HPPs is the sequencing (order) of procedures in the decision-making process, which allows for a very limited role for EIA in the process. The MoU is signed between the State and investor before the EIA is carried out. The MoU includes: (i) HPP location; (ii) terms and conditions for obtaining construction permits, commencement of construction and subsequent commencement of operations; and (iii) annual generation capacity (Governmental Decree No. 107, Ministry of Energy). This sequencing allows for
Chapter 7: Energy and environment 131
a very limited role for EIA in decision-making as it relates to HPP development;
The 20-day time period for issuance of an environmental impact permit does not provide sufficient time for the environmental authorities to study and approve a project with potential adverse effects;
There is no established mechanism for public comments and opinions to be taken into account in the decision-making process.
Regulatory measures
Reforms and concrete measures implemented in Georgia have resulted in the simplification of electric power sector regulatory norms. Georgian regulation of the hydropower sector offers potential investors ownership advantages: newly built HPPs will remain the exclusive property of prospective investors under a build-operate-own scheme (BOO), in contrast to the build-operate-transfer (BOT) system used in countries such as New Zealand, Canada and Australia. Investors are free to choose their market and price. There is no special fee for grid connection, third-party access to the grid is free, and no licence is required for exporting power. During the three winter months, the Government offers guaranteed purchase. The terms of investment in large HPPs are subject to approval by the Government. Investors enjoy an easy regulatory framework. GNERC, under its 2008 Resolution No. 20 on Electricity Supply and Consumption Rules, set out the obligations for the distribution companies to ensure free access of micro power plants to the network and obligatory purchase of electricity produced by micro power plants with a fixed rate. As a result of this, Georgian and foreign companies are actively involved in the process of construction of hydropower stations. According to the 1997 Law on Electricity and Natural Gas, tariffs for HPPs built after 1 August 2008 and for existing HPPs of less than 13 MW capacity are fully deregulated. Tariffs for HPPs built before 1 August 2008 with more than 13 MW installed capacity are regulated by GNERC. Currently, there are no feed-in tariffs. The average generation tariff in Georgia is 0.0392 lari /KWh, or approximately US$0.024/KWh, though it varies by generation asset. For example, the Enguri HPP has a tariff of US$0.0072/KWh, while G-Power has a tariff of US$0.056/KWh net of VAT. However, the BOO model promoted by the Government for the construction of HPPs would not
benefit the country’s budget sufficiently enough to justify the total change of landscape and impact on the environment that will result, together with issues surrounding the process of the involuntary resettlement of people. Analysis of the MoUs and a number of contracts between the Georgian Government and investors raises questions over what Georgia will actually receive as a result of the implementation of such projects. Private investors do not contribute to the state budget from either royalties or bonuses, as is the practice elsewhere in the world, nor do they in the form of free energy. Almost all the planned HPPs will be constructed with the purpose of exporting the electricity to the Russian Federation and/or Turkey. Exports in Georgia are not taxed. Investors do not pay for the utilization of water resources. Further analysis also suggests that the Government is under various obligations, including the established practice to grant state-owned agricultural lands, pastures and forests for a symbolic price of US$1 to potential investors intending to construct HPPs. There are concerns with regard to the sustainability of this practice, in the case of both large dam-type HPPs and run-of-river projects, as these have social impacts locally. In rural areas, local people do not have officially registered legal rights to land; thus, land parcels are granted to investors by the State and locals are left without proper compensation. At the same time, the loss of pastures, agricultural lands and forests also has negative impacts on local livelihoods. 7.9 Energy-related global and regional agreements Georgia ratified the Energy Charter Treaty (ECT) in 1995 and the Energy Charter Protocol on Energy Efficiency and Related Environmental Aspects (PEEREA) in 2004. By ratifying the PEEREA, Georgia commits itself to formulating and implementing policies for improving energy efficiency and reducing the negative environmental impacts of the energy cycle. The guiding principle of the Protocol is that contracting parties shall cooperate and, as appropriate, assist each other in developing and implementing energy efficiency policies, laws and regulations. However, despite being a party to the ECT, Georgia currently does not have an energy efficiency strategy to meet its commitments. One of the primary goals of the energy policy of the country is to achieve similarity to the EU energy policy principles and directions through
132 Part III: Interaction of environment with selected sectors/issues
harmonization of the relevant legislation. The process of market liberalization and harmonization with the EU energy legislation became particularly important after Georgia became an observer to the Energy Community in 2007. The main purpose of joining the Community is to implement the EU standards and regulations and connect Georgia to its unified energy network, which will contribute to increasing the country’s energy security and the maximum development of its transit potential. At the present time, it is not clear how the Government is preparing to meet its commitments on energy efficiency and modification of the legislative field, which would reflect the Association Agreement between the EU and Georgia, signed on 27 June 2014. 7.10 Conclusions and recommendations The Government is committed to the further development of renewable energy resources. The country has been developing HPP sites on a case-by-case basis, focusing on the benefits and costs of each site, rather than an optimal development framework. In the absence of a national energy strategy and strategic site allocation policy, serving as a long-term vision for the energy sector, it is difficult to verify why projects are needed from a national energy demand and supply point of view, why hydropower is selected as the source of energy and where the HPP dams are to be located. A number of shortcomings in the national legal and institutional framework for environmental management weakens the soundness and sustainability of decisions being made with regard to enhancing the country’s power generation infrastructure. Currently, national law in Georgia does not carry provisions for conducting SEA of national and regional development plans for different sectors of the economy, including the energy sector. Recommendation 7.1: The Government should finalize a national energy strategy in accordance with national priorities and
carry out a strategic environmental assessment of the strategy. Recommendation 7.2: The Ministry of Energy should apply hydropower plant site selection criteria based on international best practices. Recommendation 7.3: The Ministry of Environment and Natural Resources Protection should consider application of the principles of the Hydropower Sustainability Assessment Protocol developed by the International Hydropower Association. There are no national rules on the methodology for determining an acceptable minimal water flow (“environmental flow”) that shall remain in a river after water obstruction as a result of HPP development in order to sustain aquatic life and downstream ecosystems. In terms of resettlement, contracts and memoranda do not provide sufficient safeguards for citizens. The legislation does not address the issue of involuntary resettlement caused by infrastructure projects. Recommendation 7.4: The Government should: (a) Develop national rules on the methodology
for determining environmental flows; (b) Develop a resettlement policy framework. Geothermal waters are currently used in Georgia for district heating, fishpond heating, agricultural drying, industrial applications and greenhouse heating. The climatic conditions of Georgia are favourable for utilizing solar energy. The country has considerable potential biomass resources. However, the renewable power potential is not given priority at the moment. Currently, there are no legal acts or tax benefits supporting the development of alternative renewable sources of energy use in Georgia. Recommendation 7.5: The Government should consider the promotion of renewable sources of energy.
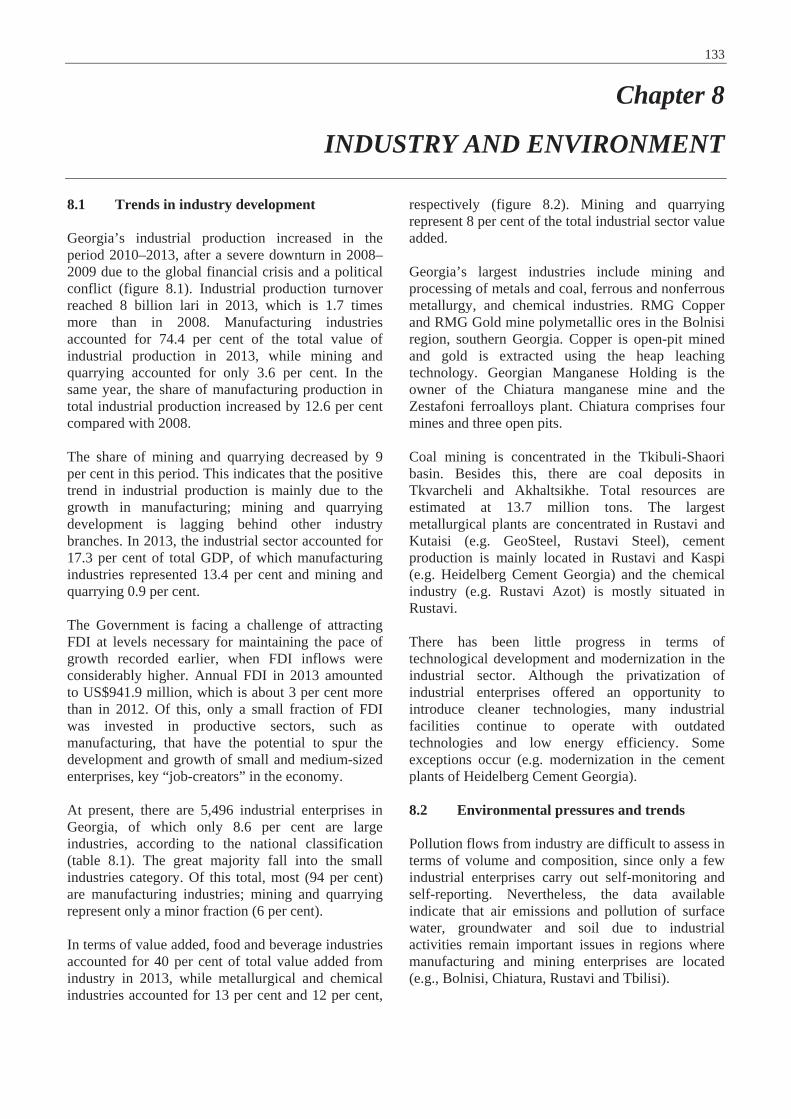
133
Chapter 8
INDUSTRY AND ENVIRONMENT
8.1 Trends in industry development Georgia’s industrial production increased in the period 2010–2013, after a severe downturn in 2008–2009 due to the global financial crisis and a political conflict (figure 8.1). Industrial production turnover reached 8 billion lari in 2013, which is 1.7 times more than in 2008. Manufacturing industries accounted for 74.4 per cent of the total value of industrial production in 2013, while mining and quarrying accounted for only 3.6 per cent. In the same year, the share of manufacturing production in total industrial production increased by 12.6 per cent compared with 2008. The share of mining and quarrying decreased by 9 per cent in this period. This indicates that the positive trend in industrial production is mainly due to the growth in manufacturing; mining and quarrying development is lagging behind other industry branches. In 2013, the industrial sector accounted for 17.3 per cent of total GDP, of which manufacturing industries represented 13.4 per cent and mining and quarrying 0.9 per cent. The Government is facing a challenge of attracting FDI at levels necessary for maintaining the pace of growth recorded earlier, when FDI inflows were considerably higher. Annual FDI in 2013 amounted to US$941.9 million, which is about 3 per cent more than in 2012. Of this, only a small fraction of FDI was invested in productive sectors, such as manufacturing, that have the potential to spur the development and growth of small and medium-sized enterprises, key “job-creators” in the economy. At present, there are 5,496 industrial enterprises in Georgia, of which only 8.6 per cent are large industries, according to the national classification (table 8.1). The great majority fall into the small industries category. Of this total, most (94 per cent) are manufacturing industries; mining and quarrying represent only a minor fraction (6 per cent). In terms of value added, food and beverage industries accounted for 40 per cent of total value added from industry in 2013, while metallurgical and chemical industries accounted for 13 per cent and 12 per cent,
respectively (figure 8.2). Mining and quarrying represent 8 per cent of the total industrial sector value added. Georgia’s largest industries include mining and processing of metals and coal, ferrous and nonferrous metallurgy, and chemical industries. RMG Copper and RMG Gold mine polymetallic ores in the Bolnisi region, southern Georgia. Copper is open-pit mined and gold is extracted using the heap leaching technology. Georgian Manganese Holding is the owner of the Chiatura manganese mine and the Zestafoni ferroalloys plant. Chiatura comprises four mines and three open pits. Coal mining is concentrated in the Tkibuli-Shaori basin. Besides this, there are coal deposits in Tkvarcheli and Akhaltsikhe. Total resources are estimated at 13.7 million tons. The largest metallurgical plants are concentrated in Rustavi and Kutaisi (e.g. GeoSteel, Rustavi Steel), cement production is mainly located in Rustavi and Kaspi (e.g. Heidelberg Cement Georgia) and the chemical industry (e.g. Rustavi Azot) is mostly situated in Rustavi. There has been little progress in terms of technological development and modernization in the industrial sector. Although the privatization of industrial enterprises offered an opportunity to introduce cleaner technologies, many industrial facilities continue to operate with outdated technologies and low energy efficiency. Some exceptions occur (e.g. modernization in the cement plants of Heidelberg Cement Georgia). 8.2 Environmental pressures and trends Pollution flows from industry are difficult to assess in terms of volume and composition, since only a few industrial enterprises carry out self-monitoring and self-reporting. Nevertheless, the data available indicate that air emissions and pollution of surface water, groundwater and soil due to industrial activities remain important issues in regions where manufacturing and mining enterprises are located (e.g., Bolnisi, Chiatura, Rustavi and Tbilisi).
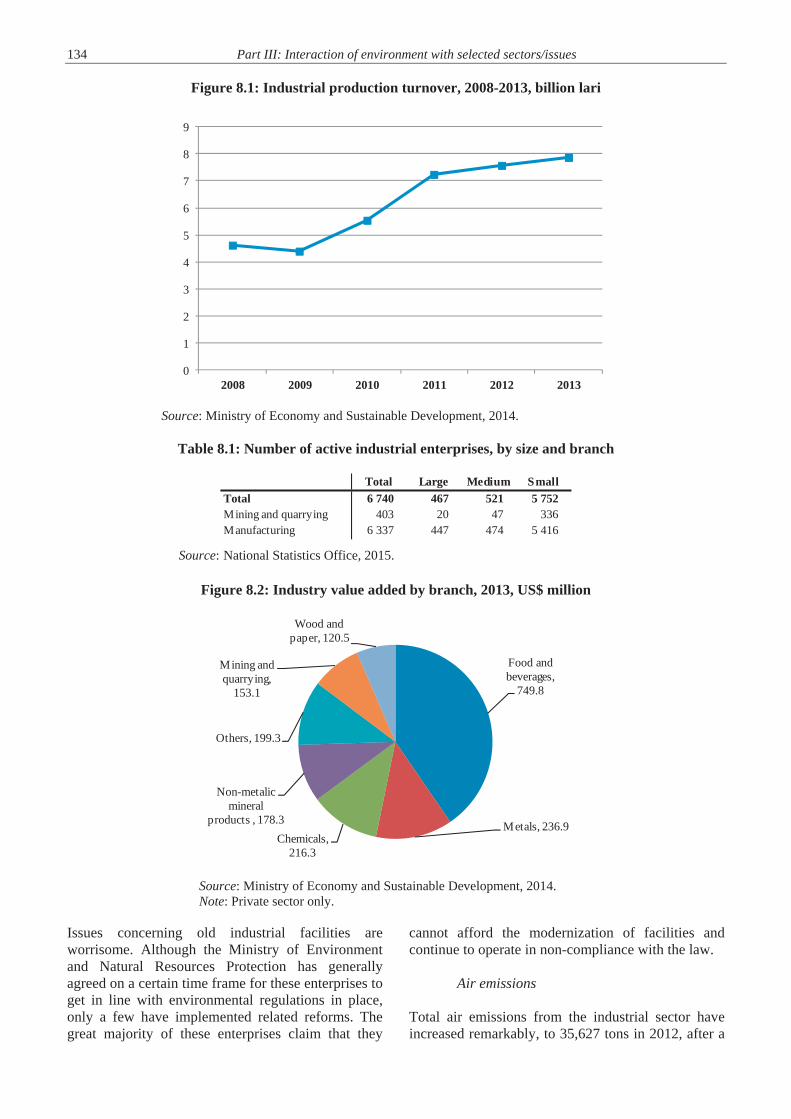
134 Part III: Interaction of environment with selected sectors/issues
Figure 8.1: Industrial production turnover, 2008-2013, billion lari
Source: Ministry of Economy and Sustainable Development, 2014.
Table 8.1: Number of active industrial enterprises, by size and branch
Source: National Statistics Office, 2015.
Figure 8.2: Industry value added by branch, 2013, US$ million
Source: Ministry of Economy and Sustainable Development, 2014.Note: Private sector only.
Issues concerning old industrial facilities are worrisome. Although the Ministry of Environment and Natural Resources Protection has generally agreed on a certain time frame for these enterprises toget in line with environmental regulations in place, only a few have implemented related reforms. Thegreat majority of these enterprises claim that they
cannot afford the modernization of facilities andcontinue to operate in non-compliance with the law.
Air emissions
Total air emissions from the industrial sector haveincreased remarkably, to 35,627 tons in 2012, after a
0
1
2
3
4
5
6
7
8
9
2008 2009 2010 2011 2012 2013
Total Large Medium SmallTotal 6 740 467 521 5 752Mining and quarrying 403 20 47 336Manufacturing 6 337 447 474 5 416
Food and beverages,
749.8
Metals, 236.9Chemicals,
216.3
Non-metalicmineral
products , 178.3
Others, 199.3
Mining and quarrying,
153.1
Wood and paper, 120.5
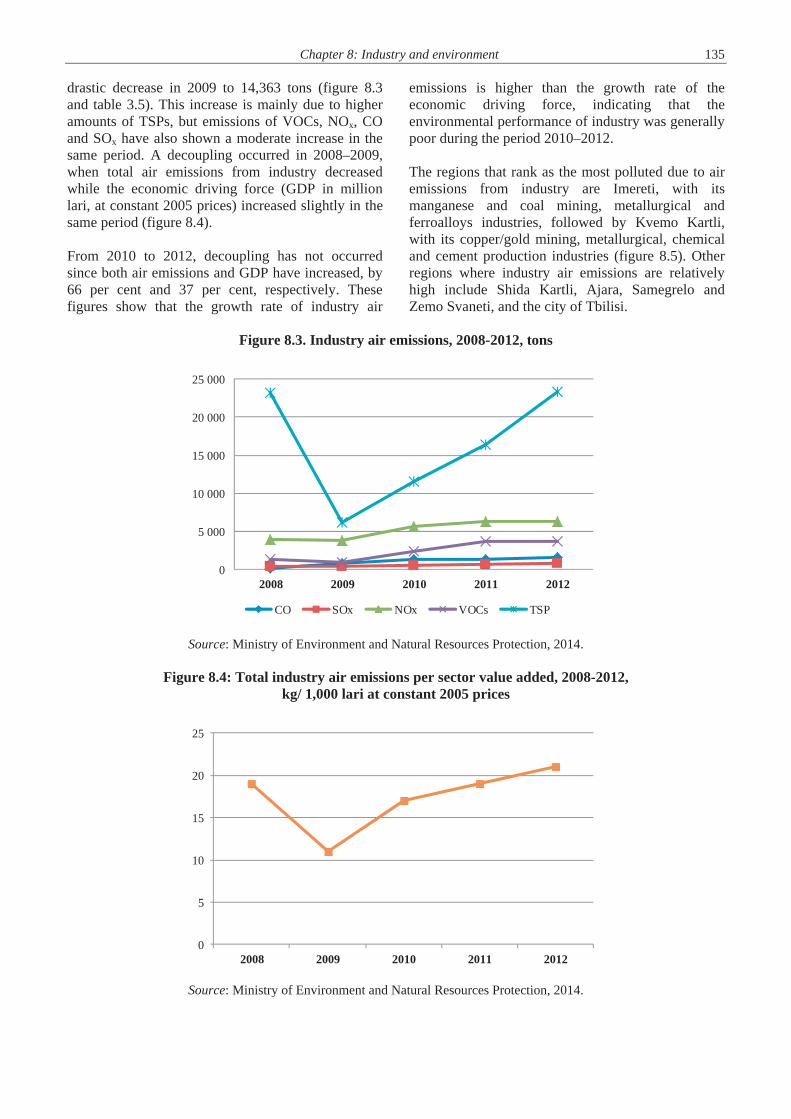
Chapter 8: Industry and environment 135
drastic decrease in 2009 to 14,363 tons (figure 8.3 and table 3.5). This increase is mainly due to higher amounts of TSPs, but emissions of VOCs, NOx, CO and SOx have also shown a moderate increase in the same period. A decoupling occurred in 2008–2009, when total air emissions from industry decreasedwhile the economic driving force (GDP in million lari, at constant 2005 prices) increased slightly in thesame period (figure 8.4).
From 2010 to 2012, decoupling has not occurred since both air emissions and GDP have increased, by66 per cent and 37 per cent, respectively. Thesefigures show that the growth rate of industry air
emissions is higher than the growth rate of the economic driving force, indicating that the environmental performance of industry was generallypoor during the period 2010–2012.
The regions that rank as the most polluted due to air emissions from industry are Imereti, with itsmanganese and coal mining, metallurgical and ferroalloys industries, followed by Kvemo Kartli, with its copper/gold mining, metallurgical, chemical and cement production industries (figure 8.5). Other regions where industry air emissions are relativelyhigh include Shida Kartli, Ajara, Samegrelo and Zemo Svaneti, and the city of Tbilisi.
Figure 8.3. Industry air emissions, 2008-2012, tons
Source: Ministry of Environment and Natural Resources Protection, 2014.
Figure 8.4: Total industry air emissions per sector value added, 2008-2012, kg/ 1,000 lari at constant 2005 prices
Source: Ministry of Environment and Natural Resources Protection, 2014.
0
5 000
10 000
15 000
20 000
25 000
2008 2009 2010 2011 2012
CO SOx NOx VOCs TSP
0
5
10
15
20
25
2008 2009 2010 2011 2012
136 Part III: Interaction of environment with selected sectors/issues
Figure 8.5. Air emissions from stationary sources in selected regions, 2012, tons
Source: Ministry of Environment and Natural Resources Protection, 2014.
Box 8.1: Improvements in Heidelberg Cement Georgia
In 2006, Heidelberg Cement Georgia, which belongs to the Heidelberg Cement Group, became the owner of four cement
are located. In order to reduce its emissions, the company installed new and efficient filters in its plants and introduced a plant in Rustavi. These improvements reduced emissions of
particulate matter from cement production.
The Heidelberg Cement Group plans to enhance the technology line of the two other plants by replacing the wet technique
plant has online monitoring for NO, CO, CH4 and dust; SO2 and CO2 are punctually measured. However, as coal was introduced as a new additional fuel, emissions of other pollutants, such as SO2plants used natural gas as a fuel. The plants have environmental impact permits and report annually to the Ambient Air
e not ISO 14000 certified, but
carried out biodiversity monitoring and recultivation activities in limestone and clay quarries. In 2013, the company’s budgetfor environmental management was about 400,000 lari.
Source: Heildelberg Cement Georgia, 2014.
Box 8.2: Environmental concerns during the rebuild of Rustavi Steel
The Rustavi Steel metallurgical plant dates from the 1950s. Today, Rustavi Steel produces each month 10,000 to 12,000 tons of molten steel, mostly from scrap metals. Previously, production was much higher, accounting for 15 per cent of the total pipe production of the former Soviet Union. Rustavi Steel is currently being reconstructed step by step. This long process is expected to finish in 2016, allowing production to increase. The plant has 22 shops ready to operate and a mill is being rebuilt for a steel melting shop. The company holds an ISO 9000 certificate for quality management. Gas emissions and dust from the stacks and shops represent a local environmental and health issue. Environmental monitoring is carried out manually in some shops and stacks.
There is no online monitoring in place and air emissions filters have not been renewed, with one exception. The company is operating without a valid environmental impact permit. In order to comply with current legal requirements, Rustavi Steel is planning to carry out an environmental audit soon. Also, the company’s management intends to prepare a plan to replace old equipment and filters and develop an environmental management plan, including waste management. Currently, industrial wastes, such as tyres and oils, are disposed of on the plant’s premises without any management.
Source: Rustavi Steel, 2014.
0
2 000
4 000
6 000
8 000
10 000
12 000
14 000
16 000
18 000
20 000
Imereti KvemoKartli
Shida Kartli Ajara Samegrelo Tbilisi
CH4
MnO2
NMVOC
CO
NOx
SO2
TSP
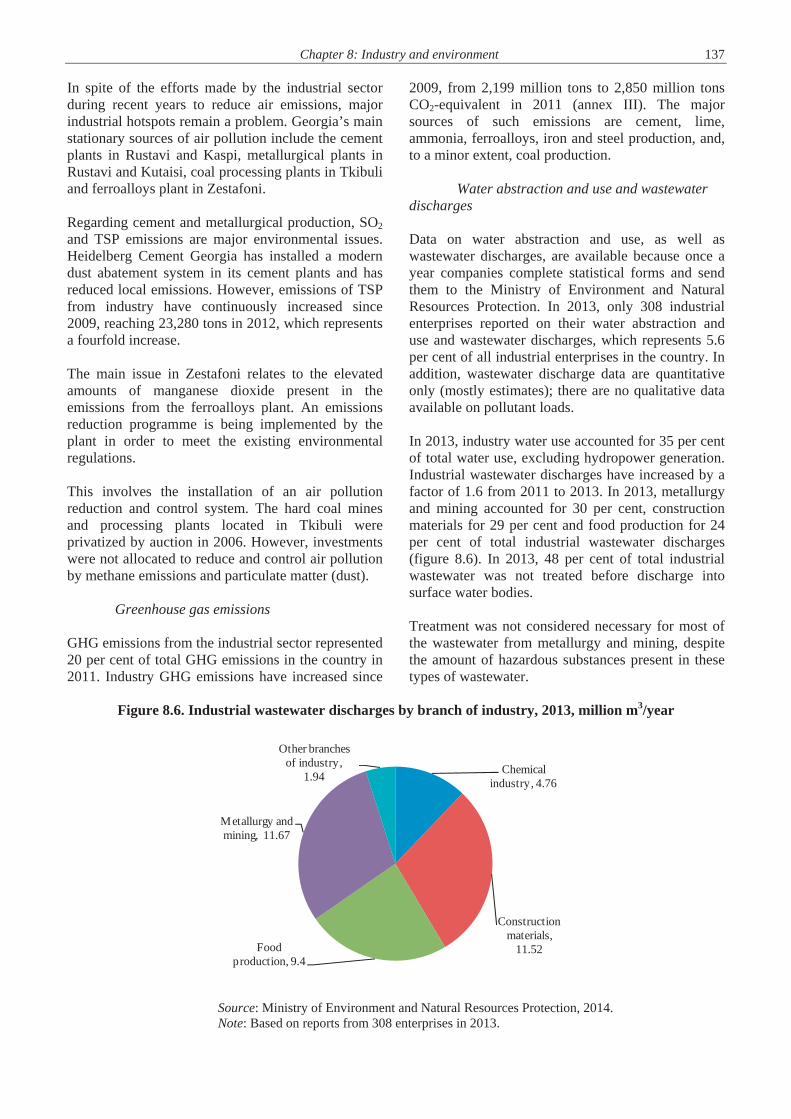
Chapter 8: Industry and environment 137
In spite of the efforts made by the industrial sector during recent years to reduce air emissions, major industrial hotspots remain a problem. Georgia’s main stationary sources of air pollution include the cement plants in Rustavi and Kaspi, metallurgical plants in Rustavi and Kutaisi, coal processing plants in Tkibuli and ferroalloys plant in Zestafoni.
Regarding cement and metallurgical production, SO2and TSP emissions are major environmental issues. Heidelberg Cement Georgia has installed a modern dust abatement system in its cement plants and has reduced local emissions. However, emissions of TSP from industry have continuously increased since 2009, reaching 23,280 tons in 2012, which represents a fourfold increase.
The main issue in Zestafoni relates to the elevated amounts of manganese dioxide present in the emissions from the ferroalloys plant. An emissions reduction programme is being implemented by the plant in order to meet the existing environmental regulations.
This involves the installation of an air pollution reduction and control system. The hard coal mines and processing plants located in Tkibuli were privatized by auction in 2006. However, investments were not allocated to reduce and control air pollution by methane emissions and particulate matter (dust).
Greenhouse gas emissions
GHG emissions from the industrial sector represented 20 per cent of total GHG emissions in the country in 2011. Industry GHG emissions have increased since
2009, from 2,199 million tons to 2,850 million tons CO2-equivalent in 2011 (annex III). The major sources of such emissions are cement, lime, ammonia, ferroalloys, iron and steel production, and, to a minor extent, coal production.
Water abstraction and use and wastewater discharges
Data on water abstraction and use, as well as wastewater discharges, are available because once a year companies complete statistical forms and send them to the Ministry of Environment and Natural Resources Protection. In 2013, only 308 industrial enterprises reported on their water abstraction and use and wastewater discharges, which represents 5.6 per cent of all industrial enterprises in the country. In addition, wastewater discharge data are quantitative only (mostly estimates); there are no qualitative data available on pollutant loads.
In 2013, industry water use accounted for 35 per cent of total water use, excluding hydropower generation. Industrial wastewater discharges have increased by a factor of 1.6 from 2011 to 2013. In 2013, metallurgy and mining accounted for 30 per cent, construction materials for 29 per cent and food production for 24 per cent of total industrial wastewater discharges (figure 8.6). In 2013, 48 per cent of total industrial wastewater was not treated before discharge into surface water bodies.
Treatment was not considered necessary for most of the wastewater from metallurgy and mining, despite the amount of hazardous substances present in these types of wastewater.
Figure 8.6. Industrial wastewater discharges by branch of industry, 2013, million m3/year
Source: Ministry of Environment and Natural Resources Protection, 2014. Note: Based on reports from 308 enterprises in 2013.
Chemical industry, 4.76
Construction materials,
11.52Food production, 9.4
Metallurgy and mining, 11.67
Other branches of industry,
1.94

138 Part III: Interaction of environment with selected sectors/issues Many industries (e.g. food, chemical and textile) discharge their wastewater into the municipal network system and the treatment depends on the efficiency of municipal services. Today, licences for water resource use and environmental impact permits do not apply to most industries. Enterprises only need a licence for the use of groundwater. Mining companies (e.g. RMG Copper, the Chiatura manganese mines and Tikbuli coal mines) are the largest polluters, discharging heavy metals and suspended solids. Acidic mine drainage is a major issue in most of these sites as heavy metals are mobilized under acid conditions and pollute surface water and groundwater, as well as contaminating soils. In addition, the risk of groundwater pollution from mining tailings is high as they usually do not have layers to avoid seepage. Wastewater discharges from the food industry also affect the surface water quality due to their high loadings of nutrients and organic material. The pollution of surface waters by industrial wastes, which are poorly managed or were accumulated in the past, is of concern. Leakages from illegal dumpsites located on riverbank slopes contaminate the rivers and pollute groundwater resources. Moreover, floods affect the waste disposed of on riverbanks, resulting in the high pollution of rivers with hazardous substances. Surface water monitoring is of particular importance because of the risk of domestic and transboundary pollution in the Kura River basin in the event of accidental spills. The most polluted rivers in the Kura River basin include the Kura River within Tbilisi and Rustavi (polluted with oil products, phenols) and the Mashavera River (zinc and copper). In the Black Sea basin, the most polluted rivers are the Kvirila River (suspended solids, oil products and manganese), Rioni River (oil products, zinc and copper), Tkibuli River (suspended solids), Kubiszkali River (oil products) and Luhumi River (arsenic).
Waste management According to the 2007 Report of Waste Inventory on the Territory of Georgia, the amount of accumulated municipal waste has been estimated at more than 12 million tons, of which 908,740 tons are hazardous wastes. Responsibility for the largest share of the industrial waste falls on the mining industry (more than 11 million tons). Historic mining wastes accumulated in different regions are pollution sources. Today, accurate statistics for the annual generation of industrial waste are lacking.
When the industrial sector operated at full capacity, the mining industry and ferrous and nonferrous metallurgy were the largest waste generators. Several thousand tons of metallurgical, ferroalloy, mining and other industrial wastes, including hazardous wastes, were then disposed of at nearby industrial facilities without environmental considerations and are currently polluting the environment. There are no landfills for industrial wastes in the country. Industrial wastes are disposed of at municipal waste landfills or, more often, at the site of the facility producing the waste. In general, environmental requirements are not observed, resulting in diffuse pollution of surface water and groundwater and soil. Industrial hazardous wastes and mining wastes, including old and present tailings containing heavy metals and other toxic substances, can be found in several regions of Georgia (figure 8.7), but are mainly concentrated in the Imereti region (85 per cent) and Racha-Lechkhumi and Kvemo Svaneti regions (11 per cent). Although these sites are hotspots with high concentrations of toxic elements, information is still lacking on the amount and characteristics of accumulated wastes. Since September 2014, the Ministry of Environment and Natural Resources Protection has started to identify industrial hotspots in order to require companies to prepare action plans for environmental rehabilitation of their waste sites. The Chiatura manganese-containing mining wastes, located in the Imereti region, are spread over 30 villages around the mining sites. Currently, there are no studies about the possibility of rehabilitating and/or reprocessing these wastes. In Zestafoni, a foreign company has started reprocessing manganese from ferroalloy metallurgy wastes. Some recultivation has been carried out by mining companies in their waste sites, but as mining does not require EIA, according to national regulations, and therefore, no environmental rehabilitation plans are required, it is difficult to find out whether companies are carrying out rehabilitation of their sites. A main hotspot of historic wastes is located in the Lentekhi and Ambrolauri districts of the Racha-Lechkhumi and Kvemo Svaneti regions, where more than 100,000 tons of arsenic-containing waste were accumulated during the Soviet period and abandoned without any environmental protection measure. The Netherlands Government supports a project on the rehabilitation of these arsenic-containing wastes (four dumps), which are located near riverbanks with a high risk of flooding (chapter 14).
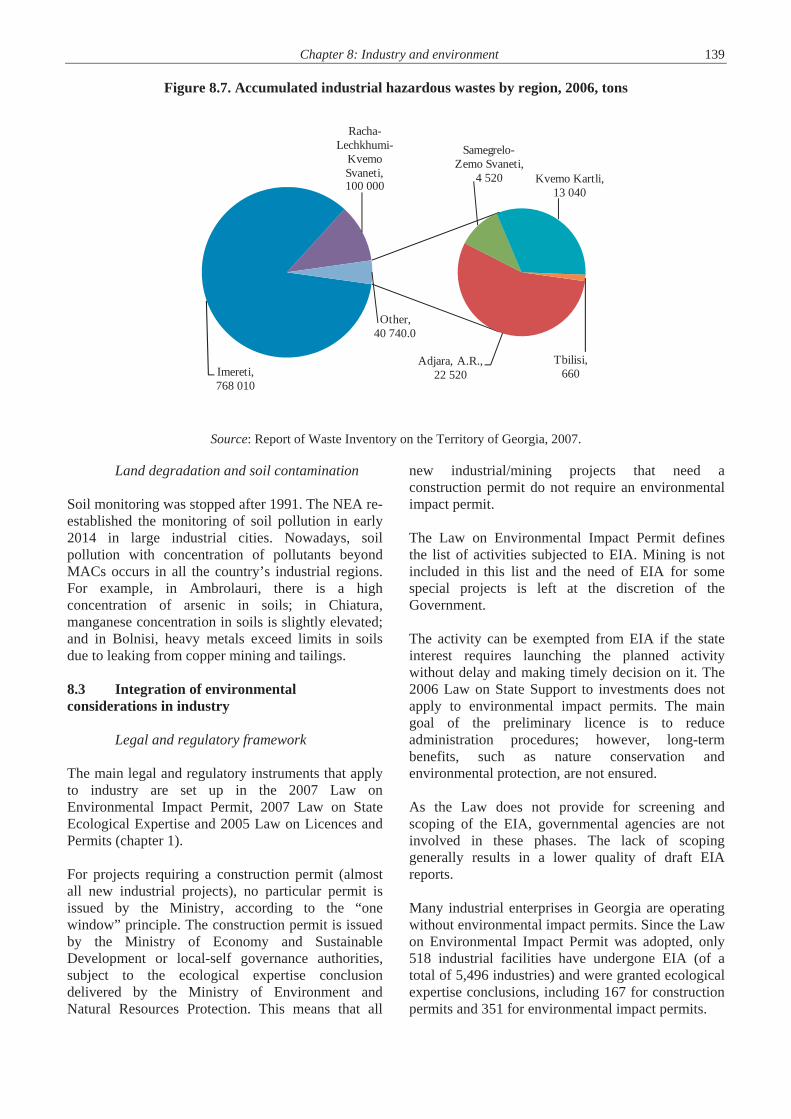
Chapter 8: Industry and environment 139
Figure 8.7. Accumulated industrial hazardous wastes by region, 2006, tons
Source: Report of Waste Inventory on the Territory of Georgia, 2007.
Land degradation and soil contamination
Soil monitoring was stopped after 1991. The NEA re-established the monitoring of soil pollution in early 2014 in large industrial cities. Nowadays, soil pollution with concentration of pollutants beyond MACs occurs in all the country’s industrial regions. For example, in Ambrolauri, there is a high concentration of arsenic in soils; in Chiatura, manganese concentration in soils is slightly elevated; and in Bolnisi, heavy metals exceed limits in soils due to leaking from copper mining and tailings.
8.3 Integration of environmental considerations in industry
Legal and regulatory framework
The main legal and regulatory instruments that apply to industry are set up in the 2007 Law on Environmental Impact Permit, 2007 Law on State Ecological Expertise and 2005 Law on Licences and Permits (chapter 1).
For projects requiring a construction permit (almost all new industrial projects), no particular permit is issued by the Ministry, according to the “one window” principle. The construction permit is issued by the Ministry of Economy and Sustainable Development or local-self governance authorities, subject to the ecological expertise conclusion delivered by the Ministry of Environment and Natural Resources Protection. This means that all
new industrial/mining projects that need a construction permit do not require an environmental impact permit.
The Law on Environmental Impact Permit defines the list of activities subjected to EIA. Mining is not included in this list and the need of EIA for some special projects is left at the discretion of the Government.
The activity can be exempted from EIA if the state interest requires launching the planned activity without delay and making timely decision on it. The 2006 Law on State Support to investments does not apply to environmental impact permits. The main goal of the preliminary licence is to reduce administration procedures; however, long-term benefits, such as nature conservation and environmental protection, are not ensured.
As the Law does not provide for screening and scoping of the EIA, governmental agencies are not involved in these phases. The lack of scoping generally results in a lower quality of draft EIA reports.
Many industrial enterprises in Georgia are operating without environmental impact permits. Since the Law on Environmental Impact Permit was adopted, only 518 industrial facilities have undergone EIA (of a total of 5,496 industries) and were granted ecological expertise conclusions, including 167 for construction permits and 351 for environmental impact permits.
Imereti, 768 010
Adjara, A.R., 22 520
Samegrelo-Zemo Svaneti,
4 520
Racha-Lechkhumi-
Kvemo Svaneti, 100 000 Kvemo Kartli,
13 040
Tbilisi, 660
Other, 40 740.0
140 Part III: Interaction of environment with selected sectors/issues
Box 8.3: Environmental issues in Zestafoni and Chiatura
The Zestafoni ferroalloys plant and Chiatura manganese mines were privatized in 2006. An agreement to comply with the environmental legislation in place was signed by the new owner and the Government. According to this agreement, the enterprise has a deadline of 2018 to comply with environmental requirements. However, the environmental requirements included in the agreement, such as mitigation, monitoring and rehabilitation plans, were not disclosed to the public. At present, no improvements have been made, as the EIA required by the legislation was not carried out and, consequently, the environmental impact permit was not issued. After an inspection carried out by the Ministry of Environment and Natural Resources Protection, the enterprise was fined 18 million lari. NGOs have asked for an environmental audit in Chiatura, without success. The main environmental issue concerning the Zestafoni ferroalloys plant involves the lack of modern and efficient filters to reduce and control air emissions, in particular manganese dioxide emissions. In the Chiatura mines, a major environmental issue relates to the lack of treatment plants for mine wastewater containing suspended solids and heavy metals (mainly manganese). Source: Green Alternative, 2014. The current environmental impact permit is too general and allows pollution up to the level of environmental quality standards. The concept of integrated permitting was not yet introduced in Georgia. There is no legislation concerning integrated pollution prevention and control (IPPC).Best available techniques (BAT) are not used to set up permit conditions. Guidelines on how to assess BAT and use BAT reference documents (BREFs) are lacking. The 2005 Law on Licences and Permits regulates certain activities through the issue of licences or permits. Licences for mineral resources exploration and exploitation are issued by the NEA. Another important law that applies to the industrial sector is the 1996 Law on Environmental Protection, which provides for environmental insurance for activities that can cause severe environmental damage. However, this requirement has not been put into practice so far. Moreover, authorities are not making proper use of environmental audit, foreseen by the Law as a tool to promote compliance with environmental requirements by existing industrial sites or during the privatization of enterprises. According to the 1996 Law on Mineral Resources, the Ministry of Environment and Natural Resources Protection is the licensor for activities related to exploration, exploitation and processing of minerals and for the use of groundwater resources. This Law does not require environmental rehabilitation plans for mining closure and environmental insurance in order to obtain a licence. After the adoption of the 2005 Law on Licences and Permits, which stipulates the need for a mineral resources use licence, there is an unsolved issue between this Law and the Law on Mineral Resources, which also provides for such a type of licence.
Other relevant legislation includes the 1999 Law on Ambient Air Protection, 1996 Ministerial Order No. 130 on the Protection of the Surface Waters from Pollution, 1994 Law on Soil Protection, 2010 Law on Control of Technical Risks, 1997 Law on Safety of Dangerous Industrial Enterprises and 1998 Law on Hazardous Chemical Substances. The 2014 Waste Management Code provides for legal conditions aiming at prevention of waste generation and increasing re-use, and introduces requirements for industrial waste permitting and reporting, but it is not applied to mining wastes. Also, a system for recording information about high-risk industrial installations and for reporting on major industrial accidents is not yet in place. Neither has the country established its pollutant release and transfer register (PRTR). In terms of economic instruments to encourage better environmental practices in mining and industry, Georgia has a tax on the use of natural resources. However, charges on pollution with harmful substances were abolished few years ago. Fines and payment for damage are still in place. There are no economic incentives for investment in cleaner production or for waste recycling and reuse (chapter 2).
Policies, strategies and plans
There is no comprehensive strategic document concerning policy directions for the industrial sector or the mining sector in Georgia. Environmental considerations related to industry have been included in some policy documents, programmes and plans, such as the 2014 Socio-Economic Development Strategy of Georgia (“Georgia 2020”), which presents directions concerning modern solid waste management.

Chapter 8: Industry and environment 141
Photo 8: Traditional bread making in Georgia
In the 2014 Regional Development Programme for the period 2015–2017, only ambient air protection issues related to industry are mentioned. NEAP-2, for the period 2012–2016, comprises a series of priority measures concerning the industrial and mining sectors, such as the management of mining wastes, industrial hazardous wastes and risk reduction for industrial accidents.
In addition, the 2014 state programme “Produce in Georgia” aims at supporting and developing the manufacturing industry through the financing of new manufacturing, technological updating of existing production and support of micro start-ups. This Programme does not cover the whole industrial sector. The drafts of the national waste management strategy and waste management plan would be particularly important for the industrial sector as they would deal with industrial and mining wastes.
Policy objectives concerning industrial pollution and hazards, and management of chemicals, are included in the 2014 Association Agreement with the EU.
Institutional framework
The Ministry of Environment and Natural Resources Protection is the national body responsible for developing, implementing and enforcing policies and strategies related to environmental protection and sustainable use of natural resources.
The DES is responsible for carrying out environmental inspections. The inspection system is weak, though. Inspections are carried out once a year in large industrial sites, but the annual plan for inspections does not take into account risk-based criteria and the operator’s performance. This plan does not list priority sectors as well as specific installations to be inspected (e.g. high-risk installations). Inspectors lack training, especially for high-risk installations and mining sites. Another issue the inspectors have to face is the lack of guidelines for environmental inspections, especially guidelines for specific sectors. Moreover, the methodology to calculate environmental damage is outdated. Enforcement is currently performed through fines as administrative measures and judicial procedures. About 800 companies were inspected from January to September 2014.
The NEA issues licences for mineral resources use and carries out environmental monitoring of air, surface water and soil pollution in major industrial regions.
The Ministry of Economy and Sustainable Development is in charge of developing and implementing the country’s economic policy. It is also responsible for technical regulations and standards, foreign trade, foreign investments, promotion of the private business sector and privatization of state property. The most relevant
142 Part III: Interaction of environment with selected sectors/issues
bodies under the Ministry dealing with industry-related issues are the following: The Department of Sustainable Development
(DSD) deals with sustainable development issues;
The Technical and Constructions Supervision Agency is responsible for issuing construction permits for industry; supervision (technical inspections), including of high-risk industrial facilities (metallurgy, mining, chemical); and compliance with the implementation of industry’s emergency response plans;
Georgia’s Innovation and Technology Agency is responsible for promoting the introduction of modern and cleaner technologies in industry.
The Ministry of Internal Affairs and its Emergency Management Agency are responsible for coordinating emergency situations in the event of an industrial accident. Coordination and communication among institutions responsible for environmental protection, at either the national or local level, are only informal. Regular and formal tools for enhancing coordination and information flow among concerned ministries/agencies/departments are not currently applied. For example, cooperation between the Ministry of Environment and Natural Resources Protection and the Ministry of Economy and Sustainable Development for carrying out joint inspections and sharing information is weak.
Measures towards greening the industry Measures for greening industry are lagging behind other priorities, such as those related to liberalizing the economy, which most of the time are not compatible with the necessary changes in production patterns and corporate social responsibility to green the economy.
Cleaner production Georgia’s industrial sector lacks cleaner production methods, with lower emissions and less waste and higher energy efficiency. Environmental and economic benefits that can arise from the introduction of cleaner production in industry are not well understood and technology-based requirements are not yet applied for environmental permitting. Although there are opportunities for introducing BAT in different industrial branches, only a few industries have introduced such techniques. As a result, the efficiency of the extraction of raw materials and
manufacturing of products is low and does not ensure the sustainable use of natural resources. Nowadays, there is a general increase in the availability of modern and cleaner technologies, but the Government’s assistance and promotion to introduce such technologies into industry is still low. Financial incentives for import, development and use of environmentally friendly technologies are not available. Moreover, foreign assistance in the areas of technology and knowledge transfer is not well developed. There is no cleaner production centre in Georgia to promote environmentally friendly technologies for industrial production. The Ministry of Economy and Sustainable Development, together with UNIDO and the OECD, has started a project aimed at promoting cleaner production methods in line with sustainable consumption and production. This project is developed within the framework of the EU’s Greening Economies in the Eastern Neighbourhood (EaP GREEN) Programme. Also, several projects have been identified, financed and accomplished in the framework of the Kyoto Protocol’s Clean Development Mechanism (CDM), providing additional investments in the energy sector as most of the projects relate to the transmission and distribution of natural gas and renovation of large-scale HPPs (chapter 3). Georgia’s industrial sector has not yet started participating in international initiatives in order to promote a green and transparent industry, such as Green Industry or the Global Reporting Initiative.
Environmental management Environmental management systems, such as the ISO 14001 series and EU Eco-Management and Audit Scheme (EMAS), are not common in Georgia. At present, only eight industrial enterprises in the country are ISO 14001 certified. Capacities on environmental management (mainly environmental economics, eco-innovation, assessment of environmental technologies) are lacking, as are incentives to improve performance. This is reflected in the low level of environmental compliance by the industrial and mining sectors. In 2013, the Ministry of Environment and Natural Resources Protection created a Green Business Award aimed at promoting environmental compliance and raising social responsibility among entrepreneurs. From 16 companies that applied for the award, Heidelberg Cement Georgia and Wissol Petroleum Georgia won the Green Business Award.

Chapter 8: Industry and environment 143
Green investments and jobs
Opportunities for green investments and job creation can be found in different industry branches, particularly in manufacturing (e.g. green products). However, green business, including investments and creation of green jobs, is underdeveloped in Georgia. Currently, there is no support to businesses’ and NGOs’ bottom-up activities in fields related to green economy. In addition, there is a lack of awareness-raising on green economy among main target groups (state administration, business community, academia, NGOs, general public). In order to enhance green business opportunities in the country, the Ministry of Economy and Sustainable Development, in partnership with UNDP, has identified four areas: sustainable agriculture and food production; green product manufacturing; clean-energy-based industries; and sustainable tourism. The project is currently in its second phase, which consists of developing pilot projects in these areas. The third phase will comprise the implementation of pilot projects in order to show the commercial attractiveness of the green sector and promote the creation of jobs in this field.
Green public procurement Support for green procurement at all levels of public administration is in its early stages in Georgia. Green public procurement is an important tool by which the leading criterion for selection of contractors for services or purchasing of products with public funds is the application of the waste prevention principle. Currently, there is no obligation for the stipulation of environmental clauses in public tender specifications to orient public authorities’ purchasing towards sustainable products and services. Furthermore, the 2009 Law on Public Procurement lacks green requirements. Moreover, communication/marketing instruments, such as codes of ethics and voluntary agreements between industry and public authorities, are not common practice in the country.
Eco-labelling The introduction of eco-labelling schemes and product marking has recently started in Georgia. In 2013, the Government adopted a Decree on Bio-production, article 15 of which relates to the labelling of bio-products. Also, the Ministry of Environment and Natural Resources Protection developed a draft law on live genetically modified organisms (GMOs). The draft law requires producers to label products sold in Georgia that contain GMO ingredients (chapter 9).
Waste prevention Extended producer responsibility, with requirements for product marking/labelling and prohibition and restriction on the use of hazardous substances, are not yet introduced in Georgia, the application of specific product standards to ensure that products are designed and manufactured in such a way as to achieve the requirements for waste prevention (e.g. minimizing waste volume/weight), are still lacking in national regulations. Also, measures for the reuse of waste as well as training and campaigns for raising public awareness on reuse, labelling and marking (such as reuse labels, for example) are not in place yet.
Innovations The current level of innovation concerning environment and industry is relatively low in Georgia. Bottom-up activities on eco-innovation business are rare and demand for R&D is very low. Although Georgia has available certain intellectual potential in scientific research institutes and academies of sciences, institutions specialized in innovation and technology transfer are lacking. The lack of innovation could be due to the absence of modern research centres, weak cooperation between universities and the industrial sector, the low level of qualified workers, poor protection of property rights and the lack of incentives for the private sector. Industry-led stakeholder fora for developing strategic research and innovation agendas, such as technology and innovation platforms, supported by both public and private funding, are not yet in place in Georgia. These platforms could be a key element in enabling eco-innovation through knowledge transfer to a wide range of industry stakeholders across the country.
Reduction of industrial accident risks The current legal framework provides for the development of internal emergency response plans in the event of industrial accidents as part of the EIA report required to obtain an environmental impact permit. As the quality of EIA reports is generally low, these plans are not well developed and cannot be considered as efficient tools for the reduction of major industrial accident risks. Also, there is no adequate and updated information on industry and mining hotspots, although some related information is found in the 2007 Report of Waste Inventory on the Territory of Georgia and 2009 Chemical Profile of Georgia. This hinders decision-makers in developing efficient risk reduction measures and related plans in the event of industrial accidents.

144 Part III: Interaction of environment with selected sectors/issues
Moreover, guidelines for reporting on major industrial accidents are currently lacking. In order to reinforce the legislation in this field, the Ministry of Environment and Natural Resources Protection is developing a project, Capacity-building for Major Accident Prevention Policy, which is supported by the Czech Republic Development Agency for 2014–2016. In 2004, Georgia signed the Declaration by the Heads of the Delegations to the Eastern European, Caucasian and Central Asian and the South-East European countries during the high-level commitment meeting organized under the Industrial Accidents Convention. As such, Georgia reiterated its determination to improve industrial safety by implementing appropriate safety measures at activities involving hazardous substances and its commitment to implementing the Industrial Accident Convention’s national tasks and to fulfilling its cross-border and multilateral duties.
Self-monitoring and self-reporting According to the Law on Ambient Air Protection, industries are required to carry out self-monitoring and to report on their emissions to the Ministry of Environment and Natural Resources Protection. Currently, only large enterprises are complying with this obligation. There is no legal obligation to report on wastewater discharges, or water abstraction and use in industry and mining activities. However, a few industrial enterprises send this information to the Ministry annually. Similarly, there is no legal obligation in place to carry out self-monitoring and self-reporting on waste generation, storage, treatment and disposal. At their own initiative in order to comply with their internal standards and policies, some industrial enterprises are currently developing their environmental monitoring systems, or planning to do so, for example, RMG Copper and Rustavi Steel. However, there are no accredited laboratories to conduct environmental monitoring analysis in the country. According to the Law on Licences and Permits, licence holders report annually on licence conditions to the administrative authorities (e.g. Ministry of Environment and Natural Resources Protection for licences for mineral resources use).
Industry-related global and regional agreements and initiatives
Georgia is party to the UN Framework Convention on Climate Change and its Kyoto Protocol, the Aarhus Convention on Access to Information, Public Participation in Decision-making and Access to Justice in Environmental Matters, and the Geneva Convention on Long-range Transboundary Air Pollution, among others. Georgia is not a party to the ECE Convention on Environmental Impact Assessment in a Transboundary Context or its Protocol on Strategic Environmental Assessment, nor the ECE Convention on the Transboundary Effects of Industrial Accidents, although the country has already engaged with a view to being a party to such conventions. Also, Georgia has signed but not ratified the Protocol on Pollutant Release and Transfer Register (PRTR) of the Aarhus Convention. Recently, Georgia has signed and ratified the Association Agreement with the EU. According to this Agreement, the parties shall develop and strengthen their cooperation on environmental issues, thereby contributing to the long-term objective of sustainable development and greening industry. The Agreement also paves the way for a Deep and Comprehensive Free Trade Area (DCFTA), representing an important opportunity for Georgia to strengthen its cooperation with the EU and benefit from bilateral free trade. Georgia participates in the assistance programme of the ECE Convention on the Transboundary Effects of Industrial Accidents. It also participates in the Greening Economies in the Eastern Neighbourhood (EaP GREEN) Programme, which aims at promoting green economy in countries of the Eastern Partnership through promoting cleaner production mechanisms in line with sustainable consumption and production. 8.4 Conclusions and recommendations The economic development and impressive growth of the last decade saw positive steps taken towards economic liberalization and attracting foreign investment. Government’s reforms have led to the improvement of general “business enabling conditions”, with reduction of the administrative burden. Conversely, policies to protect the environment and natural resources were driven by excessive deregulation, aggravating the existing environmental pollution and unsustainable use of natural resources. Important economic instruments
Chapter 8: Industry and environment 145 for environmental protection were abolished and funds to subsidize activities related to environmental friendly/green economy (e.g. energy and water savings, incentives for green business activities, eco-innovation) became scarce. Today, Georgia does not have an industrial and mining sector policy or strategy in place to guide developments in these areas. Policies for greening the economy and promoting sustainable production and consumption, cleaner production and eco-innovation are lacking. This important policy gap hampers the development and implementation of measures towards more efficient and green industry. Also, transfer of know-how related to green industry is in its very early stages in Georgia. Recommendation 8.1: The Ministry of Economy and Sustainable Development, together with the Ministry of Environment and Natural Resources Protection, should: (a) Develop a comprehensive industrial and
mining policy; (b) Promote the change of production patterns
with a view to greening industry by supporting activities related to eco-innovation, eco-design and clean production;
(c) Creat the conditions for the transfer of know-how related to industry and mining, in particular best available techniques, product standards, and technology and innovation platforms.
In the past years, long-term environmental protection and sustainable use of natural resources were not properly ensured. The 2007 Law on Environmental Impact Permit defines the list of activities that must undergo mandatory environmental impact assessment. However, polluting activities such as mining and the food industry are not included in the list. Also, according to the 2006 Law on State Support to Investments, a “preliminary licence” can be issued to a project developer, which does not require EIA prior to starting operations. Carrying out an EIA at a later stage of an ongoing project is less meaningful, as measures to avoid and reduce impacts were not previously considered, as well as the “no project” option. Recommendation 8.2: The Ministry of Environment and Natural Resources Protection, together with the Ministry of Economy and Sustainable Development, should revise the Law
on Environmental Impact Permit and the Law on State Support to Investments in order to strengthen environmental requirements for licences and permits for industry and mining facilities. At present, governmental agencies do not carry out screening and scoping of a project’s EIA, as the law does not require these phases. The lack of scoping would partially explain the generally low quality of EIA reports and the difficulties competent authorities may have in reviewing the assessments. Moreover, the time frame for reviewing an EIA report and issuing the environmental impact permit is too short and, therefore, not adequate for reliable review. Georgia has not yet introduced IPPC permits for large industrial installations. There is still no guidance on how to assess BAT, record information on high-risk industrial installations and report on major industrial accidents. Environmental self-monitoring and self-reporting by industry are not mandatory and, therefore, not enforced. Also, a national PRTR is not yet in place. The establishment of this register would contribute to enhancing transparency and public participation in decision-making. Recommendation 8.3: The Ministry of Environment and Natural Resources Protection, together with the Ministry of Economy and Sustainable Development, should: (a) Develop legislation on integrated pollution
prevention and control; (b) Establish a system for recording information
about high-risk industrial installations and for reporting on major industrial accidents;
(c) Make the system of environmental self-monitoring and self-reporting by industry and mining mandatory;
(d) Establish a national pollutant release and transfer register.
Recommendation 8.4: The Government should ratify the Protocol on Pollutant Release and Transfer Registers to the Convention on Access to Information, Public Participation in Decision-making and Access to Justice in Environmental Matters. Currently, the scope of environmental inspections in industry and mining facilities to supervise compliance with environmental permits is not risk based. High-risk installations are not always a priority for inspections. Moreover, inspectors lack capacity and training, in particular concerning
146 Part III: Interaction of environment with selected sectors/issues
technical regulations and norms for high-risk installations, BAT and IPPC. Recommendation 8.5: The Ministry of Environment and Natural Resources Protection, together with the Ministry of Economy and Sustainable Development, should enhance capacity for environmental and technical inspections of industry and mining facilities. The 2015 Waste Management Code represents a step forward in improving environmental and human health conditions throughout the country. Although this code will address waste prevention measures, environmentally sound treatment of waste (like recycling and extraction of secondary raw materials, energy recovery from waste, as well as safe disposal), introduce a waste permit system and establish mandatory waste monitoring for industries, it will not regulate mining wastes. This issue will continue to require special attention, as mining wastes represent a major environmental problem in Georgia.
Complete information on the location, amount and composition of mining wastes is lacking, hampering efficient decision-making on this issue. Another important issue related to industry concerns the lack of measures to compel manufacturers to design their products in an environmentally sound manner in order to reduce waste and environmental impacts. Extended producer responsibility is an efficient tool to move towards green industry. Recommendation 8.6: The Government should: (a) Introduce extended producer responsibility
measures by implementing legal obligations (e.g., compliance schemes, product standards, economic instruments (e.g. product charges), communication tools (e.g., eco-labelling or eco-marking)) and voluntary agreements;
(b) Develop and adopt national legislation on the management of waste from extractive industries;
(c) Carry out an inventory of closed mining waste facilities and abandoned mining waste sites.
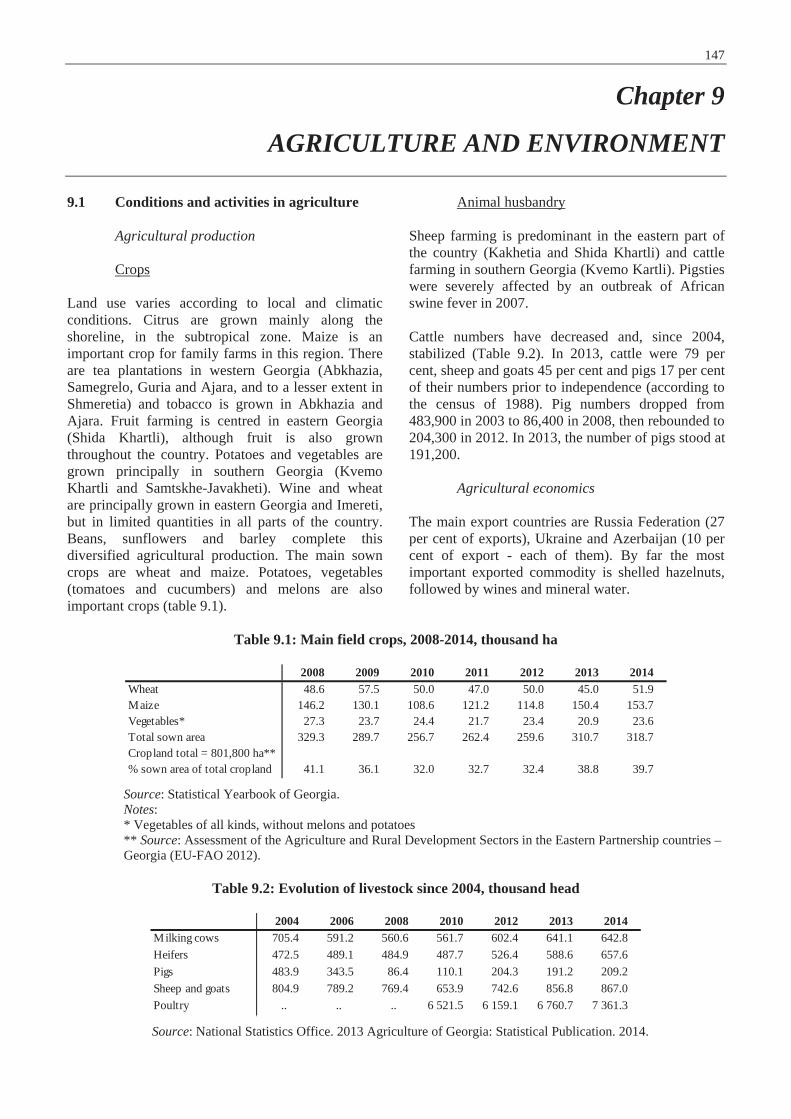
147
Chapter 9
AGRICULTURE AND ENVIRONMENT 9.1 Conditions and activities in agriculture
Agricultural production
Crops Land use varies according to local and climatic conditions. Citrus are grown mainly along the shoreline, in the subtropical zone. Maize is an important crop for family farms in this region. There are tea plantations in western Georgia (Abkhazia, Samegrelo, Guria and Ajara, and to a lesser extent in Shmeretia) and tobacco is grown in Abkhazia and Ajara. Fruit farming is centred in eastern Georgia (Shida Khartli), although fruit is also grown throughout the country. Potatoes and vegetables are grown principally in southern Georgia (Kvemo Khartli and Samtskhe-Javakheti). Wine and wheat are principally grown in eastern Georgia and Imereti, but in limited quantities in all parts of the country. Beans, sunflowers and barley complete this diversified agricultural production. The main sown crops are wheat and maize. Potatoes, vegetables (tomatoes and cucumbers) and melons are also important crops (table 9.1).
Animal husbandry Sheep farming is predominant in the eastern part of the country (Kakhetia and Shida Khartli) and cattle farming in southern Georgia (Kvemo Kartli). Pigsties were severely affected by an outbreak of African swine fever in 2007. Cattle numbers have decreased and, since 2004, stabilized (Table 9.2). In 2013, cattle were 79 per cent, sheep and goats 45 per cent and pigs 17 per cent of their numbers prior to independence (according to the census of 1988). Pig numbers dropped from 483,900 in 2003 to 86,400 in 2008, then rebounded to 204,300 in 2012. In 2013, the number of pigs stood at 191,200.
Agricultural economics The main export countries are Russia Federation (27 per cent of exports), Ukraine and Azerbaijan (10 per cent of export - each of them). By far the most important exported commodity is shelled hazelnuts, followed by wines and mineral water.
Table 9.1: Main field crops, 2008-2014, thousand ha
Source: Statistical Yearbook of Georgia. Notes: * Vegetables of all kinds, without melons and potatoes ** Source: Assessment of the Agriculture and Rural Development Sectors in the Eastern Partnership countries – Georgia (EU-FAO 2012).
Table 9.2: Evolution of livestock since 2004, thousand head
Source: National Statistics Office. 2013 Agriculture of Georgia: Statistical Publication. 2014.
2008 2009 2010 2011 2012 2013 2014Wheat 48.6 57.5 50.0 47.0 50.0 45.0 51.9Maize 146.2 130.1 108.6 121.2 114.8 150.4 153.7Vegetables* 27.3 23.7 24.4 21.7 23.4 20.9 23.6Total sown area 329.3 289.7 256.7 262.4 259.6 310.7 318.7Cropland total = 801,800 ha** % sown area of total cropland 41.1 36.1 32.0 32.7 32.4 38.8 39.7
2004 2006 2008 2010 2012 2013 2014Milking cows 705.4 591.2 560.6 561.7 602.4 641.1 642.8Heifers 472.5 489.1 484.9 487.7 526.4 588.6 657.6Pigs 483.9 343.5 86.4 110.1 204.3 191.2 209.2Sheep and goats 804.9 789.2 769.4 653.9 742.6 856.8 867.0Poultry .. .. .. 6 521.5 6 159.1 6 760.7 7 361.3
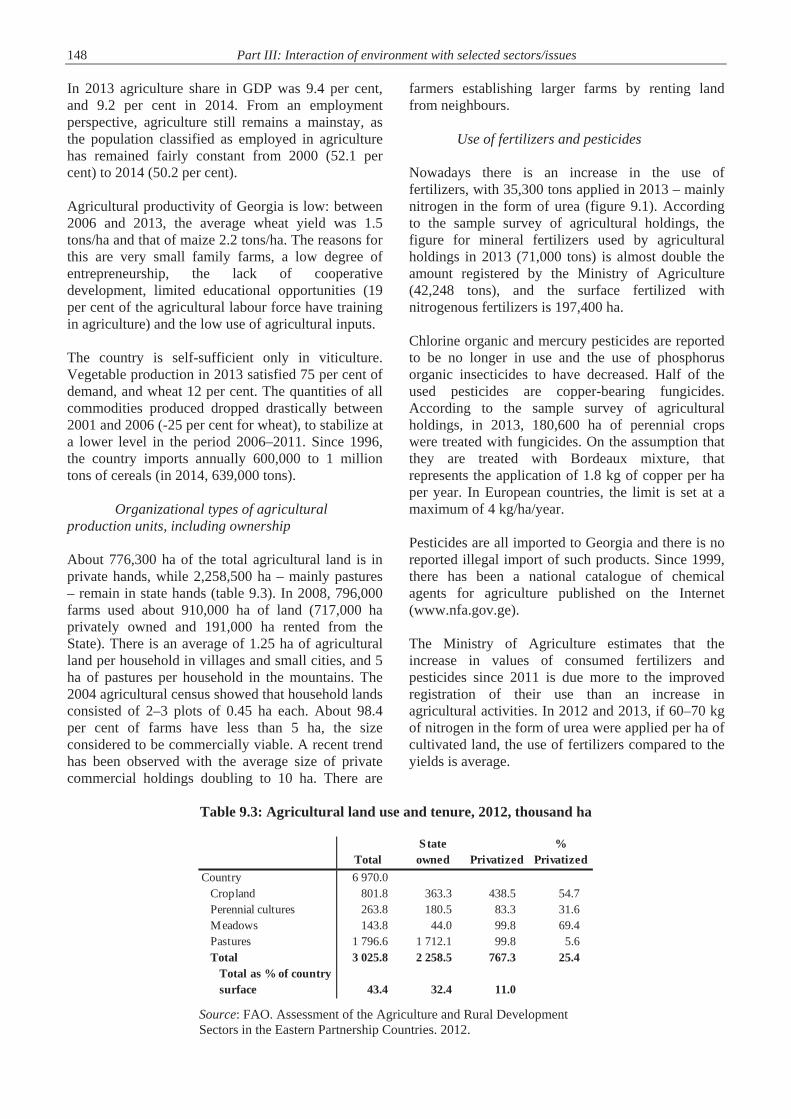
148 Part III: Interaction of environment with selected sectors/issues In 2013 agriculture share in GDP was 9.4 per cent, and 9.2 per cent in 2014. From an employment perspective, agriculture still remains a mainstay, as the population classified as employed in agriculture has remained fairly constant from 2000 (52.1 per cent) to 2014 (50.2 per cent). Agricultural productivity of Georgia is low: between 2006 and 2013, the average wheat yield was 1.5 tons/ha and that of maize 2.2 tons/ha. The reasons for this are very small family farms, a low degree of entrepreneurship, the lack of cooperative development, limited educational opportunities (19 per cent of the agricultural labour force have training in agriculture) and the low use of agricultural inputs. The country is self-sufficient only in viticulture. Vegetable production in 2013 satisfied 75 per cent of demand, and wheat 12 per cent. The quantities of all commodities produced dropped drastically between 2001 and 2006 (-25 per cent for wheat), to stabilize at a lower level in the period 2006–2011. Since 1996, the country imports annually 600,000 to 1 million tons of cereals (in 2014, 639,000 tons).
Organizational types of agricultural production units, including ownership About 776,300 ha of the total agricultural land is in private hands, while 2,258,500 ha – mainly pastures – remain in state hands (table 9.3). In 2008, 796,000 farms used about 910,000 ha of land (717,000 ha privately owned and 191,000 ha rented from the State). There is an average of 1.25 ha of agricultural land per household in villages and small cities, and 5 ha of pastures per household in the mountains. The 2004 agricultural census showed that household lands consisted of 2–3 plots of 0.45 ha each. About 98.4 per cent of farms have less than 5 ha, the size considered to be commercially viable. A recent trend has been observed with the average size of private commercial holdings doubling to 10 ha. There are
farmers establishing larger farms by renting land from neighbours.
Use of fertilizers and pesticides Nowadays there is an increase in the use of fertilizers, with 35,300 tons applied in 2013 – mainly nitrogen in the form of urea (figure 9.1). According to the sample survey of agricultural holdings, the figure for mineral fertilizers used by agricultural holdings in 2013 (71,000 tons) is almost double the amount registered by the Ministry of Agriculture (42,248 tons), and the surface fertilized with nitrogenous fertilizers is 197,400 ha. Chlorine organic and mercury pesticides are reported to be no longer in use and the use of phosphorus organic insecticides to have decreased. Half of the used pesticides are copper-bearing fungicides. According to the sample survey of agricultural holdings, in 2013, 180,600 ha of perennial crops were treated with fungicides. On the assumption that they are treated with Bordeaux mixture, that represents the application of 1.8 kg of copper per ha per year. In European countries, the limit is set at a maximum of 4 kg/ha/year. Pesticides are all imported to Georgia and there is no reported illegal import of such products. Since 1999, there has been a national catalogue of chemical agents for agriculture published on the Internet (www.nfa.gov.ge). The Ministry of Agriculture estimates that the increase in values of consumed fertilizers and pesticides since 2011 is due more to the improved registration of their use than an increase in agricultural activities. In 2012 and 2013, if 60–70 kg of nitrogen in the form of urea were applied per ha of cultivated land, the use of fertilizers compared to the yields is average.
Table 9.3: Agricultural land use and tenure, 2012, thousand ha
Source: FAO. Assessment of the Agriculture and Rural Development Sectors in the Eastern Partnership Countries. 2012.
TotalState owned Privatized
% Privatized
Country 6 970.0Cropland 801.8 363.3 438.5 54.7Perennial cultures 263.8 180.5 83.3 31.6Meadows 143.8 44.0 99.8 69.4Pastures 1 796.6 1 712.1 99.8 5.6Total 3 025.8 2 258.5 767.3 25.4
Total as % of country surface 43.4 32.4 11.0
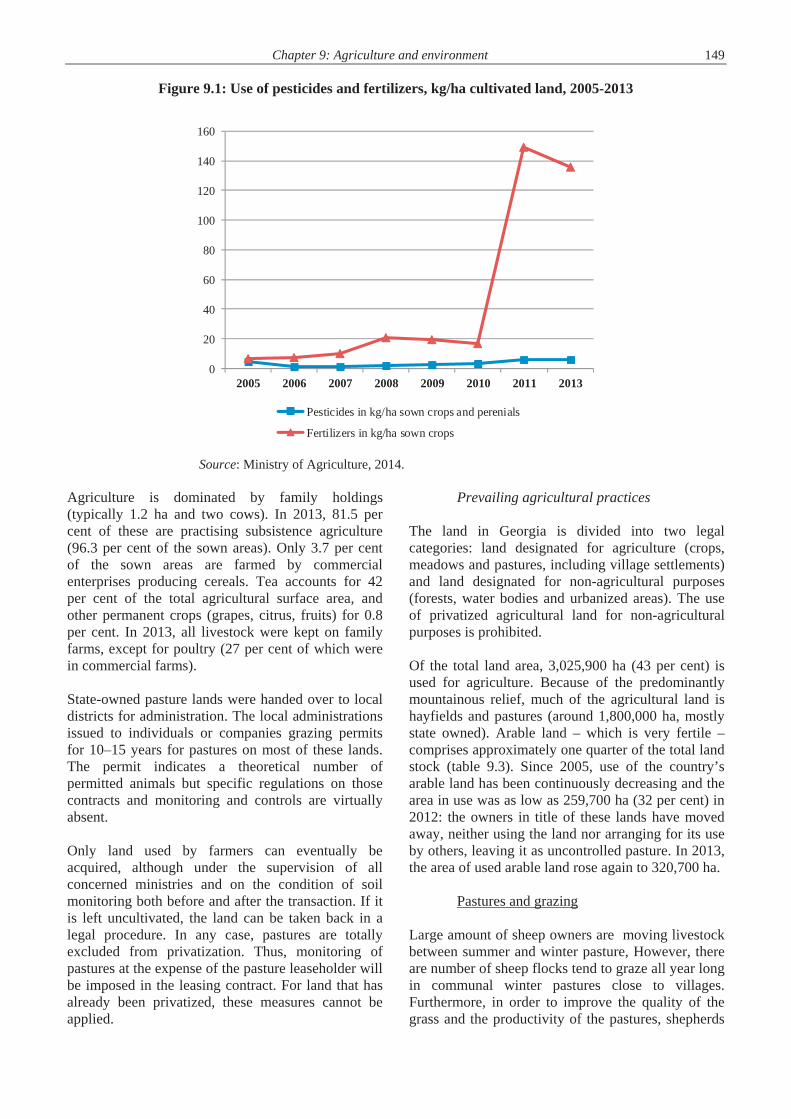
Chapter 9: Agriculture and environment 149
Figure 9.1: Use of pesticides and fertilizers, kg/ha cultivated land, 2005-2013
Source: Ministry of Agriculture, 2014.
Agriculture is dominated by family holdings (typically 1.2 ha and two cows). In 2013, 81.5 per cent of these are practising subsistence agriculture (96.3 per cent of the sown areas). Only 3.7 per cent of the sown areas are farmed by commercial enterprises producing cereals. Tea accounts for 42 per cent of the total agricultural surface area, and other permanent crops (grapes, citrus, fruits) for 0.8 per cent. In 2013, all livestock were kept on family farms, except for poultry (27 per cent of which were in commercial farms).
State-owned pasture lands were handed over to local districts for administration. The local administrations issued to individuals or companies grazing permits for 10–15 years for pastures on most of these lands. The permit indicates a theoretical number of permitted animals but specific regulations on those contracts and monitoring and controls are virtually absent.
Only land used by farmers can eventually be acquired, although under the supervision of all concerned ministries and on the condition of soil monitoring both before and after the transaction. If it is left uncultivated, the land can be taken back in a legal procedure. In any case, pastures are totally excluded from privatization. Thus, monitoring of pastures at the expense of the pasture leaseholder will be imposed in the leasing contract. For land that has already been privatized, these measures cannot be applied.
Prevailing agricultural practices
The land in Georgia is divided into two legal categories: land designated for agriculture (crops, meadows and pastures, including village settlements) and land designated for non-agricultural purposes (forests, water bodies and urbanized areas). The use of privatized agricultural land for non-agricultural purposes is prohibited.
Of the total land area, 3,025,900 ha (43 per cent) is used for agriculture. Because of the predominantly mountainous relief, much of the agricultural land is hayfields and pastures (around 1,800,000 ha, mostly state owned). Arable land – which is very fertile – comprises approximately one quarter of the total land stock (table 9.3). Since 2005, use of the country’s arable land has been continuously decreasing and the area in use was as low as 259,700 ha (32 per cent) in 2012: the owners in title of these lands have moved away, neither using the land nor arranging for its use by others, leaving it as uncontrolled pasture. In 2013, the area of used arable land rose again to 320,700 ha.
Pastures and grazing
Large amount of sheep owners are moving livestock between summer and winter pasture, However, there are number of sheep flocks tend to graze all year long in communal winter pastures close to villages. Furthermore, in order to improve the quality of the grass and the productivity of the pastures, shepherds
2005 2006 2007 2008 2009 2010 2011 20130
20
40
60
80
100
120
140
160
Pesticides in kg/ha sown crops and perenials
Fertilizers in kg/ha sown crops

150 Part III: Interaction of environment with selected sectors/issues
burn off the vegetation in late spring. By contrast, distant summer pastures tend to be underutilized or abandoned and this alters their soil properties and botanical composition, and affects the fauna, depending on these types of habitats. Furthermore, when state-owned lands were privatized, many sheep migration routes became private and were cut off, so that every year shepherds who wish to transfer sheep from winter to summer pasture and back face problems.
Water use for irrigation Water abstraction for irrigation in Georgia accounts for 14.5 per cent of the total abstracted water. The main source of water is river diversion and surface irrigation. Irrigation water supply accounted for 341 million m3 in 2012, compared with 122 million m3 in 2011. Of the 35 reservoirs in the Kura River basin, 18 are used exclusively for irrigation. Irrigation channels make up 33.4 per cent of the surface of water bodies. The main irrigation schemes are the upper Alazani (41,100 ha), lower Alazani (29,200 ha), upper Samgori (28,100 ha) and lower Samgori (28,100 ha). Despite the rehabilitation programmes carried out by the Government since 2000, the Ministry of Agriculture estimated the total area under irrigation to be as low as 24,000–25,000 ha in 2011. The reason for this situation is attributed to the lack of a land market and credit system enabling investments in production inputs, and to the deterioration of the irrigation or drainage systems. The area with potential for irrigation by gravitation is estimated at 278,000 ha; as the Ministry of Agriculture puts a priority on irrigated agriculture, the state programme “Modernization of Melioration Systems” was launched in 2012, bringing the area of irrigated land up to 88,000 ha in 2014.
Manure management
Large-scale breeding facilities (cattle and poultry) have closed down, resulting in the establishment of many small-scale facilities, and this has redistributed the emissions from a small number of large sources to a large number of small sources. The impacts of localized large emissions have been reduced. The cattle and pigs are held exclusively on the private small farms and dispersed throughout the territory: in 2012, there was an average of about 1.5 cows and 0.25 pigs per farm, so that there is no manure management at the farm level. Some cases of manure mismanagement (slurry dumped into the river) are reported and treated by the inspectorate of the
Ministry of Environment and Natural Resources Protection
Threats to agriculture
Climate variability
Over the second half of the twentieth century, winter temperatures decreased in the western part of Georgia (mean -0.2oC to -0.3oC) and there was a weak trend towards increased precipitation. Meanwhile, summer temperatures increased in the eastern part of the country (mean +0.5 oC to +0.6oC) and there was a weak trend to decreased precipitation. In 2013, the eastern part of Georgia experienced a drought, with one rainfall in two years.
Polluted soils Soil pollution takes place in some industrial areas of Georgia, and the vicinities of metal mining sites are severely affected by pollution with heavy metal through irrigation water and atmospheric deposition. According to research conducted in the Mashavera valley on cadmium, copper and zinc concentrations in the soil, land use restrictions and remediation measures would need to be applied to 30 per cent of the investigated home gardens and 50 per cent of vineyards and orchards with mixed cropping vegetables: the actual transfer of cadmium into the food chain is proven, so the local population has been affected, as have the people of the cities up the valley as far as Tbilisi, where crops from the Mashavera valley are sold in the open market (chapter 8). 9.2 Pressures from agriculture
Agrobiodiversity Georgia is one of the gene centres for important crops: wheat (12 species and 30 subspecies are present in Transcaucasia, of which two, Makha and Zanduri, are found only in Georgia), barley, oats, rye, peas, chickpeas and lentils, and fruit species (plum, cherry, quince and grape). About 100 plant families and 350 local species have been registered. There are more than 100 species of stone and seed fruit trees, nuts and berries. There are 500 known local varieties of grapes, although only 300 are present in the life collections of research institutes and peasant farms. In addition, there exist numerous species of local flora that are applied in traditional medicine. This diversity is being continuously lost, with modern agriculture prioritizing production with introduced varieties producing acceptable yields. Local varieties were kept in ex-situ collections and
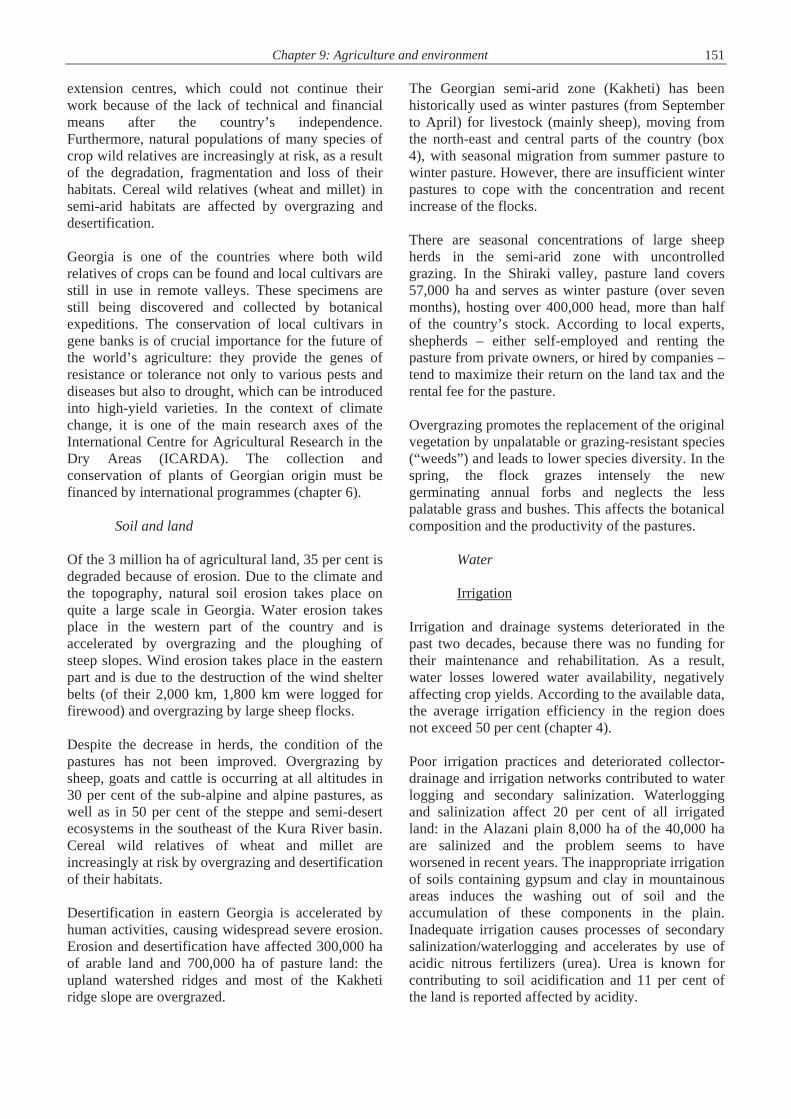
Chapter 9: Agriculture and environment 151 extension centres, which could not continue their work because of the lack of technical and financial means after the country’s independence. Furthermore, natural populations of many species of crop wild relatives are increasingly at risk, as a result of the degradation, fragmentation and loss of their habitats. Cereal wild relatives (wheat and millet) in semi-arid habitats are affected by overgrazing and desertification. Georgia is one of the countries where both wild relatives of crops can be found and local cultivars are still in use in remote valleys. These specimens are still being discovered and collected by botanical expeditions. The conservation of local cultivars in gene banks is of crucial importance for the future of the world’s agriculture: they provide the genes of resistance or tolerance not only to various pests and diseases but also to drought, which can be introduced into high-yield varieties. In the context of climate change, it is one of the main research axes of the International Centre for Agricultural Research in the Dry Areas (ICARDA). The collection and conservation of plants of Georgian origin must be financed by international programmes (chapter 6).
Soil and land Of the 3 million ha of agricultural land, 35 per cent is degraded because of erosion. Due to the climate and the topography, natural soil erosion takes place on quite a large scale in Georgia. Water erosion takes place in the western part of the country and is accelerated by overgrazing and the ploughing of steep slopes. Wind erosion takes place in the eastern part and is due to the destruction of the wind shelter belts (of their 2,000 km, 1,800 km were logged for firewood) and overgrazing by large sheep flocks. Despite the decrease in herds, the condition of the pastures has not been improved. Overgrazing by sheep, goats and cattle is occurring at all altitudes in 30 per cent of the sub-alpine and alpine pastures, as well as in 50 per cent of the steppe and semi-desert ecosystems in the southeast of the Kura River basin. Cereal wild relatives of wheat and millet are increasingly at risk by overgrazing and desertification of their habitats. Desertification in eastern Georgia is accelerated by human activities, causing widespread severe erosion. Erosion and desertification have affected 300,000 ha of arable land and 700,000 ha of pasture land: the upland watershed ridges and most of the Kakheti ridge slope are overgrazed.
The Georgian semi-arid zone (Kakheti) has been historically used as winter pastures (from September to April) for livestock (mainly sheep), moving from the north-east and central parts of the country (box 4), with seasonal migration from summer pasture to winter pasture. However, there are insufficient winter pastures to cope with the concentration and recent increase of the flocks. There are seasonal concentrations of large sheep herds in the semi-arid zone with uncontrolled grazing. In the Shiraki valley, pasture land covers 57,000 ha and serves as winter pasture (over seven months), hosting over 400,000 head, more than half of the country’s stock. According to local experts, shepherds – either self-employed and renting the pasture from private owners, or hired by companies – tend to maximize their return on the land tax and the rental fee for the pasture. Overgrazing promotes the replacement of the original vegetation by unpalatable or grazing-resistant species (“weeds”) and leads to lower species diversity. In the spring, the flock grazes intensely the new germinating annual forbs and neglects the less palatable grass and bushes. This affects the botanical composition and the productivity of the pastures.
Water Irrigation
Irrigation and drainage systems deteriorated in the past two decades, because there was no funding for their maintenance and rehabilitation. As a result, water losses lowered water availability, negatively affecting crop yields. According to the available data, the average irrigation efficiency in the region does not exceed 50 per cent (chapter 4). Poor irrigation practices and deteriorated collector-drainage and irrigation networks contributed to water logging and secondary salinization. Waterlogging and salinization affect 20 per cent of all irrigated land: in the Alazani plain 8,000 ha of the 40,000 ha are salinized and the problem seems to have worsened in recent years. The inappropriate irrigation of soils containing gypsum and clay in mountainous areas induces the washing out of soil and the accumulation of these components in the plain. Inadequate irrigation causes processes of secondary salinization/waterlogging and accelerates by use of acidic nitrous fertilizers (urea). Urea is known for contributing to soil acidification and 11 per cent of the land is reported affected by acidity.

152 Part III: Interaction of environment with selected sectors/issues
Box 9.1: Grazing in the Vashlovani National Park
Livestock grazing is a main driver in shaping the Vashlovani landscapes and created the actual ecological mosaic found in the Vashlovani National Park. In 2013, a feasibility study examined the current use of pastures in the Park. The study is part of the UNDP/EU project Sustainable Management of Pastures in Georgia to Demonstrate Climate Change Mitigation and Adaptation Benefits and Dividends for Local Communities. The objective was to classify the pastures according to their productivity and identify the most degraded sections, to propose rehabilitation and management measures for priority sections and to identify potential alternative pastures outside the Park. No alternative vacant pastures were available in the vicinity of the Park, either de facto (as they were grazed and degraded) or de jure (as they were privatized). The vegetation types range from open arid forests, low and dense shrubby vegetation on badlands, saline-specific vegetation in depressions, and riparian and mountain forests. The vegetation types important for animal husbandry are semi-desert vegetation on the foothills used currently as pastures. These species must be grazed continuously or mown for hay to prevent them reaching the stage where they are no longer palatable. The drought-tolerant Artemisia species is not consumed green in spring by the herbivores, but represents a valuable winter reserve when spring annuals are no longer available. Flocks move in the late spring from Vlashovani to the alpine Tushetia pastures and come back in October, where they graze Artemisia bushes and are fed with hay and dry vegetation before they have access to the newly growing annuals in the spring. The biomass is unevenly distributed; generally, the productivity of the pastures tends to decrease towards the south, while the best pastures are in the northern parts of the Park. The overall condition of the pastures was found to be good; both the vegetation cover and the standing biomass are high, considering the soil and climate condition. “Poor” pastures are not always necessarily due to human activity, but are more sensitive to bad grazing management and the effects of climate change. An area of degraded land in the central part of the Park is associated with intensive, unorganized and unrestrictive sheep movement along the roads used for moving the flocks of the whole Eldari region. It is important to take into account in planning the protection of the site that, for centuries, grazing livestock have become an important part of the ecosystem and share the grazing grounds with wild species. Rehabilitation measures do not address solely the excessive grazing of recent years.
Water pollution Surface waters used to be heavily polluted by excessive use of agrochemicals (nitrates and pesticides), and subsequently, in rare cases, so were the aquifers. But pressurized artesian and intermediate waters are not considered to be polluted in general. After the high volume of pesticides and fertilizers used in the second half of the twentieth century, resulting in pollution of surface water and groundwater with nitrates and pesticides, since 2003, the use of chemicals has not increased. This can be explained by the fact that the farmers cannot afford them, and also by the decrease in cultivated land area. Agricultural pollution is now considered to be negligible, on the whole, but poses a potential risk to supplies of drinking water for cities and villages, particularly where well and spring waters are used in an uncontrolled manner, in particular in western Georgia. On average, the use of fertilizers is low, but in cultivated croplands the use of nitrogen is high. The zone surrounding the water sources is not protected from fertilizers (chapter 4).
9.3 Legal, policy and institutional framework Legal framework
The 1996 Law on Environmental Protection contains the basic principles of land use as natural resource . It refers to the limit on the use of agrochemicals, and the applicable statute on the limits to the use of chemicals in the environment and rules on their use, storage and transportation. Ecological marking for pure products produced in Georgia is also addressed. Anthropogenic landscapes are recognized for protection. The 1994 Law on Soil Protection (amended in 1997 and in 2002) aims to ensure the integrity of the soil surface, conservation and increased soil fertility. The Law excludes the use of fertile land for any other than agricultural purposes. The Law prohibits the removal of topsoil from building sites without preliminary study and an approved project and requires that removed topsoil has to be stored for reuse. In the case of temporary use, such as for mining or a landfill, the land must be restored and recultivated using the stored topsoil.
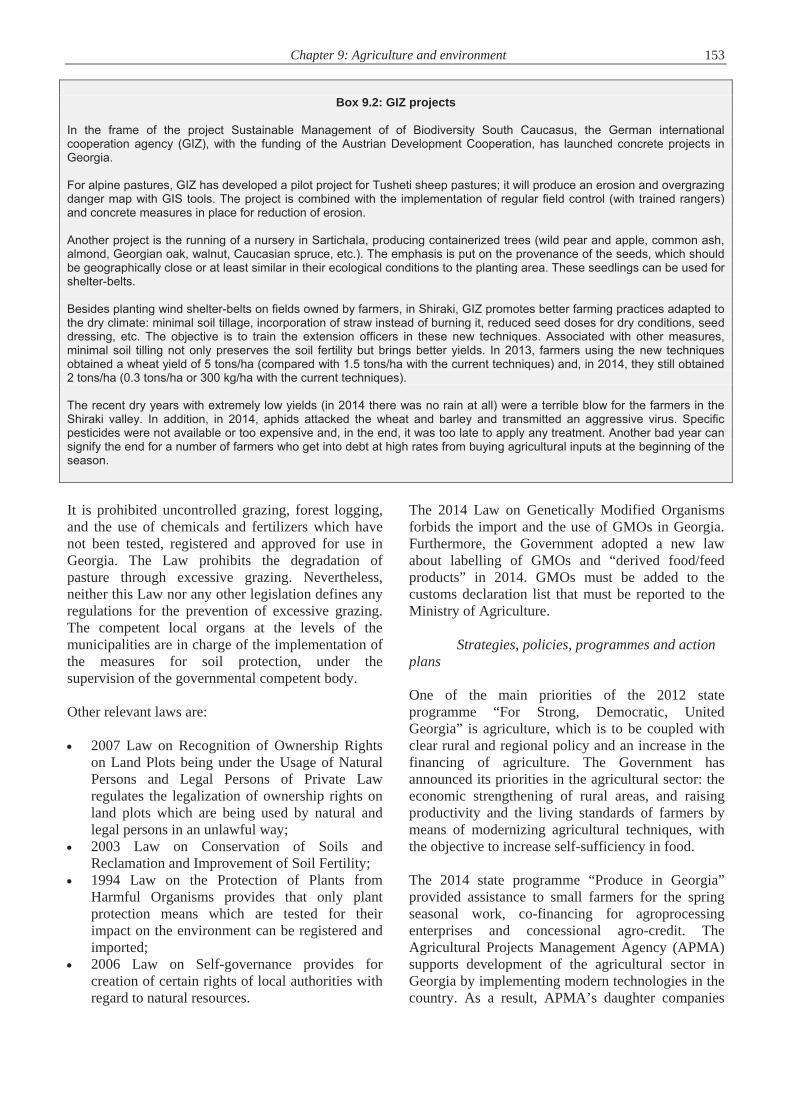
Chapter 9: Agriculture and environment 153
Box 9.2: GIZ projects
In the frame of the project Sustainable Management of of Biodiversity South Caucasus, the German international cooperation agency (GIZ), with the funding of the Austrian Development Cooperation, has launched concrete projects in Georgia. For alpine pastures, GIZ has developed a pilot project for Tusheti sheep pastures; it will produce an erosion and overgrazing danger map with GIS tools. The project is combined with the implementation of regular field control (with trained rangers) and concrete measures in place for reduction of erosion. Another project is the running of a nursery in Sartichala, producing containerized trees (wild pear and apple, common ash, almond, Georgian oak, walnut, Caucasian spruce, etc.). The emphasis is put on the provenance of the seeds, which should be geographically close or at least similar in their ecological conditions to the planting area. These seedlings can be used for shelter-belts. Besides planting wind shelter-belts on fields owned by farmers, in Shiraki, GIZ promotes better farming practices adapted to the dry climate: minimal soil tillage, incorporation of straw instead of burning it, reduced seed doses for dry conditions, seed dressing, etc. The objective is to train the extension officers in these new techniques. Associated with other measures, minimal soil tilling not only preserves the soil fertility but brings better yields. In 2013, farmers using the new techniques obtained a wheat yield of 5 tons/ha (compared with 1.5 tons/ha with the current techniques) and, in 2014, they still obtained 2 tons/ha (0.3 tons/ha or 300 kg/ha with the current techniques). The recent dry years with extremely low yields (in 2014 there was no rain at all) were a terrible blow for the farmers in the Shiraki valley. In addition, in 2014, aphids attacked the wheat and barley and transmitted an aggressive virus. Specific pesticides were not available or too expensive and, in the end, it was too late to apply any treatment. Another bad year can signify the end for a number of farmers who get into debt at high rates from buying agricultural inputs at the beginning of the season. It is prohibited uncontrolled grazing, forest logging, and the use of chemicals and fertilizers which have not been tested, registered and approved for use in Georgia. The Law prohibits the degradation of pasture through excessive grazing. Nevertheless, neither this Law nor any other legislation defines any regulations for the prevention of excessive grazing. The competent local organs at the levels of the municipalities are in charge of the implementation of the measures for soil protection, under the supervision of the governmental competent body. Other relevant laws are: 2007 Law on Recognition of Ownership Rights
on Land Plots being under the Usage of Natural Persons and Legal Persons of Private Law regulates the legalization of ownership rights on land plots which are being used by natural and legal persons in an unlawful way;
2003 Law on Conservation of Soils and Reclamation and Improvement of Soil Fertility;
1994 Law on the Protection of Plants from Harmful Organisms provides that only plant protection means which are tested for their impact on the environment can be registered and imported;
2006 Law on Self-governance provides for creation of certain rights of local authorities with regard to natural resources.
The 2014 Law on Genetically Modified Organisms forbids the import and the use of GMOs in Georgia. Furthermore, the Government adopted a new law about labelling of GMOs and “derived food/feed products” in 2014. GMOs must be added to the customs declaration list that must be reported to the Ministry of Agriculture.
Strategies, policies, programmes and action plans One of the main priorities of the 2012 state programme “For Strong, Democratic, United Georgia” is agriculture, which is to be coupled with clear rural and regional policy and an increase in the financing of agriculture. The Government has announced its priorities in the agricultural sector: the economic strengthening of rural areas, and raising productivity and the living standards of farmers by means of modernizing agricultural techniques, with the objective to increase self-sufficiency in food. The 2014 state programme “Produce in Georgia” provided assistance to small farmers for the spring seasonal work, co-financing for agroprocessing enterprises and concessional agro-credit. The Agricultural Projects Management Agency (APMA) supports development of the agricultural sector in Georgia by implementing modern technologies in the country. As a result, APMA’s daughter companies
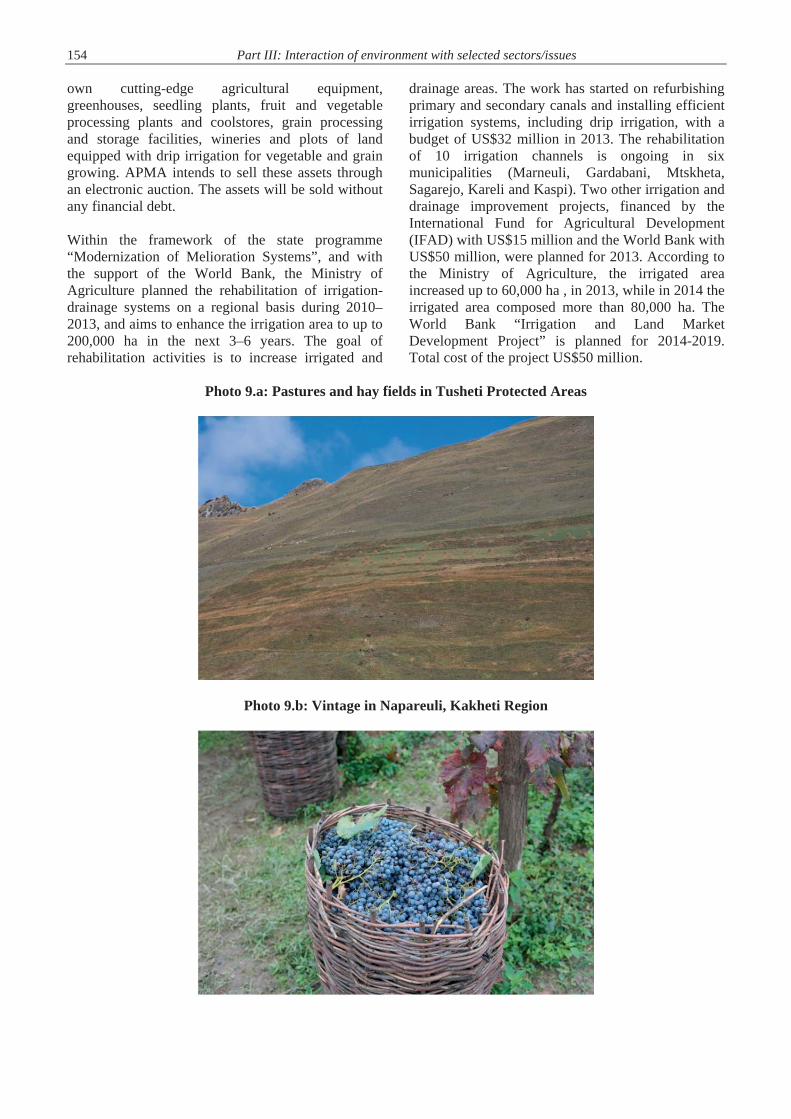
154 Part III: Interaction of environment with selected sectors/issues
own cutting-edge agricultural equipment, greenhouses, seedling plants, fruit and vegetable processing plants and coolstores, grain processing and storage facilities, wineries and plots of land equipped with drip irrigation for vegetable and grain growing. APMA intends to sell these assets through an electronic auction. The assets will be sold without any financial debt.
Within the framework of the state programme “Modernization of Melioration Systems”, and with the support of the World Bank, the Ministry of Agriculture planned the rehabilitation of irrigation-drainage systems on a regional basis during 2010–2013, and aims to enhance the irrigation area to up to 200,000 ha in the next 3–6 years. The goal of rehabilitation activities is to increase irrigated and
drainage areas. The work has started on refurbishing primary and secondary canals and installing efficient irrigation systems, including drip irrigation, with a budget of US$32 million in 2013. The rehabilitation of 10 irrigation channels is ongoing in six municipalities (Marneuli, Gardabani, Mtskheta, Sagarejo, Kareli and Kaspi). Two other irrigation and drainage improvement projects, financed by the International Fund for Agricultural Development (IFAD) with US$15 million and the World Bank with US$50 million, were planned for 2013. According to the Ministry of Agriculture, the irrigated area increased up to 60,000 ha , in 2013, while in 2014 the irrigated area composed more than 80,000 ha. The World Bank “Irrigation and Land Market Development Project” is planned for 2014-2019. Total cost of the project US$50 million.
Photo 9.a: Pastures and hay fields in Tusheti Protected Areas
Photo 9.b: Vintage in Napareuli, Kakheti Region

Chapter 9: Agriculture and environment 155 The Ministry of Agriculture has elaborated the strategy for agricultural development in Georgia (2015-2020). The Government has set up a policy for attracting foreign investors by granting them state-owned agricultural land on preferential conditions, and will continue to do so, even though a moratorium on selling agricultural land to foreigners has recently been imposed. UNDP initiated the Pasture Stakeholder Coordination Meeting in May 2014. The stakeholders are the Ministry of Agriculture, Ministry of Environment and Natural Resources Protection, and Ministry of Economy and Sustainable Development, Parliament, local NGOs, the EU, UNDP and other international organizations, and scientists. All stakeholders involved in pasture management share their experience and information, in order to identify cross-cutting issues on the policy level that need attention in order to remove barriers to sustainable land management. The last meeting was focused on sheep migratory routes.
Institutional framework The Ministry of Agriculture has overall state responsibilities for agricultural production, soil fertility, plant protection, livestock breeding and agricultural engineering, and is responsible for carrying out state control over irrigation systems. Irrigation systems are state owned and state managed through the Ministry’s Melioration Policy Department. In 2013, the Ministry of Agriculture established a Soil Management Division in the Melioration Policy Department. The structure of the Ministry will include a laboratory for scientific research on soil degradation and soil monitoring. It will perform basic soil analysis for farming enterprises and will support the extension service. As of September 2014, there are two soil laboratories: one at the Agrarian University and a private one, Multitest. Also in 2013, the Ministry of Agriculture set up thematic maps (1:500,000) of lands exposed to wind erosion and water erosion (actual and potential areas) and lands under acidification, and the state of the nutrients in the soils. The Ministry of Environment and Natural Resources Protection published an Atlas of Natural Risks and Hazards in Georgia, in 2013, with maps on floods, drought and fire. There are no maps on salinization or on soil pollution by heavy metals.
The Ministry of Environment and Natural Resources Protection created a new Land Resources Protection and Mineral Resources Service in 2013, which is charged with implementation of the Law on Soil Protection. Its main responsibilities are participation in the process of developing and implementation governmental policy of sustainable management and targeted using of land resources and mineral resources; Coordination planning and implementation measurements for land degradation and desertification prevention. The laboratory of the NEA, monitoring air, water and soil, is equipped for analysing heavy metals in the soils, but there is no legal basis allowing the monitoring of private agricultural plots that might be polluted. MACs are not yet assessed. The Ministry of Environment and Natural Resources Protection (Land Resources Protection and Mineral Resources Service) collaborates with the Ministry of Justice on land registration and with the Ministry of Economy and Sustainable Development on privatization issues, in order to establish that the plots to be registered as a property do not belong to the forest fund, the fund of protected areas or the fund of mineral resources. The National Agency of Public Registry of the Ministry of Justice is in charge of registering the land plots and of all operations related to real estate. The National Agency for State Property Management of the Ministry of Economy and Sustainable Development is the manager of state land. Local self-governance bodies are responsible for the management of water resources of local importance, but they generally have very limited competencies. The local bodies are in charge of implementing the soil protection measures. Land taxes are determined by the municipalities according to a grid established upon the soil bonity. Farms of under 5 ha are exempt from the land tax. The Rural and Agricultural Development Fund was established in January 2013 to attract investments promoting the development of Georgian agriculture. The Fund currently runs two projects: the Project Promoting the Spring Works of Land-Poor Farmers, which has handed out vouchers of differing values to those owning agricultural land; and the Preferential Agro-Credit Project, which is aimed at issuing low-interest agro-credit loans. It has a support programme for 640,000 smallholder farmers, with a fund of 100 million lari. Other objectives are the promotion of agricultural cooperatives; development of infrastructure; increase in food production, for which additional support of €41 million is expected from

156 Part III: Interaction of environment with selected sectors/issues
the European Neighbourhood Programme for Agriculture and Rural Development (ENPARD); to reduce rural poverty and to strengthen small farmers’ organizations. Generally, it can be stated that these projects have no environmental objectives and very little environmental component. 9.4 Agriculture-related global and regional agreements
United Nations Convention to Combat Desertification in Countries Experiencing Serious Drought and/or Desertification, Particularly in Africa Georgia has been a party to the United Nations Convention to Combat Desertification in Countries Experiencing Serious Drought and/or Desertification, Particularly in Africa (UNCCD) since 1999. Georgia’s First National Action Programme to Combat Desertification was adopted in 2003 but could not be implemented fully because of a lack of funding. Under the pilot project funded by GEF was adopted Second Nationl Action Programme to Combat Desertification 2015-2022. A new action programm was aligned with 10 year strategy of the UNCCD. The programme envisages research and analysis of the existing problems, in addition to activities aimed at the preparation of special action plans. The programme also envisages the measures for the agriculture sector, including, categorisation of existing pastures and determining appropriate stocking densities; support in applying traditional knowledge and experience; development of management principles and plans for arable lands; and developing sustainable use programs for agriculture. A map of water erosion risk for five pilot municipalities (Dedoplistskaro, Sagarejo, Kareli, Gori and Karbadani) using GIS tools, soil maps and satellite photos compiled with the Revised Universal Soil Loss Equation (RUSLE), which will be cross-checked in the field. However, this method is not applicable for wind erosion.
Convention on the Prior Informed Consent Procedure for Certain Hazardous Chemicals and Pesticides in International Trade Georgia ratified the Convention on the Prior Informed Consent Procedure for Certain Hazardous Chemicals and Pesticides in International Trade (Rotterdam Convention) in 2007. In 2014, Georgia has submitted record number of import responses for all pesticides listed in Annex III of the Convention, thus satisfying its obligation under the Convention.
With this national decision, the country decides to either consent to imports of a specific hazardous chemical or pesticide as listed in Annex III of the Convention, or not to consent to import or to consent subject to specified conditions. Georgia has to provide the listed industrial chemicals as well as notifications of final regulatory action. Parties shall take appropriate legislative or administrative measures to ensure that exporters within their territories comply with the decisions in each import response provided by Georgia. To meet the requirements and procedures of Rotterdam Convention, also commitments under Stockholm Convention, the Ministry of Environment and Natural Resources Protection together with the Ministry of Agriculture has elaborated the Decree of the Government “On Rule of Import and Export of Certain Hazardous Chemicals and Pesticides and Implementation of Prior Informed Consent Procedure”. It is expected that the will be approved to the Georgian Government by end of 2015. 9.5 Conclusions and recommendations All land privatized and leased by the State will from now on be submitted to regular assessments, and further information can be collected during inspections and from regular monitoring activities. Furthermore, besides those supported by the institutional donor organizations, a number of projects supported by foreign funds have been developed in Georgia. They not only bring support to the Georgian rural population but are also a source of precious field information. If ever old data are rediscovered, they have to be saved and made available. Recommendation 9.1: The Ministry of Environment and Natural Resources Protection in cooperation with the Ministry of Agriculture should improve land resource management legislation and strengthen the capacity of the Land Resources Protection and Mineral Resources Service. The Ministry of Agriculture has started with the rehabilitation of irrigation schemes of up to 200,000–220,000 ha. The rehabilitation of irrigation schemes in the eastern part of the country will result in an increasing demand for irrigation water and may become problematic because of the drier conditions: it may endanger plans for rehabilitation and enlargement of surfaces equipped for irrigation and pose a challenge for more environmentally friendly agricultural practices, as regarding soil salinity

Chapter 9: Agriculture and environment 157 management and potential impacts from water pollution. Recommendation 9.2: The Ministry of Agriculture should: (a) Implement measures to save water, such as
repairing canals or encouraging a shift to more efficient drip irrigation, the use of crop
varieties needing less water, or shifting to rain-fed dry farming systems for cereal production;
(b) Support rehabilitation of existing and construction of new irrigation and drainage systems, taking into account water protection criteria in accordance with national and regional priorities.

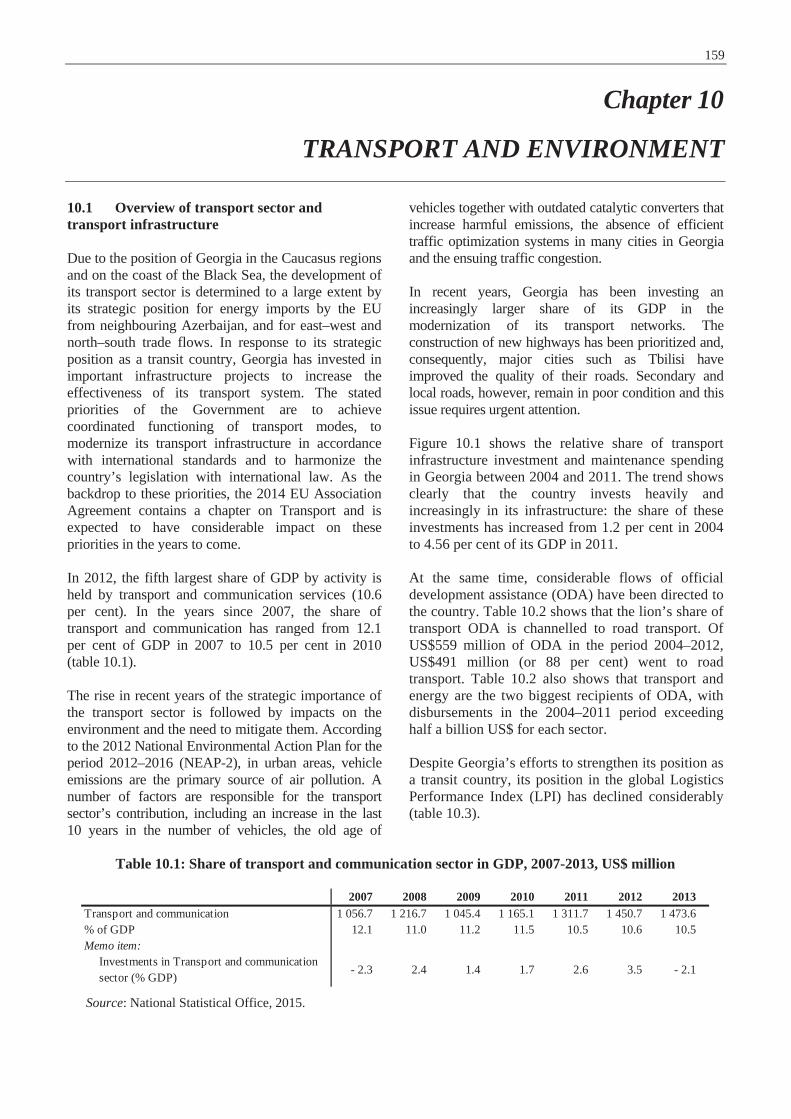
159
Chapter 10
TRANSPORT AND ENVIRONMENT 10.1 Overview of transport sector and transport infrastructure Due to the position of Georgia in the Caucasus regions and on the coast of the Black Sea, the development of its transport sector is determined to a large extent by its strategic position for energy imports by the EU from neighbouring Azerbaijan, and for east–west and north–south trade flows. In response to its strategic position as a transit country, Georgia has invested in important infrastructure projects to increase the effectiveness of its transport system. The stated priorities of the Government are to achieve coordinated functioning of transport modes, to modernize its transport infrastructure in accordance with international standards and to harmonize the country’s legislation with international law. As the backdrop to these priorities, the 2014 EU Association Agreement contains a chapter on Transport and is expected to have considerable impact on these priorities in the years to come. In 2012, the fifth largest share of GDP by activity is held by transport and communication services (10.6 per cent). In the years since 2007, the share of transport and communication has ranged from 12.1 per cent of GDP in 2007 to 10.5 per cent in 2010 (table 10.1). The rise in recent years of the strategic importance of the transport sector is followed by impacts on the environment and the need to mitigate them. According to the 2012 National Environmental Action Plan for the period 2012–2016 (NEAP-2), in urban areas, vehicle emissions are the primary source of air pollution. A number of factors are responsible for the transport sector’s contribution, including an increase in the last 10 years in the number of vehicles, the old age of
vehicles together with outdated catalytic converters that increase harmful emissions, the absence of efficient traffic optimization systems in many cities in Georgia and the ensuing traffic congestion. In recent years, Georgia has been investing an increasingly larger share of its GDP in the modernization of its transport networks. The construction of new highways has been prioritized and, consequently, major cities such as Tbilisi have improved the quality of their roads. Secondary and local roads, however, remain in poor condition and this issue requires urgent attention. Figure 10.1 shows the relative share of transport infrastructure investment and maintenance spending in Georgia between 2004 and 2011. The trend shows clearly that the country invests heavily and increasingly in its infrastructure: the share of these investments has increased from 1.2 per cent in 2004 to 4.56 per cent of its GDP in 2011. At the same time, considerable flows of official development assistance (ODA) have been directed to the country. Table 10.2 shows that the lion’s share of transport ODA is channelled to road transport. Of US$559 million of ODA in the period 2004–2012, US$491 million (or 88 per cent) went to road transport. Table 10.2 also shows that transport and energy are the two biggest recipients of ODA, with disbursements in the 2004–2011 period exceeding half a billion US$ for each sector. Despite Georgia’s efforts to strengthen its position as a transit country, its position in the global Logistics Performance Index (LPI) has declined considerably (table 10.3).
Table 10.1: Share of transport and communication sector in GDP, 2007-2013, US$ million
Source: National Statistical Office, 2015.
2007 2008 2009 2010 2011 2012 2013Transport and communication 1 056.7 1 216.7 1 045.4 1 165.1 1 311.7 1 450.7 1 473.6% of GDP 12.1 11.0 11.2 11.5 10.5 10.6 10.5Memo item:
Investments in Transport and communication sector (% GDP)
- 2.3 2.4 1.4 1.7 2.6 3.5 - 2.1

160 Part III: Interaction of environment with selected sectors/issues
Figure 10.1: Transport infrastructure investment and maintenance, 2004-2011, per cent of GDP
Source: OECD.Stat (data extracted 30 September 2014).
Table 10.2: Official development assistance, selected sectors, 2004-2012, disbursements, constant 2012 US$ million
Source: OECD.Stat (accessed 30 September 2014)
As table 10.3 shows, after an improvement of almost 20positions from 93rd in 2010 to 77th in 2012, the country’s position worsened considerably in 2014, when it lost 40 positions and it is currently ranked116th of some 160 countries that are ranked in this index. The most dramatic drop in the component variables took place in customs, where the country fell from 44th to 131st position.
This variable measures the efficiency of the clearanceprocess (i.e. speed, simplicity and predictability of formalities) by border control agencies, including customs. A decline along this dimension, besides its economic effects, may also have important environmental impacts to the extent that it is associatedwith longer queuing lines at the borders. The LPI isbased on questionnaire responses of actual users of these services.
Road sector
The main road network exceeds 20,000 km, about 1,600 km of which are main roads, 5,300 km regionalroads and the rest feeder roads. About 8,000 km are asphalt roads, 10,000 km are gravel roads and 3,000 kmare earth roads.
Five main roads and highways (859 km) are used for international transit: (i) Poti–Tbilisi–Red Bridge; (ii)Mtskheta–Kazbegi–Larsi; (iii) Sarpi–Batumi–Samtredia; (iv) Khashuri–Akhaltsikhe–Turkish border;and (v) Tbilisi–Marneuli–Guguti.By far the heaviesttraffic is observed on the east–west highway (E60), the route that runs from the Red Bridge at the Azerbaijan border to Poti Port on the Black Sea coast, via Tbilisi, adistance of about 400 km. Given the road’s strategic importance, improvement projects are ongoing
0.0
0.5
1.0
1.5
2.0
2.5
3.0
3.5
4.0
4.5
5.0
2004 2005 2006 2007 2008 2009 2010 2011
2004 2005 2006 2007 2008 2009 2010 2011 2012 TotalTransport, Total 14.21 4.40 29.58 28.75 52.93 109.46 136.11 68.20 114.91 558.56of which:
Transport policy & admin. management .. 0.20 19.15 2.52 1.78 0.76 18.27 5.27 3.85 51.81Road transport 12.26 4.20 10.37 24.58 49.36 102.37 117.37 61.24 109.68 491.44Rail transport .. .. 0.05 0.10 0.23 0.05 .. 0.54 0.61 1.58Water transport 1.96 .. .. 1.54 1.57 .. .. .. .. 5.07Air transport .. .. .. .. .. 6.28 0.48 1.14 0.74 8.63Educ./trng in transport & storage .. .. .. .. .. .. .. .. 0.03 0.03
Communications, Total 0.25 0.00 0.03 0.06 0.22 0.07 0.09 0.31 0.88 1.91Energy, Total 27.95 33.76 35.53 46.82 73.96 48.32 70.01 63.14 135.10 534.60General Environment Protection, Total 5.12 4.81 5.15 4.29 10.59 2.99 4.39 4.13 4.96 46.43
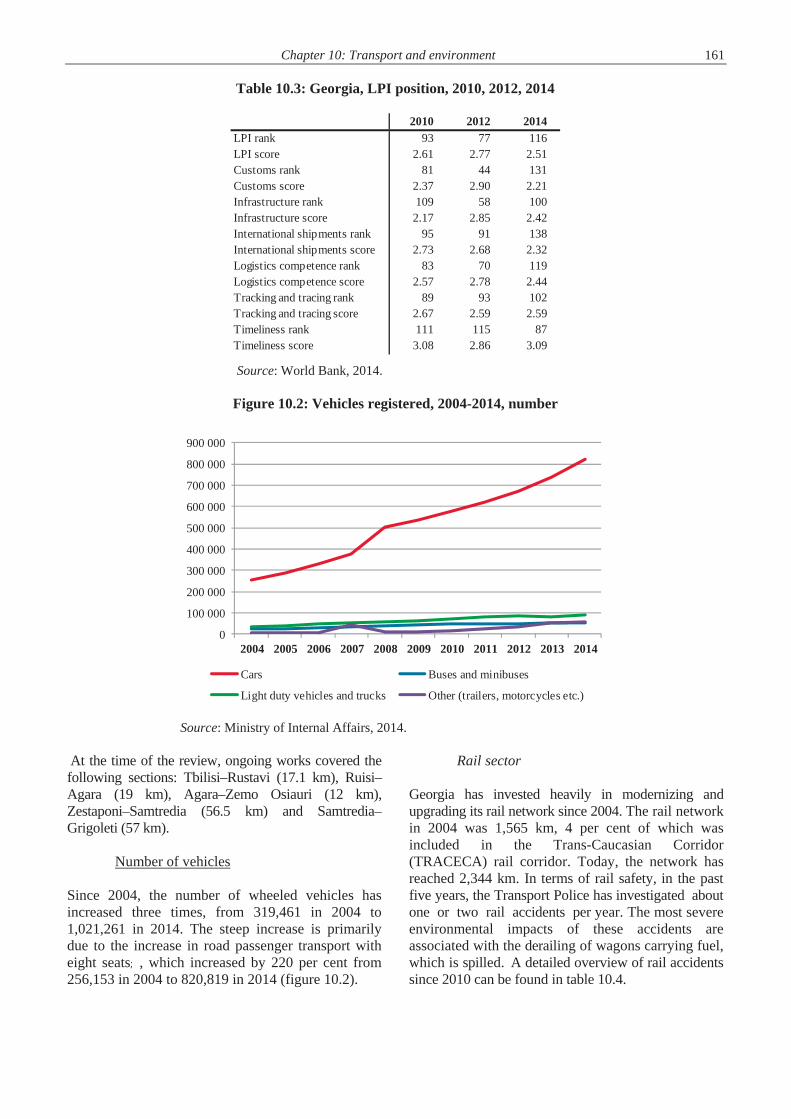
Chapter 10: Transport and environment 161
Table 10.3: Georgia, LPI position, 2010, 2012, 2014
Source: World Bank, 2014.
Figure 10.2: Vehicles registered, 2004-2014, number
Source: Ministry of Internal Affairs, 2014.
At the time of the review, ongoing works covered the following sections: Tbilisi–Rustavi (17.1 km), Ruisi–Agara (19 km), Agara–Zemo Osiauri (12 km), Zestaponi–Samtredia (56.5 km) and Samtredia–Grigoleti (57 km).
Number of vehicles
Since 2004, the number of wheeled vehicles has increased three times, from 319,461 in 2004 to 1,021,261 in 2014. The steep increase is primarilydue to the increase in road passenger transport with eight seats; , which increased by 220 per cent from 256,153 in 2004 to 820,819 in 2014 (figure 10.2).
Rail sector
Georgia has invested heavily in modernizing and upgrading its rail network since 2004. The rail networkin 2004 was 1,565 km, 4 per cent of which was included in the Trans-Caucasian Corridor(TRACECA) rail corridor. Today, the network has reached 2,344 km. In terms of rail safety, in the pastfive years, the Transport Police has investigated aboutone or two rail accidents per year. The most severeenvironmental impacts of these accidents areassociated with the derailing of wagons carrying fuel, which is spilled. A detailed overview of rail accidentssince 2010 can be found in table 10.4.
2010 2012 2014LPI rank 93 77 116LPI score 2.61 2.77 2.51Customs rank 81 44 131Customs score 2.37 2.90 2.21Infrastructure rank 109 58 100Infrastructure score 2.17 2.85 2.42International shipments rank 95 91 138International shipments score 2.73 2.68 2.32Logistics competence rank 83 70 119Logistics competence score 2.57 2.78 2.44Tracking and tracing rank 89 93 102Tracking and tracing score 2.67 2.59 2.59Timeliness rank 111 115 87Timeliness score 3.08 2.86 3.09
0
100 000
200 000
300 000
400 000
500 000
600 000
700 000
800 000
900 000
2004 2005 2006 2007 2008 2009 2010 2011 2012 2013 2014
Cars Buses and minibuses
Light duty vehicles and trucks Other (trailers, motorcycles etc.)
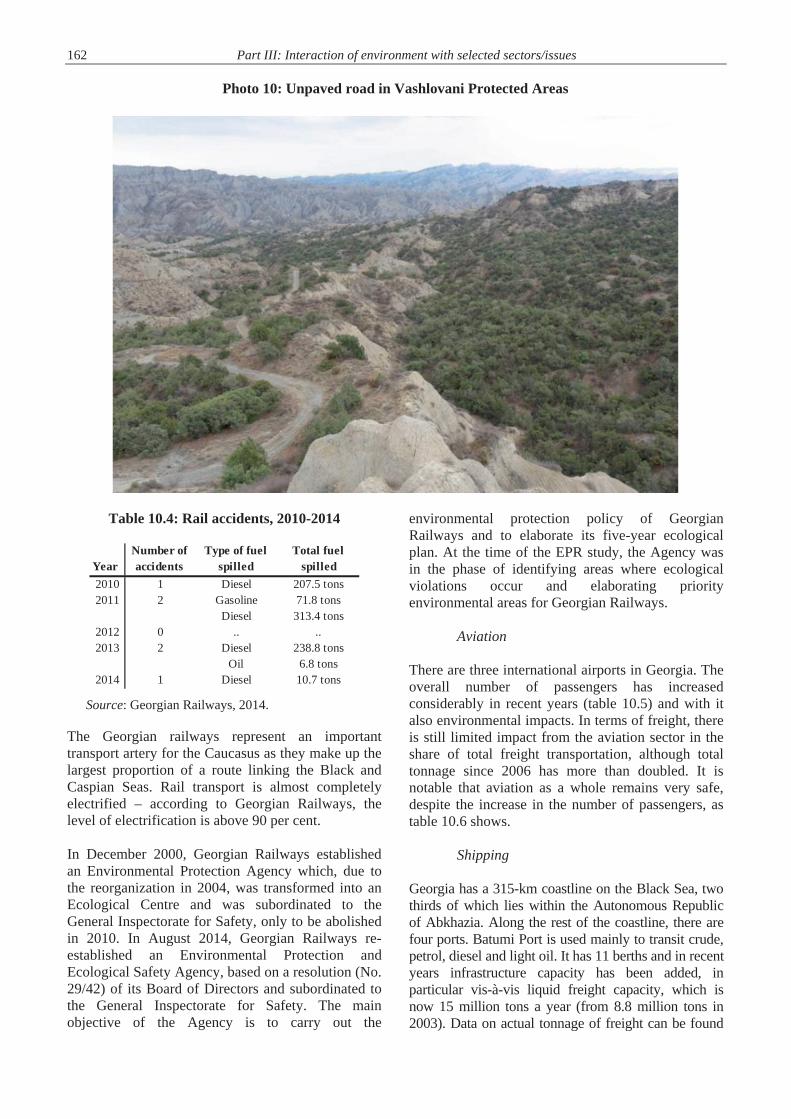
162 Part III: Interaction of environment with selected sectors/issues
Photo 10: Unpaved road in Vashlovani Protected Areas
Table 10.4: Rail accidents, 2010-2014
Source: Georgian Railways, 2014.
The Georgian railways represent an important transport artery for the Caucasus as they make up thelargest proportion of a route linking the Black andCaspian Seas. Rail transport is almost completelyelectrified – according to Georgian Railways, the level of electrification is above 90 per cent.
In December 2000, Georgian Railways establishedan Environmental Protection Agency which, due tothe reorganization in 2004, was transformed into an Ecological Centre and was subordinated to the General Inspectorate for Safety, only to be abolished in 2010. In August 2014, Georgian Railways re-established an Environmental Protection and Ecological Safety Agency, based on a resolution (No. 29/42) of its Board of Directors and subordinated tothe General Inspectorate for Safety. The main objective of the Agency is to carry out the
environmental protection policy of Georgian Railways and to elaborate its five-year ecological plan. At the time of the EPR study, the Agency was in the phase of identifying areas where ecological violations occur and elaborating priorityenvironmental areas for Georgian Railways.
Aviation
There are three international airports in Georgia. The overall number of passengers has increasedconsiderably in recent years (table 10.5) and with it also environmental impacts. In terms of freight, there is still limited impact from the aviation sector in the share of total freight transportation, although total tonnage since 2006 has more than doubled. It is notable that aviation as a whole remains very safe,despite the increase in the number of passengers, astable 10.6 shows.
Shipping
Georgia has a 315-km coastline on the Black Sea, twothirds of which lies within the Autonomous Republic of Abkhazia. Along the rest of the coastline, there are four ports. Batumi Port is used mainly to transit crude,petrol, diesel and light oil. It has 11 berths and in recentyears infrastructure capacity has been added, inparticular vis-à-vis liquid freight capacity, which is now 15 million tons a year (from 8.8 million tons in2003). Data on actual tonnage of freight can be found
YearNumber ofaccidents
Type of fuelspilled
Total fuelspilled
2010 1 Diesel 207.5 tonsGasoline 71.8 tonsDiesel 313.4 tons
2012 0 .. ..Diesel 238.8 tons
Oil 6.8 tons2014 1 Diesel 10.7 tons
2011 2
2013 2
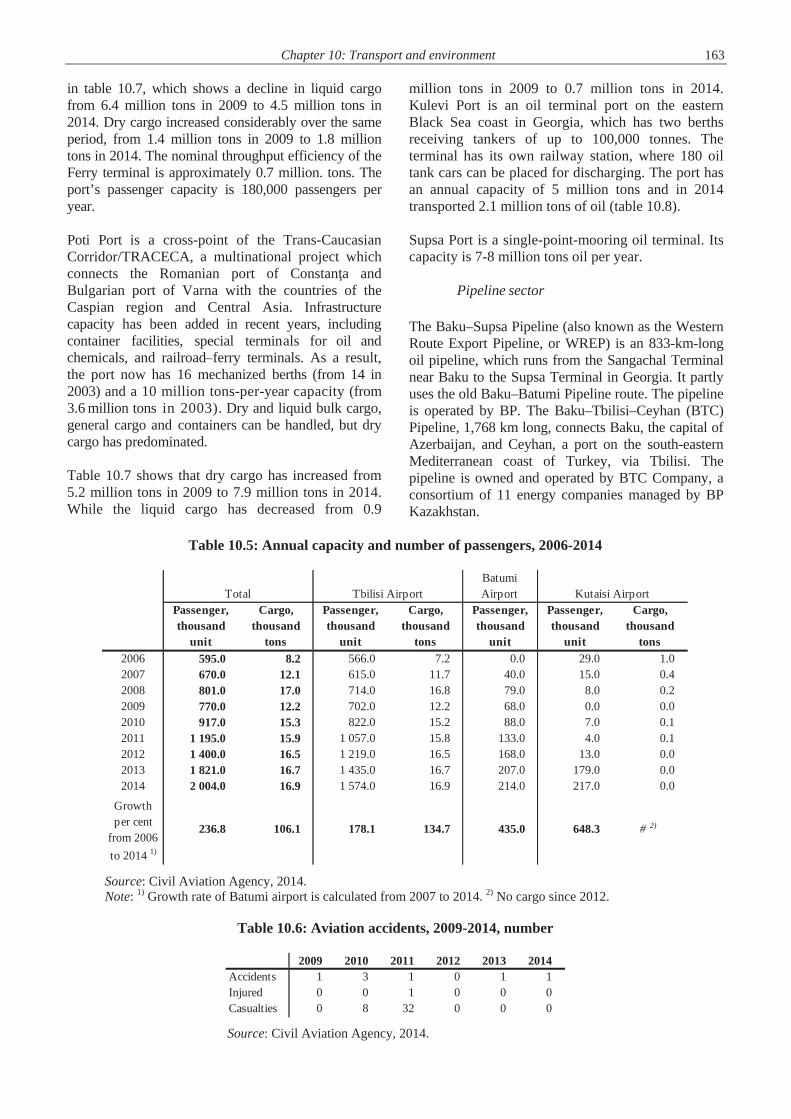
Chapter 10: Transport and environment 163 in table 10.7, which shows a decline in liquid cargo from 6.4 million tons in 2009 to 4.5 million tons in 2014. Dry cargo increased considerably over the same period, from 1.4 million tons in 2009 to 1.8 million tons in 2014. The nominal throughput efficiency of the Ferry terminal is approximately 0.7 million. tons. The port’s passenger capacity is 180,000 passengers per year. Poti Port is a cross-point of the Trans-Caucasian Corridor/TRACECA, a multinational project which connects the Romanian port of Constan a and Bulgarian port of Varna with the countries of the Caspian region and Central Asia. Infrastructure capacity has been added in recent years, including container facilities, special terminals for oil and chemicals, and railroad–ferry terminals. As a result, the port now has 16 mechanized berths (from 14 in 2003) and a 10 million tons-per-year capacity (from 3.6 million tons in 2003). Dry and liquid bulk cargo, general cargo and containers can be handled, but dry cargo has predominated. Table 10.7 shows that dry cargo has increased from 5.2 million tons in 2009 to 7.9 million tons in 2014. While the liquid cargo has decreased from 0.9
million tons in 2009 to 0.7 million tons in 2014. Kulevi Port is an oil terminal port on the eastern Black Sea coast in Georgia, which has two berths receiving tankers of up to 100,000 tonnes. The terminal has its own railway station, where 180 oil tank cars can be placed for discharging. The port has an annual capacity of 5 million tons and in 2014 transported 2.1 million tons of oil (table 10.8). Supsa Port is a single-point-mooring oil terminal. Its capacity is 7-8 million tons oil per year.
Pipeline sector The Baku–Supsa Pipeline (also known as the Western Route Export Pipeline, or WREP) is an 833-km-long oil pipeline, which runs from the Sangachal Terminal near Baku to the Supsa Terminal in Georgia. It partly uses the old Baku–Batumi Pipeline route. The pipeline is operated by BP. The Baku–Tbilisi–Ceyhan (BTC) Pipeline, 1,768 km long, connects Baku, the capital of Azerbaijan, and Ceyhan, a port on the south-eastern Mediterranean coast of Turkey, via Tbilisi. The pipeline is owned and operated by BTC Company, a consortium of 11 energy companies managed by BP Kazakhstan.
Table 10.5: Annual capacity and number of passengers, 2006-2014
Source: Civil Aviation Agency, 2014. Note: 1) Growth rate of Batumi airport is calculated from 2007 to 2014. 2) No cargo since 2012.
Table 10.6: Aviation accidents, 2009-2014, number
Source: Civil Aviation Agency, 2014.
Batumi Airport
Passenger, thousand
unit
Cargo, thousand
tons
Passenger, thousand
unit
Cargo, thousand
tons
Passenger, thousand
unit
Passenger, thousand
unit
Cargo, thousand
tons2006 595.0 8.2 566.0 7.2 0.0 29.0 1.02007 670.0 12.1 615.0 11.7 40.0 15.0 0.42008 801.0 17.0 714.0 16.8 79.0 8.0 0.22009 770.0 12.2 702.0 12.2 68.0 0.0 0.02010 917.0 15.3 822.0 15.2 88.0 7.0 0.12011 1 195.0 15.9 1 057.0 15.8 133.0 4.0 0.12012 1 400.0 16.5 1 219.0 16.5 168.0 13.0 0.02013 1 821.0 16.7 1 435.0 16.7 207.0 179.0 0.02014 2 004.0 16.9 1 574.0 16.9 214.0 217.0 0.0
Growth per cent
from 2006 to 2014 1)
236.8 106.1 178.1 134.7 435.0 648.3 # 2)
Kutaisi AirportTotal Tbilisi Airport
2009 2010 2011 2012 2013 2014Accidents 1 3 1 0 1 1Injured 0 0 1 0 0 0Casualties 0 8 32 0 0 0
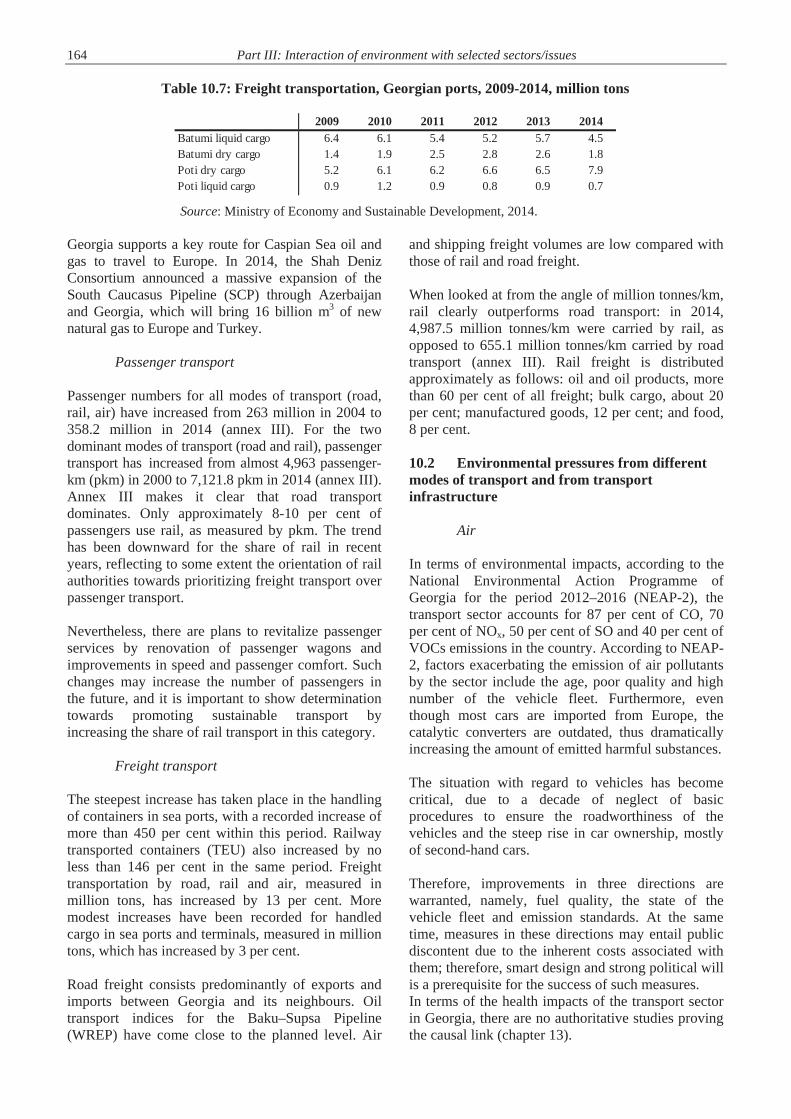
164 Part III: Interaction of environment with selected sectors/issues
Table 10.7: Freight transportation, Georgian ports, 2009-2014, million tons
Source: Ministry of Economy and Sustainable Development, 2014.
Georgia supports a key route for Caspian Sea oil and gas to travel to Europe. In 2014, the Shah Deniz Consortium announced a massive expansion of the South Caucasus Pipeline (SCP) through Azerbaijan and Georgia, which will bring 16 billion m3 of new natural gas to Europe and Turkey.
Passenger transport Passenger numbers for all modes of transport (road, rail, air) have increased from 263 million in 2004 to 358.2 million in 2014 (annex III). For the two dominant modes of transport (road and rail), passenger transport has increased from almost 4,963 passenger-km (pkm) in 2000 to 7,121.8 pkm in 2014 (annex III). Annex III makes it clear that road transport dominates. Only approximately 8-10 per cent of passengers use rail, as measured by pkm. The trend has been downward for the share of rail in recent years, reflecting to some extent the orientation of rail authorities towards prioritizing freight transport over passenger transport. Nevertheless, there are plans to revitalize passenger services by renovation of passenger wagons and improvements in speed and passenger comfort. Such changes may increase the number of passengers in the future, and it is important to show determination towards promoting sustainable transport by increasing the share of rail transport in this category.
Freight transport The steepest increase has taken place in the handling of containers in sea ports, with a recorded increase of more than 450 per cent within this period. Railway transported containers (TEU) also increased by no less than 146 per cent in the same period. Freight transportation by road, rail and air, measured in million tons, has increased by 13 per cent. More modest increases have been recorded for handled cargo in sea ports and terminals, measured in million tons, which has increased by 3 per cent. Road freight consists predominantly of exports and imports between Georgia and its neighbours. Oil transport indices for the Baku–Supsa Pipeline (WREP) have come close to the planned level. Air
and shipping freight volumes are low compared with those of rail and road freight. When looked at from the angle of million tonnes/km, rail clearly outperforms road transport: in 2014, 4,987.5 million tonnes/km were carried by rail, as opposed to 655.1 million tonnes/km carried by road transport (annex III). Rail freight is distributed approximately as follows: oil and oil products, more than 60 per cent of all freight; bulk cargo, about 20 per cent; manufactured goods, 12 per cent; and food, 8 per cent. 10.2 Environmental pressures from different modes of transport and from transport infrastructure
Air In terms of environmental impacts, according to the National Environmental Action Programme of Georgia for the period 2012–2016 (NEAP-2), the transport sector accounts for 87 per cent of CO, 70 per cent of NOx, 50 per cent of SO and 40 per cent of VOCs emissions in the country. According to NEAP-2, factors exacerbating the emission of air pollutants by the sector include the age, poor quality and high number of the vehicle fleet. Furthermore, even though most cars are imported from Europe, the catalytic converters are outdated, thus dramatically increasing the amount of emitted harmful substances. The situation with regard to vehicles has become critical, due to a decade of neglect of basic procedures to ensure the roadworthiness of the vehicles and the steep rise in car ownership, mostly of second-hand cars. Therefore, improvements in three directions are warranted, namely, fuel quality, the state of the vehicle fleet and emission standards. At the same time, measures in these directions may entail public discontent due to the inherent costs associated with them; therefore, smart design and strong political will is a prerequisite for the success of such measures. In terms of the health impacts of the transport sector in Georgia, there are no authoritative studies proving the causal link (chapter 13).
2009 2010 2011 2012 2013 2014Batumi liquid cargo 6.4 6.1 5.4 5.2 5.7 4.5Batumi dry cargo 1.4 1.9 2.5 2.8 2.6 1.8Poti dry cargo 5.2 6.1 6.2 6.6 6.5 7.9Poti liquid cargo 0.9 1.2 0.9 0.8 0.9 0.7
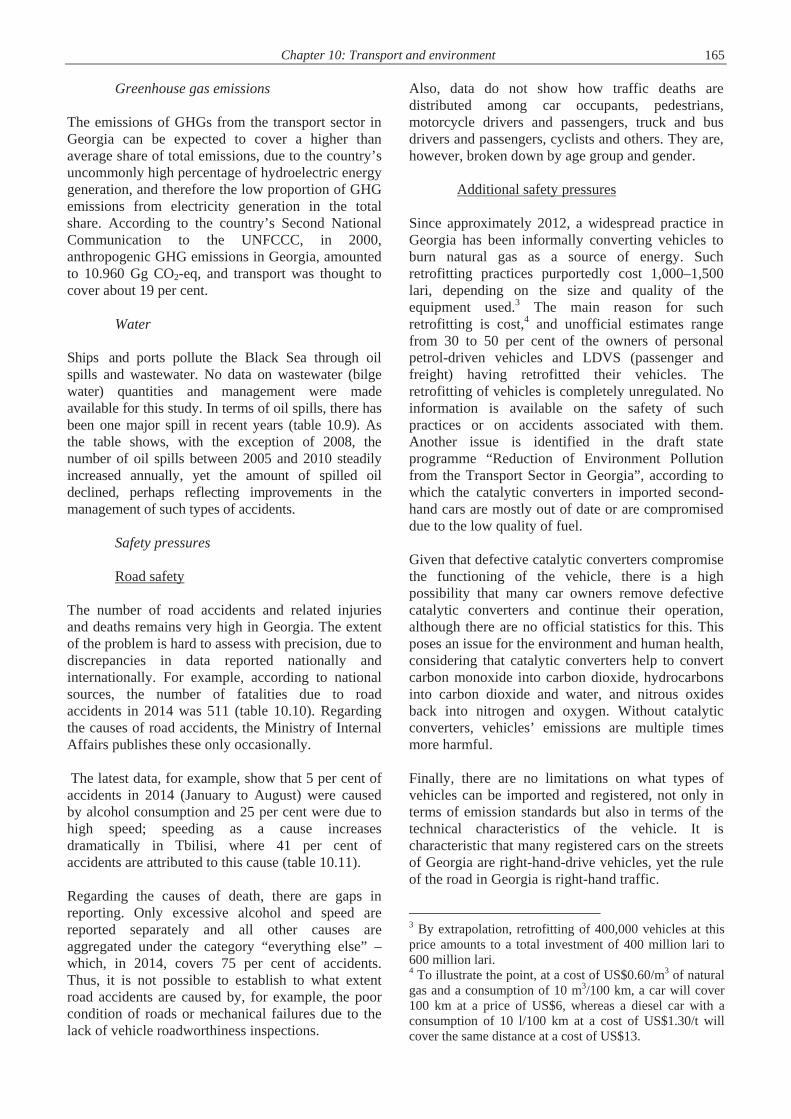
Chapter 10: Transport and environment 165
Greenhouse gas emissions The emissions of GHGs from the transport sector in Georgia can be expected to cover a higher than average share of total emissions, due to the country’s uncommonly high percentage of hydroelectric energy generation, and therefore the low proportion of GHG emissions from electricity generation in the total share. According to the country’s Second National Communication to the UNFCCC, in 2000, anthropogenic GHG emissions in Georgia, amounted to 10.960 Gg CO2-eq, and transport was thought to cover about 19 per cent.
Water Ships and ports pollute the Black Sea through oil spills and wastewater. No data on wastewater (bilge water) quantities and management were made available for this study. In terms of oil spills, there has been one major spill in recent years (table 10.9). As the table shows, with the exception of 2008, the number of oil spills between 2005 and 2010 steadily increased annually, yet the amount of spilled oil declined, perhaps reflecting improvements in the management of such types of accidents.
Safety pressures
Road safety The number of road accidents and related injuries and deaths remains very high in Georgia. The extent of the problem is hard to assess with precision, due to discrepancies in data reported nationally and internationally. For example, according to national sources, the number of fatalities due to road accidents in 2014 was 511 (table 10.10). Regarding the causes of road accidents, the Ministry of Internal Affairs publishes these only occasionally. The latest data, for example, show that 5 per cent of accidents in 2014 (January to August) were caused by alcohol consumption and 25 per cent were due to high speed; speeding as a cause increases dramatically in Tbilisi, where 41 per cent of accidents are attributed to this cause (table 10.11). Regarding the causes of death, there are gaps in reporting. Only excessive alcohol and speed are reported separately and all other causes are aggregated under the category “everything else” – which, in 2014, covers 75 per cent of accidents. Thus, it is not possible to establish to what extent road accidents are caused by, for example, the poor condition of roads or mechanical failures due to the lack of vehicle roadworthiness inspections.
Also, data do not show how traffic deaths are distributed among car occupants, pedestrians, motorcycle drivers and passengers, truck and bus drivers and passengers, cyclists and others. They are, however, broken down by age group and gender.
Additional safety pressures Since approximately 2012, a widespread practice in Georgia has been informally converting vehicles to burn natural gas as a source of energy. Such retrofitting practices purportedly cost 1,000–1,500 lari, depending on the size and quality of the equipment used.3 The main reason for such retrofitting is cost,4 and unofficial estimates range from 30 to 50 per cent of the owners of personal petrol-driven vehicles and LDVS (passenger and freight) having retrofitted their vehicles. The retrofitting of vehicles is completely unregulated. No information is available on the safety of such practices or on accidents associated with them. Another issue is identified in the draft state programme “Reduction of Environment Pollution from the Transport Sector in Georgia”, according to which the catalytic converters in imported second-hand cars are mostly out of date or are compromised due to the low quality of fuel. Given that defective catalytic converters compromise the functioning of the vehicle, there is a high possibility that many car owners remove defective catalytic converters and continue their operation, although there are no official statistics for this. This poses an issue for the environment and human health, considering that catalytic converters help to convert carbon monoxide into carbon dioxide, hydrocarbons into carbon dioxide and water, and nitrous oxides back into nitrogen and oxygen. Without catalytic converters, vehicles’ emissions are multiple times more harmful. Finally, there are no limitations on what types of vehicles can be imported and registered, not only in terms of emission standards but also in terms of the technical characteristics of the vehicle. It is characteristic that many registered cars on the streets of Georgia are right-hand-drive vehicles, yet the rule of the road in Georgia is right-hand traffic.
3 By extrapolation, retrofitting of 400,000 vehicles at this price amounts to a total investment of 400 million lari to 600 million lari. 4 To illustrate the point, at a cost of US$0.60/m3 of natural gas and a consumption of 10 m3/100 km, a car will cover 100 km at a price of US$6, whereas a diesel car with a consumption of 10 l/100 km at a cost of US$1.30/t will cover the same distance at a cost of US$13.
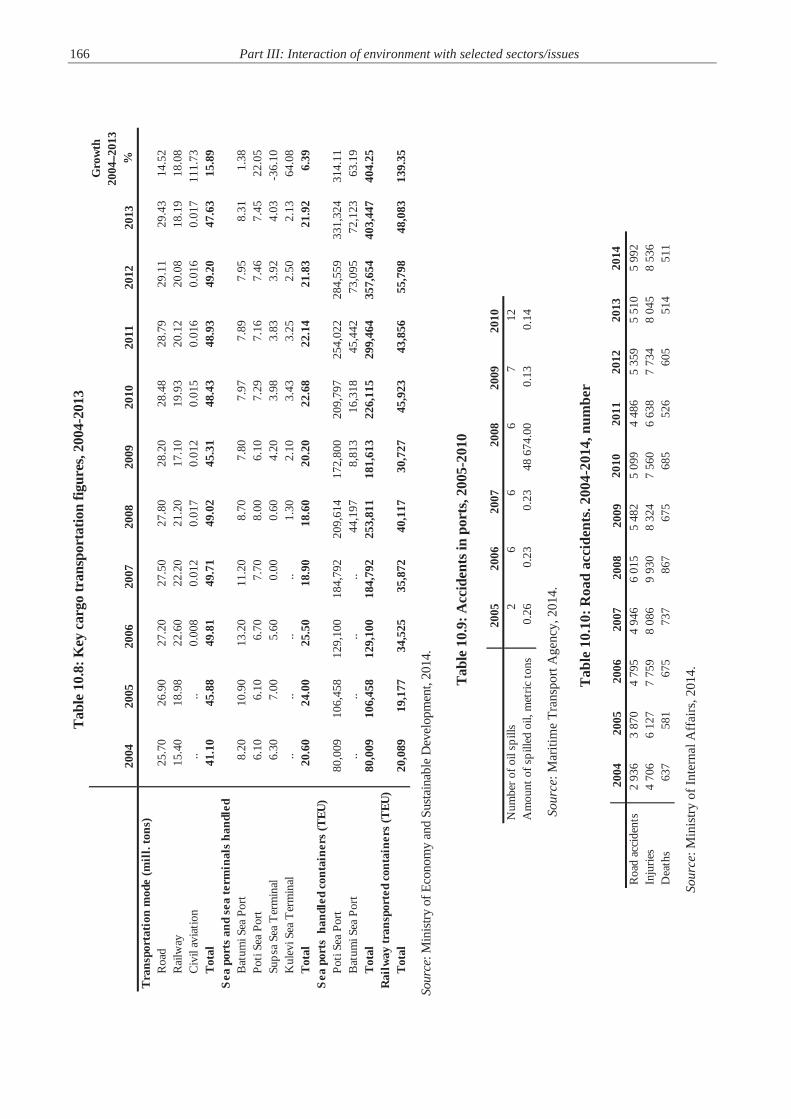
166 Part III: Interaction of environment with selected sectors/issues
Tabl
e 10
.8: K
ey c
argo
tran
spor
tatio
n fig
ures
, 200
4-20
13
So
urce
: Min
istry
of E
cono
my
and
Susta
inab
le D
evel
opm
ent,
2014
.
Tabl
e 10
.9: A
ccid
ents
in p
orts
, 200
5-20
10
So
urce
: Mar
itim
e Tr
ansp
ort A
genc
y, 2
014.
T
able
10.
10: R
oad
acci
dent
s. 20
04-2
014,
num
ber
So
urce
: Min
istry
of I
nter
nal A
ffai
rs, 2
014.
2004
2005
2006
2007
2008
2009
2010
2011
2012
2013
Gro
wth
20
04–2
013
%T
rans
port
atio
n m
ode
(mil
l. to
ns)
Roa
d25
.70
26.9
027
.20
27.5
027
.80
28.2
028
.48
28.7
929
.11
29.4
314
.52
Rai
lway
15.4
018
.98
22.6
022
.20
21.2
017
.10
19.9
320
.12
20.0
818
.19
18.0
8C
ivil
avia
tion
....
0.00
80.
012
0.01
70.
012
0.01
50.
016
0.01
60.
017
111.
73T
otal
41.1
045
.88
49.8
149
.71
49.0
245
.31
48.4
348
.93
49.2
047
.63
15.8
9S
ea p
orts
and
sea
term
inal
s ha
ndle
d B
atum
i Sea
Por
t8.
2010
.90
13.2
011
.20
8.70
7.80
7.97
7.89
7.95
8.31
1.38
Poti
Sea
Port
6.10
6.10
6.70
7.70
8.00
6.10
7.29
7.16
7.46
7.45
22.0
5Su
psa
Sea
Ter
min
al6.
307.
005.
600.
000.
604.
203.
983.
833.
924.
03-3
6.10
Kul
evi S
ea T
erm
inal
....
....
1.30
2.10
3.43
3.25
2.50
2.13
64.0
8T
otal
20.6
024
.00
25.5
018
.90
18.6
020
.20
22.6
822
.14
21.8
321
.92
6.39
Sea
por
ts h
andl
ed c
onta
iner
s (T
EU)
Poti
Sea
Port
80,0
0910
6,45
812
9,10
018
4,79
220
9,61
417
2,80
020
9,79
725
4,02
228
4,55
933
1,32
431
4.11
Bat
umi S
ea P
ort
....
....
44,1
978,
813
16,3
1845
,442
73,0
9572
,123
63.1
9T
otal
80,0
0910
6,45
812
9,10
018
4,79
225
3,81
118
1,61
322
6,11
529
9,46
435
7,65
440
3,44
740
4.25
Rai
lway
tran
spor
ted
cont
aine
rs (T
EU)
Tot
al20
,089
19,1
7734
,525
35,8
7240
,117
30,7
2745
,923
43,8
5655
,798
48,0
8313
9.35
2005
2006
2007
2008
2009
2010
Num
ber o
f oil
spill
s2
66
67
12A
mou
nt o
f spi
lled
oil,
met
ric to
ns 0
.26
0.2
3 0
.23
48 6
74.0
0 0
.13
0.1
4
2004
2005
2006
2007
2008
2009
2010
2011
2012
2013
2014
Roa
d ac
cide
nts
2 93
63
870
4 79
54
946
6 01
55
482
5 09
94
486
5 35
95
510
5 99
2In
jurie
s4
706
6 12
77
759
8 08
69
930
8 32
47
560
6 63
87
734
8 04
58
536
Dea
ths
637
581
675
737
867
675
685
526
605
514
511
Chapter 10: Transport and environment 167
Table 10.11: Causes of road accidents
Source: Ministry of Internal Affairs, 2014.
Typically, the placement of the steering wheel is on the offside of the vehicle, to ensure that the driver’s line of sight is as long as possible, which is an important safety consideration when overtaking vehicles. It follows that the free import and registration of right-hand-drive vehicles in a right-hand traffic setting poses challenges for road safety.
Major ongoing projects of environmental concern Georgian Railways has been undergoing a rolling programme of fleet renewal and managerial restructuring, which is aimed at making the service provided more efficient and comfortable for passengers (although the share of rail in passenger transport is very low and does not exceed 10 per cent). Shifting from road to rail transport could result in considerable environmental gains in terms of air pollution and GHGs (Annex VI).
Tbilisi Railway Bypass Project The Tbilisi Railway Bypass Project is currently under way, developing a new railway route that bypasses the central area of the city of Tbilisi. By moving certain railway infrastructure components from the centre of Tbilisi to the northern part of the city, freight and passenger trains will no longer transit through central Tbilisi. This project will help to alleviate future environmental and safety concerns. The railway infrastructure between the stations of Didube and Navtlugi will be dismantled; thus, in total, 73 ha area will be freed up and used for urban development.
Railway Modernization Project Georgian Railways has also started the implementation of the Railway Modernization Project. In particular, its main objectives are: improving operational safety; improving social and environmental safety.
This Project focuses primarily on the main line that runs from Tbilisi to the Black Sea, in particular to the terminals at Poti and Batumi. The Baku–Tbilisi–Kars Railway is a new corridor that will connect Azerbaijan, Georgian and Turkish railways. The construction began in 2008. It foresees the rehabilitation and reconstruction of the 178 km-long railway between Marabda and Akhalkalaki, and construction of a new railway from Akhalkalaki to the Turkish border. This project will effectively open a new rail-only corridor from the Caspian Sea to Europe via Turkey, eventually excluding the need for sea transportation once the planned rail tunnel under the Bosphorus Strait in Istanbul is complete.
Greening the sector Georgia faces challenges to improve its trade logistics and transport connectivity, to support competitiveness and job creation and to achieve long-term sustainable economic growth. In addition, the Government is keen to develop efficient and clean transport services. In response to these considerations, Georgia has jointly initiated a programme with the World Bank to promote efficient and clean transport services through the development of a Green Freight Transport and Logistics Investment Programme. At the time of this review, the Programme is ongoing. 10.3 Emission and fuel standards for vehicles There are currently no vehicle emission standards in force in Georgia to ensure the prevention of exhaust pollution from motor vehicles. From 1 January 2014, the regulations and standards on fuel quality in force have become more strict. In particular, those concerning lead content standards in Georgia are as stringent as those in the EU (table 10.15). However, there is no inspection system in place to control the quality of fuel at the distribution points. Despite the fact that the new standards for sulphur content – 40 per cent for petrol and 35 per cent for diesel – are considerably more stringent than their
Accidents 2014 (Jan-Aug) Alcohol Speed
Other causes Total
Nationally 127 635 1 795 2 557Per cent 5 25 70 ..
Of which, in Tbilisi alone 43 509 694 1 246Per cent 3.5 40.9 55.7 ..
168 Part III: Interaction of environment with selected sectors/issues
predecessors, they remain a clear outlier from equivalent standards in the EU (table 10.13). In petrol, maximum sulphur concentrations in Georgia are 15 times higher than those allowed in the EU. In diesel, the same concentrations are 20 times higher than those allowed in the EU. Given the adverse environmental and health effects of sulphur emissions, this is an area of concern with considerable room for improvement. 10.4 Assessment of performance towards greening the transport sector
Policy framework There is no policy document on transport development, however, the Ministry of Economy and
Sustainable Development is drafting a transport policy document. The risk from the absence of such a coherent policy framework is that individual modes develop in an uncoordinated way. The Ministry of Economy and Sustainable Development and the Ministry of Finance developed a proposed Socio-Economic Development Strategy of Georgia, better known as “Georgia 2020”. This strategic document identifies the development of infrastructure and the maximum utilization of Georgia’s transit potential as one of its main priorities, in order to strengthen private sector competitiveness and thus achieve inclusive economic growth.
Box 10.1: Public transport in Tbilisi In recent years, efforts have been made to promote public transport in Georgia. For example, Tbilisi Municipality purchased more than 1,000 buses for the Tbilisi Bus Company. Furthermore, the city is planning to purchase an additional 100 buses running on natural gas, in 2015. In recent years, it has received considerable investments. The underground system extends to a total of 57 km, corresponding to two lines and 22 stations. In 2012, aerial tram/cable car from Rike Park to Narikala Fortress was built. The funicular railway that runs up to Mtatsminda Mountain was opened in 1905 and was recently reconstructed. Discount regimes creating an incentive for using the public transport system have been introduced. The most successful is a joint bus–metro “Metromani” card for travel in Tbilisi. This card is a form of integrated ticketing system; however, there are still no period cards/passes, which normally increase loyalty and facilitate the use of different means of public transport, thus making the public transport option more attractive. Tbilisi, especially the city centre, was not designed to accommodate the current number of vehicles. In response to the acute traffic congestion problems that occurred in the capital, Tbilisi Municipality engaged in traffic optimization, primarily infrastructure-oriented, interventions. As a result of these interventions, a new system of intersections has been introduced, which substantially decreased the number and duration of traffic jams in the city. Additionally, an integrated traffic control centre has been created which is connected to 81 intersections (traffic lights), and aims to connect an additional 40 by the end of 2014. The functioning of the control centre is centrally controlled, i.e. it has the ability to implement and programme new timing plans directly from the control centre, although it does not appear to be designed to respond to decentralized information on traffic conditions. Despite these efforts, the congestion in Tbilisi persists and there are still options that have not been tried or fully exploited by the local authorities, and which have proven very effective elsewhere. These include technology-driven solutions, such as the deployment of Intelligent Transport Systems (ITS) solutions, but also include market and pricing tools, such as congestion pricing and road-use pricing. The general direction of the latter measures is towards reducing the attractiveness of driving private vehicles and, conversely, increasing the advantages of public transport. There is also no active policy towards promoting active mobility, notably cycling and walking, as viable alternatives for the city’s dwellers. Such initiatives, however, carry the potential to reduce vehicle traffic considerably, resulting in less congestion, air pollution and noise, fewer road accidents and less need for infrastructural interventions. The Tbilisi public transport system includes the underground (metro), buses, minibuses and taxis. Electrified transport in the form of trolleybuses and trams has been discontinued, despite the fact that these are some of the more economical and ecological means of transport (producing fewer emissions and less noise than fuel combustion). In terms of buses and minibuses, improvements have been made in terms of both the purchase of new vehicles and improvements in the condition and cleanliness of the vehicles, thus making public transport more attractive to users. However, there is not yet an active programme on eco-driving training for drivers. These facts are reflected in the actual numbers of passengers carried by public transport. Total passenger numbers have increased steadily since 2010 (table 10.12). In fact, table 10.12 underestimates the total numbers because figures reported for the privately run minibuses include only customers using the Metromani travel card and not those who pay for their tickets in cash. According to informal estimates, the number of passengers using minibuses may be as high as 350,000 per day or approximately 127.7 million passengers per year. But these figures are not corroborated. Nevertheless, the trend is improving.
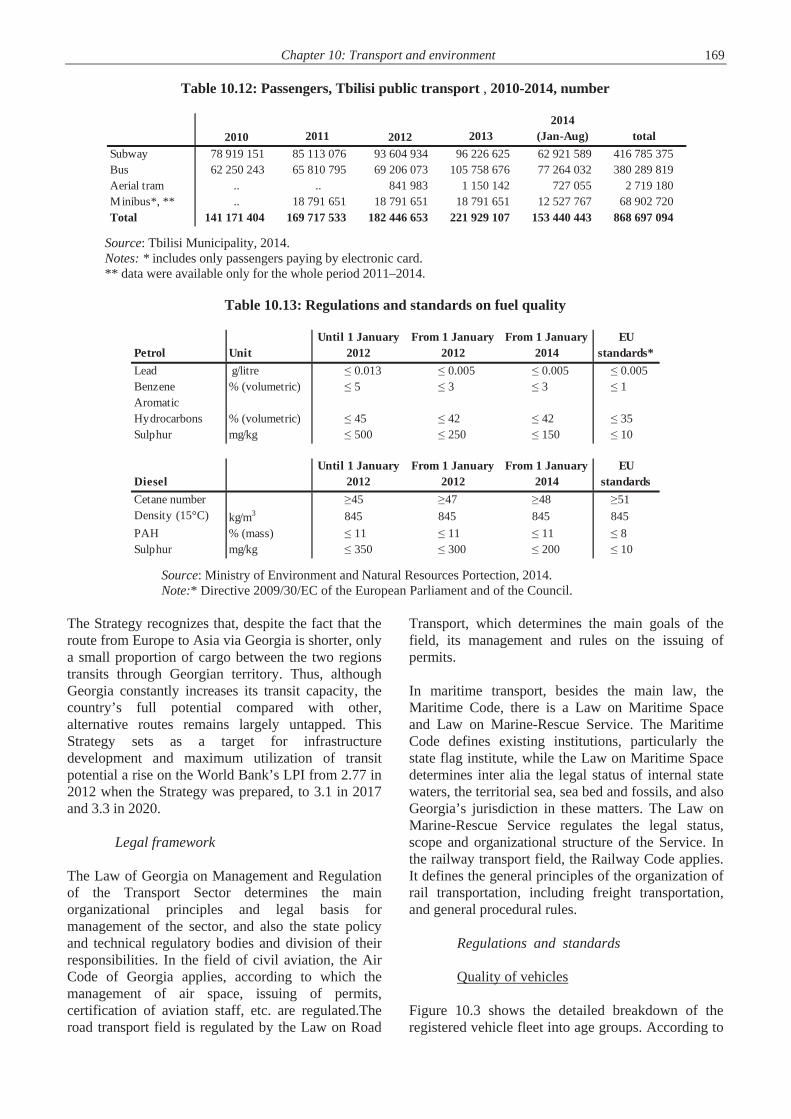
Chapter 10: Transport and environment 169
Table 10.12: Passengers, Tbilisi public transport , 2010-2014, number
Source: Tbilisi Municipality, 2014. Notes: * includes only passengers paying by electronic card. ** data were available only for the whole period 2011–2014.
Table 10.13: Regulations and standards on fuel quality
Source: Ministry of Environment and Natural Resources Portection, 2014. Note:* Directive 2009/30/EC of the European Parliament and of the Council.
The Strategy recognizes that, despite the fact that the route from Europe to Asia via Georgia is shorter, only a small proportion of cargo between the two regions transits through Georgian territory. Thus, although Georgia constantly increases its transit capacity, the country’s full potential compared with other, alternative routes remains largely untapped. This Strategy sets as a target for infrastructure development and maximum utilization of transit potential a rise on the World Bank’s LPI from 2.77 in 2012 when the Strategy was prepared, to 3.1 in 2017 and 3.3 in 2020.
Legal framework The Law of Georgia on Management and Regulation of the Transport Sector determines the main organizational principles and legal basis for management of the sector, and also the state policy and technical regulatory bodies and division of their responsibilities. In the field of civil aviation, the Air Code of Georgia applies, according to which the management of air space, issuing of permits, certification of aviation staff, etc. are regulated.The road transport field is regulated by the Law on Road
Transport, which determines the main goals of the field, its management and rules on the issuing of permits. In maritime transport, besides the main law, the Maritime Code, there is a Law on Maritime Space and Law on Marine-Rescue Service. The Maritime Code defines existing institutions, particularly the state flag institute, while the Law on Maritime Space determines inter alia the legal status of internal state waters, the territorial sea, sea bed and fossils, and also Georgia’s jurisdiction in these matters. The Law on Marine-Rescue Service regulates the legal status, scope and organizational structure of the Service. In the railway transport field, the Railway Code applies. It defines the general principles of the organization of rail transportation, including freight transportation, and general procedural rules.
Regulations and standards
Quality of vehicles Figure 10.3 shows the detailed breakdown of the registered vehicle fleet into age groups. According to
2010 2011 2012 20132014
(Jan-Aug) totalSubway 78 919 151 85 113 076 93 604 934 96 226 625 62 921 589 416 785 375Bus 62 250 243 65 810 795 69 206 073 105 758 676 77 264 032 380 289 819Aerial tram .. .. 841 983 1 150 142 727 055 2 719 180Minibus*, ** .. 18 791 651 18 791 651 18 791 651 12 527 767 68 902 720Total 141 171 404 169 717 533 182 446 653 221 929 107 153 440 443 868 697 094
Petrol UnitUntil 1 January
2012From 1 January
2012From 1 January
2014EU
standards*Lead g/litre 0.013 0.005 0.005 0.005Benzene % (volumetric) 5 3 3 1 Aromatic Hydrocarbons % (volumetric) 45 42 42 35 Sulphur mg/kg 500 250 150 10
DieselUntil 1 January
2012From 1 January
2012From 1 January
2014EU
standardsCetane number 45 47 48 51Density (15°C) kg/m3 845 845 845 845PAH % (mass) 11 11 11 8Sulphur mg/kg 350 300 200 10
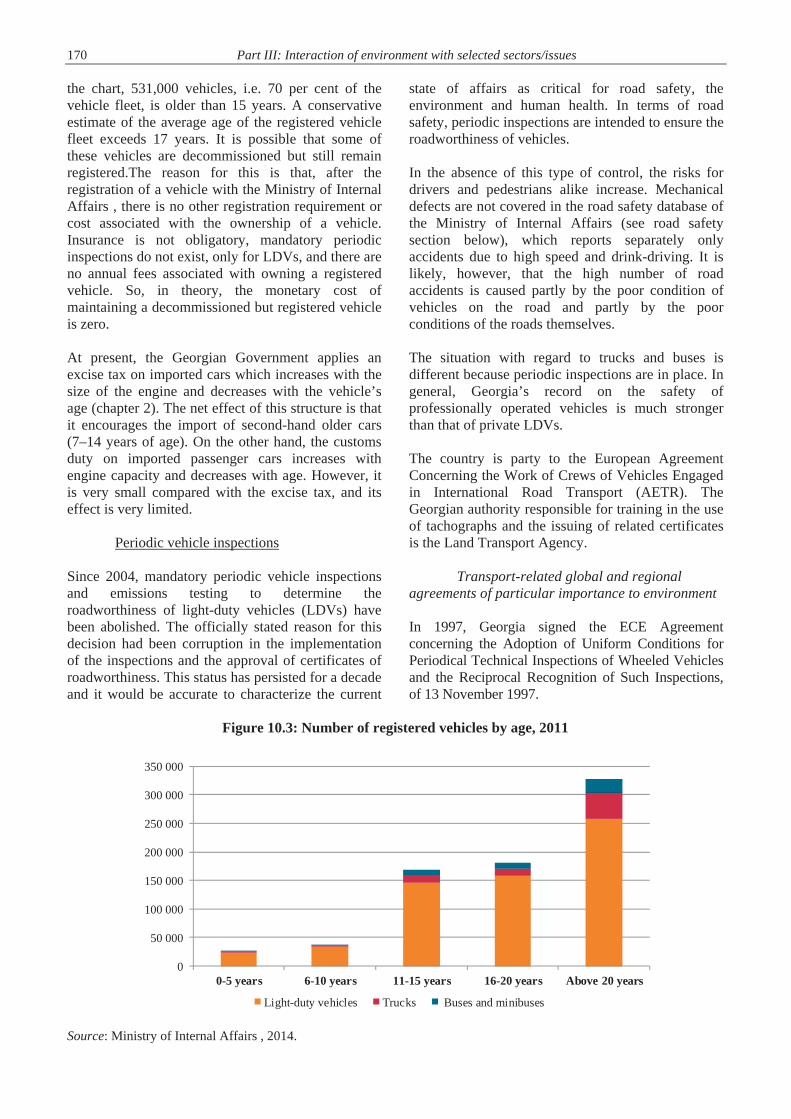
170 Part III: Interaction of environment with selected sectors/issues
the chart, 531,000 vehicles, i.e. 70 per cent of the vehicle fleet, is older than 15 years. A conservative estimate of the average age of the registered vehicle fleet exceeds 17 years. It is possible that some of these vehicles are decommissioned but still remain registered.The reason for this is that, after the registration of a vehicle with the Ministry of Internal Affairs , there is no other registration requirement or cost associated with the ownership of a vehicle. Insurance is not obligatory, mandatory periodic inspections do not exist, only for LDVs, and there are no annual fees associated with owning a registered vehicle. So, in theory, the monetary cost of maintaining a decommissioned but registered vehicle is zero.
At present, the Georgian Government applies an excise tax on imported cars which increases with the size of the engine and decreases with the vehicle’s age (chapter 2). The net effect of this structure is that it encourages the import of second-hand older cars (7–14 years of age). On the other hand, the customs duty on imported passenger cars increases with engine capacity and decreases with age. However, it is very small compared with the excise tax, and its effect is very limited.
Periodic vehicle inspections
Since 2004, mandatory periodic vehicle inspections and emissions testing to determine the roadworthiness of light-duty vehicles (LDVs) have been abolished. The officially stated reason for this decision had been corruption in the implementation of the inspections and the approval of certificates of roadworthiness. This status has persisted for a decade and it would be accurate to characterize the current
state of affairs as critical for road safety, the environment and human health. In terms of road safety, periodic inspections are intended to ensure the roadworthiness of vehicles.
In the absence of this type of control, the risks for drivers and pedestrians alike increase. Mechanical defects are not covered in the road safety database of the Ministry of Internal Affairs (see road safety section below), which reports separately only accidents due to high speed and drink-driving. It is likely, however, that the high number of road accidents is caused partly by the poor condition of vehicles on the road and partly by the poor conditions of the roads themselves.
The situation with regard to trucks and buses is different because periodic inspections are in place. In general, Georgia’s record on the safety of professionally operated vehicles is much stronger than that of private LDVs.
The country is party to the European Agreement Concerning the Work of Crews of Vehicles Engaged in International Road Transport (AETR). The Georgian authority responsible for training in the use of tachographs and the issuing of related certificates is the Land Transport Agency.
Transport-related global and regional agreements of particular importance to environment
In 1997, Georgia signed the ECE Agreement concerning the Adoption of Uniform Conditions for Periodical Technical Inspections of Wheeled Vehicles and the Reciprocal Recognition of Such Inspections, of 13 November 1997.
Figure 10.3: Number of registered vehicles by age, 2011
Source: Ministry of Internal Affairs , 2014.
0
50 000
100 000
150 000
200 000
250 000
300 000
350 000
0-5 years 6-10 years 11-15 years 16-20 years Above 20 years
Light-duty vehicles Trucks Buses and minibuses
Chapter 10: Transport and environment 171 However, it has not yet ratified this Agreement, almost 20 years after the original signature. It is certain that ratifying this Agreement would contribute towards improving the situation described above regarding the need to reinforce the roadworthiness of vehicles travelling on the roads of Georgia.Georgia is not yet a party to the 1957 European Agreement concerning the International Carriage of Dangerous Goods by Road (ADR) and the related Protocols, nor the 1970 Agreement on the International Carriage of Perishable Foodstuffs and on the Special Equipment to be Used for such Carriage (ATP). Given its position as a transit country and the high impact of accidents involving such cargoes on the environment and human health, acceding to such legal instruments would strengthen the capacity of the country to better prepare for and deal with such types of events, as well as strengthen its position as a transit corridor.
Institutional framework
Ministry of Economy and Sustainable Developmentt The Transport Policy Department (TPD) of the Ministry of Economy and Sustainable Development is the national authority for road transport, maritime transport, railways and aviation infrastructure and services. The Civil Aviation Agency under the TPD is responsible for certifying and licensing aircraft and airline crew members, and ensuring the conformity of aircraft, aviation services and airports with safety regulations and procedures. The Maritime Transport Agency under the TPD is the technical regulator for maritime transport. Georgian Railways is a state-owned company with three core businesses: infrastructure, freight operations and passenger operations. The Ministry of Economy and Sustainable Development is its supervisory body, appointing a chief executive officer, three executive directors, and a board of directors to oversee operations. The freight and passenger units compensate the infrastructure unit for rail track usage. The Land Transport Agency of the TPD oversees road transport freight and passenger services. It is responsible for ensuring the conformity of bus and freight vehicle operators with technical standards and international agreements (AETR). It issues permits and concessions for operators, including on the digital tachograph.
Others The Ministry of Internal Affairs is responsible for registering vehicles, recording traffic accidents and issuing driver licences. The Roads Department of Georgia of the Ministry of Regional Development and Infrastructure is responsible for planning, designing, constructing and maintaining secondary and international roads. The Ministry of Environment and Natural Resources Protection is responsible, among other things, for determining fuel quality standards. Local authorities oversee local roads in cities, towns and villages. Private foreign companies operate the two major airports in Georgia, while the state-owned United Airports of Georgia operates the newest international airport in Kutaisi and all regional airports. Private companies operate all the country’s ports. The Georgian Oil and Gas Corporation (GOGC), a state-owned joint stock company, is the regulator of pipelines. 10.5 Conclusions and recommendations There is no overarching strategic policy document governing the development of all modes of transport, to ensure that the sector, and individual modes within it, develop in a coherent, efficient and sustainable way. Experience across countries and over time shows that the existence of a national strategy for sustainable transport is a prerequisite for achieving synergies, avoiding overlaps and implementing well-assessed national priorities in the pursuit of sustainable transport. Recommendation 10.1: The Government should adopt a national strategy on transport, integrating all modes of transport, with the achievement of sustainable transport as its main focus. Georgia is not yet a party to UN transport agreements on the transport of dangerous goods and special cargoes, including perishable foodstuffs. Given the impact of accidents involving such cargoes on the environment and human health, Georgia would strengthen its position as a transit country with its accession to such legal instruments. Furthermore, Georgia has not yet ratified the ECE agreement on periodical technical inspections, although it signed it in 1997, almost 20 years ago. Recommendation 10.2: The Government should accede to or ratify the following United Nations transport agreements, in order to improve the environmental performance of
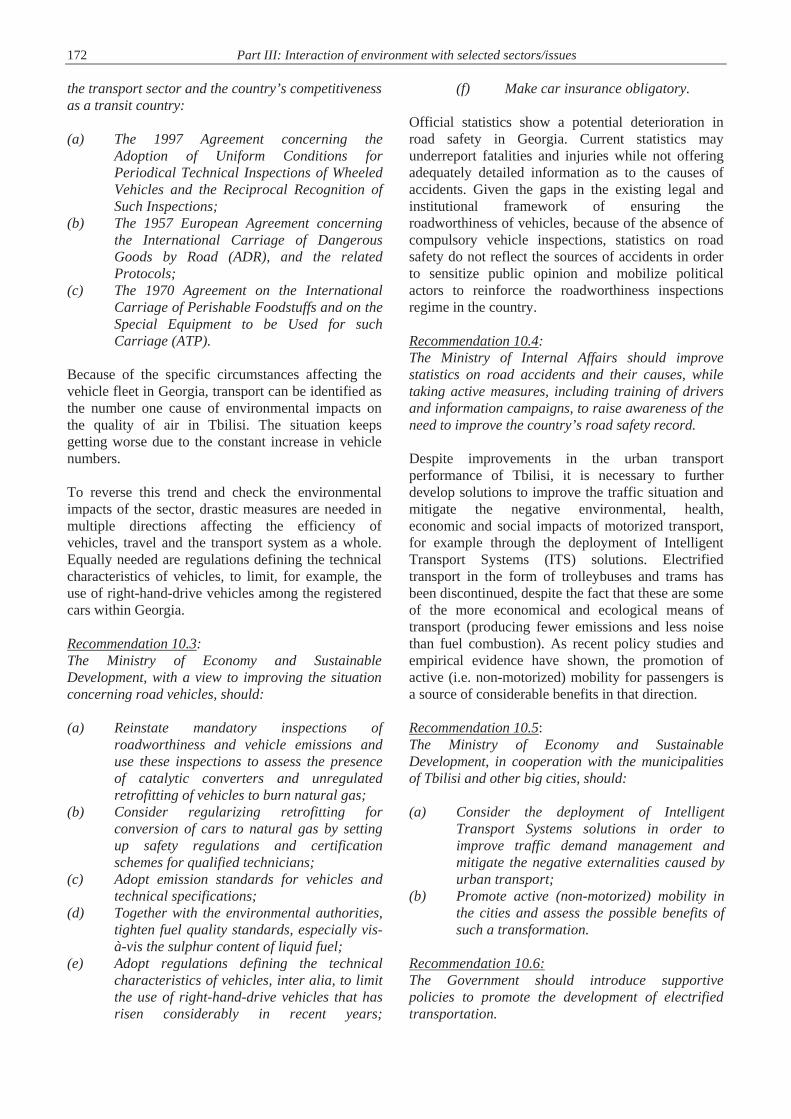
172 Part III: Interaction of environment with selected sectors/issues
the transport sector and the country’s competitiveness as a transit country: (a) The 1997 Agreement concerning the
Adoption of Uniform Conditions for Periodical Technical Inspections of Wheeled Vehicles and the Reciprocal Recognition of Such Inspections;
(b) The 1957 European Agreement concerning the International Carriage of Dangerous Goods by Road (ADR), and the related Protocols;
(c) The 1970 Agreement on the International Carriage of Perishable Foodstuffs and on the Special Equipment to be Used for such Carriage (ATP).
Because of the specific circumstances affecting the vehicle fleet in Georgia, transport can be identified as the number one cause of environmental impacts on the quality of air in Tbilisi. The situation keeps getting worse due to the constant increase in vehicle numbers. To reverse this trend and check the environmental impacts of the sector, drastic measures are needed in multiple directions affecting the efficiency of vehicles, travel and the transport system as a whole. Equally needed are regulations defining the technical characteristics of vehicles, to limit, for example, the use of right-hand-drive vehicles among the registered cars within Georgia. Recommendation 10.3: The Ministry of Economy and Sustainable Development, with a view to improving the situation concerning road vehicles, should: (a) Reinstate mandatory inspections of
roadworthiness and vehicle emissions and use these inspections to assess the presence of catalytic converters and unregulated retrofitting of vehicles to burn natural gas;
(b) Consider regularizing retrofitting for conversion of cars to natural gas by setting up safety regulations and certification schemes for qualified technicians;
(c) Adopt emission standards for vehicles and technical specifications;
(d) Together with the environmental authorities, tighten fuel quality standards, especially vis-à-vis the sulphur content of liquid fuel;
(e) Adopt regulations defining the technical characteristics of vehicles, inter alia, to limit the use of right-hand-drive vehicles that has risen considerably in recent years;
(f) Make car insurance obligatory. Official statistics show a potential deterioration in road safety in Georgia. Current statistics may underreport fatalities and injuries while not offering adequately detailed information as to the causes of accidents. Given the gaps in the existing legal and institutional framework of ensuring the roadworthiness of vehicles, because of the absence of compulsory vehicle inspections, statistics on road safety do not reflect the sources of accidents in order to sensitize public opinion and mobilize political actors to reinforce the roadworthiness inspections regime in the country. Recommendation 10.4: The Ministry of Internal Affairs should improve statistics on road accidents and their causes, while taking active measures, including training of drivers and information campaigns, to raise awareness of the need to improve the country’s road safety record. Despite improvements in the urban transport performance of Tbilisi, it is necessary to further develop solutions to improve the traffic situation and mitigate the negative environmental, health, economic and social impacts of motorized transport, for example through the deployment of Intelligent Transport Systems (ITS) solutions. Electrified transport in the form of trolleybuses and trams has been discontinued, despite the fact that these are some of the more economical and ecological means of transport (producing fewer emissions and less noise than fuel combustion). As recent policy studies and empirical evidence have shown, the promotion of active (i.e. non-motorized) mobility for passengers is a source of considerable benefits in that direction. Recommendation 10.5: The Ministry of Economy and Sustainable Development, in cooperation with the municipalities of Tbilisi and other big cities, should: (a) Consider the deployment of Intelligent
Transport Systems solutions in order to improve traffic demand management and mitigate the negative externalities caused by urban transport;
(b) Promote active (non-motorized) mobility in the cities and assess the possible benefits of such a transformation.
Recommendation 10.6: The Government should introduce supportive policies to promote the development of electrified transportation.

173
Chapter 11
FORESTRY AND ENVIRONMENT
11.1 Current situation
Extent and type of forests
Georgia is a country rich in forests, which extend from floodplain forests along the Black Sea coasts to sub-alpine stands. They occupy about 40 per cent of the territory, a total of 2,822,500 ha, with an unequal distribution across the regions. Approximately 97 per cent are located on the slopes of the Greater and Smaller Caucasus mountain ranges; the rest are found in the valleys of east Georgia and the Kolkheti lowlands. Compared to adjacent countries in the Caucasus, Georgia is relatively densely wooded. Forests cover 11 per cent of the territory in Azerbaijan and 10 per cent in Armenia, mainly due to unfavourable natural and soil conditions and scarce rainfall.
The forest area has slightly expanded over the last two decades, particularly since 2005 due to the fact that open woodlands, according to the Forest Law,
fell into the category of Forest. Primary forest of native species, with its extension of 500,000 ha largely consisting of protected forest, has remained virtually unchanged.
Forests are highly diverse. The country’s nine varied climatic zones, ranging from wet subtropical to everlasting snow and glacier zones, in combination with variation in soils and reliefs, favoured the development of diverse vegetation formations. Beech (Fagus orientalis) is the species with the highest growing stock, estimated to 229.3 million m3. It contributes approximately 50 per cent of Georgian forest stock (figure 11.1) and is most common in the Colchis region of western Georgia. Fir (Abies nordmanniana), spruce (Picea orientalis), hornbeam (Carpinus caucasica), oak (Quercus spp.), chestnut (Castanea sativa) and pine (Pinus spp) are also common and widespread species (figure 11.1), particularly in the dark coniferous forests on the mountains of Colchis and in western areas of eastern Georgia.
Source: Ministry of Environment and Natural Resources Protection ((based on new forest cover map, 2015) Note: The boundaries and names shown on this map do not imply official endorsement or acceptance by the United Nations.
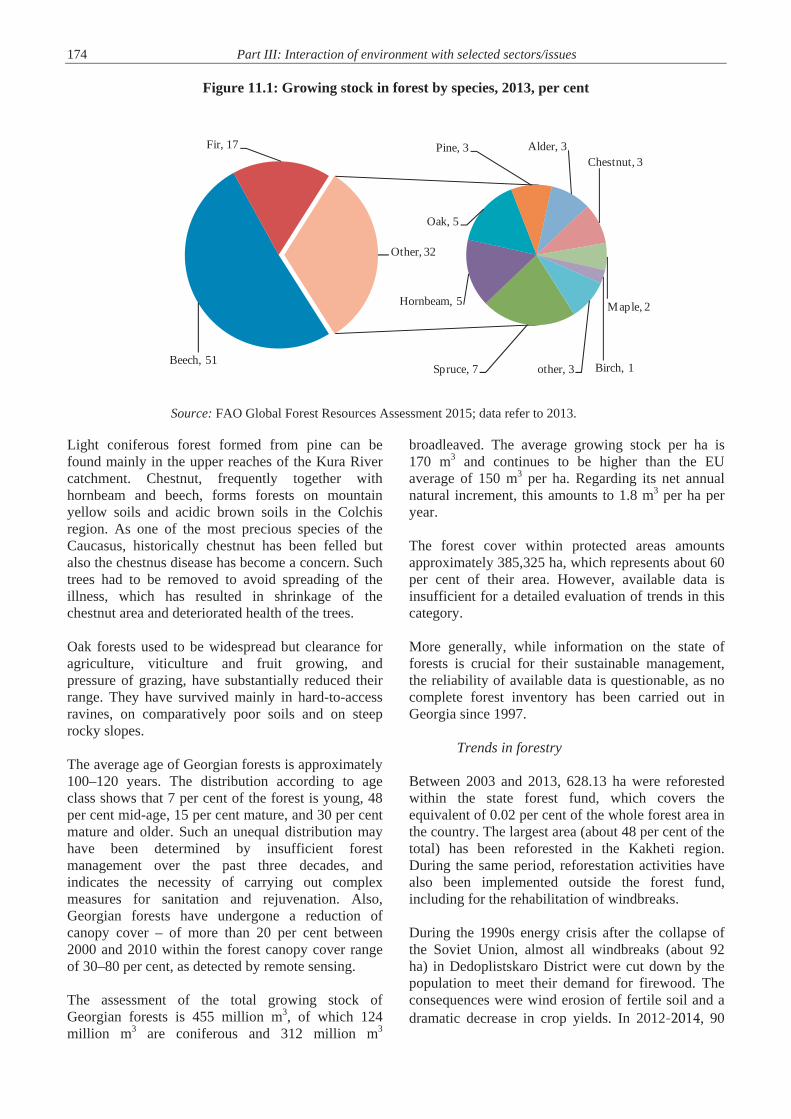
174 Part III: Interaction of environment with selected sectors/issues
Figure 11.1: Growing stock in forest by species, 2013, per cent
Source: FAO Global Forest Resources Assessment 2015; data refer to 2013.
Light coniferous forest formed from pine can be found mainly in the upper reaches of the Kura River catchment. Chestnut, frequently together with hornbeam and beech, forms forests on mountain yellow soils and acidic brown soils in the Colchis region. As one of the most precious species of the Caucasus, historically chestnut has been felled but also the chestnus disease has become a concern. Such trees had to be removed to avoid spreading of the illness, which has resulted in shrinkage of the chestnut area and deteriorated health of the trees.
Oak forests used to be widespread but clearance for agriculture, viticulture and fruit growing, and pressure of grazing, have substantially reduced their range. They have survived mainly in hard-to-access ravines, on comparatively poor soils and on steep rocky slopes.
The average age of Georgian forests is approximately 100–120 years. The distribution according to age class shows that 7 per cent of the forest is young, 48 per cent mid-age, 15 per cent mature, and 30 per cent mature and older. Such an unequal distribution may have been determined by insufficient forest management over the past three decades, and indicates the necessity of carrying out complex measures for sanitation and rejuvenation. Also, Georgian forests have undergone a reduction of canopy cover – of more than 20 per cent between 2000 and 2010 within the forest canopy cover range of 30–80 per cent, as detected by remote sensing.
The assessment of the total growing stock of Georgian forests is 455 million m3, of which 124 million m3 are coniferous and 312 million m3
broadleaved. The average growing stock per ha is 170 m3 and continues to be higher than the EU average of 150 m3 per ha. Regarding its net annual natural increment, this amounts to 1.8 m3 per ha per year.
The forest cover within protected areas amounts approximately 385,325 ha, which represents about 60 per cent of their area. However, available data is insufficient for a detailed evaluation of trends in this category.
More generally, while information on the state of forests is crucial for their sustainable management, the reliability of available data is questionable, as no complete forest inventory has been carried out in Georgia since 1997.
Trends in forestry
Between 2003 and 2013, 628.13 ha were reforested within the state forest fund, which covers the equivalent of 0.02 per cent of the whole forest area in the country. The largest area (about 48 per cent of the total) has been reforested in the Kakheti region. During the same period, reforestation activities have also been implemented outside the forest fund, including for the rehabilitation of windbreaks.
During the 1990s energy crisis after the collapse of the Soviet Union, almost all windbreaks (about 92 ha) in Dedoplistskaro District were cut down by the population to meet their demand for firewood. The consequences were wind erosion of fertile soil and a dramatic decrease in crop yields. In 2012-2014, 90
Beech, 51
Fir, 17
Spruce, 7
Hornbeam, 5
Oak, 5
Pine, 3 Alder, 3Chestnut, 3
Maple, 2
Birch, 1other, 3
Other, 32

Chapter 11: Forestry and environment 175 km on windbreaks were planted. As a result of agricultural fire in July 2015, almost 90 per cent of them were fully destroyed.
Disturbance and forest degradation
Forest fires
Regarding the extent of forests hit by wildfire, official statistics for the seven-year period 2008–2014 report that fire affects 200 ha per year on average, with an average of 24 forest fires per year. In 2014, this area amounts to 702.14 ha, with 69 fire incidents. Although data seem to show the extent of forest fires to be moderate, strong fluctuations are observed over years, due in part to the increasing occurrence of dry spells and heat waves (table 11.1). Due to their coniferous composition, the forests of the Samatskhe- Javakheti and Racha-Lechkhumi-Kvemo-Svaneti regions are the most vulnerable to forest fires. In these regions, the extent of land covered by fire in 2008 and 2009 is said to have been much wider than is reported in official statistics. The Ministry of Environment and Natural Resources Protection reports that about 950 ha of forest were burnt in Borjomi- Bakuriani forest district, but this is not included in such statistics. According to the Ministry, in 2009, Racha-Lechkhumi was the most affected region, with about 60.4 ha hit by fire; the main reason was the multiple cases of burning of straw after harvest, with fire spreading to the forest. The majority of uncontrolled fires are started by human activities during spring and autumn, notably in the context of agricultural and pastoral land use. Enhancing capacities on fire prevention and management, and wildfire disaster risk reduction, through the development of a danger rating system, the adoption of targeted policy and legislation, a budget increase and the strengthening of human capacities, including among rural communities, remain a clear priority for the country. A holistic approach and an inter-agency coordination mechanism engaging all line ministries, including the
Ministry of Agriculture and the Ministry of Internal Affairs , other relevant agencies and civil society organizations, are lacking.
Pests and diseases Pests and diseases, such as the spruce bark beetle (Ipstytipografus) and chestnut blight (Cryphonectria parasitica), pose a menace to Georgia’s forests, particularly in the Samtskhe-Javakheti and Imereti regions, where 26,000 ha and 17,000 ha, respectively, were affected in 2011–2012. Mass dying of Colchic box tree as a result of pathogenic fungi Cylindrocladium buxicola is observed in Western regions of Georgia, where almost all the stands have been destroyed in Adjara; pine tree disease is reported to be currently taking place in Tusheti and around Tbilisi. Activities aimed at managing spruce bark beetle were started in June 2013. Since then, over 5,000 units of pheromone catchers were bought by the NFA and placed in the hit regions.
Illegal logging According to official statistics, the volume of illegal logging was 8,262 m3 in 2008 and 20,994 m3 in 2014 (figure 11.2). However it still remains a threat and, in 2014, the DES detected 2,489 violations, which produced damage to the environment (e.g. deforestation and biodiversity loss) costed at more than 4.1 million lari. Illegal operations range from commercial extraction of highly valuable timber to fuelwood cutting for both local and foreign markets. A number of factors create the ground for illegal operations and undermine the reliability of official data: the long-term forest licensing regime, resulting in the transfer of land by state forest authorities without first carrying out an up-to-date forest inventory; the lack of legal instruments (legislative, procedural) to monitor the process of use of forest resources by private investors; the limited number of rangers; and the high demand by local populations for fuelwood, due to rural poverty and the lack of affordable alternatives to firewood
Table 11.1: Forest fires, 2008-2014, number
Source: Ministry of Environment and Natural Resources Protection and National Forestry Agency, 2014.
2008* 2009 2010 2011 2012 20132014
(Jan-Aug)Fire incidents 32 7 21 4 11 35 55Forest areas covered by fire in hectares 1 246 60 371 7 199 88 568
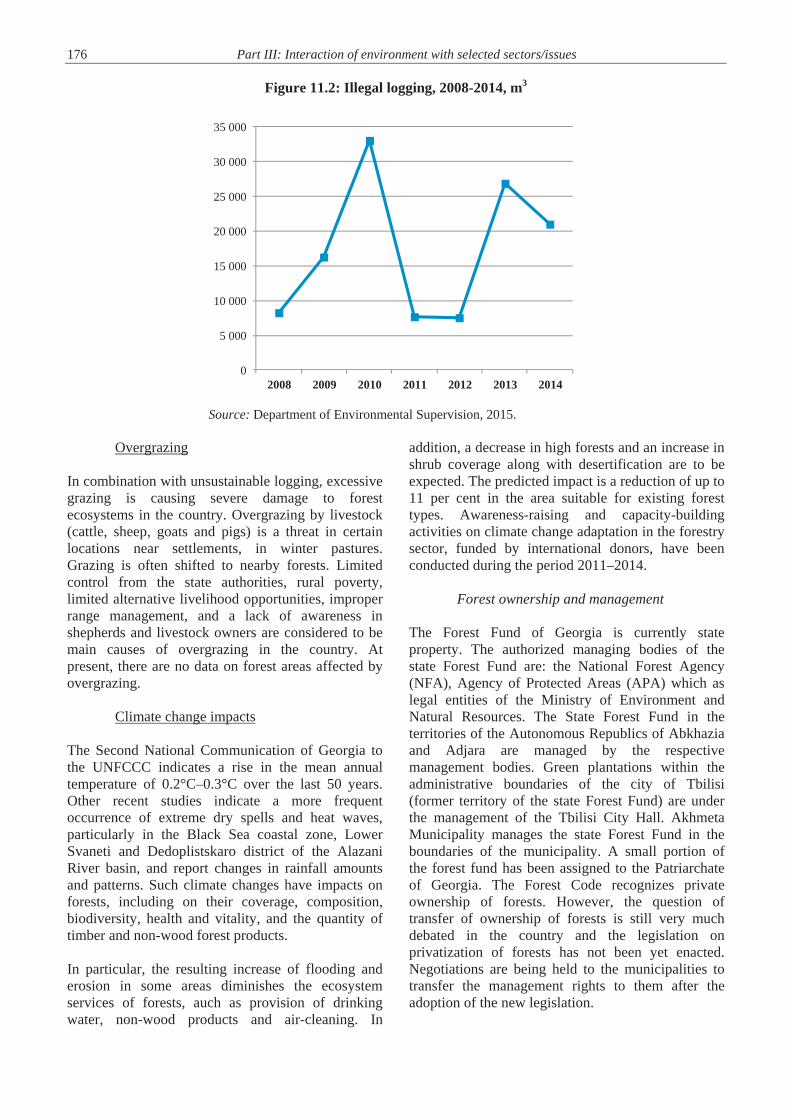
176 Part III: Interaction of environment with selected sectors/issues
Figure 11.2: Illegal logging, 2008-2014, m3
Source: Department of Environmental Supervision, 2015.
Overgrazing
In combination with unsustainable logging, excessive grazing is causing severe damage to forest ecosystems in the country. Overgrazing by livestock (cattle, sheep, goats and pigs) is a threat in certain locations near settlements, in winter pastures. Grazing is often shifted to nearby forests. Limited control from the state authorities, rural poverty, limited alternative livelihood opportunities, improper range management, and a lack of awareness in shepherds and livestock owners are considered to be main causes of overgrazing in the country. At present, there are no data on forest areas affected by overgrazing.
Climate change impacts
The Second National Communication of Georgia to the UNFCCC indicates a rise in the mean annual temperature of 0.2°C–0.3°C over the last 50 years. Other recent studies indicate a more frequent occurrence of extreme dry spells and heat waves, particularly in the Black Sea coastal zone, Lower Svaneti and Dedoplistskaro district of the Alazani River basin, and report changes in rainfall amounts and patterns. Such climate changes have impacts on forests, including on their coverage, composition, biodiversity, health and vitality, and the quantity of timber and non-wood forest products.
In particular, the resulting increase of flooding and erosion in some areas diminishes the ecosystem services of forests, auch as provision of drinking water, non-wood products and air-cleaning. In
addition, a decrease in high forests and an increase in shrub coverage along with desertification are to be expected. The predicted impact is a reduction of up to 11 per cent in the area suitable for existing forest types. Awareness-raising and capacity-building activities on climate change adaptation in the forestry sector, funded by international donors, have been conducted during the period 2011–2014.
Forest ownership and management
The Forest Fund of Georgia is currently state property. The authorized managing bodies of the state Forest Fund are: the National Forest Agency (NFA), Agency of Protected Areas (APA) which as legal entities of the Ministry of Environment and Natural Resources. The State Forest Fund in the territories of the Autonomous Republics of Abkhazia and Adjara are managed by the respective management bodies. Green plantations within the administrative boundaries of the city of Tbilisi (former territory of the state Forest Fund) are under the management of the Tbilisi City Hall. Akhmeta Municipality manages the state Forest Fund in the boundaries of the municipality. A small portion of the forest fund has been assigned to the Patriarchate of Georgia. The Forest Code recognizes private ownership of forests. However, the question of transfer of ownership of forests is still very much debated in the country and the legislation on privatization of forests has not been yet enacted. Negotiations are being held to the municipalities to transfer the management rights to them after the adoption of the new legislation.
0
5 000
10 000
15 000
20 000
25 000
30 000
35 000
2008 2009 2010 2011 2012 2013 2014

Chapter 11: Forestry and environment 177 About 20 per cent of the forest area, equivalent to 560,000 ha in 2015, is available for timber production. The rest is functionally recreational and reserve forest. Such distribution has remained practically unchanged since 1990. Since 2007, forest management rights and responsibilities have been transferred from the public administration to private companies through long-term licenses for timber harvesting only (usually for 20 years and up to 49 years) 97505,83 ha.
Economics of the forestry sector The relative economic importance of the forestry sector has been decreasing over the years and remains marginal. According to available data for 2013, the gross value added from forestry and logging amounts to 72.4 million lari, which is 0.3 per cent of national GDP. This compares with 2 per cent in Austria and 0.8 per cent in the Russian Federation for the same year. Such reduction of the share of the forestry sector is due to an increase in GDP, while the value of forestry operations has remained roughly the same over time (table 11.2). At present, the economic potential of forests is not fully used. There is large scope for development in terms of increased harvesting on a sustainable basis and processing for export, as well as for domestic consumption. In Georgia, the official consumption of timber and firewood is reported to amount to 241 m3 per 1,000 inhabitants in 2010, with an annual increase of 18.5 per cent over the period 2005–2010. Georgian exports of forest products are reported to amount to 300,000 m3 in 2010, with an annual increase of 30 per cent over the period 2005–2010 The Government revenue collected from the domestic production and trade of forest products (i.e. roundwood, awnwood, biomass, wood-based panels, pulp and paper, and non-wood forest products) and services (including concession fees, permit and licence fees) is estimated to amount to 3.75 million lari, while public expenditure on forestry-related activities amounts to 11.74 million lari. Currently, 677 people are employed in the forestry sector, of which 87 are women. This represent a sensible reduction from 2005, when the forestry sector employed 2,017 people. In Georgia, 87.1 per cent of households in rural areas and 17.4 per cent of households in urban areas depend heavily on wood for cooking and heating. Most of the wood harvested in Georgia is used directly for fuelwood and comes from forests; however, trees from fruit orchards, gardens, windbreaks, etc. complement the supply. Fuelwood is
mainly traded in informal markets and official recorded data do not properly reflect the fuelwood situation in the country. The figures for fuelwood removals dwarf the total amount of industrial roundwood removed for forest products in Georgia. In 2013, 100,000 m3 of industrial roundwood are harvested annually from the forests, with two thirds of this wood (75,000 m3) derived from hardwood species, mainly beech, and one third (43,000 m3) from softwood species. The biggest share of the hardwood species were exported unprocessed (in log form) until 2004, but this has changed dramatically. Since 2006, very little raw timber is reported to have left the country unprocessed, with sawmills now processing industrial roundwood into sawn wood for the domestic and export markets. About one third of the sawn wood was reportedly being exported in the period 2006–2013. Although domestic consumption and export of timber and construction materials have considerable potential, the unfavourable investment climate and uncertain regulatory and governance framework undermines international investors’ interest in entering the Georgian forestry sector. 11.2 Role and functions of forests
Biodiversity conservation Georgia is part of the Caucasus ecoregion – one of WWF’s 35 “priority places” and one of 34 “biodiversity hotspots” identified by the International Union for Conservation of Nature (IUCN) as being the richest and at the same time most threatened reservoirs of plant and animal life on Earth. Forests are the most important biome for biodiversity in the region, harbouring many endemic and relic species of plants and providing habitats for globally rare and endangered animals. Around 95–98 per cent of Georgian forests have natural origins. Their composition, structure, growth, development and other characteristics determine a rich biological diversity – up to 400 trees and shrub species grow in Georgian forests. About 65 per cent of animal species that are known to live in the region of the Caucasus depend on forests (chapter 6).
Protection of water and soil In Georgia, the vast majority of forested land is represented by mountainous forests providing such key ecosystem services as water regulation and soil protection.
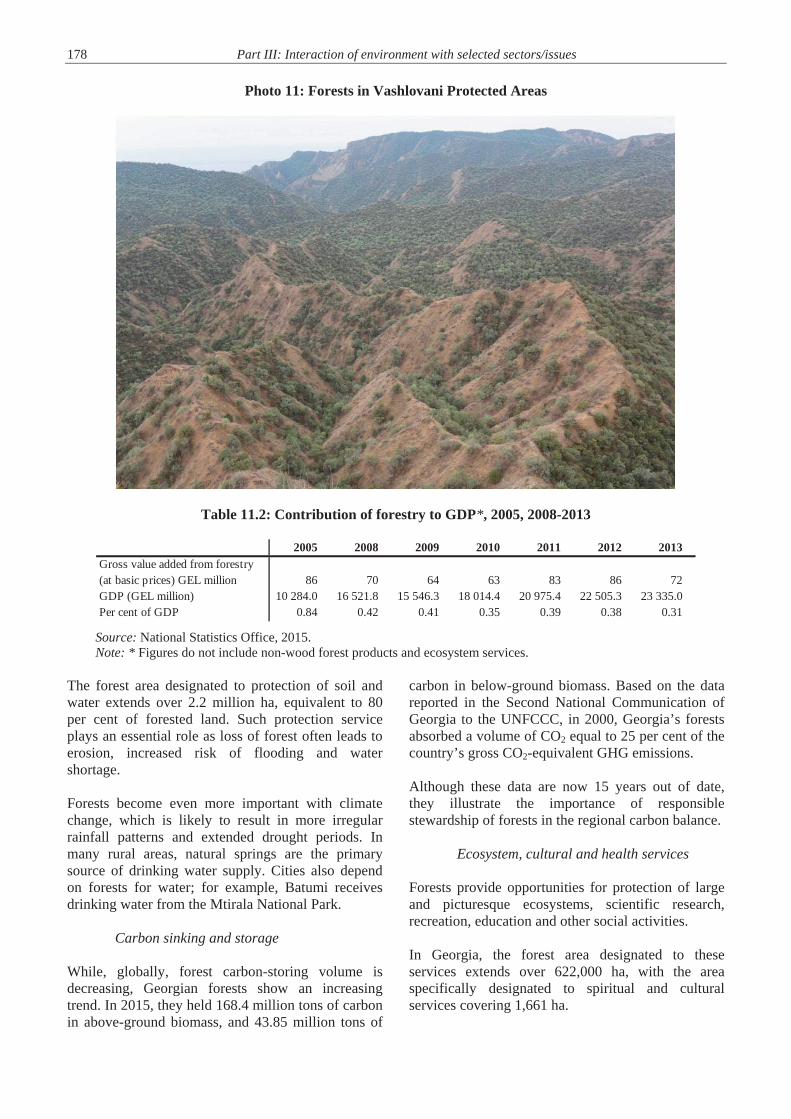
178 Part III: Interaction of environment with selected sectors/issues
Photo 11: Forests in Vashlovani Protected Areas
Table 11.2: Contribution of forestry to GDP*, 2005, 2008-2013
Source: National Statistics Office, 2015. Note: * Figures do not include non-wood forest products and ecosystem services.
The forest area designated to protection of soil and water extends over 2.2 million ha, equivalent to 80 per cent of forested land. Such protection serviceplays an essential role as loss of forest often leads to erosion, increased risk of flooding and water shortage.
Forests become even more important with climate change, which is likely to result in more irregular rainfall patterns and extended drought periods. Inmany rural areas, natural springs are the primary source of drinking water supply. Cities also depend on forests for water; for example, Batumi receives drinking water from the Mtirala National Park.
Carbon sinking and storage
While, globally, forest carbon-storing volume is decreasing, Georgian forests show an increasingtrend. In 2015, they held 168.4 million tons of carbon in above-ground biomass, and 43.85 million tons of
carbon in below-ground biomass. Based on the data reported in the Second National Communication of Georgia to the UNFCCC, in 2000, Georgia’s forests absorbed a volume of CO2 equal to 25 per cent of the country’s gross CO2-equivalent GHG emissions.
Although these data are now 15 years out of date, they illustrate the importance of responsible stewardship of forests in the regional carbon balance.
Ecosystem, cultural and health services
Forests provide opportunities for protection of largeand picturesque ecosystems, scientific research,recreation, education and other social activities.
In Georgia, the forest area designated to these services extends over 622,000 ha, with the area specifically designated to spiritual and culturalservices covering 1,661 ha.
2005 2008 2009 2010 2011 2012 2013Gross value added from forestry(at basic prices) GEL million 86 70 64 63 83 86 72GDP (GEL million) 10 284.0 16 521.8 15 546.3 18 014.4 20 975.4 22 505.3 23 335.0Per cent of GDP 0.84 0.42 0.41 0.35 0.39 0.38 0.31
Chapter 11: Forestry and environment 179 11.3 Pressures from forestry According to the Fourth National Report of Georgia to the Convention on Biological Diversity, despite recent trends indicating a decrease in illegal logging and wood and firewood extraction, these remain an important threat to forests and their biodiversity. The vast majority of rural households in the country use fuelwood extracted from nearby forests for heating and cooking and as building material. Forests provide commercial timber for both domestic markets, in particular for construction and furniture, and international markets in neighbouring countries, including Armenia, Azerbaijan, Turkey and Iran. Ineffective management and control of all these activities is leading to degradation in the composition and quality of the forests in the country. The pressure on beech forests is especially severe because of the high demand for this species and the proximity of beech forests to roads and villages, facilitating access for extraction. According to data gathered in 2009, 20,760 ha of forest need active management and restoration as a result of thinning, mudslides and other causes. But reliable and detailed data on the health of Georgian forests are not available. Economic activities have caused severe damage to floodplain forests especially. In Georgia this is particularly evident as these forests act as important corridors and refuges for many animal species. Today, only fragments of the original floodplain forests have been preserved, where the expansion of arable land and the hydrological changes caused by several artificial structures along the rivers have resulted in disruption of this ecosystem. Forests are the source of a great variety of non-timber products, such as fruits, berries, nuts, mushrooms, medical plants, honey and decorative plants. Many of these products are a common component of the diet of the rural population. These products are also marketed by rural households to generate additional income. At present, the extraction of these non-timber forest products is not legally regulated. Moreover, assessment of the status of these resources is not yet complete. Accordingly, rare, endemic and endangered species are not fully protected by law. The only exceptions to this concern the extraction of fir-tree cones, and snowdrop bulbs and cyclamen tubers, listed in the annexes to CITES (chapter 6). 11.4 Forest monitoring In Georgia, forest monitoring is currently performed by the NFA, the APA and the DES, all under the
Ministry of Environment and Natural Resources Protection. However, a comprehensive and effective monitoring system for assessing the state of forests and forest resources, using modern methodologies and based on international standards and best practices, is lacking (chapter 6). Data and assessments on the status of Georgian forests are incomplete and based on a sample of inventory or satellite images over limited periods of time. A complete forest inventory dates back to 1997, and partial updates have only recently been initiated through temporary ground plots. Forest inventories in Borjomi-Bakuriani and Kharagauli districts have been finished, Aspindza forest inventory has started by the NFA, forest inventory in Akhmeta in being negotiated with GIZ, Tianeti forest inventory is being negotiated with the World Bank. Effective monitoring of the state of forests is crucial, to support the implementation of sustainable and multipurpose forest management principles and practices. It requires reliable and up-dated information in line with international systems for forest resource assessment and an urgent update of the forest inventory, as well as the introduction of a categorization system providing the mapping of both sensitive forest stands for protection and forests with exploitable timber resources. Availability of professionals skilled to perform monitoring activities and to conduct inventories remains a challenge and training of forest personnel for this purpose is a high priority. 11.5 Assessment of environmental performance
Legal framework
Forest Code The 1999 Forest Code is intended to guarantee the protection of forests’ ecological and social functions while providing the country with commercial wood for sale. The latest revised version of the Code focuses on the relationship between state and private sector investment, on the management functions of forest resources, and the identification of ecological zones for forest mapping and inventory. The functions of environmental inspectorates are identified and these bodies are required to cooperate more closely with the prosecutor’s office in addressing illegal cutting and corruption problems. The Code provides for a system of monitoring compliance, but making the monitoring system effective requires wider funding and enhanced technical capacity.
180 Part III: Interaction of environment with selected sectors/issues
Furthermore, provisions in the Code do not correspond to principles of sustainable forest management; they are contradictory with other relevant primary and secondary legislation, and contain loopholes that provide the ground for illegal logging and forest crimes. In particular, the Code provides for the transfer of forest land into long-term licencing to private investors. However, transfer has been implemented by previous forestry authorities on the basis of old and not reliable inventory data, without first carrying out re-inventory. This responsibility is assigned to prospective licenses, without the requirement to carry out inventory before commencement of forest use. There are no legal instruments (legislative, procedural) to monitor the process of use of forest resources by private investors. Provisions for private forest ownership are not supported by necessary legislation on privatization of Georgian forests. Although the Code contains the category of local forests to be managed by self-governing units, such practice does not exist because of the lack of relevant supportive legislation and necessary resources. In 2014, the Ministry of Environment and Natural Resources Protection has undertaken a new attempt to draft a new forest code, to be submitted for review by key stakeholders, approval by the Government and final adoption by the Parliament in 2015–2016. In addition, to plug legislative gaps, in August 2014, the Ministry of Environment and Natural Resources Protection proposed a set of amendments to the 2010 Resolution No. 242 on Approval of Rules on Forest Use. The package includes various aspects, such as definitions of logging areas and legal regulation of auctions.
Law on Forest Fund Management In Georgia, the management of the state forest fund is regulated by the 2011 Law on Forest Fund Management No. 4419, amended in 2013. According to the Law, the regulation of the forest fund, except for protected areas and the territories of the Autonomous Republics of Ajara and Abkhazia, is within the jurisdiction of the NFA, an LEPL under the Ministry of Environment and Natural Resources Protection. The Law defines the basic principles of functioning of the NFA and its competencies in regard to forest fund management, including, for instance, the monitoring of the state forest fund, generation of profit from forest use and restoration of forests.
Policy framework
National Forest Concept and National Forest Programme process The 2013 National Forest Concept for Georgia is the first policy document for the country that recognizes the strategic role of this natural resource, defines the relation of the State with forests, and aims at establishing a system of sustainable forest management, which marks a step forward. The implementation of the identified principles, directions and actions requires extensive reform of primary and secondary forest legislation, and the development of an action plan for sustainable forest management with specific timeframes and responsibilities. It also requires strong institutional coordination, and effective enforcement and monitoring mechanisms. Other challenges for the development of sustainable forestry in Georgia continue to be linked to insufficient awareness and consideration of the value of forest services and public participation in decision-making for the forestry sector. Following the adoption of the Concept, the National Forest Programme process was launched in September 2013 within the framework of Forest Europe to assist reforms in the forestry area in Georgia. It is led by the Forest Policy Service. The main purposes of the National Forest Programme are to: involve stakeholders in the development of policies, strategies and legal frameworks; improve coordination among the donors, supporters and various NGOs (e.g. civil society interaction promoted by CENN, German Federal Enterprise for International Cooperation (GIZ), Austrian Development Agency/Austrian Federal Forests [ADA/OEBF] support to the formulation of a national forest programme, World Bank support to the review of the forest legislation, EU/ADA-financed Forest Law Enforcement and Governance [FLEG] initiative, and others); propose solutions to specific forest issues; communicate on initiatives and achievements for the forestry sector; and help mobilize additional funding. Within the National Forest Programme, eight thematic working groups were established: 1. Restoration and Protection of Forests; 2. Economic Valuation of Forests; 3. a) Human Capacity Development in the Forestry
Sector; b) Environmental Education and Awareness-Raising;

Chapter 11: Forestry and environment 181 4. a) Legislation;
b) Institutional Reform; 5. Forest Monitoring and Information System; 6. National Sustainable Forest Management
Standards; 7. Mitigating the Impacts and Adaptation of
Georgian forests to Climate Change; 8. Perspectives of Biosphere Reserves Formation in
Georgia. At the same time, technical groups were formed in relation to specific threats, such as forest fires, pests and diseases, and illegal logging. In each group key stakeholders are represented, including the Forest Policy Service, the NFA, the DES, academia, the private sector, donors, international organizations, other line ministries, the church and independent experts. Action plans have been elaborated for each group, also special outputs have been reached: National Action Plan for Box Tree (Buxus
Colchica) Disease has been elaborated and actions have been conducts in accordance with it, including planting 5 000 grafts, awareness raising in different regions;
Common Rules for Tending Trees in the Cities has been elaborated and has already been distributed to the Municipalities for adoption;
Amendments in the Resolutions N 240, 241, 242, 132, 46 have been decided in the framework of National Forest Programme.
Second National Environmental Action
Programme The 2012 Second National Environmental Action Programme 2012–2016 (NEAP-2) serves as a basis for long-term environmental planning in the country, including for forestry. Long-term goals, short-term targets and respective measures are proposed under 11 themes, including forestry. However, three years after its inception, most of the proposed short-term targets and measures for sustainable forest management (e.g. the development of new forest legislation, establishment of forestry units as LEPLs, and development and testing of forest information and monitoring systems) have not been achieved, A mid-term implementation report was conducted in May 2015
Institutional framework In Georgia, the forestry sector has gone through several institutional changes. In 2004, the state entity
responsible for forest management, the State Forest Department, was put under the Ministry of Environment Protection and Natural Resources, then in 2008 its licensing functions were transferred to the then Ministry of Economic Development (later renamed the Ministry of Economy and Sustainable Development). In 2011, a new reform led to a restructure. The natural resources function under the then Ministry of Environment Pretection and Natural Resources was moved to the Ministry of Energy, which became the Ministry of Energy and Natural Resources. The Environmental Inspectorate, the Investigation Department and the State Forest Department all converged into the Agency of Natural Resources, an LEPL created under the new Ministry of Environment and Natural Resources Protection. As a result of the 2011 reform, the Agency of Natural Resources governed all state forests, except those in protected areas under the APA. All key functions related to natural resources (hunting, fishing, timber and non-timber resources, and minerals) were concentrated in the Agency of Natural Resources: policy, legislation development, protection, monitoring, and control of licences and permits. The Agency was also given the function of issuing licences for use of forest resources, which, since 2008, had been with the Ministry of Economic Development. During 2013, a new reform was undertaken. Three entities were established in the system of the Ministry of Environment and Natural Resources Protection: The NFA, an LEPL, responsible for the
management of state-owned forests; The DES, responsible for inspection; The Policy Service Service, to support the
Ministry in defining the strategy and elaboration of policy documents.
As a result of the reform, the Agency of Natural Resources was abolished. The reform of 2013 is expected to enhance capacity to mobilize resources, implement the principles and actions of the National Forest Concept and more effectively address pressing challenges for the forestry sector. There is clear separation of the policy, management and supervision functions, and division of tasks among these units. Initiatives have been implemented since the reform and more is planned to contribute to the enhancement of human resources and institutional capacity for the forestry sector, including proper staffing, professional training and higher education programmes. The next steps involve improved and stronger coordination among all the Ministry of Environment

182 Part III: Interaction of environment with selected sectors/issues
and Natural Resources Protection subordinate structures for the forestry sector, as well as with other key ministries, particularly the Ministry of Agriculture in relation to land use and the Ministry of Economy and Sustainable Development concerning energy policies, and the Ministry of Internal Affairs for forest management services. Since 2013, the Forest Policy Service has been working on a donors’ coordination matrix in order to streamline donors’
efforts and contributions on forestry (box 11.2).
Department of Environmental Supervision Inspection and supervision of forests is performed by the DES. Over the last two years, environmental inspectorates have strengthened their functions and cooperate more closely with the prosecutor’s office in addressing illegal logging and corruption problems.
Box 11.1: National Forest Concept for Georgia
The 2013 National Forest Concept for Georgia defines the State’s approach to forests, taking into account their functional purposes and values. It applies to all Georgia’s forests, irrespective of the forms of ownership, possession and management. It is meant to serve as a basis for development of forestry-sector-related policy, legislation and institutional set-up. The Concept identifies key problems for the forestry sector in Georgia, its main principles and priority directions. A weak legal framework, lack of proper consideration of forests’ values and functions in the decision-making process, rural poverty, insufficient awareness and inadequate financing are identified as main threats. The principles of the Concept are in accordance with relevant statements and commitments in international agreements relevant to forestry and recognized by Georgia. They are:
Sustainable management of forests; Precautionary principle – to maintain protective functions of forests and their ecological balance; All forests are local; Separation of policy, management and supervision functions; Forests are an integral part of the sustainable development of the country.
The Concept identifies priority directions and concrete actions for forest management planning; rational use of forest resources; forest ownership, management and use rights; and adaptation to the impacts of climate change.
Box 11.2: Donors’ Coordination Matrix
Since 2012, the interest of donors and development partners in supporting the forestry sector in Georgia has increased remarkably. On 19 July 2013, the Ministry of Environment and Natural Resources Protection organized a donor coordination meeting to present the key lines of the ongoing forestry sector reform and of the 2013 National Forest Concept for Georgia, and stress the need for coordination of the growing number of projects and initiatives. As a result of the meeting, in September 2013, a Donors’ Coordination Matrix was developed by the National Forestry Agency, the Forest Policy Service and the Ministry’s Division of International Relations. The Matrix provides an overview of all donors and international partners’ contributions to the forestry sector reform in Georgia. It allows for the exchange of information about ongoing and planned initiatives, negotiation of options for harmonizing different approaches to avoid overlapping and contradictions, and identification of opportunities for synergies. In addition, it allows for the identification of gaps, where additional support is needed. Contributions are clustered by:
Donor/partner; Intervention area (political and strategic framework, legal framework, institutional framework, human capacity
development in the forestry sector, country-wide forest monitoring, country-wide forest inventory, sustainable forest management);
Type of assistance (financial support, long-term/short-term advisory support, expert study, training, study tour, workshop/conference). Currently, the Forest Policy Service is going through a second round of information-gathering, in which donors and development partners are asked to review the information provided in 2013, to indicate changes to their original planning, and to include information about new initiatives. In addition, donors and development partners were invited to participate in working groups and plenary meetings, organized in the framework of the National Forest Programme process, to negotiate their ideas to support the forestry sector reform with other key stakeholders.

Chapter11: Forestry and environment 183 This was not the case between 2010 and 2013, when the DES was moved to be under the Ministry of Energy and Natural Resources, and its control and inspection role and financial resources were, sensibly, reduced. The main functions of the Department are to prevent, detect and suppress illegal use of natural resources and environmental pollution, and to control performance through its inspectorates, licences and permits issued by the NEA. Currently, the DES is in charge of controlling 42 special licences for timber processing, 18 special hunting licences and 37 export licences. Timber processing enterprises must register with the DES, and at present there are 684 registered enterprises, mostly run by indigenous people. A modern call centre (hotline 153) was established for notification of environmental damage and crimes, including forest fires. It is widely advertised, including on the TV network. Based on available data, in 2014, 2,506 breaches of environmental law were detected, of which about half were breaches of forest legislation by illegal logging, forest clear-cutting and non-payment of licence fees. The total damage to the environment is estimated to amount to more than 6.6 million lari.
Institutional, financial and human capacity Since 2013, the Government has increased the Ministry of Environment and Natural Resources Protection budget by 100 per cent to support the ongoing processes of reorganization, including for the newly established forest-management-related institutions. Strengthening of forestry functions has been prioritized among the functions of the Ministry, and is already reflected in the increased number of staff and in staff salaries (mainly for forest rangers), as well as in the allocation of funds for commencement of the forest inventory. The NFA currently has a staff of 869, of which 83 are based in the central office. The DES has a staff of 348, of which 81 are in the central office and 267 in the territorial units; since 2010, it has benefited from an overall increase of 100 staff members and an increase in their salaries by almost 50 per cent. Challenges are related to the insufficient number of foresters and, in addition, the incumbents are poorly trained at both the theoretical and practical levels and not properly equipped. At present, there are forest units where a ranger is often responsible for a territory of more than 4,000 ha. An electronic control system needs to be put in place. In the period following Georgia’s independence, demand for forestry skills fell massively and, as a
result, many qualified people left the sector. Measures to reverse this trend have been taken over the last few years, but they will take some years to produce results and are considered to be still insufficient. In 2013, with the financial support of the USAID Human and Institutional Capacity Development Project, training modules for forest rangers were developed by the Environmental Information and Education Centre, and during 2014, training of trainers was conducted for about 250 NFA rangers. The rangers lack adequate uniforms, standard forestry equipment and SUVs. The issue of education, training and awareness-raising is covered by the National Forest Programme process. One of the working groups is currently working on human capacity development, trying to identify qualifications as well as education and training requirements for forest management, from foresters to policymakers. Professional development, training, education at bachelor and master levels, and PhD and post-doctorate research work are the key issues addressed by the group. The proposal also seeks to include short-term activities, aiming at filling the gaps in forestry education (for instance, training of trainers for NFA staff, basic knowledge for rangers, inventory), as well as a detailed human and institutional capacity action plan.
Regulatory, economic and information instruments During the period 2009–2012, the Government adopted regulations for conservation and use of forests and forest resources (box 11.3), which contribute to the improved governance of this sector. In light of the recent issuance of the National Forest Concept and the ongoing effort to prepare a new Forest Code, the regulatory framework will need to be reviewed and completed to be fully in line with sustainable forest management standards. Key instruments for effective management and monitoring of the forest fund are the long-term forest management plans with clear management goals that, since 2013, are to be developed for both production and conservation areas. According to recent data, plans exist for more than 2.8 million ha, of which about 2.5 million ha are for production and 273,700 ha for conservation. However, they are based on old forest inventory data. A few of these plans have been updated recently with the support of the EU twinning projects, in consultation with local stakeholders. Forest certification is also promoted by the National Forest Concept. However, at present, no forests in Georgia are certified with published standards and under an independently verified forest certification
184 Part III: Interaction of environment with selected sectors/issues
scheme such as those of the Forest Stewardship Council (FSC) or the Programme for the Endorsement of Forest Certification (PEFC). Regarding economic instruments for forest management, the current legislation foresees the following timber sales methods: For commercial wood: the transfer of long-term
wood use rights by the State (usually for 20 years and up to 49 years) to private companies on the basis of auctions. In 2013, the volume of cuts by licence holders for timber amounted to 108,904 m3 and for fuelwood, 11,837 m3;
For fuelwood and small-sized wood for personal consumption: the marking of trees in the forests located near population centres by the state forestry authorities; the local villagers then obtain permission to cut this wood by buying tickets for timber production, make payments and conduct wood harvesting operations themselves with hired workers. Interested people must buy a wood ticket from a bank for a small fee of 2 lari to 3 lari (€0.9 to €1.30) per m3 depending on the type of tree. The maximum volume is set at 15 m3 for the mountain villages and 7 m3 for other villages. In 2013, the volume of social cuts for timber amounted to 22,2012 m3 and for fuelwood, 483,026 m3.
Nevertheless, there are major concerns regarding the transparency of the auction system and the proper management and control of issued licences, as user rights are being issued without prior update of the forest inventory for the concerned areas and on the basis of incomplete information on volume and quality of their forest resources (chapter 2). According to the forest legislation, citizens and public organizations have the right to receive full,
reliable and timely information on the condition of the state forest fund and to participate fully in the planning and management of the state forest fund. The following information is required to be published before a decision is made on forest use in a particular area: the forest management plan, categories established in the state forest fund, the protection regime established for the state forest fund, and the allocation of areas of the state forest fund for forest use. Although the provisions regulating public participation are in line with practice in European countries and with relevant international conventions, much more needs to be done for their effective implementation.
Forestry-related agreements and processes
Georgia has signed several international environmental agreements relevant to its forestry sector, resulting in international obligations and access to international scientific and technological knowledge and funds. Georgia has been a party to the Convention on Biological Diversity since 1994 and, based on its requirements, National Biodiversity Strategy and Action Plans are developed and National Reports issued, including chapters on the forestry sector (chapter 6). In the context of Forest Europe (the Ministerial Conference on the Protection of Forests in Europe – a pan-European political process for the sustainable management of the continent’s forests), the Ministry of Environment and Natural Resources Protection regularly takes part in expert meetings in preparation for the ministerial conferences, and contributes to the Pan-European Criteria and Indicators for Sustainable Forest Management.
Box 11.3: Legal and regulatory framework in support of sustainable forest management
2005 Resolution No. 132 on Approving Rules and Terms for Issuing Forest Use License 2007 Resolution No. 105 on Rules for Marting Out of Local Forest 2007 Resolution No. 21 Approving Rules and Terms for Issuing Licenses for Export Purposes of Snowdrop Bulbs
and/or cyclamen tubers Enlisted in the Annexes of the Convention on International Trade in Endangered Species of Wild Fauna and Flora (CITES) and Fir Cones
2010 Resolution No. 240 on Establishing Boundaries of the Forest Fund 2010 Resolution No. 241 on General Care and Reforestation 2010 Resolution No. 242 on Approval of Rules on Forest Use 2011 Resolution No. 299 on Deliniation of State Forest Fund 2014 Resolution N 46 on Rules for Movement of Timber on the Territory of Georgia and Technical Regulations for
Primary Processing Facility (Sawmil) of Round Timber (Logs) 2014 Resolution No. 54 on Adopting Technical Regulation – Methods of Definition (Calculation) of Environmental
Damage
Chapter11: Forestry and environment 185 11.6 Conclusions and recommendations Available data and estimations on the status of Georgia forests are incomplete and often based on a sample of inventory and satellite images for limited periods of time. The forest inventory dates back to 1997 and partial updates have only recently been initiated through temporary ground plots. Implementation of sustainable and multipurpose forest management principles and practices requires its urgent update, as well as the introduction of an effective categorization and monitoring system of sensitive forest stands and of forests with exploitable timber resources. Forest management plans for conservation or production have not been developed for a long time, with only few exceptions, and are based on outdated and unreliable data. This undermines the effectiveness of forest monitoring and inspection activities, to be conducted through field visits or audits to verify performance against an updated forest inventory and defined management goals. At present, no forests in Georgia are certified with published standards and under an independently verified forest certification scheme such as FSC or PEFC. Recommendation 11.1: The Ministry of Environment and Natural Resources Protection should: (a) Carry out an inventory for the State Forest
Fund; (b) Ensure the development of forest
management plans for production and conservation based on the new forest inventory, including mechanisms for involving local communities;
(c) Develop a categorization of sensitive forest stands and of forests with exploitable timber resources and implement an effective forests monitoring system;
(d) Promote incentive mechanisms for the sustainable use of forest areas by forest licence holders.
The Forest Code dates back to 1999. The latest amendments were passed in 2010 and in 2011 a Law on Forest Fund Management was adopted. Thereafter, attempts have been undertaken to develop a new forest code, which have not yet produced results. Furthermore, the current primary and secondary legislation does not correspond to principles of sustainable forest management; the legislation is contradictory and contains loopholes
that provide the ground for illegal logging and forest crimes. Recommendation 11.2: The Ministry of Environment and Natural Resources Protection should develop a national forest code and harmonize relevant related primary and secondary forest legislation accordingly. The adoption of the National Forest Concept in 2013, the first forest policy document for the country, marks a step forward. The Concept recognizes the strategic role of this natural resource, defines the relation of the State with forests, and aims at establishing a system of sustainable forest management. The actual implementation of the identified principles, directions and actions now requires the development of an action plan for sustainable forest management, through strong institutional coordination and wide stakeholder consultation. Recommendation 11.3: The Ministry of Environment and Natural Resources Protection should develop a national forest management action plan, with criteria, budget, implementing entities, potential financial sources and indicators for sustainable management of forest resources, along with forest-level operational guidelines. Sustainable use of forest resources in a green economy requires a clear assessment of their economic, social and environmental value. Forests shall be managed in such a way that ensures maintenance of their ecological services and maximum benefits to society. At present, the economic potential of forests is neither fully nor efficiently used. There is large scope for development of the country’s forestry sector in terms of timber harvesting on a sustainable basis, and wood and non-wood products processing for both domestic consumption and international trade. The potential of forests for touristic and recreational purposes should also be properly assessed. Recommendation 11.4: The Ministry of Environment and Natural Resources Protection, in collaboration with the Ministry of Economy and Sustainable Development, should conduct an evaluation of the environmental, economic and social potential of the country’s forestry sector. In Georgia, in the period after independence, demand for forestry skills fell massively and, as a result, many qualified people left the sector. Measures to

186 Part III: Interaction of environment with selected sectors/issues
reverse this trend have been taken over the last few years, including with the assistance of the donor community, but they will take some years to produce results and are considered to be still insufficient. Recommendation 11.5: The Ministry of Environment and Natural Resources Protection, in cooperation with the Ministry of Education and Science, should strengthen education, training and awareness-raising on sustainable forest management at both the central and local levels, including for local communities, by:
(a) Identifying education and professional requirements for forest personnel;
(b) Developing education programmes at the university level and targeted training curricula;
(c) Strengthening relevant awareness-raising and communication activities targetting the general public and all key stakeholders, in particular local communities;
(d) Coordinating awareness-raising and capacity-building projects for the forestry sector funded by non-governmental sources (i.e., donors).
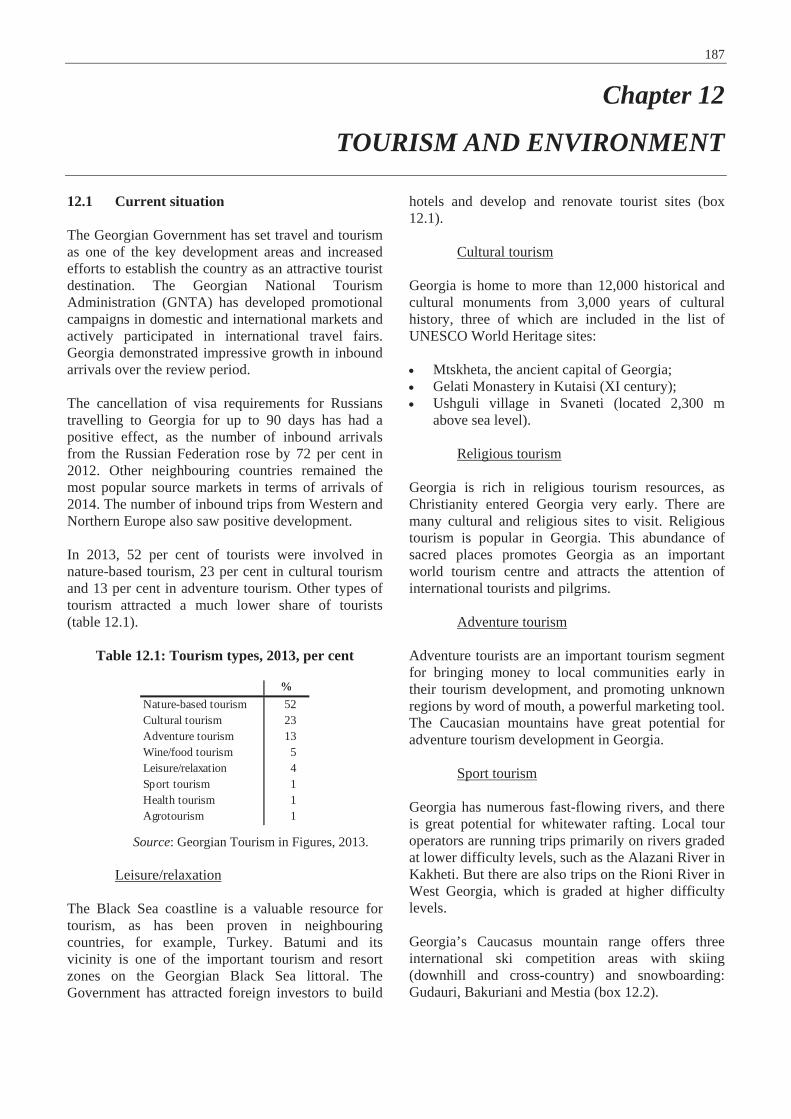
187
Chapter 12
TOURISM AND ENVIRONMENT
12.1 Current situation The Georgian Government has set travel and tourism as one of the key development areas and increased efforts to establish the country as an attractive tourist destination. The Georgian National Tourism Administration (GNTA) has developed promotional campaigns in domestic and international markets and actively participated in international travel fairs. Georgia demonstrated impressive growth in inbound arrivals over the review period. The cancellation of visa requirements for Russians travelling to Georgia for up to 90 days has had a positive effect, as the number of inbound arrivals from the Russian Federation rose by 72 per cent in 2012. Other neighbouring countries remained the most popular source markets in terms of arrivals of 2014. The number of inbound trips from Western and Northern Europe also saw positive development. In 2013, 52 per cent of tourists were involved in nature-based tourism, 23 per cent in cultural tourism and 13 per cent in adventure tourism. Other types of tourism attracted a much lower share of tourists (table 12.1).
Table 12.1: Tourism types, 2013, per cent
Source: Georgian Tourism in Figures, 2013.
Leisure/relaxation
The Black Sea coastline is a valuable resource for tourism, as has been proven in neighbouring countries, for example, Turkey. Batumi and its vicinity is one of the important tourism and resort zones on the Georgian Black Sea littoral. The Government has attracted foreign investors to build
hotels and develop and renovate tourist sites (box 12.1).
Cultural tourism Georgia is home to more than 12,000 historical and cultural monuments from 3,000 years of cultural history, three of which are included in the list of UNESCO World Heritage sites: Mtskheta, the ancient capital of Georgia; Gelati Monastery in Kutaisi (XI century); Ushguli village in Svaneti (located 2,300 m
above sea level).
Religious tourism Georgia is rich in religious tourism resources, as Christianity entered Georgia very early. There are many cultural and religious sites to visit. Religious tourism is popular in Georgia. This abundance of sacred places promotes Georgia as an important world tourism centre and attracts the attention of international tourists and pilgrims.
Adventure tourism Adventure tourists are an important tourism segment for bringing money to local communities early in their tourism development, and promoting unknown regions by word of mouth, a powerful marketing tool. The Caucasian mountains have great potential for adventure tourism development in Georgia.
Sport tourism Georgia has numerous fast-flowing rivers, and there is great potential for whitewater rafting. Local tour operators are running trips primarily on rivers graded at lower difficulty levels, such as the Alazani River in Kakheti. But there are also trips on the Rioni River in West Georgia, which is graded at higher difficulty levels. Georgia’s Caucasus mountain range offers three international ski competition areas with skiing (downhill and cross-country) and snowboarding: Gudauri, Bakuriani and Mestia (box 12.2).
%Nature-based tourism 52Cultural tourism 23Adventure tourism 13Wine/food tourism 5Leisure/relaxation 4Sport tourism 1Health tourism 1Agrotourism 1

188 Part III: Interaction of environment with selected sectors/issues
Box 12.1: Touristic potential of Ajara
Seaside tourism is one of the most popular types of tourism in Ajara. The subtropical climate, warm sea, infrastructure of sea resorts, and combination of seaside and mountain terrain create favourable conditions for holidays. The total length of the swimming zone is 21 km. The average sea temperature is 21oC –29oC. The territory of Ajara comprises the following sea resort zones: Batumi, Kobuleti, Makhinjauri, Mtsvane Kontskhi, Chakvi, Gonio, Kvariati and Sarpi. The provision of heliotherapy and thalassotherapy are the main characteristics of Batumi as a resort city. Since 2006, Batumi Port has been a member of MedCruise, the Association of Mediterranean Cruise Ports, which promotes the development of cruise tourism in Ajara. Kobuleti is distinguished from other coastal climate resorts of Ajara by its particular microclimate. The distinctive health-related feature of the region is the mild and humid climate of the Black Sea. Mtsvane Kontskhi is one of the most beautiful seaside resorts in Georgia, 9 km from Batumi, where the world famous Batumi Botanical Garden is located. The Black Sea littoral, namely the Batumi vicinities and the villages of Khelvachauri and Kobuleti Municipalities form one of the narrowest corridors for migrating birds of prey, registering over 1 million birds annually. The indicated territories rank third in the world in birdwatching capacity and are known as the Eastern Black Sea Migration Corridor. In 2012, the first birdwatching festival was held in Ajara, organized by the international organization Batumi Raptor Count and the Department of Tourism and Resorts of Ajara. The potential of birdwatching in Ajara was once again confirmed on 3 September 2012, when, according to data from Batumi Raptor Count, 179,342 migrating honey buzzards were registered during a single day – considerably exceeding the previous highest daily figure of around 124,000 migrating honey buzzards, confirmed in Israel in 1982. Source: Batumi Ajara Guide, 2013.
Box 12.2: Ski resorts in Georgia
Bakuriani is located 29 km from Borjomi at an altitude of 1,700–2,000 m. There are 70 km of pistes. In 2015, Bakuriani is celebrating its 80th birthday. In 1935, Giorgi Nikoladze first brought skiers to the resort, and since then Bakuriani became a sports centre. Gudauri is a young and rapidly developing winter sports resort located in the Kazbegi region of Georgia, 120 km from Tbilisi, at an altitude of 2,196 m near the Cross Pass. There are 50 km of pistes and the ski season lasts from December to April. Mestia, an ancient highland small town in north-west Georgia, at an altitude of 1,500 m, is a newly developing ski resort. It has two ski-lifts and some 15 km of pistes. A new airport in Mestia – Queen Tamar Airport – was opened in 2010, and flights between Mestia and Natakhtari are now available three times a week.
Wine and food tourism Wine tourism and gourmet tours in Georgia are based on a tradition of more than 500 varieties of grapes, and native and unique crops and livestock, as well as a cuisine rich in local recipes and traditions. For international cultural heritage tourists, wine tourism is usually a value-added factor of a one- to two-day visit on a longer cultural heritage tour. Wine tourism is often a half- to one-day visit on a nature-based or adventure tour. One of the main challenges facing wine tourism and its association with agriculture is the preservation of viticultural resources and the rural character and way of life. Wine and food tourism can improve the life of farmers and promote the production of agroproducts and handicrafts and the preservation of rural heritage.
Nature-based tourism Ecotourism has great potential in Georgia, due to a number of factors. Compared with many other economic activities with similar cash-flow generation, it has much less impact on the environment. Ecotourism supports partnerships between local communities and enterprises, and promotes environmental education and awareness-raising among both the local population and tourists. The Georgian system of protected areas may serve as a good base for ecotourism development in the country (introduction and chapter 6). The number of visitors in protected areas grew in the period 2007–2011 (figure 12.1). In 2013, the number of domestic visitors to protected areas was three times higher than the number of international visitors. Two protected areas are discussed in more detail in boxes 12.3 and 12.4.
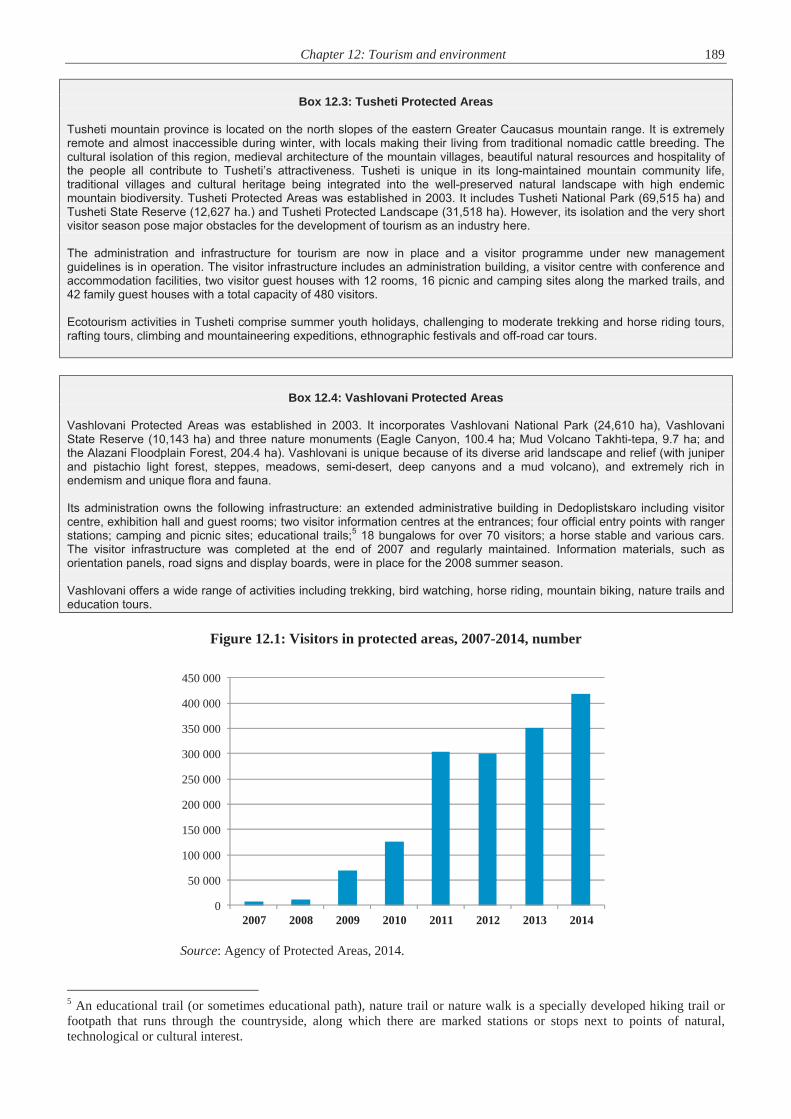
Chapter 12: Tourism and environment 189
Box 12.3: Tusheti Protected Areas
Tusheti mountain province is located on the north slopes of the eastern Greater Caucasus mountain range. It is extremely remote and almost inaccessible during winter, with locals making their living from traditional nomadic cattle breeding. The cultural isolation of this region, medieval architecture of the mountain villages, beautiful natural resources and hospitality of the people all contribute to Tusheti’s attractiveness. Tusheti is unique in its long-maintained mountain community life, traditional villages and cultural heritage being integrated into the well-preserved natural landscape with high endemic mountain biodiversity. Tusheti Protected Areas was established in 2003. It includes Tusheti National Park (69,515 ha) and Tusheti State Reserve (12,627 ha.) and Tusheti Protected Landscape (31,518 ha). However, its isolation and the very short visitor season pose major obstacles for the development of tourism as an industry here.
The administration and infrastructure for tourism are now in place and a visitor programme under new management guidelines is in operation. The visitor infrastructure includes an administration building, a visitor centre with conference and accommodation facilities, two visitor guest houses with 12 rooms, 16 picnic and camping sites along the marked trails, and 42 family guest houses with a total capacity of 480 visitors.
Ecotourism activities in Tusheti comprise summer youth holidays, challenging to moderate trekking and horse riding tours, rafting tours, climbing and mountaineering expeditions, ethnographic festivals and off-road car tours.
Box 12.4: Vashlovani Protected Areas
Vashlovani Protected Areas was established in 2003. It incorporates Vashlovani National Park (24,610 ha), Vashlovani State Reserve (10,143 ha) and three nature monuments (Eagle Canyon, 100.4 ha; Mud Volcano Takhti-tepa, 9.7 ha; and the Alazani Floodplain Forest, 204.4 ha). Vashlovani is unique because of its diverse arid landscape and relief (with juniper and pistachio light forest, steppes, meadows, semi-desert, deep canyons and a mud volcano), and extremely rich in endemism and unique flora and fauna.
Its administration owns the following infrastructure: an extended administrative building in Dedoplistskaro including visitor centre, exhibition hall and guest rooms; two visitor information centres at the entrances; four official entry points with ranger stations; camping and picnic sites; educational trails;5 18 bungalows for over 70 visitors; a horse stable and various cars. The visitor infrastructure was completed at the end of 2007 and regularly maintained. Information materials, such as orientation panels, road signs and display boards, were in place for the 2008 summer season.
Vashlovani offers a wide range of activities including trekking, bird watching, horse riding, mountain biking, nature trails and education tours.
Figure 12.1: Visitors in protected areas, 2007-2014, number
Source: Agency of Protected Areas, 2014.
5 An educational trail (or sometimes educational path), nature trail or nature walk is a specially developed hiking trail or footpath that runs through the countryside, along which there are marked stations or stops next to points of natural, technological or cultural interest.
0
50 000
100 000
150 000
200 000
250 000
300 000
350 000
400 000
450 000
2007 2008 2009 2010 2011 2012 2013 2014

190 Part III: Interaction of environment with selected sectors/issues
Figure 12.2: International arrivals, 2007-2014, number
Source: Georgian Tourism Industry Overview, 2012; Georgian Tourism in Figures, 2013.
Table 12.2: International arrivals, top 10 countries, 2012-2014
Source: Georgian National Tourism Administration, 2015.
12.2 Development in tourism activities
International visitors
In the period 2005–2013, the tourism industry inGeorgia demonstrated impressive growth. The number of international arrivals grew more than ninefold, from 560,021 in 2005 to 5,515,559 in 2014 (table 12.1). In 2012, 2013 and 2014 the number of international arrivals was higher than the total population of the country.
The statistics for 2011–2014 demonstrate that the most popular season among international travellers is summer (35 per cent of all international arrivals). Eighty-eight per cent of all arrivals are from four neighbouring countries: Turkey, Azerbaijan, Armenia and the Russian Federation, in that order (table 12.2).
An increasing trend is observed in the number of tourists from the Russian Federation. This was made
possible by the visa liberalization process and the reintroduction of direct flights. In 2013, there was a 49 per cent increase in the number of arrivals from the Russian Federation (table 12.2).
There has been a year-to-year (2013 over 2022)increase in the number of arrivals from Poland (80 per cent) and Ukraine (66 per cent), due to the introduction of direct flights by Wizz Air from Poland to Kutaisi, and the addition of flights from Ukraine. In 2014 number of arrivals from Poland increased by 25 per cent and by 13 per cent from Ukraine.
In 2014, there were 232,558 international arrivals from the EU countries, representing a 4 per centshare of total arrivals and an increase of 11 per cent over the previous year. Eighty-six per cent of tourists(4,757,264 ) arrived in Georgia by land transport and 12 per cent (643,088) by air transport. The number of
0
1 000 000
2 000 000
3 000 000
4 000 000
5 000 000
6 000 000
2007 2008 2009 2010 2011 2012 2013 2014
2012 2013 2014Change
2013-2014Change
%Turkey 1 533 236 1 597 438 1 442 695 - 154 743 -9.69Armenia 921 929 1 291 838 1 325 635 33 797 2.62Azerbaijan 931 933 1 075 857 1 283 214 207 357 19.27Russia Federation 513 930 767 396 811 621 44 225 5.76Ukraine 76 610 126 797 143 521 16 724 13.19Iran 89 697 85 598 47 929 - 37 669 -44.01Poland 20 563 36 946 46 314 9 368 25.36Israel 30 851 39 922 42 385 2 463 6.17Germany 26 448 30 815 33 446 2 631 8.54Kazakhstan 15 115 21 148 28 394 7 246 34.26
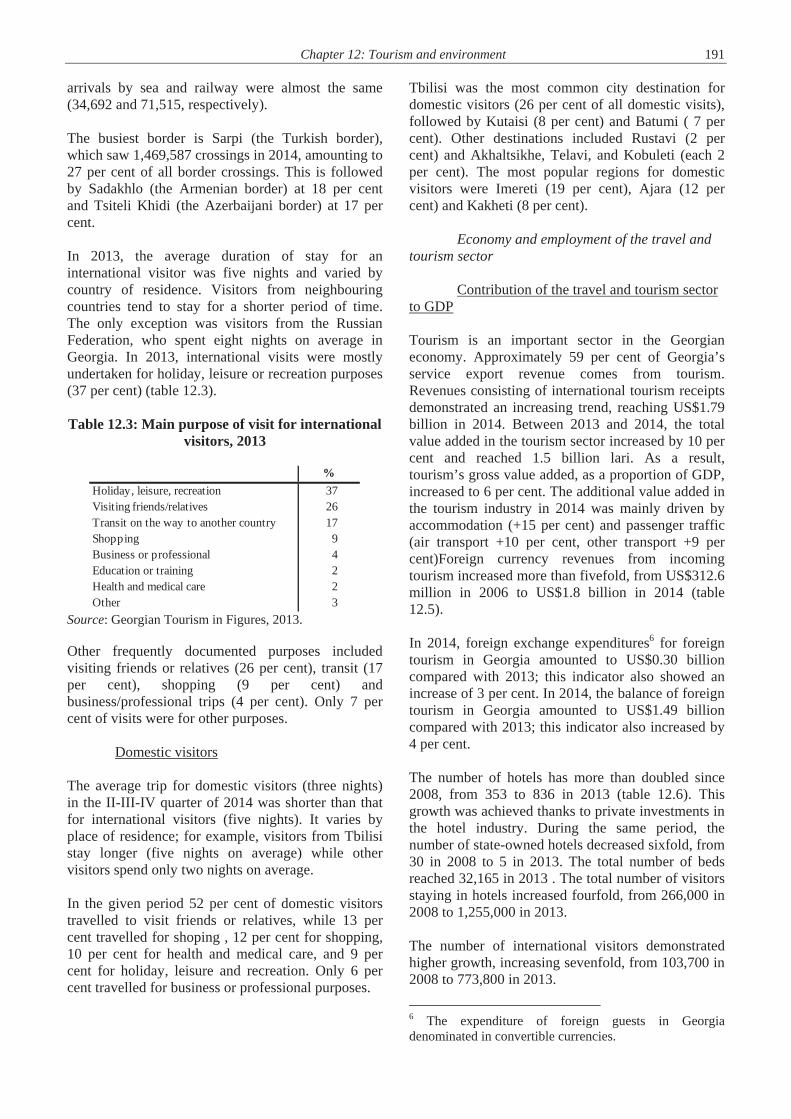
Chapter 12: Tourism and environment 191 arrivals by sea and railway were almost the same (34,692 and 71,515, respectively). The busiest border is Sarpi (the Turkish border), which saw 1,469,587 crossings in 2014, amounting to 27 per cent of all border crossings. This is followed by Sadakhlo (the Armenian border) at 18 per cent and Tsiteli Khidi (the Azerbaijani border) at 17 per cent. In 2013, the average duration of stay for an international visitor was five nights and varied by country of residence. Visitors from neighbouring countries tend to stay for a shorter period of time. The only exception was visitors from the Russian Federation, who spent eight nights on average in Georgia. In 2013, international visits were mostly undertaken for holiday, leisure or recreation purposes (37 per cent) (table 12.3). Table 12.3: Main purpose of visit for international
visitors, 2013
Source: Georgian Tourism in Figures, 2013. Other frequently documented purposes included visiting friends or relatives (26 per cent), transit (17 per cent), shopping (9 per cent) and business/professional trips (4 per cent). Only 7 per cent of visits were for other purposes.
Domestic visitors The average trip for domestic visitors (three nights) in the II-III-IV quarter of 2014 was shorter than that for international visitors (five nights). It varies by place of residence; for example, visitors from Tbilisi stay longer (five nights on average) while other visitors spend only two nights on average. In the given period 52 per cent of domestic visitors travelled to visit friends or relatives, while 13 per cent travelled for shoping , 12 per cent for shopping, 10 per cent for health and medical care, and 9 per cent for holiday, leisure and recreation. Only 6 per cent travelled for business or professional purposes.
Tbilisi was the most common city destination for domestic visitors (26 per cent of all domestic visits), followed by Kutaisi (8 per cent) and Batumi ( 7 per cent). Other destinations included Rustavi (2 per cent) and Akhaltsikhe, Telavi, and Kobuleti (each 2 per cent). The most popular regions for domestic visitors were Imereti (19 per cent), Ajara (12 per cent) and Kakheti (8 per cent).
Economy and employment of the travel and tourism sector
Contribution of the travel and tourism sector to GDP Tourism is an important sector in the Georgian economy. Approximately 59 per cent of Georgia’s service export revenue comes from tourism. Revenues consisting of international tourism receipts demonstrated an increasing trend, reaching US$1.79 billion in 2014. Between 2013 and 2014, the total value added in the tourism sector increased by 10 per cent and reached 1.5 billion lari. As a result, tourism’s gross value added, as a proportion of GDP, increased to 6 per cent. The additional value added in the tourism industry in 2014 was mainly driven by accommodation (+15 per cent) and passenger traffic (air transport +10 per cent, other transport +9 per cent)Foreign currency revenues from incoming tourism increased more than fivefold, from US$312.6 million in 2006 to US$1.8 billion in 2014 (table 12.5). In 2014, foreign exchange expenditures6 for foreign tourism in Georgia amounted to US$0.30 billion compared with 2013; this indicator also showed an increase of 3 per cent. In 2014, the balance of foreign tourism in Georgia amounted to US$1.49 billion compared with 2013; this indicator also increased by 4 per cent. The number of hotels has more than doubled since 2008, from 353 to 836 in 2013 (table 12.6). This growth was achieved thanks to private investments in the hotel industry. During the same period, the number of state-owned hotels decreased sixfold, from 30 in 2008 to 5 in 2013. The total number of beds reached 32,165 in 2013 . The total number of visitors staying in hotels increased fourfold, from 266,000 in 2008 to 1,255,000 in 2013. The number of international visitors demonstrated higher growth, increasing sevenfold, from 103,700 in 2008 to 773,800 in 2013.
6 The expenditure of foreign guests in Georgia denominated in convertible currencies.
%Holiday, leisure, recreation 37Visiting friends/relatives 26Transit on the way to another country 17Shopping 9Business or professional 4Education or training 2Health and medical care 2Other 3
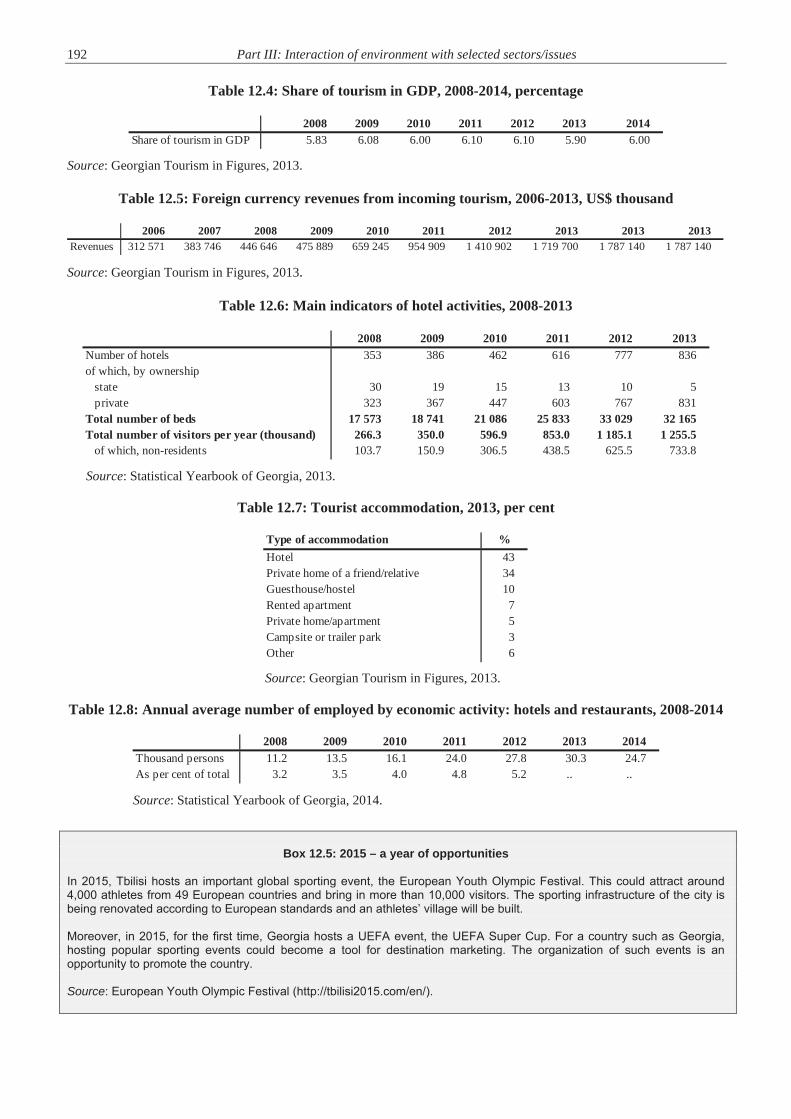
192 Part III: Interaction of environment with selected sectors/issues
Table 12.4: Share of tourism in GDP, 2008-2014, percentage
Source: Georgian Tourism in Figures, 2013.
Table 12.5: Foreign currency revenues from incoming tourism, 2006-2013, US$ thousand
Source: Georgian Tourism in Figures, 2013.
Table 12.6: Main indicators of hotel activities, 2008-2013
Source: Statistical Yearbook of Georgia, 2013.
Table 12.7: Tourist accommodation, 2013, per cent
Source: Georgian Tourism in Figures, 2013.
Table 12.8: Annual average number of employed by economic activity: hotels and restaurants, 2008-2014
Source: Statistical Yearbook of Georgia, 2014.
Box 12.5: 2015 – a year of opportunities In 2015, Tbilisi hosts an important global sporting event, the European Youth Olympic Festival. This could attract around 4,000 athletes from 49 European countries and bring in more than 10,000 visitors. The sporting infrastructure of the city is being renovated according to European standards and an athletes’ village will be built. Moreover, in 2015, for the first time, Georgia hosts a UEFA event, the UEFA Super Cup. For a country such as Georgia, hosting popular sporting events could become a tool for destination marketing. The organization of such events is an opportunity to promote the country. Source: European Youth Olympic Festival (http://tbilisi2015.com/en/).
2008 2009 2010 2011 2012 2013 2014Share of tourism in GDP 5.83 6.08 6.00 6.10 6.10 5.90 6.00
2006 2007 2008 2009 2010 2011 2012 2013 2013 2013Revenues 312 571 383 746 446 646 475 889 659 245 954 909 1 410 902 1 719 700 1 787 140 1 787 140
2008 2009 2010 2011 2012 2013Number of hotels 353 386 462 616 777 836of which, by ownership
state 30 19 15 13 10 5private 323 367 447 603 767 831
Total number of beds 17 573 18 741 21 086 25 833 33 029 32 165Total number of visitors per year (thousand) 266.3 350.0 596.9 853.0 1 185.1 1 255.5
of which, non-residents 103.7 150.9 306.5 438.5 625.5 733.8
Type of accommodation %Hotel 43Private home of a friend/relative 34Guesthouse/hostel 10Rented apartment 7Private home/apartment 5Campsite or trailer park 3Other 6
2008 2009 2010 2011 2012 2013 2014Thousand persons 11.2 13.5 16.1 24.0 27.8 30.3 24.7As per cent of total 3.2 3.5 4.0 4.8 5.2 .. ..
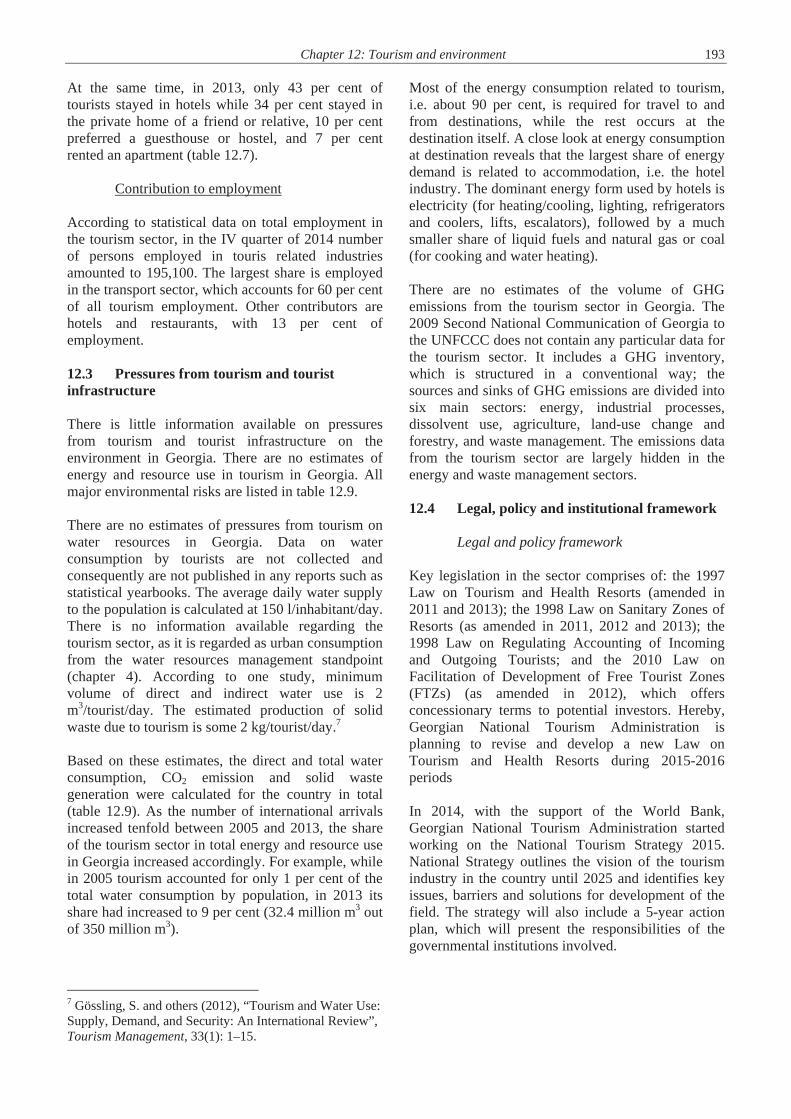
Chapter 12: Tourism and environment 193 At the same time, in 2013, only 43 per cent of tourists stayed in hotels while 34 per cent stayed in the private home of a friend or relative, 10 per cent preferred a guesthouse or hostel, and 7 per cent rented an apartment (table 12.7).
Contribution to employment According to statistical data on total employment in the tourism sector, in the IV quarter of 2014 number of persons employed in touris related industries amounted to 195,100. The largest share is employed in the transport sector, which accounts for 60 per cent of all tourism employment. Other contributors are hotels and restaurants, with 13 per cent of employment. 12.3 Pressures from tourism and tourist infrastructure There is little information available on pressures from tourism and tourist infrastructure on the environment in Georgia. There are no estimates of energy and resource use in tourism in Georgia. All major environmental risks are listed in table 12.9. There are no estimates of pressures from tourism on water resources in Georgia. Data on water consumption by tourists are not collected and consequently are not published in any reports such as statistical yearbooks. The average daily water supply to the population is calculated at 150 l/inhabitant/day. There is no information available regarding the tourism sector, as it is regarded as urban consumption from the water resources management standpoint (chapter 4). According to one study, minimum volume of direct and indirect water use is 2 m3/tourist/day. The estimated production of solid waste due to tourism is some 2 kg/tourist/day.7 Based on these estimates, the direct and total water consumption, CO2 emission and solid waste generation were calculated for the country in total (table 12.9). As the number of international arrivals increased tenfold between 2005 and 2013, the share of the tourism sector in total energy and resource use in Georgia increased accordingly. For example, while in 2005 tourism accounted for only 1 per cent of the total water consumption by population, in 2013 its share had increased to 9 per cent (32.4 million m3 out of 350 million m3).
7 Gössling, S. and others (2012), “Tourism and Water Use: Supply, Demand, and Security: An International Review”, Tourism Management, 33(1): 1–15.
Most of the energy consumption related to tourism, i.e. about 90 per cent, is required for travel to and from destinations, while the rest occurs at the destination itself. A close look at energy consumption at destination reveals that the largest share of energy demand is related to accommodation, i.e. the hotel industry. The dominant energy form used by hotels is electricity (for heating/cooling, lighting, refrigerators and coolers, lifts, escalators), followed by a much smaller share of liquid fuels and natural gas or coal (for cooking and water heating). There are no estimates of the volume of GHG emissions from the tourism sector in Georgia. The 2009 Second National Communication of Georgia to the UNFCCC does not contain any particular data for the tourism sector. It includes a GHG inventory, which is structured in a conventional way; the sources and sinks of GHG emissions are divided into six main sectors: energy, industrial processes, dissolvent use, agriculture, land-use change and forestry, and waste management. The emissions data from the tourism sector are largely hidden in the energy and waste management sectors. 12.4 Legal, policy and institutional framework
Legal and policy framework Key legislation in the sector comprises of: the 1997 Law on Tourism and Health Resorts (amended in 2011 and 2013); the 1998 Law on Sanitary Zones of Resorts (as amended in 2011, 2012 and 2013); the 1998 Law on Regulating Accounting of Incoming and Outgoing Tourists; and the 2010 Law on Facilitation of Development of Free Tourist Zones (FTZs) (as amended in 2012), which offers concessionary terms to potential investors. Hereby, Georgian National Tourism Administration is planning to revise and develop a new Law on Tourism and Health Resorts during 2015-2016 periods In 2014, with the support of the World Bank, Georgian National Tourism Administration started working on the National Tourism Strategy 2015. National Strategy outlines the vision of the tourism industry in the country until 2025 and identifies key issues, barriers and solutions for development of the field. The strategy will also include a 5-year action plan, which will present the responsibilities of the governmental institutions involved.
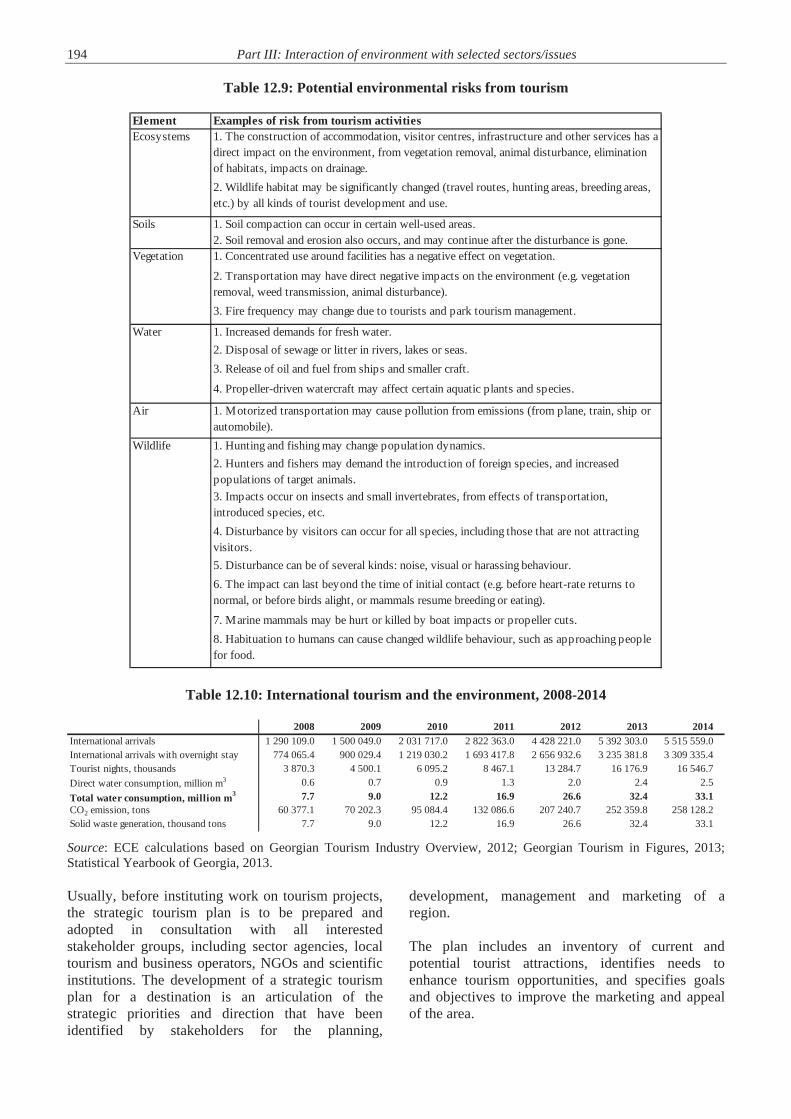
194 Part III: Interaction of environment with selected sectors/issues
Table 12.9: Potential environmental risks from tourism
Table 12.10: International tourism and the environment, 2008-2014
Source: ECE calculations based on Georgian Tourism Industry Overview, 2012; Georgian Tourism in Figures, 2013; Statistical Yearbook of Georgia, 2013. Usually, before instituting work on tourism projects, the strategic tourism plan is to be prepared and adopted in consultation with all interested stakeholder groups, including sector agencies, local tourism and business operators, NGOs and scientific institutions. The development of a strategic tourism plan for a destination is an articulation of the strategic priorities and direction that have been identified by stakeholders for the planning,
development, management and marketing of a region. The plan includes an inventory of current and potential tourist attractions, identifies needs to enhance tourism opportunities, and specifies goals and objectives to improve the marketing and appeal of the area.
Element Examples of risk from tourism activitiesEcosystems 1. The construction of accommodation, visitor centres, infrastructure and other services has a
direct impact on the environment, from vegetation removal, animal disturbance, elimination of habitats, impacts on drainage.2. Wildlife habitat may be significantly changed (travel routes, hunting areas, breeding areas, etc.) by all kinds of tourist development and use.
Soils 1. Soil compaction can occur in certain well-used areas.2. Soil removal and erosion also occurs, and may continue after the disturbance is gone.
Vegetation 1. Concentrated use around facilities has a negative effect on vegetation.
2. Transportation may have direct negative impacts on the environment (e.g. vegetation removal, weed transmission, animal disturbance).3. Fire frequency may change due to tourists and park tourism management.
Water 1. Increased demands for fresh water.2. Disposal of sewage or litter in rivers, lakes or seas.3. Release of oil and fuel from ships and smaller craft.
4. Propeller-driven watercraft may affect certain aquatic plants and species.
Air 1. Motorized transportation may cause pollution from emissions (from plane, train, ship or automobile).
Wildlife 1. Hunting and fishing may change population dynamics.2. Hunters and fishers may demand the introduction of foreign species, and increased populations of target animals.3. Impacts occur on insects and small invertebrates, from effects of transportation, introduced species, etc.4. Disturbance by visitors can occur for all species, including those that are not attracting visitors.5. Disturbance can be of several kinds: noise, visual or harassing behaviour.6. The impact can last beyond the time of initial contact (e.g. before heart-rate returns to normal, or before birds alight, or mammals resume breeding or eating).
7. Marine mammals may be hurt or killed by boat impacts or propeller cuts.8. Habituation to humans can cause changed wildlife behaviour, such as approaching people for food.
2008 2009 2010 2011 2012 2013 2014International arrivals 1 290 109.0 1 500 049.0 2 031 717.0 2 822 363.0 4 428 221.0 5 392 303.0 5 515 559.0International arrivals with overnight stay 774 065.4 900 029.4 1 219 030.2 1 693 417.8 2 656 932.6 3 235 381.8 3 309 335.4Tourist nights, thousands 3 870.3 4 500.1 6 095.2 8 467.1 13 284.7 16 176.9 16 546.7Direct water consumption, million m3 0.6 0.7 0.9 1.3 2.0 2.4 2.5Total water consumption, million m3 7.7 9.0 12.2 16.9 26.6 32.4 33.1CO2 emission, tons 60 377.1 70 202.3 95 084.4 132 086.6 207 240.7 252 359.8 258 128.2Solid waste generation, thousand tons 7.7 9.0 12.2 16.9 26.6 32.4 33.1
Chapter 12: Tourism and environment 195
Photo 12.a : Visitor’s centre in Tusheti Protected Areas
Photo 12.b : Information stand in Tusheti Protected Areas
A clear picture of the target countries is useful in order to have information regarding the potential visitors and their desires. Furthermore, environmental and social impacts of tourism development were not studied, and mitigation measures in order to avoid adverse environmental and social effects were not proposed. All of these planning processes are lacking in Georgia.
The Agency of Protected Areas (APA) and the Ministry of Environment and Natural Resources Protection itself have decided to prepare a strategy for tourism development in protected areas and guidelines for strategic, market-oriented development plans for each protected area. To this aim, the project on assessing and developing the ecotourism potential of the protected areas in Georgia began in July 2014. The project is implemented by an international team of experts from Austria, Germany, Georgia and
Slovenia, led by the International Tourism Institute’s experts.
Institutional framework
Georgian National Tourism Administration
In 2010, the Georgian National Tourism Administration (GNTA) was established as an LEPL under the Ministry of Economy and Sustainable Development; it plays an essential role in the economic development of the tourism industry in Georgia. Its mission is to ensure sustainable tourism development through positioning Georgia as a unique travel destination on the international tourist map, improving visitor experience and maximizing visitor expenditures to contribute to the national economy by effective cooperation with strategic partners.
196 Part III: Interaction of environment with selected sectors/issues
Agency of Protected Areas The APA of the Ministry of Environment and Natural Resources Protection plays a central role in the administration and management of the protected areas of Georgia. It supervises the administrations of existing protected areas and allocates the budget. The individual protected areas play a major partner role in ecotourism development, and their capacity and mandate are to be developed with this aim, in line with international best practice.
Georgian Tourism Association Georgian Tourism Association is an organization of private Tourism Companies and Hotels in Georgia. The association was founded in 2006 to promote the cooperation between the tourism companies in Georgia, cooperation between private and public sector, capacity building and quality management for tourism services, accessibility of tourism information and country marketing, and sustainable tourism development in Georgia. Georgian Tourism Association works on incoming, domestic and outgoing tourism issues and capacity building.
Georgian Incoming Tour Operators Association Georgian Incoming Tour Operators Association was established in June 2007 by leading Georgian tour operator companies. The association is represented as a non-profit legal entity, and its profile is to promote inbound tourism in Georgia, to participate in tourism promotion projects and events, to collaborate with state institutes, and to develop sustainable tourism. 12.5 Projects
Support for Georgia in the Field of Protected Area Development The World Tourism Organization (UNWTO) project Support for Georgia in the Field of Protected Area Development was carried out in the period March 2012–February 2014 by UNWTO’s Consulting Unit on Tourism and Biodiversity, with the financial support of the Federal German Ministry for the Environment, Nature Conversation, Building and Nuclear Safety, and in partnership with the APA, GNTA, GTA and the Centre for Biodiversity Conservation and Research. The project supported Georgia in applying strategies and regulations for protected area management and
sustainable tourism development in several protected mountain and freshwater areas across the country. One of the main project outcomes is the establishment of a network of biodiversity-based tourism products in five protected areas. Among the products created are a mountain biking trail in Tbilisi National Park, a zip-line park and a canyon path in Mtirala National Park and an ecopaddling tour in Kolkheti National Park Geo train in Vashlovani National Park and eco-educational and eco-touristic trails in Lagodekhi PAs. Other activities carried out within the project include various capacity-building courses with local tourism stakeholders, as well as the development and implementation of marketing strategies for each protected area.
Enhancing Sustainability of Tourism Development in Protected Areas of Georgia GTA received funding under the Ecological Awards Programme (Eco-Awards) in 2009 and 2010. Under Eco-Awards 2010, the GTA implemented a project aimed at enhancing the sustainability of tourism development in protected areas of Georgia. The project covered Tusheti, Borjomi-Kharagauli and Algeti Protected Areas. The activities and outputs implemented under the project include: Solar electricity systems and solar-powered water
heaters were set up at five family guesthouses in the Gometsari Gorge, Tusheti, which contributed to improving the level of services provided to tourists;
Training sessions were held for the owners of family guesthouses in both the Tusheti and Borjomi-Kharagauli Nature Reserves;
To increase youth awareness about environment protection, rangers’ camps were established in the Algeti and Borjomi-Kharagauli National Parks;
Information boards and road signs were installed in Algeti and Tusheti National Parks;
The organization closely cooperated with another winner of Eco-Awards 2010, Ajara Sustainable Development Association, implementing a similar project in Mtirala National Park and Kintrishi Protected Area;
Within the framework of another award, acknowledging the successful completion of the Eco-Awards Programme 2009–2011, electronic and printed maps of eight tourist routes in Tusheti were prepared.
Chapter 12: Tourism and environment 197
Support to the Tourism Sector in Georgia (2012–2013) Support to the Tourism Sector in Georgia was a joint project between Austria, represented by the Agency for European Integration and Economic Development, and the GNTA. The project was funded by the EU, with the overall objective to improve the environment conducive to an increased contribution by the tourism industry to economic development and job creation in Georgia. Within the project, Slovenia’s International Tourism Institute (ITI) has developed a model of destination management organizations (DMOs). Using this model, the GNTA will establish DMOs in each of the nine regions of Georgia. The ITI has implemented the concepts and organizational structure of the DMO model, including a DMO working plan including estimated annual budget, systems and sources of financing, and has predicted stages of realization of the model. 12.6 Conclusions and recommendations Information is not available on the pressures that tourism puts on the environment in Georgia. Neither data nor estimates are available on the pressures that tourism puts on water resources and air in Georgia, nor of the volume of GHG emissions from the Georgian tourism sector. The 2009 Second National Communication of Georgia to the UNFCCC does not contain any specific data on the tourism sector. Data on municipal waste generated by the tourism sector are hidden within the total data on municipal waste generated in the country.
Recommendation 12.1: The National Statistics Office, together with the Georgian National Tourism Administration and in cooperation with the Ministry of Environment and Natural Resources Protection, should ensure regular environment-related data collection on the tourism sector. Recommendation 12.2: The Ministry of Environment and Natural Resources Protection, together with the Georgian National Tourism Administration and in cooperation with the National Statistics Office, should undertake an assessment of the impact of the tourism sector on the environment. In 2014, the Georgian National Tourism Administration started working on the national tourism strategy until 2015. The strategy outlines the vision of the tourism industry in the country until 2025 and identifies key issues, barriers and solutions for development of the field. The strategy will also include a five-year action plan, which will present the responsibilities of the governmental institutions involved. It is expected that the final version of the strategy will be available by end of June 2015. In 2014, the Agency of Protected Areas and the Ministry of Environment and Natural Resources Protection decided to prepare a strategy for tourism development in protected areas. Recommendation 12.3: The Government should promote sustainable tourism development and consider the elaboration of a sustainable tourism development strategy.


199
Chapter 13
HEALTH AND ENVIRONMENT 13.1 Status of human health
Mortality and cause of death Overall mortality rates were 10.8 and 11.0 per 1,000 in 2013 and 2012 respectively. In 2012, 48.4 per cent of deaths were of females and 51.6 per cent of males. About 52.3 per cent of deaths occurred in urban populations while 47.7 per cent were in rural populations. In 2012, the major causes of death were circulatory system diseases (40.5 per cent) and neoplasms (10.6 per cent). Around one third of deaths (33.8 per cent) are related to symptoms, signs, and abnormal clinical and laboratory findings that are not classified by specific origin. Children under 15 comprised 1.9 per cent of the total number of deaths and had a mortality rate of 123 per 100,000 children in that age group. The major causes of infant death were due to certain conditions originating in the perinatal period (62 per cent), and congenital malformations, deformations and chromosomal abnormalities (12.4 per cent).
Maternal and child mortality ratio and the Millennium Development Goals Under MDG 4, a target was set to reduce by two thirds, between 1990 and 2015, the under-five mortality rate; the target for 2015 is at least a reduction to 12 per 1,000 live births. In Georgia, the under-five mortality rate per 1,000 live births has been declining since 2000. It was estimated at 28.7 (per 1,000 live births) in the period 1990–1994, 24.9 in 2000 and 13.0 in 2013. This is still higher than that in the EU (5 per 1,000 live births) and the European region (9 per 1,000 live births). Along with the national immunization programme, reforms have contributed to the declining trend of child mortality. Health-care financing has one of the largest state budget allocations. Since 2012, the majority of children in the 0–5 age group have been 100 per cent covered by the aged-based state health insurance programme. Other state programmes providing services related to mother-and-child care contribute to improving healthcare. Under MDG 5, a target was set to reduce by three quarters, between 1990 and 2015, the maternal
mortality ratio. The target for 2015 is at least a reduction to 16 per 100,000 live births. In Georgia, a strong decline in the maternal mortality ratio was observed from 49.2 per 100,000 live births in 2000 to 23.4 per 100,000 live births in 2005. Since 2005, the maternal mortality ratio has remained steady at 20 to 27 per 100,000 live births, except for 2009 when the ratio reached 52.1 per 100,000 live births, due to the improvement of death registration procedures and an influenza pandemic. The increase in the proportion of births attended by skilled personnel (from 97.4 per cent in 2002 to 99.8 per cent in 2012), and the higher uptake of four antenatal care visits among pregnant women (60 per cent in 2001, 84.2 per cent in 2013), are among the factors which contribute to reducing the maternal mortality ratio.
Trends in morbidity The number of hospital discharges reached 355,506 in 2012, including 7,266 hospital deaths (2 per cent). In 2012, the major causes of hospital death were linked to diseases of the circulatory system (40 per cent), diseases of the respiratory system (13 per cent), diseases of the digestive system (9 per cent) and neoplasm (7 per cent). In 2012, the number of hospitalizations of children under 15 was 80,621, including 707 hospital deaths. The major causes of hospitalization of children under 15 result from diseases of the respiratory system (50 per cent), certain infectious and parasitic diseases (19 per cent) and certain conditions originating in the perinatal period (9.6 per cent). The highest case fatality rate in this age group concerns hospitalization for diseases of the circulatory system, with 10 hospital deaths for 137 hospital discharges (7 per cent of case fatalities). Almost 67 per cent of hospital deaths of children under 15 are linked to certain conditions originating in the perinatal period, 8 per cent to diseases of the respiratory system, 7 per cent to congenital malformation, deformations and chromosomal abnormalities, and 4 per cent to certain infectious and parasitic diseases.
Non-communicable diseases Non-communicable diseases are estimated to account
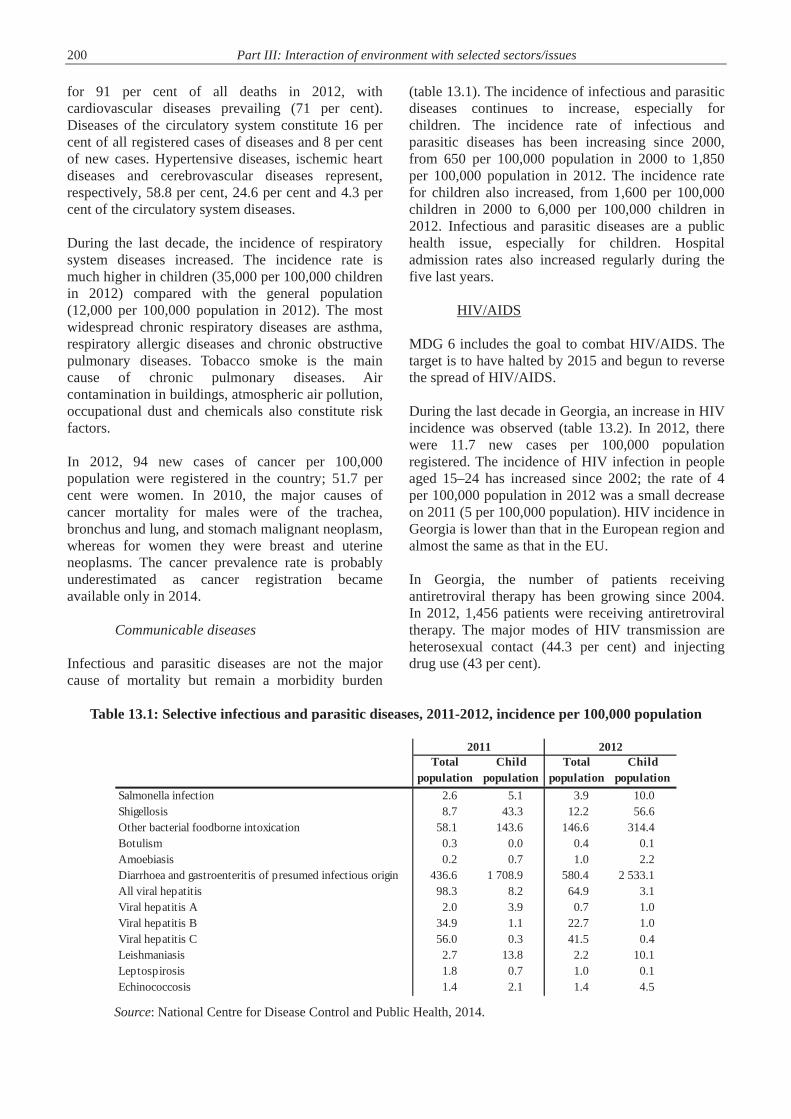
200 Part III: Interaction of environment with selected sectors/issues
for 91 per cent of all deaths in 2012, with cardiovascular diseases prevailing (71 per cent). Diseases of the circulatory system constitute 16 per cent of all registered cases of diseases and 8 per cent of new cases. Hypertensive diseases, ischemic heart diseases and cerebrovascular diseases represent, respectively, 58.8 per cent, 24.6 per cent and 4.3 per cent of the circulatory system diseases. During the last decade, the incidence of respiratory system diseases increased. The incidence rate is much higher in children (35,000 per 100,000 children in 2012) compared with the general population (12,000 per 100,000 population in 2012). The most widespread chronic respiratory diseases are asthma, respiratory allergic diseases and chronic obstructive pulmonary diseases. Tobacco smoke is the main cause of chronic pulmonary diseases. Air contamination in buildings, atmospheric air pollution, occupational dust and chemicals also constitute risk factors. In 2012, 94 new cases of cancer per 100,000 population were registered in the country; 51.7 per cent were women. In 2010, the major causes of cancer mortality for males were of the trachea, bronchus and lung, and stomach malignant neoplasm, whereas for women they were breast and uterine neoplasms. The cancer prevalence rate is probably underestimated as cancer registration became available only in 2014.
Communicable diseases Infectious and parasitic diseases are not the major cause of mortality but remain a morbidity burden
(table 13.1). The incidence of infectious and parasitic diseases continues to increase, especially for children. The incidence rate of infectious and parasitic diseases has been increasing since 2000, from 650 per 100,000 population in 2000 to 1,850 per 100,000 population in 2012. The incidence rate for children also increased, from 1,600 per 100,000 children in 2000 to 6,000 per 100,000 children in 2012. Infectious and parasitic diseases are a public health issue, especially for children. Hospital admission rates also increased regularly during the five last years.
HIV/AIDS MDG 6 includes the goal to combat HIV/AIDS. The target is to have halted by 2015 and begun to reverse the spread of HIV/AIDS. During the last decade in Georgia, an increase in HIV incidence was observed (table 13.2). In 2012, there were 11.7 new cases per 100,000 population registered. The incidence of HIV infection in people aged 15–24 has increased since 2002; the rate of 4 per 100,000 population in 2012 was a small decrease on 2011 (5 per 100,000 population). HIV incidence in Georgia is lower than that in the European region and almost the same as that in the EU. In Georgia, the number of patients receiving antiretroviral therapy has been growing since 2004. In 2012, 1,456 patients were receiving antiretroviral therapy. The major modes of HIV transmission are heterosexual contact (44.3 per cent) and injecting drug use (43 per cent).
Table 13.1: Selective infectious and parasitic diseases, 2011-2012, incidence per 100,000 population
Source: National Centre for Disease Control and Public Health, 2014.
Total population
Child population
Total population
Child population
Salmonella infection 2.6 5.1 3.9 10.0Shigellosis 8.7 43.3 12.2 56.6Other bacterial foodborne intoxication 58.1 143.6 146.6 314.4Botulism 0.3 0.0 0.4 0.1Amoebiasis 0.2 0.7 1.0 2.2Diarrhoea and gastroenteritis of presumed infectious origin 436.6 1 708.9 580.4 2 533.1All viral hepatitis 98.3 8.2 64.9 3.1Viral hepatitis A 2.0 3.9 0.7 1.0Viral hepatitis B 34.9 1.1 22.7 1.0Viral hepatitis C 56.0 0.3 41.5 0.4Leishmaniasis 2.7 13.8 2.2 10.1Leptospirosis 1.8 0.7 1.0 0.1Echinococcosis 1.4 2.1 1.4 4.5
2011 2012

Chapter 13: Health and environment 201
Table 13.2: Incidence of selected diseases (new cases), 2002, 2010, 2012-2013, per 100,000 population
Source: National Centre for Disease Control and Public Health, 2014. Note: In 2014, new TB cases and relapses = 74.8 per 100,000 population.
Tuberculosis
In 2012, mortality caused by tuberculosis was 3.9 per 100,000 population. Since 2009, the incidence of tuberculosis has decreased, from 101.4 per 100,000 population in 2009 to 84.1 per 100,000 population in 2012. Georgia is one of the 27 countries with the highest burden of multi-drug resistant tuberculosis (MDR-TB). In 2012, 9.2 per cent of new cases and 31.1 per cent of retreated cases were multi-drug resistant; this compares with 6.8 per cent of new cases in 2004 and 27.4 per cent in 2006.
Measles Peaks of measles morbidity were registered in 2004 and 2013. The 2013 peak was linked to the failure of a mass immunization campaign in 2008, which provided a basis for a measles epidemic.
Waterborne infections and bacterial foodborne intoxications In 2013, two group cases of waterborne disease and 32 group cases of foodborne disease were registered. The total incidence of bacterial foodborne intoxications was 143.6 per 100,000 population; the incidence was higher for children, reaching 314.4 per 100,000. Most of the time, foodborne diseases are related to home-prepared food. Some cases of poisoning with mushrooms are reported each year. Regarding waterborne diseases, in the period 2001–2006, 25 group cases were reported, concerning 3,194 persons, mainly in cities. In the period 2007–2013, nine group cases were reported, concerning 319 persons, and only one case was in a city. This strong decrease is related to the improvement in the distribution of quality drinking water, especially in the cities. In 2012, the incidence of diarrhoea and gastroenteritis of presumed infectious origin was still very high; it reached 2,533.1 per 100,000 children and 580.4 per 100,000 population.
Viral hepatitis In 2012, the incidence of all types of hepatitis was 64.9 per 100,000 population; children were less affected (3.1 per 100,000 children). Viral hepatitis C infections are predominant in the general population (with an incidence of 41.5 per 100,000 population) while viral hepatitis A is predominant for children (an incidence of 1.7 per 100,000 children). The incidence rate of viral hepatitis B decreased from 40 per 100,000 population in 2008 to 22 per 100,000 population in 2012, but was almost 2.5 times higher than the average rate for the European region. In 2013, 30 cases of hepatitis A were related to the quality of drinking water.
Vectorborne diseases Malaria
The incidence of Malaria has been decreasing, from 11 per 100,000 population in 2002 to 0.02 per 100,000 population in 2012. In 2012, no death due to malaria was registered. However, 22 cases of malaria, with three cases of death, were reported in 2014; 14 cases were reported during the last five years (2009–2013).
Visceral leishmaniasis
In 2012, the number of registered cases of leishmaniasis had decreased by 46 per cent compared with 2007. The incidence is higher in children (10 per 100,000 children in 2012) compared with the general population (around 2.5 per 100,000 population in 2012). After a peak reached in 2007, leishmaniasis incidence decreased. 13.2 Health risks associated with environmental factors and environmental causes of morbidity and mortality
Outdoor air pollution Air pollution mainly comes from the transport, industrial and energy sectors. More than 55 per cent of overall air pollution comes from transport (chapter
2002 2010 2012 2013HIV 2.2 9.9 11.7 10.9Malaria 10.9 0.0 0.0 0.0Tuberculosis 96.5 98.6 84.1 69.8
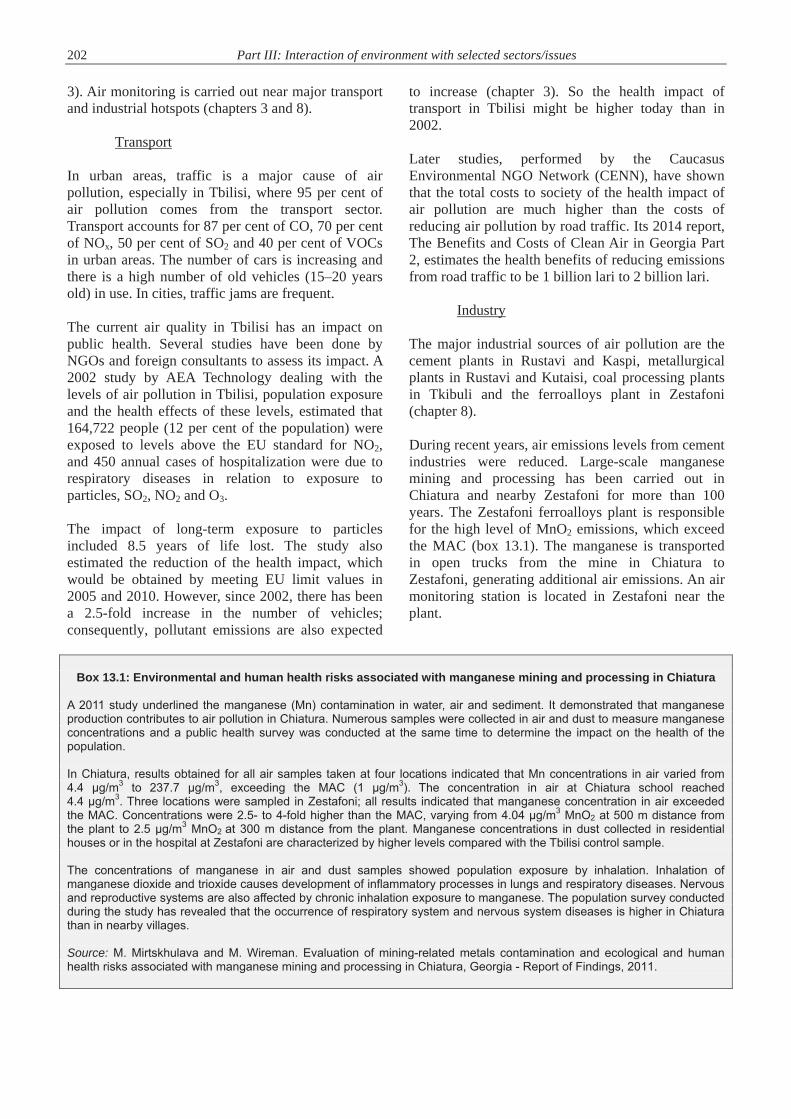
202 Part III: Interaction of environment with selected sectors/issues
3). Air monitoring is carried out near major transport and industrial hotspots (chapters 3 and 8).
Transport In urban areas, traffic is a major cause of air pollution, especially in Tbilisi, where 95 per cent of air pollution comes from the transport sector. Transport accounts for 87 per cent of CO, 70 per cent of NOx, 50 per cent of SO2 and 40 per cent of VOCs in urban areas. The number of cars is increasing and there is a high number of old vehicles (15–20 years old) in use. In cities, traffic jams are frequent. The current air quality in Tbilisi has an impact on public health. Several studies have been done by NGOs and foreign consultants to assess its impact. A 2002 study by AEA Technology dealing with the levels of air pollution in Tbilisi, population exposure and the health effects of these levels, estimated that 164,722 people (12 per cent of the population) were exposed to levels above the EU standard for NO2, and 450 annual cases of hospitalization were due to respiratory diseases in relation to exposure to particles, SO2, NO2 and O3. The impact of long-term exposure to particles included 8.5 years of life lost. The study also estimated the reduction of the health impact, which would be obtained by meeting EU limit values in 2005 and 2010. However, since 2002, there has been a 2.5-fold increase in the number of vehicles; consequently, pollutant emissions are also expected
to increase (chapter 3). So the health impact of transport in Tbilisi might be higher today than in 2002. Later studies, performed by the Caucasus Environmental NGO Network (CENN), have shown that the total costs to society of the health impact of air pollution are much higher than the costs of reducing air pollution by road traffic. Its 2014 report, The Benefits and Costs of Clean Air in Georgia Part 2, estimates the health benefits of reducing emissions from road traffic to be 1 billion lari to 2 billion lari.
Industry
The major industrial sources of air pollution are the cement plants in Rustavi and Kaspi, metallurgical plants in Rustavi and Kutaisi, coal processing plants in Tkibuli and the ferroalloys plant in Zestafoni (chapter 8). During recent years, air emissions levels from cement industries were reduced. Large-scale manganese mining and processing has been carried out in Chiatura and nearby Zestafoni for more than 100 years. The Zestafoni ferroalloys plant is responsible for the high level of MnO2 emissions, which exceed the MAC (box 13.1). The manganese is transported in open trucks from the mine in Chiatura to Zestafoni, generating additional air emissions. An air monitoring station is located in Zestafoni near the plant.
Box 13.1: Environmental and human health risks associated with manganese mining and processing in Chiatura A 2011 study underlined the manganese (Mn) contamination in water, air and sediment. It demonstrated that manganese production contributes to air pollution in Chiatura. Numerous samples were collected in air and dust to measure manganese concentrations and a public health survey was conducted at the same time to determine the impact on the health of the population. In Chiatura, results obtained for all air samples taken at four locations indicated that Mn concentrations in air varied from 4.4 μg/m3 to 237.7 μg/m3, exceeding the MAC (1 μg/m3). The concentration in air at Chiatura school reached 4.4 μg/m3. Three locations were sampled in Zestafoni; all results indicated that manganese concentration in air exceeded the MAC. Concentrations were 2.5- to 4-fold higher than the MAC, varying from 4.04 μg/m3 MnO2 at 500 m distance from the plant to 2.5 μg/m3 MnO2 at 300 m distance from the plant. Manganese concentrations in dust collected in residential houses or in the hospital at Zestafoni are characterized by higher levels compared with the Tbilisi control sample. The concentrations of manganese in air and dust samples showed population exposure by inhalation. Inhalation of manganese dioxide and trioxide causes development of inflammatory processes in lungs and respiratory diseases. Nervous and reproductive systems are also affected by chronic inhalation exposure to manganese. The population survey conducted during the study has revealed that the occurrence of respiratory system and nervous system diseases is higher in Chiatura than in nearby villages. Source: M. Mirtskhulava and M. Wireman. Evaluation of mining-related metals contamination and ecological and human health risks associated with manganese mining and processing in Chiatura, Georgia - Report of Findings, 2011.

Chapter 13: Health and environment 203
Photo 13: Recreational area in Caucasian part of Georgia
Around 650 MnO2 measurements are performed annually. The MnO2 measured concentrations have exceeded the limit values for several years. The company was given an extension until 2013 to meet limit values; after 2013, it must reduce emissions to the allowed level. In 2014, concentrations of MnO2were not yet in accordance with the limit value
There is no preventive action performed for workers and residents in Chiatura and Zestafoni to limit and avoid population exposure. There is no medical surveillance programme on workers and the general population. A risk evaluation study for each industrial plant, taking into account the pollutant emitted, emissions concentration and population exposure has not been performed so far.
Indoor air pollution
Indoor air quality is related to outdoor air quality, building materials, heating and cooking technologies, and also tobacco smoke. There are very few data on the impacts of these sources on indoor air quality in Georgia and on population health.
There are no data concerning the different sources and substances leading to indoor pollution. Exposure levels and the health impact on the population are not documented. A national population-based survey to assess the extent of indoor environmental problems in Georgian homes and other buildings is lacking. No specific action is performed or planned for indoor air quality measurement in public buildings such as kindergartens, schools, hospitals and workplaces.
The study performed on air pollution in Zestafoni (box 13.1) indicated that the ferroalloys plant contributes to dust pollution in the residences of the population.
Tobacco smoke
It has been demonstrated that population exposure to environmental tobacco smoke has a deleterious health impact. Based on WHO data, each year from 9,000 to 11,000 people are dying in Georgia from diseases associated with tobacco use; among them, 3,000 are passive smokers. The prevalence of smoking in Georgia is one of the highest among countries in Europe. According to the WHO Report on the Global Tobacco Epidemic, 2013, 30.3 per cent of the Georgian population are smokers. The prevalence of tobacco smoking is much higher among men (55.5 per cent) than women (4.8 per cent). Among young people (13–15 years old) it is 8.6 per cent (15.2 per cent of males and 2.8 per cent of females). Smoking is not forbidden in all public places. It is forbidden in health-care facilities, educational facilities and universities, but not forbidden in government facilities, indoor offices or on public transport; in cafés, bars and restaurants there is a separate area for smokers.
Carbon monoxide
Households in Tbilisi mostly use individual gas and electric heaters. Gas heaters and other heating systems with a combustion process can be responsible for carbon monoxide (CO) emission into the indoor air. CO gas has no odour and consequently
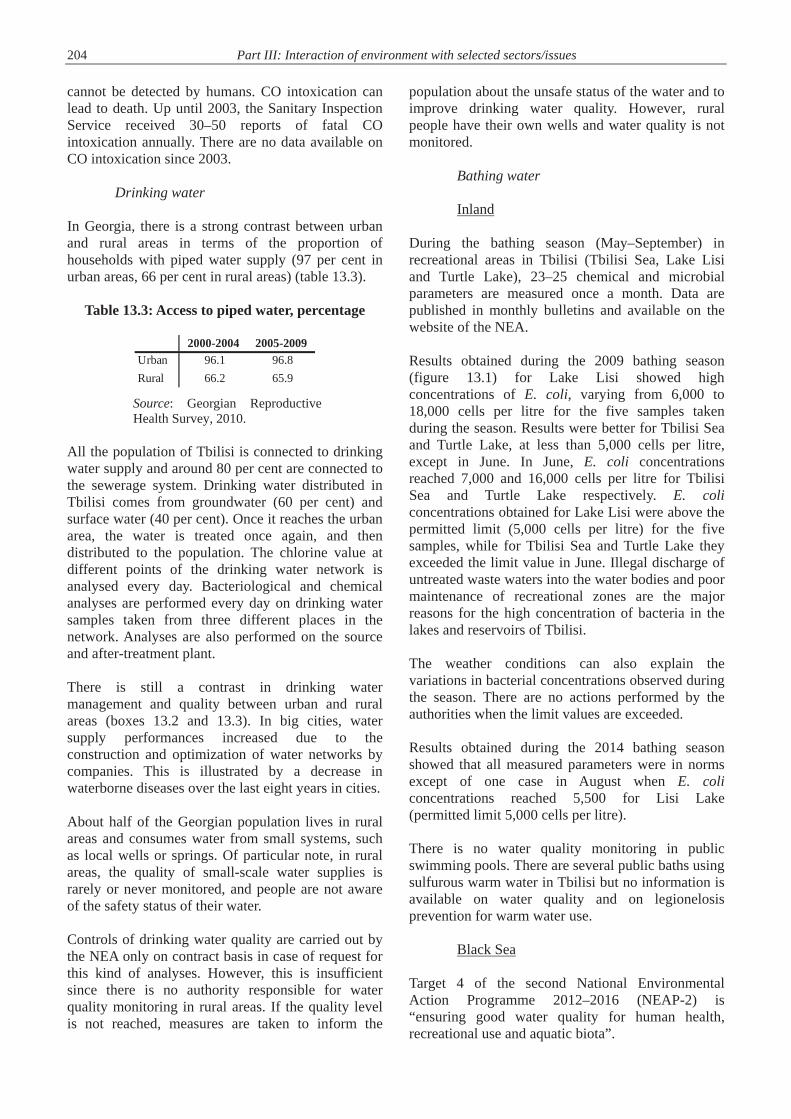
204 Part III: Interaction of environment with selected sectors/issues
cannot be detected by humans. CO intoxication can lead to death. Up until 2003, the Sanitary Inspection Service received 30–50 reports of fatal CO intoxication annually. There are no data available on CO intoxication since 2003.
Drinking water
In Georgia, there is a strong contrast between urban and rural areas in terms of the proportion of households with piped water supply (97 per cent in urban areas, 66 per cent in rural areas) (table 13.3).
Table 13.3: Access to piped water, percentage
Source: Georgian Reproductive Health Survey, 2010.
All the population of Tbilisi is connected to drinking water supply and around 80 per cent are connected to the sewerage system. Drinking water distributed in Tbilisi comes from groundwater (60 per cent) and surface water (40 per cent). Once it reaches the urban area, the water is treated once again, and then distributed to the population. The chlorine value at different points of the drinking water network is analysed every day. Bacteriological and chemical analyses are performed every day on drinking water samples taken from three different places in the network. Analyses are also performed on the source and after-treatment plant. There is still a contrast in drinking water management and quality between urban and rural areas (boxes 13.2 and 13.3). In big cities, water supply performances increased due to the construction and optimization of water networks by companies. This is illustrated by a decrease in waterborne diseases over the last eight years in cities. About half of the Georgian population lives in rural areas and consumes water from small systems, such as local wells or springs. Of particular note, in rural areas, the quality of small-scale water supplies is rarely or never monitored, and people are not aware of the safety status of their water. Controls of drinking water quality are carried out by the NEA only on contract basis in case of request for this kind of analyses. However, this is insufficient since there is no authority responsible for water quality monitoring in rural areas. If the quality level is not reached, measures are taken to inform the
population about the unsafe status of the water and to improve drinking water quality. However, rural people have their own wells and water quality is not monitored.
Bathing water
Inland During the bathing season (May–September) in recreational areas in Tbilisi (Tbilisi Sea, Lake Lisi and Turtle Lake), 23–25 chemical and microbial parameters are measured once a month. Data are published in monthly bulletins and available on the website of the NEA. Results obtained during the 2009 bathing season (figure 13.1) for Lake Lisi showed high concentrations of E. coli, varying from 6,000 to 18,000 cells per litre for the five samples taken during the season. Results were better for Tbilisi Sea and Turtle Lake, at less than 5,000 cells per litre, except in June. In June, E. coli concentrations reached 7,000 and 16,000 cells per litre for Tbilisi Sea and Turtle Lake respectively. E. coli concentrations obtained for Lake Lisi were above the permitted limit (5,000 cells per litre) for the five samples, while for Tbilisi Sea and Turtle Lake they exceeded the limit value in June. Illegal discharge of untreated waste waters into the water bodies and poor maintenance of recreational zones are the major reasons for the high concentration of bacteria in the lakes and reservoirs of Tbilisi. The weather conditions can also explain the variations in bacterial concentrations observed during the season. There are no actions performed by the authorities when the limit values are exceeded. Results obtained during the 2014 bathing season showed that all measured parameters were in norms except of one case in August when E. coli concentrations reached 5,500 for Lisi Lake (permitted limit 5,000 cells per litre). There is no water quality monitoring in public swimming pools. There are several public baths using sulfurous warm water in Tbilisi but no information is available on water quality and on legionelosis prevention for warm water use.
Black Sea
Target 4 of the second National Environmental Action Programme 2012–2016 (NEAP-2) is “ensuring good water quality for human health, recreational use and aquatic biota”.
2000-2004 2005-2009Urban 96.1 96.8Rural 66.2 65.9

Chapter 13: Health and environment 205
Box 13.2: Assessment of small-scale water supply systems in selected districts
The study carried out in 2011–2012 by WHO and the National Centre for Disease Control and Public Health (NCDCPH) on drinking water quality in Dusheti and Marneuli districts showed that about two thirds of the samples were not compliant with the national standards for Escherichia coli. The majority of the samples met the chemical standards level. Most of the small-scale water supply systems have no treatment process, but where there is chlorine treatment, practices (additional chlorine concentration, monitoring of the treatment, maintenance) were found to be inadequate. The study revealed a lack of sanitary protection zones and of installation maintenance. The results of the study underline that 40 per cent and 24 per cent of the investigated sites in Marneuli and Dusheti, respectively, could be considered to be of high or very high risk. Source: Situation assessment of small-scale water supply systems in the Dusheti and Marneuli districts of Georgia, Ministry of Labour, Health and Social Affairs and WHO Regional Office for Europe, 2013.
Box 13.3: Water quality in Khamiskuri and Khorga
According to Women in Europe for a Common Future (WECF), analyses were performed in September 2014, with a mobile laboratory, of drinking water in urban areas. The objective was also to train the Kamiskuri Water and Sanitation Resource Centre on how to use a portable laboratory and to conduct bacterial and chemical analysis in water samples. Samples of three centralized water supplies and from seven individual wells in the villages of Khamiskuri and Khorga were taken and analysed. While the results obtained for chemical parameters (nitrate, nitrite and ammonia, pH and conductivity) did not exceed limit values, the analysis of total coliform bacteria showed strong microbial pollution. WECF reported that the centralized water supply in Khamiskuri, which serves 1,200 people, was contaminated with more than 1,000 total coliform bacteria per 100 ml water. Another small-scale water supply in Khamiskuri, serving 38 households, had more than 100 total coliforms, exceeding the parametric value of 0 per 100 ml. All the tested wells showed total coliform bacteria from 35 up to more than 100 and, due to the high density of the colonies, were partly not countable. Only the two bottled mineral waters and the sample from the centralized water supply in Khorga met the standard of 0 per 100 ml water for total coliform bacteria. WECF attributed these bad results to the lack of reservoir and pipe maintenance and the absence of chlorination. Most of the wells are in bad shape, lacking covers and concrete aprons. Source: http://www.wecf.eu/english/aeticles/2014/09/water-testing.php One of the measures to reach this target is to carry out permanent monitoring of bathing water quality during the tourism season in Batumi, Kobuleti and Ureki. E. coli concentrations, measured in May (one sample) and June (two samples) 2009, fluctuated between 620 and 7,000 cells per litre in Batumi central beach aquatic area, and between 620 and 5,000 cells per litre in Kobuleti central beach area.
Radiation Ionizing radiation is in use in several sectors, such as energy, medicine, industry science and defence. Human sources of ionizing radiation are regulated by legislation. All sources and their users are collected in a database. According to NEAP-2, in 2010, 640 organizations engaged in radiation-related activities were registered, as were 1,145 generators of ionizing emissions, 1,537 so-called sealed and 762 unsealed sources. These sources’ activities vary from 1 millicurie to 35,000 millicuries.
Military sites with abandoned sources Detection, neutralization and safe storage of uncontrolled and unexploited radioactive sources is ongoing. When a source is discovered, a security zone is delimited and a recovery plan is elaborated to remove the source. Around 300 of these sources have been identified, 50 of which were neutralized between 2007 and 2010.
Medical radiation Usually, more than 90 per cent of population exposures to radiation are medical exposure, such as through diagnostic X-ray, nuclear medicine and radiation therapy. All medical workers are obliged to have specific knowledge and skills and to wear individual dosimeters. A work on identification of patient doses is starting. In order to reduce overexposure to radiation during medical procedures, the quality assurance programme is being improved in different areas and quality control is under development. Thus, there are quality requirements for medical equipment to ensure that it is used in accordance with existing standards.
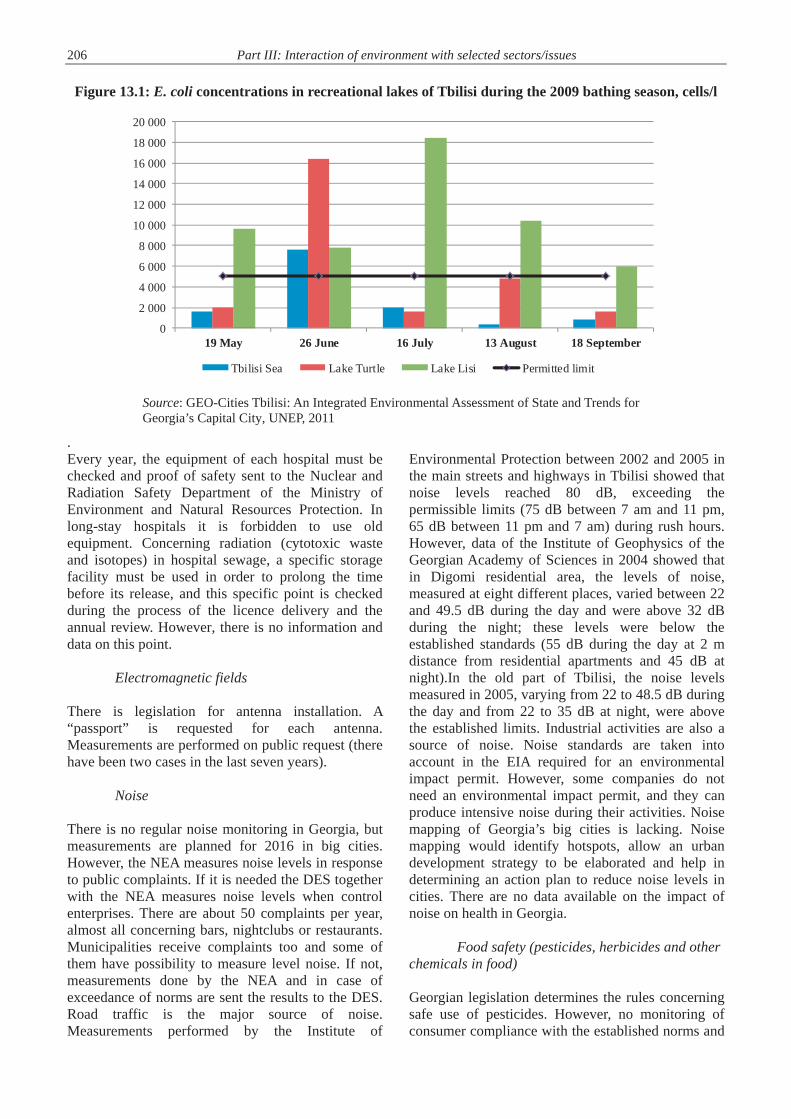
206 Part III: Interaction of environment with selected sectors/issues
Figure 13.1: E. coli concentrations in recreational lakes of Tbilisi during the 2009 bathing season, cells/l
Source: GEO-Cities Tbilisi: An Integrated Environmental Assessment of State and Trends for Georgia’s Capital City, UNEP, 2011
.Every year, the equipment of each hospital must be checked and proof of safety sent to the Nuclear and Radiation Safety Department of the Ministry of Environment and Natural Resources Protection. In long-stay hospitals it is forbidden to use old equipment. Concerning radiation (cytotoxic waste and isotopes) in hospital sewage, a specific storage facility must be used in order to prolong the time before its release, and this specific point is checked during the process of the licence delivery and the annual review. However, there is no information and data on this point.
Electromagnetic fields
There is legislation for antenna installation. A “passport” is requested for each antenna. Measurements are performed on public request (there have been two cases in the last seven years).
Noise
There is no regular noise monitoring in Georgia, but measurements are planned for 2016 in big cities. However, the NEA measures noise levels in response to public complaints. If it is needed the DES together with the NEA measures noise levels when control enterprises. There are about 50 complaints per year, almost all concerning bars, nightclubs or restaurants. Municipalities receive complaints too and some of them have possibility to measure level noise. If not, measurements done by the NEA and in case of exceedance of norms are sent the results to the DES. Road traffic is the major source of noise. Measurements performed by the Institute of
Environmental Protection between 2002 and 2005 in the main streets and highways in Tbilisi showed that noise levels reached 80 dB, exceeding the permissible limits (75 dB between 7 am and 11 pm, 65 dB between 11 pm and 7 am) during rush hours. However, data of the Institute of Geophysics of the Georgian Academy of Sciences in 2004 showed that in Digomi residential area, the levels of noise, measured at eight different places, varied between 22 and 49.5 dB during the day and were above 32 dB during the night; these levels were below the established standards (55 dB during the day at 2 m distance from residential apartments and 45 dB at night).In the old part of Tbilisi, the noise levels measured in 2005, varying from 22 to 48.5 dB during the day and from 22 to 35 dB at night, were above the established limits. Industrial activities are also a source of noise. Noise standards are taken into account in the EIA required for an environmental impact permit. However, some companies do not need an environmental impact permit, and they can produce intensive noise during their activities. Noise mapping of Georgia’s big cities is lacking. Noise mapping would identify hotspots, allow an urban development strategy to be elaborated and help in determining an action plan to reduce noise levels in cities. There are no data available on the impact of noise on health in Georgia.
Food safety (pesticides, herbicides and other chemicals in food)
Georgian legislation determines the rules concerning safe use of pesticides. However, no monitoring of consumer compliance with the established norms and
0
2 000
4 000
6 000
8 000
10 000
12 000
14 000
16 000
18 000
20 000
19 May 26 June 16 July 13 August 18 September
Tbilisi Sea Lake Turtle Lake Lisi Permitted limit
Chapter 13: Health and environment 207 rules for use of pesticides is performed.
Housing and human settlements Since 2003, no survey has been conducted to assess the extent of indoor environmental problems in Georgian homes. Collecting data on housing and other environmental exposure when lead poisoning or allergic symptoms are diagnosed would help in understanding and finding the causes of such symptoms.
Asbestos Asbestos exposure and related cancers are not monitored in Georgia. People working in the construction industry or with asbestos-containing material (e.g. cars, ships and planes) are the most exposed to asbestos. However, as asbestos is also in buildings and domestic materials, the entire population can be exposed to asbestos. There is no monitoring of asbestos fibre presence in public buildings such as schools or medical centres. Asbestos-containing products have not been produced in Georgia since 1992, while a total of 4,374 tons of imported asbestos was consumed in the year 2010–2011. Import and use of chrysotile asbestos is allowed in Georgia; All forms of amphibole asbestos as listed in Annex III of the Rotterdam convention – Crocidolite, Amosite, Actinolite, Anthophylitte, Tremolite is regulated According to the Decree N133/N of Ministry of Labour, Health and Social Affairs on “Approval of the list of hazardous chemical substances subject to prohibition of production, use and export-import or severely restricted use” (Decision: Prohibited). Moreover, to meet the requirements and procedures of Rotterdam Convention, also commitments under Stockholm Convention, Ministry of Environment and Natural Resources Protection together with Ministry of Agriculture has elaborated the Decree of the Government “On Rule of Import and Export of Certain Hazardous Chemicals and Pesticides and Implementation of Prior Informed Consent Procedure”. Abovementioned decree will be submited for the approval to the Georgian Government in 2015. Also, Established norms (Maximum allowable concentration) of Asbestos-containing dust contents in the air (Containing up to 10 per cent Chrysotile asbestos) is: maximum single -0 mg/m3; Average daily -0.06 mg/m3. Asbestos exposure occurs when asbestos is released by material deterioration, or building degradation or
destruction. According to a 2005 study,8 250–350 kg of construction waste is estimated to be generated per capita and per year in Georgia. There are several sites dedicated to construction waste in Tbilisi; however, there are no specific data on asbestos storage.
Radon In Georgia, there is no mapping of radon zones and no health risk assessment done in high risk regions. Exposure of the population to radon is a cause of lung cancer and there is an enhanced effect with tobacco smoke. Actions to reduce radon risks, such as ventilation, are not developed and construction rules do not take into account the presence of radon. There is no overall study on radon epidemiology in regard to lung cancer development; however, studies were conducted on radon concentration in air and tap water in Tbilisi (box 3.4). Considering the impact of radon on cancer morbidity, the issue of radon-related prevention seems relevant for Georgia. There is no strategy of reduction of radon risks, including recommendations and preventive activities to reduce population exposure.
Lead Young children are particularly vulnerable to the toxic effects of lead and can suffer profound and permanent adverse health effects, particularly affecting the development of the brain and nervous system. No data on lead poisoning in Georgia are available. However, the authorities are taking into account this public health problem by programming a study to collect data and better understand the level of lead poisoning in Georgia. A study is planned to be performed by the NCDCPH on monitoring the lead concentration in blood of children aged from one to five years in Tbilisi. But it is not planned to undertake a nationwide survey on lead exposure.
Mould In houses, humidity, insufficient ventilation and isolation, cooking and heating habits can lead to the development of mould. This often occurs in old houses. Exposure to mould through airborne spores leads to health problems such as allergy symptoms, including a runny nose, scratchy throat, itchy eyes, sneezing and, in more severe cases, wheezing and coughing. There are no data in Georgia on allergy symptoms in relation to indoor air quality.
8 Tbilisi waste management concept, German Society for Technical Cooperation, 2006.
208 Part III: Interaction of environment with selected sectors/issues
Under the Georgian MDG 7.3, Target 16 deals with “the harmonization of the housing sector with international standards including the development of social tenure component”. Indeed, there is no comprehensive housing regulation in Georgia. The Government has started working on the spatial planning and construction code and it is expected that it will be fully transposed and harmonized with European technical regulations by 2019. The code deals with special arrangements and building planning, and the quality of construction materials. Since 1970, there has been no master plan or strategy for Tbilisi’s development. In 2009, the master plan of prospective development of Tbilisi was approved. This plan included actions with an environmental aspect. The restoration and reconstruction of old Tbilisi, the development of new infrastructures, and the relocation of industrial enterprises from the city centre to the territory adjacent to Lilo market are
among the objectives. Green areas in Tbilisi are distributed unequally and are located at considerable distance from the most popular districts, making their accessibility rather difficult. In 2001, the green space in Tbilisi available per inhabitant had amounted to 5.6 m2. There are no cycling routes.
Waste There is no study on the impact on human health of landfills and dumpsites, which are often close to river banks. Infectious waste is collected by a specific health-care waste service company. These cover 90 per cent of health-care institutions in Tbilisi and health-care wastes are collected daily. Collected infectious waste is autoclaved and the disinfected waste is then taken to the Tbilisi municipal waste landfill. Anatomical waste is collected and buried in a special cemetery.
Box 13.4: Studies on radon presence in Tbilisi
A 2011 study on radon concentration in the air in different buildings (in living spaces and auxiliary rooms) in Tbilisi showed that radon concentration at the majority of control points ranged from sufficiently low to typical and above typical (less than 20–100 Bq/m3). However, there were control points at which radon concentration was in the range estimated as high and dangerous (100–500 Bq/m3), in some cases reaching values of an order of 1,000 Bq/m3. Another study, in 2010, demonstrated the presence of radon in the tap water of Tbilisi. The radon concentration levels detected can be divided into two groups: higher than 1 Bq/l and lower than 1 Bq/l. The measured concentrations depended on the water origin: groundwater or surface water. The population exposure was estimated and the estimated values of the effective dose and dose-equivalent committed to stomach were: 0.0060±0.0033 mSv y-1 and 0.16 ± 0.09 mSv y-1 for the first group of districts, and 0.0010 ± 0.0009 mSv y-1 and 0.026 ± 0.025 mSv y-1 for the second group of districts. Source: Indoor radon and features of its distribution in Tbilisi – The main city of Georgia. L. Mtsariashvili, N. Kekelidze, T. Jakhutashvili, E. Tulashvili, Z. Berishvili, M. Chkhaidze, M. Elizbarashvili. 13th SGEM GeoConference on Ecology, Economics, Education And Legislation, Tuesday 6 August 2013 Conference Proceedings, ISBN 978-619-7105-04-9 / ISSN 1314-2704, June 16-22, 2013, Vol. 1, 1235–1242. Radioactivity of tap water of Tbilisi city (Georgia) and estimation of radiological risk for population. L. Mtsariashvili, N. Khikhadze, N. Kekelidze, T. Jakhutashvili, E. Tulashvili. 10th International Multidisciplinary Scientific GeoConference - SGEM2010, Sunday 1 August 2010 - SGEM2010 Conference Proceedings / ISBN 10: 954-91818-1-2, June 20-26, 2010, Vol. 2, 39–46.
Box 13.5: Lead poisoning prevention week of action for Georgia
The NCDCPH coordinated the international lead poisoning prevention week of action for Georgia (22–26 October 2013). This event is part of the Global Alliance to Eliminate Lead Paint, established by UNEP and WHO in 2009. The Georgian event included national workshops and round-table discussions, and information about the campaign was shared through TV broadcasts, press articles and the Internet. The purpose was to discuss ways of banning the use of lead in paint production and the import of paint or toys containing lead, and promoting the use of alternatives. Special attention was paid to the development of national legislation in this area. The international lead poisoning prevention week of action in Georgia resulted in an agreed list of short-term actions aimed at preventing the negative impact of lead. Source: International lead poisoning prevention week of action in the WHO European Region, 20–26 October 2013 – Report, World Health Organization, 2014.
Chapter 13: Health and environment 209
Occupational health and safety Except for some specific studies, there is no information in Georgia on occupational exposure to the main health-related factors in the working environment or on work-related injuries and traumatism. In the past, before 2007, employees’ health was periodically checked and reports on occupational health were available. Only workers in high risk jobs, such as police and fire officers, have a medical examination every year. Other workers are not involved in this system, and workers with high risk exposure, such as those working in mines, construction and roadworks, have no specific medical checks related to their workplace. Environmental factors such as indoor air quality are a strong health determinant in the workplace. The results of a survey of occupationally exposed workers in manganese mining in Chiatura showed a positive association between occupational factors and health, such as central nervous system functional changes. Compared with the non-exposed group, the relative risk indices for exposed workers are higher, especially for men: sexual weakness (10.5), pneumonia (3) and radiculitis (2.5). All the workers wear protective clothing during work, which they remove after work, and almost 100 per cent take a shower, avoiding home and family contamination by their clothes. 13.3 Legal policy and institutional framework
Legal framework In 2007, by the adoption of the Law on Public Health Care, the Sanitary Codex was abolished. Consequently, the surveillance, control and majority of services involved in sanitary surveillance were abolished without an alternative structure or new legislation. There is a lack of legislation and control of the authorities in several environmental health domains, for example, safe use of chemicals, waste management, industrial emissions, occupational health, and outdoor and indoor air quality. The TAIEX report (2013) also underlines these points. The Law on Nuclear and Radiation Safety requires operators to obtain a licence in order to provide safe radiological conditions. The Law was amended in 2012 by way of harmonization with EU rules. The 2001 Ministry of Labour, Health and Social Affairs Order No. 297/N on the Approval of Environmental Quality Norms establishes norms for
drinking water, underground, recreational, water protection zones, air, soil, EMF, noise,vibration and contains 16 annexes. It provides permissible limits of noise at workplaces and for public buildings and residential sites. The permissible noise level for road traffic is 75 dB during the day and 65 DB at night (11 pm to 7 am). In a residential zone, the permissible noise level is 55 dB during the day at 2 m distance from residential apartments and 45 dB at night. There is no legislation on noise levels in bars, restaurants and nightclubs, so people, and especially young people, are exposed to high noise levels in these places. Health-care waste is regulated by the 2001 Ordinance No. 300/n on approval of the rules for collection, storage and treatment of waste from medical establishments. According to the Labour Code, the employer shall fully compensate the employee for damage incurred to his/her health resulting from the performance of his/her official duties as well as the costs of necessary medical treatment. The employer must provide employees complete, objective and explicit information available regarding all the factors that influence employees’ life and health or the safety of the environment. Occupational health and safety focuses on obligations on the employer to ensure maximally safe working conditions to protect the life and health of the employee. The Labour Code also specifies special rules for the protection of safe and healthy working conditions for pregnant women, namely, the employer shall ensure the protection of the pregnant woman from work that endangers her physical and psychological health and that of her foetus. Additionally, it is prohibited to conclude an employment contract with a pregnant woman or a nursing mother, for performing hard, unhealthy and hazardous work.
A review of labour laws and the drafting of new legislation is ongoing. Occupational health, including environmental exposure of workers, is a public health issue. Three decrees support the Law on Food Safety and Quality: The 2010 Decree No. 173 deals with the general
hygienic regulations of foodstuffs and animal feed, including production and distribution conditions. It is also focused on monitoring and official control in the areas of food safety and on veterinary and plant protection;
The 2010 Decree on Approval of the Rule of Carrying out of the Phytosanitary Border
210 Part III: Interaction of environment with selected sectors/issues
Quarantine and Veterinary Border Quarantine Control;
The 2010 Decision No. 427 approves the rules and forms of the phytosanitary certificate and re-export phytosanitary certificate.
Policy framework
There is no plan or programme on environmental health. In 2003, a national environmental health action plan (NEHAP) was elaborated but was never adopted. There is no children’s environment and health action plan (CEHAP) in Georgia.The second National Environmental Action Programme 2012–2016 (NEAP-2) underlines the impact of environmental degradation on health, but no specific actions are given to better understand the health impact. The National Commission on Tobacco Control has developed the 2013 National Strategy on Tobacco Control No. 196, and long-term action plan. The main goal of the action plan and governmental programme is the promotion of health quality in the Georgian population by reducing tobacco consumption and protecting the population from passive smoking.
Institutional framework
Ministry of Labour, Health and Social Affairs The Ministry of Labour, Health and Social Affairs defines policy that ensures a safe environment for human health. The NCDCPH develops national standards and guidelines; promotes the improvement of public health; participates in the development of public health policy; carries out epidemiological surveillance, the immunization programme, laboratory diagnostic and surveillance activities; responds to public health emergencies; and produces health statistics. Case reports and data on infectious diseases are registered with the electronic integrated system on infectious diseases of the NCDCPH. Seventy-eight diseases are under surveillance and subject to alert notification. Medical staff must send notification of a case to NCDCPH within 24 hours after its identification. In order to improve prevention and case identification, a doctor will be present in every school in the country in 2015. The Department of Medical Statistics of the NCDCPH collects and uses data from statistical
reports of medical institutions and from the National Statistics Office. In 2011, the Centre introduced electronic reporting of deaths. Since that time, registration has improved; previously, health statistics were based on incomplete deaths and births registration. The Environmental Health Division of the NCDPH was created in 2013 and has a staff of three. One of its priorities is to produce reliable information through monitoring, assessment and analysis of the health status of the population and environmental factors.
Ministry of Environment and Natural Resources Protection The Ministry of Environment and Natural Resources Protection is in charge of the monitoring and protection of the environment. It supports development of environmental education and raising environmental awareness. The Nuclear and Radiation Safety Department authorizes the use of radioactive sources, after documents have been reviewed and the installation checked and conduct-related inspections carried out, makes recommendations and imposes penalties where non-compliance is observed. Since 2014, an inspection programme is elaborated for the year, which takes into account the radiation risks, previous results and activity of the installation. The Environmental Information and Education Centre provides access to environmental information. The Centre will provide information reflecting the state of environment and how it impacts on population health. The NEA prepares and disseminates information, forecasts and warnings related to existing and expected hydrometeorological and geodynamic processes, and also environmental pollution conditions. A monthly air quality bulletin is published on the NEA’s website. Data on air quality measurements from the air stations are available, but no actions are taken to inform the population or limit emissions when limit values are exceeded. On a daily basis, the NEA measures the dose rate of gamma radiation in 15 stations on the territory of Georgia. Seven of these are automatic (stations received from IAEA in the framework of the project). The daily data are available on the website: meteo.gov.ge. After the Fukushima nuclear accident no impact was noticed on the measured values.
Chapter 13: Health and environment 211 On a seasonal basis (May–September), the NEA monitors water quality in recreational areas in Tbilisi (Tbilisi Sea, Lisi and Turtle Lakes).
Ministry of Agriculture The Food Safety Department of the National Food Agency (NFA), under the Ministry of Agriculture, is in charge of drinking water monitoring and food safety. The NFA registers pesticides and agrochemicals, and veterinary medicines. The NFA has been responsible for controlling all types of food/feed-producing establishments since 2011, according to the Law on Food Safety and Quality. State control of ventures means the monitoring of the whole chain of food production, inspecting sanitary-hygiene norms, and organoleptic checks of ready products. Every year, the NFA establishes the food safety control programme. The programme takes into account previous results and non-compliance cases. Large enterprises are inspected every year and, in the event of non-compliance, the enterprise will be inspected again. When non-compliance is observed, recommendations are delivered. If they are not realized, financial penalties are applied – the amount depends on the nature of non-compliance and varies between 400 lari and 1,200 lari. During the control, documentation is checked and sampling is performed. Samples are analysed by a laboratory accredited for analysis. Controls are mainly performed on food processors, food markets and catering (restaurants). Inspection is performed on risk analysis. The NFA delivers authorization for bottled water (mineral, spring water) and carries out inspections of bottled water companies every year. The Laboratory of the Ministry of Agriculture is in charge of analysis of animal disease, such as brucellosis, rabies, anthrax, and foot and mouth disease. It is certified in accordance with the ISO 9001:2008 quality management system for laboratory testing. It is accredited in accordance with the international standard ISO/IEC 17025:2005.
Water quality monitoring Since 2006, with the abolition of several governmental structures related to environment and human health, such as the state supervisory inspection for sanitary/hygienic norms and regulations, the State has lost control of drinking ater quality. Water companies have their own programmes and laboratories and have no obligation to hand over their sampling programme or reply to NFA requests.
The companies take samples in the same time frames as the NFA. The NFA controls the production step (the first step after treatment) and the distribution stage (tap water) but does not control the water source. The results of the environmental programme for water monitoring are not connected with the NFA. The NFA is authorized by the legislation to take samples but it cannot conduct the physico-chemical analysis because it is not accredited to do so. The laboratory in charge of the analysis is selected after a tendering process and has to be accredited onISO 17025. There are three laboratories, located in Cutishi, Batumi and Tbilisi to have countrywide distribution. If the NFA obtains positive results, it has the obligation to inform the implicated company – but the reverse is not true; companies have no obligation to inform the NFA or the population if they obtain positive results. The NFA informs the company and the municipalities and makes recommendations. If there is a health risk, the NFA organizes public information via TV, websites and local political channels. The NFA makes recommendations but companies are not obliged to take the measures recommended. Protection zones around the contaminated sources are designated but not applied, as legislation is this area was abolished in 2006. Each year, the regional units of the NFA elaborate and follow the annual programme of drinking water monitoring: location and frequency of sampling, analysis parameters. Demographics, previous results and previous outbreaks of waterborne diseases are taken into account to elaborate the sampling programme. At least one sample a year is taken at each location on the monitoring programme list. In 2014 (until September), 407 drinking water samples were analysed. Among them, 148 samples were not in conformity with the bacteriologic limit values, representing 36 per cent non-compliance. The major cause of bacterial non-compliance is due to treatment problems. Technical problems or inappropriate management of chlorine injection are responsible of most of the non-compliance. The budget for drinking water monitoring in 2014 was 240,000 lari. The number of samples depends on the dedicated budget; in 2010, 471 samples were analysed; in 2012, 75 were analysed; in 2013, 186

212 Part III: Interaction of environment with selected sectors/issues
were analysed. Since 2012, 30 per cent of the samples taken in the drinking water programme are randomly selected to determine Cu, Mn, Fe, Cd, Zn, Pb, As and oil concentrations. The results from the state monitoring of drinking water are collected in a specific database managed by the NFA.
Coordination with institutions responsible for
environmental protection The organization and responsibilities of the different ministries are well defined and, in a few cases, resolutions are adopted to make collaboration between ministries official.In order to monitor diseases caused by food, including water, the 2006 Resolution on the Rules of Information Exchange and Implementation of Measures for Elimination of Disease Outbreak, between the NFA of the Ministry of Agriculture and the NCDCPH of the Ministry of Labour, Health and Social Affairs, was adopted. The NFA and the Ministry of Labour, Health and Social Affairs exchange information on water quality results and waterborne diseases. Collaboration between the Ministry of Environment and Natural Resources Protection and the Ministry of Labour, Health and Social Affairs is in its early stages.
Preventive and information measures
A maternal mortality surveillance system was developed by the NCDCPH in 2012. Every death of a woman of reproductive age must be notified within 24 hours; it must be the subject of an epidemiological study and an autopsy must be undertaken if necessary. In 2014, the global coverage of children aged 12–23 months with anti-measles immunization was about 92 per cent. The anti-measles immunization coverage increased strongly between 2001 (around 55 per cent) and 2012. A monthly air quality bulletin is published on the NEA’s website. Data on air quality measurements from the air stations are available. However, the population is not informed about the daily level of pollution and no campaigns were conducted to inform the population on the health impact of air
pollution. Therefore, the population does not know how to adapt behaviours (e.g. the manner of driving, technical condition of the car) to limit emissions of pollutants. Preventive actions on occupational hazards and medical monitoring are not provided to workers.
Health-related global and regional agreements and processes In 2005, Georgia signed the Tashkent Declaration, “The Move from Malaria Control to Elimination”. In 1999, Georgia signed the London Protocol to the 1992 Convention on the Protection and Use of Transboundary Watercourses and International Lakes (the Protocol on Water and Health), but has not ratified it. The National Policy Dialogue (NPD) on Integrated Water Resources Management (IWRM) started in Georgia in September 2010. It focuses on three major topics: preparation of a national water law based on IWRM principles and the EU Water Framework Directive; setting targets for the implementation of the London Protocol; and transboundary activities. Georgia does not participate in any of the International Labour Organisation (ILO) environmental health conventions: 1960 Convention concerning the Protection of Workers against Ionising Radiations (Radiation Protection Convention, ILO 115), 1971 Convention concerning Protection against Hazards of Poisoning Arising from Benzene (Benzene Convention, ILO 136), 1974 Convention concerning Prevention and Control of Occupational Hazards caused by Carcinogenic Substances and Agents (Occupational Cancer Convention, ILO 139), 1977 Convention concerning the Protection of Workers against Occupational Hazards in the Working Environment Due to Air Pollution, Noise and Vibration (Working Environment (Air Pollution, Noise and Vibration) Convention, ILO 148), 1981 Convention concerning Occupational Safety and Health and the Working Environment (Occupational Safety and Health Convention, ILO 155), 1986 Convention concerning Safety in the Use of Asbestos (Asbestos Convention, ILO 162) and 1990 Convention concerning Safety in the use of Chemicals at Work (Chemicals Convention, ILO 170).

Chapter 13: Health and environment 213
Table 13.4: Vaccination and immunization data, 2013-2014
Source: National Centre for Disease Control and Public Health, 2014. Notes: a) Age for vaccination according to the calendar; b) Number vaccinated according to the calendar.
13.4 Conclusions and recommendations Since 2003, the health surveillance information system in Georgia of reporting and notification of incidents and outbreaks of infectious diseases has been improved. Each year the Ministry of Labour, Health and Social Affairs publishes the Health Care Statistical Yearbook, giving an overview of health status of the country. However, no investigation is performed to link these health data with environmental factors. In order to define priorities and strategy depending on public health issues, a better understanding of the impact of environmental factors on health and the definition of key environmental factors in Georgia are a prerequisite. Several research studies and a lot of monitoring data for environmental factors or health status are available, but they are not exploited when an environmental health issue arises. Several tools, such as monitoring, a communication centre and research, are available, but they are not used for developing environmental health diagnosis and policy. Georgia does not have a strategy, programme or plan on environmental health. A national environmental health action plan (NEHAP) for Georgia was developed for the period 1998–2003 in order to reduce environmental pollution and the population’s exposure to each environmental medium and source of pollution. However, this key document for environmental health was suspended and never
implemented. In parallel, a health and environmental information system could be developed in order to monitor environmental health effects. The elaboration of the environmental health strategy requires a multidisciplinary approach. The aim is to understand the impact of environmental factors on health, to monitor these factors and health status, to reduce and control them, and to inform the population about them. Indeed, the objectives are to reduce population exposure by reducing pollutant emissions, to take preventive actions with the population in order to modify their habits, and to have an urban development strategy that takes environmental factors into account. Recommendation 13.1: The Ministry of Labour, Health and Social Affairs, in cooperation with other relevant governmental bodies, should: (a) Carry out an assessment of environmental
health; (b) Draft a strategy on environmental health; (c) Draft a national health action plan and
ensure its consistency with the National Environmental Action Programme;
(d) Draft a children’s environment and health action plan.
Air pollution takes place in Zestafoni and transport pollution in big cities. Outdoor air quality is
Vaccine Age a) Number b) % Number b) %BCG-1 0 – 5 days 55 759 95.2 58 370 96.4Viral hepatitis B–0 0 – 12 days 46 625 79.6 57 209 94.5DPT + Hib + Viral hepatitis B-1 from 2 months to 11 months 29 days 53 224 100.0 55 811 100.7DPT + Hib + Viral hepatitis B-3 from 4 months to 11 months 29 days 51 899 97.6 50 206 90.6DPT-4 18 – 24 months 49 029 92.6 45 487 89.5Polio-1 from 2 months to 11 months 29 days 52 356 98.5 55 474 100.1Polio-3 from 4 months to 11 months 29 days 49 834 93.7 50 588 91.2Polio-4 18 – 24 months 45 305 85.6 44 215 87.0Polio-5 from 5 years to 5 years 11 months 29 days 45 672 83.3 48 065 87.4MMR-1 12 – 24 months 51 886 96.5 49 668 92.0MMR-2 from 5 years to 5 years 11 months 29 days 48 663 88.7 47 598 86.6Rotavirus-1 2 months 28 299 73.7 42 802 77.2Rotavirus-2 3 months 21 536 56.1 38 289 69.1PCV-1 2months .. .. 5 398 9.7PCV-2 3 months .. .. 201 0.4PCV-3 12 mounths .. .. 0 0.0DT from 5 years to 5 years 11 months 29 days 48 420 88.3 48 738 88.7TD 14 years 29 285 77.8 28 415 67.0
2013 2014
214 Part III: Interaction of environment with selected sectors/issues
monitored in eight places in the country. At this stage, only monthly reports on air quality is delivered to the population. However, from 2016, after improvement of monitoring network, it is planned to provide online information on air quality in order to prevent and limit population exposure. Indoor air quality is an important health determinant as time spent at home is not negligible, and fragile persons (babies, children and old persons) are the most exposed. No data are available on indoor air pollution, while several factors (e.g. asbestos, radon, carbon monoxide emission) can presumably be present in households and have impact on human health. With the implementation of the cancer register, it is expected that data on mesothelium and other cancers linked to asbestos exposure will be available. Recommendation 13.2: The Ministry of Labour, Health and Social Affairs should: (a) Study the impact on health of air pollution
exposure; (b) Develop actions to reduce the population’s
exposure to air pollution; (c) Carry out a study on asbestos exposure and
develop legislation and construction guidelines;
(d) Inform the population about the health impact from air pollution and preventive actions.
Water quality has improved in big cities and monitoring is carried out by companies. However, there is a big contrast between urban and rural areas in drinking water quality. In rural areas of Georgia, the quality of small-scale water supplies is rarely or never monitored. Bacterial contaminations of the water source and drinking water are frequent in rural areas. The number of samples analysed from the state’s drinking water quality monitoring is low (around 400 samples per year), relative to the size of the population. In big cities, companies performed analysis but the state agency has no power to control them. The lack of monitoring of recreational water quality is also underlined. Recommendation 13.3: The Ministry of Agriculture should: (a) Improve monitoring of drinking water
quality, especially in rural areas; (b) Draft legislation for the control of drinking
water quality.
Occupational health is a public health issue and environmental exposure of workers (e.g. to manganese, asbestos, lead and chemicals) is one of its aspects. Except for specific studies, in Georgia there is no information on occupational exposure to the main factors in the working environment or on work-related injuries and traumatism. Occupational health monitoring has to be performed and specific databases have to be built. For environmental exposure, the first step is to limit pollutant emission and exposure by implementing industrial processes and the wearing of protective clothing. In parallel, neither preventive actions on occupational hazards nor medical monitoring are performed on workers. These actions would enable preventive diagnosis and better understanding of damage to health in relation to work. Recommendation 13.4: The Ministry of Environment and Natural Resources Protection should develop a system for monitoring recreational water quality. Recommendation 13.5: The Ministry of Labour, Health and Social Affairs should: (a) Establish a database on work-related
injuries, traumatism and disease; (b) Develop actions on improving working
conditions and minimizing risk factors. Georgia does not participate in any of the ILO environmental health conventions, such as 1960 Convention concerning the Protection of Workers against Ionising Radiations (ILO 115), 1971 Convention concerning Protection against Hazards of Poisoning Arising from Benzene (ILO 136), 1974 Convention concerning Prevention and Control of Occupational Hazards caused by Carcinogenic Substances and Agents (ILO 139), 1977 Convention concerning the Protection of Workers against Occupational Hazards in the Working Environment Due to Air Pollution, Noise and Vibration (ILO 148), 1981 Convention concerning Occupational Safety and Health and the Working Environment (ILO 155),1986 Convention concerning Safety in the Use of Asbestos (ILO 162); 1990 Convention concerning Safety in the use of Chemicals at Work (ILO 170). Recommendation 13.6: The Ministry of Labour, Health and Social Affairs should initiate accession to the ILO conventions dedicated to the prevention and control of occupational hazards caused by hazardous substances.

215
Chapter 14
RISK MANAGEMENT OF NATURAL AND TECHNOLOGICAL/ANTHROPOGENIC HAZARDS
14.1 Current situation Technological hazards contribute the majority of disaster-related fatalities in Georgia. The number of road accidents and related injuries and deaths are shown in table 10.11. Transport accidents account for 99 per cent of all disaster-related deaths. Fires and explosions killed 147 people during the period 2010–2013, while hazardous substances leaks did not, fortunately, lead to any fatalities (table 14.1). Georgia is exposed to a wide variety of natural hazards, notably landslides, debris- and mudflows, floods, droughts, strong winds, avalanches and hail. Natural hazards do not cause as many fatalities as technological disasters. Floods and debris- and mudflows contribute to most natural-disaster-related fatalities (table 14.2). The economic losses stemming from disasters are not consistently assessed and collected. However, assessments of individual events are available, such as the hail and windstorms in eastern Georgia in the summer of 2012. This disaster affected some 75,000 people while, disproportionally, resulting in economic losses of 202 million lari (US$ 123 million). 14.2 Legal, policy and institutional framework
Legal framework
Law on Civil Safety An important piece of legislation related to disaster risk management was passed in 2014, namely the Law on Civil Safety. The Law describes the common emergency management system (roles and responsibilities), and covers prevention of, preparedness for, response to and recovery from emergencies. The Law defines the authority, rights and obligations of national autonomous republican and local governments, individuals and corporations regarding civil protection. The Law prescribes explicitly responsibilities for the Ministry of Internal Affairs, while many activities described in the Law are also mandated to the Ministry of Environment and Natural Resources Protection, such as monitoring, sampling and analysis following emergencies. However, the capacities within the
Ministry of Environment and Natural Resources Protection are very limited to undertake these tasks. The Law is a framework law, and within the coming two years, a further 50 by-laws will need to be developed to harmonize existing legislation with that of the EU.
Spatial planning
Spatial planning can be an important disaster risk management tool. Despite Georgia having a number of laws covering spatial planning, the siting of hazardous activities is not addressed. A new spatial planning and construction code has been drafted with the support of GIZ. The draft code stipulates that land use planning and development plans at national, regional, municipality and city levels have to be drawn up, which would be subjected to EIA.
Policy framework No national strategy for disaster risk management has been developed, although a thorough assessment of capacities for disaster risk reduction (DRR) has been undertaken on which a capacity-development plan can be based (chapter 1). Of the policies described below, no official evaluations of their implementation were available.
National Response Plan for Natural and Technological Emergency Situations The 2008 National Response Plan on Natural and Manmade Emergency Situations, Decree No. 415, defines roles and responsibilities of different state authorities when responding to emergency situations. This Plan represents the main framework document for management of emergency situations, including industrial accidents. The Ministry of Environment and Natural Resources Protection is responsible for the development of sectoral response plans, namely for forest fires and chemical and radiological emergencies. The drafts of these response plans are available. The Ministry of Environment and Natural Resources Protection is seeking external support for their finalization and implementation.

216 Part III: Interaction of environment with selected sectors/issues
Table 14.1: Man-made emergencies, 2010-2013
Source: Transport Statistics Office; Ministry of Internal Affairs, 2014.
Table 14.2: Natural disasters, 2010-2013
Source: National Environmental Agency, 2014.
Due to changes in the Constitution and in certain responsibilities in line ministries, as well as the establishment in December 2013 of the State Security and Crisis Management Council under the Prime Minister, a revision of the Plan is foreseen, although no concrete timeline for this revision has been set.
Threat Assessment Document for the period
2010–2013 The 2010 Threat Assessment Document for the period 2010–2013 provided an analysis of threats to the country, including scenario development, likelihoods and consequences. One of the five parts of the Threats Assessment Document dealt specifically with natural and man-made threats and challenges. Reportedly, this section focuses on ecologically dangerous developments in the breakaway territories, challenges posed by earthquakes, chemical spills, accidents at hydroelectric power plants and emergencies on main pipelines. The contents of the threat assessments are not for public disclosure, although discussions are ongoing
whether to disclose or not for public at least part of the section related to natural and man-made disasters.
National Environmental Action Programme 2012–2016 The second National Environment Action Programme 2012–2016 (NEAP-2) highlights disasters as one of its 11 themes, with a long-term goal to minimize the loss of human lives, negative impacts on human health and the environment, and economic losses (chapter 1). NEAP-2 lists four short-term targets, which focus on early warning systems, flash floods, mitigation of the consequences of hail, drought and avalanches, and, most notably, risk reduction for industrial accidents.
National Strategy and Action Plan for Mitigating Chemical, Biological, Radiological and Nuclear Threats The aim of the 2014 National Strategy for Mitigating Chemical, Biological, Radiological and Nuclear (CBRN) Threats is to promote the development of a common mechanism relating to the CBRN threats throughout the country. It will be focused on the
Number Death Injury Number Death Injury Number Death Injury2010 5 099 7 560 685 9 060 40 60 1 .. 142011 4 486 6 638 526 8 160 44 64 2 .. ..2012 5 359 7 734 605 10 006 46 98 1 .. 732013 5 510 8 045 514 9 025 48 98 1 .. ..
Hazardous substance leaksFires, explosions, expl. risks Fires, explosions, expl. Risks
2010 2011 2012 2013Number 250 94 325 336Deaths 3 3 1 ..Number 81 37 88 93Deaths 2 8 5 ..Number 18 23 15 8Deaths 3 9 5 0Number 4 1 1 0Deaths 0 0 0 0Number 8 10 5 20Deaths 1 0 0 3Number 8 6 15 8Deaths 1 1 1 0Number 15 14 15 23Deaths 0 0 0 0
Total Deaths 10 21 12 3
Strong winds
Avalanches
Hail
Landslides
Debris/Mudflows
Floods
Droughts

Chapter 14: Risk management of natural and technological/anthropogenic hazards 217 management components of the CBRN incidents, such as prevention, preparedness and response. Linkages with the respective provisions of the Convention on the Transboundary Effects of Industrial Accidents are being considered and addressed in the CBRN. In 2015 as a follow up to the National CBRN Threat Reduction Strategy, the Georgian Interagency Coordinating Council for Countering Chemical, Biological, Radiological and Nuclear (CBRN) Threats officially approved the CBRN National Action Plan for Georgia. It contains a set of actions aimed at reaching the objectives enshrined in the Strategy and covers the period 2015-2019. Implementation of the CBRN Action Plan is overseen by the Interagency Coordinating Council for Countering CBRN Threats.
Institutional framework
Ministry of Environment and National Resources Protection The Ministry of Environment and Natural Resources Protection – in particular, its Natural and Anthropogenic Hazards Management Service – is involved in the process of developing an action plan of the CBRN Strategy for chemical threats, which includes accidental chemical releases from industrial and transport accidents. Activities are further foreseen to include the planning and tracking of DRR activities, support in hazard mapping and development of early warning activities. Natural and Anthropogenic Hazards Management Service is furthermore inter alia in charge of disaster risk reduction strategies and policies, planning of disaster risk reduction activities, setup of a database of DRR activities, and capacity development related to the Early Warning System. The National Environmental Agency (NEA), under the Ministry of Environment and Natural Resources Protection, is mandated to monitor ongoing hydro-meteorological, geodynamic and geological events, as well as to provide monitoring of environmental and chemical (through its laboratory) pollution, to issue license permits for the exploitation of natural resources, and to ensure the sound functioning of monitoring systems. The Environmental Supervision Department of the Ministry of Environment and Natural Resources Protection conducts environmental integrated control including on high risk facilities. The Department amongst its other functions has the authority to issue administratives orders to enforce facilities to take
corrective actions or refrain from an activity to reduce potential risks. The Deparment is authorized to assess environmental damage and charge penalties.
Ministry of Internal Affairs
The Emergency Management Agency within the Ministry of Internal Affairs coordinates the roles of responsible ministries or agencies, as defined in the National Response Plan for Natural and Technological Emergency Situations. It focuses on prevention of, preparedness for and response to both natural and man-made disasters.
State Security and Crisis Management Council The State Security and Crisis Management Council was established in December 2013. It coordinates and manages any kind of national-level crisis response, excluding the crisis of war. The Council has been mandated to elaborate proposals on preventive and response measures to political, social, economic and ecological threats. It also manages the Crisis Operations Centre.
Cooperation and coordination In addition, a number of other institutions, NGOs and foreign donors are undertaking and supporting disaster risk management and DRR activities. The Capacity for Disaster Reduction Initiative (CADRI) assessment report provides an overview of these actors, as does the online database “Who does what where in disaster risk reduction in Georgia” (www.3w.org.ge) managed by the Ministry of Environment and Natural Resources Protection. The CADRI report indicates that the “overall institutional arrangement for DRR is scattered and requires improvement”, for example a range of actors collect information related to disaster events using different methodologies and criteria. It also indicates that Georgia’s preparedness and response, as in most countries, are better established and managed than the other parts of the Hyogo Framework for Action that were reviewed. In particular, the response component of Georgia’s disaster management framework could benefit from contributing to and participating in related international networks, such as that of the United Nations Disaster Assessment and Coordination (UNDAC) team and the International Search and Rescue Advisory Group (INSARAG). Concerning the establishment of a coordination structure for DRR, to date, three separate coordination structures of some sort exist, rather than one consolidated platform:

218 Part III: Interaction of environment with selected sectors/issues
A DRR think tank hosted by the Ministry of Environment and Natural Resources Protection;
An experts advisory panel (comprised of more than 100 government, NGO, academic and independent experts) hosted by the Ministry of Internal Affairs;
A DRR education coordination group hosted by the Ministry of Education and Science.
Disaster risk management
A positive trend is noticeable in the attention that disaster risk management has been receiving since 2010. The number of studies and reports, as well as strategies, policies and legislation focusing on disaster risk management has increased considerably. In a rather short time span of only four years, disaster risk management is now becoming a well-established policy area, providing basic analysis behind disaster trends (including climate change) at a more detailed national level, as well as at a regional level in the south Caucasus. Nevertheless, there is still no unified database registering the various types of disasters, including their impacts. No identification of technological hotspots (fires, transport and miscellaneous accidents) in Tbilisi has taken place, nor have all large dams undergone a safety assessment and, subsequently, early warning systems been installed. The analytical centre with a unified database on disasters and risks has not yet been established in the NEA The project Capacity Building in the Prevention of Major Accidents is being implemented in 2014 to 2016. The project specifically aims to strengthen the legal basis of major accident prevention. It covers assessment of national legislation; drafting of new law on major accidents – harmonization with the EU Seveso Directive and ECE Convention on the Transboundary Effects of Industrial Accidents (TEIA Convention); training for the environmental inspectorate; elaboration of guiding documents; and capacity-building for environmental monitoring.
Disaster Risk Reduction Capacity Assessment In March 2014, the Government, together with the UN Country Team, undertook a DRR Capacity Assessment. The assessment took the Hyogo Framework for Action (and not disaster risk management as such) as its reference framework. The assessment revealed that there is a high level of government willingness and potential to move from a
reactive approach of disaster response to a more proactive DRR approach. It stated that technical, human and financial capacities exist; however, they need better coordination, prioritization and systematization across all relevant sectors, governance levels and institutions. The assessment report contains 49 recommendations to be implemented over a three- to five-year period and will form the basis of a national plan of action for capacity development in DRR. The national plan would also contain cost estimations for implementation. The assessment hardly addressed the issue of industrial hazards and accidents, only noting in its analysis that data collection takes place in an ad hoc manner and the data are scattered across institutions.
Atlas of Natural Hazards and Risks of Georgia The Caucasus Environmental NGO Network (CENN) published in 2011 the Atlas of Natural Hazards and Risks of Georgia, in both hard copy and an online version. The Atlas aims to provide national and local governments, businesses and the local population with information about existing and potential natural hazards, risks and socioeconomic vulnerability. The Atlas has been well received and provides valuable information for spatial planning and other DRR decisions. The web-based Atlas allows users to view hazards interactively, the exposed elements at risk and the risk per administrative unit, and can be updated. The Atlas does not include man-made disasters, but it appears that additional GIS layers could fairly easily be added to provide a more comprehensive overview of multi-hazard risks.
Assessment The disaster risk management context is developing in Georgia, demonstrated through a number of strategies and action plans, and, to a much lesser extent, in legislation. Risk identification and mapping are two important founding elements of disaster risk management. Identification and assessment of man-made hazards has received little attention as part of the overall progress made in disaster risk management. The focus, almost without exception, has been on natural hazards. While industrial and chemical hazards are mentioned, this does not go beyond basic rhetoric nor has any implementation on this front taken place.

Chapter 14: Risk management of natural and technological/anthropogenic hazards 219
Photo 14: Rock fall in Vashlovani Protected Areas
Legislation and enforcement are a very weak link and a number of industries are operating way beyond the requirements set by the authorities as they are driven by factors such as reputational risks, liability and risks of losing investments rather than compliance with national legislation. Most interestingly, the high-profile development of oil and gas pipelines has resulted in the embedding of foreign legislation from the Netherlands and Austria into the country agreement, making the exploiting companies de facto subject to foreign norms and standards in Georgia.
The lack of attention to man-made hazards, including industrial accidents, large dam failures, oil spills (at land and at sea), transport accidents and accidents related to so-called legacy hazardous waste sites, has resulted in a gap in risk identification and thus subsequent analysis and evaluation of hazards and risks facing Georgia today. Disaster risk management is based on a multi-hazard and multi-risk approach, covering, in principle, all natural and man-made disasters. An incomplete picture of hazards can lead to inefficient priority-setting and subsequent resource misallocations. To date, no up-to-date and complete inventory exists of facilities or sites containing hazardous materials. A relatively comprehensive overview of locations where hazardous substances are used is contained in the 2009 Chemical Profile of Georgia, which primarily used data from 2006. No update has been prepared since then. This can partly be attributed to the responsibilities for and
knowledge of industrial and chemical risks being scattered across several institutions, and the lack of agreement on legal designation of hazardous substances and activities, in addition to a lack of political attention and leadership to address these issues.
In particular, the lack of agreement on legal designation of hazardous substances and activities is worrisome. This issue would ultimately be addressed when legislation is harmonized with international best practices, but this does not provide short-term solutions. To obtain an indication of where and which industries could be considered hazardous, one can use proxy indicators such as through the permitting system and/or the list of enterprises that have on-site firefighting teams.
There is a list of activities subject to an environmental impact permit, although the current list is insufficient even for environmental standards, let alone for risk management of industrial hazards (chapters 1 and 10). The implementation of various strategies and plans is thus limited by the lack of a legal definition (as well as physical inventory) of industrial and/or chemical hazards.
For example, NEAP-2 singles out high-risk industries as those which produce/process oil products, chemicals, plastics, mineral and construction materials, metallurgical and mining products, and
220 Part III: Interaction of environment with selected sectors/issues
mentions specifically the Baku–Tbilisi–Ceyhan (BTC) and Baku–Supsa (WREP) Pipelines, and Enguri large HPP dam. It does not provide a comprehensive list or inventory of, or criteria for managing, these high-risk industries. Georgia’s heavy industry, including fertilizer production, metallurgical industries and oil refineries, is concentrated in Rustavi, Zestafoni, near Batumi and Poti, and the Kvemo Kartli region. In addition, the amount of hazardous chemicals, including chlorine (for drinking water treatment) and ammonia (for cooling) is considerable throughout the country, posing risks both at their points of use and in their transport by rail and road. Other potentially hazardous facilities and installations include the oil and gas pipelines traversing the country, and the four terminals and ports along its Black Sea coast. Other man-made hazards are the 14 large HPP dams that exist in Georgia. According to the State Security and Crisis Management Council, a number of unspecified dams have been subjected to a risk assessment, including downstream flood mapping. However, no comprehensive risk assessment has taken place of these man-made hazards and thus their scale and scope; furthermore, the secondary or knock-on effects of these during natural disasters remain unknown. This is rendering already developed and approved strategies and plans incomplete. Without a proper inventory and basic risk assessment, authorities would not be in a position to anticipate and minimize potential impacts, and thus would be limited to response activities only, as was recently demonstrated through the flooding of an abandoned arsenic processing plant (box 14.1). A lack of (external) resources, in addition to a lack of internal capacities, were cited as contributing factors to the low implementation rate of existing disaster-management strategies and plans. Thus, the strengthening of the EIA, permitting and enforcement system, by making more hazardous facilities and/or use of hazardous substances subject to EIA and permitting, can have a direct and positive effect on managing industrial hazards. At the moment, approximately 500 facilities – of an estimated 6,000 – have undergone an EIA and are thus subject to ecological expertise. A revision of the EIA legislation is foreseen in mid-2015, providing an excellent opportunity. The decision of which industrial facilities will be included can be informed by a number of existing relevant lists, including those from the TEIA
Convention and the Seveso Directive, as well as the Flash Environmental Assessment Tool (FEAT) used by OCHA, UNEP and UNDAC. Site-specific risk reduction measures are not part of the permit. The legacy of hazardous waste from former industrial activities, as well as from former military bases, continues to be an important challenge (chapter 5). To date, no detailed overview exists of the total number and location of legacy sites, making it hard to quantify and qualify the risks associated with legacy waste. The only exceptions to this are the inventory of persistent organic pollutants (POPs) produced with support from the Food and Agriculture Organization of the United Nations (FAO), and the rehabilitation of the Iagluja hazardous waste dump in 2014. 14.3 Related global and regional agreements Georgia does not yet participate in some of the global response and preparedness networks, such as UNDAC and INSARAG. Benefits of participating in these networks include the exchange of experiences and learning lessons from other national response systems and international and regional cooperation networks, adherence to globally accepted national and international standards, and the opportunity to support large multilateral humanitarian response operations. The Ministry of Foreign Affairs will also have an important decision-making role to play in engaging with these networks, and, ultimately, providing international humanitarian assistance.
United Nations Development Assistance Framework The United Nations Development Assistance Framework (UNDAF) outlines the areas of collaboration between the UN and the Government for the period 2011–2015. DRR is one of the three priority thematic areas of the Framework and includes the following five outcomes: DRR is a national and local priority with an
established, strong institutional basis for implementation;
Disaster risks are identified, assessed and monitored and early warning is enhanced;
A culture of safety and resilience is built at all levels using knowledge, innovation and education;
Underlying risk factors are reduced, focusing on sustainable environmental and natural resource management;
Disaster preparedness for effective response is strengthened at all levels.

Chapter 14: Risk management of natural and technological/anthropogenic hazards 221
Box 14.1: Environmental emergency with potential international impacts at legacy waste site Arsenic mining, processing and storage has been undertaken for up to 52 years at three sites in north-west Georgia, referred to as Tsana 1, 2 and 3. All arsenic-related activity at the Tsana sites ended in 1992 and the arsenic facilities and arsenic materials were abandoned. Over 50,000 tons of wastes have been reported to be stored in unprotected steel containers that are in a deteriorated condition with a high probability of leakage. As such, they pose a threat to both the nearby population and the whole of western Georgia, since the Tsana sites are all adjacent to the Tskhenistskali River, a tributary of the Rioni River that flows into the Black Sea. Flooding in September 2013 caused erosion at Tsana 1, and an immediate security risk associated with the resulting increased potential for steel containers of arsenic waste to enter the river. An immediate intervention was required in order to prevent an accident happening at Tsana 1. As a temporary solution, the Government diverted the river from the site and started building a protective dyke. It was confirmed that no arsenic had spread as a result of the floods. Further support was provided through the Environment and Security Initiative (ENVSEC) together with the Joint UNEP/OCHA Environment Unit. At Tsana 1, drums of arsenic waste that had been reported to be located on the soil surface and adjacent to the river in 2013 are no longer visible. Following further investigations, these drums have been located and will require excavation and disposal. A remediation concept has been agreed with the Ministry of Environment and Natural Resources Protection following consideration of remediation technology options and solutions. The preferred solution is “containment” within a secure sarcophagus. This solution, proven in countries around the world, is appropriate to the conditions at Tsana and to the resources available to Georgia, and is cost effective to implement and maintain. Subsequently, detailed designs and costs have been developed for each of the Tsana sites so that remediation actions can be implemented. Source: Addressing emergency environmental and security threats at the arsenic mining and processing sites in Tsana, Georgia, Ministry of Environment and Natural Resources Protection, ENVSEC, OSCE, and UNEP, 2014. While the broad goals stipulated in the UNDAF may have been ambitious at first, the joint prioritization of DRR by the UN and the Government has had the intended spin-off in terms of awareness-raising and a shift in attitudes towards prevention and preparedness, rather than only response to natural and man-made disasters.
Convention on the Transboundary Effects of Industrial Accidents Georgia has expressed the intention to join the TEIA Convention and has already started reporting under the framework of the Convention. In November 2013, a high-level meeting took place in Tbilisi which resulted in around 20 recommended actions to be undertaken to facilitate ratification of the Convention. As a priority, a national action plan has to be developed, based on the self-assessment carried out in 2013. No overview exists yet, identifying which industrial facilities would fall within the scope of the Convention.
Electronic Regional Risk Atlas
One of the activities of the EU’s Programme for the Prevention, Preparedness, and Response to Man-Made and Natural Disasters in the ENPI East Region (PPRD East) is the development of the Electronic Regional Risk Atlas (ERRA), covering Armenia, Azerbaijan, Belarus, Georgia, the Republic of
Moldova and Ukraine. The database, including hazards maps, critical assets/infrastructure maps, vulnerability and risk maps is accessible on http://erra.pprd-east.eu/. The ERRA allows for aggregating geodata, creating thematic maps and performing research on risk assessment on a regional scale. It appears that the added value of this atlas is somewhat limited, in particular as the granularity of data used is too large to be of specific use in Georgia at a regional or local level.
Association Agreement with the European Union Implementation of the Association Agreement with the EU might have far reaching implications for the way disaster risk management is practised in Georgia. Areas of closer collaboration and reforms identified in the Agreement include governance and sector cooperation, energy, transport, industrial cooperation and education, all of which are of relevance to disaster risk management. Of particular importance will be the cooperation in the areas of environment (which explicitly includes flood risk management and industrial hazards) and civil protection (which explicitly includes DRR and hazard and risk assessments). Noteworthy here is that cooperation on civil protection spans not only the preparation for and response to, but also the prevention of, both natural and man-made disasters.

222 Part III: Interaction of environment with selected sectors/issues
Box 14.2: Disaster risk reduction tools
DRR tools, including the Flash Environmental Assessment Tool (FEAT) and Awareness and Preparedness for Emergencies at Local Level (APELL), can provide a number of advantages in the absence of any legal provisions in the national legislation. Advantages to using FEAT for preparedness include its science-based and easy-to-use format, the relatively limited time needed and the low cost of compilation of an overview of the most hazardous facilities. This time advantage is particularly important in instances where the national legislation regulating hazardous installations is limited or completely lacking. The investment for a country is also low; there is free online training available, while a workshop, including a full-day FEAT training for stakeholders, usually lasts two to three days. FEAT can thus fill a gap while legislation, governing systems and land-use planning have yet to extend to fully governing such potential emergencies. APELL is a modular, flexible methodological tool for preventing accidents and, failing this, minimizing their impacts. This is achieved by assisting decision-makers and technical personnel to increase community awareness and to prepare coordinated response plans involving industry, government and the local community, in the event that unexpected events should endanger life, property or the environment. APELL was originally developed to cover risks arising from fixed installations, but it has also been adapted for specific applications, including transport and mining. Source: www.eecentre.org; Nijenhuis and Wahlstrom (2014); Posthuma, Nijenhuis, Wahlstrom et al (2014); www.unep.org/apell Alignment with EU directives governing critical infrastructures, major accident hazards (Seveso Directive), the Floods Directive and the Water Framework Directive will be of importance to disaster risk management. The updating of existing, and development of new, laws will take many years to complete and consideration should be given to priority areas of work until then. As of December 2014, the Agreement had not yet been ratified by all EU Member States. 14.4 Conclusions and recommendations Georgia has started to embrace the notions of DRR and disaster risk management and a noticeable shift is taking place from a “response-only” to a more integrated approach to DRR, covering preparedness and prevention, for example as demonstrated in the 2014 Law on Civil Safety, among others. In particular, the country’s external partners have been playing an important role in supporting strategies and plans, as well as local-level projects, such as the removal or securing of legacy waste sites. The number of assessments and studies related to DRR and disaster risk assessment has resulted in a long list of recommendations, most of which have yet to be implemented. DRR and disaster risk management activities are generally based on a multi-hazard risk identification, analysis and evaluation. Attention has primarily been focusing on natural hazards and a number of “blind spots” still exist, in particular relating to risks associated with man-made disasters, including industrial accidents, large dam failure, legacy waste, transport accidents and oil spills on land and at sea.
Recommendation 14.1: The State Security and Crisis Management Council should coordinate a national multi-hazard risk identification and assessment exercise to serve as a basis for the collective prioritization of disaster risk reduction and disaster risk management activities and updating the new national threat assessment document. An industrial hazard identification covering the Industrial Accidents Convention or the Seveso Directive has not been carried out. The amended Annex I to the Industrial Accidents Convention covering hazardous activities (to enter into force in December 2015) has been fully aligned with Annex I of the Seveso III Directive. In the absence of a legal framework identifying hazardous substances and activities, existing tools, such as the Flash Environmental Assessment Tool (FEAT) and Awareness and Preparedness for Emergencies at Local Level (APELL), can be applied with a minimum of cost and effort to support industrial hazard identification, followed by site-specific preparedness programmes. Recommendation 14.2: The Ministry of Environment and Natural Resources Protection should undertake the identification and mapping of hazardous activities. Existing tools for environmental policy-making, in particular EIA and environmental permitting, provide an opportunity to address not only environmental pollution but also industrial hazards. Specific risk reduction measures are not included in the permits.

Chapter 14: Risk management of natural and technological/anthropogenic hazards 223 Recommendation 14.3: The Ministry of Environment and Natural Resources Protection should ensure that site-specific risk reduction measures are included in the EIA and environmental permits. The response component of the disaster management system is well developed in Georgia. However, its engagement in international fora, including the United Nations Disaster Assessment and Coordination (UNDAC) teams, Environmental Emergency Response Network and International Search and Rescue Advisory Group (INSARAG) is limited. Recommendation 14.4: The Government should initiate the process of joining key international response networks, such as the United Nations Disaster Assessment and Coordination teams, the Environmental Emergency
Response Network and the International Search and Rescue Advisory Group. The following recommendation from the previous EPR remains valid. Georgia has expressed the intention to accede the Convention on the Transboundary Effects of Industrial Accidents and has already started reporting under the framework of the Convention. However, the identification of industrial facilities that would fall within the scope of the Convention was not carried out. Recommendation 14.5: As soon as appropriate capacities for implementation are available, and pursuant to the Partnership and Cooperation Agreement with the European Union, the Government should ratify the Convention on the Transboundary Effects of Industrial Accidents.

ANNEXES
Annex I: Implementation of the recommendations in the second review Annex II: Participation of Georgia in multilateral environmental agreements Annex III: Key data and indicators available for the review Annex IV: Millenium Development Goals indicators, 2008-2014 Annex V: List of major environment-related legislation Annex VI: Results of the For Future Inland Transport Systems (ForFITS) tool

227
Annex I
IMPLEMENTATION OF THE RECOMMENDATIONS IN THE SECOND ENVIRONMENTAL PERFORMANCE
REVIEW9 PART I: POLICYMAKING, PLANNING AND IMPLEMENTATION Chapter 1: Policymaking framework for environmental protection and sustainable development Recommendation 1.1: The Ministry of Environment Protection and Natural Resources, in further developing the Environmental Code, should: (a) Ensure that the Code includes adequate provisions for public participation in accordance with national
and international obligations; (b) Ensure that broad support for the draft Environmental Code is being established during its drafting
phase, through engaging civil society and involving other ministries as well as members of the Cabinet of Ministers in order to increase the possibility of its adoption and subsequent implementation;
(c) Continue to work on parallel tracks to ensure that existing gaps in sectoral environmental legislation are adequately addressed.
The recommendation has not been implemented. Recommendation 1.2: The Government, under the leadership of the Prime Minister and the direction of the National Commission on Sustainable Development, should, as a matter of urgency: (a) Develop and adopt a national sustainable development strategy, taking into consideration international
good practices and making use of opportunities for public participation in the strategy’s formulation; (b) Ensure the strategy’s effective implementation through the development of the necessary instruments at
national level and the allocation of adequate financial resources. The recommendation has not been implemented. Recommendation 1.3: The Ministry of Environment Protection and Natural Resources should: (a) Evaluate shortcomings in the implementation of past programmes and strategies; (b) Based on these evaluations, finalize through interministerial and public consultations the second
National Environmental Action Plan (NEAP), with a linkage to the budgetary planning system, and submit it to the Government for adoption
(c) Make available the resulting documents to the public, while making every effort to identify and address possible information gaps that existed in the past.
Recommendation 1.4: The Government should: (a) Adopt with utmost urgency the second NEAP, following its finalization by MEPNR, and 9 The second review of Georgia was carried out in 2010. During the third review, progress in the implementation of the recommendations in the second review was assessed by the EPR Team based on information provided by the country.

228 Annexes
(b) Establish formal procedures for the development and adoption of the national, regional, local and/or sectoral strategies, plans or programmes. The Government should take both environmental and natural resources considerations into account, as appropriate, when developing strategies and programmes.
The implementation of recommendations 1.3 and 1.4 is ongoing. The attempt by the Ministry of Environment and Natural Resources Protection to develop the NEAP-2 for the years 2008–2012 failed. So another attempt to develop the NEAP-2 covering the period 2012–2016 started in 2010 and was finalized in 2012. The process was coordinated by the Ministry of Environment and Natural Resources Protection. The preparation of the NEAP-2 was conducted with full transparency and the participation of stakeholders. All line ministries, scientific and NGOs, as well as other interested parties, were involved in the preparatory process. Overall, both in terms of process organization and its outcome, NEAP-2 development has been well aligned with good international practice. The development of NEAP-3 has started in 2015. The NEAP-3 is expected to be adopted in 2016. 1.4 (b) Through the help of UNDP the Ministry reviewed the NEAP-2 and its implementation progress and developed “Rules of the Development of NEAP” with clear procedures, methodology and guidelines for the NEAP elaboration process in Georgia to serve as a basis for the NEAP-3. In addition UNDP conducted specialized training in strategic planning, and introducing tools and methodologies for the elaboration of strategic policy documents for the staff of the Ministry to strengthen capacities of the MENRP. Recommendation 1.5: The Ministry of Environment Protection and Natural Resources should: (a) Accelerate the process of adoption of legislation on biosafety at the national level; (b) Strengthen those institutions that will be responsible for the effective functioning of the biosafety system
in Georgia. (a) The Law on Living Modified Organisms was adopted in 2014. (b) Institutions responsible for the biosafety are determined by the Law on Living Modified Organisms:
Revenue Service is responsible for border control. In order to control introduction of genetically modified organisms into environment, special unit was created in the Department of Environmental Supervision under MENRP. Biodiversity Service under the MENRP is responsible for elaboration and implementation of biosafety policy.
* * * * *
EPR 1 - Recommendation 1.1: The Ministry of Environment and Natural Resources Protection and other relevant ministries, in attempting to converge their legislation with EU directives, should adapt the objectives and standards to national legal practice. To follow best European experience in the legal regulation of environmental protection, drafters of national laws may also borrow mechanisms or procedures from EU directives or other legislative acts and adapt them to the country’s legal system. The recommendation is implemented. The EU Association Agreement was signed in 2014. A Roadmap for EU approximation in the environmental and climate action fields was finalized in 2015. A government-wide monitoring framework was established. The Government adopts annual national action national action plans for the implementation of the Association Agreement, and Deep and Comprehensive Free Trade Area. Through EU Twining project or other technical assistance projects, Georgia drafted laws on, for example, waste management, water resources management, air protection, biodiversity, EIA/SEA, and forest law using mechanisms or procedures from EU directives or other legislative acts. EPR 1 - Recommendation 1.2: The Ministry of Environment and Natural Resources Protection and other relevant State bodies should: (a) Prepare the necessary regulations and other appropriate instruments for government decision or
adoption;
Annex I: Implementation of the recommendations in the second environmental performance review 229 (b) Amend existing laws that do not conform to the appropriate criteria. The recommendation is implemented (see implementation EPR 1 - Recommendation 1.1). EPR I - Recommendation 1.3: The Ministry of Environment and Natural Resources Protection should: (b) Redraft the Law on Environmental Permit and streamline permit issuing procedures to ensure that only
one environment-related permit is required. In this regard, the respective provisions of the Law on Water and the Law on Ambient Air Protection should be harmonized with the Law on Environmental Permits.
The recommendation has not been implemented. EPR 1 - Recommendation 1.4: (a) The Ministry of Environment and Natural Resources Protection should develop detailed regulations for
conducting State ecological expertise and environmental impact assessment that would provide for the comprehensive assessment of all impacts, including long-term, cumulative and transboundary effects. The requirements for scoping as an integral part of the EIA procedure should be introduced too;
(b) The Government is encouraged not to approve projects subject to EIA before the assessment and the State ecological expertise have been completed and the environmental permit issued by the Ministry of Environment and Natural Resources Protection, as stipulated in the law.
The implementation of the EPR 1 - Recommendation 1.4 is on-going. In 2014, the Ministry of Environment and Natural Resources Protection started to develop a new law on environmental impact permitting. This law includes provisions for the mandatory use of strategic environmental assessment (SEA) for plans and programmes. It will transpose into the national legislation the requirements of the Protocol on Strategic Environmental Assessment to the Espoo Convention on Environmental Impact Assessment in a Transboundary Context, and relevant EU legislation. The draft law is planned to be submitted to the Parliament for approval in 2016. EPR 1 - Recommendation 1.5: (b) The Ministry of Environment and Natural Resources Protection should establish an environmental
State inspectorate with full inspection powers for environmental enforcement. Companies should also be encouraged to carry out self-monitoring and reporting, as is now required in the Law on Ambient Air Protection. To support self-monitoring, the Ministry of Environment and Natural Resources Protection should encourage the establishment of accredited laboratories and accrediting agents.
In May 2013, the Department of Environmental Supervision was established and granted the authority to exercise state control over the use of natural resources. A unified electronic system of data management is being developed in the Ministry of Environment and Natural Resources Protection for the purpose of supporting companies to establish self-monitoring and accounting systems (a working group is established), which will enable entrepreneurs and companies, using the “one window” principle, to present self-monitoring results and reports. Chapter 2: Compliance and enforcement mechanisms Recommendation 2.1: In order to guarantee the effective implementation of EIA: (a) The Government should propose to the Parliament the necessary changes in the Law on Licenses and
Permits, the Law on State Support to Investments and the Law on Environmental Impact Permit in terms of expanding the scope of the activities subject to EIA and increasing the time for the environmental authorities to review the EIA report and prepare the conclusion of the EE;
230 Annexes
(b) The Ministry of Environment Protection and Natural Resources should elaborate further provisions for screening as an integral part of the EIA process concerning the activities that are beyond the scope of mandatory EIA;
(c) The Ministry of Environment Protection and Natural Resources should elaborate further provisions to introduce EIA into a transboundary context.
The implementation of the recommendation 2.1 is on-going (See implementation of EPR 1 - Recommendation 1.4). Recommendation 2.2: The Ministry of Environment Protection and Natural Resources should develop the necessary legal provisions in order to introduce the strategic environmental assessment into the national legislation as soon as possible and should submit the draft legislation to the Government and the Parliament for adoption. The implementation of the recommendation 2.2 is on-going (See implementation of EPR 1 - Recommendation 1.4). Recommendation 2.3: The Ministry of Environment Protection and Natural Resources should: (a) Differentiate environmental permitting approaches and procedures used for large industry and small
and medium-sized enterprises; (b) Introduce a system for activities not subject to integrated permits to regulate air emissions, wastewater
discharges and waste releases and water abstractions; (c) Formulate permit conditions more precisely, with a possibility of reviewing them whenever changes are
introduced into processes, production volumes or regulatory requirements; (d) Introduce gradually the integrated permitting system, based on the concept of “best available
techniques”; (e) Undertake the necessary steps to return the Environmental Monitoring Laboratory for Radiation Safety
to its jurisdiction in order to exercise effective and complete control over the implementation of the licenses and permits issued for nuclear and radiation activities;
The implementation of the recommendation 2.3 is on-going (See implementation of EPR 1 - Recommendation 1.4). Recommendation 2.4: The Ministry of Environment Protection and Natural Resources should: (a) Implement fully the Strategy of Environmental Compliance Assurance. Special attention should be paid
to the preparation of the guidelines on carrying out site visits and drawing up inspection reports as well as to the preparation of guidelines on the inventory of the regulated community;
(b) Organize regular training of environmental inspectors to strengthen the capacity of the Environmental Inspectorate and its territorial bodies and guarantee uniformity of the compliance assurance and enforcement.
(a) This part of the recommendation is not valid. (b) The Legal Entity of Public Law Environmental Information and Education Centre was established
under the Ministry in May, 2013. The Centre prepares training modules and organizes tailored training. In 2013, four modules were developed by the Centre on the priority topics defined by the Division of Environmental Policy and training of trainers was conducted. In addition, 12 staff of the Division were trained as trainers. In 2014, 15 inspectors were trained in the inspection procedures based on the module developed by the Centre.
Chapter 3: Information, public participation and education Recommendation 3.1: The Ministry of Environment Protection and Natural Resources should develop proposals, with relevant budgets and time schedules, for submission to the Government for approval:
Annex I: Implementation of the recommendations in the second environmental performance review 231 (a) To enlarge the ambient environmental monitoring networks to meet the requirements of existing
monitoring regulations; (b) To increase the number of parameters measured, in particular, PM2.5 and PM10, VOCs, PAH and
POPs in ambient air and biological parameters at all water monitoring posts; (c) To switch, step by step, to automatic measurement, and improve data quality control and storage
procedures; (d) To establish an environmental database at the National Environmental Agency that is easy for use and
accessible to the public. In 2012, the first automatic monitoring station was installed in Tbilisi at Vashlijvari meteorological station, where measurements of PM10 and PM2.5 are conducted. Recommendation 3.2: In cooperation with MEPNR, the Ministry of Labour, Health and Social Affairs, the Ministry of Agriculture and other relevant public authorities, the Ministry of Economic Development should prepare proposals with time frames and proposed budgets for submission to the Government for approval, on urgently restoring and improving the collection and publication of statistical data on the environment. Recommendations from the ECE Guidelines for the Application of Environmental Indicators in Eastern Europe, Caucasus and Central Asia that were endorsed at the Belgrade (2007) Ministerial Conference “Environment for Europe” should be used in this process. In January 2014, the Ministry of Environment and Natural Resources Protection and the National Statistics Office signed a Memorandum of Understanding (MoU) for better inter-institutional cooperation within the country. In particular, this document intends to optimize the work around the collection and dissemination of environmental data, a process that is still weak in the country. The MoU aims to improve the statistical information on environmental protection, improve the quality and accessibility of environmental data that will facilitate information exchange and dissemination of environmental statistics at the national and international levels, and, on the other hand, improve the process of preparation of the national accounts and other aggregate indicators. Recommendation 3.3: In drafting a revised presidential decree on the rules for the preparation of state-of-the-environment reports, the Ministry of Environment Protection and Natural Resources should follow the ECE Guidelines for the Preparation of Indicator-Based Environment Assessment Reports and ensure that the reports are reader-friendly and accessible to the public. In between the publications of the report, MEPNR should publish topical environmental reports including reports on environmental pollution. In 2010, the “National Report on the State of Environment of Georgia in 2007–2009” was elaborated, and it was approved on 9 December 2011. The Report was prepared and published in the Georgian and English languages. The Report is available on the official web page of the Ministry. No State of Environment report has been elaborated since 2010. Recommendation 3.4: To ensure full compliance of Georgia with the requirements of the Convention on Access to Information, Public Participation in Decision-making and Access to Justice in Environmental Matters (Aarhus Convention), the Ministry of Environment Protection and Natural Resources should develop, in cooperation with the representatives of the civil society, draft amendments to: (a) The Law on Licenses and Permits, for submission to the Government for approval and subsequent
submission to the Parliament for adoption; (b) The Governmental Decree on Approval of Provision on Procedure and Conditions of Granting
Environmental Impact Permit, for submission to the Government for approval. The implementation of the recommendation 3.4 is on-going (See implementation of EPR 1 - Recommendation 1.4). The new law will ensure better compliance with the Aarhus Convention.
232 Annexes
Recommendation 3.5: The Ministry of Education and Science, in cooperation with the Ministry of Environment Protection and Natural Resources and other stakeholders, including NGOs and the mass media, should finalize, without delay, the National Strategy on Education for Sustainable Development and develop an action plan for the implementation of the ECE Strategy on Education for Sustainable Development. It should also establish a Coordinating Council on Environmental Education and Education for Sustainable Development, involving all stakeholders, to make it an effective instrument for the promotion of the Strategy implementation. In 2012, the Government adopted the Environmental Education for Sustainable Development: Georgian National Strategy and Action Plan for the period 2012–2014, which is the basic strategic document for the implementation of the principles of education for sustainable development (ESD) at the national level in Georgia. The document was prepared by the Ministry of Environment and Natural Resources Protection in cooperation with the Ministry of Education and Science. The elaboration process of the Strategy and Action Plan involved the engagement of all stakeholders, including NGOs, educational institutions, teachers, decision-makers, the media, and local and international experts. Public hearings and discussions were held at different levels of the elaboration process. One of the key milestones in ESD implementation was establishment of the Environmental Information and Education Centre in 2013, which coordinates ESD activities in the country. To implement the Strategy and Action Plan, the Centre established an inter-agency coordination unit consisting of representatives of the Ministry of Education and Science, Ministry of Sport and Youth Affairs, Ministry of Environment and Natural Resources Protection, universities, NGOs and international organizations. The Centre initiated research that would give an overview of the education system in relation to environmental education and, at some point, ESD. The research report will be available in September 2014 and will serve as a road map for the planning of further activities of the Centre to promote environmental education in formal and non-formal education.
* * * * * EPR 1 - Recommendation 3.1: (a) The Government should adopt the programme on monitoring drawn up by the Ministry of Environment
and Natural Resources Protection and other institutions and should provide funding to carry it out. Monitoring of industrial hot spots and high-polluting facilities should be included in this programme as a matter of priority;
(b) After adoption, the Ministry of Environment and Natural Resources Protection and relevant institutions
should harmonize the environmental norms and standards with international norms and standards, and should set up an appropriate system for environmental monitoring.
(a) The recommendation has been partially implemented. Annually, the National Environmental Agency
(NEA) develops a Surface Water Quality Monitoring Programme (Annual Plan), which defines fixed sampling points, frequency of sampling and sampling parameters. The Programme is presented to the Ministry of Environment and Natural Resources Protection for review and comments, after which it is adopted by Order of the Head of the NEA. The NEA’s Environmental Pollution Monitoring Department is responsible for the implementation of the Plan. There is a tendency of increasing the number of sampling points during recent years. Some industrial hotspots and high-polluting facilities are also included in the Plan.
(b) The recommendation has not been implemented. EPR 1 - Recommendation 3.2: The Ministry of Environment and Natural Resources Protection should: (a) Prepare an amendment to the Law on Environmental Permits to extend the 45-day time frame for
public participation; (b) Improve the exchange and dissemination of all information relevant to the permit procedure, including
the environmental impact assessment and the results of the State ecological expertise, for example by creating a depository within the Ministry accessible to the public. (See Recommendations 1.3 and 1.4.)
Annex I: Implementation of the recommendations in the second environmental performance review 233 The implementation of the EPR 1 - Recommendation 3.2 is on-going (See implementation of EPR 1 - Recommendation 1.4). EPR 1 - Recommendation 3.3: The Ministry of Environment and Natural Resources Protection should: (a) Actively promote adoption by Parliament of the (draft) law on public access to environmental
information and decision-making as soon as it is finalized; (b) Following its adoption, widely publicize and distribute the law and support staff training and public
awareness campaigns on the content of the law in order to facilitate its application. The public access to environmental information and participation in decision-making components are incorporated in all new developed laws. Moreover, the definition of “environmental information” that was not reflected in the national legislation until now will be incorporated into the 1996 Law on Environmental Protection. Currently, the mentioned law with amendments is submitted to the Government for consideration. Chapter 4: Implementation of international agreements and commitments Recommendation 4.1: The Government should: (a) Strengthen active participation in international fora to improve environmental management and meet
its international obligations and commitments; (b) Comply with its reporting obligations to the United Nations Commission on Sustainable Development. (a) Georgia is engaged in the international processes through the implementation of international
commitments that are a part of 34 international agreements, including conventions and their protocols. The country is involved in the global development processes regarding climate change, Millennium Development Goals, Sustainable Development Goals, etc.
The Association Agreement with the European Union combines the large number of environmental and sustainable development commitments, as well as other international obligations in different areas. In order to contribute to the improvement of environmental management at the international level, Georgia is involved in environmental processes, e.g. the Committee on Environmental Policy (bureau member), THE PEP – Transport, Health and Environment Pan-European Programme (bureau member), Intergovernmental Working Group on the follow-up on the outcomes of Rio+20 (member), Convention on Protection of the Black Sea Against Pollution (advisory group member and member of commission), Convention on Biological Diversity (bureau member of COP 12 and COP-MOP 16), IPBES – Intergovernmental Platform on Biodiversity and Ecosystem Services (bureau member), the Pan-European Biodiversity Platform (member of standing committee), Convention on the Conservation of Migratory Species of Wild Animals (alternative bureau member), International Union for Conservation of Nature (member), International Show Caves Association (member), Green Climate Fund (member), Adaptation Fund Board (member), etc. Participation in international environmental management processes and implementation of its commitments is among the priorities of the Ministry of Environment and Natural Resources Protection, in order to support development in a sustainable way.
(b) Part b of this recommendation has not been implemented. Recommendation 4.2: The Government, in order to allow the effective functioning of the National Commission on Sustainable Development (NCSD), should: (a) Ensure that the composition of the National Commission does not require confirmation through formal
acts (government resolutions) when changes in the composition of the Cabinet of Ministers occur;

234 Annexes
(b) Provide adequate funding for the National Commission’s activities and specify the Commission’s modus operandi, including a functional work plan with an agreed timetable for the development of the country’s NSSD through comprehensive consultation with all relevant stakeholders.
The recommendation has not been implemented. Recommendation 4.3: The Ministry of Environment Protection and Natural Resources, in performing its role as the secretariat of the National Commission on Sustainable Development, should ensure that the Commission meets at regular intervals, as specified by Georgian law, and once a work plan is established, ensure that it is adhered to by all constituent parties of the Commission. The Ministry of Environment and Natural Resources Protection was not given the opportunity to act as the secretariat of the National Commission on Sustainable Development for the reasons described under Recommendation 1.2. Recommendation 4.4: The Ministry of Environment Protection and Natural Resources should elaborate a transparent mechanism and designate a lead unit to improve project coordination and enhance the Ministry’s ability to fully utilize past experience when designing new projects suitable for external funding. The recommendation has been implemented. The Ministry of Environment and Natural Resources Protection is organizing biannual donor coordination meetings, and it maintains a database on donor-financed projects. Ways and means of strengthening the role of the government in project implementation and coordination need to be explored. The project coordination unit has been established under the Department of Environmental Policy and International Relations. Recommendation 4.5: As soon as appropriate capacities for implementation are available, the Government should accede to the following conventions: The ECE Convention on the Protection and Use of Transboundary Watercourses and International
Lakes; The ECE Convention on Environmental Impact Assessment in a Transboundary Context (Espoo
Convention); The ECE Convention on the Transboundary Effects of Industrial Accidents.
The Government should also accede to the following Protocols: The relevant Protocols to the Convention on Long-range Transboundary Air Pollution; The Protocol on Pollutants Release and Transfer Registers to the Aarhus Convention; The Protocol on Water and Health and the Protocol on Civil Liability and Compensation for Damage
Caused by the Transboundary Effects of Industrial Accidents on Transboundary Waters to the Convention on the Protection and Use of Transboundary Watercourses and International Lakes;
The Protocol on Strategic Environmental Assessment to the Espoo Convention. The first part of this recommendation has not been implemented. The second part of this recommendation has been partially implemented. Georgia ratified the Protocol on Long-term Financing of the Cooperative Programme for Monitoring and Evaluation of the Long-range Transmission of Air Pollutants in Europe (EMEP) in 2013. EPR 1 - Recommendation 4.4: The Ministry of Environment and Natural Resources Protection should take the lead in identifying environmental programmes and projects that may need external support. In order to accomplish this, it should take the following steps:
Annex I: Implementation of the recommendations in the second environmental performance review 235 Establish a project preparation unit to act as a focus for coordination with donors and international
financial institutions; Set priorities for external funding on the basis of domestic problems and needs, and communicate these
priorities clearly to the donor community and international financial institutions; The recommendation has been implemented. The Department of Environmental Policy and International Relations is responsible for the coordination of new project proposals and their submission to the relevant international donor organizations or governmental bodies. In order to present major activities carried out by the Ministry, to exchange views on further cooperation and coordination with donors, and to ensure more transparent project coordination, the Ministry holds donor coordination meetings twice a year. Furthermore, where necessary, Donor Coordination Task Force meetings (sectoral meetings) are conducted as well. PART II: ECONOMIC INSTRUMENTS AND FINANCIAL RESOURCES Chapter 5: Economic instruments and expenditures for environmental protection Recommendation 5.1: The Ministry of Environment Protection, in cooperation with the Ministry of Economic Development, the Ministry of Finance and other relevant ministries, should: (a) Review the existing command-and-control approach to pollution abatement and control with a view to
ensuring (i) more effective monitoring and enforcement of pollution standards; (ii) a focus on major pollutants; and (iii) environmental relevance of existing emission norms;
(b) Review the existing system of fines to create adequate incentives that deter emitters from producing too many emissions, assuming appropriate monitoring and enforcement of environmental standards;
(c) Develop a policy paper on the feasibility of the introduction of pollution taxes for major pollutants, as a basis for the creation of stringent incentives for more environmentally friendly behaviour;
(d) Review motor vehicle-related taxes, with a view to making them supportive of environmental protection. The recommendation has been partially implemented. The polluter-pays principle has not fully fulfilled. Environmental inspections have been strengthened with the establishment of the Department of Environmental Supervision in 2013. An adequate system of fines and legislation concerning environmental liability and the determination of environmental damage compensation are lacking. The system of excise taxes on motor fuels and imports of road motor vehicles has not yet been reformed. The new Waste Management Code includes polluter-pays principle, which will be enforced with the creation of the “Extended Producer Responsibility” specified by the Waste Management Code and the identified fines for improper waste management such as littering and pollution. Recommendation 5.2: The Government should: (a) Establish an institutional platform – in the form, for example, of a “round table” – that allows at an
early stage for a systematic dialogue concerning environmental impacts of actual or planned economic policies on the one hand and the economic impacts of actual or planned environmental policies on the other;
(b) Ensure that all key actors and institutions are involved in this dialogue, i.e. competent ministries, the business sector, civil society, research institutions, and other stakeholders.
The recommendation has not been implemented. In 2013, the Government established the Economic Council, chaired by the Prime Minister, designed inter alia to coordinate the development and implementation of the national economic policy, including sector policies such as environmental policy. The Council, in its configuration and functioning, is not directly a platform for discussing environmental impacts of actual or planned economic policies on the one hand, and the economic impacts of actual or planned environmental policies on the other, but it partly covers mentioned issues, e.g. the economic impacts of planned
236 Annexes
and ongoing environmental activities of the action plan of the Ministry of Environment and Natural Resources Protection were discussed. The Council discussed an annual plan of the Ministry as well as legislative initiatives. Recommendation 5.3: The competent central and local governments, including the regulatory agency for the energy and water sector (GNERC), should: (a) Eliminate in a transparent and gradual fashion any existing price subsidies for utility services, notably
water supply and sanitation but also waste and energy services, taking into account the associated need for targeted social assistance to lower-income households;
(b) Promote, in cooperation with the corresponding utilities, the progressive installation of individual meters for electricity and water consumption;
(c) Set tariffs for water abstraction at a level that supports sustainable water resources management. The recommendation has been partially implemented. Overall, electricity tariffs are cost reflective, but there are important cross-subsidies among different consumer groups. Water supply tariffs in the majority of the country are not cost reflective and discriminate against industry and other legal entities. There has been progress with the installation of water meters; metering of electricity consumption is virtually complete. Recommendation 5.4: (a) The Government should give greater priority to environmental spending within the medium-term
expenditure framework; (b) In this context, the Ministry of Environment Protection and Natural Resources, in cooperation with
other competent Government spending units, should define medium-term priorities and objectives for environmental policy across major sectors of the economy and prepare estimates of associated costs and major benefits that would feed into the preparation of medium-term Government expenditure plans;
(c) The Government should create incentives designed to mobilize adequate private sector resources for environmental protection by strict application of the polluter-pays and user-pays principles;
(d) The Government should also instruct the Department of Statistics to conduct regular surveys on pollution abatement and control expenditures by major emitters in industry and by other economic sectors.
The recommendation has been partially implemented. The Basic Data and Directions (BDD) document and medium-term action plans have togther become an effective mechanism for the planning, prioritization and control of government expenditures. Financial resources of the Ministry of Environment and Natural Resources Protection have been increased somewhat, but the overall dependence on foreign donor funds remains quite high. PART III: INTEGRATION OF ENVIRONMENTAL CONCERNS INTO ECONOMIC SECTORS AND PROMOTION OF SUSTAINABLE DEVELOPMENT Chapter 6: Sustainable management of water resources and protection of the Black Sea Recommendation 6.1: The Ministry for Regional Development and Infrastructure should promote the adoption of the policy paper for the development of water supply and sanitation sectors and thereafter speed up the development of the required action plan, which will include measures, priorities starting with the hot spots, time tables and estimated financial requirements and resources. The recommendation has been implemented. The State Strategy Regional Development of Georgia 2010–2017 has been developed. The aim of the development of municipal infrastructure is to establish a mechanism of effective management of infrastructure systems providing different kinds of public services (water supply and water drainage, waste management, roads, transport), for their further sustainable development.

Annex I: Implementation of the recommendations in the second environmental performance review 237 Recommendation 6.2: The Ministry of Agriculture and the Ministry for Regional Development and Infrastructure should take care that self-monitoring and state control of water supplies are urgently enforced to ensure the safety of the population and to provide adequate training for the personnel. In accordance with the present legislation, since 2006, the National Food Agency of the Ministry of Agriculture has conducted the state control of drinking water safety parameters and quality. The Agency monitors drinking water every year in accordance with the Food Product Laboratory Research Programme. At the same time, the Agency is the main entity that orders and organizes tenders for accredited laboratories (all over the country) to conduct the monitoring of drinking water quality in accordance with the State’s earmarked programmes. In the event of discrepancy between water quality and the “Drinking water technical regulations”, the Agency sends recommendations to the relevant entities. The United Water Supply Company of Georgia (UWSCG) and Georgian Water and Power (GWP) (together responsible for drinking water supply for Tbilisi, Mtskheta, Rustavi and Gardabani) have their own laboratories for conducting self-monitoring of drinking water quality. Training: In October 2011, 33 representatives of water utilities, the Ministry of Labour, Health and Social Affairs, the Ministry of Agriculture and persons responsible for safe water supply at various municipalities were trained in Water Safety Planning. In September 2013, a three-day training on Drinking Water Transportation and Distribution was conducted for the staff of UWSCG, representing top management and technical managers/operators from the central office and regions. Recommendation 6.3: The Ministry for Environment Protection and Natural Resources should: (a) Ensure that the new Water Law framework reflects the protection and sustainable management of all
water resources (including groundwater and the territorial Black Sea) by introducing principles of water basin management based on the current institutional framework;
(b) Develop a Georgian national action plan (NAP) for the protection of the Black Sea based on the principles of the regional Strategic Action Plan for the Environmental Protection and Rehabilitation of the Black Sea, by taking into consideration hot spots, required measures for improvements, a timetable and the financing funds as well as measures for water supply and sanitation;
(c) Develop a strategy and action plan for further modernizing and upgrading the monitoring network in line with international guidelines and best practices to assess progress in achieving environmental policy targets. In detail, this means:
Enlarging the number of parameters that have to be controlled and introducing biological
monitoring into surface water bodies; Establishing more hydrological monitoring stations and sampling points; Linking environmental quality data with emission data by enterprises to establish cause-and-effect
relationships to be reported to compliance control; Training personnel in proper handling of appropriate analysis equipment and ensuring a high
quality of laboratory reagents. (a) The new Law on Water Resources Management has been drafted, based on the principles and
approaches of the EU Water Framework Directive. The scope of the new Law is:
Surface waters; Transitional waters; Groundwaters; Coastal waters; Territorial waters.
(b) In 2011, a National Environmental Action Plan for Georgia for the period 2012–2016 (NEAP-2, approved by the Resolution of the Government No. 127 of 24 January 2012) was developed. Due to the

238 Annexes
fact that there were not enough financial resources to develop a National Action Plan for the Black Sea, chapter 5 was developed and included into one general document – NEAP-2. The chapter is based on the principles of the regional Strategic Action Plan for the Environmental Protection and Rehabilitation of the Black Sea, which sets priorities and actions for the protection of the Black Sea. The long-term goal for the protection of the Black Sea is to improve its ecological state. This goal is in line with the target set by all countries bordering the Black Sea in the Black Sea Strategic Action Plan.
(c) The water quality monitoring network has improved, from 41 points in 2009 to 69. The number of
monitored parameters has increased. In some river basins (Chorokhi-Adjaristskhali, Khrami, Alazani, Kura), in the framework of international projects, monitoring is conducted in accordance with the EU Water Framework Directive. The number of monitored parameters has been increased (TN, TP, cyanides, arsenic, cadmium). Hydrobiological monitoring has begun, from 2012. At present, there are data on 22 rivers at more than 50 points. From 2014, groundwater monitoring began at the two wells in the Alazani-Agrichai aquifer (reactivated in the framework of the international project).
At present, 19 automated hydrological stations and 12 manual stations are functioning. By the end of 2014, the installation of 10 more automated hydrological stations is planned. The laboratory of the National Environmental Agency has applied for national accreditation and participates in inter-laboratory comparative tests. Recommendation 6.4: The Ministry for Regional Development and Infrastructure should: (a) Improve the collection rate of water bills for industrial companies and households; (b) Adopt payment on actual consumption by introducing water metering, also in apartments; (c) Raise the annual water bill to the highest affordable level, followed by annual increases according to
nominal GDP growth; (d) Increase the State budgetary resources for investment in the water sector. The tariffs for drinking water supply are set by the Georgian National Energy and Water Supply Regulatory Commission (GNERC) by its Resolution No. 17 on Adoption of Water Supply Tariffs, of 17 August 2010. The metering of drinking water supply is in progress in the cities. Up until 1 September 2010, metering of the water supply system was voluntary for the population. In compliance with Resolution No. 18 of the GNERC, dated 17 August 2010, water distribution companies were given the right of individual metering of the population. Today, in Tbilisi, about 20 per cent of consumers (mainly in the private sector) are provided with water meters; from 2015, it is planned to cover apartments. The key player in the field of drinking water supply and sanitation – UWSCG – was founded on 14 January 2010. The company provides water and wastewater services for urban settlements throughout Georgia, with the exception of Tbilisi, Mtskheta, Rustavi and the Autonomous Republic of Adjara. The company’s mission encompasses a broad range of activities, including the optimization of billing and collection processes, strengthening of its financial status, implementation of a financial management system and finalization of metering processes. The state budgetary resources for investment in the water sector are increasing. In 2013, 130 million lari were allocated for the rehabilitation and development of the drinking water systems. Recommendation 6.5: The Government should modify the mandate of the Ministry of Environment Protection and Natural Resources to include integrated water management planning and responsibility for ensuring the coordination of actions in the water sector, in particular regarding information on water. The Ministry of Environment and Natural Resources Protection has all responsibilities regarding water resources management.
* * * * *
Annex I: Implementation of the recommendations in the second environmental performance review 239 EPR 1 - Recommendation 7.1: The Ministry of Agriculture and local governments should ensure that: Drinking water utilities disinfect their water supplies with chlorine or other chemicals so that sufficient
disinfection residual is maintained within distribution systems to ensure microbiological safety; Utilities that do not disinfect are justified in this decision; for example those systems tapping protected
wells or springs with very short, protected distribution networks. As a rule, drinking water delivered by centralized water supply systems is disinfected by chlorine. The relevant laboratories (UWSCG, GWP, Ajara Water Supply Company) carry out permanent control on residual chlorine in the drinking water. Bottled water is widely consumed, especially by employees working for enterprises located in rural areas, where, in some cases, the safety of drinking water cannot be guaranteed due to the absence of permanent water quality control. EPR 1 - Recommendation 7.3: The Ministry of Environment and Natural Resources Protection should: Undertake a policy review on the use of watershed-based planning for the implementation of improved
water services and water pollution control; Draft regulations, including incentives, for watershed-based planning; and
In 2012, a “Review of the Georgian Legal and Institutional Water Framework and Recommendations for Implementation of EU Water Framework Directive Principles, including Preparation of a National Water Law” was prepared within the framework of the ECE project National Policy Dialogue on Integrated Water Resources Management in Georgia. Development of regulations for watershed-based planning started in 2014 with the support of the ECE and EU project Environmental Protection of International River Basins. EPR 1 - Recommendation 7.4: The Ministry of Environment and Natural Resources Protection should accelerate preparation of a Georgian national action plan for the Black Sea. Water management should also take into consideration good irrigation practices and the introduction of environmental sound technologies (see recommendation 11.2). See recommendation 6.3 (a). As a first step, the Ministry of Agriculture is focused on rehabilitation of the existing main irrigation channels and decreasing water losses in irrigation systems. The next step will be implementation of modern systems of sprinkling irrigation in particular regions, taking into account the geographical features of the said regions.
Chapter 7: Waste management Recommendation 7.1: When developing the new waste framework law and related legislation, the Ministry of Environment Protection and Natural Resources should: Take into consideration existing waste legislation, and identify and clearly state sub-law regulations
needed for the effective implementation of the legal framework; Include a clear classification of hazardous waste and requirements for each industrial site to report on
hazardous waste by type of waste; Include the obligation of transferring hazardous waste to licensed operators once the market will allow
it;
240 Annexes
Ensure that appropriate regulations aimed at enabling and strengthening law enforcement activities of the Inspectorate of Environmental Protection are formulated and put forward for adoption;
Establish monitoring and reporting obligations for all entities dealing with waste production and management;
This recommendation was fully implemented. The structure of the Law on Waste Management Code follows that of contemporary laws and directives/ regulations of EU Member States that are mentioned in the Georgia – EU Association Agreement. has been prepared in numerous working sessions of German and Bulgarian legal experts and Georgian counterparts. The current Law follows sets only a legal framework on waste. It will require a number of subsequent legal acts (sub-laws and by-laws) in order to become a fully implementable set of legislation on waste management. The mandate to prepare and adopt such acts are prescribed within this Law on Waste Management. The Waste Management Code was adopted end of December 2014 (chapter 5) and entered into force on 15th of January 2015. Recommendation 7.2: The Ministry of Environment Protection and Natural Resources should: (a) Strengthen the capacities of the Inspectorate of Environmental Protection by increasing the number of
inspectors who can be in part drawn from the current first responder staff; (b) Provide new and existing inspectors with training on waste and water inspections; (c) Modify the status of the existing Nuclear and Radiation Safety Service in order to strengthen its
regulatory, technical/advisory and inspection role; (d) Consolidate responsibilities for the management and disposal of radioactive waste through the
establishment of a Radioactive Waste Management Agency under MEPNR authority; (e) Increase MEPNR monitoring capacity by creating databases on waste production and waste operators,
and boost capacity to use such information for decision-making and long-term planning. This recommendation’s parts (c) and (d) on radioactive waste were implemented, but parts (a), (b) and (e) were not implemented. (a) (b) The Ministry of Environment and Natural Resources Protection does not have specific inspectors for
the waste sector. (c) (d) Progress was achieved in management of radioactive waste; it was strengthened institutionally and
responsibilities were assigned (new law in 2012) with the support of IAEA. (e) No new data on waste generation and management have been collected since 2004. Recommendation 7.3: (a) The Ministry of Environment Protection and Natural Resources should urgently elaborate a national
waste management plan; (b) The Government should provide municipalities with technical assistance and training on technology
and management skills for adequate solid waste management; (c) The Government should help municipalities to modernize their household waste management practices. (a) The waste management strategy and waste management plan have been drafted but not yet adopted. (b) (c) The creation of the Solid Waste Management Company transferred part of municipal responsibilities
for disposal sites to a specialized company and also created a platform for effective modernization of municipal waste services.
Recommendation 7.4: The Ministry of Environment Protection and Natural Resources, in cooperation with the appropriate government bodies and municipalities, should: (a) Adapt economic instruments already tested in different countries to promote a solid waste market,
private companies dealing with different types of waste, and the establishment of inter-municipal

Annex I: Implementation of the recommendations in the second environmental performance review 241
companies and public–private partnerships; as well as encourage private investment in waste management and recycling infrastructures;
(b) Use fiscal incentives and tariffs to promote the investment of industries in cleaner technology; (c) Apply the polluter-pays principle to waste management, and set the costs of the management of specific
types of waste (hazardous waste, packaging, etc.) at the charge of the producer/importer; (d) Do its utmost to gather funds to rehabilitate contaminated sites; (e) Invest part of the revenues of recycling and energy production from waste to promote the reduction of
the amount of waste produced, awareness campaigns and other direct actions on specific types of waste, using lessons learned and best practices from other countries (e.g. best practices on the reduction of the number of plastic bags).
The implementation of this recommendation is ongoing. , The establishment of incentives to promote specific waste management is already defined by the Waste management code for the development of the “Extended Producer Responsibility”, which will encourage private sector to enlarge recycling infrastructure. Economic costs of waste management have to be funded by the Government and international donors. Polluter pays principle is already defined by the waste management code. The rehabilitation of the two known polluted sites has already started with the assistance of international donors. For quite a long time there will be no revenues from recycling.
* * * * * EPR 1- Recommendation 6.1: (a) The Ministry of Environment and Natural Resources Protection should promote the adoption of the
draft law on waste management and its enforcement through the development of regulations, technical standards and norms for this law and other existing legislation on waste management;
(b) The Ministry of Environment and Natural Resources Protection, in coordination with other relevant ministries, should prepare action plans for the management of waste, including the rehabilitation of contaminated sites. This action plan should be integrated into the strategy for sustainable development.
(a) This recommendation was implemented. The Waste Management Code was adopted in 2014. (b) This recommendation has been partially implemented. NEAP-2 of 2012 includes a chapter on waste
and radioactive waste. Measures proposed in NEAP-2 are being implemented. The waste management strategy and waste management plan are prepared as drafts but they focus only on municipal waste. The waste management strategy covers a period of 15 years (2016-30) and is a living document that could be revised although the Action Plan covers a period of 5 years (2016-2020). A joint format forms the basis for the two integrated documents. The Strategy covers waste generated from service sector (households, offices, etc.) along with generated by industry, hospitals, agricultural, mining sector and others.
EPR 1 - Recommendation 6.2: The Ministry of Environment and Natural Resources Protection, in cooperation with the municipalities, should: (a) Develop an information management system for municipal waste generation, handling and recycling; (b) ; (c) Monitor air, groundwater and soil in the vicinity of landfills, with priority given to those that are
situated near big cities; (d) Support the construction of sanitary landfills, processing or incineration facilities, on the basis of
positive environmental expertise and environmental impact assessment; and (e) Raise public awareness about the environmentally sound management of municipal waste. Parts (d) and (e) of this recommendation were implemented but parts (a) and (c) have not been completed. Monitoring of waste management and its impact on the environment did not show any improvement since the last EPR. However, with the creation of the Solid Waste Management Company, conditions were created for future improvement. Construction of new landfills has progressed well, regional landfills are planned and funding is being secured.
242 Annexes
Public awareness of waste management, especially in terms of city cleanliness and recycling, has increased through social network actions and NGO support. EPR 1 - Recommendation 6.3: The Ministry of Environment and Natural Resources Protection, in cooperation with relevant stakeholders, should: (a) Introduce and implement a classification system for industrial waste and hazardous chemicals,
including pesticides, on the basis of the Globally Harmonized System of Classification and Labelling of Chemicals (GHS);
(b) Develop a permitting system for hazardous waste and draw up an inventory of major sources of hazardous and industrial waste in order to introduce the technologies for its recycling or environmentally sound treatment;
(c) On the basis of the above, start the rehabilitation of abandoned industrial waste sites and, where technically and economically possible, recycle industrial waste as a secondary raw material.
This recommendation has not been implemented. EPR 1 - Recommendation 6.4: The Ministry of Environment and Natural Resources Protection, in cooperation with relevant stakeholders and municipalities, should: (a) As a first and most urgent step, take appropriate measures to protect the population and to limit access
to the Iagluja site; (b) Develop a plan for the environmentally sound management of the site that also identifies the institutions
that will be responsible for carrying it out; (c) Carry out a risk assessment of the site in cooperation with the Ministry of Labour, Health and Social
Affairs and other relevant institutions; (d) Identify the quantities and composition of the hazardous chemicals that are buried at the site; and (e) Develop a plan for its rehabilitation. The Iagluja site was fenced and rehabilitation works are continuing under the GEF project. Identification of the best rehabilitation options for full clean-up is under preparation. This will result in a rehabilitation plan. Considering the attention given to the Iagluja site and progress of works, this recommendation is considered implemented. EPR 1 - Recommendation 6.5: The Ministry of Labour, Health and Social Affairs, in cooperation with the Ministry of Environment and Natural Resources Protection, should: (a) Organize the separate collection of medical waste, including non-anatomic medical waste, and provide
for its environmentally sound disposal or incineration throughout the country; and (b) Train personnel in the environmentally sound management of medical waste. This recommendation is still under implementation. The management of medical waste is being improved under the project Infectious Healthcare Waste Management in Georgia. Chapter 8: Risk management of natural and technological/anthropogenic hazards Recommendation 8.1: The Government should develop and adopt a national strategy on disaster risk management (DRM) complemented by a relevant national action plan taking into account disaster risk reduction and climate change adaptation measures, in compliance with national commitments and international instruments recognized by Georgia, especially the Hyogo Framework for Action (HFA). The recommendation has not been implemented.

Annex I: Implementation of the recommendations in the second environmental performance review 243 Recommendation 8.2: The Government should establish a fully functional national coordination mechanism or a national platform by strengthening the existing coordination mechanism on disaster risk management with the participation of all relevant stakeholders. In Georgia, there are several coordination mechanisms for DRR, such as: The DRR Think Tank of Georgia (hosted by the Ministry of Environment and Natural Resources
Protection), which regularly hosts an informal forum for DRR stakeholders. The Think Tank unites representatives from about 60 governmental agencies, NGOs, international organizations and academia. The forum was established in 2009 under the UNDP project Strengthening Disaster Risk Reduction System in Georgia, and in 2012 it was taken over by the Ministry of Environment and Natural Resources Protection. The Ministry also has the ownership and provides overall management of the web-based database, “Who Does What Where in Disaster Risk Reduction in Georgia” (www.3w.org.ge). This website is based on information received from partner agencies/organizations and requires continuous review and updating in order to provide an accurate picture of the DRR scenario in Georgia.
Experts’ Advisory Panel (hosted by the Emergency Management Agency), the main objective of which is to support the Agency in the development of a scientific–technical strategy on emergency prevention and mitigation, and elimination of the consequences of emergency situations. The Panel is chaired by the Ministry of Internal Affairs Deputy Minister and the members are Agency staff, representatives of governmental agencies, NGOs, and scientific and research institutes, and independent experts. It was noted that the Panel works on topics related to prevention of emergencies and loss reduction, and ensures coordination of experts in civil emergency planning under the NATO programme Partnership for Peace. Nevertheless, the draft document of the CADRI assessment report indicates that many respondents noted that they were not aware of the exact mandate and composition of the Panel, and of the roles and responsibilities of its members.
Within the framework of the DIPECHO project Supporting Disaster Risk Reduction amongst Vulnerable Communities and Institutions in Georgia, UNICEF is supporting the Ministry of Education and Science in the establishment of the national inter-agency coordination mechanism on DRR education – Disaster Risk Reduction Education Coordination Group. The objectives of the coordination group/mechanism are to promote initiatives and support further mainstreaming of DRR in both formal and informal education, as well as promoting school and pre-school disaster preparedness and safety. The first coordination meeting was held in May 2013.
Recommendation 8.3: The Government should identify hotspots in urban areas and strengthen monitoring, forecasting and early warning of natural and technological disasters in compliance with international requirements. The Ministry of Environment Protection and Natural Resources should establish an analytical centre with adequate capacity to create and maintain a database of geological, seismological and meteorological data that is easy to use and accessible to the public. Improvement/modernization of the Early Warning System has been identified as one of the priorities for Disaster Risk Reduction within the second National Environmental Action Programme of Georgia 2012–2016 (NEAP-2). Allocations of funds from the state budget were augmented for monitoring, forecast and prevention measures in the sphere of disaster risk management. An analytical centre with adequate capacity to create and maintain a database of geological, seismological and meteorological data that is easy to use and accessible to the public yet has not been established. Recommendation 8.4: The Government should improve the legal basis on for major hazard prevention in compliance with international requirements. The recommendation has not been implemented.
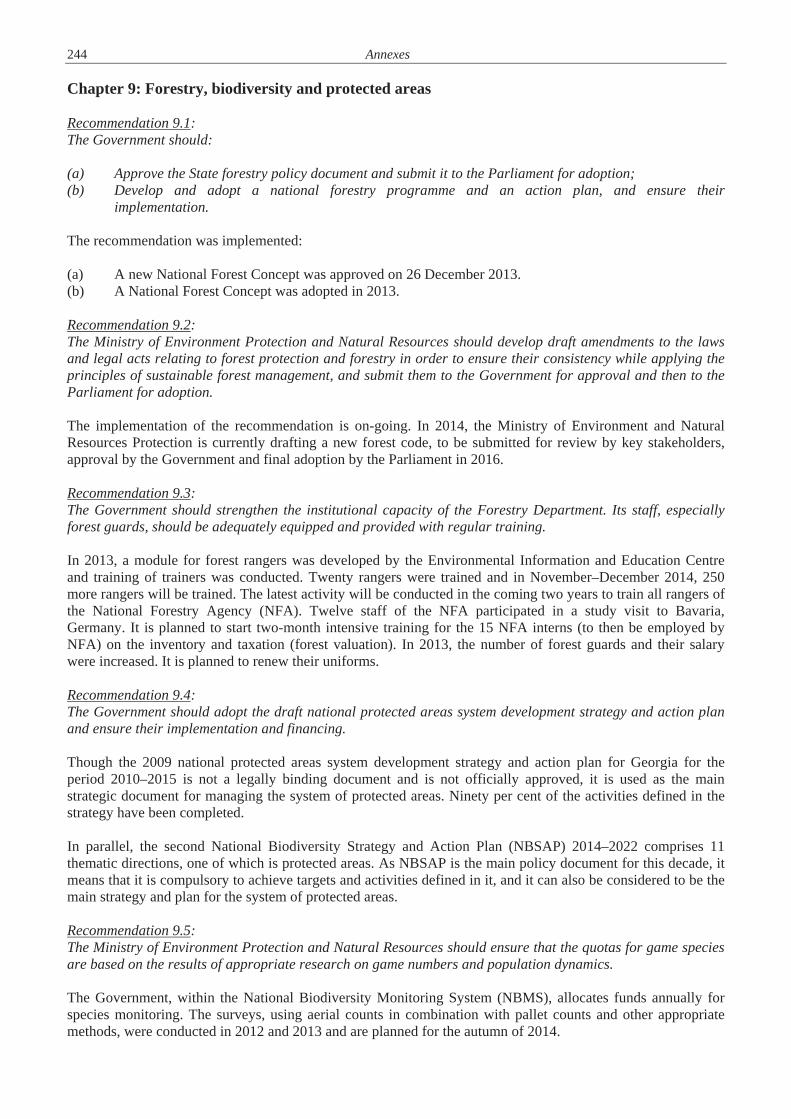
244 Annexes
Chapter 9: Forestry, biodiversity and protected areas Recommendation 9.1: The Government should: (a) Approve the State forestry policy document and submit it to the Parliament for adoption; (b) Develop and adopt a national forestry programme and an action plan, and ensure their
implementation. The recommendation was implemented: (a) A new National Forest Concept was approved on 26 December 2013. (b) A National Forest Concept was adopted in 2013. Recommendation 9.2: The Ministry of Environment Protection and Natural Resources should develop draft amendments to the laws and legal acts relating to forest protection and forestry in order to ensure their consistency while applying the principles of sustainable forest management, and submit them to the Government for approval and then to the Parliament for adoption. The implementation of the recommendation is on-going. In 2014, the Ministry of Environment and Natural Resources Protection is currently drafting a new forest code, to be submitted for review by key stakeholders, approval by the Government and final adoption by the Parliament in 2016. Recommendation 9.3: The Government should strengthen the institutional capacity of the Forestry Department. Its staff, especially forest guards, should be adequately equipped and provided with regular training. In 2013, a module for forest rangers was developed by the Environmental Information and Education Centre and training of trainers was conducted. Twenty rangers were trained and in November–December 2014, 250 more rangers will be trained. The latest activity will be conducted in the coming two years to train all rangers of the National Forestry Agency (NFA). Twelve staff of the NFA participated in a study visit to Bavaria, Germany. It is planned to start two-month intensive training for the 15 NFA interns (to then be employed by NFA) on the inventory and taxation (forest valuation). In 2013, the number of forest guards and their salary were increased. It is planned to renew their uniforms. Recommendation 9.4: The Government should adopt the draft national protected areas system development strategy and action plan and ensure their implementation and financing. Though the 2009 national protected areas system development strategy and action plan for Georgia for the period 2010–2015 is not a legally binding document and is not officially approved, it is used as the main strategic document for managing the system of protected areas. Ninety per cent of the activities defined in the strategy have been completed. In parallel, the second National Biodiversity Strategy and Action Plan (NBSAP) 2014–2022 comprises 11 thematic directions, one of which is protected areas. As NBSAP is the main policy document for this decade, it means that it is compulsory to achieve targets and activities defined in it, and it can also be considered to be the main strategy and plan for the system of protected areas. Recommendation 9.5: The Ministry of Environment Protection and Natural Resources should ensure that the quotas for game species are based on the results of appropriate research on game numbers and population dynamics. The Government, within the National Biodiversity Monitoring System (NBMS), allocates funds annually for species monitoring. The surveys, using aerial counts in combination with pallet counts and other appropriate methods, were conducted in 2012 and 2013 and are planned for the autumn of 2014.

Annex I: Implementation of the recommendations in the second environmental performance review 245 The monitoring of waterbirds has also been initiated within the NBMS: winter counts were conducted in January, 2014; data from these counts are currently being processed. However, there is no evidence that the quotas for game species are based on the results of the above-mentioned monitoring.
* * * * * EPR 1 - Recommendation 8.3: (a) The Ministry of Environment and Natural Resources Protection, together with the State Department for
the Management of Protected Areas, should:
Develop a strategy for protected areas that, inter alia, implements the requirements of the Pan-European Biodiversity and Landscape Diversity Strategy, climate change action plans, and bio-corridors;
Develop management plans for all protected areas as stipulated in the Law on Protected Areas; (b) The State Department of Forestry, in cooperation with the Ministry of Environment and Natural
Resources Protection, should develop a general strategy for the sustainable use of forests, ensuring the accomplishment of all forest functions and their stable regeneration.
(a) Both strategies, the NBSAP and the National Protected Areas System Development Strategy and Action
Plan, include some of the requirements of the Pan-European Biodiversity and Landscape Diversity Strategy and bio-corridors:
European Diploma – the preparation process for nominating Vashlovani Protected Areas for a
European Diploma started in March 2012. At the next stage, experts from the European Council visited Vashlovani Protected Areas to further estimate its value. Within a year, the decision will be made whether the application to receive the Diploma has been satisfied;
Emerald Network – 21 sites are identified in Georgia. Selected sites will be submitted for final adoption by the Bern Convention Standing Committee;
Ramsar sites – work in this direction has started. According to the plan, three lakes of Javakheti Protected Areas (Bugdasheni, Madatapa, Khanchali) will be submitted for designation as potential Ramsar sites;
World Heritage sites – the process for the nomination of Georgian protected areas as potential World Heritage sites was launched back in 2011.
Eco corridors – the network of protected areas is not totally completed; accordingly, eco-corridor planning has not yet taken place. The planned Pshav-Khevsureti Protected Areas were established and the negotiations are under way with the government on establishing Racha Protected Areas. The next step will be to plan and create eco-corridors. Moreover, their creation is one of the targets defined in the NBSAP;
Transboundary cooperation – transboundary cooperation has been more active recently than previously. Within the framework of the project Establishment of Javakheti National Park in Georgia, financed by the German Government, cooperation between the Administration of Javakheti National Park and Lake Arpi National Park in Armenia is quite successful. Exchange visits have been held, together with mutual activities, which entails creation of a joint biodiversity monitoring plan and a transboundary map. The parties also share their experience and views on protected area management issues. Furthermore, there was a workshop organized regarding cooperation between Matchakhela National Park (Georgia) and Camili Biosphere Reserve (Turkey). It is in the future plans of the Agency of Protected Areas to strengthen transboundary cooperation with various bordering protected areas.
Currently, four PAs have an updated management plan, four are under elaboration and five will start in the framework of two new projects (KfW’s Open Programme and GEF/UNDP’s Expansion and Improved Management Effectiveness of the Achara Region’s Protected Areas).

246 Annexes
(b) The Ministry of Environment and Natural Resources Protection, in cooperation with the National Forestry Agency, is currently working on several issues within the framework of the National Forest Concept. The sixth working group is dealing with adoption of national sustainable forest management standards issues that are set forth in the National Forest Concept.

247
Annex II
PARTICIPATION OF GEORGIA IN MULTILATERAL ENVIRONMENTAL AGREEMENTS
Ac = Accession; Ad = Adherence; Ap = Approval; At = Acceptance; De = Denounced; Si = Signature; Su = Succession; Ra = Ratification.
Year Year Status1958 (GENEVA) Convention on the Continental Shelf 1958 (GENEVA) Convention on Fishing and Conservation of the Living Resources of the High Seas1958 (GENEVA) Convention on the Territorial Sea and the Contiguous Zone1958 (GENEVA) Convention on the High Seas 1960 (GENEVA) Convention concerning the Protection of Workers against Ionising Radiations (ILO
115)1961 (PARIS) International Convention for the Protection of New Varieties of Plants 2008 Ac1963 (VIENNA) Convention on Civil Liability for Nuclear Damage
1997 (VIENNA) Protocol to Amend the 1963 Vienna Convention on Civil Liability for Nuclear Damage
1968 (LONDON, MOSCOW, WASHINGTON) Treaty on the Non-Proliferation of Nuclear Weapons (NPT) 1994 Ac
1969 (BRUSSELS) Convention relating to Intervention on the High Seas in Cases of Oil Pollution Casualties 1995 Ac
1971 (RAMSAR) Convention on Wetlands of International Importance Especially as Waterfowl Habitat 1977 1997 Ac1982 (PARIS) Amendment 1997 Ac1987 (REGINA) Amendments
1971 (GENEVA) Convention on Protection against Hazards from Benzene (ILO 136)1971 (LONDON, MOSCOW, WASHINGTON) Treaty on the Prohibition of the Emplacement of
Nuclear Weapons and Other Weapons of Mass Destruction on the Sea-bed and the Ocean Floor and in the Subsoil thereof
1972 (PARIS) Convention concerning the Protection of the World Cultural and Natural Heritage 1992 Su1972 (LONDON) Convention on the Prevention of Marine Pollution by Dumping of Wastes and
Other Matter1996 (LONDON) Protocol 2000 Ac
1972 (LONDON, MOSCOW, WASHINGTON) Convention on the Prohibition of the Development, Production and Stockpiling of Bacteriological (Biological) and Toxin Weapons, and on their Destruction 1996 Ac
1972 (LONDON) International Convention on the International Regulations for Preventing Collisions at Sea 1994 Ac
1972 (GENEVA) International Convention for Safe Containers 1995 Ac1973 (WASHINGTON) Convention on International Trade in Endangered Species of Wild Fauna
and Flora 1996 Ac1979 (BONN) Amendment 1996 At1983 (GABORONE) Amendment 1996 At
1973 (LONDON) Convention for the Prevention of Pollution from Ships (MARPOL) 1995 Ra1978 (LONDON) Protocol relating to the International Convention for the Prevention of Pollution from Ships 1994 Ac1997 (LONDON) Protocol to Amend the International Convention for the Prevention of Pollution from Ships, 1973, as modified by the Protocol of 1978 relating thereto
1974 (GENEVA) Convention concerning Prevention and Control of Occupational Hazards caused by Carcinogenic Substances and Agents (ILO 139)
1977 (GENEVA) Convention on Protection of Workers against Occupational Hazards from Air Pollution, Noise and Vibration (ILO 148)
Worldwide agreements Georgia
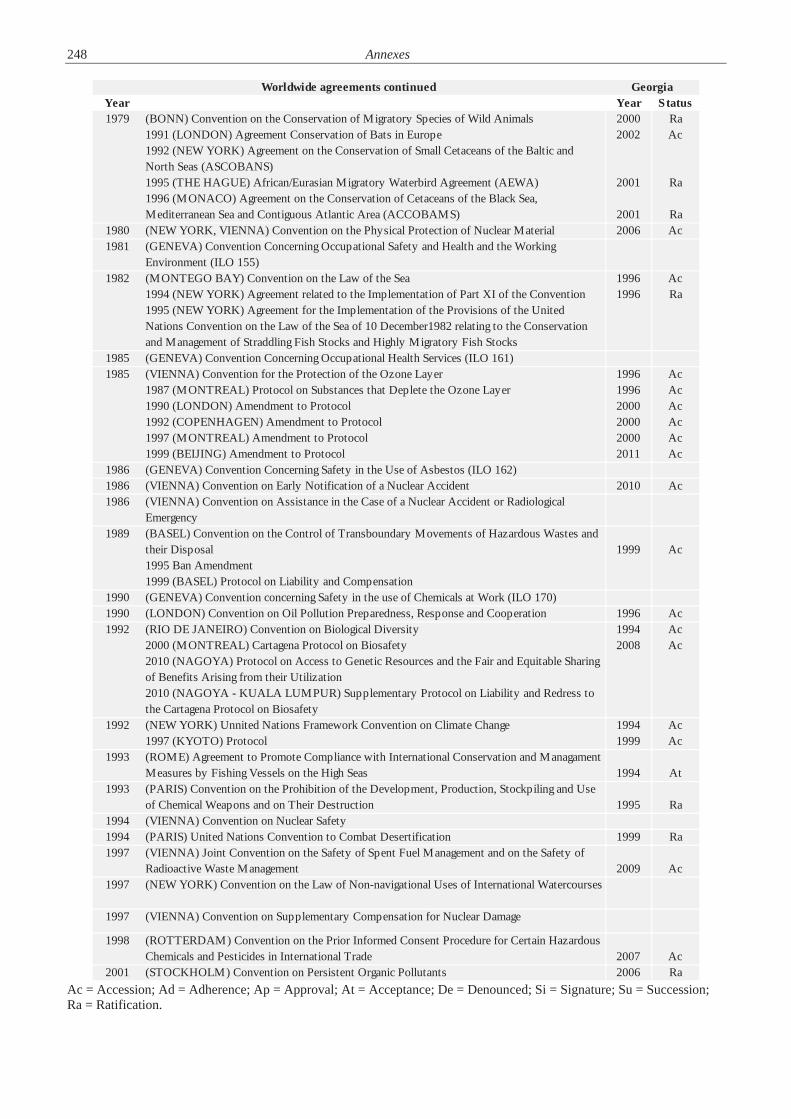
248 Annexes
Ac = Accession; Ad = Adherence; Ap = Approval; At = Acceptance; De = Denounced; Si = Signature; Su = Succession; Ra = Ratification.
Year Year Status1979 (BONN) Convention on the Conservation of Migratory Species of Wild Animals 2000 Ra
1991 (LONDON) Agreement Conservation of Bats in Europe 2002 Ac1992 (NEW YORK) Agreement on the Conservation of Small Cetaceans of the Baltic and North Seas (ASCOBANS)1995 (THE HAGUE) African/Eurasian Migratory Waterbird Agreement (AEWA) 2001 Ra1996 (MONACO) Agreement on the Conservation of Cetaceans of the Black Sea, Mediterranean Sea and Contiguous Atlantic Area (ACCOBAMS) 2001 Ra
1980 (NEW YORK, VIENNA) Convention on the Physical Protection of Nuclear Material 2006 Ac1981 (GENEVA) Convention Concerning Occupational Safety and Health and the Working
Environment (ILO 155)1982 (MONTEGO BAY) Convention on the Law of the Sea 1996 Ac
1994 (NEW YORK) Agreement related to the Implementation of Part XI of the Convention 1996 Ra1995 (NEW YORK) Agreement for the Implementation of the Provisions of the United Nations Convention on the Law of the Sea of 10 December1982 relating to the Conservation and Management of Straddling Fish Stocks and Highly Migratory Fish Stocks
1985 (GENEVA) Convention Concerning Occupational Health Services (ILO 161)1985 (VIENNA) Convention for the Protection of the Ozone Layer 1996 Ac
1987 (MONTREAL) Protocol on Substances that Deplete the Ozone Layer 1996 Ac1990 (LONDON) Amendment to Protocol 2000 Ac1992 (COPENHAGEN) Amendment to Protocol 2000 Ac1997 (MONTREAL) Amendment to Protocol 2000 Ac1999 (BEIJING) Amendment to Protocol 2011 Ac
1986 (GENEVA) Convention Concerning Safety in the Use of Asbestos (ILO 162)1986 (VIENNA) Convention on Early Notification of a Nuclear Accident 2010 Ac1986 (VIENNA) Convention on Assistance in the Case of a Nuclear Accident or Radiological
Emergency1989 (BASEL) Convention on the Control of Transboundary Movements of Hazardous Wastes and
their Disposal 1999 Ac1995 Ban Amendment1999 (BASEL) Protocol on Liability and Compensation
1990 (GENEVA) Convention concerning Safety in the use of Chemicals at Work (ILO 170)1990 (LONDON) Convention on Oil Pollution Preparedness, Response and Cooperation 1996 Ac1992 (RIO DE JANEIRO) Convention on Biological Diversity 1994 Ac
2000 (MONTREAL) Cartagena Protocol on Biosafety 2008 Ac2010 (NAGOYA) Protocol on Access to Genetic Resources and the Fair and Equitable Sharing of Benefits Arising from their Utilization 2010 (NAGOYA - KUALA LUMPUR) Supplementary Protocol on Liability and Redress to the Cartagena Protocol on Biosafety
1992 (NEW YORK) Unnited Nations Framework Convention on Climate Change 1994 Ac1997 (KYOTO) Protocol 1999 Ac
1993 (ROME) Agreement to Promote Compliance with International Conservation and Managament Measures by Fishing Vessels on the High Seas 1994 At
1993 (PARIS) Convention on the Prohibition of the Development, Production, Stockpiling and Use of Chemical Weapons and on Their Destruction 1995 Ra
1994 (VIENNA) Convention on Nuclear Safety1994 (PARIS) United Nations Convention to Combat Desertification 1999 Ra1997 (VIENNA) Joint Convention on the Safety of Spent Fuel Management and on the Safety of
Radioactive Waste Management 2009 Ac1997 (NEW YORK) Convention on the Law of Non-navigational Uses of International Watercourses
1997 (VIENNA) Convention on Supplementary Compensation for Nuclear Damage
1998 (ROTTERDAM) Convention on the Prior Informed Consent Procedure for Certain Hazardous Chemicals and Pesticides in International Trade 2007 Ac
2001 (STOCKHOLM) Convention on Persistent Organic Pollutants 2006 Ra
Worldwide agreements continued Georgia
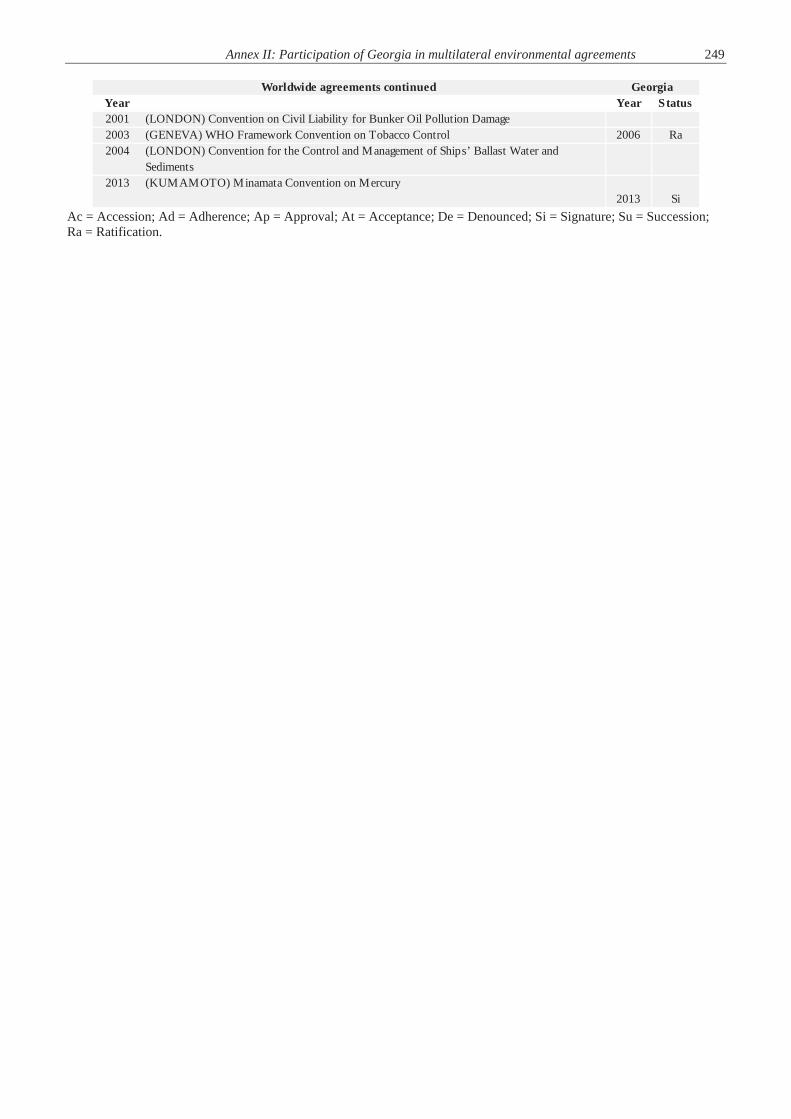
Annex II: Participation of Georgia in multilateral environmental agreements 249
Ac = Accession; Ad = Adherence; Ap = Approval; At = Acceptance; De = Denounced; Si = Signature; Su = Succession; Ra = Ratification.
Year Year Status2001 (LONDON) Convention on Civil Liability for Bunker Oil Pollution Damage2003 (GENEVA) WHO Framework Convention on Tobacco Control 2006 Ra2004 (LONDON) Convention for the Control and Management of Ships’ Ballast Water and
Sediments2013 (KUMAMOTO) Minamata Convention on Mercury
2013 Si
Worldwide agreements continued Georgia
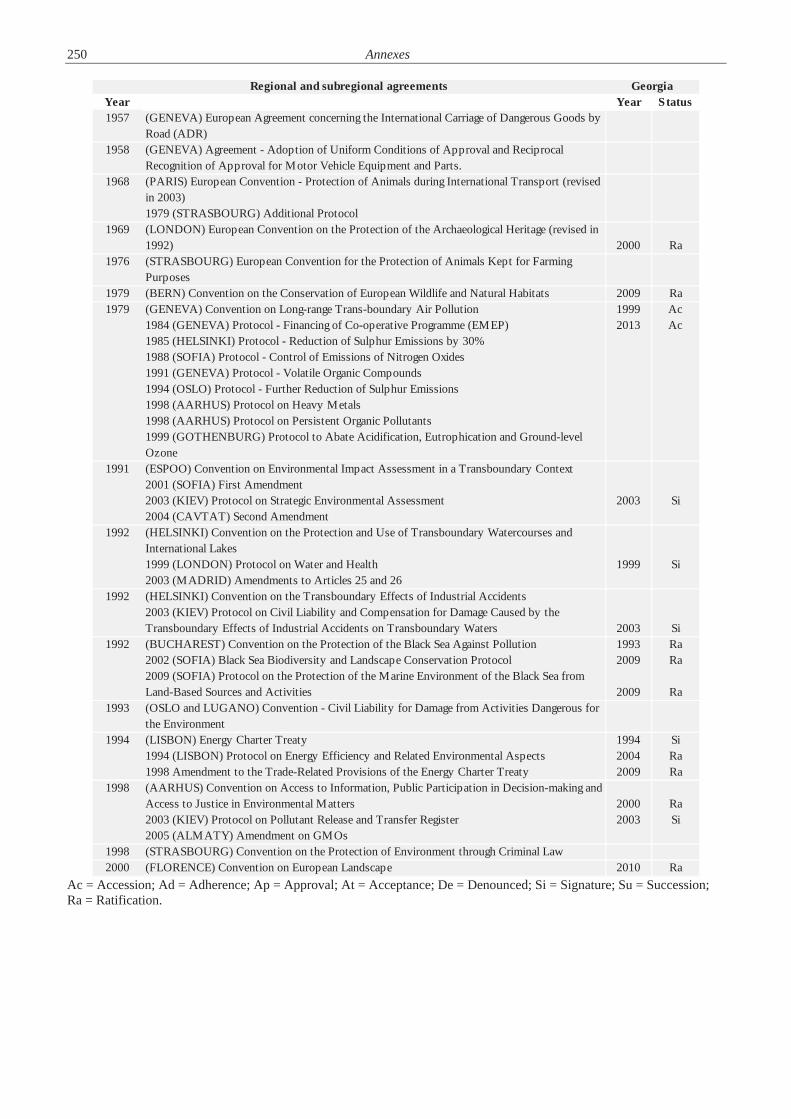
250 Annexes
Ac = Accession; Ad = Adherence; Ap = Approval; At = Acceptance; De = Denounced; Si = Signature; Su = Succession; Ra = Ratification.
Year Year Status1957 (GENEVA) European Agreement concerning the International Carriage of Dangerous Goods by
Road (ADR)1958 (GENEVA) Agreement - Adoption of Uniform Conditions of Approval and Reciprocal
Recognition of Approval for Motor Vehicle Equipment and Parts.1968 (PARIS) European Convention - Protection of Animals during International Transport (revised
in 2003)1979 (STRASBOURG) Additional Protocol
1969 (LONDON) European Convention on the Protection of the Archaeological Heritage (revised in 1992) 2000 Ra
1976 (STRASBOURG) European Convention for the Protection of Animals Kept for Farming Purposes
1979 (BERN) Convention on the Conservation of European Wildlife and Natural Habitats 2009 Ra1979 (GENEVA) Convention on Long-range Trans-boundary Air Pollution 1999 Ac
1984 (GENEVA) Protocol - Financing of Co-operative Programme (EMEP) 2013 Ac1985 (HELSINKI) Protocol - Reduction of Sulphur Emissions by 30%1988 (SOFIA) Protocol - Control of Emissions of Nitrogen Oxides1991 (GENEVA) Protocol - Volatile Organic Compounds1994 (OSLO) Protocol - Further Reduction of Sulphur Emissions1998 (AARHUS) Protocol on Heavy Metals1998 (AARHUS) Protocol on Persistent Organic Pollutants1999 (GOTHENBURG) Protocol to Abate Acidification, Eutrophication and Ground-level Ozone
1991 (ESPOO) Convention on Environmental Impact Assessment in a Transboundary Context2001 (SOFIA) First Amendment2003 (KIEV) Protocol on Strategic Environmental Assessment 2003 Si2004 (CAVTAT) Second Amendment
1992 (HELSINKI) Convention on the Protection and Use of Transboundary Watercourses and International Lakes1999 (LONDON) Protocol on Water and Health 1999 Si2003 (MADRID) Amendments to Articles 25 and 26
1992 (HELSINKI) Convention on the Transboundary Effects of Industrial Accidents2003 (KIEV) Protocol on Civil Liability and Compensation for Damage Caused by the Transboundary Effects of Industrial Accidents on Transboundary Waters 2003 Si
1992 (BUCHAREST) Convention on the Protection of the Black Sea Against Pollution 1993 Ra2002 (SOFIA) Black Sea Biodiversity and Landscape Conservation Protocol 2009 Ra2009 (SOFIA) Protocol on the Protection of the Marine Environment of the Black Sea from Land-Based Sources and Activities 2009 Ra
1993 (OSLO and LUGANO) Convention - Civil Liability for Damage from Activities Dangerous for the Environment
1994 (LISBON) Energy Charter Treaty 1994 Si1994 (LISBON) Protocol on Energy Efficiency and Related Environmental Aspects 2004 Ra1998 Amendment to the Trade-Related Provisions of the Energy Charter Treaty 2009 Ra
1998 (AARHUS) Convention on Access to Information, Public Participation in Decision-making and Access to Justice in Environmental Matters 2000 Ra2003 (KIEV) Protocol on Pollutant Release and Transfer Register 2003 Si2005 (ALMATY) Amendment on GMOs
1998 (STRASBOURG) Convention on the Protection of Environment through Criminal Law2000 (FLORENCE) Convention on European Landscape 2010 Ra
Regional and subregional agreements Georgia
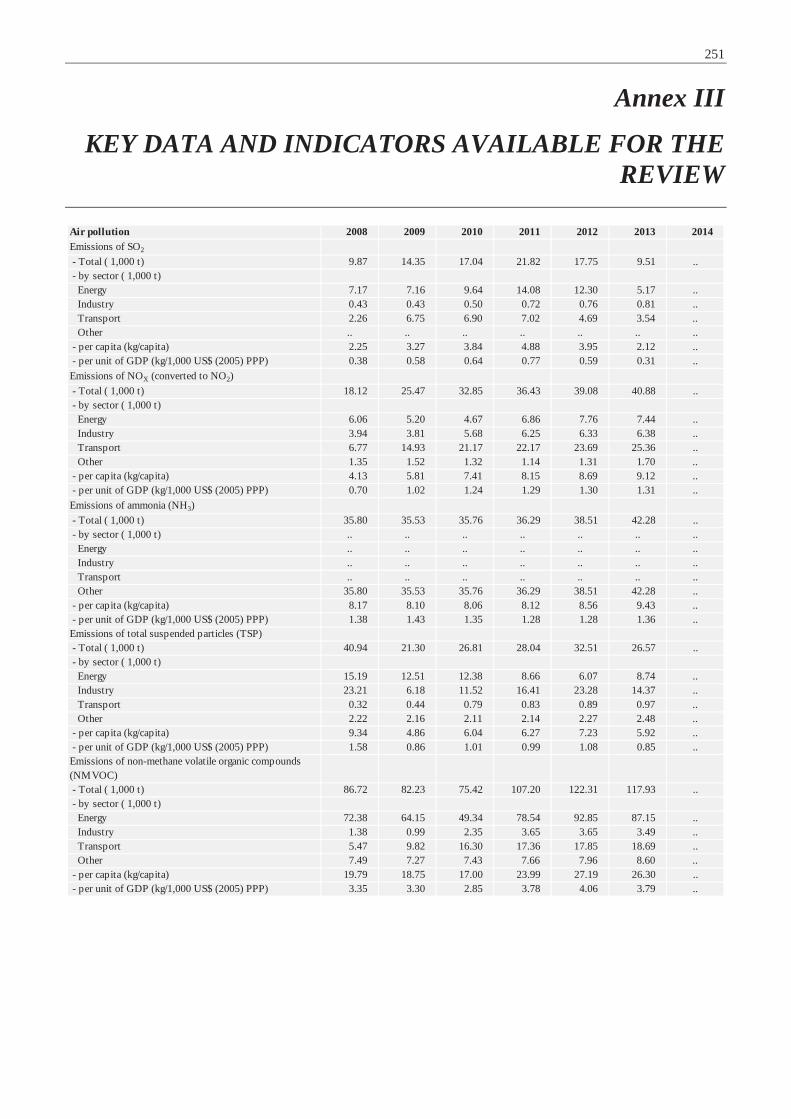
251
Annex III
KEY DATA AND INDICATORS AVAILABLE FOR THE REVIEW
Air pollution 2008 2009 2010 2011 2012 2013 2014Emissions of SO2
- Total ( 1,000 t) 9.87 14.35 17.04 21.82 17.75 9.51 .. - by sector ( 1,000 t) Energy 7.17 7.16 9.64 14.08 12.30 5.17 .. Industry 0.43 0.43 0.50 0.72 0.76 0.81 .. Transport 2.26 6.75 6.90 7.02 4.69 3.54 .. Other .. .. .. .. .. .. .. - per capita (kg/capita) 2.25 3.27 3.84 4.88 3.95 2.12 .. - per unit of GDP (kg/1,000 US$ (2005) PPP) 0.38 0.58 0.64 0.77 0.59 0.31 ..Emissions of NOX (converted to NO2) - Total ( 1,000 t) 18.12 25.47 32.85 36.43 39.08 40.88 .. - by sector ( 1,000 t) Energy 6.06 5.20 4.67 6.86 7.76 7.44 .. Industry 3.94 3.81 5.68 6.25 6.33 6.38 .. Transport 6.77 14.93 21.17 22.17 23.69 25.36 .. Other 1.35 1.52 1.32 1.14 1.31 1.70 .. - per capita (kg/capita) 4.13 5.81 7.41 8.15 8.69 9.12 .. - per unit of GDP (kg/1,000 US$ (2005) PPP) 0.70 1.02 1.24 1.29 1.30 1.31 ..Emissions of ammonia (NH3) - Total ( 1,000 t) 35.80 35.53 35.76 36.29 38.51 42.28 .. - by sector ( 1,000 t) .. .. .. .. .. .. .. Energy .. .. .. .. .. .. .. Industry .. .. .. .. .. .. .. Transport .. .. .. .. .. .. .. Other 35.80 35.53 35.76 36.29 38.51 42.28 .. - per capita (kg/capita) 8.17 8.10 8.06 8.12 8.56 9.43 .. - per unit of GDP (kg/1,000 US$ (2005) PPP) 1.38 1.43 1.35 1.28 1.28 1.36 ..Emissions of total suspended particles (TSP) - Total ( 1,000 t) 40.94 21.30 26.81 28.04 32.51 26.57 .. - by sector ( 1,000 t) Energy 15.19 12.51 12.38 8.66 6.07 8.74 .. Industry 23.21 6.18 11.52 16.41 23.28 14.37 .. Transport 0.32 0.44 0.79 0.83 0.89 0.97 .. Other 2.22 2.16 2.11 2.14 2.27 2.48 .. - per capita (kg/capita) 9.34 4.86 6.04 6.27 7.23 5.92 .. - per unit of GDP (kg/1,000 US$ (2005) PPP) 1.58 0.86 1.01 0.99 1.08 0.85 ..Emissions of non-methane volatile organic compounds (NMVOC) - Total ( 1,000 t) 86.72 82.23 75.42 107.20 122.31 117.93 .. - by sector ( 1,000 t) Energy 72.38 64.15 49.34 78.54 92.85 87.15 .. Industry 1.38 0.99 2.35 3.65 3.65 3.49 .. Transport 5.47 9.82 16.30 17.36 17.85 18.69 .. Other 7.49 7.27 7.43 7.66 7.96 8.60 .. - per capita (kg/capita) 19.79 18.75 17.00 23.99 27.19 26.30 .. - per unit of GDP (kg/1,000 US$ (2005) PPP) 3.35 3.30 2.85 3.78 4.06 3.79 ..
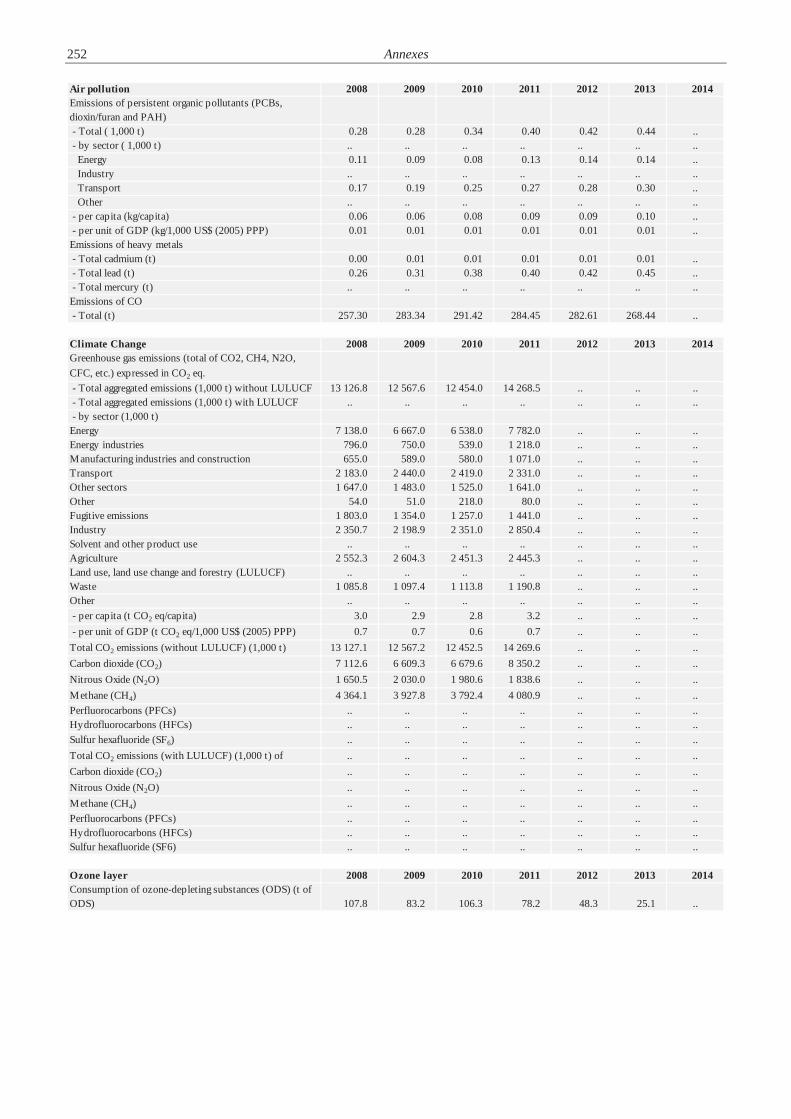
252 Annexes
Air pollution 2008 2009 2010 2011 2012 2013 2014Emissions of persistent organic pollutants (PCBs, dioxin/furan and PAH) - Total ( 1,000 t) 0.28 0.28 0.34 0.40 0.42 0.44 .. - by sector ( 1,000 t) .. .. .. .. .. .. .. Energy 0.11 0.09 0.08 0.13 0.14 0.14 .. Industry .. .. .. .. .. .. .. Transport 0.17 0.19 0.25 0.27 0.28 0.30 .. Other .. .. .. .. .. .. .. - per capita (kg/capita) 0.06 0.06 0.08 0.09 0.09 0.10 .. - per unit of GDP (kg/1,000 US$ (2005) PPP) 0.01 0.01 0.01 0.01 0.01 0.01 ..Emissions of heavy metals - Total cadmium (t) 0.00 0.01 0.01 0.01 0.01 0.01 .. - Total lead (t) 0.26 0.31 0.38 0.40 0.42 0.45 .. - Total mercury (t) .. .. .. .. .. .. ..Emissions of CO - Total (t) 257.30 283.34 291.42 284.45 282.61 268.44 ..
Climate Change 2008 2009 2010 2011 2012 2013 2014Greenhouse gas emissions (total of CO2, CH4, N2O, CFC, etc.) expressed in CO2 eq. - Total aggregated emissions (1,000 t) without LULUCF 13 126.8 12 567.6 12 454.0 14 268.5 .. .. .. - Total aggregated emissions (1,000 t) with LULUCF .. .. .. .. .. .. .. - by sector (1,000 t)Energy 7 138.0 6 667.0 6 538.0 7 782.0 .. .. ..Energy industries 796.0 750.0 539.0 1 218.0 .. .. ..Manufacturing industries and construction 655.0 589.0 580.0 1 071.0 .. .. ..Transport 2 183.0 2 440.0 2 419.0 2 331.0 .. .. ..Other sectors 1 647.0 1 483.0 1 525.0 1 641.0 .. .. ..Other 54.0 51.0 218.0 80.0 .. .. ..Fugitive emissions 1 803.0 1 354.0 1 257.0 1 441.0 .. .. ..Industry 2 350.7 2 198.9 2 351.0 2 850.4 .. .. ..Solvent and other product use .. .. .. .. .. .. ..Agriculture 2 552.3 2 604.3 2 451.3 2 445.3 .. .. ..Land use, land use change and forestry (LULUCF) .. .. .. .. .. .. ..Waste 1 085.8 1 097.4 1 113.8 1 190.8 .. .. ..Other .. .. .. .. .. .. .. - per capita (t CO2 eq/capita) 3.0 2.9 2.8 3.2 .. .. .. - per unit of GDP (t CO2 eq/1,000 US$ (2005) PPP) 0.7 0.7 0.6 0.7 .. .. ..Total CO2 emissions (without LULUCF) (1,000 t) 13 127.1 12 567.2 12 452.5 14 269.6 .. .. ..Carbon dioxide (CO2) 7 112.6 6 609.3 6 679.6 8 350.2 .. .. ..Nitrous Oxide (N2O) 1 650.5 2 030.0 1 980.6 1 838.6 .. .. ..Methane (CH4) 4 364.1 3 927.8 3 792.4 4 080.9 .. .. ..Perfluorocarbons (PFCs) .. .. .. .. .. .. ..Hydrofluorocarbons (HFCs) .. .. .. .. .. .. ..Sulfur hexafluoride (SF6) .. .. .. .. .. .. ..Total CO2 emissions (with LULUCF) (1,000 t) of .. .. .. .. .. .. ..Carbon dioxide (CO2) .. .. .. .. .. .. ..Nitrous Oxide (N2O) .. .. .. .. .. .. ..Methane (CH4) .. .. .. .. .. .. ..Perfluorocarbons (PFCs) .. .. .. .. .. .. ..Hydrofluorocarbons (HFCs) .. .. .. .. .. .. ..Sulfur hexafluoride (SF6) .. .. .. .. .. .. ..
Ozone layer 2008 2009 2010 2011 2012 2013 2014Consumption of ozone-depleting substances (ODS) (t of ODS) 107.8 83.2 106.3 78.2 48.3 25.1 ..
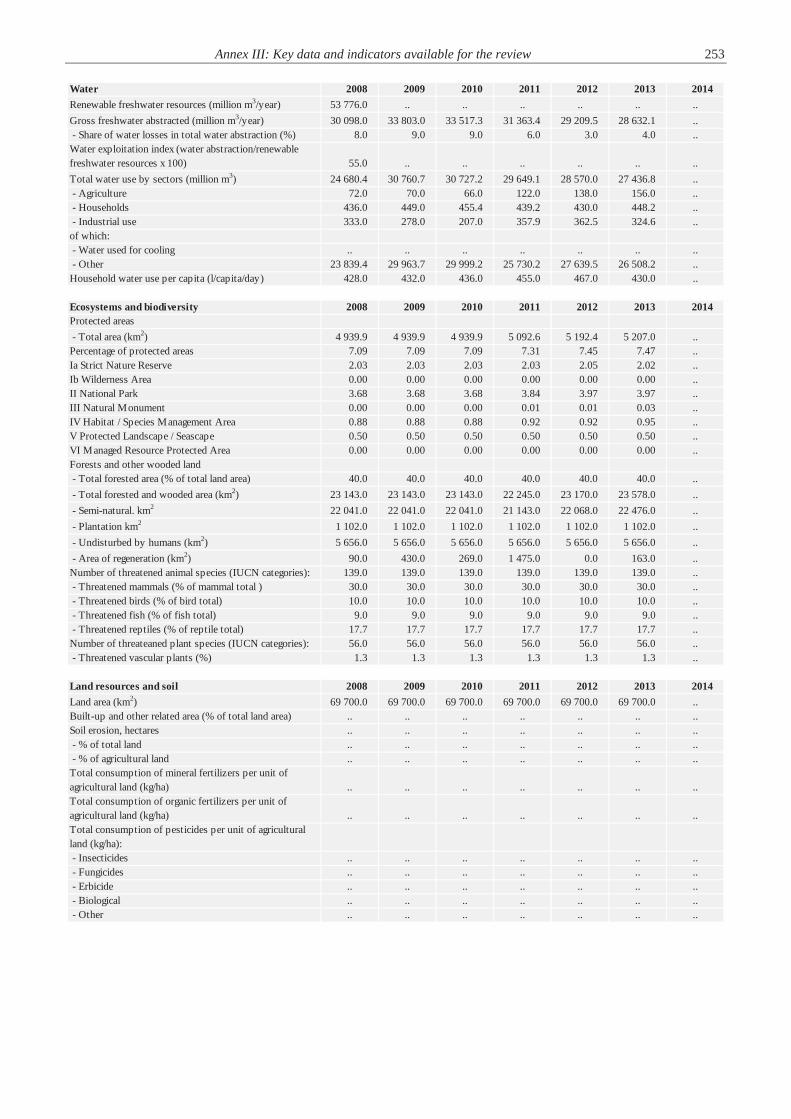
Annex III: Key data and indicators available for the review 253
Water 2008 2009 2010 2011 2012 2013Renewable freshwater resources (million m3/year) 53 776.0 .. .. .. .. .. ..Gross freshwater abstracted (million m3/year) 30 098.0 33 803.0 33 517.3 31 363.4 29 209.5 28 632.1 .. - Share of water losses in total water abstraction (%) 8.0 9.0 9.0 6.0 3.0 4.0 ..Water exploitation index (water abstraction/renewable freshwater resources x 100) 55.0 .. .. .. .. .. ..Total water use by sectors (million m3) 24 680.4 30 760.7 30 727.2 29 649.1 28 570.0 27 436.8 .. - Agriculture 72.0 70.0 66.0 122.0 138.0 156.0 .. - Households 436.0 449.0 455.4 439.2 430.0 448.2 .. - Industrial use 333.0 278.0 207.0 357.9 362.5 324.6 ..of which: - Water used for cooling .. .. .. .. .. .. .. - Other 23 839.4 29 963.7 29 999.2 25 730.2 27 639.5 26 508.2 ..Household water use per capita (l/capita/day) 428.0 432.0 436.0 455.0 467.0 430.0 ..
Ecosystems and biodiversity 2008 2009 2010 2011 2012 2013 2014Protected areas - Total area (km2) 4 939.9 4 939.9 4 939.9 5 092.6 5 192.4 5 207.0 ..Percentage of protected areas 7.09 7.09 7.09 7.31 7.45 7.47 ..Ia Strict Nature Reserve 2.03 2.03 2.03 2.03 2.05 2.02 ..Ib Wilderness Area 0.00 0.00 0.00 0.00 0.00 0.00 ..II National Park 3.68 3.68 3.68 3.84 3.97 3.97 ..III Natural Monument 0.00 0.00 0.00 0.01 0.01 0.03 ..IV Habitat / Species Management Area 0.88 0.88 0.88 0.92 0.92 0.95 ..V Protected Landscape / Seascape 0.50 0.50 0.50 0.50 0.50 0.50 ..VI Managed Resource Protected Area 0.00 0.00 0.00 0.00 0.00 0.00 ..Forests and other wooded land - Total forested area (% of total land area) 40.0 40.0 40.0 40.0 40.0 40.0 .. - Total forested and wooded area (km2) 23 143.0 23 143.0 23 143.0 22 245.0 23 170.0 23 578.0 .. - Semi-natural. km2 22 041.0 22 041.0 22 041.0 21 143.0 22 068.0 22 476.0 .. - Plantation km2 1 102.0 1 102.0 1 102.0 1 102.0 1 102.0 1 102.0 .. - Undisturbed by humans (km2) 5 656.0 5 656.0 5 656.0 5 656.0 5 656.0 5 656.0 .. - Area of regeneration (km2) 90.0 430.0 269.0 1 475.0 0.0 163.0 ..Number of threatened animal species (IUCN categories): 139.0 139.0 139.0 139.0 139.0 139.0 .. - Threatened mammals (% of mammal total ) 30.0 30.0 30.0 30.0 30.0 30.0 .. - Threatened birds (% of bird total) 10.0 10.0 10.0 10.0 10.0 10.0 .. - Threatened fish (% of fish total) 9.0 9.0 9.0 9.0 9.0 9.0 .. - Threatened reptiles (% of reptile total) 17.7 17.7 17.7 17.7 17.7 17.7 ..Number of threateaned plant species (IUCN categories): 56.0 56.0 56.0 56.0 56.0 56.0 .. - Threatened vascular plants (%) 1.3 1.3 1.3 1.3 1.3 1.3 ..
Land resources and soil 2008 2009 2010 2011 2012 2013 2014Land area (km2) 69 700.0 69 700.0 69 700.0 69 700.0 69 700.0 69 700.0 ..Built-up and other related area (% of total land area) .. .. .. .. .. .. ..Soil erosion, hectares .. .. .. .. .. .. .. - % of total land .. .. .. .. .. .. .. - % of agricultural land .. .. .. .. .. .. ..Total consumption of mineral fertilizers per unit of agricultural land (kg/ha) .. .. .. .. .. .. ..Total consumption of organic fertilizers per unit of agricultural land (kg/ha) .. .. .. .. .. .. ..Total consumption of pesticides per unit of agricultural land (kg/ha): - Insecticides .. .. .. .. .. .. .. - Fungicides .. .. .. .. .. .. .. - Erbicide .. .. .. .. .. .. .. - Biological .. .. .. .. .. .. .. - Other .. .. .. .. .. .. ..
2014

254 Annexes
Energy 2008 2009 2010 2011 2012 2013 2014Total final energy consumption (TFC) (Mtoe)* .. .. .. .. .. 3 726.3 .. - by fuelCoal .. .. .. .. .. 315.1 ..Petroleum .. .. .. .. .. 1 077.6 ..Gas .. .. .. .. .. 1 058.7 ..Nuclear .. .. .. .. .. .. ..Renewables .. .. .. .. .. 494.6 .. - by sector**Industry .. .. .. .. .. 654.1 ..Transport .. .. .. .. .. 963.1 ..Agriculture .. .. .. .. .. 13.7 ..Services .. .. .. .. .. 330.9 ..Households .. .. .. .. .. 1 467.9 ..Non-energy use .. .. .. .. .. 296.6 ..Electricity consumption (million kWh) .. .. .. .. .. .. ..Energy intensity TPES/GDP (PPP) (toe/1,000 US$ (2005) PPP)*** .. .. .. .. .. .. ..
Transportation 2008 2009 2010 2011 2012 2013 2014Passenger transport demand (million passenger/km) 6 728.6 6 728.8 6 913.6 7 107.5 7 207.7 7 375.7 .. by mode: train 674.5 626.0 654.4 641.4 625.4 584.8 .. road transport 5 568.4 5 724.3 5 884.6 6 049.4 6 218.8 6 392.9 .. water transport 5.7 3.2 3.4 2.0 .. air transport 485.7 378.5 368.9 413.5 360.1 396.0 ..Passengers transported by air transport (million passengers 0.2 0.2 0.2 0.2 0.2 0.2 ..Freight transport demand (million ton km) 7 165.6 6 029.2 6 848.1 6 690.0 6 616.8 6 172.4 .. by mode: train 6 515.7 5 417.0 6 227.5 6 054.8 5 976.6 5 525.9 .. road transport 602.6 611.1 619.7 628.4 637.3 646.1 .. water transport 45.4 .. .. 5.3 2.4 .. .. air transport 1.9 1.1 0.9 1.5 0.5 0.4 ..Number of passenger cars (including taxis), vehicles 500.9 536.1 577.2 620.9 672.7 738.7 ..Average age of passenger cars .. .. .. .. .. .. ..
Waste 2008 2009 2010 2011 2012 2013 2014Total waste generationof which: - Hazardous waste (t) .. .. .. .. .. .. .. - Non-hazardous industrial waste (1,000 t) .. .. .. .. .. .. .. - Municipal waste (1,000 m3) .. .. .. .. .. .. ..of which from households (1,000 m3) .. .. .. .. .. .. ..
Demography and Health 2008 2009 2010 2011 2012 2013 2014Total population (million inhabitants) 4 382.1 4 385.4 4 436.4 4 469.2 4 497.6 4 483.8 ..Birth rate (per 1,000) 12.9 14.4 14.1 12.9 12.7 12.9 ..Total fertility rate 1.7 1.9 1.8 1.7 1.7 1.7 ..Mortality rate (per 1,000) 9.8 10.6 10.7 11.1 11.0 10.8 ..Infant mortality rate (deaths/1,000 live births) 17.0 14.9 11.2 12.1 12.5 11.1 ..Life expectancy at birth (years) 74.2 73.6 74.4 74.5 74.7 75.2 ..Female life expectancy at birth (years) 79.0 77.7 78.7 78.6 79.0 79.4 ..Male life expectancy at birth (years) 69.3 69.2 70.0 70.2 70.2 70.8 ..Population aged 0-14 years (% of total) 17.2 17.1 17.1 17.0 16.9 17.0 ..Population ages 15-64 (% of total) 68.1 68.5 68.9 69.2 69.4 69.1 ..Population ages 65 and above (% of total) 14.7 14.4 14.0 13.8 13.7 13.9 ..Proportion of population using an improved drinking water source, total (%) - Urban (%) .. .. .. .. .. .. .. - Rural (%) .. .. .. .. .. .. ..Population with access to sanitation, total (%) 45.1 45.5 46.0 46.6 46.9 46.8 .. - Urban (%) 84.9 84.8 84.4 84.5 84.9 86.0 .. - Rural (%) 5.2 6.2 7.3 8.7 9.2 7.5 ..
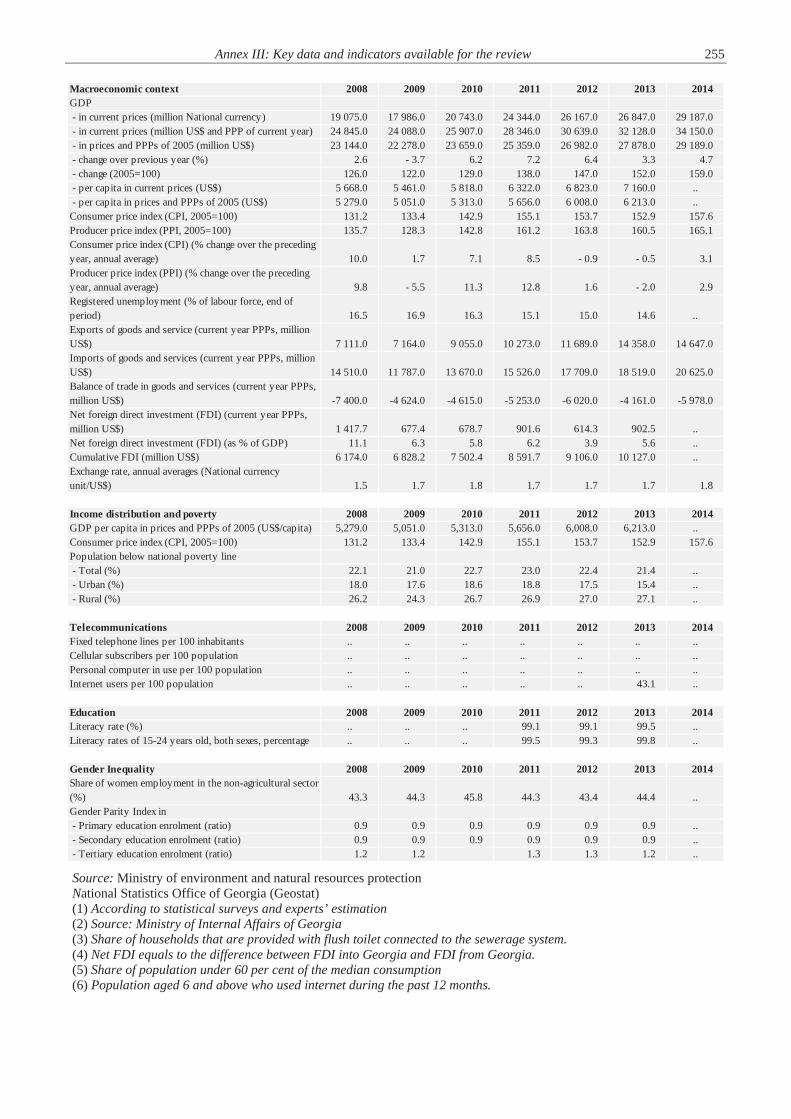
Annex III: Key data and indicators available for the review 255
Source: Ministry of environment and natural resources protection National Statistics Office of Georgia (Geostat) (1) According to statistical surveys and experts’ estimation (2) Source: Ministry of Internal Affairs of Georgia (3) Share of households that are provided with flush toilet connected to the sewerage system. (4) Net FDI equals to the difference between FDI into Georgia and FDI from Georgia. (5) Share of population under 60 per cent of the median consumption (6) Population aged 6 and above who used internet during the past 12 months.
Macroeconomic context 2008 2009 2010 2011 2012 2013 2014GDP - in current prices (million National currency) 19 075.0 17 986.0 20 743.0 24 344.0 26 167.0 26 847.0 29 187.0 - in current prices (million US$ and PPP of current year) 24 845.0 24 088.0 25 907.0 28 346.0 30 639.0 32 128.0 34 150.0 - in prices and PPPs of 2005 (million US$) 23 144.0 22 278.0 23 659.0 25 359.0 26 982.0 27 878.0 29 189.0 - change over previous year (%) 2.6 - 3.7 6.2 7.2 6.4 3.3 4.7 - change (2005=100) 126.0 122.0 129.0 138.0 147.0 152.0 159.0 - per capita in current prices (US$) 5 668.0 5 461.0 5 818.0 6 322.0 6 823.0 7 160.0 .. - per capita in prices and PPPs of 2005 (US$) 5 279.0 5 051.0 5 313.0 5 656.0 6 008.0 6 213.0 ..Consumer price index (CPI, 2005=100) 131.2 133.4 142.9 155.1 153.7 152.9 157.6Producer price index (PPI, 2005=100) 135.7 128.3 142.8 161.2 163.8 160.5 165.1Consumer price index (CPI) (% change over the preceding year, annual average) 10.0 1.7 7.1 8.5 - 0.9 - 0.5 3.1Producer price index (PPI) (% change over the preceding year, annual average) 9.8 - 5.5 11.3 12.8 1.6 - 2.0 2.9Registered unemployment (% of labour force, end of period) 16.5 16.9 16.3 15.1 15.0 14.6 ..Exports of goods and service (current year PPPs, million US$) 7 111.0 7 164.0 9 055.0 10 273.0 11 689.0 14 358.0 14 647.0Imports of goods and services (current year PPPs, million US$) 14 510.0 11 787.0 13 670.0 15 526.0 17 709.0 18 519.0 20 625.0Balance of trade in goods and services (current year PPPs, million US$) -7 400.0 -4 624.0 -4 615.0 -5 253.0 -6 020.0 -4 161.0 -5 978.0Net foreign direct investment (FDI) (current year PPPs, million US$) 1 417.7 677.4 678.7 901.6 614.3 902.5 ..Net foreign direct investment (FDI) (as % of GDP) 11.1 6.3 5.8 6.2 3.9 5.6 ..Cumulative FDI (million US$) 6 174.0 6 828.2 7 502.4 8 591.7 9 106.0 10 127.0 ..Exchange rate, annual averages (National currency unit/US$) 1.5 1.7 1.8 1.7 1.7 1.7 1.8
Income distribution and poverty 2008 2009 2010 2011 2012 2013 2014GDP per capita in prices and PPPs of 2005 (US$/capita) 5,279.0 5,051.0 5,313.0 5,656.0 6,008.0 6,213.0 ..Consumer price index (CPI, 2005=100) 131.2 133.4 142.9 155.1 153.7 152.9 157.6Population below national poverty line - Total (%) 22.1 21.0 22.7 23.0 22.4 21.4 .. - Urban (%) 18.0 17.6 18.6 18.8 17.5 15.4 .. - Rural (%) 26.2 24.3 26.7 26.9 27.0 27.1 ..
Telecommunications 2008 2009 2010 2011 2012 2013 2014Fixed telephone lines per 100 inhabitants .. .. .. .. .. .. ..Cellular subscribers per 100 population .. .. .. .. .. .. ..Personal computer in use per 100 population .. .. .. .. .. .. ..Internet users per 100 population .. .. .. .. .. 43.1 ..
Education 2008 2009 2010 2011 2012 2013 2014Literacy rate (%) .. .. .. 99.1 99.1 99.5 ..Literacy rates of 15-24 years old, both sexes, percentage .. .. .. 99.5 99.3 99.8 ..
Gender Inequality 2008 2009 2010 2011 2012 2013 2014Share of women employment in the non-agricultural sector (%) 43.3 44.3 45.8 44.3 43.4 44.4 ..Gender Parity Index in - Primary education enrolment (ratio) 0.9 0.9 0.9 0.9 0.9 0.9 .. - Secondary education enrolment (ratio) 0.9 0.9 0.9 0.9 0.9 0.9 .. - Tertiary education enrolment (ratio) 1.2 1.2 1.3 1.3 1.2 ..

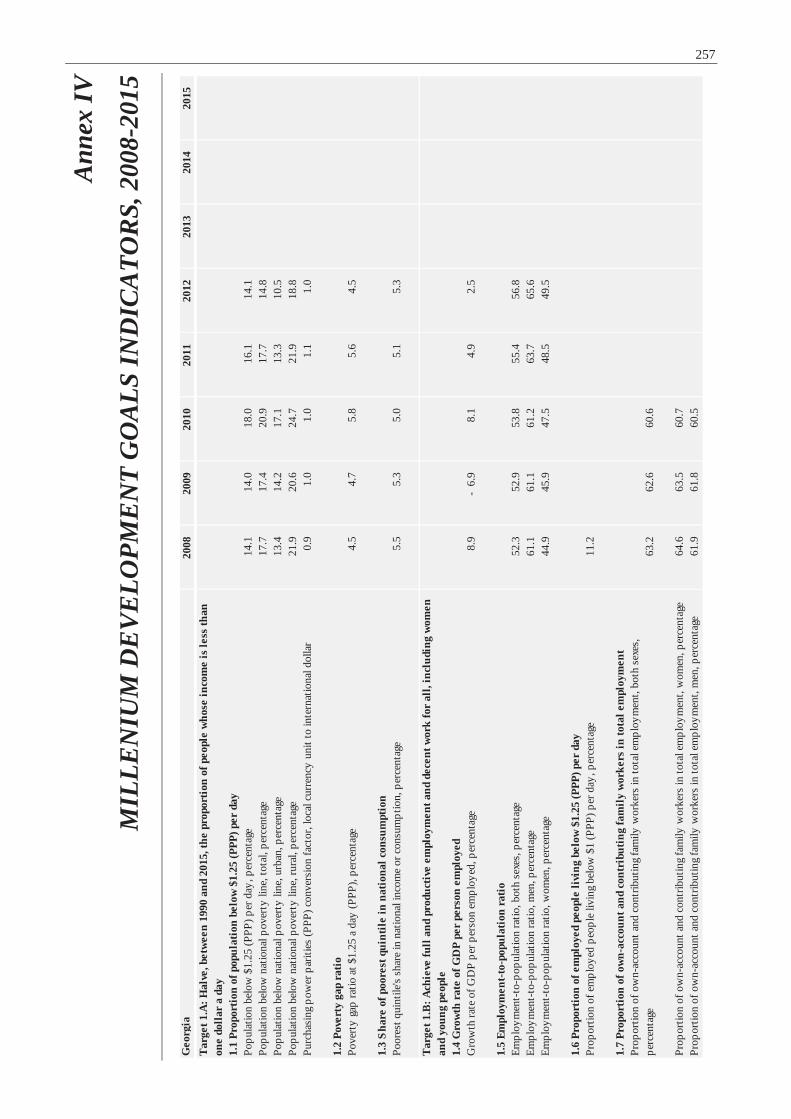
257
Ann
ex IV
MIL
LEN
IUM
DE
VE
LOPM
EN
T G
OA
LS IN
DIC
ATO
RS,
200
8-20
15
Geo
rgia
2008
2009
2010
2011
2012
2013
2014
2015
Tar
get 1
.A: H
alve
, bet
wee
n 19
90 a
nd 2
015,
the
prop
orti
on o
f peo
ple
who
se in
com
e is
less
than
on
e do
llar
a d
ay1.
1 Pr
opor
tion
of p
opul
atio
n be
low
$1.
25 (P
PP) p
er d
ayPo
pula
tion
belo
w $
1.25
(PPP
) per
day
, per
cent
age
14.
1 1
4.0
18.
0 1
6.1
14.
1Po
pula
tion
belo
w n
atio
nal p
over
ty li
ne, t
otal
, per
cent
age
17.
7 1
7.4
20.
9 1
7.7
14.
8Po
pula
tion
belo
w n
atio
nal p
over
ty li
ne, u
rban
, per
cent
age
13.
4 1
4.2
17.
1 1
3.3
10.
5Po
pula
tion
belo
w n
atio
nal p
over
ty li
ne, r
ural
, per
cent
age
21.
9 2
0.6
24.
7 2
1.9
18.
8Pu
rcha
sing
pow
er p
ariti
es (P
PP) c
onve
rsio
n fa
ctor
, loc
al c
urre
ncy
unit
to in
tern
atio
nal d
olla
r 0
.9 1
.0 1
.0 1
.1 1
.0
1.2
Pove
rty
gap
rati
oPo
vert
y ga
p ra
tio a
t $1.
25 a
day
(PPP
), pe
rcen
tage
4.5
4.7
5.8
5.6
4.5
1.3
Sha
re o
f poo
rest
qui
ntil
e in
nat
iona
l con
sum
ptio
nPo
ores
t qui
ntile
's sh
are
in n
atio
nal i
ncom
e or
con
sum
ptio
n, p
erce
ntag
e 5
.5 5
.3 5
.0 5
.1 5
.3
Tar
get 1
.B: A
chie
ve fu
ll a
nd p
rodu
ctiv
e em
ploy
men
t and
dec
ent w
ork
for
all,
incl
udin
g w
omen
an
d yo
ung
peop
le1.
4 G
row
th r
ate
of G
DP
per
pers
on e
mpl
oyed
Gro
wth
rate
of G
DP
per p
erso
n em
ploy
ed, p
erce
ntag
e 8
.9-
6.9
8.1
4.9
2.5
1.5
Empl
oym
ent-
to-p
opul
atio
n ra
tio
Empl
oym
ent-
to-p
opul
atio
n ra
tio, b
oth
sexe
s, p
erce
ntag
e 5
2.3
52.
9 5
3.8
55.
4 5
6.8
Empl
oym
ent-
to-p
opul
atio
n ra
tio, m
en, p
erce
ntag
e 6
1.1
61.
1 6
1.2
63.
7 6
5.6
Empl
oym
ent-
to-p
opul
atio
n ra
tio, w
omen
, per
cent
age
44.
9 4
5.9
47.
5 4
8.5
49.
5
1.6
Prop
orti
on o
f em
ploy
ed p
eopl
e li
ving
bel
ow $
1.25
(PPP
) per
day
Prop
ortio
n of
em
ploy
ed p
eopl
e liv
ing
belo
w $
1 (P
PP) p
er d
ay, p
erce
ntag
e 1
1.2
1.7
Prop
orti
on o
f ow
n-ac
coun
t and
con
trib
utin
g fa
mil
y w
orke
rs in
tota
l em
ploy
men
tPr
opor
tion
of o
wn-
acco
unt a
nd c
ontr
ibut
ing
fam
ily w
orke
rs in
tota
l em
ploy
men
t, bo
th s
exes
, pe
rcen
tage
63.
2 6
2.6
60.
6
Prop
ortio
n of
ow
n-ac
coun
t and
con
trib
utin
g fa
mily
wor
kers
in to
tal e
mpl
oym
ent,
wom
en, p
erce
ntag
e 6
4.6
63.
5 6
0.7
Prop
ortio
n of
ow
n-ac
coun
t and
con
trib
utin
g fa
mily
wor
kers
in to
tal e
mpl
oym
ent,
men
, per
cent
age
61.
9 6
1.8
60.
5
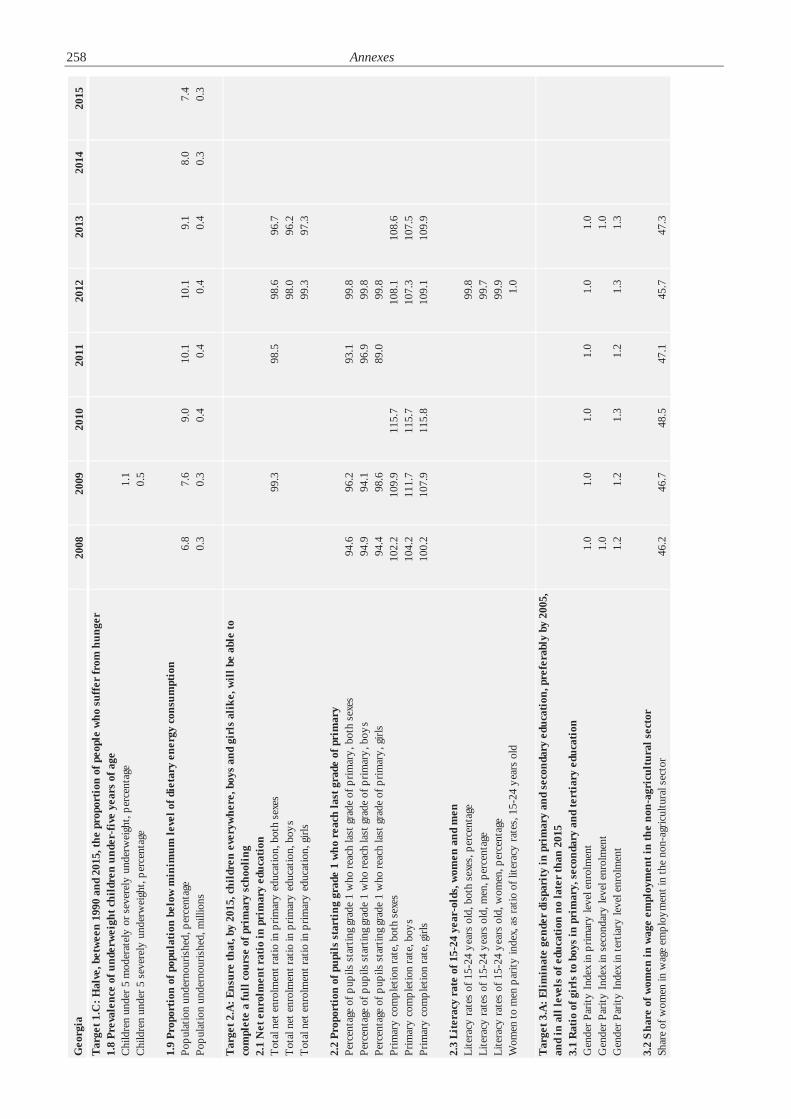
258 Annexes
G
eorg
ia20
0820
0920
1020
1120
1220
1320
1420
15T
arge
t 1.C
: Hal
ve, b
etw
een
1990
and
201
5, th
e pr
opor
tion
of p
eopl
e w
ho s
uffe
r fr
om h
unge
r1.
8 Pr
eval
ence
of u
nder
wei
ght c
hild
ren
unde
r-fi
ve y
ears
of a
geC
hild
ren
unde
r 5 m
oder
atel
y or
sev
erel
y un
derw
eigh
t, pe
rcen
tage
1.1
Chi
ldre
n un
der 5
sev
erel
y un
derw
eigh
t, pe
rcen
tage
0.5
1.9
Prop
orti
on o
f pop
ulat
ion
belo
w m
inim
um le
vel o
f die
tary
ene
rgy
cons
umpt
ion
Popu
latio
n un
dern
ouris
hed,
per
cent
age
6.8
7.6
9.0
10.
1 1
0.1
9.1
8.0
7.4
Popu
latio
n un
dern
ouris
hed,
mill
ions
0.3
0.3
0.4
0.4
0.4
0.4
0.3
0.3
Tar
get 2
.A: E
nsur
e th
at, b
y 20
15, c
hild
ren
ever
ywhe
re, b
oys
and
girl
s al
ike,
wil
l be
able
to
com
plet
e a
full
cou
rse
of p
rim
ary
scho
olin
g2.
1 N
et e
nrol
men
t rat
io in
pri
mar
y ed
ucat
ion
Tot
al n
et e
nrol
men
t rat
io in
prim
ary
educ
atio
n, b
oth
sexe
s 9
9.3
98.
5 9
8.6
96.
7T
otal
net
enr
olm
ent r
atio
in p
rimar
y ed
ucat
ion,
boy
s 9
8.0
96.
2T
otal
net
enr
olm
ent r
atio
in p
rimar
y ed
ucat
ion,
girl
s 9
9.3
97.
3
2.2
Prop
orti
on o
f pup
ils
star
ting
gra
de 1
who
rea
ch la
st g
rade
of p
rim
ary
Perc
enta
ge o
f pup
ils s
tart
ing
grad
e 1
who
reac
h la
st g
rade
of p
rimar
y, b
oth
sexe
s 9
4.6
96.
2 9
3.1
99.
8Pe
rcen
tage
of p
upils
sta
rtin
g gr
ade
1 w
ho re
ach
last
gra
de o
f prim
ary,
boy
s 9
4.9
94.
1 9
6.9
99.
8Pe
rcen
tage
of p
upils
sta
rtin
g gr
ade
1 w
ho re
ach
last
gra
de o
f prim
ary,
girl
s 9
4.4
98.
6 8
9.0
99.
8Pr
imar
y co
mpl
etio
n ra
te, b
oth
sexe
s 1
02.2
109
.9 1
15.7
108
.1 1
08.6
Prim
ary
com
plet
ion
rate
, boy
s 1
04.2
111
.7 1
15.7
107
.3 1
07.5
Prim
ary
com
plet
ion
rate
, girl
s 1
00.2
107
.9 1
15.8
109
.1 1
09.9
2.3
Lite
racy
rat
e of
15-
24 y
ear-
olds
, wom
en a
nd m
enLi
tera
cy ra
tes
of 1
5-24
yea
rs o
ld, b
oth
sexe
s, p
erce
ntag
e 9
9.8
Lite
racy
rate
s of
15-
24 y
ears
old
, men
, per
cent
age
99.
7Li
tera
cy ra
tes
of 1
5-24
yea
rs o
ld, w
omen
, per
cent
age
99.
9W
omen
to m
en p
arity
inde
x, a
s ra
tio o
f lite
racy
rate
s, 1
5-24
yea
rs o
ld 1
.0
Tar
get 3
.A: E
lim
inat
e ge
nder
dis
pari
ty in
pri
mar
y an
d se
cond
ary
educ
atio
n, p
refe
rabl
y by
200
5,
and
in a
ll le
vels
of e
duca
tion
no
late
r th
an 2
015
3.1
Rat
io o
f gir
ls to
boy
s in
pri
mar
y, s
econ
dary
and
tert
iary
edu
cati
onG
ende
r Par
ity In
dex
in p
rimar
y le
vel e
nrol
men
t 1
.0 1
.0 1
.0 1
.0 1
.0 1
.0G
ende
r Par
ity In
dex
in s
econ
dary
leve
l enr
olm
ent
1.0
1.0
Gen
der P
arity
Inde
x in
tert
iary
leve
l enr
olm
ent
1.2
1.2
1.3
1.2
1.3
1.3
3.2
Sha
re o
f wom
en in
wag
e em
ploy
men
t in
the
non-
agri
cult
ural
sec
tor
Shar
e of
wom
en in
wag
e em
ploy
men
t in
the
non-
agric
ultu
ral s
ecto
r 4
6.2
46.
7 4
8.5
47.
1 4
5.7
47.
3
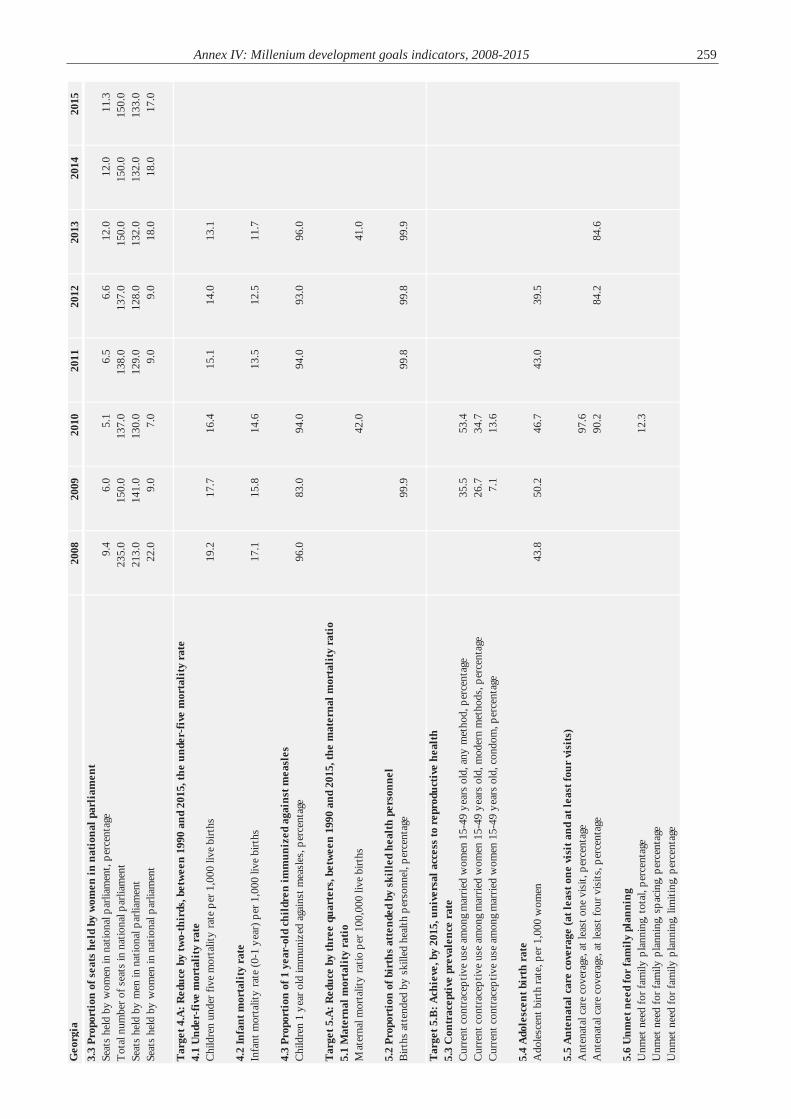
Annex IV: Millenium development goals indicators, 2008-2015 259
G
eorg
ia20
0820
0920
1020
1120
1220
1320
1420
153.
3 Pr
opor
tion
of s
eats
hel
d by
wom
en in
nat
iona
l par
liam
ent
Seat
s he
ld b
y w
omen
in n
atio
nal p
arlia
men
t, pe
rcen
tage
9.4
6.0
5.1
6.5
6.6
12.
0 1
2.0
11.
3T
otal
num
ber o
f sea
ts in
nat
iona
l par
liam
ent
235
.0 1
50.0
137
.0 1
38.0
137
.0 1
50.0
150
.0 1
50.0
Seat
s he
ld b
y m
en in
nat
iona
l par
liam
ent
213
.0 1
41.0
130
.0 1
29.0
128
.0 1
32.0
132
.0 1
33.0
Seat
s he
ld b
y w
omen
in n
atio
nal p
arlia
men
t 2
2.0
9.0
7.0
9.0
9.0
18.
0 1
8.0
17.
0
Tar
get 4
.A: R
educ
e by
two-
thir
ds, b
etw
een
1990
and
201
5, th
e un
der-
five
mor
tali
ty r
ate
4.1
Und
er-f
ive
mor
tali
ty r
ate
Chi
ldre
n un
der f
ive
mor
talit
y ra
te p
er 1
,000
live
birt
hs 1
9.2
17.
7 1
6.4
15.
1 1
4.0
13.
1
4.2
Infa
nt m
orta
lity
rat
eIn
fant
mor
talit
y ra
te (0
-1 y
ear)
per
1,0
00 li
ve b
irths
17.
1 1
5.8
14.
6 1
3.5
12.
5 1
1.7
4.3
Prop
orti
on o
f 1 y
ear-
old
chil
dren
imm
uniz
ed a
gain
st m
easl
esC
hild
ren
1 ye
ar o
ld im
mun
ized
aga
inst
mea
sles
, per
cent
age
96.
0 8
3.0
94.
0 9
4.0
93.
0 9
6.0
Tar
get 5
.A: R
educ
e by
thre
e qu
arte
rs, b
etw
een
1990
and
201
5, th
e m
ater
nal m
orta
lity
rat
io5.
1 M
ater
nal m
orta
lity
rat
ioM
ater
nal m
orta
lity
ratio
per
100
,000
live
birt
hs 4
2.0
41.
0
5.2
Prop
orti
on o
f bir
ths
atte
nded
by
skil
led
heal
th p
erso
nnel
Birt
hs a
tten
ded
by s
kille
d he
alth
per
sonn
el, p
erce
ntag
e 9
9.9
99.
8 9
9.8
99.
9
Tar
get 5
.B: A
chie
ve, b
y 20
15, u
nive
rsal
acc
ess
to r
epro
duct
ive
heal
th5.
3 C
ontr
acep
tive
pre
vale
nce
rate
Cur
rent
con
trac
eptiv
e us
e am
ong
mar
ried
wom
en 1
5-49
yea
rs o
ld, a
ny m
etho
d, p
erce
ntag
e 3
5.5
53.
4C
urre
nt c
ontr
acep
tive
use
amon
g m
arrie
d w
omen
15-
49 y
ears
old
, mod
ern
met
hods
, per
cent
age
26.
7 3
4.7
Cur
rent
con
trac
eptiv
e us
e am
ong
mar
ried
wom
en 1
5-49
yea
rs o
ld, c
ondo
m, p
erce
ntag
e 7
.1 1
3.6
5.4
Ado
lesc
ent b
irth
rat
eA
dole
scen
t birt
h ra
te, p
er 1
,000
wom
en 4
3.8
50.
2 4
6.7
43.
0 3
9.5
5.5
Ant
enat
al c
are
cove
rage
(at l
east
one
vis
it a
nd a
t lea
st fo
ur v
isit
s)A
nten
atal
car
e co
vera
ge, a
t lea
st o
ne v
isit,
per
cent
age
97.
6A
nten
atal
car
e co
vera
ge, a
t lea
st fo
ur v
isits
, per
cent
age
90.
2 8
4.2
84.
6
5.6
Unm
et n
eed
for
fam
ily
plan
ning
Unm
et n
eed
for f
amily
pla
nnin
g, to
tal,
perc
enta
ge 1
2.3
Unm
et n
eed
for f
amily
pla
nnin
g, s
paci
ng, p
erce
ntag
eU
nmet
nee
d fo
r fam
ily p
lann
ing,
lim
iting
, per
cent
age
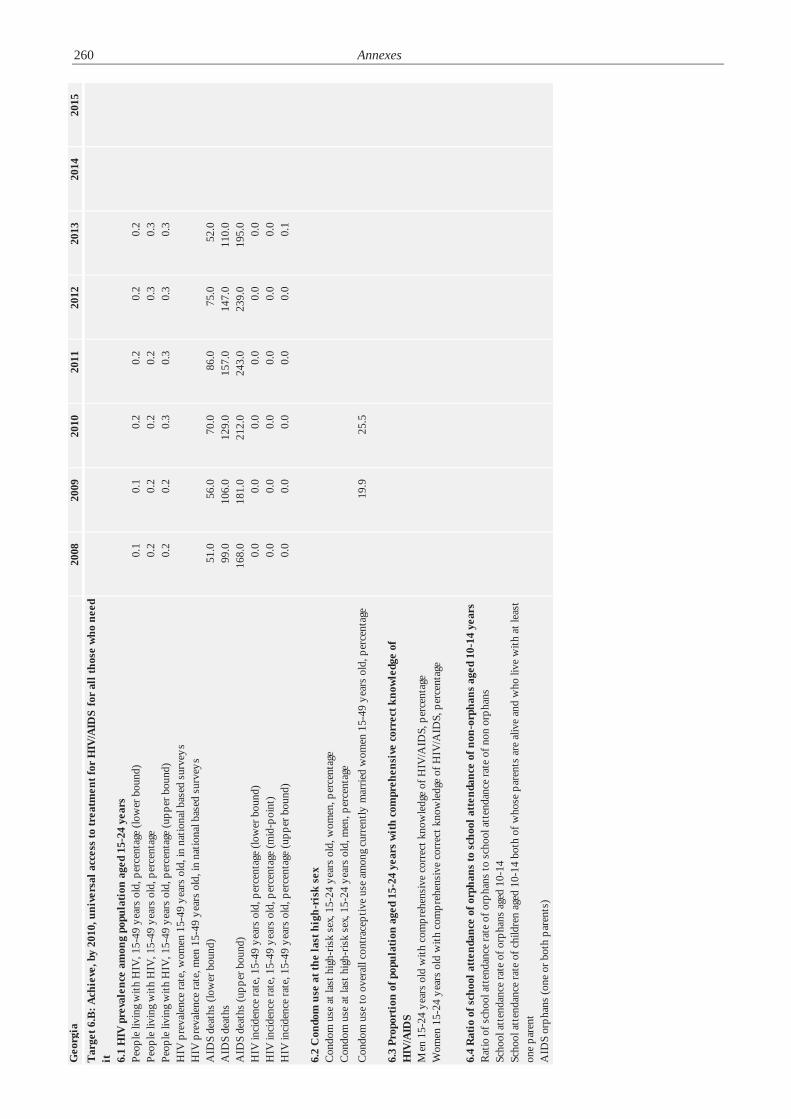
260 Annexes
G
eorg
ia20
0820
0920
1020
1120
1220
1320
1420
15T
arge
t 6.B
: Ach
ieve
, by
2010
, uni
vers
al a
cces
s to
trea
tmen
t for
HIV
/AID
S fo
r al
l tho
se w
ho n
eed
it 6.1
HIV
pre
vale
nce
amon
g po
pula
tion
age
d 15
-24
year
sPe
ople
livi
ng w
ith H
IV, 1
5-49
yea
rs o
ld, p
erce
ntag
e (lo
wer
bou
nd)
0.1
0.1
0.2
0.2
0.2
0.2
Peop
le li
ving
with
HIV
, 15-
49 y
ears
old
, per
cent
age
0.2
0.2
0.2
0.2
0.3
0.3
Peop
le li
ving
with
HIV
, 15-
49 y
ears
old
, per
cent
age
(upp
er b
ound
) 0
.2 0
.2 0
.3 0
.3 0
.3 0
.3H
IV p
reva
lenc
e ra
te, w
omen
15-
49 y
ears
old
, in
natio
nal b
ased
sur
veys
HIV
pre
vale
nce
rate
, men
15-
49 y
ears
old
, in
natio
nal b
ased
sur
veys
AID
S de
aths
(low
er b
ound
) 5
1.0
56.
0 7
0.0
86.
0 7
5.0
52.
0A
IDS
deat
hs 9
9.0
106
.0 1
29.0
157
.0 1
47.0
110
.0A
IDS
deat
hs (u
pper
bou
nd)
168
.0 1
81.0
212
.0 2
43.0
239
.0 1
95.0
HIV
inci
denc
e ra
te, 1
5-49
yea
rs o
ld, p
erce
ntag
e (lo
wer
bou
nd)
0.0
0.0
0.0
0.0
0.0
0.0
HIV
inci
denc
e ra
te, 1
5-49
yea
rs o
ld, p
erce
ntag
e (m
id-p
oint
) 0
.0 0
.0 0
.0 0
.0 0
.0 0
.0H
IV in
cide
nce
rate
, 15-
49 y
ears
old
, per
cent
age
(upp
er b
ound
) 0
.0 0
.0 0
.0 0
.0 0
.0 0
.1
6.2
Con
dom
use
at t
he la
st h
igh-
risk
sex
Con
dom
use
at l
ast h
igh-
risk
sex,
15-
24 y
ears
old
, wom
en, p
erce
ntag
eC
ondo
m u
se a
t las
t hig
h-ris
k se
x, 1
5-24
yea
rs o
ld, m
en, p
erce
ntag
eC
ondo
m u
se to
ove
rall
cont
race
ptiv
e us
e am
ong
curr
ently
mar
ried
wom
en 1
5-49
yea
rs o
ld, p
erce
ntag
e 1
9.9
25.
5
6.3
Prop
orti
on o
f pop
ulat
ion
aged
15-
24 y
ears
wit
h co
mpr
ehen
sive
cor
rect
kno
wle
dge
of
HIV
/AID
SM
en 1
5-24
yea
rs o
ld w
ith c
ompr
ehen
sive
cor
rect
kno
wle
dge
of H
IV/A
IDS,
per
cent
age
Wom
en 1
5-24
yea
rs o
ld w
ith c
ompr
ehen
sive
cor
rect
kno
wle
dge
of H
IV/A
IDS,
per
cent
age
6.4
Rat
io o
f sch
ool a
tten
danc
e of
orp
hans
to s
choo
l att
enda
nce
of n
on-o
rpha
ns a
ged
10-1
4 ye
ars
Rat
io o
f sch
ool a
tten
danc
e ra
te o
f orp
hans
to s
choo
l att
enda
nce
rate
of n
on o
rpha
nsSc
hool
att
enda
nce
rate
of o
rpha
ns a
ged
10-1
4Sc
hool
att
enda
nce
rate
of c
hild
ren
aged
10-
14 b
oth
of w
hose
par
ents
are
aliv
e an
d w
ho li
ve w
ith a
t lea
st
one
pare
ntA
IDS
orph
ans
(one
or b
oth
pare
nts)
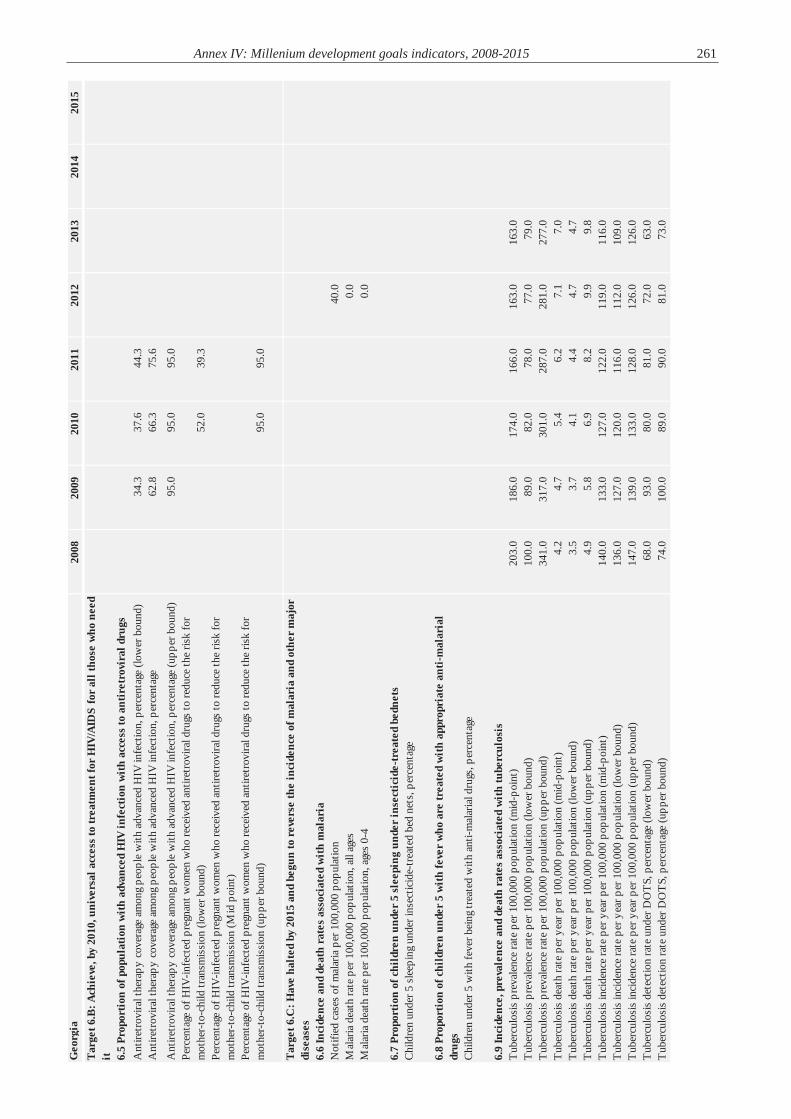
Annex IV: Millenium development goals indicators, 2008-2015 261
G
eorg
ia20
0820
0920
1020
1120
1220
1320
1420
15T
arge
t 6.B
: Ach
ieve
, by
2010
, uni
vers
al a
cces
s to
trea
tmen
t for
HIV
/AID
S fo
r al
l tho
se w
ho n
eed
it 6.5
Prop
orti
on o
f pop
ulat
ion
wit
h ad
vanc
ed H
IV in
fect
ion
wit
h ac
cess
to a
ntir
etro
vira
l dru
gsA
ntire
trov
iral t
hera
py c
over
age
amon
g pe
ople
with
adv
ance
d H
IV in
fect
ion,
per
cent
age
(low
er b
ound
) 3
4.3
37.
6 4
4.3
Ant
iretr
ovira
l the
rapy
cov
erag
e am
ong
peop
le w
ith a
dvan
ced
HIV
infe
ctio
n, p
erce
ntag
e 6
2.8
66.
3 7
5.6
Ant
iretr
ovira
l the
rapy
cov
erag
e am
ong
peop
le w
ith a
dvan
ced
HIV
infe
ctio
n, p
erce
ntag
e (u
pper
bou
nd)
95.
0 9
5.0
95.
0Pe
rcen
tage
of H
IV-in
fect
ed p
regn
ant w
omen
who
rece
ived
ant
iretr
ovira
l dru
gs to
redu
ce th
e ris
k fo
r m
othe
r-to
-chi
ld tr
ansm
issi
on (l
ower
bou
nd)
52.
0 3
9.3
Perc
enta
ge o
f HIV
-infe
cted
pre
gnan
t wom
en w
ho re
ceiv
ed a
ntire
trov
iral d
rugs
to re
duce
the
risk
for
mot
her-
to-c
hild
tran
smis
sion
(Mid
poi
nt)
Perc
enta
ge o
f HIV
-infe
cted
pre
gnan
t wom
en w
ho re
ceiv
ed a
ntire
trov
iral d
rugs
to re
duce
the
risk
for
mot
her-
to-c
hild
tran
smis
sion
(upp
er b
ound
) 9
5.0
95.
0
Tar
get 6
.C: H
ave
halt
ed b
y 20
15 a
nd b
egun
to r
ever
se th
e in
cide
nce
of m
alar
ia a
nd o
ther
maj
or
dise
ases
6.6
Inci
denc
e an
d de
ath
rate
s as
soci
ated
wit
h m
alar
iaN
otifi
ed c
ases
of m
alar
ia p
er 1
00,0
00 p
opul
atio
n 4
0.0
Mal
aria
dea
th ra
te p
er 1
00,0
00 p
opul
atio
n, a
ll ag
es 0
.0M
alar
ia d
eath
rate
per
100
,000
pop
ulat
ion,
age
s 0-
4 0
.0
6.7
Prop
orti
on o
f chi
ldre
n un
der
5 sl
eepi
ng u
nder
inse
ctic
ide-
trea
ted
bedn
ets
Chi
ldre
n un
der 5
sle
epin
g un
der i
nsec
ticid
e-tr
eate
d be
d ne
ts, p
erce
ntag
e
6.8
Prop
orti
on o
f chi
ldre
n un
der
5 w
ith
feve
r w
ho a
re tr
eate
d w
ith
appr
opri
ate
anti
-mal
aria
l dr
ugs
Chi
ldre
n un
der 5
with
feve
r bei
ng tr
eate
d w
ith a
nti-m
alar
ial d
rugs
, per
cent
age
6.9
Inci
denc
e, p
reva
lenc
e an
d de
ath
rate
s as
soci
ated
wit
h tu
berc
ulos
isT
uber
culo
sis
prev
alen
ce ra
te p
er 1
00,0
00 p
opul
atio
n (m
id-p
oint
) 2
03.0
186
.0 1
74.0
166
.0 1
63.0
163
.0T
uber
culo
sis
prev
alen
ce ra
te p
er 1
00,0
00 p
opul
atio
n (lo
wer
bou
nd)
100
.0 8
9.0
82.
0 7
8.0
77.
0 7
9.0
Tub
ercu
losi
s pr
eval
ence
rate
per
100
,000
pop
ulat
ion
(upp
er b
ound
) 3
41.0
317
.0 3
01.0
287
.0 2
81.0
277
.0T
uber
culo
sis
deat
h ra
te p
er y
ear p
er 1
00,0
00 p
opul
atio
n (m
id-p
oint
) 4
.2 4
.7 5
.4 6
.2 7
.1 7
.0T
uber
culo
sis
deat
h ra
te p
er y
ear p
er 1
00,0
00 p
opul
atio
n (lo
wer
bou
nd)
3.5
3.7
4.1
4.4
4.7
4.7
Tub
ercu
losi
s de
ath
rate
per
yea
r per
100
,000
pop
ulat
ion
(upp
er b
ound
) 4
.9 5
.8 6
.9 8
.2 9
.9 9
.8T
uber
culo
sis
inci
denc
e ra
te p
er y
ear p
er 1
00,0
00 p
opul
atio
n (m
id-p
oint
) 1
40.0
133
.0 1
27.0
122
.0 1
19.0
116
.0T
uber
culo
sis
inci
denc
e ra
te p
er y
ear p
er 1
00,0
00 p
opul
atio
n (lo
wer
bou
nd)
136
.0 1
27.0
120
.0 1
16.0
112
.0 1
09.0
Tub
ercu
losi
s in
cide
nce
rate
per
yea
r per
100
,000
pop
ulat
ion
(upp
er b
ound
) 1
47.0
139
.0 1
33.0
128
.0 1
26.0
126
.0T
uber
culo
sis
dete
ctio
n ra
te u
nder
DO
TS,
per
cent
age
(low
er b
ound
) 6
8.0
93.
0 8
0.0
81.
0 7
2.0
63.
0T
uber
culo
sis
dete
ctio
n ra
te u
nder
DO
TS,
per
cent
age
(upp
er b
ound
) 7
4.0
100
.0 8
9.0
90.
0 8
1.0
73.
0

262 Annexes
Geo
rgia
2008
2009
2010
2011
2012
2013
2014
2015
6.10
Pro
port
ion
of tu
berc
ulos
is c
ases
det
ecte
d an
d cu
red
unde
r di
rect
ly o
bser
ved
trea
tmen
t sh
ort c
ours
eT
uber
culo
sis
dete
ctio
n ra
te u
nder
DO
TS,
per
cent
age
(mid
-poi
nt)
72.
0 9
7.0
84.
0 8
5.0
76.
0 6
8.0
Tub
ercu
losi
s tr
eatm
ent s
ucce
ss ra
te u
nder
DO
TS,
per
cent
age
77.
0 7
9.0
79.
0 8
1.0
85.
0
Tar
get 7
.A: I
nteg
rate
the
prin
cipl
es o
f sus
tain
able
dev
elop
men
t int
o co
untr
y po
lici
es a
nd
prog
ram
mes
and
rev
erse
the
loss
of e
nvir
onm
enta
l res
ourc
es7.
1 Pr
opor
tion
of l
and
area
cov
ered
by
fore
stPr
opor
tion
of la
nd a
rea
cove
red
by fo
rest
, per
cent
age
39.
5
7.2
Car
bon
diox
ide
emis
sion
s, to
tal,
per
capi
ta a
nd p
er $
1 G
DP
(PPP
)C
arbo
n di
oxid
e em
issi
ons
(CO
2), t
hous
and
met
ric to
ns o
f CO
2 (C
DIA
C)
6 4
17.3
6 2
70.6
6 5
30.9
7 9
31.7
Car
bon
diox
ide
emis
sion
s (C
O2)
, tho
usan
d m
etric
tons
of C
O2
(UN
FCC
C)
Car
bon
diox
ide
emis
sion
s (C
O2)
, met
ric to
ns o
f CO
2 pe
r cap
ita (C
DIA
C)
1.5
1.4
1.5
1.8
Car
bon
diox
ide
emis
sion
s (C
O2)
, met
ric to
ns o
f CO
2 pe
r cap
ita (U
NFC
CC
)C
arbo
n di
oxid
e em
issi
ons
(CO
2), k
g C
O2
per $
1 G
DP
(PPP
) (C
DIA
C)
0.2
0.3
0.2
0.3
Car
bon
diox
ide
emis
sion
s (C
O2)
, kg
CO
2 pe
r $1
GD
P (P
PP) (
UN
FCC
C)
Ener
gy u
se (k
g oi
l equ
ival
ent)
per
$1,
000
GD
P (C
onst
ant 2
005
PPP
$) 1
16.0
124
.0 1
18.0
125
.0
7.3
Con
sum
ptio
n of
ozo
ne-d
eple
ting
sub
stan
ces
Con
sum
ptio
n of
all
Ozo
ne-D
eple
ting
Subs
tanc
es in
OD
P m
etric
tons
5.9
4.6
5.9
4.3
2.7
1.4
Con
sum
ptio
n of
ozo
ne-d
eple
ting
CFC
s in
OD
P m
etric
tons
0.0
0.0
0.0
0.0
0.0
0.0
7.4
Prop
orti
on o
f fis
h st
ocks
wit
hin
safe
bio
logi
cal l
imit
sPr
opor
tion
of fi
sh s
tock
s w
ithin
saf
e bi
olog
ical
lim
its
Tar
get 7
.B: R
educ
e bi
odiv
ersi
ty lo
ss, a
chie
ving
, by
201
0, a
sig
nifi
cant
red
ucti
on in
the
rate
of
loss
7.5
Prop
orti
on o
f tot
al w
ater
res
ourc
es u
sed
Prop
ortio
n of
tota
l wat
er re
sour
ces
used
, per
cent
age
2.9
7.6
Prop
orti
on o
f ter
rest
rial
and
mar
ine
area
s pr
otec
ted
Ter
rest
rial a
nd m
arin
e ar
eas
prot
ecte
d to
tota
l ter
ritor
ial a
rea,
per
cent
age
3.7
3.7
6.5
Ter
rest
rial a
nd m
arin
e ar
eas
prot
ecte
d, s
q. k
m.
2 8
07.4
2 8
07.4
5 9
91.0
Ter
rest
rial a
reas
pro
tect
ed to
tota
l sur
face
are
a, p
erce
ntag
e 3
.9 3
.9 8
.3T
erre
stria
l are
as p
rote
cted
, sq.
km
. 2
751
.7 2
751
.7 5
991
.0M
arin
e ar
eas
prot
ecte
d to
terr
itoria
l wat
ers,
per
cent
age
0.9
0.9
2.4
Mar
ine
area
s pr
otec
ted,
sq.
km
. 5
6.0
56.
0 1
53.0
Mar
ine
area
s pr
otec
ted
to s
ea a
reas
und
er n
atio
nal j
uris
dict
ion
(0-2
00 n
autic
al m
iles)
0.7
7.7
Prop
orti
on o
f spe
cies
thre
aten
ed w
ith
exti
ncti
onPr
opor
tion
of s
peci
es th
reat
ened
with
ext
inct
ion

Annex IV: Millenium development goals indicators, 2008-2015 263
G
eorg
ia20
0820
0920
1020
1120
1220
1320
1420
15T
arge
t 7.C
: Hal
ve, b
y 20
15, t
he p
ropo
rtio
n of
peo
ple
wit
hout
sus
tain
able
acc
ess
to s
afe
drin
king
w
ater
and
bas
ic s
anit
atio
n 7.
8 Pr
opor
tion
of p
opul
atio
n us
ing
an im
prov
ed d
rink
ing
wat
er s
ourc
ePr
opor
tion
of th
e po
pula
tion
usin
g im
prov
ed d
rinki
ng w
ater
sou
rces
, tot
al 9
5.0
96.
0 9
7.0
98.
0 9
8.0
99.
0 1
00.0
100
.0Pr
opor
tion
of th
e po
pula
tion
usin
g im
prov
ed d
rinki
ng w
ater
sou
rces
, urb
an 9
9.0
99.
0 1
00.0
100
.0 1
00.0
100
.0 1
00.0
100
.0Pr
opor
tion
of th
e po
pula
tion
usin
g im
prov
ed d
rinki
ng w
ater
sou
rces
, rur
al 9
1.0
93.
0 9
4.0
95.
0 9
6.0
98.
0 9
9.0
100
.0
7.9
Prop
orti
on o
f pop
ulat
ion
usin
g an
impr
oved
san
itat
ion
faci
lity
Prop
ortio
n of
the
popu
latio
n us
ing
impr
oved
san
itatio
n fa
cilit
ies,
tota
l 9
1.0
90.
0 8
9.0
89.
0 8
8.0
88.
0 8
7.0
86.
0Pr
opor
tion
of th
e po
pula
tion
usin
g im
prov
ed s
anita
tion
faci
litie
s, u
rban
96.
0 9
6.0
96.
0 9
6.0
95.
0 9
5.0
95.
0 9
5.0
Prop
ortio
n of
the
popu
latio
n us
ing
impr
oved
san
itatio
n fa
cilit
ies,
rura
l 8
5.0
84.
0 8
2.0
81.
0 8
0.0
79.
0 7
7.0
76.
0
7.10
Pro
port
ion
of u
rban
pop
ulat
ion
livi
ng in
slu
ms
Slum
pop
ulat
ion
as p
erce
ntag
e of
urb
an, p
erce
ntag
eSl
um p
opul
atio
n in
urb
an a
reas
Tar
get 8
.A: D
evel
op fu
rthe
r an
ope
n, r
ule-
base
d, p
redi
ctab
le, n
on-d
iscr
imin
ator
y tr
adin
g an
d fi
nanc
ial s
yste
m8.
1 N
et O
DA
, tot
al a
nd to
the
leas
t dev
elop
ed c
ount
ries
, as
perc
enta
ge o
f OEC
D/D
AC
don
ors'
gr
oss
nati
onal
inco
me
Net
OD
A a
s pe
rcen
tage
of O
ECD
/DA
C d
onor
s G
NI
Net
OD
A to
LD
Cs
as p
erce
ntag
e of
OEC
D/D
AC
don
ors
GN
IN
et O
DA
, mill
ion
US$
Net
OD
A to
LD
Cs,
mill
ion
US$
8.10
Tot
al n
umbe
r of
cou
ntri
es th
at h
ave
reac
hed
thei
r H
IPC
dec
isio
n po
ints
and
num
ber
that
ha
ve r
each
ed th
eir
HIP
C c
ompl
etio
n po
ints
(cum
ulat
ive)
Tot
al n
umbe
r of c
ount
ries
that
hav
e re
ache
d th
eir H
IPC
dec
isio
n po
ints
and
num
ber t
hat h
ave
reac
hed
thei
r HIP
C c
ompl
etio
n po
ints
(cum
ulat
ive)
8.11
Deb
t rel
ief c
omm
itte
d un
der
HIP
C a
nd M
DR
I Ini
tiat
ives
Deb
t rel
ief c
omm
itted
und
er H
IPC
initi
ativ
e, c
umul
ativ
e m
illio
n U
S$ in
end
-200
9 N
PV te
rms
Deb
t rel
ief d
eliv
ered
in fu
ll un
der M
DR
I ini
tiativ
e, c
umul
ativ
e m
illio
n U
S$ in
end
-200
9 N
PV te
rms
8.12
Deb
t ser
vice
as
a pe
rcen
tage
of e
xpor
ts o
f goo
ds a
nd s
ervi
ces
Deb
t ser
vice
as
perc
enta
ge o
f exp
orts
of g
oods
and
ser
vice
s an
d ne
t inc
ome
4.8
6.8
6.3
13.
9 7
.5 9
.4
8.13
Pro
port
ion
of p
opul
atio
n w
ith
acce
ss to
aff
orda
ble
esse
ntia
l dru
gs o
n a
sust
aina
ble
basi
sPo
pula
tion
with
acc
ess
to e
ssen
tial d
rugs
, per
cent
age
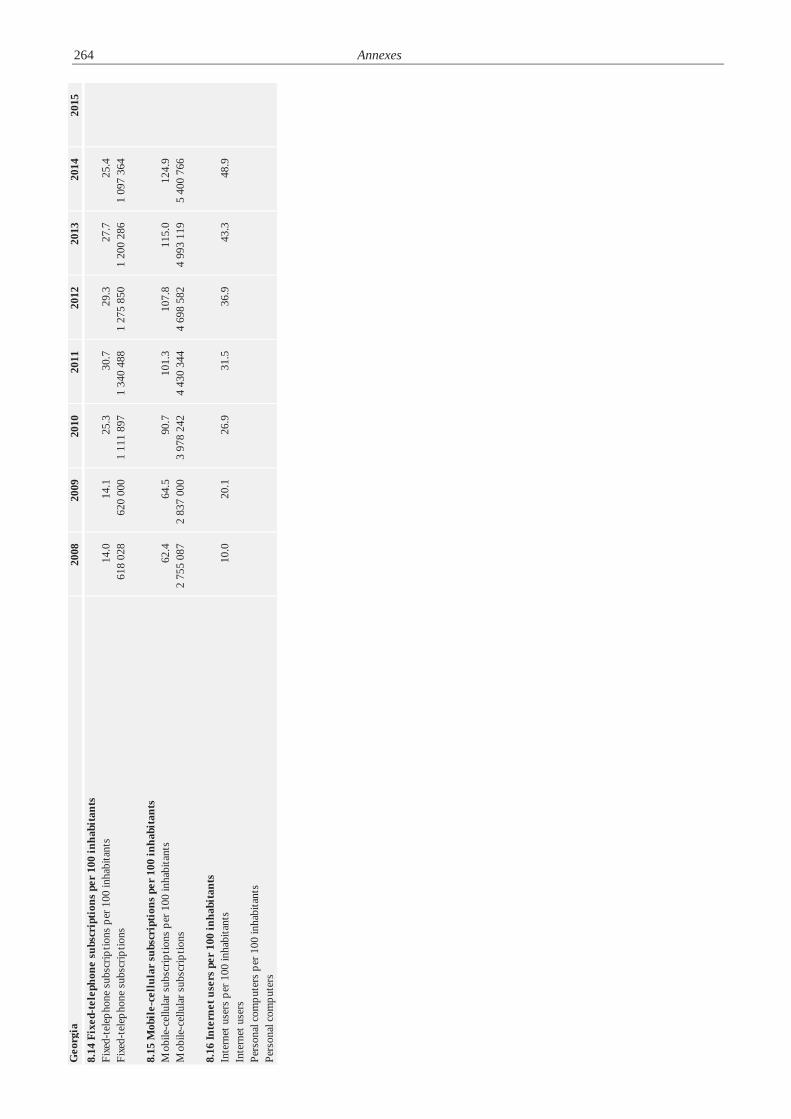
264 Annexes
Geo
rgia
2008
2009
2010
2011
2012
2013
2014
2015
8.14
Fix
ed-t
elep
hone
sub
scri
ptio
ns p
er 1
00 in
habi
tant
sFi
xed-
tele
phon
e su
bscr
iptio
ns p
er 1
00 in
habi
tant
s 1
4.0
14.
1 2
5.3
30.
7 2
9.3
27.
7 2
5.4
Fixe
d-te
leph
one
subs
crip
tions
618
028
620
000
1 11
1 89
71
340
488
1 27
5 85
01
200
286
1 09
7 36
4
8.15
Mob
ile-
cell
ular
sub
scri
ptio
ns p
er 1
00 in
habi
tant
sM
obile
-cel
lula
r sub
scrip
tions
per
100
inha
bita
nts
62.
4 6
4.5
90.
7 1
01.3
107
.8 1
15.0
124
.9M
obile
-cel
lula
r sub
scrip
tions
2 75
5 08
72
837
000
3 97
8 24
24
430
344
4 69
8 58
24
993
119
5 40
0 76
6
8.16
Inte
rnet
use
rs p
er 1
00 in
habi
tant
sIn
tern
et u
sers
per
100
inha
bita
nts
10.
0 2
0.1
26.
9 3
1.5
36.
9 4
3.3
48.
9In
tern
et u
sers
Pers
onal
com
pute
rs p
er 1
00 in
habi
tant
sPe
rson
al c
ompu
ters
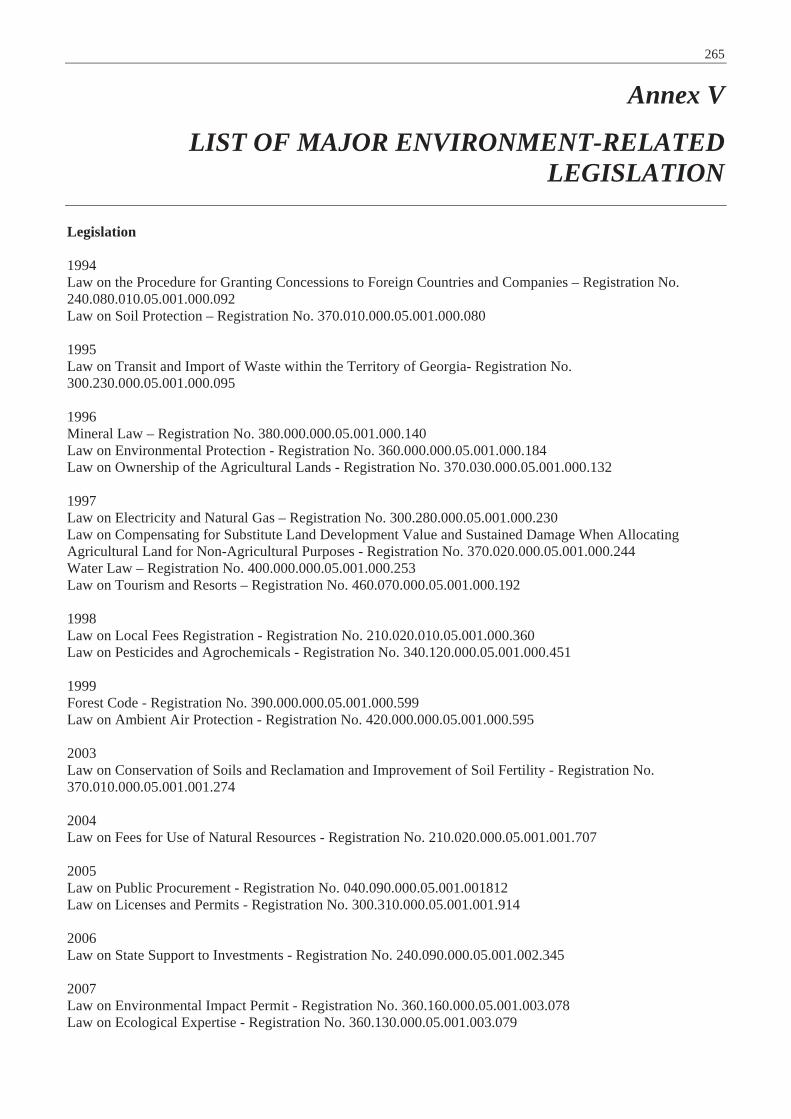
265
Annex V
LIST OF MAJOR ENVIRONMENT-RELATED LEGISLATION
Legislation 1994 Law on the Procedure for Granting Concessions to Foreign Countries and Companies – Registration No. 240.080.010.05.001.000.092 Law on Soil Protection – Registration No. 370.010.000.05.001.000.080 1995 Law on Transit and Import of Waste within the Territory of Georgia- Registration No. 300.230.000.05.001.000.095 1996 Mineral Law – Registration No. 380.000.000.05.001.000.140 Law on Environmental Protection - Registration No. 360.000.000.05.001.000.184 Law on Ownership of the Agricultural Lands - Registration No. 370.030.000.05.001.000.132 1997 Law on Electricity and Natural Gas – Registration No. 300.280.000.05.001.000.230 Law on Compensating for Substitute Land Development Value and Sustained Damage When Allocating Agricultural Land for Non-Agricultural Purposes - Registration No. 370.020.000.05.001.000.244 Water Law – Registration No. 400.000.000.05.001.000.253 Law on Tourism and Resorts – Registration No. 460.070.000.05.001.000.192 1998 Law on Local Fees Registration - Registration No. 210.020.010.05.001.000.360 Law on Pesticides and Agrochemicals - Registration No. 340.120.000.05.001.000.451 1999 Forest Code - Registration No. 390.000.000.05.001.000.599 Law on Ambient Air Protection - Registration No. 420.000.000.05.001.000.595 2003 Law on Conservation of Soils and Reclamation and Improvement of Soil Fertility - Registration No. 370.010.000.05.001.001.274 2004 Law on Fees for Use of Natural Resources - Registration No. 210.020.000.05.001.001.707 2005 Law on Public Procurement - Registration No. 040.090.000.05.001.001812 Law on Licenses and Permits - Registration No. 300.310.000.05.001.001.914 2006 Law on State Support to Investments - Registration No. 240.090.000.05.001.002.345 2007 Law on Environmental Impact Permit - Registration No. 360.160.000.05.001.003.078 Law on Ecological Expertise - Registration No. 360.130.000.05.001.003.079

266 Annexes
Law on Recognition of Ownership Rights on Land Plots being under the Usage of Natural Persons and Legal Persons of Private Law - Registration No. 370.060.000.05.001.003.003 Law on Public Health Care - Registration No. 470.000.000.05.001.002.920 2010 Law on Gender Equality - Registration No. 010.100.000.05.001.003.962 Law on Forest Fund Management - Registration No. 040.030.000.05.001.004.097 Tax Code - Registration No. 200000000.05.001.016012 2011 Law on Making Amendments to Some Legislative Acts - Registration No. 010240030.05.001.016270 Law on the Creation and Management of Javakheti Protected Area - Registration No. 360050000.05.001.016266 2012 Law on Making Amendments to Some Legislative Acts Area - Registration No. 360000000.05.001.016640 Law on Nuclear and Radiation Security Area - Registration No. 360090000.05.001.016631 2014 Law on Civil Safety - Registration No. 140070000.05.001.017468 Law on the Creation and Management of Pshav-Xevsureti Protected Area - Registration No. 360050000.05.001.017387 Law on Living Genetically Modified Organisms - Registration No. 360160000.05.001.017511 Waste Management Code - Registration No. 360160000.05.001.017608 Strategic documents 2005 National Biodiversity Strategy and Action Plan - Registration No. 340.170.000.10.003.000.161 2006 Main Directions of State Policy in Georgian Power Sector 2010 Decree of Government No. 1756 - Comprehensive Strategy and Legislative Approximation Programme in Food Safety State Strategy for Regional Development of Georgia 2010-2017, No. 172 2012 Governmental Decree No. 27 - National Environmental Action Plan (NEAP) for the period 2012-2016 National Strategy and Action Plan on Environmental Education for Sustainable Development (2012-2014), No. 980 2013 National Strategy on Tobacco Control, No. 196 - Registration No. 340150000.10.003.017363 2014 Social and Economic Development Strategy until 2020, No. 400 - Registration No. 300020000.10.003.018020 State Programme “Produce in Georgia » - Registration No. 240140000.10.003.017985 National Strategy for Mitigating Chemical, Biological, Radiological and Nuclear (CBRN) - Registration No. 164120340000.10.003.017783 Socio-Economic Development Strategy of Georgia (“Georgia 2020”), No. 400 - Registration No. 300020000.10.003.0180202014 Second National Biodiversity Strategy and Action Plan for 2014-2020 No. 343 - Registration No. 340170000.10.003.017963
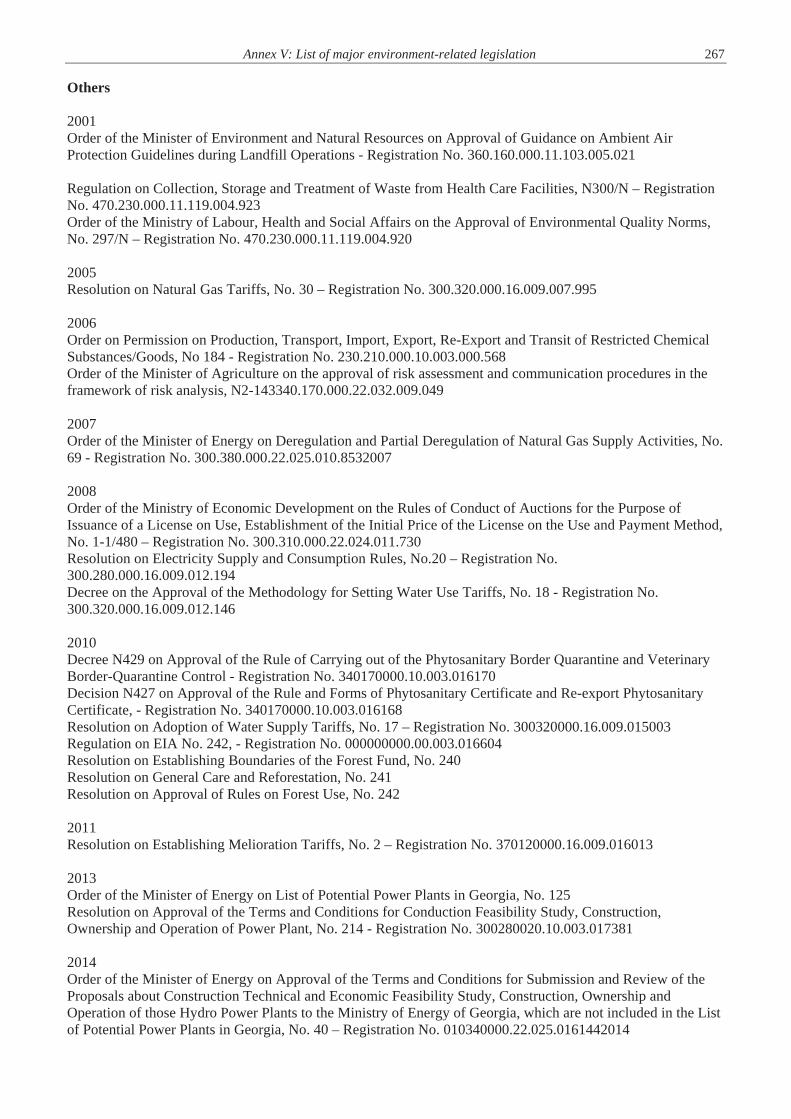
Annex V: List of major environment-related legislation 267 Others 2001 Order of the Minister of Environment and Natural Resources on Approval of Guidance on Ambient Air Protection Guidelines during Landfill Operations - Registration No. 360.160.000.11.103.005.021 Regulation on Collection, Storage and Treatment of Waste from Health Care Facilities, N300/N – Registration No. 470.230.000.11.119.004.923 Order of the Ministry of Labour, Health and Social Affairs on the Approval of Environmental Quality Norms, No. 297/N – Registration No. 470.230.000.11.119.004.920 2005 Resolution on Natural Gas Tariffs, No. 30 – Registration No. 300.320.000.16.009.007.995 2006 Order on Permission on Production, Transport, Import, Export, Re-Export and Transit of Restricted Chemical Substances/Goods, No 184 - Registration No. 230.210.000.10.003.000.568 Order of the Minister of Agriculture on the approval of risk assessment and communication procedures in the framework of risk analysis, N2-143340.170.000.22.032.009.049 2007 Order of the Minister of Energy on Deregulation and Partial Deregulation of Natural Gas Supply Activities, No. 69 - Registration No. 300.380.000.22.025.010.8532007 2008 Order of the Ministry of Economic Development on the Rules of Conduct of Auctions for the Purpose of Issuance of a License on Use, Establishment of the Initial Price of the License on the Use and Payment Method, No. 1-1/480 – Registration No. 300.310.000.22.024.011.730 Resolution on Electricity Supply and Consumption Rules, No.20 – Registration No. 300.280.000.16.009.012.194 Decree on the Approval of the Methodology for Setting Water Use Tariffs, No. 18 - Registration No. 300.320.000.16.009.012.146 2010 Decree N429 on Approval of the Rule of Carrying out of the Phytosanitary Border Quarantine and Veterinary Border-Quarantine Control - Registration No. 340170000.10.003.016170 Decision N427 on Approval of the Rule and Forms of Phytosanitary Certificate and Re-export Phytosanitary Certificate, - Registration No. 340170000.10.003.016168 Resolution on Adoption of Water Supply Tariffs, No. 17 – Registration No. 300320000.16.009.015003 Regulation on EIA No. 242, - Registration No. 000000000.00.003.016604 Resolution on Establishing Boundaries of the Forest Fund, No. 240 Resolution on General Care and Reforestation, No. 241 Resolution on Approval of Rules on Forest Use, No. 242 2011 Resolution on Establishing Melioration Tariffs, No. 2 – Registration No. 370120000.16.009.016013 2013 Order of the Minister of Energy on List of Potential Power Plants in Georgia, No. 125 Resolution on Approval of the Terms and Conditions for Conduction Feasibility Study, Construction, Ownership and Operation of Power Plant, No. 214 - Registration No. 300280020.10.003.017381 2014 Order of the Minister of Energy on Approval of the Terms and Conditions for Submission and Review of the Proposals about Construction Technical and Economic Feasibility Study, Construction, Ownership and Operation of those Hydro Power Plants to the Ministry of Energy of Georgia, which are not included in the List of Potential Power Plants in Georgia, No. 40 – Registration No. 010340000.22.025.0161442014
268 Annexes
Invalid or replaced legislation 1994 Law on the Protection of Plants from Harmful Organisms – Registration No. 340.020.000.05.001.000.086 (invalid since 08/06/2012, replaced with Georgian Code on Food and Feed Safety, Veterinary and Plant Protection) 1996 Ministerial Order on the Protection of the Surface Waters from Pollution, No. 130 - Registration No. 280.012.000.147 (invalid since 01/01/2014) 1997 Law on Land Melioration - Registration No. 370.120.000.05.001.000.254 (invalid since 04/02/2011) Law on Safety of Dangerous Industrial Enterprises - Registration No. 300.190.000.05.001.000.306 (invalid since 04/02/2011, replaced with Law of Georgia Product Safety and Free Movement Code) 1998 Law on Hazardous Chemical Substances - Registration No. 300.240.000.05.001.000.368 (invalid since 19/04/2010, replaced with Law on Product Safety and Free Movement Code) 1999 Resolution on Approval of Natural Gas Tariff Setting Rules No. 6– Registration No. 120.013.003.832 (invalid since 31/12/2014) 2001 Order of the Ministerof Environment and Natural Resources on Approval of ambient air pollution index calculation guidelines - Registration No. 360.160.000.11.103.005.023 (invalid since 01/01/2014) Ambient air pollution indices for extremely polluted, highly polluted, polluted and unpolluted areas (invalid since 01/01/2014) Order of the Minister of Environment and Natural Resources on Approval of the Provisions on Guidelines for Identifying and Inventorying the Stationary Sources of Pollution - Registration No. 360160000.11.113.004944 (invalid since 28/10/2008) Order of the Minister of Environment and Natural Resources on Registration and Reporting of Pollutant Emissions from Stationary Pollution Sources - Registration No. 360160000.11.103.004947 (invalid since 01/10/2008) Order of the Minister of Environment and Natural Resources on Approval of the Provisions on Guidelines for Calculating Environmental Damage Resulting from the Impact of Harmful Human Activity on Ambient Air - Registration No. 360160000.11.103.004955 (invalid since 25/07/2006) 2002 Approval of the provision on controlling ozone-depleting substances throughout Georgia (invalid since 18/07/2012) 2003 Order of the Minister of Labour, Health Care and Social Protection on Sanitary Rules and Norms for Arranging and Operating MSW Landfills, No. 36/N - Registration No. 470.230.000.11.119.005.698, (invalid since 10/01/2014) Sanitary Law - Registration No. 470.160.010.05.001.001.277 (replaced by 2007 Law on Public Health Care – Registration No. 470.000.000.05.001.002.920) 2004 Tax Code (invalid since replaced by Tax Code (2010)) 2005 Law on State Control for Environment Protection - Registration No. 300.100.000.05.001.001.908 (invalid since 01/01/2008, replaced by Law on Environment Protection Service) Organic Law on Local Self-Government - Registration No. 010.250.000.04.001.002.038 (invalid since 04/07/2014, replaced by Code of Local Self Government 2014)
Annex V: List of major environment-related legislation 269 2006 Law on Food Safety and Quality - Registration No. 340.170.000.05.001.002.127 (invalid since 08/06/2012, replaced with Georgian Code on Food and Feed Safety, Veterinary and Plant Protection) 2009 Regulation of the Ministry of Agriculture on Approval of Additional Requirements to Product Labeling - Registration No. 340.170.000.22.032.013.921(invalid since 01/01/2014) 2010 Law on Control of Technical Risks - Registration No. 300.160.070.05.001.003.974 (invalid since25/05/2012 replaced with the Law on Product Safety and Free Movement Code) 2011 Order of the Ministry of Energy and Natural Resources on Rules of Timber Transportation on the territory of Georgia and Approval of Technical Rules for Rough Conversion of Round wood (logs) Facility (sawing shop), No. 96 - Registration No. 3360160000.22.025.016028 (invalid since 15/01/2014) 2012 Order of the Minister of Energy and Natural Resources on Development and Approval of Forest Use Plan, No. 277– Registration No. 390050000.22.025.016089 (invalid since 19/07/2013)


271
Annex VI
RESULTS OF THE FOR FUTURE INLAND TRANSPORT SYSTEMS (ForFITS) TOOL
VI.1 Introduction
Methodology This annex has been developed by the Transport Division of the United Nations Economic Commission for Europe (ECE). It addresses projected CO2 emissions stemming from the transport sector in the country using the for Future Inland Transport Systems (ForFITS) tool. The current impact of the transport sector of Georgia on the overall CO2 emissions will be quantified and future emissions will be projected based on a reference scenario where no major shifts in the development of the transportation sector take place. Data were collected from official national sources. In some cases, data were adjusted when the scope of data provided did not match the required input definitions or if data were not internally consistent. The alternative scenarios section will provide projections of transport sector CO2 emissions under the reference scenario and three additional scenarios: shift to public transport, shift to freight rail, and vehicle fleet renewal scenarios.
Description of model ForFITS can be used for estimation and assessment of CO2 emissions in transport and evaluation of transport policies for the mitigation of CO2 emissions. ForFITS evaluates transport activity (expressed in terms of passenger kilometres (pkm)10, ton kilometres (tkm)11, and vehicle kilometres (vkm)), related vehicle stocks, energy use and CO2 emissions in a range of possible policy contexts. ForFITS is a sectoral model (Figure VI.1), covering both passenger and freight transport services on all transport modes (including aviation and maritime transport), but mainly targeting inland transport (especially road, rail, and inland waterways). Pipelines are also considered in the model. Each mode is further characterized in sub-modes (when relevant) and vehicle classes. Vehicle classes are further split to take into account of different powertrain technologies and age classes. Finally, powertrains are coupled with fuel blends that are consistent with the technology requirements. ForFITS does not provide information on the evaluation of the overall effects of changes in the transport system on the economic growth. The ForFITS tool has been proven through a series of pilot studies12 to be a useful tool for projecting future emissions under different transport policy scenarios. For the analysis of Georgia, projections account for road vehicles, non-motorized transport, rail transport and aircraft. Vessels are not included.
10 A passenger kilometre is defined as a unit of passenger carriage equal to the transportation of one passenger one kilometre. 11 A ton kilometre is defined as a unit of freight carriage equal to the transportation of one metric ton of freight one kilometre. 12 Pilot studies were performed in seven countries in 2013 - Chile, Ethiopia, France, Hungary, Montenegro, Thailand and Tunisia.

272 Annexes
Figure VI.1: ForFITS schematic
VI.2 Baseline Status
Breakdown of base year ForFITS inputs
Since 2005, registration laws in Georgia have changed to a one-time process for all new vehicles with no annual registration, mandatory insurance nor roadworthiness testing required. As a result, an accurate estimate of the vehicle fleet is not available at present as the official register is likely to overestimate the number of vehicles in operation. In March of 2017 the Government of Georgia intends to restart annual vehicles technical inspection procedures. This change in policy should improve the quality of available statistical data.
Road transport data are derived from interviews with officials from the Service Agency of the Ministry of Internal Affairs, railway transport data are derived from interviews with officials from the Tbilisi Transport company and Georgian Railways and aircraft data are based on interviews with the Georgian Civil Aviation Agency.
Data were adjusted when the rate of new registrations was incongruous with vehicle stock. Based on known limitations of data provided for vehicle stock, these data were adjusted downward for all road vehicles. Table VI.1 shows the breakdown of vehicle stock and historical new registration statistics used in the analysis of Georgia.
The breakdown of powertrains in each vehicle type was also a required input for ForFITS and data for Georgia are shown in Table VI.2. Data were adjusted for these parameters as well to align with data from pilot countries.
Baseline projections
Socio-economic data and data on fuel taxation were also collected as shown in
Table VI.3. Population projections are based on the medium fertility scenario projections for Georgia as defined by the UN Population Division in their World Population Prospects 2012 publication. The recent decline in population for Georgia is expected to continue with an overall decline in population of 11 per cent projected by 2030
The source of 2010 GDP data was the ECE statistical database. GDP projections are based on annual growth of 3.0 per cent through 2020 and 2.8 per cent from 2020-2030 and 2.2 per cent from 2030-2040 as projected by the Organisation for Economic Cooperation and Development (OECD) for Georgia. This level of growth would lead to a GDP increase of approximately 77 per cent between 2010 and 2030.

Annex VI:Results of the for future inland transport systems (ForFITS) tool 273 Fuel taxation data were collected from interviews with fuel suppliers in Georgia. Taxation data for electricity were collected from the Tbilisi Transport Company and Georgian Railway.
Table VI.1: Vehicle stock and historical new registration data: 2000, 2005, 2010
Notes: 1Passengers/vehicle for Passenger vehicles, Ton/vehicles for Freight vehicles. LDV = Light duty vehicle. lge = litres of gasoline equivalent. Vehicle stock for pipelines represents volume transported in m3. Non-motorized transport walking = estimate of number of persons walking. Figure VI.2 and Figure VI.3 show the projected WTW CO2 emissions from Georgia’s Belarus' transport sector by mode within passenger and freight transport, respectively. Projections are generated by the ForFITS tool based on transport-specific inputs given in the tables above as well as projections of socio-economic as specified in Table VI.3. This reference scenario also includes default data in ForFITS on the expected evolution of fuel consumption characteristics by powertrain in order to reflect future improvements in vehicle technology and their associated costs. The other characteristics defining the transport system in the base year (e.g. fuel taxation schemes, road pricing, passenger/freight transport system structure, fuel characteristics, powertrain technology shares, behavioural aspects) remain unchanged in projections. As a result of Georgia's projected population decline and GDP growth, the projected GDP per capita of the country is projected to almost double (from 5,045 to 10,067 in constant 2010 Purchasing Power Parity [PPP] units) between 2010 and 2030. The per capita GDP level reached in 2030 is still below levels historically coupled with a saturation of the personal vehicle ownership. This explains the projected increase of passenger transport activity and the higher contribution of personal vehicles over time despite the projected decrease in population. Freight activity increases proportionally to the growth of the economic output. Energy use is projected to grow over time in line with projected transport activity. Fuel savings associated with the improving evolution of the powertrain technologies in terms of fuel consumption only partly offset the upward influence of growing transport activity. The projected growth of WTW CO2 emissions follows closely the trend of the energy demand increase, since the emission factors remain constant.
New reg.
Avg fuel cons (lge/ 100 km) New reg.
Avg fuel cons (lge/ 100km) New reg.
Avg fuel cons (lge/ 100 km)
Active vehicles
Avg fuel cons (lge/ 100 km)
Avg travel /veh.
(km/yr)Avg
load1
Non-motorized transport
Walking .. .. .. .. .. .. 4 007 520 .. 490 1.0Two Wheelers 90 2.5 300 2.5 470 2.5 2 080 2.5 4 200 1.1
Passenger LDVsPersonal 18 790 8.5 24 714 8.5 42 602 8.5 428 740 8.5 20 000 2.0
Public transport 1 160 7.8 940 7.8 640 7.8 4 240 7.8 50 000 2.5Buses 3 610 16.6 3 010 16.6 2 605 16.6 34 350 16.6 60 000 20.0Passenger Rail 10 34.5 10 34.5 13 34.5 187 34.5 104 545 256.5Passenger Air 7 595.0 2 595.0 6 595.0 25 595.0 900 000 80.0
Freight LDVs 3 630 11.1 2 660 11.1 3 648 11.1 28 800 11.1 30 000 1.0Freight TrucksMedium-duty 1 550 18.8 1 450 18.8 1 575 18.8 12 430 18.8 70 000 3.0Heavy-duty 1 140 24.4 760 24.4 912 24.4 9 770 24.4 90 000 5.0Freight Rail 6 460.4 6 460.4 7 460.4 104 460.4 125 000 675.0
PipelinesGas .. .. .. .. .. .. 5.8 B 0.1 250.0 0.0Oil .. .. .. .. .. .. 50.2 M 0.3 250.0 0.8
Vehicle stock 2010New vehicle registrations 2010
New vehicle registrations 2005
New vehicle registrations 2000
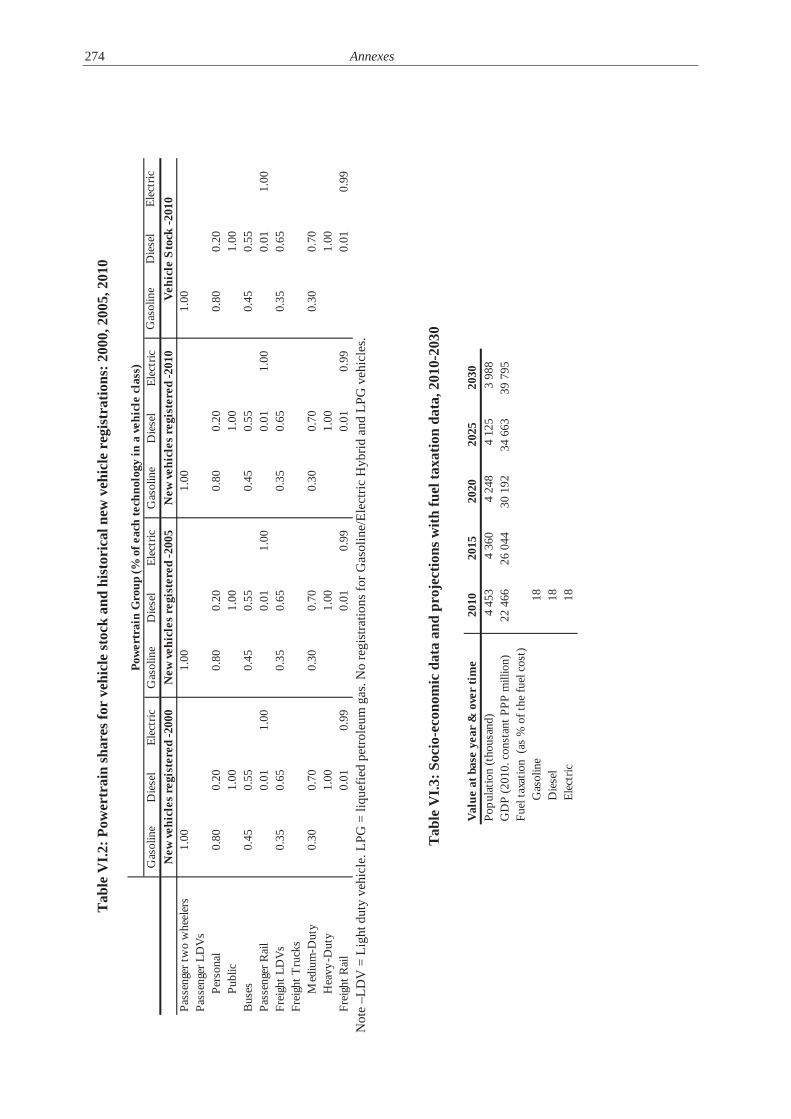
274 Annexes
Tab
le V
I.2: P
ower
trai
n sh
ares
for
vehi
cle
stoc
k an
d hi
stor
ical
new
veh
icle
reg
istr
atio
ns: 2
000,
200
5, 2
010
N
ote
–LD
V =
Lig
ht d
uty
vehi
cle.
LPG
= li
quef
ied
petro
leum
gas
. No
regi
stra
tions
for G
asol
ine/
Elec
tric
Hyb
rid a
nd L
PG v
ehic
les.
Tab
le V
I.3: S
ocio
-eco
nom
ic d
ata
and
proj
ectio
ns w
ith fu
el ta
xatio
n da
ta, 2
010-
2030
Gas
olin
eD
iese
lEl
ectr
icG
asol
ine
Die
sel
Elec
tric
Gas
olin
eD
iese
lEl
ectr
icG
asol
ine
Die
sel
Elec
tric
Pass
enge
r tw
o w
heel
ers
1.00
1.00
1.00
1.00
Pass
enge
r LD
Vs
Pers
onal
0.80
0.20
0.80
0.20
0.80
0.20
0.80
0.20
Publ
ic1.
001.
001.
001.
00B
uses
0.45
0.55
0.45
0.55
0.45
0.55
0.45
0.55
Pass
enge
r Rai
l0.
011.
000.
011.
000.
011.
000.
011.
00Fr
eigh
t LD
Vs
0.35
0.65
0.35
0.65
0.35
0.65
0.35
0.65
Frei
ght T
ruck
sM
ediu
m-D
uty
0.30
0.70
0.30
0.70
0.30
0.70
0.30
0.70
Hea
vy-D
uty
1.00
1.00
1.00
1.00
Frei
ght R
ail
0.01
0.99
0.01
0.99
0.01
0.99
0.01
0.99
New
veh
icle
s re
gist
ered
-200
0
Pow
ertr
ain
Gro
up (%
of e
ach
tech
nolo
gy in
a v
ehic
le c
lass
)
Veh
icle
Sto
ck -2
010
New
veh
icle
s re
gist
ered
-201
0N
ew v
ehic
les
regi
ster
ed -2
005
2010
2015
2020
2025
2030
4 45
34
360
4 24
84
125
3 98
822
466
26 0
4430
192
34 6
6339
795
Gas
olin
e18
Die
sel
18El
ectr
ic18
Val
ue a
t bas
e ye
ar &
ove
r ti
me
Popu
latio
n (t
hous
and)
GD
P (2
010.
con
stan
t PPP
mill
ion)
Fuel
taxa
tion
(as
% o
f the
fuel
cos
t)

Annex VI:Results of the for future inland transport systems (ForFITS) tool 275
In passenger transport, the contribution of personal cars and aircraft to the total WTW CO2 emissions is projected to increase over time due to the significant growth of personal income. On the other hand, the share ofrail and buses in overall emissions diminishes over time as with increased income, passenger transport activity is projected to shift away from public transport modes.
Figure VI.2: WTW CO2 emissions by mode in passenger under reference scenario, 2010-2030, billion kg CO2/year
Figure VI.3: WTW CO2 emissions by mode in freight transport under reference scenario, 2012-2030, billion kg CO2
Freight transport activity (tkm) on rail is projected to be higher than heavy duty trucks and freight light dutyvehicles activity. However, road freight modes are more energy intensive and contribute the most to the total WTW CO2 emissions. The share of light duty vehicles in total road freight vehicles is projected as a function ofthe GDP per capita (increases in GDP per capita result in larger shares of light vehicles in total road freight). This explains that the projected increase in the contribution of freight light duty vehicles in the total WTW CO2emissions over time and the projected reduced contribution of heavy duty trucks. The share of freight rail in the
0.0
1.0
2.0
3.0
4.0
5.0
6.0
2010 2015 2020 2025 2030
Two and Three Wheelers Light Duty Vehicles (LDVs) Large Road (Buses)
0.0
0.5
1.0
1.5
2.0
2.5
3.0
3.5
2010 2015 2020 2025 2030
Two and Three Wheelers Light Duty Vehicles (LDVs) Large Road (Trucks or HDVs) Rail

276 Annexes
overall emissions is particularly low for two reasons: i) all trains are electric; (ii) the well-to-tank (WTT)13 emission factor for electricity in Georgia is low as the electricity is mainly generated by hydraulic power. VI.3 Scenarios
Reference Scenario The reference scenario accounts for the expected evolution of socio-economic parameters such as population and GDP. It includes default data in ForFITS on the expected evolution of fuel consumption characteristics by powertrain to reflect future improvements in vehicle technology and their associated costs. Other characteristics defining the transport system in the base year (e.g. fuel taxation schemes, road pricing, passenger/freight transport system structure, fuel characteristics, powertrain technology shares, behavioral aspects) remain unchanged in projections.
Additional scenarios
Shift to Public Transport scenario The shift to public transport scenario projects future emissions assuming an evolution of the passenger transport system index towards a condition where a significant fraction of the passenger transport task is performed by public transport modes. The practical implementation of this input relies on the possibility to modify the ForFITS passenger transport system index14, an instrument that was specifically developed to help understand the changes in the passenger transport system associated with shifts to/from private vehicles from/to public transport. In the shift to public transport scenario, the gap between the passenger transport system index value calculated in the base year and the 0.7 target value characterizing regions which trend toward high density and high use of public transport as GDP increases is assumed to be progressively reduced by 20 per cent between the base year and 2040. The evolution of the passenger transport system index between the base year and 2040 is assumed to be linear, for simplicity. In practice, this assumption represents the implementation of a wide number of policies favoring public transport over personal vehicles, such as parking and access restrictions for personal vehicles, land use policies that encourage the vertical development of the city and mixed use areas, and support for the provision of appealing, widely available and high-quality public transport services. In Georgia, the passenger transport characteristic index at the base year is 0.52. This highlights the relatively high public transport use compared to other countries at similar levels of economic development. As a result, the impact of the shift to public transport scenario is lower in Georgia than in situations where the passenger transport system index at the base year is farther from the 0.7 target. However, larger changes in the passenger transport system index also highlight the need for more policy interventions in comparison with cases like Georgia where the initial high value of the index reflects a more optimistic outlook on policy interventions aimed to the promotion of the already existing public transport system. For this scenario, the gap between Georgia's current passenger transport characteristic index and the 0.7 target is reduced by 20 per cent between 2010 and 2040 (from 0.52 to 0.56)It should also be noted that moving towards a higher passenger transport characteristic index does not affect freight transport. 13 Wheel to tank (WTT) refers to CO2 emissions from the production of the fuel used for the vehicle's operation. It does not include tailpipe emissions. 14 This index ranges from 0 (indicating that the share of personal vehicles in pkm tends to 100 per cent when GDP increases) to 1 (indicating that the share of personal vehicles in pkm is 0 per cent). Between these extreme values, the index measures differences in modal choice independent of differences in GDP per capita, cost of driving and behavioural aspects. Index values represent the share of personal vehicles in pkm relative to countries or regions with similar socio-economic characteristics. Changes in modal shares over time for a country or region with a constant index value (the default option) are attributed to changes in GDP per capita, cost of driving and behavioural aspects. More information available at www.unece.org/fileadmin/DAM/trans/doc/themes/ForFITS/A_-_Coverage__methodology_and_data_requirements.pdf
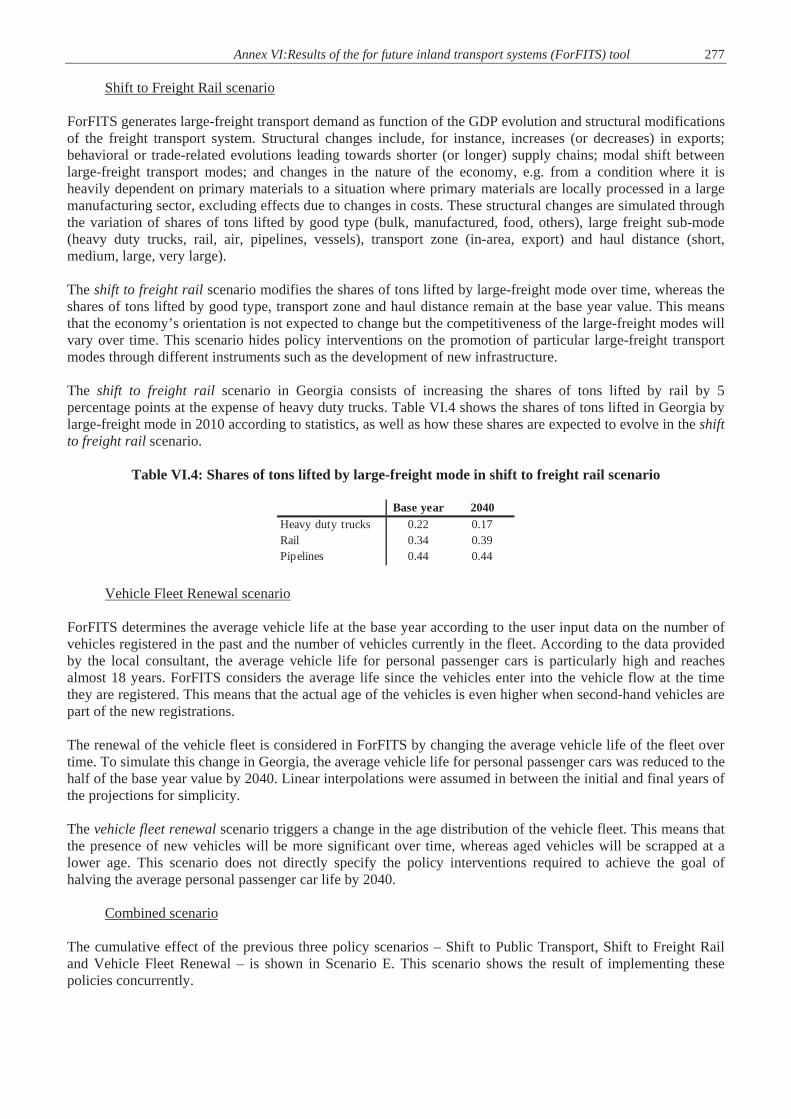
Annex VI:Results of the for future inland transport systems (ForFITS) tool 277
Shift to Freight Rail scenario ForFITS generates large-freight transport demand as function of the GDP evolution and structural modifications of the freight transport system. Structural changes include, for instance, increases (or decreases) in exports; behavioral or trade-related evolutions leading towards shorter (or longer) supply chains; modal shift between large-freight transport modes; and changes in the nature of the economy, e.g. from a condition where it is heavily dependent on primary materials to a situation where primary materials are locally processed in a large manufacturing sector, excluding effects due to changes in costs. These structural changes are simulated through the variation of shares of tons lifted by good type (bulk, manufactured, food, others), large freight sub-mode (heavy duty trucks, rail, air, pipelines, vessels), transport zone (in-area, export) and haul distance (short, medium, large, very large). The shift to freight rail scenario modifies the shares of tons lifted by large-freight mode over time, whereas the shares of tons lifted by good type, transport zone and haul distance remain at the base year value. This means that the economy’s orientation is not expected to change but the competitiveness of the large-freight modes will vary over time. This scenario hides policy interventions on the promotion of particular large-freight transport modes through different instruments such as the development of new infrastructure. The shift to freight rail scenario in Georgia consists of increasing the shares of tons lifted by rail by 5 percentage points at the expense of heavy duty trucks. Table VI.4 shows the shares of tons lifted in Georgia by large-freight mode in 2010 according to statistics, as well as how these shares are expected to evolve in the shift to freight rail scenario.
Table VI.4: Shares of tons lifted by large-freight mode in shift to freight rail scenario
Vehicle Fleet Renewal scenario ForFITS determines the average vehicle life at the base year according to the user input data on the number of vehicles registered in the past and the number of vehicles currently in the fleet. According to the data provided by the local consultant, the average vehicle life for personal passenger cars is particularly high and reaches almost 18 years. ForFITS considers the average life since the vehicles enter into the vehicle flow at the time they are registered. This means that the actual age of the vehicles is even higher when second-hand vehicles are part of the new registrations. The renewal of the vehicle fleet is considered in ForFITS by changing the average vehicle life of the fleet over time. To simulate this change in Georgia, the average vehicle life for personal passenger cars was reduced to the half of the base year value by 2040. Linear interpolations were assumed in between the initial and final years of the projections for simplicity. The vehicle fleet renewal scenario triggers a change in the age distribution of the vehicle fleet. This means that the presence of new vehicles will be more significant over time, whereas aged vehicles will be scrapped at a lower age. This scenario does not directly specify the policy interventions required to achieve the goal of halving the average personal passenger car life by 2040.
Combined scenario
The cumulative effect of the previous three policy scenarios – Shift to Public Transport, Shift to Freight Rail and Vehicle Fleet Renewal – is shown in Scenario E. This scenario shows the result of implementing these policies concurrently.
Base year 2040Heavy duty trucks 0.22 0.17Rail 0.34 0.39Pipelines 0.44 0.44

278 Annexes
Scenario results Figure VI.4 to Figure VI.8 show the evolution of passenger/freight activity (pkm/tkm), energy use (toe) for passenger and freight transport separately and total kg of CO2 emissions (WTW) for the Georgian case in the four scenarios. All scenarios use the reference scenario as a starting point for evaluating policy changes. Table VI.5 shows the values of the main outputs in the reference scenario for Georgia, at the first and last year of the projections, as well as the projections in 2030 for the four additional scenarios described above. In Figure VI.4, the shift to public transport, vehicle fleet renewal, and combined scenarios are compared with the reference scenario. Under the shift to public transport scenario total passenger transport activity (pkm) is reduced in comparison with the reference scenario (4.7 per cent lower in 2030). This reduction in passenger travel is explained by the increased density and the subsequently shorter trips by Georgians under this scenario. ForFITS contains default data on the expected evolution of the technologies over time in terms of costs and fuel consumption per km. This information is based on expected technology improvements with an estimated cost and fuel consumption reduction potential. Thus, the renewal of the fleet is coupled with an increase of the average cost of the personal passenger cars due to higher purchase vehicle costs over time. This cost effect results in a very minor reduction of the total passenger transport activity (pkm) through modeled cost elasticities under the vehicle fleet renewal scenario (0.7 per cent lower than the reference scenario in 2030).
Table VI.5: Main outputs: reference scenario
Since there is not significant interaction between the scenarios, the combined scenario shows decreases that are close to the sum of decreases resulting from the shift to public transport and vehicle fleet renewal scenarios (5.2 per cent lower than the reference scenario in 2030). The shift to freight rail scenario has a very minor impact on total tkm since the tons lifted are proportional to the GDP growth and the haul length remains the same as in the reference scenario (0.7 per cent lower than the reference scenario in 2030). Since the share of pkm on public transport modes increases over time at the expense of personal vehicles, shifting towards these more energy efficient modes triggers a reduction in the total energy use under the shift to public transport scenario (7.1 per cent lower in 2030 compared to the reference scenario). The biggest impact of the vehicle fleet renewal scenario is directly on the energy component. The increase in more energy efficient new vehicles and the earlier scrapping of less efficient older ones causes a substantial reduction in the total energy use in the transport sector compared to the reference scenario (5.5 per cent lower in 2030). Since there is not significant interaction between the scenarios, the combined scenario shows decreases that are close to the sum of decreases resulting from the shift to public transport and vehicle fleet renewal scenarios (12.1 per cent lower in 2030 compared to the reference scenario).
2010
Ref
Public Trans Shift
Freight Rail Shift
Vehicle Fleet
RenewalCombined Scenario
passenger-kilometres, billion 67.7 89.1 84.9 89.1 88.4 84.4ton-kilometres, billion 27.7 50.1 50.1 49.8 50.1 49.8Energy use, thousand toe 1 407.5 2 429.6 2 323.6 2 333.9 2 348.6 2 153.9WTW CO2 emissions, billion kg CO2 4 852.0 8 400.0 8 031.0 8 034.0 8 119.0 7 408.0WTW CO2 emissions per capita, kg CO2/person 1 089.7 2 124.9 2 031.6 2 032.3 2 053.8 1 874.0WTW CO2 emissions intensity, kg CO2/GDP * 1 000 216.0 211.1 201.8 201.9 204.0 186.2
2030

Annex VI:Results of the for future inland transport systems (ForFITS) tool 279
The distribution of the total tkm across large-freight modes varies over time accordingly with the increase of tons lifted by rail under the shift to freight rail scenario. This explains the reduction of total energy (10.1 per cent lower in 2030 compared to the reference scenario) as trains in Georgia are more energy efficient than road trucks.
Since the share of pkm on public transport modes increases over time at the expense of personal vehicles, shifting towards these more energy efficient modes triggers a reduction in overall CO2 emissions from the transport sector under the shift to public transport scenario (4.4 per cent lower in 2030 compared to the reference scenario). Similarly, under the vehicle fleet renewal scenario, the decrease of total WTW CO2emissions relative to the reference scenario (3.3 per cent lower in 2030) follows the energy trend as the emission factors remain the same.
Figure VI.4: Projected passenger kilometers under various scenarios: 2010-2030, billion pkm
Note: Shift to freight rail scenario not shown as it does not affect passenger transport projections.
Figure VI.5: Projected ton kilometers (tkm) under various scenarios: 2010-2030, billion tkm
Note: Transport shift and fleet renewal scenarios not shown as they do not affect freight transport projections.
65
70
75
80
85
90
2010 2015 2020 2025 2030
Reference Shift to public transport
Vehicle fleet renewal Combined effect
25
30
35
40
45
50
55
2010 2015 2020 2025 2030
Reference Shift to freight rail
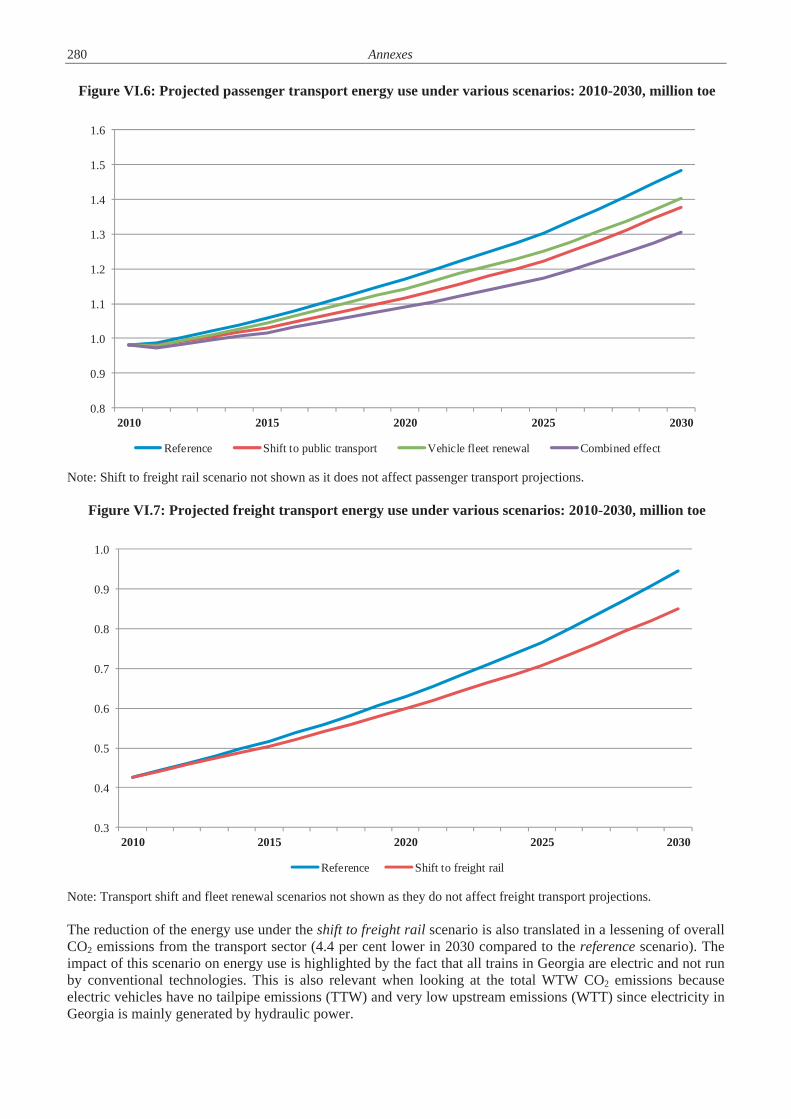
280 Annexes
Figure VI.6: Projected passenger transport energy use under various scenarios: 2010-2030, million toe
Note: Shift to freight rail scenario not shown as it does not affect passenger transport projections.
Figure VI.7: Projected freight transport energy use under various scenarios: 2010-2030, million toe
Note: Transport shift and fleet renewal scenarios not shown as they do not affect freight transport projections.
The reduction of the energy use under the shift to freight rail scenario is also translated in a lessening of overall CO2 emissions from the transport sector (4.4 per cent lower in 2030 compared to the reference scenario). The impact of this scenario on energy use is highlighted by the fact that all trains in Georgia are electric and not run by conventional technologies. This is also relevant when looking at the total WTW CO2 emissions because electric vehicles have no tailpipe emissions (TTW) and very low upstream emissions (WTT) since electricity in Georgia is mainly generated by hydraulic power.
0.8
0.9
1.0
1.1
1.2
1.3
1.4
1.5
1.6
2010 2015 2020 2025 2030
Reference Shift to public transport Vehicle fleet renewal Combined effect
0.3
0.4
0.5
0.6
0.7
0.8
0.9
1.0
2010 2015 2020 2025 2030
Reference Shift to freight rail
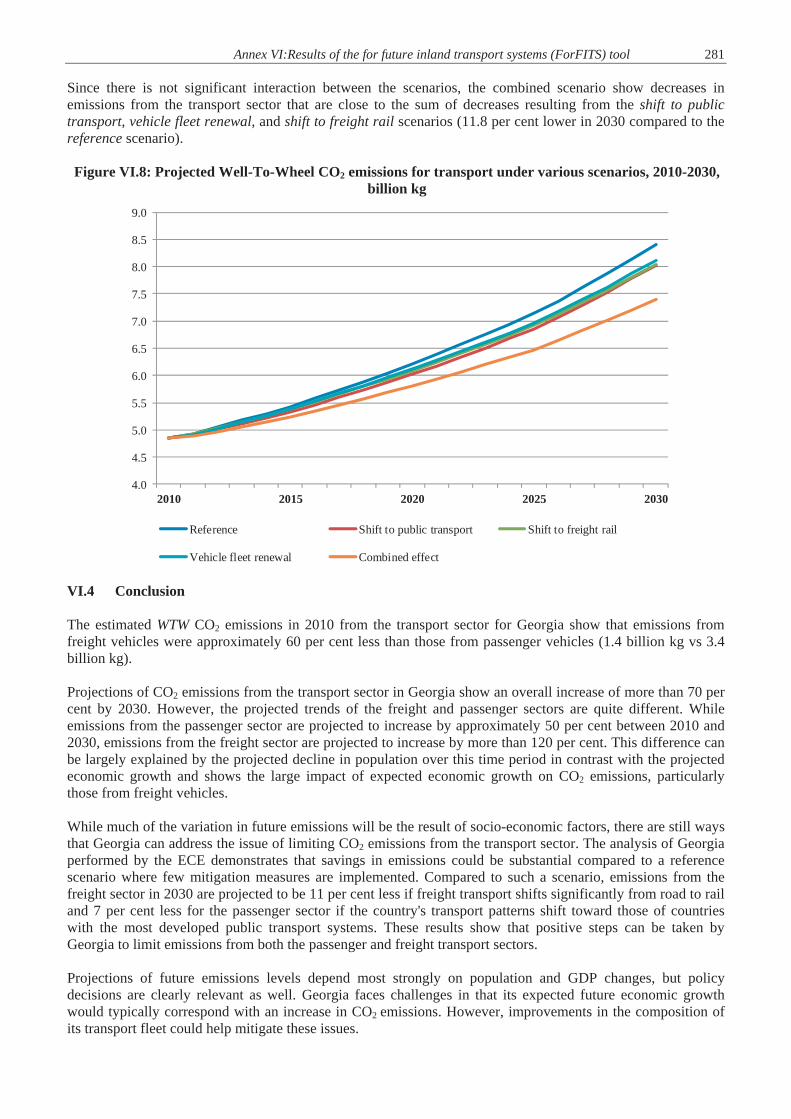
Annex VI:Results of the for future inland transport systems (ForFITS) tool 281
Since there is not significant interaction between the scenarios, the combined scenario show decreases in emissions from the transport sector that are close to the sum of decreases resulting from the shift to public transport, vehicle fleet renewal, and shift to freight rail scenarios (11.8 per cent lower in 2030 compared to the reference scenario).
Figure VI.8: Projected Well-To-Wheel CO2 emissions for transport under various scenarios, 2010-2030, billion kg
VI.4 Conclusion
The estimated WTW CO2 emissions in 2010 from the transport sector for Georgia show that emissions from freight vehicles were approximately 60 per cent less than those from passenger vehicles (1.4 billion kg vs 3.4 billion kg).
Projections of CO2 emissions from the transport sector in Georgia show an overall increase of more than 70 per cent by 2030. However, the projected trends of the freight and passenger sectors are quite different. While emissions from the passenger sector are projected to increase by approximately 50 per cent between 2010 and 2030, emissions from the freight sector are projected to increase by more than 120 per cent. This difference can be largely explained by the projected decline in population over this time period in contrast with the projected economic growth and shows the large impact of expected economic growth on CO2 emissions, particularly those from freight vehicles.
While much of the variation in future emissions will be the result of socio-economic factors, there are still ways that Georgia can address the issue of limiting CO2 emissions from the transport sector. The analysis of Georgia performed by the ECE demonstrates that savings in emissions could be substantial compared to a reference scenario where few mitigation measures are implemented. Compared to such a scenario, emissions from the freight sector in 2030 are projected to be 11 per cent less if freight transport shifts significantly from road to rail and 7 per cent less for the passenger sector if the country's transport patterns shift toward those of countries with the most developed public transport systems. These results show that positive steps can be taken by Georgia to limit emissions from both the passenger and freight transport sectors.
Projections of future emissions levels depend most strongly on population and GDP changes, but policy decisions are clearly relevant as well. Georgia faces challenges in that its expected future economic growth would typically correspond with an increase in CO2 emissions. However, improvements in the composition of its transport fleet could help mitigate these issues.
4.0
4.5
5.0
5.5
6.0
6.5
7.0
7.5
8.0
8.5
9.0
2010 2015 2020 2025 2030
Reference Shift to public transport Shift to freight rail
Vehicle fleet renewal Combined effect
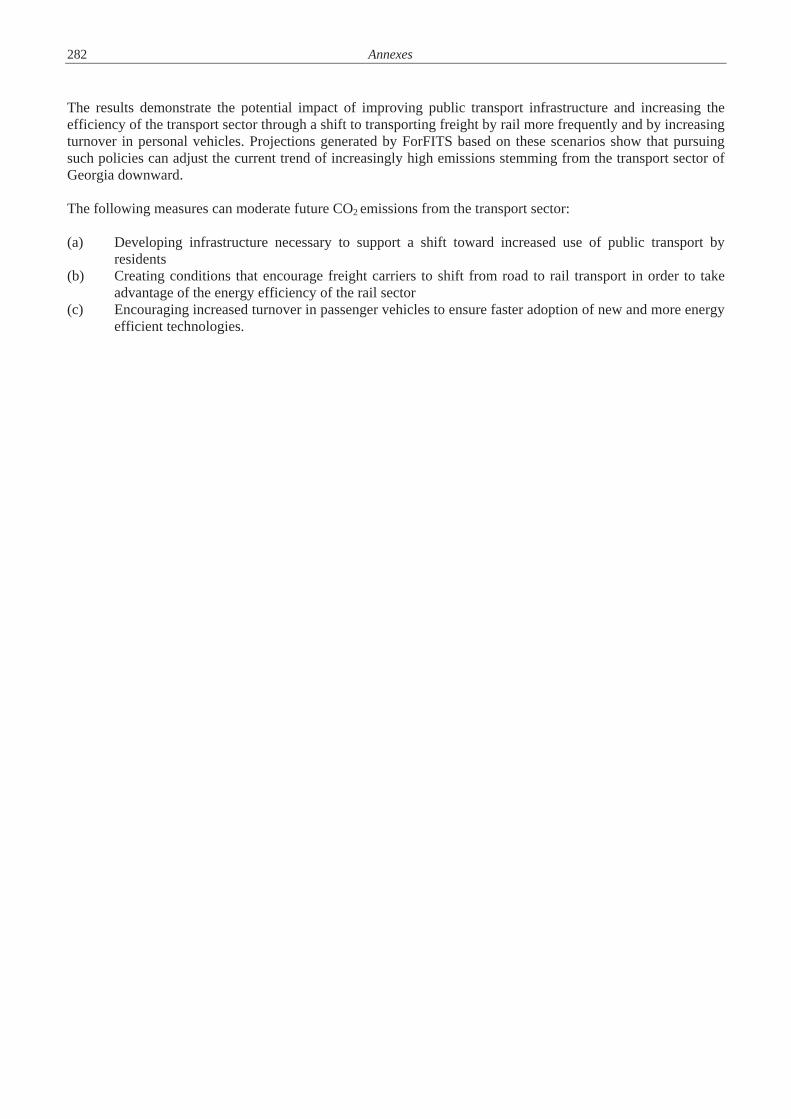
282 Annexes
The results demonstrate the potential impact of improving public transport infrastructure and increasing the efficiency of the transport sector through a shift to transporting freight by rail more frequently and by increasing turnover in personal vehicles. Projections generated by ForFITS based on these scenarios show that pursuing such policies can adjust the current trend of increasingly high emissions stemming from the transport sector of Georgia downward. The following measures can moderate future CO2 emissions from the transport sector: (a) Developing infrastructure necessary to support a shift toward increased use of public transport by
residents (b) Creating conditions that encourage freight carriers to shift from road to rail transport in order to take
advantage of the energy efficiency of the rail sector (c) Encouraging increased turnover in passenger vehicles to ensure faster adoption of new and more energy
efficient technologies.
283
Sources Personal authors:
1. Antadze, N. (2013): Assessment of the Convergence of Georgian Legislation with the EU Law: Horizontal Environmental Legislation. Green Alternative, 2013.
2. Arvis, J.-F. et al. (2014). Connecting to Compete 2014: Trade Logistics in the Global Economy -The Logistics Performance Index and Its Indicators. World Bank, Washington, DC.
3. Boadway, R. and Flatters, F. (1993). The taxation of natural resources: principles and policy issues, Volume 1. Policy Research Working Papers WPS 1210. The World Bank. October. Available from: http://econ.worldbank.org/external/
4. Cecire, M. (2013). Georgia: Rolling up its sleeves on local government reform.
5. Cramton, P. (2009). How Best to Auction Natural Resources. 21 May 2009. Available from: http://www.cramton.umd.edu/papers2005-2009/cramton-auctioning-natural-resources.pdf
6. Dolidze, A., et al. (2014). Presentation - The benefits and costs of clean air in Georgia. (CENN). Tbilisi, March 2014.
7. Egiashvili, D. (2012). Improving Land Sector Governance in Georgia: Implementation of the Land Governance Assessment Framework. World Bank Study, October 2012.
8. Egiashvili, D. (2012). Improving Land Sector Governance in Georgia: Implementation of the Land Governance Assessment Framework. World Bank Study, October 2012
9. Elseoud, A. A. (2012). Water Quality Management and IWRM. UNPD, GEF, EU.
10. Ewoldsen, H. M. (2013). Developing Climate Resilient Flood and Flash Flood Management Practices to Protect Vulnerable Communities in Georgia. Best International Practices in Dam Safety Programs. Task Report.
11. Ewoldsen, H. M. (2014). Developing Climate Resilient Flood and Flash Flood Management Practices to Protect Vulnerable Communities in Georgia. Final Report Study of Dam Safety Practices – Rioni Basin Dams.
12. Felix-Henningsen, P., et al. (2007). Heavy Metal Pollution of Soils and Food Crops due to Mining Wastes in the Mashavera River Valley. Bulletin of the Georgian National Academy of Sciences, vol. 175, no. 3. Agricultural Sciences. Soil Sciences.
13. Gassmann, F., et. al. (2013). Economic and Social Vulnerability in Georgia. UNDP.
14. Gauss, M., et al. (2009). Transboundary air pollution by main pollutants (S, N, O3) and PM, Georgia. Meteorologisk Institute, MSC West, Oslo. August 2013. Available from: http://www.emep.int/publ/reports/2010/Country_Reports/report_RS.pdf
15. Gochitashvili, M. (2012). Georgian Energy Sector. Main Priorities of Gas Sector Development. Energy Efficiency Centre Georgia. Publishing House “Meridiani” Tbilisi – 2012.
16. Gottfried, M., et al. (2012). Continent-wide response of mountain vegetation to climate change. Nature Climate Change 2, 111–115.
17. Gujaraidze, K. (2011). NGO Green Alternative: Some Topical Issues Related to Planning and Management of Landfills December, 2011.
18. Gujaraidze, K. (2011). Some Topical Issues Related to Planning and Management of Landfills. Green Alternative, December 2011.
19. Inasaridze, A. (2013). The Case of the Georgian Forest Reform: Transition from Centrally Planned to Market Oriented Forest Management. Available from: http://www.goldmercury.org/publishing/2013/08/the-case-of-the-georgian-forest-reformtransition-from-centrally-planned-to-market-oriented-forest-management/
20. King, L. and Khubua, G. (eds) (2009). “Georgia in Transition. Experiences and Perspectives“. Schriften
284 Sources
zur Internationalen Entwicklungs- und Umweltforschung. Herausgegeben vom Zentrum für international Entwicklungs- und Umweltforschung. Band 26. Peter Lang GmbH. Frankfurt am Main 2009. ISBN978-3631-58977-9.
21. Kochladze, M. (2009). Risky deal, risky business. Khudoni hydropower plant, Georgia. Green Alternative. June 2009.
22. Kochladze, M. (2011). Georgian Energy Sector Development Prospects. Policy Brief. Green Alternative. May, 2011.
23. Kochladze, M. (2012). Resource Efficiency Gains and Green Growth Perspectives in Georgia.
24. Kochladze, M. (2013). Off Balance. The Georgian energy sector and the contradictions in EU policy and practice. CEE Bankwatch Network. March 2013.
25. Kochladze, M. (2014). Sustainable Development - the challenge to the Eastern Partnership. South Caucasus Regional Office of the Heinrich Boell Foundation. January 2014.
26. Kordzakhia, M., et al. (2014). The Benefits and Costs of Clean Air in Georgia Part 2. MENRP. Tbilisi, June 2014. Available from: http://moe.gov.ge/files/Clean_Air_Report_2_-_CBA_-_10_June_2014.pdf
27. Kötschau, K. (2012). “Impact of Land Reform Strategies on Rural Poverty in the Commonwealth of Independent States. Comparison between Georgia and Moldova“. Schriften zur Internationalen Entwicklungs- und Umweltforschung. Herausgegeben vom Zentrum für international Entwicklungs- und Umweltforschung. Band 28. PETER LANG GmbH. Frankfurt am Main 2012. ISBN978-3631-62321-3.
28. Kozeltsev, M. and Terentyev, A. (2011). Analysis of Existing Systems and Methods of Current Practices of Environmental Liability and Environmental Damage Assessment in the EECCA countries.
29. Luleva, P., et al. (2013). TAIEX Report. Developing an Environment and health policy in Georgia –Expert Mission on Development of Effective Environment and Health System in Georgia -TAIEX Mission 53899 – Tbilisi, 2013.
30. Matcharashvili, I. (2012). Problems and Challenges of Forest Governance in Georgia. Tbilisi, Association Green Alternative.
31. Matcharashvili, I. (2013). Hunting of endangered animals. Association Green Alternative. Tbilisi.
32. Mtsariashvili, L., et al. Indoor radon and features of its distribution in Tbilisi-The main city of Georgia. 13th SGEM GeoConference on Ecology, Economics, Education And Legislation, Tuesday 6 August 2013 Conference Proceedings, ISBN 978-619-7105-04-9 / ISSN 1314-2704, June 16-22, 2013, Vol. 1, 1235 – 1242.
33. Mtsariashvili, L., et al. Radioactivity of tap water of Tbilisi city (Georgia) and estimation of radiological risk for population.
34. Murgulia, S., et al. (2011). Fiscal Decentralization in Georgia. Center for Strategic Research and Development of Georgia. Available from: http://csrdg.ge/upload/editor/file/EU%20gia%202011/FD%20study-eng.pdf
35. Murvanidze, M. An ecological assessment of different forest types of Borjomi gorge protected territories by indicator insects and education of local population on conservation of biodiversity. RSG-7838-1. 2010-2013.
36. Shiganova, T. A. (1998). Invasion of the Black Sea by the ctenophore Mnemiopsis leidyi and recent changes in pelagic community structure. Fisheries Oceanography 7:3/4, 305-310, 1998
37. Shonia, G. (2012). Status and function of GNERC in energy and water supply sectors: Responsibilities and Activities, 3 July, 2012 Vienna, Austria. Available from: http://www.energy-community.org/pls/portal/docs/1674179.PDF
38. Skorupska, A. and Zasztowt, K. (2014). Georgia’s Local Government Reform: How to Escape from the Soviet Past (and How Poland Can Help). Policy Paper, No. 4 (87), February 2014. The Polish Institute of International Affairs©PISM. Available from: http://www.isn.ethz.ch/Digital-Library/Publications/Detail/?lng=en&id=177215
39. Stec, S. (2014). Review of legislation on environmental impact assessment of Georgia with regard to
Sources 285
implementation of the Espoo Convention. EaP Green Programme. Final Report. January 2014.
40. Sutton R. William et al. “Integrating Environment into Agriculture and Forestry. Progress and Prospects in Eastern Europe and Central Asia”. Europe and Central Asia Region sustainable Development Department. The World Bank, Washington DC. ISBN 978-0-8213-7743-7.
41. Tushurashvili, G. (2013). Energy Strategy and Energy Policy Developments for the Promotion of Clean Power Generation in Georgia.
Material from Georgia:
42. 10th International Multidisciplinary Scientific GeoConference - SGEM2010, Sunday 1 August 2010 - SGEM2010 Conference Proceedings/ ISBN 10: 954-91818-1-2, June 20-26, 2010, Vol. 2, 39-46 pp.
43. Analysis of the State of Implementation of Georgia’s first National Biodiversity Strategy and Action Plan. Compilation of the situation analyses prepared for the purpose of elaborating the second Biodiversity Strategy and Action Plan. Draft. 16 August 2013.
44. Association Green Alternative (2011). Water – From presidential residence to our taps, i.e “Georgian-style privatization”-3.
45. Association Green Alternative (2012). Agreement against the Environment Review of the Law of Georgia of March 20, 2012 on Making Amendments to Some Legislative Acts of Georgia. April 2012.
46. Association Green Alternative (2012). Ambient air protection in Georgia: Institutions and regulatory instruments Policy Brief. Tbilisi. Available from: http://www.greenalt.org/webmill/data/file/publications/air_protection_policy_brief_ENG.pdf
47. Association Green Alternative (2012). Environmental Policy, Institutional and Regulatory Gap Analysis. Tbilisi, February 2012.
48. Association Green Alternative (2012). Water sector: Current institutional arrangement and regulatory mechanisms. Policy Brief. February 2012.
49. Association Green Alternative (2013). Assessment of Implementation of the ENP EU-Georgia Action Plan. Environment and Sustainable Development (2007-2012). Tbilisi, 2013.
50. Association Green Alternative (2013). Convergence of Georgian Legislation with the EU Law Horizontal Environmental Legislation.
51. Association Green Alternative (2013). Paravani HPP: Study on the impacts of EU controversial investments. Tbilisi, 2013.
52. Association Green Alternative (2013). Secretly Concluded Agreements Against the Environment.
53. Association Green Alternative (2014). Implementation of Aarhus Convention in Georgia. Alternative Report. April 2014.
54. Association Green Alternative (2014). Opportunities for Public Participation in the Decision-Making on Issuing Environmental Impact Permits in Georgia. Policy Brief. June, 2014.
55. Association Green Alternative (2014). Second fatal landslide in Georgian Dariali valley. August 22, 2014. Available from: http://greenalt.org/news/second-fatal-landslide-in-georgian-dariali-valley/
56. Bank of Georgia (2012). Georgia’s Hydropower Potential. Giving water the green light. Georgia’s Hydropower Potential Industry Overview.
57. Caucasus Environmental NGO Network (CENN) (2012). Solid Waste Management in the Kakheti and Adjara Regions of Georgia. November, 2012.
58. Caucasus Environmental NGO Network (CENN) (2014). White Paper on Options for Improving Automotive Fuel Economy in Georgia. Georgia.
59. Caucasus Institute for Peace, Democracy and Development (2009). Policy Brief: Forestry Sector Reform in Georgia. March.
60. Caucasus Nature Fund. Annual Report 2012.
286 Sources
61. Civil Georgia – Daily News Online. Electricity Tariff Cuts Announced. 24 December 2012. Available from: http://www.civil.ge/eng/article.php?id=25585
62. Civil Georgia – Daily News Online. Tbilisi municipality increases waste collection fees. 29 December 2010. Available from: http://www.civil.ge/eng/article.php?id=22999
63. Civil Georgia – Daily News Online. Tbilisi waste collection fee tied to electricity bills. 24 June 2011. Available from: http://www.civil.ge/eng/article.php?id=23661
64. Consortium of NGOs Georgian Greens / Friends of Earth Georgia and Eco-Vision (2012). Report On Municipal Solid Waste Management in Georgia, 2012.
65. Energy Charter Secretariat (2012). In-Depth Review of Energy Efficiency Policies and Programmes: Georgia.
66. Energy Efficiency Centre Georgia (2013). Municipal Energy Efficiency Policy Reform in Georgia. June 2013, Tbilisi.
67. GAMMA Ltd. (2011). Dariali Hydro Power Plant Construction and Operation Project: Environmental and Social Impact Assessment Report, 2011.
68. Georgia and EU (2013). National Water Policy Dialogue on Integrated Water Resources Management. Results and lessons learnt from Georgian National Policy Dialogue on Integrated Water Resources Management under European Union Water Initiative. Tbilisi 2013.
69. Georgian National Investment Agency (2013). A Legal Guide to Business in Georgia. Part 3: General Review of Current Licenses and Permits Applicable in Georgia. Tbilisi, 2013.
70. Government of Georgia (2011). Basic Data and Directions for 2012-2015. Tbilisi 2011.
71. Government of Georgia (2013). Socio-economic Development Strategy of Georgia “Georgia 2020”.
72. Government of Georgia (2014). Georgia National Report on Progress towards Achieving the Millennium Development Goals. September 2014.
73. JSC TELASI (2013). Financial statements for the year ended 31 December 2013. Available from: http://www.telasi.ge/en/
74. Ministry of Energy (2006). Main Directions of State Policy in Georgian Power Sector.
75. Ministry of Energy and Water Regulatory Commission GNERC (1998). Resolution # 3 On Approval of the Electricity Tariff Methodology, Setting Rules and Procedures. 1 July 1998, Tbilisi
76. Ministry of Energy and Water Regulatory Commission GNERC (1999). Resolution # 6 On Approval of Natural Gas Tariff Setting Rules and Methodology September 8, 1999,Tbilisi.
77. Ministry of Energy and Water Regulatory Commission GNERC (2008). Resolution # 18 On Approval of Methodology for Establishing Tariffs on Water Supply. August 29, 2008, City of Kutaisi.
78. Ministry of Energy and Water Regulatory Commission GNERC (s.d.). Georgian National Energy and Water Supply Regulatory Commission Regulations.
79. Ministry of Energy of Georgia. Avani Hydropower Plant.
80. Ministry of Environment and Natural Resources Protection MENRP (2009). Georgia’s Second National Communication to the UNFCCC. Tbilisi, 2009. Available from: http://unfccc.int/resource/docs/natc/geonc2.pdf
81. Ministry of Environment and Natural Resources Protection MENRP (2013). Aarhus Convention Implementation Report of Georgia. December 2013.
82. Ministry of Environment and Natural Resources Protection MENRP (2012). National Environmental Action Programme of Georgia 2012 –2016. Tbilisi, 2012.
83. Ministry of Environment and Natural Resources Protection MENRP (2014). Draft National Waste Management Plan 2014. Tbilisi. Version: 28.03.2014

Sources 287
84. Ministry of Environment and Natural Resources Protection MENRP (2014). National Waste Management Strategy 2014.
85. Ministry of Environment and Natural Resources Protection MENRP (2014). National Waste Management Plan 2014.
86. Ministry of Environment and Natural Resources Protection MENRP (2011). Water abstraction and water use in Georgia in 2011. Wastewater discharge in Georgia in 2011.
87. Ministry of Environment and Natural Resources Protection MENRP (2014). The Law of Georgia on Water Resources Management.
88. Ministry of Environment and Natural Resources Protection MENRP (2010). CLRTAP/EMEP Emission Inventory Status Report 2008 Georgia. Vienna 2010. Available from: http://www.ceip.at/ms/ceip_home1/ceip_home/status_reporting/2010_submissions/
89. Ministry of Environment and Natural Resources Protection MENRP (2014). CLRTAP/EMEP Emission Inventory Status Report 2012 Georgia. Centre on Emission Inventories and Projections, Vienna, 2014. Available from: http://www.ceip.at/ms/ceip_home1/ceip_home/status_reporting/2014_submissions/
90. Ministry of Environment and Natural Resources Protection MENRP (2007). Report of Waste Inventory on the Territory of Georgia.
91. Ministry of Environment and Natural Resources Protection MENRP (2011). National Report on the State of the Environment of Georgia 2007-2009. Tbilisi 2011. Available from: http://moe.gov.ge/files/Saministros%20Prioritetebi/eng_erovnuli_mokhseneba_2009.pdf
92. Ministry of Environment and Natural Resources Protection MENRP (2012). “Forest Area”- Bio Trends - National Biodiversity Monitoring System of Georgia. 2012.
93. Ministry of Environment and Natural Resources Protection MENRP (2013). “BioTrends” Results of the National Biodiversity Monitoring System in Georgia. March 2013.
94. Ministry of Environment and Natural Resources Protection MENRP (2014). Draft National Waste Management Strategy 2014-2030. Tbilisi.
95. Ministry of Environment and Natural Resources Protection MENRP. Georgian National Action Plan for Implementation of the EU Harmonisation plan in the field of air quality governance and meeting corresponding international obligations.
96. Ministry of Environment and Natural Resources Protection of Georgia MENRP. Available from: http://moe.gov.ge/index.php?lang_id=ENG&sec_id=3
97. Ministry of Labor, Health and Social Affairs, Georgia and WHO regional office for Europe. Situation assessment of small scale water supply systems in the Dusheti and Marneuli districts of Georgia.
98. Ministry of Regional Development and Infrastructure (2011). Municipal Development Fund – Annual Report 2011. Tbilisi.
99. Ministry of Regional Development and Infrastructure (2013). Kakheti Regional Roads Improvement Project: Rehabilitation of Sasadilo-Sioni Road. Environmental Impact Assessment. Draft Final Report. Tbilisi, August 2013.
100. Ministry of Regional Development and Infrastructure (2013). LTD “Solid Waste Management Company of Georgia”. 6 months report of 2013.
101. National Biodiversity Strategy and Action Plan of Georgia, 2014 – 2020.
102. National Statistics Office (2013). Statistical Yearbook of Georgia: 2013. Tbilisi, 2013.
103. NPD/IWRM (2011). National Water Policy Dialogue on Integrated Water Resources Management in Georgia under the European Union Water Initiative. Report on mapping major issues, stakeholders and processes in water sector in Georgia. Tbilisi.
104. REC Caucasus (2011). Promoting competitiveness and efficiency of small and medium enterprises through cleaner production in South Caucasus.
105. REC Caucasus (2014). Strengthen Cleaner Production policy and practice in the South Caucasus countries through applying integrated and preventive environmental strategy.
288 Sources
106. State Strategy for Regional Development of Georgia 2010-2017.
107. Task force for Regional Development in Georgia (2009). Regional Development in Georgia – Diagnostic Report. Tbilisi 2009.
108. Task force for Regional Development in Georgia (2010). Strategy Recommendations for Regional Development in Georgia for the years 2011-2017. Tbilisi 2010.
109. Tbilisi Municipality (ed.) John Horan (2007). Tbilisi Millennium Development Goals Report. Tbilisi, 2007. Available from: http://www.ge.undp.org/content/dam/georgia/docs/mdgrep/GE_mdg_tbilisi_2007_eng_sm.pdf
110. United Water Supply Company of Georgia LLC. Bucharest, November 7th, 2011. Available from: http://www.unece.org/fileadmin/DAM/env/water/npd/United_water_supply_company_of_Georgia.pdf
Regional and international institutions:
111. Asian Development Bank ADB (2010). Developing an Urban Water Supply and Sanitation Sector Strategy and Regulatory Framework for Georgia PATA 7492 GEO: Final Report Output 4 – Sector Regulatory Framework.
112. Asian Development Bank ADB (2010). Georgia: Developing an Urban Water Supply and Sanitation Sector Strategy and Regulatory Framework for Georgia PATA 7492-GEO. Final Report. Output 3 – Urban Water Supply and Sanitation Tariffs. December 2010. Available from: http://www.adb.org/sites/default/files/projdocs/2012/43556-012-geo-tacr-03.pdf
113. Asian Development Bank ADB (2010). Proposed Multi tranche Financing Facility Georgia: Urban Services Improvement Investment Program. Environmental Assessment and Review Framework.
114. Asian Development Bank ADB (2011). Georgia Solid Waste Management Review, August 2011.
115. Asian Development Bank ADB (2014). Asian Development Bank & Georgia: Fact Sheet (As of 31 December 2013). Available from: http://www.adb.org/publications/georgia-fact-sheet
116. Asian Development Bank ADB (2014). Georgia Transport Sector Assessment, Strategy, and Road Map. 2014.
117. Carnegie endowment for International Peace (2013). Eurasia Outlook December 6, 2013. Available from: http://carnegieendowment.org/2013/12/06/georgia-s-proposed-local-government-reform-expected-to-boost-democracy-and-economic-development/gvgt?reloadFlag=1
118. Caucasus Biodiversity Council (2012). Ecoregion Conservation Plan for the Caucasus: 2012 Revised and Updated Edition.
119. Commission on the Protection of the Black Sea Against Pollution (2013). Resolutions (open session) of the 29th Regular Meeting. Istanbul.
120. Council of Europe - Congress of Local and Regional Authorities (2013), Local and regional democracy in Georgia. 24th Session, Strasbourg, 19-21 March 2013. CG(24)10FINAL, 19 March 2013. Monitoring Committee. Available from: https://wcd.coe.int/ViewDoc.jsp?id=2041765&Site=COE.
121. EBRD (2011). Modernizing solid waste management in Georgia. Available from: http://www.ebrd.com/pages/project/case/eastern/georgia_rustavi.shtml
122. EBRD (2013). “EBRD helps introduce waste recycling in Georgia”. 30 October 2013. Available from: http://www.ebrd.com/english/pages/news/press/2013/131030.shtml
123. EBRD (2013). Strategy for Georgia as approved by the Board of Directors at its meeting on 4 September 2013. September 2013. Available from: http://www.ebrd.com/downloads/country/strategy/georgia.pdf
124. EBRD (2014). Wissol Petroleum Georgia (EBRD–Projects). Available from: www.ebrd.com/english/pages/project/pas/2014/45236.shtml
125. ECFDC, GCCW, and AMECO (2012). Ten-year investment plan of the financial status of the Protected Area System. Capacity building of the Agency of Protected Areas for managing cost efficiency of
Sources 289
Protected Areas. Promotion of the Georgian PA System Financial Status. UNDP/GEF (unpublished).
126. Economist - European Intelligence Unit (2014). Country Report Georgia, September 2014.
127. Environment and Security ENVSEC (2014). “Proposal for a National Fire Management Policy of Georgia” - Initiative Project: Phase Three - Enhancing National Capacity on Fire Management and Wildfire Disaster Risk Reduction in the South Caucasus". Revised version 25 March 2014.
128. Environment and Security ENVSEC, OSCE and UNEP (2011). GEO-Cities Tbilisi: An integrated Environmental Assessment of State and Trends for Georgia's Capital City. December 2011.
129. EU - Georgia Association Agreement (2014).
130. EU (2013). Environmental Protection of International River Basins Project. Annex 2.4 – Joint Field Surveys in the Kura River Basin. Summary Report. European Union; Hulla and Co. Human Dynamics KG. Environmental Protection of International River Basins.
131. EU (2013). River Basin Analysis in The Chorokhi - Adjaristskali pilot basin, Georgia. European Union; Hulla and Co. Human Dynamics KG. Environmental Protection of Internatinal River Basins.
132. EU (2014). Association Agreement between the European Union and the European Atomic Energy Community and their Member States, of the one part, and Georgia, of the other part (EU-Georgia Association Agreement), Title IV: Trade and Trade-Related Matters, 2014.
133. EU Neighbourhood Info Centre. Greening economies in the Eastern Neighbourhood. Available from: http://www.enpi-info.eu/maineast.php?id=437&id_type=10
134. European Commission (2011). Opportunities and Options for Promoting a Green Economy in the Eastern Partnership Countries. June 2011.
135. European Commission (2013). Press release. Eastern Partnership: Armenia, Georgia, and Moldova join Eastern European Efficiency and Environment Partnership. Brussels, 22 October. Available from: http://europa.eu/rapid/press-release_IP-13-985_en.htm
136. European Commission (2014). Joint staff working document, Implementation of the European Neighbourhood Policy. Statistical Annex accompanying the document “Joint communication to the European Parliament, the Council, the European Economic and Social Committee and the Committee of Regions: Neighbourhood at the Crossroads: Implementation of the European Neighbourhood Policy in 2013”. Brussels, 27.3.2014 SWD(2014) 98 final
137. European Commission Development and Cooperation – EuropeAid: Georgia – Cooperation Programmes 2007-2013. Available from: http://ec.europa.eu/europeaid/where/neighborurhood/country-cooperation/georgia_en.htm.
138. European Union Water Initiative National Policy Dialogues: Achievements and lessons learned, February 2013, ECE Water Series n°6
139. Eurostat (2011). Forestry in the EU and the World, 2011 Edition.
140. EUWI (2012). A think-piece for the EUWI Finance Working Group. May 2012. Available from: http://www.euwi.net/files/Water_Pricing_FINAL.pdf
141. EUWI (2012). Pricing water resources to finance their sustainable management.
142. Federal Ministry for Economic Cooperation and Development BMZ and KfW Entwicklungsbank (2010). Adaptation to Climate Change in the Kura-Aras River Basin. River Basin Snapshot. Draft for Discussion.
143. Food and Agricultural Organization FAO (2010). Global Forest Resources Assessment 2010 – Country Report Georgia. FRA 2010/075.
144. Food and Agricultural Organization FAO (2010). Global Forest Resources Assessment 2010. Country Report Georgia (Draft). FRA 2015.
145. Food and Agricultural Organization FAO (2012). Country Profile Georgia - Forests and the Forestry Sector. 2012.
146. GEF and UNDP (2010). Project Document: Disposal of POPs Pesticides and Initial Steps for
290 Sources
Containment of Dumped POPs Pesticides in Georgia, 2010.
147. Global Forest Coalition (2008). Forests and the Biodiversity Convention - Independent Monitoring of the Implementation of the Expanded Programme of Work in Georgia. May 2008.
148. IBRD, IDA and IFC (2009). Country Partnership Strategy For Georgia FY2010 – FY2013. August 11, 2009.
149. IBRD, IDA and IFC (2014). Country Partnership Strategy For Georgia FY2014 – FY2017. April 9, 2014.
150. IFAD (2012). Georgia Agricultural Support Project – ASP. Supplementary Financing Design Report - Main Report and Annexes. July 2012. Available from: http://www.ifad.org/operations/projects/design/107/georgia.pdf
151. IMF (2013). Georgia Country Report No. 13/264, August 2013 (2013 Article IV consultations).
152. International Hydropower Association (2010). Hydropower Sustainability Assessment Protocol. Background Document. November 2010.
153. Netherlands Commission for Environmental Assessment (2013). Advisory Review of the Environmental and Social Impact Assessment of the Khudoni Hydropower Project. NCEA OS24 – B017/ISBN 978-90-421-3781-3. Georgia. May 2013.
154. NPD/IWRM (2013). Results and lessons learned from the Georgian National. Tbilisi: National Water Policy Dialogue on Integrated Water Resources Management under the European Union Water Initiative.
155. NPD/IWRM, ECE-led (2012). Review of the Georgian Legal and Institutional Water Framework and Recommendations for Implementation of EU Water Framework Directive Principles, including Preparation of a National Water Law. National Policy Dialogue on Integrated Water Resources Management under the European Union Water Initiative.
156. OECD (2011). Environmental Taxation: A Guide for Policy Makers. September 2011.
157. OECD (2012). “Refocusing Economic And Other Monetary Instruments For Greater Environmental Impact: How To Unblock Reform In EECCA Countries”, Annual EAP Task Force meeting, 24-25 September 2012.
158. OECD (2012). Strengthening the economic and financial dimension of integrated water resources management in Armenia, Azerbaijan and Georgia. Case study on the Kura river basin. Environment Directorate - Environmental Policy Committee - Task force for the implementation of the Environmental Action Programme for central and Eastern Europe, Caucasus and central Asia. ENV/EPOC/EAP (2102)10. September.
159. OECD (2014). Creating Incentives for Greener Products. Policy Manual for Eastern Partnership Countries. Paris.
160. OECD. Environment in emerging and transition economies, EaP Green: Programme objectives, expected results and components. www.oecd.org/env/outreach/eapgreen-objectives.htm
161. OSCE/UNEP (2011). An Integrated Environmental Assessment of State and Trends for Georgia’s Capital City. Tbilisi 2009. Available from: www.unep.org/geo/pdfs/GEO-Cities_Tbilisi_Full-report.pdf
162. Peipsi (2011). Transboundary Water Management in Eastern Europe, the Caucasus and Central Asia. Role of NGOs in promoting Integrated Water Resources Management. ECE, UNESCO Participation Programme 2010-2011; Estonian Ministry of Foreign Affairs, Development Cooperation.
163. Pöyry AS (2010). The Electricity Sector In Georgia – An Overview. Commissioned by the Ministry of Energy in Georgia. Econ-Report 2010-007. Oslo 2010. Available from: http://www.greengeorgia.ge/sites/default/files/The%20Electricity%20Sector%20in%20Georgia%20Overview.pdf
164. Pricewaterhouse Cooper PwC. Georgia Pocket Tax Book 2011.
165. Secretariat of the Convention on Biological Diversity (2010). Global Biodiversity Outlook 3. Montréal.
166. Seureca (2012). Wastewater Management Strategy and Feasibility Studies for six selected cities and
Sources 291
towns. Veolia Environment.
167. Transparency International Georgia (2014). The new Local Self-Government Code: Overview of the main novelties. 10 March 2014. Available from: www.transparency.ge/en/node/4000
168. Twinning Project Fiche: Strengthening the Capacities of the Ministry of Environment Protection and Natural Resources in Development and Improvement of Waste Management System in Georgia, March 12, 2010, Tbilisi, Georgia.
169. UNIDO Resource Efficient and Cleaner Production (RECP) Demonstration component Project of the EaP GREEN Programme of the EU in Georgia, 2013-2016. Available from: www.recpnet.org
170. United Nations Development Programme UNDP/GEF Kura Project (2013). Reducing Transboundary Degradation in the Kura-Ara(k)s River Basin. Updated Transboundary Diagnostic Analysis. Final draft for approval. Baku/ Tbilisi/Yerevan.
171. United Nations Development Programme UNDP/GEF Project (2012). Reducing Transboundary Degradation in the Kura-Ara(k)s River Basin. Regional Capacity Needs Assessment for Integrated Water Resources Management. Tbilisi, Baku, Yerevan.
172. United Nations Development Programme UNDP/GEF Project (2013). Reducing Transboundary Degradation in the Kura-Ara(k)s River Basin. Desk Study – Analysis of Trends in hydropower, agricultural and municipal water use in the Kura Ara(k)s river basin. Tbilisi, Baku, Yerevan.
173. United Nations Development Programme UNDP/GEF Project (2013). Reducing Transboundary Degradation in the Kura-Ara(k)s River Basin. Desk Study – Climate Change. Tblisi, Baku, Yerevan.
174. United Nations Development Programme UNDP/GEF Project (2013). Reducing Transboundary Degradation in the Kura-Ara(k)s River Basin. Desk Study – Hydrology. Tblisi, Baku, Yerevan.
175. United Nations Development Programme UNDP/GEF Project (2013). Reducing Transboundary Degradation in the Kura-Ara(k)s River Basin. Desk Study – water quality hot-spots in the Kura-Ara(k)s river basin. Tbilisi, Baku, Yerevan.
176. United Nations Development Programme UNDP/GEF Project (2013). Reducing Transboundary Degradation in the Kura-Ara(k)s River Basin. Executive Summary. Tbilisi, Baku, Yerevan.
177. United Nations Development Programme UNDP/GEF Project (2013). Reducing Transboundary Degradation in the Kura-Ara(k)s River Basin. Updated Transboundary Diagnostic Analysis. Tbilisi, Baku, Yerevan.
178. United Nations Development Programme UNDP/GEF Project (2014). Reducing Transboundary Degradation in the Kura-Ara(k)s River Basin. Draft IWRM Plan for Georgia. Tbilisi.
179. United Nations Development Programme UNDP/GEF Project (2014). Reducing Transboundary Degradation in the Kura-Ara(k)s River Basin. Strategic Action Program. Draft for Ministers Comments.
180. United Nations Economic Commission for Europe (2011). Second Assessment of transboundary rivers, lakes and groundwaters. New York; Geneva: Economic Commission for Europe. Convention on the Protection and Use of Transboundary Watercourses and International Lakes.
181. United Nations Economic Commission for Europe (2013). Draft guidance on resolving a possible systemic inconsistency enhancing consistency between the Convention and the environmental assessment within the framework of State ecological expertise in countries of Eastern Europe, the Caucasus and Central Asia. Working Group on Environmental Impact Assessment and Strategic Environmental Assessment. November 2013.
182. United Nations Economic Commission for Europe (2013). Results and Lessons Learnt from Georgian National Policy Dialogue on Integrated Water Resources Management under European Union Water Initiative. Tbilisi, 2013.
183. United Nations Environment Programme UNEP and UNDP (2011). State of the Environment of the Caspian Sea 2010.
184. United Nations Environment Programme UNEP and WWF (2013). The Economics of Ecosystems and Biodiversity (TEEB). Scoping Study for Georgia. November 2013.
292 Sources
185. United States Agency for International Development USAID (2013). Energy Policy White Paper: Energy Policy Directions for Georgia. Hydro Power and Energy Planning Project (HPEP). Deloitte Consulting LLP. October 2013.
186. University of Gothenburg (2009). Georgia Environmental and Climate Change Policy Brief, Draft 2009-01-22. Gothenburg 2009. Available from: http://sidaenvironmenthelpdesk.se/wordpress3/wp-content/uploads/2013/04/Georgia-EnvCC-Policy-Brief-Draft-090130.pdf
187. USAID (2011). Integrated Natural Resources Management in Watersheds (INRMW) of Georgia Program Technical Report 1. Rapid National Assessment. February.
188. USAID (2013). Policy Brief: Analysis of Draft Laws to reform Local Self-Government in Georgia. Prepared by William Cartier. July 2013.
189. USAID (2014). Methodology for the Assessment of Environmental Flow Levels in Rivers and Streams – Integrated Natural Resources Management in Watersheds of Georgia (INRMW).
190. USAID (2014). The Summary of the “Socio-Economic Development Strategy for Georgia, Georgia 2020”. February 2014. Available from: http://pdf.usaid.gov/pdf_docs/PA00JPSG.pdf
191. World Bank (2007). Integrating Environment into Agriculture and Forestry Progress and Prospects in Eastern Europe and Central Asia. Volume II Georgia, Country Review. November 2007.
192. World Bank (2009). Convenient Solutions to an Inconvenient Truth: Ecosystem-based Approaches to Climate Change.
193. World Bank (2010). Towards Improved Rural Sanitation in Georgia. Sanitation, hygiene and wastewater support service briefing note; no. SWAT 1. Water Partnership Programme. Maryanne Leblanc (SWAT), Ahmed A. R. Eiweida (Country Sector Coordinator).
194. World Bank (2011). Improving the sustainability of road management and financing in Georgia. Available from: www-wds.worldbank.org/external/default/WDSContentServer/WDSP/IB/2012
195. World Bank (2013). Georgia - Public Expenditure and Financial Accountability (PEFA) Assessment 2012. September 2013.
196. World Bank (2014). International Bank for Reconstruction and Development Project Appraisal Document on a proposed loan in the amount of US $60 million to Georgia for a Transmission Grid Strengthening Project. April 18, 2014.
197. World Bank (2014). International development association project. Appraisal document on a proposed credit in the amount of SDR 32.40 million (us$50 million equivalent) to Georgia for an irrigation and land market development project. Report No: PAD862. Sustainable Development Department. South Caucasus Country. Unit Europe and Central Asia Region.
198. World Bank Group (2014). Georgia Partnership Program Snapshot. April 2014.
199. World Bank Group (2014). State and Trends of Carbon Pricing 2014. Washington DC, May 2014. Available from: http://www-wds.worldbank.org/external/default/WDS
200. World Commission on Dams (2000). Dams and Development – A New Framework for Decision Making. November 2000.
201. World Health Organization WHO (2012). The human and financial burden of asbestos in the WHO European region; WHO meeting report; 5-6 November 2012. Bonn, Germany.
202. World Health Organization WHO (2013). Report on the Global Tobacco Epidemic 2013.
203. World Health Organization WHO (2014). International lead poisoning prevention week of action in the WHO European Region, 20–26 October 2013. Report 2014.
204. WWF and EU (2012). Adaptation of Forests to Climate Change - Increasing the resilience of forest ecosystems against climate change in the South Caucasus countries through forest transformation. 2012.

Sources 293
205. ZOÏ Environment Network (2010). Climate Change in the South Caucasus.
206. ZOÏ Environment Network and ENVSEC (2011). Climate Change in the South Caucasus.
Websites:
207. Asian Development Bank www.adb.org/projects/
208. Black Sea Commission www.blacksea-commission.org
209. EMBLAS Environmental Monitoring in the Black Sea www.emblasproject.org/
210. European Bank for Reconstruction and Development www.ebrd.com
211. Global Water for Sustainability www.globalwaters.net
212. Hydropower and Energy Planning Project www.hydropower.ge
213. Ministry of Energy of Georgia http://www.energy.gov.ge/index.php?lang=eng
214. Ministry of Energy of Georgia www.energy.gov.ge
215. Ministry of Environment and Natural Resources Protection of Georgia MENRP http://moe.gov.ge
216. National Environmental Agency of Georgia http://www.nea.gov.ge/index.php?lang_id=ENG&sec_id=1
217. United Water Supply Company of Georgia www.water.gov.ge/eng/
218. World Bank www.worldbank.org


ISBN 978-92-1-117101-3
Geo
rgia
Envi
ronm
enta
l Per
form
ance
Rev
iew
s
United Nations publicationSales No. E.16.II.E.3
Information ServiceUnited Nations Economic Commission for Europe
Palais des NationsCH - 1211 Geneva 10, SwitzerlandTelephone: +41(0)22 917 44 44Fax: +41(0)22 917 05 05E-mail: [email protected]: http://www.unece.org
Printed at United Nations, Geneva1601604 (E)–February 2016–1,173
ECE/CEP/177
The United Nations Economic Commission for Europe (ECE) EnvironmentalPerformance Review Programme assesses progress made by individualcountries in reconciling their economic and social development withenvironmental protection, as well as in meeting international commitments onenvironment and sustainable development.
The EPR Programme assists countries to improve their environmental policies by making concrete recommendations for better policy design and implementation.
such as those in agriculture, energy, transport and health. Through the peer review process, the reviews promote dialogue among governments about the effectiveness of environmental policies as well as the exchange of practical experience in implementing sustainable development and green economy initiatives. They also promote greater government accountability to the public.
The present publication contains the third Environmental Performance Review of Georgia. The review takes stock of the progress made by Georgia in the management of its environment since the country was reviewed in 2010 for the second time. It assesses the implementation of the recommendations contained in the second review. The third review covers policy-making, implementation
on air protection, water and waste management, biodiversity and protected areas, energy, industry, agriculture, transport, forestry, tourism, health and risk management of natural and technological/anthropogenic hazards. The review makes suggestions for strengthening efforts towards a comprehensive and systemic response to sustainable development challenges.