How Do Illicit Drugs Move Across Countries? A Network ...
23
Manuscript accepted for publication in the Journal of Drug Issues 47(2), April 2017, pp. 217–240, doi: https://doi.org/10.1177/0022042616682426 How Do Illicit Drugs Move Across Countries? A Network Analysis of the Heroin Supply to Europe Luca Giommoni, 1 * Alberto Aziani, 2 Giulia Berlusconi 3 Abstract Illicit drugs are trafficked across manifold borders before ultimately reaching consumers. Consequently, interdiction of cross-border drug trafficking forms a critical component of the European Union’s initiative to reduce drug supplies. However, there is contradictory evidence about its effectiveness, which is due, in part, to a paucity of information about how drugs flow across borders. This study uses a network approach to analyze international drug trafficking both to and within Europe, drawing on several perspectives to delineate the factors that affect how drug shipments move across borders. The analysis explicates how drug trafficking is concentrated along specific routes; moreover, we demonstrate that its structure is not random but, rather, driven by specific factors. In particular, corruption and social and geographical proximity are key factors explaining the configuration of heroin supply to European countries. This study also provides essential insights into the disruption of traffickers’ illicit activities. Keywords drug trafficking, network analysis, heroin. Introduction Illicit drugs, especially heroin and cocaine, travel across multiple borders before reaching consumer markets (Caulkins, 2015). Although, in principle, drug traffickers have a plethora of suitable routes through which to move illicit drugs, in actuality, drug trafficking is concentrated along specific routes, as countries generally have a limited number of trading partners (Boivin, 2013, 2014a; European Monitoring Centre for Drugs and Drug Addiction [EMCDDA] & EUROPOL, 2013; United Nations Office on Drugs and Crime [UNODC], 2015d). In this critical respect, the international trade network of illicit drugs is indeed less dense than that which pertains to legal commodities (Boivin, 2013, 2014a). The concentration of drug trafficking along a few specific routes follows well-established trends of other forms of criminal behavior. Indeed, an extensive corpus of criminological literature now demonstrates how crime is not uniformly distributed and some areas have higher crime rates than others (Curman, Andresen, & Brantingham, 2014; Sherman, Gartin, & Buerger, 1989; Weisburd & Amram, 2014; Weisburd, Groff, & Yang, 2012). These findings form the cornerstone of the so-called hot-spot policing approach (Weisburd, 2015). The underlying logic of this approach is that law enforcement 1 Cardiff University, School of Social Sciences, UK 2 Università Cattolica del Sacro Cuore, Milan, Italy 3 National University of Ireland, Maynooth, Ireland * Corresponding Author: Luca Giommoni, School of Social Sciences, Cardiff University, Glamorgan Building, King Edward VII Avenue, Cardiff CF10 3WT, Wales, UK. Email: [email protected]
-
Upload
khangminh22 -
Category
Documents
-
view
3 -
download
0
Transcript of How Do Illicit Drugs Move Across Countries? A Network ...
Manuscript accepted for publication in the Journal of Drug Issues 47(2), April 2017, pp. 217–240, doi:
https://doi.org/10.1177/0022042616682426
How Do Illicit Drugs Move Across Countries? A Network
Analysis of the Heroin Supply to Europe
Luca Giommoni,1* Alberto Aziani,2 Giulia Berlusconi3
Abstract Illicit drugs are trafficked across manifold borders before ultimately reaching consumers.
Consequently, interdiction of cross-border drug trafficking forms a critical component of the European Union’s
initiative to reduce drug supplies. However, there is contradictory evidence about its effectiveness, which is due,
in part, to a paucity of information about how drugs flow across borders. This study uses a network approach to
analyze international drug trafficking both to and within Europe, drawing on several perspectives to delineate the
factors that affect how drug shipments move across borders. The analysis explicates how drug trafficking is
concentrated along specific routes; moreover, we demonstrate that its structure is not random but, rather, driven
by specific factors. In particular, corruption and social and geographical proximity are key factors explaining the
configuration of heroin supply to European countries. This study also provides essential insights into the disruption
of traffickers’ illicit activities.
Keywords drug trafficking, network analysis, heroin.
Introduction
Illicit drugs, especially heroin and cocaine, travel across multiple borders before reaching consumer
markets (Caulkins, 2015). Although, in principle, drug traffickers have a plethora of suitable routes
through which to move illicit drugs, in actuality, drug trafficking is concentrated along specific routes,
as countries generally have a limited number of trading partners (Boivin, 2013, 2014a; European
Monitoring Centre for Drugs and Drug Addiction [EMCDDA] & EUROPOL, 2013; United Nations
Office on Drugs and Crime [UNODC], 2015d). In this critical respect, the international trade network
of illicit drugs is indeed less dense than that which pertains to legal commodities (Boivin, 2013, 2014a).
The concentration of drug trafficking along a few specific routes follows well-established trends of
other forms of criminal behavior. Indeed, an extensive corpus of criminological literature now
demonstrates how crime is not uniformly distributed and some areas have higher crime rates than others
(Curman, Andresen, & Brantingham, 2014; Sherman, Gartin, & Buerger, 1989; Weisburd & Amram,
2014; Weisburd, Groff, & Yang, 2012). These findings form the cornerstone of the so-called hot-spot
policing approach (Weisburd, 2015). The underlying logic of this approach is that law enforcement
1 Cardiff University, School of Social Sciences, UK 2 Università Cattolica del Sacro Cuore, Milan, Italy 3 National University of Ireland, Maynooth, Ireland
* Corresponding Author:
Luca Giommoni, School of Social Sciences, Cardiff University, Glamorgan Building, King Edward VII Avenue, Cardiff
CF10 3WT, Wales, UK.
Email: [email protected]
2
resources should be concentrated within the areas where crime most commonly occurs (Sherman et al.,
1998). Several studies went one step further and identified the characteristics of these “hot” areas (Eck,
Clarke, & Guerette, 2007; Smith, Frazee, & Davison, 2000; Weisburd et al., 2012; Wikström, 2012),
establishing how socioeconomic (e.g., low income, ethnic heterogeneity, residential instability) and
physical features (e.g., land use and presence of risky facilities) of places can help us account for crime
concentration. Such research was invaluable in terms of providing an evidence-base from which to both
efficiently manage police resources and design social interventions aimed at tackling the root causes of
crime (Weisburd, Groff, & Yang, 2013).
The disruption of illicit drug trafficking, both within the European Union (EU) and along its external
borders, constitutes a key priority of the EU Drugs Strategy (2013-2020; Council of the European Union,
2012). Yet, evidence pertaining to the effectiveness of current interdiction programs is contradictory at
best (Collins, 2014). For example, traffickers adapt to interdiction programs by either changing their
modes of transportation and hiding techniques, or shifting to alternative routes (Friesendorf, 2005;
Manski, Pepper, & Thomas, 1999; Reuter, 2014; Seccombe, 1995; Windle & Farrell, 2012). The latter
form of adaptation is often referred to as the “balloon effect,” and suggests that stronger law enforcement
actions in one location will result in the displacement of drug trafficking activities to another location
(Friesendorf, 2005; Hawdon & Kleiman, 2011; Reuter, 2014). The balloon analogy derives from the
similarity between this dynamic and that of incompressible fluids that move toward areas of lower
resistance when under pressure (Mora, 1996). Consequently, eradications, seizures, and other drug
control interventions taking place in one country may damage others if coordination schemes are scant
(Chouvy, 2012; Mora, 1996; Reuter, 2014). The emergence of a supply route of cocaine to Europe via
Africa following the instantiation of increased level of controls between the Netherlands and the
Netherlands Antilles is a recent example which testifies to the notorious balloon effect and the limits of
interdiction programs (Reuter, 2014; UNODC, 2007, 2013).
The concentration of drug trafficking along specific routes also suggests that traffickers are driven by
specific motives (Boivin, 2014a; Reuter, 2014; UNODC, 2015c). The understanding of how and why
crime focuses within particular areas proved to be integral to the introduction of new criminal justice
and social interventions aimed at reducing crime. Similarly, one would think that gaining insights into
the concentration of drug trafficking along specific routes could also aid efforts to identify the most
effective counter-policies, evaluate the consequences of interdiction programs, and anticipate the
possible displacement of traffickers’ illicit activities because of such programs. However, there has
hitherto been a dearth of empirical research investigating which factors shape the geographic
configuration of international drug trafficking and why it concentrates along a specific and limited range
of paths (Trumbore & Woo, 2014).
The present contribution investigates the determinants of the geopolitical configuration of heroin
supply to European countries. It draws from several disciplines (i.e., criminology, macroeconomics, and
geography) to explain what factors determine how drug shipments move across countries. The reason
for our focus on the trafficking of heroin to Europe is twofold. First, heroin consumption still accounts
for a large share of drug-related health and social costs in Europe (EMCDDA, 2015). For example, 40
experts from across the EU recently judged heroin to be the most harmful illicit psychoactive substance
in Europe, as well as the second most harmful overall with respect to 16 harm criteria (van Amsterdam,
Nutt, Phillips, & van den Brink, 2015). The purity of the heroin available in certain European markets,
and therefore its potential harm, is increasing alongside the number of overdose deaths (EMCDDA,
2015). Second, Europe has a large availability of country-level data. As concluded in the first European
Conference on Drug Supply Indicators, “. . . a considerable amount of data on drug supply is already
3
being collected in a systematic way across the EU, and the way forward is to build on what already
exists . . .” (EMCDDA, 2010, p. 7). Despite this article’s focus, the methodological approach can be
replicated and adapted to other geographic areas, illicit substances (e.g., cocaine, cannabis), and illicit
markets (e.g., trafficking in human beings).
The article is structured as follows. The section “Theoretical Perspective on International Drug
Trafficking” reviews literature on the manifold factors that shape international drug trafficking, in
addition to outlining the theoretical framework. The section “Data and Method” introduces the empirical
methodology, before proceeding to discuss the data; the analytical strategy mobilized in the article; and
its limitations. The section “Results and Discussion” presents and discusses the results. The article
concludes by delineating the emergent research and policy implications.
Theoretical Perspective on International Drug Trafficking
Current knowledge of the various factors underpinning the geopolitical configuration of transnational
drug trafficking routes is limited, both theoretically and empirically—in fact, it is practically absent in
the latter instance (von Lampe, 2012). While a range of authors, such as Caulkins, Crawford, and Reuter
(1993); Akyeampong (2005); Decker and Townsend-Chapman (2008); Paoli and Reuter (2008); and
Kleemans (2013), provide some valuable insights, there is neither a systematic knowledge-base nor an
established framework from which to explicate the geographical configuration of transnational drug
trafficking routes. The contribution by Reuter (2014) centers on three models and marks the sole attempt
to systematically organize knowledge about how smugglers choose drug routes.
The first model is founded upon the idea that the costs imposed by law enforcement authorities, such
as loss of shipments, confiscation of assets, and, more importantly, incarceration, are the principal costs
for drug traffickers (Caulkins & Reuter, 1998; Kuziemko & Levitt, 2004; Reuter & Kleiman, 1986).
Resultantly, the more national law enforcement agencies increase these costs, the less attractive a
country will be (Reuter, 2014).
The second model identifies geographical proximity to the main producer or consumer countries as
an important risk factor for becoming a transhipment country, as traveling long distances increases
transportation costs as well as the risk of interception and arrest (Reuter, 2014). As Reuter (2014) pointed
out, the proximity of both Mexico to the United States and the Balkan countries to Western Europe is a
crucial factor in their pivotal role in the trafficking of cocaine and heroin, respectively.
In the third model, Reuter (2014) argues that social ties among countries, such as migration patterns,
may shape drug trafficking routes. With regard to the drug trade in Western Europe, for example, Paoli
and Reuter (2008) found that Turkish and Albanians dominate both the import and retail distribution of
heroin, whereas Colombians have a leading role in the import of cocaine from South America. Along
with the relative proximity to production or key trafficking countries, a large immigrant diaspora in
several European countries is a common trait of these ethnic groups. In a similar vein, Nigerian
traffickers are now increasingly playing an important role in the trafficking of cocaine. Despite Nigeria’s
distance from any significant producer or consumer country, the migration of 3 million Nigerians to
Southeast Asia, the United States, Latin America, and Europe goes some way to helping us explain this
emergent dynamic (Paoli & Reuter, 2008). Although easy access to suppliers and fertile ground for
corruption may constitute a competitive advantage to be exploited in transnational drug trafficking
activities, other authors stress the relevance of diasporas and social networks as crucial assets for
transnational crimes in general (Bruinsma & Bernasco, 2004; Kleemans & van De Bunt, 1999; Soudijn
4
& Kleemans, 2009; van Duyne, 1993) and drug trafficking specifically (Akyeampong, 2005; Zaitch,
2002).
This study, following the aforesaid framework elaborated by Reuter (2014), develops three
hypotheses for the purposes of understanding the geopolitical configuration of the international supply
of heroin to Europe. The first hypothesis relates to the claim that the routes offering high economic
returns and low risks of interception are more likely to be used to traffic drugs. The “risks and prices”
model developed by Reuter and Kleiman (1986) postulates that traffickers are rational actors who seek
to maximize profits and reduce risks. According to this perspective, countries imposing lower costs,
namely, a lower risk of interception and higher profits for traffickers, should be more likely to import
and/or export heroin. Similarly, corrupt officials reduce the risk of interception and thus facilitate drug
trafficking, although bribing custom officers may represent initial costs for traffickers (Desroches, 2007;
Greenfield & Paoli, 2012; Van Dijk, 2007; Trumbore & Woo, 2014). Boivin (2014b) found that price
markups tend to be lower in destination countries with high levels of corruption. This confirms that the
monetary costs for bribing custom officials are lower than the non-monetary costs of a higher risk of
arrest or seizure (Reuter & Kleiman, 1986).
The second hypothesis states that heroin flows are more likely to occur within countries that are
geographically close to each other. As Reuter (2014) noted, geographic proximity can reduce the costs
associated with drug trafficking. Indeed, several studies have documented the negative effect of
geographic distance on legal trade. In a meta-analysis of 103 studies, Disdier and Head (2008) found
that a 10% increase in distance lowers legal trade by about 9%. The effect of geographic distance on
illegal trade is even larger. Caulkins and Bond (2012) calculated that the price of marijuana in the United
States increased by about US$325 to US$475 per pound per 1,000 miles of distance from Mexico. As
traffickers operate under the threat of law enforcement authorities, longer distances involve longer
exposure to risk of interception and arrest.
The third hypothesis predicts that countries that are socially closer are more likely to be connected to
each other than countries that are not. As Reuter (2014) argued, besides geography, certain social factors,
such as migration flow between two countries, may facilitate trafficking between them. Several studies
in macroeconomics, for example, point out that social proximity between countries reduces the barriers
for legal trade by providing opportunities for businesses and easier access to valuable information
(Ghemawat, 2001; Prashantham, Dhanaraj, & Kumar, 2015; Rauch, 1999; Sgrignoli, Metulini, Schiavo,
& Riccaboni, 2015). Therefore, it is reasonable to assume that the effect of social proximity would also
apply to illegal trading, inasmuch as participants cannot rely on legal institutions to solve their disputes.
That is to say, traffickers need to agree on quantity, purity, conditions of the shipment, and payment.
They may also need to deal with unexpected and hostile situations (i.e., seizure of the shipment) where
the two parties need to find a common solution (Lameli, Nitsch, Südekum, & Wolf, 2013). Speaking
the same language, sharing the same sociocultural background, or coming from the same institutional
setting increase trust in the partner and reduce transaction costs (Combes, Lafourcade, & Mayer, 2005;
Kleemans & van De Bunt, 1999; Paoli & Reuter, 2008).
Language and cultural affinity facilitate cross-border transactions by providing traders with the
opportunity to rely on non-economic, sociocultural factors (e.g., reputation and trust of suppliers, ethnic
ties) to find international partners and to reduce uncertainties in trading (Lee & Park, 2016; Sgrignoli et
al., 2015). As observed in legal trading, preexisting ties are a determinant factor during the search for a
trading partner, and informal networks also play a key role in shaping international trade (Rauch, 1999).
For example, informal networks may sanction violations of the trafficking agreements by blacklisting
the deviant partner and excluding him or her from future deals (Rauch & Trindade, 2002). Especially in
5
the context of illicit industries, preexisting ties rather than market-driven reasons (i.e., profits or
dimension of the market) may lead to the decision to export to specific countries.
Data and method
The Heroin Trafficking Network
Following the work of Paoli, Greenfield, and Reuter (2009), this study conceives of international drug
trafficking as a series of trading relations among countries. Although the authors do not use network
analysis techniques, they employ a framework and terminology (e.g., “flow model”) in line with this
approach. This is also consistent with other researchers who have subsequently utilized a social network
approach to study the international trafficking of illicit drugs (Boivin, 2013, 2014a, 2014b; Chandra &
Joba, 2015).
Data on heroin trafficking network to and within Europe derive from seizure cases reported in the
UNODC individual drug seizure (IDS) database that contains information about the origin, transit, and
destination of shipments seized (Boivin, 2011, 2013, 2014b; UNODC, 2015c). This information is used
to identify the pairs of countries exporting and importing heroin with each other and, in turn, to establish
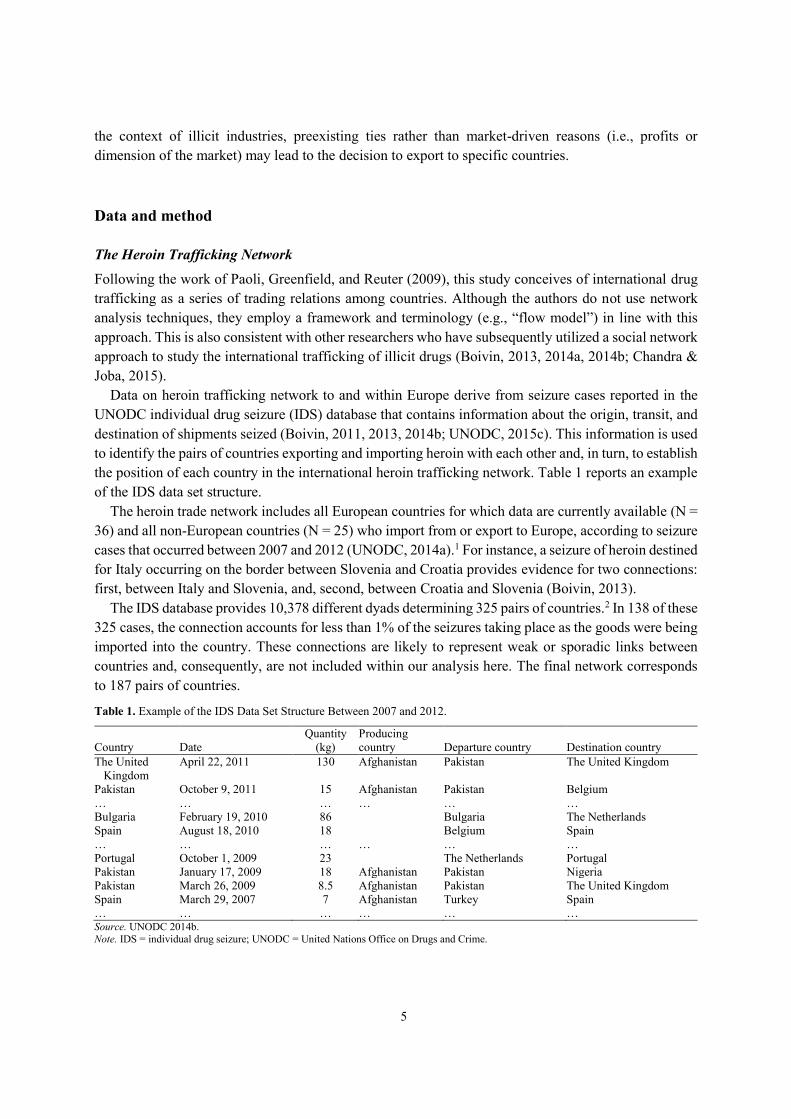
the position of each country in the international heroin trafficking network. Table 1 reports an example
of the IDS data set structure.
The heroin trade network includes all European countries for which data are currently available (N =
36) and all non-European countries (N = 25) who import from or export to Europe, according to seizure
cases that occurred between 2007 and 2012 (UNODC, 2014a).1 For instance, a seizure of heroin destined
for Italy occurring on the border between Slovenia and Croatia provides evidence for two connections:
first, between Italy and Slovenia, and, second, between Croatia and Slovenia (Boivin, 2013).
The IDS database provides 10,378 different dyads determining 325 pairs of countries.2 In 138 of these
325 cases, the connection accounts for less than 1% of the seizures taking place as the goods were being
imported into the country. These connections are likely to represent weak or sporadic links between
countries and, consequently, are not included within our analysis here. The final network corresponds
to 187 pairs of countries.
Table 1. Example of the IDS Data Set Structure Between 2007 and 2012.
Country Date
Quantity
(kg)
Producing
country Departure country Destination country
The United
Kingdom
April 22, 2011 130 Afghanistan Pakistan The United Kingdom
Pakistan October 9, 2011 15 Afghanistan Pakistan Belgium
… … … … … …
Bulgaria February 19, 2010 86 Bulgaria The Netherlands
Spain August 18, 2010 18 Belgium Spain
… … … … … …
Portugal October 1, 2009 23 The Netherlands Portugal
Pakistan January 17, 2009 18 Afghanistan Pakistan Nigeria
Pakistan March 26, 2009 8.5 Afghanistan Pakistan The United Kingdom
Spain March 29, 2007 7 Afghanistan Turkey Spain
… … … … … … Source. UNODC 2014b.
Note. IDS = individual drug seizure; UNODC = United Nations Office on Drugs and Crime.
6
Independent variables
This study uses both nodal and relational attributes data to understand what factors make up the
European heroin trafficking network. Nodal attributes refer to specific features of importing countries,
such as the level of corruption, whereas relational attributes provide information about the links between
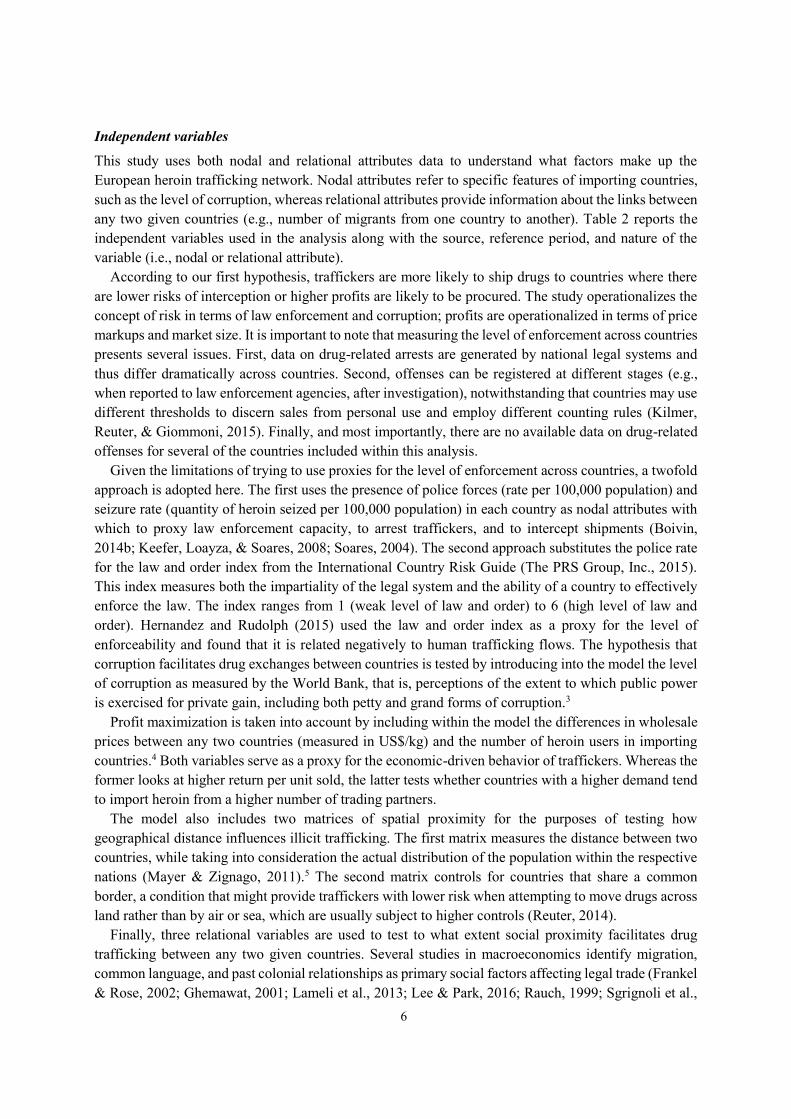
any two given countries (e.g., number of migrants from one country to another). Table 2 reports the
independent variables used in the analysis along with the source, reference period, and nature of the
variable (i.e., nodal or relational attribute).
According to our first hypothesis, traffickers are more likely to ship drugs to countries where there
are lower risks of interception or higher profits are likely to be procured. The study operationalizes the
concept of risk in terms of law enforcement and corruption; profits are operationalized in terms of price
markups and market size. It is important to note that measuring the level of enforcement across countries
presents several issues. First, data on drug-related arrests are generated by national legal systems and
thus differ dramatically across countries. Second, offenses can be registered at different stages (e.g.,
when reported to law enforcement agencies, after investigation), notwithstanding that countries may use
different thresholds to discern sales from personal use and employ different counting rules (Kilmer,
Reuter, & Giommoni, 2015). Finally, and most importantly, there are no available data on drug-related
offenses for several of the countries included within this analysis.
Given the limitations of trying to use proxies for the level of enforcement across countries, a twofold
approach is adopted here. The first uses the presence of police forces (rate per 100,000 population) and
seizure rate (quantity of heroin seized per 100,000 population) in each country as nodal attributes with
which to proxy law enforcement capacity, to arrest traffickers, and to intercept shipments (Boivin,
2014b; Keefer, Loayza, & Soares, 2008; Soares, 2004). The second approach substitutes the police rate
for the law and order index from the International Country Risk Guide (The PRS Group, Inc., 2015).
This index measures both the impartiality of the legal system and the ability of a country to effectively
enforce the law. The index ranges from 1 (weak level of law and order) to 6 (high level of law and
order). Hernandez and Rudolph (2015) used the law and order index as a proxy for the level of
enforceability and found that it is related negatively to human trafficking flows. The hypothesis that
corruption facilitates drug exchanges between countries is tested by introducing into the model the level
of corruption as measured by the World Bank, that is, perceptions of the extent to which public power
is exercised for private gain, including both petty and grand forms of corruption.3
Profit maximization is taken into account by including within the model the differences in wholesale
prices between any two countries (measured in US$/kg) and the number of heroin users in importing
countries.4 Both variables serve as a proxy for the economic-driven behavior of traffickers. Whereas the
former looks at higher return per unit sold, the latter tests whether countries with a higher demand tend
to import heroin from a higher number of trading partners.
The model also includes two matrices of spatial proximity for the purposes of testing how
geographical distance influences illicit trafficking. The first matrix measures the distance between two
countries, while taking into consideration the actual distribution of the population within the respective
nations (Mayer & Zignago, 2011).5 The second matrix controls for countries that share a common
border, a condition that might provide traffickers with lower risk when attempting to move drugs across
land rather than by air or sea, which are usually subject to higher controls (Reuter, 2014).
Finally, three relational variables are used to test to what extent social proximity facilitates drug
trafficking between any two given countries. Several studies in macroeconomics identify migration,
common language, and past colonial relationships as primary social factors affecting legal trade (Frankel
& Rose, 2002; Ghemawat, 2001; Lameli et al., 2013; Lee & Park, 2016; Rauch, 1999; Sgrignoli et al.,
7
2015). Their effect is tested by considering migration flows among the 61 countries included within the
analysis, the presence of a language spoken by at least 9% of the population in any pair of countries,
and historical colonial relationships among countries. Migration data from the United Nations Global
Migration Database (UNGMD) report the number (“stock”) of international migrants, for each country,
in relation to their country of origin. Data on common language and historical colonial relationships
derive from the Centre d’Etudes Prospectives et d’Informations Internationales (CEPII).
Table 2. Independent Variables.
Dimension Variable Source Period Typea
Risk of enforcement Police agents, rate per 100,000 population UNODC 2009-2012
(average)
N
Seizures, rate on 100,000 population Authors’ elaboration on
UNODC data 2009-2012
(average) N
Control of corruption World Bank 2009-2012
(average) N
Law and order index International Country Risk
Guide
2015 N
Profits Wholesale price markups Authors’ elaboration on
UNODC data
2009-2012
(average)
R
Users UNODC 2009-2012 N
Geographic distance Border adjacency CEPII NA R
Weighted distance CEPII NA R
Social distance Migrants UNGMD 2010 R
Language spoken by at least 9% of the
population
CEPII 2000-2008 R
Colonial relationship CEPII NA R Source. Authors’ elaboration.
Note. UNODC = United Nations Office on Drugs and Crime; CEPII = Centre d’Etudes Prospectives et d’Informations Internationales;
UNGMD = United Nations Global Migration Database. aN = nodal attribute data; R = relational attribute data.
Exponential Random Graph Models (ERGMs)
ERGMs are a class of statistical models for networks that allow for the prediction of the probability of
tie formation based on a set of covariates (nodal and relational attribute data) and the properties of the
network itself (Robins, Pattison, Kalish, & Lusher, 2007). These models formulate the probability of
observing a set of connections as follows:
𝑃(𝑌 = 𝑦|𝑋) = exp[𝜃𝑇𝑔(𝑦, 𝑋)]/𝑘(𝜃)
where 𝑌 is the set of edges in a network, 𝑦 is a particular given set of edges, 𝑋 represents a matrix of
attributes for the vertices in the network, 𝑔(𝑦, 𝑋) a vector of network statistics, 𝜃 corresponds to the
vector of coefficients, and 𝑘(𝜃) a normalizing constant (Goodreau, Handcock, Hunter, Butts, & Morris,
2008). Both dyad independence models and dyad dependence models—that is, those controlling for
higher order inter-dependencies between countries—are estimated (Robins et al., 2007).
Most statistical models assume that all observations are conditionally independent. Yet, “when
modelling international trade the assumption of conditional independence is difficult to sustain even in
the presence of directed country or dyad fixed effects” (Ward, Ahlquist, & Rozenas, 2013, p. 96).
ERGMs enable researchers to take into account inter-dependencies among observations, including
higher order dependencies, that is, reciprocity, transitivity, balance, and clusterability (Wasserman &
Faust, 1994). To cite an example, transitivity encapsulates the logic that the “friend of a friend is a
friend.” Henceforth, if country i trades with country j, and country j trades with country k, then the
8
probability of a flow of goods between i and k is greater than that between i and a fourth country that
has no prior or preexisting trade relationship.
ERGMs take into account dependencies among observations by including parameters for endogenous
structural effects, such as reciprocity, transitivity, and the distribution of incoming and outgoing ties in
the trafficking network. A parameter for mutual dyads (MUTUALS) captures the probability of
reciprocal ties between any two given countries. Two terms are added to account for transitivity in the
network: geometrically weighted dyadwise shared partners (GWDSP) and geometrically weighted
edgewise shared partners (GWESP). They represent twopaths and transitive triads, respectively.
Geometrically weighted in-degree (GWIDEGREE) and out-degree (GWODEGREE) are included to
capture the skewed distribution of ties among countries. These parameters aid us in our attempt to
capture processes influenced by the characteristics of the network and, in turn, limit the problem of
model degeneracy (Hunter, 2007; Hunter & Handcock, 2006).
The study adopts an iterative development model to identify the combination of variables that best fit
the data (Goodreau, Kitts, & Morris, 2009; Papachristos, Hureau, & Braga, 2013). The suitability of the
models is assessed through comparing the Akaike information criterion (AIC) and by performing
goodness-of-fit checks outlined in the work of Hunter, Goodreau, and Handcock (2008). The analyses
are performed using the Statnet suite of packages (Handcock et al., 2016; Handcock, Hunter, Butts,
Goodreau, & Morris, 2008) for R (R Core Team, 2016).
Limits
This study begins to construct the heroin trafficking network by utilizing information from the UNODC
IDS data set. However, it is important to note that UN member states only submit information about
relevant seizure cases on a voluntary basis (Boivin, 2014b). Consequently, some countries may not
report information, resulting in a lack of particular connections in the network (Boivin, 2011). By using
data spanning across several years (2007-2012) and by focusing specifically on European countries,
which tend to provide more information than non-European ones, we hope to reduce the risk of omitting
significant links. Having said this, the network can only ever be partial and incomplete, lacking in both
minor connections and important ones. Most notably, the network neglects the pivotal role of Russia as
a transhipment point to Central Europe, due to the paucity of information provided by Russia and its
neighboring countries (i.e., Belarus, Ukraine, and Estonia).
Other potential biases derive from misunderstandings during the compilation of the IDS by UN
member states. Specifically, there is an observed tendency for officers to sometimes indicate the last
country for which they can track the shipment, which, of course, can be different from the last country
from which the heroin actually flowed (Boivin, 2011). That said, a careful check of the information of
each seizure case may add to the meaningfulness of the analysis, but it does not guarantee the reliability
of the original information.
The network under analysis also considers if two countries export/import heroin from each other, but
it does not take into account the amount of drug which is traded, thus ignoring a critical element of the
complexity of drug trafficking. However, this modeling of the network reduces the potential bias
stemming from the non-uniformity of reporting on significant seizures. Indeed, including quantities may
upwardly inflate the role of exporter for countries with a higher interception rate. The only way in which
this bias would affect this analysis is if some countries tend to enforce more along certain borders than
others.6
The operationalization of the independent variables also raises several concerns. First, the rate of
police officials may not serve as an appropriate proxy for the level of enforcement against the supply of
9
drugs. That is to say, police officials are employed for manifold duties besides enforcing the supply of
illicit drugs, not to mention that higher numbers of police officials do not necessarily equate to better
policing performance. However, we wish to note that several other studies have used this variable to
estimate the risk of interception given the lack of better proxies at a cross-national level (Boivin, 2014a;
Keefer et al., 2008; Soares, 2004). Similarly, seizure rate is not a straightforward indicator of the level
of interdiction, as seizures are an outcome of several factors including quantity of drug supplied,
interdiction, and the care taken by traffickers (Kilmer & Hoorens, 2010; Kilmer et al., 2015; MacCoun
& Reuter, 2001). Disentangling the effects of these complex factors is at this present moment simply
not possible. The introduction of the law and order index, which aims to measure the capability of
institutions to monitor illicit activities, represents one such concerted attempt to corroborate the results
about the effect of law enforcement on international drug trafficking. However, as with the aforesaid
variables, the law and order index does not specifically assess enforcement against the supply of illicit
drugs but, rather, the institution’s overall performance.
The illegality of the heroin market makes it incredibly difficult to collect reliable data on the number
of users and pricing (Reuter & Greenfield, 2001). Such data collection issues are exacerbated yet further
when extended to cross-country analysis, as estimates may reflect both differences across countries and
countries’ idiosyncratic data collection methods. Such factors introduce cross-country comparability
issues and, ultimately, affect the analysis (Kilmer et al., 2015). With respect to the number of heroin
consumers, the adoption of the total number of estimated users reduces the bias introduced by different
estimate methods of the drugs prevalence. Kilmer et al. (2015) and UNODC (2015c) provided detailed
discussions about the limits and potential biases caused by the use of such data.
Results and Discussion
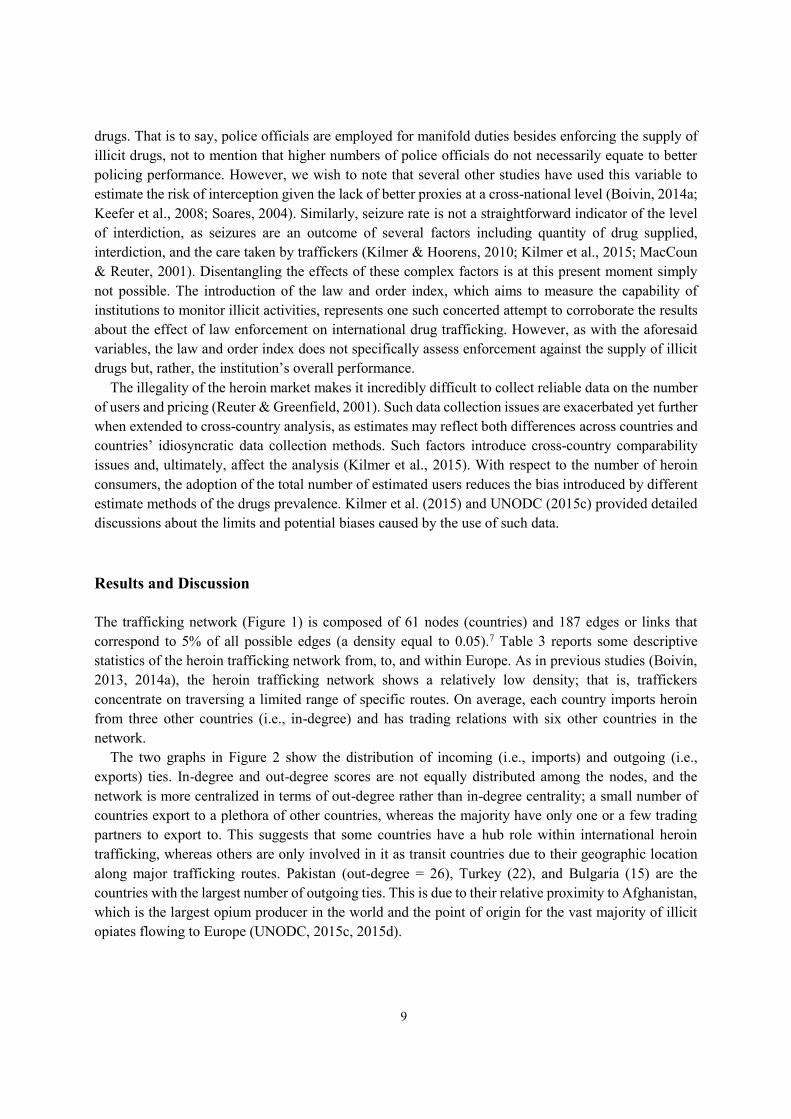
The trafficking network (Figure 1) is composed of 61 nodes (countries) and 187 edges or links that
correspond to 5% of all possible edges (a density equal to 0.05).7 Table 3 reports some descriptive
statistics of the heroin trafficking network from, to, and within Europe. As in previous studies (Boivin,
2013, 2014a), the heroin trafficking network shows a relatively low density; that is, traffickers
concentrate on traversing a limited range of specific routes. On average, each country imports heroin
from three other countries (i.e., in-degree) and has trading relations with six other countries in the
network.
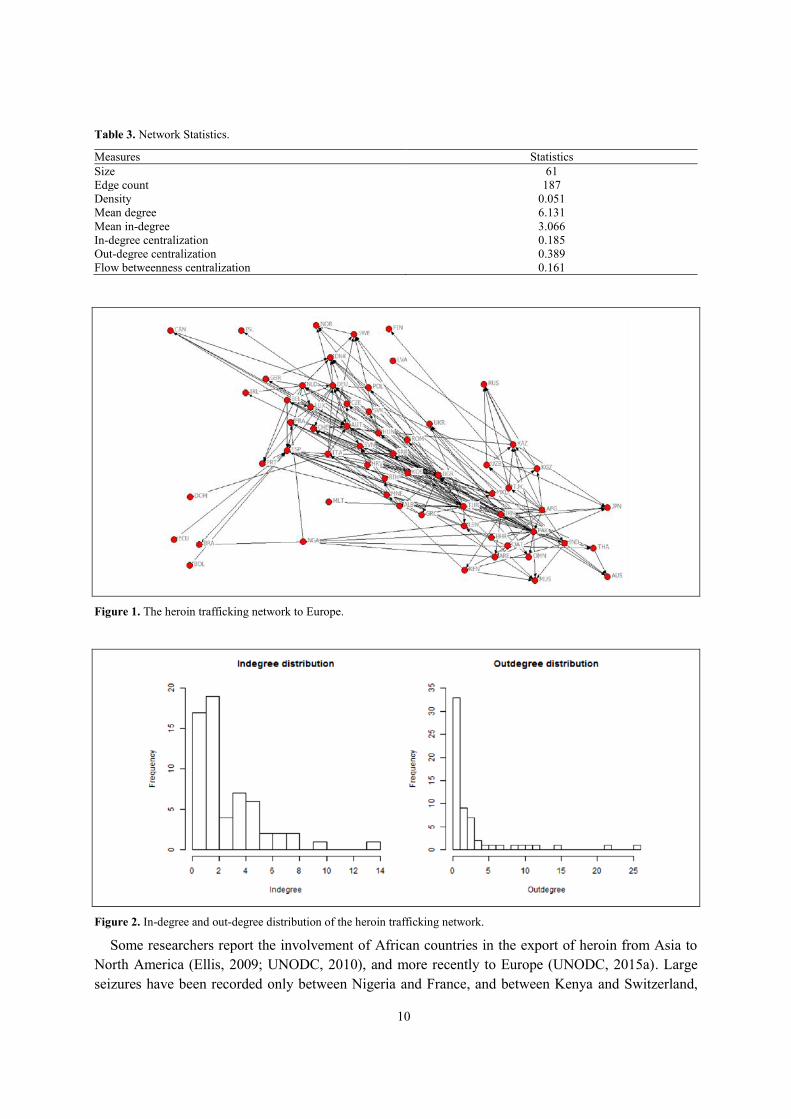
The two graphs in Figure 2 show the distribution of incoming (i.e., imports) and outgoing (i.e.,
exports) ties. In-degree and out-degree scores are not equally distributed among the nodes, and the
network is more centralized in terms of out-degree rather than in-degree centrality; a small number of
countries export to a plethora of other countries, whereas the majority have only one or a few trading
partners to export to. This suggests that some countries have a hub role within international heroin
trafficking, whereas others are only involved in it as transit countries due to their geographic location
along major trafficking routes. Pakistan (out-degree = 26), Turkey (22), and Bulgaria (15) are the
countries with the largest number of outgoing ties. This is due to their relative proximity to Afghanistan,
which is the largest opium producer in the world and the point of origin for the vast majority of illicit
opiates flowing to Europe (UNODC, 2015c, 2015d).
10
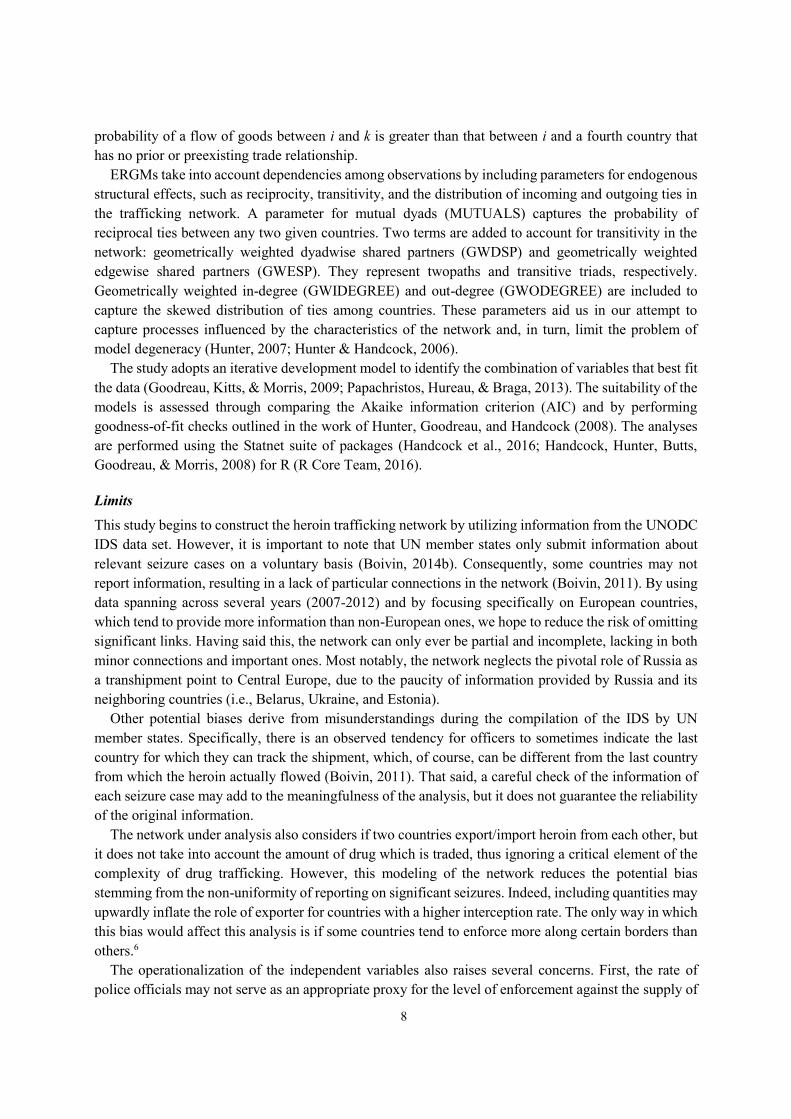
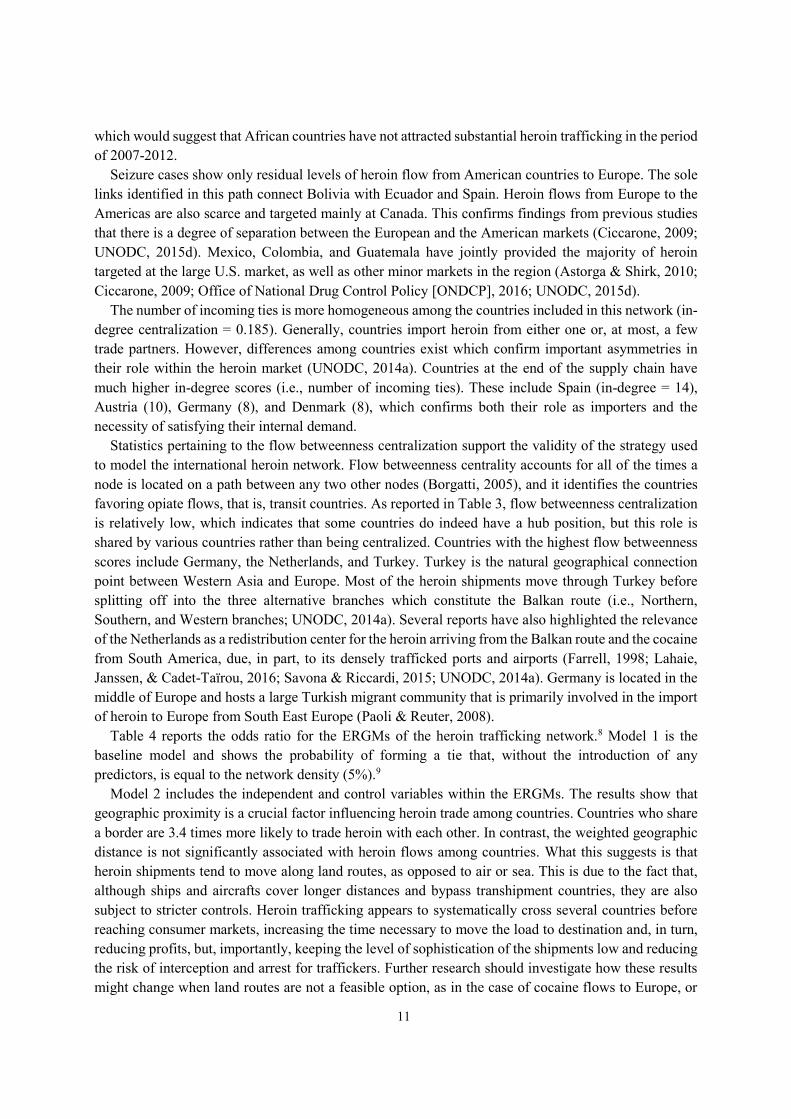
Table 3. Network Statistics.
Measures Statistics
Size 61
Edge count 187
Density 0.051
Mean degree 6.131
Mean in-degree 3.066
In-degree centralization 0.185
Out-degree centralization 0.389
Flow betweenness centralization 0.161
Figure 1. The heroin trafficking network to Europe.
Figure 2. In-degree and out-degree distribution of the heroin trafficking network.
Some researchers report the involvement of African countries in the export of heroin from Asia to
North America (Ellis, 2009; UNODC, 2010), and more recently to Europe (UNODC, 2015a). Large
seizures have been recorded only between Nigeria and France, and between Kenya and Switzerland,
11
which would suggest that African countries have not attracted substantial heroin trafficking in the period
of 2007-2012.
Seizure cases show only residual levels of heroin flow from American countries to Europe. The sole
links identified in this path connect Bolivia with Ecuador and Spain. Heroin flows from Europe to the
Americas are also scarce and targeted mainly at Canada. This confirms findings from previous studies
that there is a degree of separation between the European and the American markets (Ciccarone, 2009;
UNODC, 2015d). Mexico, Colombia, and Guatemala have jointly provided the majority of heroin
targeted at the large U.S. market, as well as other minor markets in the region (Astorga & Shirk, 2010;
Ciccarone, 2009; Office of National Drug Control Policy [ONDCP], 2016; UNODC, 2015d).
The number of incoming ties is more homogeneous among the countries included in this network (in-
degree centralization = 0.185). Generally, countries import heroin from either one or, at most, a few
trade partners. However, differences among countries exist which confirm important asymmetries in
their role within the heroin market (UNODC, 2014a). Countries at the end of the supply chain have
much higher in-degree scores (i.e., number of incoming ties). These include Spain (in-degree = 14),
Austria (10), Germany (8), and Denmark (8), which confirms both their role as importers and the
necessity of satisfying their internal demand.
Statistics pertaining to the flow betweenness centralization support the validity of the strategy used
to model the international heroin network. Flow betweenness centrality accounts for all of the times a
node is located on a path between any two other nodes (Borgatti, 2005), and it identifies the countries
favoring opiate flows, that is, transit countries. As reported in Table 3, flow betweenness centralization
is relatively low, which indicates that some countries do indeed have a hub position, but this role is
shared by various countries rather than being centralized. Countries with the highest flow betweenness
scores include Germany, the Netherlands, and Turkey. Turkey is the natural geographical connection
point between Western Asia and Europe. Most of the heroin shipments move through Turkey before
splitting off into the three alternative branches which constitute the Balkan route (i.e., Northern,
Southern, and Western branches; UNODC, 2014a). Several reports have also highlighted the relevance
of the Netherlands as a redistribution center for the heroin arriving from the Balkan route and the cocaine
from South America, due, in part, to its densely trafficked ports and airports (Farrell, 1998; Lahaie,
Janssen, & Cadet-Taïrou, 2016; Savona & Riccardi, 2015; UNODC, 2014a). Germany is located in the
middle of Europe and hosts a large Turkish migrant community that is primarily involved in the import
of heroin to Europe from South East Europe (Paoli & Reuter, 2008).
Table 4 reports the odds ratio for the ERGMs of the heroin trafficking network.8 Model 1 is the
baseline model and shows the probability of forming a tie that, without the introduction of any
predictors, is equal to the network density (5%).9
Model 2 includes the independent and control variables within the ERGMs. The results show that
geographic proximity is a crucial factor influencing heroin trade among countries. Countries who share
a border are 3.4 times more likely to trade heroin with each other. In contrast, the weighted geographic
distance is not significantly associated with heroin flows among countries. What this suggests is that
heroin shipments tend to move along land routes, as opposed to air or sea. This is due to the fact that,
although ships and aircrafts cover longer distances and bypass transhipment countries, they are also
subject to stricter controls. Heroin trafficking appears to systematically cross several countries before
reaching consumer markets, increasing the time necessary to move the load to destination and, in turn,
reducing profits, but, importantly, keeping the level of sophistication of the shipments low and reducing
the risk of interception and arrest for traffickers. Further research should investigate how these results
might change when land routes are not a feasible option, as in the case of cocaine flows to Europe, or
12
when the value per volume is lower, as in the case of Chinese counterfeit cigarettes or resin cannabis
from Morocco.
The results show that both migration flows and common language have an effect on the way heroin
moves between countries, whereas prior colonial relationships appear to not be significantly associated
with it. As is the case with legal trade, paired countries with intense migration flows are also more likely
to traffic heroin with each other. This confirms findings from previous studies on the influence of
migration patterns on drug trafficking routes (Akyeampong, 2005; Paoli & Reuter, 2008; Zaitch, 2002).
For instance, Paoli and Reuter (2008) found that Turkish and Albanian ethnic groups dominate the
import and retail distribution of heroin in Europe. Despite their predominance, these groups do not act
as a monolithic bloc but, rather, cooperate or compete with other ethnic groups to smuggle heroin into
Europe. Criminal groups involved in transnational drug trafficking tend to organize their activities along
a continuum with large, longlasting, and well-organized groups at one extreme, and small, temporary
networks of collaborating criminals at the other (Kostakos & Antonopoulos, 2010; Ruggiero & Khan,
2007; von Lampe, 2013).
Furthermore, countries where sections of the population speak the same language are 1.9 times more
likely to traffic heroin. Egger and Lassmann (2012) showed how speaking the same language increases
trade flows between two countries by 44%. Common language serves as a proxy for a form of cultural
contiguity between particular countries. Several studies document how common or similar cultural
arrangements make agreements between trading partners easier (Frankel & Rose, 2002; Lameli et al.,
2013). For example, transaction costs are lower if partners share the same cultural or religious
background (Combes et al., 2005). This is as valid for drug trafficking as it is for legal trade. Above all,
cultural proximity provides traffickers with the opportunity to rely on non-economic factors to find
international partners (e.g., reputation and trust of suppliers, belonging to the same ethnic group). This
reduces uncertainties in a market that operates “both without and against the state” (Paoli, 2002, p. 64),
that is, a market whose participants cannot resort to legal authorities to enforce their agreements, and
are constantly under threat of arrest.
The inclusion of migration flows and language may go some way to explaining why the colony–
colonizer relationship does not significantly affect the heroin network. According to previous analyses,
ethnicity and migration patterns are crucial determinants of the international flows of both illicit and
licit goods (Paoli & Reuter, 2008; Rauch & Trindade, 2002). Language and migration flows can capture
the effect of culture and ethnicity, and, from an econometric perspective, mitigate the role of past
colonial relationships in the formation of trading connections. Lameli et al. (2013) examined various
aspects of linguistic influences on trade, concluding that the principal effect from speaking the same
language is the promotion of cultural proximity among partners. Migration patterns often overlap with
colonial relationships. For instance, half of the Colombians who migrated to Europe reside in Spain.
Consequently, migration flows may account for the movement of people from former colonies to
colonizer countries, in turn, limiting the effect of colonial relationships in the model.
Market forces also seem to affect, in part, the heroin trafficking network. That is to say, countries
with a high demand tend to import heroin from a larger number of countries, while the maximization of
profits (operationalized in terms of trade price markups) does not seem to affect the formation of a
trafficking route. The number of heroin users is significantly and positively correlated with the
probability of forming a tie. For example, the largest Western and Central European markets (i.e., the
United Kingdom, France, Italy, and Germany), which constitute the bulk of European heroin
consumption, import from a higher number of countries than most other countries within the network.10
Large markets provide more business opportunities, which, in turn, attracts more traffickers and drug
13
flows from different trading partners. An alternative explanation is that greater availability of heroin in
countries along important trafficking routes facilitates its distribution and consumption among the local
population (Beyrer et al., 2000; United Nations International Drug Control Programme [UNDCP],
1998). The methodology utilized here does not allow us to definitively identify the direction of the
causality, and therefore, we must stress that both dynamics may coexist.
The literature is unanimous concerning the fact that economic profits are the primary driving force of
drug trafficking (Arlacchi & Lewis, 1990; Chi, Hayatdavoudi, Kruszona, & Rowe, 2013; Desroches,
2007; Kenney, 2007). However, the results of the current study indicate that gross profits only partially
affect the structure of the heroin trafficking network. In fact, the influence of indicators of social
proximity is stronger in this case, thus demonstrating how social and cultural relations are more relevant
predictors of the formation of heroin trafficking routes than market-driven reasons (i.e., profits;
Kleemans, 2013). Nonetheless, better connections, faster transactions, and lower risk of detection and
scams have an economic value that traffickers are likely to take into account when organizing their
businesses.
Corruption is positively and significantly associated with the number of incoming ties; the higher the
level of corruption, the higher the number of connections through which heroin enters the country. For
each one-unit increase in the level of corruption in the importing country, the likelihood of forming a
link increases by 1.1 times, when everything else is held constant. Corruption reduces risks and non-
monetary costs, hence providing traffickers with protection against arrests and seizures (Basu, 2014).
Consequently, it can perhaps be thought of as providing a similar function for the black market that the
enforceability of contracts does for legal commerce. In the same way that strong institutions protect
legal and property rights and, in turn, facilitate legal trade, so corrupted officials guarantee the traffickers
impunity and success in shipping drug loads.
Previous literature underlines that corruption can increase as a consequence of increased drug flows
(Boyum & Kleiman, 2001; Chalk, 2011; Corso, Mercy, Simon, Finkelstein, & Miller, 2007; Giraldo,
1999; Guizado, 2005; Moser, Lister, McIlwaine, Shrader, & Tornqvist, 1999; Singer, 2008; Thoumi,
2002). The use of a general corruption index, which does not focus on drug-related bribes, suggests that
corruption has a stronger impact on connections rather than the other way round.
From a drug policy perspective, the main finding of the study is that the tightness of law enforcement
actions (police forces and seizures) in a country is ineffective in discouraging the formation of a
trafficking connection. The robustness of the results is supported in Model 3 by introducing the Crime
and Order Index from the International Country Risk Guide (The PRS Group, Inc., 2015). The only
difference between Models 2 and 3 centers on the influence of seizure rates in importing countries. In
Model 2, seizure rate coefficients are positive and significant; that is, more seizures are associated with
a larger number of connections in the trafficking network. Countries exposed to larger flows of heroin
are, in turn, expected to dedicate greater attention to fighting the traffic. Therefore, the positive
correlation between seizure rates and the presence of heroin flows might be due to the historical
evolution of drug trafficking and its enforcement in the countries within the network.
Models 2 and 3 suggest that enforcement does not prevent the formation of drug trafficking flows.
Reuter and Kleiman’s (1986) “risks and prices” model, used in several drug policy analyses, assumes
that the risk of arrest and incarceration is the main cost for supplying illicit drugs. However, empirical
studies show little evidence that additional enforcement might affect the supply of illicit drugs (Pollack
& Reuter, 2014; Décary-Hétu & Giommoni, 2016).
As Paoli and colleagues (2009) pointed out, the international supply of opiates cannot be cut, and
moreover, supply-oriented policies have a limited influence. Besides having a low probability of
14
success, a supply-reduction approach and the imposition of criminal laws for drug-related crimes in
general may worsen the situation by fueling corruption and violence, and incurring other economic,
political, and social costs (Calderón, Robles, Díaz-Cayeros, & Magaloni, 2015; Eck & Maguire, 2000;
Freeman, 2006; Greenfield & Paoli, 2012; Kleiman, 2011; Kleiman, Caulkins, Hawken, & Kilmer,
2012; MacCoun & Reuter, 2001; Miron, 1999; Osorio, 2015; Paoli et al., 2009; Riley, 1998; Rios, 2013).
Despite these side effects, law enforcement actions form the cornerstone of antidrug policies in most
countries (Caulkins & Reuter, 2010; Collins, 2014; Mejía & Restrepo, 2014; Werb et al., 2011). This
does not mean that a supply-side intervention should not be used but simply that a more harm reduction–
oriented approach, aiming at limiting its side effects, may be more impactful and have longer term
effects (Greenfield & Paoli, 2012). The results of this study, in particular, suggest that policies centered
on tackling heroin trafficking in specific regions should primarily focus on neighboring production
countries and countries with a hub position (i.e., those with several trading partners and/or those
facilitating drug trade among other countries in the network).
Finally, the model includes parameters that account for the structure of the network. The parameter
for mutual dyads shows that there is a 5% probability of reciprocal ties between any two given countries,
indicating that heroin shipments do not tend to move back and forth between countries but rather flow
in one direction—from producer to consumer countries. GWIDEGREE and GWODEGREE capture the
skewed distribution of incoming and outgoing ties among the countries, respectively. The latter shows
that the probability of forming a new outgoing tie decreases as the number of a country’s already existing
outgoing links increases. In contrast, GWDSP and GWESP account for the transitivity in the network
by capturing two-paths and transitive triads. The former is negative and statistically significant,
indicating that the probability of two countries exchanging heroin via a third country decreases as the
number of intermediaries already in use increases. The latter is positive and statistically significant,
indicating that the probability of forming a tie increases when the added edge increases the transitivity
in the network. What these findings indicate, above all, is that the overall result of drug trafficking
disruption interventions may vary depending on a country’s role in the network. Tightening controls
along connections that have alternatives are unlikely to have meaningful side effects for third countries,
whereas, targeting countries that increase the transitivity in the network may, on the contrary, result in
the reduction of heroin flows within other markets.
Most of the relationships investigated above could also, to some extent, be explained in reverse. Some
of the findings shed light on the association between key variables, but they remain an inadequate ground
for stronger causal inferences. While the characteristics of the national markets and of drug
countermeasures influence the structure of the supply, the latter, in turn, is likely to modify the market
and to shape countering policies. These reverse effects are going to be stronger whenever the
phenomenon endures over time, as it does in most heroin markets. A country afflicted by pervasive
corruption, as aforesaid, would tend to attract a higher number of heroin flows. However, at the same
time, massive drug shipments may lead to increased levels of corruption. Ceteris paribus, the same logic
applies to the rate of police officers. The lower the level of law enforcement, the higher the likelihood
of drug flows to a country, yet countries exposed to significant flows of drugs might react with an
increase in the number of police officers assigned to drug units, thus making the phenomenon more
complex to interpret. Future studies should include longitudinal analyses to test how robust the results
are to different specifications.
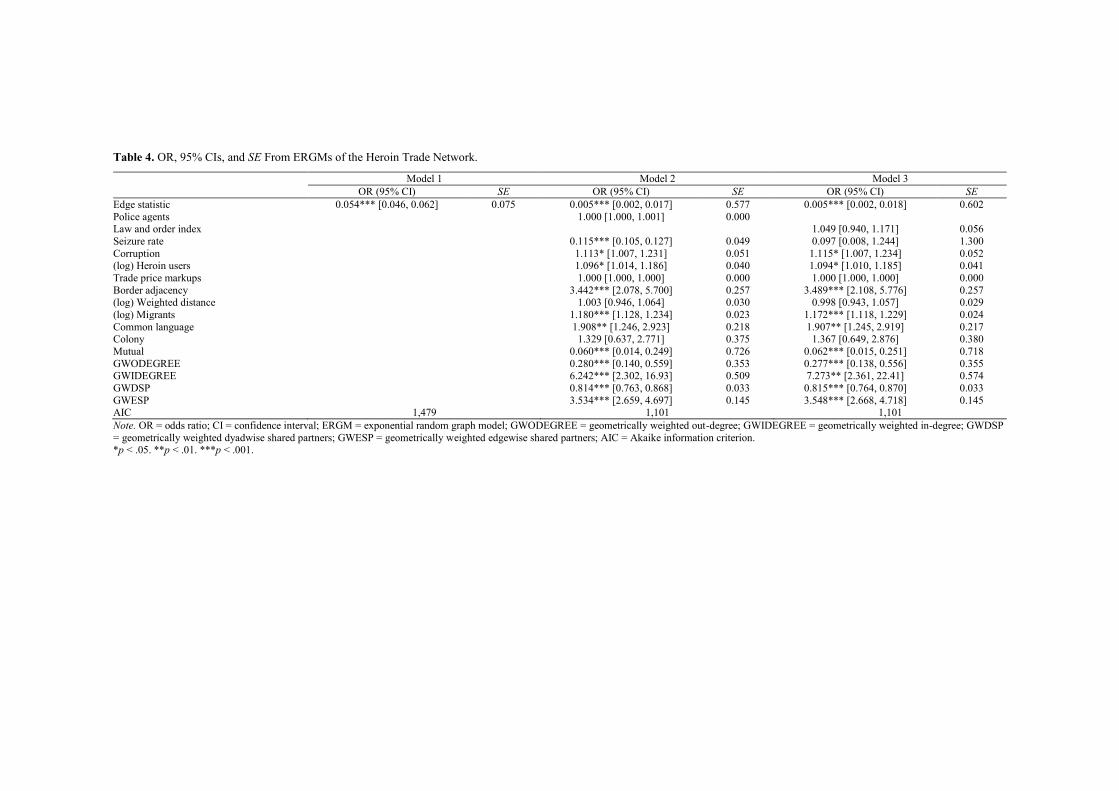
Table 4. OR, 95% CIs, and SE From ERGMs of the Heroin Trade Network.
Model 1 Model 2 Model 3
OR (95% CI) SE OR (95% CI) SE OR (95% CI) SE
Edge statistic 0.054*** [0.046, 0.062] 0.075 0.005*** [0.002, 0.017] 0.577 0.005*** [0.002, 0.018] 0.602
Police agents 1.000 [1.000, 1.001] 0.000 Law and order index 1.049 [0.940, 1.171] 0.056
Seizure rate 0.115*** [0.105, 0.127] 0.049 0.097 [0.008, 1.244] 1.300
Corruption 1.113* [1.007, 1.231] 0.051 1.115* [1.007, 1.234] 0.052 (log) Heroin users 1.096* [1.014, 1.186] 0.040 1.094* [1.010, 1.185] 0.041
Trade price markups 1.000 [1.000, 1.000] 0.000 1.000 [1.000, 1.000] 0.000
Border adjacency 3.442*** [2.078, 5.700] 0.257 3.489*** [2.108, 5.776] 0.257 (log) Weighted distance 1.003 [0.946, 1.064] 0.030 0.998 [0.943, 1.057] 0.029
(log) Migrants 1.180*** [1.128, 1.234] 0.023 1.172*** [1.118, 1.229] 0.024
Common language 1.908** [1.246, 2.923] 0.218 1.907** [1.245, 2.919] 0.217 Colony 1.329 [0.637, 2.771] 0.375 1.367 [0.649, 2.876] 0.380
Mutual 0.060*** [0.014, 0.249] 0.726 0.062*** [0.015, 0.251] 0.718
GWODEGREE 0.280*** [0.140, 0.559] 0.353 0.277*** [0.138, 0.556] 0.355 GWIDEGREE 6.242*** [2.302, 16.93] 0.509 7.273** [2.361, 22.41] 0.574
GWDSP 0.814*** [0.763, 0.868] 0.033 0.815*** [0.764, 0.870] 0.033
GWESP 3.534*** [2.659, 4.697] 0.145 3.548*** [2.668, 4.718] 0.145 AIC 1,479 1,101 1,101
Note. OR = odds ratio; CI = confidence interval; ERGM = exponential random graph model; GWODEGREE = geometrically weighted out-degree; GWIDEGREE = geometrically weighted in-degree; GWDSP
= geometrically weighted dyadwise shared partners; GWESP = geometrically weighted edgewise shared partners; AIC = Akaike information criterion. *p < .05. **p < .01. ***p < .001.
Conclusion
This study confirms that both drug trafficking clusters along specific routes and its structure is not
random but, in actual fact, driven by specific factors. Specifically, risks, profits, and geographic and
social proximity affect the configuration of heroin supplied to European countries.
The study proves that there is a strong overlap between the determinants of legal and illegal trade.
Geographic and social proximity affect drug trafficking in much the same way that they affect licit trade
flows. Geographic distance increases the risk of interception, as well as transportation and
communication costs. Hence, two countries sharing a border are more likely to trade in heroin, because
the imminent proximity reduces both the level of organization needed to ship the drug and the
complexity of trafficking in general. Social proximity is also an essential driver of the structure of
international trafficking routes. Several studies have identified drug trafficking as an inefficient
business, due, in part, to working without the protection of any legal authority and the risk of arrest
(Paoli, 2002; Reuter, 1985). Hence, social proximity is a valuable resource for finding business
counterparts, procuring access to strategic information, and in terms of settling disputes and reducing
uncertainties.
This article offers several key insights for law enforcement authorities and policy makers. Interdiction
programs have accounted for a large share of drug control expenditure in recent years (Babor et al.,
2010; EMCDDA, 2008). Indeed, even countries with lenient regulations for the drug market—that is,
the Netherlands—invest most of their budgets in tackling the supply of illicit drugs (Rigter, 2006). It is
our contention that the stated priority of the EU Drugs Strategy (2013-2020) to disrupt the international
supply of illicit drugs would be better achieved by employing strategies aimed at reducing corruption
and consumer demand for heroin, rather than focusing on stricter enforcement of the supply. Increasing
resilience against corruption would reduce the porousness of borders and prevent countries from
becoming a part of main trafficking routes. At the same time, it would also help to decrease the costs
stemming from the militarization of borders and the war on drugs (i.e., reduction in trade efficiency,
violence, and mass incarceration). Similarly, demand control programs trying to cut heroin consumption
by reducing the number of users and/or the quantity of the drug which they consume—such as via opioid
substitution therapies—may discourage the formation of drug trafficking routes.
These recommendations do not imply that supply-side interventions should simply be abandoned;
rather, we are proposing that the authorities should take a more problem-oriented approach. Law
enforcement authorities should focus their interdiction programs on specific connections: those
identified in the network and those that, according to the parameters identified here (i.e., geographic
proximity, common language, and migration pattern), are more likely to become trafficking routes. As
for hot-spot policing, drug enforcement should concentrate on the same areas where drug trafficking
occurs.
The findings of this study can also help to develop risk assessment models, which aid our ability to
predict the balloon effect. As the literature demonstrates, if authorities clamp down against specific
connections, then traffickers displace to alternative routes. Interdiction in one country can have direct
consequences for another; hence, policy makers who are planning a major crackdown should consider
the potential effects of doing so on other countries. The parameters identified in this study can be used
to predict where traffickers are more likely to displace to. This would help to prevent or, at the very
17
least, reduce the balloon effect and, more importantly, strengthen the effect of the crackdown on illicit
drug trafficking flows.
This study represents the first empirical attempt to understand which factors explain the formation of
drug trafficking routes. Although, as demonstrated, it already provides expedient insights and
recommendations, further work is required to aid law enforcement and border guards working on the
ground. In particular, future research should focus on the concentration of drug trafficking at local level
and include information about the mode of transportation of drug shipments. This is because evidence
suggests that drug trafficking also concentrates at a micro level (Rengert, Chakravorty, Bole, &
Henderson, 2000; Rengert, Ratcliffe, & Chakravorty, 2005). A geospatial network analysis, which
combines information on the international drug trafficking network and its geographical concentration
at a micro level, could therefore provide critical information for law enforcement authorities. When
paired with information about the means of transportation of drug loads, it may be crucial in terms of
developing a problem-oriented approach to disrupt international drug trafficking.
Appendix
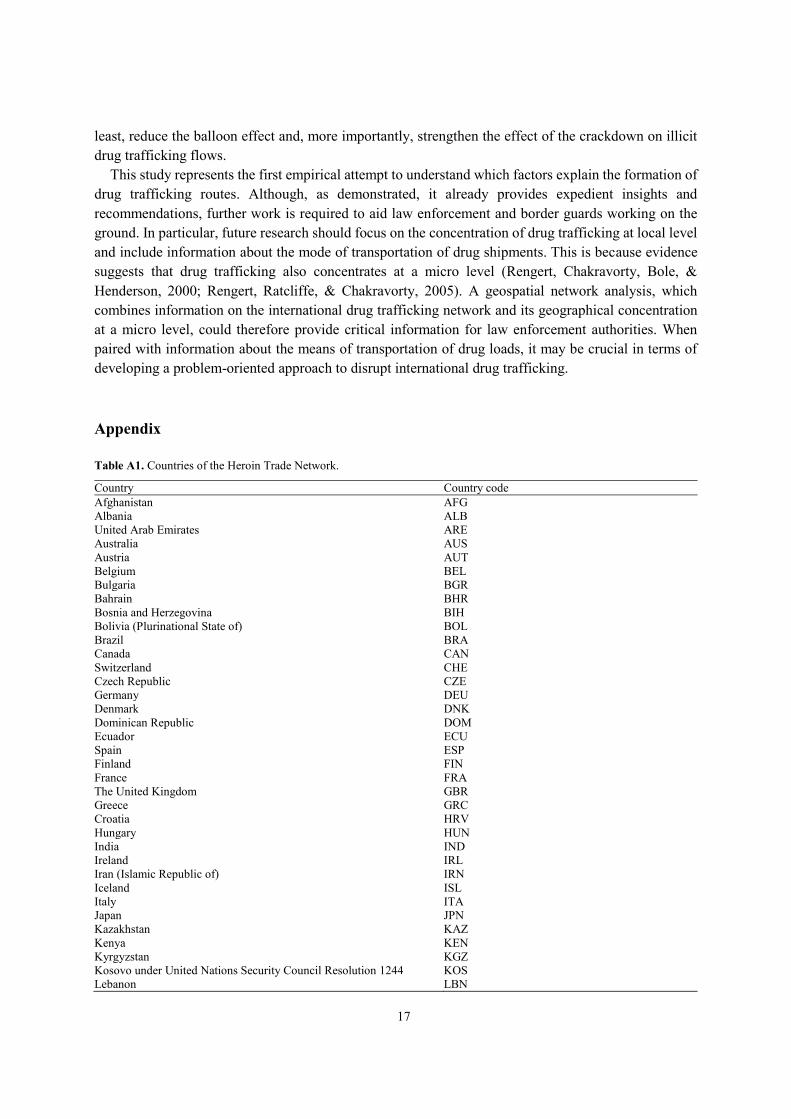
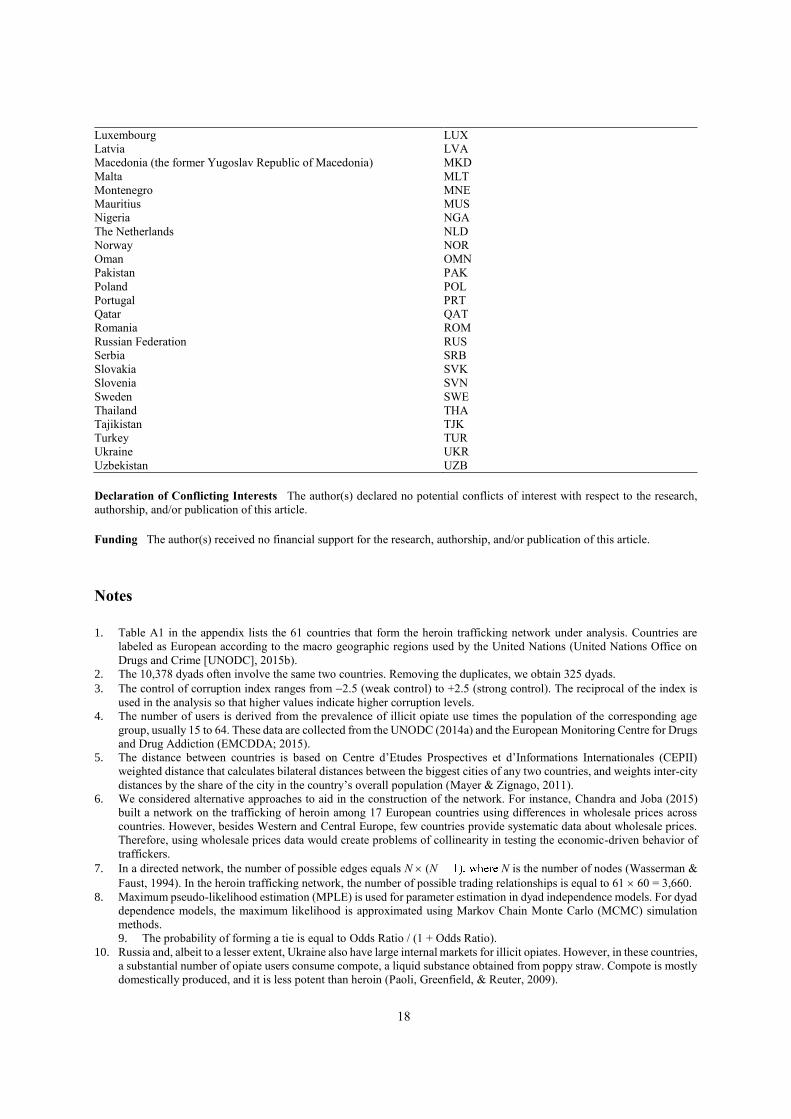
Table A1. Countries of the Heroin Trade Network.
Country Country code
Afghanistan AFG
Albania ALB
United Arab Emirates ARE
Australia AUS
Austria AUT
Belgium BEL
Bulgaria BGR
Bahrain BHR
Bosnia and Herzegovina BIH
Bolivia (Plurinational State of) BOL
Brazil BRA
Canada CAN
Switzerland CHE
Czech Republic CZE
Germany DEU
Denmark DNK
Dominican Republic DOM
Ecuador ECU
Spain ESP
Finland FIN
France FRA
The United Kingdom GBR
Greece GRC
Croatia HRV
Hungary HUN
India IND
Ireland IRL
Iran (Islamic Republic of) IRN
Iceland ISL
Italy ITA
Japan JPN
Kazakhstan KAZ
Kenya KEN
Kyrgyzstan KGZ
Kosovo under United Nations Security Council Resolution 1244 KOS
Lebanon LBN
18
Luxembourg LUX
Latvia LVA
Macedonia (the former Yugoslav Republic of Macedonia) MKD
Malta MLT
Montenegro MNE
Mauritius MUS
Nigeria NGA
The Netherlands NLD
Norway NOR
Oman OMN
Pakistan PAK
Poland POL
Portugal PRT
Qatar QAT
Romania ROM
Russian Federation RUS
Serbia SRB
Slovakia SVK
Slovenia SVN
Sweden SWE
Thailand THA
Tajikistan TJK
Turkey TUR
Ukraine UKR
Uzbekistan UZB
Declaration of Conflicting Interests The author(s) declared no potential conflicts of interest with respect to the research,
authorship, and/or publication of this article.
Funding The author(s) received no financial support for the research, authorship, and/or publication of this article.
Notes
1. Table A1 in the appendix lists the 61 countries that form the heroin trafficking network under analysis. Countries are
labeled as European according to the macro geographic regions used by the United Nations (United Nations Office on
Drugs and Crime [UNODC], 2015b).
2. The 10,378 dyads often involve the same two countries. Removing the duplicates, we obtain 325 dyads.
3. The control of corruption index ranges from 2.5 (weak control) to +2.5 (strong control). The reciprocal of the index is
used in the analysis so that higher values indicate higher corruption levels.
4. The number of users is derived from the prevalence of illicit opiate use times the population of the corresponding age
group, usually 15 to 64. These data are collected from the UNODC (2014a) and the European Monitoring Centre for Drugs
and Drug Addiction (EMCDDA; 2015).
5. The distance between countries is based on Centre d’Etudes Prospectives et d’Informations Internationales (CEPII)
weighted distance that calculates bilateral distances between the biggest cities of any two countries, and weights inter-city
distances by the share of the city in the country’s overall population (Mayer & Zignago, 2011).
6. We considered alternative approaches to aid in the construction of the network. For instance, Chandra and Joba (2015)
built a network on the trafficking of heroin among 17 European countries using differences in wholesale prices across
countries. However, besides Western and Central Europe, few countries provide systematic data about wholesale prices.
Therefore, using wholesale prices data would create problems of collinearity in testing the economic-driven behavior of
traffickers.
7. In a directed network, the number of possible edges equals N (N N is the number of nodes (Wasserman &
Faust, 1994). In the heroin trafficking network, the number of possible trading relationships is equal to 61 60 = 3,660.
8. Maximum pseudo-likelihood estimation (MPLE) is used for parameter estimation in dyad independence models. For dyad
dependence models, the maximum likelihood is approximated using Markov Chain Monte Carlo (MCMC) simulation
methods.
9. The probability of forming a tie is equal to Odds Ratio / (1 + Odds Ratio).
10. Russia and, albeit to a lesser extent, Ukraine also have large internal markets for illicit opiates. However, in these countries,
a substantial number of opiate users consume compote, a liquid substance obtained from poppy straw. Compote is mostly
domestically produced, and it is less potent than heroin (Paoli, Greenfield, & Reuter, 2009).
19
References
Akyeampong, E. (2005). Diaspora and drug trafficking in West Africa: A case study of Ghana. African Affairs,
104, 429-447.
Arlacchi, P., & Lewis, R. (1990). Imprenditorialità illecita e droga: Il mercato dell’eroina a Verona. Bologna,
Italy: Il Mulino.
Astorga, L., & Shirk, D. A. (2010). Drug trafficking organizations and counter-drug strategies in the U.S.-Mexican
context. San Diego, CA: Center for US-Mexican Studies.
Babor, T. F., Caulkins, J. P., Edwards, G., Fischer, B., Foxcroft, D. R., Humphreys, K., . . . Reuter, P. H. (2010).
Drug policy and the public good. Oxford, UK: Oxford University Press.
Basu, G. (2014). Concealment, corruption, and evasion: A transaction cost and case analysis of illicit supply chain
activity. Journal of Transportation Security, 7, 209-226.
Beyrer, C., Razak, M. H., Lisam, K., Chen, J., Lui, W., & Yu, X. F. (2000). Overland heroin trafficking routes and
HIV-1 spread in South and South-East Asia. AIDS, 14, 75-83.
Boivin, R. (2011). Le monde à l’envers: Analyse de la structure du trafic transnational de drogues illicites.
Montréal, Quebec, Canada: Université de Montréal.
Boivin, R. (2013). Drug trafficking networks in the world economy. In C. Morselli (Ed.), Crime and networks (pp.
182-194). New York, NY: Routledge.
Boivin, R. (2014a). Macrosocial network analysis: The case of transnational drug trafficking. In A. J. Masys (Ed.),
Networks and network analysis for defence and security (pp. 49-61). New York, NY: Springer.
Boivin, R. (2014b). Risks, prices, and positions: A social network analysis of illegal drug trafficking in the world-
economy. International Journal on Drug Policy, 25, 235-243.
Borgatti, S. P. (2005). Centrality and network flow. Social Networks, 27, 55-71.
Boyum, D. A., & Kleiman, M. A. R. (2001). Substance abuse policy from a crime control perspective. In J. Q.
Wilson & J. Petersilia (Eds.), Crime (2nd ed.). Oakland, CA: Institute for Contemporary Studies.
Bruinsma, G., & Bernasco, W. (2004). Criminal groups and transnational illegal markets. Crime, Law and Social
Change, 41, 79-94.
Calderón, G., Robles, G., Díaz-Cayeros, A., & Magaloni, B. (2015). The beheading of criminal organizations and
the dynamics of violence in Mexico. Journal of Conflict Resolution, 59, 1455-1485.
Caulkins, J. P. (2015). After the grand fracture: Scenarios for the collapse of the international drug control regime.
Journal of Drug Policy Analysis. Advance online publication. doi:10.1515/jdpa-2015-0008
Caulkins, J. P., & Bond, B. M. (2012). Marijuana price gradients: Implications for exports and export-generated
tax revenue for California after legalization. Journal of Drug Issues, 42, 28-45.
Caulkins, J. P., Crawford, G., & Reuter, P. (1993). Simulation of adaptive response: A model of drug interdiction.
Mathematical and Computer Modelling, 17(2), 37-52.
Caulkins, J. P., & Reuter, P. H. (1998). What price data tell us about drug markets. Journal of Drug Issues, 28,
593-613.
Caulkins, J. P., & Reuter, P. H. (2010). How drug enforcement affects drug prices. Crime and Justice, 39, 213-
271.
Chalk, P. (2011). The Latin American drug trade: Scope, dimensions, impact, and response. Santa Monica, CA:
RAND.
Chandra, S., & Joba, J. (2015). Transnational cocaine and heroin flow networks in Western Europe: A comparison.
International Journal of Drug Policy, 26, 772-780.
Chi, J., Hayatdavoudi, L., Kruszona, S., & Rowe, B. (2013). Reducing drug violence in Mexico: Options for
implementing targeted enforcement. Los Angeles: University of California, Los Angeles.
Chouvy, P.-A. (2012). A typology of the unintended consequences of drug crop reduction. Journal of Drug Issues,
43, 216-230.
Ciccarone, D. (2009). Heroin in brown, black and white: Structural factors and medical consequences in the U.S.
heroin market. International Journal of Drug Policy, 20, 277-282.
Collins, J. (2014). The economics of a new global strategy. In J. Collins (Ed.), Ending the drug wars (pp. 8-15).
London, England: The London School of Economics and Political Science.
Combes, P.-P., Lafourcade, M., & Mayer, T. (2005). The trade-creating effects of business and social networks:
Evidence from France. Journal of International Economics, 66, 1-29.
Corso, P. S., Mercy, J. A., Simon, T. R., Finkelstein, E. A., & Miller, T. R. (2007). Medical costs and productivity
losses due to interpersonal and self-directed violence in the United States. American Journal of Preventive
Medicine, 32, 474-482.
20
Council of the European Union. (2012, December 29). EU drugs strategy (2013-20): Official Journal of the
European Union (2012/C 402/01). Retrieved from http://eur-lex.europa.eu/legal-
content/EN/TXT/?uri=celex%3A52012XG1229(01)
Curman, A. S. N., Andresen, M. A., & Brantingham, P. J. (2014). Crime and place: A longitudinal examination of
street segment patterns in Vancouver, BC. Journal of Quantitative Criminology, 31, 127-147.
Décary-Hétu, D., & Giommoni, L. (2016). Do Police Crackdowns Disrupt Drug Cryptomarkets? A Longitudinal
Analysis of the Effects of Operation Onymous. Crime, Law and Social Change, 1–21.
Decker, S. H., & Townsend-Chapman, M. (2008). Drug smugglers on drug smuggling: Lessons from the inside.
Philadelphia, PA: Temple University Press.
Desroches, F. (2007). Research on upper level drug trafficking: A review. Journal of Drug Issues, 37, 827-844.
Disdier, A.-C., & Head, K. (2008). The puzzling persistence of the distance effect on bilateral trade. Review of
Economics and Statistics, 90, 37-48.
Eck, J. E., Clarke, R. V., & Guerette, R. T. (2007). Risky facilities: Crime concentration in homogeneous sets of
establishments and facilities. In G. Farrell, K. J. Bowers, S. D. Johnson, & M. Townsley (Eds.), Imagination
for crime prevention: Essays in honour of Ken Pease (pp. 225-264). Monsey, NY: Criminal Justice Press.
Eck, J. E., & Maguire, E. R. (2000). Have changes in policing reduced violent crime? An assessment of the
evidence. Cambridge, UK: Cambridge University Press.
Egger, P. H., & Lassmann, A. (2012). The language effect in international trade: A meta-analysis. Economics
Letters, 116, 221-224.
Ellis, S. (2009). West Africa’s international drug trade. African Affairs, 108, 171-196.
European Monitoring Centre for Drugs and Drug Addiction. (2008). Towards a better understanding of drug-
related public expenditure in Europe. Lisbon, Portugal: Author.
European Monitoring Centre for Drugs and Drug Addiction. (2010). First European conference on drug supply
indicators: A joint initiative to develop sustainable options for monitoring drug markets, crime and supply
reduction activities. Brussels, Belgium: European Monitoring Centre for Drugs and Drug Addiction &
European Commission.
European Monitoring Centre for Drugs and Drug Addiction. (2015). European drug report 2015: Trends and
developments. Lisbon, Portugal: Author.
European Monitoring Centre for Drugs and Drug Addiction & EUROPOL. (2013). EU drug markets report: A
strategic Analysis. Lisbon, Portugal: Author.
Farrell, G. (1998). Routine Activities and Drug Trafficking: The Case of the Netherlands. International Journal of
Drug Policy 9 (1): 21–32.
Frankel, J., & Rose, A. (2002). An estimate of the effect of common currencies on trade and income. The Quarterly
Journal of Economics, 117, 437-466.
Freeman, L. (2006). State of siege: Drug-related violence and corruption in Mexico: Unintended consequences of
the war on drugs. Washington, DC: Washington Office on Latin America.
Friesendorf, C. (2005). Squeezing the balloon? United States air interdiction and the restructuring of the South
American drug industry in the 1990s. Crime, Law and Social Change, 44, 35-78.
Ghemawat, P. (2001). Distance still matters: The hard reality of global expansion. Harvard Business Review,
79(8), 137-147.
Giraldo, J. (1999). Corrupted justice and the schizophrenic state in Colombia. Social Justice, 26(4), 31-54.
Goodreau, S. M., Handcock, M. S., Hunter, D. R., Butts, C. T., & Morris, M. (2008). A statnet tutorial. Journal of
Statistical Software, 24(1), 1-27.
Goodreau, S. M., Kitts, J. A., & Morris, M. (2009). Birds of a feather, or friend of a friend? Using exponential random
graph models to investigate adolescent social networks. Demography, 46, 103-125.
Greenfield, V. A., & Paoli, L. (2012). If supply-oriented drug policy is broken, can harm reduction help fix it?
Melding disciplines and methods to advance international drug-control policy. International Journal of Drug
Policy, 23, 6-15.
Guizado, Á. C. (2005). Bogotá: Observatorio de las Relaciones entre Europa y América Latina & Centro de
Estudios Socioculturales y Internacionales [Drug trafficking: Perspectives from Europe, Latin America and the
United States] Proceedings from the international seminar Drug Trafficking: the Relations between Europe,
Latin America and the United States, Bogotá, Colombia.
Handcock, M. S., Hunter, D. R., Butts, C. T., Goodreau, S. M., Krivitsky, P. N., Bender-deMoll, S., & Morris, M.
(2016). statnet: Software tools for the statistical analysis of network data (Version 2016.9). The Statnet Project.
Available from www.statnet.org
21
Handcock, M. S., Hunter, D. R., Butts, C. T., Goodreau, S. M., & Morris, M. (2008). statnet: Software tools for
the representation, visualization, analysis and simulation of network data. Journal of Statistical Software, 24(1),
1548-7660.
Hawdon, J. E., & Kleiman, M. A. R. (2011). Encyclopedia of drug policy (Vol. 2). Thousand Oaks, CA: SAGE.
Hernandez, D., & Rudolph, A. (2015). Modern day slavery: What drives human trafficking in Europe? European
Journal of Political Economy, 38, 118-139.
Hunter, D. R. (2007). Curved exponential family models for social networks. Social Networks, 29, 216-230.
Hunter, D. R., Goodreau, S. M., & Handcock, M. S. (2008). Goodness of fit of social network models. Journal of
the American Statistical Association, 103, 248-258.
Hunter, D. R., & Handcock, M. S. (2006). Inference in curved exponential family models for networks. Journal
of Computational and Graphical Statistics, 15, 565-583.
Keefer, P., Loayza, N., & Soares, R. (2008). The development impact of the illegality of drug trade. Washington,
DC: The World Bank.
Kenney, M. (2007). The architecture of drug trafficking: Network forms of organisation in the Colombian cocaine
trade. Global Crime, 8, 233-259.
Kilmer, B., & Hoorens, S. (2010). Understanding illicit drug markets, supply-reduction efforts, and drug-related
crime in the European Union. Santa Monica, CA: RAND.
Kilmer, B., Reuter, P. H., & Giommoni, L. (2015). What can be learned from cross-national comparisons of data
on illegal drugs? Crime and Justice, 44, 227-296.
Kleemans, E. R. (2013). Organized crime and the visible hand: A theoretical critique on the economic analysis of
organized crime. Criminology and Criminal Justice, 13, 615-629.
Kleemans, E. R., & van De Bunt, H. G. (1999). The social embeddedness of organized crime. Transnational
Organized Crime, 5, 19-36.
Kleiman, M. A. R. (2011). Surgical strikes in the drug wars: Smarter policies for both sides of the border. Foreign
Affairs, 90(5), 89-101.
Kleiman, M. A. R., Caulkins, J. P., Hawken, A., & Kilmer, B. (2012). Eight questions for drug policy research.
Issues in Science and Technology, 28(4), 79-88.
Kostakos, P. A., & Antonopoulos, G. A. (2010). The “good,” the “bad” and the “Charlie”: The business of cocaine
smuggling in Greece. Global Crime, 11, 34-57.
Kuziemko, I., & Levitt, S. D. (2004). An empirical analysis of imprisoning drug offenders. Journal of Public
Economics, 88, 2043-2066.
Lahaie, E., Janssen, E., & Cadet-Taïrou, A. (2016). Determinants of heroin retail prices in metropolitan France:
Discounts, purity and local markets. Drug and Alcohol Review, 35, 597-604.
Lameli, A., Nitsch, V., Südekum, J., & Wolf, N. (2013). Same same but different: Dialects and trade (CESIFO
Working Paper No. 4245). Munich, Germany: Center for Economic Studies & Ifo Institute.
Lee, C. W., & Park, S. (2016). Does religious similarity matter in international trade in services? The World
Economy, 39, 409-425.
MacCoun, R., & Reuter, P. (2001). Drug war heresies: Learning from other vices, times, and places. New York,
NY: Cambridge University Press.
Manski, C. F., Pepper, J. V., & Thomas, Y. F. (1999). Assessment of two cost-effectiveness studies on cocaine
control policy. Washington, DC: The National Academies Press.
Mayer, T., & Zignago, S. (2011). Notes on CEPII’s distances measures: The GeoDist database. Paris, France:
Centre d’Etudes Prospectives et d’Informations Internationales.
Mejía, D., & Restrepo, P. (2014). Why is strict prohibition collapsing? A perspective from producer and transit
countries. In J. Collins (Ed.), Ending the drug wars (pp. 26-32). London, England: The London School of
Economics and Political Science.
Miron, J. A. (1999). Violence and the U.S. prohibitions of drugs and alcohol. American Law and Economics
Review, 1, 78-114.
Mora, F. O. (1996). Victims of the balloon effect: Drug trafficking and U.S. policy in Brazil and the Southern
Cone of Latin America. The Journal of Social, Political, and Economic Studies, 21, 115-140.
Moser, C. O. N., Lister, S., McIlwaine, C., Shrader, E., & Tornqvist, A. (1999). Violence in Colombia: Building
sustainable peace and social capital. Washington, DC: The World Bank.
Office of National Drug Control Policy. (2016). The international heroin market. Retrieved from
https://www.whitehouse.gov/ondcp/global-heroin-market
Osorio, J. (2015). The contagion of drug violence: Spatiotemporal dynamics of the Mexican war on drugs. Journal
of Conflict Resolution, 59, 1403-1432.
Paoli, L. (2002). The paradoxes of organized crime. Crime, Law and Social Change, 37, 51-97.
22
Paoli, L., Greenfield, V. A., & Reuter, P. (2009). The world heroin market: Can supply be cut? Oxford, UK:
Oxford University Press.
Paoli, L., & Reuter, P. H. (2008). Drug trafficking and ethnic minorities in Western Europe. European Journal of
Criminology, 5, 13-37.
Papachristos, A. V., Hureau, D. M., & Braga, A. A. (2013). The corner and the crew: The influence of geography
and social networks on gang violence. American Sociological Review, 78, 417-447.
Pollack, H. A., & Reuter, P. (2014). Does tougher enforcement make drugs more expensive? Addiction, 109, 1959-
1966.
Prashantham, S., Dhanaraj, C., & Kumar, K. (2015). Ties that bind: Ethnic ties and new venture
internationalization. Long Range Planning, 48, 317-333.
The PRS Group, Inc. (2015). The international country risk guide. Available from http://www.prsgroup.com/
Rauch, J. E. (1999). Networks versus markets in international trade. Journal of International Economics, 48, 7-
35.
Rauch, J. E., & Trindade, V. (2002). Ethnic Chinese networks in international trade. The Review of Economics
and Statistics, 84, 116-130.
R Core Team. (2016). R: A language and environment for statistical computing (Version 3.3.1). Vienna, Austria:
R Foundation for Statistical Computing. Available from www.R-project.org
Rengert, G. F., Chakravorty, S., Bole, T., & Henderson, K. (2000). A geographic analysis of illegal drug markets.
In M. Natarajan & M. Hough (Eds.), Illegal drug markets: From research to prevention policy (pp. 219-239).
Monsey, NY: Criminal Justice Press.
Rengert, G. F., Ratcliffe, J. H., & Chakravorty, S. (2005). Policing illegal drug markets: Geographic approaches
to crime reduction. Monsey, NY: Criminal Justice Press.
Reuter, P. H. (1985). The organization of illegal markets: An economic analysis. Washington, DC: National
Institute of Justice.
Reuter, P. H. (2014). The mobility of drug trafficking. In J. Collins (Ed.), Ending the drug wars (pp. 33-40).
London, England: The London School of Economics and Political Science.
Reuter, P. H., & Greenfield, V. (2001). Measuring global drug markets: How good are the numbers and why should
we care about them? World Economics, 2, 159-173.
Reuter, P. H., & Kleiman, M. A. R. (1986). Risks and prices: An economic analysis of drug enforcement. Crime
and Justice, 7, 289-340.
Rigter, H. (2006). What drug policies cost: Drug policy spending in the Netherlands in 2003. Addiction, 101, 323-
329.
Riley, K. J. (1998). Homicide and drugs: A tale of six cities. Homicide Studies, 2, 176-205.
Rios, V. (2013). Why did Mexico become so violent? A self-reinforcing violent equilibrium caused by competition
and enforcement. Trends in Organized Crime, 16, 138-155.
Robins, G., Pattison, P., Kalish, Y., & Lusher, D. (2007). An introduction to exponential random graph (p*) models
for social networks. Social Networks, 29, 173-191.
Ruggiero, V., & Khan, K. (2007). The organisation of drug supply: South Asian criminal enterprise in the UK.
Asian Journal of Criminology, 2, 163-177.
Savona, E. U., & Riccardi, M. (Eds.). (2015). From illegal markets to legitimate businesses: The portfolio of
organised crime in Europe. Trento, Italy: Transcrime—Università degli Studi di Trento.
Seccombe, R. (1995). Squeezing the balloon: International drugs policy. Drug and Alcohol Review, 14, 311-316.
Sgrignoli, P., Metulini, R., Schiavo, S., & Riccaboni, M. (2015). The relation between global migration and trade
networks. Physica A: Statistical Mechanics and Its Applications, 417, 245-260.
Sherman, L. W., Gartin, P. R., & Buerger, M. E. (1989). Hot spots of predatory crime: Routine activities and the
criminology of place. Criminology, 27, 27-56.
Sherman, L. W., Gottfredson, D. C., MacKenzie, D. L., Eck, J., Reuter, P., & Bushway, S. D. (1998). Preventing
crime: What works, what doesn’t, what’s promising. Washington, DC: National Institute of Justice.
Singer, M. (2008). Drugs and development: The global impact of drug use and trafficking on social and economic
development. International Journal of Drug Policy, 19, 467-478.
Smith, W. R., Frazee, S. G., & Davison, E. L. (2000). Furthering the integration of routine activity and social
disorganization theories: Small units of analysis and the study of street robbery as a diffusion process.
Criminology, 38, 489-524.
Soares, R. R. (2004). Development, crime and punishment: Accounting for the international differences in crime
rates. Journal of Development Economics, 73, 155-184.
Soudijn, M. R. J., & Kleemans, E. R. (2009). Chinese organized crime and situational context: Comparing human
smuggling and synthetic drugs trafficking. Crime, Law and Social Change, 52(5), Article 457.
23
Thoumi, F. E. (2002). Illegal drugs in Colombia: From illegal economic boom to social crisis. Annals of the
American Academy of Political and Social Science, 582, 102-116.
Trumbore, P. F., & Woo, B. (2014). Smuggler’s blues: Examining why countries become narcotics transit states
using the new international narcotics production and transit (INAPT) data set. International Interactions, 40,
763-787.
United Nations International Drug Control Programme. (1998). Economic and social consequences of drug abuse
and illicit trafficking. Vienna, Austria: Author.
United Nations Office on Drugs and Crime. (2007). Cocaine trafficking in West Africa: A threat to stability and
development. Vienna, Austria: Author.
United Nations Office on Drugs and Crime. (2010). World drug report 2010. Vienna, Austria: Author.
United Nations Office on Drugs and Crime. (2013). Transnational organized crime in West Africa: A threat
assessment. Vienna, Austria: Author.
United Nations Office on Drugs and Crime. (2014a). The illicit drug trade through South-Eastern Europe. Vienna,
Austria: Author.
United Nations Office on Drugs and Crime. (2014b). Individual drug seizures. Retrieved from
https://data.unodc.org/#state:0
United Nations Office on Drugs and Crime. (2015a). Afghanistan opiate trafficking through the Southern Route.
Vienna, Austria: Author.
United Nations Office on Drugs and Crime. (2015b). Composition of macro geographical (continental) regions,
geographical sub-regions, and selected economic and other groupings. Vienna, Austria: Author. Retrieved
from http://unstats.un.org/unsd/methods/m49/m49regin.htm
United Nations Office on Drugs and Crime. (2015c). Drug money: The illicit proceeds of opiates trafficked on the
Balkan route. Vienna, Austria: Author.
United Nations Office on Drugs and Crime. (2015d). World drug report 2015. Vienna, Austria: Author.
van Amsterdam, J., Nutt, D., Phillips, L., & van den Brink, W. (2015). European rating of drug harms. Journal of
Psychopharmacology, 29, 655-660.
Van Dijk, J. (2007). The world of crime: Breaking the silence on problems of security, justice and development
across the world. Thousand Oaks, CA: SAGE.
van Duyne, P. C. (1993). Organized crime markets in a turbulent Europe. European Journal on Criminal Policy
and Research, 1(3), 10-30.
von Lampe, K. (2012). Transnational organized crime challenges for future research. Crime, Law and Social
Change, 58, 179-194.
von Lampe, K. (2013). Transnational organized crime in Europe. In J. S. Albanese & P. L. Reichel (Eds.),
Transnational organized crime: An overview in six continents (pp. 75-92). Thousand Oaks, CA: SAGE.
Ward, M. D., Ahlquist, J. S., & Rozenas, A. (2013). Gravity’s rainbow: A dynamic latent space model for the
world trade network. Network Science, 1, 95-118.
Wasserman, S., & Faust, K. (1994). Social network analysis: Methods and applications. Cambridge, UK:
Cambridge University Press.
Weisburd, D. (2015). The law of crime concentration and the criminology of place. Criminology, 53, 133-157.
Weisburd, D., & Amram, S. (2014). The law of concentrations of crime at place: The case of Tel Aviv-Jaffa. Police
Practice and Research, 15, 101-114.
Weisburd, D., Groff, E. R., & Yang, S.-M. (2012). The criminology of place: Street segments and our
understanding of the crime problem. Oxford, UK: Oxford University Press.
Weisburd, D., Groff, E. R., & Yang, S.-M. (2013). Understanding and controlling hot spots of crime: The
importance of formal and informal social controls. Prevention Science, 15, 31-43.
Werb, D., Rowell, G., Guyatt, G., Kerr, T., Montaner, J., & Wood, E. (2011). Effect of drug law enforcement on
drug market violence: A systematic review. International Journal of Drug Policy, 22(2), 87-94.
Wikström, P.-O. H. (2012). Breaking rules: The social and situational dynamics of young people’s urban crime.
Oxford, UK: Oxford University Press.
Windle, J., & Farrell, G. (2012). Popping the balloon effect: Assessing drug law enforcement in terms of
displacement, diffusion, and the containment hypothesis. Substance Use & Misuse, 47, 868-876.
Zaitch, D. (2002). Trafficking cocaine: Colombian drug entrepreneurs in the Netherlands. The Hague, The
Netherlands: Springer.