
Performance Improvement by Introducing Mobility in ... - UNSWorks
Upload
khangminh22Category
view
0download
0
Looking back to move forward:Retrospective automated analysis of
prostate radiotherapy trials data
Author:Dale Roach
Supervisors:A/Prof Lois Holloway
Dr Michael Jameson
A/Prof Jason Dowling
Prof Martin Ebert
A thesis in fulfilment of the requirementsfor the degree of Doctor of Philosophy in the
Faculty of MedicineUniversity of New South Wales
July 2020

Thesis/Dissertation Sheet
Surname/Family Name : Roach
Given Name/s : Dale Anthony
Abbreviation for degree as give in the University calendar : PhD Faculty : Faculty of Medicine
School : SWS Clinical School
Thesis Title : Looking back to move forward: Retrospective automated analysis of prostate radiotherapy trials data
Abstract 350 words maximum: (PLEASE TYPE)
Radiotherapy clinical trials incorporate quality assurance (QA) protocols to improve the efficacy of treatment. Uncertainties in contouring and treatment planning propagate throughout the radiotherapy workflow. Automated methods can reduce these uncertainties, however analysis techniques providing dosimetric insight should be incorporated to ensure assessments of quality are clinically relevant. This thesis investigated and developed advanced analysis techniques for assessing variability in contouring and treatment planning for prostate radiotherapy. An initial study investigated correlations between contouring metrics and simulated treatment outcome for prostate radiotherapy. Measurements of contouring variability between manual and gold standard Clinical Target Volume (CTV) contours were correlated with variations in dosimetry from treatment plans developed using these contours. It was found that volumetric contouring metrics correlated with outcome, while commonly utilised overlap and boundary contouring metrics did not. Inter-observer contouring variability for multiple male pelvic structures was then assessed utilising these metrics. Variability between observers was small for structures routinely contoured within the clinic. However, substantial variation existed for structures of emerging interest in radiotherapy toxicity studies. An atlas was developed for automated contouring, with CTV retrospectively contoured upon the RADAR, CHHiP, and RT01 clinical trial datasets. Vector mappings identified spatial regions where contouring variability significantly increased the risk of treatment failure. These regions primarily occurred near soft-tissue boundaries, such as the bladder and rectum, whereupon it was shown that contouring variability of CTV does impact patient outcome for prostate radiotherapy. Finally, an assessment of automated treatment techniques shared between centres was undertaken. Automated treatment techniques were robust enough to be adapted to meet other centre’s protocols, while generating treatment plans that satisfied local clinical protocols. To improve treatment within clinical trials uncertainties associated with each step of the radiotherapy workflow must be understood. QA protocols incorporating the techniques developed within this thesis, combined with the emerging automated techniques investigated, would improve the statistical significance of future clinical trials while improving the efficacy of patient treatment.
Declaration relating to disposition of project thesis/dissertation I hereby grant to the University of New South Wales or its agents a non-exclusive licence to archive and to make available (including to members of the public) my thesis or dissertation in whole or in part in the University libraries in all forms of media, now or here after known. I acknowledge that I retain all intellectual property rights which subsist in my thesis or dissertation, such as copyright and patent rights, subject to applicable law. I also retain the right to use all or part of my thesis or dissertation in future works (such as articles or books). …………………………………………………………… Signature
……….……………………...…….… Date
The University recognises that there may be exceptional circumstances requiring restrictions on copying or conditions on use. Requests for restriction for a period of up to 2 years can be made when submitting the final copies of your thesis to the UNSW Library. Requests for a longer period of restriction may be considered in exceptional circumstances and require the approval of the Dean of Graduate Research.

ORIGINALITY STATEMENT ‘I hereby declare that this submission is my own work and to the best of my knowledge it contains no materials previously published or written by another person, or substantial proportions of material which have been accepted for the award of any other degree or diploma at UNSW or any other educational institution, except where due acknowledgement is made in the thesis. Any contribution made to the research by others, with whom I have worked at UNSW or elsewhere, is explicitly acknowledged in the thesis. I also declare that the intellectual content of this thesis is the product of my own work, except to the extent that assistance from others in the project's design and conception or in style, presentation and linguistic expression is acknowledged.’ Signed …………………………………………….............. Date ……………………………………………..............

COPYRIGHT STATEMENT ‘I hereby grant the University of New South Wales or its agents a non-exclusive licence to archive and to make available (including to members of the public) my thesis or dissertation in whole or part in the University libraries in all forms of media, now or here after known. I acknowledge that I retain all intellectual property rights which subsist in my thesis or dissertation, such as copyright and patent rights, subject to applicable law. I also retain the right to use all or part of my thesis or dissertation in future works (such as articles or books).’ ‘For any substantial portions of copyright material used in this thesis, written permission for use has been obtained, or the copyright material is removed from the final public version of the thesis.’ Signed ……………………………………………...........................
Date ……………………………………………..............................
AUTHENTICITY STATEMENT ‘I certify that the Library deposit digital copy is a direct equivalent of the final officially approved version of my thesis.’
Signed ……………………………………………...........................
Date ……………………………………………..............................

i
INCLUSION OF PUBLICATIONS STATEMENT
UNSW is supportive of candidates publishing their research results during their candidature as detailed in the UNSW Thesis Examination Procedure. Publications can be used in their thesis in lieu of a Chapter if: • The student contributed greater than 50% of the content in the publication and is the
“primary author”, ie. the student was responsible primarily for the planning, execution and
preparation of the work for publication • The student has approval to include the publication in their thesis in lieu of a Chapter from
their supervisor and Postgraduate Coordinator. • The publication is not subject to any obligations or contractual agreements with a third
party that would constrain its inclusion in the thesis Please indicate whether this thesis contains published material or not.
☐ This thesis contains no publications, either published or submitted for publication (if this box is checked, you may delete all the material on page 2)
☐
Some of the work described in this thesis has been published and it has been documented in the relevant Chapters with acknowledgement (if this box is checked, you may delete all the material on page 2)
☒ This thesis has publications (either published or submitted for publication) incorporated into it in lieu of a chapter and the details are presented below
CANDIDATE’S DECLARATION
I declare that:
• I have complied with the Thesis Examination Procedure
• where I have used a publication in lieu of a Chapter, the listed publication(s) below meet(s) the requirements to be included in the thesis.
Name Dale Roach
Signature Date (dd/mm/yy)
Postgraduate Coordinator’s Declaration (to be filled in where publications are used in lieu of Chapters) I declare that:
• the information below is accurate • where listed publication(s) have been used in lieu of Chapter(s), their use complies
with the Thesis Examination Procedure • the minimum requirements for the format of the thesis have been met.
PGC’s Name
PGC’s Signature Date (dd/mm/yy)
ii
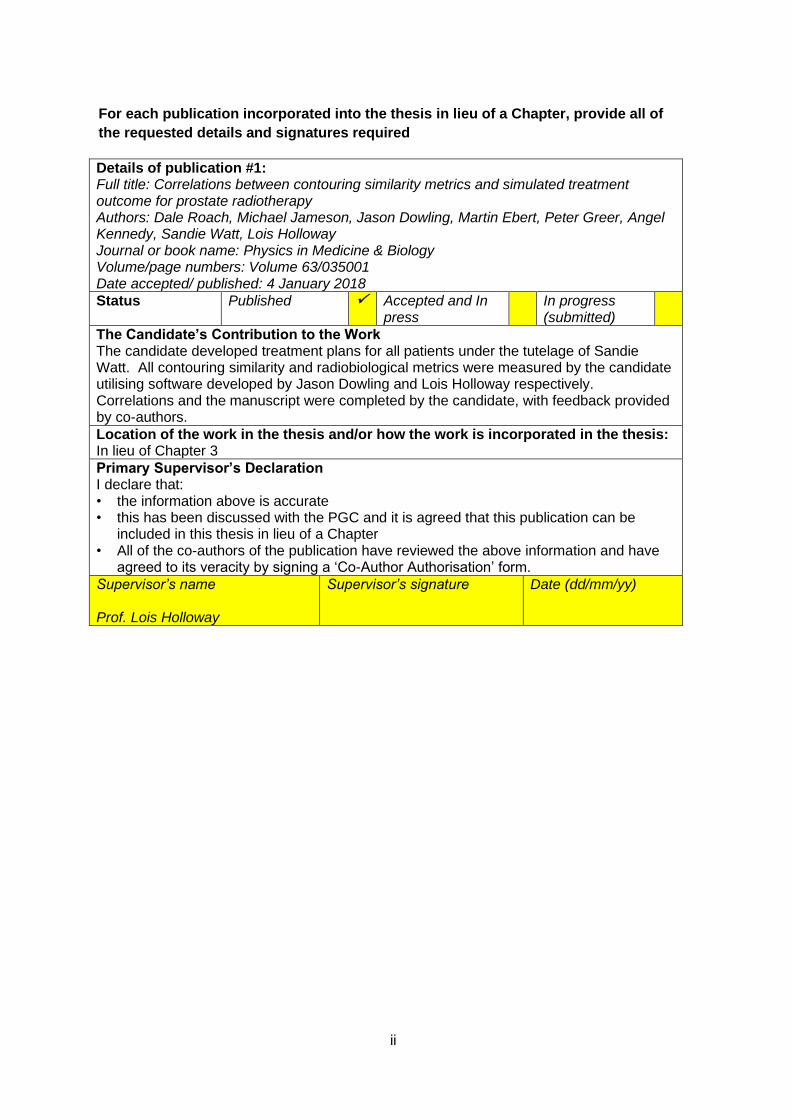
For each publication incorporated into the thesis in lieu of a Chapter, provide all of the requested details and signatures required Details of publication #1: Full title: Correlations between contouring similarity metrics and simulated treatment outcome for prostate radiotherapy Authors: Dale Roach, Michael Jameson, Jason Dowling, Martin Ebert, Peter Greer, Angel Kennedy, Sandie Watt, Lois Holloway Journal or book name: Physics in Medicine & Biology Volume/page numbers: Volume 63/035001 Date accepted/ published: 4 January 2018 Status Published ✓ Accepted and In
press In progress
(submitted)
The Candidate’s Contribution to the Work The candidate developed treatment plans for all patients under the tutelage of Sandie Watt. All contouring similarity and radiobiological metrics were measured by the candidate utilising software developed by Jason Dowling and Lois Holloway respectively. Correlations and the manuscript were completed by the candidate, with feedback provided by co-authors. Location of the work in the thesis and/or how the work is incorporated in the thesis: In lieu of Chapter 3 Primary Supervisor’s Declaration I declare that: • the information above is accurate • this has been discussed with the PGC and it is agreed that this publication can be
included in this thesis in lieu of a Chapter • All of the co-authors of the publication have reviewed the above information and have
agreed to its veracity by signing a ‘Co-Author Authorisation’ form. Supervisor’s name Prof. Lois Holloway
Supervisor’s signature Date (dd/mm/yy)

iii
Details of publication #2: Full title: Multi-observer contouring of male pelvic anatomy: Highly variable agreement across conventional and emerging structures of interest Authors: Dale Roach, Lois Holloway, Michael Jameson, Jason Dowling, Angel Kennedy, Peter Greer, Michele Krawiec, Robba Rai, Jim Denham, Jeremiah De Leon, Karen Lim, Megan Berry, Rohen White, Sean Bydder, Hendrick Tan, Jeremy Croker, Alycea McGrath, John Matthews, Robert J Smeenk, Martin Ebert Journal or book name: Journal of Medical Imaging and Radiation Oncology Volume/page numbers: Volume 63/264-271 Date accepted/ published:27 November 2018 Status Published ✓ Accepted and In
press In progress
(submitted)
The Candidate’s Contribution to the Work The candidate assisted in the development of the contouring protocol, as well as participating by contouring the structures required for the study. The candidate compiled and cleaned all data as required, and performed the assessment of contouring variations between observers. The manuscript was completed by the candidate, with feedback provided by co-authors. Location of the work in the thesis and/or how the work is incorporated in the thesis: In lieu of Chapter 4 Primary Supervisor’s Declaration I declare that: • the information above is accurate • this has been discussed with the PGC and it is agreed that this publication can be
included in this thesis in lieu of a Chapter • All of the co-authors of the publication have reviewed the above information and have
agreed to its veracity by signing a ‘Co-Author Authorisation’ form. Supervisor’s name Prof. Lois Holloway
Supervisor’s signature Date (dd/mm/yy)

iv
Details of publication #3: Full title: Adapting automated treatment planning configurations across international centres for prostate radiotherapy Authors: Dale Roach, Geert Wortel, Cesar Ochoa, Henrik Jensen, Eugene Damen, Philip Vial, Tomas Janssen, Christian Rønn Hansen Journal or book name: Physics and Imaging in Radiation Oncology Volume/page numbers: Volume 10/7-13 Date accepted/ published: 14 April 2019 Status Published ✓ Accepted and In
press In progress
(submitted)
The Candidate’s Contribution to the Work The candidate participated in the initial AutoPlanning configuration development phase, developing planning techniques that met the other centre’s protocol. These planning techniques were applied to the validation datasets, with the candidate responsible for all planning at Liverpool. All datasets were analysed by the candidate, with assistance from code written by Christian Hansen. The manuscript was completed by the candidate, with feedback provided by co-authors. Location of the work in the thesis and/or how the work is incorporated in the thesis: In lieu of Chapter 5 Primary Supervisor’s Declaration I declare that: • the information above is accurate • this has been discussed with the PGC and it is agreed that this publication can be
included in this thesis in lieu of a Chapter • All of the co-authors of the publication have reviewed the above information and have
agreed to its veracity by signing a ‘Co-Author Authorisation’ form. Supervisor’s name Prof. Lois Holloway
Supervisor’s signature Date (dd/mm/yy)

Acknowledgements
First and foremost, I want to extend my utmost gratitude to my supervisors A/Prof Lois
Holloway and Dr Michael Jameson. Throughout my candidacy they have consistently
provided the support and drive I required to complete my thesis. It has been an amazing
journey, and I could not have hoped for more wonderful supervisors to guide me along
the way. To Lois, thank you for your kindness and belief in me. To Michael, thank you
for your tutelage and compassion. I can never understate the level of appreciation I feel
towards you both.
To my supervisors A/Prof Jason Dowling and Prof Martin Ebert, I could always rely on
you both for being patient and considerate mentors during my candidacy. Jason, thank you
for your assistance in so many aspects of my work, along with the passionate discussions
about our respective football clubs! Martin, your enthusiasm for the project ensured I
grew passionate about the work I was doing. Thank you both again for being wonderful
supervisors.
To all past and present staff and students at the Ingham Institute that I shared my
journey with, thank-you for sharing such a wonderfully memorable chapter of my life.
The friendships I made have ensured that the journey was enjoyable, filled with laughter
over many coffee breaks. While there are too many to thank individually, mention must
go to Rob Finnegan and Jarryd Buckley. Here’s to the many enlightening discussions and
shared experiences throughout our journeys presenting our respective work around the
globe.
To the staff at Liverpool and Macarthur Cancer Therapy Centres, thank you for the
support that was readily available throughout my candidacy, as well as the tolerance and
assistance afforded me when juggling thesis writing with starting my work as a registrar.
Thank you to Melanie Rennie, Sandie Watt, and Rohan Gray for teaching me the art
of treatment planning. Thank you to Shivani Kumar and Vikneswary Batumalai for the
collaborative work, as well as helping me feel part of the clinical environment.
To my fellow registrars Joshua Hiatt and Iliana Peters, thank you for all the assistance
you both graciously offered while I finalised my candidacy. Sincere thanks also go out to
viii

ix
Vinod Nelson and Tania Ervin, whose support in ensuring this thesis was completed in
a timely fashion was tremendously appreciated. Finally, a large thanks goes out to Amy
Walker, who I have now shared the journey from research to registrar with for nearly five
years. The laughter and kindness will never be forgotten, and I look forward to usurping
you at your desk.
The all the collaborative groups I have been involved with, thank you for the amazing
opportunities I have been presented over these past few years. To Angel Kennedy, Marco
Marcello, and all the other staff and students at Sir Charles Gairdner Hospital, thank you
for making me feel so welcome during my stay. Thank you also to Phil Vial, Christian
Rønn Hansen, and Geert Wortel for involving me in your research. It was an amazing
opportunity to be directly involved with so many centres around the world during my
candidacy.
To my mum and dad, thank you for all your love and support throughout the entire
journey. I know you were both nervous when I said I would be at university for four more
years, but your faith in what I could accomplish was never in doubt. I hope I have made
you both proud. Finally, to my dearest Navami. Never could I have imagined I would find
someone so caring and supportive to stand by me during my journey. The love between
us will never wane, and I dedicate this thesis to the future that we will make together.

List of Publications1. Roach, D., Jameson, M. G., Dowling, J. A., Ebert, M. A., Greer, P. B., Kennedy, A.
M., ... & Holloway, L. C. (2018). Correlations between contouring similarity metrics
and simulated treatment outcome for prostate radiotherapy. Physics in Medicine &
Biology, 63(3), 035001.
2. Kumar, S., Holloway, L., Roach, D., Pogson, E., Veera, J., Batumalai, V., ... &
Moses, D. (2018). The impact of a radiologist‐led workshop on MRI target volume
delineation for radiotherapy. Journal of medical radiation sciences, 65(4), 300-310.
3. Roach, D., Holloway, L. C., Jameson, M. G., Dowling, J. A., Kennedy, A., Greer,
P. B., ... & Ebert, M. A. (2019). Multi‐observer contouring of male pelvic anatomy:
Highly variable agreement across conventional and emerging structures of interest.
Journal of medical imaging and radiation oncology, 63(2), 264-271.
4. Roach, D., Wortel, G., Ochoa, C., Jensen, H. R., Damen, E., Vial, P., ... &
Hansen, C. R. (2019). Adapting automated treatment planning configurations across
international centres for prostate radiotherapy. Physics and Imaging in Radiation
Oncology, 10, 7-13.
5. Kennedy, A., Dowling, J., Greer, P. B., Holloway, L., Jameson, M. G., Roach, D.,
... & Ebert, M. A. (2019). Similarity clustering‐based atlas selection for pelvic CT
image segmentation. Medical physics, 46(5), 2243-2250.
6. Roach, D., Denham, J. W., Joseph, D. J., Gulliford, S. L., Dearnaley, D. P.,
Sydes, M. R., ... & Ebert, M. A. (2020). Spatial analysis of target volume contours
within three international prostate radiotherapy trials - Clinical impact of contouring
variations on patient outcome. Submitted, Under Review.
List of Publications xi
8. Batumalai, V., Burke, S., Roach, D., Lim, K., Dinsdale, G., Jameson, M., ... &
Vinod, S. (2020). Impact of dosimetric differences between computed tomography
(CT) and magnetic resonance imaging (MRI) derived target volumes for external
beam cervical cancer radiotherapy. Submitted, Under Review.
9. Marcello, M., Denham, J.W., Kennedy, A., Haworth, A., Steigler, A., ... , Roach,
D., ... & Ebert, M.A. (2020). Reduced dose posterior to prostate predicts for
increased treatment failure in pooled voxel-wise analysis of 3 randomised phase 3
trials. Submitted, Under Review.
10. Marcello, M., Denham, J.W., Kennedy, A., Haworth, A., Steigler, A., ... , Roach,
D., ... & Ebert, M.A. (2020). Association of spatial radiotherapy dose distribu-
tion and urinary toxicity across three randomised phase 3 trials. Submitted, Under
Review.
11. Marcello, M., Denham, J.W., Kennedy, A., Haworth, A., Steigler, A., ... , Roach,
D., ... & Ebert, M.A. (2020). Dose hotspots in central rectum and low-intermediate
doses to perirectal fat space correlate with rectal bleeding and tenesmus respectively
in pooled voxel-wise analysis of 3 randomised phase 3 trials. Submitted, Under
Review.
List of Abbreviations
3D-CRT Three-Dimensional Conformal RadiotherapyADT Androgen Deprivation TherapyAP AutoPlanningaRVD Absolute Relative Volume DifferenceAS Androgen SuppressionASR Age Standardised RateCHHiP Conventional versus Hypofractionated High-dose Intensity-modulated
radiotherapy for Prostate cancerCI Conformity IndexCNN Convolutional Neural NetworkCOV Coefficient of VariationCSIRO Commonwealth Scientific and Industrial Research OrganisationCT Computer TomographyCTV Clinical Target VolumeDCP Distance-to-Agreement Cut-pointDICOM Digital Imaging and Communications in MedicineDIR Deformable Image RegistrationDMPO Direct Machine Parameter OptimisationDNA Deoxynucleic AcidDRE Digital Rectal ExaminationDSC Dice Similarity CoefficientDtA Distance-to-AgreementDVH Dose-Volume HistogramDX Dose Volume LevelEAS External Anal SphincterEBRT External Beam RadiotherapyEORTC European Organisation for Research and Treatment of CancerEPID Electronic Portal Imaging DeviceEUD Equivalent Uniform DoseG0,1,2 Gap cell cycle phasesGTV Gross Tumour VolumeGy GrayHD/HAUS Hausdorff DistanceHDR-BT High Dose-Rate BrachytherapyHI Homogeneity IndexHIFU High-Intensity Focussed UltrasoundHR Hazard RatioIAS Internal Anal SphincterICC Intraclass Correlation CoefficientICRU International Commission on Radiation Units and MeasurementsIGRT Image Guided Radiotherapy

List of Abbreviations xiii
IMRT Intensity Modulated RadiotherapyIsoX Isodose VolumeISUP International Society of Urological PathologyLAM Levator Ani MuscleLDR-BT Low Dose-Rate BrachytherapyLINAC Linear AcceleratorM Mitosis cell cycle phaseMASD Mean Absolute Surface DistanceMeV Mega-electronVoltMLC Multileaf CollimatorMRC Medical Research CouncilMRI Magnetic Resonance ImagingMU Monitor UnitMV MegavoltageNCCN National Comprehensive Cancer NetworkNHMRC National Health and Medical Research CouncilNHS National Health ServiceNTCP Normal Tissue Complication ProbabilityNVB Neurovascular BundleOAR Organs-at-RiskPET Positron Emission TomographyPRM Puborectalis MusclePRO Patient Report OutcomesPRS Peri-rectal SpacePRV Planning Organ-at-Risk VolumePSA Prostate-Specific AntigenPTV Planning Target VolumePV Protocol ViolationsQA Quality AssuranceQARC Quality Assurance Review CentreRADAR Randomised Androgen Deprivation and RadiotherapyRO Radiation OncologistROI Region of InterestRTOG Radiation Therapy Oncology GroupS Synthesis cell cycle phaseSBRT Stereotactic Body RadiotherapySD Standard DeviationSTAPLE Simultaneous Truth and Performance Level EstimationSUAS Setup Accuracy StudySV Seminal VesiclesTCP Tumour Control ProbabilityTMC Trial Management CommitteeTNM Tumour, Nodal, MetastasisTPS Treatment Planning SystemTROG Trans-Tasman Radiation Oncology GroupTRUS Transrectal UltrasoundVMAT Volumetric Modulated Arc TherapyVOLSIM Volume Similarity

List of Figures
1.1 Early variations in quality will be encapsulated by all further steps of theradiotherapy workflow, affecting the overall quality of the clinical trial. Thefour key topics addressed by this thesis focus on the early stages of theradiotherapy workflow, with latter topics directly tied to improving clinicaltrial quality assurance. How each topic relates to the radiotherapy workflowis represented by the shading of the corresponding circles. . . . . . . . . . . 3
2.1 Incidence (solid line) and mortality (dashed line) rates of prostate cancerin Australian men. Image adapted from [1]. . . . . . . . . . . . . . . . . . . 9
2.2 Male pelvic anatomy. Image adapted from [2]. . . . . . . . . . . . . . . . . . 102.3 Zonal anatomy of A) a young, and B) an older male prostate. Image adapted
from [3]. . . . . . . . . . . . . . . . . . . . . . . . . . . . . . . . . . . . . . . 112.4 Gleason Grading schematics, where a higher grade is assigned to cancer
cells possessing less structural similarity with healthy prostate cells. Imageadapted from [4]. . . . . . . . . . . . . . . . . . . . . . . . . . . . . . . . . . 13
2.5 Evolution of utilisation of treatment technique, stratified by risk assessment.Image adapted from [5]. . . . . . . . . . . . . . . . . . . . . . . . . . . . . . 16
2.6 Murine melanoma cell survival curve. Multiple independent trials are plot-ted (boxes), along with the geometric mean values (triangle) to generatea cell survival curve. The solid curve corresponds to the linear quadraticmodel [6]. . . . . . . . . . . . . . . . . . . . . . . . . . . . . . . . . . . . . . 23
2.7 Linear Quadratic Model components. Each individual component of themodel are shown in dashed blue, with the final survival curve shown in red[6]. . . . . . . . . . . . . . . . . . . . . . . . . . . . . . . . . . . . . . . . . . 24
2.8 The therapeutic Ratio. If the dose required for 50% TCP (Dt) is less thanthe dose required for 50% NTCP (Dn), then the therapeutic ratio will begreater than one, and treatment will overall be beneficial to the patient (A).Conversely, a therapeutic ratio less than one corresponds to treatment withgreater complications to normal tissue than tumour control (B) [6]. . . . . . 26
2.9 Early versus late responding tissues. At low doses early responding tissueshave a smaller surviving fraction. When the dose is increased the survivallines cross, resulting in a significantly reduced surviving fraction for lateresponding tissues at increased doses [7]. . . . . . . . . . . . . . . . . . . . . 27
xiv

List of Figures xv
2.10 Hypothetical cellular survival curve undergoing fractionated treatment. Ateach point of fractionation, a new shoulder region appears following re-pair of sub-lethal damage. Consequently, the dose required to produce anequivalent effect (for example, 2% cell survival) is substantially larger thanif fractionation weren’t utilised [8]. . . . . . . . . . . . . . . . . . . . . . . . 28
2.11 Cell repair following differing fractionation regimes. The red curve corre-sponds to survival if no fractionation was utilised (i.e., a large single dose).Blue and green curves correspond to treatments of differing dose per frac-tion. As the dose per fraction is further reduced, the equivalent survivalcurves (dashed lines) will approach the limit where only lethal damage froma single track is observed (yellow line) [6]. . . . . . . . . . . . . . . . . . . . 29
2.12 Example DVH for a prostate cancer patient undergoing VMAT treatment.Curves corresponding to dose distributions for CTV (red), PTV (blue),bladder (yellow), and rectum (green) are shown. Treatment plan charac-teristics such as CTV dose uniformity and reduced high doses within therectum can be quickly and concisely observed. . . . . . . . . . . . . . . . . . 37
2.13 Comparison between 3D-CRT (left) and IMRT (right) prostate cancer treat-ment plans. The 95% isodose level (i.e. the region receiving at least 95%of the prescription dose) is shaded red. IMRT produces a more conformaltreatment plan, with faster dose drop-off outside the target volume [9]. . . . 39
2.14 Relapse free survival for patients with and without treatment protocol vi-olations (PV). Factors affecting relapse-free survival included inadequatecontouring, insufficient dose to the target volume during planning, dose-rate being too slow for treatment, and encountered technical difficulties[10]. . . . . . . . . . . . . . . . . . . . . . . . . . . . . . . . . . . . . . . . . 46
2.15 Locoregional control amongst patients whose plans were initially compliant(yellow), made compliant following QARC assessment (blue), non-compliantbut assessed as having no major impact on tumour control (purple), andnon-compliant but assessed as having a major impact on tumour control(red). The only statistically significant difference arose between the firstthree and the final grouping [11]. . . . . . . . . . . . . . . . . . . . . . . . . 47
2.16 Inter-observer contouring variation at the prostatic apex by five observers[12]. . . . . . . . . . . . . . . . . . . . . . . . . . . . . . . . . . . . . . . . . 50
2.17 Cumulative incidence of prostate cancer mortality. Significant reductionswere observed for patients received 18 months androgen deprivation therapyin conjunction with radiotherapy [13]. . . . . . . . . . . . . . . . . . . . . . 55
2.18 Examples of different atlases. From left to right; a single-atlas with a sin-gle template image, a multi-atlas with all template images utilised duringauto-contouring, a multi-atlas with a single best-fit template used for auto-contouring, and a multi-atlas with a subset of template images used forauto-contouring. Image reproduced from [14]. . . . . . . . . . . . . . . . . . 63
2.19 Steps required for multi-atlas development (above dashed line) and imple-mentation (below dashed line). Steps are ordered chronologically, withdashed blocks optional. Image adapted from [15]. . . . . . . . . . . . . . . . 64
2.20 Workflow for implementation of a multi-atlas, automatically contouringstructures on an incoming query image. Image is adapted from [16]. . . . . 65
List of Figures xvi
2.21 To deform the image on the left to match the image on the right, non-rigidregistration is utilised. Vector fields correspond to the individual transfor-mations applied to each voxel. Image adapted from [16]. . . . . . . . . . . . 66
3.1 Observer and STAPLE volume spread for each structure across all 35 pa-tients for trial 1. Notch box-plots show a significant difference in CTV andPTV median volumes by observer (B) compared to observers (A) and (C).Differences between observer median rectum volumes were found to be notstatistically significant. . . . . . . . . . . . . . . . . . . . . . . . . . . . . . . 74
3.2 Spread in observer dice similarity coefficient (DSC) for CTV, PTV, bladder,and rectum across all patients for trial 1 . . . . . . . . . . . . . . . . . . . . 74
3.3 Patient 32 containing the poorest overlapping PTV contour (DSC = 0.7612)on T2 MR. Observer (A) (red), (B) (purple), and (C) (orange) contours areoutlined on (clockwise from top) transverse, coronal, and sagittal images.STAPLE volume is shaded light blue. . . . . . . . . . . . . . . . . . . . . . 75
3.4 Patient 1 PTV contours on T2 MR. All observer contours recorded DSC >0.9 with respect to the STAPLE volume shaded in light blue. However, dueto significant portions of Observer C’s (orange) PTV failing to include theSTAPLE volume, insufficient dose was delivered to the STAPLE PTV forthese treatment plans. . . . . . . . . . . . . . . . . . . . . . . . . . . . . . . 75
3.5 Significant Spearman correlations for PTV (top image, p < 0.00035) andrectum (bottom image, p < 0.00026) for trial 1. Volume similarity, sensi-tivity, specificity and C-Factor significantly correlated with a range of ra-diobiological metrics for both structures. Most correlations identified wereweak, although TCPPoisson, minimum dose, and dose homogeneity showedmoderate correlations with volume similarity, sensitivity, and specificity forPTV. . . . . . . . . . . . . . . . . . . . . . . . . . . . . . . . . . . . . . . . 76
3.6 PTV volume similarity versus rectum NTCP, ρ = 0.33. . . . . . . . . . . . . 763.7 Variations in contoured volumes for each structure across the five patients
in trial 2. Gold standard volumes for each structure are shown as a blackcross. Due to the use of a majority vote, each gold standard volume is bydefinition smaller than the median volume for each structure. . . . . . . . . 77
3.8 Spread in observer DSC for CTV, PTV, bladder, and rectum across allpatients for trial 2. . . . . . . . . . . . . . . . . . . . . . . . . . . . . . . . . 77
3.9 Patient 4 PTV contours on (clockwise from top) transverse, coronal, andsagittal images. Observer A (highlighted dark green) displayed the poorestoverlapping PTV with respect to the majority vote PTV (shaded light blue),with a DSC of 0.8167. . . . . . . . . . . . . . . . . . . . . . . . . . . . . . . 78
3.10 Patient 4 dose distribution derived from observer A’s PTV contour (figure9). The majority vote PTV is outlined in light blue, while the 78 Gy, 50Gy, and 39 Gy isodose lines are shaded light green, red, and light blue re-spectively. This treatment plan resulted in zero tumour control probabilityfor the majority vote PTV. It can clearly be seen on the sagittal and coronalslices that significant portions of the majority vote PTV were under-dosedduring treatment planning. . . . . . . . . . . . . . . . . . . . . . . . . . . . 78

List of Figures xvii
3.11 Significant Spearman correlations for PTV with p < 0.00035 for trial 2.Correlations for PTV were much stronger than those observed in trial 1(figure 5), ranging from moderate (sensitivity, C-Factor) to strong (volumesimilarity, specificity). . . . . . . . . . . . . . . . . . . . . . . . . . . . . . . 79
4.1 Pairwise DSC for CT (blue) and MR (green) structures (see Table 1 foracronym definitions). . . . . . . . . . . . . . . . . . . . . . . . . . . . . . . . 103
4.2 Observer volume variations for CT and MR defined CTV. Significant dif-ferences between median CT and MR volume were observed for all patients(P < 0.05). . . . . . . . . . . . . . . . . . . . . . . . . . . . . . . . . . . . . 103
4.3 (a) Sagittal view of patient 2, where variations in superior boundary forrectum contours between two observers (filled contours) resulted in pooroverlap of bowel bag contours (outlined). (b) Density distribution of all ob-server rectum contours for patient 2, ranging from 100% observer agreement(purple) to only a single observer (red). . . . . . . . . . . . . . . . . . . . . 104
4.4 Variations in contouring for left and right NVB for Patient 1. For manyobservers, no contour overlap was evident. . . . . . . . . . . . . . . . . . . . 104
4.5 Pairwise Volume Similarity for CT (blue) and MR (green) structures. Asno distinction between which observer contour would be treated as the goldstandard volume, absolute values of volume similarity are reported here. . . 112
4.6 Pairwise sensitivity scores for CT (blue) and MR (green) structures . . . . . 1154.7 Pairwise specificity scores for CT (blue) and MR (green) structures . . . . . 1184.8 Pairwise Hausdorff Distance scores for CT (blue) and MR (green) structures 1214.9 Pairwise Mean Absolute Surface Distance scores for CT (blue) and MR
(green) structures . . . . . . . . . . . . . . . . . . . . . . . . . . . . . . . . . 1244.10 Pairwise Euclidean Centroid Distance scores for CT (blue) and MR (green)
structures . . . . . . . . . . . . . . . . . . . . . . . . . . . . . . . . . . . . . 1274.11 Detail of genito-urinary structures . . . . . . . . . . . . . . . . . . . . . . . 161
5.1 Schematic of Distance-to-Agreement (DtA) vector construction betweenCTVAtlas (blue) and CTVManual (red). A vector propagating from thecentre-of-mass of CTVManual intersects CTVManual and CTVAtlas. DtAbetween CTVs along this vector is measured (red arrow), with positive DtAcorresponding to CTVManual extending further outwards than CTVAtlas.Vectors were sampled every 6°, in both azimuthal and elevation, providinga complete spatial mapping of contouring variation. . . . . . . . . . . . . . 169
5.2 Median DtA between CTVManual and CTVAtlas for RADAR (top-left),RT01 (top-right), and CHHiP (bottom-left) datasets following vector anal-ysis. Shaded areas within each figure correspond to spatial regions where nostatistically significant difference existed between CTVAtlas and CTVManual
(p > 0.05 following Wilcoxon Analysis). Positive DtA values (yellow shadedregions) correspond to CTVManual extending further compared to CTVAtlas.Negative DtA values (blue shaded regions) correspond to the converse. Spa-tial regions corresponding to median bladder and rectum position lyingwithin 5mm of CTVAtlas are shown in the bottom-right figure. . . . . . . . 171
5.3 Hazard Ratio mappings with corresponding significance levels for overallpatient survival across RADAR, RT01, and CHHiP trials. . . . . . . . . . . 172

List of Figures xviii
5.4 Hazard Ratio mappings with corresponding significance levels for local pro-gression across RADAR, RT01, and CHHiP trials. . . . . . . . . . . . . . . 173
5.5 Hazard Ratio mappings with corresponding significance levels for PSA pro-gression across RADAR, RT01, and CHHiP trials. . . . . . . . . . . . . . . 174
5.6 DtA Cut-points (DCP) across RADAR, RT01, and CHHiP patients, basedon recorded patient death. Each vector cut-point was calculated using max-rank sum statistics, whereby patients dichotomised by DCP result in themost significant difference in patient outcome calculated by Wilcoxon ranksum test. . . . . . . . . . . . . . . . . . . . . . . . . . . . . . . . . . . . . . 182
5.7 DtA Cut-points (DCP) across RADAR, RT01, and CHHiP patients, basedon local progression. . . . . . . . . . . . . . . . . . . . . . . . . . . . . . . . 183
5.8 DtA Cut-points (DCP) across RADAR, RT01, and CHHiP patients, basedon PSA progression. . . . . . . . . . . . . . . . . . . . . . . . . . . . . . . . 184
5.9 Adjusted p-value mappings for recorded patient death across RADAR, RT01,and CHHiP patients. p-values were adjusted using the Free Step-Down Re-sampling method as described by Westfall and Young (Algorithm 2.8, pages66 – 67) [17]. . . . . . . . . . . . . . . . . . . . . . . . . . . . . . . . . . . . 185
5.10 Adjusted p-value mappings for local progression across RADAR, RT01, andCHHiP patients. . . . . . . . . . . . . . . . . . . . . . . . . . . . . . . . . . 186
5.11 Adjusted p-value mappings for PSA progression across RADAR, RT01, andCHHiP patients. . . . . . . . . . . . . . . . . . . . . . . . . . . . . . . . . . 187
6.1 Schematic of the study design. Participating centres had a local prostateradiotherapy protocol and associated AP configuration. Each centre creatednew AP configurations for the other two protocols through modification oftheir local AP configuration, based on a training dataset of three patientsprovided by each centre (pre-contoured CT datasets). . . . . . . . . . . . . 194
6.2 Median PTV DVHs for all patients for AP Configurations A (blue), B (red),and C (green). Note that the scale begins at 60 Gy for clarity. Solidlines correspond to host-centre AP configuration, modified configurationsare dashed. Solid and dotted grey p-value curves, indicating significantdifferences between population median DVHs, are also illustrated. Thedashed black line shows p=0.05. (For interpretation of the references tocolour in this figure legend, the reader is referred to the web version of thisarticle.) . . . . . . . . . . . . . . . . . . . . . . . . . . . . . . . . . . . . . . 195
6.3 Median Rectum DVHs for all patients for AP Configurations A (blue), B(red), and C (green). Solid and dotted grey p-value curves again indicatesignificant differences between population median DVHs. (For interpreta-tion of the references to colour in this figure legend, the reader is referredto the web version of this article.) . . . . . . . . . . . . . . . . . . . . . . . . 196
6.4 Mean left femoral head DVHs for all patients for AP Configurations A(blue), B (red), and C (green). Note that scale begins at 60 Gy for clarity.Solid lines correspond to host-centre AP configuration, modified configura-tions are dashed. Solid and dotted grey p-value curves, indicating signifi-cant differences between population mean DVHs, are also illustrated. Thedashed black line shows p = 0.05. . . . . . . . . . . . . . . . . . . . . . . . . 215
List of Figures xix
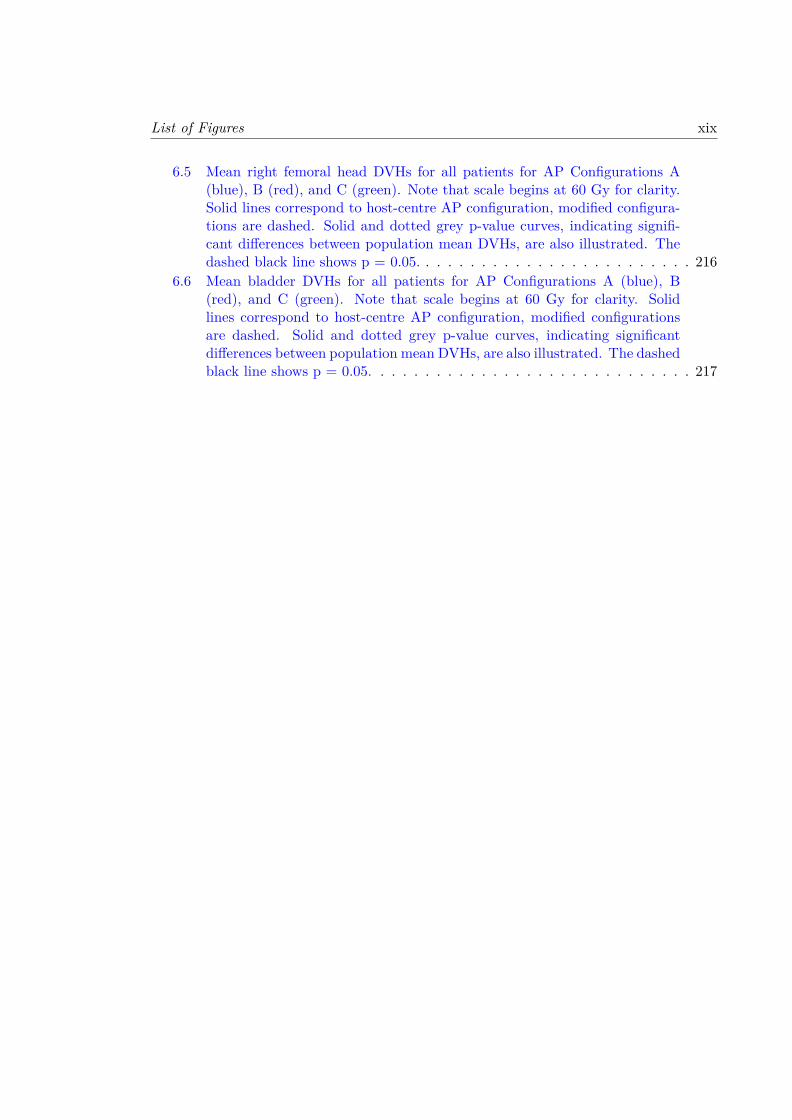
6.5 Mean right femoral head DVHs for all patients for AP Configurations A(blue), B (red), and C (green). Note that scale begins at 60 Gy for clarity.Solid lines correspond to host-centre AP configuration, modified configura-tions are dashed. Solid and dotted grey p-value curves, indicating signifi-cant differences between population mean DVHs, are also illustrated. Thedashed black line shows p = 0.05. . . . . . . . . . . . . . . . . . . . . . . . . 216
6.6 Mean bladder DVHs for all patients for AP Configurations A (blue), B(red), and C (green). Note that scale begins at 60 Gy for clarity. Solidlines correspond to host-centre AP configuration, modified configurationsare dashed. Solid and dotted grey p-value curves, indicating significantdifferences between population mean DVHs, are also illustrated. The dashedblack line shows p = 0.05. . . . . . . . . . . . . . . . . . . . . . . . . . . . . 217
List of Tables
2.1 Gleason gradings and descriptions, defined at ISUP Consensus Conference2005 [18]. . . . . . . . . . . . . . . . . . . . . . . . . . . . . . . . . . . . . . 12
2.2 Clinical TNM Definitions . . . . . . . . . . . . . . . . . . . . . . . . . . . . 142.3 Clinical Staging of prostate cancer, where X corresponds to an unknown
PSA or Gleason . . . . . . . . . . . . . . . . . . . . . . . . . . . . . . . . . . 152.4 South Western Sydney Cancer Therapy CTV and PTV contouring guidelines. 342.5 EORTC defined QA levels for a clinical trial [19]. . . . . . . . . . . . . . . . 44
3.1 Contouring similarity and radiobiological metrics. . . . . . . . . . . . . . . . 723.2 Contouring similarity metric derivations. . . . . . . . . . . . . . . . . . . . . 733.3 Strength of Spearman’s correlation ρ. . . . . . . . . . . . . . . . . . . . . . . 733.4 Mean, standard deviation, and COV of structure volumes across trial 1
patient cohort. . . . . . . . . . . . . . . . . . . . . . . . . . . . . . . . . . . 743.5 Mean differences between observer and STAPLE plan dosimetry. . . . . . . 753.6 Mean, standard deviation, and COV of observer structure volumes for trial
2 patients. . . . . . . . . . . . . . . . . . . . . . . . . . . . . . . . . . . . . . 773.7 Mean differences between trial 2 observer and majority vote plan dosimetry. 783.8 ICCs and minimum required number of observers for study reliability. . . . 803.9 Department prostate treatment planning protocol . . . . . . . . . . . . . . . 843.10 Trial 1 DSC statistics . . . . . . . . . . . . . . . . . . . . . . . . . . . . . . 863.11 Trail 1 95% Hausdorff Statistics . . . . . . . . . . . . . . . . . . . . . . . . . 863.12 Bladder contouring similarity and radiobiological metric correlations, Trial
1: STAPLE gold standard . . . . . . . . . . . . . . . . . . . . . . . . . . . . 873.13 Rectum contouring similarity and radiobiological metric correlations, Trial
1: STAPLE gold standard . . . . . . . . . . . . . . . . . . . . . . . . . . . . 873.14 CTV contouring similarity and radiobiological metric correlations, Trial 1:
STAPLE gold standard . . . . . . . . . . . . . . . . . . . . . . . . . . . . . 883.15 PTV contouring similarity and radiobiological metric correlations, Trial 1:
STAPLE gold standard . . . . . . . . . . . . . . . . . . . . . . . . . . . . . 883.16 Bladder contouring similarity and radiobiological metric correlations, Trial
1: observer gold standard . . . . . . . . . . . . . . . . . . . . . . . . . . . . 903.17 Rectum contouring similarity and radiobiological metric correlations, Trial
1: observer gold standard . . . . . . . . . . . . . . . . . . . . . . . . . . . . 903.18 CTV contouring similarity and radiobiological metric correlations, Trial 1:
observer gold standard . . . . . . . . . . . . . . . . . . . . . . . . . . . . . . 91
xx

List of Tables xxi
3.19 PTV contouring similarity and radiobiological metric correlations, Trial 1:observer gold standard . . . . . . . . . . . . . . . . . . . . . . . . . . . . . . 91
3.20 Trial 2 DSC statistics . . . . . . . . . . . . . . . . . . . . . . . . . . . . . . 923.21 Trail 2 95% Hausdorff statistics . . . . . . . . . . . . . . . . . . . . . . . . . 933.22 Bladder contouring similarity and radiobiological metric correlations, Trial
2: majority vote gold standard . . . . . . . . . . . . . . . . . . . . . . . . . 943.23 Rectum contouring similarity and radiobiological metric correlations, Trial
2: majority vote gold standard . . . . . . . . . . . . . . . . . . . . . . . . . 943.24 CTV contouring similarity and radiobiological metric correlations, Trial 2:
majority vote gold standard. Note: correlations for iso90 weren’t possibledue to every observer patient having 100% coverage of the CTV at the 90%isodose level, exactly matching the majority vote plans for each patient. . . 95
3.25 PTV contouring similarity and radiobiological metric correlations, Trial 2:majority vote gold standard . . . . . . . . . . . . . . . . . . . . . . . . . . . 95
3.26 Bladder contouring similarity and radiobiological metric correlations, Trial2: radiation oncologist and radiotherapist contours only . . . . . . . . . . . 96
3.27 Rectum contouring similarity and radiobiological metric correlations, Trial2: radiation oncologist and radiotherapist contours only . . . . . . . . . . . 96
3.28 CTV contouring similarity and radiobiological metric correlations, Trial 2:radiation oncologist and radiotherapist contours only. Note: correlations foriso90 weren’t possible due to every observer patient having 100% coverageof the CTV at the 90% isodose level, exactly matching the majority voteplans for each patient. . . . . . . . . . . . . . . . . . . . . . . . . . . . . . . 97
3.29 PTV contouring similarity and radiobiological metric correlations, Trial 2:radiation oncologist and radiotherapist contours only . . . . . . . . . . . . . 97
4.1 Contoured structures . . . . . . . . . . . . . . . . . . . . . . . . . . . . . . . 1004.2 Mean, standard deviation (SD) and coefficient of variation (COV) of ob-
server contour volumes . . . . . . . . . . . . . . . . . . . . . . . . . . . . . . 1024.3 Contouring variation metrics . . . . . . . . . . . . . . . . . . . . . . . . . . 1084.4 DSC distribution . . . . . . . . . . . . . . . . . . . . . . . . . . . . . . . . . 1104.5 Absolute Volume Similarity Distribution . . . . . . . . . . . . . . . . . . . . 1134.6 Sensitivity Distribution . . . . . . . . . . . . . . . . . . . . . . . . . . . . . 1164.7 Specificity Distribution . . . . . . . . . . . . . . . . . . . . . . . . . . . . . . 1194.8 Hausdorff Distance Distribution . . . . . . . . . . . . . . . . . . . . . . . . . 1224.9 Mean Absolute Surface Distance Distribution . . . . . . . . . . . . . . . . . 1254.10 Euclidean Centroid Distance Distribution . . . . . . . . . . . . . . . . . . . 1284.11 Contouring experience levels of CT structures for all volunteers prior to
commencement of this investigation. Volunteers have been stratified asRadiation Oncologists (RO) or non-Radiation Oncologists (Non-RO). Me-dian experience level for each structure is bolded red, with the lower boundbolded if the median lies between two columns. . . . . . . . . . . . . . . . . 130
List of Tables xxii
4.12 Contouring experience levels of CT structures for all volunteers prior tocommencement of this investigation. Volunteers have been stratified asRadiation Oncologists (RO) or non-Radiation Oncologists (Non-RO). Me-dian experience level for each structure is bolded red, with the lower boundbolded if the median lies between two columns. . . . . . . . . . . . . . . . . 131
4.13 Wilcoxon rank sum testing of contoured volumes between Radiation Oncol-ogists (RO) and non-Radiation Oncologists (Non-RO). Median volumes foreach structure for each patient are given in cm3. P-values indicate differ-ences between median volumes, with p-values < 0.05 bolded red. However,Bonferroni corrections must be made due to the large number (85) of statis-tical tests undertaken. This requires p < 0.0006 for statistical significance,which no comparison reached. . . . . . . . . . . . . . . . . . . . . . . . . . . 132
4.14 CT Structures . . . . . . . . . . . . . . . . . . . . . . . . . . . . . . . . . . . 1374.15 MR Structures . . . . . . . . . . . . . . . . . . . . . . . . . . . . . . . . . . 147
5.1 Patient numbers, baseline variables, and recorded patient outcome acrosseach clinical trial. Patients were dichotomised based on disease-risk groupsand cancer stages. Baseline variable and patient outcome numbers are withrespect to patients analysed. . . . . . . . . . . . . . . . . . . . . . . . . . . . 167
5.2 Hazard Ratios for patient death within bladder and rectum spatial regionsfor RADAR, RT01, and CHHiP patients. . . . . . . . . . . . . . . . . . . . 188
5.3 Hazard Ratios for local progression within bladder and rectum spatial re-gions for RADAR, RT01, and CHHiP patients. . . . . . . . . . . . . . . . . 189
5.4 Hazard Ratios for PSA progression within bladder and rectum spatial re-gions for RADAR, RT01, and CHHiP patients. . . . . . . . . . . . . . . . . 190
6.1 Target and high/constraint priority OAR prescriptions and evaluations.Complete lists of evaluation criteria can be found within Table 6.4 (sup-plementary material). . . . . . . . . . . . . . . . . . . . . . . . . . . . . . . 193
6.2 Target and high/constraint priority OAR mean and standard deviations(S.D.) for all protocols. Conformity and homogeneity indices are shown forall PTVs. Differences in metrics considered significant (p< 0.05) are bolded.Complete list of objectives can be found within Table 6.9 (supplementarymaterial). . . . . . . . . . . . . . . . . . . . . . . . . . . . . . . . . . . . . . 194
6.3 Total deviations for each AP configuration. Specific deviations can be foundin Table 6.10 (supplementary material). . . . . . . . . . . . . . . . . . . . . 196
6.4 Target objectives, and OAR evaluations for all three protocols . . . . . . . . 1996.5 AP Technique A adapted across all three protocols . . . . . . . . . . . . . . 2016.6 AP Technique B adapted across all three protocols . . . . . . . . . . . . . . 2036.7 AP Technique C adapted across all three protocols . . . . . . . . . . . . . . 2056.8 Treatment planning system and beam setup configurations . . . . . . . . . . 2076.9 Patient demographics . . . . . . . . . . . . . . . . . . . . . . . . . . . . . . 2086.10 Target and OAR mean and standard deviations (S.D.) for each centre’s
protocols. Conformity and homogeneity indices are also shown for eachprotocol’s PTV. Differences in metrics considered significant (p < 0.05) arebolded. . . . . . . . . . . . . . . . . . . . . . . . . . . . . . . . . . . . . . . . 209

List of Tables xxiii
6.11 Total recorded violations by each centre’s AP technique . . . . . . . . . . . 2126.12 Modified AP Technique B to meet distributed protocol B criteria . . . . . . 2136.13 Original and modified AP technique B for protocol B, with significant dif-
ferences between metrics bolded. . . . . . . . . . . . . . . . . . . . . . . . . 214

Contents
Acknowledgements viii
List of Publications x
List of Abbreviations xii
List of Figures xiv
List of Tables xx
Table of Contents xxiv
1 Introduction 11.1 Introduction . . . . . . . . . . . . . . . . . . . . . . . . . . . . . . . . . . . . 21.2 Thesis Aims and Chapter Outlines . . . . . . . . . . . . . . . . . . . . . . . 51.3 The Journey . . . . . . . . . . . . . . . . . . . . . . . . . . . . . . . . . . . 7
2 Literature Review 82.1 Prostate Cancer . . . . . . . . . . . . . . . . . . . . . . . . . . . . . . . . . . 9
2.1.1 Epidemiology . . . . . . . . . . . . . . . . . . . . . . . . . . . . . . . 92.1.2 Anatomy . . . . . . . . . . . . . . . . . . . . . . . . . . . . . . . . . 102.1.3 Detection and Staging . . . . . . . . . . . . . . . . . . . . . . . . . . 11
2.1.3.1 Biopsies and Gleason Score . . . . . . . . . . . . . . . . . . 122.1.3.2 TNM Staging . . . . . . . . . . . . . . . . . . . . . . . . . . 14
2.2 Prostate Cancer Treatment . . . . . . . . . . . . . . . . . . . . . . . . . . . 152.2.1 Overview of Treatment Techniques . . . . . . . . . . . . . . . . . . . 152.2.2 Radiotherapy . . . . . . . . . . . . . . . . . . . . . . . . . . . . . . . 16
2.2.2.1 External Beam Radiotherapy . . . . . . . . . . . . . . . . . 162.2.2.2 Brachytherapy . . . . . . . . . . . . . . . . . . . . . . . . . 17
2.2.3 Non-Radiotherapy Treatments . . . . . . . . . . . . . . . . . . . . . 172.2.3.1 Active Surveillance . . . . . . . . . . . . . . . . . . . . . . . 172.2.3.2 Surgery . . . . . . . . . . . . . . . . . . . . . . . . . . . . . 182.2.3.3 Systemic Therapies . . . . . . . . . . . . . . . . . . . . . . 192.2.3.4 Focal Therapy . . . . . . . . . . . . . . . . . . . . . . . . . 20
2.3 Principles of Radiotherapy . . . . . . . . . . . . . . . . . . . . . . . . . . . . 20
xxiv
Table of Contents xxv
2.3.1 Cellular Damage and Death . . . . . . . . . . . . . . . . . . . . . . . 202.3.2 Radiobiological Models for Radiotherapy . . . . . . . . . . . . . . . 22
2.3.2.1 Linear-Quadratic Model . . . . . . . . . . . . . . . . . . . . 242.3.3 Therapeutic Ratio . . . . . . . . . . . . . . . . . . . . . . . . . . . . 252.3.4 Fractionation . . . . . . . . . . . . . . . . . . . . . . . . . . . . . . . 25
2.3.4.1 Repair . . . . . . . . . . . . . . . . . . . . . . . . . . . . . 272.3.4.2 Repopulation . . . . . . . . . . . . . . . . . . . . . . . . . . 292.3.4.3 Redistribution . . . . . . . . . . . . . . . . . . . . . . . . . 302.3.4.4 Reoxygenation . . . . . . . . . . . . . . . . . . . . . . . . . 302.3.4.5 Radioresistance . . . . . . . . . . . . . . . . . . . . . . . . 31
2.4 Radiotherapy Workflow . . . . . . . . . . . . . . . . . . . . . . . . . . . . . 322.4.1 Imaging . . . . . . . . . . . . . . . . . . . . . . . . . . . . . . . . . . 322.4.2 Contouring . . . . . . . . . . . . . . . . . . . . . . . . . . . . . . . . 33
2.4.2.1 Target Volumes . . . . . . . . . . . . . . . . . . . . . . . . 332.4.2.2 Organs-at-Risk . . . . . . . . . . . . . . . . . . . . . . . . . 35
2.4.3 Treatment Planning . . . . . . . . . . . . . . . . . . . . . . . . . . . 352.4.3.1 3D-Conformal Radiotherapy . . . . . . . . . . . . . . . . . 372.4.3.2 Intensity Modulated Radiotherapy . . . . . . . . . . . . . . 382.4.3.3 Volumetric Modulated Arc Therapy . . . . . . . . . . . . . 402.4.3.4 Stereotactic Body Radiotherapy . . . . . . . . . . . . . . . 40
2.4.4 Treatment Delivery . . . . . . . . . . . . . . . . . . . . . . . . . . . . 412.4.4.1 Image Guided Radiotherapy . . . . . . . . . . . . . . . . . 42
2.5 Quality Assurance in Radiotherapy . . . . . . . . . . . . . . . . . . . . . . . 432.5.1 Quality Assurance in Clinical Trials . . . . . . . . . . . . . . . . . . 432.5.2 Contouring Variability and Uncertainty . . . . . . . . . . . . . . . . 48
2.5.2.1 Origin of Contouring Uncertainties . . . . . . . . . . . . . . 492.5.2.2 Efforts to Reduce Contouring Uncertainties . . . . . . . . . 502.5.2.3 Clinical Impact of Contouring Variations . . . . . . . . . . 51
2.5.3 Treatment Planning Variability . . . . . . . . . . . . . . . . . . . . . 522.6 Clinical Trials . . . . . . . . . . . . . . . . . . . . . . . . . . . . . . . . . . . 54
2.6.1 RADAR . . . . . . . . . . . . . . . . . . . . . . . . . . . . . . . . . . 542.6.1.1 Setup Accuracy Study (SUAS) . . . . . . . . . . . . . . . . 56
2.6.2 RT01 . . . . . . . . . . . . . . . . . . . . . . . . . . . . . . . . . . . 572.6.3 CHHiP . . . . . . . . . . . . . . . . . . . . . . . . . . . . . . . . . . 58
2.7 Automated Contouring . . . . . . . . . . . . . . . . . . . . . . . . . . . . . . 602.7.1 Atlas-Based Contouring . . . . . . . . . . . . . . . . . . . . . . . . . 612.7.2 Multi-Atlas Development . . . . . . . . . . . . . . . . . . . . . . . . 632.7.3 Atlas Workflow . . . . . . . . . . . . . . . . . . . . . . . . . . . . . . 64
2.7.3.1 Registration . . . . . . . . . . . . . . . . . . . . . . . . . . 652.7.3.2 Contour Propagation and Fusion . . . . . . . . . . . . . . . 67
2.7.4 Limitations of Atlases . . . . . . . . . . . . . . . . . . . . . . . . . . 68
3 Correlations between contouring similarity metrics and simulated treat-ment outcome for prostate radiotherapy 69

Table of Contents xxvi
3.1 Supplementary Material A . . . . . . . . . . . . . . . . . . . . . . . . . . . . 84
4 Multi-observer contouring of male pelvic anatomy: Highly variable agree-ment across conventional and emerging structures of interest 984.1 Supplementary Material A . . . . . . . . . . . . . . . . . . . . . . . . . . . . 1074.2 Supplementary Material B . . . . . . . . . . . . . . . . . . . . . . . . . . . . 134
5 Spatial analysis of target volume contours within three internationalprostate radiotherapy trials – Clinical impact of contouring variabilityon patient outcome 1625.1 Abstract . . . . . . . . . . . . . . . . . . . . . . . . . . . . . . . . . . . . . . 164
5.1.1 Background and Purpose . . . . . . . . . . . . . . . . . . . . . . . . 1645.1.2 Materials and Methods . . . . . . . . . . . . . . . . . . . . . . . . . 1645.1.3 Results . . . . . . . . . . . . . . . . . . . . . . . . . . . . . . . . . . 1645.1.4 Conclusion . . . . . . . . . . . . . . . . . . . . . . . . . . . . . . . . 165
5.2 Introduction . . . . . . . . . . . . . . . . . . . . . . . . . . . . . . . . . . . . 1655.3 Materials and Methods . . . . . . . . . . . . . . . . . . . . . . . . . . . . . . 166
5.3.1 Clinical Trial Datasets . . . . . . . . . . . . . . . . . . . . . . . . . . 1665.3.2 Atlas-Based Contouring . . . . . . . . . . . . . . . . . . . . . . . . . 1685.3.3 Vector Mappings . . . . . . . . . . . . . . . . . . . . . . . . . . . . . 1695.3.4 Statistical Analysis . . . . . . . . . . . . . . . . . . . . . . . . . . . . 170
5.4 Results . . . . . . . . . . . . . . . . . . . . . . . . . . . . . . . . . . . . . . . 1715.5 Discussion . . . . . . . . . . . . . . . . . . . . . . . . . . . . . . . . . . . . . 1765.6 Conclusions . . . . . . . . . . . . . . . . . . . . . . . . . . . . . . . . . . . . 1805.7 Acknowledgements . . . . . . . . . . . . . . . . . . . . . . . . . . . . . . . . 1805.8 Supplementary Material A . . . . . . . . . . . . . . . . . . . . . . . . . . . . 182
6 Adapting automated treatment planning configurations across interna-tional centres for prostate radiotherapy 1916.1 Supplementary Material A . . . . . . . . . . . . . . . . . . . . . . . . . . . . 199
7 Discussion and Conclusion 2187.1 General Discussion . . . . . . . . . . . . . . . . . . . . . . . . . . . . . . . . 2197.2 Inter-observer contouring uncertainties for intact prostate radiotherapy . . . 2227.3 Contouring variability within clinical trial datasets . . . . . . . . . . . . . . 2247.4 Quality of automated treatment planning techniques between centres . . . . 2267.5 Future Work . . . . . . . . . . . . . . . . . . . . . . . . . . . . . . . . . . . 2277.6 Conclusion . . . . . . . . . . . . . . . . . . . . . . . . . . . . . . . . . . . . 230
Bibliography 232

CHAPTER 1
Introduction
1

Chapter 1. Introduction 2
1.1 Introduction
Prostate cancer is the leading cancer diagnosis in Australian men, with 18,291 new inci-
dents accounting for 26.2% of all cancer cases in 2014 [1]. This number was projected to
rise to 19,508 by 2019, corresponding to a 1 in 6 risk of Australian men developing prostate
cancer by the age of 85 [20]. Conversely, prostate cancer mortality risk is comparatively
low at an estimated 1 in 35 [20]. While this is attributable to the indolent nature of the
disease, it also showcases that treatment for prostate cancer is highly successful. Multiple
treatment techniques are available, with preferred treatment based on tumour staging,
patient age, and potential risks of treatment-induced toxicity [21].
Radiotherapy is one of the major treatment techniques that is utilised within the clinic.
Optimal usage recommendations state that 58% of all prostate cancer patients should
receive external beam radiotherapy (EBRT) at some stage during treatment [22]. To
ensure high quality radiotherapy is safely delivered to a patient, precision and accuracy of
the radiotherapy beam must be assessed. While continual developments in engineering and
technology have resulted in the ability to deliver incredibly precise treatment, accuracy is
inherently dependent on the manual processes involved during the radiotherapy workflow.
Specifically, variations in quality of contouring and treatment planning have been shown to
reduce the effectiveness of treatment for patients, while additionally reducing the efficacy
of clinical trials [11, 23].
Clinical trials utilise Quality Assurance (QA) protocols to reduce these uncertainties asso-
ciated with each step within the radiotherapy workflow. Notwithstanding modern adaptive
techniques, radiotherapy incorporates a comparatively linear workflow. Early variations in
quality will subsequently propagate throughout the radiotherapy workflow, compromising
both the effectiveness of treatment and the clinical trial. This is represented in Figure
1.1, whereby uncertainties within the early manual steps will be encapsulated by all fur-
ther stages of the radiotherapy workflow. It is therefore imperative that a comprehensive
assessment of these uncertainties is undertaken within each clinical trial to provide the
highest quality of treatment.

Chapter 1. Introduction 3
Figure 1.1: Early variations in quality will be encapsulated by all further stepsof the radiotherapy workflow, affecting the overall quality of the clinical trial. Thefour key topics addressed by this thesis focus on the early stages of the radiother-apy workflow, with latter topics directly tied to improving clinical trial qualityassurance. How each topic relates to the radiotherapy workflow is represented by
the shading of the corresponding circles.
Contouring, otherwise known as segmentation or delineation, is the outlining of target
volumes and organs-at-risk (OARs) on an image. As one of the early stages within the
radiotherapy workflow, errors and uncertainties associated with contouring will propagate
throughout the remaining radiotherapy processes. Consequently, contouring uncertainties
have been regarded as one of the largest sources of uncertainty within radiotherapy [24].
Assessments of contouring uncertainties have been documented for multiple sites [25],
however no consensus metric choice for analysis exists [26, 27]. Not only does this make
comparisons between studies difficult, with metrics often displaying no correlation with
one another [28], but the metric utilised may have little to no correlation with dosimetry
[29, 30]. Consequently, an assessment of correlations between contouring variation metrics
and simulated treatment outcome for prostate cancer radiotherapy was justified.
Automated contouring is well investigated within the literature, with commonly utilised
methods including shape models [31], deep learning [32], and atlas-based segmentation
[15, 16]. Atlas-based segmentation incorporates a priori clinical information in the form
of manual contours that make up the atlas. Consequently, the resultant quality of the
Chapter 1. Introduction 4
automatically generated contours will be dependent on the quality of the contours within
the atlas. A male pelvic atlas for intact prostate radiotherapy requires bladder, rectum,
femoral heads and bowel bag OAR contours, as well as the clinical target volume (CTV).
However, recent literature has investigated dose to neighbouring OARs such as penile bulb
[33], perirectal fat space [34], and various pelvic floor muscles [35] as potential sources of
toxicity during prostate radiotherapy.
A male pelvic atlas that incorporates these emerging OARs could therefore be utilised
to investigate large prostate radiotherapy clinical trial datasets. An assessment of inter-
observer contouring variations for these structures would need to be undertaken during
development of the atlas. When applied to the clinical trial dataset, variations between the
original manual contours and the atlas contours could be assessed. Contouring variations
in specific spatial regions could then be correlated with significant variations in patient
outcomes within the clinical trial.
Intensity Modulated Radiotherapy (IMRT) and Volumetric Modulated Arc Therapy (VMAT)
are modern radiotherapy treatment techniques commonly utilised by clinical trials. The
quality of the treatment plans generated by these techniques is inherently dependent on
the skill of the clinician responsible for developing the treatment plan [36, 37]. Automated
approaches to treatment planning provide tools to standardise the quality of these treat-
ment plans, while being developed at a fraction of the time [38]. Multiple studies have
assessed the Pinnacle3 AutoPlanning™ (AP) module for automated treatment planning
for a range of treatment sties [39–42]. Compared to manually derived treatment plans, AP
generated plans have been found to be non-inferior in quality, while providing significant
time savings for the clinic. However, AP configurations in these studies were developed
and validated within a single institution. The robustness and quality of AP configurations
adapted to new protocols, such as those distributed during a clinical trial, has thus not
been adequately investigated.
The overarching aim of this thesis was the development and utilisation of advanced analysis
techniques for assessing contouring and treatment planning quality. Analysis techniques
incorporated clinical trial outcome data during development, ensuring the results and

Chapter 1. Introduction 5
findings from this work could ultimately be translated into improving future clinical trial
quality assurance.
1.2 Thesis Aims and Chapter Outlines
The aims of the thesis, along with corresponding chapter outlines, are detailed below.
1. Assess inter-observer contouring uncertainties for target volumes and
organs-at-risk for intact prostate radiotherapy:
(a) Determine the contouring variation metrics that significantly correlate with
simulated treatment outcome for prostate radiotherapy (Chapter 3).
(b) Investigate the prevalence of inter-observer contouring variations for multiple
male pelvic structures on Computer Tomography (CT) and Magnetic Resonance
Imaging (MRI) (Chapter 4).
2. Retrospectively analyse contouring variability across multiple clinical trial
datasets, correlating contouring variation with recorded patient outcomes:
(a) Apply a validated male pelvic atlas to automatically contour patient datasets
within the RADAR, CHHiP, and RT01 clinical trials.
(b) Spatially analyse variations between the original trial and atlas CTV contours,
correlating contouring variations with multiple clinical trial outcomes (Chapter
5).
3. Evaluate the robustness and quality of automated treatment planning
techniques between international centres:
(a) Investigate the robustness and quality of automated treatment planning con-
figurations, with each participating centre’s configurations iteratively adapted
to generate treatment plans meeting the remaining centre’s protocols (Chapter
6).

Chapter 1. Introduction 6
Individual chapter outlines are broken down below:
Chapter 2 reviews the literature, covering the basics of prostate cancer and available
treatment methods. The principles of radiotherapy are presented, along with an overview
of the radiotherapy workflow. The notion of quality assurance is introduced, with an
emphasis on contouring and treatment planning variability. After discussing key prostate
radiotherapy clinical trials, the role and process of automation in radiotherapy is discussed.
Chapter 3 investigates multiple metrics that are commonly utilised to assess inter-
observer contouring variations for prostate radiotherapy. Correlations between these con-
touring metrics and simulated treatment outcome measures is determined. Significant
correlations are elucidated using two separate datasets.
Chapter 4 assesses the extent of inter-observer contouring variations from multiple ob-
servers for numerous male pelvic structures on CT and MRI datasets. Standard structures
that are routinely contoured for clinical radiotherapy, as well as multiple emerging struc-
tures of growing interest within clinical trials are investigated.
Chapter 5 details how the RADAR, CHHiP, and RT01 clinical trial datasets were ret-
rospectively contoured using the developed male pelvic atlas. Incorporation of vector
mappings allowed for a comprehensive spatial mapping of contouring variations between
original trial and automatically generated atlas CTVs. Spatial regions where contour-
ing variations correlated with multiple patient outcomes within the clinical trials were
identified
Chapter 6 compares automated treatment planning configurations from three interna-
tional cancer therapy centres, each utilising the Pinnacle3 treatment planning system.
Clinical prostate AP configurations were adapted by each centre to meet other centre’s
treatment planning protocols. Robustness of AP configurations is assessed using number
of protocol violations and various dosimetry metrics.
Chapter 7 summarises the preceding chapters, discussing the relevance of the presented
work when translated to improving the quality of radiotherapy within a clinical trial. An
outline of potential future work utilising the developed techniques and datasets is provided.
Chapter 1. Introduction 7
1.3 The Journey
Funding for this candidacy was provided by National Health and Medical Research Coun-
cil (NHMRC) Project Grant 1077788. The work carried out in this thesis was conducted
within the South Western Sydney Clinical School at Liverpool Hospital. Research was
principally undertaken at the Ingham Institute for Applied Medical Research, with con-
touring and treatment planning assistance provided by both the Institute and Liverpool
Hospital. Expertise and computational resources were provided by the Australian e-Health
Research Centre at CSIRO. Atlas development was undertaken at Sir Charles Gairdner
Hospital.

CHAPTER 2
Literature Review
8

Chapter 2. Literature Review 9
2.1 Prostate Cancer
2.1.1 Epidemiology
Cancer remains one of the largest burdens of disease globally, with an estimated 18.1
million new diagnoses and 9.6 million deaths worldwide in 2018 [43]. Prostate cancer
is one of the most prevalent forms of cancer, accounting for nearly a quarter of all non-
melanoma cancer diagnoses in men from developed nations [44]. Incidence rates of prostate
cancer are highest in developed countries, likely due to more thorough screening and
diagnostic practices [45]. Mortality rates, conversely, have been found to be higher in
developing countries [45]. Risk factors associated with prostate cancer include race, age,
family history, and diet [21, 46].
Approximately one in two Australian’s will develop cancer before the age of 85 [47], with
one in five Australian men developing prostate cancer [1, 48]. In 2012 the age standardised
rate (ASR) for prostate cancer incidence was approximately 112 out of every 100,000
Figure 2.1: Incidence (solid line) and mortality (dashed line) rates of prostatecancer in Australian men. Image adapted from [1].

Chapter 2. Literature Review 10
Figure 2.2: Male pelvic anatomy. Image adapted from [2].
Australian men, whilst mortality ASR was 12.9 out of every 100,000 [49]. Figure 2.1
shows the changes in ASR rates over the last 30 years.
Prostate cancer treatment typically involves one or more of chemotherapy, surgery, hor-
monal therapy, or radiotherapy. Radiotherapy is delivered either externally using linear
accelerators (LINACs), or in vivo via brachytherapy, and is an essential component of
curative treatment for prostate cancer [50]. External radiotherapy should be utilised for
58% of all prostate cancer patients [22].
2.1.2 Anatomy
The prostate is a small, spherical gland within the male pelvis located anterior to the
rectum, and inferior to the bladder and seminal vesicles (Figure 2.2). The urethra passes
from the bladder neck and enters the prostate at the superior base as the prostatic ure-
thra, before exiting at the prostatic apex as the membranous urethra. Ejaculatory ducts
transporting sperm and seminal vesicle fluid enter the prostate at the posterior base, con-
necting to the prostatic urethra at the verumontanum. The prostate generates an alkaline
fluid that mixes with seminal vesicle fluid to generate semen [13].
Chapter 2. Literature Review 11
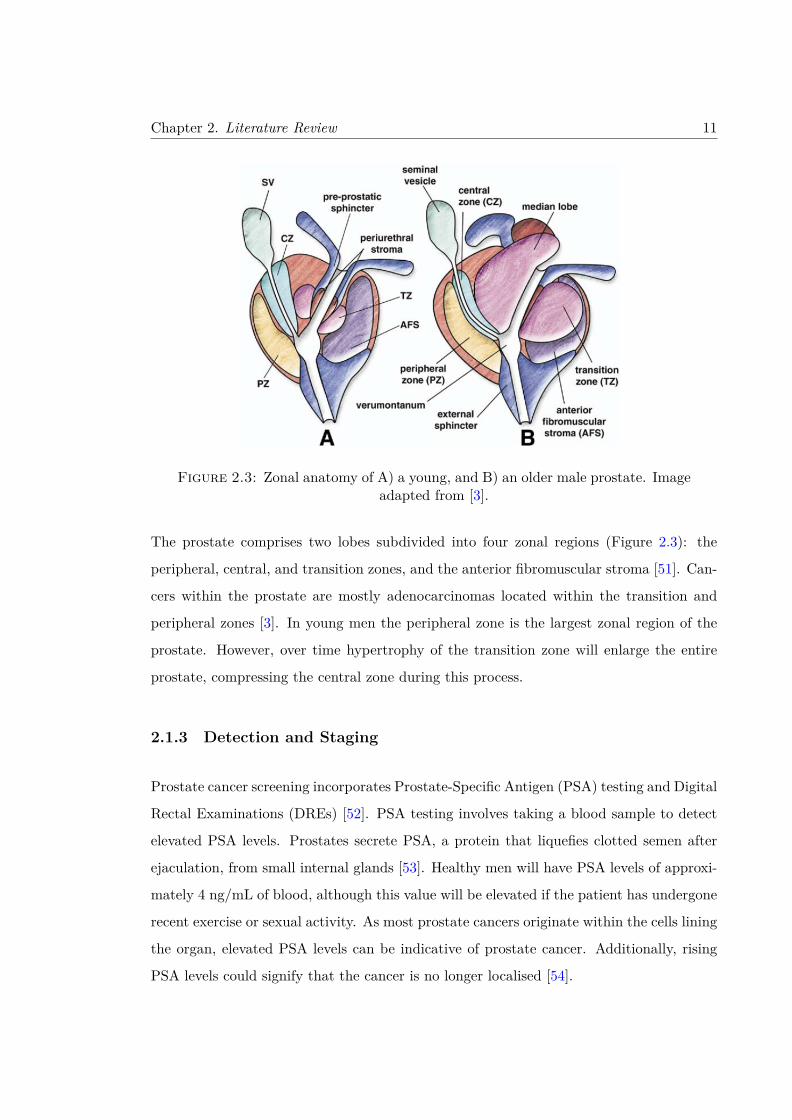
Figure 2.3: Zonal anatomy of A) a young, and B) an older male prostate. Imageadapted from [3].
The prostate comprises two lobes subdivided into four zonal regions (Figure 2.3): the
peripheral, central, and transition zones, and the anterior fibromuscular stroma [51]. Can-
cers within the prostate are mostly adenocarcinomas located within the transition and
peripheral zones [3]. In young men the peripheral zone is the largest zonal region of the
prostate. However, over time hypertrophy of the transition zone will enlarge the entire
prostate, compressing the central zone during this process.
2.1.3 Detection and Staging
Prostate cancer screening incorporates Prostate-Specific Antigen (PSA) testing and Digital
Rectal Examinations (DREs) [52]. PSA testing involves taking a blood sample to detect
elevated PSA levels. Prostates secrete PSA, a protein that liquefies clotted semen after
ejaculation, from small internal glands [53]. Healthy men will have PSA levels of approxi-
mately 4 ng/mL of blood, although this value will be elevated if the patient has undergone
recent exercise or sexual activity. As most prostate cancers originate within the cells lining
the organ, elevated PSA levels can be indicative of prostate cancer. Additionally, rising
PSA levels could signify that the cancer is no longer localised [54].
Chapter 2. Literature Review 12
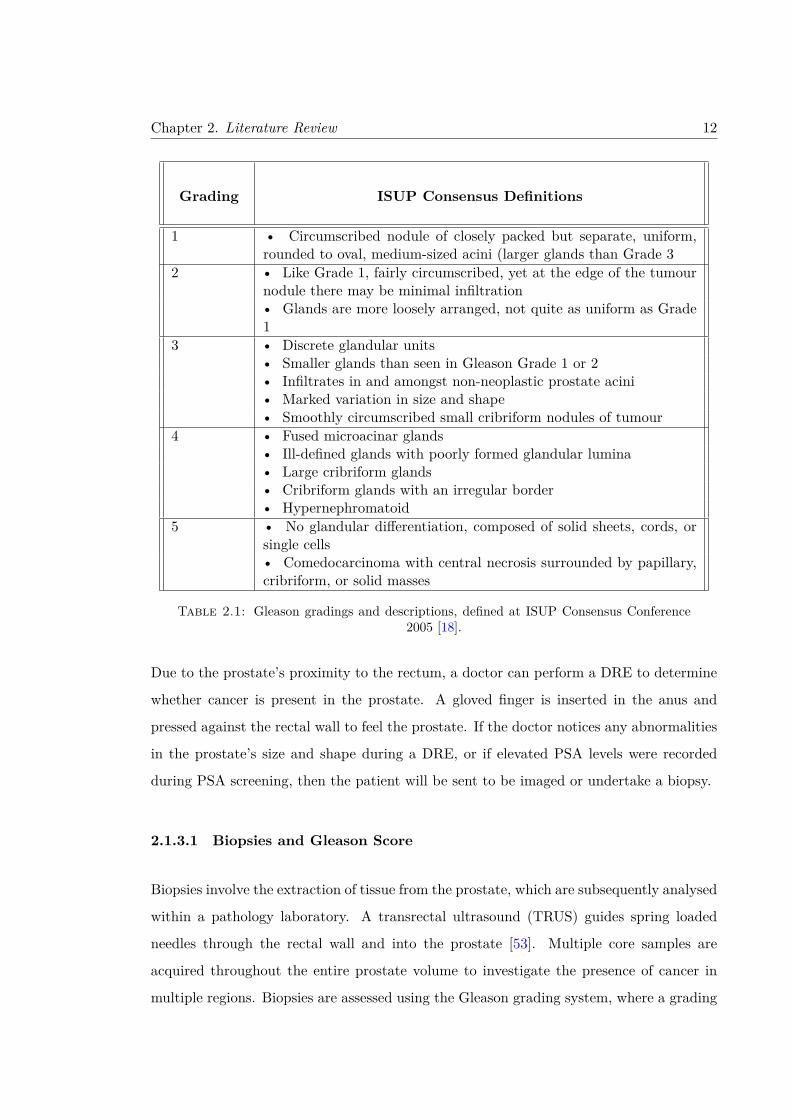
Grading ISUP Consensus Definitions
1 • Circumscribed nodule of closely packed but separate, uniform,rounded to oval, medium-sized acini (larger glands than Grade 3
2 • Like Grade 1, fairly circumscribed, yet at the edge of the tumournodule there may be minimal infiltration• Glands are more loosely arranged, not quite as uniform as Grade1
3 • Discrete glandular units• Smaller glands than seen in Gleason Grade 1 or 2• Infiltrates in and amongst non-neoplastic prostate acini• Marked variation in size and shape• Smoothly circumscribed small cribriform nodules of tumour
4 • Fused microacinar glands• Ill-defined glands with poorly formed glandular lumina• Large cribriform glands• Cribriform glands with an irregular border• Hypernephromatoid
5 • No glandular differentiation, composed of solid sheets, cords, orsingle cells• Comedocarcinoma with central necrosis surrounded by papillary,cribriform, or solid masses
Table 2.1: Gleason gradings and descriptions, defined at ISUP Consensus Conference2005 [18].
Due to the prostate’s proximity to the rectum, a doctor can perform a DRE to determine
whether cancer is present in the prostate. A gloved finger is inserted in the anus and
pressed against the rectal wall to feel the prostate. If the doctor notices any abnormalities
in the prostate’s size and shape during a DRE, or if elevated PSA levels were recorded
during PSA screening, then the patient will be sent to be imaged or undertake a biopsy.
2.1.3.1 Biopsies and Gleason Score
Biopsies involve the extraction of tissue from the prostate, which are subsequently analysed
within a pathology laboratory. A transrectal ultrasound (TRUS) guides spring loaded
needles through the rectal wall and into the prostate [53]. Multiple core samples are
acquired throughout the entire prostate volume to investigate the presence of cancer in
multiple regions. Biopsies are assessed using the Gleason grading system, where a grading

Chapter 2. Literature Review 13
Figure 2.4: Gleason Grading schematics, where a higher grade is assigned tocancer cells possessing less structural similarity with healthy prostate cells. Image
adapted from [4].
based on the patterns and magnitude of cancer growth will be assigned. These gradings
were introduced in 1966 [55], whereby five distinct patterns of growth have been identified
[4, 18]. Gleason grading definitions are listed in Table 2.1, with examples of these gradings
illustrated in Figure 2.4.
As cancers are heterogeneous structures, rather than homogeneous, a range of gradings
will usually be observed during the biopsy. The Gleason Score is the sum of the two
Gleason Gradings that make up the majority of the tumour [18]. If most of the tumour
(approximately 95%) is comprised of a single grade, then the Gleason Score will be double
this single grading. Consequently, the final Gleason Score assigned will lie between 2 and
10. However Gleason Scores of 4 or less are rarely diagnosed due to a lack of consensus
regarding clinical relevance and reproducibility [18].

Chapter 2. Literature Review 14
Stage Definition
Tumour TX Primary tumour cannot be assessedStage T0 No evidence of primary tumour
T1 Clinically unapparent tumour neither palpable nor vis-ible by imaging
T1a Tumour incidental histologic finding in ≤ 5% of tissueresected
T1b Tumour incidental histologic finding in > 5% of tissueresected
T1c Tumour identified by needle biopsy (e.g., because ofelevated PSA)
T2 Tumour confined within prostateT2a Tumour involves one-half of one lobe or lessT2b Tumour involves more than one-half of one lobe, but
not both lobesT2c Tumour involves both lobesT3 Tumour extends through the prostate capsuleT3a Extracapsular extension (unilateral or bilateral)T3b Tumour invades seminal vesicle(s)T4 Tumour is fixed or invades adjacent structures other
than seminal vesicles, such as external sphincter, rec-tum, bladder, levator muscles, and/or pelvic wall
Lymph NX Regional lymph nodes were not assessedNodes N0 No regional lymph node metastasis
N1 Metastasis in regional lymph node(s)Distant M0 No distant metastasisMetastasis M1 Distant Metastasis
M1a Non-regional lymph node(s)M1b Bone(s)M1c Other site(s) with or without bone disease
Table 2.2: Clinical TNM Definitions
2.1.3.2 TNM Staging
Once diagnosed, prostate cancer is staged by the size, prevalence, and spread of the can-
cer throughout neighbouring tissues and organs. TNM staging for prostate cancer was
introduced in 1992 [56], with clinical and pathological definitions regularly updated [57].
Clinical TNM definitions for prostate cancer staging are listed in Table 2.2, whereby the
cancer will be assigned individual scores related to the tumour size (T), nodal involvement

Chapter 2. Literature Review 15
Stage T N M PSA Gleason
I T1a-c N0 M0 < 10 ≤ 6T2a N0 M0 < 10 ≤ 6T1-T2a N0 M0 X X
II T1a-c N0 M0 < 20 7T1a-c N0 M0 ≥ 10, < 20 ≤ 6T2a N0 M0 ≥ 10, < 20 ≤ 6T2a N0 M0 < 20 7T2b N0 M0 < 20 ≤ 7T2b N0 M0 X X
IIB T2c N0 M0 ANY ANYT1-2 N0 M0 ≥ 20 ANY
III T3a-b N0 M0 ANY ANY
IV T4 N0 M0 ANY ANYANY N1 M0 ANY ANYANY ANY M1 ANY ANY
Table 2.3: Clinical Staging of prostate cancer, where X corresponds to an unknownPSA or Gleason
(N), and presence of distant metastasis (M).
Clinical staging of a patient involves an overall assessment of PSA levels, Gleason Score,
and TNM Staging (Table 2.3). Clinical decisions related to the optimal treatment method
for the patient are derived from this final clinical staging.
2.2 Prostate Cancer Treatment
2.2.1 Overview of Treatment Techniques
Treatment techniques for localised prostate cancer include active surveillance, radical
prostatectomy, androgen deprivation therapy, and radiotherapy. Often multiple tech-
niques are utilised throughout the management of a patient, such as neoadjuvant androgen
deprivation therapy combined with radiotherapy [58]. Clinical utilisation rates for these
techniques over the last 15 years are shown in Figure 2.5. The ideal treatment technique for

Chapter 2. Literature Review 16
a patient will depend on multiple factors such as clinical staging, comorbidities, potential
for complications, and life expectancy [59, 60].
2.2.2 Radiotherapy
Following the discovery of X-rays by Roentgen in 1895, it was quickly realised that these
beams could be used in the treatment of skin lesions [61, 62]. Radiotherapy is the treatment
of cancer utilising ionising radiation to interact with molecules within the patient. This
radiation can be delivered either externally or in vivo via sources implanted within the
patient (brachytherapy). The molecular mechanisms governing radiation damage are the
same in both instances and are further described in section 2.3. Principles of Radiotherapy.
2.2.2.1 External Beam Radiotherapy
External Beam Radiotherapy (EBRT) is one of the most important treatment techniques,
with 48.3% of all cancer patients suitable for EBRT at some stage during treatment [63].
This value rises to 58% for prostate cancer patients [22]. EBRT is delivered using Linear
Accelerators (LINACs), which produce high energy beams of photons or electrons and
deliver them with sub-millimetre precision and accuracy. Clinical photon beams typically
Figure 2.5: Evolution of utilisation of treatment technique, stratified by riskassessment. Image adapted from [5].

Chapter 2. Literature Review 17
operate at 6 and 18 MV, while electron beams can operate at (but not limited to) 6, 9,
12, 16 and 22 MeV [64]. Further information regarding the workflow for EBRT is found
in subsubsection 2.3.4.5. Radioresistance.
2.2.2.2 Brachytherapy
Brachytherapy delivers a localised dose to the target volume via insertion of radioactive
seeds within the patient. Brachytherapy treatment of prostate cancer uses iodine-121 or
palladium-103 radioisotopes for low dose-rate brachytherapy (LDR-BT), and iridium-192
for high dose-rate brachytherapy (HDR-BT) [65]. In LDR-BT the seeds are permanently
implanted in the patient for a set time, and is recommended for patients with low-risk
prostate cancer and an expected life expectancy exceeding 5 years [65, 66]. HDR-BT in-
volves temporary implanting of the radioactive seeds, and is typically used as a radioactive
boost in conjunction with EBRT for intermediate and high risk patients [65, 67].
Brachytherapy’s efficacy for patients with low-risk prostate cancer has been verified in
multiple studies investigating biochemical control and overall survival [68]. In long term
follow up studies LDR-BT was found to improve biochemical control and overall survival
rates after 5, 7 and 12 years compared to EBRT within single institutions [69, 70], although
this has yet to be verified within a randomised clinical trial. HDR-BT studies have similarly
shown either comparable or even improved biochemical and survival outcomes compared
to other prostate cancer treatment techniques [67, 71].
2.2.3 Non-Radiotherapy Treatments
2.2.3.1 Active Surveillance
Active surveillance was introduced as a treatment technique to counter the large number
of over-diagnosed patients detected from PSA screening [72]. Nearly half of the men aged
between 55 and 67 with elevated PSA readings were estimated not to require additional
treatments [73]. Examples include benign and slow growing cancers, where the patient
would pass from other circumstances before encountering any symptoms of the cancer [74].

Chapter 2. Literature Review 18
Typically, only low-risk prostate cancers are eligible for active surveillance [75], although
variations are observed between institutions [76]. Older patients with intermediate-risk
prostate cancer, while suffering concurrent illnesses, may also be offered active surveillance
as an alternative treatment [77].
Active surveillance involves the continual monitoring of the patient through periodic biop-
sies, PSA screening, and magnetic resonance imaging (MRI) [77, 78]. Low-risk prostate
cancer progresses slowly, often going undetected in patients until post-mortem analysis.
Many men will subsequently never suffer the associated symptoms, and therefore not re-
quire radical treatment from radiotherapy or surgery [77]. Long-term follow up data from
an active surveillance clinical trial found that, of the 993 prostate patients receiving active
surveillance treatment, only 15 patient’s (1.5%) deaths were attributed to prostate cancer,
while an additional 13 patients (1.3%) developed metastases [79]. These figures mirror re-
sults reported from other clinical trials involving low-risk patients undergoing more radical
treatments [80].
Regular surveillance is required due to the potential for the cancer to progress suddenly.
Whilst the optimal timeframe for surveillance is still a matter of contention, most studies
recommend a combination of PSA testing performed every 3 - 6 months combined with
biopsies conducted every 12 - 24 months [75, 77, 79]. Regular MRI scanning has been
shown to aid in determination of disease progression, although this work is ongoing [81].
If at any stage the cancer has been shown to progress, the treatment strategy for the
patient must be altered.
2.2.3.2 Surgery
The most commonly utilised treatment technique for prostate cancer is a radical prostate-
ctomy. A prostatectomy is suitable for localised prostate cancer at any staging, however
for low-risk cancers it shows no significant improvements on overall survival compared
with active surveillance [82]. Early studies have shown that most prostate cancers are
both multifocal and bilateral [83]. Therefore the prostate and seminal vesicles must be
completely removed during a prostatectomy to provide confidence that all cancer cells
have been removed [84].

Chapter 2. Literature Review 19
During surgery preservation of the neurovascular bundle is critical, as damage to these
nerves can lead to erectile dysfunction [85]. The likelihood of developing erectile dysfunc-
tion following a prostatectomy varies within the literature, ranging from less than 10% up
to nearly 100% [86]. Recent advancements made in surgical techniques include the develop-
ment of laparoscopic radical prostatectomy and implementation of robotic approaches [87].
Laparoscopic surgery is minimally invasive surgery shown to reduce morbidity and blood
loss [88], whilst robotic processes have reduced the risk of perioperative complications such
as death and nerve injury [89].
2.2.3.3 Systemic Therapies
Androgen Deprivation Therapy (ADT) is often used in conjunction with radiotherapy,
with multiple clinical trials demonstrating the benefits of adjuvant ADT with radiother-
apy for patients with localised prostate cancer [90–97]. Primary ADT trials have been
less promising, showing little to no improvements in survival and quality of life [98, 99].
Primary ADT trials additionally saw increased cancer morbidity rates compared to radical
prostatectomy and EBRT [100].
A patient’s quality of life can be significantly impaired following ADT treatment. Common
side-effects include loss of sexual prowess (reduced libido and/or erectile dysfunction), gy-
naecomastia (body feminisation), loss of bone density, loss of cognitive function, fatigue,
and depression [101]. These physiological and sexual changes can be detrimental to a
relationship, with the patient’s partner often placed under significant distress [102]. Con-
sequently, utilisation of ADT as a primary treatment technique has significantly reduced
in recent times (Figure 2.5). However, it is still utilised if the prostate cancer is sufficiently
advanced with bone metastases also present [90].
If a tumour has metastasised and is no longer localised, many of the previous treatment
techniques will no longer be suitable. The treatment intent will often move from curative
to palliative, with chemotherapy commonly utilised in these situations. The administra-
tion of docetaxel every three weeks has been shown to improve overall patient survival
while reducing pain in clinical trials [103, 104], and is now widely used within the clinic
[105]. Significant side effects are observed with docetaxel, with gastrointestinal upset and

Chapter 2. Literature Review 20
peripheral neuropathy common with chemotherapy [21]. If the patient becomes resistant
to docetaxel, cabazitaxel combined with prednisone can also be utilised [106, 107]. It was
shown that utilisation of cabazitaxel helped improve overall survival in patients who had
previously been treated with docetaxel [108, 109].
Immunotherapy utilises the body’s own immune system to treat tumours by suppressing
protein receptors that would ordinarily inhibit the immune system from eradicating can-
cerous cells [110]. Immunotherapy using multiple agents has been shown to be effective
for treating prostate cancer patients with tumours that have become resistant to ADT
[111]. Immunotherapy agent Provenge has been shown to be safe and improve patient
outcomes in phase I and II clinical trials [112]. Meanwhile, Sipuleucel-T was shown to
prolong overall survival in patients with metastatic prostate cancer in a phase III clinical
trial, however had no significant impact on time to disease progression [113].
2.2.3.4 Focal Therapy
A less popular treatment method for localised prostate cancer is focal therapy [114], which
incorporates either cryotherapy or high-intensity focused ultrasound (HIFU) [115, 116].
Focal therapy methods attempt to preserve the tissue surrounding the cancer to reduce
potential toxicities, whilst maintaining an ability to provide curative treatment. Focal
therapy has been adopted in other tumour locations, however currently there is a lack of
evidence supporting its use within the clinic for prostate cancer patients [114].
2.3 Principles of Radiotherapy
2.3.1 Cellular Damage and Death
Radiotherapy aims to induce cellular death of cancers, with lethal damage to the cell’s
DNA a crucial component of this [6, 117]. Radiation damage to DNA is observed as
the development of DNA crosslinks, damaged DNA bases, single-strand DNA breaks, or
double-strand DNA breaks [6]. Of these, double-strand DNA breaks are of the most
importance in radiotherapy, as repair is often not possible [118]. This compromises the

Chapter 2. Literature Review 21
cell’s ability to repopulate, resulting in the eventual death of the cell. However, the
quantity of double-strand breaks during radiotherapy is comparatively small compared to
other forms of damage. For a cell receiving 1 Gray (Gy) of absorbed dose, only 25 – 50
double-strand breaks will be observed. This is significantly smaller than the 500 – 1000
single-strand breaks that will occur [6].
Radiation damages DNA either directly or indirectly. Direct damage arises when incident
radiation interacts with the hydrocarbons present in DNA strands, depositing energy that
directly ionises the molecules within the DNA [117]. The resulting free radicals are highly
reactive, resulting in a chain reaction of additional damage to hydrocarbons present in the
DNA. It has been found that direct interactions account for only 30% of all DNA damage,
with indirect interactions accounting for the remaining 70% [118].
Indirect damage to DNA arises from the ionisation of water molecules within the cell
[117]. Upwards of 80% of the mass of a typical cell is made up of water, resulting in
the majority of deposited dose being absorbed by these molecules. Ionisation of water
molecules results in highly unstable H2O+ cations, which subsequently decompose into
hydrogen (H) and hydroxyl (OH) radicals. These hydroxyl radicals are highly reactive
due to their unpaired electron, often diffusing short distances before undergoing further
reactions. Therefore, indirect damage requires the DNA strands to lie within the diffusion
distances of the radicals (approximately 10 – 20 Å) [6]. The ensuing chemical reactions
produce the aforementioned single- and double-strand breaks.
A cancerous cell is defined to have died once it has lost its ability to proliferate [6]. This
can arise from the complete destruction and breakdown of the cell, or from the cell losing
the ability to divide and repopulate. This latter process, known as senescence, occurs
naturally in healthy mitotic cells of a certain age. Senescence can be induced following
radiation damage to cancerous cells, usually following double-strand breaks, often resulting
in increased polyploidy [117, 119].
Physical destruction a cell can occur from apoptosis, necrosis, and mitotic catastrophe
[120]. Of these, the mitotic catastrophe is the most common following radiotherapy [6],
although it represents a pathway as opposed to a form of cell death [120]. As the name
suggests, mitotic catastrophe occurs during mitosis, where a cell’s chromosomes divide in

Chapter 2. Literature Review 22
preparation for cell proliferation [121]. If defects and damage of the DNA have been left
unrepaired in the original cell, the resultant cells following proliferation will retain the
same damaged DNA structure. These abnormalities will result in an eventual breakdown
in the cell’s functional integrity, although this may take several iterations of proliferation
before the cell reaches this stage. Apoptosis is the most common form of cellular death
following mitotic catastrophe [6, 120].
Apoptosis, also known as ‘programmed cellular death’, is a genetically regulated form of
cellular death [6, 117, 120]. It is governed by the tumour-suppressor protein p53, which
stabilises upon stresses and damage to DNA and begins a controlled destruction of the cell
[120]. Apoptosis is a non-inflammatory process, resulting in a shrinkage of the cytoplasm,
blebbing, and condensation of the nucleus (amongst other processes) [117]. Cells at the
end of apoptosis will fragment into smaller bodies, which are sequentially destroyed by
phagocytic cells in the body [6].
Conversely, cells undergoing necrosis will swell significantly, resulting in an eventual rup-
ture of the cellular membrane [6]. Necrosis was initially believed to be non-regulated
(passive), although recent evidence suggests that DNA pathways exist that regulate this
behaviour [122, 123]. Inflammation follows the rupturing of a cell, with the leakage of
cellular components creating a damaging environment for neighbouring cells [6].
2.3.2 Radiobiological Models for Radiotherapy
The fundamental goal for cancer cure requires the cellular death of all cancerous cells
within the patient. If this is not achieved, any remaining clonogenic cells will proliferate,
resulting in the eventual return of the tumour. As cellular death from radiation is a
stochastic process, cell assays are used to evaluate how cells respond to radiation [6, 117].
A known quantity of cancerous cells are irradiated with a specific radiation dose and
allowed to incubate. Cells are defined to have survived the treatment if they can continue
to proliferate and form cell colonies. The ratio between total cell colonies and the initial
number of cancerous cells is the plating efficiency.

Chapter 2. Literature Review 23
Figure 2.6: Murine melanoma cell survival curve. Multiple independent trialsare plotted (boxes), along with the geometric mean values (triangle) to generatea cell survival curve. The solid curve corresponds to the linear quadratic model
[6].
As multiple factors will affect a cell’s ability to proliferate and form a colony, a second cell
assay is prepared. This control group is set up in identical fashion to the original assay,
except it receives no radiation. The ratio between plating efficiencies gives the percentage
of cells that would survive this dose of radiation. This cell survival can be calculated
for many combinations of doses and cell types and plotted on a semi-logarithmic scale to
generate a cell survival curve (Figure 2.6).
The overall shape of a survival curve is influenced by many factors, however all curves
display a low dose ‘shoulder’ region, followed by a linear response at higher doses [6]. Cell
survival curve characteristics are dependent on cell type, quality of radiation, and whether
the cell is healthy or cancerous. Multiple radiobiological models exist for cell survival
curves, the most popular being the Linear Quadratic Model [124]. Whilst the model does
not exactly match the observed survival curves, especially at higher doses, it does allow
for quick and simple comparisons between different treatment regimes.

Chapter 2. Literature Review 24
Figure 2.7: Linear Quadratic Model components. Each individual componentof the model are shown in dashed blue, with the final survival curve shown in red
[6].
2.3.2.1 Linear-Quadratic Model
The linear quadratic model assumes that cell death is caused by double-strand breaks in
DNA from either a single or multiple interactions [125]. The rate of cell death is therefore
dependent on the probability that the double-strand break is the result of a single particle
interaction (α), or two independent particles produced two single-strand breaks in close
proximity (β). Mathematically, the survival probability is expressed as:
S = e−(αD−βD2) (2.1)
The constants α and β are unique for each cell type and differ between healthy and
cancerous tissues. Values range from 0.1 – 1 Gy−1 for α, and 0.01 – 0.1 Gy−2 for β [6].
Figure 2.7 shows the effect of these parameters on the resulting survival curve. The initial
‘shoulder’ region of the curve is primarily due to the α term, with this term describing
cell death due to irreparable damage. Conversely, β corresponds to cell death due to the
accumulation of otherwise repairable damage [126]. As the delivered dose increases, the
number of single-strand breaks increases. The probability that two of these lie within close

Chapter 2. Literature Review 25
proximity, resulting in a double-strand break, subsequently increases [6, 117]. At larger
doses this term therefore becomes the dominant contributor to the survival curve.
The ratio α/β equates to the dose where both linear and quadratic components within the
model equally contribute to cell death (i.e. the intersection between the two blue lines in
Figure 2.7). This quantity describes the shape of the shoulder region of the survival curve,
where the largest variations between cell survival curves are observed [117]. The shape of
this shoulder region is important when considering fractionated treatment regimes.
2.3.3 Therapeutic Ratio
Radiotherapy aims to provide a lethal dose to cancerous cells, whilst simultaneously min-
imising the impact of radiation damage to neighbouring healthy tissues. This is achieved
by maximising the therapeutic ratio; a ratio of tumour control and normal tissue compli-
cations at a specific dose [6]. This is illustrated further in Figure 2.8, where dose-response
curves for tumours and normal tissues are drawn in red and blue respectively. These curves
give the respective probabilities of a tumour being treated (tumour control probability -
TCP) and healthy tissue reacting with a specified toxicity (normal tissue complication
probability - NTCP) at specific doses.
An increase in the therapeutic ratio, and subsequent improvement in radiotherapy treat-
ment outcome, can be achieved by shifting either the tumour dose response curve (red)
to the left, or the normal tissue response curve (blue) to the right. The most common
method of achieving an improved therapeutic ratio involves dividing the total treatment
into multiple smaller doses in a process known as fractionation [6, 117].
2.3.4 Fractionation
As mentioned earlier, the α/β ratio is a useful quantity for describing the shoulder region of
a cell’s survival curve. As β is a measure of how well a cell can recover following repairable
damage, cells with larger values of β (and smaller α/β ratios) have large shoulder regions
and are classed as late responders to radiation. Conversely, smaller β values (and larger

Chapter 2. Literature Review 26
Figure 2.8: The therapeutic Ratio. If the dose required for 50% TCP (Dt)is less than the dose required for 50% NTCP (Dn), then the therapeutic ratiowill be greater than one, and treatment will overall be beneficial to the patient(A). Conversely, a therapeutic ratio less than one corresponds to treatment with
greater complications to normal tissue than tumour control (B) [6].
α/β ratios) have smaller shoulder regions, with these tissues labelled as early responders
[117].
Most tumours are early responders, partly due to their enhanced proliferation rates com-
pared to normal tissues, with corresponding α/β ratios of approximately 8 – 12 Gy. How-
ever, recent evidence suggests that slow proliferating tumours (such as prostate cancer)
display characteristics similar to late responders with smaller α/β ratios [127–132].
The premise behind fractionation is early responding tissues are less resistant to radiation
damage at lower doses than late responding tissues (Figure 2.9). At these low doses this
equates to the therapeutic ratio being favourable to treatment. With increasing dose the
survival curves eventually cross, corresponding to the therapeutic ratio no longer being
favourable for treatment (Figure 2.8).
If the total dose is divided into multiple fractions of small dose, then cells will be able
to repair sub-lethal damage caused by the single strand breaks dictated by the β term in
the linear-quadratic model. Each additional fractionated treatment will therefore display
a pronounced shoulder region due to cell death caused by a single track once again being
the dominant component (Figure 2.10) [6].

Chapter 2. Literature Review 27
Figure 2.9: Early versus late responding tissues. At low doses early respondingtissues have a smaller surviving fraction. When the dose is increased the sur-vival lines cross, resulting in a significantly reduced surviving fraction for late
responding tissues at increased doses [7].
Whilst repair is the major radiobiological process that alters fractionated survival curve,
additional cellular processes must be considered as well. These include repopulation, redis-
tribution, reoxygenation, and radioresistance; and combined with repair are colloquially
are known as ‘The Five Rs of Radiotherapy’ [8, 133]. Significantly, not all processes im-
prove the therapeutic ratio, so all must be considered when assessing the benefits and
extent of fractionation for each cancer site.
2.3.4.1 Repair
A cell’s ability to repair DNA is dependent on the type of damage that has transpired.
Double-strand breaks are difficult to repair, with attempts often producing erroneous
results that eventually leads to cell death. Single-strand breaks are much easier to repair
due to the reciprocal base pair still being present in the DNA, allowing for knowledge of
which base pair was severed. The repair process starts instantaneously, and depending on
cell type can take between 6 and 12 hours to finish [117].

Chapter 2. Literature Review 28
Cellular repair between treatment fractions results in a reduction in the steepness of the
effective survival curve. This is observed in Figure 2.11, where two fractionation schedules
(blue and green) produce effective survival curves of differing steepness. As the fractionated
dose is reduced, the quantity of sub-lethal single-strand breaks combining to form double-
strand breaks is reduced, resulting in a comparative increase in the number of single-strand
breaks that get repaired. This results in a shallower survival curve, and with continual
reduction in fractionated dose this asymptotically approaches the limit of a survival curve
where only single track damage occurs during treatment [6].
As cancerous cells typically have larger α/β ratios than normal tissues, and hence a reduced
shoulder region, sub-lethal damage is a significant contributor to cellular death at these
low fractionation doses. Consequently, a smaller proportion of cancer cells sufficiently
repair between fractions, resulting in a significant separation between the survival curves of
healthy and cancerous cells. This separation is at its greatest when individual fractionated
doses are equal [6, 8]. As a result, cellular repair results in an increase in the therapeutic
Figure 2.10: Hypothetical cellular survival curve undergoing fractionated treat-ment. At each point of fractionation, a new shoulder region appears followingrepair of sub-lethal damage. Consequently, the dose required to produce anequivalent effect (for example, 2% cell survival) is substantially larger than if
fractionation weren’t utilised [8].

Chapter 2. Literature Review 29
Figure 2.11: Cell repair following differing fractionation regimes. The red curvecorresponds to survival if no fractionation was utilised (i.e., a large single dose).Blue and green curves correspond to treatments of differing dose per fraction. Asthe dose per fraction is further reduced, the equivalent survival curves (dashedlines) will approach the limit where only lethal damage from a single track is
observed (yellow line) [6].
ratio during fractionation.
2.3.4.2 Repopulation
Throughout treatment both healthy and cancerous cells continue to proliferate and re-
populate. However, as the surviving fraction of cells is reduced during treatment, the
proliferation rate of surviving cells begins to accelerate after specific time period to coun-
teract this [134]. As a smaller fraction of cancer cells survive each fractionated dose, they
will experience enhanced repopulation earlier than healthy cells will [6]. This reduces the
steepness of cancer cell survival curves, resulting in a reduction of the therapeutic ratio.
To counteract the effects of repopulation, fractionation treatments must be completed in
as short a time as allowable. Estimates indicate that every additional day of treatment
reduces tumour control by 0.5% [117]. However, cancers with small α/β ratios (such as

Chapter 2. Literature Review 30
prostate) have significantly reduced proliferation rates, and thus the effect of repopulation
are significantly reduced for these cancers [6].
2.3.4.3 Redistribution
The cell cycle is a series of checkpoints that a cell passes through before it begins prolifer-
ating. It consists of interphase (consisting of the G1, S, and G2 phases) and mitosis (M).
During the gap phases (G1 and G2) the cell increases in size in anticipation of proliferation,
whilst DNA splitting occurs during the synthesis (S) phase. Finally, the cell splits into
two copies of itself during mitosis. If a cell is not set to divide, it can exist in stasis within
the G0 phase, separate from the rest of the cell cycle. The cell can move in and out of this
state, depending on the need for it to divide and repopulate [2, 6].
A cell’s radiosensitivity depends on the phase of the cell cycle that it resides in [135]. Cells
in the S-phase will have the greatest resistance to radiation damage, whilst cell death is
increased if the cell is either undergoing mitosis or is towards the end of the G1 phase.
Additionally, it has been observed that a cell’s progression through the cell cycle is halted if
DNA damage is detected [136]. This occurs at the G2 checkpoint, and therefore radiation
will see an accumulation of cells with an increased radiosensitivity.
Therefore, redistribution during fractionated treatment has the overall effect of increas-
ing a cell’s radiosensitivity. As the effects of redistribution depend on a cell’s ability to
move through the cell cycle and proliferate, highly proliferating cells are therefore more
radiosensitive than slowly proliferating cells [6]. Consequently, redistribution will produce
a steeper survival curve for cancerous cells than healthy tissues (where most cells are lo-
cated in the more radioresistant G0 phase), leading to an increase in the therapeutic ratio
during fractionation.
2.3.4.4 Reoxygenation
Indirect damage through ionisation of water molecules into hydroxyl radicals accounts for
approximately 70% of all cellular damage. Repair mechanisms can overcome the single-
strand breaks formed by these radicals, however the presence of nearby oxygen hinders

Chapter 2. Literature Review 31
this process. Oxygen reacts with the damaged DNA, producing stable molecules that can
only be repaired with enzymes [6]. This repair mechanism is slower than repair through
chemical means, increasing the likelihood of multiple single-strand breaks combining to
form a double-strand break. This effect is highly significant, with a well oxygenated cell
three times more radiosensitive than a poorly oxygenated (hypoxic) cell [6].
To remain well oxygenated, cells must be located within 70 µm (i.e. the diffusion distance
of oxygen) of a capillary [6]. Any cells located further than this will either be hypoxic or
dead. This is commonly seen in tumours, where the rapid uncontrolled proliferation of
cells results in regions of cells located large distances from nearby capillaries. Angiogenesis,
the mechanism of creating of new blood vessels, can reoxygenate these cells. This process
is not well structured though, and consequently large hypoxic regions are commonly found
within a tumour [6]. This increases the radioresistance of the tumour, resulting in a
subsequent reduction of the therapeutic ratio.
During fractionated treatment the well oxygenated cancer cells are initially killed, result-
ing in the increase of the relative proportion of hypoxic cells within a tumour. However,
due to the outer cancer cells dying off, a portion of these hypoxic cells can now become
oxygenated. These newly oxygenated cells become more radiosensitive, with an increased
likelihood of receiving a lethal dose during the next treatment fraction. This process
repeats, resulting in a significant decrease in total surviving cells following fractionated
treatment [6]. Consequently, reoxygenation of hypoxic cancerous cells because of fraction-
ation results in an increase of the therapeutic ratio.
2.3.4.5 Radioresistance
Repair, repopulation, redistribution, and reoxygenation were initially the only mechanisms
considered when describing the biological effects of fractionation [8]. It was later shown
that cancer cells from different cell lines exhibit unique radiosensitivities at low doses [133].
This effect is magnified during fractionation, consequently affecting the therapeutic ratio
for treatment.

Chapter 2. Literature Review 32
2.4 Radiotherapy Workflow
The radiotherapy workflow consists of four key components: imaging, contouring, treat-
ment planning, and treatment delivery. The methods incorporated at each step have
evolved over time, with improvements in both available technology and quality assurance
(QA) protocols implemented in the clinic.
The International Commission on Radiation Units and Measurements (ICRU) have pub-
lished multiple protocols covering a range of radiotherapy treatment techniques [137–139].
Due to differences in available resources within separate clinics, protocol recommendations
have been divided into three separate tiers. Level 1 recommendations correspond to the
minimum required standards of QA a clinic must meet, with only conventional radiother-
apy to be implemented at this level. Level 2 protocols must be met for more modern
treatment methods such as Intensity Modulated Radiotherapy (IMRT) and Stereotactic
Body Radiotherapy (SBRT), whilst level 3 protocols correspond to reporting for clinical
trial research [137].
2.4.1 Imaging
All patients receiving radiotherapy undergo an initial planning scan, which is required
for subsequent treatment planning. During this scan the patient will be oriented in the
treatment position, with the tumour within the scanned field-of-view. Treatment plan-
ning systems (TPS) require electron density information to accurately simulate delivered
radiation dose throughout the body. Currently only Computed Tomography (CT) scans
provide this information, although investigations are underway determining whether spe-
cialised workflows incorporating MRI scans can also provide this information [140, 141].
As well as this primary scan, often a patient will receive a secondary MRI or Positron-
Emission Tomography (PET) scan. This is particularly true for prostate cancer patients,
where an MRI scan is often incorporated due to the increased soft tissue contrast these
scans provide. This has increased accuracy in identification and contouring of the prostate,
Chapter 2. Literature Review 33
resulting in improved dose coverage of the target volume and reduced dose delivered to
surrounding organs at risk [142, 143].
All secondary scans must be registered to the primary scan within the TPS. For prostate
cancer, this can be easily accomplished if fiducial gold seeds had been implanted within
the prostate gland [144]. These seeds can be easily identified on both CT and T1-weighted
MRI scans, allowing for quick and accurate registration of images within the TPS.
2.4.2 Contouring
Following image registration, the radiation oncologist will outline multiple structures and
regions within the scans. This process of contouring (otherwise known as delineation
or segmentation) is completed either within the TPS or an additional vendor software.
Contoured regions include the target volume(s), where dose is to be prescribed, as well as
neighbouring organs-at-risk.
2.4.2.1 Target Volumes
ICRU 83 defines multiple target volumes that are to be implemented during radiotherapy
treatment planning and reporting [137]. These volumes are derived from anatomical,
physiological, and geometric concepts, and contouring of these structures are an integral
component of the prostate radiotherapy workflow.
The Gross Tumour Volume (GTV) is defined as ’the gross demonstrable extent and location
of the tumour’. This corresponds to the volume of known tumour infiltration that can
clearly be seen on the scans. It may consist of a primary tumour site, as well as nodal or
metastatic regions. It is imperative during radiotherapy treatment that the entire GTV
receives adequate dose to obtain local tumour control [137].
Following this definition of the GTV, the Clinical Target Volume (CTV) is then defined
as the ‘volume of tissue that contains demonstrable GTV and/or subclinical malignant
disease with a certain probability of occurrence…’ [137]. This is the volume of suspected
microscopic tumour infiltration which cannot be observed on the scan. Consequently,

Chapter 2. Literature Review 34
Risk CTV PTV
Low Prostate CTV + 7mmIntermediate Prostate + proximal 1cm of seminal vesi-
clesCTV + 7mm
High Prostate + entire seminal vesicles CTV + 7mm
Table 2.4: South Western Sydney Cancer Therapy CTV and PTV contouring guidelines.
pathological knowledge is required to account for potential avenues of microscopic spread
of the tumour. Margins required to define the CTV from the GTV are based on clinical
trial data.
Studies investigating prostate cancer found that 80% of all carcinomas were bilateral, with
nearly all carcinomas either peripheral or both peripheral and central [83]. Consequently,
due to the high probability of the cancer being bilateral, the CTV will typically be com-
prised of the entire prostate gland. Depending on the staging of the cancer, seminal vesicles
may additionally be included within the CTV. Contouring guidelines to aid in defining the
CTV for prostate cancer patients are available [145], while guidelines for CTV contouring
of prostate cancer patients at South Western Sydney Cancer Therapy are shown in Table
2.4.
Finally, the Planning Target Volume (PTV) was introduced to account for geometrical un-
certainties derived from organ motion and setup variations during treatment [137]. Each of
these could result in a significant shift of the CTV between individual treatment fractions.
To ensure that the CTV always receives adequate dose coverage, an additional margin
is applied to the CTV to generate the PTV. By ensuring that the entirety of the PTV
receives the prescription dose, this ensures that the CTV receives the prescribed dose,
regardless of potential variations in geometric setup between treatment fractions.
Care must be taken when defining PTV margins. While large margins will ensure satis-
factory dose coverage, there will be a resultant increase in dose delivered to neighbouring
healthy tissue. Conversely, too small a margin would preserve neighbouring tissue, but
could result in inadequate dose coverage for the CTV. PTV margins implemented for
prostate cancer patients at Liverpool Hospital are listed in Table 2.4.

Chapter 2. Literature Review 35
2.4.2.2 Organs-at-Risk
Organs-at-Risk (OARs) are healthy organs neighbouring the PTV where delivered dose
is to be minimised to preserve their functional integrity and reduce potential toxicities
developing. For prostate cancer commonly considered OARs are the bladder, rectum,
and femoral heads. Multiple studies have investigated the consequences of large doses
being delivered to these organs [146]. This information has allowed for appropriate dose
constraints during treatment planning to be determined for these OARs.
Guidelines are available to improve OAR contouring accuracy, such as those for the male
pelvic anatomy [147]. However, just as for the target volumes where a margin was added
to account for organ motion and setup uncertainties, an additional margin may also be
applied to the OAR. The Planning Organ-at-Risk Volume (PRV) will therefore be used
during treatment planning to ensure that the corresponding OAR will never be located
within a high dose region, and consequently will satisfy corresponding dose constraints,
during all treatment fractions.
2.4.3 Treatment Planning
Following contouring, all patient scans and contours are transferred to the TPS (If not
already located there) for treatment plan optimisation. Additional information required
includes the prescription dose and treatment method, OAR dose constraints, beam quality,
and the planned fractionation schedule. The TPS will then calculate a treatment plan for
the patient based on these parameters. Prescription doses must be met in order for the
treatment plan be clinically accepted, and are prescribed to either a single point or a target
volume depending on treatment method [137].
Two methods of treatment planning can be performed by the TPS, forward planning
and inverse planning. Forward planning is the simpler of the two, with treatment beams
inserted into the TPS first, and dose delivered to target volumes and OARs calculated
based on the set beam geometry. Beams are iteratively adjusted, with the resultant dose
distribution recalculated each time, until a clinically acceptable plan is created. This is
typically used for simpler treatment setups and palliative treatments.

Chapter 2. Literature Review 36
However, this process cannot be used for more advanced treatment techniques such as
IMRT and Volumetric Modulated Arc Therapy (VMAT), which subsequently utilise in-
verse planning. Inverse planning differs from forward planning by starting with the desired
target volume dose objectives and OAR constraints. Beam weightings and orientations
are then determined by the TPS following automatic optimisation to best satisfy these
objectives and constraints.
The initial mathematical algorithms utilised by inverse planning systems were developed by
Brahme et al. [148, 149], with modern dynamic processes optimising fluence maps based on
multi-leaf collimator (MLC) segments [150]. This method is utilised by the SmartArc™
planning module for VMAT treatment planning within the Pinnacle3 TPS [151]. This
module is an extension of the Direct Machine Parameter Optimisation (DMPO) module,
which is based on direct aperture optimisation [152].
Dose objectives for target volumes are chosen to ensure the developed treatment plan satis-
fies the prescription. Dose constraints for OARs are also assigned at this stage. Weightings
are assigned to dictate how the TPS prioritises balancing the corresponding dose objectives
and constraints during optimisation. Additional planning volumes, such as expansions or
contractions of original contours, can also be utilised to improve treatment plan quality.
Once beam parameters, dose objectives and constraints have been set, an initial treatment
plan is generated by the TPS and an assessment is made of each dose objective. This
assessment will be a measure of how well the individual dose objective was met by the
treatment plan, weighted by the dose objective weighting. The TPS will then iteratively
adjust beam weightings, characteristics (such as dose rate and gantry angle dwell time),
and MLC positions until a treatment plan that best meets all dose objectives is derived.
If an adequate treatment plan is not obtained during this initial optimisation process,
additional dose constraints and objectives can be specified to guide the treatment plan to
an optimal solution [153].
Figure 2.12 shows an example of a Dose-Volume Histogram (DVH), where each curve
corresponds to the percentage volume of an organ that would receive the stated dose or
higher. Dose objectives for each target volume or OAR will usually correspond to a single
position on the curve, which makes DVHs useful to quickly assess the acceptability of a
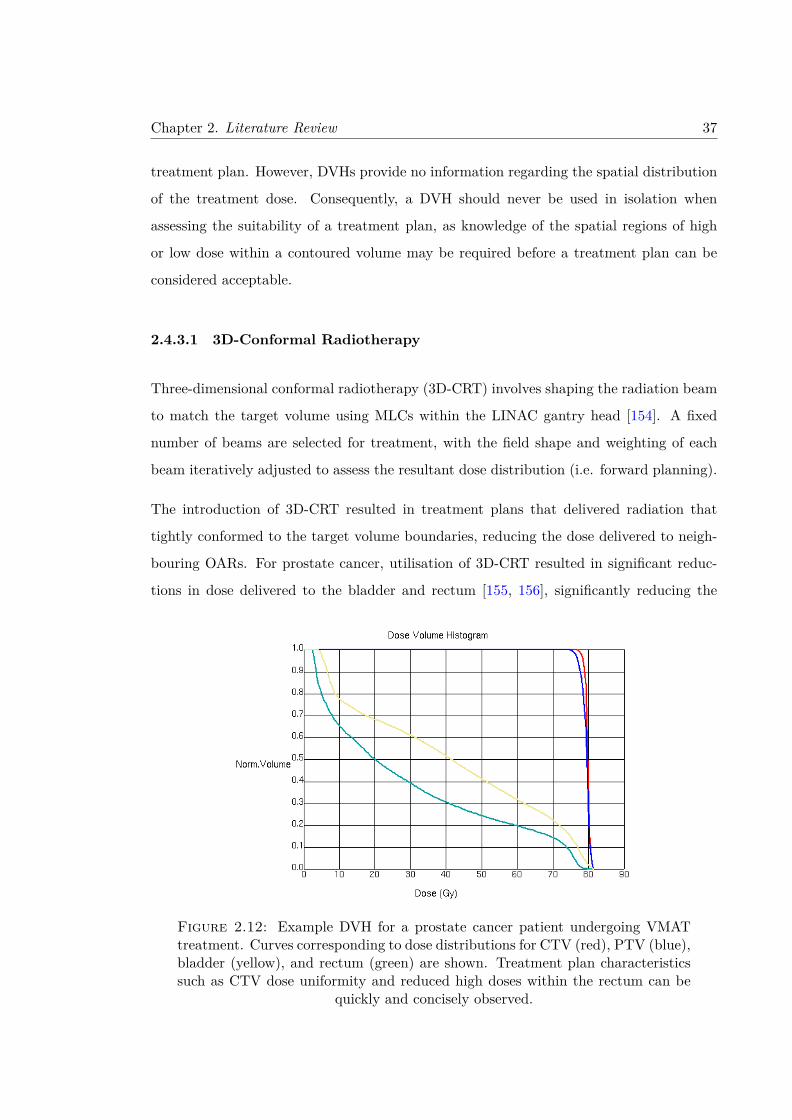
Chapter 2. Literature Review 37
treatment plan. However, DVHs provide no information regarding the spatial distribution
of the treatment dose. Consequently, a DVH should never be used in isolation when
assessing the suitability of a treatment plan, as knowledge of the spatial regions of high
or low dose within a contoured volume may be required before a treatment plan can be
considered acceptable.
2.4.3.1 3D-Conformal Radiotherapy
Three-dimensional conformal radiotherapy (3D-CRT) involves shaping the radiation beam
to match the target volume using MLCs within the LINAC gantry head [154]. A fixed
number of beams are selected for treatment, with the field shape and weighting of each
beam iteratively adjusted to assess the resultant dose distribution (i.e. forward planning).
The introduction of 3D-CRT resulted in treatment plans that delivered radiation that
tightly conformed to the target volume boundaries, reducing the dose delivered to neigh-
bouring OARs. For prostate cancer, utilisation of 3D-CRT resulted in significant reduc-
tions in dose delivered to the bladder and rectum [155, 156], significantly reducing the
Figure 2.12: Example DVH for a prostate cancer patient undergoing VMATtreatment. Curves corresponding to dose distributions for CTV (red), PTV (blue),bladder (yellow), and rectum (green) are shown. Treatment plan characteristicssuch as CTV dose uniformity and reduced high doses within the rectum can be
quickly and concisely observed.
Chapter 2. Literature Review 38
number of patients developing acute and late gastrointestinal and genitourinary toxicities
[157]. By producing treatment plans with dose coverage conformal to the target volume,
the introduction of 3D-CRT also provided an opportunity to dose escalate, potentially
improving the treatment efficacy [158].
However, genitourinary and gastrointestinal toxicities were still observed when utilising
3D-CRT for prostate cancer treatment, particularly during dose escalation trials [159].
Attempts at reducing high rectal doses were often compromised by the need to provide
adequate dose coverage to the target volume [160]. Optimal dose distributions for 3D-CRT
are only possible if the tumour is either spherical in shape, or if a large number of beams
are selected for treatment. Furthermore, developed treatment plans sometimes required
delivery of radiation at clinically impossible gantry angles. For these reasons the use of
3D-CRT to treat prostate cancer has been replaced by more modern treatment techniques
such as IMRT and VMAT.
2.4.3.2 Intensity Modulated Radiotherapy
IMRT is an extension of 3D-CRT, where the intensity profile across each treatment beam’s
cross section is varied throughout treatment [161]. This modulation is performed using
the MLCs, which either move while the beam is on (dynamic IMRT), or incrementally
move into whilst the beam is off (step-and-shoot IMRT) [153]. Treatment planning for
IMRT requires inverse planning, compared to forward planning utilised for 3D-CRT.
Figure 2.13 demonstrates how IMRT treatment plans can achieve highly conformal dose
distributions around the PTV with fewer beams than 3D-CRT. Again, the resultant con-
formal dose distributions allow for the possibility to escalate delivered dose to the target
volumes without significantly increasing OAR dose, which has been investigated in multi-
ple clinical trials [9, 162–165].
While utilisation of IMRT was hypothesised to lead to improvements in relapse-free sur-
vival for prostate cancer patients [163, 166], observed trial outcomes found that these
improvements were either minimal [167, 168] to non-existent [169]. This was due to 3D-
CRT treatment plans still achieving conformal dose distributions across the PTV (Figure

Chapter 2. Literature Review 39
Figure 2.13: Comparison between 3D-CRT (left) and IMRT (right) prostatecancer treatment plans. The 95% isodose level (i.e. the region receiving at least95% of the prescription dose) is shaded red. IMRT produces a more conformal
treatment plan, with faster dose drop-off outside the target volume [9].
2.13). The most significant advantage of IMRT over 3D-CRT is the reduction of gastroin-
testinal and genitourinary toxicities [170–173]. Dose delivered to the rectum, bladder, and
femoral heads are significantly reduced when using IMRT [167, 168], which has resulted
in reduced acute and late grade 1 and 2 rectal toxicities such as rectal bleeding and gas-
trointestinal morbidity [165, 174]. However, utilisation of IMRT has been seen to result
in a small increase in erectile dysfunction for patients [175].
Concerns have been raised over the increased leakage radiation and low dose wash that
arises from IMRT. It is estimated that the utilisation of IMRT doubles the rate of secondary
cancers following treatment compared to 3D-CRT [176]. Additionally, a disadvantage of
IMRT is the significant increase in treatment times, with patients sometimes required
to remain stationary for 15-20 minutes. During this time factors such as internal organ
movement due to bladder filling will result in an increased uncertainty in the accuracy of
treatment delivery. Additionally, the increased time on couch (and subsequent increase in
required hospital resources) results in an increased cost for IMRT treatment [169, 177],
although this is offset by the reduction of late toxicities. These concerns have since been
alleviated following the introduction of VMAT into clinical practice.

Chapter 2. Literature Review 40
2.4.3.3 Volumetric Modulated Arc Therapy
VMAT is an extension of IMRT that substantially reduces treatment time for the patient,
whilst maintaining comparable treatment plan quality [178, 179]. Rather than modulating
the intensity of a fixed number of beams, VMAT continuously irradiates the patient as
the gantry rotates in a pre-defined arc [161]. During gantry rotation the dose rate contin-
uously varies, while MLCs dynamically modulate the intensity of the beam’s cross section.
Consequently, the entire treatment is able to be completed in a single arc [180].
Studies investigating the efficacy of VMAT for prostate cancer patients have shown it
offers either comparable or superior treatment plan quality compared to IMRT and 3D-
CRT, with boosted CTV and reduced rectum doses commonly observed [179, 181–184].
More significantly, large reductions were observed in treatment times (2.2 minutes versus
8.1 minutes [185]) and delivered MU for VMAT compared to IMRT [181, 184, 186, 187].
While VMAT adds extra complexity during treatment, and consequently results in an
increase in required Quality Assurance (QA), for prostate cancer patients it is regarded as
the current EBRT treatment method of choice.
2.4.3.4 Stereotactic Body Radiotherapy
Stereotactic Body Radiotherapy (SBRT) is an additional treatment method, where large
doses are delivered to the treatment volume over only a few fractions. This can either be
as monotherapy, or as a boost dose [188, 189]. Utilisation of SBRT requires tumours with
well-defined boundaries, with margins in the order of millimetres applied to the target
volume. This contrasts with 3D-CRT and IMRT, where applied margins will be in the
order of a centimetre [190].
Compared to other treatment methods, SBRT treatment has a difference in treatment
philosophy and intent. While 3D-CRT, IMRT, and VMAT attempts to deliver a dose that
maximises the therapeutic ratio between tumour and normal tissue cells, SBRT instead
attempts to deliver an ablative dose to the tumour volume that completely kills off all
present cancerous cells. Consequently, dose delivered to normal tissue during SBRT must
be minimised due to the high likelihood of significant toxicities developing [191]. For this

Chapter 2. Literature Review 41
reason, regular imaging must be incorporated for SBRT during treatment delivery (see
subsubsection 2.4.4.1. Image Guided Radiotherapy).
SBRT represents a promising treatment method for prostate cancer due to the prostate
having a suspected low α/β ratio [192]. As described in subsubsection 2.3.2.1. Linear-
Quadratic Model, a lower α/β ratio means that prostate tumours will be more sensitive to
larger doses per fraction. So much so, that some models have predicted an increase of up to
15-20% in biochemical control when SBRT is utilised [193]. Additionally, a smaller number
of fractions reduces overall treatment times from 8 – 9 weeks down to 1 - 2 weeks [194].
This could have significant benefits for patients that would have difficulty committing to
long fractionation schedules, along with reducing the overall cost of treatment.
Preliminary trials have demonstrated the safety of current SBRT techniques for treating
prostate cancer [194–197], with survival and toxicity rates comparable to other forms of
radiotherapy [194, 195, 197–204]. Five year follow up of the HYPO-RT-PC trial, inves-
tigating intermediate- and high-risk prostate cancer patients found that a 42.7 Gy in 7
fraction treatment regime was non-inferior in patient outcome compared to a traditional 78
Gy in 39 fraction treatment schedule [205]. Additionally, the PACE clinical trial found no
significant increase in gastrointestinal or genitourinary acute toxicities for prostate cancer
patients treated using SBRT [206].
2.4.4 Treatment Delivery
Following treatment plan optimisation and acceptance, the final step in the radiotherapy
workflow is the accurate delivery of the developed treatment plan to the patient over
multiple fractions. It is imperative that the patient is setup in the same position on the
treatment couch as they were during the planning scan. Tattoos or radiopaque markers
on the patient are used as reference points to align the patient with the in-room geometry,
while most modern LINACs incorporate on-board imaging to further improve patient setup
accuracy.
In order to ensure the accuracy of treatment, an intensive QA protocol is implemented
to determine whether the dose distribution delivered during each fraction of treatment

Chapter 2. Literature Review 42
matches the distribution prescribed during treatment planning [207]. However even with
perfect patient setup and radiotherapy QA, the accuracy of treatment is still compromised
by the variability in position and shape of the target volumes. For prostate cancer this
can be due to internal motion of the prostate, as well as variable rectal and bladder filling
between treatment fractions [208, 209].
2.4.4.1 Image Guided Radiotherapy
Modern radiotherapy treatments incorporate Image Guided Radiotherapy (IGRT) to vali-
date patient setup (and consequently, target volume location) before and during treatment.
Imaging choices include Electronic Portal Imaging Devices (EPIDs), kilovoltage imaging
using fiducial markers or Cone-Beam CT, and transabdominal ultrasound for prostate po-
sition validation [210]. It has been shown that utilisation of IGRT significantly improves
toxicity free survival for prostate cancer radiotherapy [211, 212].
EPIDs are semiconductor detector systems included with nearly all modern LINACs. They
utilise the megavoltage treatment beam of the LINAC to generate a two-dimensional x-
ray image of the patient. A major benefit of EPIDs for IGRT is that images are created
from the beams eye view, providing a direct confirmation positioning of the target volume
with respect to the treatment beam. However, images obtained from megavoltage x-
rays display poor to negligible soft tissue contrast. Bony structures or fiducial markers
implanted within the prostate will instead be used as surrogates to verify the position of
the target volume. This does introduce an uncertainty in patient setup and alignment, as
it requires knowledge of the relationship between these structure’s locations and the PTV
[210].
Conversely, kilovoltage imaging systems produce images with superior soft tissue contrast,
but are mounted perpendicular to the delivered treatment beam. Acquired images are
reconstructed into a digitally reconstructed radiograph to validate the target volume po-
sition. Validation is performed either through the alignment of fiducial markers that were
surgically implanted in the prostate, or via the acquisition of a Cone-Beam CT scan that
allows for a direct registration with the original planning CT scan. Whilst this process

Chapter 2. Literature Review 43
will introduce some uncertainty in target volume alignment, the benefit is that a surro-
gate is no longer required for target volume alignment. For prostate cancer radiotherapy,
alignment utilising EPIDs is generally considered acceptable for IGRT [210], however for
stereotactic treatments Cone-Beam CTs will be required.
2.5 Quality Assurance in Radiotherapy
Advancements in technology and medical knowledge have allowed for the continual im-
provement in patient outcome following radiotherapy treatment. Improvements in dose
distribution conformality have resulted in greater loco-regional control and relapse-free sur-
vival rates, whilst simultaneously reducing complications arising in neighbouring tissues
[213]. However, technological advancements result in an inherent increase in treatment
complexity, with each additional step within the treatment workflow providing additional
sources of uncertainty during treatment delivery [213].
Quality assurance (QA) protocols within radiotherapy are the implemented procedures
undertaken to ensure no major deviations are observed between the desired and actual
delivered treatment [214, 215]. Most radiotherapy centres have local QA protocols based on
working group recommendations [216], ensuring that each patient’s treatment is delivered
to a high standard. However, additional QA protocols are required when multiple centres
participate in a large clinical trial. Clinical trials are used in radiotherapy to investigate
the efficacy of new treatment technologies or techniques to improve patient outcome. In
order to obtain significant results, high quality data must be obtained to ensure potential
confounding factors are kept to a minimum. For these reasons, clinical trials incorporate
extensive QA not only ensures the safety of the patient and efficacy of treatment when
investigating a new technique, but additionally ensures that statistically significant results
can be derived from a limited sample size [217, 218].
2.5.1 Quality Assurance in Clinical Trials
Guidelines can be generated to assess the level of QA provided by a clinic in a clinical
trial [19, 214, 219], with Table 2.5 providing an example of these. Most uncertainties in

Chapter 2. Literature Review 44
Clinical Trial QA
Level 1 Facility questionnaireExternal reference dosimetry audit
Level 2 Dummy runLevel 3 Limited individual case reviewLevel 4 Extensive individual case reviewLevel 5 Complex dosimetry check
Table 2.5: EORTC defined QA levels for a clinical trial [19].
radiotherapy arise from human error, so peer review is a critical component of a strong
QA protocol [220].
It has been shown that high levels of QA within a clinical trial improves patient care
and quality of life, while reducing toxicities from treatment [11, 214, 221]. Additionally,
implementation of a strong QA protocol can improve a clinical trial’s cost effectiveness by
reducing the required patient numbers to be recruited [214, 218]. Substandard QA may
result in an underpowered study, where subtle differences in treatment outcome would not
be observed [218].
Despite the evidence validating the need for strong QA protocols to be employed within
a clinical trial, centres are often unable or even unwilling to meet these levels of QA.
Funding issues, perceived lack of benefit, significant increases in workload, and additional
delays in patient accrual due to increased QA procedures are reasons given by centres
for not meeting the required levels of QA for a clinical trial [217]. Adherence to QA
protocols has been shown to range from 8% to 71% [221], with studies confirming that
patients receiving a reduced level of QA during treatment had a resultant poorer treatment
efficacy and increased rate of toxicities [10, 11, 23, 222–224].
In a study by Abrams et al., patients with resected pancreatic adenocarcinomas received
chemotherapy with concurrent radiotherapy [225]. Following the study, correlations be-
tween protocol compliance and patient survival and toxicity were investigated [222]. Com-
pliance was assessed in a binary fashion as either per protocol, or less than protocol de-
manded. Of the 416 patients within the study, only 216 received treatment per protocol.

Chapter 2. Literature Review 45
It was found that patients that received treatment considered less than protocol demanded
had an increased risk of treatment failure, as well as an increased risk of developing grade
4 or 5 nonhematologic toxicity.
A separate study investigating unresectable pancreatic cancer measured survival, toxicity,
and response rates for patients treated with bevacizumab, capecitabine, and concurrent
radiotherapy [23]. It was found that 13.4% of patients in this study had unacceptably
large tumour contour volumes, resulting in a significant volume of healthy normal tissue
included within the target volume. This manifested in a significant increase grade 3+
gastrointestinal toxicities for these patients both during chemoradiotherapy (45% versus.
18%) and maintenance chemotherapy (45% versus. 13%) [23].
Dühmke et al. expanded on previous work investigating the role of radiotherapy following
chemotherapy for advanced Hodgkin’s disease patients [226]. The primary endpoint in
this trial was to assess whether reduction in radiotherapy dose would not compromise
treatment efficacy. Protocol violations, such as incorrectly contoured target volumes and
incorrect dose distributions, were identified in 127 of the 369 patients within the study
[10]. Patients who received treatment that violated protocol guidelines were observed to
have a statistically significant reduction in relapse free survival (72% versus. 84% after 7
years, Figure 2.14).
Another study retrospectively investigated 135 Hodgkin’s lymphoma patients where QA
was performed during radiotherapy, in order to assess relationships between major protocol
violations and recorded patient outcome [224]. Major protocol violations were observed in
47% of treated patients, with incorrect target volume contours the most common source.
However, 6.5 years following treatment no statistically significant correlation was observed
between protocol compliance and treatment failure rates. Notably, this is one of the only
studies where correlations were not observed, and has since been criticised due to the
small number of events recorded in the study (only 17 patients receiving radiotherapy
failed treatment) [217].
Eisbruch et al. investigated the efficacy of hypofractionated IMRT treatment for patients
with oropharyngeal cancer [223]. The QA protocol implemented in this study required
the study chair to review a number of submitted cases from each participating institution.

Chapter 2. Literature Review 46
Figure 2.14: Relapse free survival for patients with and without treatment pro-tocol violations (PV). Factors affecting relapse-free survival included inadequatecontouring, insufficient dose to the target volume during planning, dose-rate being
too slow for treatment, and encountered technical difficulties [10].
Both target volume and organ-at-risk contours were assessed, with minor and major vari-
ation gradings attributed to cases where the prescription criteria was not met. 2 out of 4
patients assessed as having major contouring variations resulting in significant underdosage
were observed to have locoregional failure following treatment. Conversely, locoregional
failure was only observed in 3 of the 49 patients without major contouring variations.
Finally, substantial evidence linking poor quality QA with treatment efficacy comes from
a phase III trial investigating the addition of tirapazamine in conjunction with chemora-
diotherapy for advanced squamous cell carcinomas in head and neck patients [227]. The
QA protocol consisted of interventional review of treatment plans throughout the trial, as
well as retrospective analysis of radiotherapy plans and documents by the Trial Manage-
ment Committee (TMC) [11]. Initial results from the trial found no significant difference
between trial arms with respect to overall survival, failure-free survival rates, and time to
locoregional failure. Only 166 of the 857 patient plans were found to be protocol compliant
during interventional review. Recommendations were returned to clinics for the remaining

Chapter 2. Literature Review 47
Figure 2.15: Locoregional control amongst patients whose plans were initiallycompliant (yellow), made compliant following QARC assessment (blue), non-compliant but assessed as having no major impact on tumour control (purple),and non-compliant but assessed as having a major impact on tumour control (red).The only statistically significant difference arose between the first three and the
final grouping [11].
687 patients from the Quality Assurance Review Centre (QARC). Following treatment,
retrospective review found that 208 plans still failed to meet QA protocol. Of these plans,
it was predicted that non-compliance of QA protocol would majorly impact tumour control
probability in 97 patients [11].
Non-compliance in order of prevalence was attributed to poor dose distributions in plan-
ning, incorrect dose descriptions, incorrect contouring, and excessively prolonged treat-
ment. However, incorrect contouring was adjudged to result in the most serious ramifica-
tions for tumour control [11]. An inverse correlation was observed to exist between the size
of the clinic and the percentage of patient plans that failed to meet QA protocol. Clinics
treating more than 20 patients in the trial had a non-compliance rate of 5.4%, compared
to 29.8% for clinics with less than 5 patients enrolled.
Figure 2.15 illustrates the locoregional failure rates from the study, where patients have
been divided into four cohorts following review by the TMC. The first three cohorts consist

Chapter 2. Literature Review 48
of patients with initially compliant treatment plans (yellow), plans that were initially non-
compliant but made compliant following QARC review (blue), and plans that were non-
compliant at TMC review, but assessed to not have any significant effect on tumour control
probability (purple). No statistically significant difference in overall survival, failure-free
survival rates, and time to locoregional failure were found between these patient cohorts.
The fourth subgroup (red) consisted of non-compliant plans at TMC review, where it was
anticipated that non-compliance would result in a significant impact on tumour control.
These patients were observed to have significantly poorer outcomes than the initial three
cohorts across all three end points. After two years freedom from locoregional failure
and overall survival had reduced to 54% and 50% respectively. This corresponded to
20% reduction when compared to patients with initially compliant plans (78% and 70%
respectively), and was twice the survival benefit hypothesised using tirapazamine within
the trial [227]. Consequently, not only does poor QA in radiotherapy mask potential
benefits form within a clinical trial, but conversely a strong QA protocol can result in
clinical benefits equivalent to an advancement in cancer treatment [11].
2.5.2 Contouring Variability and Uncertainty
QA protocols attempt to minimise the errors and uncertainties in treatment that may
arise during any stage of the radiotherapy process. These uncertainties may originate
from mechanical or human processes. Of all the uncertainties that may arise, uncertainty
in contouring target volumes and organs-at-risk is considered the greatest source of in-
accuracy within radiotherapy [24, 213, 228]. Poorly defined target volume contours may
result in significant regions of the tumour not receiving adequate dose, leading to poorer
treatment efficacy and increased risk of recurrence [228].
Contouring variation can be sub-categorised as being either inter-observer (between ob-
servers utilising the same image set) or intra-observer (same observer across different
time points). Inter-observer variation constitutes a random error, however intra-observer
contouring variation can be considered both systematic and random. An example of a

Chapter 2. Literature Review 49
systematic error is the inherent bias of a clinician when contouring the datasets. The vari-
ations in contours can be significant, with contoured prostate volumes observed to vary
by up to a factor of 1.6 [228].
Multiple studies have investigated the extent of contouring variations in radiotherapy
across a wide range of treatment sites including lung [229, 230], cervix [231–233], breast
[234, 235], bladder [236, 237], oropharynx [238], and prostate [239, 240]. Common reasons
cited for these variations include:
• Poor quality scans or incorrect imaging modality for treatment planning [24, 228,
229, 239, 241–243]
• Inadequate observer training [11, 24, 228, 231, 240]
• A lack of, or substandard QA protocols or guidelines [228, 230, 234, 243–248]
• Personal bias and interpretation of the observer (i.e. an unwillingness to include a
portion of volume due to its proximity to a critical structure) [24, 249, 250]
Consequently, because of its prevalence, peer review of a clinician’s contours is regarded
as one of the most important portions of QA during the radiotherapy workflow [220, 251].
2.5.2.1 Origin of Contouring Uncertainties
Studies investigating inter-observer contouring variability of the prostate on CT found the
largest uncertainties near the prostatic apex and seminal vesicles [12, 252–257]. This is
illustrated in Figure 2.16, where a large variation between five clinicians contours at the
prostatic apex is observed [12]. Uncertainties in contouring the prostate base have also
been observed, but typically are not as prevalent [252, 254, 256].
Inclusion of rectal tissue in the prostate contour results in erroneous treatment volumes,
and it has been shown only 84% of the true pathologically defined treatment volume is
properly contoured in a prostate contouring study [249]. An interesting observation from
this same study was that the contoured volume was 30% larger than the true volume. It

Chapter 2. Literature Review 50
Figure 2.16: Inter-observer contouring variation at the prostatic apex by fiveobservers [12].
was suggested by the study that a large portion of neighbouring tissue, such as rectal wall,
was incorrectly contoured as the prostate.
When comparing imaging modalities, prostate volumes contoured on CT images have been
shown to be up to 40% larger than their equivalent volumes contoured on MRI [239, 256–
258]. Additionally, prostate volumes contoured on MR showed considerably less inter-
observer variation than corresponding CT contours [239, 258, 259]. This is attributed to
the clearer soft tissue resolution of structures, such as the prostatic apex, provided by MR
scans [142, 260]. Similar trends were observed for prostatectomy patients, where target
volumes defined using MR were reduced by 9 – 13% compared to those defined using CT
[261].
2.5.2.2 Efforts to Reduce Contouring Uncertainties
High quality radiotherapy requires precise contouring of the target volumes for treatment
planning [24], therefore, efforts have been made to reduce the variability inherent in the
Chapter 2. Literature Review 51
process. Urethral and bladder contrast agents have been shown to reduce contouring
variation on CT scans [262]. As poor image resolution contributes to increased variability
[263], advances in imaging technology and software capabilities also lead to a reduction in
contouring uncertainty [26].
Multimodality imaging incorporating MR scans have now become standard-of-care for
prostate cancer treatments [243, 264]. Typically, gold seeds are surgically implanted into
the patient’s prostate prior to scanning. These seeds are easily detected on both MR and
CT scans, which allows for simple registration of the two scans. This is complicated if
significant differences in bladder and rectum filling are observed between scans, as well
as potential calcifications and poor seed placement, all of which affect the quality of the
registration [264].
Explicit guidelines and clinician training have been shown to be the most significant factors
in reducing inter-observer contouring variations [228], with poor guidelines shown to have
a greater impact on contouring variability than incorrect imaging modality [243]. For this
reason, clinical trial guidelines will explicitly clarify the regions to be contoured prior to
study commencement [244–247]. Implementation of ‘evidence based’ protocols increases
the mean target contour volume, whilst simultaneously decreasing the inter-observer vari-
ability [244]. Training programs also reduce inter-observer contouring variation within the
clinic [231, 232, 235, 240, 256, 265].
2.5.2.3 Clinical Impact of Contouring Variations
Studies investigating the clinical and radiobiological impact of inter-observer contouring
variations for prostate cancer patients are limited. Fiorino et al. investigated inter-observer
contouring variations of rectal contours from three observers for prostate cancer patients,
and found significant variation in rectum contours in only two patients [266]. These
patients both had large spacings for the CT scans (10 mm slice thickness), and variations
in NTCP were found to correlate with deviations in the anterior boundary of the rectum.
Two studies have investigated the impact on dosimetry of inter-observer contouring vari-
ability of the target volume for prostate cancer patients [12, 244]. The first incorporated
Chapter 2. Literature Review 52
five patients datasets, with target volumes contoured by five observers [12]. Significant
differences in contoured volumes were observed around the prostatic apex and seminal
vesicles. No correlation between contouring variation and organ-at-risk dose metrics were
observed. The study concluded that regions where contouring variation was greatest cor-
responded to regions with the smallest impact on rectal and bladder toxicity.
Meanwhile, Mitchell et al. investigated the impact of introducing a protocol on inter-
observer contouring variations for postprostatectomy patients [244]. While introduction
of the protocol reduced variability between observers, an increase in mean CTV volume
across all three patients was observed. This corresponded to an increase in the number of
plans with unacceptable rectal dosimetry.
Van Herk et al. assessed the impact of contouring variability through insertion of random
and systematic errors into target volume contours within the treatment plan [267]. The
target volume contour was randomly displaced or rotated during dose computation, with
the resultant change in EUD and TCP assessed. The required planning margin that must
be applied to the target volume to counter these contouring variations was empirically
determined. It was found that a margin of 10 mm ensured that TCP reduced by less than
1% due to these introduced geometric errors.
Subsequently, no modern studies with large patient numbers have adequately investigated
the clinical and dosimetric effects of inter-observer contouring variation for prostate cancer
patients. It is known that dose distributions for more modern techniques such as VMAT
and SBRT vary from these, where tighter dose profiles are required for safe treatment.
Consequently, inter-observer contouring variation could produce substantial clinical and
dosimetric errors in treatment with these techniques, compared to those observed with
conformal radiotherapy or brachytherapy.
2.5.3 Treatment Planning Variability
While inter-observer contouring variability represents a major uncertainty when delivering
high quality radiotherapy, another source of uncertainty is the development of the clinically
acceptable treatment plan within the Treatment Planning System (TPS). Variability in

Chapter 2. Literature Review 53
quality between planners is a consequence of human-driven processes generating these
plans, as well as the often-subjective measures used to evaluate the suitability of these
plans. For these reasons, quantitative metrics to explicitly describe plan quality should be
incorporated in conjunction with other quality control measures such as peer review [268].
Inter-centre IMRT planning exercises have been performed for multiple sites, with CT
image sets and pre-defined contours distributed to participating centres to remove the
impact of contouring variation from the study [36, 269–272]. Dose objectives or metrics
for target volumes and neighbouring OARs are used to assess the acceptability of these
treatment plans, while some studies also incorporate a qualitative assessment from a ra-
diation oncologist [273, 274]. Technical factors associated with the deliverability of the
treatment plan, such as treatment time and monitor unit number, have also been assessed
when assessing plan quality [269].
Significantly, in all these studies there was at least a single plan that was able to fulfil
all dose objectives strictly. The feasibility of planning delivery systems to meet required
dose objectives is therefore feasible as long as appropriate guidelines and protocols have
been clearly outlined prior to treatment planning [269, 271]. Retrospective review of 803
IMRT plans found that head and neck patients displayed the largest dosimetric variation
between patients, while prostate plans displayed the least [271].
Identifying the cause of variability is difficult, with conflicting results within the literature.
Batumalai et al. found that planning experience significantly affected plan quality for
IMRT head and neck plans, whereby only the two most experienced dosimetrists were
able to meet all PTV and OAR dose constraints [273]. This was not seen in other studies
[36, 37], where an intrinsic ‘planner skill’ was proposed as the most significant contributor
to planning quality [36]. Multicriteria optimisation processes [274, 275] and feasibility
estimation tools [276] have been shown to reduce planning variability while increasing
treatment plan quality from inexperienced planners.

Chapter 2. Literature Review 54
2.6 Clinical Trials
2.6.1 RADAR
In 2003 the Trans-Tasman Radiation Oncology Group (TROG) began recruiting patients
into a randomised phase III multicentre clinical trial to determine the efficacy of 18 months
androgen deprivation treatment (ADT) following radiotherapy Trans-Tasman Radiation
Oncology Group [277]. The trial was planned as an extension of a previous study that
indicated 6 months adjuvant ADT improved patient outlook [278, 279]. The Randomised
Androgen Deprivation and Radiotherapy (RADAR) trial was a two-by-two factorial trial,
with patients randomly allocated to one of four treatment groups in a 1:1:1:1 split. Trial
arms consisted of either 6 or 18 months ADT treatment using Leuprorelin acetate, with or
without additional bisphosphonate therapy through the administration of zoledronic acid
Trans-Tasman Radiation Oncology Group [277].
A total of 1071 patients were enrolled into RADAR across 23 centres throughout Australia
and New Zealand between 2003 and 2007 [280]. Eligibility criteria was locally advanced
prostate cancer, defined as either stage T2b and greater, or T2a with Gleason score of
7+. Patients with lymph node involvement or metastases were excluded from the trial,
along with those with comorbidities that would compromise five years of survival [280].
Previous prostate cancer therapy, osteoporosis resulting in vertebrae height reduction of
30% or more, and bisphosphonate treatment also excluded patients from the trial.
Initial primary endpoints investigated in the RADAR trial were biochemical failure and
patient survival rates Trans-Tasman Radiation Oncology Group [277, 280], however these
changed to prostate cancer specific mortality after the initial ADT trial showed PSA
progression failed to correlate with these endpoints [279]. Ten year follow up results showed
that the addition of zoledronic acid when combined with ADT and radiotherapy had no
significant effect on patient survival rates [13]. Patients that received 18 months ADT
combined with radiotherapy had a 3.7% reduction in prostate cancer-specific mortality
compared to patients receiving 6 months ADT with radiotherapy (9.7% versus 13.3%
respectively, sub-hazard ratio of 0.70, Figure 2.17).
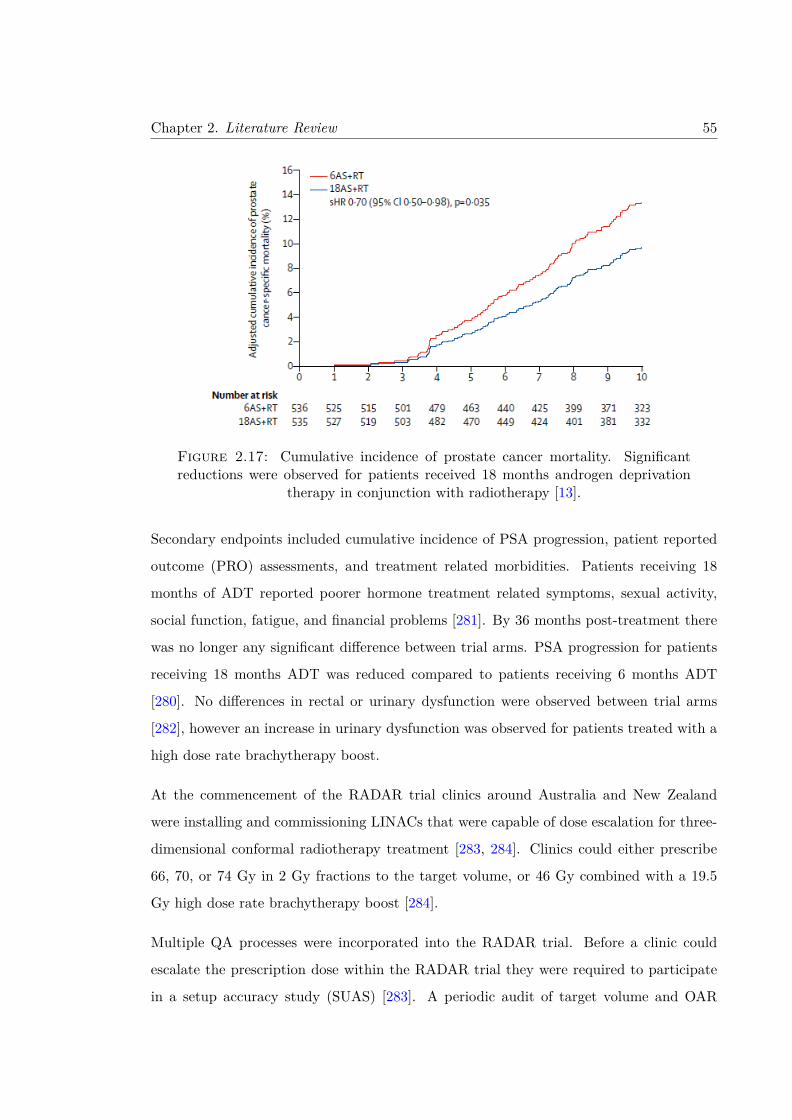
Chapter 2. Literature Review 55
Figure 2.17: Cumulative incidence of prostate cancer mortality. Significantreductions were observed for patients received 18 months androgen deprivation
therapy in conjunction with radiotherapy [13].
Secondary endpoints included cumulative incidence of PSA progression, patient reported
outcome (PRO) assessments, and treatment related morbidities. Patients receiving 18
months of ADT reported poorer hormone treatment related symptoms, sexual activity,
social function, fatigue, and financial problems [281]. By 36 months post-treatment there
was no longer any significant difference between trial arms. PSA progression for patients
receiving 18 months ADT was reduced compared to patients receiving 6 months ADT
[280]. No differences in rectal or urinary dysfunction were observed between trial arms
[282], however an increase in urinary dysfunction was observed for patients treated with a
high dose rate brachytherapy boost.
At the commencement of the RADAR trial clinics around Australia and New Zealand
were installing and commissioning LINACs that were capable of dose escalation for three-
dimensional conformal radiotherapy treatment [283, 284]. Clinics could either prescribe
66, 70, or 74 Gy in 2 Gy fractions to the target volume, or 46 Gy combined with a 19.5
Gy high dose rate brachytherapy boost [284].
Multiple QA processes were incorporated into the RADAR trial. Before a clinic could
escalate the prescription dose within the RADAR trial they were required to participate
in a setup accuracy study (SUAS) [283]. A periodic audit of target volume and OAR

Chapter 2. Literature Review 56
contours was also introduced. Following treatment, manual review of treatment planning
data for all patients was undertaken [285].
2.6.1.1 Setup Accuracy Study (SUAS)
The SUAS was a multifaceted QA program that required enrolled clinics to participate
in benchmarking exercises, electronic treatment plan review, structure audits, dosimetry
phantom studies, and treatment set-up verification studies [283]. A multi-centre QA study
of this magnitude had only been completed previously once [286], so software was developed
to analyse the large amounts of data provided by the study [287].
Clinics were to include at least 10 patient’s pelvic datasets to be treated according to the
RADAR trial protocol in the benchmarking exercise. During each fraction of treatment
setup accuracy was to be verified with either on-board imaging systems, electronic portal
imaging devices, or film [283]. Protocols related to patient setup and immobilisation, as
well as bladder and rectum filling, were left to the clinic’s discretion.
To participate in dose escalation, a clinic was required to demonstrate their capacity to
safely deliver radiation at each successive dose level. Assessment was based on Australasian
Consensus Guidelines for three dimensional conformal radiation therapy [288], which re-
quired at least 90% of treatment isocentres to lie within 10 mm of the intended isocentre.
Clinics that met only this requirement were only able to deliver 66 Gy treatment while
participating within the trial. If 90% of treatment isocentres were within 5 mm, the clinic
could escalate the treatment dose to 70 or 74 Gy. An option of escalating dose to 78 Gy
during treatment was also available, which required 90% of treatment isocentres lie within
3 mm of the intended isocentre [283].
All 22 centres enrolled within the setup accuracy study were able to meet the requirements
for 66 Gy treatment. Additionally, all but three of the centres satisfied the requirements
for dose escalation to 70 or 74 Gy. Four clinics were eligible to treat with a prescription
of 78 Gy, however due to personal choice or failing to satisfy other trial criteria, no clinics
escalated dose to this value [283]. By providing a range of dose prescriptions, the RADAR
trial generated enough data to simultaneously investigate the role of dose escalation on
Chapter 2. Literature Review 57
treatment outcome. It was subsequently found that escalated dose led to a reduction in
the local progression, independent of which treatment arm the patient was enrolled in
[284].
Throughout the SUAS, questionnaires were administered to participating clinics, to allow
treatment and verification techniques from each clinic to be disclosed to the trial coordina-
tors. Setup data was analysed for random and systematic errors and associated with the
clinic’s procedures to identify potential sources for these errors. Feedback and recommen-
dations were then supplied to each clinic. A secondary survey found that 65% of audited
clinics changed clinical practice guidelines following participation within this trial [283].
Implementation of the SUAS resulted in the acquisition of a large, high quality dataset
for the RADAR trial, with lower protocol variation rates observed compared to previous
trials [278, 279]. Reduced rates of high-grade toxicity throughout the RADAR trial were
praised as indications of the effectiveness of this QA protocol [289]. However, secondary
analysis of the RADAR dataset identified correlations between treatment planning and
delivery factors and recorded patient outcome. It was found that patient treatments
calculated using rigorous dose calculation algorithms, as well as treatments involving 7
or more treatment beams, resulted in a significant higher incidence of local composite
progression [290]. Retrospective analysis additionally revealed clinical factors such as
smoking and utilisation of laxative correlated with increased urinary and gastrointestinal
toxicities respectively [291, 292].
2.6.2 RT01
The Medical Research Council (MRC) RT01 trial within the United Kingdom was ini-
tiated to investigate dose escalation for prostate cancer radiotherapy [293, 294]. At the
time, recent advancements in delivering conformal radiotherapy meant many centres were
investigating the efficacy on patient outcome when prescribed dose was increased from the
standard dose of 64 Gy in 32 fractions [295–297]. The RT01 trial was designed as a phase
3, open-labelled randomised controlled trial, with primary endpoints being biochemical
progression-free survival and overall survival [298].

Chapter 2. Literature Review 58
Men with histologically confirmed T1b – T3a localised prostate cancer (i.e., not nodal
or metastatic involvement) with PSA < 50 ng/mL were eligible for the trial. Between
January 1998 and December 2001, a total of 843 men were randomly assigned to either a
control or dose escalated cohort. The control group received 64 Gy in 32 fractions, while
the dose escalated group received 74 Gy in 37 fractions. All patients were treated using 3D
Conformal Radiotherapy. Randomisation was stratified by risk of seminal vesicle invasion
and treatment centre. Patients in both trial arms also received neoadjuvant androgen
deprivation therapy for 3 – 6 months prior the commencement of radiotherapy [294].
Ten year follow up revealed that patient’s receiving escalated dose had a significantly
improved biochemical progression free survival compared to the control group (55% versus
43%, Hazard Ratio = 0.69). However, these improvements were not translated to overall
survival at ten years, which was identical between both trial arms. Additionally, significant
increases in bladder, bowel, and sexual toxicities were observed in the dose escalated
cohort immediately following radiotherapy [159, 299, 300]. Increased dose delivered to
neighbouring organs-at-risk were found to increase erectile dysfunction [301] and multiple
rectal toxicities [302–304].
Quality assurance procedures for the RT01 trial included the distribution of a question-
naire covering treatment planning and delivery [305], as well a purpose built phantom for
dosimetry auditing [306]. Both were found to help estimate and minimise potential setup
errors. Portal imaging was also utilised in the trial to ensure that treatment delivery was
accurate and precise [307]. Finally, a clinical planning exercise was employed to provide an
assessment of contouring variability amongst participating centres [254]. The variability
in target volume contours was found to be sufficient for the purposes of the trial.
2.6.3 CHHiP
The Conventional versus Hypofractionated High-dose intensity-modulated radiotherapy
for Prostate cancer (CHHiP) trial is a randomised, phase 3, non-inferiority trial also con-
ducted within the United Kingdom investigating the efficacy of hypofractionated treat-
ment for localised prostate cancer patients [308]. The study sought to confirm findings
from smaller randomised trials comparing a hypofractionated treatment schedule against

Chapter 2. Literature Review 59
conventional fractionation [309–311]. Rationale for hypofractionation was derived from
recent findings that the α/β ratio for prostate cancer was small (1.4 – 1.9 Gy), compared
to standard tumours with α/β ratios of approximately 10 Gy [127–132].
Between October 2002 and June 2011, a total of 3216 men with localised prostate cancer
were enrolled into the CHHiP trial. Eligibility criteria for trial enrolment was histologically
confirmed T1b – T3a prostate cancer with no nodal or metastatic involvement. Patients
were randomly assigned into one of three cohorts, with randomisation stratified by National
Comprehensive Cancer Network (NCCN) risk group and treatment centre. The first cohort
received a conventional fractionation schedule of 74 Gy in 37 fractions. The second cohort
received a hypofractionated schedule of 60 Gy in 20 fractions, while the third also received
hypofractionated treatment of 57 Gy in 19 fractions [308]. All treatment plans were
delivered with intensity-modulated techniques, with some receiving optional IGRT.
Primary endpoint for the study was time to biochemical or clinical failure, with a goal of
showing that hypofractionated treatment of a large cohort of patients was non-inferior to
standard fractionation. Early assessments in 2006 of the first 457 patients revealed that
hypofractionated treatment was being well tolerated at 2 years follow up [312]. Five year
follow up found no significant difference in biochemical or clinical failure between the 74
Gy and 60 Gy cohorts (88.3% and 90.6% respectively) [308]. While non-inferiority was
established for the 60 Gy cohort, it could not be established for the 57 Gy cohort. No
significant differences in bladder or bowel toxicities (Radiation Therapy Oncology Group
(RTOG) Grade 2 or greater grading) between cohorts [308, 313].
Secondary analysis found no significant differences in patient outcome were observed
when patients were stratified by age [314]. Additionally, treatment plans developed using
inverse-planning methods resulted in reductions in bowel toxicity when compared against
forward-planning methods [315]. As a result, hypofractionated treatment of 60 Gy in 20
fractions was recommended as the new standard of treatment by the NHS. Clinical practice
throughout UK has subsequently changed based on these findings, with hypofractionated
treatment accounting for 49% of prostate cancer radiotherapy treatments by 2017 [316].
Quality assurance procedures developed for the CHHiP trial consisted of pre-trial process
documents, planning benchmark cases, and dosimetry site visits [317]. Minor protocol
Chapter 2. Literature Review 60
deviations observed included incorrect bladder or bowel preparation, no patient immobil-
isation, and out of tolerance treatment verification. Prospective review of contouring was
completed for 100 patients, where major variations were observed in 71 of the cases. This
led to the clarification within the trial protocol of PTV margins to reduce the extent of
contouring uncertainty [317].
2.7 Automated Contouring
Due to the prevalence of variation within manual contouring, as well as the substantial
time and financial resources that are required, much work has been undertaken investi-
gating the efficacy and efficiency of automatic and semi-automatic contouring methods
[28]. Automatic contouring reduces the clinical workload, whilst providing a consistent
definition of the contour boundary. Some methods, such as thresholding based on an
intensity value, can be performed on a scan in isolation. However, most automatic con-
touring methods incorporate a priori clinical data, although how this data is utilised varies
between methods.
Commonly investigated automatic contouring methods include statistical shape models,
machine learning, and atlas-based methods [28]. Statistical shape models are comprised of
multiple surfaces and shapes corresponding to the structure to be contoured. An incoming
image to be contoured can then have features from these surfaces propagated via surface
meshes, vector fields, landmarks [31]. These methods are particularly stable against local
image artefacts and perturbations, due to the final contour being restricted to anatomically
plausible shapes. Statistical shape models have been shown to successfully contour bone
[318], brain [319], cardiac [320], and pelvic soft tissue structures [321, 322].
Machine learning, and in particular the subfield of deep learning, has seen an exponen-
tial rise in popularity in medical imaging contouring studies [323, 324]. The premise of
deep learning focuses on the construction of multiple processing layers to learn features
and representations of inputted data. Structure within these datasets is learned through
back-projection algorithms, which then update the internal parameters that represent the
data [32]. While many architectures for this process exist, one of the most common are
Chapter 2. Literature Review 61
convolutional neural networks (CNN) [325, 326]. CNNs assign weights that are shared
between common features within an image that are spatially correlated, reducing the de-
grees of freedom within a model and considerably reducing computational requirements.
However, despite many advancements in recent times, a significant drawback for deep
learning are the large datasets required for training, along with the increased demands on
computational power [327].
Multiple studies have used deep learning to automatically contour soft tissue structures,
where results comparable to inter-observers have been regularly observed across multiple
sites [328, 329]. A popular CNN architecture for automatic contouring used in these studies
is the U-Net architecture [330]. For prostate segmentation, most studies have investigated
contouring on MRI [331–337], however deep learning has been applied to ultrasound [338]
and CT images [339, 340]. Dice Similarity Coefficients (DSC) of 0.87 – 0.88 were recorded
in these respective studies for prostate segmentation on CT, which is comparable to values
observed within inter-observer contouring variation studies. Accurate segmentation of the
prostate on MRI using deep learning could be utilised in future MRI-only planning of
prostate radiotherapy [341].
Automatic contouring utilising atlas-based methods requires a single or collection of refer-
ence images with the desired contours already segmented [16, 28]. By finding the optimal
mapping between the reference image and the input image, a transformation can be ap-
plied to the contours to match the anatomy of the input image. Atlases can incorporate
information from both CT and MRI scans [342–345], and multiple studies have investi-
gated constructing atlases for sites such as brain [346–348], prostate [342, 344, 349, 350],
and cardiac substructures [351, 352]. Additionally, atlases can be utilised as an initial
step in automatic contouring, before additional methods such as deep learning are used to
refine the contour boundaries [331, 333].
2.7.1 Atlas-Based Contouring
Atlas-based contouring allows for information regarding a structure’s spatial relationship
with neighbouring anatomy to be incorporated within the automatic segmentation [353].
Atlases consist of either a single or collection of reference images, each with previously

Chapter 2. Literature Review 62
contoured structures by a trained expert [15]. Automatic contouring of an incoming pa-
tient scan proceeds by registering the atlas to match the anatomy of the new scan. This
transformation is applied to the contoured structures, which can then be propagated to the
incoming patient scan. This process is fast, reproducible, and can incorporate information
from multiple imaging modalities such as CT and MRI [342–345].
Multiple different methods for atlas construction and utilisation exist in the literature,
with examples shown in Figure 2.18 [354]. The earliest and simplest method utilises a
single template image as the atlas, with contoured structures directly propagated onto the
incoming scan following registration [355]. While easy to implement and not computa-
tionally intensive, single atlases fail to account for significant variation between incoming
patient anatomy [356].
Consequently, most atlases consist of multiple template images. Early investigations would
identify a single template image from within the atlas to use for automatic contouring
[357]. This soon evolved to probabilistic atlas-based contouring, whereby all template
images were registered into a single coordinate frame [358–360]. Utilisation of these atlases
provided information regarding the probability that the structure to be contoured was
present at different locations within the incoming image.
Finally, multi-atlases utilise all template images to define the contour [347, 354, 361].
Following registration of all template images, either all or some selection of the registered
template images will have contours propagated onto the incoming patient scan. The final
automatic contour will then be generated either through a voting or statistical method.
Utilisation of a multi-atlas has been shown to overcome the issue of observer bias present
when only a single template is used within the atlas.
Figure 2.19 shows a generic workflow for the development and implementation of a multi-
atlas [15]. Multi-atlas development requires the initial generation of template images
and associated contours to form the atlas, as well as an optional offline learning phase.
Keys steps when implementing an atlas to an incoming image are atlas registration, label
(or contour) propagation and fusion. While atlas selection, online learning, and post-
processing are strictly not required during atlas implementation, these optional steps will
improve the quality of the automatically contoured structure.

Chapter 2. Literature Review 63
Figure 2.18: Examples of different atlases. From left to right; a single-atlaswith a single template image, a multi-atlas with all template images utilised dur-ing auto-contouring, a multi-atlas with a single best-fit template used for auto-contouring, and a multi-atlas with a subset of template images used for auto-
contouring. Image reproduced from [14].
2.7.2 Multi-Atlas Development
The fundamental property of atlases is that structures previously contoured by trained
experts on the template images are utilised to automatically contour the incoming patient
image. Consequently, the quality of automatic contour will be dependent on the quality
of the atlas contours (i.e. rubbish in equals rubbish out). Template images that are
representative of the anatomy within the incoming datasets to the contoured is imperative
[356]. This can be performed via visual inspection [362], or through automated clustering
[363, 364].
It has been shown that the accuracy of automatic contouring improves as the number of
template images within the multi-atlas is increased [365, 366]. However, each additional
template image will result in diminishing returns regarding contouring quality. Conse-
quently, as acquisition of expert-defined contours is a time and cost-intensive venture, a
pre-defined number of template images should be decided upon at commencement of multi-
atlas development. This number will be dependent on the imaging modality utilised, and
the structure (or structures) to be contoured [16, 367]. Disagreement exists within the
literature regarding the optimal number of template images required to construct an atlas

Chapter 2. Literature Review 64
Figure 2.19: Steps required for multi-atlas development (above dashed line)and implementation (below dashed line). Steps are ordered chronologically, with
dashed blocks optional. Image adapted from [15].
[346, 354, 368]. Consequently, most studies will estimate this number based on available
computational resources and previous experiences [15].
To reduce the burden on a single expert when acquiring contours, it has been proposed
that contouring of the template images should be opened up to multiple observers who
aren’t experts [369]. The impact of inter-observer contouring variability within the atlas
can be abated through the utilisation of well-defined guidelines [251]. It has been shown
that utilisation of multiple observer’s contours within the atlas can lead to significant
improvements compared to utilisation of only a single observer’s contours [370].
2.7.3 Atlas Workflow
The workflow for applying a developed multi-atlas to automatically contour structure on
an incoming patient scan is shown in Figure 2.20. A collection of M template images are
each rigidly registered to the incoming query image, a similarity metric is then calculated to

Chapter 2. Literature Review 65
Figure 2.20: Workflow for implementation of a multi-atlas, automatically con-touring structures on an incoming query image. Image is adapted from [16].
assess the similarity between registered template and incoming image (Step 1). Registered
template images are ranked according to this metric, and the top n template images are
selected for non-rigid registration based on a metric threshold (Step 2).
These n template images are deformably registered to the incoming image, with the non-
rigid deformations applied to associated atlas contours. These contours are subsequently
propagated onto the incoming patient scan (Step 3). A decision is made to fuse these
propagated contours for each structure, which defines the final contour (Step 4).
2.7.3.1 Registration
Registration is the spatial transformation of points from a deformable image mapped onto
homologous points on a target image [16]. This transformation can be applied either
to the entire image, or locally on a voxel-per-voxel basis. Rigid registration is the most
popular global registration technique, where rotations and translations are performed to
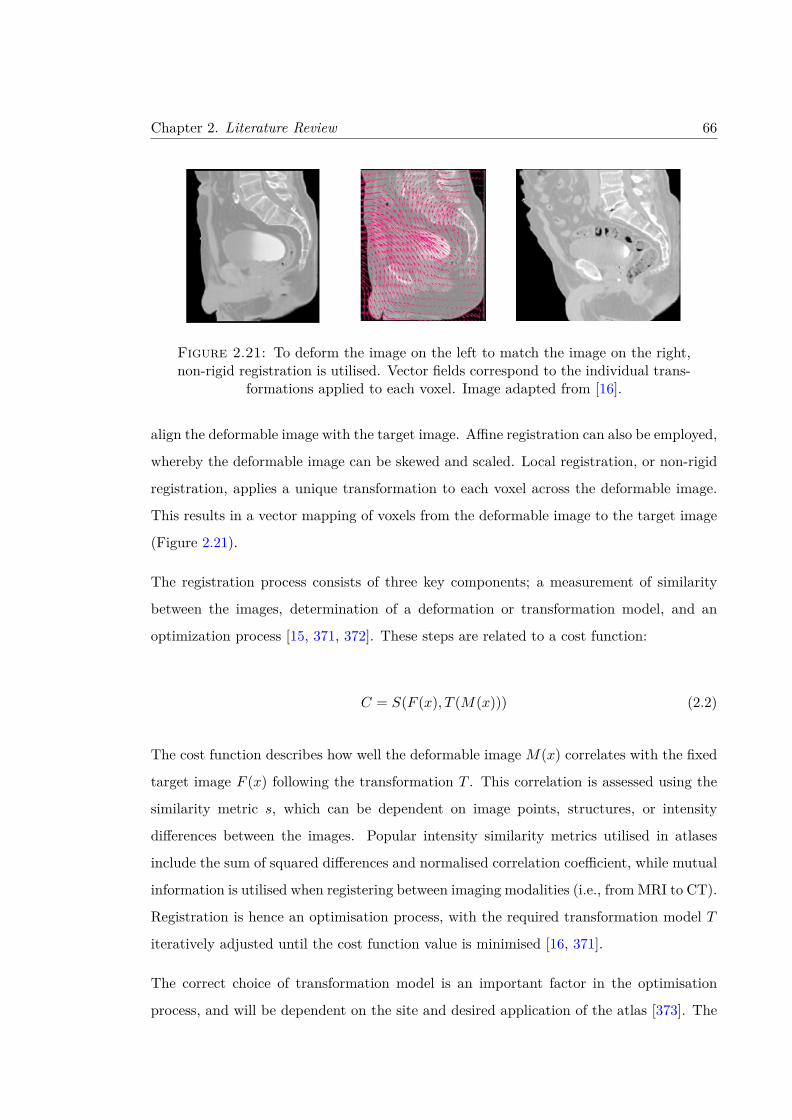
Chapter 2. Literature Review 66
Figure 2.21: To deform the image on the left to match the image on the right,non-rigid registration is utilised. Vector fields correspond to the individual trans-
formations applied to each voxel. Image adapted from [16].
align the deformable image with the target image. Affine registration can also be employed,
whereby the deformable image can be skewed and scaled. Local registration, or non-rigid
registration, applies a unique transformation to each voxel across the deformable image.
This results in a vector mapping of voxels from the deformable image to the target image
(Figure 2.21).
The registration process consists of three key components; a measurement of similarity
between the images, determination of a deformation or transformation model, and an
optimization process [15, 371, 372]. These steps are related to a cost function:
C = S(F (x), T (M(x))) (2.2)
The cost function describes how well the deformable image M(x) correlates with the fixed
target image F (x) following the transformation T . This correlation is assessed using the
similarity metric s, which can be dependent on image points, structures, or intensity
differences between the images. Popular intensity similarity metrics utilised in atlases
include the sum of squared differences and normalised correlation coefficient, while mutual
information is utilised when registering between imaging modalities (i.e., from MRI to CT).
Registration is hence an optimisation process, with the required transformation model T
iteratively adjusted until the cost function value is minimised [16, 371].
The correct choice of transformation model is an important factor in the optimisation
process, and will be dependent on the site and desired application of the atlas [373]. The

Chapter 2. Literature Review 67
two most popular models for non-rigid registration are the B-Spline free form deformation
[374, 375], and the diffeomorphic Demons Algorithm [376]. Additionally, many models
incorporate prior knowledge of the deformations in the form of regularisation constraints
to ensure that any transformations are still realistic [15, 372].
2.7.3.2 Contour Propagation and Fusion
Following registration of the deformable atlas images, associated contours are propagated
to the target image. This process will require interpolation of the deformable image
into the coordinate system of the target image, which if incorrectly applied can lead to
artefacts within the registration [16, 377]. Each atlas image transfers a label to every
voxel within the target image [363, 378], which can either be binary (voxel is or isn’t
within the contour), or take a value from a probability distribution. Nearest-neighbour
interpolation is frequently used [379], which provides a tissue consistency step along with
the propagation of information from the atlas images.
When utilising a multi-atlas, propagation of multiple atlas contours will result in differing
labels for voxels within the target image. Consequently, a decision will need to be made
regarding the final label attributed to each voxel. There are many available methods
for this decision, with a majority vote the simplest method utilised [15]. As the name
suggests, each voxel within the target image will take a final label corresponding to the
most frequent label provided by all propagated atlas contours. Further variations of this
set incorporate a threshold level of agreement, for example 30% agreement, rather than a
simple majority [16].
It should be noted that simple majority voting does not take into consideration the qual-
ity of registration between the atlas and target image. A simple extension was therefore
weighted voting, whereby weights are assigned based on the level of similarity between the
atlas and target image following registration. Initial investigations utilised normalised mu-
tual information to provide weightings [380], however these global weights were unable to
account for the localised variations in registration accuracy. Consequently, local-weighted
voting methods were developed to provide voxel-by-voxel weights to each atlas contour,

Chapter 2. Literature Review 68
based on similarity within a small regions between the registered atlas and target image
[378, 381].
Aside from voting methods, probabilistic algorithms such as expectation-maximisation
have also been used to define the final contour from propagated atlas contours. The
STAPLE algorithm is an example of this, whereby the ‘true’ target image contour is
estimated through maximisation of the sensitivity and specificity of all propagated atlas
contours [382, 383]. A key assumption of the algorithm is that all information regarding
the true contour is provided by the propagated atlas contours. Further refinements of the
STAPLE algorithm integrate atlas selection, to ensure only atlas images with acceptable
similarity with the target image are included in the generation of the target image contour
[384].
2.7.4 Limitations of Atlases
Atlases exhibit great promise for improving the efficacy and efficiency of contouring in
clinical trials, and are now incorporated in many commercial treatment planning systems
[28]. However, work is still required in the design, implementation and validation of these
atlases before they display the accuracy required for clinical use [350, 385]. Currently,
atlases have been unable to generate contours that were an improvement on what a trained
expert would be able to produce [386]. In fact, for each of these investigated techniques, at
least one large mistake was made that an experienced observer or clinician would not make.
Consequently, when employed clinically, adjustments must often be made to automatic
contours, negating the time savings otherwise provided by the atlas [387, 388].

CHAPTER 3
Correlations between contouring
similarity metrics and simulated
treatment outcome for prostate
radiotherapy
69

© 2018 Institute of Physics and Engineering in Medicine
1. Introduction
Inter- and intra-observer contouring variability remains one of the largest sources of uncertainty in radiotherapy (Weiss and Hess 2003, Van Dyk et al 2013), with poor contouring significantly impacting the quality of treatment and patient outcome in clinical trials (Peters et al 2010). Uncertainties in contouring for prostate cancer radiotherapy have been attributed to imaging modality (Dubois et al 1998, Rasch et al 1999), observer training (Khoo et al 2012), and an over-cautiousness of clinicians limiting rectal tissue volume contoured by trimming the planning target volume (PTV) (Gao et al 2007). Implementation of clinical protocols and utilisation of MRI
D Roach et al
Printed in the UK
035001
PHMBA7
© 2018 Institute of Physics and Engineering in Medicine
63
Phys. Med. Biol.
PMB
1361-6560
10.1088/1361-6560/aaa50c
3
1
14
Physics in Medicine & Biology
IOP
23
January
2018
Correlations between contouring similarity metrics and simulated treatment outcome for prostate radiotherapy
D Roach1,2 , M G Jameson2,3, J A Dowling1,4,8,9,10, M A Ebert5,6,9, P B Greer7,8, A M Kennedy5, S Watt3 and L C Holloway1,2,3,9
1 South Western Sydney Clinical School, University of New South Wales, Sydney, Australia2 Ingham Institute for Applied Medical Research, Sydney, Australia3 Liverpool Cancer Therapy Centre, Liverpool Hospital, Sydney, Australia4 Australian e-Health Research Centre, CSIRO, Royal Brisbane Hospital, Herston, Australia5 Sir Charles Gairdner Hospital, Nedlands, Australia6 Faculty of Science, School of Physics, University of Western Australia, Crawley, Australia7 Calvary Mater Newcastle Hospital, Newcastle, Australia8 School of Mathematical and Physical Sciences, University of Newcastle, Newcastle, Australia9 Centre for Medical Radiation Physics, University of Wollongong, Wollongong, Australia10 Institute of Medical Physics, University of Sydney, Sydney, Australia
E-mail: [email protected]
Keywords: prostate, inter-observer variability, contouring, similarity metrics, VMAT
Supplementary material for this article is available online
AbstractMany similarity metrics exist for inter-observer contouring variation studies, however no correlation between metric choice and prostate cancer radiotherapy dosimetry has been explored. These correlations were investigated in this study. Two separate trials were undertaken, the first a thirty-five patient cohort with three observers, the second a five patient dataset with ten observers. Clinical and planning target volumes (CTV and PTV), rectum, and bladder were independently contoured by all observers in each trial. Structures were contoured on T2-weighted MRI and transferred onto CT following rigid registration for treatment planning in the first trial. Structures were contoured directly on CT in the second trial. STAPLE and majority voting volumes were generated as reference gold standard volumes for each structure for the two trials respectively. VMAT treatment plans (78 Gy to PTV) were simulated for observer and gold standard volumes, and dosimetry assessed using multiple radiobiological metrics. Correlations between contouring similarity metrics and dosimetry were calculated using Spearman’s rank correlation coefficient.
No correlations were observed between contouring similarity metrics and dosimetry for CTV within either trial. Volume similarity correlated most strongly with radiobiological metrics for PTV in both trials, including TCPPoisson (ρ = 0.57, 0.65), TCPLogit (ρ = 0.39, 0.62), and EUD (ρ = 0.43, 0.61) for each respective trial. Rectum and bladder metric correlations displayed no consistency for the two trials. PTV volume similarity was found to significantly correlate with rectum normal tissue complication probability (ρ = 0.33, 0.48). Minimal to no correlations with dosimetry were observed for overlap or boundary contouring metrics. Future inter-observer contouring variation studies for prostate cancer should incorporate volume similarity to provide additional insights into dosimetry during analysis.
PAPER2018
RECEIVED 28 April 2017
REVISED
18 December 2017
ACCEPTED FOR PUBLICATION
4 January 2018
PUBLISHED 22 January 2018
https://doi.org/10.1088/1361-6560/aaa50cPhys. Med. Biol. 63 (2018) 035001 (14pp)
Chapter 3. Prostate contouring metric correlations 70

2
D Roach et al
reduces inter-observer contouring variability (Dubois et al 1998, Rasch et al 1999, Mitchell et al 2009), although only limited agreement amongst observers is reached (Ost et al 2011).
The prevalence of inter-observer contouring variability for prostate cancer has been thoroughly investigated, however few studies have additionally assessed the impact of this variability on dosimetry (Vinod et al 2016a). Of the studies that have investigated this, only neighbouring organ-at-risk (OAR) dosimetry has been evaluated (Foppiano et al 2003, Livsey et al 2004, Mitchell et al 2009, Perna et al 2011). Consequently, no study has assessed the impact of inter-observer contouring variability on target volume dosimetry for prostate radiotherapy. Addi-tionally, studies to date utilised 3D-CRT, whereas most prostate cancer treatments now employ more modern techniques such as intensity modulated radiotherapy (IMRT), volumetric modulated arc therapy (VMAT), or stereotactic body radiotherapy (SBRT). These techniques generate tighter dose distributions matching the radiotherapy target volumes, and have been shown to reduce dose and subsequent toxicities to OARs (Palma et al 2008, Al-Mamgani et al 2009, Quan et al 2012). However, due to the steep dose gradients produced by these techniques, poorly contoured target volumes could result in larger impacts on dosimetry than has been observed in previous studies.
Similarity metrics are utilised to quantify contouring variations; however, no consensus exists over the choice of metric to incorporate during an investigation (Jameson et al 2010, Fotina et al 2012). This restricts compariso ns being made between studies, as similarity metrics cited may poorly correlate with one another (Sharp et al 2014). A combination of boundary and volume metrics is recommended (Fotina et al 2012), how-ever these metric choices may have little to no correlation with dosimetry. Studies investigating non-small cell lung cancers (Jameson et al 2014) and head and neck cancers (Beasley et al 2016) found that commonly utilised overlap metrics conformity index and DSC displayed weak or no correlations with simulated treatment outcome respectively. The aim of this study was to evaluate correlations between contouring similarity metrics and dosim-etry for prostate cancer planned for VMAT radiotherapy.
2. Materials and methods
2.1. Patient datasets and contouringTwo patient datasets were utilised for this study. The first trial incorporated forty-two patients from a prior study containing pre-treatment CT and MRI scans for localised prostate radiotherapy (Dowling et al 2015). Three observers (two experienced radiation oncologists, one experienced research radiation therapist) independently contoured clinical target volume (CTV) (Hodapp 2012), rectum, and bladder on T2-weighted MRI based on trial contouring protocol using Eclipse™ treatment planning software (Varian Medical Systems, Palo Alto, CA, USA). MRI scans were rigidly registered to CT with respect to gold fiducial markers implanted in the prostate, and CTV, rectum, and bladder contours were transferred to CT for treatment planning.
The second trial utilised a five patient subset from the previous trial, with patients selected based on prior clustering of post registration intensity based image similarities of potential atlas images with respect to the larger RADAR patient dataset (Trans-Tasman Radiation Oncology Group (TROG) 2005) using affinity propaga-tion (Frey and Dueck 2007, Kennedy et al 2016). This work was to be used during additional atlas based segmen-tation analyses. Ten observers across four treatment centres (two medical physicists, one radiation therapist, one radiographer, and six radiation oncologists) contoured CTV, rectum, and bladder on CT based on trial contour-ing protocol, with five observers using Eclipse™ (Varian Medical Systems, Palo Alto, CA) and five observers using Pinnacle3® (Philips Healthcare, Best, Netherlands) treatment planning software. A uniform 7 mm margin was applied to the CTV in both trials to define the PTV (Hodapp 2012). Following contouring, DICOM structure files were returned and imported into Pinnacle3® for treatment planning.
2.2. Gold standard volumesIn the absence of pathological information, ‘gold standard’ reference volumes were estimated for each structure from observer contours. The first trial utilised the simultaneous truth and performance level estimation (STAPLE) algorithm to generate these volumes (Warfield et al 2004). For the second trial, the large number of observers resulted in overlapping CTV and rectum STAPLE volumes that were deemed inappropriate for the study. Consequently, a majority vote was used to define the gold standard volumes for each structure in this trial. The impact the choice of gold standard volume has on analysis was investigated by a supplementary study of the first trial dataset, whereby observer contours were iteratively designated as additional gold standard volumes. Gold standard volumes were created within MilxView, an open-sourced image manipulation and processing platform developed by the Commonwealth Scientific and Industrial Research Organisation (CSIRO) biomedical informatics group (Burdett et al 2010).
Phys. Med. Biol. 63 (2018) 035001 (14pp)
Chapter 3. Prostate contouring metric correlations 71
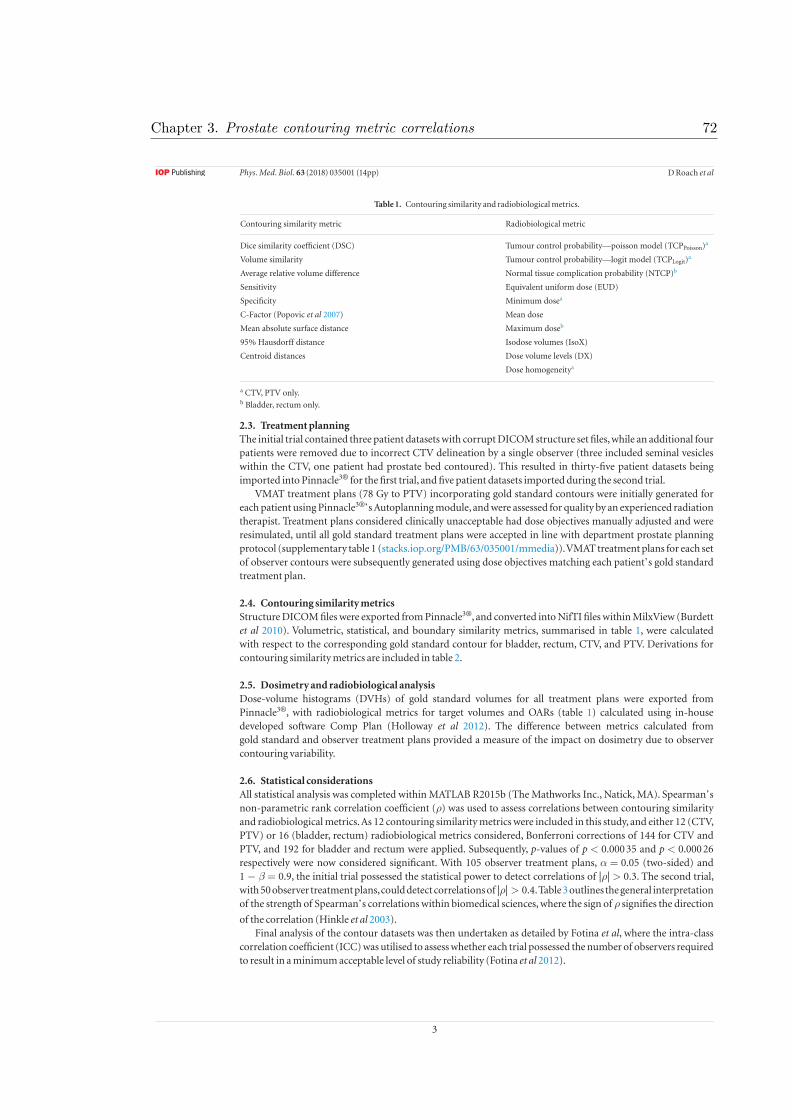
3
D Roach et al
2.3. Treatment planningThe initial trial contained three patient datasets with corrupt DICOM structure set files, while an additional four patients were removed due to incorrect CTV delineation by a single observer (three included seminal vesicles within the CTV, one patient had prostate bed contoured). This resulted in thirty-five patient datasets being imported into Pinnacle3® for the first trial, and five patient datasets imported during the second trial.
VMAT treatment plans (78 Gy to PTV) incorporating gold standard contours were initially generated for each patient using Pinnacle3®’s Autoplanning module, and were assessed for quality by an experienced radiation therapist. Treatment plans considered clinically unacceptable had dose objectives manually adjusted and were resimulated, until all gold standard treatment plans were accepted in line with department prostate planning protocol (supplementary table 1 (stacks.iop.org/PMB/63/035001/mmedia)). VMAT treatment plans for each set of observer contours were subsequently generated using dose objectives matching each patient’s gold standard treatment plan.
2.4. Contouring similarity metricsStructure DICOM files were exported from Pinnacle3®, and converted into NifTI files within MilxView (Burdett et al 2010). Volumetric, statistical, and boundary similarity metrics, summarised in table 1, were calculated with respect to the corresponding gold standard contour for bladder, rectum, CTV, and PTV. Derivations for contouring similarity metrics are included in table 2.
2.5. Dosimetry and radiobiological analysisDose-volume histograms (DVHs) of gold standard volumes for all treatment plans were exported from Pinnacle3®, with radiobiological metrics for target volumes and OARs (table 1) calculated using in-house developed software Comp Plan (Holloway et al 2012). The difference between metrics calculated from gold standard and observer treatment plans provided a measure of the impact on dosimetry due to observer contouring variability.
2.6. Statistical considerationsAll statistical analysis was completed within MATLAB R2015b (The Mathworks Inc., Natick, MA). Spearman’s non-parametric rank correlation coefficient (ρ) was used to assess correlations between contouring similarity and radiobiological metrics. As 12 contouring similarity metrics were included in this study, and either 12 (CTV, PTV) or 16 (bladder, rectum) radiobiological metrics considered, Bonferroni corrections of 144 for CTV and PTV, and 192 for bladder and rectum were applied. Subsequently, p-values of p < 0.000 35 and p < 0.000 26 respectively were now considered significant. With 105 observer treatment plans, α = 0.05 (two-sided) and 1 − β = 0.9, the initial trial possessed the statistical power to detect correlations of |ρ| > 0.3. The second trial, with 50 observer treatment plans, could detect correlations of |ρ| > 0.4. Table 3 outlines the general interpretation of the strength of Spearman’s correlations within biomedical sciences, where the sign of ρ signifies the direction
of the correlation (Hinkle et al 2003).Final analysis of the contour datasets was then undertaken as detailed by Fotina et al, where the intra-class
correlation coefficient (ICC) was utilised to assess whether each trial possessed the number of observers required to result in a minimum acceptable level of study reliability (Fotina et al 2012).
Table 1. Contouring similarity and radiobiological metrics.
Contouring similarity metric Radiobiological metric
Dice similarity coefficient (DSC) Tumour control probability—poisson model (TCPPoisson)a
Volume similarity Tumour control probability—logit model (TCPLogit)a
Average relative volume difference Normal tissue complication probability (NTCP)b
Sensitivity Equivalent uniform dose (EUD)
Specificity Minimum dosea
C-Factor (Popovic et al 2007) Mean dose
Mean absolute surface distance Maximum doseb
95% Hausdorff distance Isodose volumes (IsoX)
Centroid distances Dose volume levels (DX)
Dose homogeneitya
a CTV, PTV only.b Bladder, rectum only.
Phys. Med. Biol. 63 (2018) 035001 (14pp)
Chapter 3. Prostate contouring metric correlations 72

4
D Roach et al
3. Results
3.1. Trial 1 resultsObserver and STAPLE volumes for CTV, PTV, bladder, and rectum are plotted in figure 1. Mean, standard deviation (SD), and coefficient of variation (COV) of these volumes are summarised in table 4. Observer B consistently contoured larger CTV (+11.03 cc), PTV (+22.44 cc), and rectum (+19.09 cc), although only CTV and PTV were considered statistically significant (figure 1). Minimal variations were seen between observers A, C, and STAPLE volumes for CTV, PTV, and rectum, and between all observer and STAPLE bladder volumes. Additional descriptive statistics can be found in supplementary tables 2 and 3. Figure 2 plots DSC for observer contours with respect to the corresponding STAPLE contour. The poorest overlapping PTV contour (DSC = 0.7612) is outlined purple in figure 3.
Mean differences between observer and STAPLE plan dosimetry for selected radiobiological metrics are shown in table 5. Negligible variations in CTV dosimetry were observed. Significant variations in dosimetry were seen for PTV, with several observer treatment plans failing to adequately treat the STAPLE volume (D95 < 76.2 Gy, supplementary table 1). One such treatment plan utilised observer C’s contours (orange) in figure 4, where observer C’s smaller PTV resulted in a significant portion of the STAPLE PTV receiving inadequate dose.
Table 2. Contouring similarity metric derivations.
Metric Equations and derivations
Dice similarity coefficient (DSC) DSC = 2|X∩Y||X|+|Y|
Volume similarity VOLSIM = Y−X(X+Y)/2
True positive (negative) Number of voxels lying within (outside) the observer contour that also lie within
(outside) the gold standard contour
False positive (negative) Number of voxels lying within (outside) the observer contour that lie outside
(within) the gold standard contour
Sensitivity p = True PositivesTrue Positives+False Negatives
Specificity q = True NegativesTrue Negatives+False Positives
Mean absolute surface distance MASD = 1NXS+NYS
(∑
x∈XS
miny∈YS
d (x, y) +∑
y∈YS
minx∈XS
d (y, x)
)
95% Hausdorff distance HDasym (XS, YS) = 95th percentilex∈XS
(miny∈YS
d(x, y))
HD (XS, YS) = max(HDasym (XS, YS) , HDasym(YS, XS))
Centroid (euclidean) Euclidean distance between centre-of-mass for gold standard and observer
Centroid (sagittal plane) Distance in sagittal plane between centre-of-mass for gold standard and observer
Centroid (coronal plane) Distance in coronal plane between centre-of-mass for gold standard and observer
Centroid (axial plane) Distance in axial plane between centre-of-mass for gold standard and observer
Absolute relative volume difference aRVD = |100 ×(
|X||Y| − 1
)|
C-Factor (Popovic et al 2007) d = 2p(1−q)p+(1−q) +
2(1−p)q(1−p)+q
C =
d, p � q̂ p > 1 − q
−d, p < q̂ p > 1 − q
undefined, p � 1 − q
X: Number of voxels within gold standard contour.
Y: Number of voxels within observer contour.
XS: Surface points of gold standard contour.
YS: Surface points of observer contour.
NXS: Number of surface points of gold standard contour.
NYS: Number of surface points of observer contour.
d(x,y): Euclidean distance from point x to point y.
Table 3. Strength of spearman’s correlation ρ.
Spearman’s |ρ| Strength of correlation
0.90–1.00 Very strong correlation
0.70–0.90 Strong correlation
0.50–0.70 Moderate correlation
0.30–0.50 Weak correlation
0.00–0.30 Negligible correlation
Phys. Med. Biol. 63 (2018) 035001 (14pp)
Chapter 3. Prostate contouring metric correlations 73

5
D Roach et al
Correlations between contouring similarity and radiobiological metrics were investigated using Spear-man’s ρ, with complete lists of correlations found in supplementary tables 4–7. No significant correlations were observed for CTV and bladder. Significant correlations for PTV and rectum are displayed in figure 5. Volume similarity exhibited the strongest correlation to dosimetry for both PTV and rectum. The strongest correlating radiobiological metrics for PTV volume similarity were minimum dose (ρ = 0.67), TCPPoisson (ρ = 0.57), dose homogeneity (ρ = −0.52), EUD (ρ = 0.43), and TCPLogit (ρ = 0.39). The strongest correlating radiobiological metrics for rectum volume similarity were mean dose (ρ = 0.45) and EUD (ρ = 0.43), with similar correlations for absolute relative volume difference also recorded (ρ = 0.46 and 0.38 respectively). No significant correlations between contouring similarity metrics and maximum dose or NTCP for the rectum were observed.
Figure 1. Observer and STAPLE volume spread for each structure across all 35 patients for trial 1. Notch box-plots show a significant difference in CTV and PTV median volumes by observer (B) compared to observers (A) and (C). Differences between observer median rectum volumes were found to be not statistically significant.
Table 4. Mean, standard deviation, and COV of structure volumes across trial 1 patient cohort.
Observer CTV PTV Bladder Rectum
A Mean (cc) 40.13 107.53 289.98 71.50
SD (cc) 19.32 37.97 141.24 33.50
COV 0.48 0.35 0.49 0.47
B Mean (cc) 53.74 135.07 285.72 95.51
SD (cc) 24.66 45.01 138.09 46.38
COV 0.46 0.33 0.48 0.49
C Mean (cc) 40.74 109.59 297.99 73.35
SD (cc) 21.17 41.54 144.15 40.17
COV 0.52 0.38 0.48 0.55
STAPLE Mean (cc) 42.71 112.63 291.63 76.42
SD (cc) 21.30 40.98 141.51 39.05
COV 0.50 0.36 0.49 0.51
Figure 2. Spread in observer dice similarity coefficient (DSC) for CTV, PTV, bladder, and rectum across all patients for trial 1.
Phys. Med. Biol. 63 (2018) 035001 (14pp)
Chapter 3. Prostate contouring metric correlations 74

6
D Roach et al
Sensitivity and specificity correlations (table 2) were comparable to volume similarity for rectum, but weaker and correlated with fewer radiobiological metrics for PTV. Unsurprisingly the C-Factor, described as a trade-off between sensitivity and specificity (Popovic et al 2007), exhibited similar correlations to these metrics. Significant correlations were observed between differences in centroid in the sagittal plane and minimum dose (ρ = 0.45) for PTV. Overlap metrics (DSC) and boundary metrics (mean absolute surface distance and 95% Hausdorff distance) showed no significant correlations with dosimetry for PTV, while DSC only showed minimal correla-tions (ρ = −0.35–0.38) with multiple rectum isodose curves (supplementary table 5). Analysis of additional gold standard volumes found the same similarity metrics exhibiting the strongest correlations with dosimetry (supplementary material tables 8–11).
Figure 3. Patient 32 containing the poorest overlapping PTV contour (DSC = 0.7612) on T2 MR. Observer (A) (red), (B) (purple), and (C) (orange) contours are outlined on (clockwise from top) transverse, coronal, and sagittal images. STAPLE volume is shaded light blue.
Table 5. Mean differences between observer and STAPLE plan dosimetry.
ΔTCPPoisson ΔTCPLogit ΔNTCP ΔEUD
Mean SD Mean SD Mean SD Mean SD
CTV −0.0001 0.0007 −0.0009 0.0062 — — −0.07 0.46
PTV −0.0545 0.2103 −0.0035 0.0107 — — −0.74 3.39
Bladder — — — — 0.0001 0.0006 0.86 1.95
Rectum — — — — 0.0042 0.0121 0.45 1.24
Figure 4. Patient 1 PTV contours on T2 MR. All observer contours recorded DSC > 0.9 with respect to the STAPLE volume shaded in light blue. However, due to significant portions of Observer C’s (orange) PTV failing to include the STAPLE volume, insufficient dose was delivered to the STAPLE PTV for these treatment plans.
Phys. Med. Biol. 63 (2018) 035001 (14pp)
Chapter 3. Prostate contouring metric correlations 75

7
D Roach et al
Correlations between PTV contouring similarity metrics and OAR dosimetry were also investigated. No sig-nificant correlations were observed for bladder dosimetry. Figure 6 plots PTV volume similarity against rectum NTCP, where a weak correlation (ρ = 0.33) was observed.
3.2. Trial 2 resultsFigure 7 plots CTV, PTV, bladder and rectum volumes for trial 2 datasets, while spread in DSC is illustrated in figure 8. Mean, standard deviation, and COV for these volumes are again summarised in table 6, with additional descriptive statistics found in supplementary tables 12 and 13. Differences between observer and majority voting plan dosimetry are shown in table 7. Patient 4 recorded the smallest mean CTV volume (32.88 cc), while patient 5 had the largest mean CTV (74.02 cc).
Similar trends were observed for PTV volumes (patient 4: 99.61 cc, patient 5: 177.41 cc). Differences between mean rectum volumes between patients was less pronounced, ranging from patient 2 (37.69 cc) through to patient 5 (58.94 cc). Bladder volumes varied significantly between patients, ranging from patient 1 (69.27 cc) through to patient 3 (400.13 cc). Figure 9 shows all observer PTV contours for patient 4, as well as the majority vote PTV shaded in light blue. Observer 1 (green contour) recorded the poorest overlap (DSC = 0.8167) of all PTV volumes.
Table 7 again shows significant differences in PTV dosimetry, due to multiple observer PTV contours failing to adequately cover the majority vote PTV. Mean rectum dosimetry was marginally decreased for observer treat-ment plans, while mean bladder dosimetry improved compared to the gold standard treatment plan. Observer A’s PTV from figure 9 is an example of a PTV failing to treat the majority vote PTV, with the corresponding treat-ment plan shown in figure 10. Complete lists of correlations between contouring similarity metrics and radio-biological metrics are given in supplementary tables 14–17.
No significant correlations between contouring similarity metrics and dosimetry were observed for either CTV or rectum. Bladder correlations were quite variable, a shifting of the coronal plane correlated moderately with NTCP (ρ = −0.51) and multiple isodose curves. Additionally, both DSC (ρ = 0.62) and aRVD (ρ = -0.54) were found to correlate with the maximum dose delivered to the bladder.
Figure 5. Significant spearman correlations for PTV (top image, p < 0.000 35) and rectum (bottom image, p < 0.000 26) for trial 1. Volume similarity, sensitivity, specificity and C-Factor significantly correlated with a range of radiobiological metrics for both structures. Most correlations identified were weak, although TCPPoisson, minimum dose, and dose homogeneity showed moderate correlations with volume similarity, sensitivity, and specificity for PTV.
Figure 6. PTV volume similarity versus rectum NTCP, ρ = 0.33.
Phys. Med. Biol. 63 (2018) 035001 (14pp)
Chapter 3. Prostate contouring metric correlations 76

8
D Roach et al
Specificity displayed the strongest correlations with dosimetry for PTV, with strong correlations observed for TCPPoisson (ρ = 0.81), TCPLogit (ρ = 0.87), EUD (ρ = 0.85), and dose homogeneity (ρ = −0.82). Comparatively, while multiple radiobiological correlations for sensitivity were significant, they were only moderate in strength (ρ = −0.57, −0.52, and 0.60 for TCPLogit, EUD, and dose homogeneity respectively). C-Factor correlations there-
Figure 7. Variations in contoured volumes for each structure across the five patients in trial 2. Gold standard volumes for each structure are shown as a black cross. Due to the use of a majority vote, each gold standard volume is by definition smaller than the median volume for each structure.
Figure 8. Spread in observer DSC for CTV, PTV, bladder, and rectum across all patients for trial 2.
Table 6. Mean, standard deviation, and COV of observer structure volumes for trial 2 patients.
Patient CTV PTV Bladder Rectum
1 Mean (cc) 54.43 141.99 69.27 51.13
SD (cc) 6.58 14.42 4.13 6.20
COV 0.12 0.10 0.06 0.12
Majority vote (cc) 51.32 131.79 68.24 46.23
2 Mean (cc) 43.38 118.88 144.81 37.69
SD (cc) 6.13 13.51 9.03 6.81
COV 0.14 0.11 0.06 0.18
Majority vote (cc) 42.13 113.44 143.33 32.89
3 Mean (cc) 52.64 133.17 400.13 38.61
SD (cc) 7.96 15.37 7.38 2.78
COV 0.15 0.12 0.01 0.07
Majority vote (cc) 49.92 127.59 396.46 36.19
4 Mean (cc) 32.88 99.61 143.21 54.79
SD (cc) 6.59 15.68 12.08 9.95
COV 0.20 0.16 0.08 0.18
Majority vote (cc) 32.81 96.41 142.10 56.35
5 Mean (cc) 74.02 177.41 84.91 58.94
SD (cc) 11.14 20.12 3.82 6.82
COV 0.15 0.11 0.05 0.12
Majority vote (cc) 70.75 165.25 84.11 55.96
Phys. Med. Biol. 63 (2018) 035001 (14pp)
Chapter 3. Prostate contouring metric correlations 77

9
D Roach et al
fore matched the poorer performing sensitivity correlations. Volume similarity again correlated strongly with a range of radiobiological metrics for PTV, with the strongest correlations being dose homogeneity (ρ = −0.76), TCPLogit (ρ = 0.70), EUD (ρ = 0.67), TCPPoisson (ρ = 0.65), and minimum dose (ρ = 0.61). These correlations are illustrated in figure 11.
Table 7. Mean differences between trial 2 observer and majority vote plan dosimetry.
ΔTCPPoisson ΔTCPLogit ΔNTCP ΔEUD
Mean SD Mean SD Mean SD Mean SD
CTV 0.0000 0.0001 −0.0014 0.0035 — — −0.11 0.27
PTV −0.3498 0.4547 −0.0150 0.0380 — — −4.34 11.35
Bladder — — — — 0.0003 0.0009 0.44 2.75
Rectum — — — — −0.0022 0.0248 −0.20 2.23
Figure 9. Patient 4 PTV contours on (clockwise from top) transverse, coronal, and sagittal images. Observer A (highlighted dark green) displayed the poorest overlapping PTV with respect to the majority vote PTV (shaded light blue), with a DSC of 0.8167.
Figure 10. Patient 4 dose distribution derived from observer A’s PTV contour (figure 9). The majority vote PTV is outlined in light blue, while the 78 Gy, 50 Gy, and 39 Gy isodose lines are shaded light green, red, and light blue respectively. This treatment plan resulted in zero tumour control probability for the majority vote PTV. It can clearly be seen on the sagittal and coronal slices that significant portions of the majority vote PTV were under-dosed during treatment planning.
Phys. Med. Biol. 63 (2018) 035001 (14pp)
Chapter 3. Prostate contouring metric correlations 78

10
D Roach et al
Correlations between PTV volume similarity and rectum NTCP were again investigated, where a stronger (yet still weak) correlation of ρ = 0.48 was observed.
4. Discussion
Following treatment plan simulation, it was found that volumetric metrics (volume similarity, sensitivity, and specificity) assessing inter-observer contouring variation for PTV routinely correlated significantly with multiple radiobiological metrics. This was assessed using two separate trials, the first comprising of a small number of observers and large number of patients, the second with a large number of observers and small number of patients, ensuring the study captured the breadth of contouring variation that would be observed clinically. Additionally, variations in volume similarity when assessing PTV contours were found to moderately correlate with rectum NTCP. This study provides evidence linking inter-observer contouring variation metrics with dosimetry and treatment plan quality for prostate cancer patients.
Vinod et al cited 16 studies investigating inter-observer contouring variation for GU structures, identifying the most popular similarity metrics for these studies as volume, surface, overlap, and centre-of-mass respectively (Vinod et al 2016a). Only a few studies included an assessment on dosimetry (Foppiano et al 2003, Livsey et al 2004, Mitchell et al 2009, Perna et al 2011), with these studies investigating impact on OAR dosimetry opposed to treatment target volumes. As stated by Vinod et al, an assessment of contouring variation based solely on geom-etry may have little to no clinical significance, especially where no correlations between contouring metrics and dosimetry have been performed. Additionally, commonly cited spatial overlap metrics conformity index and DSC have been shown to display only minimal to no significant correlations with dosimetry for non-small cell lung cancers (Jameson et al 2014) and head and neck cancers (Beasley et al 2016) respectively. As no study cor-relating contouring similarity metrics and dosimetry had been performed for prostate radiotherapy, this study was undertaken to bring clinical relevancy and allow insights into target volume and OAR dosimetry to other inter-observer contouring variation studies.
Two trials were incorporated in this study; the first involving a small number of observers with many patients, the second a large number of observers with a small number of patients. This multiple trial analysis allowed for a technique to determine whether the calculated correlations were invariant to the trial setup. Fotina et al introduced a method for calculating the minimum number of observers required within an inter-observer con-touring study in order for a minimal acceptable level of study reliability to be reached (Fotina et al 2012). This is derived from the intraclass correlation coefficient (ICC), and suggests that a minimum value of 0.8 for the ICC is required. Table 8 lists the calculated ICC and corresponding minimum number of observers required for each structure across both trials. It was shown that each trial satisfied this criterion, with the three observers used within the first trial considered sufficient. It should be noted that, due to the initial derivation of ICC requiring knowledge of the number of observers, the derived number of observers is meant only to assess whether the trial’s observer numbers are sufficient to produce reliable results. It does not give the recommended number of
observers required for contouring analysis within the study.No similarity metrics assessing CTV contouring variations correlated significantly with any radiobiological
metric across both trials. As department treatment planning required uniform PTV dose distributions, varia-tions in CTV dose distributions were negligible (tables 5 and 7), suggesting that the PTV margins applied ade-quately accounted for inter-observer CTV contouring variation. Within the initial trial substantial agreement between observer bladder contours was observed (figures 1 and 2), resulting in minimal variations in bladder dosimetry between observer treatment plans. Consequently, the insufficient spread in data prevented significant correlations for bladder being observed. Only when additional observers were included during the second trial were correlations between contouring variation metrics and dosimetry observed.
Figure 11. Significant spearman correlations for PTV with p < 0.000 35 for trial 2. Correlations for PTV were much stronger than those observed in trial 1 (figure 5), ranging from moderate (sensitivity, C-Factor) to strong (volume similarity, specificity).
Phys. Med. Biol. 63 (2018) 035001 (14pp)
Chapter 3. Prostate contouring metric correlations 79

11
D Roach et al
Curiously, additional observers within the second trial resulted in the loss of significance in correlations between contouring and radiobiological metrics for the rectum. A possible explanation could be the wider range of slices contoured by observers when defining the superior portion of the rectum during the second trial. Within the first trial all three observers contoured the rectum on approximately equivalent slices. Consequently, the variations in contouring were more significant within each slice, and hence within regions where higher dose would have been administered. As these correlations were only weak (table 3), they were subsequently masked when larger contouring variations were introduced during the second trial due to the variable number of slices contoured, coinciding with a region receiving less dose.
DSC and 95% Hausdorff distance are commonly quoted contouring similarity metrics within the literature, however in this study these metrics exhibited little or no significant correlation with dosimetry for all structures. An explanation for this is the inability for these metrics to differentiate between observer contours that lie either within or outside the gold standard volume. Figure 4 illustrates this. For this patient, all three observer PTV contours recorded DSC scores greater than 0.9, typically considered as excellent overlap (Zijdenbos et al 1994). Adequate treatment plans for the STAPLE target volumes were simulated based on observer A and B contours. However, due to observer C’s PTV lying entirely within the STAPLE volume, significant regions of the STAPLE PTV received inadequate dose coverage during treatment planning. Consequently, markedly different treat-ment outcomes were simulated between the observer treatment plans, despite nearly identical DSC values being recorded. This is also observed in figures 9 and 10, where the smaller PTV from observer 1 resulted in inadequate coverage of the gold standard PTV. Volume similarity, sensitivity, and specificity possess the ability to differenti-ate between contours lying within or outside the gold standard volume, consequently these similarity metrics correlated with target volume dosimetry.
A concern when utilising volume similarity may be the lack of spatial information this metric provides, such that two hypothetical observer contours could each have equal volume, but share no spatial overlap. However, assuming adequate scan resolution, this hypothetical should never occur between two experienced observers for structures considered in this study. Inspection of the patient datasets found that variations in contouring for rectum, bladder, and CTV were found around the perimeter of the contours, never in the localisation of the structures. Another point of contention within this study was the choice of either STAPLE or majority vote as reference gold standard volumes for each trial. Additional analysis involving multiple gold standard volumes uti-lising the trial 1 dataset produced equivalent correlations to those seen in trial 1 (see supplementary tables 8–11).
Larger PTV volumes compromises dose sparing to nearby OARs, with a statistically significant correlation between PTV volume similarity and rectum NTCP observed in both trials (ρ = 0.33, 0.48), and shown for trial 1 in figure 6. A previous study investigating the impact of CTV and PTV contouring variations on rectum dosim-etry was unable to observe statistically significant correlations (Livsey et al 2004). This discrepancy may be due to their study utilising 3D-CRT treatment plans, opposed to VMAT treatment planning incorporated in this study. VMAT treatment plans generate steeper dose gradients around the target volumes, increasing the sensitivity of target volume dosimetry to inter-observer contouring variations (also shown in figure 10). It is anticipated that future studies investigating SBRT treatment plans, where higher dose fractions are delivered, may yield stronger correlations than were observed in this study.
Within the initial trial observer B consistently contoured significantly larger CTV and PTV volumes, result-ing in this observer’s bias being over-represented during analysis. When investigating the cause of this discrep-ancy, it was found that observer A and C had prior experiences working with one another on prostate delineation projects. Consequently, both observers interpreted and contoured structures in this study in a similar fashion. This illustrates the importance of peer review during contouring for clinical trials, although as of yet no study has investigated the statistical impact of peer review on inter-observer contouring variation (Vinod et al 2016b). Contouring is routinely regarded as one of the highest priorities for peer review during a clinical trial (Brundage et al 2013, Marks et al 2013), with surveys showing up to 59% of observer contours undergo peer review (Hoopes et al 2015). For these reasons, it was decided that a second trial arm should be undertaken, to ensure that the range of contouring variation observed could be assumed to be representative of those found in general clinical practice.
Table 8. ICCs and minimum required number of observers for study reliability.
Trial 1 Trial 2
ICC Observers ICC Observers
CTV 0.9362 3 (2.45) 0.9752 1 (0.54)
PTV 0.9345 3 (2.99) 0.9719 1 (0.66)
Bladder 0.9969 1 (0.03) 0.9979 1 (0.03)
Rectum 0.9345 2 (1.82) 0.9495 1 (0.87)
Phys. Med. Biol. 63 (2018) 035001 (14pp)
Chapter 3. Prostate contouring metric correlations 80

12
D Roach et al
The second trial arm included contours from multiple volunteers across a range of treatment centres. The large number of observers was required for an ongoing study, however included medical physicists and radiogra-phers who lacked experience in contouring. As poor clinical training within this study could produce results not relevant to standard clinical practise, additional analysis utilising only the radiation oncologist and radiothera-pist contours was performed. Adjusted CTV, PTV, bladder and rectum mean volumes (52.38 cc, 135.83 cc, 168.50 cc, 48.98 cc) and DSC (0.8976, 0.9190, 0.9561, 0.8807) across the five patients were comparable to the complete dataset (51.85 cc, 134.92 cc, 168.98 cc, 48.10 cc and 0.8872, 0.9118, 0.9530, 0.8724 respectively). Wilcoxon rank sum testing revealed no significant difference (p < 0.05) between either dataset. Additional analysis of correla-tions using this subset resulted in near equivalent correlations for PTV between volume similarity, sensitivity, specificity, and the C-Factor with multiple radiobiological metrics (supplementary tables 18–21). It can there-fore be concluded that the lack of experience of some observers did not impact the findings of this study.
Additionally, as contouring within the second trial arm was performed on two separate platforms (Eclipse™ and Pinnacle3®), there was potential for bias to be introduced within the study. Analysis of CTV, PTV, blad-der, and rectum volumes and DSC overlap for Eclipse users (52.11 cc, 137.49 cc, 170.91 cc, 47.62 cc and 0.9013, 0.9228, 0.9554, 0.8913 respectively) compared to Pinnacle users (51.60 cc, 132.45 cc, 167.13 cc, 48.56 cc and 0.8737, 0.9013, 0.9507, 0.8543 respectively) revealed slightly improved overlap for CTV, PTV and Rectum from Eclipse users. Wilcoxon rank sum testing confirmed that distribution of DSC values for these structures differed significantly (p < 0.05) between the two treatment planning systems. While this confirmed a bias in spatial over-lap dependent on treatment planning system (and consequently, treatment centre), additional analysis where either only Pinnacle or Eclipse observer contours were investigated again revealed identical correlations between contouring and radiobiological metrics that were statistically significant. Consequently, this bias was deemed by the authors not to be impactful to the studies aims.
Treatment plan generation was another potential study limitation, as poor quality treatment planning could mask the impact inter-observer contouring variability has on dosimetry. By utilising the Autoplanning mod-ule within Pinnacle3®, and having treatment plans subsequently assessed by an experienced radiation therapist, treatment plans of similar quality satisfying department planning protocol were ensured across all observer con-tour sets.
Finally, it should be noted that a key difference between the two trial arms was the difference in scans used by observers for contouring. Trial 1 required contouring on T2-weighted MR scans, that were subsequently regis-tered and fused to planning CT, while trial 2 required contouring to be performed directly on CT. However, as gold standard volumes were constructed from observer contours, differences in CTV and PTV volume typically observed between CT and MR scans in prostate contouring studies (Debois et al 1999) would be reflected in dif-ferences in gold standard volumes between the trials. As the study was investigating differences between observer contours with respect to these gold standard volumes, the impact of differing CTV and PTV volumes between the trials were compensated for during the analysis. Additionally, figures 2 and 6 reveal the spread in DSC across all structures for both trials, where similar trends were observed. These DSC values lie within the range typically seen within clinical trials (Sharp et al 2014), consequently the different imaging modality used by each trial was again felt not to be impactful to the study.
It is important to consider the clinical impact, and not just effect on dosimetry, that inter-observer contour-ing variations are responsible for. Incorrect contouring has been shown to be a significant cause of poor quality radiotherapy delivered in both pancreatic (Abrams et al 2012) and head and neck cancer trials (Peters et al 2010). With the latter it was found that poor quality treatment plans, from which 25% were attributed to poor qual-ity contouring, were responsible for up to 20% reduction in both locoregional failure-free control and overall patient survival. Additional meta-analyses of clinical trials across multiple treatment sites concluded that radi-otherapy protocol deviations were associated with both reduced treatment efficacy and patient survival rates (Weber et al 2012, Ohri et al 2013). In each meta-analysis, poor quality contouring was again concluded to be a significant factor for protocol deviations.
Additionally, the use of large rectangular treatment fields for prostate radiotherapy resulted in fewer clinical failures compared to the tightly conformal fields used in intensity-modulated radiotherapy and VMAT (Heems-bergen et al 2013). It was concluded that increased dose delivered to regions just outside the defined prostate, where subclinical spread of disease could be present, were partly responsible for this increase in treatment effi-cacy. Consequently, the accuracy of contouring is paramount in ensuring adequate dose coverage across the entire treatment volume for radiotherapy, and an assessment of accuracy based on treatment efficacy is required to relate contouring variations with clinical relevancy. Thus, this study is not just of interest dosimetrically, but has direct clinical relevance in improving the largest source of uncertainty in radiation treatment (Weiss and Hess 2003).
As well as inter-observer contouring studies, contouring similarity metrics are routinely utilised during atlas development and validation (Acosta et al 2014). Automatically contoured structures generated by an atlas for a query patient must be assessed for accuracy and precision, which usually occurs using the clinician’s original contour and commonly utilised similarity metrics DSC and Hausdorff distance. A recent proof of concept study
Phys. Med. Biol. 63 (2018) 035001 (14pp)
Chapter 3. Prostate contouring metric correlations 81
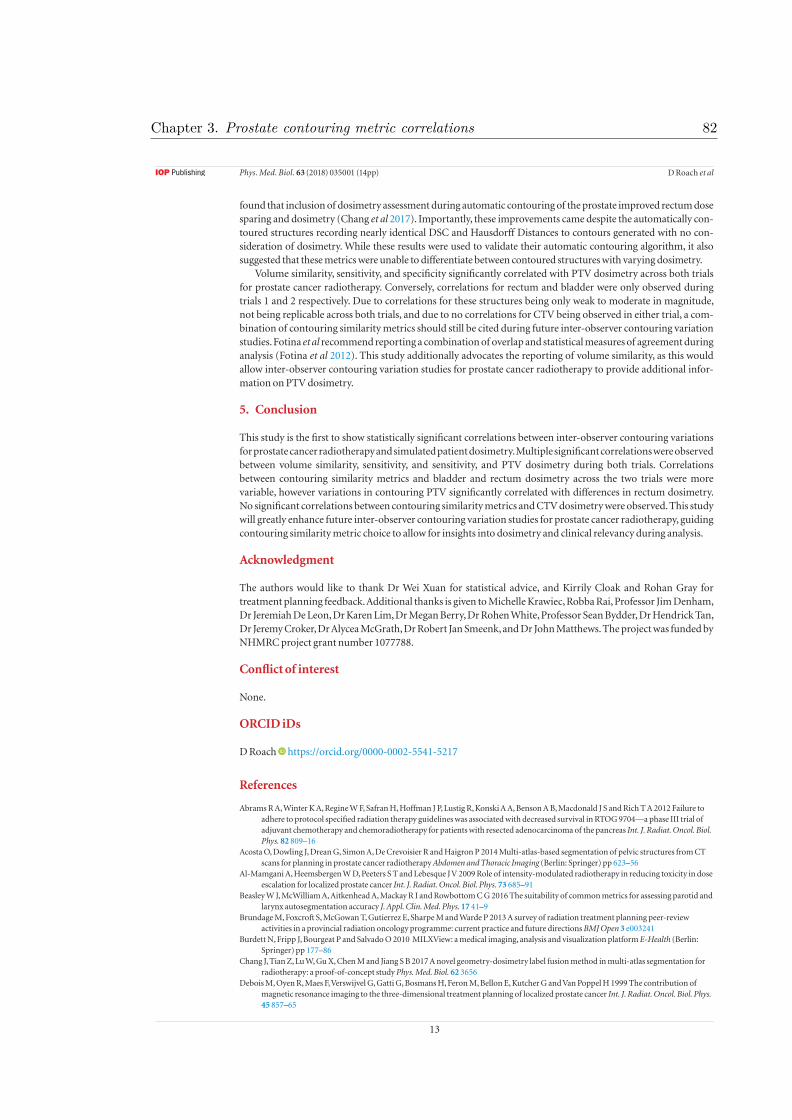
13
D Roach et al
found that inclusion of dosimetry assessment during automatic contouring of the prostate improved rectum dose sparing and dosimetry (Chang et al 2017). Importantly, these improvements came despite the automatically con-toured structures recording nearly identical DSC and Hausdorff Distances to contours generated with no con-sideration of dosimetry. While these results were used to validate their automatic contouring algorithm, it also suggested that these metrics were unable to differentiate between contoured structures with varying dosimetry.
Volume similarity, sensitivity, and specificity significantly correlated with PTV dosimetry across both trials for prostate cancer radiotherapy. Conversely, correlations for rectum and bladder were only observed during trials 1 and 2 respectively. Due to correlations for these structures being only weak to moderate in magnitude, not being replicable across both trials, and due to no correlations for CTV being observed in either trial, a com-bination of contouring similarity metrics should still be cited during future inter-observer contouring variation studies. Fotina et al recommend reporting a combination of overlap and statistical measures of agreement during analysis (Fotina et al 2012). This study additionally advocates the reporting of volume similarity, as this would allow inter-observer contouring variation studies for prostate cancer radiotherapy to provide additional infor-mation on PTV dosimetry.
5. Conclusion
This study is the first to show statistically significant correlations between inter-observer contouring variations for prostate cancer radiotherapy and simulated patient dosimetry. Multiple significant correlations were observed between volume similarity, sensitivity, and sensitivity, and PTV dosimetry during both trials. Correlations between contouring similarity metrics and bladder and rectum dosimetry across the two trials were more variable, however variations in contouring PTV significantly correlated with differences in rectum dosimetry. No significant correlations between contouring similarity metrics and CTV dosimetry were observed. This study will greatly enhance future inter-observer contouring variation studies for prostate cancer radiotherapy, guiding contouring similarity metric choice to allow for insights into dosimetry and clinical relevancy during analysis.
Acknowledgment
The authors would like to thank Dr Wei Xuan for statistical advice, and Kirrily Cloak and Rohan Gray for treatment planning feedback. Additional thanks is given to Michelle Krawiec, Robba Rai, Professor Jim Denham, Dr Jeremiah De Leon, Dr Karen Lim, Dr Megan Berry, Dr Rohen White, Professor Sean Bydder, Dr Hendrick Tan, Dr Jeremy Croker, Dr Alycea McGrath, Dr Robert Jan Smeenk, and Dr John Matthews. The project was funded by NHMRC project grant number 1077788.
Conflict of interest
None.
ORCID iDs
D Roach https://orcid.org/0000-0002-5541-5217
References
Abrams R A, Winter K A, Regine W F, Safran H, Hoffman J P, Lustig R, Konski A A, Benson A B, Macdonald J S and Rich T A 2012 Failure to adhere to protocol specified radiation therapy guidelines was associated with decreased survival in RTOG 9704—a phase III trial of adjuvant chemotherapy and chemoradiotherapy for patients with resected adenocarcinoma of the pancreas Int. J. Radiat. Oncol. Biol. Phys. 82 809–16
Acosta O, Dowling J, Drean G, Simon A, De Crevoisier R and Haigron P 2014 Multi-atlas-based segmentation of pelvic structures from CT scans for planning in prostate cancer radiotherapy Abdomen and Thoracic Imaging (Berlin: Springer) pp 623–56
Al-Mamgani A, Heemsbergen W D, Peeters S T and Lebesque J V 2009 Role of intensity-modulated radiotherapy in reducing toxicity in dose escalation for localized prostate cancer Int. J. Radiat. Oncol. Biol. Phys. 73 685–91
Beasley W J, McWilliam A, Aitkenhead A, Mackay R I and Rowbottom C G 2016 The suitability of common metrics for assessing parotid and larynx autosegmentation accuracy J. Appl. Clin. Med. Phys. 17 41–9
Brundage M, Foxcroft S, McGowan T, Gutierrez E, Sharpe M and Warde P 2013 A survey of radiation treatment planning peer-review activities in a provincial radiation oncology programme: current practice and future directions BMJ Open 3 e003241
Burdett N, Fripp J, Bourgeat P and Salvado O 2010 MILXView: a medical imaging, analysis and visualization platform E-Health (Berlin: Springer) pp 177–86
Chang J, Tian Z, Lu W, Gu X, Chen M and Jiang S B 2017 A novel geometry-dosimetry label fusion method in multi-atlas segmentation for radiotherapy: a proof-of-concept study Phys. Med. Biol. 62 3656
Debois M, Oyen R, Maes F, Verswijvel G, Gatti G, Bosmans H, Feron M, Bellon E, Kutcher G and Van Poppel H 1999 The contribution of magnetic resonance imaging to the three-dimensional treatment planning of localized prostate cancer Int. J. Radiat. Oncol. Biol. Phys. 45 857–65
Phys. Med. Biol. 63 (2018) 035001 (14pp)
Chapter 3. Prostate contouring metric correlations 82

14
D Roach et al
Dowling J A, Sun J, Pichler P, Rivest-Hénault D, Ghose S, Richardson H, Wratten C, Martin J, Arm J and Best L 2015 Automatic substitute computed tomography generation and contouring for magnetic resonance imaging (MRI)-alone external beam radiation therapy from standard mri sequences Int. J. Radiat. Oncol. Biol. Phys. 93 1144–53
Dubois D F, Prestidge B R, Hotchkiss L A, Prete J J and Bice W S Jr 1998 Intraobserver and interobserver variability of MR imaging-and CT-derived prostate volumes after transperineal interstitial permanent prostate brachytherapy Radiology 207 785–9
Foppiano F, Fiorino C, Frezza G, Greco C, Valdagni R and AIRO National Working Group on Prostate Radiotherapy 2003 The impact of contouring uncertainty on rectal 3D dose–volume data: results of a dummy run in a multicenter trial (AIROPROS01–02) Int. J. Radiat. Oncol. Biol. Phys. 57 573–9
Fotina I, Lütgendorf-Caucig C, Stock M, Pötter R and Georg D 2012 Critical discussion of evaluation parameters for inter-observer variability in target definition for radiation therapy Strahlenther. Onkol. 188 160–7
Frey B J and Dueck D 2007 Clustering by passing messages between data points Science 315 972–6Gao Z, Wilkins D, Eapen L, Morash C, Wassef Y and Gerig L 2007 A study of prostate delineation referenced against a gold standard created
from the visible human data Radiother. Oncol. 85 239–46Heemsbergen W D, Al-Mamgani A, Witte M G, van Herk M and Lebesque J V 2013 Radiotherapy with rectangular fields is associated with
fewer clinical failures than conformal fields in the high-risk prostate cancer subgroup: results from a randomized trial Radiother. Oncol. 107 134–9
Hinkle D E, Wiersma W and Jurs S G 2003 Applied Statistics for the Behavioral Sciences (Boston, MA: Houghton Mifflin)Holloway L C, Miller J-A, Kumar S, Whelan B M and Vinod S K 2012 Comp plan: a computer program to generate dose and radiobiological
metrics from dose-volume histogram files Med. Dosim. 37 305–9Hoopes D J, Johnstone P A, Chapin P S, Kabban C M S, Lee W R, Chen A B, Fraass B A, Skinner W J and Marks L B 2015 Practice patterns for
peer review in radiation oncology Pract. Radiat. Oncol. 5 32–8Hodapp N 2012 The ICRU Report 83: prescribing, recording, and reporting photon-beam intensity-modulated radiation therapy (IMRT)
Strahlenther. Onkol. 188 97–99Jameson M G, Holloway L C, Vial P J, Vinod S K and Metcalfe P E 2010 A review of methods of analysis in contouring studies for radiation
oncology J. Med. Imaging Radiat. Oncol. 54 401–10Jameson M G, Kumar S, Vinod S K, Metcalfe P E and Holloway L C 2014 Correlation of contouring variation with modeled outcome for
conformal non-small cell lung cancer radiotherapy Radiother. Oncol. 112 332–6Kennedy A M, Dowling J A, Ghose S, Rivest-Hénault D and Ebert M A 2016 Cluster Based selection of CT exemplars from a clinical dataset
for inter-patient registration and dose mapping. Poster Int. Conf. on the use of Computers in Radiation Therapy (London)Khoo E L, Schick K, Plank A W, Poulsen M, Wong W W, Middleton M and Martin J M 2012 Prostate contouring variation: can it be fixed?
Int. J. Radiat. Oncol. Biol. Phys. 82 1923–9Livsey J E, Wylie J P, Swindell R, Khoo V S, Cowan R A and Logue J P 2004 Do differences in target volume definition in prostate cancer lead
to clinically relevant differences in normal tissue toxicity? Int. J. Radiat. Oncol. Biol. Phys. 60 1076–81Marks L B, Adams R D, Pawlicki T, Blumberg A L, Hoopes D, Brundage M D and Fraass B A 2013 Enhancing the role of case-oriented peer
review to improve quality and safety in radiation oncology: executive summary Pract. Radiat. Oncol. 3 149–56Mitchell D M, Perry L, Smith S, Elliott T, Wylie J P, Cowan R A, Livsey J E and Logue J P 2009 Assessing the effect of a contouring protocol on
postprostatectomy radiotherapy clinical target volumes and interphysician variation Int. J. Radiat. Oncol. Biol. Phys. 75 990–3Ohri N, Shen X, Dicker A P, Doyle L A, Harrison A S and Showalter T N 2013 Radiotherapy protocol deviations and clinical outcomes: a
meta-analysis of cooperative group clinical trials J. Natl Cancer Inst. 105 387–93Ost P, De Meerleer G, Vercauteren T, De Gersem W, Veldeman L, Vandecasteele K, Fonteyne V and Villeirs G 2011 Delineation of the
postprostatectomy prostate bed using computed tomography: interobserver variability following the EORTC delineation guidelines Int. J. Radiat. Oncol. Biol. Phys. 81 e143–9
Palma D, Vollans E, James K, Nakano S, Moiseenko V, Shaffer R, McKenzie M, Morris J and Otto K 2008 Volumetric modulated arc therapy for delivery of prostate radiotherapy: comparison with intensity-modulated radiotherapy and three-dimensional conformal radiotherapy Int. J. Radiat. Oncol. Biol. Phys. 72 996–1001
Perna L, Cozzarini C, Maggiulli E, Fellin G, Rancati T, Valdagni R, Vavassori V, Villa S and Fiorino C 2011 Inter-observer variability in contouring the penile bulb on CT images for prostate cancer treatment planning Radiat. Oncol. 6 1
Peters L J, O’Sullivan B, Giralt J, Fitzgerald T J, Trotti A, Bernier J, Bourhis J, Yuen K, Fisher R and Rischin D 2010 Critical impact of radiotherapy protocol compliance and quality in the treatment of advanced head and neck cancer: results from TROG 02.02 J. Clin. Oncol. 28 2996–3001
Popovic A, de la Fuente M, Engelhardt M and Radermacher K 2007 Statistical validation metric for accuracy assessment in medical image segmentation Int. J. Comput. Assist. Radiol. Surg. 2 169–81
Quan E M, Li X, Li Y, Wang X, Kudchadker R J, Johnson J L, Kuban D A, Lee A K and Zhang X 2012 A comprehensive comparison of IMRT and VMAT plan quality for prostate cancer treatment Int. J. Radiat. Oncol. Biol. Phys. 83 1169–78
Rasch C, Barillot I, Remeijer P, Touw A, van Herk M and Lebesque J V 1999 Definition of the prostate in CT and MRI: a multi-observer study Int. J. Radiat. Oncol. Biol. Phys. 43 57–66
Sharp G, Fritscher K D, Pekar V, Peroni M, Shusharina N, Veeraraghavan H and Yang J 2014 Vision 20/20: perspectives on automated image segmentation for radiotherapy Med. Phys. 41 050902
Trans-Tasman Radiation Oncology Group (TROG) 2005 RADAR trial—randomised androgen deprivation and radiotherapy (https://clinicaltrials.gov/ct2/show/study/NCT00193856)
Van Dyk J, Batista J and Bauman G S 2013 Accuracy and uncertainty considerations in modern radiation oncology Mod. Technol. Radiat. Oncol. 3 361–412
Vinod S K, Jameson M G, Min M and Holloway L C 2016a Uncertainties in volume delineation in radiation oncology: a systematic review and recommendations for future studies Radiother. Oncol. 121 169–79
Vinod S K, Min M, Jameson M G and Holloway L C 2016b A review of interventions to reduce inter-observer variability in volume delineation in radiation oncology J. Med. Imaging Radiat. Oncol. 60 393–406
Warfield S K, Zou K H and Wells W M 2004 Simultaneous truth and performance level estimation (STAPLE): an algorithm for the validation of image segmentation IEEE Trans. Med. Imaging 23 903–21
Weber D C, Tomsej M, Melidis C and Hurkmans C W 2012 QA makes a clinical trial stronger: evidence-based medicine in radiation therapy Radiother. Oncol. 105 4–8
Weiss E and Hess C F 2003 The impact of gross tumor volume (GTV) and clinical target volume (CTV) definition on the total accuracy in radiotherapy Strahlenther. Onkol. 179 21–30
Zijdenbos A P, Dawant B M, Margolin R and Palmer A C 1994 Morphometric analysis of white matter lesions in MR images: method and validation IEEE Trans. Med. Imaging 13 716–24
Phys. Med. Biol. 63 (2018) 035001 (14pp)
Chapter 3. Prostate contouring metric correlations 83

Table 1: Department prostate treatment planning protocol
Patient Name: Definitive Prostate +/- SV: 78Gy to D95
Structure Contour Name Constraint Per-Protocol Minor Variation Major Variation PTV78 PTV_78 D95 > 78 Gy (100%) 76.2 - 78 Gy (98-100%) < 76.2 Gy (98%)
PTV78 PTV_78 D50 78 – 81.5 Gy 81.5 - 82.0 Gy > 82 Gy
PTV78 PTV_78 D2 < 81.9 Gy (105%) 81.9 - 83.5Gy (105-107%) > 83.5Gy (107%)
CTV78 CTV_78 D99 > 78Gy (100%) 76.2 - 78Gy (98-100%) < 76.2 Gy (98%)
ANT PROSTATE CTV_ANTPROST Aim D90 ≥ 79Gy > 79 Gy 78.5 - 79 Gy < 78.5 Gy
SV CTV_SV Aim D90 ≥ 78.5Gy > 78.5 Gy 78 - 78.5 Gy < 78 Gy
Dmax - Dmax < 83.5 Gy (107%) 83.5 - 85.8Gy (107-110%) > 85.8 Gy (110%)
Dmax - Dmax location In CTV In PTV-CTV Outside PTV
Rectum RECTUM V40 < 50% 50 - 60% > 60%
Rectum RECTUM V50 < 40% 40 - 50% > 50%
Rectum RECTUM V60 < 30% 30 - 35% > 35%
Rectum RECTUM V65 < 20% 20 - 25% > 25%
Rectum RECTUM V70 < 10% 10 - 20% > 20%
Rectum RECTUM V75 < 5% 5 - 10% > 10%
Rectum PRV RECT_78_03_NS V80 < 1 cc must be less than 1cc > 1 cc
Rectum in PTV RECT_IN_PTV V79 < 1 cc 1 - 2 cc > 2 cc
Rectum outside PTV RECT-PTV V78 < 1 cc 1 - 2 cc > 2 cc
Rectum RECTUM Post Wall Max Dose < 39Gy 39 - 45Gy > 45Gy
Chapter 3. Prostate contouring metric correlations 84
3.1 Supplementary Material A

Rectum RECTUM Slices 50% crosses PRW 0 slices 1 - 5 slices > 5 slices
Urethra PRV URETHRA_PRV V82 < 0.1 cc 0.1 - 1cc > 1cc
Bladder BLADDER V50 < 40% 40 - 50% > 50%
Bladder BLADDER V60 < 30% 30 - 40% > 40%
Fem Heads FEMUR_L / R V40 < 10% 10 - 20% > 20%
Periph Tissue P_TISSUE V50 beyond PTV + 3.5cm < 1cc 1 - 2 cc > 2cc
Chapter 3. Prostate contouring metric correlations 85

Observer CTV PTV Bladder Rectum
A Mean 0.96 0.97 0.98 0.91
SD 0.03 0.02 0.01 0.04
COV 0.03 0.02 0.01 0.05
B Mean 0.87 0.90 0.97 0.87
SD 0.08 0.06 0.01 0.07
COV 0.09 0.06 0.01 0.08
C Mean 0.96 0.97 0.98 0.94
SD 0.04 0.02 0.01 0.03
COV 0.04 0.02 0.01 0.03
Table 2: Trial 1 DSC statistics
Observer CTV PTV Bladder Rectum
A Mean (voxels) 2.64 2.87 2.03 8.99
SD (voxels) 1.42 1.67 1.21 5.64
COV 0.54 0.58 0.59 0.63
B Mean (voxels) 5.24 5.35 2.31 7.78
SD (voxels) 2.29 2.27 0.74 4.15
COV 0.44 0.43 0.32 0.53
C Mean (voxels) 2.32 2.31 2.15 6.57
SD (voxels) 1.14 1.16 1.03 6.66
COV 0.49 0.50 0.48 1.01
Table 3: Trial 1 95% Hausdorff Statistics
Chapter 3. Prostate contouring metric correlations 86

Table 4: Bladder contouring similarity and radiobiological metric correlations, Trial 1: STAPLE gold standard
Table 5: Rectum contouring similarity and radiobiological metric correlations, Trial 1: STAPLE gold standard
NTCPlkb EUD mean max iso40 iso50 iso55 iso60 iso65 iso70 iso80 iso85 iso90 DX10 DX25 DX50
DSC -0.1874 -0.2629 -0.2766 0.0382 -0.2516 -0.2541 -0.2747 -0.2414 -0.2528 -0.2464 -0.2656 -0.2575 -0.2276 -0.3123 -0.3135 -0.2401
VOLSIM -0.1007 -0.1528 -0.1381 0.0311 -0.1492 -0.1833 -0.1761 -0.1404 -0.1379 -0.1664 -0.1535 -0.1355 -0.1316 -0.2142 -0.1115 -0.0740
SENS 0.0476 0.0655 0.0454 0.0232 0.0629 0.0797 0.0646 0.0545 0.0536 0.0870 0.0521 0.0425 0.0518 0.0799 -0.0055 -0.0001
SPEC -0.0883 -0.2139 -0.1906 0.1474 -0.1750 -0.2171 -0.2156 -0.2057 -0.2174 -0.2423 -0.2319 -0.2164 -0.2120 -0.3106 -0.1749 -0.1043
MASD 0.1236 0.2156 0.2085 -0.1226 0.1804 0.1903 0.2081 0.2029 0.2248 0.2263 0.2428 0.2376 0.2183 0.2889 0.2508 0.1421
HAUS95 0.1511 0.1333 0.1409 -0.1972 0.1174 0.1172 0.1315 0.1214 0.1329 0.1331 0.1415 0.1422 0.1320 0.1870 0.1544 0.0981
CENTROID_DIST_EUC 0.0911 0.0540 0.0412 -0.2191 0.0056 0.0394 0.0433 0.0200 0.0342 0.0420 0.0676 0.0640 0.0396 0.1109 0.0718 0.0393
CENTROID_DIST_X -0.0107 -0.1009 -0.0658 0.0098 -0.0474 -0.0751 -0.0623 -0.0659 -0.0672 -0.0534 -0.0590 -0.0547 -0.0478 -0.0903 -0.1012 0.0091
CENTROID_DIST_Y 0.0813 -0.0802 -0.0299 0.0178 -0.0028 -0.0258 -0.0350 -0.0652 -0.0605 -0.0524 -0.0894 -0.0785 -0.0667 -0.0362 -0.0422 -0.0006
CENTROID_DIST_Z 0.1466 0.3310 0.2905 -0.1059 0.2589 0.2694 0.2804 0.2812 0.2688 0.2665 0.3017 0.2903 0.2591 0.2951 0.3369 0.2686
aRVD 0.0765 0.0686 0.0987 0.0014 0.0985 0.0651 0.0626 0.0612 0.0764 0.0690 0.0633 0.0564 0.0474 0.0767 0.1761 0.1139
C 0.0483 0.0665 0.0462 0.0239 0.0641 0.0805 0.0655 0.0553 0.0544 0.0877 0.0529 0.0436 0.0527 0.0806 -0.0054 0.0005
NTCPlkb EUD mean max iso35 iso40 iso50 iso55 iso60 iso65 iso70 iso80 iso85 iso90 DX25 DX50
DSC -0.1733 -0.2920 -0.3080 0.0138 -0.3259 -0.3606 -0.3755 -0.3552 -0.3714 -0.3558 -0.3504 -0.3327 -0.2943 -0.2439 -0.3065 -0.2588
VOLSIM 0.3071 0.4378 0.4530 -0.1911 0.4689 0.5123 0.5168 0.5233 0.4997 0.4844 0.4835 0.4632 0.4538 0.4093 0.5008 0.3711
SENS -0.2737 -0.4192 -0.4220 0.1282 -0.4438 -0.4909 -0.5036 -0.5015 -0.4929 -0.4735 -0.4780 -0.4546 -0.4354 -0.3839 -0.4473 -0.3299
SPEC 0.3343 0.4073 0.4420 -0.1663 0.3997 0.4298 0.4350 0.4294 0.4219 0.3941 0.4116 0.3844 0.4016 0.3881 0.4193 0.3495
MASD 0.0669 0.1754 0.2296 0.0418 0.2953 0.3143 0.3094 0.2721 0.2848 0.2614 0.2502 0.2224 0.1777 0.1291 0.2123 0.2359
HAUS95 -0.0674 0.0003 0.0566 0.0558 0.1620 0.1652 0.1356 0.0928 0.1005 0.0739 0.0637 0.0328 -0.0123 -0.0580 0.0357 0.0972
CENTROID_DIST_EUC 0.0319 0.1016 0.1250 0.0335 0.1983 0.2095 0.2032 0.1816 0.1896 0.1704 0.1619 0.1451 0.0984 0.0531 0.1306 0.1141
CENTROID_DIST_X 0.0434 0.0945 0.0523 0.0782 0.1432 0.1739 0.1553 0.1534 0.1308 0.1350 0.1128 0.0920 0.0722 0.0846 0.1067 0.0333
CENTROID_DIST_Y -0.0144 -0.1660 -0.3253 0.1793 -0.2284 -0.2414 -0.2816 -0.2903 -0.2671 -0.2658 -0.2662 -0.2361 -0.2011 -0.1157 -0.1978 -0.3115
CENTROID_DIST_Z 0.1473 0.0205 -0.2361 0.1559 -0.1233 -0.1167 -0.1473 -0.1390 -0.1392 -0.1381 -0.1426 -0.1196 -0.0869 0.0224 -0.1102 -0.2577
aRVD 0.2584 0.3835 0.4626 -0.0233 0.4092 0.4392 0.4658 0.4459 0.4610 0.4478 0.4366 0.4223 0.3932 0.3360 0.3886 0.4356
C -0.2730 -0.4185 -0.4221 0.1282 -0.4442 -0.4913 -0.5036 -0.5014 -0.4926 -0.4731 -0.4775 -0.4539 -0.4347 -0.3830 -0.4469 -0.3301
p > 0.00026
p < 0.00026
Chapter
3.Prostate
contouringmetric
correlations87

TCPpossionLQ TCPlogit EUD min mean max iso90 iso95 iso100 DX90 DX95 dosehomo
DSC 0.0565 0.0734 0.0705 0.0597 0.0677 0.0271 0.0500 -0.0138 0.0788 0.0821 0.0771 -0.1094
VOLSIM 0.0438 0.0400 0.0453 0.0378 0.0397 0.0463 0.0611 0.0723 -0.0116 0.0511 0.0643 0.0656
SENS -0.0335 -0.0229 -0.0287 -0.0442 -0.0249 -0.0565 0.0241 -0.0475 0.0278 -0.0312 -0.0389 -0.0603
SPEC 0.0013 -0.0104 -0.0054 0.0386 -0.0116 -0.0292 0.0266 0.1267 0.0032 0.0217 0.0690 0.0023
MASD -0.0312 -0.0393 -0.0372 -0.0906 -0.0324 0.0143 -0.0305 -0.0109 -0.0699 -0.0656 -0.0693 0.1661
HAUS95 -0.0420 -0.0403 -0.0394 -0.0983 -0.0314 0.0771 -0.0350 -0.0139 -0.0816 -0.0819 -0.0664 0.2104
CENTROID_DIST_EUC -0.0381 -0.0187 -0.0188 -0.0346 -0.0121 0.0151 -0.0979 -0.0236 -0.0723 -0.0714 -0.0839 0.1696
CENTROID_DIST_X -0.0072 -0.0227 -0.0116 0.0248 -0.0247 -0.0329 0.0944 0.1276 -0.0121 -0.0382 0.0152 0.0640
CENTROID_DIST_Y 0.2182 0.2055 0.2080 -0.0303 0.2013 0.1003 0.0791 -0.0127 0.1922 0.1473 0.1523 -0.0665
CENTROID_DIST_Z 0.1702 0.2025 0.2061 -0.0455 0.2053 0.0289 0.1777 0.0169 -0.0878 0.1196 0.0452 0.1753
aRVD -0.0534 -0.0661 -0.0642 -0.0400 -0.0602 -0.0556 -0.0128 0.0644 -0.0641 -0.0806 -0.0721 0.1333
C -0.0320 -0.0217 -0.0274 -0.0429 -0.0237 -0.0564 0.0241 -0.0460 0.0292 -0.0297 -0.0375 -0.0611
p > 0.00035
p < 0.00035
Table 6: CTV contouring similarity and radiobiological metric correlations, Trial 1: STAPLE gold standard
TCPpossionLQ TCPlogit EUD min mean max iso90 iso95 iso100 DX90 DX95 dosehomo
DSC -0.0419 0.1080 0.1060 -0.1994 0.1185 0.0545 0.0222 0.0380 0.0518 0.0581 0.1239 -0.0903
VOLSIM 0.5741 0.3876 0.4329 0.6722 0.3107 0.0010 0.4750 0.5162 0.5449 0.5086 0.5211 -0.5202
SENS -0.4930 -0.2978 -0.3347 -0.6115 -0.2353 -0.0063 -0.4097 -0.4179 -0.4483 -0.4106 -0.4230 0.4301
SPEC 0.5395 0.3227 0.3657 0.6404 0.2485 -0.0578 0.4125 0.4697 0.4956 0.4500 0.5115 -0.5266
MASD 0.0594 -0.0867 -0.0894 0.2137 -0.0962 -0.0441 -0.0007 -0.0239 -0.0249 -0.0316 -0.1042 0.0756
HAUS95 -0.0202 -0.1194 -0.1304 0.1191 -0.1178 0.0044 -0.0990 -0.1108 -0.0749 -0.0513 -0.1720 0.1600
CENTROID_DIST_EUC -0.0045 -0.0586 -0.0687 0.1047 -0.0553 0.0253 -0.0205 -0.0748 -0.0290 -0.0321 -0.1172 0.1144
CENTROID_DIST_X 0.3293 0.1664 0.2117 0.4527 0.1132 0.0048 0.3616 0.3670 0.2405 0.2132 0.2529 -0.2182
CENTROID_DIST_Y 0.0777 0.0828 0.1112 0.0551 0.0701 0.0895 0.1171 0.0908 -0.0081 0.0224 0.0479 0.0005
CENTROID_DIST_Z 0.0503 0.1591 0.1392 0.1248 0.1658 0.0052 0.0392 0.0128 0.0922 0.1366 0.0500 0.0066
aRVD 0.0411 -0.1051 -0.0989 0.2103 -0.1186 -0.1060 -0.0455 -0.0437 -0.0671 -0.0735 -0.1429 0.1054
C -0.4920 -0.2967 -0.3339 -0.6105 -0.2342 -0.0053 -0.4093 -0.4174 -0.4479 -0.4099 -0.4223 0.4303
Table 7: PTV contouring similarity and radiobiological metric correlations, Trial 1: STAPLE gold standard
Chapter
3.Prostate
contouringmetric
correlations88

To see whether the choice of STAPLE as a gold standard reference volume impacted the results of the study, additional reference volumes were
investigated. Each set of observer contours were iteratively designated as the gold standard volume, and contouring similarity and radiobiological metrics
for the remaining observer contours were derived in an analogous manner to those in the paper. Significant correlations are shown in Tables 8 - 11, where
once again Volume Similarity, Sensitivity, and Specificity displayed the strongest correlations with multiple radiobiological metrics. This suggests that the
choice of gold standard did not affect the observed correlations within this study.
Chapter 3. Prostate contouring metric correlations 89

NTCPlkb EUD mean max iso40 iso50 iso55 iso60 iso65 iso70 iso80 iso85 iso90 DX10 DX25 DX50
DSC -0.0166 0.0029 -0.0002 0.0212 -0.0007 -0.0002 -0.0014 -0.0007 -0.0002 0.0010 0.0010 0.0013 0.0006 0.0019 -0.0022 -0.0008
VOLSIM -0.1103 -0.2538 -0.2297 -0.0210 -0.2316 -0.2454 -0.2501 -0.2446 -0.2410 -0.2465 -0.2445 -0.2411 -0.2390 -0.2734 -0.2206 -0.1359
SENS 0.1022 0.2274 0.2067 0.0114 0.2065 0.2170 0.2212 0.2173 0.2154 0.2216 0.2194 0.2167 0.2131 0.2492 0.1927 0.1229
SPEC -0.1174 -0.2091 -0.1839 -0.0167 -0.1820 -0.1915 -0.1958 -0.1945 -0.1926 -0.1971 -0.1973 -0.1959 -0.1935 -0.2368 -0.1815 -0.1115
MASD 0.0295 -0.0020 -0.0010 -0.0238 -0.0018 -0.0025 -0.0018 -0.0013 -0.0022 -0.0026 -0.0013 -0.0004 -0.0008 0.0015 0.0007 0.0015
HAUS95 0.0551 0.0039 -0.0007 -0.0069 -0.0026 -0.0020 -0.0031 -0.0024 -0.0036 -0.0036 -0.0005 -0.0002 -0.0014 0.0051 -0.0048 0.0011
CENTROID_DIST_EUC 0.0439 -0.0010 0.0014 0.0097 0.0001 -0.0010 -0.0003 0.0005 -0.0001 -0.0001 0.0006 0.0022 0.0016 0.0085 0.0032 0.0026
CENTROID_DIST_X -0.1436 0.0072 -0.0091 0.1412 -0.0019 0.0103 0.0120 0.0095 0.0019 0.0024 0.0172 0.0129 -0.0014 -0.0006 -0.0055 0.0212
CENTROID_DIST_Y 0.0518 -0.0001 -0.0434 0.0924 -0.0436 -0.0226 -0.0227 -0.0278 -0.0263 -0.0194 -0.0049 0.0020 -0.0095 0.0001 -0.0372 -0.0560
CENTROID_DIST_Z 0.1720 0.1979 0.1932 -0.0849 0.1820 0.1672 0.1731 0.1746 0.1645 0.1637 0.1629 0.1617 0.1612 0.1988 0.2284 0.2299
C 0.1023 0.2274 0.2065 0.0118 0.2064 0.2169 0.2211 0.2173 0.2153 0.2216 0.2194 0.2167 0.2131 0.2491 0.1928 0.1226
p > 0.00026
p < 0.00026
Table 8: Bladder contouring similarity and radiobiological metric correlations, Trial 1: observer gold standard
Table 9: Rectum contouring similarity and radiobiological metric correlations, Trial 1: observer gold standard
NTCPlkb EUD mean max iso35 iso40 iso50 iso55 iso60 iso65 iso70 iso80 iso85 iso90 DX25 DX50
DSC -0.0212 -0.0200 -0.0208 -0.0044 -0.0483 -0.0483 -0.0363 -0.0309 -0.0288 -0.0234 -0.0248 -0.0131 -0.0158 -0.0082 -0.0342 -0.0423
VOLSIM 0.3471 0.5045 0.5679 -0.2704 0.5923 0.5937 0.5831 0.5786 0.5699 0.5645 0.5640 0.5453 0.5423 0.4702 0.5757 0.5029
SENS -0.3277 -0.4643 -0.5211 0.2056 -0.5543 -0.5572 -0.5439 -0.5369 -0.5299 -0.5227 -0.5226 -0.5009 -0.4998 -0.4297 -0.5385 -0.4646
SPEC 0.3139 0.4315 0.4712 -0.2539 0.4870 0.4884 0.4903 0.4862 0.4814 0.4789 0.4788 0.4649 0.4617 0.4124 0.4801 0.4191
MASD 0.0182 0.0250 0.0157 0.0130 0.0439 0.0462 0.0347 0.0308 0.0288 0.0243 0.0252 0.0157 0.0186 0.0121 0.0354 0.0480
HAUS95 0.0155 0.0302 0.0195 0.0052 0.0444 0.0494 0.0419 0.0375 0.0364 0.0334 0.0330 0.0254 0.0259 0.0216 0.0456 0.0493
CENTROID_DIST_EUC 0.0086 0.0177 0.0148 0.0088 0.0401 0.0428 0.0339 0.0286 0.0256 0.0222 0.0220 0.0128 0.0159 0.0046 0.0323 0.0323
CENTROID_DIST_X -0.0321 -0.0079 -0.0122 -0.0219 0.0639 0.0694 0.0511 0.0414 0.0158 0.0170 0.0086 -0.0094 -0.0158 0.0306 0.0102 -0.0195
CENTROID_DIST_Y -0.0336 -0.1954 -0.3443 0.0886 -0.3148 -0.3049 -0.3049 -0.3002 -0.2888 -0.2919 -0.2884 -0.2666 -0.2361 -0.1323 -0.2770 -0.3649
CENTROID_DIST_Z 0.0750 -0.0713 -0.2705 0.1075 -0.1937 -0.1837 -0.1941 -0.1875 -0.1964 -0.1951 -0.2024 -0.1887 -0.1620 -0.0539 -0.1893 -0.3273
C -0.3277 -0.4644 -0.5213 0.2054 -0.5545 -0.5574 -0.5441 -0.5371 -0.5300 -0.5228 -0.5228 -0.5010 -0.4999 -0.4297 -0.5387 -0.4648
Chapter
3.Prostate
contouringmetric
correlations90

TCPpossionLQ TCPlogit EUD min mean max iso90 iso95 iso100 DX90 DX95 dosehomo
DSC 0.1715 0.0454 0.0693 0.2690 0.0251 -0.0562 0.3807 0.3310 0.1090 0.0174 0.0670 -0.1263
VOLSIM 0.2097 0.1554 0.1792 0.2966 0.1328 -0.0668 0.5039 0.2998 0.1827 0.1436 0.1892 -0.1134
SENS -0.1870 -0.1371 -0.1589 -0.2557 -0.1160 0.0730 -0.4569 -0.2625 -0.1958 -0.1379 -0.1928 0.1220
SPEC 0.2011 0.1400 0.1615 0.3082 0.1193 -0.0716 0.4927 0.3179 0.1994 0.1432 0.1950 -0.1388
MASD -0.1795 -0.0568 -0.0798 -0.2797 -0.0369 0.0539 -0.4016 -0.3375 -0.1237 -0.0311 -0.0841 0.1389
HAUS95 -0.1865 -0.0639 -0.0865 -0.2920 -0.0431 0.0351 -0.4242 -0.3442 -0.1222 -0.0320 -0.0827 0.1382
CENTROID_DIST_EUC -0.1270 -0.0498 -0.0627 -0.1927 -0.0376 0.0277 -0.2526 -0.2440 -0.1040 -0.0413 -0.0843 0.1381
CENTROID_DIST_X 0.0810 0.0385 0.0517 0.1441 0.0275 -0.1074 0.2647 0.1192 0.1663 0.0709 0.1582 -0.1571
CENTROID_DIST_Y 0.1626 0.1634 0.1669 0.0009 0.1545 0.0242 0.0630 0.0142 0.1662 0.1125 0.1193 -0.0404
CENTROID_DIST_Z 0.2444 0.2009 0.2199 0.0555 0.1848 -0.0194 0.3224 0.1187 0.1379 0.2293 0.2072 0.0514
C -0.1863 -0.1367 -0.1585 -0.2552 -0.1157 0.0733 -0.4558 -0.2618 -0.1956 -0.1377 -0.1928 0.1222
p > 0.00035
p < 0.00035
Table 10: CTV contouring similarity and radiobiological metric correlations, Trial 1: observer gold standard
TCPpossionLQ TCPlogit EUD min mean max iso90 iso95 iso100 DX90 DX95 dosehomo
DSC 0.2254 0.3338 0.3063 0.1789 0.3525 0.0264 0.3231 0.3933 0.3015 0.3156 0.3707 -0.3640
VOLSIM 0.7649 0.7475 0.7621 0.8065 0.6840 0.0094 0.7822 0.7509 0.7716 0.7701 0.7621 -0.7420
SENS -0.6865 -0.6594 -0.6738 -0.7323 -0.5992 0.0342 -0.6969 -0.6595 -0.7008 -0.6915 -0.6727 0.6596
SPEC 0.8216 0.7644 0.7906 0.8380 0.6841 -0.0248 0.8340 0.7990 0.7818 0.7772 0.8019 -0.7834
MASD -0.2335 -0.3241 -0.3014 -0.1895 -0.3397 -0.0293 -0.3231 -0.3919 -0.2884 -0.2989 -0.3614 0.3575
HAUS95 -0.2470 -0.3051 -0.2937 -0.2062 -0.3144 -0.0298 -0.3264 -0.3812 -0.2820 -0.2948 -0.3636 0.3625
CENTROID_DIST_EUC -0.2736 -0.2776 -0.2740 -0.2161 -0.2710 -0.0336 -0.3387 -0.3609 -0.2607 -0.2669 -0.3524 0.3458
CENTROID_DIST_X 0.4876 0.4089 0.4382 0.4866 0.3412 -0.0339 0.5020 0.4590 0.4081 0.4134 0.4533 -0.4376
CENTROID_DIST_Y 0.0029 -0.0445 -0.0275 0.0316 -0.0577 0.0185 0.0085 -0.0323 -0.0845 -0.0769 -0.0225 0.0249
CENTROID_DIST_Z 0.2478 0.3095 0.3055 0.3175 0.3010 -0.0030 0.2888 0.2613 0.3154 0.3335 0.2899 -0.3003
C -0.6857 -0.6581 -0.6725 -0.7312 -0.5977 0.0336 -0.6958 -0.6583 -0.6995 -0.6902 -0.6715 0.6585Table 11: PTV contouring similarity and radiobiological metric correlations, Trial 1: observer gold standard
Chapter
3.Prostate
contouringmetric
correlations91

Patient CTV PTV Bladder Rectum
1 Mean 0.88 0.91 0.94 0.83
SD 0.03 0.02 0.01 0.04
COV 0.03 0.02 0.01 0.05
2 Mean 0.91 0.93 0.95 0.87
SD 0.03 0.02 0.01 0.06
COV 0.04 0.03 0.01 0.07
3 Mean 0.89 0.92 0.98 0.89
SD 0.02 0.01 0.01 0.04
COV 0.02 0.02 0.01 0.04
4 Mean 0.86 0.90 0.95 0.88
SD 0.06 0.04 0.03 0.07
COV 0.07 0.05 0.03 0.08
5 Mean 0.89 0.91 0.95 0.90
SD 0.02 0.02 0.01 0.03
COV 0.03 0.02 0.01 0.03
Table 12: Trial 2 DSC statistics
Chapter 3. Prostate contouring metric correlations 92

Patient CTV PTV Bladder Rectum
1 Mean (voxels) 4.65 4.98 2.88 8.65
SD (voxels) 1.07 0.91 0.72 6.59
COV 0.23 0.18 0.25 0.76
2 Mean (voxels) 3.49 3.51 2.45 11.29
SD (voxels) 0.94 0.81 0.11 13.58
COV 0.27 0.23 0.05 1.20
3 Mean (voxels) 4.02 4.46 2.08 7.60
SD (voxels) 0.89 0.88 0.43 6.34
COV 0.22 0.20 0.21 0.83
4 Mean (voxels) 4.60 4.81 2.89 9.01
SD (voxels) 1.87 1.75 0.93 8.66
COV 0.41 0.36 0.32 0.96
5 Mean (voxels) 4.86 5.02 2.57 6.06
SD (voxels) 1.44 1.45 0.52 3.32
COV 0.30 0.29 0.20 0.55
Table 13: Trial 2 95% Hausdorff statistics
Chapter 3. Prostate contouring metric correlations 93

NTCPlkb EUD mean max iso40 iso50 iso55 iso60 iso65 iso70 iso80 iso85 iso90 DX10 DX25 DX50
DSC 0.0099 0.3073 0.0980 0.6243 0.0437 0.0770 0.0954 0.1139 0.1233 0.1256 0.1122 0.0913 0.0703 0.3787 0.1637 0.0546
VOLSIM -0.1841 -0.1284 -0.0691 -0.1506 -0.0279 -0.0971 -0.1162 -0.1168 -0.1211 -0.1557 -0.1572 -0.1530 -0.1554 -0.0780 -0.0764 -0.0780
SENS 0.0635 0.1809 0.0018 0.3827 -0.0651 0.0031 0.0270 0.0329 0.0427 0.0801 0.0854 0.0732 0.0674 0.1952 0.0474 -0.0208
SPEC -0.0637 -0.0473 0.0203 0.0428 0.0350 -0.0167 -0.0187 -0.0063 -0.0055 -0.0318 -0.0433 -0.0608 -0.0660 -0.0428 0.0285 0.0119
MASD -0.0962 -0.2350 -0.1798 -0.2896 -0.1745 -0.1843 -0.1906 -0.1944 -0.1954 -0.1785 -0.1537 -0.1243 -0.1219 -0.2919 -0.2129 -0.1568
HAUS95 0.0926 -0.1938 0.0029 -0.4696 0.0169 0.0119 0.0103 0.0033 0.0060 0.0043 0.0185 0.0379 0.0512 -0.3298 -0.0353 0.0448
CENTROID_DIST_EUC -0.0038 -0.2315 -0.1130 -0.4925 -0.0704 -0.0653 -0.0726 -0.0965 -0.1081 -0.1000 -0.1049 -0.0793 -0.0502 -0.2500 -0.1516 -0.0754
CENTROID_DIST_X -0.0253 -0.0876 -0.0491 -0.0966 -0.0667 -0.0778 -0.0847 -0.0791 -0.0795 -0.0549 -0.0445 -0.0314 -0.0201 -0.1328 -0.0933 -0.0427
CENTROID_DIST_Y -0.5113 -0.4268 -0.4982 -0.1540 -0.4321 -0.4803 -0.4754 -0.4936 -0.4995 -0.5204 -0.5410 -0.5487 -0.5378 -0.2702 -0.4581 -0.4791
CENTROID_DIST_Z 0.2949 0.2826 0.3122 0.0918 0.3011 0.3166 0.3226 0.3199 0.3211 0.3288 0.3296 0.3149 0.3181 0.2041 0.3148 0.3131
aRVD -0.1242 -0.4148 -0.2103 -0.5437 -0.1788 -0.2236 -0.2424 -0.2570 -0.2538 -0.2523 -0.2323 -0.2211 -0.2049 -0.4856 -0.2650 -0.1635
C 0.0635 0.1809 0.0018 0.3827 -0.0651 0.0031 0.0270 0.0329 0.0427 0.0801 0.0854 0.0732 0.0674 0.1952 0.0474 -0.0208
Table 14: Bladder contouring similarity and radiobiological metric correlations, Trial 2: majority vote gold standard
p > 0.00026
p < 0.00026
NTCPlkb EUD mean max iso35 iso40 iso50 iso55 iso60 iso65 iso70 iso80 iso85 iso90 DX25 DX50
DSC -0.2452 -0.12449 0.12541 -0.03286 0.2048 0.18571 0.1351 0.10235 0.05959 0.04857 -0.00622 -0.05786 -0.10163 -0.15306 0.09724 0.12071
VOLSIM 0.13265 0.11878 0.19918 0.23092 0.22031 0.17612 0.15418 0.16245 0.16286 0.1599 0.17286 0.13286 0.13367 0.11051 0.15714 0.2102
SENS -0.29041 -0.20918 -0.11449 -0.19893 -0.05204 -0.03337 -0.06847 -0.09837 -0.12633 -0.13633 -0.1849 -0.18857 -0.21316 -0.22449 -0.1051 -0.06071
SPEC -0.16848 -0.05657 0.34274 0.18089 0.43275 0.34851 0.25615 0.2201 0.16741 0.14275 0.09741 0.00965 -0.02042 -0.09828 0.18278 0.43198
MASD 0.25194 0.14939 -0.07765 0.0325 -0.12398 -0.09959 -0.05969 -0.03745 -0.00418 0.00643 0.04276 0.08796 0.11184 0.15163 -0.04163 -0.05847
HAUS95 0.23502 0.15344 -0.01633 0.02423 -0.0323 -0.00696 0.0088 0.01853 0.0392 0.0499 0.06418 0.09842 0.10856 0.14924 0.00798 0.02759
CENTROID_DIST_EUC 0.24673 0.15296 -0.05776 -0.03133 -0.10092 -0.07459 -0.0501 -0.03918 -0.01408 -0.00194 0.03388 0.08276 0.10776 0.14459 -0.03041 -0.0252
CENTROID_DIST_X 0.30173 0.25092 -0.03469 0.15322 -0.0898 -0.04439 0.04765 0.11163 0.14418 0.16061 0.21316 0.23531 0.2598 0.28265 0.10847 -0.17827
CENTROID_DIST_Y 0.21408 0.14735 0.34235 0.135 0.39 0.32847 0.24602 0.20122 0.16367 0.1499 0.11888 0.12245 0.10735 0.10918 0.18316 0.43153
CENTROID_DIST_Z 0.17643 0.09367 0.26888 0.24149 0.30286 0.24265 0.16653 0.1249 0.10286 0.09592 0.06949 0.07673 0.0598 0.0651 0.12235 0.34602
aRVD -0.02653 -0.05745 -0.11449 0.14812 -0.07724 -0.09949 -0.11796 -0.09735 -0.08724 -0.09316 -0.06551 -0.07418 -0.04245 -0.05571 -0.12051 -0.02122
C -0.29041 -0.20918 -0.11449 -0.19893 -0.05204 -0.03337 -0.06847 -0.09837 -0.12633 -0.13633 -0.1849 -0.18857 -0.21316 -0.22449 -0.1051 -0.06071
Table 15: Rectum contouring similarity and radiobiological metric correlations, Trial 2: majority vote gold standard
Chapter
3.Prostate
contouringmetric
correlations94

p > 0.00035
p < 0.00035
TCPpossionLQ TCPlogit EUD min mean max iso90 iso95 iso100 DX90 DX95 dosehomo
DSC -0.0502 -0.0428 -0.0463 0.2218 -0.0376 -0.0124 NaN -0.0082 -0.0778 -0.1219 -0.1633 0.1011
VOLSIM 0.1468 0.1385 0.1272 -0.0857 0.1408 0.1479 NaN -0.0220 0.0833 0.1630 0.1369 0.0787
SENS -0.1609 -0.1774 -0.1677 0.2126 -0.1788 -0.1674 NaN 0.0367 -0.0515 -0.1983 -0.1722 -0.0974
SPEC 0.3614 0.3670 0.3539 0.1226 0.3712 0.2700 NaN 0.1321 0.0701 0.2570 0.1798 0.2036
MASD 0.0090 0.0262 0.0286 -0.2786 0.0263 0.1157 NaN 0.0140 0.0455 0.0827 0.1396 0.0024
HAUS95 0.0265 0.0181 0.0211 -0.2057 0.0184 0.0731 NaN 0.0078 0.0777 0.1130 0.1561 -0.0665
CENTROID_DIST_EUC -0.0521 -0.0162 -0.0184 -0.2000 -0.0197 0.0720 NaN 0.1690 0.1319 0.0456 0.1114 -0.1806
CENTROID_DIST_X -0.0188 -0.0839 -0.0752 0.2892 -0.0945 -0.2533 NaN 0.1708 0.3427 0.0833 0.1550 -0.3732
CENTROID_DIST_Y -0.1528 -0.1470 -0.1467 0.0270 -0.1496 -0.0301 NaN 0.0039 0.0281 -0.0700 -0.0135 -0.0811
CENTROID_DIST_Z -0.0133 0.0058 -0.0063 0.0285 0.0011 0.0838 NaN -0.0480 -0.1358 -0.1633 -0.1761 0.2082
aRVD 0.0512 -0.0196 -0.0219 0.1389 -0.0298 0.0022 NaN 0.2068 0.2290 0.0561 0.1416 -0.1414
C -0.1588 -0.1741 -0.1643 0.2096 -0.1753 -0.1638 NaN 0.0328 -0.0537 -0.1965 -0.1728 -0.0932
Table 16: CTV contouring similarity and radiobiological metric correlations, Trial 2: majority vote gold standard. Note: correlations for iso90 weren’t possible due to every observer patient having 100% coverage of the CTV at the 90% isodose level, exactly matching the majority vote plans for each patient.
TCPpossionLQ TCPlogit EUD min mean max iso90 iso95 iso100 DX90 DX95 dosehomo
DSC 0.1941 0.1647 0.1718 0.1957 0.1471 -0.0084 0.2564 0.2055 0.0107 0.0706 0.1636 -0.2082
VOLSIM 0.6490 0.7007 0.6685 0.6117 0.6869 0.1683 0.6840 0.7585 0.7705 0.7966 0.7895 -0.7605
SENS -0.4837 -0.5657 -0.5235 -0.4486 -0.5703 -0.1943 -0.5193 -0.6014 -0.6760 -0.6731 -0.6372 0.5977
SPEC 0.8078 0.8699 0.8461 0.7709 0.8422 0.3631 0.8653 0.8719 0.7105 0.7823 0.8774 -0.8175
MASD -0.1729 -0.1419 -0.1408 -0.1572 -0.1221 0.0232 -0.2305 -0.1919 -0.0207 -0.0768 -0.1648 0.2218
HAUS95 -0.0807 -0.0457 -0.0599 -0.0453 -0.0228 -0.0225 -0.1396 -0.0389 0.1355 0.0751 -0.0100 0.0430
CENTROID_DIST_EUC -0.2788 -0.2191 -0.2239 -0.2541 -0.1786 0.0157 -0.2846 -0.2957 -0.1172 -0.1727 -0.2785 0.3326
CENTROID_DIST_X -0.0782 -0.2126 -0.1938 -0.0830 -0.2643 -0.4759 -0.1186 -0.0663 -0.0628 -0.0629 -0.0501 -0.0743
CENTROID_DIST_Y 0.2333 0.1234 0.1672 0.2898 0.0646 0.1520 0.1995 0.2045 0.0042 0.0168 0.1211 -0.1463
CENTROID_DIST_Z 0.0769 0.1498 0.0927 -0.0173 0.1649 0.0851 0.0947 0.0866 0.1042 0.1424 0.0991 -0.0736
aRVD 0.2798 0.2882 0.2950 0.2642 0.2779 0.0089 0.2339 0.3132 0.3911 0.4017 0.3715 -0.3474
C -0.4814 -0.5642 -0.5215 -0.4464 -0.5695 -0.1922 -0.5170 -0.5999 -0.6773 -0.6735 -0.6358 0.5960
Table 17: PTV contouring similarity and radiobiological metric correlations, Trial 2: majority vote gold standard
Chapter
3.Prostate
contouringmetric
correlations95

NTCPlkb EUD mean max iso40 iso50 iso55 iso60 iso65 iso70 iso80 iso85 iso90 DX10 DX25 DX50
DSC -0.0754 0.3174 0.0445 0.6160 0.0006 0.0118 0.0317 0.0445 0.0588 0.0611 0.0336 -0.0031 -0.0160 0.4328 0.1129 -0.0011
VOLSIM -0.3403 -0.4042 -0.3084 -0.3204 -0.2599 -0.3168 -0.3258 -0.3294 -0.3485 -0.3877 -0.3969 -0.3857 -0.3936 -0.3373 -0.3619 -0.3258
SENS 0.1787 0.4448 0.1927 0.5283 0.1238 0.1787 0.1944 0.1961 0.2171 0.2588 0.2725 0.2504 0.2532 0.4908 0.2563 0.1742
SPEC -0.1126 -0.2464 -0.1233 0.0216 -0.1093 -0.1495 -0.1239 -0.1142 -0.1194 -0.1481 -0.1778 -0.2074 -0.2047 -0.2376 -0.1454 -0.1216
MASD -0.0616 -0.1364 -0.1426 -0.2510 -0.1608 -0.1426 -0.1535 -0.1479 -0.1490 -0.1370 -0.0941 -0.0398 -0.0476 -0.2275 -0.1521 -0.1459
HAUS95 0.2344 -0.1417 0.1175 -0.5275 0.1105 0.1358 0.1314 0.1298 0.1359 0.1331 0.1577 0.1866 0.1961 -0.2856 0.0627 0.1593
CENTROID_DIST_EUC 0.1090 -0.1062 0.0664 -0.4331 0.0723 0.0913 0.0913 0.0835 0.0622 0.0762 0.0860 0.1216 0.1375 -0.2193 0.0300 0.0700
CENTROID_DIST_X -0.0359 -0.0978 -0.0664 -0.0325 -0.1048 -0.0964 -0.1056 -0.0978 -0.1011 -0.0667 -0.0569 -0.0347 -0.0221 -0.2087 -0.0896 -0.0639
CENTROID_DIST_Y -0.5546 -0.4381 -0.5157 -0.1339 -0.4336 -0.4947 -0.4849 -0.5095 -0.5176 -0.5384 -0.5650 -0.5793 -0.5695 -0.2160 -0.4896 -0.4838
CENTROID_DIST_Z 0.4821 0.3395 0.4838 0.0616 0.4762 0.4894 0.4978 0.4933 0.4891 0.5014 0.5025 0.4843 0.4885 0.1661 0.4280 0.4997
aRVD 0.0490 -0.3854 -0.0913 -0.5569 -0.0759 -0.0994 -0.1160 -0.1252 -0.1300 -0.1331 -0.1031 -0.0840 -0.0602 -0.5067 -0.2020 -0.0445
C 0.1787 0.4448 0.1927 0.5283 0.1238 0.1787 0.1944 0.1961 0.2171 0.2588 0.2725 0.2504 0.2532 0.4908 0.2563 0.1742
Table 18: Bladder contouring similarity and radiobiological metric correlations, Trial 2: radiation oncologist and radiotherapist contours only
NTCPlkb EUD mean max iso35 iso40 iso50 iso55 iso60 iso65 iso70 iso80 iso85 iso90 DX25 DX50
DSC -0.1599 0.0185 0.1443 -0.2266 0.2129 0.2162 0.2017 0.1815 0.1434 0.1401 0.1193 0.0913 0.0563 -0.0325 0.1723 0.0462
VOLSIM 0.0773 0.0417 -0.0011 0.1627 -0.0168 -0.0501 -0.0311 0.0003 0.0241 0.0193 0.0697 0.0535 0.0689 0.0863 0.0028 0.0020
SENS -0.0888 0.0179 0.1008 -0.2269 0.1403 0.1728 0.1504 0.1182 0.0863 0.0913 0.0403 0.0350 0.0112 -0.0370 0.1115 0.0770
SPEC -0.1460 0.0216 0.3461 -0.0177 0.3863 0.3107 0.2585 0.2410 0.1971 0.1711 0.1773 0.1136 0.1008 0.0216 0.1917 0.3865
MASD 0.2504 0.0798 -0.0630 0.2252 -0.1095 -0.1014 -0.0902 -0.0860 -0.0521 -0.0415 -0.0403 -0.0076 0.0062 0.0840 -0.0725 0.0345
HAUS95 0.3241 0.1842 0.0629 0.1681 0.0462 0.0543 0.0553 0.0472 0.0736 0.0850 0.0767 0.1034 0.1020 0.1746 0.0542 0.1630
CENTROID_DIST_EUC 0.2479 0.0840 -0.0115 0.1826 -0.0403 -0.0370 -0.0574 -0.0683 -0.0543 -0.0443 -0.0476 -0.0204 -0.0039 0.0608 -0.0448 0.1106
CENTROID_DIST_X 0.2202 0.1966 0.0190 0.2031 0.0249 0.0585 0.1115 0.1773 0.2042 0.2048 0.2501 0.2249 0.2154 0.2171 0.1871 -0.0896
CENTROID_DIST_Y 0.4403 0.3129 0.3499 0.0426 0.3277 0.2826 0.2445 0.2185 0.1782 0.1765 0.1709 0.2258 0.2347 0.2810 0.2036 0.3894
CENTROID_DIST_Z 0.4759 0.3165 0.3594 0.2515 0.3300 0.2849 0.2496 0.2151 0.1964 0.1916 0.1770 0.2314 0.2314 0.2846 0.2045 0.3919
aRVD -0.0104 -0.0647 -0.1616 0.2092 -0.2165 -0.2104 -0.1770 -0.1272 -0.0891 -0.0899 -0.0457 -0.0639 -0.0342 -0.0084 -0.1457 -0.0849
C -0.0888 0.0179 0.1008 -0.2269 0.1403 0.1728 0.1504 0.1182 0.0863 0.0913 0.0403 0.0350 0.0112 -0.0370 0.1115 0.0770
p > 0.00026
p < 0.00026
Table 19: Rectum contouring similarity and radiobiological metric correlations, Trial 2: radiation oncologist and radiotherapist contours only
Chapter
3.Prostate
contouringmetric
correlations96

TCPpossionLQ TCPlogit EUD min mean max iso90 iso95 iso100 DX90 DX95 dosehomo
DSC -0.1176 -0.0846 -0.0891 0.1448 -0.0801 -0.0896 NaN 0.0840 -0.1426 -0.1667 -0.1683 0.0339
VOLSIM 0.3258 0.2863 0.2798 0.0146 0.2882 0.1333 NaN -0.0060 0.1151 0.2471 0.2280 0.1392
SENS -0.3339 -0.2863 -0.2812 0.0580 -0.2868 -0.1246 NaN 0.0397 -0.1162 -0.2737 -0.2420 -0.1255
SPEC 0.5819 0.5565 0.5506 0.1774 0.5564 0.2301 NaN 0.2437 0.2211 0.4838 0.4161 0.1205
MASD 0.0796 0.0496 0.0549 -0.1899 0.0549 0.2104 NaN -0.0879 0.1333 0.1143 0.1563 0.0493
HAUS95 0.1070 0.0737 0.0780 -0.0654 0.0776 0.1589 NaN -0.0898 0.1283 0.1248 0.1322 0.0622
CENTROID_DIST_EUC -0.0375 -0.0924 -0.0908 0.0120 -0.0938 0.0199 NaN 0.1309 0.1810 -0.0266 0.0549 -0.2132
CENTROID_DIST_X -0.0235 -0.1263 -0.1249 0.3230 -0.1443 -0.2036 NaN 0.1928 0.4073 0.1056 0.2370 -0.5073
CENTROID_DIST_Y -0.1952 -0.2244 -0.2235 0.1874 -0.2311 -0.1605 NaN -0.0610 0.1468 -0.1118 -0.0714 -0.1473
CENTROID_DIST_Z 0.0333 0.0594 0.0513 -0.1101 0.0529 0.0062 NaN 0.0013 -0.1619 -0.0627 -0.0669 0.0919
aRVD 0.2143 0.1384 0.1398 0.2395 0.1193 0.0768 NaN 0.2034 0.3964 0.1958 0.3095 -0.1269
C -0.3300 -0.2798 -0.2748 0.0527 -0.2801 -0.1171 NaN 0.0333 -0.1202 -0.2700 -0.2429 -0.1168
Table 20: CTV contouring similarity and radiobiological metric correlations, Trial 2: radiation oncologist and radiotherapist contours only. Note: correlations for iso90 weren’t possible due to every observer patient having 100% coverage of the CTV at the 90% isodose level, exactly matching the majority vote plans for each patient.
p > 0.00035
p < 0.00035
TCPpossionLQ TCPlogit EUD min mean max iso90 iso95 iso100 DX90 DX95 dosehomo
DSC -0.0254 -0.1361 -0.1129 0.0129 -0.1630 0.0560 -0.0231 -0.0415 -0.2588 -0.1964 -0.0689 -0.0165
VOLSIM 0.7297 0.7359 0.7398 0.6560 0.6927 0.1605 0.7169 0.7406 0.7653 0.8115 0.7782 -0.7230
SENS -0.5646 -0.6314 -0.6190 -0.4927 -0.6171 -0.1389 -0.5656 -0.5961 -0.6994 -0.7129 -0.6420 0.5683
SPEC 0.8609 0.8848 0.8852 0.7925 0.8409 0.3616 0.8765 0.8681 0.7107 0.7731 0.8900 -0.8073
MASD -0.0144 0.1034 0.0801 -0.0176 0.1308 -0.0300 -0.0123 0.0120 0.2190 0.1627 0.0286 0.0678
HAUS95 0.0863 0.1558 0.1324 0.1257 0.1623 -0.1379 0.0471 0.0976 0.3242 0.2628 0.1313 -0.0784
CENTROID_DIST_EUC -0.4065 -0.2686 -0.2994 -0.3577 -0.2118 -0.0762 -0.3864 -0.4090 -0.2328 -0.2759 -0.4129 0.5255
CENTROID_DIST_X 0.0146 -0.1826 -0.1331 0.0078 -0.2613 -0.4479 -0.0493 -0.0036 -0.0919 -0.0560 0.0059 -0.1711
CENTROID_DIST_Y 0.3362 0.1496 0.1849 0.3980 0.0756 0.0717 0.2978 0.2543 0.0555 0.0454 0.1465 -0.2171
CENTROID_DIST_Z -0.0805 0.0406 -0.0429 -0.2255 0.0818 0.1403 -0.0714 0.0095 0.1409 0.1557 0.0401 -0.0303
aRVD 0.5028 0.5356 0.5426 0.4401 0.5140 -0.0389 0.4751 0.5120 0.6720 0.6846 0.5793 -0.5283
C -0.5646 -0.6314 -0.6190 -0.4927 -0.6171 -0.1389 -0.5656 -0.5961 -0.6994 -0.7129 -0.6420 0.5683
Table 21: PTV contouring similarity and radiobiological metric correlations, Trial 2: radiation oncologist and radiotherapist contours only
Chapter
3.Prostate
contouringmetric
correlations97
CHAPTER 4
Multi-observer contouring of male pelvic
anatomy: Highly variable agreement
across conventional and emerging
structures of interest
98

RADIATION ONCOLOGY—ORIGINAL ARTICLE
Multi-observer contouring of male pelvic anatomy: Highlyvariable agreement across conventional and emergingstructures of interestDale Roach,1,2 Lois C Holloway,1,2,3,4 Michael G Jameson,1,2,3,4 Jason A Dowling,1,3,5,6
Angel Kennedy,7 Peter B Greer,6,8 Michele Krawiec,7 Robba Rai,1,2,4 Jim Denham,9 JeremiahDe Leon,10 Karen Lim,4,11 Megan E Berry,4,11 Rohen T White,7 Sean A Bydder,7 Hendrick T Tan,7
Jeremy D Croker,12 Alycea McGrath,7 John Matthews,13 Robert J Smeenk14 and Martin A Ebert3,7,15
1 Faculty of Medicine, University of New South Wales, Sydney, New South Wales, Australia
2 Ingham Institute for Applied Medical Research, Sydney, New South Wales, Australia
3 Centre for Medical Radiation Physics, University of Wollongong, Wollongong, New South Wales, Australia
4 Department of Radiation Oncology, Liverpool and Macarthur Cancer Therapy Centres, New South Wales, Australia
5 Australian e-Health Research Centre, CSIRO, Royal Brisbane Hospital, Brisbane, Queensland, Australia
6 School of Mathematical and Physical Sciences, University of Newcastle, Newcastle, New South Wales, Australia
7 Radiation Oncology, Sir Charles Gairdner Hospital, Perth, Western Australia, Australia
8 Calvary Mater Newcastle Hospital, Newcastle, New South Wales, Australia
9 School of Medicine and Population Health, University of Newcastle, Newcastle, New South Wales, Australia
10 Illawarra Cancer Care Centre, Wollongong, New South Wales, Australia
11 South Western Sydney Clinical School, University of New South Wales, Sydney, New South Wales, Australia
12 Fiona Stanley Hospital, Perth, Western Australia, Australia
13 Radiation Oncology, Auckland City Hospital, Auckland, New Zealand
14 Department of Radiation Oncology, Radboud University Medical Centre, Nijmegen, The Netherlands
15 School of Physics and Astrophysics, Faculty of Science, University of Western Australia, Perth, Western Australia, Australia
D Roach MSc; LC Holloway PhD; MG
Jameson PhD; JA Dowling PhD; A Kennedy
BSc; PB Greer PhD; M Krawiec BSc; R Rai
MHlthSc; J Denham MD, FRANZCR; J De Leon
MBBS, FRANZCR; K Lim MBBS, FRANZCR; ME
Berry MBBS, FRANZCR; RT White MBBS,
FRANZCR; SA Bydder MBA, MPH, FRANZCR;
HT Tan MBBS; JD Croker MBBS, FRANZCR;
A McGrath MBBS; J Matthews MBChB,
FRANZCR; RJ Smeenk MD, PhD; MA Ebert
PhD.
Correspondence
Mr. Dale Roach, Ingham Institute, Liverpool
Hospital, Locked Bag 7103, Liverpool, NSW
1871, Australia.
Email: [email protected]
Conflict of interest: None.
Submitted 5 June 2018; accepted 27
November 2018.
doi:10.1111/1754-9485.12844
Abstract
Introduction: This study quantified inter-observer contouring variations formultiple male pelvic structures, many of which are of emerging relevance forprostate cancer radiotherapy progression and toxicity response studies.Methods: Five prostate cancer patient datasets (CT and T2-weighted MR) weredistributed to 13 observers for contouring. CT structures contoured included theclinical target volume (CTV), seminal vesicles, rectum, colon, bowel bag, bladderand peri-rectal space (PRS). MR contours included CTV, trigone, membranousurethra, penile bulb, neurovascular bundle and multiple pelvic floor muscles.Contouring variations were assessed using the intraclass correlation coefficient(ICC), Dice similarity coefficient (DSC), and multiple additional metrics.Results: Clinical target volume (CT and MR), bladder, rectum and PRS contoursshowed excellent inter-observer agreement (median ICC = 0.97; 0.99; 1.00;0.95; 0.90, DSC = 0.83 � 0.05; 0.88 � 0.05; 0.93 � 0.03; 0.81 � 0.07; 0.80 �0.06, respectively). Seminal vesicle contours were more variable (ICC = 0.75,DSC = 0.73 � 0.14), while colon and bowel bag contoured volumes were consis-tent (ICC = 0.97; 0.97), but displayed poor overlap (DSC = 0.58 � 0.22;0.67 � 0.21). Smaller MR structures showed significant inter-observer variations,with poor overlap for trigone, membranous urethra, penile bulb, and left and rightneurovascular bundles (DSC = 0.44 � 0.22; 0.41 � 0.21; 0.66 � 0.21; 0.16 �0.17; 0.15 � 0.15). Pelvic floor muscles recorded moderate to strong inter-obser-ver agreement (ICC = 0.50–0.97), although large outlier variations were observed.Conclusions: Inter-observer contouring variation was significant for multiplepelvic structures contoured on MR.
Key words: contouring; delineation; inter/intra-observer variability; prostate.
© 2019 The Royal Australian and New Zealand College of Radiologists
Journal of Medical Imaging and Radiation Oncology 63 (2019) 264–271
264
Jour
nal o
f Med
ical
Imag
ing
and
Radi
atio
n O
ncol
ogy
Chapter 4. Contouring variability of male pelvic structures 99

Introduction
Contouring uncertainties are regarded as one of the lar-gest contributors to poor quality radiotherapy.1 Qualityassurance investigations during large clinical trials haverevealed contouring quality to be poor, with amendmentsrequired in over 80% of audited cases.2,3 Non-compliantcontouring has been shown to impact patient treatmentoutcomes during clinical trials.4,5
Inter-observer contouring variations for prostate, seminalvesicles, rectum and bladder have previously been investi-gated,6 with guidelines and training shown to significantlyreduce contouring variability.7–9 Additionally, clinical targetvolumes (CTVs) contoured on magnetic resonance (MR)imaging show less variation between observers than CTVscontoured on computed tomography (CT), with reducedvolumes arising from the better soft tissue definition of theprostatic apex on MR.10,11 Overlap metrics are often used toquantify contouring variations, with Dice similarity coeffi-cient (DSC) values exceeding 0.7 considered clinicallyacceptable for prostate, bladder and rectum contours.12,13
Growing numbers of studies have begun investigatingdose distributions delivered to neighbouring prostaticstructures as potential sources for toxicities followingradiotherapy, as well as becoming important organs-at-risk for modern treatment modalities.14 Structures inves-tigated include penile bulb and neurovascular bundle,15,16
trigone,17 peri-rectal space18 and various pelvic floormuscles.19 However, within these toxicity studies con-touring was performed either by a single expert, definedby simple geometric borders, or no information on thecontouring process was provided.
While consensus contouring guidelines for male pelvicstructures have been published,20 they do not cover therange of structures currently being investigated, nor dothey provide information for consensus contouring onMR. As poor-quality contouring could potentially maskfindings from clinical trials,4 and radiotherapy treatmentplanning relies on dose–volume information which is pro-gressively refined for more diverse anatomy, it is impor-tant to assess inter-observer contouring variations forthese emerging structures. This study aimed to documentand quantify contouring variations observed across multi-ple male pelvic structures on both CT and MR. In addition,it is intended that the derived multi-observer segmentedcohort will be used as a reference atlas for machine learn-ing based propagation of segmentations and their uncer-tainties to accrued and accruing clinical trial data.
Methods
Patient selection
Five prostate cancer patients were selected based on priorclustering work for a larger retrospective atlas segmenta-tion study.21,22 Using deformable registration and hierar-chical clustering, these five patients were determined to
best represent the diversity in anatomical information pre-sent within a large multi-centre clinical trial dataset.23 Eachpatient dataset contained co-registered whole pelvis plan-ning-CT (slice thickness: 2–2.5 mm) and a small field-of-view T2-weighted MR scan (slice thickness: 2 mm).24
Patient datasets were distributed to 13 observers (nineradiation oncologists, two medical physicists, one radiogra-pher, one radiation therapist (also known as planner ordosimetrist)) across five centres. Clinical experience levelranged from highly experienced to specialist trainees.
Contouring
Contoured structures for this study are listed in Table 1.The imaging modality utilized for contouring each struc-ture was pre-determined based on expert genitourinaryradiation oncologist advice for concurrent atlas-basedinvestigations. Study guidelines containing outsourcedexpert defined contours upon a sample patient were dis-tributed to all observers (Supporting Information). Addi-tionally, this sample patient along with associated expertcontours was distributed in DICOM format for additionalreference. Contouring was completed on treatment plan-ning systems available within the observer’s institution.Following contouring, post-processing for multiple struc-tures was required due to some observer’s failure toadhere to specific guideline requirements. Namely, allgenitourinary structures were removed from bowel bagcontours, while distal colon and bowel bag contours wereclipped 2 cm superior to rectum.
Interobserver variability assessment
Collated DICOM structure files were converted to NifTIformat for analysis within MilxView, an open-sourcedimage manipulation and processing platform developedby the Commonwealth Scientific and Industrial ResearchOrganisation (CSIRO).25 Intraclass correlation coeffi-cients (ICC) for contoured volumes were calculated forall structures. The ICC provides a statistical measure ofobserver reliability during contouring studies, and isdependent on the variance both within and betweenobserver contour volumes.26 An ICC greater than 0.75 is
Table 1. Contoured structures
CT Structures MR Structures
Prostate (CTV) Prostate (CTV)
Seminal vesicles (SV) Trigone
Rectum Membranous urethra (Memb. urethra)
Distal colon Penile bulb
Bowel bag Neurovascular bundle left (NVB left)
Bladder Neurovascular bundle right (NVB right)
Peri-rectal space (PRS) Internal anal sphincter (IAS)
External anal sphincter (EAS)
Puborectalis muscle (PRM)
Levator ani muscles (LAM)
© 2019 The Royal Australian and New Zealand College of Radiologists
Contouring variation of male pelvis
265
Chapter 4. Contouring variability of male pelvic structures 100

typically considered excellent agreement amongst obser-vers.27 Additionally, pairwise assessment of inter-obser-ver contouring variations was performed usingcontouring variation metrics DSC, volume similarity, sen-sitivity, specificity, 95th percentile Hausdorff distance(95_HAUS), mean absolute surface distance (MASD) andEuclidean centroid distance (Table e1).28
Statistics
Differences between CTV volumes contoured on CT andMR were assessed using two-sided Wilcoxon rank sumtesting (P < 0.05 considered significant).
Results
Mean, standard deviation and coefficient of variation (COV)of volumes for all structures are listed in Table 2 (COV = s-tandard deviation/mean). COV provides a normalized mea-sure of inter-observer variation that allows for comparisonbetween structures of differing volume. Pairwise DSC aregraphed in Figure 1, and tabulated in Table e2. Volume simi-larity, sensitivity, specificity, 95_HAUS, MASD and Euclideancentroid distance values are included in the SupportingInformation (Figs e2–e6, Tables e3–e8).
Clinical target volume
Observer CTV volumes showed excellent agreement onboth CT (ICC = 0.97, 0.90–1.00) and MR (ICC = 0.99,0.98–1.00). Median CT volumes were larger than MR(Table 2), with Wilcoxon analysis indicating significant dif-ferences across all five patients (Fig. 2). Mean 95_HAUSfor MR contours were smaller than CT (Table e5, Fig. e4),excluding patient 5 (MR: 10.39 mm, CT: 9.48 mm). Meanpairwise DSC across all patients for CT and MR were0.83 � 0.05 and 0.88 � 0.05, respectively.
Seminal vesicles
Seminal vesicle volume agreement was moderate(ICC = 0.75, 0.36–0.97), with reduced ICC attributed toa single observer contouring significantly larger volumesfor patients 2, 3 and 4 (COV = 0.58, 0,41, 0.86, respec-tively). These contours correspond to the outliersobserved in DSC (Fig. 1), volume similarity, sensitivity,95_HAUS and MASD (Figs e1, e2, e3, e5). Mean DSCacross all patients was 0.73 � 0.14.
Rectum
Excellent observer agreement in contoured rectum vol-umes and overlap was observed (ICC = 0.95, 0.85–0.99;DSC = 0.81 � 0.07). However, substantial variation in95_HAUS existed, with a maximum of 59.88 mmrecorded for patient 2 (Fig. e4, Table e6). Figure 3a illus-trates this example, where significantly different slices
for the superior rectum contour boundary were selectedby the two observers. Significant variation amongstobservers across all patients was observed at this bound-ary (Fig. 3b).
Distal colon and bowel bag
Distal colon and bowel bag were contoured 2 cm superi-orly to the rectum (Supporting Information). Due tolarge variations in rectum boundary contours, poor over-lap between observer contours was observed (Figs 1, 3a,Table e2). Mean DSC for distal colon and bowel bag were0.58 � 0.22 and 0.67 � 0.21, respectively. Large varia-tions in Euclidean centroid distances were observed(Fig. e6). ICC calculations revealed high conformity ofcontoured volumes for distal colon (ICC = 0.97, 0.92–1.00) and bowel bag (ICC = 0.97, 0.75–1.00).
Bladder
Bladder contours showed excellent agreement across vol-ume (ICC = 1.00, 1.00–1.00), overlap (DSC = 0.93 �0.03), and MASD (MASD = 0.76 mm–1.44 mm). Volumevaried significantly between patients (69.27 cm3–
400.13 cm3). Observer 95_HAUS distances revealed sig-nificant outliers for patient 4 (Fig. e4, Table e6), where asingle observer recorded pairwise 95_HAUS distances of72.20 mm–75.65 mm. Further inspection revealed a singleslice where a thin structure had been erroneously con-toured as bladder by this single observer.
Peri-rectal space
Excellent observer agreement (ICC = 0.90, 0.69–0.99) withacceptable overlap (DSC = 0.80 � 0.06) was recorded.Being a larger structure (mean volume = 299.54 cm3–
431.37 cm3), boundary metrics were more sensitive tointer-observer contouring variations than overlap metrics.While MASD was less than 10 mm for all but one pair of con-tours (Fig. e5), 95_HAUS conversely revealed all but onecontour pair having at least 10 mm separation (Fig. e4).
Trigone
Trigone ICC calculations returned a negative value(ICC = �0.29, �2.51 to 0.84), due to inter-observer con-touring variation per patient exceeding the volume differ-ences amongst patients. This is shown as the large spread involume similarity (Fig. e1, Table e3), where a median vol-ume similarity of 0.37 equates to a 45% increase betweencontoured volumes. Patient 5 had the highest agreement inobserver volumes (Table 2). Localization of the trigone waspoor, with DSC and sensitivity revealing zero overlapbetween some contours. Mean DSC was 0.44 � 0.22, withpatient 5 the most conformal. This patient also had signifi-cantly reduced 95_HAUS (9.25 � 5.47 mm) and MASD(2.13 � 1.88 mm).
© 2019 The Royal Australian and New Zealand College of Radiologists
D Roach et al.
266
Chapter 4. Contouring variability of male pelvic structures 101
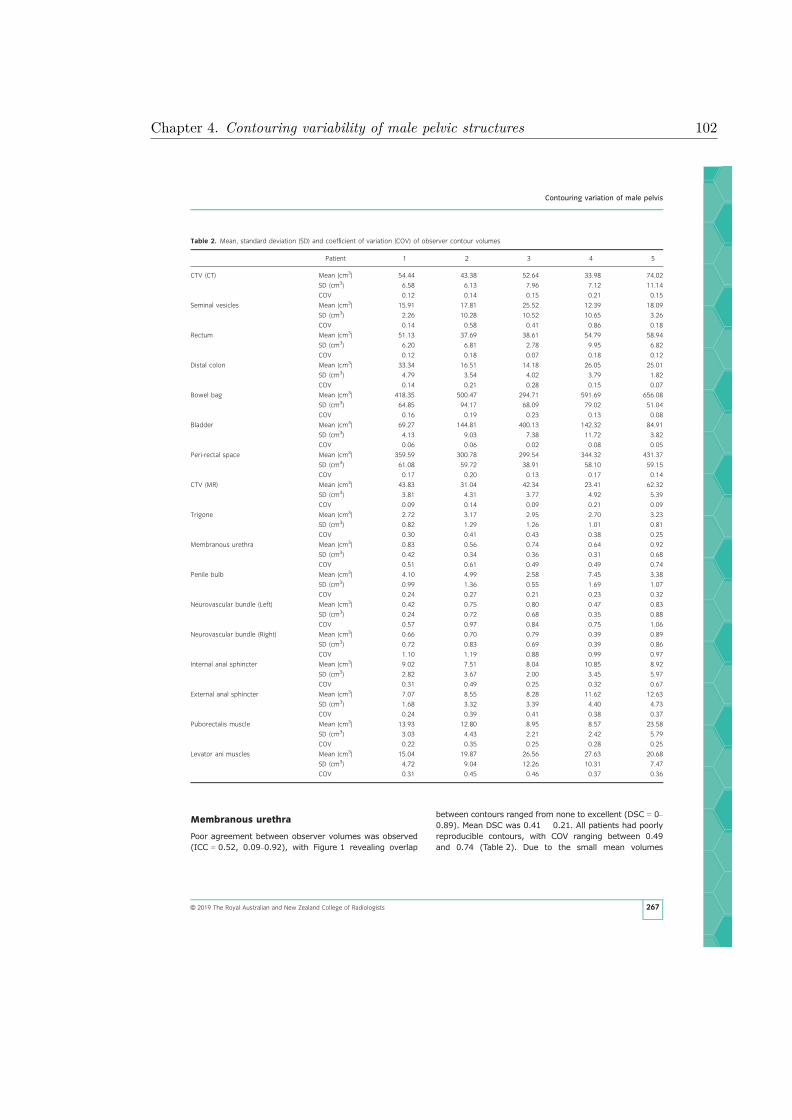
Membranous urethra
Poor agreement between observer volumes was observed(ICC = 0.52, 0.09–0.92), with Figure 1 revealing overlap
between contours ranged from none to excellent (DSC = 0–0.89). Mean DSC was 0.41 � 0.21. All patients had poorlyreproducible contours, with COV ranging between 0.49and 0.74 (Table 2). Due to the small mean volumes
Table 2. Mean, standard deviation (SD) and coefficient of variation (COV) of observer contour volumes
Patient 1 2 3 4 5
CTV (CT) Mean (cm3) 54.44 43.38 52.64 33.98 74.02
SD (cm3) 6.58 6.13 7.96 7.12 11.14
COV 0.12 0.14 0.15 0.21 0.15
Seminal vesicles Mean (cm3) 15.91 17.81 25.52 12.39 18.09
SD (cm3) 2.26 10.28 10.52 10.65 3.26
COV 0.14 0.58 0.41 0.86 0.18
Rectum Mean (cm3) 51.13 37.69 38.61 54.79 58.94
SD (cm3) 6.20 6.81 2.78 9.95 6.82
COV 0.12 0.18 0.07 0.18 0.12
Distal colon Mean (cm3) 33.34 16.51 14.18 26.05 25.01
SD (cm3) 4.79 3.54 4.02 3.79 1.82
COV 0.14 0.21 0.28 0.15 0.07
Bowel bag Mean (cm3) 418.35 500.47 294.71 591.69 656.08
SD (cm3) 64.85 94.17 68.09 79.02 51.04
COV 0.16 0.19 0.23 0.13 0.08
Bladder Mean (cm3) 69.27 144.81 400.13 142.32 84.91
SD (cm3) 4.13 9.03 7.38 11.72 3.82
COV 0.06 0.06 0.02 0.08 0.05
Peri-rectal space Mean (cm3) 359.59 300.78 299.54 344.32 431.37
SD (cm3) 61.08 59.72 38.91 58.10 59.15
COV 0.17 0.20 0.13 0.17 0.14
CTV (MR) Mean (cm3) 43.83 31.04 42.34 23.41 62.32
SD (cm3) 3.81 4.31 3.77 4.92 5.39
COV 0.09 0.14 0.09 0.21 0.09
Trigone Mean (cm3) 2.72 3.17 2.95 2.70 3.23
SD (cm3) 0.82 1.29 1.26 1.01 0.81
COV 0.30 0.41 0.43 0.38 0.25
Membranous urethra Mean (cm3) 0.83 0.56 0.74 0.64 0.92
SD (cm3) 0.42 0.34 0.36 0.31 0.68
COV 0.51 0.61 0.49 0.49 0.74
Penile bulb Mean (cm3) 4.10 4.99 2.58 7.45 3.38
SD (cm3) 0.99 1.36 0.55 1.69 1.07
COV 0.24 0.27 0.21 0.23 0.32
Neurovascular bundle (Left) Mean (cm3) 0.42 0.75 0.80 0.47 0.83
SD (cm3) 0.24 0.72 0.68 0.35 0.88
COV 0.57 0.97 0.84 0.75 1.06
Neurovascular bundle (Right) Mean (cm3) 0.66 0.70 0.79 0.39 0.89
SD (cm3) 0.72 0.83 0.69 0.39 0.86
COV 1.10 1.19 0.88 0.99 0.97
Internal anal sphincter Mean (cm3) 9.02 7.51 8.04 10.85 8.92
SD (cm3) 2.82 3.67 2.00 3.45 5.97
COV 0.31 0.49 0.25 0.32 0.67
External anal sphincter Mean (cm3) 7.07 8.55 8.28 11.62 12.63
SD (cm3) 1.68 3.32 3.39 4.40 4.73
COV 0.24 0.39 0.41 0.38 0.37
Puborectalis muscle Mean (cm3) 13.93 12.80 8.95 8.57 23.58
SD (cm3) 3.03 4.43 2.21 2.42 5.79
COV 0.22 0.35 0.25 0.28 0.25
Levator ani muscles Mean (cm3) 15.04 19.87 26.56 27.63 20.68
SD (cm3) 4.72 9.04 12.26 10.31 7.47
COV 0.31 0.45 0.46 0.37 0.36
© 2019 The Royal Australian and New Zealand College of Radiologists
Contouring variation of male pelvis
267
Chapter 4. Contouring variability of male pelvic structures 102
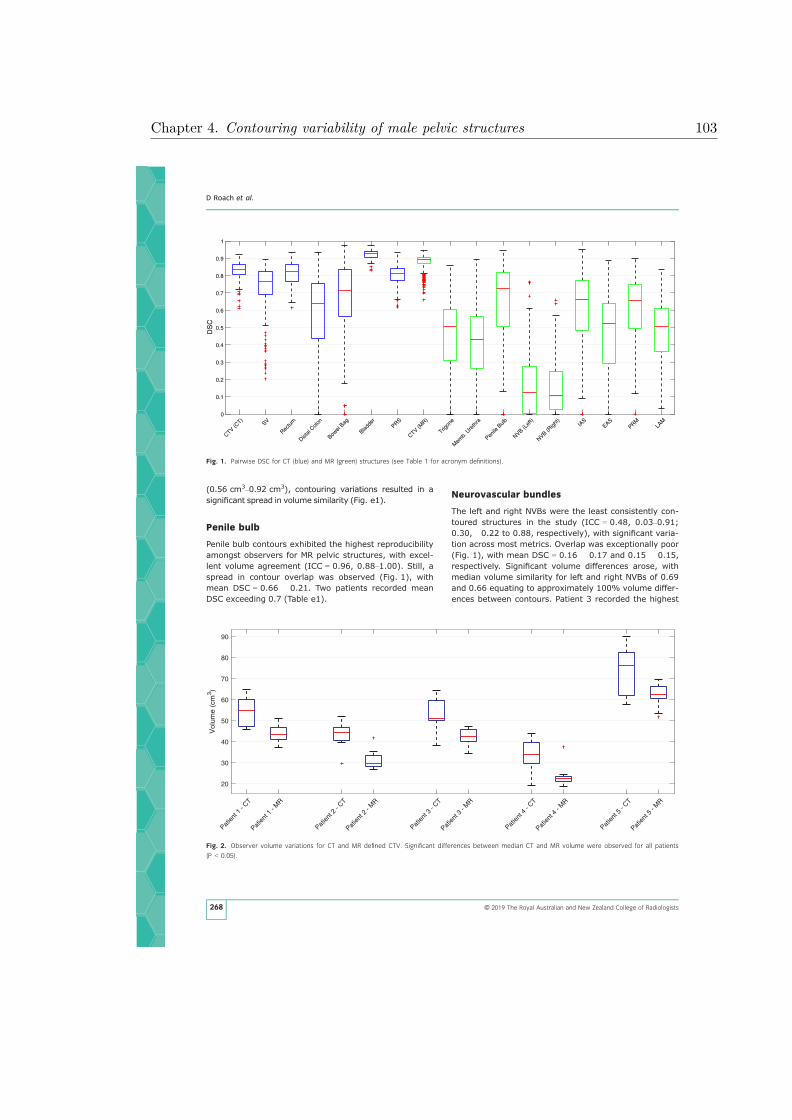
(0.56 cm3–0.92 cm3), contouring variations resulted in asignificant spread in volume similarity (Fig. e1).
Penile bulb
Penile bulb contours exhibited the highest reproducibilityamongst observers for MR pelvic structures, with excel-lent volume agreement (ICC = 0.96, 0.88–1.00). Still, aspread in contour overlap was observed (Fig. 1), withmean DSC = 0.66 � 0.21. Two patients recorded meanDSC exceeding 0.7 (Table e1).
Neurovascular bundles
The left and right NVBs were the least consistently con-toured structures in the study (ICC = 0.48, 0.03–0.91;0.30, �0.22 to 0.88, respectively), with significant varia-tion across most metrics. Overlap was exceptionally poor(Fig. 1), with mean DSC = 0.16 � 0.17 and 0.15 � 0.15,respectively. Significant volume differences arose, withmedian volume similarity for left and right NVBs of 0.69and 0.66 equating to approximately 100% volume differ-ences between contours. Patient 3 recorded the highest
Patien
t 1 -
CT
Patien
t 1 -
MR
Patien
t 2 -
CT
Patien
t 2 -
MR
Patien
t 3 -
CT
Patien
t 3 -
MR
Patien
t 4 -
CT
Patien
t 4 -
MR
Patien
t 5 -
CT
Patien
t 5 -
MR
20
30
40
50
60
70
80
90
Vol
ume
(cm
3 )
Fig. 2. Observer volume variations for CT and MR defined CTV. Significant differences between median CT and MR volume were observed for all patients
(P < 0.05).
CTV (CT)
SV
Rectu
m
Distal
Colon
Bowel
Bag
Bladde
rPRS
CTV (MR)
Trigon
e
Mem
b. U
reth
ra
Penile
Bulb
NVB (Lef
t)
NVB (Righ
t)IA
SEAS
PRMLA
M0
0.1
0.2
0.3
0.4
0.5
0.6
0.7
0.8
0.9
1
DS
C
Fig. 1. Pairwise DSC for CT (blue) and MR (green) structures (see Table 1 for acronym definitions).
© 2019 The Royal Australian and New Zealand College of Radiologists
D Roach et al.
268
Chapter 4. Contouring variability of male pelvic structures 103

mean overlap (DSC = 0.28 � 0.15, 0.24 � 0.14), how-ever, this improved overlap had no significant differenceon volume (VOLSIM = 0.62 � 0.42, 0.59 � 0.45, respec-tively).
Pelvic floor muscles
External anal sphincter, PRM and LAM recorded ICC >
0.7 (ICC = 0.86, 0.51–0.98; 0.97, 0.88–1.00; 0.79,0.44–0.97, respectively), while IAS displayed poor vol-ume agreement (ICC = 0.50, �0.01 to 0.92). Largevariations in volume similarity for all pelvic floor mus-cles were observed (Table e2, Fig. e1). Overlap for IASand PRM (DSC = 0.61 � 0.20, 0.60 � 0.19) exceededthose observed for EAS and LAM (DSC = 0.47 � 0.24;
0.48 � 0.17). DSC greater than 0.7 was observedfor patients 1 and 3 for IAS (DSC = 0.71 � 0.12, 0.72 �0.10). LAM displayed poorest specificity amongst allstructures (Fig. e3), a consequence of large volumes(15.04 cm3–27.63 cm3) coupled with poor overlap(Fig. 1).
Discussion
The aim of this study was to document the range ofinter-observer contouring variations for multiple malepelvic structures. These structures have established rele-vance to the response to radiotherapy for prostate can-cer, including the response of the cancer and the toxicitycaused by it, are of emerging interest in such studies,and may be utilized in guiding radiotherapy planningoptimization.14 Additionally, automated contouring tech-niques (atlases, shape models, machine learning, etc.)for these structures all require high quality data inputduring development to ensure accurate automated con-touring.29,30 To the authors’ knowledge, no other studyhad investigated inter-observer contouring variationsacross this range of structures, therefore an assessmentwas performed.
Previous studies have shown specific contouring met-rics correlate with dosimetry,28,31 so multiple metricswere utilized during analysis. Contouring variation met-rics for CT structures (particularly CTV, bladder, and rec-tum) matched values commonly cited within theliterature.12 Additionally, significant reductions in MRdefined CTV volumes compared to CT (Fig. 2) supportfindings from prior studies investigating the utilization ofMR for prostate cancer radiotherapy.10,11
Neighbouring structures contoured on MR displayed sig-nificant inter-observer variation. As many MR structureswere anatomically small in volume (Table 2), small
Fig. 4. Variations in contouring for left and right NVB for Patient 1. For
many observers, no contour overlap was evident.
(a) (b)
Fig. 3. (a) Sagittal view of patient 2, where variations in superior boundary for rectum contours between two observers (filled contours) resulted in poor
overlap of bowel bag contours (outlined). (b) Density distribution of all observer rectum contours for patient 2, ranging from 100% observer agreement (pur-
ple) to only a single observer (red).
© 2019 The Royal Australian and New Zealand College of Radiologists
Contouring variation of male pelvis
269
Chapter 4. Contouring variability of male pelvic structures 104

contouring variations led to significant differences instructure localization (Fig. 4). Additionally, observers par-ticipating in this study came from multiple institutions,preventing the implementation of teaching seminars priorto commencement of the study to reduce contouring vari-ations.7 Subsequently, while explicit guidelines and a sam-ple patient had been distributed for reference, contouringexperience levels were found to be a concern, promptingus to collate the experience levels of the observers in con-touring these structures (Tables e9–e10).
Assessment of experience levels revealed that non-radiation oncologists (non-ROs) often had no prior expe-rience contouring the multiple MR structures comparedto radiation oncologists (ROs). However, further Wilcoxonsigned-rank analysis revealed no statistically significantdifferences in contoured volumes between these twoobserver groups (Table e11). Consequently, the utiliza-tion of inexperienced non-RO contours was consideredrepresentative of the spread in contouring variation thatwould be encountered clinically for these structures.
Other studies have investigated inter-observer con-touring variations for some of these structures.32,33 Inthese studies a single structure’s contour was investi-gated, which Cassidy et al.32 noted would produce differ-ing inter-observer contouring variations than if multiplestructures were contoured simultaneously. In their study,they observed significantly improved overlap for NVBthan was recorded in this study (ICC = 0.89,DSC = 0.72 � 0.09). Differences in their study designinclude the implementation of training exercises prior tocontouring, utilization of an expert-defined contour for‘gold-standard’ analysis (opposed to pairwise analysis,which results in a larger spread in metric values), anddifferent MR scan sequences employed.
Additionally, in Cassidy et al.’s32 study screening ofpatients was performed, with patients excluded if extrapro-static extension was observed by a radiologist. Within thisstudy no screening was employed, as patient selection wasbased on clustering work completed for an ongoing atlasanalysis.22 As only 50% of men have NVBs in standard pos-tero-lateral positions forming distinct bundles,34 it is likelythat multiple patients within this study had no identifiableNVBs. Observers consequently contoured NVBs using clini-cal knowledge, rather than image intensity informationderived from the patient scans, leading to the large varia-tions in localization of the NVBs (Fig. 4).
This study highlights that greater efforts are required toreduce inter-observer contouring variations for these struc-tures. As outcomes of clinical trials can be masked by poorquality contouring,4 it is imperative that studies investigat-ing these emerging structures have some assessment ofcontouring quality to ensure that statistically rigorous con-clusions can be derived. This study provides a benchmarkfor the extent of inter-observer contouring variations thatcan be expected for these structures. Additionally, thisstudy emphasizes the need for continual and adequateobserver training, as well as utilization of contouring
guidelines, to reduce the inter-observer variability in con-touring these structures on MR.7–9
In conclusion, inter-observer contouring variations forCT-defined male pelvic structures matched the variationsrecorded within the literature. Smaller MR-defined struc-tures, not regularly encountered by observers, exhibitedsignificantly greater contouring variability. It is thereforeessential that studies include contouring variationassessments amongst observers before analysis of thesestructures can be undertaken.
Acknowledgements
The project was funded by NHMRC project grant number1077788.
References
1. Weiss E, Hess CF. The impact of gross tumor volume(GTV) and clinical target volume (CTV) definition onthe total accuracy in radiotherapy. Strahlenther Onkol2003; 179: 21–30.
2. Kachnic LA, Winter K, Myerson RJ et al. RTOG 0529: aphase 2 evaluation of dose-painted intensitymodulated radiation therapy in combination with 5-fluorouracil and mitomycin-C for the reduction of acutemorbidity in carcinoma of the anal canal. Int J RadiatOncol Biol Phys 2013; 86: 27–33.
3. Fairchild A, Weber DC, Bar-Deroma R et al. Qualityassurance in the EORTC 22033–26033/CE5 phase IIIrandomized trial for low grade glioma: the digitalindividual case review. Radiother Oncol 2012; 103:287–92.
4. Peters LJ, O’Sullivan B, Giralt J et al. Critical impact ofradiotherapy protocol compliance and quality in thetreatment of advanced head and neck cancer: resultsfrom TROG 02.02. J Clin Oncol 2010; 28: 2996–3001.
5. Abrams RA, Winter KA, Regine WF et al. Failure toadhere to protocol specified radiation therapyguidelines was associated with decreased survival inRTOG 9704—a phase III trial of adjuvantchemotherapy and chemoradiotherapy for patientswith resected adenocarcinoma of the pancreas. Int JRadiat Oncol Biol Phys 2012; 82: 809–16.
6. Vinod SK, Jameson MG, Min M, Holloway LC.Uncertainties in volume delineation in radiationoncology: a systematic review and recommendationsfor future studies. Radiother Oncol 2016; 121: 169–79.
7. Vinod SK, Min M, Jameson MG, Holloway LC. A reviewof interventions to reduce inter-observer variability involume delineation in radiation oncology. J MedImaging Radiat Oncol 2016; 60: 393–406.
8. Khoo EL, Schick K, Plank AW et al. Prostate contouringvariation: can it be fixed? Int J Radiat Oncol Biol Phys2012; 82: 1923–9.
9. Mitchell DM, Perry L, Smith S et al. Assessing the effectof a contouring protocol on postprostatectomyradiotherapy clinical target volumes and interphysicianvariation. Int J Radiat Oncol Biol Phys 2009; 75: 990–3.
© 2019 The Royal Australian and New Zealand College of Radiologists
D Roach et al.
270
Chapter 4. Contouring variability of male pelvic structures 105

10. Debois M, Oyen R, Maes F et al. The contribution ofmagnetic resonance imaging to the three-dimensionaltreatment planning of localized prostate cancer. Int JRadiat Oncol Biol Phys 1999; 45: 857–65.
11. Rasch C, Barillot I, Remeijer P, Touw A, van Herk M,Lebesque JV. Definition of the prostate in CT and MRI:a multi-observer study. Int J Radiat Oncol Biol Phys1999; 43: 57–66.
12. Sharp G, Fritscher KD, Pekar V et al. Vision 20/20:perspectives on automated image segmentation forradiotherapy. Med Phys 2014; 41: 050902.
13. Dice LR. Measures of the amount of ecologic associationbetween species. Ecology 1945; 26: 297–302.
14. Goddard L, Brodin NP, Bodner WR, Garg M, Tom�e WA.Comparing photon and proton based hypofractionedsbrt for prostate cancer accounting for robustness andrealistic treatment deliverability. Brit J Radiol 2018;91: 20180010.
15. Mendenhall WM, Henderson RH, Indelicato DJ, KeoleSR, Mendenhall NP. Erectile dysfunction afterradiotherapy for prostate cancer. Am J Clin Oncol2009; 32: 443–7.
16. van der Wielen GJ, Mulhall JP, Incrocci L. Erectiledysfunction after radiotherapy for prostate cancer andradiation dose to the penile structures: a criticalreview. Radiother Oncol 2007; 84: 107–13.
17. Ghadjar P, Zelefsky MJ, Spratt DE et al. Impact of doseto the bladder trigone on long-term urinary functionafter high-dose intensity modulated radiation therapyfor localized prostate cancer. Int J Radiat Oncol BiolPhys 2014; 88: 339–44.
18. Gulliford S, Ghose S, Ebert M et al. Radiotherapy dose-distribution to the perirectal fat space (PRS) is relatedto gastrointestinal control-related complications. ClinTranslat Rad Oncol 2017; 7: 62–70.
19. Smeenk RJ, Hoffmann AL, Hopman WP, van Lin ENT,Kaanders JH. Dose-effect relationships for individualpelvic floor muscles and anorectal complaints afterprostate radiotherapy. Int J Radiat Oncol Biol Phys2012; 83: 636–44.
20. Gay HA, Barthold HJ, O’Meara E et al. Pelvic normaltissue contouring guidelines for radiation therapy: aRadiation Therapy Oncology Group consensus panelatlas. Int J Radiat Oncol Biol Phys 2012; 83: e353–62.
21. Dowling JA, Sun J, Pichler P et al. Automatic substitutecomputed tomography generation and contouring formagnetic resonance imaging (MRI)-alone externalbeam radiation therapy from standard MRI sequences.Int J Radiat Oncol Biol Phys 2015; 93: 1144–53.
22. Kennedy AM, Dowling JA, Ghose S, Rivest-H�enault D,Ebert MA. Cluster Based selection of CT exemplarsfrom a clinical dataset for inter-patient registration anddose mapping. International Conference on the use ofComputers in Radiation Therapy. London, 2016.
23. Denham JW, Joseph D, Lamb DS, et al. Short-termandrogen suppression and radiotherapy versusintermediate-term androgen suppression andradiotherapy, with or without zoledronic acid, in men
with locally advanced prostate cancer (TROG 03.04RADAR): an open-label, randomised, phase 3 factorial.Lancet Oncol 2014; 15: 1076–89.
24. Dowling JA, Lambert J, Parker J et al. An atlas-basedelectron density mapping method for magneticresonance imaging (MRI)-alone treatment planningand adaptive MRI-based prostate radiation therapy. IntJ Radiat Oncol Biol Phys 2012; 83: e5–11.
25. Burdett N, Fripp J, Bourgeat P, Salvado O. MILXView: AMedical Imaging, Analysis and Visualization Platform.Springer, E-Health, 2010; 177–86.
26. Fotina I, L€utgendorf-Caucig C, Stock M, P€otter R,Georg D. Critical discussion of evaluation parametersfor inter-observer variability in target definition forradiation therapy. Strahlenther Onkol 2012; 188:160–7.
27. Bartko JJ. The intraclass correlation coefficient as ameasure of reliability. Psychol Rep 1966; 19: 3–11.
28. Roach D, Jameson MG, Dowling JA et al. Correlationsbetween contouring similarity metrics and simulatedtreatment outcome for prostate radiotherapy. PhysMed Biol 2018; 63: 035001.
29. El Naqa I, Murphy MJ. What is Machine Learning?Machine Learning in Radiation Oncology. Springer,Cham, 2015; 3–11.
30. Cruz JA, Wishart DS. Applications of machine learningin cancer prediction and prognosis. Cancer Inform2006; 2: 59–77.
31. Jameson MG, Kumar S, Vinod SK, Metcalfe PE, HollowayLC. Correlation of contouring variation with modeledoutcome for conformal non-small cell lung cancerradiotherapy. Radiother Oncol 2014; 112: 332–6.
32. Cassidy RJ, Nour SG, Liu T et al. Reproducibility incontouring the neurovascular bundle for prostate cancerradiotherapy. Pract Rad Oncol 2017; 8: e125–31.
33. Carillo V, Cozzarini C, Perna L et al. Contouringvariability of the penile bulb on CT images: quantitativeassessment using a generalized concordance index. IntJ Radiat Oncol Biol Phys 2012; 84: 841–6.
34. Kiyoshima K, Yokomizo A, Yoshida T et al. Anatomicalfeatures of periprostatic tissue and its surroundings: ahistological analysis of 79 radical retropubicprostatectomy specimens. Jpn J Clin Oncol 2004; 34:463–8.
Supporting Information
Additional Supporting Information may be found in theonline version of this article at the publisher’s web-site:
Appendix S1. Contouring variation metric derivations,additional inter-observer contouring variation analysisusing multiple additional metrics, and assessment ofobserver experience levels and profession on contouringvariations.
Appendix S2. Multi-observer study protocol distributedto all observers prior to contouring.
© 2019 The Royal Australian and New Zealand College of Radiologists
Contouring variation of male pelvis
271
Chapter 4. Contouring variability of male pelvic structures 106

1
Treatment planning system biases
Additional analysis investigated biases in contouring arising from treatment planning software used,
whether Pinnacle3® (Philips Healthcare, Best, Netherlands) or Eclipse™ (Varian Medical Systems, Palo
Alto, CA), both across individual patients and the complete patient cohort. Multiple hypothesis
testing required Bonferroni corrections of p < 0.05/102 = 0.00049 for significance. Wilcoxon testing
revealed no significant differences in volume contoured for all structures (p < 0.00049), across
individual patients as well as the entire patient dataset.
Chapter 4. Contouring variability of male pelvic structures 107
4.1 Supplementary Material A

2
Table e1: Contouring variation metrics
Metric Equations and Derivations
Volume Similarity VOLSIM =
Y-X
(X+Y)/2
Dice Similarity Coefficient (DSC) DSC =
2|X∩Y|
|X|+|Y|
True Positives Number of voxels contoured by observer X that also
lie within observer Y contour
False Positives Number of voxels contoured by observer X that do
not lie within observer Y contour
True Negatives Number of voxels not contoured by observer X that
also do not lie within observer Y contour
False Negatives Number of voxels not contoured by observer X that
lie within observer Y contour
Sensitivity p =
True Positives
True Positives + False Negatives
Specificity q =
True Negatives
True Negatives + False Positives
95th percentile Hausdorff distance
(95_HAUS)
HDasym(XS,YS) = 95th percentilex∈XS
( miny∈YS
d(x,y))
HD(XS,YS) =max(HDasym(XS,YS),HDasym(YS,XS))
Mean absolute surface distance (MASD) MASD =
1
NXS+NYS
( ∑ miny∈YS
d(x,y)
x∈XS
+∑ minx∈XS
d(y,x)
y∈YS
)
Euclidean centroid distance Straight line distance between centre-of-mass of
observer contours
X: Number of voxels within observer X contour
Y: Number of voxels within observer Y contour
XS: Surface points of observer X contour
YS: Surface points of observer Y contour
Chapter 4. Contouring variability of male pelvic structures 108

3
NXS: Number of surface points of observer X contour
NYS: Number of surface points of observer Y contour
d(x,y): Euclidean distance from point x to point y
Chapter 4. Contouring variability of male pelvic structures 109
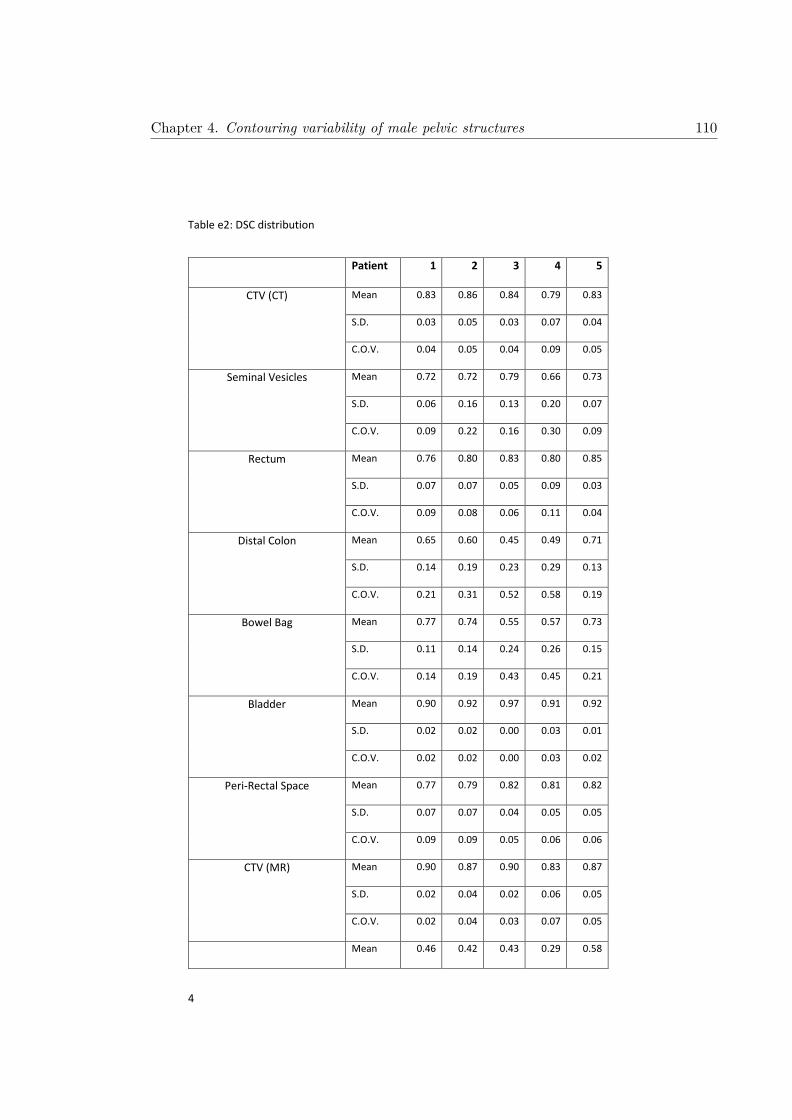
4
Table e2: DSC distribution
Patient 1 2 3 4 5
CTV (CT) Mean 0.83 0.86 0.84 0.79 0.83
S.D. 0.03 0.05 0.03 0.07 0.04
C.O.V. 0.04 0.05 0.04 0.09 0.05
Seminal Vesicles Mean 0.72 0.72 0.79 0.66 0.73
S.D. 0.06 0.16 0.13 0.20 0.07
C.O.V. 0.09 0.22 0.16 0.30 0.09
Rectum Mean 0.76 0.80 0.83 0.80 0.85
S.D. 0.07 0.07 0.05 0.09 0.03
C.O.V. 0.09 0.08 0.06 0.11 0.04
Distal Colon Mean 0.65 0.60 0.45 0.49 0.71
S.D. 0.14 0.19 0.23 0.29 0.13
C.O.V. 0.21 0.31 0.52 0.58 0.19
Bowel Bag Mean 0.77 0.74 0.55 0.57 0.73
S.D. 0.11 0.14 0.24 0.26 0.15
C.O.V. 0.14 0.19 0.43 0.45 0.21
Bladder Mean 0.90 0.92 0.97 0.91 0.92
S.D. 0.02 0.02 0.00 0.03 0.01
C.O.V. 0.02 0.02 0.00 0.03 0.02
Peri-Rectal Space Mean 0.77 0.79 0.82 0.81 0.82
S.D. 0.07 0.07 0.04 0.05 0.05
C.O.V. 0.09 0.09 0.05 0.06 0.06
CTV (MR) Mean 0.90 0.87 0.90 0.83 0.87
S.D. 0.02 0.04 0.02 0.06 0.05
C.O.V. 0.02 0.04 0.03 0.07 0.05
Mean 0.46 0.42 0.43 0.29 0.58
Chapter 4. Contouring variability of male pelvic structures 110

5
Trigone S.D. 0.23 0.17 0.21 0.24 0.15
C.O.V. 0.50 0.40 0.48 0.82 0.25
Membranous Urethra Mean 0.47 0.45 0.40 0.52 0.27
S.D. 0.20 0.17 0.20 0.13 0.23
C.O.V. 0.41 0.37 0.50 0.25 0.87
Penile Bulb Mean 0.78 0.59 0.68 0.71 0.55
S.D. 0.16 0.24 0.12 0.18 0.23
C.O.V. 0.20 0.41 0.18 0.26 0.43
Neurovascular Bundle (Left) Mean 0.07 0.16 0.28 0.17 0.13
S.D. 0.12 0.16 0.15 0.17 0.16
C.O.V. 1.70 0.99 0.52 0.98 1.21
Neurovascular Bundle (Right) Mean 0.07 0.09 0.24 0.12 0.21
S.D. 0.09 0.14 0.14 0.15 0.15
C.O.V. 1.32 1.45 0.59 1.19 0.71
Internal Anal Sphincter Mean 0.71 0.58 0.72 0.67 0.43
S.D. 0.12 0.21 0.10 0.13 0.22
C.O.V. 0.17 0.35 0.13 0.20 0.50
External Anal Sphincter Mean 0.54 0.43 0.53 0.48 0.37
S.D. 0.24 0.26 0.13 0.18 0.28
C.O.V. 0.45 0.59 0.25 0.37 0.76
Puborectalis Muscle Mean 0.66 0.51 0.61 0.53 0.69
S.D. 0.16 0.16 0.20 0.15 0.19
C.O.V. 0.24 0.32 0.33 0.28 0.27
Levator Ani Muscles Mean 0.44 0.44 0.49 0.58 0.46
S.D. 0.18 0.17 0.13 0.15 0.15
C.O.V. 0.41 0.37 0.27 0.26 0.33
Chapter 4. Contouring variability of male pelvic structures 111

6
Figure e1: Pairwise Volume Similarity for CT (blue) and MR (green) structures. As no distinction between which observer contour would be treated as the
gold standard volume, absolute values of volume similarity are reported here.
Chapter
4.Contouring
variabilityofm
alepelvic
structures112

7
Table e3: Absolute Volume Similarity Distribution
Patient 1 2 3 4 5
CTV (CT) Mean 0.16 0.17 0.17 0.25 0.18
S.D. 0.10 0.14 0.14 0.20 0.12
C.O.V. 0.63 0.85 0.80 0.80 0.65
Seminal Vesicles Mean 0.16 0.31 0.24 0.40 0.21
S.D. 0.11 0.38 0.31 0.47 0.14
C.O.V. 0.67 1.22 1.29 1.17 0.65
Rectum Mean 0.14 0.20 0.09 0.21 0.13
S.D. 0.11 0.14 0.06 0.19 0.09
C.O.V. 0.75 0.69 0.66 0.89 0.70
Distal Colon Mean 0.17 0.26 0.33 0.18 0.08
S.D. 0.12 0.16 0.22 0.12 0.06
C.O.V. 0.68 0.60 0.65 0.65 0.65
Bowel Bag Mean 0.19 0.23 0.27 0.15 0.09
S.D. 0.12 0.15 0.19 0.10 0.06
C.O.V. 0.66 0.64 0.69 0.66 0.65
Bladder Mean 0.07 0.07 0.02 0.09 0.05
S.D. 0.06 0.05 0.02 0.08 0.04
C.O.V. 0.81 0.75 0.78 0.83 0.66
Peri-Rectal Space Mean 0.18 0.24 0.16 0.20 0.16
S.D. 0.14 0.16 0.10 0.13 0.10
C.O.V. 0.76 0.70 0.64 0.65 0.67
CTV (MR) Mean 0.10 0.14 0.10 0.17 0.10
S.D. 0.07 0.11 0.08 0.18 0.08
C.O.V. 0.66 0.79 0.75 1.08 0.77
Mean 0.38 0.48 0.52 0.43 0.31
Chapter 4. Contouring variability of male pelvic structures 113

8
Trigone S.D. 0.26 0.30 0.32 0.27 0.24
C.O.V. 0.69 0.61 0.62 0.63 0.77
Membranous Urethra Mean 0.63 0.46 0.62 0.53 0.96
S.D. 0.38 0.35 0.40 0.35 0.55
C.O.V. 0.60 0.77 0.65 0.65 0.58
Penile Bulb Mean 0.29 0.33 0.26 0.27 0.42
S.D. 0.31 0.29 0.19 0.31 0.46
C.O.V. 1.07 0.86 0.72 1.17 1.11
Neurovascular Bundle (Left) Mean 0.62 0.94 0.62 0.47 1.06
S.D. 0.38 0.50 0.42 0.41 0.59
C.O.V. 0.61 0.53 0.67 0.86 0.56
Neurovascular Bundle (Right) Mean 0.87 0.85 0.59 0.88 0.69
S.D. 0.49 0.61 0.45 0.51 0.51
C.O.V. 0.56 0.72 0.76 0.58 0.74
Internal Anal Sphincter Mean 0.38 0.63 0.29 0.41 0.80
S.D. 0.32 0.51 0.19 0.29 0.49
C.O.V. 0.84 0.81 0.64 0.71 0.61
External Anal Sphincter Mean 0.29 0.52 0.48 0.46 0.41
S.D. 0.19 0.43 0.35 0.29 0.30
C.O.V. 0.68 0.83 0.73 0.63 0.73
Puborectalis Muscle Mean 0.27 0.42 0.30 0.33 0.30
S.D. 0.20 0.28 0.20 0.21 0.30
C.O.V. 0.76 0.66 0.67 0.63 0.99
Levator Ani Muscles Mean 0.38 0.56 0.58 0.45 0.44
S.D. 0.25 0.36 0.37 0.32 0.30
C.O.V. 0.65 0.65 0.64 0.70 0.68
Chapter 4. Contouring variability of male pelvic structures 114

9
Figure e2: Pairwise sensitivity scores for CT (blue) and MR (green) structures
Chapter
4.Contouring
variabilityofm
alepelvic
structures115

10
Table e4: Sensitivity Distribution
Patient 1 2 3 4 5
CTV (CT) Mean 0.84 0.83 0.85 0.79 0.82
S.D. 0.08 0.11 0.11 0.16 0.11
C.O.V. 0.10 0.13 0.13 0.20 0.13
Seminal Vesicles Mean 0.69 0.70 0.78 0.65 0.69
S.D. 0.09 0.20 0.18 0.22 0.10
C.O.V. 0.14 0.28 0.23 0.34 0.14
Rectum Mean 0.75 0.79 0.82 0.80 0.85
S.D. 0.10 0.11 0.07 0.13 0.07
C.O.V. 0.13 0.14 0.08 0.17 0.08
Distal Colon Mean 0.64 0.57 0.46 0.49 0.71
S.D. 0.14 0.20 0.24 0.28 0.14
C.O.V. 0.22 0.35 0.51 0.58 0.20
Bowel Bag Mean 0.73 0.73 0.57 0.57 0.74
S.D. 0.13 0.19 0.24 0.27 0.15
C.O.V. 0.18 0.26 0.42 0.47 0.21
Bladder Mean 0.92 0.91 0.96 0.90 0.92
S.D. 0.04 0.05 0.01 0.07 0.03
C.O.V. 0.04 0.05 0.01 0.08 0.03
Peri-Rectal Space Mean 0.79 0.80 0.82 0.83 0.83
S.D. 0.11 0.12 0.09 0.10 0.08
C.O.V. 0.14 0.15 0.11 0.12 0.10
CTV (MR) Mean 0.92 0.85 0.91 0.82 0.86
S.D. 0.05 0.09 0.05 0.12 0.07
C.O.V. 0.05 0.10 0.06 0.14 0.08
Mean 0.45 0.45 0.47 0.34 0.64
Chapter 4. Contouring variability of male pelvic structures 116

11
Trigone S.D. 0.24 0.19 0.26 0.29 0.20
C.O.V. 0.53 0.43 0.56 0.86 0.30
Membranous Urethra Mean 0.46 0.47 0.40 0.53 0.30
S.D. 0.21 0.23 0.25 0.20 0.26
C.O.V. 0.47 0.49 0.62 0.38 0.86
Penile Bulb Mean 0.80 0.64 0.70 0.77 0.61
S.D. 0.14 0.29 0.15 0.17 0.26
C.O.V. 0.17 0.45 0.22 0.23 0.42
Neurovascular Bundle (Left) Mean 0.07 0.14 0.28 0.16 0.15
S.D. 0.12 0.15 0.18 0.17 0.19
C.O.V. 1.80 1.09 0.65 1.02 1.28
Neurovascular Bundle (Right) Mean 0.07 0.09 0.25 0.14 0.24
S.D. 0.11 0.13 0.19 0.19 0.19
C.O.V. 1.57 1.41 0.77 1.31 0.78
Internal Anal Sphincter Mean 0.74 0.62 0.75 0.70 0.52
S.D. 0.16 0.29 0.16 0.21 0.27
C.O.V. 0.22 0.47 0.21 0.30 0.52
External Anal Sphincter Mean 0.52 0.42 0.56 0.44 0.37
S.D. 0.23 0.28 0.19 0.19 0.29
C.O.V. 0.45 0.66 0.34 0.43 0.79
Puborectalis Muscle Mean 0.64 0.46 0.60 0.55 0.66
S.D. 0.18 0.18 0.22 0.20 0.21
C.O.V. 0.29 0.40 0.37 0.37 0.32
Levator Ani Muscles Mean 0.47 0.51 0.49 0.57 0.54
S.D. 0.24 0.27 0.22 0.23 0.19
C.O.V. 0.51 0.54 0.45 0.40 0.36
Chapter 4. Contouring variability of male pelvic structures 117

12
Figure e3: Pairwise specificity scores for CT (blue) and MR (green) structures
Chapter
4.Contouring
variabilityofm
alepelvic
structures118

13
Table e5: Specificity Distribution
Patient 1 2 3 4 5
CTV (CT) Mean 0.9998 1.0000 0.9999 0.9999 0.9999
S.D. 0.0001 0.0000 0.0000 0.0000 0.0001
C.O.V. 0.0001 0.0000 0.0000 0.0000 0.0001
Seminal Vesicles Mean 0.9999 1.0000 1.0000 1.0000 1.0000
S.D. 0.0000 0.0001 0.0001 0.0001 0.0000
C.O.V. 0.0000 0.0001 0.0001 0.0001 0.0000
Rectum Mean 0.9998 0.9999 1.0000 0.9999 0.9999
S.D. 0.0001 0.0001 0.0000 0.0001 0.0001
C.O.V. 0.0001 0.0001 0.0000 0.0001 0.0001
Distal Colon Mean 0.9998 1.0000 0.9999 0.9999 0.9999
S.D. 0.0001 0.0000 0.0000 0.0001 0.0000
C.O.V. 0.0001 0.0000 0.0000 0.0001 0.0000
Bowel Bag Mean 0.9988 0.9989 0.9989 0.9980 0.9979
S.D. 0.0009 0.0006 0.0007 0.0013 0.0012
C.O.V. 0.0009 0.0006 0.0007 0.0013 0.0012
Bladder Mean 0.9999 0.9999 0.9999 0.9999 0.9999
S.D. 0.0001 0.0000 0.0000 0.0001 0.0000
C.O.V. 0.0001 0.0000 0.0000 0.0001 0.0000
Peri-Rectal Space Mean 0.9985 0.9994 0.9996 0.9994 0.9991
S.D. 0.0009 0.0005 0.0002 0.0004 0.0006
C.O.V. 0.0009 0.0005 0.0002 0.0004 0.0006
CTV (MR) Mean 0.9989 0.9994 0.9991 0.9993 0.9986
S.D. 0.0007 0.0006 0.0006 0.0007 0.0010
C.O.V. 0.0007 0.0006 0.0006 0.0007 0.0010
Mean 0.9997 0.9996 0.9997 0.9995 0.9997
Chapter 4. Contouring variability of male pelvic structures 119

14
Trigone S.D. 0.0002 0.0003 0.0002 0.0002 0.0001
C.O.V. 0.0002 0.0003 0.0002 0.0002 0.0001
Membranous Urethra Mean 0.9999 0.9999 0.9999 0.9999 0.9999
S.D. 0.0000 0.0000 0.0000 0.0001 0.0001
C.O.V. 0.0000 0.0000 0.0000 0.0001 0.0001
Penile Bulb Mean 0.9998 0.9996 0.9998 0.9995 0.9997
S.D. 0.0002 0.0003 0.0001 0.0003 0.0002
C.O.V. 0.0002 0.0003 0.0001 0.0003 0.0002
Neurovascular Bundle (Left) Mean 0.9999 0.9999 0.9999 0.9999 0.9999
S.D. 0.0000 0.0001 0.0001 0.0001 0.0002
C.O.V. 0.0000 0.0001 0.0001 0.0001 0.0002
Neurovascular Bundle (Right) Mean 0.9999 0.9999 0.9999 0.9999 0.9999
S.D. 0.0001 0.0001 0.0001 0.0001 0.0002
C.O.V. 0.0001 0.0001 0.0001 0.0001 0.0002
Internal Anal Sphincter Mean 0.9995 0.9995 0.9995 0.9993 0.9989
S.D. 0.0005 0.0006 0.0003 0.0006 0.0011
C.O.V. 0.0005 0.0006 0.0003 0.0006 0.0011
External Anal Sphincter Mean 0.9994 0.9992 0.9992 0.9992 0.9984
S.D. 0.0004 0.0006 0.0006 0.0006 0.0011
C.O.V. 0.0004 0.0006 0.0006 0.0006 0.0011
Puborectalis Muscle Mean 0.9993 0.9992 0.9994 0.9992 0.9990
S.D. 0.0004 0.0005 0.0004 0.0003 0.0006
C.O.V. 0.0004 0.0005 0.0004 0.0003 0.0006
Levator Ani Muscles Mean 0.9983 0.9978 0.9979 0.9983 0.9972
S.D. 0.0009 0.0014 0.0016 0.0012 0.0014
C.O.V. 0.0009 0.0014 0.0016 0.0012 0.0014
Chapter 4. Contouring variability of male pelvic structures 120

15
Figure e4: Pairwise Hausdorff Distance scores for CT (blue) and MR (green) structures
Chapter
4.Contouring
variabilityofm
alepelvic
structures121
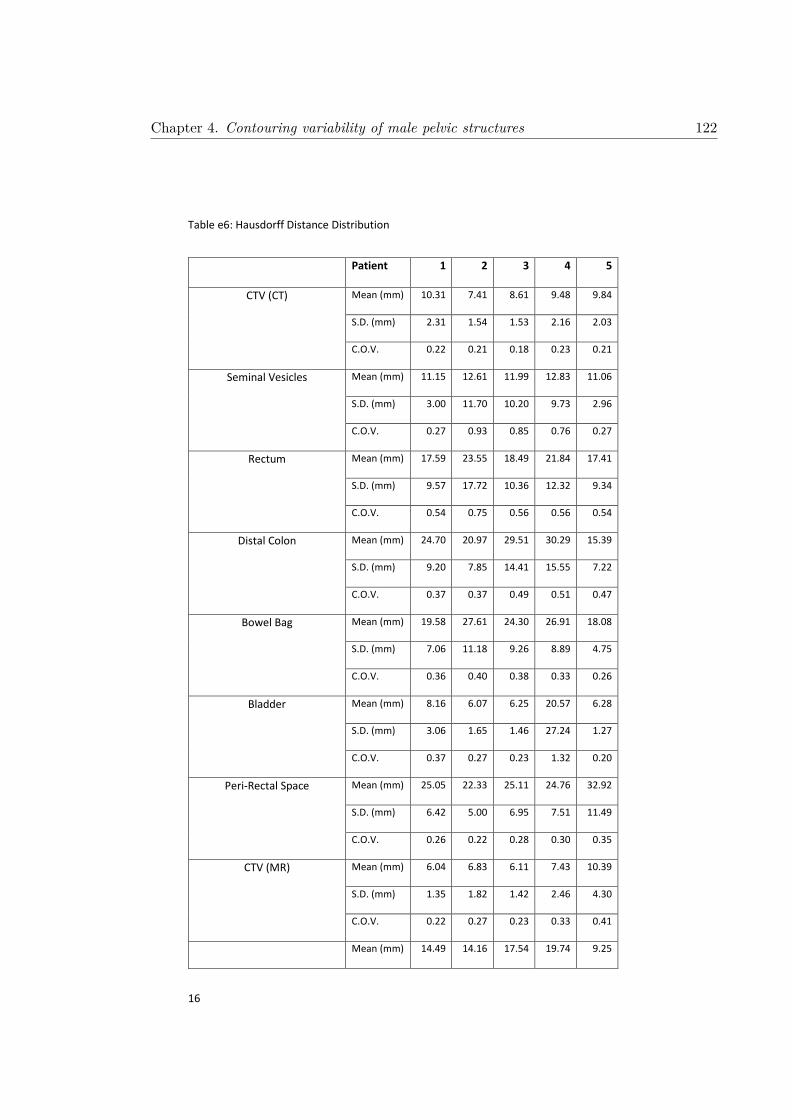
16
Table e6: Hausdorff Distance Distribution
Patient 1 2 3 4 5
CTV (CT) Mean (mm) 10.31 7.41 8.61 9.48 9.84
S.D. (mm) 2.31 1.54 1.53 2.16 2.03
C.O.V. 0.22 0.21 0.18 0.23 0.21
Seminal Vesicles Mean (mm) 11.15 12.61 11.99 12.83 11.06
S.D. (mm) 3.00 11.70 10.20 9.73 2.96
C.O.V. 0.27 0.93 0.85 0.76 0.27
Rectum Mean (mm) 17.59 23.55 18.49 21.84 17.41
S.D. (mm) 9.57 17.72 10.36 12.32 9.34
C.O.V. 0.54 0.75 0.56 0.56 0.54
Distal Colon Mean (mm) 24.70 20.97 29.51 30.29 15.39
S.D. (mm) 9.20 7.85 14.41 15.55 7.22
C.O.V. 0.37 0.37 0.49 0.51 0.47
Bowel Bag Mean (mm) 19.58 27.61 24.30 26.91 18.08
S.D. (mm) 7.06 11.18 9.26 8.89 4.75
C.O.V. 0.36 0.40 0.38 0.33 0.26
Bladder Mean (mm) 8.16 6.07 6.25 20.57 6.28
S.D. (mm) 3.06 1.65 1.46 27.24 1.27
C.O.V. 0.37 0.27 0.23 1.32 0.20
Peri-Rectal Space Mean (mm) 25.05 22.33 25.11 24.76 32.92
S.D. (mm) 6.42 5.00 6.95 7.51 11.49
C.O.V. 0.26 0.22 0.28 0.30 0.35
CTV (MR) Mean (mm) 6.04 6.83 6.11 7.43 10.39
S.D. (mm) 1.35 1.82 1.42 2.46 4.30
C.O.V. 0.22 0.27 0.23 0.33 0.41
Mean (mm) 14.49 14.16 17.54 19.74 9.25
Chapter 4. Contouring variability of male pelvic structures 122

17
Trigone S.D. (mm) 9.62 5.99 7.90 8.60 5.47
C.O.V. 0.66 0.42 0.45 0.44 0.59
Membranous Urethra Mean (mm) 6.72 5.33 7.75 5.32 10.17
S.D. (mm) 3.61 1.93 3.60 1.99 5.13
C.O.V. 0.54 0.36 0.46 0.37 0.50
Penile Bulb Mean (mm) 6.65 12.22 7.96 12.24 9.82
S.D. (mm) 2.84 6.13 3.85 6.16 3.92
C.O.V. 0.43 0.50 0.48 0.50 0.40
Neurovascular Bundle (Left) Mean (mm) 20.24 14.83 16.88 11.58 20.30
S.D. (mm) 7.46 6.00 8.85 4.03 7.40
C.O.V. 0.37 0.40 0.52 0.35 0.36
Neurovascular Bundle (Right) Mean (mm) 20.34 17.13 17.12 14.05 14.67
S.D. (mm) 6.64 7.46 8.51 5.19 6.38
C.O.V. 0.33 0.44 0.50 0.37 0.43
Internal Anal Sphincter Mean (mm) 8.55 9.64 8.50 10.79 18.01
S.D. (mm) 3.51 4.11 3.45 4.46 7.96
C.O.V. 0.41 0.43 0.41 0.41 0.44
External Anal Sphincter Mean (mm) 9.07 10.19 10.52 13.51 19.33
S.D. (mm) 6.03 4.19 3.52 5.75 11.23
C.O.V. 0.67 0.41 0.33 0.43 0.58
Puborectalis Muscle Mean (mm) 10.46 13.45 8.15 12.33 12.45
S.D. (mm) 5.10 6.94 3.88 5.58 10.73
C.O.V. 0.49 0.52 0.48 0.45 0.86
Levator Ani Muscles Mean (mm) 25.84 24.47 22.64 18.53 28.26
S.D. (mm) 11.23 7.26 8.21 9.77 9.62
C.O.V. 0.43 0.30 0.36 0.53 0.34
Chapter 4. Contouring variability of male pelvic structures 123

18
Figure e5: Pairwise Mean Absolute Surface Distance scores for CT (blue) and MR (green) structures
Chapter
4.Contouring
variabilityofm
alepelvic
structures124

19
Table e7: Mean Absolute Surface Distance Distribution
Patient 1 2 3 4 5
CTV (CT) Mean (mm) 2.12 1.56 1.86 2.18 2.24
S.D. (mm) 0.49 0.57 0.45 0.91 0.56
C.O.V. 0.23 0.36 0.24 0.42 0.25
Seminal Vesicles Mean (mm) 1.69 2.58 2.02 2.54 2.18
S.D. (mm) 0.59 3.17 2.42 3.19 0.85
C.O.V. 0.35 1.23 1.20 1.26 0.39
Rectum Mean (mm) 2.92 4.14 2.07 3.21 1.97
S.D. (mm) 1.59 3.86 1.46 2.48 0.94
C.O.V. 0.54 0.93 0.71 0.77 0.48
Distal Colon Mean (mm) 4.46 4.72 8.47 7.58 2.48
S.D. (mm) 2.52 3.27 8.19 5.79 1.72
C.O.V. 0.57 0.69 0.97 0.76 0.69
Bowel Bag Mean (mm) 3.84 4.95 6.65 7.53 4.79
S.D. (mm) 1.82 2.56 4.72 4.13 2.65
C.O.V. 0.47 0.52 0.71 0.55 0.55
Bladder Mean (mm) 0.98 0.88 0.76 1.44 0.89
S.D. (mm) 0.23 0.20 0.10 0.76 0.21
C.O.V. 0.23 0.23 0.14 0.53 0.24
Peri-Rectal Space Mean (mm) 4.37 4.18 3.81 4.02 4.82
S.D. (mm) 1.45 1.70 1.35 1.18 2.05
C.O.V. 0.33 0.41 0.35 0.29 0.43
CTV (MR) Mean (mm) 1.11 1.28 1.07 1.61 1.68
S.D. (mm) 0.33 0.60 0.34 0.81 0.79
C.O.V. 0.30 0.47 0.32 0.50 0.47
Mean (mm) 4.98 3.55 5.22 7.45 2.13
Chapter 4. Contouring variability of male pelvic structures 125

20
Trigone S.D. (mm) 6.95 2.58 4.89 6.48 1.88
C.O.V. 1.40 0.73 0.94 0.87 0.88
Membranous Urethra Mean (mm) 2.54 1.96 2.64 1.81 4.77
S.D. (mm) 1.69 1.00 1.57 0.81 3.31
C.O.V. 0.67 0.51 0.60 0.45 0.69
Penile Bulb Mean (mm) 1.27 2.92 1.52 2.30 3.23
S.D. (mm) 1.03 1.75 0.59 1.41 2.11
C.O.V. 0.81 0.60 0.39 0.62 0.65
Neurovascular Bundle (Left) Mean (mm) 10.15 5.71 4.73 4.80 9.14
S.D. (mm) 5.03 3.05 2.52 2.63 5.29
C.O.V. 0.50 0.53 0.53 0.55 0.58
Neurovascular Bundle (Right) Mean (mm) 9.94 6.55 4.96 7.06 5.21
S.D. (mm) 4.69 3.34 2.36 3.91 2.97
C.O.V. 0.47 0.51 0.48 0.55 0.57
Internal Anal Sphincter Mean (mm) 2.67 3.35 2.31 3.12 6.35
S.D. (mm) 1.40 1.96 1.17 1.89 4.08
C.O.V. 0.52 0.59 0.51 0.60 0.64
External Anal Sphincter Mean (mm) 2.26 2.86 2.74 3.65 8.15
S.D. (mm) 1.84 1.70 1.37 2.33 8.66
C.O.V. 0.82 0.60 0.50 0.64 1.06
Puborectalis Muscle Mean (mm) 2.37 3.09 2.04 2.88 2.70
S.D. (mm) 2.06 2.13 1.73 1.88 3.10
C.O.V. 0.87 0.69 0.85 0.65 1.15
Levator Ani Muscles Mean (mm) 5.53 4.16 3.78 2.86 5.19
S.D. (mm) 5.02 2.80 2.29 2.73 3.33
C.O.V. 0.91 0.67 0.61 0.95 0.64
Chapter 4. Contouring variability of male pelvic structures 126
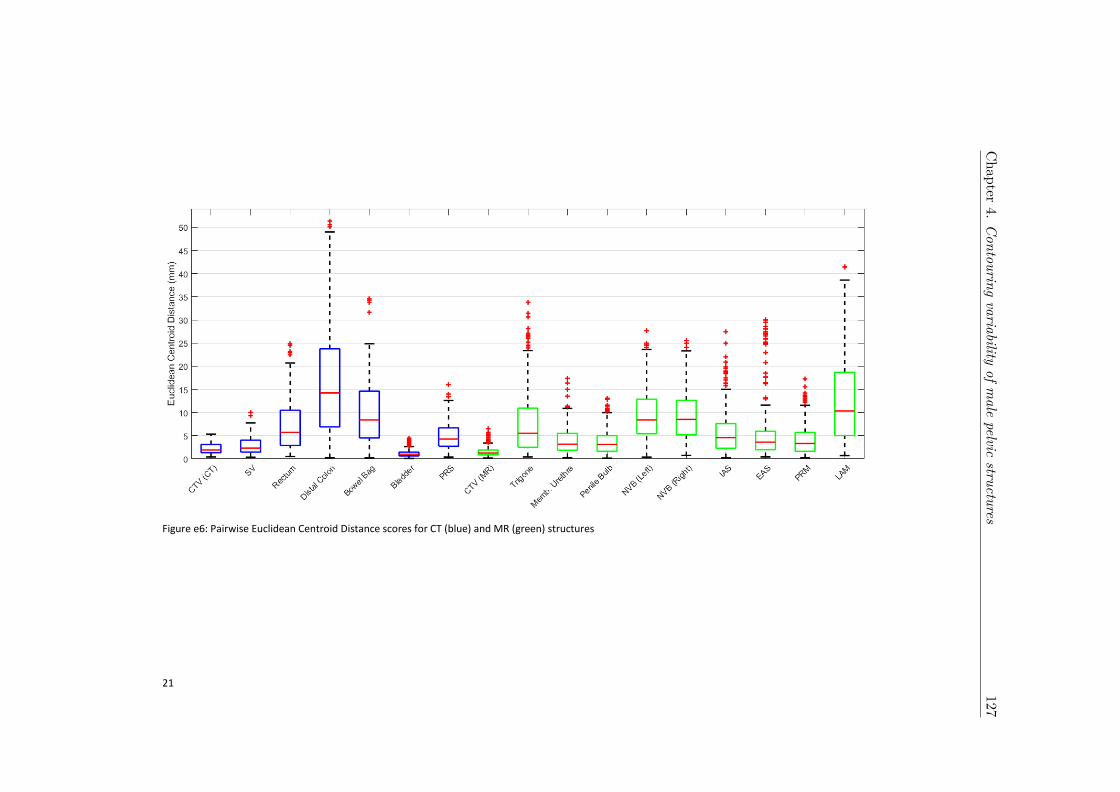
21
Figure e6: Pairwise Euclidean Centroid Distance scores for CT (blue) and MR (green) structures
Chapter
4.Contouring
variabilityofm
alepelvic
structures127

22
Table e8: Euclidean Centroid Distance Distribution
Patient 1 2 3 4 5
CTV (CT) Mean (mm) 2.63 1.41 1.98 2.27 2.76
S.D. (mm) 1.24 0.55 0.87 1.34 1.09
C.O.V. 0.47 0.39 0.44 0.59 0.40
Seminal Vesicles Mean (mm) 3.23 2.59 2.59 3.56 3.03
S.D. (mm) 1.39 2.22 2.44 2.48 1.39
C.O.V. 0.43 0.85 0.94 0.70 0.46
Rectum Mean (mm) 9.50 8.55 6.50 8.33 4.59
S.D. (mm) 5.65 7.16 4.37 6.58 2.65
C.O.V. 0.59 0.84 0.67 0.79 0.58
Distal Colon Mean (mm) 12.70 9.35 19.71 22.66 15.66
S.D. (mm) 8.11 6.20 13.17 15.91 11.35
C.O.V. 0.64 0.66 0.67 0.70 0.72
Bowel Bag Mean (mm) 7.34 8.52 12.93 12.40 9.07
S.D. (mm) 3.99 4.89 9.03 7.22 5.86
C.O.V. 0.54 0.57 0.70 0.58 0.65
Bladder Mean (mm) 1.87 0.97 0.66 1.62 1.17
S.D. (mm) 1.09 0.36 0.29 1.13 0.72
C.O.V. 0.58 0.37 0.44 0.70 0.61
Peri-Rectal Space Mean (mm) 6.61 4.52 4.60 3.44 5.56
S.D. (mm) 3.26 2.56 2.57 1.83 3.22
C.O.V. 0.49 0.57 0.56 0.53 0.58
CTV (MR) Mean (mm) 0.89 1.49 1.25 1.86 2.20
S.D. (mm) 0.39 0.93 0.52 1.06 1.43
C.O.V. 0.44 0.63 0.41 0.57 0.65
Mean (mm) 8.31 7.33 8.22 12.81 3.77
Chapter 4. Contouring variability of male pelvic structures 128
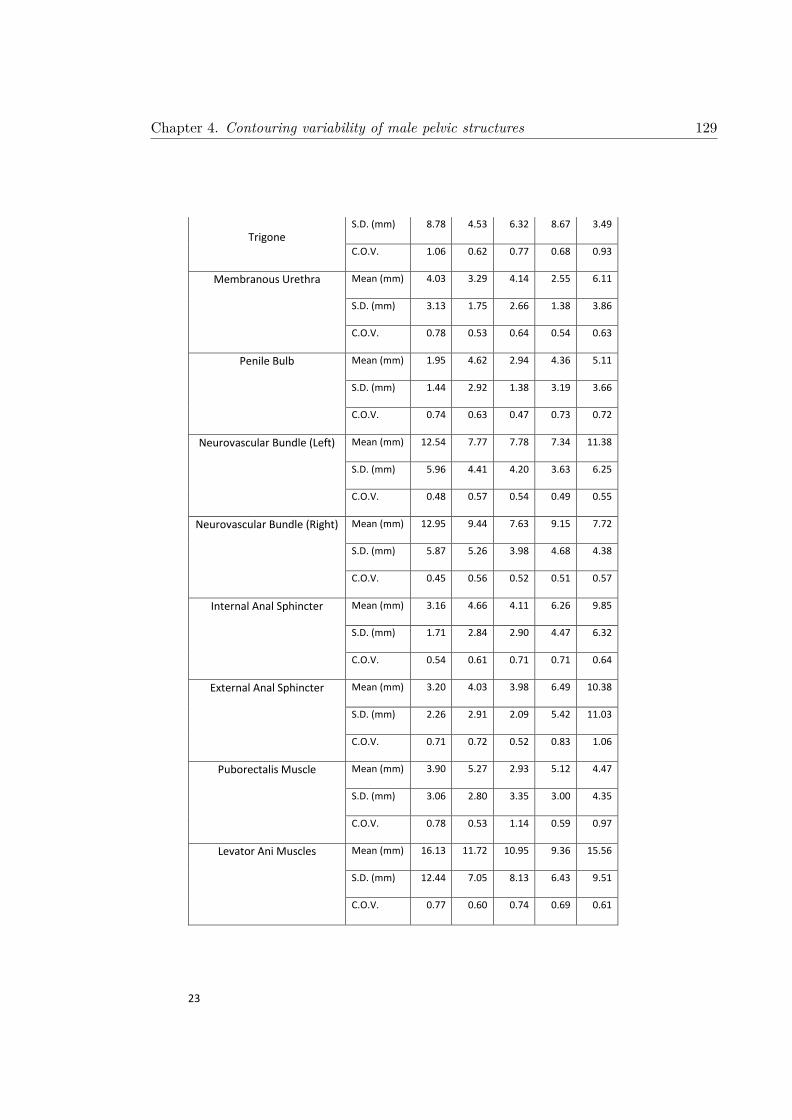
23
Trigone S.D. (mm) 8.78 4.53 6.32 8.67 3.49
C.O.V. 1.06 0.62 0.77 0.68 0.93
Membranous Urethra Mean (mm) 4.03 3.29 4.14 2.55 6.11
S.D. (mm) 3.13 1.75 2.66 1.38 3.86
C.O.V. 0.78 0.53 0.64 0.54 0.63
Penile Bulb Mean (mm) 1.95 4.62 2.94 4.36 5.11
S.D. (mm) 1.44 2.92 1.38 3.19 3.66
C.O.V. 0.74 0.63 0.47 0.73 0.72
Neurovascular Bundle (Left) Mean (mm) 12.54 7.77 7.78 7.34 11.38
S.D. (mm) 5.96 4.41 4.20 3.63 6.25
C.O.V. 0.48 0.57 0.54 0.49 0.55
Neurovascular Bundle (Right) Mean (mm) 12.95 9.44 7.63 9.15 7.72
S.D. (mm) 5.87 5.26 3.98 4.68 4.38
C.O.V. 0.45 0.56 0.52 0.51 0.57
Internal Anal Sphincter Mean (mm) 3.16 4.66 4.11 6.26 9.85
S.D. (mm) 1.71 2.84 2.90 4.47 6.32
C.O.V. 0.54 0.61 0.71 0.71 0.64
External Anal Sphincter Mean (mm) 3.20 4.03 3.98 6.49 10.38
S.D. (mm) 2.26 2.91 2.09 5.42 11.03
C.O.V. 0.71 0.72 0.52 0.83 1.06
Puborectalis Muscle Mean (mm) 3.90 5.27 2.93 5.12 4.47
S.D. (mm) 3.06 2.80 3.35 3.00 4.35
C.O.V. 0.78 0.53 1.14 0.59 0.97
Levator Ani Muscles Mean (mm) 16.13 11.72 10.95 9.36 15.56
S.D. (mm) 12.44 7.05 8.13 6.43 9.51
C.O.V. 0.77 0.60 0.74 0.69 0.61
Chapter 4. Contouring variability of male pelvic structures 129

24
Table e9: Contouring experience levels of CT structures for all volunteers prior to commencement of this investigation. Volunteers have been stratified as Radiation Oncologists (RO) or non-Radiation Oncologists (Non-RO). Median experience level for each structure is bolded red, with the lower bound bolded if the median lies between two columns.
0 Patients 1 – 10 Patients 11 – 30 Patients 30+ Patients
Prostate/CTV RO 0 0 2 7
Non-RO 3 0 0 1
Seminal Vesicles RO 0 0 3 6
Non-RO 3 0 0 1
Rectum RO 0 0 1 8
Non-RO 2 0 0 2
Distal Colon RO 0 1 2 6
Non-RO 2 0 2 0
Bowel Bag RO 1 2 3 3
Non-RO 2 2 0 0
Bladder RO 0 0 1 8
Non-RO 2 0 0 2
Peri-rectal Space RO 2 4 1 2
Non-RO 3 0 1 0
Chapter 4. Contouring variability of male pelvic structures 130

25
Table e10: Contouring experience levels of CT structures for all volunteers prior to commencement of this investigation. Volunteers have been stratified as Radiation Oncologists (RO) or non-Radiation Oncologists (Non-RO). Median experience level for each structure is bolded red, with the lower bound bolded if the median lies between two columns.
0 Patients 1 – 10 Patients 11 – 30 Patients 30+ Patients
Prostate/CTV RO 0 1 2 6
Non-RO 3 0 0 0
Trigone RO 4 4 1 0
Non-RO 4 0 0 0
Membranous Urethra
RO 0 6 1 2
Non-RO 3 1 0 0
Penile Bulb RO 0 4 4 1
Non-RO 3 1 0 0
Neurovascular Bundles
RO 3 4 2 0
Non-RO 4 0 0 0
Internal Anal Sphincter
RO 3 4 1 0
Non-RO 4 0 0 0
External Anal Sphincter
RO 3 5 1 0
Non-RO 4 0 0 0
Puborectalis Muscle
RO 4 4 1 0
Non-RO 4 0 0 0
Levator Ani Muscles
RO 4 3 2 0
Non-RO 4 0 0 0
Chapter 4. Contouring variability of male pelvic structures 131

26
Table e11: Wilcoxon rank sum testing of contoured volumes between Radiation Oncologists (RO) and non-Radiation Oncologists (Non-RO). Median volumes for each structure for each patient are given in cm3. P-values indicate differences between median volumes, with p-values < 0.05 bolded red. However, Bonferroni corrections must be made due to the large number (85) of statistical tests undertaken. This requires p < 0.0006 for statistical significance, which no comparison reached.
Patient 1 2 3 4 5
CTV (CT) RO (cm3) 53.30 45.89 55.42 34.21 76.10
Non-RO (cm3) 56.91 41.88 50.16 33.53 71.96
p-value 0.762 0.476 0.171 0.914 0.914
Seminal Vesicles RO (cm3) 15.41 14.39 23.38 8.16 18.79
Non-RO (cm3) 15.23 15.33 20.91 10.82 16.66
p-value 1.000 0.352 0.352 0.067 0.610
Rectum RO (cm3) 54.93 36.35 38.05 58.86 55.38
Non-RO (cm3) 47.13 37.41 40.26 40.69 59.30
p-value 0.038 0.914 0.352 0.381 0.610
Distal Colon RO (cm3) 31.80 17.51 16.24 28.48 24.37
Non-RO (cm3) 33.66 15.07 10.83 25.14 25.13
p-value 0.610 0.486 0.352 0.286 0.762
Bowel Bag RO (cm3) 477.40 530.18 309.55 607.21 697.09
Non-RO (cm3) 368.34 433.06 281.41 530.67 635.74
p-value 0.190 0.190 0.476 0.190 0.190
Bladder RO (cm3) 70.18 142.68 400.88 144.23 82.17
Non-RO (cm3) 70.72 152.33 401.30 140.18 88.40
p-value 0.610 0.257 0.914 0.762 0.067
Peri-Rectal Space RO (cm3) 364.79 308.39 315.70 345.72 439.66
Non-RO (cm3) 334.06 293.69 282.50 326.78 401.15
p-value 0.067 0.610 0.762 0.352 0.352
CTV (MR) RO (cm3) 43.98 29.55 43.47 22.64 63.59
Non-RO (cm3) 42.68 29.71 41.97 20.62 58.04
p-value 0.527 0.808 0.808 0.230 0.570
Trigone RO (cm3) 2.72 2.91 2.68 2.29 3.20
Non-RO (cm3) 2.76 3.39 2.94 2.71 3.73
p-value 1.000 0.927 0.788 0.927 0.283
Membranous Urethra RO (cm3) 0.87 0.46 0.80 0.65 0.73
Non-RO (cm3) 0.72 0.50 0.59 0.51 0.83
p-value 0.505 0.830 0.570 0.927 0.808
Penile Bulb RO (cm3) 4.27 5.55 2.84 8.09 3.75
Non-RO (cm3) 4.20 4.22 2.10 7.22 2.98
p-value 0.610 0.315 0.012 0.412 0.073
Neurovascular Bundle (Left) RO (cm3) 0.47 0.55 0.53 0.39 0.59
Non-RO (cm3) 0.29 0.47 0.71 0.31 0.61
p-value 0.927 1.000 0.315 0.762 0.933
Neurovascular Bundle (Right) RO (cm3) 0.53 0.47 0.59 0.35 0.68
Non-RO (cm3) 0.27 0.34 0.58 0.27 0.76
p-value 0.610 0.905 0.927 0.867 0.412
Internal Anal Sphincter RO (cm3) 8.98 7.99 6.92 9.85 5.91
Non-RO (cm3) 9.24 9.99 9.66 13.36 11.95
p-value 0.927 0.164 0.230 0.352 0.283
Chapter 4. Contouring variability of male pelvic structures 132
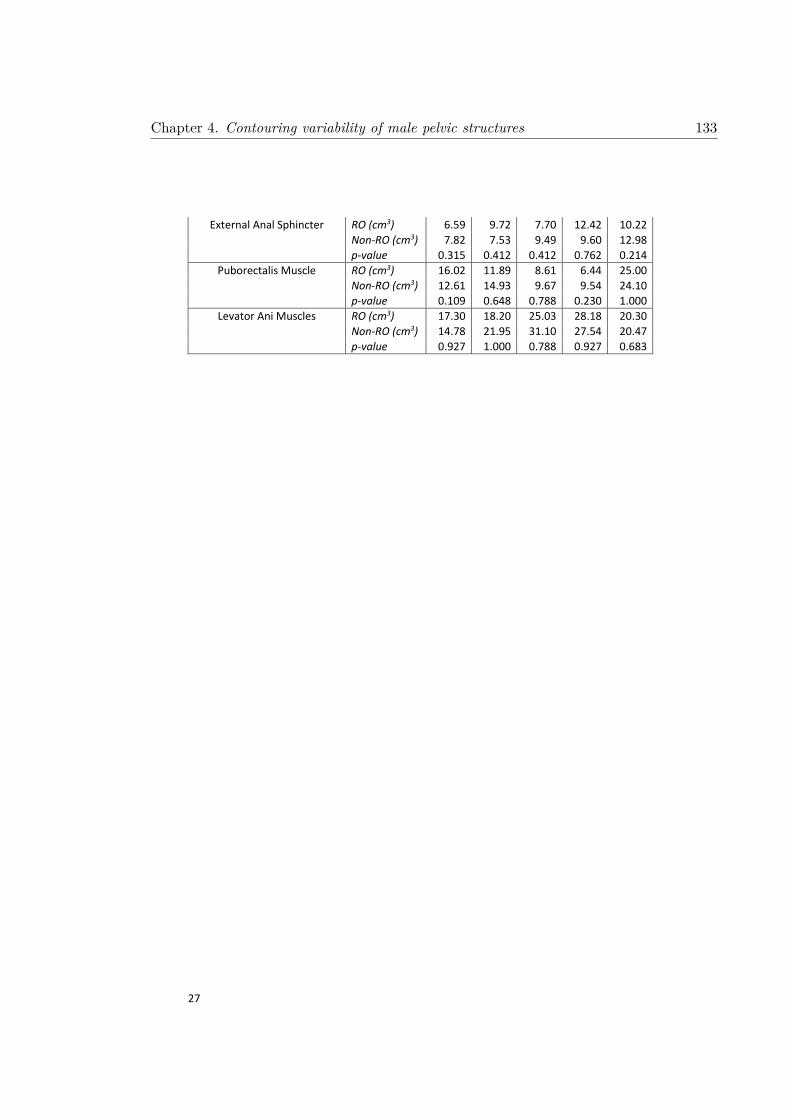
27
External Anal Sphincter RO (cm3) 6.59 9.72 7.70 12.42 10.22
Non-RO (cm3) 7.82 7.53 9.49 9.60 12.98
p-value 0.315 0.412 0.412 0.762 0.214
Puborectalis Muscle RO (cm3) 16.02 11.89 8.61 6.44 25.00
Non-RO (cm3) 12.61 14.93 9.67 9.54 24.10
p-value 0.109 0.648 0.788 0.230 1.000
Levator Ani Muscles RO (cm3) 17.30 18.20 25.03 28.18 20.30
Non-RO (cm3) 14.78 21.95 31.10 27.54 20.47
p-value 0.927 1.000 0.788 0.927 0.683
Chapter 4. Contouring variability of male pelvic structures 133

Multi-Observer Segmentation Study – Male Pelvis - Organ-specific Instructions
Naming convention, Structure_ID_Initials (e.g., Seminal_Vesc_XX)
Chapter 4. Contouring variability of male pelvic structures 134
4.2 Supplementary Material B

CT CONTOURING CHECKLIST
Prostate
☐ Contoured on CT (‘CTV_CT’)
Seminal Vesicles
☐ Contoured on CT (‘Seminal_Vesc’)
Rectum
☐ Contoured on CT (‘Rectum’)
☐ Most inferior contour level with ischial tuberosities
☐ Most superior contour at sigmoid colon
Distal Colon
☐ Contoured on CT (‘Colon’)
☐ Most superior contour 3 cm above rectum
Bowel Bag
☐ Contoured on CT (‘Bowel_Bag’)
☐ Most inferior contour small/large bowel loop?
☐ If yes, rectum is included.
☐ Most superior contour 3 cm above rectum
☐ Bladder included in Bowel Bag
Bladder
☐ Contoured on CT (‘Bladder’)
☐ Bladder contour includes bladder neck
Peri-Rectal Space
☐ Contoured on CT (‘PRS’)
☐ Most superior contour 2 cm above CTV
☐ Most inferior contour 2 cm below CTV
Chapter
4.Contouring
variabilityofm
alepelvic
structures135

MR CONTOURING CHECKLIST
Prostate
☐ Contoured on MR (‘CTV_MR’)
Trigone
☐ Contoured on MR (‘Trigone’)
Membranous Urethra
☐ Contoured on MR (‘Memb_Urethra’)
☐ Most superior contour starts below prostatic apex
☐ Most inferior contour finishes at penile bulb
Penile Bulb
☐ Contoured on MR (‘Penile_Bulb’)
☐ Located below membranous urethra and urogenital diaphragm
Neurovascular Bundle
☐ Contoured on MR (‘Neuro_Bundle’)
Pelvic Floor Muscles
☐ Contoured on MR
☐ Internal anal sphincter (‘IAS’)
☐ External anal sphincter (‘EAS’)
☐ Puborectalis muscle (‘PRM’)
☐ Levator ani muscles (‘LAM’)
Chapter
4.Contouring
variabilityofm
alepelvic
structures136
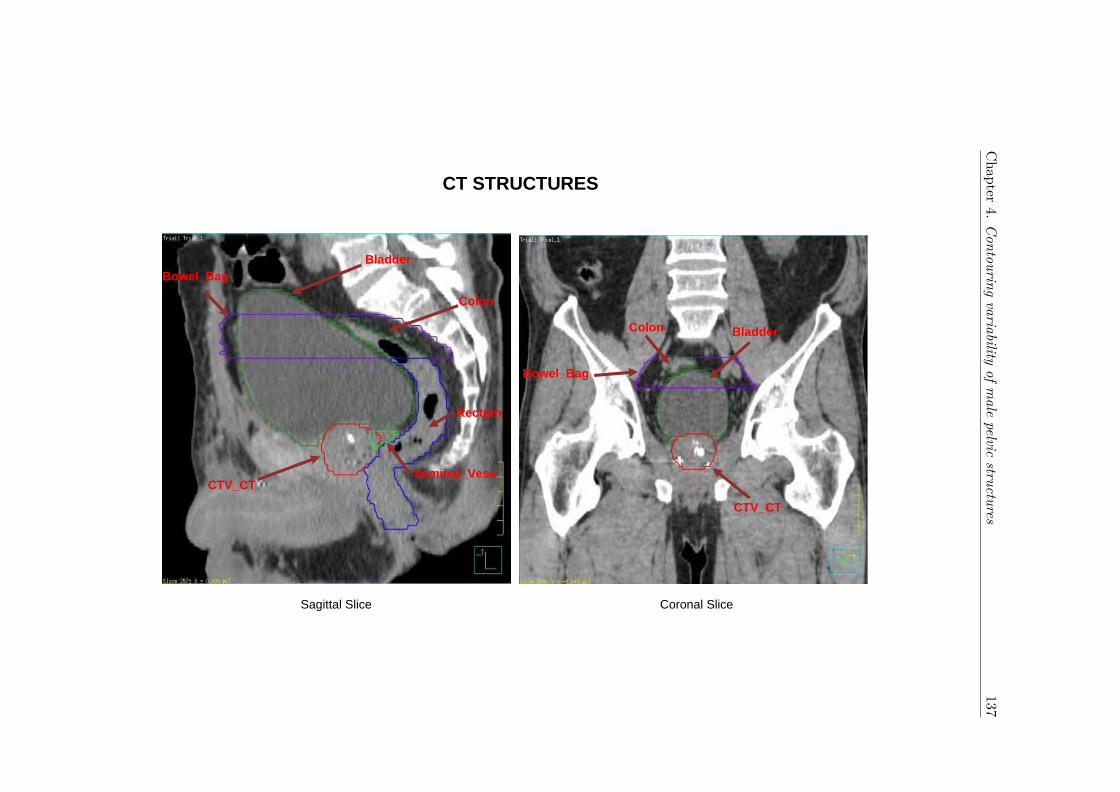
CT STRUCTURES
Sagittal Slice Coronal Slice
Bladder
Colon
Rectum
Seminal_Vesc
CTV_CT
Bowel_Bag
Bladder
CTV_CT
Colon
Bowel_Bag
Chapter
4.Contouring
variabilityofm
alepelvic
structures137
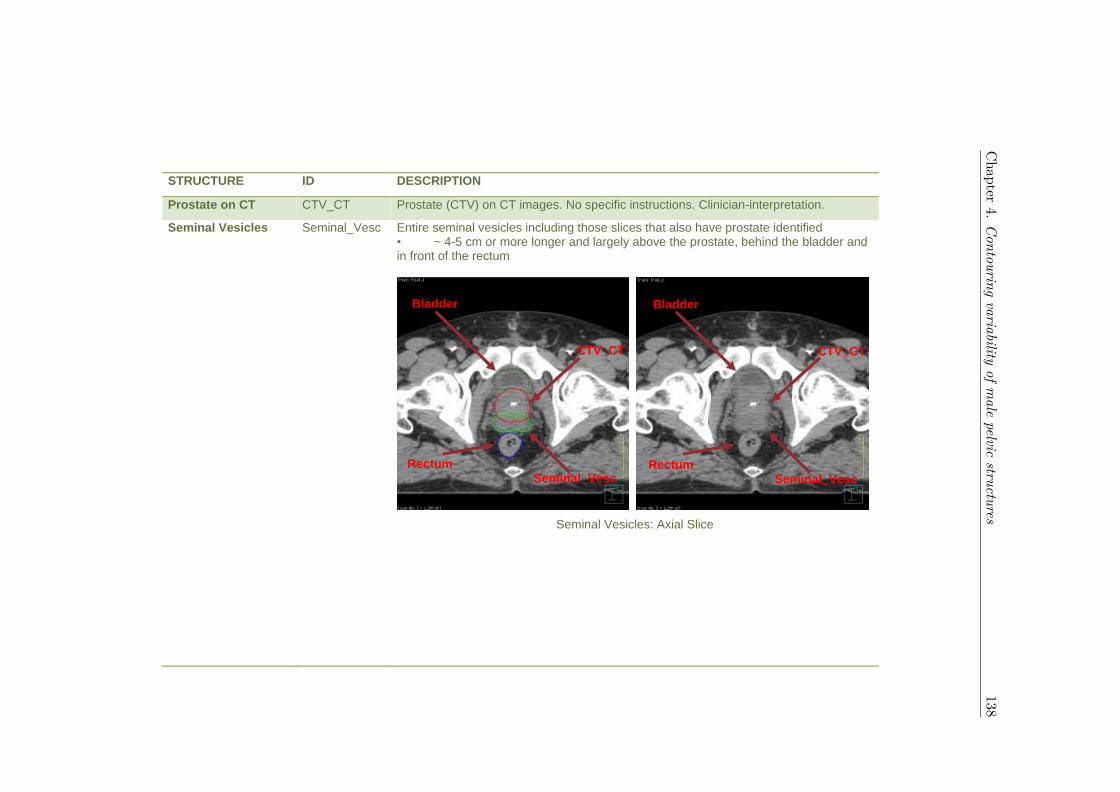
STRUCTURE ID DESCRIPTION
Prostate on CT CTV_CT Prostate (CTV) on CT images. No specific instructions. Clinician-interpretation.
Seminal Vesicles Seminal_Vesc Entire seminal vesicles including those slices that also have prostate identified • ~ 4-5 cm or more longer and largely above the prostate, behind the bladder and in front of the rectum
Seminal Vesicles: Axial Slice
Bladder
CTV_CT
Seminal_Vesc
Rectum
Bladder
CTV_CT
Seminal_Vesc
Rectum
Chapter
4.Contouring
variabilityofm
alepelvic
structures138
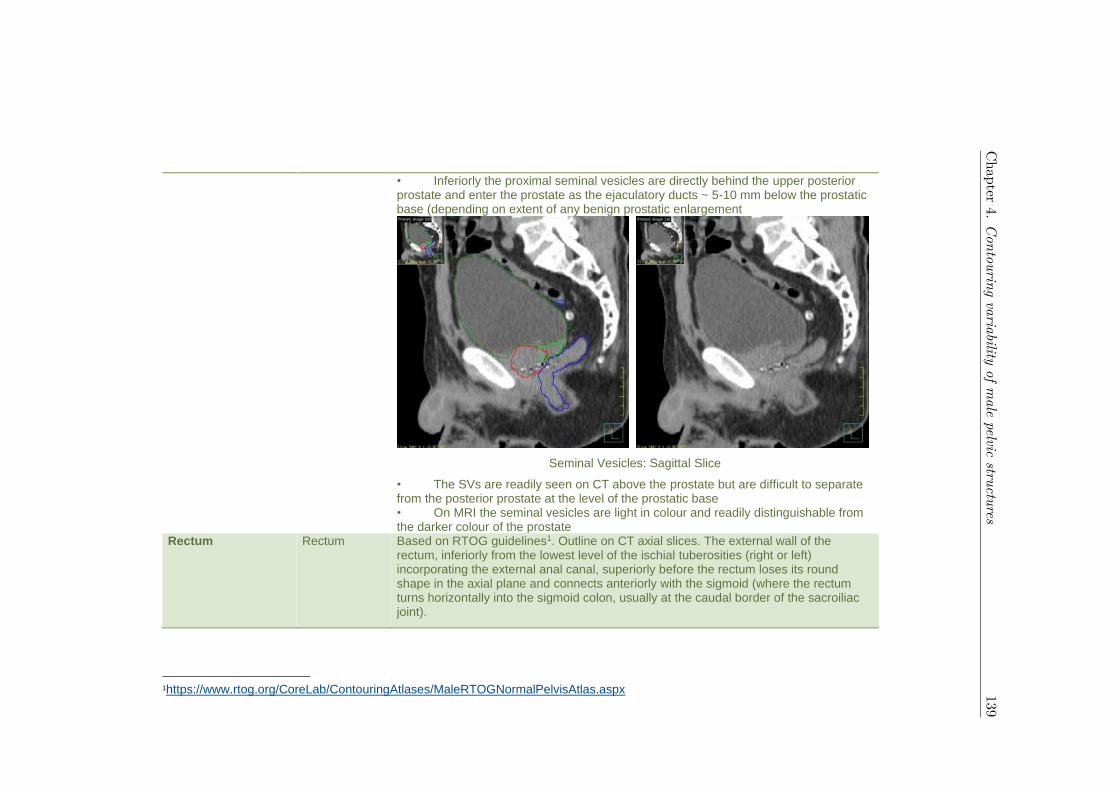
• Inferiorly the proximal seminal vesicles are directly behind the upper posterior prostate and enter the prostate as the ejaculatory ducts ~ 5-10 mm below the prostatic base (depending on extent of any benign prostatic enlargement
Seminal Vesicles: Sagittal Slice
• The SVs are readily seen on CT above the prostate but are difficult to separate from the posterior prostate at the level of the prostatic base • On MRI the seminal vesicles are light in colour and readily distinguishable from the darker colour of the prostate
Rectum Rectum Based on RTOG guidelines1. Outline on CT axial slices. The external wall of the rectum, inferiorly from the lowest level of the ischial tuberosities (right or left) incorporating the external anal canal, superiorly before the rectum loses its round shape in the axial plane and connects anteriorly with the sigmoid (where the rectum turns horizontally into the sigmoid colon, usually at the caudal border of the sacroiliac joint).
1https://www.rtog.org/CoreLab/ContouringAtlases/MaleRTOGNormalPelvisAtlas.aspx
Chapter
4.Contouring
variabilityofm
alepelvic
structures139

Rectum: Inferior Slice Rectum: Superior Slice
Rectum: Sagittal Slice
First slice ischial tuberosities are visible
Last slice before rectum loses round shape
Chapter
4.Contouring
variabilityofm
alepelvic
structures140

Distal Colon Colon Outline on CT axial slices. Large bowel, from the superior extent of the rectum contour, continuing 3 cm superiorly.
Colon: Inferior Slice Colon: Superior Slice
Colon: Sagittal Slice
Colon
Colon
3 cm
Chapter
4.Contouring
variabilityofm
alepelvic
structures141

Bowel Bag Bowel_Bag The Bowel_Bag is a simpler way of contouring the bowel, and will encompass the small-bowel and colon. Contour the abdominal contents, excluding muscle and bones. Contour every other slice when the contour is not changing rapidly – interpolate and edit as needed. Finally, subtract any overlapping non-GI normal structures. Stop contouring superiorly 3 cm above rectum, and inferiorly at the level of whichever is most inferior of the rectum or the most inferior small or large bowel loop.
Bowel Bag: Inferior Slice Bowel Bag: Superior Slice
Bowel_Bag
Chapter
4.Contouring
variabilityofm
alepelvic
structures142

Bowel Bag: Sagittal Slice
Bowel_Bag and Colon outlines contoured up to same superior slice
Chapter
4.Contouring
variabilityofm
alepelvic
structures143
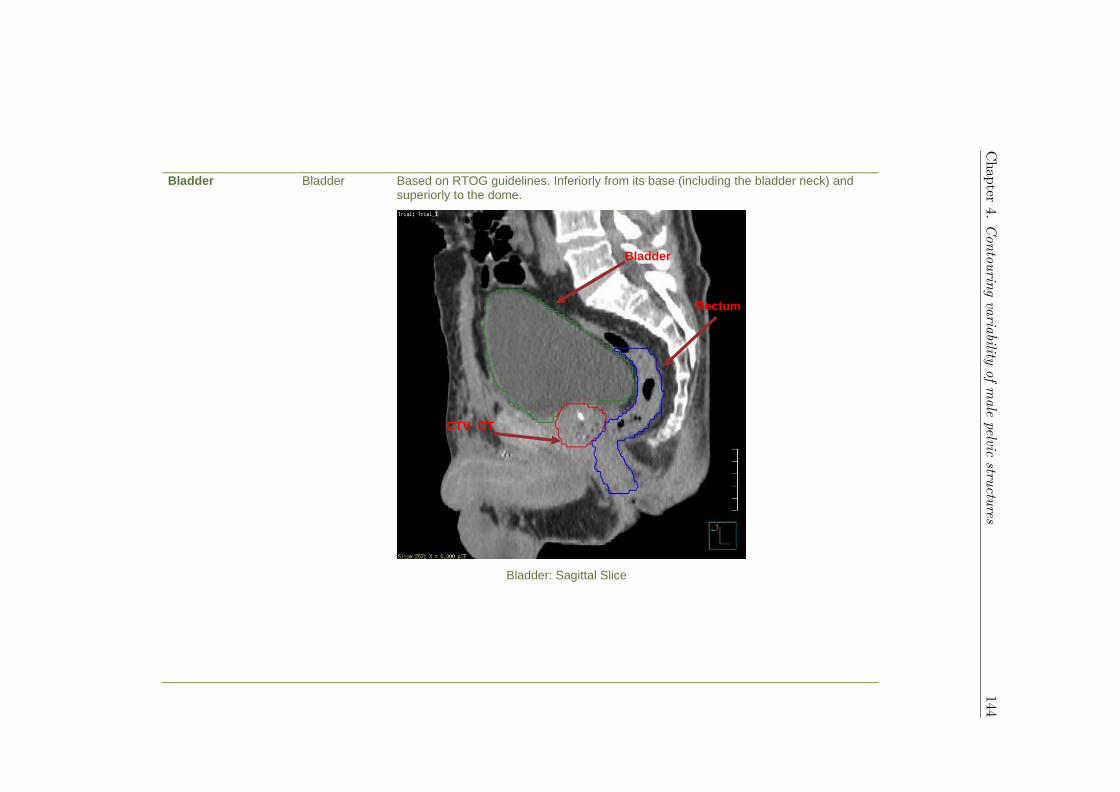
Bladder Bladder Based on RTOG guidelines. Inferiorly from its base (including the bladder neck) and superiorly to the dome.
Bladder: Sagittal Slice
Bladder
Rectum
CTV_CT
Chapter
4.Contouring
variabilityofm
alepelvic
structures144
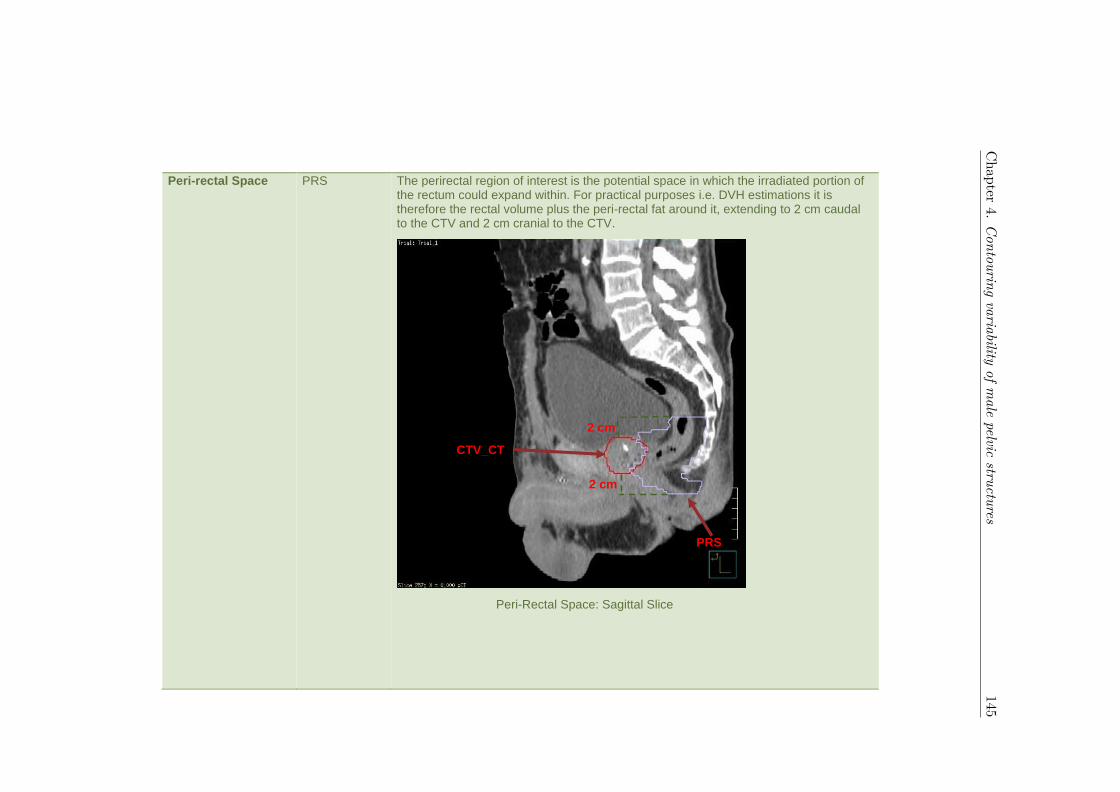
Peri-rectal Space PRS The perirectal region of interest is the potential space in which the irradiated portion of the rectum could expand within. For practical purposes i.e. DVH estimations it is therefore the rectal volume plus the peri-rectal fat around it, extending to 2 cm caudal to the CTV and 2 cm cranial to the CTV.
Peri-Rectal Space: Sagittal Slice
PRS
2 cm
CTV_CT
2 cm
Chapter
4.Contouring
variabilityofm
alepelvic
structures145

Anteriorly the perirectal fat space is defined by a coronal plane midway through the prostate. Posteriorly the perirectal fat space is defined by the anterior border of sacrum (i.e. the sacral hollow), the anterior surface of the coccyx and, caudal to this, the anterior borders of the gluteal muscles.
The caudal perpendicular line that defines the caudal extent of the peri-rectal fat space may in some cases be so caudally situated that it passes through the pelvic floor musculature.
Peri-Rectal Space: Axial Slice
Chapter
4.Contouring
variabilityofm
alepelvic
structures146
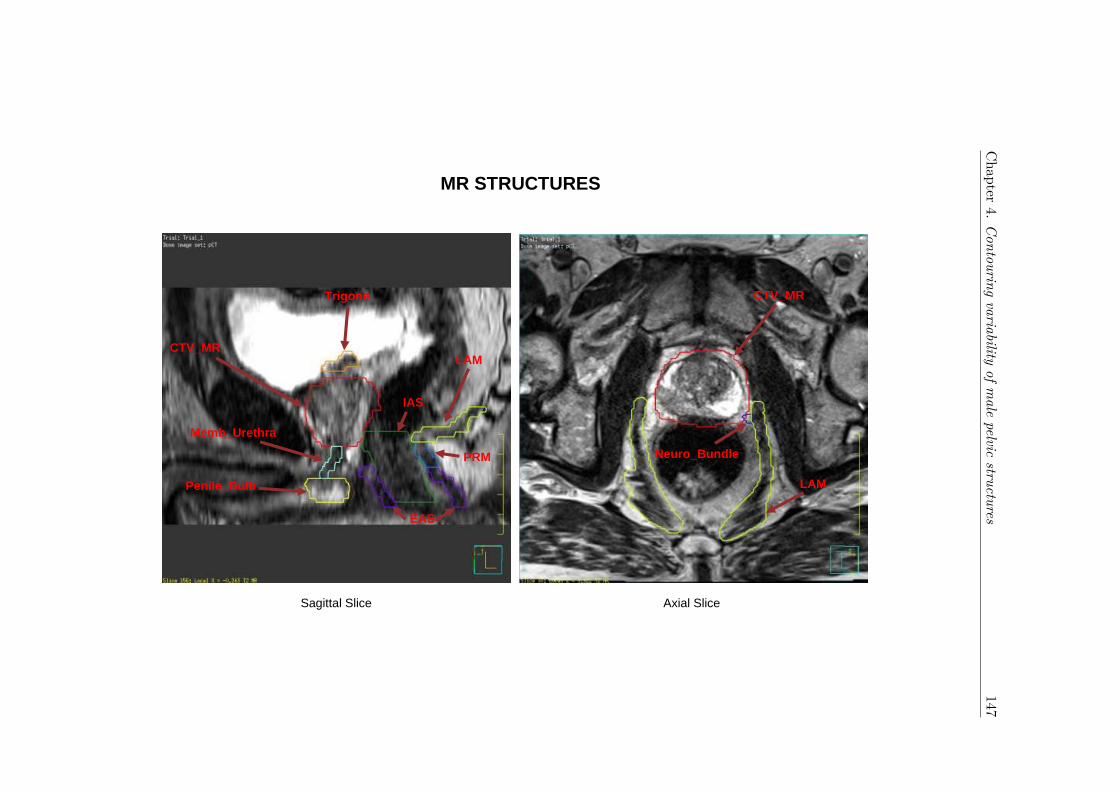
MR STRUCTURES
Sagittal Slice Axial Slice
CTV_MR
Memb_Urethra
Penile_Bulb
CTV_MR
Neuro_Bundle
Trigone
LAM
PRM
EAS
IAS
LAM
Chapter
4.Contouring
variabilityofm
alepelvic
structures147
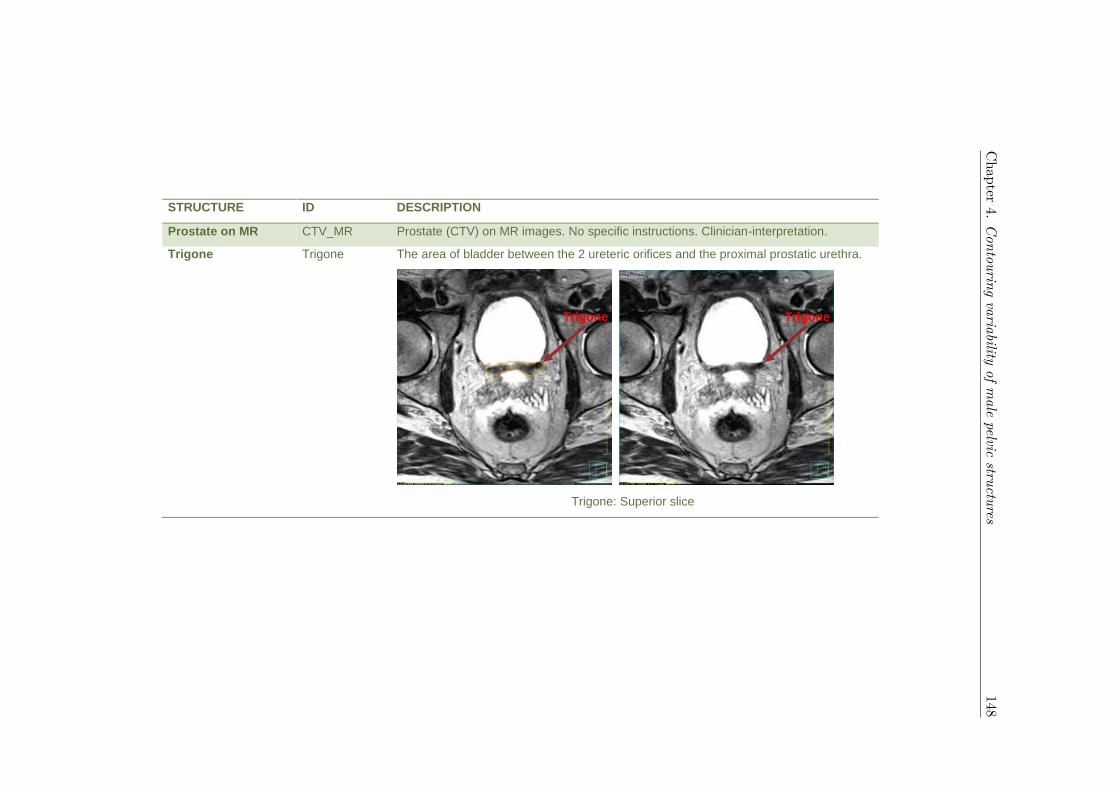
STRUCTURE ID DESCRIPTION
Prostate on MR CTV_MR Prostate (CTV) on MR images. No specific instructions. Clinician-interpretation.
Trigone Trigone The area of bladder between the 2 ureteric orifices and the proximal prostatic urethra.
Trigone: Superior slice
Trigone
Trigone
Chapter
4.Contouring
variabilityofm
alepelvic
structures148
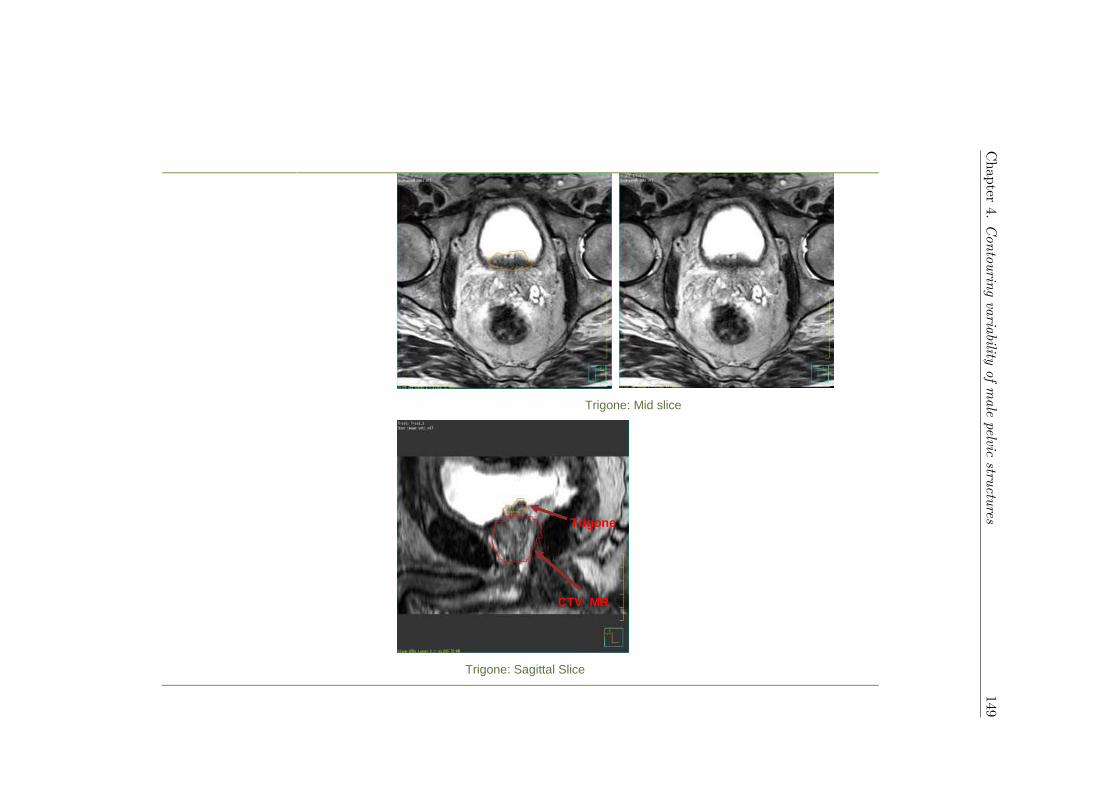
Trigone: Mid slice
Trigone: Sagittal Slice
CTV_MR
Trigone
Chapter
4.Contouring
variabilityofm
alepelvic
structures149
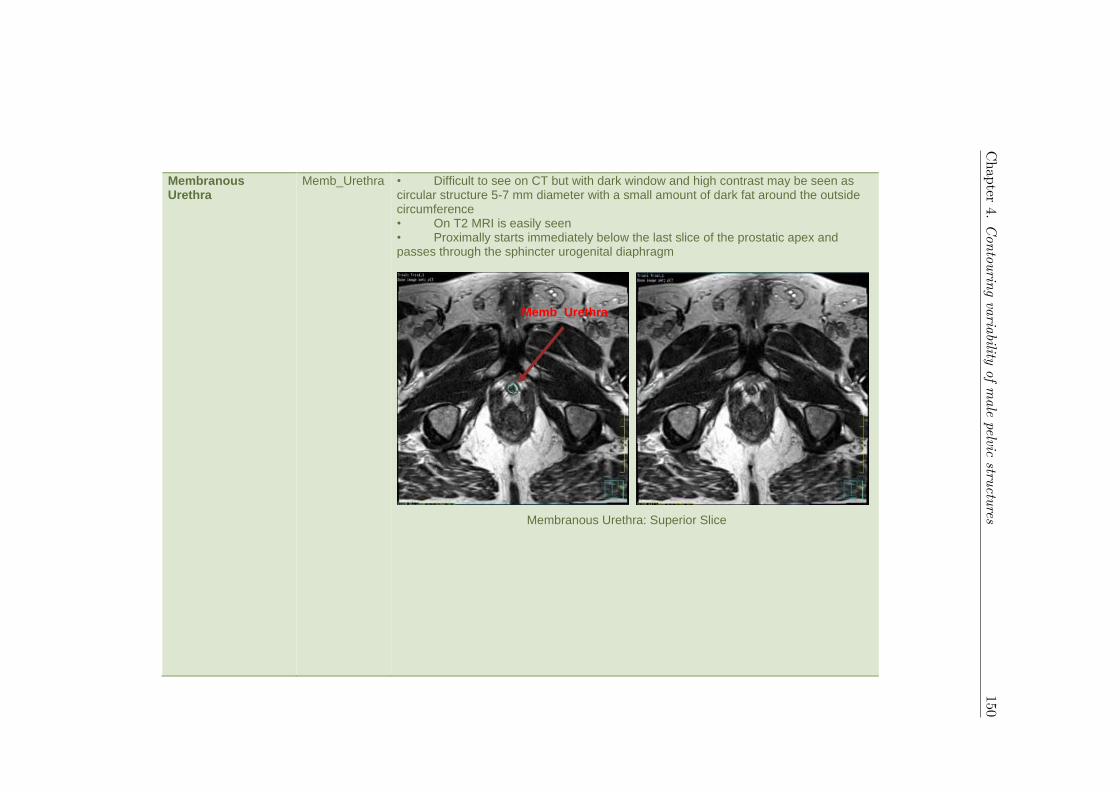
Membranous Urethra
Memb_Urethra • Difficult to see on CT but with dark window and high contrast may be seen as circular structure 5-7 mm diameter with a small amount of dark fat around the outside circumference • On T2 MRI is easily seen • Proximally starts immediately below the last slice of the prostatic apex and passes through the sphincter urogenital diaphragm
Membranous Urethra: Superior Slice
Memb_Urethra
Chapter
4.Contouring
variabilityofm
alepelvic
structures150

• Ends after 5-15 mm length as it enters the penile bulb and becomes penile urethra
Membranous Urethra: Inferior Slice
Chapter
4.Contouring
variabilityofm
alepelvic
structures151

Penile Bulb Penile_Bulb • Best visualised on MRI being white on T2 MRI and lying below membranous urethra and urogenital diaphragm • On CT best seen on axial view, and is anterior to anus and usually separated from it by a small rim of black fat • Best visualised with low brightness and dark contrast. In an axial view it is oval in shape • It is approximately 1 cm proximal to distal and is usually just above the bottom of the ischial tuberosities
Penile Bulb: Superior Slice
Penile_Bulb
Chapter
4.Contouring
variabilityofm
alepelvic
structures152

• Anteriorly it blends with the crus and corpora of the penis and on MRI the penile urethra is seen running anteriorly from it • The penile bulb is small proximally and distally blending with the urogenital diaphragm and fat respectively • The distal membranous urethra becomes the bulbar urethra and distally the bulbar urethra becomes the penile urethra • These transitions are not readily seen on CT but readily visible on MRI T2 sequence
Penile Bulb: Inferior Slice
Chapter
4.Contouring
variabilityofm
alepelvic
structures153

Neurovascular Bundle
Neuro_Bundle • May be seen on MRI as a bundle running down postero lateral aspect of both sides of prostate. However sometimes is more spread out anteriorly and posteriorly and not seen
Neurovascular Bundle: Superior Slice
Neuro_Bundle
CTV_MR
Neuro_Bundle
CTV_MR
Chapter
4.Contouring
variabilityofm
alepelvic
structures154
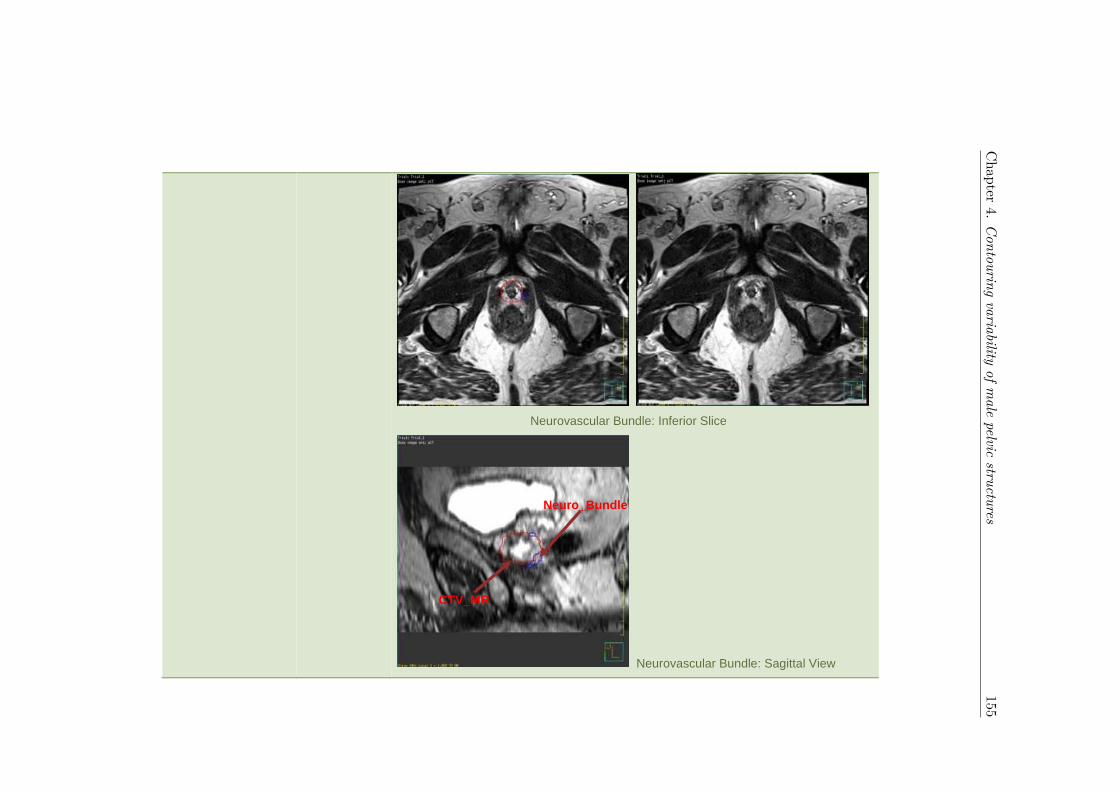
Neurovascular Bundle: Inferior Slice
Neurovascular Bundle: Sagittal View
Neuro_Bundle
CTV_MR
Chapter
4.Contouring
variabilityofm
alepelvic
structures155

Pelvic Floor Muscles IAS
EAS
PRM
LAM
• Four pelvic floor muscles are considered to be involved in normal faecal continence, which can be delineated separately on MRI images:
Pelvic Floor Muscles: Sagittal Slice
PRM
LAM
EAS
IAS
Chapter
4.Contouring
variabilityofm
alepelvic
structures156

Internal anal sphincter (IAS) - the distal continuation of the smooth muscle layer of the rectum and is usually delineated when contouring the anal canal.
IAS: Inferior slice IAS: Superior slice
IAS
Chapter
4.Contouring
variabilityofm
alepelvic
structures157

External anal sphincter (EAS) - partially encircles the IAS. It is separated from the IAS by the intersphincteric space, which can be distinguished on the axial CT-slices as a thin hypodense separation between both anal sphincters.
EAS: Inferior slice EAS: Superior slice
EAS
Chapter
4.Contouring
variabilityofm
alepelvic
structures158

Puborectalis muscle (PRM) - a U-shaped muscle, which forms a sling around the anorectal junction, thereby creating the anorectal angle; it is inserted to the pubic bone.
PRM: Inferior slice PRM: Superior slice
PRM
Chapter
4.Contouring
variabilityofm
alepelvic
structures159

Levator ani muscles (LAM) - Cranially, form a plate-like continuation of the PRM.
LAM: Inferior slice LAM: Superior slice
LAM
Chapter
4.Contouring
variabilityofm
alepelvic
structures160

Detail of genito-urinary structures
Figure 1 mid bulb on MRI
Figure 2 Mid bulb on CT
Proximal penile bulb
Distal penile bulb
Bulb Crus
corpora
Anus
Bulb
Bulb Bulb
Bulb
penile urethra
Bulb
bulbar urethra
Chapter 4. Contouring variability of male pelvic structures 161

CHAPTER 5
Spatial analysis of target volume contours
within three international prostate
radiotherapy trials – Clinical impact of
contouring variability on patient outcome
162

Chapter 5. Clinical impact of contouring variability on patient outcome 163
Spatial analysis of target volume contours withinthree international prostate radiotherapy trials -Clinical impact of contouring variability on patientoutcomeD. Roach1,2,3, J. W. Denham4, D. J. Joseph5,6,7, S. L. Gulliford8, D. P. Dearnaley9, M. R.
Sydes10, E.Hall11, A. Steigler4, J. A. Dowling1,12,13,14, A. Kennedy15, A. Haworth16, M. G.
Jameson1,2,3,12, M. Marcello5,15, P. Greer14,17, L. C. Holloway1,2,3,12,16, M. A. Ebert5,6,12,15
1Faculty of Medicine, University of New South Wales, New South Wales, Australia2Ingham Institute for Applied Medical Research, New South Wales, Australia3Department of Radiation Oncology, Liverpool and Macarthur Cancer Therapy Centres,
New South Wales, Australia4School of Medicine and Public Health, University of Newcastle, New South Wales, Aus-
tralia5University of Western Australia, Western Australia, Australia65D Clinics, Claremont, Western Australia, Australia7GenesisCare, Western Australia, Australia8Radiotherapy Department, University College London Hospitals NHS Foundation Trust,
London, United Kingdom9Academic UroOncology Unit, The Institute of Cancer Research and Royal Marsden Hos-
pital, London, United Kingdom10MRC Clinical Trials Unit, Medical Research Council, United Kingdom11Clinical Trials and Statistics Unit, The Institute of Cancer Research, London, United
Kingdom12Centre for Medical Radiation Physics, University of Wollongong, New South Wales, Aus-
tralia13Australian e-Health Research Centre, CSIRO, Royal Brisbane Hospital, Queensland,
Australia14School of Mathematical and Physical Sciences, University of Newcastle, New South
Wales, Australia15Department of Radiation Oncology, Sir Charles Gairdner Hospital, Western Australia,

Chapter 5. Clinical impact of contouring variability on patient outcome 164
Australia16School of Physics, Institute of Medical Physics, University of Sydney, New South Wales,
Australia17Calvary Mater Newcastle Hospital, New South Wales, Australia
5.1 Abstract
5.1.1 Background and Purpose
Non-compliant contouring of target volumes can lead to poorer patient outcome and mask
potential findings within clinical trials. This study retrospectively investigated correlations
between contouring variations of the clinical target volume (CTV) and recorded patient
outcomes within the RADAR, RT01, and CHHiP randomised prostate radiotherapy clin-
ical trials.
5.1.2 Materials and Methods
Prostate-only CTVAtlas were automatically contoured upon the RADAR, RT01, and
CHHiP clinical trial datasets using a previously validated male pelvic atlas. Variations
between the original contour CTVManual and CTVAtlas were evaluated using Distance-
to-Agreement (DtA) vector mappings, which incorporated spatial information during as-
sessment. Correlations between DtA vectors and recorded patient outcome measures were
assessed using Cox Proportional Hazards Modelling.
5.1.3 Results
Significant variations between CTVManual and CTVAtlas were observed at the bladder
and rectum boundaries. Insufficient contouring of CTVManual relative to CTVAtlas in
the vicinity of the bladder significantly correlated with an increased risk of patient death

Chapter 5. Clinical impact of contouring variability on patient outcome 165
(median HR = 0.57, 0.36, 0.70 for RADAR, RT01 and CHHiP) and PSA progression (me-
dian HR = 0.37, 0.56 for RT01 and CHHiP). PSA progression correlated with insufficient
contouring of CTVManual around the rectum for RADAR patients (median HR = 0.55).
Increased risk of local progression correlated with insufficient contouring at the anterior-
inferior boundary of CTVManual (median HR = 0.37, 0.16, 0.29 for RADAR, RT01 and
CHHiP).
5.1.4 Conclusion
Incorporation of DtA vector mappings allowed for a comprehensive spatial analysis of
contouring variations. Contouring variability of the CTV near the bladder and rectum
significantly increased the risk of poorer patient outcome following treatment.
5.2 Introduction
Accuracy in contouring remains one of the largest sources of geometric uncertainty in
radiotherapy [24, 228]. Deviations from protocol in target volume contouring have been
shown to reduce overall patient outcome [11, 23, 221, 222, 389], with potential findings
from clinical trials obfuscated [217, 390]. The need for high levels of quality assurance
(QA) policies for contouring during clinical trials have been recently re-emphasised [391],
with benchmarking cases highlighting the efficacy of these processes [392].
Uncertainties associated with contouring in radiotherapy have been thoroughly investi-
gated [393], however a lack of consistency regarding how contouring variations are quan-
tified makes comparisons between studies problematic [25, 26]. It has been shown that
commonly utilised contouring metrics often do not correlate with one another [28]. To
account for this, current recommendations state contouring studies should incorporate
multiple metrics during analysis [25, 27]. However, it has been shown that commonly
utilised metrics correlate poorly with dosimetry [29, 30, 394]. Furthermore, these metrics
provide no spatial information during analysis, failing to identify the specific regions where
contouring variations are most prevalent.

Chapter 5. Clinical impact of contouring variability on patient outcome 166
There has been an ongoing desire for automatic contouring methods to be implemented
within clinical practice to reduce treatment planning times [28]. Additionally, utilisation
of automatic contouring allows for a consistent definition of the contour boundary, in-
dependent of uncertainties associated with manual contouring. Not only could clinical
QA procedures assess manually-derived contours against these automatically generated
contours [395, 396], but quality of contouring in clinical trials could be retrospectively
analysed. An assessment of contouring consistency between original and automatically
generated contours could be correlated with known clinical trial endpoints, providing a
link between contouring variations and recorded patient outcomes.
The aim of this manuscript is to provide a comprehensive analysis of the clinical impact
of contouring variations of the clinical target volume (CTV) for intact prostate radiother-
apy. Three large clinical trial datasets were investigated, with recorded patient outcomes
correlated with a spatial analysis of contouring uncertainties.
5.3 Materials and Methods
5.3.1 Clinical Trial Datasets
The Trans-Tasman Radiation Oncology Group (TROG) 03.04 Randomised Androgen De-
privation and Radiotherapy (RADAR) trial investigated the clinical benefit of short- versus
intermediate-term androgen deprivation therapy combined with conformal radiotherapy
for intermediate- and high-risk prostate cancer patients [278, 280]. Comprehensive QA
practices initiated for the RADAR trial included a set-up accuracy study, planning bench-
marking exercise, and periodic auditing of target and normal tissue contours [283, 285].
In total, 1071 patients were recruited between 2003 and 2007, with 814 receiving external
beam radiotherapy.
The Medical Research Council (MRC) RT01 phase 3 clinical trial investigated the efficacy
of dose escalation during conformal radiotherapy for localised prostate cancer [293, 294].
Between 1998 and 2002 843 patients were recruited, and randomly assigned to receive
either standard (64 Gy, 32 fractions), or dose escalated (74 Gy, 37 fractions) treatment.

Chapter
5.Clinicalim
pactofcontouringvariability
onpatientoutcom
e167
RADAR RT01 CHHiP
Clinical Trial DatasetsTrial Location Australia and New Zealand United Kingdom United KingdomAccrual Period 2003 - 2007 1998 - 2001 2002 - 2011Trial Registration ISRCTN90298520 ISRCTN47772397 ISRCTN97182923Ethics approval Hunter New England Human Re-
search Ethics Committee TrialID 03/06/11/3.02
North Thames Multi-centre Re-search Ethics Committee numberMREC/97/2/16
London Multi-centre ResearchEthics Committee number04/MRE02/10
Total Patients 1071 388 253Prostate-only CTVs 513 (47.9%) 82 (21.1%) 247 (97.6%)
Baseline VariablesPrescribed dose 66 Gy: 47 (9.16%) 64 Gy: 34 (41.46%) 57 Gy: 87 (35.22%)
70 Gy: 301 (58.67%) 74 Gy: 48 (58.54%) 60 Gy: 82 (33.20%)74 Gy: 165 (32.16%) 74 Gy: 78 (31.58%)
Disease risk group Gleason score ≤ 7: 374 (72.90%) T1b, T1c, T2a WITH PSA +[Gleason score - 6]*10 < 15: 44(53.66%)
T1b, T1c, T2a WITH PSA ≤10 AND Gleason score ≤ 6: 59(23.89%)
Gleason score > 7: 139 (27.10%) T1b, T1c, T2a WITH PSA +[Gleason score - 6]*10 ≥ 15; orT2b, T3a: 38 (46.34%)
Cancer Stage ≥ T2b, 10 < PSA≤ 20, or Gleason score > 6: 188(76.11%)
Cancer Stage T2: 395 (77.00%) T1, T2a: 60 (73.17%) T1, T2a: 182 (73.68%)T3/T4: 118 (23.00%) T2b, T3a: 22 (26.83%) T2b, T2c, T3a: 65 (26.32%)
Androgen deprivation 6 months: 261 (50.88%) 3 - 6 months: 82 (100.00%) Median 24 weeks: 247 (100.00%)therapy duration 18 months: 252 (49.12%)
Patient OutcomePatient Death 116 (22.6%) 20 (24.4%) 40 (16.2%)Local Progression 30 (5.9%) 12 (14.6%) 24(9.7%)PSA Progression 182 (35.5%) 38 (46.3%) 71 (28.7%)
Table 5.1: Patient numbers, baseline variables, and recorded patient outcome across each clinical trial. Patients were dichotomised basedon disease-risk groups and cancer stages. Baseline variable and patient outcome numbers are with respect to patients analysed.

Chapter 5. Clinical impact of contouring variability on patient outcome 168
Finally, the ‘Conventional or Hypofractionated High-dose Intensity Modulated Radiother-
apy in Prostate Cancer’ (CHHiP) trial was a large multicentre randomised phase 3 trial
investigating the non-inferiority of hypofractionated radiotherapy with standard treatment
for localised prostate cancer [308, 312]. 3216 patients were recruited between 2002 and
2011, with patients randomly assigned to either a single conventional radiotherapy arm (74
Gy, 37 fractions), or one of two hypofractionated radiotherapy arms (60 Gy, 20 fractions;
57 Gy, 19 fractions). Analysis in this manuscript utilises an early cohort of 253 CHHiP
participants for whom DICOM plan data was available prior to final CHHiP outcomes
reporting.
Patient numbers, baseline variables, and 5 to 10 year patient outcome data from these
clinical trials are shown in Table 5.1. Only patients where a prostate-only CTV contour
was identified were included during this investigation.
5.3.2 Atlas-Based Contouring
The methodology of developing and validating the male pelvic atlas utilised by this study
has been outlined in previous studies [397, 398]. In brief, 13 observers contoured prostate-
only CTV (with no additional margin) across 5 exemplar patient CT scans, defining the
atlas. Exemplar patients were rigidly and deformably registered to each clinical trial
patient investigated, with atlas CTVs propagated onto each clinical trial patient. Further
details regarding construction of the atlas can be found in Kennedy et al. [397].
Local-weighted voting, following the method of Dowling et al. [345], provided weight-
ings to all atlas CTVs based on localised image similarity between the exemplar patients
and the clinical trial patient. Weighted atlas CTVs were combined to produce a proba-
bility mapping of atlas-defined CTV agreement, whereupon thresholding this probability
mapping at 50% agreement defined CTVAtlas.

Chapter 5. Clinical impact of contouring variability on patient outcome 169
Figure 5.1: Schematic of Distance-to-Agreement (DtA) vector construction be-tween CTVAtlas (blue) and CTVManual (red). A vector propagating from thecentre-of-mass of CTVManual intersects CTVManual and CTVAtlas. DtA betweenCTVs along this vector is measured (red arrow), with positive DtA correspondingto CTVManual extending further outwards than CTVAtlas. Vectors were sampledevery 6°, in both azimuthal and elevation, providing a complete spatial mapping
of contouring variation.
5.3.3 Vector Mappings
Three-dimensional vector mappings, similar to the methodology proposed by Remeijer
et al., were utilised to assess contouring variations in this study [253]. A vector prop-
agating radially outwards from the centre-of-mass of the original trial CTV (hereon de-
fined CTVManual) intersects both CTVAtlas and CTVManual contours (Figure 5.1). The
distance-to-agreement (DtA) between CTVs along this vector is always measured from
CTVManual to CTVAtlas. Thus, positive DtA values correspond to CTVManual protruding
further outwards along the radial vector than CTVAtlas (i.e. over-contouring, Figure 5.1),
while negative DtA values correspond to CTVManual lying within the CTVAtlas contour
(i.e. under-contouring).
By defining the centre-of-mass of CTVManual as the origin, all clinical trial CTVs are
rigidly registered to this coordinate system. Consequently, all vectors will be oriented

Chapter 5. Clinical impact of contouring variability on patient outcome 170
identically for all patients, allowing for direct comparisons of contouring variations between
patients along each vector. These vectors were then constructed every 6°, in both azimuthal
and elevation coordinates, producing a three-dimensional mapping of contouring variation
between CTVManual and CTVAtlas. Three-dimensional mappings of DtA were projected
into two-dimensions, whereby spatial regions corresponding to neighbouring organs-at-risk
could be identified (Figure 5.2).
5.3.4 Statistical Analysis
Significant differences between CTVManual and CTVAtlas along each vector for each trial
were assessed using Wilcoxon signed rank tests. For each patient outcome listed in Table
5.1, along each vector a DtA cut-point (DCP) was determined that resulted in the greatest
statistical difference in outcome for patients dichotomised at this point. This was calcu-
lated using max-rank sum statistics, computed using the maxstat R package [399]. Hazard
ratios for patients dichotomised by the DCP were calculated for each outcome using Cox
Proportional Hazards modelling. Baseline variables listed in Table 5.1 were included as
potential control variables during analysis, following the method employed during previous
studies investigating these datasets [290].
This process was repeated for every vector, with a unique DCP calculated each time.
Vectors with a hazard ratio (HR) larger than 1 indicated that patients with DtA larger than
DCP had an increased risk of developing the investigated patient outcome. Conversely,
vectors with HR less than 1 indicated that it was patients with DtA less than DCP had
an increased risk of experiencing the recorded outcome.
Associated p-value mappings for hazard ratios were calculated, with p < 0.05 consid-
ered statistically significant. Being an exploratory investigation, unadjusted p-values were
utilised for analysis [400]. To investigate the impact of multiple testing on HR mappings,
Free Step-Down Resampling based on the methodology of Westfall and Young was utilised
to calculate adjusted p-value mappings [17].
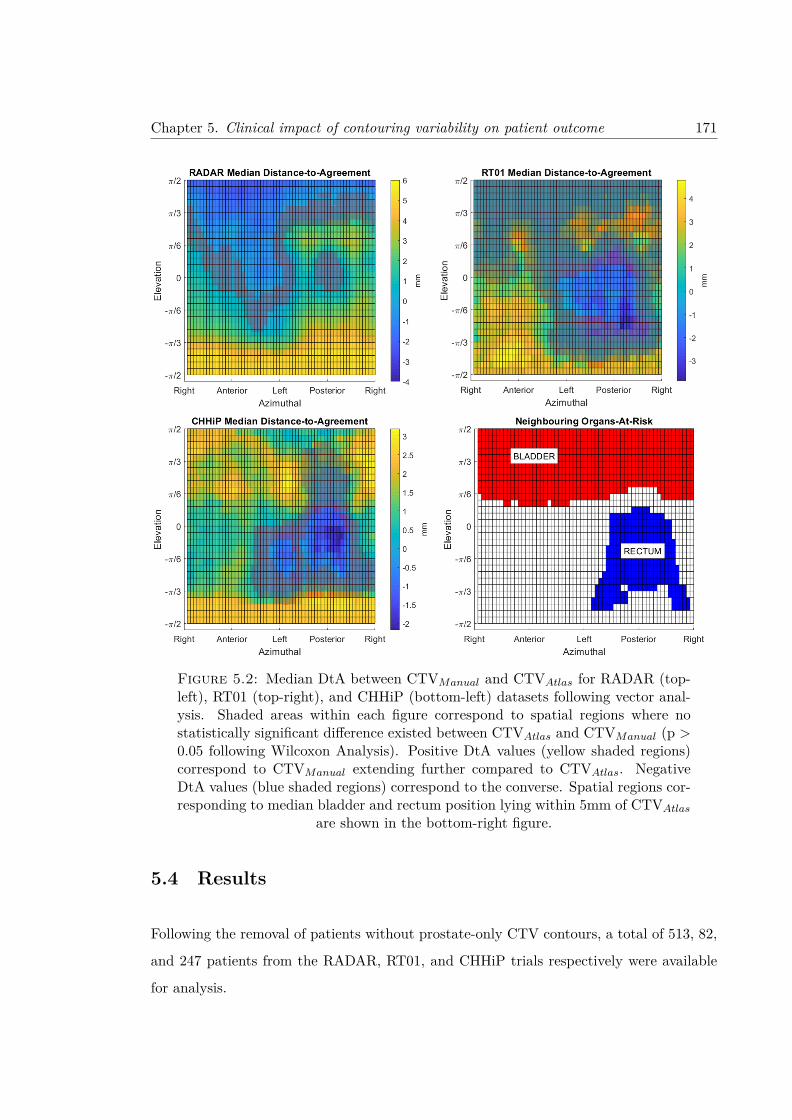
Chapter 5. Clinical impact of contouring variability on patient outcome 171
Figure 5.2: Median DtA between CTVManual and CTVAtlas for RADAR (top-left), RT01 (top-right), and CHHiP (bottom-left) datasets following vector anal-ysis. Shaded areas within each figure correspond to spatial regions where nostatistically significant difference existed between CTVAtlas and CTVManual (p >0.05 following Wilcoxon Analysis). Positive DtA values (yellow shaded regions)correspond to CTVManual extending further compared to CTVAtlas. NegativeDtA values (blue shaded regions) correspond to the converse. Spatial regions cor-responding to median bladder and rectum position lying within 5mm of CTVAtlas
are shown in the bottom-right figure.
5.4 Results
Following the removal of patients without prostate-only CTV contours, a total of 513, 82,
and 247 patients from the RADAR, RT01, and CHHiP trials respectively were available
for analysis.

Chapter 5. Clinical impact of contouring variability on patient outcome 172
Figure 5.3: Hazard Ratio mappings with corresponding significance levels foroverall patient survival across RADAR, RT01, and CHHiP trials.
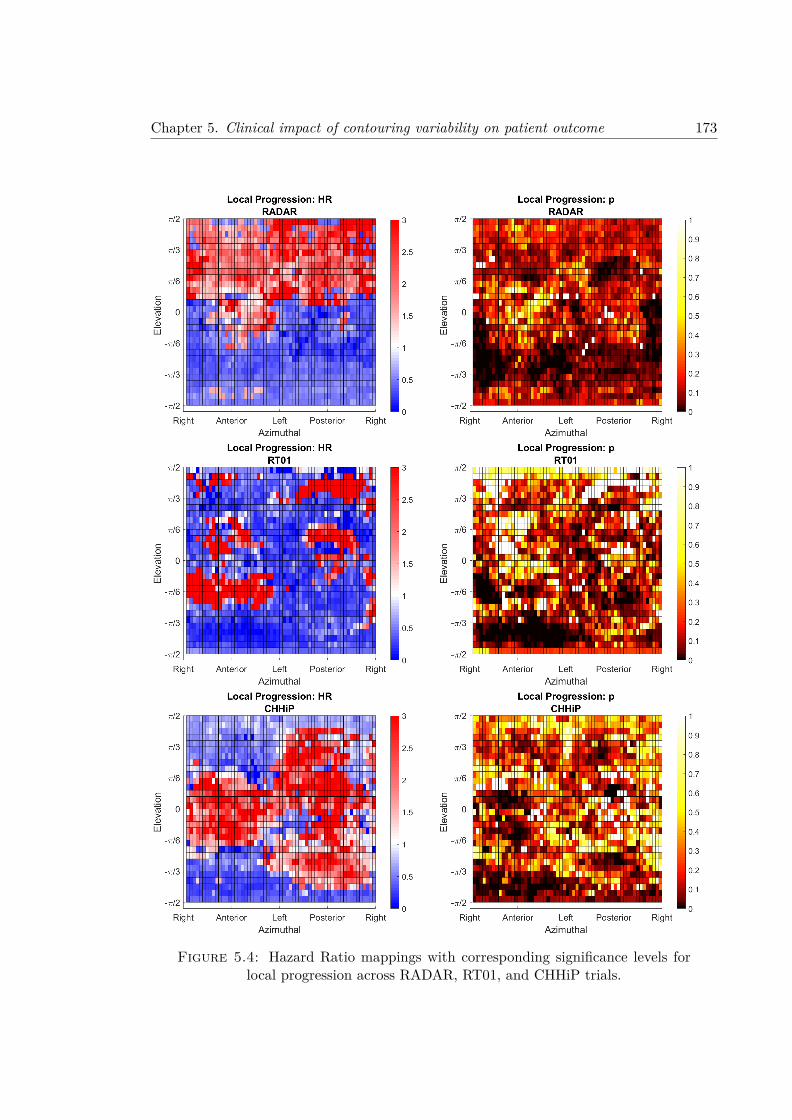
Chapter 5. Clinical impact of contouring variability on patient outcome 173
Figure 5.4: Hazard Ratio mappings with corresponding significance levels forlocal progression across RADAR, RT01, and CHHiP trials.

Chapter 5. Clinical impact of contouring variability on patient outcome 174
Figure 5.5: Hazard Ratio mappings with corresponding significance levels forPSA progression across RADAR, RT01, and CHHiP trials.

Chapter 5. Clinical impact of contouring variability on patient outcome 175
Median DtA mappings for RADAR, RT01, and CHHiP patients are shown in Figure 5.2.
Regions where DtA between CTVManual and CTVAtlas were not statistically significant are
shaded red. Spatial regions in close proximity of bladder and rectum (defined as median
OAR located within 5mm of CTVAtlas) are shown in the bottom right subfigure in Figure
5.2. CTVManual contours within the RADAR trial extended further inferiorly and posteri-
orly compared to CTVAtlas. Significant differences were observed in the superior-anterior
region, oriented towards the bladder, where CTVManual insufficiently covered CTVAtlas.
This was similarly observed for RT01 patients, however differences between CTVManual
and CTVAtlas were not statistically significant. CTVManual extended significantly further
in the inferior-anterior direction (towards membranous urethra and penile bulb), however
inadequately covered CTVAtlas in the vicinity of the rectum. CHHiP CTVs also displayed
a statistically significant region oriented towards the rectum where CTVManual inade-
quately covered CTVAtlas. However, coverage of CTVManual exceeded CTVAtlas towards
the bladder, as well as inferiorly towards the membranous urethra and penile bulb.
HR mappings for overall patient death across RADAR, RT01 and CHHiP are shown in
Figure 5.3, with associated DCP mappings found in the Supplementary Material (Figure
5.6). Near the bladder large spatial regions with statistically significant hazard ratios were
observed for RADAR (median HR = 0.57 for vectors with p < 0.05), RT01 (median HR
= 0.36), and CHHiP patients (median HR = 0.70). Adjacent to the rectum, correlations
were observed for RT01 (median HR = 0.29), however were less pronounced for RADAR
and CHHiP. Complete summaries of HR for the bladder and rectum spatial regions are
found in Tables 5.2, 5.3, and 5.4.
HR mappings for local progression across all trials are shown in Figure 5.4. No significant
results were observed near the bladder, while significant results adjacent the rectum were
only observed for RADAR (median HR = 0.37). RT01 and CHHiP patients displayed
regions of significance in the anterior-inferior orientation, while for RADAR these regions
were observed inferiorly, but slightly laterally. HRs for all three trials within these regions
were less than 1 (RADAR median HR = 0.37, RT01 median HR = 0.16, CHHiP median
HR = 0.29).
Figure 5.5 displays HR mappings for all three trials with respect to PSA progression, where
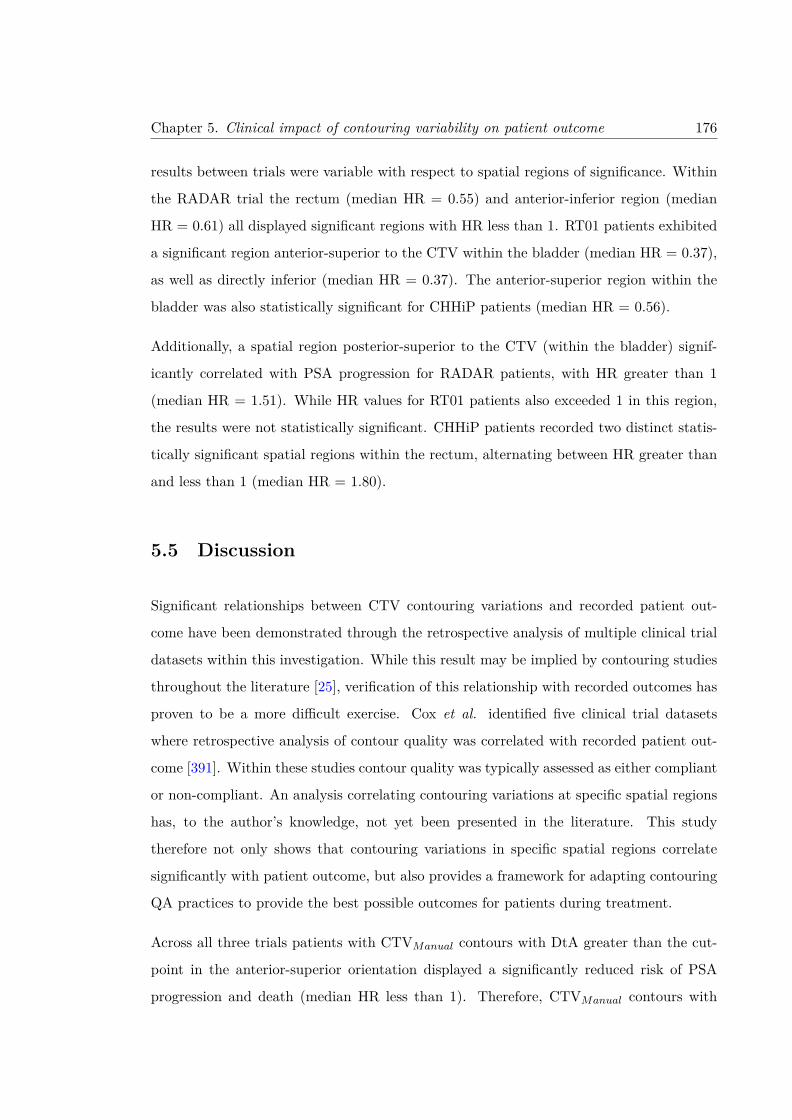
Chapter 5. Clinical impact of contouring variability on patient outcome 176
results between trials were variable with respect to spatial regions of significance. Within
the RADAR trial the rectum (median HR = 0.55) and anterior-inferior region (median
HR = 0.61) all displayed significant regions with HR less than 1. RT01 patients exhibited
a significant region anterior-superior to the CTV within the bladder (median HR = 0.37),
as well as directly inferior (median HR = 0.37). The anterior-superior region within the
bladder was also statistically significant for CHHiP patients (median HR = 0.56).
Additionally, a spatial region posterior-superior to the CTV (within the bladder) signif-
icantly correlated with PSA progression for RADAR patients, with HR greater than 1
(median HR = 1.51). While HR values for RT01 patients also exceeded 1 in this region,
the results were not statistically significant. CHHiP patients recorded two distinct statis-
tically significant spatial regions within the rectum, alternating between HR greater than
and less than 1 (median HR = 1.80).
5.5 Discussion
Significant relationships between CTV contouring variations and recorded patient out-
come have been demonstrated through the retrospective analysis of multiple clinical trial
datasets within this investigation. While this result may be implied by contouring studies
throughout the literature [25], verification of this relationship with recorded outcomes has
proven to be a more difficult exercise. Cox et al. identified five clinical trial datasets
where retrospective analysis of contour quality was correlated with recorded patient out-
come [391]. Within these studies contour quality was typically assessed as either compliant
or non-compliant. An analysis correlating contouring variations at specific spatial regions
has, to the author’s knowledge, not yet been presented in the literature. This study
therefore not only shows that contouring variations in specific spatial regions correlate
significantly with patient outcome, but also provides a framework for adapting contouring
QA practices to provide the best possible outcomes for patients during treatment.
Across all three trials patients with CTVManual contours with DtA greater than the cut-
point in the anterior-superior orientation displayed a significantly reduced risk of PSA
progression and death (median HR less than 1). Therefore, CTVManual contours with

Chapter 5. Clinical impact of contouring variability on patient outcome 177
DtA less than the cut-point in this orientation conversely had a significantly increased
risk of PSA progression and death. This region corresponds to the prostate and bladder
boundary, which can be difficult to distinguish on CT without the addition of a contrast
agent [252, 265]. Often this spatial region of the prostate receives less focus in contouring
guidelines, with recommendations stating that the boundary is easy to identify with the
addition of a contrast agent. Consequently, primary attention in these guidelines is given
towards the interface between prostate and rectum, as well as the prostatic apex [145]. If no
contrast agent is used, contouring in this region will become quite susceptible to potentially
significant variations. This was clearly seen for RADAR trial patients (Figure 5.2), where
median CTVManual was approximately 4 mm less than CTVAtlas in this region. Inadequate
contouring of the CTV in this region would result in an insufficient dose coverage, which
could lead to the poorer patient outcomes observed. A similar trend was observed for RT01
patients, however differences between CTVManual and CTVAtlas were not statistically
significant.
Significant differences in median DtA between CTVManual and CTVAtlas contours in the
posterior-inferior orientation (i.e., near the rectum) were observed for RT01 and CHHiP
trial patients. During prostate radiotherapy considerable effort is made to ensure large
doses are not delivered to the rectum to reduce potential rectal toxicities developing. This
could result in a conservative approach when contouring the CTV, additionally compro-
mising the dose coverage in this region. Interestingly, neither trial observed significant
correlations between contouring variation and patient outcome in this region. It should
be noted that median DtA between CTVManual and CTVAtlas for these trials was approx-
imately 1 mm. Additional margins applied to the manual CTVs would therefore generate
planning target volumes that would likely account for any potential insufficiency of the
CTVManual contour in this region.
Meanwhile, despite the median RADAR CTVManual exceeding the corresponding median
CTVAtlas in the vicinity of the rectum, hazard ratios for both local and PSA progression
were found to be statistically significant. While a hazard ratio less than unity corresponded
to an increased risk of progression for insufficiently contoured RADAR CTVManual con-
tours in this region, it is important to consider the DCP value utilised when calculating
these correlations (Figures 5.7 and 5.8). DCP of approximately 6 mm were calculated for

Chapter 5. Clinical impact of contouring variability on patient outcome 178
outcomes in this region for RADAR patients. These results may therefore be interpreted
as excessive contouring of CTVManual in this region significantly reducing local and PSA
progression, as opposed to inferior contouring resulting in poorer patient outcome.
Contours with DtA below the cut-point in the anterior-inferior orientation were found to
significantly correlate with an increased risk of local progression across all three trials.
Anatomically, this is where the urethra leaves the prostate as the membranous urethra
and passes through to the penile bulb. Interestingly, cut-points for local progression were
also positive in this region (Figure 5.7), although they were less than the median DtA for
each trial.
A consideration when undertaking this investigation is the interplay between CTV con-
touring variations and delivered dose distributions. This is particularly important when
the treatment delivery varied between trials. Conformal radiotherapy was utilised for
both RADAR and RT01 trials, while CHHiP patients received intensity-modulated ra-
diotherapy (IMRT) for treatment. IMRT treatment plans produce steep dose gradients
surrounding the target volume when compared to conformal radiotherapy, so the impact
of contouring variations could result in more substantial dose discrepancies. To ensure
adequate dose coverage of the CTV, particularly in the vicinity of the bladder, treatment
margins for CTV were modified in this region for the CHHiP clinical trial when compared
to RT01 [401].
While this study focussed on assessments of contouring variability for prostate-only CTV,
many patient datasets included an additional CTV that incorporated prostate and seminal
vesicles. The resulting dose distributions for these patients would obfuscate results in
the spatial region bordering the seminal vesicles, which was reflected in no statistically
significant correlations being observed in this region within this study. However, it should
be stressed that the remaining contour boundary would be invariant to the inclusion or
exclusion of the seminal vesicles when defining the CTV. Consequently, the results from
this study would not be impacted by the inclusion or exclusion of seminal vesicles during
treatment.
The multiple testing problem is a major concern for investigations with numerous measure-
ments, whereby the large number of tests performed resulting in a significant increase in

Chapter 5. Clinical impact of contouring variability on patient outcome 179
the likelihood of observing false positive results. The noise within the p-value mappings of
Figures 5.3, 5.4, and 5.5 could be interpreted as such, with statistically significant vectors
appearing at random throughout the mappings. Accounting for multiple testing in this
study is difficult, as the nature of vector construction means that tests between vectors are
not truly independent. Adjusted p-value mappings following the bootstrapping method of
Westfall and Young [17] are provided in the Supplementary Material for reference, how-
ever unadjusted p-value mappings were utilised during analysis. The authors deemed this
appropriate due to the highly conservative nature of the bootstrapping method, with many
significant results potentially obfuscated, as well as due to the exploratory nature of the
investigation [400].
To account for the potential of false positives, only statistically significant results in the
vicinity of neighbouring organs were reported in this study. Results could therefore be
explained by the uncertainty in contouring in the vicinity of these structures. While
significant results were not consistent between trials, it should be noted that the statistical
power of each trial differed substantially due to number of patients analysed (Table 5.1).
Across the three clinical trials data related to the clinical endpoints of overall survival,
local progression, and progression free survival were captured. The consistent recording
of data allowed for a unique investigation where direct comparisons between contouring
variations and outcome could be made, irrespective of the clinical pathways associated
with each endpoint. As this was an exploratory investigation, the primary purpose of
the study was to assess whether correlations could be observed for any endpoint. Future
studies could build upon the methodology developed in this study, overcoming the multiple
testing problem by investigating only a single clinically relevant endpoint such as overall
survival.
Another point of contention is the validity of the CTVAtlas contours. It had previously
been shown that the utilised male pelvic atlas displayed excellent localisation when defin-
ing the CTV, while having accuracy comparable to inter-observer variability [397, 398].
Utilisation of an automated approach allows for a reproducible method for contouring the
large number of patients across all trials. Consequently, while this trial lacked a true gold
standard, it did incorporate a consistently defined CTV across all patients from which DCP
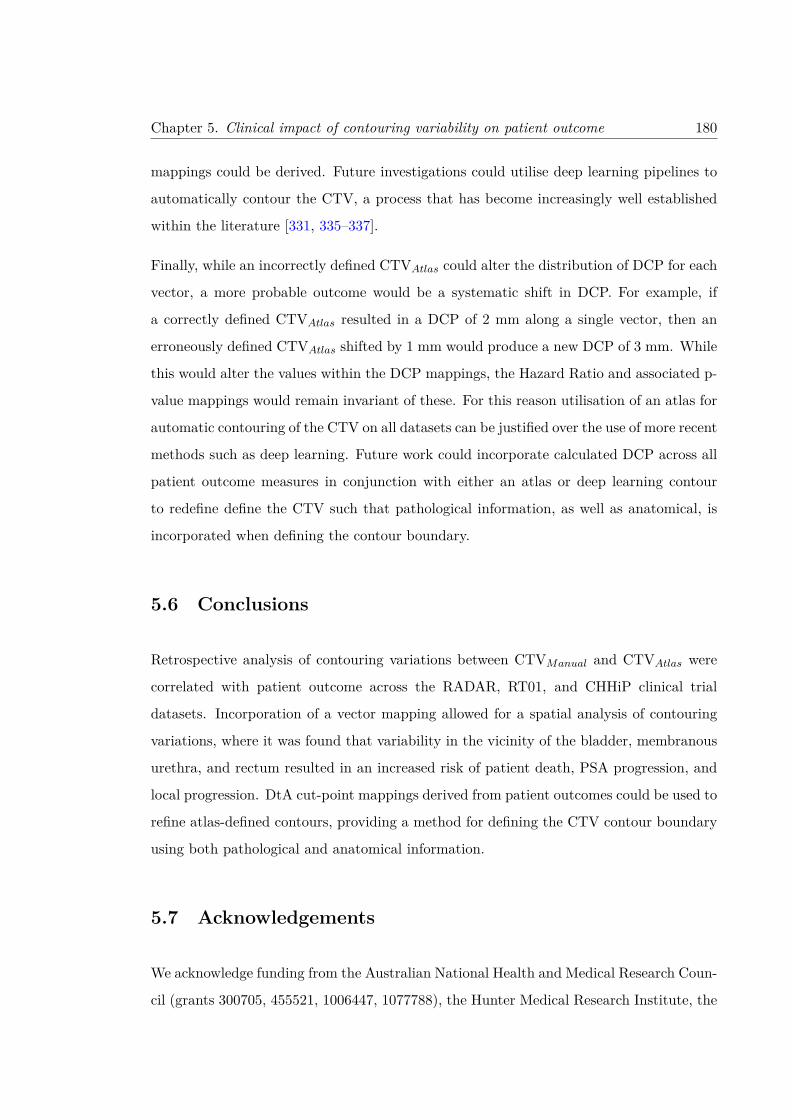
Chapter 5. Clinical impact of contouring variability on patient outcome 180
mappings could be derived. Future investigations could utilise deep learning pipelines to
automatically contour the CTV, a process that has become increasingly well established
within the literature [331, 335–337].
Finally, while an incorrectly defined CTVAtlas could alter the distribution of DCP for each
vector, a more probable outcome would be a systematic shift in DCP. For example, if
a correctly defined CTVAtlas resulted in a DCP of 2 mm along a single vector, then an
erroneously defined CTVAtlas shifted by 1 mm would produce a new DCP of 3 mm. While
this would alter the values within the DCP mappings, the Hazard Ratio and associated p-
value mappings would remain invariant of these. For this reason utilisation of an atlas for
automatic contouring of the CTV on all datasets can be justified over the use of more recent
methods such as deep learning. Future work could incorporate calculated DCP across all
patient outcome measures in conjunction with either an atlas or deep learning contour
to redefine define the CTV such that pathological information, as well as anatomical, is
incorporated when defining the contour boundary.
5.6 Conclusions
Retrospective analysis of contouring variations between CTVManual and CTVAtlas were
correlated with patient outcome across the RADAR, RT01, and CHHiP clinical trial
datasets. Incorporation of a vector mapping allowed for a spatial analysis of contouring
variations, where it was found that variability in the vicinity of the bladder, membranous
urethra, and rectum resulted in an increased risk of patient death, PSA progression, and
local progression. DtA cut-point mappings derived from patient outcomes could be used to
refine atlas-defined contours, providing a method for defining the CTV contour boundary
using both pathological and anatomical information.
5.7 Acknowledgements
We acknowledge funding from the Australian National Health and Medical Research Coun-
cil (grants 300705, 455521, 1006447, 1077788), the Hunter Medical Research Institute, the

Chapter 5. Clinical impact of contouring variability on patient outcome 181
Health Research Council (New Zealand), the University of Newcastle, the Calvary Mater
Newcastle, Abbott Laboratories and Novartis Pharmaceuticals. We gratefully acknowl-
edge the support of the Trans-Tasman Radiation Oncology Group, the Medical Research
Council Clinical Trials Unit at University College London, and the Institute of Cancer
Research UK. We also acknowledge NHS funding to the National Institute for Health Re-
search Biomedical Research Centre at the Royal Marsden NHS Foundation Trust and The
Institute of Cancer Research, London.
Chapter
5.Clinicalim
pactofcontouringvariability
onpatientoutcom
e182
5.8 Supplementary Material A
Figure 5.6: DtA Cut-points (DCP) across RADAR, RT01, and CHHiP patients, based on recorded patient death. Each vectorcut-point was calculated using max-rank sum statistics, whereby patients dichotomised by DCP result in the most significant
difference in patient outcome calculated by Wilcoxon rank sum test.
Chapter
5.Clinicalim
pactofcontouringvariability
onpatientoutcom
e183
Figure 5.7: DtA Cut-points (DCP) across RADAR, RT01, and CHHiP patients, based on local progression.

Chapter
5.Clinicalim
pactofcontouringvariability
onpatientoutcom
e184
Figure 5.8: DtA Cut-points (DCP) across RADAR, RT01, and CHHiP patients, based on PSA progression.
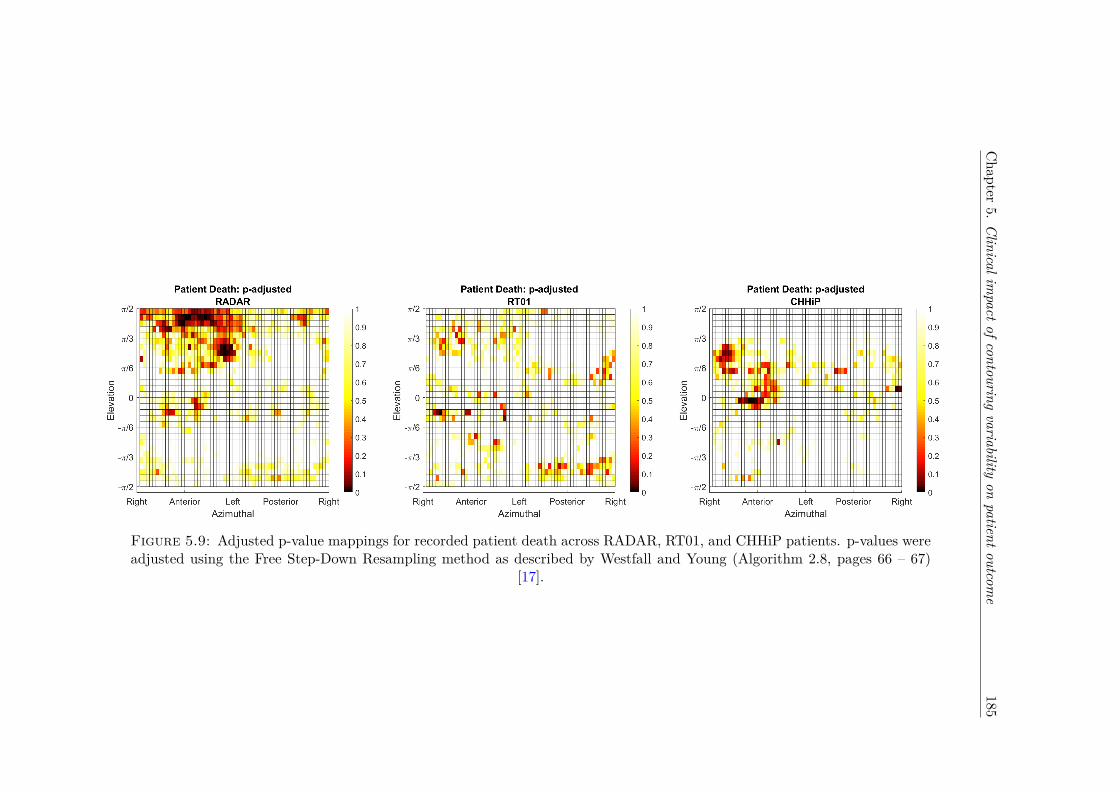
Chapter
5.Clinicalim
pactofcontouringvariability
onpatientoutcom
e185
Figure 5.9: Adjusted p-value mappings for recorded patient death across RADAR, RT01, and CHHiP patients. p-values wereadjusted using the Free Step-Down Resampling method as described by Westfall and Young (Algorithm 2.8, pages 66 – 67)
[17].

Chapter
5.Clinicalim
pactofcontouringvariability
onpatientoutcom
e186
Figure 5.10: Adjusted p-value mappings for local progression across RADAR, RT01, and CHHiP patients.

Chapter
5.Clinicalim
pactofcontouringvariability
onpatientoutcom
e187
Figure 5.11: Adjusted p-value mappings for PSA progression across RADAR, RT01, and CHHiP patients.
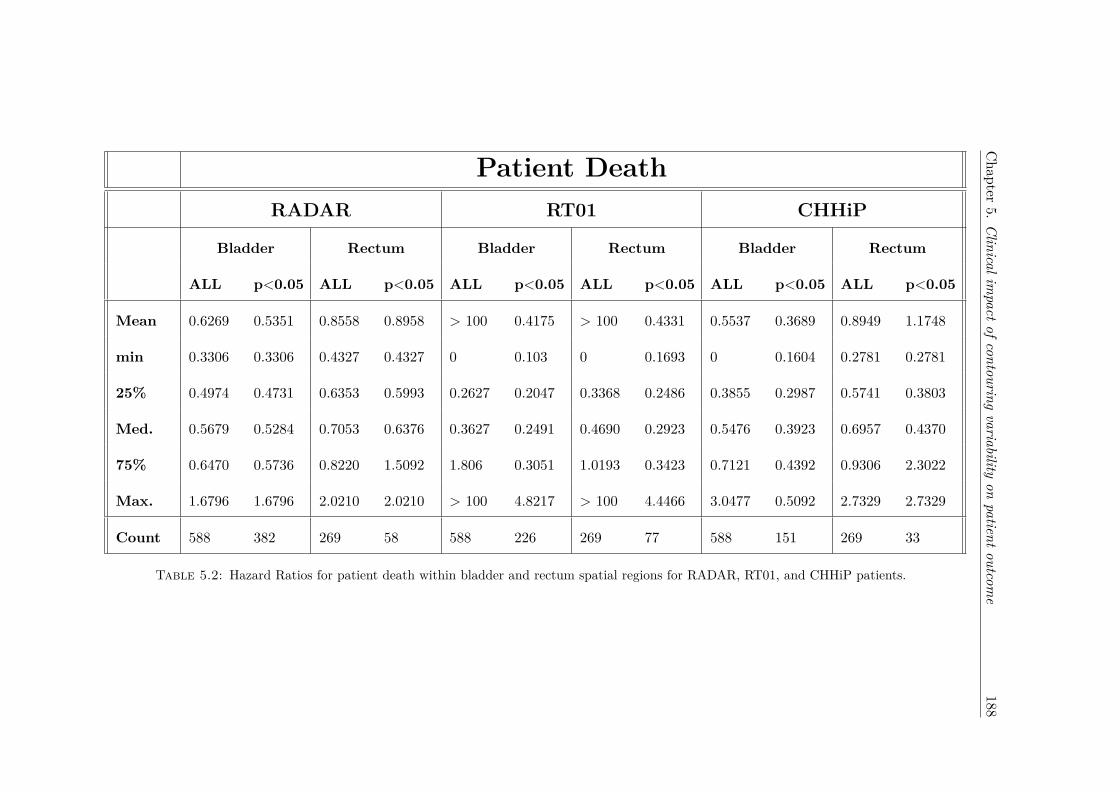
Chapter
5.Clinicalim
pactofcontouringvariability
onpatientoutcom
e188
Patient DeathRADAR RT01 CHHiP
Bladder Rectum Bladder Rectum Bladder Rectum
ALL p<0.05 ALL p<0.05 ALL p<0.05 ALL p<0.05 ALL p<0.05 ALL p<0.05
Mean 0.6269 0.5351 0.8558 0.8958 > 100 0.4175 > 100 0.4331 0.5537 0.3689 0.8949 1.1748
min 0.3306 0.3306 0.4327 0.4327 0 0.103 0 0.1693 0 0.1604 0.2781 0.2781
25% 0.4974 0.4731 0.6353 0.5993 0.2627 0.2047 0.3368 0.2486 0.3855 0.2987 0.5741 0.3803
Med. 0.5679 0.5284 0.7053 0.6376 0.3627 0.2491 0.4690 0.2923 0.5476 0.3923 0.6957 0.4370
75% 0.6470 0.5736 0.8220 1.5092 1.806 0.3051 1.0193 0.3423 0.7121 0.4392 0.9306 2.3022
Max. 1.6796 1.6796 2.0210 2.0210 > 100 4.8217 > 100 4.4466 3.0477 0.5092 2.7329 2.7329
Count 588 382 269 58 588 226 269 77 588 151 269 33
Table 5.2: Hazard Ratios for patient death within bladder and rectum spatial regions for RADAR, RT01, and CHHiP patients.

Chapter
5.Clinicalim
pactofcontouringvariability
onpatientoutcom
e189
Local ProgressionRADAR RT01 CHHiP
Bladder Rectum Bladder Rectum Bladder Rectum
ALL p<0.05 ALL p<0.05 ALL p<0.05 ALL p<0.05 ALL p<0.05 ALL p<0.05
Mean > 100 2.6031 0.5734 0.3312 > 100 1.3734 > 100 0.2199 > 100 2.2424 > 100 2.661
min 0.1963 0.1963 0 0.0987 0 0.0691 0 0.107 0 0.353 0 0.2689
25% 1.7017 2.3273 0.2847 0.2454 0.2880 0.1568 0.2376 0.1839 0.5729 0.3952 1.4566 2.5433
Med. 2.0227 2.4891 0.4142 0.3715 0.4505 0.1822 0.3146 0.2226 0.7534 2.7452 2.0544 2.9757
75% 2.5508 2.7237 0.5141 0.4126 0.9479 0.2176 0.4816 0.2498 2.0172 3.7714 3.0719 3.5602
Max. > 100 4.3482 4.4418 0.4689 > 100 20.3086 > 100 0.3096 > 100 5.2741 > 100 5.0952
Count 588 55 269 71 588 37 269 82 588 32 269 38
Table 5.3: Hazard Ratios for local progression within bladder and rectum spatial regions for RADAR, RT01, and CHHiP patients.

Chapter
5.Clinicalim
pactofcontouringvariability
onpatientoutcom
e190
PSA ProgressionRADAR RT01 CHHiP
Bladder Rectum Bladder Rectum Bladder Rectum
ALL p<0.05 ALL p<0.05 ALL p<0.05 ALL p<0.05 ALL p<0.05 ALL p<0.05
Mean 1.2306 1.4069 0.7997 0.6048 > 100 0.6873 > 100 1.0677 0.7117 0.5673 1.3710 1.5338
min 0.4712 0.4712 0.3643 0.3643 0.1006 0.1006 0.2164 0.2952 0.0897 0.0897 0.3030 0.3030
25% 1.1310 1.3952 0.6034 0.4810 0.4552 0.3262 0.5068 0.3954 0.5847 0.4834 0.6250 0.4992
Med. 1.2404 1.5056 0.7354 0.5451 1.1121 0.3707 1.2113 0.4331 0.6855 0.5590 1.2734 1.8015
75% 1.4004 1.6029 0.8436 0.6610 1.6829 0.4140 2.2886 0.4726 0.7821 0.5879 1.9277 2.1599
Max. 2.1492 2.1492 1.5462 1.4697 > 100 9.1175 > 100 7.4682 3.5215 3.5215 4.2678 4.2678
Count 588 138 269 113 588 134 269 48 588 107 269 83
Table 5.4: Hazard Ratios for PSA progression within bladder and rectum spatial regions for RADAR, RT01, and CHHiP patients.

CHAPTER 6
Adapting automated treatment planning
configurations across international
centres for prostate radiotherapy
191

Contents lists available at ScienceDirect
Physics and Imaging in Radiation Oncology
journal homepage: www.elsevier.com/locate/phro
Original Research Article
Adapting automated treatment planning configurations across internationalcentres for prostate radiotherapyDale Roacha,b,⁎, Geert Wortelc, Cesar Ochoad, Henrik R. Jensene, Eugene Damenc, Philip Vialb,d,f,Tomas Janssenc, Christian Rønn Hansene,f,ga Faculty of Medicine, University of New South Wales, Sydney, Australiab Ingham Institute for Applied Medical Research, Sydney, Australiac Department of Radiation Oncology, The Netherlands Cancer Institute, Amsterdam, The NetherlandsdDepartment of Radiation Oncology, Liverpool and Macarthur Cancer Therapy Centres, NSW, Australiae Laboratory of Radiation Physics, Odense University Hospital, Odense, Denmarkf Institute of Medical Physics, School of Physics, University of Sydney, Sydney, Australiag Institute of Clinical Research, University of Southern Denmark, Denmark
A R T I C L E I N F O
Keywords:ProstateAutomaticVMATTreatment planningPinnacleMulti-centre
A B S T R A C T
Background and purpose: Automated configurations are increasingly utilised for radiotherapy treatment plan-ning. This study investigates whether automated treatment planning configurations are adaptable across clinicswith different treatment planning protocols for prostate radiotherapy.Material and methods: The study comprised three participating centres, each with pre-existing locally developedprostate AutoPlanning configurations using the Pinnacle3® treatment planning system. Using a three-patienttraining dataset circulated from each centre, centres modified local prostate configurations to generate protocolcompliant treatment plans for the other two centres. Each centre applied modified configurations on validationdatasets distributed from each centre (10 patients from 3 centres). Plan quality was assessed through DVHanalysis and protocol compliance.Results: All treatment plans were clinically acceptable, based off relevant treatment protocol. Automatedplanning configurations from Centre’s A and B recorded 2 and 18 constraint and high priority deviations re-spectively. Centre C configurations recorded no high priority deviations. Centre A configurations producedtreatment plans with superior dose conformity across all patient PTVs (mean=1.14) compared with Centre’s Band C (mean= 1.24 and 1.22). Dose homogeneity was consistent between all centre’s configurations(mean=0.083, 0.077, and 0.083 respectively).Conclusions: This study demonstrates that automated treatment planning configurations can be shared andimplemented across multiple centres with simple adaptations to local protocols.
1. Introduction
Conventional treatment planning for Intensity ModulatedRadiotherapy (IMRT) and Volumetric Modulated Arc Therapy (VMAT)require many manual processes, with treatment planners iterativelyadjusting optimisation goals within a treatment planning system todevelop clinically acceptable treatment plans. This process is not onlytime-consuming, but treatment plan quality is inherently dependent onthe individual skill of the planner [1–5]. The importance of high-qualitytreatment planning on clinical outcomes has been demonstrated duringclinical trials [6–8].Both automated treatment planning methods and knowledge-based
optimisation engines are now available within most commercial treat-ment planning systems [9–11], and have demonstrated improvementsin planning efficiency and plan quality compared to current practice[12,13]. Multiple institutions have investigated the efficacy of auto-mated treatment planning for head and neck [14–19], oesophageal[20], and prostate cancers [21–24], and found the automatically gen-erated plan to be noninferior and often superior to manual planningquality, while significantly reducing treatment planning times. Ad-ditionally, previously complex and time-consuming stereotactic treat-ments for liver cancer have had automatic treatment plans developed[25], while quantitative tools have been constructed to automaticallyidentify poorer quality treatment plans [26,27].
https://doi.org/10.1016/j.phro.2019.04.007Received 5 October 2018; Received in revised form 10 April 2019; Accepted 14 April 2019
⁎ Corresponding author at: Ingham Institute, Liverpool Hospital, Locked Bag 7103, Liverpool, NSW 1871, Australia.E-mail address: [email protected] (D. Roach).
Physics and Imaging in Radiation Oncology 10 (2019) 7–13
2405-6316/ © 2019 The Authors. Published by Elsevier B.V. on behalf of European Society of Radiotherapy & Oncology. This is an open access article under the CC BY-NC-ND license (http://creativecommons.org/licenses/BY-NC-ND/4.0/).
T
Chapter 6. Adapting automated treatment planning configurations 192

Previous automated treatment planning studies have been con-ducted either within a single institution, or during clinical trials using asingle protocol across multiple centres [28,29]. As most radiotherapypatients are not treated within a clinical trial, they are planned ac-cording to a wide variety of local protocols and practices developed atdifferent centres. Consequently, comparisons in treatment plan qualitybetween developed automated techniques difficult, with no commonbaseline for plan comparison between centres.This study investigated whether locally developed automatic treat-
ment planning configurations for prostate radiotherapy could beadapted to meet distributed protocols shared amongst multiple centres.It provides an explicit example of how protocol sharing between centrescould proceed, allowing smaller clinics to benefit from the work oflarger centres during future clinical trials.
2. Materials and methods
2.1. AP Configuration development
The three participating centres (two European, one Australian, de-nominated A, B, and C) had previously developed automated treatmentplanning techniques utilising the AutoPlanning (AP) module withinPinnacle3® treatment planning system (Philips Radiation Oncology,Madison, WI). All centres distributed local protocol details on pre-scription, contouring and dose constraints for prostate radiotherapy(Tables 1, A.1). Evaluation criteria were specified by the host-centre aseither low, medium, high, or constraint priority. Additionally, threepatient datasets (one easy, one medium, and one difficult to plan) wereprovided by each centre as training datasets. All distributed datasetscontained target volumes and organs-at-risk previously contoured byeach centre.Each centre modified their locally developed clinical AP config-
urations using the training datasets to meet other centre’s distributedprotocols. Only dose objectives and AP optimisation parameters were tobe adjusted during configuration development (i.e. beam configuration,energy, etc. were to remain as used clinically, see Tables A.2(a–c)). Itshould be noted that all centres’ AP configurations incorporated similarVMAT treatment techniques, although the number of arcs utilised(single or dual) varied.Consequently, each centre generated three distinct VMAT AP con-
figurations to meet the dose objectives for each of the three protocols.Naming convention is shown in Fig. 1, with the protocol name corre-sponding to the origin of the patients and planning objectives.
Conversely, the naming of the AP configuration corresponds to thecentre the AP technique was developed.
2.2. Treatment planning
An additional ten prostate patient datasets with target volume andorgan-at-risk contours were distributed by each centre as validationdatasets, with each patient previously planned using the host-centre’slocal AP configuration. Treatment planning system setups and patientselection criteria are found in Tables A.3 and A.4 respectively. Centresapplied modified AP configurations to the corresponding centre’s vali-dation datasets, resulting in three AP plans each for the thirty patients.Post-optimisation following AP was allowed, based on each centre’sstandard clinical practice. All treatment plans were exported as DICOMRT files and uploaded to a single host for analysis.
2.3. AP configuration evaluation and statistics
Quantitative analyses between AP configurations were performedby dose-volume histogram (DVH) analysis, and total protocol devia-tions. Population median DVH for planning target volumes (PTVs) andOARs across all ten patients per centre were generated, utilising pre-viously developed software [16,20]. Conformity and homogeneity in-dices (CI=V95%/VPTV, HI= (D2% – D98%)/DPrescription) were calculatedfor all patient treatment plans. Two-sided Wilcoxon matched-pair signrank probability curves, previously described by Bertelsen et al. [30],were used to illustrate differences between AP configuration DVH dis-tributions. It should be noted that while individual p-values are not asolid statistical test of differences at a given dose level, given theseparameters are highly correlated, they can be used to visualize wheredifferences between the population median DVHs exist.
3. Results
All centres successfully developed AP configurations that met eachcentre’s protocols utilising the validation datasets (Table A.2(a–c),supplementary material). Mean and standard deviations of target vo-lume (Table 2), as well as constraint, high priority (Table 2), andmedium and low priority OAR evaluations (Table A.5, supplementarymaterial) were recorded across all AP configurations.
Table 1Target and high/constraint priority OAR prescriptions and evaluations. Complete lists of evaluation criteria can be found within Table A.1 (supplementary material).
Protocol A Protocol B Protocol C
Target Prescription Target Prescription Target PrescriptionPTV1 35×2Gy PTV1 39×2Gy PTV1 39×2GyPTV2 35×2.2 Gy
Target Evaluation Priority Target Evaluation Priority Target Evaluation Priority
PTV1 V95% > 99% Constraint PTV1 D95% > 100% Medium PTV1imrt D99% > 95% MediumPTV2 V95% > 99% Constraint PTV1 D2% < 105% Medium PTV1imrt D0% < 107% MediumPTV1/PTV2 D1% < 107% Constraint CTV1 D99% > 100% High PTV1imrt D95% > 95% HighPTV1/PTV2 D1% < 105% Medium PTV1 Dmax < 107% Medium–Soft PTV1 D99.9% > 66.5 Gy High
PTV_prostate_imrt D99% > 95% MediumPTV_prostate_imrt D97% > 95% High
OAR Evaluation Priority OAR Evaluation Priority OAR Evaluation Priority
Rectal Wall V75Gy < 10% High Rectum V65Gy < 20% Constraint Rectum V74Gy < 1 cm3 ConstraintRectal Wall V64Gy < 35% High Rectum V70Gy < 10% Constraint Circumference of
rectumDmax < 50 Gy Constraint
Anal Sphincter Dmean < 45 Gy High Rectum V75Gy < 5% High90% − 95% isodose tight around
targetHigh RECT_IN_PTV V79Gy < 1 cm3 High
RECT_78_03_NS V80Gy < 1 cm3 Constraint
D. Roach, et al. Physics and Imaging in Radiation Oncology 10 (2019) 7–13
8
Chapter 6. Adapting automated treatment planning configurations 193

3.1. Protocol A
AP Configurations B and C for protocol A patients recorded superiordose coverage across PTV1 and PTV2, shown by an elevated shoulderregion within the DVH curve (Fig. 2). The PTV coverage was compen-sated by superior rectal wall and anal sphincter sparing by the host APconfiguration (Table 2). A large difference between AP ConfigurationsA and C is evident in the rectum DVH curves between 10 and 60 Gy(Fig. 3), with V30Gy varying by over 20% (30.4% vs. 52.4%). Bothmodified AP configurations produced superior femoral head coverage(Table A.5, Figs. A.1, A.2).
3.2. Protocol B
AP Configurations A and C for protocol B recorded statisticallysignificant improvements in comparison to the original treatment plansfor rectum V70Gy (8.5%, 8.1% vs. 11.0%) and V75Gy (3.6%, 3.5% vs.7.6%). Conversely, rectum V40Gy and V50Gy were superior for the hostAP configuration (Fig. 3). Dose coverage across PTV1 and CTV1 weresuperior for the host configuration treatment plans, however differ-ences were generally not statistically significant. AP Configurations Aand C produced superior femoral head coverage, although AP Config-uration A produced inferior bladder V50Gy and V60Gy (Table A.5, Figs.A.1–A.3).
Fig. 1. Schematic of the study design. Participating centres had a local prostate radiotherapy protocol and associated AP configuration. Each centre created new APconfigurations for the other two protocols through modification of their local AP configuration, based on a training dataset of three patients provided by each centre(pre-contoured CT datasets).
Table 2Target and high/constraint priority OAR mean and standard deviations (S.D.) for all protocols. Conformity and homogeneity indices are shown for all PTVs.Differences in metrics considered significant (p < 0.05) are bolded. Complete list of objectives can be found within Table A.4 (supplementary material).
Centre A Centre B Centre C
Mean S.D. p-value Mean S.D. p-value Mean S.D. p-value
Protocol A/Configuration A (Host) Protocol A/Configuration B Protocol A/Configuration CPTV1: V95% > 99% 99.9% 0.1% 100.0% 0.1% 0.08 100.0% < 0.1% 0.002PTV2: V95% > 99% 99.7% 0.2% 99.9% 0.2% 0.04 100.0% < 0.1% 0.002PTV2: D1% < 107% 103.1% 0.5% 102.6% 0.6% 0.03 102.4% 0.2% 0.010Rectal Wall: V75Gy < 10% 4.2% 2.2% 5.1% 3.0% 0.11 6.6% 2.6% 0.002Rectal Wall: V64Gy < 35% 14.8% 5.8% 16.2% 5.3% 0.002 17.2% 6.0% 0.002Anal Sphincter: Dmean < 45Gy 9.1 Gy 7.7 Gy 10.4 Gy 8.7 Gy 0.004 10.0 Gy 9.4 Gy 0.23
PTV1 Conformity Index 1.19 0.04 1.33 0.06 0.002 1.31 0.06 0.002PTV2 Conformity Index 1.12 0.05 1.29 0.10 0.002 1.29 0.08 0.002PTV1 Homogeneity Index 0.13 0.01 0.10 0.01 0.002 0.09 0.01 0.002PTV2 Homogeneity Index 0.07 < 0.01 0.05 0.01 0.002 0.05 < 0.01 0.002
Protocol B/Configuration A Protocol B/Configuration B (Host) Protocol B/Configuration C
PTV1: D95% > 100% 99.2% 1.4% 0.23 99.6% 0.9% 99.2% 1.6% 0.50PTV1: D2% < 105% 104.0% 0.2% 0.69 104.0% 0.3% 104.4% 0.3% 0.02CTV1: D99% > 100% 101.0% 0.7% 0.83 101.0% 0.5% 101.3% 0.7% 0.32PTV1: Dmax < 107% 105.2% 0.3% 0.13 105.5% 0.7% 105.7% 0.3% 0.70Rectum: V65Gy < 20% 12.6% 2.8% 0.11 13.6% 4.0% 11.7% 3.3% 0.002Rectum: V70Gy < 10% 8.5% 2.1% 0.004 11.0% 3.6% 8.1% 2.4% 0.002Rectum: V75Gy < 5% 3.6% 1.2% 0.002 7.6% 2.7% 3.5% 1.2% 0.002RECT_IN_PTV: V79Gy < 1 cm3 0.1 cm3 0.1 cm3 0.004 0.5 cm3 0.4 cm3 0.1 cm3 0.1 cm3 0.006RECT_78_03_NS: V80Gy < 1 cm3 0.3 cm3 0.2 cm3 0.49 0.3 cm3 0.3 cm3 0.5 cm3 0.3 cm3 0.13
PTV1 Conformity Index 1.32 0.07 0.63 1.33 0.08 1.27 0.05 0.04PTV1 Homogeneity Index 0.07 0.02 0.006 0.06 0.01 0.08 0.03 0.006
Protocol C/Configuration A Protocol C/Configuration B Protocol C/Configuration C (Host)
PTV1imrt: D99% > 95% 93.9% 0.7% 0.006 94.9% 0.9% 0.85 95.0% 0.6%PTV1imrt: D0% < 107% 103.7% 0.5% 0.002 106.1% 0.4% 0.05 105.5% 0.8%PTV1imrt: D95% > 95% 96.2% 0.3% 0.002 97.5% 0.6% 0.04 97.1% 0.4%PTV1: D99.9% > 66.5 Gy 69.1 Gy 0.5 Gy 0.002 69.9 Gy 1.0 Gy 0.004 67.9 Gy 0.4 GyPTV_prostate_imrt: D99% > 95% 94.0% 0.9% 0.02 95.0% 0.9% 1.000 94.9% 0.6%PTV_prostate_imrt: D97% > 95% 95.6% 0.4% 0.004 96.7% 0.7% 0.16 96.3% 0.5%Rectum: V74Gy < 1 cm3 0.5 cm3 0.2 cm3 0.16 0.8 cm3 0.3 cm3 0.38 0.7 cm3 0.3 cm3
PTV1 Conformity Index 0.99 0.02 0.002 1.11 0.02 0.70 1.11 0.03PTV1 Homogeneity Index 0.11 0.01 0.002 0.12 0.01 0.70 0.12 0.01
D. Roach, et al. Physics and Imaging in Radiation Oncology 10 (2019) 7–13
9
Chapter 6. Adapting automated treatment planning configurations 194

3.3. Protocol C
AP Configuration A modified for protocol C recorded significantlypoorer D95% and D99% for PTV1imrt (96.2%, 93.9%), and D97% andD99% for PTV_prostate_imrt (95.6%, 94.0%) compared to the hostconfiguration treatment plans (97.1%, 95.0%, 96.3%, 94.9% respec-tively). Rectum V70Gy, V65Gy, V60Gy, and V50Gy were consistently hotterfor AP Configuration A (Table A.5). AP Configuration B plans producedsuperior dose coverage for PTV1imrt (D95%=97.5%) and PTV1(D99.9%= 69.9 Gy) compared to the host treatment plans(D95%= 97.1%, D99.9%=67.9 Gy), although produced hotter PTVimrt(D0%=106.09%, 105.51% respectively). High rectal dose sparing wassuperior for the host configuration compared to modified AP Config-uration B (V70Gy= 7.19%, 9.5% respectively), but poorer V50Gy (TableA.5, Fig. 3). Femoral Head maximum doses were significantly higher forthe modified AP Configurations A and B (Table A.5, Figs. A.1, A.2),although no significant differences between AP configurations wasobserved for Bladder V50Gy, V60Gy, or V70Gy.Protocol A and C patients planned with AP Configuration A dis-
played significantly increased conformity compared to APConfigurations B and C, although for Protocol A this was at the cost ofreduced homogeneity (Table 2). Homogeneity and conformity for APConfigurations B and C were consistent across protocols A and C.
Protocol B patients displayed the least conformal plans across all APconfigurations, with the significant improvements in the modified APConfiguration C plans resulting in reduced homogeneity.Total constraint/high priority deviations recorded by AP
Configurations A, B, and C were 2, 18, and 0 respectively (Table 3). Allconstraint and high priority deviations occurred for Protocol B patients.Additionally, AP Configurations B and C recorded no deviations forProtocol A patients, compared to 5 medium priority deviations re-corded by the host centre. AP Configuration A recorded a significantlylarger number of medium priority deviations (35, 15, and 17 respec-tively), while low priority deviation numbers were consistent betweenall AP configurations. Specific deviations are given in Table A.6 (sup-plementary material).
4. Discussion
With only a three-patient training dataset utilised in this study, eachcentre was successfully able to modify clinical AP configurations tomeet distributed prostate radiotherapy protocols. By ensuring thetraining datasets contained a spread with regards to planning difficulty,the modified AP configurations were able to account for the expectedanatomical variety that was encountered in the validation datasets. Theability for developed AP configurations to be modified using a small
Fig. 2. Median PTV DVHs for all patients for AP Configurations A (blue), B (red), and C (green). Note that the scale begins at 60 Gy for clarity. Solid lines correspondto host-centre AP configuration, modified configurations are dashed. Solid and dotted grey p-value curves, indicating significant differences between populationmedian DVHs, are also illustrated. The dashed black line shows p=0.05. (For interpretation of the references to colour in this figure legend, the reader is referred tothe web version of this article.)
D. Roach, et al. Physics and Imaging in Radiation Oncology 10 (2019) 7–13
10
Chapter 6. Adapting automated treatment planning configurations 195

training dataset has major potential advantages in improving qualityassurance during clinical trials, where poor quality manual treatmentplanning quality can significantly impact clinical trial efficacy [3,6].While this improvement is inherently dependent on centres possessingthe same treatment planning system, it still represents an improvementin reducing treatment plan variation in these trials.Across all patients, only a single constraint and high priority de-
viation were recorded by the modified AP configurations (Table 3).Both deviations occurred for a single patient from centre B, with thispatient exhibiting a large overlap (12.5%) between PTV and rectum. Asthe original clinically accepted treatment plan for this patient also re-corded identical protocol deviations, all treatment plans developedfrom modified AP configurations were considered clinically acceptable.
Treatment plans developed by AP Configuration B delivered higherdoses to PTV than those developed by AP Configurations A and C forProtocol C (Table 2, Fig. 2). This contributed in hotter doses beingdelivered to the rectum (Fig. 3), although differences were often mar-ginal and not significant. Significant differences were seen between APconfigurations for intermediate rectum doses, with host-centre treat-ment plans delivering reduced dose at these volumes for all protocols,except for Protocol C, where AP Configuration B produced lower doses.This is reflective of the different emphasis centres placed on meetingconstraint and high priority deviations, with less importance placed onmoderate and low priority deviations. Similarly, Figs. A.1 and A.2 showsignificantly reduced dose to the femoral heads across all protocols byAP Configuration C. Table A.2 shows that AP Configuration C was the
Fig. 3. Median Rectum DVHs for all patients for AP Configurations A (blue), B (red), and C (green). Solid and dotted grey p-value curves again indicate significantdifferences between population median DVHs. (For interpretation of the references to colour in this figure legend, the reader is referred to the web version of thisarticle.)
Table 3Total deviations for each AP configuration. Specific deviations can be found in Table A.5 (supplementary material).
AP Configuration A AP Configuration B AP Configuration C
Protocol A Protocol B Protocol C Protocol A Protocol B Protocol C Protocol A Protocol B Protocol C
Constraint 1 8High 1 10Medium 5 7 23 4 11 4 13Low 1 11 13 11
D. Roach, et al. Physics and Imaging in Radiation Oncology 10 (2019) 7–13
11
Chapter 6. Adapting automated treatment planning configurations 196

only AP configuration that included the femoral heads as objectives.Multiple constraint and high priority deviations were recorded for
protocol B by the host AP configuration. Further inspection revealed adiscrepancy between the protocol requirements submitted by centre Bfor the study, and what was utilised clinically. ln particular, rectumV65Gy, V70Gy, and V75Gy were assigned higher priorities for this studythan applied clinically. To account for this, the host AP configurationfor protocol B was modified for further analysis to bring it in line withthe distributed protocol. The modified AP configuration is given inTable A.7, with new DVH parameters shown in Table A.8 (supple-mentary material). The modified AP configuration significantly reducedV65Gy, V70Gy, and V75Gy, meeting distributed protocol for all metricsexcept V75Gy, at the expense of poorer dose coverage. It should be notedthat these rectum doses were still significantly warmer than thoseachieved by AP Configurations A and C for this protocol.A concern with this type of analysis, particularly with multiple
metrics with an inherent dependence to one another, is the detection offalse positives from multiple testing. Bonferroni corrections are oftenemployed to account for this, however these corrections risk being tooconservative. Just as with the median DVHs, the results presented hereare illustrative of differences that arise between AP configurations forthe same protocol. As the main aim of this investigation was to assesswhether AP configurations could be adapted to meet these protocols,rather than document the extent that these plans differ, it was decidedby the authors not to proceed with multiple testing procedures.A limitation of this study is the lack of qualitative assessment from
an experienced radiation oncologist to assess the clinical acceptabilityof treatment plans developed from the modified AP configurations. Asthis was an investigation assessing whether AP configurations could beadapted between centres to meet local protocol, quantitative analysisonly was proposed. Future work investigating improvements in treat-ment plan quality through sharing of multiple centre’s AP configura-tions would require such a qualitative assessment.Automated treatment planning for prostate radiotherapy is a high
interest field, with multiple studies investigating implementation ofknowledge-based [22,23,29] and template derived [21] treatmentplanning protocols. Investigations validating the use of RapidPlan(Varian Medical Systems, Palo Alto, USA) have demonstrated the fea-sibility of sharing models across multiple centres [10,11]. This studyprovides further evidence for the viability of sharing clinical protocolsand training datasets to aid template based automatic treatment plan-ning of prostate cancer.Through the distribution of clinical protocols and three patient
training datasets centres were able to adapt local AP configurations tosatisfy other centre’s protocols. This study shows that AP configurationsare readily adaptable to different prostate radiotherapy protocols, andprovides a methodology for the sharing of AP configurations acrosscentres to assist efficient implementation and increased uptake of AP inthe clinic for the benefit of patients. Future work can then investigateadapting and improving local AP configurations based on the colla-boration of multiple centre’s configurations.
Funding
This project was partly funded by NHMRC project grant number1077788, Danish Cancer Society grant, University of Southern Denmarkscholarship and Odense University Hospital scholarship.
Conflict of interest statement
None.
Acknowledgements
The authors would like to thank Lois Holloway and MichaelJameson for their feedback.
Appendix A. Supplementary data
Supplementary data to this article can be found online at https://doi.org/10.1016/j.phro.2019.04.007.
References
[1] Batumalai V, Jameson MG, Forstner DF, Vial P, Holloway LC. How important isdosimetrist experience for intensity modulated radiation therapy? A comparativeanalysis of a head and neck case. Pract Radiat Oncol 2013;3:e99–106. https://doi.org/10.1016/j.prro.2012.06.009.
[2] Nelms BE, Robinson G, Markham J, Velasco K, Boyd S, Narayan S, et al. Variation inexternal beam treatment plan quality: an inter-institutional study of planners andplanning systems. Pract Radiat Oncol 2012;2:296–305. https://doi.org/10.1016/j.prro.2011.11.012.
[3] Berry SL, Boczkowski A, Ma R, Mechalakos J, Hunt M. Interobserver variability inradiation therapy plan output: Results of a single-institution study. Pract RadiatOncol 2016;6:442–9. https://doi.org/10.1016/j.prro.2016.04.005.
[4] Moore KL, Brame RS, Low DA, Mutic S. Quantitative metrics for assessing planquality. Semin Radiat Oncol 2012. https://doi.org/10.1016/j.semradonc.2011.09.005.
[5] Hansen C, Sykes J, Barber J, West K, Bromley R, Szymura K, et al. Multicentreknowledge sharing and planning/dose audit on flattening filter free beams for SBRTlung. J Phys Conf Ser 2015. https://doi.org/10.1088/1742-6596/573/1/012018.
[6] Peters LJ, O'Sullivan B, Giralt J, Fitzgerald TJ, Trotti A, Bernier J, et al. Criticalimpact of radiotherapy protocol compliance and quality in the treatment of ad-vanced head and neck cancer: results from TROG 02.02. J Clin Oncol2010;28:2996–3001. https://doi.org/10.1200/JCO.2009.27.4498.
[7] Abrams RA, Winter KA, Regine WF, Safran H, Hoffman JP, Lustig R, et al. Failure toadhere to protocol specified radiation therapy guidelines was associated with de-creased survival in RTOG 9704—a phase III trial of adjuvant chemotherapy andchemoradiotherapy for patients with resected adenocarcinoma of the pancreas. Int JRadiat Oncol Biol Phys 2012;82:809–16. https://doi.org/10.1016/j.ijrobp.2010.11.039.
[8] Dühmke E, Franklin J, Pfreundschuh M, Sehlen S, Willich N, Rühl U, et al. Low-doseradiation is sufficient for the noninvolved extended-field treatment in favorableearly-stage Hodgkin’s disease: long-term results of a randomized trial of radio-therapy alone. J Clin Oncol 2001;19:2905–14. https://doi.org/10.1200/JCO.2001.19.11.2905.
[9] Xhaferllari I, Wong E, Bzdusek K, Lock M, Chen JZ. Automated IMRT planning withregional optimization using planning scripts. J Appl Clin Med Phys2013;14:176–91. https://doi.org/10.1120/jacmp.v14i1.4052.
[10] Fogliata A, Belosi F, Clivio A, Navarria P, Nicolini G, Scorsetti M, et al. On the pre-clinical validation of a commercial model-based optimisation engine: application tovolumetric modulated arc therapy for patients with lung or prostate cancer.Radiother Oncol 2014;113:385–91. https://doi.org/10.1016/j.radonc.2014.11.009.
[11] Schubert C, Waletzko O, Weiss C, Voelzke D, Toperim S, Roeser A, et al. Intercentervalidation of a knowledge based model for automated planning of volumetricmodulated arc therapy for prostate cancer. The experience of the German RapidPlan Consortium. PLoS One 2017;12:e0178034. https://doi.org/10.1371/journal.pone.0178034.
[12] Moore KL, Kagadis GC, McNutt TR, Moiseenko V, Mutic S. Vision 20/20: automa-tion and advanced computing in clinical radiation oncology. Med Phys 2014;41.https://doi.org/10.1118/1.4842515.
[13] Heijmen B, Voet P, Fransen D, Penninkhof J, Milder M, Akhiat H, et al. Fully au-tomated, multi-criterial planning for Volumetric Modulated Arc Therapy–an inter-national multi-center validation for prostate cancer. Radiother Oncol 2018. https://doi.org/10.1016/j.radonc.2018.06.023.
[14] Hazell I, Bzdusek K, Kumar P, Hansen CR, Bertelsen A, Eriksen JG, et al. Automaticplanning of head and neck treatment plans. J Appl Clin Med Phys 2016;17. https://doi.org/10.1120/jacmp.v17i1.5901.
[15] Gintz D, Latifi K, Caudell J, Nelms B, Zhang G, Moros E, et al. Initial evaluation ofautomated treatment planning software. J Appl Clin Med Phys 2016;17. https://doi.org/10.1120/jacmp.v17i3.6167.
[16] Hansen CR, Bertelsen A, Hazell I, Zukauskaite R, Gyldenkerne N, Johansen J, et al.Automatic treatment planning improves the clinical quality of head and neck cancertreatment plans. Clin Transl Radiat Oncol 2016;1:2–8. https://doi.org/10.1016/j.ctro.2016.08.001.
[17] Krayenbuehl J, Norton I, Studer G, Guckenberger M. Evaluation of an automatedknowledge based treatment planning system for head and neck. Radiat Oncol2015;10:226. https://doi.org/10.1186/s13014-015-0533-2.
[18] Kusters J, Bzdusek K, Kumar P, van Kollenburg PM, Kunze-Busch M, Wendling M,et al. Automated IMRT planning in Pinnacle. Strahlenther Onkol 2017;193:1031–8.https://doi.org/10.1007/s00066-017-1187-9.
[19] Tol JP, Delaney AR, Dahele M, Slotman BJ, Verbakel WF. Evaluation of a knowl-edge-based planning solution for head and neck cancer. Int J Radiat Oncol Biol Phys2015;91:612–20. https://doi.org/10.1016/j.ijrobp.2014.11.014.
[20] Hansen CR, Nielsen M, Bertelsen AS, Hazell I, Holtved E, Zukauskaite R, et al.Automatic treatment planning facilitates fast generation of high-quality treatmentplans for esophageal cancer. Acta Oncol 2017;56:1495–500. https://doi.org/10.1080/0284186X.2017.1349928.
[21] Nawa K, Haga A, Nomoto A, Sarmiento RA, Shiraishi K, Yamashita H, et al.Evaluation of a commercial automatic treatment planning system for prostate
D. Roach, et al. Physics and Imaging in Radiation Oncology 10 (2019) 7–13
12
Chapter 6. Adapting automated treatment planning configurations 197

cancers. Med Dosim 2017. https://doi.org/10.1016/j.meddos.2017.03.004.[22] Nwankwo O, Mekdash H, Sihono DSK, Wenz F, Glatting G. Knowledge-based ra-
diation therapy (KBRT) treatment planning versus planning by experts: validationof a KBRT algorithm for prostate cancer treatment planning. Radiat Oncol2015;10:111. https://doi.org/10.1186/s13014-015-0416-6.
[23] Powis R, Bird A, Brennan M, Hinks S, Newman H, Reed K, et al. Clinical im-plementation of a knowledge based planning tool for prostate VMAT. Radiat Oncol2017;12:81. https://doi.org/10.1186/s13014-017-0814-z.
[24] Chanyavanich V, Das SK, Lee WR, Lo JY. Knowledge-based IMRT treatment plan-ning for prostate cancer. Med Phys 2011;38:2515–22. https://doi.org/10.1118/1.3574874.
[25] Gallio E, Giglioli FR, Girardi A, Guarneri A, Ricardi U, Ropolo R, et al. Evaluation ofa commercial automatic treatment planning system for liver stereotactic body ra-diation therapy treatments. Phys Med 2018;46:153–9. https://doi.org/10.1016/j.ejmp.2018.01.016.
[26] Wang Y, Heijmen BJ, Petit SF. Prospective clinical validation of independent DVHprediction for plan QA in automatic treatment planning for prostate cancer patients.
Radiother Oncol 2017;125:500–6. https://doi.org/10.1016/j.radonc.2017.09.021.[27] Janssen TM, Kusters M, Wang Y, Wortel G, Monshouwer R, Damen E, et al.
Independent knowledge-based treatment planning QA to audit Pinnacle autoplan-ning. Radiother Oncol 2018. https://doi.org/10.1016/j.radonc.2018.10.035.
[28] Wu B, Kusters M, Kunze-busch M, Dijkema T, McNutt T, Sanguineti G, et al. Cross-institutional knowledge-based planning (KBP) implementation and its performancecomparison to Auto-Planning Engine (APE). Radiother Oncol 2017;123:57–62.https://doi.org/10.1016/j.radonc.2017.01.012.
[29] Good D, Lo J, Lee WR, Wu QJ, Yin F-F, Das SK. A knowledge-based approach toimproving and homogenizing intensity modulated radiation therapy planningquality among treatment centers: an example application to prostate cancer plan-ning. Int J Radiat Oncol Biol Phys 2013;87:176–81. https://doi.org/10.1016/j.ijrobp.2013.03.015.
[30] Bertelsen A, Hansen CR, Johansen J, Brink C. Single arc volumetric modulated arctherapy of head and neck cancer. Radiother Oncol 2010;95:142–8. https://doi.org/10.1016/j.radonc.2010.01.011.
D. Roach, et al. Physics and Imaging in Radiation Oncology 10 (2019) 7–13
13
Chapter 6. Adapting automated treatment planning configurations 198

Table A.1: Target objectives, and OAR evaluations for all three protocols
Protocol A Protocol B Protocol C
Target Prescription Target Prescription Target Prescription PTV1 35 x 2 Gy PTV1 39 x 2 Gy PTV1 39 x 2 Gy PTV2 35 x 2.2 Gy Target Evaluation Priority Target Evaluation Priority Target Evaluation Priority PTV1 V95% > 99% Constraint PTV1 D95% > 100% Medium PTV1imrt D99% > 95% Medium PTV2 V95% > 99% Constraint PTV1 D2% < 105% Medium PTV1imrt D0% < 107% Medium PTV1/PTV2 D1% < 107% Constraint CTV1 D99% > 100% High PTV1imrt D95% > 95% High PTV1/PTV2 D1% < 105% Medium PTV1 Dmax < 107% Medium –
Soft PTV1 D99.9% > 66.5
Gy High
PTV_prostate_imrt D99% > 95% Medium PTV_prostate_imrt D97% > 95% High OAR Evaluation Priority OAR Evaluation Priority OAR Evaluation Priority Rectal Wall V75Gy < 10% High Rectum V40Gy < 50% Medium Rectum V74Gy < 1cm3 Constraint Rectal Wall V64Gy < 35% High Rectum V50Gy < 40% Medium Rectum V70Gy < 20% Medium Anal Sphincter Dmean < 45 Gy High Rectum V60Gy < 30% Medium Rectum V70Gy < 10% Soft Femur Joint Area Dmax < 50 Gy Medium Rectum V65Gy < 20% Constraint Rectum V65Gy < 30% Medium 90% - 95% isodose tight around target
High Rectum V70Gy < 10% Constraint Rectum V60Gy < 50% Medium
No rectum hotpots Medium Rectum V75Gy < 5% High Rectum V50Gy < 60% Medium RECT_IN_PTV V79Gy < 1 cm3 High Circumference of
rectum Dmax < 50 Gy Constraint
RECT_78_03_NS V80Gy < 1 cm3 Constraint Femur Cap Dmax < 52 Gy Medium Post rectum Dmax < 39 Gy Medium Femur Cap V50Gy < 50% Medium Femoral Heads V40Gy < 10% Soft Penile Bulb V40Gy < 50% Medium Bladder V50Gy < 40% Soft Bladder V70Gy < 30% Medium Bladder V60Gy < 30% Soft Bladder V70Gy < 20% Soft Peripheral Tissue V50Gy < 1 cm3 Soft Bladder V60Gy < 40% Medium Bladder V60Gy < 25% Soft
Chapter
6.Adapting
automated
treatmentplanning
configurations199
6.1 Supplementary Material A

Bladder V50Gy < 60% Medium Bladder V50Gy < 50% Soft Bowel Cavity V50Gy < 50% Medium
Chapter
6.Adapting
automated
treatmentplanning
configurations200

Table A.2(a): AP Technique A adapted across all three protocols
Protocol A
Target Optimisation Goals Dose PTV70min77 70 Gy PTV2 77 Gy Organs at Risk Objective Dose Volume Priority Compromise Rectal Wall Mean Dose 0 Gy High Yes PTVring Max Dose 66.5 Gy High Yes Anal Sphincter Mean Dose 0 Gy High Yes Rectal Wall Max DVH 75 Gy 7% High Yes RECT-PTV+5 Max Dose 0 Gy Medium Yes Tuning Balance 20% Dose Fall-Off 1.5 cm Hot-Spot Maximum Goal 107% Use Cold-Spot ROIs Yes Protocol B
Target Optimisation Goals Dose PTV1MR-CTV_safe 79 Gy CTV_safe 80 Gy Organs at Risk Objective Dose Volume Priority Compromise Rectum Max DVH 65 Gy 17% Medium Yes Rectum Max DVH 75 Gy 2% Medium Yes Rectum Max DVH 40 Gy 47% Medium Yes Rectum Max DVH 70 Gy 7% Medium Yes Tuning Balance 11% Dose Fall-Off 2.6 cm Hot-Spot Maximum Goal 107% Use Cold-Spot ROIs Yes Protocol C
Target Optimisation Goals Dose Level resd_ptv 70 Gy ptv-ctv 78.01 Gy PTV78imrt 78 Gy Organs at Risk Objective Dose Level Volume Priority Compromise Rectum Mean Dose 0 Gy High Yes Rectum Max DVH 74 Gy 1% High Yes PTVring Max Dose 74.1 Gy High Yes Bladder Max DVH 70 Gy 17% Medium Yes
Chapter 6. Adapting automated treatment planning configurations 201

Bladder Max DVH 60 Gy 22% Medium Yes Tuning Balance 20% Dose Fall-Off 1.5 cm Hot-Spot Maximum Goal 107% Use Cold-Spot ROIs Yes
Chapter 6. Adapting automated treatment planning configurations 202
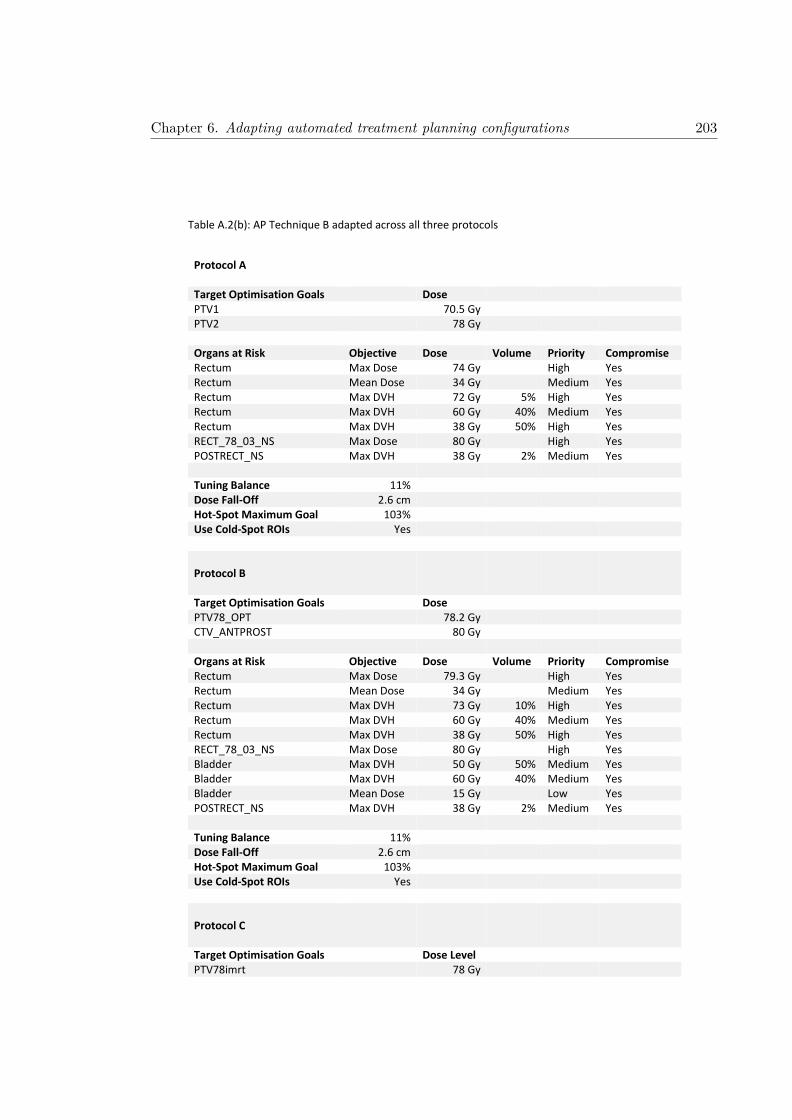
Table A.2(b): AP Technique B adapted across all three protocols
Protocol A
Target Optimisation Goals Dose PTV1 70.5 Gy PTV2 78 Gy Organs at Risk Objective Dose Volume Priority Compromise Rectum Max Dose 74 Gy High Yes Rectum Mean Dose 34 Gy Medium Yes Rectum Max DVH 72 Gy 5% High Yes Rectum Max DVH 60 Gy 40% Medium Yes Rectum Max DVH 38 Gy 50% High Yes RECT_78_03_NS Max Dose 80 Gy High Yes POSTRECT_NS Max DVH 38 Gy 2% Medium Yes Tuning Balance 11% Dose Fall-Off 2.6 cm Hot-Spot Maximum Goal 103% Use Cold-Spot ROIs Yes Protocol B
Target Optimisation Goals Dose PTV78_OPT 78.2 Gy CTV_ANTPROST 80 Gy Organs at Risk Objective Dose Volume Priority Compromise Rectum Max Dose 79.3 Gy High Yes Rectum Mean Dose 34 Gy Medium Yes Rectum Max DVH 73 Gy 10% High Yes Rectum Max DVH 60 Gy 40% Medium Yes Rectum Max DVH 38 Gy 50% High Yes RECT_78_03_NS Max Dose 80 Gy High Yes Bladder Max DVH 50 Gy 50% Medium Yes Bladder Max DVH 60 Gy 40% Medium Yes Bladder Mean Dose 15 Gy Low Yes POSTRECT_NS Max DVH 38 Gy 2% Medium Yes Tuning Balance 11% Dose Fall-Off 2.6 cm Hot-Spot Maximum Goal 103% Use Cold-Spot ROIs Yes Protocol C
Target Optimisation Goals Dose Level PTV78imrt 78 Gy
Chapter 6. Adapting automated treatment planning configurations 203

CTV_ANTPROST 80 Gy PTV1 72 Gy Organs at Risk Objective Dose Level Volume Priority Compromise Rectum Max Dose 73 Gy High Yes Rectum Mean Dose 34 Gy Medium Yes Rectum Max DVH 72.5 Gy 2% High Yes Rectum Max DVH 60 Gy 40% Medium Yes Rectum Max DVH 38 Gy 50% High Yes RECT_78_03_NS Max Dose 72 Gy High Yes Bladder Max DVH 50 Gy 40% Medium Yes Bladder Max DVH 60 Gy 30% Medium Yes Bladder Mean Dose 15 Gy Low Yes POSTRECT_NS Max DVH 38 Gy 2% Medium Yes Tuning Balance 11% Dose Fall-Off 2.6 cm Hot-Spot Maximum Goal 103% Use Cold-Spot ROIs Yes
Chapter 6. Adapting automated treatment planning configurations 204

Table A.2(c): AP Technique C adapted across all three protocols
Protocol A
Target Optimisation Goals Dose PTV1 70 Gy PTV2 77 Gy CTV1 77 Gy Organs at Risk Objective Dose Volume Priority Compromise Rectal Wall Max DVH 75 Gy 10% High Yes Rectal Wall Max DVH 64 Gy 35% High Yes Rectal Wall Mean Dose 50 Gy High Yes Anal Sphincter Mean Dose 45 Gy High Yes Femur Joint Area (Left) Max Dose 50 Gy Medium Yes Femur Joint Area (Right) Max Dose 50 Gy Medium Yes Tuning Balance 11% Dose Fall-Off 2.6 cm Hot-Spot Maximum Goal 107% Use Cold-Spot ROIs Yes Protocol B
Target Optimisation Goals Dose PTV1 78.5 Gy CTV1 80.5 Gy PTVring3mm-Rectum 78.5 Gy Organs at Risk Objective Dose Volume Priority Compromise Rectum Max DVH 40 Gy 50% Medium Yes Rectum Max DVH 50 Gy 40% Medium Yes Rectum Max DVH 60 Gy 30% Medium Yes Rectum Max DVH 65 Gy 20% High Yes Rectum_non_compromise Max DVH 70 Gy 10% High No Rectum Max DVH 75 Gy 5% Medium Yes Rectum Max DVH 79 Gy 1.4% Medium Yes Rectum Mean Dose 45 Gy Medium Yes RECT_78_03_NS Max DVH 80 Gy 5% High Yes Femoral Heads (Left) Max DVH 40 Gy 10% Low Yes Femoral Heads (Right) Max DVH 40 Gy 10% Low Yes Bladder Max DVH 50 Gy 40% Low Yes Bladder Max DVH 60 Gy 30% Low Yes Peripheral Tissue Max DVH 60 Gy 0% Low Yes Tuning Balance 11% Dose Fall-Off 2.6 cm Hot-Spot Maximum Goal 107% Use Cold-Spot ROIs Yes
Chapter 6. Adapting automated treatment planning configurations 205

Protocol C
Target Optimisation Goals Dose Level PTV78imrt 77.5 Gy PTVinRec 68 Gy PTV78LatRectum 77.3 Gy PTV_prostata_imrt 77.5 Gy PTVindreRand 77.4 Gy Organs at Risk Objective Dose Level Volume Priority Compromise RectumVclose Max DVH 74 Gy 25% High No Bladder Max DVH 70 Gy 20% Medium Yes Bladder Mean Dose 30 Gy Medium Yes Bowel Cavity Max DVH 70 Gy 1% High Yes Bowel Cavity Mean Dose 40 Gy High Yes Femur Cap (Left) Max Dose 52 Gy Medium Yes Femur Cap (Right) Max Dose 52 Gy Medium Yes RectumRes Mean Dose 20 Gy High Yes Penile Bulb Mean Dose 40 Gy High Yes RectumPostWall Max Dose 50 Gy High No BladderIMRT Max Dose 74.1 Gy High Yes Tuning Balance 11% Dose Fall-Off 2.6 cm Hot-Spot Maximum Goal 107% Use Cold-Spot ROIs Yes
Chapter 6. Adapting automated treatment planning configurations 206

Table A.3: Treatment planning system and beam setup configurations
Centre A Centre B Centre C
LINAC Versa HD 5 mm MLC at ISO
Versa HD 5 mm MLC at ISO
Versa HD 5 mm MLC at ISO
Slice Thickness 3 mm 2 mm 3 mm Dose Grid 4 mm x 4 mm x 4 mm 2.5 mm x 2.5 mm x 2.5
mm 3 mm x 3 mm x 3 mm
Dose Algorithm Collapsed Cone Adaptive Convolve Collapsed Cone Arcs Dual Arc Single Arc Single Arc Beam Energy 10 MV 6 MV 18 MV Beam Angles 140° - 220° 176° - 184° 180° - 182° Collimator 20° 10° 35°
Chapter 6. Adapting automated treatment planning configurations 207

Table A.4: Patient demographics
Protocol A Protocol B Protocol C
Selection Criteria
High Risk (T1-T3a AND PSA >= 20 AND Gleason >=8) OR (T3b – T4a)
High Risk (T1-T3a AND PSA >= 20 AND Gleason >=8) OR (T3b – T4a)
Hormonal Treatment
Yes Yes
Age 58 – 83 (Median: 72) 66.8 – 76.9 (Median: 70.7) PTV Volume PTV1: 84.96 – 313.81 cm3
(Median: 160.91 cm3) PTV2:55.70 – 246.28 cm3 (Median: 113.45 cm3)
PTV1: 110.36 – 373.88 cm3 (Median: 136.07 cm3)
PTV1: 104.65 – 307.92 cm3 (Median: 139.15 cm3)
PTV/Rectum Overlap
PTV1: 2.28 – 11.30% (Median: 6.84%) PTV2: 0.32 - 4.75% (Median: 1.84%)
PTV1: 1.30 – 12.50% (Median: 7.35%)
PTV1: 3.47 – 14.22% (Median: 8.13%)
Planning Difficulty
Easy: 2 Medium: 3 Hard: 5
Easy: 2 Medium: 4 Hard: 4
Easy: 2 Medium: 3 Hard: 5
Chapter 6. Adapting automated treatment planning configurations 208

Table A.5: Target and OAR mean and standard deviations (S.D.) for each centre’s protocols. Conformity and homogeneity indices are also shown for each protocol’s PTV. Differences in metrics considered significant (p < 0.05) are bolded.
AP Technique A AP Technique B AP Technique C
Mean S.D. p-value Mean S.D. p-value Mean S.D. p-value
Protocol A
PTV1: V95% > 99% 99.9% 0.1% 100.0% 0.1% 0.08 100.0% < 0.1% 0.002 PTV2: V95% > 99% 99.7% 0.2% 99.9% 0.2% 0.04 100.0% < 0.1% 0.002 PTV2: D1% < 107% 103.1% 0.5% 102.6% 0.6% 0.03 102.4% 0.3% 0.01 Rectal Wall: V75Gy < 10% 4.2% 2.3% 5.1% 3.0% 0.11 6.6% 2.6% 0.002 Rectal Wall: V64Gy < 35% 14.8% 5.8% 16.2% 5.3% 0.002 17.2% 6.0% 0.002 Anal Sphincter: Dmean < 45 Gy 9.1 Gy 7.7 Gy 10.4 Gy 8.7 Gy 0.004 10.0 Gy 9.4 Gy 0.23 Femur Joint Area (Left): Dmax < 50 Gy 45.9 Gy 6.0 Gy 36.7 Gy 6.6 Gy 0.002 19.8 Gy 9.2 Gy 0.002 Femur Joint Area (Right): Dmax < 50 Gy 43.9 Gy 6.7 Gy 35.9 Gy 7.1 Gy 0.002 19.9 Gy 7.9 Gy 0.002 PTV1 Conformity Index 1.19 0.04 1.33 0.06 0.002 1.31 0.06 0.002 PTV2 Conformity Index 1.12 0.05 1.29 0.10 0.002 1.29 0.08 0.002 PTV1 Homogeneity Index 0.13 0.01 0.10 0.01 0.002 0.09 0.01 0.002 PTV2 Homogeneity Index 0.07 < 0.01 0.05 0.01 0.002 0.05 < 0.01 0.002 Protocol B
PTV1: D95% > 100% 99.2% 1.4% 0.23 99.6% 0.9% 99.2% 1.6% 0.51 PTV1: D2% < 105% 104.0% 0.2% 0.69 104.0% 0.3% 104.4% 0.3% 0.02 CTV1: D99% > 100% 101.0% 0.7% 0.83 101.0% 0.5% 101.3% 0.7% 0.32 PTV1: Dmax < 107% 105.2% 0.3% 0.13 105.5% 0.7% 105.7% 0.3% 0.70 Rectum: V40Gy < 50% 34.8% 6.0% 0.002 25.7% 6.1% 31.9% 7.0% 0.002 Rectum: V50Gy < 40% 24.6% 4.6% 0.002 20.3% 5.1% 22.4% 5.5% 0.02 Rectum: V60Gy < 30% 16.4% 3.4% 0.28 15.8% 4.4% 15.1% 4.0% 0.23 Rectum: V65Gy < 20% 12.6% 2.8% 0.11 13.6% 4.0% 11.7% 3.3% 0.002 Rectum: V70Gy < 10% 8.5% 2.1% 0.004 11.0% 3.6% 8.1% 2.4% 0.002
Chapter
6.Adapting
automated
treatmentplanning
configurations209
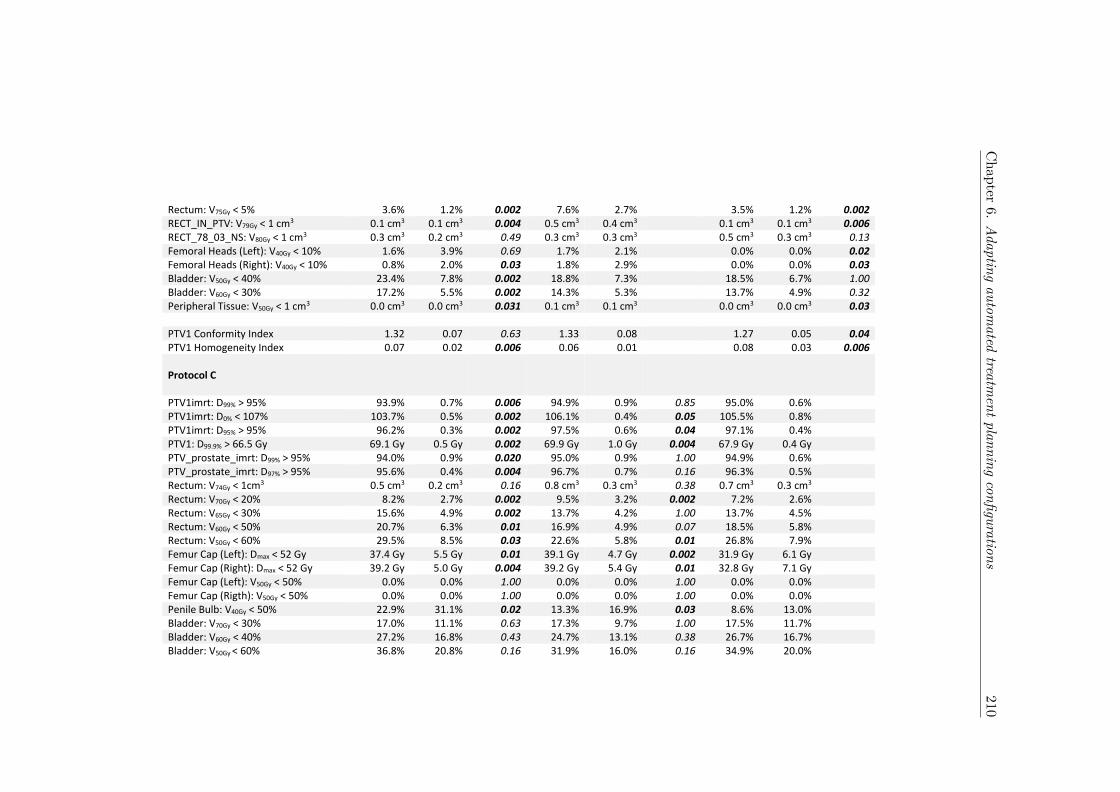
Rectum: V75Gy < 5% 3.6% 1.2% 0.002 7.6% 2.7% 3.5% 1.2% 0.002 RECT_IN_PTV: V79Gy < 1 cm3 0.1 cm3 0.1 cm3 0.004 0.5 cm3 0.4 cm3 0.1 cm3 0.1 cm3 0.006 RECT_78_03_NS: V80Gy < 1 cm3 0.3 cm3 0.2 cm3 0.49 0.3 cm3 0.3 cm3 0.5 cm3 0.3 cm3 0.13 Femoral Heads (Left): V40Gy < 10% 1.6% 3.9% 0.69 1.7% 2.1% 0.0% 0.0% 0.02 Femoral Heads (Right): V40Gy < 10% 0.8% 2.0% 0.03 1.8% 2.9% 0.0% 0.0% 0.03 Bladder: V50Gy < 40% 23.4% 7.8% 0.002 18.8% 7.3% 18.5% 6.7% 1.00 Bladder: V60Gy < 30% 17.2% 5.5% 0.002 14.3% 5.3% 13.7% 4.9% 0.32 Peripheral Tissue: V50Gy < 1 cm3 0.0 cm3 0.0 cm3 0.031 0.1 cm3 0.1 cm3 0.0 cm3 0.0 cm3 0.03 PTV1 Conformity Index 1.32 0.07 0.63 1.33 0.08 1.27 0.05 0.04 PTV1 Homogeneity Index 0.07 0.02 0.006 0.06 0.01 0.08 0.03 0.006 Protocol C
PTV1imrt: D99% > 95% 93.9% 0.7% 0.006 94.9% 0.9% 0.85 95.0% 0.6% PTV1imrt: D0% < 107% 103.7% 0.5% 0.002 106.1% 0.4% 0.05 105.5% 0.8% PTV1imrt: D95% > 95% 96.2% 0.3% 0.002 97.5% 0.6% 0.04 97.1% 0.4% PTV1: D99.9% > 66.5 Gy 69.1 Gy 0.5 Gy 0.002 69.9 Gy 1.0 Gy 0.004 67.9 Gy 0.4 Gy PTV_prostate_imrt: D99% > 95% 94.0% 0.9% 0.020 95.0% 0.9% 1.00 94.9% 0.6% PTV_prostate_imrt: D97% > 95% 95.6% 0.4% 0.004 96.7% 0.7% 0.16 96.3% 0.5% Rectum: V74Gy < 1cm3 0.5 cm3 0.2 cm3 0.16 0.8 cm3 0.3 cm3 0.38 0.7 cm3 0.3 cm3 Rectum: V70Gy < 20% 8.2% 2.7% 0.002 9.5% 3.2% 0.002 7.2% 2.6% Rectum: V65Gy < 30% 15.6% 4.9% 0.002 13.7% 4.2% 1.00 13.7% 4.5% Rectum: V60Gy < 50% 20.7% 6.3% 0.01 16.9% 4.9% 0.07 18.5% 5.8% Rectum: V50Gy < 60% 29.5% 8.5% 0.03 22.6% 5.8% 0.01 26.8% 7.9% Femur Cap (Left): Dmax < 52 Gy 37.4 Gy 5.5 Gy 0.01 39.1 Gy 4.7 Gy 0.002 31.9 Gy 6.1 Gy Femur Cap (Right): Dmax < 52 Gy 39.2 Gy 5.0 Gy 0.004 39.2 Gy 5.4 Gy 0.01 32.8 Gy 7.1 Gy Femur Cap (Left): V50Gy < 50% 0.0% 0.0% 1.00 0.0% 0.0% 1.00 0.0% 0.0% Femur Cap (Rigth): V50Gy < 50% 0.0% 0.0% 1.00 0.0% 0.0% 1.00 0.0% 0.0% Penile Bulb: V40Gy < 50% 22.9% 31.1% 0.02 13.3% 16.9% 0.03 8.6% 13.0% Bladder: V70Gy < 30% 17.0% 11.1% 0.63 17.3% 9.7% 1.00 17.5% 11.7% Bladder: V60Gy < 40% 27.2% 16.8% 0.43 24.7% 13.1% 0.38 26.7% 16.7% Bladder: V50Gy < 60% 36.8% 20.8% 0.16 31.9% 16.0% 0.16 34.9% 20.0%
Chapter
6.Adapting
automated
treatmentplanning
configurations210

Bowel Cavity: V50Gy < 50% 0.7% 2.2% 0.50 0.7% 2.0% 0.25 0.5% 1.5% PTV1 Conformity Index 0.99 0.02 0.002 1.11 0.03 0.70 1.11 0.03 PTV1 Homogeneity Index 0.11 0.01 0.002 0.12 0.01 0.70 1.12 0.01
Chapter
6.Adapting
automated
treatmentplanning
configurations211
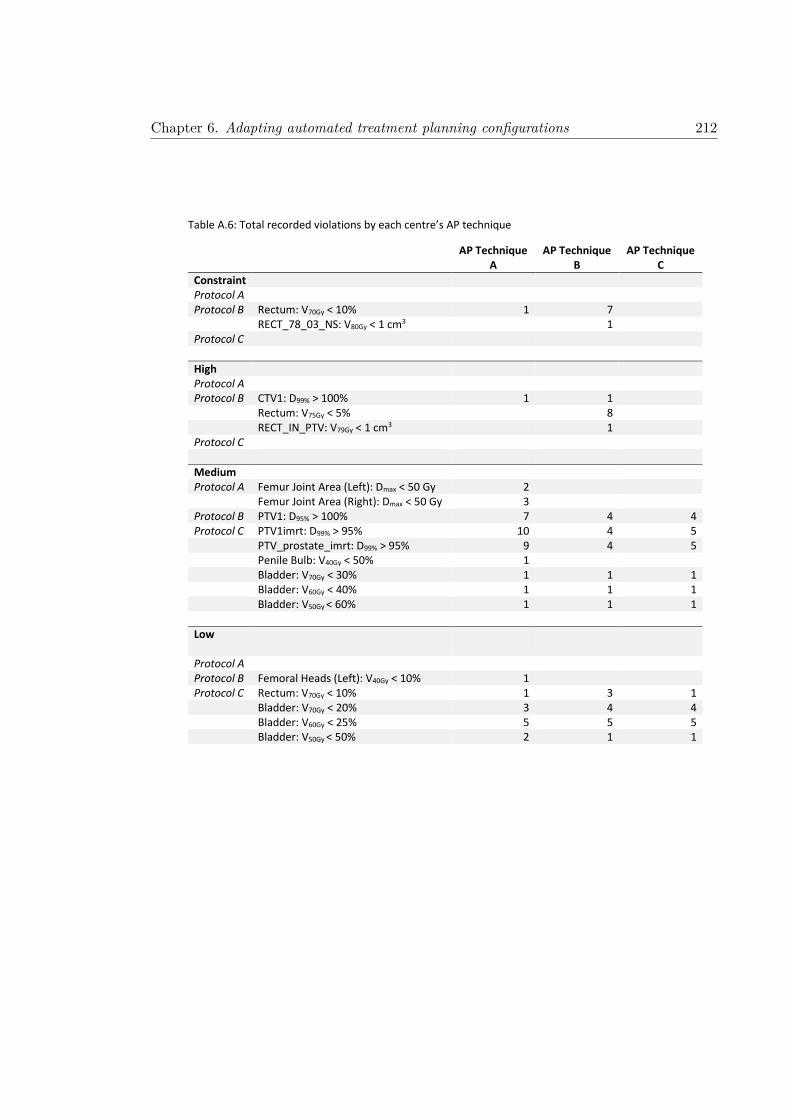
Table A.6: Total recorded violations by each centre’s AP technique
AP Technique A
AP Technique B
AP Technique C
Constraint Protocol A Protocol B Rectum: V70Gy < 10% 1 7 RECT_78_03_NS: V80Gy < 1 cm3 1 Protocol C
High Protocol A Protocol B CTV1: D99% > 100% 1 1 Rectum: V75Gy < 5% 8 RECT_IN_PTV: V79Gy < 1 cm3 1 Protocol C
Medium Protocol A Femur Joint Area (Left): Dmax < 50 Gy 2
Femur Joint Area (Right): Dmax < 50 Gy 3 Protocol B PTV1: D95% > 100% 7 4 4 Protocol C PTV1imrt: D99% > 95% 10 4 5 PTV_prostate_imrt: D99% > 95% 9 4 5 Penile Bulb: V40Gy < 50% 1 Bladder: V70Gy < 30% 1 1 1 Bladder: V60Gy < 40% 1 1 1 Bladder: V50Gy < 60% 1 1 1
Low
Protocol A Protocol B Femoral Heads (Left): V40Gy < 10% 1 Protocol C Rectum: V70Gy < 10% 1 3 1 Bladder: V70Gy < 20% 3 4 4 Bladder: V60Gy < 25% 5 5 5 Bladder: V50Gy < 50% 2 1 1
Chapter 6. Adapting automated treatment planning configurations 212

Table A.7: Modified AP Technique B to meet distributed protocol B criteria
Target Optimisation Goals Dose PTV78_OPT 78.4 Gy CTV_ANTPROST 80 Gy Organs at Risk Objective Dose Volume Priority Compromise Rectum Max Dose 78.3 Gy High Yes Rectum Mean Dose 33.5 Gy Medium Yes Rectum Max DVH 73 Gy 5% High Yes Rectum Max DVH 60 Gy 40% Medium Yes Rectum Max DVH 38 Gy 50% High Yes RECT_78_03_NS Max Dose 80 Gy High Yes Bladder Max DVH 50 Gy 50% Medium Yes Bladder Max DVH 60 Gy 40% Medium Yes Bladder Mean Dose 15 Gy Low Yes POSTRECT_NS Max DVH 38 Gy 2% Medium Yes Tuning Balance 11% Dose Fall-Off 2.6 cm Hot-Spot Maximum Goal 103% Use Cold-Spot ROIs Yes
Chapter 6. Adapting automated treatment planning configurations 213

Table A.8: Original and modified AP technique B for protocol B, with significant differences between metrics bolded.
AP Technique B AP Technique B (Modified
Mean S.D. Mean S.D. p-value
PTV1: D95% > 100% 99.6% 0.9% 99.1% 0.7% 0.006 PTV1: D2% < 105% 104.0% 0.3% 104.4% 0.2% 0.01 CTV1: D99% > 100% 101.0% 0.5% 100.1% 0.5% 0.004 PTV1: Dmax < 107% 105.5% 0.7% 106.0% 0.7% 0.16 Rectum: V40Gy < 50% 25.7% 6.1% 25.0% 4.7% 0.32 Rectum: V50Gy < 40% 20.3% 5.1% 19.3% 4.4% 0.07 Rectum: V60Gy < 30% 15.8% 4.4% 14.7% 4.1% 0.05 Rectum: V65Gy < 20% 13.6% 4.0% 12.4% 3.9% 0.04 Rectum: V70Gy < 10% 11.0% 3.6% 9.7% 3.5% 0.01 Rectum: V75Gy < 5% 7.6% 2.7% 5.8% 2.1% 0.002 RECT_IN_PTV: V79Gy < 1 cm3 0.5 cm3 0.4 cm3 0.4 cm3 0.3 cm3 0.32 RECT_78_03_NS: V80Gy < 1 cm3 0.3 cm3 0.3 cm3 0.2 cm3 0.2 cm3 0.70 Femoral Heads (Left): V40Gy < 10% 1.7% 2.1% 0.9% 2.7% 0.81 Femoral Heads (Right): V40Gy < 10% 1.8% 2.9% 0.3% 0.5% 0.31 Bladder: V50Gy < 40% 18.8% 7.3% 18.3% 6.3% 0.85 Bladder: V60Gy < 30% 14.3% 5.3% 13.7% 4.5% 0.38 Peripheral Tissue: V50Gy < 1 cm3 0.1 cm3 0.1 cm3 < 0.1 cm3 < 0.1 cm3 0.03 PTV1 Conformity Index 1.33 0.08 1.24 0.05 0.002 PTV1 Homogeneity Index 0.06 0.01 0.07 0.01 0.002
Chapter 6. Adapting automated treatment planning configurations 214
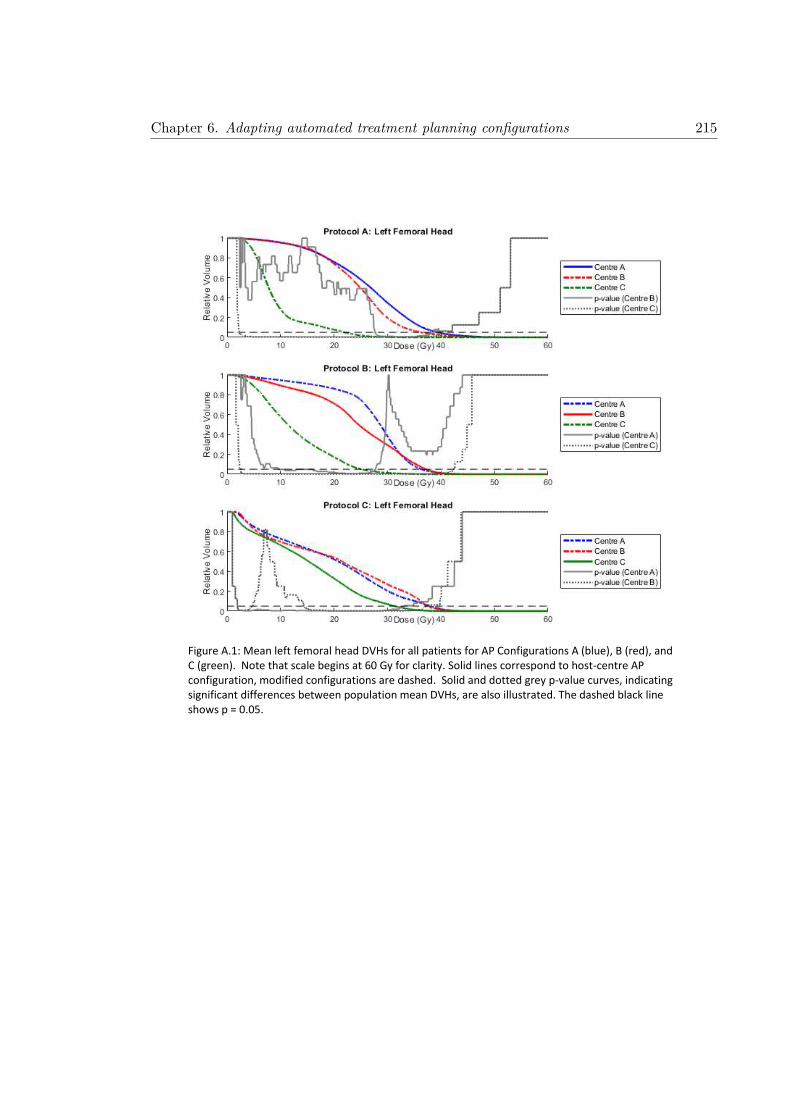
Figure A.1: Mean left femoral head DVHs for all patients for AP Configurations A (blue), B (red), and C (green). Note that scale begins at 60 Gy for clarity. Solid lines correspond to host-centre AP configuration, modified configurations are dashed. Solid and dotted grey p-value curves, indicating significant differences between population mean DVHs, are also illustrated. The dashed black line shows p = 0.05.
Chapter 6. Adapting automated treatment planning configurations 215

Figure A.2: Mean right femoral head DVHs for all patients for AP Configurations A (blue), B (red), and C (green). Note that scale begins at 60 Gy for clarity. Solid lines correspond to host-centre AP configuration, modified configurations are dashed. Solid and dotted grey p-value curves, indicating significant differences between population mean DVHs, are also illustrated. The dashed black line shows p = 0.05.
Chapter 6. Adapting automated treatment planning configurations 216

Figure A.3: Mean bladder DVHs for all patients for AP Configurations A (blue), B (red), and C (green). Note that scale begins at 60 Gy for clarity. Solid lines correspond to host-centre AP configuration, modified configurations are dashed. Solid and dotted grey p-value curves, indicating significant differences between population mean DVHs, are also illustrated. The dashed black line shows p = 0.05.
Chapter 6. Adapting automated treatment planning configurations 217

CHAPTER 7
Discussion and Conclusion
218
Chapter 7. Discussion and Conclusion 219
7.1 General Discussion
This thesis investigated the utilisation of advanced analysis techniques to quantify vari-
ability observed during contouring and treatment planning. These developed techniques
allow for a determination of the clinical impact that results from variation in quality dur-
ing these steps. It is well established that these manual processes are prone to significant
inter-observer variations [25, 36], with uncertainties propagating throughout all aspects of
treatment due to these steps being at the beginning of the radiotherapy workflow (Figure
1.1). Incorporation of automated methods to reduce variation, along with utilisation of
the aforementioned analysis techniques presented in this thesis, will allow for significant
improvements in quality assurance during a clinical trial
Inter-observer contouring variability is widely investigated within the literature, however
there exists a lack of consensus regarding how these variations are to be quantified [26, 27].
Not only do commonly utilised contouring metrics fail to correlate with one another [28],
but often they provide no dosimetric context regarding the clinical impact of the varia-
tion. This was addressed in Chapter 3, whereby contouring metrics that correlated with
simulated treatment outcome for prostate radiotherapy were identified. These metrics
were subsequently utilised during investigations in Chapter 4, whereby inter-observer con-
touring variability of multiple male pelvic structures were assessed on both CT and MRI
datasets.
The utilisation of automation to reduce inter-observer variation in radiotherapy is of sig-
nificant interest within the literature [28]. Automatic contouring is a rapidly developing
field, with many studies investigating the use of atlas-based contouring methods [15]. Not
only does atlas-based contouring provide significant time-savings within the clinical work-
flow, but it can also be applied retrospectively to investigate large clinical trial datasets.
Variations between atlas and manually defined CTV contours across the RADAR, RT01,
and CHHiP prostate radiotherapy clinical trial datasets were investigated in Chapter 5.
This was assessed using vector mappings, whereby specific spatial regions with significant
variability surrounding the CTV were identified for each trial. Cox Regression analysis
was utilised to identify regions where contouring variability correlated with a significant
Chapter 7. Discussion and Conclusion 220
increase in risk of treatment failure. These results confirm that not only does contouring
variability impact the efficacy of treatment, but the clinical impact is highly dependent
on the spatial location of these discrepancies.
Automation has also been incorporated into treatment planning, with most vendors now
providing some form of automatic treatment planning module within their treatment plan-
ning system. Common methods of automation are knowledge-based models, favoured by
Varian3 within their RapidPlan™ module [402], and template-driven modules ,such as the
AutoPlanning™ module in Pinnacle3 [42]. AutoPlanning™ (AP) configurations are devel-
oped locally, with clinics developing site specific processes to generate treatment plans that
are clinically acceptable based on local protocol. Chapter 6 investigated the robustness
and quality of three different clinic’s AP configurations, and showed that each configu-
ration was able to be adapted to meet each other clinic’s treatment planning protocol.
This highlighted the ability for AP configurations to be shared between clinics, whereby
smaller centres that may lack the resources required to develop local AP configurations
could benefit from the work performed by larger centres.
This thesis investigated advanced analysis techniques aimed at addressing some of the
largest sources of uncertainty within the radiotherapy workflow, particularly with respect
to clinical trial quality assurance. Insight is provided into how these techniques could be
utilised to quantify, characterise, and reduce the variability that is observed. The main
themes of research carried out during this candidature were outlined in Chapter 1 and
include:
1. An assessment of inter-observer contouring uncertainties for target volumes and
organs-at-risk for intact prostate radiotherapy,
2. The effect of target volume contouring variability on recorded patient outcome within
prostate radiotherapy clinical trial datasets, and
3. An evaluation of quality and robustness of automated treatment planning configu-
rations shared between international centres.
These three themes each relate to improving quality assurance of radiotherapy clinical
trials (Figure 1.1). During a clinical trial it is imperative that there is an understanding
Chapter 7. Discussion and Conclusion 221
of possible uncertainties associated with each step within the radiotherapy workflow. This
is particularly true for investigations looking at emerging techniques and treatments, as
uncertainties and variations that arise early in the radiotherapy workflow will propagate
throughout all stages of treatment. Reductions in quality of treatment will not only
compromise potential findings from the clinical trial, but could also potentially place the
patient at risk if dangerous treatment is administered.
It is important when assessing contouring variability to understand the clinical impact
these variations would have on treatment outcome. Contouring metrics that quantify
variation, but provide no information regarding how a patient will respond to treatment
that utilises these contours, will provide no benefit to clinical trials aiming to improve
patient outcome. By identifying metrics that do correlate with treatment outcome for
prostate radiotherapy, future clinical trials could therefore incorporate these metrics during
quality assurance procedures. This would ensure that assessment of contouring quality
during benchmarking would be based on treatment outcome measures, as opposed to
simple topological descriptions.
An understanding of the extent of contouring variability is required when determining
potential links between delivered dose distributions to anatomical structures and recorded
patient outcomes. Any uncertainty in identifying the structure during contouring will
result in an associated uncertainty in the actual dose delivered to that structure. This
uncertainty and variation could not only weaken any potential correlations, but may addi-
tionally result in completely erroneous findings altogether. This is particularly true when
investigating anatomical regions where multiple small structures overlap. As was shown in
Chapter 4, significant differences can arise when contouring small structures of emerging
interest. Consequently, investigations studying dose delivered to these structures will have
uncertainty in any findings unless appropriate measures were undertaken to either reduce
or quantify this variability.
Conversely, if it is found that variations exist when defining the target volume contours
during a clinical trial, then a significant number of enrolled patients will receive inade-
quate radiotherapy treatment. This would drastically impact the patient’s care, as well
as limiting the clinical trial’s efficacy. This is also true for treatment planning, whereby
Chapter 7. Discussion and Conclusion 222
inadequate dose coverage of the target volume could fail to meet the trial’s protocols. For
these reasons, quantifying and reducing variability in contouring and treatment planning
are two of the most important considerations when creating a quality assurance protocol
for a clinical trial. This is the basis for investigations within this thesis. Through analysis
of clinical trial datasets and recorded patient outcomes, results were able to link these
variations and poorer treatment outcomes for these patient. Future clinical trials could
significantly improve the quality of patient treatment through use of the results from these
retrospective analyses, allowing us to move forward in standards of clinical care.
7.2 Inter-observer contouring uncertainties for intact prostate
radiotherapy
Chapter 3 identified multiple contouring variation metrics commonly utilised in contour-
ing studies, and assessed whether these metrics significantly correlated with simulated
treatment outcome for prostate radiotherapy. Two datasets were investigated; the first
comprised of 35 patients independently contoured by 3 observers, the second a cohort
of 5 patients contoured by 10 observers. Clinical target volume (CTV), planning target
volume (PTV), bladder and rectum were contoured on all datasets, with each structure
having gold standard volumes separately defined using majority voting and the STAPLE
algorithm. Treatment plans were generated for each patient based on local protocol at the
time (VMAT treatment with 78 Gy prescription dose). The impact contouring variations
between observer and gold standard contours had on treatment efficacy was investigated
using various radiobiological metrics such as tissue control probability (TCP), normal
tissue complication probability (NTCP), and equivalent uniform dose (EUD).
No significant correlations between any contouring variation metrics and all simulated
treatment outcome measures were observed for CTV contours. This was attributed to
the uniform dose distribution generated by the treatment plans for the PTV, resulting
in no substantial dose discrepancies across the CTV for all observer’s contours. Margins
utilised to generate PTV for prostate radiotherapy are therefore sufficient to account for
inter-observer contouring variation of the CTV. Volume similarity significantly correlated

Chapter 7. Discussion and Conclusion 223
with simulated treatment outcome for PTV across both patient datasets, with TCPPoisson
(ρ = 0.57, 0.65), TCPLogit (ρ = 0..39, 0.62), and EUD (ρ = 0.43, 0.61) all statistically
significant. PTV volume similarity was also shown to significantly correlate with rectum
NTCP (ρ = 0.0.33, 0.48), highlighting that contouring variation of the target volumes
can negatively impact toxicity in neighbouring organs-at-risk (OARs). Most notably, the
Dice Similarity Coefficient (DSC) and Hausdorff Distance both displayed no significant
correlation with any radiobiological metric. These contouring metrics are highly utilised
within the literature [25], however each fails to differentiate whether an observer’s contour
is over- or under-contoured with respect to the gold standard. As these two situations will
result in substantially different dose distributions delivered to the gold standard volume,
these metrics alone cannot be used to evaluate the dosimetric impact of contouring vari-
ability. Consequently, it is recommended by this work that volume similarity is utilised
along with these metrics during future contouring variation studies.
This ethos was adopted within Chapter 4, where multiple metrics were utilised to assess
contouring variations between 13 observers on 5 male pelvic datasets. Structures were
contoured on both CT and T2 weighted MRI scans, and included both standard clinical
structures as well as neighbouring OARs of growing interest in radiotherapy studies [34,
403, 404]. While studies had begun investigating inter-observer contouring variability for
some of these structures, no study had looked at the breadth of structures investigated
here. Additionally, the impact of contouring variability when all structures were contoured
simultaneously is often neglected in these studies, despite this being what would occur
clinically. Inter-observer contouring variation of structures contoured on CT were found
to be comparable to values within the literature [28], while CTV contoured on T2-weighted
MRI showed excellent inter-observer agreement (median DSC = 0.88). However, many of
the emerging structures contoured on MRI showed far more variation between observers,
with structures such as the left and right neurovascular bundle, membranous urethra and
trigone showing significant inter-observer variation (median DSC = 0.16, 0.15, 0.41, and
0.44 respectively).
It was found that the relative experience of observers did not impact results, with the
variation in contouring between the more experienced observers as substantial as those
with less experience contouring these structures. However, experience in contouring the

Chapter 7. Discussion and Conclusion 224
emerging structures was consistently low for all observers, and was attributed as the most
probable cause of variability. This is a salient point, with studies investigating dose de-
livered to these structures often failing to adequately address these uncertainties. Clinical
trials require the true volume to be contoured for findings to be statistically significant,
however as this is rarely known all clinical trials will have an associated uncertainty at
this early stage within the radiotherapy workflow. Consequently, it was a recommendation
from this work that all radiotherapy clinical trials must provide some details regarding the
quality assurance of each structure’s contours.
Additionally, automated contouring methods such as atlases utilise a priori clinical infor-
mation to automatically contour patient datasets. It is a well-known maxim in computer
science that “rubbish in equals rubbish out”, with this statement particularly true for
atlas-based contouring. Multiple observer’s contours are utilised when developing an at-
las, which due to resource demands will usually come from observer’s with a wide range
of experience. The variability in contours that comprise the atlas will therefore place a
cap on the quality of the automatically generated contours, no matter the accuracy of the
registration. As this study shows, this variation is quite significant for many structures.
Consequently, a thorough investigation of inter-observer contouring variability must be
incorporated as a first step during atlas development.
7.3 Contouring variability within clinical trial datasets
Chapter 5 utilised an atlas to retrospectively contour CTVAtlas on the RADAR, RT01, and
CHHiP prostate radiotherapy clinical trial datasets. Contours within the atlas originated
from the inter-observer study of Chapter 4, while atlas development and validation was
performed by Kennedy et al [397]. Following the automatic contouring of CTVAtlas on all
clinical trial patients, variations between these and the original contours from the clinical
trials (CTVManual) were assessed using vector mappings. Vectors propagating from the
centroid of CTVManual were sampled every 6 degrees in both polar coordinates (azimuthal
and elevation), allowing for the Distance-to-Agreement (DtA) between contours to be
measured across the entire CTV surface. This method allowed for the spatial regions
where significant contouring variations occurred to be identified, providing information

Chapter 7. Discussion and Conclusion 225
that is lost when a global metric that attributes a single value to describe contouring
variation is used.
For RADAR patients CTVManual were found to be significantly under-contoured in the
vicinity of the bladder with respect to CTVAtlas, while simultaneously being over-contoured
posteriorly towards the rectum. Additionally, both RADAR and RT01 CTVManual con-
tours overextended inferiorly in the direction of the penile bulb. RT01 and CHHiP patient’s
had CTVManual contours that were under-contoured near the rectum, while CHHiP pa-
tient’s CTVManual contours were over-contoured in the vicinity of the bladder. It was
noted that significant differences existed between the three clinical trials with respect to
dose prescriptions, contouring protocols, and treatment techniques. Each of these differ-
ences could be responsible for the differences in contouring variations observed between the
trials. This highlights the requirement for assessing inter-observer contouring variability
during every clinical trial, as variations will not be consistent even if the same treatment
site is investigated.
By spatially analysing contouring variations across these clinical trials, it was possible to
assess the clinical impact contouring variations in specific regions had on treatment efficacy.
For every vector generated, a DtA cut-point was identified such that the largest difference
in a particular treatment outcome was observed between patients dichotomised by this
DtA. This cut-point was unique not only for each vector, but also for each trial as well as
each treatment outcome measure investigated. Within this study, the treatment outcomes
considered were patient death, local progression, and PSA progression. Hazard Ratios were
calculated that indicated the associated risk of a patient observing each of these outcomes,
dependent on whether the patient’s DtA between CTVManual and CTVAtlas along this
vector either exceeded or fell short of the calculated cut-point. This was analogous to the
original CTVManual being over- or under-contoured respectively in this region.
It was found that under-contouring of CTVManual in the vicinity of the bladder resulted
in a significant increase in risk of patient death (median HR = 0.57, 0.36, and 0.70 for
RADAR, RT01, CHHiP respectively) and PSA progression (median HR = 0.37, 0.56
for RT01, CHHiP). Additionally, insufficient contouring in the vicinity of the rectum for
RADAR patients resulted in an increased risk of PSA progression (median HR = 0.55).

Chapter 7. Discussion and Conclusion 226
Finally, insufficient contouring in the anterior-inferior orientation (towards the penile bulb)
resulted in significantly increased risk of local progression across all three clinical trials
(median HR = 0.37, 0.16, 0.29 for RADAR, RT01, CHHiP).
These results verify that the specific spatial regions where contouring variations occur
is an important factor when assessing risk of treatment failure following radiotherapy.
The most significant regions of contouring variations occur near where the CTV borders
neighbouring OARs, such as the bladder and rectum. The soft tissue boundaries can often
be difficult to distinguish, particularly on CT, with the resultant manual CTV contours
often being conservatively defined to reduce dose delivered to the neighbouring OARs. If
the tumour volume was inadequately irradiated, it can be easily reasoned that this would
result in the poorer patient outcomes observed in this study. Consequently, this work not
only identified the clinical impact of contouring variability within prostate radiotherapy
clinical trials, but also provided the framework for a complete spatial analysis during future
contouring studies.
7.4 Quality of automated treatment planning techniques be-
tween centres
Automated treatment planning is increasingly utilised to improve efficiency within the
radiotherapy workflow. The Pinnacle3 treatment planning system had recently introduced
the AutoPlanning™ (AP) module, a template-based method of automatically generating
treatment plans through iterative re-optimisation of specified planning goals. It had been
shown that AP treatment plans were non-inferior in quality compared to manual plans
across multiple treatment sites, while being generated in a significantly shorter time [39,
41, 42]. However, significant resources are required by a clinic to develop AP configurations
that are specific to local treatment protocols, which can be a burden for centre’s lacking
the resources to complete this process. Chapter 6 investigated the ability to adapt AP
configurations developed by one clinic to meet the treatment protocols of other clinics,
with the robustness of these configurations and quality of the generated plans assessed.

Chapter 7. Discussion and Conclusion 227
Three centres (one Australian, two European) shared treatment protocols and training
datasets, with the intention of each centre modifying their local intact prostate AP con-
figurations to meet the treatment protocols of the other two centres. Once modified AP
configurations were developed for all centre’s protocols, validation datasets of 10 patients
were distributed by each centre. Treatment plans generated using the modified AP con-
figurations were compared against the original clinic’s treatment plan via DVH analysis
and protocol compliance. When assessing plans generated using the modified AP configu-
rations, only a single constraint and high priority deviation was recorded. These occurred
on a difficult prostate plan, whereby significant overlap between the PTV and rectum oc-
curred, and where the original clinically accepted plan also displayed these same violations.
Consequently, all modified AP configurations were able to generate clinically acceptable
treatment plans.
This study verified that AP configurations could be shared between clinics, being robust
enough to adapted to meet local treatment planning protocols. Smaller centre’s lacking the
resources to develop and validate individual AP configurations could therefore utilise AP
configurations previously developed by other centres, reducing the workload on therapists
while improving the quality of treatment. Additionally, clinical trials require specific
treatment protocols to be met by participating centres. Centres that utilise the Pinnacle3
AutoPlanning™ module could therefore adapt AP configurations to meet these clinical
trial protocols, reducing the impact of planning variation that is found within clinical
trials.
7.5 Future Work
The methods developed within this thesis provide opportunities for many additional future
investigations. Examples of potential future work following on from these studies include:
1. Further investigations correlating contouring variations metric with treatment out-
come for prostate radiotherapy when treated with advanced treatment techniques,
such as Stereotactic Body Radiotherapy (SBRT),

Chapter 7. Discussion and Conclusion 228
2. The utilisation of vector mappings to assess the impact of CTV contouring variability
on recorded urinary and toxicity outcomes within the RADAR, RT01, and CHHiP
clinical trial datasets,
3. Automatic contouring of additional male pelvic structures that are within the atlas
upon these clinical trial datasets, allowing for subsequent investigations of the clinical
impact of dose to these structures on treatment and toxicity, and
4. An investigation into the utilisation of AP configurations to improve treatment plan-
ning quality during a benchmarking exercise for a multicentre clinical trial.
Chapter 3 identified contouring variation metrics that significantly correlated with simu-
lated treatment outcome for prostate patients treated utilising Volumetric Modulated Arc
Therapy (VMAT). The primary findings were that the volumetric metrics, such as vol-
ume similarity, correlated significantly with outcome while boundary and overlap metrics
did not. This was due to the metric’s ability to distinguish target volume contours that
produced inadequate dose distributions to the gold standard volume. However, modern
treatment techniques such as Stereotactic Body Radiotherapy (SBRT) are increasingly
being investigated as alternatives to VMAT [202, 405]. These treatments deliver highly
ablative doses to the target volume, producing significantly different dose distributions
compared to VMAT [406]. This difference in treatment delivery could result in the ob-
served correlations no longer being statistically significant. Additionally, the margins used
to generate PTV many no longer be sufficient to ensure CTV contouring variability did
not impact the resultant CTV dose distribution. Consequently, further assessment in-
vestigating correlations between contouring metrics and treatment outcomes should be
undertaken for prostate patient treated with SBRT, as well as any other new treatment
technique.
The work presented in Chapter 5 displayed a novel method for investigating correlations
between contouring variations and treatment failure. Treatment failure was defined as pa-
tient death, local progression, or PSA progression sometime during 5 to 10 year follow-up
for the RADAR, RT01, and CHHiP clinical trials. It was found that contouring variabil-
ity in specific spatial regions resulted in significant increases in risk of observing these

Chapter 7. Discussion and Conclusion 229
outcomes. Further work could expand on this by utilising both the prostate and seminal
vesicle contours within the atlas to define the Clinical Target Volume. This would allow
for the inclusion of a greater portion of patients within the three datasets, improving the
statistical power and findings from this analysis. Increased statistical power could also be
achieved through the introduction of permutation testing methods within the methodol-
ogy to account for multiple testing issues. Additionally, the contouring similarity metrics
investigated in chapter 3 could also be brought into the analysis as well to complement
the analysis.
Additional follow-up data is also available from these clinical trial datasets. Urinary tox-
icities such as haematuria and dysuria were recorded for each patient, along with rectal
toxicities such as rectal bleeding, stool frequency, and tenesmus. As a treatment plan’s
dose distribution is inherently dependent on the contours, variability when defining the
target volume contour may result in additional dose being delivered to neighbouring OARs
such as the bladder and rectum. This could result in an increased risk in developing the
aforementioned toxicities. Investigating the correlations between CTV contouring vari-
ability and each urinary and rectal toxicity would improve our understanding concerning
how contouring uncertainties in prostate radiotherapy affects all aspects of treatment ef-
ficacy. The information gleaned from this work, combined with the results from Chapter
5, could then allow us to define target volume boundaries for prostate radiotherapy based
on pathological boundaries (i.e., defining the contour such that there is the smallest risk
of treatment failure or developing toxicities), as well as anatomical information.
The atlas utilised in Chapter 5 was derived from the multiple observer’s contours upon
the five patient datasets within Chapter 4. Significant results were obtained following
investigations utilising the CT-defined CTVAtlas contour, however this was only a single
structure contained within the atlas. As well as the MR-defined CTV, an additional
14 structures and OARs have each been propagated upon all patient datasets within the
RADAR, RT01, and CHHiP clinical trials. Future studies could investigate the known dose
distributions that were planned for each patient, and correlate these doses delivered to each
of the automatically contoured structures with the recorded patient outcomes. Utilisation
of this rich dataset could therefore provide further information not only on potential dose

Chapter 7. Discussion and Conclusion 230
constraints for these emerging structures, but also provide evidence regarding the clinical
benefit of utilising MRI to define the CTV boundary for prostate radiotherapy.
Finally, the assessment of AP configuration robustness in Chapter 6 showed that these
configurations were able to be adapted to meet other centre’s treatment planning proto-
cols in a retrospective assessment. This feasibility study was illuminating, however the
greatest potential benefit of this work would be during a large multicentre clinical trial,
where multiple participating centres are required to generate treatment plans that meet
the clinical trial protocols. Most clinical trials will incorporate a benchmarking exercise
at the beginning of the study to assess the capability of centre’s to generate treatment
plans of sufficient quality [283, 286]. Even so, treatment planning variability is prominent
in clinical trials, and has been shown to reduce both the effectiveness of treatment, as well
as the statistical power of the clinical trial [11]. By introducing an AP configuration that
is specific to the clinical trial’s protocol, it would be easily manageable to distribute this
configuration to all participating centres that utilise the Pinnacle3 AutoPlanning™ mod-
ule, removing the potential variability in treatment planning between these centres. An
assessment on the effectiveness of sharing a single AP configuration in a manner analogous
to Chapter 6, but in the context of a clinical trial benchmarking exercise, would signifi-
cantly reduce treatment planning variability while improving the quality and effectiveness
of the clinical trial.
7.6 Conclusion
The work compiled within this thesis investigated advanced analysis techniques which,
when combined with automated methods of contouring and treatment planning, can be
utilised to improve quality assurance in radiotherapy clinical trials. It was shown in this
thesis that the contouring metric volume similarity significantly correlated with simu-
lated treatment outcome for prostate radiotherapy, while commonly utilised overlap and
boundary contouring metrics did not. These metrics were utilised during an assessment of
inter-observer contouring variation for multiple male pelvic structures. Emerging struc-
tures were found to have significant variation between observer contours. Vector mappings
were incorporated to provide a spatial analysis of contouring variation between automatic

Chapter 7. Discussion and Conclusion 231
atlas CTV and original trial CTV. This method identified of specific regions surrounding
the CTV where contouring variations resulted in significantly increased risk of treatment
failure. Finally, when investigating automated treatment methods, it was found that mod-
ified AP configurations were successfully able to generate clinically acceptable treatment
plans for all treatment protocols.
All of these investigations have focussed on what are often regarded as the greatest sources
of uncertainty within radiotherapy. As future clinical trials in radiotherapy strive to find
key breakthroughs that will significantly improve quality of care for cancer patients, it is
essential to understand the uncertainties associated with all steps within the radiotherapy
workflow. It is hoped that the work presented herein will assist in this manner, with the
methods and analysis techniques utilised by future clinical trials in conjunction with the
automated methods of contouring and treatment planning explored in this work.

Bibliography
[1] Australian Institute of Health and Welfare (AIHW). Australian cancer incidence
and mortality (acim) books: Prostate cancer, 2017. URL http://www.aihw.gov.
au/acim-books.
[2] OpenStax College. Anatomy & Physiology. OpenStax College, 2013. URL http:
//cnx.org/content/col11496/latest/.
[3] Patrick W McLaughlin, Sara Troyer, Sally Berri, Vrinda Narayana, Amichay
Meirowitz, Peter L Roberson, and James Montie. Functional anatomy of the
prostate: implications for treatment planning. International Journal of Radiation
Oncology* Biology* Physics, 63(2):479–491, 2005. ISSN 0360-3016.
[4] Jonathan I Epstein. An update of the gleason grading system. The Journal of
urology, 183(2):433–440, 2010. ISSN 0022-5347.
[5] Matthew R Cooperberg and Peter R Carroll. Trends in management for patients
with localized prostate cancer, 1990-2013. JAMA, 314(1):80–82, 2015. ISSN 0098-
7484.
[6] Ian F Tannock, Richard P Hill, Robert G Bristow, and Lea Harrington. The Basic
Science of Oncology, 5th Edition. Boston: MacGraw Hill, 2013. ISBN 0071387749.
[7] Nagalingam Suntharalingam, Ervin B Podgorsak, and Jolyon H Hendry. Basic ra-
diobiology. Radiation oncology physics: A handbook for teachers and students, 2005.
[8] H Rodney Withers. The four r’s of radiotherapy. Adv Radiat Biol, 5(3):241–271,
1975.
232

References 233
[9] Michael J Zelefsky, Zvi Fuks, and Steven A Leibel. Intensity-modulated radiation
therapy for prostate cancer. In Seminars in radiation oncology, volume 12, pages
229–237. Elsevier, 2002. ISBN 1053-4296.
[10] Eckhart Dühmke, Jeremy Franklin, Michael Pfreundschuh, Susanne Sehlen, Norman
Willich, Ursula Rühl, Rolf-Peter Müller, Peter Lukas, Anton Atzinger, and Ursula
Paulus. Low-dose radiation is sufficient for the noninvolved extended-field treatment
in favorable early-stage hodgkin’s disease: long-term results of a randomized trial
of radiotherapy alone. Journal of clinical oncology, 19(11):2905–2914, 2001. ISSN
0732-183X. doi: https://doi.org/10.1200/JCO.2001.19.11.2905.
[11] Lester J Peters, Brian O’Sullivan, Jordi Giralt, Thomas J Fitzgerald, Andy Trotti,
Jacques Bernier, Jean Bourhis, Kally Yuen, Richard Fisher, and Danny Rischin.
Critical impact of radiotherapy protocol compliance and quality in the treatment
of advanced head and neck cancer: results from trog 02.02. Journal of Clinical
Oncology, 28(18):2996–3001, 2010. ISSN 0732-183X. doi: https://doi.org/10.1200/
JCO.2009.27.4498.
[12] Jacqueline E Livsey, James P Wylie, Ric Swindell, Vincent S Khoo, Richard A
Cowan, and John P Logue. Do differences in target volume definition in prostate
cancer lead to clinically relevant differences in normal tissue toxicity? International
Journal of Radiation Oncology* Biology* Physics, 60(4):1076–1081, 2004. ISSN
0360-3016.
[13] James W Denham, David Joseph, David S Lamb, Nigel A Spry, Gillian Duchesne,
John Matthews, Chris Atkinson, Keen-Hun Tai, David Christie, and Lizbeth Kenny.
Short-term androgen suppression and radiotherapy versus intermediate-term andro-
gen suppression and radiotherapy, with or without zoledronic acid, in men with
locally advanced prostate cancer (trog 03.04 radar): 10-year results from a ran-
domised, phase 3, factorial trial. The Lancet Oncology, 20(2):267–281, 2019. ISSN
1470-2045.
[14] Peressutti Devis and Schipaanboord Bas. Overview of atlas-based segmenta-
tion approaches. figshare, 2018. doi: 10.6084/m9.figshare.6809597.v1. URL

References 234
https://figshare.com/articles/Overview_of_atlas-based_segmentation_
approaches/6809597.
[15] Juan Eugenio Iglesias and Mert R Sabuncu. Multi-atlas segmentation of biomedical
images: a survey. Medical image analysis, 24(1):205–219, 2015. ISSN 1361-8415.
[16] Oscar Acosta, Jason Dowling, Gael Drean, Antoine Simon, Renaud De Crevoisier,
and Pascal Haigron. Multi-atlas-based segmentation of pelvic structures from CT
scans for planning in prostate cancer radiotherapy, pages 623–656. Springer, 2014.
ISBN 1461484979.
[17] Peter H Westfall and S Stanley Young. Resampling-based multiple testing: Examples
and methods for p-value adjustment, volume 279. John Wiley & Sons, 1993. ISBN
0471557617.
[18] Jonathan I Epstein, William C Allsbrook Jr, Mahul B Amin, Lars L Egevad, and
ISUP Grading Committee. The 2005 international society of urological pathology
(isup) consensus conference on gleason grading of prostatic carcinoma. The American
journal of surgical pathology, 29(9):1228–1242, 2005. ISSN 0147-5185.
[19] Damien C Weber, Philip MP Poortmans, Coen W Hurkmans, Edwin Aird, Akos
Gulyban, and Alysa Fairchild. Quality assurance for prospective eortc radiation
oncology trials: the challenges of advanced technology in a multicenter international
setting. Radiotherapy and Oncology, 100(1):150–156, 2011. ISSN 0167-8140.
[20] Australian Institute of Health and Welfare. Cancer in australia 2019.
Report, AIHW, 2019. URL https://www.aihw.gov.au/reports/cancer/
cancer-in-australia-2019.
[21] Mary Weinstein Dunn and Meredith Wallace Kazer. Prostate cancer overview. In
Seminars in oncology nursing, volume 27, pages 241–250. Elsevier, 2011. ISBN
0749-2081.
[22] Stephen R Thompson, Geoff P Delaney, Susannah Jacob, Jesmin Shafiq, Karen
Wong, Timothy P Hanna, Gabriel S Gabriel, and Michael B Barton. Estimation of
the optimal utilisation rates of radical prostatectomy, external beam radiotherapy
References 235
and brachytherapy in the treatment of prostate cancer by a review of clinical practice
guidelines. Radiotherapy and Oncology, 2016. ISSN 0167-8140.
[23] Christopher H Crane, Kathryn Winter, William F Regine, Howard Safran, Tyvin A
Rich, Walter Curran, Robert A Wolff, and Christopher G Willett. Phase ii study of
bevacizumab with concurrent capecitabine and radiation followed by maintenance
gemcitabine and bevacizumab for locally advanced pancreatic cancer: Radiation
therapy oncology group rtog 0411. Journal of Clinical Oncology, 27(25):4096–4102,
2009. ISSN 0732-183X.
[24] CF Njeh. Tumor delineation: The weakest link in the search for accuracy in radio-
therapy. Journal of medical physics/Association of Medical Physicists of India, 33
(4):136, 2008.
[25] Shalini K Vinod, Michael G Jameson, Myo Min, and Lois C Holloway. Uncertainties
in volume delineation in radiation oncology: A systematic review and recommenda-
tions for future studies. Radiotherapy and Oncology, 121(2):169–179, 2016. ISSN
0167-8140.
[26] Michael G Jameson, Lois C Holloway, Philip J Vial, Shalini K Vinod, and Peter E
Metcalfe. A review of methods of analysis in contouring studies for radiation oncol-
ogy. Journal of medical imaging and radiation oncology, 54(5):401–410, 2010. ISSN
1754-9485.
[27] I Fotina, C Lütgendorf-Caucig, M Stock, R Pötter, and D Georg. Critical discus-
sion of evaluation parameters for inter-observer variability in target definition for
radiation therapy. Strahlentherapie und Onkologie, 188(2):160–167, 2012. ISSN
0179-7158.
[28] Gregory Sharp, Karl D Fritscher, Vladimir Pekar, Marta Peroni, Nadya Shusharina,
Harini Veeraraghavan, and Jinzhong Yang. Vision 20/20: perspectives on automated
image segmentation for radiotherapy. Medical physics, 41(5):050902, 2014. ISSN
0094-2405.
[29] Michael G Jameson, Shivani Kumar, Shalini K Vinod, Peter E Metcalfe, and Lois C
Holloway. Correlation of contouring variation with modeled outcome for conformal

References 236
non-small cell lung cancer radiotherapy. Radiotherapy and Oncology, 112(3):332–336,
2014. ISSN 0167-8140.
[30] William J Beasley, Alan McWilliam, Adam Aitkenhead, Ranald I Mackay, and
Carl G Rowbottom. The suitability of common metrics for assessing parotid and
larynx autosegmentation accuracy. Journal of Applied Clinical Medical Physics, 17
(2), 2016. ISSN 1526-9914.
[31] Tobias Heimann and Hans-Peter Meinzer. Statistical shape models for 3d medical
image segmentation: a review. Medical image analysis, 13(4):543–563, 2009. ISSN
1361-8415.
[32] Yann LeCun, Yoshua Bengio, and Geoffrey Hinton. Deep learning. nature, 521
(7553):436, 2015. ISSN 1476-4687.
[33] Mack Roach, Jiho Nam, Giovanna Gagliardi, Issam El Naqa, Joseph O Deasy, and
Lawrence B Marks. Radiation dose–volume effects and the penile bulb. International
Journal of Radiation Oncology* Biology* Physics, 76(3):S130–S134, 2010. ISSN
0360-3016.
[34] SL Gulliford, S Ghose, MA Ebert, A Kennedy, J Dowling, J Mitra, DJ Joseph,
and JW Denham. Radiotherapy dose-distribution to the perirectal fat space (prs) is
related to gastrointestinal control-related complications. Clinical and Translational
Radiation Oncology, 7:62–70, 2017. ISSN 2405-6308.
[35] Robert Jan Smeenk, Aswin L Hoffmann, Wim PM Hopman, Emile NJ Th van Lin,
and Johannes HAM Kaanders. Dose-effect relationships for individual pelvic floor
muscles and anorectal complaints after prostate radiotherapy. International Journal
of Radiation Oncology* Biology* Physics, 83(2):636–644, 2012. ISSN 0360-3016.
[36] Benjamin E Nelms, Greg Robinson, Jay Markham, Kyle Velasco, Steve Boyd,
Sharath Narayan, James Wheeler, and Mark L Sobczak. Variation in external
beam treatment plan quality: an inter-institutional study of planners and plan-
ning systems. Practical radiation oncology, 2(4):296–305, 2012. ISSN 1879-8500.
doi: https://doi.org/10.1016/j.prro.2011.11.012.

References 237
[37] Sean L Berry, Amanda Boczkowski, Rongtao Ma, James Mechalakos, and Margie
Hunt. Interobserver variability in radiation therapy plan output: Results of a single-
institution study. Practical radiation oncology, 6(6):442–449, 2016. ISSN 1879-8500.
doi: https://doi.org/10.1016/j.prro.2016.04.005.
[38] Ilma Xhaferllari, Eugene Wong, Karl Bzdusek, Michael Lock, and Jeff Z Chen.
Automated imrt planning with regional optimization using planning scripts. Journal
of applied clinical medical physics, 14(1):176–191, 2013. ISSN 1526-9914. doi: https:
//doi.org/10.1120/jacmp.v14i1.4052.
[39] Christian Rønn Hansen, Anders Bertelsen, Irene Hazell, Ruta Zukauskaite, Niels
Gyldenkerne, Jørgen Johansen, Jesper G Eriksen, and Carsten Brink. Automatic
treatment planning improves the clinical quality of head and neck cancer treatment
plans. Clinical and Translational Radiation Oncology, 1:2–8, 2016. ISSN 2405-6308.
doi: https://doi.org/10.1016/j.ctro.2016.08.001.
[40] Christian Rønn Hansen, Morten Nielsen, Anders Smedegaard Bertelsen, Irene Hazell,
Eva Holtved, Ruta Zukauskaite, Jon Kroll Bjerregaard, Carsten Brink, and Uffe
Bernchou. Automatic treatment planning facilitates fast generation of high-quality
treatment plans for esophageal cancer. Acta Oncologica, 56(11):1495–1500, 2017.
ISSN 0284-186X. doi: https://doi.org/10.1080/0284186X.2017.1349928.
[41] Irene Hazell, Karl Bzdusek, Prashant Kumar, Christian R Hansen, Anders Bertelsen,
Jesper G Eriksen, Jørgen Johansen, and Carsten Brink. Automatic planning of head
and neck treatment plans. Journal of Applied Clinical Medical Physics, 17(1), 2016.
ISSN 1526-9914. doi: https://doi.org/10.1120/jacmp.v17i1.5901.
[42] Kanabu Nawa, Akihiro Haga, Akihiro Nomoto, Raniel A Sarmiento, Kenshiro Shi-
raishi, Hideomi Yamashita, and Keiichi Nakagawa. Evaluation of a commercial au-
tomatic treatment planning system for prostate cancers. Medical Dosimetry, 2017.
ISSN 0958-3947. doi: https://doi.org/10.1016/j.meddos.2017.03.004.
[43] Freddie Bray, Jacques Ferlay, Isabelle Soerjomataram, Rebecca L Siegel, Lindsey A
Torre, and Ahmedin Jemal. Global cancer statistics 2018: Globocan estimates of

References 238
incidence and mortality worldwide for 36 cancers in 185 countries. CA: a cancer
journal for clinicians, 68(6):394–424, 2018. ISSN 0007-9235.
[44] Lindsey A Torre, Freddie Bray, Rebecca L Siegel, Jacques Ferlay, Joannie
Lortet‐Tieulent, and Ahmedin Jemal. Global cancer statistics, 2012. CA: a can-
cer journal for clinicians, 65(2):87–108, 2015. ISSN 1542-4863.
[45] Melissa M Center, Ahmedin Jemal, Joannie Lortet-Tieulent, Elizabeth Ward,
Jacques Ferlay, Otis Brawley, and Freddie Bray. International variation in prostate
cancer incidence and mortality rates. European urology, 61(6):1079–1092, 2012. ISSN
0302-2838.
[46] Muhammad Naeem Bashir. Epidemiology of prostate cancer. Asian Pac J Cancer
Prev, 16:5137–5141, 2015.
[47] Australian Institute of Health and Welfare (AIHW). Australian cancer incidence
and mortality (acim) books: Prostate cancer, 2015. URL http://www.aihw.gov.
au/acim-books.
[48] Peter D Baade, Danny R Youlden, Susanna M Cramb, Jeff Dunn, and Robert A
Gardiner. Epidemiology of prostate cancer in the asia-pacific region. Prostate inter-
national, 1(2):47–58, 2013. ISSN 2287-8882.
[49] Jacques Ferlay, Isabelle Soerjomataram, Rajesh Dikshit, Sultan Eser, Colin Mathers,
Marise Rebelo, Donald Maxwell Parkin, David Forman, and Freddie Bray. Cancer
incidence and mortality worldwide: sources, methods and major patterns in globocan
2012. International journal of cancer, 136(5):E359–E386, 2015. ISSN 1097-0215.
[50] Alan Pollack and Gunar K Zagars. External beam radiotherapy dose response of
prostate cancer. International Journal of Radiation Oncology* Biology* Physics, 39
(5):1011–1018, 1997. ISSN 0360-3016.
[51] John E McNeal. The zonal anatomy of the prostate. The prostate, 2(1):35–49, 1981.
ISSN 1097-0045.
[52] WJ Catalona, JP Richie, FR Ahmann, MA Hudson, PT Scardino, RC Flanigan,
JB Dekernion, TL Ratliff, LR Kavoussi, and BL Dalkin. Comparison of digital rectal

References 239
examination and serum prostate specific antigen in the early detection of prostate
cancer: results of a multicenter clinical trial of 6,630 men. The Journal of urology,
151(5):1283–1290, 1994. ISSN 0022-5347.
[53] National Comprehensive Cancer Network. Nccn clinical practice guidelines in on-
cology (nccn guidelines): Prostate cancer. National Comprehensive Cancer Network
(NCCN), 2015.
[54] Alan W Partin, Michael W Kattan, Eric NP Subong, Patrick CWalsh, Kirk J Wojno,
Joseph E Oesterling, Peter T Scardino, and JD Pearson. Combination of prostate-
specific antigen, clinical stage, and gleason score to predict pathological stage of
localized prostate cancer: a multi-institutional update. Jama, 277(18):1445–1451,
1997. ISSN 0098-7484.
[55] Donald F Gleason. Classification of prostatic carcinomas. Cancer chemotherapy
reports. Part 1, 50(3):125–128, 1966. ISSN 0069-0112.
[56] FH Schröder, P Hermanek, L Denis, WR Fair, MK Gospodarowicz, and
M Pavone‐Macaluso. The tnm classification of prostate cancer. The Prostate, 21
(S4):129–138, 1992. ISSN 1097-0045.
[57] Liang Cheng, Rodolfo Montironi, David G Bostwick, Antonio Lopez‐Beltran, and
Daniel M Berney. Staging of prostate cancer. Histopathology, 60(1):87–117, 2012.
ISSN 1365-2559.
[58] Ian M Thompson, Richard K Valicenti, Peter Albertsen, Brian J Davis, S Larry
Goldenberg, Carol Hahn, Eric Klein, Jeff Michalski, Mack Roach, and Oliver Sartor.
Adjuvant and salvage radiotherapy after prostatectomy: Aua/astro guideline. The
Journal of urology, 190(2):441–449, 2013. ISSN 0022-5347.
[59] Axel Heidenreich, Patrick J Bastian, Joaquim Bellmunt, Michel Bolla, Steven Joniau,
Theodor van der Kwast, Malcolm Mason, Vsevolod Matveev, Thomas Wiegel, and
F Zattoni. Eau guidelines on prostate cancer. part 1: screening, diagnosis, and
local treatment with curative intent—update 2013. European urology, 65(1):124–
137, 2014. ISSN 0302-2838.

References 240
[60] Australian Cancer Network Management of Metastatic Prostate Cancer Work-
ing Party. Clinical Practice Guidelines for the Management of Locally Advanced
and Metastatic Prostate Cancer. Cancer Council Australia and Australian Cancer
Network, 2010.
[61] George Miller MacKee. X-rays and Radium in the Treatment of Diseases of the Skin.
Lea& Febiger, 1921.
[62] Manuel Lederman. The early history of radiotherapy: 1895–1939. International
Journal of Radiation Oncology* Biology* Physics, 7(5):639–648, 1981. ISSN 0360-
3016.
[63] Michael B Barton, Susannah Jacob, Jesmin Shafiq, Karen Wong, Stephen R Thomp-
son, Timothy P Hanna, and Geoff P Delaney. Estimating the demand for radiother-
apy from the evidence: a review of changes from 2003 to 2012. Radiotherapy and
Oncology, 112(1):140–144, 2014. ISSN 0167-8140.
[64] Ervin B Podgorsak. Radiation Oncology Physics: A handbook for teachers and
students, volume 657. International Atomic Energy Agency, 2005.
[65] Piotr Wojcieszek and Brygida Białas. Prostate cancer brachytherapy: guidelines
overview. Journal of contemporary brachytherapy, 4(2):116, 2012.
[66] Daniel Ash, Anthony Flynn, Jan Battermann, Theodorous de Reijke, Paulo
Lavagnini, and Leo Blank. Estro/eau/eortc recommendations on permanent seed
implantation for localized prostate cancer. Radiotherapy and Oncology, 57(3):315–
321, 2000. ISSN 0167-8140.
[67] A Challapalli, E Jones, C Harvey, GO Hellawell, and SA Mangar. High dose rate
prostate brachytherapy: an overview of the rationale, experience and emerging ap-
plications in the treatment of prostate cancer. The British journal of radiology,
2012.
[68] Juanita Crook, Himu Lukka, Laurence Klotz, Nancy Bestic, and Mary Johnston.
Systematic overview of the evidence for brachytherapy in clinically localized prostate
cancer. Canadian Medical Association Journal, 164(7):975–981, 2001. ISSN 0820-
3946.
References 241
[69] Tom Pickles, Mira Keyes, W James Morris, Prostate Outcomes, and Provincial
Prostate Brachytherapy Program. Brachytherapy or conformal external radiotherapy
for prostate cancer: a single-institution matched-pair analysis. International Journal
of Radiation Oncology* Biology* Physics, 76(1):43–49, 2010. ISSN 0360-3016.
[70] Al V Taira, Gregory S Merrick, Wayne M Butler, Robert W Galbreath, Jonathan
Lief, Edward Adamovich, and Kent E Wallner. Long-term outcome for clinically
localized prostate cancer treated with permanent interstitial brachytherapy. Inter-
national Journal of Radiation Oncology* Biology* Physics, 79(5):1336–1342, 2011.
ISSN 0360-3016.
[71] Daniel E Spratt, Zachary S Zumsteg, Pirus Ghadjar, Marisa A Kollmeier, Xin Pei,
Gilad Cohen, William Polkinghorn, Yoshiya Yamada, and Michael J Zelefsky. Com-
parison of high‐dose (86.4 gy) imrt vs combined brachytherapy plus imrt for in-
termediate‐risk prostate cancer. BJU international, 114(3):360–367, 2014. ISSN
1464-410X.
[72] Ruth Etzioni, David F Penson, Julie M Legler, Dante di Tommaso, Rob Boer, Pe-
ter H Gann, and Eric J Feuer. Overdiagnosis due to prostate-specific antigen screen-
ing: lessons from us prostate cancer incidence trends. Journal of the National Cancer
Institute, 94(13):981–990, 2002. ISSN 0027-8874.
[73] Gerrit Draisma, Rob Boer, Suzie J Otto, Ingrid W van der Cruijsen, Ronald AM
Damhuis, Fritz H Schröder, and Harry J de Koning. Lead times and overdetection
due to prostate-specific antigen screening: estimates from the european randomized
study of screening for prostate cancer. Journal of the National Cancer Institute, 95
(12):868–878, 2003. ISSN 0027-8874.
[74] H Gilbert Welch and William C Black. Overdiagnosis in cancer. Journal of the
National Cancer Institute, 102(9):605–613, 2010. ISSN 0027-8874.
[75] Marc A Dall’Era, Peter C Albertsen, Christopher Bangma, Peter R Carroll, H Bal-
lentine Carter, Matthew R Cooperberg, Stephen J Freedland, Laurence H Klotz,
Christopher Parker, and Mark S Soloway. Active surveillance for prostate cancer:

References 242
a systematic review of the literature. European urology, 62(6):976–983, 2012. ISSN
0302-2838.
[76] Viacheslav Iremashvili, Lisét Pelaez, Murugesan Manoharan, Mercé Jorda, Daniel L
Rosenberg, and Mark S Soloway. Pathologic prostate cancer characteristics in pa-
tients eligible for active surveillance: a head-to-head comparison of contemporary
protocols. European urology, 62(3):462–468, 2012. ISSN 0302-2838.
[77] Laurence Klotz. Active surveillance for prostate cancer: a review. Current urology
reports, 11(3):165–171, 2010. ISSN 1527-2737.
[78] Chris H Bangma, Meelan Bul, Theo H van der Kwast, Tom Pickles, Ida J Korfage,
Caroline M Hoeks, Ewout W Steyerberg, Guido Jenster, Michael W Kattan, and
Lara Bellardita. Active surveillance for low-risk prostate cancer. Critical reviews in
oncology/hematology, 85(3):295–302, 2013. ISSN 1040-8428.
[79] Laurence Klotz, Danny Vesprini, Perakaa Sethukavalan, Vibhuti Jethava, Liying
Zhang, Suneil Jain, Toshihiro Yamamoto, Alexandre Mamedov, and Andrew Loblaw.
Long-term follow-up of a large active surveillance cohort of patients with prostate
cancer. Journal of Clinical Oncology, page JCO. 2014.55. 1192, 2014. ISSN 0732-
183X.
[80] Matthew R Cooperberg. Long-term active surveillance for prostate cancer: Answers
and questions. Journal of Clinical Oncology, 33(3):238–240, 2015. ISSN 0732-183X.
[81] Vincent Fradet, John Kurhanewicz, Janet E Cowan, Alexander Karl, Fergus V Coak-
ley, Katsuto Shinohara, and Peter R Carroll. Prostate cancer managed with active
surveillance: Role of anatomic mr imaging and mr spectroscopic imaging1. Radiol-
ogy, 2010.
[82] Anna Bill-Axelson, Lars Holmberg, Hans Garmo, Jennifer R Rider, Kimmo Taari,
Christer Busch, Stig Nordling, Michael Häggman, Swen-Olof Andersson, and Anders
Spångberg. Radical prostatectomy or watchful waiting in early prostate cancer. New
England Journal of Medicine, 370(10):932–942, 2014. ISSN 0028-4793.

References 243
[83] David P Byar and FK Mostofi. Carcinoma of the prostate: prognostic evaluation of
certain pathologic features in 208 radical prostatectomies. Cancer, 30(1):5–13, 1972.
ISSN 1097-0142.
[84] Patrick C Walsh and Herbert Lepor. The role of radical prostatectomy in the man-
agement of prostatic cancer. Cancer, 60(S3):526–537, 1987. ISSN 1097-0142.
[85] Jochen Walz, Arthur L Burnett, Anthony J Costello, James A Eastham, Markus
Graefen, Bertrand Guillonneau, Mani Menon, Francesco Montorsi, Robert P Myers,
and Bernardo Rocco. A critical analysis of the current knowledge of surgical anatomy
related to optimization of cancer control and preservation of continence and erection
in candidates for radical prostatectomy. European urology, 57(2):179–192, 2010. ISSN
0302-2838.
[86] Ahmed Magheli and Arthur L Burnett. Erectile dysfunction following prostatectomy:
prevention and treatment. Nature Reviews Urology, 6(8):415–427, 2009. ISSN 1759-
4812.
[87] Ashutosh Tewari, James O Peabody, Melissa Fischer, Richard Sarle, Guy Vallancien,
V Delmas, Mazen Hassan, Aditya Bansal, Ashok K Hemal, and Bertrand Guillon-
neau. An operative and anatomic study to help in nerve sparing during laparoscopic
and robotic radical prostatectomy. European urology, 43(5):444–454, 2003. ISSN
0302-2838.
[88] Ingolf Türk, Serdar Deger, Björn Winkelmann, Bernd Schönberger, and Stefan A
Loening. Laparoscopic radical prostatectomy. European urology, 40(1):46–53, 2001.
ISSN 1421-993X.
[89] Ashutosh Tewari, Prasanna Sooriakumaran, Daniel A Bloch, Usha Seshadri-
Kreaden, April E Hebert, and Peter Wiklund. Positive surgical margin and pe-
rioperative complication rates of primary surgical treatments for prostate cancer: a
systematic review and meta-analysis comparing retropubic, laparoscopic, and robotic
prostatectomy. European urology, 62(1):1–15, 2012. ISSN 0302-2838.
[90] Nima Sharifi, James L Gulley, and William L Dahut. Androgen deprivation therapy
for prostate cancer. Jama, 294(2):238–244, 2005. ISSN 0098-7484.

References 244
[91] Anthony V D’Amico, Judith Manola, Marian Loffredo, Andrew A Renshaw, Alyssa
DellaCroce, and Philip W Kantoff. 6-month androgen suppression plus radiation
therapy vs radiation therapy alone for patients with clinically localized prostate
cancer: a randomized controlled trial. Jama, 292(7):821–827, 2004. ISSN 0098-7484.
[92] Colleen A Lawton, Kathryn Winter, Roger Byhardt, William T Sause, Gerald E
Hanks, Anthony H Russell, Marvin Rotman, Arthur Porter, David G McGowan,
and John D DelRowe. Androgen suppression plus radiation versus radiation alone
for patients with d1 (pn+) adenocarcinoma of the prostate (results based on a na-
tional prospective randomized trial, rtog 85-31). International Journal of Radiation
Oncology* Biology* Physics, 38(5):931–939, 1997. ISSN 0360-3016.
[93] Colleen A Lawton, Kathryn Winter, Kevin Murray, Mitchell Machtay, John B Mesic,
Gerald E Hanks, Christopher T Coughlin, and Miljenko V Pilepich. Updated results
of the phase iii radiation therapy oncology group (rtog) trial 85-31 evaluating the
potential benefit of androgen suppression following standard radiation therapy for
unfavorable prognosis carcinoma of the prostate. International Journal of Radiation
Oncology* Biology* Physics, 49(4):937–946, 2001. ISSN 0360-3016.
[94] Miljenko V Pilepich, Kathryn Winter, Colleen A Lawton, Robert E Krisch, Harvey B
Wolkov, Benjamin Movsas, Eugen B Hug, Sucha O Asbell, and David Grignon. An-
drogen suppression adjuvant to definitive radiotherapy in prostate carcinoma—long-
term results of phase iii rtog 85–31. International Journal of Radiation Oncology*
Biology* Physics, 61(5):1285–1290, 2005. ISSN 0360-3016.
[95] Miljenko V Pilepich, Kathryn Winter, Madhu J John, John B Mesic, William Sause,
Phillip Rubin, Colleen Lawton, Mitchell Machtay, and David Grignon. Phase iii ra-
diation therapy oncology group (rtog) trial 86-10 of androgen deprivation adjuvant
to definitive radiotherapy in locally advanced carcinoma of the prostate. Inter-
national Journal of Radiation Oncology* Biology* Physics, 50(5):1243–1252, 2001.
ISSN 0360-3016.
[96] Eric M Horwitz, Kathryn Winter, Gerald E Hanks, Colleen A Lawton, Anthony H
Russell, and Mitchell Machtay. Subset analysis of rtog 85-31 and 86-10 indicates an
advantage for long-term vs. short-term adjuvant hormones for patients with locally

References 245
advanced nonmetastatic prostate cancer treated with radiation therapy. Interna-
tional Journal of Radiation Oncology* Biology* Physics, 49(4):947–956, 2001. ISSN
0360-3016.
[97] Michael J Zelefsky, Yoshiya Yamada, Marisa A Kollmeier, Alison M Shippy,
and Michelle A Nedelka. Long-term outcome following three-dimensional
conformal/intensity-modulated external-beam radiotherapy for clinical stage t3
prostate cancer. european urology, 53(6):1172–1179, 2008. ISSN 0302-2838.
[98] Grace L Lu-Yao, Peter C Albertsen, Dirk F Moore, Weichung Shih, Yong Lin,
Robert S DiPaola, and Siu-Long Yao. Survival following primary androgen de-
privation therapy among men with localized prostate cancer. Jama, 300(2):173–181,
2008. ISSN 0098-7484.
[99] Arnold L Potosky, Kevin Knopf, Limin X Clegg, Peter C Albertsen, Janet L Stan-
ford, Ann S Hamilton, Frank D Gilliland, J William Eley, Robert A Stephenson,
and Richard M Hoffman. Quality-of-life outcomes after primary androgen depriva-
tion therapy: results from the prostate cancer outcomes study. Journal of Clinical
Oncology, 19(17):3750–3757, 2001. ISSN 0732-183X.
[100] Matthew R Cooperberg, Andrew J Vickers, Jeanette M Broering, and Peter R Car-
roll. Comparative risk‐adjusted mortality outcomes after primary surgery, radio-
therapy, or androgen‐deprivation therapy for localized prostate cancer. Cancer, 116
(22):5226–5234, 2010. ISSN 1097-0142.
[101] Rowan G Casey, Niall M Corcoran, and S Larry Goldenberg. Quality of life issues
in men undergoing androgen deprivation therapy: a review. Asian J Androl, 14(2):
226–31, 2012.
[102] Mariët Hagedoorn, Robbert Sanderman, Hilde N Bolks, Jolanda Tuinstra, and
James C Coyne. Distress in couples coping with cancer: a meta-analysis and crit-
ical review of role and gender effects. Psychological bulletin, 134(1):1, 2008. ISSN
1939-1455.

References 246
[103] Dominik R Berthold, Gregory R Pond, Freidele Soban, Ronald de Wit, Mario Eisen-
berger, and Ian F Tannock. Docetaxel plus prednisone or mitoxantrone plus pred-
nisone for advanced prostate cancer: updated survival in the tax 327 study. Journal
of Clinical Oncology, 26(2):242–245, 2008. ISSN 0732-183X.
[104] Ian F Tannock, Ronald de Wit, William R Berry, Jozsef Horti, Anna Pluzanska,
Kim N Chi, Stephane Oudard, Christine Théodore, Nicholas D James, and Ingela
Turesson. Docetaxel plus prednisone or mitoxantrone plus prednisone for advanced
prostate cancer. New England Journal of Medicine, 351(15):1502–1512, 2004. ISSN
0028-4793.
[105] eviQ. Prostate metastatic docetaxel three weekly and prednisolone, 2015.
URL https://www.eviq.org.au/medical-oncology/urogenital/prostate/
249-prostate-metastatic-docetaxel-three-weekly-and#literature-search.
[106] 2010.
[107] Channing J Paller and Emmanuel S Antonarakis. Cabazitaxel: a novel second-line
treatment for metastatic castration-resistant prostate cancer. Drug design, develop-
ment and therapy, 5:117, 2011.
[108] Stephane Oudard. TROPIC: Phase iii trial of cabazitaxel for the treatment of
metastatic castration-resistant prostate cancer. Future Oncology, 7(4):497–506, 2011.
ISSN 1479-6694.
[109] JS De Bono, S Oudard, M Ozguroglu, S Hansen, JH Machiels, L Shen, P Matthews,
AO Sartor, and TROPIC Investigators. Cabazitaxel or mitoxantrone with prednisone
in patients with metastatic castration-resistant prostate cancer (mCRPC) previously
treated with docetaxel: Final results of a multinational phase iii trial (TROPIC).
Journal of Clinical Oncology, 28(15):4508–4508, 2010. ISSN 0732-183X.
[110] 2013.
[111] Charles G Drake. Prostate cancer as a model for tumour immunotherapy. Nature
Reviews Immunology, 10(8):580–593, 2010. ISSN 1474-1741.
References 247
[112] Eric J Small, Paige Fratesi, David M Reese, George Strang, Reiner Laus, Mad-
husudan V Peshwa, and Frank H Valone. Immunotherapy of hormone-refractory
prostate cancer with antigen-loaded dendritic cells. Journal of Clinical Oncology, 18
(23):3894–3903, 2000. ISSN 0732-183X.
[113] Philip W Kantoff, Celestia S Higano, Neal D Shore, E Roy Berger, Eric J Small,
David F Penson, Charles H Redfern, Anna C Ferrari, Robert Dreicer, and Robert B
Sims. Sipuleucel-t immunotherapy for castration-resistant prostate cancer. New
England Journal of Medicine, 363(5):411–422, 2010. ISSN 0028-4793.
[114] Massimo Valerio, Hashim U Ahmed, Mark Emberton, Nathan Lawrentschuk, Mas-
simo Lazzeri, Rodolfo Montironi, Paul L Nguyen, John Trachtenberg, and Thomas J
Polascik. The role of focal therapy in the management of localised prostate cancer:
a systematic review. European urology, 66(4):732–751, 2014. ISSN 0302-2838.
[115] John F Ward and J Stephen Jones. Focal cryotherapy for localized prostate cancer:
a report from the national cryo on‐line database (cold) registry. BJU international,
109(11):1648–1654, 2012. ISSN 1464-410X.
[116] Sébastien Crouzet, Olivier Rouviere, Xavier Martin, and Albert Gelet. High-
intensity focused ultrasound as focal therapy of prostate cancer. Current opinion
in urology, 24(3):225–230, 2014. ISSN 0963-0643.
[117] S Khaled and KD Held. Radiation Biology: A Handbook for Teachers and Students.
Training Coarse Series. International Atomic Energy Agency, 2010.
[118] Penny Jeggo and Martin F Lavin. Cellular radiosensitivity: how much better do we
understand it? International journal of radiation biology, 85(12):1061–1081, 2009.
ISSN 0955-3002.
[119] Judith Campisi and Fabrizio d’Adda di Fagagna. Cellular senescence: when bad
things happen to good cells. Nature reviews Molecular cell biology, 8(9):729–740,
2007. ISSN 1471-0072.
[120] J Martin Brown and Laura D Attardi. The role of apoptosis in cancer development
and treatment response. Nature Reviews Cancer, 5(3):231–237, 2005. ISSN 1474-
175X.
References 248
[121] Maria Castedo, Jean-Luc Perfettini, Thomas Roumier, Karine Andreau, Rene
Medema, and Guido Kroemer. Cell death by mitotic catastrophe: a molecular
definition. Oncogene, 23(16):2825–2837, 2004. ISSN 0950-9232.
[122] Wei-Xing Zong, Dara Ditsworth, Daniel E Bauer, Zhao-Qi Wang, and Craig B
Thompson. Alkylating dna damage stimulates a regulated form of necrotic cell
death. Genes& development, 18(11):1272–1282, 2004. ISSN 0890-9369.
[123] Dana E Christofferson and Junying Yuan. Necroptosis as an alternative form of
programmed cell death. Current opinion in cell biology, 22(2):263–268, 2010. ISSN
0955-0674.
[124] Larry Bodgi, Aurélien Canet, Laurent Pujo-Menjouet, Annick Lesne, Jean-Marc
Victor, and Nicolas Foray. Mathematical models of radiation action on living cells:
from the target theory to the modern approaches. a historical and critical review.
Journal of Theoretical Biology, 2016. ISSN 0022-5193.
[125] Albrecht M Kellerer and Harald H Rossi. A generalized formulation of dual radiation
action. Radiation Research, 75(3):471–488, 1978. ISSN 0033-7587.
[126] KH Chadwick and HP Leenhouts. A molecular theory of cell survival. Physics in
medicine and biology, 18(1):78, 1973. ISSN 0031-9155.
[127] Jian Z Wang, M Guerrero, and X Allen Li. How low is the α/β ratio for prostate
cancer? International Journal of Radiation Oncology* Biology* Physics, 55(1):
194–203, 2003. ISSN 0360-3016.
[128] David J Brenner, Alvaro A Martinez, Gregory K Edmundson, Christina Mitchell,
Howard D Thames, and Elwood P Armour. Direct evidence that prostate tumors
show high sensitivity to fractionation (low α/β ratio), similar to late-responding
normal tissue. International Journal of Radiation Oncology* Biology* Physics, 52
(1):6–13, 2002. ISSN 0360-3016.
[129] Ivan R Vogelius and Søren M Bentzen. Meta-analysis of the alpha/beta ratio for
prostate cancer in the presence of an overall time factor: Bad news, good news, or
no news? International Journal of Radiation Oncology* Biology* Physics, 85(1):
89–94, 2013. ISSN 0360-3016.

References 249
[130] Alexandru Dasu and Iuliana Toma-Dasu. Prostate alpha/beta revisited–an analysis
of clinical results from 14 168 patients. Acta Oncologica, 51(8):963–974, 2012. ISSN
0284-186X.
[131] Felix Leborgne, Jack Fowler, José H Leborgne, and Julieta Mezzera. Later outcomes
and alpha/beta estimate from hypofractionated conformal three-dimensional radio-
therapy versus standard fractionation for localized prostate cancer. International
Journal of Radiation Oncology* Biology* Physics, 82(3):1200–1207, 2012. ISSN
0360-3016.
[132] Cécile Proust-Lima, Jeremy MG Taylor, Solène Sécher, Howard Sandler, Larry
Kestin, Tom Pickles, Kyoungwha Bae, Roger Allison, and Scott Williams. Con-
firmation of a low α/β ratio for prostate cancer treated by external beam radiation
therapy alone using a post-treatment repeated-measures model for psa dynamics. In-
ternational Journal of Radiation Oncology* Biology* Physics, 79(1):195–201, 2011.
ISSN 0360-3016.
[133] G Gordon Steel, Trevor J McMillan, and JH Peacock. The 5rs of radiobiology.
International journal of radiation biology, 56(6):1045–1048, 1989. ISSN 0955-3002.
[134] HR Withers, JMG Taylor, and B Maciejewski. The hazard of accelerated tumor
clonogen repopulation during radiotherapy. Acta Oncologica, 27(2):131–146, 1988.
ISSN 0284-186X.
[135] George D Wilson. Radiation and the cell cycle, revisited. Cancer and Metastasis
Reviews, 23(3-4):209–225, 2004. ISSN 0167-7659.
[136] Michael B Kastan and Jiri Bartek. Cell-cycle checkpoints and cancer. Nature, 432
(7015):316–323, 2004. ISSN 0028-0836.
[137] ICRU. Icru report 83: Prescribing, recording, and reporting photon-beam intensity-
modulated radiation therapy (imrt). Journal of the ICRU, 10(1), 2010.
[138] Douglas Jones. Icru report 50—prescribing, recording and reporting photon beam
therapy. Medical Physics, 21(6):833–834, 1994. ISSN 0094-2405.

References 250
[139] A Wambersie and T Landgerg. Icru report 62: Prescribing, recording and reporting
photon beam therapy. ICRU Publ Bethesda MD, 1999.
[140] P Metcalfe, GP Liney, L Holloway, A Walker, M Barton, GP Delaney, S Vinod, and
W Tome. The potential for an enhanced role for mri in radiation-therapy treatment
planning. Technology in cancer research& treatment, 12(5):429–446, 2013. ISSN
1533-0346.
[141] Peter B Greer, Jason A Dowling, Jonathon A Lambert, Jurgen Fripp, Joel Parker,
James W Denham, Chris Wratten, Anne Capp, and Olivier Salvado. A magnetic
resonance imaging-based workflow for planning radiation therapy for prostate cancer.
Medical Journal of Australia, 194(4):S24, 2011. ISSN 0025-729X.
[142] Marc Debois, Raymond Oyen, Frederik Maes, Geert Verswijvel, Giovanna Gatti,
Hilde Bosmans, Michel Feron, Erwin Bellon, Gerald Kutcher, and Hein Van Poppel.
The contribution of magnetic resonance imaging to the three-dimensional treatment
planning of localized prostate cancer. International Journal of Radiation Oncology*
Biology* Physics, 45(4):857–865, 1999. ISSN 0360-3016.
[143] Louise Dickinson, Hashim U Ahmed, Clare Allen, Jelle O Barentsz, Brendan Carey,
Jurgen J Futterer, Stijn W Heijmink, Peter J Hoskin, Alex Kirkham, and Anwar R
Padhani. Magnetic resonance imaging for the detection, localisation, and charac-
terisation of prostate cancer: recommendations from a european consensus meeting.
European urology, 59(4):477–494, 2011. ISSN 0302-2838.
[144] CC Parker, A Damyanovich, T Haycocks, M Haider, A Bayley, and CN Catton. Mag-
netic resonance imaging in the radiation treatment planning of localized prostate can-
cer using intra-prostatic fiducial markers for computed tomography co-registration.
Radiotherapy and oncology, 66(2):217–224, 2003. ISSN 0167-8140.
[145] Carl Salembier, Geert Villeirs, Berardino De Bari, Peter Hoskin, Bradley R. Pieters,
Marco Van Vulpen, Vincent Khoo, Ann Henry, Alberto Bossi, Gert De Meerleer,
and Valérie Fonteyne. ESTRO ACROP consensus guideline on ct- and mri-based
target volume delineation for primary radiation therapy of localized prostate cancer.
Radiotherapy and Oncology, 127(1):49–61, 2018. ISSN 0167-8140.

References 251
[146] Claudio Fiorino, Riccardo Valdagni, Tiziana Rancati, and Giuseppe Sanguineti.
Dose–volume effects for normal tissues in external radiotherapy: pelvis. Radio-
therapy and Oncology, 93(2):153–167, 2009. ISSN 0167-8140.
[147] Hiram A Gay, H Joseph Barthold, Elizabeth O’Meara, Walter R Bosch, Issam
El Naqa, Rawan Al-Lozi, Seth A Rosenthal, Colleen Lawton, W Robert Lee, and
Howard Sandler. Pelvic normal tissue contouring guidelines for radiation therapy:
a radiation therapy oncology group consensus panel atlas. International Journal of
Radiation Oncology* Biology* Physics, 83(3):e353–e362, 2012. ISSN 0360-3016.
[148] Anders Brahme, J-E Roos, and Ingemar Lax. Solution of an integral equation en-
countered in rotation therapy. Physics in medicine and biology, 27(10):1221, 1982.
ISSN 0031-9155.
[149] Anders Brahme. Optimization of stationary and moving beam radiation therapy
techniques. Radiotherapy and Oncology, 12(2):129–140, 1988. ISSN 0167-8140.
[150] Karl Bzdusek, Henrik Friberger, Kjell Eriksson, Björn Hårdemark, David Robinson,
and Michael Kaus. Development and evaluation of an efficient approach to volumetric
arc therapy planning. Medical physics, 36(6):2328–2339, 2009. ISSN 0094-2405.
[151] Vladimir Feygelman, Geoffrey Zhang, and Craig Stevens. Initial dosimetric eval-
uation of smartarc–a novel vmat treatment planning module implemented in a
multi‐vendor delivery chain. Journal of applied clinical medical physics, 11(1):99–
116, 2010. ISSN 1526-9914.
[152] MA Earl, DM Shepard, S Naqvi, XA Li, and CX Yu. Inverse planning for intensity-
modulated arc therapy using direct aperture optimization. Physics in Medicine&
Biology, 48(8):1075, 2003. ISSN 0031-9155.
[153] Steven A Leibel, Zvi Fuks, Michael J Zelefsky, Suzanne L Wolden, Kenneth E
Rosenzweig, Kaled M Alektiar, Margie A Hunt, Ellen D Yorke, Linda X Hong,
and Howard I Amols. Intensity‐modulated radiotherapy. The Cancer Journal, 8(2):
164–176, 2002. ISSN 1528-9117.
[154] Z Fuks and A Horwich. Clinical and technical aspects of conformal therapy. Radio-
therapy and Oncology, 29(2):219, 1993. ISSN 0167-8140.

References 252
[155] Alan Pollack, Gunar K Zagars, George Starkschall, Constance H Childress, Susan
Kopplin, Arthur L Boyer, and Isaac I Rosen. Conventional vs. conformal radiother-
apy for prostate cancer: preliminary results of dosimetry and acute toxicity. In-
ternational Journal of Radiation Oncology* Biology* Physics, 34(3):555–564, 1996.
ISSN 0360-3016.
[156] David P Dearnaley, Vincent S Khoo, Andrew R Norman, Lesley Meyer, Alan Nahum,
Diana Tait, John Yarnold, and Alan Horwich. Comparison of radiation side-effects
of conformal and conventional radiotherapy in prostate cancer: a randomised trial.
The Lancet, 353(9149):267–272, 1999. ISSN 0140-6736.
[157] David E Morris, Bahman Emami, Peter M Mauch, Andre A Konski, May L Tao,
Andrea K Ng, Eric A Klein, Najeeb Mohideen, Mark D Hurwitz, and Bendick A
Fraas. Evidence-based review of three-dimensional conformal radiotherapy for local-
ized prostate cancer: an astro outcomes initiative. International Journal of Radiation
Oncology* Biology* Physics, 62(1):3–19, 2005. ISSN 0360-3016.
[158] Michael Brundage, Himu Lukka, Juanita Crook, Padraig Warde, Glenn Bauman,
Charles Catton, Barbara R Markman, Manya Charette, and Cancer care Ontario
Practice Guidelines Initiative Genitourinary Cancer Disease Site Group. The use
of conformal radiotherapy and the selection of radiation dose in t1 or t2 low or
intermediate risk prostate cancer–a systematic review. Radiotherapy and oncology,
64(3):239–250, 2002. ISSN 0167-8140.
[159] Isabel Syndikus, Rachel C Morgan, Matthew R Sydes, John D Graham, and David P
Dearnaley. Late gastrointestinal toxicity after dose-escalated conformal radiotherapy
for early prostate cancer: results from the uk medical research council rt01 trial
(isrctn47772397). International Journal of Radiation Oncology* Biology* Physics,
77(3):773–783, 2010. ISSN 0360-3016.
[160] Lynn J Verhey. Comparison of three-dimensional conformal radiation therapy and
intensity-modulated radiation therapy systems. In Seminars in radiation oncology,
volume 9, pages 78–98. Elsevier, 1999. ISBN 1053-4296.

References 253
[161] Yasumasa Nishimura and Ritsuko Komaki. Intensity-Modulated Radiation Therapy:
Clinical Evidence and Techniques. Tokyo: Springer Japan, 2015. ISBN 4431554858.
[162] Oren Cahlon, Michael J Zelefsky, Alison Shippy, Heather Chan, Zvi Fuks, Yoshiya
Yamada, Margie Hunt, Steven Greenstein, and Howard Amols. Ultra-high dose
(86.4 gy) imrt for localized prostate cancer: toxicity and biochemical outcomes.
International Journal of Radiation Oncology* Biology* Physics, 71(2):330–337, 2008.
ISSN 0360-3016.
[163] Christopher R King, Thomas A DiPetrillo, and David E Wazer. Optimal radio-
therapy for prostate cancer: predictions for conventional external beam, imrt, and
brachytherapy from radiobiologic models. International Journal of Radiation On-
cology* Biology* Physics, 46(1):165–172, 2000. ISSN 0360-3016.
[164] Michael J Zelefsky, Zvi Fuks, Margie Hunt, Henry J Le, Danna Lombardi, Clifton C
Ling, Victor E Reuter, Ennapadam S Venkatraman, and Steven A Leibel. High
dose radiation delivered by intensity modulated conformal radiotherapy improves
the outcome of localized prostate cancer. The Journal of urology, 166(3):876–881,
2001. ISSN 0022-5347.
[165] Michael J Zelefsky, Heather Chan, Margie Hunt, Yoshiya Yamada, Alison M Shippy,
and Howard Amols. Long-term outcome of high dose intensity modulated radiation
therapy for patients with clinically localized prostate cancer. The Journal of urology,
176(4):1415–1419, 2006. ISSN 0022-5347.
[166] Gary Luxton, Steven L Hancock, and Arthur L Boyer. Dosimetry and radiobiologic
model comparison of imrt and 3d conformal radiotherapy in treatment of carcinoma
of the prostate. International Journal of Radiation Oncology* Biology* Physics, 59
(1):267–284, 2004. ISSN 0360-3016.
[167] Pascal Fenoglietto, Benoit Laliberte, Ali Allaw, Norbert Ailleres, Katia Idri,
Meng Huor Hay, Carmen Llacer Moscardo, Sophie Gourgou, Jean-Bernard Dubois,
and David Azria. Persistently better treatment planning results of intensity-
modulated (imrt) over conformal radiotherapy (3d-crt) in prostate cancer patients

References 254
with significant variation of clinical target volume and/or organs-at-risk. Radiother-
apy and Oncology, 88(1):77–87, 2008. ISSN 0167-8140.
[168] Maria T Vlachaki, Terrance N Teslow, Chad Amosson, Nathan W Uy, and Salahud-
din Ahmad. Imrt versus conventional 3dcrt on prostate and normal tissue dosimetry
using an endorectal balloon for prostate immobilization. Medical Dosimetry, 30(2):
69–75, 2005. ISSN 0958-3947.
[169] Silvia Hummel, EL Simpson, P Hemingway, MD Stevenson, and A Rees. Intensity-
modulated radiotherapy for the treatment of prostate cancer: a systematic review and
economic evaluation, volume 14. Health Technology Assessment, 2010.
[170] Oren Cahlon, Margie Hunt, and Michael J Zelefsky. Intensity-modulated radiation
therapy: supportive data for prostate cancer. In Seminars in radiation oncology,
volume 18, pages 48–57. Elsevier, 2008. ISBN 1053-4296.
[171] Justin E Bekelman, Nandita Mitra, Jason Efstathiou, Kaijun Liao, Robert Sun-
derland, Deborah N Yeboa, and Katrina Armstrong. Outcomes after intensity-
modulated versus conformal radiotherapy in older men with nonmetastatic prostate
cancer. International Journal of Radiation Oncology* Biology* Physics, 81(4):e325–
e334, 2011. ISSN 0360-3016.
[172] Michael J Zelefsky, Zvi Fuks, Margie Hunt, Yoshiya Yamada, Christine Marion,
C Clifton Ling, Howard Amols, Ennapadam S Venkatraman, and Steven A Leibel.
High-dose intensity modulated radiation therapy for prostate cancer: early toxic-
ity and biochemical outcome in 772 patients. International Journal of Radiation
Oncology* Biology* Physics, 53(5):1111–1116, 2002. ISSN 0360-3016.
[173] Michael J Zelefsky, Emily J Levin, Margie Hunt, Yoshiya Yamada, Alison M Shippy,
Andrew Jackson, and Howard I Amols. Incidence of late rectal and urinary toxicities
after three-dimensional conformal radiotherapy and intensity-modulated radiother-
apy for localized prostate cancer. International Journal of Radiation Oncology*
Biology* Physics, 70(4):1124–1129, 2008. ISSN 0360-3016.
[174] Michael J Zelefsky, Zvi Fuks, Laura Happersett, Henry J Lee, C Clifton Ling,
Chandra M Burman, Margie Hunt, Theresa Wolfe, ES Venkatraman, and Andrew

References 255
Jackson. Clinical experience with intensity modulated radiation therapy (imrt) in
prostate cancer. Radiotherapy and Oncology, 55(3):241–249, 2000. ISSN 0167-8140.
[175] Nathan C Sheets, Gregg H Goldin, Anne-Marie Meyer, Yang Wu, YunKyung Chang,
Til Stürmer, Jordan A Holmes, Bryce B Reeve, Paul A Godley, and William R
Carpenter. Intensity-modulated radiation therapy, proton therapy, or conformal
radiation therapy and morbidity and disease control in localized prostate cancer.
Jama, 307(15):1611–1620, 2012. ISSN 0098-7484.
[176] Eric J Hall and Cheng-Shie Wuu. Radiation-induced second cancers: the impact of
3d-crt and imrt. International Journal of Radiation Oncology* Biology* Physics, 56
(1):83–88, 2003. ISSN 0360-3016.
[177] Hannah E Carter, Andrew Martin, Deborah Schofield, Gillian Duchesne, Annette
Haworth, Colin Hornby, Mark Sidhom, and Michael Jackson. A decision model to
estimate the cost-effectiveness of intensity modulated radiation therapy (imrt) com-
pared to three dimensional conformal radiation therapy (3dcrt) in patients receiving
radiotherapy to the prostate bed. Radiotherapy and Oncology, 112(2):187–193, 2014.
ISSN 0167-8140.
[178] Robert W Kopp, Michael Duff, Frank Catalfamo, Dhiren Shah, Michael Rajecki,
and Kehkashan Ahmad. Vmat vs. 7-field-imrt: assessing the dosimetric parameters
of prostate cancer treatment with a 292-patient sample. Medical Dosimetry, 36(4):
365–372, 2012. ISSN 0958-3947.
[179] Enzhuo M Quan, Xiaoqiang Li, Yupeng Li, Xiaochun Wang, Rajat J Kudchadker,
Jennifer L Johnson, Deborah A Kuban, Andrew K Lee, and Xiaodong Zhang. A com-
prehensive comparison of imrt and vmat plan quality for prostate cancer treatment.
International Journal of Radiation Oncology* Biology* Physics, 83(4):1169–1178,
2012. ISSN 0360-3016.
[180] Karl Otto. Volumetric modulated arc therapy: Imrt in a single gantry arc. Medical
physics, 35(1):310–317, 2008. ISSN 0094-2405.
[181] R Shaffer, WJ Morris, V Moiseenko, M Welsh, C Crumley, S Nakano, M Schmu-
land, T Pickles, and K Otto. Volumetric modulated arc therapy and conventional

References 256
intensity-modulated radiotherapy for simultaneous maximal intraprostatic boost: a
planning comparison study. Clinical oncology, 21(5):401–407, 2009. ISSN 0936-6555.
[182] Pengpeng Zhang, Laura Happersett, Margie Hunt, Andrew Jackson, Michael Zelef-
sky, and Gig Mageras. Volumetric modulated arc therapy: planning and evaluation
for prostate cancer cases. International Journal of Radiation Oncology* Biology*
Physics, 76(5):1456–1462, 2010. ISSN 0360-3016.
[183] David Palma, Emily Vollans, Kerry James, Sandy Nakano, Vitali Moiseenko,
Richard Shaffer, Michael McKenzie, James Morris, and Karl Otto. Volumetric mod-
ulated arc therapy for delivery of prostate radiotherapy: comparison with intensity-
modulated radiotherapy and three-dimensional conformal radiotherapy. Interna-
tional Journal of Radiation Oncology* Biology* Physics, 72(4):996–1001, 2008. ISSN
0360-3016.
[184] Chiao-Ling Tsai, Jian-Kuen Wu, Hsiao-Ling Chao, Yi-Chun Tsai, and Jason Chia-
Hsien Cheng. Treatment and dosimetric advantages between vmat, imrt, and helical
tomotherapy in prostate cancer. Medical Dosimetry, 36(3):264–271, 2011. ISSN
0958-3947.
[185] Min Rao, Wensha Yang, Fan Chen, Ke Sheng, Jinsong Ye, Vivek Mehta, David
Shepard, and Daliang Cao. Comparison of elekta vmat with helical tomotherapy
and fixed field imrt: plan quality, delivery efficiency and accuracy. Medical physics,
37(3):1350–1359, 2010. ISSN 0094-2405.
[186] Melanie TM Davidson, Samuel J Blake, Deidre L Batchelar, Patrick Cheung, and
Katherine Mah. Assessing the role of volumetric modulated arc therapy (vmat)
relative to imrt and helical tomotherapy in the management of localized, locally
advanced, and post-operative prostate cancer. International Journal of Radiation
Oncology* Biology* Physics, 80(5):1550–1558, 2011. ISSN 0360-3016.
[187] Dirk Wolff, Florian Stieler, Grit Welzel, Friedlieb Lorenz, Yasser Abo-Madyan,
Sabine Mai, Carsten Herskind, Martin Polednik, Volker Steil, and Frederik Wenz.
Volumetric modulated arc therapy (vmat) vs. serial tomotherapy, step-and-shoot
References 257
imrt and 3d-conformal rt for treatment of prostate cancer. Radiotherapy and oncol-
ogy, 93(2):226–233, 2009. ISSN 0167-8140.
[188] David Pryor, Mark Sidhom, Sankar Arumugam, Joseph Bucci, Sarah Gallagher,
Joanne Smart, Melissa Grand, Lee Wilton, and Jarad Martin. Phase 2 multicentre
study of gantry-based stereotactic radiotherapy boost for intermediate and high risk
prostate cancer (prometheus). Frontiers in oncology, 9:217, 2019. ISSN 2234-943X.
[189] Matthew Richardson, Mark Sidhom, Sarah Gallagher, Mel Grand, David Pryor,
Joseph Bucci, Lee Wilton, Sankar Arumugam, Sarah Keats, and Jarad M Martin.
Prostate multicentre external beam radiotherapy using a stereotactic boost: the
prometheus study protocol. BMC cancer, 18(1):588, 2018. ISSN 1471-2407.
[190] Stanley H Benedict, Kamil M Yenice, David Followill, James M Galvin, William
Hinson, Brian Kavanagh, Paul Keall, Michael Lovelock, Sanford Meeks, and Lech
Papiez. Stereotactic body radiation therapy: the report of aapm task group 101.
Medical physics, 37(8):4078–4101, 2010. ISSN 0094-2405.
[191] Brian K Chang and Robert D Timmerman. Stereotactic body radiation therapy: a
comprehensive review. American journal of clinical oncology, 30(6):637–644, 2007.
ISSN 0277-3732.
[192] Jack Fowler, Rick Chappell, and Mark Ritter. Is α/β for prostate tumors really
low? International Journal of Radiation Oncology* Biology* Physics, 50(4):1021–
1031, 2001. ISSN 0360-3016.
[193] Jack F Fowler, Mark A Ritter, Rick J Chappell, and David J Brenner. What hy-
pofractionated protocols should be tested for prostate cancer? International Journal
of Radiation Oncology* Biology* Physics, 56(4):1093–1104, 2003. ISSN 0360-3016.
[194] Debra E Freeman and Christopher R King. Stereotactic body radiotherapy for low-
risk prostate cancer: five-year outcomes. Radiation Oncology, 6(1), 2011. ISSN
1748-717X.
[195] Berit L Madsen, R Alex Hsi, Huong T Pham, Jack F Fowler, Laura Esagui, and
John Corman. Stereotactic hypofractionated accurate radiotherapy of the prostate

References 258
(sharp), 33.5 gy in five fractions for localized disease: first clinical trial results.
International Journal of Radiation Oncology* Biology* Physics, 67(4):1099–1105,
2007. ISSN 0360-3016.
[196] B Detti, P Bonomo, L Masi, R Doro, S Cipressi, C Iermano, I Bonucci, D Frances-
chini, V Di Cataldo, and L Di Brina. Cyberknife treatment for low and intermediate
risk prostate cancer. Cancer investigation, 2015. ISSN 0735-7907.
[197] Alan J Katz, Michael Santoro, Fred Diblasio, and Richard Ashley. 6 year cyberknife
prostate cancer study released. Radiation Oncology, 8:118, 2013.
[198] Christopher R King, James D Brooks, Harcharan Gill, Todd Pawlicki, Cristian
Cotrutz, and Joseph C Presti. Stereotactic body radiotherapy for localized prostate
cancer: interim results of a prospective phase ii clinical trial. International Journal
of Radiation Oncology* Biology* Physics, 73(4):1043–1048, 2009. ISSN 0360-3016.
[199] Christopher R King, James D Brooks, Harcharan Gill, and Joseph C Presti. Long-
term outcomes from a prospective trial of stereotactic body radiotherapy for low-risk
prostate cancer. International Journal of Radiation Oncology* Biology* Physics, 82
(2):877–882, 2012. ISSN 0360-3016.
[200] Ellen A Wiegner and Christopher R King. Sexual function after stereotactic body
radiotherapy for prostate cancer: results of a prospective clinical trial. International
Journal of Radiation Oncology* Biology* Physics, 78(2):442–448, 2010. ISSN 0360-
3016.
[201] Thomas P Boike, Yair Lotan, L Chinsoo Cho, Jeffrey Brindle, Paul DeRose, Xian-Jin
Xie, Jingsheng Yan, Ryan Foster, David Pistenmaa, and Alida Perkins. Phase i dose-
escalation study of stereotactic body radiation therapy for low-and intermediate-risk
prostate cancer. Journal of Clinical Oncology, 29(15):2020–2026, 2011. ISSN 0732-
183X.
[202] Leonard N Chen, Simeng Suy, Sunghae Uhm, Eric K Oermann, Andrew W Ju, Viola
Chen, Heather N Hanscom, Sarah Laing, Joy S Kim, and Siyuan Lei. Stereotactic
body radiation therapy (sbrt) for clinically localized prostate cancer: the georgetown
university experience. Radiat Oncol, 8(1):58, 2013.

References 259
[203] Jay L Friedland, Debra E Freeman, Mary Ellen Masterson-McGary, and David M
Spellberg. Stereotactic body radiotherapy: an emerging treatment approach for
localized prostate cancer. Technology in cancer research& treatment, 8(5):387–392,
2009. ISSN 1533-0346.
[204] William C Jackson, Jessica Silva, Holly E Hartman, Robert T Dess, Amar U Kishan,
Whitney H Beeler, Laila A Gharzai, Elizabeth M Jaworski, Rohit Mehra, Jason WD
Hearn, Todd M Morgan, Simpa S Salami, Matthew R Cooperberg, Payal D Mahal,
Brandon Aand Soni, Samuel Kaffenberger, Paul L Nguyen, Neil Desai, Felix Y Feng,
Zachary S Zumsteg, and Daniel E Spratt. Stereotactic body radiation therapy for
localized prostate cancer: a systematic review and meta-analysis of over 6,000 pa-
tients treated on prospective studies. International Journal of Radiation Oncology*
Biology* Physics, 104(4):778–789, 2019. ISSN 0360-3016.
[205] Anders Widmark, Adalsteinn Gunnlaugsson, Lars Beckman, Camilla Thellenberg-
Karlsson, Morten Hoyer, Magnus Lagerlund, Jon Kindblom, Claes Ginman, Bengt
Johansson, Kirsten Björnlinger, Mihajl Seke, Mans Agrup, Per Fransson, Björn
Tavelin, David Norman, Björn Zackrisson, Harald Anderson, Elisabeth Kjellen, Lars
Franzen, and Per Nilsson. Ultra-hypofractionated versus conventionally fractionated
radiotherapy for prostate cancer: 5-year outcomes of the HYPO-RT-PC randomised,
non-inferiority, phase 3 trial. The Lancet, 394(10196):385–395, 2019. ISSN 0140-6736.
[206] Douglas H Brand, Alison C Tree, Peter Ostler, Hans van der Voet, Andrew Loblaw,
William Chu, Daniel Ford, Shaun Tolan, Suneil Jain, Alexander Martin, John
Staffurth, Philip Camilleri, Kiran Kancherla, John Frew, Andrew Chan, Ian S.
Dayes, Daniel Henderson, Stephanie Brown, Clare Cruickshank, Stephanie Burnett,
Aileen Duffton, Clare Griffin, Victoria Hinder, Kirsty Morrison, Olivia Naismith,
Emma Hall, and Nicholas van As. Intensity-modulated fractionated radiotherapy
versus stereotactic body radiotherapy for prostate cancer (pace-b): acute toxicity
findings from an international, randomised, open-label, phase 3, non-inferiority trial.
The Lancet Oncology, 20(11):1531–1543, 2019. ISSN 1470-2045.
[207] James M Galvin, Gary Ezzell, Avraham Eisbrauch, Cedric Yu, Brian Butler, Ying
Xiao, Isaac Rosen, Julian Rosenman, Michael Sharpe, and Lei Xing. Implementing

References 260
imrt in clinical practice: a joint document of the american society for therapeutic
radiology and oncology and the american association of physicists in medicine. Inter-
national Journal of Radiation Oncology* Biology* Physics, 58(5):1616–1634, 2004.
ISSN 0360-3016.
[208] James M Balter, Howard M Sandler, Kwok Lam, Robert L Bree, Allen S Lichter,
and Randall K Ten Haken. Measurement of prostate movement over the course of
routine radiotherapy using implanted markers. International Journal of Radiation
Oncology* Biology* Physics, 31(1):113–118, 1995. ISSN 0360-3016.
[209] JM Crook, Y Raymond, D Salhani, H Yang, and B Esche. Prostate motion during
standard radiotherapy as assessed by fiducial markers. Radiotherapy and Oncology,
37(1):35–42, 1995. ISSN 0167-8140.
[210] Marciana Nona Duma and Patrick Kupelian. IGRT: How and When, pages 103–
107. Springer, 2015. ISBN 3642370985. URL http://www.springer.com/fr/book/
9783642370984.
[211] Michael J Zelefsky, Marisa Kollmeier, Brett Cox, Anthony Fidaleo, Dahlia Sperling,
Xin Pei, Brett Carver, Jonathan Coleman, Michael Lovelock, and Margie Hunt.
Improved clinical outcomes with high-dose image guided radiotherapy compared
with non-igrt for the treatment of clinically localized prostate cancer. International
Journal of Radiation Oncology* Biology* Physics, 84(1):125–129, 2012. ISSN 0360-
3016.
[212] Ken Takeda, Yoshihiro Takai, Kakutaro Narazaki, Masatoshi Mitsuya, Rei
Umezawa, Noriyuki Kadoya, Yukio Fujita, Toshiyuki Sugawara, Masaki Kubozono,
and Eiji Shimizu. Treatment outcome of high-dose image-guided intensity-modulated
radiotherapy using intra-prostate fiducial markers for localized prostate cancer at a
single institute in japan. Radiat Oncol, 7(1):105, 2012.
[213] J Van Dyk, JJ Batista, and Glenn S Bauman. Accuracy and uncertainty considera-
tions in modern radiation oncology. The Modern Technology of Radiation Oncology,
3:361–412, 2013.
References 261
[214] Damien C Weber, Coen W Hurkmans, Christos Melidis, Wilfried Budach, Jo-
hannes H Langendijk, Lester J Peters, Vincent Grégoire, Philippe Maingon, and
Christophe Combescure. Outcome impact and cost-effectiveness of quality assur-
ance for radiotherapy planned for the eortc 22071–24071 prospective study for head
and neck cancer. Radiotherapy and Oncology, 111(3):393–399, 2014. ISSN 0167-8140.
[215] David Thwaites, Pierre Scalliet, Jan Willem Leer, and Jens Overgaard. Quality
assurance in radiotherapy: European society for therapeutic radiology and oncology
advisory report to the commission of the european union for the ‘europe against
cancer programme’. Radiotherapy and Oncology, 35(1):61–73, 1995. ISSN 0167-8140.
[216] Eric E Klein, Joseph Hanley, John Bayouth, Fang‐Fang Yin, William Simon, Sean
Dresser, Christopher Serago, Francisco Aguirre, Lijun Ma, and Bijan Arjomandy.
Task group 142 report: Quality assurance of medical accelerators a. Medical physics,
36(9Part1):4197–4212, 2009. ISSN 0094-2405.
[217] Damien C Weber, Milan Tomsej, Christos Melidis, and Coen W Hurkmans. Qa
makes a clinical trial stronger: evidence-based medicine in radiation therapy. Ra-
diotherapy and Oncology, 105(1):4–8, 2012. ISSN 0167-8140.
[218] Morten N Pettersen, Edwin Aird, and Dag R Olsen. Quality assurance of dosime-
try and the impact on sample size in randomized clinical trials. Radiotherapy and
Oncology, 86(2):195–199, 2008. ISSN 0167-8140.
[219] Christos Melidis, Walther R Bosch, Joanna Izewska, Elena Fidarova, Eduardo Zu-
bizarreta, Kenneth Ulin, Satoshi Ishikura, David Followill, James Galvin, and An-
nette Haworth. Global harmonization of quality assurance naming conventions in
radiation therapy clinical trials. International Journal of Radiation Oncology* Biol-
ogy* Physics, 90(5):1242–1249, 2014. ISSN 0360-3016.
[220] Lawrence B Marks, Robert D Adams, Todd Pawlicki, Albert L Blumberg, David
Hoopes, Michael D Brundage, and Benedick A Fraass. Enhancing the role of case-
oriented peer review to improve quality and safety in radiation oncology: executive
summary. Practical radiation oncology, 3(3):149–156, 2013. ISSN 1879-8500.

References 262
[221] Nitin Ohri, Xinglei Shen, Adam P Dicker, Laura A Doyle, Amy S Harrison, and
Timothy N Showalter. Radiotherapy protocol deviations and clinical outcomes: a
meta-analysis of cooperative group clinical trials. Journal of the National Cancer
Institute, page djt001, 2013. ISSN 0027-8874.
[222] Ross A Abrams, Kathryn A Winter, William F Regine, Howard Safran, John P
Hoffman, Robert Lustig, Andre A Konski, Al B Benson, John S Macdonald, and
Tyvin A Rich. Failure to adhere to protocol specified radiation therapy guidelines
was associated with decreased survival in rtog 9704—a phase iii trial of adjuvant
chemotherapy and chemoradiotherapy for patients with resected adenocarcinoma of
the pancreas. International Journal of Radiation Oncology* Biology* Physics, 82(2):
809–816, 2012. ISSN 0360-3016. doi: https://doi.org/10.1016/j.ijrobp.2010.11.039.
[223] Avraham Eisbruch, Jonathan Harris, Adam S Garden, Clifford KS Chao, William
Straube, Paul M Harari, Giuseppe Sanguineti, Christopher U Jones, Walter R Bosch,
and K Kian Ang. Multi-institutional trial of accelerated hypofractionated intensity-
modulated radiation therapy for early-stage oropharyngeal cancer (rtog 00-22). In-
ternational Journal of Radiation Oncology* Biology* Physics, 76(5):1333–1338, 2010.
ISSN 0360-3016.
[224] Berthe MP Aleman, Théodore Girinsky, Richard WM van Der Maazen, Simon Strijk,
Paul Meijnders, Roberto Bortolus, Manouk JJ Olofsen-van Acht, Marnix LM Ly-
beert, Yolande Lievens, and Houchingue Eghbali. Quality control of involved-field
radiotherapy in patients with advanced hodgkin’s lymphoma (eortc 20884). Inter-
national Journal of Radiation Oncology* Biology* Physics, 63(4):1184–1190, 2005.
ISSN 0360-3016.
[225] William F Regine, Kathryn A Winter, Ross A Abrams, Howard Safran, John P
Hoffman, Andre Konski, Al B Benson, John S Macdonald, Mahesh R Kudrimoti,
and Mitchel L Fromm. Fluorouracil vs gemcitabine chemotherapy before and after
fluorouracil-based chemoradiation following resection of pancreatic adenocarcinoma:
a randomized controlled trial. Jama, 299(9):1019–1026, 2008. ISSN 0098-7484.
[226] Carol J Fabian, Carl M Mansfield, Steve Dahlberg, Stephen E Jones, Thomas P
Miller, Ellis Van Slyck, Petre N Grozea, Francis S Morrison, Charles A Coltman, and
References 263
Richard I Fisher. Low-dose involved field radiation after chemotherapy in advanced
hodgkin disease: A southwest oncology group randomized study. Annals of internal
medicine, 120(11):903–912, 1994. ISSN 0003-4819.
[227] Danny Rischin, Lester J Peters, Brian O’Sullivan, Jordi Giralt, Richard Fisher, Kally
Yuen, Andy Trotti, Jacques Bernier, Jean Bourhis, and Jolie Ringash. Tirapazamine,
cisplatin, and radiation versus cisplatin and radiation for advanced squamous cell
carcinoma of the head and neck (trog 02.02, headstart): a phase iii trial of the trans-
tasman radiation oncology group. Journal of Clinical Oncology, page JCO. 2009.27.
4449, 2010. ISSN 0732-183X.
[228] Elisabeth Weiss and Clemens F Hess. The impact of gross tumor volume (gtv)
and clinical target volume (ctv) definition on the total accuracy in radiotherapy.
Strahlentherapie und Onkologie, 179(1):21–30, 2003. ISSN 0179-7158.
[229] Roel JHM Steenbakkers, Joop C Duppen, Isabelle Fitton, Kirsten EI Deurloo, Lam-
bert J Zijp, Emile FI Comans, Apollonia LJ Uitterhoeve, Patrick TR Rodrigus,
Gijsbert WP Kramer, and Johan Bussink. Reduction of observer variation using
matched ct-pet for lung cancer delineation: a three-dimensional analysis. Interna-
tional Journal of Radiation Oncology* Biology* Physics, 64(2):435–448, 2006. ISSN
0360-3016.
[230] Femke OB Spoelstra, Suresh Senan, Cecile Le Péchoux, Satoshi Ishikura, Francesc
Casas, David Ball, Allan Price, Dirk De Ruysscher, John R van Sörnsen de Koste,
and Lung Adjuvant Radiotherapy Trial Investigators Group. Variations in target vol-
ume definition for postoperative radiotherapy in stage iii non–small-cell lung cancer:
Analysis of an international contouring study. International Journal of Radiation
Oncology* Biology* Physics, 76(4):1106–1113, 2010. ISSN 0360-3016.
[231] Dee H Wu, Nina A Mayr, Yasemin Karatas, Rifat Karatas, Mustafa Adli, Susan M
Edwards, James D Wolff, Allen Movahed, Joseph Montebello, and William TC Yuh.
Inter-observer variation in cervical cancer tumor delineation for image-based radio-
therapy planning among and within different specialties. Journal of Applied Clinical
Medical Physics, 6(4), 2005. ISSN 1526-9914.
References 264
[232] Primož Petrič, Robert Hudej, Peter Rogelj, Mateja Blas, Kari Tanderup, Elena Fi-
darova, Christian Kirisits, Daniel Berger, Johannes Carl Athanasios Dimopoulos,
and Richard Pötter. Uncertainties of target volume delineation in mri guided adap-
tive brachytherapy of cervix cancer: A multi-institutional study. Radiotherapy and
Oncology, 107(1):6–12, 2013. ISSN 0167-8140.
[233] Taran Paulsen Hellebust, Kari Tanderup, Christoffer Lervåg, Elena Fidarova, Daniel
Berger, Eirik Malinen, Richard Pötter, and Primož Petrič. Dosimetric impact of
interobserver variability in mri-based delineation for cervical cancer brachytherapy.
Radiotherapy and Oncology, 107(1):13–19, 2013. ISSN 0167-8140.
[234] X Allen Li, An Tai, Douglas W Arthur, Thomas A Buchholz, Shannon Macdonald,
Lawrence B Marks, Jean M Moran, Lori J Pierce, Rachel Rabinovitch, and Alphonse
Taghian. Variability of target and normal structure delineation for breast cancer
radiotherapy: an rtog multi-institutional and multiobserver study. International
Journal of Radiation Oncology* Biology* Physics, 73(3):944–951, 2009. ISSN 0360-
3016.
[235] Ross P Petersen, Pauline T Truong, Hosam A Kader, Eric Berthelet, Junella C Lee,
Michelle L Hilts, Adam S Kader, Wayne A Beckham, and Ivo A Olivotto. Target
volume delineation for partial breast radiotherapy planning: clinical characteristics
associated with low interobserver concordance. International Journal of Radiation
Oncology* Biology* Physics, 69(1):41–48, 2007. ISSN 0360-3016.
[236] John P Logue, Carole L Sharrock, Richard A Cowan, Graham Read, Julie Marrs,
and David Mott. Clinical variability of target volume description in conformal radio-
therapy planning. International Journal of Radiation Oncology* Biology* Physics,
41(4):929–932, 1998. ISSN 0360-3016.
[237] Anne E Saarnak, Menno Boersma, Bart NFM van Bunningen, René Wolterink, and
Marcel J Steggerda. Inter-observer variation in delineation of bladder and rectum
contours for brachytherapy of cervical cancer. Radiotherapy and Oncology, 56(1):
37–42, 2000. ISSN 0167-8140.

References 265
[238] Benjamin E Nelms, Wolfgang A Tomé, Greg Robinson, and James Wheeler. Varia-
tions in the contouring of organs at risk: test case from a patient with oropharyngeal
cancer. International Journal of Radiation Oncology* Biology* Physics, 82(1):368–
378, 2012. ISSN 0360-3016.
[239] Coen Rasch, Isabelle Barillot, Peter Remeijer, Adriaan Touw, Marcel van Herk, and
Joos V Lebesque. Definition of the prostate in ct and mri: a multi-observer study.
International Journal of Radiation Oncology* Biology* Physics, 43(1):57–66, 1999.
ISSN 0360-3016.
[240] Eric LH Khoo, Karlissa Schick, Ashley W Plank, Michael Poulsen, Winnie WG
Wong, Mark Middleton, and Jarad M Martin. Prostate contouring variation: can
it be fixed? International Journal of Radiation Oncology* Biology* Physics, 82(5):
1923–1929, 2012. ISSN 0360-3016.
[241] Stephen L Breen, Julia Publicover, Shiroma De Silva, Greg Pond, Kristy Brock,
Brian O’Sullivan, Bernard Cummings, Laura Dawson, Anne Keller, and John Kim.
Intraobserver and interobserver variability in gtv delineation on fdg-pet-ct images
of head and neck cancers. International Journal of Radiation Oncology* Biology*
Physics, 68(3):763–770, 2007. ISSN 0360-3016.
[242] Gabriela Altorjai, Irina Fotina, Carola Lütgendorf-Caucig, Markus Stock, Richard
Pötter, Dietmar Georg, and Karin Dieckmann. Cone-beam ct-based delineation
of stereotactic lung targets: the influence of image modality and target size on
interobserver variability. International Journal of Radiation Oncology* Biology*
Physics, 82(2):e265–e272, 2012. ISSN 0360-3016.
[243] Coen Rasch, Roel Steenbakkers, and Marcel van Herk. Target definition in prostate,
head, and neck. In Seminars in radiation oncology, volume 15, pages 136–145.
Elsevier, 2005. ISBN 1053-4296.
[244] Darren M Mitchell, Lesley Perry, Steve Smith, Tony Elliott, James P Wylie,
Richard A Cowan, Jacqueline E Livsey, and John P Logue. Assessing the effect
of a contouring protocol on postprostatectomy radiotherapy clinical target volumes
References 266
and interphysician variation. International Journal of Radiation Oncology* Biology*
Physics, 75(4):990–993, 2009. ISSN 0360-3016.
[245] Patrick Bowden, Richard Fisher, Michael Mac Manus, Andrew Wirth, Gillian Duch-
esne, Michael Millward, Allan McKenzie, Judy Andrews, and David Ball. Measure-
ment of lung tumor volumes using three-dimensional computer planning software.
International Journal of Radiation Oncology* Biology* Physics, 53(3):566–573, 2002.
ISSN 0360-3016.
[246] Edwin PM Jansen, Jasper Nijkamp, Michael Gubanski, Pehr ARM Lind, and Marcel
Verheij. Interobserver variation of clinical target volume delineation in gastric cancer.
International Journal of Radiation Oncology* Biology* Physics, 77(4):1166–1170,
2010. ISSN 0360-3016.
[247] Luigi Franco Cazzaniga, Maria Antonella Marinoni, Alberto Bossi, Ernestina
Bianchi, Emanuela Cagna, Dorian Cosentino, Luciano Scandolaro, Marica Valli, and
Milena Frigerio. Interphysician variability in defining the planning target volume in
the irradiation of prostate and seminal vesicles. Radiotherapy and oncology, 47(3):
293–296, 1998. ISSN 0167-8140.
[248] Benedikt Engels, Guy Soete, D Verellen, and Guy Storme. Conformal arc radio-
therapy for prostate cancer: increased biochemical failure in patients with distended
rectum on the planning computed tomogram despite image guidance by implanted
markers. International Journal of Radiation Oncology* Biology* Physics, 74(2):
388–391, 2009. ISSN 0360-3016.
[249] Zhanrong Gao, David Wilkins, Libni Eapen, Christopher Morash, Youssef Wassef,
and Lee Gerig. A study of prostate delineation referenced against a gold standard
created from the visible human data. Radiotherapy and oncology, 85(2):239–246,
2007. ISSN 0167-8140.
[250] Alistair M Pooler, Helen M Mayles, Olivia F Naismith, John P Sage, and David P
Dearnaley. Evaluation of margining algorithms in commercial treatment planning
systems. Radiotherapy and Oncology, 86(1):43–47, 2008. ISSN 0167-8140.

References 267
[251] Shalini K Vinod, Myo Min, Michael G Jameson, and Lois C Holloway. A review of
interventions to reduce inter‐observer variability in volume delineation in radiation
oncology. Journal of medical imaging and radiation oncology, 60(3):393–406, 2016.
ISSN 1754-9485.
[252] Claudio Fiorino, Michele Reni, Angelo Bolognesi, Giovanni Mauro Cattaneo, and
Riccardo Calandrino. Intra-and inter-observer variability in contouring prostate and
seminal vesicles: implications for conformal treatment planning. Radiotherapy and
oncology, 47(3):285–292, 1998. ISSN 0167-8140.
[253] Peter Remeijer, Coen Rasch, Joos V Lebesque, and Marcel van Herk. A general
methodology for three-dimensional analysis of variation in target volume delineation.
Medical Physics, 26(6):931–940, 1999. ISSN 0094-2405.
[254] Beatrice Seddon, Margaret Bidmead, Jane Wilson, Vincent Khoo, and David Dear-
naley. Target volume definition in conformal radiotherapy for prostate cancer: qual-
ity assurance in the mrc rt-01 trial. Radiotherapy and Oncology, 56(1):73–83, 2000.
ISSN 0167-8140.
[255] Piet Ost, Gert De Meerleer, Tom Vercauteren, Werner De Gersem, Liv Veldeman,
Katrien Vandecasteele, Valérie Fonteyne, and Geert Villeirs. Delineation of the post-
prostatectomy prostate bed using computed tomography: interobserver variability
following the eortc delineation guidelines. International Journal of Radiation On-
cology* Biology* Physics, 81(3):e143–e149, 2011. ISSN 0360-3016.
[256] Geert M Villeirs, Koen Van Vaerenbergh, Luc Vakaet, Samuel Bral, Filip Claus,
Wilfried J De Neve, Koenraad L Verstraete, and Gert O De Meerleer. Interobserver
delineation variation using ct versus combined ct+ mri in intensity–modulated radio-
therapy for prostate cancer. Strahlentherapie und Onkologie, 181(7):424–430, 2005.
ISSN 0179-7158.
[257] Mack Roach, Pamela Faillace-Akazawa, Christine Malfatti, John Holland, and Hed-
vig Hricak. Prostate volumes defined by magnetic resonance imaging and computer-
ized tomographic scans for three-dimensional conformal radiotherapy. International

References 268
Journal of Radiation Oncology* Biology* Physics, 35(5):1011–1018, 1996. ISSN
0360-3016.
[258] Carola Lütgendorf-Caucig, Irina Fotina, Markus Stock, Richard Pötter, Gregor
Goldner, and Dietmar Georg. Feasibility of cbct-based target and normal struc-
ture delineation in prostate cancer radiotherapy: multi-observer and image multi-
modality study. Radiotherapy and Oncology, 98(2):154–161, 2011. ISSN 0167-8140.
[259] Donald F Dubois, Bradley R Prestidge, Laura A Hotchkiss, James J Prete, and
William S Bice Jr. Intraobserver and interobserver variability of mr imaging-
and ct-derived prostate volumes after transperineal interstitial permanent prostate
brachytherapy. Radiology, 207(3):785–789, 1998. ISSN 0033-8419.
[260] Michael Milosevic, Sachi Voruganti, Ralph Blend, Hamideh Alasti, Padraig Warde,
Michael McLean, Pamela Catton, Charles Catton, and Mary Gospodarowicz. Mag-
netic resonance imaging (mri) for localization of the prostatic apex: comparison to
computed tomography (ct) and urethrography. Radiotherapy and oncology, 47(3):
277–284, 1998. ISSN 0167-8140.
[261] Jana Sefrova, Karel Odrazka, Petr Paluska, Zdenek Belobradek, Milos Brodak, Mar-
tin Dolezel, Petr Prosvic, Zuzana Macingova, Milan Vosmik, and Petr Hoffmann.
Magnetic resonance imaging in postprostatectomy radiotherapy planning. Interna-
tional Journal of Radiation Oncology* Biology* Physics, 82(2):911–918, 2012. ISSN
0360-3016.
[262] Richard K Valicenti, John W Sweet, Walter W Hauck, Richard S Hudes, Tony Lee,
Adam P Dicker, Frank M Waterman, Pramila R Anne, Benjamin W Corn, and
James M Galvin. Variation of clinical target volume definition in three-dimensional
conformal radiation therapy for prostate cancer. International Journal of Radiation
Oncology* Biology* Physics, 44(4):931–935, 1999. ISSN 0360-3016.
[263] Elise M Pogson, Jarrad Begg, Michael G Jameson, Claire Dempsey, Drew Latty,
Vikneswary Batumalai, Andrew Lim, Kankean Kandasamy, Peter E Metcalfe, and
Lois C Holloway. A phantom assessment of achievable contouring concordance across

References 269
multiple treatment planning systems. Radiotherapy and Oncology, 2015. ISSN 0167-
8140.
[264] Lili Chen, Robert A Price, Lu Wang, Jinsheng Li, Lihong Qin, Shawn McNeeley, C-
M Charlie Ma, Gary M Freedman, and Alan Pollack. Mri-based treatment planning
for radiotherapy: dosimetric verification for prostate imrt. International Journal of
Radiation Oncology* Biology* Physics, 60(2):636–647, 2004. ISSN 0360-3016.
[265] Patrick W McLaughlin, Cheryl Evans, Mary Feng, and Vrinda Narayana. Radio-
graphic and anatomic basis for prostate contouring errors and methods to improve
prostate contouring accuracy. International Journal of Radiation Oncology* Biol-
ogy* Physics, 76(2):369–378, 2010. ISSN 0360-3016.
[266] Claudio Fiorino, Vittorio Vavassori, Giuseppe Sanguineti, Carla Bianchi, Gio-
vanni Mauro Cattaneo, Anna Piazzolla, and Cesare Cozzarini. Rectum contouring
variability in patients treated for prostate cancer: impact on rectum dose–volume
histograms and normal tissue complication probability. Radiotherapy and oncology,
63(3):249–255, 2002. ISSN 0167-8140.
[267] Marcel van Herk, Peter Remeijer, and Joos V Lebesque. Inclusion of geometric uncer-
tainties in treatment plan evaluation. International Journal of Radiation Oncology*
Biology* Physics, 52(5):1407–1422, 2002. ISSN 0360-3016.
[268] Kevin L Moore, R Scott Brame, Daniel A Low, and Sasa Mutic. Quantitative metrics
for assessing plan quality. In Seminars in radiation oncology, volume 22, pages 62–
69. Elsevier, 2012. ISBN 1053-4296. doi: https://doi.org/10.1016/j.semradonc.2011.
09.005.
[269] Jörg Bohsung, Sofie Gillis, Rafael Arrans, Annemarie Bakai, Carlos De Wagter,
Tommy Knöös, Ben J Mijnheer, Marta Paiusco, Bruce A Perrin, and Hans Welle-
weerd. Imrt treatment planning—a comparative inter-system and inter-centre plan-
ning exercise of the estro quasimodo group. Radiotherapy and oncology, 76(3):354–
361, 2005. ISSN 0167-8140.
References 270
[270] MJ Williams, MJ Bailey, D Forstner, and Peter E Metcalfe. Multicentre quality
assurance of intensity‐modulated radiation therapy plans: A precursor to clinical
trials. Australasian radiology, 51(5):472–479, 2007. ISSN 0004-8461.
[271] Indra J Das, Chee-Wai Cheng, Kashmiri L Chopra, Raj K Mitra, Shiv P Srivas-
tava, and Eli Glatstein. Intensity-modulated radiation therapy dose prescription,
recording, and delivery: patterns of variability among institutions and treatment
planning systems. Journal of the National Cancer Institute, 100(5):300–307, 2008.
ISSN 0027-8874.
[272] B Nelms, J Caudell, D Gintz, and V Feygelman. Head and neck plan quality: where
we are and does it matter? In Journal of Physics: Conference Series, volume 1154,
page 012018. IOP Publishing, 2019. ISBN 1742-6596.
[273] Vikneswary Batumalai, Michael G Jameson, Dion F Forstner, Philip Vial, and Lois C
Holloway. How important is dosimetrist experience for intensity modulated radia-
tion therapy? a comparative analysis of a head and neck case. Practical radiation
oncology, 3(3):e99–e106, 2013. ISSN 1879-8500. doi: https://doi.org/10.1016/j.prro.
2012.06.009.
[274] Roel GJ Kierkels, Ruurd Visser, Hendrik P Bijl, Johannes A Langendijk, Aart A
van‘t Veld, Roel JHM Steenbakkers, and Erik W Korevaar. Multicriteria optimiza-
tion enables less experienced planners to efficiently produce high quality treatment
plans in head and neck cancer radiotherapy. Radiation oncology, 10(1):87, 2015.
ISSN 1748-717X.
[275] David L Craft, Theodore S Hong, Helen A Shih, and Thomas R Bortfeld. Improved
planning time and plan quality through multicriteria optimization for intensity-
modulated radiotherapy. International Journal of Radiation Oncology* Biology*
Physics, 82(1):e83–e90, 2012. ISSN 0360-3016.
[276] N Alves, T Ventura, J Mateus, M Capela, and MC Lopes. Do a priori expectations
of plan quality offset planning variability in head and neck imrt? Radiation Physics
and Chemistry, page 108580, 2019. ISSN 0969-806X.

References 271
[277] Radar trial - randomised androgen deprivation and radiotherapy, 2005. URL https:
//clinicaltrials.gov/ct2/show/study/NCT00193856.
[278] James W Denham, Allison Steigler, David S Lamb, David Joseph, Hedy Mameghan,
Sandra Turner, John Matthews, Ian Franklin, Chris Atkinson, and John North.
Short-term androgen deprivation and radiotherapy for locally advanced prostate
cancer: results from the trans-tasman radiation oncology group 96.01 randomised
controlled trial. The lancet oncology, 6(11):841–850, 2005. ISSN 1470-2045.
[279] James W Denham, Allison Steigler, David S Lamb, David Joseph, Sandra Turner,
John Matthews, Chris Atkinson, John North, David Christie, and Nigel A Spry.
Short-term neoadjuvant androgen deprivation and radiotherapy for locally advanced
prostate cancer: 10-year data from the trog 96.01 randomised trial. The lancet
oncology, 12(5):451–459, 2011. ISSN 1470-2045.
[280] James W Denham, David Joseph, David S Lamb, Nigel A Spry, Gillian Duchesne,
John Matthews, Chris Atkinson, Keen-Hun Tai, David Christie, and Lizbeth Kenny.
Short-term androgen suppression and radiotherapy versus intermediate-term andro-
gen suppression and radiotherapy, with or without zoledronic acid, in men with lo-
cally advanced prostate cancer (trog 03.04 radar): an open-label, randomised, phase
3 factorial trial. The Lancet Oncology, 15(10):1076–1089, 2014. ISSN 1470-2045.
[281] James W Denham, Chantelle Wilcox, David Joseph, Nigel A Spry, David S Lamb,
Keen-Hun Tai, John Matthews, Chris Atkinson, Sandra Turner, and David Christie.
Quality of life in men with locally advanced prostate cancer treated with leuprorelin
and radiotherapy with or without zoledronic acid (trog 03.04 radar): secondary
endpoints from a randomised phase 3 factorial trial. The Lancet Oncology, 13(12):
1260–1270, 2012. ISSN 1470-2045.
[282] James W Denham, Chantelle Wilcox, David S Lamb, Nigel A Spry, Gillian Duchesne,
Chris Atkinson, John Matthews, Sandra Turner, Lizbeth Kenny, and Keen-Hun Tai.
Rectal and urinary dysfunction in the trog 03.04 radar trial for locally advanced
prostate cancer. Radiotherapy and Oncology, 105(2):184–192, 2012. ISSN 0167-8140.

References 272
[283] Annette Haworth, Rachel Kearvell, Peter B Greer, Ben Hooton, James W Denham,
David Lamb, Gillian Duchesne, Judy Murray, and David Joseph. Assuring high
quality treatment delivery in clinical trials–results from the trans-tasman radiation
oncology group (trog) study 03.04 “radar” set-up accuracy study. Radiotherapy and
Oncology, 90(3):299–306, 2009. ISSN 0167-8140.
[284] James W Denham, Allison Steigler, David Joseph, David S Lamb, Nigel A Spry,
Gillian Duchesne, Chris Atkinson, John Matthews, Sandra Turner, and Lizbeth
Kenny. Radiation dose escalation or longer androgen suppression for locally advanced
prostate cancer? data from the trog 03.04 radar trial. Radiotherapy and Oncology,
115(3):301–307, 2015. ISSN 0167-8140.
[285] Rachel Kearvell, Annette Haworth, Martin A Ebert, Judy Murray, Ben Hooton,
Sharon Richardson, David J Joseph, David Lamb, Nigel A Spry, and Gillian Duch-
esne. Quality improvements in prostate radiotherapy: outcomes and impact of com-
prehensive quality assurance during the trog 03.04 ‘radar’trial. Journal of medical
imaging and radiation oncology, 57(2):247–257, 2013. ISSN 1754-9485.
[286] SE Griffiths, S Stanley, and M Sydes. Recommendations on best practice for ra-
diographer set-up of conformal radiotherapy treatment for patients with prostate
cancer: experience developed during the mrc rt01 trial (isrtcn 47772397). Journal
of Radiotherapy in Practice, 4(2-3):107–117, 2004. ISSN 1467-1131.
[287] Martin A Ebert, Annette Haworth, Rachel Kearvell, Ben Hooton, Rhonda Coleman,
Nigel Spry, Sean Bydder, and David Joseph. Detailed review and analysis of complex
radiotherapy clinical trial planning data: evaluation and initial experience with the
swan software system. Radiotherapy and Oncology, 86(2):200–210, 2008. ISSN 0167-
8140.
[288] M Skala, M Berry, G Duchesne, K Gogna, K‐H Tai, S Turner, A Kneebone, A Rolfo,
and A Haworth. Australian and new zealand three‐dimensional conformal radiation
therapy consensus guidelines for prostate cancer. Australasian radiology, 48(4):493–
501, 2004. ISSN 1440-1673.
References 273
[289] Martin A Ebert, Max Bulsara, Annette Haworth, Rachel Kearvell, Sharon Richard-
son, Angel Kennedy, Nigel A Spry, Sean A Bydder, David J Joseph, and James W
Denham. Technical quality assurance during the trog 03.04 radar prostate radiother-
apy trial: Are the results reflected in observed toxicity rates? Journal of medical
imaging and radiation oncology, 59(1):99–108, 2015. ISSN 1754-9485.
[290] Marco Marcello, Martin Ebert, Annette Haworth, Allison Steigler, Angel Kennedy,
David Joseph, and James Denham. Association between treatment planning and
delivery factors and disease progression in prostate cancer radiotherapy: Results
from the trog 03.04 radar trial. Radiotherapy and Oncology, 126(2):249–256, 2018.
ISSN 0167-8140.
[291] Noorazrul Yahya, Martin A Ebert, Max Bulsara, Annette Haworth, Rachel Kearvell,
Kerwyn Foo, Angel Kennedy, Sharon Richardson, Michele Krawiec, and David J
Joseph. Impact of treatment planning and delivery factors on gastrointestinal tox-
icity: an analysis of data from the radar prostate radiotherapy trial. Radiation
Oncology, 9(1):282, 2014. ISSN 1748-717X.
[292] Noorazrul Yahya, Martin A Ebert, Max Bulsara, Annette Haworth, Angel Kennedy,
David J Joseph, and Jim W Denham. Dosimetry, clinical factors and medication
intake influencing urinary symptoms after prostate radiotherapy: An analysis of
data from the radar prostate radiotherapy trial. Radiotherapy and Oncology, 116(1):
112–118, 2015. ISSN 0167-8140.
[293] David P Dearnaley, Matthew R Sydes, John D Graham, Edwin G Aird, David Bot-
tomley, Richard A Cowan, Robert A Huddart, Chakiath C Jose, John HL Matthews,
and Jeremy Millar. Escalated-dose versus standard-dose conformal radiotherapy in
prostate cancer: first results from the mrc rt01 randomised controlled trial. The
lancet oncology, 8(6):475–487, 2007. ISSN 1470-2045.
[294] David P Dearnaley, Gordana Jovic, Isabel Syndikus, Vincent Khoo, Richard A
Cowan, John D Graham, Edwin G Aird, David Bottomley, Robert A Huddart,
and Chakiath C Jose. Escalated-dose versus control-dose conformal radiotherapy
for prostate cancer: long-term results from the mrc rt01 randomised controlled trial.
The lancet oncology, 15(4):464–473, 2014. ISSN 1470-2045.

References 274
[295] Deborah A Kuban, Susan L Tucker, Lei Dong, George Starkschall, Eugene H Huang,
M Rex Cheung, Andrew K Lee, and Alan Pollack. Long-term results of the md
anderson randomized dose-escalation trial for prostate cancer. International Journal
of Radiation Oncology* Biology* Physics, 70(1):67–74, 2008. ISSN 0360-3016.
[296] Anthony L Zietman, Michelle L DeSilvio, Jerry D Slater, Carl J Rossi, Daniel W
Miller, Judith A Adams, and William U Shipley. Comparison of conventional-dose
vs high-dose conformal radiation therapy in clinically localized adenocarcinoma of
the prostate: a randomized controlled trial. Jama, 294(10):1233–1239, 2005. ISSN
0098-7484.
[297] Michael J Zelefsky, Steven A Leibel, Paul B Gaudin, Gerald J Kutcher, Neil E
Fleshner, E S Venkatramen, Victor E Reuter, William R Fair, C Clifton Ling, and Zvi
Fuks. Dose escalation with three-dimensional conformal radiation therapy affects the
outcome in prostate cancer. International Journal of Radiation Oncology* Biology*
Physics, 41(3):491–500, 1998. ISSN 0360-3016.
[298] Matthew R Sydes, Richard J Stephens, A Rollo Moore, Edwin G Aird, A Margaret
Bidmead, Lesley J Fallowfield, John Graham, Sue Griffiths, W Philip Mayles, and
Ali McGuire. Implementing the uk medical research council (mrc) rt01 trial (isrctn
47772397): methods and practicalities of a randomised controlled trial of conformal
radiotherapy in men with localised prostate cancer. Radiotherapy and oncology, 72
(2):199–211, 2004. ISSN 0167-8140.
[299] David P Dearnaley, Matthew R Sydes, Ruth E Langley, John D Graham, Robert A
Huddart, Isabel Syndikus, John HL Matthews, Christopher D Scrase, Chakiath C
Jose, and John Logue. The early toxicity of escalated versus standard dose conformal
radiotherapy with neo-adjuvant androgen suppression for patients with localised
prostate cancer: results from the mrc rt01 trial (isrctn47772397). Radiotherapy and
oncology, 83(1):31–41, 2007. ISSN 0167-8140.
[300] GC Barnett, Gert De Meerleer, SL Gulliford, MR Sydes, Rebecca M Elliott, and
DP Dearnaley. The impact of clinical factors on the development of late radia-
tion toxicity: results from the medical research council rt01 trial (isrctn47772397).
Clinical Oncology, 23(9):613–624, 2011. ISSN 0936-6555.

References 275
[301] Stephen A Mangar, Matthew R Sydes, Helen L Tucker, Jerome Coffey, Syed A
Sohaib, Stefano Gianolini, Steve Webb, Vincent S Khoo, MRC RT01 Trial Manage-
ment Group, and David P Dearnaley. Evaluating the relationship between erectile
dysfunction and dose received by the penile bulb: using data from a randomised con-
trolled trial of conformal radiotherapy in prostate cancer (mrc rt01, isrctn47772397).
Radiotherapy and oncology, 80(3):355–362, 2006. ISSN 0167-8140.
[302] Sarah L Gulliford, Kerwyn Foo, Rachel C Morgan, Edwin G Aird, A Margaret
Bidmead, Helen Critchley, Philip M Evans, Stefano Gianolini, W Philip Mayles, and
A Rollo Moore. Dose–volume constraints to reduce rectal side effects from prostate
radiotherapy: evidence from mrc rt01 trial isrctn 47772397. International Journal
of Radiation Oncology* Biology* Physics, 76(3):747–754, 2010. ISSN 0360-3016.
[303] Florian Buettner, Sarah L Gulliford, Steve Webb, Matthew R Sydes, David P Dear-
naley, and Mike Partridge. Assessing correlations between the spatial distribution
of the dose to the rectal wall and late rectal toxicity after prostate radiotherapy: an
analysis of data from the mrc rt01 trial (isrctn 47772397). Physics in Medicine&
Biology, 54(21):6535, 2009. ISSN 0031-9155.
[304] Florian Buettner, Sarah L Gulliford, Steve Webb, Matthew R Sydes, David P Dear-
naley, and Mike Partridge. The dose–response of the anal sphincter region–an anal-
ysis of data from the mrc rt01 trial. Radiotherapy and Oncology, 103(3):347–352,
2012. ISSN 0167-8140.
[305] W Philip M Mayles, A Rollo Moore, Edwin GA Aird, A Margaret Bidmead, David P
Dearnaley, Sue E Griffiths, Richard J Stephens, and AP Jim Warrington. Ques-
tionnaire based quality assurance for the rt01 trial of dose escalation in conformal
radiotherapy for prostate cancer (isrctn 47772397). Radiotherapy and oncology, 73
(2):199–207, 2004. ISSN 0167-8140.
[306] A Rollo Moore, AP Jim Warrington, Edwin GA Aird, A Margaret Bidmead, and
David P Dearnaley. A versatile phantom for quality assurance in the uk medi-
cal research council (mrc) rt01 trial (isrctn47772397) in conformal radiotherapy for
prostate cancer. Radiotherapy and oncology, 80(1):82–85, 2006. ISSN 0167-8140.

References 276
[307] S Stanley, S Griffiths, MR Sydes, AR Moore, I Syndikus, and DP Dearnaley.
Accuracy and reproducibility of conformal radiotherapy using data from a ran-
domised controlled trial of conformal radiotherapy in prostate cancer (mrc rt01,
isrctn47772397). Clinical Oncology, 20(8):582–590, 2008. ISSN 0936-6555.
[308] David Dearnaley, Isabel Syndikus, Helen Mossop, Vincent Khoo, Alison Birtle,
David Bloomfield, John Graham, Peter Kirkbride, John Logue, and Zafar Malik.
Conventional versus hypofractionated high-dose intensity-modulated radiotherapy
for prostate cancer: 5-year outcomes of the randomised, non-inferiority, phase 3
chhip trial. The Lancet Oncology, 17(8):1047–1060, 2016. ISSN 1470-2045.
[309] Bridget F Koontz, Alberto Bossi, Cesare Cozzarini, Thomas Wiegel, and Anthony
D’Amico. A systematic review of hypofractionation for primary management of
prostate cancer. European urology, 68(4):683–691, 2015. ISSN 0302-2838.
[310] Nicholas G Zaorsky, Nitin Ohri, Timothy N Showalter, Adam P Dicker, and Robert B
Den. Systematic review of hypofractionated radiation therapy for prostate cancer.
Cancer treatment reviews, 39(7):728–736, 2013. ISSN 0305-7372.
[311] VS Khoo and DP Dearnaley. Question of dose, fractionation and technique: in-
gredients for testing hypofractionation in prostate cancer–the chhip trial. Clinical
oncology, 20(1):12–14, 2008. ISSN 0936-6555.
[312] David Dearnaley, Isabel Syndikus, Georges Sumo, Margaret Bidmead, David Bloom-
field, Catharine Clark, Annie Gao, Shama Hassan, Alan Horwich, and Robert Hud-
dart. Conventional versus hypofractionated high-dose intensity-modulated radio-
therapy for prostate cancer: preliminary safety results from the chhip randomised
controlled trial. The lancet oncology, 13(1):43–54, 2012. ISSN 1470-2045.
[313] David Dearnaley, Helen Mossop, Isabel Syndikus, Vincent Khoo, DJ Bloomfield,
Chris C Parker, John Logue, Christopher D Scrase, Alison J Birtle, and John
Staffurth. 5-year patient-reported outcomes of bowel and urinary bother in the
chhip trial (cruk/06/016). Journal of Clinical Oncology, 2017.

References 277
[314] James M Wilson, David P Dearnaley, Isabel Syndikus, Vincent Khoo, Alison Birtle,
David Bloomfield, Ananya Choudhury, John Graham, Catherine Ferguson, and Za-
far Malik. The efficacy and safety of conventional and hypofractionated high-dose
radiation therapy for prostate cancer in an elderly population: A subgroup analysis
of the chhip trial. International Journal of Radiation Oncology* Biology* Physics,
100(5):1179–1189, 2018. ISSN 0360-3016.
[315] OF Naismith, C Griffin, I Syndikus, C South, H Mayles, P Mayles, V Khoo, C Scrase,
J Graham, and S Hassan. Forward-and inverse-planned intensity-modulated radio-
therapy in the chhip trial: A comparison of dosimetry and normal tissue toxicity.
Clinical Oncology, 2019. ISSN 0936-6555.
[316] David Dearnaley and Emma Hall. How will the chhip trial affect the future of
prostate radiotherapy? Expert Review of Anticancer Therapy, 2018.
[317] O Naismith, H Mayles, M Bidmead, CH Clark, S Gulliford, S Hassan, V Khoo,
K Roberts, C South, and E Hall. Radiotherapy quality assurance for the chhip trial:
Conventional versus hypofractionated high-dose intensity-modulated radiotherapy
in prostate cancer. Clinical Oncology, 2019. ISSN 0936-6555.
[318] Christos Davatzikos, Dengfeng Liu, Dinggang Shen, and Edward H Herskovits. Spa-
tial normalization of spine mr images for statistical correlation of lesions with clinical
symptoms. Radiology, 224(3):919–926, 2002. ISSN 0033-8419.
[319] Dinggang Shen, Edward H Herskovits, and Christos Davatzikos. An adaptive-focus
statistical shape model for segmentation and shape modeling of 3-d brain structures.
IEEE transactions on medical imaging, 20(4):257–270, 2001. ISSN 0278-0062.
[320] Dominik Fritz, Daniel Rinck, Rüdiger Dillmann, and Michael Scheuering. Segmen-
tation of the left and right cardiac ventricle using a combined bi-temporal statistical
model. In Medical Imaging 2006: Visualization, Image-Guided Procedures, and Dis-
play, volume 6141, page 614121. International Society for Optics and Photonics,
2006.

References 278
[321] Yiqiang Zhan and Dinggang Shen. Deformable segmentation of 3-d ultrasound
prostate images using statistical texture matching method. IEEE Transactions on
Medical Imaging, 25(3):256–272, 2006. ISSN 0278-0062.
[322] Vladimir Pekar, Michael R Kaus, Cristian Lorenz, Steven Lobregt, Roel Truyen,
and Juergen Weese. Shape-model-based adaptation of 3d deformable meshes for
segmentation of medical images. InMedical Imaging 2001: Image Processing, volume
4322, pages 281–289. International Society for Optics and Photonics, 2001.
[323] Berkman Sahiner, Aria Pezeshk, Lubomir M Hadjiiski, Xiaosong Wang, Karen
Drukker, Kenny H Cha, Ronald M Summers, and Maryellen L Giger. Deep learning
in medical imaging and radiation therapy. Medical physics, 46(1):e1–e36, 2019. ISSN
0094-2405.
[324] Carlos E Cardenas, Jinzhong Yang, Brian M Anderson, Laurence E Court, and
Kristy B Brock. Advances in auto-segmentation. In Seminars in radiation oncology,
volume 29, pages 185–197. Elsevier, 2019. ISBN 1053-4296.
[325] Kunihiko Fukushima. Neocognitron: A self-organizing neural network model for a
mechanism of pattern recognition unaffected by shift in position. Biological cyber-
netics, 36(4):193–202, 1980. ISSN 0340-1200.
[326] Matthew Lai. Deep learning for medical image segmentation. arXiv preprint
arXiv:1505.02000, 2015.
[327] Erik Smistad, Thomas L Falch, Mohammadmehdi Bozorgi, Anne C Elster, and Frank
Lindseth. Medical image segmentation on gpus–a comprehensive review. Medical
image analysis, 20(1):1–18, 2015. ISSN 1361-8415.
[328] MR Avendi, Arash Kheradvar, and Hamid Jafarkhani. A combined deep-learning
and deformable-model approach to fully automatic segmentation of the left ventricle
in cardiac mri. Medical image analysis, 30:108–119, 2016. ISSN 1361-8415.
[329] Pim Moeskops, Max A Viergever, Adriënne M Mendrik, Linda S de Vries,
Manon JNL Benders, and Ivana Išgum. Automatic segmentation of mr brain images
with a convolutional neural network. IEEE transactions on medical imaging, 35(5):
1252–1261, 2016. ISSN 0278-0062.
References 279
[330] Olaf Ronneberger, Philipp Fischer, and Thomas Brox. U-net: Convolutional net-
works for biomedical image segmentation. In International Conference on Medical
image computing and computer-assisted intervention, pages 234–241. Springer, 2015.
[331] Ruida Cheng, Holger R Roth, Le Lu, Shijun Wang, Baris Turkbey, William Gandler,
Evan S McCreedy, Harsh K Agarwal, Peter Choyke, and Ronald M Summers. Active
appearance model and deep learning for more accurate prostate segmentation on mri.
InMedical Imaging 2016: Image Processing, volume 9784, page 97842I. International
Society for Optics and Photonics, 2016.
[332] Mohamed S Elmahdy, Thyrza Jagt, R Th Zinkstok, Yuchuan Qiao, Rahil Shahzad,
Hessam Sokooti, Sahar Yousefi, Luca Incrocci, CAM Marijnen, and Mischa Hooge-
man. Robust contour propagation using deep learning and image registration for
online adaptive proton therapy of prostate cancer. Medical physics, 2019. ISSN
0094-2405.
[333] Ruida Cheng, Holger R Roth, Nathan S Lay, Le Lu, Baris Turkbey, William Gandler,
Evan S McCreedy, Thomas J Pohida, Peter A Pinto, and Peter L Choyke. Automatic
magnetic resonance prostate segmentation by deep learning with holistically nested
networks. Journal of Medical Imaging, 4(4):041302, 2017. ISSN 2329-4302.
[334] Zhiqiang Tian, Lizhi Liu, Zhenfeng Zhang, and Baowei Fei. Psnet: prostate segmen-
tation on mri based on a convolutional neural network. Journal of Medical Imaging,
5(2):021208, 2018. ISSN 2329-4302.
[335] Qikui Zhu, Bo Du, Baris Turkbey, Peter L Choyke, and Pingkun Yan. Deeply-
supervised cnn for prostate segmentation. In 2017 International Joint Conference
on Neural Networks (Ijcnn), pages 178–184. IEEE, 2017. ISBN 1509061827.
[336] Shu Liao, Yaozong Gao, Aytekin Oto, and Dinggang Shen. Representation learn-
ing: a unified deep learning framework for automatic prostate mr segmentation.
In International Conference on Medical Image Computing and Computer-Assisted
Intervention, pages 254–261. Springer, 2013.

References 280
[337] Yanrong Guo, Yaozong Gao, and Dinggang Shen. Deformable mr prostate segmen-
tation via deep feature learning and sparse patch matching. IEEE transactions on
medical imaging, 35(4):1077–1089, 2015. ISSN 0278-0062.
[338] Emran Mohammad Abu Anas, Parvin Mousavi, and Purang Abolmaesumi. A deep
learning approach for real time prostate segmentation in freehand ultrasound guided
biopsy. Medical image analysis, 48:107–116, 2018. ISSN 1361-8415.
[339] Ling Ma, Rongrong Guo, Guoyi Zhang, Funmilayo Tade, David M Schuster, Peter
Nieh, Viraj Master, and Baowei Fei. Automatic segmentation of the prostate on
ct images using deep learning and multi-atlas fusion. In Medical Imaging 2017:
Image Processing, volume 10133, page 101332O. International Society for Optics
and Photonics, 2017.
[340] Samaneh Kazemifar, Anjali Balagopal, Dan Nguyen, Sarah McGuire, Raquibul Han-
nan, Steve Jiang, and Amir Owrangi. Segmentation of the prostate and organs at
risk in male pelvic ct images using deep learning. Biomedical Physics & Engineering
Express, 4(5):055003, 2018. ISSN 2057-1976.
[341] Sharif Elguindi, Michael J Zelefsky, Jue Jiang, Harini Veeraraghavan, Joseph O
Deasy, Margie A Hunt, and Neelam Tyagi. Deep learning-based auto-segmentation of
targets and organs-at-risk for magnetic resonance imaging only planning of prostate
radiotherapy. Physics and Imaging in Radiation Oncology, 12:80–86, 2019. ISSN
2405-6316.
[342] Shekhar S Chandra, Jason A Dowling, Kai-Kai Shen, Parnesh Raniga, Josien PW
Pluim, Peter B Greer, Olivier Salvado, and Jurgen Fripp. Patient specific prostate
segmentation in 3-d magnetic resonance images. Medical Imaging, IEEE Transac-
tions on, 31(10):1955–1964, 2012. ISSN 0278-0062.
[343] JA Dowling, N Burdett, PB Greer, J Sun, J Parker, P Pichler, P Stanwell, S Chan-
dra, D Rivest-Hénault, and S Ghose. Automatic atlas based electron density and
structure contouring for mri-based prostate radiation therapy on the cloud. In Jour-
nal of Physics: Conference Series, volume 489, page 012048. IOP Publishing, 2014.
ISBN 1742-6596.

References 281
[344] Jason A Dowling, Jonathan Lambert, Joel Parker, Olivier Salvado, Jurgen Fripp,
Anne Capp, Chris Wratten, James W Denham, and Peter B Greer. An atlas-based
electron density mapping method for magnetic resonance imaging (mri)-alone treat-
ment planning and adaptive mri-based prostate radiation therapy. International
Journal of Radiation Oncology* Biology* Physics, 83(1):e5–e11, 2012. ISSN 0360-
3016.
[345] Jason A Dowling, Jidi Sun, Peter Pichler, David Rivest-Hénault, Soumya Ghose,
Haylea Richardson, Chris Wratten, Jarad Martin, Jameen Arm, and Leah Best.
Automatic substitute computed tomography generation and contouring for magnetic
resonance imaging (mri)-alone external beam radiation therapy from standard mri
sequences. International Journal of Radiation Oncology* Biology* Physics, 93(5):
1144–1153, 2015. ISSN 0360-3016.
[346] Paul Aljabar, Rolf A Heckemann, Alexander Hammers, Joseph V Hajnal, and Daniel
Rueckert. Multi-atlas based segmentation of brain images: atlas selection and its
effect on accuracy. Neuroimage, 46(3):726–738, 2009. ISSN 1053-8119.
[347] Rolf A Heckemann, Joseph V Hajnal, Paul Aljabar, Daniel Rueckert, and Alexander
Hammers. Automatic anatomical brain mri segmentation combining label propaga-
tion and decision fusion. NeuroImage, 33(1):115–126, 2006. ISSN 1053-8119.
[348] Minjie Wu, Caterina Rosano, Pilar Lopez-Garcia, Cameron S Carter, and Howard J
Aizenstein. Optimum template selection for atlas-based segmentation. Neuroimage,
34(4):1612–1618, 2007. ISSN 1053-8119.
[349] Chao Lu, Sudhakar Chelikani, Xenophon Papademetris, Jonathan P Knisely,
Michael F Milosevic, Zhe Chen, David A Jaffray, Lawrence H Staib, and James S
Duncan. An integrated approach to segmentation and nonrigid registration for appli-
cation in image-guided pelvic radiotherapy. Medical Image Analysis, 15(5):772–785,
2011. ISSN 1361-8415.
[350] Jeremiah Hwee, Alexander V Louie, Stewart Gaede, Glenn Bauman, David D’Souza,
Tracy Sexton, Michael Lock, Belal Ahmad, and George Rodrigues. Technology
References 282
assessment of automated atlas based segmentation in prostate bed contouring. Radiat
Oncol, 6:110, 2011.
[351] Rongrong Zhou, Zhongxing Liao, Tinsu Pan, Sarah A Milgrom, Chelsea C Pinnix,
Anhui Shi, Linglong Tang, Ju Yang, Ying Liu, and Daniel Gomez. Cardiac atlas
development and validation for automatic segmentation of cardiac substructures.
Radiotherapy and Oncology, 122(1):66–71, 2017. ISSN 0167-8140.
[352] Robert Finnegan, Jason Dowling, Eng-Siew Koh, Simon Tang, James Otton, Ge-
off Delaney, Vikneswary Batumalai, Carol Luo, Pramukh Atluri, and Athiththa
Satchithanandha. Feasibility of multi-atlas cardiac segmentation from thoracic plan-
ning ct in a probabilistic framework. Physics in Medicine& Biology, 64(8):085006,
2019. ISSN 0031-9155.
[353] Torsten Rohlfing, Robert Brandt, Randolf Menzel, Daniel B Russakoff, and Calvin R
Maurer Jr. Quo vadis, atlas-based segmentation?, pages 435–486. Springer, 2005.
ISBN 0306486075.
[354] Torsten Rohlfing, Robert Brandt, Randolf Menzel, and Calvin R Maurer. Evaluation
of atlas selection strategies for atlas-based image segmentation with application to
confocal microscopy images of bee brains. NeuroImage, 21(4):1428–1442, 2004. ISSN
1053-8119.
[355] Dzung L Pham, Chenyang Xu, and Jerry L Prince. Current methods in medical
image segmentation. Annual review of biomedical engineering, 2(1):315–337, 2000.
ISSN 1523-9829.
[356] Nhat Trung Doan, Jonathan Orban de Xivry, and Benoît Macq. Effect of inter-
subject variation on the accuracy of atlas-based segmentation applied to human
brain structures. In Medical Imaging 2010: Image Processing, volume 7623, page
76231S. International Society for Optics and Photonics, 2010.
[357] Torsten Rohlfing, Robert Brandt, Randolf Menzel, and Calvin R Maurer Jr. Seg-
mentation of three-dimensional images using non-rigid registration: Methods and
validation with application to confocal microscopy images of bee brains. In Medical
References 283
Imaging 2003: Image Processing, volume 5032, pages 363–374. International Society
for Optics and Photonics, 2003.
[358] John Ashburner and Karl J Friston. Unified segmentation. Neuroimage, 26(3):
839–851, 2005. ISSN 1053-8119.
[359] Hyunjin Park, Peyton H Bland, and Charles R Meyer. Construction of an abdominal
probabilistic atlas and its application in segmentation. IEEE Transactions on medical
imaging, 22(4):483–492, 2003. ISSN 0278-0062.
[360] BT Thomas Yeo, Mert R Sabuncu, Rahul Desikan, Bruce Fischl, and Polina Golland.
Effects of registration regularization and atlas sharpness on segmentation accuracy.
Medical image analysis, 12(5):603–615, 2008. ISSN 1361-8415.
[361] Arno Klein, Brett Mensh, Satrajit Ghosh, Jason Tourville, and Joy Hirsch. Mind-
boggle: automated brain labeling with multiple atlases. BMC medical imaging, 5
(1):7, 2005. ISSN 1471-2342.
[362] Jinzhong Yang, Yongbin Zhang, Lifei Zhang, and Lei Dong. Automatic segmentation
of parotids from ct scans using multiple atlases. Medical image analysis for the clinic:
a grand challenge, pages 323–330, 2010.
[363] Thomas R Langerak, Floris F Berendsen, Uulke A Van der Heide, Alexis NTJ Kotte,
and Josien PW Pluim. Multiatlas‐based segmentation with preregistration atlas
selection. Medical physics, 40(9):091701, 2013. ISSN 0094-2405.
[364] Saman Nouranian, S Sara Mahdavi, Ingrid Spadinger, William J Morris, Septimu E
Salcudean, and Purang Abolmaesumi. A multi-atlas-based segmentation framework
for prostate brachytherapy. IEEE transactions on medical imaging, 34(4):950–961,
2014. ISSN 0278-0062.
[365] Oscar Acosta, Antoine Simon, Frédéric Monge, Frédéric Commandeur, Cunka
Bassirou, Guillaume Cazoulat, Renaud De Crevoisier, and Pascal Haigron. Evalua-
tion of multi-atlas-based segmentation of ct scans in prostate cancer radiotherapy.
In Biomedical Imaging: From Nano to Macro, 2011 IEEE International Symposium
on, pages 1966–1969. IEEE, 2011. ISBN 1424441277.

References 284
[366] Bas Schipaanboord, Djamal Boukerroui, Devis Peressutti, Johan Van Soest, Tim
Lustberg, Timor Kadir, Andre Dekker, Wouter van Elmpt, and Mark Gooding. Can
atlas-based auto-segmentation ever be perfect? insights from extreme value theory.
IEEE transactions on medical imaging, 38(1):99–106, 2018. ISSN 0278-0062.
[367] Jimit Doshi, Guray Erus, Yangming Ou, Susan M Resnick, Ruben C Gur,
Raquel E Gur, Theodore D Satterthwaite, Susan Furth, Christos Davatzikos, and
Alzheimer’s Neuroimaging Initiative. Muse: Multi-atlas region segmentation utiliz-
ing ensembles of registration algorithms and parameters, and locally optimal atlas
selection. Neuroimage, 127:186–195, 2016. ISSN 1053-8119.
[368] Daniel J Blezek and James V Miller. Atlas stratification. Medical image analysis,
11(5):443–457, 2007. ISSN 1361-8415.
[369] John A Bogovic, Bruno Jedynak, Rachel Rigg, Annie Du, Bennett A Landman,
Jerry L Prince, and Sarah H Ying. Approaching expert results using a hierarchical
cerebellum parcellation protocol for multiple inexpert human raters. NeuroImage,
64:616–629, 2013. ISSN 1053-8119.
[370] Hongzhi Wang and Paul A Yushkevich. Guiding automatic segmentation with multi-
ple manual segmentations. In International Conference on Medical Image Computing
and Computer-Assisted Intervention, pages 429–436. Springer, 2012.
[371] William R Crum, Thomas Hartkens, and DLG Hill. Non-rigid image registration:
theory and practice. The British Journal of Radiology, 2004.
[372] Aristeidis Sotiras, Christos Davatzikos, and Nikos Paragios. Deformable medical
image registration: A survey. IEEE transactions on medical imaging, 32(7):1153,
2013.
[373] BT Thomas Yeo, Mert R Sabuncu, Tom Vercauteren, Daphne J Holt, Katrin
Amunts, Karl Zilles, Polina Golland, and Bruce Fischl. Learning task-optimal reg-
istration cost functions for localizing cytoarchitecture and function in the cerebral
cortex. IEEE transactions on medical imaging, 29(7):1424–1441, 2010. ISSN 0278-
0062.

References 285
[374] Daniel Rueckert, Luke I Sonoda, Carmel Hayes, Derek LG Hill, Martin O Leach, and
David J Hawkes. Nonrigid registration using free-form deformations: application to
breast mr images. Medical Imaging, IEEE Transactions on, 18(8):712–721, 1999.
ISSN 0278-0062.
[375] Gustavo K Rohde, Akram Aldroubi, and Benoit M Dawant. The adaptive bases
algorithm for intensity-based nonrigid image registration. IEEE transactions on
medical imaging, 22(11):1470–1479, 2003. ISSN 0278-0062.
[376] Tom Vercauteren, Xavier Pennec, Aymeric Perchant, and Nicholas Ayache. Non-
parametric diffeomorphic image registration with the demons algorithm. Medical
Image Computing and Computer-Assisted Intervention–MICCAI 2007, pages 319–
326, 2007.
[377] Josien PW Pluim, JB Antoine Maintz, and Max A Viergever. Interpolation arte-
facts in mutual information-based image registration. Computer vision and image
understanding, 77(2):211–232, 2000. ISSN 1077-3142.
[378] Xabier Artaechevarria, Arrate Munoz-Barrutia, and Carlos Ortiz-de Solórzano.
Combination strategies in multi-atlas image segmentation: application to brain mr
data. IEEE transactions on medical imaging, 28(8):1266–1277, 2009. ISSN 0278-
0062.
[379] Michaël Sdika. Combining atlas based segmentation and intensity classification with
nearest neighbor transform and accuracy weighted vote. Medical Image Analysis, 14
(2):219–226, 2010. ISSN 1361-8415.
[380] Xabier Artaechevarria, Arrate Muñoz-Barrutia, and Carlos Ortiz-de Solórzano. Ef-
ficient classifier generation and weighted voting for atlas-based segmentation: Two
small steps faster and closer to the combination oracle. In Medical Imaging 2008:
Image Processing, volume 6914, page 69141W. International Society for Optics and
Photonics, 2008.

References 286
[381] Ivana Isgum, Marius Staring, Annemarieke Rutten, Mathias Prokop, Max A
Viergever, and Bram Van Ginneken. Multi-atlas-based segmentation with local de-
cision fusion—application to cardiac and aortic segmentation in ct scans. IEEE
transactions on medical imaging, 28(7):1000–1010, 2009. ISSN 0278-0062.
[382] Alireza Akhondi-Asl and Simon K Warfield. Simultaneous truth and performance
level estimation through fusion of probabilistic segmentations. Medical Imaging,
IEEE Transactions on, 32(10):1840–1852, 2013. ISSN 0278-0062.
[383] Simon K Warfield, Kelly H Zou, and William M Wells. Simultaneous truth and
performance level estimation (staple): an algorithm for the validation of image seg-
mentation. Medical Imaging, IEEE Transactions on, 23(7):903–921, 2004. ISSN
0278-0062.
[384] Thomas Robin Langerak, Uulke A van der Heide, Alexis NTJ Kotte, Max A
Viergever, Marco Van Vulpen, and Josien PW Pluim. Label fusion in atlas-based
segmentation using a selective and iterative method for performance level estima-
tion (simple). IEEE transactions on medical imaging, 29(12):2000–2008, 2010. ISSN
0278-0062.
[385] I Simmat, P Georg, D Georg, W Birkfellner, G Goldner, and M Stock. Assessment
of accuracy and efficiency of atlas-based autosegmentation for prostate radiotherapy
in a variety of clinical conditions. Strahlentherapie und Onkologie, 188(9):807–815,
2012. ISSN 0179-7158.
[386] Geert Litjens, Robert Toth, Wendy van de Ven, Caroline Hoeks, Sjoerd Kerkstra,
Bram van Ginneken, Graham Vincent, Gwenael Guillard, Neil Birbeck, and Jin-
dang Zhang. Evaluation of prostate segmentation algorithms for mri: the promise12
challenge. Medical image analysis, 18(2):359–373, 2014. ISSN 1361-8415.
[387] Carl Sjöberg, Martin Lundmark, Christoffer Granberg, Silvia Johansson, Anders
Ahnesjö, and Anders Montelius. Clinical evaluation of multi-atlas based segmenta-
tion of lymph node regions in head and neck and prostate cancer patients. Radiation
Oncology, 8(1):229, 2013. ISSN 1748-717X.
References 287
[388] Jean-François Daisne and Andreas Blumhofer. Atlas-based automatic segmentation
of head and neck organs at risk and nodal target volumes: a clinical validation.
Radiation oncology, 8(1):154, 2013. ISSN 1748-717X.
[389] Kirrily Cloak, Michael G Jameson, Andrea Paneghel, Kirsty Wiltshire, Andrew
Kneebone, Maria Pearse, Mark Sidhom, Colin Tang, Carol Fraser‐Browne, and
Lois C Holloway. Contour variation is a primary source of error when delivering
post prostatectomy radiotherapy: Results of the trans‐tasman radiation oncology
group 08.03 radiotherapy adjuvant versus early salvage (raves) benchmarking exer-
cise. Journal of Medical Imaging and Radiation Oncology, 2019. ISSN 1754-9477.
[390] Amy Tien Yee Chang, Li Tee Tan, Simon Duke, and Wai-Tong Ng. Challenges
for quality assurance of target volume delineation in clinical trials. Frontiers in
Oncology, 7:221, 2017. ISSN 2234-943X.
[391] Samantha Cox, Anne Cleves, Enrico Clementel, Elizabeth Miles, John Staffurth,
and Sarah Gwynne. Impact of deviations in target volume delineation–time for a
new rtqa approach? Radiotherapy and Oncology, 137:1–8, 2019. ISSN 0167-8140.
[392] Marie Lambrecht, Enrico Clementel, Jan-Jacob Sonke, Ursula Nestle, Sonja Ade-
bahr, Mathias Guckenberger, Nicolaus Andratschke, Damien C Weber, Marcel Ver-
heij, and Coen W Hurkmans. Radiotherapy quality assurance of sbrt for patients
with centrally located lung tumours within the multicentre phase ii eortc lungtech
trial: Benchmark case results. Radiotherapy and Oncology, 132:63–69, 2019. ISSN
0167-8140.
[393] Barbara Segedin and Primoz Petric. Uncertainties in target volume delineation in
radiotherapy–are they relevant and what can we do about them? Radiology and
oncology, 50(3):254–262, 2016. ISSN 1581-3207.
[394] Dale Roach, Michael G Jameson, Jason A Dowling, Martin Andrew Ebert, Peter B
Greer, Angel M Kennedy, Sandie Watt, and Lois C Holloway. Correlations be-
tween contouring similarity metrics and simulated treatment outcome for prostate
radiotherapy. Physics in medicine and biology, 2018. ISSN 1361-6560.

References 288
[395] MB Altman, JA Kavanaugh, HO Wooten, OL Green, TA DeWees, H Gay,
WL Thorstad, H Li, and S Mutic. A framework for automated contour quality
assurance in radiation therapy including adaptive techniques. Physics in medicine
and biology, 60(13):5199, 2015. ISSN 0031-9155.
[396] M Jameson, J Dowling, J Faustino, K Cloak, M Sidhom, J Martin, J De Leon,
M Berry, D Pryor, and L Holloway. Po-0823: Trac: Automated atlas based ma-
chine learning qa of contouring accuracy for the prometheus trial. Radiotherapy and
Oncology, 127:S429–S430, 2018. ISSN 0167-8140.
[397] Angel Kennedy, Jason Dowling, Peter B Greer, Lois Holloway, Michael G Jameson,
Dale Roach, Soumya Ghose, David Rivest‐Hénault, Marco Marcello, and Martin A
Ebert. Similarity clustering based atlas selection for pelvic ct image segmentation.
Medical physics, 2019. ISSN 0094-2405.
[398] Dale Roach, Lois C Holloway, Michael G Jameson, Jason A Dowling, Angel Kennedy,
Peter B Greer, Michele Krawiec, Robba Rai, Jim Denham, and Jeremiah De Leon.
Multi‐observer contouring of male pelvic anatomy: Highly variable agreement across
conventional and emerging structures of interest. Journal of medical imaging and
radiation oncology, 2019. ISSN 1754-9477.
[399] T Hothorn. maxstat: Maximally selected rank statistics. r package version 0.7-22,
2015.
[400] Ralf Bender and Stefan Lange. Adjusting for multiple testing—when and how?
Journal of clinical epidemiology, 54(4):343–349, 2001. ISSN 0895-4356.
[401] CP South, VS Khoo, O Naismith, A Norman, and DP Dearnaley. A comparison of
treatment planning techniques used in two randomised uk external beam radiother-
apy trials for localised prostate cancer. Clinical oncology, 20(1):15–21, 2008. ISSN
0936-6555.
[402] Carolin Schubert, Oliver Waletzko, Christian Weiss, Dirk Voelzke, Sevda Toperim,
Arnd Roeser, Silvia Puccini, Marc Piroth, Christian Mehrens, and Jan-Dirk Kueter.
Intercenter validation of a knowledge based model for automated planning of vol-
umetric modulated arc therapy for prostate cancer. the experience of the german

References 289
rapidplan consortium. PloS one, 12(5):e0178034, 2017. ISSN 1932-6203. doi:
https://doi.org/10.1371/journal.pone.0178034.
[403] Gerard J van der Wielen, John P Mulhall, and Luca Incrocci. Erectile dysfunction
after radiotherapy for prostate cancer and radiation dose to the penile structures: a
critical review. Radiotherapy and Oncology, 84(2):107–113, 2007. ISSN 0167-8140.
[404] Pirus Ghadjar, Michael J Zelefsky, Daniel E Spratt, Per Munck af Rosenschöld,
Jung Hun Oh, Margie Hunt, Marisa Kollmeier, Laura Happersett, Ellen Yorke, and
Joseph O Deasy. Impact of dose to the bladder trigone on long-term urinary function
after high-dose intensity modulated radiation therapy for localized prostate cancer.
International Journal of Radiation Oncology* Biology* Physics, 88(2):339–344, 2014.
ISSN 0360-3016.
[405] Alan Jay Katz and Josephine Kang. Quality of life and toxicity after sbrt for organ-
confined prostate cancer, a 7-year study. Frontiers in oncology, 4:301, 2014. ISSN
2234-943X.
[406] Sergiu Scobioala, Christopher Kittel, Khaled Elsayad, Kai Kroeger, Michael Oertel,
Laith Samhouri, Uwe Haverkamp, and Hans Theodor Eich. A treatment planning
study comparing imrt techniques and cyber knife for stereotactic body radiotherapy
of low-risk prostate carcinoma. Radiation Oncology, 14(1):143, 2019. ISSN 1748-
717X.
Copyright © 2022 FDOKUMEN