Coaching and feedback in the exercise periods ... - UNSWorks
Upload
khangminh22Category
view
0download
0
Cardiac biomarkers in Chronic Kidney Disease
Author:Kadappu, Krishna
Publication Date:2017
DOI:https://doi.org/10.26190/unsworks/19460
License:https://creativecommons.org/licenses/by-nc-nd/3.0/au/Link to license to see what you are allowed to do with this resource.
Downloaded from http://hdl.handle.net/1959.4/57421 in https://unsworks.unsw.edu.au on 2022-04-20

THE UNIVERSITY OF NEW SOUTH WALES Thesis/Dissertation Sheet
Surname or Family name: Kadappu
First name: Krishna
Abbreviation for degree as given in the University calendar: PhD 1771
School: South West Sydney Clinical School
Title: Cardiac biomarkers in Chronic Kidney Disease
Other name/s: Kishor
Faculty: Medicine
The majority of patients with end stage renal disease die of cardiovascular causes. Co-morbid conditions like diabetes and hypertension are shared by both chronic kidney disease (CKD) and cardiovascular disease. To help physicians to identify high risk CKD patients, there is a need of sensitive biomarker to detect subclinical cardiac abnormalities in the early stages of CKD to permit initiation of necessary therapeutic intervention.
CKD results in several alterations in cardiovascular structure and function. We hypothesized that left atrial (LA) volume and LA strain would be sensitive markers of myocardial involvement in early CKD even In the presence of co existent diabetes and hypertension. We also hypothesized that LA metrics would be more sensitive parameters than LV parameters. We further hypothesized that LA metrics may be more sensitive than the measurement of N terminal brain naturetic peptide (NT ProBNP) to detect myocardial dysfunction in CKD patients.
To prove these congruent hypotheses, we recruited three groups of patients; the first group comprised of stage 3 CKD patients (30-59mL/min/1.73m2) with or without hypertension and or diabetes but without any previous cardiac events. Control groups were age and sex matched subjects with hypertension and or diabetes with normal renal function, without any previous cardiac history and the third group comprised of healthy adults. We additionally studied patients with diabetes and hypertension without CKD, to examine the independent effect of these conditions on LA parameters.
We found that LA metrics were significantly reduced in both the CKD group and the risk factor matched control group, compared with normal subjects. Importantly, LA metrics were significantly altered in CKD patients compared to risk factor matched subjects Indicating these parameters are sensitive markers to detect myocardial Involvement despite the presence of coexistent hypertension and diabetes. LA volume and strain also showed incremental value in diagnosing myocardial dysfunction In CKD in the presence of hypertension and diabetes. Finally we compared LA parameters with NT ProBNP; even though NT ProBNP was significantly elevated in CKD patients compared to the control group, levels were below the upper normal reference range whereas LA metrics were significantly altered compared to control group. These findings indicate that LA metrics are a sensitive, non-invasive tool to detect myocardial involvement in early CKD.
Declaration relating to disposition of project thesis/dissertation
I hereby grant to the University of New South Wales or its agents the right to archive and to make available my thesis or dissertation in whole or in part in the University libraries in all forms of media, now or here after known, subject to the provisions of the Copyright Act 1968. I retain all property rights, such as patent rights. I also retain the right to use in future works (such as articles or books) all or part of this thesis or dissertation.
I also authorise University Microfilms to use the 350 word abstract of my thesis in Dissertation Abstracts International (this is applicable to doctoral theses only).
The University recognises that there may be exceptional circumstances requiring restrictions on copying or conditions on use. Requests for restriction for a period of up to 2 years must be made in writing. Requests for a longer period of restriction may be considered in exceptional circumstances and require the approval of the Dean of Graduate Resea rch .
FOR OFFICE USE ONLY Date of completion of requirements for Award :
THIS SHEET IS TO BE GLUED TO THE INSIDE FRONT COVER OF THE THESIS

COPYRIGHT STATEMENT
‘I hereby grant the University of New South Wales or its agents the right to archive and to make available my thesis or dissertation in whole or part in the University libraries in all forms of media, now or here after known, subject to the provisions of the Copyright Act 1968. I retain all proprietary rights, such as patent rights. I also retain the right to use in future works (such as articles or books) all or part of this thesis or dissertation. I also authorise University Microfilms to use the 350 word abstract of my thesis in Dissertation Abstract International (this is applicable to doctoral theses only). I have either used no substantial portions of copyright material in my thesis or I have obtained permission to use copyright material; where permission has not been granted I have applied/will apply for a partial restriction of the digital copy of my thesis or dissertation.'
Signed ……………………………………………...........................
Date ……………………………………………...........................
AUTHENTICITY STATEMENT
‘I certify that the Library deposit digital copy is a direct equivalent of the final officially approved version of my thesis. No emendation of content has occurred and if there are any minor variations in formatting, they are the result of the conversion to digital format.’
Signed ……………………………………………...........................
Date ……………………………………………...........................

1
Cardiac biomarkers in Chronic Kidney Disease
Krishna Kishor Kadappu
A thesis in fulfilment of the requirements for the degree of
Doctor of Philosophy
South Western Sydney Clinical School
Faculty of Medicine
March 2017

Cardiac biomarkers in Chronic Kidney Disease
2
Table of content
Declaration 5 Abstract 6 List of figures 8 List of tables 9 Abbreviations 10 Acknowledgements 12 Publications 13 Chapter 1: Introduction and literature review 16
1.1Chronic Kidney Disease 17 1.1 Effect on Australian population 17
1.2 Classification 19 1.3 CKD and CVD: the relationship 20
1.3.1 Impact of CKD on the cardiovascular system 201.3.2.Underestimation of cardiovascular risk in CKD 21
1.4 Pathophysiology of cardio renal syndrome 21 1.4.1Uraemia and CVD 25 1.4.2 Cardiovascular disease due to volume overload in CKD 25 1.4.3 Renin-angiotensin aldosterone system in CKD 26
1.5 Myocardial involvement in CKD 29 1.5.1 Left ventricular hypertrophy in CKD 29
1.5.1.1 Pressure and volume overload causing LVH 31 1.5.1.2 Non haemodynamic cause of LVH 32
1.5.2 Diastolic Dysfunction in CKD 32 1.6 Diastolic function and diastolic heart failure 33 1.7 Diagnosis of diastolic dysfunction 35
1.7.1 Mitral inflow velocities 35 1.7.1.1 Clinical utility 37 1.7.1.2 Limitations 38
1.7.2 Tissue Doppler imaging to evaluate diastolic function 38 1.7.3 Left atrial volume and diastolic function 39
1.8 Strain and strain rate imaging 41 1.8.1 Left atrial strain and SR in evaluation of atrial function 44
1.8.1.1 Doppler strain and SR 44 1.8.1.2 Two dimensional strain 46
1.8.2 Clinical utility of LA Strain and strain rate 491.8.3 Left ventricular strain imaging 50
1.9 Biochemical marker of myocyte injury 51 1.10 Diagnosis of cardiomyopathy in CKD 53
1.10.1 Mitral inflow velocities in CKD 531.10.2 Tissue Doppler imaging in CKD 54 1.10.3 LA volume and CKD 541.10.4 Strain evaluation in CKD 551.10.5 BNP / NT -Pro BNP in CKD 56
1.11Future directions for risk evaluation 57 1.12 Overall Aim 58 References 61

Cardiac biomarkers in Chronic Kidney Disease
3
Chapter 2: General methodology 85 2.1 Subject groups 86 2.2 Echocardiography 87
2.2.1 Left ventricular measurements 88 2.2.2 Diastolic function 88 2.2.3 LA measurements 89 2.2.4 LA strain 89
2.2.4.1 Colour tissue Doppler strain 89 2.2.4.2 Two dimensional LA strain 90
2.2.5 Left ventricular 2D strain 90 2.3 Inter and Intra observer Variability 91 2.4 NT pro BNP assay 91 2.5 Statistical Analysis 91 Reference 93
Chapter 3. Changes in left atrial volume in diabetes mellitus: more than diastolic dysfunction? 96
3.1 Abstract 96/1016 3.2 Introduction 96/1016 3.3 Methods 96/1017 3.4 Results 96/1018 3.5 Discussion 96/1020 3.6 Limitation 96/1022 3.7 Conclusion 96/1022 3.8 Acknowledgement 96/1023 3.9 Reference 96/1023
Chapter 4: Chronic Kidney Disease is Independently Associated with Alterations in Left Atrial Function 97
4.1 Abstract 97/956 4.2 Introduction 97/956 4.3 Methods 97/957 4.4 Results 97/960 4.5 Discussion 97/962 4.6 Limitation 97/963 4.7 Conclusion 97/963 4.8 Acknowledgement 97/964 4.9 Reference 97/964
Chapter 5: Independent Echocardiographic Markers of Cardiovascular Involvement in Chronic Kidney Disease: 98 The Value of Left Atrial Function and Volume
5.1 Abstract 98/359 5.2 Introduction 98/360 5.3 Methods 98/360 5.4 Results 98/361 5.5 Discussion 98/364 5.6 Limitation 98/366 5.7 Conclusion 98/366 5.8 Reference 98/366
Chapter 6: Tissue Doppler Imaging in Echocardiography: Value and Limitations 99
6.1 TDI Measurement 99/224

Cardiac biomarkers in Chronic Kidney Disease
4
6.2Quantitative Systolic Function Assessment: s’ Velocity 99/227 6.3 Diastolic Function Assessment: e’ Velocity 99/227 6.4 Late Diastolic a’ Velocity 99/228 6.5Clinical Utility and Prognostic Implications of TDI Velocities: Systolic s’ Velocity 99/228 6.6 Stress TDI 99/228 6.7 Valvular Heart Disease 99/229 6.8 Cardiac Dyssynchrony 99/229 6.9 Early Diastolic (e’) Velocity 99/229 6.10 E/ e’ Ratio 99/229 6.11 Diastolic Stress Testing 99/229 6.12 e’ Velocity and CAD 99/230 6.13 e’ Velocity in Cardiomyopathy and Constrictive Pericarditis 99/230 6.14 a’ Velocity in Clinical Practice 99/230 6.16 Right Ventricular Function 99/230 6.17 Limitations 99/230 6.18 Conclusion 99/231 6.19 References 99/231
Chapter 7: Biomarkers of chronic kidney disease: the value of left atrial metrics 100
7.1 Abstract 101 7.2 Introduction 102 7.3 Methods 103 7.4 Results 106 7.5 Discussion 111 7.6 Limitation 114 7.7 Conclusion 115 7.8 Reference 115
Chapter 8: Conclusion 122 8.Cardiac Biomarker in CKD 123 8.1 Diastolic dysfunction 125 8.2 LV strain 126 8.3 Left atrial volume 126 8.4 LA function by strain analysis 127 8.5 NT- pro BNP 128 8.6 A ‘sensitive’ biomarker to detect cardiac involvement in CKD 128 8.7 Future direction 129 8.8 Reference 130

Cardiac biomarkers in Chronic Kidney Disease
Declaration
ORIGINALITY ST A TEMENT
'I hereby declare that this submission is my own work and to the best of my knowledge
it contains no materials previously published or written by another person, or substantial
proportions of material which have been accepted for the award of any other degree or
diploma at UNSW or any other educational institution, except where due
acknowledgement is made in the thesis. Any contribution made to the research by
others, with whom I have worked at UNSW or elsewhere, is explicitly acknowledged in
the thesis. I also declare that the intellectual content of this thesis is the product of my
own work, except to the extent that assistance from others in the project's design and
conception or in style, presentation and linguistic expression is acknowledged. '
SUPERVISOR STATEMENT
I hereby certify that all co-authors of the published or submitted papers agree to Krishna
Kishor Kadappu submitting those papers as part of his/her Doctoral Thesis.
5

Cardiac biomarkers in Chronic Kidney Disease
6
Abstract
The majority of patients with end stage renal disease die of cardiovascular causes. Co-
morbid conditions like diabetes and hypertension are shared by both chronic kidney
disease (CKD) and cardiovascular disease. To help physicians to identify high risk CKD
patients, there is a need of sensitive biomarker to detect subclinical cardiac
abnormalities in the early stages of CKD to permit initiation of necessary therapeutic
intervention.
CKD results in several alterations in cardiovascular structure and function. We
hypothesized that left atrial (LA) volume and LA strain would be sensitive markers of
myocardial involvement in early CKD even in the presence of co existent diabetes and
hypertension. We also hypothesized that LA metrics would be more sensitive
parameters than LV parameters. We further hypothesized that LA metrics may be more
sensitive than the measurement of N terminal brain naturetic peptide (NT- ProBNP) to
detect myocardial dysfunction in CKD patients.
To prove these congruent hypotheses, we recruited three groups of patients; the first
group comprised of stage 3 CKD patients (30-59mL/min/1.73m2) with or without
hypertension and or diabetes but without any previous cardiac events. Control groups
were age and sex matched subjects with hypertension and or diabetes with normal renal
function, without any previous cardiac history and the third group comprised of healthy
adults. We additionally studied patients with diabetes and hypertension without CKD, to
examine the independent effect of these conditions on LA parameters.
We found that LA metrics were significantly reduced in both the CKD group and the
risk factor matched control group, compared with normal subjects. Importantly, LA
metrics were significantly altered in CKD patients compared to risk factor matched
Cardiac biomarkers in Chronic Kidney Disease
7
subjects indicating these parameters are sensitive markers to detect myocardial
involvement despite the presence of coexistent hypertension and diabetes. LA volume
and strain also showed incremental value in diagnosing myocardial dysfunction in CKD
in the presence of hypertension and diabetes. Finally we compared LA parameters with
NT- ProBNP; even though NT- ProBNP was significantly elevated in CKD patients
compared to the control group, levels were below the upper normal reference range
whereas LA metrics were significantly altered compared to control group. These
findings indicate that LA metrics are a sensitive, non-invasive tool to detect myocardial
involvement in early CKD.

Cardiac biomarkers in Chronic Kidney Disease
8
List of figures
Figure1.1 Deaths from cardiovascular disease, diabetes and
chronic kidney disease 18
Figure 1.2 Patho physiology of Cardio renal syndrome 23
Figure 1.3 LV pressure overload, LV volume overload, and myocyte
death inchronic uraemia. 24
Figure1.4 Inhibition of the renin-angiotensin system by ACE inhibitors
and angiotensin II type 1 receptor blockers 27
Figure1.5 Renin–angiotensin system cascade 28
Figure1.6 Direct and indirect actions of angiotensin-II on the atrium 29
Figure1.7 Effects of hemodynamic and non-hemodynamic factors on
the pathogenesis of LVH in CKD patients 31
Figure1.8 Pathogenesis of LVH in CKD 32
Figure1.9 Mitral inflow velocity 35
Figure1.10 Myocardial strain 42
Figure1.11 Strain rate 43
Figure1.12 LA strain by tissue Doppler imaging 45
Figure1.13 LA strain rate by tissue Doppler imaging 46
Figure1.14 LA systolic strain by speckle tracking 48
Figure1.15 LA strain rate by speckle tracking 48
Figure1.16 2 D speckle tracking Left ventricular strain analysis 51
Figure 2.1 Tissue Doppler imaging 88
Figure7.1 Left atrial 2D global strain 105

Cardiac biomarkers in Chronic Kidney Disease
9
List of Tables
Table 1.1 NKF Classification of Chronic Kidney Disease 19
Table 2.1 Grades of diastolic dysfunction 89
Table 7.1 Clinical and traditional echocardiographic characteristics of
the study population 107
Table 7.2 Left atrial and ventricular strain parameters 108
Table 7.3 Pearson correlation of parameters to NT pro-BNP 109
Table 7.4 Independent Predictors of NT pro-BNP 110
Table 7.5 Independent Predictors for CKD group 110

Cardiac biomarkers in Chronic Kidney Disease
10
Abbreviations
2D 2 dimensional
A wave Late diastolic transmitral velocity
a’ Late peak diastolic tissue velocity
ACE Angiotensin-converting enzyme
ANP Atrial natriuretic peptide
ANOVA Analysis of variance
ASE American Society of Echocardiography
BNP Brain natriuretic peptide
CAD Coronary artery disease
CHF Congestive heart failure
CKD Chronic Kidney Disease
CVD Cardiovascular disease
DT Deceleration time
E wave Early diastolic transmitral velocity
e’ Early peak diastolic tissue velocity
ESRF End stage renal failure
GFR Glomerular filtration rate
hsTnT High sensitivity troponin
LA Left atria
LAVI Left atrial volume indexed to body surface area
LV left ventricle
LVH left ventricular hypertrophy
LVMI Left ventricular mass indexed to body surface area
NKF National Kidney Foundation
NT Pro BNP N-terminal pro brain natriuretic peptide
NYHA New York heart association
PW Pulsed-wave
PVD Peripheral vascular disease
Cardiac biomarkers in Chronic Kidney Disease
11
RAAS Renin-angiotensin aldosterone system
ROI Region of interest
s’ Peak systolic tissue velocity
SD Standard deviation
SR Strain rate
SRs Systolic strain rate
SRe Early diastolic strain rate
SRa Late diastolic strain rate
TDI Tissue Doppler imaging

Cardiac biomarkers in Chronic Kidney Disease
12
Acknowledgment
It is with my great pleasure that I thank many people who made this thesis possible.
Firstly, I would like to express my sincere gratitude to my dedicated supervisor
Professor Liza Thomas. Her enthusiasm and expertise in conducting the research is
exemplary.
Her encouragement and constant guidance made this work possible. Her inspiration and
work ethics are invaluable to me. I am also indebted to my co-supervisor, Professor
John French for his support not only in guiding me through this research, but also in my
career from the beginning of my advance trainee days.
I would like to express my gratitude to the many co-authors for their invaluable
contribution to this research. My sincere appreciation goes to all the subjects who
volunteered to participate in this project spending their time. I would also like to thank
my renal colleagues especially Dr. Spicer, Dr. Aravindan and Dr. Narayan, who helped
me to recruit their patients to this study. I sincerely thank NHMRC for providing me
scholarship to conduct this research.
I would like to thank almighty God for the many good opportunity he provided to me. I
wish to express my thanks to my parents and in-laws for the love and support they
provided to me throughout this venture. A special thanks to my kids Preetham and
Priyanka for their patience and love with their hugs and laughter which made this task
easier. Last but not the least, I would like to thank my loving wife Subhashini, who had
to contribute much more time towards looking after kids and family along with her
career and for listening, persevering and loving me throughout this journey.
Cardiac biomarkers in Chronic Kidney Disease
13
Publications
During the course of this project several manuscripts and abstracts have been published
1. Kadappu KK, Cai L, Thomas D, Xuan W, French J, Thomas L. Biomarkers of
chronic kidney disease: the value of left atrial metrics (In press).
2. Kadappu KK, Abhayaratna K, Boyd A, French JK, Xuan W, Abhayaratna W,
Thomas L.J Independent Echocardiographic Markers of Cardiovascular
Involvement in Chronic Kidney Disease: The Value of Left Atrial Function and
Volume. Am Soc Echocardiogr. 2016 April ; 29(4) 359-367.
3. Kadappu KK, Thomas L. Tissue Doppler Imaging in Echocardiography: Value and
Limitations,Heart Lung Circ. 2015 Mar;24(3):224-33.
4. Kadappu KK, Kuncoro A, Hee L, Aravindan A, Spicer S, Suryanarayanan
G, Xuan W, Boyd A, French J, Thomas L. Chronic Kidney Disease is
Independently Associated with Alterations in Left Atrial Function
Echocardiography. 2014 Sep;31(8):956-64.
5. Kadappu KK, Boyd A, Haluska B, Maverick T, Thomas L. Changes in Left Atrial
volume in diabetes mellitus: More than diastolic dysfunction. Eur Heart J
Cardiovasc Imaging. 2012 Dec;13(12):1016-23.
6. Leung DY, Chi C, Allman C, Boyd A, Ng CTA, Kadappu KK, Thomas L.
Prognostic implications of left atrial volume index in patients in sinus rhythm. Am J
Cardiol 2010;105:1635-39.
7. Ng CTA, Tran DT, Newman M, Allman CJ, Vidaic J, Kadappu KK, Boyd AC,
Thomas L, Leung DY. Comparison of myocardial tissue velocities measured with
tissue Doppler imaging and two-dimensional speckle tracking. Am J Cardiol, 2008 ;
102: 784-789.

Cardiac biomarkers in Chronic Kidney Disease
14
Abstracts
8. Kadappu KK, Cai L, French J, Thomas L. Left Atrial Strain an Early Marker of
Future Adverse Cardiovascular Events in Chronic Kidney Disease. ACC 2016
Chicago.
9. Kadappu KK, Cai L, Thomas D, French J, Thomas L. Left atrial strain an earlier
marker than NTproBNP to assess cardiac involvement in CKD. Heart, Lung and
circulation 2015.
10. Kadappu KK, Abayaratna W, Abayaratna K, French J, Thomas L. Left atrial and
ventricular changes in Chronic Kidney Disease. GHEART Vol 9/1S/2014 j March,
2014 e145.
11. Kadappu KK, Boyd A, French J, Thomas L. LA volume and dynamics in Chronic
Kidney Disease. Eur Heart J (2012) 33 (suppl 1): 1093.
12. Kadappu KK, Kuncoro A, Hee L, Boyd A, Aravindan A, Suryanarayanan G,
Spicer S, French J, Thomas L. Impact of Renal Dysfunction on Left Atrial
Parameters in CKD with Hypertension. Heart, Lung and Circulation, Volume 21,
Supplement 1, 2012, PageS210
13. Kadappu KK, Boyd A, Eshoo S, Haluka B, Yeo A, Marwick T, Thomas L. Left
Atrial Changes in Diabetes Mellitus More Than Diastolic Dysfunction? Heart, Lung
and Circulation, Volume 21, Supplement 1, 2012, Page S212
14. Kadappu KK, Eagale K, Rajaratnam R , Leung D et al. Can strain and strain rate
useful in assessing left ventricular filling pressure? Heart Lung and circulation 2011;
20S:S162.

Cardiac biomarkers in Chronic Kidney Disease
15
15. Kadappu KK, Boyd A, Haluska B, Maverick T, Thomas L. Atrial Dysfunction in
diabetes mellitus using 2D strain imaging. Heart Lung and circulation
2010;19:S395.
16. Kadappu KK, Boyd A, Thomas L et al. Comparison of pulsed wave and colour
tissue Doppler derived echocardiographic estimation of left ventricular end diastolic
pressure. Heart Lung and circulation 2010;19:S406.
17. Kadappu KK, Rajaratnam R, Thomas L et al. Does time to peak E velocity versus
time to peak e’ velocity accurately predict left ventricular end diastolic pressure?
Heart Lung and circulation 2010;19:S420.
18. Kadappu KK, Boyd AC, French J, Thomas L. Can left atrial volume be used as a
surrogate marker of left ventricular end diastolic pressure? Heart Lung and
circulation 2009;18:S21.
19. Kadappu KK, Boyd AC, French J, Thomas L. Comparing tissue Doppler imaging
with speckle tracking in estimating left ventricular end diastolic pressure. Heart
Lung and circulation 2009;18:S26.
20. Kadappu KK, Boyd AC, French J, Thomas L. Comparison of tissue Doppler
“online “ versus “Offline” echocardiographic estimation of left ventricular end
diastolic pressure. Heart Lung and circulation 2009;18:S27.

Cardiac biomarkers in Chronic Kidney Disease
16
Chapter 1: Introduction and literature review

Cardiac biomarkers in Chronic Kidney Disease
17
1. Chronic Kidney Disease
Chronic Kidney disease (CKD) is one of the leading health problems in developed
countries. Almost 10-15% of the population in developed countries are at risk of
developing CKD and this percentage is much higher in people older than 65 years1.
CKD is defined as a decrease in glomerular filtration rate (GFR) and/or increase in urine
albumin excretion. Importantly, CKD is associated with a heightened risk of
cardiovascular disease (CVD) and increased all-cause as well as CVD mortality2.
1.1 Effect of CKD on Australian population
From the Kaiser permanente renal registry, which evaluated 1,120,295 from 1996 to
2000 with median follow up of 2.84 years, it was noted that in a diverse adult
population, a reduced eGFR was associated with increased risk of death, cardiovascular
events, and hospitalization independent of known traditional risk factors3. Thus, CKD
and CVD are both serious conditions, independently contributing to poor health and
affecting millions of Australians, often leading to further health complications,
disability, loss of quality of life and premature death4. In individuals where CKD is co
existent with CVD, a significant increase in adverse events is observed5.
The report from the National Centre for Monitoring Vascular Diseases at the Australian
Institute of Health and Welfare in 2014 demonstrated the following6
• In 2011, CVD, diabetes and CKD together resulted in 52,899 deaths, which is 36% of
all causes of mortality. Sixty one percentage of all deaths had at least 1 of these
conditions as an underlying or associated cause of death.
• CKD was the underlying cause of 2.1% of all deaths and was an underlying or
associated cause of 14,842 deaths, (10% of all causes of mortality).

Cardiac biomarkers in Chronic Kidney Disease
18
• Twenty seven percent of diabetes deaths were associated with CKD and 64% of
diabetes deaths were due to CVD.
• Fifty six percent of CKD deaths were due to cardiac causes; of that 29% was
associated with heart failure and cardiomyopathy, while the remaining other 27%
were due to coronary artery disease.
Fig:1.1 Deaths from cardiovascular disease, diabetes and chronic kidney disease
and their relationships listed as cause of death from 2011. The overlap between the
conditions had been demonstrated diagrammatically6 (Source AIHW national
mortality database).

Cardiac biomarkers in Chronic Kidney Disease
19
1.2 Classification of CKD
In 2002, the National Kidney Foundation (NKF) published clinical practice guidelines
on evaluation, classification, and risk stratification in CKD7. The key to any staging
system is that each stage of the disease process is associated with important prognostic
or treatment implications and in CKD patients, cardiovascular risk was one element that
decided the staging system, particularly with regard to prognosis. In these guidelines,
CKD is defined as either
(1) Kidney damage for ≥3 months, as confirmed by kidney biopsy or markers of kidney
damage, with or without a decrease in GFR,
(2) eGFR <60 mL/ min−1 per 1.73 m2 for ≥3 months, with or without kidney damage.
The NKF further classifies CKD into 5 stages of CKD, based on the level of kidney
function, regardless of the specific diagnosis. (Table1. 1)7
Stage Description GFR (mL per minute per 1.73 m2)
1 Kidney damage with normal or elevated GFR ≥90
2 Kidney damage with mildly decreased GFR 60-89
3 Moderately decreased GFR 30-59
4 Severely decreased GFR 15-29
5 Kidney failure <15
Table 1.1 NKF Classification of Chronic Kidney Disease7

Cardiac biomarkers in Chronic Kidney Disease
20
1.3 CKD and CVD: the relationship
It is a well-known fact that individuals with CKD are more likely to die of
cardiovascular causes than of end stage renal failure (ESRF)8. Forty percent of newly
diagnosed ESRF patients have coronary artery disease (CAD) and 21% have peripheral
vascular disease (PVD)9. It was noted that the risk of cardiovascular death in patients
with mild renal failure is increased 1.7-fold compared to the age adjusted normal
population3. The effect of renal failure with a 10 ml/min decrease in eGFR, is linked to
a 7% increase in the risk of de novo atherosclerosis and CVD10. It was noted that even
early stages of CKD are high-risk states for adverse CVD outcomes7. There are several
landmark publications, which have established that estimated eGFR <60 mL/min/1.73
m2 is associated with a graded increase in cardiovascular disease risk3, 11. The presence
of CKD heightens an individual’s risk for CVD incidence3, death from CVD12 and all-
cause mortality12, 13. Cardiovascular risk further increases when eGFR declines below a
threshold of 45–60 ml/min/1.73 m2 14. The presence of a low eGFR, regardless of
whether in stages 3-5 of CKD, identifies an individual with a high burden of
cardiovascular risk factors that may not otherwise be accounted for3. Hence, recognition
that these individuals are at higher risk is critical. Weiner and Sarnak in their review
noted that some cohort studies suggested that an eGFR <60 mL/min/1.73 m2 or urine
albumin creatinine ratio >30 mg/g may yield equivalent coronary risk similar to a
patient with known coronary disease or diabetes15.
1.3.1 Impact of CKD on the cardiovascular system
Some CVD events, such as myocardial infarction and stroke, can be immediate life-
threatening events, whereas a chronic condition, such as CKD, persists over a long time.
Hence CKD patients require long term monitoring and intensive management that

Cardiac biomarkers in Chronic Kidney Disease
21
impose a substantial burden on both the community and the health-care system.
Modifying and controlling risk factors early in the disease process not only reduces the
risk of adverse events but also has a favourable impact on disease progression and the
development of complications, leading to large health gains for the population.
In summary, there are complex causal relationships between CVD and CKD. These, in
combination with shared risk factors like diabetes, hypertension and
hypercholesterolemia, often result in CKD and CVD occurring together in an
individual, and may lead to more severe manifestations of both individual conditions
and an overall poorer prognosis3.
1.3.2. Underestimation of cardiovascular risk in Chronic Kidney Disease
The probability of future CVD events in the general population can be estimated with
reasonable accuracy using the Framingham equation which was derived from the
Framingham study cohort16. However, despite being robust in numerous situations, this
equation often underestimates cardiovascular events among adults with stage 3 and 4
CKD without clinical CVD17. Both “traditional” and “CKD related” (non-traditional)
CVD risk factors may contribute to this increased risk. Although CKD is strongly
linked with CVD, it remains to be determined whether this strong association is simply
due to shared CVD risk factors or due to unique traits consequential to CKD. Earlier
studies showed, classical risk factors, such as age, hypertension or diabetes do not fully
account for the increase in cardiovascular risk in CKD patients3, 12, 13.
1.4 Pathophysiology of cardio renal syndrome
CKD is associated with increased cardiovascular mortality and morbidity, particularly
related to ischemic heart disease and cardiomyopathy leading to heart failure18. Severity

Cardiac biomarkers in Chronic Kidney Disease
22
and incidence of coronary artery disease is inversely proportional to glomerular
filtration rate19. Along with other traditional risk factors for coronary artery disease,
inflammation, oxidative stress20-23 along with mineralocorticoid excess in CKD24 are
responsible for increased severity of coronary artery disease. Abnormal bone and
mineral metabolism in CKD are also partially responsible for this25. The prevalence of
congestive heart failure increases with associated reduction in kidney function26.
Cardiomyopathy in CKD can be attributed to both pressure and volume overload, as
well as CKD associated factors which alter the myocardium. Hypertension, which is a
common cause or consequence of CKD results in significant pressure overload and
maladaptive left ventricular changes. Moreover, the potential increased circulatory fluid
overload from CKD27 would also additionally contribute to these maladaptive cardiac
changes. Associated factors like activation of the autonomic nervous system and of the
renin-angiotensin pathway5, stimulation of hyper trophic and profibrinogenic factors28
additionally contribute to the cardiomyopathy (figure 1. 2).
Cardiac biomarkers in Chronic Kidney Disease
23
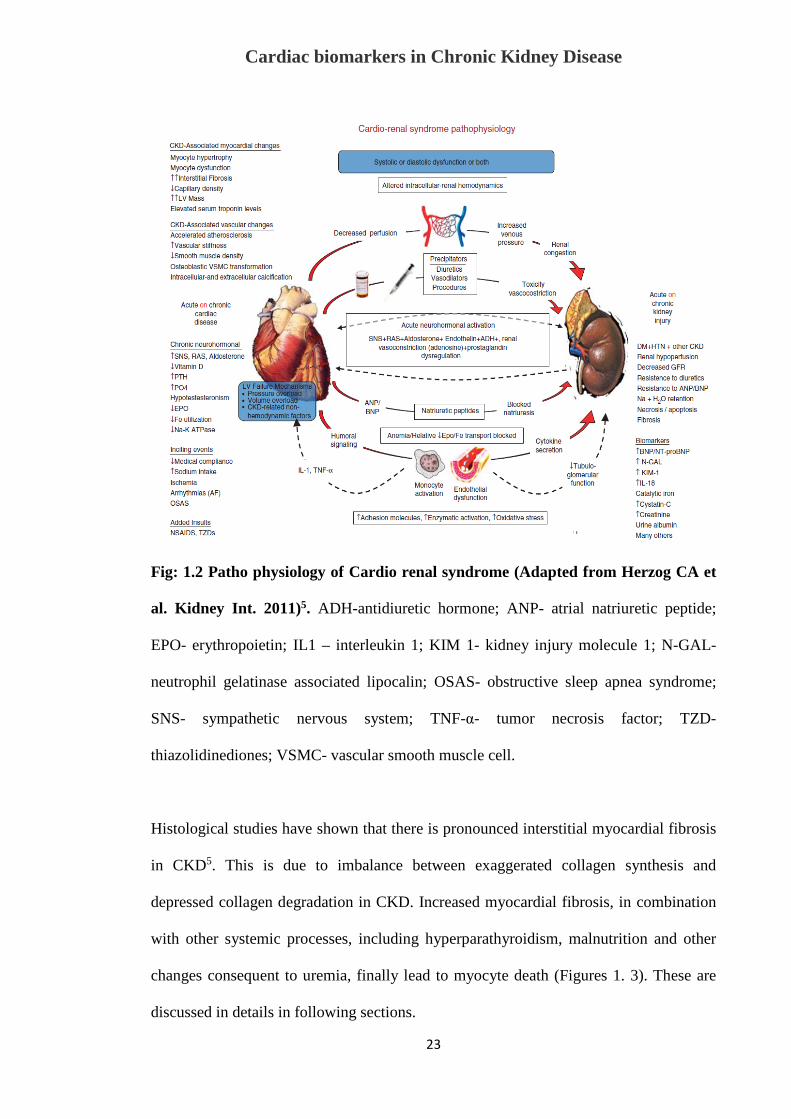
Fig: 1.2 Patho physiology of Cardio renal syndrome (Adapted from Herzog CA et
al. Kidney Int. 2011)5. ADH-antidiuretic hormone; ANP- atrial natriuretic peptide;
EPO- erythropoietin; IL1 – interleukin 1; KIM 1- kidney injury molecule 1; N-GAL-
neutrophil gelatinase associated lipocalin; OSAS- obstructive sleep apnea syndrome;
SNS- sympathetic nervous system; TNF-α- tumor necrosis factor; TZD-
thiazolidinediones; VSMC- vascular smooth muscle cell.
Histological studies have shown that there is pronounced interstitial myocardial fibrosis
in CKD5. This is due to imbalance between exaggerated collagen synthesis and
depressed collagen degradation in CKD. Increased myocardial fibrosis, in combination
with other systemic processes, including hyperparathyroidism, malnutrition and other
changes consequent to uremia, finally lead to myocyte death (Figures 1. 3). These are
discussed in details in following sections.

Cardiac biomarkers in Chronic Kidney Disease
24
Fig:1.3 LV pressure overload, LV volume overload, and myocyte death in chronic
uraemia. Parfrey P and Foley RN. JASN; 199929.
The traditional cardiac risk factors, including hyperlipidaemia, hypertension, and
diabetes mellitus were a major focus in evaluation of CKD in the past. It was also
shown patients with 1st or 2nd degree relative with CKD have a higher incidence of
CKD30, 31. It was also shown that there is increased prevalence of CKD in females due
to better recall, familial aggregation, matrilineal, mitochondrial mutations and increased
risk for hypertension31 . A cross sectional study among 74000 patients in Norway
between 1995 and 1997 showed other cardiac risk factors like obesity, physical
inactivity and smoking are also risk factors for CKD32.

Cardiac biomarkers in Chronic Kidney Disease
25
1.4.1 Uraemia and CVD
As mentioned above, traditional risk factors for CVD are altered by the uremic state,
such as dyslipidaemia, prothrombotic factors and hyperhomocysteinemia as well as
factors associated with chronic uraemia such as hemodynamic overload, anaemia,
increased oxidant stress, hypoalbuminemia, and divalent ion abnormalities. These
uraemia-related risk factors also contribute to cardiovascular risk as mentioned
previously29, and these co existent risk factors result in increased coronary
atherosclerosis and ischemic heart disease in CKD patients33. They also predispose to
abnormal coronary perfusion and atherosclerosis29. Disorders of coronary microvascular
perfusion predispose to the development of cardiomyopathy, which in turn worsens
microvascular disease34. It is noted that in 27% of haemodialysis patients, ischaemic
symptoms are caused by non-atherosclerotic disease 35. This may be due to underlying
small vessel disease (caused by hypertension, diabetes mellitus, and calcium phosphate
deposition), reduced capillary density, and abnormal myocyte bioenergetics36. These
maladaptive changes with consequent left ventricular hypertrophy (LVH) can
additionally predispose to ischemic symptoms with reduced coronary reserve,
consequent to the relative increase in cardiac muscle mass.
1.4.2 Cardiovascular disease due to volume overload in CKD
An increase in circulating blood volume causes not only LV remodelling but also
vascular remodelling. Continuous volume overload results in increase in myocyte length
with a consequent increase in LV volume37. Sustained fluid overload in CKD, due to
salt and water retention, anaemia, and in those on renal replacement therapy from an
arteriovenous fistula, results in eccentric LV hypertrophy29. This is initially sensed as

Cardiac biomarkers in Chronic Kidney Disease
26
‘beneficial’ by helping to maintaining stable wall stress. However, this eventually
becomes maladaptive, and is harmful as it results in myocyte death, decrease in
capillary density with an increase in myocardial fibrosis38. The consequence of these
maladaptive cardiac changes results in both systolic and diastolic dysfunction 38. It was
also noted, that the LV volume-LV pressure curve is displaced to the left, and altered in
such a manner that small changes in LV volume result in large changes in LV pressure,
predisposing to the development of symptomatic LV failure36.
In addition to the impact on the heart, volume overload results in vascular remodelling
and arteriosclerosis with thickened, dilated, and noncompliant arteries36. Atherosclerosis
is a different pathophysiological entity from arteriosclerosis, and is characterized by
arterial plaques that are focal, intermittent in distribution, occlusive in nature, and with a
predilection for arterial bifurcation sites39. However, arteriosclerosis too predisposes to
ischemic heart disease by decreasing subendocardial coronary perfusion36.
Atherosclerosis is common in CKD, but has been attributed to the presence of other risk
factors like hypertension and diabetes, which when combined with arteriosclerosis, may
enhance the likelihood of ischemia and altered myocardial perfusion39.
1.4.3 Renin-angiotensin aldosterone system in CKD
The renin-angiotensin aldosterone system (RAAS) is a well-known regulator of blood
pressure and determinant of target-organ damage40. It controls fluid and electrolyte
balance through coordinated effects on the heart, blood vessels, and kidneys. A cascade
of intermediate peptide products that comprises the renin-angiotensin-aldosterone
system is shown in figure 1. 4.

Cardiac biomarkers in Chronic Kidney Disease
27
Fig:1.4 Inhibition of the renin-angiotensin system by angiotensin-converting
enzyme (ACE) inhibitors and angiotensin II type 1 receptor (AT1) blockers.
Source: Thurman JM & Schrier RW Am J Med; 200341.
Synthesis commences upon the release of renin, primarily by juxtaglomerular cells but
also by other tissues42, 43. Renin is a rate-limiting enzyme whose synthesis is influenced
by kidney disease and electrolyte imbalance. Renin cleaves angiotensinogen, which is
synthesized by the liver, forming angiotensin I. Angiotensin-converting enzyme (ACE)
then converts angiotensin I to angiotensin II. ACE is found in the endothelial cells of
the lung, vascular endothelium, and cell membranes of the kidneys, heart, and brain.
This enzyme also degrades bradykinin to inactive fragments, reducing the serum level
of endogenous vasodilators. This pathway is known as the circulatory renin-
angiotensin-aldosterone system. This same cascade also resides in individual organs,
where it is known as the “tissue” renin-angiotensin-aldosterone system44. Figure 1. 5
depicts the renin angiotensin aldosterone cascade.

Cardiac biomarkers in Chronic Kidney Disease
28
Fig:1.5 Renin–angiotensin system cascade. Source Ehrlich, Hohnloser and Nattel.
Eur Heart J; 200645 .
It is well established that the heart has angiotensin receptors and that activation of
angiotensin II results in myocardial fibrosis and consequent heart failure46-48. The
RAAS is activated in many diseased states including hypertension49, 50 diabetes51, 52
(which are common comorbidities in CKD), as well as in CKD53. In an experimental rat
model, the continuous infusion of angiotensin II resulted in left atrial (LA) fibrosis
similar to LA fibrosis that occurred in CKD54. RAAS activation has a maladaptive
impact on cardiac structure by promotion of myocardial fibrosis (Fig 1.6). This RAAS
activation may at least in part be responsible myocardial dysfunction that is evident
from an early stage of CKD and later causes overt heart failure.

Cardiac biomarkers in Chronic Kidney Disease
29
Fig:1.6 Direct and indirect actions of angiotensin-II on the atrium. Source Ehrlich,
Hohnloser and Nattel. Eur Heart J; 200645
1.5. Myocardial involvement in CKD
As mentioned earlier, the combination of uraemia related risk factors, activation of
RAAS as well as fluid and volume overload, all consequently lead to alterations in
myocyte properties with consequent myocardial dysfunction. These alterations at a
cellular level manifest as left ventricular hypertrophy with consequent diastolic
dysfunction that in turn alters LA volume and function. Thus CKD has various effects
on cardiac structure and function.
1.5.1 Left ventricular hypertrophy in CKD
Left ventricular hypertrophy (LVH) is highly prevalent in CKD and ESRF.
Approximately 40% patients with CKD and 75% ESRF patients have LVH55, 56. The

Cardiac biomarkers in Chronic Kidney Disease
30
prevalence and severity of LVH parallels the severity of CKD55. It has also been shown
in early CKD that together with myocyte hypertrophy and disarray, there is interstitial
fibrosis, which has been documented on endomyocardial biopsy57. LVH is an
independent risk factor for adverse future cardiovascular outcome including
arrhythmias, sudden death, heart failure and ischaemic heart disease58. In CKD patients,
LVH is the strongest predictor of cardiovascular mortality12. The pathogenesis of LVH
is multifactorial in CKD where haemodynamic as well as non-haemodynamic stimuli
act synergistically causing an increase in concentric or eccentric LVH. CKD associated
factors such as hypertension, arteriosclerosis, anaemia and hyperparathyroidism and
increased RAAS activity may all contribute and result in maladaptive LVH,
characterized by structural changes in the myocardium. These structural changes
including collagen accumulation, fibrosis and calcification, in addition to continuing LV
overload, in CKD leads to consequent LVH (Fig 1. 7 ).

Cardiac biomarkers in Chronic Kidney Disease
31
Fig:1.7 Effects of hemodynamic and non-hemodynamic factors on the pathogenesis
of LVH and the impairment of renal function in CKD patients. Source Taddei et
al. Heart Fail Rev; 200158
1.5.1.1 Pressure and volume overload causing LVH
As was discussed earlier, CKD causes arteriosclerosis and hypertension, which opposes
LV ejection and causes pressure overload on the ventricle leading to the development of
concentric LVH. The RAAS system also plays a role by causing myocardial fibrosis,
which in turn leads to compensatory eccentric LVH58. Anaemia is highly prevalent in
CKD due to reduced erythropoietin production. This potentiates volume overload on the
heart and to compensate, there is an increase in left ventricular mass and eccentric
LVH59. Anaemia also leads to progressive cardiac damage by reducing subendocardial
perfusion, that again stimulates the development of myocardial fibrosis56, 60.

Cardiac biomarkers in Chronic Kidney Disease
32
1.5.1.2 Non haemodynamic cause of LVH
In renal failure defective vitamin D production is responsible for hypocalcaemia and
secondary hyperparathyroidism. This causes elevated serum phosphate and an abnormal
phosphate calcium ratio leading to vascular calcification and LVH58, 61. Excess
parathyroid hormone in CKD facilitates the entry of calcium into vascular and cardiac
myocytes resulting in increased myocyte contractility and peripheral vascular resistance.
This again results in LVH, myocardial fibrosis and a consequent ‘hypertrophic
cardiomyopathy62, 63. Low vitamin D levels have also been shown to cause endothelial
dysfunction, increase vascular resistance and calcification which in turn leads to LVH64.
(fig.1.8)
Fig:1.8 Pathogenesis of LVH in CKD. Source Taddei et al. Heart Fail Rev; 200158
1.5.2 Diastolic Dysfunction in CKD
Diastolic dysfunction is characterised by alteration in ventricular relaxation and
compliance. Fifty to 65% patients with CKD have diastolic dysfunction65. Diastolic

Cardiac biomarkers in Chronic Kidney Disease
33
dysfunction is an independent prognostic factor in CKD66. Diastolic dysfunction is even
observed in patients with early stages of CKD67. Diastolic dysfunction in CKD is
multifactorial. CKD causes an increase in circulatory preload which contributes to
diastolic dysfunction68. Activation of RAAS leads to myocardial fibrosis and diastolic
dysfunction69. Microvascular abnormalities, LVH, coronary artery disease, fluid and
electrolyte abnormalities, neurohumoral alterations and other co morbidities like
hypertension and diabetes associated with CKD are all contributors to the development
of diastolic dysfunction in CKD70. Thus, in CKD, multiple maladaptive processes
causes diastolic dysfunction that eventually progress to heart failure and leads to poor
cardiovascular outcomes. Hence it is important to diagnose this early and treat
contributory factors aggressively to prevent future adverse cardiovascular events.
1.6 Diastolic function and diastolic heart failure
Diastole is a complex process and extends from aortic valve closure to mitral valve
closure during the cardiac cycle. Diastole comprises of four phases, namely isovolumic
relaxation phase, passive filling phase (due to left ventricle relaxation), slow filling
phase (diastasis) and finally LV filling phase (consequent to active atrial contraction).
The isovolemic relaxation time is mediated by active myocardial relaxation, while early
diastolic filling is load dependent and is influenced by active as well as passive factors
such as myocardial mass, interstitial fibrosis, and chamber geometry. Normal diastolic
function is defined as the ability to accept adequate left ventricular filling, while
maintaining a low ventricular diastolic pressure. LV diastolic relaxation, even in a
healthy individual, alters as age advances 71. Abnormal diastolic relaxation is
accelerated in certain disease states which causes alteration in LV geometry and
Cardiac biomarkers in Chronic Kidney Disease
34
structure, especially LVH can significantly alter early filling due to impaired LV
relaxation72.
Diastolic dysfunction occurs when the myocardium loses its ability to generate force
and contraction and remains at an unstressed length causing abnormal myocardial
relaxation. This will result in changes in onset, rate, and extent of ventricular pressure
decline and filling. This also in turn changes the relationship between pressure and
volume or stress and strain during diastole. This results in a decrease in ventricular
relaxation and/or an increase in ventricular stiffness. Chamber stiffness is determined
by the stiffness of myocardium, LV mass and LV mass/volume ratio. These changes
occur as a result of LV pressure and volume overload and may additionally promote
myocyte death36. Finally diastolic dysfunction presents with heart failure symptoms
with relatively preserved systolic LV function. Diastolic heart failure or ‘heart failure
with preserved ejection fraction’ refers to a condition in which abnormalities in cardiac
mechanical function are present during diastole, affecting LV relaxation properties73.
Thus the ventricular chamber is unable to accept an adequate volume of blood during
diastole, at normal diastolic pressures and at volumes sufficient to maintain an
appropriate stroke volume.
Diastolic function as previously outlined, is complex and no single measure can
quantitate diastolic dysfunction. However diastolic dysfunction can be assessed non-
invasively by incorporation of different echocardiographic parameters, including mitral
inflow Doppler velocities, tissue Doppler imaging, pulmonary vein flow and left atrial
parameters. In fact, diastolic dysfunction has been categorised as grades, using these
varying echocardiographic parameters. Biochemical abnormalities have also been
reported with diastolic dysfunction with an increase in brain natriuretic peptide73-76.

Cardiac biomarkers in Chronic Kidney Disease
35
1.7 Diagnosis of diastolic dysfunction
1.7.1 Mitral inflow velocities
Transmitral flow velocity, one of the earliest measures of diastolic function evaluation,
often still remains the method of choice in routine clinical practice77. From the apical 4
chamber view, using pulsed-wave (PW) Doppler, mitral inflow patterns are obtained
that can be used to evaluate LV filling78. A sample volume (1 = 3-mm) is placed at the
mitral leaflet tips, and a diastolic filling profile is obtained (Figure1. 9). Mitral inflow
measurements comprise of estimating the peak early filling (E-wave) and late diastolic
filling (A-wave) velocities, the E/A ratio, deceleration time (DT) of early filling velocity
as well as mitral A-wave duration and total diastolic filling time (figure 1. 9).
Fig:1.9 Mitral inflow velocity

Cardiac biomarkers in Chronic Kidney Disease
36
Mitral inflow patterns to grade diastolic dysfunction are identified by the peak mitral E
and A wave velocity, the E/A ratio and DT. The diastolic function grades using
transmitral Doppler inflow includes 4 grades of severity; normal, impaired LV
relaxation, pseudo normal LV filling, and restrictive LV filling79. Several diastolic
parameters, including E/A ratio and deceleration time of the early diastolic wave, have a
biphasic response to diastolic dysfunction. The normal atrial contribution to total
diastolic filling is around 30% and the peak A wave velocity is smaller than the E wave
velocity with an E/A ratio >1. In the initial stages of diastolic dysfunction, an increase
in LV filling pressure produces a low E wave and a high A wave velocity, resulting in
reversal of the E/A ratio. When diastolic dysfunction progresses and LV compliance is
reduced even further, LA pressure increases progressively in order to maintain a
transmitral pressure gradient. The E wave velocity increases and the E/A ratio can be
>1.5. This will lead to normalisation of E/A ratio despite the presence of moderate to
severe diastolic dysfunction and is referred to as a pseudo normal pattern. With
progressive worsening of diastolic dysfunction, there is slower LV relaxation with a
consequent increase in LA pressure, that results in a further increase in peak E velocity,
and a very short DT, which is called restrictive filling pattern80. However, transmitral
flow velocity is influenced by loading conditions, particularly preload. A number of
variables other than LV diastolic function and filling pressures can also affect mitral
inflow, including normal aging, heart rate and rhythm, presence of first degree heart
block, cardiac output, mitral annular size and LA function79. Normal ageing affects the
values of mitral inflow velocities and time intervals; age-related changes in diastolic
function represent a physiological alteration in myocardial relaxation. With increasing
age, the mitral E velocity and E/A ratio decrease, whereas DT and A velocities
increase79.

Cardiac biomarkers in Chronic Kidney Disease
37
Grade 1 diastolic dysfunction is characterised by E/A ratio < 1, with a prolonged
deceleration time (>240ms). In pseudonormal filling, the E/A ratio is between 1 and 2
and the deceleration time between 160 and 240ms. In restrictive filling pattern E/A
ratio is > 2 with deceleration time is < 160ms.
The determination of pseudo normal pattern may be difficult by mitral inflow velocities
alone. Mitral E-wave velocity is preload dependent as it reflects the LA-LV pressure
gradient during early diastole.77. LV compliance and LA contractile function can affect
mitral A wave as it reflects the pressure gradient across the mitral valve in late diastole.
The peak E-wave velocity and DT are influenced by LV diastolic pressures following
mitral valve opening and also LV compliance/ relaxation. So both E velocity and DT
are affected by alterations in LV end-systolic and/or end-diastolic volumes, LV elastic
recoil, and/or LV diastolic pressures directly.
1.7.1.1 Clinical utility of diastolic function assessment
LV diastolic function using mitral in flow velocities are classified into 4 grades; normal
(DT =160-240ms, E/A ratio =0.9-1.5, e’ velocity ≥10 cm/s), impaired relaxation
(DT>240ms, E/A ratio <0.9, e’ velocity <10 cm/s), pseudo normal (DT = 160 - 240ms,
E/A ratio = 0.9 - 1.5, e’ velocity <8 cm/s) and restrictive (DT < 160ms, E/A ratio > 2.0,
e’ velocity <5 cm/s)79 based on mitral inflow Doppler along with tissue Doppler
velocity of the mitral annulus.
PW Doppler mitral flow velocity variables and filling patterns in patients with reduced
LV function correlate better with cardiac filling pressures, functional class, and
prognosis81-83. A shortened mitral DT and increased E/A velocity ratio represent
advanced diastolic dysfunction, increased LA pressure, and worse functional class. It

Cardiac biomarkers in Chronic Kidney Disease
38
has also been shown that restrictive filling pattern is associated with a poor prognosis,
especially if it persists after preload reduction in a variety of cardiac conditions84.
1.7.1.2 Limitations of mitral inflow for evaluation of diastolic dysfunction
Even though mitral inflow velocity is easy to measure and has good reproducibility, it
has several drawbacks. Mitral inflow velocity patterns have a “U-shaped” relationship
with LV diastolic function in patients with cardiac disease. This distinction is not as
important in instances with reduced LV systolic function (when there is often coexistent
diastolic dysfunction as well), but the problem of recognizing pseudo normal filling
pattern and diastolic heart failure in patients with normal or relatively preserved LV
systolic function is often difficult, by measuring mitral inflow velocity alone. As
mentioned earlier, factors like sinus tachycardia 85, conduction system disease and
arrhythmias make mitral inflow variables more difficult to interpret. Sinus tachycardia
and first-degree AV block causes partial or complete fusion of the mitral E and A
waves. In atrial flutter, mitral inflow velocities are not accurate as LV filling is
influenced by the rapid atrial contractions86. Moreover, mitral inflow is age dependent
and exquisitely sensitive to loading conditions.
1.7.2 Tissue Doppler imaging to evaluate diastolic function
Tissue Doppler imaging (TDI) for echocardiographic evaluation of myocardial function
has revolutionised the quantitative evaluation of myocardial function. Traditional
Doppler is designed to image the high frequency, low amplitude signals caused by
blood flow in the heart. However, myocardial motion, which comprises of low velocity,
high amplitude signals, is measured by using tissue Doppler imaging87 and is obtained
by inverting the low pass filter used in traditional Doppler to a high pass filter. Tissue

Cardiac biomarkers in Chronic Kidney Disease
39
Doppler measures myocardial contraction and relaxation velocities rather than blood
flow velocities.
Tissue Doppler imaging e’ velocity, a relatively load independent parameter, measures
LV relaxation in early diastole 88. e’ velocity is measured from both septal and lateral
mitral annulus in the apical four chamber view; as such septal e’ velocity is lower than
that of lateral annular e’ velocity79. The current recommendation of the ASE is that an
average of septal and lateral annular e’ velocity be utilised for all practical purposes79.
e’ velocity correlates inversely with early diastolic pressure (dP/dt) or tau (time constant
of LV relaxation) 89 thereby reflecting LV relaxation and elastic recoil. In healthy
adults, an average of septal and lateral e’ velocity < 8 cm/s indicates impaired LV
diastolic function, while > 8 cm/s is considered normal90. Normal ageing reduces e’
velocity91 in both the septal and lateral annulus. In more advanced diastolic dysfunction,
as mentioned previously, using mitral inflow pattern alone to identify a pseudo normal
pattern may be difficult 92; the e’ velocity is used to differentiate between normal and
pseudo normal pattern. e’ velocity is reduced even in subjects with early diastolic
dysfunction, occurring almost 10-15 years prior to reduction of mitral E velocity93.
Hence, e’ velocity is included early in the algorithm for diastolic dysfunction evaluation
in the current EAE/ASE guidelines79. Diastolic function assessment by tissue Doppler
imaging is discussed in greater detail in chapter 6.
1.7.3 Left atrial volume and diastolic function
The left atrium is most commonly thought of as a chamber receiving blood from the
pulmonary veins and conveying it to the left ventricle, through both passive and active
diastolic filling. However, the left atrium has different functions; it modulates
ventricular filling and this comprises LA reservoir function, serves as a conduit for

Cardiac biomarkers in Chronic Kidney Disease
40
blood flow from the pulmonary veins to the LV and finally demonstrates active
contractile function in late diastole94. Early diastolic atrioventricular gradient and LA
conduit volume reduces with impaired LV relaxation, while contractile pump function
is enhanced to compensate and thereby maintain optimal LV filling.
The LA also reflects LV filling pressure and is capable of remodelling (enlarging) in
response to elevation in LV filling pressure. It is in this role, as an ongoing “biomarker”
of sustained elevation in LV filling pressures, that LA size is an important marker in
assessing diastolic function95. Doppler velocities and time intervals are instantaneous
measures and reflect filling pressures at the time of measurement, whereas LA volume
reflects long term effects of LV filling pressures. Thus LA volume is regarded as a
surrogate measure of both the severity and chronicity of diastolic dysfunction.
While early studies have used the LA diameter or area measurement, there is good
evidence to demonstrate that a biplane left atrial volume is a more accurate measure of
LA size96. The enlargement of the left atrium is not symmetrical and this is perhaps why
a biplane volume is a more accurate estimate of LA volume. A biplane LA volume,
from the apical 4-chamber and 2-chamber views, is an easy, feasible and reproducible
measure97. There is a significant relationship between LA remodelling and
echocardiographic indices of diastolic function98. Additionally, a LA volume indexed to
body surface area >34 mL/m2 was an independent predictor of adverse events,
including death, heart failure, atrial fibrillation and ischemic stroke99. An important
caveat to remember though is that LA dilatation can also be seen in athletes100 and
patients with other medical conditions in the absence of diastolic dysfunction; the
presence of atrial arrhythmias being a notable cause for LA enlargement. Therefore, it is
important to consider LA volume measurements in conjunction with a patient’s clinical
history as well as other echocardiographic parameters.

Cardiac biomarkers in Chronic Kidney Disease
41
1.8 Strain and strain rate imaging
Strain and strain rate (SR) imaging is a new echocardiographic technique used to assess
myocardial deformation, by estimating spatial gradients of myocardial velocities. If
every part of an object moves with the same velocity, then a moving object is not
necessarily undergoing deformation. When different elements of the object move at
different velocities, the object changes shape during its movement, and this results in
deformation. The fractional change in length of an element of the object, compared to
its original length, is called Lagrangian strain101. Deformation can be expressed not only
relative to the original length, but also relative to the length at a previous moment in
time. Natural strain is the instantaneous reference strain value which changes during the
deformation process. Lagrangian and natural strain have a nonlinear relationship, so in
small deformations the two strains are approximately equal, but in large deformations
the difference becomes significant102.

Cardiac biomarkers in Chronic Kidney Disease
42
Fig:1. 10 Myocardial strain. Pavlopoulos H and Nihoyannopoulos P. Int J
Cardiovasc Imaging; 2008101
Strain is a dimensionless parameter and deformation is expressed as a percentage. An
increase in length from original length (ie relaxation) results in “positive strain”, while a
decrease in length from original (ie contraction) is considered “negative strain”. Strain
rate is the rate at which deformation changes i.e. change of strain per unit of time. In a
beating heart, the unstressed original length is difficult to measure, so end-diastolic
length is most often used103. Thus SR describes the rate of shortening or lengthening of
an object or a part of the heart, and its measurement unit is (1/s).

Cardiac biomarkers in Chronic Kidney Disease
43
Fig:1.11 Strain rate. Pavlopoulos H and Nihoyannopoulos P. Int J Cardiovasc
Imaging; 2008101
In cardiac muscle physiology, strain is directly related to fibre shortening and SR to the
speed of shortening, which is a measure of contractility. Any cardiac condition that
causes abnormal myocardial contraction or ‘deformation’ like left ventricular
hypertrophy, diastolic dysfunction or myocardial fibrosis, will impair strain and SR.
Alterations in LV strain have been reported in a variety of conditions that have overt or
subclinical cardiac involvement102, 104-109.
Strain measurements can be obtained from Doppler derived images (ie based on
myocardial velocity gradients)103 or using 2 dimensional speckle tracking and are
discussed later in greater detail.
Cardiac biomarkers in Chronic Kidney Disease
44
1.8.1 Left atrial strain and SR in evaluation of atrial function
Strain and SR imaging is increasingly being used to assess LA function. There are
number of studies that have evaluated LA function using strain imaging110-114. Strain
measurements can be performed by using either tissue Doppler imaging or by 2D
speckle tracking as mentioned earlier. Strain curves are monophasic, whereas SR curves
of the LA are triphasic (fig1. 12, 1.13, 1.14 and 1.15).
LA phasic function has been described previously. LA strain can be measured
throughout the cardiac cycle and permits the evaluation of LA phasic function. Peak
LA systolic strain is a measure of LA reservoir function (global and regional LA
function), while SR can quantitate reservoir, conduit and contractile phases115. Early
diastolic SR is a measure of LA conduit function and late diastolic SR indicative of LA
contractile function. Recent reports have assessed LA strain and SR and its utility in
evaluating LA function in atrial fibrillation, heart failure and ischemic heart disease 116
110, 117. Normal values from healthy subjects derived from groups of healthy subjects
from various centres are now available118. The normal LA strain from this study in
normal individuals is reported as 45.5 +/- 11.4%.
1.8.1.1 Doppler strain and SR
Unlike, tissue Doppler velocity, Doppler derived strain parameters are relatively
unaffected by heart motion and tethering of adjacent segments104. Four and 2 chamber
images acquired at high frame rate (>100FPS) are used for evaluation of strain
parameters. An average of septal, lateral, inferior and anterior walls are typically used to
describe global LA strain. The sample volume for strain measurements are obtained
using a narrow sector because of the thin atrial wall (10 x 2 mm sample volume), placed
5 mm superior to the atrio-ventricular junction. The Doppler beam is aligned parallel to

Cardiac biomarkers in Chronic Kidney Disease
45
atrial wall using a narrow sector angle (300) at the end of expiration so that signal noise
and angle artefacts can be minimised. Using dedicated software and an offline
measuring station, the image is tracked frame by frame, ensuring that the sample
volume for each frame is moved to its original location in the middle of the segment119.
The superiority of strain measurements has been demonstrated with strain analysis
providing better site specificity over tissue Doppler velocity data for tracking local
systolic function120, especially as strain measurements are independent of any tethering
effects. A limitation of Doppler strain imaging involves signal–noise interference, an
issue that can be addressed by increasing the sample distance, as well as angle
dependency of the technique121.
Fig:1. 12 LA strain by tissue Doppler imaging
Systolic strain

Cardiac biomarkers in Chronic Kidney Disease
46
Fig:1. 13 LA strain rate by tissue Doppler imaging
1.8.1.2 Two-dimensional speckle tracking strain
As stated earlier, the Doppler technique is angle dependent and this is the main reason
why measurements are limited to certain segments, especially when trying to estimate
radial and circumferential function of the left ventricle. An alternative method, using B-
mode images, is the estimation of strain and SR by 2 dimensional “speckle tracking”.
The ultrasound reflected from the tissue is the result of interference by numerous
reflected wavelets from the non-homogeneous medium. The interference pattern
(resulting in bright and dark pixels in a B mode image) remains relatively constant for
any small region in the myocardium. This unique pattern is called a ‘speckle’. In the
speckle tracking analysis, a defined region is tracked, following a search algorithm
based on optical flow method, trying to recognize the most similar speckle pattern from
one frame to another122. The algorithm searches for an area with the smallest difference
in the total sum of pixel values, which is the smallest sum of absolute differences. The

Cardiac biomarkers in Chronic Kidney Disease
47
technique is angle-independent as it is based on the displacement of speckles, defined
with respect to the wall rather than the ultrasound beam. 2D speckle tracking derived
strain has been validated by sonomicrometry 123. With respect to the left ventricle, it
provides information on longitudinal, circumferential and radial myocardial function,
estimating directly Lagrangian strain parameters with better lateral resolution compared
to tissue Doppler due to a higher density of scan lines in the grey scale images. With the
left atrium, given it’s thin walls, only longitudinal strain is currently evaluated. 2D
strain analysis is semi-automated and tracking of the sample throughout the cardiac
cycle does not need to be done manually (Fig 1.14 and 1.15); it is also angle
independent.
Although it seems to be an attractive method, limitations are also present. Strain
measurements are inherently dependent on the quality of the 2 dimensional images and
with the assumption that the speckle pattern remains constant throughout the cardiac
cycle. The re-orientation of myocardial fibres, the out-of-plane motion of scatterers, the
resemblance between subsequent images, the ability to track with sufficient temporal
resolution and the difference in axial and lateral resolution are all factors that modify the
extracted values. Moreover, 2D images for strain analysis need to be acquired at a high
frame rate (> 55-60fps). Despite these limitations, strain measurements have been
demonstrated to be reproducible118.
Cardiac biomarkers in Chronic Kidney Disease
48
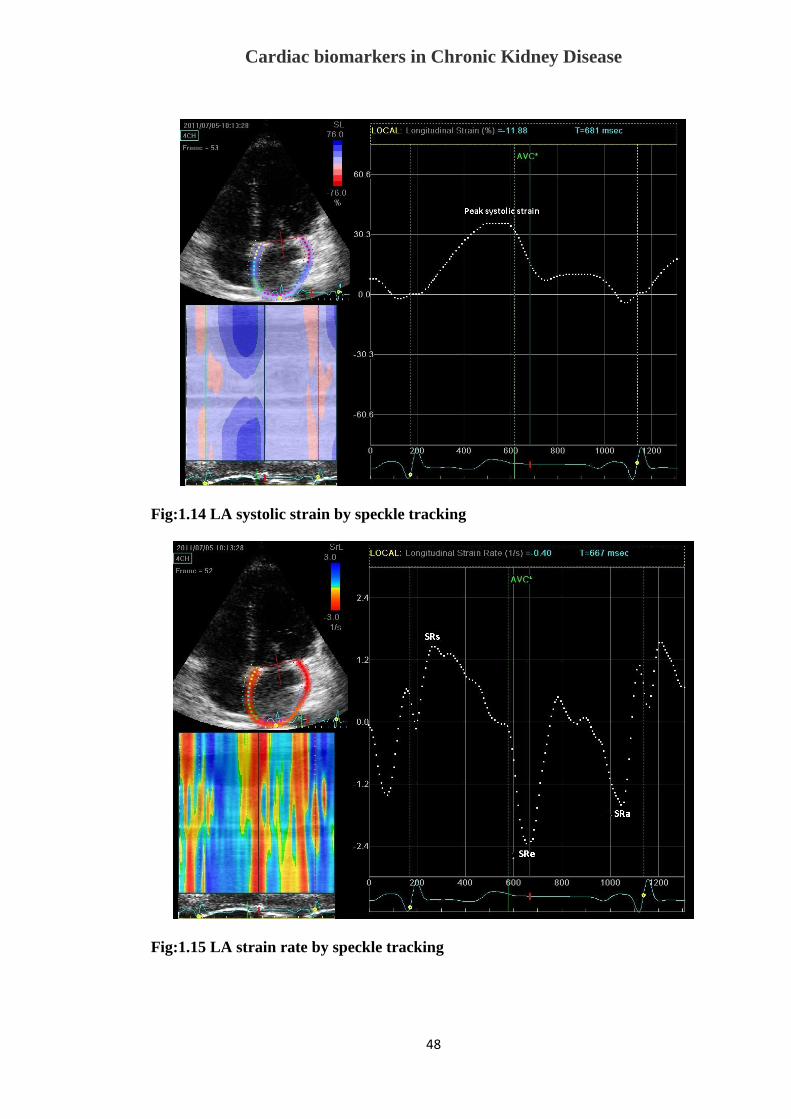
Fig:1.14 LA systolic strain by speckle tracking
Fig:1.15 LA strain rate by speckle tracking
Cardiac biomarkers in Chronic Kidney Disease
49
1.8.2 Clinical utility of LA Strain and SR
Strain imaging is a novel echocardiographic technique, and has been used to assess LA
function in different clinical conditions; it has additionally been used as a prognostic
tool for adverse cardiovascular outcomes124-129.
Atrial function is an integral part of cardiac evaluation and has in the past been
demonstrated to be a biomarker of cardiac events. This is because LV dysfunction (both
systolic and diastolic) as well as LV hypertrophy alters atrial function. Standard
echocardiographic parameters in evaluating ventricular diastolic function are pulsed-
wave Doppler mitral inflow analysis, tissue Doppler imaging measurements and LA
volume. As mentioned earlier, LA strain and SR parameters have been validated in the
evaluation of LV diastolic function130. LA strain during atrial systole is significantly
reduced in diastolic heart failure patients secondary to LA stiffness131. Interestingly, LA
dysfunction with changes in strain and SR has been observed in patients with
amyloidosis in the absence of other echocardiographic features of cardiac
involvement115. It was also demonstrated that diastolic dysfunction and LVH secondary
to hypertension impairs LA strain parameters to a greater degree than observed in the
adaptive LVH in athletes126. Alterations in LA strain have been demonstrated in normal
ageing, prior to any alteration in LA volume132. Similar findings were reported by
another group, who demonstrated that even before LA dilatation occurs, LA 2D strain
was abnormal in patients with hypertension and diabetes133. LA deformation is impaired
in patients with hypertension or diabetes due to multiple reasons. Both conditions cause
diastolic dysfunction, but additionally activate the RAAS, that may consequently result
in myocardial fibrosis134, 135. Atrial strain has emerged as an important predictor for the
maintenance of sinus rhythm following cardioversion and AF ablation136, 137. Atrial

Cardiac biomarkers in Chronic Kidney Disease
50
strain has also shown prognostic value as a predictor of adverse cardiovascular events in
acute myocardial infarction and hypertrophic cardiomyopathy138, 139.
1.8.3 Left ventricular strain imaging
LV systolic function is traditionally measured by evaluation of LV ejection fraction.
More recently strain analysis of LV contractile function has been reported140; shortening
of myocardium results in negative strain (Fig 1.16). LV strain too can be derived from
tissue Doppler imaging or using 2D speckle tracking. However, given its ease of
measurement and angle independence, 2D speckle tracking strain is more commonly
utilised. Normal values for LV strain have been published109 and good reproducibility of
these measurements has been reported141. LV strain is affected by both age and sex of
the individual107. LV strain correlates well with other measures of cardiac function and
can detect changes in myocardial contractility across a wide range of different
conditions including hypertension, diabetes, ischaemic heart disease and CKD66, 142-148.
Strain and SR are sensitive parameters and have been shown to detect early LV
involvement, prior to changes in LV ejection fraction149, 150 . Thus strain measurements
detect early “subclinical involvement” of myocardium.

Cardiac biomarkers in Chronic Kidney Disease
51
Fig:1.16 2 D speckle tracking Left ventricular strain analysis. Dotted line indicates
mean systolic strain
1.9 Biochemical markers of myocyte injury
In heart failure, the cardiac endocrine system, particularly atrial natriuretic peptide
(ANP) and brain natriuretic peptide (BNP) are activated151. The natriuretic peptides are
a group of structurally similar but genetically distinct peptides that have diverse actions
in cardiovascular, renal and endocrine homeostasis.
BNP is a cardiac neurohormone secreted from the ventricles in response to ventricular
volume expansion and pressure overload152. Abnormal diastolic filling pressure, the key
functional abnormality in diastolic heart failure, also leads to release of BNP and its
biologically inactive fragment N-terminal pro BNP (NT-pro BNP) both of which are
released predominantly by the ventricles in response to stretch and are useful for the

Cardiac biomarkers in Chronic Kidney Disease
52
diagnosis of heart failure153. BNP, as mentioned earlier, is predominantly of ventricular
origin, and is produced in cardiomyocytes, as a response to increased ventricular end-
diastolic pressure, in the form of pre-proBNP. In peripheral blood, proBNP is broken
down into the active peptide, BNP, and an inactive molecule, NT-pro BNP. BNP and
NT-pro BNP levels are known to be elevated in patients with symptomatic LV
dysfunction and correlates with NYHA class and prognosis154, 155.
BNP levels may also reflect diastolic dysfunction in patients with heart failure156. In an
earlier study of patients with normal systolic function, elevated BNP levels could
reliably detect the presence of diastolic abnormalities on echocardiography76. In a
group of CHF patients with normal LV size and contraction, in whom early diastolic
dysfunction with an impaired relaxation pattern was observed, a higher BNP value
represented a more advanced degree of diastolic dysfunction in comparison to a similar
group with normal BNP. Hence BNP can add value to evaluation of diastolic
dysfunction, which has not previously been appreciated and may provide an additional
important tool for recognizing the presence of diastolic dysfunction. It was also shown
that NT-pro BNP levels also have similar diagnostic accuracy for diastolic heart failure
as echocardiographically derived TDI measurements and is superior to conventional
Doppler echocardiographic parameters157. NT-pro BNP values correlate well with
invasive parameters of LV filling pressure75. NT- pro BNP levels are relatively easy to
obtain and can be performed serially, thereby having an extra advantage in that they
may additionally provide a surrogate end point for the evaluation of various treatments
of heart failure. It was also noted that falling BNP levels with medical treatment for
heart failure was associated with a fall in wedge pressures, a lower readmission rate to
the hospital and a better prognosis158. Thus, monitoring BNP / NT-pro BNP levels in
future treatment protocols for diastolic dysfunction may provide valuable information

Cardiac biomarkers in Chronic Kidney Disease
53
regarding treatment efficacy and patient outcomes. Even though there is a reasonable
correlation between the values of BNP and NT-pro BNP in heart failure, it was shown
that NT-pro BNP as slightly superior to BNP in diagnosing heart failure159. It was also
shown NT-pro BNP is technically easier to measure; it could thus become the method
of choice for screening for heart failure in routine clinical practice.
1.10 Diagnosis of cardiomyopathy in CKD
As was discussed earlier, CKD commonly causes LV hypertrophy. Although diastolic
dysfunction is not uncommon in patients with normal wall thickness, LV hypertrophy is
among the most common causes for diastolic dysfunction with consequent heart failure.
Myocardial hypertrophy results in altered relaxation of myocardium, which reduces
early diastolic filling. In the presence of normal LA pressure, this shifts a greater
proportion of LV filling to late diastole, during atrial contraction. As left ventricular
pressures increase, the LA pressure gradually increases over time, in a bid to maintain
early diastolic filling. This ultimately results in enlargement of LA as well as LA
dysfunction. The LA stretch consequent to the raised LA pressure additionally results in
secretion of natriuretic peptide including BNP.
1.10.1 Mitral inflow velocities in CKD
In CKD, earlier reports have shown that mitral E velocity was lower and A velocity was
higher, resulting in a decreased E/A ratio, which increases in parallel with the severity
of renal dysfunction67. It was also shown that there is a reduction in the E wave
deceleration time in CKD. However, CKD also causes a change in intravascular
volume; hence mitral inflow Doppler when used alone is less reliable to diagnose
diastolic function in CKD patients, as it is exquisitely volume dependent and is

Cardiac biomarkers in Chronic Kidney Disease
54
therefore altered by loading79. Most CKD patients are elderly and also have associated
conditions like hypertension and diabetes, which in themselves alter myocardial
relaxation. These coexistent conditions thereby compound the diastolic dysfunction in
CKD by their additive effect, resulting in mitral inflow velocities being a less reliable
tool to detect diastolic dysfunction in CKD.
1.10.2 Tissue Doppler imaging in CKD
Various studies have shown that TDI is superior method for evaluation of diastolic
function in patients with CKD regardless of the mitral inflow velocity flow pattern and
is more sensitive for detecting diastolic dysfunction compared with conventional
echocardiography67, 72. CKD results in altered loading conditions and transmitral flow
is very dependent on loading. As TDI is less load dependent, it is more accurate in
diagnosing diastolic dysfunction in CKD patients59. It was also shown that TDI has a
prognostic role in detecting diastolic dysfunction in CKD160. e’ velocity also had
independent prognostic value in ESRF patients161. There are few studies that have
concluded that E/e’ ratio >15 is an independent predictor of general and cardiovascular
mortality in end stage CKD patients162, 163. However, its role in early CKD is not
delineated in the literature.
1.10.3 LA volume and CKD
It has also been previously reported that LA diameter has independent prognostic value
and provides a small but significant incremental value to clinical variables in predicting
CVD mortality in patients with CKD with preserved left ventricular systolic function164.
More recently, it was demonstrated that LA volume indexed to body surface area
(LAVI), was a predictor of adverse cardiac events in early CKD165. Abnormal diastolic

Cardiac biomarkers in Chronic Kidney Disease
55
function, while almost always present, may not be accurately estimated and have
reduced predictive value for determining of adverse cardiac events in CKD patients,
because of fluctuating filling pressure in ESRF 164. On the other hand, LA size which is
a robust correlate of LV diastolic dysfunction may be a more stable measurement that is
relatively preload independent166. Barberato and colleagues showed that fluctuations in
LA size were less pronounced than changes in Doppler indices of diastolic filling during
haemodialysis167. Indexed LA diameter >24 mm/m2 had incremental predictive value
for adverse CV outcome 164 in 200 CKD patients and stage 3 and 4 CKD subjects with
LAVI >32 ml/m2 had significantly lower event-free survival165. A possible explanation
for its additional prognostic ability is that LA size provides a composite measure of the
total haemodynamic burden that would reflect both LV systolic dysfunction and
diastolic dysfunction. It was also documented that the progressive increase in left atrial
volume (LAV) predicts incident cardiovascular events in dialysis patients independent
of the corresponding baseline measurement of LAV and of LV mass and function168.
This finding indicates that monitoring LA size by echocardiography provides
independent prognostic information in patients with ESRF. Such data is not available in
early CKD patients.
1.10.4 Strain evaluation in CKD
LV strain and SR are of prognostic significance in patients with late and end-stage
CKD66. Edwards and colleagues showed reduced LV strain even in asymptomatic
individuals with early CKD without clinical evidence of heart disease and hypothesised
that this may be secondary to myocardial fibrosis resulting in abnormal myocardial
deformation142. Given that the atrium has thinner myocardial walls, involvement of LA

Cardiac biomarkers in Chronic Kidney Disease
56
myocardium should be detected earlier than in the ventricle; however, there are only
limited data in the literature regarding LA strain parameters in early CKD.
As mentioned earlier, LA strain is also reduced in conditions commonly associated with
CKD like hypertension and diabetes133, 169. However, the independent additive value of
CKD if any, has not been evaluated. Strain and strain rate are very sensitive parameters
that need to be evaluated in greater detail in CKD patients; importantly its prognostic
value in CKD needs to be determined.
1.10.5 BNP / NT-pro BNP in CKD
Sakuma and co-workers showed that CKD patients with the highest plasma BNP
quartile had a 4- to 5-fold higher CV risk, including heart failure, stroke, myocardial
infarction and sudden cardiac death compared with the subgroup with the lowest plasma
BNP quartile170. It has also been shown that a plasma naturetic peptide level was a
strong and independent predictor of CKD progression171. Even though, BNP is excreted
by the kidney172, BNP levels within the upper reference limit are seen in most stage 3
CKD patients, despite having a decreased eGFR173. Hence, altered cardiac function is
the more likely explanation for elevated BNP levels in patients with CKD174 rather than
as a consequence of altered renal function. NT-pro BNP has also demonstrated
prognostic utility for adverse cardiovascular events in advanced renal failure175, 176.
Bruch and colleagues showed that CKD patients with NT-pro BNP >1400pg/ml had
poor cardiovascular outcomes177. Pfister and colleagues reported that NT-pro BNP was
a sensitive marker for detection of systolic and diastolic heart failure157. However, there
is no accepted standard cut off values for NT-pro BNP or BNP, as indicators of early
myocardial involvement in CKD which could potentiate their use as biomarkers for
adverse cardiovascular events.

Cardiac biomarkers in Chronic Kidney Disease
57
Future directions for risk evaluation
Patients with CKD, irrespective of the cause, are at increased risk of CVD, including
coronary artery disease, cerebrovascular disease, PVD and heart failure. In fact, all
CKD patients should be considered as “highest risk” group for cardiovascular disease,
irrespective of levels of traditional CVD risk factors as mentioned earlier. All CKD
patients are recommended to undergo assessment for CVD risk factors; including
measurement of “traditional” CVD risk factors as well as “CKD-related” CVD risk
factors. This is due to the exceptionally high cardiovascular risk in CKD, including the
identification of traditional and non-traditional risk factors.
Given the poor performance of the Framingham equation in adults with CKD, there is a
need of future studies exploring risk equations, which include traditional CVD risk
factors, incorporating additionally unique comorbidities associated with CKD, for
prediction of adverse cardiovascular events in this group of patients. Included among
these, is the improved understanding of the critical role of vascular stiffness in
individuals with CKD and how this pathophysiology may contribute to heightened
cardiovascular disease risk, with multiple trials focusing on cardiovascular disease risk-
factor modification in individuals with CKD15. Roberts and colleagues showed by
improving pre dialysis cardiovascular disease care, a decrease in cardiovascular
mortality was seen in dialysis patients, thereby reflecting future directions regarding
early diagnosis of cardiovascular involvement in CKD. The aggressive management of
risk factors in this high risk group may provide improved cardiovascular outcomes178. It
is therefore important to develop novel non-invasive markers that may be predictors for
adverse cardiovascular events in CKD patients.

Cardiac biomarkers in Chronic Kidney Disease
58
1.12 Overall Aim
Cardiovascular disease is common in CKD patients; the majority of patients with ESRF
die of cardiovascular events rather than renal failure179. Diastolic dysfunction and LVH
is commonly seen in ESRF67. However, these overt cardiac abnormalities are usually
manifest at advanced stages of renal disease, when the patient’s prognosis is poor.
While there are a few reports related to cardiac involvement in CKD, such data are
limited. Early identification of cardiac involvement in CKD patients could lead to
altered management and therapeutic strategies that may improve their longer term
outcomes. Thus, the overall aim of this doctoral research project was to identify a
sensitive biomarker to recognise early cardiac involvement and diagnosis of early
cardiomyopathy in CKD.
We selected echocardiography, as it is a noninvasive cardiac investigation and NT-pro
BNP as a biochemical parameter and sought to determine which of these would be the
more sensitive biomarker to detect cardiac involvement in early CKD.
Echocardiography is easily available, does not expose an individual to radiation making
serial evaluation safe and echocardiographic parameters are reproducible; moreover an
echocardiogram is routinely performed in almost all CKD patients as part of their
routine clinical care. Hence utilising an echocardiographic marker to identify CKD
patients at risk is a very attractive option.
NT-pro BNP is a powerful prognostic and diagnostic non-invasive tool in heart failure
management, which is again relatively inexpensive, widely available and reproducible.
There are various studies that have previously examined the utility of a variety of
echocardiographic parameters including mitral inflow Doppler study, TDI180, left atrial
volume181, left ventricular strain142 as well as biochemical parameters like BNP and NT-
pro BNP170, 175 in patients with ESRF. These parameters have also been evaluated for

Cardiac biomarkers in Chronic Kidney Disease
59
their prognostic utility to assess adverse cardiovascular outcomes. However, there is
paucity in the literature the evaluation of these parameters in early CKD, when
aggressive management and therapeutic intervention may significantly impact on long
term adverse events.
It is a well-known fact that diabetes and hypertension are co-existent conditions in most
CKD patients. Both diabetes and hypertension cause CVD independently and contribute
to adverse cardiovascular outcomes, but more importantly can alter echocardiographic
LV and LA parameters. What needs to be established if there is an independent and
incremental effect of CKD in addition to diabetes and hypertension on cardiac structure
and function and whether echocardiographic LV and LA parameters can detect this
independent effect.
Many studies have previously shown the high prevalence of diastolic dysfunction in
patients with diabetes182-184. In fact, diastolic dysfunction is considered the earliest
marker of diabetic cardiomyopathy182, 185. Most of the previous studies to evaluate
diastolic dysfunction in diabetes are based on mitral inflow pattern186, 187, Doppler tissue
imaging182, 183 or left ventricular strain188 and these reports are in normotensive diabetic
patients. Even though diastolic dysfunction causes LA enlargement and dysfunction79,
there is paucity in the literature regarding LA volume and function in diabetes alone or
associated with hypertension.
Hypertension is also a well-known factor contributing to diastolic dysfunction.
Contractile alterations in myocytes, structural ventricular hypertrophy, extracellular and
perivascular fibrosis and myocardial ischemia are implicated as the factors causing
diastolic dysfunction in hypertension189, 190. TDI e’ velocity was shown to be a good
indicator to detect diastolic dysfunction in hypertensive patients even in the absence of
LVH191. LA enlargement has been previously reported in hypertension192. Recently it

Cardiac biomarkers in Chronic Kidney Disease
60
was shown that LA function is abnormal in hypertensive patients193. However, there are
limited data regarding LA size and function as evaluated by strain parameters in
hypertensive patients, especially associated with CKD.
We hypothesised that LA volume and function would be a sensitive marker of
myocardial involvement in early CKD and would have independent incremental value,
permitting its use as a biomarker even in the presence of diabetes and hypertension. We
further hypothesised that alteration in LA parameters might occur early thereby
rendering this as a sensitive biomarker to detect cardiovascular involvement in early
CKD.
In order to examine the above mentioned hypotheses, the following sub studies were
designed to address specific issues as outlined below
1. To investigate the changes in LA volume and LA function assessed by strain in
patients with diabetes and hypertension, with normal renal function, individually
or in combination.
2. To investigate the changes in LA size and function by strain in patients with
CKD and hypertension as compared to patients with hypertension, with normal
renal function.
3. To determine which echocardiographic parameter is the most sensitive
parameter to detect cardiovascular involvement in CKD in the presence of
diabetes and or hypertension
4. To evaluate whether NT-pro BNP or previously identified echocardiographic
parameters would be the most sensitive measure of cardiac involvement in stage
3 CKD patients.
By addressing the above mentioned specific aims, we sought to determine the most
effective biomarker to detect cardiac involvement in early CKD.

Cardiac biomarkers in Chronic Kidney Disease
61
References:
1. Chadban SJ, Briganti EM, Kerr PG, Dunstan DW, Welborn TA, Zimmet PZ, et
al. Prevalence of kidney damage in Australian adults: The AusDiab kidney study. J Am
Soc Nephrol. 2003;14:S131-8.
2. Chang A, Kramer H. Should eGFR and albuminuria be added to the
Framingham risk score? Chronic kidney disease and cardiovascular disease risk
prediction. Nephron Clin Pract. 2011;119:c171-7; discussion c7-8.
3. Go AS, Chertow GM, Fan D, McCulloch CE, Hsu CY. Chronic kidney disease
and the risks of death, cardiovascular events, and hospitalization. N Engl J Med.
2004;351:1296-305.
4. Australian Institute of Health and Welfare 2014. Cardiovascular disease,
diabetes and chronic kidney disease— Australian facts: Prevalence and incidence.
Cardiovascular, diabetes and chronic kidney disease series no. 2.Cat. no. CDK 2.
Canberra: AIHW. 2015.
5. Herzog CA, Asinger RW, Berger AK, Charytan DM, Diez J, Hart RG, et al.
Cardiovascular disease in chronic kidney disease. A clinical update from Kidney
Disease: Improving Global Outcomes (KDIGO). Kidney Int. 2011;80:572-86.
6. AIHW. Australian Institute of Health and Welfare 2014. Cardiovascular disease,
diabetes and chronic kidney disease—Australian facts: Mortality. Cardiovascular,
diabetes and chronic kidney disease series CDK. 2014;1:1.
7. K/DOQI clinical practice guidelines for chronic kidney disease: evaluation,
classification, and stratification. Am J Kidney Dis. 2002;39:S1-266.
8. Newman AB, Arnold AM, Naydeck BL, Fried LP, Burke GL, Enright P, et al.
"Successful aging": effect of subclinical cardiovascular disease. Arch Intern Med.
2003;163:2315-22.
Cardiac biomarkers in Chronic Kidney Disease
62
9. Stack AG, Messana JM. Renal replacement therapy in the elderly: medical,
ethical, and psychosocial considerations. Adv Ren Replace Ther. 2000;7:52-62.
10. Anavekar NS, McMurray JJ, Velazquez EJ, Solomon SD, Kober L, Rouleau JL,
et al. Relation between renal dysfunction and cardiovascular outcomes after myocardial
infarction. N Engl J Med. 2004;351:1285-95.
11. Weiner DE, Tighiouart H, Amin MG, Stark PC, MacLeod B, Griffith JL, et al.
Chronic kidney disease as a risk factor for cardiovascular disease and all-cause
mortality: a pooled analysis of community-based studies. J Am Soc Nephrol.
2004;15:1307-15.
12. Shlipak MG, Fried LF, Cushman M, Manolio TA, Peterson D, Stehman-Breen
C, et al. Cardiovascular mortality risk in chronic kidney disease: comparison of
traditional and novel risk factors. JAMA. 2005;293:1737-45.
13. Parikh NI, Hwang SJ, Larson MG, Levy D, Fox CS. Chronic kidney disease as a
predictor of cardiovascular disease (from the Framingham Heart Study). Am J Cardiol.
2008;102:47-53.
14. Matsushita K, van der Velde M, Astor BC, Woodward M, Levey AS, de Jong
PE, et al. Association of estimated glomerular filtration rate and albuminuria with all-
cause and cardiovascular mortality in general population cohorts: a collaborative meta-
analysis. Lancet. 2010;375:2073-81.
15. Weiner DE, Sarnak MJ. A decade after the KDOQI CKD guidelines: impact on
the cardiovascular disease-CKD paradigm. Am J Kidney Dis. 2012;60:710-2.
16. Kannel WB, Feinleib M, McNamara PM, Garrison RJ, Castelli WP. An
investigation of coronary heart disease in families. The Framingham offspring study.
Am J Epidemiol. 1979;110:281-90.

Cardiac biomarkers in Chronic Kidney Disease
63
17. Weiner DE, Tighiouart H, Elsayed EF, Griffith JL, Salem DN, Levey AS, et al.
The Framingham predictive instrument in chronic kidney disease. J Am Coll Cardiol.
2007;50:217-24.
18. Foley RN, Parfrey PS, Sarnak MJ. Epidemiology of cardiovascular disease in
chronic renal disease. J Am Soc Nephrol. 1998;9:S16-23.
19. Chonchol M, Whittle J, Desbien A, Orner MB, Petersen LA, Kressin NR.
Chronic kidney disease is associated with angiographic coronary artery disease. Am J
Nephrol. 2008;28:354-60.
20. Bhatt DL. Anti-inflammatory agents and antioxidants as a possible "third great
wave" in cardiovascular secondary prevention. Am J Cardiol. 2008;101:4D-13D.
21. Cottone S, Lorito MC, Riccobene R, Nardi E, Mule G, Buscemi S, et al.
Oxidative stress, inflammation and cardiovascular disease in chronic renal failure. J
Nephrol. 2008;21:175-9.
22. Cottone S, Nardi E, Mule G, Vadala A, Lorito MC, Riccobene R, et al.
Association between biomarkers of inflammation and left ventricular hypertrophy in
moderate chronic kidney disease. Clin Nephrol. 2007;67:209-16.
23. Menon V, Gul A, Sarnak MJ. Cardiovascular risk factors in chronic kidney
disease. Kidney Int. 2005;68:1413-8.
24. Briet M, Schiffrin EL. Aldosterone: effects on the kidney and cardiovascular
system. Nat Rev Nephrol. 2010;6:261-73.
25. Kovesdy CP, Ahmadzadeh S, Anderson JE, Kalantar-Zadeh K. Association of
activated vitamin D treatment and mortality in chronic kidney disease. Arch Intern Med.
2008;168:397-403.

Cardiac biomarkers in Chronic Kidney Disease
64
26. Bagshaw SM, Cruz DN, Aspromonte N, Daliento L, Ronco F, Sheinfeld G, et al.
Epidemiology of cardio-renal syndromes: workgroup statements from the 7th ADQI
Consensus Conference. Nephrol Dial Transplant. 2010;25:1406-16.
27. Nardi E, Palermo A, Mule G, Cusimano P, Cottone S, Cerasola G. Left
ventricular hypertrophy and geometry in hypertensive patients with chronic kidney
disease. J Hypertens. 2009;27:633-41.
28. Cerasola G, Nardi E, Palermo A, Mule G, Cottone S. Epidemiology and
pathophysiology of left ventricular abnormalities in chronic kidney disease: a review. J
Nephrol. 2011;24:1-10.
29. Parfrey PS, Foley RN. The clinical epidemiology of cardiac disease in chronic
renal failure. J Am Soc Nephrol. 1999;10:1606-15.
30. Ferguson R, Grim CE, Opgenorth TJ. A familial risk of chronic renal failure
among blacks on dialysis? J Clin Epidemiol. 1988;41:1189-96.
31. McClellan W, Speckman R, McClure L, Howard V, Campbell RC, Cushman M,
et al. Prevalence and characteristics of a family history of end-stage renal disease among
adults in the United States population: Reasons for Geographic and Racial Differences
in Stroke (REGARDS) renal cohort study. J Am Soc Nephrol. 2007;18:1344-52.
32. Hallan S, de Mutsert R, Carlsen S, Dekker FW, Aasarod K, Holmen J. Obesity,
smoking, and physical inactivity as risk factors for CKD: are men more vulnerable? Am
J Kidney Dis. 2006;47:396-405.
33. London GM. Vascular disease and atherosclerosis in uremia. Nefrologia.
2005;25 Suppl 2:91-5.
34. Factor SM, Sonnenblick EH. Hypothesis: is congestive cardiomyopathy caused
by a hyperreactive myocardial microcirculation (microvascular spasm)? Am J Cardiol.
1982;50:1149-52.

Cardiac biomarkers in Chronic Kidney Disease
65
35. Rostand SG, Kirk KA, Rutsky EA. Dialysis-associated ischemic heart disease:
insights from coronary angiography. Kidney Int. 1984;25:653-9.
36. London GM, Parfrey PS. Cardiac disease in chronic uremia: pathogenesis. Adv
Ren Replace Ther. 1997;4:194-211.
37. Cohn JN, Ferrari R, Sharpe N. Cardiac remodeling--concepts and clinical
implications: a consensus paper from an international forum on cardiac remodeling.
Behalf of an International Forum on Cardiac Remodeling. J Am Coll Cardiol.
2000;35:569-82.
38. London GM. Cardiovascular disease in chronic renal failure: pathophysiologic
aspects. Semin Dial. 2003;16:85-94.
39. London GM, Drueke TB. Atherosclerosis and arteriosclerosis in chronic renal
failure. Kidney Int. 1997;51:1678-95.
40. Remuzzi G, Perico N, Macia M, Ruggenenti P. The role of renin-angiotensin-
aldosterone system in the progression of chronic kidney disease. Kidney Int Suppl.
2005:S57-65.
41. Thurman JM, Schrier RW. Comparative effects of angiotensin-converting
enzyme inhibitors and angiotensin receptor blockers on blood pressure and the kidney.
Am J Med. 2003;114:588-98.
42. Skeggs LT, Dorer FE, Kahn JR, Lentz KE, Levine M. The biochemistry of the
renin-angiotensin system and its role in hypertension. Am J Med. 1976;60:737-48.
43. Erdos EG. Angiotensin I converting enzyme and the changes in our concepts
through the years. Lewis K. Dahl memorial lecture. Hypertension. 1990;16:363-70.
44. Johnston CI. Franz Volhard Lecture. Renin-angiotensin system: a dual tissue
and hormonal system for cardiovascular control. J Hypertens Suppl. 1992;10:S13-26.

Cardiac biomarkers in Chronic Kidney Disease
66
45. Ehrlich JR, Hohnloser SH, Nattel S. Role of angiotensin system and effects of
its inhibition in atrial fibrillation: clinical and experimental evidence. Eur Heart J.
2006;27:512-8.
46. Dzau VJ. Cell biology and genetics of angiotensin in cardiovascular disease. J
Hypertens Suppl. 1994;12:S3-10.
47. Dzau VJ, Mukoyama M, Pratt RE. Molecular biology of angiotensin receptors:
target for drug research? J Hypertens Suppl. 1994;12:S1-5.
48. Dzau VJ, Pratt R, Gibbons GH. Angiotensin as local modulating factor in
ventricular dysfunction and failure due to coronary artery disease. Drugs. 1994;47
Suppl 4:1-13.
49. Cesari M, Rossi GP, Pessina AC. Biological properties of the angiotensin
peptides other than angiotensin II: implications for hypertension and cardiovascular
diseases. J Hypertens. 2002;20:793-9.
50. Manrique C, Lastra G, Gardner M, Sowers JR. The renin angiotensin
aldosterone system in hypertension: roles of insulin resistance and oxidative stress. Med
Clin North Am. 2009;93:569-82.
51. Abuissa H, O'Keefe J, Jr. The role of renin-angiotensin-aldosterone system-
based therapy in diabetes prevention and cardiovascular and renal protection. Diabetes
Obes Metab. 2008;10:1157-66.
52. Hsueh WA, Wyne K. Renin-Angiotensin-aldosterone system in diabetes and
hypertension. J Clin Hypertens (Greenwich). 2011;13:224-37.
53. Brewster UC, Perazella MA. The renin-angiotensin-aldosterone system and the
kidney: effects on kidney disease. Am J Med. 2004;116:263-72.
54. Takahashi N, Kume O, Wakisaka O, Fukunaga N, Teshima Y, Hara M, et al.
Novel strategy to prevent atrial fibrosis and fibrillation. Circ J. 2012;76:2318-26.

Cardiac biomarkers in Chronic Kidney Disease
67
55. Levin A, Singer J, Thompson CR, Ross H, Lewis M. Prevalent left ventricular
hypertrophy in the predialysis population: identifying opportunities for intervention. Am
J Kidney Dis. 1996;27:347-54.
56. Middleton RJ, Parfrey PS, Foley RN. Left ventricular hypertrophy in the renal
patient. J Am Soc Nephrol. 2001;12:1079-84.
57. Aoki J, Ikari Y, Nakajima H, Mori M, Sugimoto T, Hatori M, et al. Clinical and
pathologic characteristics of dilated cardiomyopathy in hemodialysis patients. Kidney
Int. 2005;67:333-40.
58. Taddei S, Nami R, Bruno RM, Quatrini I, Nuti R. Hypertension, left ventricular
hypertrophy and chronic kidney disease. Heart Fail Rev. 2011;16:615-20.
59. Hayashi SY, Rohani M, Lindholm B, Brodin LA, Lind B, Barany P, et al. Left
ventricular function in patients with chronic kidney disease evaluated by colour tissue
Doppler velocity imaging. Nephrol Dial Transplant. 2006;21:125-32.
60. Metivier F, Marchais SJ, Guerin AP, Pannier B, London GM. Pathophysiology
of anaemia: focus on the heart and blood vessels. Nephrol Dial Transplant. 2000;15
Suppl 3:14-8.
61. Andress DL. Vitamin D in chronic kidney disease: a systemic role for selective
vitamin D receptor activation. Kidney Int. 2006;69:33-43.
62. Rostand SG, Drueke TB. Parathyroid hormone, vitamin D, and cardiovascular
disease in chronic renal failure. Kidney Int. 1999;56:383-92.
63. Smogorzewski M, Zayed M, Zhang YB, Roe J, Massry SG. Parathyroid
hormone increases cytosolic calcium concentration in adult rat cardiac myocytes. Am J
Physiol. 1993;264:H1998-2006.

Cardiac biomarkers in Chronic Kidney Disease
68
64. London GM, Guerin AP, Verbeke FH, Pannier B, Boutouyrie P, Marchais SJ, et
al. Mineral metabolism and arterial functions in end-stage renal disease: potential role
of 25-hydroxyvitamin D deficiency. J Am Soc Nephrol. 2007;18:613-20.
65. Kunz K, Dimitrov Y, Muller S, Chantrel F, Hannedouche T. Uraemic
cardiomyopathy. Nephrol Dial Transplant. 1998;13 Suppl 4:39-43.
66. Rakhit DJ, Zhang XH, Leano R, Armstrong KA, Isbel NM, Marwick TH.
Prognostic role of subclinical left ventricular abnormalities and impact of
transplantation in chronic kidney disease. Am Heart J. 2007;153:656-64.
67. Otsuka T, Suzuki M, Yoshikawa H, Sugi K. Left ventricular diastolic
dysfunction in the early stage of chronic kidney disease. J Cardiol. 2009;54:199-204.
68. Masugata H, Senda S, Goda F, Yamagami A, Okuyama H, Kohno T, et al.
Echocardiographic assessment of the cardio-renal connection: is left ventricular
hypertrophy or diastolic function more closely correlated with estimated glomerular
filtration rate in patients with cardiovascular risk factors? Clin Exp Hypertens.
2010;32:113-20.
69. Martin FL, McKie PM, Cataliotti A, Sangaralingham SJ, Korinek J, Huntley
BK, et al. Experimental mild renal insufficiency mediates early cardiac apoptosis,
fibrosis, and diastolic dysfunction: a kidney-heart connection. Am J Physiol Regul
Integr Comp Physiol. 2012;302:R292-9.
70. Sato W, Kosaka T, Koyama T, Ishida M, Iino K, Watanabe H, et al. Impaired
renal function is a major determinant of left ventricular diastolic dysfunction:
assessment by stress myocardial perfusion imaging. Ann Nucl Med. 2013;27:729-36.
71. Iskandrian AS, Hakki AH. Age-related changes in left ventricular diastolic
performance. Am Heart J. 1986;112:75-8.

Cardiac biomarkers in Chronic Kidney Disease
69
72. Pecoits-Filho R, Barberato SH. Echocardiography in chronic kidney disease:
diagnostic and prognostic implications. Nephron Clin Pract. 2010;114:c242-7.
73. Zile MR, Brutsaert DL. New concepts in diastolic dysfunction and diastolic
heart failure: Part I: diagnosis, prognosis, and measurements of diastolic function.
Circulation. 2002;105:1387-93.
74. Paulus WJ, Tschope C, Sanderson JE, Rusconi C, Flachskampf FA, Rademakers
FE, et al. How to diagnose diastolic heart failure: a consensus statement on the
diagnosis of heart failure with normal left ventricular ejection fraction by the Heart
Failure and Echocardiography Associations of the European Society of Cardiology. Eur
Heart J. 2007;28:2539-50.
75. Tschope C, Kasner M, Westermann D, Gaub R, Poller WC, Schultheiss HP. The
role of NT-proBNP in the diagnostics of isolated diastolic dysfunction: correlation with
echocardiographic and invasive measurements. Eur Heart J. 2005;26:2277-84.
76. Lubien E, DeMaria A, Krishnaswamy P, Clopton P, Koon J, Kazanegra R, et al.
Utility of B-natriuretic peptide in detecting diastolic dysfunction: comparison with
Doppler velocity recordings. Circulation. 2002;105:595-601.
77. Appleton CP, Hatle LK, Popp RL. Relation of transmitral flow velocity patterns
to left ventricular diastolic function: new insights from a combined hemodynamic and
Doppler echocardiographic study. J Am Coll Cardiol. 1988;12:426-40.
78. Appleton CP, Jensen JL, Hatle LK, Oh JK. Doppler evaluation of left and right
ventricular diastolic function: a technical guide for obtaining optimal flow velocity
recordings. J Am Soc Echocardiogr. 1997;10:271-92.
79. Nagueh SF, Appleton CP, Gillebert TC, Marino PN, Oh JK, Smiseth OA, et al.
Recommendations for the evaluation of left ventricular diastolic function by
echocardiography. Eur J Echocardiogr. 2009;10:165-93.

Cardiac biomarkers in Chronic Kidney Disease
70
80. Little WC, Oh JK. Echocardiographic evaluation of diastolic function can be
used to guide clinical care. Circulation. 2009;120:802-9.
81. Faris R, Coats AJ, Henein MY. Echocardiography-derived variables predict
outcome in patients with nonischemic dilated cardiomyopathy with or without a
restrictive filling pattern. Am Heart J. 2002;144:343-50.
82. Pinamonti B, Zecchin M, Di Lenarda A, Gregori D, Sinagra G, Camerini F.
Persistence of restrictive left ventricular filling pattern in dilated cardiomyopathy: an
ominous prognostic sign. J Am Coll Cardiol. 1997;29:604-12.
83. Xie GY, Berk MR, Smith MD, Gurley JC, DeMaria AN. Prognostic value of
Doppler transmitral flow patterns in patients with congestive heart failure. J Am Coll
Cardiol. 1994;24:132-9.
84. Valantine HA, Appleton CP, Hatle LK, Hunt SA, Billingham ME, Shumway
NE, et al. A hemodynamic and Doppler echocardiographic study of ventricular function
in long-term cardiac allograft recipients. Etiology and prognosis of restrictive-
constrictive physiology. Circulation. 1989;79:66-75.
85. Appleton CP. Influence of incremental changes in heart rate on mitral flow
velocity: assessment in lightly sedated, conscious dogs. J Am Coll Cardiol.
1991;17:227-36.
86. Schnittger I, Appleton CP, Hatle LK, Popp RL. Diastolic mitral and tricuspid
regurgitation by Doppler echocardiography in patients with atrioventricular block: new
insight into the mechanism of atrioventricular valve closure. J Am Coll Cardiol.
1988;11:83-8.
87. Isaaz K, Munoz del Romeral L, Lee E, Schiller NB. Quantitation of the motion
of the cardiac base in normal subjects by Doppler echocardiography. J Am Soc
Echocardiogr. 1993;6:166-76.

Cardiac biomarkers in Chronic Kidney Disease
71
88. Agmon Y, Oh JK, McCarthy JT, Khandheria BK, Bailey KR, Seward JB. Effect
of volume reduction on mitral annular diastolic velocities in hemodialysis patients. Am J
Cardiol. 2000;85:665-8, A11.
89. Oki T, Tabata T, Yamada H, Wakatsuki T, Shinohara H, Nishikado A, et al.
Clinical application of pulsed Doppler tissue imaging for assessing abnormal left
ventricular relaxation. Am J Cardiol. 1997;79:921-8.
90. Kadappu KK, Thomas L. Tissue Doppler imaging in echocardiography: value
and limitations. Heart Lung Circ. 2015;24:224-33.
91. Chahal NS, Lim TK, Jain P, Chambers JC, Kooner JS, Senior R. Normative
reference values for the tissue Doppler imaging parameters of left ventricular function: a
population-based study. Eur J Echocardiogr. 2010;11:51-6.
92. Oh JK, Park SJ, Nagueh SF. Established and novel clinical applications of
diastolic function assessment by echocardiography. Circ Cardiovasc Imaging.
2011;4:444-55.
93. Sohn DW, Chai IH, Lee DJ, Kim HC, Kim HS, Oh BH, et al. Assessment of
mitral annulus velocity by Doppler tissue imaging in the evaluation of left ventricular
diastolic function. J Am Coll Cardiol. 1997;30:474-80.
94. Prioli A, Marino P, Lanzoni L, Zardini P. Increasing degrees of left ventricular
filling impairment modulate left atrial function in humans. Am J Cardiol. 1998;82:756-
61.
95. Douglas PS. The left atrium: a biomarker of chronic diastolic dysfunction and
cardiovascular disease risk. J Am Coll Cardiol. 2003;42:1206-7.
96. Lester SJ, Ryan EW, Schiller NB, Foster E. Best method in clinical practice and
in research studies to determine left atrial size. Am J Cardiol. 1999;84:829-32.

Cardiac biomarkers in Chronic Kidney Disease
72
97. Lang RM, Bierig M, Devereux RB, Flachskampf FA, Foster E, Pellikka PA, et
al. Recommendations for chamber quantification. Eur J Echocardiogr. 2006;7:79-108.
98. Tsang TS, Barnes ME, Gersh BJ, Bailey KR, Seward JB. Left atrial volume as a
morphophysiologic expression of left ventricular diastolic dysfunction and relation to
cardiovascular risk burden. Am J Cardiol. 2002;90:1284-9.
99. Abhayaratna WP, Seward JB, Appleton CP, Douglas PS, Oh JK, Tajik AJ, et al.
Left atrial size: physiologic determinants and clinical applications. J Am Coll Cardiol.
2006;47:2357-63.
100. D'Andrea A, Riegler L, Cocchia R, Scarafile R, Salerno G, Gravino R, et al. Left
atrial volume index in highly trained athletes. Am Heart J. 2010;159:1155-61.
101. Pavlopoulos H, Nihoyannopoulos P. Strain and strain rate deformation
parameters: from tissue Doppler to 2D speckle tracking. Int J Cardiovasc Imaging.
2008;24:479-91.
102. D'Hooge J, Heimdal A, Jamal F, Kukulski T, Bijnens B, Rademakers F, et al.
Regional strain and strain rate measurements by cardiac ultrasound: principles,
implementation and limitations. Eur J Echocardiogr. 2000;1:154-70.
103. Urheim S, Edvardsen T, Torp H, Angelsen B, Smiseth OA. Myocardial strain by
Doppler echocardiography. Validation of a new method to quantify regional myocardial
function. Circulation. 2000;102:1158-64.
104. Di Salvo G, Pacileo G, Caso P, Verrengia M, Rea A, Santoro G, et al. Strain rate
imaging is a superior method for the assessment of regional myocardial function
compared with Doppler tissue imaging: a study on patients with transcatheter device
closure of atrial septal defect. J Am Soc Echocardiogr. 2005;18:398-400.
105. Eshoo S, Boyd AC, Ross DL, Marwick TH, Thomas L. Strain rate evaluation of
phasic atrial function in hypertension. Heart. 2009;95:1184-91.
Cardiac biomarkers in Chronic Kidney Disease
73
106. Gondi S, Dokainish H. Right ventricular tissue Doppler and strain imaging:
ready for clinical use? Echocardiography. 2007;24:522-32.
107. Kocabay G, Muraru D, Peluso D, Cucchini U, Mihaila S, Padayattil-Jose S, et
al. Normal left ventricular mechanics by two-dimensional speckle-tracking
echocardiography. Reference values in healthy adults. Rev Esp Cardiol (Engl Ed).
2014;67:651-8.
108. Liu YW, Su CT, Huang YY, Yang CS, Huang JW, Yang MT, et al. Left
ventricular systolic strain in chronic kidney disease and hemodialysis patients. Am J
Nephrol. 2011;33:84-90.
109. Marwick TH, Leano RL, Brown J, Sun JP, Hoffmann R, Lysyansky P, et al.
Myocardial strain measurement with 2-dimensional speckle-tracking echocardiography:
definition of normal range. JACC Cardiovasc Imaging. 2009;2:80-4.
110. Blume GG, McLeod CJ, Barnes ME, Seward JB, Pellikka PA, Bastiansen PM,
et al. Left atrial function: physiology, assessment, and clinical implications. Eur J
Echocardiogr. 2011;12:421-30.
111. Cameli M, Caputo M, Mondillo S, Ballo P, Palmerini E, Lisi M, et al. Feasibility
and reference values of left atrial longitudinal strain imaging by two-dimensional
speckle tracking. Cardiovasc Ultrasound. 2009;7:6.
112. Cameli M, Lisi M, Righini FM, Focardi M, Alfieri O, Mondillo S. Left atrial
speckle tracking analysis in patients with mitral insufficiency and history of paroxysmal
atrial fibrillation. Int J Cardiovasc Imaging. 2012;28:1663-70.
113. D'Andrea A, Caso P, Romano S, Scarafile R, Cuomo S, Salerno G, et al.
Association between left atrial myocardial function and exercise capacity in patients
with either idiopathic or ischemic dilated cardiomyopathy: a two-dimensional speckle
strain study. Int J Cardiol. 2009;132:354-63.

Cardiac biomarkers in Chronic Kidney Disease
74
114. Inaba Y, Yuda S, Kobayashi N, Hashimoto A, Uno K, Nakata T, et al. Strain
rate imaging for noninvasive functional quantification of the left atrium: comparative
studies in controls and patients with atrial fibrillation. J Am Soc Echocardiogr.
2005;18:729-36.
115. Modesto KM, Dispenzieri A, Cauduro SA, Lacy M, Khandheria BK, Pellikka
PA, et al. Left atrial myopathy in cardiac amyloidosis: implications of novel
echocardiographic techniques. Eur Heart J. 2005;26:173-9.
116. Rosca M, Lancellotti P, Popescu BA, Pierard LA. Left atrial function:
pathophysiology, echocardiographic assessment, and clinical applications. Heart.
2011;97:1982-9.
117. Zhang Q, Yip GW, Yu CM. Approaching regional left atrial function by tissue
Doppler velocity and strain imaging. Europace. 2008;10 Suppl 3:iii62-9.
118. Morris DA, Takeuchi M, Krisper M, Kohncke C, Bekfani T, Carstensen T, et al.
Normal values and clinical relevance of left atrial myocardial function analysed by
speckle-tracking echocardiography: multicentre study. Eur Heart J Cardiovasc
Imaging. 2015;16:364-72.
119. Thomas L. Assessment of atrial function. Heart Lung Circ. 2007;16:234-42.
120. Voigt JU, Nixdorff U, Bogdan R, Exner B, Schmiedehausen K, Platsch G, et al.
Comparison of deformation imaging and velocity imaging for detecting regional
inducible ischaemia during dobutamine stress echocardiography. Eur Heart J.
2004;25:1517-25.
121. Yip G, Abraham T, Belohlavek M, Khandheria BK. Clinical applications of
strain rate imaging. J Am Soc Echocardiogr. 2003;16:1334-42.
122. Bohs LN, Trahey GE. A novel method for angle independent ultrasonic imaging
of blood flow and tissue motion. IEEE Trans Biomed Eng. 1991;38:280-6.

Cardiac biomarkers in Chronic Kidney Disease
75
123. Helle-Valle T, Crosby J, Edvardsen T, Lyseggen E, Amundsen BH, Smith HJ, et
al. New noninvasive method for assessment of left ventricular rotation: speckle tracking
echocardiography. Circulation. 2005;112:3149-56.
124. Liu Y, Wang K, Su D, Cong T, Cheng Y, Zhang Y, et al. Noninvasive
assessment of left atrial phasic function in patients with hypertension and diabetes using
two-dimensional speckle tracking and volumetric parameters. Echocardiography.
2014;31:727-35.
125. Agoston G, Gargani L, Miglioranza MH, Caputo M, Badano LP, Moreo A, et al.
Left atrial dysfunction detected by speckle tracking in patients with systemic sclerosis.
Cardiovasc Ultrasound. 2014;12:30.
126. D'Andrea A, De Corato G, Scarafile R, Romano S, Reigler L, Mita C, et al. Left
atrial myocardial function in either physiological or pathological left ventricular
hypertrophy: a two-dimensional speckle strain study. Br J Sports Med. 2008;42:696-
702.
127. Gabrielli L, Enriquez A, Cordova S, Yanez F, Godoy I, Corbalan R. Assessment
of left atrial function in hypertrophic cardiomyopathy and athlete's heart: a left atrial
myocardial deformation study. Echocardiography. 2012;29:943-9.
128. Spethmann S, Stuer K, Diaz I, Althoff T, Hewing B, Baumann G, et al. Left
atrial mechanics predict the success of pulmonary vein isolation in patients with atrial
fibrillation. J Interv Card Electrophysiol. 2014;40:53-62.
129. Debonnaire P, Leong DP, Witkowski TG, Al Amri I, Joyce E, Katsanos S, et al.
Left atrial function by two-dimensional speckle-tracking echocardiography in patients
with severe organic mitral regurgitation: association with guidelines-based surgical
indication and postoperative (long-term) survival. J Am Soc Echocardiogr.
2013;26:1053-62.

Cardiac biomarkers in Chronic Kidney Disease
76
130. Leischik R, Littwitz H, Dworrak B, Garg P, Zhu M, Sahn DJ, et al.
Echocardiographic Evaluation of Left Atrial Mechanics: Function, History, Novel
Techniques, Advantages, and Pitfalls. Biomed Res Int. 2015;2015:765921.
131. Kurt M, Wang J, Torre-Amione G, Nagueh SF. Left atrial function in diastolic
heart failure. Circ Cardiovasc Imaging. 2009;2:10-5.
132. Boyd AC, Richards DA, Marwick T, Thomas L. Atrial strain rate is a sensitive
measure of alterations in atrial phasic function in healthy ageing. Heart. 2011;97:1513-
9.
133. Mondillo S, Cameli M, Caputo ML, Lisi M, Palmerini E, Padeletti M, et al.
Early detection of left atrial strain abnormalities by speckle-tracking in hypertensive and
diabetic patients with normal left atrial size. J Am Soc Echocardiogr. 2011;24:898-908.
134. Kadappu KK, Boyd A, Eshoo S, Haluska B, Yeo AE, Marwick TH, et al.
Changes in left atrial volume in diabetes mellitus: more than diastolic dysfunction? Eur
Heart J Cardiovasc Imaging. 2012;13:1016-23.
135. Kokubu N, Yuda S, Tsuchihashi K, Hashimoto A, Nakata T, Miura T, et al.
Noninvasive assessment of left atrial function by strain rate imaging in patients with
hypertension: a possible beneficial effect of renin-angiotensin system inhibition on left
atrial function. Hypertens Res. 2007;30:13-21.
136. Di Salvo G, Caso P, Lo Piccolo R, Fusco A, Martiniello AR, Russo MG, et al.
Atrial myocardial deformation properties predict maintenance of sinus rhythm after
external cardioversion of recent-onset lone atrial fibrillation: a color Doppler
myocardial imaging and transthoracic and transesophageal echocardiographic study.
Circulation. 2005;112:387-95.
137. Schneider C, Malisius R, Krause K, Lampe F, Bahlmann E, Boczor S, et al.
Strain rate imaging for functional quantification of the left atrium: atrial deformation

Cardiac biomarkers in Chronic Kidney Disease
77
predicts the maintenance of sinus rhythm after catheter ablation of atrial fibrillation. Eur
Heart J. 2008;29:1397-409.
138. Antoni ML, ten Brinke EA, Atary JZ, Marsan NA, Holman ER, Schalij MJ, et
al. Left atrial strain is related to adverse events in patients after acute myocardial
infarction treated with primary percutaneous coronary intervention. Heart.
2011;97:1332-7.
139. Paraskevaidis IA, Farmakis D, Papadopoulos C, Ikonomidis I, Parissis J,
Rigopoulos A, et al. Two-dimensional strain analysis in patients with hypertrophic
cardiomyopathy and normal systolic function: a 12-month follow-up study. Am Heart J.
2009;158:444-50.
140. Cho GY, Marwick TH, Kim HS, Kim MK, Hong KS, Oh DJ. Global 2-
dimensional strain as a new prognosticator in patients with heart failure. J Am Coll
Cardiol. 2009;54:618-24.
141. Cheng S, Larson MG, McCabe EL, Osypiuk E, Lehman BT, Stanchev P, et al.
Reproducibility of speckle-tracking-based strain measures of left ventricular function in
a community-based study. J Am Soc Echocardiogr. 2013;26:1258-66 e2.
142. Edwards NC, Hirth A, Ferro CJ, Townend JN, Steeds RP. Subclinical
abnormalities of left ventricular myocardial deformation in early-stage chronic kidney
disease: the precursor of uremic cardiomyopathy? J Am Soc Echocardiogr.
2008;21:1293-8.
143. Ballo P, Quatrini I, Giacomin E, Motto A, Mondillo S. Circumferential versus
longitudinal systolic function in patients with hypertension: a nonlinear relation. J Am
Soc Echocardiogr. 2007;20:298-306.
144. Kang SJ, Lim HS, Choi BJ, Choi SY, Hwang GS, Yoon MH, et al. Longitudinal
strain and torsion assessed by two-dimensional speckle tracking correlate with the

Cardiac biomarkers in Chronic Kidney Disease
78
serum level of tissue inhibitor of matrix metalloproteinase-1, a marker of myocardial
fibrosis, in patients with hypertension. J Am Soc Echocardiogr. 2008;21:907-11.
145. Zoroufian A, Razmi T, Taghavi-Shavazi M, Lotfi-Tokaldany M, Jalali A.
Evaluation of subclinical left ventricular dysfunction in diabetic patients: longitudinal
strain velocities and left ventricular dyssynchrony by two-dimensional speckle tracking
echocardiography study. Echocardiography. 2014;31:456-63.
146. Ng AC, Delgado V, Bertini M, van der Meer RW, Rijzewijk LJ, Shanks M, et
al. Findings from left ventricular strain and strain rate imaging in asymptomatic patients
with type 2 diabetes mellitus. Am J Cardiol. 2009;104:1398-401.
147. Mochizuki Y, Tanaka H, Matsumoto K, Sano H, Toki H, Shimoura H, et al.
Clinical features of subclinical left ventricular systolic dysfunction in patients with
diabetes mellitus. Cardiovasc Diabetol. 2015;14:37.
148. Hoit BD. Strain and strain rate echocardiography and coronary artery disease.
Circ Cardiovasc Imaging. 2011;4:179-90.
149. Spethmann S, Dreger H, Schattke S, Riemekasten G, Borges AC, Baumann G,
et al. Two-dimensional speckle tracking of the left ventricle in patients with systemic
sclerosis for an early detection of myocardial involvement. Eur Heart J Cardiovasc
Imaging. 2012;13:863-70.
150. Dogan S, Aydin M, Gursurer M, Dursun A, Onuk T, Madak H. Prediction of
subclinical left ventricular dysfunction with strain rate imaging in patients with mild to
moderate rheumatic mitral stenosis. J Am Soc Echocardiogr. 2006;19:243-8.
151. Chen HH, Burnett JC. Natriuretic peptides in the pathophysiology of congestive
heart failure. Curr Cardiol Rep. 2000;2:198-205.
152. Cheung BM, Kumana CR. Natriuretic peptides--relevance in cardiovascular
disease. JAMA. 1998;280:1983-4.

Cardiac biomarkers in Chronic Kidney Disease
79
153. Mair J, Hammerer-Lercher A, Puschendorf B. The impact of cardiac natriuretic
peptide determination on the diagnosis and management of heart failure. Clin Chem Lab
Med. 2001;39:571-88.
154. Clerico A, Iervasi G, Del Chicca MG, Emdin M, Maffei S, Nannipieri M, et al.
Circulating levels of cardiac natriuretic peptides (ANP and BNP) measured by highly
sensitive and specific immunoradiometric assays in normal subjects and in patients with
different degrees of heart failure. J Endocrinol Invest. 1998;21:170-9.
155. Tsutamoto T, Wada A, Maeda K, Hisanaga T, Maeda Y, Fukai D, et al.
Attenuation of compensation of endogenous cardiac natriuretic peptide system in
chronic heart failure: prognostic role of plasma brain natriuretic peptide concentration in
patients with chronic symptomatic left ventricular dysfunction. Circulation.
1997;96:509-16.
156. Yu CM, Sanderson JE, Shum IO, Chan S, Yeung LY, Hung YT, et al. Diastolic
dysfunction and natriuretic peptides in systolic heart failure. Higher ANP and BNP
levels are associated with the restrictive filling pattern. Eur Heart J. 1996;17:1694-702.
157. Pfister R, Scholz M, Wielckens K, Erdmann E, Schneider CA. Use of NT-
proBNP in routine testing and comparison to BNP. Eur J Heart Fail. 2004;6:289-93.
158. Cheng V, Kazanagra R, Garcia A, Lenert L, Krishnaswamy P, Gardetto N, et al.
A rapid bedside test for B-type peptide predicts treatment outcomes in patients admitted
for decompensated heart failure: a pilot study. J Am Coll Cardiol. 2001;37:386-91.
159. Fonseca C, Sarmento PM, Minez A, Goncalves E, Covas R, Dias AR, et al.
Comparative value of BNP and NT-proBNP in diagnosis of heart failure. Rev Port
Cardiol. 2004;23:979-91.
160. Cho GY. Diastolic dysfunction and chronic kidney disease. Korean J Intern
Med. 2013;28:22-4.

Cardiac biomarkers in Chronic Kidney Disease
80
161. Sharma R, Pellerin D, Gaze DC, Mehta RL, Gregson H, Streather CP, et al.
Mitral peak Doppler E-wave to peak mitral annulus velocity ratio is an accurate
estimate of left ventricular filling pressure and predicts mortality in end-stage renal
disease. J Am Soc Echocardiogr. 2006;19:266-73.
162. Dokainish H, Zoghbi WA, Lakkis NM, Al-Bakshy F, Dhir M, Quinones MA, et
al. Optimal noninvasive assessment of left ventricular filling pressures: a comparison of
tissue Doppler echocardiography and B-type natriuretic peptide in patients with
pulmonary artery catheters. Circulation. 2004;109:2432-9.
163. Peckova M, Charvat J, Schuck O, Hill M, Svab P, Horackova M. The
association between left ventricular diastolic function and a mild-to-moderate decrease
in glomerular filtration rate in patients with type 2 diabetes mellitus. J Int Med Res.
2011;39:2178-86.
164. Chan MY, Wong HB, Ong HY, Yeo TC. Prognostic value of left atrial size in
chronic kidney disease. Eur J Echocardiogr. 2008;9:736-40.
165. Hee L, Nguyen T, Whatmough M, Descallar J, Chen J, Kapila S, et al. Left atrial
volume and adverse cardiovascular outcomes in unselected patients with and without
CKD. Clin J Am Soc Nephrol. 2014;9:1369-76.
166. Appleton CP, Galloway JM, Gonzalez MS, Gaballa M, Basnight MA.
Estimation of left ventricular filling pressures using two-dimensional and Doppler
echocardiography in adult patients with cardiac disease. Additional value of analyzing
left atrial size, left atrial ejection fraction and the difference in duration of pulmonary
venous and mitral flow velocity at atrial contraction. J Am Coll Cardiol. 1993;22:1972-
82.
167. Barberato SH, Mantilla DE, Misocami MA, Goncalves SM, Bignelli AT, Riella
MC, et al. Effect of preload reduction by hemodialysis on left atrial volume and

Cardiac biomarkers in Chronic Kidney Disease
81
echocardiographic Doppler parameters in patients with end-stage renal disease. Am J
Cardiol. 2004;94:1208-10.
168. Tripepi G, Benedetto FA, Mallamaci F, Tripepi R, Malatino L, Zoccali C. Left
atrial volume monitoring and cardiovascular risk in patients with end-stage renal
disease: a prospective cohort study. J Am Soc Nephrol. 2007;18:1316-22.
169. Kadappu KK, Boyd A, Eshoo S, Haluska B, Yeo AE, Marwick TH, et al.
Changes in left atrial volume in diabetes mellitus: more than diastolic dysfunction? Eur
Heart J Cardiovasc Imaging. 2012;13:1016-23.
170. Sakuma M, Nakamura M, Tanaka F, Onoda T, Itai K, Tanno K, et al. Plasma B-
type natriuretic peptide level and cardiovascular events in chronic kidney disease in a
community-based population. Circ J. 2010;74:792-7.
171. Yasuda K, Kimura T, Sasaki K, Obi Y, Iio K, Yamato M, et al. Plasma B-type
natriuretic peptide level predicts kidney prognosis in patients with predialysis chronic
kidney disease. Nephrol Dial Transplant. 2012;27:3885-91.
172. Srisawasdi P, Vanavanan S, Charoenpanichkit C, Kroll MH. The effect of renal
dysfunction on BNP, NT-proBNP, and their ratio. Am J Clin Pathol. 2010;133:14-23.
173. Tagore R, Ling LH, Yang H, Daw HY, Chan YH, Sethi SK. Natriuretic peptides
in chronic kidney disease. Clin J Am Soc Nephrol. 2008;3:1644-51.
174. Zoccali C, Mallamaci F, Benedetto FA, Tripepi G, Parlongo S, Cataliotti A, et
al. Cardiac natriuretic peptides are related to left ventricular mass and function and
predict mortality in dialysis patients. J Am Soc Nephrol. 2001;12:1508-15.
175. Fu S, Luo L, Ye P, Yi S, Liu Y, Zhu B, et al. The ability of NT-proBNP to
detect chronic heart failure and predict all-cause mortality is higher in elderly Chinese
coronary artery disease patients with chronic kidney disease. Clin Interv Aging.
2013;8:409-17.

Cardiac biomarkers in Chronic Kidney Disease
82
176. Varghese K, Cherian G, Abraham UT, Hayat NJ, Johny KV. Predictors of
coronary disease in patients with end stage renal disease. Ren Fail. 2001;23:797-806.
177. Bruch C, Fischer C, Sindermann J, Stypmann J, Breithardt G, Gradaus R.
Comparison of the prognostic usefulness of N-terminal pro-brain natriuretic Peptide in
patients with heart failure with versus without chronic kidney disease. Am J Cardiol.
2008;102:469-74.
178. Roberts MA, Polkinghorne KR, McDonald SP, Ierino FL. Secular trends in
cardiovascular mortality rates of patients receiving dialysis compared with the general
population. Am J Kidney Dis. 2011;58:64-72.
179. Newman AB, Arnold AM, Naydeck BL, Fried LP, Burke GL, Enright P, et al.
"Successful aging": effect of subclinical cardiovascular disease. Arch Intern Med.
2003;163:2315-22.
180. Kim MK, Kim B, Lee JY, Kim JS, Han BG, Choi SO, et al. Tissue Doppler-
derived E/e' ratio as a parameter for assessing diastolic heart failure and as a predictor of
mortality in patients with chronic kidney disease. Korean J Intern Med. 2013;28:35-44.
181. Tripepi G, Mattace-Raso F, Mallamaci F, Benedetto FA, Witteman J, Malatino
L, et al. Biomarkers of left atrial volume: a longitudinal study in patients with end stage
renal disease. Hypertension. 2009;54:818-24.
182. From AM, Scott CG, Chen HH. The development of heart failure in patients
with diabetes mellitus and pre-clinical diastolic dysfunction a population-based study. J
Am Coll Cardiol. 2010;55:300-5.
183. Di Bonito P, Moio N, Cavuto L, Covino G, Murena E, Scilla C, et al. Early
detection of diabetic cardiomyopathy: usefulness of tissue Doppler imaging. Diabet
Med. 2005;22:1720-5.

Cardiac biomarkers in Chronic Kidney Disease
83
184. Poirier P, Bogaty P, Garneau C, Marois L, Dumesnil JG. Diastolic dysfunction
in normotensive men with well-controlled type 2 diabetes: importance of maneuvers in
echocardiographic screening for preclinical diabetic cardiomyopathy. Diabetes Care.
2001;24:5-10.
185. Galderisi M. Diastolic dysfunction and diabetic cardiomyopathy: evaluation by
Doppler echocardiography. J Am Coll Cardiol. 2006;48:1548-51.
186. Zarich SW, Arbuckle BE, Cohen LR, Roberts M, Nesto RW. Diastolic
abnormalities in young asymptomatic diabetic patients assessed by pulsed Doppler
echocardiography. J Am Coll Cardiol. 1988;12:114-20.
187. Zabalgoitia M, Ismaeil MF, Anderson L, Maklady FA. Prevalence of diastolic
dysfunction in normotensive, asymptomatic patients with well-controlled type 2
diabetes mellitus. Am J Cardiol. 2001;87:320-3.
188. Ernande L, Bergerot C, Rietzschel ER, De Buyzere ML, Thibault H,
Pignonblanc PG, et al. Diastolic dysfunction in patients with type 2 diabetes mellitus: is
it really the first marker of diabetic cardiomyopathy? J Am Soc Echocardiogr.
2011;24:1268-75 e1.
189. Mandinov L, Eberli FR, Seiler C, Hess OM. Diastolic heart failure. Cardiovasc
Res. 2000;45:813-25.
190. Slama M, Susic D, Varagic J, Frohlich ED. Diastolic dysfunction in
hypertension. Curr Opin Cardiol. 2002;17:368-73.
191. Naqvi TZ, Neyman G, Broyde A, Mustafa J, Siegel RJ. Comparison of
myocardial tissue Doppler with transmitral flow Doppler in left ventricular hypertrophy.
J Am Soc Echocardiogr. 2001;14:1153-60.

Cardiac biomarkers in Chronic Kidney Disease
84
192. Pearson AC, Gudipati C, Nagelhout D, Sear J, Cohen JD, Labovitz AJ.
Echocardiographic evaluation of cardiac structure and function in elderly subjects with
isolated systolic hypertension. J Am Coll Cardiol. 1991;17:422-30.
193. Eshoo S, Ross DL, Thomas L. Impact of mild hypertension on left atrial size and
function. Circ Cardiovasc Imaging. 2009;2:93-9.

Cardiac biomarkers in Chronic Kidney Disease
85
Chapter 2: General methodology

Cardiac biomarkers in Chronic Kidney Disease
86
General methodology
Outlined below is the general methodology that has been used throughout the conduct
of the various sub studies that comprise this body of research.
2.1 Subject groups
Study approval was obtained from the Human Research and Ethics Committee South
Western Area Health Service (HREC/09/LPOOL/53). All participants provided written
informed consent.
One hundred subjects with stage 3 chronic kidney disease (CKD), (eGFR of 30-59
ml/min/1.73m2) by modified diet in renal disease formula were recruited from
Liverpool Hospital, Sydney, Australia. Staging of CKD was done as per National
Kidney Foundation criteria1. Patients were identified from the renal outpatient clinics.
All patients had renal function checked for the previous six month to ensure no acute
deterioration in renal function due to any cause and that stable renal dysfunction was
present over the 6 month period prior. Risk factor matched controls were recruited from
Liverpool Hospital from among patients screened as part of the chest pain pathway.
Additionally, age, gender and risk factor matched controls with normal renal function,
were randomly selected from a patient data base from the Canberra Hospital, ACT.
All subjects had detailed medical history including cardiovascular symptoms,
medication history, family history and risk factors. They all underwent detailed clinical
examination including obtaining height, weight and blood pressure, as well as a
systemic examination. All recruited subjects had a baseline ECG, baseline blood for
renal function, full blood count, hsTnT, NT- pro BNP and glycosylated haemoglobin
where appropriate. They also had urine examination for albumin, protein and creatinine.

Cardiac biomarkers in Chronic Kidney Disease
87
All patients had a comprehensive baseline echocardiographic examination and
proceeded to a stress echocardiogram to rule out ischaemic heart disease. They also had
cardiac biomarkers tested; hsTnT and NT- proBNP were evaluated at baseline,
immediately after and 2 hours post exercise. All blood samples were spun and serum
was stored at -800 freezer for analysis by batch processing.
Exclusion criteria:
1. Patients with a history of previous cardio vascular disease, including coronary
artery disease, valvular heart disease, cardiomyopathy or any cardiac arrhythmia.
2. Patients who had more than mild valvular regurgitation or stenosis or significant
mitral annular calcification, were excluded from the study.
3. Patients who had positive stress echocardiogram for exercise induced ischemia
were excluded from the study.
2.2 Echocardiography
A comprehensive transthoracic echocardiogram, including 2 dimensional, colour
Doppler and tissue Doppler imaging, was performed in all recruited patients.
Commercially available ultrasound machines (Vivid 7 and vivid E9, General Electric
Medical Systems, Milwaukee, WI, USA) equipped with a 2.5-MHz variable frequency
transducer was used for echocardiographic evaluation. M mode, 2D and colour Doppler
images were obtained from standard echocardiographic views, including parasternal and
apical views with subjects in the left lateral decubitus position. Zoomed views of the
LA were obtained in 4 and 2 chamber views at high frame rate (>70fps) and an average
of 3 cardiac cycles was stored for off line measurements. Tissue Doppler imaging of the
LA was performed and images were acquired at high frame rates (~110 fps) and stored
digitally for offline analysis.

Cardiac biomarkers in Chronic Kidney Disease
88
2.2.1 Left ventricular measurements
LV end systolic and end diastolic volumes were measured by Simpson’s biplane
method from the apical 4 and 2 chamber views and the LV ejection fraction was
calculated. Left ventricular wall thickness, LV end diastolic and end systolic diameters
were measured using M mode from the parasternal long axis view and LV mass index
(LVMI) was calculated using the LV end diastolic diameter, interventricular septal and
posterior wall thickness as per ASE criteria2, 3.
2.2.2 Diastolic function
Transmitral flow velocities were obtained by placing a pulsed Doppler sample volume
at the mitral leaflet tips in the apical 4-chamber view. Peak velocity in early (E-wave)
and late diastole (A-wave) and the E-wave deceleration time (DT) were measured and
E/A ratio calculated (Fig1.9).
Pulsed wave Doppler tissue imaging was used to measure peak velocity in systole (s’)
early (e’) and late (a’) diastole with the sample volume placed at the septal and lateral
annulus 4. An average of the septal and lateral e’ velocities were calculated as per ASE
recommendations5 (Fig.2.1).
Fig. 2.1. Tissue Doppler imaging

Cardiac biomarkers in Chronic Kidney Disease
89
Left ventricular diastolic function was classified using standard echocardiographic
parameters, including transmitral peak E velocity, peak A velocity, the E/A ratio and
deceleration time. Patients were divided into groups based on diastolic function as per
ASE criteria 5 (Table 2.1).
Group Deceleration time(ms) E/A ratio e’ velocity(cm/s)
Normal 160-240 0.9-1.5 ≥10
Impaired relaxation >240 <0.9 <10
Pseudo normal 160 - 240 0.9 - 1.5 <8
Restrictive < 160 > 2.0 <5
Table 2.1 Grades of diastolic dysfunction6
2.2.3 LA measurements
Maximal LA volume was measured at end systole from zoomed images of the LA in the
apical 4 and 2 chamber views using Simpson’s biplane method; LA volume was
indexed to BSA (LAVI)7, 8. An average of 3 measurements was used for all parameters.
2.2.4 LA strain
LA strain was obtained by using two technique; tissue Doppler derived strain and 2D
speckle tracking strain.
2.2.4.1Colour tissue Doppler Strain
Colour Doppler tissue images were obtained in both the apical 4 and 2 chamber views
(septal, and lateral, inferior and anterior walls) with sector width selected to maintain
frame rates >100 fps and were analysed off-line using commercially available software
(Echo PAC version 6.2)9, 10. LA global strain and SR were calculated as an average of

Cardiac biomarkers in Chronic Kidney Disease
90
strain measured from 4 sites (anterior, inferior, septal and lateral walls), with particular
emphasis to maintain an angle of interrogation of less than 30° with the atrial walls
(Figure 1.12 and 1.13). The sample volume (10x2mm) was placed in the superior
segments of the septal, lateral, inferior and anterior walls and tracked frame by frame, to
maintain its position within the LA wall. A Gaussian 60 smoothing was used and the
peak systolic strain and SR were measured in each segment. SR is the rate of change in
strain and is measure throughout the cardiac cycle; SR was measured in systole (SRs),
early diastole (SRe), as well as in late diastole (SRa). GS and SR for final analysis were
calculated by averaging values from the septal, lateral, inferior, and anterior walls.
2.2.4.2 Two dimensional LA strain
2D LA strain analysis was performed using customized computer software (Echo PAC,
Vingmed, General Electric, Horten, Norway), from 4- and 2-chamber LA images
acquired at high frame rates (>70 fps)11. The endocardial border was manually traced in
end-systole and the software automatically tracked the myocardial region of interest
(ROI), with QRS gating as previously accepted12. The width of the ROI was manually
adjusted (by decreasing the ROI for the thin walled atrium) to ensure proper tracking of
the myocardial wall. Peak systolic strain measurement was obtained (Figure1. 14). SRs,
SRe and SRa were measured (Figure1.15).
2.2.5 Left ventricular 2D strain
LV myocardial strain was similarly measured from apical 4- and 2-chamber images,
obtained at high frame rates (>70fps) (Figure 12). Unlike the LA, the region of interest
(ROI) used for LV strain measurement was significantly thicker. An average of 3 values
was calculated as a measure of LV strain.

Cardiac biomarkers in Chronic Kidney Disease
91
2.3 Inter and Intra observer Variability
We randomly selected 10 studies for inter and intra observer variability. LA volume,
strain and SR were analysed by 2 different individuals and by the same individual on a
different day using offline images, to evaluate inter and intra observer variability. Inter
and intra observer variability was evaluated by estimating intra class correlation
coefficients.
2.4 NT- pro BNP assay
Blood samples were collected from all subjects using a wide bore cannula from the
anticubital fossa vein. These samples were centrifuged for 20 minutes at 2000 rpm and
the serum was extracted and was stored at -800C for batch analysis. NT-pro BNP
immunoassay (Roche Mannheim, Germany) was performed by using standard
diagnostic techniques13. A cut off value of >100pg/ml, for the particular kit used
indicates cardiac involvement with left ventricular dysfunction (which includes either
systolic and/ or diastolic cardiac)14.
2.5 Statistical Analysis
All continuous variables are expressed as mean ± SD, while categorical variables are
expressed as a percentage. We used log transformation of NT-pro BNP for the statistical
calculation. An independent samples t-test analysis was performed to evaluate
differences between the CKD group and risk factor matched controls. Differences
among groups were examined by one way ANOVA with post hoc Bonferroni analysis.
Correlation between variables was analysed using Pearson’s correlation. Multiple linear
regression or logistic regression model was used to determine independent predictors as
appropriate. In order to compare the incremental predictive value of various

Cardiac biomarkers in Chronic Kidney Disease
92
echocardiographic parameters, a baseline model containing significant
echocardiographic co-variates was constructed, and a logistic regression model was
used to obtain the ‘c’ value. Inter and intra observer variability was assessed by
intraclass correlation coefficient. Data were analysed by either Statistical Package for
Social Sciences for Windows, version 22 (SPSS, Chicago, Illinois) or SAS 9.2 (Cary,
North Carolina, USA).

Cardiac biomarkers in Chronic Kidney Disease
93
Reference:
1. K/doqi clinical practice guidelines for chronic kidney disease: Evaluation,
classification, and stratification. American journal of kidney diseases.
2002;39:S1-266
2. Devereux RB, Alonso DR, Lutas EM, Gottlieb GJ, Campo E, Sachs I, Reichek
N. Echocardiographic assessment of left ventricular hypertrophy: Comparison to
necropsy findings. The American journal of cardiology. 1986;57:450-458
3. Foppa M, Duncan BB, Rohde LE. Echocardiography-based left ventricular mass
estimation. How should we define hypertrophy? Cardiovascular ultrasound.
2005;3:17
4. Ommen SR, Nishimura RA, Appleton CP, Miller FA, Oh JK, Redfield MM,
Tajik AJ. Clinical utility of doppler echocardiography and tissue doppler
imaging in the estimation of left ventricular filling pressures: A comparative
simultaneous doppler-catheterization study. Circulation. 2000;102:1788-1794
5. Nagueh SF, Appleton CP, Gillebert TC, Marino PN, Oh JK, Smiseth OA,
Waggoner AD, Flachskampf FA, Pellikka PA, Evangelista A.
Recommendations for the evaluation of left ventricular diastolic function by
echocardiography. Journal of the American Society of Echocardiography.
2009;22:107-133
6. Nagueh SF, Appleton CP, Gillebert TC, Marino PN, Oh JK, Smiseth OA,
Waggoner AD, Flachskampf FA, Pellikka PA, Evangelisa A. Recommendations
for the evaluation of left ventricular diastolic function by echocardiography.
European journal of echocardiography. 2009;10:165-193
7. Lang RM, Badano LP, Mor-Avi V, Afilalo J, Armstrong A, Ernande L,
Flachskampf FA, Foster E, Goldstein SA, Kuznetsova T, Lancellotti P, Muraru

Cardiac biomarkers in Chronic Kidney Disease
94
D, Picard MH, Rietzschel ER, Rudski L, Spencer KT, Tsang W, Voigt JU.
Recommendations for cardiac chamber quantification by echocardiography in
adults: An update from the american society of echocardiography and the
european association of cardiovascular imaging. Journal of the American
Society of Echocardiography. 2015;28:1-39 e14
8. Lang RM, Bierig M, Devereux RB, Flachskampf FA, Foster E, Pellikka PA,
Picard MH, Roman MJ, Seward J, Shanewise J, Solomon S, Spencer KT, St
John Sutton M, Stewart W. Recommendations for chamber quantification.
European journal of echocardiography. 2006;7:79-108
9. Eshoo S, Boyd AC, Ross DL, Marwick TH, Thomas L. Strain rate evaluation of
phasic atrial function in hypertension. Heart. 2009;95:1184-1191
10. Kadappu KK, Kuncoro AS, Hee L, Aravindan A, Spicer ST, Suryanarayanan G,
Xuan W, Boyd A, French JK, Thomas L. Chronic kidney disease is
independently associated with alterations in left atrial function.
Echocardiography. 2014;31:956-964
11. Kadappu KK, Boyd A, Eshoo S, Haluska B, Yeo AE, Marwick TH, Thomas L.
Changes in left atrial volume in diabetes mellitus: More than diastolic
dysfunction? European heart journal cardiovascular Imaging. 2012;13:1016-
1023
12. Hoit BD. Left atrial size and function: Role in prognosis. Journal of the
American College of Cardiology. 2014;63:493-505
13. Yeo KT, Dumont KE, Brough T. Elecsys nt-probnp and bnp assays: Are there
analytically and clinically relevant differences? Journal of cardiac failure.
2005;11:S84-88

Cardiac biomarkers in Chronic Kidney Disease
95
14. Pfister R, Scholz M, Wielckens K, Erdmann E, Schneider CA. Use of nt-probnp
in routine testing and comparison to bnp. European journal of heart failure.
2004;6:289-293
Cardiac biomarkers in Chronic Kidney Disease
Chapter 3: Changes in left atrial volume in diabetes mellitus more than diastolic dysfunction?
Publication 1
Kadappu KK, Boyd A, Eshoo S, Haluska B, Yeo A, Marwick T and Thomas L. Changes in left atrial volume in diabetes mellitus: more than diastolic dysfunction?
European Heart Journal-Cardiovascular Imaging (2012) 13, 1016-1023
Declaration
I certify that this publication was a direct result of my research towards this PhD and that reproduction in this thesis doesn't breach copyright regulations
Krishna Kishor Kadappu
96
. . . . . . . . . . . . . . . . . . . . . . . . . . . . . . . . . . . . . . . . . . . . . . . . . . . . . . . . . . . . . . . . . . . . . . . . . . . . . . . . . . . . . . . . . . . . . . . . . . . . . . . . . . . . . . . . . . . . . . . . . . . . . . . . . . . . . . . . . . . . . . . . . . . . . . . . . . . . . . . . . . . . . . . . . . . . . . . . . . . . .
. . . . . . . . . . . . . . . . . . . . . . . . . . . . . . . . . . . . . . . . . . . . . . . . . . . . . . . . . . . . . . . . . . . . . . . . . . . . . . . . . . . . . . . . . . . . . . . . . . . . . . . . . . . . . . . . . . . . . . . . . . . . . . . . . . . . . . . . . . . . . . . . . . . . . . . . . . . . . . . . . . . . . . . . . . . . . . . . . . . . .
Changes in left atrial volume in diabetesmellitus: more than diastolic dysfunction?†
Krishna Kishor Kadappu1, Anita Boyd1, Suzanne Eshoo2, Brian Haluska3,Anthony E.T. Yeo4, Thomas H. Marwick5, and Liza Thomas1,6*
1South Western Sydney Clinical School, University of New South Wales and Liverpool Hospital, NSW, Australia; 2University of Western Sydney and Campbelltown Hospital, NSW,Australia; 3Princess Alexandra Hospital, University of Queensland, Brisbane, Australia; 4Ingham Institute for Applied Medical Research, Liverpool, NSW, Australia; 5Cleveland Clinic,Cleveland, USA; and 6University of Sydney, NSW, Australia
Received 18 January 2012; revised 23 March 2012; accepted after revision 28 March 2012; online publish-ahead-of-print 27 April 2012
Aim To evaluate left atrial (LA) volume and function as assessed by strain and strain rate derived from 2D speckle trackingand their association with diastolic dysfunction (DD) in patients with diabetes mellitus (DM).
Methodsand results
Seventy three patients with DM were compared with age- and gender-matched normal controls; 30 patients with DMalone were compared to those with hypertension (HT) alone. The maximum LA volume, traditional measures ofatrial function, 2D strain and strain rate were analysed. The LA indexed volume (LAVI) was larger in DM groupthan that in normal controls (38.2+ 9.9 vs. 20.5+4.8 ml/m2, P , 0.0001), as well as in DM alone compared withhypertensive patients (33.9+ 10 vs. 25.7+8 ml/m2, P , 0.0001). Global strain was significantly reduced in theDM group compared with that in normal controls (22.5+8.67 vs. 30.6+8.27%; P , 0.0001) but was similarwith HT. There was a weak correlation between LAVI and global strain with increasing grades of DD (r ¼ 0.439,P , 0.0001 and r ¼ 2 0.316, P , 0.0001, respectively) in the diabetic group. However, there was no significant dif-ference in LAVI between these groups. A logistic regression analysis for predictors of LAVI demonstrated that onlydiabetes was a determinant of LAVI. Patients with diabetes showed a significant reduction in global strain comparedwith normal controls but no difference with increasing grades of diastolic function.
Conclusions LA enlargement in DM is independent of associated HT and diastolic function. LA enlargement is associated with LAdysfunction as evaluated by 2D strain. It is likely that a combination of DD and a diabetic atrial myopathy contributeto LA enlargement in patients with DM.
- - - - - - - - - - - - - - - - - - - - - - - - - - - - - - - - - - - - - - - - - - - - - - - - - - - - - - - - - - - - - - - - - - - - - - - - - - - - - - - - - - - - - - - - - - - - - - - - - - - - - - - - - - - - - - - - - - - - - - - - - - - - - - - - - - - - - - - - - - - - - - - - - - - - - - - - - - -Keywords Left atrium † Diabetes mellitus † 2D speckle tracking † Strain † Strain rate
IntroductionDiastolic heart failure with preserved left ventricular (LV) systolicfunction is a well-recognized entity.1 The presence of type 2 dia-betes mellitus (DM) in general has a significant association withthe development of diastolic dysfunction (DD) and subsequentheart failure.2 Moreover, the prevalence of LV DD in patientswith DM is significantly greater than that in the general populationand is reported between 43 and 75%.3,4
The ‘booster pump’ effect of left atrial (LA) contraction in thelate diastole contributes up to 30% of cardiac output5 and is of
particular importance in patients with LV dysfunction or heartfailure. Additionally, LA enlargement and dysfunction have beenconsidered surrogate markers of the chronicity and severity ofDD.6 Thus, the evaluation of LA function in patients with DM isimportant as it may reflect underlying DD while at the sametime estimating atrial contractile function contribution to cardiacoutput.
Structural and functional changes in the left atrium have beenpreviously demonstrated in patients with DM albeit in smallnumbers.7,8 Hypertension (HT), a common coexistent cardiacrisk factor is also associated with altered LA size and function.9
†Institution of study: Liverpool Hospital NSW and Princess Alexandra Hospital Brisbane.
* Corresponding author. Tel: +61 2 87383070, Email: [email protected]
Published on behalf of the European Society of Cardiology. All rights reserved. & The Author 2012. For permissions please email: [email protected]
European Heart Journal – Cardiovascular Imaging (2012) 13, 1016–1023doi:10.1093/ehjci/jes084
by guest on Novem
ber 29, 2015D
ownloaded from

It has been established that tissue Doppler-derived strain imagingcan assess LA function in varying conditions with LA dysfunc-tion.10– 13 However, tissue Doppler-derived strain measurementsare time intensive and limited by angle dependency.14 LA straincan also be derived from two-dimensional (2D) images byspeckle tracking which is a semi-automated process not limitedby angle dependency.15
The aim of the present study was to (i) evaluate the LA size inpatients with type 2 DM and evaluate the independent effect ofDM on the LA size compared with controls and those with HTalone, (ii) evaluate LA function by 2D speckle tracking-derivedstrain compared with a group of age-matched normal subjectsand those with HT alone and (iii) to evaluate the LA volumechange with varying grades of DD in patients with DM. We add-itionally hypothesized that LA dysfunction would be present inpatients with DM due to the increased prevalence of DD in DMwith increasing LA size with worsening grades of diastolic function.
Methods
Study populationSeventy-six subjects with type 2 DM were recruited from the Prin-cess Alexandra Hospital, Brisbane. Patients were identified fromthe cardiology and endocrinology department; 43 of the 76patients had coexistent mild HT (mean systolic BP: 140+14 mmHg and mean diastolic BP: 81+ 8 mmHg). Three patientswere excluded from the final analysis due to suboptimal imagequality. All recruited patients were on therapy for DM includingdiet control, oral hypoglycemic agent or insulin. Study approvalwas obtained from the human research and ethics committeeand all recruited patients provided written consent. A comprehen-sive transthoracic echocardiogram was performed in all recruitedpatients. There was no ECG or echocardiographic evidence of cor-onary artery disease and all patients underwent a stress echocar-diogram to rule out latent ischaemia. Patients were excludedfrom the study, if they had greater than mild mitral or aortic regur-gitation or aortic stenosis or any degree of mitral stenosis. None ofthe recruited patients or controls had any history of congestiveheart failure and all patients had a normal LV ejection fraction.
Age-matched ‘normal’ subjects were identified from a depart-mental database at Liverpool Hospital, Sydney. These healthyvolunteers were recruited from the community and were careful-ly screened for a history of cardiovascular, peripheral vascular orcerebrovascular disease and for the presence of cardiovascularrisk factors including HT, DM, hypercholesterolemia. They hadno abnormal findings on routine physical examination, werenormotensive and had a normal ECG and echocardiogram andwere not receiving any cardio-active medications. Thirty patientswith mild HT were identified from a departmental database andrecruited as a comparator group. These subjects had systolicpressure .140 but ,160 mmHg and diastolic pressure .90but ,100 mmHg. Blood pressure recordings were performedon three separate times and all previously recorded measure-ments were ,160/100 mmHg. The HT group had no other asso-ciated cardiac risk factor. A subgroup comparison of the 30
patients with DM alone was performed with the 30 patientswith HT.
Conventional echocardiographyA commercially available ultrasound machine (Vivid 7, GeneralElectric Medical Systems, Milwaukee, WI, USA) equipped with a2.5-MHz variable frequency transducer was used for echocardio-graphic evaluation. 2D and colour Doppler images were obtainedfrom standard echocardiographic views, including parasternal andapical views with patients and subjects in a left lateral decubitusposition. Tissue Doppler imaging was used to obtain systolic anddiastolic velocities from the mitral annulus. 2D images wereacquired at high frame rates (�70 fps) and stored digitally foroffline strain analysis.
Left ventricular measurementsLeft ventricular wall thickness, LV end diastolic (LVEDD) and endsystolic (LVESD) diameters were measured using M mode fromthe parasternal long axis view. LV end systolic and end diastolicvolumes were measured by Simpson’s biplane method from theapical four- and two-chamber views and the LV ejection fractionwas calculated. LV mass index (LVMI) was calculated using the dia-stolic measurements of left ventricular internal diameter, interven-tricular septal thickness and posterior wall thickness.16
Transmitral flow velocities were obtained by placing a pulsedwave Doppler sample volume at the mitral leaflet tips in theapical four-chamber view. Peak velocity in early (E-wave) andlate diastole (A-wave) and E-wave deceleration time (DT) weremeasured and E/A ratio calculated. Pulsed wave Doppler tissueimaging was used to measure the peak velocity in early (E′) andlate (A′) diastole with the sample volume placed at the septaland lateral annulus.17 An average of the septal and lateral E′ veloci-ties were calculated as per ASE recommendation.18 The E/E′ ratiowas calculated as an estimate of LV diastolic pressure.17
Diastolic classificationLV diastolic function was classified as normal (DT ¼ 160–240 ms,E/A ratio ¼ 0.9–1.5, E′ velocity ≥ 10 cm/s), impaired relaxation(DT . 240 ms, E/A ratio , 0.9, E′ velocity , 10 cm/s), pseudo-normal (DT ¼ 160–240 ms, E/A ratio ¼ 0.9–1.5, E′ velocity ,
8 cm/s) and restrictive (DT , 160 ms, E/A ratio . 2.0, E′
velocity , 5 cm/s) as per previously defined criteria.18,19 In threepatients, E′ velocity was between 8 and 10 with DT 160–240and the E/A ratio ¼ 0.9–1.5, with a E/E′ of ,10. These patientswere grouped under the normal diastolic function group. The DMgroup was divided into groups based on diastolic function: Group1, normal (n ¼ 16); Group 2, impaired relaxation (n ¼ 33); Group3, pseudo normal (n ¼ 23) and restrictive (n ¼ 1). As only onepatient had restrictive filling, this patient was combined with the 23patients with pseudonormal filling pattern to comprise Group 3.
Traditional LA measurementsThe LA volume was measured using the prolate ellipse method20
incorporating LA diameters from three planes; the maximum LAvolume was indexed to body surface area (LAVI).
Atrial function was estimated using traditional measures includ-ing the peak transmitral A-wave velocity, A-wave velocity time
Left atrial volume in diabetes mellitus 1017
by guest on Novem
ber 29, 2015D
ownloaded from

integral (VTI) and the atrial fraction (A-wave VTI/total mitral inflowVTI).
An average of three measurements was used for the finalanalysis.
2D speckle tracking strain imagingOf the 76 recruited patients with DM, strain measurements couldonly be obtained in 73 (96%). 2D speckle tracking strain and strainrate (SR) analysis, using customized computer software (EchoPAC,Vingmed, General Electric, Horten, Norway) was performed usinga zoomed view of the LA from the apical four chamber acquired at�70 fps. The LA endocardium was manually drawn in end systole;thereafter the endocardial borders were automatically tracked bythe computer software throughout the cardiac cycle. The LA myo-cardial width was adjusted by varying the thickness of the ROIapplied to track the LA borders. The LA myocardium wasdivided into six segments (basal, mid-, and apical segments of theseptum and lateral wall, respectively). The software displayedpeak longitudinal systolic strain (S) (Figure 1A), systolic (S-SR),early diastolic (E-SR), and late diastolic (A-SR) atrial strain ratesfor each of the six individual segments (Figure 1B).
LA S-SR is measured during the passive stretching of the LAduring left ventricular systole and is thus an index of LA reservoirfunction.21 Similarly, the E-SR and A-SR have been used as indicesof LA conduit and LA contractile function, respectively.22 Data pre-sented are an average of three measurements.
Statistical analysisAll values are expressed as mean+ SD. An independent samples‘t’-test analysis was performed to evaluate the differencesbetween the DM group and normal controls. Differences amongthose with DM alone (n ¼ 30), HT group and normal controlswere examined by one-way ANOVA with post hoc Bonferroni ana-lysis. Data were considered significant if P , 0.05. Spearman’s rankcorrelation was used to assess the correlation between LAVI andglobal strain with grades of DD. Differences among the DMgroup based on diastolic function grade were examined byone-way ANOVA with post hoc Bonferroni analysis. Data wereconsidered significant if P , 0.05. Data were analysed using SPSS(version 17.0, SPSS, Inc., Chicago, Illinois). A logistic regression ana-lysis was performed using SAS 9.2 (Cary, NC, USA) to examine therelationship between LAVI and global strain with other covariatesincluding age, diastolic grade, E/E′ ratio, LVMI, the presence of HTand patient group (i.e. the presence of diabetes).
ResultsA total of 73 DM patients and an equal number of age-matchedcontrols were included in the final analysis. Demographic data ofthe DM group vs. controls are presented in Table 1. As expected,the DM group weighed more than controls (92.3+ 20.3 vs.74.2+14.6 kg, P , 0.0001) and had a higher BSA (2.1+ 0.25 vs.1.86+0.21 m2, 0.0001). In the DM group, 16 subjects hadnormal diastolic function (Group 1), 33 impaired relaxation(Group 2) and 23 pseudonormal or restrictive filling (Group 3)as stated earlier. Thus, 78% of the DM group had some form ofDD, while 33% had Grade 2 or more DD. In contrast 89% patients
in the control group had normal diastolic function and the remain-ing 11% (8 patients) had impaired relaxation. Forty-three of the 73patients had mild HT: 12 in Group 1, 16 in Group 2, and 15 inGroup 3 had coexistent mild HT.
Demographic data in the subgroup with DM alone vs. patientswith HT and controls are presented in Table 2. The HT groupwas older, and not surprisingly had a higher systolic and diastolicblood pressure. The DM group weighed more than both healthycontrols and HT group and consequently had a higher BSA.
LV systolic and diastolic parametersLV end diastolic and end systolic diameters were similar in the DMgroup and controls. Although LV ejection fraction was in thenormal range in both groups, the LV ejection fraction was higherin the DM group (Table 1). The LV mass was higher in the DMgroup but when indexed to BSA (LVMI), no statistically significantdifferences were observed between groups (Table 1). As expected,traditional LV diastolic function parameters including peak E and Avelocities, E/A ratio, DT, and E/E′ were abnormal in patients withDM compared with controls (Table 1).
Comparison between the subgroup of patients with DM alonevs. HT group and normal controls demonstrated LV wall thicknesswas increased in the HT group, with a significantly greater indexedLV mass. LVEF was in the normal range in the three groups withLVEF higher than controls in both the DM and HT groups. Trad-itional LV diastolic parameters were altered in the DM and HTgroups (Table 2).
LA volume and functionThe LA maximum volume and LAVI were significantly larger in theDM group than that in normal controls (Table 1). The peak A vel-ocity was higher in the DM group. Although the A-wave VTI wassimilar, a higher atrial fraction as well as the A′ velocity wasobserved in the DM group (Table 1). In the subgroup comparison,LAVI increased only in the DM group compared with both thegroups with HT and normal controls. Parameters of atrial functionincluding A-wave VTI, atrial fraction, and A′ velocity were similar inthe DM and HT groups.
Atrial strain measurementsPeak positive 2D strain was reduced in the DM group across all sixsegments (Table 3). Global strain, derived as an average of six seg-ments, was 22.5+8.7% in the diabetic group vs. 30.6+ 8.3% inthe normal control group (P value , 0.0001; Table 3). Patients inthe DM group had altered phasic LA function with impaired LAreservoir and conduit functions as indicated by a reduction in LAS-SR and LA E-SR, respectively. LA A-SR, an indicator of LA con-tractile function, was also reduced in the DM group (Table 3). Inthe subgroup comparison between the DM and HT groups vs.controls, LA strain was similar in the DM and HT groups with asignificant reduction in S-SR, E-SR, and A-SR in the DM group(Table 4).
Determinants of LAVI in DMWe examined the relationship between LAVI to age, group (DMand control groups), E/E′ ratio, LVMI, diastolic grade, LVEF, and
K.K. Kadappu et al.1018
by guest on Novem
ber 29, 2015D
ownloaded from

presence of HT to determine univariate predictors of LAVI. Thesepredictors were entered into a logistic regression analysis(Table 5). In this model, a statistically significant relationship was
only present between LAVI and presence of diabetes (P ,
0.0001), adjusting for all other covariates including the diastolicgrade and presence of HT. The logistic regression model
Figure 1 (A) Global strain of the left atrium obtained from the apical four-chamber view and (B) strain rate obtained from the four-chamberview demonstrating systolic (S-SR) and diastolic strain rate (E-SR and A-SR).
Left atrial volume in diabetes mellitus 1019
by guest on Novem
ber 29, 2015D
ownloaded from

demonstrated a predictive value (power) of 0.88 for the patientgroup (i.e. presence of diabetes) to LAVI.
LA volume and dysfunction in the DMgroup based on severity of diastolicdysfunctionA weak correlation was observed between varying grades of DDand LAVI by Spearman’s rank correlation (r ¼ 0.439, P , 0.0001).Similarly, a weak negative correlation was seen with global strainand grades of DD (r ¼ 2 0.316, P , 0.0001).
A subgroup analysis for varying grades of LVDD was performedwithin the DM group using ANOVA with post hoc Bonferoni cor-rection. However, there was no significant difference in LAVI,global strain or systolic or diastolic SR measurements amongvarying grades of diastolic function in the DM group (Table 6).
DiscussionOur study confirms the high prevalence of DD in DM, with 78% ofpatients with DM manifesting some diastolic abnormality. We de-liberately included a significant proportion with coexistent mild HTas would be seen in the routine clinical scenario. We demon-strated LA enlargement in patients with DM that was independentof the effects of HT and grade of DD. There was associated atrialdysfunction that was also independent of the grades of DD in thisgroup. The subgroup analysis performed between patients withDM alone and a group with HT additionally demonstrated a signifi-cantly larger LAVI in the DM group.
LA sizeLA enlargement has previously been reported in subjects with DM.Poulsen et al.1 demonstrated moderate-to-severe LA enlargement(LA volume index . 32 ml/m2) in a third of their study populationcomprising 305 subjects with DM. However, only 40% had abnor-mal diastolic function in their study group. In our study population,two-thirds of the DM group had DD and more than half had asso-ciated HT. LA enlargement is a surrogate marker of LVDD6 andgiven the high prevalence of DD in the DM group is a likely con-tributor. LAVI was larger in the patients with DM alone thanthose in HT.
In the current DM group, 16 patients were classified as having‘normal’ diastolic function; interestingly LA enlargement waspresent in this group as well. Further, no significant differencewas noted in the LA volume across the three grades of diastolicfunction. These observations are similar to that reported byJarnert.8 In that study, mean LAVI was increased even in the sub-group with normal diastolic function. Despite a significant increasein the maximum LAV with grades of DD, LAVI failed to demon-strate any significant difference between grades of DD. This sug-gests that an altered LV diastolic function in DM onlycontributes in part to observed LA changes. Thus, it is likely thatan independent atrial cardiomyopathy associated with DM maybe a likely contributor to LA enlargement.
LA functionEchocardiographic parameters to measure LA function are stillevolving. Global and phasic LA function using 2D strain and SRparameters are feasible and have been used to assess LAdysfunction.14,15
2-D speckle tracking-derived strain analysis was demonstratedto be a feasible method to assess LA longitudinal strain inhealthy subjects.23 2D strain measurements are semi-automatedwith less variability compared with tissue Doppler-derivedstrain.24 In the current study, both global and segmental systolicstrains were significantly reduced in the DM group as previouslydemonstrated using TDI7 and velocity vector imaging (VVI)-derivedstrain.8 Global strain was also similarly reduced in the group withHT.
Muranaka et al.7 suggested that the fibrotic change in the atriumin diabetes is responsible for the reduction in atrial phasic functionas measured by SR parameters. Asbun et al.25 also demonstratedthat diabetic cardiomyopathy causes atrial fibrosis with a conse-quent reduction in LA compliance.25 Thus, atrial fibrosis may
. . . . . . . . . . . . . . . . . . . . . . . . . . . . . . . . . . . . . . . . . . . . . . . . . . . . . . . . . . . . . . . . . . . . . . . . . . . . . . . .
Table 1 Demographic and echocardiographic (leftventricular and left atrial) parameters
Parameters DM group(n 5 73)
Normal(n 5 73)
P value
Age (years) 43+11 43+10 0.79
Height (cm) 168.1+9.4 170.6+9.1 0.10
Weight (kg) 92.25+20.30 74.19+14.61 ,0.0001*
BSA (m2) 2.09+0.25 1.86+0.21 ,0.0001*
Co-existenthypertension
43 (59%) 0
Smokers 35 (48%) 0
LVEDD (cm) 4.7+0.56 4.7+0.79 0.7
LVESD (cm) 2.8+0.52 2.9+0.47 0.8
LVEF (%) 67+5 61+4 0.01*
Peak E velocity (m/s) 0.69+0.14 0.73+0.03 0.03*
Peak A velocity (m/s) 0.7+0.15 0.59+0.19 ,0.0001*
E/A ratio 1.02+0.26 1.34+0.41 ,0.0001*
DT (ms) 224.9+35.5 208.2+37.5 0.006*
S′ velocity (cm/s) 6.9+1.4 7.4+1.4 0.02*
E′ velocity (cm/s) 6.5+1.9 9.5+2.2 ,0.0001*
E/E′ ratio 11.34+3.4 8.07+2.1 ,0.0001*
LV mass (g) 177.9+50.5 153.3+58.5 0.008*
LVMI (g/m2) 85+21 81+27 0.37
LAV (ml) 79.8+29.3 38.2+9.9 ,0.0001*
LAVI (ml/m2) 38.2+9.9 20.5+4.8 ,0.0001*
A VTI (cm) 7.8+1.9 7.6+2.3 0.59
A′ velocity (cm/s) 9.5+1.8 8.8+1.6 0.029*
Atrial fraction (%) 38.19+7.59 35.48+8.15 0.04*
A velocity, late mitral inflow velocity; A′ velocity, late diastolic mitral annular tissueDoppler velocity; BSA, body surface area; DT, deceleration time; E velocity, earlymitral inflow velocity; E′ velocity, early diastolic mitral annular tissue Dopplervelocity; LAV, maximum left atrial volume; LAVI, maximum left atrial volumeindexed to BSA; LV, left ventricle; LVEDD, left ventricular end diastolic diameter;LVEF, left ventricular ejection fraction; LVESD, left ventricular end systolicdiameter; LVMI, left ventricular mass indexed to BSA; S′ velocity, systolic mitralannular tissue Doppler velocity; VTI, velocity time integral.*P value , 0.05 compared with normal.
K.K. Kadappu et al.1020
by guest on Novem
ber 29, 2015D
ownloaded from

alter LA compliance with a reduction in reservoir function asobserved by the reduced S-SR. E-SR was reduced and is the reflec-tion of altered LV relaxation with a consequent reduction in the LAconduit function. Thus, it is likely that atrial fibrosis is greater in theDM as both S-SR and E-SR were higher in the HT group.
Traditional parameters including transmitral A velocity, atrialfraction, and A′ velocity were increased in subjects with DM aswell as in the group with HT. These indicate a compensatory in-crease in blood flow in late diastole given the reduced early diastol-ic filling consequent to LV DD. The increased LA volume wouldadditionally result in increased flow during atrial contraction.However the A-SR was decreased, suggesting altered intrinsic LAfunction with a reduction in atrial deformation during its contract-ile phase even compared with the HT group.
LA changes and grades of diastolicdysfunctionLA enlargement was present in the DM group even in patients withnormal diastolic function; only a weak correlation was observedbetween LAVI and varying diastolic grades. Despite the presence
. . . . . . . . . . . . . . . . . . . . . . . . . . . . . . . . . . . . . . . . . . . . . . . . . . . . . . . . . . . . . . . . . . . . . . . . . . . . . . . . . . . . . . . . . . . . . . . . . . . . . . . . . . . . . . . . . . . . . . . . . . . . . . . . . . . . . . . . . . . . . . . . . . . . . . . . . . . . . . . . . . . . . . . . . . . . . . .
Table 2 Demographic and echocardiographic parameters in diabetes mellitus subgroup vs. hypertension group vs.controls
Parameters DM only (n 5 30) Normal (n 5 73) HT group (n 5 30) P value
Age (years) 49+12† 43+10 56+13* ,0.0001
Height (cm) 167.1+8 170.6+9.1 168.5+11 0.22
Weight (kg) 94+20*,† 74.19+14.61 81.5+13 ,0.0001
BSA (m2) 2.12+0.3*,† 1.86+0.21 1.95+0.2 ,0.0001
Systolic BP (mm Hg) 118.5+11*,† 125.5+11 145.7+17* ,0.0001
Diastolic BP (mm Hg) 74.2+7.5† 77.8+6.9 84.4+9.6* ,0.001
LVEDD (cm) 4.6+0.53 4.7+0.79 4.8+0.4 0.65
LVESD (cm) 2.7+0.54 2.9+0.47 2.9+0.51 0.16
LVEDV(ml) 85+18.7 89+21.4 94+19.5 0.09
LVESV(ml) 29+9.6* 35+10.4 33+10.9 0.001
LVEF (%) 63+13.7 61+4 66+6* 0.001
Peak E velocity (m/s) 0.66+0.13* 0.73+0.03 0.71+0.15 0.05
Peak A velocity (m/s) 0.7+0.17* 0.59+0.19 0.73+0.26* 0.002
E/A ratio 0.98+0.27* 1.34+0.41 1.05+0.36* ,0.0001
DT (ms) 230.1+38.9 208.2+37.5 240.4+40.2* 0.002
S′ velocity (cm/s) 6.4+0.9* 7.4+1.4 7.2+1.4 0.002
E′ velocity (cm/s) 5.9+1.9*† 9.5+2.2 7.3+2* ,0.0001
E/E′ ratio 12.03+3.7* 8.07+2.1 10.67+4.7* ,0.0001
LVMI (g/m2) 82+26† 81+27 98+13* 0.007
LAV (ml) 71.4+21.6*,† 38.2+9.9 50.2+16.5* ,0.0001
LAVI (ml/m2) 33.9+10.5*,† 20.5+4.8 25.7+8.1* ,0.0001
A VTI (cm) 7.3+1.8 7.6+2.3 8.3+2.9 0.23
A′ (cm/s) 9.2+2.1 8.8+1.6 10+2* 0.02
Atrial fraction (%) 36.84+8.57 35.48+8.15 39.67+11.12 0.11
A velocity, late mitral inflow velocity; A′ velocity, late diastolic mitral annular tissue Doppler velocity; BSA, body surface area; DT, deceleration time; E velocity, early mitral inflowvelocity; E′ velocity, early diastolic mitral annular tissue Doppler velocity; LAV, maximum left atrial volume; LAVI, maximum left atrial volume indexed to BSA; LVEDD, leftventricular end diastolic diameter; LVEDV, left ventricular end diastolic volume; LVEF, left ventricular ejection fraction; LVESD, left ventricular end systolic diameter ,LVESV, leftventricular end systolic volume; LVMI, left ventricular mass indexed to BSA; S′ velocity, systolic mitral annular tissue Doppler velocity; VTI, Velocity time integral.*P , 0.05 compared with normal; †P , 0.05 compare with the HT group.
. . . . . . . . . . . . . . . . . . . . . . . . . . . . . . . . . . . . . . . . . . . . . . . . . . . . . . . . . . . . . . . . . . . . . . . . . . . . . . . .
Table 3 2D strain and strain rate in patients withdiabetes and normal controls
Parameters DM group(n 5 73)
Normal(n 5 73)
P value
Basal septum strain (%) 31.5+16.3 42.9+17.9 ,0.0001*
Mid septum strain (%) 31.1+13.6 42.4+15.9 ,0.0001*
Apical septum strain (%) 22.2+13.5 28.5+14.6 0.008*
Basal lateral strain (%) 35.4+17.4 49.9+20 ,0.0001*
Mid lateral strain (%) 21.6+12.7 28.3+13 0.002*
Apical lateral strain (%) 10.9+14.9 17.3+12.4 0.005*
Global strain (%) 22.5+8.7 30.6+8.3 0.0001*
S-SR (s-1) 1.1+0.4 1.7+0.4 ,.0001*
E-SR (s-1) 0.9+0.4 1.6+0.6 ,.0001*
A-SR (s-1) 1.1+0.5 1.6+0.6 ,.0001*
A-SR, late diastolic strain rate; DM, diabetes mellitus; E-SR, early diastolic strainrate; S-SR, systolic strain rate.*P value , 0.05 compared with normal.
Left atrial volume in diabetes mellitus 1021
by guest on Novem
ber 29, 2015D
ownloaded from
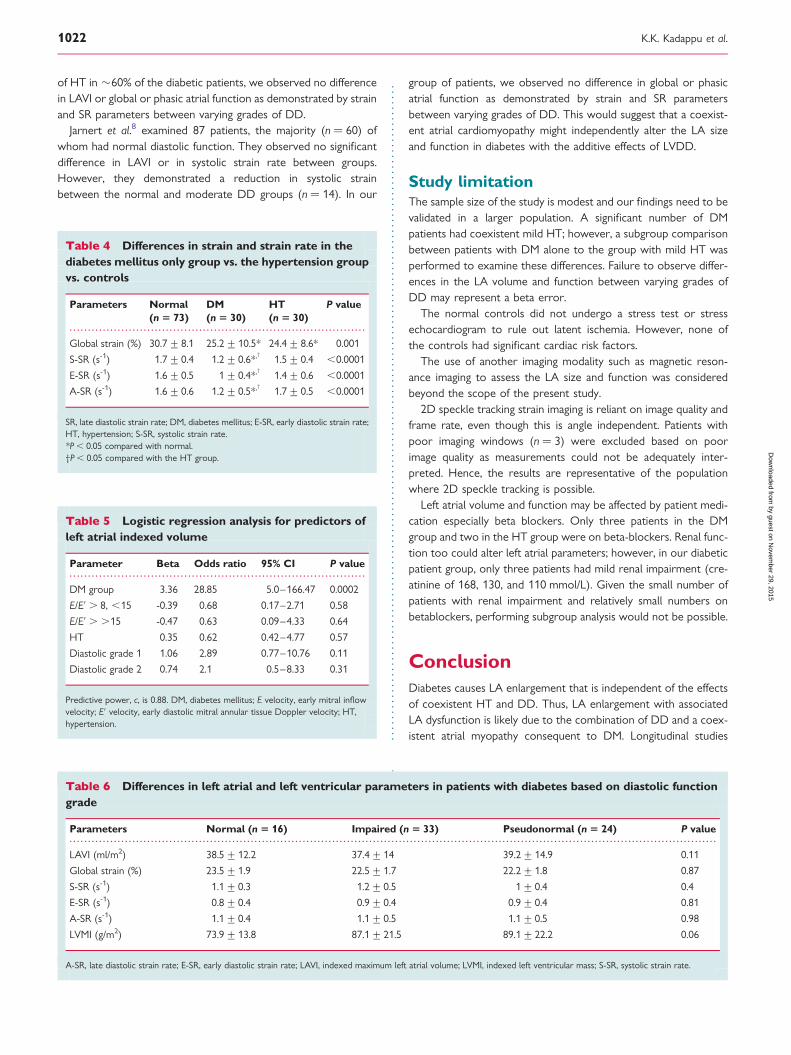
of HT in �60% of the diabetic patients, we observed no differencein LAVI or global or phasic atrial function as demonstrated by strainand SR parameters between varying grades of DD.
Jarnert et al.8 examined 87 patients, the majority (n ¼ 60) ofwhom had normal diastolic function. They observed no significantdifference in LAVI or in systolic strain rate between groups.However, they demonstrated a reduction in systolic strainbetween the normal and moderate DD groups (n ¼ 14). In our
group of patients, we observed no difference in global or phasicatrial function as demonstrated by strain and SR parametersbetween varying grades of DD. This would suggest that a coexist-ent atrial cardiomyopathy might independently alter the LA sizeand function in diabetes with the additive effects of LVDD.
Study limitationThe sample size of the study is modest and our findings need to bevalidated in a larger population. A significant number of DMpatients had coexistent mild HT; however, a subgroup comparisonbetween patients with DM alone to the group with mild HT wasperformed to examine these differences. Failure to observe differ-ences in the LA volume and function between varying grades ofDD may represent a beta error.
The normal controls did not undergo a stress test or stressechocardiogram to rule out latent ischemia. However, none ofthe controls had significant cardiac risk factors.
The use of another imaging modality such as magnetic reson-ance imaging to assess the LA size and function was consideredbeyond the scope of the present study.
2D speckle tracking strain imaging is reliant on image quality andframe rate, even though this is angle independent. Patients withpoor imaging windows (n ¼ 3) were excluded based on poorimage quality as measurements could not be adequately inter-preted. Hence, the results are representative of the populationwhere 2D speckle tracking is possible.
Left atrial volume and function may be affected by patient medi-cation especially beta blockers. Only three patients in the DMgroup and two in the HT group were on beta-blockers. Renal func-tion too could alter left atrial parameters; however, in our diabeticpatient group, only three patients had mild renal impairment (cre-atinine of 168, 130, and 110 mmol/L). Given the small number ofpatients with renal impairment and relatively small numbers onbetablockers, performing subgroup analysis would not be possible.
ConclusionDiabetes causes LA enlargement that is independent of the effectsof coexistent HT and DD. Thus, LA enlargement with associatedLA dysfunction is likely due to the combination of DD and a coex-istent atrial myopathy consequent to DM. Longitudinal studies
. . . . . . . . . . . . . . . . . . . . . . . . . . . . . . . . . . . . . . . . . . . . . . . . . . . . . . . . . . . . . . . . . . . . . . . . . . . . . . . .
Table 4 Differences in strain and strain rate in thediabetes mellitus only group vs. the hypertension groupvs. controls
Parameters Normal(n 5 73)
DM(n 5 30)
HT(n 5 30)
P value
Global strain (%) 30.7+8.1 25.2+10.5* 24.4+8.6* 0.001
S-SR (s-1) 1.7+0.4 1.2+0.6*,† 1.5+0.4 ,0.0001
E-SR (s-1) 1.6+0.5 1+0.4*,† 1.4+0.6 ,0.0001
A-SR (s-1) 1.6+0.6 1.2+0.5*,† 1.7+0.5 ,0.0001
SR, late diastolic strain rate; DM, diabetes mellitus; E-SR, early diastolic strain rate;HT, hypertension; S-SR, systolic strain rate.*P , 0.05 compared with normal.†P , 0.05 compared with the HT group.
. . . . . . . . . . . . . . . . . . . . . . . . . . . . . . . . . . . . . . . . . . . . . . . . . . . . . . . . . . . . . . . . . . . . . . . . . . . . . . . .
Table 5 Logistic regression analysis for predictors ofleft atrial indexed volume
Parameter Beta Odds ratio 95% CI P value
DM group 3.36 28.85 5.0–166.47 0.0002
E/E′ . 8, ,15 -0.39 0.68 0.17–2.71 0.58
E/E′ . .15 -0.47 0.63 0.09–4.33 0.64
HT 0.35 0.62 0.42–4.77 0.57
Diastolic grade 1 1.06 2.89 0.77–10.76 0.11
Diastolic grade 2 0.74 2.1 0.5–8.33 0.31
Predictive power, c, is 0.88. DM, diabetes mellitus; E velocity, early mitral inflowvelocity; E′ velocity, early diastolic mitral annular tissue Doppler velocity; HT,hypertension.
. . . . . . . . . . . . . . . . . . . . . . . . . . . . . . . . . . . . . . . . . . . . . . . . . . . . . . . . . . . . . . . . . . . . . . . . . . . . . . . . . . . . . . . . . . . . . . . . . . . . . . . . . . . . . . . . . . . . . . . . . . . . . . . . . . . . . . . . . . . . . . . . . . . . . . . . . . . . . . . . . . . . . . . . . . . . . . .
Table 6 Differences in left atrial and left ventricular parameters in patients with diabetes based on diastolic functiongrade
Parameters Normal (n 5 16) Impaired (n 5 33) Pseudonormal (n 5 24) P value
LAVI (ml/m2) 38.5+12.2 37.4+14 39.2+14.9 0.11
Global strain (%) 23.5+1.9 22.5+1.7 22.2+1.8 0.87
S-SR (s-1) 1.1+0.3 1.2+0.5 1+0.4 0.4
E-SR (s-1) 0.8+0.4 0.9+0.4 0.9+0.4 0.81
A-SR (s-1) 1.1+0.4 1.1+0.5 1.1+0.5 0.98
LVMI (g/m2) 73.9+13.8 87.1+21.5 89.1+22.2 0.06
A-SR, late diastolic strain rate; E-SR, early diastolic strain rate; LAVI, indexed maximum left atrial volume; LVMI, indexed left ventricular mass; S-SR, systolic strain rate.
K.K. Kadappu et al.1022
by guest on Novem
ber 29, 2015D
ownloaded from

including larger patient numbers are required to ascertain if para-meters of atrial size and function may predict future adverse car-diovascular outcomes in a diabetic population.
AcknowledgementK.K.K. is currently receiving National Health and Medical ResearchCouncil (NHMRC) scholarship.
Conflict of interest: none declared.
FundingNational Health and Medical Research Council (NHMRC) scholarshipNo. APP1018215.
References1. Poulsen MK, Henriksen JE, Dahl J, Johansen A, Gerke O, Vach W et al. Left ven-
tricular diastolic function in type 2 diabetes mellitus: prevalence and associationwith myocardial and vascular disease. Circ Cardiovasc Imaging 2010;3:24–31.
2. Nichols GA, Hillier TA, Erbey JR, Brown JB. Congestive heart failure in type 2 dia-betes: prevalence, incidence and risk factors. Diabetes Care 2001;24:1614–9.
3. Boyer JK, Thanigaraj S, Schechtman KB, Perez JE. Prevalence of ventricular diastol-ic dysfunction in asymptomatic, normotensive patients with diabetes mellitus. Am JCardiol 2004;93:870–5.
4. Zabalgoitia M, Ismaeil MF, Anderson L, Maklady FA. Prevalence of diastolic dys-function in normotensive, asymptomatic patients with well controlled type 2 dia-betes mellitus. Am J Cardiol 2001;87:320–3.
5. Spencer K, Mor-Avi V, Gorcsan J, DeMaria AN, Kimball TR, Monaghan MJ et al.Effects of aging on left atrial reservoir, conduit, and booster pump function: amulti-institution acoustic quantification study. Heart 2001;85:272–7.
6. Tsang TS, Barnes ME, Gersh BJ, Bailey KR, Seward JB. Left atrial volume as a mor-phophysiologic expression of left ventricular diastolic dysfunction and relation tocardiovascular risk burden. Am J Cardiol 2002;90:1284–9.
7. Muranaka A, Yuda S, Tsuchihashi K, Hashimoto A, Nakata T, Miura T et al. Quan-titative assessment of left ventricular and left atrial functions by strain rate imagingin diabetic patients with and without hypertension. Echocardiography 2009;26:262–71.
8. Jarnert C, Melchern A, Caidahl K, Persson H, Ryden L, Eriksson MJ. Left atrial vel-ocity vector imaging for the detection and quantification of left ventricular diastol-ic function in type 2 diabetes. Eur J Heart Fail 2008;10:1080–7.
9. Eshoo S, Ross DL, Thomas L. Impact of mild hypertension on left atrial size andfunction. Circ Cardiovasc Imaging 2009;2:93–9.
10. Inaba Y, Yuda S, Kobayashi N, Hashimoto A, Uno K, Nakata T et al. Strain rateimaging for noninvasive functional quantification of the left atrium: comparativestudies in controls and patients with atrial fibrillation. J Am Soc Echocardiogr2005;18:729–36.
11. Di Salvo G, Caso P, Lo Piccolo R, Fusco A, Martiniello AR, Russo MG et al. Atrialmyocardial deformation properties predict maintenance of sinus rhythm after
external cardioversion of recentonset lone atrial fibrillation: a colour Dopplermyocardial imaging and transthoracic and transesophageal echocardiographicstudy. Circulation 2005;112:387–95.
12. Kokubu N, Yuda S, Tsuchihashi K, Hashimoto A, Nakata T, Miura T et al. Non-invasive assessment of left atrial function by strain rate imaging in patients withhypertension: a possible beneficial effect of renin-angiotensin system inhibitionon left atrial function. Hypertens Res 2007;30:13–21.
13. Abd El Rahman MY, Hui W, Timme J, Ewert P, Berger F, Dsebissowa F et al. Ana-lysis of atrial and ventricular performance by tissue Doppler imaging in patientswith atrial septal defects before and after surgical and catheter closure. Echocar-diography 2005;22:579–85.
14. Kim DG, Lee KJ, Lee S, Jeong SY, Lee YS, Choi YJ et al. Feasibility of two-dimensional global longitudinal strain and strain rate imaging for the assessmentof left atrial function: a study in subjects with a low probability of cardiovasculardisease and normal exercise capacity. Echocardiography 2009;26:1179–87.
15. D’Andrea A, De Corato G, Scarafile R, Romano S, Reigler L, Mita C et al. Leftatrial myocardial function in either physiological or pathological left ventricularhypertrophy: a two-dimensional speckle strain study. Br J Sports Med 2008;42:696–702.
16. Devereux RB, Reichek N. Echocardiographic determination of left ventricularmass in man: anatomic validation of the method. Circulation 1997;55:613–9.
17. Ommen SR, Nishimura RA, Appleton CP, Miller FA, Oh JK, Redfield MM et al.Clinical utility of doppler echocardiography and tissue doppler imaging in the es-timation of left ventricular filling pressures. Circulation 2000;102:1788–94.
18. Nagueh SF, Appleton CP, Gillebert TC, Marino PN, Oh JK, Smiseth OA et al.Recommendations for the evaluation of left ventricular diastolic function by echo-cardiography. J Am Soc echocardiogr 2009;22:107–33.
19. Lester SJ, Tajik AJ, Nishimura RA, Oh JK, Khandheria BK, Seward JB. Unlocking themysteries of diastolic function: deciphering the Rosetta stone 10 years later. J AmColl Cardiol 2008;51:679–89.
20. Lang RM, Bierig M, Devereux RB, Flachskampf FA, Foster E, Pellikka PA et al.Recommendations for chamber quantification: a report from the AmericanSociety of Echocardiography’s Guidelines and Standards Committee and theChamber Quantification Writing Group, developed in conjunction with the Euro-pean Association of Echocardiography, a branch of the European Society of Car-diology. J Am Soc Echocardiogr 2005;18:1440–63.
21. Cianciulli TF, Saccheri MC, Lax JA, Bermann AM, Ferreiro DE. Two-dimensionalspeckle tracking echocardiography for the assessment of atrial function. World JCardiol 2010;2:163–70.
22. Eshoo S, Semsarian C, Ross DL, Marwick TH, Thomas L. Comparison of left atrialphasic function in hypertrophic cardiomyopathy versus systemic hypertensionusing strain rate imaging. Am J Cardiol 2011;107:290–6.
23. Cameli M, Caputo M, Mondillo S, Ballo P, Palmerini E, Lisi M et al. Feasibility andreference values of left atrial longitudinal strain imaging by two-dimensionalspeckle tracking. Cardiovascular Ultrasound 2009;7:6.
24. Sirbu C, Herbots L, D’hooge J, Claus P, Marciniak A, Langeland T et al. Feasibilityof strain and strain rate imaging for the assessment of regional left atrial deform-ation: a study in normal subjects. Eur J Echocardiogr 2006;7:199–208.
25. Asbun J, Villarreal FJ. The pathogenesis of myocardial fibrosis in the setting of dia-betic cardiomyopathy. J Am Coll Cardiol 2006;47:693–700.
Left atrial volume in diabetes mellitus 1023
by guest on Novem
ber 29, 2015D
ownloaded from

Cardiac biomarkers in Chronic Kidney Disease
Chapter 4: Chronic Kidney Disease is Independently Associated with Alterations in Left Atrial Function
Publication 2
Kadappu KK, Kuncoro A, Hee L, Aravindan A, Spicer S, Suryanarayanan G, Xuan W, Boyd A, French J, and Thomas L.
Chronic Kidney Disease is Independently Associated with Alterations in Left Atrial Function Echocardiography. 2014 Sep;31(8):956-64.
Declaration
I certify that this publication was a direct result of my research towards this PhD and that reproduction in this thesis doesn't breach copyright regulations
Krishna Kishor Kaclappu
97

Chronic Kidney Disease is Independently Associatedwith Alterations in Left Atrial Function
Krishna K. Kadappu, M.D.,*,†,‡ Ario S. Kuncoro, M.D.,§ Leia Hee, Ph.D.,†,¶ Anathakrishnapuram Aravindan, M.D.,‡,**Stephen T. Spicer, Ph.D.,*,** Govindarajan Suryanarayanan, M.D.,‡,** Wei Xuan MAppStat, Ph.D.,*,††Anita Boyd, Ph.D.,* John K. French, Ph.D.,*,† and Liza Thomas, Ph.D.*,†,¶
*South Western Sydney Clinical School, The University of New South Wales, Sydney, Australia; †CardiologyDepartment, Liverpool Hospital, Liverpool, Australia; ‡Cardiology Department, Campbelltown Hospital,University of West Sydney, Campbelltown, Australia; §Department of Cardiology and Vascular Medicine,University of Indonesia National Cardiovascular Centre Harapan Kita, Jakarta, Indonesia; ¶University ofSydney, Sydney, Australia; **Renal Department, Liverpool Hospital, Liverpool, Australia; and ††InghamInstitute of Applied Medical Research, Liverpoool, Australia
Background: Chronic kidney disease (CKD) is associated with increased cardiovascular morbidity andmortality; hence detection of early cardiovascular involvement in CKD is important to prevent futureadverse cardiovascular events. Left atrial (LA) enlargement and dysfunction has been reported in endstage renal disease. However, there is a paucity of published data regarding the evaluation of LA func-tion in CKD using noninvasive imaging parameters. In this study, we evaluated biplane LA volume aswell as LA function (LA global systolic strain (GS) and strain rate [SR]) in stage 3 CKD patients (eGFR 30–59 mL/min per 1.73 m2) to determine if LA function parameters are more significantly altered by thepresence of CKD in addition to changes due to hypertension alone. Methods: Thirty-three CKD patients(eGFR 30–59 mL/min per 1.73 m2) with hypertension were compared to 33 normal controls and 34hypertensive (HT) subjects with normal renal function; all participants underwent a detailed transtho-racic echocardiogram. Indexed biplane LA volume (LAVI), LA segmental function, and GS and SR (sys-tolic, early, and late diastole) derived from tissue Doppler imaging (TDI) were measured. Univariatepredictors of LA strain were determined. Multiple logistic regression analysis was used to examine theeffect of patient group (i.e. CKD) on GS and SR as well as LAVI. Results: Left atrial volume indexed wassignificantly increased in both the HT and CKD with HT group compared to normal controls(28 � 9 mL/m2 vs. 28 � 9 mL/m2 vs. 23 � 5 mL/m2, respectively, P = 0.02). However, LAVI was simi-lar in the HT and CKD with HT group (28 � 9 mL/m2 vs. 28 � 9 mL/m2; P = NS). LA GS and SR werereduced in both the CKD with HT and HT group, compared to controls. However, a significantly lowerLA GS was present in the CKD with HT group (Controls vs. HT vs. CKD with HT: 54.9 � 14.5% vs.34.5 � 6.2% vs. 25.7 � 9.3%, respectively; P = 0.001). To examine the effect of group, (i.e. presenceof CKD) multiple logistic regression analysis was performed with univariate predictors including indexedleft ventricular mass (LVMI), LV diastolic grade, LAVI, peak A-wave velocity, b-blocker therapy, GS andSR; this demonstrated that CKD had an independent effect on LA GS and SR (systolic, early, and late dias-tole). GS demonstrated moderate correlation with systolic blood pressure (r = �0.5, P = 0.01), diastolicgrade (r = �0.5, P = 0.01), E′ velocity (r = 0.6, P = 0.0001), peak A velocity (r = �0.5, P = 0.004), andLAVI (r = �0.6, P = 0.002). Conclusions: Left atrial dysfunction is evident in stage 3 CKD with associ-ated LA enlargement. This study demonstrates that LA GS and SR were reduced in the CKD groupdespite similar LAVI in the CKD with HT and HT group. Hence LA GS and SR may be a more sensitivenoninvasive tool to detect cardiovascular involvement in CKD. (Echocardiography 2014;31:956–964)
Key words: color Doppler tissue imaging, diastolic function, left atrial volume, strain, chronic kidneydisease, strain rate imaging
Chronic kidney disease (CKD) is associatedwith increased cardiovascular morbidity includ-
ing coronary artery disease,1 heart failure2 as wellas atrial fibrillation.3 CKD is an independent riskfactor for cardiovascular disease (CVD) and clini-cal cardiovascular risk calculators such as the Fra-mingham predictive instrument under estimatefuture cardiac events in stage 3 CKD (eGFR 30–59 mL/min per 1.73 m2).4 Hence there is a need
Address for correspondence and reprint requests: Liza Tho-mas, Ph.D., Cardiology Department, Liverpool Hospital, Eliza-beth Street, Liverpool, NSW 2170, Australia.Fax: +61 2 87383054;E-mail: [email protected]
956
© 2014, Wiley Periodicals, Inc.DOI: 10.1111/echo.12503 Echocardiography

for noninvasive cardiac markers over and aboveclinical risk factors to estimate individual patientrisk to predict future adverse cardiac events inCKD patients. Identification of patients at riskcould alert physicians to monitor cardiovascu-lar risk and implement aggressive risk factorcontrol.
Left atrial (LA) enlargement has beenreported in end stage renal disease (ESRD) andLA volume is an independent prognostic factorin ESRD.5 Changes that may cause alterationsin LA size and function are multifactorial inESRD. Left ventricular (LV) hypertrophy andsystolic dysfunction5 are reported as major con-tributors. Diastolic dysfunction due to LVhypertrophy is also reported in early stages ofrenal disease.6 However, LA involvement inCKD is not well described. CKD is commonlyassociated with hypertension (HT) and diabetesmellitus, both of which may independentlyalter LA properties.7,8 CKD also results inchanges in the renin-angiotensin-aldosteronesystem (RAAS), which may enhance atrial fibro-sis 3,9,10 with consequent LA enlargement anddysfunction.
The LA has multiple functions; it acts as a res-ervoir for blood during ventricular systole, as aconduit for the passage of blood from the pul-monary veins to the LV in early diastole and as acontractile chamber to augment LV filling in latediastole.11 Tissue Doppler imaging (TDI) strain(GS) and strain rate (SR) techniques, which evalu-ate myocardial deformation,12 enable the evalua-tion of atrial deformation throughout the cardiaccycle, providing a sensitive and accurate assess-ment of global and phasic atrial function.13 TDIallows noninvasive assessment of global and seg-mental LA function.14 TDI-derived GS and SR is afeasible technique and has been used to assessLA function in a variety of conditions with LA dys-function.15–18
The overall aim of this study was to evaluatethe independent effect of mild CKD (stage3–eGFR 30–59 mL/min per 1.73 m2) and HT onLA size and function. This was determined byspecific aims to (1) evaluate LA size in patientswith stage 3 CKD with associated HT and evalu-ate the independent effect of renal dysfunctionon LA size by comparison to a group of normalcontrols and a group with HT with normal renalfunction; (2) evaluate LA function by tissueDoppler derived strain in stage 3 CKD patientswith HT compared to a group of age-matchednormal subjects and patients with HT with nor-mal renal function. We hypothesized that thepresence of CKD would have an additive effect,independent of HT, resulting in greater LAenlargement and consequent greater degree ofLA dysfunction.
Methods:Thirty-three stage 3 CKD patients (eGFR 30–59 mL/min per 1.73 m2) with hypertension werecompared to 33 normal controls and 34 HT sub-jects with normal renal function.
Study Population:Thirty-three subjects with stage 3 CKD (eGFR of30–59 mL/min per 1.73 m2 by modified diet inrenal disease formula) were recruited from Liver-pool Hospital, Sydney, Australia. Staging of CKDwas done as per standard criteria.19 We onlyincluded patients with an eGFR <60 mL/min per1.73 m2 as this is the cutoff value by definitionfor CKD where there is increased prevalence ofCVD risk factors.20 We also excluded stage 4 CKDas there is an increased incidence of fluid over-load and LV hypertrophy,21 which in turn altersLA size and function. Patients were identifiedfrom the renal outpatient department; allpatients had coexistent mild HT (mean systolicBP = 133 � 4.6 mmHg and mean diastolicBP = 74 � 2.1 mmHg) and were on antihyper-tensive medication. The causes for renal impair-ment are as listed: HT (n = 19), drug induced,renal calculus, chronic inflammatory nephropa-thy, glomerulo nephritis, ischemic nephropathyand chronic granulomatous nephropathy (n = 2in each category), hepatitis, single kidney, andpoly cystic kidney disease (n = 1 in each cate-gory). Study approval was obtained from theHuman research and ethics committee SouthWestern Area Health Service (HREC/09/LPOOL/53), and all recruited patients provided writteninformed consent.
A comprehensive transthoracic echocardio-gram including two-dimensional, 2D, colorDoppler, and TDI was performed in all recruitedpatients. There was no ECG or echocardiographicevidence of coronary artery disease and allpatients underwent a stress echocardiogram torule out occult ischemia; one patient wasexcluded due to evidence of ischemia on stresstesting. Patients with greater than mild mitral oraortic regurgitation, aortic stenosis or any degreeof mitral stenosis were excluded from the study.No patient had more than mild mitral annularcalcification. None of the patients or controls hada previous history of congestive heart failure oratrial fibrillation and had a normal LV ejectionfraction.
Age-matched “normal” control subjects(n = 33) were obtained from a departmentaldatabase. These healthy volunteers wererecruited from the community and were carefullyscreened for a history of cardiovascular, periph-eral vascular or cerebrovascular disease, and forthe presence of cardiovascular risk factors includ-
957
Chronic Kidney Disease and Left Atrium

ing HT, diabetes mellitus, and hypercholesterol-emia. They had no abnormal findings on routinephysical examination, were normotensive andhad a normal ECG (Philips Medical Systems,Andover, MA, USA) and echocardiogram. Theywere not receiving any cardio-active medications.Thirty-four age- and gender-matched patientswith mild HT were also identified from a depart-mental database and recruited as a comparatorgroup. These subjects had systolic pressure >140but <160 mmHg and diastolic pressure >90 but<100 mmHg. Blood pressure recordings wereperformed at 3 separate times and all previouslydocumented blood pressure measurements were<160/100 mmHg. All the patients were on anti-hypertensive medication. The HT group had noother associated cardiac risk factor, in particular,diabetes mellitus and had no previous history ofcardiovascular, peripheral vascular or cerebrovas-cular disease.
Echocardiography:Commercially available ultrasound machines(Vivid 7 and Vivid E9, General Electric Healthcare,Horten, Norway) equipped with a 2.5 MHzvariable frequency transducer was used for echo-cardiographic evaluation. 2D and color Dopplerimages were obtained from standard echocardio-graphic views, including parasternal and apicalviews with subjects in the left lateral decubitusposition. Zoomed views of the LA were obtainedin four- and two-chamber views and an averageof 3 cardiac cycles was stored. TDI of the LA wasperformed and images were acquired at highframe rates (~110 fps) and stored digitally foroffline strain analysis.
Left Ventricular Measurements:Left ventricular end-systolic (LVESV) and end-dia-stolic volumes (LVEDV) were measured by Simp-son’s biplane method from the apical four- andtwo-chamber views and the LV ejection fractionwas calculated. LV wall thickness, LV end-diastolic(LVEDD) and end-systolic (LVESD) diameterswere measured using M mode from the paraster-nal long-axis view and LV mass index (LVMI) wascalculated using the LV end-diastolic diameter,interventricular septal and posterior wall thick-ness as per ASE criteria.22
Transmitral flow velocities were obtained byplacing a pulsed-Doppler sample volume at themitral leaflet tips in the apical four-chamber view.Peak velocity in early (E-wave) and late diastole(A-wave) and the E-wave deceleration time (DT)were measured and the E/A ratio calculated.Pulsed-wave Doppler tissue imaging was used tomeasure peak velocity in early (E′) and late (A′)diastole with the sample volume placed at theseptal and lateral annulus.23 An average of the
septal and lateral E′ velocities was calculated asper ASE recommendations.24 The E/average E′ratio was calculated as an estimate of LV fillingpressure.23 LV diastolic function was classifiedusing standard echocardiographic parameters,including peak E-wave velocity, peak A-wavevelocity, the E/A ratio, and DT. Patients weredivided into groups based on diastolic functionas (1) normal (DT = 160 � 240 ms, E/A ratio =0.9 � 1.5, E′ velocity ≥ 10 cm/sec); (2) impairedrelaxation (DT > 240 ms, E/A ratio < 0.9, E′velocity < 10 cm/sec); (3) pseudonormal (DT =160 – 240 ms, E/A ratio = 0.9 � 1.5, E′ veloc-ity < 8 cm/sec) and (4) restrictive (DT < 160 ms,E/A ratio > 2.0, E′ velocity < 5 cm/sec) as perpreviously defined criteria.24
LA Measurements:Traditional Measurements: Maximal LA volumewas measured at end systole from zoomedimages of the LA in the apical four- and two-chamber views using Simpson’s biplane method;LA volume was indexed to body surface area(BSA) (LAVI). Atrial function was estimated by tra-ditional atrial parameters including peak transmi-tral A-wave velocity, A-wave velocity timeintegral (VTI) and the atrial fraction (A-wave VTI/total mitral inflow VTI). An average of 3 measure-ments was used for all parameters.
LA Strain: Left atrial GS and SR were measured aspreviously described.25 Briefly, color Dopplertissue images were obtained in both the apicalfour- and two-chamber views (septal, and lateral,inferior and anterior walls) with sector widthselected to maintain frame rates >100 fps andwere analyzed off line using commercially avail-able software (Echo PAC version 6.2, General Elec-tric Healthcare). LA GS and SR were measuredfrom 4 sites with particular emphasis to maintainan angle of interrogation of less than 30° with theatrial walls (Figs. 1 and 2). The sample volume(10 9 2 mm) was placed in the superior seg-ments of the septal, lateral, inferior, and anteriorwalls and tracked frame by frame to maintain itsposition within the LA wall. A Gaussian 60smoothing was used and the peak systolic GS andSR were measured in each segment. The SR wasmeasured in systole (S-SR), early diastole (E-SR), aswell as in late diastole (A-SR). GS and SR for finalanalysis were calculated by averaging values fromthe septal, lateral, inferior, and anterior walls.
Inter-Observer and Intra-Observer Variability:Inter- and intra-observer variability was evaluatedin 10 subjects; a single observer performedrepeat measurements at a different time pointand a second observer, blinded to the initial mea-surements, performed measurements indepen-
958
Kadappu, et al.

dently at a later date. Investigator 1, who wasblinded to the clinical details of patients andsubjects, performed LA GS measurements.This investigator performed a second set of
measurements on a subsequent day, selectingthe best 3 cardiac cycles, blinded to the previousresults, as well as to the group that the patientand subject belonged to. A second investigator
Figure 1. Color tissue Doppler strain from the inferior basal atrial segment. The sample volume (10 9 2 mm) was manuallytracked, throughout the cardiac cycle to ensure that blood pool was not sampled. SS = systolic strain; ROI = region of interest.
Figure 2. Color tissue Doppler SR imaging of the inferior basal segment. The sample volume (10 9 2 mm) was manually trackedthroughout the cardiac cycle. The trace demonstrates phasic atrial SR in systole (S-SR) and diastole (E-SR and A-SR).S-SR = systolic strain rate; E-SR = early diastolic strain rate; A-SR = late diastolic strain rate; ROI = region of interest.
959
Chronic Kidney Disease and Left Atrium

independently selected the best 3 cardiac cyclesand performed measurements blinded to theprevious investigators measurements as well as tothe group of the patient. An average of 3 mea-surements was used for the final analysis. Test–retest variability was performed on ten subjectsby repeating their imaging later that day.
Statistical Analysis:All values are expressed as mean � SD. Datawere analyzed using SPSS (version 19.0, SPSSInc., Chicago, IL, USA). Differences among thethree groups for continuous variables were exam-ined by one-way ANOVA with post hoc Bonfer-roni analysis. Data were considered significant ifP < 0.05. Categorical variables were comparedusing a chi-square test. Univariate predictors forgroup were determined by simple logistic regres-sion. These variables were entered into a multiplelogistic regression model to determine the effectof renal dysfunction. Logistic regression analysiswas performed using SAS 9.2 (Cary, NC, USA).This analysis was performed separately for GSand SR with other covariates to eliminate theeffect of colinearity between strain and SR. Pear-son’s correlation was used to determine clinicaland echocardiographic predictors of GS andLAVI. Intra-class correlation was used to measureinter- and intra-observer variability.
Results:A total of 100 patients and control subjects com-prised the study group; 33 CKD patients with HT,33 age-matched normal controls and 34 subjectswith mild HT and normal renal function wereincluded in the final analysis. Demographic datafor the 3 groups are presented in Table I. Themean age was 64 � 11 years in the CKD groupand was similar in normal controls and the HTgroup. Twenty-one of 33 subjects in the CKD
group and 18/34 in HT group were men. MeanBSA was similar in all 3 groups. 73% of CKDpatients were on angiotensin receptor blockers(ARB) as compared to 62% in the HT group(P = 0.24) while 21% in the CKD group and 41%in the HT group were on angiotensin-convertingenzyme inhibitors (ACEI). A small percentage inboth the CKD and HT groups were on b-blockersand diuretics, but neither of them was on spiron-olactone (Table I).
LV Systolic and Diastolic Parameters:As expected LVEDV was larger in the CKD group(P = 0.03) (Table II). LV ejection fraction was inthe normal range in all 3 groups. LV massindexed to BSA LVMI was significantly higher inthe HT group (P < 0.0001). LV diastolic functionparameters including the E/A ratio (P = 0.02), E′velocity (P = 0.03), and E/E′ (P = 0.001) weresignificantly different in patients with CKD andthe HT group compared to controls, but notbetween HT and HT with CKD group (Table II).However, there was no significant difference inpeak E-wave velocity (P = 0.06) and DT(P = 0.23) among groups (Table II).
LA Volume and Function:Left atrial maximum volume was larger in theCKD group compared to controls. However,when LA volume was indexed to BSA (LAVI), itwas significantly larger in both the CKD as well asHT groups compared to controls (P = 0.02); LAVIwas similar between the CKD and HT groups.Peak A-wave velocity was significantly higher inthe CKD group compared to both controls andthe HT group (P = 0.002). A-wave VTI was similarin all 3 groups. There was moderate correlationbetween LAVI with systolic BP (r = 0.5, P = 0.01)and GS (r = �0.6, P = 0.002) and low correla-tion with LVMI (r = 0.4, P = 0.05) (Table III).
TABLE I
Demographic Parameters in CKD Group versus HT Group versus Controls
ParametersControls(n = 33)
CKD + HT(n = 33)
HT Group(n = 34) P-Value
Age (years) 65 � 11 64 � 11 64 � 11 0.85Sex (male %) 12 (37%) 21 (63%) 18 (53%) 0.08BSA (m2) 1.86 � 0.23 1.9 � 0.23 1.96 � 0.25 0.28Systolic BP (mm Hg) 124 � 13 133 � 27 136 � 19 0.07Diastolic BP (mm Hg) 75 � 9 74 � 12 80 � 10 0.06b-blocker 0 8 (24%) 2 (6%) 0.03*ACEI 0 7 (21%) 14 (41%) 0.07ARB 0 24 (73%) 21 (62%) 0.24Diuretics 0 7 (21%) 8 (24%) 0.53
ACEI = angiotensin converting enzyme inhibitor; ARB = angiotensin receptor blocker; BSA = body surface area; HT = hyperten-sive; CKD = chronic kidney disease.*P < 0.05 compared to HT group.
960
Kadappu, et al.

Atrial Strain Measurements:Color tissue Doppler GS, derived as an average of4 segments, was significantly reduced in the CKDgroup compared to both the HT group and con-trols (P < 0.001) (Table IV). A statistically signifi-cant difference was also present between the HTgroup and controls (P = 0.001). Patients in theCKD group additionally had altered phasic LAfunction with impaired LA reservoir and conduitfunction as demonstrated by a reduction in LAS-SR (P < 0.0001) and LA E-SR (P < 0.0001)compared with both the HT group and controls.No difference was observed between the HTgroup and controls. LA A-SR, a measure of LAcontractile function, was also reduced in the CKDgroup (P < 0.0001) (Table IV). There was
moderate correlation between GS and systolic BP(r = �0.5, P = 0.01), diastolic grade (r = �0.5,P = 0.01), E′ velocity (r = 0.6, P = 0.0001), peakA-wave velocity (r = �0.5, P = 0.004), and LAVI(r = �0.6, P = 0.002) (Table III).
Effect of Renal Dysfunction on LV and LAParameters:To examine the effect of group (i.e. presence ofrenal dysfunction vs. HT) on LV and LA parame-ters that were significantly different betweengroups, we performed logistic regression analysis(Table V). LVMI, LV diastolic grade, LAVI, peakA-wave velocity, b-blocker therapy, and GS wereentered into the model. Similar analysis was per-formed using SR (S-SR, E-SR, and A-SR) instead of
TABLE II
Conventional Echocardiographic Parameters in CKD Group versus HT Group versus Controls
ParametersControls(n = 33)
CKD + HT(n = 33)
HT Group(n = 34) P-Value
LVEDD (cm) 4.8 � 0.5 4.8 � 0.5† 5.3 � 0.4* 0.001LVEDV(mL) 94 � 21 106 � 31† 90 � 25 0.034LVESV(mL) 38 � 10 42 � 13 37 � 11 0.25LVEF (%) 60 � 5 62 � 5 59 � 6 0.07Peak E-wave velocity (m/s) 0.63 � 0.1 0.7 � 0.1 0.7 � 0.2 0.06Peak A-wave velocity (m/s) 0.66 � 0.2 0.79 � 0.2*† 0.67 � 0.2 0.002E/A ratio 1.0 � 0.2 0.92 � 0.2† 1.1 � 0.3 0.02DT (ms) 226 � 50 207 � 43 221 � 50 0.23E′ velocity (cm/sec) 8 � 2 7 � 2* 7 � 2 0.03E/E′ ratio 8 � 2 10 � 3* 10 � 3* 0.001LVMI (g/m2) 93 � 30 106 � 33† 137 � 43* <0.0001LAV (mL) 43 � 9 54 � 20* 52 � 17 0.02LAVI (mL/m2) 23 � 5 28 � 9* 28 � 9* 0.02A VTI (cm) 8.7 � � 2.4 8.2 � 2.1 8.5 � � 2.4 0.69Atrial fraction (%) 41.6 � 6 38.1 � 7.6 38 � 9 0.11A′ velocity (cm/sec) 10 � 2 12 � 2 9 � 2 0.54
A velocity = late mitral inflow velocity; A′ = late diastolic mitral annular tissue Doppler velocity; BSA = body surface area;DT = deceleration time; E velocity = early mitral inflow velocity; E′ velocity = early diastolic mitral annular tissue Doppler velocity;LAV = maximum left atrial volume; LAVI = maximum left atrial volume indexed to BSA; LVEDD = left ventricular end-diastolicdiameter; LVEDV = left ventricular end-diastolic volume; LVEF = left ventricular ejection fraction; LVESV = left ventricular end-sys-tolic volume; LVMI = left ventricular mass indexed to BSA; VTI = velocity time integral; HT = hypertensive; CKD = chronic kidneydisease.*P < 0.05 compared to normal.†P < 0.05 compare to HT group.
TABLE III
Correlation between LAVI (mL/m2) and GS (%) with Clinical and Echocardiographic Parameters
E′ velocity (cm/sec) LVMI (g/m2)
Peak A-wave(cm/sec)
Sys BP(mmHg)
Diastolicgrade GS (%)
r P r P r P r P r P r P
LAVI �0.3 0.36 0.4 0.05 0.3 0.38 0.5 0.01 �0.2 0.8 �0.6 0.002GS 0.6 0.0001 �0.4 0.11 �0.5 0.004 �0.5 0.01 �0.5 0.01
E′ = early diastolic tissue Doppler velocity at mitral annulus; LVMI = left ventricular mass indexed to BSA; peak A = late diastolicmitral inflow velocity; LAVI = left atrial volume indexed to BSA; GS = global systolic strain.
961
Chronic Kidney Disease and Left Atrium

GS (both parameters were not entered into a sin-gle model due to effects of colinearity as SR is aderivative of GS). LVMI (odds ratio 0.97[0.96–0.99], P = 0.03), GS (odds ratio 0.87[0.81–0.95],P = 0.002), and SR in all phases were influencedby the presence of renal dysfunction. While GSand SR parameters were lower in the CKD group,a paradoxical finding of a lower LVMI in the CKD
as compared to the HT group was observed.Thus, despite a relatively lower LVMI in the CKDgroup compared to the HT group, significantlylower atrial GS measurements were observedsuggesting an independent effect of renal diseaseon atrial function. Similar analysis was also per-formed between the CKD and controls and dem-onstrated a similar effect of CKD on atrial GS andSR.
Observer Variability:Intra-observer variability for S-SR by inter-classcorrelation was 0.99, 0.97 for E-SR, 0.95 for A-SR,and 0.97 for GS. Inter-observer variability byinter-class correlation was 0.99 for S-SR, 0.94 forE-SR, and 0.94 for A-SR, and 0.94 for GS.
Discussion:In this study, we recruited stage 3 CKD patientswith HT (n = 33) and compared these patientsto age-matched patients with HT and normalrenal function (n = 34) and normal healthy con-trols (n = 33). We specifically used a comparatorgroup with HT alone to evaluate the effect ofconcomitant renal dysfunction, as HT indepen-dently causes LA changes.5,7 While LAVI wasincreased in both CKD and HT groups com-pared to controls, it failed to discriminatebetween the CKD and HT groups. LA GS wasreduced in both the HT and CKD groups com-pared to controls with a significant differenceamong the 3 groups implying an additive effectof renal disease on LA function. This reductionin LA function was evident before significant LAenlargement had occurred (i.e. LAVI similarbetween the CKD and HT group), suggestingthat LA functional changes may precedechanges in LA volume.
LA Function and CKD:Evaluation of global and phasic LA function usingGS and SR parameters is feasible and theseparameters have been established as a sensitive
TABLE IV
Differences in GS and SR in CKD Group versus HT Group versus Controls
ParametersControls(n = 33) CKD (n = 33) HT (n = 34) P-Value
GS (%) 54.9 � 14.5 25.7 � 9.3*† 34.5 � 6.2* 0.001S-SR (/sec) 2.4 � 0.7 1.2 � 0.3*† 2.2 � 0.6 <0.0001E-SR (/sec) 1.9 � 0.6 1.1 � 0.5*† 1.8 � 0.5 <0.0001A-SR (/sec) 3.3 � 0.6 1.7 � 0.5*† 3.1 � 0.8 <0.0001
A-SR = late diastolic strain rate; CKD = chronic kidney disease; E-SR = early diastolic strain rate; GS = global systolic strain;HT = hypertension; S-SR = systolic strain rate; CKD = chronic kidney disease.*P < 0.05 compared to normal.†P < 0.05 compared to HT group.
TABLE V
Logistic Regression Analysis: (a) HT Patients with or withoutCKD as the Dependent Variable and Echo Parameters as
Explanatory Variables. (b) HT Patients with or without CKD asthe Dependent Variable and Subindex of Global Strain (GS) as
Explanatory Variables
ParameterAdjusted Odds Ratio*,† (95%
Confidence Interval) P-Value
(a)GS (%) 0.87 (0.81–0.95) 0.002LAVI (mL/m2) 0.94 (0.91–1.05) 0.64Peak A (cm/sec) 9.15 (0.26–326) 0.22Diastolic grade 1.04 (0.29–3.74) 0.94LVMI (g/m2) 0.97 (0.96–0.99) 0.03b-Blocker 9.6(0.91–10.1) 0.06
(b)S-SR (/sec) 0.003 (0.001–0.051) <0.0001E-SR (/sec) 0.08 (0.02–0.32) 0.0004A-SR (/sec) 0.024 (0.004–0.154) <0.0001
Peak A = late mitral inflow velocity; GS = global systolicstrain; LAVI = maximum left atrial volume indexed to BSA;LVMI = left ventricular mass indexed to BSA; S-SR = systolicstrain rate; E-SR = early diastolic strain rate; A-SR = late dia-stolic strain rate; HT = hypertensive; CKD = chronic kidneydisease.*All the five predictors were simultaneously included into thelogistic regression model with CKD versus HT as the depen-dent variable, adding b-blockers as another confounder.†Subindex of global strain, S-SR E-SR and A-SR, were used sep-arately in a Logistic Regression model with HT patients with orwithout CKD as the dependent variable. Each of the aboveLogistic Regression model also included LAVI, peak A, diastolicgrade and LVMI as covariates.
962
Kadappu, et al.

measure to assess LA function.15–17,26 A tradi-tional parameter of LA function, the peak A-wavevelocity, was increased in the CKD group andrepresents the compensatory increase in late dia-stolic filling, given the reduced early LV diastolicfilling. Altered LA compliance with a reduction inreservoir function was present, as observed byreduced GS and S-SR. Altered LV relaxation witha consequent reduction in the LA conduit func-tion is likely responsible for the reduced E–SR.Atrial contractile function also was decreased inthe CKD group. Thus, one could postulate thatperhaps atrial fibrosis consequent to RAAS activa-tion in the CKD group results in an additivereduction in LA function over that observed as aconsequence of HT alone.
Despite similar LAVI in the HT and CKDgroups, a reduction in LA GS measurements wasobserved in the CKD group. Boyd et al.,26 previ-ously demonstrated normal LAVI despite reduc-tion in strain measurements in a group of normalvolunteers. Thus, LA functional changes may pre-cede overt LA enlargement even in diseasedstates.
Mechanisms for Altered Atrial Function inCKD:There are multiple mechanisms by which CKDcan potentially alter LA properties. HT per seincreases LVMI with a consequent increase in dia-stolic dysfunction and resultant enlargement ofthe LA with associated dysfunction. The develop-ment of HT and fluid overload in CKD addition-ally results in the activation of the intra-renalRAAS that in turn activates inflammatory fac-tors.27 Cardiac fibroblast proliferation is regu-lated by angiotensin II,28 through theangiotensin II type 1 receptor, which in turn pro-motes TGF-b1 synthesis.29 TGF-b1 stimulatesfibrous tissue formation and this effect has previ-ously been demonstrated within the atrium.30
Kokubu et al.18 used atrial S-SR to assess LAfunction in HT patients; they demonstrated thatS-SR was reduced in HT subjects even prior to thedevelopment of LA enlargement. However, whenRAAS inhibitors (ACEI/angiotensin receptorblocker) were used to treat HT, subjects with anon-dilated LA demonstrated an improvement inLA S-SR with values posttherapy being similar tonormotensive controls. They therefore postulatedthat RAAS activation in HT subjects is responsiblefor atrial dysfunction consequent to atrial fibrosis.The presence of CKD with concomitant HT willlikely enhance this RAAS activation. From litera-ture pertaining to clinical trials, there is evidenceof benefit from RAAS blockade on the progres-sion of CKD.10 Although not demonstrated inthis study, it is likely that RAAS pathway inhibitioncould reduce atrial fibrosis with the potential for
improvement in atrial function as demonstratedby Kokubu et al.
LA Volume in CKD:Tripepi et al.5,31 reported LA enlargement inde-pendent of LVMI and diastolic dysfunction inESRD. They further demonstrated that in ESRD,LAVI was an independent predictor of futureadverse cardiovascular outcomes. Similar dataregarding LA size in patients with CKD are lack-ing. We found that LAVI was significantlyincreased in the CKD group compared to age-matched normal controls, but was similar to HTpatients with normal renal function. Hence LAVIcould not discriminate between the effects of HTalone and HT associated with renal dysfunctionin CKD.
However, a significant reduction in GS and SR(S-SR, E-SR, and A-SR) was observed in the CKDgroup compared to the HT group with normalrenal function; despite a similar degree of LAenlargement. Future studies incorporating bothLAVI and LA function are needed to evaluate itsrole as a predictor of adverse cardiovascularevents.
Study Limitations:The sample size of the study is modest and thesefindings need to be validated in a larger popula-tion; however, significant differences wereobserved among the 3 groups. We have postu-lated that the decreased GS and SR are due to LAfibrosis, secondary to RAAS activation as a conse-quence of CKD and HT. We were unable to cor-roborate this with tissue histology demonstratingincreased atrial fibrosis in CKD patients, whichwas beyond the scope of this study. There issome variability in GS measurements; however,our results are similar to those reported previ-ously and reflect an intrinsic limitation of thetechnique. Longitudinal follow-up is required todetermine the clinical implication of this finding(i.e. Does reduced LA GS in CKD patients predis-pose development of atrial fibrillation?) andfuture studies aim to examine clinical outcomesin this high risk group.
Conclusion:Cardiovascular involvement is a common causeof morbidity and mortality in CKD. LA involve-ment with an increase in atrial fibrillation occur-rence is well documented in ESRD. We havedemonstrated changes in LA size and function inpatients with stage 3 CKD and HT and have dem-onstrated an additive effect of CKD on LA func-tion. Even though we have not directlydemonstrated the association between RAAS acti-vation and LA GS, reduction in GS and SR is likely
963
Chronic Kidney Disease and Left Atrium

due to atrial fibrosis that in turn is mediated viaRAAS activation. GS and SR were reduced beforeLA enlargement occurred and could be used todetect atrial dysfunction in CKD. Future longitu-dinal studies are required for evaluating theeffects of RAAS inhibitor therapy on LA GS and SRand to evaluate its utility as a prognostic markerof adverse cardiovascular events.
Acknowledgments: Krishna K. Kadappu is currently receivingNational Health and Medical Research Council (NHMRC)scholarship.
Reference1. Astor BC, Coresh J, Heiss G, et al: Kidney function and
anemia as risk factors for coronary heart disease and mor-tality: The Atherosclerosis Risk in Communities (ARIC)Study. Am Heart J 2006;151:492–500.
2. Kottgen A, Russell SD, Loehr LR, et al: Reduced kidneyfunction as a risk factor for incident heart failure: The ath-erosclerosis risk in communities (ARIC) study. J Am SocNephrol 2007;18:1307–1315.
3. Alonso A, Lopez FL, Matsushita K, et al: Chronic kidneydisease is associated with the incidence of atrial fibrilla-tion: The Atherosclerosis Risk in Communities (ARIC)study. Circulation 2011;123:2946–2953.
4. Weiner DE, Tighiouart H, Elsayed EF, et al: The Framing-ham predictive instrument in chronic kidney disease.J Am Coll Cardiol 2007;50:217–224.
5. Tripepi G, Benedetto FA, Mallamaci F, et al: Left atrialvolume in end-stage renal disease: A prospective cohortstudy. J Hypertens 2006;24:1173–1180.
6. Essig M, Escoubet B, de Zuttere D, et al: Cardiovascularremodelling and extracellular fluid excess in early stagesof chronic kidney disease. Nephrol Dial Transplant 2008;23:239–248.
7. Eshoo S, Ross DL, Thomas L: Impact of mild hypertensionon left atrial size and function. Circ Cardiovasc Imaging2009;2:93–99.
8. Kadappu KK, Boyd A, Eshoo S, et al: Changes in leftatrial volume in diabetes mellitus: More than diastolicdysfunction? Eur Heart J Cardiovasc Imaging2012;13:1016–1023.
9. Ehrlich JR, Hohnloser SH, Nattel S: Role of angiotensinsystem and effects of its inhibition in atrial fibrillation:Clinical and experimental evidence. Eur Heart J 2006;27:512–518.
10. Siragy HM, Carey RM: Role of the intrarenal renin-angio-tensin-aldosterone system in chronic kidney disease. AmJ Nephrol 2010;31:541–550.
11. Blume GG, McLeod CJ, Barnes ME, et al: Left atrial func-tion: Physiology, assessment, and clinical implications.Eur J Echocardiogr 2011;12:421–430.
12. Fontana A, Zambon A, Cesana F, et al: Tissue Doppler, tri-plane echocardiography, and speckle tracking echocardiog-raphy: Different ways of measuring longitudinal myocardialvelocity and deformation parameters. A comparative clinicalstudy. Echocardiography 2012;29:428–437.
13. Pavlopoulos H, Nihoyannopoulos P: Strain and strain ratedeformation parameters: From tissue Doppler to 2Dspeckle tracking. Int J Cardiovasc Imaging 2008;24:479–491.
14. Mor-Avi V, Lang RM, Badano LP, et al: Current and evolv-ing echocardiographic techniques for the quantitativeevaluation of cardiac mechanics: aSE/EAE consensusstatement on methodology and indications endorsed bythe Japanese Society of Echocardiography. J Am Soc Echo-cardiogr 2011;24:277–313.
15. Abd El Rahman MY, Hui W, Timme J, et al: Analysis ofatrial and ventricular performance by tissue Dopplerimaging in patients with atrial septal defects before andafter surgical and catheter closure. Echocardiography2005;22:579–585.
16. Di Salvo G, Caso P, Lo Piccolo R, et al: Atrial myocardialdeformation properties predict maintenance of sinusrhythm after external cardioversion of recent-onset loneatrial fibrillation: A color Doppler myocardial imagingand transthoracic and transesophageal echocardio-graphic study. Circulation 2005;112:387–395.
17. Inaba Y, Yuda S, Kobayashi N, et al: Strain rate imagingfor noninvasive functional quantification of the leftatrium: Comparative studies in controls and patients withatrial fibrillation. J Am Soc Echocardiogr 2005;18:729–736.
18. Kokubu N, Yuda S, Tsuchihashi K, et al: Noninvasiveassessment of left atrial function by strain rate imaging inpatients with hypertension: A possible beneficial effect ofrenin-angiotensin system inhibition on left atrial function.Hypertens Res 2007;30:13–21.
19. Levey AS, Eckardt KU, Tsukamoto Y, et al: Definition andclassification of chronic kidney disease: A position state-ment from Kidney Disease: improving Global Outcomes(KDIGO). Kidney Int 2005;67:2089–2100.
20. Sarnak MJ, Levey AS, Schoolwerth AC, et al: Kidney dis-ease as a risk factor for development of cardiovasculardisease: A statement from the American Heart Associa-tion Councils on Kidney in Cardiovascular Disease, HighBlood Pressure Research, Clinical Cardiology, and Epide-miology and Prevention. Circulation 2003;108:2154–2169.
21. Levin A, Singer J, Thompson CR, et al: Prevalent left ven-tricular hypertrophy in the predialysis population: Identi-fying opportunities for intervention. Am J Kidney Dis1996;27:347–354.
22. Foppa M, Duncan BB, Rohde LE: Echocardiography-based left ventricular mass estimation. How should wedefine hypertrophy? Cardiovasc Ultrasound 2005;3:17.
23. Ommen SR, Nishimura RA, Appleton CP, et al: Clinicalutility of Doppler echocardiography and tissue Dopplerimaging in the estimation of left ventricular filling pres-sures: A comparative simultaneous Doppler-catheteriza-tion study. Circulation 2000;102:1788–1794.
24. Nagueh SF, Appleton CP, Gillebert TC, et al: Recommen-dations for the evaluation of left ventricular diastolic func-tion by echocardiography. J Am Soc Echocardiogr 2009;22:107–133.
25. Eshoo S, Boyd AC, Ross DL, et al: Strain rate evaluation ofphasic atrial function in hypertension. Heart 2009;95:1184–1191.
26. Boyd AC, Richards DA, Marwick T, et al: Atrial strain rateis a sensitive measure of alterations in atrial phasic func-tion in healthy ageing. Heart 2011;97:1513–1519.
27. Hohnloser SH, Connolly SJ: Atrial fibrillation, moderatechronic kidney disease, and stroke prevention: New anti-coagulants, new hope. Eur Heart J 2011;32:2347–2349.
28. McEwan PE, Gray GA, Sherry L, et al: Differential effectsof angiotensin II on cardiac cell proliferation and intra-myocardial perivascular fibrosis in vivo. Circulation 1998;98:2765–2773.
29. Dostal DE: Regulation of cardiac collagen: Angiotensinand cross-talk with local growth factors. Hypertension2001;37:841–844.
30. Verheule S, Sato T, Everett Tt, et al: Increased vulnerabil-ity to atrial fibrillation in transgenic mice with selectiveatrial fibrosis caused by overexpression of TGF-beta1. CircRes 2004;94:1458–1465.
31. Tripepi G, Benedetto FA, Mallamaci F, et al: Left atrial vol-ume monitoring and cardiovascular risk in patients withend-stage renal disease: A prospective cohort study. J AmSoc Nephrol 2007;18:1316–1322.
964
Kadappu, et al.

Cardiac biomarkers in Chronic Kidney Disease
Chapter 5: Independent Echocardiographic Markers of Cardiovascular Involvement in Chronic Kidney Disease: The Value of
Left Atrial Function and Volume.
Publication 3
Kadappu KK, Abhayaratna K, Boyd A, French J, Xuan W, Abhayaratna W, Thomas L. Independent Echocardiographic Markers of Cardiovascular Involvement in
Chronic Kidney Disease: The Value of Left Atrial Function and Volume. Am Soc Echocardiogr. 2016 April; 29(4) 359-367.
Declaration
I certify that this publication was a direct result of my research towards this PhD and that reproduction in this thesis doesn't breach copyright regulations
Krishna Kishor Kadappu
98

CARDIAC INVOLVEMENT IN
CHRONIC KIDNEY DISEASEFrom the Sou
Sydney, Austr
Hospital, Live
Campbelltown
Western Syd
Health Servic
Sydney, Aust
Research, Liv
Independent Echocardiographic Markers ofCardiovascular Involvement in Chronic Kidney
Disease: The Value of Left Atrial Function and Volume
Krishna K. Kadappu, MD, Katrina Abhayaratna, BSc, Anita Boyd, PhD, John K. French, PhD,Wei Xuan, MAppStat, PhD, Walter Abhayaratna, PhD, and Liza Thomas, PhD, Sydney, Liverpool,
Campbelltown, and Canberra, Australia
Background: Chronic kidney disease (CKD) is associated with increased cardiovascular mortality andmorbidity, particularly ischemic heart disease and cardiomyopathy. Newer echocardiographic techniquessuch as myocardial strain analysis provides the opportunity to detect early myocardial dysfunction. The aimof this study was to examine echocardiographic parameters, in particular left atrial (LA) function and volume,in patients with CKD. A further aimwas to determine echocardiographic parameters that are sensitive to detectcardiovascular involvement in early CKD.
Methods: Seventy-six patients with stage 3 CKD (estimated glomerular filtration rate, 30–59 mL/min/1.73 m2)with hypertension and/or diabetes mellitus, without any previous cardiac illness, were prospectively recruited.These patients were compared with subjects matched for age, sex, and risk factors (hypertension and/or dia-betes mellitus) with normal renal function and 76 healthy age-matched control subjects. Two-dimensionalstrain analyses of the left atrium and left ventricle were performed. Comprehensive echocardiographic exam-inations were performed in all participants, and traditional echocardiographic parameters including indexedLA volume (LAVI) and two-dimensional strain analysis of the left ventricle and left atrium were performed inall participants. Differences among the three groups on demographic, clinical, and echocardiographic param-eters were examined.
Results: LA systolic strain (20.96 6.3% vs 27.46 7.9%, P < .0001) and systolic and late diastolic strain rateswere altered in the CKD group, while early diastolic strain rate was similar to that in the risk factor–matchedgroup. LAVIwas significantly larger in theCKDgroupcomparedwith the risk factor–matched groupandhealthycontrol subjects (38.56 10 vs 31.26 9 vs 22.36 5mL/m2, P < .0001). LV strain as well as LV systolic and earlydiastolic strain rateswere similar in theCKD and risk factor–matched groups. LV late diastolic strain rate, a sur-rogate measure of LA contractile function, was, however, reduced in the CKD group. Forward logistic regres-sion analysis showed LA global strain to be the most sensitive predictor for the presence of CKD, followed byLAVI; though LV late diastolic strain rate was reduced in the CKD group, it was not an independent predictor.Furthermore, the addition of LA strain to traditional echocardiographic parameters significantly increased thepredictive power to detect cardiovascular involvement (C statistic = 0.65 vs C statistic = 0.84, P < .0001).Increased LAVI, reduced left ventricular global strain, and the presence of CKD were independent predictorsof LA strain, while left ventricular mass index, E/e0 ratio, and the presence of CKD were predictors of LAVI.
Conclusion: LA strain and LAVI are more sensitive parameters than traditional echocardiographic parame-ters as well as left ventricular strain in patients with early CKD. LA strain and LAVI may be useful to detectmyocardial involvement in stage 3 CKD, and LA alterations may be consequent to increased activation ofthe renin-angiotensin-aldosterone pathway, causing myocardial fibrosis in CKD. (J Am Soc Echocardiogr2016;29:359-67.)
Keywords: Left atrium, Chronic kidney disease, Left atrial volume, Left atrial strain, Left ventricular strain
th Western Sydney Clinical School, University of New South Wales,
alia (K.K.K., J.K.F., W.X., L.T.); theCardiology Department, Liverpool
rpool, Australia (K.K.K., J.K.F., L.T.); the Cardiology Department,
Hospital, Campbelltown, Australia (K.K.K.); the University of
ney, Campbelltown, Australia (K.K.K.); Canberra Hospital and
e, Canberra, Australia (K.A., W.A.); the University of Sydney,
ralia (A.B., L.T.); and the Ingham Institute of Applied Medical
erpool, Australia (W.X.).
Dr Kadappu received a National Health andMedical Research Council scholarship
(GTN 1018215) to conduct this research.
Reprint requests: Liza Thomas, PhD, Liverpool Hospital, Cardiology Department,
Elizabeth Street, Liverpool, NSW 2170, Australia (E-mail: [email protected]).
0894-7317/$36.00
Copyright 2016 by the American Society of Echocardiography.
http://dx.doi.org/10.1016/j.echo.2015.11.019
359

Table 1 Classification of CKD
Stage Description eGFR(mL/min/1.73 m2)
1 Kidney damage with normal
or increased GFR
$90
2 Kidney damage with mildreduced GFR
60–89
3 Moderately decreased GFR 30–59
4 Severely decreased GFR 15–29
5 Kidney failure <15
GFR, Glomerular filtration rate.
Abbreviations
ACE = Angiotensin-converting enzyme
CKD = Chronic kidneydisease
CVD = Cardiovascular
disease
DM = Diabetes mellitus
DTI = Doppler tissue imaging
eGFR = Estimated glomerularfiltration rate
ESRF = End-stage renalfailure
HT = Hypertension
ICC = Intraclass correlationcoefficient
LA = Left atrial
LAVI = Left atrial volumeindexed to body surface area
LV = Left ventricular
LVEF = Left ventricularejection fraction
LVMI = Left ventricular massindexed to body surface area
RAAS = Renin-angiotensin-aldosterone system
SRa = Late diastolic strain
rate
SRe = Early diastolic strain
rate
SRs = Systolic strain rate
2D = Two-dimensional
360 Kadappu et al Journal of the American Society of EchocardiographyApril 2016
Chronic kidney disease (CKD),an important emerging globalhealth issue, is associated withincreased cardiovascular mortal-ity and morbidity,1 particularlyrelated to ischemic heart diseaseand cardiomyopathy.2
Cardiovascular risk in patientswith CKD is multifactorial. BothCKD and cardiovascular disease(CVD) share the common tradi-tional risk factors, such as diabetesmellitus (DM) and hypertension(HT). Importantly, traditional riskfactors, such the Framinghamrisk score, often underestimatecardiovascular risk in patientswith CKD.3 Underestimation oftrue cardiovascular risk in patientswith CKD can be explained bynontraditional risk factors; struc-tural and biochemical abnormal-ities occur more commonly inpatients with CKD and increasethe risk for CVD.
We used themodifiedNationalKidney Foundation classificationof CKD, based on estimatedglomerular filtration rate (eGFR)4,5
(Table 1). All stages of kidney dis-ease have a high risk for thedevelopment of adverse CVD1;however, >11% risk for adversecardiovascular has been reportedin stage 3 CKD.1
Conventional echocardiogra-phy evaluates cardiac structureand function and remains a com-mon examination performed inalmost all patients with CKD.However, conventional echocar-
diographic parameters have limited sensitivity, with changes evidentonly once overt cardiac involvement has occurred. It is well docu-mented that left ventricular (LV) hypertrophy and coronary artery dis-ease are common in patients with end-stage renal disease.6 LV strainwas also shown to be reduced in patients with CKD, mainly in end-stage renal failure (ESRF).7,8 Tripepi et al.9 demonstrated that changesin left atrial (LA) volume predict cardiovascular events in dialysis pa-tients, independent of baseline LAvolume or LVmass. They concludedmonitoring LA size is useful for monitoring cardiovascular risk in pa-tients with ESRF. However, there are limited data regarding LA func-tion assessed by strain parameters and LA volume in early CKD.
Activation of the renin-angiotensin-aldosterone system (RAAS) inCKD caused myocardial fibrosis in an animal model.10 Saito et al.11
demonstrated that myocardial fibrosis can be detected by two-dimensional (2D) strain. Given that the atrium has thinner wallsthan the ventricle, it is possible that alterations in myocardial deforma-tion may be detected earlier in the atrium using strain analysis.
Two-dimensional strain is an angle-independent, semiautomatedtechnique that evaluates LA function.12 The aim of our study wasto investigate the value of LA volume and 2D strain analysis in the
detection of myocardial involvement in early CKD in patients withcoexistent DM and/or HT. We hypothesized that atrial dysfunctionin patients with CKD can be detected at an early stage and thatCKDmay result inmyocardial dysfunction, independent and additiveto the effects of coexistent DM and HT.We also hypothesized that LAstrain analysis may be more sensitive than LA volume indexed tobody surface area (LAVI) or LV strain parameters in patients withCKD to detect myocardial involvement.
METHODS
Seventy-six patients with stage 3 CKD (eGFR, 30–59 mL/min/1.73 m2 by the Modification of Diet in Renal Disease formula) withHT or DM (or both) and without any previous cardiac illness wereprospectively recruited and compared with subjects matched forage, sex, and risk factors (HTand/or DM) with normal renal functionand 76 healthy age-matched control subjects.
Study Population
The final study group comprised 228 subjects. Patients with CKDwith HT and/or DM (n = 76) were recruited prospectively fromthe renal outpatient clinic at Liverpool Hospital (Sydney,Australia). CKD staging was done according to standard criteria4,5;the etiology for CKD was HT (n = 29), diabetic nephropathy(n = 31), drug related, renal calculus, chronic inflammatorynephropathy, glomerulonephropathy, ischemic nephropathy, chronicgranulomatous nephropathy, and single kidney (n = 2 for each) andhepatitis and polycystic kidney disease (n = 1 each). We selectedpatients with stage 3 CKD because patients with eGFRs < 60 mL/min/1.73 m2 have previously been shown to have an increasedprevalence of CVD.1,13 Two patients with CKD were excludedfrom the final analysis because they had positive results on stresselectrocardiography for exercise-induced ischemia, and 74 patientswere used in the final analysis.All patients with CKD were screened for coexistent HT and/or
DM. None of these patients had previous cardiovascular, peripheralvascular, or cerebrovascular disease. All study subjects were in sinusrhythm, and none had any histories of atrial fibrillation. The patientswith CKD were regularly followed by their renal physicians andwere optimally treated for their blood pressure and DM. All patientswith HTwere on one or more antihypertensive medications, with sys-tolic pressure < 140 mm Hg and diastolic pressure < 90 mm Hg. Alldiabetic patients were either on oral hypoglycemic agents and/or in-sulin, and their glycated hemoglobin levels were <7%. All patientswith CKD underwent baseline transthoracic echocardiography to
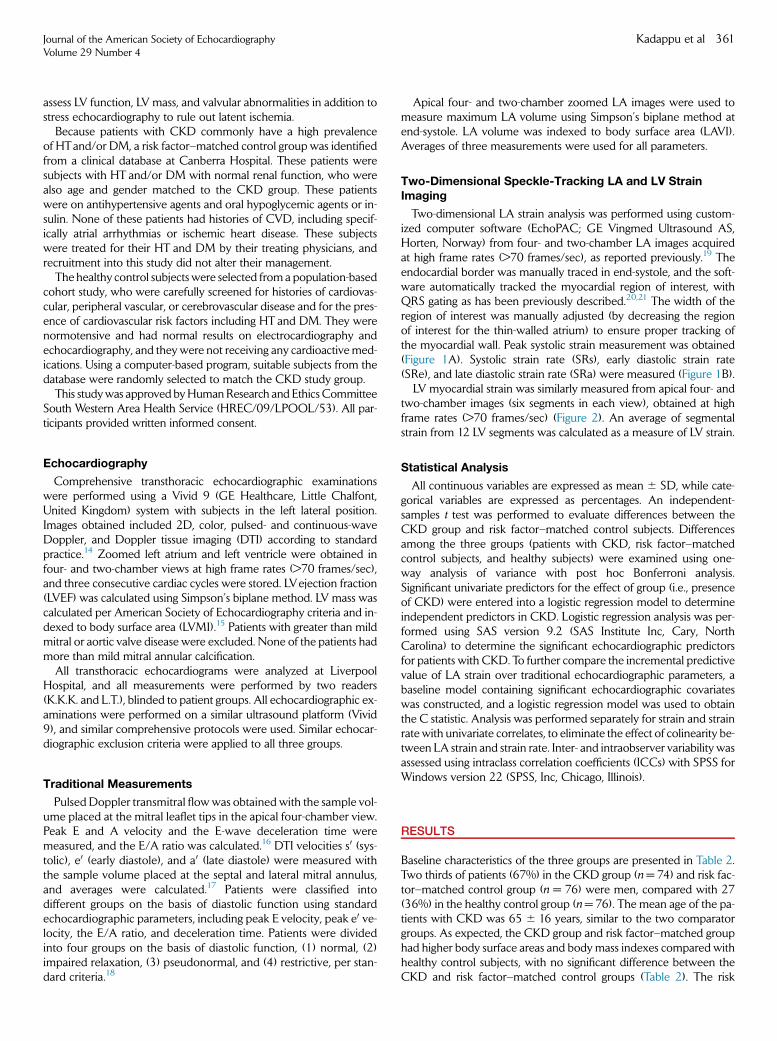
Journal of the American Society of EchocardiographyVolume 29 Number 4
Kadappu et al 361
assess LV function, LV mass, and valvular abnormalities in addition tostress echocardiography to rule out latent ischemia.Because patients with CKD commonly have a high prevalence
of HTand/or DM, a risk factor–matched control group was identifiedfrom a clinical database at Canberra Hospital. These patients weresubjects with HT and/or DM with normal renal function, who werealso age and gender matched to the CKD group. These patientswere on antihypertensive agents and oral hypoglycemic agents or in-sulin. None of these patients had histories of CVD, including specif-ically atrial arrhythmias or ischemic heart disease. These subjectswere treated for their HT and DM by their treating physicians, andrecruitment into this study did not alter their management.The healthy control subjects were selected from a population-based
cohort study, who were carefully screened for histories of cardiovas-cular, peripheral vascular, or cerebrovascular disease and for the pres-ence of cardiovascular risk factors including HT and DM. They werenormotensive and had normal results on electrocardiography andechocardiography, and they were not receiving any cardioactive med-ications. Using a computer-based program, suitable subjects from thedatabase were randomly selected to match the CKD study group.This studywas approved byHumanResearch and EthicsCommittee
South Western Area Health Service (HREC/09/LPOOL/53). All par-ticipants provided written informed consent.
Echocardiography
Comprehensive transthoracic echocardiographic examinationswere performed using a Vivid 9 (GE Healthcare, Little Chalfont,United Kingdom) system with subjects in the left lateral position.Images obtained included 2D, color, pulsed- and continuous-waveDoppler, and Doppler tissue imaging (DTI) according to standardpractice.14 Zoomed left atrium and left ventricle were obtained infour- and two-chamber views at high frame rates (>70 frames/sec),and three consecutive cardiac cycles were stored. LVejection fraction(LVEF) was calculated using Simpson’s biplane method. LV mass wascalculated per American Society of Echocardiography criteria and in-dexed to body surface area (LVMI).15 Patients with greater than mildmitral or aortic valve disease were excluded. None of the patients hadmore than mild mitral annular calcification.All transthoracic echocardiograms were analyzed at Liverpool
Hospital, and all measurements were performed by two readers(K.K.K. and L.T.), blinded to patient groups. All echocardiographic ex-aminations were performed on a similar ultrasound platform (Vivid9), and similar comprehensive protocols were used. Similar echocar-diographic exclusion criteria were applied to all three groups.
Traditional Measurements
Pulsed Doppler transmitral flowwas obtained with the sample vol-ume placed at the mitral leaflet tips in the apical four-chamber view.Peak E and A velocity and the E-wave deceleration time weremeasured, and the E/A ratio was calculated.16 DTI velocities s0 (sys-tolic), e0 (early diastole), and a0 (late diastole) were measured withthe sample volume placed at the septal and lateral mitral annulus,and averages were calculated.17 Patients were classified intodifferent groups on the basis of diastolic function using standardechocardiographic parameters, including peak E velocity, peak e0 ve-locity, the E/A ratio, and deceleration time. Patients were dividedinto four groups on the basis of diastolic function, (1) normal, (2)impaired relaxation, (3) pseudonormal, and (4) restrictive, per stan-dard criteria.18
Apical four- and two-chamber zoomed LA images were used tomeasure maximum LA volume using Simpson’s biplane method atend-systole. LA volume was indexed to body surface area (LAVI).Averages of three measurements were used for all parameters.
Two-Dimensional Speckle-Tracking LA and LV StrainImaging
Two-dimensional LA strain analysis was performed using custom-ized computer software (EchoPAC; GE Vingmed Ultrasound AS,Horten, Norway) from four- and two-chamber LA images acquiredat high frame rates (>70 frames/sec), as reported previously.19 Theendocardial border was manually traced in end-systole, and the soft-ware automatically tracked the myocardial region of interest, withQRS gating as has been previously described.20,21 The width of theregion of interest was manually adjusted (by decreasing the regionof interest for the thin-walled atrium) to ensure proper tracking ofthe myocardial wall. Peak systolic strain measurement was obtained(Figure 1A). Systolic strain rate (SRs), early diastolic strain rate(SRe), and late diastolic strain rate (SRa) were measured (Figure 1B).LV myocardial strain was similarly measured from apical four- and
two-chamber images (six segments in each view), obtained at highframe rates (>70 frames/sec) (Figure 2). An average of segmentalstrain from 12 LV segments was calculated as a measure of LV strain.
Statistical Analysis
All continuous variables are expressed as mean 6 SD, while cate-gorical variables are expressed as percentages. An independent-samples t test was performed to evaluate differences between theCKD group and risk factor–matched control subjects. Differencesamong the three groups (patients with CKD, risk factor–matchedcontrol subjects, and healthy subjects) were examined using one-way analysis of variance with post hoc Bonferroni analysis.Significant univariate predictors for the effect of group (i.e., presenceof CKD) were entered into a logistic regression model to determineindependent predictors in CKD. Logistic regression analysis was per-formed using SAS version 9.2 (SAS Institute Inc, Cary, NorthCarolina) to determine the significant echocardiographic predictorsfor patients with CKD. To further compare the incremental predictivevalue of LA strain over traditional echocardiographic parameters, abaseline model containing significant echocardiographic covariateswas constructed, and a logistic regression model was used to obtainthe C statistic. Analysis was performed separately for strain and strainrate with univariate correlates, to eliminate the effect of colinearity be-tween LA strain and strain rate. Inter- and intraobserver variability wasassessed using intraclass correlation coefficients (ICCs) with SPSS forWindows version 22 (SPSS, Inc, Chicago, Illinois).
RESULTS
Baseline characteristics of the three groups are presented in Table 2.Two thirds of patients (67%) in the CKD group (n = 74) and risk fac-tor–matched control group (n = 76) were men, compared with 27(36%) in the healthy control group (n = 76). The mean age of the pa-tients with CKD was 65 6 16 years, similar to the two comparatorgroups. As expected, the CKD group and risk factor–matched grouphad higher body surface areas and body mass indexes compared withhealthy control subjects, with no significant difference between theCKD and risk factor–matched control groups (Table 2). The risk

Figure 1 (A) LA global 2D strain. (B) LA 2D strain rate including sytolic SRs and diastolic SRe and SRa measurements.
Figure 2 LV global strain. LVGLS, Peak systolic LV global longitudinal strain.
362 Kadappu et al Journal of the American Society of EchocardiographyApril 2016
factor–matched control group had higher blood pressure comparedwith both the CKD and normal groups. More patients in theCKD group were on b–blockers (18 vs 11, P = .002) as well asangiotensin-converting enzyme (ACE) inhibitors (25 vs 17,P = .007) compared with the risk factor–matched group. Six patientswith CKD were on spironolactone; however, none in the risk factor–matched control group were on spironolactone.
Traditional Echocardiographic Parameters
LVEFs were normal in all three groups; LVMI was 97 6 32 g/m2 inthe CKD group, 1046 31 g/m2 in the risk factor–matched control
group, and 85 6 28 g/m2 in healthy control subjects, which wasalso within the normal range (43–95 g/m2 in women and 49–115 g/m2 in men). Even though LVMI was similar between patientswith CKD and risk factor–matched control subjects, LVMI washigher than in healthy control subjects (Table 2). Only four subjectsin CKD group had normal diastolic function; 35 had impairedrelaxation, 33 had pseudonormal relaxation, and two had restric-tive patterns. In contrast, 18% of patients in the risk factor–matchedcontrol group had normal diastolic function, 45% had impairedrelaxation, 37% had pseudonormal relaxation, and none had arestrictive pattern. The healthy control subjects had either normaldiastolic function or impaired relaxation patterns. DTI s0 velocity

Table 2 Clinical and traditional echocardiographic characteristics of the study population
Parameter CKD group Risk factor–matched group Healthy control subjects P
Age (y) 65.5 6 16 65.3 6 10 61.7 6 8 .08
Men 48 (65%) 50 (65%) 26 (34%) <.001*
Systemic HT 69 (93%) 70 (92%) 0 .59
DM 35 (47%) 36 (47%) 0 .98
Body surface area (m2) 1.94 6 0.24 1.97 6 0.24 1.82 6 0.22 <.0001*
Body mass index (kg/m2) 29.9 6 6.7 30.1 6 5.3 26 6 4.5 <.0001*
Systolic blood pressure (mm Hg) 127 6 18 150 6 18 123 6 12 <.0001†
Diastolic blood pressure (mm Hg) 72 6 8 85 6 9 75 6 9 <.0001†
Peak A (m/sec) 0.78 6 0.17 0.75 6 0.2 .68 6 0.17 .003*
A VTI (cm) 8.8 6 2.3 8.9 6 2.3 9.3 6 2.9 .5
LVEF (%) 65.8 6 6.5 65.8 6 6.5 60 6 5 <.0001*
LVMI (g/m2) 97.1 6 31.7 104.7 6 30.9 85.1 6 27.6 <.0001*
LAVI (mL/m2) 38.5 6 10.3 31.2 6 8.6 22.3 6 4.5 <.0001*†
s0 (cm/sec) 7 6 1.5 7.3 6 1.8 7.5 6 1.5 .16
e0 (cm/sec) 6.3 6 1.6 6.9 6 2.6 8 6 2 <.0001*
a0 (cm/sec) 9.4 6 2.1 9.5 6 2 10.3 6 1.9 .009*
E/e0 12 6 3.8 11.1 6 4.9 8.9 6 2.5 <.0001*
E/A ratio 0.94 6 0.24 0.99 6 0.39 1.03 6 0.24 .19
VTI, Velocity-time integral.Data are expressed as mean 6 SD or as number (percentage).
*P < .05 versus healthy control subjects.†P < .05 versus risk factor–matched group.
Table 3 LA strain parameters
LA strain
parameter CKD group
Risk
factor–matched
group
Healthy
control
subjects P
LA GS (%) 20.9 6 6.3 27.4 6 7.9 36.8 6 9 <.0001*†
LA SRs (sec�1) 1.1 6 0.3 1.2 6 0.3 1.9 6 0.5 <.0001*†
LA SRe (sec�1) 1 6 0.3 1.1 6 0.4 1.6 6 0.5 <.0001*
Journal of the American Society of EchocardiographyVolume 29 Number 4
Kadappu et al 363
was similar in the three groups, but both early (e0) and late (a0) dia-stolic velocities on DTI were significantly different between healthycontrol subjects and patients with CKD and risk factor–matchedcontrol subjects. E/e0 ratios were higher in the CKD group thanthat observed in risk factor–matched control or healthy controlsubjects (Table 2). However, none of these parameters could differ-entiate patients with CKD from the risk factor–matched controlsubjects.
LA SRa (sec�1) 1.5 6 0.4 1.8 6 0.6 2.3 6 0.8 <.0001*†
GS, Global strain.Data are expressed as mean 6 SD.
*P < .05 versus healthy control subjects.†P < .05 versus risk factor–matched group.
LA Parameters
LA strain, SRs (reservoir function), and SRa (contractile function) werereduced in the CKD group (Tables 3 and 4), while LA conduitfunction (as measured by SRe) was similar to that in the comparatorgroup. LAVI was significantly larger in the CKD group, comparedwith both risk factor–matched and healthy control subjects. Weused current reported values of increased LAVI14 (>34 mL/m2) andthe lower limit for LA strain (<34%) reported in the literature.22,23
When applying these normal cutoffs to the CKD group, 29 patients(38%) with CKD had normal LA volumes (<34 mL/m2),14 whereasonly two patients (3%) had normal LA global strain of >34%.23
We further analyzed LV longitudinal strain, SRs, SRe, and SRa inthe CKD and risk factor matched control groups (Table 4). LV sys-tolic strain as well as LV SRs and SRe were similar between patientswith CKD and risk factor–matched control subjects, demon-strating that LV contractile function as well as early diastolic relax-ation were altered by the presence of DM and/or HT but thatcoexistent renal dysfunction did not additionally alter LV strain.Only LV SRa, a surrogate measure of LA contractile function,was reduced in the CKD group compared with the risk factor–matched control group (Table 4).
Logistic Regression Analysis
Forward logistic regression analysis was performed to determine in-dependent predictors of CKD. LA global strain, LAVI, LVMI, dia-stolic grade, E/e0 ratio, LV strain, and age were used as covariatesafter adjusting for medications including b-blockers and ACE inhib-itors. We also substituted LV SRa instead of LV strain in the samemodel, but this was not shown to be an independent predictor ofCKD. LA global strain (P < .0001) was the first predictor in thismodel, indicating that it is the most sensitive echocardiographicparameter in CKD, followed by LAVI (P = .005). We also performedlogistic regression model to evaluate the incremental value of LAstrain over the traditional echocardiographic parameters, includingdiastolic grade, LVMI, and E/e0, as the baseline model. The indepen-dent and incremental value of LA strain, LAVI, and LV SRa overbaseline was assessed individually as well as in an incrementalmodel. LA strain had significant predictive value when added to

Table 4 LA and LV strain parameters between CKD and riskfactor–matched control groups
Strain parameter CKD group Risk factor–matched group P
LA GS (%) 20.9 6 6.3 27.4 6 7.9 <.0001*
LA SRs (sec�1) 1.1 6 0.3 1.2 6 0.3 .03*
LA SRe (sec�1) 1 6 0.3 1.1 6 0.4 .54
LA SRa (sec�1) 1.5 6 0.4 1.8 6 0.6 .01*
LV GS (%) 15.6 6 3.7 16.8 6 3.6 .05
LV SRs (sec�1) 0.84 6 0.2 0.84 6 0.2 .92
LV SRe (sec�1) 0.81 6 0.3 0.9 6 0.3 .09
LV SRa (sec�1) 0.82 6 0.3 0.95 6 0.3 .006*
Data are expressed as mean 6 SD.
*P < .05 versus risk factor–matched group.
364 Kadappu et al Journal of the American Society of EchocardiographyApril 2016
traditional echocardiographic parameters, as did LAVI. However, LVSRa had no additional benefit to predict cardiovascular involvementin CKD (Figure 3). We also performed analysis to determine inde-pendent determinants of LA strain and LAVI. Presence of CKD,LAVI, LVMI, diastolic grade, E/e0 ratio, LV strain, and b-blocker ther-apy, along with age, were used as covariates in the model for LAstrain. Increased LAVI and reduced LV global strain were predictorsof reduced LA strain. Importantly, presence of CKD was also an in-dependent predictor for reduced LA strain. When a similar analysiswas performed to determine independent predictors of increasedLAVI, presence of CKD along with LVMI and E/e0 ratio were shownto be predictors (Table 5).
Inter- and Intraobserver Variability
LA strain and strain rate were analyzed by two different individualsand by the same individual on a different day to evaluate inter- andintraobserver variability. Inter- and intraobserver variability wasevaluated by estimating ICCs; ICCs for LA strain were 0.97(0.92–0.99) and 0.98 (0.95–0.99), respectively. Inter and intraob-server ICCs for LA SRs were 0.95 (0.88–0.98) and 0.98 (0.96–0.99), for LA SRe were 0.96 (0.90–0.98) and 0.99 (0.98–0.99),and for LA SRa were 0.97 (0.91–0.99) and 0.99 (0.97–0.99),respectively.
DISCUSSION
We have demonstrated that patients with CKD have altered LA func-tion and LA enlargement compared with risk factor–matched controlsubjects and healthy normal subjects. Importantly, traditional param-eters of LV function as well as LV longitudinal strain, LV SRs, and LVSRe, although altered in the presence of DM and/or HT, were notfurther altered by early renal impairment. The presence of CKD,however, had a differential effect on LA function and LAVI, thusdemonstrating that monitoring LA characteristics may be importantin patients with CKD. Diastolic dysfunction is commonly present inpatients with CKD and as a consequence may additionally contributeto LA changes.
Traditional risk factors are important predictors of adverse cardio-vascular events in the general population24; however, calculation ofthe Framingham risk score underestimates cardiac events in patientswith CKD.3 Identification of a sensitive noninvasive biomarker for
cardiovascular involvement and possibly as a predictor for adverseoutcomes would be useful in patients with CKD.
We included only patients with stage 3 CKD in our study for mul-tiple reasons. A number of studies have demonstrated increased car-diovascular mortality in ESRF1,2,7,9,25,26; however, there is a paucityof data regarding LA characteristics (both function and volume) inpatients with stage 3 CKD, even though there is evidence todemonstrate that the myocardium is already involved in stage 3CKD.1 Additionally, in patients with eGFRs < 30 mL/min/1.73 m2
(stages 4 and 5), there is increased fluid overload and LV hypertro-phy,26 conditions that independently alter LA size and function.
The aim of this study was specifically to detect early and subtle car-diac involvement using newer echocardiographic parameters thatmay be more sensitive compared with traditional echocardiographicparameters. Patients with stages 4 and 5 CKD have already beenshown to have abnormalities in traditional echocardiographic param-eters,27 and hence inclusion of this group will not provide any newinformation than what has been previously reported. Moreover, noprevious studies have examined the incremental effect of CKD onLA characteristics, beyond the influence of traditional cardiovascularrisk factors such as HT and DM. Patients with CKD often have asso-ciated HT and/or DM, and as such, both may independently be riskfactors for the development of myocardial dysfunction. Thus, weconsidered patients with stage 3 CKD as a good cohort to identify car-diac involvement in early CKD.
The pathogenesis of cardiomyopathy and alteration of LA func-tion (in this instance measured by LA strain) and volume in patientswith CKD is multifactorial.9,28-30 LA volume changes may occurbecause of pressure and volume overload. Coexistent coronaryartery disease may also contribute to LA enlargement.31 Pressureoverload in CKD can be due to valvular heart disease, HT, and alter-ations in LV compliance due to LV hypertrophy (diastolic dysfunc-tion) as well as systolic dysfunction. CKD also causes fluidoverload, which in turn may lead to LA dilatation. Most patientswith CKD have associated HT and DM, both conditions againknown to cause reduced LA strain and increase in LA volume. LAcharacteristics were altered in the risk factor–matched control groupas well. However, no studies have specifically examined LA enlarge-ment and LA dysfunction in patients with early CKD. In this study,we have demonstrated that the presence of CKD has an additionalimpact on LA volume and function, over and above that of risk fac-tors such as HTand DM. Previously it was also noted that LAvolumewas independently related to LV mass, LVEF, and E/A ratio in pa-tients with ESRF.30 We hypothesized that this may be secondary toincreased activation of the RAAS, with resultant myocardial fibrosisthat in turn alters LA function and LA volume. We have not beenable to specifically measure RAAS activation in the CKD group,but we have demonstrated that LA strain is affected earlier thanLA volume in stage 3 CKD,32 which indirectly supports this hypoth-esis, as myocardial fibrosis would alter LA strain earlier than LA dila-tation, which is a more chronic process.
We specifically sought to identify echocardiographic parametersthat are sensitive to detect myocardial involvement in early CKDand that could be a discriminator for the effects of renal diseasebeyond those of associated risk factors such as HT and/or DM. Ithas been previously demonstrated that LA enlargement in CKD isa predictor of patients who progress to dialysis.33 In our study, despitenormal LVMI and LVEF, the CKD group showed impaired LA func-tion, and the presence of CKD was an independent predictor of bothLAVI and LA strain. There was a significant reduction in e0 velocity,while E/e0 was elevated in both patients with CKD and the risk

Figure 3 Incremental diagnostic value of LA strain in CKD (C statistic). LAGS, LA global strain.
Table 5 Multivariate analysis to determine independentpredictors of LAVI and LA global strain
Predictor
LAVI LA global strain
b P b P
Group �0.38 <.0001 0.28 <.0001
LVMI 0.27 <.0001 �0.03 .70
LA strain �0.08 .30 — —
LAVI — — �0.18 .01
Diastolic grade 0.01 .89 �0.05 .48
E/e0 ratio 0.17 .01 �0.09 .20
LV strain �0.09 .27 0.43 <.0001
Age 0.09 .24 �0.10 .22
b-blocker 0.02 .84 �0.06 .40
Journal of the American Society of EchocardiographyVolume 29 Number 4
Kadappu et al 365
factor–matched group. However, there was no significant differencebetween the CKD and risk factor–matched control groups. Hence,DTI may not be useful to differentiate cardiovascular involvementin patients with CKD in the presence of HT and/or DM.
Studies have previously demonstrated that 2D LV strain is reducedin patients with CKD and ESRF7,8; Edwards et al.34 demonstrated thatsubclinical LV dysfunction is present even in early CKD that can bediagnosed by LV strain measurements. It was also demonstrated inESRF that reduction in LV strain predicts adverse cardiac events, despitenear normal standard echocardiographic measurements.35 LV strain isalso reduced in patients with HT and DM.11,36 However, in our study,LV strain, SRs, and SRe were similar in the CKD and risk factor–matched control groups. LV SRa, an indicator of LA contractilefunction, was significantly reduced in the CKD population, furtherdemonstrating differential atrial involvement in CKD.
We have demonstrated that alterations in LA strain are more sen-sitive and precede changes observed in the left ventricle in patientswith CKD. These atrial changes are likely multifactorial, including dia-stolic dysfunction, the effects of DM and HT, as well as increasedRAAS activation in patients with CKD with consequent promotionof myocardial fibrosis. It appears that these changes are detectedearlier in the left atrium than the left ventricle and could be due tothe relatively small mass of myocardium in the left atrium.
Both b-blockers and ACE inhibitors can affect LA strain and LAVI,with treatment resulting in an increase in LA strain with a reduction inLAVI. However, despite more patients in the CKD group being ontreatment with b-blockers and ACE inhibitors, patients in this groupshowed significantly decreased LA strain and increased LAVI. Thus,despite treatment, alterations in LA strain and LAVI are present andthus may be useful to detect cardiovascular involvement in CKD.Importantly, we also adjusted for the effect of medications in statisti-cal analysis, and in the presence of CKD, there was no independenteffect of treatment with b-blockers or ACE inhibitors.
Measurement of LAVI and LV strain parameters is simpler and lesstime consuming than measurement of LA strain. However, our aimwas to find the most sensitive parameter to detect involvement ofthe cardiovascular system in early CKD. Hence we determined thevarious echocardiographic parameters that are significantly alteredin early CKD. We performed forward logistic regression analysis tospecifically determine which parameter was the more sensitive mea-sure and to determine independent predictors in patients with CKD.This analysis showed that LA strain was the most significant and sen-sitive parameter to detect myocardial involvement. We also demon-strated the incremental predictive value of LA strain when added totraditional echocardiographic parameters (Figure 3). Altered LAstrain has been shown to be a predictor of adverse cardiac outcomesin varying conditions in earlier studies,21,37,38 and although this studylacks longitudinal data, extrapolation from other reports would

366 Kadappu et al Journal of the American Society of EchocardiographyApril 2016
suggest that altered LA strain may be a predictor of adverseoutcomes in the CKD group as well. Thus, LA strain may helpclinicians to identify which patients with CKD require carefulmonitoring and aggressive medical therapy. It has been previouslyreported that reduction in LA strain parameters can be reversed, iftreated early with ACE inhibitors.39,40 Thus it is likely that LAstrain is altered early, at a stage when aggressive therapy canreverse the changes observed.
LV SRa, though significantly different between the CKD and riskfactor–matched groups, was not an independent predictor of CKD,and it did not add any additional predictive value to other echocardio-graphic parameters (Figure 3) in patients with CKD. Hence, althoughit is easier tomeasure, it is less sensitive for the detection of myocardialinvolvement in CKD.
Strengths and Limitations
In this prospective study, we could select the CKD cohort using strictinclusion and exclusion criteria. Although these results are cross-sectional, we are presently following patients longitudinally to deter-mine the value of LA strain and LAVI on adverse cardiac outcomes.We also chose the risk factor–matched group from a different hospi-tal. This was to done to widen the demography and to reduce selec-tion bias. Importantly, echocardiography was performed using similarcomprehensive protocols at both sites, with all measurements beingperformed at a single core laboratory from digital images.
We assessed diastolic dysfunction by using mitral inflow Dopplervelocity and tissue Doppler. We did not, however, measure pulmo-nary vein Doppler parameters.
Image quality is important for strain analysis, and poor image qual-ity may underestimate strain parameters. In this study, we includedonly patients in whom image quality was adequate to measure 2Dstrain. EchoPAC is not specifically designed for LA strain measure-ment, but earlier studies confirmed that it is feasible to use this soft-ware for the measurement of LA strain.22
Although we included more sensitive echocardiographic measuresto assess myocardial function, the quantification of myocardial fibrosisby magnetic resonance imaging and of RAAS activation usingbiochemical markers was beyond the scope of our study.
CONCLUSIONS
In patients with CKD, LA function (as evaluated by strain) and LAVIare altered earlier than LV parameters, including LVEF, LV strain, andLV SRa. Accordingly, LA strain and strain rate are useful parameters todetect myocardial involvement in early stages of CKD and may helpidentify patients who need monitoring and targeted medical therapy.Although we postulate that our findings may represent the effect ofincreased RAAS activity on the myocardium in patients with CKD,future studies specifically evaluating the effect of RAAS inhibitorson LA strain and strain rate are required to determine the role ofRAAS in the promotion of myocardial fibrosis in CKD.
REFERENCES
1. Go AS, Chertow GM, Fan D, McCulloch CE, Hsu CY. Chronic kidney dis-ease and the risks of death, cardiovascular events, and hospitalization. NEngl J Med 2004;351:1296-305.
2. Foley RN, Parfrey PS, Sarnak MJ. Epidemiology of cardiovascular diseasein chronic renal disease. J Am Soc Nephrol 1998;9:S16-23.
3. Weiner DE, Tighiouart H, Elsayed EF, Griffith JL, Salem DN, Levey AS,et al. The Framingham predictive instrument in chronic kidney disease. JAm Coll Cardiol 2007;50:217-24.
4. K/DOQI clinical practice guidelines for chronic kidney disease: evalua-tion, classification, and stratification. Am J Kidney Dis 2002;39:S1-266.
5. Levey AS, Eckardt KU, Tsukamoto Y, Levin A, Coresh J, Rossert J, et al.Definition and classification of chronic kidney disease: a position state-ment from Kidney Disease: Improving Global Outcomes (KDIGO). Kid-ney Int 2005;67:2089-100.
6. Foley RN. Clinical epidemiology of cardiac disease in dialysis patients: leftventricular hypertrophy, ischemic heart disease, and cardiac failure. SeminDial 2003;16:111-7.
7. Liu YW, Su CT, Huang YY, Yang CS, Huang JW, Yang MT, et al. Left ven-tricular systolic strain in chronic kidney disease and hemodialysis patients.Am J Nephrol 2011;33:84-90.
8. Yan P, Li H, Hao C, Shi H, Gu Y, Huang G, et al. 2D-speckle tracking echo-cardiography contributes to early identification of impaired left ventricularmyocardial function in patients with chronic kidney disease. Nephron ClinPract 2011;118:c232-40.
9. Tripepi G, Benedetto FA, Mallamaci F, Tripepi R, Malatino L, Zoccali C.Left atrial volume monitoring and cardiovascular risk in patients withend-stage renal disease: a prospective cohort study. J Am Soc Nephrol2007;18:1316-22.
10. Ehrlich JR, Hohnloser SH, Nattel S. Role of angiotensin system and effectsof its inhibition in atrial fibrillation: clinical and experimental evidence. EurHeart J 2006;27:512-8.
11. Saito M, Okayama H, Yoshii T, Higashi H, Morioka H, Hiasa G, et al. Clin-ical significance of global two-dimensional strain as a surrogate parameterof myocardial fibrosis and cardiac events in patients with hypertrophic car-diomyopathy. Eur Heart J Cardiovasc Imaging 2012;13:617-23.
12. Vianna-Pinton R, Moreno CA, Baxter CM, Lee KS, Tsang TS,Appleton CP. Two-dimensional speckle-tracking echocardiography ofthe left atrium: feasibility and regional contraction and relaxation differ-ences in normal subjects. J Am Soc Echocardiogr 2009;22:299-305.
13. Sarnak MJ, Levey AS, Schoolwerth AC, Coresh J, Culleton B, Hamm LL,et al. Kidney disease as a risk factor for development of cardiovasculardisease: a statement from the American Heart Association Councils onKidney in Cardiovascular Disease, High Blood Pressure Research, Clin-ical Cardiology, and Epidemiology and Prevention. Circulation 2003;108:2154-69.
14. Lang RM, Badano LP, Mor-Avi V, Afilalo J, Armstrong A, Ernande L, et al.Recommendations for cardiac chamber quantification by echocardiogra-phy in adults: an update from the American Society of Echocardiographyand the European Association of Cardiovascular Imaging. J Am Soc Echo-cardiogr 2015;28:1-39.
15. Foppa M, Duncan BB, Rohde LE. Echocardiography-based left ventricularmass estimation. How should we define hypertrophy? Cardiovasc Ultra-sound 2005;3:17.
16. Appleton CP, Jensen JL, Hatle LK, Oh JK. Doppler evaluation of left andright ventricular diastolic function: a technical guide for obtaining optimalflow velocity recordings. J Am Soc Echocardiogr 1997;10:271-92.
17. Ommen SR, Nishimura RA, Appleton CP, Miller FA, Oh JK,Redfield MM, et al. Clinical utility of Doppler echocardiography and tis-sue Doppler imaging in the estimation of left ventricular filling pressures:a comparative simultaneous Doppler-catheterization study. Circulation2000;102:1788-94.
18. Nagueh SF, Appleton CP, Gillebert TC, Marino PN, Oh JK, Smiseth OA,et al. Recommendations for the evaluation of left ventricular diastolic func-tion by echocardiography. J Am Soc Echocardiogr 2009;22:107-33.
19. Kadappu KK, Boyd A, Eshoo S, Haluska B, Yeo AE, Marwick TH, et al.Changes in left atrial volume in diabetes mellitus: more than diastolicdysfunction? Eur Heart J Cardiovasc Imaging 2012;13:1016-23.
20. Agoston G, Gargani L, Miglioranza MH, Caputo M, Badano LP, Moreo A,et al. Left atrial dysfunction detected by speckle tracking in patients withsystemic sclerosis. Cardiovasc Ultrasound 2014;12:30.

Journal of the American Society of EchocardiographyVolume 29 Number 4
Kadappu et al 367
21. Hoit BD. Left atrial size and function: role in prognosis. J Am Coll Cardiol2014;63:493-505.
22. Cameli M, Caputo M, Mondillo S, Ballo P, Palmerini E, Lisi M, et al.Feasibility and reference values of left atrial longitudinal strain imag-ing by two-dimensional speckle tracking. Cardiovasc Ultrasound2009;7:6.
23. Morris DA, Takeuchi M, Krisper M, Kohncke C, Bekfani T, Carstensen T,et al. Normal values and clinical relevance of left atrial myocardial functionanalysed by speckle-tracking echocardiography: multicentre study. EurHeart J Cardiovasc Imaging 2015;16:364-72.
24. Grundy SM, Balady GJ, Criqui MH, Fletcher G, Greenland P, Hiratzka LF,et al. Guide to primary prevention of cardiovascular diseases. A statementfor healthcare professionals from the Task Force on Risk Reduction. Amer-ican Heart Association Science Advisory and Coordinating Committee.Circulation 1997;95:2329-31.
25. Foley RN, Parfrey PS, Harnett JD, Kent GM, Martin CJ, Murray DC, et al.Clinical and echocardiographic disease in patients starting end-stage renaldisease therapy. Kidney Int 1995;47:186-92.
26. Levin A, Singer J, Thompson CR, Ross H, Lewis M. Prevalent left ventric-ular hypertrophy in the predialysis population: identifying opportunitiesfor intervention. Am J Kidney Dis 1996;27:347-54.
27. McIntyre CW, John SG, Jefferies HJ. Advances in the cardiovascularassessment of patients with chronic kidney disease. NDT Plus 2008;6:383-91.
28. Shizuku J, Yamashita T, Ohba T, Kabaya T, Nitta K. Left atrial volume is anindependent predictor of all-cause mortality in chronic hemodialysis pa-tients. Intern Med 2012;51:1479-85.
29. Tripepi G, Benedetto FA, Mallamaci F, Tripepi R, Malatino L, Zoccali C.Left atrial volume in end-stage renal disease: a prospective cohort study.J Hypertens 2006;24:1173-80.
30. Tripepi G, Mattace-Raso F, Mallamaci F, Benedetto FA, Witteman J,Malatino L, et al. Biomarkers of left atrial volume: a longitudinal studyin patients with end stage renal disease. Hypertension 2009;54:818-24.
31. Moller JE, Hillis GS, Oh JK, Seward JB, Reeder GS, Wright RS, et al. Leftatrial volume: a powerful predictor of survival after acute myocardialinfarction. Circulation 2003;107:2207-12.
32. Kadappu KK, Kuncoro AS, Hee L, Aravindan A, Spicer ST,Suryanarayanan G, et al. Chronic kidney disease is independently associ-ated with alterations in left atrial function. Echocardiography 2014;31:956-64.
33. Chen SC, Su HM, Hung CC, Chang JM, Liu WC, Tsai JC, et al. Echocar-diographic parameters are independently associated with rate of renalfunction decline and progression to dialysis in patients with chronic kid-ney disease. Clin J Am Soc Nephrol 2011;6:2750-8.
34. EdwardsNC, Hirth A, Ferro CJ, Townend JN, Steeds RP. Subclinical abnor-malities of left ventricular myocardial deformation in early-stage chronickidney disease: the precursor of uremic cardiomyopathy? J Am Soc Echo-cardiogr 2008;21:1293-8.
35. Krishnasamy R, Isbel NM, Hawley CM, Pascoe EM, Leano R, Haluska BA,et al. The association between left ventricular global longitudinal strain,renal impairment and all-cause mortality. Nephrol Dial Transplant 2014;29:1218-25.
36. Ng AC, Delgado V, Bertini M, van der Meer RW, Rijzewijk LJ, Shanks M,et al. Findings from left ventricular strain and strain rate imaging inasymptomatic patients with type 2 diabetes mellitus. Am J Cardiol2009;104:1398-401.
37. Cameli M, Lisi M, Focardi M, Reccia R, Natali BM, Sparla S, et al. Leftatrial deformation analysis by speckle tracking echocardiography for pre-diction of cardiovascular outcomes. Am J Cardiol 2012;110:264-9.
38. Shaikh AY, Maan A, Khan UA, Aurigemma GP, Hill JC, Kane JL, et al.Speckle echocardiographic left atrial strain and stiffness index as predictorsof maintenance of sinus rhythm after cardioversion for atrial fibrillation: aprospective study. Cardiovasc Ultrasound 2012;10:48.
39. Dimitroula H, Damvopoulou E, Giannakoulas G, Dalamanga E,Dimitroulas T, Sarafidis PA, et al. Effects of renin-angiotensin system inhi-bition on left atrial function of hypertensive patients: an echocardio-graphic tissue deformation imaging study. Am J Hypertens 2010;23:556-61.
40. Kokubu N, Yuda S, Tsuchihashi K, Hashimoto A, Nakata T, Miura T, et al.Noninvasive assessment of left atrial function by strain rate imaging in pa-tients with hypertension: a possible beneficial effect of renin-angiotensinsystem inhibition on left atrial function. Hypertens Res 2007;30:13-21.

Cardiac biomarkers in Chronic Kidney Disease
Chapter 6: Tissue Doppler Imaging in Echocardiography: Value and Limitations.
Publication 4
Kadappu KK and Thomas L. Tissue Doppler Imaging in Echocardiography: Value and Limitations.
Heart Lung Circ. 2015 Mar;24(3):224-33.
Declaration
I certify that this publication was a direct result of my research towards this PhD and that reproduction in this thesis doesn't breach copyright regulations
Krishna Kishor Kadappu
99

Heart, Lung and Circulation (2015) 24, 224–233
1443-9506/04/$36.00
http://dx.doi.org/10.1016/j.hlc.2014.10.003
REVIEW
Tissue Doppler Imagin
g in Echocardiography: Value and LimitationsKrishna K. Kadappu, MBBS, MDa,b,c, Liza Thomas, MBBS, PhD a,b*
aSouth Western Sydney Clinical School, The University of New South Wales, University of Western Sydney, NSW, AustraliabCardiology Department, Liverpool Hospital, University of Western Sydney, NSW, AustraliacCardiology Department, Campbelltown Hospital, University of Western Sydney, NSW, Australia
Received 15 October 2014; accepted 15 October 2014; online published-ahead-of-print 28 October 2014
Tissue Doppler imaging (TDI) is a useful echocardiographic technique to evaluate global and regional
myocardial systolic as well as diastolic function. It can also be used to quantify right ventricular and left
atrial function. Recent studies have demonstrated its utility as a diagnostic as well as prognostic tool in
different cardiac conditions including coronary artery disease, heart failure (both systolic and diastolic),
valvular heart disease, cardiomyopathies as well as constrictive pericarditis. TDI measurements are also
helpful to identify patients who will benefit from cardiac resynchronisation therapy. Even though it is
reproducible and relatively easy to obtain, it is underutilised in routine clinical practice. TDI is readily
available on most commercially available echocardiographic systems, and we recommend that TDI be used
for routine clinical echocardiographic evaluation of patients.
Keywords Tissue Doppler imaging � Colour tissue Doppler imaging � Myocardial contraction velocity� Left ventricular systolic function � Left ventricular diastolic function
Tissue Doppler imaging (TDI) for echocardiographic evalua-
tion of myocardial function was first described in 1989, [1] and
has revolutionised the quantitative evaluation of myocardial
function. Doppler ultrasound relies on detection of a fre-
quency shift of ultrasound signals reflected from moving
objects. In the heart, both blood flow and myocardial contrac-
tion result in velocity changes. Blood flow causes high fre-
quency, low amplitude signals that are obtained using
traditional Doppler. Tissue Doppler imaging is designed to
characterise low velocity, high amplitude signals from myo-
cardial motion [2], and are obtained by inverting the low pass
filter used in traditional Doppler to a high pass filter.
The myocardium has subendocardial and epicardial
layers, with the former having longitudinally arranged myo-
fibres [3]. During ventricular contraction, various layers
exert varying tension with the endocardium moving greater
distances. Tissue Doppler imaging examines the longitudi-
nal component of myocardial contraction throughout the
cardiac cycle.
© 2014 Australian and New Zealand Society of Cardiac and Thoracic Surgeons (ANZSCTS) a
Inc. All rights reserved.
*Corresponding author. Cardiology Department, Liverpool Hospital, Elizabeth Stree
Email: [email protected]
Tissue Doppler imaging is obtained using pulsed wave
tissue Doppler or colour tissue Doppler imaging (CTDI).
Pulsed wave TDI measures peak longitudinal myocardial
velocity from a single segment, but has to be performed
‘on line’. Colour tissue Doppler imaging is performed ‘off
line’, and can interrogate velocities from multiple sites simul-
taneously [4]. However, CTDI represents the mean peak
velocity, and are �25% lower than pulsed wave Doppler
[5]. The two methods are therefore not interchangeable.
The major disadvantage of TDI is its angle dependence i.e.
if the angle of incidence exceeds 15 degrees, there is �4%
underestimation of velocity [6]. Accurate TDI imaging addi-
tionally requires high frame rates (>100fps) for image acqui-
sition with excellent temporal resolution.
TDI MeasurementThe TDI signal over a cardiac cycle has three peaks, a positive
systolic peak and two negative diastolic peaks (Fig. 1A & B).
nd the Cardiac Society of Australia and New Zealand (CSANZ). Published by Elsevier
t, Liverpool, NSW 2170, Australia Tel.: +61 2 87383070; fax: +61 2 87383054.,

Figure 1 (A) Pulsed wave tissue Doppler Imaging from the apical 4 chamber view sampling from the septal mitral annulus(B) Colour Tissue Doppler Imaging from the apical 4 chamber view sampling from the septal mitral annulus.
Tissue Doppler Imaging in Echocardiography 225
The positive systolic wave (s’ velocity, Sa or Sm) represents
myocardial contraction. The negative waves represent the
early diastolic myocardial relaxation (e’ velocity, Ea or Em)
and active atrial contraction in late diastole (a’ velocity, Aa or
Am) (Fig. 1 A & B). The time to peak s’ velocity can be
measured and segmental heterogeneity can be ascertained
using CTDI [7] (Fig. 2). Additionally, isovolaemic contraction
and relaxation periods can also be identified. (Fig. 3) Pulsed
wave TDI velocity measurements are obtained by placing the
sample volume at the mitral annular level (denoted Sa/s’ or
Ea/e’ or Aa/a’) or within the basal LV myocardial segment
(denoted Sm or Em or Am). Tissue Doppler imaging velocities
can be measured either from the septal or lateral annulus, but
the current recommendation is that e’ velocity is expressed as
the average of septal and lateral measurements [8]. The current
accepted nomenclature favours denoting TDI velocities as s’, e’
and a’, although the other abbreviations are also commonly
used. Normal pulsed TDI values are given in Table 1.
Normal ageing can alter TDI derived myocardial veloci-
ties. There is a decrease in s’ and e’ velocities with ageing,

Figure 3 IVCT and IVRT measurements from pulsed wave TDI trace. IVCT = isovolumetric contraction time; IVRT = iso-volumetric relaxation time.
Figure 2 Colour tissue Doppler image from the apical 4 chamber view sampling from the septal and lateral mitral annulusillustrating dyssynchronous contraction of the LV.
226 K.K. Kadappu, L. Thomas
with a corresponding increase in a’ velocity [8]. Nagueh and
colleagues have reported age-based normal cut-off values for
basal septal and lateral segments [8] (Table 2)
TDI measurements are reported in varying cardiac condi-
tions with validation as a marker of LV systolic dysfunction
[9,10], diastolic dysfunction [8,11], LV dyssynchrony [12–14],
right ventricular [15] and atrial function [16]. It is useful in the
evaluation of coronary artery disease [17] and has prognostic
implications [15,18–21]. Tissue Doppler imaging measure-
ments are more sensitive than conventional echocardiography
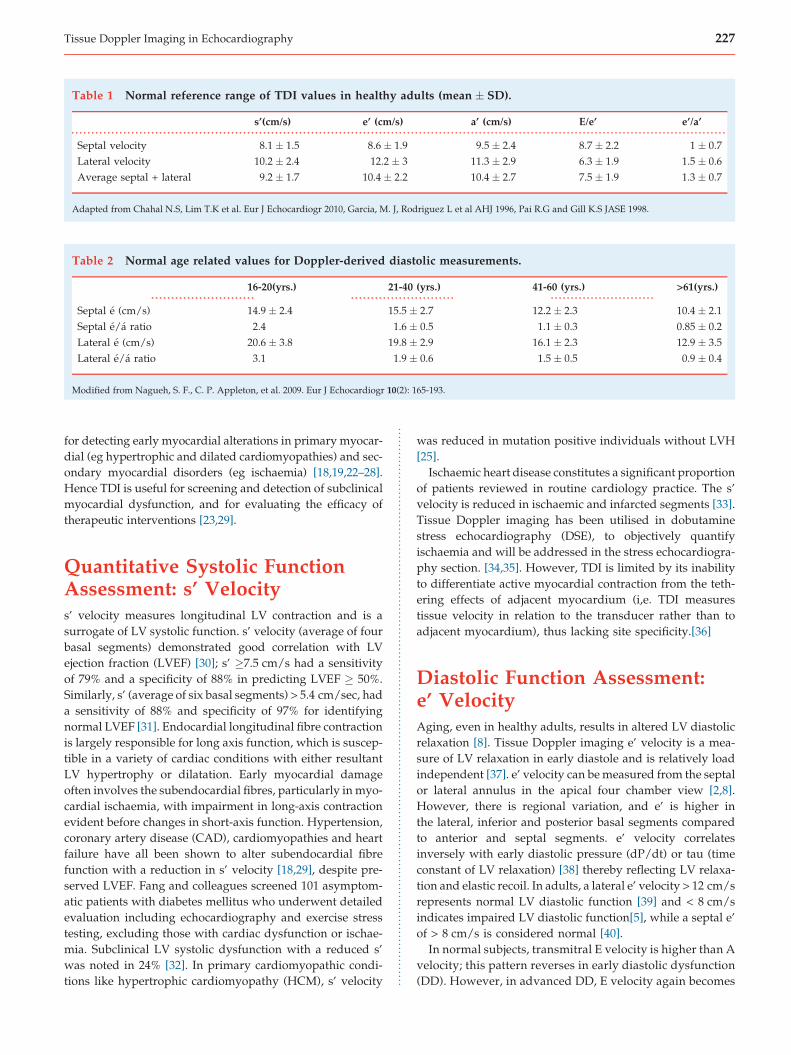
Table 2 Normal age related values for Doppler-derived diastolic measurements.
16-20(yrs.) 21-40 (yrs.) 41-60 (yrs.) >61(yrs.)
Septal e (cm/s) 14.9 � 2.4 15.5 � 2.7 12.2 � 2.3 10.4 � 2.1
Septal e/a ratio 2.4 1.6 � 0.5 1.1 � 0.3 0.85 � 0.2
Lateral e (cm/s) 20.6 � 3.8 19.8 � 2.9 16.1 � 2.3 12.9 � 3.5
Lateral e/a ratio 3.1 1.9 � 0.6 1.5 � 0.5 0.9 � 0.4
Modified from Nagueh, S. F., C. P. Appleton, et al. 2009. Eur J Echocardiogr 10(2): 165-193.
Table 1 Normal reference range of TDI values in healthy adults (mean � SD).
s’(cm/s) e’ (cm/s) a’ (cm/s) E/e’ e’/a’
Septal velocity 8.1 � 1.5 8.6 � 1.9 9.5 � 2.4 8.7 � 2.2 1 � 0.7
Lateral velocity 10.2 � 2.4 12.2 � 3 11.3 � 2.9 6.3 � 1.9 1.5 � 0.6
Average septal + lateral 9.2 � 1.7 10.4 � 2.2 10.4 � 2.7 7.5 � 1.9 1.3 � 0.7
Adapted from Chahal N.S, Lim T.K et al. Eur J Echocardiogr 2010, Garcia, M. J, Rodriguez L et al AHJ 1996, Pai R.G and Gill K.S JASE 1998.
Tissue Doppler Imaging in Echocardiography 227
for detecting early myocardial alterations in primary myocar-
dial (eg hypertrophic and dilated cardiomyopathies) and sec-
ondary myocardial disorders (eg ischaemia) [18,19,22–28].
Hence TDI is useful for screening and detection of subclinical
myocardial dysfunction, and for evaluating the efficacy of
therapeutic interventions [23,29].
Quantitative Systolic FunctionAssessment: s’ Velocitys’ velocity measures longitudinal LV contraction and is a
surrogate of LV systolic function. s’ velocity (average of four
basal segments) demonstrated good correlation with LV
ejection fraction (LVEF) [30]; s’ �7.5 cm/s had a sensitivity
of 79% and a specificity of 88% in predicting LVEF � 50%.
Similarly, s’ (average of six basal segments) > 5.4 cm/sec, had
a sensitivity of 88% and specificity of 97% for identifying
normal LVEF [31]. Endocardial longitudinal fibre contraction
is largely responsible for long axis function, which is suscep-
tible in a variety of cardiac conditions with either resultant
LV hypertrophy or dilatation. Early myocardial damage
often involves the subendocardial fibres, particularly in myo-
cardial ischaemia, with impairment in long-axis contraction
evident before changes in short-axis function. Hypertension,
coronary artery disease (CAD), cardiomyopathies and heart
failure have all been shown to alter subendocardial fibre
function with a reduction in s’ velocity [18,29], despite pre-
served LVEF. Fang and colleagues screened 101 asymptom-
atic patients with diabetes mellitus who underwent detailed
evaluation including echocardiography and exercise stress
testing, excluding those with cardiac dysfunction or ischae-
mia. Subclinical LV systolic dysfunction with a reduced s’
was noted in 24% [32]. In primary cardiomyopathic condi-
tions like hypertrophic cardiomyopathy (HCM), s’ velocity
was reduced in mutation positive individuals without LVH
[25].
Ischaemic heart disease constitutes a significant proportion
of patients reviewed in routine cardiology practice. The s’
velocity is reduced in ischaemic and infarcted segments [33].
Tissue Doppler imaging has been utilised in dobutamine
stress echocardiography (DSE), to objectively quantify
ischaemia and will be addressed in the stress echocardiogra-
phy section. [34,35]. However, TDI is limited by its inability
to differentiate active myocardial contraction from the teth-
ering effects of adjacent myocardium (i,e. TDI measures
tissue velocity in relation to the transducer rather than to
adjacent myocardium), thus lacking site specificity.[36]
Diastolic Function Assessment:e’ VelocityAging, even in healthy adults, results in altered LV diastolic
relaxation [8]. Tissue Doppler imaging e’ velocity is a mea-
sure of LV relaxation in early diastole and is relatively load
independent [37]. e’ velocity can be measured from the septal
or lateral annulus in the apical four chamber view [2,8].
However, there is regional variation, and e’ is higher in
the lateral, inferior and posterior basal segments compared
to anterior and septal segments. e’ velocity correlates
inversely with early diastolic pressure (dP/dt) or tau (time
constant of LV relaxation) [38] thereby reflecting LV relaxa-
tion and elastic recoil. In adults, a lateral e’ velocity > 12 cm/s
represents normal LV diastolic function [39] and < 8 cm/s
indicates impaired LV diastolic function[5], while a septal e’
of > 8 cm/s is considered normal [40].
In normal subjects, transmitral E velocity is higher than A
velocity; this pattern reverses in early diastolic dysfunction
(DD). However, in advanced DD, E velocity again becomes

228 K.K. Kadappu, L. Thomas
higher than the A wave (pseudonormal pattern), making it
difficult to use mitral inflow pattern to evalute DD [41].
However, e’ velocity is reduced even in subjects with early
DD, occurring almost 10-15 years prior to reduction of mitral
E velocity [42]. Its utility is evident from its inclusion in the
EAE/ASE guidelines for assessment of diastolic dysfunc-
tion [8].
Late Diastolic a’ VelocityLate diastolic TDI a’ (a’/Aa/Am) velocity is useful in assessing
atrial function. The a’ velocity is a marker of global atrial
function [43]. a’ velocity increases with age [8], with no signif-
icant regional variation in a’ velocity (septum or lateral wall)
[44]. a’ velocity correlates with other measures of left atrial
function including transmitral peak A velocity, atrial fraction
and atrial ejection force [43,45]. Colour tissue Doppler imaging
a’ velocity permits evaluation of segmental atrial function [43].
Clinical Utility and PrognosticImplications of TDI Velocities:Systolic s’ Velocitys’ velocity has been investigated in a variety of cardiac con-
ditions, including heart failure, cardiomyopathies, valvular
as well as coronary artery disease [9,23,28,35], for both diag-
nosis as well as for long-term prognosis. It is also useful to
identify patients with cardiac dyssynchrony [7].
Wang et al. reported that s’ was lower in non-survivors at
19 month follow-up in 252 patients with cardiovascular risk
[28]. A similar increase in adverse cardiovascular events was
seen in hypertrophic cardiomyopathy patients with a low s’
velocity [23]. The prospective SPHERE (multicenter proSPec-
tive study of ecHocardiography in hypERtEnsion) study [18]
enrolled 1556 patients with LVEF � 50%; 286 (18%) had
LVDD (advanced LVDD in 128, less advanced in 158).
s’ velocity was reduced in LVDD and was an independent
predictor of advanced LVDD. Seo and colleagues evaluated
s’ velocity and its relation with dp/dt in experimental dogs
during dobutamine and esmolol infusion. s’ showed a dose-
dependent increase and decrease after dobutamine and
esmolol infusions, respectively. [46]. More recently a reduced
s’ velocity was demonstrated despite preserved LVEF, in
patients undergoing chemotherapy for breast cancer [47].
s’ velocity is useful in detecting and assessing prognosis in
CAD. Hoffmann and colleagues measured s’ from six annular
segments prior to coronary angiography [48]. Both s’ velocity
and E/e’ negatively correlated with vessels with significant
stenosis. s’ was reduced regionally and globally in patients
with three-vessel disease. In another study, 296 patients with
stable angina with normal LVEF were compared with 188
patients without significant CAD [49]; 108 had �70% stenosis
in at least one epicardial coronary artery. Average (six annular
segments) s’ remained an independent predictor of CAD
after multivariable analysis of exercise ECG and conventional
echocardiographic parameters. Tissue Doppler imaging s’ can
also diagnose early myocardial ischaemia [50]. Biering-Soren-
sen and co-workers also noted that a low s’ velocity after ST
elevation MI (STEMI) resulted in poor prognosis [51] in 391
patients treated with primary percutaneous coronary inter-
vention. Patients with low s’ at median follow up of 25 months
had >2 times risk for the composite end point of death, heart
failure, or recurrent myocardial infarction (hazard ratio, 2.60;
95% CI 1.64-4.13; P < .001).
Stress TDIStress echocardiography is an essential tool in the clinical
work-up of subjects with suspected CAD or latent ischaemia.
Wall motion scoring by visual assessment has improved
accuracy compared with stress electrocardiography, but
has high inter-observer variability [52]. Segmental TDI
velocities are reduced with ischaemia and recover with
reperfusion [53] and can differentiate transmural from non-
transmural infraction [53,54]. Yamada et al reported a smaller
increase in myocardial velocities in ischaemic segments with
dobutamine stress echocardiography (DSE); peak TDI s’
velocity of <12 cm/s had 80% accuracy for detecting ischae-
mic segments [55]. Cain et al combined TDI with wall motion
score and derived cut-off values of myocardial Doppler
velocities in 128 normal subjects [56]. s’ velocity for the septal,
anteroseptal and inferior basal segments was � 7 cm/sec and
� 5 cm/sec for the mid segments; s’ was � 6 cm/sec for basal
and � 4 cm/sec for mid segments of other walls. When
applied to 114 patients who underwent DSE and angiogra-
phy, a sensitivity of 83% and specificity of 73% was present
for detection of � 50% coronary artery stenosis, but were not
significantly different to visual assessment.
Marwick and colleagues reported prognostic value of s’
velocity; patients with a lower s’ velocity had more adverse
events (average s’ � 4.9 +/- 1.7 cm/s versus 6.4 +/- 6.5 cm/s;
p < 0.001) [35]. s’ velocity can also be used with low dose DSE
to determine viability; the percentage increase in s’ velocity
in viable segments, four weeks after revascularisation was 45
+/-10%, versus 25+/-12% in non-viable segments. [34].
Both s’ velocity [24] and isovolumic acceleration [26] reflect
regional wall motion. Isovolumic acceleration is less affected
by ventricular loading compared to myocardial velocity. In
the Myocardial Doppler in Stress Echocardiography (MYD-
ISE) study, 149 patients had DSE before coronary angiogra-
phy. Both peak s’ velocity and isovolumic acceleration, at rest
and post stress, from basal and mid segments were compared
to angiographic results. Isovolumic acceleration velocity was
a better diagnostic marker for CAD and in combination with
peak s’ had an accuracy of 85-95% to diagnose coronary
stenosis [24,26]. Hence, combining TDI with DSE, may
improve accuracy for identifying ischaemic segments, reduce
inter observer variability and determine viability.
Measurements can also be performed during exercise
echocardiography [33]. A s’ velocity of <5 cm/s at peak stress
predicted exercise induced wall motion abnormality [57]

Tissue Doppler Imaging in Echocardiography 229
Valvular Heart DiseaseTissue Doppler imaging has been useful in identifying sub-
clinical myocardial dysfunction in patients with valvular
heart disease. Patients with aortic stenosis have reduced
mitral annular excursion despite normal LVEF [58]. LV lon-
gitudinal shortening, age and indexed aortic valve area, were
independent predictors of symptoms in patients with aortic
stenosis [59].
A reduction in longitudinal s’ velocity has also been dem-
onstrated in asymptomatic patients with severe aortic regur-
gitation [60].
In patients with chronic mitral regurgitation, LV function
appears ‘hyperdynamic’ but there is often subclinical dys-
function with reduced s’ velocity [20]. In 169 patients who
underwent mitral valve surgery s’ was the only independent
predictor of LV reverse remodelling. Haluska et al [61] fur-
ther demonstrated that s’ velocity was lower in mitral regur-
gitation patients without contractile reserve on exercise
echocardiography.
Cardiac DyssynchronyPatients with severe systolic dysfunction have evidence of
electromechanical dyssynchrony [62], with delayed propa-
gation of electrical activity from the LV septum to the lateral
wall. Prognostic value of LV dyssynchrony, was first
reported by Bader and co-workers [63], and TDI was consid-
ered one of the most useful echocardiographic dyssynchrony
measures [7,12]. Colour tissue Doppler imaging was consid-
ered superior to pulsed TDI, as multiple segments could be
measured from the same cardiac cycle. Systolic dyssyn-
chrony is the delay in time to peak s’ velocity between the
septal and lateral walls (Fig. 2). Bax and colleagues in their
meta-analysis concluded that TDI could predict responders
to resynchronisation therapy with 87-97% sensitivity and
55-100% specificity [14]; further, a septal to lateral delay
�65 m/s, had prognostic value [7]. Systolic dyssynchrony
was further defined as the standard deviation of time to peak
s’ velocity from 12 segments; a value � 33ms, was an inde-
pendent predictor of reverse remodelling [12].
While dyssynchrony determined by TDI showed great
promise early on, more recent trials demonstrated that QRS
duration >150m/sec with a left bundle branch block pattern is
the best determinant of responders to resynchronisation ther-
apy [64]. However, the prevalence of systolic dyssynchrony is
more marked in patients with a wide QRS (51% in the narrow
QRS group versus 73% in the wide QRS group)[13].
In summary, systolic myocardial velocity (s’/Sa/Sm) mea-
sured at the mitral annulus or basal myocardial segment
correlates with LVEF and dP/dt. s’ detects subclinical myo-
cardial dysfunction in various cardiac disorders including
CAD, CHF, hypertension, diabetes and primary cardiomy-
opathies. The s’ velocity can be used in stress echocardiog-
raphy [35] for improved identification of ischaemia and
viability and also has prognostic value.
Early Diastolic (e’) VelocityAlthough s’ velocity is a good predictor of long term cardio-
vascular outcome, e’ appears superior [21]. Reduction in e’
velocity had prognostic significance in 518 subjects, who
were followed for two years. Reduction in e’ velocity and
increased left atrial dimensions were the strongest predictors
for cardiac mortality [65]. In 182 patients with LV systolic
impairment, e’ <3 cm/s emerged as the best prognostic
marker for cardiac mortality at long term follow-up [10].
Comparable results were reported in hypertensive patients
with LV hypertrophy [28]. e’ velocity was also reduced in
patients with hypertrophic cardiomyopathy who had pul-
monary oedema versus stable patients [27]. Hence e’ velocity
is a sensitive marker of LV DD and a prognostic predictor of
cardiovascular outcomes.
E/ e’ RatioMitral inflow E velocity increases with higher LV filling
pressure (LVFP) with a corresponding reduction in e’ veloc-
ity [66]. The ratio of E/e’ correlates well with LV end diastolic
pressure or pulmonary capillary wedge pressure [66]. An E/
e’ > 15 using septal e’ or E/e’ >12 using lateral e’ velocity, is a
surrogate marker of elevated LVFP. In a cohort with dilated
cardiomyopathy with similar systolic function, patients with
an elevated E/e’ were more symptomatic [21]. Additionally,
the independent predictive value of E/e’> 15 for cardiac
mortality and heart failure has been documented [16] and
subsequently confirmed by Dokainish and co-workers [67].
Hillis and colleagues examined E/e’ ratio as a prognostic
indicator after myocardial infarction in 250 unselected
patients followed for a median of 13 months. Seventy-three
patients (29%) with an E/e’ >15, had an associated increased
mortality (log-rank statistic 21.3, p < 0.0001); moreover E/e’
was the most powerful independent predictor of survival
(risk ratio 4.8, 95% CI 2.1 - 10.8, p = 0.0002) [68]. The same
group also reported that E/e’ ratio >15 was a useful predictor
of LV dilation after infarction [69].
In another study, 417 patients admitted with heart failure
were followed for a median of 306 days [70]; an increase in E/
e’ was linearly associated with increased all-cause mortality.
E/e’ ratio is also useful in detecting early LV DD in patients
with untreated early onset hypertension and hyperinsulinae-
mia [71].
Diastolic Stress TestingIn heart failure with preserved ejection fraction (HFpEF), it is
diastolic dysfunction that precipitates symptoms; HFpEF is
the cause for � 50% of all heart failure cases [72]. Symptoms
of diastolic dysfunction are often exertional, due to elevated
LVFP during exercise [73]. As discussed earlier, E/e’ ratio is a
surrogate for LVFP. E/e’ was evaluated during exercise in 45
patients presenting with exertional dyspnoea with normal
230 K.K. Kadappu, L. Thomas
LVEF by Ha and colleagues, with supine bicycle exercise;
patients with normal resting E/e’, that increased with exer-
cise, had significantly shorter exercise duration [74]. In a
recent study of 522 patients referred for stress echocardiog-
raphy [75], the relative contributions of exercise E/e’ and
ischaemia to cardiovascular outcomes was assessed. E/e’
was obtained at rest and after exercise. Patients with a normal
exercise E/e’ and those without exercise induced ischaemia,
had better prognosis than those with ischaemia (with or
without raised exercise E/e’). Importantly cardiovascular
outcomes were similar in patients with increased exercise
E/e’ without ischaemia, to those who developed exercise
induced ischaemia. Additionally, patients with normal rest-
ing E/e’ but elevated exercise E/e’ had worse outcomes than
those with normal exercise E/e’. Thus exercise induced
elevations in E/e’ was associated with increased cardiovas-
cular hospitalisation, independent of inducible ischaemia
[75]. E/e’ correlates with exercise LVFP [76], and latent
diastolic dysfunction can be unmasked with exercise
E/e’ ratio.
e’ Velocity and CADReduction of TDI e’ occurs early in myocardial ischaemia
[50]. As mentioned earlier, Hoffmann and colleagues studied
E/e’ along with s’ in patients with CAD [48]. Similar to s’
velocity, E/e’ negatively correlated with the number of ves-
sels with significant stenosis. e’ velocity was reduced in the
segments supplied by a stenotic artery. Average e’ velocity
remained an independent predictor of CAD, after adjustment
for baseline exercise ECG and conventional echocardio-
graphic parameters [49].
Biering-Sorensen and co-workers also noted a low e’ veloc-
ity after STEMI resulted in greater risk for the composite of
death, heart failure, or a new myocardial infarction (hazard
ratio, 2.26; 95% CI 1.44-3.55; P < .001) [51].
e’ Velocity in Cardiomyopathyand Constrictive PericarditisDiastolic TDI velocities are reduced in inherited cardiomy-
opathies and could be used to detect the condition at a
preclinical stage. Reduced e’ velocity has been demonstrated
in genotype positive patients with hypertrophic cardiomy-
opathy prior to the development of LV hypertrophy [22].
Similarly, e’ velocities were reduced in Fabry patients before
they developed LVH [19], and stratified patients based on
severity in primary AL amyloidosis [77].
It is often difficult, both clinically and using traditional
echocardiography, to differentiate pericardial constriction
from restrictive cardiomyopathy; TDI is useful in differenti-
ating these two conditions. Septal e’ velocity is reduced in
restrictive cardiomyopathy whereas it was normal or ‘supra
normal’ in constrictive pericarditis (septal vs lateral e’: 12.3 vs
5.1 cm/s, p < 0.001). A septal e’ � 8 cm/s resulted in 95%
sensitivity and 96% specificity for the diagnosis of constric-
tive pericarditis [78]. Further, because of pericardial adhesion
to the lateral LV wall in constriction, the LV and RV lateral e’
velocities are not significantly different, and often reduced
when compared to septal e’ [79]. The reduction in lateral e’
velocity is termed ‘annulus reversus’ [80]. By combining
ventricular septal shift with a septal e’ �9 cm/s, 87% sensi-
tivity and 91% specificity for detection of constriction was
demonstrated [81].
a’ Velocity in Clinical PracticeThe a’ velocity represents atrial contractile function, and is
useful in evaluating atrial dysfunction. Wang and co-work-
ers, using tertiles of a’ velocity (<4, 4 to 7, and>7 cm/s)
observed that a’ <4 cm/s and a’ � 4 but <7 cm/s, had an
increased hazard ratio for cardiac death compared with a’ >
7 cm/s (HR: 11.53, 95% CI: 4.1- 32.39 and HR: 4.28, 95% CI:
1.54 - 11.9 respectively) [65]. a’ velocity was also found to be
reduced in ventricular [82] and atrial dysfunction [83].
The duration from onset of the P-wave on electrocardiogram
to peak TDI a’-velocity of the lateral left atrial wall (PA-TDI
duration) has been proposed as an independent predictor of
AF recurrence post cardioversion [84], and can also predict
maintenance of sinus rhythm. Reports on the utility of a’
velocity are limited and require validation in larger groups.
Right Ventricular FunctionEchocardiographic quantification of right ventricular (RV)
function is under-reported due to the difficulty in accurate
evaluation given its retrosternal position, making imaging
more challenging. Similar to the LV, pulsed TDI velocities of
the right ventricle demonstrate a base to apex gradient [85]
with lateral RV s’ being greater than the LV lateral s’ velocity.
Colour tissue Doppler imaging is also useful in assessing
segmental RV velocities offline [86]. In normal individuals,
RV s’ velocity is 14 � 2 cm/s [87]. Meluzin and co-workers,
reported good correlation between RV s’ velocity and RV
ejection fraction (r = 0.648, P < 0.001); RV s’ velocity <
11.5 cm/s predicted RV dysfunction (EF < 45%) with a sen-
sitivity of 90% and specificity of 85% [15]. Reduced s’ is seen
in posterior myocardial infarction, chronic pulmonary
hypertension [15] and chronic airway limitation [88]. More
recently, RV dysfunction has been reported in elite athletes
[89], while Bos and co-workers, reported a reduced RV s’
velocity in asymptomatic patients with congenitally cor-
rected transposition of the great arteries [90] and in tetralogy
of Fallot [91]. Hence TDI is a useful tool to assess early RV
dysfunction.
LimitationsAlthough TDI measurements are relatively robust, there is a
learning curve for acquisition and analysis of TDI data.

Tissue Doppler Imaging in Echocardiography 231
Commercially available machines may use varying algo-
rithms that may provide different TDI velocities [92]. It is
also not clear where in the spectral trace of the pulsed Dopp-
ler envelope to measure tissue velocity; a recent study rec-
ommends measurement at the mid portion of the spectral
trace [93] (Fig. 1A). Tissue Doppler imaging is angle depen-
dent and if the angle of interrogation exceeds 20 degrees, then
the velocity may be underestimated. Even though TDI sig-
nals are robust, it is not unusual to have some variation in
signal amplitude and timing by minimal alterations in posi-
tion of the sample volume. This is particularly important in
dyssynchrony studies as cursor position may alter timing.
Sometimes interpretation of pulsed TDI traces may be chal-
lenging, as there are multiple peaks.
ConclusionTissue Doppler imaging is a robust echocardiographic
technique for quantification of global and regional myocar-
dial contractile function as well as left ventricular relaxa-
tion and E/e’ is a surrogate for LVFP. Tissue Doppler
imaging measurements are powerful prognostic markers
in a variety of cardiovascular conditions. As it is relatively
easy to obtain and is reproducible, its incorporation in
routine clinical echocardiographic evaluation should be
considered.
Conflict of interestThere are no conflicts of interest.
References[1] Isaaz K, Thompson A, Ethevenot G, Cloez JL, Brembilla B, Pernot C.
Doppler echocardiographic measurement of low velocity motion of the
left ventricular posterior wall. The American Journal of Cardiology
1989;64:66–75.
[2] Isaaz K, Munoz del Romeral L, Lee E, Schiller NB. Quantitation of the
motion of the cardiac base in normal subjects by Doppler echocardiog-
raphy. Journal of the American Society of Echocardiography 1993;6:
166–76.
[3] Rushmer RF, Crystal DK, Wagner C. The functional anatomy of ventric-
ular contraction. Circulation Research 1953;1:162–70.
[4] Ho CY, Solomon SD. A clinician’s guide to tissue Doppler imaging.
Circulation 2006;113:e396–8.
[5] Abraham TP, Dimaano VL, Liang HY. Role of tissue Doppler and strain
echocardiography in current clinical practice. Circulation 2007;116:
2597–609.
[6] Heimdal A, Stoylen A, Torp H, Skjaerpe T. Real-time strain rate imaging
of the left ventricle by ultrasound. Journal of the American Society of
Echocardiography 1998;11:1013–9.
[7] Bax JJ, Bleeker GB, Marwick TH, Molhoek SG, Boersma E, Steendijk P,
et al. Left ventricular dyssynchrony predicts response and prognosis
after cardiac resynchronization therapy. Journal of the American College
of Cardiology 2004;44:1834–40.
[8] Nagueh SF, Appleton CP, Gillebert TC, Marino PN, Oh JK, Smiseth OA,
et al. Recommendations for the evaluation of left ventricular diastolic
function by echocardiography. European Journal of Echocardiography
2009;10:165–93.
[9] Nikitin NP, Loh PH, Silva R, Ghosh J, Khaleva OY, Goode K, et al.
Prognostic value of systolic mitral annular velocity measured with Dopp-
ler tissue imaging in patients with chronic heart failure caused by left
ventricular systolic dysfunction. Heart 2006;92:775–9.
[10] Wang M, Yip G, Yu CM, Zhang Q, Zhang Y, Tse D, et al. Independent and
incremental prognostic value of early mitral annulus velocity in patients
with impaired left ventricular systolic function. Journal of the American
College of Cardiology 2005;45:272–7.
[11] Garcia MJ, Thomas JD, Klein AL. New Doppler echocardiographic
applications for the study of diastolic function. Journal of the American
College of Cardiology 1998;32:865–75.
[12] Yu CM, Fung WH, Lin H, Zhang Q, Sanderson JE, Lau CP. Predictors of
left ventricular reverse remodeling after cardiac resynchronization ther-
apy for heart failure secondary to idiopathic dilated or ischemic cardio-
myopathy. The American Journal of Cardiology 2003;91:684–8.
[13] Yu CM, Lin H, Zhang Q, Sanderson JE. High prevalence of left ventricu-
lar systolic and diastolic asynchrony in patients with congestive heart
failure and normal QRS duration. Heart 2003;89:54–60.
[14] Bax JJ, Abraham T, Barold SS, Breithardt OA, Fung JW, Garrigue S, et al.
Cardiac resynchronization therapy: Part 1. Journal of the American
College of Cardiology 2005;46:2153–67.
[15] Meluzin J, Spinarova L, Bakala J, Toman J, Krejci J, Hude P, et al. Pulsed
Doppler tissue imaging of the velocity of tricuspid annular systolic
motion; a new, rapid, and non-invasive method of evaluating
right ventricular systolic function. European Heart Journal 2001;22:
340–8.
[16] Yamamoto T, Oki T, Yamada H, Tanaka H, Ishimoto T, Wakatsuki T, et al.
Prognostic value of the atrial systolic mitral annular motion velocity in
patients with left ventricular systolic dysfunction. Journal of the Ameri-
can Society of Echocardiography: 2003;16:333–9.
[17] Agarwal R, Gosain P, Kirkpatrick JN, Alyousef T, Doukky R, Singh G,
et al. Tissue Doppler imaging for diagnosis of coronary artery disease: a
systematic review and meta-analysis. Cardiovascular Ultrasound 2012;
10:47.
[18] Dini FL, Galderisi M, Nistri S, Buralli S, Ballo P, Mele D, et al. Abnormal
left ventricular longitudinal function assessed by echocardiographic and
tissue Doppler imaging is a powerful predictor of diastolic dysfunction in
hypertensive patients: the SPHERE study. International Journal of Car-
diology 2013;168:3351–8.
[19] Pieroni M, Chimenti C, Ricci R, Sale P, Russo MA, Frustaci A. Early
detection of Fabry cardiomyopathy by tissue Doppler imaging. Circula-
tion 2003;107:1978–84.
[20] Song Y, Lee S, Kwak YL, Shim CY, Chang BC, Shim JK. Tissue Doppler
imaging predicts left ventricular reverse remodeling after surgery
for mitral regurgitation. The Annals of Thoracic Surgery 2013;96:
2109–15.
[21] Yu CM, Sanderson JE, Marwick TH, Oh JK. Tissue Doppler imaging a
new prognosticator for cardiovascular diseases. Journal of the American
College of Cardiology 2007;49:1903–14.
[22] Ho CY, Sweitzer NK, McDonough B, Maron BJ, Casey SA, Seidman JG,
et al. Assessment of diastolic function with Doppler tissue imaging to
predict genotype in preclinical hypertrophic cardiomyopathy. Circula-
tion 2002;105:2992–7.
[23] Kitaoka H, Kubo T, Hayashi K, Yamasaki N, Matsumura Y, Furuno T,
et al. Tissue Doppler imaging and prognosis in asymptomatic or mildly
symptomatic patients with hypertrophic cardiomyopathy. European
Heart Journal Cardiovascular Imaging 2013;14:544–9.
[24] Madler CF, Payne N, Wilkenshoff U, Cohen A, Derumeaux GA, Pierard
LA, et al. Non-invasive diagnosis of coronary artery disease by quanti-
tative stress echocardiography: optimal diagnostic models using off-line
tissue Doppler in the MYDISE study. European Heart Journal 2003;24:
1584–94.
[25] Nagueh SF, Bachinski LL, Meyer D, Hill R, Zoghbi WA, Tam JW, et al.
Tissue Doppler imaging consistently detects myocardial abnormalities in
patients with hypertrophic cardiomyopathy and provides a novel means
for an early diagnosis before and independently of hypertrophy. Circu-
lation 2001;104:128–30.
[26] Pauliks LB, Vogel M, Madler CF, Williams RI, Payne N, Redington AN,
et al. Regional response of myocardial acceleration during isovolumic
contraction during dobutamine stress echocardiography: a color tissue
Doppler study and comparison with angiocardiographic findings. Echo-
cardiography 2005;22:797–808.
[27] Richartz BM, Werner GS, Ferrari M, Figulla HR. Comparison of left
ventricular systolic and diastolic function in patients with idiopathic
dilated cardiomyopathy and mild heart failure versus those with severe
heart failure. The American Journal of Cardiology 2002;90:390–4.
[28] Wang M, Yip GW, Wang AY, Zhang Y, Ho PY, Tse MK, et al. Tissue
Doppler imaging provides incremental prognostic value in patients with
systemic hypertension and left ventricular hypertrophy. Journal of
Hypertension 2005;23:183–91.

232 K.K. Kadappu, L. Thomas
[29] Correale M, Totaro A, Ieva R, Ferraretti A, Musaico F, Di Biase M. Tissue
Doppler imaging in coronary artery diseases and heart failure. Current
Cardiology Reviews 2012;8:43–53.
[30] Alam M, Wardell J, Andersson E, Samad BA, Nordlander R. Effects of
first myocardial infarction on left ventricular systolic and diastolic func-
tion with the use of mitral annular velocity determined by pulsed wave
Doppler tissue imaging. Journal of the American Society of Echocardi-
ography 2000;13:343–52.
[31] Gulati VK, Katz WE, Follansbee WP, Gorcsan 3rd J. Mitral annular
descent velocity by tissue Doppler echocardiography as an index of
global left ventricular function. The American Journal of Cardiology
1996;77:979–84.
[32] Fang ZY, Schull-Meade R, Leano R, Mottram PM, Prins JB, Marwick TH.
Screening for heart disease in diabetic subjects. American Heart Journal
2005;149:349–54.
[33] Pasquet A, Armstrong G, Beachler L, Lauer MS, Marwick TH. Use of
segmental tissue Doppler velocity to quantitate exercise echocardiography.
Journal of the American Society of Echocardiography: 1999;12:901–12.
[34] Altinmakas S, Dagdeviren B, Uyan C, Keser N, Gumus V, Pektas O.
Prediction of viability by pulsed-wave Doppler tissue sampling of asyn-
ergic myocardium during low-dose dobutamine challenge. International
Journal of Cardiology 2000;74:107–13.
[35] Marwick TH, Case C, Leano R, Short L, Baglin T, Cain P, et al. Use of
tissue Doppler imaging to facilitate the prediction of events in patients
with abnormal left ventricular function by dobutamine echocardiogra-
phy. The American Journal of Cardiology 2004;93:142–6.
[36] Voigt JU, Nixdorff U, Bogdan R, Exner B, Schmiedehausen K, Platsch G,
et al. Comparison of deformation imaging and velocity imaging for
detecting regional inducible ischaemia during dobutamine stress echo-
cardiography. European Heart Journal 2004;25:1517–25.
[37] Agmon Y, Oh JK, McCarthy JT, Khandheria BK, Bailey KR, Seward JB.
Effect of volume reduction on mitral annular diastolic velocities in
hemodialysis patients. The American Journal of Cardiology 2000;
85:665–8. A11.
[38] Oki T, Tabata T, Yamada H, Wakatsuki T, Shinohara H, Nishikado A,
et al. Clinical application of pulsed Doppler tissue imaging for assessing
abnormal left ventricular relaxation. The American Journal of Cardiology
1997;79:921–8.
[39] Yamada H, Oki T, Mishiro Y, Tabata T, Abe M, Onose Y, et al. Effect of
aging on diastolic left ventricular myocardial velocities measured by
pulsed tissue Doppler imaging in healthy subjects. Journal of the Ameri-
can Society of Echocardiography: 1999;12:574–81.
[40] Chahal NS, Lim TK, Jain P, Chambers JC, Kooner JS, Senior R. Normative
reference values for the tissue Doppler imaging parameters of left ven-
tricular function: a population-based study. European Journal of Echo-
cardiography: 2010;11:51–6.
[41] Oh JK, Park SJ, Nagueh SF. Established and novel clinical applications of
diastolic function assessment by echocardiography. Circulation Cardio-
vascular Imaging 2011;4:444–55.
[42] Sohn DW, Chai IH, Lee DJ, Kim HC, Kim HS, Oh BH, et al. Assessment of
mitral annulus velocity by Doppler tissue imaging in the evaluation of
left ventricular diastolic function. Journal of the American College of
Cardiology 1997;30:474–80.
[43] Thomas L, Levett K, Boyd A, Leung DY, Schiller NB, Ross DL. Changes in
regional left atrial function with aging: evaluation by Doppler tissue
imaging. European Journal of Echocardiography 2003;4:92–100.
[44] Lindstrom L, Wranne B. Pulsed tissue Doppler evaluation of mitral
annulus motion: a new window to assessment of diastolic function. Clin
Physiol 1999;19:1–10.
[45] Hesse B, Schuele SU, Thamilasaran M, Thomas J, Rodriguez L. A rapid
method to quantify left atrial contractile function: Doppler tissue imaging
of the mitral annulus during atrial systole. European Journal of Echo-
cardiography 2004;5:86–92.
[46] Seo JS, Kim DH, Kim WJ, Song JM, Kang DH, Song JK. Peak systolic
velocity of mitral annular longitudinal movement measured by pulsed
tissue Doppler imaging as an index of global left ventricular contractility.
American Journal of Physiology Heart and Circulatory Physiology
2010;298:H1608–15.
[47] Fallah-Rad N, Walker JR, Wassef A, Lytwyn M, Bohonis S, Fang T, et al.
The utility of cardiac biomarkers, tissue velocity and strain imaging, and
cardiac magnetic resonance imaging in predicting early left ventricular
dysfunction in patients with human epidermal growth factor receptor II-
positive breast cancer treated with adjuvant trastuzumab therapy. Jour-
nal of the American College of Cardiology 2011;57:2263–70.
[48] Hoffmann S, Mogelvang R, Olsen NT, Sogaard P, Fritz-Hansen T, Bech J,
et al. Tissue Doppler echocardiography reveals distinct patterns of
impaired myocardial velocities in different degrees of coronary artery
disease. European Journal of Echocardiography: 2010;11:544–9.
[49] Hoffmann S, Jensen JS, Iversen AZ, Sogaard P, Galatius S, Olsen NT, et al.
Tissue Doppler echocardiography improves the diagnosis of coronary
artery stenosis in stable angina pectoris. European Heart Journal Car-
diovascular Imaging 2012;13:724–9.
[50] Gorcsan 3rd J, Strum DP, Mandarino WA, Pinsky MR. Color-coded tissue
Doppler assessment of the effects of acute ischemia on regional left
ventricular function: comparison with sonomicrometry. Journal of the
American Society of Echocardiography: 2001;14:335–42.
[51] Biering-Sorensen T, Jensen JS, Pedersen S, Galatius S, Hoffmann S, Jensen
MT, et al. Doppler tissue imaging is an independent predictor of outcome
in patients with ST-segment elevation myocardial infarction treated with
primary percutaneous coronary intervention. Journal of the American
Society of Echocardiography: 2014;27:258–67.
[52] Hoffmann R, Marwick TH, Poldermans D, Lethen H, Ciani R, van der
Meer P, et al. Refinements in stress echocardiographic techniques
improve inter-institutional agreement in interpretation of dobutamine
stress echocardiograms. European Heart Journal 2002;23:821–9.
[53] Derumeaux G, Ovize M, Loufoua J, Pontier G, Andre-Fouet X, Cribier A.
Assessment of nonuniformity of transmural myocardial velocities by
color-coded tissue Doppler imaging: characterization of normal, ische-
mic, and stunned myocardium. Circulation 2000;101:1390–5.
[54] Derumeaux G, Loufoua J, Pontier G, Cribier A, Ovize M. Tissue Doppler
imaging differentiates transmural from nontransmural acute myocardial
infarction after reperfusion therapy. Circulation 2001;103:589–96.
[55] Yamada E, Garcia M, Thomas JD, Marwick TH. Myocardial Doppler
velocity imaging–a quantitative technique for interpretation of dobut-
amine echocardiography. The American Journal of Cardiology 1998;
82:806–9. A9-10.
[56] Cain P, Baglin T, Case C, Spicer D, Short L, Marwick TH. Application of
tissue Doppler to interpretation of dobutamine echocardiography and
comparison with quantitative coronary angiography. The American
Journal of Cardiology 2001;87:525–31.
[57] Katz WE, Gulati VK, Mahler CM, Gorcsan 3rd J. Quantitative evaluation
of the segmental left ventricular response to dobutamine stress by tissue
Doppler echocardiography. The American Journal of Cardiology 1997;
79:1036–42.
[58] Takeda S, Rimington H, Smeeton N, Chambers J. Long axis excursion in
aortic stenosis. Heart 2001;86:52–6.
[59] Tongue AG, Dumesnil JG, Laforest I, Theriault C, Durand LG, Pibarot P.
Left ventricular longitudinal shortening in patients with aortic stenosis:
relationship with symptomatic status. The Journal of Heart Valve Disease
2003;12:142–9.
[60] Vinereanu D, Ionescu AA, Fraser AG. Assessment of left ventricular long
axis contraction can detect early myocardial dysfunction in asymptom-
atic patients with severe aortic regurgitation. Heart 2001;85:30–6.
[61] Haluska BA, Short L, Marwick TH. Relationship of ventricular longitu-
dinal function to contractile reserve in patients with mitral regurgitation.
American Heart Journal 2003;146:183–8.
[62] Bleeker GB, Bax JJ, Steendijk P, Schalij MJ, van der Wall EE. Left ventric-
ular dyssynchrony in patients with heart failure: pathophysiology, diag-
nosis and treatment. Nature clinical practice Cardiovascular Medicine
2006;3:213–9.
[63] Bader H, Garrigue S, Lafitte S, Reuter S, Jais P, Haissaguerre M, et al.
Intra-left ventricular electromechanical asynchrony. A new independent
predictor of severe cardiac events in heart failure patients. Journal of the
American College of Cardiology 2004;43:248–56.
[64] Peterson PN, Greiner MA, Qualls LG, Al-Khatib SM, Curtis JP, Fonarow
GC, et al. QRS duration, bundle-branch block morphology, and outcomes
among older patients with heart failure receiving cardiac resynchroni-
zation therapy. JAMA 2013;310:617–26.
[65] Wang M, Yip GW, Wang AY, Zhang Y, Ho PY, Tse MK, et al. Peak early
diastolic mitral annulus velocity by tissue Doppler imaging adds inde-
pendent and incremental prognostic value. Journal of the American
College of Cardiology 2003;41:820–6.
[66] Ommen SR, Nishimura RA, Appleton CP, Miller FA, Oh JK, Redfield
MM, et al. Clinical utility of Doppler echocardiography and tissue Dopp-
ler imaging in the estimation of left ventricular filling pressures: A
comparative simultaneous Doppler-catheterization study. Circulation
2000;102:1788–94.
[67] Dokainish H, Zoghbi WA, Lakkis NM, Ambriz E, Patel R, Quinones MA,
et al. Incremental predictive power of B-type natriuretic peptide and
tissue Doppler echocardiography in the prognosis of patients with
congestive heart failure. Journal of the American College of Cardiology
2005;45:1223–6.

Tissue Doppler Imaging in Echocardiography 233
[68] Hillis GS, Moller JE, Pellikka PA, Gersh BJ, Wright RS, Ommen SR, et al.
Noninvasive estimation of left ventricular filling pressure by E/e’ is a
powerful predictor of survival after acute myocardial infarction. Journal
of the American College of Cardiology 2004;43:360–7.
[69] Hillis GS, Ujino K, Mulvagh SL, Hagen ME, Oh JK. Echocardiographic
indices of increased left ventricular filling pressure and dilation after
acute myocardial infarction. Journal of the American Society of Echocar-
diography: 2006;19:450–6.
[70] Santas E, Garcia-Blas S, Minana G, Sanchis J, Bodi V, Escribano D, et al.
Prognostic Implications of Tissue Doppler Imaging-Derived E/Ea Ratio
in Acute Heart Failure Patients. Echocardiography 2014.
[71] Agu NC, McNiece Redwine K, Bell C, Garcia KM, Martin DS, Poffen-
barger TS, et al. Detection of early diastolic alterations by tissue Doppler
imaging in untreated childhood-onset essential hypertension. JASH
2014;8:303–11.
[72] Klapholz M, Maurer M, Lowe AM, Messineo F, Meisner JS, Mitchell J,
et al. Hospitalization for heart failure in the presence of a normal left
ventricular ejection fraction: results of the New York Heart Failure
Registry. Journal of the American College of Cardiology 2004;43:1432–8.
[73] Zile MR, Brutsaert DL. New concepts in diastolic dysfunction and dia-
stolic heart failure: Part I: diagnosis, prognosis, and measurements of
diastolic function. Circulation 2002;105:1387–93.
[74] Ha JW, Oh JK, Pellikka PA, Ommen SR, Stussy VL, Bailey KR, et al.
Diastolic stress echocardiography: a novel noninvasive diagnostic test for
diastolic dysfunction using supine bicycle exercise Doppler echocardi-
ography. Journal of the American Society of Echocardiography:
2005;18:63–8.
[75] Holland DJ, Prasad SB, Marwick TH. Prognostic implications of left
ventricular filling pressure with exercise. Circulation Cardiovascular
Imaging 2010;3:149–56.
[76] Burgess MI, Jenkins C, Sharman JE, Marwick TH. Diastolic stress echo-
cardiography: hemodynamic validation and clinical significance of esti-
mation of ventricular filling pressure with exercise. Journal of the
American College of Cardiology 2006;47:1891–900.
[77] Koyama J, Ray-Sequin PA, Davidoff R, Falk RH. Usefulness of pulsed
tissue Doppler imaging for evaluating systolic and diastolic left ventric-
ular function in patients with AL (primary) amyloidosis. The American
Journal of Cardiology 2002;89:1067–71.
[78] Ha JW, Ommen SR, Tajik AJ, Barnes ME, Ammash NM, Gertz MA, et al.
Differentiation of constrictive pericarditis from restrictive cardiomyopa-
thy using mitral annular velocity by tissue Doppler echocardiography.
The American Journal of Cardiology 2004;94:316–9.
[79] Choi JH, Choi JO, Ryu DR, Lee SC, Park SW, Choe YH, et al. Mitral and
tricuspid annular velocities in constrictive pericarditis and restrictive
cardiomyopathy: correlation with pericardial thickness on computed
tomography. JACC Cardiovascular Imaging 2011;4:567–75.
[80] Reuss CS, Wilansky SM, Lester SJ, Lusk JL, Grill DE, Oh JK, et al. Using
mitral ‘annulus reversus’ to diagnose constrictive pericarditis. European
Journal of Echocardiography: 2009;10:372–5.
[81] Welch TD, Ling LH, Espinosa RE, Anavekar NS, Wiste HJ, Lahr BD, et al.
Echocardiographic diagnosis of constrictive pericarditis: Mayo Clinic
criteria. Circulation Cardiovascular Imaging 2014;7:526–34.
[82] Yu CM, Fung JW, Zhang Q, Kum LC, Lin H, Yip GW, et al. Tissue
Doppler echocardiographic evidence of atrial mechanical dysfunction in
coronary artery disease. International Journal of Cardiology 2005;105:
178–85.
[83] Boyd AC, Schiller NB, Ross DL, Thomas L. Segmental atrial contraction
in patients restored to sinus rhythm after cardioversion for chronic atrial
fibrillation: a colour Doppler tissue imaging study. European Journal of
Echocardiography 2008;9:12–7.
[84] Maffe S, Paffoni P, Dellavesa P, Cucchi L, Zenone F, Bergamasco L, et al.
Prognostic Value of Total Atrial Conduction Time Measured with Tissue
Doppler Imaging to Predict the Maintenance of Sinus Rhythm after
External Electrical Cardioversion of Persistent Atrial Fibrillation. Echo-
cardiography. 2014; Jul 22. doi: 10.111.
[85] Lindqvist P, Waldenstrom A, Henein M, Morner S, Kazzam E. Regional
and global right ventricular function in healthy individuals aged 20-90
years: a pulsed Doppler tissue imaging study: Umea General Population
Heart Study. Echocardiography 2005;22:305–14.
[86] Kukulski T, Hubbert L, Arnold M, Wranne B, Hatle L, Sutherland GR.
Normal regional right ventricular function and its change with age: a
Doppler myocardial imaging study. Journal of the American Society of
Echocardiography: 2000;13:194–204.
[87] Gondi S, Dokainish H. Right ventricular tissue Doppler and strain imag-
ing: ready for clinical use? Echocardiography 2007;24:522–32.
[88] Moustapha A, Lim M, Saikia S, Kaushik V, Kang SH, Barasch E. Interro-
gation of the tricuspid annulus by Doppler tissue imaging in patients with
chronic pulmonary hypertension: implications for the assessment of right-
ventricular systolic and diastolic function. Cardiology 2001;95:101–4.
[89] La Gerche A, Burns AT, Mooney DJ, Inder WJ, Taylor AJ, Bogaert J, et al.
Exercise-induced right ventricular dysfunction and structural remodel-
ling in endurance athletes. European Heart Journal 2012;33:998–1006.
[90] Bos JM, Hagler DJ, Silvilairat S, Cabalka A, O’Leary P, Daniels O, et al.
Right ventricular function in asymptomatic individuals with a systemic
right ventricle. Journal of the American Society of Echocardiography:
2006;19:1033–7.
[91] Harada K, Toyono M, Yamamoto F. Assessment of right ventricular
function during exercise with quantitative Doppler tissue imaging in
children late after repair of tetralogy of Fallot. Journal of the American
Society of Echocardiography: 2004;17:863–9.
[92] Denes M, Farkas K, Erdei T, Lengyel M. Comparison of tissue Doppler
velocities obtained by different types of echocardiography systems: are
they compatible? Echocardiography 2010;27:230–5.
[93] Dhutia NM, Zolgharni M, Willson K, Cole G, Nowbar AN, Dawson D,
et al. Guidance for accurate and consistent tissue Doppler velocity mea-
surement: comparison of echocardiographic methods using a simple
vendor-independent method for local validation. European Heart Jour-
nal Cardiovascular Imaging 2014;15:817–27.

Cardiac biomarkers in Chronic Kidney Disease
Chapter 7: Biomarkers of chronic kidney disease: the value of left atrial metrics
Publication 5
Krishna K. Kadappu,, Lawrence Cai, David Thomas, Wei Xuan, John K. French, Liza Thomas At press
Declaration
I certify that this publication wa~ a direct result of my research towards this PhD and that reproduction in this thesis doesn't breach copyright regulations
Krishna Kishor Kadappu
100

Cardiac biomarkers in Chronic Kidney Disease Biomarkers of chronic kidney disease: the value of left atrial metrics
100
Biomarkers of chronic kidney disease: the value of left atrial metrics
Krishna K. Kadappu, MD 1,2,3,4;Lawrence Cai 1,2;David Thomas, MSc 5; Wei Xuan,
MAppStat,PhD1,6; John K. French, PhD 1,2 ; Liza Thomas, PhD 1,2,7 1 South Western Sydney Clinical School, University of New South Wales, NSW, Australia 2 Cardiology Department, Liverpool Hospital, NSW, Australia. 3 Cardiology Department, Campbelltown Hospital, NSW, Australia. 4 University of Western Sydney 5Department of Biochemistry, Liverpool Hospital, NSW, Australia. 6 Ingham Institute of Applied Medical Research, NSW, Australia. 7 Westmead Hospital, University of Sydney
Institution of work: Liverpool Hospital, Liverpool, Australia
Corresponding Author: Prof. Liza Thomas, PhD Cardiology Department, Liverpool Hospital, Elizabeth Street, Liverpool, NSW 2170, Australia [email protected] Phone: + 61 2 87383797 Fax: +61 2 87383341 Conflict of interest: There are no conflicts of interest

Cardiac biomarkers in Chronic Kidney Disease Biomarkers of chronic kidney disease: the value of left atrial metrics
101
Abstract
Aim: We sought to identify an easily available non-invasive, biomarker to detect
cardiovascular involvement in early chronic kidney disease (CKD).
Methods: Sixty nine stage 3 CKD patients (eGFR of 30-59 ml/min/1.73m2) were
compared with 31 risk factor matched controls with normal renal function. A
comprehensive echocardiogram was performed in all participants and
echocardiographic parameters including indexed left atrial (LA) volume and LA 2-
dimensional strain analysis were performed in all participants. N terminal pro- brain
natriuretic peptide (NT-pro BNP) levels were also measured in all study participants.
Results: LA systolic strain (21.2±6.3 vs 26.9±8.9%; p = 0.002) and systolic, early and
late diastolic strain rate were significantly lower in the CKD group compared to the risk
factor matched group. However, traditional echocardiographic parameters including left
ventricular (LV) ejection fraction and indexed LV mass were similar between CKD
patients and controls, although E/e’ was significantly higher in the CKD group (12±4.8
vs 9.6±3.4; P=0.007). LA volume indexed to body surface area (LAVI) was
significantly larger in the CKD group compared to risk factor matched group (32.7 ± 8.6
vs 26.6 ± 11.7 ml/m2; p = 0.01). Though NT-pro BNP levels were relatively higher in
the CKD group (20.8±24 vs 5.9±6.2pg/ml (p=0.001)), levels were within the upper
reference limit (<100pg/ml).
Conclusion: LAVI and LA strain parameters, are sensitive biomarkers of early
cardiovascular involvement in stage 3 CKD patients that are easily available. Our
preliminary analysis demonstrated that LA parameters are more sensitive than NT-pro
BNP to detect myocardial involvement in CKD. Longitudinal studies in a larger cohort
of patients are needed to evaluate their prognostic utility.
Key words: LA strain, LA volume, NT-pro BNP, Chronic Kidney Disease
Cardiac biomarkers in Chronic Kidney Disease Biomarkers of chronic kidney disease: the value of left atrial metrics
102
Introduction
Patients with chronic kidney disease (CKD) are frequently asymptomatic and CKD is
often detected by the presence of proteinuria, haematuria, or reduced GFR1.
Furthermore, the prevalence of CKD is increasing in the general population due to
increased risk factors like obesity, diabetes and hypertension2. As the prevalence of
CKD increases, the risk of associated cardiovascular disease (CVD) also increases;
traditional predictive instruments like the Framingham risk score, while useful, under
estimates CVD risk in CKD patients3. Due to the large number of CKD patients in the
general population, a simple non-invasive biomarker to identify cardiovascular
involvement in CKD patients would be attractive. Identification of patients at higher
risk could prompt interventions that reduce future adverse cardiovascular events.
A number of studies have reported the utility of brain natriuretic peptide (BNP) / N
terminal pro BNP (NT-pro BNP) as a cardiovascular prognostic marker in CKD4-6. An
echocardiographic examination is routinely performed in almost all CKD patients to
assess left ventricular and valvular function as standard practice in most institutions.
Both left atrial (LA) volume7 and LA strain have been shown to be predictors of
cardiovascular mortality in end-stage renal disease8. Our group has previously
demonstrated that LA function evaluated by 2D strain analysis is reduced even in early
CKD9, as well as in diabetes 10, which often results in CKD. In view of these previous
observations, we sought to determine whether NT-pro BNP levels or evaluation of
echocardiographic LA metrics (LA volume indexed to body surface area - LAVI and
LA strain) would be the more sensitive biomarker that would identify cardiovascular
involvment in early CKD patients.

Cardiac biomarkers in Chronic Kidney Disease Biomarkers of chronic kidney disease: the value of left atrial metrics
103
Material and methods
Stage 3 CKD patients (with eGFR of 30-59 ml/min/1.73m2 by modified diet in renal
disease formula), without any previous cardiac illness were screened from the renal
outpatient clinic at Liverpool Hospital, Sydney, Australia. These CKD patients were
compared to subjects with similar cardiac risk factors but who had normal renal
function, admitted for evaluation of chest pain. These control subjects had no dynamic
ECG changes with below the upper reference limit of high sensitivity troponin
measurements. All patients and controls had stress echocardiogram to rule out
myocardial ischemia. Any patients with a previous history of heart failure or atrial
arrhythmia, and those with greater than mild valvular disease or significant mitral
annular calcification were excluded from this study.
This study was approved by Human Research and Ethics Committee South Western
Area Health Service (HREC/09/LPOOL/53). All participants provided written informed
consent.
Echocardiography
A comprehensive transthoracic echocardiogram was performed with subjects in the left
lateral decubitus position using a Vivid 9 (GE Healthcare) system. M mode, 2
dimensional, colour, pulsed and continuous wave Doppler and tissue Doppler imaging
were obtained according to standard practice11. An average of 3 cardiac cycles with
zoomed LA images were obtained from the apical 4 and 2 chamber views at high frame
rate (>70 fps) and was stored digitally.
Traditional measurements
Left ventricular (LV) ejection fraction (EF) was calculated using Simpson’s biplane

Cardiac biomarkers in Chronic Kidney Disease Biomarkers of chronic kidney disease: the value of left atrial metrics
104
method. LV mass was calculated as per American society of echocardiographic (ASE)
criteria and indexed to BSA (LV mass index -LVMI)12. Pulsed Doppler transmitral flow
was obtained with the sample volume placed at the mitral leaflet tips in the apical 4-
chamber view. Peak E and A velocity and the E-wave deceleration time (DT) were
measured and E/A ratio were calculated13. Tissue Doppler velocities were measured
with the sample volume placed at the septal and lateral mitral annulus14. Patients were
classified into different diastolic grades as per standard criteria15. Apical 4- and 2-
chamber zoomed LA images were used to measure maximum LA volume using
Simpson’s biplane method at end-systole. LA volume was indexed to BSA. An average
of 3 measurements was used for all parameters.
2D speckle tracking LA/ LV Strain Imaging
2D LA strain analysis was performed using customized computer software (EchoPAC,
Vingmed, General Electric, Horten, Norway) from LA zoomed views from apical 4 and
2 chamber images obtained at high frame rates. The endocardial border was manually
traced in end-systole and the software automatically traces the myocardium. The width
of the region of interest (ROI) was manually adjusted by decreasing the ROI (as the
atrium is thin walled) to ensure proper tracking of the myocardial wall. Peak systolic
strain (fig.7.1); systolic (SRs), early diastolic (SRe) and late diastolic (SRa) atrial strain
rates were measured as described earlier16. Similarly LV strain and strain rate were also
measured by using the same software from zoomed LV images obtained at a high frame
rate.
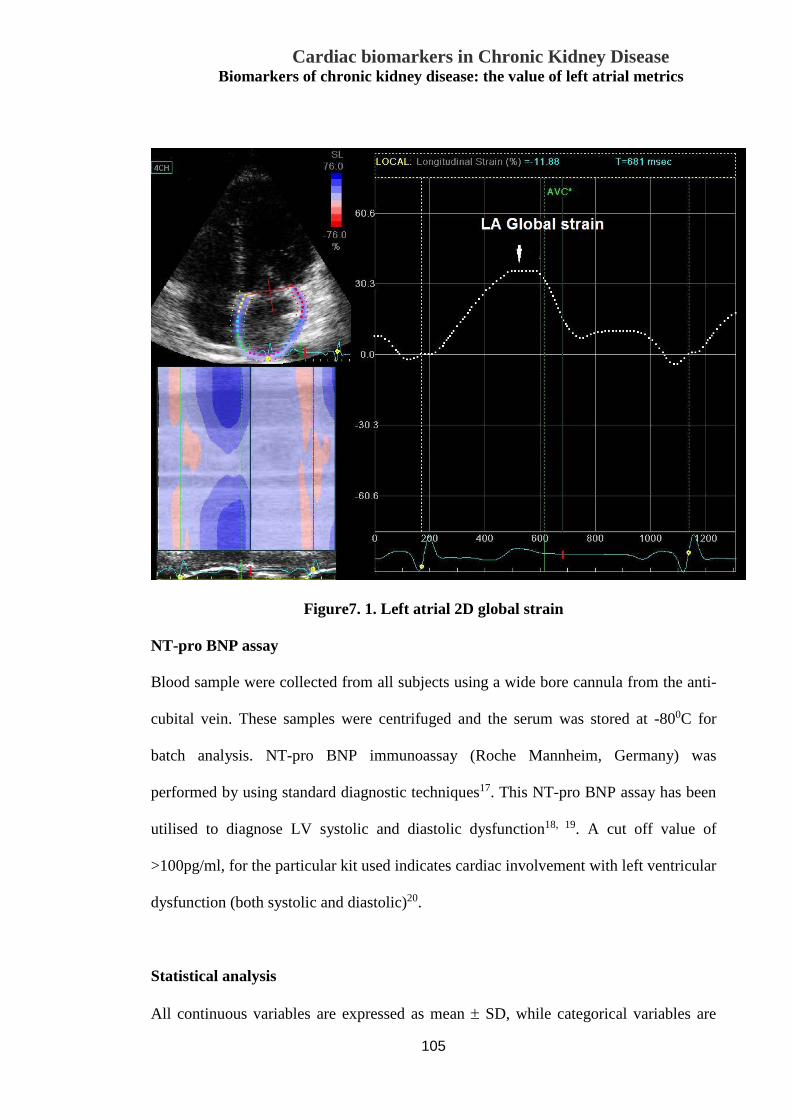
Cardiac biomarkers in Chronic Kidney Disease Biomarkers of chronic kidney disease: the value of left atrial metrics
105
Figure7. 1. Left atrial 2D global strain
NT-pro BNP assay
Blood sample were collected from all subjects using a wide bore cannula from the anti-
cubital vein. These samples were centrifuged and the serum was stored at -800C for
batch analysis. NT-pro BNP immunoassay (Roche Mannheim, Germany) was
performed by using standard diagnostic techniques17. This NT-pro BNP assay has been
utilised to diagnose LV systolic and diastolic dysfunction18, 19. A cut off value of
>100pg/ml, for the particular kit used indicates cardiac involvement with left ventricular
dysfunction (both systolic and diastolic)20.
Statistical analysis
All continuous variables are expressed as mean ± SD, while categorical variables are

Cardiac biomarkers in Chronic Kidney Disease Biomarkers of chronic kidney disease: the value of left atrial metrics
106
expressed as a percentage. An independent samples t-test analysis was performed to
evaluate differences between the CKD group and controls. NT- pro BNP was log
transformed as it is not uniformly distributed. Pearson correlation was used to assess the
correlation between variables. Significant univariate predictors for the effect of group
(i.e. presence of CKD) were entered into a logistic regression model to determine
independent predictors for CKD as well as for NT-pro BNP. Logistic regression model
was also used to select the most sensitive bio-marker to detect cardiovascular
involvement in early CKD. All statistical analysis was performed by using Statistical
Package for Social Sciences for Windows, version 22 (SPSS, Chicago, Illinois) and
SAS 9.2 (Cary, North Carolina, USA). Inter and intra observer variability was assessed
by intraclass correlation coefficient using Statistical Package for Social Sciences for
Windows, version 22 (SPSS, Chicago, Illinois).
Results
Baseline characteristics are presented in Table7.1. Seventy one CKD patients were
screened; 2 were excluded from the study as the stress echocardiogram was positive for
exercise induced ischemia. Thus a total of sixty nine CKD patients were compared to
31 controls in the final analysis. Majority of CKD patients had renal impairment due to
diabetes (n=30) and or hypertensive nephropathy (n=29). The remainder were drug-
related, due to renal calculi, chronic inflammatory nephropathy, glomerulonephropathy,
chronic granulomatous nephropathy (n=2 for each) and due to hepatitis and polycystic
kidney disease (n=1). The CKD patients were older and their mean age was 63.9 years
where as mean age was 50.6 years in the control group (p<0.001). Both patient groups
had similar body surface area (Table7.1). A total of 68 patients (55 in CKD and 13 in
controls) had hypertension and forty (34 in CKD and 6 in control) had diabetes. Though
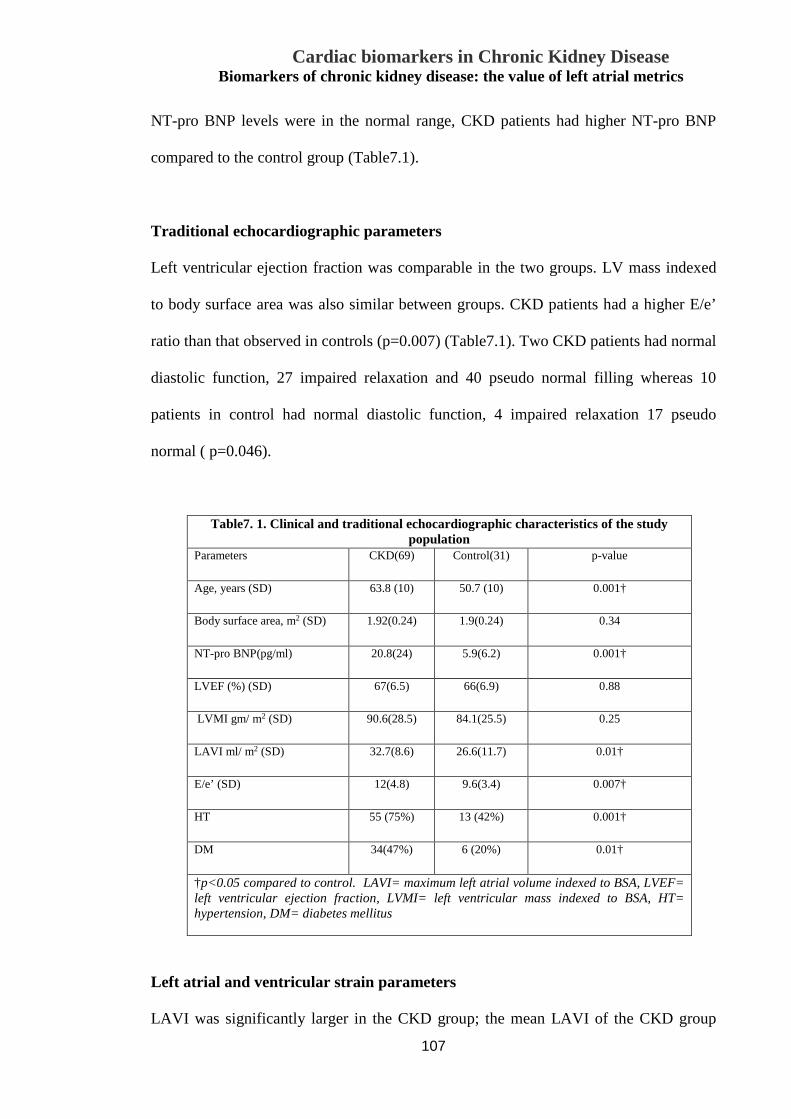
Cardiac biomarkers in Chronic Kidney Disease Biomarkers of chronic kidney disease: the value of left atrial metrics
107
NT-pro BNP levels were in the normal range, CKD patients had higher NT-pro BNP
compared to the control group (Table7.1).
Traditional echocardiographic parameters
Left ventricular ejection fraction was comparable in the two groups. LV mass indexed
to body surface area was also similar between groups. CKD patients had a higher E/e’
ratio than that observed in controls (p=0.007) (Table7.1). Two CKD patients had normal
diastolic function, 27 impaired relaxation and 40 pseudo normal filling whereas 10
patients in control had normal diastolic function, 4 impaired relaxation 17 pseudo
normal ( p=0.046).
Table7. 1. Clinical and traditional echocardiographic characteristics of the study population
Parameters CKD(69) Control(31) p-value
Age, years (SD) 63.8 (10) 50.7 (10) 0.001†
Body surface area, m2 (SD) 1.92(0.24) 1.9(0.24) 0.34
NT-pro BNP(pg/ml) 20.8(24) 5.9(6.2) 0.001†
LVEF (%) (SD) 67(6.5) 66(6.9) 0.88
LVMI gm/ m2 (SD) 90.6(28.5) 84.1(25.5) 0.25
LAVI ml/ m2 (SD) 32.7(8.6) 26.6(11.7) 0.01†
E/e’ (SD)
12(4.8) 9.6(3.4) 0.007†
HT
55 (75%) 13 (42%) 0.001†
DM
34(47%) 6 (20%) 0.01†
†p<0.05 compared to control. LAVI= maximum left atrial volume indexed to BSA, LVEF= left ventricular ejection fraction, LVMI= left ventricular mass indexed to BSA, HT= hypertension, DM= diabetes mellitus
Left atrial and ventricular strain parameters
LAVI was significantly larger in the CKD group; the mean LAVI of the CKD group

Cardiac biomarkers in Chronic Kidney Disease Biomarkers of chronic kidney disease: the value of left atrial metrics
108
was in the ‘mild LA enlargement’ range as per the ASE guidelines, while the mean
values of the control group was within the normal range for LAVI. LA systolic strain,
SRs (reservoir function), SRe (LA conduit function) and SRa (contractile function)
were all reduced in the CKD group (Table7.2). LV global strain was reduced in both
groups, but not statistically difference between the groups (Table7.2). When we applied
the current accepted normal values of LAVI (<34 ml/m2)21 and LA strain (>32%)22, 30
(43.5%) patients in the CKD group had LAVI greater than 34 ml/m2 whereas 67 (97%)
patients had LA global strain < 32%.
Table7. 2. Left atrial and ventricular strain parameters
Strain parameter CKD(69) Control(31) p value
LA GS (%) 21.2±6.3 26.9±8.9 <0.002†
LA SRs (s-1) 1.2±0.3 1.4±0.4 <0.001†
LA SRe (s-1) 1±0.3 1.4±0.4 <0.0001†
LA Sra (s-1) 1.6±0.4 2.1±0.6 <0.001†
LV strain (%) 15.5 ±3.8 16.8±3.7 0.11
†p<0.05 compared to control LA GS= left atrial strain, LA SRa= Left atrial late diastolic strain rate, LA SRe = Left atrial early diastolic strain rate, LASrs= left atrial systolic strain rate, LV strain= left ventricular systolic strain.
Correlation between NT-pro BNP and LAVI
NT-pro BNP levels correlated with LAVI, and correlated inversely with LA strain and
eGFR. The correlation of NT-pro BNP with LV strain and LAEF were weaker
compared to LA volume and LA strain (Table7.3).
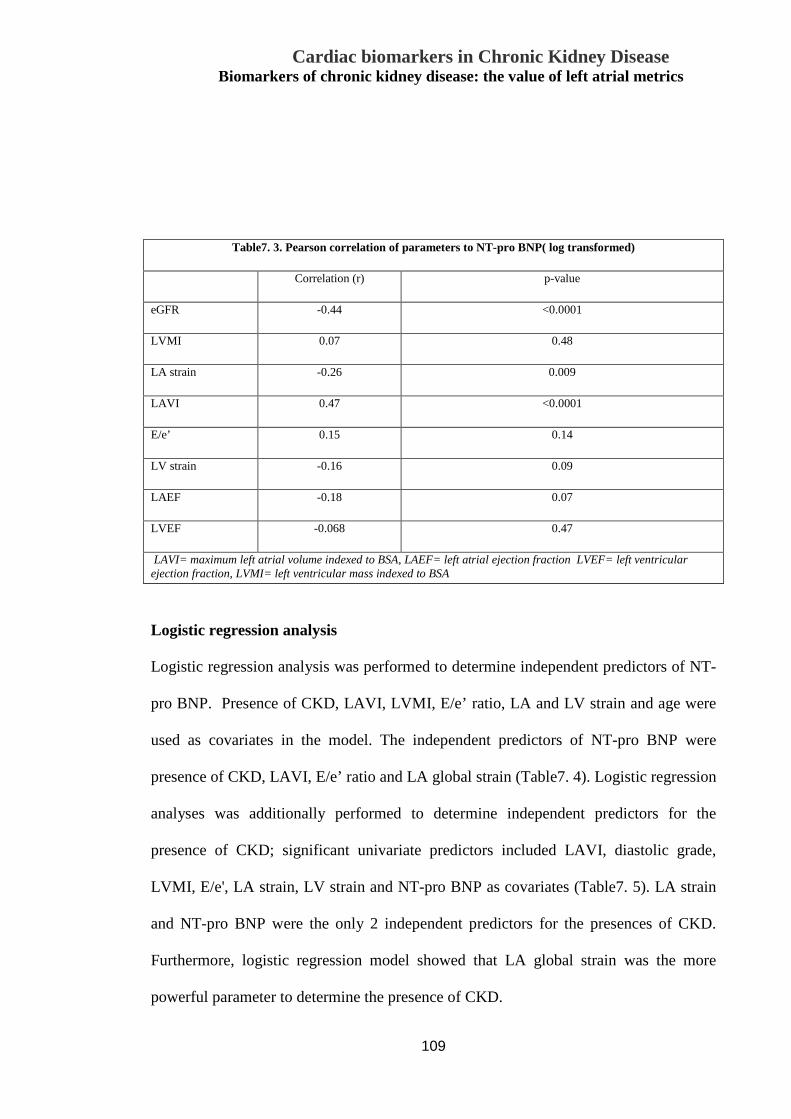
Cardiac biomarkers in Chronic Kidney Disease Biomarkers of chronic kidney disease: the value of left atrial metrics
109
Logistic regression analysis
Logistic regression analysis was performed to determine independent predictors of NT-
pro BNP. Presence of CKD, LAVI, LVMI, E/e’ ratio, LA and LV strain and age were
used as covariates in the model. The independent predictors of NT-pro BNP were
presence of CKD, LAVI, E/e’ ratio and LA global strain (Table7. 4). Logistic regression
analyses was additionally performed to determine independent predictors for the
presence of CKD; significant univariate predictors included LAVI, diastolic grade,
LVMI, E/e', LA strain, LV strain and NT-pro BNP as covariates (Table7. 5). LA strain
and NT-pro BNP were the only 2 independent predictors for the presences of CKD.
Furthermore, logistic regression model showed that LA global strain was the more
powerful parameter to determine the presence of CKD.
Table7. 3. Pearson correlation of parameters to NT-pro BNP( log transformed)
Correlation (r) p-value eGFR -0.44 <0.0001 LVMI 0.07 0.48 LA strain -0.26 0.009 LAVI 0.47 <0.0001 E/e’ 0.15 0.14 LV strain -0.16 0.09 LAEF -0.18 0.07 LVEF -0.068 0.47 LAVI= maximum left atrial volume indexed to BSA, LAEF= left atrial ejection fraction LVEF= left ventricular
ejection fraction, LVMI= left ventricular mass indexed to BSA

Cardiac biomarkers in Chronic Kidney Disease Biomarkers of chronic kidney disease: the value of left atrial metrics
110
Table7. 5. Independent Predictors for CKD group
CKD group
predictor Beta p-value
LAVI -.004 .976
Diastolic Grade -.122 .227
LVMI .037 .721
E/e' -.125 .229
LA strain .261 .029†
LV strain -.221 .826
NT-pro BNP -.257 .016†
†p<0.05 compared to control LAVI=left atrial volume indexed to BSA, LVMI=left ventricular mass indexed to BSA
Table7. 4. Independent Predictors of NT-pro BNP (log transformed)
NT-pro BNP Predictor Beta
p-value
Group -0.26 0.004† LVMI -0.15 0.09 LA strain -0.19 0.017† LAVI 0.28 0.004† E/e’ 0.18 0.037† LV strain -0.11 0.27 Age 0.15 0.17 †p<0.05 compared to control
LAVI=left atrial volume indexed to BSA, LVMI=left ventricular mass indexed to BSA
Cardiac biomarkers in Chronic Kidney Disease Biomarkers of chronic kidney disease: the value of left atrial metrics
111
Inter and intra observer variability
LA strain and strain rate were analysed by 2 different individuals and by the same
individual on a different day, to evaluate inter and intra observer variability. Inter and
intra observer variability was evaluated by estimating intraclass correlation coefficients
(ICC); ICC for LA strain were 0.97(0.92-0.99) and 0.98 (0.95-0.99) respectively. Inter
and intra observer ICC for LA SRs was 0.95 (0.88-0.98) and 0.98 (0.96-0.99), LASRe
0.96 (0.90-0.98) and 0.99 (0.98-0.99) and LASRa 0.97 (0.91-0.99) and 0.99 (0.97-0.99)
respectively.
Discussion
Several patients with CKD present with associated CVD, and have adverse
cardiovascular events; in fact, CKD patients often die from cardiovascular disease rather
than progress to ESRD23 . It is therefore important to find an early marker of
cardiovascular involvement in CKD patients. Such a parameter should be non-invasive
and easily obtainable. Both LA strain as well as BNP have demonstrated alterations
especially in conditions with cardiovascular involvement including myocardial
infarction24, 25 and cardiac failure26. In this study, we evaluated NT-pro BNP levels, LA
volume and function by 2D strain and diastolic dysfunction to determine which of these
parameters would be more sensitive to detect myocardial involvement in stage 3 CKD
patients. Moreover, almost all CKD patients would undergo a transthoracic
echocardiogram as part of their clinical evaluation. We selected only stage 3 CKD
patients as there is a paucity of reports in this particular subgroup, although they
demonstrate a significant increase in adverse CV events27. In our earlier studies we have
reported altered LA function assessed by 2D strain in stage 3 CKD patients9, thereby

Cardiac biomarkers in Chronic Kidney Disease Biomarkers of chronic kidney disease: the value of left atrial metrics
112
indicating alterations in LA function metrics even in early CKD. As our present report
is based on a cross sectional study, we are unable to comment on its specific prognostic
value in CKD patients; however, the prognostic value of LA strain has been
demonstrated in other high risk patient groups28, 29.
LAVI has been independently associated with increased cardiovascular risk and CVD
burden30 and is a powerful predictor of medium-term outcome in patients with
suspected heart failure31. LA enlargement is also a predictor of increased cardiovascular
morbidity and mortality in end stage kidney disease32. Combining LA volume with
measures of LA function has been shown to be a more powerful predictor of adverse
events33. 2D LA strain is a new and sensitive method for evaluating global and phasic
LA function34. There are reports demonstrating prognostic utility of LA strain in atrial
fibrillation and cardiomyopathy35, 36. Our group has previously reported that LA strain
was reduced, even though LAVI was similar between the CKD and non CKD controls
with hypertension. We postulated that this could be due to excessive activation of renin-
angiotensin-aldosterone (RAAS) system in CKD. Activation of RAAS can lead to
myocardial fibrosis which in turn alters myocardial deformation properties, with
preferential involvement of the LA over the LV given its relatively thin walls. RAAS
blockade using ACE inhibitor therapy in patients with hypertension has resulted in the
normalisation of LA strain and strain rate37, 38, and would therefore support this
hypothesis.
It has previously been shown that plasma naturetic peptide levels is an independent
predictor of CKD progression39. Even though BNP is excreted by the kidney, BNP
levels that are within the upper reference limit, are seen in most stage 3 CKD patients,
despite having a decreased eGFR40. Hence, altered cardiac function is the more likely
cause for elevated BNP levels in patients with CKD41. rather than as a consequence of

Cardiac biomarkers in Chronic Kidney Disease Biomarkers of chronic kidney disease: the value of left atrial metrics
113
altered renal function. NT-pro BNP has also demonstrated prognostic utility for adverse
cardiovascular events in patients with advanced renal failure5, 42. Bruch and colleagues
showed that CKD patients with NT-pro BNP >1400pg/ml had poor cardiovascular
outcome. Pfister and colleagues reported that NT-pro BNP was a sensitive marker for
detection of systolic and diastolic heart failure20. However, there is no accepted standard
cut off value for NT-pro BNP or BNP, as indicators of early myocardial involvement in
CKD that could potentiate their use as biomarkers for adverse cardiovascular events.
We found that although NT-pro BNP levels were higher in the CKD group, the absolute
value was within the reference range (<100pg/ml) in all CKD patients. The presence of
CKD was however an independent predictor of NT-pro BNP level on logistic regression
analysis, indicating a relationship between elevation of this peptide and the presence of
CKD. Left atrial parameters (LAVI, LA strain) and diastolic dysfunction were also
independent predictors of NT-pro BNP. Diastolic dysfunction consequent to CKD
would lead to LA enlargement and dysfunction43, and this may in turn increase NT-pro
BNP levels in CKD patients. However, as the NT-pro BNP levels were within the
‘normal’ range, its value as a marker of cardiac involvement in stage 3 CKD patients is
limited.
Echocardiograms are routinely performed in stage 3 CKD patients as part of their
routine clinical evaluation and management. As such, this group of patients often
require serial transthoracic echocardiograms. Interestingly, we found that there was no
significant difference between traditional echocardiographic parameters like LVEF or
LVMI between CKD patients and the control group (with normal renal function); hence
these parameters are unlikely to detect early cardiac involvement in CKD patients with
no previous history of CVD. However, more patients with CKD had abnormal diastolic
function by traditional grading using mitral inflow velocity. While this could be

Cardiac biomarkers in Chronic Kidney Disease Biomarkers of chronic kidney disease: the value of left atrial metrics
114
attributed in part to the older age in the CKD patients, in the logistic regression model
diastolic grading was not a predictor of CKD. CKD patients also had a higher E/e’ ratio
indicating elevated LV filling pressure, consequent to diastolic dysfunction. Even
though, E/e’ ratio has been demonstrated to be superior to other echocardiographic
indices for the assessment of diastolic dysfunction as well as LV filling pressure14 , we
observed that the mean E/e’ of 12 was in the ‘grey zone’ ( ie between 8-15) and was not
different to the control group. Hence the use of E/e’ cannot be specifically used to
determine cardiovascular involvement in CKD and may be attributable to associated
risk factors including hypertension and diabetes. LV systolic strain was lower than
reference value in both groups; however, there was no statistically significant difference
between the groups. This may be due to the relatively increased myocardial mass in the
LV compared to the LA, making it a less sensitive marker in early CKD. LA volume
and LA strain parameters including global systolic strain, SRs, SRe and SRa were
abnormal in CKD group compared to control group. As mentioned earlier, we have
demonstrated that LA strain is reduced early, and in this study we demonstrated that this
reduction occurs even prior to any elevation of a cardiac biomarker like NT-pro BNP in
Stage 3 CKD patients, thereby indicating that LA strain parameters are probably more
sensitive and better suited to detect cardiac involvement in this subset of patients.
Moreover 97% of CKD patients had a reduced LA strain while only 45% had an
enlarged LAVI, using standard reference ranges.
Limitations
In this relatively small “proof of concept” study, we compared stage 3 CKD patients
with risk factor matched control patients with normal renal function, on average 13
years younger. As both levels of cardiac protein biomarkers and echocardiographic

Cardiac biomarkers in Chronic Kidney Disease Biomarkers of chronic kidney disease: the value of left atrial metrics
115
parameters changes with age, whether age was an unappreciated confounding factor
cannot be specifically be excluded in this study because of the small numbers. This was
a cross sectional study and therefore the impact of these parameters on future adverse
outcomes is not available. However, follow up of these patients is presently underway.
Conclusion
Echocardiographic evaluation of left atrial volume and strain parameters are sensitive
measures that are relatively easy to obtain, and have the potential to be used as
indicators to detect early myocardial involvement in stage 3 CKD patients. Our
analysis demonstrated that LA function parameters using 2D strian are more sensitive
than NT-pro BNP levels in detecting myocardial involvement in CKD. However,
longitudinal studies in a larger cohort of patients are needed to assess their prognostic
implications.
Acknowledgement:
Krishna K. Kadappu received National Health and Medical Research Council
(NHMRC) scholarship to conduct this research.
Reference:
1.Chadban SJ, Briganti EM, Kerr PG, Dunstan DW, Welborn TA, Zimmet PZ, et al.
Prevalence of kidney damage in Australian adults: The AusDiab kidney study. J Am Soc
Nephrol. 2003;14:S131-8.
2.Coresh J, Selvin E, Stevens LA, Manzi J, Kusek JW, Eggers P, et al. Prevalence of
chronic kidney disease in the United States. JAMA. 2007;298:2038-47.
3.Weiner DE, Tighiouart H, Elsayed EF, Griffith JL, Salem DN, Levey AS, et al. The

Cardiac biomarkers in Chronic Kidney Disease Biomarkers of chronic kidney disease: the value of left atrial metrics
116
Framingham predictive instrument in chronic kidney disease. J Am Coll Cardiol.
2007;50:217-24.
4.Bruch C, Fischer C, Sindermann J, Stypmann J, Breithardt G, Gradaus R. Comparison
of the prognostic usefulness of N-terminal pro-brain natriuretic Peptide in patients with
heart failure with versus without chronic kidney disease. Am J Cardiol. 2008;102:469-
74.
5.Fu S, Luo L, Ye P, Yi S, Liu Y, Zhu B, et al. The ability of NT-proBNP to detect
chronic heart failure and predict all-cause mortality is higher in elderly Chinese
coronary artery disease patients with chronic kidney disease. Clin Interv Aging.
2013;8:409-17.
6.Sakuma M, Nakamura M, Tanaka F, Onoda T, Itai K, Tanno K, et al. Plasma B-type
natriuretic peptide level and cardiovascular events in chronic kidney disease in a
community-based population. Circ J. 2010;74:792-7.
7.Tripepi G, Benedetto FA, Mallamaci F, Tripepi R, Malatino L, Zoccali C. Left atrial
volume in end-stage renal disease: a prospective cohort study. J Hypertens.
2006;24:1173-80.
8.Cameli M, Lisi M, Focardi M, Reccia R, Natali BM, Sparla S, et al. Left atrial
deformation analysis by speckle tracking echocardiography for prediction of
cardiovascular outcomes. Am J Cardiol. 2012;110:264-9.
9.Kadappu KK, Kuncoro AS, Hee L, Aravindan A, Spicer ST, Suryanarayanan G, et al.
Chronic kidney disease is independently associated with alterations in left atrial
function. Echocardiography. 2014;31:956-64.
10.Kadappu KK, Boyd A, Eshoo S, Haluska B, Yeo AE, Marwick TH, et al. Changes in
left atrial volume in diabetes mellitus: more than diastolic dysfunction? Eur Heart J
Cardiovasc Imaging. 2012;13:1016-23.
Cardiac biomarkers in Chronic Kidney Disease Biomarkers of chronic kidney disease: the value of left atrial metrics
117
11.Lang RM, Bierig M, Devereux RB, Flachskampf FA, Foster E, Pellikka PA, et al.
Recommendations for chamber quantification: a report from the American Society of
Echocardiography's Guidelines and Standards Committee and the Chamber
Quantification Writing Group, developed in conjunction with the European Association
of Echocardiography, a branch of the European Society of Cardiology. J Am Soc
Echocardiogr. 2005;18:1440-63.
12.Foppa M, Duncan BB, Rohde LE. Echocardiography-based left ventricular mass
estimation. How should we define hypertrophy? Cardiovasc Ultrasound. 2005;3:17.
13.Appleton CP, Jensen JL, Hatle LK, Oh JK. Doppler evaluation of left and right
ventricular diastolic function: a technical guide for obtaining optimal flow velocity
recordings. J Am Soc Echocardiogr. 1997;10:271-92.
14.Ommen SR, Nishimura RA, Appleton CP, Miller FA, Oh JK, Redfield MM, et al.
Clinical utility of Doppler echocardiography and tissue Doppler imaging in the
estimation of left ventricular filling pressures: A comparative simultaneous Doppler-
catheterization study. Circulation. 2000;102:1788-94.
15.Nagueh SF, Appleton CP, Gillebert TC, Marino PN, Oh JK, Smiseth OA, et al.
Recommendations for the evaluation of left ventricular diastolic function by
echocardiography. J Am Soc Echocardiogr. 2009;22:107-33.
16.Kadappu KK, Boyd A, Eshoo S, Haluska B, Yeo AE, Marwick TH, et al. Changes in
left atrial volume in diabetes mellitus: more than diastolic dysfunction? Eur Heart J
Cardiovasc Imaging. 2012;13:1016-23.
17.Yeo KT, Dumont KE, Brough T. Elecsys NT-ProBNP and BNP assays: are there
analytically and clinically relevant differences? J Card Fail. 2005;11:S84-8.
18.Tschope C, Kasner M, Westermann D, Gaub R, Poller WC, Schultheiss HP. The role
of NT-proBNP in the diagnostics of isolated diastolic dysfunction: correlation with

Cardiac biomarkers in Chronic Kidney Disease Biomarkers of chronic kidney disease: the value of left atrial metrics
118
echocardiographic and invasive measurements. Eur Heart J. 2005;26:2277-84.
19.Mueller T, Gegenhuber A, Poelz W, Haltmayer M. Comparison of the Biomedica
NT-proBNP enzyme immunoassay and the Roche NT-proBNP chemiluminescence
immunoassay: implications for the prediction of symptomatic and asymptomatic
structural heart disease. Clin Chem. 2003;49:976-9.
20.Pfister R, Scholz M, Wielckens K, Erdmann E, Schneider CA. Use of NT-proBNP in
routine testing and comparison to BNP. Eur J Heart Fail. 2004;6:289-93.
21.Lang RM, Badano LP, Mor-Avi V, Afilalo J, Armstrong A, Ernande L, et al.
Recommendations for cardiac chamber quantification by echocardiography in adults: an
update from the American Society of Echocardiography and the European Association
of Cardiovascular Imaging. J Am Soc Echocardiogr. 2015;28:1-39 e14.
22.Morris DA, Takeuchi M, Krisper M, Kohncke C, Bekfani T, Carstensen T, et al.
Normal values and clinical relevance of left atrial myocardial function analysed by
speckle-tracking echocardiography: multicentre study. Eur Heart J Cardiovasc
Imaging. 2015;16:364-72.
23.Collins AJ. Cardiovascular mortality in end-stage renal disease. Am J Med Sci.
2003;325:163-7.
24.Antoni ML, ten Brinke EA, Atary JZ, Marsan NA, Holman ER, Schalij MJ, et al.
Left atrial strain is related to adverse events in patients after acute myocardial infarction
treated with primary percutaneous coronary intervention. Heart. 2011;97:1332-7.
25.Mayr A, Mair J, Schocke M, Klug G, Pedarnig K, Haubner BJ, et al. Predictive value
of NT-pro BNP after acute myocardial infarction: relation with acute and chronic infarct
size and myocardial function. Int J Cardiol. 2011;147:118-23.
26.Dogan C, Ozdemir N, Hatipoglu S, Bakal RB, Omaygenc MO, Dindar B, et al.
Relation of left atrial peak systolic strain with left ventricular diastolic dysfunction and

Cardiac biomarkers in Chronic Kidney Disease Biomarkers of chronic kidney disease: the value of left atrial metrics
119
brain natriuretic peptide level in patients presenting with ST-elevation myocardial
infarction. Cardiovasc Ultrasound. 2013;11:24.
27.Go AS, Chertow GM, Fan D, McCulloch CE, Hsu CY. Chronic kidney disease and
the risks of death, cardiovascular events, and hospitalization. N Engl J Med.
2004;351:1296-305.
28.Tripepi G, Benedetto FA, Mallamaci F, Tripepi R, Malatino L, Zoccali C. Left atrial
volume monitoring and cardiovascular risk in patients with end-stage renal disease: a
prospective cohort study. J Am Soc Nephrol. 2007;18:1316-22.
29.Hoit BD. Left atrial size and function: role in prognosis. J Am Coll Cardiol.
2014;63:493-505.
30.Tsang TS, Barnes ME, Gersh BJ, Bailey KR, Seward JB. Left atrial volume as a
morphophysiologic expression of left ventricular diastolic dysfunction and relation to
cardiovascular risk burden. Am J Cardiol. 2002;90:1284-9.
31.Lim TK, Dwivedi G, Hayat S, Majumdar S, Senior R. Independent value of left
atrial volume index for the prediction of mortality in patients with suspected heart
failure referred from the community. Heart. 2009;95:1172-8.
32.Hee L, Nguyen T, Whatmough M, Descallar J, Chen J, Kapila S, et al. Left atrial
volume and adverse cardiovascular outcomes in unselected patients with and without
CKD. Clin J Am Soc Nephrol. 2014;9:1369-76.
33.Abhayaratna WP, Seward JB, Appleton CP, Douglas PS, Oh JK, Tajik AJ, et al. Left
atrial size: physiologic determinants and clinical applications. J Am Coll Cardiol.
2006;47:2357-63.
34.Saraiva RM, Demirkol S, Buakhamsri A, Greenberg N, Popovic ZB, Thomas JD, et
al. Left atrial strain measured by two-dimensional speckle tracking represents a new
tool to evaluate left atrial function. J Am Soc Echocardiogr. 2010;23:172-80.

Cardiac biomarkers in Chronic Kidney Disease Biomarkers of chronic kidney disease: the value of left atrial metrics
120
35.D'Andrea A, Caso P, Romano S, Scarafile R, Cuomo S, Salerno G, et al. Association
between left atrial myocardial function and exercise capacity in patients with either
idiopathic or ischemic dilated cardiomyopathy: a two-dimensional speckle strain study.
Int J Cardiol. 2009;132:354-63.
36.Cameli M, Lisi M, Righini FM, Focardi M, Alfieri O, Mondillo S. Left atrial speckle
tracking analysis in patients with mitral insufficiency and history of paroxysmal atrial
fibrillation. Int J Cardiovasc Imaging. 2012;28:1663-70.
37.Dimitroula H, Damvopoulou E, Giannakoulas G, Dalamanga E, Dimitroulas T,
Sarafidis PA, et al. Effects of renin-angiotensin system inhibition on left atrial function
of hypertensive patients: an echocardiographic tissue deformation imaging study. Am J
Hypertens. 2010;23:556-61.
38.Kokubu N, Yuda S, Tsuchihashi K, Hashimoto A, Nakata T, Miura T, et al.
Noninvasive assessment of left atrial function by strain rate imaging in patients with
hypertension: a possible beneficial effect of renin-angiotensin system inhibition on left
atrial function. Hypertens Res. 2007;30:13-21.
39.Yasuda K, Kimura T, Sasaki K, Obi Y, Iio K, Yamato M, et al. Plasma B-type
natriuretic peptide level predicts kidney prognosis in patients with predialysis chronic
kidney disease. Nephrol Dial Transplant. 2012;27:3885-91.
40.Tagore R, Ling LH, Yang H, Daw HY, Chan YH, Sethi SK. Natriuretic peptides in
chronic kidney disease. Clin J Am Soc Nephrol. 2008;3:1644-51.
41.Zoccali C, Mallamaci F, Benedetto FA, Tripepi G, Parlongo S, Cataliotti A, et al.
Cardiac natriuretic peptides are related to left ventricular mass and function and predict
mortality in dialysis patients. J Am Soc Nephrol. 2001;12:1508-15.
42.Varghese K, Cherian G, Abraham UT, Hayat NJ, Johny KV. Predictors of coronary
disease in patients with end stage renal disease. Ren Fail. 2001;23:797-806.

Cardiac biomarkers in Chronic Kidney Disease Biomarkers of chronic kidney disease: the value of left atrial metrics
121
43.Nagueh SF, Appleton CP, Gillebert TC, Marino PN, Oh JK, Smiseth OA, et al.
Recommendations for the evaluation of left ventricular diastolic function by
echocardiography. Eur J Echocardiogr. 2009;10:165-93.

Cardiac biomarkers in Chronic Kidney Disease
122
Chapter 8: Discussion and concluding remarks
Cardiac biomarkers in Chronic Kidney Disease
123
The “cardio-renal syndrome” is a well described condition in medical literature1. CKD
and heart disease have a close relationship. Traditional risk factors like hypertension
and diabetes, leads to endothelial dysfunction and accelerated atherosclerosis causing
progression of CKD. This results in anaemia, uraemia, volume overload, chronic
inflammation, oxidative stress and nuero-humeral changes which in turn results in
cardiac remodelling, left ventricular hypertrophy, increased ischaemic risk, coronary
and valvular calcification, pump failure and lethal arrhythmias2. Despite CKD being an
independent risk factor for cardiovascular disease, most of the landmark trials excluded
this high risk group from their study population. Importantly, routinely used clinical
cardiovascular risk calculators, such as the Framingham predictive instrument, under
estimate future adverse cardiac events in stage 3 CKD (eGFR 30-59 ml/min/1.73m2)
patients3. For these reasons, there is a need to develop novel non-invasive cardiac bio
markers, over and above clinical risk factors, to estimate individual patient risk to
predict future adverse cardiac events in CKD patients.
8 Cardiac biomarkers in CKD
As mentioned earlier, volume overload along with other co morbidities like
hypertension and diabetes in CKD will result in myocardial hypertrophy and diastolic
dysfunction4. Long standing diastolic dysfunction results in LA enlargement as well as
LA dysfunction. It has also been demonstrated that hypertension, diabetes and CKD all
cause RAAS activation, that in turn causes myocardial fibrosis and cardiac
dysfunction5. This will also result in altered myocardial deformation with consequent
impairment in left atrial and ventricular strain and strain rate6. Atrial and ventricular
involvement also results in elevation in cardiac neuropeptides like naturetic peptide7.

Cardiac biomarkers in Chronic Kidney Disease
124
LA and LV function were assessed by traditional as well as newer echocardiographic
technique like strain and strain rate; strain analysis has been shown in numerous
conditions to be more accurate than LV ejection fraction ( needs a few refs) Strain and
strain rate enables the evaluation of myocardial deformation throughout the cardiac
cycle, providing a sensitive and accurate assessment of global ventricular and global
and phasic atrial function8, 9. Strain and strain rate can be derived from tissue Doppler
imaging or 2D speckle tracking8.
Cardiac dysfunction has also been evaluated by the measurement of BNP/ NT-pro BNP.
Both of these bio markers have been shown to be elevated in ESRF with poor
prognostic outcome10, 11. However, again there is paucity in literature regarding their
role in early CKD.
There are numerous studies regarding various cardiac biomarkers to assess cardiac
involvement in end stage renal failure (ESRF) and their prognostic utilities12-18. It is
well established that patients with left ventricular hypertrophy, which is common in
ESRF, have poor cardiac outcome4. ESRF patients also have reduced left ventricular
strain, diastolic dysfunction, increased left atrial volume and elevated cardiac troponin
and NT-pro BNP all indicating long term adverse cardiac outcome14, 15, 17, 18. However
there are limited data regarding left atrial volume and function in early CKD. While
alterations in several echocardiographic parameters have been previously demonstrated,
the most sensitive tool among them, to identify cardiac involvement from CKD
independently, especially with coexistent hypertension and diabetes, has not been
determined.
We hypothesised that being a thin walled and low pressure chamber, left atrial metrics
should be altered early in CKD which could be used as an early marker of cardiac

Cardiac biomarkers in Chronic Kidney Disease
125
involvement in CKD. This in turn helps the clinician to identify the high risk patient
who needs aggressive medical management, to prevent future adverse cardiac events.
To prove our hypothesis, we evaluated traditional echocardiographic parameters
including diastolic dysfunction and LA volume and newer indices like LV and LA
strain parameters as well as NT-pro BNP as a biochemical marker, to assess the
sensitivity of these various parameters to diagnose cardiovascular involvement in early
CKD. Initially we examined these parameters in subjects with risk factors like diabetes
and hyper tension without CKD and compared them with CKD patients with similar
risk factors (ie diabetes and hypertension), which can themselves also cause diastolic
dysfunction with consequent changes in LA and LV metrics.
8. 1 Diastolic dysfunction
We found that more than 75% of a diabetic population studied had diastolic
dysfunction. This was irrespective of their age. The majority of them had grade 2 or
greater diastolic dysfunction. In contrast, only 11% of similar age and sex matched
subjects without diabetes had diastolic dysfunction. It was also noted that traditional
diastolic parameters like E/A ratio, e’ and E/e’ are statistically different in patients with
hypertension. The majority of CKD patients who had hypertension or diabetes also had
diastolic dysfunction. Most of them had grade 2 or greater diastolic dysfunction. We
however did not observe any significant difference in the number of patients with
diastolic dysfunction in diabetics as well as hypertensive patients with normal or
abnormal renal function. Hence assessing diastolic dysfunction by traditional
echocardiographic parameters could not differentiate cardiac involvement from diabetes
or hypertension alone from that associated with CKD.

Cardiac biomarkers in Chronic Kidney Disease
126
8.2 LV strain
LV strain has been used in a variety of conditions to demonstrate subclinical myocardial
dysfunction, when traditional parameters like LV ejection fraction were normal. Left
ventricular strain was significantly reduced in patients with diabetes and hypertension
with normal renal function. When CKD was additionally present, a further reduction of
ventricular strain was observed, but was not statistically different between the groups.
Hence by using ventricular strain, we can diagnose abnormal myocardial deformation,
without the ability to differentiate between CKD, diabetes and hypertension groups.
8.3 Left atrial volume
LA volume is increasingly used as a biomarker of adverse future cardiovascular events.
It has been shown that LA volume indexed to body surface area (LAVI) is increased in
hypertension, diabetes as well as CKD. Additionally, LA volume is a marker of severity
and chronicity of LV diastolic dysfunction.
Interestingly, we observed in our diabetes patients, even those patients classified as
having normal diastolic function had LA enlargement. Further, no significant difference
was observed in LA volumes across the 3 grades of diastolic function. This suggests
that altered LV diastolic function only contributes in part to observed LA changes in
diabetic patients. Thus, it is likely that other factors, contributing to an atrial myopathy
associated with diabetes, may be a likely contributor to LA enlargement. Even though
diabetes independently causes LA enlargement, when associated with CKD, a
differential increase in LA volume was observed compared with the diabetic patients
with normal renal function. Hence LAVI is a useful echocardiographic parameter to
detect specific cardiac involvement in CKD, with the ability to discriminate between
different patient groups.

Cardiac biomarkers in Chronic Kidney Disease
127
Left atrial enlargement is seen in hypertension, with a significantly increased LAVI
compared to age and sex matched healthy adults. We however failed to demonstrate a
significant difference between LAVI in patients with hypertension with normal renal
function and hypertensive patients with CKD.
8.4 LA function by strain analysis
Evaluation of global and phasic LA function using strain and strain rate parameters is
feasible and these parameters have been established as a sensitive measure to assess LA
function. In a variety of clinical conditions, significant reduction in LA function was
evident before significant LA enlargement had occurred, suggesting that LA functional
changes may precede changes in LA volume.
We demonstrated the feasibility of assessing LA global and phasic function by using
strain and strain rate in diabetic patients. Along with LA enlargement, we noted that
there was a reduction in LA function with a decrease in LA global strain and strain rate.
We also noted that hypertension per se causes altered LA function. LA dysfunction was
demonstrated by altered LA strain although strain rate parameters were not significantly
altered.
Importantly, we demonstrated that LA global strain was reduced in patients with
hypertension and diabetes with CKD. This reduction was statistically significant
compared with age, sex and risk factor matched controls with normal renal function.
This indicates that LA strain is the sensitive marker to assess the cardiac involvement in
early CKD compared to other echocardiographic parameters.

Cardiac biomarkers in Chronic Kidney Disease
128
8.5 NT-pro BNP
It has been shown that plasma naturetic peptide levels are a strong and independent
predictor of CKD progression. Altered cardiac function is the likely explanation for
elevated BNP levels in CKD patients. However, in our study, most stage 3 CKD
patients had normal NT-pro BNP levels despite having a decreased eGFR. Even though
the presence of CKD was an independent predictor of NT-pro BNP level, we found that
the absolute value was within the reference range (<100pg/ml) in all CKD patients.
Hence, using current normal values, NT-pro BNP as a marker of cardiac involvement in
stage 3 CKD patients is limited.
8.6 A ‘sensitive’ biomarker to detect cardiac involvement in CKD
From the studies performed, we found that most CKD patients have diastolic
dysfunction, which is also commonly seen in other co-morbid conditions including
hypertension and diabetes. Even though evaluation of diastolic function is a good
diagnostic tool to assess cardiac involvement, its usefulness in differentiate cardiac
involvement in the various conditions is limited. We also showed that NT-pro BNP had
some utility in indicating cardiac involvement in CKD patients; however, as its value
was within the normal reference range, it has limited utility in detecting cardiac
involvement in early CKD.
However, we demonstrated that both LA volume and LA strain parameters are
abnormal in early CKD and that CKD had an independent ‘additive’ effect on LA
metrics even in the presence of hypertension and diabetes. We also showed that LA
volume and LA strain has incremental value in diagnosing cardiac involvement in CKD,
even in the presence of other risk factors. Thus, our research showed that LA metrics
were the most sensitive ‘biomarker’ in demonstrating myocardial involvement in early

Cardiac biomarkers in Chronic Kidney Disease
129
CKD.
In CKD patients, altered LA compliance with a reduction in reservoir function was
present, as observed by reduced systolic strain rate. Altered LV relaxation with a
consequent reduction in the LA conduit function is likely responsible for the reduced
early diastolic strain rate. Atrial contractile function also was decreased in the CKD
group. Despite similar LAVI in the hypertension and CKD groups, a differential
reduction in LA strain measurements was observed in the CKD group. Thus, LA
functional changes may precede overt LA enlargement, in disease states like CKD.
Based on previous work in animal models19, we postulated that perhaps atrial fibrosis
consequent to RAAS activation in the CKD resulted in the reduction in LA function
over that observed as a consequence of co existent diastolic dysfunction.
8.7 Future direction
LA size and function are very sensitive to alterations in LV function, and are
reproducible echocardiographic parameters. Thus LA metrics may be used to assess
cardiovascular pathology and are increasingly used by clinicians in the follow up of
patients. However, we did not performed longitudinal studies to evaluate alterations in
LA metrics and to determine its value as a prognostic marker as part of this doctoral
thesis. Future studies should be performed investigating the prognostic value of
alterations in LA metrics on cardiovascular outcome in CKD patients. It is likely that
patients who demonstrate an increase in LA volume or reduction in LA strain would be
more likely to have adverse events. It would be important to determine the magnitude of
change that would likely result in adverse events.
Even though we haven’t performed a specific treatment intervention in the CKD patient
group with altered strain, there are few studies that have previously examined the effect

Cardiac biomarkers in Chronic Kidney Disease
130
of treatment. One such example is by using alteration in LA strain rate in hypertensive
patients following intervention with anti-hypertensive medications. It was noted ACE
inhibitors ‘reverse’ or improve LA strain rate to normal values by 6 weeks20. Our
hypothesis is that activation of RAAS may contribute significantly, causing the
reduction in strain and strain rate in CKD. Future studies with RAAS inhibitor therapy
in CKD patients with abnormal LA strain, should be performed to evaluate if LA
metrics can be improved with such therapeutic intervention. These studies may
additionally help to guide the clinician to facilitate a more detailed understanding of the
pathophysiology of cardiac involvement in CKD.
Increasing technological advances have produced numerous newer techniques for
assessing myocardial function. The current techniques we used to perform strain
analysis are mainly designed to assess the left ventricle. Hence future development of
strain analysis specifically designed to evaluate the left atrium needs to be developed
and validated.
8.8 Reference:
1. McCullough PA, Ahmad A. Cardiorenal syndromes. World J Cardiol. 2011;3:1-
9.
2. Ronco C, McCullough P, Anker SD, Anand I, Aspromonte N, Bagshaw SM, et
al. Cardio-renal syndromes: report from the consensus conference of the acute dialysis
quality initiative. Eur Heart J. 2010;31:703-11.
3. Parikh NI, Hwang SJ, Larson MG, Levy D, Fox CS. Chronic kidney disease as a
predictor of cardiovascular disease (from the Framingham Heart Study). Am J Cardiol.
2008;102:47-53.
Cardiac biomarkers in Chronic Kidney Disease
131
4. Di Lullo L, Gorini A, Russo D, Santoboni A, Ronco C. Left Ventricular
Hypertrophy in Chronic Kidney Disease Patients: From Pathophysiology to Treatment.
Cardiorenal Med. 2015;5:254-66.
5. Ehrlich JR, Hohnloser SH, Nattel S. Role of angiotensin system and effects of
its inhibition in atrial fibrillation: clinical and experimental evidence. Eur Heart J.
2006;27:512-8.
6. Kadappu KK, Abhayaratna K, Boyd A, French JK, Xuan W, Abhayaratna W, et
al. Independent Echocardiographic Markers of Cardiovascular Involvement in Chronic
Kidney Disease: The Value of Left Atrial Function and Volume. J Am Soc
Echocardiogr. 2015.
7. Maisel A. B-type natriuretic peptide levels: diagnostic and prognostic in
congestive heart failure: what's next? Circulation. 2002;105:2328-31.
8. Gorcsan J, 3rd, Tanaka H. Echocardiographic assessment of myocardial strain. J
Am Coll Cardiol. 2011;58:1401-13.
9. Boyd AC, Richards DA, Marwick T, Thomas L. Atrial strain rate is a sensitive
measure of alterations in atrial phasic function in healthy ageing. Heart. 2011;97:1513-
9.
10. Bruch C, Fischer C, Sindermann J, Stypmann J, Breithardt G, Gradaus R.
Comparison of the prognostic usefulness of N-terminal pro-brain natriuretic Peptide in
patients with heart failure with versus without chronic kidney disease. Am J Cardiol.
2008;102:469-74.
11. Sakuma M, Nakamura M, Tanaka F, Onoda T, Itai K, Tanno K, et al. Plasma B-
type natriuretic peptide level and cardiovascular events in chronic kidney disease in a
community-based population. Circ J. 2010;74:792-7.

Cardiac biomarkers in Chronic Kidney Disease
132
12. Taddei S, Nami R, Bruno RM, Quatrini I, Nuti R. Hypertension, left ventricular
hypertrophy and chronic kidney disease. Heart Fail Rev. 2011;16:615-20.
13. Liu YW, Su CT, Huang YY, Yang CS, Huang JW, Yang MT, et al. Left
ventricular systolic strain in chronic kidney disease and hemodialysis patients. Am J
Nephrol. 2011;33:84-90.
14. Krishnasamy R, Isbel NM, Hawley CM, Pascoe EM, Leano R, Haluska BA, et
al. The association between left ventricular global longitudinal strain, renal impairment
and all-cause mortality. Nephrol Dial Transplant. 2014;29:1218-25.
15. Khan NA, Hemmelgarn BR, Tonelli M, Thompson CR, Levin A. Prognostic
value of troponin T and I among asymptomatic patients with end-stage renal disease: a
meta-analysis. Circulation. 2005;112:3088-96.
16. Tripepi G, Benedetto FA, Mallamaci F, Tripepi R, Malatino L, Zoccali C. Left
atrial volume in end-stage renal disease: a prospective cohort study. J Hypertens.
2006;24:1173-80.
17. Tripepi G, Mattace-Raso F, Mallamaci F, Benedetto FA, Witteman J, Malatino
L, et al. Biomarkers of left atrial volume: a longitudinal study in patients with end stage
renal disease. Hypertension. 2009;54:818-24.
18. Wang AY, Lai KN. Use of cardiac biomarkers in end-stage renal disease. J Am
Soc Nephrol. 2008;19:1643-52.
19. Brilla CG. Renin-angiotensin system mediated mechanisms: cardioreparation
and cardioprotection. Heart. 2000;84 Suppl 1:i18-9:discussion i50.
20. Kokubu N, Yuda S, Tsuchihashi K, Hashimoto A, Nakata T, Miura T, et al.
Noninvasive assessment of left atrial function by strain rate imaging in patients with
hypertension: a possible beneficial effect of renin-angiotensin system inhibition on left
atrial function. Hypertens Res. 2007;30:13-21.
Copyright © 2022 FDOKUMEN