SUSTAINABILITY - UNSWorks - UNSW Sydney
196
EDUCATING BUILDING PROFESSIONALS FOR THE FUTURE IN THE GLOBALISED WORLD 42 nd AUBEA CONFERENCE 2018 Australasian Universities Building Education Association (AUBEA) VOLUME 3 SUSTAINABILITY Editors: Associate Professor Khoa Do Associate Professor Monty Sutrisna Dr Emil Jonescu Dr Atiq Zaman Cisco Provider Code 003013
-
Upload
khangminh22 -
Category
Documents
-
view
7 -
download
0
Transcript of SUSTAINABILITY - UNSWorks - UNSW Sydney

EDUCATING BUILDING PROFESSIONALS FOR THE FUTURE
IN THE GLOBALISED WORLD
42nd AUBEA CONFERENCE 2018Australasian Universities Building Education Association (AUBEA)
VOLUME 3
SUSTAINABILITY
Editors:Associate Professor Khoa Do
Associate Professor Monty SutrisnaDr Emil Jonescu
Dr Atiq Zaman
Cisco Provider Code 003013

i.
42nd AUBEA CONFERENCE 2018Australasian Universities Building Education Association (AUBEA)
EDUCATING BUILDING PROFESSIONALS FOR THE FUTURE
IN THE GLOBALISED WORLD
CURTIN UNIVERSITY
Cisco Provider Code 003013
26 - 28 September 2018Singapore
SUSTAINABILITY, VOLUME 3
Editors:Associate Professor Khoa Do
Associate Professor Monty SutrisnaDr Emil JonescuDr Atiq Zaman

1.
ACKNOWLEDGEMENTS
Conference Organising Committee
Associate Professor Monty Sutrisna (Conference Chair)
Ms Kristie-Lee Stephens (Conference Treasurer & Secretariat)
Mr Chris Leong (Conference Coordinator)
Associate Professor Khoa Do (Co-chair)
Dr Oluwole (Alfred) Olatunji (Co-chair & Innovation Stream Co-lead)
Mr Barry Cooper-Cooke (Innovation Stream Co-lead)
Dr Ahmed Hammad (Technology Stream Co-lead)
Dr Chamila Ramanayaka (Technology Stream Co-lead)
Dr Emil Jonescu (Suatainability Stream Co-lead)
Dr Atiq Zaman (Suatainability Stream Co-lead)
Scientific Committee
Full papers accepted for publishing in the Conference Proceedings are subject to a blind peer review process. The 2018 Conference Committee gratefully acknowledges the generous work of the reviewers, who provide constructive and invaluable feedback within tight time frames to ensure the high standard of published papers. A full list of scientific committee is published on pages x.
Professor Joseph Ooi, Vice Dean (Academic), School of Design and Environment, National University Singapore
Professor Peter NewmanJohn Curtin Distinguished Professor, School of Design & the Built Environment,Curtin
Professor Low Sui PhengProfessor School of Design and Environment, National University Singapore
Professor Robert AmorHead of Department, Dept. of Computer Science, University of Auckland
Stream Experts
1.
Copyright© Copyright in individual articles contained in the Proceedings of the AUBEA Conference 2018 is vested in each of the author(s)
Copyright for these proceedings is vested in Curtin University on behalf of AUBEA.
CitationDo, K, Sutrisna, M., Jonescu, E. and Zaman, A. (2018), 42nd AUBEA Conference 2018: Educating Building Professionals for the Future in the Globalised World, Vol 3: Sustainability, Australia. [ISBN 978-0-9871831-5-6 (Print) & ISBN 978-0-9871831-8-7 (e-Book)]
Proceedings of the 42nd AUBEA Conference 2018Published 2018 by Curtin University, Western Australia Kent Street Bentley 6845 Western Australia
SPONSORS & PARTNERS
PLATINUM Sponsor and Host University
GOLD Sponsors and Partners
SILVER Sponsors and Partners
Welcome Reception Venue Host and Supporter
ii.iii.
42nd AUBEA Conference 2018: Educating Building Professionals for the Future in the Globalised World42nd AUBEA Conference 2018: Educating Building Professionals for the Future in the Globalised World

v.
KEYNOTE SPEAKERS
MR PHIL LAZARUS
Mr Phil Lazarus is an American Architect with over 20 years of experience leveraging the power of BIM on behalf of architects, engineers, contractors and clients. Involved with Singapore’s largest developments since 2006, Phil has been leading the charge in promoting technology based innovation throughout Asia.In his current role as Aurecon’s Digital Practice Leader, Phil oversees the activities of over 200 digital engineering staff. He leads Aurecon’s Singapore-based Centre of Digital Excellence; exporting best practices for Digital Implementation to operations in Hong Kong, Thailand, Vietnam, China, and Indonesia.
Keynote AddressBring Ideas to Life through Applied Technology in Engineering
Architect | MBADigital Practice Leader, Aurecon | Asia
PROF WILLIE TAN
Professor Willie Tan is Head of Department, Department of Building, School of Design and Environment (SDE), National University of Singapore (NUS). He was the Program Director of the MSc(Project Management) program (2003-13) and Co-Director of the Center for Project Management and Construction Law (2005-7). He is an editorial board member of the International Journal of Project Management and Infrastructure Asset Management, among others. Professionally, he has chaired visit panels for Project Management Institute’s (PMI) Global Accreditation Center to accreditate university programs in project management. He has served as a consultant in project management and infrastructure development in many countries in Asia and the Middle East.
Keynote AddressEducating for the future in Construction: An institutional perspective
Head, Department of Building I National University of Singapore
MR JOHN ANDERSON
Mr John Anderson is the Executive General Manager for John Holland’s South East Asia business region and has more than 20 years’ engineering experience gained through his work in Vietnam, Indochina, Sudan, Hong Kong, Singapore, Australia and Indonesia. His engineering experience includes civil and building construction, marine construction, environmental protection, structural-steel work, traffic management, viaduct construction, land/marine-foundation works, and planning and overall site coordination.
Keynote AddressConstruction Industry in the Globalised Market
Executive General Manager | John Holland’s South East Asia
iv.
PREFACE
PROFESSORSETH KUNIN
FOREWORD FROM THE CHAIRIt is with great delight I am writing this introduction for AUBEA 2018 Conference proceeding. Throughout the long history from its formation in 1975, AUBEA has been convening annual conferences successfully. This 42nd AUBEA conference, however, is the first AUBEA conference held in the Asia region. This represents the recognition of the significant roles played by the Asian region in the global building industry and building education. As soon as we received the mandate to host this conference, the organising committee immediately considered Singapore as a potential venue for the conference. Singapore as a place has inspired us to articulate the theme of this conference as: “Educating Building Professionals for the Future: Innovation, Technology and Sustainability in the Globalised Market”. The theme embodies characteristics, challenges and opportunities facing the building education sector at the current time and beyond. We all know that the very nature of our building education sector calls for in-depth collaboration between industry and academia to educate building professionals fit for the future. Industry and academia are shaping the future of the profession together and it is highly celebrated in this conference through the selection of the prominent keynotes and stream experts, as well as the highly interactive conference programme.
I would like to take this opportunity to show my gratitude to my colleagues in the organising committee who have been working very hard to make this conference a reality. On behalf of the organising committee, I would also like to thank the AUBEA
Deputy Vice-Chancellor, International
Council for entrusting us with the mandate to host the conference and also to show appreciation to the sponsors and partners of this conference that has supported the conference. We also would like to acknowledge the important contribution from the scientific reviewers who have been generously donating their time to review abstracts and full papers submitted to this conference to ensure the quality of the papers accepted, as well as the session chairs who are instrumental to the success of the delivery of the paper presentation sessions.
Last but not least, it is our aim to recognise excellence. Therefore, the organising committee have also set up various scholarships and awards in this conference. We have set up the AUBEA 2018 conference to provide a conducive environment and a platform for industry and academia to further collaborate in educating building professionals for the future. On behalf of the organising committee I would like to thank delegates for joining us in this celebration of learning and participating in this exciting conference.
ASSOCIATE PROFESSOR MONTY SUTRISNA
42nd AUBEA Conference 2018: Educating Building Professionals for the Future in the Globalised World42nd AUBEA Conference 2018: Educating Building Professionals for the Future in the Globalised World
I am delighted to write a preface to this volume on sustainability arising from the AUBEA 2018 Conference hosted by Curtin University. As a global university Curtin considers enhancing sustainability to be one of its core strategic activities both in relation to research and engagement. With campuses encircling the Indian Ocean, as well as researchers engaged in projects throughout the world, academics and students within the university are addressing a wide range of issues related to sustainability from a global perspective.
This proceedings and the conference upon which it is based challenge us the think about sustainability from a number of different perspectives. Sustainability of the environment is a fundamental question, a number of the papers deal with this issue, from exploring the implications of the rise in sea levels to examining the uptake and development of zero energy and other technologies to enable the construction industry to play a more significant role in ongoing environmental and social sustainability. This is not a minor issue given the size and impact of construction on the environment and its central role in creating sustainable social spaces.
The papers also take up aspects of sustainability that relate to the interface between the construction industry and academia. They challenge us to address issues of developing curricula that prepare future generations of architects and engineers to both theoretically and practically engage with developing a sustainable future. Other papers address the challenges of developing a sustainable workforce, whether it be sustainable pathways allowing professionals to move into academia or the medical and other issues impacting the construction workforce.
As a social scientist, the impact of architecture and construction on society and people’s lived experience is of particular interest and importance. Human emotion and mental and physical wellbeing are also a fundamental aspects of sustainable futures. This aspect is specifically explored in the chapter discussing the use of luminal architecture to help western societies in addressing issues of loss and grief. This chapter highlights the important role of architecture in both expressing and shaping culture, and the need, as highlighted in this conference, for a reflective and reflexive approach to the role of architecture and construction in addressing the challenges of sustainability both technological and cultural.
Chair of AUBEA 2018 Conference

vii.
Leads, TECHNOLOGY Stream Curtin University, Australia
Leads, SUSTAINABILITY Stream Curtin University, Australia
Throughout history, the creativity and capacity of people’s imagination have been main drivers in the theorisation of technology implemented in our daily lives. In today’s age, technology integration within the built environment has reached a highly influential level that shapes the overall interaction of people with buildings that are surrounding them. Technology has also meant that the capacity for educating building professionals for the future has advanced to an exceptional level, permitting the dynamics of an
In its broadest terms, the definition of ‘sustainability’ has been in a perpetual state of refinement since its inception some 40 years ago. It is generally accepted to be the ability to preserve, sustain and balance healthy environmental, economic and social systems, on an international scale. Next to this, exponential population growth and shifts to urban environments necessitates a sustainably-responsible demand for construction and densification of cities. Construction has the capacity to make a critical impact on global
the sustainability agenda given that buildings in the first world contribute to more than forty percent of energy consumption over their lifetime. When we consider production of raw materials, construction, operation, maintenance and decommissioning—densification and as a consequence—construction (of cities) provides significant opportunities for sustainable development of built environments and infrastructure. For our survival, it is incumbent upon built environment professionals to research, debate and converge around robust and honest discussion, in unity. The Sustainability stream at the 2018 AUBEA Conference aspires to this, and considers aspects such as design, construction technology, monitoring, standards and management of buildings; materials, products and technology performance; energy, resource efficiency, and processes in building; operation and maintenance; stakeholder engagement; health, safety and working conditions; innovative financing models; infrastructure, urban fabric and architecture; adaptive reuse; and information management. In the spirit of professionalism and friendship we look forward to, and trust that you will be equally rewarded, with the academic and industry contributions from the many delegates from across the globe.
Dr Emil Jonescu Dr Atiq Zaman
Dr Ahmed Hammad
Dr Chamila Ramanayaka
evolving industry to be rapidly transferred to its key players.In the context of the built environment, technology plays a significant role in defining the overall systems that are opening new avenues in integration of the built and human environments: from real-time data that is instantly generated, and which enables constant analysis of implemented strategies, to the use of artificial intelligence to automate essential functions within the built environment through enhanced pattern recognition.
The 42nd Australasian Universities Building Education Association (AUBEA) Conference aims to showcase the novel approaches that are implemented for integrating technology within the built environment, with focus on its adoption to further enhance the education of professionals in the field. It is through exhibiting and sharing of the most recent advances in technology integration within the built environment that we envisage an enhanced sector that is capable of bridging human behaviour with its surrounding built environment worldwide. The “technology stream” of AUBEA this year hence provides a pivotal exploration and deep insight into future applications of intelligent technology in the built environment, helping to further ignite the adoption of effective technology within the field. Please join us for this unique experience in Singapore!
vi.
Educating Building Professional for the Future in the Globalised World
The overarching theme of the 2018 AUBEA Conference is ‘Educating Building Professionals for the Future in the Globalised World’ in recognition of the multiple and complex demands placed on assessment in higher education. Some of these challenges are long standing, such as those relating to continuously synchronising education and industry practice. Other challenges are emerging as national priorities, funding arrangements and policy frameworks change.
The THREE streams:1. Innovation 2. Technology 3. Sustainability
CONFERENCE THEMES
Leads, INNOVATION Stream Curtin University, Australia
Mr Barry Copper-Cooke
Dr Oluwole (Alfred) Olatunji
Innovation and Science Australia (ISA) indicated in the Australia 2030 “Prosperity Through Innovation” report that innovation was “fresh thinking that creates value”. It went on to state, “Australia is in a $1.6 trillion global innovation race” and identified five imperatives for action by government. At the centre of these imperatives was culture and ambition, surrounded by government, industry, education and research and development. While there is not the space to go into the finer detail of each of these
Professor Joseph Ooi, Vice Dean (Academic), School of Design and Environment, National University Singapore
Professor Peter NewmanJohn Curtin Distinguished Professor, School of Design & the Built Environment,Curtin
Professor Low Sui PhengProfessor School of Design and Environment, National University Singapore
Professor Robert AmorHead of Department, Dept. of Computer Science, University of Auckland
Stream Experts
imperatives it is clear that the participants at the 42nd AUBEA conference have a vested interest in each of these imperative in whatever part of the globe they are located.
The breadth of the papers presented is wide covering a vast array of subjects that pivot around the central theme of innovation. Performance in any industry is important and none more so than the construction industry, where none performance can come with high liquidated damages. One paper looks at the effect of cultural diversity on project performance, with a focus on its contribution to project success. On a similar theme of culture, the re-purposing of surveillance cameras is investigated, with the suggestion that they may be used to support urban densification in a sustainable way. The push for the densification of our cities cannot happen if the cost of construction is high, this then poses a challenge to industry to perform better and increase productivity while maintaining quality and keeping consumer costs at an affordable rate. One paper looks at the drivers and barriers to innovation along with identifying how government and industry can drive more innovations to achieve significant productivity performance. From an industry perspective teams of people are at the heart of a construction organisation and to get students work ready is one of the primary focuses of education establishments. Two papers look at both these perspectives one focused on educating work-ready students and the other reports on student’s teamwork experiences during online study. This, I would suggest, is an important piece of work considering that more and more universities around the world are looking to delivering their courses on-line. How does this approach effect two important components of effective teamwork, communication and collaboration? I trust you will enjoy your time at the 42nd AUBEA conference hosted by Curtin in Singapore, a place that has proven to be innovative, technological and sustainable when it comes to construction and the built environment.
42nd AUBEA Conference 2018: Educating Building Professionals for the Future in the Globalised World42nd AUBEA Conference 2018: Educating Building Professionals for the Future in the Globalised World
ix.
EDITORIAL
viii.
GENERAL INFORMATION
42nd AUBEA Conference 2018: Educating Building Professionals for the Future in the Globalised World42nd AUBEA Conference 2018: Educating Building Professionals for the Future in the Globalised World
Conference plenary venue The conference will take place principally in the Ramada Hotel.
Registration Delegates can register from 08:00 am on Thursday, September 27. The registration desk is located in the foyer of the Ramada Hotel.The registration desk will be staffed throughout the conference to take general enquiries.
Presenter support Presenters are asked to be in their designated room 5 minutes prior to the start of the session in their stream in order to load and check any files they require and to confer with the session chair.
For everyone’s benefit To ensure everyone’s enjoyment of this event, please:
• Remember to turn off your mobile phones or set ‘silent mode’;• Arrive on time for sessions;• If you are presenting, keep to time limits and follow directions of the session chair; and• Ask us if you have any questions or if you need assistance.
Assistance Please don’t hesitate to ask Curtin conference staff or volunteers. Conference helpers are readily identifiable by their red coloured lanyards.
Meals Full registration includes lunch, morning & afternoon tea and the conference dinner. Walk-inSingle day registrations include lunch, morning & afternoon tea and the conference dinner on the 27 September or site visit on 28 September.
Tea, coffee and lunches will be served in the foyer of the Ramada Hotel.
The conference dinner will be held at the Ramada Hotel, with a reception commencing at 07:00 pm. If you travel independently to the venue, ensure you arrive in time to allow all guests to be seated by 06:45 pm.
Dress: Business Smart.
Proceedings The website www.aubea2018.com.au will maintain an electronic copy of the proceedings. These conference proceedings (including abstracts and program) will also be supplied on USB to delegates on registration. Photography Curtin University will be photographing various parts of this conference. Your image and/or contributions may be photographed and used in printed or electronic publications as part of the conference archive and for educational purposes. If you have any concerns about this, please contact staff at the registration desk on the day. the day.
Feedback Please use the evaluation forms in your conference bag to provide us with feedback and suggestions for improving the next AUBEA conference. These will be collected on Friday, 28 September 2018.
We also welcome your input at the registration desk at any time.
This section contains the abstracts and full papers presented at the conference. On behalf of the conference committee, we would like to acknowledge and thank the delegates that submitted papers for consideration under the conference themes of Innovation,Technology and Sustainability. Table 1 below shows the number of submissions and outcomes in each category.
Table below: AUBEA 2018: Submissions and outcomes
Papers (Innovation)
Papers(Technology)
Papers(Sustainability)
46
26
30
102
Submission Format
Abstracts Received
Full Papers Received
36
31
35
102
Final outcomes(total)
27
28
34
89
Full papers identified as ‘Full Paper – Peer Reviewed’ in the Conference Proceedings have undergone a blind peer review process, with de-identified feedback and suggestions for revisions provided to authors. All submissions were also reviewed by members of the conference committee review panel. We gratefully acknowledge the generous work of the reviewers, a national and international group of colleagues who contributed their time and expertise to provide review commentary, including constructive and valuable feedback for all submissions.
These proceedings are published by Curtin University under ISBN 978-0-9871831-5-6 (Print) & ISBN 978-0-9871831-8-7 (e-Book). We hope that this collection of papers will make a positive contribution to the ongoing discussion about those challenging issues that lie at the heart of assessment.
Editorial Committee
Disclaimer
The papers published in this Conference Program have been reviewed, edited and proofread to the best of our ability within the timeframe permitted. We acknowledge that there may be further proofing errors.
Associate Professor Khoa Do (Volumes 1, 2 & 3)Associate Professor Monty Sutrisna (Volumes 1, 2 & 3) Mr Barry Cooper-Cooke (Volume 1)Dr Oluwole (Alfred) Olatunji (Volume 1)Dr Ahmed Hammad (Volume 2)Dr Chamila Ramanayaka (Volume 2)Dr Emil Jonescu (Volume 3)
Dr Atiq Zaman (Volume 3)
Total
xi.
SCIENTIFIC COMMITTEE
x.
TABLE OF CONTENTS
Sponsors & Partners
Aknowledgements
Preface & Forward from the chair
Keynote Speakers
Conference Themes
General Information
Editorial
Scientific Committee
Table of Contents
List of Full Papers
ii.
iii.
iv.
v.
vi. & vii.
viii.
ix.
x.
xi.
xi., xii & xiii.
Page Number
Aquatic architecture: a sustainable refuge in response to rising sea levels in the Maldives(Ahdha Moosa, Khoa Do, Emil Jonescu, Monty Sutrisna and Ahmed Hammad)
Validation of the psychological contract of safety scale on construction sites(Mohammad Tanvi Newaz, Peter Davis, Marcus Jefferies and Manikam Pillay)
Barriers to entering academic life for construction practitioners(Willy Sher and John Smolders)
Education & training for zero energy and lean manufacturing & construction of housing in Australia(Felix Kin Peng Hui, Alessandra Akemi Yokota and Lu Aye)
Canopy: career transitions in academia and architecture(Guillermo Aranda-Mena and Luisa Scambia)
The impact of fatigue on workforce sustainability in the construction industry (Tania Lipsham, Kathryn Davies and Linda Kestle)
Work-related diseases in the Australian construction industry(Imriyas Kamardeen)
Exploring the potential for achieving the triple bottom-line of sustainability through offsite manufacturing(Monty Sutrisna, Chris Leong, Ahmed Hammad and Atiq Zaman)
Comparative economic-environmental feasibility of reinforced concrete and laminated steel structures(Raoni Fragoso, Ahmed Hammad, Assed Haddad, Emil Jonescu and Khoa Do)
16
28
38
47
61
73
83
96
107
42nd AUBEA Conference 2018: Educating Building Professionals for the Future in the Globalised World
LIST OF FULL PAPERS I PEERED REVIEWED I SUSTAINABILITY - BOOK 3
42nd AUBEA Conference 2018: Educating Building Professionals for the Future in the Globalised World
Mohammad Najjar Universidade Federal do Rio de Janeiro, Escola Politécnica
Oluwole (Alfred) Olatunji Curtin University, Australia
Claudio Palma Tyréns, Stockholm, Sweden
Srinath Perera University of Western SydneyAwais, Australia
Awais Piracha University of Western Sydney, Australia
David Proverbs Birmingham City University, United Kingdom
Chamila Ramanayaka Curtin University, Australia
James Rotimi Massey University, New Zealand
Gesa Ruge University of Canberra, Australia
Fred Sherratt Anglia Rusking University, United Kingdom
Sui Pheng Low National University of Singapore, Singapore
Monty Sutrisna Cutin University, Australia
Austin Williams Kingston University, United Kingdom
Peng Wu Curtin University, Australia
Atiq Zaman Curtin University, Australia
Loza Ahmadi Curtin University, Australia
Tahmina Ahsan Curtin University, Australia
Karam Al-Obaidi University of Malaya, Malaysia
Maxwell Antwi-Afari HongKong Polytechnic University, Hong Kong
Behrouz Beheshti Curtin University, Australia
Maria BostenaruIon Mincu University of Architecture and Urbanism, Bucharest, Romania
Nicholas Chileshe University of South Australia
John Chong Cutin University, Australia
Simon Colquhoun Curtin University, Australia
Barry Cooper-Cooke Curtin University, Australia
Khoa Do Curtin University, Australia
Barry Elswood City of Stirling, WA, Australia
Christine Eon Curtin University, Australia
Karol Figueiredo Universidade Federal do Rio de Janeiro, Escola Politécnica
Raoni Fragoso Universidade Federal do Rio de Janeiro, Escola Politécnica
Valerie Francis University of Melbourne, Australia
Seyed Ghaffar Brunel University, United Kingdom
Brian Guo University of Canterbury, NZAssed, New Zealand
Ahmed Hammad Curtin University/UNSW, Australia
Mary Hardie University of Western Sydney, Australia
Ying Hong University of New South Wales, Australia
Mostafa Jelodar Auckland University of Technology, New Zealand
Emil Jonescu Curtin University, Australia
Sophia Kanaouti Univerity of Athens, Greece
Linda Kestle Unitec, New Zealand
Craig Langston Bond University, Australia
Celine Lee Curtin University, Australia
Xin Liu Cutin University, Australia
Kim Maund University of Newcastle, Australia
Titus Mercea Curtin University, Australia
Susana Merino Rivero City of Perth, WA, Australia

xii.
42nd AUBEA Conference 2018: Educating Building Professionals for the Future in the Globalised World
Challenges in integrating LCSA and MCDA approaches in building projects: limitations and the way forward (Karoline Figueiredo, Ahmed Hammad, Assed Haddad, Khoa Do and Emil Jonescu)
Systemic sustainable construction industry development: a research agenda (William Gyadu-Asiedu, Adwoa Ampadu-Asiamah and Alfred Fokuo-Kusi)
Interactive effects of project complexity and resilient safety culture on safety performance of construction projects(Minh Tri Trinh and Yingbin Feng)
Revisiting challenges inherent to multicultural construction projects using input from field professionals (Thi Ly Vu, Payam Rahnamayiezekavat, Sungkon Moon, Sherif Mostafa and Swapan Saha)
The importance of environmental sustainability to obtain finance for port developments in Australia and Indonesia(Haya ALDaghlas, Felix Hui and Colin Duffield)
The future construction management advantage: facilitating sustainable development (Gesa Ruge)
Comparative evaluation of building rating tools in different contexts: Cases of LEED and SEED (Muhammad Afrasiab Khan, Samad Sepasgozar and Changxin Wang)
A decomposition analysis of the global warming potential of China’s manufacturing industry: 1994-2014(Peng Wu and Xiangyu Wang)
Post-political planning and the tale of two cities: community engagement in urban planning and development in Sydney (Awais Piracha and Mary Hardie)
Stakeholder engagement in Johannesburg’s Corridors of Freedom Urban Regeneration Project (Kofi Quartey and Kola Ijasan)
Potential of New Zealand trades to export prefabricated timber panels (Wajiha Shahzad and Mohammed Razeen)
A matter of sustaining life after death: liminal architectures role in loss, grief and acceptance(Jonathon Peake, Khoa Do, Emil Jonescu, Monty Sutrisna and Ahmed Hammad)
118
128
139
147
156
166
176
185
194
206
224
234
xiii.
42nd AUBEA Conference 2018: Educating Building Professionals for the Future in the Globalised World
Determinants of construction organisations’ performance: A systematic literature review(Hamzah Alqudah, Mani Poshdar, James Rotimi and Luqman Oyewobi)
Evaluating Green Star rating tools through user perception: Kano survey and Taguchi review(Valeria Maria Cabello Gorchs and Samad M. E. Sepasgozar)
Investigating key factors influencing consumers’ decision to purchase low-Volatile organic compound building products(Jack Bebbington and Samad M. E. Sepasgozar)
Utilisation of new tools for indoor quality measurements: Case of six-green star rated building(Ehsan Bolideh and Samad M.E. Sepasgozar)
Evolution of building rating tools: a next generation rating model(Muhammad Afrasiab Khan, Samad Sepasgozar and Changxin Wang)
Construction and demolition waste management through a systematic deconstruction approach: case of the ‘Whole House Reuse’ project(Atiq U. Zaman, Juliet Arnott, Kate Mclntyre and Jonathon Hannon)
A critical review of the life cycle assessment of roads – some preliminary findings(Rui Jiang and Peng Wu)
The impact of payment systems on construction project and organisation performance(Emmanuel Dele Omopariola and Abimbola Olukemi Windapo)
The key factors of construction projects complexity: The TOESCIG framework (Alireza Moghayedi, Abimbola Windpo and Oluwole Olatunji)
A framework for modeling FM organizational response to users’ post-occupancy feedback (Olatunji Abisuga, Changxin Wang and Imriyas Kamardeen)
Embedding users in collaborative FM practice for sustainable post occupancy evaluation of higher educational buildings (Olatunji Abisuga, Imriyas Kamardeen and Changxin Wang)
The role of public private partnership in improving service delivery in South Africa(Mashwama Nokulunga, Thwala Didi, Keitumetse Tserema and Aigbavboa Clinton)
Employment challenges in mega construction projects in Sri Lanka(Shavindree Nissanka, Thanuja Ramachandr, Devindi Geekiyanage and Chamila Dilhan Ramanayaka)
244
254
265
275
285
294
305
315
327
339
349
370
379
Page Number
Page Number

42nd AUBEA Conference 2018: Educating Building Professionals for the Future in the Globalised World
retaining walls to full city-scale sea walls embedded along entire coastlines. The response to RSLs, therefore, is incrementally and proportionally applied, with the aim of continually staying ahead of this destructive force. In the last decade, this global crisis has drawn the attention of governments, universities, and research agencies which are collectively seeking adequate and appropriate strategies. From Copenhagen across to Calcutta, from Vancouver across to Annapolis, numerous coastal cities and island nations are under threat. The truth is the oceans will continue to rise, regardless of efforts placed to slow down climate change; what is currently adopted will slow down, not reverse the rate of RSL.
The invasive destruction of RSL places people, animals, plants, and structures all at risk. Currently, most solutions appear only to serve a short or medium-term purpose to address this problem. At the same time, there is no panacea that can suit every RSL scenario across the globe. This research acknowledges that the RSL issue is at a crisis-point, and therefore has explored and identified one specific area of investigation where RSL impacts will be considered as a design proposition. These involve mitigating the outcomes of large-scale population displacement and resettlements as a response strategy. Survival is likely to be the most significant concern for populations embarking on large-scaledisplacement and resettlement. To stay and attempt to defend, as futile as this may be, to retreat, or to relocate are the three primary options that are currently available and are the basis upon which solutions are being developed. This research focuses, in particular, on the design of a habitable built infrastructure which can be used for population relocation by drawing from the disciplines of architecture and construction, and this paper serves to outline the research framework for phase one of a two-phase research project by design dissertation. The anticipated outcome of this research project is to develop an architectural design prototype for a habitable built infrastructure for population relocation for the island nation of the Maldives.
Being the “flattest country in the world”, the islands of the Maldives have an average height of 1.8 metres above sea level (USC 2011) and have minimal protection against the rising tides. The island capital Malé is at greatest risk, with a morphology sprawling to the edge of its natural protective reef, presenting the greatest RSL challenge with an inevitable doomsday scenario of full submersion. With few options to remedy the situation, the city of Malé depends completely on a constructed tetrapod wall (Naylor 2015) to dampen the impact of the tidal waves, as the city, within a narrow shoreline,encroaches onto the protective reef and buffer tidal zone. The Maldives government recognises that this wall is but a temporary medium-term solution affording it little time to seek more sustainable longer-term alternatives. Ideally, permanent solutions need to be sought to secure an uncertain future to counter the certainty of RSL impacts on its population, infrastructure, food, and economic security. The climate initiative launched by the United Nations Development Program has identified the need to “strengthen resilience and adaptive capacity to climate-related hazards”, (United Nations Development Programme 2018), and with this, it is evident that a physical implementation is needed to provide a resilient response for the Maldives, and other island nations alike. This research by design is in direct response to this call for action,and the research will analyse case studies and outline both current and speculative futures of those that have considered the methods of adaptive aquatic architecture as a means of resilience against RSL. This will be developed into a design brief to establish the scope of the project. This brief aims to be developed into, and serve as design guidelines for theMaldivian retreat and relocation framework. The outcome of the research will explore resilient design as an adaptive response to not only RSL but also as a response to the population increase and sprawling urban morphology of the island city of Malé. The
42nd AUBEA Conference 2018: Educating Building Professionals for the Future in the Globalised World
Aquatic architecture: a sustainable refuge in response to rising sea levels in the Maldives
Ahdha Moosa1, Khoa Do2, Emil Jonescu3,Monty Sustrisna4 and Ahmed Hammad5
1,2,3,4&5School of Design and the Built Environment, Curtin University, Perth, 6084, WA, AUSTRALIA
E-mails: [email protected]; [email protected]; [email protected];[email protected]; [email protected]
Abstract: Unlike the immediacy of tsunamis, volcanic eruptions, and earthquakes, the non-immediate threat of Rising Sea Levels (RSL) creates an unprecedented silent environmental crisis. The tipping point in response to RSL crisis is that it approaches incrementally and thus may not be apparent until the devastating effects are well upon the community. Predictive modelling, simulations and forecasting are employed to illustrate the degree of impact of RSL crisis, often creating the perception of far-off risks––ones that are not likely to occur immediately. The resultant sense of denial or acceptance of the inevitable given the current predicament in which one faces, with no foreseeable solution, creates the illusion of an unavoidable scenario with only one outcome––complete submergence. RSLs are likely to bring devastating consequences of significant proportion. Coastal communities and cities are acutely aware of the fragility of the relationship with the natural forces of change that continuously shape our oceans and landforms, otherwise known as ocean morphology. Given this, the citizens of the island nation of the Maldives are under a State-of-Alert by order of government. The situation in the Maldives, today, is critical, with the genuine threat of RSL crisis of uncontrollablemagnitude. The most likely outcome for the nation is a complete submersion of the island. There is an urgency to find possible solutions, which range from short-term remedial solutions, medium-term combative barriers, and a sustainable long-term solution which would be ideal but is yet to apply. To this end, this research paper provides a design framework that will develop an architectural prototype of a built typology to offer a long-term responsibility for the island nation of Maldives.
Keywords:Aquatic Architecture, Climate Change Refugee, Maldives, Rising Sea-Level, Sustainable
1 Introduction
Rising Sea Level (RSL) is a silent and deceptively inconspicuous event with disastrous and catastrophic consequences. Predictions from data collected by some agencies and research centres, from across the globe, which monitor the morphology of major coastal towns and cities most likely to experience the devastating impacts of RSL, are made with high accuracy. The evidence suggests that these locations will inflict with the most significant impacts. Understanding the science is critical to comprehend the magnitude and speed of this impending situation. Concurrently, the data identifies globally risk-prone areas that are most in danger to warn of a range of possible threats, from small-scale periodical flooding to total submersion. Mobilisation plans for preparation as well as combative measures are also implemented at varying degrees, from small sandbag
16. 17.
42nd AUBEA Conference 2018: Educating Building Professionals for the Future in the Globalised World
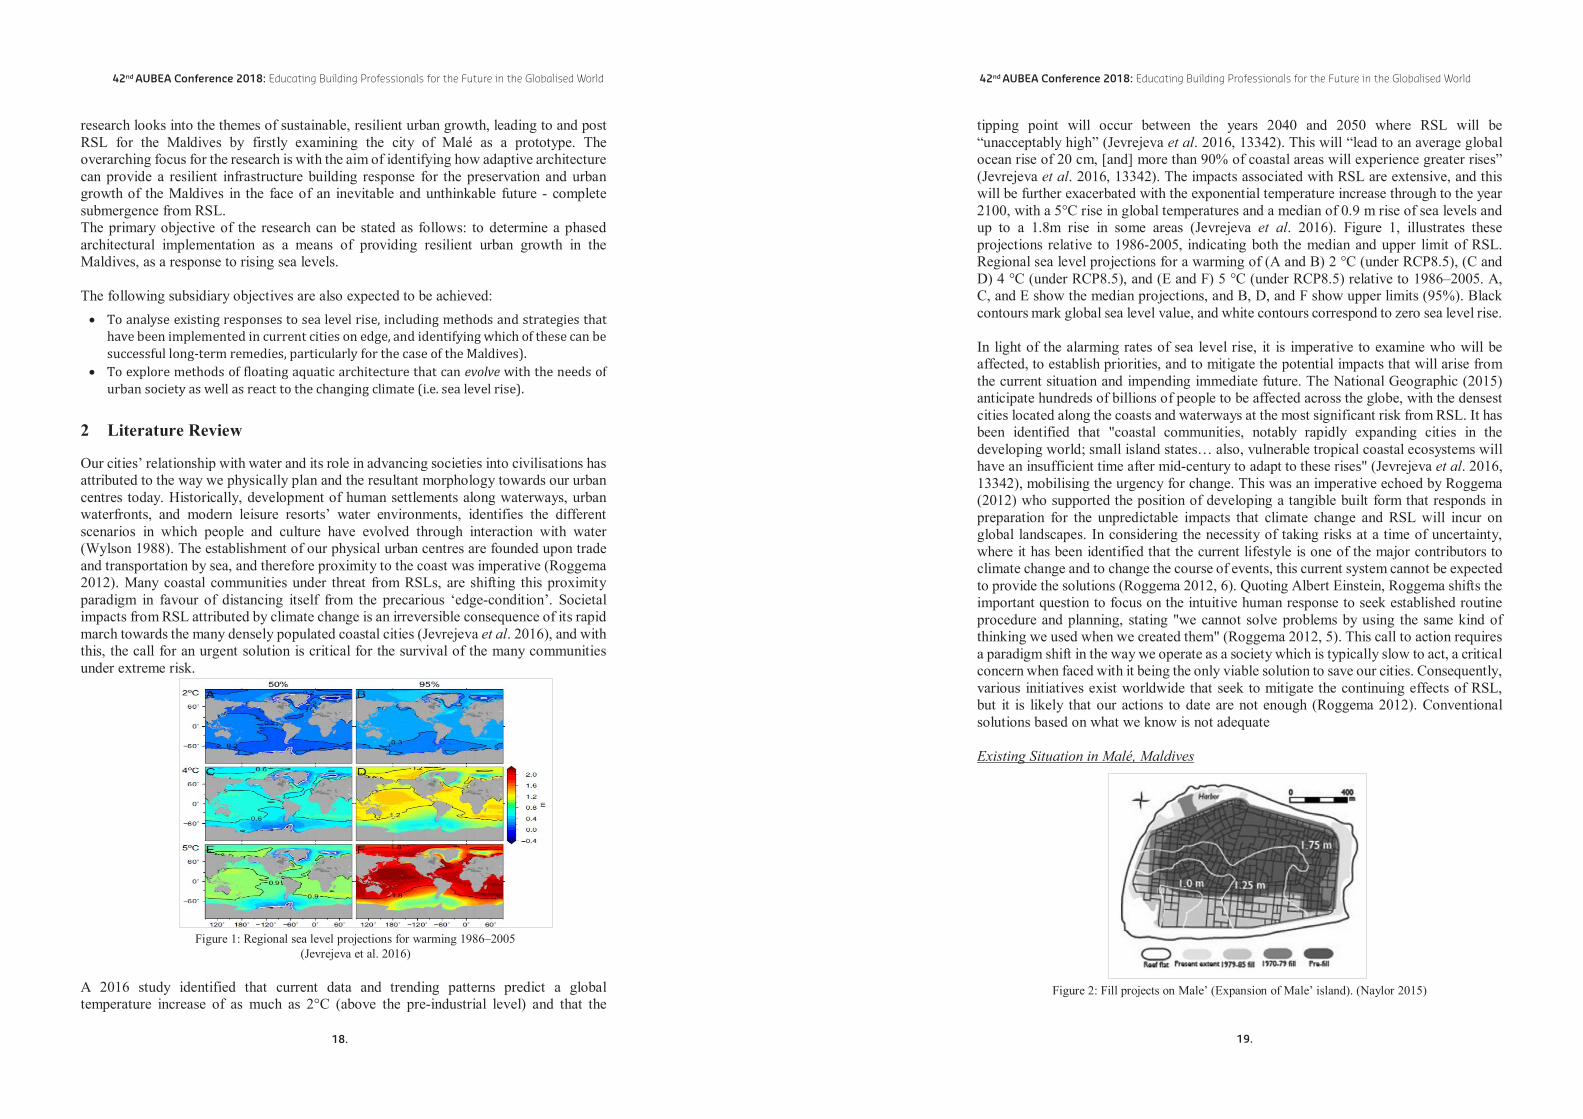
tipping point will occur between the years 2040 and 2050 where RSL will be “unacceptably high” (Jevrejeva et al. 2016, 13342). This will “lead to an average global ocean rise of 20 cm, [and] more than 90% of coastal areas will experience greater rises” (Jevrejeva et al. 2016, 13342). The impacts associated with RSL are extensive, and this will be further exacerbated with the exponential temperature increase through to the year 2100, with a 5°C rise in global temperatures and a median of 0.9 m rise of sea levels and up to a 1.8m rise in some areas (Jevrejeva et al. 2016). Figure 1, illustrates these projections relative to 1986-2005, indicating both the median and upper limit of RSL.Regional sea level projections for a warming of (A and B) 2 °C (under RCP8.5), (C and D) 4 °C (under RCP8.5), and (E and F) 5 °C (under RCP8.5) relative to 1986–2005. A, C, and E show the median projections, and B, D, and F show upper limits (95%). Black contours mark global sea level value, and white contours correspond to zero sea level rise.
In light of the alarming rates of sea level rise, it is imperative to examine who will beaffected, to establish priorities, and to mitigate the potential impacts that will arise from the current situation and impending immediate future. The National Geographic (2015) anticipate hundreds of billions of people to be affected across the globe, with the densestcities located along the coasts and waterways at the most significant risk from RSL. It has been identified that "coastal communities, notably rapidly expanding cities in the developing world; small island states… also, vulnerable tropical coastal ecosystems will have an insufficient time after mid-century to adapt to these rises" (Jevrejeva et al. 2016, 13342), mobilising the urgency for change. This was an imperative echoed by Roggema (2012) who supported the position of developing a tangible built form that responds in preparation for the unpredictable impacts that climate change and RSL will incur on global landscapes. In considering the necessity of taking risks at a time of uncertainty,where it has been identified that the current lifestyle is one of the major contributors to climate change and to change the course of events, this current system cannot be expected to provide the solutions (Roggema 2012, 6). Quoting Albert Einstein, Roggema shifts the important question to focus on the intuitive human response to seek established routine procedure and planning, stating "we cannot solve problems by using the same kind of thinking we used when we created them" (Roggema 2012, 5). This call to action requiresa paradigm shift in the way we operate as a society which is typically slow to act, a critical concern when faced with it being the only viable solution to save our cities. Consequently, various initiatives exist worldwide that seek to mitigate the continuing effects of RSL,but it is likely that our actions to date are not enough (Roggema 2012). Conventional solutions based on what we know is not adequate
Existing Situation in Malé, Maldives
Figure 2: Fill projects on Male’ (Expansion of Male’ island). (Naylor 2015)
42nd AUBEA Conference 2018: Educating Building Professionals for the Future in the Globalised World
research looks into the themes of sustainable, resilient urban growth, leading to and post RSL for the Maldives by firstly examining the city of Malé as a prototype. The overarching focus for the research is with the aim of identifying how adaptive architecture can provide a resilient infrastructure building response for the preservation and urban growth of the Maldives in the face of an inevitable and unthinkable future - complete submergence from RSL.The primary objective of the research can be stated as follows: to determine a phased architectural implementation as a means of providing resilient urban growth in the Maldives, as a response to rising sea levels.
The following subsidiary objectives are also expected to be achieved:• To analyse existing responses to sea level rise, including methods and strategies that
have been implemented in current cities on edge, and identifying which of these can be successful long-term remedies, particularly for the case of the Maldives).
• To explore methods of floating aquatic architecture that can evolve with the needs of urban society as well as react to the changing climate (i.e. sea level rise).
2 Literature Review
Our cities’ relationship with water and its role in advancing societies into civilisations has attributed to the way we physically plan and the resultant morphology towards our urban centres today. Historically, development of human settlements along waterways, urban waterfronts, and modern leisure resorts’ water environments, identifies the different scenarios in which people and culture have evolved through interaction with water(Wylson 1988). The establishment of our physical urban centres are founded upon trade and transportation by sea, and therefore proximity to the coast was imperative (Roggema 2012). Many coastal communities under threat from RSLs, are shifting this proximity paradigm in favour of distancing itself from the precarious ‘edge-condition’. Societal impacts from RSL attributed by climate change is an irreversible consequence of its rapidmarch towards the many densely populated coastal cities (Jevrejeva et al. 2016), and with this, the call for an urgent solution is critical for the survival of the many communities under extreme risk.
A 2016 study identified that current data and trending patterns predict a global temperature increase of as much as 2°C (above the pre-industrial level) and that the
Figure 1: Regional sea level projections for warming 1986–2005 (Jevrejeva et al. 2016)
18. 19.

42nd AUBEA Conference 2018: Educating Building Professionals for the Future in the Globalised World
3 Research Methodology
The proposed research methodology is based on qualitative an iterative design method, as shown in Figure 3.
3.1 Qualitative ResearchQualitative research methods will form the framework for this research. A bricolage of tactics will be incorporated to support the research by design process. This methodologyentails establishing a sound understanding of the concepts behind the research, in this case, concepts related to ‘aquatic architecture’ and the Maldives. This can then be appliedto the spatial qualities of the proposed design outcome. It calls for the collection of various empirical materials, or data, to be collated and interpreted to be understood by the researcher (Groat and Wang 2013). The research proposal, to date, has identified a significant collection of quantitative data necessary to comprehend the rate of RSL – as it is through the interpretation of how this quantitative data will directly affect the design outcome and its spatial qualities, this remains within the threshold of qualitative research.
3.2 Design Methods (research by design)As initiated through the background study for this research proposal, the methods of document study (literature review) and case study will be carried on throughout the iterative prototype-testing design process to appropriately benchmark design considerations and firmly place the design outcome within existing frameworks of knowledge. Utilising an iterative design process allows for an evolution of observations, findings, and applied outcomes. This process will be documented through scenario visualisations (sketching, diagramming, collaging, constructional drawings), and 3D modelling for further exploration, which is then to be embedded into the context of the proposed location of the Maldives. As expected of any research by the design process, this documentation will continue to evolve as the design is modelled, tested, and refined– this problem requires reconsideration, a design-led process.
Figure 3. Proposed framework
42nd AUBEA Conference 2018: Educating Building Professionals for the Future in the Globalised World
The Maldives is small island nation lying in the South-West of the Indian Peninsula and is made up of just under 1,300 islands, averaging a mere 1.6m above sea level (Naylor 2015). The island’s morphology is that of “reef islands typically formed via the accumulation of reef rubble in the lagoon, with additional sediments being added to this core by wave action” (Naylor 2015, 730). The individual islands are arranged in a 750-km long chain of atolls (from the Maldivian word atolhu), meaning “large annular reefs containing a central lagoon” (Betzler et al. 2013; Droxler 1992, quoted in Naylor 2015, 729. The atoll-reef structure acts as natural protection from tidal waves and storm surges, however over an extended period, wave erosion and other factors, have diminished the atoll reef’s effectiveness. The capital city of Malé has undergone an intensive coral mining and landfill to expand the small island in the 1970s-1980s due to population growth and higher standard-of-living expectations (Figure 2) (Naylor 2015). At the same time, this has dramatically weakened the island's natural defences against wave events due to a reduced capacity to buffer, dampen and protect the island's reef and lagoon. After the devastating floods of 1987, a design tactic was implemented to introduce fortifications along the island’s coastline (Naylor 2015). This resulted in the construction of a tetrapod seawall structure – essentially creating a protective artificial reef. Naylor (2015) identifiesthis method of fortified resilience as a supplementary element as part of a much larger fortification plan needed in the future as a result of local ecosystem damage, as well as the city’s high vulnerability to climate change and continuous population growth. The concern here is whether ‘heavier fortifications’ are a sustainable and feasible option to combat the rapidly rising sea levels, or if the Maldives can adapt to maintain current, or at least similar, urban patterns within a new and sustainable framework.
Urban resilience is defined as to anticipate the degree of change and impact as a direct consequence of adversity to build the capacity of a community (Sanderson et al. 2016). This highlights opportunities for design and architecture to contribute to the current global situation. Defined by the effects of climate change and RSL, the current climatic context inherently engenders the need for resilience at an urban scale. Ultimately it is the way in which communities will respond to these stressful situations that will define their futures,irrespective of the strategy, be it fortification and hiding behind an ever-growing wall, retreating from the rising tides, or adapting and planning our cities into liveable, responsive environments that engage and utilise the environmental context. There have been extensive studies on existing methods of the latter, including the concept of “aquatecture” as defined by Wylson (1988) in which water is incorporated as a design strategy, or similarly, Watson and Adams (2011), who share a similar line of thinking where they offer a design guide for intelligent water design. Their tool encompasses water as a design resource and considers the possibility for opportunities created by the consequence of the disaster, looking specifically at approaches to sustainably managing water resources. This is especially important for at-risk communities and presents flood-resistant design opportunities (Watson and Adams 2011). The call is for designers to consider these types of responsive and adaptive tactics at an urban scale for the coastal communities on the edge – such as that of the Maldives – where the design response must rise quicker than the RSL.
20. 21.

42nd AUBEA Conference 2018: Educating Building Professionals for the Future in the Globalised World
Case Study 03: Floating Island Project, Seasteading Institute
Conceptualised in 2013, the Seasteading Institute (seasteading.org) initiated The Floating City Project which embodies aspects of both “seasteading” (defined as a community living at sea and largely responsible for setting its own rules and culture) and “start-up cities” through the creation of an independently governed floating city (Seasteading Institute 2017). Located within the territorial waters of an existing country, the floating islands were allowed economic and political stability and protection, as well as lowered costs to engineer within shallower waters. At the forefront of innovation in ‘aquatecture’(Wylson 1988), the Seasteading Institute’s approach is developed, informed, and designed to a political and economic framework. Through the creation of an “independent society” (Seasteading Institute 2017) with its laws and governance, the proposed Floating Island is free of political and nationalistic governance. The proposal addresses the possibility of providing a sanctuary for those in danger of RSL – a systematic growth of their ‘floating city’ which would be self-sustaining and independent, providing a feasibleoption for the island nation of the Maldives where the entire nation is at risk.
Case Study 04: Floating Houses in Ijburg, Architectenbureau Marlies Rohmere
The city of Amsterdam in the Netherlands, embraces its many waterways through the introduction of floating dwellings, in some cases forming entire districts. The district of Ijburg has 75 floating houses, designed by Architectenbureau Marlies Rohmere (2011), in which the houses rise and fall with the oscillating tides while providing an alternative housing typology within the densely populated city. The architects discuss the significance of designing on and with water: “Water is not like land. If you plan to build on water, you need to do so with respect for the unique nature of water. Water is pioneering; water is an adventure, danger, and relaxation, water lets you elude the rulesof dry land" (Architectenbureau Marlies Rohmere 2011). The design tactics applied to
Figure 5: MOSE: How it Will Work (MOSE 2017)
Figure 6: Floating City Concept (Seasteading Institute 2017) Figure 7: Floating Houses in IJburg (Architectenbureau Marlies Rohmere
42nd AUBEA Conference 2018: Educating Building Professionals for the Future in the Globalised World
3.3. Review of the Selected Case Study
Case Study 01: Sea Change Boston, Sasaki Associates
This project by Sasaki Associates explores the cause and effect of rising sea levels, storm surges, and flooding in Boston, MA. The design proposal is a long-term resiliency strategy for the Greater Boston area to tackle the issue of perpetual flooding firmly. The proposal firstly maps the projected RSL scenarios for various implementations of designschemes. Sasaki Associates provides in-depth analysis by design on how to respond to the impending issue. The proposal not only focuses on the education of the broader community but also seeks the engagement of the regional government in respect toproviding a regional dialogue on resilience planning strategy for Greater Boston.A global consortium of experts from across the globe in the fields of climate, engineering,
academia, advoca were displayed at an exhibition for the broader community (i.e. call-to-action) (Sasaki Associates 2017). However, the critical phase is to test and apply these design proposals and engage the smaller at-risk communities around the world as a matter of urgency. A ‘call-to-action’ is needed to start the conversation, but it is imperative toensure that the cy, and politics were consulted, and the resulting findings and proposals momentum for action is maintained, whereby the ideas developed become realised.
Case Study 02: Project MOSE, Venice
Within the category of fortification, the MOSE Project (MOSE 2017) aims to prevent flooding in Venice whereby an automated inclining wall separates the Venetian Lagoon from the Adriatic Sea. This megastructure is installed as 78 mobile gates automatically raised when tidal waves are above 110 metres, blocking the flow of the tide and preventing the water from entering the lagoon. The MOSE project further incorporates other tactics of fortification which include strengthening the coastal areas, raising the quaysides, and paving the city. Although this case study addresses RSL, it does so through a lens of seeing the MOSE project as a temporary solution of fortification as the projectdoes not present a sustainable long-term solution. However, this short to medium termimplementation shows the various possibilities of technologies, construction, and infrastructure systems that could potentially be adapted to advance the development of a long-term sustainable solution feasible for the Maldives. The design tactic of fortificationessentially buys time. The crux of this tactic is what is being done with this grace-period,ultimately that will be the determining factor for the fate of these coastal cities.
Figure 4: Options for Climate Change Reactions (Sasaki Associates 2017)
22. 23.

42nd AUBEA Conference 2018: Educating Building Professionals for the Future in the Globalised World
RSL is almost 2m (Jevrejeva et al. 2016), the Maldives with an average of 1.6m above sea level (Naylor 2015), would become mostly uninhabitable. The third design tactic,adapt, considers a holistic approach where the element of water is accepted and utilised (harnessed) as an element included in the design. This approach is most famously demonstrated through examples of Dutch cities, notably, the city of Rotterdam, where there are delegated flood zones within the urban master plan scheme. This is part of a “resilience approach… aiming to improve the whole capacity of the urban system to deal with changing and more extreme conditions in the future” (van Veelan 2016, 24). Although adaptation is seemingly the most holistic and long-term approach out of the three design options, this design approach is also the most extensive, and to implementsuccessfully, would require a staged methodology.
This research by design project primarily aims to propose a resilient architectural solutionas a means of adapting to RSL in the Maldives. The design criteria, informed from the research and case studies, ensures the delivery of the primary objective. The design calls for an adaptive and resilient response, which should deliver the following outcomes:
1. Adaptability of the design to meet the needs of the Maldivian population regardingpopulation growth – adopting the scalability of a modular typology.
• This would encompass a potential expansion of the current island of Malé, through the introduction of modular components rather than landfill (no longer an option, as discussed)
• As the expansion evolves (or sea levels rise dramatically), the possibility of breaking away from existing landmasses and forming new artificial “islands” is presented
• The outcome would be to design one module in detail, with an overarching ‘masterplan’ aspect as a possibility to be further explored
2. The resilience of the design to be able to withstand and adapt to the changing climate conditions – specifically sea level rise. This will be explored through the exploration of a floating typology (‘aquatic architecture’).
• This outcome explores the utilisation of water as a design element that functions in correlation with rising sea levels
• Viable technologies and possibilities for ‘floating architecture’ need to be explored further – expansion of existing case study and literature review
3. A phased process of development to ensure sustainable resilience (“resilience approach” (van Veelan 2016))• A clear outline of a phased strategy of resilience – the modular design implementation
will be developed over time (long-term), and therefore other methods of resilience will need to be implemented for short-term mitigation.
Although the proposed modular "islands" have the potential to harbour any (or multiple) building typologies, it is critical to identify the initial implementation should be addressedas a means of enabling the locals to transition into this proposed way of living. Therefore, the initial modular ‘island’, which will be designed as a template for further development will entail a multi-use community building/development. This community development would include: •A community hub (public domain) •Residential apartments (aligning with the existing residential typology found in Malé) •Opportunity for commercial/retail (small businesses, cafés and others)
42nd AUBEA Conference 2018: Educating Building Professionals for the Future in the Globalised World
these floating communities will be extremely useful in high-risk areas or small island nations who have no option for retreat. The atoll-lagoon structure of the Maldivian islands could prove to be an ideal condition for sheltered waters that could support this type of tactical design of adaptive architecture – however, this needs to be explored through further research, prototyping, and testing to be determined.
Case Study 06: Sama-Bajau People Within the Sama-Bajau People is a small community known as Bajau Laut, who live a nomadic lifestyle within the oceans of Sabah, Borneo. Adopting the title of ‘Sea Gypsies’,they live on boats and villages of stilt houses connected by wooden planks (Hayo 2015),as seen in Figures 7a and 7b. This method of adaptive living and construction has been prevalent for centuries – and was “fundamental in the evolution of coastal dwellings (for the Sama-Bajau)”, (Eafifi Ismail, Ibrahim and Sani Hj Ahmad 2015, 115-116). Utilizing a nomadic and adaptive way of living makes this group of people more resilient to rising sea levels. Although their structures and dwellings lack the resilience and permanency of modern construction, they are given the ability to change and adapt to the conditions of climate – preserving their way of life.
4 Findings and Discussion
Identifying and analysing examples of successfully implemented methods of resilience from around the world in response to RSL are imperative to understanding the task at hand. As defined by Sasaki Associates, building resilience to RSL can be categorised across three design tactics: 1) fortify (keep water out); 2) retreat (move to higher ground); and 3) adapt (live with water) (Sasaki Associates 2017). The first method, fortify, appears to be the most popularly adopted and encompasses barricading coastal lines under threatto keep the water out – this is a short-term solution to a long-term problem. As proven by the MOSE project in Venice (see Case Study 03), this method is not a solution, but merely a delaying of the inevitable. However, fortification could be implemented as an element of a phased intervention in gaining more time for a more extensive long-term method(s)to be applied. Design tactic two, retreat, is a viable option with historical precedent, in some instances. Many communities living on the edge have utilised nomadic-seasonal migrations, including the early people of the Maldives, “after an extreme disaster, the Maldivian populations would resettle from disaster ruin zones to area that are least affected, undeveloped islands, as happened to twelve islands following floods in 1819” (Cazes-Duvat 2005, quoted in Naylor 2015, 733). An expected standard in the rural islands of the Maldives is the provision of basic services and amenities, with access to support infrastructure on the larger islands. Thus the nomadic tradition of the Maldivian people was phased out and is no longer a feasible option within the contemporary urban framework. However, this perceived primitive practice of relocation is not a viable option in the current modern setting. Additionally, when considering the maximum projected
Figure 7a: Bajau Laut stilt houses along the coast (Hayo 2015)
Figure 7b: Bajau Laut community (Hayo 2015)
24. 25.
42nd AUBEA Conference 2018: Educating Building Professionals for the Future in the Globalised World
MOSE. 2017. “MOSE.” Ministero delle Infrastrutture e dei Trasporti. https://www.mosevenezia.eu/mose/?lang=en
Naylor, Alexander K. 2015. “Island Morphology, Reef Resources, and Development Paths in the Maldives.” Progress in Physical Geography 39(6): 728-749. DOI: 10.1177/0309133315598269
Roggema, Rob. 2012. Swarming Landscapes: The Art of Designing For Climate Adaptation: Advances In Global Change Research. Springer Netherlands.
Sanderson, Eric W., William D. Solecki, John R. Waldman, Adam S. Parris. 2016. Prospects for Resilience. Washington: Island Press.
Sasaki Associates. 2017. “Sea Change: Boston.” Sasaki. http://www.sasaki.com/project/360/sea-change-boston/172
The National Geographic. 2015. “Sea Level Rise.” The National Geographic Society. https://www.nationalgeographic.com/environment/global-warming/sea-level-rise/
The Seasteading Institute. 2017. “Floating City Project.” The Seasteading Institute https://www.seasteading.org/floating-city-project/
United Nations Development Programme. 2018. “Goal 11: Sustainable Cities and Communities.” The United Nations. http://www.undp.org/content/undp/en/home/sustainable-development-goals/goal-11-sustainable-cities-and-communities.html
UCS (Union of Concerned Scientists). 2011. "Sea Level Rise in the Republic of Maldives." Climate Hot Map. https://www.climatehotmap.org/global-warming-locations/republic-of-maldives.html
United Nations Development Programme. 2018. “Goal 13: Climate Action.” The United Nations. http://www.undp.org/content/undp/en/home/sustainable-development-goals/goal-13-climate-action/
van Veelen, Peter Christiaan. 2016. “Adaptive Planning for Resilient Coastal Waterfronts.” A+BE: Architecture and the Built Environment 19: 1-248. DOI 10.7480/abe.2016.19
Water-Technology.Net. 2017. “MOSE Project, Venice, Venetian Lagoon, Italy.” http://www.water-technology.net/projects/mose-project/
Watson, Donald, and Michele Adams. 2011. Design for Flooding: Architecture, Landscape, And Urban Design For Resilience To Flooding and Climate Change. Hoboken, N.J.: John Wiley & Sons.
Wylson, Anthony. 1988. Aquatecture. London: The Architectural Press.
42nd AUBEA Conference 2018: Educating Building Professionals for the Future in the Globalised World
Essentially, the module becomes the beginning of a new community within the existing urban framework of Malé, and as the public need for expansion and response to RSL become more critical. The city can slowly begin a migration onto the proposed scaleabledevelopment – which will develop and grow as required.
5 Conclusion and Further Research
The research proposed not only imbues significance on a personal level but instils a global relevance as well. With most of the world’s population residing in low-lying coastal areas, the exponentially increasing adverse effects of climate change, and specifically RSL,affect millions of communities around the globe. Maldivians face the challenge of overcoming a possible loss of country – and it is becoming evident that there is very little being done both nationally and on a global scale.
Utilising the framework established by current global initiatives, this research project seeks to align itself to real-world outcomes. The United Nations Development Programme (UNDP), highlight ‘Climate Action’ as one of their ‘Sustainable Development Goals’ in their 2030 Agenda for Sustainable Development. The outlined targets of this goal include to, "strengthen resilience and adaptive capacity to climate-related hazards and natural disasters in all countries", as well as to "integrate climate change measures into national policies, strategies and planning" (United Nations Development Programme 2018), which aligns with the proposed outcomes of this research project. Consequently, although many initiatives like this are in place, there is a minimal transition into physical outputs from these identified goals and targets –identifying a clear need for a design reaction.
The research also proposes architectural significance through the exploration of the relationship between architecture, people, and water. Specifically, looking at an adaptive response to the extreme climate condition of rising sea levels, testing the limits and possibilities of an architectural implementation in such a difficult situation.
6 References
Architectenbureau Marlies Rohmere. 2011. “Floating Houses Ijburg.” Marlies Rohmer Architects & Urbanists. http://www.rohmer.nl/en/project/waterwoningen-ijburg/
Bitterman, Noemi. 2013. “‘Aquatourism’: Submerged Tourism, a Developing Area”. Current Issues in Tourism 17(9): 772-782. DOI: 10.1080/13683500.2013.811222
Eafifi Ismail, Iziq, Ismail Ibrahim, and Abdullah Sani Hj Ahmad. 2015. "Influences of Regional Sama-Bajau Coastal Dwellings: Social Perspectives Through Identity Molding". International Journal of Culture And History 1(2): 115-121. doi:10.18178/ijch.2015.1.2.022.
Groat, Linda, and David D Wang. 2013. Architectural Research Methods. 2nd ed. New York, NY: Wiley.
Hayo. 2015. “The Curious Story of the Sea Gypsies of Borneo.” Hayo Magazine. http://hayo.co/the-curious-story-of-the-sea-gypsies-of-borneo/
International Organization for Migration. 2015. “Global Migration Trends Factsheet.” International Organization for Migration. http://gmdac.iom.int/global-migration-trends-factsheet
Jevrejeva, Svetlana, Luke P. Jackson, Riccardo E. M. Riva, Aslak Grinsted, John C. Moore.2016. “Coastal Sea Level Rise with Warming Above 2 °C.” Proceedings of the National Academy of Sciences Nov 2016 113 (47) 13342-13347. DOI:10.1073/pnas.1605312113
26. 27.

28.
42nd AUBEA Conference 2018: Educating Building Professionals for the Future in the Globalised World
Validation of the psychological contract of safety scale on construction sites
Mohammad Tanvi Newaz1, Peter Davis2,Marcus Jefferies3 and Manikam Pillay3
1,2&3School of Architecture and Built Environment, The University of Newcastle, AUSTRALIA
4School of Health Science, The University of Newcastle, AUSTRALIA
Emails: [email protected], [email protected],[email protected], [email protected]
Abstract:
Psychological Contract of Safety (PCS) is conceptualized as the belief of an individual with regards to mutual safety obligations inferred from implicit or explicit promises of the supervisor and worker. Although literature on psychological contracts is growing, the existence of psychological contract in relation to safety has not been established in construction. Viewing safety through the lens of the psychological contract and considering the influence of the supervisor on construction sites, this research seeks to identify psychological contract in the conversations of employees about safety by demonstrating reciprocity in relation to employer and employee safety obligations. The safety obligations identified from the Australian health sector were used to develop and validate a measure of psychological contract of safety (PCS) in construction. In order to validate PCS scale at construction sites, data were collected from a mega-construction project in Sydney, Australia. In addition to the existence of psychological contract, factor analyse identified two underlying aspects: employer and employee obligations. However, due to the discriminant validity issue, relational and transactional dimensions of two aspects of obligations could not be validated or confirmed. Internal consistency ratings using Cronbach's alpha found the components of the psychological contract of safety measure to be reliable. The paper presents a refined and validated psychological contract of safety measure that allows investigation of the positive and negative outcomes associated with fulfilment and breach of the psychological contract of safety in future research.
Keywords: Construction safety, Psychological contract, Scale validation, Supervisor, Worker.
1. Introduction
Although the construction industry has made improvements in safety through the application of systems, standards, and technology, more of the same will not further significantly improve safety performance, because, no matter how automated a production process or complex a management system is, people operate the process or the system (Sunindijo et al., 2017). In this regard one line of inquiry has focussed on the role first-level supervisors play in translating senior management commitment to safety into safety values and practices in workgroups (Lingard et al., 2012). A second, related
42nd AUBEA Conference 2018: Educating Building Professionals for the Future in the Globalised World
29.
area that has received little attention is the influence that organizationally-based social exchanges between workers and supervisors have on safety (Hofmann and Morgeson, 1999). Blau (1964), while discussing social exchange theory, argued that when one party acted in ways that provided benefits to a second party, an implied obligation was generated for future reciprocity. This ‘psychological contract’ which is assumed as a consequent of social exchange theory (Blau, 1964), can be introduced to capture the momentum between supervisors and workers to explore their relationships in terms of safety. Advancing this line of thinking further, Psychological contract of safety (PCS) can be conceptualized as the beliefs of individuals about reciprocal safety obligations inferred from implicit or explicit promises (Walker and Hutton, 2006, Newaz et al., 2016b, Newaz et al., 2016a). Hence, this research argues, in order to examine the relationship between supervisor and worker a scale of psychological contract of safety should be developed to measure the strength of this relationship (based on mutual obligations of safety). The identified safety obligations from Australian health sector will be used to develop and validate a measure of psychological contract of safety (PCS) in construction. The subsequent sections of literature review explains how safety can be improved through psychological contract.
2. Literature Review
2.1 Psychological Contract (PC)
Psychological contract is based on social exchange theory, where employees are motivated by maintaining a balance between inputs and outputs when reciprocity is sought in social transactions (Blau, 1964). According to this norm of reciprocity (Gouldner, 1960), when employers do not fulfil their promises and obligations, employees experience psychological contract breach and reciprocate by adapting their contributions to the organization (e.g. by reducing their efforts and performance); (Lub et al., 2015). As a result, like the other work settings (Walker, 2010), it is expected that fulfilment or breach of psychological contract will have an impact on employee’s/worker’s behaviour in a construction setting. Since supervisors and workers are found as the prominent ‘Safety Agents’ (Zhang et al., 2015), examining their mutual relationship through ‘psychological contract’ provides better insight as to workers behaviour associated with safety outcomes, either positively or negatively. The next section describes how safety can be viewed through the lens of psychological contract.
2.2 Psychological Contract of Safety (PCS)
The extant psychological contract literature has tended to treat immediate managers exclusively as key agents representing the interests of organizations with respect to the psychological contract between employees and organizations (Conway and Briner, 2002).Numerous studies have shown that employees' immediate managers are a central force in shaping the individuals' experience at workplace (Lee and Taylor, 2014, Bass, 1990, Kozlowski and Doherty, 1989). Sully (2001) proposed the psychological contract as means of exploring reciprocal relationships, arguing that safety was already based on reciprocity involving a duty of care on the part of an employer and a reciprocal obligation to uphold safety standards on the part of an employee (Walker and Hutton, 2006). The research of Walker and Hutton (2006) provides qualitative evidence of reciprocity between perceived employer and employee safety obligations (Mullen et al., 2017).

42nd AUBEA Conference 2018: Educating Building Professionals for the Future in the Globalised World
employer and employee safety obligation scales were measured by the scale developed by Walker (2013). The scale comprises 12 employer safety obligations and 15 employee safety obligations.
To ensure the quality of data collected before starting data analysis, all the completed questionnaires (N = 352) were checked against systematic response patterns and more than 5% missing items (Seo, 2005, Walker, 2013). Through this data screening process, 30 out of 352 completed questionnaires were excluded from the dataset. The pattern of missing data was found to be random and less than 5% (Walker, 2010). The Expectation Maximization (EM) method (Muthen and Muthen, 1998, Schreiber et al., 2006, Walker, 2010, Walker, 2013) was used to replace missing data using SPSS Missing Value Analysis, as suggested by Bø et al. (2004), Schreiber et al. (2006) and Walker (2010).Preliminary (consistency) analyse including mean ratings of the safety obligations, un-rotated principal component factor analysis and standardised Cronbach’s α coefficient were performed using IBM SPSS v24. The un-rotated principal component factor analysis was performed to check for commonality within the data set. The computer program AMOS (v24) was employed to conduct Confirmatory Factor Analysis (CFA) and evaluate the overall fit of the model tested, using maximum likelihood (MLE) estimation. This study adopts Structural Equation Modelling (SEM) as it enabled an examination of a series of dependence relationships simultaneously (Hair et al., 2014). The next section explains the research findings from the study.
5. Findings
5.1 Descriptive Statistics
As suggested by Hazen et al. (2015), mean and standard deviations for each construct are important to mention as reported below. In addition, correlations among all the construct are reported in Table 1 below. All variables were significantly correlated (p < 0.01). Toidentify whether data were normally distributed (Hazen et al., 2015), skewness and kurtosis values were obtained. The level of skewness (range: -0.361 to -0.831) as well as the level of kurtosis (range: -0.052 to 2.952) (Xiong et al., 2015) in this sample fell within acceptable parameters (not >3.29) for the sample size on all variables (Tabachnick and Fidell, 2007, Chew et al., 2017).
α Mean SD EmEE_Rel
EmEE_Tran
EmpLR_Rel
EmpLR_Tran
EMER_Ob
EMEE_Ob
EmEE_Rel 0.901 4.06 0.7 1 .697** .502** .418** - -EmEE_Tran 0.907 4.24 0.7 .697** 1 .456** .374** - -EmpLR_Rel 0.866 3.72 0.6 .502** .456** 1 .732** - -EmpLR_Tran 0.882 3.04 0.5 .418** .374** .732** 1 - -
EmpER_Obl 0.923 3.71 0.8 - - - - 1 .535**
EmpEE_Obl 0.938 4.13 0.6 - - - - .535** 1
EmEE_Rel: Employee Relational Obligation, EmEE_Tran: Employee Relational Obligation, EmpLR_Rel: Employer Relational Obligation, EmpLR_Tran: Employer Transacitional Obligation, EMER_Ob: Employer Obligations, EMEE_Ob: Employee Obligations
** Correlation is significant at the 0.01 level (2-tailed).
Table 1: Descriptive statistics and correlations among constructs
42nd AUBEA Conference 2018: Educating Building Professionals for the Future in the Globalised World
Employees develop beliefs or perceptions about employer safety obligations (and employee safety obligations to the employer) during the term of employment (Walker and Hutton, 2006, Mullen et al., 2017). Noteworthy to this context, in a series of studies, Walker and Hutton (2006), Walker (2010), and Walker (2013) developed and tested apsychological contract of safety (PCS) scale in Australian health sector and identified safety climate, safety behaviour and safety outcomes (number of accident and injury) assignificantly related with the level of fulfilment or breach of PCS. The pilot test conducted in Walker (2010) study included 29 construction workers along with other healthemployees and meat processing workers. In addition, the seminal work of Rousseau (1990) on psychological contracts found two underlying contract dimensions characterized by the type of employment relationship perceived between the two parties: transactional and relational. Transactional contracts are short-term contracts that have an economic focus and relational contracts are longer-term contracts with a socio-emotional focus. The PCS scale developed by Walker (2010) comprises both transactional and relational aspects for employer and employee safety obligations. For example, Employee Safety Interests and Provision of Resources are labelled as relational and transactional contract successively for the scale of employer safety obligations. Whereas ComplianceBehaviour and Communication and Reporting Behaviour are categorized as transactional and contract successively for the scale of employee safety obligations. The next section identifies the research aim and objective.
3. Research Aim and Objective
Sully (2001) argued that to better understand the relationship between safety behaviour and an individual employee, it is important to understand the dynamics underlying the relationship between employees and their organization. Hence, this research aims to develop and validate the safety obligations that construct psychological contract of safety, developed from the day-to-day interactions between supervisor and workers at construction sites. The specific objective of the current study was to identify the safety obligations between supervisor and worker that construct the psychological contract of safety at construction site.
4. Research Methodology
Quantitative methods are used in safety perception research to study a large number of workers’ perception of policies, procedures, and practices that specify the right significance of safety in their organization (Zohar, 1980, Murphy et al., 2018). Ojanen et al. (1988) argue that the only way to measure the safety perception is by surveys. Consistent with previous psychological contract of safety (PCS) studies (Walker, 2010, Walker, 2013), in developing and validating a multi-item measure of PCS, this study adopts the scale development guidelines recommended by Netemeyer et al. (2003). Data were collected from a mega-construction project ($AU3.7 billion) in New South Wales, Australia. A survey was administered using ‘Viewpoint’ automated response system with ‘clicker’ hand-held devices (Zhang et al., 2015). A total of 352 construction workersparticipated in 5 surveys at 5 different sites of the project. The survey consisted of threeparts: (1) employer safety obligation; (2) employee safety obligation; and (3)demographic information. All the items except demographic information questions were rated on five-point Likert scales ranging from ‘1= Strongly Disagree’ to ‘5 = Strongly Agree’. The survey scales were subjected to reliability analysis. Cronbach’s α, as a measure of internal consistency reliability, was 0.944 for the entire questionnaire. Both
30. 31.

42nd AUBEA Conference 2018: Educating Building Professionals for the Future in the Globalised World
In the next step, the researchers performed CFA with two factors solutions (employer and employee safety obligations). The two factors model resulted in an acceptable fit, chi-square statistic is 2.587 (p = 0.00), RMSEA= 0.070, CFI = 0.921, SRMR= 0.056. In case of convergent and discriminant validity, there was no issue observed for the two factorssolution. The square root of the AVE was also greater than the largest correlation between the construct and another construct (the variance shared between two constructs), which implied significant discriminant validity (Mohamed, 2002). Noteworthy to mention, due to the poor model fit and discriminant validity issues, the relational and transactional factors could not be confirmed and validated for each scale of employer and employee safety obligations. As a result, the authors chose to use the full scale of each employer and employee obligation scales rather than breaking them down to relational and transactional dimensions.
As shown in Table 2, all loadings relating indicators to latent factors were statistically significant (p < .001). Item 1 of the employer relational obligation (EmpLR_Rel_01) wasdropped in the confirmatory factor analysis due to low factor loadings (below 0.63)(Tabachnick and Fidell, 2007, Comrey and Lee, 1992).
Factor LoadingsEmployer Safety ObligationsMy employer meets their obligation to:
EmpLR_Rel_02 Involve employees in safety decision making 0.753EmpLR_Rel_03 Listen to employee safety concerns 0.708EmpLR_Rel_04 Inform employees about the outcome of safety meetings 0.711
EmpLR_Rel_05 Carry out safety incident investigations to prevent accidents happening again 0.722
EmpLR_Rel_06 Set a good example for safety behaviour 0.725EmpLR_Tran_02 Conduct regular safety training with all employees 0.737EmpLR_Tran_03 Keep work equipment functioning properly 0.744EmpLR_Tran_04 Supply proper work equipment 0.638EmpLR_Tran_05 Provide training in the safe use of equipment 0.662EmpLR_Tran_06 Maintain a safe workplace 0.700
Employee Safety ObligationsI meet my obligation to:
EmEE_Tran_02 Follow safety rules 0.707EmEE_Tran_03 Comply with procedures regarding hazards and risks 0.684EmEE_Tran_04 Maintain a clean, safe work environment 0.720EmEE_Tran_05 Ensure that work demands do not compromise safety 0.727EmEE_Tran_06 Use work equipment properly 0.706EmEE_Tran_07 Willingly participate in safety training 0.679EmEE_Rel_01 Report hazards and risks 0.737EmEE_Rel_02 Encourage co-workers to report safety concerns 0.745EmEE_Rel_03 Raise safety concerns 0.757EmEE_Rel_04 Report safety incidents or near misses 0.738
EmEE_Rel_05 Inform incoming shifts or work teams of current hazards and risks 0.730
EmEE_Rel_06 Co-operate with the injury management process 0.733
Table 2. CFA Factor Loadings
42nd AUBEA Conference 2018: Educating Building Professionals for the Future in the Globalised World
5.2 Exploratory Factor Analysis
Promax with Kaiser Normalization rotation was selected for principal component analysis (PCA) due to its merit in maximizing the amount of variance explained by factors and seeking a mathematically superior solution. The stability of a factor was determined by the factor having at least three items loading onto it both substantively and distinctively(Hair et al., 1998, Walker, 2010). Interestingly, the initial unforced PCA of the safety obligations items revealed four factors with eigenvalues greater than one from the 27questions and the explained total variance was 64.33 %. The KMO value was 0.942, exceeding the recommended value of 0.6; and Bartlett’s Test of Sphericity reached statistical significance which was large (chi-square value=5571.441 with small pvalue=0.000) (Zhang et al., 2015, Wu et al., 2015). Observing the items loading, two factors of employer safety obligations scale (transactional and relational) and two factors of employee safety obligation scale (transactional and relational) were prevailed. A factor loading of 0.5 is considered to be the rule of thumb for determining items with significant loadings on a particular factor (Hair et al., 2014). Examining the factor loading score and cross-loading pattern of the items, some of the items were considered to be dropped from the scale. For example, EmEE_Tran_01, EmEE_Tran_08, EmEE_Tran_09, EmpLR_Tran_01 were dropped from the scale due to poor loading score and cross loading with other factor. Another PCA with Promax with Kaiser Normalization rotationwas conducted for the next factor analysis. With a KMO of 0.937 and Bartlett’s Test of Sphericity reached statistical significance which was large (chi-square value=4482.275with small p value=0.000), supporting the factorability of the correlation matrix (Choudhry et al., 2009).
In the next step, since there were two factors (employer and employee safety obligations) intended to measure the psychological contract of safety scale, the number of extracted factors was set at two to enable comparison with the four-factor structure obtained from unforced PCA. The two factor solutions (employer and employee safety obligations) explained 55.85% of total variance, comparable to other related research study (Walker, 2010). The KMO value was 0.937, and Bartlett’s Test of Sphericity reached statistical significance which was large (chi-square value = 4482.275 with small p value=0.000). In an additional step, both employer and employee obligations scale were explored separately to check the relational and transactional dimensions and achieved successful factor loadings (under each dimension) which will be further assessed through confirmatory factor analysis.
5.3 Confirmatory Factor Analysis
A Confirmatory Factor Analysis (CFA) was performed using structural equation modelling (SEM) to determine how well the proposed model fitted the survey response data and individual items measured the independent factors of safety climate (Hinkin, 1998). First, the researchers tried to get a model fit including the four factors solutionemerged from exploratory factor analysis. The four factors model resulted in good fit, chi-square statistic is 2.036 (p = 0.00), RMSEA= 0.057, CFI = 0.947, SRMR= 0.047 following the cut-off point recommended by Wheaton et al. (1977), Browne and Cudeck (1993), Bentler (1990), Marsh and Hocevar (1985). However, the model could not pass the discriminant validity test. The square root of the AVE for EMEE_Tran is less than its correlation with EMEE_Rel, the square root of the AVE for EMPLR_Rel is less than its correlation with EMPLR_Tran and the square root of the AVE for EMPLR_Tran is less than its correlation with EMPLR_Rel (Mohamed, 2002, Hazen et al., 2015). Hence, the four factors model could not be validated in this sample of construction workers.
32. 33.

42nd AUBEA Conference 2018: Educating Building Professionals for the Future in the Globalised World
6. Conclusions and Future Research
The aim of the study was to identify the safety obligations that construct psychological contract of safety at construction site. The concept of psychological contract of safety (PCS) has been demonstrated as a distinctive way of examining occupational safety because of the emphasis on mutual safety obligations between employer and employee. The validated measures of psychological contract of safety can be used to capture the perception of workers regarding their mutual obligations and determine how these obligations affect workers’ safety perception and behaviour. As a consequence, a more rigorous investigation could be conducted to examine the mutual relationships between other safety agents (between top level managers and site supervisors or the individual worker and co-workers) to learn how safety perception get influenced at different levels of organization. In addition, more notable research findings can be achieved if the PCS scale is used in small and medium construction companies to understand the dynamics between workers and supervisors. Research is ongoing on how the level of fulfilment or breach of mutual obligations between supervisor and workers predicts safety climate and behaviour within the construction site setting. Safety practitioners and researchersinterested in introducing management intervention to improve safety outcomes could focus on this aspect of mutual relationship (PCS) between safety agents and develop their safety initiatives to promote high level of safety awareness.
One limitation acknowledged in this study is that the majority of respondents were male (91.9%). However, gender has been barely an important focus of safety scale development research (Walker, 2010) and such imbalance is not surprising since the construction industry is male-dominated (Zhang et al., 2015). A second limitation includes self-report measures and possible biases (Walker, 2013) which may diminish the merits of employee safety obligations scale for further practice. Nevertheless, the potential problem of bias was kept to a minimum by allowing respondents remain anonymous with the use of novel data collection techniques.
7. References
Bass, B. M. (1990). From transactional to transformational leadership: Learning to share the vision. Organizational dynamics, Vol.18, pp.19-31.
Bentler, P. M. (1990). Comparative fit indexes in structural models. Psychological bulletin,Vol.107, pp.238.
Blau, P. M. (1964). Exchange and power in social life, New York, Wiley.Bø, T. H., Dysvik, B. & Jonassen, I. (2004). LSimpute: accurate estimation of missing values in
microarray data with least squares methods. Nucleic acids research, Vol.32, pp.e34-e34.
Browne, M. W. & Cudeck, R. (1993). Alternative ways of assessing model fit. Sage focus editions, Vol.154, pp.136-136.
Chew, J., Haase, A. M. & Carpenter, J. (2017). Individual and family factors associated with self-esteem in young people with epilepsy: A multiple mediation analysis. Epilepsy & Behavior, Vol.66, pp.19-26.
Choudhry, R. M., Fang., D. & Lingard., H. (2009). Measuring safety climate of a construction company. Journal of construction Engineering and Management Vol.135, pp.890-899.
Comrey, A. & Lee, H. (1992). Interpretation and application of factor analytic results. Comrey AL, Lee HB. A first course in factor analysis, Vol.2.
Conway, N. & Briner, R. B. (2002). A daily diary study of affective responses to psychologicalcontract breach and exceeded promises. Journal of Organizational Behavior, Vol.23,pp.287-302.
42nd AUBEA Conference 2018: Educating Building Professionals for the Future in the Globalised World
6. Discussion and Implications
This study was designed to address validation the psychological contract of safety scalewith a large sample of construction workers. The identified and validated safety obligations enrich the understanding of contents by which a psychological contract of safety is developed and comprised at construction site. The psychological contract of safety measure developed and validated in this paper comprised two scales, firstly, the employer obligations scale, consisting of 10 items, and secondly, the employeeobligations scale, consisting of 12 items. Noteworthy to mention, in the study by Walker and Hutton (2006), it proposed the PCS scale by collecting qualitative evidence and further Walker (2010) validated the scale through exploratory factor analysis but did not report any confirmatory factor analysis in the paper for the two factors model suggested.Addressing this gap, this study reveals results of confirmatory factor analysis for both two factors and four factors solutions along with exploratory factor analysis. Interestingly, the four factors model could not be validated in this sample of construction due to the issue discriminant validity of the proposed constructs. The authors recommend to use the two factors solutions (Employer and Employee safety obligations) to examine the reciprocity and strength of the relationship between supervisor and worker. It is evident that, like the other work settings (Walker, 2010), construction workers do develop mutual obligations based on safety (PCS) and the content of those obligations are validated through this research. Lack of empirical evidence of reciprocity has been an issue for psychological contract (Walker and Hutton, 2006, Guest, 1998) which has been confirmed in construction settings through this research.
The findings of this research have significant implications for construction managers and practitioners, particularly improving the mutual relationship between workers and supervisor. The factors, or aspects found with low level of fulfilment should be discussedin the morning (toolbox) meetings whereas the aspects which have high levels of fulfilment should be continued or reinforced to improve the relationship between workers and supervisors. In case of training supervisors, special attention should be given to introduce the concept of psychological contract and discussed how supervisors can achieve high levels of fulfilment of PCS. When the safety training programs are designed to incorporate PCS concepts and use the scale to measure the level of fulfilment, both old and new site supervisors would benefit from having them in place. The information collected from the measure could be used to focus where the perceptions of safety vary between managers and employees, and also, eventually, deliver a basis for promoting better employee-employer relationships (Walker, 2010). For example, workers might perceive that the employer safety obligation Supply prepare work equipment(EmpLR_Tran_04) has not been met. By being made aware of this information, managers have the opportunity to ensure all the workers do possess required work equipment and understand their functioning.
Applying psychological contract theory to occupational safety provides a new direction for construction safety research recognising that supervisors play a key role in managing safety. Safety supervision and leadership studies can be benefited by understanding the potential of psychological contract of safety (PCS) theory and its implication to construction safety research. The concurrent focus on both parties that contribute to the occupational safety context is innovative and delivers an alternative to the traditional one-sided method of examining safety in construction. Researchers who are interested inbehaviour change research should find a new direction to analyse in how supervisors’ behaviour could be modified to produce better safety outcomes.
34. 35.

42nd AUBEA Conference 2018: Educating Building Professionals for the Future in the Globalised World
Schreiber, J. B., Nora, A., Stage, F. K., Barlow, E. A. & King, J. (2006). Reporting structural equation modeling and confirmatory factor analysis results: A review. The Journal of educational research, Vol.99, pp.323-338.
Seo, D.-C. (2005). An explicative model of unsafe work behavior. Safety Science, Vol.43,pp.187-211.
Sully, M. (2001) Published. When rules are not enough: Safety regulation and safety culture in the commercial driving context. INSURANCE COMMISSION OF WESTERN AUSTRALIA CONFERENCE ON ROAD SAFETY, PERTH, WESTERN AUSTRALIA, 2001.
Sunindijo, R. Y., Zou, P. X. & Dainty, A. (2017). Managerial Skills for Managing Construction Safety. Civil Engineering Dimension, Vol.19, pp.63-72.
Tabachnick, B. G. & Fidell, L. S. (2007). Using multivariate statistics, Allyn & Bacon/Pearson Education.
Walker, A. (2010). The development and validation of a psychological contract of safety scale. J Safety Res, Vol.41, pp.315-21.
Walker, A. (2013). Outcomes associated with breach and fulfillment of the psychological contract of safety. J Safety Res, Vol.47, pp.31-7.
Walker, A. & Hutton, D. M. (2006). The application of the psychological contract to workplace safety. J Safety Res, Vol.37, pp.433-41.
Wheaton, B., Muthen, B., Alwin, D. F. & Summers, G. F. (1977). Assessing reliability and stability in panel models. Sociological methodology, Vol.8, pp.84-136.
Wu, C., Xinyi, S., Tao Wang & Fang, D. (2015). Core Dimensions of the Construction Safety Climate for a Standardized Safety-Climate Measurement. Journal of Construction Engineering and Management, Vol.141.
Xiong, B., Skitmore, M. & Xia, B. (2015). A critical review of structural equation modeling applications in construction research. Automation in Construction, Vol.49, pp.59-70.
Zhang, R. P., Lingard, H. & Nevin, S. (2015). Development and validation of a multilevel safety climate measurement tool in the construction industry. Construction Management and Economics, Vol.33, pp.818-839.
Zohar, D. (1980). Safety climate in industrial organizations: Theoretical and applied implications. Journal of Applied Psychology, Vol.65, pp.96-102.
42nd AUBEA Conference 2018: Educating Building Professionals for the Future in the Globalised World
Gouldner, A. W. (1960). The norm of reciprocity: A preliminary statement. American sociological review, pp.161-178.
Guest, D. (1998). Is the Psychological Contract worth taking seriously?Hair, J. F., Black, W. C., Babin, B. J., Anderson, R. E. & Tatham, R. L. (1998). Multivariate
data analysis, Prentice hall Upper Saddle River, NJ.Hair, J. F., Gabriel, M. & Patel, V. (2014). AMOS covariance-based structural equation
modeling (CB-SEM): guidelines on its application as a marketing research tool. Brazilian Journal of Marketing, Vol.13.
Hazen, B. T., Overstreet, R. E. & Boone, C. A. (2015). Suggested reporting guidelines for structural equation modeling in supply chain management research. The International Journal of Logistics Management, Vol.26, pp.627-641.
Hinkin, T. R. (1998). A brief tutorial on the development of measures for use in survey questionnaires. Organizational research methods, Vol.1, pp.104-121.
Hofmann, D. A. & Morgeson, F. P. (1999). Safety-related behavior as a social exchange : The role of perceived organizational support and leader–member exchange. Journal of Applied Psychology, Vol.84, pp.286-296.
Kozlowski, S. W. & Doherty, M. L. (1989). Integration of climate and leadership: Examination of a neglected issue. Journal of applied psychology, Vol.74, pp.546.
Lee, J. & Taylor, M. S. (2014). Dual roles in psychological contracts: When managers take both agent and principal roles. Human Resource Management Review, Vol.24, pp.95-107.
Lingard, H., Cooke, T. & Blismas, N. (2012). Do Perceptions of Supervisors’ Safety Responses Mediate the Relationship between Perceptions of the Organizational Safety Climate and Incident Rates in the Construction Supply Chain? Journal of Construction Engineering and Management, Vol.138, pp.234-241.
Lub, X. D., Bal, P. M., Blomme, R. J. & Schalk, R. (2015). One job, one deal…or not: do generations respond differently to psychological contract fulfillment? The International Journal of Human Resource Management, pp.1-28.
Marsh, H. W. & Hocevar, D. (1985). Application of confirmatory factor analysis to the study of self-concept: First-and higher order factor models and their invariance across groups. Psychological bulletin, Vol.97, pp.562.
Mohamed, S. (2002). Safety climate in construction site environments. Journal of Construction Engineering and Management, Vol.128, pp.375-384.
Mullen, J., Kelloway, E. K. & Teed, M. (2017). Employer safety obligations, transformational leadership and their interactive effects on employee safety performance. Safety science,Vol.91, pp.405-412.
Murphy, L. A., Robertson, M. M., Huang, Y.-H., Jeffries, S. & Dainoff, M. J. (2018). A sociotechnical systems approach to enhance safety climate in the trucking industry: Development of a methodology. Applied ergonomics, Vol.66, pp.82-88.
Muthen, L. K. & Muthen, B. O. (1998). Mplus [computer software]. Los Angeles, CA: Muthén & Muthén.
Netemeyer, R. G., Bearden, W. O. & Sharma, S. (2003). Scaling procedures: Issues and applications, Sage Publications.
Newaz, M. T., Davis, P., Jefferies, M. & Pillay, M. (2016a). The Psychological Contract of Safety: The Missing Link Between Safety Climate and Safety Behaviour in Construction Sites. Advances in Safety Management and Human Factors. Springer.
Newaz, M. T., Jefferies, M., Davis, P. & Pillay, M. (2016b) Published. Using the psychological contract to measure safety outcomes on construction sites. Proc., 32nd Annual ARCOM Conf., PW Chan and CJ Neilson, eds., Association of Researchers in Construction Management, Manchester, UK.
Ojanen, K., Seppala, A. & Aaltonen, M. (1988). Measurement methodology for the effects of accident prevention programs. Scandinavian journal of work, environment and health,Vol.14, pp.95-96.
Rousseau, D. M. (1990). New hire perceptions of their own and their employer's obligations: A study of psychological contracts. Journal of organizational behavior, Vol.11, pp.389-400.
36. 37.
42nd AUBEA Conference 2018: Educating Building Professionals for the Future in the Globalised World
excluding industry practitioners as those with industry experience rarely have time to devote to completing a PhD.
Not only are universities finding it difficult to attract suitably qualified staff, they are struggling to retain those that are appointed. For example, salary and excessive workload have been identified as the main motivators for nursing academics leavinguniversity (Goodrich, 2014; McDonald, 2010). Nursing and construction management have much in common, and it is reasonable to draw comparisons between these disciplines (Williams, Simmons, Levett-Jones, Sher, & Bowen, 2012). Other general reasons for staff leaving academia include the decrease in government fundingresulting in fewer positions, the nature of the academic environment, fewer individuals considering academia, and increased emigration of academics from Australia (Tysinger, Diamanduros, & Tysinger, 2010; Wilson, Wood, Solomonides, Dixon, & Goos, 2014).
This state of affairs is exacerbated by the fact that the current cohort of academic staff is aging. Ten years ago, Karantonis (2008) observed that nearly 30 percent of the construction academics in Australia were over 55 years of age. Based on data available in 2010 (Williams et al., 2010 p. 27), 18% of construction academics are now over 65 and 21% are in the ‘over 55 years old’ bracket. Not only is it going to be difficult to replace those who retire, an increased number of staff is required for the new degree programs. This clearly necessitates new recruitment approaches and has meant that universities have sought to recruit staff from alternate sources. In some cases, highly qualified international applicants have been appointed. However, their lack of local knowledge and, in some cases, difficulties in communicating effectively with students in English have made some academic heads reluctant to appoint such individuals (Sher, 2012).
Universities in Australia make extensive use of sessional staff (Cowley, 2010; Gottschalk & McEachern, 2010). This is especially true for construction disciples, where industry practitioners are frequently engaged to assist in various ways including providing lectures, facilitating site visits, conducting tutorials and assisting with assessment. Their efforts are generally well received and valued by staff as well as students. As such, they provide an ideal cohort to recruit future academics from. However, very few industry practitioners successfully transition to academic life. This reality has provided the stimulus for this study. The research question which this paper seeks to answer is “What difficulties do industry practitioners experience when attempting to transition from site to academia?”
2 Research Methodology
This study has explored the lived experiences of construction practitioners interested in pursuing an academic career. Lived experience studies have found favour as aneffective means of understanding what it means for individuals to experience certain situations. The approach relies on interpretivism, as explained by Nicholls (2009)
“Interpretivism tries to understand what it is to be human. It is associated with aphenomenological tradition that seeks to understand experience through the eyes ofthe person experiencing it (Van Manen, 1990). It is the oldest and most well-established of the qualitative traditions, and the one that has gained the most tractionin health care, particularly in nursing and occupational therapy. Interpretivists viewthe objectivity of the world as a subjectively lived phenomenon.” (p. 530)
42nd AUBEA Conference 2018: Educating Building Professionals for the Future in the Globalised World
Barriers to Entering Academic Life for Construction Practitioners
Willy Sher1 and John Smolders2
1School of Architecture and Built Environment, University of Newcastle,Newcastle, NSW 2308
2School of Computing, Engineering and Mathematics, Western Sydney University,Penrith, NSW 2751
E-mails: [email protected]; [email protected]
Abstract: The construction industry relies mainly on universities to prepare future generations of construction managers. The education these students receive is founded on the requirements of the professional bodies that accredit these degrees and is vocational in nature. Over the years universities have moved to recruit staff with research higher degrees but construction academics with postgraduate qualifications are scarce. In many cases those that are recruited have little local site experience. There is concern that whilst these academics may be well qualified in academic terms, their lack of familiarity with contemporary construction practices compromises their teaching and potentially the student’s learning. Several universities employ industry practitioners as sessional academics to augment the delivery of various courses. Student feedback on these courses is generally positive but few industry practitioners have managed to transition to academic life. This paper explores the views of experienced construction managers who have either attempted to secure academic appointments or are considering applying for in academic positions. It explores the barriers they encounter for acceptance in academic life.
Keywords:Transition, industry to university, tertiary teaching, industry practitioners.
1 Introduction and Literature Review
The construction industry makes a significant contribution to the Australian economy. Worldwide, there is an ongoing and growing need for construction projects (Cook & Chatterjee, 2015), indicating that the present skills shortage of tradespeople as well as of construction professionals is likely to continue and worsen. Universities in Australia have recognised the need to produce students with the requisite knowledge, skills and attitudes as evidenced by the increased number of providers. In 2010, twelve universities offered construction management and quantity surveying-related degree programs (Williams, Sher, & Simmons, 2010). In 2018 fourteen universities now offer these degrees. Students recognise the career opportunities that the construction industry offers as indicated by their patronage of the aforementioned providers. However, universities have found it increasingly difficult to recruit staff with the requisite skills and experience to teach. Two main issues make it difficult to find suitable staff. Firstly, most universities require academic staff to possess a research higher degree. Secondly, applicants require current knowledge of the local construction industry. In tandem, these requirements exclude a large number of would-be applicants. Possessing a doctorate effectively acts as a gate-keeper
38. 39.
42nd AUBEA Conference 2018: Educating Building Professionals for the Future in the Globalised World
16. Is there anything else you would like to tell me about your experience as a teacher?
17. Do you see any barriers for industry professionals entering academia?
Table 2. Seed questions for practitioners without teaching experience
1. Why are you considering transitioning to academia?
2. What do you think working as an academic will be like?
3. Have you considered sharing your knowledge and experience of industry with construction students? If so, how have you followed this up?
4. If you have applied for (or are considering applying for) an academic post, what encouragement and / or barriers have you experienced?
5. What do you feel you can offer to students and academic staff?
6. What experience do you have of developing people’s skills?
7. Is there anything else you would like to tell me about your wish to transition to academic life?
3 Findings and Discussion
This section provides a preliminary analysis of participants’ responses. Selected themes are presented below based on a tentative thematic coding of the transcripts.This paper showcases the themes that attracted the immediate attention of the authors. A more all-encompassing analysis will be conducted and published in due course.
3.1 Challenges facedAll of the participants with experience of university teaching agreed that meeting academic requirements (i.e. being in possession of a PhD) meant that they were unlikely to secure a permanent academic position. Only one participant possessed aPhD. Another participant questioned the contribution of a PhD to university teaching, saying “I think the obvious wrongdoing is the fact that lecturers have to have a PhD. I can’t see that as being relevant at all.” (Participant F)
Another participant interpreted the requirement for academics to possess a research higher degree as incestuous. She argued that this barrier ensured that academics were recruited in preference to practitioners. This made it difficult for industry applicantsto secure an academic post. She continued saying “While you may have credentials, there’s sort of a period of time you’ve got to build those relationships to ensure that you can - yeah, you have the credibility. That’s fair enough, but I think that is a barrier.” (Participant G)
In addition, remuneration was also seen as an impediment as industry salaries considerably outstrip academic ones. A participant argued that it is unlikely that a seasoned construction professional would accept an academic position unless they were already financially secure and (possibly) semi-retired from industry. Carrying this scenario forward, it was observed that the starting salary of a graduate is comparable to that of an associate lecturer. On graduation a student is likely to progress
42nd AUBEA Conference 2018: Educating Building Professionals for the Future in the Globalised World
A qualitative study was conducted to gain an understanding of these individuals’ lived experiences. Approval was obtained from the University of Newcastle’s ethics committee (Approval Number H-2017-0112). With the assistance of the Australian Institute of Building (AIB), interested construction professionals in NSW were invited to be participate. To date eleven construction practitioners have been interviewed. Four of these had experience of teaching at university.
Prompts for the semi-structured interviews (see Table 1 and Table 2) were drawn from a yet-to-be published systematic-literature review designed to identify literature that answered the following question “What impacts the transition of construction industry practitioners to construction higher education?” The semi-structured interviews questions used by Hurst (2010) were most useful in this regard.
The interviews were audio recorded and then transcribed by a professional transcription service. As recommended by Easton, McComish, and Greenberg (2000),the transcriptions were checked by listening to the audio and then reviewed.Participants’ perspectives were identified using NVivo© nodes and thematically assigned codes according to Mertens (2014).
This paper reports on interviews conducted between April and May 2018. The study is on-going and additional practitioners are still to be invited to participate. This paper therefore presents an initial analysis of the issues that were identified.
Table 1. Seed questions for practitioners with experience of teaching
1. What prompted you to move into higher education?
2. How did you feel about embarking on a new role?
3. Can you describe your feelings just before embarking on your new role?
4. Tell me about your experiences of moving into higher education.
5. What aspects made it easier for you?
6. What important things helped you in this transition?
7. What ways of coping did you use?
8. On reflection, which ways did you find most useful?
9. Looking back, were there any prior experiences that helped to prepare you to come into higher education as a lecturer.
10. Tell me about those experiences that you feel may have contributed (positively or negatively) to your transition.
11. How do you think these experiences helped you? In what way? Looking back would you have done anything differently?
12. If applicable, could anything else have helped to make your transition easier?
13. How confident do you now feel in your ability to function as an academic? How has this developed?
14. What do you feel are your strengths (and weaknesses) as a teacher?
15. How have students reacted to your teaching?
40. 41.

42nd AUBEA Conference 2018: Educating Building Professionals for the Future in the Globalised World
Other participants felt they could contribute in other diverse ways. For example, one saw his contribution as helping students (and graduates) to start on their own as building contractors. Another believed that having started his working life as a carpenter, he provided a valuable role model of how tradespeople could progress their careers. (This participant now manages major projects.) Yet another participant sawhis contribution as being a lateral thinker and problem solver, arguing that his engagement with students also provided a role model in this regard.
Reflecting on what practitioners could offer in their teaching, another participant was sceptical. She observed that “what you find is that the people who work in the [subjective course] are very narrow in their views of probably wanting to accept outside influence.” (Participant G).
3.3 Lessons learnt based on teaching experiencesSome of the participants who had had opportunities to teach at university offered views of their experiences. Most of the issues raised were negative possibly indicating that they had an axe to grind. One participant with considerable experience as a sessionalacademic was critical of what he felt was the cavalier manner in which he had beentreated. He had been asked at short notice to prepare and deliver lectures on a topic relatively new to him. He did this willingly as he enjoyed interacting with students but would have liked feedback from fulltime academics on his lecturing approach as well as feedback from students. None of these were forthcoming. Some of these concerns were echoed by another participant who felt she would have benefitted from staff training opportunities.
3.4 Obstacles experienced by participantsOne of the participants was critical of the manner in which his teaching activities were arranged and administered. He said “The structured administration around it was probably best described as ill-informed and quite ordinary and quite disappointing, rigid, arbitrary and not that intelligent” (Participant B). To place this in context, the practitioner who made this statement is a senior construction project leader with an extensive track record of successful completion of major state significant projects. His reactions are understandable as the management structures in commercial construction organisations are vastly different to those within universities.
Whilst acknowledging the research component required by universities, one participant felt that research should be more targeted towards Master students than PhD students. He argued that the former who would benefit more from an industry practitioner’s viewpoint saying “I think the PhD process comes with all sorts of abstract and traditional academic processes and procedures that probably don’t fit that well” (Participant B).
Another participant was concerned about the requirement for academics to publish research papers. He did not see this as relevant to what he saw as his primary role -imparting his industry experience to students.
3.5 Personal feelings about academic workThree participants expressed their desire to teach but did want to engage in research and administration activities. One was of the view that working as an academic could not be harder than working on a construction project. Another participant thought that working as an academic would be a lot easier than working in a mainstream construction job.
42nd AUBEA Conference 2018: Educating Building Professionals for the Future in the Globalised World
his/her construction career to that of a contracts administrator or ever a junior project manager by the time an associate lecturer might be promoted to a lecturer. The pay differential between industry and academia discourages a move to academic life. In this connection a participant said “I think it’s a long road. I think there’s lots of obstacles while you’re there. There’s lecturer, senior lecturer, tutor… there’s all these steps. It’s like starting in the construction industry again I suppose.” (Participant K)
With regard to PhDs, participants also mentioned anomalies in the ways in which academic appointments are made at different universities and in other disciplines. For example, one participant observed that the law discipline at a university has found it difficult to recruit solicitors with a PhD and now accepts those with LLBs as an alternative. Another participant noted that two universities that offer construction management degrees have recently advertised for practice-based construction professionals without a PhD with a starting salary at the senior lecturer level. He went on to say that at his own university, the engineering discipline has taken on engineers without a PhD as teachers but added that his school would remunerate such appointments at the associate lecturer pay scale. In this connection it is worth noting an attempt by the AIB to gain support for increasing the salaries of construction academics (AIB, 2008). They argued that the proposed emoluments would be similar to the practice payments offered to academics in some medical fields. However, this initiative was unsuccessful.
In summary, those interviewed felt strongly that a PhD should not prohibit applicants from being offered an academic post. They considered that they could make considerable contributions to students’ learning. Furthermore, academic salaries are modest in comparison to those offered in industry. Financial rewards were thus not seen as a drawcard by most of those interviewed. Participants noted that they might consider a move to academic life as a step towards retirement. However, this may not suit universities.
3.2 Participants’ contributions based on their industry experienceParticipants felt that they could make meaningful contributions to university teachingin a number of ways. Management was seen as a key aspect of a construction manager’s working life and an area where industry practitioner’s real-world experiences overshadowed academic theory. One participant highlighted the need for students to appreciate and develop their ability to manage people so that they couldprioritise their actions. He said “I'm finding that's probably one of the hardest things at the moment, to get people to deal with steam rollers and peanuts and see the difference between them.” (Participant D). Other participants also emphasized people skills, stating that with appropriate mentoring, more can be accomplished. One argued that with “power control and over supervision, you tend to turn off that engagement”(Participant C). Indeed, people management was noted by several participants as ofkey importance to construction students. One of the participants had completed a four-year management and psychology course, highlighting the value he personally attached to the topic.
Another topic that participants felt they could contribute to was financial management. They felt that university courses did not provide students with an adequate understanding of money. Participants felt they could bring to life the practical implications of managing the finances of construction companies when they engage with students.
42. 43.

42nd AUBEA Conference 2018: Educating Building Professionals for the Future in the Globalised World
A female participant felt her experiences of university life were positive apart from workload (which she noted to be onerous). She also had negative experiences of applying for promotion. She said
“as a woman (I was) put into an associate lecturer role first. Even though I had teaching experience at a university in Europe, my two other male colleagues have been employed already on lecturer level without teaching experience. I had to go throughthe proper promotions process... So, this definitely was a negative as well.”(Participant A)
Another participant viewed the lecturing component of his sessional responsibilities as positive but felt let down by his university with regard to training. His employment contract excluded these opportunities. He expressed a strong desire to engage in these activities and the lack of support had a demotivating effect.
4 Conclusion and Further Research
The findings noted above are very much a work in progress. The key themes that have emerged to date include universities requiring academics to possess PhD’s and the modest salaries that academics generally receive. All of those interviewed wanted to “give back” by embedding their knowledge and experience in their teaching activities. They emphasised the authentic contributions they could make by encouraging students to develop their personal people skills. Other topics they felt well-placed to contribute to included problem solving and financial management. It is noteworthy that the experiences of those who had worked as sessional academics were not all positive. Having an opportunity to express themselves may have influenced their decision to participate in this study. Their comments should therefore be viewed with circumspection.
Industry practitioners have honed their skill set over many years. They understand theconstruction industry having lived and observed it. They are confident and have significant pride from their achievements. They have been responsible for the delivery of major projects constrained by time, cost, weather and adverse industrial actions. They seek recognition, not as academics but rather as practitioners who are keen to impart their knowledge and skills to new generation of constructors.
This paper has thus identified some of the issues that impact on those who transition from working in the construction industry to academia. This study is on-going. Additional participants are being sought and findings on the consolidated dataset will be made available at a future date.
5 Acknowledgement
The authors wish to set their discussion comments in the context of their own personal lived experiences. John Smolders has spent most of his working life as a contractor and developer, and transitioned successfully into academic life eight years ago. Willy Sher is a construction management graduate from the early 1970’s who has been an academic for over 30 years.
42nd AUBEA Conference 2018: Educating Building Professionals for the Future in the Globalised World
Yet another participant had a different view stating “whether you're in a university or whether you're in business - it's just the concentrations there that are different. The obligation to explore and develop new ideas and add value to what you're doing shouldn’t be any different” (Participant B).
Only two participants expressed a desire to engage in research activities and both were female. One could see herself as an academic, depending on her other commitments.She believed strongly that building her personal network would help with her research.
A number of participants wanted to offer their services to universities but did not know how to go about this. Some suggested that universities may have no interest in engaging industry to assist with teaching. One participant in particular expressed a strong desire to lecture but felt that he had left such a move too late in his career.
One of the female participants recounted frustration at her abortive effort to secure an academic post. She acknowledged the need for competition when applying for a position but was resigned to failure, as she felt the job would be given to an existing staff member.
3.6 Transitioning to academic lifeOnly one participant with experience of university teaching mentioned that she had issues adapting to the university environment. She said that she relied heavily on her peers but had experienced difficulties with senior management. Other participants had no issues with coping or adjusting to delivering lectures.
Another participant mentioned that it was fun to teach but that she had received little support for her activities. She said “Academics have a different focus, or a goal how to teach students and also it's like a different approach, how to teach students”(Participant A).
One participant reflected that divisions in industry were present at universities as well. She noted that barriers existed between the disciplines of architecture and construction management, causing friction. In addition, she observed these divisions impacted on sessional staff as they were not always kept well-informed.
Another participant commented on the differences in professional development that existed between industry and in academia. They argued that industry professionals were constantly encouraged and supported to keep up-to-date with the latest developments whereas, academics are not necessarily able to avail themselves of similar opportunities.
3.7 Experience gainedA participant observed that she had learnt the art of being a mentor as a result of her experiences as a sessional academic. She had been encouraged to enter academia by her professor. Having worked in this capacity for some time, she felt more confident of her teaching skills, regardless of her poor experiences with management.
Several participants enjoyed being able to give back to society (and students) the knowledge they had gained during their working lives. This was a recurring themewith the proviso that their goodwill was not abused.
44. 45.
42nd AUBEA Conference 2018: Educating Building Professionals for the Future in the Globalised World
Education & training for zero energy and lean manufacturing & construction of housing in Australia
Felix Kin Peng Hui1, Alessandra Akemi Yokota2 and Lu Aye3
1,2&3Renewable Energy and Energy Efficiency Group, Department of Infrastructure Engineering, Melbourne School of Engineering,
The University of Melbourne, Vic 3010, AUSTRALIA
E-mails: [email protected]; [email protected]; [email protected]
Abstract:For zero energy and efficient production of mass customised housing, good outcomes are possible only when it is supported by a good education curriculum and infrastructure. This paper reports on the status of education for zero energy and lean manufacturing and construction of houses in Australia by investigating offerings of Victorian schools, vocational training and higher education sectors in these respects. The courses currently offered within Australian Qualifications Framework (AQF) were assessed. It was found that there are still gaps in the education infrastructure that do not provide fully for opportunities to educate the workforce in these areas. Although the main knowledge areas of zero energy are sufficiently covered by courses involving sustainability, renewable energy, energy efficiency in buildings and infrastructure construction, the teaching of lean concepts are not widespread in all these education sectors in Australia.
Keywords:Australian Qualifications Framework (AQF), Education, Infrastructure, Lean Manufacturing & Construction, Zero Energy House.
1 Introduction
The production of energy efficient, mass customised houses offers good potential to solving the housing affordability problem in Australia. Zuhairi et al. (2016, p. 282) stated “Prefabrication and modular construction are believed to be the solution for constructing houses that meet the vast number of demands in urban areas in a short period of time”.Mass customised house manufacturing lends itself easily to application of lean principles such as waste and cost reduction, has been applied successfully in similar type of mass customised environment in the manufacturing sector. The quest for energy efficient homes are also important given that the costs of electricity and natural gas have been risen in the past few years. Prices for households increased on average by 72% for electricity and 54% for natural gas in the 10 years to June 2013 in Australia (Swoboda 2018).
Zero Energy and Lean Construction - Why are these important?Lean principles and practices can be applied to any business or production process, in any industry to reduce wastes and costs. They can be applied in realizing Zero Energy Demand Buildings (ZEDB). They can be used to promote energy savings throughout a building’s lifecycle. Sands (2010) argued that the emerging energy economy is demanding innovative, cost effective, high performance buildings. A lean and powerful construction industry that is resource efficient and cost effective is required to deliver affordable housing. Pulakka et al. (2016) concluded that the lean construction is a
42nd AUBEA Conference 2018: Educating Building Professionals for the Future in the Globalised World
6 References
AIB. (2008). AIB Seeks Private Sector Salaries For Building Academics, March 2008. Retrieved from http://www.aib.org.au/news/2008(March)UniSalaries.htm
Cook, D., & Chatterjee, P. (2015). Our changing world: let’s be ready. Retrieved from http://www.rics.org/Global/2015_RICS_Futures_Our%20Changing%20World_76p%20(2).pdf
Cowley, J. (2010). Confronting the Reality of Casualisation in Australia. Recognising Difference and Embracing Sessional Staff in Law Schools. University of New South Wales Faculty of Law Research Series, 10(1), 27-43.
Easton, K. L., McComish, J. F., & Greenberg, R. (2000). Avoiding Common Pitfalls in Qualitative Data Collection and Transcription. Qualitative health research, 10, 703-707.
Goodrich, R. S. (2014). Transition to academic nurse educator: A survey exploring readiness, confidence, and locus of control. Journal of Professional Nursing, 30(3), 203-212.
Gottschalk, L., & McEachern, S. (2010). The frustrated career: casual employment in higher education. Australian Universities’ Review, 52(1), 37-50.
Hurst, K. M. (2010). Experiences of new physiotherapy lecturers making the shift from clinical practice into academia. Physiotherapy, 96(3), 240-247.
Karantonis, A. (2008). A profile of construction academics in Australia. Paper presented at the Australian Universities Building Education Association Annual Conference.
McDonald, P. J. (2010). Transitioning from clinical practice to nursing faculty: Lessons learned. Journal of Nursing Education, 49(3), 126-131.
Mertens, D. M. (2014). Research and evaluation in education and psychology: Integrating diversity with quantitative, qualitative, and mixed methods: Sage publications.
Nicholls, D. (2009). Qualitative reserach: Part one - Philosophies. International Journal of Therapy and Rehabilitation, 16(10), 526 - 533.
Sher, W. (2012). Tertiary construction management education: the lived experience of academic staff in Australia. (PhD), The University of Newcastle, Newcastle.
Tysinger, P. D., Diamanduros, T. D., & Tysinger, J. A. (2010). Making the Transition from Practitioner to Academic. Communiqué, 39(2), 10-11.
Van Manen, M. (1990). Researching Lived Experience. New York: SUNY Press.Williams, A., Sher, W., & Simmons, C. (2010). Construction education in Australia: a review
of learning and teaching challenges and opportunities: ALTC.Williams, A., Simmons, C., Levett-Jones, T., Sher, W., & Bowen, L. (2012). Facilitating work
integrated learning (WIL) through skills-enabled e-portfolios in construction and nursing final report. Priority Project.
Wilson, M. J., Wood, L., Solomonides, I., Dixon, P., & Goos, M. (2014). Navigating the career transition from industry to academia. Industry and Higher Education, 28(1), 5-13.
46. 47.

42nd AUBEA Conference 2018: Educating Building Professionals for the Future in the Globalised World
5 and 6, this includes applications in a broader context and the ability to provide highly specialised advice.
The HE (Level 7 and above) requires self-directed learning within broader parameters while Level 8 and 9 require expert judgement and specialist work as a practitioner. With these in mind, this paper seeks to explore the current status of zero energy and lean construction education in these three areas of educational focus. In general, the construction industry requires a skilled and adaptable workforce. People joining the industry should have generic and skill-specific workforce training and hold the required competencies in the sector. People joining the workforce in the design of systems need higher level cognitive skills and must also be adaptable and contextualise knowledge for applications.
3.1 Zero Energy Building Education and Lean Construction Education in Schools
The Australian School CurriculumThe Australian school curriculum (ACARA, 2016) already provides basic understanding in relation to energy for general education in the physical sciences, chemistry, earth and environment up to Year 10. In fact, topics such as the origins of energy, energy transformation are covered in the physics and chemistry curricula while related topics in the areas of energy transformation, energy storage, usage are found in the earth and physical sciences which are taught at secondary school (Year 7 to 10). Specific units such as the ACES076 looks at renewable resources are those that are typically replenished attime scales of years to decades and include harvestable resources (for example, water, biota and some energy resources) and services (for example, ecosystem services) (ACSES076). This curriculum is supplemented by a variety of teaching resources some even developed by external agencies and private organisations as part of their corporate social responsibility (CSR) program. Origin’s Energy for school targeted at as early Year 3 and provides materials to Year 8, on topics of awareness for origins of energy, ways to promote energy efficiency and solar energy, a source of renewable energy (Origin, 2018).These resources are free for teachers and students. Activity based learning such as the creation of a poster to promote energy efficiency and writeup of what it means to have a solar energy at your school, leading to a nation-wide competition.
ResourceSmart (2018) portal hosted by Sustainability Victoria contains various modules for school to promote good learning outcomes in sustainability. Among its contents, the energy module focuses on energy reduction and its links to the themes of sustainability and climate change. The contents include activity-based learning such as engaging students in energy audits (ResourceSmart 2018). In comparison, a developed nation such as the United States already has targeted educational energy consumption reduction programs and goals for a zero energy building (Zero Energy Resources 2018). The Australian School Curriculum do not specify any trade related topics such as construction much less a specialised area such as lean construction. Students in the school system do have a chance to undertake VET education as part of their subject options.
3.2 Zero Energy Building Education and Lean Construction Education in the VET/TAFE Sector
In Australia, the Vocational and Technical Education or VET sector delivers workplace-specific skills and knowledge. The VET curricula cover a wide range of careers and industries, including trades and office work, retail, hospitality and technology. Different predefined sectors have industry skill councils that developed and standardised training
42nd AUBEA Conference 2018: Educating Building Professionals for the Future in the Globalised World
collaborative working method and an innovative way to achieve nearly Zero Energy Buildings (nZEB) targets and good indoor environment. Ladhad and Parrish (2013) presented a case study of an existing 1536 m2 office building retrofit in Phoenix, Arizona. They discussed the role of lean principles and construction practices in making the zero-net-energy retrofit project successful in terms of both energy efficiency and cost efficiency. Lausman (2016, para. 12) also reported “Lean methodologies reduced waste, increased value and delivered a ‘Net Zero’ energy facility (the Mosaic Center in Edmonton, Alberta) three months ahead of schedule and three percent under budget!”.Therefore, the application of lean principles and zero energy in construction may offer great potential in contributing to housing affordability in Australia.
Exploring the current state of zero energy and lean construction education in AustraliaEducation, training and certification for zero energy and efficient work methods are generally deliver in parts at varying level some subjects or course programs. How much of these are deliver within the education system in Australia? What exactly is the status and how well do they equipping students with knowledge and skills to be effective professionals in these areas?
2 Method
The authors conducted a comprehensive review which included on-line contents of courses and subjects put up by education service providers in the areas of zero energy and lean construction. These are then compiled, compared and analysed for gaps where education has not met the requirements of industry. The review is divided along the educational framework specified in the Australian Qualifications Framework (AQF) i.e. schools, vocational education and training (VET) and higher education (HE) (AQFC, 2013). This study is limited to Australian education system and institutions.
3 Review
The Australian Qualifications Framework (AQF)In order to address these questions, it is necessary to discuss briefly the Australian Qualifications Framework which describes the national policy for regulating qualifications in Australia, the broad aims at each level and the contents of zero energy and lean construction that are taught at various levels. It differentiates school, vocational education & training, and higher education. Educational outcomes for each of these levels are clearly defined so that qualifications can be consistently linked and student pathways to educational goals defined. This enables clarity and consistency to the qualifications and expected learning outcomes.
The aim of the Australian school sector is to provide students with a general education from Year 1 to Year 10. In terms of science learning inquiry skills, this is broadly categorised and translates into six key concepts of (1) pattern order and organisation, (2) forms and function (3) stability and change (4) scale and measurement (5) matter and energy and (6) systems (VCAA 2018).
The VET sector on the other hand, provides for skill-specific training in defined industries. In particular, graduates holding a Level 3 qualification have the ability to apply knowledge and skills to work autonomously in a known environment. Graduates holding a Level 4 qualification are able to demonstrate judgment in a changing context. At Levels
48. 49.

42nd AUBEA Conference 2018: Educating Building Professionals for the Future in the Globalised World
Table 2 Examples of Units of Energy-related Units of CompetenciesCode Unit of Competency
UEENEEK123A Carry out basic repairs to renewable energy apparatusUEENEEK110A Co-ordinate maintenance of renewable energy (RE) apparatus and systemsUEENEEK133A Design hybrid renewable power systemsUEENEEK129A Design renewable energy (RE) heating systemsUEENEEK139A Design stand-alone renewable energy (RE) systemsUEENEEK140A Develop engineering solutions to renewable energy (RE) problemsUEENEEK127A Diagnose and rectify faults in renewable energy control systemsAHCAGB508 Improve agricultural sustainability using renewable energy and recycle systemsICTSUS401 Install and test renewable energy system for ICT networksUEENEEK121A Manage renewable energy (RE) projectsUEENEEK123A Carry out basic repairs to renewable energy apparatusUEPMNT369A Monitor climatic conditions for renewable electricity generationUEPOPS359A Monitor climatic conditions for renewable energy productionUEENEEK122A Plan renewable energy (RE) projectsUEENEEK128A Solve problems in stand-alone renewable energy systems
UEENEEK149A Verify compliance and functionality of an extra low voltage renewable energy installation
UEENEEE074B Write specifications for renewable energy engineering projects
Table 3 Examples of commonly taught lean-related units of competenciesUnit Code Competency Unit
MSS403021A Facilitate a just-in-time systemMSS403040A Facilitate and improve implementation of 5SMSS403051A Mistake proof an operational processMSS405002A Analyse and map a value streamMSS405003A Manage a value streamMSS405021A Develop a just-in-time system
Design of housing and energy systems requires higher level of cognitive and adaptable skills. Therefore, it is not surprising that the courses offered are at the trades level and targeted at the fabrication and maintenance of zero energy systems, efficient energy systems and efficient manufacturing of houses.
3.3 Zero Energy Building and Lean Construction in The Higher Education Sector
Climate change is a major concern and energy supply plays a significant role in terms of environmental damages due to its high greenhouse gas (GHG) emissions. To tackle this issue, Australia has offered various dedicated courses related to renewable energy across the country since 1998. In 2008, Thomas et al. (2008) documented available courses related to energy in both Australia and New Zealand. At that time, 4 undergraduate, 17 postgraduate and 8 research degrees were available in Australia. Due to public policies and targets stablished for increasing the use of renewables, the country has continued investing in education for the area in the last twenty years. To update those numbers, available courses and subjects which are related to Zero Energy, Energy Efficiency and Sustainable Energy in Australia were investigated. As of today, 10 undergraduate courses and 19 postgraduate courses are offered. Research higher degrees were excluded in this analysis. Some of the courses available today are the same ones that were reported back in 2008 by Thomas et al. (2008), while others were replaced by new courses with a more robust or specific area of knowledge. For instance, the Murdoch University offers a Master Degree in Energy studies since 2008. However, the course is now named ‘Energy and Carbon Studies’. The results show:
42nd AUBEA Conference 2018: Educating Building Professionals for the Future in the Globalised World
packages, qualifications, accredited courses, units of competency and skill sets which are standardised for use by the Technical and Further Education (TAFE) providers and Registered Training Organisations (RTOs).
In our review of the skillsets and workplace training the relevant training packages such as the Construction, Plumbing and Services Training Package (CPC08, 2017), Electrotechnology Training Package (UEE11), the Property Services Training Package (CPP, 2017), Sustainability Training Package (MSS, 2016), the Manufacturing Training Package (MSA07, 2014). The search revealed several “renewable energy” or “energy efficiency” qualifications at AQF Levels 3 (Certificate III), 4 (Certificate IV), 5 (Diploma) and 6 (Advanced Diploma). A search of the training packages showed at least 12 qualifications related to renewable energy and energy. Table 1 shows that most of these are found in the electrotechnology training packages.
Table 1 Examples of Australian energy-related VET qualificationsCourse Code Qualification Training Package
UEE62011 Advanced Diploma of Engineering technology -Renewable energy UEE Electrotechnology
UEE60911 Advanced Diploma of Renewable Energy technology UEE ElectrotechnologyUEE32011 Cert III in Renewable Energy – ELV UEE ElectrotechnologyUEE41911 Cert IV in Electrical - Renewable Energy UEE ElectrotechnologyUEE41611 Cert IV in Renewable Energy UEE ElectrotechnologyUEE50711 Diploma of Renewable Energy Engineering UEE ElectrotechnologyUEE22111 Certificate II in Sustainable Energy (Career Start) UEE Electrotechnology
UEE42811 Certificate IV in Air-conditioning Systems Energy Management and Control UEE Electrotechnology
CPP51012 Diploma of Residential Building Energy Assessment CPP Property ServicesUEE43111 Certificate IV in Energy Efficiency and Assessment UEE ElectrotechnologyUEE41011 Certificate IV in Energy Management and Control UEE ElectrotechnologyCPP51012 Diploma of Residential Building Energy Assessment CPP Property Services22311VIC Course in Retrofitting for Energy and Water Efficiency CPP Property Services
Numerous units of competencies were found. A further examination of the training packages found over 200 units of competencies related to energy while only 45 relates to renewable energy and only 15 relates to energy efficiency. Table 2 shows examples of some of these energy-related units of competencies.
From the review of the current training packages, it can be seen the curricula for the qualifications and topics related to zero energy such as renewable energy and energy efficiency exists. However, the number of institutions offering these are not many. While qualifications and unit of competencies are available, it is up to the TAFE and RTOs to when to offer courses and units of competencies for the courses.
There are no specific qualifications toward lean construction although there are many construction courses covered in the CPC Construction, Plumbing and Services Training Package (2017). Most of the qualifications have options for students to enrol in units of competency that teaches lean concepts such as 5S (term refers to five steps – sort, set in order, shine, standardize and sustain), Just-in-time and value stream. Most of these units are found in in the MSA07 Manufacturing Training Package (2014) such as MSS40203 Apply 5S Procedures, MSAPMSUP390A Structured Problem Solving. Although written primarily for the manufacturing industry, these can be used and contextualised for other training packages used in the building industry. More examples of such lean specific topics are listed in Table 3.
50. 51.

42nd AUBEA Conference 2018: Educating Building Professionals for the Future in the Globalised World
4 Discussion
From our review of online contents of the Australian school systems, schools from Year 3 to Year 10 have sufficient contents related the origins of energy, the conversion of energy, and even topics such as sustainability of the continued use of fossil fuel-based energy and effects such as climate change. This result indicates that students should generally be able to undertake specialist studies in TAFE’s and universities due to having previous basic knowledge on the topic.
A review of the VET system on the other hand, shows the traditional skill specific training is well developed. However, energy-related trainings are only available in certain sectors such as the Electrotechnology and the Property Services training and not specifically found in the Construction, Plumbing and Service Training Package. Lean construction unit of competencies are also not listed in the CPC Construction, Plumbing and Services Training Package (2017). It should be noted that although students can nominate units of competencies found in other training packages, it is up to the educational institution to offer them and these have to be contextualised to the building industry.
In the higher education sector where higher level cognitive skills such as design skills are developed, there are no currently specific qualifications offered in zero energy or lean construction however there are numerous universities offering coursework subjects related to energy management, energy in buildings and there are notably fewer universities offering subjects related to energy related construction. Lean construction topics may currently be offered as part of subjects as specific lean construction courses were not found in any universities in Australia.
These may perhaps leave gaps that should be filled up either by industry - associations of by private education providers offering non-for-credit or non-award type courses such as Continuing Professional Development (CPD) courses which is offered by Engineers Australia. The difficulty with such courses is that there are usually unregulated and therefore lacking in quality control. These courses also tend to be offered only when there is sufficient demand to justify organising the courses.
5 Conclusions
Two important current topics in the buildings are lean construction and zero energy buildings. These development and education of practitioners skilled in these concepts will have and influence on the industry’s ability to reduce in the quest for affordable housing development. In our investigation we found that although the main knowledge areas of zero energy are sufficiently covered by courses involving sustainability, renewable energy, energy efficiency in buildings and infrastructure construction, there are still gaps as teaching of lean concepts are not widespread for achieving affordable housing and infrastructure in all these sectors in Australia. The increase of housing demand and challenges in relation to energy supply forecasted for the future in Australia shows the importance of bringing together zero energy and lean construction concepts into the forefront of schools and universities curriculum. Therefore, new course and subject offerings in the construction, facilities management and energy management areas should include not just topics on lean construction and zero energy but whole subjects which are standalone units.
42nd AUBEA Conference 2018: Educating Building Professionals for the Future in the Globalised World
• one Associate Degree of Applied Engineering in Renewable Energy Technologies;
• nine Bachelor Degrees, being the majority in Engineering, one in Science and one in Technology;
• one Graduate Certificate in Energy and Carbon Studies;• four Graduate Diplomas;• two Master Degree specialisations, being the first in Energy Efficiency Modelling
and Implementation and the second in Renewable and Sustainable Energy Engineering;
• twelve Master Degrees, being seven in Engineering, one in Science, one in Energy efficient and Sustainable Building, one in Energy Systems, one in Sustainable Energy, and one in Environment.
Despite energy efficiency being a priority, construction is another major concern nowadays as the country has been experiencing significant population growth in the last decades. Lean Construction combines lean manufacture principles applied to construction, ensuring higher quality, potential cost reduction and reduced time of construction. In relation to Lean Construction, no graduate nor postgraduate course was found. The search included certificate, diploma, undergraduate, and postgraduate courses in Australia. Besides the lack of undergraduate and postgraduate courses in the area, trainings and events related to this topic are provided by the Lean Construction Institute Australasia (LCIA) and Engineering Education Australia (EEA). It highlights the fact that the area is emerging and there is a potential for developing courses for higher education in Lean Construction. Considering the combination of teaching in energy and construction, only one specific course provides a Master Degree which is specifically related to energy efficiency and construction. Royal Melbourne Institute of Technology (RMIT) offers a Master of Energy Efficient and Sustainable Building to both local and international students.
Coursework subjects were also explored with the aim of investigating the specific areas of study for each one of the offered courses in Australia. Seventy coursework subjects were identified according to the syllabus of each discipline. Coursework subjects related to energy were excluded as the area of knowledge was sometimes not relevant to ZeroEnergy. The subjects which includes teaching in specific areas related to Zero Energy, Renewable Energy and Sustainable Energy were considered.
The findings show that:
• There is no specific undergraduate and/or postgraduate course offered with certificate in Zero Energy, Lean Construction, or Energy Management.
• There is no specific undergraduate and/or postgraduate course in energy which includes ‘Lean Construction’.
• Thirteen coursework subjects related to energy are related to buildings.• Two coursework subjects related to energy are related to construction.• Thirteen coursework subjects related to energy include management.• None of the coursework subjects related to energy includes lean construction.
The list of courses and coursework subjects are provided in Appendix A and B.
52. 53.

42nd AUBEA Conference 2018: Educating Building Professionals for the Future in the Globalised World
Appendix A- List of Courses available in Australia
Course University LevelAssociate Degree of applied engineering (renewable energy technologies) TAFE NSW Undergraduate
Bachelor of Technology (Renewable Energy Systems) University of Newcastle UndergraduateBachelor of Engineering Honours (BE(Hons)) in Renewable Energy Engineering Murdoch University Undergraduate
Bachelor of Engineering Majoring in Renewable Energy Systems
Australian National University Undergraduate
Bachelor of Engineering (Electrical and Renewable Energy) Honours Edith Cowan University Undergraduate
Bachelor of Engineering (honours) Major in Photovoltaics and Solar Energy
University of New South Wales Undergraduate
Bachelor of Engineering (Honours) Major in Renewable Energy Engineering
University of New South Wales Undergraduate
Bachelor of Engineering (Sustainable Energy Systems) Griffith University Undergraduate
Bachelor of Engineering Sustainable Energy Systems Australian National University Undergraduate
Bachelor of Renewable Energy Engineering (Honours) Monash University UndergraduateGraduate Certificate in Energy and Carbon Studies (GradCertEnCbSt) Murdoch University Postgraduate
Graduate Diploma in Energy and Carbon Studies (GradDipEnCbSt) Murdoch University Postgraduate
Graduate Diploma in Energy and the Environment (Energy, Emissions and Environment) Murdoch University Postgraduate
Graduate Diploma in Energy Efficient and Sustainable Building RMIT Postgraduate
Graduate Diploma in Sustainable Energy RMIT PostgraduateMaster of Energy Efficient and Sustainable Building RMIT Postgraduate
Master of Energy Systems The University of Melbourne Postgraduate
Master of Sustainable Energy Queensland University of Technology Postgraduate
Master of Engineering (Electrical and Renewable Energy Engineering) Deakin University Postgraduate
Master of Engineering (Sustainable Energy) RMIT Postgraduate
Master of Engineering in Renewable Energy Australian National University Postgraduate
Master of Engineering in Sustainable Systems University of New South Wales Postgraduate
Master of Engineering Science Specialisation in Photovoltaics and Solar Energy
University of New South Wales Postgraduate
Master of Engineering Science Specialisation in Renewable Energy
University of New South Wales Postgraduate
Master of Environment (Energy Efficiency Modelling and Implementation)
The University of Melbourne Postgraduate
Master of Philosophy in Engineering - Photovoltaics and Solar Energy
University of New South Wales Postgraduate
Master of Science Renewable and Sustainable Energy (MRenSusEn) Murdoch University Postgraduate
Specialisation - Energy Efficiency Modelling and Implementation
The University of Melbourne Postgraduate
Specialisation - Renewable and sustainable energy engineering Monash University Postgraduate
42nd AUBEA Conference 2018: Educating Building Professionals for the Future in the Globalised World
6 References
ACARA – The Australian Curriculum, Assessment and Reporting Authority (2016), The Australian Curriculum, ACARA, Sydney, Australia.
AQFC – The Australian Qualifications Framework Council (2013), Australian Qualifications Framework, 2nd edition, the Australian Qualifications Framework Council, Australian Government Department of Education and Training, Canberra, Australia.
CPC Construction, Plumbing and Services Training Package (2017), Release 3.0. Australian Government, URL: https://training.gov.au/TrainingComponentFiles/CPC/CPC_R3.0.pdf,viewed: 25 May 2018.
CPP Property Training Package (2017), Release 1.0, Australian Government, URL: https://training.gov.au/TrainingComponentFiles/CPP/CPP_R5.0.pdf, viewed: 25 May 2018.
Ladhad, A. and Parrish, K. (2013), The role of lean practices for zero net energy retrofits. in: Formoso, C.T. & Tzortzopoulos, P., 21st Annual Conference of the International Group for Lean Construction. Fortaleza, Brazil, 31 July-2 August 2013. pp 895-904.
Lausman, K. (2016), Lean to Be ‘Green’. http://www.lcicanada.ca/lean-to-be-green/, viewed: 2June 2018.
MSA07 Manufacturing Training Package (2014), release 8.4, Australian Government, URL: https://training.gov.au/TrainingComponentFiles/MSA07/MSA07_R8.4.pdf, viewed: 25May 2018.
MSS Sustainability Training Package (2017), Release 1.0, Australian Government, URL: https://training.gov.au/TrainingComponentFiles/MSS/MSS_R1.0.pdf, viewed: 25 May 2018.
Origin (2018), Energy for Schools, URL: https://www.originenergy.com.au/about/community/energy-for-schools.html, viewed: 30 May 2018.
Pulakka, S., Vares, S., Nykänen, E., Saari, M., and Häkkinen, T, (2016), Lean production of cost optimal wooden nZEB. Energy Procedia, vol. 96, pp.202-211.
ResourceSmart, Sustainability Victoria URL: http://www.sustainability.vic.gov.au/School/Modules, viewed: 30 May 2018.
Sands, M.S. (2010), Standards and measures--whole-building metrics driving innovation and high performance. Lean Construction Journal, pp. 1-17.
Swoboda, K. (2018), Energy prices—the story behind rising costs, URL: https://www.aph.gov.au/About_Parliament/Parliamentary_Departments/Parliamentary_Library/pubs/BriefingBook44p/EnergyPrices, Parliament of Australia, viewed: 16 June 2018.
Thomas, C. Jennings, P.J. and Lloyd, B. (2008), Renewable energy courses in Australian andNew Zealand universities, Solar Progress, pp. 1-6.
UEE Electrotechnology Training Package (2017), Australian Government, release 1.0. URL: https://training.gov.au/TrainingComponentFiles/UEE/UEE_R1.0.pdf, viewed: 25 May 2018.
VCAA (2018), Learning in Science: The key concepts, Victorian Curriculum Foundation-10, URL: http://victoriancurriculum.vcaa.vic.edu.au/science/introduction/learning-in-scienceviewed: 16 June 2018.
Zero Energy Resources (2018), URL: https://www.zeroenergy.org/zero-energy-schools/,viewed: 30 May 2018.
Zuhairi, A.H., Beng, G.H. and Hung, F.C. (2016), Design revolution for affordable housing in tropical country, in Proceedings of the CIB World Building Congress 2016, Volume V, Advancing products and services, Edt. Nebil Achour, pp. 282-301.
54. 55.

42nd AUBEA Conference 2018: Educating Building Professionals for the Future in the Globalised World
Course Subject University Level of degree
Construction
/Building
Management
Master of Engineering in Renewable Energy
Integration of Renewable Energy into Power Systems and Microgrids
Australian National University
Postgraduate - Yes
Master of Engineering in Renewable Energy
Urban Energy and Energy Efficiency
Australian National University
Postgraduate Yes -
Master of Engineering in Renewable Energy
Industrial Energy Efficiency and Decarbonisation
Australian National University
Postgraduate - -
Master of Engineering in Renewable Energy
Solar Thermal Technologies
Australian National University
Postgraduate - -
Bachelor of Engineering (Electrical and RenewableEnergy) Honours
Sustainability and Renewable Energy
Edith Cowan University
Undergraduate - -
Bachelor of Engineering (Electrical and RenewableEnergy) Honours
Renewable Energy Conversions 1
Edith Cowan University
Undergraduate Yes -
Bachelor of Engineering (Electrical and RenewableEnergy) Honours
Renewable Energy Conversions 2
Edith Cowan University
Undergraduate - -
Associate Degree of applied engineering (renewable energy technologies)
Foundation studies in renewable energy and sustainability
TAFE NSW
Undergraduate - -
Associate Degree of applied engineering (renewable energy technologies)
Renewable energy resource analysis
TAFE NSW
Undergraduate - -
Associate Degree of applied engineering (renewable energy technologies)
Grid connected photovoltaic power systems
TAFE NSW
Undergraduate - -
Associate Degree of applied engineering (renewable energy technologies)
Solar and thermal energy systems
TAFE NSW
Undergraduate - -
Bachelor of Engineering (honours) Major in Photovoltaics and Solar Energy/ Sustainable Systems
Sustainable and Renewable Energy Technologies
University of New South Wales
Undergraduate - -
Bachelor of Engineering (honours) Major in Photovoltaics and Solar Energy
Low Energy Buildings and PV
University of New South Wales
Undergraduate Yes -
Bachelor of Engineering (Honours) Major in Renewable Energy Engineering
Renewable Energy Policy and International Programs
University of New South Wales
Undergraduate - -
Master of Engineering Science Specialisation in Photovoltaics and Solar Energy
Sustainable Energy for Developing Countries
University of New South Wales
Postgraduate Yes -
Master of Engineering Science Specialisation in Photovoltaics and Solar Energy
Photovoltaic Technology and Manufacturing
University of New South Wales
Postgraduate - -
Master of Engineering Science Specialisation in Photovoltaics and Solar Energy
Advanced Photovoltaic Manufacturing
University of New South Wales
Postgraduate - -
42nd AUBEA Conference 2018: Educating Building Professionals for the Future in the Globalised World
Appendix B – Coursework subjects available in Australia
Course Subject University Level of degree
Construction
/Building
Management
Bachelor of Engineering Honours (BE(Hons)) in Renewable Energy Engineering
Applied Photovoltaics
Murdoch University Graduate - -
Bachelor of Engineering Honours (BE(Hons)) in Renewable Energy Engineering
Renewable Energy Systems Engineering
Murdoch University Graduate - -
Master of Science Renewable and Sustainable Energy
Energy System Murdoch University Graduate - -
Master of Science Renewable and Sustainable Energy
Case Studies of Renewable Energy Systems
Murdoch University Graduate - Yes
Master of Science Renewable and Sustainable Energy
Renewable Energy Resource
Murdoch University Graduate - -
Master of Science Renewable and Sustainable Energy
Renewable Energy Devices
Murdoch University Graduate - -
Master of Science Renewable and Sustainable Energy
Renewable Energy Systems Design
Murdoch University Graduate - -
Master of Science Renewable and Sustainable Energy
Energy Efficiency, System Analysis and Auditing
Murdoch University Graduate - -
Master of Science Renewable and Sustainable Energy
Industrial and Commercial Energy Efficiency Technologies
Murdoch University Graduate - -
Master of Science Renewable and Sustainable Energy
Energy Efficient Buildings
Murdoch University Graduate Yes -
Bachelor of Engineering Sustainable Energy Systems
Engineering Sustainable Systems
Australian National University
Undergraduate - -
Bachelor of Engineering Sustainable Energy Systems/ Bachelor of Engineering Majoring in RenewableEnergy Systems/Master of Engineering in Renewable Energy
Energy Resources and Renewable Technologies
Australian National University
Undergraduate - -
Bachelor of Engineering Majoring in RenewableEnergy Systems/ Master of Engineering in Renewable Energy
Photovoltaic Technologies
Australian National University
Undergraduate - -
Bachelor of Engineering Majoring in RenewableEnergy Systems
Solar Thermal Technologies
Australian National University
Undergraduate - -
Master of Engineering in Renewable Energy
Photovoltaic Power Plants
Australian National University
Postgraduate Yes -
56. 57.

42nd AUBEA Conference 2018: Educating Building Professionals for the Future in the Globalised World
Course Subject University Level of degree
Construction
/Building
Management
Specialisation - Renewable and sustainable energy engineering
Sustainable energy systems
Monash University
Postgraduate - -
Specialisation - Renewable and sustainable energy engineering
Energy efficiency and sustainability engineering
Monash University
Postgraduate Yes -
Specialisation - Renewable and sustainable energy engineering
Renewable energy systems
Monash University
Postgraduate - -
Engineering PhD students.Advanced photovoltaics and energy storage
Monash University
Postgraduate - -
Master of Energy Efficient and Sustainable Building
Sustainable Energy Fundamentals RMIT Graduate - -
Master of Energy Efficient and Sustainable Building Building Systems RMIT Graduate Yes -
Master of Energy Efficient and Sustainable Building
Sustainability in the built environment: A focus on building and design
RMIT Graduate Yes -
Master of Energy Efficient and Sustainable Building
Sustainable Building technologies RMIT Graduate Yes -
Master of Energy Efficient and Sustainable Building
Energy Water and Airflow in Buildings RMIT Graduate Yes -
Master of Energy Efficient and Sustainable Building
Sustainable Energy Systems and design RMIT Graduate - -
Graduate Diploma in Sustainable Energy
Energy Efficiency and Demand Management
RMIT Graduate - -
Graduate Diploma in Sustainable Energy Photovoltaic Systems RMIT Graduate - -
Master of Sustainable Energy
Energy Principles and Renewable Energy
QueenslandUniversity of Technology
Graduate - -
Master of Sustainable Energy
Low Emission Technologies and Supply Systems
QueenslandUniversity of Technology
Graduate - -
Master of Sustainable Energy
Energy Efficiency and Transport
QueenslandUniversity of Technology
Graduate - -
Others ZEMCH Sustainable Design Workshop
The University of Melbourne
Graduate Yes -
Others Energy Efficiency Technology
The University of Melbourne
Graduate - -
Others Environmental Systems
The University Graduate Yes -
42nd AUBEA Conference 2018: Educating Building Professionals for the Future in the Globalised World
Course Subject University Level of degree
Construction
/Building
Management
Master of Engineering Science Specialisation in Photovoltaics and Solar Energy
Managing Energy Efficiency
University of New South Wales
Postgraduate Yes Yes
Master of Engineering Science Specialisation in Photovoltaics and Solar Energy
Photovoltaic Stand-Alone System Design and Installation
University of New South Wales
Postgraduate - -
Master of Engineering Science Specialisation in Renewable Energy/ Photovoltaics and Solar Energy/ Bachelor of Engineering (Honours) Major in Renewable Energy Engineering
Low Energy Buildings and Photovoltaics
University of New South Wales
Postgraduate Yes -
Master of Engineering Science Specialisation in Renewable Energy/ Photovoltaics and Solar Energy
Grid-Connected Photovoltaic Systems
University of New South Wales
Postgraduate - -
Master of Engineering Science Specialisation in Renewable Energy/ Bachelor of Engineering (Honours) Major in Renewable Energy Engineering
Energy Efficiency
University of New South Wales
Postgraduate Yes -
Master of Engineering Science Specialisation in Renewable Energy/ Photovoltaics and Solar Energy
Photovoltaics
University of New South Wales
Postgraduate - -
Master of Engineering Science Specialisation in Renewable Energy
Renewable Energy System Modelling and Analysis
University of New South Wales
Postgraduate Yes -
Master of Engineering Science Specialisation in Renewable Energy/ Photovoltaics and Solar Energy
Hybrid Renewable Energy Systems
University of New South Wales
Postgraduate - -
Master of Engineering Science Specialisation in Renewable Energy
Integrated Design Studio 4 High Performance Buildings
University of New South Wales
Postgraduate Yes -
Master of Engineering Science Specialisation in Renewable Energy
Solar Thermal Energy Design
University of New South Wales
Postgraduate - -
Master of Engineering Science Specialisation in Renewable Energy/ Photovoltaics and Solar Energy
Advanced Photovoltaics
University of New South Wales
Postgraduate - -
Bachelor of Renewable Energy Engineering (Honours)
Solar energy Monash University
Undergraduate - -
58. 59.

42nd AUBEA Conference 2018: Educating Building Professionals for the Future in the Globalised World
Canopy: career transitions in academia and architecture
Guillermo Aranda-Mena1&2 and Luisa Scambia3
1School of Property, Construction and Project Management, RMIT Melbourne2 School of Architecture, Politecnico di Milano
3 Foster + Partners, London
E-mail: [email protected]
Abstract:The world is rapidly changing due technology advancement and globalisation. Cities will continue growing at a rapid pace. Professions and university degrees in the built-environment need to better reflect these occurring phenomena. A challenge for architects is to stay relevant in professional practice beyond the domain of their profession. A dialogue needs to take place about established and newly opening career paths in architecture education and practice. What are the leadership and professional transferable skills that need to be considered in curricula development? The lines between undergraduate, postgraduate and professional practice are also blurring. In order to stay relevant the profession and degrees in architecture will have to adapt and respond from factors such as the 4.0 (digital) revolution; evolving procurement and client engagement modes; and the changing nature of socio-intellectual capital gravitating towards transdisciplinary practice. Two lineal career experiences across academia and industry examine the changing nature of architecture practice. The technique applied is that of ‘the reflective practitioner’, much used in legal and medical education. The first case maps the transition of an early career architect coming from postgraduate education and entering the professional world. The second case explores the transition from an academic at professorial level into practice-based research. Results are discussed in relation to impacts on pedagogy, career-path development and curricula development.
Keywords: architectural education, reflective practice, resilience, sustainability
1 Introduction
It is acknowledged that university degrees for the professional disciplines need to adapt to encourage the acquisition of decision-making and leadership skills beyond strict discipline boundaries (Wiek and Walter 2009; Ertas et.al 2003). The blurring lines between undergraduate and postgraduate education are also seen as valuable as experiential knowledge comes into play and students at both levels are constantly being challenged for the value that higher education brings to professional practice. This is a healthy scenario as it forces professionals, engaged with various practice groups, to hone and improve their knowledge and skills with greater intellectual rigour (Drake 1998). It is challenging to, and demanding of, the “student professionals”.
We have identified three areas of change occurring globally in the construction industry: (1) the information and communications technology revolution; (2) client-owner-designer-builder relationships under various emerging procurement modes; and (3) the sustainability circular-economy. All these combine to create new cultural, social and economic frames for professional practice, bringing new opportunities and new challenges to the design professions (Aranda-Mena 2016b).
42nd AUBEA Conference 2018: Educating Building Professionals for the Future in the Globalised World
Course Subject University Level of degree
Construction
/Building
Management
of Melbourne
Others Renewable Energy
The University of Melbourne
Graduate - -
Others Renewable Energy Swinburne University Degree - -
Others Solar Energy
The University of Melbourne
Graduate - -
Others Energy Efficiency Technology
The University of Melbourne
Graduate - -
Others Renewable Energy Principles
Curtin University Graduate - -
Others Introduction to Renewable Energy
Curtin University Graduate - -
OthersSustainable Energy Systems and Technologies
Curtin University Graduate - -
Others Renewable Energy Systems
Curtin University Graduate - -
60. 61.

42nd AUBEA Conference 2018: Educating Building Professionals for the Future in the Globalised World
myriad of client bodies. Perhaps, it would be best to describe architects as conductors who orchestrate and take the lead in reconciling all the goals for a building or other structure. But an orchestra conductor is not formed overnight, young architects and graduates need to land their first jobs with fewer challenges and difficulties than they currently face. If following the analogy, also conductors must come through accomplishing concert-level performance skills with a musical instrument. Perhaps more attention into how to become a professionally competent architect, rather than what defines the architect should be a priority and providing the skilling and tooling for bridging from education into practice. Diversifying the profession of architecture could certainly alleviate the employability challenge. This has implications for professional registration, as not all recorded work activities would be recognised towards professional accreditation by various registration boards.
This paper instead focuses on the less conventional areas in which architectural education and practice could gain more terrain and momentum thus expanding the practice canopy.Indicators of success with transitional practice meaning a seamlessly move between education and professional practice in either direction. We consider issues such as resilience and maintaining relevance in a market driven economic where push-pull factors from industry and students (future employees) (Shury 2017).
In the next section transitory experiences across academia and industry are mapped out and articulated via a narrative depicting the changing nature of the architectural profession and the challenges and opportunities that come with the changing time we live in. The applied technique is Schön’s ‘The reflective practitioner: how professionals think in action’ (Schön 1991) using two personal experiences as the case studies. The first represents a mid-career academic with a high interest in professional practice and much of his research engaged with project and practitioners going beyond education and academia; while the second case explores the transition of graduates entering the professional world by moving across disciplines.
3 Method: Reflective Practice
Schön (1991) describes a situation of the learning process that occurs in a sheltered environment but which prepares graduates to become ‘reflective practitioners’ thus increasing control and resilience of their professional futures.
“That process which takes place in the architectural design studio is characteristic of a whole tradition of professional education which I call the deviant tradition. We really have two traditions of professional education. Up till now I have focused on the university-based schools of the professions, based upon the Veblen effect (or social desirability bias). But at the same time we have the studios of design. I think we can also include here the peculiar process by which people have learned, probably not in school but through some kind of apprenticeship in a practice setting, to become competent lawyers (for instance)…. And the basic pattern of these different versions of the ‘deviant; tradition, which I have dubbed ‘the reflective practicum’ is: You learn by doing, in Dewey’s phrase (1938 p.43).” Dewey places education as a verb rather than a noun and with that he is seen as the philosopher that defines ‘learning’ (Rodgers 2002).
What does learning by doing mean in today’s terms? Learning by doing, even before you know what it is and the apprentice begins to do in the presence of a professional mentor, or senior practitioner who is good at doing (whatever is it, craftsmanship, design work, music…) and whose business is to try to help you learn how to do it (Schön 1991).
42nd AUBEA Conference 2018: Educating Building Professionals for the Future in the Globalised World
One of the most obvious challenges is the increasing need (and expectation) for architects to communicate effectively with other participants in the project design team, especially with other professional disciplines. On a horizontal axis, trans-disciplinary practice is increasingly becoming the norm rather than the exception. On a vertical axis transitional practice will continue to attract interest due to a number of factors such as longer life expectancy, increasing demand from some industries such as property sector and downsizing of others such as manufacturing; and career changes due to personal choice.
2 Critical Review: Expanding the Canopy of Practice
Researchers have explored the transition from education into practice, concluding that tertiary education institutions and employers should collaborate to encourage student learning in a manner that promotes employability skills and attributes, without sacrificing academic content, as some institutions have feared (Lowden et al. 2011). This is to ensure that tertiary institutions continue to equip students with deep intellectual capabilities and applied practical skills [to make them] work-ready” (Archer et al. 2008, p.8), however, as the learning process is not a lineal it makes sense to investigate study and work transition with in-depth research techniques. They can shed light into meaningful experiences for career and life. Although individual subjective experiences, the technique helps to identify areas of research interest as to inform future studies, questions and research focus for larger quantitative studies.
One approach is to gain work experience during university education: “The general consensus regarding the usefulness of work placements to promote graduate employability, indicates that industry-trained employees are often preferred to those without work experience and thus how the HEI and employer collaboration requires improvement” (Shury 2017; Lowden et al. 2011).
Higher education and work experience in architecture need to include project management (Aranda-Mena, 2016b) and deeper engagement with Building Information Modelling (BIM) (Aranda-Mena, 2017a). Improvements with practice and project operations including stakeholder management and communication with clients can be highly beneficial for young graduates. However, brining managerial and technology skills as core part of architectural training in higher education presents a challenge, the discipline is well rooted into tradition often more aligned with arts (Krupinska 2014). The challenge thus goes beyond technical capabilities on technical knowledge (such as in Sasada 1999 or Herr et.a. 2011) and skills acquisition but also with changing culture, professional identity and tradition are areas to look at (Aranda-Mena et. al 2017b).
Furthermore, if going back to the foundation of what it is to be an architect? Boundaries are often arbitrary and not necessarily drawn by practitioners. In a traditional sense an architect is “a professional person who is qualified to design and provide advice — both aesthetic and technical — on proposed and existing buildings in both public and private landscapes” Canada (RAIC accessed 2018). In Australia the AIA defines an architect as the professional “that pushes boundaries when it comes to living, investigates new technologies and materials, and help ensure that what we build is environmentally sustainable, importantly, the architect designs no just for today, but for future generations” (AIA accessed 2018).
Both definitions fall short in acknowledging the realities of architectural practice. Architects serve as trusted advisors; their role is holistic, blending diverse requirements and disciplines in a creative process, while serving the public interest and addressing a
62. 63.
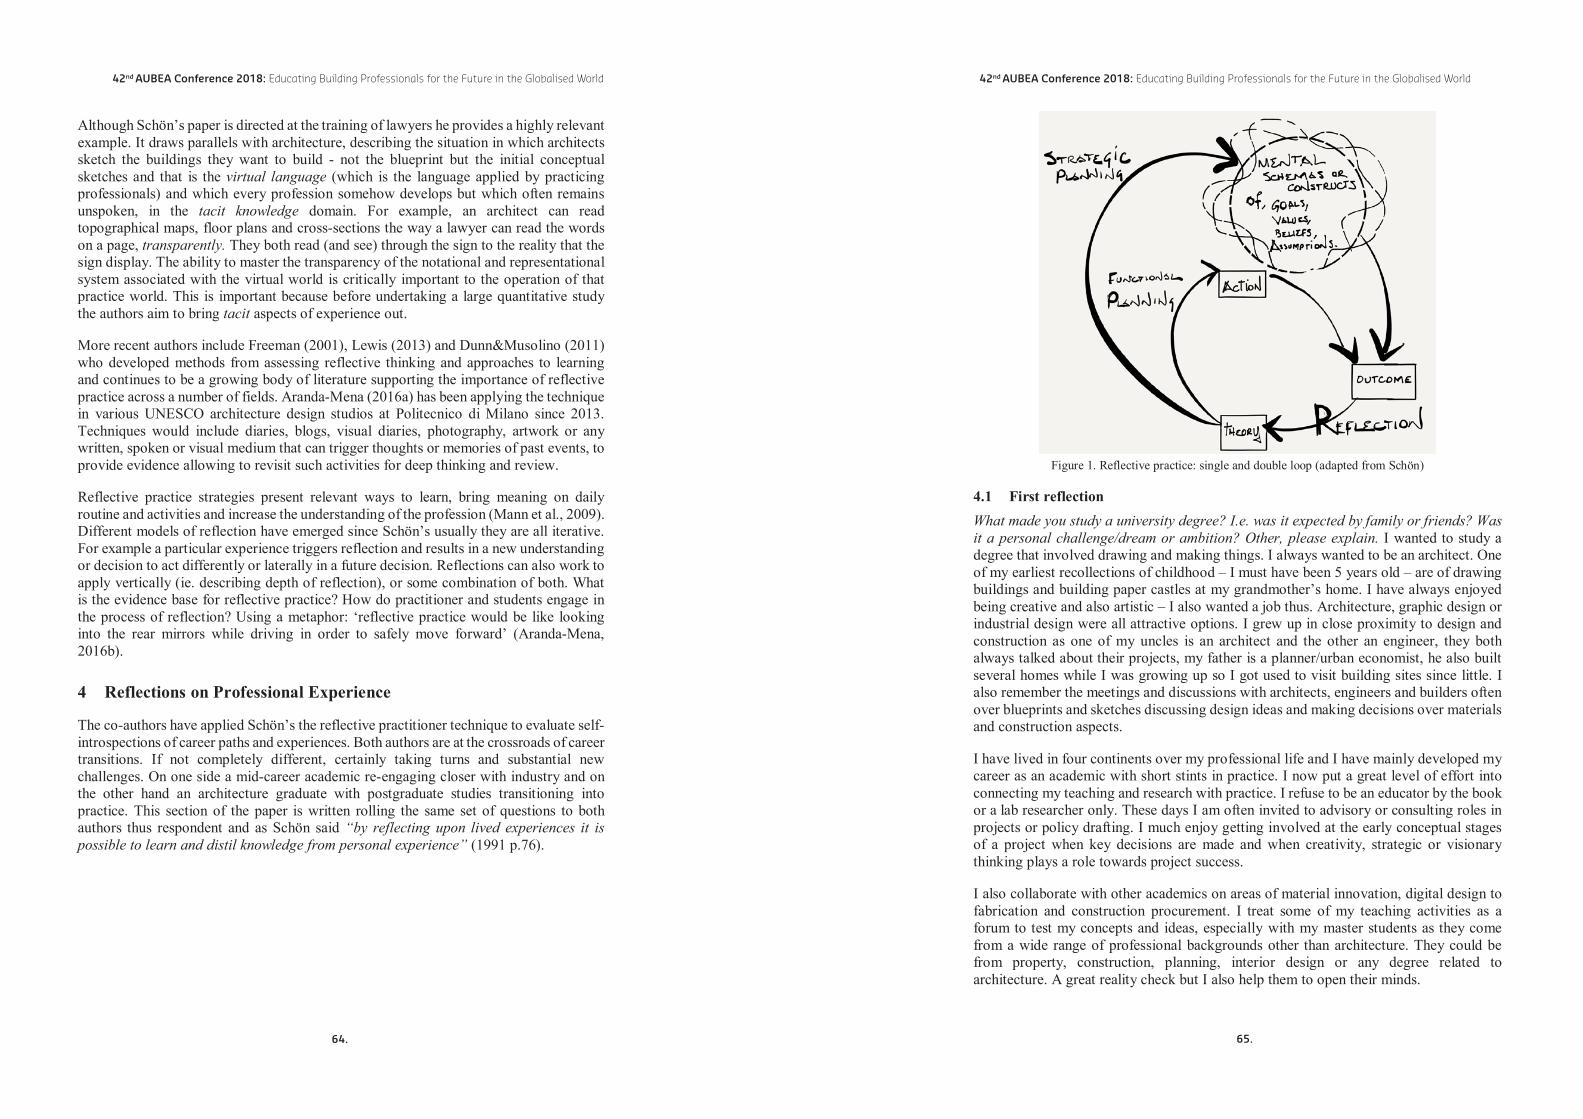
42nd AUBEA Conference 2018: Educating Building Professionals for the Future in the Globalised World
Figure 1. Reflective practice: single and double loop (adapted from Schön)
4.1 First reflectionWhat made you study a university degree? I.e. was it expected by family or friends? Was it a personal challenge/dream or ambition? Other, please explain. I wanted to study a degree that involved drawing and making things. I always wanted to be an architect. Oneof my earliest recollections of childhood – I must have been 5 years old – are of drawing buildings and building paper castles at my grandmother’s home. I have always enjoyed being creative and also artistic – I also wanted a job thus. Architecture, graphic design or industrial design were all attractive options. I grew up in close proximity to design and construction as one of my uncles is an architect and the other an engineer, they both always talked about their projects, my father is a planner/urban economist, he also built several homes while I was growing up so I got used to visit building sites since little. Ialso remember the meetings and discussions with architects, engineers and builders often over blueprints and sketches discussing design ideas and making decisions over materials and construction aspects.
I have lived in four continents over my professional life and I have mainly developed my career as an academic with short stints in practice. I now put a great level of effort into connecting my teaching and research with practice. I refuse to be an educator by the book or a lab researcher only. These days I am often invited to advisory or consulting roles in projects or policy drafting. I much enjoy getting involved at the early conceptual stagesof a project when key decisions are made and when creativity, strategic or visionary thinking plays a role towards project success.
I also collaborate with other academics on areas of material innovation, digital design to fabrication and construction procurement. I treat some of my teaching activities as a forum to test my concepts and ideas, especially with my master students as they come from a wide range of professional backgrounds other than architecture. They could befrom property, construction, planning, interior design or any degree related to architecture. A great reality check but I also help them to open their minds.
42nd AUBEA Conference 2018: Educating Building Professionals for the Future in the Globalised World
Although Schön’s paper is directed at the training of lawyers he provides a highly relevant example. It draws parallels with architecture, describing the situation in which architects sketch the buildings they want to build - not the blueprint but the initial conceptual sketches and that is the virtual language (which is the language applied by practicing professionals) and which every profession somehow develops but which often remains unspoken, in the tacit knowledge domain. For example, an architect can read topographical maps, floor plans and cross-sections the way a lawyer can read the words on a page, transparently. They both read (and see) through the sign to the reality that the sign display. The ability to master the transparency of the notational and representational system associated with the virtual world is critically important to the operation of that practice world. This is important because before undertaking a large quantitative study the authors aim to bring tacit aspects of experience out.
More recent authors include Freeman (2001), Lewis (2013) and Dunn&Musolino (2011) who developed methods from assessing reflective thinking and approaches to learning and continues to be a growing body of literature supporting the importance of reflective practice across a number of fields. Aranda-Mena (2016a) has been applying the technique in various UNESCO architecture design studios at Politecnico di Milano since 2013. Techniques would include diaries, blogs, visual diaries, photography, artwork or any written, spoken or visual medium that can trigger thoughts or memories of past events, to provide evidence allowing to revisit such activities for deep thinking and review.
Reflective practice strategies present relevant ways to learn, bring meaning on daily routine and activities and increase the understanding of the profession (Mann et al., 2009). Different models of reflection have emerged since Schön’s usually they are all iterative. For example a particular experience triggers reflection and results in a new understanding or decision to act differently or laterally in a future decision. Reflections can also work to apply vertically (ie. describing depth of reflection), or some combination of both. What is the evidence base for reflective practice? How do practitioner and students engage in the process of reflection? Using a metaphor: ‘reflective practice would be like looking into the rear mirrors while driving in order to safely move forward’ (Aranda-Mena, 2016b).
4 Reflections on Professional Experience
The co-authors have applied Schön’s the reflective practitioner technique to evaluate self-introspections of career paths and experiences. Both authors are at the crossroads of career transitions. If not completely different, certainly taking turns and substantial new challenges. On one side a mid-career academic re-engaging closer with industry and on the other hand an architecture graduate with postgraduate studies transitioning into practice. This section of the paper is written rolling the same set of questions to both authors thus respondent and as Schön said “by reflecting upon lived experiences it is possible to learn and distil knowledge from personal experience” (1991 p.76).
64. 65.

42nd AUBEA Conference 2018: Educating Building Professionals for the Future in the Globalised World
of a safety net an architecture degree should play for those not so inclined to become A-league architects. I think it should. What is taught during university studies should provide a launch-pad to finding the first job. Even when higher education is about shaping minds at a deeper level it should provide the tooling to kick-start a professional career and that should be as much are priority as developing an eye for beauty and nurturing design sensibilities.
How do you see Universities and higher education responding to the changing nature of the professions? One of the areas that I felt I could have learnt more during myarchitecture degree was in building technology and construction. Shortly after graduating I enrolled into a master of science in European Construction Engineering, the course equipped me with engineering design, construction technical and managerial skills that my architecture degree did not covered. The master had three strong components including, construction innovation, sustainability and international practice. During my studies I got to experience life in three European countries (as each semester was taught in a different country) on top of that he program had students from across science, engineering and design. It was such an eye opener when it came to experiencing culture moving from disciplinary/professional to country or national cultures. Truly internationaland transdisciplinary education. The logistics to do this are not practical nor for every taste nor pocket, but the lessons should be pursued on a regular basis. Even in a classroom set up. Students and education programs will continue to adapt as they respond to changing environments. Evolution is not about the survival of the fittest but the one who is better adapts to changing scenarios. Change and adaptation will be key to success in professional practice, the question is often on the level resilience required.
What is your understanding of transferable skills? Please comment. Transferable skills is a bit like a Swiss army knife, a tool you might be able to apply or operate over various circumstances/conditions. If we think of architectural education and in this way it might open up more opportunities for graduates at entry level. If applying the above metaphor, at the moment many schools of architecture want to provide the Samurai sword rather than the more rounded toolkit. This might be because fields of construction, engineering and science are seen often seen as external to architecture?
What is you long-term career ambition? Academia has been home for me and I have developed a fruitful research career, but I always kept strong links with industry to complement my academic life. I am always trying to bridge across to practice and increasingly moving my research to apply directly to projects or clients, rather than policy writing or basic research. I think this can work well in cycles or life stages and one only needs when to make moves. My ambition is to increase my direct participation in practice, in the form of advisory roles to government and private sector in areas of value management, conceptual design and planning projects. Also on the uptake of BIM technologies on both fronts, governance and hands-on guidelines. To achieve this I will continue applying my research and teaching directly to projects.
What is your view and/or understanding of professional resilience? My understanding ofresilience is about being able to endure hardships without giving up on your initial dreams and objective. Resilience in architecture is tricky as it takes many years before one sees results. Architects in their mid-40s are perceived as young. People like Zaha Hadid worked for about 20 years on areas related to architecture such as teaching and graphic design before she got her first commission. Others include Peter Cook with similar span of time in between practice concept development and obtaining large commissions, there are 30 years apart in between the Archigram movement which co-founded and his Kunsthaus in Graz, Austria. On the other had Moshe Safdie was only a university student
42nd AUBEA Conference 2018: Educating Building Professionals for the Future in the Globalised World
Did your university degree aligned with your expectations. Please explain why yes OR why not? I very much enjoyed studying architecture and had a great experience undertaking my undergraduate studies but after graduation I did not feel I was equipped with enough professional knowledge and technical skills to feel confident at the job interview. I landed on my first job working for a multinational contractor. I contributed preparing tender applications for projects such as office towers, marinas and beach resorts. I also worked on areas of heritage and restoration and international project on this field same project that brought me back to academia.
As a young professional I decided to undertake a Master of Science in European Construction Engineering to inform me better on materials and design technology. The Master was a European program thought across four countries including Denmark, Portugal, Italy and England. The whole class had to move every semester, it was really great, that was back in the mid-90’s. Same time when Frank Gehry built the Guggenheim museum in Bilbao. I remember seeing it under construction and being surprised, intrigued and inspired by it. It was a bold, challenging, non-conventional yet a sophisticated building (I was back in Bilbao a couple of years ago and still love it).
Back then I felt I needed to gain more knowledge on project management and construction technology. Many of the architects that inspired me were the pioneers of the high-tech movement of the late 70’s and 80’s including Norman Foster, Richard Rogers, Renzo Piano, Nicholas Grimshaw, Jean Nouvel, I. M. Pei, Kisho Kurokawa who I met at RIBA and Daniel Libeskind’s who I met at the Royal Academy of Arts unveiling his winning proposal for the extension the V&A Museum in London. As years passed by I understood that good architecture goes beyond bricks and mortar and I got more interested in rethinking questions on buildings, their impact to the environment and human behaviour. Problem solving became of a different nature and often found practice asking narrow or partial questions and solving misunderstood problems. Academia provides an opportunity to reset questions and influence practice.
During my late twenties while doing my PhD at the University of Reading in the UK I moved into a more intellectual and conceptual space and at that time writing became a priority over drawing. My doctoral thesis dealt with environmental psychology, ergonomics and cognitive science. The architectural schools and practices that became more interesting to me dealt with creativity on an emotional level. I re-visited the early works of Frank Gehry including the fish sculpture in Barçelona. In 1996 I met Zaha Hadid (1957-2017) at the UIA conference in Barcelona 1996, she hardly had anything built at the time but she was already famous internationally. I first came across her work in El Croquis Spanish architecture magazine (issue 1991) and found her take on design intriguing and inspiring, heavily linked to the Russian modernist painting movement know as Suprematism. Back then, the only freestanding building she had built was the fire station at the Vitra furniture factory near Basel, Switzerland. Her work was highly conceptual, incredibly interesting and evocative. Two other inspirational and influential figures at the time were Philippe Starck and Alvaro Siza Vieira whom I met in his studio in 1997 while studying a semester in Porto for my Masters.
How do you think a university degree can prepare young people to become better at what they do? Ie. Independently of the particular technical skills learnt. Success is not only due academic qualifications but much of it evolves from practice and experience. An academic degree can only place aspiring future leaders on a stage, how well do people do after graduation is another story. It much depends where do you see a career evolving and in some cases a University degree might feel as an obstruction when some young adults are keen to firstly the getting experience. However, the discussion is often on how much
66. 67.
42nd AUBEA Conference 2018: Educating Building Professionals for the Future in the Globalised World
clients and contractors. I believe this would metaphorically provide some buoys to beginmy sailing more confidently.
Did collaborative practice improve after completing your postgraduate studies? To some extent, but much more should be done before it can be considered common practice in the industry. During my masters we were used to working collaboratively between architect and engineers. In my first work experience as an external environmental consultant in the UK the architect, as main designer, would distribute tasks and deadlines that engineers comply with and based on which some discussion would occur. However, often too late for environmental strategies to be seamlessly embedded in the design. Currently, as an environmental designer in an integrated architectural practice, collaboration is a mutual goal and the intent is that to start at concept stage, though it is not always achieved.
How do you think a university degree responds with today’s changing workplace? Ie. please discuss on the expectations from employers. From my professional and academic experience in the realms of architecture, environmental design and energy modelling, I think that university degrees are generally responding to the changing workplace while industry is more receptive to implementing innovation. Developing and nurturing relationships between academia and industry bring mutual benefits among which the application of innovation and research outcomes which allows industry to progress and academia to verify the applicability of its efforts as well as a consequent level of publicity.
Personally, my main concern when looking for a job was my scarce knowledge of regulations and procedures used in the industry. However, while it may have been a bit of challenge at my early interviews, it soon became clear at work that this was not going to be an obstacle. Practicing professionals are aware that graduates require extra training, however academic qualifications are preferred as a point of departure when it comes to landing on your first job, at least this is the case in architecture, because it ensures a method of practice and thinking rather than a specific knowledge.
Exposure to digital modelling is beneficial but not an essential criterion. At graduate level it would be more important to have appreciation for the built environment, ability to process problems and enthusiasm for design, rather than core modelling skills. Professionals do not expect graduates to have specific skills but to be well-rounded and to able to understand the underlying mechanisms behind the design. Technical competencies instead, seem to be anticipated from those with work experience and, overall, the impression is that a combination of work experience and university education with postgraduate studies is perceived as the best option.
How do you think a university degree can prepare young people to become better at what they do? Ie. Independently of the particular technical skills learnt. Over time universities have evolved to impressive educational standards and students have infinite possibilities to develop their aspirations to the fullest. However, in an era where sky is the limit, I think increasing the proportion of relevant practical experiences, such as site visits and first-hand or simulated work experiences would further improve the mostly theoretical academic experience. This would further shape the minds and open views which, in architecture, is the essence of creativity.
5 Discussion and Conclusion
From the employers view the initial assumption that students taking university and postgraduate studies in architecture is often formed from their own experience with
42nd AUBEA Conference 2018: Educating Building Professionals for the Future in the Globalised World
when his housing scheme know as ‘Habitat’ was built as part of the Montreal, Expo’70. Several decades later his Sands Marina towers, the Science Museum and Sky Habitat took off in Singapore.
Do you think your professional resilience aligns with personal resilience? And if so, how?Certainly, aligning professional and personal needs is what will see a career come to fruition in the long run. One can only endure a long career if motivated enough. For me merging academia and architecture provides enough diversity and intellectual stimulation to stay in business for the long run!
4.2 Second reflectionWhat made you study a university degree? I.e. expectations by family or friends? Was it a personal challenge/dream or ambition? Please comment. My childhood ambition was to do what I described as a “happy job”: one that dealt with making the small world in my reach more enjoyable and exciting. Given that most of our lives are spent in some form of built environment, during high school this “vision” translated into wanting to become either an architect or an engineer. However, the more I tried to decide for one or the other, the more I kept seeing these two professions as different sides of the same coin, so I finally I opted for architectural engineering. The intention was to explore both realms, open more career prospects and challenge myself with technical knowledge, that I felt would be beneficial whatever the outcome. Finally, after completing my degree and having convinced myself the importance of a holistic approach to architecture, I worked for a couple of years in different areas related to architecture and engineering consulting. Although limited, throughout these experiences, I noticed how resources were often used very inefficiently, both in terms of professional expertise and project/environmental resources: communication and physical distance between architects and engineers resulted in time consuming exercises that could have been avoided had things been developed as a collaborative effort from the start; lack of driver and diverse client agenda resulted in inefficient use of existing resources and traditional approaches. The whole process felt out-dated and, while looking for an alternative design approach, I stumbled across environmental sustainable design (ESD). I immediately felt this would be the future of architecture and decided to specialize in this field by enrolling at an MSc in Environmental Design and Engineering running at University College London (UCL).
In all cases, I have always felt fully in control of my choices and aspirations, however, while my family and friends were expecting me to undertake my first degree, the further postgraduate studies were a much more conscious personal challenge. I was very keen on learning something innovative, a developing area with emerging and future potential in architecture, while also becoming more competitive and attractive in the market.
Did your university degree align with your expectations? Explain why yes or why not?Iloved both my courses, however both could have been improved and offer some modules that are significantly more stimulating than others. Therefore, while my expectations were generally satisfied, the complete lack of practical experience and, in some cases, the reduced pragmatism of some classes resulted in superficial knowledge. A similar experience applies to both my home university and the international one, which to a certain extent, made me feel adrift amongst a sea of information.
Therefore, while I understand and appreciate the importance of fostering creativity, speculative thinking and imagination at university, I believe it should be possible to expose students to more practical courses and workshops. For example, presenting them with practical industry problems and which could also involve real issues in dealing
68. 69.

42nd AUBEA Conference 2018: Educating Building Professionals for the Future in the Globalised World
undertaking studies. Universities curricula keeps evolving, responding to the rapidly changing times we live in particularly with the impact of procurement methods and technology that directly impact architecture. Universities have a great opportunity to tap into this and the programs and courses they design will have a direct impact in the way the profession shapes practice. On the other hand, graduates and young professionals are keen to align their education and career dreams and aspirations with the practicalities of employment. Exposure to regulations and building rating systems is also important and not to be forgotten during education but it should be a priority.
Overall, two different recruitment trends can emerge: those interested in specific competences either design, technical or managerial and those interested in the candidate’s generalist aptitude including flair for schematic design, creative thinking and confidence with pushing their visions forward. The first one is more stable and has a safety net; the second one comes with a higher level or risk-taking. In the second case, it is less significant to drill too far with learning highly technical skills and courses should reflect this. While in the long run strategic thinking is more important for students to develop, strategic and technical competencies are in higher demand by employers and student expect to excel on these during their university degrees. Professionals however perceive training as an on-going and evolving activity around their business and their own personnel and professional growth.
Disregarding the understanding of highly technical aspects such as building services and the importance attributed to on-site experiences, the knowledge provided by academic institutions is perceived differently by professionals and students. Professionals indicate the knowledge of building physics and the understanding of building information modelling exercises were certainly challenging for students; commercial acumen, understanding of work flow and compliance are instead considered important but not essential. University provides sound theoretical preparation and activates thinking but not necessarily being seen, nor experienced, a project to its ‘closure’ will always present a challenge when studying applied degrees such as architecture. Among different interpretations, it seems reasonable to infer that experience broadens the understanding of a topic and thus the awareness of its complexity while it is more immediate for students to perceive their practical limits when starting their first job.
In terms of moving forward with architectural education, this paper has discussed thetransitions between university and industry and also between blurring professional boundaries such as architecture and environmental sustainable design. Discussions emerged from reflective diaries and participant complement their views. Aligned with a stand on lifelong-learning this paper wants surpass curricula development and to reach the next generation of professionals and academics to think of the expanding canopy of practice including the blurring lines between research and industry and also across all related building, environmental, social sciences and property disciplines. A model for lifelong-learning to develop resilient practitioners and professionals who could sustain long and successful careers. The following model adapted from Black and Plowright (2010) seems to be the direction in which we want to head. Figure 2 shows the iterative process of thinking and deep reflections with an overlap of theory and practice. An interesting set of questions, techniques and approaches to applying the technique might arise but this seems a positive sign especially at early and midcareer. The future of professional education will be less dependent on guided coaching but on self-directed learning. In this paper we have explored approaches to reflective practice which can applied to learning and professional development in a new innovative way.
42nd AUBEA Conference 2018: Educating Building Professionals for the Future in the Globalised World
Figure 2. Model of reflective practice adapted from Black and Plowirght (2010)To close this heading it is important to remind our self on the changing nature of education and life-long learning. Also on increase life expectancy and the longer we live the more we will need tools, methods and techniques to prioritise our professional development as to moving in various organisational directions.
6 References
Atkinson, R.C. and Shiffrin, R.M. (1968) Human memory: a proposed system and its control process, in K.W. Spence (ed.), The psychology of learning and motivation: advances in research and theory, Academic Press, New York, 89–195.
Archer, L. (2008). Younger academics’ constructions of authenticity, success and professional identity. Studies in Higher Education, 33(4), 385-403.
Aranda-Mena, G. (2016a) The UNESCO Chair: Australasia Architecture Studio at Mantua. 50th International Conference of the Architectural Science Association: Revisiting the role of Architectural Science at the University of Adelaide, Australia
Aranda-Mena, G. (2016b) Four Value Propositions for Architecture Education. 50th International Conference of the Architectural Science Association: Revisiting the role of Architectural Science In Design and Practice at the University of Adelaide
Aranda-Mena, G. (2017a) BIM Integration In Architecture Studios: The G-Lab MilanoConference: AUBEA, Project: The G_LAB: Architecture Studio. Melbourne, Au.
Aranda-Mena, G. (2017b) Value Management In Architectural Education: Case Projects On Re-Purposing Heritage Sites. AUBEA Conference Melbourne, Australia
Bernus, J.S. and Chase, M.A. (1990) Decision making in a networked environment, in H. Eschenauer, J. Koski and A. Osyczka (eds.), Technology and Communication, Springer-Verlag, Berlin, 376–396.
Black, P.E. and Plowright, D. (2010) A multi-dimensional model of reflective learning for professional development. Journal of Reflective Practice. 11:2, 245-258.
Croquis (1991). Zaha Hadid, 1983-1991. Madrid: El Croquis Editorial, Spain (52).Dewey, J. (1938). 1963. Experience and education. Collier/McMillan New York.
70. 71.

42nd AUBEA Conference 2018: Educating Building Professionals for the Future in the Globalised World
The impact of fatigue on workforce sustainability in the construction industry
Tania Lipsham1, Kathryn Davies2 and Linda Kestle3
1Building Construction and Services, Unitec Institute of Technology, Auckland 1025, NEW ZEALAND
E-mails: [email protected]; [email protected]; [email protected]
Abstract: The construction industry is widely recognised as very demanding of its workers, and fatigue is a common result. Long working hours, unreasonable deadlines, heavy workloads, lack of resources, and a macho work culture are common features of industry practices internationally which can be seen to contribute to this. At the same time, there are widespread concerns around workforce sustainability. Developing and maintaining a skilled workforce is a challenge for many employers, particularly in the current situation with a large cohort of aging workers leading to an imminent need for workforce renewal. This paper presents the results of an exploratory study into the conditions leading to fatigue and its impact on construction workers in Auckland, New Zealand. Participants described fatigue-related effects such as damaged relationships and increased workplace conflict, job dissatisfaction and poor work-life balance, as well as specific health and safety issues such as deteriorated vision, mental exhaustion and impaired decision-making leading to accidents. Managing fatigue in the face of the demanding work environment is a specific health and safety concern for older workers, given the physicality of many construction industry roles. For younger workers, while health and safety is still an issue, a potentially more important factor is the effect of fatigue on workers’ satisfaction and thus retention within the construction workforce, and how fatigue and its causes and consequences affect the image of the construction industry.
Keywords:fatigue management, health and safety, work-life balance, work hours, worker retention
1 Introduction
In New Zealand, as in many developed countries, the construction industry is currentlyfacing a skills shortage. Companies are struggling to retain skilled and experienced employees, and the recruitment of new entrants to the industry at all levels is not keeping pace with the demand for workers. At the same time, the impending retirement of the ‘baby boomer’ generation is adding further pressure in a sector that is experiencing strong and continued growth. Companies are seeking to capitalise on the current buoyant market,to enhance performance and improve productivity, to maintain financial health, attract investment, and satisfy the needs of stakeholders, while remaining competitive. These goals are threatened if the costs involved to manage employee retention and recruitment, health and safety and wider productivity are high. Poor management of these issues causes a significant knock-on effect to the industry, and therefore the economy. At an individual level, impacts are equally large, with wellbeing, income and family and community involvement all affected. Worker fatigue is an under-recognised factor in all of these issues, which originates with the individual, but has potential consequences at organisational through to national levels.
42nd AUBEA Conference 2018: Educating Building Professionals for the Future in the Globalised World
Drake, S. M. (1998). Creating Integrated Curriculum: Proven Ways To Increase Student Learning. Corwin Press, Inc., 2455 Teller Road, Thousand Oaks, CA 91320 ISBN-0-8039-6717-9
Dunn, L. and Musolino, G. (2011). Assessing Reflective Thinking and Approaches to Learning. Journal of Allied Health, 40(3): 128-36.
Ertas, A., Maxwell, T., Rainey, V. P., & Tanik, M. M. (2003). Transformation of higher education: the transdisciplinary approach in engineering. IEEE Transactions on Education, 46(2), 289-295.
Freeman, M. (2001). Reflective logs: An aid to clinical teaching and learning. International Journal of Language and Communication Disorders, 36 (2 Supplement), 411-416.
Herr, C. M., Gu, N., Roudavski, S. and Schnabel, M.A. (2011) Circuit Bending, Breaking and Mending: Proceedings of the 16th International Conference on Computer-Aided Architectural Design Research in Asia CAADRIA 2011. HK
Krupinska, J. (2014) What an architecture student should know. Routledge Publishers ISNB: 978041570232
Lewis, A. V. (2013). Reflective practice “ what is it and how do I do it? Journal of Clinical Practice in Speech-Language Pathology, 15(2), 70-74.
Lowden, K., Hall, S., Elliot, D., & Lewin, J. (2011). Employers’ perceptions of the employability skills of new graduates. London: Edge Foundation.
Minsk, M.L. (1990) Process models for cultural integration, Journal of Culture, 11(4), 4Peter, A., Newton, B. and Wills, C. (2009) Multiple authored book, Open Press, H.K.Rodgers, C. (2002). Defining reflection: Another look at John Dewey and reflective
thinking. Teachers college record, 104(4), 842-866.Sasada, T. (1999) Computer graphics and design: presentation, design development and
conception, CAADRIA99, Shanghai, 21–29.Scambia, L. and Hong, SM (2017) With regards to energy modelling: how does students’
knowledge compare with industry expectations? Proceedings of the 15th IBPSA Conference. International Building Performance Simulation Association San Francisco, CA, USA, Aug. 7-9
Schön, D. A. (1991) The reflective practitioner: How professionals think in action. Taylor & Francis Group UK 384 pages ISBN 9781351883160
Stiny, G. (1977) Ice-ray: a note on the generation of Chinese lattice designs, Environment and Planning, 4(1), 89–98.
Shury, J. and IFF Research Ltd. (2017). Employer Perspectives Survey 2016: Technical Report.UK Department for Education. UK Commission’s Employer Skills Survey
Thompson, N. and Pascal, J. (2012) Developing critically reflective practice, Reflective Practice, 13:2, 311-325, DOI: 10.1080/14623943.2012.657795
Webster, H. (2008) Architectural Education after Schön: Cracks, Blurs, Boundaries and Beyond, Journal for Education in the Built Environment, 3:2, 63-74
Wiek, A. and Walter, A. I. (2009). A transdisciplinary approach for formalized integrated planning and decision-making in complex systems. European Journal of Operational Research, 197(1), 360-370.
72. 73.

42nd AUBEA Conference 2018: Educating Building Professionals for the Future in the Globalised World
Although more difficult to define and quantify, subjective effects of fatigue on morale and individuals’ perceptions of the industry are also an important consideration. Fatigue has been shown to be significant factor in burnout and work-life conflict in construction employees (Lingard, 2010), and so is a contributing factor in building a negative image of construction that deters people from entering or staying in the industry. Job satisfaction plays a big part in retaining skilled workers. Caruso (2006) argues that ongoing fatigue can force construction employees to leave their job, and Lingard et al. (2007) identifies adirect link between limiting work to a 5-day week and retention of salaried employees, with reduced fatigue, greater job satisfaction and less stress all contributing to higher rates of staff retention. However, there is clearly a socio-economic aspect that must be considered, as the same study identifies that wage earners were concerned about the resulting loss of net income. Francis and Lingard (2012) urge the construction industry to rethink traditional work patterns and work environments, and suggest that improving the working environment, including through fatigue management, could potentially assist with retaining skilled workers and attracting new recruits.
Management of work-life balance is another area where fatigue is an important element.With long work hours, weekend work and inflexible work schedules it is understandable that many construction workers experience work-life conflict (Morrison & Thurnell, 2012). Dual-earning households are now common, and the need to care for dependants both young and elderly is increasing. Therefore, non-work responsibilities provide workers with additional pressure within their home environment, often causing conflict. Fatigue, both physical and emotional, can be a direct result of trying to meet too many demands at work and at home.
3 Research Methodology
This research project was an exploratory study of the impact of fatigue on workers’ experience of the construction industry, and how it contributes to their attitudes and perceptions of the industry. A qualitative survey approach was used, based on semi-structured interviews. A series of open-ended questions were prepared, with a variety of predetermined prompts to be used if necessary. As emphasised by Alvesson (2011), the value of using this type of interview structure is that it provides a framework so that specific issues can be addressed, but has the flexibility to allow in-depth exploration of the interviewees’ varied opinions and experiences. This ensured that all participants discussed the core elements of the research topic, but also allowed them to describe their own experiences in a way that suited them. The intention of this approach was not to provide a representative view of how fatigue affects the construction industry, but rather to explore some of the experiences and attitudes of individuals involved in the industry to gain an awareness of their concerns. This individual-level view is a means of providing insight into performance issues within the construction industry (Phua, 2013).
Personal and industry networks were used to contact potential participants who were construction industry employees with personal experience of fatigue. The 16 individualswho were selected to participate were drawn from different companies across the Auckland region, and represented a wide range of characteristics: construction experience varied from new entrants (a few months) to 21 years in the industry; and a variety of site-based and office roles were represented. The sample included two participants in skilledtrades roles, and the remainder were construction professionals such as quantity surveyors, construction managers and project managers. Some of the key features of the participants’ employment characteristics are represented in Figure 1. Both male and female participants were included, with a variety of family situations; ages ranged from
42nd AUBEA Conference 2018: Educating Building Professionals for the Future in the Globalised World
This paper presents the results of an exploratory study which sought to identify some of the issues facing the New Zealand industry regarding worker fatigue. A qualitative approach was taken, using in-depth interviews with a small self-selected sample of industry participants who have experienced fatigue in their daily roles. No attempt has been made to quantify any of the various experiences as representative of a particular type of role or industry discipline. Instead, the goal was to identify and describe experiences situations and influences that have affected the participants in relation to fatigue, and explore the potential implications of these on the wider industry.
No work on fatigue has previously been conducted in the New Zealand construction industry, but due to the requirements of the Health and Safety at Work Act (HSWA) 2015 it is an issue that is attracting increased attention. While health and safety is a valuable focus for the industry, it is important that it is not the only aspect of fatigue considered. International literature suggests that fatigue and its contributing factors have a wide range of impacts on construction workers and the industry as a whole, and this research demonstrates that these are of concern within the New Zealand environment as well.
2 Literature Review
Fatigue is a complex condition which can affect job performance, and may have a cumulative effect over time (Phillips, 2014). Depending on the individual, fatigue can present itself in different ways. Lingard (2010) and Phillips (2014) describe the personal and workplace effects of fatigue, including emotional exhaustion, psychological distress,anxiety and depression, absenteeism, poor work performance, increased risk or rate of accidents, and increased human error. Many of the undesirable characteristics of the construction industry, including exposure to extreme weather conditions, unpaid overtime, and tight deadlines, have been shown to increase the likelihood of worker fatigue (Morrison and Thurnell, 2012). Consequently, fatigue is a multi-faceted problem with many causes and consequences, which is particularly relevant to construction.
Fatigue is often seen as a consequence of the type of work carried out in the construction industry. Various studies have explored fatigue from this perspective, including the impacts of working at height (Chang et al., 2009), the physical condition of project sites(Pheng and Chuan, 2006), and the contribution of other factors such as operation of construction machinery, hazardous materials, and weather (Haslam et al., 2005). More commonly however, fatigue in the industry is attributed to the long hours worked by construction workers, whether resulting from working long stretches of time during a day with little or no break, or working many consecutive days without a day off to recover (Haslam et al., 2005). Despite research demonstrating the negative consequences of consistently working long hours, the practice has been normalised within the industry (Goldenhar et al., 2003), so that the resulting fatigue is often seen simply as an expected part of the job.
Much of the research on fatigue in the construction industry has been concerned with its effect on health and safety. Caruso (2006) performed a comprehensive workplace studywhich identified that fatigue can negatively impact the performance of any employee.Cognitive, sensory and motor functioning were shown to be increasingly impaired as work-time and thus fatigue increased, and fatigue has been shown to be a principal cause of accidents in the construction industry (Chan, 2011). Work Safe New Zealand (WSNZ) (2017) emphasises that fatigue management can minimise incidents and injuries, andeffectively increases opportunities for companies to improve performance and reducecosts associated with accidents, as well as improving employee morale.
74. 75.
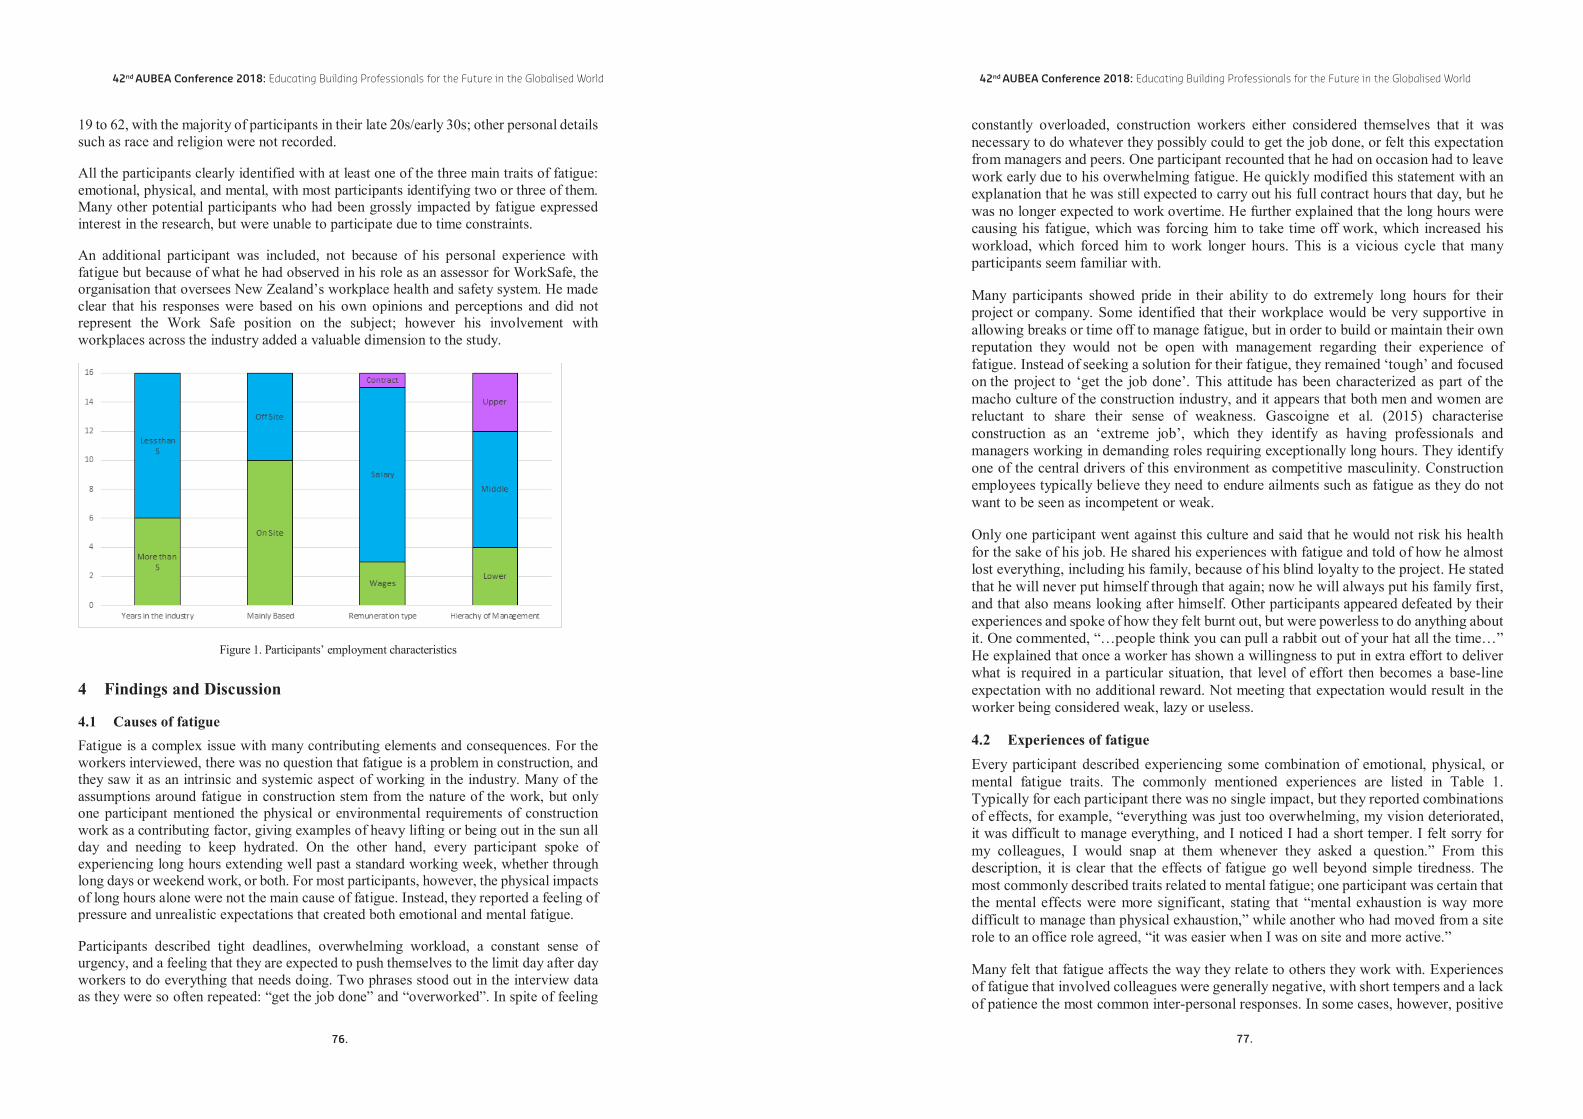
42nd AUBEA Conference 2018: Educating Building Professionals for the Future in the Globalised World
constantly overloaded, construction workers either considered themselves that it was necessary to do whatever they possibly could to get the job done, or felt this expectation from managers and peers. One participant recounted that he had on occasion had to leave work early due to his overwhelming fatigue. He quickly modified this statement with an explanation that he was still expected to carry out his full contract hours that day, but he was no longer expected to work overtime. He further explained that the long hours were causing his fatigue, which was forcing him to take time off work, which increased his workload, which forced him to work longer hours. This is a vicious cycle that many participants seem familiar with.
Many participants showed pride in their ability to do extremely long hours for their project or company. Some identified that their workplace would be very supportive in allowing breaks or time off to manage fatigue, but in order to build or maintain their ownreputation they would not be open with management regarding their experience of fatigue. Instead of seeking a solution for their fatigue, they remained ‘tough’ and focused on the project to ‘get the job done’. This attitude has been characterized as part of the macho culture of the construction industry, and it appears that both men and women are reluctant to share their sense of weakness. Gascoigne et al. (2015) characterise construction as an ‘extreme job’, which they identify as having professionals and managers working in demanding roles requiring exceptionally long hours. They identify one of the central drivers of this environment as competitive masculinity. Construction employees typically believe they need to endure ailments such as fatigue as they do not want to be seen as incompetent or weak.
Only one participant went against this culture and said that he would not risk his health for the sake of his job. He shared his experiences with fatigue and told of how he almost lost everything, including his family, because of his blind loyalty to the project. He statedthat he will never put himself through that again; now he will always put his family first,and that also means looking after himself. Other participants appeared defeated by their experiences and spoke of how they felt burnt out, but were powerless to do anything about it. One commented, “…people think you can pull a rabbit out of your hat all the time…” He explained that once a worker has shown a willingness to put in extra effort to deliver what is required in a particular situation, that level of effort then becomes a base-line expectation with no additional reward. Not meeting that expectation would result in the worker being considered weak, lazy or useless.
4.2 Experiences of fatigueEvery participant described experiencing some combination of emotional, physical, or mental fatigue traits. The commonly mentioned experiences are listed in Table 1.Typically for each participant there was no single impact, but they reported combinations of effects, for example, “everything was just too overwhelming, my vision deteriorated, it was difficult to manage everything, and I noticed I had a short temper. I felt sorry for my colleagues, I would snap at them whenever they asked a question.” From this description, it is clear that the effects of fatigue go well beyond simple tiredness. The most commonly described traits related to mental fatigue; one participant was certain that the mental effects were more significant, stating that “mental exhaustion is way more difficult to manage than physical exhaustion,” while another who had moved from a site role to an office role agreed, “it was easier when I was on site and more active.”
Many felt that fatigue affects the way they relate to others they work with. Experiences of fatigue that involved colleagues were generally negative, with short tempers and a lack of patience the most common inter-personal responses. In some cases, however, positive
42nd AUBEA Conference 2018: Educating Building Professionals for the Future in the Globalised World
19 to 62, with the majority of participants in their late 20s/early 30s; other personal detailssuch as race and religion were not recorded.
All the participants clearly identified with at least one of the three main traits of fatigue:emotional, physical, and mental, with most participants identifying two or three of them.Many other potential participants who had been grossly impacted by fatigue expressedinterest in the research, but were unable to participate due to time constraints.
An additional participant was included, not because of his personal experience withfatigue but because of what he had observed in his role as an assessor for WorkSafe, theorganisation that oversees New Zealand’s workplace health and safety system. He madeclear that his responses were based on his own opinions and perceptions and did notrepresent the Work Safe position on the subject; however his involvement withworkplaces across the industry added a valuable dimension to the study.
Figure 1. Participants’ employment characteristics
4 Findings and Discussion
4.1 Causes of fatigueFatigue is a complex issue with many contributing elements and consequences. For the workers interviewed, there was no question that fatigue is a problem in construction, and they saw it as an intrinsic and systemic aspect of working in the industry. Many of the assumptions around fatigue in construction stem from the nature of the work, but only one participant mentioned the physical or environmental requirements of construction work as a contributing factor, giving examples of heavy lifting or being out in the sun all day and needing to keep hydrated. On the other hand, every participant spoke of experiencing long hours extending well past a standard working week, whether through long days or weekend work, or both. For most participants, however, the physical impacts of long hours alone were not the main cause of fatigue. Instead, they reported a feeling of pressure and unrealistic expectations that created both emotional and mental fatigue.
Participants described tight deadlines, overwhelming workload, a constant sense of urgency, and a feeling that they are expected to push themselves to the limit day after day workers to do everything that needs doing. Two phrases stood out in the interview data as they were so often repeated: “get the job done” and “overworked”. In spite of feeling
76. 77.
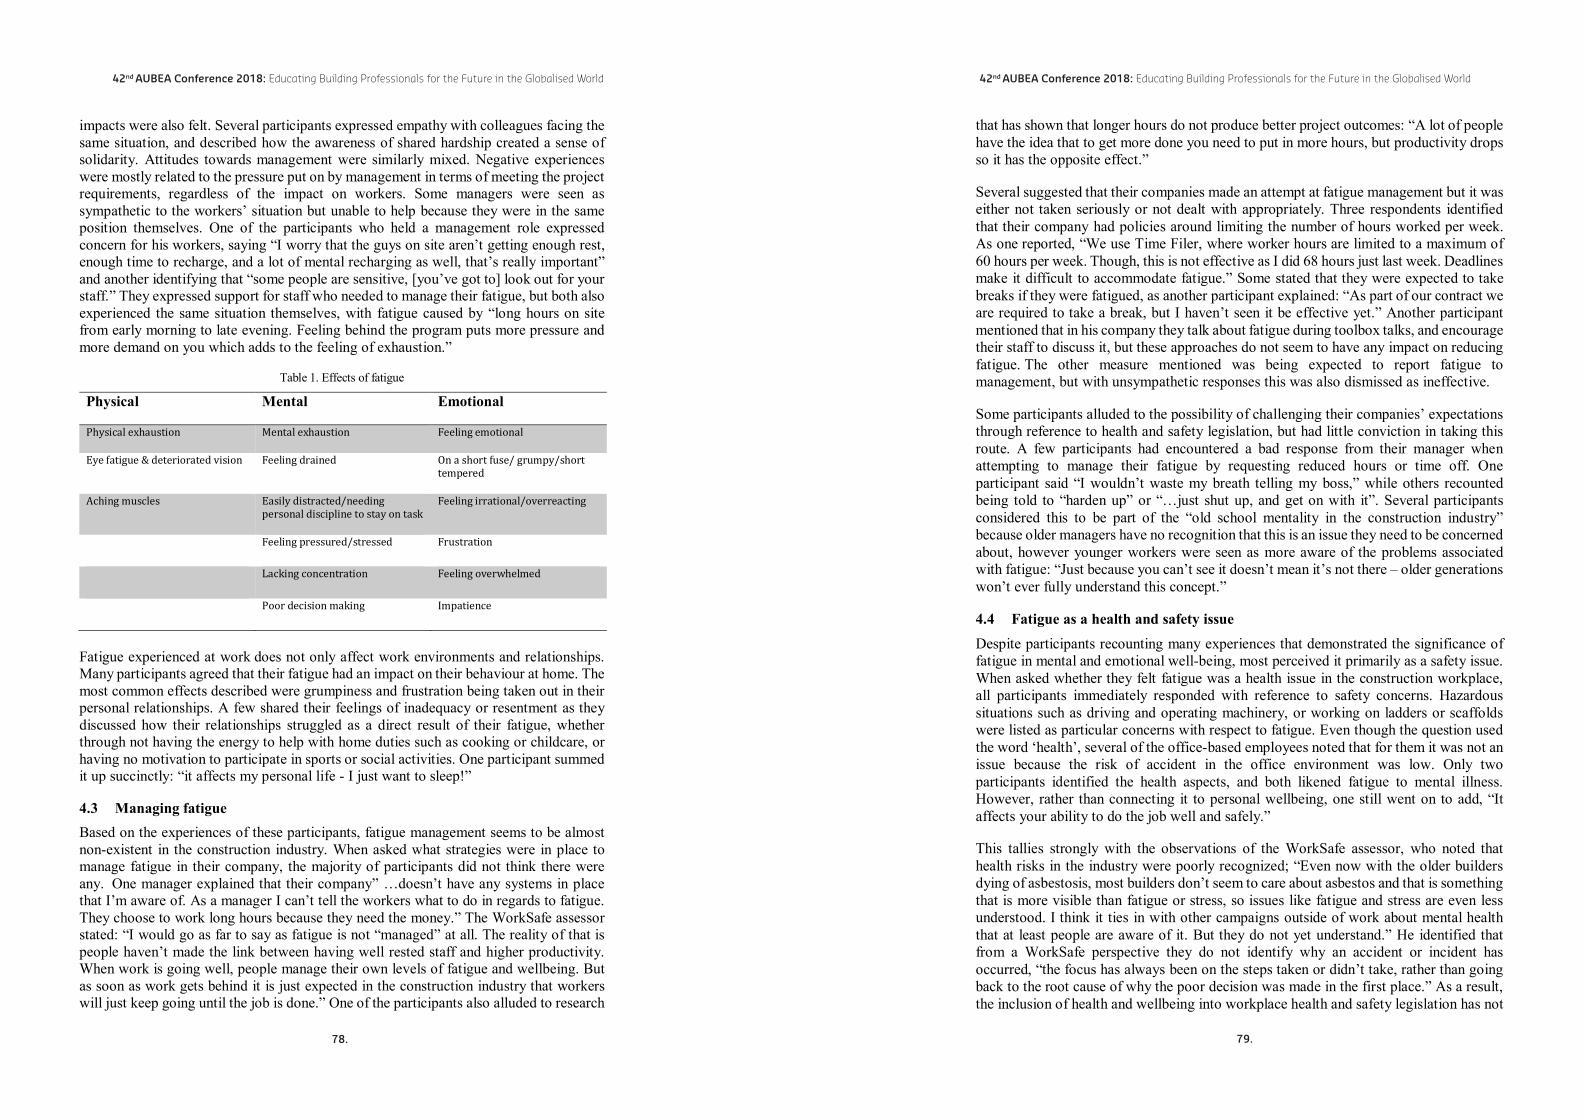
42nd AUBEA Conference 2018: Educating Building Professionals for the Future in the Globalised World
that has shown that longer hours do not produce better project outcomes: “A lot of people have the idea that to get more done you need to put in more hours, but productivity dropsso it has the opposite effect.”
Several suggested that their companies made an attempt at fatigue management but it was either not taken seriously or not dealt with appropriately. Three respondents identified that their company had policies around limiting the number of hours worked per week. As one reported, “We use Time Filer, where worker hours are limited to a maximum of 60 hours per week. Though, this is not effective as I did 68 hours just last week. Deadlines make it difficult to accommodate fatigue.” Some stated that they were expected to take breaks if they were fatigued, as another participant explained: “As part of our contract we are required to take a break, but I haven’t seen it be effective yet.” Another participant mentioned that in his company they talk about fatigue during toolbox talks, and encourage their staff to discuss it, but these approaches do not seem to have any impact on reducing fatigue. The other measure mentioned was being expected to report fatigue to management, but with unsympathetic responses this was also dismissed as ineffective.
Some participants alluded to the possibility of challenging their companies’ expectations through reference to health and safety legislation, but had little conviction in taking this route. A few participants had encountered a bad response from their manager when attempting to manage their fatigue by requesting reduced hours or time off. One participant said “I wouldn’t waste my breath telling my boss,” while others recounted being told to “harden up” or “…just shut up, and get on with it”. Several participants considered this to be part of the “old school mentality in the construction industry”because older managers have no recognition that this is an issue they need to be concerned about, however younger workers were seen as more aware of the problems associated with fatigue: “Just because you can’t see it doesn’t mean it’s not there – older generations won’t ever fully understand this concept.”
4.4 Fatigue as a health and safety issueDespite participants recounting many experiences that demonstrated the significance of fatigue in mental and emotional well-being, most perceived it primarily as a safety issue. When asked whether they felt fatigue was a health issue in the construction workplace, all participants immediately responded with reference to safety concerns. Hazardous situations such as driving and operating machinery, or working on ladders or scaffolds were listed as particular concerns with respect to fatigue. Even though the question used the word ‘health’, several of the office-based employees noted that for them it was not an issue because the risk of accident in the office environment was low. Only two participants identified the health aspects, and both likened fatigue to mental illness. However, rather than connecting it to personal wellbeing, one still went on to add, “Itaffects your ability to do the job well and safely.”
This tallies strongly with the observations of the WorkSafe assessor, who noted that health risks in the industry were poorly recognized; “Even now with the older builders dying of asbestosis, most builders don’t seem to care about asbestos and that is something that is more visible than fatigue or stress, so issues like fatigue and stress are even less understood. I think it ties in with other campaigns outside of work about mental health that at least people are aware of it. But they do not yet understand.” He identified that from a WorkSafe perspective they do not identify why an accident or incident has occurred, “the focus has always been on the steps taken or didn’t take, rather than going back to the root cause of why the poor decision was made in the first place.” As a result,the inclusion of health and wellbeing into workplace health and safety legislation has not
42nd AUBEA Conference 2018: Educating Building Professionals for the Future in the Globalised World
impacts were also felt. Several participants expressed empathy with colleagues facing the same situation, and described how the awareness of shared hardship created a sense of solidarity. Attitudes towards management were similarly mixed. Negative experiences were mostly related to the pressure put on by management in terms of meeting the project requirements, regardless of the impact on workers. Some managers were seen as sympathetic to the workers’ situation but unable to help because they were in the same position themselves. One of the participants who held a management role expressed concern for his workers, saying “I worry that the guys on site aren’t getting enough rest, enough time to recharge, and a lot of mental recharging as well, that’s really important”and another identifying that “some people are sensitive, [you’ve got to] look out for your staff.” They expressed support for staff who needed to manage their fatigue, but both also experienced the same situation themselves, with fatigue caused by “long hours on site from early morning to late evening. Feeling behind the program puts more pressure and more demand on you which adds to the feeling of exhaustion.”
Table 1. Effects of fatigue
Physical Mental Emotional
Physical exhaustion Mental exhaustion Feeling emotional
Eye fatigue & deteriorated vision Feeling drained On a short fuse/ grumpy/short tempered
Aching muscles Easily distracted/needing personal discipline to stay on task
Feeling irrational/overreacting
Feeling pressured/stressed Frustration
Lacking concentration Feeling overwhelmed
Poor decision making Impatience
Fatigue experienced at work does not only affect work environments and relationships. Many participants agreed that their fatigue had an impact on their behaviour at home. The most common effects described were grumpiness and frustration being taken out in their personal relationships. A few shared their feelings of inadequacy or resentment as they discussed how their relationships struggled as a direct result of their fatigue, whether through not having the energy to help with home duties such as cooking or childcare, or having no motivation to participate in sports or social activities. One participant summed it up succinctly: “it affects my personal life - I just want to sleep!”
4.3 Managing fatigueBased on the experiences of these participants, fatigue management seems to be almost non-existent in the construction industry. When asked what strategies were in place to manage fatigue in their company, the majority of participants did not think there were any. One manager explained that their company” …doesn’t have any systems in place that I’m aware of. As a manager I can’t tell the workers what to do in regards to fatigue. They choose to work long hours because they need the money.” The WorkSafe assessorstated: “I would go as far to say as fatigue is not “managed” at all. The reality of that is people haven’t made the link between having well rested staff and higher productivity. When work is going well, people manage their own levels of fatigue and wellbeing. But as soon as work gets behind it is just expected in the construction industry that workers will just keep going until the job is done.” One of the participants also alluded to research
78. 79.
42nd AUBEA Conference 2018: Educating Building Professionals for the Future in the Globalised World
depended more on younger people coming into the industry rather than the older managers, “I believe it is a generational culture issue. You can keep telling people that getting tired makes it more dangerous, but unless they grow up believing that I don’t think we’re going to get any real change.”
With the small sample used in this study any gendered differences in the experience of fatigue have not been explored, but the gender imbalance in the construction industry is a well-recognised phenomenon. Sunindijo and Kamardeen (2017) found that fatigue and its contributing factors are stressors for both male and female construction professionals,and that female professionals may be more severely impacted. This potentially creates additional impacts on workforce sustainability if women are deterred from entering theindustry, or leave as a result of their experiences with fatigue.
5 Conclusions and Further Research
All participants consider that fatigue is a significant issue with impacts on productivity and performance, work-life balance, and health & safety. The only positive aspect noted was that some workers found it heartening to know that they were part of a shared experience, as they see co-workers endure fatigue as well. Many felt that it was just an expected part of working in construction, but all believed that it had a negative impact on themselves, their families, their work environment and the projects they worked on. Most of the concern around fatigue, both in the literature and from the interviews, focuses on the health & safety aspects and the increased risk of accidents and injury on site. However, the experiences recounted by this group of construction employees indicates much wider cause for concern. Over half of the group had either changed jobs themselves or seen co-workers do so, as a result of fatigue and the factors that contribute to fatigue. Tolerance of these conditions appears to be lower in younger employees than in older workers. In order to successfully manage ongoing recruitment for renewal and expansion of the construction workforce, more attention needs to be given to addressing the root causes of fatigue, and improving the very negative conditions that workers are experiencing on a daily basis. Very few strategies were identified that were used by companies or workers to combat fatigue. The experience of most participants was that there were no strategies in place to help combat fatigue. Some who had experienced attempts to limit hours or introduce requirements for breaks or rest periods saw very little change in the way work was managed, so are yet to be convinced that there is a solution to the problem of fatigue.
The participants in this study were self-selected as being affected by fatigue in their daily roles, and their experiences as reported here are useful to illustrate the impacts of fatigueat an individual level. A future area of research that would be of value in the current tight employment market would be a similar investigation focusing specifically on workers who have recently changed jobs or left the industry, to attempt to identify the significance of fatigue and its contributing factors on employee retention and career choices. There is no doubt from the results presented here that fatigue is a real problem for construction employees. Investigating the extent and impact of that problem warrants further study.
42nd AUBEA Conference 2018: Educating Building Professionals for the Future in the Globalised World
made any significant difference, “We are still focussing on machine guards, slips,tripsand falls, falls from height, site boundaries, rather than discussing and influencing duty holders in respect to fatigue.”
The impacts on health and happiness reported in the literature are clearly supported by the findings of this research. Undesirable effects of fatigue on work-life balance, work and personal relationships, and mental, emotional and physical health were all described by participants. These contribute negatively to job satisfaction and workers’ retention within the industry (Chih, et al., 2016) and also the image that is presented of the construction industry. Brace and Gibb (2005) describe “ill health”, including fatigue, as being problematic for construction employees, with an impact on recruitment and job retention.
4.5 Fatigue as a workforce sustainability issueAlthough it was not an issue at the forefront of participants’ minds, it was evident that fatigue affects their perceptions of the construction industry as a desirable occupation. Three of the participants had previously changed employers because of negative experiences with fatigue, and others spoke of seeing co-workers take extended leave, change employers, or burn out and leave the industry altogether. Several were quite negative about their chosen career path and cynical about their future in the industry. The likelihood of change in the near future was felt to be very low.
Younger workers tended to argue that companies needed to do more to reduce the demands on their employees. Suggestion actions that are needed include better resourcing with more staff on the job, changing schedules, and limiting hours. The attitude of managers was also called into question, with several participants challenging the mindset which viewed employees as just another resource. One participant argued that it was how he was treated that drove the feelings of fatigue rather than just the amount of expected of him “I had one manager who kept telling the workers to work harder and longer hours - I just left that job! A good manager who cares about the workers makes you want to work harder and do more for them.” This was reiterated by another who stated that “no one really cares about the people – they just want to get the job done.” Two participantsalso laid some of the responsibility on the clients, whose unrealistic expectations drove the high pressure environment. Again this came back to the companies, however, with one participant noting that while clients need to be made aware of the impact that their tight programmes have on workers’ health, productivity and quality, “the company needs to explain this to the client. But unless you are an extremely large company, it’s probably not likely!”
Older workers, while experiencing similar levels of fatigue, seemed to be more accepting that it was just part of how the industry is. They had fewer expectations of the companies or management, and felt that it was their own responsibility to manage their fatigue:“When you are as old as me, you learn to just deal with it on your own.” Government support was seen as necessary by several people across the age groups, though several cautioned that although government pressure was necessary to drive change, it could potentially make things more difficult if systems were required that did not match the needs of the industry.
The most common suggestion for change across all participants was the need for employees to speak up and help to change the mindset of the companies, to help shape the culture, and to work to make positive changes in the industry. Several described the need for a cultural shift, allowing for comfortable communication around fatigue in the workplace. Some, including the WorkSafe assessor, felt that management of fatigue
80. 81.

42nd AUBEA Conference 2018: Educating Building Professionals for the Future in the Globalised World
Work-related diseases in the Australian construction industryImriyas Kamardeen
Faculty of Built Environment, University of New South Wales, NSW 2052, SYDNEY, AUSTRALIA
Email: [email protected]
Abstract:Work-related diseases in construction have not gained enough attention though they are as critical as work injuries. This study investigated the diseases recurrently suffered by construction workers in Australia and their severities. It was found that fatalities are primarily caused by occupational cancers, respiratory system diseases and circulatory system diseases. Similarly, most of permanent incapacities are caused by nerves system diseases at work. Chemicals, substances, heat and other environmental factors are found to be the primary agents of work-related diseases affecting construction workers. Proving occupational causes for diseases is challenging and as such obtaining fair workers compensation is at stake. The findings of this study establish the association between diseases and occupations within the construction industry in a bid to curtail the challenge and uncertainties facing construction workers. It is also recommended that if workplace health authorities maintain a nation-widee-occupational exposure registry and mandates employers and employees to record their occupation and hazard exposure details whenever a new job role is assigned/assumed to/by an individual, it will further reduce the challenges and uncertainties surrounding workers’ compensation for occupational diseases.
Keywords: Work health and safety, work-related diseases, construction, workers compensation, Australia.
1 Introduction
The construction industry is vital for the economy of any country; it creates the physical infrastructure essential for the functioning of the nation, provides jobs for many residents and contributes significantly to GDP. Meanwhile, it is characterised by high rates of work-related fatalities, injuries and diseases globally (Cigularov et al. 2010). Riva et al. (2012) reported that the prevalence of work-related diseases in the construction industry is high, with a peak among the elderly, but also significant occurrences among young people. They further asserted that the percentage of workers with limited fitness to work, caused by work-related diseases, is high too. These diseases impose significant physical and economic sufferings on workers and the economy and thus need to be prevented. Much research has been conducted globally to investigate fatalities and injuries from different perspectives. However, work-related diseases have not gained enough attention due to their invisibility and the challenges involved in obtaining accurate data (Safe Work Australia 2017). Numerous challenges are associated with obtaining accurate data owing to the time lag between the exposure and the disease onset, as well as the possibility of multiple causes, both work-related and non-work related, for a single disease.
42nd AUBEA Conference 2018: Educating Building Professionals for the Future in the Globalised World
6 References
Alvesson, M. (2011). Interpreting interviews. Sage Publications Ltd, London. Brace, C. L., and Gibb, A. G. (2005). ‘A health management process for the construction
industry’’ Proceedings of the 4th Triennial International Conference Rethinking and Revitalizing Construction Safety, Health, Environment and Qualityhttp://www.irbnet.de/daten/iconda/CIB_DC25261.pdf, viewed: 15/06/2018.
Caruso, C. C. (2006). ‘Possible broad impacts of long work hours’, Industrial Health, 44(4), pp 531-536.
Chan, M. (2011). ‘Fatigue: The most critical accident risk in oil and gas construction’, Construction Management and Economics, 29(4), pp 341-353
Chang, F.L., Sun, Y.M., Chuang, K.H. and Hsu, D.J., (2009). ‘Work fatigue and physiological symptoms in different occupations of high-elevation construction workers’, Applied Ergonomics, 40(4), pp.591-596.
Chih, Y.Y., Kiazad, K., Zhou, L., Capezio, A., Li, M. and D. Restubog, S.L., (2016).‘Investigating employee turnover in the construction industry: A psychological contract perspective.’ Journal of Construction Engineering and Management, 142(6), p.04016006.
Francis, V., and Lingard, H. (2012). ‘The case for family-friendly work practices in the Australian construction industry’, Construction Economics and Building, 2(1), 28-36.
Gascoigne, C., Parry, E. and Buchanan, D., (2015), ‘Extreme work, gendered work? How extreme jobs and the discourse of ‘personal choice’ perpetuate gender inequality’, Organization, 22(4), pp. 457-475.
Goldenhar, L. M., Hecker, S., Moir, S., and Rosecrance, J. (2003). ‘The “Goldilocks model” of overtime in construction: not too much, not too little, but just right.’ Journal of Safety Research, 34(2), pp 215-226.
Haslam, R. A., Hide, S. A., Gibb, A. G., Gyi, D. E., Pavitt, T., Atkinson, S., and Duff, A. R. (2005). ‘Contributing factors in construction accidents.’ Applied Ergonomics, 36(4), pp401-415.
Lingard, H. (2010). ‘The impact of individual and job characteristics on 'burnout' among civil engineers in Australia and the implications for employee turnover’, Construction Management and Economics. 21(1), pp 69-80.
Lingard, H., Brown, K., Bradley, L., Bailey, C., and Townsend, K. (2007). ‘Improving employees’ work-life balance in the construction industry: Project alliance case study’, Journal of Construction Engineering and Management, 133(10), pp 807-815.
Morrison, E., and Thurnell, D. (2012). ‘Employee preferences for work-life benefits in a large New Zealand construction company’, Australasian Journal of Construction Economics and Building, 12(1), 12-25.
Pheng, L.S. and Chuan, Q.T., (2006). ‘Environmental factors and work performance of project managers in the construction industry’, International Journal of Project Management,24(1), pp 24-37.
Phillips, R. O. (2014). What is fatigue and how does it affect the safety performance of human transport operators? Fatigue in Transport Report I, Institute of Transport Economics (TØI) and The Research Council of Norway, Oslo, Norway. www.toi.no/getfile.php/Publikasjoner/T%C3%98I%20rapporter/2014/1351-2014/1351-2014-elektronisk.pdf, viewed: 15/06/2018.
Phua, F.T.T. (2013) ‘Construction management research at the individual level of analysis: current status, gaps and future directions’, Construction Management and Economics,31(2), pp 167-179.
Sunindijo, R.Y. and Kamardeen, I., 2017. ‘Work stress is a threat to gender diversity in the construction industry.’ Journal of Construction Engineering and Management, 143(10), p.04017073.
Work Safe New Zealand. (WSNZ) (2017). ‘Fatigue - what's the problem?’https://worksafe.govt.nz/topic-and-industry/work-related-health/fatigue/fatigue-whats-the-problem/, viewed: 15/06/2018.
82. 83.
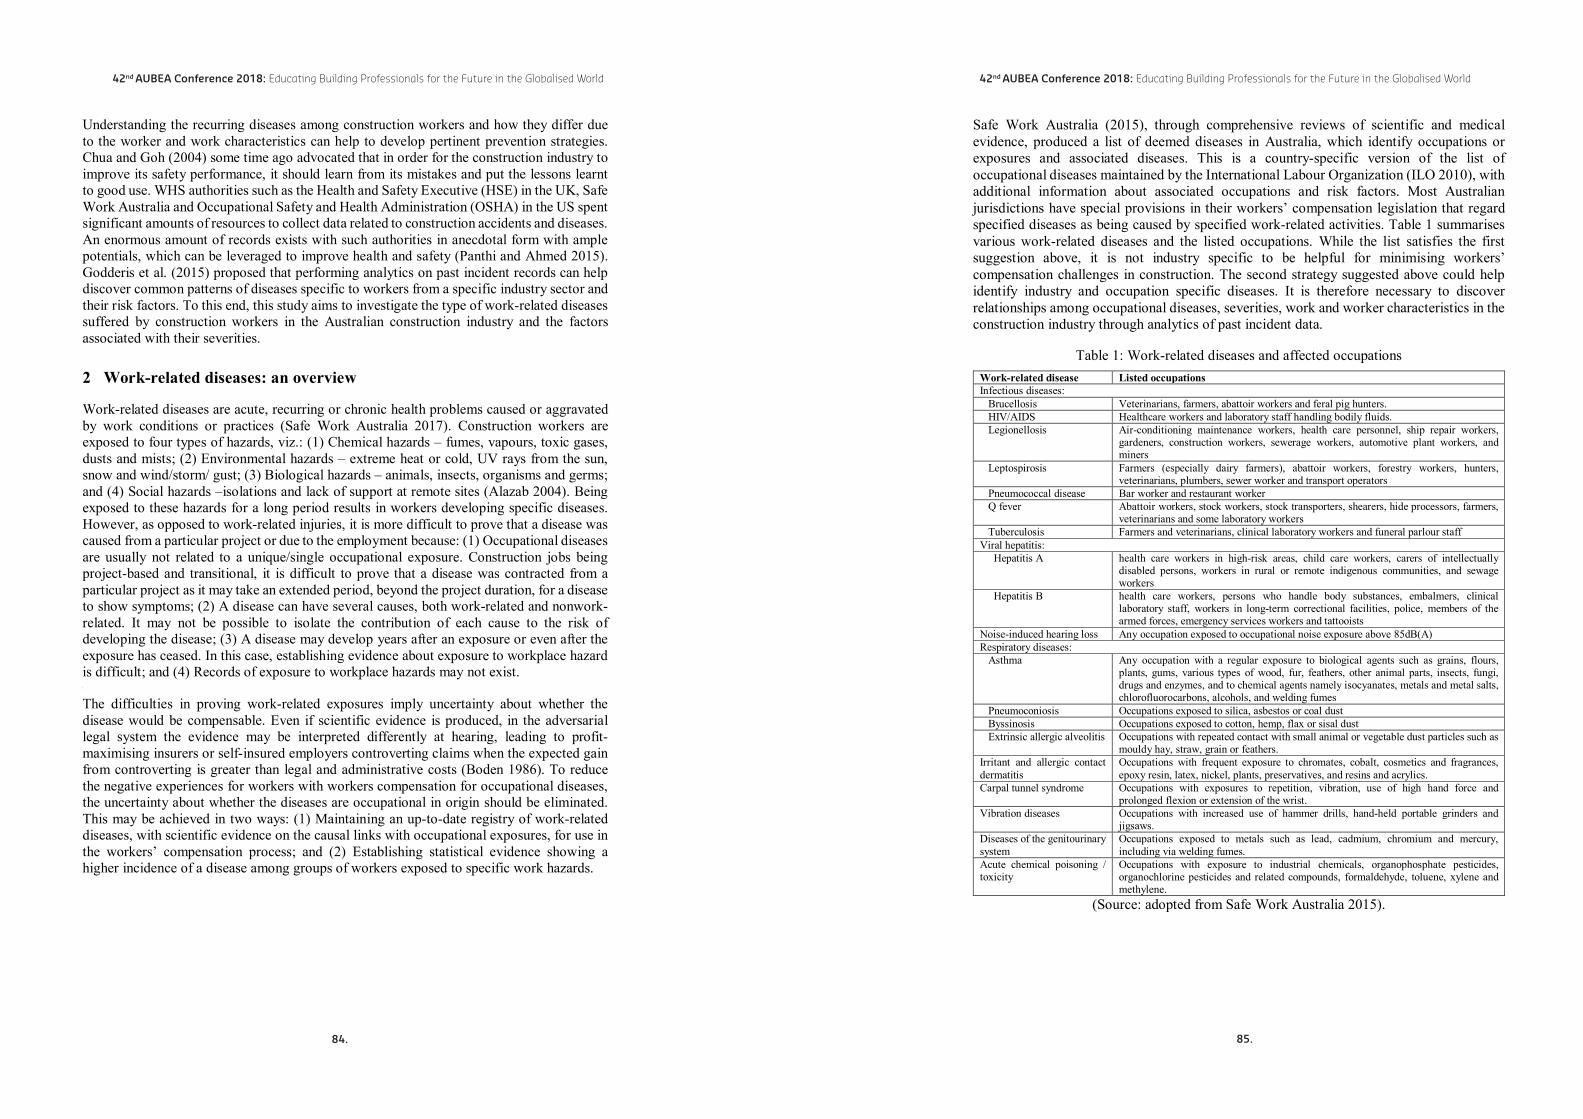
42nd AUBEA Conference 2018: Educating Building Professionals for the Future in the Globalised World
Safe Work Australia (2015), through comprehensive reviews of scientific and medical evidence, produced a list of deemed diseases in Australia, which identify occupations or exposures and associated diseases. This is a country-specific version of the list of occupational diseases maintained by the International Labour Organization (ILO 2010), with additional information about associated occupations and risk factors. Most Australian jurisdictions have special provisions in their workers’ compensation legislation that regardspecified diseases as being caused by specified work-related activities. Table 1 summarises various work-related diseases and the listed occupations. While the list satisfies the first suggestion above, it is not industry specific to be helpful for minimising workers’ compensation challenges in construction. The second strategy suggested above could help identify industry and occupation specific diseases. It is therefore necessary to discover relationships among occupational diseases, severities, work and worker characteristics in the construction industry through analytics of past incident data.
Table 1: Work-related diseases and affected occupationsWork-related disease Listed occupationsInfectious diseases: Brucellosis Veterinarians, farmers, abattoir workers and feral pig hunters. HIV/AIDS Healthcare workers and laboratory staff handling bodily fluids. Legionellosis Air-conditioning maintenance workers, health care personnel, ship repair workers,
gardeners, construction workers, sewerage workers, automotive plant workers, and miners
Leptospirosis Farmers (especially dairy farmers), abattoir workers, forestry workers, hunters, veterinarians, plumbers, sewer worker and transport operators
Pneumococcal disease Bar worker and restaurant worker Q fever Abattoir workers, stock workers, stock transporters, shearers, hide processors, farmers,
veterinarians and some laboratory workers Tuberculosis Farmers and veterinarians, clinical laboratory workers and funeral parlour staffViral hepatitis: Hepatitis A health care workers in high-risk areas, child care workers, carers of intellectually
disabled persons, workers in rural or remote indigenous communities, and sewage workers
Hepatitis B health care workers, persons who handle body substances, embalmers, clinical laboratory staff, workers in long-term correctional facilities, police, members of the armed forces, emergency services workers and tattooists
Noise-induced hearing loss Any occupation exposed to occupational noise exposure above 85dB(A)Respiratory diseases: Asthma Any occupation with a regular exposure to biological agents such as grains, flours,
plants, gums, various types of wood, fur, feathers, other animal parts, insects, fungi, drugs and enzymes, and to chemical agents namely isocyanates, metals and metal salts, chlorofluorocarbons, alcohols, and welding fumes
Pneumoconiosis Occupations exposed to silica, asbestos or coal dust Byssinosis Occupations exposed to cotton, hemp, flax or sisal dust Extrinsic allergic alveolitis Occupations with repeated contact with small animal or vegetable dust particles such as
mouldy hay, straw, grain or feathers.Irritant and allergic contact dermatitis
Occupations with frequent exposure to chromates, cobalt, cosmetics and fragrances, epoxy resin, latex, nickel, plants, preservatives, and resins and acrylics.
Carpal tunnel syndrome Occupations with exposures to repetition, vibration, use of high hand force and prolonged flexion or extension of the wrist.
Vibration diseases Occupations with increased use of hammer drills, hand-held portable grinders and jigsaws.
Diseases of the genitourinary system
Occupations exposed to metals such as lead, cadmium, chromium and mercury, including via welding fumes.
Acute chemical poisoning / toxicity
Occupations with exposure to industrial chemicals, organophosphate pesticides, organochlorine pesticides and related compounds, formaldehyde, toluene, xylene and methylene.
(Source: adopted from Safe Work Australia 2015).
42nd AUBEA Conference 2018: Educating Building Professionals for the Future in the Globalised World
Understanding the recurring diseases among construction workers and how they differ due to the worker and work characteristics can help to develop pertinent prevention strategies. Chua and Goh (2004) some time ago advocated that in order for the construction industry toimprove its safety performance, it should learn from its mistakes and put the lessons learnt to good use. WHS authorities such as the Health and Safety Executive (HSE) in the UK, Safe Work Australia and Occupational Safety and Health Administration (OSHA) in the US spent significant amounts of resources to collect data related to construction accidents and diseases.An enormous amount of records exists with such authorities in anecdotal form with ample potentials, which can be leveraged to improve health and safety (Panthi and Ahmed 2015). Godderis et al. (2015) proposed that performing analytics on past incident records can help discover common patterns of diseases specific to workers from a specific industry sector and their risk factors. To this end, this study aims to investigate the type of work-related diseases suffered by construction workers in the Australian construction industry and the factors associated with their severities.
2 Work-related diseases: an overview
Work-related diseases are acute, recurring or chronic health problems caused or aggravated by work conditions or practices (Safe Work Australia 2017). Construction workers areexposed to four types of hazards, viz.: (1) Chemical hazards – fumes, vapours, toxic gases, dusts and mists; (2) Environmental hazards – extreme heat or cold, UV rays from the sun, snow and wind/storm/ gust; (3) Biological hazards – animals, insects, organisms and germs;and (4) Social hazards –isolations and lack of support at remote sites (Alazab 2004). Being exposed to these hazards for a long period results in workers developing specific diseases. However, as opposed to work-related injuries, it is more difficult to prove that a disease was caused from a particular project or due to the employment because: (1) Occupational diseases are usually not related to a unique/single occupational exposure. Construction jobs being project-based and transitional, it is difficult to prove that a disease was contracted from aparticular project as it may take an extended period, beyond the project duration, for a disease to show symptoms; (2) A disease can have several causes, both work-related and nonwork-related. It may not be possible to isolate the contribution of each cause to the risk of developing the disease; (3) A disease may develop years after an exposure or even after the exposure has ceased. In this case, establishing evidence about exposure to workplace hazard is difficult; and (4) Records of exposure to workplace hazards may not exist. [[
The difficulties in proving work-related exposures imply uncertainty about whether the disease would be compensable. Even if scientific evidence is produced, in the adversarial legal system the evidence may be interpreted differently at hearing, leading to profit-maximising insurers or self-insured employers controverting claims when the expected gain from controverting is greater than legal and administrative costs (Boden 1986). To reduce the negative experiences for workers with workers compensation for occupational diseases,the uncertainty about whether the diseases are occupational in origin should be eliminated. This may be achieved in two ways: (1) Maintaining an up-to-date registry of work-related diseases, with scientific evidence on the causal links with occupational exposures, for use in the workers’ compensation process; and (2) Establishing statistical evidence showing a higher incidence of a disease among groups of workers exposed to specific work hazards.
84. 85.
42nd AUBEA Conference 2018: Educating Building Professionals for the Future in the Globalised World
the attributes were derived from different classification systems that exist in Australia. The mechanisms of injury, for instance, were based on the Type Of Occurrences Classification System (TOOCS) 3rd Edition of the Australian Safety and Compensation Council (Australian Safety and Compensation Council 2008). Similarly, occupation classifications were based on the Australian and New Zealand Standard Classification of Occupations (ANZSCO) 1st
Edition. Grouping intervals for age were derived from the classifications used by the Australian Bureau of Statistics (ABS) in its various reports. Of the 67,527 c cases, 21 were missing values for the age attribute, and therefore were removed from the dataset.
Table 3: Selected variables for investigationVariable
Age
Gender Occupation
Nature of disease
Bodily location affected
Mechanism of disease
Agency of disease
Severity outcome
Statistical analyses were carried out to investigate: (1) the types of diseases suffered by construction workers in Australia and their distributions across the variables studied, and (2) the associations between disease severities and the variables. Crosstabs, along with bar graphs, were created to examine the disease distribution across different variable scales andchi-square tests were performed to study the associations between the disease severity across the variable scales.
4 Results and discussions
The findings of the statistical analyses are discussed under the variable headings below.
4.1 Age
Figure 1 shows the distribution of occupational diseases and severities across different age groups in the construction industry. The bar graph illustrates the overall disease prevalence whereas the crosstab delineates the association between age and disease severities. It is
42nd AUBEA Conference 2018: Educating Building Professionals for the Future in the Globalised World
3 Research method
This study adopted the archival analysis technique. Data required for the research was obtained from Safe Work Australia, which is a government agency responsible for work health and safety. It has chapters representing every state and each chapter maintains a database of workplace incidents for all industries. When a formal request for construction incident and compensation data was made to the federal body, they collated data from the different chapters and provided to the author upon formally signing a confidentiality agreement. The entire process took about 12 months, but the dataset was large, encompassing 391,494 cases of workers’ compensation claims filed by the construction industry across Australia between 2002 and 2014. Filtering the database, a subset of 67,527 cases of work-related diseases was extracted for this study. A typical case was characterised by 23 attributes and Table 2 explains the definitions of these attributes.
Table 2: Attribute definitionsAttribute label Attribute definitionDate of incident The date the occupational disease was first reported to the employerDate of reporting The date the claim was reported to the employerDate of claim The date the claim was lodged with the insurer by the employerDate determined The date the insurer accepted or denied liability for the claimWork status The claimant’s last known work statusIndustry of employer Main activity of the employer at the time of reporting the incidentSize of employer The number of full-time workers employed by the claimant’s companyYear of birth Year of birth of the worker making the claim Gender The gender of the workerOccupation The worker’s occupation at the time of the injury/diseaseDuty status The worker’s duty status at the time of the injury/diseaseHours usually worked each week
The number of hours and minutes usually worked each week (including overtime) by the injured worker
Weekly earnings (in $) Gross weekly earning rounded in whole dollarsIndustry of workplace Main activity of the employer at which the worker was injured or experienced the
exposure resulting in diseasePostcode of workplace Australian postcodeNature of injury/disease The most serious injury/disease sustained or suffered by the worker Bodily location of injury/disease
Part of the body affected by the most serious injury/disease
Mechanism of injury/disease
The action, exposure or event that was the direct cause of the most serious injury/disease
Agent of injury/disease The object, substance or circumstance directly involved in inflicting the most serious injury/disease
Breakdown agent of injury/disease
The circumstance (i.e. hazardous work practices or environment) that principally led to the most serious injury/disease
Severity outcomes Severity of the work-related injury/disease (fatal, permanent incapacity or temporary incapacity)
Time lost (hours) The number of hours and minutes lost for which compensation was paidCompensation ($) All payments made to the worker or worker’s family in compensation for the death,
injury or disease
Data preparation was performed to: (1) remove noise, (2) handle records with missing values, (3) filter relevant attributes for data analysis, and (4) redefine attribute measurements to enable robust analyses. Upon a careful examination of the dataset and the nature of the attributes, 8 out of 23 attributes of the dataset were considered suitable for analysis. The original measurement scales of the attributes were revised as shown in Table 3. All the attributes were made categorical to enable non-parametric analyses. The categories used for
86. 87.

42nd AUBEA Conference 2018: Educating Building Professionals for the Future in the Globalised World
Chi-square results GenderDisease severity category
TotalFatal
Permanent incapacity
Temporary incapacity
x2=217.847, df=2, p<0.001
Male 425 14821 50032 65278Female 2 225 2022 2249
Total 427 15046 52054 67527Figure 2: Workers’ gender and disease severity
4.3 Occupation
Figure 3 depicts the distribution of occupational diseases and severities across different occupations in the construction industry. The bar graph illustrates the overall disease prevalence whereas the crosstab appraises of the association between occupations and disease severities. Technicians and trade workers, labourers and machinery operators account for 90% of the diseases. Moreover, trade workers represent heavily in fatalities as well as in permanent and temporary incapacities due to work-related diseases, followed by labourers. It is concerning that a significant number of trade workers suffer fatal diseases from their work.
Chi-square results Occupation Disease severity category Total
42nd AUBEA Conference 2018: Educating Building Professionals for the Future in the Globalised World
evident from the results that fatalities and permanent incapacities due to work-related diseases increase with the age of construction workers. The highest number of fatal diseases occurred in the age group of 60 and above. The statistical results confirm that the age of construction workers is strongly associated with the disease severity (x2 =9011.073, df=10, p<0.001).
Chi-square results Age categoryDisease severity distribution
TotalFatal
Permanent incapacity
Temporary incapacity
x2=9011.073, df=10, p<0.001
Under 20 4 69 1226 129920 to 29 15 669 9903 1058730 to 39 24 1548 12511 1408340 to 49 25 3124 13316 1646550 to 59 56 5112 10650 1581860 & above 303 4524 4448 9275
Total 427 15046 52054 67527Figure 1: Workers’ age and disease severity
4.2 Gender
Figure 2 shows the distribution of occupational diseases and severities across different gender in the construction industry. The bar graph illustrates the overall disease prevalence whereas the crosstab delineates the association between gender and disease severities. The results show that more male workers are killed, and permanently and temporarily incapacitated by work-related diseases. However, construction being a male-dominated industry, with only around 11% female representation in Australia, the outcome is self-intuitive and not surprising.
88. 89.

42nd AUBEA Conference 2018: Educating Building Professionals for the Future in the Globalised World
x2=39280.434, df=16, p<0.001
Skin diseases 3 92 2600 2695Nervous system diseases 1 11475 5358 16834Respiratory system diseases 97 350 550 997Circulatory system diseases 52 33 402 487Infectious diseases 6 12 267 285Cancer 248 357 499 1104Other diseases 10 42 295 347
Total 427 15046 52054 67527Figure 4: Disease types and severity
4.5 Bodily location of disease
Figure 5 illustrates the spread of the bodily parts affected due to occupational diseases in the construction industry. The bar graph exhibits an overall picture of the bodily parts affected due to occupational diseases in the construction industry whereas the crosstab appraises of the association between the bodily parts and disease severities. It is evident that more than 90% of the fatalities occurred by damage to organs in the trunk of the body and 75% of permanent incapacities were due to diseases affecting the head.
Variable Body location of diseaseDisease severity category
TotalFatal
Permanent incapacity
Temporary incapacity
x2=31851.182, df=16, p<0.001
Head 7 11277 3667 14951Neck 3 126 1816 1945Trunk 393 1962 24912 27267Upper limbs 3 1056 13091 14150Lower limbs 2 275 6409 6686Multiple locations 5 229 1159 1393Systemic locations 12 81 609 702Psychological system (non-physical location) 0 2 18 20Unspecified location 2 38 373 413
Total 427 15046 52054 67527Figure 5: Bodily locations affected
42nd AUBEA Conference 2018: Educating Building Professionals for the Future in the Globalised World
FatalPermanent incapacity
Temporary incapacity
x2=8515.576, df=18, p<0.001
Unknown 114 66 79 259Managers 16 678 1643 2337Professionals 7 367 1308 1682Technicians & Trade Workers 197 6402 25906 32505Community & Personal Service Workers 4 127 746 877Clerical & Administrative Workers 1 110 985 1096Sales Workers 4 61 420 485Machinery Operators & Drivers 11 1854 5479 7344Labourers 72 5381 15488 20941
Total 427 15046 52054 67527Figure 3: Occupation and disease severity
4.4 Nature of disease
Figure 4 depicts the distribution of different types of occupational diseases and severities in the construction industry. The bar graph illustrates the prevalence of different disease typeswhereas the crosstab explains the association between occupational diseases and disease severities. It is evident that the most common occupational disease suffered in the construction industry is musculoskeletal and connective tissue disorders, followed by nervous system and sense organ diseases, and digestive system diseases. These three diseases account for more than 90% of the incidents. Nevertheless, the incidents of fatalities occur largely due to other diseases. During the 13-year period of data collection, almost two-third of the fatalities have been caused by other three diseases, namely neoplasms (cancer),respiratory system diseases and circulatory system diseases. Moreover, almost 80% of the permanent incapacities have been caused by nervous system and sense organ diseases.
Chi-square results Nature of diseaseDisease severity category
TotalFatal
Permanent incapacity
Temporary incapacity
Musculoskeletal & connective tissue diseases 8 2513 34632 37153Digestive system diseases 2 172 7451 7625
90. 91.

42nd AUBEA Conference 2018: Educating Building Professionals for the Future in the Globalised World
association between the agents and disease severities suffered. More than half of the occupation diseases in the construction industry has been due to the use or/exposure to three agents, namely: non-powered tools, materials and substances, and environmental agents. However, although insignificant in terms of percentage exposure to chemicals account for a significant portion of fatalities, followed by materials and substances. Chemicals, and materials and substances together account for more than half of fatalities whereas environmental agencies are responsible for one-third of permanent incapacities.
Chi-square results Agent Disease severity categoryTotal
FatalPermanent incapacity
Temporary incapacity
x2=10318.749, df=16, p<0.001
Machinery & fixed plant 1 1421 2834 4256Mobile plant & transport 7 2184 3457 5648Powered equipment, tools & appliances 2 1596 2939 4537Non-powered equipment, hand tools & appliances
10 834 12117 12961
Chemicals 153 117 962 1232Materials & substances 94 1345 12063 13502Environmental agencies 31 4607 6399 11037Animal, human & biological agencies 16 71 1404 1491Other agencies 113 2871 9879 12863
Total 427 15046 52054 67527Figure 7: Agent of disease
5 Conclusion
Safe Work Australia and similar work health and safety authorities around the world have listed numerous diseases that can be deemed by jurisdictions as possibly caused by occupations. However, it is important to identify the diseases that are specific to different industries for making the preventive measure more pertinent and effective. This study
42nd AUBEA Conference 2018: Educating Building Professionals for the Future in the Globalised World
4.6 Mechanism
Figure 6 depicts different mechanisms that triggered occupational diseases in the construction industry. The bar graph shows a broader profile of mechanism, causingoccupational diseases in the construction industry whereas the crosstab explains the association between the mechanisms and disease severities suffered. More than 70% of the occupational diseases are caused by body stressing, and sound and pressure. This is intuitive because construction sites are noisy, and the work demands physical exertion. However, chemicals and other substance as well as environmental factors are responsible for more than 65% of the fatalities.
Chi-square results MechanismDisease severity category
TotalFatal
Permanent incapacity
Temporary incapacity
x2=40437.232, df=18, p<0.001
Falls 8 377 6105 6490Hitting objects with a part of body 30 97 2479 2606Struck by moving objects 7 135 2118 2260Sound & pressure 2 10972 1988 12962Body stressing 11 2180 33220 35411Heat, electricity & other environmental factors
42 185 1000 1227
Chemical & other substances 236 561 1645 2442Biological factors 3 92 459 554Mental stress 3 3 34 40Vehicle accident 85 444 3006 3535
Total 427 15046 52054 67527Figure 6: Mechanism of disease
4.7 Agent
Figure 7 shows the various exposures and agents that caused occupational diseases in the construction industry. The bar graph represents the proportion of different agents, causing occupational diseases in the construction industry whereas the crosstab explains the
92. 93.

42nd AUBEA Conference 2018: Educating Building Professionals for the Future in the Globalised World
Alazab R M A (2004). Work-related diseases and occupational injuries among workers in the construction industry. African Newsletter on Occupational Health and Safety, 14: 37-42. online at: http://www.bvsde.paho.org/bvsacd/cd46/alazab.pdf
Australian Safety and Compensation Council (2008) Type Of Occurrence Classification System (TOOCS) 3rd Ed. (Rev. 1). Canberra: Australian Safety and Compensation Council.
Boden L.I. 1986. "Problems in Occupational Disease Compensation." In Current Issues in Workers' Compensation, James Chelius, ed. Kalamazoo, MI: W.E. Upjohn Institute for Employment Research, pp. 313–326. https://doi.org/10.17848/9780880995443.ch13
Chua D K H and Goh Y M. (2004). Incident causation model for improving feedback of safety knowledge. Journal of Construction Engineering and Management, 130(4):542-551.
Cigularov K, Chen P and Rosecrance J. (2010) The effects of error management climate and safety communication on safety: A multi-level study. Accident Analysis and Prevention, 42(5):1498-1506.
Cigularov K, Chen P and Rosecrance J. (2010) The effects of error management climate and safety communication on safety: A multi-level study. Accident Analysis and Prevention, 42(5):1498-1506.
Godderis L, Mylle G, Coene M, Verbeek C, Viaene B, Bulterys S and Schouteden M. (2015). Datawarehouse for detection of occupational disease in OHS data. Occupational Medicine 65(8):651-658.
International Labour Organization (ILO) (2010). ILO List of Occupational Diseases. URL:http://www.ilo.org/wcmsp5/groups/public/---ed_protect/---protrav/---safework/documents/publication/wcms_125137.pdf. Accessed: 3 July 2018
Panthi K and Ahmed S. M (2015) Predictive models from accident reports. 5ist ASC Annual International Conference Proceedings. URL:: http://ascpro.ascweb.org/chair/paper/CPRT344002015.pdf. Accessed: 26 July 2018.
Riva M M, Bancone C, Bigoni F, Bresciani M, Santini M, Mosconi G (2012). Work-related diseases and the fitness to work in the construction industry. G Ital Med Lav Ergon. 34(3):306-12Safe Work Australia. (2015). Deemed Diseases in Australia. Online at https://www.safeworkaustralia.gov.au/system/files/documents/1702/deemed-diseases.pdf . Accessed on January 19, 2018].
Safe Work Australia. (2015). Deemed Diseases in Australia. Online at https://www.safeworkaustralia.gov.au/system/files/documents/1702/deemed-diseases.pdf . Accessed on January 19, 2018].
Safe Work Australia. (2017). Work-related Disease Research. Online at https://www.safeworkaustralia.gov.au/statistics-and-research/research-and-studies/work-related-disease-research. Accessed on January 18, 2018]
42nd AUBEA Conference 2018: Educating Building Professionals for the Future in the Globalised World
identified three work-related diseases that are contracted by construction workers and lead to their fatalities, which are cancer, respiratory system diseases and circulatory system diseases.Moreover, it has been found that nerves system diseases contracted by construction workers result in permanent incapacitation. In terms of agencies for diseases, exposure to chemicals, substances and environmental factors are the primary catalysts for work-related diseases among construction workers. The findings imply that trades workers who are involved with chemical and substances as well as those who are exposed to heat, electricity and other environmental agencies have to be inducted and safety trained very well about potential harms they can be faced with and proper safety measures that they need to follow at work. Three key practical implications are drawn from the study:
• Unlike injuries and fatalities, it is often difficult to prove occupational causalities for diseases. An insurer can argue that a claimed disease might have been caused by factorsthat are unrelated to work. Moreover, construction is a project-based business and a worker may work on different projects that are undertaken by different contractors. A disease may be creeping in/ contracted by the worker while working on a project and the symptoms might surface much later while working on another project. Therefore, it is hard to prove that working on a particular project caused the disease. Again, the insurer could argue that the disease pre-existed. These scenarios will place severe psychological and economic strains on affected workers. To address these complications, it is recommended that workplace health authorities maintain a national level, e-occupational exposure registry. Employers and employees can be mandated to record their occupation and hazard exposure details whenever a new job role is assigned. This registry would
• Construction organisations should place special emphasis on educating construction workers on the proper use of personal protective equipment for the prevention of diseases. They should also be informed of the practical difficulties involved in establishing occupational causation for diseases and the urgency of following necessary preventive steps.
• The industry should have policies for transferring to alternative jobs workers who are sensitive to work-related diseases to continue their occupation while ensuring a safe work environment. This may be quite difficult for specialized tradespersons as they cannot be just job transferred. Nonetheless, new mechanisms need to be explored for risk minimization for tradespersons too.
This study revealed the type of diseases and the construction workforce groups that are vulnerable to those diseases. Further studies are suggested to investigate specific trades such as carpenter, concreter, plumber, etc. and the occupational diseases they are exposed to, and specific prevention measures required.
6 Acknowledgement
The author would like to thank Safe Work Australia for providing the workers’ compensation data required for this research.
7 References
94. 95.

42nd AUBEA Conference 2018: Educating Building Professionals for the Future in the Globalised World
technologies in construction industry. Being recognised as a construction technique from as early as 1800s, OSM was not really looked into until recently for its potentials in improving efficiency in the process, precision in the products, ability to include various environmental features and hence keeping up with requirements, optimising the use of declining workforce, minimising health and safety risks and to significantly shorten the construction cycles (Steindhart and Manley 2016; Goulding et al., 2015; Khalfan and Maqsood 2014; Schoenborn 2012; Smith 2010). These have earned OSM the term “modern method of construction” since 1990s (Gibb 1999).
With those potential advantages mentioned above, there is a common expectation for OSM to be widely adopted. However, the OSM’s uptake in reality has not been as predicted (Rahman 2013). The global research publication looking into OSM has beengrowing at a relatively steady rate since 1998. But, the actual uptakes in many construction industries have not been inline. For example, a study of the total offsite construction output in the UK between 1998 and 2008 revealed a modest increase between 1998 and 2008 (Taylor 2010). In Australia it was indicated that only 3% of the new housing in Australia utilises prefabrication (Steindhart and Manley 2016). Many researchers and scholars have studied the lower uptake of OSM attempting tounderstand the reasons behind the lower uptake (e.g. Rahman 2013; Arif and Egbu 2010; Pan et al. 2008; CRC Construction Innovation 2007), but there has not been a realconsensus among their outcomes.
It is generally accepted that the earlier focus in deciding to implement OSM were mainly the cost and schedule performance of a project (Shahzad et al. 2014). Indeciding to implement OSM in a more recent time, a number of factors including project costs, time, quality, sustainability, site, project and procurement constraints have impacted the implementation of OSM in a project (Blismas et al., 2005). These identified factors can be generally grouped within the three main groups also known as the triple bottom-line (TBL) of sustainability, namely economic, environmental and social. This paper provides a review of sustainability procurement in the format of a framework that has been developed in this research embodying the triple bottom-line of sustainability (economic, environmental and social) to map the potential ways of achieving the TBL of sustainability in projects implementing OSM.
2. Research methodology
At this early stage of study, the research methodology to be implemented to better understand the potentials for achieving the triple bottom line of sustainability through implementing OSM in construction projects is literature review. In conducting research, literature review has been regarded necessary to understand what already known and written down, relevant to the research (Robson 2013). Thus, it involves systematically identifying, locating, and analysing documents containing information related to the research problem. These documents can include articles, abstracts, reviews, monographs, dissertations, books, other research reports, and electronic media. In this research, the literature review is focused on scholarly journal articles supported by various conference articles as well as scholarly books and book chapters as well as professional industry reports. The review started off with gaining further understanding on offsite manufacturing itself including its terminologies, history, positioning in different sectors and typical lifecycle. This is followed by focusing the review on the triple bottom line of sustainability and identifying the potentials of achieving themthrough OSM lifecycle.
42nd AUBEA Conference 2018: Educating Building Professionals for the Future in the Globalised World
Exploring the potential for achieving the triple bottom-line of sustainability through offsite manufacturing
Monty Sutrisna1, Chris Leong2, Ahmed Hammad3 and Atiq Zaman4
1,2,3&4School of Design and the Built Environment, Curtin University, Perth, 6084, WESTERN AUSTRALIA
E-mails: [email protected]; [email protected]; [email protected];[email protected]
Abstract:Triggered by the rapid depletion of natural resources, sustainability has now becoming a popular topic that has been linked to various aspects of human’s life. Given the very scale of the global construction industry, sustainability has emerged as one of the main features in the construction industry including in choosing the construction method such as offsite manufacturing (OSM) in construction. In fact, one of the main advantages of OSM has been expected as its potential to minimise waste as well as higher level of productivity and hence supporting sustainability. However, it has also been reported that despite all its advantages, the uptake of OSM is still considered relatively low in the construction industry. In discussing about sustainability, various scholars have championed the importance of looking into this matter through a more holistic view of sustainability including economical, social and environmental. This is also known as the triple bottom-line of sustainability. This paper presents a review of the current development in analysing the achievement of the triple bottom-line of sustainability throughout the lifecycle of offsite construction projects. The outcomes of this review areexpected to unveil various points within the lifecycle of projects delivered with the offsite construction techniques that can be improved to better facilitate the achievement of the triple bottom-line of sustainability in these projects. The findings can be used by practitioners to improve and better justify the implementation of offsite construction techniques and subsequently, further promoting the use of such techniques in the construction industry.
Keywords: construction, sustainability, triple bottom line, offsite manufacturing
Introduction
It has been generally accepted that there are currently increasing demands in the society (including in the construction industry) for sustainability factors to be considered inpractices in order to reduce any environmental and social impacts (Azhar et al. 2011). Thus, sustainability has become an important decision-making factor in procuring a construction project in the current market place (Schlueter and Thesseling 2009). This ‘movement’ is understood as the societal needs to be considered in the construction procurement processes (Leinonen and Houvila 2000) and signifies the increase of wider public and communities’ influence in the delivery and procurement of construction projects. One of the implications was the potential to implement construction techniques that have been perceived as embodying sustainability, such as the offsite manufacturing (OSM).
Further development of offsite manufacturing (OSM) has been considered one of the most important innovations in construction methods leveraging the advancement of
96. 97.
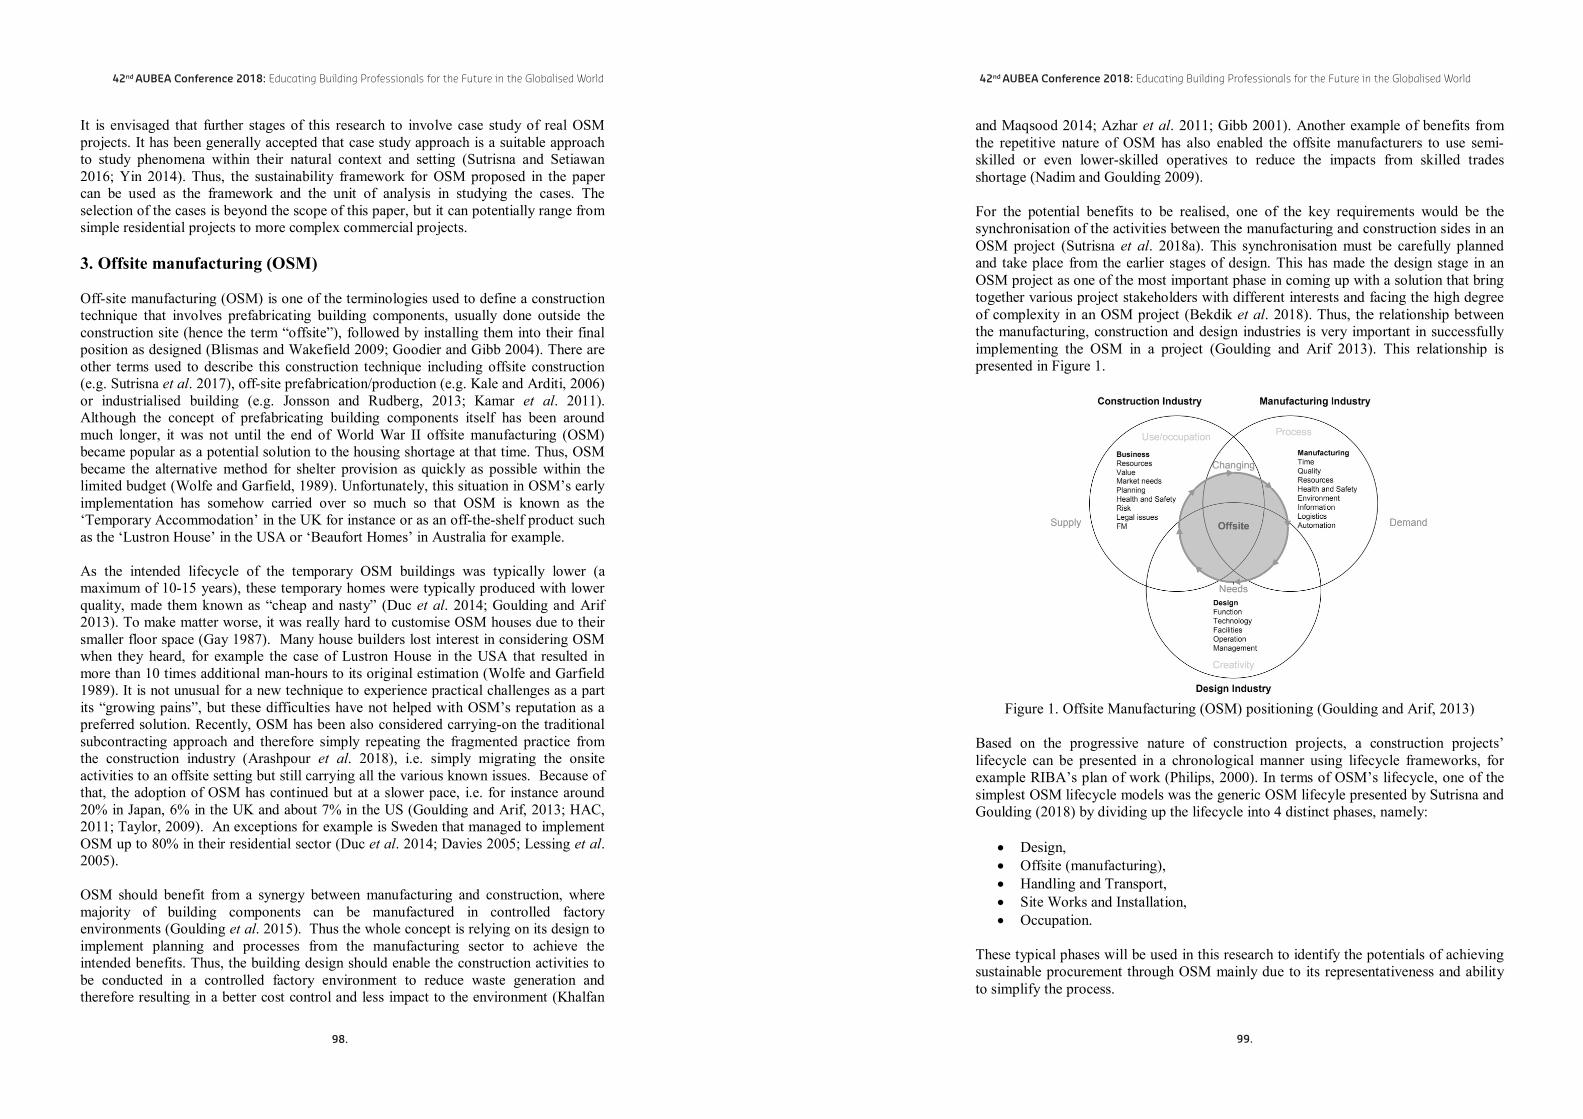
42nd AUBEA Conference 2018: Educating Building Professionals for the Future in the Globalised World
and Maqsood 2014; Azhar et al. 2011; Gibb 2001). Another example of benefits from the repetitive nature of OSM has also enabled the offsite manufacturers to use semi-skilled or even lower-skilled operatives to reduce the impacts from skilled trades shortage (Nadim and Goulding 2009).
For the potential benefits to be realised, one of the key requirements would be the synchronisation of the activities between the manufacturing and construction sides in an OSM project (Sutrisna et al. 2018a). This synchronisation must be carefully planned and take place from the earlier stages of design. This has made the design stage in an OSM project as one of the most important phase in coming up with a solution that bring together various project stakeholders with different interests and facing the high degree of complexity in an OSM project (Bekdik et al. 2018). Thus, the relationship between the manufacturing, construction and design industries is very important in successfully implementing the OSM in a project (Goulding and Arif 2013). This relationship is presented in Figure 1.
Figure 1. Offsite Manufacturing (OSM) positioning (Goulding and Arif, 2013)
Based on the progressive nature of construction projects, a construction projects’ lifecycle can be presented in a chronological manner using lifecycle frameworks, for example RIBA’s plan of work (Philips, 2000). In terms of OSM’s lifecycle, one of the simplest OSM lifecycle models was the generic OSM lifecyle presented by Sutrisna and Goulding (2018) by dividing up the lifecycle into 4 distinct phases, namely:
• Design,• Offsite (manufacturing), • Handling and Transport, • Site Works and Installation, • Occupation.
These typical phases will be used in this research to identify the potentials of achieving sustainable procurement through OSM mainly due to its representativeness and ability to simplify the process.
42nd AUBEA Conference 2018: Educating Building Professionals for the Future in the Globalised World
It is envisaged that further stages of this research to involve case study of real OSM projects. It has been generally accepted that case study approach is a suitable approach to study phenomena within their natural context and setting (Sutrisna and Setiawan 2016; Yin 2014). Thus, the sustainability framework for OSM proposed in the paper can be used as the framework and the unit of analysis in studying the cases. The selection of the cases is beyond the scope of this paper, but it can potentially range from simple residential projects to more complex commercial projects.
3. Offsite manufacturing (OSM)
Off-site manufacturing (OSM) is one of the terminologies used to define a construction technique that involves prefabricating building components, usually done outside the construction site (hence the term “offsite”), followed by installing them into their final position as designed (Blismas and Wakefield 2009; Goodier and Gibb 2004). There are other terms used to describe this construction technique including offsite construction (e.g. Sutrisna et al. 2017), off-site prefabrication/production (e.g. Kale and Arditi, 2006) or industrialised building (e.g. Jonsson and Rudberg, 2013; Kamar et al. 2011). Although the concept of prefabricating building components itself has been around much longer, it was not until the end of World War II offsite manufacturing (OSM) became popular as a potential solution to the housing shortage at that time. Thus, OSM became the alternative method for shelter provision as quickly as possible within the limited budget (Wolfe and Garfield, 1989). Unfortunately, this situation in OSM’s early implementation has somehow carried over so much so that OSM is known as the ‘Temporary Accommodation’ in the UK for instance or as an off-the-shelf product such as the ‘Lustron House’ in the USA or ‘Beaufort Homes’ in Australia for example.
As the intended lifecycle of the temporary OSM buildings was typically lower (a maximum of 10-15 years), these temporary homes were typically produced with lower quality, made them known as “cheap and nasty” (Duc et al. 2014; Goulding and Arif2013). To make matter worse, it was really hard to customise OSM houses due to theirsmaller floor space (Gay 1987). Many house builders lost interest in considering OSM when they heard, for example the case of Lustron House in the USA that resulted in more than 10 times additional man-hours to its original estimation (Wolfe and Garfield1989). It is not unusual for a new technique to experience practical challenges as a part its “growing pains”, but these difficulties have not helped with OSM’s reputation as a preferred solution. Recently, OSM has been also considered carrying-on the traditional subcontracting approach and therefore simply repeating the fragmented practice fromthe construction industry (Arashpour et al. 2018), i.e. simply migrating the onsite activities to an offsite setting but still carrying all the various known issues. Because of that, the adoption of OSM has continued but at a slower pace, i.e. for instance around20% in Japan, 6% in the UK and about 7% in the US (Goulding and Arif, 2013; HAC, 2011; Taylor, 2009). An exceptions for example is Sweden that managed to implement OSM up to 80% in their residential sector (Duc et al. 2014; Davies 2005; Lessing et al.2005).
OSM should benefit from a synergy between manufacturing and construction, wheremajority of building components can be manufactured in controlled factory environments (Goulding et al. 2015). Thus the whole concept is relying on its design to implement planning and processes from the manufacturing sector to achieve the intended benefits. Thus, the building design should enable the construction activities to be conducted in a controlled factory environment to reduce waste generation and therefore resulting in a better cost control and less impact to the environment (Khalfan
98. 99.

42nd AUBEA Conference 2018: Educating Building Professionals for the Future in the Globalised World
allowing a degree of flexibility for clients but based on that standardised componentsfor the subsequent manufacturing process. In terms of manufacturing process, it has been acknowledged that the construction industry needs to adopt higher degree of industrialisation to reduce cost and that prefabrication is the first step in industrialisation (Richard 2005). In transporting the completed modular units, the dimension and weight of the volumetric units to be transported will have to follow the physical limitations of the delivery vehicle as well as complying with the highway authority’s requirements (Sutrisna and Goulding 2018; Schoenborn 2012). Existing site condition including the site logistics, access to site or manoeuvring space and/or any obstructions also need to be taken into account in transferring the modular units to ensure smoother site works (Sutrisna et al. 2017). At the end of the process, during the occupancy, clients/users will require more economic operation and maintenance.
3.2. Environmental sustainability of OSM
The relatively novel notion of “green procurement” typically refers to environmental considerations enshrined into purchasing policies, programmes and actions to facilitate recycling, reuse and resource reduction (Carter and Carter 1998). A study reported that the implementation of the more conventional onsite construction techniques can produce waste up to 40% from all new products brought to construction site (Smith, 2010). Environmentally sustainable delivery, therefore, should concern with reducing the environmental impacts at every project development phases from the design phase to include the provision of environmentally-friendly construction materials (low embodied energy and renewable materials), application of alternative constructiontechniques (off-site manufacturing), up to the implementation of eco-design principles (energy efficient and passive-design to reduce/minimise dependency to non-renewable energy sources). Varnäs et al. (2009) suggested to incorporate environmental features into a project in the preliminary design, in the tendering for the construction contract and the tendering/considering the building services such as heating, ventilation and air conditioning.
In manufacturing the OSM units as well as subsequent phases, potentials for OSM in addressing environmental considerations have been well documented including the reduction of waste during the manufacturing process itself, minimising the onsite activities and hence reducing the environmental impacts associated to onsite construction processes or even in reducing carbon footprints as a whole (Jaillon and Poon 2014; Azhar et al. 2011). Thus, for example by designing the OSM units to optimise transport vehicle capabilities but within the regulations (particularly highway requirements), the minimum transporting cycles can be minimised to limit the carbon footprints from transportation. Another example would be by transferring as many construction activities as possible to be conducted offsite, this will likely shorten the construction time on site and hence minimise pollution, the use of water and energy onsite. At the end of the process, during the occupancy, clients/users will typically require less dependency to non-renewable energy sources to run their building.
3.3. Social sustainability of OSM
The social sustainability has been perceived initially from the corporate social responsibility (CSR) perspective where various social aspects such as employment, labour standard, gender equality, wellbeing, and so on are considered in the whole supply chains (McCrudden 2004). The more recent development of social sustainability includes further aspects including the use of local suppliers and subcontractors,
42nd AUBEA Conference 2018: Educating Building Professionals for the Future in the Globalised World
4. The triple bottom line of sustainability in OSM: A proposed framework
The serious impact towards our natural environment has changed societal expectations to demand awareness and considerations by leaders of their practices (Colbert and Kurucz 2007). So much so that sustainability aspect is now considered one of the sources of competitiveness embodied in the principles of procurement management (Savitz and Weber 2006; de Burgos Jimenez and Céspedes Lorente, 2001). Thus, procurement is the vehicle to implement sustainability into practices that extends to the whole supply chains (Meehan and Bryde 2011). A lot of organisations have extended their attention to also look beyond traditional financial performance by embeddingenvironmental and social performance of procurement known as the triple bottom line (TBL) approach (Hollos et al. 2012; Birkin et al. 2009). Sustainability has now become the new paradigm in many construction industries and one of the most important considerations in delivering and procuring projects (Schlueter and Thesseling 2009). This demonstrates the results from growing pressure from the wider public in delivering and procuring construction projects (Nibbelink et al. 2017; Leinonen and Houvila 2000). Sustainable procurement has been used as the generic terminology to describeproject’s delivery/procurement aligned with the TBL philosophy applying the principles of sustainable development: ensuring a strong, healthy and just society, living within environmental limits whilst promoting good governance (Walker and Brammer, 2009).
3.1. Economical sustainability of OSM
Economical sustainability has been defined as a way to operate that allows delivery withcost benefits and cost savings by embracing a whole-of-life costing way of thinking,impacts of supply chains and sustainability criteria (Zeppel 2014). Whilst this can be impacted by policies, such as landfill levies, carbon taxes and so on (Thomson and Jackson, 2007), this paper focuses on the design, manufacturing and construction processes only. It has been acknowledged that within the total development cost, the construction cost will typically be the most significant component (between 42.8-65.8%) in comparison to other costs such as land, service and finance, government charges and margins (Hsieh et al. 2012; Urbis 2011). In procuring and delivering construction projects, the cost associated with material, transportation and labour have been considered the cost drivers that are typically considered in selecting a construction method (Chen et al. 2010). There are a large numbers of publications discussingconstruction cost (Warsame 2006), however the offsite construction cost has not been widely covered.
There have been various discussions from both sides of the argument whether implementing OSM is actually cheaper than constructing with the more conventional onside construction. A recent investigation on the implementation of OSM technique in the housing sector has revealed that migrating onsite construction activities to be conducted offsite alone may not necessarily result in lower overall construction costs (Sutrisna et al. 2018b). Instead, the financial benefits will be realised at the entire supply chain level. The limited demands (volume) as well as the client’s requirements for higher degrees of customisation in offsite production has been the main factors found to limit the economic benefits that can be typically expected from a manufacturing operation. Because of these, the design phase of OSM projects holds the main keys in achieving the economic sustainability by optimising the standardisation of the building/structure components with repetitions in production in mind whilst still
100. 101.
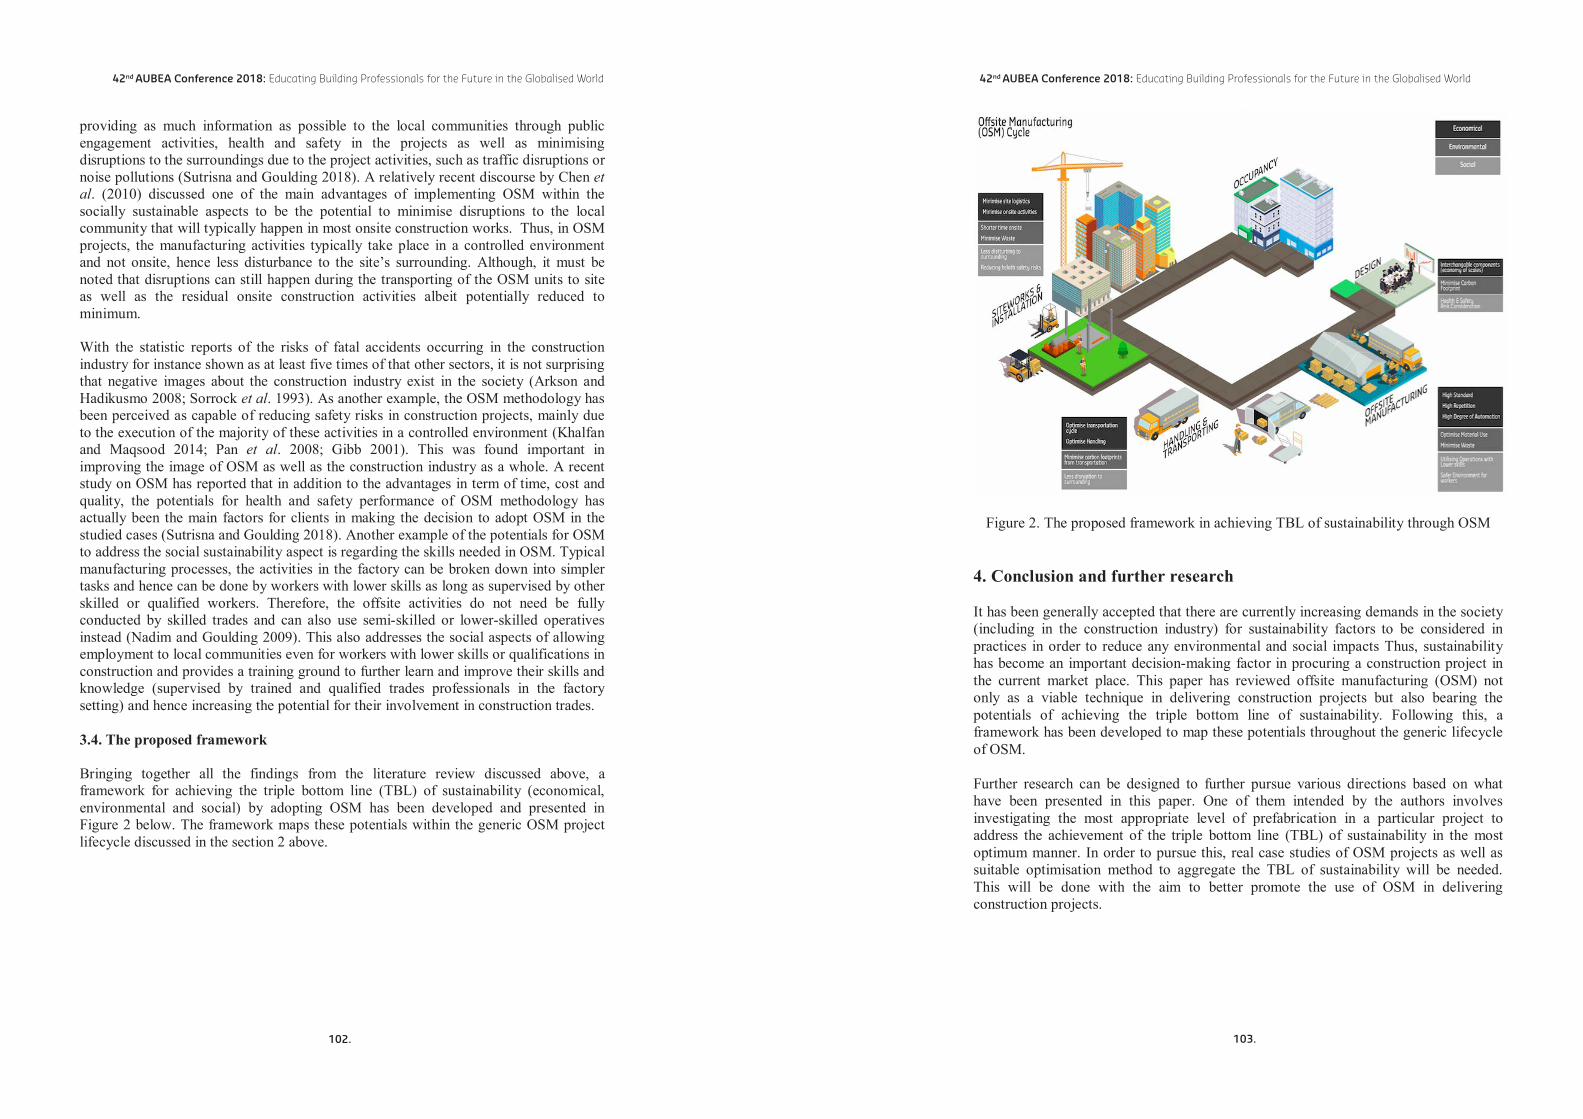
42nd AUBEA Conference 2018: Educating Building Professionals for the Future in the Globalised World
Figure 2. The proposed framework in achieving TBL of sustainability through OSM
4. Conclusion and further research
It has been generally accepted that there are currently increasing demands in the society (including in the construction industry) for sustainability factors to be considered in practices in order to reduce any environmental and social impacts Thus, sustainability has become an important decision-making factor in procuring a construction project in the current market place. This paper has reviewed offsite manufacturing (OSM) not only as a viable technique in delivering construction projects but also bearing thepotentials of achieving the triple bottom line of sustainability. Following this, a framework has been developed to map these potentials throughout the generic lifecycle of OSM.
Further research can be designed to further pursue various directions based on what have been presented in this paper. One of them intended by the authors involves investigating the most appropriate level of prefabrication in a particular project to address the achievement of the triple bottom line (TBL) of sustainability in the most optimum manner. In order to pursue this, real case studies of OSM projects as well as suitable optimisation method to aggregate the TBL of sustainability will be needed. This will be done with the aim to better promote the use of OSM in delivering construction projects.
42nd AUBEA Conference 2018: Educating Building Professionals for the Future in the Globalised World
providing as much information as possible to the local communities through public engagement activities, health and safety in the projects as well as minimising disruptions to the surroundings due to the project activities, such as traffic disruptions or noise pollutions (Sutrisna and Goulding 2018). A relatively recent discourse by Chen et al. (2010) discussed one of the main advantages of implementing OSM within the socially sustainable aspects to be the potential to minimise disruptions to the local community that will typically happen in most onsite construction works. Thus, in OSM projects, the manufacturing activities typically take place in a controlled environment and not onsite, hence less disturbance to the site’s surrounding. Although, it must be noted that disruptions can still happen during the transporting of the OSM units to site as well as the residual onsite construction activities albeit potentially reduced to minimum. With the statistic reports of the risks of fatal accidents occurring in the construction industry for instance shown as at least five times of that other sectors, it is not surprising that negative images about the construction industry exist in the society (Arkson and Hadikusmo 2008; Sorrock et al. 1993). As another example, the OSM methodology has been perceived as capable of reducing safety risks in construction projects, mainly due to the execution of the majority of these activities in a controlled environment (Khalfan and Maqsood 2014; Pan et al. 2008; Gibb 2001). This was found important in improving the image of OSM as well as the construction industry as a whole. A recent study on OSM has reported that in addition to the advantages in term of time, cost and quality, the potentials for health and safety performance of OSM methodology has actually been the main factors for clients in making the decision to adopt OSM in the studied cases (Sutrisna and Goulding 2018). Another example of the potentials for OSM to address the social sustainability aspect is regarding the skills needed in OSM. Typical manufacturing processes, the activities in the factory can be broken down into simpler tasks and hence can be done by workers with lower skills as long as supervised by other skilled or qualified workers. Therefore, the offsite activities do not need be fully conducted by skilled trades and can also use semi-skilled or lower-skilled operatives instead (Nadim and Goulding 2009). This also addresses the social aspects of allowing employment to local communities even for workers with lower skills or qualifications in construction and provides a training ground to further learn and improve their skills and knowledge (supervised by trained and qualified trades professionals in the factory setting) and hence increasing the potential for their involvement in construction trades.
3.4. The proposed framework
Bringing together all the findings from the literature review discussed above, a framework for achieving the triple bottom line (TBL) of sustainability (economical, environmental and social) by adopting OSM has been developed and presented in Figure 2 below. The framework maps these potentials within the generic OSM project lifecycle discussed in the section 2 above.
102. 103.

42nd AUBEA Conference 2018: Educating Building Professionals for the Future in the Globalised World
Architectural Engineering and Design Management, 11(3), pp.163-184.HAC (2011), Preserving Affordable Manufactured Home Communities in Rural America: A
Case Study, Housing Assistance Council, Washington, USA.Hollos, D., Blome, C. and Foerstl, K. (2012), 'Does sustainable supplier co-operation affect
performance? Examining implications for the triple bottom line, International Journal of Production Research, 50(11), 2968-2986.
Hsieh, W., Norman, D. and Orsmond, D. (2012), ‘Supply-side Issues in the Housing Sector’, RBA Bulletin, September Quarter 2012, Reserve Bank of Australia, pp. 11-20
Jaillon, L. and Poon, C.S. (2014), ‘Life cycle design and prefabrication in buildings: A review and case studies in Hong Kong’, Automation in construction, 39, pp.195-202.
Jonsson, P., Rudberg, M. and Holmberg, S. (2013), ‘Centralised supply chain planning at IKEA’, Supply Chain Management: An International Journal, 18(3), pp.337-350.
Kale, S. and Arditi, D. (2006), ‘Diffusion of ISO 9000 certification in the precast concrete industry’, Construction Management and Economics, 24(5), pp.485-495.
Kamar, A.M., Hamid, Z.A. and Azman, N.A. (2011), ‘Industrialized building system (IBS): Revisiting issues of definition and classification’, International journal of emerging sciences, 1(2), p.120-132.
Khalfan, M. M. A. and Maqsood, T. (2014), ‘Current State of Off-Site Manufacturing in Australian and Chinese Residential Construction’, Journal of Construction Engineering, http://dx.doi.org/10.1155/2014/164863
Leinonen, J. and Huovila, P. (2000), ‘Requirements management in life cycle design’, Proceedings of ILCDES 2000, Integrated Life-Cycle Design of Materials and Structures, Helsinki, Finland, May 22–24, pp. 46–50.
Lessing, J., Stehn, L. and Ekholm, A. (2005), 'Industrialised housing: definition and categorization of the concept', In: Annual conference of the International Group for Lean Construction, 18-21 July 2005, International group for lean construction, pp. 471-480.
Meehan, J., and Bryde, D. (2011), 'Sustainable procurement practice', Business Strategy and the Environment, 20(2), pp. 94-106.
McCrudden, C. (2004), 'Using public procurement to achieve social outcomes', Natural resources forum, 28(4), pp. 257-267), Blackwell Publishing Ltd.
Nadim, W. and Goulding, J.S. (2009), ‘Offsite production in the UK: The construction industry and academia’, Architectural Engineering and Design Management, 5(3), pp.136-152.
Nibbelink, J.G., Sutrisna, M. and Zaman, A.U. (2017), ‘Unlocking the potential of early contractor involvement in reducing design risks in commercial building refurbishment projects–a Western Australian perspective.’, Architectural Engineering and Design Management, 13(6), pp.439-456.
Pan, W., Gibb, A.G. and Dainty, A.R. (2008), ‘Leading UK housebuilders' utilization of offsite construction methods’, Building Research & Information, 36(1), pp.56-67.
Philips, R. (2000), The Architect’s Plan of Work, Royal Institute of British Architects, London.
Rahman, M.M., (2013), ‘Barriers of implementing modern methods of construction’, Journal of Management in Engineering, 30(1), pp.69-77.
Richard, R.-B. (2005), ‘Industrialised building systems: reproduction before automation and robotics’, Automation in Construction, 14(2005), pp. 442 – 451.
Robson, C. (2013), Real world research: A resource for users of social research methods in applied settings, 4th ed., Wiley-Blackwell, Hoboken, NJ.
Savitz, A.W. and Weber, K. (2006), The Triple Bottom Line, Jossey-Bass, San Francisco, CASchlueter, A. and Thesseling, F. (2009), ‘Building information model based energy/exergy
performance assessment in early design stages’, Automation in construction, 18(2), pp.153-163.
Schoenborn, J., (2012), A case study approach to identifying the constraints and barriers to design innovation for modular construction, Doctoral dissertation, Virginia Polytechnic Institute and State University, Blacksburg, VA.
Shahzad, W.M, Mbachu, J. and Domingo, N. (2014), ‘Prefab content versus cost and time savings in construction projects: A regression analysis’, Proceedings of the 4th New
42nd AUBEA Conference 2018: Educating Building Professionals for the Future in the Globalised World
5. References
Arashpour, M., Wakefield, R., Abbasi, B., Arashpour, M. and Hosseini, R. (2018) ‘Optimal process integration architectures in off-site construction: Theorizing the use of multi-skilled resources’, Architectural Engineering and Design Management, 14(1-2), pp. 46-59.
Arif, M. and Egbu, C. (2010), ‘Making a case for offsite construction in China’, Engineering, Construction and Architectural Management, 17(6), pp.536-548.
Aksorn, T., and Hadikusumo, B. H. W. (2008), ‘Critical success factors influencing safety program performance in Thai construction projects’, Safety Science, 46(4), pp. 709-727.
Azhar, S., Carlton, W.A., Olsen, D. and Ahmad, I. (2011), ‘Building information modeling for sustainable design and LEED® rating analysis’, Automation in construction, 20(2), pp. 217-224.
Birkin F., Polesie T. and Lewis L. (2009), ‘A new business model for sustainable development: an exploratory study using the theory of constraints in Nordic organizations’, Business Strategy and the Environment 18(5), pp. 277–290.
Bekdik, B., Pörzgen, J., Bull, S.S. and Thuesen, C. (2018), Modularising design processes of façades in Denmark: re-exploring the use of design structure matrix, Architectural Engineering and Design Management, 14(1-2), pp.95-108.
Blismas, N. and Wakefield, R. (2009), ‘Drivers, constraints and the future of offsite manufacture in Australia’, Construction innovation, 9(1), pp.72-83.
Blismas, N. G., Pendlebury, M., Gibb, A. and Pasquire, C. (2005), ‘Constraints to the use of off-site production on construction projects’, Architectural Engineering and Design Management, 1(3), 153-162.
Carter, C.R. and Carter, J.R., (1998), ‘Interorganizational determinants of environmental purchasing: initial evidence from the consumer products industries’, Decision Science, 29(3), pp. 659-669.
Chen, Y., Okudan, G. E. and Riley, D. R. (2010), 'Sustainable performance criteria for construction method selection in concrete buildings', Automation in Construction,19(2010), pp. 235–244.
Colbert, B. A. and Kurucz, E. C. (2007), 'Three conceptions of triple bottom line business sustainability and the role for HRM', People and Strategy, 30(1), pp. 21-29.
CRC for Construction Innovation (2007), ‘Off-site manufacture in Australia: Current state and future directions’, In: Blismass, N. (Ed.), Off-site Manufacture in Australia, Cooperative Research Centre for Construction Innovation.
Davies, C. (2005), The Prefabricated Home, Reaktion Books, London.De Burgos Jimenez, J., and Céspedes Lorente, J. J. (2001) 'Environmental performance as an
operations objective', International Journal of Operations & Production Management, 21(12), pp. 1553-1572.
Duc, E., Forsythe, P. J. and Orr, K. (2014)' 'Is there really a case for Off-Site Manufacturing?', In: ISARC, Proceedings of the International Symposium on Automation and Robotics in Construction (Vol. 31, p. 1). Vilnius Gediminas Technical University, Department of Construction Economics & Property.
Gay, O. (1987), 'Prefabs: A Study in Policy-Making', Public Administration, (65) Winter 1987, pp. 401-422.
Gibb, A.G.F. (1999), Off-site Fabrication: Prefabrication, Pre-assembly and Modularisation,John Wiley & Sons, New York.
Gibb, A.G. (2001), ‘Standardization and pre-assembly-distinguishing myth from reality using case study research’, Construction Management & Economics, 19(3), pp.307-315.
Goodier, C. and Gibb, A. (2007), ‘Future opportunities for offsite in the UK’, Construction Management and Economics, 25(6), pp.585-595.
Goulding, J.S., and Arif, M., (2013), Research Road Map Report: Offsite Production and Manufacturing, Publication 372, International Council for Research and Innovation in Building and Construction, ISBN 978-90-6363-076-8
Goulding, J.S., Pour Rahimian, F., Arif, M. and Sharp, M.D. (2015), ‘New offsite production and business models in construction: priorities for the future research agenda’,
104. 105.

42nd AUBEA Conference 2018: Educating Building Professionals for the Future in the Globalised World
Comparative economic-environmental feasibility of reinforced concrete and laminated steel structuresRaoni Fragoso1, Ahmed Hammad2, Assed Haddad3,
Emil Jonescu4 and Khoa Do5
1Universidade Federal Fluminense, Niterói, BRASIL2,4&5Curtin University, Perth, WESTERN AUSTRALIA
3Escola Politécnica, Universidade Federal do Rio de Janeiro,Rio de Janeiro, BRASIL
E-mails: [email protected]; [email protected]; [email protected];[email protected]; [email protected]
Abstract:The structural system of a building can be executed in several ways. The solution chosen is the responsibility of the structural engineer and would be impacted by the loads on the structure, the location of the structure and the amount of budget available in the project. Once all this information is obtained, there will be a need for deciding on the type of structure to adopt for the building. Determining a sustainable solution requires consideration of the traditional economic factors, along with the environmental aspects through a Life Cycle Assessment (LCA) approach. In this paper, two commonly adopted structural systems are contrasted through an LCA approach, namely laminated steel and reinforced concrete. The economic assessment presented considers not only material costs, but also the cost of manpower, schedule requirements and the method of execution. For the environmental analysis, the scenarios were classified according to the carbon dioxide (𝐶𝐶𝐶𝐶𝑂𝑂𝑂𝑂2) mass emitted. Three scenarios that are considered vary according to the construction method adopted. The first being the construction of a metallic structure with steel deck slab and without shoring, while the other two being reinforced concrete structures where shoring is adopted: for one of them a conventional slab is utilized, while for the others, a precast slab, waffle slab and flat slab is adopted. The objective of this study is to demonstrate a correlation between cost and environmental impacts for each system, hence presenting a tool in decision-making for engineering designs.
Keywords:Buildings, Economic feasibility, Laminated steel, Life cycle assessment, Reinforced concrete.
1 Introduction
Studies of materials used in structural building systems are currently very focused on mechanical properties, as in Lacki, Derlatka, & Kasza (2017). The discussion of economic and environmental feasibility is often overlooked and the choice of the structural system becomes exclusively technical, based on the experience of the designer involved (Hammad, Akbarnezhad, & Oldfield, 2018). Nowadays, in the literature, there are not many published studies investigating the economic-environmental feasibility of astructural system, contrary to what can be found in relation to the study of its associated mechanical behaviour. The objective of this article is to establish an analysis methodology for structural designs, and performance indicators, in order to evaluate which type of
42nd AUBEA Conference 2018: Educating Building Professionals for the Future in the Globalised World
Zealand Built Environment Research Symposium (NZBERS), Auckland, New Zealand. 14 November.
Smith, R. E. (2010), Prefab Architecture: A Guide to Modular Design and Construction, John Wiley & Sons, Hobboken, NJ.
Sorock, G.S., Smith, E.O.H. and Goldoft, M. (1993), ‘Fatal occupational injuries in the New Jersey construction industry 1983 to 1989’, Journal of Occupational and Environmental Medicine, 35(9), pp.916-921.
Steinhardt, D. A and Manley, K. (2016), ‘Adoption of prefabricated housing–the role of country context’, Sustainable Cities and Society, 22(2016), pp. 126–135
Sutrisna, M., Lofthouse, B. and Goulding, J. (2017), ‘Exploring the Potential of Offsite Construction to Alleviate Constraints to House Building in Western Australia’, Proceeding of the International Research Conference: Shaping Tomorrow’s Built Environment, the University of Salford in conjunction with CIB, Salford, 11-12September 2017, pp. 896-907.
Sutrisna, M., Ramanayaka, C. and Goulding, J. (2018a), ‘Developing work breakdown structure matrix for managing offsite construction projects’, Architectural Engineering and Design Management (accepted, in press)
Sutrisna, M., Cooper-Cooke, B., Goulding, J. and Ezcan V. (2018b), ‘Investigating the Cost of Offsite Construction Housing in Western Australia’, International Journal of Housing Markets and Analysis (accepted, in press)
Sutrisna, M. and Goulding, J. (2018), Managing information flow and design processes to reduce design risks in offsite construction projects, Engineering Construction and Architectural Management (accepted, in press).
Sutrisna, M. and Setiawan, W. (2016), ‘The Application of Grounded Theory Methodology in Built Environment Research’, In: Ahmed, V., Opoku, A., and Aziz, Z. (Eds.), Research Methodology in the Built Environment: A Selection of Case Studies, Taylor and Francis, Oxford, pp. 231-245.
Urbis (2011), National Dwelling Cost Study, Urbis Pty Ltd. for the National Housing Supply Council, Australia.
Varnäs, A., Balfors, B. and Faith-Ell, C. (2009), 'Environmental consideration in procurementof construction contracts: current practice, problems and opportunities in green procurement in the Swedish construction industry', Journal of Cleaner Production,17(13), 1214-1222.
Warsame, A. (2006), Supplier structure and Housing construction costs, Report 5:73, Building and Real Estate Economics, Department of Infrastructure, Royal Institute of Technology, Stockholm, Sweden.
Wolfe, T. and Garfield, L (1989), 'A New Standard for Living: The Lustron House, 1946-1950', Perspectives in Vernacular Architecture, 3(1989), pp. 51-61.
Yin, R. K. (2014), Case Study Research: Design and Methods, 5th ed., Sage Publication. Thousand Oaks, CA.
Zeppel, H. (2014), Green procurement by local government: a review of sustainability criteria, Australian Centre for Sustainable Business and Development (ACSBD) working Paper Number 8, University of Southern Queensland.
106. 107.

42nd AUBEA Conference 2018: Educating Building Professionals for the Future in the Globalised World
Being 𝑞𝑞𝑞𝑞𝑖𝑖𝑖𝑖 the total amount of the resource 𝑖𝑖𝑖𝑖 , 𝑠𝑠𝑠𝑠𝑘𝑘𝑘𝑘 the activity quantity 𝑘𝑘𝑘𝑘 and 𝑝𝑝𝑝𝑝𝑖𝑖𝑖𝑖,𝑘𝑘𝑘𝑘 the coefficient of productivity of the resource 𝑖𝑖𝑖𝑖 in the activity 𝑘𝑘𝑘𝑘.
The total cost of the resource 𝑖𝑖𝑖𝑖 (𝐶𝐶𝐶𝐶𝑖𝑖𝑖𝑖) is the product of the unitary cost of the resource 𝑖𝑖𝑖𝑖 (𝑐𝑐𝑐𝑐𝑖𝑖𝑖𝑖)by the total amount of the resource 𝑖𝑖𝑖𝑖.
𝐶𝐶𝐶𝐶𝑖𝑖𝑖𝑖 = 𝑞𝑞𝑞𝑞𝑖𝑖𝑖𝑖 ∙ 𝑐𝑐𝑐𝑐𝑖𝑖𝑖𝑖 = ��𝑠𝑠𝑠𝑠𝑘𝑘𝑘𝑘 ∙ 𝑝𝑝𝑝𝑝𝑖𝑖𝑖𝑖,𝑘𝑘𝑘𝑘
𝑛𝑛𝑛𝑛
𝑘𝑘𝑘𝑘=1
� ∙ 𝑐𝑐𝑐𝑐𝑖𝑖𝑖𝑖 Eq. (2)
In order to evaluate economic feasibility, the total cost of each scenario is calculated as the sum of the 𝑚𝑚𝑚𝑚 resource costs needed to build the system:
𝐶𝐶𝐶𝐶𝐶𝐶𝐶𝐶 = �𝐶𝐶𝐶𝐶𝑖𝑖𝑖𝑖
𝑚𝑚𝑚𝑚
𝑖𝑖𝑖𝑖=1
Eq. (3)
2.2 Life cycle assessmentLife cycle assessment is used to analyse the impact of a product during its life, i.e., during all stages of its life, including extraction, production, transportation, use and disposal(ISO, 2006).
ISO standards require that goal and scope of the study be clearly defined. This includes the definition of a functional unit, which corresponds to the study object, with which the inputs and outputs will be related. In addition, it is necessary to define precisely what the boundaries of the study will be, i.e., which stages of the life cycle will be considered in the analysis.
In this article, a single-familiar low standard building of approximately 73 square meters will be considered as the functional unit. In addition, the study will be a cradle-to-grave analysis, i.e., the system boundary will encompass all stages of the life cycle, from raw material extraction to the final disposal of materials.
In this paper the life cycle assessment was quantified according to the emission of carbon dioxide (𝐶𝐶𝐶𝐶𝑂𝑂𝑂𝑂2) equivalent in the atmosphere. The mass of 𝐶𝐶𝐶𝐶𝑂𝑂𝑂𝑂2 emitted from the extraction and production of material 𝑖𝑖𝑖𝑖 belonging to a component in the structural system (𝐶𝐶𝐶𝐶𝑂𝑂𝑂𝑂2,𝑖𝑖𝑖𝑖) is obtained by the product of the quantity of a material, Eq. (1), and the mass of 𝐶𝐶𝐶𝐶𝑂𝑂𝑂𝑂2generated for the production of a unit of that same resource (𝑝𝑝𝑝𝑝𝑖𝑖𝑖𝑖,𝐶𝐶𝐶𝐶𝑂𝑂𝑂𝑂2), i.e.:
𝑃𝑃𝑃𝑃𝑖𝑖𝑖𝑖 ,𝐶𝐶𝐶𝐶𝑂𝑂𝑂𝑂2 = 𝑞𝑞𝑞𝑞𝑖𝑖𝑖𝑖 ∙ 𝑝𝑝𝑝𝑝𝑖𝑖𝑖𝑖,𝐶𝐶𝐶𝐶𝑂𝑂𝑂𝑂2 Eq. (4)
The amount of 𝐶𝐶𝐶𝐶𝑂𝑂𝑂𝑂2 produced in the transport of materials is calculated as the product of the 𝐶𝐶𝐶𝐶𝑂𝑂𝑂𝑂2 per kilometre (𝑡𝑡𝑡𝑡𝑖𝑖𝑖𝑖,𝐶𝐶𝐶𝐶𝑂𝑂𝑂𝑂2 ) and the travelled distance of transport. The average transport distance of a material, within Rio de Janeiro, is approximately 10 kilometres,thus (De Lassio, França, Espirito Santo, & Haddad, 2016):
𝐶𝐶𝐶𝐶𝐶𝐶𝐶𝐶𝑂𝑂𝑂𝑂2,𝑖𝑖𝑖𝑖 = 10 ∙ 𝑡𝑡𝑡𝑡𝑖𝑖𝑖𝑖,𝐶𝐶𝐶𝐶𝑂𝑂𝑂𝑂2 Eq. (5)
42nd AUBEA Conference 2018: Educating Building Professionals for the Future in the Globalised World
structure is most advantageous for a particular building, thus establishing a decision-making model for designers who do not undertake such type of study.
The analysis was made for a case study representing a low standard single family building in the city of Rio de Janeiro, Brazil. This building was chosen with the intention of introducing a novel approach in building design to this part of the population, where access to quality engineering is restricted, leading to the duplication of the same methods, which can be inappropriate sometimes, being adopted on a range of projects. The study is thus performed based on the Brazilian environmental conditions and local production processes, and the data used should be regulated for application in other locations. The environmental assessment is done through the LCA, applicable to several types of products and systems (Marinoski & Ghisi, 2018). However, based on research, no application of this type of evaluation was found in structural systems of buildings.
This work aims to establish a systemic view in the design of structures for the decision of the designer engineer on what kind of systems to adopt, not only economically but also environmentally, seeing that it is increasingly necessary to optimise the efficiency of buildings, and environmentally certified projects are more requested. This decision has a direct impact on the design and construction process of other building systems.
2 Literature Review
2.1 Economic FeasibilityThe budgeting process of a building involves two types of costs, namely direct and indirect. The direct costs include all activities performed to construct the building, i.e. the aggregate values of production, while indirect costs are those generated by the construction of the building, such as costs related to administration of the company that carries out the work, insurance construction, administrative taxes, etc.
The economic feasibility between the two structural systems was performed by analysingonly the direct costs, since indirect costs do not have large variations for the casesconsidered. The direct cost is evaluated from 3 main points: manpower, materials and equipment.
The cost of manpower is directly related to the productivity of the workers in the region where the building will be constructed. There are detailed databases with the ratio productivity per hour for each activity performed, by region, made available bygovernments and private companies. The databases are updated based on representative samples of the construction manpower population in determined regions. The database used in this work is SINAPI (CAIXA, 2015), a result of data collection conducted by IBGE (Brazilian Institute of Geography and Statistics), SCO (SMO, 2018), a data base cost by FGV (Getúlio Vargas Foundation) and SBC a study on productivity (Stabile, 2006). SINAPI provides not only productivity data but also average costs of materials and equipment.
The total quantity of each resource 𝑖𝑖𝑖𝑖 will be the result of the equation below, if for 𝑛𝑛𝑛𝑛activities:
𝑞𝑞𝑞𝑞𝑖𝑖𝑖𝑖 = �𝑠𝑠𝑠𝑠𝑘𝑘𝑘𝑘 ∙ 𝑝𝑝𝑝𝑝𝑖𝑖𝑖𝑖,𝑘𝑘𝑘𝑘
𝑛𝑛𝑛𝑛
𝑘𝑘𝑘𝑘=1
Eq. (1)
108. 109.
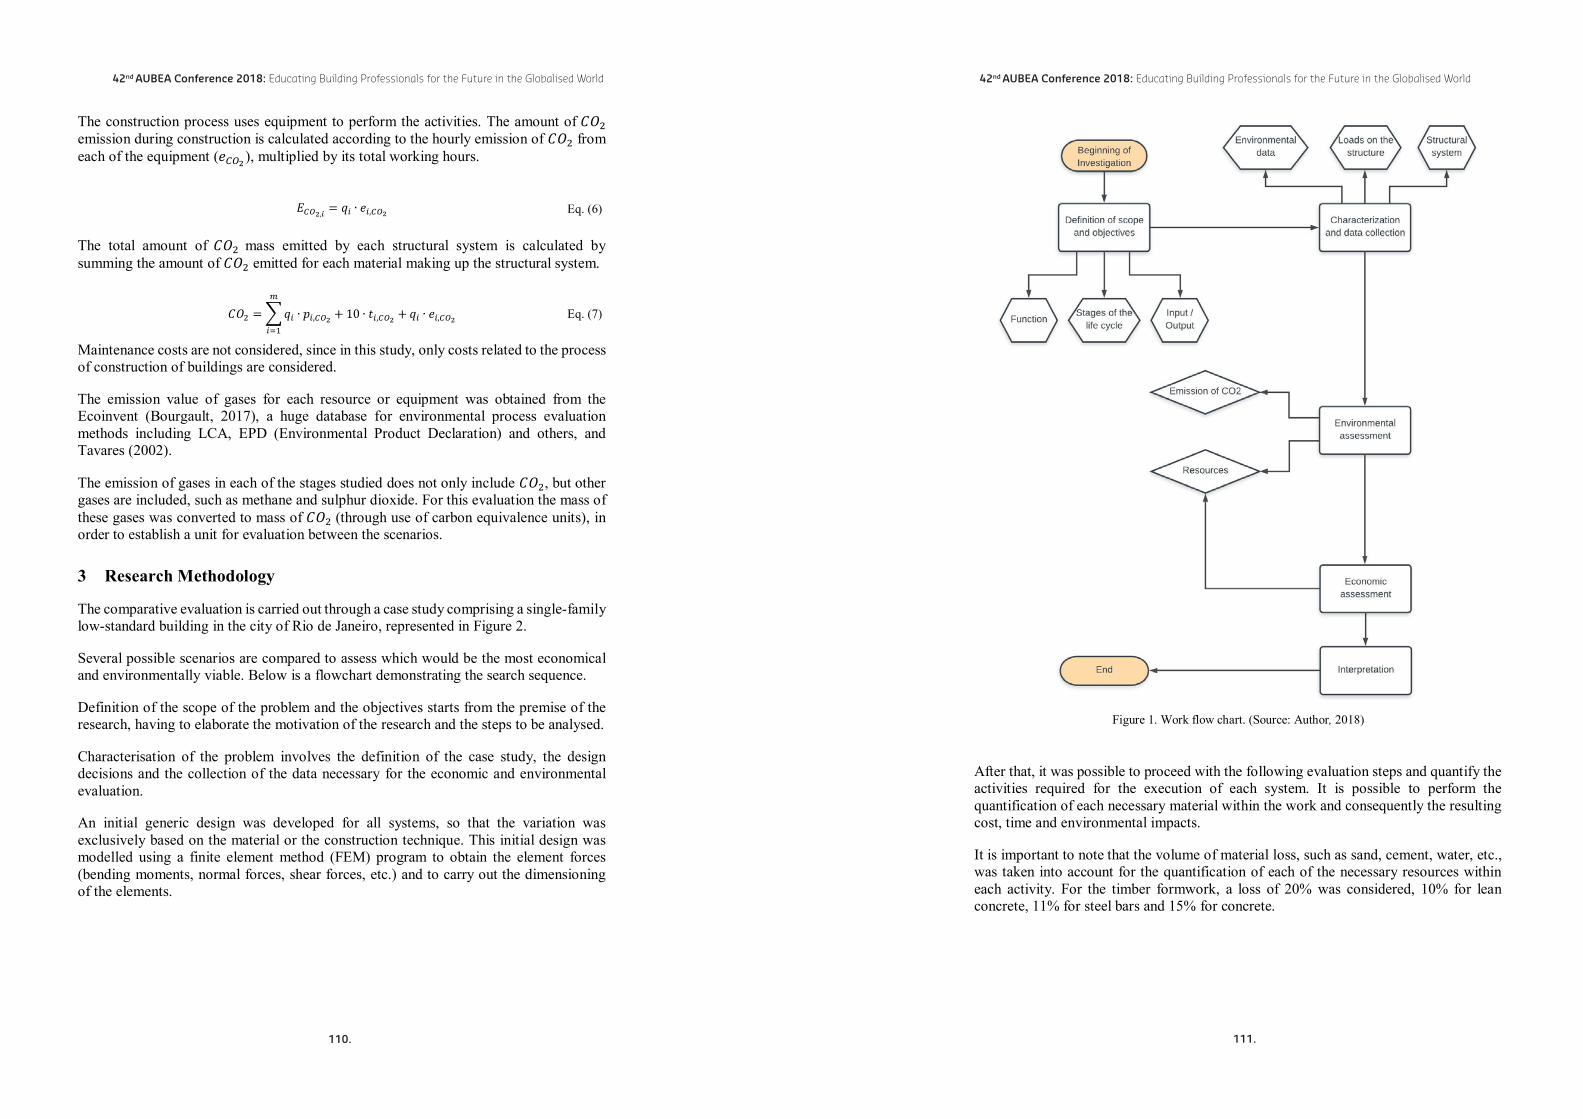
42nd AUBEA Conference 2018: Educating Building Professionals for the Future in the Globalised World
Figure 1. Work flow chart. (Source: Author, 2018)
After that, it was possible to proceed with the following evaluation steps and quantify the activities required for the execution of each system. It is possible to perform the quantification of each necessary material within the work and consequently the resultingcost, time and environmental impacts.
It is important to note that the volume of material loss, such as sand, cement, water, etc., was taken into account for the quantification of each of the necessary resources within each activity. For the timber formwork, a loss of 20% was considered, 10% for lean concrete, 11% for steel bars and 15% for concrete.
42nd AUBEA Conference 2018: Educating Building Professionals for the Future in the Globalised World
The construction process uses equipment to perform the activities. The amount of 𝐶𝐶𝐶𝐶𝑂𝑂𝑂𝑂2emission during construction is calculated according to the hourly emission of 𝐶𝐶𝐶𝐶𝑂𝑂𝑂𝑂2 from each of the equipment (𝑒𝑒𝑒𝑒𝐶𝐶𝐶𝐶𝑂𝑂𝑂𝑂2), multiplied by its total working hours.
𝐸𝐸𝐸𝐸𝐶𝐶𝐶𝐶𝑂𝑂𝑂𝑂2,𝑖𝑖𝑖𝑖 = 𝑞𝑞𝑞𝑞𝑖𝑖𝑖𝑖 ∙ 𝑒𝑒𝑒𝑒𝑖𝑖𝑖𝑖,𝐶𝐶𝐶𝐶𝑂𝑂𝑂𝑂2 Eq. (6)
The total amount of 𝐶𝐶𝐶𝐶𝑂𝑂𝑂𝑂2 mass emitted by each structural system is calculated by summing the amount of 𝐶𝐶𝐶𝐶𝑂𝑂𝑂𝑂2 emitted for each material making up the structural system.
𝐶𝐶𝐶𝐶𝑂𝑂𝑂𝑂2 = �𝑞𝑞𝑞𝑞𝑖𝑖𝑖𝑖 ∙ 𝑝𝑝𝑝𝑝𝑖𝑖𝑖𝑖,𝐶𝐶𝐶𝐶𝑂𝑂𝑂𝑂2 + 10 ∙ 𝑡𝑡𝑡𝑡𝑖𝑖𝑖𝑖,𝐶𝐶𝐶𝐶𝑂𝑂𝑂𝑂2 + 𝑞𝑞𝑞𝑞𝑖𝑖𝑖𝑖 ∙ 𝑒𝑒𝑒𝑒𝑖𝑖𝑖𝑖,𝐶𝐶𝐶𝐶𝑂𝑂𝑂𝑂2
𝑚𝑚𝑚𝑚
𝑖𝑖𝑖𝑖=1
Eq. (7)
Maintenance costs are not considered, since in this study, only costs related to the process of construction of buildings are considered.
The emission value of gases for each resource or equipment was obtained from the Ecoinvent (Bourgault, 2017), a huge database for environmental process evaluation methods including LCA, EPD (Environmental Product Declaration) and others, and Tavares (2002).
The emission of gases in each of the stages studied does not only include 𝐶𝐶𝐶𝐶𝑂𝑂𝑂𝑂2, but other gases are included, such as methane and sulphur dioxide. For this evaluation the mass of these gases was converted to mass of 𝐶𝐶𝐶𝐶𝑂𝑂𝑂𝑂2 (through use of carbon equivalence units), in order to establish a unit for evaluation between the scenarios.
3 Research Methodology
The comparative evaluation is carried out through a case study comprising a single-family low-standard building in the city of Rio de Janeiro, represented in Figure 2.
Several possible scenarios are compared to assess which would be the most economical and environmentally viable. Below is a flowchart demonstrating the search sequence.
Definition of the scope of the problem and the objectives starts from the premise of the research, having to elaborate the motivation of the research and the steps to be analysed.
Characterisation of the problem involves the definition of the case study, the design decisions and the collection of the data necessary for the economic and environmental evaluation.
An initial generic design was developed for all systems, so that the variation was exclusively based on the material or the construction technique. This initial design was modelled using a finite element method (FEM) program to obtain the element forces (bending moments, normal forces, shear forces, etc.) and to carry out the dimensioning of the elements.
110. 111.

42nd AUBEA Conference 2018: Educating Building Professionals for the Future in the Globalised World
Smax (kN) 22,6320 0,0000 22,3910 22,0440 8,8090
Column Conventional Flat Precast Waffle Steel Deck
Mxx,max (kN.m) 0,6961 1,4713 0,6629 0,7527 5,0212
Myy,max (kN.m) 1,0797 1,4817 1,0532 1,0994 2,4191
Smax (kN) 0,3600 0,4940 0,3510 0,3660 1,6740
Nmax (kN) 93,0670 144,8100 86,0570 110,2100 76,2300
The main structural elements were dimensioned for each study scenario. The dimensioning of the concrete elements was carried out in accordance with the requirements of NBR 6118 (ABNT, 2014), and the laminated steel elements according to NBR 8800 (ABNT, 2008), presented in Table 2.
Table 2. Dimensioning of the elements.
Slab Conventional Flat Precast Waffle Steel Deckh (cm) 8,0 24,0 21,0 21,0 14,0
Positive steel ϕ 6,3 mm s 15 cm
ϕ 10 mm s 20 cm 2 ϕ 8 mm ϕ 8 mm s 125
cmMF-75
(1,25mm)
Negative steel ϕ 6,3 mm s 5cm
ϕ 10 mm s 15 cm
ϕ 6,3 mm s 35 cm
ϕ 6,3 mm s 85 cm Q - 92
Beam Conventional Flat Precast Waffle Steel Deckb (cm) 12,0 - 12,0 12,0
W 150 x 13,0h (cm) 40,0 - 40,0 40,0
Positive steel 3 ϕ 12,5 mm - 3 ϕ 12,5 mm 3 ϕ 12,5 mmNegative steel 3 ϕ 12,5 mm - 3 ϕ 12,5 mm 3 ϕ 12,5 mm
Column Conventional Flat Precast Waffle Steel Deckb (cm) 14,0 14,0 14,0 14,0
W 150 x 22,5 (H)h (cm) 14,0 14,0 14,0 14,0
Steel 4 ϕ 12,5 mm 4 ϕ 12,5 mm 4 ϕ 12,5 mm 4 ϕ 12,5 mm
Foundation Conventional Flat Precast Waffle Steel DeckA (cm) 120,0 145,0 115,0 130,0 105,0B (cm) 120,0 145,0 115,0 130,0 105,0h (cm) 50,0 55,0 45,0 50,0 45,0
Steel ϕ 8,0 mm s 20 cm
ϕ 8,0 mm s 20 cm
ϕ 8,0 mm s 20 cm
ϕ 8,0 mm s 20 cm
ϕ 8,0 mm s 20 cm
* ϕ is the diameter of rebar, MF-75 is the type of steel deck produced by Metform, s is the space between rebars in slabs and foundations.
After the dimensioning, it is possible to choose the activities needed to execute each of the structural systems and to organize the Work Breakdown Structure (WBS), presented below in Table 3.
42nd AUBEA Conference 2018: Educating Building Professionals for the Future in the Globalised World
Figure 2 . Architecture/Structural Design. (Source: Author, 2018)
4 Findings and Discussion
With the structure modelled in SAP2000, it was possible to obtain the values of the element forces for the dimensioning of the structural elements of each system, presented in Table 1.
Table 1. Element Forces.
Slab Conventional Flat Precast Waffle Steel Deck
Mxx,max (kN.m/m) 2,6054 17,5420 2,2182 3,6437 10,0938
Myy,max (kN.m/m) 2,4502 22,4974 1,9502 4,6347 6,6177
Mxx,min (kN.m/m) 4,4820 63,5912 3,4499 9,1977 21,2357
Myy,min (kN.m/m) 5,5249 98,1126 3,9363 10,8288 26,2834
Smax (kN/m) 42,8100 521,5200 30,3200 84,4900 172,8700
Beam Conventional Flat Precast Waffle Steel Deck
Mmax (kN.m) 25,6772 0,0000 24,9792 26,2367 5,9259
Mmin (kN.m) 28,2975 0,0000 27,4630 28,9825 7,8344
112. 113.
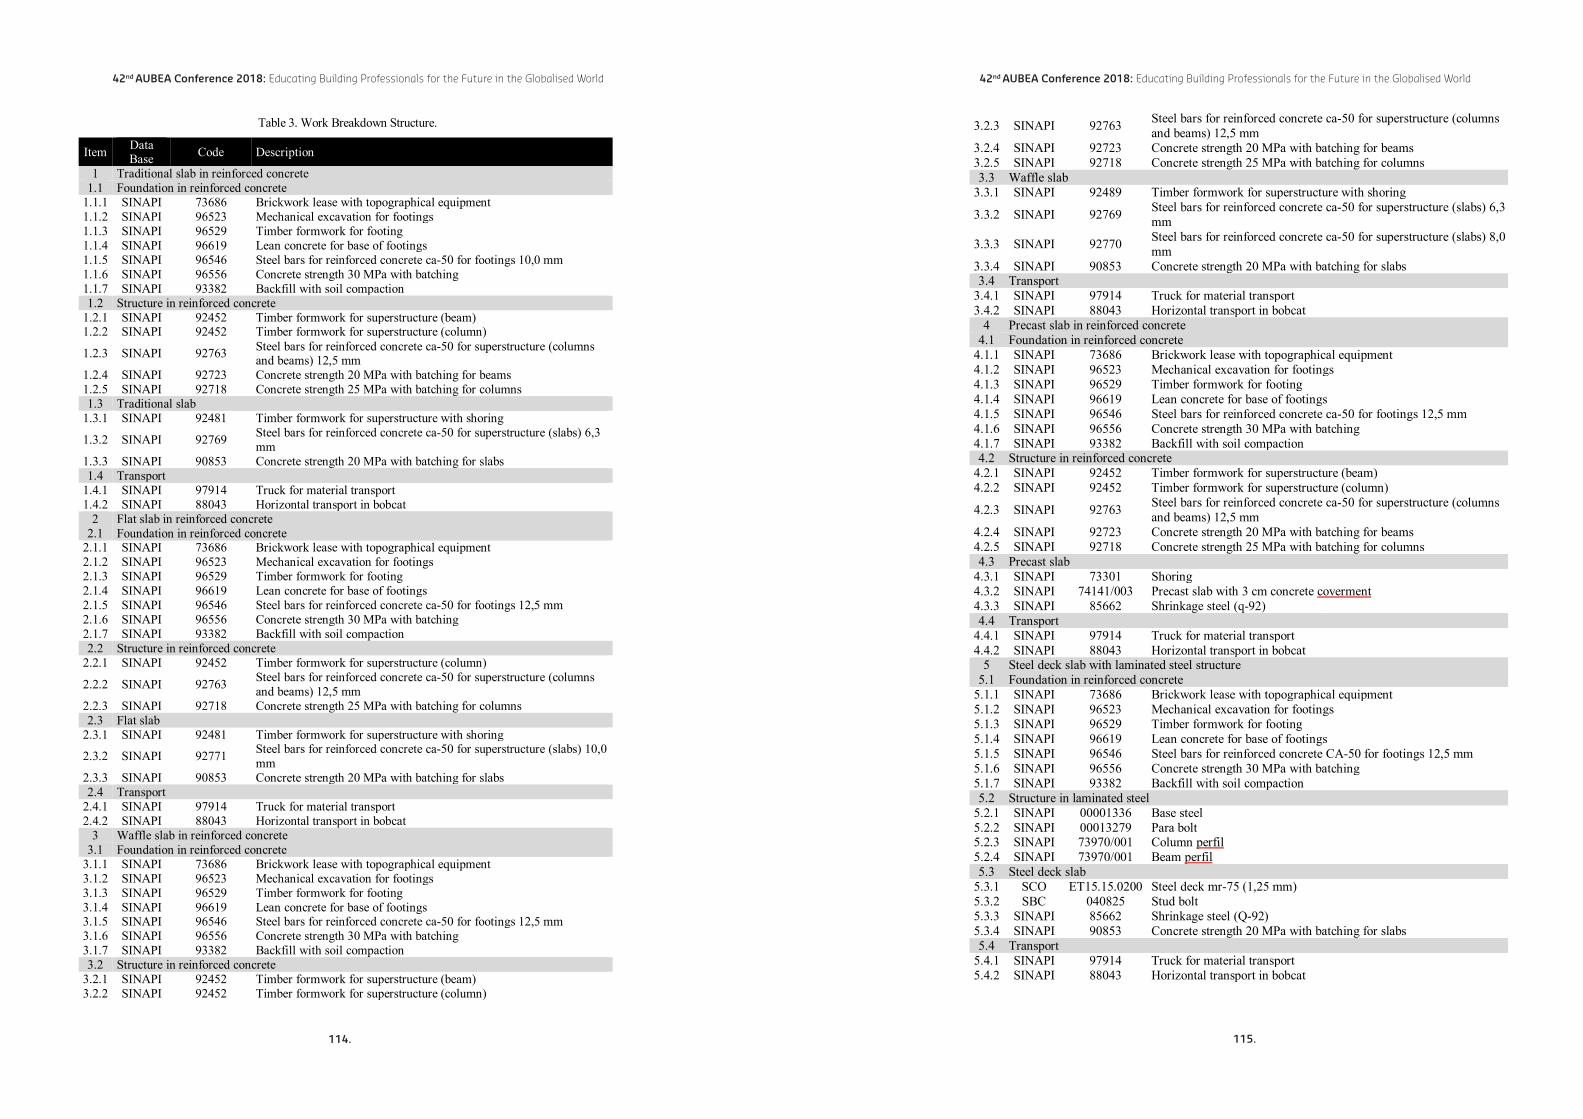
42nd AUBEA Conference 2018: Educating Building Professionals for the Future in the Globalised World
3.2.3 SINAPI 92763 Steel bars for reinforced concrete ca-50 for superstructure (columns and beams) 12,5 mm
3.2.4 SINAPI 92723 Concrete strength 20 MPa with batching for beams3.2.5 SINAPI 92718 Concrete strength 25 MPa with batching for columns3.3 Waffle slab
3.3.1 SINAPI 92489 Timber formwork for superstructure with shoring
3.3.2 SINAPI 92769 Steel bars for reinforced concrete ca-50 for superstructure (slabs) 6,3 mm
3.3.3 SINAPI 92770 Steel bars for reinforced concrete ca-50 for superstructure (slabs) 8,0 mm
3.3.4 SINAPI 90853 Concrete strength 20 MPa with batching for slabs3.4 Transport
3.4.1 SINAPI 97914 Truck for material transport3.4.2 SINAPI 88043 Horizontal transport in bobcat
4 Precast slab in reinforced concrete4.1 Foundation in reinforced concrete
4.1.1 SINAPI 73686 Brickwork lease with topographical equipment4.1.2 SINAPI 96523 Mechanical excavation for footings4.1.3 SINAPI 96529 Timber formwork for footing4.1.4 SINAPI 96619 Lean concrete for base of footings4.1.5 SINAPI 96546 Steel bars for reinforced concrete ca-50 for footings 12,5 mm4.1.6 SINAPI 96556 Concrete strength 30 MPa with batching4.1.7 SINAPI 93382 Backfill with soil compaction4.2 Structure in reinforced concrete
4.2.1 SINAPI 92452 Timber formwork for superstructure (beam)4.2.2 SINAPI 92452 Timber formwork for superstructure (column)
4.2.3 SINAPI 92763 Steel bars for reinforced concrete ca-50 for superstructure (columns and beams) 12,5 mm
4.2.4 SINAPI 92723 Concrete strength 20 MPa with batching for beams4.2.5 SINAPI 92718 Concrete strength 25 MPa with batching for columns4.3 Precast slab
4.3.1 SINAPI 73301 Shoring4.3.2 SINAPI 74141/003 Precast slab with 3 cm concrete coverment4.3.3 SINAPI 85662 Shrinkage steel (q-92)4.4 Transport
4.4.1 SINAPI 97914 Truck for material transport4.4.2 SINAPI 88043 Horizontal transport in bobcat
5 Steel deck slab with laminated steel structure5.1 Foundation in reinforced concrete
5.1.1 SINAPI 73686 Brickwork lease with topographical equipment5.1.2 SINAPI 96523 Mechanical excavation for footings5.1.3 SINAPI 96529 Timber formwork for footing5.1.4 SINAPI 96619 Lean concrete for base of footings5.1.5 SINAPI 96546 Steel bars for reinforced concrete CA-50 for footings 12,5 mm5.1.6 SINAPI 96556 Concrete strength 30 MPa with batching5.1.7 SINAPI 93382 Backfill with soil compaction5.2 Structure in laminated steel
5.2.1 SINAPI 00001336 Base steel5.2.2 SINAPI 00013279 Para bolt5.2.3 SINAPI 73970/001 Column perfil5.2.4 SINAPI 73970/001 Beam perfil5.3 Steel deck slab
5.3.1 SCO ET15.15.0200 Steel deck mr-75 (1,25 mm)5.3.2 SBC 040825 Stud bolt5.3.3 SINAPI 85662 Shrinkage steel (Q-92)5.3.4 SINAPI 90853 Concrete strength 20 MPa with batching for slabs5.4 Transport
5.4.1 SINAPI 97914 Truck for material transport5.4.2 SINAPI 88043 Horizontal transport in bobcat
42nd AUBEA Conference 2018: Educating Building Professionals for the Future in the Globalised World
Table 3. Work Breakdown Structure.
Item Data Base Code Description
1 Traditional slab in reinforced concrete1.1 Foundation in reinforced concrete
1.1.1 SINAPI 73686 Brickwork lease with topographical equipment1.1.2 SINAPI 96523 Mechanical excavation for footings1.1.3 SINAPI 96529 Timber formwork for footing1.1.4 SINAPI 96619 Lean concrete for base of footings1.1.5 SINAPI 96546 Steel bars for reinforced concrete ca-50 for footings 10,0 mm1.1.6 SINAPI 96556 Concrete strength 30 MPa with batching1.1.7 SINAPI 93382 Backfill with soil compaction1.2 Structure in reinforced concrete
1.2.1 SINAPI 92452 Timber formwork for superstructure (beam)1.2.2 SINAPI 92452 Timber formwork for superstructure (column)
1.2.3 SINAPI 92763 Steel bars for reinforced concrete ca-50 for superstructure (columns and beams) 12,5 mm
1.2.4 SINAPI 92723 Concrete strength 20 MPa with batching for beams1.2.5 SINAPI 92718 Concrete strength 25 MPa with batching for columns1.3 Traditional slab
1.3.1 SINAPI 92481 Timber formwork for superstructure with shoring
1.3.2 SINAPI 92769 Steel bars for reinforced concrete ca-50 for superstructure (slabs) 6,3 mm
1.3.3 SINAPI 90853 Concrete strength 20 MPa with batching for slabs1.4 Transport
1.4.1 SINAPI 97914 Truck for material transport1.4.2 SINAPI 88043 Horizontal transport in bobcat
2 Flat slab in reinforced concrete2.1 Foundation in reinforced concrete
2.1.1 SINAPI 73686 Brickwork lease with topographical equipment2.1.2 SINAPI 96523 Mechanical excavation for footings2.1.3 SINAPI 96529 Timber formwork for footing2.1.4 SINAPI 96619 Lean concrete for base of footings2.1.5 SINAPI 96546 Steel bars for reinforced concrete ca-50 for footings 12,5 mm2.1.6 SINAPI 96556 Concrete strength 30 MPa with batching2.1.7 SINAPI 93382 Backfill with soil compaction2.2 Structure in reinforced concrete
2.2.1 SINAPI 92452 Timber formwork for superstructure (column)
2.2.2 SINAPI 92763 Steel bars for reinforced concrete ca-50 for superstructure (columns and beams) 12,5 mm
2.2.3 SINAPI 92718 Concrete strength 25 MPa with batching for columns2.3 Flat slab
2.3.1 SINAPI 92481 Timber formwork for superstructure with shoring
2.3.2 SINAPI 92771 Steel bars for reinforced concrete ca-50 for superstructure (slabs) 10,0 mm
2.3.3 SINAPI 90853 Concrete strength 20 MPa with batching for slabs2.4 Transport
2.4.1 SINAPI 97914 Truck for material transport2.4.2 SINAPI 88043 Horizontal transport in bobcat
3 Waffle slab in reinforced concrete3.1 Foundation in reinforced concrete
3.1.1 SINAPI 73686 Brickwork lease with topographical equipment3.1.2 SINAPI 96523 Mechanical excavation for footings3.1.3 SINAPI 96529 Timber formwork for footing3.1.4 SINAPI 96619 Lean concrete for base of footings3.1.5 SINAPI 96546 Steel bars for reinforced concrete ca-50 for footings 12,5 mm3.1.6 SINAPI 96556 Concrete strength 30 MPa with batching3.1.7 SINAPI 93382 Backfill with soil compaction3.2 Structure in reinforced concrete
3.2.1 SINAPI 92452 Timber formwork for superstructure (beam)3.2.2 SINAPI 92452 Timber formwork for superstructure (column)
114. 115.

42nd AUBEA Conference 2018: Educating Building Professionals for the Future in the Globalised World
6 References
ABNT. (2008). NBR 8800:2008 - Projeto de estruturas de aço e de estruturas mistas de aço e concreto de edifícios. ASSOCIAÇÃO BRASILEIRA DE NORMAS TÉCNICAS.https://doi.org/01.080.10; 13.220.99
ABNT. (2014). ABNT NBR 6118:2014 - Projeto de estruturas de concreto — Procedimento. ASSOCIAÇÃO BRASILEIRA DE NORMAS TÉCNICAS, 238. https://doi.org/01.080.10; 13.220.99
Bourgault, G. (2017). Implementation of impact assessment methods in Ecoinvent version 3.4. Zürich, Switzerland: Ecoinvent.
CAIXA. (2015). SINAPI: Metodologias e Conceitos. Retrieved from http://www.caixa.gov.br/Downloads/sinapi-manual-de-metodologias-e-conceitos/Livro_SINAPI_Metodologias_e_Conceitos_versao_digital_3_Edicao.pdf
De Lassio, J., França, J., Espirito Santo, K., & Haddad, A. (2016). Case study: LCA methodology applied to materials management in a Brazilian residential construction site. Journal of Engineering (United States), 2016. https://doi.org/10.1155/2016/8513293
Hammad, A. W., Akbarnezhad, A., & Oldfield, P. (2018). Optimising Embodied Carbon and U-value in Load Bearing Walls: A Mathematical Bi-Objective Mixed Integer Programming Approach. Energy and Buildings. https://doi.org/10.1016/j.enbuild.2018.05.061
ISO. (2006). ISO 14040:2006 - Environmental management -- Life cycle assessment --Principles and framework. International Organization for Standardization.
Lacki, P., Derlatka, A., & Kasza, P. (2017). Comparison of steel-concrete composite column and steel column. Composite Structures.https://doi.org/10.1016/J.COMPSTRUCT.2017.11.055
Marinoski, A. K., & Ghisi, E. (2018). Avaliação de viabilidade ambiental e econômica de sistemas de aproveitamento de água pluvial em habitação de baixo padrão: estudo de caso em Florianópolis, SC. Ambiente Construído, 18(1), 423–443. https://doi.org/10.1590/s1678-86212018000100230
SMO. (2018). Catálogo de itens de serviço. Retrieved June 25, 2018, from http://www2.rio.rj.gov.br/sco/
Stabile, M. (2006). Composições Analíticas de Custos. Rio de Jnaeiro.Tavares, S. F. (2002). Metodologia de análise do ciclo de vida energético de edificações
residenciais brasileiras. Universidade Federal de Santa Catarina.
42nd AUBEA Conference 2018: Educating Building Professionals for the Future in the Globalised World
After the choice of activities, it was possible to estimate the costs and time required to execute each of the solutions, as well as quantify the materials, equipment and manpowerneeded. The final results are displayed in Table 4.
Table 4. Economic-environmental assessment.
Model Economic (R$) Environmental (kg CO2) Time (hours worked)Conventional R$61.217,82 9.646,47 1.188Flat R$60.608,12 11.383,85 1.121Waffle R$41.957,00 7.080,36 778Precast R$47.304,12 8.873,09 942Steel Deck R$60.257,14 9.958,37 1.022
Observing the results obtained from the conducted analysis, it is noticed that the structural system comprised of the Waffle slab is more economical and environmentally advantageous, compared to all other method. In addition, it is the system that is associatedwith the least amount of time necessary for execution. On the other hand, the Conventional slab is less economical in contrast (45,91%), along with its higher timeduration requirement (52,62%). The precast system is the most used in this type of construction and based on this study is the second best system, in all aspects, being a good choice of structural system. The Flat slab system is the least environmentally friendly system measured in terms of kg of CO2 emitted.
*The percentages were made over the Waffle system.
5 Conclusion and Further Research
The study demonstrated that for the construction of low-standard buildings, which have small areas, the most commonly adopted Conventional reinforced concrete slab systemis not necessarily economical. On the other hand, less conventional systems, such as the Waffle slab, or even the Precast, are much more economically feasible.
From the environmental perspective, the Waffle slab proved to be the least aggressive to the environment, in terms of total carbon emissions during construction, and the quickest to be constructed too.
It is important to emphasise that the construction time was measured only in hours worked, not taking into account the curing time of the concrete, since it is a limitation for the continuation of other stages of work. In this case, the laminated steel structure becomes a more feasible option, since compared to the time of construction of the Conventional and Flat slab does not have such a disproportionate value as it requires no curing.
The limitation of this study is that it does not consider the overall members making up the building as the emphasis was only on the structural system. The authors will endeavour to examine the overall elements within buildings considered in future studies.
116. 117.

42nd AUBEA Conference 2018: Educating Building Professionals for the Future in the Globalised World
fully harmonious way. In addition, it is imperative that the concern to minimise the impacts is related to the whole project life cycle, from the extraction and processing of the raw materials, to the final disposal of the project (or its elements). This gave rise to life cycle analysis approaches, focusing on environmental, economic and social impacts throughout the various cycles involved in a project.
Since the late 1960s, researchers have been developing a basis for the current methods of life cycle analysis. Initially, the impacts of interest were energy consumption, solid waste production, air and water pollutants (Andrews et al., 2000). Thus, the concept of Environmental Life Cycle Assessment (E-LCA) began to be implemented, usually referred to simply as Life Cycle Assessment (LCA).
Over time, the concepts of Life Cycle Costing (LCC) and Social Life Cycle Assessment (s-LCA) also emerged. LCC is defined as an assessment of all costs associated with the life cycle of a product linked to one of the actors in the product life cycle, such as the supplier, manufacturer or consumer (Ciroth et al., 2008). This assessment must be related to real money flows. On the other hand, s-LCA refers to a systematic method which accounts for all impacts borne by society throughout the life cycle of a product (Andrews et al., 2000). When the assessment covers all the environmental, social and economic impacts in the decision-making process, Life Cycle Sustainability Assessment (LCSA) approach is applicable.
When considering LCSA, the study becomes more extensive and consequently more complex, as new uncertainties arise and several stakeholders are involved (Clímaco and Valle, 2016). The need to analyse multiple factors when adopting the LCSA approachsuggests the use of Multi Criteria Decision Analysis (MCDA). This methodology can be defined as a collection of formal approaches which seek to take into account several criteria to aid in decision making (Belton and Stewart, 2002). MCDA is particularly useful when different social, economic, and environmental indicators are contrasted (Motuzienė et al., 2016). Adopting MCDA on projects, it becomes possible to incorporate various perspectives when considering the impacts of decisions made.
There are a high number of methods in the scientific literature to support strategic decision making, such as mathematical optimization (Hammad et al., 2016; Hammad et al., 2018) fuzzy set theory (Onat et al., 2016), and the analytic hierarchy process (Ahmad and Tahar, 2014). Yet there is no method which is known to be the most appropriate as it would depend on the setting in which the project case considered is, along with the information that is available. As a result, this research explores the possibility of utilisingan integrated platform that combines LCSA and MCDA. The purpose is not to define a more appropriate method for the analysis of construction projects, but to present a possibility of integration between methodologies that together have the capacity to transform buildings projects into more sustainable ones.
This paper is organised as follows: in the next section, a literature review is presented on the various LCSA and MCDA methods deployed; previous attempts that partially integrate both platforms are also discussed. Based on the literature review conducted, a detailed framework is proposed that integrates LCSA and MCDA. Final concluding remarks are then discussed to outline some of the challenges faced by the construction industry in adopting the proposed framework.
42nd AUBEA Conference 2018: Educating Building Professionals for the Future in the Globalised World
Challenges in integrating LCSA and MCDA approaches in building projects: limitations and the way forward
Karoline Figueiredo1, Ahmed Hammad2, Assed Haddad3,Khoa Do4 and Emil Jonescu5
1&3Programa de Engenharia Ambiental, Federal University of Rio de Janeiro,Rio de Janeiro, BRAZIL
2,4&5School of Design and the Built Environment, Curtin University, Perth, 6084, WA, AUSTRALIA
E-mails: [email protected]; [email protected]; [email protected];[email protected]; [email protected]
Abstract: Extensive effort is being placed on transforming the construction industry into a more sustainable sector. One approach that has been emphasised in the literature is that related to life cycle vision, with specific targets to utilise it for limiting the high rates of energy and material consumption associated with building projects. However, construction still lacks in approaches that simultaneously account for social, environmental and economic aspects when it comes to decision making. Life Cycle Sustainability Assessment (LCSA) is an approach that refers to the evaluation of all these sustainability pillars throughout the life cycle of a product. When it comes to application of LCSA, the decision maker involved needs to be able to weigh the associated impacts. A Multi Criteria Decision Analysis (MCDA) approach finds great applicability when it comes to deciding the best alternatives for a given project. This paper highlights some of the challenges of integrating these two methodologies together. A framework that describes the steps to be taken to integrate these approaches is presented, focusing on building projects.
Keywords:Life Cycle Sustainability Assessment, Multi-Criteria Decision Analysis, Sustainable Construction.
1 Introduction
The construction industry is responsible for the large consumption of natural resources, with rates of up to 40% reported in terms of material consumption by the sector (DPTI, 2017). Along with the significant material consumption rates, the construction sector generates large amounts of waste; reports that construction is responsible for 33% of total waste in the European Union (EEA, 2010). Thus, the concept of sustainability in construction has always been linked to the quest to reduce impacts of construction operations, particularly environmental ones. Industry professionals and researchers around the world have been attempting to study alternative technologies, materials, and design concepts that are less damaging to the environment. However, sustainability is not only concerned with environmental issues, as it involves an interaction between a triple bottom line framework comprised of social, economic and environmental factors.
Economic and social issues are crucial for sustainable development which also deserve special treatment (Sjostromand Bakens, 1999). In order to enhance the sustainability of construction, it is important to simultaneously account for all sustainability pillars in a
118. 119.
42nd AUBEA Conference 2018: Educating Building Professionals for the Future in the Globalised World
2.2 Multi Criteria Decision AnalysisMCDA, also known as Multiple-criteria decision-making (MCDM), is an approach used to aid in the decision-making process, incorporating information about the problem to perform the analysis of several alternatives or actions from different points of view. There are many studies on MCDA in various fields of knowledge, such as business, government and medicine, beyond the construction sector. A recent paper presents an empirical application and comparison of six different MCDA approaches for the purpose of assessing sustainable housing affordability (Mulliner et al., 2016). This work evaluates the robustness of the methods and contrasts the resulting rankings.
Different MCDA methods can yield different results when applied to the same decision problem. For this reason, the interpretation phase of the results is crucial. It is worth emphasising that the decision-making process is related in some way to the experience of the person that performs the analysis, since it is always necessary to interpret deeply the changes made in the project and the values found for each alternative. There are different methods to support strategic decision making. Criteria such as subjectivity, acceptability and adaptability should be addressed for each method, establishing the applicability of each one. Therefore, it is up to the decision maker to be rational in choosing the method, respecting the observed criteria.
One of the methods commonly applied in the academic world is the multi-criteria decision aiding constructivist (MCDA-C) methodology (Espinosa and Salinas, 2013). Another diffused method is the Analytic Hierarchy Process (AHP). This is based on the Newtonian and Cartesian method of thinking, which consists of breaking down the problem into smaller ones as many times as necessary until a clear and scalable level is reached. A third method is the Displaced Ideal Method, developed in 1973. This method assumes that the attributes considered have a certain interdependence relation. When choosing a specific type of dependency and considering it as an anchor of the problem, the search for the solution is centred on the proximity of an alternative to the anchor elements, that is, the distance between the ideal alternative and the bad alternative (Zeleny, 1976).
2.3 Integration of LCSA and MCDA togetherThe methodologies focused on the life cycle concept allow quantifying various types of impacts. However, the implementation of these techniques increases the complexity of decision making and therefore require systematic tools and methods (Gaudreault et al., 2009). In this context, MCDA and LCSA complement each other well. It is clear how the process of integration can still be much more exploited, given its great potential. There are still relatively few studies combining MCDA and the life cycle concept. Among the existing ones, most of them analyse only environmental issues, this not being an LCSA approach.
It is becoming more recurrent to find studies that use the MCDA to normalize environmental and economic outcomes. A study carried out in 2017 surveyed the existing studies developing or implementing different methods for combining environmental and economic analysis of products, technologies and systems (Miah et al., 2017). Although the study does not consider the social issues of a project, this is interesting to understand the progress of using MCDA to integrate life cycle analysis approaches. The authors reported that 30 studies conducted between 1999 and 2016 used MCDA to integrate LCA and LCC. Of these, 6 are related to building projects. There were also 32 studies, between 2002 and 2016, in which environmental and economic analysis is taken as an optimization problem. Among these studies, 10 are about buildings.
42nd AUBEA Conference 2018: Educating Building Professionals for the Future in the Globalised World
2 Literature Review
2.1 Life Cycle Sustainability AssessmentIn the 1990s, the International Standards Organization (ISO) published the most recognized standards of LCA methodology (Khasreen, 2009): ISO 14040 Principles and framework, ISO 14041 Goal definition and inventory analysis, ISO 14042 Life-cycle impact assessment and ISO 14043 Life-cycle interpretation. This approach has been widely applied in the construction sector since that time, as an important tool to evaluate the environmental impacts of construction materials in the different phases of the project life cycle (Fava, 2006).
In addition, a number of LCC and s-LCA approaches have been developed. Until then, however, the concepts and definitions related to the LCSA were not yet clearly presented. In 2003, a study presented a proposal to combine LCA with LCC and s-LCA, but the term LCSA was not used at the time (Klöpffer, 2003). The first time this term was used was in 2007, but the authors only analysed the impacts of climate change and resource depletion on their LCA, combining this analysis with an LCC, which does not completely meet the ‘triple bottom line’ model of sustainability (Guinée, 2016). In 2009, a study conducted by the Institute of Environmental Sciences, at Leiden University, presented a guideline for LCSA when implemented on general products (Zamagni et al., 2009). Even so, there is yet so little efforts conducted on building-based LCSA.
Among the studies that focused on the construction sector, many of them are not related to an entire building but are limited to individual elements of a building. A recent paper presents a sustainability assessment framework applied to a case study of reinforced concrete buildings subjected to earthquakes (Gencturk et al., 2016). However, the scope was limited to the structural components of the building. The system boundary excluded the phases which are not directly related to structural performance.
Another article applies LCSA in fly ash concrete structures (Wang et al., 2017). For this study, the authors defined the function unit as 1 m³ of fly ash concrete, again not being a complete analysis of a building. In addition, they performed the analysis using a boundary that does not include all phases of the life cycle, being restricted mainly to the phase of acquisition of raw material and allocation of ready mixed concrete.
A framework for evaluating the sustainability performance of modular buildings was proposed, through the development of sustainability indices (Kamali, 2018). In the study, sustainability performance indicators were determined, and their benchmarks were established. Although some of the social, economic and environmental impacts were considered in a case study of a building, it is evident that there is still much difficulty in obtaining the necessary data.
According to United Nations Environment Programme (UNEP), Life Cycle Thinking is a way of providing information to stakeholders so that they can make the best decisions regarding the life cycles of products and services, and their social, environmental and economic impacts (UNEP, 2012). It is noticeable that environmental analyses are much more structured due to the large availability of databases and a greater focus of studies and technical standards on this specific sustainability factor. This however does not exclude the importance of investing in the Life Cycle Thinking related to social and economic analyses.
120. 121.

42nd AUBEA Conference 2018: Educating Building Professionals for the Future in the Globalised World
functional unit of the study will be considered as the whole building, while the reference flows will be the different alternatives of material bills to construct such a building.
The impact categories to be considered should be chosen by the decision maker, analysing which are the most relevant to the target audience of the study. As the intention is to use an MCDA method to aid in decision making, each impact category shall be considered as an indicator identified by a single variable. In order to present an integrated framework, 3 indicators are chosen for each of the dimensions of the analysis: environmental,economic and social. Variables are defined for each of the parameters, where 𝐷𝐷𝐷𝐷𝑖𝑖𝑖𝑖 refers to the dimension i, while 𝑋𝑋𝑋𝑋𝑗𝑗𝑗𝑗 refers to the indicator j. The variables are presented in Table 1.
Table 1. Dimensions and indexes to be considered in the analysis
Dimensions (𝐷𝐷𝐷𝐷𝑖𝑖𝑖𝑖) Indicators (𝑋𝑋𝑋𝑋𝑗𝑗𝑗𝑗)
(D1) Environmental
(X1) Climate Changes
(X2) Resources depletion
(X3) Acidification
(D2) Economic
(X4) Construction materials costs
(X5) Operational water costs
(X6) Operational energy costs
(D3) Social
(X7) Health and comfort
(X8) Adaptability
(X9) Noise
With all the data obtained and characterised, an MCDA method is used to weight the results found and thus enable the professional to choose the best alternative. The best alternative will be the choice that is considered to be the most sustainable, based on the ‘triple bottom line’ model of sustainability.
As previously mentioned, the MCDA method chosen for this study is the Displaced Ideal method. It is calculated based on Zeleny's work (Zeleny, 1976). The best alternative should be chosen in relation to each of the analysed dimensions. The anchor value, considered the ideal solution, is determined to be the maximum value of each one of the sets. Each alternative can be represented by a vector of 𝑛𝑛𝑛𝑛 numbers, as follows:
𝑋𝑋𝑋𝑋𝑘𝑘𝑘𝑘 = �𝑥𝑥𝑥𝑥1𝑘𝑘𝑘𝑘, 𝑥𝑥𝑥𝑥2𝑘𝑘𝑘𝑘, … , 𝑥𝑥𝑥𝑥𝑛𝑛𝑛𝑛𝑘𝑘𝑘𝑘�
In this representation, the element 𝑥𝑥𝑥𝑥𝑗𝑗𝑗𝑗𝑘𝑘𝑘𝑘 41Tcorresponds to the result obtained by the indicator 𝑗𝑗𝑗𝑗 in the alternative 𝑘𝑘𝑘𝑘. In this way, the vector 𝑋𝑋𝑋𝑋𝑘𝑘𝑘𝑘 includes all the information for each proposed alternative. As an example, suppose that one of the alternatives for the construction of the building, considered as Alternative 1, would be the use of the following list of materials: solid wood doors; 1.20m x 1.20m aluminium windows with tempered glass; enamelled ceramic floors; reinforced concrete slabs and walls made with ceramic blocks of 9cm x 19cm x 19cm.
Considering this list of materials, all environmental, economic and social impacts shouldbe calculated, based on previously defined indicators. Thus, the first vector of the study, related to Alternative 1, will be obtained.
𝑋𝑋𝑋𝑋1 = (𝑥𝑥𝑥𝑥11,𝑥𝑥𝑥𝑥21, … , 𝑥𝑥𝑥𝑥91)
42nd AUBEA Conference 2018: Educating Building Professionals for the Future in the Globalised World
Another paper published in 2016 presents a case study of a house project, in which the alternative envelopes were analysed (Motuzienė et al., 2016). Life cycle assessment was used to estimate the environmental impacts of the alternative envelopes, while LCC analysis included the initial investment and the replacement costs. Again, social impacts were not taken into account.
3 Research Methodology
The incorporation of multi-criteria decision making into LCSA is a challenge since there are no certain recommendations or best methods offered. It is believed that there will never be a single best approach to all kinds of multi-objective mathematical programming problems (Ignizio, 1983). For this study, the proven concepts about buildings and constructed assets, based on European Standards, will be used to develop a LCSA framework (EN 15643‐1, 2010; EN 15643‐2, 2011; EN 15643‐3, 2012; EN 15643‐4,2012). In considering environmental, economic and social analysis as an optimization problem, the Displaced Ideal methods will be adopted as the MCDA method in the proposed framework.
To begin the analysis, the decision maker must have the prototype of the building. This would typically involve the three-dimensional (3-D) model developed as a Building Information Modelling (BIM) (Eastman, 2008); doing so significantly increases the performance and quality of the project. Utilising BIM makes it possible to gather environmental, economic and social data in the same model. It is important that, at this stage of project design, all construction materials and construction methods alternatives are listed. Having all the building data available in BIM, it’s possible to start the analysis.
To begin the LCSA study, it is important to first define the goal and scope of the analysis clearly and accurately. At this level, the following information needs to be decided on:functional unit, system boundary, reference flows, assumptions and limitation of the study. The system boundary refers to the size of LCSA, and the choice of the system boundary can significantly affect the results of the study (Gaudreault et al., 2010). In this work, the use of a cradle-to-grave analysis is encouraged, i.e., going through all phases of the project life cycle, as shown in Figure 1. However, it is important that the practitioner analyses the need for each project to determine the boundaries of the study.
Figure 1. Layout of the system boundary proposed(Source: Authors, 2018)
The purpose of the framework presented in this work is the comparison between different alternatives, from the environmental, economic and social perspectives. Therefore, the
122. 123.
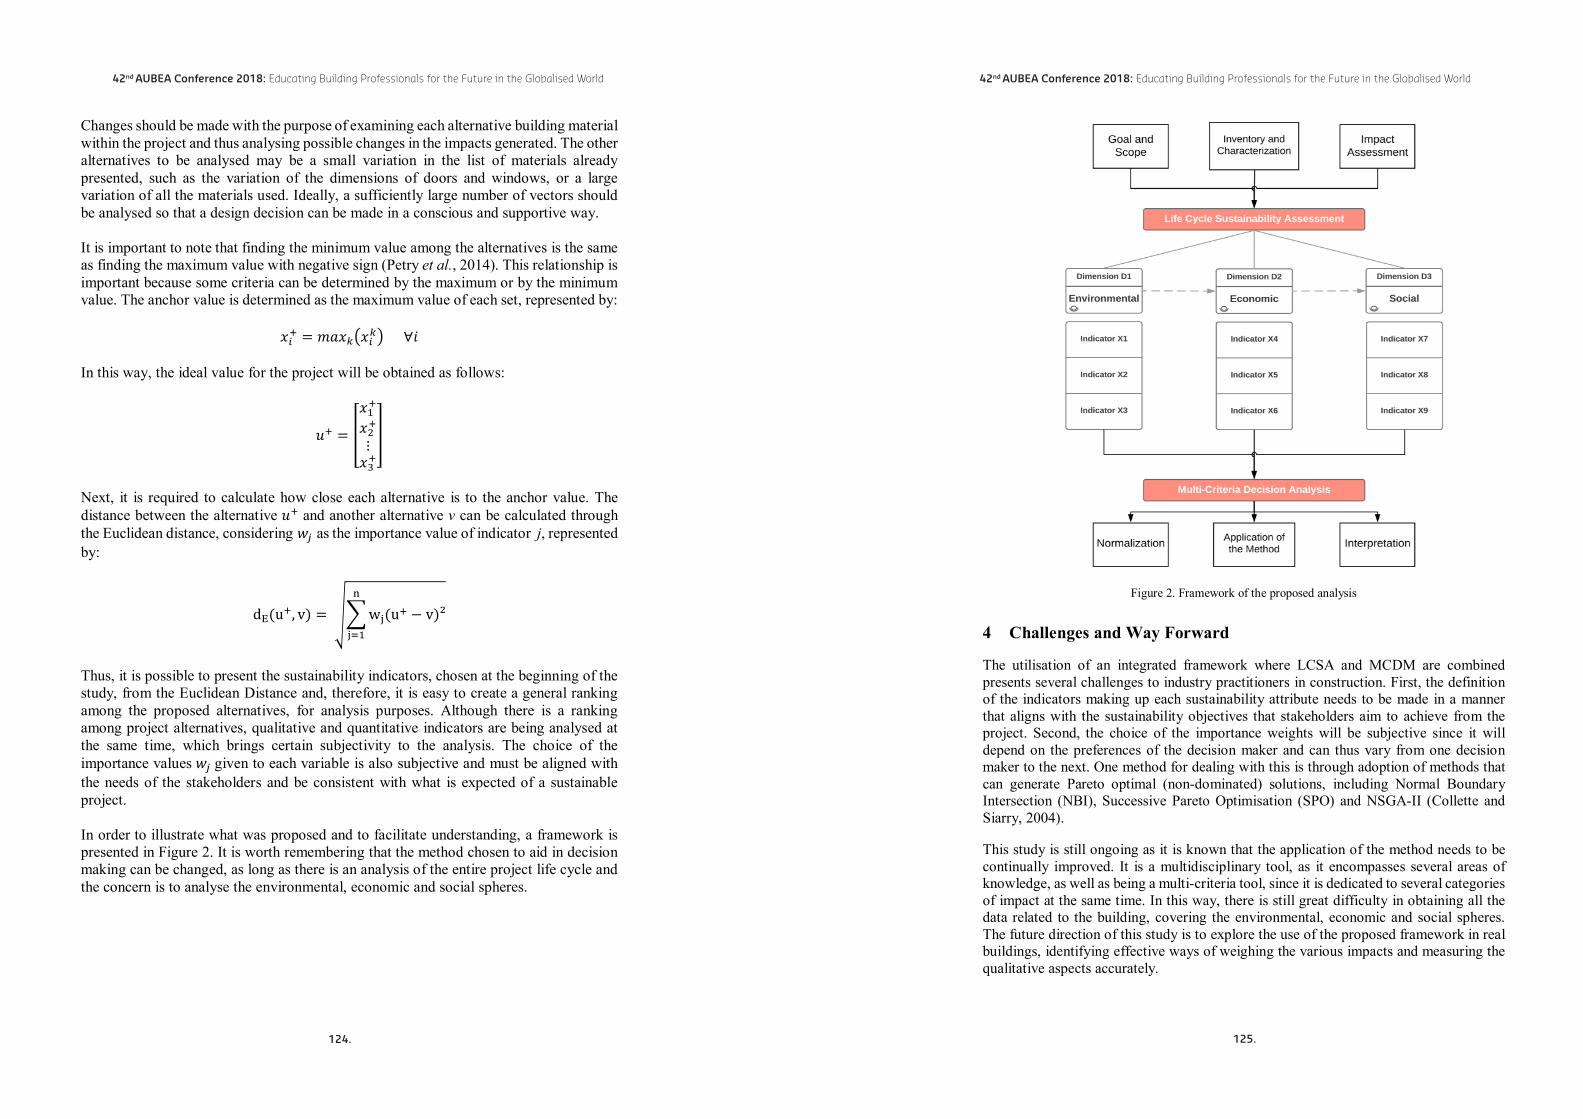
42nd AUBEA Conference 2018: Educating Building Professionals for the Future in the Globalised World
Changes should be made with the purpose of examining each alternative building material within the project and thus analysing possible changes in the impacts generated. The other alternatives to be analysed may be a small variation in the list of materials already presented, such as the variation of the dimensions of doors and windows, or a large variation of all the materials used. Ideally, a sufficiently large number of vectors should be analysed so that a design decision can be made in a conscious and supportive way.
It is important to note that finding the minimum value among the alternatives is the same as finding the maximum value with negative sign (Petry et al., 2014). This relationship is important because some criteria can be determined by the maximum or by the minimum value. The anchor value is determined as the maximum value of each set, represented by:
𝑥𝑥𝑥𝑥𝑖𝑖𝑖𝑖+ = 𝑚𝑚𝑚𝑚𝑚𝑚𝑚𝑚𝑥𝑥𝑥𝑥𝑘𝑘𝑘𝑘�𝑥𝑥𝑥𝑥𝑖𝑖𝑖𝑖𝑘𝑘𝑘𝑘� ∀𝑖𝑖𝑖𝑖
In this way, the ideal value for the project will be obtained as follows:
𝑢𝑢𝑢𝑢+ = �
𝑥𝑥𝑥𝑥1+
𝑥𝑥𝑥𝑥2+⋮𝑥𝑥𝑥𝑥3+�
Next, it is required to calculate how close each alternative is to the anchor value. The distance between the alternative 𝑢𝑢𝑢𝑢+ and another alternative v can be calculated through the Euclidean distance, considering 𝑤𝑤𝑤𝑤𝑗𝑗𝑗𝑗 as the importance value of indicator j, represented by:
dE(u+, v) = ��wj(u+ − v)²n
j=1
Thus, it is possible to present the sustainability indicators, chosen at the beginning of the study, from the Euclidean Distance and, therefore, it is easy to create a general ranking among the proposed alternatives, for analysis purposes. Although there is a ranking among project alternatives, qualitative and quantitative indicators are being analysed at the same time, which brings certain subjectivity to the analysis. The choice of the importance values 𝑤𝑤𝑤𝑤𝑗𝑗𝑗𝑗 given to each variable is also subjective and must be aligned with the needs of the stakeholders and be consistent with what is expected of a sustainable project.
In order to illustrate what was proposed and to facilitate understanding, a framework is presented in Figure 2. It is worth remembering that the method chosen to aid in decision making can be changed, as long as there is an analysis of the entire project life cycle and the concern is to analyse the environmental, economic and social spheres.
124. 125.
42nd AUBEA Conference 2018: Educating Building Professionals for the Future in the Globalised World
Figure 2. Framework of the proposed analysis
4 Challenges and Way Forward
The utilisation of an integrated framework where LCSA and MCDM are combined presents several challenges to industry practitioners in construction. First, the definition of the indicators making up each sustainability attribute needs to be made in a manner that aligns with the sustainability objectives that stakeholders aim to achieve from the project. Second, the choice of the importance weights will be subjective since it will depend on the preferences of the decision maker and can thus vary from one decision maker to the next. One method for dealing with this is through adoption of methods that can generate Pareto optimal (non-dominated) solutions, including Normal Boundary Intersection (NBI), Successive Pareto Optimisation (SPO) and NSGA-II (Collette and Siarry, 2004).
This study is still ongoing as it is known that the application of the method needs to be continually improved. It is a multidisciplinary tool, as it encompasses several areas of knowledge, as well as being a multi-criteria tool, since it is dedicated to several categories of impact at the same time. In this way, there is still great difficulty in obtaining all the data related to the building, covering the environmental, economic and social spheres. The future direction of this study is to explore the use of the proposed framework in real buildings, identifying effective ways of weighing the various impacts and measuring the qualitative aspects accurately.
42nd AUBEA Conference 2018: Educating Building Professionals for the Future in the Globalised World
5 References
Ahmad, S., Tahar, R.M., 2014. Selection of renewable energy sources for sustainable development of electricity generation system using analytic hierarchy process: A case of Malaysia. Renew. Energy 63, pp 458–466.
Andrews, E. S., Barthel, L. P., Beck, T., Benoît, C., Ciroth, A., Cucuzzella, C., and Mazeau, P. (2000). Guidelines for social life cycle assessment of products, United Nations Environment Programme, Belgium.
Antón, Á., and Díaz, J. (2014). Integration of LCA and BIM for Sustainable Construction. International Journal of Social, Management, Economics and Business Engineering, 8(5), pp 1356–1360.
Belton, V., & Stewart, T. (2002). Multiple criteria decision analysis: an integrated approach. Springer Science & Business Media.
Ciroth, A., Hunkeler, D., Huppes, G., Lichtenvort, K., Rebitzer, G., Rüdenauer, I., and Steen, B. (2008). Environmental Life Cycle Costing, SETAC-CRC, Pensacola, FL.
Clímaco, J. C. N., and Valle, R. (2016). ‘MCDA and LCSA—A Note on the Aggregation of Preferences’. In: Kunifuji S., Papadopoulos G., Skulimowski A., Kacprzyk J., Knowledge, Information and Creativity Support Systems, vol. 416, Springer, Cyprus, November 6-8, 2014, pp. 105-116.
Collette, Y., Siarry, P., 2004. Multiobjective Optimization: Principles and Case Studies. Springer Science & Business Media.
DPTI – Department of Planning, Transport and Infrastructure (2017), Government of South Australia, Environmentally Sustainable Building Materials – Selection [Online]. Available: https://www.dpti.sa.gov.au/__data/assets/pdf_file/0009/293688/ Environmentally_Sustainable_Building_Materials.pdf
Eastman, C.M., 2008. BIM Handbook: A Guide to Building Information Modeling for Owners, Managers, Designers, Engineers and Contractors. John Wiley & Sons.
EEA (2010). The European Environment State and outlook 2010. Material resources and waste. European Environment Agency, Copenhagen.
EN 15643‐1. (2010). Sustainability of Construction Works–Assessment of Buildings – Part 1: General framework.
EN 15643‐2. (2011). Sustainability of Construction Works–Assessment of Buildings – Part 2: Framework for the assessment of environmental performance
EN 15643‐3. (2012). Sustainability of Construction Works–Assessment of Buildings–Part 3: Framework for the Assessment of Social Performance.
EN 15643‐4. (2012). Sustainability of Construction Works–Assessment of Buildings – Part 4: Framework for the assessment of economic performance
Espinosa, F., and Salinas, G. (2013). Selection of improvement strategies for working condition for to maintenance function using constructivist multicriteria decision aid approach MCDA. Información Tecnológica, Talca, Chile, 24(3), pp 57-72.
Fava, J. A. (2006). ‘Will the next 10 years be as productive in advancing life cycle approaches as the last 15 years?’, The International Journal of Life Cycle Assessment, 11(1), pp. 6-8.
Gaudreault, C., Samson, R., Stuart, P. (2009) Implications of choices and interpretation in LCA for multi-criteria process design: de-inked pulp capacity and cogeneration at a paper mill case study. Journal of cleaner production, 17(17), pp 1535-1546.
Gaudreault, C., Samson, R., and Stuart, P. (2010). Energy decision making in a pulp and paper mill: selection of LCA system boundary. The International Journal of Life Cycle Assessment, 15(2), pp 198-211.
Gencturk, B., Hossain, K., and Lahourpour, S. (2016). ‘Life cycle sustainability assessment of RC buildings in seismic regions’, Engineering Structures, 110, pp 347-362.
Guinée, J. (2016) ‘Life Cycle Sustainability Assessment: What Is It and What Are Its Challenges?’. In: Clift R., Druckman A., Taking Stock of Industrial Ecology, pp 45-68, Springer, Cham.
Hammad, A.W., Akbarnezhad, A., Oldfield, P., 2018. Optimising Embodied Carbon and U-value in Load Bearing Walls: A Mathematical Bi-Objective Mixed Integer Programming Approach. Energy Build. https://doi.org/10.1016/j.enbuild.2018.05.061
42nd AUBEA Conference 2018: Educating Building Professionals for the Future in the Globalised World
Hammad, A.W.A., Akbarnezhad, A., Rey, D., 2016. A multi-objective mixed integer nonlinear programming model for construction site layout planning to minimise noise pollution and transport costs. Autom. Constr. 61, 73–85. https://doi.org/10.1016/j.autcon.2015.10.010
Ignizio, J. P. (1983). Generalized goal programming an overview. Computers & OperationsResearch, 10(4), pp 277-289.
ISO, E. (2006). Environmental Management–Life Cycle Assessment – Principles and Framework (ISO 14040: 2006). European Committee for Standardization.
Kamali, M., Hewage, K., and Milani, A. S. (2018). ‘Life cycle sustainability performance assessment framework for residential modular buildings: Aggregated sustainability indices’, Building and Environment, 138, pp 21-41.
Khasreen, M. M., Banfill, P. F., & Menzies, G. F. (2009). Life-cycle assessment and the environmental impact of buildings: a review. Sustainability, 1(3), 674-701.
Klöpffer, W. (2003). ‘Life-cycle based methods for sustainable product development’, International Journal of Life Cycle Assessment, 8 (3), pp 157–159.
Miah, J. H., Koh, S. C. L., and Stone, D. (2017). ‘A hybridised framework combining integrated methods for environmental Life Cycle Assessment and Life Cycle Costing’, Journal of Cleaner Production, 168, pp 846-866.
Motuzienė, V., Rogoža, A., Lapinskienė, V., and Vilutienė, T. (2016). ‘Construction solutions for energy efficient single-family house based on its life cycle multi-criteria analysis: a case study’, Journal of Cleaner Production, 112, pp 532-541.
Mulliner, E., Malys, N., Maliene, V. (2016). Comparative analysis of MCDM methods for the assessment of sustainable housing affordability. Omega, 59, pp 146-156.
Onat, N.C., Gumus, S., Kucukvar, M., Tatari, O., 2016. Application of the TOPSIS and intuitionistic fuzzy set approaches for ranking the life cycle sustainability performance of alternative vehicle technologies. Sustain. Prod. Consum. 6, 12–25. https://doi.org/10.1016/j.spc.2015.12.003
Petry, J. F., Silva, G., Sell, T. M., da Silva, M. Z., and Hein, N. (2014). Análise Decisória Multicritério na Avaliação da Sustentabilidade dos Municípios de Santa Catarina. Desenvolve Revista de Gestão do Unilasalle, 3(1), pp 149-170.
Sjostrom, C., & Bakens, W. (1999). CIB Agenda 21 for sustainable construction: why, how and what, Building Research & Information, 27(6), pp 347-353.
UNEP – UNITED NATIONS ENVIRONMENT PROGRAMME (2012). Greening the economy through life cycle thinking: ten years of the Unep/Setac Life Cycle Initiative, Kenya - UNEP.
Wang, J., Wang, Y., Sun, Y., Tingley, D. D., and Zhang, Y. (2017). ‘Life cycle sustainability assessment of fly ash concrete structures’, Renewable and Sustainable Energy Reviews, 80,pp 1162-1174.
Zamagni, A., Buttol, P., Buonamici, R., Masoni, P., Guinée, J. B., Huppes, G., and Rydberg, T. (2009). ‘Blue paper on life cycle sustainability analysis’. EU FP6 Project No 037075, Co-ordination Action for Innovation in Life-Cycle Analysis for Sustainability.
Zeleny M. (1976) The Theory of the Displaced Ideal. In: Zeleny M. (eds) Multiple Criteria Decision Making Kyoto 1975. Lecture Notes in Economics and Mathematical Systems (Operations Research), 123. Springer, Berlin, Heidelberg, pp 153-206.
126. 127.
42nd AUBEA Conference 2018: Educating Building Professionals for the Future in the Globalised World
Systemic sustainable construction industry development: a research agenda
William Gyadu-Asiedu1, Adwoa Ampadu-Asiamah2 and Alfred Fokuo-Kusi3
1Koforidua Technical University, P.O. Box 981, Koforidua, Eastern Region, GHANA.
2Accra Technical University, Barnes Rd., Adabraka. P.O. Box GP 561,Accra, Greater Accra region, GHANA.
3Sunyani Technical University, P.O. Box 206, SUNYANI, Brong ahafo region, GHANA.
Email: [email protected], [email protected], [email protected]
Abstract: To achieve sustainable construction everywhere, the construction industry should focus on sustainable development. This requires a consideration of issues related to all the constituents of the construction industry. It therefore requires a systems thinking approach. In addition, it is necessary, for purposes of global relevance, that these are linked to the sustainable development goals (SDGs). This paper proposes a research agenda to stimulate academic and industry effort to address these concerns in the built environment. The study uses the review research strategy to analyse existing literature in order to elucidate the various aspects of the CI that need to be considered in a holistic research approach. It is proposed that the research uses the Delphi method to identify and assess the maturity levels of the constituents of the industry, apply the appropriate systems thinking tools to understand and structure the industry. Further, the models shall be tested within a building information modelling (BIM) environment. Finally, a performance measurement framework shall be designed to measure, monitor and manage the development levels of the constituents of the industry along the social, economic and environmental pillars of sustainability. This shall be considered within the framework of the components of construction industry development. The paper delivered two main study frameworks. The first is expected to guide the study in the areas of structuring the components of CI development. The other will guide the process of systemically and sustainably developing the industry.
Keywords: BIM, Integration, Complexity, Sustainable Construction, Systems Thinking
1 Introduction
Sustainable construction (SC) can only be achieved within a sustainable construction industry (CI) system. Thus, the sustainability of the CI must be the ultimate objective for every country seeking to accomplish the sustainable construction agenda. Further, sustainable CI itself must be aligned with the broader concept of sustainability or, more succinctly, sustainable development. The concept of sustainability which emanated from the Rio Declaration (Agenda 21) (UNSD, 1992) has since fine-tuned its objectives into the sustainable development goals (SDGs) (ICSU, ISSU, 2015). Thus, the quest for
42nd AUBEA Conference 2018: Educating Building Professionals for the Future in the Globalised World
sustainable construction, to be meaningful, should be linked with the SDGs. This is against the backdrop that the construction industry (CI) has since identified itself at the forefront in making the world a better place, defining its role through the pursuance of a sustainable construction agenda (Kibert, 1994; Du Plessis et al., 2002; Du Plessis, 2007). As an economic investment, its relationship with economic development is well posited (Myer, 2013; Olanrewaju & Abdul-Aziz, 2015). Indeed, the CIB (2004) defines SC as: ‘the sustainable production, use, maintenance, demolition, and reuse of buildings and constructions or their components’, while sustainable buildings and built environments are seen as ‘the contributions by buildings and the built environment for achievement—components of—sustainable development’.The concept of sustainability itself is a complex subject, fusing it within the construction setting does not make it any simpler. Schalcher (2015) posited that two things describe complexity: the system and the process. Due to the different stakeholders and organisations (who have other competing interests besides the current project) involved as well the process of product development, the construction activities itself should be seen as a very complex one, by definition. The need to balance these with the requirements of sustainability (i.e., Environmental, Economic and Social “pillars”) to achieve the SDGs goes the increase the complexity of the whole exercise (Martens and Carvalho, 2017; Schropfer, Tah and Kurul, 2017; Bahihashemi et al., 2017).
Significantly, each of the three pillars of sustainability has a different objective to achieve and sometimes contend with one another. For example, the dichotomy is clear between the quest for economic growth (brown) and that of environmental protection (green) pillars or dimensions of sustainability (McGranahan and Satterthwaite, 2000). The factors that promote the accomplishment of the former appear to increase those factors that work against the latter. This creates a dichotomous situation between the two dimensions. Yet, sustainable development will depend on a “green”, not “brown”, economy for its success; where the green economy is defined as: “an economy in which economic growth and environmental responsibility to work together in a mutually reinforcing fashion while supporting progress on social development” (ICC, 2012).Bringing this on board, the comparison of Mcgranahan and Satterthwaite (2000) could be depicted as in table 1.
Table 1 A comparison between the Economic and Environmental Pillars of Sustainability
Focus Economic (Brown) Economic (green) Environmental (Green)Key concern Human well-being Business and
society's well-beingEco-systemic well-being
Timeframe Immediate Transitory DelayedScale Local Think global, act
localThink global, act local
Concerned about Low-income groups All-income groups Future generationsView of nature Manipulate and use Generate, recycle
and re-use.Protect and work with
Environmental services Provide more Optimise Use less
Source: Adapted from McGranahan and Satterthwaite (2000) which include authors’ input.
Thus, a trichotomous relationship among the three pillars is perceivable, altogether, pushing the frontiers of complexity. In addition, the construction industry operates on connectivity of a large number of different stakeholders and organisations –making it a system of systems. This also
128. 129.

42nd AUBEA Conference 2018: Educating Building Professionals for the Future in the Globalised World
makes it one of the most linked industries. Further, the nature of the production processes exposes it to varying degrees of uncertainty and inevitable fragmentation. Gajendran et al. (2011) summarised the major challenges faced by industry militating against its development: Fragmentation, complexity, interconnectivity and uncertainty.These are exacerbated by such social phenomena as corruption (The World Bank, 2011; CIOB, 2006; PwC, 2009), informality (Gajendran et al., 2011; Wells, 2007) and culture(Kirvrak et al., 2008; Misnan and Mohammed, 2007; McSween, 2003) which characterise the industry in most countries at varying degrees. The question about how to work to achieve a sustainable construction industry becomes key. The linkages of the CI with other industries (Manufacturing, mining, agriculture, Banking or financial, other services, etc.) add another dimension to the complexity.
1.1 The Problem statement
Evidence shows that the construction industry is plagued with several problems confronting its development agenda (World Bank, 1994; Nhabinde et al., 2012; FMI, 2015). Relevant ones include those relating to product development processes (e.g. Client dissatisfaction), stakeholders (e.g. Industry dissatisfaction) (World Bank, 2011; FMI, 2015; ICM, 2016) and contracting processes (e.g. Supply chain problems) (Latham, 1994; Egan, 1998; Baiden and Price, 2010; Wells, 2014). Even though the difficulty posed by the peculiar nature of the industry has been widely acknowledged little has been done to address them holistically. Attempt to develop the industry has often conceptualized the industry as an island and not as part of a broader global system. This situation underscores a fundamental problem to overcome in order to meet the expectations of sustainable construction, and hence, sustainable development. The complex nature of the industry and that of the project development process as well as the challenges resulting from the interconnectivity among them constrains efforts at engendering scientific diagnosis and restructuring for systemic development of the CI. Adding the dimensions of sustainability makes the “whole” picture blurred and difficult to grasp towards a better consideration of CI development today that will take care of development tomorrow; and the kind that will reminisce the relevant SDGs.
1.2 The Aim of the Study
The aim of the study is to propose a research framework for systemic, sustainable CI development taking into consideration the fundamental challenges confronting the industry and the quest to accomplish the relevant SDG targets. Specifically, the study will identify the structure and behaviour of the constituents of the CI and design a framework for systemic sustainable development using appropriate tools and methodologies. The system thinking philosophy is the main paradigm governing the research approach. Draper (1993) has said that systems thinking is understood as the ability to see the world as a complex system where everything is connected to everything else. This paper posits that it is a deficiency in theory and practice and counterproductive for different groups to pursue a common agenda in isolation and with a self-contained approach.
2 Literature Review
Three areas of import to CI industry development are addressed: system thinking, the components of the CI and the need for integration of the fragmented industry. These three are seen to underpin the study.
42nd AUBEA Conference 2018: Educating Building Professionals for the Future in the Globalised World
2.1 A System thinking approach to CI Development
According to UNESCO (2017), “Sustainable development cannot be achieved by technological solutions, political regulation or financial instruments alone. The methodology required is the one that will look at the whole picture and find out what can be done to build a resilient system and adaptable structures that takes care of complexity, rather than filter it out (OECD, 2017). System thinking is the main approach recommended in this study in which the CI shall be considered as a system of systems with all organisations in the industry as the constituent systems. Ison (2010:22) defined a system as: “an integrated whole of which the essential properties emerge from the relationships between the component parts”. Within the CI, systems are organisations and firms operating to define the CI work as a system of systems. These include: clients, contractors, consultants, supplies, suppliers, etc., and even projects as temporary organisations (Lundin and Söderholm, 1995). System thinking has been seen as an invaluable tool to address complex problems of sustainability. Cloud (2009) has said: “system dynamics and systems thinking can be taught without involving sustainability, but sustainability cannot be taught without involving systems thinking. Systems can be defined as elements joined together by dynamics that produce an effect, create a whole or influence other elements of a system.
2.2 The Components of Construction Industry Development
According to Ofori (2012), construction industry development promotes: • Increased value for money to industry clients as well as environmental
responsibility in the delivery process • The viability and competitiveness of domestic construction enterprises • Optimisation of the role of all participants and stakeholders through process,
technology, institutional enhancement, and through appropriate human resource development. This is especially important during project execution.
In addressing the transformational or development question of CI development this paper identifies the boundary conditions in the form of components. Ofori (2015) identifies the components of construction industry development as: technology development, corporate development, institution building, material development, human resource development, documentation, procedures and practices, and operating environment. After assessing the present state of the CI and the global trends that will impact on the industry, the World Economic Forum (WEF) (2016) then introduces a conceptual industry-transformation framework, listing a number of measures, grouped in eight topical areas and classified into three groups: measure taken by private companies on their own; measures taken by companies in collaborations with their peers –or by the industry as a whole; and measures taken by the government, acting both as the regulator, and as a major project owner. The eight topical areas are: (1) technology material and tools (2) processes and operations (3) strategy and business model innovation (4) people, organization and culture (5) industry collaboration (6) joint industry marketing (7) regulation and policies and (8) public procurement.According to the report, the future transformation of the CI would be shaped by market and customer trends, sustainability and resilient trends, societal and workforce trends, and finally, political and societal trends. It is important to look at these industry-transformation framework in the light of the green economic framework and along its roadmap (ICC, 2012) completely. It is expected that this would profoundly change the industry as a system and towards the path of sustainable growth. Given the construction industry’s societal, environmental and economic importance, it is expected that even small improvements in performance will have a strong effect in all three domains.
130. 131.

42nd AUBEA Conference 2018: Educating Building Professionals for the Future in the Globalised World
2.3 Towards the Integration of the CI system: Removing Boundaries and Partnering
The first attempt in overcoming the challenges aforementioned is to focus on the integration of the CI system. For the construction team, integration is defined as the point “where different disciplines or organizations with different goals, needs and cultures merge into a single cohesive and mutually supporting unit with the collaborative alignment of processes and cultures” (Baiden & Price, 2010). A major recommendation of Rethinking Construction (Latham, 1994) is that an integrated project process will deliver the best value to the client and the user. According to Baiden and Price (2010), integrated construction project team is characterized by single focus and objectives, diminished boundaries between individuals, and teamwork based on beneficial outcomes. In a related study, Baiden et al. (2006) found that collaboration of the project team can be determined by the following factors: common goal, among firms, trust, self-governing teams, focus on end-user needs, and free exchange of information. The ICMS (2016) survey reports that (this is also supported by the World Economic Forum, 2016) “while advances in technology like BIM and modular construction can help, efficiency improvements of the scale required will only be achieved if the industry evolves – and develops leaner, more collaborative ways of working across the supply chain.” The CI, however, cannot “evolve” to the expected nature without careful and appropriate research and development. Thus the importance of partnering is underscored. Partnering has been considered an effective way of dealing with fragmentation and isolationism and removing boundaries and antagonisms in project execution (Spang and Riemann, 2011). Bennett and Jayes (1998) identified three levels of partnering: (1) First Generation Partnering – Project Partnering (2) Second Generation Partnering –Strategic Partnering (3) Third Generation Partnering – System Partnering. It is important to recall that the last goals of the millennium development goals (MDGs) and that of the SDGs, i.e., Goals 8 and 17 respectively, focus on “partnering for development and goal accomplishments respectively: MDG 8: Develop a global partnership for development (Way, 2015), andSDG 17: Partnership for goals (ICSU, ISSU, 2015).
3 Research Methodology
The study shall use the Delphi method to identify the maturity levels of the component of sustainable CI development and those of its constituent organisations (or systems). This is to ensure that professionals and academics provide the required information in an iterative manner. Various system thinking tools shall be employed in the study for understanding and modelling the CI for systemic sustainable development. This shall include: Brainstorming tools (e.g. Double QQ), Dynamic thinking tools (e.g. Behaviour over time (BOTs); Causal loop diagrams (CLDs); Structural thinking tools (Graphical function diagrams, Structural behaviour pairs and Policy structures) and Computer-based tools (Computer models, Management flight simulators and Learning laboratories) as appropriate.
The goal of the modelling is to improve our understanding of the ways in which performance of an organization or a system in the CI is related to: (1) its internal structure and operating policies, including those of customers, competitors, and suppliers and then to use that understanding to design high leverage policies for success and, by extension, and (2) its constituent systems or organisations. Performance
42nd AUBEA Conference 2018: Educating Building Professionals for the Future in the Globalised World
measurement concepts shall be employed to design assessment systems that will measure, monitor and manage the levels of development of the components of CI development in the various organisations along the three pillars of sustainability and, subsequently, the whole of the industry.Following this, the models designed will be tested in an environment of 3D BIM. A prototype CI shall be created and filled with the appropriate data for simulation. The key words here are: collaboration, integration and partnering –all in the name of system thinking.
4 Findings and Discussion
At the proposal stage the study used the review research strategy to analyse existing literature in order to elucidate the various aspects of the CI that needs to be considered in a holistic research setting. The approach explores a complex analysis -in this case multicriteria-linkage analysis of grouped metrics -which examines the extant literature to systematically identify contents in terms of pre-known and anticipated classes of knowledge (Bryman and Bell, 2007) and to achieve functional synthesis. The results are the framework for the study as described in tables 2 and 3.In table 2, the components of CI development (Ofori, 2015) are confirmed by mapping them with the measures of the conceptual industry-transformation framework of the WEF (2016) and the green economy concept and roadmap (ICC, 2012). By this synthesis, it was possible to classify them into the three groups. Further, these were also aligned with the expected benefits for CI development. Finally, the improvements that all these efforts will yield in the three pillars of sustainability were also represented.Table 3 considers a systemic, sustainable construction industry development. The process involves the design of a CI system of systems which ensures that all the systems: clients, consultants, contractors, and so on, as identifiable, are developed along the eight (8) components of CI development (Ofori, 2015). For each system or organisation, the focus is to ensure a component-by-component development along the Social (S), Economic (E) and Environmental (Ev.) dimensions. This measures the level of sustainable development of the organisation at any point in time. Thus, for each of the different organisations in the industry, i.e., clients, contractors, consultants, etc., (considered as systems of a CI), their sustainable development is ensured through a deliberate effort towards Technology, Corporate, Human Resource, Materials development, etc., (as are applicable), taking into consideration the pillars of sustainability in each case. Along each row, a system is developed in a particular component. The cumulative effect measures the development of the component; for example, the technology component of the industry.
132. 133.

42nd AUBEA Conference 2018: Educating Building Professionals for the Future in the Globalised World
Table 2. A proposed Guide for CI Development through the Components (Ofori, 2012, 2015; WEF, 2016)
Components of CI development (Ofori, 2015)
Conceptual Industry Transformation framework (WEF, 2016; ICC, 2012)
Expected benefits of CI development (Ofori, 2012)
Areas of Expected Improvement (WEF (2016)
Measures Classification Groups
Technology development
Technology
Measures undertaken by private companies
Stakeholder and participant optimisation through technology • Society
• Economy• Environment
Corporate development
Strategy and business model innovation
Viability and competitiveness of domestic construction enterprises
Human resource development
People, organization and culture
Stakeholder and participant optimizationof institutional enhancement through human resource development
Institution building
Public procurement
Measures undertaken by governments
Stakeholder and participant optimization through institutional enhancement
• Society• Economy• Environment
Regulation and policy
Material development
Materials and tools
Measures undertaken by industry
Increased money for clients and industry
• Society• Economy• Environment
Documentation Process and operations
Environmental responsibility of the delivery process
Procedures and practices
Stakeholder and participant optimization through processes
Operating environment
Industry collaborationJoint industry marketing
42nd AUBEA Conference 2018: Educating Building Professionals for the Future in the Globalised World
Methodology for Sustainable CI Development
In a related vein, the vertical results in the table measure the overall sustainable development of each system or organisation. These individual results are also important for the monitoring and management of the sub-systems or organizations in the industry. Finally, proposed standards of verification and validations are established as described below.
Components of CI development
Construction Industry Systems Results Showing sustaina
ble development of
a CI compone
ntClients Projects Consult
antsContractors
Subcontractors
Suppliers
Regulatory bodies
S E Ev.
S E Ev.
S E Ev.
S E Ev.
S E Ev.
S E Ev.
S E Ev.
Technologydevelopment (TD)
Sust.TD.
Corporate development (CD)
Sust. CD.
Human resource development (HR)
Sust. HR
Institution building (IB)
Sust. IB
Material development (MD)
Sust. MD
Documentation (Dtn)
Sust. Dtn.
Procedures and practices (PP)
Sust. PP
Operating environment (OE)
Sust. OE
Results showing Sustainable development of a CI organisation
Sust. Dev. Clients
Sust. Dev. Project
Sust. Dev.Consultants
Sust. Dev. Contractors
Sust. Dev. Subcontractors
Sust. Dev. Suppliers
Sust. Dev. Regulatory Bodies.
Overall systemic sustainable CI development
134. 135.

42nd AUBEA Conference 2018: Educating Building Professionals for the Future in the Globalised World
4.1 Measuring Systemic, Sustainable Development
The assessment of systemic, sustainable development proposed by this research shall be accomplished by the hierarchical measurement using the indicators related to the social, economic and environmental dimensions of each system in the industry. These are represented in percentages as a comparison between industry standards and actual performance. Thus, below each pillar, the overall percentage value is recorded at the level of development in a particular component.Using the formula:
Kn = S + E +Env ≤ 100, for each organisation, and,
Cn = (K1 + K2 + …+ Kn)/100 ≤ 100,
Where: Kn represent a system or organisation: clients, contractors, etc.,
And Cn represents the overall measure of the level of systemic, sustainable development of a certain component of construction industry development.
Thus, the summation of all Cs will yield the result showing the state of sustainable development of the industry.
5 Conclusion and Further Research
The major contribution of this paper to the debate on the CI development agenda is the emphasis on ensuring sustainability using a systemic approach. In addition, this study propounds that sustainable construction industry development should be seen as part of the global agenda of a sustainable world as it began with the Agenda 21 and now the SDGs. The CI as system of construction systems is also a part of a larger global system. Thus, sustainable construction as the root for developing the industry, and as a core part of the sustainable development agenda, should be taken to the next level: to be totally linked to the global agenda of sustainable development. This means that researchers who are contributing to the debate should not do so as on an “island”. They must consider, alongside the approaches towards achieving the goals of sustainable construction, the impacts, attractions and the distractions from other industries or systems which might be contributing towards the SDGs by either collaborating or contending with the CI. The situation depicts a complex problem, more than has hitherto been considered.The scale and nature of the uncertainty and complexity of the challenges confronting the industry and its quest for sustainability have meant that this must be pursued with a different way of thinking, a different world view and a different approach to solving its problems. Systems approaches to the problem is recommended for research and development in SC. The aim is to effect system change (OECD, 2017). It is about confronting the sustainable development problem holistically, looking into future scenarios and bringing all who matter on board, achieving a common good rather than a sectorial good.
42nd AUBEA Conference 2018: Educating Building Professionals for the Future in the Globalised World
This study provides a framework within which sustainable CI development could be engineered. In considering all the factors and actors at play and identifying all obstacles and challenges standing in the way of development, the systemic, sustainable CI development problem could be clearly defined. By identifying the components of CI developments and the dynamics within sustainable construction, the stage should be set for a holistic approach to the CI sustainable development question. A research agenda towards a holistic CI development is, thus, set for the industry. The expected direct beneficiaries are the various CI development agencies set up in various countries who may need to re-align their focus towards achieving their relevant SDGs.
6. References
Baiden B.K., Price A.D.F. and Dainty, A.R.J. (2006), ‘The Extent of System Integration within Construction Projects’, International Journal of Project Management, Volume 24, pp 19-26
Baiden B.K, and Price, A.D.F. (2010), ‘The Effect of Integration on Project Delivery Team Effectiveness’, International Journal of Project Management, 29(2), pp 129-136.
Banihashemi, S.; Hosseini, M.R.; Golizadeh, H.; Sankaran, S. (2017). Critical success factors (CSFs) for integration of sustainability into construction project management practices in developing countries. International Journal of Project Management, 35, pp 1103–1119.
Bennett, J. and Jayes, S. (1998), The Seven Pillars of Partnering. A Guide to Second Generation Partnering, London- United Kingdom: Thomas Telford
Bryman, A. and Bells, C. (2007), Business Research Methods, Oxford University Press
CIB (2004), 50 Years of International Cooperation to Build a Better World. CIB, RotterdamDraper, F. (1993). A proposed sequence for developing systems thinking in a grades 4–12
curriculum. Systems Dynamic Review, 9, 207–214.CIOB (2006), Corruption in the UK Construction Industry, Survey 2006. www.ciob.org.uk.Cloud, J.P. (2009), ‘Some Systems Thinking Concepts for Environmental Educators During the
Decade of Education for Sustainable Development, In: Chalkley, B., Haigh, M., Higgitt, D., Eds, Education for Sustainable Development, Routledge: New York, NY, USA, 2009; pp 225–229.
Du Plessis, C. (2002), Agenda 21 for Sustainable Construction in Developing Countries, CSIR Report BOU/E0204, CSIR, CIB & UNEP-IETC, Pretoria.
Du Plessis (2007), ‘A Strategic Framework for Sustainable Construction in Developing Countries’, Construction Management and Economics, 25, pp 67–76
Gajendran, T., Brewer, G, Runeson, G. and Dainty, A. (2011), ‘Investigating Informality in Construction Philosophy’, paradigm and Practice. Australasian Journal of construction economics and Building, 14, pp 84-98
Honour, E. (2013), ‘Verification and Validation Issues in System of Systems’, In: Larsen, Legay, Nyman (Eds.): 1st Workshop on Advances in Systems of Systems (AiSoS 2013) EPTCS 133, pp 2–7.
ICSU, ISSU (2015), Review of the Sustainable Development Goals: the science perspective.Paris, International Council of Science (ICSU).
Kibert, C. J. (1994), ‘Final Session of First International Conference of CIB TG16 on Sustainable Construction, Tampa, Florida, November.
Kirvrak, S., Ross, A. and Arslan, G. (2008), ‘Effects of Cultural Difference in Construction Projects: An Investigation among UK Construction Professionals’, International Conference on Multintina Construction Projects. Securing High Performance through Cultural awareness and dispute Avoidance. SHANGAI, CHINA.
Lundin, R. A. and Söderholm, A. (1995), “A theory of temporary organization”, Scandinavian Journal of Management 11(4), pp 437-455.
136. 137.

42nd AUBEA Conference 2018: Educating Building Professionals for the Future in the Globalised World
Martens, M.L.; Carvalho, M.M. (2017). Key factors of sustainability in project management context: A survey exploring the project managers’ perspective. International Journal of Project Management, 35, pp 1084–1102.
McGranahan, G. and Satterthwaite, D. (2000), ‘Environmental Health and Ecological Sustainability: Reconciling the Brown and Green Agendas in urban development, In: Pugh, C. (ed.) Sustainable Cities in Developing Countries, Earthscan, London.
McSween, T.E. (2003), ‘The values-based safety process: Improving your safety culture with behavior-based safety. (2rd ed.), New York, Wiley.
Misnan, M.S and Mohammed, A.H. (2007), ‘Developing a Safety Culture in the Construction Industry: a Conceptual Framework, In: Boyd, D. (Ed). Procedings of the ARCOM conference, 3-5 September, 2007, Belfast, Uk, Asociation of Construction Managers.
Myers, D. (2013), Construction Economics: A new approach (3rd ed.). New York: Routledge.Nhabinde, V, Marreugular, C. Pubisse, A., V. (2012), ‘The Challenges and the Way Frward for
the Construction Industry in Mozambique, International Grult Centre (IGC),Mozambique.
OECD (2017), ‘Working with change: Systems Approaches to Public Sector Challenges. OECD observatory of public Sector Innovation. EU.
Ofori, G. (2012), ‘The Construction Industries in Developing Countries: Strategic Review of the Book. In: Ofori, G. (Ed), New Perspectives on Construction in Developing countries. Spon, Abingdon, pp 1-15.
Ofori, G. (2015), ‘Nature of Construction Industry, Its needs and Its Development: A review of Decades of Research, Journal of Construction in Developing Countries, 20(2), pp 115–135.
Olanrewaju, A.L., and Abdul-Aziz, A-R. (2015), ‘Building Maintenance Processes andPractices: The case of a fast developing country, Science Business Media. Singapore.
PwC (2009), Corruption Prevention in the Engineering & Construction Industry, Risk and Regulation Anti-Corruption.
Schröpfer, V.L.M.; Tah, J.; Kurul, E. (2017). Mapping the knowledge flow in sustainable construction project teams using social network analysis. Engineering. Construction, Architectural Management, 24, pp 229–259.
Spang, K. and Riemann, S. (2011), A guideline for Partnership between Client and Contractor in Infrastructure Project in Germany, Management and Innovation for a Sustainable Built Environment, Amsterdam, the Netherlands.
UNSD (1992), ‘Agenda 21’, United Nations Conference on Environment and Development. Rio de Jeneiro, Brazil.
Way, C. (2015), The Millennium Development Goals Report, UN. New York.Wells, J. (2007), ‘Informality in the Construction sector in Developing Countries’, Construction
Management and Economics, 25(1), pp 87-93. Wheatcraft, L.S. (2012), ‘Thinking ahead to verification and validation. Requirements
Experiments Experiment, Training and Service for successive Projects.World Bank (1994), World Development Report 1994: Infrastructure for Development, World
Bank, Washinton, D.C. World Bank (2011), Curbing Fraud, Corruption, collusion in the road sector, Washington DC.
http://www.worldbank.org/integrity.World Economic forum (2014), The Global competitiveness report 2014-2015.
www3.worldforum.org/docs/WEF.GlabalcompetitivenessReport_2014-15.
42nd AUBEA Conference 2018: Educating Building Professionals for the Future in the Globalised World
Interactive effects of project complexity and resilient safety culture on safety performance of construction projects
Minh Tri Trinh1 and Yingbin Feng2
1&2School of Computing, Engineering and Mathematics, Western Sydney University, Locked Bag 1797, Penrith NSW, AUSTRALIA
Email: [email protected]
Abstract: The increasing complexity of construction projects renders construction organisations more vulnerable to accidents as it produces more changing and unforeseen shapes of safety risks. The concept of resilient safety culture has been therefore proposed to address the limitations of the traditional safety culture approach by responding to the changing and unforeseen safety risks associated with the unique and complex nature of construction projects. This study aims to examine the interactive effects of project complexity and resilient safety culture on safety performance of construction projects. To fulfil the research aim, a quantitative approach and a survey research design were adopted. Data were collected using questionnaires with 78 completed building projects. The structural equation modelling (SEM) technique with partial least-squares estimation (PLS) was used to analyse the data collected. The results of this study (1) supported the hypothesized negative impact of project complexity on safety performance, and (2) supported the hypothesized moderating effect of resilient safety culture on the relationship between project complexity and safety performance. The findings of this study imply that increasing project complexity levels did not automatically result in negative safety performance. The extent to which safety performance of a construction project adversely affected by project complexity, was directly related to the capabilities of its contractors and employees to manage safety risks on sites. These findings offer aframe of safety practices in order to achieve a sustained improvement of safety performance regardless of the changing complexity levels of construction projects.
Keywords:Construction, Project Complexity, Resilience, Safety Culture, Safety Performance
1 Introduction
Construction process is increasingly complex as the result of the interaction between various parts with dynamic and uncertain properties (Luo et al. 2016). The increasingly inherent complexity of project complexity has led to the changing and unforeseen shape of safety risks and poses challenges for traditional safety management approaches (Bergström et al. 2015). As a result, although there are substantial efforts on traditional approaches for achieving a high level of safety culture, the traditional safety culture approach may be ineffective to ensure a sustained improvement of safety performance in the construction environment (Trinh et al. 2018).
In light of the above, resilience engineering approach has been recognised as a solution to the lack of effectiveness of traditional approaches in responding to the changing and unforeseen safety risks associated with the increasingly complex nature of sociotechnical systems (Pęciłło 2016). Akselsson et al. (2009, p. 4) put forward to
138. 139.

42nd AUBEA Conference 2018: Educating Building Professionals for the Future in the Globalised World
define resilient safety culture as “an organisational culture that fosters safe practices for improved safety in an ultra-safe organisation striving for cost-effective safety management by stressing the resilience engineering, organisational learning and continuous improvements”. Trinh et al. (2018) discuss the concept of resilient safety culture and its application in achieving an ultra-safe organisation in the construction environment. Nevertheless, little research has been conducted to empirically examine the effects of the project complexity and resilient safety culture on safety performance of construction projects. It remained unclear whether a construction organisation with a high level of resilient safety culture sustains their safety performance improvement under the changing complexity levels of construction projects. Against this background, this study aims to examine the interactive effects of project complexity and resilient safety culture on safety performance of construction projects.
2 Literature Review
2.1 Resilient safety cultureSafety culture has been broadly acknowledged as a critical concept for improving safety performance within any construction organisation (Choudhry et al. 2007; Cooper 2000; Fang & Wu 2013; Wiegmann et al. 2004). The most widely accepted definition of safety culture was proposed from Safety of Nuclear Installations Report: “The safety culture of an organisation is the product of individual and group values, attitudes perceptions, competencies and patterns of behaviour that determine the commitment to and the style and proficiency of an organisation’s health and safety management characterised by communications founded on mutual trust, shared perceptions of the importance of safety and by confidence in the efficacy of preventive measures” (ACSNI 1993, p.23). In order to explain the concept of safety culture, triad models of safety culture could be used as a framework for measuring and examining the reciprocal interactions between psychological, behavioural and situational safety-related factors for safety performance improvement in different settings (Cooper 2000; Geller 1994).
From a resilience engineering perspective of safety management, an organisation manages safety risks proactively and creates safety via four resilience processes (or capabilities), which includes anticipating (knowing what to expect), monitoring (knowing what to look for), responding (knowing what to do), and learning (knowing what can happened) (Hollnagel 2013; Pęciłło 2016; Shirali et al. 2015). Organisational resilience is multidimensional (Akgün & Keskin 2014; Lengnick-Hall et al. 2011). A review of literature by Pillay et al. (2010) identified the three dimensions of organisational resilience, which include: (1) cognitive resilience, (2) behavioural resilience, and (3) contextual resilience.
Based on a comparison of the safety culture dimensions and organisational resilience dimensions, Trinh et al. (2018) defined resilient safety culture as an organisation’s psychological/cognitive, behavioural, and situational/contextual capabilities to “anticipate, monitor, respond and learn” in order to manage safety risks and create an ultra-safe organisation. Accordingly, the overall resilient safety culture is assessed based on the following 3 dimensions: (1) psychological/cognitive resilience; (2) contextual resilience; and (3) behavioural resilience.
42nd AUBEA Conference 2018: Educating Building Professionals for the Future in the Globalised World
2.2 Project complexityBaccarini (1996, p.202) defined project complexity as “‘consisting of many varied interrelated parts’ and can be operationalized in terms of differentiation and interdependency.”. In the definition, differentiation refers to the number of varied components of the project (tasks, specialists, subsystems, and parts), and interdependency refers to the degree of interlinkages among these components. Williams (1999)’s study indicated that the overall project complexity could be characterized by structural complexity (i.e. number of elements and interdependence of elements) and uncertainty (i.e. uncertainty in goals and uncertainty in methods). Bosch-Rekveldt et al. (2011) divided project complexity factors into three groups: technical, organisational and environmental. Technical aspect involves goals, scope, tasks and technology. Organisational aspect of project complexity includes size, resources, project team and trust. Environmental project complexity comprises external stakeholders, location and market conditions (Bosch-Rekveldt et al. 2011).
2.3 Normal accident theory and its implicationNormal Accident Theory (NAT) assumes that accidents involve the unanticipated interaction of a multitude of events in a complex system rather than as a result of a few or a number of component failures (Perrow 1994). NAT postulates that the more tightly coupled and complex a system is, the more vulnerable it is to accidents (Perrow 1994). NAT implies that the inherent changing and unforeseen shape of safety risks of construction projects is positively associated with the complexity of the project. Resilient safety culture aims to develop an ultra-safe organisation which is characterised by continuous improvements of safety performance and the capability of creating foresight, recognising and anticipating the changing shape of safety risks in the complex sociotechnical systems. The negative impact of project complexity on safety performance is therefore likely to be moderated by the resilient safety culture of the organisation. The following hypotheses are proposed:
Hypothesis 1 – Project complexity have negative impacts on safety performance of construction projects.
Hypothesis 2 – The impacts of project complexity on safety performance become weaker when there is a higher level of resilient safety culture.
Figure 1 depicts the relationships specified in Hypotheses 1 and 2.
Figure 1. Hypothesized project complexity, resilient safety culture, and safety performance relationships
Project complexity Safety performance
Resilient safety culture
H1H2
(-)
140. 141.
42nd AUBEA Conference 2018: Educating Building Professionals for the Future in the Globalised World
3 Research Methodology
MeasuresAccording to the hypotheses suggested in this study, the three major variables include and safety performance, project complexity, and resilient safety culture.
Safety performance: To measure safety performance, the formula for calculating Recordable Incident Rate (IR) is given below:
OSHA Recordable Incident Rate (Jaselskis et al. 1996):Number of OSHA recordable cases 200000
Number of employee labor hours workedIR = ×
In the formula, the 200000 employee hours worked reflects a 100-person crew working 40 hours per week for 50 weeks.
Project complexity: Bosch-Rekveldt et al.’s (2011) framework was adopted to assess a complexity level of a construction project in this study. Accordingly, project complexity level can be determined based on three dimensions (i.e. technical complexity, organisational complexity and environmental complexity).Technical project complexity was characterised by four parameters, which include: goal, scope, tasks, and technology. Organisational aspect of project complexity were characterised by four parameters, which include: size, resources, project team, and trust. The environmental aspect of project complexity were characterised by three parameters, which include: external stakeholders, location, and market conditions.
Resilient safety culture: The level of resilient safety culture is determined based on three factors: (1) psychological resilience, (2) contextual resilience, and (3) behavioural resilience. Each dimension of resilient safety culture could be evaluated using the measurable scales, which are actual safety practices implemented on construction sites reflecting all four resilience capabilities (Hollnagel 2013; Pęciłło 2016; Shirali et al. 2015). Anticipating is the capability of an orgnisation to identify the potential threats to the state of safety that should be prevented or avoided; monitoring is the capability of an organisation to check the pre-defined indicators of regular threats to see whether they change and whether they require a readiness to respond; responding is the capability of an organisation to respond to the regular and irregular threats via implementing a set of responses or via adjusting normal functions; and learning is the capability of an organisation to take lessons from experiences, in particular how to learn useful lessons from the experiences of success and failure.
Sample and data collectionA questionnaire survey was selected. The questionnaire was consequently revised and finalised based on the experts’ feedback. The research objective suggests a project’s contractor as the unit of analysis. The building construction projects in Vietnam were chosen. For each randomly selected project, a project manager was contacted via telephone or email to request their participation in this research. The questionnaire was consequently revised and finalised based on the experts’ feedback.
42nd AUBEA Conference 2018: Educating Building Professionals for the Future in the Globalised World
The questionnaire included 5 parts. The first part consists of questions about the general characteristics of the construction project. The second part requires respondents to provide information about safety performance of the project, as measured by Recordable Incident Rate. The third part consists of questions to measure the complexity level of a construction project. Respondents were required to indicate the level of their agreement on a five-point Likert scale (between 1 = “Strongly disagree” and 5 = “Strongly agree”) for each statements on the actual conditions of the project during the delivery process in their completed construction projects. The fourth part consists of questions relating to safety practices to measure resilient safety culture. Based on the actual safety practices which were implemented in their completed construction projects, respondents were required to indicate the level of their agreement on a five-point Likert scale ( between 1 = “Strongly disagree” and 5 = “Strongly agree”) for each of statements found in this part. The fifth part collects the “types of project positions” whom the respondents consulted with when they were completing the questionnaire (e.g., site manager, site safety manager, site supervisor, site safety officer).
115 project managers of 438 contacted building projects participated in this study representing a response rate of 26.2%. The information of 78 completed building projects was input into a database after excluding invalid questionnaires and outliers.
Data analysis methodStructural equation modelling (SEM) has been widely used for data analysis (Feng et al. 2017). There are two stages of SEM model including (1) measurement model which presents the relationships between those constructs and their corresponding measurement items and (2) structural model which presents the relationships between predictor and predicted constructs (Hair et al. 2016). In this research, SEM was adopted to confirm the factor structure of the main latent variables found in this study, and further determine whether or not the relationship between project complexity and safety performance is affected by resilient safety culture.
4 Results
4.1 Measurement model analysisIndicators with very low loadings (below 0.4) were eliminated from the constructs, as suggested by Hair et al. (2016). In addition, the results of convergent validity test show the measurement items are appropriate for their respective constructs. In addition, the results of discriminant validity indicate that discriminant validity is satisfactory and, that resilient safety culture and project complexity are different from each other. As a result, the confirmatory factor analysis of measurement model validates 13 measurement items of project complexity and 24 measurement items of resilient safety culture.
4.2 Structural model analysisThe relationship between project complexity and safety performance was investigated by SEM-PLS. The testing result of the model shows that project complexity has a significant positive correlation with Recordable Incident Rate (IR) ( = 0.310, t-value = 2.478, p<0.01)β . Therefore, hypothesis H1 is supported.
SEM models were then used to test whether the impact of project complexity on safety performance become weaker when there is a higher level of resilient safety culture. The results show that there are significant positive correlations between moderating effect 1
142. 143.

42nd AUBEA Conference 2018: Educating Building Professionals for the Future in the Globalised World
and IR ( = - 0.308, p<0.01)β . Figure 2 shows the variance of the simple slope for IR on project complexity at different levels of resilient safety culture. The red line indicates the relationship for an average level of the moderator variable ‘Resilient safety culture.The other two lines (blue and green) indicate the relationship between resilient safety culture and IR for smaller and greater levels of the contextual resilience (e.g. moderator variable). The blue line, which represents a low level of resilient safety culture, has steeper slope while the green line, which represents an average level of resilient safety culture, has a flatter slope. This finding indicates that higher resilient safety culture levels entail a weaker relationship between project complexity and IR. This provides empirical evidence to support the hypothesis H2. The statistical results and their implications are discussed in the next section.
Figure 2. Simple slope line in SmartPLS for IR on centered project complexity at three typical values of centered resilient safety culture
5 Discussion and Conclusion
This study examined the interactive effects of project complexity and resilient safety culture on safety performance of construction projects. The negative significant relationship between project complexity and safety performance is supported. This finding can be explained by the construction accident causation models (Haslam et al. 2005; Suraji et al. 2001), where it was found that construction project complexities fall into the category of distal factors of accident causation, produce the changing and unforeseen safety risks on sites, and thus make the construction organisations more vulnerable to accidents. Nonetheless, the negative impact of project complexity on safety performance become weaker when there is a higher level of resilient safety culture. These findings indicate that increasing project complexity levels did not automatically result in negative safety performance as measured by Recordable Incident Rate. Stronger resilient safety culture could reduce the adverse effect of project complexity on safety performance. These findings imply that the extent to which safety performance of a construction project adversely affected by project complexity, was more likely be mitigated with higher capabilities to manage safety risks as measured by
42nd AUBEA Conference 2018: Educating Building Professionals for the Future in the Globalised World
resilient safety culture levels. This finding can also be supported by Harvey et al. (2016), where it was indicated that although construction projects become increasingly complex, changing and unforeseen safety risks in the construction process are not highly unpredictable and frequent. Construction processes are therefore visible and can be understood, and thus provide construction organisations more changes to recognise potential safety issues and act appropriately (Harvey et al. 2016). Consequently, although the complex nature of construction projects tends to increase, its associated safety risks seem to be recognised and withstood by contractors in the project construction stage. This study offer construction organisations with a frame of safe practice in order to achieve a sustained improvement of safety performance regardless of the changing complexity levels of construction projects.
In the future research, it would be worthwhile to further give insights into how each dimensions of project complexity impact on safety performance. Another possible research approach can be on how different aspects of resilient safety culture impact on the relationship above. Such studies could offer understanding of how different aspect of project complexity impact on safety performance, and how organisations’ capability to management safety risks withstand the increasingly complex nature of construction projects.
6 Acknowledgement
This research is jointly supported by the Ministry of Education and Training, Vietnam and Western Sydney University (Project ID: P00022974).
7 References
ACSNI 1993, Advisory Committee on the Safety of Nuclear Installations. Third report: Organizing for safety, HSE Books, Health and Safety Commission. Sheffield, UK.
Akgün, AE & Keskin, H 2014, 'Organisational resilience capacity and firm product innovativeness and performance', International Journal of Production Research, vol. 52, no. 23, pp. 6918-37.
Baccarini, D 1996, 'The concept of project complexity: a review', International Journal of Project Management, vol. 14, no. 4, pp. 201-4.
Bergström, J, van Winsen, R & Henriqson, E 2015, 'On the rationale of resilience in the domain of safety: A literature review', Reliability Engineering & System Safety, vol. 141, pp. 131-41.
Bosch-Rekveldt, M, Jongkind, Y, Mooi, H, Bakker, H & Verbraeck, A 2011, 'Grasping project complexity in large engineering projects: The TOE (Technical, Organizational and Environmental) framework', International Journal of Project Management, vol. 29, no. 6, pp. 728-39.
Choudhry, RM, Fang, D & Mohamed, S 2007, 'The nature of safety culture: A survey of the state-of-the-art', Safety Science, vol. 45, no. 10, pp. 993-1012.
Cooper, MD 2000, 'Towards a model of safety culture', Safety Science, vol. 36, no. 2, pp. 111-36.
Fang, D & Wu, H 2013, 'Development of a Safety Culture Interaction (SCI) model for construction projects', Safety Science, vol. 57, pp. 138-49.
Feng, Y, Wu, P, Ye, G & Zhao, D 2017, 'Risk-Compensation Behaviors on Construction Sites: Demographic and Psychological Determinants', Journal of Management in Engineering,vol. 33, no. 4, p. 04017008.
Geller, ES 1994, 'Ten principles for achieving a total safety culture', Professional Safety, vol. 39, no. 9, p. 18.
Hair, JF, Hult, GTM, Ringle, CM & Sarstedt, M 2016, A primer on partial least squares structural equation modeling (PLS-SEM), Sage Publications.
144. 145.
42nd AUBEA Conference 2018: Educating Building Professionals for the Future in the Globalised World
Harvey, EJ, Waterson, P & Dainty, ARJ 2016, 'Applying HRO and resilience engineering to construction: Barriers and opportunities', Safety Science.
Haslam, RA, Hide, SA, Gibb, AGF, Gyi, DE, Pavitt, T, Atkinson, S & Duff, AR 2005, 'Contributing factors in construction accidents', Applied ergonomics, vol. 36, no. 4, pp. 401-15.
Hollnagel, E 2013, Resilience engineering in practice: A guidebook, Ashgate Publishing, Ltd.Jaselskis, EJ, Anderson, SD & Russell, JS 1996, 'Strategies for achieving excellence in
construction safety performance', Journal of Construction Engineering and Management,vol. 122, no. 1, pp. 61-70.
Lengnick-Hall, CA, Beck, TE & Lengnick-Hall, ML 2011, 'Developing a capacity for organizational resilience through strategic human resource management', Human Resource Management Review, vol. 21, no. 3, pp. 243-55.
Luo, L, He, Q, Xie, J, Yang, D & Wu, G 2016, 'Investigating the Relationship between Project Complexity and Success in Complex Construction Projects', Journal of Management in Engineering, vol. 33, no. 2, p. 04016036.
Pęciłło, M 2016, 'The resilience engineering concept in enterprises with and without occupational safety and health management systems', Safety Science, vol. 82, pp. 190-8.
Perrow, C 1994, 'The limits of safety: the enhancement of a theory of accidents', Journal of Contingencies and Crisis Management, vol. 2, no. 4, pp. 212-20.
Pillay, M, Borys, D, Else, D & Tuck, M 2010, 'Safety Culture and Resilience Engineering –Exploring Theory and Application in Improving Gold Mining Safety Executive', paper presented to Gravity Gold Conference, Ballarat, Vic.
Shirali, GHA, Motamedzade, M, Mohammadfam, I, Ebrahimipour, V & Moghimbeigi, A 2015, 'Assessment of resilience engineering factors based on system properties in a process industry', Cognition, Technology & Work, vol. 18, no. 1, pp. 19-31.
Suraji, A, Duff, AR & Peckitt, SJ 2001, 'Development of causal model of construction accident causation', Journal of Construction Engineering and Management, vol. 127, no. 4, pp. 337-44.
Trinh, MT, Feng, Y & Jin, X 2018, 'Conceptual Model for Developing Resilient Safety Culture in the Construction Environment', Journal of Construction Engineering and Management,vol. 144, no. 7, p. 06018003.
Wiegmann, DA, Zhang, H, von Thaden, TL, Sharma, G & Gibbons, AM 2004, 'Safety Culture: An Integrative Review', The International Journal of Aviation Psychology, vol. 14, no. 2, pp. 117-34.
Williams, TM 1999, 'The need for new paradigms for complex projects', International Journal of Project Management, vol. 17, no. 5, pp. 269-73.
42nd AUBEA Conference 2018: Educating Building Professionals for the Future in the Globalised World
Revisiting challenges inherent to multicultural construction projects using input from field professionals
Thi Ly Vu1, Payam Rahnamayiezekavat2, Sungkon Moon3,Sherif Mostafa4 and Swapan Saha5
1School of Design and the Built Environment, Curtin University, Perth, 6084, WA, AUSTRALIA
2&5School of Computing, Engineering and Mathematics,Western Sydney University, Sydney, 2116, NSW, AUSTRALIA
3School of Engineering, Swinburne University of Technology,Melbourne, 3122, Victoria, AUSTRALIA
4 School of Engineering and Built Environment,Griffith University, Gold Coast, 4215, Queensland, AUSTRALIA
E-mails: [email protected]; [email protected];[email protected]; [email protected]; [email protected]
Abstract: The cross-cultural communication in construction projects is beyond just a barrier to the circulation of information. Accordingly, this research endeavours at isolating the multicultural challenges encountered in construction projects and mapping those surfaced challenges to different aspects of project performance. Unlike the previous studies which examined cultural differences from the perspective of team dynamics, this research emphasises on the implication of such differences regarding the successful execution of construction processes. Specifically, this research intended to highlight the mechanism through which cultural challenges potentially compromise the satisfactory delivery of projects by causing a quality defect, safety breach, logistics failure, contractual conflict and ineffective workforce training. To achieve the research aim, the study was scoped at the process/operational (construction site) level of a constructionproject. The research employed qualitative data approach by interviewing 15 construction professionals experiencing difficulties to be fully integrated into the workplace while working in a multicultural environment. To highlight the scale of ethnic diversity in projects being studied, the research team was able to document particpants opinions who had collectively interacted with colleagues from 16 different nationalities. The results revealed that while interviewees strongly acknowledge the fact that cultural inconsistencies deteriorate relationships on-site, they articulated that high performance is reinstated after those differences are understood and addressed. This finding urges the need for the development of more effective cultural acclimatisation programs which according to data collected in this study was missing in 11 out of 15 reviewed cases.
Keywords:Construction projects, Cross-cultural communication, Field professionals, Multicultural challenges, Project performance
146. 147.

42nd AUBEA Conference 2018: Educating Building Professionals for the Future in the Globalised World
1 Introduction
In response to the globalisation, the construction industry has gradually reshaped its project delivery framework to be more agile in terms of covering more geographical locations. Comes with this desire the need for project management team to quickly adapt to the local business environment and accommodate multinational labour force. However, development of a structured interaction between project personnel representing different cultures introduced a new management challenge that was less of a concern to project managers in conventional domestic projects. Despite this trend, the lack of cross-cultural research in the context of the construction industry has been noticed by several researches (Ofori and Toor, 2009; Giritli et al., 2013; Pheng and Leong, 2000). Accordingly, this study is an endeavour to understand the dynamics caused by cultural clashes in one-of-a-kind context of construction projects. In tandem with research works investigating the element of culture in construction (Kim et al., 2015; Cheah et al., 2006; Makilouko, 2004), interview was deployed to capture factors that specifically affect multi-cultural project teams. Note must be taken that this study is not intended to benchmark effectiveness of multicultural delivery teams against their domestic counterparts, but this research is an attempt to surface requirements of effective performance in a multinational construction environment. It is envisaged that the outcome of this study is of value to project managers in charge of multicultural teams, policy makers favouring streamlined mobility of global workforce, and of course to developers of induction programs to acclimatise newcomers.
2 Cultural Diversity in Construction Projects
Wysocki (2007) has precisely highlighted that the integrated fabric that defines a project is “a sequence of unique, complex, and connected activities”. Cultural inconsistencies, on the other hand, interrupt the required connectedness in a project environment. Not surprisingly, Pinto (2007) indicates that project management “involves administration of technology, people, culture and stakeholders”. Barczak et al. (2006) do not limit the cultural differences to language and nationality but go further to discuss affiliation to different firms as an issue of a cultural mismatch. Such disparities eventually result in contradictory expectations about how to handle a relationship with colleagues and making decisions (Maznevski and Di Stefano, 2000). If the common ground is not established among project team, mutual trust gradually deteriorates as misunderstanding accumulates (Aarseth et al., 2014). It is evident that trust is the backbone of a successful cross-cultural leadership (Grisham and Walker, 2008). Studies like the one of Kealey et al. (2006) discuss the lack of trust as a cause of “cultural friction”. They continue that mismanagement of international projects may result in political situation where expatriates overlook the views and experience of local personnel representing the majority. Elaborating on the issue of overlooking, Edward and Price (2009) explain that project managers from various countries respond differently to the same strategic issue mainly because of the distinction in their perception of opportunities and threats associated with multicultural projects. Inconsistent perception across project team exacerbated by cultural norms and peer pressure jeopardises project performance by compromising the ability of personnel to attain a healthy work-life balance (Turner et al., 2009).
Withholding team spirit is recommended by Jaeger and Adair (2013) to be the answer to abovementioned challenges of multicultural projects. Accordingly, Jiang and Pretorius (2011) investigated the impact of cultural differences on team building capacity. As a key enabling step towards team spirit, Muller and Turner (2007) emphasise the
42nd AUBEA Conference 2018: Educating Building Professionals for the Future in the Globalised World
importance of training the project team about the local culture of the region hosting the project. Of course, communication is also pivotal to the establishment of team spirit for better cultural assimilation in international construction projects (Khan, 2014). It is widely accepted that communication malfunctions hinder achieving project’s targets. Therefore, to ensure a robust information exchange among teams, cultural bias should be considered to avoid filtration or distortion of the message being sent (Angeleanu et al., 2016). Leadership in a multicultural environment of a project requires a profound understanding of existing cultural belief and working behaviour (Ochieng et al., 2013). The extent of the training crucial for expatriate workforce covers basic skills such as living in a foreign culture up to professional interaction with local colleagues (Kealy et al., 2006).
3 Research Methodology
Interviews with construction professionals who accepted research team’s invitation were carried out to extract the list of most paralysing attributes of multicultural construction worksite. The interview questions were designed in a way to accustom the interviewee to the context of the research by firstly asking their opinion about the three repeatedly mentioned performance barriers in multinational projects being a) language; b) different cultural norms; and c) interaction with local authorities. It is interesting that when participants were asked to rank barriers determined through the course of the interview (i.e. abovementioned three plus those identified by the interviewee), all of them placed the barriers provided by the research team at the top of the list in the sameorder. In particular, interview questions were designed to enrich the list of challenges prevalent to multicultural projects and to explore the impact of those difficulties on the interviewee’s work, strategies adopted to moderate the negative consequences, and interviewee’s assessment regarding the effectiveness of the deployed resolutions.Interview questions are provided in Appendix A.
3.1 Interview ParticipantsDue to the geographical dependence of accessible projects, 80% of interviewees were Vietnamese joining two Australians and one with an Irish background. It is noted that the eligibility criteria applied to invite participants were either possession of work experience in multicultural construction projects delivered in a foreign country or record of interaction with co-workers who came from a different cultural background. As such, participants collectively named 16 different nationalities with whom they interacted in a contractual capacity. The list of nationalities includes Vietnamese, Chinese, German, Australian, Indian, British, Indonesian, Brazilian, Korean, Filipino, Mongolian, Zambian, Malian, French, Japanese and American. The data for this research was collected through 15 interviews with industry professionals, and their attributes are provided in Table 1.
148. 149.

42nd AUBEA Conference 2018: Educating Building Professionals for the Future in the Globalised World
Table 1. Attributes of 15 invited Interview participants
Interview Participant Nationality Industry work profile
IP1 Vietnamese• Experienced Engineering Manager • Vice Project Director at some thermal power plant projects in
Vietnam.IP2 Vietnamese • Experienced Project Leader
IP3 Vietnamese • Working as an Engineer• Project manager at a Thermal Power Plant project
IP4 Vietnamese • Experienced construction contractor at big supermarket and a thermos power plant project
IP5 Vietnamese • Worked as a construction coordinator at a processing plant project.
IP6 Vietnamese • Had experience in working at Hydropower plant and a processing plant project in Vietnam.
IP7 Australian• Worked as project engineer and mechanical engineer at
construction project for processing plant in Mongolia, Zambia and Indonesia.
IP8 Australian
• 10 years of experience working on a construction project in Indonesia in the mining industry, ranging from construction superintendent to project manager.
• Experienced work in Mali, Africa as well.
IP9 Irish • Worked as project development manager and provide construction supervision in a Nickel processing plant construction project.
IP10 Vietnamese• Worked as Project Assistant for an Expressway Project in Vietnam
for 4 years with members coming from Spain, Korea, Philippines, China and Vietnam.
IP11 Australian • Have experience working in Brazil, England and Indonesia as construction manager at a Mineral processing plant.
IP12 Vietnamese
• Worked on some construction projects operated in China as a mechanical consultant.
• Had experience in thermos power and oil refinery projects performed in Vietnam.
IP13 Vietnamese • Worked as a Civil engineer in a thermos-power project in Vietnam with members coming from America, England and Vietnam.
IP14 Vietnamese• Experienced work in thermos power projects in Vietnam with
project team members coming from China, America, Rumania, Finland, England and Vietnam.
IP15 Vietnamese
• Experienced working on construction projects for water processing plant, bridges, thermos power plant where directly work with team members coming from America, China, France, Denmark, Philippines, Japan, Germany and Vietnam.
4 Findings and Discussion
Substantial evidence emerged from collected data affirming the significance of three commonly perceived barriers being a) having team members speaking different native languages, b) practising different cultural etiquettes, and c) difficulty in working with local authorities. Emphasising the significance of verbal communication, IP2 calls misunderstanding as “the biggest hindrance to the work.” Interestingly, sketches or written notes were often mentioned by the participants as effective tools to remove misunderstanding. Confirming the adverse consequences of the existing clashes of cultural norms, IP6 echoes almost all other participants in saying that it “affects working manner, life style, and problem solving.” Berating the third most commonly mentioned barrier, IP3 explains his ongoing confusion with the process of completing paperwork, getting approvals and resolving issues. IP 4 adds to this list conflicts with local authorises in regard to recruitment, compensation and security.
42nd AUBEA Conference 2018: Educating Building Professionals for the Future in the Globalised World
Furthermore, other themes were identified in the data corpus troubling cooperation in multicultural project environments. Challenges surfaced after interrogating the collected data include a) mismatched perception of quality, b) clashing skillset, c) conflicting hazard sensitivity, and d) settling in community embracing the project. We look at each one of developed themes in order.
4.1 Mismatched perception of qualityBesides the requirements to adopt local technical standards, cultural clashes arise relating to the definition of quality. IP12 stated that “quality standards of each country are different so when they gather in one project each of them does not have either knowledge or experience working with those different ones.” In three occasions, quality was recognised as the centre of the conflict. Firstly, high expectation of team lead is not matched by the field personnel. In this regard, IP8 claimed that “the main challenge was the technical standards being far less than what we expected.” Secondly, site crew delivering higher quality except for appreciation that they never receive. IP9 explained a situation where the difference in understanding of quality escalated to a sore relationship between a supervisor and a hand. He mentioned that “We had to fly more of own personnel [to the project] to closely manage and control work in field.” Thirdly, unnecessary friction may not be associated with a technical defect but the mismatching of understating what is meant by a specification as simple as the shade of white to apply to the wall. IP7 indicated that situation gets worse if “due to different costumes, it is not easy to identify the co-worker is upset [about the quality]. As such, the issues are not dealt with and can escalate.” This observation coincides with the viewpoint that multiculturalism brings into projects various perspectives regarding technical aspects (Barzak et al., 2006). It was highlighted in the interviews that there should be mutually agreed quality and technical standards to apply to the project and to have a mechanismin place to bond all parties involved in the project to these unified standards.
4.2 Clashing skillsetUsing the analogy of driving a vehicle, the skill of controlling a car and compliance with traffic rules may be implemented differently in different traffic settings. Besides the difficulty in finding skilled workers, the Interview participants pointed to the issue of assembling a harmonised team of professionals. The clash of skillset manifests itself by what IP 8 referred to as the need for “continuous instruction and management at the lower level.” From the lean perspective, this extra “micro-management” is a source ofwaste. The participants rooted these incompatible skillsets, as indicated by IP10, to the ‘training’. They believed that differences in education system bring about this challenge to the project. For instance, interviewees who worked on projects performed in Vietnam stated that local staffs are more focused on theory rather than practical skills. Even hands-on workers such as welders and fitters did not possess a valid certificate to prove their ability to perform quality work despite the fact that they were competent in the job. The project management had to locate a training program and send them to an accredited assessment centre to obtain a qualified certificate. To connect skilled workers on site, IP14 suggested developing project culture training similar to induction programs to company culture. The participant particularly emphasised the danger of deploying an unsustainable solution of importing the entire team of professionals. Not only this solution may violate the domestic policies on the ratio of local to the expatriateworkforce, but it also imposes the risk of delay associated with acquiring work permits. Another fundamental issue with a full team of expatriates highlighted to be the replacement strategy specially when they take leave to travel to their home country. It is worth to mention that analysis of interviews reflects that difficulty in working with local authorities was mostly related to policy enforcement other than disagreement on
150. 151.

42nd AUBEA Conference 2018: Educating Building Professionals for the Future in the Globalised World
engineering design and technical specification. Some areas named by the participants included access and transportation license, permits, costs, employment conditions, tariffs and royalties.
4.3 Conflicting hazard sensitivityConflicting safety vision is another component found to contribute to the challenging environment of a multicultural construction project. The interview participants elaborated the differences of risk-taking behaviour in different cultures by the means of examples such as crane lifts, site evacuation plan, hazards to environment, site security, responsibility in respect to others, working style and professional conduct on site, and even discussions on use of turbans in lieu of standard hardhat as such practice was actually permitted in England. Again, the participants, unequivocally, suggested the need for comprehensive safety training tailored to the type of project. The overlook of conflicting hazard sensitivity may result in “desensitization” of the mixed cohort and eventually give rise to a catastrophic incident. The opposite of such an undesirable phenomenon has been experimentally proved where only exposure to first aid training improved safety performance in terms of working at height (Lingard, 2002). Likewise, if contradictory risk-taking behaviours linked to multiple cultures present on site is not dealt with properly, the unsafe behaviour of co-workers may diminish hazard sensitivity in those who are placed in a less sensitive ecosystem.
4.4 Settling in the host communityAnother challenge nested in cultural incongruity found to impact the workforce beyond the boundaries of the site was settlement in the community surrounding the project specifically in remote and isolated projects. As a matter of work-life balance, struggle to establish normal lifestyle will act as an external stressor degrading the effectiveness of the working force at the work-front. An indicator of such source of friction was referred to by IP1 concerning lack of trust in the correctness of the service provided by the translators. Difficulties in bonding with translators whose service is based on an understanding of the client’s needs alarms the high likelihood of broken relationship with the broader community. Another example provided in the interviews was indifference of expatriate professionals to swearing while the local community perceived the frequent use of swearing offensive. On the other hand, local accepted conduct might cause anxiety where those conducts are against norms of another culture such as prevalent bribery for everyday activities like clearing luggage from custom or validating driver’s licence. Another case was about temporary shutdowns for cultural ceremonies and duties. The interview participants mostly believed that this issue is the most straightforward one to resolve but also reminded the need to educate the workforceabout the community that embraces the project. IP6 correctly pinpointed the effectiveness of “programs to connect project and the local community.” In the same line of thought, IP12 underlined that in a multicultural construction project, “information about the host country should be achieved before the project starts.”
5 Conclusion and Further Research
This manuscript reported challenges in multicultural construction projects where building professionals with different cultural belief and working behaviour team up to accomplish construction tasks. Lack of harmony, if not managed effectively, results in chaos on-site manifested as poor performance. The steppingstone to effective management is to understand the latent challenges inherent to projects employing multicultural teams. In other words, this work was an attempt to delve into the issue of
42nd AUBEA Conference 2018: Educating Building Professionals for the Future in the Globalised World
cultural complexity and its influence on team performance and success. Fifteen interviews with professionals who currently work in the industry confirmed the existence of three commonly accepted challenges of a) diverse languages, b) different cultural norms, and c) difficulty in working with local authorities. On top of them, major challenges at field discovered to arise from a) mismatched perception of quality, b) clashing skillset, c) conflicting hazard sensitivity, and d) settling in community embracing the project. The key message extracted from the interviews was the general agreement on manageability of cultural diversity on site in a manner that once mutual understating is achieved among project team, cultural differences no longer hinder performance. In the light of findings of this work, further research is required to develop an overarching cultural acclimatisation program to assure challenges identified in this paper are addressed before engagement of the site personnel in construction activities.
6 References
Aarseth, W., Rolstadås, A. and Andersen, B. (2014), ‘Managing Organizational Challenges in Global Projects’, International Journal of Managing Projects in Business, 7 (1), pp 103-132.
Angeleanu, A., Keppler, T. and Eidenmüller, T. (2016), ‘Effective Stakeholder Management in International Supply Chain Projects’, In: International Conference on Management, Leadership and Governance, Academic Conferences and publishing limited, 4-6 April 2016, pp 9.
Barczak, G., McDonough, E.F. and Athanassiou, N. (2006), ‘So You Want to Be A Global Project Leader?’, Research Technology Management, 49 (3), pp 28-35.
Cheah, Y.J.C., Chew, A.S.D. and Huang, J. (2006), ‘Marketing Foreign Interior Design Services in China’, Building Research & Information, 34 (6), pp 584–595.
Edward, G.O. and Price, A.D. (2009), ‘Framework for Managing Multicultural Project Teams’, Engineering, Construction and Architectural Management, 16 (6), pp 527-543.
Grisham, T. and Walker, D. (2008), ‘Cross-cultural leadership’, International Journal of Managing Projects in Business, 1 (3), pp 439-445.
Giritli, H., Öney-Yazıcı, E., Topçu-Oraz, G. and Acar E. (2013), ‘The Interplay between Leadership and Organizational Culture in the Turkish Construction Sector’, International Journal of Project Management, 31 (2), pp 228-238.
Jaeger, M. and Adair, D. (2013), ‘Cross Cultural Construction Project Management in The GCC Countries: A Local Perspective on Western Project Parties’, International Journal of Construction Project Management, 5 (1): pp 67-83.
Jiang, D. and Pretorius, L. (2011), ‘Cross-Cultural Communication Behavior in International Engineering Projects: Chinese And South African Perspectives’, South African Journal of Industrial Engineering, 22 (2): pp 54-67.
Kealey, D.J., Protheroe, D.R., MacDonald, D. and Vulpe, T. (2006), ‘International Projects: Some Lessons on Avoiding Failure and Maximizing Success’, Performance Improvement,45 (3), pp 38-46.
Khan, A.U. (2014), ‘Effects of Cultural Assimilation on The Performance of a Construction Project–Evidence From UAE’, Benchmarking: An International Journal, 21 (3), pp 430-449.
Kim, S., Kim, J.D., Shin, Y. and Kim, G.H. (2015), ‘Cultural Differences in Motivation Factors Influencing the Management of Foreign Laborers in the Korean Construction Industry’, International Journal of Project Management, 33 (7), pp 1534-1547.
Lingard, H. (2010), ‘The Effect of First Aid Training on Australian Construction Workers' Occupational Health and Safety Knowledge and Motivation to Avoid Work-Related Injury or Illness’, Construction Management and Economics, 20 (3), pp 263-273.
Ma¨kilouko, M. (2004), ‘Coping with Multicultural Projects: The Leadership Styles of Finnish Project Managers’, International Journal of Project Management, 22 (5), pp 223–333.
152. 153.
42nd AUBEA Conference 2018: Educating Building Professionals for the Future in the Globalised World
Maznevski, M.L. and DiStefano, J.J. (2000), ‘Global Leaders Are Team Players: Developing Global Leaders Through Membership on Global Teams’, Human Resource Management, 39(2), pp 195-208.
Müller, R. and Turner, R., (2007), ‘The Influence of Project Managers on Project Success Criteria and Project Success by Type of Project’, European Management Journal, 25 (4), pp 298-309.
Ochieng, E.G., Price, A.D.F., Ruan, X., Egbu, C.O. and Moore. D. (2013), ‘The Effect of Cross-Cultural Uncertainty and Complexity within Multicultural Construction Teams’, Engineering, Construction and Architectural Management, 20 (3), pp 307-324.
Ofori, G. and Toor, S.U.R. (2009), ‘Research on Cross‐Cultural Leadership and Management in Construction: A Review and Directions for Future Research’, Construction Management and Economics, 27 (2), pp 119-133.
Pheng, L.S. and Leong, C.H.Y. (2000), ‘Cross-Cultural Project Management for International Construction in China’, International Journal of Project Management, 18 (5), pp 307-316.
Pinto, J.K. (2007), Project management: Achieving competitive advantage, Pearson/Prentice Hall, Upper Saddle River, NJ, USA.
Turner, M., Lingard, H. and Francis, V., (2009), ‘Work-Life Balance: An Exploratory Study Of Supports And Barriers In A Construction Project’, International Journal of Managing Projects in Business, 2 (1), pp 94-111.
Wysocki, R.K. (2007), Effective Project management: Traditional, agile, extreme, Wiley, Indianapolis, IN.
Appendix A - Interview Questions1. Have you ever worked or managed a project conducted in a foreign country? If yes, could you please specify what country, what kind of project (construction, education, health care…) and what was your position?
2. Have you ever worked or managed a project with members hold different nationality or come from different cultures? If yes, could you please specify what nationality, what kind of project (construction, education, health care…) and what your position was?
3. What troubles/problems did you experience coming from having project members speaking different languages? What did you do to solve the problems? And what should have done better to solve those in your opinion?
4. How did the difference between that/those countries background to your culture background affect your project work?
5. During the project time, what difficulties come from that/those countries’ authority behaviour? How were those difficulties with the authority solved?
6. Apart from the above mentioned challenges, what other challenges you experienced? (For example training for staffs, industrial standards, education…)
7. Was there any stakeholder engagement program ran in your project? How do you evaluate effect of this/these program(s)?
8. Out of all the above mentioned challenges (different languages speaking members, cultural background, authority in a foreign country and other challenges you specify) in your opinion, can you please rank them in term of difficulty to deal with? (Which one is the toughest one to deal with? Which one is less difficult to deal with and why?
9. In your opinion, which challenge should be put in as first priority to deal with when working in a multicultural project? Why?
10. Have you ever attended any workshop or received any training on multiculturalism or multicultural working environment?
154. 155.

42nd AUBEA Conference 2018: Educating Building Professionals for the Future in the Globalised World
The importance of environmental sustainability to obtain finance for port developments in Australia and Indonesia
Haya ALDaghlas1, Felix Hui2, Colin Duffield3
12&3School of Engineering, The University of Melbourne, Parkville 3010, Victoria, AUSTRALIA
E-mails: [email protected]; [email protected]; [email protected]
Abstract: Major ports in Australia and Indonesia that adjoin major cities seek private finance to support capital investments. Competition for both local and international investors is high, and while there is significant interest as financiers seek to diversify their portfolio,there are also concerns regarding the long-term sustainability of investments due to environmental legacies associated with many ports. Potential sources of pollution include water, air, and soil. In the meantime. Environmental expectations from investors, like the World Bank, generally have conditions imposed on loan agreements dictating their environmental sustainability expectations. This study examines the importance of environmental sustainability to obtain finance for port developments and deduces thatrequired upskilling of port organisations if finance is to be secured for new developments. Having undertaken a critical review of the literature, the study reports the findings of a detailed questionnaire of government officials, financiers and operators associated with ports in Australia and Indonesia. Findings from this research propose that the port industry should invest more in educating port internal and external stakeholders on the importance of environmental sustainability to port development and daily operations. Not only to be able to attract more private finance to port development projects but also to ensure that the environmental regulations are being well understood and implemented.
Keywords: Environmental Sustainability, Internal Finance, International Finance, Ports.
1 Introduction
Seaports are considered potential sources of pollution that includes water, air, and soil.As a result, achieving environmental sustainability in port is of great concern not only forrelevant authorities but also policy-makers, and the general public (Acciaro et al., 2014).With several stakeholders associated with the port industry, port authority and government are recommended to work together to design and select policies not only aiming at enhancing the environment but also at having a positive social impact (Jong-Kyun Woo et al., 2018).
While the majority of the research literature focuses on interests of the main stakeholders of the port such as the port authorities, governments, policy maker, and the localcommunity, there is not much said about private investors in ports. This is important as the latest trend in finance options involve transferring the port ownership from the government to the public sector (Chen et al., 2017)This research investigates the importance of environmental sustainability to obtain finance for port developments in Australia and Indonesia.This paper presents the findings of an online questionnaire of government officials, financiers and operators associated with ports in Australia and Indonesia, to indicate the
156. 157.
42nd AUBEA Conference 2018: Educating Building Professionals for the Future in the Globalised World
importance of environmental sustainability in port development projects. To investigate the importance of the role of environmental sustainability to obtain finance for port developments in Australia and Indonesia, an online survey was used to surveygovernment officials, financiers and operators associated with ports in Australia and Indonesia.
The survey results show most of the respondents considered environmental sustainability as important in attracting both international and local finance, as well as the overall importance of port performance sustainability. As the research is at the initial stages, the survey results combined with the existing literature can lead the way to the next step. An in-depth investigation on how the involvement of private investors reflect on the importance of environmental sustainability, what measures are in place to ensure the investor’s awareness and commitment to the environment, and how to ensure that the environmental practices are not only in place but also are being followed.
2 Literature Review
2.1 Commercial outcomes and Environmental awarenessIn a study conducted to examine the factors that drive company investments in green innovation by (Saunila et al., 2017) it was found that there is a positive correlation between the decision to invest in green innovation and the company values towards a wide range of sustainability dimensions. Nevertheless; it is not only the company values that impact investment decision but more importantly is the people who actually make the decisions and sign the paperwork.Finance executives who choose to take an outstanding role in sustainability triple bottom line, they need to include sustainability in their costing scheme, investment decisions, and in the reward and performance measures (CFO, 2008). Siegel (2009) argues that companies must practice green management only when it is in the interest of the company and its shareholders and not only from a moral, social perspective. In addition, Siegel states that companies should be sceptical about management decision allocating resources for environmental and social responsibility without a logical returnon investment to ultimately maximise the company wealth. Consistent with the quantitative study conducted by (Besley and Ghatak, 2007) which shows that companies engaged with environmental groups will earn lower profits, but at the same time companies that gain reputation in support of good actions may earn higher profits.
The debate whether investing in sustainability contradicts with firms goal of maximisingprofits seems to be settled in the new framework proposed by (Schoenmaker, 2017) for sustainable finance. Schoenmaker argues that the traditional model of maximising profit for shareholders has a short-term prospect. Whereas the new framework suggests looking at a stakeholder approach that aims to create stability in the Triple Bottom Line is more long-term focused.
In Australia, the Responsible Investment Association Australasia (RIAA) is a peak industry body that represents investors in Australia and New Zealand who choose an ethically responsible approach in their investments, including sustainability-themedinvesting. In 2017 the RIAA announced that responsible Australian investments areoutperforming mainstream investments due to the growing market towards responsible investment (RIAA, 2017).

42nd AUBEA Conference 2018: Educating Building Professionals for the Future in the Globalised World
2.2 Environmental Sustainably in PortsSeaports are considered potential sources of pollution that includes water, air, and soil.As a result, achieving environmental sustainability in port is of great concern not only for relevant authorities but also policy-makers, and the general public (Acciaro et al., 2014).With several stakeholders associated with the port industry, port authority and government are recommended to work together to design and select policies not only aiming at enhancing the environment but also at having a positive social impact (Jong-Kyun Woo et al., 2018). Assunta Di Vaio and Luisa Varriale (2018) agree that effective implementation of environmental regulations requires the involvement of the various stakeholders of the port. In facilitating environmental advancement port authorities should act in favour of the wider community beyond the organisation boundaries (René Taudal Poulsen et al., 2018).
While the literature is focusing on the main stakeholders of the port being port authorities, government and policy maker, and the local community. Which is true in the case of government-owned ports, however, there is not much said about private investors in ports, following the latest trend in transferring port ownership from the government to the public sector.
In Indonesia, ports are owned by the government and operated by a state-owned enterprise with the exception of Port of Tanjung Perak in Surabaya. The Port of Tanjung Perak is operated by Pelindo III a state-owned port with 51% of the share, and DP World limited which owns 49% shares. However; in Australia, several city and regional ports are being leased under the asset recycling model since the early 90s. The state governments in Australia are using this model to free capital from public asset and re-invest in other infrastructure projects (Chen et al., 2017). Under the asset recycling model, the port is leased through a long-term lease to the private sector, while the private owner becomes the landlord and the operator of the port, the government remains the regulator and maintains the right of land after the end of the lease. Australia has been attracting both private local and international investors to invest in Australian ports (Chen et al., 2017).
It can be seen from Table 1 that port investment is attracting several financing firms such as fund management, superannuation, Investment Corporation and others. With this diverse background of investors now acting as a landlord of critical infrastructure, this study aims at investigating the importance of environmental sustainability to obtain finance for port developments.
Table 1: The transaction details and investors in three major city ports. Source: Authors.
Port State Duration of the Lease
Year of the lease
Investors
Port of Brisbane Queensland 99-year 2010 • Global Infrastructure Partners (GIP) 27% until 2013.Caisse de dépôt et placement du Québec 2013- Present
• Queensland Investment Corporation (QIC) 27%
• Industry Funds Management (IFM) 27%
• Tawreed 19%
42nd AUBEA Conference 2018: Educating Building Professionals for the Future in the Globalised World
Port of Botany and Port Kembla
New South Wales
99-year 2013 • Industry Funds Management (IFM) 45%
• Australian Super 20%• Tawreed 20%• Qsuper15%
Port of Melbourne Victoria 50-year 2016 • Global Infrastructure Partners (GIP) 40% (GIP, China Investment Corporation CIC, Korea’s National Pension Service NPS)
• OMERS 20%• Future Fund 20%• Queensland Investment Corporation
(QIC) 20%
3 Research Strategy
In order to explore the importance of environmental sustainability to obtain finance for port developments in Australia and Indonesia. The researchers designed an onlinequestionnaire of government officials, financiers and operators associated with ports in Australia and Indonesia. Surveys can be used to explore aspects of a situation (Kelley et al., 2003), as this research is at early stages results from the survey can be used to direct the way to a qualitative study to investigate this topic in depth and produce theoretical insight such as using case study approach, the case study approach generates theoretical insights from evidence-based practice, which helps in exploring a phenomenon (Wu and Choi, 2005). This research was conducted in accordance with the Engineering Human Ethics Advisory Group guidelines at the University of Melbourne and had research ethics approval.
A total of 373 questionnaires were dispatched via e-mail in Australia. Participants from government organizations, financing entities and operators associated with ports in Australia were e-mailed the questionnaire either directly or via organisation contactperson, the participants were asked to reflect on their individual experience, 65 and 88 respondents returned the questionnaires in Australia and Indonesia respectively, theseresponses were de-identified and used in the analysis representing 17.4% response rate in Australia, the response rate in Indonesia cannot be measured as the majority of questionnaires were dispatch via relevant organisations to their employees.
This investigation is part of a larger research project that examines the Efficient Facilitation of Major Infrastructure Projects – Port Planning and Development. The following results only reports the response to Port Sustainability questions under funding and finance section. While 65 and 88 respondents returned the questionnaires, only 34 and 33 participants in Australia and Indonesia respectively attended the Port Sustainability questions.
The low response rate presents one of the methodological challenges in using web surveys as it attracts lower response rate compared to other surveying methods (Kaplowitz et al.,2012). The low response rate can be due to security and privacy concerns associated with the internet thus the respondent might become worried about sharing their data via the internet (Manfreda et al., 2008). However, there are several other factors that can impact the response rate to a web survey such as Invitation Mode, Invitation Length, Survey efforts (Completion Time), and Subject line (Kaplowitz et al., 2012).
158. 159.

42nd AUBEA Conference 2018: Educating Building Professionals for the Future in the Globalised World
The participants have extensive experience in ports with an average of 20 years of experience in Australian Ports, and an average of 9 years of experience in Indonesian Ports. This extensive experience indicates the participants’ creditability and their responses can present an indication of the industry’s view in Australia and Indonesia. The respondents’ profile is shown in Figure 1 and Figure 2.
In the questionnaire, the participants were asked the following questions to indicate the importance of environmental sustainability in port development projects.Their responses are recorded using a five-point Likert scale ranging from Not at all important, to Very important
1. How important is environmental sustainability in obtaining international finance for port development?
2. How important is environmental sustainability in obtaining internal finance for port development?
3. How important is the environmental performance to your port?
4 Survey Results and Discussion
9%
12%
9%
9%
32%
18%
6%6%
Australian Respondents
Consultant
Policy
Port management
Engineering/project management
Terminal & transport operation
State Owned Enterprise
Government
Others
Figure 1: The Australian Survey respondents’ profile
42nd AUBEA Conference 2018: Educating Building Professionals for the Future in the Globalised World
A total of 34 respondents in Australia and 33 respondents in Indonesia responded to the port sustainability questions. The respondents’ profile is shown in Figure 1 and Figure 2
4.1 The importance of environmental sustainability in obtaining financeIn questions one and two the respondents were asked to rate the importance of environmental sustainability in obtaining both international and internal finance. Investing in port infrastructure attracts both international and internal (domestic) institutional investors. Table 1 reflects the diverse shareholder's structure in Australian ports, including sovereignty fund and private equity funds (PEFs). PEFs are mainly superannuation funds and infrastructure investment funds, who consider ports as mature assets with high returns (Chen et al., 2017).
Figure 3 and Figure 4 show the responses to question one and two in Australia and Indonesia respectively; the most frequently occurring responses indicate that environmental sustainability is important in obtaining both internal and international finance for port development. With more respondents think that environmental sustainability is more important in obtaining international finance rather than internal finance. Whereas there is slightly more response indicating that environmental sustainability is very important in internal finance.
In Australia, the top category who responded as important is from Policy, whereas Consultant and Engineering/Project Management were the top categories who responded as very important. This indicates the commitment to environmental frameworks by these categories; this could also be because they are not the owner neither the investors in this case, therefore their decision is not commercially focused.
However; the responses that indicated environmental sustainability as not important or neutral are substantial and cannot be ignored, most of the respondents are from port management and terminal operators both in Australia and Indonesia. This may reflect a low level of awareness of existing environmental frameworks in both countries that
15%
3%
36%
6%
18%
18%
3%
Indonesian Respondents
Consultant
Policy
State-owned Company
Custom
Terminal & Transport Operation
Government
Ohers
Figure 2: The Indonesian Survey respondents’ profile
160. 161.

42nd AUBEA Conference 2018: Educating Building Professionals for the Future in the Globalised World
constitute the importance of environment in investing and managing the port. Also due to the fact that they are within the owner-investor cycle and they can be identified as commercially-focused port stakeholder groups.
For example in Victoria, Australia the new owner of the port of Melbourne must adhere to Port Management Act 1995 (Vic) and the Environment Protection Act 1970 (Vic), the Port issues an annual Environment Management Plan (Gibb, 2018). In addition; the adherence to environmental related acts was clearly highlighted in the Port of Melbourne Lease transaction document (Victoria, 2016).
In Indonesia, the most recent National Medium-Term Development Plan 2015-2019 (RPJMN 2015-2019) specifies that the green economy is to be the foundation of Indonesia’s development program. It also emphasises environmental sustainability and enhances the quality of the environment (UNPDF, 2016).
In examining the neutral responses in both countries, it can be observed that more participants in Australia answered neutrally compared to Indonesian participants, this might be an indication of a slightly better awareness program within Indonesia. Also; it can reflect the impact of ownership structure on the importance of environmental sustainability which is mostly private in Australia compared to state-owned in Indonesia. However; more investigation is needed to confirm this assumption.
4.2 The importance of environmental performance to the portAs shown in Figure 5 most of the respondents to question three (How important is the environmental performance to your port?) considered that environmental performance is significant in for port both in Australia and Indonesia. 91% of the Australian participants believe that the environmental performance is important and very import to the port, and 84% of the Indonesian participants do agree.
On the other hand; 3% of the Australian respondents think that the environmental performance is not important, along with 6% respond as neutral, these responses came mainly from terminal and port operators. This again raises the question of whether appropriate awareness programs of the importance of environmental sustainability to the port exist in line with the regulation and frameworks that are in place.
0% 0%3%
6%
15%
24%
42%45%
39%
24%
0%
10%
20%
30%
40%
50%
1. Sustainability in international finance 2. Sustainability in internal finance
Indonesian Survey Results
Not all important Not important Neutral Important Very Important
Figure 3: Australian Survey responses to questions one and two.
42nd AUBEA Conference 2018: Educating Building Professionals for the Future in the Globalised World
Similarly; 15% of the Indonesian respondents who works in state-owned enterprises, and terminal operations rated the environmental performance as neutral. In the meantime; PT.Pelindo II the state-owned corporation that manages the Port of Tanjung Priok has developed a project in 2015 to support the development of a clean ports program in the Port of Tanjung Priok, Jakarta. Thus; more efforts are needed to educate the relevant portstakeholders of the importance of sustainability to the port and the projects in place to promote sustainability.
4.3 Discussion In order to investigate the importance of environmental sustainability to obtain finance
for port developments in Australia and Indonesia. The researchers designed an online questionnaire of government officials, financiers and operators associated with ports in Australia and Indonesia.
The survey results show most of the respondents considered environmental sustainability is important in attracting both international and internal finance, as well as the overall importance of port performance sustainability.
However; substantial responses that rated the importance of environmental sustainability to port as not important or neutral both in Australia and Indonesia despite the existing regulation and environmental frameworks. Port industry should invest more in educating port internal and external stakeholders on the importance of environmental sustainability to port development and daily operations. Not only to be able to attract more private finance to port development projects but also to ensure that the environmental regulationsare being well understood and implemented.
Education plays a vital role in increasing the environmental concern; it improves the people understanding of the science behind the serval environmental issues. Education promotes citizen-government engagement. Higher education level leads to higher engagement in environmental, political issues and environmental activism that support environment protecting policies (UNESCO, 2015).
0% 0%3%
0%6%
15%
56%
48%
35% 36%
0%
10%
20%
30%
40%
50%
60%
Australia Indonesia
The importnace of environmental performance to the port
Not all important Not important Neutral Important Very Important
Figure 4: Indonesian Survey responses to questions one and two.
162. 163.

42nd AUBEA Conference 2018: Educating Building Professionals for the Future in the Globalised World
As the research is at the initial stages, the survey results combined with the current research literature can lead the way to the next step. An in-depth investigation on how development projects between the port and private investors reflect on the importance of environmental sustainability, what measures are in place to ensure investor's awareness and commitment to the environment, especially that most of these development projects are long-term, and to make sure that correct environmental practices are clearly stated.The next step is to conduct a qualitative study to investigate this topic in depth and produce theoretical insight such as using case study approach; the case study approachgenerates theoretical insights from evidence-based practice, which helps in exploring a phenomenon (Wu and Choi, 2005).
5 Conclusion and further research
Australian and Indonesian ports seek private local and international finance to support port development projects. While ports present potential sources of pollution, environmental sustainability is a concern under the long-term involvement of the private sector.
This paper presents the initial stage of a larger investigation into the importance of environmental sustainability to obtain finance for port developments in Australia and Indonesia. The results from an online questionnaire of government officials, financiers and operators associated with ports in Australia and Indonesia show most of the respondents considered environmental sustainability is important in attracting both international and local finance, as well as the overall importance of port performance sustainability.
However; a noteworthy number of responses rated the importance of environmental sustainability to port as not important or neutral both in Australia and Indonesia despitethe existing regulation and environmental frameworks. Port industry should invest more in educating port internal and external stakeholders on the importance of environmental sustainability to port development and daily operations. The education initiative should aim at increasing the awareness of the existing environmental regulations and frameworks, as well as at ensuring the implementation of the relevant legislation.
As a next step, this research will take a qualitative study case approach to conduct an in-depth investigation and contribute with theoretical insight. With the current research,literature focuses on the main stakeholders of the port being port authorities, governmentand policy maker, and the local community. Findings from this research will contribute to the literature by introducing the sustainability perspective of the private investors as they become key port stakeholders.
Future researchers are encouraged to investigate the importance of environmental sustainability in attracting private finance to other critical state-owned infrastructure such as airports.
6 Acknowledgement
The financial and logistical support received from the Australia-Indonesia Centre is gratefully acknowledged along with the background funders of the Department of Foreign Affairs and Trade, Australia, DIKTI in Indonesia and support from The University of Melbourne, Universitas Gadja Mada and the Universitas Indonesia for the time release given to staff. Many thanks to the industry participants for their openness and assistance
42nd AUBEA Conference 2018: Educating Building Professionals for the Future in the Globalised World
and also to the many people who either participated in workshop activities or responded to the questionnaires.
7 References
Acciaro, M., Vanelslander, T., Sys, C., Ferrari, C., Roumboutsos, A., Giuliano, G., Lam, J. S. L. & Kapros, S. (2014). Environmental sustainability in seaports: a framework for successful innovation.
Assunta Di Vaio & Luisa Varriale (2018). Management Innovation for Environmental Sustainability in Seaports: Managerial Accounting Instruments and Training for Competitive Green Ports beyond the Regulations. MDPI.
Besley, T. & Ghatak, M. (2007). Retailing public goods: The economics of corporate social responsibility Journal of Public Economics, 91, 1645-1663.
CFO (2008). The Role of Finance in Environmental Sustainability Efforts. CFO research services and Jones Lang Lasalle.
Chen, S.-L., Pateman, H. & Sakalayen, Q. (2017). The latest trend in Australian port privatisation: Drivers, processes and impacts. Research in Transportation Business & Management, 22, 201-213.
Gibb, P. (2018). SEMP Port of Melbourne Operations Pty Ltd Safety and Environment Management Plan. Port of Melbourne
Jong-Kyun Woo, Daniel S.H. Moon & Jasmine Siu Lee Lam (2018). The impact of environmental policy on ports and the associated economic opportunities. Transportation Research Part A: Policy and Practice, 110, 234-242.
Kaplowitz, M. D., Lupi, F., Couper, M. P. & Thorp, L. (2012). The Effect of Invitation Design on Web Survey Response Rates. Social Science Computer Review 30, 339-349.
Kelley, K., Clark, B., Brown, V. & Sitzia, J. (2003). Good practice in the conduct and reporting of survey research.
Manfreda, K. L., Berzelak, J., Vehovar, V., Bosnjak, M. & Haas, I. (2008). Web surveys versus other survey modes: a meta-analysis comparing response rates. International Journal of Market Research, 50, 79-104.
René Taudal Poulsen, Stefano Ponte & Henrik Sornn-Friese (2018). Environmental upgrading in global value chains: The potential and limitations of ports in the greening of maritime transport. Geoforum, 89, 83-95.
RIAA (2017). Australian Responsible Investments Outperforming Mainstream Investments: New Report. Responsible Investment Association Australasia
Saunila, M., Ukko, J. & Rantala, T. (2017). Sustainability as a driver of green innovation investment and exploitation. Journal of Cleaner Production, 179, 631-641.
Schoenmaker, D. (2017). Investing for the common good: A sustainable finance framework. Bruegel Essay and Lecture Series.
Siegel, D. S. (2009). Green Management Matters Only If It Yields More Green: An Economic/Strategic Perspective. Exchange
UNESCO (2015). Sustainable Development Begins with Education Education for All Global Monitoring Report.
UNPDF (2016). Government-United Nations Partnership for Development Framework.Victoria, T. P. o. (2016). Delivering Victorian Infrastructure (Port of Melbourne Lease
Transaction).Wu, Z. & Choi, T. Y. (2005). Supplier–supplier relationships in the buyer-supplier triad:
Building theories from eight case studies. Journal of Operations Management,, 27-52.
164. 165.

42nd AUBEA Conference 2018: Educating Building Professionals for the Future in the Globalised World
The future construction management advantage: facilitating sustainable development
Gesa Ruge
School of Management, Faculty of Business, Government & Law,University of Canberra, ACT 2617, AUSTRALIA
E-mail: [email protected]
Abstract: The construction and operation of buildings internationally accounts for 40% of raw materials and over 30% of greenhouse gas emissions. The Global Construction 2030 report forecasts that construction industry outputs will grow by 85% to $15.5 trillion worldwide. This will significantly increase the impact and opportunities for sustainable development management across construction sectors and services. Yet, there are concerns if building and construction managers are ready to lead from the ‘front end’ and manage the day to day complexities of facilitating sustainable development outcomes.Previous large scale quantitative studies identified that construction and engineering managers have fragmented sustainable development beliefs and values. Not surprising perhaps, considering the diversity of roles, backgrounds and lack of education for sustainable development in the construction industry to date. In order to contribute new knowledge to this field of research, the sustainable development understanding of Australian construction managers has been investigated. A qualitative methodology was developed to collate in-depth data through personal interviews with constructiondirectors, project managers and site managers. Key findings show that construction managers across roles and businesses have sustainable development beliefs and values, which are not fragmented as argued in previous studies, but can be related to a spectrum of professional practice and industry values. These findings shift the research perspective of sustainable development in construction towards making management values and beliefs explicit and encouraging managers to better understand and develop their sustainable development skills advantage.
Keywords:Sustainable development; management practice; construction management skills
1 Introduction
The World Economic Forum in its recent research report on the global construction industry (Forum, 2016) emphasised the increasing importance of triple bottom line responsibility and the industry’s long term impact on communities worldwide.
The construction industry…creates new jobs, drives economic growth, and provides solutions to address social, climate and energy challenges. The construction industry serves almost all other industries, as all economic value creation occurs within or by means of buildings or other “constructed assets” (p.9).
Over the last decade industry standards and regulations for sustainable building and construction have increased and today are more clearly linked to economic and environmental business and project parameters (Ashe et al., 2003; Ball, 2002; Berardi,
42nd AUBEA Conference 2018: Educating Building Professionals for the Future in the Globalised World
2012). Today, costs and skills for increased sustainable construction, products and services are being included in construction projects’ cost planning, design and on site management (Shen, Tam, Tam, & Ji, 2010; Son, Kim, Chong, & Chou, 2011). In terms of environmental importance, construction sectors internationally are the largest consumer of raw materials. More than 40% of all energy use is linked to buildings and today the operation of buildings accounts globally for around 30% of global greenhouse gas emissions (Taheriattar & Farzanehrafat, 2014). Almost a quarter of Australia’s total greenhouse gas emissions are a result of energy demand in the building sector (Research Oxford Economics, 2017).
Despite recognition of the importance and impact of sustainable development in the global context, the Australian building and construction industry today does not have an agreed definition for sustainable development. It does however refer back and build on the internationally accepted definition from the Brundtland report for sustainable development, “… that meets the needs of the present without compromising the ability of future generations to meet their own needs (WCED, 1987). For example, the Green Building Council of Australia (GBCA), an industry peak body supporting sustainable development in the property and construction sector, has adopted the Brundtland definition in its corporate statements and notes that, ‘a sustainable property industry will balance environmental, social and economic issues to ensure a viable and valuable industry for future generations’ (Green Building Council of Australia, 2016). The Federal Government’s ‘National Strategy for Ecologically Sustainable Development’ (NSESD) released in 1992 has maintained the following definition:
Using, conserving and enhancing the community's resources so that ecological processes, on which life depends, are maintained, and the total quality of life, now and in the future, can be increased (Australian Government, 1992).
Australian construction directors, project managers and site managers are aware that their decisions have economic, environmental, social and legal implications on the business, their clients and the long-term future of the community they contribute to. However, construction businesses and the industry sector overall, have been slow adopters of corporate sustainability practice and reporting. In Australia, this is partly due to the high number of small to medium enterprises, lacking the skill, scope and time to engage in formal training or reporting beyond minimum legislated standards or contractual conditions (Forum, 2016; KPMG, 2015; Murray & Dainty, 2013).
In the construction industry the concept of procedural frameworks and sustainability ratings have over the last decade been accepted and adopted as industry practice tool to support internal construction project management processes and sustainable construction reporting to clients and communities externally (Chernev & Blair, 2015; Kaatz et al,2006). This has allowed businesses to become more confident and skilled to develop their values and practices and thereby contribute to sustainable development outcomes for their clients and communities more broadly (Chernev & Blair, 2015; Hall & Purchase, 2006).This ‘adoption into practice’ stage also marks a phase of management transition in the transformation of the globalising construction industry.
National and international frameworks, checklists, certifications and rating schemes specify ‘what’ to measure to quantify outcomes at the end of a process, such as emissions, waste, water, energy. However, it appears that there is a significant research and knowledge gap in relation to ‘how’ the less explored perceptions and values of business
166. 167.
42nd AUBEA Conference 2018: Educating Building Professionals for the Future in the Globalised World
managers at the front end of the project inform sustainable design, development and delivery process and practice (Pedersen, 2010; Son et al., 2011).
Even though the constructor’s role has been researched in various ways, the constructor’s awareness of and preparedness for sustainability, which is inevitably needed to successfully deliver a sustainable project, has not been the focus of previous studies (Son et al., 2011, p.338).
This study explores the underlying values and beliefs that are shaping sustainable development decision making and thereby also the longer-term development outcomes.
2 Literature Review
International research with a focus on management for sustainable development in the construction sector is limited. However several studies have found that ‘sustainability’ and ‘sustainable development’ convey different meanings to different people in the industry (Atkinson, 2008). Chong interpreted this seemingly diverse spread of responses in his research as ‘confusion about perception and understanding of sustainability and sustainable construction’ (Chong et al., 2009b). He argued that knowledge of sustainable construction ‘is fragmented within the industry and construction stakeholders do not have a platform to integrate their knowledge’ (p.153). These findings illustrate that there are disparate findings to date and a specific research gap in relation to investigating sustainable development beliefs and values in the construction sector. The theoretical management literature has highlighted the need for more in-depth inquiries into industry specific contexts to update knowledge and make a contribution to academic theory and industry practice (Barnett, 2007; Costa & Menichini, 2013; Kurucz, 2008).
To address this gap and develop a suitable research methodology and design, a literature review with a focus on quantitative and qualitative methodologies was undertaken. The literature review examined a wide range of international journal articles, which investigated the construction industry, management and sustainability issues. The majority of quantitative research studies reviewed focused on larger scale random samples broadly across industry sectors such as engineering businesses, industry professionals or surveys across a diverse range of construction contractors and suppliers (Chong et al., 2009a; T. Jones, Yongwei, & Goodrum, 2010; Smith, Smith, & Sharicz, 2011).
The findings across these larger and diverse samples highlighted the variations in terms of individual and sub-sector understandings of sustainability as well as variations and gaps between sustainability perception and corporate practice (Abidin, 2010; Al-Sari, Al-Khatib, Avraamides, & Fatta-Kassinos, 2012; D. G. Jones, Reid, & Gilbert, 2008;Petrovic‐Lazarevic, 2008). These findings are not unexpected, because the studies are based on a varied sample across diverse segments of the construction sector. The responses and expressions from engineers, architects, consultants and construction suppliers vary substantially due to their diverse roles, expertise and professional contexts. This also highlights that quantitative research studies, despite large samples and data collected via electronic surveys, offer only limited insights. Whilst these studies provide findings on ‘what are the issues’ related to sustainable development understandings, they do seem to leave the underlying ‘why’ and ‘how’ questions unanswered.
These quantitative studies were then compared with research studies that utilised a qualitative research methodologies, which also investigated the construction industry,
42nd AUBEA Conference 2018: Educating Building Professionals for the Future in the Globalised World
management and sustainability issues. The research designs of these studies were based on smaller and targeted samples for personal interviews, business case studies, industry focus groups or practice focused frameworks (Ashe et al., 2003; Khalfan, 2006; Mathur, Price, & Austin, 2008; Pinkse & Dommisse, 2009). Across these qualitative studies, the findings extended beyond the identification of issues or gaps and provided deeper insights in terms of barriers or connections, conditions and linkages that may explain the ‘how’ and ‘why’ of the phenomena investigated (Atkinson, 2008; Khalfan, 2006; Pearce, 2008;Revell & Blackburn, 2007). In addition, the methodological research literature highlights the advantages of qualitative and smaller samples and that in-depth interviews are better suited to capture detailed changes in industry specific contexts (Ghauri, 2004; Sinkovics & Ghauri, 2008). This methodology and targeted design can uncover more holistic views and insights into management values and practice (De Ruyter & Scholl, 1998; Gephart, 2004; Welch, Piekkari, Plakoyiannaki, & Paavilainen-Mäntymäki, 2011).
3 Research Methodology
Based on these findings, a qualitative research methodology was considered as better suited to capture the sustainable development perceptions of construction managers. Abounded case study utilising a purposive sampling technique was developed and applied across three small to medium sized construction businesses. Across these three businesses, 27 personal interviews of around 60 minutes each were conducted. In each business, three directors, three project managers and three site managers participated voluntarily to describe and discuss their sustainable development perceptions and practice. This allowed the collection of 9 interviews from each business. In addition, the 27 interviews in total provide a sample of nine interviews across each of the management roles of directors, project managers and site managers.
Being an ‘insider’ to the Australian building and construction industry allowed the author to gain access and undertake personal interviews with construction professionals on sustainable development in management, which have not been conducted to date in Australia. The qualitative research methodology and design as well as the emic perspective in relation to the Australian construction industry enhanced the reflective investigation of industry specific views and values in a contextual setting (Schaffer & Riordan, 2003). This research insider’s reflexivity is captured by Tricia Le Gallais as she maps her personal journey as researcher, describing the development stages and increasing capacity to reflect and resulting reflexivity (Le Gallais, 2008).
The insider researcher has, as a member of the ‘in-group’, access to its past and present histories. Such shared experiences engender a sense of sameness leading to the awareness of a group or collective identity. This enables group members to set the boundaries of the way they live and work (Le Gallais, 2008, p.146).
The data analysis followed an iterative process of inductive and deductive analysis and coding of the transcribed interviews which led to the development of context pattern, then multiple sub-themes and arrival at five key themes, which are discussed in this paper.This rigorous and iterative research process applied is an intrinsic aspect of the continuing verification and validity of the qualitative methodology and resultant findings (Sinkovics & Alfoldi, 2012; Sinkovics & Ghauri, 2008).
168. 169.

42nd AUBEA Conference 2018: Educating Building Professionals for the Future in the Globalised World
4 Findings and Discussion
At the beginning of each interview research participants were asked to describe what sustainable development means to them. For example, one director of a construction business responded by saying:
Sustainable development is an old and a new thing I would suggest in terms of perception, because good practice should be sustainable anyway…..We’re accountable in my personal opinion, to be stewards of what we’ve been given here and good stewards at that, both from a resource point of view and from a ‘what are my kids going to have?’ point of view.
The detailed responses from each interview were thematically analysed in an iterative inductive process. Initially these responses, as reported in the quantitative studies reviewed, appeared as very personal expressions and seemed to vary significantly in wording, content and connections described. However, through the subsequent qualitative research methodology and text analysis, several pattern and clear themes emerged.
The key findings were a number of themes that can be broadly mapped against the main building and construction life cycle stages and thereby form a contextual spectrum ofsustainable development perceptions. This spectrum of beliefs and values highlights the importance and impact of sustainability aspects from early project start-up and design development for client approval via themes related to cost planning and complex procurement for sustainable material and on-site construction practice. Further, theconstruction managers also demonstrated through their practice examples that in their management engagement they are actively contributing to the longer term sustainable operation and eventual reuse or redevelopment of building construction. The majority of managers interviewed expressed their concern about the future skills needs and capacity of the construction industry to facilitate long term sustainable development outcomes for clients, businesses and communities.
The qualitative research investigation for patterns and sub-themes led to the identification of five key themes, listed below together with a small samples of interview statements from construction directors, project managers and site managers.
4.1 Theme 1 - Sustainable development integration at early design and project stages with consideration for targeted longer-term outcomes.
(SD)… starts at very early stages with the developer or the builder. ..(at) the designing stage of a development where it’s critical ....almost a pre-requisite…to say, look, we want to achieve a good environmental status. (PM)(SD)… consideration being given to the impact that a project or a task is going to have on the environment that we live in….a thought process that is considered right from, I guess, the very inception … and when an idea is being developed. (Dir 5) I think sustainable development for me is the changing of the design to make our buildings more energy efficient and be less damaging to the environment … and better to people’s health, I suppose as well, is an important part of it. (SM)
42nd AUBEA Conference 2018: Educating Building Professionals for the Future in the Globalised World
4.2 Theme 2 - Managing conflicts between short term financial and long term sustainable development goals.
(SD is) ...obviously managing cost, financially good outcomes for the business, and that will perform well in the current conditions but also moving forward into the future and provide a benefit, not only to the people that are purchasing that product but just longer term… look at it holistically. (PM) Sustainability can be seen in a number of different ways. it needs to be financially sustainable but also environmentally sustainable. … contributing to the environmental sustainability will in the long run have economic benefits. (Dir)
4.3 Theme 3 - Focus on environmentally sustainable business and project processes
…encourage to build buildings and developments that are manmade and promote…renewable or sustainable energy source. but also to provide things that aren’t detrimental to the environment. (PM)I can tell you that we recycle our builder’s rubbish which I think helps with sustainable building...(SM) I’d say as anything from the building materials you use, through to the inputs used to run the building…. So it’s a matter of designing buildings so that their environmental footprint is minimised… with the ideal goal of having energy neutral or positive generating facilities. (Dir)
4.4 Theme 4 - Integrate long term SD perspective into construction business practice
Sustainability came into it because it’s just good practice at the end of the day, its nothing new. …it’s about the materials we use, the life span of the materials, more importantly it’s how they’re produced. (Dir)It is about the practices that we undertake in our delivery of projects...of how we can build those projects with as little impact on the environment as we possibly can.. it’s about the ongoing impact of the operation of that building. (Dir)
4.5 Theme 5 - SD is shaping the future of businesses, industry and society
It is thinking longer term and how we’re going to use our resources into the future. It’s about being able to build and develop something that’s going to last longer and also have a lesser impact on the environment and avoid negative impacts on the economy or population. (SM)(SD)…is building now that will not damage or change anything for the future or future generations or anything down the track. (PM)
Whilst this research is based on a small but purposively selected sample, the findings clearly show that there is a broad alignment of key themes across the construction management spectrum. It can therefore be argued that findings from this research indicate how Australian construction managers are actively operating across the sustainable development spectrum and striving to support longer term outcomes for business, industry and communities. Important also is the finding, that the themes are reflected in responses across management roles of Directors, Project Managers as well as Site Managers. See Figure 1 below. This indicates that the identified themes are significant and that in addition, these values are not specific to professional role or the individual corporate business, but instead are embedded more deeply in underlying construction
170. 171.

42nd AUBEA Conference 2018: Educating Building Professionals for the Future in the Globalised World
industry values and beliefs. This indicates that construction managers bring industry specific perceptions and values to their day to day practice for the management of sustainable development in construction.
Figure 1. Sustainable development perceptions of construction managers
An important additional finding emerged, when the managers were asked about their sustainability skills development and training. Only 1 of the 27 interviewees had received formal training on sustainable construction at University. All others, despite an average 20 years of professional industry expertise have had no formal training in or about sustainability in construction to date, but would like to be more skilled in this area. TheAustralian construction managers interviewed have developed their own sustainability perception and practice through project specific roles, long term business expertise and by working closely with expert stakeholders such as clients, architects and engineers.International research with a focus on sustainable development in the construction sector made similar findings. For example Atkinson (Atkinson, 2008) identified that ‘sustainability’ and ‘sustainable development’ clearly convey different meanings to different people. Chong interpreted the extensive spread of responses in his research as ‘confusion about perception and understanding of sustainability and sustainable construction’ (Chong et al., 2009b).He argued that knowledge of sustainable construction ‘is fragmented within the industry and construction stakeholders do not have a platform to integrate their knowledge’ (p.153).
The findings from this research extend this debate and make a more careful distinction of sustainable development perceptions in industry specific settings. It is argued here that the Australian construction managers interviewed have clear personal sustainable development values contextualised through their industry specific experiences and continuing stakeholder engagement as managers. These beliefs and values aligned across five key themes have a common and grounded basis in construction management practice.These key themes have been demonstrated to link and reach across the sustainable development project as well as longer term industry lifecycle and impact on community wellbeing. This alignment appears to be consistent irrespective of roles. Directors, Project
42nd AUBEA Conference 2018: Educating Building Professionals for the Future in the Globalised World
Managers as well as Site Managers perceptions spread across the identified spectrum of values with minor differentiation. This indicates that the identified themes are significant and that in addition, these values are not specific to professional role or the individual corporate business, but may be embedded more deeply in construction industry values and beliefs connecting to the management for sustainable development.
5 Conclusion and Further Research
This research investigates the less explored perceptions and values of managers actively facilitating sustainable development in construction management. It provides new insights into how business directors, project managers and site managers in the Australian building and construction industry engage with their stakeholders in their day to day practice for integration of sustainable development at each project stage. Key findings highlight that construction managers’ sustainable development beliefs and values are not fragmented as identified in previous studies, but are rather aligned across a clear spectrum of construction management practice. Five key themes which reflect sustainable development in construction management have been identified. These reach across and beyond the design and construction project cycle to longer term community and future industry skills concerns. These findings shift the research perspective of sustainable development in construction management. This further highlights the importance for construction managers to make their management values and beliefs more explicit from the ‘front end’ of the project and be an active facilitator for sustainable development across all design and construction management processes with clear linkage to longerterm outcomes for future users and communities. Further research opportunities are for international collaboration to extend and apply this research methodology in other countries in order to expand the in-depth understanding of sustainable development perceptions and practice in the construction industry globally. For industry stakeholders and educators alike this research opens new avenues to integrate sustainable development as management skill and practice into construction education and continuing professionaldevelopment.
6 References
Abidin, N. Z. (2010). Sustainable Construction in Malaysia -- Developers' Awareness. International Journal of Social Sciences, 5(2), 122-129.
Al-Sari, M. I., Al-Khatib, I. A., Avraamides, M., & Fatta-Kassinos, D. (2012). A study on the attitudes and behavioural influence of construction waste management in occupied Palestinian territory. Waste Management & Research, 30(2), 122-136.
Ashe, B., Newton, P., Enker, R., Bell, J., Apelt, R., Hough, R., . . . Hargreaves, R. (2003). Sustainability and the Building Code of Australia. Retrieved from http://hdl.handle.net/1959.3/78307
Atkinson, G. (2008). Sustainability, the capital approach and the built environment. Building Research & Information, 36(3), 241-247. doi:10.1080/09613210801900734
Australian Government. (1992). National Strategy for Ecologically Sustainable Development.Canberra, Australia Department of Environment and Energy Retrieved from http://www.environment.gov.au/about-us/esd/publications/national-esd-strategy-part1#WIESD.
Ball, J. (2002). Can ISO 14000 and eco-labelling turn the construction industry green? Building and Environment, 37(4), 421-428. doi:10.1016/s0360-1323(01)00031-2
Barnett, M. L. (2007). Stakeholder influence capacity and the variability of financial returns to corporate social responsibility. Academy of Management Review, 32(3), 794-816.
Berardi, U. (2012). Sustainability Assessment in the Construction Sector: Rating Systems and Rated Buildings. Sustainable Development, 20(6), 411-424. doi:10.1002/sd.532
172. 173.

42nd AUBEA Conference 2018: Educating Building Professionals for the Future in the Globalised World
Chernev, A., & Blair, S. (2015). Doing well by doing good: The benevolent halo of corporate social responsibility. Journal of Consumer Research, 41(6), 1412-1425.
Chong, W. K., Kumar, S., Haas, C. T., Beheiry, S. M., Coplen, L., & Oey, M. (2009a). Understanding and interpreting baseline perceptions of sustainability in construction among civil engineers in the United States. Journal of Management in Engineering, 25(3), 143-154.
Chong, W. K., Kumar, S., Haas, C. T., Beheiry, S. M. A., Coplen, L., & Oey, M. (2009b). Understanding and Interpreting Baseline Perceptions of Sustainability in Construction among Civil Engineers in the United States. Journal of Management in Engineering, 25(3), 143-154. doi:10.1061/(asce)0742-597x(2009)25:3(143)
Costa, R., & Menichini, T. (2013). A multidimensional approach for CSR assessment: the importance of the stakeholder perception. Expert Systems with Applications, 40(1), 150-161.
De Ruyter, K., & Scholl, N. (1998). Positioning qualitative market research: reflections from theory and practice. Qualitative market research: An international journal, 1(1), 7-14.
Forum, W. E. (2016). Shaping the Future of Construction: A Breakthrough in Mindset and Technology. Geneva: World Economic Forum Retrieved from www.weforum.org
https://www.weforum.org/projects/future-of-construction.Gephart, R. P. (2004). Qualitative research and the Academy of Management Journal. Academy
of Management Journal, 47(4), 454-462. Ghauri, P. (2004). Designing and conducting case studies in international business research.
Handbook of qualitative research methods for international business, 109-124. Green Building Council of Australia. (2016). What is Sustainable Development? . GBCA Fact
Sheet. Retrieved from https://www.gbca.org.au/resources/fact-sheets/what-is-sustainable-development/
Hall, M., & Purchase, D. (2006). Building or bodging? Attitudes to sustainability in UK public sector housing construction development. Sustainable Development, 14(3), 205-218. doi:10.1002/sd.265
Jones, D. G., Reid, K. L., & Gilbert, D. G. (2008). Sustainability Assessment Considering Asset and Building Life Cycles Smart & Sustainable Built Environments (pp. 321-334): Blackwell Publishing Ltd.
Jones, T., Yongwei, S., & Goodrum, P. M. (2010). An investigation of corporate approaches to sustainability in the US engineering and construction industry. Construction Management & Economics, 28(9), 971-983. doi:10.1080/01446191003789465
Kaatz, E., Root, D., Bowen, P., & Hill, R. (2006). Advancing key outcomes of sustainability building assessment. Building Research & Information, 34(4), 308-320. doi:10.1080/09613210600724608
Khalfan, M. M. A. (2006). MANAGING SUSTAINABILITY WITHIN CONSTRUCTION PROJECTS. Journal of Environmental Assessment Policy & Management, 8(1), 41-60.
KPMG. (2015). Global Construction Survey 2015. Retrieved on 16 September 2016 from: https://home.kpmg.com/xx/en/home/insights/2015/2003/maturity-in-preparation.html
Kurucz, E., Colbert, B. and Wheeler, D. , . ( 2008). The business case for corporate social responsibility. Oxford: : Oxford University Press.
Le Gallais, T. (2008). Wherever I go there I am: reflections on reflexivity and the research stance. Reflective Practice, 9(2), 145-155.
Mathur, V. N., Price, A. D. F., & Austin, S. (2008). Conceptualizing stakeholder engagement in the context of sustainability and its assessment. Construction Management & Economics, 26(6), 601-609. doi:10.1080/01446190802061233
Murray, M., & Dainty, A. (2013). Corporate social responsibility in the construction industry:Routledge.
Pearce, O. (2008). Holistic Assessment of Sustainability and its Application at Halcrow. Journal of Corporate Citizenship(30), 37-65.
Pedersen, E. (2010). Modelling CSR: How Managers Understand the Responsibilities of Business Towards Society. Journal of Business Ethics, 91(2), 155-166. doi:10.1007/s10551-009-0078-0
42nd AUBEA Conference 2018: Educating Building Professionals for the Future in the Globalised World
Petrovic‐Lazarevic, S. (2008). The development of corporate social responsibility in the Australian construction industry. Construction Management and Economics, 26(2), 93-101.
Pinkse, J., & Dommisse, M. (2009). Overcoming barriers to sustainability: an explanation of residential builders' reluctance to adopt clean technologies. Business Strategy & the Environment (John Wiley & Sons, Inc), 18(8), 515-527. doi:10.1002/bse.615
Research Oxford Economics. (2017). Global Construction Report 2030. Retrieved from Hampshire, United Kingdom: http://www.globalconstruction2030.com/
Revell, A., & Blackburn, R. (2007). The business case for sustainability? An examination of small firms in the UK's construction and restaurant sectors. Business Strategy & the Environment (John Wiley & Sons, Inc), 16(6), 404-420.
Shen, L.-y., Tam, V. W. Y., Tam, L., & Ji, Y.-b. (2010). Project feasibility study: the key to successful implementation of sustainable and socially responsible construction management practice. Journal of Cleaner Production, 18(3), 254-259. doi:10.1016/j.jclepro.2009.10.014
Sinkovics, R. R., & Ghauri, P. N. (2008). Enhancing the trustworthiness of qualitative research in international business. Management International Review, 48(6), 689-714.
Smith, P. A., Smith, P. A., & Sharicz, C. (2011). The shift needed for sustainability. The Learning Organization, 18(1), 73-86.
Son, H., Kim, C., Chong, W. K., & Chou, J. S. (2011). Implementing sustainable development in the construction industry: constructors' perspectives in the US and Korea. Sustainable Development, 19(5), 337-347.
Taheriattar, R., & Farzanehrafat, M. (2014). Construction Managers’ Perception of the Factors Affecting Sustainability in Construction Projects. International Journal of Sustainable Construction Engineering and Technology, 5(1), 22-32.
WCED, U. (1987). United Nations World Commission on Environment and Developmemt, 1987: Our Common Future. Link: http://www. un-documents. net/wced-ocf. htm (zuletzt abgerufen am 03.12. 2012).
Welch, C., Piekkari, R., Plakoyiannaki, E., & Paavilainen-Mäntymäki, E. (2011). Theorising from case studies: Towards a pluralist future for international business research. Journal of International Business Studies, 42(5), 740-762.
174. 175.

42nd AUBEA Conference 2018: Educating Building Professionals for the Future in the Globalised World
Comparative evaluation of building rating tools in different contexts: Cases of LEED and SEED
Muhammad Afrasiab Khan1, Samad Sepasgozar2 and Changxin Wang3
1,2&3Department of Construction Management and Property,Faculty of Built Environment, University of New South Wales,
Sydney, 2052, NSW, AUSTRALIA
E-mails: [email protected]; [email protected]; [email protected]
Abstract: Buildings are the reasons of significant amount of global energy usage, carbon dioxide emissions, resource consumption, waste water production. To tackle these problems, building rating tools have been developed by different countries so that buildings could be constructed and evaluated according to a better sustainable culture. However, these tools might not be suitable to other contexts in terms of climate and building construction systems. This paper aims to compare two building rating tools LEED and SEED being used in developed and developing countries, respectively. The similarities and differences of these two types of building rating systems are discussed and their performance is analysed by considering the way credits are allocated. It was found that having great differences in the social, economic and environmental performance of these countries, still there were considerable similarities in the allocation of credits to Indoor Environmental Quality, Water, Transportation, Sustainable Sites, Energy, Material & Resources. This triggers the question that if developing countries should also follow the same path to achieve better sustainable development as developed countries or not?
Keywords:Building rating tools, LEED, SEED, Pakistan
1 Introduction
The construction industry has been continuously involved in updating the quality of life and meeting the demands of a growing needs of civilisations. However, it has been widely criticised for increased carbon emissions and global warming (Thomas and Thomas, 2017; Ding, 2008). This includes 70% consumption of electricity (Pulselli et al, 2007) and 12 % potable water (Wang et al, 2005), which results in a production of as much as 65% of waste disposal (Yudelson, 2010). In addition, they also a cause a huge amount of harmful emissions resulting in about 30% of greenhouse gases (Keysar and Pearce, 2007), and further 18% due to material exploitation (Reddy and Jagadish, 2003). A far-reaching impact is on the health and decreased productivity are some of the least discussed by-product of these advancements (Ries et al, 2006).
In response to this, a green building movement has been initiated which alleviates the negative impact of the construction sector on the environment. The movement is aimed at important socioeconomic benefits for the society. In addition, the environmental and economic benefits to this movement are highly regarded. However, to achieve full benefits of this movement, a proper selection of technologies and materials is required. Illankoon et al. (2017) has identified seven critical areas for devising a rating system
42nd AUBEA Conference 2018: Educating Building Professionals for the Future in the Globalised World
which includes the (a) location or site, (b) energy, (c) water, (d) quality of indoor environment, (e) material, (f) pollution and (g) management.
Building rating tools are considered as a part of this movement as they provide a framework to lead to a better and more sustainable development (Nsairat et al, 2009). In this paper, an in-depth analysis of two building rating tools LEED and SEED being used in developed and developing countries, respectively, has been carried out.
2 Literature Review
When a buildings lifecycle is discussed, the construction related wastes and its impacts on society are a highly important. The demand for enhanced life quality in addition to catering the existing housing demand has resulted in increased constructions leading to CO2 emissions. To address the issue, a standard protocol is required to assess how sustainable a building is. Hence the idea of sustainable development leading to a balance between catering growing needs of society and while reducing its negative impacts on the society and environment was developed.
Sustainable development is defined by Brundtland Commission in 1987 as ‘meets the needs of the present without compromising the ability of future generations to meet their own needs’. the commission was developed to assess the economic aspects and environmental consideration of construction industry. Since 1987, many guidelines have been developed to meet the demands. A stress has been laid on reduction of CO2 emissions which leads to global warming and the excessive use of material and natural resources has also been discouraged (Cole, 1998; Crawley & Aho, 1999). Therefore, various sustainability assessment systems have been designed to evaluate and classify the buildings based on quality, standard, or performance (Ding, 2008). These rating systems serve as a yardstick to measure the sustainability and building footprints from its initial stages to the whole life cycle.
2.1 Building Rating ToolsSince 1987, several assessing systems have been developed and utilized. Of these tools, Leadership in Energy and Environmental Design (LEED) is developed and widely used in US, whereas Building Research Establishment Environmental Assessment Management (BREEAM) is developed by UK. Comprehensive Assessment System for Building Environmental Efficiency (CASBEE) is Japanese rating system, GREENSTAR is Australian rating tools, while Korea uses Green Building Certification System (GBCS). Some countries have multiple rating systems which are specific to the requirement of theindustry sector. United States has the maximum number of 4 rating systems, whereas UK and Australia have 3 systems each (Tam et al. 2018). It is worth mentioning here that these each system is designed by the local governments and/or originations in line with the infrastructure requirements and availability of resources. These systems provide a guideline in various aspects of construction. Tools such as LEED and BREEAM are used during design, construction and operations phases. Each system also takes a unique approach for rating a building and hence affects its outcome. He et al. 2018 notes that GS is based on performance of building whereas EED and ASGB are more focused on design guide.
A critical review of literature reveals that several researches have previously tried to compare the various assessments tools by evaluating their pros and cons. The outcomes of each system depend on which factor they consider the most critical. Mattoni et al. (2018) have compared five major rating tools (CASBEE, Green Star, BREEAM, LEED
176. 177.

42nd AUBEA Conference 2018: Educating Building Professionals for the Future in the Globalised World
and ITACA) using six new macro-aggregation areas. They have found that the energy is always given the most credit amongst all systems other the CASBEE, whereas as water is the least important. Todd et al. (2013) has investigated the achievements of LEED system credits with a focus on worldwide trends in LEED-NC and LEED-EBOM. Lee and Burnett. (2008) have assessed the energy criteria HK-BEAM, BREEM, and LEED. Ng et al. (2013) have evaluated several systems based on carbon emissions.
According to Ding (2008), the current systems lack majorly in communications and interactions among various parties involved in the investigation of the environmental impacts and sustainability assessments. However, no existing system is perfect and there is a major concern among researchers for improvement of these systems (Suzer, 2005). There is a dire need for comprehensive environmental characteristics evaluation criteria based on individual aspects, such as architects would focus on design features whereasbuilders might be more interested in the economic aspects. The residents would be concerned about the living conditions and health while, the environmental agencies would tend to favour a lower carbon footprint (Ding, 2008; Leaman and Bordass, 2007).
2.1.1 LEED
Leadership in Energy and Environmental Design (LEED) was created in 1998 by US Green Building Council (USGBC) to assess business interiors, and structures utilized for various purposes and neighbourhood advancements in view of criteria set up. Globally, LEED is a well-recognized symbol of brilliance in green buildings. It uses score checklist to evaluate the sustainability of the projects (Suzer, 2015). Different levels of certification, from Sliver, Gold to Platinum can be achieved based on the credit points achieved from the checklist. LEED rating systems have 100 points and another 6 for Innovation & Design process and 4 points for Regional Priority points, which makes a total of 110 points (USGBC, 2014). Each credit is allocated points based on the environmental impacts and human benefits of the building-related impacts that it addresses. Projects achieve certification if they earn points according to the following levels; Certified (40–49) points, Silver (50–59) points, Gold (60–79) points, Platinum (80+) points.
2.1.2 SEED
Sustainability in Energy and Environmental Development was published by Pakistan Green Building council in October 2016. It is the first version of rating tools launched through Pakistan Green Building Council (PGBC, 2016). PBBC, the first of its kind was established in 2012 to address the issues related to sustainable development in Pakistan. It comprises of matters on the various buildings sectors in Pakistan which include (a) housing schemes, (b) multifamily low rise, (c) healthcare, (d) hospitability, (e) warehouse, (f) distribution centre, (g) retails, (h) schools, (i) core and shells etc. The rating system SEED gives weightage to (a)integrative project management, (b) location & Transport, (c) Sustainable Sites, (d) Water Efficiency, (e) Energy & Atmosphere, (f) Materials & Resources, (g) Indoor Environmental Quality and (h) innovation. It was established to reverse the involvement towards global climate change, improve the individual health and wellbeing, protect and restore water resource, and to enhance community health and quality of life. The weightages are given to various indicators and they combine to make the final score and building are given numerous categories according to the final score. The rating tools categories the building into four categories according to the points obtained; Silver (40-49) points, Golden (50-59) points, Platinum (60-69) points, Titanium (70+) points.
42nd AUBEA Conference 2018: Educating Building Professionals for the Future in the Globalised World
3 Methodology
Two Building rating tools have been chosen considering how they best fit the goals of the investigation and the author’s own expertise in this area. Internationally, most frequently used building rating tool (LEED) and locally used rating tool in Pakistan (SEED) is examined as far as their trends of addressing to the Triple bottom line.
The quantitative analysis methodology is used as a technique for classifying numerous credits points to fall under the three pillars of sustainability. The credit points given in the categories such as Energy & Atmosphere, Location & Transport, Indoor EnvironmentQuality, Water Efficiency, Material resources, Sustainable Sites and Innovation have been identified as if they address Environment, Social or Economic sustainability. The comparative analysis is further supported by the discussion in the Literature review such as launch date, scale of rating and methodology of the system.
4 Findings and Discussion
All countries in this world are not the same, there are deep contradictions and differences in the main features such as resources, exploitation, income, pollution, industry and poverty etc. Developed countries like United States are much ahead in terms of economic development and have less social problems, hence they can afford to invest on the environment. On the other hand, developing countries like Pakistan are still facing economic and social problems, living standards are very low, population is still struggling for food, clean water, health facilities, jobs and education facilities. In this situation, investing heavily on environment and giving it top priority might be questionable for developing countries like Pakistan. The developed world has achieved this development through an unsustainable way however the countries following them need to recognise which is the most suitable path to follow for them (Cohen, 2006)
4.1 Sustainable Development Goals
The seventeen Sustainable Development Goals were adopted by the members of united nations in September 2015. They embody a common universal vision to address all the three dimensions of sustainable development into action at all fronts including domestic, countrywide, and worldwide. They set ambitious targets across the three dimensions of sustainability which includes economic growth, social justice and environmental sustainability, underpinned by upright governance (Keesstra, 2016). The sustainable development goals set a universal plan of sustainable development, calling on all countries to follow a holistic approach which will incorporate all the thee pillars of sustainability. The sustainable development Index ranks 149 countries on behalf of their achievements according to the 17 goals. According to this index US was ranked 25 out of 149 countries with a total score of 72.7 out of 100, however Pakistan was ranked 115 out of 149 countries with a score of 45.7 out of 100 (OCED, 2016). This significant difference in the position, scores and achievements of sustainable development goals of both countries demonstrates the standings as well as challenges and targets of these countries in terms of environmental, economic and social sustainability.
178. 179.
42nd AUBEA Conference 2018: Educating Building Professionals for the Future in the Globalised World
Figure 1. Sustainable Development Goals Dashboard(Source: SDG, I&D, 2016)
The Sustainable development goals starting from 1 to 17 are nominated as No Poverty, Zero Hunger, Good Health and Well-being, Quality Education, Gender Equality, Clean Water and Sanitation, Affordable and Clean Energy, Decent Work and Economic Growth, Industry, Innovation and Infrastructure, Reduced Inequality, Sustainable Cities and Communities, Responsible Consumption and Production, Climate Action, LifeBelow Water, Life on Land, Peace and Justice Strong Institutions and Partnerships to achieve the Goal. The dashboard (figure. 1) demonstrates the achievements and targets for both US and Pakistan in accordance with the 17 sustainable development goals asstated earlier. Outcomes of both countries reveal that the action agenda for US and Pakistan. Pakistan face much bigger challenges in terms of social and economic sustainability, so its focus should be more towards the socio-economic aspects of sustainability.
4.2 Credit Distribution
The figure given below illustrates that both green building rating tools LEED & SEED have adopted almost the same category weightings. Energy and the Atmosphere have been given more than 28% of the total credits, both systems have allocated almost the same weightages despite significant difference in the energy demand, consumption and per capita carbon dioxide emission between US and Pakistan. This situation reflects that very high priority given to this energy and atmosphere ignoring the difference in the climate zone which in case of US is tropical however Pakistan is hot humid/ tropical. The percentages of credit points in the Location & transport is almost 15% of the total credits and indoor environment quality is 14% in both rating systems. Water efficiency, Material & resources, sustainable sites and innovation are almost the same. Considering the differences in achievements of sustainable development goals, targets for both countries are different from each other, however the distribution of credit points is same which reflects the lack of research and focus towards demands by SEED.
42nd AUBEA Conference 2018: Educating Building Professionals for the Future in the Globalised World
Figure 2. Trends of Credit Points division in LEED & SEED
4.3 Triple Bottom Line
As per the division proposed in ISO/AWI 21929, Energy and atmosphere, materials and resources, indoor air quality relate directly to the environmental pillar of sustainability (Castro, 2015), Water efficiency is included in both environmental and economic pillars, Sustainable sites belong to Indoor air quality comes under socio-economic aspect of sustainability. However, Location & transport belongs to all the three pillars of sustainability (Awadh, O., 2017). A few credit points that are procedural, administrative or are not related to three pillars of sustainability come under others. The figure given below demonstrates the division of credit points in all the three pillars in LEED and SEED.
Figure 3. Weightages allocated to Pillars of Sustainability
Despite of great difference in the achievements of sustainable development goals, both rating systems allocated environmental pillar the maximum significance which is 60% in case of LEED and 58% in case of SEED. LEED allocated 14% to social pillar which comes at third number in pillars of sustainability however SEED allocated 21% credits to the social sustainability which is somehow more than LEED. As far as the economic pillar of sustainability is concerned, LEED gave 18% and SEED allocated only 15% to it. Although, Pakistan is a poor country and the annual per capita income is almost ten times less than US, still SEED gave it the least importance.
180. 181.

42nd AUBEA Conference 2018: Educating Building Professionals for the Future in the Globalised World
5 Conclusion
Most of the building rating tools have been established for domestic use however some are developed for international use. Some of the locally developed systems are being ‘imported’ and used beyond their country of origin and become ‘international’ systems(Cole & Valdebenito, 2013). The US made LEED is an example of such tools which is considered one of the top two building rating tool practiced internationally. This rating tool was established according to the local conditions of the US; thus, the prioritizationof the environmental pillar is based on the data derived from US. The overall comparison of LEED and SEED reveals that both systems function based on a similar technique with only a rare difference. No matter which part of the world the buildings are in, if accessed under both systems, they will achieve same rating. Due to the necessity to address problems in local contexts of specific countries or regions, different rating tools shouldhave a focus on different areas according to their own local requirements and challenges(Doan et al, 2017). It is evident that the locally developed in US, LEED rating systems isused in Pakistan without being subjected to alterations with respect to cultural, local geographical, social and economic parameters. To move forward towards a more sustainable world is inevitable but the path to follow for developing countries like Pakistan is different from the developed ones. More credits should be allocated to the regional priority, so that each rating system could focus on their own challenges and set their own targets. If local priority is not considered, then it may lead to a situation where the outcomes of an assessment may not depict the reality of the country or the region. In addition, where the rating system is used improperly it can consequence in a poor performance of buildings. In such a situation rating system becomes just a sustainability mask and result in misleading the sustainability targets.
As far as tending to the triple bottom line in concerned, both the rating systems are concentrated around the Environmental aspect of sustainability, however, the economic aspect is given the least focus in case of SEED. The author will argue that although the environmental pillar is very significant but in developing countries like Pakistan Economic and social pillars should not be ignored to this extent. To overcome this issue, Evolution is needed in the building rating tools, hence, studies should be undertaken to achieve the conceivable outcomes and techniques for including new indicators that expand the scope and areas of building rating tools which are specific to the requirements of the country. This comparative analysis proposes that SEED could be optimized focusing more on the transportation, Well-being, Economic Growth, Innovation, Sustainable sites. In addition to social and economic factors, it is also recommended to include Institutional factors as part of assessment criteria building rating systems for a more thorough and comprehensive review of the project. Further research is desired to authenticate the effects of adding more social, economic and institutional factors to current building rating systems.
6 References
Ali, H.H. and Al Nsairat, S.F., 2009. Developing a green building assessment tool for developing countries–Case of Jordan. Building and Environment, 44(5), pp.1053-1064.
Awadh, O., 2017. Sustainability and green building rating systems: LEED, BREEAM, GSAS and Estidama critical analysis. Journal of Building Engineering, 11, pp.25-29.
Andreu, I. C., & Oreszczyn, T., 2004. Architects need environmental feedback. Building Research & Information, 32(4), 313-328.
Cohen, B., 2006. Urbanization in developing countries: Current trends, future projections, and key challenges for sustainability. Technology in society, 28(1-2), pp.63-80.
42nd AUBEA Conference 2018: Educating Building Professionals for the Future in the Globalised World
Cole, R.J., Valdebenito, M.J., 2013. The importation of building environmental certification systems: international usages of BREEAM and LEED. Build. Res. Information 41 (6), 662e676.
Crawley, D., & Aho, I., 1999. Building environmental assessment methods: Applications and development trends. Building Research & Information, 27(4), 300-308.
de Fátima Castro, M., Mateus, R. and Bragança, L., 2015. A critical analysis of building sustainability assessment methods for healthcare buildings. Environment, development and sustainability, 17(6), pp.1381-1412.
Ding, G. K. C., 2008. Sustainable construction: The role of environmental assessment tools. Journal of Environmental Management, 86(3), 451-464.
Doan, D.T., Ghaffarianhoseini, A., Naismith, N., Zhang, T., Ghaffarianhoseini, A. and Tookey, J., 2017. A critical comparison of green building rating systems. Building and Environment, 123, pp.243-260.
He, Y., Kvan, T., Liu, M. and Li, B., 2018. How green building rating systems affect designing green. Building and Environment, 133, pp.19-31.
Illankoon, I.C.S., Tam, V.W., Le, K.N. and Shen, L., 2017. Key credit criteria among international green building rating tools. Journal of Cleaner Production, 164, pp.209-220.
Keesstra, S.D., Bouma, J., Wallinga, J., Tittonell, P., Smith, P., Cerdà, A., Montanarella, L., Quinton, J.N., Pachepsky, Y., van der Putten, W.H. and Bardgett, R.D., 2016. The significance of soils and soil science towards realization of the United Nations Sustainable Development Goals. Soil, 2(2), p.111.
Keysar, E. and Pearce, A.R., 2007. Decision support tools for green building: facilitating selection among new adopters on public sector projects. Journal of Green Building, 2(3), pp.153-171.
Kibert, C.J., 2016. Sustainable construction: green building design and delivery. John Wiley & Sons
Leaman, A., & Bordass, B., 2007. Are users more tolerant of ‘green’ buildings. Building Research and Information, 35(6), 662–673.
Leaman, A., & Bordass, B, 2001. Assessing building performance in use 4: The Probe occupant surveys and their implications. Building Research & Information, 29(2), 129-143.
Lee, W.L. and Burnett, J., 2008. Benchmarking energy use assessment of HK-BEAM, BREEAM and LEED. Building and Environment, 43(11), pp.1882-1891.
Mattoni, B., Guattari, C., Evangelisti, L., Bisegna, F., Gori, P. and Asdrubali, F., 2018. Critical review and methodological approach to evaluate the differences among international green building rating tools. Renewable and Sustainable Energy Reviews, 82, pp.950-960.
Ng, S.T., Chen, Y. and Wong, J.M., 2013. Variability of building environmental assessment tools on evaluating carbon emissions. Environmental impact assessment review, 38, pp.131-141.
OECD (Organization for Economic Cooperation and Development). 2016a. OECD Statistics. Stats.oecd.org. Retrieved on 7 July 2016 from http://stats.oecd.org/
Pakistan Green Building Council (PGBC), SEEDV1 2016. Retrieved from. http://pakistangbc.org/seed/ [accessed 09.06.18.].
Pulselli, R.M., Simoncini, E., Pulselli, F.M. and Bastianoni, S., 2007. Energy analysis of building manufacturing, maintenance and use: Em-building indices to evaluate housing sustainability. Energy and buildings, 39(5), pp.620-628.
Ries, R., Bilec, M.M., Gokhan, N.M. and Needy, K.L., 2006. The economic benefits of green buildings: a comprehensive case study. The Engineering Economist, 51(3), pp.259-295.
Reijnders, L., & Van Roekel, A., 1999. Comprehensiveness and adequacy of tools for the environmental improvement of buildings. Journal of Cleaner Production, 7(3), 221-225.
Reddy, B.V. and Jagadish, K.S., 2003. Embodied energy of common and alternative building materials and technologies. Energy and buildings, 35(2), pp.129-137.
Sustainable development Goals, Index & Dashboards, (SDG, I&D 2016), Retrievedrom. http://www.sdgindex.org/assets/files/sdg_index_and_dashboards_compact.pdf [accessed
11.06.18.].Suzer, O., 2015. A comparative review of environmental concern prioritization: LEED vs other
major certification systems. Journal of environmental management, 154, pp.266-283.
182. 183.

42nd AUBEA Conference 2018: Educating Building Professionals for the Future in the Globalised World
Tam, V.W., Karimipour, H., Le, K.N. and Wang, J., 2018. Green neighbourhood: Review on the international assessment systems. Renewable and Sustainable Energy Reviews, 82, pp.689-699.
Thomas, L.E. and Thomas, P.C., 2017. Realising Intentions: An evaluation of green building rating tools for Australian buildings. Passive Low Energy Architecture 2017-Design to Thrive.
Todd, J.A., Pyke, C. and Tufts, R., 2013. Implications of trends in LEED usage: rating system design and market transformation. Building Research & Information, 41(4), pp.384-400.
US Green Building Council (USGBC), 2014a. Regional Priority Credits. Retrievedfrom. http://www.usgbc.org/rpc [accessed 09.06.18.].US Green Building Council (USGBC), 2009. LEED 2009 for New Construction and Major
Renovations Rating System (v.3), Washington, USA. Retrieved from. http://www.usgbc.org/Docs/Archive/General/Docs5546.pdf [accessed 09.06.18.].
Wang, W., Zmeureanu, R. and Rivard, H., 2005. Applying multi-objective genetic algorithms in green building design optimization. Building and environment, 40(11), pp.1512-1525.
Yudelson, J., 2010. The green building revolution. Island Press.
42nd AUBEA Conference 2018: Educating Building Professionals for the Future in the Globalised World
A decomposition analysis of the global warming potential of China’s manufacturing industry: 1994-2014
Peng Wu1 and Xiangyu Wang2
1&2School of Design and the Built Environment, Curtin University, Perth, 6102, WESTERN AUSTRALIA
E-mails: [email protected]; [email protected]
Abstract: Global climate change is one of the biggest threat to human development. As one of the largest contributors to global climate change, the manufacturing industry has been challenged on its operational activities and their impact on global environment. This papers therefore aims to investigate the contribution of the manufacturing to global climate change and more importantly, evaluate the contribution of factors, including production structure, energy intensity, industry structure, fuel mix and emission factors, on global climate change. The results show that production, i.e. the manufacturing output, is the most important contributor to the carbon emissions level while energy intensity, i.e. average energy consumption per value added, is the most effective strategy that has been adopted to reduce carbon emissions. In addition, industry structure, fuel mix and emission factor are proven to be also effective in reducing carbon emissions. The results are useful for regulatory authorities to establish relevant strategies to reduce the impact of China’s manufacturing industry on the environment.
Keywords:Manufacturing industry; carbon emissions; carbon decomposition; policy; sustainable development
1 Introduction
Global climate change has been recognized as one of the biggest environmental impacts and it is commonly agreed that global climate change is mainly caused by human activity (Melillo et al., 1993; Wang et al., 2018). The atmospheric carbon emissions concentration has been relatively stable before the industrial era (Stocker et al., 2013). The CO2concentration is currently at 408.8 parts per million (ppm) (June 2017), which is much higher than the average CO2 concentration in the past two centuries (around 280 ppm)(American Chemical Society, 2017).
China is the largest carbon dioxide emitters since 2008 (Boden et al., 2017). Fossil fuel combustion and industrial processes of China account for almost 30% of global carbon dioxide emissions (Boden et al., 2017). The manufacturing industry accounts for 57.5% of the national total energy consumption in 2014, thus becoming the single largest contributor to global climate change in China (China Climate Change Info-Net, 2016).Ensuring a sustainable development of the manufacturing industry is of critical importance for China to meet the target of 40%-45% emissions reduction from 2005 to 2020 (China Climate Change Info-Net, 2016).
The past trend of carbon emissions is useful to understand the current situation and make future decisions on achieving carbon reduction target (Wu et al., 2014a; Wu et al., 2017a).As such, many studies have been conducted on analyzing how the level of carbon
184. 185.

42nd AUBEA Conference 2018: Educating Building Professionals for the Future in the Globalised World
emissions has been changing over the past few decades. For example, the influence of five factors, including energy structure, energy intensity, industry structure, economic output and population scale, on energy-induced carbon emissions of China, is investigated by (Xu et al., 2014). Similarly, a structural decomposition analysis (SDA) is developed to analyze the impact of five factors, including population, urbanization level, industrial structure, technology and household consumption behavior on China’s regional carbon emissions (Feng et al., 2012). It should be noted that as “factory of the world”, China’s manufacturing industry plays a significant role in achieving its reduction target. However, the manufacturing industry is characterized by its large variability related to the energy types and consumption ways (Hammond et al., 2012). As such, very limited studies have been conducted on analyzing the influencing factors of the carbon emissions from China’s manufacturing industry through decomposition analysis.
This paper therefore aims to investigate the contribution of five important factors, including production structure, energy intensity, industry structure, fuel mix and emission factors, on China’s global warming potential (GWP) level from 1994 to 2014. It is expected that the results can be used for assisting the decision making in establishing environment-related policies in China. The paper is organized in the following structure. Section 2 provides a review of related studies. Section 3 presents the research method and the results are shown in Section 4. Section 4 discusses the impact of the results and concludes this study.
2 Literature Review
The changes of energy-related emissions are usually driven by multiple factors such as energy consumption, energy intensity, energy structure, economic output, population, investment, and other factors (Cansino et al., 2015). The manufacturing industry is one of the most energy intensive industries that produce emissions (Akbostancı et al., 2011; Wang et al., 2014). The influencing factors of carbon emissions from the manufacturing industry have been studied by a few researchers from different countries (See Table 1).
Table 1. Influencing factors of emissions change from the manufacturing industry
References Influencing factors Countries
Diakoulaki and Mandaraka (2007) Output, EI, IS, FM, Utility Mix 14 EU Countries
Akbostancı et al. (2011) Activity Effect, IS, EI, FM, EF Turkey
Hammond and Norman (2012) Output, IS, EI, FM, EF UK
Jeong and Kim (2013) Activity Effect, IS, EI, FM, EF Korean
Ren et al. (2014) Output, IS, EI, EF China
NOTES:
EI - Energy Intensity; IS - Industry Structure; FM - Fuel Mix; EF - Emission Factor.
The most commonly adopted influencing factors include:
• Production. It refers to the value added of manufacturing output. This factor can best track the physical production of products. In addition, the factors is widely reported and does not have the issue of double counting (Hammond et al., 2012).
42nd AUBEA Conference 2018: Educating Building Professionals for the Future in the Globalised World
• Energy intensity. It refers to the average energy consumption per unit of value added. The factor represents the cost of converting energy into value added. High energy intensity indicates a high cost of the conversion process.
• Industry structure. This factor represents the composition of the manufacturing industry. As some subsectors, e.g. smelting and pressing of ferrous metals, are energy intensive, an increase in the relative size of these subsectors will lead to an increase in emissions.
• Fuel mix. Different fuels have different calorific values and emission factors. For example, the calorific value of diesel is two times of coal, reported by China’s National Standard GB/T 2589-2008: General Rules for Comprehensive Energy Consumption Calculation.
• Emission factor. The emission factor of different fuel types may change. The emission factors of fuel are normally fixed in previous studies (Hammond et al., 2012). The emission factor of electricity normally changes, because the composition of power generation changes and the process of coal-fired electricity generation improves every year.
These five influencing factors are also adopted in this study to analyze their contribution towards the GWP of China’s manufacturing industry. LMDI can be used to conduct decomposition analysis for emissions changes as LMDI gives perfect decomposition and can handle the value zero in the data set (Ang, 2004). Based on these literature review, LMDI is herein selected as the decomposition analysis technique in this study.
3 Research Method
The GHGs (including CO2, CH4 and N2O) of energy consumption (excluding electricity consumption) are calculated based on CO2 equivalent. The GHGs of electricity consumption are calculated separately. Considering that CH4 and N2O have higher GWP than CO2, the GHG of the manufacturing industry can be calculated by:
𝐺𝐺𝐺𝐺𝐺𝐺𝐺𝐺𝐺𝐺𝐺𝐺𝑀𝑀𝑀𝑀𝑀𝑀𝑀𝑀𝑀𝑀𝑀𝑀𝑀𝑀𝑀𝑀𝑀𝑀𝑀𝑀𝑀𝑀𝑀𝑀𝑀𝑀𝑀𝑀𝑀𝑀𝑀𝑀𝑀𝑀𝑀𝑀𝑀𝑀𝑀𝑀𝑀𝑀𝑀𝑀𝑀𝑀𝑀𝑀𝑀𝑀𝑀𝑀 = 𝐶𝐶𝐶𝐶𝐶𝐶𝐶𝐶2,𝑀𝑀𝑀𝑀𝑀𝑀𝑀𝑀𝑀𝑀𝑀𝑀𝑀𝑀𝑀𝑀𝑀𝑀𝑀𝑀𝑀𝑀𝑀𝑀𝑀𝑀𝑀𝑀𝑀𝑀𝑀𝑀𝑀𝑀𝑀𝑀𝑀𝑀𝑀𝑀𝑀𝑀𝑀𝑀𝑀𝑀𝑀𝑀𝑀𝑀𝑀𝑀 + 23 𝐶𝐶𝐶𝐶𝐺𝐺𝐺𝐺4,𝑀𝑀𝑀𝑀𝑀𝑀𝑀𝑀𝑀𝑀𝑀𝑀𝑀𝑀𝑀𝑀𝑀𝑀𝑀𝑀𝑀𝑀𝑀𝑀𝑀𝑀𝑀𝑀𝑀𝑀𝑀𝑀𝑀𝑀𝑀𝑀𝑀𝑀𝑀𝑀𝑀𝑀𝑀𝑀𝑀𝑀𝑀𝑀𝑀𝑀𝑀𝑀 + 296 𝑁𝑁𝑁𝑁2𝐶𝐶𝐶𝐶𝑀𝑀𝑀𝑀𝑀𝑀𝑀𝑀𝑀𝑀𝑀𝑀𝑀𝑀𝑀𝑀𝑀𝑀𝑀𝑀𝑀𝑀𝑀𝑀𝑀𝑀𝑀𝑀𝑀𝑀𝑀𝑀𝑀𝑀𝑀𝑀𝑀𝑀𝑀𝑀𝑀𝑀𝑀𝑀𝑀𝑀𝑀𝑀𝑀𝑀𝑀𝑀 (1)
The National Bureau of Statistics of China reports the annual energy consumption by sector in the China Statistics Yearbook. The GHG emissions of the annual energy consumption are calculated by:
𝐶𝐶𝐶𝐶𝐶𝐶𝐶𝐶2,𝑡𝑡𝑡𝑡 = ∑ ∑ 𝐶𝐶𝐶𝐶𝐶𝐶𝐶𝐶2,𝑖𝑖𝑖𝑖𝑖𝑖𝑖𝑖,𝑡𝑡𝑡𝑡8𝑖𝑖𝑖𝑖=1
29𝑖𝑖𝑖𝑖=1 = ∑ ∑ 𝐸𝐸𝐸𝐸𝑖𝑖𝑖𝑖𝑖𝑖𝑖𝑖,𝑡𝑡𝑡𝑡 × 𝐸𝐸𝐸𝐸𝐸𝐸𝐸𝐸𝐶𝐶𝐶𝐶𝐶𝐶𝐶𝐶2,𝑖𝑖𝑖𝑖 × 𝑉𝑉𝑉𝑉𝑖𝑖𝑖𝑖 8
𝑖𝑖𝑖𝑖=129𝑖𝑖𝑖𝑖=1 (2)
𝐶𝐶𝐶𝐶𝐺𝐺𝐺𝐺4,𝑡𝑡𝑡𝑡 = ∑ ∑ 𝐶𝐶𝐶𝐶𝐺𝐺𝐺𝐺4,𝑖𝑖𝑖𝑖𝑖𝑖𝑖𝑖,𝑡𝑡𝑡𝑡8𝑖𝑖𝑖𝑖=1
29𝑖𝑖𝑖𝑖=1 = ∑ ∑ 𝐸𝐸𝐸𝐸𝑖𝑖𝑖𝑖𝑖𝑖𝑖𝑖,𝑡𝑡𝑡𝑡 × 𝐸𝐸𝐸𝐸𝐸𝐸𝐸𝐸𝐶𝐶𝐶𝐶𝐶𝐶𝐶𝐶4,𝑖𝑖𝑖𝑖 × 𝑉𝑉𝑉𝑉𝑖𝑖𝑖𝑖8
𝑖𝑖𝑖𝑖=129𝑖𝑖𝑖𝑖=1 (3)
𝑁𝑁𝑁𝑁2𝐶𝐶𝐶𝐶𝑡𝑡𝑡𝑡 = ∑ ∑ 𝑁𝑁𝑁𝑁2𝐶𝐶𝐶𝐶𝑖𝑖𝑖𝑖𝑖𝑖𝑖𝑖,𝑡𝑡𝑡𝑡8𝑖𝑖𝑖𝑖=1
29𝑖𝑖𝑖𝑖=1 = ∑ ∑ 𝐸𝐸𝐸𝐸𝑖𝑖𝑖𝑖𝑖𝑖𝑖𝑖,𝑡𝑡𝑡𝑡 × 𝐸𝐸𝐸𝐸𝐸𝐸𝐸𝐸𝑁𝑁𝑁𝑁2𝐶𝐶𝐶𝐶,𝑖𝑖𝑖𝑖 × 𝑉𝑉𝑉𝑉𝑖𝑖𝑖𝑖8
𝑖𝑖𝑖𝑖=129𝑖𝑖𝑖𝑖=1 (4)
Where:
CO2,t, CH4,t, and N2Ot refer to the total CO2, CH4 and N2O emissions in year t;
i refers to the sectors within the manufacturing industry following the industry classification codes in the China Statistical Yearbook (see Table 2 for the detailed manufacturing subsectors included in this study);
j refers to the types of energy consumption, including (raw coal, coke, crude oil, gasoline, kerosene, diesel oil, fuel oil, natural gas and electricity);
186. 187.

42nd AUBEA Conference 2018: Educating Building Professionals for the Future in the Globalised World
Eij,t refers to the energy consumption of source j from sector i in year t;
𝐸𝐸𝐸𝐸𝐸𝐸𝐸𝐸𝐶𝐶𝐶𝐶𝐶𝐶𝐶𝐶2 ,𝑖𝑖𝑖𝑖, 𝐸𝐸𝐸𝐸𝐸𝐸𝐸𝐸𝐶𝐶𝐶𝐶𝐶𝐶𝐶𝐶4,𝑖𝑖𝑖𝑖 and 𝐸𝐸𝐸𝐸𝐸𝐸𝐸𝐸𝑁𝑁𝑁𝑁2𝐶𝐶𝐶𝐶,𝑖𝑖𝑖𝑖is the emission factors of energy source j on a net calorific basis reported by IPCC (2006); and
Vj is the Chinese specific low-calorific value of energy source j (excluding electricity), reported in the National Standard GB/T 2589-2008: General Rules for Comprehensive Energy Consumption Calculation.
Table 2. The subsectors of China’s manufacturing industry
No. Industry description1 Processing of food from agricultural products2 Manufacture of foods3 Manufacture of liquor, beverages and refined tea4 Manufacture of tobacco5 Manufacture of textile6 Manufacture of textile, wearing apparel and accessories7 Manufacture of leather, fur, feather and related products and footwear8 Processing of timber, manufacture of wood, bamboo, rattan, palm and straw products9 Manufacture of furniture
10 Manufacture of paper and paper products11 Printing and reproduction of recording media
12 Manufacture of articles for culture, education, arts and crafts, sport and entertainment activities
13 Processing of petroleum, coking and processing of nuclear fuel14 Manufacture of raw chemical materials and chemical products15 Manufacture of medicines16 Manufacture of chemical fibers17 Manufacture of rubber and plastics products18 Manufacture of non-metallic mineral products19 Smelting and pressing of ferrous metals20 Smelting and pressing of non-ferrous metals21 Manufacture of metal products22 Manufacture of general purpose machinery23 Manufacture of special purpose machinery24 Manufacture of automobiles25 Manufacture of railway, ship, aerospace and other transport equipment26 Manufacture of electrical, machinery and apparatus27 Manufacture of computers, communication and other electronic equipment28 Manufacture of measuring instruments and machinery29 Other manufacture
This study uses LMDI method to analyze the contribution of each influencing factor to the GWP of China’s manufacturing industry. LMDI uses a logarithmic weight function instead of arithmetic weight function.
Following the LMDI method, the GWP of China’ manufacturing industry can be calculated by:
GWP = ∑ ∑ 𝐺𝐺𝐺𝐺𝐺𝐺𝐺𝐺𝐺𝐺𝐺𝐺𝑖𝑖𝑖𝑖𝑖𝑖𝑖𝑖𝑖𝑖𝑖𝑖𝑖𝑖𝑖𝑖 = ∑ ∑ 𝑄𝑄𝑄𝑄 𝑄𝑄𝑄𝑄𝑖𝑖𝑖𝑖𝑄𝑄𝑄𝑄𝐸𝐸𝐸𝐸𝑖𝑖𝑖𝑖𝑄𝑄𝑄𝑄𝑖𝑖𝑖𝑖
𝐸𝐸𝐸𝐸𝑖𝑖𝑖𝑖𝑖𝑖𝑖𝑖𝐸𝐸𝐸𝐸𝑖𝑖𝑖𝑖
𝐺𝐺𝐺𝐺𝐺𝐺𝐺𝐺𝐺𝐺𝐺𝐺𝑖𝑖𝑖𝑖𝑖𝑖𝑖𝑖𝐸𝐸𝐸𝐸𝑖𝑖𝑖𝑖𝑖𝑖𝑖𝑖
𝑖𝑖𝑖𝑖𝑖𝑖𝑖𝑖 = ∑ ∑ 𝑄𝑄𝑄𝑄 · 𝐼𝐼𝐼𝐼𝐼𝐼𝐼𝐼𝑖𝑖𝑖𝑖 · 𝐸𝐸𝐸𝐸𝐼𝐼𝐼𝐼𝑖𝑖𝑖𝑖 · 𝐸𝐸𝐸𝐸𝐸𝐸𝐸𝐸𝑖𝑖𝑖𝑖𝑖𝑖𝑖𝑖 · 𝐸𝐸𝐸𝐸𝐸𝐸𝐸𝐸𝑖𝑖𝑖𝑖𝑖𝑖𝑖𝑖𝑖𝑖𝑖𝑖𝑖𝑖𝑖𝑖 (5)
Where:
Q is the value added of the manufacturing industry; Qi is the value added of the subsector i; Ei is the energy consumption of subsector i; Eij is the fuel consumption from source j in subsector i; GWPij is the global warming potential of fuel source j of subsector i; ISi
42nd AUBEA Conference 2018: Educating Building Professionals for the Future in the Globalised World
is the activity share of subsector i in terms of value added; EIi is the energy intensity of subsector i; and FMij is the fuel mix in subsector i.
Consequently, the change in GWP of China’s manufacturing industry can be decomposed into the changes of the five influencing factors, by:
∆𝐺𝐺𝐺𝐺𝐺𝐺𝐺𝐺𝐺𝐺𝐺𝐺 = ∆𝐺𝐺𝐺𝐺𝐺𝐺𝐺𝐺𝐺𝐺𝐺𝐺𝑄𝑄𝑄𝑄 + ∆𝐺𝐺𝐺𝐺𝐺𝐺𝐺𝐺𝐺𝐺𝐺𝐺𝐼𝐼𝐼𝐼𝐼𝐼𝐼𝐼 + ∆𝐺𝐺𝐺𝐺𝐺𝐺𝐺𝐺𝐺𝐺𝐺𝐺𝐸𝐸𝐸𝐸𝐼𝐼𝐼𝐼 + ∆𝐺𝐺𝐺𝐺𝐺𝐺𝐺𝐺𝐺𝐺𝐺𝐺𝐹𝐹𝐹𝐹𝐹𝐹𝐹𝐹 + ∆𝐺𝐺𝐺𝐺𝐺𝐺𝐺𝐺𝐺𝐺𝐺𝐺𝐸𝐸𝐸𝐸𝐹𝐹𝐹𝐹 (6)
∆𝐺𝐺𝐺𝐺𝐺𝐺𝐺𝐺𝐺𝐺𝐺𝐺𝑄𝑄𝑄𝑄 = ∑ ∑ 𝐿𝐿𝐿𝐿�𝐺𝐺𝐺𝐺𝐺𝐺𝐺𝐺𝐺𝐺𝐺𝐺𝑖𝑖𝑖𝑖𝑖𝑖𝑖𝑖𝑇𝑇𝑇𝑇,𝐺𝐺𝐺𝐺𝐺𝐺𝐺𝐺𝐺𝐺𝐺𝐺𝑖𝑖𝑖𝑖𝑖𝑖𝑖𝑖0� 𝑙𝑙𝑙𝑙𝑀𝑀𝑀𝑀 𝑄𝑄𝑄𝑄𝑇𝑇𝑇𝑇
𝑄𝑄𝑄𝑄09𝑖𝑖𝑖𝑖=1
28𝑖𝑖𝑖𝑖=1 = ∑ ∑ 𝐺𝐺𝐺𝐺𝐺𝐺𝐺𝐺𝐺𝐺𝐺𝐺𝑖𝑖𝑖𝑖𝑖𝑖𝑖𝑖
𝑇𝑇𝑇𝑇−𝐺𝐺𝐺𝐺𝐺𝐺𝐺𝐺𝐺𝐺𝐺𝐺𝑖𝑖𝑖𝑖𝑖𝑖𝑖𝑖0
ln 𝐺𝐺𝐺𝐺𝐺𝐺𝐺𝐺𝐺𝐺𝐺𝐺𝑖𝑖𝑖𝑖𝑖𝑖𝑖𝑖𝑇𝑇𝑇𝑇−ln 𝐺𝐺𝐺𝐺𝐺𝐺𝐺𝐺𝐺𝐺𝐺𝐺𝑖𝑖𝑖𝑖𝑖𝑖𝑖𝑖
0 𝑙𝑙𝑙𝑙𝑀𝑀𝑀𝑀𝑄𝑄𝑄𝑄𝑇𝑇𝑇𝑇
𝑄𝑄𝑄𝑄09𝑖𝑖𝑖𝑖=1
28𝑖𝑖𝑖𝑖=1 (7)
∆𝐺𝐺𝐺𝐺𝐺𝐺𝐺𝐺𝐺𝐺𝐺𝐺𝐼𝐼𝐼𝐼𝐼𝐼𝐼𝐼 = ∑ ∑ 𝐿𝐿𝐿𝐿�𝐺𝐺𝐺𝐺𝐺𝐺𝐺𝐺𝐺𝐺𝐺𝐺𝑖𝑖𝑖𝑖𝑖𝑖𝑖𝑖𝑇𝑇𝑇𝑇,𝐺𝐺𝐺𝐺𝐺𝐺𝐺𝐺𝐺𝐺𝐺𝐺𝑖𝑖𝑖𝑖𝑖𝑖𝑖𝑖0� 𝑙𝑙𝑙𝑙𝑀𝑀𝑀𝑀 𝐼𝐼𝐼𝐼𝐼𝐼𝐼𝐼𝑖𝑖𝑖𝑖𝑇𝑇𝑇𝑇
𝐼𝐼𝐼𝐼𝐼𝐼𝐼𝐼𝑖𝑖𝑖𝑖0
9𝑖𝑖𝑖𝑖=1
28𝑖𝑖𝑖𝑖=1 = ∑ ∑ 𝐺𝐺𝐺𝐺𝐺𝐺𝐺𝐺𝐺𝐺𝐺𝐺𝑖𝑖𝑖𝑖𝑖𝑖𝑖𝑖
𝑇𝑇𝑇𝑇−𝐺𝐺𝐺𝐺𝐺𝐺𝐺𝐺𝐺𝐺𝐺𝐺𝑖𝑖𝑖𝑖𝑖𝑖𝑖𝑖0
ln 𝐺𝐺𝐺𝐺𝐺𝐺𝐺𝐺𝐺𝐺𝐺𝐺𝑖𝑖𝑖𝑖𝑖𝑖𝑖𝑖𝑇𝑇𝑇𝑇−ln 𝐺𝐺𝐺𝐺𝐺𝐺𝐺𝐺𝐺𝐺𝐺𝐺𝑖𝑖𝑖𝑖𝑖𝑖𝑖𝑖
0 𝑙𝑙𝑙𝑙𝑀𝑀𝑀𝑀𝐼𝐼𝐼𝐼𝐼𝐼𝐼𝐼𝑖𝑖𝑖𝑖𝑇𝑇𝑇𝑇
𝐼𝐼𝐼𝐼𝐼𝐼𝐼𝐼𝑖𝑖𝑖𝑖0
9𝑖𝑖𝑖𝑖=1
28𝑖𝑖𝑖𝑖=1 (8)
∆𝐺𝐺𝐺𝐺𝐺𝐺𝐺𝐺𝐺𝐺𝐺𝐺𝐸𝐸𝐸𝐸𝐼𝐼𝐼𝐼 = ∑ ∑ 𝐿𝐿𝐿𝐿�𝐺𝐺𝐺𝐺𝐺𝐺𝐺𝐺𝐺𝐺𝐺𝐺𝑖𝑖𝑖𝑖𝑖𝑖𝑖𝑖𝑇𝑇𝑇𝑇 ,𝐺𝐺𝐺𝐺𝐺𝐺𝐺𝐺𝐺𝐺𝐺𝐺𝑖𝑖𝑖𝑖𝑖𝑖𝑖𝑖0� 𝑙𝑙𝑙𝑙𝑀𝑀𝑀𝑀 𝐸𝐸𝐸𝐸𝐼𝐼𝐼𝐼𝑖𝑖𝑖𝑖𝑇𝑇𝑇𝑇
𝐸𝐸𝐸𝐸𝐼𝐼𝐼𝐼𝑖𝑖𝑖𝑖0
9𝑖𝑖𝑖𝑖=1
28𝑖𝑖𝑖𝑖=1 = ∑ ∑ 𝐺𝐺𝐺𝐺𝐺𝐺𝐺𝐺𝐺𝐺𝐺𝐺𝑖𝑖𝑖𝑖𝑖𝑖𝑖𝑖
𝑇𝑇𝑇𝑇−𝐺𝐺𝐺𝐺𝐺𝐺𝐺𝐺𝐺𝐺𝐺𝐺𝑖𝑖𝑖𝑖𝑖𝑖𝑖𝑖0
ln 𝐺𝐺𝐺𝐺𝐺𝐺𝐺𝐺𝐺𝐺𝐺𝐺𝑖𝑖𝑖𝑖𝑖𝑖𝑖𝑖𝑇𝑇𝑇𝑇−ln 𝐺𝐺𝐺𝐺𝐺𝐺𝐺𝐺𝐺𝐺𝐺𝐺𝑖𝑖𝑖𝑖𝑖𝑖𝑖𝑖
0 𝑙𝑙𝑙𝑙𝑀𝑀𝑀𝑀𝐸𝐸𝐸𝐸𝐼𝐼𝐼𝐼𝑖𝑖𝑖𝑖
𝑇𝑇𝑇𝑇
𝐸𝐸𝐸𝐸𝐼𝐼𝐼𝐼𝑖𝑖𝑖𝑖0
9𝑖𝑖𝑖𝑖=1
28𝑖𝑖𝑖𝑖=1 (9)
∆𝐺𝐺𝐺𝐺𝐺𝐺𝐺𝐺𝐺𝐺𝐺𝐺𝐹𝐹𝐹𝐹𝐹𝐹𝐹𝐹 = ∑ ∑ 𝐿𝐿𝐿𝐿�𝐺𝐺𝐺𝐺𝐺𝐺𝐺𝐺𝐺𝐺𝐺𝐺𝑖𝑖𝑖𝑖𝑖𝑖𝑖𝑖𝑇𝑇𝑇𝑇,𝐺𝐺𝐺𝐺𝐺𝐺𝐺𝐺𝐺𝐺𝐺𝐺𝑖𝑖𝑖𝑖𝑖𝑖𝑖𝑖0� 𝑙𝑙𝑙𝑙𝑀𝑀𝑀𝑀 𝐹𝐹𝐹𝐹𝐹𝐹𝐹𝐹𝑖𝑖𝑖𝑖𝑇𝑇𝑇𝑇
𝐹𝐹𝐹𝐹𝐹𝐹𝐹𝐹𝑖𝑖𝑖𝑖0
9𝑖𝑖𝑖𝑖=1
28𝑖𝑖𝑖𝑖=1 = ∑ ∑ 𝐺𝐺𝐺𝐺𝐺𝐺𝐺𝐺𝐺𝐺𝐺𝐺𝑖𝑖𝑖𝑖𝑖𝑖𝑖𝑖
𝑇𝑇𝑇𝑇−𝐺𝐺𝐺𝐺𝐺𝐺𝐺𝐺𝐺𝐺𝐺𝐺𝑖𝑖𝑖𝑖𝑖𝑖𝑖𝑖0
ln 𝐺𝐺𝐺𝐺𝐺𝐺𝐺𝐺𝐺𝐺𝐺𝐺𝑖𝑖𝑖𝑖𝑖𝑖𝑖𝑖𝑇𝑇𝑇𝑇−ln 𝐺𝐺𝐺𝐺𝐺𝐺𝐺𝐺𝐺𝐺𝐺𝐺𝑖𝑖𝑖𝑖𝑖𝑖𝑖𝑖
0 𝑙𝑙𝑙𝑙𝑀𝑀𝑀𝑀𝐹𝐹𝐹𝐹𝐹𝐹𝐹𝐹𝑖𝑖𝑖𝑖
𝑇𝑇𝑇𝑇
𝐹𝐹𝐹𝐹𝐹𝐹𝐹𝐹𝑖𝑖𝑖𝑖0
9𝑖𝑖𝑖𝑖=1
28𝑖𝑖𝑖𝑖=1 (10)
∆𝐺𝐺𝐺𝐺𝐺𝐺𝐺𝐺𝐺𝐺𝐺𝐺𝐸𝐸𝐸𝐸𝐹𝐹𝐹𝐹 = ∑ ∑ 𝐿𝐿𝐿𝐿�𝐺𝐺𝐺𝐺𝐺𝐺𝐺𝐺𝐺𝐺𝐺𝐺𝑖𝑖𝑖𝑖𝑖𝑖𝑖𝑖𝑇𝑇𝑇𝑇 ,𝐺𝐺𝐺𝐺𝐺𝐺𝐺𝐺𝐺𝐺𝐺𝐺𝑖𝑖𝑖𝑖𝑖𝑖𝑖𝑖0� 𝑙𝑙𝑙𝑙𝑀𝑀𝑀𝑀 𝐸𝐸𝐸𝐸𝐹𝐹𝐹𝐹𝑖𝑖𝑖𝑖𝑇𝑇𝑇𝑇
𝐸𝐸𝐸𝐸𝐹𝐹𝐹𝐹𝑖𝑖𝑖𝑖0
9𝑖𝑖𝑖𝑖=1
28𝑖𝑖𝑖𝑖=1 = ∑ ∑ 𝐺𝐺𝐺𝐺𝐺𝐺𝐺𝐺𝐺𝐺𝐺𝐺𝑖𝑖𝑖𝑖𝑖𝑖𝑖𝑖
𝑇𝑇𝑇𝑇−𝐺𝐺𝐺𝐺𝐺𝐺𝐺𝐺𝐺𝐺𝐺𝐺𝑖𝑖𝑖𝑖𝑖𝑖𝑖𝑖0
ln 𝐺𝐺𝐺𝐺𝐺𝐺𝐺𝐺𝐺𝐺𝐺𝐺𝑖𝑖𝑖𝑖𝑖𝑖𝑖𝑖𝑇𝑇𝑇𝑇−ln 𝐺𝐺𝐺𝐺𝐺𝐺𝐺𝐺𝐺𝐺𝐺𝐺𝑖𝑖𝑖𝑖𝑖𝑖𝑖𝑖
0 𝑙𝑙𝑙𝑙𝑀𝑀𝑀𝑀𝐸𝐸𝐸𝐸𝐹𝐹𝐹𝐹𝑖𝑖𝑖𝑖
𝑇𝑇𝑇𝑇
𝐸𝐸𝐸𝐸𝐹𝐹𝐹𝐹𝑖𝑖𝑖𝑖0
9𝑖𝑖𝑖𝑖=1
28𝑖𝑖𝑖𝑖=1 (11)
The outputs of Equations 7-11 represent the contribution of the influencing factors of output, industry structure, energy intensity, fuel mix, and emission factor respectively.
4 Results
The energy-related GWP of China’ manufacturing industry and corresponding percentage of China’s total GWP from 1994-2014 are shown in Figure 1(A). The GWP of China’s manufacturing industry shows an upward trend from 2.31 billion t CO2e in 1994 to 8.71 billion t CO2e in 2014. The GWP growth from 2003-2004 has the largest growth rate of 22.17%. The contribution of China’s manufacturing industry to the overall GWP decreases to the lowest of 48.11% in 2003. Its contribution has been increasing since then and sits at 54.77% in 2014, demonstrating the importance of China’s manufacturing industry to the country’s overall GWP. The contributions of CO2, CH4 and N2O to China’ GWP are fairly stable, at around 99.55%, 0.15% and 0.30% respectively.
The top five subsectors (in terms of GWP contribution) in the manufacturing industry are presented in Figure 1(B). From 1994-1995, the top five subsectors are smelting and pressing of ferrous metals (22.99%-23.30%), petroleum processing and coking products (20.50%-21.50%), raw chemical materials and chemical products (15.97%-16.00%), non-metal mineral products (13.70%-13.63%), and textile (3.46%-3.30%). Starting from 1996, smelting and pressing nonferrous metals has taken over textile as the fifth largest manufacturing subsectors in terms of GWP contribution. From 1996-2014, the top five subsectors of GWP in manufacturing are petroleum processing and coking products (21.52%-29.00%), smelting and pressing of ferrous metals (22.71%-26.38%), raw chemical materials and chemical products (17.66%-13.14%), non-metal mineral products (13.55%-10.76%), and smelting and pressing of nonferrous metals (3.01%-6.20%).
Figure 2 shows the results of the decomposition analysis from 1994-2014 in a cumulative way. From 1994-2004, the GWP of China’s manufacturing industry has increased by 5280.30 million t CO2e. Production change because of increased value added is the largest contributor to the increase of GWP, accounting for 123% of the increase. On the other hand, energy intensity, industry structure, fuel mix and emission factor all contribute to the reduction of GWP, at 4643.61, 1142.46, 727.50 and 31.32 million tCO2e respectively. It can be therefore concluded that three strategies have proven to be effective in reducing the carbon emissions in the manufacturing industry. The three strategies
188. 189.

42nd AUBEA Conference 2018: Educating Building Professionals for the Future in the Globalised World
include structure change, i.e. composition of the manufacturing has changed. High emission subsectors such as the production of chemical materials and chemical products have been gradually reduced in terms of production volume. In addition, emission factors change also contributes to the reduction of GWP in China’s manufacturing industry. The smaller value of emission factors is caused by improvement in electricity production (i.e. the less use of coal and higher portion of renewable sources) (Feng et al., 2012). The most significant factor is energy intensity. As less energy is used to produce per unit of value added, the energy intensity has been significantly improved and leads to less GWP.
Figure 1. The GWP of China’s manufacturing industry. (A) The GWP of China’s manufacturing industry and its corresponding percentage of China’s total GWP; (B) The top five manufacturing subsectors (in
terms of GWP contribution) of China from 1994-2014.
Figure 2. The cumulative contribution of the five influencing factors towards the GWP of China’s manufacturing industry
42nd AUBEA Conference 2018: Educating Building Professionals for the Future in the Globalised World
Figure 3 shows the results of the decomposition analysis at a yearly basis. Three most notable years with significant reduction of annual GWP can be identified, including 2007-2008, 2011-2012 and 2013-2014, with an estimated reduction of 0.88, 0.35 and 0.73 billion tCO2e respectively.
Figure 3. The yearly contribution of the five influencing factors towards the GWP of China’s manufacturing industry
5 Discussions and conclusions
Sustainability and global climate change is a rising concern and the issue has been included in various decision making process, including selecting materials (Zhong and Wu, 2015; Zhong et al., 2016), developing green materials (Wu et al., 2015; Wu et al., 2014a; Wu et al., 2014b), new manufacturing and construction technologies (Li et al., 2017; Song et al., 2017) and promoting green building.
This paper systematically evaluates the contribution of China’s manufacturing industry towards global climate change through the use of LMDI. The results show that the rapid expansion of China’s manufacturing industry is the most important source of global warming potential from 1994. However, various strategies have proven to be effective in mitigating the impact. These strategies include the improvement of energy intensity and energy efficiency, the structural change of the industry, fuel mix change towards cleaner energy and the improvement of emission factors. Three notable periods which have
190. 191.

42nd AUBEA Conference 2018: Educating Building Professionals for the Future in the Globalised World
significant emission reduction include 2008-2009 when a major structural change of industry is spotted, 2011-2012 when emission factors have been improved and 2013-2014when another significant structural change is identified. The results are useful to establish relevant strategies and policies to reduce the impact of the manufacturing industry on the environment.
6 Acknowledgement
This research was funded by the Australian Research Council Discovery Early Career Researcher Award (Project No. DE170101502) by the Australian Government.
7 References
Akbostancı, E., Tunç, G. İ., and Türüt-Aşık, S. (2011), ‘CO2 emissions of Turkish manufacturing industry: a decomposition analysis’, Applied Energy, 88(6), 2273-2278.
American Chemical Society. (2017), ‘What are the greenhouse gas changes since the Industrial Revolution?’, https://www.acs.org/content/acs/en/climatescience/greenhousegases/industrialrevolution.html, viewed: 10/07/2017.
Ang, B. W. (2004), ‘Decomposition analysis for policymaking in energy: which is the preferred method?’, Energy policy, 32(9), 1131-1139.
Boden, T. A., Marland, G. and Andres, R. J. (2017), ‘National CO2 Emissions from Fossil-Fuel Burning, Cement Manufacture, and Gas Flaring: 1751-2014’, Carbon Dioxide Information Analysis Center, Oak Ridge National Laboratory, U.S. Department of Energy, doi 10.3334/CDIAC/00001_V2017.
Cansino, J. M., Sánchez-Braza, A., and Rodríguez-Arévalo, M. L. (2015), ‘Driving forces of Spain׳ s CO2 emissions: A LMDI decomposition approach’, Renewable and Sustainable Energy Reviews, 48, 749-759.
China Climate Change Info-Net. (2016), ‘First Biennial Update Report on Climate Change 2016’, http://www.ccchina.gov.cn/archiver/ccchinacn/UpFile/Files/Default/20170124155928346053.pdf, viewed: 17/08/2017.
Feng, K., Siu, Y. L., Guan, D., and Hubacek, K. (2012), ‘Analyzing drivers of regional carbon dioxide emissions for China’, Journal of Industrial Ecology, 16(4), 600-611.
Gao, L., Xie, C., Zhang, Z., and Waller, S. T. (2012), ‘Network‐Level Road Pavement Maintenance and Rehabilitation Scheduling for Optimal Performance Improvement and Budget Utilization’, Computer‐Aided Civil and Infrastructure Engineering, 27(4), 278-287.
GHD. (2015), ‘Infrastructure Australia 2015 Infrastructure maintenance a report for infrastructure Australia’, http://infrastructureaustralia.gov.au/policy-publications/publications/files/GHD-Infrastructure-Maintenance.pdf, viewed: 25/08/2017.
Giustozzi, F., Crispino, M., and Flintsch, G. (2012), ‘Multi-attribute life cycle assessment of preventive maintenance treatments on road pavements for achieving environmental sustainability’, The International Journal of Life Cycle Assessment, 17(4), 409-419.
Hammond, G. P., and Norman, J. B. (2012), ‘Decomposition analysis of energy-related carbon emissions from UK manufacturing’, Energy, 41(1), 220-227.
Jeong, K., and Kim, S. (2013), ‘LMDI decomposition analysis of greenhouse gas emissions in the Korean manufacturing sector’, Energy Policy, 62, 1245-1253.
Kobayashi, K., Kaito, K., and Lethanh, N. (2012), ‘A statistical deterioration forecasting method using hidden Markov model for infrastructure management’, Transportation Research Part B: Methodological, 46(4), 544-561.
Li X, Shen GQ, Wu P, Fan H, Wu H and Teng Y (2017), RBL-PHP: Simulation of Lean Construction and Information Technologies for Prefabrication Housing Production. Journal of Management in Engineering, 34(2), 04017053.
42nd AUBEA Conference 2018: Educating Building Professionals for the Future in the Globalised World
Melillo, J. M., McGuire, A. D., Kicklighter, D. W., Moore, B., Vorosmarty, C. J., and Schloss, A. L. (1993), ‘Global climate change and terrestrial net primary production’, Nature,363(6426), 234.
Moutinho, V., Moreira, A. C., and Silva, P. M. (2015), ‘The driving forces of change in energy-related CO2 emissions in Eastern, Western, Northern and Southern Europe: The LMDI approach to decomposition analysis’, Renewable and Sustainable Energy Reviews, 50,1485-1499.
Ren, S., Yin, H., and Chen, X. (2014), ‘Using LMDI to analyze the decoupling of carbon dioxide emissions by China's manufacturing industry’, Environmental Development, 9, 61-75.
Song Y, Wang X, Tan Y, Wu P, Sutrisna M, Cheng J C and Hampson K (2017), Trends and Opportunities of BIM-GIS Integration in the Architecture, Engineering and Construction Industry: A Review from a Spatio-Temporal Statistical Perspective. ISPRS International Journal of Geo-Information, 6(12), 397.
Stocker, T. F., Qin, D., Plattner, G. K., Tignor, M., Allen, S. K., Boschung, J., ... and Midgley, P. M. (2013), ‘IPCC, 2013: Climate Change 2013: The Physical Science Basis. Contribution of Working Group I to the Fifth Assessment Report of the Intergovernmental Panel on Climate Change’, Cambridge University Press, Cambridge, United Kingdom and New York, NY, USA, pp 1535.
Wang, T., Wang, J., Wu, P., Wang, J., He, Q., and Wang, X. (2018), ‘Estimating the environmental costs and benefits of demolition waste using life cycle assessment and willingness-to-pay: A case study in Shenzhen’, Journal of Cleaner Production, 172, 14-26.
Wang, W., Liu, X., Zhang, M., and Song, X. (2014), ‘Using a new generalized LMDI (logarithmic mean Divisia index) method to analyze China's energy consumption’, Energy,67, 617-622.
Wu, P., Low, S. P., Xia, B., and Zuo, J. (2014a), ‘Achieving transparency in carbon labelling for construction materials–Lessons from current assessment standards and carbon labels’, Environmental Science & Policy, 44, 11-25.
Wu, P., Xia, B., Pienaar, J., and Zhao, X. (2014b), ‘The past, present and future of carbon labelling for construction materials–a review’, Building and Environment, 77, 160-168.
Wu, P., Song, Y., Wang, J., Wang, X., Zhao, X. and He, Q. (2017a), ‘Regional Variations of Credits Obtained by LEED 2009 Certified Green Buildings—A Country Level Analysis’, Sustainability, 10(1), 20.
Wu, P., Song, Y., Shou, W., Chi, H., Chong, H. Y., and Sutrisna, M. (2017b), ‘A comprehensive analysis of the credits obtained by LEED 2009 certified green buildings’, Renewable and Sustainable Energy Reviews, 68, 370-379.
Xu, S. C., He, Z. X., and Long, R. Y. (2014), ‘Factors that influence carbon emissions due to energy consumption in China: Decomposition analysis using LMDI’, Applied Energy, 127,182-193.
Zhong, Y., and Wu, P. (2015), ‘Economic sustainability, environmental sustainability and constructability indicators related to concrete-and steel-projects’, Journal of Cleaner Production, 108, 748-756.
Zhong Y, Ling F.Y.Y. and Wu, P. (2016), Using Multiple Attribute Value Technique for the Selection of Structural Frame Material to Achieve Sustainability and Constructability. Journal of Construction Engineering and Management, 143(2), 04016098.
192. 193.

42nd AUBEA Conference 2018: Educating Building Professionals for the Future in the Globalised World
Post-political planning and the tale of two cities: community engagement in urban planning and development in Sydney
Awais Piracha1 and Mary Hardie2
1School of Social Sciences and Psychology,Western Sydney University, AUSTRALIA
2School of Computing, Engineering and Mathematics, Western Sydney University, AUSTRALA
E-mails: [email protected]; [email protected]
Abstract: Planning reforms in NSW Australia have been guided by the post-political neoliberal thought. The reforms focus on economic development and have weakened social and ecological provisions in planning. They have resulted in weakening of community engagement in planning. Independent scholars have used rational, collaborative and post political neoliberal planning theory to explain the reforms. However, theoretical underpinnings of effective community action by the affluent in the East and resignation to fate by the poor in West in Sydney metropolitan have not been explored. This research explores the spatial dimension of the post-political planning thought in Sydney NSW.
Keywords:Post-political planning, community engage, urban planning and development
1 Introduction
Planning system in NSW is in perpetual reform. Rapid economic growth is the main motivation. Community engagement in planning matters is considered the barrier that slows the planning process, related construction and economic development. Softening community engagement in planning matters has therefore been the main-stay of the planning reforms that have taken place for the last 15 years.
The NSW state has implied it has adopted discursive democracy and collaborative planning approaches. Various scholars have tried to explain what has been transpiring in NSW through various planning theory lenses including rational, communicative/participatory and post-political neoliberal planning theories. This paper presents a brief review of the scholarly work on engagement aspect of planning reform in NSW.
The reality of community engagement in planning in NSW however is explained more by ability of the communities to engage than any of the aforementioned planning theories. It is a tale of two cities in metro Sydney. This paper presents examples that demonstrate that community engagement in planning in Sydney plays out very differently in the affluent East (NIMBY1-Land) than in the poor West (Bogan2-Land).
1 NIMBY stands for Not in In My Backyard. It refers to people who want to enjoy benefits for urban development but would like any new construction projects in their neighborhoods. People of affluent areas often exhibit this behavior.
2 Bogan is an Australian slang. It refers to people with unrefined or unsophisticated speech, clothing, and behaviour. Usually people in poor neighbourhoods are referred to with this derogatory term.
42nd AUBEA Conference 2018: Educating Building Professionals for the Future in the Globalised World
Among the NSW planning apparatus, the community engagement philosophy for Sydney Metropolitan seems to be “NIMBY-Land is too hard - dump it on BOGAN-Land - they will not even notice it”. This paper explains how affluent communities craftily use their connectedness and mastery of digital technologies to stymie even the most reasonable developments and how the poor are unable to voice opposition even to the most outrageous.
This paper argues that post-political planning discussion has neglected the spatial variation in community engagement with planning and planning outcomes within a metro, state or province. It highlights the need to search for a suitable theoretical frame that could explain the current situation and guide the future discussions on the tale of two cities for community engagement in Sydney NSW.
2 Evolution of planning theory as it relates to planning in NSW
The temporal evolution and merits of various planning theory have been explored by a number of researchers since 1970s. Faludi (1973), Healey (1992), Yiftachel (1998) and Allmendinger (2009) are the most prominent examples of that research.
Contemporary Planning, since its inception in the twentieth century, has been entrenched in modernity or scientific/instrumental rationality. Healey has traced the roots of rational comprehensive process model of planning in the Mannheimian conception of planning as the ‘rational mastery of the irrational' and its translation by the Chicago school into this highly influential form of planning practice.
“Mannheim's advocacy of a form of planning which harnessed systematised social scientific knowledge and techniques to the management of collective affairs in a democratic society proved inspirational for the influential Chicago school of rational decision making.” (Healey, 1992;p145)
Thoughts of Plato, Karl Mannheim, John Friedman, and the Chicago School serve as intellectual basis of rational planning (Healey, 1992; Green 2009). Rational planning is rooted in the liberal democracy and scientific rationalism and has strong and ever growing underpinnings of neoliberal economic thought. In NSW, in addition to neoliberalism, rational planning has undertones of political imperatives, pragmatism, and even corruption (Schatz and Piracha,2013; Piracha 2014; Piracha 2015). Since 1970s there has been a growing concern about rational planning because of environmental harm to local environments and ignoring of differing interests and cultural contexts of individual communities i.e. social justice considerations. The concerns of rational planning have led to two different thoughts (Healey 1992).
The first is to expand the realm of rationality beyond scientific truth to include diverse communities’ thoughts. Jürgen Habermas proposes communicative rationality as a solution (Bernstein 1985). This concept of Habermas serves as basis of discursive/deliberative democracy and communicative/ collaborative planning. Coining the term, “Planning through Debate” Patsy Healey (1992) argues in favour of this style of planning. A consensus is sought in this type of planning through an expanded view of rationality. Habermas encourages us not to give up on reason. He would like the society to shift emphasis from an individualised, subject-object conception of reason to reasoning formed within inter-subjective communication (Healey 1992). Habermas' communicative rationality is similar to practical reasoning that includes all the ways we use to understand and know things (Allmandinger, 2009).
194. 195.

42nd AUBEA Conference 2018: Educating Building Professionals for the Future in the Globalised World
Habermas' theory of communicative rationality action has been criticised by those who believe that social relations of class, race. gender and culture have such deep divisions that cannot be resolved through rationality. They rather require power struggle (Healey, 1992).
The second is the postmodern thought/relativism that is based on philosophies of Gramci and Foucault. Postmodern rejects rationality and argues that consensus serves only interests the powerful (Allmandinger, 2009). Agonism championed by Chantal Mouffe (2000) is a strand of the postmodern thought. According to Mouffe agonistic pluralism negates consensus seeking instrumental rationality and Habermas’ theory of communicative rationality. Rather than achieving consensus Mouffe (2000) would like to provide an arena where differences can be confronted. The postmodern thought faces the problem of difficulty in translating it into workable planning tool/system/mechanism (Allmandinger, 2009).
3 Western Sydney and the post-political thought
The collapse of the Berlin Wall and dissolution of the Eastern Block heralded a uni-polar world. Francis Fukuyama in his 1992 book The End of History and The Last Man argued that the Western liberal democracy is the endpoint of humanity's sociocultural evolution and the final form of human governance. Post-politics or post-ideological politics is another term that was coined by the radical philosophers to describe the politics of consensus in the wake of Soviet Union’s demise and end of the post-Cold War period (Metzger et. al., 2014). Allmendinge and Haughton (2012) argue that post-politics has replaced antagonism and agonism with consensus in planning. In this new context conflict in planning is brushed over or residualised. This has led to new types of dissents in planning with unpredictable and occasionally undesirable outcomes (Allmendinge and Haughton, 2012).
There was a pre-political when planners/architects as experts had definitive answers due to their technical specialized knowledge and rational approach (Metzger et al, 2014). Rational planning was practiced in that era. From 1960s there have been dissenting voices (Jacob, Harvey, Davidoff, Healy) highlighting the ecological and social consequences of rational planning (Metzger et. al., 2014). Healey wrote about the communicative /collaborative turn to planning (Healey, 1992). Then came the post-political with governance, managerialism and consensus in planning inspired by the third way politics of the Clinton and Blair. In that brave new world politics was not about left or right – it was about economic management (Metzger et. al. 2014).
Mouffe (2005) took issue with the post-political vision of globalization, universalization of liberal democracy, cosmopolitanism and consensual democracy. She claims that the consensual approach to democracy in fact leads to antagonism. To solve this problem, she argued for an agnostic approach in which various actors could contest hegemonic consensual politics.
Mouffe’s advocacy for the agnostic approach has been widely debated. Yamamoto (2016) contends that Mouffe’s inspired agnostic planning is not a universal solution. He argues that in certain planning situations consensus or depoliticization may be necessary. Purcell (2002) invoking Henry Lefebvre’s right to the city, argues for citizen’s participation in the politics. Legacy (2016) suggest that despite the post-political community engagement is well and alive and is finding new ways of engaging in the politics to achieve their planning objectives. She makes her case through the example of a successful campaign
42nd AUBEA Conference 2018: Educating Building Professionals for the Future in the Globalised World
in Melbourne that could stop the proposed East West Link road project that was at a very advanced stage of planning.
This research would argue that the consequences of the post-political planning have not been uniform. The affluent, well-educated, well-resourced and well connected could find ways to achieve their planning objectives (avoiding over-development or even any development) despite the post-political planning’s limited scope of accommodating opposition to development. The post-political planning has a greater impact on the poor who do not have means or ability to fill the void left by the departure of the political. The spatial/regional dimension of the non-uniform impacts of the post-political planning have not been discussed much. This paper seeks to fill that research void.
4 The Western Sydney Context
Western Sydney (Region) is defined variedly. In the most widely accepted definition it covers 13 LGAs, from Parramatta and Bankstown in the east, to Blue Mountains and Wollondilly in the west. Western Sydney currently contains about 44% of the Greater Sydney’s population and is forecasted to grow by an average of 1.8 percent per annum for the next 20 years. Two out of every three new Sydneysiders in the next twenty years will live in western Sydney (.id, 2016).
Western Sydney is faced by multiple challenges. It lags behind Eastern Sydney in income growth. A study by Irvine (2015) of tax data of 229 Sydney post codes revealed that the Western Sydney fell way behind in income growth in the 10 years from 2003 to 2013. Irvine (2015) informs us that, “Jobs have been sucked east back to the city. Former inner-city slums have transformed into exclusive enclaves of wealth and opportunity. Meanwhile, Sydney's western suburbs have fallen behind.” Farrelley (2016) eloquently makes a similar point, “the eastern city, has all the money, the revered institutions, the harbour, the beaches, the clean air, the global connections and of course, the decision-makers”. Climate is another very significant disadvantage Western Sydney faces. It is much hotter in Summers and much colder in Winters in Western Sydney. The summer heat in the region is likely to further prolonged and intensify by the climate change (O’Neil, 2016).
Even though Western Sydney’s population is growing fast its economy, reliant on manufacturing, is in relative decline. As a consequence, Western Sydney residents are faced with a growing jobs deficit (O’Neil, 2016). Many Western Sydney residents need to travel to Eastern Sydney to access jobs. As Western Sydney has very little public transport infrastructure, its residents rely on cars for daily commute to East or somewhere else within West. As a result, Western Sydney faces the increasing level of traffic congestion. About three quarter of the Sydney workers rely on cars for travel to work (O’Neil, 2016). Traffic congestion results in economic loss, air pollution, healthproblems, less time available to spend with family.
Fagan and O’Neil (2015) report that the numbers workers in financial and professional services in Western Sydney are significantly behind the rest of the city. They further report that only half of the information services works residing in Western Sydney could find jobs in Western Sydney. These workers increasingly rely on commuting to the East. Fagan and O’Neil (2015) conclude that Western Sydney does not have access to the global Sydney’s jobs in finance business and professional services.
Saulwick (2016) quoting Jeff Roberts (Economic Commissioner – Greater Sydney Commissioner) reports the existence so called “Latte Line” that divides haves (of Eastern
196. 197.
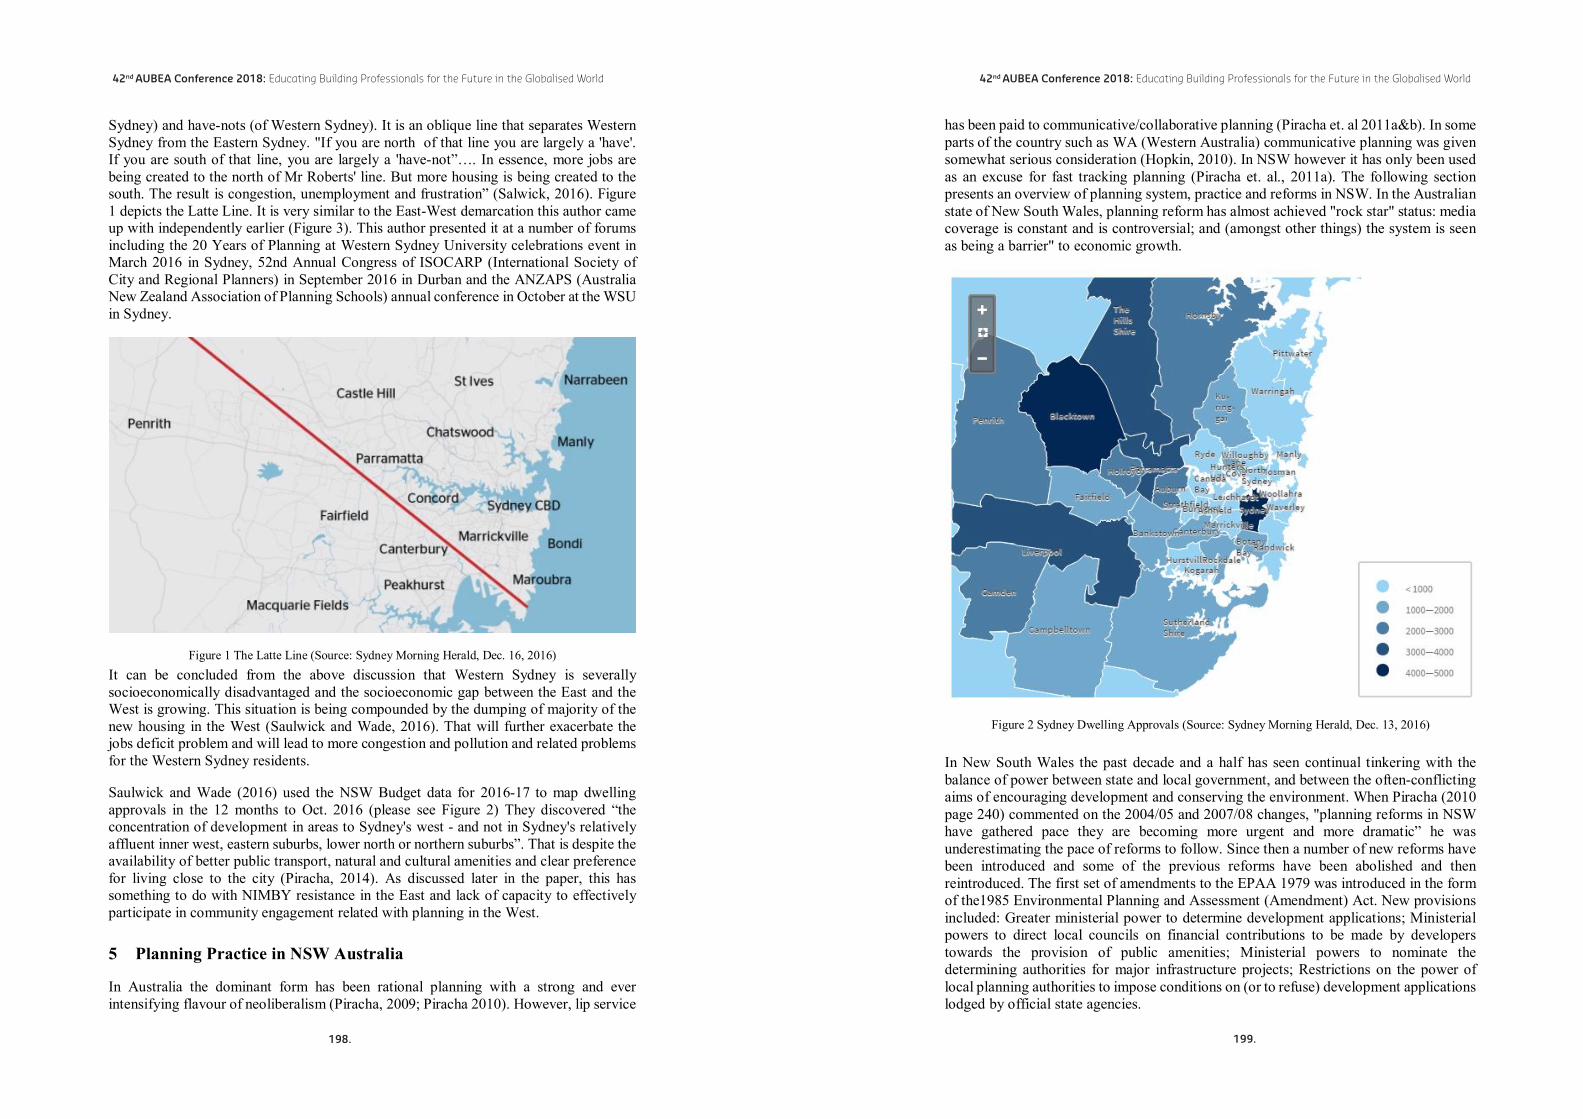
42nd AUBEA Conference 2018: Educating Building Professionals for the Future in the Globalised World
Sydney) and have-nots (of Western Sydney). It is an oblique line that separates Western Sydney from the Eastern Sydney. "If you are north of that line you are largely a 'have'. If you are south of that line, you are largely a 'have-not”…. In essence, more jobs are being created to the north of Mr Roberts' line. But more housing is being created to the south. The result is congestion, unemployment and frustration” (Salwick, 2016). Figure 1 depicts the Latte Line. It is very similar to the East-West demarcation this author came up with independently earlier (Figure 3). This author presented it at a number of forums including the 20 Years of Planning at Western Sydney University celebrations event in March 2016 in Sydney, 52nd Annual Congress of ISOCARP (International Society of City and Regional Planners) in September 2016 in Durban and the ANZAPS (Australia New Zealand Association of Planning Schools) annual conference in October at the WSU in Sydney.
Figure 1 The Latte Line (Source: Sydney Morning Herald, Dec. 16, 2016)It can be concluded from the above discussion that Western Sydney is severally socioeconomically disadvantaged and the socioeconomic gap between the East and the West is growing. This situation is being compounded by the dumping of majority of the new housing in the West (Saulwick and Wade, 2016). That will further exacerbate the jobs deficit problem and will lead to more congestion and pollution and related problems for the Western Sydney residents.
Saulwick and Wade (2016) used the NSW Budget data for 2016-17 to map dwelling approvals in the 12 months to Oct. 2016 (please see Figure 2) They discovered “the concentration of development in areas to Sydney's west - and not in Sydney's relatively affluent inner west, eastern suburbs, lower north or northern suburbs”. That is despite the availability of better public transport, natural and cultural amenities and clear preference for living close to the city (Piracha, 2014). As discussed later in the paper, this has something to do with NIMBY resistance in the East and lack of capacity to effectively participate in community engagement related with planning in the West.
5 Planning Practice in NSW Australia
In Australia the dominant form has been rational planning with a strong and ever intensifying flavour of neoliberalism (Piracha, 2009; Piracha 2010). However, lip service
42nd AUBEA Conference 2018: Educating Building Professionals for the Future in the Globalised World
has been paid to communicative/collaborative planning (Piracha et. al 2011a&b). In some parts of the country such as WA (Western Australia) communicative planning was given somewhat serious consideration (Hopkin, 2010). In NSW however it has only been used as an excuse for fast tracking planning (Piracha et. al., 2011a). The following section presents an overview of planning system, practice and reforms in NSW. In the Australian state of New South Wales, planning reform has almost achieved "rock star" status: media coverage is constant and is controversial; and (amongst other things) the system is seen as being a barrier" to economic growth.
Figure 2 Sydney Dwelling Approvals (Source: Sydney Morning Herald, Dec. 13, 2016)
In New South Wales the past decade and a half has seen continual tinkering with the balance of power between state and local government, and between the often-conflicting aims of encouraging development and conserving the environment. When Piracha (2010 page 240) commented on the 2004/05 and 2007/08 changes, "planning reforms in NSW have gathered pace they are becoming more urgent and more dramatic” he was underestimating the pace of reforms to follow. Since then a number of new reforms have been introduced and some of the previous reforms have been abolished and then reintroduced. The first set of amendments to the EPAA 1979 was introduced in the form of the1985 Environmental Planning and Assessment (Amendment) Act. New provisions included: Greater ministerial power to determine development applications; Ministerial powers to direct local councils on financial contributions to be made by developers towards the provision of public amenities; Ministerial powers to nominate the determining authorities for major infrastructure projects; Restrictions on the power of local planning authorities to impose conditions on (or to refuse) development applications lodged by official state agencies.
198. 199.

42nd AUBEA Conference 2018: Educating Building Professionals for the Future in the Globalised World
In 1993, further amendments to the Act enhanced the planning minister's approval powers, and excluded local councils from the decision-making process in certain matters (Park 2010). In 1997 came further major amendments including the introduction of the concept of state significant development. Developments declared to be "state significant" in an Environmental Planning Instrument (EPI) were to be determined by the Minister. In the same set of reforms, the concepts of "exempt" and "complying" development were introduced. Very small developments were to be exempt from seeking approvals; and slightly larger complying developments were to face simpler standards -based approval processes (Park 2010). The 1997 reforms constituted the forerunner of more drastic and more controversial reforms to the state planning system which followed.
After coming to power in 2011 the new conservative government in NSW introduced many reforms to the state planning system. In April 2013 NSW Government released a White Paper entitled "A New Planning System for NSW" and the conversation around it. The major changes in it can be summarised as follows: Ecologically sustainable development The mention of ecologically sustainable development (ESD) has been replaced with narrower 'sustainable development' in the proposed new planning system. The precautionary principle, biodiversity, ecological integrity and the polluter pays principle have been omitted altogether. This reflects the trend in planning in recent years to give pre-eminence to economic development over ecological sustainability.
In 2015-16 development assessment aspect of planning continues to become speedy, automated and privatized. Community engagement in planning is weakening. Local council mergers are taking place. Local strategic planning is getting replaced by metro and state planning endeavours such as Greater Sydney Commission. The latest planning reforms are absolutely in line with the changes of the recent past.
Many of the above mentioned reforms of planning have been under the pretext of collaborative planning. The NSW state government has repeatedly argued they are making these fast-tracking changes in the planning system as that is what mom and dad developers (general public) want (Piracha et. al. 2011). The following section outlines how the above described theory and system of planning in actual manifests in community engagement and planning outcomes.
6 Case studies that tell a tale of the two cities
Sydney is a beautiful harbour-side city. Properties with views of water are however beyond affordability for the most. Proximity to water, CBD, and good schools (important factors in modern lifestyle) fetches much higher property prices than the rest of the metro. In recent years the property price gap has markedly increased between Eastern part of metro i.e. closer to water, CBD and good schools (in particular in the northeast) and the western part that is away from natural and cultural amenities (Piracha, 2014).
There exists a transport, employment, educational, health and cultural divide between the rich east and the poor west. The east is very well served by public transport, jobs, educational and health infrastructure. The east also has the first rate cultural facilities and even good weather (warmer than the west in winter and cooler in summer). Western Sydney experiences a job deficit, has a highly congested car reliant transportation system, poor quality educational institutions, poor health outcomes and lower life expectancy and higher mortality (The Daily Telegraph 2013; The Centre for Western Sydney 2015).
The residents of Eastern Sydney are more well educated and are well versed in the use of social media. They are able to effectively participate in planning. They often resist
42nd AUBEA Conference 2018: Educating Building Professionals for the Future in the Globalised World
proposed developments in their areas through vocal protests and mobilizing their networks through traditional and social media. Their actions often verge on the borders of NIMBYism and they have been accused of engaging in entrenchment of privilege. They do not wish any changes (in particular increase in population density) in their areas.
The western Sydney residents have little capacity to effectively participate in community engagement in urban planning. They seem unable to oppose even landfills, recycling facilities for smelly and hazardous waste, motorways and warehouses with heavy track movements in their midst. Figure 3 shows the east-west divide of the Sydney metro with an oblique line. To the east of the line lies the NIMBY Land and to the west the Bogan Land. The diving line has been drawn on the Sydney metro strategy.
Figure 3 The NIMBY Land and the Bogan Land (Source: drawn by the author on the Sydney Metro Strategy of Department of Planning and Environment NSW released in Dec. 2014)
The Attitude of the planning agencies towards community engagement can be summarized as, “NIMBY Land is too hard, let us dump it on the Bogan Land – they will not even notice it”. In the following three examples of this phenomena have been described.
6.1 Parramatta Road Corridor RedevelopmentParramatta Road is the 20 km long corridor, which connects Sydney’s two CBDs: Parramatta in the west and Sydney CBD in the east. The corridor can be characterised by traffic congestion, noise and low quality commercial activity such as second-hand car yards.
Urban Growth NSW – the main state-owned developer came up with a redevelopment plan for the Corridor that includes Parramatta Road, land adjoining and at least one block back from the Road, and eight growth Precincts (Urban Growth 2016).
200. 201.

42nd AUBEA Conference 2018: Educating Building Professionals for the Future in the Globalised World
Urban Growth (2016) NSW consulted with the ten councils (municipalities) along the corridor to deliver the Parramatta Road Urban Transformation Strategy. The strategy is the NSW Government’s 30-year plan for densification and betterment of the corridor. Main outcomes of the project are outlined by the Urban Growth (2015) as up to 70,000 people in 40,000 new homes over the next 30 years.
In the consultation process for the development of the eight precincts along the corridor, the Urban Growth encountered stiff resistance to any population density increase by the affluent communities in the East. An indication of very high level of opposition to any density increase is the eastern local council (municipality) of Leichardt’s complete refusal to cooperate with
Urban Growth in developing the renewal strategy (Urban Growth 2015). The protracted community consultation lead to the strategy that is very weird. As a result of the high resistance in the east the strategy dumps most of the additional residential development (high density) on the western end of the corridor The eastern end of the corridor closer to the Sydney CBD will see almost no density increase. Figure 4 shows the eight precincts along the corridor that will receive the additional population.
Figure 4 Eight precincts of the Parramatta Road Urban Transformation Strategy (Source: Urban Growth 2015)
There is no discernible difference in current population densities of the precincts in the east and the west (estimation conducted by the author using Australian Bureau of Statistics census data). Good planning practice would demand higher increase in densities closer to the Sydney CBD in the east which a large number of people regularly visit to access employment, health, education and cultural facilities. Providing higher densities on the eastern side of the corridor would have led to reduced travel demand due to shorter trips and possibility of access to facilities by non-motorised transport. However due to very high community opposition in the east the Urban Growth has proposed quite the opposite. The three western most precincts of Granville, Auburn and Homebush are planned to received 70% of the additional housing and population while the two eastern
42nd AUBEA Conference 2018: Educating Building Professionals for the Future in the Globalised World
proposed developments in their areas through vocal protests and mobilizing their networks through traditional and social media. Their actions often verge on the borders of NIMBYism and they have been accused of engaging in entrenchment of privilege. They do not wish any changes (in particular increase in population density) in their areas.
The western Sydney residents have little capacity to effectively participate in community engagement in urban planning. They seem unable to oppose even landfills, recycling facilities for smelly and hazardous waste, motorways and warehouses with heavy track movements in their midst. Figure 3 shows the east-west divide of the Sydney metro with an oblique line. To the east of the line lies the NIMBY Land and to the west the Bogan Land. The diving line has been drawn on the Sydney metro strategy.
Figure 3 The NIMBY Land and the Bogan Land (Source: drawn by the author on the Sydney Metro Strategy of Department of Planning and Environment NSW released in Dec. 2014)
The Attitude of the planning agencies towards community engagement can be summarized as, “NIMBY Land is too hard, let us dump it on the Bogan Land – they will not even notice it”. In the following three examples of this phenomena have been described.
6.1 Parramatta Road Corridor RedevelopmentParramatta Road is the 20 km long corridor, which connects Sydney’s two CBDs: Parramatta in the west and Sydney CBD in the east. The corridor can be characterised by traffic congestion, noise and low quality commercial activity such as second-hand car yards.
Urban Growth NSW – the main state-owned developer came up with a redevelopment plan for the Corridor that includes Parramatta Road, land adjoining and at least one block back from the Road, and eight growth Precincts (Urban Growth 2016).
202. 203.

42nd AUBEA Conference 2018: Educating Building Professionals for the Future in the Globalised World
7 Conclusion
Thinking in the post-political planning era has been shifting from rational planning to collaborative planning informed by the communicative rationality as well as to postmodern thought including agonism. The state of NSW in Australia is no exception. Traditional rational planning in that state has been (claimed) to have become more collaborative/communicative.
While it is known what the temporal changes in planning theory and its application are, the spatial dimension is not very well studied. It is not recognized that different planning theories may explain the planning and community participation conditions in different parts of a metro at the same time.
This paper has presented three case studies that demonstrate that community participation and planning outcomes take very different shapes in the affluent east and the poor west in Sydney while operating under the same planning regime informed by the same planning theory. Affluent and well connected communities in the east are able to resist and prevent even very simple and appropriate developments. Poor and despondent communities in west are unable to oppose even the most outrageous developments in their midst. The post-political planning regime seem to have affected the poor area more adversely.
8 References
Allmendinger, P., and Haughton, G. (2012) ‘Postpolitical spatial planning in England: a crisis of consensus?’ Transactions, Institute of British Geographers, 37: pp 89–103.
Allmendinger, P. (2009). Planning Theory (2nd ed.). New York: Palgrave MacmillanBell, L., and Bremmer, J. (2013) Burning Waste for Energy – It doesn’t stack- up: Exposing the
push towards unsustainable waste to energy technology in Australia, National Toxics Network Inc. Australia
Bernstein, R. (1985). Habermas and modernity (Studies in contemporary German social thought). Cambridge, Mass.: MIT Press.
DoP&E (2014) A Plan for Growing Sydney, Department of Planning and Environment NSW, Sydney
Fagan, B., and O’Neil, P. (2015) Work, Places and People in Western Sydney, Centre for Western Sydney, Western Sydney University
Faludi, A. (1973). A reader in planning theory (Urban and regional planning series; 5). Oxford: Pergamon Press.
Farrelley, E. (2016) It's time to choose, Sydney: which future do we want?, Sydney MorningHerald, Nov. 25
Green, B. (2009). Karl Mannheim. Journal of Classical Sociology, 9(2), pp 234-259.Healey, P. (1992). Planning through debate: The communicative turn in planning theory. The
Town Planning Review, 63(2), pp143.Hopkins, D. (2010). Planning a City through ‘Dialogue’: Deliberative Policy-making in Action
in Western Australia. Urban Policy and Research, 28(3), pp 261-276..id the population experts (2015) “Western Sydney profile - a region of diversity and growth”
http://blog.id.com.au/2015/population/local-government/western-sydney-diverse-and-growing-rapidly/ viewed on 08 Dec. 2016
Irvine, J. (2015) Rich city, poor city: the rising crisis in our suburbs Sydney Morning Herald, May 10
Legacy, C. (2016) “Is there a crisis of participatory planning?” Planning Theory, 16(4) pp 425–442
Metzger, J., Allmendinger, P., and Oosterlynck, S. (2014) “The Contested Terrain of European Territorial Governance” in Planning Against the Political: Democratic Deficits in European Territorial Governance, ed. J Metzger, P Allmendinger and S Oosterlynck, Routledge
42nd AUBEA Conference 2018: Educating Building Professionals for the Future in the Globalised World
Mouffe, C. (2000) The Democratic Paradox. London, New York. VersoMouffe, C. (2005), On the Political Routledge, NYO’Neil, P. (2016) Addressing Westerns Sydney’s Job Slide, Centre for Western Sydney, Western
Sydney UniversityPark, H. (2010). NSW Planning Framework: History of Reforms, eBrief 10/2010, NSW
Parliamentary Library Research Services, SydneyPiracha A, (2009), Community wishes vs. developers' wants: ePlanning as an instrument of the
neo-liberal planning reforms in NSW Australia, Proceedings of the Computers in Urban Planning and Urban Management Conference, pp 1-12
Piracha A, (2010), The NSW (Australia) Planning Reforms and their Implications for Planning Education and Natural and Built Environment, Local Economy, 25(3), pp 240-250
a Piracha, A., Dunn, K., Goodman, R., Maginn, P., Phibbs, P., (2011), Australian Public Attitudes towards Town Planning: Towards a Research Agenda, Proceedings of the World Planning Schools Congress 2011 (Planning's Future - Future's Planning: Planning in an Era of Global (Un)Certainty and Transformation)
b Piracha, A., Williamson, W., Parolin, B., (2011), ePlanning Evolutions in Australia: A New South Wales Perspective, Proceedings of the 12th International Conference on Computers in Urban Planning and Urban Management (CUPUM)
Piracha, A. (2014), Water views, affluence and concern for sustainable transport: the case of Sydney, Australia, International Society of City and Regional Planners. Congress, pp 1297-1312
Piracha, A. (2015), eDevelopment-assessment as "smart ePlanning" for New South Wales (NSW) Australia, International Conference on Computers in Urban Planning and Urban Management, pp 273.1-273.19
Piracha, A. (2014), Water views, affluence and concern for sustainable transport: the case of Sydney, Australia, International Society of City and Regional Planners Congress, Gdynia, pp 1297-1312
Purcell, M. (2002) “Excavating Lefebvre: The right to the city and its urban politics of the inhabitant GeoJournal 58(2-3), pp 99-108
Saulwick, J., and Wade, M. (2016) Where is Sydney's housing development happening? Just look at this map Sydney Morning Herald, Dec. 13
Saulwick, J. (2016) “How Sydney's planners are using the 'Latte Line' to try and reshape the city” Sydney Morning Herald, Dec. 17
Schatz, L., Piracha, A., (2013), Investigating the motivations, rhetoric and controversy surrounding recent planning reforms in New South Wales Australia and Ontario Canada in Frontiers of Planning: Visionary Futures for Human Settlements, Colman, Jim, Gossop, Chris, China, pp 96-109
Schmitt, A. (2012). Modernity and Plato: Two paradigms of rationality. Rochester, N.Y.: Camden House.
SMH (2015) Waste facility proposal for Eastern Creek in western Sydney leaves too many unanswered questions http://www.smh.com.au/environment/waste-facility-proposal-for-eastern-creek-in-western-sydney-leaves-too-many-unanswered-questions-groups-say-20150907-gjguw5.html viewed on 15 06 2016
The Centre for Western Sydney (2015) Work, Places and People in Western Sydney, Western Sydney University, Sydney
The Daily Telegraph (2013) Study maps Sydney's great income divide, Sydney April 19Ting, I. and Bagshaw, E. (2016) HSC results 2016: Sydney divided by education 'latte line,
Sydney Morning Herald, Dec 23Urban Growth (2015) Draft Parramatta Road Urban Transformation Strategy, Sydney NSWWilliamson, W. and Ruming, K. (2015), Who’s talking, who’s listening: exploring social media
use by community groups using social network analysis, International Conference on Computers in Urban Planning and Urban Management, pp 187.1-187.22
Yamamoto, A. (2017) Why agonistic planning? Questioning Chantal Mouffe’s thesis of the ontological primacy of the political, Planning Theory: 16(4) pp 384–403
Yiftachel, O. (1998). Planning and social control: Exploring the dark side. Journal of Planning Literature, 12(4), 395-406
205.

42nd AUBEA Conference 2018: Educating Building Professionals for the Future in the Globalised World
Stakeholder engagement in Johannesburg’s Corridors of Freedom Urban Regeneration Project
Kofi Quartey1 and Kola Ijasan2
1&2School of Construction Economics and Management, University of the Witwatersrand, Johannesburg, SOUTH AFRICA
E-mails: [email protected]; [email protected]
Abstract: The purpose of this study is to investigate the inherent characteristics of key stakeholder engagement in the new corridors of freedom urban regeneration project to determine the areas of engagement that can be improved. This study proposes a snowball sampling technique to obtain a comprehensive list of key stakeholders. Interviews conducted with project planners to obtain their responsibilities and contributions in the engagement processes. Electronic questionnaires will be circulated to determine the views of key stakeholders regarding their engagement activities. Findings from literature indicate that existing stakeholder engagement protocols in the Corridors of freedom need to be redesigned to foster stronger partnerships amongst key stakeholders in future Corridors of freedom projects. There is a significant need for literature to contextualise inter-key stakeholder engagement practices to understand its implications for community participation and project success. This research does not delve too much into the influence of communities regarding the inter-key stakeholder engagements. This study has potential to influence future transit oriented developments in South African cities and other cities in a positive way to ensure even more sustainable successful urban transport planning in current top-down oriented stakeholder engagement approaches. The study takes cognisance of the need to ensure a robust inter-key stakeholder engagement amongst key stakeholders in the prevalent adopted top-down approach rather than motivating for a bottom-down participatory approach as suggested by various studies.
Keywords: Corridors of Freedom, Decision-making, Stakeholder engagement, Transit Oriented Development, Urban regeneration
1 Introduction
Transit-oriented development (TOD) is frequently cited as a planning strategy which facilitates sustainability transitions on urban and regional levels (Qvistrom & Bengtsson, 2015). The TOD concept was a rebranding of an old concept that existed in a non-classified or non-defined state (Carlton, 2007). Ebenezer Howard created a movement centred on satellite cites enabled by rail transit access. As he described in “To-morrow: A Peaceful Path to Real Reform” in 1898, and again in 1902 in his work titled “Garden Cities of To-morrow,” (Carlton, 2007). It was Peter Calthorpe however who formalised the concept of TOD in the late 1990s when he published The New American Metropolis” in 1993. It was the re-branding of an old concept. Calthorpe saw TOD as a neo-traditional guide to sustainable community planning. Many cities and regions have accepted TOD planning at a conceptual level but have not gone past this level to implement it at the practical level (Curtis, Rene and Bertolini, 2009).
42nd AUBEA Conference 2018: Educating Building Professionals for the Future in the Globalised World
Cervero (2014) stated that more than half of the world’s population faces unprecedented transport and mobility challenges. Predictions from the World Bank have also indicated that by 2030, 60 percent of the world's human population would have shifted to urban areas, while by 2050 the percentage is expected to increase to 70 percent (Cervero, 2013). Much of the shift in human population to urban areas is to occur in developing countries (Nnaemeka-Okeke, 2016; Yeh and Li, 2001). As we gradually approach the time for the manifestation of these predictions, it is becoming increasingly important for stakeholders to create partnerships and carry out robust engagement strategies that would ensure the success of bringing about convenient and efficient mobility in and around urban areas.
Since TODs are perceived as an enabler of economic activity within the public, and private sector environment and establishing a capable public transportation system requires effective inter-key stakeholder engagement (Bond, 2018; Currie, 2017). The Corridor of freedom (COF) Transit oriented development (TOD) is a form of urban regeneration. It is a form of Transit Served Real Estate development that has primarily focus on achieving transformation of cities, towns using well planned transport networks and its associated infrastructure. The corridors of freedom (COF) is currently being undertaken in Johannesburg, and has been described as "ambitious mega-project" involving the upgrade of transportation infrastructure that builds on previously constructed transport infrastructure (The University of the Witwatersrand, 2017). The COF is meant to bring freedom of movement to all ofJohannesburg’s urban population (Venter, 2016). The focus, however, is largely on the majority of non-whites who had their mobility impeded in apartheid, South Africa (Ballard et al., 2017). The significant aspect of the COF, therefore, is to overhaul the existing spatial inequalities that once existed under the rule of the Apartheid government. A corridor is a long passage that is taken to reach an intended destination. The name corridors of freedom (COF) can be metaphorically interpreted to symbolise the journey that a people who were once oppressed and segregated in a racist system are now travelling on a passage that is gradually exposing them to new economic, social and environmental opportunities (Ballard et al., 2017). The beneficiaries of the corridors of freedom are travelling on a path to their freedom which entails access to new economic opportunities, social opportunities of access to educational institutions, healthcare and recreational facilities (Roger, 2016; Venter, 2016).
This goal of freedom cannot be achieved without first engaging in effective stakeholder engagement, first amongst the key stakeholders such as project initiators, planner, investors amongst other key players. Stakeholders are people and organisations who have a stake in an issue, even though they may have no formal role in the decision-making process (Kahane et al. 2013). When urban planners, in collaboration with other stakeholders can foresee the various social, economic and environmental impacts of a proposed development, its successful execution is likely to occur (Sharifi and Yamagata, 2014).
2 Literature Review
2.1 Theoretical background of TOD
Urban developments in close proximity to transit stations are a critical component to transit success and the physical form of an urban area is dependent on the existence of strategically positioned transit nodes. The existence of transit is evident since the period of horse drawn
206. 207.

42nd AUBEA Conference 2018: Educating Building Professionals for the Future in the Globalised World
carts and when one looks back in the history of cities, villages and towns, it is evident that their developments have been shaped by the types of transits they used whether it was streetcars, automobiles, horse drawn carts or bicycles (Dittmar and Ohland, 2012). It is therefore evident that TODs are not a new thing but a re-invention of an existing thing in a modern context. The TOD concept was a rebranding of an old concept that existed in a non-classified or non-defined state (Carlton, 2007). Ebenezer Howard for example, created a movement centred on satellite cites enabled by rail transit access. As he described in “To-morrow: A Peaceful Path to Real Reform” in 1898, and again in 1902 in his work titled “Garden Cities of To-morrow,” (Carlton, 2007). It was Peter Calthorpe however who formalised the concept of TOD in the late 1990s when he published The New American Metropolis” in 1993. It was the re-branding of an old concept. Calthorpe saw TOD as a neo-traditional guide to sustainable community planning. Many cities and regions have accepted TOD planning at a conceptual level but have not gone past this level to implement it at the practical level (Curtis, Rene and Bertolini, 2009). Many of the urban design features that that we seek to restore today have long existed. These include the walkable, cyclable areas. The new challenge we face however, involves harmoniously incorporating TODs in cities that are now filled with many buses, car and motorbikes as common modes of transportation (Dittmar and Ohland, 2012).
Extensive literature in stakeholder engagement and urban regeneration tends to focus on communities as stakeholders, their involvement or a lack thereof in TODs and other development projects (Peens, 2016; Griffith, 2017; Strong, et al., 2017). Literature that has already been analysed that are similar to this study is that of Cascetta et al. (2015), Searle, Darchen and Huston (2014) and Thomas and Bertolini (2014). Elements of successful TOD planning, critical success factors and implementation are discussed by the above-mentioned scholars. However, comparisons of engagement activities and strategies in the different places such as Campagna Italy, Perth Australia, and Cape Town South Africa do not compare their local stakeholder engagement activities with the engagement activities that have taken place in other parts of the world. A study by Wey (2015) for example, revealed how the Taiwanese Taipei city council were tasked with choosing a suitable site out of seven sites to construct a new metro railway transit station. The study proposed the use of a combination of bottom-down and the top-down approach to participation (Wey, 2015).
Regarding computer-based community participation, Cohen et al. (2015) proposed the Visual Enhanced Sustainability Conversation (VESCs). Milan, (2015) proposed the use of the ENVISION tool. Hanzl (2007) discussed the role of Information Technology (IT) as a tool for citizen participation in urban planning using city model simulations and internet chat platforms such as e-society. Wang et al. (2016) also presented a two-stage Partial Least Square (PLS) to build a hierarchical linear public participation approach that is intended to make the process of participation more reliable and stable. Tarquinio and Rossi (2014) explored the use of internet technologies and web tools by FTSE Italia. According to Milan (2015), the effectiveness of stakeholder engagement with the supplementation of computer-based programs gives a higher probability of sustainable TOD implementation (Milan, 2015).The inspiration drawn from these studies stems from the need for inclusion of technology in conducting engagement activities whether it be inter-key stakeholder engagement or community participation which may increase participation (Hanzl, 2007; Millan, 2015).
42nd AUBEA Conference 2018: Educating Building Professionals for the Future in the Globalised World
Ferrilli, Saco and Blessi (2016) and Lambton (2013) discussed existing factors that constitute a hindrance to the participation of communities. Abdullah et al. (2015) analysed the process of engagement during the preparation of Kaula Lumpur’s Development City Plan (KLDCP) which revealed the achievability of comprehensive participatory planning. Amado et al. (2016) discussed the process based on the interplay between public and private sectors. The study developed a new methodology for regenerating impoverished areas in Luanda, Angola(Amado et al., 2016). Donaldson & Duplessis (2013) investigated the experiences of urban renewal programme in the development of Khayelitsha CBD in Cape Town. The study was based on a qualitative study that comprised views and perspectives of a segment of the project's stakeholders. The study concluded that the success of any programme is dependent on how well its problems are diagnosed by stakeholders (Donaldson and Duplessis, 2013). The limitation of this study, however, was that it placed more emphasis on institutions and their roles in urban regeneration without linking the impact of key stakeholder roles on community’s involvement in decision making. The study also did not provide a descriptive or illustrative data on community institutions and the nature of their collaboration with other institutions in the development of the Khayelitsha Central Business District (CBD) project. Issues in the decision-making process regarding spatial integration, economic growth and employment are aspects on which more emphasis could have been placed (Donaldson & Duplesis, 2013).
2.2 Stakeholder Engagement Models & Frameworks Various mapping models for stakeholder engagement exist in literature from other disciplines. These include writings from health sciences, environmental management, sustainability marketing, business, climate change adaptation (Kenley et al. 2013; Concannon et al., 2014; Swart, Biesbroek, and Lourenço, 2014; Ingabire et al., 2018). Estuary and shellfish management (Turek, 2014), control of alien species (Nova et al., 2018) and the deployment of electricity transmission grids (Komendantova, Vocciante and Battaglini (2015) all make use of stakeholder engagement practices as a solution to problems. Rawhouser, Cummings and Marcus (2017) 3nalyzing and empirically tested how variation in stakeholder engagement patterns can influence the process and outcomes of standard sustainability developments. Dentoni and Ross (2013) investigated the why, when, which and how multi-stakeholder engagements (MSEs) are effective actions for managers and policy-makers to deal with wicked problems in the agricultural sector. Stakeholder analysis, mapping and techniques are discussed by Krstić (2014). Similar to Nova et al. (2018), Matos and Silvestre (2013) investigated how decision-makers could better connect with stakeholders to overcome conflicting interests. O’Riordan and Fairbrass (2014) provided an analytical tool which was designed to be of practical use for business decision-makers when managing their stakeholder engagement activities in the pharmaceutical industry. Forsythe et al. (2016) analysed patient and stakeholder engagement in 50 pilot projects. Di Madaloni and Davis (2017) investigated how local community’s stakeholder is perceived in the United Kingdom. All these scholars share commonalities in their topic because of they all present principles, or engagement models and frameworks that are meant to combat issues within their respective disciplines. In the real estate context of urban regeneration, engagement has been used as a means to enhance smart growth and provide superb linkages within urban areas.
208. 209.

42nd AUBEA Conference 2018: Educating Building Professionals for the Future in the Globalised World
Table of Key Literatures on Stakeholder engagement in TOD projects
Article/ Author Case Study Country Key aspect of TOD/ Planning frameworks
Findings
Jacobson & Forsyth 2008
7 American TOD Projects
•
United States of America
Solving multiple and complex design challenges inherent inTODs will depend on the particular circumstances surrounding each project, and on theability of designers, policymakers, engineers, and local citizens to balance competingobjectives.
Deng & Nelson 2011
Recent developments in bus rapid transit: a review of the literature.
Brisbane BRTs
Curitiba, BrazilTransMilenio in BogotáOttawa, CanadaJapanChinaIndia
BRT Developments impact on Land development, technical performance and cost issues
Appropriately designed and operated BRT systems offer an innovative approach to providing a high‐quality transport service, comparable to a rail service but at a relatively low cost and short implementation time. more evidence from Asia and Europe should be gathered to enhance the understanding of the full impact of BRT
Todes 2012
Urban growth and strategic spatial planning in Johannesburg, South Africa.
Johannesburg urban areas
South Africa Potentials and challenges of Linking strategic spatial planning and infrastructure development
linking of strategic spatial planning infrastructure has common-sense appeal. It gives planners useful levers to influence urban spatial change in urban sprawl subjected cities within developing countries
Dorsey & Mulder (2013)
Ogden, Utah United States of America
Development of mass transit systems and their provision of various socio-economic and environmental benefits.
Community based input in the efforts to shape that Ogden, Utah receives less preference and therefore. Recommend that the need to create a balance amongst the interests of that of the private sector, government and the community
Lambton 2013 Montréal Canada Hindrances to effective
participation
The participation process was thus reduced to a "chance for the public to react to proposals" rather than actively participate.
traditional way of consultation presents many logistical setbacks to active participation: timing, the location of events, lack of childcare, and language barriers
42nd AUBEA Conference 2018: Educating Building Professionals for the Future in the Globalised World
Ogra & Ndebele, 2014
The role of 6ds: density, diversity, design, destination, distance, and demand management in transit-orienteddevelopment (TOD).
Johannesburg’s corridor transit-orienteddevelopment
South Africa “6Ds”: Design, Diversity, Density, and Distance, Destination, and Demand management
The application of “6Ds" through
TOD can aid in addressing current challenges that confront urban transport systems within cities.
De Sa Santos 2014
Johannesburg’s corridor transit-orienteddevelopment
South Africa Proposed urban agriculture infill/food security/ agritropolis
Production of food in the inner city would require less transportation travel time. Cost of transporting produce will decrease. May assist in developing interests in people to grow their own food gardens communally or privately
Searle, Duchen and Husten 2014
Footscray Australia. Stakeholder engagement impact on project delivery.
Lack of clear leadership roles, lack of agreements among stakeholders regarding project objectives.
It is important to undertake effective governance to ensure successful planning and delivery of TODs
Abdullah et al. 2015
Public Participation in the Kuala Lumpur Draft City Plan 2020
Kaula Lumpur
Malaysia Analysis of the public views and comments regarding the Kaula Lumpur City plan.
The process of participation that took place shows signs of improvement in participation in Malaysia
Chapman, 2015 Johannesburg (western areas
South Africa,
Evolution of spatial planning policies in Johannesburg from apartheid till present day.
Participation in 2008 was not adequate. communities were only involved at the end of the design process.
The City of Johannesburg (COJ) has made some progress since 2008 calling for community input regarding how they want their community to develop rather than professionals dictating how development is to happen.
210. 211.

42nd AUBEA Conference 2018: Educating Building Professionals for the Future in the Globalised World
Cohen et al. 2015
Aligning Public Participation to Stakeholders’ Sustainability
Phoenix, Arizona
United States
The use of Visually Enhanced Sustainability Communication (VESC) in Urban development public participation
The use of VESC aided in the successful facilitation of discussions regarding pertinent sustainability issues and embedded sustainability objectives into the project reports
Cascetta et al. 2015
Campania Italy Elements of decision-making processes in transportation systems
The quality of the decision-making process is a key factor for successful planning, which depends on how the process is structured.
planning and designing transportation systems should expressly be recognized as managing complex, multi-agent decision-making processes in which political, technical and communication abilities should be incorporated so as to design solutions which are consistent, and, at the same time, maximize stakeholders’ consensus.
Milan 2015
How participatory planning processes for transit-oriented development contribute to social sustainability
Not specified United States of America
Europe
The assistance of computer-basedtechnologies in stakeholder engagement.
The effectiveness of stakeholder engagement with the supplementation of computer-based programmes gives a higher probability for the achievement of sustainable implementation of TODs.
Wey 2015
Regarding smart growth of TOD planning in site selection formetro transit station in Taipei, Taiwan
Taipei Taiwan Fuzzy Analytic Hierarchy Process (FAHP) and Data Envelopment Analysis (DEA) model with assurance region approach is applied to select the most suitable station site from a given set of possible stationsites
42nd AUBEA Conference 2018: Educating Building Professionals for the Future in the Globalised World
Amado et al. 2016
Regeneration of informal areas: An integrated approach
Luanda Angola Partnership Model based on inclusion of state as main supporter and collaboration of major stakeholders
The partnership approach that presents a win-win situation is that where the state supports the private sector - an approach based on financial profit and social benefit.
Peens, 2016
The influence of public participation on the Corridors of Freedom policy-making process and project.
Johannesburg Empire Perth Corridor
South Africa Stakeholder engagement & Public participation
Participation was initially technocratic.
Resident mobilisation forced inclusion of public in policy process.
Participation needs to be embraced from the start and clearly incorporated into consultant’s briefs, and a variety of spaces for participation need to be provided
Bickford 2016
Transit oriented development in the South African context: an analytical review of Johannesburg's recent urban policy and strategy
Johannesburg
Cleveland
South Africa
United States of America
Focuses on TODs within the South African context by reconciling both international and local literatures.
Planning Frameworks:National Development plan, Strategic Area Framework
Not enough emphasis being placed on TOD as a process and as such the land development dynamics which have inform and enabled processes internationally are not being adequately thought through in the South African context
From reviewing literature, it is evident that there has been a shift in the focus of employing stakeholder engagement, analysis and mapping tools. It is evident that when stakeholder engagement studies began to emerge initially, case studies were analysed by means of the traditional approach. According to Rensburg (2011) the traditional form of stakeholder engagement is fragmented and limited because its focus is on managing relationships rather than building them. The new approach to stakeholder engagement however, is integrated and on-going, and it focuses more on building relationships to achieve long-term goals. The aspect of building relationships is what is lacking in the engagement initiatives of the COF regeneration project. Some case studies that seek to include technology in achieving exhibit the pursuit of modern stakeholder engagement (Miller, 2015; Wang, 2016). There are limitations to these engagements in that they fall short of being emergent and fall back into the category of the traditional form of stakeholder engagement (Rensburg, 2011). A missing factor in all these studies is the absence of linking stakeholder analysis, stakeholder mapping and categorization to the outcome of community engagements and whether these
212. 213.

42nd AUBEA Conference 2018: Educating Building Professionals for the Future in the Globalised World
engagements were successfully participatory or non-participatory in nature (Peens, 2016; Griffith, 2017; Noland et al., 2017; Strong, et al., 2017).Moreover, what the stakeholder literatures that have been discussed hitherto, do not deal with extensively is the distinction between top-down approaches and bottom-up approaches, and how to analyse the engagements of governments that are oriented towards adopting top-down approaches. Wang (2016) states that top-down approaches of engagement tend to scale faster than bottom-up engagement ways of decision-making. Bottom-up strategies are often time-consuming and more laborious to control (Wang, 2016). The argument presented by this study in this regard is that, although the top-down approach is often viewed as an approach that is not accommodative of all-inclusive engagement, participation. In a top-down approach can be conducted in a way that would somehow consider the views and opinions of community’s post inter key-stakeholder engagement (Wang, 2016). It is for this reason that the comparison of stakeholder engagement in the corridors of freedom and other projects around the world is significant. Since most studies from the literature indicate the prevalence of top-down engagement strategies, it is essential to find a solution that would help to increase effective stakeholder engagement in top-down oriented decision-making. Thesignificance of this study lies in the possibilities of deriving a means of ensuring inclusive engagement of all stakeholders in top-down engagement decision-making context.
3 Theoretical FrameworkThe stakeholders are identified as those individuals and groups that rely on the company to analyse their personal goals and on whom the company is dependent on its existence (Rhenman, 1968). Stakeholder theory consists of two main components, stakeholder engagement and stakeholder management. Stakeholder engagement is the process where stakeholders’ views on their relationships with other organisations, programmes and project are elicited (Friedman & Miles, 2006). Stakeholder management, however, deals with the analysis and identification of stakeholders and categorisation according to responsibility, power/ influence at the decision-making table. The emerging trend in the social sciences where stakeholder-oriented theories developed from various disciplines are incorporated in various works cannot be denied (Frodeman, 2010). This interdisciplinary approach proves useful in that it provides a broader understanding of specific research problems and creates a more effective way to be fully engaged in the research topic (Frodeman, 2010). Stakeholder engagement, which is one of the components of the stakeholder theory, has risen on the agenda of public relations in the practical sense and forms but an aspect of stakeholder theory. The emergence of the concept stakeholders occurred in the 1960’s from Stanford Research Institute. It emerged at a time when there was a desperate need for managers to understand the concerns of shareholders, employers, lenders and suppliers to develop objectives that stakeholders could support (Luoma-aho, 2015). According to Collins, Kearins and Roper (2005) stakeholder analysis and engagement emanate from stakeholder theory. Friedman & Miles (2006) define stakeholder analysis as a technique that is used to identify and assess the influence and importance of key people, communities or organisations that may impact the success of an activity or a project. Stakeholder analysis forms an essential part of developing a useful engagement plan.
3.1 Theorized perspectives
Stakeholder engagement is an under-theorised area (Greenwood, 2007; Grigore et al., 2017). Amidst this under-theorisation however, many scholars and organisations have proposed
42nd AUBEA Conference 2018: Educating Building Professionals for the Future in the Globalised World
various stakeholder engagement strategies. Fernando and Lawrence (2014) justify the existence of various engagement strategies explaining that the inadequacy of a single theory to explain the relationship between organisations and the society within which it operates. Fernando and Lawrence (2014) advocate for more multi-theoretical studies to contribute to stakeholder theory and stakeholder engagement. Fernando and Lawrence (2014) in constructing an intergrated theoreitical framework for corporate social responsibility discuss two other theories that complement the stakeholder theory. These are the legitimacy theory and institutional theory. Their study argues that these three theories should be seen as complementary rather than competing with each other. Kaler (2003) however, rejects a stakeholder engagement typology that is based on the division of stakeholder theories into normative, descriptive and instrumental. Van Dyk & Fourie (2012) also state that there are five dimensions be taken into consideration when 9nalyzingstakeholder engagement; 1) the use of open communication, 2) commitment, 3) trust, 4) satisfaction and 5) co-operation. These are the presence of these five dimensions in the deliberation practices amongst stakeholders that will be used in this dissertation. They will serve as criteria that will help to determine the nature of stakeholder engagement.
3.2 Applicability to Research
The applicability of this theory to this research topic lies in the fact that various scholars. Cascetta et al. (2015) have developed Freeman’s theory and have either enhanced it or have applied it to their study to prove and test the benefits of conducting stakeholder engagement. The stakeholder theory asserts that a firm exists to serve its stakeholders apart from achieving its 9nalyzing9tion target interests (Achterkamp & Vos, 2008). This chapter discusses the techniques that will be employed to (1) generate an initial list of stakeholders, (2) to identify the interests of each stakeholder and compare their level of power, and (3) depict how stakeholders related with and influenced each other in decision-making processes through communication processes. Stakeholder engagement although synonymous with public engagement is not limited to decisions involving public organisations; since it is recognizedas a useful tool that is also applicable in the management decisions in a firm, evidently it can be adapted to inter-key stakeholder engagements.
3.3 Stakeholder Analysis
A stakeholder analysis enables the 9nalyzing9tion of stakeholders regarding their interests and potential influence (Marega and Uratarič, 2011). The most efficient way to get a clear picture of who are the relevant stakeholders is to carry out a stakeholder analysis. Stakeholder analysis involves identifying all relevant stakeholders, to differentiate between different categories of stakeholders and to investigate the relationships between the project and stakeholders and among stakeholders themselves (Cundy et al. 2013).
214. 215.

42nd AUBEA Conference 2018: Educating Building Professionals for the Future in the Globalised World
Figure 1. Methodological steps for Stakeholder Analysis (Source: Marega and Uratarič, 2011)
3.3.1 Stakeholder identification
Stakeholder identification forms an integral part of stakeholder management. It is needful to devise an approach that is systematic when seeking to identify stakeholders at early stages so that engagement activities can be planned appropriately (Mathur et al., 2007). The process of identifying stakeholders is useful for answering the first research question of this study (To who are the relevant stakeholders of the COF according to South African policy and who they are in the COF stakeholder deliberations that have taken place over the past five years). There are various ways that stakeholder can be identified. One of the ways is a snowball sampling technique where referrals are made by the relevant interviewees to the interviewer as to who the other members of the stakeholders are (Reed et al., 2009).
42nd AUBEA Conference 2018: Educating Building Professionals for the Future in the Globalised World
Figure 2. Schematic representation of rationale, typology and methods for stakeholder analysis. Source:
(Reed et al., 2009).
3.3.2 Stakeholder categorisation
Many techniques for mapping stakeholders exist. Some method of analyzing stakeholders is stakeholder mapping (Schmeer, 2000). The interests of stakeholders and their level of power or influence in a project can be depicted on a power/ interest grid (Ackerman and Eden, 2011). Stakeholders are plotted on a matrix/grid which has two key attributes of stakeholders, one characteristic on the y-axis and another attribute on the x-axis (Brouwer et al., 2013). Stakeholders may be mapped on an importance/influence matrix, which analyses stakeholders impact vs priority, power vs interest, readiness vs power, support vs opposition, or constructive/destructive matrix, problem-frame map, or policy attractiveness/stakeholder capability grid (Ackerman and Eden, 2011). This study will focus mainly on the power vs interest grid because it is essential to understand the power that each stakeholder possesses since it brings the focus on empowering or controlling the impact of the different stakeholders during the engagement.
216. 217.

42nd AUBEA Conference 2018: Educating Building Professionals for the Future in the Globalised World
\
4 Research methodology 4.1 Research Methods
The data collection procedure intends to obtain primary and secondary information from key stakeholders that are involved in COF project currently underway in Johannesburg. Interviews shall be used to get stakeholders views about participation in TOD and also the nature of each of their roles in its participatory process. Moreover, public participation documents shall be received from these stakeholders. Collection of data is communication that involves the transfer of data from the respondent to the researcher (Fellows & Liu, 2015). This research shall make use of existing published research studies (secondary data) such as journal articles, newspaper articles, government reports and policy documents that deal with urban regeneration and public participation, community participation. The research method employed in this study shall be the mixed methods approach because it draws from the strength of both qualitative and quantitative research. The quantitative aspect emerges from the primary data shall be obtained is through in-depth interviews. In-depth interviews create the opportunity to get information about the attitudes, perceptions, expectations, and feelings where the interviewer guides the process (Oppenheim, 2000). Interviews shall be targeted at representatives or key informants, also referred to as "gatekeepers" from both the governmental and non-governmental agencies involved in the COF TOD project. This shall include the representatives of the JDA and other connected organisations and individuals. Creswell (2017) stated that gatekeepers are deemed to be well informed and often points to other relevant sources of information. Members of communities are regarded as stakeholders and interviews shall also be targeted at people that have first-hand-knowledge of the COF project, are or have been actively involved in engaging with stakeholders. The interviews shall be recorded then the data obtained shall be analysed, interpreted, transcribed and incorporated in the dissertation. Interview questionnaire sheet shall be administered to key stakeholders for collecting data to obtain answers to a series of question. This questionnaire developed for this study will take advantage of open-ended questions (see Appendix C). The
SubjectsLow Power High interest (could be positive or negative)Management could encourage conditions to increase the power of positive and convert them to players or neutralize negative
Players High PowerHigh interest (could be positive or negative)Significant stakeholders who deserve sustained management attention
CrowdLow power, Low interest Can be seen as potential rather than actual stakeholdersInterest and power could be raised, but unlikely to be worth management time/effort restored.
Context SettersHigh power, low interest Can influence the future overall contextManagement should seek to raise awareness and develop positive interest and convert them into players
Power
Inte
rest
Figure 3. Power interest grid (Source: Ackerman and Eden 2011).
42nd AUBEA Conference 2018: Educating Building Professionals for the Future in the Globalised World
use of this type of questionnaire for this study since it allows respondents to respond to answers in their own words. This allows a researcher to gain more insight into the way in which the respondent is feeling. The method by which stakeholders shall be identified has been extensively discussed in the theoretical framework. Moreover, the quantitative aspect of this study will use the information obtained from the literature, policy documents and the open-ended interviews to generate the following matrices and flow diagrams in a quantitative form:
• Stakeholder Map• Stakeholder Profiles• Stakeholder Register• Stakeholder influence/interest matrix• power/interest matrix• Communications Plan
The purpose of generating these is to reveal the engagement patterns that are characteristic of the COF and compare them with that of other engagement strategies in TOD projects in metropolitan cities around the world with purposes of identifying aspects of engagement that can be improved upon for better community participation in top-down participatory approaches.
4.2 Sampling
Respondents shall be determined using a snowball sampling through information obtained from the City of Johannesburg Municipality and affiliated stakeholders, internet searches, documented information that makes referrals to other key stakeholders of the COF project. Stakeholders identified will range from community representatives to employees in various designated organisations involved in the COF initiative. Snowball sampling is used by researchers when the sample of the population being studied is very rare or limited to a sub-group. The sub-group, in this case, are key stakeholders. All interviews shall begin from the City of Johannesburg (COJ) and JDA for reasons that they are the organisation spear-heading the COF project. It is anticipated that referrals to key stakeholders by the COJ and JDA will be made. Organisations will then also refer to other stakeholders significant to this study fulfilling the snowballing process. Snowball sampling occurs in instances where a researcher aims to use research participants to recruit other participants for a test or examination. In research where potential participants are difficult, to find snowball sampling is used. The reasoning behind the name "snowball sampling" is because in theory once a snowball rolls it accumulates in size by gathering more snow as it rolls along.
5 Interim ResultsIt is important to note that this study is a work in progress. Feld data for this study is yet to be collected as ethical clearance for data collection phase is currently pending. Regardless, findings generated from the extensive review of various literature thus far indicate the following: 1) there is a prevalent lack of comprehensive literature on key stakeholder engagements in mega-project regeneration literature, especially in the African context. 2) Africa in general and South Africa can improve and increase stakeholder engagement effectiveness and efficiency by patronising computer-based participation tools. 3) Regarding stakeholder engagement amongst key stakeholders, there needs to be more forging of
218. 219.

42nd AUBEA Conference 2018: Educating Building Professionals for the Future in the Globalised World
partnerships to strengthen the quality of decisions that are made and also to increase the innovative contributions that are made regarding the planning, design and implementation of the projects. The more partnerships are formed, the more ideas could be generated, thus creating a situation where the project stands to be more all-inclusive to cater for the needs of the masses of transit users. 4) Regarding community participation, the city of Johannesburg municipality should consider patronising user-friendly computer-based participation toolswhich would help to ameliorate the marginalisation of poor community members in decision-making process. installing 12-hour operational comments and responses participation digital platforms could prove beneficial to all stakeholders. Moreover, as the world is shifting towards being more technology friendly, and with the extensive use of mobile phones, data, and wireless internet connections, the traditional way of engaging stakeholders is slowly fading away. Johannesburg is becoming a smart city with these could make use of platforms that could ensure that all citizens engage in decision making (Milan, 2015). These communication technologies could prove beneficial in increasing participation in stakeholder engagement activities. This could eliminate the inability of stakeholders to forge partnerships or to participate in decision-making due to their inability to physically attend decision-making meetings (Hanzl, 2007). These platforms would serve to receive the comments and responses of the various community members that wish to voice their views and opinions, delights and concerns regarding future COF projects. Accompanying this would require trained personnel or volunteers in the form of students who would be employed by the COJ municipality to collect the data from the digital platforms, analyse them and present their findings in statistical form. The statistics generated from the views and opinions would then aid in determining the outcome of the TOD projects.
6 ConclusionThe topic of stakeholder engagement is extensively interrogated in various disciplines such as the health sciences, environmental conservation and management, pharmacology, mega project construction and others (Dentoni and Ross, 2013; Kenley et al 2013; Concannon et al., 2014; Komendantova, Vocciante and Battaglini, 2015; Ingabire et al., 2018; Swart, Biesbroek, and Lourenço, 2014; O’Riordan and Fairbrass, 2014; Forsythe et al., 2016). Most stakeholder engagement TOD literature tend to focus on community-based stakeholder engagement, rather than inter key-stakeholder engagement (Cohen et al., 2015; Wey, 2015; Peens, 2016; Griffith, 2017; Strong, et al., 2017). Undertaking a robust stakeholder engagement in decision-making is the key to achieving socio economic and environmental sustainability. Decisions that are made in real estate transport-based regeneration projects needs to be heavily stakeholder oriented (The University of the Witwatersrand, 2017). In a top down approach, the key decision makers must engage effectively with each other, and key community representatives such as ward leaders and the like. Deficiencies in stakeholder satisfaction is evident in both developed and developing countries as there is a cry for more accountability and sustainable long-term partnerships. The Corridors of freedom mega project has been implemented to bring about liberation to marginalized communities affected by apartheids segregation. The Journey to freedom of access via transit should rather begin with a participatory approach in decision-making from the onset. This must be mandatory inthe design, implementation and operational phases. Apart from the lack of comprehensive literature on key stakeholder engagements in mega-project regeneration literature, the nature of participation amongst key stakeholders has also not been sufficiently investigated in other Stakeholder engagement literature from other disciplines. There is a need for literature to investigate the engagement of key stakeholders amongst each other in top-down engagement
42nd AUBEA Conference 2018: Educating Building Professionals for the Future in the Globalised World
contexts. The studies that have been reviewed also do not sufficiently investigate whether or not and how the way that engagement activities in stakeholder engagements amongst key stakeholders has a bearing on the outcome of community participation. There is also a lack of comparisons made in comparing other metropolitan cities’ stakeholder engagement strategies around the world to identify the strengths and weaknesses that can be used to create a new within the global context, and even an engagement strategy that patronises the use of technology for stakeholder engagement in the developing world.
7 References Achterkamp, M.C. and Vos, J.F., 2008. Investigating the use of the stakeholder notion in project
management literature, a meta-analysis. International Journal of Project Management, 26(7), pp.749-757.
Ackermann, F. and Eden, C., 2011. Strategic management of stakeholders: Theory and practice. Long range planning, 44(3), pp.179-196.
Amado, M.P., Ramalhete, I., Amado, A.R. and Freitas, J.C., 2016. Regeneration of informal areas: An integrated approach. Cities, 58, pp.59-69.
Ballard, R., Dittgen, R., Harrison, P. and Todes, A., 2017. Megaprojects and urban visions: Johannesburg’s Corridors of Freedom and Modderfontein. Transformation: Critical Perspectives on Southern Africa, 95(1), pp.111-139.
Brouwer, J.H., Hiemstra, W., van Vugt, S.M. and Walters, H., 2013. Analysing stakeholder power dynamics in multi-stakeholder processes: insights of practice from Africa and Asia. Knowledge Management for Development Journal, 9(3), pp.11-31.
Collins, E., Kearins, K. and Roper, J., 2005. The risks in relying on stakeholder engagement for the achievement of sustainability. Electronic Journal of Radical Organisation Theory, 9(1), p.81.
Creswell, J.W., 2013. Research design: Qualitative, quantitative, and mixed methods approaches.Sage publications.
Cervero, R., 2013. Linking urban transport and land use in developing countries. Journal of Transport and Land Use, 6(1), pp.7-24.
Concannon, T. W., Fuster, M., Saunders, T., Patel, K., Wong, J. B., Leslie, L. K., & Lau, J. (2014). A systematic review of stakeholder engagement in comparative effectiveness and patient-centered outcomes research. Journal of general internal medicine, 29(12), 1692-1701.
Cohen, M.C., 2015. Aligning Public Participation Processes in Urban Development Projects to the Local Context (Doctoral dissertation, Arizona State University).
Crotty, M., 1998. Interpretivism: For and against culture. M. Crotty, The foundations of social research: Meaning and perspective in the research process, pp.66-78.
Deng, T. and Nelson, J.D., 2011. Recent developments in bus rapid transit: a review of the literature. Transport Reviews, 31(1), pp.69-96.
De Sa Santos, N., 2014. Creating Urban Agriculture in the Corridors of Freedom-Case of the Turffontein Node.
Di Maddaloni, F. and Davis, K., 2017. Project manager’s perception of the local communities’stakeholder in megaprojects. An empirical investigation in the UK. International Journal of Project Management.
Dittmar, H. and Ohland, G. (2012). The new transit town:best practices in transit-oriented development. Washington, D.C.: Island, p.5.
Donaldson, R. and Du Plessis, D., 2013. The urban renewal programme as an area-based approach to renew townships: The experience from Khayelitsha’s Central Business District, Cape Town. Habitat International, 39, pp.295-301.
Fellows, R.F. and Liu, A.M., 2015. Research methods for construction. John Wiley & Sons.Ferilli, G., Sacco, P.L. and Blessi, G.T., 2016. Beyond the rhetoric of participation: New challenges
and prospects for inclusive urban regeneration. City, Culture and Society, 7(2), pp.95-100.
220. 221.

42nd AUBEA Conference 2018: Educating Building Professionals for the Future in the Globalised World
Fernando, S. and Lawrence, S., 2014. A theoretical framework for CSR practices: integrating legitimacy theory, stakeholder theory and institutional theory. Journal of Theoretical Accounting Research, 10(1), pp.149-178.
Griffith, J., 2017. Equitable Access to Public Transport: Corridor Plans for Transit-Oriented Development in Soweto, South Africa and Boston, Massachusetts Compared. Journal of Comparative Urban Law and Policy, 1(1), p.5.
Hanzl, M., 2007. Information technology as a tool for public participation in urban planning: a review of experiments and potentials. Design Studies, 28(3), pp.289-307.
Ingabire, C.M., Rulisa, A., Van Kempen, L., Muvunyi, C., Koenraadt, C.J., Van Vugt, M., Mutesa, L., Van Den Borne, B. and Alaii, J., 2015. Factors impeding the acceptability and use of malaria preventive measures: implications for malaria elimination in eastern Rwanda. Malaria Journal, 14(1), p.136.
Jacobson, J. and Forsyth, A., 2008. Seven American TODs: Good practices for urban design in transit-oriented development projects. Journal of Transport and Land Use, 1(2).
Kahane, D., Loptson, K., Herriman, J. and Hardy, M., 2013. Stakeholder and citizen roles in public deliberation. Journal of Public Deliberation, 9(2).
Kaler, J., 2003. Differentiating stakeholder theories. Journal of Business Ethics, 46(1), pp.71-83.Keneley, M., O’Toole, K., Coffey, B. and MacGarvey, A., 2013. Stakeholder participation in
estuary management: the development of Victoria’s Estuary Entrance Management Support System. Australasian Journal of environmental management, 20(1), pp.49-62.
Komendantova, N., Vocciante, M. and Battaglini, A., 2015. Can the BestGrid process improve stakeholder involvement in electricity transmission projects? Energies, 8(9), pp.9407-9433.
Krstić, N., 2014. Stakeholder management from the business perspective. Megatrend revija, 11(2), pp.165-182.
Lambton, P., 2013. Collaborative Planning Processes for Transit-Oriented Development. Supervised research project at McGill University.
Mathur, V.N., Price, A.D., Austin, S.A. and Moobela, C., 2007. Defining, identifying and mapping stakeholders in the assessment of urban sustainability.
Matos, S. and Silvestre, B.S., 2013. Managing stakeholder relations when developing sustainable business models: the case of the Brazilian energy sector. Journal of Cleaner Production, 45,pp.61-73.
Milan, B.F., 2016. How participatory planning processes for transit-oriented development contribute to social sustainability. Journal of Environmental Studies and Sciences, 6(3), pp.520-524.
Nnaemeka-Okeke, R., 2016. Urban Sprawl and Sustainable City Development in Nigeria. Journal of Ecological Engineering, 17(2).
Ogra, A. and Ndebele, R., 2014. The role of 6Ds: density, diversity, design, destination, distance, and demand management in transit oriented development (TOD).
Oppenheim, A.N., 2000. Questionnaire design, interviewing and attitude measurement.Bloomsbury Publishing.
Parés, M., Bonet-Martí, J. and Marti-Costa, M., 2012. Does participation really matter in urban regeneration policies? Exploring governance networks in Catalonia (Spain). Urban Affairs Review, 48(2), pp.238-271.
Peens, B.C., 2016. The influence of public participation on the Corridors of Freedom policy-making process and project: the case of Empire-Perth Development Corridor (Doctoral dissertation).
Qviström, M. and Bengtsson, J., 2015. What kind of transit-oriented development? Using planning history to differentiate a model for sustainable development. European Planning Studies, 23(12), pp.2516-2534.
Reed, M.S., Graves, A., Dandy, N., Posthumus, H., Hubacek, K., Morris, J., Prell, C., Quinn, C.H. and Stringer, L.C., 2009. Who’s in and why? A typology of stakeholder analysis methods for natural resource management. Journal of environmental management, 90(5), pp.1933-1949.
Rogerson, J.M., 2016. Tourism geographies of the past: The uneven rise and fall of beach apartheid in South Africa. In Celebrateacenturyofgeography: Proceedings of the Centenary
42nd AUBEA Conference 2018: Educating Building Professionals for the Future in the Globalised World
Conference of the Society of South African Geographers, Stellenbosch: Society of South African Geographers (pp. 212-218).
Schmeer, K., 2000. Stakeholder analysis guidelines. Policy toolkit for strengthening health sector reform, 2, pp.1-43
Sharifi, A. and Yamagata, Y., 2014. Resilient urban planning: Major principles and criteria. Energy Procedia, 61, pp.1491-1495.
Soweto Urban. (2018). Rea Vaya bus driver recruitment underway | Soweto Urban. [online] Available at: https://sowetourban.co.za/17385/rea-vaya-bus-driver-recruitment-underway/ [Accessed 23 Jul. 2018].
Swart, R., Biesbroek, R. and Lourenço, T.C., 2014. Science of adaptation to climate change and science for adaptation. Frontiers in environmental science, 2, p.29.
Thanh, N.C. and Thanh, T.T., 2015. The interconnection between interpretivist paradigm and qualitative methods in Education. American Journal of Educational Science, 1(2), pp.24-27.
The Exchange Lofts. (2018). The Exchange loft development links to the Corridors of Freedom project. [online] Available at: http://exchangelofts.co.za/development-overview/corridors-of-freedom/ [Accessed 23 Jul. 2018].
The University of the Witwatersrand, J. (2018). 2017-08 – Corridors of freedom and transformation through transit – Wits University. [online] Wits.ac.za. Available at: https://www.wits.ac.za/news/latest-news/research-news/2017/2017-08/corridors-of-freedom-and-transformation-through-transit.html [Accessed 20 May. 2017].
Thomas, R. and Bertolini, L., 2014. Beyond the case study dilemma in urban planning: using a meta-matrix to distil critical success factors in transit-oriented development. Urban Policy and Research, 32(2), pp.219-237.
Thomas, R., Pojani, D., Lenferink, S., Bertolini, L., Stead, D. and van der Krabben, E., 2018. Is transit-oriented development (TOD) an internationally transferable policy concept? Regional Studies, pp.1-13.
Turek, D., 2014. Stakeholder Engagement for the Rhode Is-land Shellfish Management Plan: A Social Network Analysis. University of Rhode Island.
Venter, C., 2016. Assessing the potential of bus rapid transit-led network restructuring for enhancing affordable access to employment–The case of Johannesburg’s Corridors of Freedom. Research in Transportation Economics, 59, pp.441-449.
Wang, A., Hu, Y., Li, L. and Liu, B., 2016. Group Decision Making Model of Urban Renewal Based on Sustainable Development: Public Participation Perspective. Procedia Engineering, 145, pp.1509-1517.
Wey, W.M., 2015. Smart growth and transit-oriented development planning in site selection for a new metro transit station in Taipei, Taiwan. Habitat International, 47, pp.158-168.
Yeh, A.G.O. and Li, X., 2001. A constrained CA model for the simulation and planning of sustainable urban forms by using GIS. Environment and Planning B: Planning and Design, 28(5), pp.733-753.
222. 223.

42nd AUBEA Conference 2018: Educating Building Professionals for the Future in the Globalised World
Potential of New Zealand trades to export prefabricated timber panels
Wajiha Shahzad1 and Mohammed Razeen2
1&2School of Engineering and Advanced Technology, Massey University,Auckland, 0632, NEW ZEALAND
E-mails: [email protected]; [email protected]
Abstract: Recent analysis reveal that New Zealand forestry can enormously contribute to country’s economy through additional wood processing. According to Forest Owners Association(FOA) 53% of timber grown in New Zealand is exported to different countries in form of raw timber logs. This timber is then used by the importing countries for various purposes including building panels. If New Zealand start exporting prefabricated timber panels for manufactured houses instead of raw timber logs, this can increase the domestic wood processing business as well as flourish the local prefabrication industry that struggles due to small country size. This research paper therefore reviews the export potential of prefabricated timber panels for manufactured houses also known as packaged or flatpack houses. The research has explored the constraints faced by the trades, that hinder the manufacturing and export of value added timber products i.e. building panels.Additionally, the study has investigated the potential solutions that can address the identified constraints and help increase the domestic processing businesses. An industry wide survey was conducted to collect data from building manufacturers, prefabricators and timber trades including forest growers and exporters. Analysis of data revealed that raw material and skills required for prefabricating timber panels are available in New Zealand. However, there was a common recurring criticism for lack of support from the government. Government level assessment of export potential, feasibility study for this business model and presence of proper trade theory for engineered timber and prefab sector can help thrive New Zealand timber manufacturing industry.
Keywords: export, New Zealand, panels, prefabrication, timber
1 Introduction
Timber is a significant industry of New Zealand with gross income of $5 billion/annum,creating 20,000 direct employments and contributing 3% to country’s Gross Domestic Product (GDP). In 2017, $2.41 billions of softwood logs were exported beating all the previous records. Wood availability in country is projected to increase to 35 million cubic meters in next two years (MAF, 2010; Woodco, 2012). This will require marketing an extra 7 million cubic meters of logs without compromising expectations of investors and stakeholders. It is a known fact that increase in supply of a product without commensurate increase in market demand leads to weaker product price (A. Katz, 2013). Currently New Zealand exports 53% of timber as raw logs and 47% is processed in New Zealand. This study forms basis for making use of full potential of current and future projected timber growth by converting timber in to a value-added product i.e. prefabricated timber panels for manufactured houses, instead of exporting raw timber logs. This notion can have multiple benefits for New Zealand, including: boost in domestic timber processing businesses, wider market for prefab manufacturers that can lead to more investment in prefabrication sector, shift from mundane traditional construction to technologically
42nd AUBEA Conference 2018: Educating Building Professionals for the Future in the Globalised World
advanced manufacturing, increased demand of timber products to balance anticipated increase in supply, more jobs creation and better financial returns.
The aim of this study was to examine the potential of prefabricated timber panels that can be exported to different countries that can have a positive impact on New Zealand’s economy. To achieve the aim of this study following research objectives were developed:
1. To investigate the current state of New Zealand’s timber and prefabrication industry to identify its potential to export prefabricated timber panels.
2. To explore the constraints that are hindering New Zealand trades to export prefabricated timber panels to international market.
3. To examine the potential solutions that can address the identified constraints and allow for export of value added timber products.
The scope of this study was limited to the New Zealand timber and prefabrication industry. Prefabricated timber panels used for manufactured houses also known as kit-set or flat pack homes is the only value-added timber product investigated in this study. Since the study included learning about the trades, most of the study participants refused to share their financial credibility on export details due to the small size and competitive nature of industry. Hence inability of collecting real time data became a limitation of this study.
2 Prefabrication in Context
Prefabrication of building components often known as “Prefab’ is defined as a rather newconstruction approach, in which bulk of building components are manufactured in remote offsite location for quick onsite assembly (Shahzad et al., 2015). Prefabricationtechnology is often misinterpreted and suffers from historical misunderstandings like poor quality and temporary buildings that provides one-size-fits-all solution (Bell and Southcombe, 2012). These misperceptions are major impediment to stakeholder’s acceptance of prefabrication and subsequent success in New Zealand (Shahzad, 2016; Laing and Edge 2000). According to Bell (2009), prefabrication can be viewed as a system that bundles products and services and pre-pack them for delivery to the clients.
It is a very beneficial concept that offers substantial advantages including but not limited to cost saving, time saving, better quality product, improved health and safety and enhanced project and organisation level productivity (Cook, 2005; Kaufmann and Remick, 2009).
2.1 Prefabricated houses as industrialised goodsIndustrialised prefabricated houses are quite different from traditionally built houses andhave been proven to be successful in various parts of the world (Laing and Edge, 2000).Laing et. al. (2001) claims that standardizing the construction process can create value for the consumers, which is one of the essential goals of marketers. The concept of industrialised kit-set houses is not new, Aladdin Ready-Cut Houses was founded in US in 1906. Between 1908 to 1940, Sear Roebuck & Co. sold around 100,000 kit-set houses using their catalogues. These house kits were delivered by mail and each kit included lumber, nails, shingles, windows, doors, hardware, house paint and instructions to assemble (Arieff and Burkhart, 2002). In later years, the prefabricated houses lost their charm owing to its inability to deliver bespoke designs (Scofield et al., 2009).
224. 225.

42nd AUBEA Conference 2018: Educating Building Professionals for the Future in the Globalised World
It is noted that decision making process for purchasing prefabricated houses involve a lot of time, effort, and participation (Koklič and Vida, 2009). Another study (Cooke andFriedman, 2001) reports that customers consider price as an indicator of quality of prefabricated houses. Prefabricated houses being less costly compared to traditionallybuilt houses are often perceived as low-quality housing.
2.2 Prefabricated housing in New ZealandNew Zealand has very long history of prefabricated houses. James Busby first arrived in Waitangi (New Zealand) in 1833, he brought the treaty house with him in form of a kit-set home. Other prominent early prefabricated houses include Auckland Governor’s house and Chief Justice Martin’s house in Judges Bay (Bell and Southcombe, 2012). 1920 a factory was established in Frankton, that could produce components for a house in a day and a half, which were then transported by rail around the North Island for assembly at site by just two people in two weeks’ time (Bell and Southcombe, 2012). Down the track, three factors dented uptake and acceptance of prefabrication in New Zealand including: 1978 recession, design and manufacture shortcomings that didn’t allow for enough customization to meet the changing client demands, and sociocultural issues around communication and marketing. An overall lack of financing, marketing and customer awareness has caused the demise of many prefabricated businesses in New Zealand and the loss of many innovative systems to the construction industry in New Zealand (Bell and Southcombe, 2012).
2.3 Potential benefits of prefabrication to be realised by New ZealandUnfortunately, New Zealand has not fully realized the potential of this valuable technology (Shahzad et al., 2015). In one of the recent studies (Shahzad 2018), it was observed that use of prefabricated construction in New Zealand saves up to 21% of projects cost and saves 47% of time required for project completion, resulting in 10% improvement in project productivity. Uptake of manufactured houses is acknowledged as the future of New Zealand construction industry in order to make the housing affordable. By industrialising the house production, New Zealand with more availability of timber, can industrialise the prefabrication production and potentially trade with different countries. This will not only benefit the domestic construction industry by improving the supply of affordable housing but will also boost the country’s potential to export value added timber products to global market. In New Zealand, much of the debate surrounding the use of processing incentives and restriction of raw material exports has been focussed on the forest industry (Gilbert, 2000). New Zealand has a tendency to export unprocessed logs rather than value added products (Gilbert, 2000). “Lately timber producing countries have severely curtailed log exports to stimulate wood processing at home. This force wood-based enterprises in Japan and other log importing countries to identify, evaluate and implement several adjustment strategies for their survival. It also implies significant industry realignment and new competitive relationships for the timber companies in Indonesia, Malaysia and Philippines” (Laarman, 1984). Many countries that depend on export of various raw materials, the policies are designed to restrict these exports. It is understood that if a country exports most of their raw materials then the country is somehow not performing to their full potential.
2.4 Timber, trade, employment and export of New ZealandCurrent growth of forest harvests is New Zealand has been brought about by the steady rate of planting that took place from 1980 to mid-1990. These plantings have given rise to increased wood availability. Which has contributed to the rise in harvests from 20.3 million cubic metres in 2007 to 27.5 million cubic metres in 2012 (MAF, 2013). This
42nd AUBEA Conference 2018: Educating Building Professionals for the Future in the Globalised World
increase was predicted in early 2000 (MAF, 2000), but there has been limited interest in processing this resource domestically. Owing to limited domestic demand, forest growers took advantage of opportunities offshore (China, Russia, Austria, Korea & Vietnam) (A. Katz, 2013). Half of this harvest is exported as aw timber logs (MAF, 2012). The Woodscape research indicates that there are pro table processing opportunities and increasing the scale increases profitability in almost all cases. These findings highlight the importance of markets − increasing your scale only works if you can sell the entire output (Evison, 2013). It is clearly understood that New Zealand has a trend to export more unprocessed timber logs rather than adding value to it. In other countries the scenario is different. Indonesia has been utilising export restriction on unprocessed wood to encourage domestic producing. But, how far the restriction of raw wood logs be an appropriate policy to increase the level of in-house processing is still a question mark.
2.5 Export potential assessmentBy year 2022, the forest industry in New Zealand will be harvesting an additional 10 million cubic metres of logs, with a potential annual harvest of 36 million cubic metres. If all this harvest increase is exported as logs, the industry would generate an additional $1.29 billion in export revenue by year 2022. By processing more of the harvest and manufacturing a range of higher-value products, the industry could increase export revenue by $6.2 billion to generate annual export earnings of $12.3 billion by year 2022. This is more than double the $4.9 billion in export earnings in year 2011. (Kantz, 2012).
Export of prefabricated panels is supported by an extensive supply chain, which include sawmills, timber merchants, joinery manufacturers, which supply wooden doors, windows, and other components; and suppliers of other building products such as metal roofing, windows and insulation materials. A study on potential export revenues Andres Katz (2012) states “The analysis showed export revenues increasing from $4.8 billion to $12.3 billion, by marketing a larger quantity of wood and increasing the quantity and value of wood processing. This will require the industry to expand into new product areas and participate in more sophisticated, higher-valued building applications where currently engineered steel and concrete based products are used. In addition, it was assumed that the industry would capitalise on the potential demand for ‘green’ wood chemicals and create additional value from what is an under-utilised part of the resource”. Diversifying the economy and broadening the export base towards high growth sectors is critical for future development and poverty alleviation (Kabir, August 2016). Export potential assessment helps in assessment of export opportunities and increasing the share in the world trade by Export Potential Index (EPI) and Market Attractive Index (MAI).
2.6 Non-tariff barriers and export marketNon-tariff barriers are trade barriers such as regulations or government policies. These non-tariff barriers are the rules that makes it difficult or costly to export a product to a market. World Trade Organisation (WTO) negotiations aim to reduce trade barriers that distort and inhibit international trade. While there has been significant success in lowering tariff barriers, a simultaneous rise in non-tariff barriers have also been reported (APEC, 1999; Andres Katz, 2008). New Zealand has a long history of regulation and intervention in trade, and the forestry sector is no exception. During the period from 1962 until early 1980’s emphasis was laid to encourage the exports as it became clear that the plantations established earlier in the century would in fact be surplus to domestic requirements. From 1985 came the deregulation of the industry and the removal of export incentives. The debate over export restrictions became a major topic of debate again in 1993. The export restrictions had a possibly positive effect of assurance of continuity of domestic timber supply and prevention of shortages caused by abnormal foreign demand (Gilbert, 2000).
226. 227.
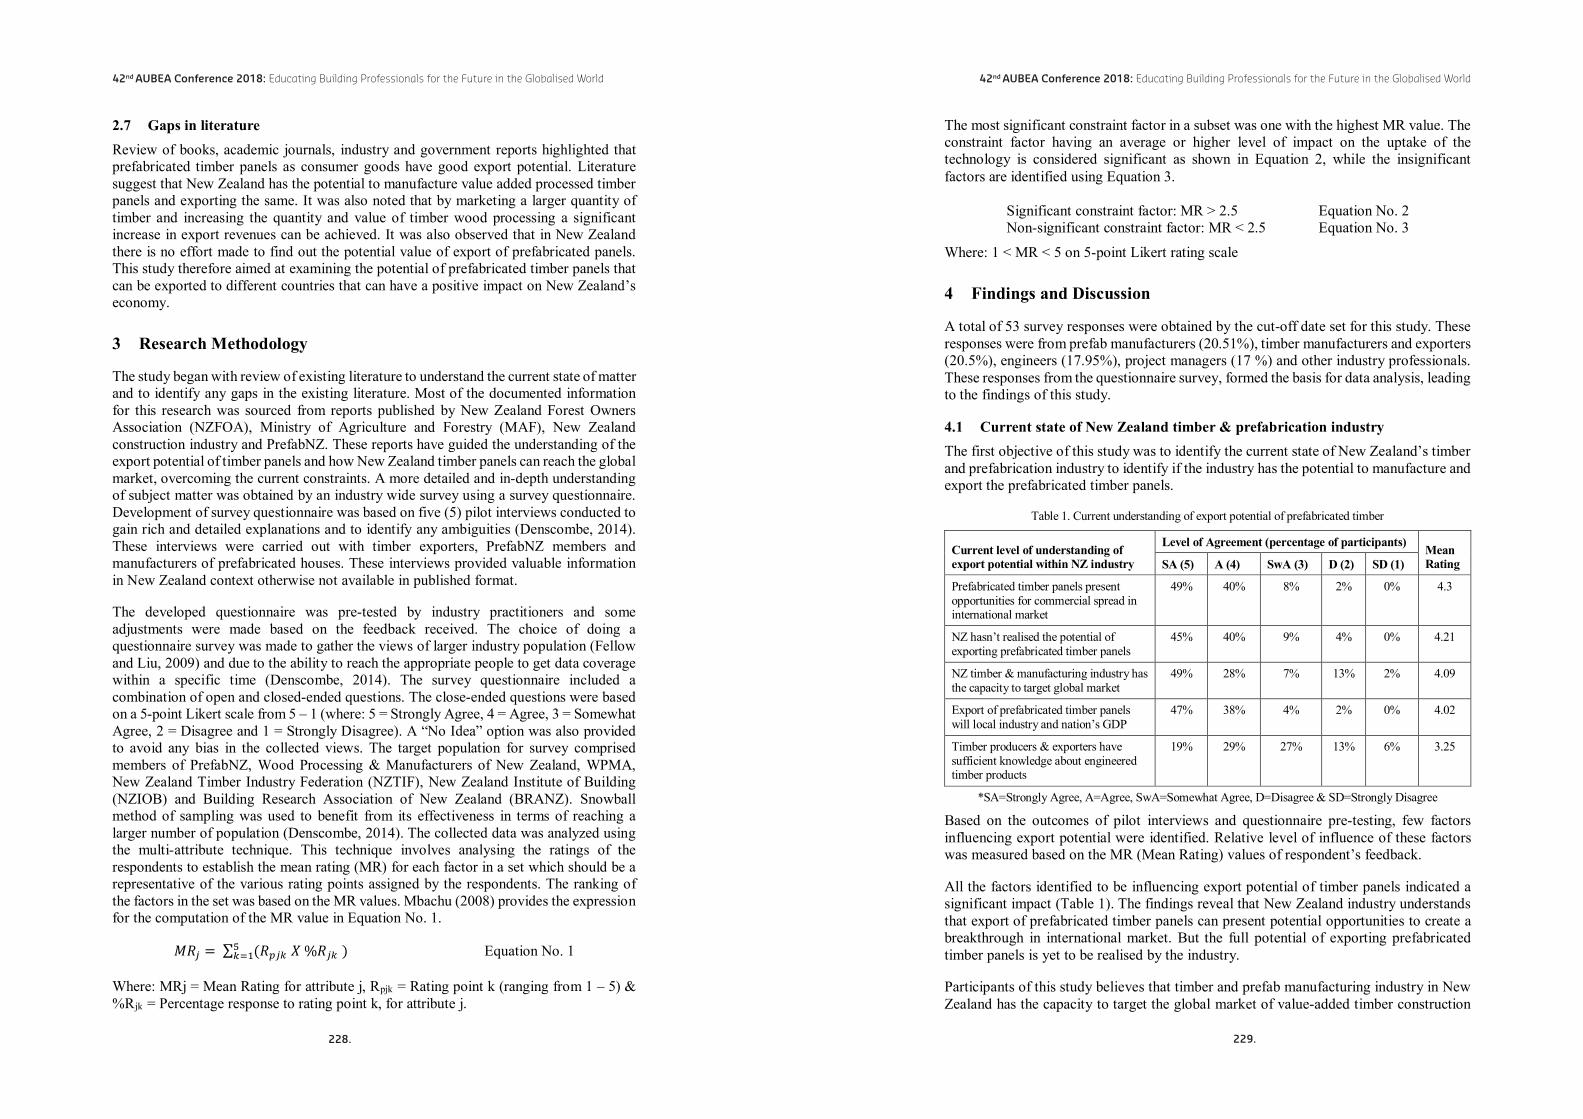
42nd AUBEA Conference 2018: Educating Building Professionals for the Future in the Globalised World
2.7 Gaps in literatureReview of books, academic journals, industry and government reports highlighted that prefabricated timber panels as consumer goods have good export potential. Literature suggest that New Zealand has the potential to manufacture value added processed timber panels and exporting the same. It was also noted that by marketing a larger quantity of timber and increasing the quantity and value of timber wood processing a significant increase in export revenues can be achieved. It was also observed that in New Zealand there is no effort made to find out the potential value of export of prefabricated panels. This study therefore aimed at examining the potential of prefabricated timber panels that can be exported to different countries that can have a positive impact on New Zealand’s economy.
3 Research Methodology
The study began with review of existing literature to understand the current state of matter and to identify any gaps in the existing literature. Most of the documented information for this research was sourced from reports published by New Zealand Forest Owners Association (NZFOA), Ministry of Agriculture and Forestry (MAF), New Zealand construction industry and PrefabNZ. These reports have guided the understanding of the export potential of timber panels and how New Zealand timber panels can reach the global market, overcoming the current constraints. A more detailed and in-depth understanding of subject matter was obtained by an industry wide survey using a survey questionnaire.Development of survey questionnaire was based on five (5) pilot interviews conducted to gain rich and detailed explanations and to identify any ambiguities (Denscombe, 2014). These interviews were carried out with timber exporters, PrefabNZ members and manufacturers of prefabricated houses. These interviews provided valuable information in New Zealand context otherwise not available in published format.
The developed questionnaire was pre-tested by industry practitioners and some adjustments were made based on the feedback received. The choice of doing a questionnaire survey was made to gather the views of larger industry population (Fellow and Liu, 2009) and due to the ability to reach the appropriate people to get data coverage within a specific time (Denscombe, 2014). The survey questionnaire included a combination of open and closed-ended questions. The close-ended questions were based on a 5-point Likert scale from 5 – 1 (where: 5 = Strongly Agree, 4 = Agree, 3 = Somewhat Agree, 2 = Disagree and 1 = Strongly Disagree). A “No Idea” option was also provided to avoid any bias in the collected views. The target population for survey comprised members of PrefabNZ, Wood Processing & Manufacturers of New Zealand, WPMA, New Zealand Timber Industry Federation (NZTIF), New Zealand Institute of Building (NZIOB) and Building Research Association of New Zealand (BRANZ). Snowball method of sampling was used to benefit from its effectiveness in terms of reaching a larger number of population (Denscombe, 2014). The collected data was analyzed using the multi-attribute technique. This technique involves analysing the ratings of the respondents to establish the mean rating (MR) for each factor in a set which should be a representative of the various rating points assigned by the respondents. The ranking of the factors in the set was based on the MR values. Mbachu (2008) provides the expression for the computation of the MR value in Equation No. 1.
𝑀𝑀𝑀𝑀𝑀𝑀𝑀𝑀𝑗𝑗𝑗𝑗 = ∑ (𝑀𝑀𝑀𝑀𝑝𝑝𝑝𝑝𝑗𝑗𝑗𝑗𝑝𝑝𝑝𝑝 𝑋𝑋𝑋𝑋 %𝑀𝑀𝑀𝑀𝑗𝑗𝑗𝑗𝑝𝑝𝑝𝑝 )5𝑝𝑝𝑝𝑝=1 Equation No. 1
Where: MRj = Mean Rating for attribute j, Rpjk = Rating point k (ranging from 1 – 5) & %Rjk = Percentage response to rating point k, for attribute j.
42nd AUBEA Conference 2018: Educating Building Professionals for the Future in the Globalised World
The most significant constraint factor in a subset was one with the highest MR value. The constraint factor having an average or higher level of impact on the uptake of the technology is considered significant as shown in Equation 2, while the insignificant factors are identified using Equation 3.
Significant constraint factor: MR > 2.5 Equation No. 2Non-significant constraint factor: MR < 2.5 Equation No. 3
Where: 1 < MR < 5 on 5-point Likert rating scale
4 Findings and Discussion
A total of 53 survey responses were obtained by the cut-off date set for this study. These responses were from prefab manufacturers (20.51%), timber manufacturers and exporters (20.5%), engineers (17.95%), project managers (17 %) and other industry professionals. These responses from the questionnaire survey, formed the basis for data analysis, leading to the findings of this study.
4.1 Current state of New Zealand timber & prefabrication industryThe first objective of this study was to identify the current state of New Zealand’s timber and prefabrication industry to identify if the industry has the potential to manufacture and export the prefabricated timber panels.
Table 1. Current understanding of export potential of prefabricated timber
Current level of understanding of export potential within NZ industry
Level of Agreement (percentage of participants) Mean RatingSA (5) A (4) SwA (3) D (2) SD (1)
Prefabricated timber panels present opportunities for commercial spread in international market
49% 40% 8% 2% 0% 4.3
NZ hasn’t realised the potential of exporting prefabricated timber panels
45% 40% 9% 4% 0% 4.21
NZ timber & manufacturing industry has the capacity to target global market
49% 28% 7% 13% 2% 4.09
Export of prefabricated timber panels will local industry and nation’s GDP
47% 38% 4% 2% 0% 4.02
Timber producers & exporters have sufficient knowledge about engineered timber products
19% 29% 27% 13% 6% 3.25
*SA=Strongly Agree, A=Agree, SwA=Somewhat Agree, D=Disagree & SD=Strongly Disagree
Based on the outcomes of pilot interviews and questionnaire pre-testing, few factors influencing export potential were identified. Relative level of influence of these factors was measured based on the MR (Mean Rating) values of respondent’s feedback.
All the factors identified to be influencing export potential of timber panels indicated a significant impact (Table 1). The findings reveal that New Zealand industry understands that export of prefabricated timber panels can present potential opportunities to create a breakthrough in international market. But the full potential of exporting prefabricated timber panels is yet to be realised by the industry.
Participants of this study believes that timber and prefab manufacturing industry in New Zealand has the capacity to target the global market of value-added timber construction
228. 229.
42nd AUBEA Conference 2018: Educating Building Professionals for the Future in the Globalised World
products. It is observed that exploiting the export potential of timber panels will enhance the local manufacturing industry and will ultimately contribute to the country’s GDP. Study participants also believe that while New Zealand is not utilizing its full potential. the producers and exporters of timber have sufficient knowledge about the manufacturing and export of prefabricated or engineering timber products.
4.2 Constraints to the export of prefabricated timber panelsThe second research objective of this study was to identify the constraints that are limiting the country’s potential to manufacture and export the prefabricated timber panels, that is a more profitable business model. Six constraints were identified (Table 2) to be responsible for hindering the export of value added timber products.
Table 2. Constraints related to export of value-added prefabricated timber panels
Constraints
Level of Agreement (percentage of participants) Mean RatingSA (5) A (4) SwA (3) D (2) SD (1)
Lack of realisation of export potential by NZ Government and other stakeholders
40% 26% 18% 10% 0% 3.78
Lack of support from the Government in terms of policy making and subsidies
20% 46% 20% 8% 0% 3.6
Timber sector is not current with demands of Int’l markets due to lack export potential analysis
22% 52% 8% 6% 0% 3.54
Lack of automation in prefabrication & manufacturing industry like CAD/CAM
20% 30% 24% 16% 2% 3.26
Current skill levels are inadequate to meet the requirements of Int’l market
20% 30% 24% 16% 2% 3.26
High tariffs for exporters on processed wood compared to low/none on raw logs
28% 18% 18% 4% 0% 2.74
*SA=Strongly Agree, A=Agree, SwA=Somewhat Agree, D=Disagree & SD=Strongly Disagree
These factors are discussed one by one in order of their influence. The first and most significant constraint is the fact that New Zealand Government and other stakeholders (timber producers & exporters) have not fully realised the potential benefits of exporting prefabricated panels made of New Zealand timber to the global market. Further to this there is general lack of support from the Government. There are no subsidies for manufacturers and exporters that can encourage them to export value-added timber products instead of raw timber. This a lack of policy support for timber industry to grow its potential. Another significant constraint is the fact that New Zealand timber industry is not keeping it’s pace to know and understand the demands of international market. This is simple due to the fact that no export potential analysis has ever been carried out. Some other factors limiting the timber industry’s potential include lack of highly trained and skilled workers and lack of automation i.e. use of CAD and CAM technologies. High tariffs on export of processed wood compared to raw timber is also discouraging the export of value-added timber products.
4.3 Potential solutions to increase the export of prefabricated timber panelsThird and last objective of this study was to identify the solutions that can overcome the constraints limiting the export potential. Some very useful solutions were identified in line with the recognized constraints during the data collection process.
42nd AUBEA Conference 2018: Educating Building Professionals for the Future in the Globalised World
Table 3. Potential solutions to address the identified constraints to the export potential of timber panels
Solutions
Level of Agreement (percentage of participants) Mean RatingSA (5) A (4) SwA (3) D (2) SD (1)
Identification of target market/buyers,using proper marketing tools and communication strategies
34% 52% 8% 4% 0% 4.1
Identify demand of timber panels in Int’l market through export potential analysis
34% 52% 7% 5% 0% 4.1
Encouraging more investment in domestic wood processing industry
32% 50% 6% 10% 0% 3.98
Government to invest in upskilling of the human resources
30% 50% 10% 2% 4% 3.88
More automation in prefabrication & manufacturing industry like CAD/CAM
30% 36% 10% 10% 2% 3.46
Reduction of tariffs & taxes on export of value-added timber products
20% 30% 24% 16% 2% 3.26
Export ban on raw timber logs to increase export of prefabricated products
16% 14% 42% 18% 8% 3.06
*SA=Strongly Agree, A=Agree, SwA=Somewhat Agree, D=Disagree & SD=Strongly Disagree
Identification of target market or buyers would be the first step to benefits from the export potential of prefabricated timber products. This needs to be done using proper communication and marketing strategies. There is a need to carry out export potential analysis to exactly understand the demand of prefabricated timber panels for manufactured homes in international market. To overcome the constraints to export potential, more investment is needed in local wood processing industry to enhance its capacity and efficiency. As well as there is need for Government to invest in the upskilling of human resources employed in this sector. More investment in automation of timber manufacturing industry with more use of CAD and CAM technologies is also needed to boost the quality and efficiency of the sector to meet the global market standards. Another suggestion coming from the participants is reducing the taxes and tariffs on the export of value added timber products. If the outcomes of export potential analysis are positive for New Zealand, it is worth considering a ban on exporting the raw timber like many other timber products exporting countries including Canada and Malaysia.
5 Conclusion and Further Research
This paper studied the current trends of New Zealand prefabrication and timber industry to identify the barriers that are hindering the export potential of prefabricated timber products and to identify the solutions to overcome these barriers. Analysis of collected data shows that the timber construction products currently being manufactured in New Zealand do not meet the requirements of international market. Hence there is a need to make the timber products more desirable to suit the international market to pitch the export potential. Generally, New Zealand timber manufacturers and exporters find it easy and straight forward to export the raw timber logs rather than processing them to products that may or may not meet the needs of international market. Policy hurdles such as high taxes and tariffs also discourage the industry to export value-added timber products. Industry requires support from the Government in form of new trade policy for engineered timber products, to attract more investors and manufacturers. Another barrier to
230. 231.

42nd AUBEA Conference 2018: Educating Building Professionals for the Future in the Globalised World
production and export of timber construction products is the fact that prefabrication of building components in New Zealand is in its infancy and this industry needs to develop more appropriate skill base. Lack of prefabrication manufacturing plants and requirement of installing more Computer Aided Design/Computer Aided Manufacturing (CAD/CAM) machinery is also limiting the industry attempt to try export of value added products. Moreover, there is a need of upgrading the skills of New Zealand labour to compete with the global market. Lack of collaboration among government, industry, and research institute is another reason for the failure of upbringing of prefabricated timber products.
It is evident that timber industry contributes significantly to the long-term profitability of commercial forestry in New Zealand. What is needed at present is new investment/investors for the wood processing sector and a strategy to achieve tangible support from the government.
It is recommended that; an export potential assessment and feasibility study should be conducted to realize the real needs of the global market for prefabricated timber construction products that in-turn can form a basis for manufacturing and export of prefabricated timber products in New Zealand.
6 References
APEC. (1999), 'Study of non-tariff measures in the forest products sector'. New Zealand Forest Research Institute, Rotorua, New Zealand.
Arieff, A., and Burkhart, B. (2002), 'Prefab: Salt Lake City': Gibbs Smith, 2002,1st ed.Bell, P. (2009), 'Kiwi Prefab: Prefabricated Housing in New Zealand: An Historical and
Contemporary Overview with Recommendations for the Future'. Bell, P., and Southcombe, M. A. (2012), 'Kiwi prefab: Cottage to cutting edge prefabricated
housing in New Zealand', Auckland, NZ, Balasoglou Books, 2012.Cook, B. (2005), 'An assessment of the potential contribution of prefabrication to improve the
quality of housing: a Scottish perspective'. Construction Information Quarterly, 7(2), 50-55. Cooke, A., and Friedman, A. (2001), 'Ahead of their time: The sears catalogue of prefabricated
houses'.Craig, A., Laing, R., and Edge, M. (2000), 'The social acceptability of prefabrication and
standardisation in relation to new housing'. Paper presented at the 16th IAPS Conference: 21st century: Cities, Social Life and Sustainable Development, Paris.
Denscombe, M. (2014), 'The good research guide: for small-scale social research projects', Maidenhead, England: McGraw-Hill Education/Open University Press, 2014, 5th ed.
Ebong, I. (2006), 'Kit homes modern', Harper Collins.Evison, D. (2013), 'Some observations on the economics of commercial forestry in New
Zealand', NZ Journal of Forestry, 58(3), 3. Gann, D. M. (1996), 'Construction as a manufacturing process? Similarities and differences
between industrialized housing and car production in Japan', Construction Management and Economics, 14(5), 437-450. doi:10.1080/014461996373304
Gilbert, J. (2000), 'Trade policy, processing and New Zealand forestry', Ashgate.Hart, S. (2003), 'Prefabrication, the speculative builder's tool, has been discovered by modernist
designers'.Kabir, R. (2016), 'Export potential assessment', Retrieved from
https://www.academia.edu/27918426/Export_Potential_AssessmentsKantz, A. (2012), 'Potential export revenues from forest and wood products by 2022', Report to
the NZ Wood Council http://www/. woodco. org. nz/images/stories/pdfs/Potential_Forest_Products_Export_Revenue_in_2022.[7 April 2014], 58, no.3.
Katz, A. (2008), 'Are non-tariff measures important in exports of finished wood products to Japan, China and the US? The case of prefabricated houses'. New Zealand Journal of Forestry, 53(1), 16.
42nd AUBEA Conference 2018: Educating Building Professionals for the Future in the Globalised World
Katz, A. (2013), 'A strategic review of New Zealand log exports', New Zealand Journal of Forestry, Te Putahi Ngaherehere o Aotearoa.
Kaufmann, M., and Remick, C. (2009), 'Prefab green', Gibbs Smith, 2009, 1st ed.Koklič, M. K., and Vida, I. (2009), 'A strategic household purchase: Consumer house buying
behavior', International Research Journal, 7(1), 75-96. Laarman, J. G. (1984), 'Timber exports from Southeast Asia: Away from logs towards
processed wood', Columbia Journal of World Business, 19(1), 77. Lidelow, H. (2017), 'Industrialised construction in Sweden-Platforms, flow efficiency,
modularization and operations strategies in construction'. PrefabNZ Colab 2017, Auckland, New Zealand.
MAF. (2010), 'New Zealand wood availability forecasts 2010-2040', Ministry of Agriculture and Forestry, Wellington.
MAF. (2012), 'Forestry production and trade for the December 2011 Quarter', Ministry of Agriculture and Forestry, Wellington.
NZFOA. (2016), 'New Zealand plantation forest industry facts and figures', NZFO Association (Ed.), 16. (2015-16). New Zealand Forest Owners Association.
Philp, M. (2015), 'An Idea whose time has come', Retrieved from http://pureadvantage.org/news/2015/04/14/an-idea-whose-time-has-come/2/
PrefabNZ, P. B. (2012), 'Kiwi prefab: Challenging times', Paper presented at the NZ Wood PrefabNZ conference, Wellington.
Rybczynski, W. (2009), 'Home delivery: Fabricating the modern dwelling', Journal of the Society of Architectural Historians, 68(2), 254-256. doi:10.1525/jsah.2009.68.2.254
Shahzad, W., Mbachu, J., and Domingo, N. (2015), 'Marginal productivity gained through prefabrication: Case studies of building projects in Auckland', Buildings, 5(1), 196-208
Shahzad, WM. (2016), 'Comparative analysis of the productivity levels achieved through the use of panelised prefabrication technology with those of traditional building system'.(Doctoral Thesis, Massey University, New Zealand)
Shahzad, W. (2018), 'Panellised prefab's benefits', Build Magazine, BRANZ, Wellington.Turner, J. A., Buongiorno, J., Zhu, S., and Maplesden, F. (2008), 'Effect of non-tariff barriers on
secondary processed wood product trade: New Zealand exports to the United States, China and Japan'.
Wittausch, W. K. (1948), Harvard Business Review, 26(6), 693-712. Woodco. (2012), 'New Zealand forest and wood products industry strategic action plan', Wood
Council of New Zealand Inc (Woodco), Wellington.
232. 233.

42nd AUBEA Conference 2018: Educating Building Professionals for the Future in the Globalised World
A matter of sustaining life after death: Liminal architectures role in loss, grief and acceptance
Jonathon Peake1, Khoa Do2, Emil Jonescu3, Monty Sutrisna4 and AhmedHammad5
1,2,3,4&5School of Design and the Built Environment, Curtin University, Perth, 6084, WA, AUSTRALIA
E-mails: [email protected]; [email protected]; [email protected];[email protected]; [email protected]
Abstract: A resting place, a cemetery, a memorial, a burial ground, a grieving place or a ceremonial space of death are places of significant in our constructed cities. The impact from the loss of life by way of a natural process of aging or a crisis brings sharply into perspective for those so-called left behind, to reflect on their mortality. Grief is an intense and potentially crippling response that will be experienced by most if not all people at some stage in their life. This paper presents a design framework for the development of an innovative and sustainable architectural (building) prototype that offers constructed spatial responses for the support of the loss and grieving process. The design framework is principled on the application that well-considered environments can have an impactful effect on people. It is well documented in the literature and accepted by the discipline of architecture that high-quality environments will attribute positively to people’s state of mind, perceptual awareness, cognitive wellness, and physical and mental healing. A matter of life and death is explored by way of liminal architectures role in loss, grief and acceptance. The design framework presented in this paper is the first phase of intended two-phase research underpinned by design.
Keywords:liminal architecture, design, spatial, death, grief, acceptance
1 Introduction
Loss and grief caused by death will be experienced by most if not all people throughout their lifetime and spaces to process and express this are scarce. Current primary facilitators of this are religious, funerary architectural typologies, yet these have been pushed to the fringes of cities by western societies, causing denial and fear of death through this disconnect and a stagnation in funerary architecture (Heathcote 1999, 6). Currently, Australian society is trending towards a more secular lifestyle and retreats for those in a bereaved state to process, grieve and heal are sparse. Such trend is likely to lead to a demand-based physical manifestation, disconnect and stagnation in funerary architecture, in particular, in Western Australia which is above the Australian average (30%) for people identifying as “no religion” (33%) (ABS 2016). Moreover, at a city-level, 36.1% of people residing in Perth had no religion and 17.4% did not answer the question on religion, compared with 57.8% and 32.5% respectively for people residing in the outer regions (City of Perth 2018).
Given this trend, this proposed research by design aims to provide an urban, centralised space within Perth, Western Australia for bereaved users, religious or secular, to attend, facilitating the healing rituals associated with the experience of grief and the transition to acceptance. It will also provide greater visibility, consciousness and awareness of
42nd AUBEA Conference 2018: Educating Building Professionals for the Future in the Globalised World
mortality with sensibility to the wider community through its siting and design statement. The proposal will be explored through a qualitative research methodology that will examine the phenomenological aspects of architecture and how the spaces created assist with the grieving process. The established design framework draws on the research through a thematic literature review complimented with data analysis that will inform the research by design and interactive modelling process. This methodology will be an iterative exercise of exploration, creation, application and refinement of an innovative and sustainable architectural typology. Case studies of existing and speculative exemplary precedents of funerary architecture are examined, along with best practice theories application gathered from relevant literature. The culmination of this process will act to explore the question of how architecture can facilitate and enable people who are experiencing and coping with bereavement towards a state of acceptance and healing.The design framework presented in this paper establishes the terms of reference outlining the research by design:
How can architectural design facilitate and enable people experiencing and coping with bereavement towards a state of acceptance?
• Explore a multifaceted architecture that responds to the needs of the “Socially Dead” after terminal diagnosis and the survivors left behind after their loved oneshave passed. A person who has received a terminal diagnosis may undergo isolation, amplifying self-grief (Charmaz 1980).
• Examine how architecture can bring awareness to the issue of death and loss to a death-denying society, presenting a de-sanitised view and reengaging community.
• Using a sensory architectural approach to generate the architectures spatial qualities, explore how it can engage both physically and mentally with the user.
2 Literature Review
Curl (2002) provides an established overview of funerary architecture which dates back to the ancient Egyptian necropolis, expressing the instinctive human condition of griefand the way death was celebrated. The author suggests that modern rituals and architecture no longer deals with the acceptance of death; moreover, through poor funerary architecture, in turn, devalues life itself (Curl 2002, 359-367). In this analysis of funerary architecture, it was argued that as a result, western societies’ fears of death, and thus disregard of funerary architecture stagnates ideas and movement in this typology (Curl 2002, 367). This sentiment strongly aligns to the call for innovativedesign alternatives and architectural typologies, which Curl (2002, 346) describes ashaving a multitude of architectural works, and the power they have over the individual or a collective in providing a place of mourning and of hope. This text highlights the way in which earlier societies have addressed loss, grief and mourning, giving insight to an alternative model. Recent examples, however, outline a number of challenging limitations, giving rise to Heathcote (1999) who argued that such circumstances contributed to missed opportunities and bridging of gaps in knowledge. Heathcote (1999) supports Curl’s (2002, 367) attestation that western society’s sentiment toward death as being taboo, in itself, contributes to a disassociation from a logical inevitability. Heathcote’s (1999, 6) position on the current state of the city, is that “death has been torn out of the heart of the city and a significant part of the city has died as a result”.This observation based on a typical out-of-sight, out-of-mind, westernised perspectiveof death, whereby shifting it out of the everyday context removes it from our consciousness. This highlights an unhealthy approach and disregard for the difficult but
234. 235.

42nd AUBEA Conference 2018: Educating Building Professionals for the Future in the Globalised World
necessary conversations around the topic of mortality, which the proposed design of the new building typology aims to remedy. Heathcote (1999, 167) addresses the idea of ritual-embedded architecture, through exploration of funerary architecture, however, this aspect merely addresses one side of the ritual and process, successfully hamperingthe proposed typology’s effective facilitation of necessary functions. To this end the proposed typology looks at the architecture as a precursor of ritual, not to impose but to ameliorate existing attitudes towards rituals, providing for a user-centred approach to ritual, and by realigning towards healthier attitudes around the experience of death. Curl (2002) and Heathcote (1999) share parallel concepts of funerary architecture, with Curl (2002) exploring primarily traditional religious and ritualistic aspects, while Heathcote (1999) takes a secular approach focusing upon memorials derived from monuments, both having similar yet unique spatial qualities relevant to the lived experience of a user.
Pallasmaa (2012) further discusses these themes qualitatively from an intangibleperspective, though the author does not exclusively address funerary architecturedirectly per se. The author’s theory directly addresses the phenomenological aspects produced in the works previously discussed with affirmation of the inherent importanceof our sensory capabilities to fully conceive and understand the empowering qualities of buildings designed to stimulate perceptual experience. The theory and application of space, time and architecture is powerful, connecting the user to space through their direct experience at a specific moment in time.
In this study, the proposed typology will interpret Pallasmaa’s (2012) theories by establishing a series of spatial design principles that will be tested and implementedthroughout the design process in this research. Pallasmaa (2012, 76) suggests that architecture is not only concerned with aesthetic evaluation, rather, it is essential to experience and to form an appreciation for the spatial encounter. The reference to the definition of ‘encounter’ is used in this research to establish a dialogue between user and space (building). The author does not explicitly state how buildings achieve this through its qualitative nature, instead provides a theoretical understanding of buildings beyond the ‘bricks and mortar’. Likewise, others have explored the role of senses, but goes further to link sensory to landscapes within funerary architecture, addressing both physical and emotional influences that landscapes contribute. Baptist (2010, 305), for example describes the similarities between grief and landscape, as that which is in a constant state of flux and evokes inherent experiences between the deceased and the environment in which the experience is attained. Baptist (2010, 299: 305) theorises that architecture needs to be fluid for a diversity of users and considers the influence that landscape has over our senses, thus a minimal intervention such as a roadside marker,for example, can elicit a strong emotional response serving to create a bereavement connection. Baptist’s theory of connection between the depart, the user and the landscape provides a foundation for this research, in addressing built architecture andlandscape, as well as experience of built form holistically with bereavement (Baptist2010, 294-297). The design of the typology will be situated within an urban environment, and aims to engage with its immediate surrounds, creating a proposition that generates a healthy environment for the greater community and the bereaved.
The theory of salutogenic by Antonovsky (Barton and Tsourou 2000, 7) describes asupportive approach to architecture, one that possess core qualities aimed at passively improving the experiences and health of its users. Linking to Baptist’s (2010, 294-297) ideas on integrating user experience and landscape, Barton and Tsourou (2000, 11) implement salutogenic principles to establish guidelines into city design with the focus
42nd AUBEA Conference 2018: Educating Building Professionals for the Future in the Globalised World
on strategies for healthy urban environments. Together, these two theories help to establish a supportive presence for the site that benefits the community and the bereaved alike. The current guidelines outlined by Barton and Tsourou (2000), however, require adjustment to suit the unique typology given that at this stage they are more suited to a medical typology, notwithstanding this, the overarching principles of support can be applied. Hockey et al. (2010) offers a space-relative perspective on the presence of death, and a commentary on the way it can shape the spatial qualities of the architecture, where they discuss funerary spaces via social constructionism, as a user interacts with a space they give it a unique meaning, while the associated societal norms may influence the way the space is experience or considered. Gino and Norton’s (2014, 271) study suggests that this combination aids in the acceptance and healing process for the userthrough habitation of “a common psychological mechanism [that] both underlies these different rituals... Engaging in rituals mitigates grief by restoring the feelings of gaining control that are impaired by both life-changing (the death of loved ones) and more superficial (losing lotteries) losses”. This presents a case for the architecture such that it does not dictate space but is multifaceted, supportive of salutogenic, is ritually unique to the user, and offers control through sensory spatial connection.
The previous authors discuss architecture and its spatial qualities regarding to those in a bereaved state, while the following provide a psychological analysis of the bereaved. Freeman (2005, 1-11) provides an overview to the process of loss and grief from diagnosis (the start of Social Death) to final death (Physiological Death). The authoruses case studies of induvial, families and the community that are in a bereaved state and describes the challenges faced by those coming to acceptance. The text does not contain architecture specifically, but it will inform the typology as it is the terms and processes outlined within to which the typology will respond. Freeman outlines the phases of grief resolution and how rituals, remembrance and intervention (for this research, the architectural interventions) may play a role in a user’s recovery anddiscusses social support for the bereaved, and how at an intense emotional time it is important for isolation to be reduced (Freeman 2005, 125-139). This relates to the salutogenic framework supporting the typology sitting within the urban landscape to create a secure, ordered, and objective presence, contributing positively to alleviate grief reactions (Barton and Tsourou 2000, 7: Freeman 2005, 129). Charmaz (1980) discusses the social process of dying, providing an informative account on the patients’ diagnosed as terminal. Charmaz (1980, 126-130) expands upon Freeman’s (2005, 3) work by analysing the implications death has over the social realm of the diagnosed user and the survivors, placing an equal focus on the time before death. Charmaz (1980, 168) prescribes forms pre-emptive support and treatment for the dying and the eventual survivors as an imperative intervention, retaining a connected social circle and thus lessening associated isolation described by Freeman (2005, 128). This provides another key user, the survivor and bereaved who may be most impacted.
The following precedents reside in the deathscape, the liminal zone where users, the living and the deceased, can connect. Spanish architect Enric Miralles (dec.), designed the Igualada Cemetery which acts as an exploration of the permanence of death and impermanence of life, providing a journey through the complexities of the cycle of life (Sperzana 2016, 62). The Project was achieved through raw materiality, the architecture left seemingly incomplete, aging-in-place and timelessness reflecting those laid to rest on the site (Heathcote 199, 166-169). Miralles intentionally designed the work to be incomplete such that users performing ritual, inhabit the site as the completing element. The typology envisions this significant consideration. Users to become part of the architecture, an encounter generated by the rituals performed and not
236. 237.

42nd AUBEA Conference 2018: Educating Building Professionals for the Future in the Globalised World
solely by the architecture (Sperzana 2016, 64). Carlo Scarpa explores a funerary procession and journey through thresholds (in Brion Cemetery) and landscape (Stern 1994). Scarpa uses artefacts along this path to provide foci, points of connection and reflection for users to identify with (Heathcote 1999, 205). Symbolic expressionsthroughout engage the user and their senses as Pallasmaa (2012, 44) describes, sight, smell, touch play a role inviting the user onwards. Scarpa has created an inhabitabledeathscape, one not burdening the user with the heaviness of death but one thatacknowledges, respects death and creates a beautiful living landscape, like Baptist (2010, 299) discusses, this idea of acknowledgement and giving back, a concept to beexplored with the typology in an urban and community context. Skogskyrkogården by Asplund and Lewerentz shifts in scale, the site begins to cater for the greater community while like Brion and Igualada, acknowledges the smaller key human scaled details (Johansson 1995, 22). The modest buildings provide an unassuming and humble footprint on the site allowing the detail qualities to be amplified, a key attribute to the typology, contextual awareness built forms. The architecture is inhabited by usersundergoing a search, seeking and discovering support, so materiality and finish will bekept simple and refined, humble and not distracting (Heathcote 1999, 77). This user-discovery experience is one that sees architecture as not taking centre stage, merely facilitating the ritual of death whilst providing comfort, atmosphere and positive reinforcement of the authentic experiences (Johansson 1996, 71).
The previous case studies are cemeteries, however, deathscapes can extend to places of education, remembrance or memorial. Architect Maya Lin’s Vietnam War Memorial acts as a monument to the fallen, a place for the living to grieve, heal and to connect as individuals or as a collective (Klein 2015). This expression is expressed via a monument consisting of a black granite wall inscribed with the names of the fallen, so extensive is the list that they seem to merge into a singular scribe reflecting the scale and enormity of the loss (Heathcote 1999, 143). Similarly, like the work of Skogskyrkogården, Hockey et al. (2010 223-225), suggests that it reduces the architecture to its minimum and enhancing meaning, drawing an empowerment of the bereaved to be the complementary (completing) element of the project by way of providing the ritual. This echoes the notion that the architecture can be humble and unassuming in its form and construction, but enriching and powerful by way of its spatial qualities and of a user-discovery and experience. The Jewish Museum in Berlin by architect Daniel Libeskind, was developed with the themes of memorial and grief by design, through spatialnarrative, user-discovery, and self-directed learning through a regulated experience, knowledge orientation and experientially formed understanding. The design of the Jewish Museum and museums generally, as a typology, are constructed environments prefaced on providing a materialisation of memory captured and communicated throughthe collective artefacts, while memorials embody memory themselves and promote ritual. Libeskind balances his museum between these two ideals through immersive user-discovery and careful control over the atmosphere and experience for user-discovery through the architecture. This will become valuable for the development of the loss and grief typology, as Freeman (2010, 135) describes. In the next section, the research methodology proposed is presented, built from the basis of the review conducted in the literature.
3 Research Methodology
The overarching methodology used the design framework will be a qualitative approach. This approach will allow the development of the typology and the addressingof the intangible aspects of the typology proposal. The process of analysis and
42nd AUBEA Conference 2018: Educating Building Professionals for the Future in the Globalised World
interpreting firstly involves examining international case studies; a comparative analysis is then conducted to local case studies in order to form a critical regional benchmarking. This will provide a set of spatial design criteria and program supported with a qualitative data collection which will directly inform the design applications for the typology. This research analyses data and explores design through prototyping, as an iterative process through a phenomenological approach (Groat and Wang 2013, 222). The typology will be designed to explore the user-discovery method to generate the architectural spatial qualities and the experiences they have with it. Thephenomenological theory of enquiry, dealing with the user’s lived experience within a complex environment, allow this research to interpret the connection between spatial qualities and how they interact with a user, creating experience (Groat and Wang 2013, 228).
3.1 Methods
The methods undertaken towards achieving the desired design outcomes for the typology will be through the application of design analysis to support the implementation of research by design.
3.1.1 Design AnalysisThe analysis component will use two methods, a precedent case-study and an extensiveliterature review, each referencing relevant and supportive best practice strategies. The analysis of precedent case studies is used to explore existing and speculative exemplars of architecture which deal with death-scapes. This will allow the research design framework for the establishment of the typology to draw on an established body of work that have successfully engage and responded to the issues that arise from the specific project settings (Groat and Wang 2013, 421). This will be explored through architectural drawings and modelling at varying scales by way of sectional, diagrammatic, plan, massing, diametric and trimetric projection drawings to articulatethe typology. The phenomenological exploration of the precedents employing the technique of collaging can assist in communicating the realisation of the typologies intent. Undertaking a literature review has given a background of synthesising ideas and themes within funerary, bereavement and memorial architecture, in particular, when considering how they relate to the user-discovery experience (Groat and Wang 2013, 142).
3.1.2 Research by DesignData collected through the analysis will be interpreted and used to explore the opportunities in developing solutions to the main objective via a typology proposal. Consisting of architectural exploration, experimentation and output, producing iterations of proposals through critical enquiry via; diagramming, plans, elevations, sections, rendering, modelling, collages informed by an initial programme development (Hauberg 2011, 7). Till (2008, 8) validates this method of research and is accepted by the RIBA Charter stating architecture itself is a method of research, the embodiment of this research culminating as the built form. A site analysis will also be undertaken of the chosen area in Perth, Western Australia. The site investigation explores the potential location as a catchment to understand the demographics and occupancy rates of those who are currently using the space. These explorations will be a response to the design brief and seek to make a connection to draw a correlation between the methodology and methods used and communicating the proposed typology to satisfy and the meet the research outcome (Hauberg 2011, 8).
238. 239.
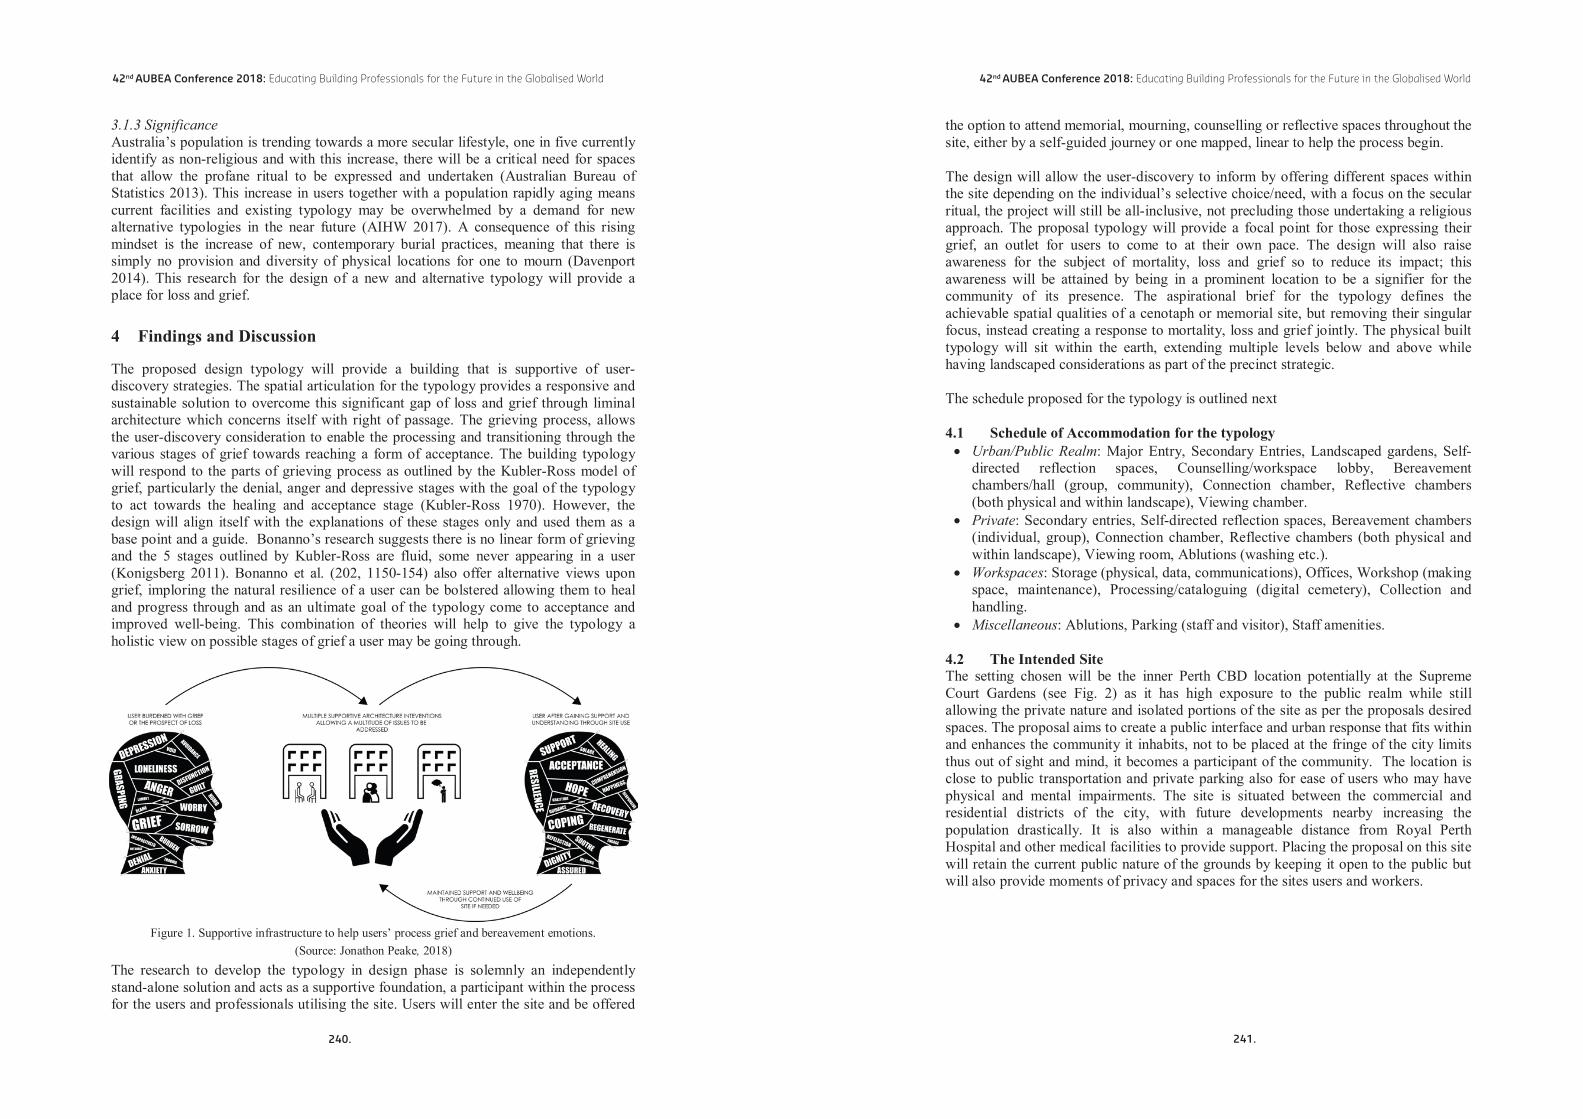
42nd AUBEA Conference 2018: Educating Building Professionals for the Future in the Globalised World
3.1.3 SignificanceAustralia’s population is trending towards a more secular lifestyle, one in five currently identify as non-religious and with this increase, there will be a critical need for spaces that allow the profane ritual to be expressed and undertaken (Australian Bureau of Statistics 2013). This increase in users together with a population rapidly aging means current facilities and existing typology may be overwhelmed by a demand for new alternative typologies in the near future (AIHW 2017). A consequence of this risingmindset is the increase of new, contemporary burial practices, meaning that there is simply no provision and diversity of physical locations for one to mourn (Davenport 2014). This research for the design of a new and alternative typology will provide a place for loss and grief.
4 Findings and Discussion
The proposed design typology will provide a building that is supportive of user-discovery strategies. The spatial articulation for the typology provides a responsive and sustainable solution to overcome this significant gap of loss and grief through liminal architecture which concerns itself with right of passage. The grieving process, allows the user-discovery consideration to enable the processing and transitioning through the various stages of grief towards reaching a form of acceptance. The building typology will respond to the parts of grieving process as outlined by the Kubler-Ross model of grief, particularly the denial, anger and depressive stages with the goal of the typology to act towards the healing and acceptance stage (Kubler-Ross 1970). However, the design will align itself with the explanations of these stages only and used them as a base point and a guide. Bonanno’s research suggests there is no linear form of grieving and the 5 stages outlined by Kubler-Ross are fluid, some never appearing in a user (Konigsberg 2011). Bonanno et al. (202, 1150-154) also offer alternative views upon grief, imploring the natural resilience of a user can be bolstered allowing them to heal and progress through and as an ultimate goal of the typology come to acceptance and improved well-being. This combination of theories will help to give the typology a holistic view on possible stages of grief a user may be going through.
Figure 1. Supportive infrastructure to help users’ process grief and bereavement emotions.(Source: Jonathon Peake, 2018)
The research to develop the typology in design phase is solemnly an independently stand-alone solution and acts as a supportive foundation, a participant within the process for the users and professionals utilising the site. Users will enter the site and be offered
42nd AUBEA Conference 2018: Educating Building Professionals for the Future in the Globalised World
the option to attend memorial, mourning, counselling or reflective spaces throughout the site, either by a self-guided journey or one mapped, linear to help the process begin.
The design will allow the user-discovery to inform by offering different spaces within the site depending on the individual’s selective choice/need, with a focus on the secularritual, the project will still be all-inclusive, not precluding those undertaking a religious approach. The proposal typology will provide a focal point for those expressing theirgrief, an outlet for users to come to at their own pace. The design will also raiseawareness for the subject of mortality, loss and grief so to reduce its impact; this awareness will be attained by being in a prominent location to be a signifier for the community of its presence. The aspirational brief for the typology defines the achievable spatial qualities of a cenotaph or memorial site, but removing their singular focus, instead creating a response to mortality, loss and grief jointly. The physical builttypology will sit within the earth, extending multiple levels below and above while having landscaped considerations as part of the precinct strategic.
The schedule proposed for the typology is outlined next
4.1 Schedule of Accommodation for the typology• Urban/Public Realm: Major Entry, Secondary Entries, Landscaped gardens, Self-
directed reflection spaces, Counselling/workspace lobby, Bereavement chambers/hall (group, community), Connection chamber, Reflective chambers (both physical and within landscape), Viewing chamber.
• Private: Secondary entries, Self-directed reflection spaces, Bereavement chambers (individual, group), Connection chamber, Reflective chambers (both physical and within landscape), Viewing room, Ablutions (washing etc.).
• Workspaces: Storage (physical, data, communications), Offices, Workshop (making space, maintenance), Processing/cataloguing (digital cemetery), Collection and handling.
• Miscellaneous: Ablutions, Parking (staff and visitor), Staff amenities.
4.2 The Intended SiteThe setting chosen will be the inner Perth CBD location potentially at the Supreme Court Gardens (see Fig. 2) as it has high exposure to the public realm while still allowing the private nature and isolated portions of the site as per the proposals desired spaces. The proposal aims to create a public interface and urban response that fits within and enhances the community it inhabits, not to be placed at the fringe of the city limits thus out of sight and mind, it becomes a participant of the community. The location is close to public transportation and private parking also for ease of users who may have physical and mental impairments. The site is situated between the commercial and residential districts of the city, with future developments nearby increasing the population drastically. It is also within a manageable distance from Royal Perth Hospital and other medical facilities to provide support. Placing the proposal on this site will retain the current public nature of the grounds by keeping it open to the public but will also provide moments of privacy and spaces for the sites users and workers.
240. 241.

42nd AUBEA Conference 2018: Educating Building Professionals for the Future in the Globalised World
Figure 2. Site location and surrounds(Source: Jonathon Peake, 2018)
5 Conclusion and Further Research
This research provides an insight into the way in which western societies has disassociated itself over time from the inevitability of death following life as non-taboo topics of equal significance, in particular in our cities which no longer celebrate this life-process. Unlike pagan societies of the past other existing cultures, western countries tend to distance themselves from issues surrounding end of life and the experiences leading up to death. It could be said that space shapes behaviour and over time behaviour becomes culture. Thus the proposed design provides a supportive spatial articulation, a responsive and sustainable solution that addresses current culture and predicted trends, overcoming this significant gap of loss and grief through liminal architecture.
This research looks to re-engage western societies society back to the significance of associating life with death through built form, an architectural design proposition that embraces the human and occupants as one of the key elements in achieving the transition through deathscape, from life to death, feeling of loss and mourning, and the healing process.
6 References
Australian Bureau of Statistics. (2013). ‘Australian Social Trends Losing my Religion’.Australian Government.http://www.abs.gov.au/ausstats/[email protected]/Lookup/4102.0Main+Feature s30Nov+2013.
ABS. (2016). ‘Census data reveals ‘no religion’ is rising fast, 2016 Census: Religion’http://www.abs.gov.au/AUSSTATS/[email protected]/mediareleasesbyReleaseDate/7E65A144540551D7CA258148000E2B85?OpenDocument
Australian Bureau of Statistics. (2013). ‘Australian Social Trends Losing my Religion’.Australian Government.http://www.abs.gov.au/ausstats/[email protected]/Lookup/4102.0Main+Feature s30Nov+2013
Australian Institute of Health and Welfare. (2017). ‘Older Australia at a Glance’. Australian Government. https://www.aihw.gov.au/reports/older-people/older-australia-at-a-
42nd AUBEA Conference 2018: Educating Building Professionals for the Future in the Globalised World
glance/contents/demographics-of-older-australians/australia-s-changing-age-and-gender-profile.
Baptist, K. (2010). ‘Diaspora: Death Without a Landscape’. Mortality 15 (4). 294-307. https://doi.org/10.1080/13576275.2010.513162.
Barton, H., and Catherine, T. (2000). Healthy Urban Planning: A WHO Guide to Planning for People. London, UK: Spon Press.
Bonanno, G., Carr, D, Haring, M, Lehman, D, Nesse, R, Sonnega, J, Tweed, R, and Wortman,C. (2002). ‘Resilience to Loss and Chronic Grief: A Prospective Study from Preloss to 18-Months Postloss’. Journal of Personality and Social Psychology 83 (5): pp 1150-1164. doi:10.1037//0022-3514.83.5.1150.
Charmaz, K. (1980). The Social Reality of Death. USA: Addison-Wesley Publishing Company.City of Perth. (2018). ‘City of Perth Community Profile: Religion’. idcommunity Demographic
Resources. https://profile.id.com.au/perth/religionCurl, J. (2002). Death and Architecture: An Introduction to Funerary and Commemorative
Buildings in the Western European Tradition, with Some Consideration of Their Settings.Sparkford, UK: J.H. Haynes & Co Ltd.
Davenport, J. (2014). ‘The Future of Cemeteries in Australia: A Matter of life and Death’.Issues. http://www.issuesmagazine.com.au/article/issue-september-2014/future-cemeteries-australia-matter-life-and-death.html.
Freeman, S. (2005). Grief and Loss: Understanding the Journey. California, USA: Thomson Brooks/Cole.
Gino, F., and Norton, M. (2014). ‘Rituals Alleviate Grieving for Love Ones, Lover and Lotteries’. Journal of Experimental Psychology: General 143 (1): pp 266-272. http://dx.doi.org/1 0.1037/a0031772.
Groat, L., and Wang, D. (2013). Architectural Research Methods. 2nd ed. USA: Wiley.Harper, S. (2010). ‘Behind Closed Doors? Corpses and Mourners in English and American
Funeral Premises’ In: Jenny Hockey, Carol Komaromy and Kate Woodthorpe, The Matter of Death: Space, Place and Materiality. Great Britain: Palgrave MacMillian. https:/doi.org/10.1057/9780230283060.
Hauberg, J. (2011). ‘Research by Design – A Research Strategy’. Architecture and Education Journal 5 (1): pp 1-9.http://revistas.ulusofona.pt/index.php/revlae/article/view/2680/2043.
Heathcote, E. (1999). Monument Builders. West Sussex, UK: Wiley.Hockey, J., Komaromy, C and Woodthorpe, K. (2010). Recovering Presence. The Matter of
Death: Space, Place and Materiality. Great Britain: Palgrave MacMillian. https:/doi.org/10.1057/9780230283060.
Johansson, B. (1996). Tallum: Gunnar Asplund’s and Sigurd Lewerentz’s Woodlands Cemetery in Stockholm. Stockholm: Byggforlaget.
Klein, C. (2015). ‘The Remarkable Story of Maya Lin’s Vietnam Veterans Memorial’.Biography. https://www.biography.com/news/maya-lin-vietnam-veterans-memorial.
Konigsberg, R. (2011). ‘New Ways to Think About Grief’. Time. http://content.time.com/time/magazine/article/0,9171,2042372-2,00.html.
Kubler-Ross, E. (1970). On Death and Dying. London, UK: Tavistock.Nemeskeri, T. 2014. ‘Places of Remembrance’. The Canadian Architect 59 (3): p 38. https://
search-proquest-com.dbgw.lis.curtin.edu.au/docview/1515633086?accountid=10382.Pallasmaa, J. (2012). The Eyes of the Skin. Cornwall, UK: Wiley.Pjesivac, Z. (2015). ‘Between Museum, Monument and Memorial: Daniel Libeskind’s Jewish
Museum in Berlin’. Kultura 4 (8): pp 101-109. https://doaj.org/article/bf82d185a5174cf090419 efb38d6f8a5.
Sperzana, P. (2016). ‘Time as a Medium: Early Work of Miralles’. Architectural Design 86 (1): 60-65. doi:10.1002/ad.2002.
Stern, M. (1994). ‘Passages in the Garden: An Iconology of the Brion Tomb’. Landscape Journal. 13 (1): pp 37-57. Wisconsin: University of Wisconsin Press. https://www.jstor.org/stable/43324115
Till, J. (2008). ‘Three Myths and One Model’. Building Material 17 (1): pp 4-10. https://jeremytill.s3. amazonaws.com/uploads/post/attachment/34/2007_Three_Myths_and_One_Model.pdf
242. 243.

42nd AUBEA Conference 2018: Educating Building Professionals for the Future in the Globalised World
Determinants of construction organisations’ performance: A systematic literature review
Hamzah Alqudah1, Mani Poshdar2, James Rotimi3 and Luqman Oyewobi4
1&2School of Engineering, Computer and Mathematical Sciences,Auckland University of Technology, Auckland, 1010, NEW ZEALAND3School of Engineering and Advanced Technology, Massey University,
Auckland, 0745, NEW ZEALAND4School of Environmental Technology, Federal University of Technology,
Minna, Niger State, 65, NIGERIA
E-mails: [email protected]; [email protected]; [email protected];[email protected]
AbstractOrganisations in the same industry compete with observable performance differentials. Efforts to understand the causes and the determinants of performance differentials among organisations have led to both empirical and theoretical controversy in mainstream strategic management research. Despite all the efforts that have been done, no research has developed a comprehensive review. This research carried out a Systematic Literature Review (SLR) to create an overview of the currently available scientific knowledge on determinants of construction organisations' performance. Competitive advantage has been adopted as an idea that is superior to the traditional indicators which are seen as being sufficient to enable continuous improvement of performance. The research design involved two parts, the first aimed to analyse and synthesize related literature to present the main determinants of construction organisations' performance. The second part focused on developing a conceptual framework of these performance determinants. Of the 781 articles retrieved, 81 articles met the inclusion criteria and were included in the review. The analysis of the results showed that competitive strategies, resources and capabilities, and diversification had the most attention from the researchers. These results provide a benchmark on what has been done, provides a direction for future research and indicate their potential areas of focus.
Keywords:Competitive Advantage, Conceptual Framework, Construction Organisations, Performance Determinants, Systematic Literature Review
1 IntroductionIt is essential that organisations continuously seek to improve their performance to gain a competitive advantage and maintain sustainability in the dynamic and hypercompetitive construction industry (Rudd et al., 2008).
Many factors contribute to shaping organisational performance, which also explain the differences in those performances. Attempting to understand causes and sources of thesedifferentials, is one of the fundamental motivations in strategic management research (Oyewobi et al., 2016). Construction organisations need this knowledge as part of their survival strategy. It will help them to design and to adopt efficient approaches to improve their performance (Gavera et al., 2011).
Despite all the advancements in organisational performance research, there is a lack of aggregated information across different research studies. The systematic literature review
42nd AUBEA Conference 2018: Educating Building Professionals for the Future in the Globalised World
(SLR) adopted in the current study, will support discovery, synthesis, and mapping of key organisational performance research. An SLR collects a wide range of evidence from various situations over a long period (Haddaway, 2015). Therefore this paper presents the results of an SLR conducted on the determinants of organisational performance as they relate to the construction industry.
2 Background of Competitive Advantage and Construction Performance Studies
Construction industry battles with increased competition and unstable operating environments, both in developed and developing countries (Tan et al., 2012). Consequently, competitive advantage and its contributing factors continue to receiveattention in construction management studies (Tan et al., 2012; Oyewobi et al., 2016). Competitive advantage refers to superior attributes of an organisation with which it addsvalue to its products and services, thus gaining an advantage over its competitors within the same niche (Lynch, 2012). The importance of competitive advantage is not only shown on its ability to enable sustainable growth, but also from its ability to accept globalisation and dynamic competition in today’s world (Flanagan et al., 2007). Many studies stress a considerable attention to achieve competitive advantage for organisation from the 1960s, and three main schools have dominated and later on have been introduced to the construction sector (Flanagan et al., 2007): Porter’s (1980) competitive advantage and competitive strategy models (Betts and Ofori, 1992; Langford and Male, 2001), the resource-based view and the core competence approach (Barney, 1991), and the strategic management approach (Venegas and Alarcon, 1997).
The development of performance measurement systems enables the quantification of the competitive advantage of an organisation. Yang et al. (2010) suggest that construction organisations' performance can be measured at three different levels: project, stakeholder,and organisational level. This measurement can be based on the level of success attained in meeting business objectives (Bititci et al. 1997).
Performance measurement first started in construction, with the project level (Yang et al.,2010). Three key performance indicators have generally been used to measure projects’ performance: time, cost and quality (Kagioglou et al., 2001). With the development of performance measurement in the construction industry over the past decade, its target has extended from the project level to organisational and stakeholder levels (Wang andHuang, 2006). At the stakeholder level, the measurements’ focus on the relationshipsamong different contracting parties, such as owners, contractors, and consultants. Wang and Huang (2006) provided proof of the interconnections between the performance of stakeholders and project success. The third pillar of measuring performance in the construction context is at the organisational performance level. The importance of identifying an organization's performance is evident throughout global market sectors.Owing to the simultaneous implementation of various projects and the control of many input resources within the construction industry, it becomes critical to carrying out performance measurement at organization levels (Lin and Shen, 2007). Many measurement frameworks have been developed over the years to measure performance at the organisational level. These frameworks include key performance indicator (KPI), balanced scorecard (BSC) model, and the European Foundation for Quality Management (EFQM) excellence model (Lin and Shen, 2007).
Construction performance at the organisational level represents the overall performance that will guarantee the survival of an organisation in a competitive business environment (Tan et al., 2012). It contrasts project level or stakeholder level measures, which cover
244. 245.

42nd AUBEA Conference 2018: Educating Building Professionals for the Future in the Globalised World
only the performance of single dimensions. The current study focuses on identifying the main determinants of performance at the organisational level.
3 Research Methodology
This study conducted a systematic literature review (SLR) to outline the determinants of organisations' performance in the construction industry. It used the Scopus database as the main source of data collection. Figure 1 gives the flowchart of literature showing the design of this research, statistics of the results and the flow of the SLR. This study involved identifying the determinants of organisations' performance in the construction industry and the development of a conceptual framework of the performance determinants. A mix of qualitative and quantitative methods was followed for analysing the search results. The analysis used NVivo software package that has a proven ability in mixed research method (Andrew et al., 2008). The details of the stages undertaken to develop the SLR are explained in the following section.
Figure 1: Flowchart of literature search performed.
3.1 Developing the SLR
The three phases of developments were as follows:
3.1.1 First Phase: Identification
Scopus was chosen as the primary search database because of its broad coverage of the leading journals and conferences in the construction management subject area. The database was searched for keyword strings within the title, abstract, and keywords. Careful attention was given to choosing the search keywords to maximize the coverage of the related article. No restriction was decided to be set on the publication date, whichensured the conclusiveness of the search results.
The string of the keywords selected in the search criteria was as follows:
TITLE-ABS-KEY((Determinants OR Source OR Cause OR Effect OR Influence) AND (Performance OR Effectiveness OR "Competitive Advantages") AND (Construction)
PRE/5 (Organisation OR Company OR Firm OR Contractor))
42nd AUBEA Conference 2018: Educating Building Professionals for the Future in the Globalised World
Since “Construction" was a generic word that could be found in different contexts (e.g., management construction) the search was decided to be limited to the cases in which the distance between the word "construction" and "Organisation OR Company OR Firm OR Contractor” was not exceeding five words. It was to assure that the keywords would be used in the same sentence and the search results would remain within the scope of the research.
3.1.2 Second Phase: Screening
This phase used a skim and scan technique where the titles and abstracts were screened.Figure 1 shows that 87 articles were taken to the full-text screening.
3.1.3 Third Phase: Eligibility
The target of this phase was to narrow down the findings to the scope of this research. Inclusion and exclusion criteria were used to categorise a full-text screened publications as shown in Table 1. Particular attention was given to the critical references, which were missing in the identification phase. A backward and forward snowballing technique was engaged to cover critical references. Backward snowballing pinpointed the articles that had already been cited by the publications, where forward snowballing pinpointed the articles that had to cite the publications under screening. The new findings were analysed and categorised by using the same criteria as the abstract, and the full-text screening done.
Table 1: Inclusion and Exclusion Criteria
Catalogue Inclusion and Exclusion Criteria
Determinants of performanceInclusion Criteria
1. Discussions on the determinants of the performance in the construction organisation
2. Discussions on the factors affecting the success and the failure of the organisation
Exclusion Criteria
1. Determinants of the performance in a different context
The full-text scanning phase was conducted using NVivo. The primary node and a set of sub-nodes were defined, that represented the main research topic. Table 2 shows the designed central node that helped to answer the research question. This node was used to extract data by assigning the relevant textual data to each determinant during full-text scanning. The extracted data were taken to the next stage where they were synthesised and reported.
Table 2: NVivo node for Determinants of Performance
Nodes RoleDeterminants of Performance Addressing the determinants of the performance in organisation level.
4 Findings and Discussion4.1 Annual Research Productivity on Performance Determinants
According to the first-stage search results, the total number of papers that had discussed the determinants of construction performance was 800 with a gradual increase in frequency from 1 in 1975 to 89 in 2017.
As figure 2 shows, the number of research on organisational performance determinants topics had substantially increased within the first ten years of the 21st century with 243
246. 247.

42nd AUBEA Conference 2018: Educating Building Professionals for the Future in the Globalised World
articles, far more than the 46 published in the 1990s. A peak was observed in 2017 with 89 articles.
Figure 2. Annual distribution of the Performance determinants related article (Source: Scopus)
4.2 Main Determinants of Organisational Performance
The primary objective of the current study was to identify the primary determinants of organisational performance from previous studies to develop a conceptual framework. A comprehensive analysis and review of selected articles were conducted using NVivo software. The results show that researchers considered 18 factors as the main organisational performance determinants. These 18 determinants and the frequency of their mention in previous studies are summarised in Table 3. The table shows that competitive strategy received the most attention from researchers.
Table 3: Organisational Performance Determinates
No. Determinants Number of times used as the main variable
1 Competitive Strategies (CS) 122 Organisational Characteristics (OCH) 63 Resources and Capabilities (RC) 54 Strategic Management (SM) 55 Diversification and Internationalisation (DI) 56 Total Quality Management (TQM) 47 Organisational Learning (OL) 48 Environmental Factors (EF) 49 Organisational Culture (OCL) 2
10 Knowledge Management (KM) 211 Innovation (INN) 212 Information Technology (IT) 313 Human Resource Management (HRM) 114 Procurement Process Coordination (PPC) 115 Marketing Resource (MR) 116 Factors of Corporate Management (FCM) 117 Effect of Strength of Relationships with Other Parties (ROP) 118 Construction Equipment Selection Factors (CESF) 1
42nd AUBEA Conference 2018: Educating Building Professionals for the Future in the Globalised World
4.3 Conceptual Framework: Determinants of Organisational Performance.
Figure 3: Conceptual Framework of Performance Determinants
This section presents the developed conceptual framework (Figure 3) of the performance determinates of construction organisations, and the hypothesis are briefly outlined. The arrows represent the direct effect of the external and internal determinants on the organisational performance. All the main determinants and the relationship with the competitive advantage are derived from the review of the literature. The study found all the determinants could be categorised into external and internal determinants.
As an external determinant, relationships with other parties and business environmental factors are the influencer of the organisational performance. The performance of construction companies is influenced by the strength of their relationships with the parties involved in typical construction projects such as public or private clients, regulatory agencies, subcontractors, labour unions, material dealers, surety companies, and financial institutions. This strength found to have a direct positive relationship with the organisational performance (Hausman, 2001; Dainty et al., 2003). While, business environmental have a positive effect on organisational performance (Oyewobi et al.,2016) and a moderating effect on organisational characteristics (Oyewobi et al., 2016: 2017).
Internal factors of the organisational characteristics have been categorised into three main themes management style, decision-making style, and resources and capabilities related determinants. Competitive strategies, management strategies, total quality management, knowledge management, and human resources management are min managerial determinants of the organisation performance. Competitive advantage has a positive relationship with competitive strategies (Porter, 1980; Miller and Cardinal, 1994; Tan et al., 2012, Oyewobi et al., 2016: 2017), strategic management (Dikmen et al., 2005; Isik et al., 2009), total quality management (Lee et al., 2011; Duh et al., 2012; Panuwatwanich & Nguyen, 2017), knowledge management (Yusof and Virgiyanti, 2016; ElFar et al.,2017), and human resource management (Zhai et al., 2013). Business environment influences the competitive strategies positively and moderate its relationship with the competitive advantage (Nandakumar et al., 2010; Oyewobi et al., 2017). While firm size significantly and negatively affects the relation between performance and strategic management (Anikeeff and Sriram, 2008). Regarding management style, performance tends to improve when management appreciates and rewards efficiency, excellence, openness, social skill and contribution to a decision. (Oyewobi et al., 2016: 2017).
248. 249.

42nd AUBEA Conference 2018: Educating Building Professionals for the Future in the Globalised World
Competitive strategies suggest a sequence of organised and linked decisions that provide organisations with a competitive advantage over the competitors (Schuler and Jackson, 1987). Moreover, strategic management significantly related to the performance as the way it is used to achieve the present objective (Dikmen et al., 2005).
Decision-making style is a significant area of interest within the field of performance differential, which is acknowledged to have an impact on organisational performance (Amzat and Idris, 2012; Oyewobi et al., 2016). Three determinants have a link to the decision-making style; construction equipment selection, the factor of corporate management, and procurement process coordination. Competitive advantage positively linked with construction equipment selection (Samee and Pongpeng, 2015), the factor of corporate management (Madu et al., 1996; Riantini and Firmansyah, 2008), and procurement process coordination (Lambert et al., 1998; Othman et al., 2015). The bettercapability of company's management in planning, instructing, leading, communicating and managing information to determine resources required will improve the company'sperformance (Madu et al., 1996).
The last theme that deployed in the internal organisational characteristics is the resources and capabilities. Moreover, that categorised into six categories information technology, organisational learning, marketing resources, innovation, diversification, organisational culture. A considerable amount of literature has been published on the relationship between resources and capabilities and organisational performance in the construction industry. These studies demonstrated that resources and capabilities have a positive relationship with organisational performance and offer competitive advantages (Barney, 2011; Tan et al., 2012; Oyewobi et al., 2016; Tripathi and Jha, 2017).
Competitive advantage is positively and directly associated with information technology (EI-Mashaleh et al., 2006; Sun et al., 2008), organisational learning (Wong et al., 2014; Zhai et al., 2013), marketing resources (Zahra et al., 2000), innovation (Crossan andApaydin, 2010; Martínez-Román et al., 2017), diversification (Oyewobi et al., 2013; Horta et al., 2016), and organisational culture (Li and Jones, 2010). In contrast, some other studies showed that competitive advantage could act negatively with the diversified (Kim and Reinschmidt, 2012; Ofori and Chan, 2000) and innovated companies (Noktehdan et al., 2015) under specific circumstances. Due to the lack of empirical evidence, a vague and neutral situation have been found between competitive advantage and marketing resources (Covin and Slevin, 1991) and diversification (Choi and Russell, 2005; Ibrahim and Kaka, 2007). Resources and capabilities found to have a positive impact on organisational performance in a variety of ways; such as improving internal organisational performance, matching the base of resources with the fluctuatingenvironments, and creating changes in the market.
5 Conclusion and Further Research
This research focused on the determinants of performance of construction organisations. Organisations performance determinants are becoming an important vehicle forexplaining performance differentials within the construction industry. A systematicliterature review was conducted within the current study, in two stages. The first stage was a skim and scan of the title, abstract, and keywords of related articles published on the search engine "Scopus". The second step was a full-text review of some selected articles. A set of determinants of organisational performance were established from the review, which was then used to develop a conceptual framework, The conceptual framework presents the relationships and potential interactions between each determinant and organisations’ competitive advantage. There are many dimensions of thoughts on the nature of relationships and the levels of interactions/influence of these determinants on
42nd AUBEA Conference 2018: Educating Building Professionals for the Future in the Globalised World
competitive advantage. Some of these contrasting opinions are presented. The framework developed will be the object of further empirical studies (outside the scope of the current study). Further research work could be conducted to ascertain performance differentials within different business hierarchies (small, medium and large-scale construction firms) and to establish performance determinants at the project and stakeholder levels.
6 References Amzat, I. H., & Idris, A. R. (2012) ‘Structural equation models of management and decision
making styles with job satisfaction of academic staff in Malaysian Research University’,International Journal of Educational Management, 26(7), pp 616-645.
Andrew, S., Salamonson, Y. & Halcomb E.J. (2008). ‘Integrating mixed methods data analysis using NVivo: An example examining attrition and persistence of nursing students’, International Journal of Multiple Research Approaches, 2(1), pp 36-43.
Anikeeff, M.A., & Sriram, V. (2008). ‘Construction management strategy and developer performance’, Engineering, Construction and Architectural Management, 15(6), pp 504-513.
Barney, J.B. (2011), Gaining and Sustaining Competitive Advantage, 4th ed., Prentice Hall, Upper Saddle River, NJ.
Betts, M. & Ofori, G. (1992). ‘Strategic planning for competitive advantage’, Construction Management and Economics, 10(6), pp 511–532.
Bititci, U.S., Carrie, A.S., & McDevitt, L. (1997). ‘Integrated performance measurement systems: a development guide’, International journal of operations & production management, 17(5), pp 522-534.
Choi, J. & Russel, J.S. (2005). ‘Long-term entropy change of United States public construction firms’, Journal of Management in Engineering, 21(1), pp 17–26.
Covin, K. & Slevin, D. (1991), ‘A conceptual model of entrepreneurship as firm behavior’,Entrepreneurship Theory and Practice, 16(1), pp 121-154.
Crossan, M., & Apaydin, M. (2010). ‘A multi-dimensional framework of organizationalinnovation: A systematic review of the literature’, Journal of Management Studies, 47(6), pp 1154–1191.
Dainty, A.R.J., Cheng, M. ., & Moore, D. . (2003). ‘Redefining performance measures for construction project managers: An empirical evaluation’, Construction Management and Economics, 21(2), pp 209–221.
Dikmen, I., Birgonul, M.T., & Kiziltas, S. (2005). ‘Prediction of organizational effectiveness in construction companies’, Journal of Construction Engineering and Management, 131(2), pp 252-261.
Duh, R., Hsu, A., & Huang, P. (2012). ‘Determinants and performance effect of TQM practices: An integrated model approach’, Total Quality Management & Business Excellence,23(5/6), pp 689–701.
Elfar, A., Elsaid, A.M., & Elsaid, E. (2017). ‘How knowledge management implementation affects the performance of Egyptian construction companies’, Journal of Applied Business Research, 33(3), p 409.
El-Mashaleh, M., O’Brien, W.J., & Minchin Jr, R.E. (2006). ‘Firm performance and information technology utilization in the construction industry’, Journal of Construction Engineering and Management, 132(5), pp 499-507.
Flanagan, R., Lu, W., Shen, L., & Jewell, C. (2007). ‘Competitiveness in construction: a critical review of research’, Construction Management and Economics, 25:9, pp 989-1000.
Haddaway, N.R. (2015). ‘A call for better reporting of conservation research data for use in meta‐analyses’, Conservation Biology, 29(4), pp1242-1245.
Hausman, A. (2001). ‘Variations in relationship strength and its impact on performance and satisfaction in business relationships’, Journal of Business, Industry and Marketing, 16(7), pp 600-616.
Horta, I.M., Kapelko, M., Oude Lansink, A., & Camanho, A.S. (2016). ‘The impact of internationalization and diversification on construction industry performance’, International Journal of Strategic Property Management, 20(2), pp 172-183.
250. 251.

42nd AUBEA Conference 2018: Educating Building Professionals for the Future in the Globalised World
Ibrahim, Y.M. & Kaka, A.P. (2007). ‘The impact of diversification on the performance of UK construction firms’, Journal of Financial Management of Property and Construction,12(2), pp 73-86.
Isik, Z., Arditi, D., Dikmen, I., & Birgonul, M.T. (2009). ‘Impact of resources and strategies on construction company performance’, Journal of Management in Engineering, 26(1), pp 9-18.
Kagioglou, M., Cooper, R., & Aouad, G. (2001). ‘Performance management in construction: a conceptual framework’, Construction Management and Economics, 19(1), pp 85-95.
Kim, H. and Reinschmidt, K.F. (2012), ‘Market structure and organizational performance of construction organizations’, Journal of Management in Engineering, 28(2), pp 212-220.
Lambert, D.M., Cooper, M.C., & Pagh, J.D. (1998), ‘Supply chain management: implementation issues and research opportunities’, International Journal of Logistics Management, 9(2), pp 141-158.
Lee, Y., Moon, H., & Lee, H. (2011). ‘Investigating the structural hierarchy of quality capabilities in construction organizations’, Journal of Asian Architecture and Building Engineering, 10(1), pp 141-148.
Li, S.K., & Jones, G. (2010). ‘A study of the effect of functional subcultures on the performance of Hong Kong construction companies’, Systemic Practice and Action Research, 23(6), pp 509-528.
Lin, G.B. & Shen, Q.P. (2007). ‘Measuring the performance of value management studies in construction: critical review’, Journal of Management in Engineering, 23(1), pp. 2‐9.
Lynch, R. (2012). Strategic Management (6th ed.), Pearson Prentice Hall.Madu, C.N., Kuei, C.H., & Jacob, R.A. (1996). ‘An empirical assessment of the influence of
quality dimensions on organizational performance’, International Journal of Production Research, 34(7), pp 1943-1962.
Martínez-Román, J.A., Tamayo, J.A., & Gamero, J. (2017). ‘Innovativeness and its influence on growth and market extension in construction firms in the Andalusian region’, Journal of Engineering and Technology Management, 43, pp 19-33.
Miller, C.C. & Cardinal, L.B. (1994), ‘Strategic planning and firm performance: a synthesis of more than two decades’, Academy of Management Journal, 37(6), pp 1649-1665.
Nandakumar, M.K., Ghobadian, A. & O’Regan, N. (2010). ‘Business-level strategy and performance: The moderating effects of environment and structure’, Management Decision, 48(6), pp 907-939.
Noktehdan, M., Shahbazpour, M., & Wilkinson, S. (2015). ‘Driving innovative thinking in the New Zealand construction industry’, Buildings, 5(2), pp 297-309.
Ofori, G. & Chan, S.L. (2000). ‘Growth paths of construction enterprises in Singapore, 1980-98’, Engineering, Construction and Architectural Management, 7(3), pp 307-321.
Oyewobi, L.O., Windapo, A.O., Rotimi, J.O.B., & Jimoh, R.A. (2016). ‘Relationship between competitive strategy and construction organisation performance: The moderating role of organisational characteristics’, Management Decision, 54(9), pp 2340-2366.
Oyewobi, L.O., Windapo, A.O., & Cattell, K.S. (2013). ‘Impact of business diversification on South African construction companies' corporate performance’, Journal of Financial Management of Property and Construction, 18(2), pp 110-127.
Oyewobi, L.O., Windapo, A.O., Rotimi, J.O.B., & Jimoh, R.A. (2017). ‘Determining strategic clusters and performance of construction organizations in South Africa’, International Journal of Construction Management, 1-11.
Panuwatwanich, K., & Nguyen, T.T. (2017). ‘Influence of Total Quality Management on performance of Vietnamese construction firms’, Procedia Engineering, 182, pp 548-555.
Porter, M.E. (1980). Competitive Advantage: Creating and Sustaining Superior Performance.New York: Free Press.
Rudd, J., Greenley, G., Beastson, A. & Lings, I. (2008), ‘Strategic planning and performance: extending the debate’, Journal of Business Research, 61(2), pp 99-108.
Samee, K. & Pongpeng, J. (2012). ‘Construction equipment selection: a common procedure’, Proceedings of the 2nd International Symposium on Technology for Sustainability (ISTS 2012), 21-24 November 2012, The Swissotel Le Concorde, Bangkok, Thailand, pp 281-284.
42nd AUBEA Conference 2018: Educating Building Professionals for the Future in the Globalised World
Schuler, R.S., & Jackson, S.E. (1987). ‘Linking competitive strategies with human resource management practices’, The Academy of Management Executive, (1987-1989), 207-219.
Sun, J., Ding, L., & Gu, X. (2008, December). ‘Empirical Study on Impact of Information Technology on Construction Firm Performance’, In Information Management, Innovation Management and Industrial Engineering, 2008. ICIII'08. International Conference on (Vol. 1, pp 54-57). IEEE.
Tan, Y., Shen, L. & Langston, C. (2012). ‘Competition Environment, Strategy, and Performance in the Hong Kong Construction Industry’, Journal of Construction Engineering and Management, 138(3), pp 352-360.
Tripathi, K.K., & Jha, K.N. (2017). ‘Determining success factors for a construction organization: A structural equation modelling approach’, Journal of Management in Engineering, 34(1), 04017050.
Wang H, Huang J (2006). ‘The relationships between key stakeholders project performance and project success: Perceptions of Chinese construction supervising engineers’, International Journal of Project Management, 24(3), pp 253- 260.
Wong, P.S., Demertjis, M., Hardie, M., & Lo, C.Y. (2014). ‘The effect of unlearning on organisational learning behaviour and performance in construction contracting organisations’, International Journal of Project Organisation and Management, 6(3), pp197-214.
Yang, H., Yeung J.F.Y., Chan A.P.C., Chiang Y.H., & Chan D.W.M., (2010). ‘A critical review of performance measurement in construction’, Journal of Facilities Management, 8(4), pp 269-284.
Zahra, S.A., Ireland, D., & Hitt, M. (2000), ‘International expansion by new venture firms: international diversity, mode of market entry, technology learning and performance’, Academy of Management Journal, 10(1), pp 925-950.
Zhai, X., Liu, A.M., & Fellows, R. (2013). ‘Role of human resource practices in enhancingorganizational learning in Chinese construction organizations’, Journal of Management in Engineering, 30(2), pp 194-204.
252. 253.

42nd AUBEA Conference 2018: Educating Building Professionals for the Future in the Globalised World
Evaluating Green Star rating tools through user perception: Kano survey and Taguchi review
Valeria Maria Cabello Gorchs1 and Samad M. E. Sepasgozar2
1 & 2 Faculty of Built Environment, University of New South Wales Sydney,Sydney, 2052, NSW, AUSTRALIA
E-mails: [email protected]; [email protected]
Abstract: There is intensive literature on green buildings and rating tools; however, there are few studies evaluating the tools utilized in complex case studies. The purpose of this study is to evaluate the performance of the Green Star rating system ‘Design & As Built’ tool through an analysis of user perception and satisfaction. The study was conducted in a 6 Green Star education building at UNSW Kensington campus. A questionnaire based on Kano’s satisfaction model was designed and distributed to random participants at the selected building. In this study, the assumption was the green buildings performance is high from the users perspective. Findings shows the significance and effect of the determined factors and any gaps in rating systems regarding aspects of design that affect user comfort and well-being. The study evaluated the perception of students in the building. The finding of the study shows that the rating system variables were ‘Indifferent’ to users which shows a neutral preference of the IEQ dimensions. Details of this ongoing study will be discussed in the paper. It did not consider other physical and instrumental readings for its analysis and surveyed a limited number of participants. The analysis of user perception in green buildings can be a helpful tool when reassessing rating system’s criteria. Post-occupancy evaluations are usually performed in both green and conventional buildings.
Keywords: Rating System, Sustainability, Building, Desing, As Built, User perception.
1 Introduction
A Green building, as defined by the Green Building Council of Australia, “incorporates design, construction and operational practices that significantly reduce or eliminate its negative impact on the environment and its occupants” (GBCA, 2017). This need to reduce negative impact on not only the environment, but also the occupants’ well-being has been recognized by organizations through the development of rating systems. Australia’s Green Star rating system, launched in 2003, aims to improve environmental efficiencies, boosting productivity and improving the health and well-being (GBCA, 2017). In Australia, around one quarter of national carbon emissions are a result of the built environment (GBCA, 2017). It is one of the highest emitting countries in the world even though its population represents only 0.33% of the world’s population. If the operation of residential and commercial buildings were to reach zero carbon emissions by 2050, the country’s reduction target signed in the Paris Climate Change Agreement would be reduced by 28% (Yu et al., 2017). The aim of this study is to explore the perception and satisfaction of occupants of 6-star Green Star buildings, to investigate whether the performance of these buildings is either appropriate or less than what is targeted from them to satisfy the occupants needs, and to identify any gaps in the rating system regarding improvements to user comfort, productivity, and health. Through the
42nd AUBEA Conference 2018: Educating Building Professionals for the Future in the Globalised World
results gathered from survey data, the study’s main objective is to then evaluate the rating tool from occupants’ perception. A significant amount of research to date has focused on measuring the efficiency of green buildings with regards to energy-saving while less attention has been given to the effort of keeping IEQ at appropriate satisfaction level for occupants (Liang et al. 2013). However, a comprehensive evaluation of human comfort, behaviour and satisfaction is necessary to better understand the performance of these buildings. This study will address the issue of whether highly rated buildings are performing as they are expected and, unlike previous studies, will evaluate this using a different questionnaire model. Most studies have used post-occupancy evaluation surveys such as the CBE survey from the University of California, Berkeley. However, this research proposes the use of the Kano Model for user satisfaction as a novel approach to evaluating occupant satisfaction of green buildings.
2 Literature of Rating Systems
Sustainable building rating systems or also referred to as ‘green’ rating systems are defined as “tools that examine the performance or expected performance of a ‘whole building’(Fowler and Rauch 2006). The certification of buildings through green rating tools is regularly voluntary, but the recognition and rewards obtained usually encourage companies and organizations to pursue them. Green rating tools assess the performance of buildings regarding specific sustainability criteria, with energy consumption usually the main criteria. At first, the Council considered adopting the LEED rating system or the UK’s BREEAM; however, it became clear that a rating tool that could accurately represent local conditions would be more suitable (2012). Hence, it reflects the local sustainability needs and demands which, for example, could include the highest standards for water conservation due to draughts, or other circumstances involving climate, building standards or particular environmental concerns (Mitchell 2010). Buildings must achieve minimum credits in each of these categories in order to obtain specific ratings. The certification process commences with the preparation of the application by a project team member with accredited professional status and its submission to the Green Building Council of Australia. Then, the documentation for claimed credits is validated by a panel of Certified Assessors to guarantee that it complies with requirements outlined in the Technical Manual associated with each rating tool. The credit points awarded then determine the Green Star rating awarded to the building (Xia et al. 2013). Figure 3 below shows IEQ credits and their available rating points for the ‘Design & As Built” rating tool. A total of 17 points are available in this category out of 100 core points available, being Energy, with 22 points, the criteria with most possible points available.
Measuring IEQ in green buildings: Numerous studies have been published in relation to certified, sustainable design, construction, and operation, particularly around energy and water savings. However, according to Lee & Kim (2008), “there is a lack of comprehensive studies examining whether the IEQ of sustainable buildings contributes to occupant's life”. It is a common perception that certified green buildings are substantially superior in performance than conventional buildings. Lee & Kim (2008) found that LEED-certified buildings had higher occupant satisfaction in office furnishings quality, thermal comfort quality, air quality, and cleanliness but underperformed in areas such as office layout quality, lighting quality, and acoustic quality. Occupants were also less satisfied with lighting in an analysis by Abbaszadeh et. al (2006) and by Altomonte & Schiavon (2013) in which 65 LEED and 79 non-LEED buildings were compared through surveys. Satisfaction with air quality was also slightly higher than in non-LEED buildings. Table 1 summarizes methods and findings of several studies performed in relation to occupant perception of green building Indoor Environmental Quality. Most
254. 255.

42nd AUBEA Conference 2018: Educating Building Professionals for the Future in the Globalised World
research regarding IEQ user perception in green buildings has been carried out in commercial office buildings and in some rare cases in residential buildings.
Table 1: Previous research on IEQ perception in green buildings
Measured Variables Method Findings
Thermal environment, indoor air quality, visual and acoustic environment (Pei et
al. 2015).
POE surveys within green and conventional office buildings in two climate zones of China.
A significantly higher satisfaction level than conventional buildings.
Quality of office layout, office furnishings, thermal comfort, indoor air quality (IAQ), lighting, acoustics,
and cleanliness and maintenance (Lee and Kim
2008).
Compared seven IEQ criteria in relation to
occupant's satisfaction and performance
between LEED and non-LEED-certified
buildings.
LEED-certified: satisfaction with office furnishings quality, IAQ, and cleanliness
and maintenance quality; non-LEED-certified: satisfaction with office layout quality, lighting quality, and acoustic
quality.
Physical measurements of several indoor environment quality variables in similar locations (Ravindu et al.
2015).
Questionnaires were used to investigate; the
indoor environment quality of a green factory building.
Thermal comfort, ventilation, and ability tocontrol indoor environment of the green
factory were comparatively less satisfactory. Acoustics, indoor air quality and work
layout did not indicate a significant difference.
Noise, lighting, air quality in winter and summer,
temperature in winter and summer (Gou et al. 2012).
BUS Questionnaire used to compare two
LEED certified offices in Hong Kong to
conventional office spaces.
There was no significant difference in the overall satisfaction with IEQ between two LEED offices and conventional offices in
the same city.
Office layout, office furnishings, thermal
comfort, air quality, lighting, acoustics, cleanliness and
maintenance, overall(Altomonte and Schiavon
2013).
CBE database analysis for 65 LEED and 79 non-LEED buildings, commercial offices.
Equal satisfaction with the building overall and with the workspace in both LEED and non-LEED; no statistical significance was
found for differences in occupant satisfaction with furniture adjustability,
temperature, and comfort of furnishing in both buildings
Office layout, office furnishings, thermal
comfort, air quality, lighting, acoustics, cleanliness and
maintenance, overall(Abbaszadeh, Zagreus et al.
2006).
Analysis and comparison of 21 LEED certified
buildings and CBE database of 160 non-
green buildings.
Occupants in green buildings are on average more satisfied with office furnishings, air
quality, thermal comfort, cleaning and maintenance, and overall workspace and building. Lighting and acoustic quality in green buildings do not show a significant improvement in comparison to non-green
buildings.
Thermal comfort, air quality, lighting, acoustic quality,
office layout, office furnishings, cleanliness and
maintenance, overall satisfaction (Kim and de
Dear 2011).
Samples from 351 different office
buildings were used to estimate the impact ofindividual IEQ factors
on occupants’ satisfaction.
The IEQ item with the biggest impact was ‘amount of space’ in both positive and
negative directions. Thermal discomfort has a stronger impact on overall satisfaction than thermal comfort. Workspace cleanliness had
the least impact.
Education buildings such as the Tyree building, are less commonly evaluated for research on user perception. However, as they also include office space for research and managing staff, they could also fit into the office building ‘category’. This study evaluates the perception of students in the building which proposes a different perspective as students are seldom asked to rate their study spaces. They are usually disregarded as full-time
42nd AUBEA Conference 2018: Educating Building Professionals for the Future in the Globalised World
building occupants even though some may spend more time in the building than regular full-time staff. A research gap can therefore be identified in the assessment of green education buildings from the perspective of students, or random users of the building. This addresses areas in the building which may be overlooked in the design and performance as constant post-occupancy evaluations are carried out amongst staff members in particular office areas.
3 Modelling users’ satisfaction
To develop the questionnaire for this research, with the intention of evaluating user perception of IEQ at the Tyree Energy Technologies Building, two models for product design and satisfaction were evaluated: Taguchi’s robust design and Kano’s model of customer satisfaction. Genichi Taguchi, a Japanese quality consultant, proposed a quality-improvement technique aiming at reducing variations in products and processes known as robust design. He classified inputs to a ‘system’ (the process being studied), as “control’ factors and “noise” factors. “Control factors” refer to parameters which can be easily controlled and manipulated and “noise factors” to those which are difficult to control(Nair et al. 1992). Noise factors are also referred to as the sources of variation and consequently the causes of low quality (Zhang and de Dear 2017). Any variation amongst noise factors causes variation in the system’s performance so the main target in robust design is to find the appropriate setting of control factors at which the system will be insensitive to variations in the noise factors(Nair, Bovas et al. 1992). The signal-to-noise ratio is a key metric in Taguchi’s robust design. It measures the variation from the target value of the system’s response to noise factors(Zhang and de Dear 2017). By employing Taguchi’s technique, time can be significantly reduced in experimental investigation for optimization of product design as it is highly effective in exploring the effects of numerous factors on performance as well as the amount of influence individual factors might have (Haniff et al. 2011). The use of ‘orthogonal arrays’, Taguchi’s experimental design, allows researchers to estimate these influences independently (Zhang and de Dear 2017). Taguchi’s methods have been commonly used in quality control of manufacturing processes. However, its application in the built environment has been limited.(Zhang and de Dear 2017). Zhang & de Dear applied the method toward optimizing air-conditioning control in order optimize thermal comfort and cognitive performance in building users. Another study has applied the method in optimizing envelope characteristics in buildings to improve energy performance (Zhang and de Dear 2017). When analysing the applicability of Taguchi’s method to determine occupants’ perceptions of indoor environmental quality in buildings, it is crucial to first determine what aspect of the building needs to be optimized and which are the factors that can affect it.
Kano Model: In the 1980’s, Professor Noriaki Kano and several of his colleagues from Tokyo Rika University, developed a very successful and widely used customer-defined quality model (Berger et al. 1993). Until then, customer satisfaction was commonly seen as one-dimensional; meaning the higher the product quality, the higher the customer’s satisfaction and vice-versa. However, high customer satisfaction cannot be guaranteed just by exceedingly fulfilling product requirements, each individual requirement’s ‘type’ also defines the perceived product quality (Sauerwein et al. 1996). Kano therefore introduced a two-dimensional quality model after observing customers’ product awareness and determining that product quality attributes and customer satisfaction had a non-linear relationship (Lin et al. 2017). The following three quality attributes or requirements, were suggested by Kano and lead to customer satisfaction or dissatisfaction when sufficient or insufficient: 1) Must-be: representing aspects in which the customer is more dissatisfied when the product is less functional but where the satisfaction is never
256. 257.

42nd AUBEA Conference 2018: Educating Building Professionals for the Future in the Globalised World
above neutral no matter how functional it becomes(Berger, Blauth et al. 1993). In other words, these requirements are expected by the customer so they will not increase their satisfaction but will greatly affect their dissatisfaction. 2) Attractive: these aspects indicate the greatest influence on customer satisfaction regarding a given product. The customer is therefore more satisfied when it is more functional but is not dissatisfied when it is less functional as the requirement is not ‘expected’(Berger, Blauth et al. 1993). If these requirements are not met then it will not lead to dissatisfaction with the product. Aspects of a product which are classified as ‘attractive’ can also be seen as additional features which greatly improve customer satisfaction but will not necessarily decrease the user’s perception of the product if they weren’t there. 3) One-dimensional: these requirements, as mentioned before, represent aspects with which satisfaction is simply proportional to the quality and functionality of the product. Customers may also be indifferent to a product aspect. An increase in the functionality of this quality attribute does not lead to satisfaction and a decrease does not lead to dissatisfaction either (Lin, Tsai et al. 2017). This would be represented in Figure 1 as the horizontal axis itself. The first question of Kano asks how the customer would feel with that individual feature of the product and the second asks how they would feel if it were not present. These questions can be answered on a 5-point scale through the following responses: Like,Must-be (or Expect), Neutral, Live with (or Tolerate), Dislike. The response obtained regarding each aspect or feature of the product can then be further classified into one of six categories: A: Attractive, M: Must-be, O: One-dimensional, I: Indifferent, R: Reverse,Q: Questionable. The categories Reverse and Questionable refer to possible contradictions in the customer’s answers or a reversal of how the customer would have felt regarding the functional and dysfunctional questions (Berger, Blauth et al. 1993).Questionable responses, for example, would be those in which the customer responds to both liking and disliking a feature of the product. A Reverse response would indicate that what the survey developer thought as functional was in fact dysfunctional from the customer’s point of view.
Applicability of the Kano model in the IEQ domain: If thinking of a green building as a marketable product and its users as consumers, then, when aiming at evaluating their perception of the indoor environmental quality, aspects of building comfort such as temperature, lighting, ventilation, etc can be considered ‘features’ of the building or ‘product’. By developing and surveying a Kano model questionnaire, these variables, could be classified into the Kano categories, to understand which ones have the greatest impact on user satisfaction. Kim & de Dear (2011) analysed the possibility of classifying building IEQ factors as either Must-be, One-dimensional, or Attractive; however, they used the CBE survey database to classify these variables according to their impact on the overall satisfaction (through regression coefficients) and not through a Kano questionnaire.
4 Research Methodology
The study was conducted at the Tyree Energy Technologies Building at the University of New South Wales Kensington campus. A self-developed questionnaire using functional and dysfunctional questions from the Kano model and combining variables from Green Star credits and other post occupancy evaluation surveys was handed out. Students were selected randomly, aiming at obtaining a diverse mix of ages, gender, and range of activities being carried out at the building. The following images show the areas of the building where the surveys were distributed.
42nd AUBEA Conference 2018: Educating Building Professionals for the Future in the Globalised World
Figure 1.Ground Floor Study Area. Lower Ground Study Area Upper levels’ study lounges Ground Floor Café (Bar Navitas) Tyree Energy Technologies Building, UNSW Sydney.
The variables chosen fall under nine main categories: Indoor Air Quality, Acoustic Comfort, Lighting Comfort, Thermal Comfort, Office Layout, Office Furnishings, Cleanliness and Maintenance, Productivity, and Aesthetics. Figure 2 display the dimensions assessed and classify the variables asked in each specific pair of questions.
Figure 2: IEQ dimensions and variables: (a) adopted from Post-Occupancy Evaluation Surveys; b) adopted from Green Star credits
The Kano questionnaire, as mentioned before, is characterised by asking two questions for each variable: a functional (positive) and a dysfunctional (negative) question. Therefore, to incorporate IEQ variables into this model, the first question in each pair asks occupants how they feel towards the current ‘feature’ or variable and the second one how they would feel if it were the opposite. For example, as shown in Figure 16, the first pair of questions asks: “How do you feel about the air quality in your study space (i.e. odours, stale air, cleanliness)?” and the second one “How would you feel if the air quality was not the same standard as current, in your study space?”.
(a)
(b)
258. 259.

42nd AUBEA Conference 2018: Educating Building Professionals for the Future in the Globalised World
5 Findings and Discussion
The analysis corresponding to the Kano model questionnaire is centred on combining the responses from the functional and dysfunctional questions using the Kano Evaluation. For each variable, one determines which category it falls into by looking up the respondents answer in the table. For example, if the response to the first question was ‘Like’ and the response to the second question was ‘Neutral’, then the category is identified by the intersection of the first row and the third column, which in this particular case would be ‘A’ or ‘Attractive’.
Figure 3. Gender demographic in five selected areas sampled at the Tyree building.
Figure 3 shows the proportion of female versus male participants in the study. From the 75 questionnaires which were accepted and analysed, 37 respondents were female and 35, representing a surprisingly gender-balanced sample. The majority of respondents were between 18 and 24 years old, an expected result for an education building; spent 2 to 5 hours per week studying in the building; and 67 out of 75 were full- time students. The leading activity carried out at the specific location in which they were surveyed was Individual Study, followed by Classes although this includes all students sampled in one of the lecture rooms. The preferred reason why respondents chose Tyree building was because of Available Workspace followed by Thermal and Furniture comfort. Table 5 summarizes the demographics results obtained from the 75 respondents. A total of 103 questionnaires were handed out but 75 were accepted, representing approximately 73%. Although lower than expected (at least 75% would have been best), the results obtained from this study could add to further research or act as a pilot study. Rejected surveys were either incomplete, corresponded to occupants of the building who spend less than 2 hours weekly in the building, or had marked the same response for all 24 sets of questions, meaning they had not read and responded accurately.
2.1 IEQ Variables The general results obtained for all variables including all different areas of the building are shown in the following table. These are classified into the four main Kano attributes plus Reverse and Questionable. From these results, percentages of Attractive, Must-be, One-dimensional, and Indifferent attributes were calculated and each variable was classified into a specific Grade or attribute. Table 4 shows the percentages and results obtained from this analysis.
125 6 7 7
37
8 92 3
13
35
0
10
20
30
40
Ground FloorStudy Area
Upper LevelLounge Areas
Café (BarNavitas)
Lower GroundStudy Area
Lecture RoomLower Ground
Total
FEMALE MALE
42nd AUBEA Conference 2018: Educating Building Professionals for the Future in the Globalised World
Table 2: Results obtained from Kano questionnaires in all locations at the Tyree building
Table 4 shows that all variables fell into the ‘Indifferent’ category. This indicates that occupants remained mostly neutral regarding their preference or likeness of the evaluated IEQ dimensions. When considering that this building is a 6-Star green building, expectations regarding Indoor Environmental Quality were particularly high. Preferably responses expected would have been ‘Like’ for the functional question and ‘Dislike’ for the dysfunctional question, indicating a categorization of ‘Outstanding’. However, as seen in the table percentages of responses in the Outstanding category do not exceed 10%, which is significantly low. The following list further explains the results obtained from major variables. Most respondents remained neutral towards their perception of the building’s air quality. The findings show only 1 ‘Reverse’ response, which would have represented a general dislike of the feature. 10% of participants considered it an Outstanding feature, pointing out that this was one of the highest results in terms of satisfaction.
Table 3: Classification of IEQ variables into Kano attributes.
VARIABLE A M R O Q I TOTAL A M R O Q I TOTAL A M R O Q I TOTAL1 Air quality 6 3 1 3 3 31 47 4 3 0 4 1 15 27 10 6 1 7 4 46 742 Air ventilation 6 5 4 1 2 29 47 3 4 0 4 1 14 26 9 9 4 5 3 43 733 Air ventilation control 2 6 0 0 8 30 46 0 4 3 1 1 17 26 2 10 3 1 9 47 724 Internal noise levels 0 15 0 1 6 24 46 0 7 0 4 2 13 26 0 22 0 5 8 37 725 Speech privacy 2 4 0 2 5 34 47 2 6 1 1 1 15 26 4 10 1 3 6 49 736 Glare 4 3 1 3 1 35 47 2 4 3 1 0 16 26 6 7 4 4 1 51 737 Artificial lighting 3 5 3 1 3 31 46 4 7 1 2 1 13 28 7 12 4 3 4 44 748 Natural lighting 4 11 0 2 5 25 47 2 6 1 2 3 13 27 6 17 1 4 8 38 749 Lighting control 1 9 0 1 5 30 46 2 2 0 1 1 22 28 3 11 0 2 6 52 74
10 Outdoor views 4 5 1 2 8 27 47 2 6 1 0 3 16 28 6 11 2 2 11 43 7511 Colours 4 1 1 0 4 37 47 4 0 4 1 0 19 28 8 1 5 1 4 56 7512 Visual privacy 2 5 1 1 5 32 46 5 0 1 1 2 19 28 7 5 2 2 7 51 7413 Room temperature 5 4 1 1 3 32 46 1 1 1 2 2 20 27 6 5 2 3 5 52 7314 Surface temperature 5 2 1 0 1 36 45 1 5 0 1 1 19 27 6 7 1 1 2 55 7215 Temperature control 3 5 0 1 6 30 45 2 0 0 1 2 22 27 5 5 0 2 8 52 7216 Breakout space 1 4 1 1 5 31 43 2 3 0 1 1 20 27 3 7 1 2 6 51 7017 Collaboration space 3 5 0 2 4 31 45 2 2 0 2 0 21 27 5 7 0 4 4 52 7218 Individual workspace 4 11 1 2 5 22 45 4 6 0 1 2 14 27 8 17 1 3 7 36 7219 Furniture comfort 4 12 0 0 1 28 45 4 1 0 2 2 17 26 8 13 0 2 3 45 7120 Furniture adaptability 1 12 0 0 2 31 46 1 3 0 1 0 22 27 2 15 0 1 2 53 73
21 Cleanliness and maintenance 10 8 0 5 0 23 46 1 2 0 2 2 20 27 11 10 0 7 2 43 73
22 Productivity 5 12 0 7 2 20 46 2 4 0 2 1 18 27 7 16 0 9 3 38 7323 Building aesthetics 9 4 0 2 0 31 46 3 2 0 2 1 19 27 12 6 0 4 1 50 7324 Outdoors connection 2 7 2 3 3 29 46 1 4 0 3 3 16 27 3 11 2 6 6 45 73
TOTAL KANO'S ATTRIBUTES
TOTAL MORNINGKANO'S ATTRIBUTES
TOTAL AFTERNOONKANO'S ATTRIBUTES
VARIABLE A O M I TOTAL GRADE1 Air quality 14% 10% 9% 67% 100% I2 Air ventilation 14% 8% 14% 65% 100% I3 Air ventilation control 3% 2% 17% 78% 100% I4 Internal noise levels 0% 8% 34% 58% 100% I5 Speech privacy 6% 5% 15% 74% 100% I6 Glare 9% 6% 10% 75% 100% I7 Artificial lighting 11% 5% 18% 67% 100% I8 Natural lighting 9% 6% 26% 58% 100% I9 Lighting control 4% 3% 16% 76% 100% I
10 Outdoor views 10% 3% 18% 69% 100% I11 Colours 12% 2% 2% 85% 100% I12 Visual privacy 11% 3% 8% 78% 100% I13 Room temperature 9% 5% 8% 79% 100% I14 Surface temperature 9% 1% 10% 80% 100% I15 Temperature control 8% 3% 8% 81% 100% I16 Breakout space 5% 3% 11% 81% 100% I17 Collaboration space 7% 6% 10% 76% 100% I18 Individual workspace 13% 5% 27% 56% 100% I19 Furniture comfort 12% 3% 19% 66% 100% I20 Furniture adaptability 3% 1% 21% 75% 100% I
21 Cleanliness and maintenance 15% 10% 14% 61% 100% I
22 Productivity 10% 13% 23% 54% 100% I23 Building aesthetics 17% 6% 8% 69% 100% I24 Outdoors connection 5% 9% 17% 69% 100% I
260. 261.
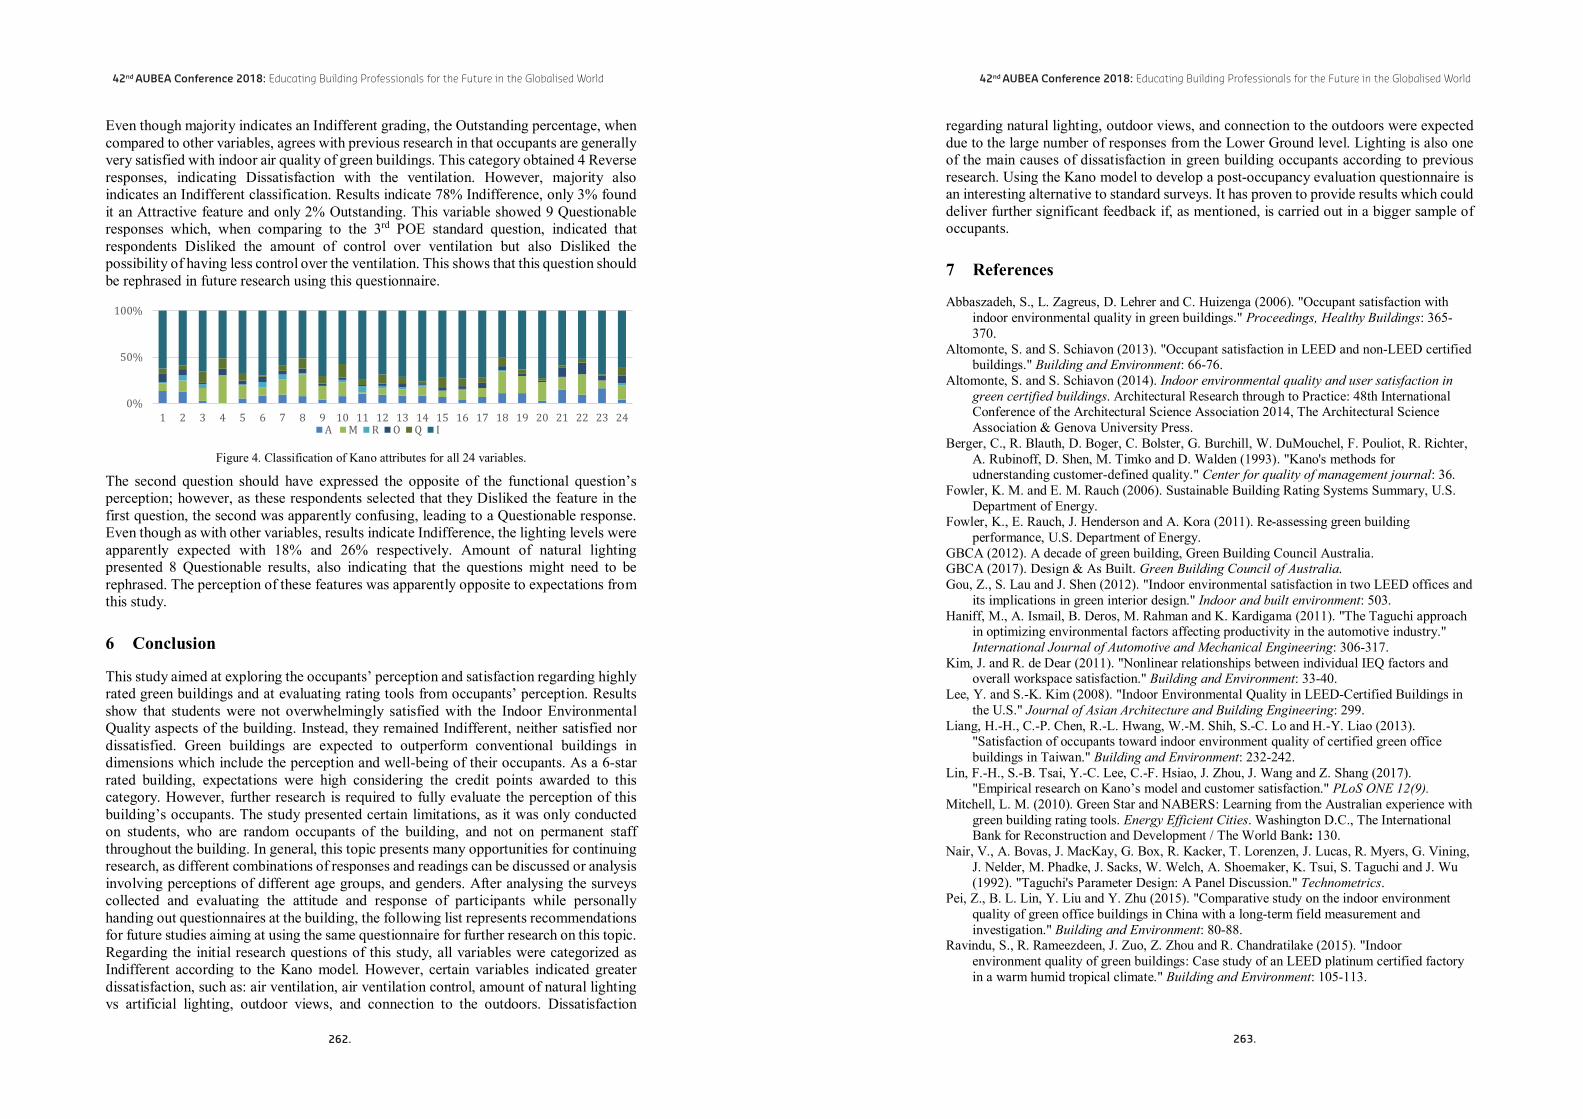
42nd AUBEA Conference 2018: Educating Building Professionals for the Future in the Globalised World
Even though majority indicates an Indifferent grading, the Outstanding percentage, when compared to other variables, agrees with previous research in that occupants are generally very satisfied with indoor air quality of green buildings. This category obtained 4 Reverse responses, indicating Dissatisfaction with the ventilation. However, majority also indicates an Indifferent classification. Results indicate 78% Indifference, only 3% found it an Attractive feature and only 2% Outstanding. This variable showed 9 Questionable responses which, when comparing to the 3rd POE standard question, indicated that respondents Disliked the amount of control over ventilation but also Disliked the possibility of having less control over the ventilation. This shows that this question should be rephrased in future research using this questionnaire.
Figure 4. Classification of Kano attributes for all 24 variables.
The second question should have expressed the opposite of the functional question’s perception; however, as these respondents selected that they Disliked the feature in the first question, the second was apparently confusing, leading to a Questionable response. Even though as with other variables, results indicate Indifference, the lighting levels were apparently expected with 18% and 26% respectively. Amount of natural lighting presented 8 Questionable results, also indicating that the questions might need to be rephrased. The perception of these features was apparently opposite to expectations from this study.
6 Conclusion
This study aimed at exploring the occupants’ perception and satisfaction regarding highly rated green buildings and at evaluating rating tools from occupants’ perception. Results show that students were not overwhelmingly satisfied with the Indoor Environmental Quality aspects of the building. Instead, they remained Indifferent, neither satisfied nor dissatisfied. Green buildings are expected to outperform conventional buildings in dimensions which include the perception and well-being of their occupants. As a 6-star rated building, expectations were high considering the credit points awarded to this category. However, further research is required to fully evaluate the perception of this building’s occupants. The study presented certain limitations, as it was only conducted on students, who are random occupants of the building, and not on permanent staff throughout the building. In general, this topic presents many opportunities for continuing research, as different combinations of responses and readings can be discussed or analysis involving perceptions of different age groups, and genders. After analysing the surveys collected and evaluating the attitude and response of participants while personally handing out questionnaires at the building, the following list represents recommendations for future studies aiming at using the same questionnaire for further research on this topic. Regarding the initial research questions of this study, all variables were categorized as Indifferent according to the Kano model. However, certain variables indicated greater dissatisfaction, such as: air ventilation, air ventilation control, amount of natural lighting vs artificial lighting, outdoor views, and connection to the outdoors. Dissatisfaction
0%
50%
100%
1 2 3 4 5 6 7 8 9 10 11 12 13 14 15 16 17 18 19 20 21 22 23 24A M R O Q I
42nd AUBEA Conference 2018: Educating Building Professionals for the Future in the Globalised World
regarding natural lighting, outdoor views, and connection to the outdoors were expected due to the large number of responses from the Lower Ground level. Lighting is also one of the main causes of dissatisfaction in green building occupants according to previous research. Using the Kano model to develop a post-occupancy evaluation questionnaire is an interesting alternative to standard surveys. It has proven to provide results which could deliver further significant feedback if, as mentioned, is carried out in a bigger sample of occupants.
7 References
Abbaszadeh, S., L. Zagreus, D. Lehrer and C. Huizenga (2006). "Occupant satisfaction with indoor environmental quality in green buildings." Proceedings, Healthy Buildings: 365-370.
Altomonte, S. and S. Schiavon (2013). "Occupant satisfaction in LEED and non-LEED certified buildings." Building and Environment: 66-76.
Altomonte, S. and S. Schiavon (2014). Indoor environmental quality and user satisfaction in green certified buildings. Architectural Research through to Practice: 48th International Conference of the Architectural Science Association 2014, The Architectural Science Association & Genova University Press.
Berger, C., R. Blauth, D. Boger, C. Bolster, G. Burchill, W. DuMouchel, F. Pouliot, R. Richter, A. Rubinoff, D. Shen, M. Timko and D. Walden (1993). "Kano's methods for udnerstanding customer-defined quality." Center for quality of management journal: 36.
Fowler, K. M. and E. M. Rauch (2006). Sustainable Building Rating Systems Summary, U.S. Department of Energy.
Fowler, K., E. Rauch, J. Henderson and A. Kora (2011). Re-assessing green building performance, U.S. Department of Energy.
GBCA (2012). A decade of green building, Green Building Council Australia.GBCA (2017). Design & As Built. Green Building Council of Australia.Gou, Z., S. Lau and J. Shen (2012). "Indoor environmental satisfaction in two LEED offices and
its implications in green interior design." Indoor and built environment: 503.Haniff, M., A. Ismail, B. Deros, M. Rahman and K. Kardigama (2011). "The Taguchi approach
in optimizing environmental factors affecting productivity in the automotive industry." International Journal of Automotive and Mechanical Engineering: 306-317.
Kim, J. and R. de Dear (2011). "Nonlinear relationships between individual IEQ factors and overall workspace satisfaction." Building and Environment: 33-40.
Lee, Y. and S.-K. Kim (2008). "Indoor Environmental Quality in LEED-Certified Buildings in the U.S." Journal of Asian Architecture and Building Engineering: 299.
Liang, H.-H., C.-P. Chen, R.-L. Hwang, W.-M. Shih, S.-C. Lo and H.-Y. Liao (2013). "Satisfaction of occupants toward indoor environment quality of certified green office buildings in Taiwan." Building and Environment: 232-242.
Lin, F.-H., S.-B. Tsai, Y.-C. Lee, C.-F. Hsiao, J. Zhou, J. Wang and Z. Shang (2017). "Empirical research on Kano’s model and customer satisfaction." PLoS ONE 12(9).
Mitchell, L. M. (2010). Green Star and NABERS: Learning from the Australian experience with green building rating tools. Energy Efficient Cities. Washington D.C., The International Bank for Reconstruction and Development / The World Bank: 130.
Nair, V., A. Bovas, J. MacKay, G. Box, R. Kacker, T. Lorenzen, J. Lucas, R. Myers, G. Vining, J. Nelder, M. Phadke, J. Sacks, W. Welch, A. Shoemaker, K. Tsui, S. Taguchi and J. Wu (1992). "Taguchi's Parameter Design: A Panel Discussion." Technometrics.
Pei, Z., B. L. Lin, Y. Liu and Y. Zhu (2015). "Comparative study on the indoor environment quality of green office buildings in China with a long-term field measurement and investigation." Building and Environment: 80-88.
Ravindu, S., R. Rameezdeen, J. Zuo, Z. Zhou and R. Chandratilake (2015). "Indoor environment quality of green buildings: Case study of an LEED platinum certified factory in a warm humid tropical climate." Building and Environment: 105-113.
262. 263.

42nd AUBEA Conference 2018: Educating Building Professionals for the Future in the Globalised World
Sauerwein, E., F. Bailom, K. Matzler and H. H. Hinterhuber (1996). The Kano model: how to delight your customers. IX International Working Seminar on Production Economics, Innsbruck.
TEMC (2013). The Tyree Energy Technologies Building. TEMC 2013, Brookfield Johnson Controls.
TETB (2017). Tyree Energy Technologies Building (TETB) facilities. UNSW Engineering.Xia, B., J. Zuo, M. Skitmore, S. Pullen and Q. Chen (2013). "Green Star points obtained by
Australian building projects." Journal of Architecture Engineering: 302-308.Yu, M., T. Wiedmann, R. Crawford and C. Tait (2017). The carbon footprint of Australia’s
construction sector. International High-Performance Built Environment Conference – ASustainable Built Environment Conference, Procedia Engineering 180.
Zhang, F. and R. de Dear (2017). "Application of Taguchi method in optimisng thermal comfortand cognitive performance during direct load control events." Building and Environment 160-168.
42nd AUBEA Conference 2018: Educating Building Professionals for the Future in the Globalised World
Investigating key factors influencing consumers’ decision to purchase low-Volatile Organic Compound building products
Jack Bebbington1 and Samad M. E. Sepasgozar2
1 & 2 Faculty of Built Environment, University of New South Wales Sydney,
Sydney, 2052, NSW AUSTRALIA
E-mails: [email protected]; [email protected] Abstract: Volatile organic compounds (VOCs) are ubiquitous in indoor air from both natural and man-made sources and have long been associated with respiratory diseases such as asthma, and several forms of cancer. Building products are a major source of concern, and consequentially, VOC emissions limits are included in most indoor air quality criteria for green-rated buildings. But despite low-VOC products being recognised as the most effective means of controlling indoor air pollution in buildings, there is an evident absence of marketing and investment in these products in the current retail building sector. This market gap has the potential to improve indoor air quality in Australian buildings due to the inherent benefits of low-VOC products over conventional products in terms of their lower emissions rates of harmful VOCs. VOC concentrations are typically 10 times higher indoors compared to outdoors, and poor indoor air quality is estimated to cost the Australian economy over $12 billion per year due to lost productivity and illness. In fact, indoor and outdoor air pollution collectively account for significantly more deaths each year than Australia’s national road toll. In the absence of existing regulation controlling the emissions of VOCs in building products or in indoor air, the retail market presents an opportunity for low-VOC products to ease the relative cost and health burden as a result of poor indoor air quality in Australian buildings. Moreover, Australian consumers are becoming increasingly concerned about the environmental and personal health effects of the products they purchase, presenting a lucrative investment opportunity in a relatively untapped retail market for low-VOC products. Keywords: Volatile organic compounds, indoor air quality, low-VOC products, retail building market.
1 Introduction
Volatile Organic Compounds (VOCs) are a group of carbon-based chemicals that easily evaporate at room temperature, and ‘off-gas’ from various building products, including paints, sealants, adhesives and engineered timber. VOCs are a main category of indoor pollutant classified by the Australian Medical Association (AMA, 2013, p.3), and are associated with a variety of acute and chronic health effects, ranging from sensory and skin irritation to increased incidences of liver and kidney disease (EPA, 2018). Australian research shows that exposure to benzene, toluene and formaldehyde can exacerbate asthma. VOC criteria for new and renovated buildings are now prescribed in most global green building standards and guidelines, which recognise the importance of reducing VOC emissions by the installation of low-VOC products. The U.S Green Building Council’s Leadership Energy & Environment Design (LEED), Indoor Air Quality credit
264. 265.

42nd AUBEA Conference 2018: Educating Building Professionals for the Future in the Globalised World
criteria, The American Society for Heating, Refrigerating and Air-Conditioning Engineers (ASHRAE) high performance building standard, The WELL building standard and the Green Building Council of Australia’s Green Star certification scheme are some examples of existing guidelines and standards that control the emission of VOCs by the prescription of certified, low-VOC building products (AIHA Construction and Toxicology Committees, and Green Building Working Group (2015), p.1. Moreover, low-emitting materials or products are identified as the most effective measure for controlling indoor air emissions when compared to other ‘reactive’ measures, such as increasing flow rates of return air exhaustion, and outdoor air intake (AIRAH, 2016).
2 Evaluation of low-VOC building products in the current market
The accessibility of low-VOC products has been identified as an evident constraint to consumption through an evaluation of the current retail market. As illustrated, it is apparent that low-VOC products (specifically paints, adhesives and sealants) are neither advertised nor segregated from their conventional counterparts in order to encourage consumption. In fact, only some low-VOC paints could be found in-store or online, but not adhesives or sealants.
Figure 1. Showing a wide range of products with the absence of low-VOC paints, silicone and adhesives at a selected
shop, and showing the absence of marketing to promote the purchase of these products.
The ‘home improvements’ market (i.e. the ‘Do-It-Yourself’ (DIY) market) has been identified as the most feasible market avenue for low-VOC products. The DIY’ sector in Australia represents a large market share of total residential building activity (approx. 45%, ABS; Housing Industry Association, 2016), and a significant potential for a change in consumption behaviour towards low-VOC products to positively influence the air quality of Australian homes, but also for retailers who are inherently at amongst a growing global market for online specialist retailers (Smits et al., 2013, 2014). In fact, the DIY (or “home improvements”) market in Australia is expected to turnover $33.37 billion by 2019 (Housing Industry Association, 2016), and growth in the coming years is representative of a strong DIY culture in Australia (Morgan, 2017). According to the Renovations Round Up Report, 3.71 million Australians in 2016 either painted a wall, ceiling or window sill in their home, and 3.38 million spent money on electrical installations and plumbing work respectively. Additionally, over 2.93 million refurbished their home in some way by installing curtains, carpet or wallpaper (Morgan, 2017).
Possibly included in paint: Aromatic hydrocarbons
(toluene, xylenes, ethylbenzene, benzene, Acetone
42nd AUBEA Conference 2018: Educating Building Professionals for the Future in the Globalised World
Figure 2. Screenshots of search results for “Low-VOC” and “Volatile Organic Compound” on the
Bunnings.com.au website. Several variations of these searches also returned no results. Showing the lack of advertising, certification labels or clear indication of a product as “low-VOC” and of the benefits of
low-VOC alternatives. Note: while some low-VOC paints are sold in store, they are evidently difficult to identify as “low-VOC” for a consumer not actively seeking out these products.
3 Research Methodology
The aim of this study is to identify the main factors influencing low-VOC product consumption in the Australian retail market, in order to develop a conceptual model for predicting consumers’ behaviour in this context. Initially, accessibility was identified as an inherent constraint to consumption in the current retail market. A survey will be administered to DIY consumers who own their own home, with the intended sample size to be over 150 respondents.
Table 1. Selected survey questions.
1 I know what VOCs are and how they are formed from building materials and products 2 I have good understanding of what common building materials and products emit Volatile Organic Compounds 3 I have a good understanding of the associated health consequences of both short and long term exposure to VOCs 4 I think that if I knew more about the health consequences of VOCs I would be more likely to purchase them 5 I think that low-VOC products would be more expensive than conventional products 6 I would be willing to pay __% extra for a bucket of paint that costs $100 if I knew that it had very low-VOC content 7 I would be willing to pay __% extra for a container of silicone glue that costs $20 if I knew that it had very low-VOC content 8 I would be willing to pay __% extra for a container of floor cleaner that costs $10 if I knew that it had very low-VOC content 9 I think low-VOC products are easily accessible 10 I think that if low-VOC products were more accessible and advertised in-store I would be more likely to purchase them 11 I am confident that when a product has an eco-label it will cause less damage to my health or the environment than other
products 12 I trust the environmental claims of eco-labels 13 I have consciously purchased a low-VOC product when renovating my home 14 I have purchased the following products for use in my home: Paints, adhesives or sealants; Carpet; Timber; PVC plastic
pipes (for hydraulic or electrical installations); Thermal or acoustic insulation; Cleaning products (e.g. bleach or floor cleaner)
15 I regularly recycle at home or at work 16 I would consider myself to be an environmentally conscious consumer 17 I intend to purchase a low-VOC alternative when next shopping for one of the following products: Paints, adhesives or
sealants; Carpet; Timber; PVC plastic pipes (for hydraulic or electrical installations); Thermal or acoustic insulation; Cleaning products (e.g. bleach or floor cleaner)
4 Green products and current green product theory
The green product market has transitioned in recent years from what was once a niche that ebbed and flowed with public sentiment to find its place in a growing number of global consumer markets, and as a lucrative sector for profit-driven retail organisations (Smits et al., 2013, 2014). A 2011 McKinsey survey conducted in developing and emerging countries showed that nearly 90% of consumers worry about the environmental and social impact of the goods and services they buy, but only one in three are willing to translate this attitude into an actual purchasing behaviour (de Figueiredo & Guillen, 2011). This variance is described in the literature as the “green purchasing inconsistency”,
“very low VOC”
266. 267.
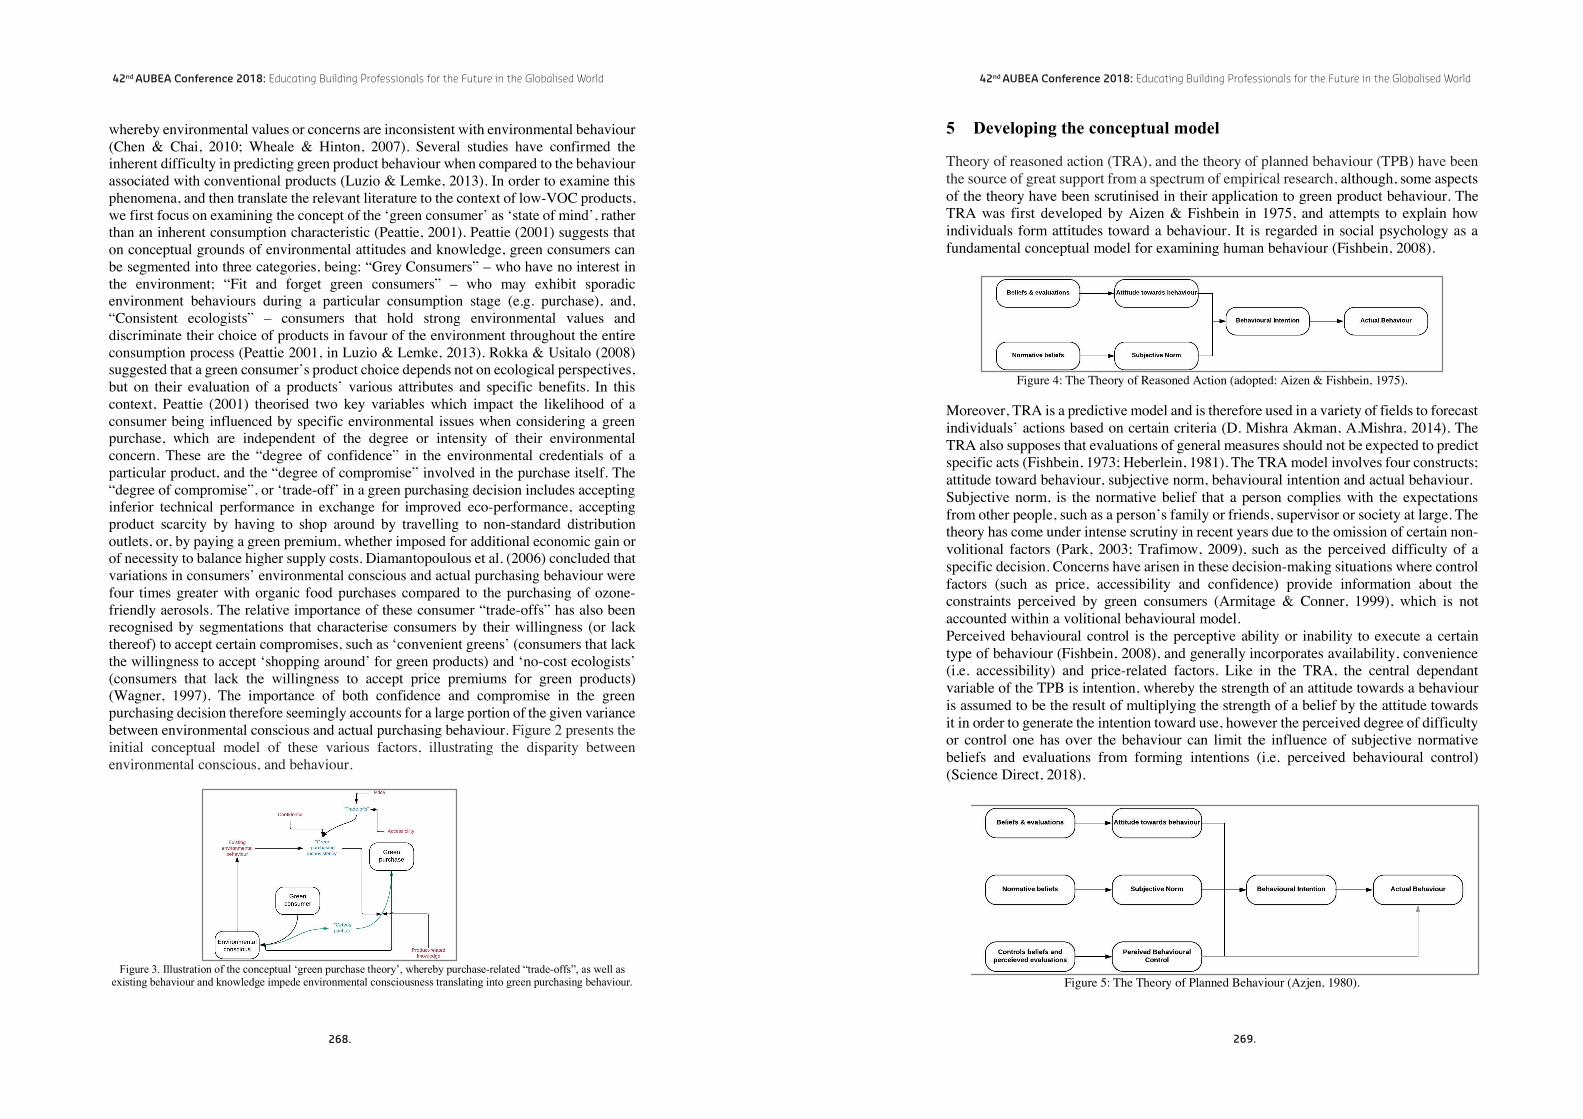
42nd AUBEA Conference 2018: Educating Building Professionals for the Future in the Globalised World
whereby environmental values or concerns are inconsistent with environmental behaviour (Chen & Chai, 2010; Wheale & Hinton, 2007). Several studies have confirmed the inherent difficulty in predicting green product behaviour when compared to the behaviour associated with conventional products (Luzio & Lemke, 2013). In order to examine this phenomena, and then translate the relevant literature to the context of low-VOC products, we first focus on examining the concept of the ‘green consumer’ as ‘state of mind’, rather than an inherent consumption characteristic (Peattie, 2001). Peattie (2001) suggests that on conceptual grounds of environmental attitudes and knowledge, green consumers can be segmented into three categories, being: “Grey Consumers” – who have no interest in the environment; “Fit and forget green consumers” – who may exhibit sporadic environment behaviours during a particular consumption stage (e.g. purchase), and, “Consistent ecologists” – consumers that hold strong environmental values and discriminate their choice of products in favour of the environment throughout the entire consumption process (Peattie 2001, in Luzio & Lemke, 2013). Rokka & Usitalo (2008) suggested that a green consumer’s product choice depends not on ecological perspectives, but on their evaluation of a products’ various attributes and specific benefits. In this context, Peattie (2001) theorised two key variables which impact the likelihood of a consumer being influenced by specific environmental issues when considering a green purchase, which are independent of the degree or intensity of their environmental concern. These are the “degree of confidence” in the environmental credentials of a particular product, and the “degree of compromise” involved in the purchase itself. The “degree of compromise”, or ‘trade-off’ in a green purchasing decision includes accepting inferior technical performance in exchange for improved eco-performance, accepting product scarcity by having to shop around by travelling to non-standard distribution outlets, or, by paying a green premium, whether imposed for additional economic gain or of necessity to balance higher supply costs. Diamantopoulous et al. (2006) concluded that variations in consumers’ environmental conscious and actual purchasing behaviour were four times greater with organic food purchases compared to the purchasing of ozone-friendly aerosols. The relative importance of these consumer “trade-offs” has also been recognised by segmentations that characterise consumers by their willingness (or lack thereof) to accept certain compromises, such as ‘convenient greens’ (consumers that lack the willingness to accept ‘shopping around’ for green products) and ‘no-cost ecologists’ (consumers that lack the willingness to accept price premiums for green products) (Wagner, 1997). The importance of both confidence and compromise in the green purchasing decision therefore seemingly accounts for a large portion of the given variance between environmental conscious and actual purchasing behaviour. Figure 2 presents the initial conceptual model of these various factors, illustrating the disparity between environmental conscious, and behaviour.
Figure 3. Illustration of the conceptual ‘green purchase theory’, whereby purchase-related “trade-offs”, as well as existing behaviour and knowledge impede environmental consciousness translating into green purchasing behaviour.
42nd AUBEA Conference 2018: Educating Building Professionals for the Future in the Globalised World
5 Developing the conceptual model
Theory of reasoned action (TRA), and the theory of planned behaviour (TPB) have been the source of great support from a spectrum of empirical research, although, some aspects of the theory have been scrutinised in their application to green product behaviour. The TRA was first developed by Aizen & Fishbein in 1975, and attempts to explain how individuals form attitudes toward a behaviour. It is regarded in social psychology as a fundamental conceptual model for examining human behaviour (Fishbein, 2008).
Figure 4: The Theory of Reasoned Action (adopted: Aizen & Fishbein, 1975).
Moreover, TRA is a predictive model and is therefore used in a variety of fields to forecast individuals’ actions based on certain criteria (D. Mishra Akman, A.Mishra, 2014). The TRA also supposes that evaluations of general measures should not be expected to predict specific acts (Fishbein, 1973; Heberlein, 1981). The TRA model involves four constructs; attitude toward behaviour, subjective norm, behavioural intention and actual behaviour. Subjective norm, is the normative belief that a person complies with the expectations from other people, such as a person’s family or friends, supervisor or society at large. The theory has come under intense scrutiny in recent years due to the omission of certain non-volitional factors (Park, 2003; Trafimow, 2009), such as the perceived difficulty of a specific decision. Concerns have arisen in these decision-making situations where control factors (such as price, accessibility and confidence) provide information about the constraints perceived by green consumers (Armitage & Conner, 1999), which is not accounted within a volitional behavioural model. Perceived behavioural control is the perceptive ability or inability to execute a certain type of behaviour (Fishbein, 2008), and generally incorporates availability, convenience (i.e. accessibility) and price-related factors. Like in the TRA, the central dependant variable of the TPB is intention, whereby the strength of an attitude towards a behaviour is assumed to be the result of multiplying the strength of a belief by the attitude towards it in order to generate the intention toward use, however the perceived degree of difficulty or control one has over the behaviour can limit the influence of subjective normative beliefs and evaluations from forming intentions (i.e. perceived behavioural control) (Science Direct, 2018).
Figure 5: The Theory of Planned Behaviour (Azjen, 1980).
268. 269.

42nd AUBEA Conference 2018: Educating Building Professionals for the Future in the Globalised World
6 Modelling the customers’ behaviour of using green product
The TPB is utilised as the framework for the conceptual model that is theorised to predict low-VOC product behaviour, however, the additional factor of existing environmental behaviour, as well as the degree of confidence (trust) associated with the eco-label of low-VOC products are considered additional factors that influence behaviour. Eco-labels are an important defining factor in Australian organic consumers’ decision to purchase green products (Lawson et al., 2017) and trust has been shown to mediate the relationship between green perceived value and green perceived risk – the two antecedents of green purchase intention (Chen et al., 2012). Several other studies have also examined trust in the context of eco-labels (Dekhili and Achabou, 2014; Tzilivakis et al., 2012; Proto et al., 2007; Grankvist & Biel., 2004; D'Souza et al., 2007)). Both perceived price premiums and perceived accessibility comprise the perceived behavioural control construct.
Figure 6: A modified planned behaviour model for predicting the green product acceptance.
7 Factors influencing the intention to purchase low-VOC products
Product-related knowledge: The importance of knowledge as a key factor contributing to green purchasing behaviour was previously discussed through Ardash’s economic rationale of green purchasing. The term “ceteris paribus” was used to describe the importance of knowledge being available in a convenient and intelligible way in order for green consumer conscious to translate into behaviour. Product-related knowledge is considered in this context since knowledge will have a greater influence when reinforced against the personal-health related impacts of a specific product (Lawson et al., 2017; Fransson & Grling, 1999). For example, knowledge relating to the consequences of VOCs in paint would seemingly have a greater influence in shaping the behaviour of a consumer who intends to purchase a bucket of paint, rather than knowledge relating to VOCs outside of a product-specific or building context, since this knowledge is less relatable to an individuals’ consumption choice (Follows et al., 2000; Joshi & Rahman, 2013). Existing environmental behaviour: This concept was discussed whereby “consistent ecologists” are, in theory, no more likely to purchase green products than “grey consumers”. In order to examine the influence of existing environmental behaviour on low-VOC product behaviour, recycling activity is used as the theme for comparison with the intention to purchase low-VOC products. According to ABS data on current Australian social trends, recycling activity is the most common form of environmentally conscious behaviour (ABS, 2010), and in this light it will act as the measure for “consistent ecologists” from the sample population. Habits were also discussed in this context, where the regular purchasing of conventional building products may impede a change of behaviour to
42nd AUBEA Conference 2018: Educating Building Professionals for the Future in the Globalised World
purchase low-VOC products, since consumers possess an inherent need for learned sequences and acts.
Perceived Behavioural Control: Perceived behavioural control (PBC) essentially indicates the degree of perceived ease or difficulty involved in a purchasing decision. Both price premiums and a lack of product accessibility can render a decision seeming unrealistic, difficult or even impossible (Fishbein, 2008), where if a consumer feels that a green products price is too high or is inaccessible, green consumption will be impeded as the benefits of the purchase no longer outweigh the degree of compromise involved with the purchase (Gleim et al., 2013).
Perceived Price Premiums: It seems that while price is still a major concern for Australian organic consumers, it may have less of an effect on the purchasing of chemical products, such as low-VOC products, due to their inherent nature as “win-win” products. A green product’s price is generally inflated due to costs for ‘better’ raw materials, as well as the social and environmental value created by eco-certification labels (Ling, 2013; Zhao and Zhong, 2015), however if a product’s price is too high and not realistically affordable, it therefore becomes difficult to purchase (D’Souza et al., 2007), and the degree of perceived control or difficulty over a purchasing decision with respect to affordability outweighs the relative benefits of the product (Gleim et al., 2013). While price is still considered a major barrier to the purchasing of green products (Young et al., 2010; Steg et al., 2014), products labelled as “low-toxicity” and “chemical-free” are likely to yield a greater willingness to accept price premiums due to their assured health benefits (Gnert, 1991; Diamantopoulous et al., 2006; Lawson et al., 2017). It seems that while price is still considered to be the main barrier to purchasing other green products, consumers are more likely to pay a price premium when a product is connotative with “chemical-free” attributes, and when they are aware of the relative benefits of the product with regard to their personal-health, as well as the health of their families (Lawson et al., 2017).
Perceived Product Accessibility: The economic influences that affect consumers extend beyond the consideration of just a product’s price, whereby the time and effort required to search and evaluate a product can be considered as part of the cost of consumption (Gleim et al., 2013). Product accessibility appears to be a significant factor preventing low-VOC product consumption in the current retail market (see section 2). The “degree of comprimise” was also discussed as an inherent trade-off for green consumers, which is associated with the need to shop around for green products. Outside of this concept, and the findings of the practical investigation, there is a limited range of empirical research surrounding the influence of accessibility on green product behaviour. Strong links have been found between the accessibility of organic food products and purchasing behaviour (Young et al., 2010; Vermier & Verbeke, 2008), including in the Australia organic market (Lea & Worsley, 2007). Nonetheless, product accessibility appears to be a significant factor preventing low-VOC product consumption.
Trust in the Eco-Label: Peattie (2001) described both the “degree of confidence” and the “degree of comprimise” as the two underlying factors influencing green purchasing, which are independent of environmental conscious, highlighting the importance of confidence in green product claims for consumers. Studies have revealed that consumers generally look for simple and user-friendly information while purchasing green products (Polonsky, Bhaskaran & Cary, 2005; Vanclay et al., 2011), which is usually provided in the form of an eco-label. Eco-labels guarantee authentic information and are based on stringent evaluation methods that “promote best practice products” (Good Environmental Choice Australia, 2018), and have been shown to assist consumers to “make a distinction
270. 271.

42nd AUBEA Conference 2018: Educating Building Professionals for the Future in the Globalised World
between competing product alternatives and to choose the least environmentally damaging option” (Karl & Orwat, 1999). While there is an absence of research examining the influence of eco-labels on building products towards consumers, eco-labels are reportedly an important and reliable feature for organic food consumers in Australia (Lawson et al., 2017). Knowledge of a product’s functional attributes is also related to the confidence in the green claims of these products (Young et al., 2010; Vermeir and Verbeke, 2008), whereby several studies have found that a lack of consumer trust and credence in green claims was a significant barrier towards the purchasing of green products (Bang et al., 2000; Gupta and Ogden, 2009; Krystallis et al., 2008; Tung et al., 2012; Vermeir and Verbeke, 2008).
Behavioural Intention: A reasoned action approach to understanding behaviour suggests that behavioural intention is the most reliable indicator of whether one will, or will not, perform a certain behaviour (Fishbein, 2008). Though in order for a measure of intention to correlate with a behaviour, the same conditions must be present including action, target, context and time (Fishbein, 2008). That is, the two variables must be ceteris paribus; measured at equivalent levels of either generality, or specificity. “I intend to . . . .” “I will try to . . . ,” and “I plan to . . .” (Fishbein, 2008), form the basis of statements used to assess a consumer’s level of intention to purchase a particular product or engage in a particular behaviour.
Table 2: Table of the model constructs and their relationships Existing environmental behaviour
H1 – “Consistent ecologists” are no more likely to purchase low-VOC products than regular consumers H2 – The regular purchasing of conventional indoor pollutant products negatively influences the intention to purchase low-VOC products
Perceived price premiums
H3 – The importance a consumer attaches to price does not significantly influence the intention to purchase low-VOC products. H4 - The level of existing knowledge regarding the personal health effects of VOCs in building products, or “product-related knowledge”, will positively influence the willingness to accept price premiums for low-VOC products.
Perceived accessibility
H5 - The perceived price premium of a low-VOC product has a lesser on the intention to purchase low-VOC products influence than the perceived accessibility.
Trust (eco-labels)
H6 – The trust a consumer relates to the eco-label positively influences the intention to purchase low-VOC products. H7 - The level of existing knowledge regarding the personal health effects of VOCs in building products will positively influence the level of trust associated with the eco-label.
8 Conclusion and Further Research
The aim of this study was to identify the key factors influencing low-VOC product consumption in order to develop a conceptual model for predicting consumers’ behaviour in this context. To do so, an intensive literature review was conducted to identify these factors from theoretical concepts relating to green products, and the most reliable product acceptance theory being the Theory of Planned Behaviour was then modified in the context of the literature findings to form the conceptual model. A total of four factors were selected to develop the model being existing environmental behaviour, perceived price premiums and accessibility, as well as the trust associated with eco-labels. Accessibility was initially identified as an evident constraint to consumption, however, the relative influence of this factor, and the other purchasing factors remains to be seen, and no current research has been found that examines the consumer impediments to low-VOC product consumption, nor “green” building product consumption in a wider context. Will consumers pay a price premium for low-VOC products? If so much more will they pay? Will an increase in accessibility lead to increased consumption? Do consumers value
42nd AUBEA Conference 2018: Educating Building Professionals for the Future in the Globalised World
the eco-label and is trust a barrier to consumption? What is the influence of existing environmental behaviour in changing behaviour? It is hoped that this research will answer these questions, and in-turn influence retailers to consider investing in low-VOC products. The results of this paper are important in light of the relevant evidence that low-VOC products are indeed, the most effective means for controlling indoor air pollution and promoting indoor air quality. Poor indoor air quality has been identified as both a significant threat to the economy, and a threat to human health via the contribution of building products to VOC concentrations. The main limitation of this ongoing study is the restriction of the sample to DIY consumers. While this sector comprises roughly 45% of total residential building activity in Australia, the relative influence of external cost constraints for subcontractors and building contractors purchasing and prescribing indoor pollutant products such as paints would conflict with DIY consumers purchasing these products from outside of an occupational setting. This research will contribute to improving indoor air quality in Australian buildings and prompt the regulation of VOCs in building products. The future direction for this research is to undertake the sample analysis by use of a survey questionnaire amongst DIY consumers who own their own home.
9 References
ABS (2016). 8752.0 - Building Activity, Australia, Past Releases. [online] Available at: http://www.abs.gov.au/AUSSTATS/[email protected]/second+level+view?ReadForm&prodno=8752.0&viewtitle=Building%20Activity,%20Australia~Dec%202017~Latest~11/04/2018&&tabname=Past%20Future%20Issues&prodno=8752.0&issue=Dec%202017&num=&view=& [Accessed 21 May 2018].
ABS (2010). 4102.0 - Australian Social Trends, 2010. [online] Available at: http://www.abs.gov.au/AUSSTATS/[email protected]/Lookup/4102.0Main+Features20Jun+2010 [Accessed 21 Mar. 2018].
AIHA Construction and Toxicology Committees, and Green Building Working Group (2015). Volatile Organic Compounds (VOC) Criteria for New Construction. White Paper. Falls Church, Virginia: American Inustrial Hygiene Association, p.3.
Apps.sepa.org.uk. (n.d.). Pollutant Fact Sheet. [online] Available at: http://apps.sepa.org.uk/spripa/Pages/SubstanceInformation.aspx?pid=86 [Accessed 20 May 2018].
Armitage, C.J.,Conner,M.T.,1999.Distinguishingperceptionsofcontrolfromself- efficacy: predicting consumption of a low fat diet using the theory of planned behavior.J.Appl.Soc.Psychol.29(1),72–90.
Australia State of the Environment Report. (2011). Indoor air quality. [online] Available at: https://soe.environment.gov.au/theme/ambient-air-quality/topic/indoor-air-quality-2 [Accessed 24 Apr. 2018].
Australian Centre for Agriculture and Law (AgLaw Centre) (2017). Australian Organic Market Report. Australian Organic Market Report 2017. [online] Nundah Queensland: Australian Organic Ltd. Available at: http://austorganic.com/ao-market-report/ [Accessed 21 Mar. 2018].
Australian Government Department of Health: National Industrial Chemicals Notification and Assessment Scheme. (2016). Formaldehyde in pressed wood products - NICNAS. [online] Available at: https://www.nicnas.gov.au/chemical-information/factsheets/chemical-name/formaldehyde-in-pressed-wood-products [Accessed 9 Apr. 2018].
Australian Institute of Refrigeration, Airconditioning and Heating (AIRAH) (2016). Indoor Air Quality Handbook. [online] Canberra: Australian Building Codes Board, p.26. Available at: http://www.abcb.gov.au/Resources/Publications/Education-Training/Indoor-air-quality [Accessed 21 Mar. 2018].
Australian Medical Association (2013). Inquiry into the impacts on health of air quality in Australia. Australian Medical Association, p.2.
272. 273.

42nd AUBEA Conference 2018: Educating Building Professionals for the Future in the Globalised World
Bang, H. K., Ellinger, A. E., Hadjimarcou, J., & Traichal, P. A. (2000). Consumer concern, knowledge, belief, and attitude toward renewable energy: An application of the reasoned action theory. Psychology & Marketing, 17(6), 449-468.
Bunnings. (2018). Paint | Varnish, Exterior Paint & Wall Paint At Bunnings Warehouse. [online] Available at: https://www.bunnings.com.au/our-range/paint-decorating/paint [Accessed 14 Mar. 2018].
Bunnings. (2018). Silicone Sealants available from Bunnings Warehouse. [online] Available at: https://www.bunnings.com.au/our-range/bathroom-plumbing/plumbing/tools/silicone-sealants?gclid=Cj0KCQjw3InYBRCLARIsAG6bfMTXFMfe_7f0VZDUt6fXPBf0SxU0BV_UNP46eqC28T_dw--jOsk7PfEaAnNjEALw_wcB [Accessed 14 Mar. 2018].
Centre for Health, Environment and Justice (n.d.). PVC, the Poison Plastic. CETEC (2010). Australian Building Services Journal. Measurement of Chemical Emissions
from Building Products. [online] p.41. Available at: http://www.cetec.com.au/download/?id=359 [Accessed 14 Apr. 2018].
Chen, T. B., & Chai, L. T. (2010). Attitude towards the environment and green products: Consumers’ perspective. Management science and engineering, 4(2), 27-39.
D'Souza, C., Taghian, M. & Khosla, R. J Target Meas Anal Mark (2007) 15: 69. https://doi.org/10.1057/palgrave.jt.5750039
Dekhili, S. and Achabou, M. (2014). Eco-labelling brand strategy: Independent certification versus self-declaration. University of Strasbourg.
De Figueiredo, J. and Guillen, M. (2011). Green Products: Perspectives on Innovation and Adoption. Parkway: CRC Press.
Department of the Environment and Energy. (2018). Department of the Environment and Energy. [online] Available at: http://www.environment.gov.au/topics/environment-protection/air-quality/indoor-air
Development of WHO Guidelines for Indoor Air Quality. (2006). In: Working Group Meeting. [online] Copenhagen, Denmark: WHO Regional Office for Europe. Available at: http://www.euro.who.int/__data/assets/pdf_file/0007/.../AIQIAQ_mtgrep_Bonn_Oct06.pdf [Accessed 9 Apr. 2018].
Environmental Protection Agency (EPA) (2012). Benzene. p.1. Fishbein, M. (2008). "A Reasoned Action Approach to Health Promotion." Medical decision
making : an international journal of the Society for Medical Decision Making 28(6): 834-844.
Follows, S.B. and Jobber, D. (2000), "Environmentally responsible purchase behaviour: a test of a consumer model", European Journal of Marketing, Vol. 34 Nos 5/6, pp. 723-746.
GECA. (n.d.). Good Environmental Choice Australia. [online] Available at: http://www.geca.eco/ [Accessed 4 Jan. 2018].
Gleim, M., et al. (2013). Against the Green: A Multi-method Examination of the Barriers to Green Consumption.
Goodman, N., Steinemann, A., Wheeler, A., Paevere, P., Cheng, M. and Brown, S. (2017). Volatile organic compounds within indoor environments in Australia. The University of Melbourne.
Grankvistet, G. and Biel, A. (2004). The Impact of Environmental Labelling on Consumer Preference: Negative vs. Positive Labels. Journal of Consumer Policy, [online] 27(2), pp.213-230. Available at: https://link.springer.com/article/10.1023%2FB%3ACOPO.0000028167.54739.94 [Accessed 16 Apr. 2018].
274.
42nd AUBEA Conference 2018: Educating Building Professionals for the Future in the Globalised World
Utilisation of new tools for indoor quality measurements: Case of six-green star rated building
Ehsan Bolideh1 and Samad M.E. Sepasgozar 2
1&2 University of New South Wales, AUSTRALIAE-mails: ehs.bolideh@gmail; [email protected]
Abstract:
Green star buildings contribute to reducing the energy consumption. However, they should also enhance the occupants’ experiences and satisfaction of using the building. There are traditional methods to measure post-occupant experience of using a building. However, investigations to design mix methods of measuring occupants’ experience by utilization of new tools and technologies are scarce. This study aims to design and utilize mix methods for measuring the users’ experience and provide more accurate information of occupants’ experience comparingto environmental factors such as temperature and CO2. To do so, four main tools were used at the same time such as (i) unstructured interview with occupants, (ii) environmental measurement sensor, (iii) thermal scanner and (iv) a 360 camera. This mix measurement method helps to evaluate and improve the current condition of existing green star building and provide feedback for the future designers. This ongoing study identifies key factors affectingthe users comfort. Despite the fact that the selected building has areas to study and activities related to the study for students, most of them chose the café areas outside the building. The main reason is that it provides a better atmosphere in sense of environmental factors. This is an ongoing study and will continue investigation different factors over time and compare it with conventional buildings.
Keywords:
Green building, indoor air quality, photography, six-green star rated building, thermal scanner,user comfort, user’s experience.
1 Introduction
Nowadays, buildings industry accounts for nearly 40 percent of overall energy consumption and being recognized as a significant contributor to half of the world’s greenhouse gases (Ryan, 2017). Regarding energy consumption and enormous waste, the construction industry has a significant adverse impact on the environment which caused to increase the amount of carbondioxide (Ryan, 2017). Australia is a place which highly exposed to adverse effects of climate change: extreme weather, rising sea levels and there is a substantial need to cut down the energy consumption (house-energy, 2016). According to City of Sydney Council (2017), as a part of Paris Agreement, most sectors including those in Australia and the rest of the world need be net or nearly net zero energy building by 2050 or sooner. In addressing the building energy’s consumption as well as clean energy generation and energy efficiency, the net-zero building could contribute to the building industry sector (Ryan, 2017). Generally, the green style buildings are designed and structured to motivate the use of energy with as efficiently as possible, and the resources are like energy, water, and materials to reduce the adverse effects of buildings on environmental (Steinemann et al., 2017).
In recent years there has been a shift toward achieving net zero energy building, particularly in Europe (Ryan, 2017). According to City of Sydney Council (2017), Australia in 2016, commissioned energy consultancy firm to achieve the net-zero energy and this study included two real apartment buildings in Sydney (30-storey) and Melbourne (65-storey). The results of
275.

42nd AUBEA Conference 2018: Educating Building Professionals for the Future in the Globalised World
the buildings show that the net-zero residential buildings are highly cost-effective and technically feasible. According to WBDG (2016), since the building are designed for the people, it is critical to ensure that the outcome of the construction is effective and also keeping the space a comfortable, efficient, healthy, and safe place for the users. Occupant’s behaviouris directly conducted with the building energy consumption and indoor environment which affect the building’s energy consumption itself, so any increase in optimizing the energy consumption needs to fully understand the occupant behaviour to enhance the energy simulation (Jia et al., 2017). However, in most cases the relationship between the energy consumption and its comfortability for the users are forgotten (Lawrence and Keime, 2016). Moreover, there is still a gap between in developments in the field of physical building and environmental psychology and there is still a huge lack of large-scale surveys is being felt (Lawrence and Keime, 2016). Besides, Several studies show that the low indoor air quality (IAQ) has a negative impact on the occupants’ health and causes to low productivity or low academic performance and as a result, the provision of good indoor air quality measurement is critical (Telejko, 2017)
Therefore, there is an increasing need to work on occupant’s behaviour relationship with building design and energy consumption in order to find out what the best ways are to minimize this gap. This paper aims to illustrate the best methods to analyse the relationship between the occupant's comfortability, building design, and energy consumption. This paper can support the research question which could help the green buildings to perform more effectively and have a better indoor air quality for their users. The outline of this paper is structured to first, analysethe previous study and presents their limitation. Secondly, review the modelling and measurement section of methods analyse. Thirdly, it will present the method of approach, and finally it will discuss the findings and provide the final conclusion.
2 Literature Review
2.1 Observation approachesThe indoor environmental quality has been assessed and checked mainly by three different Research Establishment Environmental Assessment Method, such as LEES, GREEN Star and BREEAM (Steinman). In some research studies the IEQ in green buildings were analysed in accordance with the conventional building which was not certified, while the indoor air quality measurement (IAQ) was analysed in almost 50 % of these studies (Steinemann et al., 2017).Researchers mostly focused on the probabilistic model of human’s behavioural development in their previous research studies; using sensors and surveyed data to build the relationship of indoor and outdoor environmental factors and compare them with people’s behaviours (Yan et al. Occupant behaviour modelling). The problem with this method is that we cannot simply count the number of users in each section of the building, however, other measurements are also required to analyses the users behavioural and explain how the environmental factors could affect occupant’s comfort.
2.1.1 Indicative post-occupancy evaluation approach
This approach includes fast evaluation through the structured surveys for the building’s occupants along with the consistent observation by the researcher (Vásquez-Hernández and Restrepo Álvarez, 2017). However, this method is limited due to social logic and cost of formulation, and it only focuses on the current situation, not future (Vásquez-Hernández and Restrepo Álvarez, 2017).2.1.2 User satisfaction method based on real-time experience
This application examines the situation based on physical factors of cooling and heating in an indoor environmental space which uses sensors and Data log systems (Shafaghat et al., 2016).
42nd AUBEA Conference 2018: Educating Building Professionals for the Future in the Globalised World
However, the limitation of this application is that ISO, which has been used in user’s thermal comfort measurement, it is dependent on the human body’s heat transformation and need to be evaluated more precisely to find out the relation of the thermal comfort and user’s behaviour(Shafaghat et al., 2016).2.1.3 Chamber experiment studies
It includes several methods of user satisfaction, such as PMV-Fanger, Markov, and ASHRAE-55, however, it has limitation in terms of comfort study sensation which indicates that in an environment with displaced ventilation (DV) system relatively high can cause to the user’s discomfort, which an extraordinary study to understand the effect of this method is needed (Shafaghat et al., 2016).
2.2 Photo analysisA mixed method is used to analyse the user’s behaviour in a more scientific way which includes qualitative and quantitative approaches. Graneheim et al. (2017) indicate that the using a deductive approach to qualitative analyses the observed model, occupants, cause to move from a more abstract and general level to a more concrete and specific one. The most beneficial point of qualitative approach is to the richness of the collected data which need to be coded and in a valid and reliable way (Moretti et al., 2011). Young et al. (2012) conducted survey research on animals behavioral pattern, and he divided that pattern into two parts: Comfort (e.g., setting, and lying down) and movement behavioral (e.g., setting in an area or walking into bushes). Similarly, the human behaviour can be coded through the picture analysis and it will be divided into two parts, static behaviour (e.g., doing the assignments with computers or studying individually or group work) and dynamic (e.g., eating foods, chat with friend) and based on the assumption if the photos show a high frequency of activities with less available spaces to sit, it indicates that the users feel comfortable.
Table 1. Summary of review on people’s typical behavioral responses to indoor thermal discomfort.
Occupants’ behavioural responses Definitions and measuring factors Limitations
If the indoor thermal condition istoo hot or humid, the behavioural
response may be to leave the room for cooler locations.
Indoor thermal condition influence on human behaviour (Brager and Baker, 2009,
Hwang and Chen, 2010).
Limited information exists regarding occupant
behaviour
A user maybe move computer desks to be situated closer to the AC vents if it is too hot near a
window
A user’s adjustment of furniture location and positioning to better suit the preferred
thermal conditions of a room. (Brager and Baker, 2009, Huang et al., 2015).
A limited number of people has done the
opening and closing the window
A user may prefer a material padded desk chair than a steel
chair in an air-conditioned room as they would be more comfortable to sit on.
A user’s adjustment of furniture material to better suit their preferred indoor thermal
conditions of a room. (Brager and Baker, 2009).
Lack of the data accuracy to get such
information
If a room is too cold or hot a user may be influenced to drink tea or a cold glass of water to counteract
the conditions.
A user’s influence on eating habits based on their preferred indoor thermal conditions of a room. (Hwang and Chen, 2010, Tweed et
al., 2013).
The number of peoples was limited, and lack of information exists
for analysing the occupant behaviour
If a room is too cold or hot a user may be influenced to be more activity and move around to
generate body heat, or sit still and not move to reduce body heat.
A user’s influence on their level of physical activity based on their preferred indoor
thermal conditions of a room. (Hwang and Chen, 2010, Tweed et al.,
2013).
The behavior pattern of the users was not
assessed
276. 277.

42nd AUBEA Conference 2018: Educating Building Professionals for the Future in the Globalised World
If a room it too hot or cold it can significantly influence the numberof layers an individual may wear.
A user’s influence on their clothing choices based on the indoor thermal conditions of a
room. (Hwang and Chen, 2010, Tweed et al.,
2013).
Lack of the web-cam lead to that the
behaviour pattern of the occupant should
not be assessed
3 Modelling and measurement
Many research has been conducted to review and analyse the user’s comfort through numerous tools and strategies to come up with primary user’s behaviours in which they are being used to cope with the thermal environment (Graneheim et al., 2017). Moretti et al. (2011) have developed occupant’s responses behaviours to thermal environment in a different situation (See table 2). Along with these measurements and analysis of user’s behaviours, a number of the data collection which include CO2, humidity, and temperature also conducted during this research. The below tables illustrate some specific responses from the users.
Table 2. Summary of specific behaviour patterns and measures.
Factors Measures Definition
Response to environment
Going to the nearest door Changing the position in the different situation so that the user will feel more comfortable. (Huang, Lin & Lien 2015) (Hwang & Chen
2010)
Going to the colder and desirable area
Take off the clothe Thermal sensation will lead to cloth changes (Tweed et al. 2014) ( Hwang & Chen 2010)Put on the clothe
Main activity
Reading
Doing a physical activity to increase or decrease the heat production of the body (Huang, Lin &
Lien 2015) (Tweed et al. 2014) (Hwang & Chen 2010)
Discussingchat with friends
Assignment and studyRest and relax
Changes in position Working with computer
Drinking hot coffee Intake food or liquid (for the cooling orwarming adjustment) (Tweed et al. 2014)
(Hwang & Chen 2010)Drinking a cup of tea
Drink Food
Students’ reactions
Moving from leather sofa to plastic desk
Adopting furniture material to reference user’s furniture material adjustment (Brager & Baker
2009)Changing from plastic desk to leather sofa
Changing position Change direction and seating position regarding colder or warmer adaption (Huang, Lin & Lien
2015)Changing the desk orientation
Another measurement factor is CO2. Previous studies suggested that the level of the CO2,humidity, temperature, and its impact on human health should be within a standard range. Table 3 shows the suggested values for this measure.
Table 3. Standard ranges of measured factorsElements Levels Interpretation
CO2
250-350 ppm (Asere et al., 2016) Normal background and acceptable650 ppm: ASHRAE (Prill, 2013) Maximum threshold
1000 - 2500 ppm (Asere et al., 2016) Body feels tired and sleepy
42nd AUBEA Conference 2018: Educating Building Professionals for the Future in the Globalised World
2500 - 5000 ppm (Asere et al., 2016) Leads to the heart rate increases and some symptoms similar to intoxication
>5000pm (Asere et al., 2016) Causes of a headache and even death
Humidity40%-55% (Wolkoff, 2018) Standard
>71% and 40% > (Autodesk, 2017) Lead to feel muggy Temperature 20o – 25o (Lomas and Giridharan, 2012) Standard
Table 3 also shows the standard range for humidity. According to Wolkoff (2018), the relative humidity is measured by hygrometer, and it is the percentage of water vapor in air relative in a room to the total amount of vapour in the same room air, and the absolute humidity amounts the water in grams per kg of air as defined pressure. The two main complaints conducted in dry air are sensory irritation in eyes and upper airways which also affect the sleepless habit and work performance (Wolkoff, 2018). Too much humidity can reinforce the amount of the heat and caused to feel muggy, while the small percentage of that lead to the space uncomfortably dry (Autodesk, 2017). Occupants generally consider the 40% to 55% relative humidity to be more comfortable; however the any percentage of below 40% or above 55% will be caused that users feel muggy and wet (Autodesk, 2017).
Table 3 also shows the standard range for temperature. According to Liu et al. (2013),understanding the interaction between the occupants and the building is critical regarding achieving thermal comfort and building’ energy consumption. The adaptive behaviour of the occupants such as operating windows, heating/cooling units, and their personal adjustment clothing can significantly impact the building energy consumption (Liu et al., 2013).
4 Research Methodology
In this research, a six-green star rated building was chosen due to being recognized as a specific high-quality building and was divided into four main zones. The reason that these four zones are chosen is because most student’s activities occur in these areas. The below picture shows a layout plan of the chosen areas.
Figure 1. The layout plan including four zones, and images from two selected zones. (a) Layout plan; (b) Study area; (c) Café (Pictures (b) and (c) are taken on 5/8/2018 at 11:00 am)
Table 4 shows the sampling information and the selected zones for collecting the required data. Each zone contains 32 samples which they are taken from 5/7/2018 to 5/16/2018.
(a) (b) (c)
278. 279.

42nd AUBEA Conference 2018: Educating Building Professionals for the Future in the Globalised World
Table 4. Data profile and the study zones.
Location Area (M2)
Furniture Capacity Sample Date
Zone 1 Ground level 120 Chairs, sofa, andtables
45 32 5/7/2018 to5/16/2018
Zone 2 Study area 100 Chairs, sofa, andtables
25 32 5/7/2018 to5/16/2018
Zone 3 Café area 130 Chairs, sofa, andtables
70 32 5/7/2018 to5/16/2018
Zone 4 Outside of the Café area 160 Chairs and tables 50 32 5/7/2018 to5/16/2018
To attain the key factors affecting the Tyree building environment a preliminary questionnaireis carried out to identify most influence factors. The case study research also was conducted by the IAQ sensors during weekdays which is the busiest period and within two times a day, one in the morning between 9 am to 12 pm, and another was carried out in the evening between 1:30 pm to 4 pm. The IAQ tool helps to analyse the level of CO2, humidity, and temperature with high accuracy within the period of time. In photo analyse section, a qualitative approach is carried out to identifying the behavioral pattern of occupants and then encoding each subject to finalising the correlation between the occupant's body posture or adjustment in accordance to IAQ data. The photos were taken at the same time as IAQ tool testing.
Figure 2. North-East of the Tyree building (3Dmodel) showing zone 4.
Thermal imaging can be used as a supplementary method in diagnostic to do the analysis and achieve the best of the result to validate the data which conducted with the IAQ tool. Numerous thermal images are taken to achieve the high accuracy data. In figure 4, picture (a) shows the thermal image of the zone 4 which temperature ranges between 21.5 to 23.5, and picture (b) is showing the same space which is fully occupied.
Tyree building
(Zone 4)
Vegetation
N
(a) (b)
42nd AUBEA Conference 2018: Educating Building Professionals for the Future in the Globalised World
Figure 3. Thermal image of the selected angel at Zone (3), (a) thermal image showing the temperature ranging from 21.5 to 24 centigrade; (b) photo showing students activity and the study area in café.
The environmental factors could profoundly impact on the user’s comfort, and along with the building energy consumption, these factors are also important (Huisman et al., 2012).Therefore, the environmental factors like lighting, design, and furniture’s comfort were also analysed.
5 Results and Discussion
The investigation focused on factors related to indoor air quality, building design, and facility management. Main factors including CO2, temperature, and humidity were measured for each zone and at different times during selected weeks. The measured factors were compared with the standard ranges given by the literature (Wolkoff, 2018; Autodesk, 2017; Asere et al., 2016).Figure 5 shows the results of measured factors such as CO2 level, temperature, humidity, available seats, and the number of users in each selected zone from the time 9:30 to 15:00 pm. The figure shows that all the measured factors fall within the standard range during the day.However, most people used exterior areas including the café and around even though other areas were empty at the time.
Figure 4. Summary of the data taken by the IAQ with user's numbers, proposed date (5/7/2018) from 9:30 am to 15:00 pm.
Figure 6 shows the same information for a selected week (5/08/201 to 5/16/2018). Interestingly,the most popular place for students was inside and outside the café. The measurements show that the place condition in terms of the amount of CO2, temperature, and humidity were great and the six-star building was functioning well.Figures 4, 5 and 6 show that there is not a big variation comparing the standard. However, the design factors were observed as the main reasons influencing the differences of occupants in different zones. The influential design factors are as follows:
• The study area of the ground floor is lack of proper environmental design (coach without backs and triangular shaped table) which affected the user’s comfort
• The study area is lack of privacy (the chairs in front are so close to each other)• The lower ground area does not provide a proper atmosphere for the students, it is
because lack of clean columns, it is more like a big storage because of huge and different machineries placed around the staircase which make feel to students to be unsafe
280. 281.

42nd AUBEA Conference 2018: Educating Building Professionals for the Future in the Globalised World
• Inside the café area is chosen by the large group of students because this area has good seats and tables, unlike the study area, it provides a space for the group work.
Figure 5. Summary of the data taken by the IAQ with user's numbers proposed selected days (5/08/2018 and 5/08/2018) from 9:30 am-15 pm
Figure 7 shows several pictures which were taken at the same time verifying the result of the most crowded areas.
Figure 6. Thermal images of each selected zones. a) zone 4; b) zone 1; c) zone 1
(a)
(b)
(c)
42nd AUBEA Conference 2018: Educating Building Professionals for the Future in the Globalised World
Figure 7. 360 views of the selected zones at 11 am showing the number of occupants and their activities separately. a) zone 1; b) zone 2; c) zone 3; d) zone 4.
6 Conclusion and Further Research
The aim of this study was to examine the user’s comfort and other factors such as building design, and indoor air quality of a selected green building ranked as six-star. We used different tools including thermal scanner and 360 camera to identify the occupant rate in the four selected zones in the building. The analysis showed that most of the users were most likely using the zones, which are not designed for the studying purposes. Surprisingly, most of users spend their times in the café area and around since these areas are providing a suitable atmosphere in sense of design. The analysis also showed that the zones’ features failed to fully satisfy users, while the zones were main areas of an expensive building which are allocated to users’ study and conversation. The results show that design and environmental factors such as temperature, CO2,and humidity should be considered for green building designs to provide an outstanding atmosphere to its users.
The results of the study are important to architects to take the identified factors into consideration when designing a green star building. The limitation of this ongoing study was that this experimentation was done in the duration of only two months, which needs be extendedfor a longer term. For future investigation, it would be interesting to have a comparative study on the post-occupants behaviour on higher and lower green star rated buildings.
7 References
ASERE, L., MOLS, T. & BLUMBERGA, A. 2016. Assessment of Energy Efficiency Measures on Indoor Air Quality and Microclimate in Buildings of Liepaja Municipality. Energy Procedia,95, 37-42.
AUTODESK. 2017. Humidity [Online]. Available: https://sustainabilityworkshop.autodesk.com/buildings/humidity [Accessed 2017 2017].
BRAGER, G. & BAKER, L. 2009. Occupant satisfaction in mixed-mode buildings. Building Research & Information, 37, 369-380.
COUNCIL, C. O. S. 2017. Net-Zero apartment buildings [Online]. Available: http://www.cityofsydney.nsw.gov.au/vision/towards-2030/sustainability/carbon-reduction/net-zero-apartment-buildings [Accessed].
Zone 1 Zone 2
Zone 3 Zone 4
Machinery tools stored in LGLack of backUnusual shaped
Studying Studying & Chatting
(a)
(c)
(b)
(d)
282. 283.
42nd AUBEA Conference 2018: Educating Building Professionals for the Future in the Globalised World
GRANEHEIM, U. H., LINDGREN, B.-M. & LUNDMAN, B. 2017. Methodological challenges in qualitative content analysis: A discussion paper. Nurse Education Today, 56, 29-34.
HUANG, K.-T., LIN, T.-P. & LIEN, H.-C. 2015. Investigating Thermal Comfort and User Behaviors in Outdoor Spaces: A Seasonal and Spatial Perspective. Advances in Meteorology, 2015, 1-11.
HWANG, R. L. & CHEN, C. P. 2010. Field study on behaviors and adaptation of elderly people and their thermal comfort requirements in residential environments. Indoor Air, 20, 235-45.
JIA, M., SRINIVASAN, R. S. & RAHEEM, A. A. 2017. From occupancy to occupant behavior: An analytical survey of data acquisition technologies, modeling methodologies and simulation coupling mechanisms for building energy efficiency. Renewable and Sustainable Energy Reviews, 68, 525-540.
LAWRENCE, R. & KEIME, C. 2016. Bridging the gap between energy and comfort: Post-occupancy evaluation of two higher-education buildings in Sheffield. Energy and Buildings, 130, 651-666.
LIU, J., YAO, R. & MCCLOY, R. 2013. An investigation of thermal comfort adaptation behaviour in office buildings in the UK. Indoor and Built Environment, 23, 675-691.
MORETTI, F., VAN VLIET, L., BENSING, J., DELEDDA, G., MAZZI, M., RIMONDINI, M., ZIMMERMANN, C. & FLETCHER, I. 2011. A standardized approach to qualitative content analysis of focus group discussions from different countries. Patient Education and Counseling, 82, 420-428.
PRILL, R. 2013. WSU Energy Program.
RYAN, C. 2017. Acheiving Net Zero Buildings.
SHAFAGHAT, A., KEYVANFAR, A., ABD. MAJID, M. Z., LAMIT, H. B., AHMAD, M. H., FERWATI, M. S. & GHOSHAL, S. K. 2016. Methods for adaptive behaviors satisfactionassessment with energy efficient building design. Renewable and Sustainable Energy Reviews,57, 250-259.
STEINEMANN, A., WARGOCKI, P. & RISMANCHI, B. 2017. Ten questions concerning green buildings and indoor air quality. Building and Environment, 112, 351-358.
TELEJKO, M. 2017. Attempt to Improve Indoor Air Quality in Computer Laboratories. Procedia Engineering, 172, 1154-1160.
TWEED, C., DIXON, D., HINTON, E. & BICKERSTAFF, K. 2013. Thermal comfort practices in the home and their impact on energy consumption. Architectural Engineering and Design Management, 10, 1-24.
VÁSQUEZ-HERNÁNDEZ, A. & RESTREPO ÁLVAREZ, M. F. 2017. Evaluation of buildings in real conditions of use: Current situation. Journal of Building Engineering, 12, 26-36.
WBDG, T. 2016. PROVIDE COMFORTABLE ENVIRONMENTS [Online]. Available: https://www.wbdg.org/design-objectives/productive/provide-comfortable-environments[Accessed 10].
WOLKOFF, P. 2018. Indoor air humidity, air quality, and health – An overview. International Journal of Hygiene and Environmental Health, 221, 376-390.
YOUNG, T., FINEGAN, E. & BROWN, R. 2012. Effects of summer microclimates on behavior of lions and tigers in zoos.
42nd AUBEA Conference 2018: Educating Building Professionals for the Future in the Globalised World
Evolution of Building Rating Tools: A next generation Rating Model
Muhammad Afrasiab Khan1, Samad Sepasgozar2 and Changxin Wang3
1,2&3Department of Construction Management and Property,Faculty of Built Environment, University of New South Wales,
Sydney, 2052, NSW, AUSTRALIA
E-mails: [email protected]; [email protected]; [email protected]
Abstract: This paper aims to visualize the future of building rating systems by providing a novel building rating model. It begins with a review of building rating systems and their practices. Building rating tools have primarily been criticised from mainly three perspectives; first is the triple bottom line which necessitates that the building rating tools should undertake holistic approach towards addressing the pillars of sustainability, second is the life cycle analysis which requires that all the phases of construction should be including in the assessment and the third is international usage which demands that the weightages should be adjusted according to the local challenges and requirements of differed regions of the world. The author argues that the rhetoric discussion on triple bottom line, life cycle analysis and localization of the context will not pave the way for building practices towards a better sustainable built environment. It is even more important to advance the current engineering practices, widen the set of indicators, inclusion of the life cycle analysis thinking and consideration of the regional preferences while allocation of the weightages. To overcome these issues, a hypothetical model “SOBRM” has been formulated as a result of this research which will pave way to provide a more holistic rating system.
Keywords:Building rating tools; Triple bottom line; life cycle analysis.
1 Introduction
Evaluating and monitoring sustainability levels for built environments has become vital in recent times because of global challenges in coping with increasing urbanisation as well as man-driven land modifications and of course climate change. Several countries and regions have developed building rating tools for assessing buildings, which can allow government bodies, building specialists and architects to evaluate buildings with confidence. The main reason for this drive for assessment is increased interest and awareness towards sustainable practices. Sustainable structures are the buildings which are designed to use resources such as water, electricity, materials efficiently, and reducewaste, and contamination (USGBC, 2009). This helps in reducing carbon footprint and improving human wellbeing. The rating tools used such as DGNB (Ger-many), BREEAM (United Kingdom), LEED (United States and Canada), Green Star (Australia), Green Mark (Singapore) and CASBEE (Japan) have helped the specialists in measuring the sustainability of buildings worldwide. This is done by crediting a site for its benefits to the users such area and site, preservation of water, vitality, and materials, and tenant solace and wellbeing. The achievement of a certain project is determined by maximum score, therefore, the higher the credit score, the better it is.
284. 285.
42nd AUBEA Conference 2018: Educating Building Professionals for the Future in the Globalised World
Although, each of these tools are constantly upgraded, these are generally aimed at marketing purposes only. Seldom are there any experimental researches or hypothetical theories behind upgradation of these tools which may lead to many problematic results. To address these issues, a comprehensive framework with standardized and homogeneous methodology aimed at refining the current building assessment system was required. Hence, a state of the art Sustainable office building rating model (SOBRM) is presented as an alternate. It is based on an audit of the current building rating tools and ideas carried out in this article through literature review. This model provides a holistic, nature-based and lucrative sustainability resolution for encouraging a better sustainable development.
2 Methodology
Literature review was predominantly chosen as the research methodology, the model presented in this research is based on the short comings and critiques of the existing rating systems hence it could only be possible through reviewing the existing techniques. In In the first round, a comprehensive literature search was carried out using Web of Science and Scopus looking for keywords are one or any combinations of “building rating tools” + “review” + “triple bottom line” + “life cycle analysis”. Primarily, 246 articles were found. After initial screening of titles and abstracts, the duplicates were then eliminated, as a result only 126 articles were left for the further review. The next round selection was based on two basic research aims: to find out the critiques; to identify the suggestions and solutions. Finally, 61 articles (Table 1) fell into above mentioned two aims. Out of them, 22 empirical as well as theoretical studies are found examining triple bottom line and highlighting the significance of paying adequate attention to all dimensions of sustainability including social and economic aspects. 19 articles look for life cycle assessment. 20 articles focus on internationalization of building rating tool or localization of indicators. Besides the 61 articles, relevant books, reference guides and reports are reviewed for more in-depth and comprehensive discussion.
Table 1. Sources of Literature review
Review Theme Sourcea) Environmental focus
of assessment tools,
b) Requirement of
holistic approach
Cole, (1998, 1999, 2005), Todd (2001), Lee (2002), Forsberg and von Malmborg
(2004), Gibberd (2005), Sinou and Kyvelou (2006), R.A. Fenner (2006), Fenner and
Ryce (2008), Alwaer et al. (2008), Ding (2008), Mao et al. (2009), Rajesh Kumar
(2012), Andras (2015), András, and Melinda (2015), Zhonghua Gou (2016), Diaz-
Sarachaga (2016), Omair Awadh (2017), Jose Manuel (2017), Omair (2017), I. M.
Chethana (2017), Tayyab (2017), J. Park (2017).
a) Life Cycle Analysis
b) Inclusion of all phases
of building projects
Reijnders and van Roekel (1999), Dunn (2003), Rapoport (2006), Sassi (2006), Haapio
and Viitaniemi (2008a), Haapio and Viitaniemi (2008b), Sebake (2009), Ali and Al
Nsairat (2009), Collins and Kunz (2009), Hikmat H Ali (2009), Hall and Datta (2010),
Binh K. (2011), Tsai et al. (2014), Ravi S. (2014), F. Asdrubali (2015), Ozge Suer
(2015), Montagna (2016), Dwyer (2016), Grace (2017).
a) International rating
tool
b) Localization of
indicators
Todd et al. (2001), Lin (2006), Sassi (2006), A. Vionov (2006), Lee and Burnett,
(2008), Reed et al. (2009), Zuhairuse et al. (2009), Mao (2009), Ali & Al-Nsairat
(2009), Teriman (2009), Zuhairuse (2009) Ali and Al Nsairat (2009), Hikmat H Ali,
(2009), Poston et al. (2010), Reed et al. (2011), Al-Sallal et al. (2012), Alyami and
Rezgui (2012), Rouzbeh (2017), Mohannad (2017), F.A. Al-Jebouri (2017).
42nd AUBEA Conference 2018: Educating Building Professionals for the Future in the Globalised World
The main research objective was to develop a conceptual model based on the literature review. This model will serve as a foundation for the assessment of building. It could later be adjusted according to the specific needs of each country. The literature review has revealed that the most accepted model for assessing building performance consists of sustainability pillars and all phases of a project life cycle. This research also serves as a basis for paving way to determine an initial list of indicators to include in the assessment model. The hypothetical model is mainly developed because of the outcome of the literature review.
3 Result and Discussion
A substantial relationship between different building rating tools is found. BREEAM (UK) lies the footing of the development of the others building rating tools. Resemblance between tools is found in terms of working methodology, phases, application, foundation, credit allocations, categories and labelling. Differences have also been found because of market consideration, flexibility, providers and weighting systems. The review of measurement and benchmark of these building tools concepts and practices highlights the deficiencies of assessment towards sustainability performance. According to the literature review, there are three main reasons for the critique of these tools which are discussed in the subsequent headings.
3.1 Environmental FocusBuilding rating tools deliver a methodological framework to quantify and monitor the ecological performance of buildings, highlighting the building professions the significance of sustainable development in the construction process. Generally, criteria-based rating tools have a set of credits and weightings it gives, which are generic and user-friendly. However, a comprehensive review of these tools has concluded that that several important indicators are still missing and need to be addressed. This includes issues pertaining to life-cycle assessment, allocation of weightage to pillars of sustainability, and climate change. It is highlighted that the economic and social aspects are neglected. (Mao et al. 2009). Sinou and Kevelou suggest that these tools are more focussed on the site and area, energy and resources, indoor quality environment. They further advocate that no single method exists which focuses on all parameters patricianly economic, social and relief and therefore a dire need for one system benefitting all exists. (Sinou and Kyvelou, 2006). Ecological loadings, resource use and health issues should be organised and included into well-defined subcategories inside the framework of the assessment methods (Cole, 2005). A clear majority of tools were attentive too much on environmental sustainability while did not pay attention to the coverage of social, economic, and institutional aspects of sustainability (Zhang et al., 2014). There is no single system which addresses all the aspects, especially economic, social and institutional ones appropriately. Almost all tools are concentrated on landscape-site, resou rces, energy and quality of the indoor environment which are associated to the environmental sustainability (Sinou and Kyvelou, 2009). Enclosure of economic, social and institutional aspects will gain significance in future tools. Existing building rating tools do not adequately consider ecological effects in a single tool; they do not contribute comprehensively in the overall evaluation of sustainable development. The sustainable development perceptions in construction help ensure long lasting environmental, economic and social growth in society but building rating tools do not address them appropriately (Fenner and Ryce, 2008). Great recognition, interaction and communication amongst the stakeholders of various sectors in the industry is required to promote the acceptance of current building rating tools. Main obstacles to the acceptance of these tools are still the complexity, inflexibility and lack of consideration of an adjustable weighting
286. 287.

42nd AUBEA Conference 2018: Educating Building Professionals for the Future in the Globalised World
system (Ding, 2008). The additional inclusion of the indicators in the systems can reinforce the economic and the social dimension of sustainability, while the adjustment and development of distinct energy potential indicator, through which energy usage can be controlled, can contribute to better environmental sustainability. The integration of well-being indicators into building assessment systems guarantees broad community benefit (WHO, 2014), and reinforces the social sustainability of the building rating systems (András Reith, 2015). Attaining a building certification does not essentially means that the building is successful in reaching its sustainability targets (Mao et al. 2009).
3.2 Life Cycle AnalysisSince the early 2000, schemes for assessment of buildings based on LCA have established for the building sector. Majority of these methods have projected to be used for selection of building material, building design and local utility options (waste management, energy supply and transport type) through the design phase. Life Cycle Analysis based systems include detailed coverage of environmental influences associated with design and building materials. However, life cycle analysis-based systems do not cover the total array of relations between buildings and environment such as the post occupancy, siting, indoor environment and user behaviour (Reijnders and van Roekel, 1999). It is hard to compare different rating tools and their results because of differences in type of building, phases of the project life cycle and the dependence on diverse guidelines and databases. All the project phases are not covered in one tool, some ignore the construction and demolition phases of project life cycle (Ali and Nisariat, 2009). Service life issues have not been thoroughly considered in the building rating tools. Hence, the high-quality buildings of nowadays will be the low-quality buildings of the future. The benefits will be maximising service life of buildings when included properly into building rating tools. Clarification of the relation between post occupancy and pre-occupancy phases of buildings within the rating tools is required (Haapio and Viitaniemi, 2009). The number of indicators that assess building energy performance impact the final rating scores considerably but there is no clear consideration of energy performance is related to which phase of project life cycle (Omair, 2017). The understanding of sustainability is increasing, it is the need of the time to incorporate life cycle analysis to broaden the comprehension in the next generation tools. There is a noticeable room for improvement in adaptation of assessment methods with Life cycle analysis concept to deliver a better and comprehensive quantitative tool (Sebake, 2009).
3.3 Regional PriorityMost of the tools were initially developed to demonstrate local or national priorities ofsustainability issues. However, they have been either directly used or modified for use in some other countries or reigns as they have grown in wide markets all over the world. For instance, LEED, developed in the United States has been applied to more than thirty countries. Arguably, introducing these tools from one country to others produced problematic consequences particularly on social and economic sustainability. To address these issues, a standardized and homogeneous methodology and a comprehensiveframework with specific criteria for updating and finetuning the existing system were required. To reduce biases and conflicts, it is suggested that performance criteria or credits reflect regional, national and cultural varieties by transfer weights to numerous credits as per the regional and local conditions (Al-Sallal et al, 2012). Green Building Council is beneficial as a reference and basis for developing a domestic assessment method. Social, cultural, economic and historical contexts all play a significant role in defining the kind of opportunities and barriers that could possibly be faced in developing nations to develop a domestic rating tool. Green Building Council has participated very positively in the
42nd AUBEA Conference 2018: Educating Building Professionals for the Future in the Globalised World
development of building rating tools and could continue to do so in the future (Todd et. al, 2001). Developing a common assessment framework to enable international comparisons is getting attention internationally (Lee and Burnett, 2008). Better transparency and reduction of the differences between rating tools is essential to decrease users’ confusion. Critically the absence of a genuine international sustainable building rating tool hinders the goal of better sustainable development (Reed et al, 2009). Standardisation of evaluation protocols is required to provide a foundation for a common platform which will eventually enable the comparison between different building rating tools and pave way for their globalization. Many common ecological practices are yet to be implemented in developing nations because of lack of the essential significant data such as embodied energy pertinent to the context of those particular countries (Zuhairuse et al. 2009). Categories are generally being defined according to the limitations of tools and they are different from country to country dependent on the local context. There are many similar categories common between developing and developed nations, but they are different in each category weighting. Each nation should develop their own assessment technique; however, they can learn from other nations experts. There are three main roots behind the creation of the variety of presently available national tools: those based on the Green Building Council frameworks, those founded on LEED guidelines and those developed because of the analysis of other building rating tools available within different regional contexts (Ali and Al Nisariat, 2009). Most of the criteria are still based on the quantitative data and few on the responsive and developmental influences on economic, social and cultural issues. Flexibility and variation are still issues that are yet to be addressed within building rating tools to resolve the regional and local differences. To design and construct sustainable buildings and communities in extreme and harsh environments is a complex job that needs specialised knowledge and creative thinking, it is different from the same buildings in the moderate environment. There is noteworthy evidence of difference in the environment, communities, culture and economies betweendifferent countries, it is too significant to be ignored (Poston et al, 2010). Hence, each tool has its exclusive characteristics and emphasis on certain indicators, so using the same building rating tool in each country may lead to faulty results.
4 Sustainable Office Building Rating Model (SOBRM)
Sustainability and building life cycle based theoretical model has been developed using the literature review approach to evaluate the performance of buildings. This serves as the theoretical framework which will provides a basis for determining the relevant indicators that will describe the quantifiable phenomenon for rating the office buildings. This model is composed of a set of two key criterions, one lie down on the x axis and other on the y axis. The intersection of both main levels of the model generates sixteen subcategories. Each category represents key interactions between social, economic, environment, governance and Design, Construction, Operation & Maintenance and Demolition which represent the first level of the model. The proposed subcategories will represent the performance indicators which are based on the intersection of main pillars of sustainability and the main phases of life cycle of a building. The development of this novel model will serve as the holistic framework to allocate the weightages to all the indicators. According to the newly development model new categories related to the unique social, cultural, environment and governance requirements will be addressed. The components of the proposed system were divided into three levels. First level consists of two basic criteria which are the pillars of the sustainability and phases of building life cycle. Second level consists of the two basic characteristics which are regional priority and the stakeholders. Third and the final level of the model consists of the indicators
288. 289.

42nd AUBEA Conference 2018: Educating Building Professionals for the Future in the Globalised World
which will be designed because of intersection of first two levels of the model. The components of all the three levels are described briefly;
a) Quadruple Bottom Line represents the first level of sustainable development, it includes governance as the forth pillar in addition to triple bottom line. According to Engelbrecht (2011) and Teriman et al (2009) quadruple bottom line sustainability is originates and further extends the triple bottom line perception of sustainability to take in governance. This definition infers that the governance framework drives beyond simply relationships between administrators in local management and relevant stakeholders in the development process. Amstrong et al. (2006) stressed that governance has become an issue of international significance. Hence, the function of governance is vital towards achieving sustainable development. Governance should be combined within the current triple bottom line. Therefore, the model incorporating the governance laying the foundation of next generation building rating systems, known as the quadruple bottom-line sustainability (QBL) rating has been proposed in this paper.
b) Life Cycle Analysis covers the basic level in the model which includes all the life stages of the project right from design to the demolition. Material, energy and material criteria have been criticized for given inappropriate significance for different stages. This model provides the opportunity to allocate weightages to numerous indicators according to their regional priority and impact on each stage of the project life cycle.
c) Regional Priority covers the second level of SOBRM. Developing building rating system could be based on the studying and analyzing the best practices around the globe but it should focus on the local demands and challenges (Hikmat & Saba, 2009). To incorporate the local context, regional priority has been allocated the second level so that all the indicators can be adjusted accordingly.
d) Primary, developing such an assessment model needs collaboration and participation of multi dimension stakeholders during the process of development. Stakeholders are included in this model as groups based on different phases of construction; owner, designer and architect are included as the stakeholders from the design phase, project team, community and contractor from construction phase, facility manager, maintenance team and building occupants from the operation and maintenance phase, community, contractor and owner from the demolition phase. The first second set of stakeholders includes government agencies and regulatory authorities which are involved during the whole life cycle of the buildings.
e) Indicators formulate third and last level of SOBRM. They are result of the intersection between Quadruple bottom line and the phases of project life cycle. The Social pillar represents the People, environment represent planet, economic represent profit and the governance pillar represent the policy. So, this model gives a 4P framework to combine with all the phases of building life cycle to obtain the indicators which will cover all the dimensions of suitability satisfying the regional priority and stakeholders at the same time.
42nd AUBEA Conference 2018: Educating Building Professionals for the Future in the Globalised World
Figure 1. Sustainable Office Building Rating Model (SOBRM)
The first stage was the development and formulation of the basic structure of the model. This model will be tested, validated and verified through Semi-structured interviews. These interviews will be undertaken involving experts who have been involved in development of building rating tools. However, the second stage involves the assignment of weightages and relative importance for the assessment categories and their relevant performance indicators, which can be validated through a survey that included different stakeholders of the industry from building engineers, building regulators, and sustainability experts for the specific regions or countries. Weightages will be allocated after taking input from stakeholders from representative fields via a questionnaire.
5 Conclusion and Further Research
As far as tending the construction and demolition phases of project are concerned, they are not covered in most of the building rating tools. Construction and demolition phases have significant effects on the society and environment hence ignoring them will not be appropriate. On the other hand, addressing the pillars of sustainability is concerned, most of the systems are generally concentrated around the Environmental aspect of sustainability, however, the economic and social aspect is given the minimum focus. The institutional and cultural aspects could be covered under the governance. Although the environmental pillar is very significant Economic and social pillars should also get their due share. In addition, rating systems designed for one country is applied to many others without adjustment of weightages and enclosure of regional indicators specific to each country’s need. To overcome these issue, evolution is desirable in the building rating tools, hence, studies should be undertaken to achieve the possible outcomes and techniques for including new indicators that expand the scope and areas of building rating tools by covering all the sustainability pillars and phases of project life cycle which are aligned with the requirements of each country.
290. 291.

42nd AUBEA Conference 2018: Educating Building Professionals for the Future in the Globalised World
The model that has been presented in this paper provides a solution for above mentioned issues and promotes a better sustainable development. This sustainability and life cycle-oriented model has been developed which can be implemented at the project and policy level to assess social, economic, ecological and institutional dimensions of sustainability. It provides a prospect indicator-based assessment model to evaluate the performance of office buildings that is comprehensive, integrated and multi-scale. The weightages given to any specific pillar of sustainability can be adjusted according to the regional priority. Many local government agencies around the globe can utilise this model as the basis to develop a comprehensive rating tool according to their own local priority. The main challenge in this sustainability assessment model is identifying an appropriate and comprehensive set of scientific, practical and policy-based indicators which help to effectively monitor sustainability progress in the effort to build a profitable sustainable environment and society. However, implementing the model can have numerous barriers because of constraints in availability of resources, proper research, understanding of their local needs, management of the stakeholders, orientation of challenges and characteristics of the economy of each country. These factors also influence the capability of the model to deliver benefits, particularly at specific regional level. Thus, it is vital to understand under which circumstances these projected weightages of indicators should be configured and distributed to reach the desired level of sustainability and thereby to provide the utmost benefits.
6 References
Ali, H.H. and Al Nsairat, S.F., 2009. Developing a green building assessment tool for developing countries–Case of Jordan. Building and Environment, 44(5), pp.1053-1064.
Al-Sallal, K.A., Al-Rais, L. and Dalmouk, M.B., 2013. Designing a sustainable house in the desert of Abu Dhabi. Renewable energy, 49, pp.80-84.
Armstrong, P., Segal, N., & Davis, B. 2006. Corporate governance in South Africa. Handbook on international corporate governance, 210-31.
Awadh, O., 2017. Sustainability and green building rating systems: LEED, BREEAM, GSAS and Estidama critical analysis. Journal of Building Engineering, 11, pp.25-29.
Cole, R.J., 2005. Building environmental assessment methods: redefining intentions and roles. Building Research & Information, 33(5), pp.455-467.
Darus, Z.M., Hashim, N.A., Salleh, E., Haw, L.C., Rashid, A.K.A. and Manan, S.N.A., 2009. Development of rating system for sustainable building in Malaysia. WSEAS Transactions on Environment and Development, 5(3), pp.260-72.
Ding, G.K., 2008. Sustainable construction—The role of environmental assessment tools. Journal of environmental management, 86(3), pp.451-464.
Engelbrecht, M., 2010. Towards the quadruple bottom line: Corporate governance and sustainability in the 21st century–a South African perspective. Browser Download This Paper.
Fenner, R.A. and Ryce, T., 2008, March. A comparative analysis of two building rating systems Part 1: Evaluation. In Proceedings of the Institution of Civil Engineers-Engineering Sustainability (Vol. 161, No. 1, pp. 55-63). Thomas Telford Ltd.
Haapio, A. and Viitaniemi, P., 2008. Environmental effect of structural solutions and building materials to a building. Environmental impact assessment review, 28(8), pp.587-600.
Lee, W.L. and Burnett, J., 2008. Benchmarking energy use assessment of HK-BEAM, BREEAM and LEED. Building and Environment, 43(11), pp.1882-1891.
Mao, X., Lu, H. and Li, Q., 2009, September. A comparison study of mainstream sustainable/green building rating tools in the world. In Management and Service Science, 2009. MASS'09. International Conference on (pp. 1-5). IEEE.
Poston, A., Emmanuel, R. and Thomson, C., 2010, September. Developing holistic frameworks for the next generation of sustainability assessment methods for the built environment. In Proc. Of the 26th Annual ARCOM Conference(pp. 1487-1496).
42nd AUBEA Conference 2018: Educating Building Professionals for the Future in the Globalised World
Reith, A. and Orova, M., 2015. Do green neighbourhood ratings cover sustainability?. Ecological Indicators, 48, pp.660-672.
Reijnders, L. and Van Roekel, A., 1999. Comprehensiveness and adequacy of tools for the environmental improvement of buildings. Journal of Cleaner Production, 7(3), pp.221-225.
Schulte, K.W., 2009. International comparison of sustainable rating tools. Journal of Sustainable Real Estate, 1(1), pp.1-22.
Sebake, T.N., 2009. Overview of green building rating tools. Green Building.Sinou, M. and Kyvelou, S., 2006. Present and future of building performance assessment tools.
Management of Environmental Quality: An International Journal, 17(5), pp.570-586.Teriman, S., Yigitcanlar, T. and Mayere, S., 2009. Sustainable urban development: a quadruple
bottom line assessment framework. In The second infrastructure theme postgraduate conference: conference proceedings (pp. 228-238). Queensland University of Technology, Faculty of Built Environment and Engineering.
Todd, J.A., Crawley, D., Geissler, S. and Lindsey, G., 2001. Comparative assessment of environmental performance tools and the role of the Green Building Challenge. Building Research & Information, 29(5), pp.324-335.
Zhang, X., Wu, Y., Shen, L. and Skitmore, M., 2014. A prototype system dynamic model for assessing the sustainability of construction projects. International Journal of Project Management, 32(1), pp.66-76.
292. 293.

42nd AUBEA Conference 2018: Educating Building Professionals for the Future in the Globalised World
Construction and demolition waste management through a systematic deconstruction approach:
case of the ‘Whole House Reuse’ project
Atiq U. Zaman1, Juliet Arnott2, Kate Mclntyre2 and Jonathon Hannon3
1School of Design and the Built Environment, Curtin University, Perth, 6084, WESTERN AUSTRALIA
2&3Rekindle, Christchurch, 8011, NEW ZEALAND 4Zero Waste Academy, Massey University, Palmerston North 4442, NEW ZEALAND.
Emails: [email protected]; [email protected];[email protected];[email protected]
Abstract: The study considers the ‘Whole House Reuse’ (WHR), a community-driven project for managing construction and demolition (C&D) waste in Christchurch. The WHR project applies an alternative deconstruction (labor intensive) approach instead of traditional demolition (machine intensive) approach to maximise resource recovery. The study applies characterization of materials to quatify the resuable, recylable and non-recyclable materials. The study finds that around 12 tons of various construction materials were recovered, most which would otherwise be disposed to landfill in the traditional demolition approach. The study estimates that the recovered materials could potentially save around 502,158MJ of embodied energy and prevent carbon emission of around 27,029kg (CO2e). In addition, the project successfully engages local communities and designers to produce 400 new products using the recovered materials and exhibited to the local people. The study concludes that there is a huge prospect in regard to resource recovery, emission reduction, employment and small business opportunities using deconstruction of an old house. The socio-cultural importance of the WHR project is definitely immense; however, the greater benefits of such projects are often ignored and remain unreported to wider audiences as most of the external and environmental costs have not been considered in the traditional linear economy.
Keywords:Construction and demolition waste, Deconstruction, Demolition, Resource Recovery, Whole House Reuse.
1 Introduction
A typical residential house can be expected to last on average 50 years and at the ‘end-of-life’ phase, the old structures require major refurbishment or need to be demolished for new development (Cuéllar-Franca and Azapagic, 2012; Dahlstrøm, et al., 2012). Around 200,000-300,000 buildings are demolished in the United States each year, which would significantly contribute (about 90%) to the generation of total C&D waste of 534 million tons annually (Mcardle, 2011, US-EPA, 2018).
Demolition is generally taken place at the end-of-life phase of a residential building. The traditional demolition of building process often involves a rapid knock down of buildings using heavy machinery without caring much about waste materials. As a result of this damaging and value destroying process most of the demolition waste is generally consigned to lineal disposal pathways such as landfill and or incineration (with or without
42nd AUBEA Conference 2018: Educating Building Professionals for the Future in the Globalised World
energy recovery). The term “deconstruction” also refers to as ‘building’/‘house/home’ deconstruction. Diyamandoglu & Fortuna (2015) define deconstruction as the process of disassembling a physical structure to its components in reverse order to that used during construction with minimum damage so that they maintain their original physical properties and structural integrity. Therefore, the deconstruction of building i.e. “systematic disassembly of buildings in order to maximize recovered materials reuse and recycling” involves carefully taking apart portions of buildings or removing their contents with the primary goal of reuse in mind (NAHB, 2000; CIB, 2005).
This study aims to conceptualize the key challenges and opportunities associated with applying deconstruction of residential buildings in a New Zealand context. The study considers a deconstruction project entitled “Whole House Reuse” (2013-15), as a case study and seeks to propose a number of recommendations for the development of comprehensive strategies for deconstruction practices in the Pacific region.
At this point it is useful to clarify that the case study ‘whole house reuse’ (WHR) project involves whole house deconstruction coupled to the aspiration of entire material reuse. As such this project can be distinguished from the concept and practice of whole house reuse (also commonly referred to as whole house recycling), whereby the entire structure/ building is literally jacked up put on a truck and relocated so as to be reused (albeit often repaired, renovated / refurbished, redesigned and repurposed) in various degree of its original format.
2 Literature Review
2.1 Construction and Demolition (C&D) Waste Management in New ZealandApproximately 850,000 tonnes of C&D waste are sent to landfills each year in New Zealand. However, this estimate varies, depending on the level of building activity (Level, 2014). Historically the previous New Zealand Waste Strategy (NZWS:2002) entitled ‘Towards Zero Waste and a Sustainable New Zealand’ established targets for all Territorial Authorities to measure C&D waste and to set local diversion goals (2005) and nationally for 50% reduction by weight of C&D waste going to landfills by (2008) (Storey et al., 2014). However, these targets were non-enforceable and were not well supported by the requisite framework of legislation, policies, programs and regulatory and market based economic instruments needed to drive achievement (PCE, 2006; Storey and Pedersen, 2014; Storey et al., 2014).
Under the pretext that they were “not able to be measured or achieved” (MfE, 2010) the subsequent NZWS: 2010 abandoned not just the C&D related targets, but also all 28 other waste minimization targets and with this the transparent aspiration and accountability that targets are recognized as providing (Hannon, 2018). Whilst the development of the Waste Minimization Act (WMA:2008) provided mechanisms for improving waste data, one of the key challenges in seeking to better manage / minimize C&D waste in New Zealand is that national data collection and reporting remains poor (WasteMINZ, 2018). Whilst recognizing the inconsistency and incompleteness of data in this sphere, recent estimates put C&D at 17% of total MSW and identify the lower $/tonne disposal charge applying to C&D relative to MSW as an enabler landfill rather than resource recovery (Storey and Pedersen, 2014). The C&D waste mainly consists of timber, metal, concrete, paper, glass and other construction materials.
Table 1 provides an overview of the legislative - regulatory and strategy - policy environment designed to influence and control waste recycling and disposal activities,
294. 295.
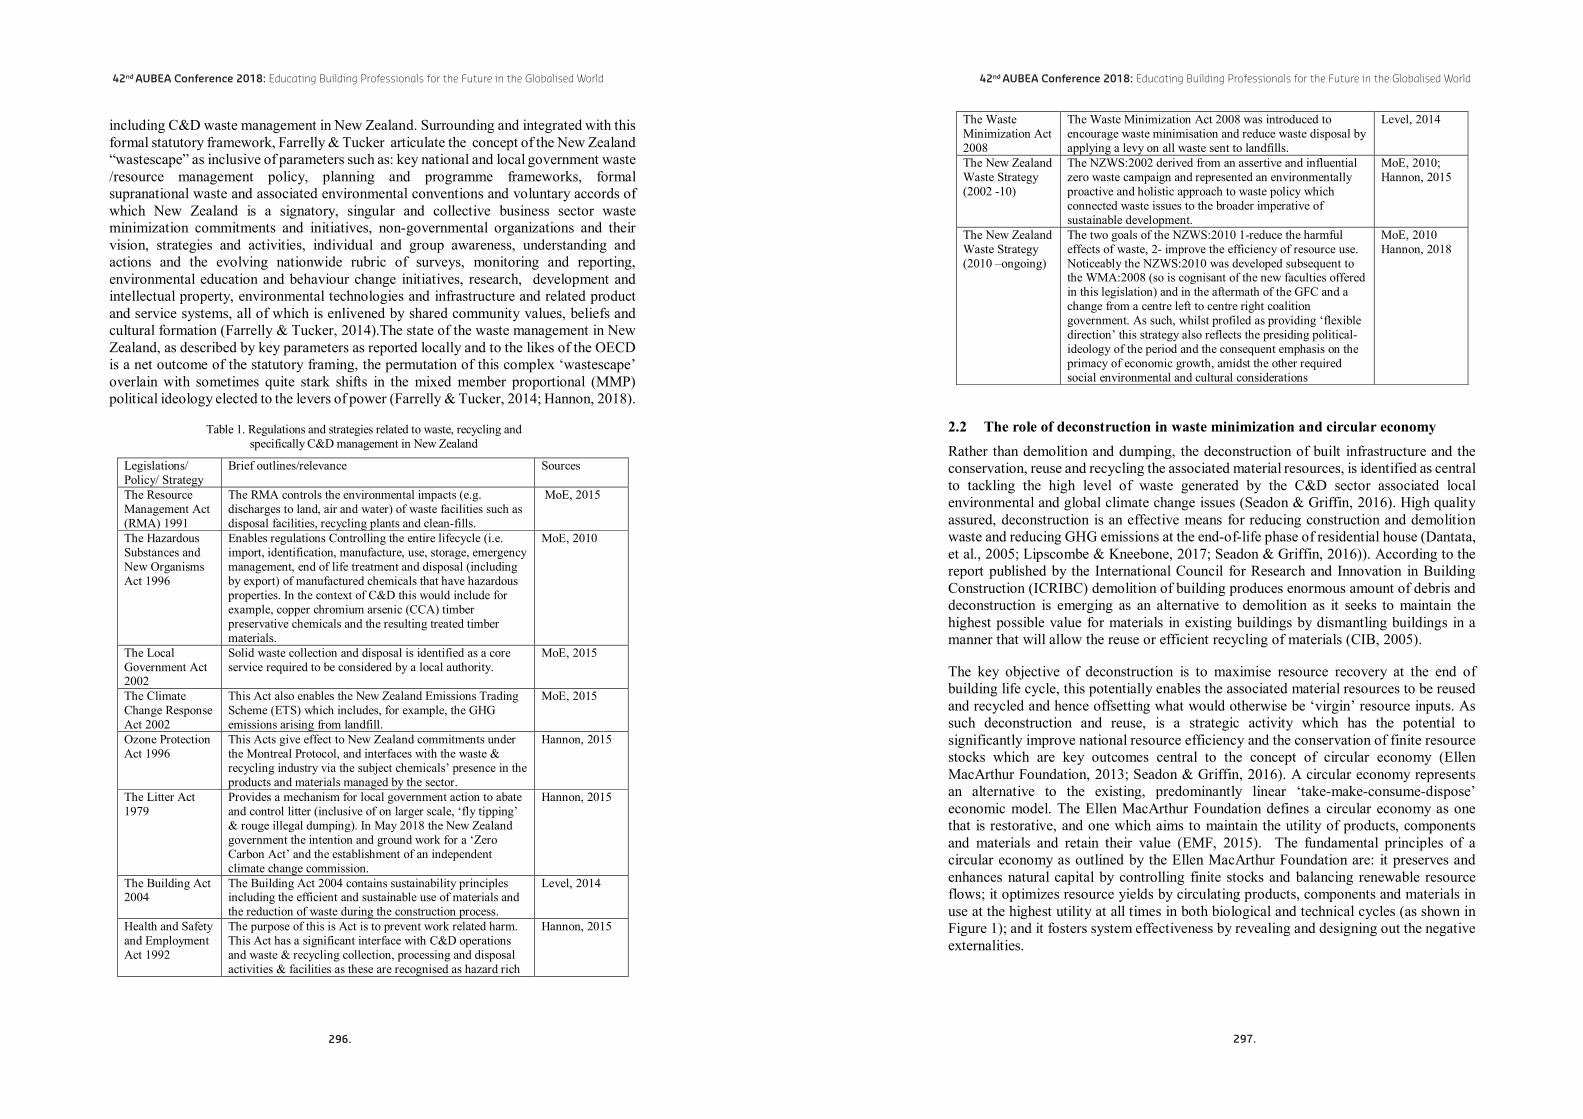
42nd AUBEA Conference 2018: Educating Building Professionals for the Future in the Globalised World
including C&D waste management in New Zealand. Surrounding and integrated with this formal statutory framework, Farrelly & Tucker articulate the concept of the New Zealand “wastescape” as inclusive of parameters such as: key national and local government waste /resource management policy, planning and programme frameworks, formal supranational waste and associated environmental conventions and voluntary accords of which New Zealand is a signatory, singular and collective business sector wasteminimization commitments and initiatives, non-governmental organizations and their vision, strategies and activities, individual and group awareness, understanding and actions and the evolving nationwide rubric of surveys, monitoring and reporting, environmental education and behaviour change initiatives, research, development and intellectual property, environmental technologies and infrastructure and related product and service systems, all of which is enlivened by shared community values, beliefs and cultural formation (Farrelly & Tucker, 2014).The state of the waste management in New Zealand, as described by key parameters as reported locally and to the likes of the OECD is a net outcome of the statutory framing, the permutation of this complex ‘wastescape’ overlain with sometimes quite stark shifts in the mixed member proportional (MMP) political ideology elected to the levers of power (Farrelly & Tucker, 2014; Hannon, 2018).
Table 1. Regulations and strategies related to waste, recycling and specifically C&D management in New Zealand
Legislations/ Policy/ Strategy
Brief outlines/relevance Sources
The Resource Management Act (RMA) 1991
The RMA controls the environmental impacts (e.g. discharges to land, air and water) of waste facilities such as disposal facilities, recycling plants and clean-fills.
MoE, 2015
The Hazardous Substances and New Organisms Act 1996
Enables regulations Controlling the entire lifecycle (i.e. import, identification, manufacture, use, storage, emergency management, end of life treatment and disposal (including by export) of manufactured chemicals that have hazardous properties. In the context of C&D this would include for example, copper chromium arsenic (CCA) timber preservative chemicals and the resulting treated timber materials.
MoE, 2010
The Local Government Act 2002
Solid waste collection and disposal is identified as a core service required to be considered by a local authority.
MoE, 2015
The Climate Change Response Act 2002
This Act also enables the New Zealand Emissions Trading Scheme (ETS) which includes, for example, the GHG emissions arising from landfill.
MoE, 2015
Ozone Protection Act 1996
This Acts give effect to New Zealand commitments under the Montreal Protocol, and interfaces with the waste & recycling industry via the subject chemicals’ presence in the products and materials managed by the sector.
Hannon, 2015
The Litter Act 1979
Provides a mechanism for local government action to abate and control litter (inclusive of on larger scale, ‘fly tipping’ & rouge illegal dumping). In May 2018 the New Zealand government the intention and ground work for a ‘Zero Carbon Act’ and the establishment of an independent climate change commission.
Hannon, 2015
The Building Act 2004
The Building Act 2004 contains sustainability principles including the efficient and sustainable use of materials and the reduction of waste during the construction process.
Level, 2014
Health and Safety and Employment Act 1992
The purpose of this is Act is to prevent work related harm. This Act has a significant interface with C&D operations and waste & recycling collection, processing and disposal activities & facilities as these are recognised as hazard rich
Hannon, 2015
42nd AUBEA Conference 2018: Educating Building Professionals for the Future in the Globalised World
The Waste Minimization Act 2008
The Waste Minimization Act 2008 was introduced to encourage waste minimisation and reduce waste disposal by applying a levy on all waste sent to landfills.
Level, 2014
The New Zealand Waste Strategy (2002 -10)
The NZWS:2002 derived from an assertive and influential zero waste campaign and represented an environmentally proactive and holistic approach to waste policy which connected waste issues to the broader imperative of sustainable development.
MoE, 2010;Hannon, 2015
The New Zealand Waste Strategy (2010 –ongoing)
The two goals of the NZWS:2010 1-reduce the harmful effects of waste, 2- improve the efficiency of resource use. Noticeably the NZWS:2010 was developed subsequent to the WMA:2008 (so is cognisant of the new faculties offered in this legislation) and in the aftermath of the GFC and a change from a centre left to centre right coalition government. As such, whilst profiled as providing ‘flexible direction’ this strategy also reflects the presiding political-ideology of the period and the consequent emphasis on the primacy of economic growth, amidst the other required social environmental and cultural considerations
MoE, 2010 Hannon, 2018
2.2 The role of deconstruction in waste minimization and circular economyRather than demolition and dumping, the deconstruction of built infrastructure and the conservation, reuse and recycling the associated material resources, is identified as central to tackling the high level of waste generated by the C&D sector associated local environmental and global climate change issues (Seadon & Griffin, 2016). High quality assured, deconstruction is an effective means for reducing construction and demolition waste and reducing GHG emissions at the end-of-life phase of residential house (Dantata, et al., 2005; Lipscombe & Kneebone, 2017; Seadon & Griffin, 2016)). According to the report published by the International Council for Research and Innovation in Building Construction (ICRIBC) demolition of building produces enormous amount of debris and deconstruction is emerging as an alternative to demolition as it seeks to maintain the highest possible value for materials in existing buildings by dismantling buildings in a manner that will allow the reuse or efficient recycling of materials (CIB, 2005).
The key objective of deconstruction is to maximise resource recovery at the end of building life cycle, this potentially enables the associated material resources to be reused and recycled and hence offsetting what would otherwise be ‘virgin’ resource inputs. As such deconstruction and reuse, is a strategic activity which has the potential to significantly improve national resource efficiency and the conservation of finite resource stocks which are key outcomes central to the concept of circular economy (Ellen MacArthur Foundation, 2013; Seadon & Griffin, 2016). A circular economy represents an alternative to the existing, predominantly linear ‘take-make-consume-dispose’ economic model. The Ellen MacArthur Foundation defines a circular economy as one that is restorative, and one which aims to maintain the utility of products, components and materials and retain their value (EMF, 2015). The fundamental principles of a circular economy as outlined by the Ellen MacArthur Foundation are: it preserves and enhances natural capital by controlling finite stocks and balancing renewable resource flows; it optimizes resource yields by circulating products, components and materials in use at the highest utility at all times in both biological and technical cycles (as shown in Figure 1); and it fosters system effectiveness by revealing and designing out the negative externalities.
296. 297.

42nd AUBEA Conference 2018: Educating Building Professionals for the Future in the Globalised World
Figure 1: The circular economy—a restorative industrial system by design (Source: EMF, 2015)
3 Research Methodology
This study tried to investigate the environmental and socio-economic benefits of the ‘Whole House Reuse’ (WHR) project facilitated by Rekindle. Various construction materials were recovered during the deconstruction process and all materials were catalogued based on the article type, volume of the materials and number of units available. A booklet of ‘Whole House Reuse: Deconstruction’ was prepared. The physical classification and assessment of materials and the potential of materials recovery were determined using the catalogued based on the following criteria presented in Table 2.
The scores 1-10 were used to rate the materials in the context of reusability, reparability, recyclability and disposal to landfill. A score of 10 means the item could be reused as is without compromising any material value, aesthetic and a lower score means low efficiency in reusability and recyclability. Previous studies have indicated that recycling and resource recovery efficiency often determine by the amount of personal effort and inconvenience involved (Lipsey, 1977; Oskamp et al., 1991). The study considers the materials which require a lowest level of wiliness and efforts to recycle, therefore, the materials that scored 5 or more were considered in the analysis of environmental benefits.
42nd AUBEA Conference 2018: Educating Building Professionals for the Future in the Globalised World
Table 2: The scores used to characterize catalogued materials
Scale (1-10) Description Interpretation 01 Disposal/landfill Not suitable for recycling/composting 02 Composting Suitable for biodegradation 03 Low recyclability Recycle requires high efforts 04 Medium recyclability Recycle requires medium efforts 05 High recyclability Recycle requires low efforts 06 Repair requires high efforts Substitutes functions with high efforts 07 Repair requires low efforts Substitutes functions with low efforts 08 Reuse for alternative purposes Replaces other functionalities 09 Reuse as is Substitutes similar functions 10 Reuse as is Substitutes similar functions and aesthetics
3.1 The environmental assessmentThe environmental benefits of harvested materials were calculated based on energy and associated carbon dioxide emission reduction to the atmosphere. The study used the Inventory of Carbon and Energy (ICE) database to calculate the embodied energy and carbon emission reduction from the recovered materials used in Table 3. The calculation used in the ICE database is considered the geographical context of United Kingdom. Since there is no similar database in the context of New Zealand, the study assumed similarity between the UK and New Zealand contexts and therefore, the authors acknowledge an associated margin of error may exist in the calculations. However, in providing indicative findings, the research meets the underlying objectives of the article, which is to initiate discussion around the value of conducing further research to quantify benefits of deconstruction approaches such as illustrated in the WHR project.
Table 3: The embodied energy and carbon emission reduction from C&D materials [31] (Hammond and Jones, 2011)
Material types Mixed material Virgin materialEmbodied Energy (MJ/KG)
CO2e (Kg/Kg)
Embodied Energy (MJ/KG)
CO2e (Kg/Kg)
Brass 44 2.64 80 4.8Copper 42 2.71 57 3.81Aluminium 155 9.16 218 12.79Lead 25.21 1.67 49 3.37Stainless Steel 20.1 1.46 35.4 2.89Bricks 3 0.24 3 0.24Ceramic 10 0.7 20 1.14Concrete 0.75 0.107 1 0.15Glass 11.5 0.59 15 0.91Masonry 1.1 0.174 1.1 0.174Melamine 97 4.19 97 4.19Textile/Fabric 74 3.9 74 3.9Plastic 80.5 3.31 95.3 3.76PVC 68.6 3.23 77.2 3.1Plywood 15 0.45 15 0.45Timber 10 0.31 16 0.58
3.2 Case study of the ‘Whole House Reuse’ projectThe devastating earthquakes in 2010 and 2011 in Canterbury, New Zealand resulted in 10,000 homes being declared unfit for further occupation and requiring demolition and by 2014 around half of the homes within Christchurch City’s ‘Residential Red Zone’ had
298. 299.

42nd AUBEA Conference 2018: Educating Building Professionals for the Future in the Globalised World
been demolished. Traditional demolition which typically crushes and removes materials using a mechanical excavator in a relatively quick and tightly scheduled timeframe, is the most commonly applied method. The affected homeowners in Christchurch commonly describe feeling shocked, alienated and further traumatized by the destructiveness of demolition process (Arnott & McIntyre, 2014). The Whole House Reuse (WHR) project was initiated within the context of Christchurch City’s post-earthquake response, as the antithesis of the prevailing ‘frenzy’ of destructive demolition and wastage. As such, the project celebrates a thoughtful and resourceful alternative and demonstrates the careful nature of deconstruction, which enables high quality products to be upcycled from salvaged resources. The project was conceptualized as an opportunity to conduct a detailed exploration and examination of the economic, artistic / design, social, cultural and environmental potential of transformative material reuse of the, often over-looked, resources that make up one home. Figure 2 shows the deconstruction process of WHR project.
Figure 2: Catalogue of deconstructed components/materials (Courtesy: Guy Frederick)
4 Findings and Discussion
The catalogued items were carefully categorized based on physical assessment of the quality of the harvested materials and level of reusability, reparability and recyclability. A total 480 items were catalogued. Only 1% of the materials (mainly shelf units) were rated as 10, meaning that these items / materials could be reused as is, without and compromise in the quality, functionality and aesthetics of the items / materials. Another 1% of the harvested materials were scored as 9 (mainly timber and hardboard materials) which means that these items can be utilized in serving a purpose of similar quality and functionality. Around 7% of catalogued materials were scored as 8 (i.e. “Replaces other functionalities”), whilst most of the materials were scored at between 5 and 7 (around 70%), indicating that a significant amount of construction materials (around 79%) can be harvested through deconstruction process and can potentially be recirculated in the consumption supply chain by the demonstrated reuse, repair and recycle practices.
4.1 Environmental benefits of recovered materialsThe study found that timber was the highest contributor in terms of material saving (58.2 per cent) followed by bricks (25 per cent) and aluminium (14.2 per cent). However, in terms of embodied energy saving, aluminium contributed the most – 75.37 per cent –
42nd AUBEA Conference 2018: Educating Building Professionals for the Future in the Globalised World
followed by timber (19.98 per cent) and bricks (2.57 per cent). A total 502,158MJ of embodied energy was potentially saved, and around 27,029 kg (CO2e) of carbon emissions were potentially reduced by recovering materials (by offsetting virgin materials).
Table 4: Embodied energy and carbon emission reduction through recovered materials
Materials Virgin materialsEmbodied energy (MJ) Carbon reduction (CO2e)MJ % Kg %
Brass 184.0 0.04% 11.0 0.04%Copper 193.8 0.04% 13.0 0.05%Aluminium 372032.4 74.09% 21827.0 80.75%Lead 24.5 0.00% 1.7 0.01%Stainless Steel 591.2 0.12% 48.3 0.18%Bricks 9030.0 1.80% 722.4 2.67%Ceramic 910.0 0.18% 51.9 0.19%Concrete 100.0 0.02% 15.0 0.06%Glass 97.5 0.02% 5.9 0.02%Masonry 6.1 0.00% 1.0 0.00%Melamine 485.0 0.10% 21.0 0.08%Textile/Fabric 488.4 0.10% 25.7 0.10%Plastic 4078.8 0.81% 160.9 0.60%PVC 486.4 0.10% 19.5 0.07%Plywood 1249.4 0.25% 37.5 0.14%Timber 112200.5 22.34% 4067.3 15.05%Total 502158 MJ 27029 Kg CO2e
Potentially, the WHR project saved around 139,488kWh of energy, which is equivalent to the annual electricity uses of six households in Christchurch. Simultaneously the amount of carbon emissions prevented by the WHR project can be equated to offsetting the annual emissions of six passenger cars in New Zealand. On this basis the environmental benefits from the context of the 10,000 Christchurch homes that were declared fit for demolition in 2011 can be examined. Hypothetically, had a similar deconstruction approach as illustrated in the WHR project been implemented then around 5,021,580 gigajoule of energy could be saved and 270,290 tonnes of carbon emission could be potentially prevented.
4.2 Socio-economic benefits of the projectsThe WHR project was sequenced in three distinct phases, namely: (i)- the deconstruction of house, (ii)- the creation of innovative products and (iii)- a public exhibition, education and awareness raising and auction of the products and art works remanufactured from recovered / harvested materials (NB: arguably a 4th aspect of this project can also be conceptualized in the ongoing work of Rekindle in initiating follow-on projects which seek to build on and expand the scope of demonstration, research/learning and communication around the value of C&D recovery reuse and recycling. After the completion of the house dismantling process, the deconstructed materials were stored for the next phase of project activities. The 2nd creative reuse phase of the project involved 282 designers, artisans, builders and craftspeople and around 400 objects were produced from the material resources harvested during the deconstruction phase of the WHR project. Figure 3 shows the new products created by various designers.
300. 301.
42nd AUBEA Conference 2018: Educating Building Professionals for the Future in the Globalised World
Figure 3: New products from recovered materials (Courtesy: Guy Frederick)
The WHR project significantly relied on the voluntary work contributed by local community and artists. Indicative of this commitment, approximately 1105.5 hours were recorded as being spent to produce 52 objects i.e. an average 21 hours for each object thatlocal artists had spent to create new products from the recovered materials. As part of the 3rdexhibitioon – auction phases of the WHR project 122 of the created objects were sold for a total of NZD $43425. Whilst this demonstrates a strong financial outcome (along numerous other social, cultural environmental attributes) it can be recognized that when evaluated by a singular economic metric the project may not be 100% financially viable on a stand-alone basis under current market conditions. However, the project indicates that when given the opportunity of involvement local community’s artists and environmentalists demonstrated high social engagement with big picture ‘ethos’ of the project via a considerable investment of time, enabling labor cost to be minimized.
Deconstruction and reuse not only provides resource recovery, but also rehabilitates and values the memories and personal connection with the physical materials, space and time housed in our construct of home. The owners of the case study project have vast memories around the house. In a conversation, the owners of the property stated that “that was the place we brought our two boys back after they were born and we had fantastic birthday parties and different moments there”.
5 Conclusion and Further Research
The study presented a case study entitled the ‘Whole House Reuse’ (WHR) project, from Christchurch, New Zealand involving deconstruction and material reuse of resources embodied in a family house. . The project illustrated both the challenges and opportunities in deconstruction processes. Although the deconstruction process has a considerable potential for material recovery and environmental benefits, under current socio-economic and environmental policy settings, the associated labor costs versus resale value of the harvested and remade items significantly influence the viability of a deconstruction project.
The case study established that over twelve tonnes of recyclable materials were able to be harvested from the subject building. Under a business as usual scenario, in the absence of applying the WHR deconstruction practices it would be expected that most of the recovered resources would have ended-up in landfill. Given this data, now appears as a suitable junction in which to not only reappraise the WHR project outcomes within New Zealand’s relatively limited and sporadic C&D waste minimization programme experience, but to assert on the basis of these indicative data, alongside emerging international good practice and the associated research findings, the value of this entire work area as a driver for zero waste and a circular economy.
42nd AUBEA Conference 2018: Educating Building Professionals for the Future in the Globalised World
6 Acknowledgement
This article is primarily based on the data of the Whole House Reuse project supported by the Sustainable Initiatives Fund Trust, Creative Communities and Jamon Construction Ltd and the project was instigated and facilitated by Rekindle. The authors declare no conflict of interest with anybody regarding this article.
7 References
Arnott, J., & McIntyre, K. (Eds.). (2014). Whole House Reuse: Deconstruction. Christchurch: Rekindle.
CIB, 2005. Deconstruction and Materials Reuse –an International Overview, Final Report of Task Group 39 on Deconstruction. Available at http://www.irbnet.de/daten/iconda/CIB1287.pdf (Cited on 11.07.2017).
Cuéllar-Franca, R. M., & Azapagic, A. (2012). Environmental impacts of the UK residential sector: life cycle assessment of houses. Building and Environment, 54, 86-99.
Dahlstrøm, O., Sørnes, K., Eriksen, S. T., & Hertwich, E. G. (2012). Life cycle assessment of asingle-family residence built to either conventional-or passive house standard. Energy and buildings, 54, 470-479.
Dantata, N., Touran, A., & Wang, J. (2005). An analysis of cost and duration for deconstruction and demolition of residential buildings in Massachusetts. Resources, Conservation and Recycling, 44(1), 1-15.
Diyamandoglu, V., & Fortuna, L. M. (2015). Deconstruction of wood-framed houses: Material recovery and environmental impact. Resources, Conservation and Recycling, 100, 21-30.
Ellen MacArthur Foundation. (2013). Towards the circular economy 1: Economic and business rationale for an accelerated transition. Retrieved from Cowes, Isle of Wright: http://www.ellenmacarthurfoundation.org/business/reports
Ellen MacArthur Foundation-EMF, 2015, 'Circular economy overview', Ellen MacArthur Foundation, available at http://www.ellenmacarthurfoundation.org/circular-economy/overview/concept, accessed 29 November 2016.
Farrelly, T., & Tucker, C. (2014). Action research and residential waste minimisation inPalmerstonNorth, New Zealand. Resources, Conservation and Recycling, 91, 11-26.
Hammond, Geoff and Jones, Craig, 2011. Inventory of Carbon and Energy (ICE) Version 2.0. Sustainable Energy Research Team, University of Math, UK. Available at www.carbonsolutions.com/Resources/ICE%20V2.0%20-%20Jan%202011.xls
Hannon, J. (2015). Waste vs zero waste: The contest for engaging and shaping our ambient ‘waste-making’ culture. Paper presented at the Unmaking Waste 2015: Transforming production and consumption in time and place, Zero Waste SA Research Centre for Sustainable Design and Behaviour and the University of South Australia, Adelaide. http://unmakingwaste2015.org/
Hannon, J. (2018). (Un) Changing Behaviour: (New Zealand’s delay & dysfunction in utilising) Economic Instruments in the Management of Waste? Retrieved from New Zealand Product Stewardship Council: https://www.nzpsc.nz
Level, 2014. Material Use, The Authority on Sustainable Building, available at http://www.level.org.nz/material-use/minimising-waste/ (accessed on 29 November 2016).
Lipscombe, F., & Kneebone, P. (2017). C&D Waste Crafting a Powerful Ecolabel: a Call for Input. Paper presented at the WasteMINZ Hamilton, NZ. https://www.wasteminz.org.nz/pubs/wasteminz-2017-c-a-call-for-input/
Lipsey, M. W. (1977). Personal antecedents and consequences of ecologically responsible behavior: A review. American Psycholog. Ass., Journal Suppl. Abstract Service.
Mcardle,M. 2011. Are There Too Many Homes in America? The Atlantic, published on 21 June 2011, available at https://www.theatlantic.com/business/archive/2011/06/are-there-too-many-homes-in-america/240786/
MfE. (2010). The New Zealand waste strategy: Reducing harm, improving efficiency (NZWS:2010). Retrieved from http://www.mfe.govt.nz/publications/waste/waste-strategy/
302. 303.

42nd AUBEA Conference 2018: Educating Building Professionals for the Future in the Globalised World
MoE, 2010. The New Zealand Waste Strategy: Reducing harm, improving efficiency, Ministry of Environment, New Zealand Government, available at http://www.mfe.govt.nz/sites/default/files/wastestrategy.pdf (accessed on 29 November 2016).
MoE, 2015. Related waste legislation, Ministry of Environment, New Zealand Government, available at http://www.mfe.govt.nz/waste/waste-strategy-and-legislation/related-waste-legislation (accessed on 29 November 2016).
NAHB, 2000. A guide to deconstruction, National Association of Home Builders, Department of Housing and Urban Development, Washington, D.C. available at https://www.huduser.gov/portal//Publications/PDF/decon.pdf (Cited on 11.07.2016).
Oskamp, S., Harrington, M. J., Edwards, T. C., Sherwood, D. L., Okuda, S. M., & Swanson, D. C. (1991). Factors influencing household recycling behavior. Environment and behavior, 23(4), 494-519.
Seadon, J. K., & Griffin, J. (2016). Reducing Construction and Demolition waste via Deconstruction and Reuse. Paper presented at the WasteMINZ, Auckland. https://www.wasteminz.org.nz/pubs/11296/
Storey, J., Gjerde, M., Charleson, A., & Pedersen Zari, M. (2014). The State of deconstrcution in New Zealand 2003 - Synopsis. In J. Arnott & K. McIntyre (Eds.), Whole House Reuse: Deconstruction Christchurch: Rekindle.
Storey, John. B. and Pedersen, Maibritt, 2014. Overcoming the barriers to deconstruction and materials reuse in New Zealand, in “Barriers for Deconstruction and Reuse/Recycling of Construction Materials”, Shiro Nakajima (edited), CIB Publication 397.
US-EPA, 2018. Sustainable Management of Construction and Demolition Materials, available at https://www.epa.gov/smm/sustainable-management-construction-and-demolition-materials#America
WasteMINZ. (2018). Local Government Waste Management Manifesto: Developed by the Territorial Authority Forum, a sector group of WasteMINZ. Retrieved from Auckland: https://www.wasteminz.org.nz/wp-content/uploads/2018/01/Local-Government-Waste-Manifesto-final-22012018.pdf
42nd AUBEA Conference 2018: Educating Building Professionals for the Future in the Globalised World
A critical review of the life cycle assessment of roads – some preliminary findings
Rui Jiang1 and Peng Wu1
1&2School of Design and the Built Environment, Curtin University, Perth, 6084, WA, AUSTRALIA
E-mails: [email protected]; [email protected]
Abstract: Transportation sector, which is considered as one of the largest contributors to environmental issues, has been encouraged more environmental friendly and sustainable practices. In order to objectively and accurately quantify the sustainability of road construction and maintenance, a large number of life cycle assessment (LCA) studies have been conducted in recent years. However, it should be noted that there are significant inconsistencies in these studies, from the selection of functional unit, system boundaries and the environmental impacts that are investigated. It is therefore necessary to understand the development and implementation of the LCA approach in road projects, its challenges and future research agenda. This paper presents the preliminary results of a critical review of existing LCA studies on roads. The research shows that material production phase and road construction phase are often included in a LCA study, while use phase, maintenance and rehabilitation phase as well as end-of-life phase are still not well investigated, especially the use phase. To increase the accuracy of LCA results and inform decision making, dynamic life cycle modelling, vehicle-pavement interaction modelling, consideration of albedo effects and integration of life cycle cost (LCC) analysis are gaining more research interest. In addition, uncertainty related to the pavement condition and data has not been well captured and needs more consideration in future study.
Keywords:Life cycle assessment (LCA), roads, sustainable development, green infrastructure
1 Introduction
The concept of sustainable development is defined as the development which can meet the needs of the present without compromising the ability to meet the needs of the future (WCED, 1987). The rising recognition of the concept is related to addressing environmental concerns with economic and social considerations in an integrated approach (Hopwood et al., 2005). Due to the rising recognition, there have been a very large number of initiatives to assess the environmental impact of processes/products/developments to ensure that they meet the tight environmental regulations. For example, in the building and construction industry, various green building rating systemshave been developed to assess and certify buildings which have superior performance in the area of sustainability development (Wu et al., 2016).
Similar to the construction and building industry, the transportation sector is also considered as one of the largest contributors to environmental issues. According to the U.S. Environmental Protection Agency (2013), the transportation sector accounts for almost 27% of the total U.S. greenhouse gas (GHG) emissions. Due to the large amount of raw materials consumed in the construction and maintenance stages, the transportation sector also has significant impact on biodiversity, wildlife, urban stormwater and urban environment (Australian Bureau of Statistics, 2013). As such, transportation agencies are focusing on developing new strategies, including green procurement (Varnäs et al., 2009) and encouraging more environmental friendly and sustainable practices (Schlegel et al., 2016). Rating systems such as Envision, Greenroads, the Civil Engineering Environmental Quality Assessment and Award Scheme (CEEQUAL) and Infrastructure Sustainability (IS) are giving a large propotion of credits to environmental aspects.
304. 305.

42nd AUBEA Conference 2018: Educating Building Professionals for the Future in the Globalised World
In order to objectively and accurately quantify the environmental impact of products/processes, the life cycle assessment (LCA) approach has been developed and formalised in ISO 14040 (2006) and ISO 14044 (2006). Since its establishment, LCA has been widely adopted to assess the environmental impact of road construction and maintenance.
Despite the large number of LCA studies in the transportation sector, it should be noted that there are significant inconsistencies which have been identified in these studies, from the selection of functional unit, system boundaries and the environmental impacts that are investigated (Santero et al., 2011). In addition, Butt et al. (2015) also pointed out that very few tools developed in these studies have been adopted by road authorities because LCA studies of roads are comprehensive and the direct implementation at the project level is not always feasible. It is therefore critical to understand the development and implementation of the LCA approach in road projects to improve the credibility and utility of the approach and its relevant tools. This study aims to: 1) evaluate the current development and implementation of LCA in road projects; 2) investigate the barriersand challenges that may affect the development and implementation of LCA in road projects; and 3) propose future research agenda based on the evaluation and investigation.
2 The LCA Methodology
2.1 Life cycle assessmentAccording to Rebitzer et al. (2004), LCA is a methodology framework to estimate and evaluate the environmental impacts of products/processes over their life cycle. The life cycle normally includes manufacturing, transportation, use and end-of-life phases. There are four steps in LCA studies (ISO 14040, 2006), including goal and scope definition, inventory analysis, life cycle impact assessment, and interpretation.
Figure 1. ISO standards related to the development and use of LCAGiven that LCA can help evaluate the environmental impact objectively if appropriately used, many international standards have been published to ensure standardized and consistent development and application of LCA. As can be seen from Figure 1, these international standards can be categorized into three levels. Level 1, including ISO 14040 (2006) and ISO 14044 (2006), outlines the principles, frameworks, requirements and guidelines of LCA. Level 2 standards, including ISO 14048 (2002), ISO 14047 (2012) and ISO 14049 (2012) provide explanations to the Level 1 standards. The explanations include the data documentation format to ensure transparent and unambiguous documentation (ISO 14048, 2002), illustrative examples on the use of ISO 14044 (2006) in identifying impact assessment situations (ISO 14047, 2012) and goal and scope definition and inventory analysis (ISO 14049, 2012). The principles and explanations are
42nd AUBEA Conference 2018: Educating Building Professionals for the Future in the Globalised World
then implemented in a few scenarios to evaluate quantify the assessment of specific environmental impacts, e.g. eco-efficiency (ISO 14045, 2012), water footprint (ISO 14046, 2014) and carbon footprint (ISO 14067, 2013).
2.2 Three LCA approaches of roadThe most commonly adopted LCA approach is the process-LCA, which uses the process flow diagram, based on which the inputs and outputs of each process are calculated and aggregated into scores representing the environmental impact of the product/process system. This method has been adopted quite extensively in evaluating the environmental impact of road projects. For example, Huang et al. (2009) used the process-LCA to evaluate the environmental impact of pavement construction and maintenance. Two separate process maps, including one for asphalt pavement construction and one for the treatment of pavement surface, were used as the basis for evaluating the environmental impact. Similarly, Park et al. (2003) estimated the environmental impact of the life cycle of highways, including manufacturing of construction materials, construction, maintenance and repair, as well as demolition and recycling, through the process-LCA approach. The most obvious advantage of process-LCA is that it can help evaluate the environmental impact of a pre-defined system boundary quite easily. However, according to Suh and Huppes (2005), process analysis of the whole economy is limited because it is not possible to collect the inputs and outputs of every economic activity. In addition, the simplification of the product system in process-LCA may also lead to problems such as not capturing all significant sources of inputs and outputs.
As such, a new approach of Economic Input-Output life cycle assessment (EIO-LCA) was proposed based on Leontief’s input-output model, which states that industries are co-related by producing and consuming intermediate industry outputs. As such, the activities of the whole economy can also be represented by a process map, only in which each box represents an economic sector, rather than a specific process (Hendrickson et al., 1998). According to Santero et al. (2011), only two studies, Horvath and Hendrickson (1998) and Muga et al. (2009), have investigated the environmental impact of pavements using EIO-LCA. In recent years, very few studies have adopted the EIO-LCA approach alone in estimating the environmental impact of roads. This is due to the significant errors that this method can cause by grouping different products into a single sector. For example, the investigation of the environmental impact of asphalt using EIO-LCA will based on the information from petroleum refineries, which may include other petroleum-based products such as diesel and gasoline (Santero et al., 2011). In addition, as EIO-LCA focuses on reported industry values, it will either overestimate or underestimate the environmental impacts of some isolated product systems. Therefore, many studies in recent years adopted a hybrid method to evaluate the environmental impacts.
The hybrid LCA approach combines the process-LCA and EIO-LCA. It is very commonly used in the transportation sector which is a very complex system consisting of vehicles, infrastructure and fuels (Facanha and Horvath, 2006). EIO-LCA can be used to quantify the production of commodities. As such, it is usually adopted in the production and manufacturing stages of the product systems. For example, Tatari et al. (2012) adopted EIO-LCA in the processes related to life cycle phases of materials extraction and processing of pavement materials. The emissions during the transportation and mixing plant operations are calculated based on process-LCA. Similar approaches were adopted in Facanha and Horvath (2006) and Aurangzeb et al. (2014) where EIO-LCA was adopted in the manufacturing and transportation stages and process-LCA was adopted during construction and maintenance activities. Table 1 summarises the hybrid life cycle approach and its adoption in various life cycle stages in recent studies.
Some interesting findings can be obtained from Table 1. Hybrid LCA has significant benefit of including the environmental impacts from associate service sectors. Neglecting the environmental impacts of these service sectors may lead to an underestimation of the environmental impacts of roads. As such, more studies in recent years adopt the hybrid approach instead of the process-LCA approach, which is identified as the most commonly adopted approach in Santero et al.(2011).
306. 307.

42nd AUBEA Conference 2018: Educating Building Professionals for the Future in the Globalised World
In the stage of materials extraction and production, the hybrid approach is usually adopted. For example, Hassan (2009) quantified the environmental impacts of titanium dioxide, which is a coating material for concrete pavement, by adopting a hybrid approach. Process-LCA is adopted for the manufacturing of titanium dioxide, cement and surface mix production, as well as the external and internal transportation processes. On the other hand, EIO-LCA was adopted to calculate the production of fuels and equipment. A similar strategy was adopted in Kucukvar and Tatari (2012) and Rodriguez-Alloza et al. (2015).
Table 1. Scope of work in various LCA studies of road
Studies
Life cycle stagesMaterials
extraction and production
Transportation Construction UseMaintenance
and rehabilitation
End-of-life treatments
Park et al. (2003) EIO-LCA Process-LCA Process-
LCA × EIO-LCA Process-LCA
Treloar et al. (2004)
Process-LCA and
EIO-LCA×
Process-LCA and EIO-LCA
EIO-LCA EIO-LCA ×
Bilec et al. (2006) EIO-LCA Process-LCA
Process-LCA and EIO-LCA
× × ×
Hassan (2009) Process-LCA and EIO-LCA Process-LCA × × × ×
Cass and Mukherjee (2011)
Process-LCA and EIO-LCA Process-LCA Process-
LCA × × ×
Tatari et al. (2012) EIO-LCA Process-LCA Process-
LCA × × ×
Kucukvar and Tatari (2012)
Process-LCA and EIO-LCA Process-LCA EIO-LCA × × ×
Aurangzeb et al. (2014) EIO-LCA Process-LCA Process-
LCA × Process-LCA ×
Rodriguez-Alloza et al. (2015)
Process-CA and EIO-LCA × × × × ×
3 Research Method
In order to systematically review the development and use of LCA in road projects, a comprehensive literature review is conducted. Content analysis, which is commonly adopted as a structured approach for analysing a large body of studies, is adopted (Krippendorff, 2012). This method is adopted because it is recommended as the best fit for analysing textual data (Erlingssonand Brysiewicz, 2017). According to Krippendorff (2012), the content analysis typically involves the establishment of the analysis boundary based on the research objective, followed by identifying sample articles, coding and analysis, as well as summarising the findings. In this study, the objective is to investigate the development and use of LCA in road projects. As such, the use of LCA in other types of infrastructure and construction projects, is excluded.
A three-stage process is adopted to retrieve all articles that are relevant with the research objective. The three-stage process includes a scope definition stage, a searching stage and a manual checking of relevance stage. In the scope definition stage, it is decided that only journal articles will be targeted, as these articles are perceived to have a relatively high research impact. Conference papers are therefore excluded from this review. In addition, as this study aims to investigate the recent development and implementation of LCA, reviews and editorials are also excluded. In the searching stage, the paper retrieval strategy is to use keywords of (“life cycle assessment” or “LCA”) AND (“road”) to identify articles that contain such keywords in the article’s title, abstract or keywords section. The databases adopted in this study include Scopus and Web of Science,
42nd AUBEA Conference 2018: Educating Building Professionals for the Future in the Globalised World
which are considered as the top two leading databases in terms of quality and coverage. This paper only presents some preliminary findings as part of the literature review has been conducted.
4 Findings and Discussion
4.1 The life cycle of roadThe aforementioned review shows that the life cycle of road typically includes the extraction and production of materials, transportation of materials, construction, use, maintenance and rehabilitation and end-of-life treatments. The extraction and production of materials usually includes the processes related to the acquisition and process of raw materials and materials production (i.e. mixing plant operations). The construction stage includes all preservation and construction activities, such as the use of paving equipment (Zhang et al., 2010). It should be noted that transportation processes of transporting materials from manufacturing plants to construction sites may be integrated into the construction stage (e.g. Zhang et al., 2010) or treated as separate stage (e.g. Hassan, 2009), depending on the specific aims of the studies. The use stage often focuses on the energy consumption and emissions related to vehicular activities (Yu and Lu, 2012). Maintenance and rehabilitation deals with three levels of maintenance treatment, such as routine maintenance, preservation and rehabilitation. Among such, routine maintenance is reactive to specific problems, preservation is proactive and well-scheduled, and rehabilitation usually includes structural enhancements of an existing road (Torres-Machi et al., 2018). In addition, end-of-life treatments includes the demolition, debris transport, recycling and final disposal at the end of a road’s service life (Park et al., 2003). Table 2 shows the scope of work in ten highly cited recent LCA studies of road.
Table 2. Scope of work in various LCA studies of road
Studies
Life cycle stages
Materials Transportation Construction UseMaintenance
and rehabilitation
End-of-life
treatmentsHuang et al. (2009) ● ● ● × ● ×Park et al. (2003) ● × ● × ● ●Kucukvar and Tatari (2012) ● ● ● × × ×
Butt et al. (2014) ● ● ● × ● ●Chowdhury et al. (2010) ● ● × × × ×
Weiland and Muench (2010) ● ● ● × ● ○
Yu and Lu (2012) ● ● ● ● ● ●Saeedzadeh et al. (2018) ● ● ● × ● ●
Moretti et al. (2018) ● ● ● × × ×Gilbert et al. (2017) ● × ● ○ × ×Notes: ● – included; ○ – limited consideration; × – not included
4.2 LCA for pavement materialsA great majority of the studies in the LCA of roads target at the use of life cycle assessment for selecting sustainable pavement materials in either road construction or maintenance in order to achieve optimal environmental performance. For example, Birgisdóttir et al. (2007) evaluated the use of bottom ash as a substitution of natural gravel in road construction and found that compared to landfill, using bottom ash as a substitution can help improve the environmental performance on most environmental impact categories, except eco-toxicity in water and human toxicity via soil. While the eco-toxicity in water is mainly caused by the leaching of heavy metals, the human toxicity via soil is mainly caused by the leaching of arsenic. It is therefore concluded that using bottom ash as a replacement material in road construction may not always bring environmental benefit. Similarly, Samieadel et al. (2018) compared the environmental burdens of the production
308. 309.

42nd AUBEA Conference 2018: Educating Building Professionals for the Future in the Globalised World
of bio-modified binder with the conventional asphalt binder. The results show that great improvements in energy consumption and global warming potential have been achieved by using bio-binder as an additive.
Table 3. LCA applied for selecting pavement materials
Studies Materials investigated System boundary Results
Birgisdóttir et al. (2007) Bottom ash
Design phaseConstruction phaseUse phaseEnd-of-life phase
Lower global warmingLower acidificationHigher toxicity
Samieadel et al. (2018)
Bio-modified binder Material production phase
Lower global warmingLower energy
Conventional asphalt binder
Higher global warmingHigher energy
Chowdhury et al. (2010)
Recycled concrete pavement Material production
andTransportation
Higher global warmingHigher acidificationLower toxicity
Fly ash Lower global warmingLower acidificationMixed results on toxicityBottom ash
Chiu et al.(2008)
Recycled hot mix asphaltConstruction phaseUse phaseMaintenance phase
-23% of environmental impact (EI)Asphalt rubber -23% of EIGlassphalt +19% of EITraditional hot-mixed asphalt Base line
Saeedzadeh et al. (2018)
Virgin asphalt Material production phaseConstruction phaseMaintenance phaseEnd-of-life phase
Relatively low environmental burdens
High reclaimed asphalt pavement (RAP)
Highest environmental burdens(Energy, CO2, CO, PM10)
RAP & recycled asphalt shingles (RAS)
Second highest environmental burdens
Balanced mix design Least environmental burdens
Farina et al.(2017)
Bituminous mixtures containing crumb rubber
Material production phaseConstruction phaseMaintenance phase
Significant benefits in energy and global warming
Bituminous mixtures containing RAP
Slightly improved in energy and global warming
In road maintenance, as recycled materials are heavily preferred over the past few years due to the rising recognition of sustainability, it appears that many studies have been conducted on analysing the environmental performance of these recycled materials through life cycle assessment. For example, Chowdhury et al. (2010) investigated three types of recycled materials, including coal fly ash, coal bottom ash and recycled concrete pavement through LCA and found that fly ash and bottom ash can help mitigate the environmental impact of global warming and acidification when compared to natural aggregate based on a 2:1 transportation distance ratio (natural aggregate transportation: industrial by-products transportation). However, recycled concrete pavement has much higher global warming potential and acidification potential when compared to natural aggregate. In addition, four types of commonly adopted materials in road pavement work, including traditional hot mix asphalt, recycled hot mix asphalt, asphalt rubber and Glassphalt are investigated in Chiu et al. (2008). It is found that using recycled hot mix asphalt can help reduce the environmental impact by approximately 23%. On the other hand, using Glassphalt will not help mitigate the environmental impact of traditional hot mix asphalt and using asphalt rubber will lead to an increase of environmental burden by 16%.
42nd AUBEA Conference 2018: Educating Building Professionals for the Future in the Globalised World
5 Challenges and recent developments
5.1 System boundary selectionMost of the existing studies have investigated the environmental impacts from material production phase and road construction phase. However, use phase, maintenance and rehabilitation phase as well as end-of-life phase are still not well captured, especially the use phase. Moreover, Galatioto et al. (2015) suggested that the traffic emissions from the delay caused by maintenance activities should also be integrated into the life cycle assessment of roads.
There is also a rising consideration of expanding the use of LCA to road planning phase in order to make informed decision in an early stage. This has been pioneered by integrating LCA with other approaches such as case-based reasoning model (Park et al., 2018) and geographic information system (GIS) – based approach (Karlsson et al., 2017), which are able to process and provide estimated data when case-specific information is insufficient. To address the problem, a larger number of related research is still in need.
5.2 Development in modelling approachesIn order to increase the accuracy of LCA results, great improvements in modelling approaches have been achieved in recent studies. For example, Ziyadi et al. (2018) proposed a roughness-speed impact model to better capture the environmental impacts resulting from vehicle-pavement interaction. Apart from pavement surface roughness effects, Zhang et al. (2010) also took into account the traffic congestion caused by construction activities and developed a dynamic LCA model. Gilbert et al. (2017) considered the albedo effects of cool pavement and observed a decrease of primary energy demand and global warming potential in use phase. In addition, the combination of LCA and LCC have been cast much light upon, especially when dealing with maintenance decisions (Torres-Machi et al., 2017; Torres-Machi et al., 2018; Santos et al., 2017).
5.3 Uncertainty considerationUncertainty mainly comes from two sources. One is the uncertainty related to the decay of pavement condition. For example, the road roughness changes during the use stage and therefore results in unfixed rolling resistance which impacts the pavement-vehicle interaction. The maintenance strategies for keeping a road in good service, such as maintenance type and frequency, also require justification during the service life due to the degradation of pavement condition. Therefore, there has been much criticism of the widely used functional unit including lane-kilometre and square-metre of pavement due to the lack of uncertainty consideration (Inyim et al., 2016). The other source of uncertainty is data uncertainty. This uncertainty not only lies in the limitation of available datasets and the uncertainty of these datasets themselves, it also comes from the process data such as the complicated traffic information. It is therefore recommended that such uncertainty should be well considered in future studies.
6 Conclusion and Further Research
This paper presents some preliminary findings of a content analysis based review on LCA studies of road. LCA of road usually includes six phases, namely material production, material transportation, construction, use, maintenance and rehabilitation and end-of-life treatments.Sustainable pavement materials have been well researched during the life cycle in order to optimise the performance of roads, especially the recycled materials. In recent studies, there is also a trend to conduct LCA research in an early stage such as planning phase; and researchers are contributing to more accurate and comprehensive modelling approaches by accommodating new impacts in LCA such as albedo effects, noise, time effects and traffic delay etc. However, challenges still exist in current studies. For example, compared with other phases, use, maintenance and rehabilitation as well as end-of-life phases are less frequently considered.Uncertainty in terms of the pavement condition and data has not been well captured either. Therefore, it is recommended that future research considers the system boundary carefully and
310. 311.

42nd AUBEA Conference 2018: Educating Building Professionals for the Future in the Globalised World
make more effort to deal with the uncertainty mentioned above. To further develop the body of knowledge, a more holistic review will also be conducted by the authors in the next step.
7 Acknowledgement
This research was funded by the Australian Research Council Discovery Early Career Researcher Award (Project No. DE170101502) by the Australian Government.
8 References
Aurangzeb, Q., Al-Qadi, IL., Ozer, H. and Yang, R. (2014), ‘Hybrid life cycle assessment for asphalt mixtures with high RAP content’, Resources, Conservation and Recycling, 83, pp 77-86.
Australian Bureau of Statistics. (2013), ‘Environmental impacts of Australia’s transport system’, http://www.abs.gov.au/AUSSTATS/[email protected]/Previousproducts/1301.0Feature%20Article312003?opendocument&tabname=Summary&prodno=1301.0&issue=2003&num=&view=, viewed: 05/05/2014.
Bilec, M., Ries, R., Matthews, HS. and Sharrard, AL. (2006), ‘Example of a hybrid life-cycle assessment of construction processes’, Journal of Infrastructure Systems, 12(4), pp 207-215.
Birgisdottir, H., Bhander, G., Hauschild, MZ. and Christensen, TH. (2007), ‘Life cycle assessment of disposal of residues from municipal solid waste incineration: recycling of bottom ash in road construction or landfilling in Denmark evaluated in the ROAD-RES model’, Waste Management, 27(8), pp S75-84.
Butt, AA., Mirzadeh, I., Toller, S. and Birgisson, B. (2014), ‘Life cycle assessment framework for asphalt pavements: methods to calculate and allocate energy of binder and additives’, International Journal of Pavement Engineering, 15(4), pp 290-302.
Butt, AA., Toller, S. and Birgisson, B. (2015), ‘Life cycle assessment for the green procurement of roads: a way forward’, Journal of Cleaner Production, 90, pp 163-70.
Cass, D. and Mukherjee, A. (2011), ‘Calculation of greenhouse gas emissions for highway construction operations by using a hybrid life-cycle assessment approach: case study for pavement operations’, Journal of Construction Engineering and Management, 137(11), pp 1015-1025.
Chiu, CT., Hsu, TH. and Yang, WF. (2008), ‘Life cycle assessment on using recycled materials for rehabilitating asphalt pavements’, Resources, Conservation and Recycling, 52(3), pp 545-56.
Chowdhury, R., Apul, D. and Fry, T. (2010), ‘A life cycle based environmental impacts assessment of construction materials used in road construction’, Resources, Conservation and Recycling, 54(4), pp 250-5.
Erlingsson, C. and Brysiewicz, P. (2017), ‘A hands-on guide to doing content analysis’, African Journal of Emergency Medicine, 7(3), pp.93-99.
Facanha, C. and Horvath, A. (2006), ‘Environmental Assessment of Freight Transportation in the US (11 pp)’, The International Journal of Life Cycle Assessment, 11(4), pp 229-39.
Farina, A., Zanetti, M.C., Santagata, E. and Blengini, G.A. (2017), ‘Life cycle assessment applied to bituminous mixtures containing recycled materials: Crumb rubber and reclaimed asphalt pavement’, Resources, Conservation and Recycling, 117, pp.204-212.
Galatioto, F., Huang, Y., Parry, T., Bird, R. and Bell, M. (2015), ‘Traffic modelling in system boundary expansion of road pavement life cycle assessment’, Transportation Research Part D: Transport and Environment, 36, pp 65-75.
Gilbert, H.E., Rosado, P.J., Ban-Weiss, G., Harvey, J.T., Li, H., Mandel, B.H., Millstein, D., Mohegh, A., Saboori, A. and Levinson, R.M., 2017. Energy and environmental consequences of a cool pavement campaign. Energy and Buildings, 157, pp.53-77.
Hassan, MM. (2009), ‘Quantification of the environmental benefits of ultrafine/nanotitanium dioxide photocatalyst coatings for concrete pavement using hybrid life-cycle assessment’, Journal of Infrastructure Systems, 16(2), pp 160-6.
42nd AUBEA Conference 2018: Educating Building Professionals for the Future in the Globalised World
Hopwood, B., Mellor, M. and O'Brien, G. (2005), ‘Sustainable development: mapping different approaches’, Sustainable Development, 13(1), pp 38-52.
Horvath, A. and Hendrickson, C. (1998), ‘Comparison of environmental implications of asphalt and steel-reinforced concrete pavements’, Transportation Research Record: Journal of the Transportation Research Board, 1626, pp 105-13.
Huang, Y., Bird, R. and Heidrich, O. (2009), ‘Development of a life cycle assessment tool for construction and maintenance of asphalt pavements’, Journal of Cleaner Production, 17(2), pp 283-96.
Inyim, P., Pereyra, J., Bienvenu, M. and Mostafavi, A. (2016), ‘Environmental assessment of pavement infrastructure: A systematic review’, Journal of environmental management, 176,pp 128-138.
ISO 14040. (2006), Environmental management – life cycle assessment – principles and framework, International Organization for Standardization, Geneva.
ISO 14044. (2006), Environmental management – life cycle assessment – requirements and guidelines, International Organization for Standardization, Geneva.
ISO 14045. (2012), Environmental management – Eco-efficiency assessment of product systems – principles, requirements and guidelines, International Organization for Standardization, Geneva.
ISO 14046. (2014), Environmental management -- Water footprint -- Principles, requirements and guidelines, International Organization for Standardization, Geneva.
ISO 14047. (2012), Environmental management -- Life cycle assessment -- Illustrative examples on how to apply ISO 14044 to impact assessment situations, International Organization for Standardization, Geneva.
ISO 14048. (2002), Environmental management -- Life cycle assessment -- Data documentation format. International Organization for Standardization, Geneva.
ISO 14049. (2012), Environmental management -- Life cycle assessment -- Illustrative examples on how to apply ISO 14044 to goal and scope definition and inventory analysis.International Organization for Standardization, Geneva.
ISO 14067. (2013), Greenhouse gases -- Carbon footprint of products -- Requirements and guidelines for quantification and communication. International Organization for Standardization, Geneva.
Karlsson, C.S.J., Miliutenko, S., Björklund, A., Mörtberg, U., Olofsson, B. and Toller, S. (2017), ‘Life cycle assessment in road infrastructure planning using spatial geological data’, The International Journal of Life Cycle Assessment, 22(8), pp 1302-1317.
Krippendorff, K. (2012), Content Analysis: An introduction to its methodology (3rd ed.),Thousand Oaks, CA: Sage.
Kucukvar, M. and Tatari, O. (2012), ‘Ecologically based hybrid life cycle analysis of continuously reinforced concrete and hot-mix asphalt pavements’, Transportation Research Part D: Transport and Environment, 17(1), pp 86-90.
Moretti, L., Mandrone, V., D'Andrea, A. and Caro, S. (2018), ‘Evaluation of the environmental and human health impact of road construction activities’, Journal of Cleaner Production,172, pp.1004-1013.
Muga, HE., Mukherjee, A., Mihelcic, JR. and Kueber, MJ. (2009), ‘An integrated assessment of continuously reinforced and jointed plane concrete pavements’, Journal of Engineering, Design and Technology, 7(1), pp 81-98.
Park, K., Hwang, Y., Seo, S. and Seo, H. (2003), ‘Quantitative assessment of environmental impacts on life cycle of highways’, Journal of Construction Engineering and Management,129(1), pp 25-31.
Park, J.Y., Lee, D.E. and Kim, B.S. (2018), ‘Development of environmental load-estimating model for road planning phase: Focus on road earthwork’, KSCE Journal of Civil Engineering, 22(2), pp 459-466.
Rebitzer, G., Ekvall, T., Frischknecht, R., Hunkeler, D., Norris, G., Rydberg, T., Schmidt, WP., Suh, S., Weidema, BP. and Pennington, DW. (2004), ‘Life cycle assessment: Part 1: Framework, goal and scope definition, inventory analysis, and applications’, Environment International, 30(5), pp 701-20.
312. 313.

42nd AUBEA Conference 2018: Educating Building Professionals for the Future in the Globalised World
Rodríguez-Alloza, A. M., Malik, A., Lenzen, M., and Gallego, J. (2015), ‘Hybrid input–output life cycle assessment of warm mix asphalt mixtures’, Journal of Cleaner Production, 90, pp 171-182.
Saeedzadeh, R., Romanoschi, S.A., Akbariyeh, N., Khajeh-Hosseini, M. and Abdullah, A.Q. (2018). ‘Sustainability Assessment of Recycled Asphalt Mixtures Based on Performance in Full-Scale Testing’, Journal of Transportation Engineering, 144(2), pp 04018024.
Samieadel, A., Schimmel, K. and Fini, E.H. (2018). ‘Comparative life cycle assessment (LCA) of bio-modified binder and conventional asphalt binder’, Clean Technologies and Environmental Policy, 20(1), pp.191-200.
Santero, NJ., Masanet, E. and Horvath, A. (2011), ‘Life-cycle assessment of pavements Part II: Filling the research gaps’, Resources, Conservation and Recycling, 55(9), pp 810-8.
Santos, J., Flintsch, G. and Ferreira, A. (2017), ‘Environmental and economic assessment of pavement construction and management practices for enhancing pavement sustainability’, Resources, Conservation and Recycling, 116, pp 15-31.
Schlegel, T., Puiatti, D., Ritter, HJ., Lesueur, D., Denayer, C. and Shtiza, A. (2016), ‘The limits of partial life cycle assessment studies in road construction practices: A case study on the use of hydrated lime in Hot Mix Asphalt’, Transportation Research Part D: Transport and Environment, 48, pp 141-60.
Suh, S. and Huppes, G. (2005), ‘Methods for life cycle inventory of a product’, Journal of Cleaner Production, 13(7), pp 687-97.
Tatari, O., Nazzal, M. and Kucukvar, M. (2012), ‘Comparative sustainability assessment of warm-mix asphalts: a thermodynamic based hybrid life cycle analysis’, Resources, Conservation and Recycling, 58, pp 18-24.
Torres-Machi, C., Pellicer, E., Yepes, V. and Chamorro, A. (2017), ‘Towards a sustainable optimization of pavement maintenance programs under budgetary restrictions’, Journal of cleaner production, 148, pp 90-102.
Torres-Machi, C., Osorio-Lird, A., Chamorro, A., Videla, C., Tighe, S. L., and Mourgues, C. (2018), ‘Impact of environmental assessment and budgetary restrictions in pavement maintenance decisions: Application to an urban network’, Transportation Research Part D: Transport and Environment, 59, pp 192–204.
Treloar, G. J., Love, P. E., and Crawford, R. H. (2004), ‘Hybrid life-cycle inventory for road construction and use’, Journal of construction engineering and management, 130(1), pp 43-49.
U.S. Environmental Protection Agency. (2013), ‘Transportation and climate’, http://www.epa.gov/otaq/climate/basicinfo.htm, viewed: 04/05/2014.
Varnäs, A., Balfors, B. and Faith-Ell, C. (2009), ‘Environmental consideration in procurement of construction contracts: current practice, problems and opportunities in green procurement in the Swedish construction industry’, Journal of Cleaner Production, 17(13), pp 1214-22.
Weiland, C., and Muench, S. (2010), ‘Life-cycle assessment of reconstruction options for interstate highway pavement in Seattle, Washington’, Transportation Research Record: Journal of the Transportation Research Board, 2170, pp 18-27.
World Commission on Environment and Development (WCED). (1987), Our Common Future,Oxford University Press, Oxford.
Wu, P., Mao, C., Wang, J., Song, Y. and Wang, X. (2016), ‘A decade review of the credits obtained by LEED v2. 2 certified green building projects’, Building and Environment, 102,pp 167-78.
Yu, B., and Lu, Q. (2012), ‘Life cycle assessment of pavement: Methodology and case study’. Transportation Research Part D: Transport and Environment, 17(5), pp 380-388.
Yuan, X., Tang, Y., Li, Y., Wang, Q., Zuo, J., and Song, Z. (2018), ‘Environmental and economic impacts assessment of concrete pavement brick and permeable brick production process-A case study in China’, Journal of Cleaner Production, 171, pp 198-208.
Zhang, H., Lepech, M. D., Keoleian, G. A., Qian, S., and Li, V. C. (2010), ‘Dynamic life-cycle modeling of pavement overlay systems: Capturing the impacts of users, construction, and roadway deterioration’, Journal of Infrastructure Systems, 16(4), pp 299-309.
Ziyadi, M., Ozer, H., Kang, S. and Al-Qadi, I.L. (2018), ‘Vehicle energy consumption and an environmental impact calculation model for the transportation infrastructure systems’, Journal of Cleaner Production, 174, pp 424-436.
42nd AUBEA Conference 2018: Educating Building Professionals for the Future in the Globalised World
The impact of payment systems on construction project and organisation performance
Emmanuel Dele Omopariola1 and Abimbola Olukemi Windapo2
1&2Faculty of Engineering and the Built Environment, University of Cape Town, Cape Town, 7700, SOUTH AFRICA
E-mails: [email protected]; [email protected]
AbstractThe poor performance of construction projects and organisations is a global phenomenon in the construction industry. This paper examines the payment systems used in the construction sector and whether they affect project and organisationperformance. This stems from the view held by scholars that the type and quality of payment systems used on construction projects, affect their successful completion.There has been limited research that investigates the quality and appropriateness of payment systems used in the construction industry. A comprehensive review of extant literature into payment systems and construction company performance was used in the study to obtain the information required. It emerged that the delivery of successful quality projects which meet client requirements, is often impacted by the payment systems used. Based on these findings, the study concludes that construction projects and organisations will continue to experience poor performance if payment systems are not carefully selected to fit the project and organisation context. Therefore, the study recommends that further studies using empirical data should be undertaken to determinewhich of the payment systems in the construction industry - interim payment, advance payment, stage payment, milestone payment and payment on completion, best fit the profile of each construction project and organisation, and at what stage of a project each of the payment systems should be used.
Keywords:Advance payment system, interim payment system, milestone payment system, payment on completion, project and organisation performance, stage payment system.
1 IntroductionCompared to other industries, the construction industry contributes about 10% of the Gross National Product (GNP) (Navon, 2005). This makes it a vital industry in any economy of any nation. This contribution can be measured in terms of improvement in the area of physical infrastructure, like buildings, roads and bridges, and also in the area of social development, such as employment creation and prospects for entrepreneurs (Ofori, 1991; Giang and Pheng, 2011; Windapo and Cattell, 2013; Oke, et al., 2016).
However, Dlungwana, et al., (2002) noted that the construction industry GDP has significantly fallen due to the poor performance of construction companies. Clients expect that the construction project is finished at a specific estimated cost that is within budget, on time, to technical specification and meeting client satisfaction (Windapo et al., 2017; CIOB, 2004). Nevertheless, this has not been the case, due to numerouscriteria for success, for example the performance of the stakeholders. The poor performance of construction projects has been acknowledged internationally (Kazimu, 2012; and Memon et al., 2012). Oke et al., (2016) established that construction activities are faced with numerous simple to complex difficulties, ranging from late
314. 315.
42nd AUBEA Conference 2018: Educating Building Professionals for the Future in the Globalised World
payments to litigation, which are also precipitated to a significant degree by an inept payment system (Aje et al., 2017). Furthermore, an unsuitable payment system has been one of the global causes of the failure of projects (Aje et al., 2017; and Danuri et al.,2006). It is also a critical obstacle to the performance of the construction industry (Danuri et al., 2006). Similarly, Sherif and Kaka (2003) showed that to attain an exceptional performance of construction project depends on the fit between the chosen payment system and the project qualities and client requirements.
Payment has always been the main subject of disputes, which leads to financial adversity that could result in arbitration or litigation (Danuri et al., 2006). Davis Langdon and Seah Consultancy (2000) note that construction payment problems have a domino effect on the payment chain of a construction project. When a delay occurs in payment of a contractor from the client, such a delay affects the payment due to the sub-contractor or supplier, who is bound in a contract with the construction company (Odeyinka and Kaka, 2005; Egan, 1998). Odeyinka and Kaka (2005) posited that, due to the way the supply chain in the construction industry was structured, once there was afailure in the flow of cash from the client to another party like the contractor, it wouldjeopardize the efficient delivery of project, resulting in insolvency. This in turn would affect the organisational performance of the construction companies.
Previous researchers (see Sherif and Kaka, 2003; Odeyinka and Kaka, 2005) have shown that contractors are dissatisfied with the available payment systems because of the difficulties encountered, which affect their cash flow projection during the execution of the project. Njie et al., (2005) established that several main contractors sometimes encounter financial problems when payments (their basis of cash flow) for work done do not come in as projected, and sometimes even stop altogether, which impacts on the efficiency of the contractor (Odeyinka and Kaka, 2005; Lowe 1997). Therefore, the issue of payment for work done on construction tasks cannot be underestimated in the success of construction projects (Aje, et al., 2017).To inspire performance in construction projects calls for an efficient payment system, sufficient cash flow and asound financial management system (Arditi et al., 2000; Lowe, 1997). More so, there is evidence from the literature that shows that construction projects are only successful if the diverse stakeholders engaged in the project have managed their finances efficiently (Kaka and Lewis, 2003). Sherrif and Kaka (2003) stressed that contractors have developed innovative ways to augment cash flow. The traditional ways include adaptive strategies like front-end loading; and radical ways such as over-measurement of materials and work done, and delay in payment to subcontractors and suppliers (Njie et al., 2005; Kaka, 2001).
This investigative study examines the payment systems in use and whether these enhance the performance of projects and construction companies’ organisation. Thus, the study will argue the link between payment systems and construction company performance. Nonetheless, rarely have researchers matched payment systems to project and organisation performance in order to determine the most appropriate system. This exploratory study will fill this gap in knowledge.
2 Overview of project payment systems, project and organisationperformance2.1 Project payment systems used in the construction industryWong et al., (2006) and Sheriff and Kaka (2003) identified different types of payment methods currently in use for the payment of construction services, namely: interim
42nd AUBEA Conference 2018: Educating Building Professionals for the Future in the Globalised World
valuation; advance payment; stage payment; milestone payment; and payment on completion.2.1.1 Interim/ progress payment system
The most frequently used type of payment system as work on-site is in progress, is known as interim payment (Sherrif and Kaka, 2004; Judi and Abdul-Rashid, 2010). Thus, interim payment means a payment made for the time being and gradually based on a gradual review of the estimated value of the work carried out by the contractor,which is periodically done on site, and is also known as a running account (Ansah, 2011). The specified date of interim payment could vary from fortnightly to monthly;the actual duration is normally the period as agreed in the signed contract. The system requires that the client structures the timing of the work; it is also part of the administration required by all the parties (Anderson and Damnjanovic, 2008). 2.1.2 Advance payment system
Wong et al., (2006) describes advance payment as the sum of money usually paid to the contractor by the employer before the commencement of the work on site. The inadequacy of the construction industry to commit to, and accept the final cost and deadline of a project, as required by the client, is becoming apparent, particularly now that the cost and time of borrowing money is high (Aje et al., 2017). The main reason for employing this system of payment is to help the contractor to start up and finance the contract without resorting to unnecessary external loans, and to maintain a healthy cash flow (Abeysekera, 2002). An advance payment in effect offers the contractor an interest-free loan during the beginning phase of the contract, where the utmost strain is laid upon a contractor’s cash flow (Oke et al., 2013).This practice is frequently used in public work contracts (Ansah, 2011). 2.1.3 Stage payment system
This system is used at particular phases of work and it is employed in small lump sum contracts without specification of quantities, where a percentage of the whole amount is to be paid over a number of stages (Ansah, 2011).These magnitudes are fixed and do not rely upon any re-measurement of work. They are also applied in Turnkey, Design and Build as well as contracts involving repetitive works (Ansah, 2011; Singh and Lakanathan, 1992). The stage payment system decreases running time, cost of design and contract administration, and estimate measurement of quantities to prepare interim payments (Cheetham et al., 1995; Potts, 1988).
2.1.4 Milestone payment systemThis system is used when specific items of work have been effectively completed(Cheng et al., 2009). Thus, milestone payment is described as the type of paymentwhich is made when distinctive goals are met. According to Cheng et al., (2009) and Pott (1988) the milestone payment has been in use in some public projects for quite some time. These include the Hong Kong Mass Transit Railway Corporation (MTRC), the airport core programme contracts, the UK fast-track construction project and some other significant work contracts in public sector procurement (Cheng et al., 2009).
2.1.5 Payment on completionPayment on completion is paid when the practical completion of a segment of work is realized. It may be paid as an entire contract payment after the handing over of the project to the employer (Ansah, 2011 and Wong et al., 2006). This implies that the contractor is solely responsible for funding the project and the contractor is only paid when the specified phase is attained and certified by the contract administrator. The
316. 317.

42nd AUBEA Conference 2018: Educating Building Professionals for the Future in the Globalised World
client must also be ready to bear this payment burden, and to source and effect payment,which may be a considerable lump sum amount, upon taking delivery of the work (Ansah, 2011; Wong et al., 2006).
2.2 Construction project and organisation performance Performance denotes success of an outcome from carrying out construction projects at due time, on an agreed budget, delivering work of good quality and a good product (Sun,2000; Raisbeck et al., 2009); measure of a separate entity, the professional roleplayers, an organisation and the attainment of the work plan; financial, practical, productivity and managerial efficiency, profitability, and meeting client and employee satisfaction (Ramanchandra and Rotimi, 2011); and demonstrating the capacity of the technical know-how of an organisation (Hatush and Skitmore, 1997).
However, construction project performance has been reported in several studies with the following challenges; over budget, missing schedule, poor quality, inappropriate use of payment systems and client dissatisfaction (Sherif and Kaka, 2003; Odeyinka and Kaka, 2005; Hai and Watanabe, 2014). According to Tucker et al., (2015) business performance is described as the effectiveness of a company relative to its goals and objectives, and also to the entire economic outcome of the undertakings embarked on by the organisation, over a specified period. The main business performance measures areprofitability, efficiency and productivity, which according to Norris (1990),Walker and Ruekert (1987) are seen as boosts to financial gain; the rudiments of running a corporate enterprise (Naoum, 2003); and a function of timely delivery (Soetanto et al., 2001), in the context of payment systems in the construction industry. Therefore, to some extent the evaluation of business performance using these three categories (time, budget and quality) includes sizeable trade-offs (Donaldson, 1984). In this study, construction project and organisation performance will be taken to mean profitability, efficiency and productivity of the company. Sherif and Kaka (2003) affirm that most construction companies are solvent, but still fail, because they are not making a profit as expected due to the type of payment systems they employ.
2.3 Relationship between payment systems and project and organisationperformance
An examination of the literature confirms the existence of a relationship between appropriateness of the selected payment systems and successful construction project ,due to its effect on contractors’ cash flow (CIOB, 2004; Danuri et al., 2006; Motawa and Kaka, 2009; Ramachandra and Rotimi, 2011). Sheriff and Kaka (2003) aver that cash flow is one of the essential means for contractors to deliver a successful project in the construction industry. They noted that if payment is not made when due to the contractor, it will hurt the success of the construction project and construction company performance. This is aligned to the findings of previous research by Potts (1988) and Xiong et al., (2014) that the success of construction projects is a result of construction team performance, which rests upon the improvement in their motivation, the use of a suitable payment method and the team’s cooperation. As noted by Motawa et al.,(2008), a suitable payment system will act as a performance enabler. In the framework developed by Sheriff and Kaka (2003) to define the payment system, it was found that the selection of an unsuitable payment system resulted in cost and time overruns, and also in excessive claims and disputes on a project, resulting in poor project performance. Potts (1988) found that motivating a contractor financially will lead to more significant achievement and satisfactory progress of work.
42nd AUBEA Conference 2018: Educating Building Professionals for the Future in the Globalised World
3 Research methodologyA systematic review of the scholarly literature was adopted for the study. Payment systems and project and organisation performance are the broad concepts that include a large number of related constructs and themes. Project and organisation performance is one term that has been used as a commonly accepted definition. Therefore, any study into this concept should endeavour to derive a meaning from the various studiesavailable. A systematic literature review approach enables the development of knowledge through this multiplicity of viewpoints obtained from various research scholars. Concepts and themes such as project payment systems, forms of payment systems such as interim payment, advance payment, stage payment, milestone payment, and payment on completion, project and organisation performance, were used to extract information from the selected articles, reports, theses, dissertations, and books. Scholars such as Ramanchandra, and Rotimi (2011) have also adopted systematic review methodology to study payment systems in the construction industry. Hence this methodology is considered appropriate for this study.
The literature search was conducted on Google Scholar, Primo and University of Cape Town’s electronic library (https://www.lib.uct.ac.za/&usg=AOvVaw2GdHaMTdj-w9NKfJLgwJpA). The review included peer-reviewed articles and conference proceedings; also ‘grey literature’ such as non-peer reviewed articles, reports, theses, dissertations, and books. Furthermore, as a supplementary search, all articles that have cited articles and are relevant to the study were reviewed in other to ensure that the search is comprehensive. The sources of selected articles for the study are listed in Table 1.
Table 1: Sources of peer-reviewed articlesSources Year of publication Number
of articles
Construction Management and Economics 2009,2005,2003,1997, 1999,1988
6
Journal of Financial Management of Property and Construction. 2008, 2005, 1998, 1997
4
Engineering, Construction and Architectural Management 2009, 2000, 1995 3
Journal of Construction Engineering and Management 2006, 2004 2International Journal of Project Management 2014, 2003 2International Journal of Quality and Reliability Management 2001, 2000 2
Journal of construction project Management and Innovation 2016, 2011 2Built Environment Project and Asset Management 2017 1Journal of Construction Business and Management 2017 1
Journal of Engineering, Design and Technology 2015 1Journal of Advanced Performance and Information Value 2014 1International Journal of Real Estate Studies 2012 1
Journal of the South African Institution of Civil Engineering 2012 1Interdisciplinary Journal of Contemporary Research in Business 2012 1Habitat International Journal 2011 1Journal of Surveying, Construction and Property 2010 1Building Journal Hong Kong China 2009 1
Engineering Economist 2004 1Journal of Management in Engineering 1990 1Journal of Marketing 1987 1Automation in Construction 1984 1
3rd Proc. Research Conference of the Nigerian Institute of Quantity SurveyorsRECON3
2017 1
1st Proc. Annual Research Conference (AnReCon) of the Nigerian Institute of Quantity Surveyors 2013 1
International Research Conference on Sustainability in Built Environment 2011 1
318. 319.

42nd AUBEA Conference 2018: Educating Building Professionals for the Future in the Globalised World
Sources Year of publication Number of articles
International Conference on Construction, Culture, Innovation and Management (CCIM)
2006 1
20th Annual ARCOM Conference 2004 119th Annual ARCOM Conference 2003 1First International Conference on Construction in the 21st Century (CITC
2002)2002 1
17th Annual ARCOM Conference 2001 1Proceedings of the 36th Annual Transactions of the American Association of Cost Engineers
1992 1
4 The development of a framework of payment systems and projectand organisation performance
The study examines the payment systems used and how this impact project andorganisation performance. Based on the literature survey, the study proposes a framework of payment systems and project and organisation performance, which mayresult in optimal project and organisation performance shown in Figure 1.
Figure 1: Framework of payment systems and project and organisation performance The framework shown in Figure 1 is based on the following arguments drawn from past research in the area.
4.1 Interim paymentAccording to Maritz and Robertson (2012); and Blyth and Kaka (1999), the application of an interim payment system within the construction industry is a regular means of guaranteeing cash flow for contractors and sub-contractors alike, as it increases project performance. Odeyinka and Kaka (2005) posit that the effect of the chain payment structure is that the failure of one party affects the other parties, ranging from loss of income to full-blown insolvency. This is destructive to organisational performance. Murdoch and Hughes (2000) argue extensively on the need to adopt well-defined payments and payment schedules to simplify the construction process in construction projects; except on small contracts and sub-contracts that reduce the need for thecontractor to finance the processes within the project. Interim payment relieves the contractor’s cash flow, on the basis that project finance is cheaper for the client than it is for the individual contractor (Egan, 1998; Murdoch and Hughes, 2000). Consequently, the interim payment system can be a useful means of guaranteeing cash flow forcontractors and sub-contractors, to avoid full-blown insolvency. It helps to avoid a
42nd AUBEA Conference 2018: Educating Building Professionals for the Future in the Globalised World
decrease in project and organisation performance, and thereby enhances efficiency and productivity in project and organisation performance.
4.2 Advance paymentPrevious researchers (see Aje, et al., 2017; Oke et al., 2013; Motawa and Kaka, 2009) have argued that clients could use advance payments to speed up the progress of work, ensure quality of work, avert cost escalation and payment delay in relation to the projects, and achieve performance targets. According to Ellis (1991) advance payment to contractors is the active catalyst of a large number of successful projects in the construction industry. Wang (1984) is of the opinion that construction developments are capital demanding and require an enormous amount of funds for their realization. Therefore, advance payment to contractors has an impact on construction project delivery (Oke, et al., 2013). Project finance literature has defined the advance payment system as an essential factor in project accomplishment (Elazouni and Gab-Allah, 2004; Li Bing et al., 2005). Advance payment helps the contractor to establish the client's commitment to project finance, and project owners to get the commitment of contractors to prompt performance (Berends and Dhillon, 2004; Jagboro 1998). Abeysekera (2002) have shown that advance payment assists the contractor to maintain a hearty and robust cash flow at any stage of the project contract, it ensures the clients allegiance to project finance, and the contractors’ commitment to speedy performance (Aje, et al., 2017). In essence, advance payment avoids execution and payment delay,speeds up the progress of work and averts cost escalation on the project. This ensuresthe quality of work in order to achieve performance efficiency and productivity.
4.3 Stage paymentIn the previous work of Blyth and Kaka (1999), stage payment reflected the nature of the stages and the completion of the work packages. According to Cheetham et al.,(1995), a stage payment system reduces administrative time and cost of design, and allows the project team to embark on productive project performance. Blyth and Kaka (1999) posit that stage payment is a strategy used to improve efficiency and performance of construction organisations and that there would be no disagreement between contractors’ and project owners’ quantity surveyors over evaluation of work, if stage payments were used. Blyth and Kaka (1999) note that stage payment has a negative impact on contractors' cash flow requiring the contractor to have either a higher borrowing capacity or a more substantial cash reserve, and a reduction in the profit within the contract. Conclusively, a system that reduces administrative time andcost of design, and allows a reliable project stakeholder to embark on a productive project strategy to improve effectiveness and performance, leads to efficiency in project and organisation performance.
4.4 Milestone paymentThis payment system aims to identify milestones that, if attained, would guarantee payments that compensate the contractor's possible outflow of cash at any point in the construction project activities when the milestone become appropriate and due (Blyth and Kaka, 1999). According to Cheetham et al., (1995), distinct milestones that present a logical plan for the incentive of performance, create a clear perception connecting performance and payment, increase profitability and also facilitate successful management of the project, to attain organisation performance (Blyth and Kaka, 1999). In the work of Potts (1988), the client considered the milestone payment system a success, because projects were completed within budget before the tendered completion dates, and the system provided a positive attitude to succeed, which contributed to construction companies motivation to meet the milestone deadlines, leading to better
320. 321.

42nd AUBEA Conference 2018: Educating Building Professionals for the Future in the Globalised World
performance. Cheng et al., (2009), note that the flexibility of milestone payment is open to abuse if it is not managed correctly. It might lead to rushing the work or low attentiveness to quality, to meet milestone deadlines. The milestone payment system definitely leads to the profitability of project, and enhances organisation performance due to its presentation of a logical plan, incentives for performance, clear understanding of the connection between performance and payment, and the enhancement of productivity. All these effects are beneficial to the successful management of the project, reflected in good organisation performance.
4.5 Payment on completionThis type of payment system functions well where it is convenient to complete a project by a definite date, but not necessary to finish before the agreed time. According to Wong et al., (2006), payment on completion is the type of payment made to the contractor at the practical completion stage of a construction project on site. Olatunji et al., 2017) posit that payment on completion is the preferred choice for settlement of payment for work carried out, but this is done in exceptional cases where the contract is based on drawings and specification, meaning that it works best where the project is rather small and to be executed within the range of the clients’ financial budget, to pay without stress at once. It therefore concludes that this type of payment leads to productivity and profitability, as it allow for managerial efficiency in the project as a whole, good financial management, meeting client and employee satisfaction (Wong et al., 2006; Olatunji et al., 2017) because the contractor is solely responsible for funding the project.
5 Discussion, conclusion and further researchPoor project and organisation performance and failure of construction operations have been linked to the use of inappropriate payment systems. However, making the most effective use of quality and suitable payment systems is arguably one of the ways to attain an optimal level of efficiency in construction operations. An appropriate and fair payment system within the construction supply chain is expected by the industry to improve performance. A significant number of disputes in construction are related to problems in payment; successful construction projects can only be sustained and attained if the appropriate payment systems are identified in a clear and agreed approach. Planning of the payment options would assist the project stakeholder to avoid payment disputes and help to unravel the awkward concerns of cash management, by reducing insolvency and optimising cash flow. It results in fair payment when due, and enhances the quality of the project process.
Five payment systems were identified, which include interim payment, advance payment, stage payment, milestone payment, and payment on completion. Also, efficiency, profitability and productivity were identified as the indicators of project and organisation performance.
The findings of the study show that an interim payment system and advance payment system can guarantee efficiency and productivity of project and organisationperformance. The stage payment method was found to be a system that leads to the efficiency of projects and organisations by reducing administration time and cost of design. Milestone payment increases profitability and facilitates successful management of the project to attain organisation performance.Lastly, payment on completion was found to lead to productivity and profitability.Based on these findings, the study concludes that the usage of a single payment system will lead to poor project and organisation performance; hence, only a combination of payment systems will bring about an effective project and organisation performance.
42nd AUBEA Conference 2018: Educating Building Professionals for the Future in the Globalised World
For example, payment on completion can be combined with any of stage payment, interim payment or advance payment system to ensure an effective project and organisational performance. Similarly, milestone payment system can be combined with any of interim payment or advance payment system to ensure an effective project and organisational performance. Payment systems impact project and organisationperformance in different ways and that construction projects and organisations would continue to experience poor performance if payment systems are not carefully selected to fit the project and organisation context. Therefore, the study recommends that further studies using empirical study should be undertaken to determine which of the payment systems in the construction industry - interim payment, advance payment, stage payment, milestone payment and payment on completion, best fit the profile of each construction project and organisation, and at what stage of projects should the paymentsystems be used in the construction industry.
6 AcknowledgementsThe financial support of the University of Cape Town (UCT), the National Research Foundation (NRF) and TETFUND concerning this research are hereby recognized. The ideas articulated, and inferences arrived at, are those of the author and are not to be ascribed to UCT, NRF or TETFUND.
7 ReferencesAbeysekera,V. (2002), ‘Re-engineering payment procedures: an agenda for client
financed construction’, In: Ng, S.T. Cheung, S. Lam, K. & Poon, S. (Eds), Re-engineering construction: Enabling and motivating excellence, Hong Kong, pp 79-85.Aje, I.O., Olatunji, A.O. and Olalusi, A.O. (2017), ‘Overrun causations under advance payment
regimes’, Built Environment Project and Asset Management, Volume 7 (1), pp 86-98.Anderson, S.D. and Damnjanovic, I. (2008), ‘NCHRP Synthesis 379: Selection and evaluation
of alternative contracting methods to accelerate project completion’, National Cooperative Highway Research Board, Washington, DC.
Ansah, S.K. (2011), ‘Causes and effects of delayed payments by clients on constructionprojects in Ghana’, Journal of Construction Project Management and Innovation,Volume1(1), pp 27 – 45.
Arditi, D., Koksal, A. and Kale, S. (2000), ‘Business failures in the construction industry’,Journal of Engineering, Construction and Architectural Management, Volume 7(2), pp 120-132.
Berends, T. and Dhillon, J. (2004), ‘An analysis of contract cost phasing on engineering and construction projects’, The Engineering Economist, Volume 49(4), pp 327-337.
Blyth, K., and Kaka, A. (1999), ‘The industry's view of stage payments and the Latham recommendations’, In: Hughes, W(Ed.), 15th Annual ARCOM Conference, Liverpool, John Moore University, 15-17, September 1999, pp 635 – 643.
Cheetham, D.W., Lewis, J. and Jones, S.T. (1995), ‘The effect of stage payments oncontractor's cash flow: some possible consequences’, Engineering, Construction
and Architectural Management, Volume 2(3), pp 237-246.Cheng, T., Soo, G. Kumaraswamy, M. and Jin, W. (2009), ‘Security of Payment for Hong Kong
Construction Industry – Workable Alternatives and Suggestions’, Building Journal Hong Kong China, pp 60-77. CIOB. (2004), ‘Improving Payment Practices’, Construction Act Consultationhttp://www.ciob.org.uk/ciob/siteRoot/News_Room/Construction_industry_News/Article.as px?id=724, view: 15/06/ 2017.
CIOB. (2004), ‘Improving Payment Practices’, Construction Act Consultation http://www.ciob.org.uk/ciob/siteRoot/News_Room/Construction_Industry_News/Article.as px?id=724, view 15/06/2018
Danuri, M. M., Munaaim, M. C. Rahman, H. A. and Hanid, M. (2006), ‘Late and Non-
322. 323.
42nd AUBEA Conference 2018: Educating Building Professionals for the Future in the Globalised World
Payment Issues in the Malaysian Construction Industry - Contractor's Perspective’, In: International Conference on Construction, Culture, Innovation and Management (CCIM), Malaysia, 22-24, pp 34-43.
Davis Langdon and Seah Consultancy (2003), ‘Construction payment blues – Why that domino effect’? Executive Summaries for the Practitioner, 3 (3): September 2003.
Dlungwana, S; Nxumalo, X.H., Van Hysteen, S., Rwelamila, P. and Noyana, C. (2002), ‘The development and implementation of the South African Construction’, Excellence Model (SACEM), Conference on Construction in the 21st Century (CITC 2002), Challenges and Opportunities in Management and Technology.
Donaldson, G. (1984), ‘Managing Corporate Wealth’, Praeger, New York.Egan, J. (1998), ‘Rethinking Construction’, DETR, London.Elazouni, A.M. and Gab-Allah, A.A. (2004), ‘Finance-based scheduling of construction projects
using integer programming’, Journal of Construction Engineering and Management,Volume 130(1), pp 15-24.
Ellis, C.M. (1991), ‘Advance payment and project duration performance’, Australian Institute of Quantity Surveyors Journal, Volume 3(2), pp 17-21.
Giang, D.T.H. and Pheng, L.S. (2011), ‘Role of construction in economic development: Review of key concepts in the past 40 years’, Habitat International Journal, Volume
35(1), pp 118-125.Hai N.L. and Watanabe, T. (2014), ‘The status quo and perspective for improvement of public
works procurement performance in Vietnam’, Journal of Advanced Performance and Information Value, Volume 6, pp 22–39.
Hatush, Z., and Skitmore, M. (1997), ‘Criteria for contractor selection’, ConstructionManagement and Economics, Volume15, pp 327-340.
Jagboro, G.O. (1998), ‘The effect of payment for advance purchase of building materials on contractor's cash-flow projections’. Journal of Financial Management of Property and Construction, Volume 3 (3), pp 71-83.
Judi, S.S. and Abdul-Rashid, R. (2010), ‘Contractor’s right of action for late or non- payment bythe employer’, Journal of Surveying, Construction and Property, Volume 1(1), pp 1-31.
Kaka, A.P. (2001), ‘The case for Re-engineering contract payment mechanism’, 17th Annual ARCOM Conference, Association of Researchers in Construction Management , the University of Salford, 5-7 September 2001, pp 371-379.
Kaka, A. P., and Lewis, J. (2003), ‘Development of a company-level dynamic cash flow forecasting model (DYCAFF)’, Construction Management and Economics, Volume21(7), pp 693-705.
Kazimu, M.A. (2012), ‘Significant factors that cause cost overrun in building construction project in Nigeria, Interdisciplinary Journal of Contemporary Research in Business, Volume 3(11), pp 775-780.
Li, Bing, Akintoye, A., Edwards, P.J. and Hardcastle, C. (2005), ‘Critical success factors for PPP/PFI projects in the UK construction industry’, Construction Management and Economics, Volume 23 (5), pp 459-471.
Lowe, J. G. (1997), ‘Insolvency in the U.K. construction industry’, Journal of FinancialManagement of Property and Construction, Volume 2(1), pp 83-107.
Maritz, M.J. and Robertson, D.C. (2012), ‘What are the legal remedies available to contractors and consultants to enforce payment?’ Journal of the South African Institution of Civil Engineering, Volume 54(2), pp 27-35.
Memon, A.H; Rahman, I.A. and Aziz, A.A.A. (2012), ‘The causal factors of large project's cost overrun: A survey in Southern part of Peninsular Malaysia’, International Journal of Real Estate Studies, Volume 7(2), pp 1-15.
Motawa, I. and Kaka, A. (2009), ‘Modelling payment mechanisms for supply chain in construction’, Engineering, Construction and Architectural Management, Volume 16(4), pp 325-336.
Motawa, I., Kaka, A. and Wong, C. H. (2008), ‘Development of transparent payment systems’. Journal of Financial Management of Property and Construction, Volume 13 (2), pp 143-156.
Murdoch, I. J. and Hughes, W. (2000), Construction Contracts: Law and Management, Spon Press, London.
42nd AUBEA Conference 2018: Educating Building Professionals for the Future in the Globalised World
Naoum, S. (2003), ‘An overview into the concept of partnering’, International Journal of Project Management, Volume 21(1), pp 71-76.
Navon, R. (2005), ‘Automated project performance control of construction project’, Automation in construction, Volume 14, pp 144-476.
Njie, A; Langford, D; Kaka, A. and Fortune, C. J. (2005), ‘Rethinking Construction using payment systems: towards a theoretical analysis framework’, In: K.Sullivan and D.T. Kashiwagi, CIBD W92/T23/W107/International Symposium on procurement systems -The Impact of Cultural Differences and Systems on Construction Performance. LasVegas, Nevada, 8-10 February, pp 645- 653.
Norris, W.E. (1990), ‘Margin of profit: teamwork’, Journal of Management in Engineering,Volume 6(1), pp 20 – 28.
Odeyinka, H.A. and Kaka, A. (2005), ‘An Evaluation of contractors’ satisfaction with payment terms influencing construction cash flow’, Journal of Financial
Management of Property and Construction, Volume 10(3), pp 171 – 180.Ofori, G. (1991), ‘Programmes for improving the performance of contracting firms in
developing countries: a review of approaches and appropriate options’, Construction Management and Economics, Volume 9(1), pp 19-38.
Oke, A.E., Ogunsemi, D.R, Aje, I.O. and Morakinyo, G.A. (2013), ‘Performance of advance payment bond in construction projects’, Ahmed, D.I, Proceedings of the 1st Annual Research Conference (AnReCon), Nigerian Institute of Quantity Surveyors, Abuja, 3- 5September 2013, pp 478-486.
Oke, A; Ogungbile. A; Oyewobi, L. and Tengan, C. (2016), ‘Economic development as a function of construction project performance’, Journal of Construction Project Management and Innovation, Volume 6(2), pp 1447-1459.
Olatunji,O.S., Ogunsemi,D.R, Akinradewo, O.F. and Akinola, J.A. (2017), ‘Assessment of the payment options adopted in the delivery of public projects in Nigeria’, Yakubu, I., Nuru, G. and Idris, K, Proceedings of the 3rd Research Conference of the RECON3,Nigerian Institute of Quantity Surveyors (NIQS), Abuja, 25 – 27 September 2017, pp 420-429.
Potts, K.F. (1988), ‘An alternative payment system for major ‘fast track’ construction projects’,Construction Management and Economics, Volume 6 (1), pp 25-33.
Raisbeck, P., Duffield, C. and Ming, Xu (2009), ‘Comparative performance of PPPs traditional procurement in Australia’, Construction Management and Economics, Volume 28, pp 345-359.
Ramanchandra, T. and Rotimi, J. O. (2011), ‘Review of Methods for Mitigating Payment Risks in Construction’, International Research Conference on Sustainability in Built Environment, Volume 1, pp198-207.
Sherif, E. and Kaka, A. (2003), ‘Factors Influencing the Selection of Payment Systems in Construction Projects’, In: 19th Annual Conference, ARCOM, The University of Brighton, 3-5 September 2003, pp. 63-70.
Sherif, E. and Kaka, A. (2004), ‘A multi-criteria mode for the selection of the payment systems in construction projects’, In: Khosrowshahi, F. (Ed.), 20th Annual Conference, ARCOM, Heriot-Watt University, 1-3 September 2004, pp163-172.
Singh, S. and Lakanathan, G. (1992), ‘Computer-based cash flow model’, In: Proceedings of the 36thAnnual Transactions, American Association of Cost Engineers – AACE, WV, USA, pp 5-14.
Soetanto, R; Proverbs, D.G. and Holt, G. D. (2001), ‘Achieving quality construction projects based on harmonious working relationships – clients' and architects' perceptions of contractor performance’, International Journal of Quality and Reliability Management,Volume 18(5), pp 528 – 548.
Sun, H. (2000), ‘Total quality management, ISO 9000 certification and performanceimprovement’, International Journal of Quality and Reliability Management, Volume17 (2), pp168-179.
Tucker, G.C., Windapo, A. and Cattel, K. (2015), ‘Exploring the use of financial capacity as a predictor of construction company corporate performance: evidence from South Africa’,Journal of Engineering, Design and Technology, Volume 13(4), pp 1-18.
324. 325.

42nd AUBEA Conference 2018: Educating Building Professionals for the Future in the Globalised World
Walker, O.C., and Ruekert, R.W. (1987), ‘Marketing’s role in the implementation of business strategies: a critical review and conceptual framework’, Journal of Marketing, Volume 51, pp 15-33.
Wang, C. H. (1984), ‘Optimization model for construction projects duration using a multi-stage decision process’, Engineering optimization journal, Volume 4(2), pp 12-14.
Windapo, A. and Cattel, K. (2013), ‘The South African Construction Industry: Perceptions of Key Challenges Facing Its Performance, Development and Growth’, Journal ofConstruction in Developing Countries, Volume 18(2), pp 65-79.
Windapo, A; Odediran, S. Moghayedi, A. Adediran, A. and Oliphant, D. (2017), ‘Determinants of Building Costs in South Africa’, Journal of Construction Business and Management,Volume 1(1), pp 8-13.
Wong, C., Kaka, A.P, Fortune, C. and Langford, D. (2006), ‘A multi-criteria Decision-Making Framework for Alternative Payment Systems using AHP Analysis’, Journal ofConstruction Engineering Management, Volume 130 (5), pp 691-698.
Xiong, B., Skitmore, M. Xia, B. Masrom, M. A., Ye, K. and Bridge, A. (2014), ‘Examining the influence of participant performance factors on contractor satisfaction: A structuralequation model’, International Journal of Project Management, Volume 32(3), pp482-491.
42nd AUBEA Conference 2018: Educating Building Professionals for the Future in the Globalised World
The key factors of construction projects complexity: The TOESCIG framework
Alireza Moghayedi1, Abimbola Windpo2 and Oluwole Olatunji3
1&2Department of Construction Economics and Management, University of Cape Town, Cape Town, SOUTH AFRICA
3School of Design and the Built Environment, Curtin University, Perth, AUSTRALIA
E-mails: [email protected], [email protected], [email protected]
Abstract: Construction projects are complex in nature, thus identifying and evaluating these complexities are critical to construction project performance. However, the factors which make a project complex and the impact that they have on a project performance are not widely recognised. Therefore, this study examines the complexity factors and their sources towards developing a holistic complexity framework for construction projects. The research made use of a systematic review of extant literature in the area of project complexity in identifying the complex factors that impact construction project performance and a content analysis technique in developing a complexity framework for construction projects. It emerged from the study that the key complexity causing factors (out of 65) that impact construction project performance are diversity of the project scope, number of organisational units/departments and the number of organisational structure hierarchies. Also, it was found that these factors can be distributed by Technological, Organisational, Environmental, Scope, Cultural, Information and Goal (TOESCIG) sources. The TOESCIG complexity framework presents the factors that contribute to project complexity from a theoretical perspective. Based on the TOESCIG complexity framework of construction projects, the study concludes that the Scope and Organisational components are at the centre of construction project complexity. Further studies that use the TOESCIG complexity framework developed in establishing an intelligent complexity model for construction projects and subsequently in an investigation of the relationship between project complexity and project performance are recommended.
Keywords: Construction Complexity, Complexity Framework, TOESCIG(Technological, Organisational, Environmental, Scope, Cultural, Information, Goal)
1 Introduction
Complexity is one of the most critical and controversial topics in project management, because of different views and definitions held by various organisations in the construction industry and, there is no universally accepted definition of complexity (Bakhshi, Ireland, & Gorod, 2016). Varying level and degree of complexity exist in all types of construction projects. However, there has been an increase in project complexity over time and how organisations anticipate, comprehend and navigate complexity determines their successes and failures (Project Management Institution, 2013).
Project complexity is a broad topic, a well researched and published area, which relates to any subject and therefore there is a wealth of information about it. However, there is still a lack of understanding of what constitutes project complexity (Bakhshi et al., 2016;
326. 327.

42nd AUBEA Conference 2018: Educating Building Professionals for the Future in the Globalised World
H. Wood & Ashton, 2010). According to Cicmil, Williams, Thomas, and Hodgson (2006)construction project complexity is one of most relevant and an emerging topic in the field of construction management in past three decades. However, there is a lack of consensus definition of complexity which makes it difficult to identify the factors causing complexity. complexity is described as an intricate state consisting of many varied interrelated parts within a project, it involves uncertainties, different actions and states such that the effect of actions is difficult to assess Baccarini (1996), Harvey Maylor, Vidgen, and Carver (2008); Whitty and Maylor (2009) and Xia and Chan (2012). Vidal, Marle, and Bocquet (2011) defined project complexity as elements which makes projects difficult to understand, predict and control its overall behaviour, even when the reasonable amount of information is available.
Previous studies have focused on two types of project complexity which are Complexity in Projects and Complexity of Projects. The first stream studied projects through the various theories such as complexity theory (Cooke-Davies, Cicmil, Crawford, & Richardson, 2007; Whitty & Maylor, 2009), Co-evolutionary theory (Benbya & McKelvey, 2006), Organisational theory (Cicmil & Marshall, 2005), Contingency theory (Steinbach, Holcomb, Holmes, Devers, & Cannella, 2017), Theory of constraints (Cicmil, Cooke-Davies, Crawford, & Richardson, 2009), Systems theory (Thelen, 2005), Network theory (Pathak, Day, Nair, Sawaya, & Kristal, 2007), Nonlinearity and chaos theory (Strogatz, 2018), and adaptive self-organisation theory). While the second stream studied projects through identifying the characteristics of complex projects (Geraldi, Maylor, & Williams, 2011; Harvey Maylor et al., 2008; Nguyen, Tran, Nguyen, & Le-Hoai, 2016; Qureshi & Kang, 2015). Due to the beneficial rule of characteristics of complex to the identification of complexity sources and the common area between the practitioner and academic this study focuses on the second stream.
Understanding the complexity of a construction project in today's complex and dynamic environment is very difficult (Sinha, Nicholson, Steinmetz, & McCusker, 2006), because of the lack of relevant knowledge and the high level of uncertainty in construction projects (Moghayedi & Windapo, 2017). Construction projects performance in terms of productivity, profitability, efficiency and satisfaction are historically poor (Bertelsen, 2003). This poor performance has been adduced to the fact that construction projects are complex (Baccarini, 1996; Mills, 2001). Despite this, there is currently no system available by which construction project complexity can be measured and evaluated (H. Wood & Ashton, 2010). Before any measure of complexity can be obtained, it is essential to identify what factors make the construction projects complex. Although extensive research on project complexity exists, however, the factors which make a project complex and the impact that they have on a project performance are not widely recognised.(Qureshi & Kang, 2015; H. Wood & Ashton, 2010) identifying and evaluating the complexity factors and their sources on projects, provides support to decisions made for keeping construction project behaviour under control. The study of project complexity factors that make projects challenging to understand, predict and control, a tougher task to perform and harder to foresee its related elements is vital (Qureshi & Kang, 2015).
The study advances that being able to measure the complexity at an early stage will lead to a better understanding of the project and therefore could be of great benefit in successfully managing projects and reducing the risks and uncertainties associated with complexity.
Therefore, this study examines the complexity factors and their causative sources towards developing a holistic complexity framework for construction projects.
42nd AUBEA Conference 2018: Educating Building Professionals for the Future in the Globalised World
2 Research Methodology
The current study examines the complexity factors and their causative sources in projects by using content analysis of most relevant articles in the field of project complexity and particularly construction project complexity towards developing a holistic complexity framework for construction projects. The study adopted a systematic review of 21 articles using construction complexity and complexity framework as search terms. A significant number of research studies have been undertaken to identify the project complexity factors (Bosch-Rekveldt, Jongkind, Mooi, Bakker, & Verbraeck, 2011; Brockmann & Girmscheid, 2007; Makui, Moeinzadeh, & Bagherpour, 2017; H Maylor, 2003; Harvey Maylor et al., 2008; Peng, Heim, & Mallick, 2014; Qureshi & Kang, 2015; Remington, Zolin, & Turner, 2009; Vidal & Marle, 2008; Vidal et al., 2011; Vidal, Marle, & Bocquet, 2013; Xia & Chan, 2012). However, few of them categorize these factors to a project complexity framework (Bosch-Rekveldt et al., 2011; Geraldi et al., 2011; He, Luo, Hu, & Chan, 2015; Makui et al., 2017; Nguyen et al., 2016; Vidal & Marle, 2008; Vidal et al., 2011). Project complexity frameworks that have been documented in literature are the TOE (Technical, Organisational and Environmental) framework based on fifty complexity factors advanced by Bosch-Rekveldt et al. (2011); and the TOGECI (Technical, Organisational, Goal, Environmental, Cultural and Information) proposed by He et al. (2015) based on 28 complexity factors in mega construction projects in China. Through extensive literature review, 115 complexity factors were identified and justified using content analysis technique where overlapping factors were either combined or eliminated. 65 key construction project complexity factors were recognised and adopted according to the number of cited by the scholars.
The summary of the top 18 factors identified is presented in Table 1. Also, all the 65 factors retained are shown in Figure 2. Concerning previous empirical study, Vidal et al. (2011) evaluated the project complexity by using Delphi process and the Analytic Hierarchy Process and Identified 70 project complexity factors under the four families of Size, Variety, Interdependence and Context. While Qureshi and Kang (2015) identified and evaluated 38 organisational complexity factors using structural equation modelling.
3 Findings
3.1 Complexity factorsThe systematic literature review and content analysis identified 65 factors of which the top eighteen are shown in Table 1. It can be seen from Table 1 that the Variety of the project scope, Number of organisational structure hierarchies and Number of organisational units and departments are factors with the highest citation (80%) among the other complexity factors. In the next level, the None linearity & reputability and Design and specifications are cited by 75% of scholars, 70% of the literature surveyed cited novelty of construction products and Dynamics of scope/task activities. On the other hand, Capacity of transferring information, Level of processing information and Information uncertainty had been cited more recently (since 2014) by 30% of the literature sources. This may be because of the new trend of using disruptive technologies in construction projects (Hu, Chan, & Le, 2014).
328. 329.

42nd AUBEA Conference 2018: Educating Building Professionals for the Future in the Globalised World
Table 1: Project complexity factors sourced from the literature review
Complexity Factor
Maylor (2003)
Cicm
il and Marshall (2005)
Brockm
ann and Girm
scheid (2008)V
idal and Marle (2008)
Maylor et al. (2008)
Rem
ington et al. (2009)B
osch-Rekveldt et al. (2011)
Vidal et al. (2011)
Xia and C
han (2012)V
idal, Marle et al. (2013)
Peng, Heim
et al. (2014) H
anisch and Wald (2014)
Lu, L
uo et al. (2015)H
e, Luo et al. (2015)
Qureshi and K
ang (2015)D
amasiotis and Fitsilis (2015)
Nguyen, T
ran et al. (2016)L
uo, He et al. (2016)
Bakhshi et al. (2016)
Kian M
anesh Rad, Sun et al. (2017)
Makui, M
oeinzadeh et al. (2017)N
umber of tim
es cited
Diversity of the project scope 16Number of Organisational units/departments 16
Number of Organisational structure hierarchies 16
None linearity & reputability of the organisation 15
Design and specifications 15Novelty of construction products 14
Dynamics of scope/ task activities 14
Degree of innovation adopted by the Organisation 13
Multiple and interrelated phases of a project 13
Uncertainty of scopes 13Cross-Organisational interdependence 13
Integration of more than one system or platform in organization
13
Using highly difficult technology 13
Variety of technological dependencies 13
Diversity of project goals 13Multiple stakeholders 13Variety of the interest of the stakeholder 13
Diversity of technology in project 13
Remoteness of project location 13
42nd AUBEA Conference 2018: Educating Building Professionals for the Future in the Globalised World
3.2 Complexity sources and Framework
Project complexity factors are classified according to technological/technical, organisational, resource, task, cultural, social, mission, stakeholders, team, delivery, goal, interfaces and dependencies/interdependence, management processes, work practices, time, Environmental, size/scale, variety, context, structure, tools and method, urgency of the project, geological condition, novelty, Information and Sociopolitical complexity (Baccarini (1996); H Maylor (2003); Brockmann and Girmscheid (2007);Harvey Maylor et al. (2008); Remington et al. (2009); Bosch-Rekveldt et al. (2011);Vidal et al. (2011); Xia and Chan (2012) Peng et al. (2014) He et al. (2015) Nguyen et al. (2016) Luo, He, Xie, Yang, and Wu (2016) Kian Manesh Rad, Sun, and Bosché (2017). While a recent and comprehensive research in the field of project complexity by Makui et al. (2017) established 13 complexity sources namely: scope, time, cost, integration, human resource, communication, risk, procurement, stakeholder, contract, environment, organisation and strategy.
The chronology of the sources of project complexity highlighted in Figure 1 shows that the holistic complexity frameworks, developed gradually over time (between 1996-2017). This confirms the essential of providing a holistic complexity framework which is able to identify and characterise the different construction projects complexity. The historical development shows that complexity frameworks are sufficiently similar and able to support the development of a holistic complexity framework.
Furthermore, Figure 1 reveals that every scholar has different categories of project complexity. Based on the historical development and classification of project complexity frameworks it can be deduced that Organisational Complexity and Technical/ Technological Complexity and Scope complexity are three key aspects of project complexity besides Cultural complexity, Environmental complexity, Information complexity and Goal complexity.
The recognised and adopted 65 complexity factors identified in this study through literature review and content analysis are assigned to seven major complexity sources based on the best fit between the definition of complexity sources and the nature of the complexity factor as described in each previous study.
Therefore, the current study proposes a TOESCIG project complexity framework to measure the complexity of construction projects developed as shown in Figure 2.Developing the holistic complexity framework for construction projects (Figure 2) brought to light that the scope complexity contains the most number of complexity factors and reveals the fundamental and structural role of scope complexity on construction projects. The TOESCIG complexity framework has got these seven groups of complexity factors. They are at the same level at this point in time, the next phase of the research may try to determine appropriate weighting and/or relationship between project complexity and construction project performance.
The TOESCIG concept model classified the complexity factors of construction projects into seven categories described in the following sub-sections.
330. 331.

42nd AUBEA Conference 2018: Educating Building Professionals for the Future in the Globalised World
Figure 1: Chronological development of project complexity sources.
42nd AUBEA Conference 2018: Educating Building Professionals for the Future in the Globalised WorldFigure 2: TOESCIG complexity framework
332. 333.
Figure 2: TOESC
IG com
plexity framew
ork

42nd AUBEA Conference 2018: Educating Building Professionals for the Future in the Globalised World
3.2.1 Technical/ Technological complexity
Technological complexity refers to the influence of technical procedures and tools to construct the projects (Baccarini, 1996), the technology involved and the inherent difficulty of the process itself (H. L. Wood & Gidado, 2008). Recently the trend of innovative technologies in construction projects has increased the level of technological complexity (Harty et al., 2007; Hu et al., 2014). Many researchers have reported technical/ technological complexity as one of the important sources of complexity in construction projects which is influenced by various factors such as diversity of technology, dependence of technological processes, interaction between the technology system and the external environment (Baccarini, 1996; Bosch-Rekveldt et al., 2011; H Maylor, 2003).
3.2.2 Organisational complexityOrganisational complexity refers to the complexity of executing a project by a project organisation. According to (Baccarini, 1996), Organisational complexity is the most central part of project complexity. Vidal and Marle (2008) established that 70% of project complexity factors are caused by organisational source, which is of concern to the project manager (Bosch-Rekveldt et al., 2011). Organisational complexity is manifested by differentiation and operational interdependencies (Baccarini, 1996), that involves project staff, organisational structure, number of hierarchies and various teams.
3.2.3 Environmental complexityEnvironmental complexity refers to the complexity of a context such as the natural, legal, political and economic environment in which a project is constructed (Li, Yang, and Guo (2009). Environmental complexity is affected by the complexity of project stakeholders whose interests and needs are also affected by the environment (Bosch-Rekveldt et al., 2011).
3.2.4 Scope ComplexityScope Complexity refers to complexity on works that needs to be accomplished to deliver a construction with the specified features and functions (He et al., 2015). Scope complexity is structural and caused by various factors, such as Diversity of scope in the project, Nature of Project and uncertainty of scope, is often cited as a significant contributor to construction project complexity (Williams, 1999). Scope complexity is also noted to stem from ambiguity that existed in several potential interpretations of goals and objectives of projects (Remington et al., 2009).
3.2.5 Cultural complexityCultural complexity refers to the influence of societies and humanities on the project.This complexity is related to the people involved in a project and the relationships between project parties. He et al. (2015) defined cultural complexity as a diversity of the cultural software in the human mindset. According to (H. L. Wood & Gidado, 2008)cultural complexity is one of the important sources of construction complexity and as being the most difficult to predict and manage. Brockmann and Girmscheid (2007) note that cultural complexity is influenced by various factors such as team trust, cognitive flexibility, emotional quotient and system thinking.
3.2.6 Information complexity
Information complexity refers to complicated communication among project stakeholders under complicated contractual arrangements throughout the whole project delivery
42nd AUBEA Conference 2018: Educating Building Professionals for the Future in the Globalised World
process (He et al., 2015). Information complexity includes information systems, the degree of obtaining information, levels of processing and transmission of information (Li et al., 2009). As a result of the expanding scale of construction projects Li et al. (2009)noted that information dependency among different project participants increases information complexity accordingly.
3.2.7 Goal complexityGoal complexity refers to the ambiguity that existed in the interpretation of projects objectives and goals (Remington et al., 2009). According to (Williams, 1999) goal complexity is a structural complexity because the majority of projects have multiple goals. Goal complexity is usually caused by several factors, such as various project participants' requirements, project scope complexity, and uncertainty.
4 Discussion of Finding
This study findings corroborates earlier research by Williams (1999) who established that Scope complexity is a structural complexity which was often cited as a major contributor to construction project complexity.
Also, Organisational complexity consists of twelve (12) complexity factors and all of these factors had been cited by more than half of the selected scholars in this study. The high level of citation verified the critical role of organisational factors on the complexity of construction projects which is aligned with the Bosch-Rekveldt et al. (2011) and Baccarini (1996) claims Organisational complexity is the most central part of project complexity and it is the most concerned of project manager.
Technological complexity contains ten (10) factors with more cited recently, which this proved the finding of Harty et al. (2007) and Hu et al. (2014) that the recent trend of innovative technologies in construction projects has increased the level of technological complexity of projects. Cultural and environmental complexities contain eight (8) complexity factors each with a wide range of repetition.
Due to the high involvement of human on construction projects the cultural complexity is one of the important sources of construction complexity, however, only had been considered and cited by a third of scholars. This low consideration of cultural complexity is because of the difficulty of predicting and managing of social and cultural factors which are aligned with H. L. Wood and Gidado (2008) findings. Conversely, to the culturalcomplexity, the environmental complexity factors has been cited by more than half of scholars which reveals the influence of environmental factors on the complexity of construction projects.
The information complexity consists of six complexity factors that each factor has been cited only by less than a third of scholars. This complexity is strictly dependent on the technical/ technological factors and the level of technology involved in the construction projects which recently had been added to one of the complexity sources of construction projects (Makui, Moeinzadeh et al. 2017).
The goal complexity includes only four (4) factors; however, these factors had been cited by more than half of the literature examined. This is because of dependency of project performance and objectives to goal complexity and also multiple objectives and goals of construction projects (Williams, 1999) which make the goal complexity one of the important complexity sources in construction projects.
334. 335.
42nd AUBEA Conference 2018: Educating Building Professionals for the Future in the Globalised World
5 Conclusion
The main objective of this research was to identify and examine the complexity factors and their causative sources towards developing a holistic complexity framework for construction projects.
This was achieved by examining and reviewing the extensive most relevant literature in the area of construction project complexity. The study used a content analysis technique in the review to demonstrate the current understanding of commonalities and differences in the construction project complexity factors outlined in literature. As a result of this exploration, 65 complexity factors identified under the seven major complexity sources and the holistic complexity framework for construction projects was developed. The broad literature review of this study enabled the development of the TOESCIGconstruction project complexity framework to identify and characterise different factors of construction projects complexity. Based on these findings, this study advances that the key factors causing complexity on projects are the diversity of the project scope, number of organisational units/departments and the number of organisational structure hierarchies, which are found within the scope/activity and organisational sources of the complexity framework.
The developed construction project complexity framework provides both practitioners and academics with a shared language to recognise and make sense of what is making construction projects complex. Such a common language allows utilising practitioners' experiences and academic knowledge on assessing and managing the different construction project complexity. Therefore, the construction project complexity framework developed will be employed as the basis of evaluating the complexity of different construction projects using various assessment techniques such as classical multivariate statistical analysis techniques and systematical intelligence techniques to establish whether there is a relationship between project complexity and construction project performance.
6 Acknowledgement
The financial assistance of the National Research Foundation (NRF) towards this research is hereby acknowledged. The opinions expressed, and conclusions arrived at, are those of the authors and are not necessarily to be attributed to the NRF.
7 References
Baccarini, D. (1996). The concept of project complexity - a review. International Journal of Construction Management, 14, 201-204.
Bakhshi, J., Ireland, V., & Gorod, A. (2016). Clarifying the project complexity construct: Past, present and future. International Journal of Project Management, 34(7), 1199-1213.
Benbya, H., & McKelvey, B. (2006). Using coevolutionary and complexity theories to improve IS alignment: a multi-level approach. Journal of Information technology, 21(4), 284-298.
Bertelsen, S. (2003). Complexity - construction in a new perspective. Paper presented at the 11th Annual conference in the international group for lean construction, Blacksburg, VA.
Bosch-Rekveldt, M., Jongkind, Y., Mooi, H., Bakker, H., & Verbraeck, A. (2011). Grasping project complexity in large engineering projects: The TOE (Technical, Organizational and Environmental) framework. International Journal of Project Management, 29(6), 728-739.
Brockmann, C., & Girmscheid, G. (2007). Complexity of megaprojects. Paper presented at the CIB World Building Congress: construction for development: 14-17 May 2007, Cape Town International Convention Centre, South Africa.
42nd AUBEA Conference 2018: Educating Building Professionals for the Future in the Globalised World
Cicmil, S., Cooke-Davies, T., Crawford, L., & Richardson, K. (2009). Exploring the complexity of projects: Implications of complexity theory for project management practice.
Cicmil, S., & Marshall, D. (2005). Insights into collaboration at the project level: complexity, social interaction and procurement mechanisms. Building Research & Information, 33(6), 523-535.
Cicmil, S., Williams, T., Thomas, J., & Hodgson, D. (2006). Rethinking project management: researching the actuality of projects. International Journal of Project Management, 24(8), 675-686.
Cooke-Davies, T., Cicmil, S., Crawford, L., & Richardson, K. (2007). We're not in Kansas anymore, Toto: Mapping the strange landscape of complexity theory, and its relationship to project management. Project Management Journal, 38(2), 50.
Geraldi, J., Maylor, H., & Williams, T. (2011). Now, let's make it really complex (complicated) A systematic review of the complexities of projects. International Journal of Operations & Production Management, 31(9), 966-990.
Harty, C., Goodier, C. I., Soetanto, R., Austin, S., Dainty, A. R., & Price, A. D. (2007). The futures of construction: a critical review of construction future studies. Construction Management and Economics, 25(5), 477-493.
He, Q., Luo, L., Hu, Y., & Chan, A. P. (2015). Measuring the complexity of mega construction projects in China—A fuzzy analytic network process analysis. International Journal of Project Management, 33(3), 549-563.
Hu, Y., Chan, A. P., & Le, Y. (2014). Understanding the determinants of program organization for construction megaproject success: Case study of the shanghai expo construction. Journal of Management in Engineering, 31(5), 05014019.
Institute, P. M. (2013). A Guide to the Project Management Body of Knowledge: PMBOK Guide: Project Management Institute.
Kian Manesh Rad, E., Sun, M., & Bosché, F. (2017). Complexity for megaprojects in the energy sector. Journal of Management in Engineering, 33(4), 04017009.
Li, H., Yang, N., & Guo, X. (2009). Research on the structure of the complexity of complex project system. Soft Science, 23(2), 75-79.
Luo, L., He, Q., Xie, J., Yang, D., & Wu, G. (2016). Investigating the relationship between project complexity and success in complex construction projects. Journal of Management in Engineering, 33(2), 04016036.
Makui, A., Moeinzadeh, P., & Bagherpour, M. (2017). Developing a fuzzy inference approach to evaluate the static complexity of construction projects. Journal of Intelligent & Fuzzy Systems, 32(3), 2233-2249.
Maylor, H. (2003). Project Management 3rd Edition: Pearson Education Limited. In: London.Maylor, H., Vidgen, R., & Carver, S. (2008). Managerial complexity in project‐based
operations: A grounded model and its implications for practice. Project Management Journal, 39(S1).
Mills, A. (2001). A systematic approach to risk management for construction. Structural survey, 19(5), 254-252.
Moghayedi, A., & Windapo, A. (2017). Developing A Data Gathering Tool For Modelling Uncertainty In Highway Projects. In The Proceedings of the 9th International Conference on Construction in the 21st Century (March 2017 ed., Vol. 1, pp. 773-781): CITC.
Nguyen, L. D., Tran, D. Q., Nguyen, A. T., & Le-Hoai, L. (2016). Computational model for measuring project complexity in construction. Paper presented at the Fuzzy Information Processing Society (NAFIPS), 2016 Annual Conference of the North American.
Pathak, S. D., Day, J. M., Nair, A., Sawaya, W. J., & Kristal, M. M. (2007). Complexity and adaptivity in supply networks: Building supply network theory using a complex adaptive systems perspective. Decision sciences, 38(4), 547-580.
Peng, D. X., Heim, G. R., & Mallick, D. N. (2014). Collaborative product development: The effect of project complexity on the use of information technology tools and new product development practices. Production and Operations Management, 23(8), 1421-1438.
Qureshi, S. M., & Kang, C. (2015). Analysing the organizational factors of project complexity using structural equation modelling. International Journal of Project Management, 33(1), 165-176.
336. 337.

42nd AUBEA Conference 2018: Educating Building Professionals for the Future in the Globalised World
Remington, K., Zolin, R., & Turner, R. (2009). A model of project complexity: distinguishing dimensions of complexity from severity. Paper presented at the Proceedings of the 9th International Research Network of Project Management Conference.
Sinha, H., Nicholson, B. P., Steinmetz, L. M., & McCusker, J. H. (2006). Complex genetic interactions in a quantitative trait locus. PLoS genetics, 2(2), e13.
Steinbach, A. L., Holcomb, T. R., Holmes, R. M., Devers, C. E., & Cannella, A. A. (2017). Top management team incentive heterogeneity, strategic investment behavior, and performance: A contingency theory of incentive alignment. Strategic Management Journal, 38(8), 1701-1720.
Strogatz, S. H. (2018). Nonlinear dynamics and chaos: with applications to physics, biology, chemistry, and engineering: CRC Press.
Thelen, E. (2005). Dynamic systems theory and the complexity of change. Psychoanalytic Dialogues, 15(2), 255-283.
Vidal, L.-A., & Marle, F. (2008). Understanding project complexity: implications on project management. Kybernetes, 37(8), 1094-1110.
Vidal, L.-A., Marle, F., & Bocquet, J.-C. (2011). Measuring project complexity using the Analytic Hierarchy Process. International Journal of Project Management, 29(6), 718-727.
Vidal, L.-A., Marle, F., & Bocquet, J.-C. (2013). Building up a project complexity framework using an international Delphi study. International Journal of Technology Management, 62(2/3/4), 251-283.
Whitty, S. J., & Maylor, H. (2009). And then came complex project management (revised). International Journal of Project Management, 27(3), 304-310.
Williams, T. M. (1999). The need for new paradigms for complex projects. International Journal of Project Management, 17(5), 269-273.
Wood, H., & Ashton, P. (2010). The factors of project complexity.Wood, H. L., & Gidado, K. (2008). An overview of complexity theory and its application the
construction industry. Paper presented at the 24th Annual ARCOM Conference, Cardiff, UK.
Xia, B., & Chan, A. P. (2012). Measuring complexity for building projects: a Delphi study. Engineering, Construction and Architectural Management, 19(1), 7-24.
42nd AUBEA Conference 2018: Educating Building Professionals for the Future in the Globalised World
A framework for modeling FM organizational response to users’ post-occupancy feedback
Olatunji Abisuga1, Changxin Wang2 and Imriyas Kamardeen2
1,2&3Faculty of Built Environment, University of New South Wales,Sydney, 2052, NSW, AUSTRALIA
E-mails: [email protected]; [email protected]; [email protected]
Abstract: The sustainability of facility performance is essential to meet users’ expectations. Post -occupancy evaluation (POE) is the process of collecting feedbacks from facility end-users on their perception about facility performance. These feedbacks are the confirmation or disconfirmation of the expected facility services performance of the buildings they occupied. Hence, how facility management (FM) organizations learn from and respond to users’ feedback is paramount to sustain users’ satisfaction and loyalty. Most POE studies have focused on investigating users’ satisfaction without the FM organizational response and its impact on users’ post-occupancy experience. This study proposes a conceptual framework to examine the relationship between FM organizational response to facility users’ feedback and users’ satisfaction. To achieve this aim, a review of the literature was conducted on POE studies (focus on higher educational buildings) and services organizational response dimensions. The organizational response constructs such as redress (atonement), facilitation, timelessness (promptness), apology, credibility (explanation), attentiveness and effort are considered. Users’ satisfaction to feedback handling is viewed based on anticipated space retention and utilization. A relationshipmodel between FM organizational response and user satisfaction to feedback handling is developed. The framework will be adapted to measure the perception of users’ satisfaction with FM service delivery. The study findings will facilitate FM effectiveness,facility performance sustainability and improve users post occupancy experience.
Keywords:Facility management, feedback, organizational response, post occupancy evaluation, users
1 Introduction
Buildings are constructed to accommodate and facilitate human indoor activities. Constructed buildings according to their types and purpose during occupancy are expected to meet users’ expectations and satisfaction. Post-occupancy feedback is the expression of satisfaction or dissatisfaction with the performance of a building from users’ perceptions. Suggestively, satisfaction is a complimentary feedback, when building performance match with users’ needs. However, dissatisfaction (complaint) arises when there is a mismatch between building performance and users’ expectations. According to Goins and Moezzi (2013), dissatisfaction in the form of a complaint, can indicate the inadequacy or insufficiency of a building to meet users requirement. Users’ feedback can also be used for building performance analysis and prediction (Baird and Dykes, 2012; Goins and Moezzi, 2013). In fact, complaint link end-users and building systems together (Goins and Moezzi, 2013). Moreover, facilities end-users’ satisfaction is paramount to
338. 339.
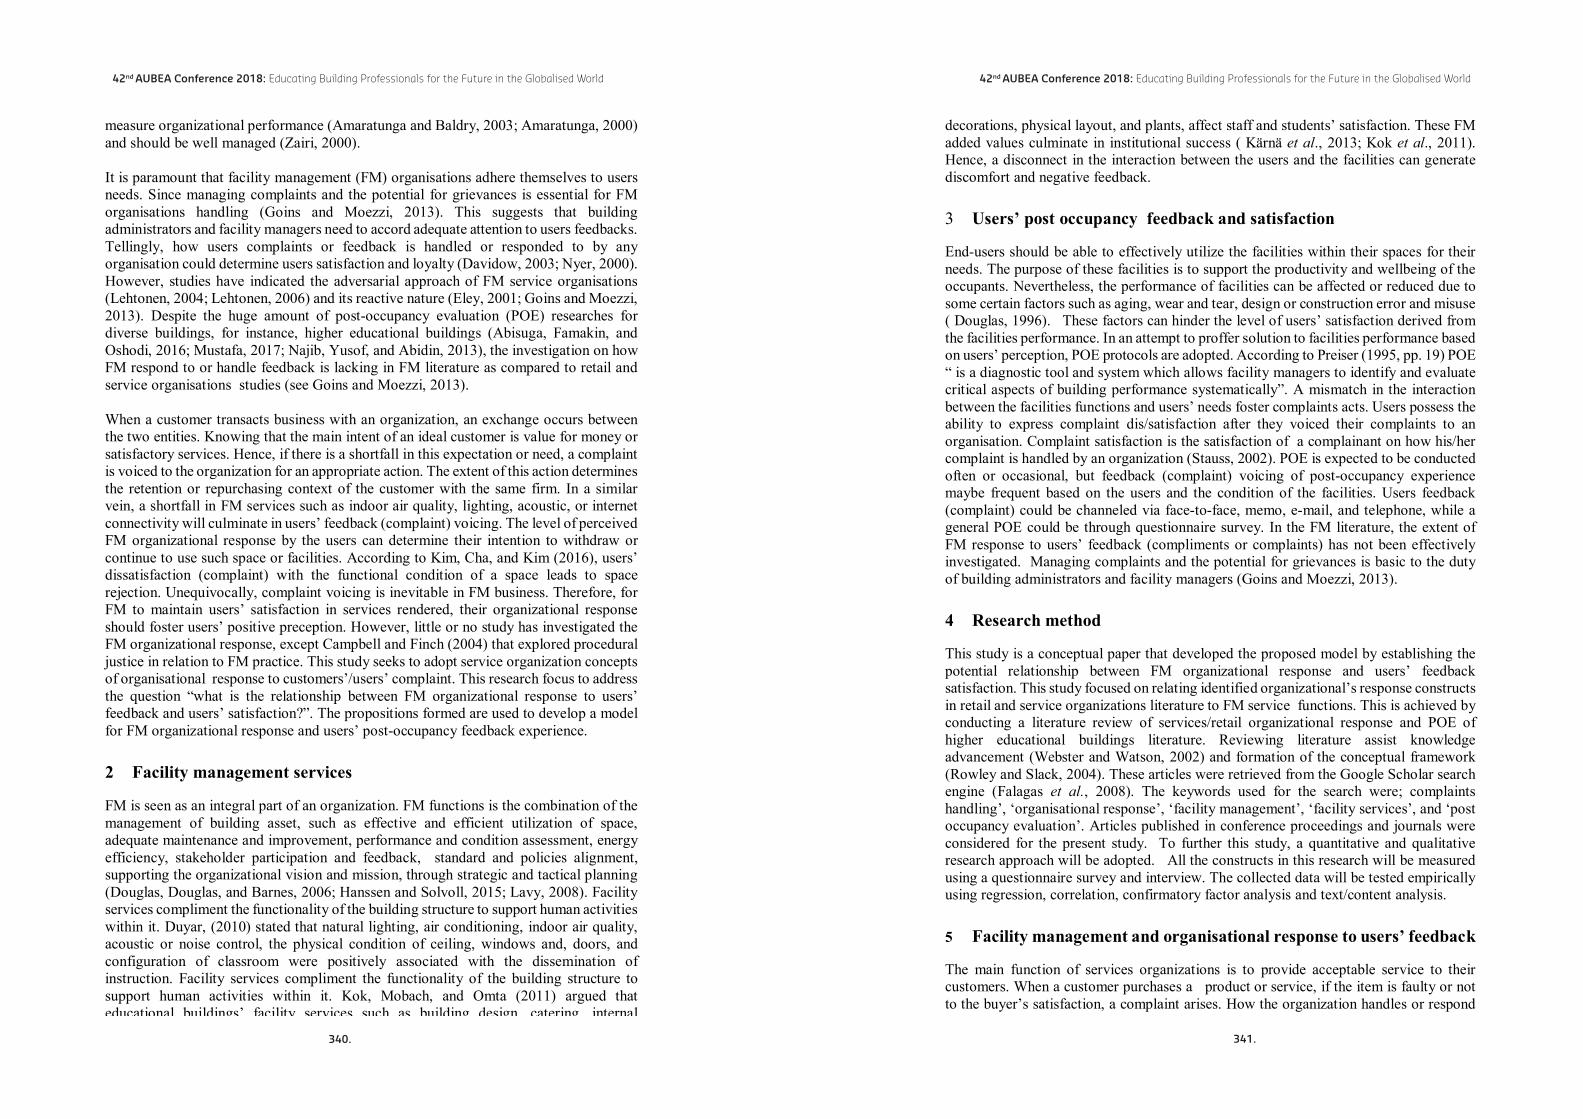
42nd AUBEA Conference 2018: Educating Building Professionals for the Future in the Globalised World
measure organizational performance (Amaratunga and Baldry, 2003; Amaratunga, 2000)and should be well managed (Zairi, 2000).
It is paramount that facility management (FM) organisations adhere themselves to users needs. Since managing complaints and the potential for grievances is essential for FM organisations handling (Goins and Moezzi, 2013). This suggests that building administrators and facility managers need to accord adequate attention to users feedbacks. Tellingly, how users complaints or feedback is handled or responded to by any organisation could determine users satisfaction and loyalty (Davidow, 2003; Nyer, 2000).However, studies have indicated the adversarial approach of FM service organisations (Lehtonen, 2004; Lehtonen, 2006) and its reactive nature (Eley, 2001; Goins and Moezzi, 2013). Despite the huge amount of post-occupancy evaluation (POE) researches for diverse buildings, for instance, higher educational buildings (Abisuga, Famakin, andOshodi, 2016; Mustafa, 2017; Najib, Yusof, and Abidin, 2013), the investigation on how FM respond to or handle feedback is lacking in FM literature as compared to retail and service organisations studies (see Goins and Moezzi, 2013).
When a customer transacts business with an organization, an exchange occurs between the two entities. Knowing that the main intent of an ideal customer is value for money or satisfactory services. Hence, if there is a shortfall in this expectation or need, a complaint is voiced to the organization for an appropriate action. The extent of this action determines the retention or repurchasing context of the customer with the same firm. In a similar vein, a shortfall in FM services such as indoor air quality, lighting, acoustic, or internet connectivity will culminate in users’ feedback (complaint) voicing. The level of perceived FM organizational response by the users can determine their intention to withdraw or continue to use such space or facilities. According to Kim, Cha, and Kim (2016), users’ dissatisfaction (complaint) with the functional condition of a space leads to space rejection. Unequivocally, complaint voicing is inevitable in FM business. Therefore, for FM to maintain users’ satisfaction in services rendered, their organizational response should foster users’ positive preception. However, little or no study has investigated theFM organizational response, except Campbell and Finch (2004) that explored procedural justice in relation to FM practice. This study seeks to adopt service organization concepts of organisational response to customers’/users’ complaint. This research focus to address the question “what is the relationship between FM organizational response to users’ feedback and users’ satisfaction?”. The propositions formed are used to develop a model for FM organizational response and users’ post-occupancy feedback experience.
2 Facility management services
FM is seen as an integral part of an organization. FM functions is the combination of the management of building asset, such as effective and efficient utilization of space, adequate maintenance and improvement, performance and condition assessment, energy efficiency, stakeholder participation and feedback, standard and policies alignment, supporting the organizational vision and mission, through strategic and tactical planning (Douglas, Douglas, and Barnes, 2006; Hanssen and Solvoll, 2015; Lavy, 2008). Facility services compliment the functionality of the building structure to support human activities within it. Duyar, (2010) stated that natural lighting, air conditioning, indoor air quality, acoustic or noise control, the physical condition of ceiling, windows and, doors, and configuration of classroom were positively associated with the dissemination of instruction. Facility services compliment the functionality of the building structure to support human activities within it. Kok, Mobach, and Omta (2011) argued that educational buildings’ facility services such as building design, catering, internal
42nd AUBEA Conference 2018: Educating Building Professionals for the Future in the Globalised World
decorations, physical layout, and plants, affect staff and students’ satisfaction. These FM added values culminate in institutional success ( Kärnä et al., 2013; Kok et al., 2011).Hence, a disconnect in the interaction between the users and the facilities can generate discomfort and negative feedback.
3 Users’ post occupancy feedback and satisfaction
End-users should be able to effectively utilize the facilities within their spaces for their needs. The purpose of these facilities is to support the productivity and wellbeing of the occupants. Nevertheless, the performance of facilities can be affected or reduced due to some certain factors such as aging, wear and tear, design or construction error and misuse ( Douglas, 1996). These factors can hinder the level of users’ satisfaction derived from the facilities performance. In an attempt to proffer solution to facilities performance based on users’ perception, POE protocols are adopted. According to Preiser (1995, pp. 19) POE “ is a diagnostic tool and system which allows facility managers to identify and evaluate critical aspects of building performance systematically”. A mismatch in the interaction between the facilities functions and users’ needs foster complaints acts. Users possess the ability to express complaint dis/satisfaction after they voiced their complaints to an organisation. Complaint satisfaction is the satisfaction of a complainant on how his/her complaint is handled by an organization (Stauss, 2002). POE is expected to be conducted often or occasional, but feedback (complaint) voicing of post-occupancy experience maybe frequent based on the users and the condition of the facilities. Users feedback (complaint) could be channeled via face-to-face, memo, e-mail, and telephone, while a general POE could be through questionnaire survey. In the FM literature, the extent of FM response to users’ feedback (compliments or complaints) has not been effectively investigated. Managing complaints and the potential for grievances is basic to the duty of building administrators and facility managers (Goins and Moezzi, 2013).
4 Research method
This study is a conceptual paper that developed the proposed model by establishing the potential relationship between FM organizational response and users’ feedback satisfaction. This study focused on relating identified organizational’s response constructs in retail and service organizations literature to FM service functions. This is achieved by conducting a literature review of services/retail organizational response and POE of higher educational buildings literature. Reviewing literature assist knowledge advancement (Webster and Watson, 2002) and formation of the conceptual framework (Rowley and Slack, 2004). These articles were retrieved from the Google Scholar search engine (Falagas et al., 2008). The keywords used for the search were; complaints handling’, ‘organisational response’, ‘facility management’, ‘facility services’, and ‘post occupancy evaluation’. Articles published in conference proceedings and journals were considered for the present study. To further this study, a quantitative and qualitative research approach will be adopted. All the constructs in this research will be measured using a questionnaire survey and interview. The collected data will be tested empirically using regression, correlation, confirmatory factor analysis and text/content analysis.
5 Facility management and organisational response to users’ feedback
The main function of services organizations is to provide acceptable service to their customers. When a customer purchases a product or service, if the item is faulty or not to the buyer’s satisfaction, a complaint arises. How the organization handles or respond
340. 341.

42nd AUBEA Conference 2018: Educating Building Professionals for the Future in the Globalised World
to the customer complaint will determine whether the customer will continue to patronizethem. The construction industry product or good is the built facilities and the end-users are the customers. Facility users are the most prone to the impacts of dysfunctional facilities. Specifically, POE is a strategic measurement of customer satisfaction (Amaratunga, Baldry, and Sarshar, 2000), and can be employed to gather occupant complaints (Goins and Moezzi, 2013). Additionally, the FM literature suggests the efficacy of customers complains response as an added value to FM organizational effectiveness (Amaratunga et al., 2000; Goins and Moezzi, 2013; Koleoso et al., 2017).Unfortunately, facilities users’ feedbacks through traditional POE have not been given much attention or used to inform future design (Göçer, Hua, and Göçer, 2015).
The impact of organisational responses to complaints on post-complaint customer behaviour is paramount for FM organizational excellence. According to Davidow (2003),post-complaint consumer behaviour such as repurchase intentions or engagement in word-of-mouth can be affected by how organizations respond to complaints.Complainants in the real sense expect compensation (atonement) such as refund, free gift,and replacement by the organization relative to the dissatisfaction they experienced (Karatepe, 2006). Invariably, the context of FM services may be a little different because of the nature of product or services rendered. A synthesis of previous studies shows thatbasic organizational response to complaints, viewed as an appropriate complaint management process consists of attentiveness, efforts, timeliness (promptness),facilitation, redress (atonement), apology and credibility (explanation) (Davidow, 2000; Davidow, 2003; Karatepe, 2006; Stauss, 2002). The details are discussed below.
4.1 Timeliness (Promptness): Timeliness is the speed or time taken an organization to respond to or handle a customer complaint. This can be described as responsiveness in service quality delivery. The finding of Davidow (2000) indicates that timeliness had a positive significant influence on satisfaction and word of mouth valence. According to Karatepe (2006), customers expectation is a swiftly organizational response to their complaints. In addition, promptness has a stronger impact on customers’ perceptions of procedural justice than facilitation (Karatepe, 2006). Furthermore, speed had a positive impact on delight with the complaint handling, but no impact on the dissatisfaction of complaint handling (Estelami, 2000). This indicates that FM organization should endeavour to respond faster to users’ complaints and be proactive in nature. These findings prompt the following propositions:
P 1. Promptness of FM organizational response to feedback is positively related to the end user’s satisfaction with the feedback handling.
P 2: Promptness of FM organizational response to feedback, is positively related to the end user’s intended space retention and utilization.
P 3: Promptness of FM organisational response to feedback, is positively related to end-user’s word-of-mouth activity.
4.2 Facilitation: Facilitation is the policies, procedures, and structure that an organization has in place to support customers engagement in complaints and communications (Davidow, 2003). Accordingly, facilitation enables dissatisfied customers to voice their complaints to the organization (Karatepe, 2006). However, facilitation may encourage complainants to be heard, but it does not determine a satisfactory outcome (Davidow, 2000). Davidow (2000) found that facilitation has no significant impact on post-complaint customer behaviour. However, Nyer (2000) stated the level of consumer satisfaction can be increased if there is a communicative channel where dissatisfied customers can express
42nd AUBEA Conference 2018: Educating Building Professionals for the Future in the Globalised World
their feeling and opinions (i.e. complain). Therefore, the following propositions are developed:
P 4: The higher the perceived level of FM organizational facilitation, the higher the enduser’s satisfaction with the feedback handling.
P 5: The higher the perceived level of FM organizational facilitation, the higher the endusers intended space retention and utilization.
P 6: The higher the perceived level of FM organizational facilitation, the more positive the end user’s word-of-mouth activity.
4.3 Redress (atonement): This is the response outcome that a user receives from the organization in response to a complaint (Davidow, 2003). Actually, the customer will evaluate the organizational response in relation to the final outcome in view of the actual problems encountered (Davidow, 2000). Redress is believed to be the most valued feedback response (Einwiller and Steilen, 2015). Organizations sometimes provide atonement in the form of a corrective measure which has a positive significant impact on complaint satisfaction (Einwiller and Steilen, 2015). FM organization redress on negative feedback or complaint is majorly addressed with corrective action. Based on the findings, the following propositions are developed:
P 7: The higher the perceived level of redress, the higher the end user’s satisfaction with the feedback handling.
P 8: There is a positive relationship between a perceived level of redress and end-users intended space retention and utilization.
P 9: There is a positive relationship between a perceived level of redress and end-usersword-of-mouth activity.
4.4 Apology: Apology is an acknowledgment by the organization to the complainant’s request or distress. Accordingly, an apology can also be seen as a psychological compensation (Davidow, 2000). Furthermore, an apology has a positive significant relationship with word of mouth valence, no impact on satisfaction and a negative influence on repurchase intentions. Contrarily, expressing regret or apology is non-effective (Einwiller and Steilen, 2015). Einwiller and Steilen (2015) suggested that regret and apology are expected responses to complaints. Complainants receiving a compliment or “thank you” have a positive effect on complaint satisfaction (Einwiller and Steilen, 2015). This prompts the proposition that:
P 10: There is a positive relationship between the perceived sincerity of apology and end-user satisfaction with the feedback handling.
P 11: There is a positive relationship between the perceived sincerity of apology and end-users intended space retention and utilization.
P 12: There is a positive relationship between the perceived sincerity of apology and end-users word-of-mouth activity.
4.5 Credibility (explanation): This is the ability or willingness of the organization to be able to give an account or explanation for the problem or failure that cause users complaints. As reported by Davidow (2000), credibility has a significant influence on satisfaction, repurchase intentions, and word of mouth valence. Einwiller and Steilen (2015) finding shows that complainants are less concern with explanations. In view of the stated facts, the following propositions are proposed:
342. 343.
42nd AUBEA Conference 2018: Educating Building Professionals for the Future in the Globalised World
P 13: The higher the perceived level of explanation, the higher the end user’s satisfaction with complaint handling.
P 14: The higher the perceived level of explanation, the higher the end user’s intended space retention and utilization.
P 15: The higher the perceived level of explanation, the higher the end user’s word-of -mouth activity.
4.6 Attentiveness: Attentiveness is the interaction and relationship established between the organization representative and the customer via communication (Davidow, 2003). A study shows that attentiveness is the most important dimension having the highest impact on satisfaction and repurchase (Davidow, 2000). Einwiller and Steilen (2015) grouped regret, inquiring further information, understanding, and gratitude as organizational attentiveness. They attested that complainants were dissatisfied from been asked further information or the organization’s understanding of their unfortunate situation (Einwiller and Steilen, 2015). This prompts the proposition that:
P 16: FM attentiveness to user’s feedback is positively related to the end user’s satisfaction with the feedback handling.
P 17: The higher the perceived level of FM attentiveness, the higher the end user’s intended space retention and utilization.
P 18: FM attentiveness to user’s feedback is positively related to the end-user’s word-of-mouth activity.
4.7 Effort: Effort the amount of energy expended to accomplish a task. Accordingly,Karatepe (2006) stated that effort can be conceptualized as the amount of positive energy channel to service failures recovery by the frontline employees. Karatepe (2006) found that effort is positively related to complainants’ perceptions of interactional justice. In addition, effort exert stronger influences on customers’ perceptions of interactional justice than those of apology and explanation (Karatepe, 2006). Interpersonal effort displayed by organization’s front desk personnel appear to have a key role on customers’ perception of interactional justice (Karatepe, 2006).
Based on the findings, the following propositions are developed:
P 19: The extend of FM desk help effort to resolved user’s complaints is positively related to end-user’s satisfaction.
P 20: The extend of FM desk help effort to resolved user’s complaints is positively related to user’s intended space retention and utilisation.
P 21: The extend of FM desk help effort to resolved user’s complaints is positively related to user’s word-of-mouth activity.
4.8 Satisfaction: Satisfaction is the user’s overall effective feeling about the FM organization ways of handling their feedback. Users satisfaction would be influence by FM response as in timeliness, facilitation, redress, apology, credibility, which have been mentioned and hypothesis above. Satisfaction was found to have a positive relationship with repurchase intention and word-of-mouth (Davidow, 2000). That means satisfaction with a space by a user can lead to a positive spread of word that encourage other users to utilize the same space. User’s satisfaction would also encourage the intention of a user to retain his/her space.
42nd AUBEA Conference 2018: Educating Building Professionals for the Future in the Globalised World
P 22: Satisfaction with feedback handling will have a positive relationship with users’ word-of-mouth.P 23: Satisfaction with feedback handling will have a positive relationship with the users’ intention to retain and utilized space.
4.9 Word-of-mouth: According to Davidow (2000) in marketing, word -of-mouth activity is an important variable. Kwun, Ellyn, and Choi(2013) study the impact of campus foodservice attributes on customer satisfaction, image, and word-of-mouth. From the study users satisfaction culminate into word-of-mouth. Therefore, if end-users are not satisfied with a product or service, they could exhibit a behaviour that negates the image of the service provider. This could lead to an intention not to patronized the provider anymore and discouragement of other users too. Satisfaction was found to have a positive relationship with word-of-mouth valence (Davidow, 2000).
P 24: Word-of-mouth will have a positive relationship with an intention for space retention and utilization.
Based on the developed propositions, this research developed the proposed detailed model indicating the relationship between each construct (see Figure 1). Figure 1 shows the detailed proposed model of FM organizational response to post-occupancy feedback from users.
344. 345.

42nd AUBEA Conference 2018: Educating Building Professionals for the Future in the Globalised World
6 Discussion of findings and future research
This study seeks to extend the previous research work (see Campbell and Finch, 2004)on finding the mediating constructs that mediate the relationships between users’ satisfaction and organizational response to feedback (compliments/complaints) within the FM context. Additionally, it extends the study of Goins and Moezzi (2013) to establish the relationship between complaint handling and facility performance. Moreover, there is no study yet that investigate the relationship between organizational response to complaints constructs and users’ satisfaction evaluation in FM literature. Therefore, this study is expected to channel a new direction of outcome from the perspective of the implication of establishing an empirical relationship between FM organizational complaint handling and users’ satisfaction evaluation. The propositions would be tested qualitatively and quantitatively. A questionnaire survey would be conducted to collect HE facilities end-users perception of FM team respond to their complaints and how it is handled. Due to the dearth of literature in FM in relation to the subject matter, an interview would also be conducted to gather real-life scenerio of the FM-users relationship in the study area. The findings of this study will assist facility managers to reposition themselves from their adversarial approach to a proactive approach in users’ feedback management.Users’ feedback will extend the purpose of each building component to meet users’ satisfaction and assist FM personnel to understand better the users’ needs.
This paper suggests for future study to adopt the statistical testing for the proposed model on the relationship between FM organisational response and users satisfaction; and other constructs such as interactive justice, distributive justice, procedural justice, FM performance, FM knowledge management, and complaints channels (questionnaire, face to face, memo, telephone, mobile applications, building information modelling). The aim is to provide a further understanding of the of different interrelationship that may influence FM organizational response to feedback and users satisfaction.
7 Conclusions
The present study presents a framework for modeling FM organizational response to users’ post-occupancy feedback. The framework indicates that there is a possible relationship between FM organizational complaints handling and users’ satisfaction, word of mouth activities and loyalty. The FM organizational complaints response identified are promptness, facilitation, redress, apology, explanation, attentiveness and effort. Previous studies have established that these organizational complaints response factors have significant impacts on customers behaviour and satisfaction. Nevertheless, these facts have not yet been established in FM and facililties end-users relationship context. To further this study, a quantitative and qualitative research approach will be adopted.The findings of the study will compare FM services to other service organizations in previous studies. This may reveal the specific context of FM services and products to end-users as customers, in relation to complaints handling. The results of the future analysis will be reviewed to confirm if the model is consistent with the discussion in the previous literature. In addition, there is a need to extend this proposed model to test various FM functions to reveal users satisfaction with how their feedbacks are handle. This will facilitate improvement in FM services and performance.
42nd AUBEA Conference 2018: Educating Building Professionals for the Future in the Globalised World
8 Acknowledgement
I want to express my appreciation to the management of Lagos State Polytechnic and Tertiary Education Trust Fund (TetFund) in Nigeria for their funding contribution toward my Ph.D. study in University of New South Wales, Australia.
9 References
Abisuga, A. O., Famakin, I. O. and Oshodi, O. S. (2016), ‘Educational building conditions and the health of users’, Construction Economics and Building, 16(4). doi: 10.5130/AJCEB.v%25vi%25i.4979.
Amaratunga, D. and Baldry, D. (2003), ‘A conceptual framework to measure facilities management performance’, Property Management, 21(2), pp. 171–189.
Amaratunga, D., Baldry, D. and Sarshar, M. (2000), ‘Performance evaluation in facilities management : using the balance score card approach’, COBRA 2000 Conference, (July 2015), pp. 1–15.
Amaratunga, R. (2000), ‘Assessment of facilities management performance’, Facilities, 18, pp. 258–266.
Baird, G. and Dykes, C. (2012), ‘The potential for the use of the occupants’ comments in the analysis and prediction of building performance’, Buildings, 2, pp. 33–42.
Campbell, L. and Finch, E. (2004), ‘Customer satisfaction and organisational justice’, Facilities,22(7/8), pp. 178–189.
Davidow, M. (2000), ‘The bottom line impact of organizational responses to customer complaints’, Journal of Hospitality & Tourism Research, 24(4), pp. 473–490.
Davidow, M. (2003) ‘Organizational responses to customer complaints: what works and what doesn’t’, Journal of Service Research, 5(3), pp. 225–250.
Douglas, J. (1996), ‘Building performance and its relevance to facilities management’, Facilities, 14(3/4), pp. 23–32.
Douglas, J., Douglas, A. and Barnes, B. (2006), ‘Measuring student satisfaction at a UK university’, Quality Assurance in Education, 14(3), pp. 251–267.
Duyar, I. (2010), ‘Relationship between school facility conditions and the delivery of instruction’, Journal of Facilities Management, 8(1), pp. 8–25.
Einwiller, S. A. and Steilen, S. (2015), ‘Handling complaints on social network sites - An analysis of complaints and complaint responses on Facebook and Twitter pages of large US companies’, Public Relations Review, 41(2), pp. 195–204.
Eley, J. (2001), ‘How do post-occupancy evaluation and the facilities manager meet?’, Building Research & Information, 29(2), pp. 164–167.
Estelami, H. (2000), ‘Competitive and procedural determinants of delight and disappointment in consumer complaint outcomes’, Journal of Service Research, 2(3), pp. 285–300.
Falagas, M. E., Pitsouni, E.I., Malietzis, G.A. and Pappas, G. (2008), ‘Comparison of PubMed , Scopus , Web of Science , and Google Scholar : strengths and weaknesses’, The FASEB Journal, 22, pp. 338–342.
Göçer, Ö., Hua, Y. and Göçer, K. (2015), ‘Completing the missing link in building design process: Enhancing post-occupancy evaluation method for effective feedback for building performance’, Building and Environment, 89, pp. 14–27.
Goins, J. and Moezzi, M. (2013), ‘Linking occupant complaints to building performance’, Building Research and Information, 41, pp. 361–372.
346. 347.

42nd AUBEA Conference 2018: Educating Building Professionals for the Future in the Globalised World
Hanssen, T.-E. S. and Solvoll, G. (2015), ‘The importance of university facilities for student satisfaction at a Norwegian University’, Facilities, 33(13/14), pp. 744–759.
Karatepe, O. M. (2006), ‘Customer complaints and organizational responses: The effects of complainants’ perceptions of justice on satisfaction and loyalty’, International Journal of Hospitality Management, 25(1), pp. 69–90.
Kärnä, S., Julin, P. and Nenonen, S. (2013), ‘User satisfaction on a university campus by students and staff’, Intelligent Buildings International, 5(2), pp. 69–82.
Kim, T. W., Cha, S. H. and Kim, Y. (2016), ‘Space choice, rejection and satisfaction inuniversity campus’, Indoor and Built Environment, in press(0), pp. 1–11.
Kok, H. B., Mobach, M. P. and Omta, O. S. (2011), ‘The added value of facility management in the educational environment’, Journal of Facilities Management, 9(4), pp. 249–265.
Koleoso, H. A., Omirin, M. and Adewunmi, Y. A. (2017), ‘Performance measurement scale for facilities management service in Lagos-Nigeria’, Journal of Facilities Management, 15(2).
Kwun, D. J.-W., Ellyn, E. and Choi, Y. (2013), ‘Campus foodservice attributes and their effects on customer satisfaction, image, and word-of-mouth’, Journal of Foodservice Business Research, 16(3), pp. 276–297.
Lavy, S. (2008), ‘Facility management practices in higher education buildings : A case study’, Journal of Facilities Management, 6(4), pp. 303–315.
Lehtonen, T. (2004), ‘Attributes and success factors of partnering relations – a theoretical framework for facility services’, Nordic Journal of Surveying and Real Estate Research, 2, pp. 31–46.
Lehtonen, T. (2006), ‘Collaborative relationships in facility services’, Leadership & Organization Development Journal, 27(6), pp. 449–464.
Mustafa, F. A. (2017), ‘Performance assessment of buildings via post-occupancy evaluation: A case study of the building of the architecture and software engineering departments in Salahaddin University-Erbil, Iraq’, Frontiers of Architectural Research, doi: 10.1016/j.foar.2017.06.004.
Najib, N. ‘Ulyani M., Yusof, N. A. and Abidin, N. Z. (2013), ‘Student residential satisfaction in research universities’, Journal of Facilities Management, 9(3), pp. 200–212.
Nyer, P. U. (2000), ‘An investigation into whether complaining can cause increased consumer satisfaction’, Journal of Consumer Marketing, 17(1), pp. 9–19.
Preiser, W. F. E. (1995), ‘Post-occupancy evaluation: how to make buildings work better’, Facilities, 13(11), pp. 19–28.
Rowley, J. and Slack, F. (2004), ‘Conducting a Literature Review: MRN’, Management Research News, 27(6), pp. 30–39.
Stauss, B. (2002), ‘The dimensions of complaint satisfaction: process and outcome complaint satisfaction versus cold fact and warm act complaint satisfaction’, Managing Service Quality, 12(3), pp. 173–183.
Webster, J. and Watson, R. T. (2002), ‘Analyzing the Past to Prepare for the Future : Writing a Literature Review’, MIS Quarterly, 26(2), pp. xiii–xxiii.
Zairi, M. (2000), ‘Managing customer satisfaction: a best practice perspective’, The TQM Magazine, 12(6), pp. 389–394.
42nd AUBEA Conference 2018: Educating Building Professionals for the Future in the Globalised World
Embedding users in collaborative FM practice for sustainable post occupancy evaluation of higher educational buildings
Olatunji Abisuga1, Imriyas Kamardeen2 and Changxin Wang3
1,2&3Faculty of Built Environment, University of New South Wales,Sydney, 2052, NSW, AUSTRALIA
E-mails: [email protected]; [email protected]; [email protected]
Abstract:Facility management (FM) relationship with users and client organizations has been said to be adversarial in nature. For FM to be able to successfully capture post occupancy information of massive constructed facilities the perceptions of the users are paramount. This necessitates the need for a collaborative practice between FM and the users to foster an effective two-ways communication for a sustainable post-occupancy evaluation (POE) of higher educational (HE) buildings. This study proposed an integrated collaborative FM for post-occupancy evaluation (ICFM-POE) framework for HE buildings. The framework is based on activity theory (AT). This study adopted an exploratory literature review ofidentified factors essential to achieving the ICFM-POE framework. The findings of this study indicate that as a rule, collaboration attributes such as trust, willingness to collaborate and openness in communication are vital to foster a mutual relationship between the FM team and the users. A mobile application is also identified as an FM tool that can facilitate a proactive two-way information sharing between users and FM team during POE activity. The implementation of the framework would foster a sustainable POE protocols and stakeholders’ participation in decision making that would improve existing facilities and future design. Further study needs to be conducted to validate the ICFM-POE framework.
Keywords: Activity theory, collaborative FM, facility management, post occupancy evaluation, users.
1 Introduction
A building generally accommodates human and support their indoor activities. According to Douglas (1996), buildings have three primary functions i.e. to provide enclosure, protection, privacy and climate exposure barrier. Moreover, users expect the building they occupy to meet some performance criteria that match their needs. It can be suggested that there is an interaction between the users and the building they occupy (Goins and Moezzi, 2013). These interactions cannot be overestimated or ignored. Tellingly, there are anecdotal shred of evidences that higher educational (HE) buildings’ facilities affect users’ behaviour (Leung and Fung, 2005), health (Abisuga, et al., 2016),performance (Issa, et al., 2011) and satisfaction (Sawyerr and Yusof, 2013). Therefore, meeting HE buildings end-user requirement is paramount. Unfortunately, HE buildings users’ requirements are diverse and change over time (Price et al., 2003). This makes meeting users’ needs a difficult task for facility managers (Kamarazaly, 2014).
Facility managers could receive information on how facilities performance match users’ expectation, most time through POE and complaint voicing. According to Zimmerman and Martin (2001), POE is the logical process feedback loop, where lessons learned from
348. 349.

42nd AUBEA Conference 2018: Educating Building Professionals for the Future in the Globalised World
end-users’ experience is utilized to inform continuous improvement and future design. POE focuses on the requirements of building users such as aesthetic quality, health, safety, psychological comfort, security functionality and efficiency, and satisfaction (Preiser, 2002). The performance of buildings in-use should support users’ functions and a misfit from this could generate users’ dissatisfaction. Expression of users’ dis/satisfactions via comments or complaints can be utilized to predict and improve building performance (Baird and Dykes, 2012; Goins and Moezzi, 2013). Based on these attestations, there is a need for facility managers to actively involve users in POE protocols and decision making.
One of the primary FM function is to integrate the workplace and the users together for effectiveness and productivity. Therefore, users need to communicate with FM about their interactions with their workplace facilities and how it affects their productivity. Unfortunately, FM relationship with users and client organizations has been said to be adversarial in nature (Lehtonen, 2006), which as culminate to poor quality information for FM decision making (Jylhä and Suvanto, 2015). Recently, the focus on collaborative FM practice is increasing (Lehtonen, 2006; Mohd-Noor and Pitt, 2009; Weerasinghe and Sandanayake, 2017). Collaboration is the mutual co-existence between a group of people to share common goals. Collaborative facility services are the FM functions and information that can be shared within an organisation(s). To achieve a sustainable POE of the constructed facilities, end-users involvement is paramount (Preiser, 2002).Therefore, there is a need to investigate what are the factors that can encourage users’ participation in a proactive POE practice in collaboration with the FM organization. Hence, this study seeks to explore the necessary factors that can foster users’ participation in HE buildings POE activities. To achieve this aim, activity theory (AT) is adopted to establish the units of analysis in POE protocol. The units of analysis provide an insight into the interactions within the POE activity system, and what are the necessary issues that need to be addressed to embed users into a collaborative FM practice. The outcome of the study is targeted to foster a mutual relationship between FM and users.
2 Collaborative facility services
Collaboration is the agreement of oneness between diverse people within a system or systems to share common goal and achievement. According to Mattessich and Monsey (1992, pp. 11), “collaboration is a mutually beneficial and well-defined relationship entered into by two or more organizations to achieve common goals”. However, prior FM practices have experienced poor communication and deficiencies in service management (Lehtonen, 2006). This has resulted in the need to improve the collaborative efforts of FM with other stakeholders in the constructed environment. Collaborative facility services are FM functions that may be shared within an organization or organizations (Weerasinghe and Sandanayake, 2017). Weerasinghe and Sandanayake (2017) identified engineering and consultancy services, maintenance services, housekeeping services, pest control services, security service, waste management systems, vehicle fleet management, energy management, facilities inventory supply services, health and safety management, corporate level facilities, facilities quality assurance and building performance evaluation as FM services that can be collaboratively executed. Hence, building performance evaluation (i.e. POE) can be collaboratively managed within an organization involving the users and FM.
42nd AUBEA Conference 2018: Educating Building Professionals for the Future in the Globalised World
3 The concept of activity theory and its applications
AT model was initially formulated for describing human behaviour. With the AT model, human activity can be modelled and framed by the triadic relationship between a subject and an object mediated by artefacts or tools (Leontyev, 1978). But the original AT triadic model was expanded on by the addition of three more elements (community, division of labour, and rules) to form a comprehensive context of human behaviour (Bertelsen and Bødker, 2003; Engestrom, 1987). This is because these three elements (subject, object,and tool) cannot be separated without violating the main purpose of human activity (Leontyev, 1978).
In construction management research, AT has been applied as a theoretical lens to analysis project complexity, interactions within actors, and the examination of artefacts/tools development and implementation in construction activities. For instance, Hartmann and Bresnen (2011) investigated the emergence of partnering in construction from AT perspective. Similarly, Gottlieb and Haugbølle (2013) view the contradiction and collaboration in partnering in the construction industry using AT concept. Mäki and Kerosuo (2015) used activity-theoretical analysis on the adoption and utilization of BIM to uncover the resultant contradiction in construction site management. Lu et al., (2018) analysed the evolutionary and contradictions in the implementation of building information modelling (BIM) in building operation and maintenance with AT model. Hence, if AT can be used to investigate BIM adoption as a new technology or tool, and also collaborative practices in construction management contexts, then there is a possibility of extending it to advance POE activities. Moreover, POE is regarded as a technology (Li, et al., 2018) and tool (Cleveland and Fisher, 2014; Riley et al., 2010; Tookaloo and Smith, 2015). In addition, POE is view from a socio-technical approach (Chiu et al., 2014; Ning and Chen, 2016), that makes POE a human activity with a technological context.
Accordingly, a conceptual framework is proposed for a collaborative FM practice for POE of higher educational buildings as shown in Figure 1. According to Figure 1, the collaborative FM activity system for POE of HE buildings comprises of Subject, Object,Rules, Community, Division of labour and Tools which are termed as activity elements.
Figure. 1 Proposed collaborative FM approach to POE of HE buildings activity
350. 351.

42nd AUBEA Conference 2018: Educating Building Professionals for the Future in the Globalised World
The conceptual framework gives more details the unit of analysis that can be investigated during POE procedures. The explanation of each element is as follow:
I. Subject: The subject is the person or the people under study. The subject in relation to higher educational building POE is the users (students and staff). They are the ones directly affected by the facility performance when conducting their day-to-day activities. The subjects are the people that conduct the POE of the building facilities according to the level of their satisfaction. The focal point of studying the activity is the subject (Kain and Wardle, 2004).
II. Object: The object is the activity to be done or the intended activity. Concerning the current investigation, the object is the HE building to be evaluated.
III. Community: The community comprises groups of activities and teams of workers within the POE activity system. It is also seen as the larger group in which the subject is inclusive and which respondents express their view (Kain and Wardle, 2004). According to Kain and Wardle (1997), the community’s needs to determine the activity and they divided the work required to achieve their objectives. For this study, the community comprises of the users, FM organization, design and construction team, and other service vendors.
IV. Tools: This is the mediator by which the action or activity is performed. Tools or artefacts that may be in the form of signs, language, machines, and computer. Mostly, it is more of technology adoption as related to this study in performing facilities performance evaluation. The traditional POE tools for data collection or investigation are the questionnaire, interview, observation/walkthrough, these are users based approach. The expert based approach comprises the adoption of information communication technology (ICT) devices such as building information modelling (BIM), sensors, mobile applications etc.
V. Division of labour: The division of labour (DoL) is the way to distribute work or responsibility related to POE among the stakeholders within the community. The expected DoL among the community is users’ complaints / feedbacks on facilities performance and FM complaints handling. The management of the facilities is the sole duty of the FM department. Therefore, it is the responsibility of the students and staff to express how the facilities meet their requirements and support their daily activities.
VI. Rules: Rules are the sets of requirements that assist to decide how and why a person may act in a pattern of social conditions (Kain and Wardle, 2004). It is the guidelines that form or check the activity of the community. Some of the rules for POE activity system are facility performance indicators, design standards and regulations, procedures for evaluation of quality and educational spaces, users’ guidelines and instructions, university FM policy and practice.
VII. Outcomes: These are the results of the POE based on the users’ perception of how the facilities meet their needs in the learning environment. Additionally, the expected outcomes are to improve facility performance, collaborative FM practice and increase users’ satisfaction. The outcomes are believed to be ongoing (Kain and Wardle, 2004). Hence, there is a need for continuous POE of educational facilities.
VIII. Motives: Motives includes the object and outcome of the activity. The motive is to initiate a collaborative FM approach to the POE activity. This would encourage users’ participation.
42nd AUBEA Conference 2018: Educating Building Professionals for the Future in the Globalised World
4 Research method
This study is at conceptual stage and an integrated collaborative FM model is proposed for POE of HE buildings coordination based on the review of the literature. According toWebster and Watson (2002) review of literature is essential to advance knowledge and uncovers areas where research is needed. Additionally, literature review facilitates the formation of conceptual framework (Rowley and Slack, 2004). The present study focuses on how AT could be adapted to show the interactions within a collaborative FM approach to POE activity. This scope necessitated the retrieval of articles from online databases and search engines – Scopus and Google Scholar (see Falagas et al., 2008). The search keywords used for the search exercise were; ‘collaboration’, ‘collaborative FM’, ‘facility management’, ‘higher education buildings’, and ‘post-occupancy evaluation’. Articles published in conference proceedings and journals were the publications considered for this study. Collaborative attributes and success factors that need to exist between users and FM team were identified from the literature, and are adopted in the framework. In addition, content analysis of POE of HE buildings researches was conducted to extract various stakeholders considered. Furthermore, the essential tools for collaborative POE coordination was also explored. The extracted concepts are used for the formation of the proposed ICFM-POE framework.
5 Discussion of findings and Conclusions
5.1 The Subject and the Community involvement in post occupancy evaluation
There is a vital need for stakeholders’ involvement in facilities management of higher educational buildings evaluation. Despite this, studies have shown that most time users’ perception is not considered during the design and management of higher educational buildings (Adewunmi et al., 2011; Germany, 2014). This scenario indicates that collaborative decision-making practice in educational facilities management is low.However, the level of awareness of the need for a collaborative practice in learning space management is on the increase. Oblinger (2005) suggested that the management, teaching staff, students at all levels, design and construction teams, information technology personnel, librarians, and teaching and learning support staff should all be at the table during the design phase of learning space project. In support of this, Radcliffe (2008)shows the teams that were involved in the Next Generation Learning Spaces (NGLS) Project at University of Queensland, Australia, which includes learners, teachers, learning support staff, administrators and design and technology professionals at the university and nationally. Additionally, during the Project Hub undertaken in Swinburne University of Technology, Australia, the stakeholders identified were students, academics, the librarians, management and services departments (Lee, 2008). Furthermore, Lehtonen (2006) attest that to achieve success in business, the users’ perspective is a vital collaborative success factor for FM. Hence, the involvement of the faculty in learning space design, construction or renovation is paramount (Lippincott, 2009). Therefore, there should be a collaborative effort between the identified stakeholders in HE buildings evaluation (see Table 1). Nevertheless, how can collaboration between the end-users and FM be fostered? This necessitates the need to examine the collaborative relationship that exists between users and FM organization and proffer strategies to improve it. The next section presents key attributes of collaborative relationships and how could they be usedto improve the POE process.
352. 353.
42nd AUBEA Conference 2018: Educating Building Professionals for the Future in the Globalised World
Table 1. Identified stakeholders in educational buildings evaluationStakeholders Author(s)
Institution management Lee (2008); Oblinger (2005); Radcliffe (2008)Teaching staff Lippincott (2009); Oblinger (2005); Radcliffe (2008)
Students Lee (2008); Oblinger (2005); Radcliffe (2008)Design and construction team Oblinger (2005); Radcliffe (2008)
Librarians Lee (2008); Oblinger (2005); Radcliffe (2008)Information technology personnel Oblinger (2005); Radcliffe (2008)
Support staff Oblinger (2005); Radcliffe (2008)Services department (FM) Lee (2008); Oblinger (2005);
5.2 The Rules as attributes of collaborative facility management services
Collaborative practice cannot be achieved without a mutual relationship effort among the stakeholders involved. Accordingly, collaborative effort is an expression of the partnering relation ( Lehtonen, 2004). Lehtonen (2004; 2006) examined the attributes and success factors of a collaborative relationship in facility services. Lehtonen (2004) and Lehtonen (2006) stated that the attributes of collaborative facility services include commitment, continuous development, a participation of different organization levels, mutual trust, openness and promise of mutual benefits. Furthermore, the success factors of facility service collaborative relationship are two-way information-sharing, clearly-defined goal, mutual participation in relationship development and planning, mutually-agreed goals and joint problem-solving (Lehtonen, 2004). Collaborative success factors have been well researched in public management and professional practice. For instance, Mattessich and Monsey (1992) classified collaboration success factors into six categories namely (1) Environment (2) Membership (3) Communications (4) Process/Structure (5) Purpose and (6) Resources. Huxham (2003) identified trust, membership structure and leadership (policy) as the collaborative success factors. In a similar study, the determinants of a successful collaboration were grouped into three categories namely (1) System determinants i.e. social system, cultural system, professional system and educational system (2) Organisational determinants i.e. organisational structure, organisational philosophy, administrative support, team resources, coordination and communication mechanisms (3) Interactional determinants i.e. willingness to collaborate, trust, communication and mutual respect (San Martín-Rodríguez et al., 2005). Table 2 shows the collaborative attributes and success factors that are examined in relation to POE of HE buildings in the current study. The next section presents tools that could fostercollaborative relationships and how could they be used to improve the POE process.
Table 2. Factors influencing collaborative practice for post occupancy evaluation of HE buildings.
Author(s) Attributes Factors influencing collaborative FM-POE practice
Systemic determinantShen et al., (2010) Systems integration Fragmentation in communication flow/feedback
among stakeholdersMattessich and Monsey
(1992)Regulation/standard Awareness of facilities performance standard
ratingMattessich and Monsey
(1992)Self-
interest/compromiseDiversity of users’ needs
Organisational determinantsMattessich and Monsey
(1992)Policy guidelines Provision of FM policy guideline for POE and
users’ rolesPatel et al. (2012) Skills FM team are skilful in handling users’ feedback
42nd AUBEA Conference 2018: Educating Building Professionals for the Future in the Globalised World
Patel et al., (2012),Heimbürger and Dietrich
(2012)
Incentive/reward Administrative support and incentive to motivate user participation
Mattessich and Monsey (1992)
Openness Climate of openness in communication of POE feedback
Mattessich and Monsey (1992)
Coordinationmechanism/tool
Provision of appropriate POE feedbacks coordination mechanism and tools
Heimbürger and Dietrich (2012), Mattessich and
Monsey (1992)
Training User training and development in facilities operation
Mattessich and Monsey (1992)
Joint decision making Involvement of users in FM decision making
Interactional determinantsLehtonen (2006),
Mattessich and Monsey (1992), Heimbürger and
Dietrich (2012)
Willingness Willingness to collaborate between users and FM
Patel et al., (2012),Mattessich and Monsey
(1992),Xue et al. (2010)
Trust Existence of mutual trust between users and FM
Mattessich and Monsey (1992)
Respect FM accordance of respect to users’ needs
Mattessich and Monsey (1992)
Two-way sharing of information
Existence of proactive communication between users and FM
5.3 The Tools for collaborative FM for post occupancy evaluation coordination
Technology development and integration can facilitate collaboration relationship, and improve the efficiency of the FM process. According to Patel, et al., (2012), technologies support collaboration when people are co-located, separated by distance and time. Technologies such as conferencing, email, knowledge management tools, and schedulingtools can support a collaborative effort by aiding communication and coordination among team members in different locations, organizational and time zone (Patel et al., 2012). The tools that should be adopted to integrate users with FM should be able to effectively collect information from the users (Tolman and Parkkila, 2009). Actually, users’ complaint can be voiced through telephone, face to face, email, work order system, social media and memos in retail and service organizations (Dalton et al., 2013, Mattila and Wirtz, 2004, Goins and Moezzi, 2013) as shown in Table 3. In addition, the concept of socioBIM was proposed to host the participation of users/public in POE of buildings (Grover, Li, andFroese, 2015; Shoolestani, Shoolestani, Froese, and Vanier, 2015). For POE, the tool to be adopted should foster two-way communication between the stakeholders in real-time, since the Subject uses the tool to mediate with the Object. Nevertheless, mobile technology is believed to be of prominent potential for FM in POE coordination (Tolman et al., 2009).Mobile application has been adopted for information sharing within stakeholders in the architecture engineering construction operation (AECO) industry (Bowden, Dorr, Thorpe, and Anumba, 2006; Lin, Cheung, and Siao, 2014). In the area of building operation mobile application, most integrated with BIM technology has been employed to tackled maintenance (Lin and Su, 2013; Stefan Bankosz and Kerins, 2014) and facility management (Gheisari and Irizarry, 2016; Kim, Lim, Kim, and Kim, 2013) tasks. Mobile applications adopted in all previous studies focused on the construction professional interaction. However, application of mobile technology to POE has not been investigated. This study seeks to investigate how two-way sharing of POE information between the users and FM can be achieved using a mobile application.
354. 355.

42nd AUBEA Conference 2018: Educating Building Professionals for the Future in the Globalised World
Table 3. Tools for post occupancy complaint reporting/ evaluationComplaint/POE reporting channels Author(s)
Email Goins and Moezzi (2013)Memo Goins and Moezzi (2013)Face to face Goins and Moezzi (2013)Questionnaire Preiser (1995)Interview/focus group Preiser (1995)Telephone Goins and Moezzi (2013)Work order system Goins and Moezzi (2013)Social media (POE 2.0) Dalton et al., (2013)SocioBIM Shoolestani et al., (2015), Grover, Li and Froese,
(2015)Mobile-based POE application Proposed
The current study proposed an integrated collaborative FM framework for POE of HE buildings. The POE coordination is a view from the concept of AT. The AT concept indicates the interactions between the actors and their environment in which they operate, with the tool/ artefact they adopted to mediate with their environment. According to the proposed ICFM-POE framework (see Figure 1) the elements that are needful for an effective collaborative effort are paramount for the execution of a sustainable POE in HE.
i. The actors as the Subject and the Community comprises the individuals that influence the system. These individuals that need to contribute to POE of HE buildings as listed in Table 1 should be encouraged to participate. This is vital because the users are directly in day to day interaction with the facilities provided and they experienced how its affect their daily life. They would be in the best position to relate the functionality and performance of the facilities and how it can be improved to match their needs. But users’ participation needs to be motivated and sustain with some elemental policies and rules as explained below.
ii. The Rules indicates the policy, regulations or conditions that governed the activity system. Therefore, embedding users into a collaborative FM practice for POE activity, collaborative rules need to be embraced. These rules are collaborative attributes and success factors that can support a collaborative relationship. The Rules according to the findings of this study are grouped into three categories as systemic, organisation, and interaction determinants (see Table 2). Tellingly, trust, mutual respect, openness in communication and willingness to collaborate should exist between the users and the FM team before sustainable collaborative efforts can be achieved. This is supported by Durugbo (2014) that argued that coordinating information for collaborative networks requires open door policies. Furthermore, the resolution of issues such as users’ self-interest and ability to compromise can foster collaboration during POE activity. Awareness and knowledge of how facilities functions and its operational details can possibly improve POE coordination. This can be achieved through training of both users and FM personnel.
iii. Furthermore, human activity is not complete without a mediating tool. For a sustainable POE to be maintained, a tool that can foster a collaborative platform forcommunication is vital. It is a known fact that communication is one of the factors that influence collaboration success (Mattessich and Monsey, 1992). Collaborativepractice involve frequent interaction, continuous updating, openness, circulation of all vital information between all stakeholders (Mattessich and Monsey, 1992). Based on this, the present study identified a mobile application as a mediating tool for effective communication links within the stakeholders to foster proper cohesion and decision making. Suggestively, due to human mobility a static tool or communication platform
42nd AUBEA Conference 2018: Educating Building Professionals for the Future in the Globalised World
maybe constrain to support effective POE functions. A user-centred configured mobile application should support stakeholders’ participation in facilities performance complaints voicing and POE practice in HE environment. This will complement and improve the traditional POE format via questionnaire and interview.
In conclusion, the identified factors are essential for embedding users in a collaborative FM practice for sustainable POE of HE facilities. These collaborative attributes can facilitate a mutual relationship between users and the FM team. The involvement of a user in voicing feedback is vital for FM functions. But users would only be motivated to collaborate with FM team if they perceived the willingness of FM to collaborate with them.FM team should also endeavour to create a trustworthy and respectful relationship with the users. If the users know that their feedback would be well handled and responded to in improving the facilities, they will participate more. Furthermore, openness in communication between users and FM in relation to users’ needs would improve collaborative practice. Openness in communication and trust between the subject and the community stakeholders would foster the willingness to collaborate with FM. In addition, standard and regulation as FM policy (rules) that indicate the importance of users’feedback and users’ responsibilities would foster collaborative practice. Users engagement in decision making with FM, where self-interests are discussed and spirit of compromisedisplay, would encourage sharing of common goals. The motivation of users through reward and incentive from FM, for their feedback voicing, would facilitate users’participation. A collaborative effort could also be achieved when users are knowledgeableabout how facilities function and operate via training from FM. FM personnel also need skills and the know-how of the management of the facilities and the users. When users experience with a spirit of oneness exhibit by FM personnel, they would intent to cooperate. The easy of facilitation of the communication and information sharing between users and FM via mobile application provide on real-time exchange of feedbacks in acollaborative environment. All these factors have to be considered as a unit of analysis in the POE activity system and implement to embed user in a collaborative FM practice in HE. The outcome of this study will improve FM practice, facilities performance and users’ satisfaction.
6 Future research
This is an ongoing research. To further this study, a case study research will be employed, using a questionnaire survey and interview to collect data from the targeted setting. Is also essential to empirically investigate the impact of the adoption and utilization of the mobile based-POE tool. Hence, the development and utilization of a prototype mobile application to facilitate the collaborative FM-POE activity system would be investigated. The findings of the future study will be used to validate the proposed integrated collaborative FM framework for POE.
7 Acknowledgement
I want to express my appreciation to the management of Lagos State Polytechnic and Tertiary Education Trust Fund (TetFund) in Nigeria for their funding contribution toward my Ph.D. study in University of New South Wales, Australia.
356. 357.
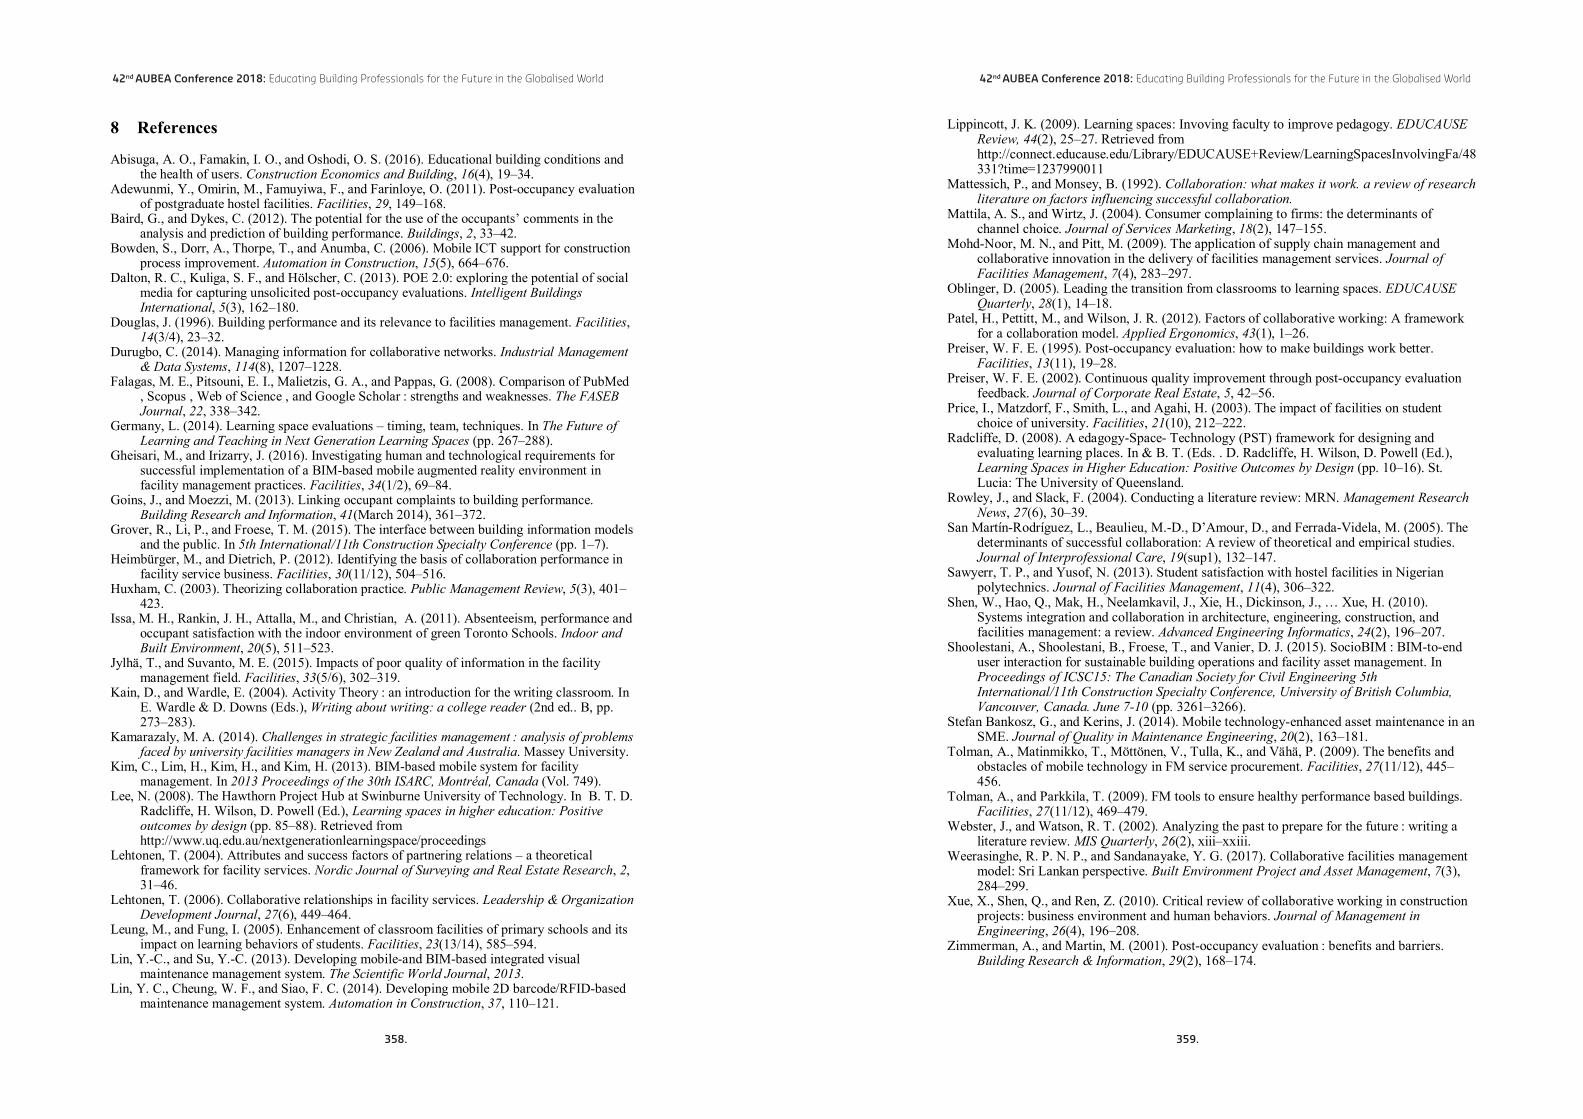
42nd AUBEA Conference 2018: Educating Building Professionals for the Future in the Globalised World
8 References
Abisuga, A. O., Famakin, I. O., and Oshodi, O. S. (2016). Educational building conditions and the health of users. Construction Economics and Building, 16(4), 19–34.
Adewunmi, Y., Omirin, M., Famuyiwa, F., and Farinloye, O. (2011). Post-occupancy evaluation of postgraduate hostel facilities. Facilities, 29, 149–168.
Baird, G., and Dykes, C. (2012). The potential for the use of the occupants’ comments in the analysis and prediction of building performance. Buildings, 2, 33–42.
Bowden, S., Dorr, A., Thorpe, T., and Anumba, C. (2006). Mobile ICT support for construction process improvement. Automation in Construction, 15(5), 664–676.
Dalton, R. C., Kuliga, S. F., and Hölscher, C. (2013). POE 2.0: exploring the potential of social media for capturing unsolicited post-occupancy evaluations. Intelligent Buildings International, 5(3), 162–180.
Douglas, J. (1996). Building performance and its relevance to facilities management. Facilities,14(3/4), 23–32.
Durugbo, C. (2014). Managing information for collaborative networks. Industrial Management & Data Systems, 114(8), 1207–1228.
Falagas, M. E., Pitsouni, E. I., Malietzis, G. A., and Pappas, G. (2008). Comparison of PubMed , Scopus , Web of Science , and Google Scholar : strengths and weaknesses. The FASEB Journal, 22, 338–342.
Germany, L. (2014). Learning space evaluations – timing, team, techniques. In The Future of Learning and Teaching in Next Generation Learning Spaces (pp. 267–288).
Gheisari, M., and Irizarry, J. (2016). Investigating human and technological requirements for successful implementation of a BIM-based mobile augmented reality environment in facility management practices. Facilities, 34(1/2), 69–84.
Goins, J., and Moezzi, M. (2013). Linking occupant complaints to building performance. Building Research and Information, 41(March 2014), 361–372.
Grover, R., Li, P., and Froese, T. M. (2015). The interface between building information models and the public. In 5th International/11th Construction Specialty Conference (pp. 1–7).
Heimbürger, M., and Dietrich, P. (2012). Identifying the basis of collaboration performance in facility service business. Facilities, 30(11/12), 504–516.
Huxham, C. (2003). Theorizing collaboration practice. Public Management Review, 5(3), 401–423.
Issa, M. H., Rankin, J. H., Attalla, M., and Christian, A. (2011). Absenteeism, performance and occupant satisfaction with the indoor environment of green Toronto Schools. Indoor and Built Environment, 20(5), 511–523.
Jylhä, T., and Suvanto, M. E. (2015). Impacts of poor quality of information in the facility management field. Facilities, 33(5/6), 302–319.
Kain, D., and Wardle, E. (2004). Activity Theory : an introduction for the writing classroom. In E. Wardle & D. Downs (Eds.), Writing about writing: a college reader (2nd ed.. B, pp. 273–283).
Kamarazaly, M. A. (2014). Challenges in strategic facilities management : analysis of problems faced by university facilities managers in New Zealand and Australia. Massey University.
Kim, C., Lim, H., Kim, H., and Kim, H. (2013). BIM-based mobile system for facility management. In 2013 Proceedings of the 30th ISARC, Montréal, Canada (Vol. 749).
Lee, N. (2008). The Hawthorn Project Hub at Swinburne University of Technology. In B. T. D. Radcliffe, H. Wilson, D. Powell (Ed.), Learning spaces in higher education: Positive outcomes by design (pp. 85–88). Retrieved from http://www.uq.edu.au/nextgenerationlearningspace/proceedings
Lehtonen, T. (2004). Attributes and success factors of partnering relations – a theoretical framework for facility services. Nordic Journal of Surveying and Real Estate Research, 2,31–46.
Lehtonen, T. (2006). Collaborative relationships in facility services. Leadership & Organization Development Journal, 27(6), 449–464.
Leung, M., and Fung, I. (2005). Enhancement of classroom facilities of primary schools and its impact on learning behaviors of students. Facilities, 23(13/14), 585–594.
Lin, Y.-C., and Su, Y.-C. (2013). Developing mobile-and BIM-based integrated visual maintenance management system. The Scientific World Journal, 2013.
Lin, Y. C., Cheung, W. F., and Siao, F. C. (2014). Developing mobile 2D barcode/RFID-based maintenance management system. Automation in Construction, 37, 110–121.
42nd AUBEA Conference 2018: Educating Building Professionals for the Future in the Globalised World
Lippincott, J. K. (2009). Learning spaces: Invoving faculty to improve pedagogy. EDUCAUSE Review, 44(2), 25–27. Retrieved from http://connect.educause.edu/Library/EDUCAUSE+Review/LearningSpacesInvolvingFa/48331?time=1237990011
Mattessich, P., and Monsey, B. (1992). Collaboration: what makes it work. a review of research literature on factors influencing successful collaboration.
Mattila, A. S., and Wirtz, J. (2004). Consumer complaining to firms: the determinants of channel choice. Journal of Services Marketing, 18(2), 147–155.
Mohd-Noor, M. N., and Pitt, M. (2009). The application of supply chain management and collaborative innovation in the delivery of facilities management services. Journal of Facilities Management, 7(4), 283–297.
Oblinger, D. (2005). Leading the transition from classrooms to learning spaces. EDUCAUSE Quarterly, 28(1), 14–18.
Patel, H., Pettitt, M., and Wilson, J. R. (2012). Factors of collaborative working: A framework for a collaboration model. Applied Ergonomics, 43(1), 1–26.
Preiser, W. F. E. (1995). Post-occupancy evaluation: how to make buildings work better. Facilities, 13(11), 19–28.
Preiser, W. F. E. (2002). Continuous quality improvement through post-occupancy evaluation feedback. Journal of Corporate Real Estate, 5, 42–56.
Price, I., Matzdorf, F., Smith, L., and Agahi, H. (2003). The impact of facilities on student choice of university. Facilities, 21(10), 212–222.
Radcliffe, D. (2008). A edagogy-Space- Technology (PST) framework for designing and evaluating learning places. In & B. T. (Eds. . D. Radcliffe, H. Wilson, D. Powell (Ed.), Learning Spaces in Higher Education: Positive Outcomes by Design (pp. 10–16). St. Lucia: The University of Queensland.
Rowley, J., and Slack, F. (2004). Conducting a literature review: MRN. Management Research News, 27(6), 30–39.
San Martín-Rodríguez, L., Beaulieu, M.-D., D’Amour, D., and Ferrada-Videla, M. (2005). The determinants of successful collaboration: A review of theoretical and empirical studies. Journal of Interprofessional Care, 19(sup1), 132–147.
Sawyerr, T. P., and Yusof, N. (2013). Student satisfaction with hostel facilities in Nigerian polytechnics. Journal of Facilities Management, 11(4), 306–322.
Shen, W., Hao, Q., Mak, H., Neelamkavil, J., Xie, H., Dickinson, J., … Xue, H. (2010). Systems integration and collaboration in architecture, engineering, construction, and facilities management: a review. Advanced Engineering Informatics, 24(2), 196–207.
Shoolestani, A., Shoolestani, B., Froese, T., and Vanier, D. J. (2015). SocioBIM : BIM-to-end user interaction for sustainable building operations and facility asset management. In Proceedings of ICSC15: The Canadian Society for Civil Engineering 5th International/11th Construction Specialty Conference, University of British Columbia, Vancouver, Canada. June 7-10 (pp. 3261–3266).
Stefan Bankosz, G., and Kerins, J. (2014). Mobile technology-enhanced asset maintenance in an SME. Journal of Quality in Maintenance Engineering, 20(2), 163–181.
Tolman, A., Matinmikko, T., Möttönen, V., Tulla, K., and Vähä, P. (2009). The benefits and obstacles of mobile technology in FM service procurement. Facilities, 27(11/12), 445–456.
Tolman, A., and Parkkila, T. (2009). FM tools to ensure healthy performance based buildings. Facilities, 27(11/12), 469–479.
Webster, J., and Watson, R. T. (2002). Analyzing the past to prepare for the future : writing a literature review. MIS Quarterly, 26(2), xiii–xxiii.
Weerasinghe, R. P. N. P., and Sandanayake, Y. G. (2017). Collaborative facilities management model: Sri Lankan perspective. Built Environment Project and Asset Management, 7(3), 284–299.
Xue, X., Shen, Q., and Ren, Z. (2010). Critical review of collaborative working in construction projects: business environment and human behaviors. Journal of Management in Engineering, 26(4), 196–208.
Zimmerman, A., and Martin, M. (2001). Post-occupancy evaluation : benefits and barriers. Building Research & Information, 29(2), 168–174.
358. 359.

42nd AUBEA Conference 2018: Educating Building Professionals for the Future in the Globalised World
over US $ 100 million (approximately) and spread over 36 months or more to complete.However, in the world of projects, megaprojects are denominated as the wild beasts which are phenomenal and hard to tame (Zidane et al, 2013). Due to inherent complexities and high-risk levels of these projects, they possess a high tendency of failure. As Ahmed and Othman (2013) explained, these projects are said to be risky undertakings that consume substantial amount of time, cost and require highly trained design and construction professionals. On a similar note, Merrow (2011) indicated that the failure rate of mega projects is a high rate as 66% and an equal share is noted for failing to meet the objectives for which they were constructed. While emphasising the critical necessity of successfully implementing these projects in developing countries, Ahmed and Othman (2013) highlighted that developing countries experience shortages of knowledge, skills, capabilities, and finance. So, the critical necessity of these resources for mega constructions and the deficiency of these in developing countries create a two-edged dilemma. It is therefore a prevailing perceptive that this paradox constitutes a predicament for the actualization of mega construction project goals in developing countries (Othman, 2014). In order to address the higher failure rates, it is essential to study the restraining forces or the challenging factors towards successfully implementing mega construction projects. While several studies have focused on this aspect from the developing countries perspective, Othman (2014) classified the challenges into four main categories namely engineering, human development, managerial & political and sustainability challenges.
On the other hand, it is clearly apparent from past studies that availability of high-quality human resources affects mega project performance directly. According to Othman (2014), the implementation of mega construction projects requires advanced design knowledge and technical skills, competent human resources and managerial capabilities. Furthermore, multidisciplinary contributions from various organizations and professional expertise in program planning, control and highly trained employees especially in the field of project management is another area of concern (Kerzner, 2006). In the construction of 2010 FIFA World Cup Stadia in South Africa which was a mega construction shortage of skilled labour was ranked as one of the topmost causes of cost overrun and time delays (Baloyi & Bekker, 2011). Another example is the development of Nelson Mandela Bay Metropole in South Africa where lack of trained on-site supervisors and highly qualified staff drove to cost overruns (Koen & Theron, 2008).
In Sri Lanka, according to ICRA Lanka (2011), the employment base in the local construction industry is made up of four categories as professional, technical, machine operators and craft category. Regard to the performance, the skilled labour force utilized inefficiently is estimated to be over 60% of the total skilled labour (Jayalath, 2016). Further, a significant share, over 80% of the construction workforce is casually employed and has had no proper training in any trades (Jayawardane & Gunawardena, 1998). A decade ago, in the local construction industry, only 5 % are skilled labourers among 500,000 directly employed workers and it is one third out of the forecasted skilled labour requirement (Weddikkara, 2006). The comparison of current demand and supply of the skill trades shows an unbalanced level in considerable skills due to lack of training programs and lower wage level, poor attitude of younger generation and working conditions have created scarcity in skill supply which adversely influenced on skilled labour demand in the present days (Anuruddika & Sandanayake, 2015).
As Sri Lanka attempts to become a Foreign Direct Investment (FDI) hotspot, top construction industry experts yesterday warned the sector is ill-equipped to absorb inflows due to a growing labour shortage. Right now, there is a huge shortage of both skilled and unskilled labour because people are not willing to join the industry (Wijeya Newspapers, 2016). In the last ten years, we have seen the emergence of mega projects
42nd AUBEA Conference 2018: Educating Building Professionals for the Future in the Globalised World
Employment challenges in mega construction projectsin Sri Lanka
Shavindree Nissanka1, Thanuja Ramachandr2, Devindi Geekiyanage3 and Chamila Dilhan Ramanayaka4
1,2,3Department of Building Economics, University of Moratuwa,Moratuwa 10400, SRI LANKA
4Department of Building Economics, Curtin University,Bentley WA 6102, AUSTRALIA
E-mails: [email protected]; [email protected]; [email protected];[email protected]
Abstract:
With the current economic trends, investments towards mega construction projects are happening in hefty amounts, consuming a considerable proportion, 8% of the global GDP. However, the inherent characteristics of megaprojects include a higher level of risk and uncertainty claiming a project failure rate of 66%. The literature indicates that employment challenges are of significant concern in many researchers. This study attempts to investigate the employment challenges in mega construction projects and propose possible strategies to overcome those challenges. A questionnaire survey was administered to ninety professionals experienced in handling mega constructions in Sri Lanka. According to descriptive statistics reults from a ranking through a Likert scale of 1-5, the top three significant challenges are: shortage of on-site skilled workers, lack of professional expertise in technical areas, and lack of trained workers on site, with means value of above 3.9. However, a detailed scrutiny of these challenges indicates that they are inter-related and could be grouped into four major challenging areas: workforce supply, project management, human resource management and project-specific issues. The analysis further shows that human resource management issues are significant challenges for the professional sector (mean=4.4) while workforce supply issues are significant for technical, craft and operating sectors (mean>4.5). Having more attractive and desirable job market, producing more qualified workforce, and technological advancement are the topmost strategies which could be employed in addressing the above challenges. Based on these, the construction employment challenges across the various sub-sectors could be addressed in a strategic systematic approach which would ultimately contribute to successful implementation of mega construction projects in Sri Lanka.
Keywords:
Construction employment, Mega construction, Sri Lanka, Strategies
1 Introduction
A mega construction project could be defined as a large-scale project with a price tag of one billion dollars; or the “new animal” that has a strikingly poor performance in economy, environment, and public support (Fiori & Kovaka, 2005). In other words, they are massive investments initiated in line with the expectations of the governments in achieving national and international sustainable development objectives (Marrewijket al., 2008). In the Sri Lankan context De Silva (2014) define Mega projects, as projects costing
360. 361.

42nd AUBEA Conference 2018: Educating Building Professionals for the Future in the Globalised World
construction field and the project value of mega construction projects where participants involved. Table1 provides a summary of the respondents’ profile.
Table 1. Profile of the respondents
Main Criteria Sub-criteria Respondents
No Percentage (%)
Designation
Contract Managers 5 6
Project Directors 6 7
Project Managers 15 17
Planning Engineers 3 14
Project Quantity Surveyors 24 26
Project Engineers 27 30
Total 100 100
Experience
10-20 Years 35 39
20-30 years 25 28
Above 30 years 30 33
Total 100 100
Value of the project
200 Million- 500 Million 22 23
500 Million -1Billion USD 47 52
Over 1 Billion USD 21 24
Total 100 100
In terms of designation, 30% of them have served as project engineers, 26% of Project quantity surveyors and 17% was Project Managers. A little sample consisted of contract managers and project directors. More than 60% of participants have over 20 years of experience. Although a "Mega Project" is defined as an investment which exceeds a value of USD 1 Billion in monetary terms (Fiori & Kovaka, 2005), in the Sri Lankan context completed projects of this value are only a hand few. Therefore, the project values were categorized into US$200 Million- 500 Million US$500 Million -1Billion and Over US$1 Billion. The majority of the respondents (over 50%) fall under the US$ 500 Million -1Billion category.
3.2 Construction Employment Challenges
A list of construction employment challenges established through literature review was presented to professionals who have experienced in mega construction projects in Sri Lanka. They ranked those challenges according to their degree of impact towards the mega construction projects in Sri Lanka as shown in Table 2.
42nd AUBEA Conference 2018: Educating Building Professionals for the Future in the Globalised World
in Sri Lanka on an unprecedented scale with developments like the Hambantota Port, Mattala Airport, Sooriyawewa Cricket ground, the new expressways, Uma Oya project for example (Bandarage, 2015). In pursuant to this, the new mega plan envisages transforming the Western Province by 2030 to a Megapolis or a mega city which is estimated to be US$ 40 billion investment (Mushtaq, 2016). However, in the local construction industry, even before the mega projects like the Port City, Megalopolis and other infrastructural developments are to commence in 2016, the impact of the shortage of the appropriate skills and the workforce, in general, was observed (Wijemanne, 2016). On the similar note, Wickramasinghe (2012) stressed that manpower shortfall in the construction industry will be a pivotal issue to be addressed by policymakers, particularly at a time when mega social and physical infrastructure projects are happening all over Sri Lanka. Despite significant concerns with regards to mega constructions and its' manpower requirements, no specific studies which have explored the employment challenges in mega constructions specifically for the different employment subsectors and means of mitigating those challenges and issues. On this note, this research addresses this knowledge gap by investigating the construction employment challenges in different employment sub-sectors and the mitigating mechanisms with regards to implementation of mega construction projects in Sri Lanka.
2 Research Methodology
An extensive literature review concluded that construction employment challenges are of significant concern in mega constructions and impact the project outcome in terms of cost, time and quality. Afterwards, a questionnaire survey was conducted to collect participants' views on significant employment challenges in mega constructions and the possible response mechanisms in the local scenario. The survey method was chosen as it is a very popular form of data collection, especially when gathering information from large groups and economically (Noor, 2008).
The survey consisted of two consecutive rounds of questionnaires administered to experienced professionals who have experienced mega constructions in Sri Lanka. Organizations that have undertaken mega constructions were identified through company websites and a background study. Then each of these firms was contacted and asked for professionals who have worked for mega constructions projects in the areas of project management, contract administration and labour handling with a minimum 10-years’experience in the construction field. Accordingly, the questionnaire was distributed among a sample of 100 professionals and 90 of them were returned which offered a response rate of 90%.
A Likert scale of 1-5 where 5 represents “Critical”, 4 - “Very Influential”, 3 -Influential”, 2 - “Somewhat Influential’ and 1 represents “Not Applicable” was employed to determine the significance of the employment challenges in handling mega constructions in the Sri Lankan context. Inferences were derived based on descriptive statistics of mean, standard deviation.
3 Research Findings
3.1 Profile of Research Participants
As part of the questionnaire survey, background information of research participants was collected. It included designation of the participants, number of years of experience in the
362. 363.

42nd AUBEA Conference 2018: Educating Building Professionals for the Future in the Globalised World
average work productivity due to complexity, improper coordination that would lead to the inactivity of some engineering trades and time consuming error corrections and improper implementation of project management processes could be considered as issues related to project management aspect.
The next main concern is not managing the existing workforce in the proper way. The challenges of the management team lacking effective leadership, motivation, competency, and people skills, high turnover of project personnel in the mega-project organization, career risks, because most of the undertaking do not advance past the planning stage and therefore, pose an unpopular career course and lack of providing and managing high- qualified human resources are such issues which could be called as human resource management issues.
The left-over challenges lack of professional expertise knowledge in technical areas and tight service market, lack of internal capacity with regard to new technology and in-house resources will depend on the nature and type of project. These challenges will be decided by the design and technical requirements and will not be common to every mega construction project. Therefore, these can be called as project-specific issues.
So accordingly, the 16 challenges could be mainly gathered under the four areas of project management issues, workforce supply issues, human resource management issues and project-specific issues. Instead of 16 diverse factors, 4 principal areas simplify the underlying issues and facilitates to identify the trigger points in a more simplified manner. Hence these four principal challenging areas are taken forward and tested for the different employment subsectors in the next section.
3.3 Challenges in the Employment Subsectors
The principal challenging areas identified from phase 1 were tested with respect to each of the sub-sectors of employment. This was done in order to identify the most severe challenges for each of the sub-sectors separately. The results of the four sub-sectors are summarized and presented in Table 3.
Table 1. Occurrence of the decision resulted from a two-decision-makers condition
(Source: Sutrisna and Potts, 2004)
ChallengeProfessional Technical Operator Craft
Mean Std. Dev Mean Std.
Dev Mean Std. Dev Mean Std. Dev
Project Management Issues 3.022 0.866 3.911 1.062 3.289 0.843 3.289 0.843
Workforce supply issues 3.356 1.131 4.356 0.679 4.422 0.690 4.644 0.484
Human resource management issues 4.356 0.712 3.200 0.919 2.933 0.939 2.956 0.767
Project-specific issues 3.511 0.968 2.044 0.903 2.089 0.900 2.089 0.900
As observed in Table 3, workforce supply issues are the most significant area for the technical, operator and craft sub-sectors. Amongst for the technical and operator sectors this area is highly influential with mean values above 4.000 while for the craft sector it is a critical concern with a mean value of above 4.500. However, for the professional sub-sector, the most significant area is human resource management issues. When analysing the results for the project management issues it is apparent that it is less significant for the professional sector compared to the other three sectors. However, the project-specific
42nd AUBEA Conference 2018: Educating Building Professionals for the Future in the Globalised World
Table 2. Construction employment challenges
(Source: Sutrisna and Potts, 2004)
Code Challenging Factors Mean Std. Dev
F1 Shortage of on-site skilled workers or local labour forces 4.000 1.151
F2 Lack of professional expertise in technical areas 3.990 1.167
F3 Lack of trained workers on site. 3.940 1.228
F4 The management team lacking effective leadership, motivation, competency, and people skills.
3.790 1.148
F5 High turnover of project personnel in the mega-project organization 3.700 1.078
F6 Lack of providing and managing high- qualified human resources 3.690 0.957
F7 Difficulty resourcing the right skills and matching with project demands and geography/low-quality labour in remote locations.
3.590 0.848
F8 Career risks, because most of the undertaking do not advance past the planning stage and therefore, pose an unpopular career course.
3.560 1.072
F9 Lack of experienced staff to accept critical roles which they are not prepared for
3.420 1.105
F10 Poor coordination and integration of work crews/teams; inexperienced personnel in critical positions.
3.420 1.171
F11 Improper implementation of project management processes and training of key project staff due to resource shortages.
3.400 0.996
F12 Under average work productivity due to complexity. 3.400 0.958
F13 A small number of staff assigned to the team causing insufficient oversight 3.360 1.268
F14 Improper coordination that would lead to the inactivity of some engineering trades and time-consuming error corrections.
3.320 0.906
F15 Tight service market, lack of internal capacity with regard to new technology and in-house resources.
3.190 0.950
F16 Lack of providing quality education and professional training programs with necessary skills
3.120 0.992
When these employment challenges are studied, it is apparent that they are focused on different aspects as well as these aspects are repeated along the challenges. Also, as all 16 factors are influential in the local context (with mean values above 3) addressing all of them strategically is not practical and furthermore when these challenges are closely scrutinized some of them seems to be correlated and connected with each other. Therefore, few major areas were identified as underlying concerns of these 16 diverse challenges.
As observed in Table 2, the first few factors repeat the term lack which implies a shortage. This is in both quality and quantity of workforce. Therefore, the challenges of lack of available on-site skilled workers or local labour forces, lack of providing quality education and professional training programs with necessary skills, difficulty resourcing the right skills and matching with project demands and geography, lack of properly trained workers on site and lack of experienced staff to accept critical roles which they are not prepared for are concerns due to workforce supply issues.
Another aspect amongst these challenges is related to productivity, lack of coordination, complexities and inadequacy of processes. Hence the challenges of a small number of staff assigned to the team causing insufficient oversight, poor coordination and integration of work crews/teams; inexperienced personnel in critical positions, under
364. 365.

42nd AUBEA Conference 2018: Educating Building Professionals for the Future in the Globalised World
4.1 Project Management Issues
When looking at the challenges grouped under this subtheme, it is clear that all these issues arise due to issues related to productivity, lack of coordination and poor management practices. Therefore, the name “Project Management Issues” was assigned for this group. However, when these are considered in the context of mega constructions it is important to investigate how the severity of this category is affected by the inherent characteristics of mega constructions. On this note, multidisciplinary contributions from various organizations and professional expertise in program planning, control and highly trained employees especially in the field of project management is another area of concern in mega constructions (Kerzner, 2006). It was evident that the labour productivity varies with the project cost and project duration where higher the cost lowers the productivity and higher the time duration lowers the productivity was reported (Nasir Zadeh and Nojedehi, 2013). According to same authors, the optimum level of labour productivity throughout the project development phases will play a critical role in obtaining project success. In line with the significant concerns related to labour productivity issues in mega constructions it is reported that due to high cost and long-time scales of these projects, the labour productivity levels will tend to further worsen. In relation to the different subsectors, project management issues are the most critical type in technical, operator and craft sectors while for the professional sector it is somewhat less influential. Implementing better advance project management practices for coordinating these complex projects require advanced technology as well as effective training for the workforce. Therefore, in addressing these issues the most common solutions would be the technological advancement and providing effective guidance and training aiming mega constructions.
4.2 Workforce Supply Issues When the individual issues are studied, it emphasizes that there is a shortage in number of workers, skill level, education level as well as sufficient training. Despite all these sourcing, the workers at different locations and under different conditions have also become challenging. So, these issues are mainly due to the workforce supply structure.In line with these issues, Jayawardane and Gunawardena (1998) reported that a significant portion of over 80% the construction workforce is casually employed and has had no proper training in any trades. This context is still persistent which has led the Sri Lankan construction industry to remain wasteful, tradition-bound, plagued by delays, cost overruns and contractual disputes (National Chamber of Exporters of Sri Lanka, 2016). The main reason for the shortage of workers is that the construction industry is not perceived as a good prosperous workplace. Therefore, the desirability for the industry jobs should be enhanced and in addressing the skill level issues better training and career development opportunities should be granted. Furthermore, the production of quality construction workforce should be increased so that when the upcoming mega constructions are implemented we are equipped with the right skills and people.
4.3 Human Resource Management Issues When the issues under the third group are studied, they emphasize a situation where the available human resources are not managed properly. So, personal development goals are not achieved without any proper direction for the individuals in the construction industry. In explaining the reasons behind these findings, Anuruddika and Sandanayake (2015) state that lack of training programs and lower wage level, poor attitude of the younger generation and working conditions have created scarcity in skill supply. If we are to
42nd AUBEA Conference 2018: Educating Building Professionals for the Future in the Globalised World
issues report a mean value of above 3.50 only in the professional sub-sector indicating a higher significance whereas in the other three sectors it is less influential with mean values below 2.500.
3.3.1 Professional Sub Sector
In the Professional sub-sector since most challenging area is human resource management issues the most significant challenges for this respective subsector would be lack of providing and managing high- qualified human resources, the management team lacking effective leadership, motivation, competency, and people skills high turnover of project personnel in the mega-project organization and career risks because most of the undertaking do not advance past the planning stage and therefore, pose an unpopular career course. However, the project-specific issues also reported being highly influential for this subsector with a mean value of 3.511which indicates that lack of professional expertise knowledge in technical areas and tight service market, lack of internal capacity with regard to new technology and in-house resources will also be significant concerns.
3.3.2 Technical Sub Sector
As workforce supply issues turns out to be the most significant concern, shortage of on-site skilled workers or local labour forces, lack of properly trained workers on site and difficulty sourcing the right skills and matching with remote geographic locations and lack of providing quality education and professional training programs with necessary skills will be the most common challenges for the technical sector.
3.3.3 Operator Sub Sector
In the Operator, sub-sector also the most challenging area is reported to be Workforce Supply Issues which concludes that the most challenging sectors will be same as in the technical sector. Following this the most significant is for the operator subsector is the project management issues which indicates that productivity lack of integration and coordination will be also influential respectively.
3.3.4 Craft Sub Sector
In the last subsector, Craft category, also the most challenging area is reported to be Workforce Supply Issues with a mean value of 4.644 which is reported as a critical concern. Craft sector reported the highest mean value for these issues which indicates a severe workforce supply issue when compared to the other sub-sectors.
4 Discussion and Conclusions
The literature revealed 16 employment challenges affecting mega constructions in developing countries. According to the analysis, the most significant factors were lack of properly trained workers (mean=4.00), lack of professional expertise knowledge in technical areas (mean=3.99), and a shortage of on-site skilled local labour forces (mean=3.94). When looking at this result it is evident that the labour and skill shortage persistent in the local construction industry seems to fall into major focus areas. Therefore, these 16 employment challenges were then grouped under main challenging areas of project management, workforce supply issues, human resource management and project-specific issues.
366. 367.

42nd AUBEA Conference 2018: Educating Building Professionals for the Future in the Globalised World
Payment Issues in the Malaysian Construction Industry - Contractor's Perspective’, In: International Conference on Construction, Culture, Innovation and Management (CCIM), Malaysia, 22-24, pp 34-43.
Davis Langdon and Seah Consultancy (2003), ‘Construction payment blues – Why that domino effect’? Executive Summaries for the Practitioner, 3 (3): September 2003.
Dlungwana, S; Nxumalo, X.H., Van Hysteen, S., Rwelamila, P. and Noyana, C. (2002), ‘The development and implementation of the South African Construction’, Excellence Model (SACEM), Conference on Construction in the 21st Century (CITC 2002), Challenges and Opportunities in Management and Technology.
Donaldson, G. (1984), ‘Managing Corporate Wealth’, Praeger, New York. Egan, J. (1998), ‘Rethinking Construction’, DETR, London.Elazouni, A.M. and Gab-Allah, A.A. (2004), ‘Finance-based scheduling of construction projects
using integer programming’, Journal of Construction Engineering and Management,Volume 130(1), pp 15-24.
Ellis, C.M. (1991), ‘Advance payment and project duration performance’, Australian Institute of Quantity Surveyors Journal, Volume 3(2), pp 17-21.
Giang, D.T.H. and Pheng, L.S. (2011), ‘Role of construction in economic development: Review of key concepts in the past 40 years’, Habitat International Journal, Volume35(1), pp 118-125.
Hai N.L. and Watanabe, T. (2014), ‘The status quo and perspective for improvement of public works procurement performance in Vietnam’, Journal of Advanced Performance and Information Value, Volume 6, pp 22–39.
Hatush, Z., and Skitmore, M. (1997), ‘Criteria for contractor selection’, Construction Management and Economics, Volume15, pp 327-340.
Jagboro, G.O. (1998), ‘The effect of payment for advance purchase of building materials on contractor's cash-flow projections’. Journal of Financial Management of Property and Construction, Volume 3 (3), pp 71-83.
Judi, S.S. and Abdul-Rashid, R. (2010), ‘Contractor’s right of action for late or non- payment bythe employer’, Journal of Surveying, Construction and Property, Volume 1(1), pp 1-31.
Kaka, A.P. (2001), ‘The case for Re-engineering contract payment mechanism’, 17th Annual ARCOM Conference, Association of Researchers in Construction Management , the University of Salford, 5-7 September 2001, pp 371-379.
Kaka, A. P., and Lewis, J. (2003), ‘Development of a company-level dynamic cash flow forecasting model (DYCAFF)’, Construction Management and Economics, Volume21(7), pp 693-705.
Kazimu, M.A. (2012), ‘Significant factors that cause cost overrun in building construction project in Nigeria, Interdisciplinary Journal of Contemporary Research in Business, Volume 3(11), pp 775-780.
Li, Bing, Akintoye, A., Edwards, P.J. and Hardcastle, C. (2005), ‘Critical success factors for PPP/PFI projects in the UK construction industry’, Construction Management and Economics, Volume 23 (5), pp 459-471.
Lowe, J. G. (1997), ‘Insolvency in the U.K. construction industry’, Journal of FinancialManagement of Property and Construction, Volume 2(1), pp 83-107.
Maritz, M.J. and Robertson, D.C. (2012), ‘What are the legal remedies available to contractors and consultants to enforce payment?’ Journal of the South African Institution of Civil Engineering, Volume 54(2), pp 27-35.
Memon, A.H; Rahman, I.A. and Aziz, A.A.A. (2012), ‘The causal factors of large project's cost overrun: A survey in Southern part of Peninsular Malaysia’, International Journal of Real Estate Studies, Volume 7(2), pp 1-15.
Motawa, I. and Kaka, A. (2009), ‘Modelling payment mechanisms for supply chain in construction’, Engineering, Construction and Architectural Management, Volume 16 (4), pp 325-336.
Motawa, I., Kaka, A. and Wong, C. H. (2008), ‘Development of transparent payment systems’. Journal of Financial Management of Property and Construction, Volume 13 (2), pp 143-156.
Murdoch, I. J. and Hughes, W. (2000), Construction Contracts: Law and Management, Spon Press, London.
42nd AUBEA Conference 2018: Educating Building Professionals for the Future in the Globalised World
handle the upcoming mega developments successfully the available workforce needs to be safeguarded and retained properly in the industry or else the poorly motivated workers will fail to give their best to the industry. Therefore, in line with the views of Ofori (2012) managing the available employment base in the right manner will make sure of a transformational change in the industry structure from a state of being "dirty, dangerous and demanding" to a one of "professional, productive and progressive".
4.4 Project Specific IssuesThese challenges are decided by the complexity and nature of the project. However, according to Haynes (2002), mega constructions are technologically and logistically demanding. Hence the demands will vary from one project to another. If these complex projects are to be handled tactfully prior experience and knowledge in the specific fields will be instrumental. Therefore, providing specialized pieces of training on the technical expertise areas as well as upgrading the technological usage will address these types of issues. However effective labour planning mechanisms also need to be implemented so that such specialized knowledge and experience requirements could be identified and addressed before the project inception.
As a concluding remark in addressing the major concerns of employment perspective in mega constructions increasing production of the quality construction workforce, increasing the attractiveness for the construction industry jobs, technologicaladvancement, providing effective guidance and training as well as effective labour planning mechanisms will be pivotal. Identifying the different concerns with regard to different sub-sectors of employment will facilitate a more effective approach in initiating these strategic mechanisms which will ultimately contribute to a better project outcome.
References
Ahmed, A. and Othman, E. (2013), ‘Challenges of mega construction projects in developing countries’, Organization, Technology and Management in Construction, 5(1), pp 730-746.
Ahmed, A. and Othman, E. (2013), ‘Challenges of mega construction projects in developing countries’, Organization, Technology and Management in Construction,5(1), pp 730-746.
Anuruddika, N. and Sandanayake, Y.G. (2015), ‘An investigation into skilled labour requirement in Sri Lankan building construction industry’, In Proceedings of the 4th World Construction Symposium, Ceylon Institute of Builders, Colombo 01.
Baloyi, L. and Bekker, M. (2011), ‘Causes of construction cost and time overruns: The 2010 FIFA World Cup stadia in South Africa’, The Physical Development Sciences,18(1), pp 51-67.
Bandarage, C. (2015),‘Mega Projects is not the way; but, Small Business’, LankaWeb, http://www.lankaweb.com/news/items/2015/08/16/mega-projects-is-not-the-way-but-small-business-microcredit/, viewed:12/05/2016.
Dain, S. (2016, September 29), ‘Construction industry builds case for foreign labour’, Wijeya Newspapers, http://www.ft.lk/article/537795/Construction-industry-builds-case-for-foreign-labour, viewed: 08/04/2016.
De Silva, U. (2014, November 4). Unsolicited Tenders (Procurements) for Mega Projects, Create ‘Mega’ Corruption – Sri Lanka Guardian. Retrieved from https://www.slguardian.org/unsolicited-tenders-procurements-for-mega-projects-create-mega-corruption/
368. 369.
42nd AUBEA Conference 2018: Educating Building Professionals for the Future in the Globalised World
Government of South Africa alone cannot meet the high demand of delivering proper infrastructure on time, hence, the collaboration between public and private sectors is required. The collaboration between government and the business sector is primarily informed by the fact that improved infrastructure benefits both sectors in the performance of their functions and responsibilities in society. Moreover, government had to invest in massive infrastructural roll-out in an effort to provide basic services such as water, health care, electricity, housing, road transport (Budget review, 2018).
2 South African infrastructure
South Africa is one of the countries that are experiencing the backlog in infrastructural service delivery and this has a negative impact to the economy and the residents of the country. Government has been doing their best to come up with solutions of how to reduce the service delivery backlogs whereby they have come up with suggestion to achieve their goal of giving the community everything they need without struggling and they decided to take PPPs as one of the solution to this problem (Bovis, 2010; Manuel, 2007). However,PPPs is not the answer to infrastructural service backlog but it can only reduce the challenge faced by our government (Ntshangase, 2002). PPP’s have been used in a number of countries as a means to deliver and manage public infrastructure (Mashwama et al,.2017b).
According to Manchidi and Merrifield (2001), given the fiscal constraints in South Africa, Public-Private Partnerships are discussed as an alternative method of realizing infrastructure delivery and supplementing public sector resources (Manchidi and Merrifield, 2001). One of the key political drivers behind the PPP is the desire to improve the nation’s infrastructure and supporting public services without placing undue strain on scarce public funds and without having to increase taxation (Alfen et al., 2010). Other reasons for the adoption of PPP model by various governments include amongst others; skills transfer by the private sector to the public sector and achieving greater efficiency by limiting the usually lengthy government bureaucracy. Public sector is usually rich in human resources but lacks in expertise whereas private sector has more expertise but lacks in human resources (Asmati, 2010). The private sector can often react more quickly, as there is no bureaucratic hierarchy for decision making (Asmati, 2010).
The financing of PPPs is a very challenging aspect and modes of financial funding are not predetermined on the level of the project but rather on the level of the financial modes (Lattemann et al, 2009). Treasury Regulation 16 states that the financing of PPPs is not prescriptive into a structure, but it is assumed that it will vary from project to project and sector to sector that will be closely linked to the funding sources secured for that deal (Manuel, 2007). However, PPPs are usually involving the private sector raising both the debt and equity to finance the project. According to Ntshangase (2002) some PPP projects are financed by both the government and the private entity. According Ntshangase (2002), the form of payment used in South Africa are availability based payment, shadow toll based payments and user fee payment.
3 Public Private Partnership (PPP) definition
It appears that there is no single definition that encompasses all aspect of PPP project and can be put forth as a standard definition (Mashwama, 2017b; Bekka, 2012; Grimsey and Lewis, 2002; Hall, 2015). Following are different definition of PPP as per (Mashwama, et al., 2017; Asmati, 2010; Hall, 2015; Bekka, 2012 and Nichols, 2014).
42nd AUBEA Conference 2018: Educating Building Professionals for the Future in the Globalised World
The role of public private partnership in improving service delivery in South Africa
Mashwama Nokulunga1, Thwala Didi2, Keitumetse Tserema3and Aigbavboa Clinton4
1,2&3Department of Construction Management and Quantity Surveying, University of Johannesburg/Johannesburg, SOUTH AFRICA
4Sustainable Human Settlement and Construction Research Centre, Faculty of Engineering and the Built Environment, University of Johannesburg/ Johannesburg,
SOUTH AFRICA
E-mails: {nokulungam, didibhukut, caigbavboa}@uj.ac.za, [email protected]
Abstract: South Africa is confronted with huge infrastructure service delivery backlogs, which has a negative impact on the country’s economic growth and improvement of the lives of its citizens. The infrastructural backlog cannot be sufficiently addressed by government alone, as it requires a collaborative effort from both the public (government) and private (business) sectors. The study examined the contribution made by Private Public Partnerships (PPPs) in delivering infrastructure projects. The data used for the study were derived from both primary and secondary sources. The secondary sources were review of literature and primary data were obtained through the use of structured questionnaires which were distributed to construction stakeholders in the public and private sectors, who were involved in the PPP’s projects in South Africa in the Gauteng province. A total of 90 questionnaire were distributed and 80 came back and used for the study. The study revealed that: PPPs speed up the infrastructural projects; completes the infrastructure projects much quicker than the traditional method; PPP increase the effectiveness of projects; completes work on time or even ahead of schedule; greater cost transparency; cost savings; reduction of life-cycle maintenance costs; reduction of the service deliverybacklog, etc. The research has revealed that the projects delivered through PPP are of great quality and they are maintained well. Hence, PPPs should be practiced as often as the traditional method because it breach the gap of abandonment, unfinished and delays in projects.
Keywords: Infrastructure, Public-private partnerships, Service delivery, South Africa.
1 Introduction
Inadequate infrastructure is a constraint on growth worldwide, and particularly in developing countries (Ntshangase, 2002). Infrastructure services are often inadequate to meet demand, resulting in congestion and they are often of low quality or unreliable,while many areas are simply un-served (Manuel, 2007). This poor infrastructure performance reflects pervasive challenges facing governments (Bovis, 2010). Reviewed literature reveals that poor planning and coordination, weak analysis underpinning project selection, pursuit of political gain, and corruption, mean that the limited resources are often spent on the wrong projects (Mashwama et al., 2017b). The traditional method of delivering infrastructural projects is often poorly maintained, increasing costs and reducing benefits (Bovis, 2010 and Mashwama et al, 2017b).
370. 371.
42nd AUBEA Conference 2018: Educating Building Professionals for the Future in the Globalised World
avoids the additional cost of separate contracts for design and construction. The public owner owns the project and is solely responsible for O &M and can either perform such services with their own forces or contract out the O&M services to another contractor.
e. Design, Build, maintain (DBM) - The contractor design and builds the project. However, the owner operates the constructed asset while the contractor perform routine maintance and or repairs on the project for the duration of the PPP contractmeeting the availability or project usability requirement of the contract.
f. Design, Build, Operate, Maintain (DBOM) - The contractor is responsible for all four elements of the contract. The contractor is typical paid from the revue gained through the operation of the constructed facility or project.
g. Design, Build, Finance, Operate (DBFO) – The contractor performs the three basic functions of the project (design, build and operate). The contractor finances the whole project from their own coffers. The contractor is paid over the life of the project from the revenue generated by the constructed facility.
h. Design, Build, Finance, operate, maintain (DBFOM) – The contractor designs, builds finances, operates and maintains the constructed facility and the contractor performs all four functions plus provide the financing for the project using private funds, while the constructed facility is owned by the public owner, the contractor is paid over the life time of the project from the revenue generated from constructed asset.
i. Design, Build, Finance, Operate, Maintain, Transfer (DSBFOMT) - The private contractor performs all function of the project, including financing the project and paid through the revenue generated. The contractor normally owns the facility for the term of the PPP duration. The contractor transfers the ownership, maintance and responsibility of the project once the PPP contract ends.
j. Build, Transfer, Operate (BTO) - The BTO is similar to the BOT, but the O&M of the project is performed by the owner at the end of the project. The private contractor and public company enter into an agreement whereby the contractor operates the constructed project for certain period.
k. Build, Own, Operate, Transfer (BOOT) – The contractor owns the project for the duration of the contract. Like the BOT the private contractor may or may-not provide some or all the financing for the project.
l. Lease, Develop and Operate (LDO) – The private contractor leases the facility from the public owner and uses the generated funds to expand the facility under a contract with the owner. The contractor is paid by the owner for the owner’s uses of the facility.
m. Concession – The public owner sells the right to operate and maintain an existing asset to a private contractor. Typical, under concession model, the duration of the concession is for a very long duration. Typical example Chicago skyway project was leased to a private PPP contractor for 99 years; while the Indiana toll road concession was inked for a 75 year term. The contractor is normally paid from the revenue earned on the project from toll or user fees.
42nd AUBEA Conference 2018: Educating Building Professionals for the Future in the Globalised World
A contractual arrangement between a public agency and a private sector company. Through this agreement, the skills and asset of each sector (public and private are shared in delivering a service or facility for the use of the general public. In addition to the sharing of resources, each party shares in the risks and awards potential in the delivery ofthe services and /or facility. Or it a contractual agreement formed between public and private sector partners, which includes private sector financing. The agreements involve a government agency contracting with a private company to renovate, construct, operate, maintain or manage a facility or system. The sector retains ownership of the facility; however, the private party may be given additional decision rights in determining how the project or task will be completed.
Furthermore it is an arrangement of roles and relationships in which two or more public and private entities coordinate in a complementary way to achieve their separate objectives through the joint pursuit of one or more common objectives. Or a long term contract between the public and private sectors where mutual benefits are sought and where ultimately the private sector provides operating services or puts private finance at risk.
For the purpose of the paper will adopt the definition of PPP as: a long term contract between government (national or local government) or government owned entity (Public agency) and a private sector (typically a consortium) in which:
The public agency leverages the private sector party skills and assets to perform all or significant aspect of a project (For example, financing, design, construct and /or O&M).The public agency and the private sector party share in some fashion or another the risks and rewards of the project. The public agency retains some measure of control over the project (either through ownership of the project or contractual provisions binding the private sector party).
4 Types and forms of PPPs
Following are the most common, legal and operational types of public-private partnerships in South Africa as per (Alfen et al., 2009; Manchidi and Merrified, 2001)
a. Build-Operate-Transfer (BOT). The arrangement involves the transfer of responsibility for constructing, financing and operating a single facility to a private sector partner for a fixed period of time. At the end of that period, the responsibility reverts to the public entity.
b. Design-Build-Finance-Operate (DBO). The service provider is usually responsible for financing the project during construction. The government purchases the asset from the developer for a pre-agreed price prior to commissioning and takes all ownership risks from that time.
c. Build-Operate-Own (BOO). It involves the granting of ownership rights inperpetuity to develop, finance, design, build, own, operate and maintain an asset. The private sector own the asset outright and retains the ownership and operating revenue risk, with no transfer to the public sector.
d. Design/Build (D/B) - This is the most basic type of PPP project. Here the private contractor designs and constructs the project for a fixed, not to exceed or guaranteed maximum price, to meet the performance specifications and requirement of the public owner. The public agency finances the project but
372. 373.

42nd AUBEA Conference 2018: Educating Building Professionals for the Future in the Globalised World
6.3 Risk distribution/ better risk allocation
PPPs distribute the risks between the public and private sectors depending on the strength of each entity to handle certain risks and on the expectation that the private sector willassume substantial risks in its long-term engagement in delivering infrastructure and public services. Risk assessment in PPPs is a totally different exercise than the assessment of risk in traditional public contracts mainly because risks are shared in PPPs and the public entity can be able to focus on other things other than the infrastructural service delivery (Bovis 2010).
6.4 Innovation
The involvement of private sector in the design and construction process result in a higher quality project (Bovis, 2010).
6.5 Adequate facility pricingEfficient pricing has been identified as the key benefit to the PPP model as the private sector would be more likely to use efficient pricing concepts such as congestion pricing(Hall, 2015).
6.6 Best solutionPPP play a huge role in delivering project when there budget constraint, unwillingness to raise taxes and the inability to sell government bond. Furthermore, the Private Company can use private financing to construct the project (Nichols, 2014).
6.7 Avoids increasing government debtPrivate financing of the project allows the public owner to receive a complete project at the end of the contract without increasing public debt and they hardly impair the public owner’s bonds ratings (Manuel, 2007).
6.8 Budget reliefThis will depend on the strategy being used, private funding for projects do not impact the public owners budget. Moreover, PPP projects are privately financed and they provide budget certainty or security. Furthermore, this reduces capital spending for the public or government as payment are often deferred until the project is complete and goes into operation (Manuel, 2007 and Hall, 2015).
6.9 Better performing assetsPPP projects would guarantee a completed working structure or facility to generate good revenue, so that the contractor can generate revenue to pay the debt owed to them (Alfen et al., 2009).
6.10 Avoids underbiddingIn the conventional strategy of design bid build process the contractor will bid low to win the project and then pursue numerous changes and claims. While under the PPP strategy this is eliminated totally (Ntshangase, 2002).
6.11 Technical expertiseThe private entity gives public entity access to the technical experience and evidence of the private sector throughout the entire project. Moreover, more innovation is highly possible on PPP project since they are based on output specifications which maximizes
42nd AUBEA Conference 2018: Educating Building Professionals for the Future in the Globalised World
5 The role played by PPPs in Gauteng
The PPPs’ offering has been used as a credible solution to bridge the infrastructure deficitof many states in both the developed and developing world (Mashwama et al., 2017b;Hall, 2015). PPPs can provide a number of specific benefits to the public sector. In particular, they can offer value for money solutions, where the PPP can attain lower costs, higher levels of service through innovation and reduced risk for the public sector (Bovis, 2010). According to UN-HABITAT, (2004) state that the most significant attributes of PPPs is the increased certainty of outcomes both in terms of on-time delivery of projects and within-budget.
Following are project executed in Gauteng through PPP and with great success (Budget review, 2018).
Table1: Successful project executed through PPP(Source: Budget Review: 2018)
Project name Government institution
Type Financingstructure
Project value
R million
Form of payment
SANRAL N4 East Toll Road
SANRAL DFBOT Debt: 80%Equity: 20%
3 200 User charges
SANRAL N3 Toll Road SANRAL DFBOT Debt: 80%Equity: 20%
3 000 User charges
SANRAL N4 West Toll Road
SANRAL DFBOT Debt: 80%Equity: 20%
3 200 User charges
National fleet management
Department of Transport
DFO Equity:100% 919 Service fee
Gautrain Rapid Rail Link Gauteng Department of
Public Transport , Roads and Works
DFBOT Debt : 11%Equity: 2%Govt: 87%
31800 User charges and patronage guarantee
SANRAL Gauteng Freeway Improvement
Plan Toll Road
SANRAL DFBOT Debt:100% 2000 User charges
6 The benefits of PPP
6.1 Value for money
PPPs can provide a number of specific benefits to the public sector. In particular, they can offer value for money solutions, where the PPP can attain lower costs, higher levels of service through innovation and reduced risk for the public sector (Bovis, 2010). Moreover, by bundling design, construction, operation and maintance into a single contract the public owner can eliminate the cost associated with procuring and managing a series of separate contractors for all the project phases.
6.2 Time and budgetAccording to UN-HABITAT (2004), one of the most significant attributes of PPPs is the increased certainty of outcomes both in terms of on-time delivery of projects and within - budget. Shorter construction period is guaranteed since, PPP project utilizes private funding, hence, construction delays is eliminated and bundling the design and construction process into a single contract will help shorten the duration of the project.
374. 375.
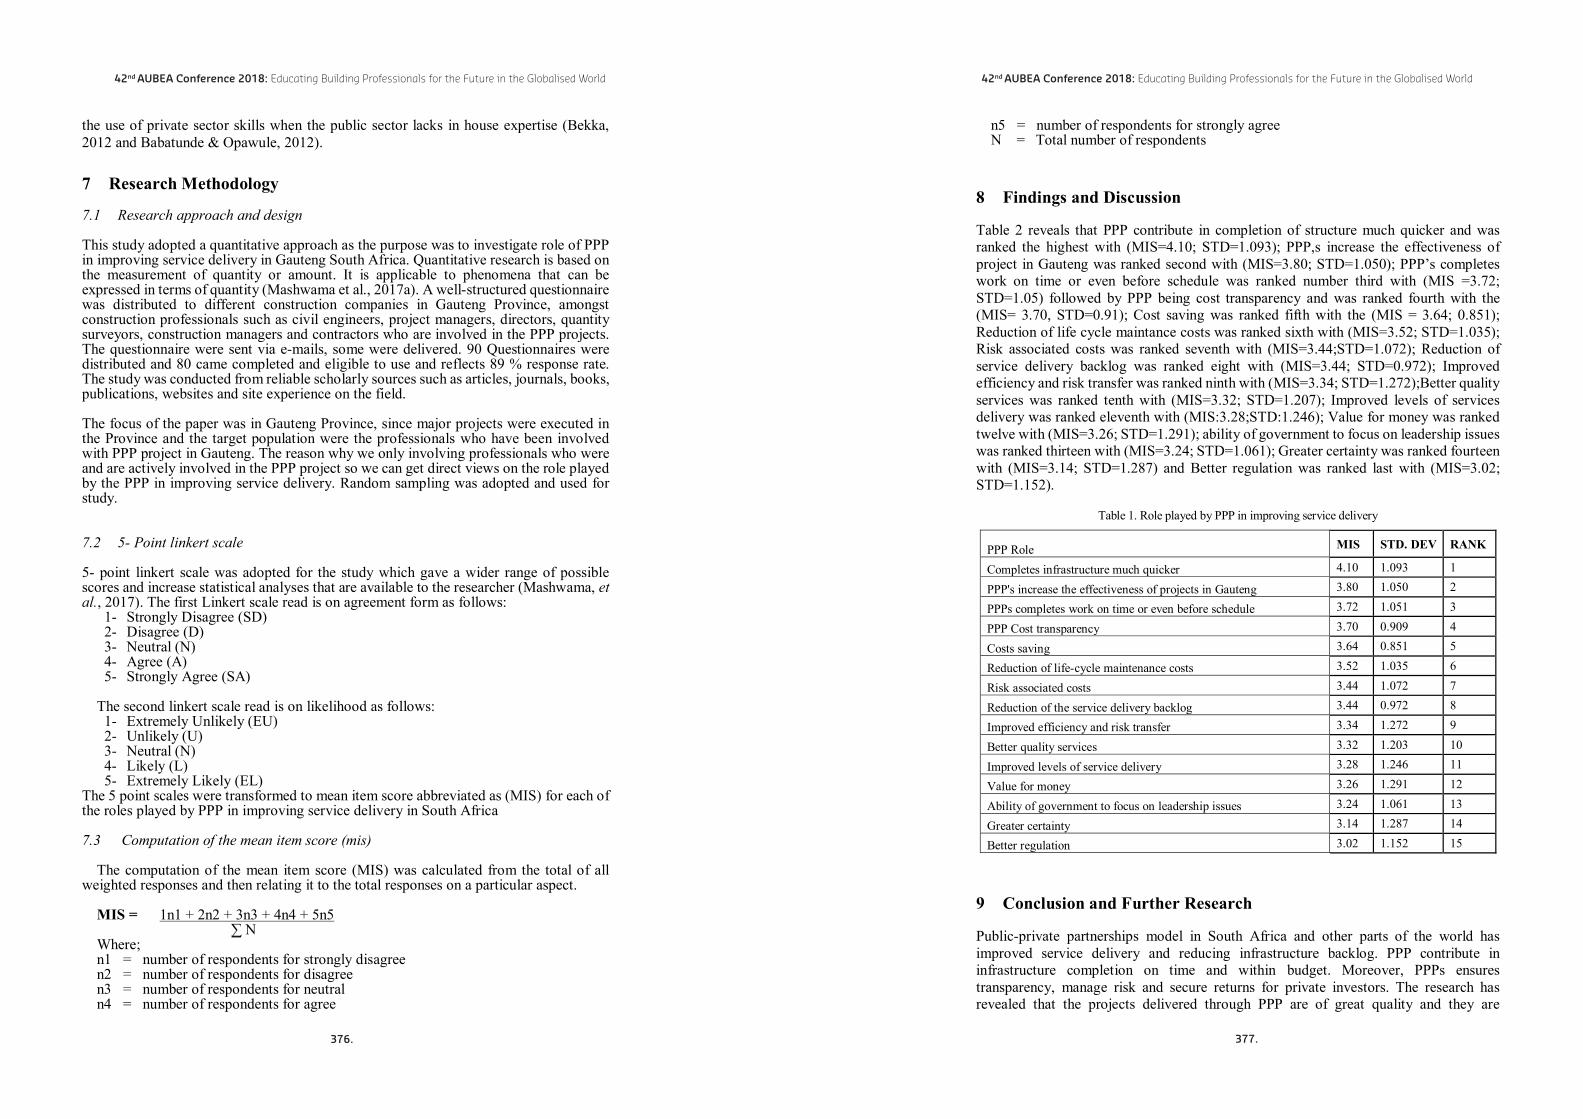
42nd AUBEA Conference 2018: Educating Building Professionals for the Future in the Globalised World
n5 = number of respondents for strongly agreeN = Total number of respondents
8 Findings and Discussion
Table 2 reveals that PPP contribute in completion of structure much quicker and was ranked the highest with (MIS=4.10; STD=1.093); PPP,s increase the effectiveness of project in Gauteng was ranked second with (MIS=3.80; STD=1.050); PPP’s completes work on time or even before schedule was ranked number third with (MIS =3.72; STD=1.05) followed by PPP being cost transparency and was ranked fourth with the (MIS= 3.70, STD=0.91); Cost saving was ranked fifth with the (MIS = 3.64; 0.851); Reduction of life cycle maintance costs was ranked sixth with (MIS=3.52; STD=1.035); Risk associated costs was ranked seventh with (MIS=3.44;STD=1.072); Reduction of service delivery backlog was ranked eight with (MIS=3.44; STD=0.972); Improved efficiency and risk transfer was ranked ninth with (MIS=3.34; STD=1.272);Better quality services was ranked tenth with (MIS=3.32; STD=1.207); Improved levels of services delivery was ranked eleventh with (MIS:3.28;STD:1.246); Value for money was ranked twelve with (MIS=3.26; STD=1.291); ability of government to focus on leadership issueswas ranked thirteen with (MIS=3.24; STD=1.061); Greater certainty was ranked fourteen with (MIS=3.14; STD=1.287) and Better regulation was ranked last with (MIS=3.02; STD=1.152).
Table 1. Role played by PPP in improving service delivery
PPP Role MIS STD. DEV RANK
Completes infrastructure much quicker 4.10 1.093 1
PPP's increase the effectiveness of projects in Gauteng 3.80 1.050 2
PPPs completes work on time or even before schedule 3.72 1.051 3
PPP Cost transparency 3.70 0.909 4
Costs saving 3.64 0.851 5
Reduction of life-cycle maintenance costs 3.52 1.035 6
Risk associated costs 3.44 1.072 7
Reduction of the service delivery backlog 3.44 0.972 8
Improved efficiency and risk transfer 3.34 1.272 9
Better quality services 3.32 1.203 10
Improved levels of service delivery 3.28 1.246 11
Value for money 3.26 1.291 12
Ability of government to focus on leadership issues 3.24 1.061 13
Greater certainty 3.14 1.287 14
Better regulation 3.02 1.152 15
9 Conclusion and Further Research
Public-private partnerships model in South Africa and other parts of the world has improved service delivery and reducing infrastructure backlog. PPP contribute in infrastructure completion on time and within budget. Moreover, PPPs ensures transparency, manage risk and secure returns for private investors. The research has revealed that the projects delivered through PPP are of great quality and they are
42nd AUBEA Conference 2018: Educating Building Professionals for the Future in the Globalised World
the use of private sector skills when the public sector lacks in house expertise (Bekka, 2012 and Babatunde & Opawule, 2012).
7 Research Methodology
7.1 Research approach and design
This study adopted a quantitative approach as the purpose was to investigate role of PPP in improving service delivery in Gauteng South Africa. Quantitative research is based on the measurement of quantity or amount. It is applicable to phenomena that can be expressed in terms of quantity (Mashwama et al., 2017a). A well-structured questionnaire was distributed to different construction companies in Gauteng Province, amongst construction professionals such as civil engineers, project managers, directors, quantity surveyors, construction managers and contractors who are involved in the PPP projects.The questionnaire were sent via e-mails, some were delivered. 90 Questionnaires were distributed and 80 came completed and eligible to use and reflects 89 % response rate. The study was conducted from reliable scholarly sources such as articles, journals, books, publications, websites and site experience on the field.
The focus of the paper was in Gauteng Province, since major projects were executed in the Province and the target population were the professionals who have been involved with PPP project in Gauteng. The reason why we only involving professionals who were and are actively involved in the PPP project so we can get direct views on the role played by the PPP in improving service delivery. Random sampling was adopted and used for study.
7.2 5- Point linkert scale
5- point linkert scale was adopted for the study which gave a wider range of possible scores and increase statistical analyses that are available to the researcher (Mashwama, et al., 2017). The first Linkert scale read is on agreement form as follows:
1- Strongly Disagree (SD)2- Disagree (D)3- Neutral (N)4- Agree (A)5- Strongly Agree (SA)
The second linkert scale read is on likelihood as follows:1- Extremely Unlikely (EU)2- Unlikely (U)3- Neutral (N)4- Likely (L)5- Extremely Likely (EL)
The 5 point scales were transformed to mean item score abbreviated as (MIS) for each of the roles played by PPP in improving service delivery in South Africa
7.3 Computation of the mean item score (mis)
The computation of the mean item score (MIS) was calculated from the total of all weighted responses and then relating it to the total responses on a particular aspect.
MIS = 1n1 + 2n2 + 3n3 + 4n4 + 5n5 ∑ NWhere;n1 = number of respondents for strongly disagreen2 = number of respondents for disagreen3 = number of respondents for neutraln4 = number of respondents for agree
376. 377.

42nd AUBEA Conference 2018: Educating Building Professionals for the Future in the Globalised World
maintained well. Hence, PPPs should be practiced as often as the traditional method because it breach the gap of abandonment, unfinished and delays in projects. However, despite the success of PPP in delivering infrastructure, it is declining instead of increasing and creating less opportunities for private investors. The decline is mainly as a result of delays and cancelled projects and increase restrictive international regulatory requirement on banks is limiting their ability to provide debt funding. Furthermore, the government need to increase more credible PPP project so as to attract private investors, private sectors to venture into them and plan their long term investment with appropriate return of investment. Moreover the Government need to increase more awareness about the beauty and benefits of PPPs and also conduct training more often for the public and thus bridging the gap of skills and capacity.
10 References
Asmati.A. (2010).Is public private partnership an effective instrument to implement SDIs?FIG congress facing the challenges-building capacity held in Sydney. Conducted by library association in Australia. Sydney: library association.
Alfen, H.W.,Fischer,K.,Liedel,K. & Riemann,k. (2010). An integrated risk management systems for PPP projects. Journal of financial management of property and construction. 15(3), pp 260-282
Babatunde, 0.S. and Opawole, A. (2012). Critical success factors in public-private partnership on infrastructure delivery in Nigeria. Journal of facilities management, 10(3), pp 212-225
Bekka, K. (2012). Public Private Partnership for infrastructure development: Acquiring new skills for a new age. HDR, Silver Spring.
Bovis, C.H. (2010). Public Private Partnerships in the 24th century. In ERA Forum. 11(3), pp 379-398
Budget review, (2018). Public- Private Partnerships, pp 153-158Grimsey, D., Lewis, M.K. (2002). Evaluating the risk of Public Private Partnership for
infrastructure projects. International Journal of Project Management. Volume. 20.Hall, D. (2015). Why Public Private Partnerships don’t work. The many advantages of the public
Alternative. Public services international research unit, University of Greenwich, UK.Latterman, C; Kupke, S., L and Stieglitz, S. (2009). Impact of PPPs to broadband diffusion in
Europe. Transforming government people, process and policies, 3(4), pp 355-374Manchidi, E.M. & Merifield, A. (2001). Public-Private Partnerships: Public infrastructure
investment and prospects for economic growth in South Africa. Empowerment through economic transformation. Edited by Khosa,M.M. Durban: African Millennium press.
Manuel, T.A. (2007). Introducing Public Private Partnerships in South Africa. National Treasury. PPP unit. Pp 1-36.
Mashwama, N.X, Aigbavboa, C. and Thwala, D. (2017a). An assessment of the critical success factor for the reduction of cost of poor quality in construction projects in Swaziland. Procedia Engineering. 196, pp 447-453.
Mashwama, N.X, Aigbaboa, C. and Thwala, D. (2017b). A theoretical assessment of the challenges of Public Private Partnership in Improving Infrastructure service delivery in Swaziland. Proceedings of the 4th international conference on infrastructure development and investment strategies for Africa. DII-2017. 30 August -1September 2017. Livingstone, Zambia. pp 299-239.
Nichols, R. (2010). The Pros and cons of privatizing government functions. Management and labor.
Ntshangase, B.A. (2002). Public Private Partnership for service delivery in South Africa. MA Thesis, University of Durban-Westville.
United Nations Economic Commission for Europe. (2004).Governance in Public Private Partnerships for infrastructure development. Geneva: United Nations.
42nd AUBEA Conference 2018: Educating Building Professionals for the Future in the Globalised World
Employment challenges in mega construction projectsin Sri Lanka
Shavindree Nissanka1, Thanuja Ramachandr2, Devindi Geekiyanage3 and Chamila Dilhan Ramanayaka4
1,2,3Department of Building Economics, University of Moratuwa,Moratuwa 10400, SRI LANKA
4Department of Building Economics, Curtin University,Bentley WA 6102, AUSTRALIA
E-mails: [email protected]; [email protected]; [email protected];[email protected]
Abstract:
With the current economic trends, investments towards mega construction projects are happening in hefty amounts, consuming a considerable proportion, 8% of the global GDP. However, the inherent characteristics of megaprojects include a higher level of risk and uncertainty claiming a project failure rate of 66%. The literature indicates that employment challenges are of significant concern in many researchers. This study attempts to investigate the employment challenges in mega construction projects and propose possible strategies to overcome those challenges. A questionnaire survey was administered to ninety professionals experienced in handling mega constructions in Sri Lanka. According to descriptive statistics reults from a ranking through a Likert scale of 1-5, the top three significant challenges are: shortage of on-site skilled workers, lack of professional expertise in technical areas, and lack of trained workers on site, with means value of above 3.9. However, a detailed scrutiny of these challenges indicates that they are inter-related and could be grouped into four major challenging areas: workforce supply, project management, human resource management and project-specific issues. The analysis further shows that human resource management issues are significant challenges for the professional sector (mean=4.4) while workforce supply issues are significant for technical, craft and operating sectors (mean>4.5). Having more attractive and desirable job market, producing more qualified workforce, and technological advancement are the topmost strategies which could be employed in addressing the above challenges. Based on these, the construction employment challenges across the various sub-sectors could be addressed in a strategic systematic approach which would ultimately contribute to successful implementation of mega construction projects in Sri Lanka.
Keywords:
Construction employment, Mega construction, Sri Lanka, Strategies
1 Introduction
A mega construction project could be defined as a large-scale project with a price tag of one billion dollars; or the “new animal” that has a strikingly poor performance in economy, environment, and public support (Fiori & Kovaka, 2005). In other words, they are massive investments initiated in line with the expectations of the governments in achieving national and international sustainable development objectives (Marrewijket al., 2008). In the Sri Lankan context De Silva (2014) define Mega projects, as projects costing
378. 379.

42nd AUBEA Conference 2018: Educating Building Professionals for the Future in the Globalised World
over US $ 100 million (approximately) and spread over 36 months or more to complete.However, in the world of projects, megaprojects are denominated as the wild beasts which are phenomenal and hard to tame (Zidane et al, 2013). Due to inherent complexities and high-risk levels of these projects, they possess a high tendency of failure. As Ahmed and Othman (2013) explained, these projects are said to be risky undertakings that consume substantial amount of time, cost and require highly trained design and construction professionals. On a similar note, Merrow (2011) indicated that the failure rate of mega projects is a high rate as 66% and an equal share is noted for failing to meet the objectives for which they were constructed. While emphasising the critical necessity of successfully implementing these projects in developing countries, Ahmed and Othman (2013) highlighted that developing countries experience shortages of knowledge, skills, capabilities, and finance. So, the critical necessity of these resources for mega constructions and the deficiency of these in developing countries create a two-edged dilemma. It is therefore a prevailing perceptive that this paradox constitutes a predicament for the actualization of mega construction project goals in developing countries (Othman, 2014). In order to address the higher failure rates, it is essential to study the restraining forces or the challenging factors towards successfully implementing mega construction projects. While several studies have focused on this aspect from the developing countries perspective, Othman (2014) classified the challenges into four main categories namely engineering, human development, managerial & political and sustainability challenges.
On the other hand, it is clearly apparent from past studies that availability of high-quality human resources affects mega project performance directly. According to Othman (2014), the implementation of mega construction projects requires advanced design knowledge and technical skills, competent human resources and managerial capabilities. Furthermore, multidisciplinary contributions from various organizations and professional expertise in program planning, control and highly trained employees especially in the field of project management is another area of concern (Kerzner, 2006). In the construction of 2010 FIFA World Cup Stadia in South Africa which was a mega construction shortage of skilled labour was ranked as one of the topmost causes of cost overrun and time delays (Baloyi & Bekker, 2011). Another example is the development of Nelson Mandela Bay Metropole in South Africa where lack of trained on-site supervisors and highly qualified staff drove to cost overruns (Koen & Theron, 2008).
In Sri Lanka, according to ICRA Lanka (2011), the employment base in the local construction industry is made up of four categories as professional, technical, machine operators and craft category. Regard to the performance, the skilled labour force utilized inefficiently is estimated to be over 60% of the total skilled labour (Jayalath, 2016). Further, a significant share, over 80% of the construction workforce is casually employed and has had no proper training in any trades (Jayawardane & Gunawardena, 1998). A decade ago, in the local construction industry, only 5 % are skilled labourers among 500,000 directly employed workers and it is one third out of the forecasted skilled labour requirement (Weddikkara, 2006). The comparison of current demand and supply of the skill trades shows an unbalanced level in considerable skills due to lack of training programs and lower wage level, poor attitude of younger generation and working conditions have created scarcity in skill supply which adversely influenced on skilled labour demand in the present days (Anuruddika & Sandanayake, 2015).
As Sri Lanka attempts to become a Foreign Direct Investment (FDI) hotspot, top construction industry experts yesterday warned the sector is ill-equipped to absorb inflows due to a growing labour shortage. Right now, there is a huge shortage of both skilled and unskilled labour because people are not willing to join the industry (Wijeya Newspapers, 2016). In the last ten years, we have seen the emergence of mega projects
42nd AUBEA Conference 2018: Educating Building Professionals for the Future in the Globalised World
in Sri Lanka on an unprecedented scale with developments like the Hambantota Port, Mattala Airport, Sooriyawewa Cricket ground, the new expressways, Uma Oya project for example (Bandarage, 2015). In pursuant to this, the new mega plan envisages transforming the Western Province by 2030 to a Megapolis or a mega city which is estimated to be US$ 40 billion investment (Mushtaq, 2016). However, in the local construction industry, even before the mega projects like the Port City, Megalopolis and other infrastructural developments are to commence in 2016, the impact of the shortage of the appropriate skills and the workforce, in general, was observed (Wijemanne, 2016). On the similar note, Wickramasinghe (2012) stressed that manpower shortfall in the construction industry will be a pivotal issue to be addressed by policymakers, particularly at a time when mega social and physical infrastructure projects are happening all over Sri Lanka. Despite significant concerns with regards to mega constructions and its' manpower requirements, no specific studies which have explored the employment challenges in mega constructions specifically for the different employment subsectors and means of mitigating those challenges and issues. On this note, this research addresses this knowledge gap by investigating the construction employment challenges in different employment sub-sectors and the mitigating mechanisms with regards to implementation of mega construction projects in Sri Lanka.
2 Research Methodology
An extensive literature review concluded that construction employment challenges are of significant concern in mega constructions and impact the project outcome in terms of cost, time and quality. Afterwards, a questionnaire survey was conducted to collect participants' views on significant employment challenges in mega constructions and the possible response mechanisms in the local scenario. The survey method was chosen as it is a very popular form of data collection, especially when gathering information from large groups and economically (Noor, 2008).
The survey consisted of two consecutive rounds of questionnaires administered to experienced professionals who have experienced mega constructions in Sri Lanka. Organizations that have undertaken mega constructions were identified through company websites and a background study. Then each of these firms was contacted and asked for professionals who have worked for mega constructions projects in the areas of project management, contract administration and labour handling with a minimum 10-years’experience in the construction field. Accordingly, the questionnaire was distributed among a sample of 100 professionals and 90 of them were returned which offered a response rate of 90%.
A Likert scale of 1-5 where 5 represents “Critical”, 4 - “Very Influential”, 3 -Influential”, 2 - “Somewhat Influential’ and 1 represents “Not Applicable” was employed to determine the significance of the employment challenges in handling mega constructions in the Sri Lankan context. Inferences were derived based on descriptive statistics of mean, standard deviation.
3 Research Findings
3.1 Profile of Research Participants
As part of the questionnaire survey, background information of research participants was collected. It included designation of the participants, number of years of experience in the
380. 381.

42nd AUBEA Conference 2018: Educating Building Professionals for the Future in the Globalised World
construction field and the project value of mega construction projects where participants involved. Table1 provides a summary of the respondents’ profile.
Table 1. Profile of the respondents
Main Criteria Sub-criteria Respondents
No Percentage (%)
Designation
Contract Managers 5 6
Project Directors 6 7
Project Managers 15 17
Planning Engineers 3 14
Project Quantity Surveyors 24 26
Project Engineers 27 30
Total 100 100
Experience
10-20 Years 35 39
20-30 years 25 28
Above 30 years 30 33
Total 100 100
Value of the project
200 Million- 500 Million 22 23
500 Million -1Billion USD 47 52
Over 1 Billion USD 21 24
Total 100 100
In terms of designation, 30% of them have served as project engineers, 26% of Project quantity surveyors and 17% was Project Managers. A little sample consisted of contract managers and project directors. More than 60% of participants have over 20 years of experience. Although a "Mega Project" is defined as an investment which exceeds a value of USD 1 Billion in monetary terms (Fiori & Kovaka, 2005), in the Sri Lankan context completed projects of this value are only a hand few. Therefore, the project values were categorized into US$200 Million- 500 Million US$500 Million -1Billion and Over US$1 Billion. The majority of the respondents (over 50%) fall under the US$ 500 Million -1Billion category.
3.2 Construction Employment Challenges
A list of construction employment challenges established through literature review was presented to professionals who have experienced in mega construction projects in Sri Lanka. They ranked those challenges according to their degree of impact towards the mega construction projects in Sri Lanka as shown in Table 2.
42nd AUBEA Conference 2018: Educating Building Professionals for the Future in the Globalised World
Table 2. Construction employment challenges
(Source: Sutrisna and Potts, 2004)
Code Challenging Factors Mean Std. Dev
F1 Shortage of on-site skilled workers or local labour forces 4.000 1.151
F2 Lack of professional expertise in technical areas 3.990 1.167
F3 Lack of trained workers on site. 3.940 1.228
F4 The management team lacking effective leadership, motivation, competency, and people skills.
3.790 1.148
F5 High turnover of project personnel in the mega-project organization 3.700 1.078
F6 Lack of providing and managing high- qualified human resources 3.690 0.957
F7 Difficulty resourcing the right skills and matching with project demands and geography/low-quality labour in remote locations.
3.590 0.848
F8 Career risks, because most of the undertaking do not advance past the planning stage and therefore, pose an unpopular career course.
3.560 1.072
F9 Lack of experienced staff to accept critical roles which they are not prepared for
3.420 1.105
F10 Poor coordination and integration of work crews/teams; inexperienced personnel in critical positions.
3.420 1.171
F11 Improper implementation of project management processes and training of key project staff due to resource shortages.
3.400 0.996
F12 Under average work productivity due to complexity. 3.400 0.958
F13 A small number of staff assigned to the team causing insufficient oversight 3.360 1.268
F14 Improper coordination that would lead to the inactivity of some engineering trades and time-consuming error corrections.
3.320 0.906
F15 Tight service market, lack of internal capacity with regard to new technology and in-house resources.
3.190 0.950
F16 Lack of providing quality education and professional training programs with necessary skills
3.120 0.992
When these employment challenges are studied, it is apparent that they are focused on different aspects as well as these aspects are repeated along the challenges. Also, as all 16 factors are influential in the local context (with mean values above 3) addressing all of them strategically is not practical and furthermore when these challenges are closely scrutinized some of them seems to be correlated and connected with each other. Therefore, few major areas were identified as underlying concerns of these 16 diverse challenges.
As observed in Table 2, the first few factors repeat the term lack which implies a shortage. This is in both quality and quantity of workforce. Therefore, the challenges of lack of available on-site skilled workers or local labour forces, lack of providing quality education and professional training programs with necessary skills, difficulty resourcing the right skills and matching with project demands and geography, lack of properly trained workers on site and lack of experienced staff to accept critical roles which they are not prepared for are concerns due to workforce supply issues.
Another aspect amongst these challenges is related to productivity, lack of coordination, complexities and inadequacy of processes. Hence the challenges of a small number of staff assigned to the team causing insufficient oversight, poor coordination and integration of work crews/teams; inexperienced personnel in critical positions, under
382. 383.

42nd AUBEA Conference 2018: Educating Building Professionals for the Future in the Globalised World
average work productivity due to complexity, improper coordination that would lead to the inactivity of some engineering trades and time consuming error corrections and improper implementation of project management processes could be considered as issues related to project management aspect.
The next main concern is not managing the existing workforce in the proper way. The challenges of the management team lacking effective leadership, motivation, competency, and people skills, high turnover of project personnel in the mega-project organization, career risks, because most of the undertaking do not advance past the planning stage and therefore, pose an unpopular career course and lack of providing and managing high- qualified human resources are such issues which could be called as human resource management issues.
The left-over challenges lack of professional expertise knowledge in technical areas and tight service market, lack of internal capacity with regard to new technology and in-house resources will depend on the nature and type of project. These challenges will be decided by the design and technical requirements and will not be common to every mega construction project. Therefore, these can be called as project-specific issues.
So accordingly, the 16 challenges could be mainly gathered under the four areas of project management issues, workforce supply issues, human resource management issues and project-specific issues. Instead of 16 diverse factors, 4 principal areas simplify the underlying issues and facilitates to identify the trigger points in a more simplified manner. Hence these four principal challenging areas are taken forward and tested for the different employment subsectors in the next section.
3.3 Challenges in the Employment Subsectors
The principal challenging areas identified from phase 1 were tested with respect to each of the sub-sectors of employment. This was done in order to identify the most severe challenges for each of the sub-sectors separately. The results of the four sub-sectors are summarized and presented in Table 3.
Table 1. Occurrence of the decision resulted from a two-decision-makers condition
(Source: Sutrisna and Potts, 2004)
ChallengeProfessional Technical Operator Craft
Mean Std. Dev Mean Std.
Dev Mean Std. Dev Mean Std. Dev
Project Management Issues 3.022 0.866 3.911 1.062 3.289 0.843 3.289 0.843
Workforce supply issues 3.356 1.131 4.356 0.679 4.422 0.690 4.644 0.484
Human resource management issues 4.356 0.712 3.200 0.919 2.933 0.939 2.956 0.767
Project-specific issues 3.511 0.968 2.044 0.903 2.089 0.900 2.089 0.900
As observed in Table 3, workforce supply issues are the most significant area for the technical, operator and craft sub-sectors. Amongst for the technical and operator sectors this area is highly influential with mean values above 4.000 while for the craft sector it is a critical concern with a mean value of above 4.500. However, for the professional sub-sector, the most significant area is human resource management issues. When analysing the results for the project management issues it is apparent that it is less significant for the professional sector compared to the other three sectors. However, the project-specific
42nd AUBEA Conference 2018: Educating Building Professionals for the Future in the Globalised World
issues report a mean value of above 3.50 only in the professional sub-sector indicating a higher significance whereas in the other three sectors it is less influential with mean values below 2.500.
3.3.1 Professional Sub Sector
In the Professional sub-sector since most challenging area is human resource management issues the most significant challenges for this respective subsector would be lack of providing and managing high- qualified human resources, the management team lacking effective leadership, motivation, competency, and people skills high turnover of project personnel in the mega-project organization and career risks because most of the undertaking do not advance past the planning stage and therefore, pose an unpopular career course. However, the project-specific issues also reported being highly influential for this subsector with a mean value of 3.511which indicates that lack of professional expertise knowledge in technical areas and tight service market, lack of internal capacity with regard to new technology and in-house resources will also be significant concerns.
3.3.2 Technical Sub Sector
As workforce supply issues turns out to be the most significant concern, shortage of on-site skilled workers or local labour forces, lack of properly trained workers on site and difficulty sourcing the right skills and matching with remote geographic locations and lack of providing quality education and professional training programs with necessary skills will be the most common challenges for the technical sector.
3.3.3 Operator Sub Sector
In the Operator, sub-sector also the most challenging area is reported to be Workforce Supply Issues which concludes that the most challenging sectors will be same as in the technical sector. Following this the most significant is for the operator subsector is the project management issues which indicates that productivity lack of integration and coordination will be also influential respectively.
3.3.4 Craft Sub Sector
In the last subsector, Craft category, also the most challenging area is reported to be Workforce Supply Issues with a mean value of 4.644 which is reported as a critical concern. Craft sector reported the highest mean value for these issues which indicates a severe workforce supply issue when compared to the other sub-sectors.
4 Discussion and Conclusions
The literature revealed 16 employment challenges affecting mega constructions in developing countries. According to the analysis, the most significant factors were lack of properly trained workers (mean=4.00), lack of professional expertise knowledge in technical areas (mean=3.99), and a shortage of on-site skilled local labour forces (mean=3.94). When looking at this result it is evident that the labour and skill shortage persistent in the local construction industry seems to fall into major focus areas. Therefore, these 16 employment challenges were then grouped under main challenging areas of project management, workforce supply issues, human resource management and project-specific issues.
384. 385.

42nd AUBEA Conference 2018: Educating Building Professionals for the Future in the Globalised World
4.1 Project Management Issues
When looking at the challenges grouped under this subtheme, it is clear that all these issues arise due to issues related to productivity, lack of coordination and poor management practices. Therefore, the name “Project Management Issues” was assigned for this group. However, when these are considered in the context of mega constructions it is important to investigate how the severity of this category is affected by the inherent characteristics of mega constructions. On this note, multidisciplinary contributions from various organizations and professional expertise in program planning, control and highly trained employees especially in the field of project management is another area of concern in mega constructions (Kerzner, 2006). It was evident that the labour productivity varies with the project cost and project duration where higher the cost lowers the productivity and higher the time duration lowers the productivity was reported (Nasir Zadeh and Nojedehi, 2013). According to same authors, the optimum level of labour productivity throughout the project development phases will play a critical role in obtaining project success. In line with the significant concerns related to labour productivity issues in mega constructions it is reported that due to high cost and long-time scales of these projects, the labour productivity levels will tend to further worsen. In relation to the different subsectors, project management issues are the most critical type in technical, operator and craft sectors while for the professional sector it is somewhat less influential. Implementing better advance project management practices for coordinating these complex projects require advanced technology as well as effective training for the workforce. Therefore, in addressing these issues the most common solutions would be the technological advancement and providing effective guidance and training aiming mega constructions.
4.2 Workforce Supply Issues When the individual issues are studied, it emphasizes that there is a shortage in number of workers, skill level, education level as well as sufficient training. Despite all these sourcing, the workers at different locations and under different conditions have also become challenging. So, these issues are mainly due to the workforce supply structure.In line with these issues, Jayawardane and Gunawardena (1998) reported that a significant portion of over 80% the construction workforce is casually employed and has had no proper training in any trades. This context is still persistent which has led the Sri Lankan construction industry to remain wasteful, tradition-bound, plagued by delays, cost overruns and contractual disputes (National Chamber of Exporters of Sri Lanka, 2016). The main reason for the shortage of workers is that the construction industry is not perceived as a good prosperous workplace. Therefore, the desirability for the industry jobs should be enhanced and in addressing the skill level issues better training and career development opportunities should be granted. Furthermore, the production of quality construction workforce should be increased so that when the upcoming mega constructions are implemented we are equipped with the right skills and people.
4.3 Human Resource Management Issues When the issues under the third group are studied, they emphasize a situation where the available human resources are not managed properly. So, personal development goals are not achieved without any proper direction for the individuals in the construction industry. In explaining the reasons behind these findings, Anuruddika and Sandanayake (2015) state that lack of training programs and lower wage level, poor attitude of the younger generation and working conditions have created scarcity in skill supply. If we are to
42nd AUBEA Conference 2018: Educating Building Professionals for the Future in the Globalised World
handle the upcoming mega developments successfully the available workforce needs to be safeguarded and retained properly in the industry or else the poorly motivated workers will fail to give their best to the industry. Therefore, in line with the views of Ofori (2012) managing the available employment base in the right manner will make sure of a transformational change in the industry structure from a state of being "dirty, dangerous and demanding" to a one of "professional, productive and progressive".
4.4 Project Specific IssuesThese challenges are decided by the complexity and nature of the project. However, according to Haynes (2002), mega constructions are technologically and logistically demanding. Hence the demands will vary from one project to another. If these complex projects are to be handled tactfully prior experience and knowledge in the specific fields will be instrumental. Therefore, providing specialized pieces of training on the technical expertise areas as well as upgrading the technological usage will address these types of issues. However effective labour planning mechanisms also need to be implemented so that such specialized knowledge and experience requirements could be identified and addressed before the project inception.
As a concluding remark in addressing the major concerns of employment perspective in mega constructions increasing production of the quality construction workforce, increasing the attractiveness for the construction industry jobs, technologicaladvancement, providing effective guidance and training as well as effective labour planning mechanisms will be pivotal. Identifying the different concerns with regard to different sub-sectors of employment will facilitate a more effective approach in initiating these strategic mechanisms which will ultimately contribute to a better project outcome.
References
Ahmed, A. and Othman, E. (2013), ‘Challenges of mega construction projects in developing countries’, Organization, Technology and Management in Construction, 5(1), pp 730-746.
Ahmed, A. and Othman, E. (2013), ‘Challenges of mega construction projects in developing countries’, Organization, Technology and Management in Construction,5(1), pp 730-746.
Anuruddika, N. and Sandanayake, Y.G. (2015), ‘An investigation into skilled labour requirement in Sri Lankan building construction industry’, In Proceedings of the 4th World Construction Symposium, Ceylon Institute of Builders, Colombo 01.
Baloyi, L. and Bekker, M. (2011), ‘Causes of construction cost and time overruns: The 2010 FIFA World Cup stadia in South Africa’, The Physical Development Sciences,18(1), pp 51-67.
Bandarage, C. (2015),‘Mega Projects is not the way; but, Small Business’, LankaWeb, http://www.lankaweb.com/news/items/2015/08/16/mega-projects-is-not-the-way-but-small-business-microcredit/, viewed:12/05/2016.
Dain, S. (2016, September 29), ‘Construction industry builds case for foreign labour’, Wijeya Newspapers, http://www.ft.lk/article/537795/Construction-industry-builds-case-for-foreign-labour, viewed: 08/04/2016.
De Silva, U. (2014, November 4). Unsolicited Tenders (Procurements) for Mega Projects, Create ‘Mega’ Corruption – Sri Lanka Guardian. Retrieved from https://www.slguardian.org/unsolicited-tenders-procurements-for-mega-projects-create-mega-corruption/
386. 387.

42nd AUBEA Conference 2018: Educating Building Professionals for the Future in the Globalised World
Fiori, C. and Kovaka, M. (2005), ‘Defining Megaprojects: Learning from Construction at the Edge of Experience’, Construction Research Congress.doi:10.1061/40754(183)70
ICRA Lanka (2011, October 12), Construction. ICRA Lanka, Colombo. Jayalath, C. (2016),‘Major Shortage of Skilled Workers in the Domestic Construction
Industry; Is India the Answer?’, Lankaweb,http://www.lankaweb.com/news/items/2016/08/28/major-shortage-of-skilled-workers-in-the-domestic-construction-industry-is-india-the-answer/, viewed: 22/06/2016.
Jayawardane, A.K.W. and Gunawardena, N.D. (1998), ‘Construction workers in developing countries: a case study of Sri Lanka’, Construction Management and Economics, 16 (5), pp 521-530.
Kerzner, H. (2006), Project Management. John Wiley and Sons, New York.Koen, D. and Theron, F. (2010), ‘Innovative Design Management and Development
Control Case Study: Nelson Mandela Bay Metropole–South Africa’, Gestão&Tecnologia de Projetos, 5(3).
Marrewijk, A., Clegg, S.R., Pitsis, T.S. and Veenswijk, M. (2008), ‘Managing public-private megaprojects: Paradoxes, complexity, and project design’. International Journal of Project Management, 26(6), pp 591-600.
Merrow, E.W. (2011) Industrial Megaprojects: Concepts, strategies, and practices for success, Wiley, John & Sons, Oxford, United Kingdom.
Mushtaq, M. (2016),‘Sri Lanka's $40bn 'megapolis' plan is bold -- but achievable?’, Nikkei Asian Review, https://asia.nikkei.com/Politics-Economy/Policy-Politics/Sri-Lanka-s-40bn-megapolis-plan-is-bold-but-%20achievable, viewed: 22/07/2016.
Noor, K. (2008), ‘Case study: A strategic research methodology’, American Journal of Applied Sciences, 5(11), pp 1602-1604.
Othman, A. (2014), ‘Mega construction projects in developing countries’, African Journal of Engineering Research, 2(4), pp 73–84.
Silva T.L.R.T. (2016), ‘Problems faced by the construction industry’, Daily News, http://www.dailynews.lk/?q=2015/09/27/business/problems-faced-construction-industry, viewed: 17/06/2016.
Weddikkara, C. (2006, November 8),‘Sri Lanka faces skilled worker shortage to meet construction boom’, Lanka Business Online,http://ftp.lankabusinessonline.com/news/sri-lanka-construction-industry-faces-labour-shortage/1956901613, viewed: 24/07/2016.
Zidane, Y.J., Johansen, A. and Ekambaram, A. (2013), ‘Megaprojects-Challenges and Lessons Learned’, Procedia - Social and Behavioral Sciences, 74(1), pp 349-357.
388.

Cisco Provider Code 003013
Contact details
CURTIN UNIVERSITYBentley CampusWestern Australia
www.curtin.edu.au