Contribution of intrinsic factors to heat resistance ... - UNSWorks
317
CONTRIBUTION OF INTRINSIC FACTORS TO HEAT RESISTANCE OF ASCOSPORES OF BYSSOCHLAMYS A thesis submitted to The University of New South Wales as fulfilment of the requirements for the degree of DOCTOR OF PHILOSOPHY by ANH LINH NGUYEN B. Sci. Hons (Food Science and Technology) (UNSW, Australia) School of Chemical Engineering The University of New South Wales Sydney, NSW, Australia January 2012
-
Upload
khangminh22 -
Category
Documents
-
view
4 -
download
0
Transcript of Contribution of intrinsic factors to heat resistance ... - UNSWorks
CONTRIBUTION OF INTRINSIC FACTORS TO HEAT RESISTANCE OF ASCOSPORES OF
BYSSOCHLAMYS
A thesis
submitted to The University of New South Wales
as fulfilment of the requirements for the degree of
DOCTOR OF PHILOSOPHY
by
ANH LINH NGUYEN B. Sci. Hons (Food Science and Technology) (UNSW, Australia)
School of Chemical Engineering
The University of New South Wales
Sydney, NSW, Australia
January 2012
PLEASE TYPE
Surname or Family name: NGUYEN
First name: ANH LINH
THE UNIVERSITY OF NEW SOUTH WALES Thesis/Dissertation Sheet
Other name/s:
Abbreviation for degree as given in the University calendar: PhD
School: School of Chemical Engineering Faculty: Engineering
Title: CONTRIBUTION OF INTRINSIC FACTORS TO HEAT RESISTANCE OF ASCOSPORES OF BYSSOCHLAMYS
Abstract 350 words maximum: (PLEASE TYPE)
Byssoch/amys is a fungus that causes spoilage of heat processed fruit products by producing heat resistant ascospores. This thesis investigated heat resistant properties of ascospores of Byssoch/amys .fulva and Byssoch/amys nivea. Heat inactivation of the ascospores at temperatures of 82.5 - 90°C showed activation, shoulder, exponential reduction and tailing phases. The D values of the ascospores increased significantly with culture age over the period of 4 - 24 weeks, and the average increase was 3.5 - 7-fold for B . .fulva strains and 2 - 4-fold for B. nivea strains. Ascospores of B . .fulva were more heat resistant than those of B. nivea.
Ultrastructure of the ascospores examined by electron microscopy comprised a cell wall, a thick intermediate space (IMS) and a dense cytoplasm. Examining the arrangement of materials in the ascospores with differential scanning calorimetry provided evidence of a glassy state. Aging improved the robustness of the ascospore structure whereas heating reduced its integrity. Older ascospores occasionally had more sub-layers in the IMS. Ascospores of B . .fulva bad a more resilient structure and more elaborated outer coating than those of B. nivea.
Flow cytometry revealed heterogeneity in preparations of dormant and heat treated ascospores at different ages. Heating affected the integrity of the ascospore wall, which was manifested as increased autofluorescence, permeability to SYTO 9 and clumping of the ascospores. Sub-populations of activated and sub-lethally injured ascospores mostly appeared after heat treatments.
Proteomic analysis of ascospores by 2D gel electrophoresis showed that less than 4% of their total proteins significantly changed their expression after heating and aging. Most of the changed proteins were metabolic enzymes, which possibly had been pre-synthesised and stored in dormant ascospores. For B. nivea, three proteins were identified as heat shock proteins 60, 70 and general stress protein 39. Latent protein synthesis, denaturation and defragmentation of proteins into peptides possibly caused changes in the protein expressions.
The results showed that population, structural and molecular factors contribute simultaneously and synergistically to the beat resistance of Byssoch/amys ascospores. Data obtained provide a platform for further studies to understand the biological mechanisms of heat resistance of their ascospores and for the food industry to develop more effective heat processes to inactivate these fungi.
Declaration relating to disposition of project thesis/dissertation
I hereby grant to the University of New South Wales or its agents the right to archive and to make available my thesis or dissertation in whole or in part in the University libraries in all forms of media, now or here after known, subject to the provisions of the Copyright Act 1968. I retain all property rights, such as patent rights. I also retain the right to use in future wor1<s (such as articles or books) all or part of this thesis or dissertation.
I also authorise University Microfilms to use the 350 word abstract of my thesis in Dissertation Abstracts International (this is applicable to doctoral theses only).
Witness , ,_g_ f./.1/~r;-~ .............. .
The University recognises that there may be exceptional circumstances requiring restrictions on copying or conditions on use. Requests for restriction for a period of up to 2 years must be made in writing. Requests for a longer period of restriction may be considered in exceptional circumstances and re uire the a roval of the Dean of Graduate Research.
FOR OFFICE USE ONLY Date of completion of requirements for Award:
THIS SHEET IS TO BE GLUED TO THE INSIDE FRONT COVER OF THE THESIS

ORIGINALITY STATEMENT
'I hereby declare that this submission is my own work and to the best of my knowledge it contains no materials previously published or written by another person, or substantial proportions of material which have been accepted for the award of any other degree or diploma at UNSW or any other educational institution. except where due acknowledgement is made in the thesis. Any contribution made to the research by others, with whom I have worked at UNSW or elsewhere, is explicitly acknowledged in the thesis. I also declare that the intellectual content of this thesis is the product of my own work, except to the extent that assistance from others in the project's design and conception or in style, presentation and li guistic expression is acknowledged.'
Signed
Date ........... ~l /.. \ / 2-0J.f:.:--. .. .......................... .
COPYRIGHT STATEMENT
'I hereby grant the University of New South Wales or its agents the right to archive and to make available my thesis or dissertation in whole or part in the University libraries in all forms of media, now or here after known, subject to the provisions of the Copyright Act 1968. I retain all proprietary rights, such as patent rights. I also retain the right to use in future works (such as articles or books) all or part of this thesis or dissertation. I also authorise University Microfilms to use the 350 word abstract of my thesis in Dissertation Abstract International (this is applicable to doctoral theses only). I have either used no substantial portions of copyright material in my thesis or I have obtained permission to use copyright material; where permission has not been granted I have applied/will apply for a partial restriction of the digital copy of
::::sisordis~~~J¢~ ......................... . Date ........... ~1 .. ./. .. l/.W.~~ ........................................ .
AUTHENTICITY STATEMENT
'I certify that the Library · deposit digital copy is a direct equivalent of the final officially approved version of my thesis. No emendation of content has occurred and if there are any minor ariations in formatting, they are the result of the conversion to digital format.'
Signed
Date .......... !!4 . ./..~ . ./.~~-~ ........................................ .

Acknowledgements
I wish to express my utmost sincere gratitude to my university supervisor, Prof Graham
Fleet (School of Chemical Engineering, UNSW, Australia) and my CSIRO supervisors,
Dr Ailsa Hocking and Dr Nai Tran-Dinh (Food and Nutritional Sciences,
Commonwealth Scientific and Industrial Research Organisation, North Ryde, Australia)
for their expert advice, guidance, endless encouragement and support during the course
of this research and the completion of this thesis.
I would also like to thank the two following organisations for their financial support
which really made PhD life less stressful: the University of New South Wales for
granting the University International Postgraduate Award and CSIRO for funding all
research activities that I have carried out at North Ryde facility.
I wish to thank all members of the Food Processing and Microbiology Research Group
at North Ryde for their warm welcoming and sharing their expertise, ideas and
experience since the first day I came. With their encouragement and support, I have
really had a taste of being a professional researcher without losing a work-life balance.
I would also thank several lecturers, researchers, technicians of various research
facilities that I have had opportunities to work with in different parts of my project. I
wish to thank Dr Minoo Moghaddam (CSIRO Health and Molecular Technology, North
Ryde) for her provision of the DSC machine and help in operation and maintenance; Dr
Janet Paterson (School of Chemical Engineering, UNSW) for her advice on the DSC
experiment; Ms Debra Birch and Ms Nicole Vella (Microscopy Unit, Macquarie
University, NSW) for their instruction and help in preparing samples and using electron
microscopes; Dr Alamgir Khan, Dr Charlie Ahn, Ms Veronika Polaskova and Ms Vidya
Nelaturi (Australian Proteome Analysis Facility, Macquarie University) for their help in
experimental guidance and advice with regard to proteomic analysis.
And many thanks to the group of foodie friends, whom I have known since the
undergraduate time, for their effort in keeping me happy.
Finally, I would like to thank my family and my girlfriend back in Vietnam for their
endless love, patience and support throughout this study.
i
Table of Contents
List of Figures .............................................................................................................. v
List of Tables .............................................................................................................. ix
List of Appendices ..................................................................................................... xi
Abstract ......................................................................................................................... 1
Chapter 1 – Introduction ......................................................................................... 3
Chapter 2 – Literature review ............................................................................... 7
2.1 Taxonomy ............................................................................................................. 7 2.2 Morphology .......................................................................................................... 9 2.3 Physiology ........................................................................................................... 10
2.3.1 Temperature ..................................................................................................... 11 2.3.2 Hydrogen ion concentration (pH) and types of acid ....................................... 13 2.3.3 Gaseous atmosphere ........................................................................................ 14 2.3.4 Water activity (aw) ........................................................................................... 15 2.3.5 Important metabolites produced by Byssochlamys .......................................... 15
2.3.5.1 Metabolic enzymes .................................................................................... 16 2.3.5.2 Mycotoxins ................................................................................................ 16
2.3.6 Other environmental factors ............................................................................ 17 2.4 Ecology and food spoilage caused by Byssochlamys species .................... 19
2.4.1 Ecology of B. fulva and B. nivea ..................................................................... 19 2.4.2 Food spoilage caused by B. fulva and B. nivea ............................................... 20
2.5 Heat resistance of ascospores of Byssochlamys species ............................ 22 2.5.1 Heat resistance of Byssochlamys ascospores in thermal processes ................. 23 2.5.2 D and z values of ascospores of B. fulva and B. nivea .................................... 25
2.6 Factors contributing to the heat resistance of Byssochlamys ascospores ..................................................................................................................................... 29
2.6.1 Effects of food/medium composition on heat resistance of Byssochlamys ascospores ................................................................................................................. 29 2.6.2 Effects of ascospore age on heat resistance ..................................................... 31 2.6.3 Contributions of ascospore ultrastructure to heat resistance ........................... 32 2.6.4 Chemical composition and heat resistance of ascospores ............................... 34 2.6.5 Trehalose, glassy state and heat resistance of ascospores ............................... 35 2.6.6 Molecular factors of heat resistance of Byssochlamys ascospores .................. 36
2.7 Concluding remarks ......................................................................................... 37 Chapter 3 – Thermal inactivation of ascospores of Byssochlamys fulva and Byssochlamys nivea during aging ............................................................... 39
3.1 Introduction ....................................................................................................... 39 3.2 Materials and methods .................................................................................... 41
3.2.1 Fungal cultures, growth conditions and ascospore harvest ............................. 41
ii
3.2.2 Heat resistance of ascospores at different ages ............................................... 42 3.2.3 Heat resistance of sequential generations of ascospores surviving heat treatments ................................................................................................................. 43
3.3 Results ................................................................................................................. 43 3.3.1 Effects of age on thermal inactivation of ascospores ...................................... 43 3.3.2 Thermal reduction time (D) of Byssochlamys ascospores ............................... 50 3.3.3 Heat resistance of sequential generations of ascospores surviving heat treatments ................................................................................................................. 54
3.4 Discussion ........................................................................................................... 58 3.4.1 Inactivation kinetics of Byssochlamys ascospores .......................................... 58
3.4.1.1 Heat activation phase ................................................................................ 58 3.4.1.2 Shoulder and tailing phases ...................................................................... 59
3.4.2 Heat resistance and age of Byssochlamys ascospores ..................................... 61 3.4.3 Proposed mechanisms of age-induced heat resistance in ascospores .............. 63 3.4.4 Calculating D values from non-logarithmic survival curves ........................... 63
3.5 Concluding remarks ......................................................................................... 64 Chapter 4 – Electron microscopy investigation of ultrastructure of Byssochlamys ascospores at two different ages and after different heating treatments ................................................................................................... 66
4.1 Introduction ....................................................................................................... 66 4.2 Materials and methods .................................................................................... 67
4.2.1 Fungal samples and heat treatment of ascospores ........................................... 67 4.2.2 Reagents used for sample preparation for EM ................................................ 68 4.2.3 Sample preparation .......................................................................................... 68
4.2.3.1 Scanning electron microscopy (SEM) ....................................................... 68 4.2.3.2 Transmission electron microscopy (TEM) ................................................ 69
4.2.4 Dimensions of the ascospores and image processing ...................................... 69 4.3 Results ................................................................................................................. 70
4.3.1 SEM study of Byssochlamys ascospores ......................................................... 70 4.3.2 TEM study of Byssochlamys ascospores ......................................................... 77
4.4 Discussion ........................................................................................................... 83 4.4.1 Multilayered ultrastructure and heat resistance of Byssochlamys ascospores . 83 4.4.2 Effects of heat treatments on the ultrastructure of Byssochlamys ascospores . 85 4.4.3 Effects of age on the ultrastructure of Byssochlamys ascospores.................... 86 4.4.4 Recommendations for future research using electron microscopy .................. 87
4.5 Concluding remarks ......................................................................................... 87 Chapter 5 – Application of Differential Scanning Calorimetry (DSC) to examine the arrangement of material in Byssochlamys ascospores ....... 89
5.1 Introduction ....................................................................................................... 89 5.2 Materials and methods .................................................................................... 90
5.2.1 Fungal strains, ascospore harvest and heat treatment ...................................... 90 5.2.2 Preparation of ascospore samples for DSC ..................................................... 91 5.2.3 Differential scanning calorimetry .................................................................... 91
5.2.3.1 Selection of scanning rates ....................................................................... 91 5.2.3.2 DSC analysis of ascospore samples .......................................................... 92 5.2.3.3 Other comparative experiments ................................................................ 92

iii
5.3 Results ................................................................................................................. 93 5.3.1 Screening for the optimal scanning rate .......................................................... 93 5.3.2 DSC analysis of Byssochlamys ascospores ..................................................... 95
5.3.2.1 Comparison of dormant ascospores between ages, species and strains . 100 5.3.2.2 DSC comparisons of ascospores after heat treatments .......................... 102
5.4 Discussion ......................................................................................................... 108 5.4.1 Characteristics of DSC transitions of Byssochlamys ascospores .................. 108 5.4.2 Arrangement of intracellular materials and heat resistance of Byssochlamys ascospores ............................................................................................................... 110
5.4.2.1 Comparisons between species and ages ................................................. 110 5.4.2.2 Comparisons between physiological states induced by heat .................. 110
5.4.3 Possible existence of a glassy state in Byssochlamys ascospores .................. 111 5.4.4 Experimental designs and effects on DSC profiles ....................................... 112
5.4.4.1 Effects of sample preparation methods ................................................... 112 5.4.4.2 Effects of scanning (heating) rates .......................................................... 113
5.5 Concluding remarks ....................................................................................... 114 Chapter 6 – Heterogeneity in ascospore populations of Byssochlamys and its relationship with heat resistance ........................................................ 116
6.1 Introduction ..................................................................................................... 116 6.2 Methodology ..................................................................................................... 117
6.2.1 Fungal strains and ascospore preparation ...................................................... 117 6.2.2 Thermal treatments of Byssochlamys ascospores for flow cytometry ........... 118 6.2.3 Staining of ascospores with fluorescent dyes ................................................ 119 6.2.4 Microscopic examination of SYTO 9-stained ascospores............................. 119 6.2.5 Flow cytometric analysis ............................................................................... 120 6.2.6 Data collection and analysis .......................................................................... 120 6.2.7 Procedure of differentiating groups of ascospores ........................................ 121
6.3 Results ............................................................................................................... 123 6.3.1 Penetration of SYTO 9 into ascospores......................................................... 123 6.3.2 Evaluation of fluorescent dyes for differentiating sub-populations of Byssochlamys ascospores ....................................................................................... 125 6.3.3 Differentiating sub-populations of unstained ascospores .............................. 129
6.3.3.1 Sub-populations of unstained ascospores of B. fulva ............................. 129 6.3.3.2 Sub-populations of unstained ascospores of B. nivea ............................. 132
6.3.4 Differentiating sub-populations of SYTO 9-stained ascospores ................... 135 6.3.4.1 Sub-populations of SYTO 9-stained ascospores of B. fulva .................... 135 6.3.4.2 Sub-populations of SYTO 9-stained ascospores of B. nivea ................... 140
6.4 Discussion ......................................................................................................... 145 6.4.1 Penetration of SYTO 9 into Byssochlamys ascospores and the protective roles of the cell wall of the ascospores ............................................................................ 145 6.4.2 Evaluation of SYTO 9 and PI in differentiating sub-populations of Byssochlamys ascospores ....................................................................................... 146 6.4.3 Fluorescence mechanisms of SYTO 9 in Byssochlamys ascospores ............. 147 6.4.4 Differentiating sub-populations of Byssochlamys ascospores ....................... 148
6.4.4.1 Sub-populations of dormant ascospores ................................................. 148 6.4.4.2 Sub-populations of heat activated ascospores ........................................ 149 6.4.4.3 Sub-populations of heat-inactivated ascospores ..................................... 149
6.5 Concluding remarks ....................................................................................... 151
iv
Chapter 7 – Proteomic profiles of ascospores of Byssochlamys species detected by two dimensional gel electrophoresis during aging and heat treatment ................................................................................................................... 153
7.1 Introduction ..................................................................................................... 153 7.2 Materials and methods .................................................................................. 155
7.2.1 Isolation and preparation of ascospore samples ............................................ 155 7.2.2 Heat treatment of ascospores ......................................................................... 155 7.2.3 Proteomic analysis of ascospores .................................................................. 156
7.2.3.1 Reagents .................................................................................................. 158 7.2.3.2 Protein extraction and quantification ..................................................... 158 7.2.3.3 Two-dimensional (2D) gel electrophoresis ............................................. 160 7.2.3.4 Protein visualisation and gel image analysis.......................................... 161 7.2.3.5 Sample preparation for mass spectrometry ............................................ 161 7.2.3.6 Peptide mass fingerprinting by mass spectrometry ................................ 162 7.2.3.7 Database search and protein identification ............................................ 163
7.3 Results ............................................................................................................... 164 7.3.1 General features of proteome of Byssochlamys ascospores .......................... 164 7.3.2 Proteomic profiles of ascospores following heat treatments ......................... 164 7.3.3 Proteomic profiles of ascospores at two ages ................................................ 169 7.3.4 Protein identification ..................................................................................... 173
7.3.4.1 Identification of proteins from B. fulva ascospores ................................ 173 7.3.4.2 Identification of proteins from B. nivea ascospores................................ 174
7.4 Discussion ......................................................................................................... 179 7.4.1 Proteomes of Byssochlamys ascospores after heat treatments and aging ...... 179
7.4.1.1 Changed proteomic profiles of ascospores after heat treatments ........... 180 7.4.1.2 Changed proteomic profiles of ascospores during aging ....................... 181
7.4.2 Protein identification and functions in Byssochlamys ascospores ................. 182 7.4.2.1 Stress related proteins ............................................................................. 182 7.4.2.2 Other identified proteins and their potential functions in ascospores .... 184
7.4.3 Low percentage of significant matches and poor agreement between estimated MW and pI values .................................................................................................. 185 7.4.4 General assessment of the proteome of Byssochlamys ascospores............... 186 7.4.5 Recommendations for future research ........................................................... 187
7.5 Concluding remarks ....................................................................................... 188 Chapter 8 – General discussion and conclusions ........................................ 190
8.1 Introduction ..................................................................................................... 190 8.2 Age, dormancy and heat resistance of ascospores ................................... 191 8.3 Ultrastructure and heat resistance of ascospores .................................... 192 8.4 Proteins and heat resistance of ascospores ............................................... 194 8.5 Population heterogeneity and heat resistance of ascospores ................. 195 8.6 Recommendations for future research ...................................................... 197 8.7 Conclusions ...................................................................................................... 198
References ................................................................................................................. 200 Appendices ................................................................................................................ 240

v
List of Figures
Figure 3.1. Heat inactivation of B. fulva FRR 2299 ascospores from (A) 4 week, (B) 6
week, (C) 8 week, (D) 12 week and (E) 24 week cultures; inactivation temperatures are
85oC (■), 87.5oC (♦) and 90oC (▲) ................................................................................. 44
Figure 3.2. Heat inactivation of B. fulva FRR 2785 ascospores from (A) 4 week, (B) 6
week, (C) 8 week, (D) 12 week and (E) 24 week cultures; inactivation temperatures are
85oC (■), 87.5oC (♦) and 90oC (▲) ................................................................................. 45
Figure 3.3. Heat inactivation of B. nivea FRR 4421 ascospores from (A) 4 week, (B) 6
week, (C) 8 week, (D) 12 week and (E) 24 week cultures; inactivation temperatures are
82.5oC (○), 85oC (□) and 87.5oC (◊) ............................................................................... 46
Figure 3.4. Heat inactivation of B. nivea FRR 4421 ascospores from (A) 4 week, (B) 6
week, (C) 8 week, (D) 12 week and (E) 24 week cultures; inactivation temperatures are
82.5oC (○), 85oC (□) and 87.5oC (◊) ............................................................................... 47
Figure 3.5. Average activation levels of B. fulva FRR 2299 (A), B. fulva FRR 2785 (B),
B. nivea FRR 4421 (C) and B. nivea FRR 6002 (D) ....................................................... 49
Figure 3.6. D values of ascospores of B. fulva FRR 2299 (A) and FRR 2785 (B), B.
nivea FRR 4421 (C) and FRR 6002 (D) at different culture ages and inactivation
temperatures; Temperature: 82.5oC (●), 85oC (♦), 87.5oC (■) and 90oC (▲) ................ 53
Figure 3.7. B. fulva FRR 2299: representative survivor curves of subsequent
generations of 4 week ascospore cultures derived from the ‘tailing’ phase of the parent
and three sequential generations ..................................................................................... 55
Figure 3.8. B. nivea FRR 6002: representative survivor curves of subsequent
generations of 4 week old ascospore cultures derived from the ‘tailing’ phase of the
parent and three sequential generations .......................................................................... 56
Figure 3.9. Comparing D values of 4 week ascospores derived from the parent and
three sequential “tailing” generations of B. fulva FRR 2299 and B. nivea FRR 6002.... 57
Figure 4.1. Scanning electron micrographs of B. fulva FRR 2299 dormant ascospores
and ascus at 4 (A, C) and 24 weeks (B, D) ..................................................................... 70
Figure 4.2. Scanning electron micrographs of B. nivea FRR 4421 dormant ascospores at
4 (A, C) and 24 weeks (B, D).......................................................................................... 71
vi
Figure 4.3. Scanning electron micrographs of 24 week old B. fulva FRR 2299 (A, C, E)
and B. nivea FRR 4421 (B, D) ascospores activated at 75oC for 30 minutes ................. 72
Figure 4.4. Scanning micrographs of 24 week old B. fulva FRR 2299 (A, C, E) and B.
nivea FRR 4421 (B, D) ascospores inactivated at 95oC for 30 minutes ......................... 73
Figure 4.5. Distributions of size measurements of dormant and activated ascospores of
B. fulva FRR 2299 and B. nivea FRR 4421 .................................................................... 76
Figure 4.6. Ultrastructures of ascospores of B. fulva FRR 2299. Sample: 4 week,
dormant (A), 24 week, dormant (B), 24 week, activated (C – D), 24 week, inactivated
(E – F) ............................................................................................................................. 78
Figure 4.7. Ultrastructures of ascospores of B. nivea FRR 4421. Sample: 4 week,
dormant (A), 24 week, dormant (B), 24 week, activated (C – D), 24 week, inactivated
(E – F) ............................................................................................................................. 79
Figure 4.8. Area-to-area ratios of different compartments of B. fulva FRR 2299
ascospores using the whole data set or the top 25% based on length and width ............ 81
Figure 4.9. Area ratios of different compartments of B. nivea FRR 4421 using the
whole data set or the top 25% based on length and width .............................................. 82
Figure 5.1. DSC thermograms of ascospores of B. fulva FRR 2299 scanned at four
heating rates: 2.5 Kmin-1 (A), 5 Kmin-1 (B), 7.5 Kmin-1 (C) and 10 Kmin-1 (D) ........... 94
Figure 5.2. DSC thermograms of ascospores of B. fulva FRR 2299 at 6 and 24 weeks.
Treatment: A – dormant, B – activated at 75oC for 30 minutes, C – inactivated at 95oC
for 30 minutes ................................................................................................................. 96
Figure 5.3. DSC thermograms of ascospores of B. fulva FRR 2785 at 6 and 24 weeks.
Treatment: A – dormant, B – activated at 75oC for 30 minutes, C – inactivated at 95oC
for 30 minutes ................................................................................................................. 97
Figure 5.4. DSC thermograms of ascospores of B. nivea FRR 4421 at 6 and 24 weeks.
Treatment: A – dormant, B – activated at 75oC for 30 minutes, C – inactivated at 95oC
for 30 minutes ................................................................................................................. 98
Figure 5.5. DSC thermograms of ascospores of B. nivea FRR 6002 at 6 and 24 weeks.
Treatment: A – dormant, B – activated at 75oC for 30 minutes, C – inactivated at 95oC
for 30 minutes ................................................................................................................. 99
vii
Figure 5.6. The cooling segments during DSC analysis of ascospores of B. fulva FRR
2299, B. fulva FRR 2785, B. nivea FRR 4421 and B. nivea FRR 6002 ........................ 102
Figure 5.7. Thermograms of Byssochlamys dormant ascospores prepared in crucibles
with punctured lids ........................................................................................................ 106
Figure 5.8. Thermograms of Byssochlamys dormant ascospores prepared in aqueous
forms without drying ..................................................................................................... 107
Figure 5.9. Thermograms of Byssochlamys dormant ascospores prepared by vacuum
drying ............................................................................................................................ 108
Figure 6.1. Data collecting area on forward scattering (FSC) versus side scattering
(SSC) dot plots for B. fulva FRR 2299 (A), B. fulva FRR 2785 (B), B. nivea FRR 4421
(C) and B. nivea FRR 6002 (D) .................................................................................... 121
Figure 6.2. Procedure to differentiate sub-populations of Byssochlamys ascospores .. 122
Figure 6.3. Penetration of SYTO 9 into ascospores in response to heat treatment at
90oC for B. fulva FRR 2299 (left) or 87.5oC B. nivea FRR 6002 (right) ...................... 124
Figure 6.4. Comparative staining of 4 week ascospores of B. fulva FRR 2299 with
different nucleic acid stains ........................................................................................... 127
Figure 6.5. Comparative staining of 4 week ascospores of B. nivea FRR 4421 with
different nucleic acid stains ........................................................................................... 128
Figure 6.6. Sub-populations of unstained ascospores of B. fulva FRR 2299 at different
ages and after a heat treatment at 90oC for up to 30 minutes ........................................ 130
Figure 6.7. Sub-populations of unstained ascospores of B. fulva FRR 2785 at different
ages and after a heat treatment at 90oC for up to 30 minutes ........................................ 131
Figure 6.8. Sub-populations of unstained ascospores of B. nivea FRR 4421 at different
ages and after a heat treatment at 87.5oC for up to 30 minutes ..................................... 133
Figure 6.9. Sub-populations of unstained ascospores of B. nivea FRR 6002 at different
ages and after a heat treatment at 87.5oC for up to 30 minutes ..................................... 134
Figure 6.10. Sub-populations of SYTO 9-stained ascospores of B. fulva FRR 2299 at
different ages and after a heat treatment at 90oC for up to 30 minutes ......................... 136
viii
Figure 6.11. Sub-populations of SYTO 9-stained ascospores of B. fulva FRR 2785 at
different ages and after a heat treatment at 90oC for up to 30 minutes ......................... 137
Figure 6.12. Changed abundances of sub-populations of B. fulva ascospores stained by
SYTO 9 after a heat treatment at 90oC; ascospores are 4 weeks old ............................ 139
Figure 6.13. Sub-populations of SYTO 9-stained ascospores of B. nivea FRR 4421 at
different ages and after a heat treatment at 87.5oC for up to 30 minutes ...................... 141
Figure 6.14. Sub-populations of SYTO 9-stained ascospores of B. nivea FRR 6002 at
different ages and after a heat treatment at 87.5oC for up to 30 minutes ...................... 142
Figure 6.15. Changed percentages of sub-populations of B. nivea ascospores stained by
SYTO 9 after heat treatment at 87.5oC. Ascospores are 4 weeks old ........................... 144
Figure 7.1. Treatment of Byssochlamys ascospores used for proteome analysis ......... 156
Figure 7.2. Proteome analysis of Byssochlamys ascospores ........................................ 157
Figure 7.3. (A) Positions of significantly changed protein spots of B. fulva FRR 2299 in
response to heat treatment at 90oC; (B) normalised volumes of protein spots changing
with heating time ........................................................................................................... 166
Figure 7.4. (A) Positions of significantly changed protein spots of B. nivea FRR 6002
in response to heat treatment at 87.5oC; (B) normalised volumes of protein spots
changing with heating time ........................................................................................... 168
Figure 7.5. Changed proteomic profiles of B. fulva FRR 2299 ascospores during aging.
(A) Significantly different proteins spots between 4 and 12 weeks; (B) Changed
abundance of selected protein spots at 4 and 12 weeks ................................................ 171
Figure 7.6. Changed proteomic profiles of B. nivea FRR 6002 ascospores during aging.
(A) Significantly different spots between 4 and 12 weeks; (B) Increased abundance of
selected protein spots at 4 and 12 weeks; (C) Decreased abundance of selected protein
spots at 4 and 12 weeks ................................................................................................. 172
Figure 8.1. Relationships between the heat resistance and intrinsic properties of
Byssochlamys ascospores investigated in this thesis ..................................................... 191
ix
List of Tables
Table 2.1. Taxonomy of the genus Byssochlamys and its Paecilomyces anamorphs ....... 9
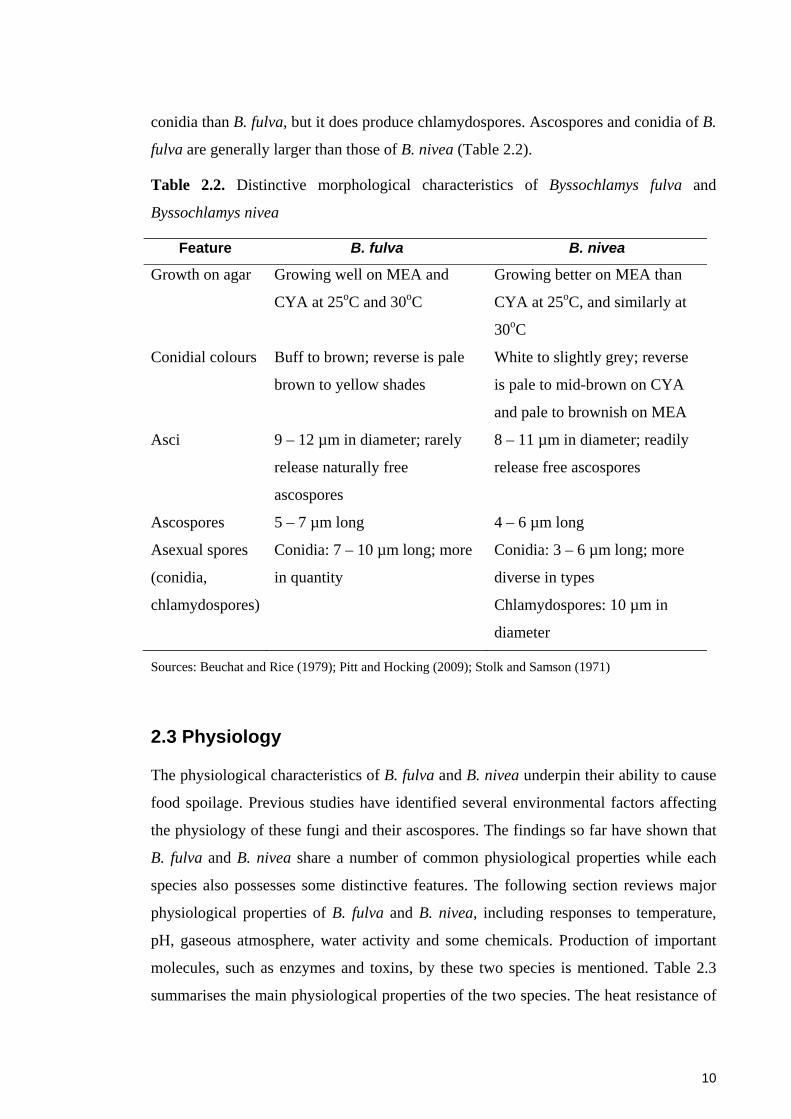
Table 2.2. Distinctive morphological characteristics of Byssochlamys fulva and
Byssochlamys nivea ......................................................................................................... 10
Table 2.3. Physiological properties (except heat resistance) of Byssochlamys fulva and
Byssochlamys nivea ......................................................................................................... 12
Table 2.4. Major food spoilage cases involving Byssochlamys fulva and Byssochlamys
nivea ................................................................................................................................ 21
Table 2.5. Heat resistance of Byssochlamys fulva ascospores with respect to heating
regimens .......................................................................................................................... 24
Table 2.6. Heat resistance of Byssochlamys nivea ascospores with respect to heating
regimens .......................................................................................................................... 25
Table 2.7. D and z values of ascospores of the species Byssochlamys fulva .................. 26
Table 2.8. D and z values of ascospores of the species Byssochlamys nivea ................. 27
Table 3.1. Thermal reduction times (D) in minutes ± standard deviation (SD) of
Byssochlamys ascospores at different ages and inactivation temperatures; each value is
an average of three experiments ...................................................................................... 51
Table 4.1. Dimensions of Byssochlamys ascospores at different ages and physiological
states; measurements are expressed as average values (mean) or medians of the
distribution of the data sets ............................................................................................. 75
Table 5.1. DSC scanning programs for analysis of Byssochlamys ascospores .............. 92
Table 5.2. Peak temperatures and enthalpy at different scanning rates.......................... 95
Table 5.3. Temperatures of major transitions (peaks and step changes) from the DSC
analysis of dormant ascospores of Byssochlamys species ............................................ 101
Table 5.4. Peak and step change temperatures from the DSC analysis of Byssochlamys
ascospores activated at 75oC for 30 minutes ................................................................. 104
Table 5.5. Peak and step change temperatures from the DSC analysis of Byssochlamys
ascospores inactivated at 95oC for 30 minutes .............................................................. 105

x
Table 6.1. Predicted identities of sub-populations of unstained B. fulva ascospores ... 132
Table 6.2. Predicted identities of sub-populations of unstained B. nivea ascospores .. 135
Table 6.3. Predicted identities of sub-populations of SYTO 9-stained B. fulva
ascospores ..................................................................................................................... 138
Table 6.4. Predicted identities of sub-populations of SYTO 9-stained B. nivea
ascospores ..................................................................................................................... 143
Table 7.1. Reagents used in the proteomic analysis of Byssochlamys ascospores ....... 158
Table 7.2. Search parameters set in the database search program Mascot ................... 163
Table 7.3. Significantly changed protein spots (in terms of normalised spot volumes) of
Byssochlamys ascospores following a heat treatment ................................................... 165
Table 7.4. Significantly changed protein spots (in terms of normalised spot volumes)
between 4 and 12 week Byssochlamys ascospores ....................................................... 170
Table 7.5. Identification of selected proteins extracted from B. fulva FRR 2299
ascospores after heat treatments and at different age .................................................... 175
Table 7.6. Identification of selected proteins extracted from B. nivea FRR 6002
ascospores after heat treatments and at different ages .................................................. 177
xi
List of Appendices
Appendix 3.1. Screened heat resistance of the four Byssochlamys strains selected for
usage in this thesis ......................................................................................................... 240
Appendix 3.2. Proportions (in %) of the activated population at 1 minute out of the
initially added ascospore concentration (5 – 6 log10) .................................................. 241
Appendix 3.3. Average activation levels of the four B. fulva and B. nivea strains being
tested in this experiment; each experiment started with a population of 105 – 106
ascospores/mL ............................................................................................................... 242
Appendix 3.4. Representative ascospores suspensions after glass bead treatment of B.
fulva FRR 2299 (A) and B. nivea FRR 4421 (B) .......................................................... 243
Appendix 5.1. Thermograms of B. fulva FRR 2299 ascospores scanned after one week
conditioning .................................................................................................................. 244
Appendix 5.2. Thermograms of B. fulva FRR 2785 ascospores scanned after one week
conditioning .................................................................................................................. 245
Appendix 5.3. Thermograms of B. nivea FRR 4421 ascospores scanned after one week
conditioning .................................................................................................................. 246
Appendix 5.4. Thermograms of B. nivea FRR 6002 ascospores scanned after one week
conditioning .................................................................................................................. 247
Appendix 5.5. Excess water in dense ascospore solutions being removed by drying over
granulated silica gel in a desiccator .............................................................................. 248
Appendix 6.1. Comparative staining of 8 week ascospores of B. fulva FRR 2299 with
SYTO 9 and PI; ascospores are treated at 90oC for up to 30 minutes .......................... 249
Appendix 6.1. (cont’d) Comparative staining of 12 week ascospores of B. fulva FRR
2299 with SYTO 9 and PI; ascospores are treated at 90oC for up to 30 minutes ......... 250
Appendix 6.2. Comparative staining of 4 week ascospores of B. fulva FRR 2785 with
SYTO 9 and PI; ascospores are treated at 90oC for up to 30 minutes .......................... 251
Appendix 6.2. (cont’d) Comparative staining of 8 week ascospores of B. fulva FRR
2785 with SYTO 9 and PI; ascospores are treated at 90oC for up to 30 minutes ......... 252
xii
Appendix 6.2. (cont’d) Comparative staining of 12 week ascospores of B. fulva FRR
2785 with SYTO 9 and PI; ascospores are treated at 90oC for up to 30 minutes ......... 253
Appendix 6.3. Comparative staining of 8 week ascospores of B. nivea FRR 4421 with
SYTO 9 and PI; ascospores are treated at 87.5oC for up to 30 minutes ....................... 254
Appendix 6.3. (cont’d) Comparative staining of 12 week ascospores of B. nivea FRR
4421 with SYTO 9 and PI; ascospores are treated at 87.5oC for up to 30 minutes ...... 255
Appendix 6.4. Comparative staining of 4 week ascospores of B. nivea FRR 4421 with
SYTO 9 and PI; ascospores are treated at 87.5oC for up to 30 minutes ....................... 256
Appendix 6.4. (cont’d) Comparative staining of 8 week ascospores of B. nivea FRR
4421 with SYTO 9 and PI; ascospores are treated at 87.5oC for up to 30 minutes ...... 257
Appendix 6.4. (cont’d) Comparative staining of 12 week ascospores of B. nivea FRR
4421 with SYTO 9 and PI; ascospores are treated at 87.5oC for up to 30 minutes ...... 258
Appendix 6.5. Subpopulations of unstained 4 week ascospores of B. fulva FRR 2299
following a heat treatment at 90oC for up to 30 minutes .............................................. 259
Appendix 6.5. (cont’d) Subpopulations of 8 week unstained ascospores of B. fulva
FRR 2299 ...................................................................................................................... 260
Appendix 6.5. (cont’d) Subpopulations of 12 week unstained ascospores of B. fulva
FRR 2299 ...................................................................................................................... 261
Appendix 6.6. Subpopulations of 4 week unstained ascospores of B. fulva FRR 2785
following a heat treatment at 90oC for up to 30 minutes .............................................. 262
Appendix 6.6. (cont’d) Subpopulations of 8 week unstained ascospores of B. fulva
FRR 2785 ...................................................................................................................... 263
Appendix 6.6. (cont’d) Subpopulations of 12 week unstained ascospores of B. fulva
FRR 2785 ...................................................................................................................... 264
Appendix 6.7. Subpopulations of 4 week unstained ascospores of B. nivea FRR 4421
following a heat treatment at 87.5oC for up to 30 minutes ........................................... 265
Appendix 6.7. (cont’d) Subpopulations of 8 week unstained ascospores of B. nivea
FRR 4421 ...................................................................................................................... 266

xiii
Appendix 6.7. (cont’d) Subpopulations of 12 week unstained ascospores of B. nivea
FRR 4421 ...................................................................................................................... 267
Appendix 6.8. Subpopulations of 4 week unstained ascospores of B. nivea FRR 6002
following a heat treatment at 87.5oC for up to 30 minutes ........................................... 268
Appendix 6.8. (cont’d) Subpopulations of 8 week unstained ascospores of B. nivea
FRR 6002 ...................................................................................................................... 269
Appendix 6.8. (cont’d) Subpopulations of 12 week unstained ascospores of B. nivea
FRR 6002 ...................................................................................................................... 270
Appendix 6.9. Subpopulations of SYTO 9-stained ascospores of B. fulva FRR 2299 at 4
weeks old following a heat treatment at 90oC for up to 30 minutes ............................ 271
Appendix 6.9. (cont’d) Subpopulations of SYTO 9-stained ascospores of B. fulva FRR
2299 at 8 weeks old ....................................................................................................... 272
Appendix 6.9. (cont’d) Subpopulations of SYTO 9-stained ascospores of B. fulva FRR
2299 at 12 weeks old ..................................................................................................... 273
Appendix 6.10. Subpopulations of SYTO 9-stained ascospores of B. fulva FRR 2785 at
4 weeks old following a heat treatment at 90oC for up to 30 minutes ......................... 274
Appendix 6.10. (cont’d) Subpopulations of SYTO 9-stained ascospores of B. fulva
FRR 2785 at 8 weeks old .............................................................................................. 275
Appendix 6.10. (cont’d) Subpopulations of SYTO 9-stained ascospores of B. fulva
FRR 2785 at 12 weeks old ............................................................................................ 276
Appendix 6.11. Changed percentages of ascospore subpopulations of B. fulva FRR
2299 after a heat treatment at 90oC ............................................................................... 277
Appendix 6.12. Changed percentages of ascospore subpopulations of B. fulva FRR
2785 after a heat treatment at 90oC ............................................................................... 278
Appendix 6.13. Subpopulations of SYTO 9-stained ascospores of B. nivea FRR 4421 at
4 weeks old following a heat treatment at 87.5oC for up to 30 minutes ...................... 279
Appendix 6.13. (cont’d) Subpopulations of SYTO 9-stained ascospores of B. nivea
FRR 4421 at 8 weeks old .............................................................................................. 280
xiv
Appendix 6.13. (cont’d) Subpopulations of SYTO 9-stained ascospores of B. nivea
FRR 4421 at 12 weeks old ............................................................................................ 281
Appendix 6.14. Subpopulations of SYTO 9-stained ascospores of B. nivea FRR 6002 at
4 weeks old following a heat treatment at 87.5oC for up to 30 minutes ...................... 282
Appendix 6.14. (cont’d) Subpopulations of SYTO 9-stained ascospores of B. nivea
FRR 6002 at 8 weeks old .............................................................................................. 283
Appendix 6.14. (cont’d) Subpopulations of SYTO 9-stained ascospores of B. nivea
FRR 6002 at 12 weeks old ............................................................................................ 284
Appendix 6.15. Changed percentages of ascospore subpopulations of B. nivea FRR
4421 after a heat treatment at 87.5oC ............................................................................ 285
Appendix 6.16. Changed percentages of ascospore subpopulations of B. nivea FRR
6002 after a heat treatment at 87.5oC ............................................................................ 286
Appendix 7.1. Standard curve of the Bradford assay (A); protein concentrations and
conductivity measurements of triplicate protein extracts (S1 – S3) from Byssochlamys
ascospores (B) ............................................................................................................... 287
Appendix 7.2. Molecular weight (A, C) and isoelectric point (B, D) distribution of
protein resolved on 2D-gels of B. fulva FRR 2299 (top) and B. nivea FRR 4421
(bottom) ascospores ...................................................................................................... 288
Appendix 7.3. Differentially expressed proteins of B. fulva FRR 2299 ascospores
during a heat treatment at 90oC ..................................................................................... 289
Appendix 7.4. Differentially expressed proteins of B. nivea FRR 6002 ascospores
during a heat treatment at 87.5oC .................................................................................. 290
Appendix 7.5. Differentially expressed proteins of B. fulva FRR 2299 ascospores at 4
and 12 weeks ................................................................................................................. 291
Appendix 7.6. Protein spots of B. nivea FRR 6002 on 2D gels that significantly
changed with ascospore ages ........................................................................................ 292
Appendix 7.7. Amino acid sequences of the matched proteins of Byssochlamys
ascospores; matched peptides between the searched proteins and the theoretical proteins
are in red ........................................................................................................................ 293

1
Abstract
Byssochlamys is a fungus that causes spoilage of heat processed fruit products by
producing heat resistant ascospores. This thesis investigated heat resistant properties of
ascospores of Byssochlamys fulva and Byssochlamys nivea. Heat inactivation of the
ascospores at temperatures of 82.5 – 90oC showed activation, shoulder, exponential
reduction and tailing phases. The D values of the ascospores increased significantly
with culture age over the period of 4 – 24 weeks, and the average increase was 3.5 – 7-
fold for B. fulva strains and 2 – 4-fold for B. nivea strains. Ascospores of B. fulva were
more heat resistant than those of B. nivea.
Ultrastructure of the ascospores examined by electron microscopy comprised a cell
wall, a thick intermediate space (IMS) and a dense cytoplasm. Examining the
arrangement of materials in the ascospores with differential scanning calorimetry
provided evidence of a glassy state. Aging improved the robustness of the ascospore
structure whereas heating reduced its integrity. Older ascospores occasionally had more
sub-layers in the IMS. Ascospores of B. fulva had a more resilient structure and more
elaborated outer coating than those of B. nivea.
Flow cytometry revealed heterogeneity in preparations of dormant and heat treated
ascospores at different ages. Heating affected the integrity of the ascospore wall, which
was manifested as increased autofluorescence, permeability to SYTO 9 and clumping of
the ascospores. Sub-populations of activated and sub-lethally injured ascospores mostly
appeared after heat treatments.
Proteomic analysis of ascospores by 2D gel electrophoresis showed that less than 4% of
their total proteins significantly changed their expression after heating and aging. Most
of the changed proteins were metabolic enzymes, which possibly had been pre-
synthesised and stored in dormant ascospores. For B. nivea, three proteins were
identified as heat shock proteins 60, 70 and general stress protein 39. Latent protein
synthesis, denaturation and defragmentation of proteins into peptides possibly caused
changes in the protein expressions.
The results showed that population, structural and molecular factors contribute
simultaneously and synergistically to the heat resistance of Byssochlamys ascospores.
Data obtained provide a platform for further studies to understand the biological

2
mechanisms of heat resistance of their ascospores and for the food industry to develop
more effective heat processes to inactivate these fungi.
3
Chapter 1 – Introduction
Since the studies of Nicolas Appert and Louis Pasteur in the 19th century thermal
processes such as pasteurisation have been widely used by food manufacturers to extend
the shelf life and to ensure the microbial safety of foods (Adams and Moss, 2008; Silva
and Gibbs, 2004). However, some microorganisms are able to survive the thermal
processes commonly employed by the food industry, thereby compromising the
intended goals of food stability and food safety. Such organisms are collectively
described as heat resistant microorganisms (Mouchacca, 2007). Sporulation is a
common strategy used by these microorganisms to resist environmental stresses,
including heating. The best known example is the production of heat resistant
endospores by species of bacteria within the genera Bacillus and Clostridium (Atrih and
Foster, 2002; Gerhardt and Marquis, 1989; Scheldeman et al., 2006). Fungi, including
the yeasts and the filamentous fungi, are not generally recognised as heat resistant
microorganisms although they can produce some forms of spores (Adamek and Rönner,
1996; Hocking and Jensen, 2001; Tribst et al., 2009). Some fungal species produce
ascospores as part of their sexual cycle of reproduction. Although the ascospores of
these species do not have the same heat resistance as bacterial endospores, they do,
nevertheless, have considerably greater heat resistance than vegetative cells (Hocking
and Pitt, 2001) and this property needs considerations when designing heat processes
for certain foods and beverages. The heat resistance of fungal ascospores varies with the
species, but ascospores of species within the genera Byssochlamys, Talaromyces and
Neosartorya are most notable for their increased heat resistance (Dijksterhuis, 2007;
Tribst et al., 2009).
Species within the genus Byssochlamys Westling are considered as being thermo-
tolerant, and the two most important species with respect to food safety and quality are
Byssochlamys fulva and Byssochlamys nivea (Hocking and Pitt, 2001; Tournas, 1994).
Similar to other heat tolerant fungi, the heat resistance of Byssochlamys species is
attributed to the production of ascospores, which are able to survive heat treatments at
85 – 90oC for several minutes (Hocking and Jensen, 2001; Houbraken et al., 2006).
More importantly, sub-lethal temperatures in the range 60 – 80oC can activate the
ascospores and trigger their germination mechanism (Beuchat, 1992; Kikoku et al.,
2009; Splittstoesser et al., 1972). The ability of Byssochlamys ascospores to survive

4
temperatures of 60 – 90oC undermines the efficacy of thermal food processes that
operate within this range. Consequently, species within the genus Byssochlamys have
been frequently associated with the spoilage of heat processed fruit-based products such
as fruit juices and canned fruits (Beuchat, 1998; Splittstoesser, 1978; Tribst et al., 2009).
In addition, both B. fulva and B. nivea produce a range of mycotoxins, especially patulin
which may be deleterious to human health (Puel et al., 2010; Sant’Ana et al., 2010).
Thus, the heat resistant ascospores of B. fulva and B. nivea may cause significant
economic loss to the food industry and pose a potential risk to public health.
Because of their commercial significance, various studies have been conducted over the
years to understand the ecology, taxonomy, physiology and biochemistry of
Byssochlamys species, and these properties have been discussed in reviews by Stolk and
Samson (1971), Beuchat and Rice (1979), Pitt and Hocking (2009) and Samson et al.
(2009). Notably, B. fulva and B. nivea are able to grow at low water activity (0.892 –
0.993), acidic conditions (pH 3.0 – 4.5), with a great tolerance to low oxygen and high
carbon dioxide contents (Beuchat and Rice, 1979; Panagou et al., 2010; Roland and
Beuchat, 1984b). Production and germination of ascospores can also occur in these
unfavourable conditions (Splittstoesser et al., 1969, 1972). The heat resistant properties
of these ascospores have been described by various workers (Bayne and Michener,
1979; Casella et al., 1990; Houbraken et al., 2006; King et al., 1979). These two species
also produce strong pecteolytic enzymes that can disintegrate the tissues of fruits (Rice
and Beuchat, 1978a, b; Rice et al., 1977a; Ugwuanyi and Obeta, 1999). Collectively,
these properties explain why B. fulva and B. nivea are major causes of spoilage of heat
processed fruit products.
Many factors can affect the heat resistance of Byssochlamys ascospores and,
consequently, a wide variation in their heat resistant properties has been reported in the
literature (Bayne and Michener, 1979; Casella et al., 1990; Dijksterhuis, 2007;
Splittstoesser, 1978). Ascospores from different species and strains show significant
difference in their response to time/temperature combinations. High sugar, high salt and
high solids content in foods can increase the heat resistance of the ascospores whereas
the presence of food preservatives make them more susceptible to heat (Beuchat, 1981;
Engel and Teuber, 1991; Hatcher et al., 1979). Acidity can either increase or decrease
their heat resistance, depending on both the concentration of hydrogen ions (pH) and
types of acids present in the heating environment (Splittstoesser, 1978; Splittstoesser et
5
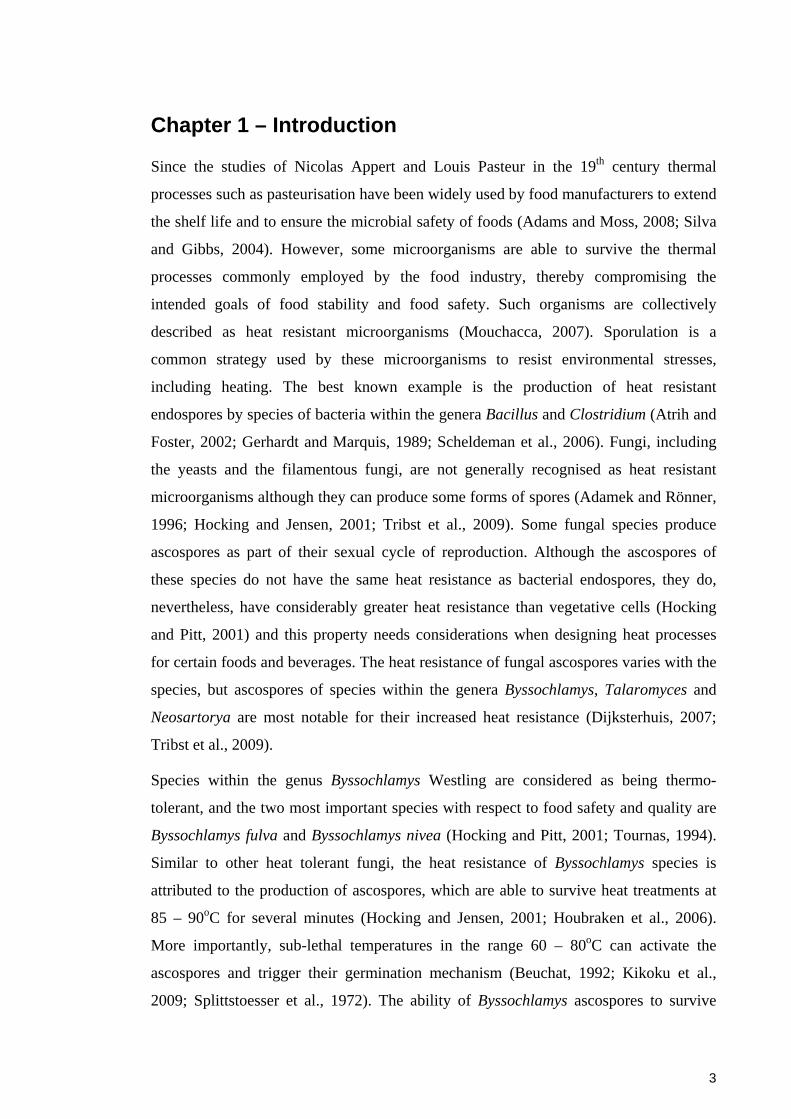
al., 1974b). Notably, the age of the cultures from which the ascospores are harvested, or
ascospore age, can affect significantly their tolerance to heat. A general trend is that the
heat resistance increases with the ascospore age. For example, Casella et al. (1990)
showed that thermal reduction times (D values) at 80 – 90oC of B. nivea ascospores
generally increased with ascospore age between 4 and 16 weeks. Prior to the study of
Casella et al. (1990), Yates and Ferguson (1963) also observed that ascospores from 14
day cultures of B. nivea could tolerate heat treatments better than those from 4 week
cultures.
Although some progress has been made in describing the heat resistant properties of
Byssochlamys species, there is limited knowledge about the mechanisms that underpin
this important characteristic. Additionally, compared with other equally important heat
resistant moulds belonging to the genera Talaromyces and Neosartorya (Dijksterhuis et
al., 2007; Fedorova et al., 2007, 2008), the ultrastructure, chemical composition and
genomics of Byssochlamys species are poorly understood.
In recent times, consumer preference is moving towards more natural, preservative-free,
minimally processed foods and beverages (Sloan, 2010, 2011; Zink, 1997). The new
trend limits the flexibility of food processors in controlling heat resistant
microorganisms and their spores by traditional methods since excessive heating and
food preservatives are no longer desirable. In this context, it is important to have a
better understanding of the inherent mechanisms of heat resistance of Byssochlamys
ascospores, since such knowledge may enable food processors to optimise their
processing systems to produce foods with enhanced quality and safety.
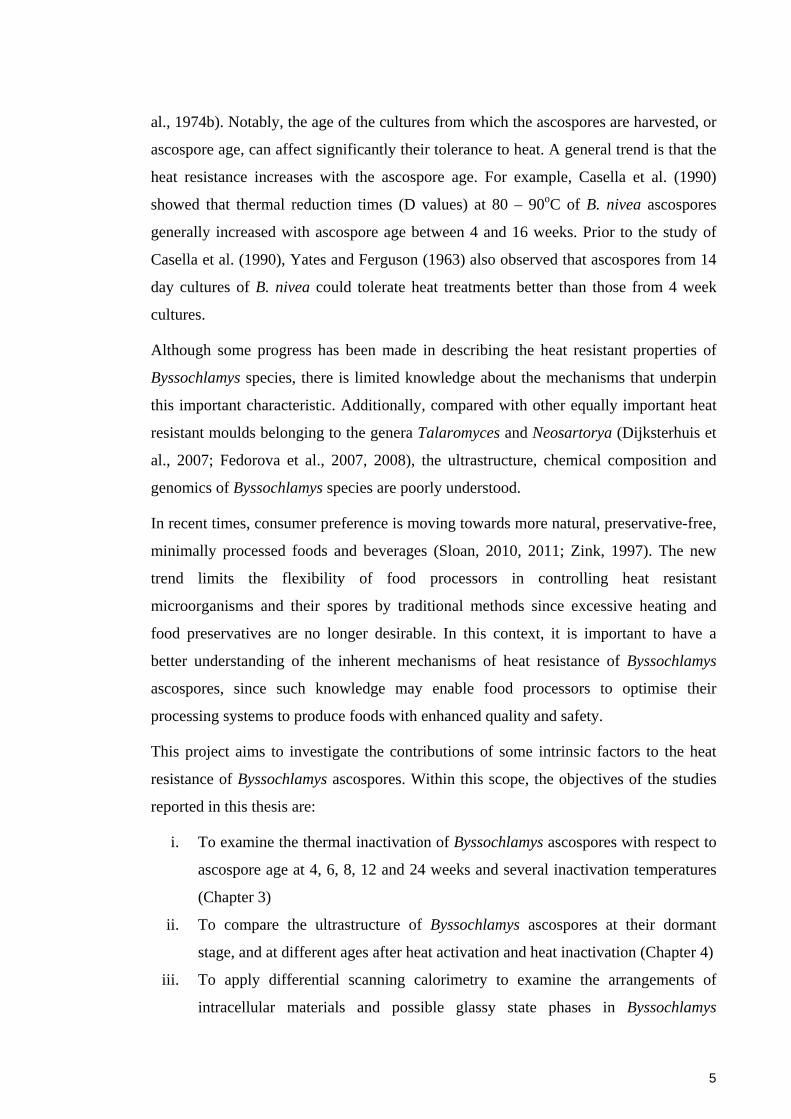
This project aims to investigate the contributions of some intrinsic factors to the heat
resistance of Byssochlamys ascospores. Within this scope, the objectives of the studies
reported in this thesis are:
i. To examine the thermal inactivation of Byssochlamys ascospores with respect to
ascospore age at 4, 6, 8, 12 and 24 weeks and several inactivation temperatures
(Chapter 3)
ii. To compare the ultrastructure of Byssochlamys ascospores at their dormant
stage, and at different ages after heat activation and heat inactivation (Chapter 4)
iii. To apply differential scanning calorimetry to examine the arrangements of
intracellular materials and possible glassy state phases in Byssochlamys
6
ascospores at their dormant stage, and at different ages after heat activation and
heat inactivation (Chapter 5)
iv. To characterise the heterogeneity within the populations of Byssochlamys
ascospores at different ages and after heat treatment, using flow cytometry
(Chapter 6)
v. To examine the proteomic profiles of Byssochlamys ascospores at different ages
and after heat treatment, using two dimensional gel electrophoresis and mass
spectrometry (Chapter 7)
The two species, B. fulva and B. nivea, selected for these studies represent strains that
have been implicated in the spoilage of fruit juices and dairy products in Australia, New
Zealand and Brazil.
The outcomes of this project will:
i. Advance knowledge about the heat resistant properties of Byssochlamys
ascospores, and provide a platform for more detailed studies of their heat
resistance mechanisms
ii. Assist food manufacturers to design more effective thermal processes to control
food spoilage by Byssochlamys species

7
Chapter 2 – Literature review
Byssochlamys species are filamentous fungi that can cause spoilage of heat processed
foods due to production of heat resistant ascospores. Their ascospores and mycelial
outgrowth are often found in spoilt products of fruit juices and canned fruits. Research
so far has studied the physiology of the fungi and some external factors that affect the
heat resistance of their ascospores. However, the mechanisms of heat resistance are not
well understood and requirements for such knowledge are coming from the scientific
community, the food industry and consumers. As a background to the objectives of this
thesis described in Chapter 1, this literature review will assess the currently available
knowledge about various aspects of Byssochlamys ascospores and their heat resistance,
focusing primarily on two species, Byssochlamys fulva and Byssochlamys nivea.
The survey will consider some general information about the taxonomy, biology,
physiology and ecology of the two species with regard to their roles in food spoilage.
This will be followed by a more detailed discussion of the ascospores of B. fulva and B.
nivea, the heat resistance of their ascospores and reported factors that contribute to their
thermo-tolerance. Although the material presented in this Chapter mainly concerns B.
fulva and B. nivea, knowledge of other species and microorganisms will be considered
where relevant.
2.1 Taxonomy
The genus Byssochlamys Westling is classified within the kingdom Eumycota (Fungi),
phylum Ascomycota, class Eurotiomycetes, order Eurotiales and family
Trichocomaceae. Being a member of the Ascomycota group, Byssochlamys species are
capable of sexually reproducing by the production of ascospores borne in a sac-like
structure, or ascus (plural: asci) (Malloch, 1981). Each ascus is produced by crozier
formation and bears eight ascospores (Sautter and Hock, 1982). However, unlike other
ascomycetes, Byssochlamys species are characterised by the lack of true peridial
structures, such as cleistothecia or gymnothecia, covering the asci. Their asci are formed
in globoid clusters loosely entangled in webs of fine white hyphae (Pitt and Hocking,
2009; Stolk and Samson, 1971).
8
Byssochlamys nivea is the type species of the genus, first isolated and described by
Westling in 1909 (Brown and Smith, 1957). Byssochlamys fulva was later isolated from
canned fruits in England in the early 1930s. Many other species were then added to the
genus according to various morphological similarities with the type species (Cain, 1956;
Ram, 1968; von Arx, 1986). Some species of the genus Byssochlamys can reproduce
asexually by production of conidia and chlamydospores. Based on the morphological
similarities of the conidial stage, the genus Paecilomyces has been erected to
accommodate the anamorphs of Byssochlamys (Olliver and Smith, 1933; Samson and
Tansey, 1975).
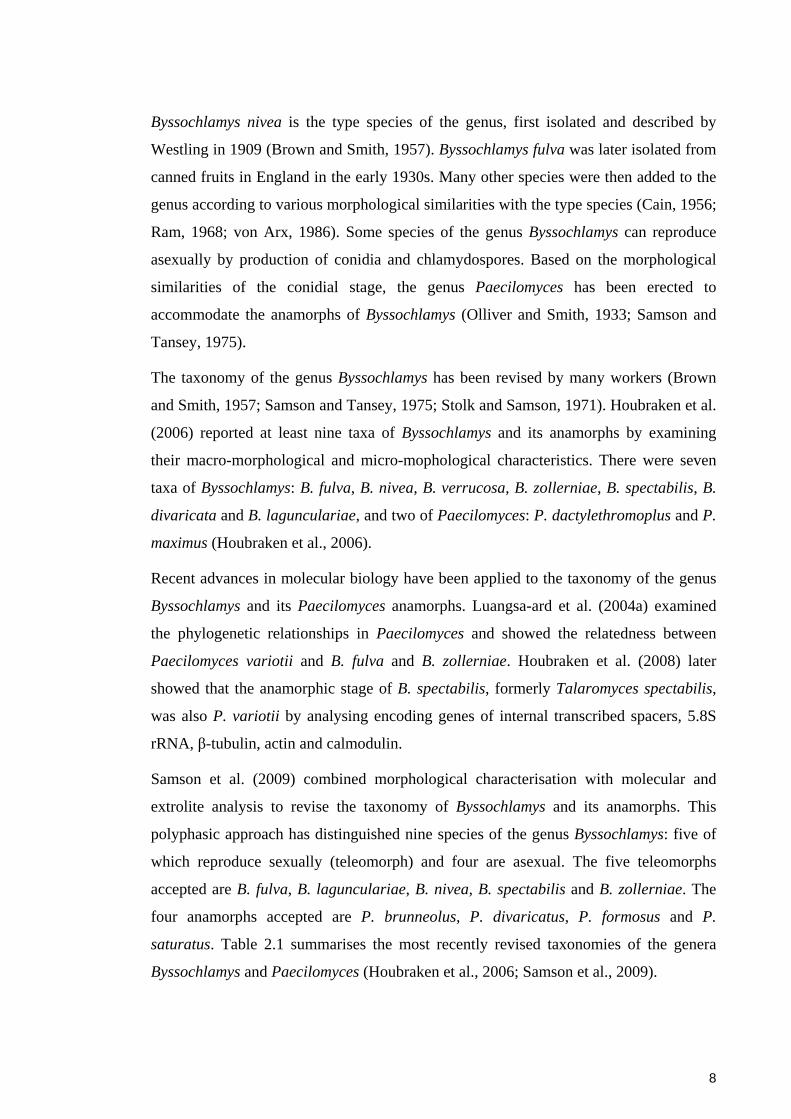
The taxonomy of the genus Byssochlamys has been revised by many workers (Brown
and Smith, 1957; Samson and Tansey, 1975; Stolk and Samson, 1971). Houbraken et al.
(2006) reported at least nine taxa of Byssochlamys and its anamorphs by examining
their macro-morphological and micro-mophological characteristics. There were seven
taxa of Byssochlamys: B. fulva, B. nivea, B. verrucosa, B. zollerniae, B. spectabilis, B.
divaricata and B. lagunculariae, and two of Paecilomyces: P. dactylethromoplus and P.
maximus (Houbraken et al., 2006).
Recent advances in molecular biology have been applied to the taxonomy of the genus
Byssochlamys and its Paecilomyces anamorphs. Luangsa-ard et al. (2004a) examined
the phylogenetic relationships in Paecilomyces and showed the relatedness between
Paecilomyces variotii and B. fulva and B. zollerniae. Houbraken et al. (2008) later
showed that the anamorphic stage of B. spectabilis, formerly Talaromyces spectabilis,
was also P. variotii by analysing encoding genes of internal transcribed spacers, 5.8S
rRNA, β-tubulin, actin and calmodulin.
Samson et al. (2009) combined morphological characterisation with molecular and
extrolite analysis to revise the taxonomy of Byssochlamys and its anamorphs. This
polyphasic approach has distinguished nine species of the genus Byssochlamys: five of
which reproduce sexually (teleomorph) and four are asexual. The five teleomorphs
accepted are B. fulva, B. lagunculariae, B. nivea, B. spectabilis and B. zollerniae. The
four anamorphs accepted are P. brunneolus, P. divaricatus, P. formosus and P.
saturatus. Table 2.1 summarises the most recently revised taxonomies of the genera
Byssochlamys and Paecilomyces (Houbraken et al., 2006; Samson et al., 2009).

9
Table 2.1. Taxonomy of the genus Byssochlamys and its Paecilomyces anamorphs
Species accepted in Houbraken
et al. (2006)
Species accepted in Samson
et al. (2009)
Teleomorph
Byssochlamys
B. divaricata, B. fulva, B.
lagunculariae, B. nivea, B.
verrucosa, B. spectabilis and B.
zollerniae
B. fulva, B. lagunculariae, B.
nivea, B. spectabilis and B.
zollerniae
Anamorphs
Paecilomyces
P. dactylethromoplus and P.
maximus
P. brunneolus, P. divaricatus,
P. formosus and P. saturatus.
2.2 Morphology
Morphologies of B. fulva and B. nivea and their Paecilomyces anamorphs have been
described by Olliver and Smith (1933) and Olliver and Rendle (1934) and later
reviewed by other researchers (Beuchat and Rice, 1979; Brown and Smith, 1957; Pitt
and Hocking, 2009; Stolk and Samson, 1971). Some morphological features of the two
species are described in the following sections and the differences are highlighted in
Table 2.2.
Both B. fulva and B. nivea grow well on Malt extract agar (MEA) and Czapek yeast
extract agar (CYA), which are frequently used in the characterisation of these species.
Their colonies can cover the Petri dish after 7 days, especially at 30oC. The mycelia of
Byssochlamys are usually sparse, low and produce colourless exudates on the surface
when growing for more than 6 weeks. There are clear differences between B. fulva and
B. nivea with respect to colours of the colonies (Table 2.2).
B. fulva and B. nivea form abundant conidia, asci and ascospores after culture for one
week. When observed under the microscope, asci are seen as single, naked spherical
clusters, each of which contains 8 ascospores, which are hyaline, smooth walled and
usually entangled in webs of hyphae. Conidia are formed on phialides, and are smooth
walled and mostly ellipsoidal with flat ends. The ascospores are refractile and brighter
than the conidia. Mature cultures of B. nivea release free ascospores from asci more
frequently than those of B. fulva. Compared with B. fulva, B. nivea also produces fewer
10
conidia than B. fulva, but it does produce chlamydospores. Ascospores and conidia of B.
fulva are generally larger than those of B. nivea (Table 2.2).
Table 2.2. Distinctive morphological characteristics of Byssochlamys fulva and
Byssochlamys nivea
Feature B. fulva B. nivea
Growth on agar Growing well on MEA and
CYA at 25oC and 30oC
Growing better on MEA than
CYA at 25oC, and similarly at
30oC
Conidial colours Buff to brown; reverse is pale
brown to yellow shades
White to slightly grey; reverse
is pale to mid-brown on CYA
and pale to brownish on MEA
Asci 9 – 12 µm in diameter; rarely
release naturally free
ascospores
8 – 11 µm in diameter; readily
release free ascospores
Ascospores 5 – 7 µm long 4 – 6 µm long
Asexual spores
(conidia,
chlamydospores)
Conidia: 7 – 10 µm long; more
in quantity
Conidia: 3 – 6 µm long; more
diverse in types
Chlamydospores: 10 µm in
diameter
Sources: Beuchat and Rice (1979); Pitt and Hocking (2009); Stolk and Samson (1971)
2.3 Physiology
The physiological characteristics of B. fulva and B. nivea underpin their ability to cause
food spoilage. Previous studies have identified several environmental factors affecting
the physiology of these fungi and their ascospores. The findings so far have shown that
B. fulva and B. nivea share a number of common physiological properties while each
species also possesses some distinctive features. The following section reviews major
physiological properties of B. fulva and B. nivea, including responses to temperature,
pH, gaseous atmosphere, water activity and some chemicals. Production of important
molecules, such as enzymes and toxins, by these two species is mentioned. Table 2.3
summarises the main physiological properties of the two species. The heat resistance of

11
ascospores of B. fulva and B. nivea is also dependent on a similar group of variables,
and this property is reviewed in detail in another section.
2.3.1 Temperature
B. fulva has been reported to produce mycelial growth within the temperature range 6.5
– 43oC (King et al., 1969), with the optimum growth occurring at about 30 – 37oC
(Stolk and Samson, 1971). The corresponding figures for B. nivea are 10 – 40oC with a
similar optimum temperature range for growth (Stolk and Samson, 1971). The growth
responses to temperatures may vary with media, solute and water activity but, generally,
for both species growth is significantly slowed at temperatures below 21oC (King et al.,
1969; Roland and Beuchat, 1984a; Roland et al., 1984a, b). Sub-zero temperatures
between -12oC and -7oC exhibited a fungistatic effect on B. fulva cultures but did not
kill the fungi (Beuchat and Rice, 1979). No growth of B. nivea mycelia was reported at
7 and -30oC (Beuchat and Toledo, 1977).
The growth temperatures of B. fulva and B. nivea presented above have been recently
confirmed by a study of Panagou et al. (2010) using the model of Baranyi and the
cardinal model with inflection. The authors estimated the optimal temperature for
growth is 32.1oC, which is similar for both species. The maximum and minimum
growth temperatures of B. fulva are 46.4oC and 9.1oC, respectively. B. nivea grows
within a slightly narrower temperature range than B. fulva, 43.2oC down to 10.5oC.
The optimal growth temperatures are also suitable for production of ascospores and
patulin. Cultures of B. fulva can produce ascospores after 4 – 7 days when grown at
30oC compared with 8 or 19 days at 25oC and 20oC, respectively (Hull, 1939;
Splittstoesser et al., 1969). Similarly, the 30 – 37oC range results in better production of
patulin and more heat resistant ascospores for B. nivea (Engel and Teuber, 1991; Roland
and Beuchat, 1984b) than lower temperatures. These temperatures also support a faster
recovery and growth of B. nivea cultures that have been heat treated compared with
incubation below 30oC (Casella et al., 1990).

12
Table 2.3. Physiological properties (except heat resistance) of Byssochlamys fulva and
Byssochlamys nivea
Feature B. fulva B. nivea Temperature Growth and sporulation: optimal 32oC,
max 46oC, min 9oC
Fungistatic: -12oC to -7oC
Growth and sporulation: optimal
32oC, max 43oC, min 10oC
Inhibitory: -30oC and 7oC
pH Growth: optimal 3.0 – 3.5, tolerant 2 –
9
Sporulation: optimal: 2 – 3
Activating factors: chloride and nitrate
ions
Growth: tolerant 3.5 – 6.0
Germination: tolerant 3.0 – 6.3,
optimal 4 – 4.5
Activating, germinating factors:
acetate ions
Gases Absolute requirement for O2, require
residual O2 (0.27%)
Tolerate high CO2 (20 – 90%) and
high N2 (99.9%) content
Require residual O2 (0.5%)
Tolerate high CO2 (5 – 90%) and high
N2 (30%) content
Growth inhibited by >70% CO2
Water activity Growth: optimal 0.985, max 0.993,
min 0.893, no growth < 0.88
Optimal temperatures support growth
at lower aw
Growth: optimal 0.984, max 0.992,
min 0.892, no growth < 0.88
Optimal temperatures support growth
at lower aw
SO2 Growth: tolerant: up to 50 ppm, or up
to 250 ppm with sugar
Growth: tolerant: 50 – 75 ppm
Patulin production: tolerant up to 25
ppm
Preservatives Potassium sorbate: up to 250 ppm
Sodium benzoate: up to 250 ppm
Potassium sorbate: up to 400 ppm
Sodium benzoate: up to 1000 ppm
Enzymes Different types of pectinase, protease
and lipase
Possibly pectinase, protease and
lipase
Mycotoxins Byssochlamic acid, byssotoxin A Byssochlamic acid, byssotoxin A,
mycophenolic acid, patulin
Sugar Tolerant up to 20%, inhibitory > 30%
Protect ascospores: 28 – 65%
Pressure Mycelia: killed at 200 – 300 MPa
Ascospores: at least 600 MPa
References: Beuchat and Rice (1979), Beuchat and Toledo (1977), Pitt and Hocking (2009), Splittstoesser
et al. (1974b)

13
2.3.2 Hydrogen ion concentration (pH) and types of acid
Several studies have examined the effects of pH on the physiology of B. fulva (Beuchat
ad Rice, 1979; Splittstoesser et al., 1969, 1970). The optimal pH for growth of B. fulva
is 3.0 – 3.5 while the upper and lower limits for growth are pH 2 and pH 9, respectively
(Beuchat and Rice, 1979; Hull, 1939; Olliver and Rendle, 1934; Tournas, 1994).
Sporulation of B. fulva also occurs in the pH range 2 – 9, with the optimal production of
ascospores in the pH range 2 – 4, depending on the medium used (Hebert and Larson,
1972; Splittstoesser et al., 1969). In addition, pH 2 – 4 is more effective in activating
ascospores than higher pH conditions (Splittstoesser et al., 1970). Splittstoesser et al.
(1972) also found good activation of the ascospores at more acidic condition, pH 1,
whereas pH 1.6 – 2.0 can be detrimental to this property.
There have been fewer studies on the effects of pH on the physiology of B. nivea. The
optimal pH for mycelial growth of B. nivea is unknown but the fungus can tolerate and
grow in conditions of pH 3.5 – 6.0 (Yates and Ferguson, 1963). Germination of the
ascospores occurs over a wide range of pH values, 3.0 – 6.3, and most effectively at pH
4.0 – 4.5 (Yates et al., 1968). Ascospores can be thermally activated at pH 1 – 7 but the
lower extreme exhibits the optimal activating effects (Splittstoesser et al., 1970).
Apart from hydrogen ion concentration (pH), the types of acid and specific anions used
to fortify media have varying effects on the physiology of both B. fulva and B. nivea. So
far, only a few studies have examined these factors and more research is needed to
confirm and expand the results available. Splittstoesser et al. (1969) compared the
production of B. fulva ascospores in media with pH amended by addition of either
NaOH, HCl or tartaric acid. The authors found no significant differences among the
three chemicals in supporting the ascospore generation. However, Splittstoesser et al.
(1972) showed that chloride and nitrate ions were better activating factors for B. fulva
ascospores than phosphate and sulphate. For ascospores of B. nivea, acetate ions were
better activating and germinating factors than phosphate, citrate ions and other metal
cations (Yate, 1973; Yates et al., 1968).
14
2.3.3 Gaseous atmosphere
B. fulva and B. nivea are micro-aerobic microorganisms that can withstand extremely
low oxygen tensions. The ability to grow and function on residual oxygen is quite
specific to these species, which is a selective advantage over other heat resistant moulds
in canned products. There are differences in reported levels of oxygen required by B.
fulva. Olliver and Rendle (1934) observed growth of the species under oxygen tension
as low as 0.068 MPa. Oxygen concentrations of 0.27% or a trace amount in an
atmosphere occupied by 99.999% nitrogen were sufficient to support the growth of B.
fulva (King et al., 1969). Mycelial growth stopped if oxygen was completely removed,
but it resumed in the presence of air, proving an absolute requirement of oxygen by B.
fulva (King et al., 1969).
B. nivea appears to be able to survive at much lower oxygen tension than B. fulva.
Growth was observed under a vacuum pressure of 0.013 MPa (Put and Kruiswijk,
1964). Oxygen concentrations of 1.4 – 5.1% in the headspace of sealed pouches
provided sufficient oxygen to support the viability of B. nivea inocula over 13 month
storage at 21oC. However, the protective effect was greatly reduced at 9.5 – 9.7%
oxygen (Roland et al., 1984b). This contradictory effect of oxygen on fungal growth
could be due to detrimental oxidative changes in ascospores.
Yates and Ferguson (1963) reported an increase of B. nivea biomass in virtually pure
CO2 and N2 atmospheres. However, the experimental procedure of this study may not
have created true anaerobic conditions and residual oxygen may still have been present
to support mycelial growth. More research is needed to establish whether B. nivea is
able to grow under facultative anaerobic conditions.
The growth and physiological activities of B. fulva and B. nivea are also dependent on
the concentrations of other gases such as CO2 or N2. B. fulva can tolerate CO2 at a
concentration as high as 20 – 90% in the presence of at least 0.5% oxygen (Pitt and
Hocking, 2009; Taniwaki et al., 2001). Similarly, B. nivea can survive in 5 – 90% of
CO2 or 30% N2 and 20% oxygen (Yates et al., 1967). However, CO2 concentrations
above 70% can have an inactivating effect on the germination of ascospores whereas N2
does not support fungal development (Yates et al., 1968). The current knowledge cannot
explain fully the responses of Byssochlamys species to different atmospheres. Thus,
15
future studies need to focus on investigating the cellular and biochemical activity of
these species under modified gaseous conditions.
2.3.4 Water activity (aw)
The mycelial growth of B. fulva can occur within the water activity range 0.893 – 0.993,
with optimum growth at about 0.985 (Panagou et al., 2010). For B. nivea, the
corresponding aw ranges for growth is 0.892 – 0.992 and the optimal value is about
0.984 (Panagou et al., 2010; Zimmermann et al., 2011). The growth responses to water
activity can vary with medium, solute and growth temperatures but for both species no
growth is generally detected below an aw of 0.84 (Orth, 1976; Roland and Beuchat,
1984a; Valík and Piecková, 2001).
Effects of aw on ascospore germination and patulin production have been reported
predominantly for B. nivea rather than B. fulva. Germination of B. nivea ascospores can
occur at water activity range 0.90 – 0.99, with longer lag time at lower aw values
(Zimmermann et al., 2011). The lower limit of water activity for the germination of B.
nivea ascospores was estimated to be 0.84 (Orth, 1976). Reduced water activity of 0.91
– 0.99 with sugar or sodium chloride could also assist the survival and germination of B.
nivea ascospores exposed to heat and cold conditions (Beuchat, 1981; Beuchat and
Toledo, 1977).
Patulin production of B. nivea occurred at water activity between 0.959 – 0.992, the
lower extreme of which was often associated with cultures grown at temperatures that
were closer to the optimal range 30 – 37oC (Roland and Beuchat, 1984b). The minimum
aw for patulin production at 21, 30 and 37oC were 0.978, 0.968 and 0.959, respectively.
For B. fulva, the water activity range for patulin production is not available. However,
the species has been reported to produce patulin in Czapek-Dox broth containing 0.5%
sucrose and in fruit juices with contents of soluble solids between 4.8 – 18.3% (Rice et
al., 1977b).
2.3.5 Important metabolites produced by Byssochlamys
The extracellular metabolites of Byssochlamys species comprise relatively diverse
chemicals and, generally, have two major impacts on food quality (Houbraken et al.,
16
2006; Samson et al., 2009). One major group of metabolites consists of various lytic
enzymes that can degrade food constituents leading to food spoilage. The second group
is mycotoxins which can affect food safety.
2.3.5.1 Metabolic enzymes
Byssochlamys species produce pectolytic enzymes which can degrade pectins in foods.
Olliver and Rendle (1934) were the first to report the secretion of pectin-degrading
enzymes by B. fulva. This property was confirmed in later studies where a diversity of
pectolytic enzymes was found, including protopectinase, polygalacturonase, pectin-
esterase and pectate lyase (Beaven and Brown, 1949; Chu and Chang, 1973;
Kotzekidou, 1991; Put and Kruiswijk; 1964; Reid 1950; Ugwuanyi and Obeta, 1999).
High biosynthesis and activity of polygalacturonase were required to maintain a good
fungal growth, especially in sugar-limited environments where this enzyme could
transform pectin into more utilizable forms for fungal metabolism (Rice and Beuchat,
1978a, b; Rice et al., 1977a).
Apart from pectinases, Byssochlamys species have been reported to produce other
classes of enzymes, including a rennin-like protease called byssochlamyopeptidase A
(Chu et al., 1973), lipase (Ku and Hang, 1994), α-amylase (Doyle et al., 1998) and
vanillyl-alcohol oxidase (Furukawa et al., 1999a, b). So far most of the studies on
enzyme secretion have been limited to B. fulva and research is needed to determine
whether such properties are also found in B. nivea.
2.3.5.2 Mycotoxins
B. fulva and B. nivea produce several mycotoxins in media and fruit juices, including
mycophenolic acid (Puel et al., 2005), patulin (Puel et al., 2007) and byssochlamic acid
(Samson et al., 2009). B. fulva has been also reported to produce byssotoxin A (Frisvad
and Thrane, 1995; Kramer et al., 1976) but its prevalence in food is poorly documented
due to uncharacterised chemical structure (Houbraken et al., 2006).
Among the compounds above, patulin is the most documented mycotoxin associated
with Byssochlamys species. Patulin is produced by B. nivea and less frequently by B.
fulva in fruit juices (Houbraken et al., 2006; Rice, 1980; Rice et al., 1977b). However,
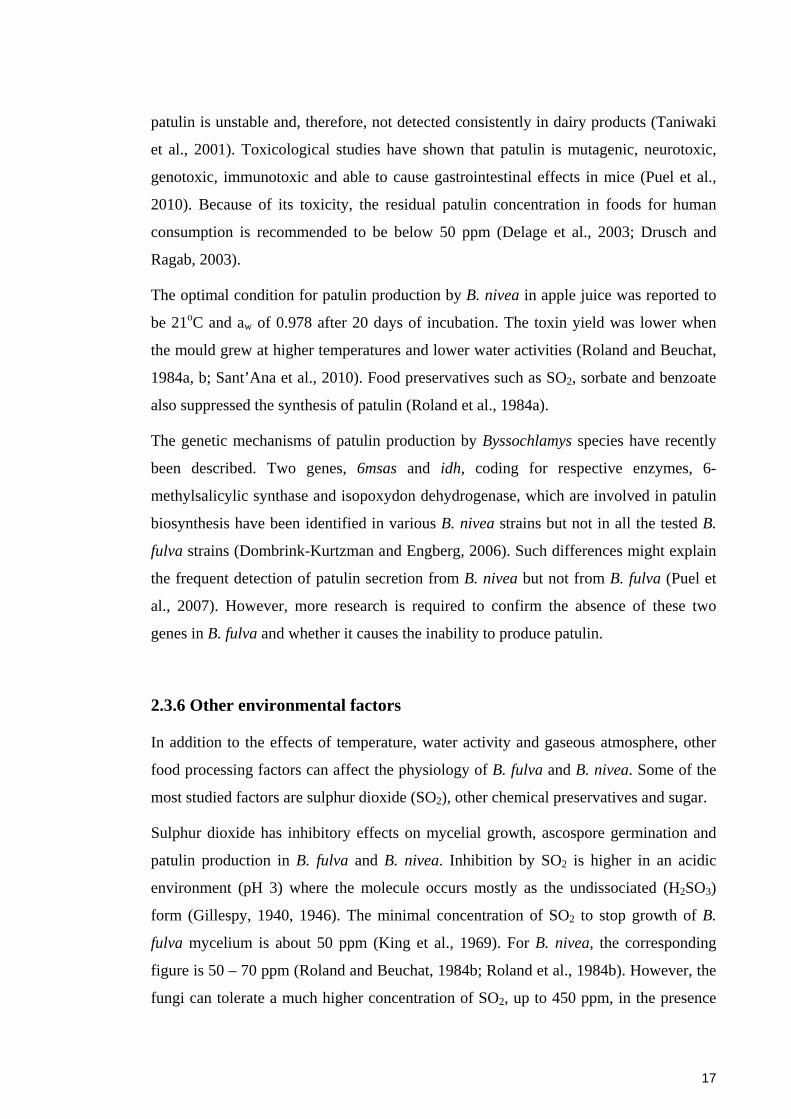
17
patulin is unstable and, therefore, not detected consistently in dairy products (Taniwaki
et al., 2001). Toxicological studies have shown that patulin is mutagenic, neurotoxic,
genotoxic, immunotoxic and able to cause gastrointestinal effects in mice (Puel et al.,
2010). Because of its toxicity, the residual patulin concentration in foods for human
consumption is recommended to be below 50 ppm (Delage et al., 2003; Drusch and
Ragab, 2003).
The optimal condition for patulin production by B. nivea in apple juice was reported to
be 21oC and aw of 0.978 after 20 days of incubation. The toxin yield was lower when
the mould grew at higher temperatures and lower water activities (Roland and Beuchat,
1984a, b; Sant’Ana et al., 2010). Food preservatives such as SO2, sorbate and benzoate
also suppressed the synthesis of patulin (Roland et al., 1984a).
The genetic mechanisms of patulin production by Byssochlamys species have recently
been described. Two genes, 6msas and idh, coding for respective enzymes, 6-
methylsalicylic synthase and isopoxydon dehydrogenase, which are involved in patulin
biosynthesis have been identified in various B. nivea strains but not in all the tested B.
fulva strains (Dombrink-Kurtzman and Engberg, 2006). Such differences might explain
the frequent detection of patulin secretion from B. nivea but not from B. fulva (Puel et
al., 2007). However, more research is required to confirm the absence of these two
genes in B. fulva and whether it causes the inability to produce patulin.
2.3.6 Other environmental factors
In addition to the effects of temperature, water activity and gaseous atmosphere, other
food processing factors can affect the physiology of B. fulva and B. nivea. Some of the
most studied factors are sulphur dioxide (SO2), other chemical preservatives and sugar.
Sulphur dioxide has inhibitory effects on mycelial growth, ascospore germination and
patulin production in B. fulva and B. nivea. Inhibition by SO2 is higher in an acidic
environment (pH 3) where the molecule occurs mostly as the undissociated (H2SO3)
form (Gillespy, 1940, 1946). The minimal concentration of SO2 to stop growth of B.
fulva mycelium is about 50 ppm (King et al., 1969). For B. nivea, the corresponding
figure is 50 – 70 ppm (Roland and Beuchat, 1984b; Roland et al., 1984b). However, the
fungi can tolerate a much higher concentration of SO2, up to 450 ppm, in the presence

18
of 10% sugar (King et al., 1969). Germination of the ascospores is prevented at high
SO2 concentrations such as 300 ppm (Beuchat, 1976). The use of 90 ppm SO2 in
combination with thermal processes increases the efficacy of the treatments in
inactivating ascospores tenfold (King et al., 1969). A SO2 concentration of 25 ppm is
sufficient to stop patulin production (Roland et al., 1984a).
Other common food preservatives such as benzoate and sorbate compounds are also
inhibitory against Byssochlamys species but the effects varied with species. Potassium
sorbate and sodium benzoate stop growth of B. fulva at a similar concentration of 250
ppm (King et al., 1969), but 400 ppm and 1000 ppm, respectively are needed to prevent
growth of B. nivea (Beuchat, 1976; Roland and Beuchat, 1984b; Roland et al., 1984a).
The inhibition by these preservatives is enhanced when combined with heating
(Beuchat, 1981).
The two less common preservatives, dimethyldicarbonate and diethylpyrocarbonate,
have been shown to stop Byssochlamys cultures from growing at minimum
concentrations of 50 ppm and 600 ppm, respectively (Beuchat, 1976; van der Riet and
Pinches, 1991; van der Riet et al., 1989).
Sugar can affect the behaviour of B. fulva and B. nivea in different ways depending on
concentration. Up to 20% sucrose (w/v) is favourable for mycelial growth, sporulation
and germination while sugar contents above 30% hinder those activities (Hatcher et al.,
1979; Hull, 1939; Olliver and Rendle, 1934). High sugar contents from 28% to 65% can
protect their ascospores against environmental stresses including heating (Splittstoesser
and Splittstoesser, 1977; Splittstoesser et al., 1974b).
Effects of fungicidal chemicals other than food preservatives on Byssochlamys species
have been reported less frequently. Olliver and Rendle (1934) observed that 2.2 gL-1 of
ammonia or 0.5% (v/v) of acetyldehyde inhibited growth of B. fulva. Asci of B. fulva
had a remarkable resistance to various strengths of antiseptic solutions, such as
formaldehyde, Lysol, sodium hypochlorite and mercuric chloride (Hull, 1939).
High pressure processing can affect the physiology of B. fulva and B. nivea. Their
mycelia are inactivated by treatments at 200 – 300 MPa (Butz et al., 1996). Short
treatments, such as 10 seconds or 15 minutes depending on the applied pressure, at the
pressure range 400 – 600 MPa can activate the ascospores (Dijksterhuis and Teunissen,
2004; Ferreira et al., 2009). Longer treatments or pressures above 600 MPa have
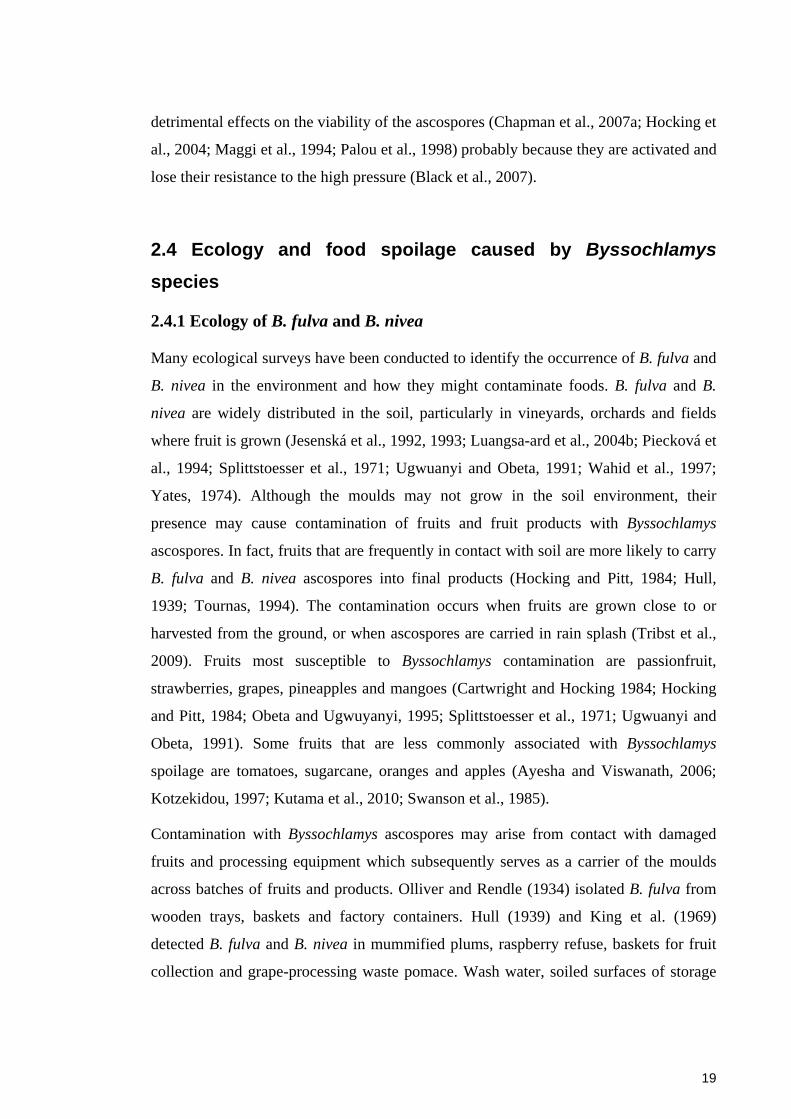
19
detrimental effects on the viability of the ascospores (Chapman et al., 2007a; Hocking et
al., 2004; Maggi et al., 1994; Palou et al., 1998) probably because they are activated and
lose their resistance to the high pressure (Black et al., 2007).
2.4 Ecology and food spoilage caused by Byssochlamys species
2.4.1 Ecology of B. fulva and B. nivea
Many ecological surveys have been conducted to identify the occurrence of B. fulva and
B. nivea in the environment and how they might contaminate foods. B. fulva and B.
nivea are widely distributed in the soil, particularly in vineyards, orchards and fields
where fruit is grown (Jesenská et al., 1992, 1993; Luangsa-ard et al., 2004b; Piecková et
al., 1994; Splittstoesser et al., 1971; Ugwuanyi and Obeta, 1991; Wahid et al., 1997;
Yates, 1974). Although the moulds may not grow in the soil environment, their
presence may cause contamination of fruits and fruit products with Byssochlamys
ascospores. In fact, fruits that are frequently in contact with soil are more likely to carry
B. fulva and B. nivea ascospores into final products (Hocking and Pitt, 1984; Hull,
1939; Tournas, 1994). The contamination occurs when fruits are grown close to or
harvested from the ground, or when ascospores are carried in rain splash (Tribst et al.,
2009). Fruits most susceptible to Byssochlamys contamination are passionfruit,
strawberries, grapes, pineapples and mangoes (Cartwright and Hocking 1984; Hocking
and Pitt, 1984; Obeta and Ugwuyanyi, 1995; Splittstoesser et al., 1971; Ugwuanyi and
Obeta, 1991). Some fruits that are less commonly associated with Byssochlamys
spoilage are tomatoes, sugarcane, oranges and apples (Ayesha and Viswanath, 2006;
Kotzekidou, 1997; Kutama et al., 2010; Swanson et al., 1985).
Contamination with Byssochlamys ascospores may arise from contact with damaged
fruits and processing equipment which subsequently serves as a carrier of the moulds
across batches of fruits and products. Olliver and Rendle (1934) isolated B. fulva from
wooden trays, baskets and factory containers. Hull (1939) and King et al. (1969)
detected B. fulva and B. nivea in mummified plums, raspberry refuse, baskets for fruit
collection and grape-processing waste pomace. Wash water, soiled surfaces of storage
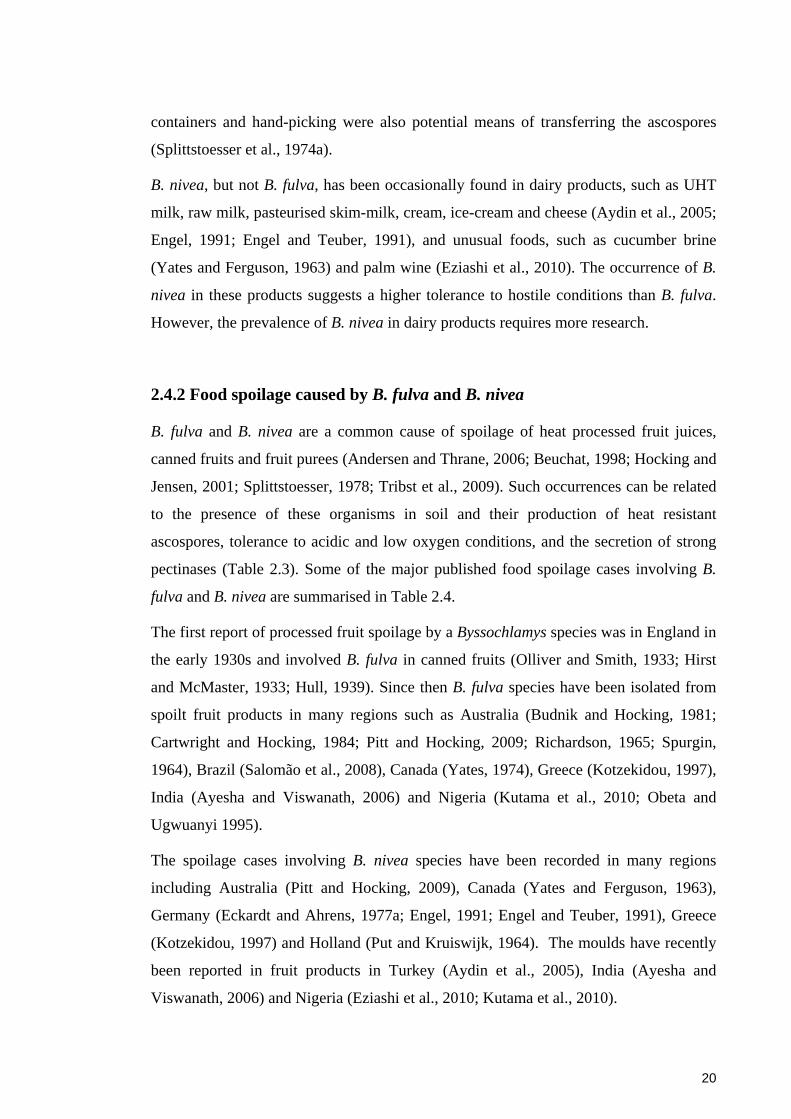
20
containers and hand-picking were also potential means of transferring the ascospores
(Splittstoesser et al., 1974a).
B. nivea, but not B. fulva, has been occasionally found in dairy products, such as UHT
milk, raw milk, pasteurised skim-milk, cream, ice-cream and cheese (Aydin et al., 2005;
Engel, 1991; Engel and Teuber, 1991), and unusual foods, such as cucumber brine
(Yates and Ferguson, 1963) and palm wine (Eziashi et al., 2010). The occurrence of B.
nivea in these products suggests a higher tolerance to hostile conditions than B. fulva.
However, the prevalence of B. nivea in dairy products requires more research.
2.4.2 Food spoilage caused by B. fulva and B. nivea
B. fulva and B. nivea are a common cause of spoilage of heat processed fruit juices,
canned fruits and fruit purees (Andersen and Thrane, 2006; Beuchat, 1998; Hocking and
Jensen, 2001; Splittstoesser, 1978; Tribst et al., 2009). Such occurrences can be related
to the presence of these organisms in soil and their production of heat resistant
ascospores, tolerance to acidic and low oxygen conditions, and the secretion of strong
pectinases (Table 2.3). Some of the major published food spoilage cases involving B.
fulva and B. nivea are summarised in Table 2.4.
The first report of processed fruit spoilage by a Byssochlamys species was in England in
the early 1930s and involved B. fulva in canned fruits (Olliver and Smith, 1933; Hirst
and McMaster, 1933; Hull, 1939). Since then B. fulva species have been isolated from
spoilt fruit products in many regions such as Australia (Budnik and Hocking, 1981;
Cartwright and Hocking, 1984; Pitt and Hocking, 2009; Richardson, 1965; Spurgin,
1964), Brazil (Salomão et al., 2008), Canada (Yates, 1974), Greece (Kotzekidou, 1997),
India (Ayesha and Viswanath, 2006) and Nigeria (Kutama et al., 2010; Obeta and
Ugwuanyi 1995).
The spoilage cases involving B. nivea species have been recorded in many regions
including Australia (Pitt and Hocking, 2009), Canada (Yates and Ferguson, 1963),
Germany (Eckardt and Ahrens, 1977a; Engel, 1991; Engel and Teuber, 1991), Greece
(Kotzekidou, 1997) and Holland (Put and Kruiswijk, 1964). The moulds have recently
been reported in fruit products in Turkey (Aydin et al., 2005), India (Ayesha and
Viswanath, 2006) and Nigeria (Eziashi et al., 2010; Kutama et al., 2010).

21
Table 2.4. Major food spoilage cases involving Byssochlamys fulva and Byssochlamys nivea
Species Products Region Year References
B. fulva Canned fruits (strawberries, plums, raspberries, gooseberries, loganberries)
England 1931 – 1934 Hirst and McMaster (1933), Olliver and Rendle (1934)
Canned strawberries Australia 1964 – 1965 Richardson (1965), Spurgin (1964)
Canned apple-grape drink, canned blackberries, cherry pie filling, fruit drink, fruit pudding, grape concentrate, fruits collected from orchards
USA 1967 – 1969 King et al. (1969), Maunder (1969), Splittstoesser et al. (1971)
Canned strawberries Canada 1974 Yates (1974)
Fruit based baby gel product (containing passionfruit), mixed fruit (orange, grape, passionfruit) juices, grape juice, fruit juice jelly
Australia 1980 – 2009 Budnik and Hocking (1981), Cartwright and Hocking (1984), Pitt and Hocking (2009)
Canned tomato paste Greece 1997 Kotzekidou (1997)
Under-processed sugarcane juice in tetrapaks India 2006 Ayesha and Viswanath (2006)
Apple concentrate Brazil 2008 Salomão et al. (2008)
Bottled raphia palm wine Nigeria 2010 Eziashi et al. (2010)
B. nivea Processed strawberries The Netherlands 1963 Put and Kruiswijk (1964)
Apple drink, canned blackberries USA 1965 – 1969 Maunder (1969)
Tinned strawberries Germany 1977 Eckardt and Ahrens (1977a)
Fresh cheese, whole milk, silage and raw milk Germany 1991 Engel and Teuber (1991)
Canned tomato paste Greece 1997 Kotzekidou (1997)
Cheese, fruit yoghurt, ice cream with fruits and fruit juices Turkey 2005 Aydin et al. (2005)
Under-processed sugarcane juice in tetrapaks India 2006 Ayesha and Viswanath (2006)
Bottled raphia palm wine Nigeria 2010 Eziashi et al. (2010)
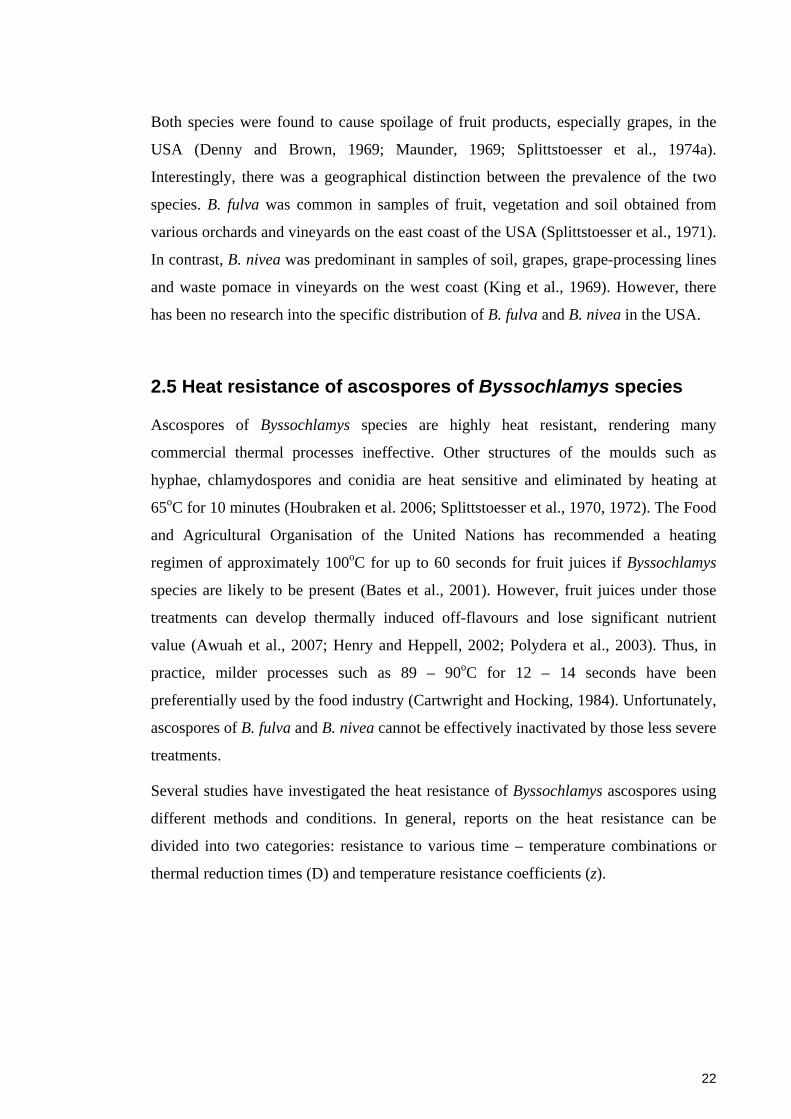
22
Both species were found to cause spoilage of fruit products, especially grapes, in the
USA (Denny and Brown, 1969; Maunder, 1969; Splittstoesser et al., 1974a).
Interestingly, there was a geographical distinction between the prevalence of the two
species. B. fulva was common in samples of fruit, vegetation and soil obtained from
various orchards and vineyards on the east coast of the USA (Splittstoesser et al., 1971).
In contrast, B. nivea was predominant in samples of soil, grapes, grape-processing lines
and waste pomace in vineyards on the west coast (King et al., 1969). However, there
has been no research into the specific distribution of B. fulva and B. nivea in the USA.
2.5 Heat resistance of ascospores of Byssochlamys species
Ascospores of Byssochlamys species are highly heat resistant, rendering many
commercial thermal processes ineffective. Other structures of the moulds such as
hyphae, chlamydospores and conidia are heat sensitive and eliminated by heating at
65oC for 10 minutes (Houbraken et al. 2006; Splittstoesser et al., 1970, 1972). The Food
and Agricultural Organisation of the United Nations has recommended a heating
regimen of approximately 100oC for up to 60 seconds for fruit juices if Byssochlamys
species are likely to be present (Bates et al., 2001). However, fruit juices under those
treatments can develop thermally induced off-flavours and lose significant nutrient
value (Awuah et al., 2007; Henry and Heppell, 2002; Polydera et al., 2003). Thus, in
practice, milder processes such as 89 – 90oC for 12 – 14 seconds have been
preferentially used by the food industry (Cartwright and Hocking, 1984). Unfortunately,
ascospores of B. fulva and B. nivea cannot be effectively inactivated by those less severe
treatments.
Several studies have investigated the heat resistance of Byssochlamys ascospores using
different methods and conditions. In general, reports on the heat resistance can be
divided into two categories: resistance to various time – temperature combinations or
thermal reduction times (D) and temperature resistance coefficients (z).

23
2.5.1 Heat resistance of Byssochlamys ascospores in thermal processes
Responses of ascospores of B. fulva and B. nivea to various heating regimens are
summarised in Tables 2.5 and 2.6, respectively. The heat resistance of the ascospores is
based on their survival after various heat treatments as reported in the literature.
Ascospores of B. fulva are more heat resistant than those of B. nivea. Processes of at
least 80oC for 20 minutes are required to inactivate B. nivea ascospores (Engel and
Teuber, 1991; Sant’Ana et al., 2009) whereas minimal treatments at 86oC for 53
minutes are needed for effective inactivation of B. fulva (Michener and King, 1974).
Use of lower temperatures for longer time is not practical in modern food production
(Splittstoesser et al., 1971). Moreover, ascospores of the two species can be activated
and outgrow following treatments at 70 – 80oC for about 20 – 60 minutes (Splittstoesser
and Splittstoesser, 1977; Splittstoesser et al., 1970, 1972). Thus, application of a heat
shock at 70 – 80oC has been used in screening and enumeration of heat resistant moulds
in food products (Beuchat, 1992; Beuchat and Pitt, 2001).
The heat resistance data in Tables 2.5 and 2.6 show some inconsistency in responses of
the two species to heat treatments which can be attributed to strain variations, heating
and counting methods, and the food or medium matrix in which the organisms were
present (Dijksterhuis, 2007; Splittstoesser and Splittstoesser, 1977).

24
Table 2.5. Heat resistance of Byssochlamys fulva ascospores with respect to heating
regimens
Heating regimen# Heating medium Lethality* Reference
70 – 80oC, 20 – 60 min
Homogenates of food products
A Beuchat and Pitt (2001)
87 – 88oC, 30 min Canned/bottled fruits NL Olliver and Smith (1933)
89oC, 30 min Saline NL Olliver and Rendle (1934)
84 – 88oC, 30 min Fruit syrups NL “
100oC, 2 – 3.5 min Live steam L “
85oC, 20 min Tomato paste NL Kotzekidou (1997)
85oC, 30 min Citrate buffer (pH 3) L Gillespy (1938)
77oC, 10 min (twice) spaced by 46oC, 30 min
Citrate buffer (pH 3) L “
88oC, 40 min – 95oC, 1.5 min
Strawberry syrup L Richardson (1965)
87.8oC, 81.4 min – 92.2oC, 13.7 min
Reconstituted grape juice
L King et al. (1969)
86.7oC, 118 min – 92.2oC, 6.8 min
Grape juice concentrate
L “
Up to 80oC, 60 min Grape juice homogenates
NL Splittstoesser et al. (1971)
85oC, 60 – 180 min Fruit juices NL Splittstoesser et al. (1974b)
86oC, 53 min Grape juice L Michener and King (1974)
Heat at 95oC, hold at 93oC for 30 sec
Clarified apple juice NL (1.7) Sant’Ana et al. (2009)
Heat at 96oC, hold at 94oC for 30 sec
Clarified apple juice L (4.8) “
* denotes survivability of moulds after heat treatment: A – activation, L – lethal, no detectable colonies,
NL – non-lethal, detectable colonies; numbers in brackets are log reduction of survival counts

25
Table 2.6. Heat resistance of Byssochlamys nivea ascospores with respect to heating
regimens
Heating regimen Heating medium Lethality* Reference
70 – 80oC, 20 – 60 min
Homogenates of food products
A Beuchat and Pitt (2001)
75oC, 7 hr Grape juice L Beuchat and Toledo (1977)
77.5oC, 20 min Ringer's solution NL Engel and Teuber (1991)
85oC, 20 min Tomato paste NL Kotzekidou (1997)
88oC, 45 min 30% sucrose (pH 4) NL Yates and Ferguson (1963)
87.5oC, 10 min Heat processed strawberries
NL Put and Kruiswijk (1964)
90 – 92oC, 10 min Heat processed strawberries
L “
80.5oC, 20 min – 90oC, 20 sec
Ringer's solution L (6) Engel and Teuber (1991)
90oC, 20 sec – 92oC, 12 sec
UHT milk, ice cream L (6) “
* denotes survivability of moulds after heat treatment: A – activation, L – lethal, no detectable colonies,
NL – non-lethal, detectable colonies; numbers in brackets are log reduction of survival counts
2.5.2 D and z values of ascospores of B. fulva and B. nivea
D value is defined as the amount of time required to inactivate 90% of a microbial
population and z value is the temperature increment required to change D values by a
factor of 10 (Adam and Moss, 2008). Some D and z values for the ascospores of B.
fulva and B. nivea that have been reported in different heating media are presented in
Tables 2.7 and 2.8, respectively. In general, B. fulva ascospores have higher D and z
values, and, therefore, are more heat resistant than B. nivea. For ascospores of B. fulva,
the typical D90 value is 1 – 12 minutes (Bayne and Michener, 1979) and the z value is 6
– 7oC (King et al., 1969). For B. nivea, the working D85 value is 0.6 – 1.2 minutes and
the z value is 4.2 – 5.8oC (Quintavalla and Spotti, 1993). Ascospores of B. fulva and B.
nivea are comparable with those of other heat resistant moulds. Ascospores of

26
Neosartorya fischeri have reported D90 values of 4.4 – 6.6 minutes and those of
Talaromyces flavus have D90 values of 2 – 8 minutes (Dijksterhuis and Samson, 2006;
King and Halbrook, 1987; Kotzekidou, 1997). A recent study reported that ascospores
of the new B. spectabilis species have D85 values of 47 – 75 minutes, making this
species one of the most heat resistant moulds (Houbraken et al. 2006).
Table 2.7. D and z values of ascospores of the species Byssochlamys fulva
D value Heating medium References
D85 = 26.18 – 59.78 min Clarified apple juice Sant’Ana et al. (2009)
D86 = 13 – 14 min Grape juice Michener and King (1974)
D87.8 = 4.8 – 11.3 min Grape juice King et al. (1969)
D87.8 = 1.6 min Grape juice with 250 ppm SO2
“
D90 = 1 – 12 min Chemically defined medium, clarified apple juice
Bayne and Michener (1979), Sant’Ana et al. (2009)
D92 = 27 – 37.5 min Distilled water Casella et al. (1990)
D92 = 3.27 – 3.97 min Clarified apple juice Sant’Ana et al. (2009a)
D95 = 1.10 – 2.52 min Clarified apple juice “
z value (oC)
6 – 7 Grape juice King et al. (1969)
7.1 Clarified apple juice Sant’Ana et al. (2009)
10 – 13.9 Grape juice (12oBrix) Hatcher et al. (1979)

27
Table 2.8. D and z values of ascospores of the species Byssochlamys nivea
D value Heating medium Reference
D75 = 60 min Grape juice Beuchat and Toledo (1977)
D80 = 6.6 – 5.7 min Grape juice (17oBrix) Quintavalla and Spotti (1993)
D84 = 36 – 46 sec Ringer's solution, UHT
milk, ice cream
Engel and Teuber (1991)
D85 = 0.6 – 1.2 min Grape juice (17oBrix) Quintavalla and Spotti (1993)
D86 = 12 – 18 sec Ringer's solution, UHT
milk, ice cream
Engel and Teuber (1991)
D88 = 33.8 – 49.5 sec
Sucrose or salt solutions
with potassium sorbate
and sodium benzoate
Beuchat (1981), Casella et al.
(1990)
D90 = 2.7 – 4 sec Ringer's solution, UHT
milk, ice cream
Engel and Teuber (1991)
D92 = 1.4 – 1.9 sec Ringer's solution, UHT
milk, ice cream “
z value (oC)
4 – 6.1 Potato dextrose agar, MEA Casella et al. (1990)
4.2 – 5.8 Grape juice (17oBrix) Quintavalla and Spotti (1993)
6 – 7 Cream (10% w/v fat
content)
Engel and Teuber (1991)
6 – 8 Ringer's solution “
Some studies have reported difficulties in calculating the D values of ascospores of B.
fulva and B. nivea because of the complexity of their death kinetics. Particularly, the
thermal inactivation curves of the ascospores of B. fulva and B. nivea do not always
follow the first order semi-logarithmic pattern. The curves are characterised by a
shoulder phase prior to the accelerating inactivation (King et al., 1979) followed by a
tailing phase towards the end of the treatments (Bayne and Michener, 1979). These
phases are often excluded from the calculation of D values, thereby underestimating the
heat resistance of the ascospores.
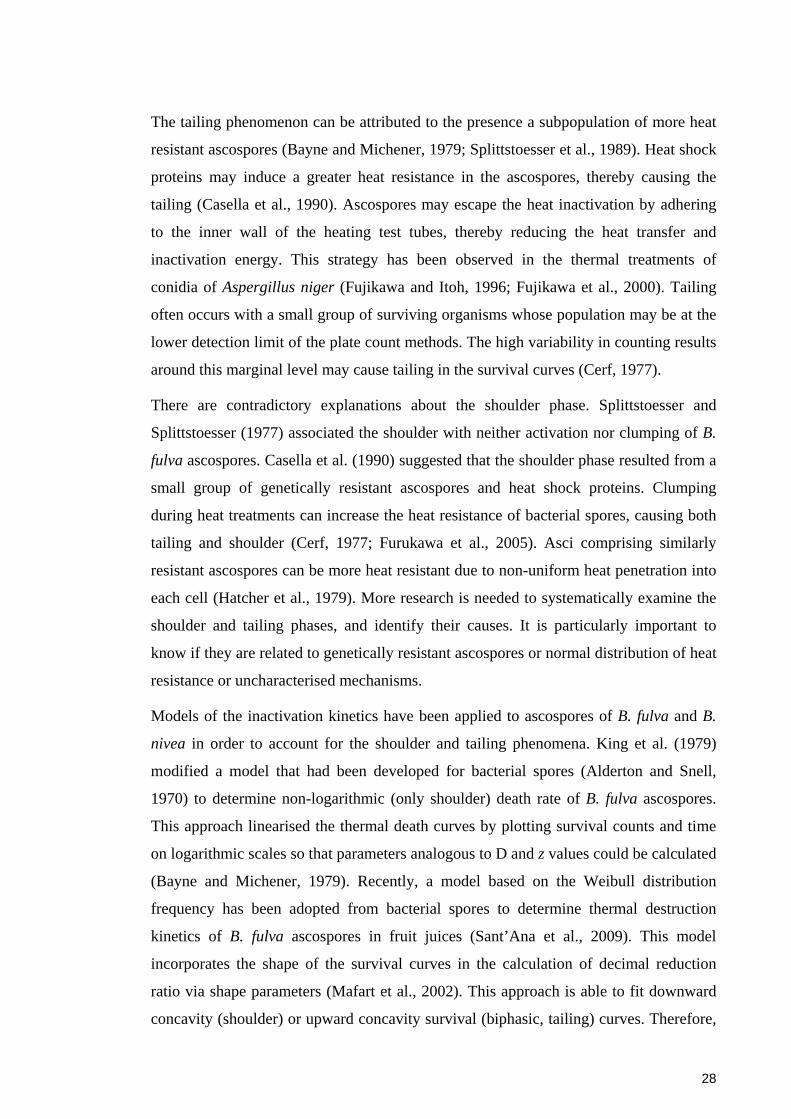
28
The tailing phenomenon can be attributed to the presence a subpopulation of more heat
resistant ascospores (Bayne and Michener, 1979; Splittstoesser et al., 1989). Heat shock
proteins may induce a greater heat resistance in the ascospores, thereby causing the
tailing (Casella et al., 1990). Ascospores may escape the heat inactivation by adhering
to the inner wall of the heating test tubes, thereby reducing the heat transfer and
inactivation energy. This strategy has been observed in the thermal treatments of
conidia of Aspergillus niger (Fujikawa and Itoh, 1996; Fujikawa et al., 2000). Tailing
often occurs with a small group of surviving organisms whose population may be at the
lower detection limit of the plate count methods. The high variability in counting results
around this marginal level may cause tailing in the survival curves (Cerf, 1977).
There are contradictory explanations about the shoulder phase. Splittstoesser and
Splittstoesser (1977) associated the shoulder with neither activation nor clumping of B.
fulva ascospores. Casella et al. (1990) suggested that the shoulder phase resulted from a
small group of genetically resistant ascospores and heat shock proteins. Clumping
during heat treatments can increase the heat resistance of bacterial spores, causing both
tailing and shoulder (Cerf, 1977; Furukawa et al., 2005). Asci comprising similarly
resistant ascospores can be more heat resistant due to non-uniform heat penetration into
each cell (Hatcher et al., 1979). More research is needed to systematically examine the
shoulder and tailing phases, and identify their causes. It is particularly important to
know if they are related to genetically resistant ascospores or normal distribution of heat
resistance or uncharacterised mechanisms.
Models of the inactivation kinetics have been applied to ascospores of B. fulva and B.
nivea in order to account for the shoulder and tailing phenomena. King et al. (1979)
modified a model that had been developed for bacterial spores (Alderton and Snell,
1970) to determine non-logarithmic (only shoulder) death rate of B. fulva ascospores.
This approach linearised the thermal death curves by plotting survival counts and time
on logarithmic scales so that parameters analogous to D and z values could be calculated
(Bayne and Michener, 1979). Recently, a model based on the Weibull distribution
frequency has been adopted from bacterial spores to determine thermal destruction
kinetics of B. fulva ascospores in fruit juices (Sant’Ana et al., 2009). This model
incorporates the shape of the survival curves in the calculation of decimal reduction
ratio via shape parameters (Mafart et al., 2002). This approach is able to fit downward
concavity (shoulder) or upward concavity survival (biphasic, tailing) curves. Therefore,

29
more research is still required to understand the complex inactivation kinetics of
Byssochlamys ascospores so that new models customised for dealing with shoulder and
tailing phases can be developed.
2.6 Factors contributing to the heat resistance of Byssochlamys ascospores
Despite the importance of the heat resistance property in contributing to food spoilage,
little is known about the mechanisms behind the survival of Byssochlamys ascospores
during heat treatments. Previous studies on heat resistant microorganisms suggest that
thermotolerance is a function of many factors rather than a single element (Atrih and
Foster, 2001). Many factors contributing to the heat resistance of Byssochlamys
ascospores have been reported. So far, most of the well-defined factors, such as
compositions of foods and heating media, are extrinsic to the ascospores (Beuchat and
Rice, 1979). However, knowledge about intrinsic factors involved in heat resistance is
sparse and still not fully understood. Some intrinsic factors that are reviewed here are
the age, ultrastructure, intracellular configuration and genetics of the ascospores.
2.6.1 Effects of food/medium composition on heat resistance of Byssochlamys
ascospores
The heat resistance of Byssochlamys ascospores varies according to the composition of
the matrix or medium in which they were suspended (Table 2.5 – 2.6). Consequently,
food composition affects the responses of the ascospores to heat treatments.
Sugars, predominantly sucrose and natural sugars in fruit juices, help with the activation
and protect ascospores against thermal inactivation. The protective effects of sugar
depend on factors such as its concentration, soluble solids in fruit juices and pH. Media
with sucrose concentrations above 5% generally activate ascospores of B. fulva more
quickly and effectively than water (Splittstoesser and Splittstoesser, 1977). Sugar
contents up to 20% can increase the heat resistance of ascospores of B. fulva and B.
nivea (Beuchat, 1981; Eckardt and Ahrens, 1977b; King et al., 1969). Similar protection
for the ascospores occurs in fruit juices with high concentrations of soluble solids
including sugar, for instance 5 – 52oBrix, although the effectiveness is reduced in acidic
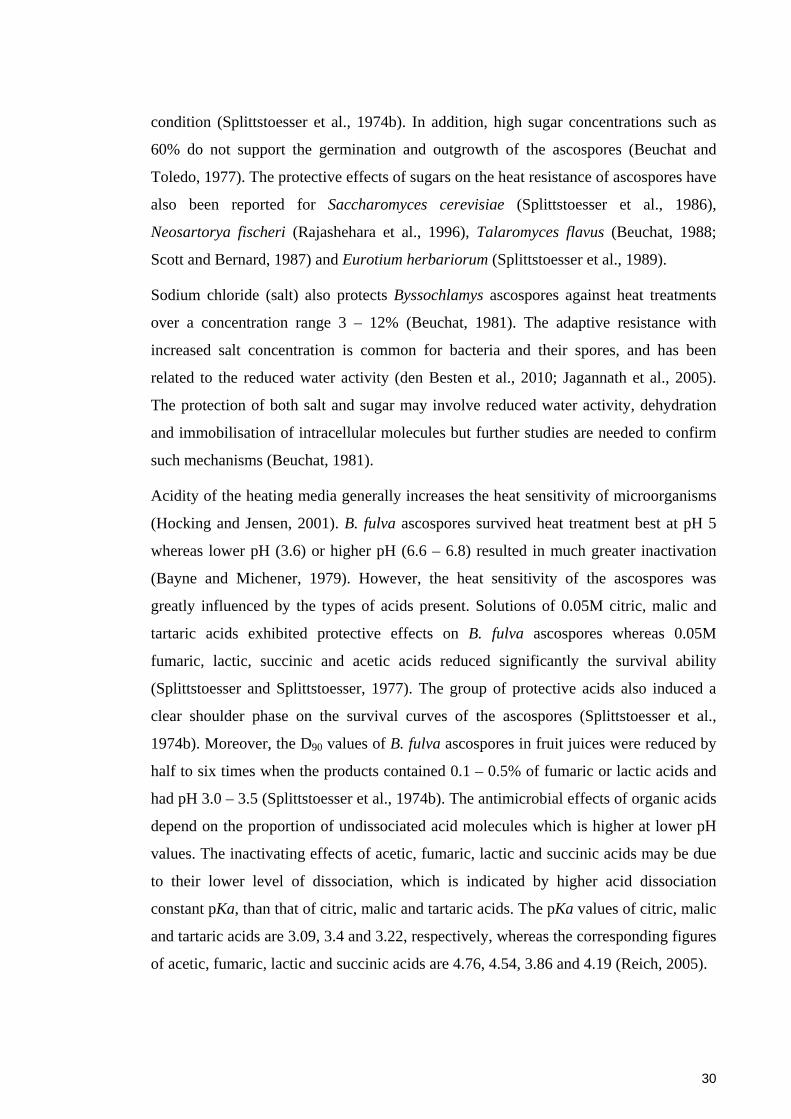
30
condition (Splittstoesser et al., 1974b). In addition, high sugar concentrations such as
60% do not support the germination and outgrowth of the ascospores (Beuchat and
Toledo, 1977). The protective effects of sugars on the heat resistance of ascospores have
also been reported for Saccharomyces cerevisiae (Splittstoesser et al., 1986),
Neosartorya fischeri (Rajashehara et al., 1996), Talaromyces flavus (Beuchat, 1988;
Scott and Bernard, 1987) and Eurotium herbariorum (Splittstoesser et al., 1989).
Sodium chloride (salt) also protects Byssochlamys ascospores against heat treatments
over a concentration range 3 – 12% (Beuchat, 1981). The adaptive resistance with
increased salt concentration is common for bacteria and their spores, and has been
related to the reduced water activity (den Besten et al., 2010; Jagannath et al., 2005).
The protection of both salt and sugar may involve reduced water activity, dehydration
and immobilisation of intracellular molecules but further studies are needed to confirm
such mechanisms (Beuchat, 1981).
Acidity of the heating media generally increases the heat sensitivity of microorganisms
(Hocking and Jensen, 2001). B. fulva ascospores survived heat treatment best at pH 5
whereas lower pH (3.6) or higher pH (6.6 – 6.8) resulted in much greater inactivation
(Bayne and Michener, 1979). However, the heat sensitivity of the ascospores was
greatly influenced by the types of acids present. Solutions of 0.05M citric, malic and
tartaric acids exhibited protective effects on B. fulva ascospores whereas 0.05M
fumaric, lactic, succinic and acetic acids reduced significantly the survival ability
(Splittstoesser and Splittstoesser, 1977). The group of protective acids also induced a
clear shoulder phase on the survival curves of the ascospores (Splittstoesser et al.,
1974b). Moreover, the D90 values of B. fulva ascospores in fruit juices were reduced by
half to six times when the products contained 0.1 – 0.5% of fumaric or lactic acids and
had pH 3.0 – 3.5 (Splittstoesser et al., 1974b). The antimicrobial effects of organic acids
depend on the proportion of undissociated acid molecules which is higher at lower pH
values. The inactivating effects of acetic, fumaric, lactic and succinic acids may be due
to their lower level of dissociation, which is indicated by higher acid dissociation
constant pKa, than that of citric, malic and tartaric acids. The pKa values of citric, malic
and tartaric acids are 3.09, 3.4 and 3.22, respectively, whereas the corresponding figures
of acetic, fumaric, lactic and succinic acids are 4.76, 4.54, 3.86 and 4.19 (Reich, 2005).
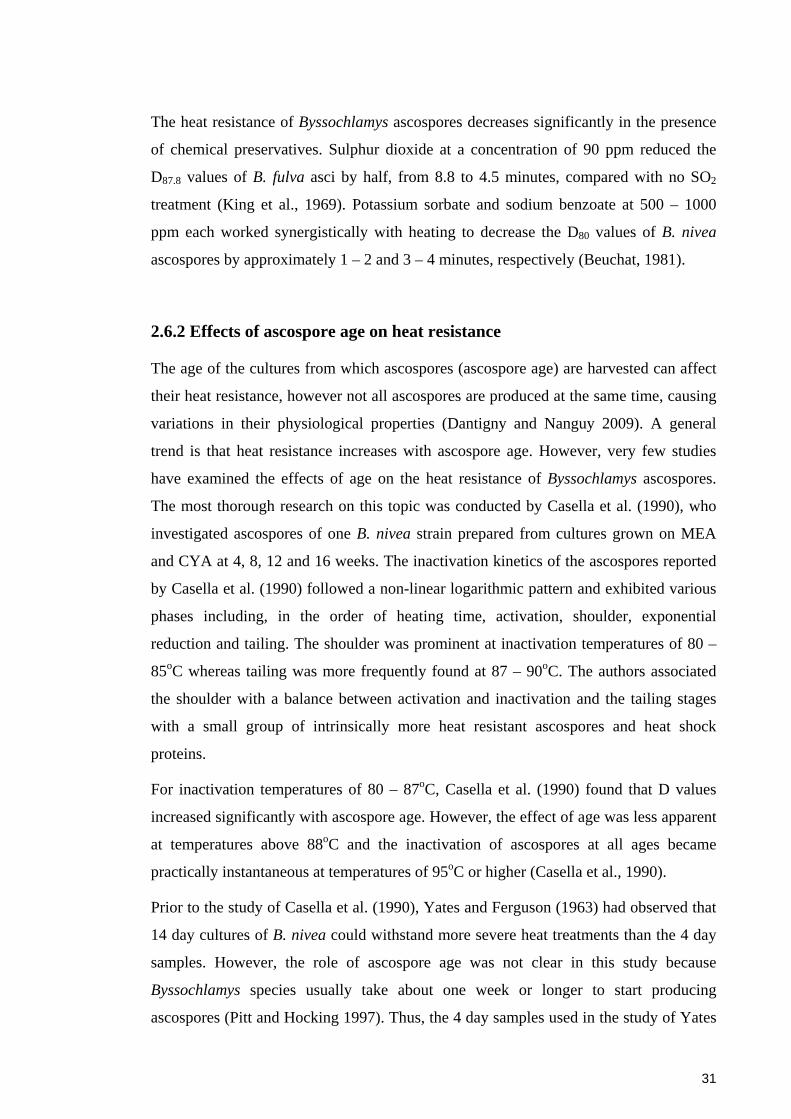
31
The heat resistance of Byssochlamys ascospores decreases significantly in the presence
of chemical preservatives. Sulphur dioxide at a concentration of 90 ppm reduced the
D87.8 values of B. fulva asci by half, from 8.8 to 4.5 minutes, compared with no SO2
treatment (King et al., 1969). Potassium sorbate and sodium benzoate at 500 – 1000
ppm each worked synergistically with heating to decrease the D80 values of B. nivea
ascospores by approximately 1 – 2 and 3 – 4 minutes, respectively (Beuchat, 1981).
2.6.2 Effects of ascospore age on heat resistance
The age of the cultures from which ascospores (ascospore age) are harvested can affect
their heat resistance, however not all ascospores are produced at the same time, causing
variations in their physiological properties (Dantigny and Nanguy 2009). A general
trend is that heat resistance increases with ascospore age. However, very few studies
have examined the effects of age on the heat resistance of Byssochlamys ascospores.
The most thorough research on this topic was conducted by Casella et al. (1990), who
investigated ascospores of one B. nivea strain prepared from cultures grown on MEA
and CYA at 4, 8, 12 and 16 weeks. The inactivation kinetics of the ascospores reported
by Casella et al. (1990) followed a non-linear logarithmic pattern and exhibited various
phases including, in the order of heating time, activation, shoulder, exponential
reduction and tailing. The shoulder was prominent at inactivation temperatures of 80 –
85oC whereas tailing was more frequently found at 87 – 90oC. The authors associated
the shoulder with a balance between activation and inactivation and the tailing stages
with a small group of intrinsically more heat resistant ascospores and heat shock
proteins.
For inactivation temperatures of 80 – 87oC, Casella et al. (1990) found that D values
increased significantly with ascospore age. However, the effect of age was less apparent
at temperatures above 88oC and the inactivation of ascospores at all ages became
practically instantaneous at temperatures of 95oC or higher (Casella et al., 1990).
Prior to the study of Casella et al. (1990), Yates and Ferguson (1963) had observed that
14 day cultures of B. nivea could withstand more severe heat treatments than the 4 day
samples. However, the role of ascospore age was not clear in this study because
Byssochlamys species usually take about one week or longer to start producing
ascospores (Pitt and Hocking 1997). Thus, the 4 day samples used in the study of Yates
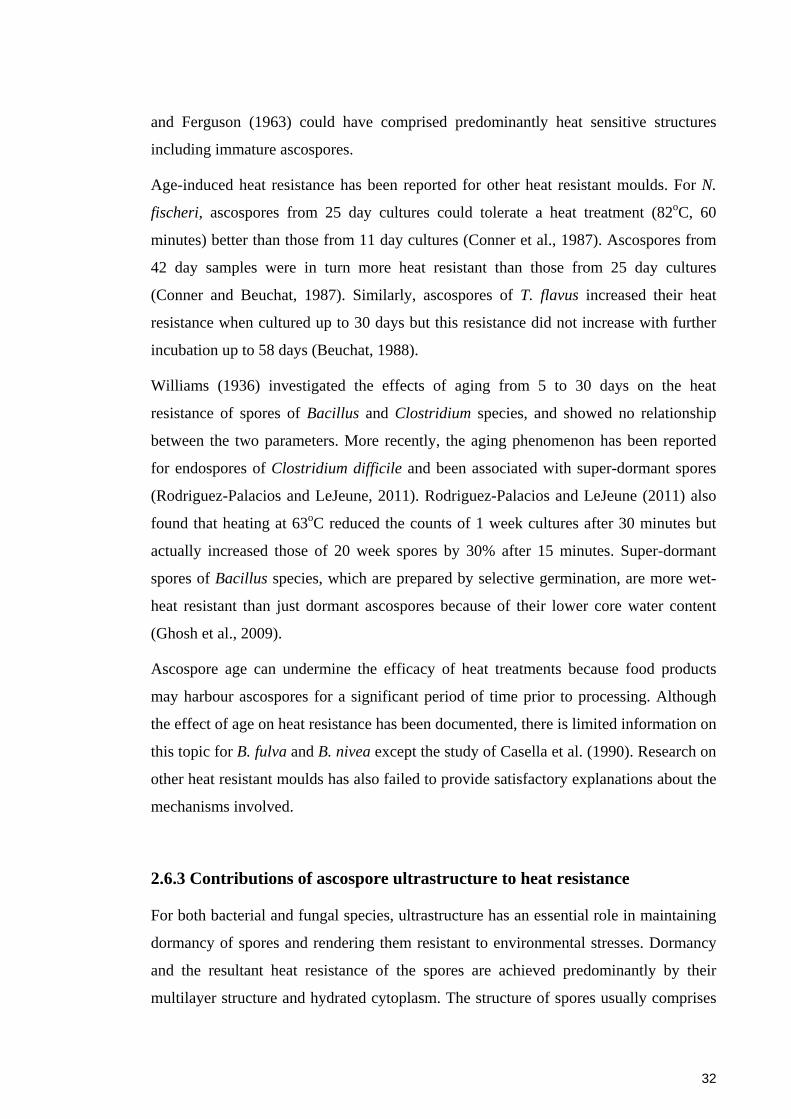
32
and Ferguson (1963) could have comprised predominantly heat sensitive structures
including immature ascospores.
Age-induced heat resistance has been reported for other heat resistant moulds. For N.
fischeri, ascospores from 25 day cultures could tolerate a heat treatment (82oC, 60
minutes) better than those from 11 day cultures (Conner et al., 1987). Ascospores from
42 day samples were in turn more heat resistant than those from 25 day cultures
(Conner and Beuchat, 1987). Similarly, ascospores of T. flavus increased their heat
resistance when cultured up to 30 days but this resistance did not increase with further
incubation up to 58 days (Beuchat, 1988).
Williams (1936) investigated the effects of aging from 5 to 30 days on the heat
resistance of spores of Bacillus and Clostridium species, and showed no relationship
between the two parameters. More recently, the aging phenomenon has been reported
for endospores of Clostridium difficile and been associated with super-dormant spores
(Rodriguez-Palacios and LeJeune, 2011). Rodriguez-Palacios and LeJeune (2011) also
found that heating at 63oC reduced the counts of 1 week cultures after 30 minutes but
actually increased those of 20 week spores by 30% after 15 minutes. Super-dormant
spores of Bacillus species, which are prepared by selective germination, are more wet-
heat resistant than just dormant ascospores because of their lower core water content
(Ghosh et al., 2009).
Ascospore age can undermine the efficacy of heat treatments because food products
may harbour ascospores for a significant period of time prior to processing. Although
the effect of age on heat resistance has been documented, there is limited information on
this topic for B. fulva and B. nivea except the study of Casella et al. (1990). Research on
other heat resistant moulds has also failed to provide satisfactory explanations about the
mechanisms involved.
2.6.3 Contributions of ascospore ultrastructure to heat resistance
For both bacterial and fungal species, ultrastructure has an essential role in maintaining
dormancy of spores and rendering them resistant to environmental stresses. Dormancy
and the resultant heat resistance of the spores are achieved predominantly by their
multilayer structure and hydrated cytoplasm. The structure of spores usually comprises

33
three major compartments, consisting of a cell-wall, cortex or cortex-like layers and a
cytoplasm where most materials essential for growth are located (Driks, 1999, 2003).
The cell walls of spores are often significantly thicker than those of vegetative cells.
They can be made of more than one layer and are relatively impermeable and, along
with the cell membrane, prevent the loss of moisture and important intracellular
molecules, as well as preventing the entry of unfavourable chemicals (Atrih and Foster,
2002; Setlow, 2006; Sussman and Douthit, 1973; Warth, 1985). The low moisture
condition inside the spores can stabilise molecules and hinder chemical reactions,
protecting proteins and nucleic acid materials from denaturation (Atrith and Foster,
2002; Gerhardt and Murrell, 1978; Orsburn et al., 2008).
Despite its potential importance to the heat resistance, only a few studies have examined
the ultrastructure of Byssochlamys ascospores. Put and Kruiswijk (1964) used a light
microscope to examine the morphology of B. nivea ascospores found in spoilt canned
strawberries. In their photomicrographs, the ascospores exhibited a distinct coat, an
extremely dense central region and a translucent space sandwiched between these two
compartments. However, the authors did not provide a more detailed description of the
microscopic findings. Later Partsch et al. (1969) used transmission electron microscopy
to identify distinctive features of conidia and ascospores of a strain of B. fulva. They
found that the ascospores had a thicker cell wall (0.2 – 0.3 µm) than the conidia (0.1 –
0.2 µm). In addition, the ascospores had an unusually thick intermediate space (1 – 2
µm) that was absent in the heat sensitive conidia. The thick cell wall and intermediate
space were suggested to be important factors in the heat resistance of the ascospores.
Using scanning electron microscopy, Hatcher et al. (1979) showed a building up of an
outer layer of the asci of B. fulva when comparing samples from 30 and 90 day cultures.
Their result suggested a critical link between ascospore ultrastructure, age and heat
resistance properties.
The multilayered ultrastructure observed in Byssochlamys ascospores is generally
similar to that of other heat resistant moulds. Ascospores of N. fischeri have a thick cell
wall and intermediate space enclosing a dense cytoplasm. Interestingly, the cell wall
comprised four layers including a thick outer cell wall (0.1 – 0.2 µm) (Conner et al.,
1987). Ascospores of T. macrosporus also showed the three major compartments and a
relatively thick multilayered cell wall (Dijksterhuis et al., 2007).

34
In summary, information on the ultrastructure of ascospores of Byssochlamys species is
limited to only a few studies. This needs to be extended to provide more data about the
effects of age on their ultrastructure and changes to this ultrastructure during heat
inactivation.
2.6.4 Chemical composition and heat resistance of ascospores
Chemical composition has a crucial role in determining the dormancy and heat
resistance of microbial spores (Dijksterhuis et al., 2002; Setlow, 2006). Only one study
(Banner et al., 1979) so far has investigated the chemical composition of Byssochlamys
ascospores. Banner et al. (1979) compared the chemical composition of ascospores from
two B. fulva strains with different heat resistance. They found that the ascospores of
both strains had an unusual lipid composition and contained a high proportion of fatty
acids with backbones longer than 20 carbons. However, the heat resistant ascospores
had more total fatty acid, and a higher percentage of fatty acids longer than 18 carbons
than the heat sensitive samples. Moreover, there were no significant differences
between two strains in terms of other components such as carbohydrates, amino acids
and minerals. Thus, the authors concluded that proteins, minerals and carbohydrates
were not heat resistant factors of Byssochlamys ascospores. The fatty acids could
contribute to the heat resistance since they might be involved in membrane transport
systems and rigidity of the cell wall (Fisher et al., 1972). However, no research has been
done since then to elucidate the roles of fatty acids in the heat resistance of
Byssochlamys ascospores.
Despite the conclusions drawn by Banner et al. (1979) about carbohydrates and
proteins, many studies have showed that specific groups of these compounds are related
to thermotolerance. Trehalose, in particular, is one of the most common stress protectors
in fungal cells (Dijksterhuis et al., 2002; Thevelein, 1984). This sugar interacts with
various families of heat shock proteins, protecting cells from environmental stresses
such as dehydration and high temperatures (Tereshina, 2005). The importance of
trehalose and proteins will be discussed in the next sections.
35
2.6.5 Trehalose, glassy state and heat resistance of ascospores
Trehalose is a ubiquitous disaccharide in fungi (Thevelein, 1984). Trehalose contents in
fungal spores are widely variable, ranging from 2.6% to 35% of dry weight (van Laere,
1989). Trehalose has not been reported in B. fulva or B. nivea but it has been found in
ascospores of other heat resistant moulds, such as N. fischeri, having 6.1 µg of trehalose
per mg of dry ascospores (Conner et al., 1987) and T. macrosporus having 9 – 17%
trehalose on a wet cell basis (Dijksterhuis et al., 2002). The fact that trehalose is found
to accumulate at high concentrations in fungal spores suggests its important role during
fungal dormancy.
The major function of trehalose in fungal spores is as an energy reserve (Elbein, 1974;
Sussman, 1976; Tereshina, 2005). A rapid release of the intracellular trehalose often
signals germination (Dijksterhuis et al., 2002, 2007), injury or death of fungal spores
(Mandels et al., 1965). Additionally, trehalose protects cells against many adverse
environmental conditions including heat stress, water stress and oxidative stress.
Accumulated trehalose has been associated with enhanced stress resistances in conidia
of Emericella nidulans (Fillinger et al., 2001) and vegetative cells of Saccharomyces
cerevisiae (Elliott et al. 1996; van Dijck et al., 1995) and Schizosaccharomyces pombe
(Soto et al., 1999).
The protective actions of trehalose generally involve three major properties: the
inactivity in chemical reactions, its ability to replace water in interactions with
biomaterials, and the ability to form a glassy state (Luo et al., 2008). First, trehalose is
chemically and thermodynamically stable at elevated temperatures, at low pH and in
reactions with proteins and, therefore, it does not participate in reactions leading to
degradation of other molecules (Teramoto et al., 2008). Second, trehalose can replace
water in hydrogen bonding with molecules, such as proteins (Allison et al., 1999;
Klimov and Thirumalai, 1997) and membranous phospholipids (Bogaart et al., 2007;
Crowe et al., 1984, 1996), stabilising their structures and preventing denaturation by
dehydration. Although other carbohydrates can replace water, trehalose is more
effective because of the larger hydrated volume which allows it to substitute for more
water molecules (Sola-Penna and Meyer-Fernandes, 1998).
A glassy state is a special arrangement of material molecules at low moisture content,
which is in semi-solid and stable structure but still maintains a certain degree of
36
flexibility of the fluid state (Leopold et al., 1994). The glassy state mechanism has been
a popular hypothesis to explain the heat resistance of fungal ascospores because it
creates an intracellular environment protecting biological materials against chemical
and mechanical denaturation (Dijksterhuis, 2007; Dijksterhuis et al., 2007). The low
moisture content inside the ascospores is favourable for a glassy state because
polyhydroxy sugars such as trehalose, sucrose, mannitol and erythritol can substitute
water in hydrogen bonding with intracellular molecules and protect them (Allison et al.,
1999; Dougan et al., 2011; Izutsu and Kojima, 2002; Sola-Penna and Meyer-Fernandes,
1998). A glass-like structure has been observed inside endospores of Bacillus species
and has been associated with the heat tolerance of these cells (Leuschner and Lillford,
2003; Stecchini et al., 2006). Despite suggestive results from other species, the presence
of a glassy state in Byssochlamys ascospores has not been examined and further
research is needed to investigate such a structure and how it might affect the heat
responses of the fungi.
2.6.6 Molecular factors of heat resistance of Byssochlamys ascospores
The genomes of B. fulva and B. nivea species have not been fully sequenced. So far
only genes that are needed for taxonomy and detection of those two species have been
sequenced, including 18S rDNA (Luangsa-ard et al., 2004a), 28S rRNA (Untereiner et
al., 2002), 5.8S rDNA, ITS1, ITS2 (Houbraken et al., 2008; Samson et al., 2009), β-
tubulin (Nakayama et al., 2010; Puel et al., 2007), actin (Houbraken et al., 2008) and
calmodulin (Samson et al., 2009). Some genes encoding for important enzymes are also
sequenced, such as patulin production enzymes, isoepoxydon dehydrogenase and 6-
methylsalicylic acid synthase (Dombrink-Kurtzman and Engberg, 2006; Puel et al.,
2007), and RNA polymerase beta (Peterson, 2008). Thus, genomic aspects of the heat
resistance of Byssochlamys ascospores are still poorly understood. Research on
transcriptomics and proteomics of heat resistance is limited by the lack of genomic
information.
High temperature can induce expression of various groups of stress-related compounds
such as proteins or sugars in fungal and yeast cells (Albrecht et al., 2010; Chen and
Chen, 2004; Goldani et al., 1994; Piper, 1993). The most studied stress-related
protectors are heat shock proteins (HSPs), which are molecular chaperones in microbial
37
cells, protecting intracellular proteins from thermal denaturation (Li and Srivastava,
2004). The protection of HSPs is based on their interactions with proteins, helping to
maintain their native structures or refolding misfolded proteins (Burnie et al., 2005).
Casella et al. (1990) suggested that HSPs might contribute to the heat resistance of
ascospores of B. nivea but further studies are required to examine the protein profiles of
Byssochlamys ascospores and how they might change during heat inactivation.
2.7 Concluding remarks
Byssochlamys species, particularly B. fulva and B. nivea, have caused problems in the
fruit juice and the canned fruit industry for nearly 80 years. From the early studies, a
considerable body of knowledge has been gained about their taxonomy, morphology,
physiology, sources of contamination and significances in food quality and safety. It is
well established that B. fulva and B. nivea can survive in highly acidic (pH 3.0 – 4.5)
and low water activity (0.892 – 0.993) environments with an extremely small
requirement of oxygen. Ascospores of the fungi are widely distributed in soil; hence,
frequent contact with soil in orchards renders fruits most susceptible to Byssochlamys
contamination. Byssochlamys species can produce mycotoxins, most notably patulin and
byssochlamic acid.
The ability of B. fulva and B. nivea to survive thermal processes is attributed mostly to
the production of highly heat resistant ascospores. Typically, thermal destruction times
(D) are 1 – 12 minutes at 90oC for ascospores of B. fulva and 0.6 – 1.2 minutes at 85oC
for those of B. nivea. Therefore, they can easily survive pasteurisation processes used by
the food industry. Moreover, the heat resistance is greatly enhanced by the presence of
common food components such as sugars and salts. Effects of acids on the ascospores
can either be inhibitory or protective depending on types of acid. However, heat
treatments coupled with low pH (less than 3.6) and food preservatives are effective in
inactivating the ascospores. Additionally, the analysis of heat resistance is complicated
by phenomena such as the presence of a shoulder and tailing on the survival curves.
Current knowledge of the physiology, chemical composition and ultrastructure of
Byssochlamys ascospores, unfortunately, is insufficient to explain their remarkable heat
resistance. Most of the studies have examined only effects of extrinsic factors on the
heat resistance, leaving a gap in our knowledge of how ascospores achieve the property
38
intrinsically. There have been theoretical links between the heat resistance and
ascospore age, ultrastructure, chemical composition, physical arrangements of
intracellular materials and heat-stress proteins. They represent areas for future research
in order to elucidate the ultimate mechanisms of heat resistance of Byssochlamys
ascospores.
Apart from the need for scientific knowledge, research on the bases of heat resistance is
also fuelled by demands of the food industry and consumers. Consumers are urging less
processed, more natural products with minimal preservatives. That in turns drives food
manufacturers to develop novel, milder processing techniques (Sloan, 2010; Zink,
1997). Thus, a better understanding of the heat resistance properties of Byssochlamys
ascospores would be beneficial for the food industry, assisting it to develop effective
processes that could meet consumers’ demands and expectations.
39
Chapter 3 – Thermal inactivation of ascospores of Byssochlamys fulva and Byssochlamys nivea during aging
3.1 Introduction
Heat resistant microorganisms are defined as those that can survive thermal processes
such as pasteurisation which is commonly used by the food industry (Houbraken and
Samson, 2006). They represent a small yet significant group of major concern to the
food manufacturers, especially those whose products rely on thermal processing as the
major hurdle for microbiological stability. In most cases, they acquire the thermo-
tolerance by producing structures such as endospores, ascospores, thick-walled
chlamydospores, cleistothecia and sclerotia which are dormant and resistant to adverse
conditions including heat (Atrih and Foster, 2002; Beuchat and Pitt, 2001; Tournas,
1994). Members of this group include spore-forming bacteria such as Bacillus spp. and
Clostridium spp. (Atrih and Foster, 2002), and some filamentous fungi such as
Byssochlamys spp., Talaromyces spp. and Neosartorya spp.) (Mouchacca, 2007).
Byssochlamys fulva and B. nivea are two of the most heat resistant fungal species of
relevance to the food industry (Samson, 1989; Samson et al., 1995). Their ascospores
are able to survive thermal treatments at 90oC, rendering pasteurisation ineffective
(Bayne and Michener, 1979). Outbreaks of food spoilage linked to these two species
have been regularly reported in many regions including Australia (Hocking and Pitt,
1984; Richardson, 1965), North America (Denny and Brown, 1969; Yates, 1974),
Europe (Kotzekidou, 1997), Asia (Ayesha and Viswanath, 2006) and Africa (Ugwuanyi
and Obeta, 1991). Soil often serves as a reservoir for Byssochlamys ascospores, so food
materials that may come into contact with soil are more likely to be contaminated by
these fungi (Jesenská et al., 1993). B. fulva and B. nivea often spoil canned fruits and
fruit juices because of their tolerance to acidity, low oxygen conditions and the
production of pectinolytic enzymes (Beuchat, 1998; Tribst et al., 2009; Ugwuanyi et al.,
1999). They can also produce the mycotoxin patulin, which may be a significant risk to
public health (Becci et al., 1981; Rice et al., 1977b, 1980; Taniwaki et al., 2010).
Hence, it is important to understand factors that underpin the heat resistance of

40
Byssochlamys ascospores so that they can be effectively controlled during food
processing.
Several studies have reported on the heat resistance of Byssochlamys ascospores.
Research on heat resistance and physiology of Byssochlamys species prior to 1976 has
been reviewed by Beuchat and Rice (1979) and more recent studies have been discussed
by many authors (Beuchat, 1998; Pitt and Hocking, 2009; Tournas, 1994). Thermal
reduction times (D) and thermal resistant coefficients (z) of B. fulva ascospores have
been reported as 1 – 12 minutes at 90oC and 6 – 7oC, respectively, while those of B.
nivea ascospores are 0.6 – 12 minutes at 85oC and 4 – 6.8oC, respectively (Casella et al.,
1990; Michener and King, 1974). The range of D values reflects the effects of several
factors on heat resistance of B. fulva and B. nivea ascospores. While there are
differences in D values between the two species, strains within these species also show
some variations in this property (Bayne and Michener, 1979; Engel and Teuber, 1991).
Food components such as sugar, salt, some types of acids and food solids have been
reported to increase the D values of the ascospores (Beuchat, 1981; Beuchat, 1998;
Beuchat and Toledo, 1977; Splittstoesser and Splittstoesser 1977; Splittstoesser et al.,
1974b). However, the heat resistance of the ascospores decreased in the presence of
food preservatives (e.g. SO2, sorbate and benzoate) or in acidic environments with pH
values below 3.5 (Roland et al., 1984a, b; Splittstoesser et al., 1974b).
The age of the cultures from which ascospores were harvested (ascospore age) was also
noted to affect their heat resistance in such a way that the heat resistance generally
increased with ascospore age (Beuchat, 1988; Conner et al., 1987; Dantigny and
Nanguy, 2009; Engel and Teuber, 1991). For Byssochlamys, only a few studies have
reported the effect of age on ascospore heat resistance. Casella et al. (1990) showed that
B. nivea ascospores became more heat resistant when the ascospore age increased from
4 to 16 weeks. Slongo et al. (2008) reported similar increased thermo-tolerance in fruit
juices for 1 and 2 months old ascospores of B. nivea. However, these studies were
limited to only one strain of B. nivea species and a maximum age of 16 weeks. Age can
undermine the efficacy and design of heat processes because products can harbour
ascospores for significant periods of time prior to processing. Consequently, more
research is needed to better understand the thermal inactivation kinetics of ascospores as
a function of their age.
41
This Chapter reports the thermal inactivation of ascospores obtained from B. fulva and
B. nivea after culture for 4, 6, 8, 12 and 24 weeks. Two strains of each species were
examined as three different inactivation temperatures.
3.2 Materials and methods
3.2.1 Fungal cultures, growth conditions and ascospore harvest
Four fungal strains, B. fulva FRR 2299, B. fulva FRR 2785, B. nivea FRR 4421 and B.
nivea FRR 6002, from the fungal culture collection of the Division of Food and
Nutritional Sciences, CSIRO, North Ryde, Australia were used in this study. The B.
fulva strains were originally isolated from Australian fruit juice samples, B. nivea FRR
4421 was isolated from Brazilian strawberries and B. nivea FRR 6002 was from a New
Zealand dairy product. These strains were screened from others in the collection to
ensure that they were efficient producers of ascospores and had different levels of heat
resistance. During the screening process, ascospores of B. fulva FRR 2785 were more
heat resistant than those of B. fulva FRR 2299, and those of B. nivea FRR 6002 were
more resistant than those of B. nivea FRR 4421 (Appendix 3.1).
The fungi were grown on Malt Extract Agar (MEA) at 30oC for 4, 6, 8, 12 and 24
weeks. At the end of the incubation, plates were flooded with 0.05% (w/v) aqueous
Tween 80 (Merck, VIC, Australia) and the fungal biomass was scraped from the surface
using sterile bent glass rods. Ascospores were freed from asci and mycelium using a
modified version of a previously described method (Splittstoesser et al., 1974b).
Approximately 1.4 mL of harvested biomass was added into 2 mL centrifuge tubes
(Biocorp, VIC, Australia) which contained about 0.3 g of glass beads with a diameter of
maximum 106 µm (Sigma-Aldrich, NSW, Australia). The tubes were then shaken in a
FastPrep® FP120A machine (MP Biomedicals, NSW, Australia) at a speed setting of 5.5
for 180 seconds for B. fulva strains and 90 seconds for B. nivea strains. The
homogenates were filtered through sterile glass wool to remove glass beads and
mycelial fragments. The filtrates were washed three times by centrifugation at 4000g for
20 minutes at 4oC in sterile distilled water (SDW). The pellet was resuspended in SDW,
distributed into 1.5mL aliquots and stored at 4oC for further usage. The numbers of free
ascospores and remaining asci were counted after glass bead treatment by phase contrast
microscopic observation using a haemocytometer (Marienfeld, Germany).
42
3.2.2 Heat resistance of ascospores at different ages
The heat challenges were conducted at 85oC, 87.5oC and 90oC for up to 90 minutes for
B. fulva strains and at 82.5oC, 85oC and 87.5oC for up to 60 minutes for B. nivea strains.
The heating menstruum was citrate phosphate buffer (CPB) pH 4.0 which comprised
citric acid and di-sodium hydrogen orthophosphate at the final concentrations of about
0.0626M and 0.0748M , respectively (Ajax Finechem, Australia).
Ascospore concentrations were adjusted to 107 cells/mL with SDW prior to each
experiment. The suspension was pre-heated at 65oC for 10 minutes to inactivate any
remaining vegetative cells and heat sensitive conidia (Houbraken et al., 2006). One
hundred microlitres of the pre-treated suspension was then added to closed glass tubes
containing 9.9 mL CPB that had been brought up to the pre-determined temperature in a
thermally controlled water bath (Thermoline Scientific). Temperatures of CPB in the
tubes were monitored throughout the experiment via a digital thermocouple placed in an
identical tube containing the similar amount of CPB immersed in the same water bath.
The tubes were heated for 1, 2, 4, 8, 12, 16, 20, 30, 40 and 60 minutes for B. nivea
strains or all the time points up to 90 minutes for B. fulva strains. The sample for time
“0” contained 9.9 mL CPB and 100 µL of pre-treated ascospore suspension and
received no further heat treatment. At the end of the heating time, tubes were cooled
down in an ice slurry for 20 seconds, serially diluted in 0.1% (w/v) aqueous
bacteriological peptone (Amyl Media, Australia) and viable ascospore populations
determined by spread-plating on MEA in duplicate. MEA plates were incubated at 30oC
for up to 5 days and counted for colony forming units (cfu). Each heat treatment was
done in triplicate.
Decimal reduction times (D) were defined as the time to reduce the microbial
population by 90% were calculated from the portion of the (semi-log) survival curves
where surviving counts were linearly reduced (Casella et al., 1990; Hatcher et al., 1979).
Analysis of variances (ANOVA) and t-tests were performed using the statistical
package in Microsoft® Excel and MiniTab 15 (MiniTab Inc., PA, USA). The same
significance level (α = 0.05) was used for all statistical comparisons.
43
3.2.3 Heat resistance of sequential generations of ascospores surviving heat
treatments
To assess whether survivors at the end of the heat treatments were intrinsically more
heat resistant, serial subculturing and heating were carried out with the surviving
populations for four generations. For this experiment, ascospores prepared from 4 week
old B. nivea FRR 6002 and B. fulva FRR 2299 cultures were used. Ascospore
suspensions were heat treated at 85oC and 87.5oC for up to 60 and 40 minutes,
respectively, and spread-plated on MEA in duplicate. From colonies that developed on
MEA plates from surviving ascospores, two were randomly selected. These colonies
were independently subcultured and incubated on MEA at 30oC for 4 weeks to generate
new ascospore crops. The heat resistance of these ascospores was determined using the
same procedure as already described and D values determined. One representative of
the surviving colonies on MEA of the longest heating time was isolated and the process
of culture for 4 week ascospore harvest and heating was repeated. In all this process was
repeated for three generations.
3.3 Results
3.3.1 Effects of age on thermal inactivation of ascospores
Ascospores harvested from 4, 6, 8, 12 and 24 week old cultures were heated at 85, 87.5
or 90oC for B. fulva strains or 82.5, 85, 87.5oC for B. nivea strains. Figures 3.1 – 3.4
show the survival curves for B. fulva FRR 2299, B. fulva FRR 2785, B. nivea FRR 4421
and B. nivea FRR 6002, respectively. The initial viable counts of the ascospores before
heating were 102 – 104 cfu/mL. None of the heat treatments gave complete inactivation
of the ascospores even after heating for 90 minutes, and viable populations of 102 – 103
cfu/mL were detected at end of the treatments.
The survival curves of Byssochlamys ascospores comprised four phases: activation,
shouldering, linear reduction and tailing. The activation phase happened in the first
minute of heating when ascospore viable counts abruptly increased to a maximum
population, which varied with strains, ages and temperatures. For most conditions, there
was a short period of time when the population remained at this maximum level (within
0.3 log10 for at least three consecutive time points) before undergoing a rapid linear

44
inactivation. This short period of time is referred as the shoulder phase. After this
shoulder, progressive inactivation of the ascospores occurred. The rate of inactivation
was approximately linear across several times points, but then the rate decreased giving
an extended period, the tailing phase, where the population did not decrease by more
than 0.5 log10.
Log1
0 (c
fu/m
L)
Heating time (min)
Figure 3.1. Heat inactivation of B. fulva FRR 2299 ascospores from (A) 4 week, (B) 6
week, (C) 8 week, (D) 12 week and (E) 24 week cultures; inactivation temperatures are
85oC (■), 87.5oC (♦) and 90oC (▲); each point is an average of three experiments; the
approximately linear reduction part of a curve is between the highest activation point
and time point indicated by arrows of the same colour
A B
C D
E

45
Log1
0 (c
fu/m
L)
Heating time (min)
Figure 3.2. Heat inactivation of B. fulva FRR 2785 ascospores from (A) 4 week, (B) 6
week, (C) 8 week, (D) 12 week and (E) 24 week cultures; inactivation temperatures are
85oC (■), 87.5oC (♦) and 90oC (▲); each point is an average of three experiments; the
approximately linear reduction part of a curve is between the highest activation point
and time point indicated by arrows of the same colour
A B
C D
E
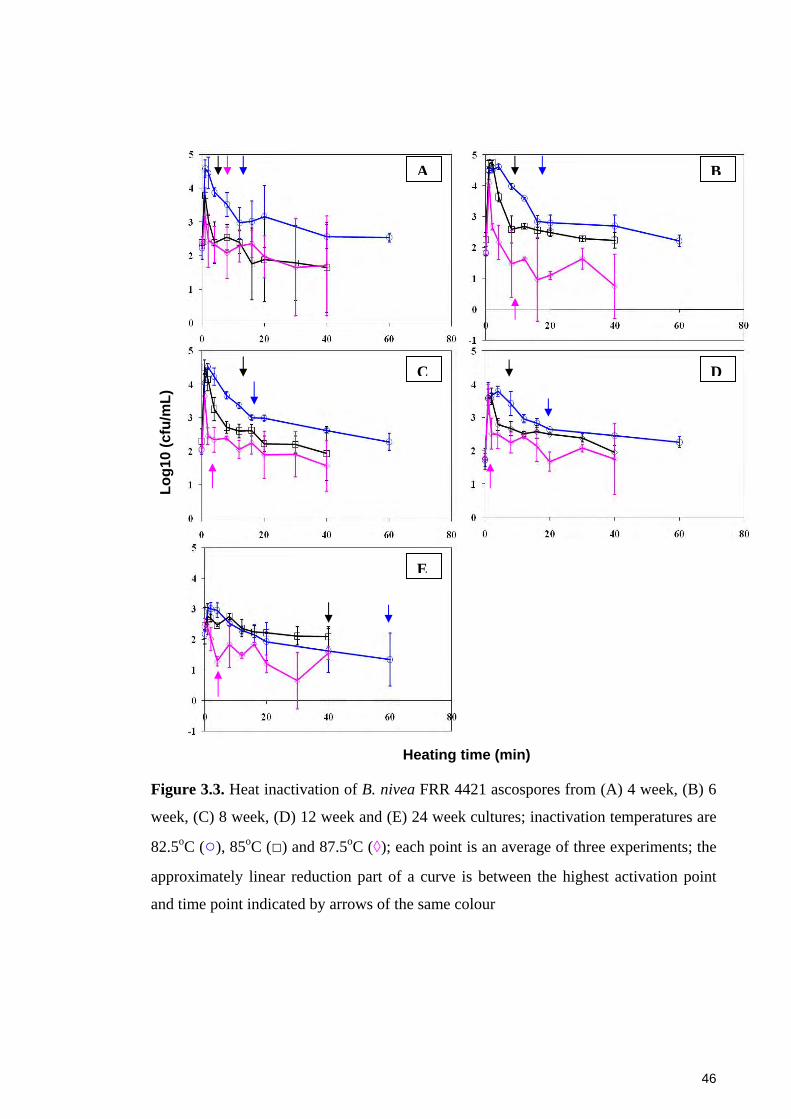
46
Log1
0 (c
fu/m
L)
Heating time (min)
Figure 3.3. Heat inactivation of B. nivea FRR 4421 ascospores from (A) 4 week, (B) 6
week, (C) 8 week, (D) 12 week and (E) 24 week cultures; inactivation temperatures are
82.5oC (○), 85oC (□) and 87.5oC (◊); each point is an average of three experiments; the
approximately linear reduction part of a curve is between the highest activation point
and time point indicated by arrows of the same colour
A B
C D
E

47
Log1
0 (c
fu/m
L)
Heating time (minutes)
Figure 3.4. Heat inactivation of B. nivea FRR 6002 ascospores from (A) 4 week, (B) 6
week, (C) 8 week, (D) 12 week and (E) 24 week cultures; inactivation temperatures are
82.5oC (○), 85oC (□) and 87.5oC (◊); each point is an average of three experiments; the
approximately linear reduction part of a curve is between the highest activation point
and time point indicated by arrows of the same colour
A B
C D
E

48
During the activation stage, the viable counts of B. fulva increased from initial levels of
2 – 3 log10 (cfu/mL) to about 5 – 5.5 log10 (cfu/mL) maximum, representing an
approximate 1000 fold increase. For B. nivea, their counts increased slightly less than
the B. fulva, going from 2 – 3 log10 (cfu/mL) up to about 4 – 5 log10 (cfu/mL)
maximum. The maximum viable counts due to activation at 1 minute were much closer
to the initial concentration of ascospores, which was about 5 – 6 log10 (cells/mL),
added at the beginning of the heat treatment, but 100% activation was not achieved.
However, the degree of activation varied between strains, ascospore age and, to a lesser
extent, heating conditions (Figure 3.5). To elaborate the data presented in Figure 3.5,
the detailed comparisons of the thermal activation across heating conditions and
ascospore age are presented in Appendices 3.2 and 3.3.
Age of ascospores affected their activation in the first minute of the heat treatment and
was strain dependent. For most strains, the highest level of activation (2.5 – 3 log10)
predominantly happened with 6 – 12 week ascospores. However, the 24 week samples
followed by the 4 week samples exhibited significantly lower activation (1 – 1.5 log10).
Exceptionally, ascospores of B. fulva FRR 2299 demonstrated a different dynamic of
activation, which significantly increased from about 1.8 log10 at 4 weeks to about 2.7
log10 at 6 weeks but did not change between 6 and 24 weeks.
For all tested strains, the level of activation was not significantly different when
ascospores of the same age were treated at different inactivation temperatures.
Exceptions occurred with the 4 and 24 week B. nivea FRR 4421, and the 24 week B.
nivea FRR 6002. In those cases, higher temperature (e.g. 87.5oC) significantly reduced
the levels of activation compared with less severe treatments at 82.5oC and 85oC.
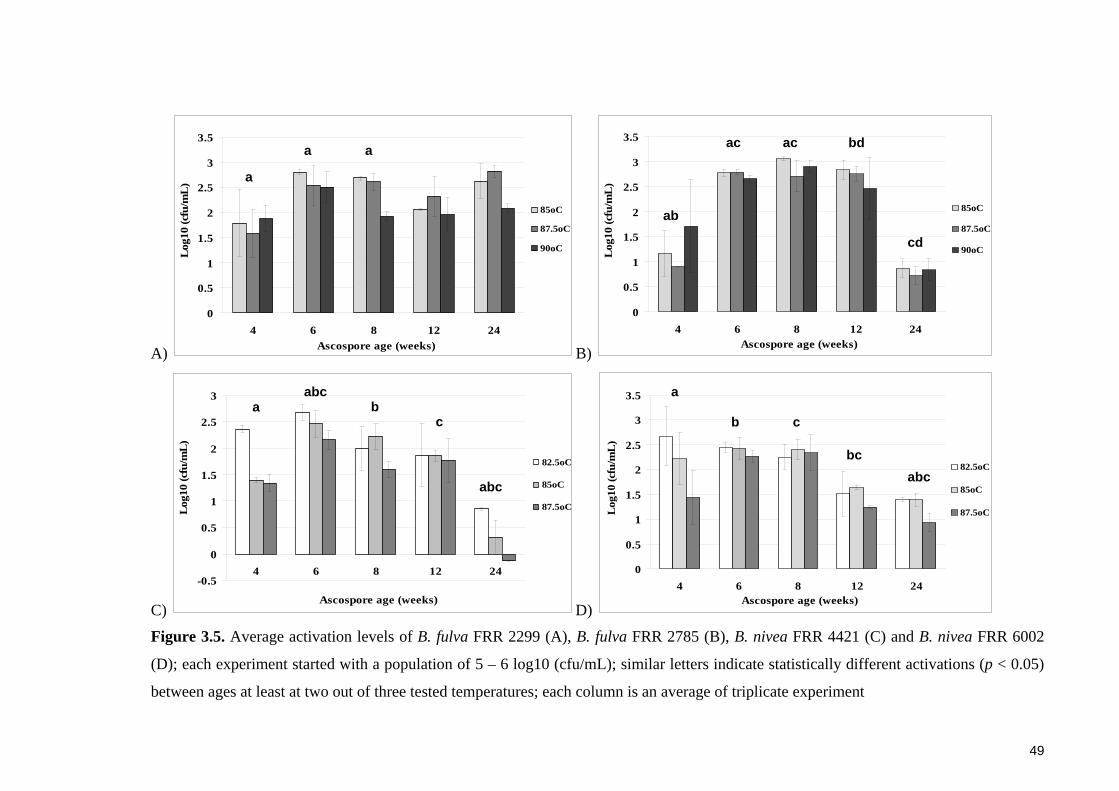
49
A)
0
0.5
1
1.5
2
2.5
3
3.5
4 6 8 12 24Ascospore age (weeks)
Log
10 (c
fu/m
L)
85oC
87.5oC
90oC
B)
0
0.5
1
1.5
2
2.5
3
3.5
4 6 8 12 24Ascospore age (weeks)
Log
10 (c
fu/m
L)
85oC
87.5oC
90oC
C)
-0.5
0
0.5
1
1.5
2
2.5
3
4 6 8 12 24
Ascospore age (weeks)
Log
10 (c
fu/m
L)
82.5oC
85oC
87.5oC
D)
0
0.5
1
1.5
2
2.5
3
3.5
4 6 8 12 24Ascospore age (weeks)
Log
10 (c
fu/m
L)
82.5oC
85oC
87.5oC
Figure 3.5. Average activation levels of B. fulva FRR 2299 (A), B. fulva FRR 2785 (B), B. nivea FRR 4421 (C) and B. nivea FRR 6002
(D); each experiment started with a population of 5 – 6 log10 (cfu/mL); similar letters indicate statistically different activations (p < 0.05)
between ages at least at two out of three tested temperatures; each column is an average of triplicate experiment
a
a a
ab
cd
ac ac bd
a
abc
abc b
c
abc bc
a
b c
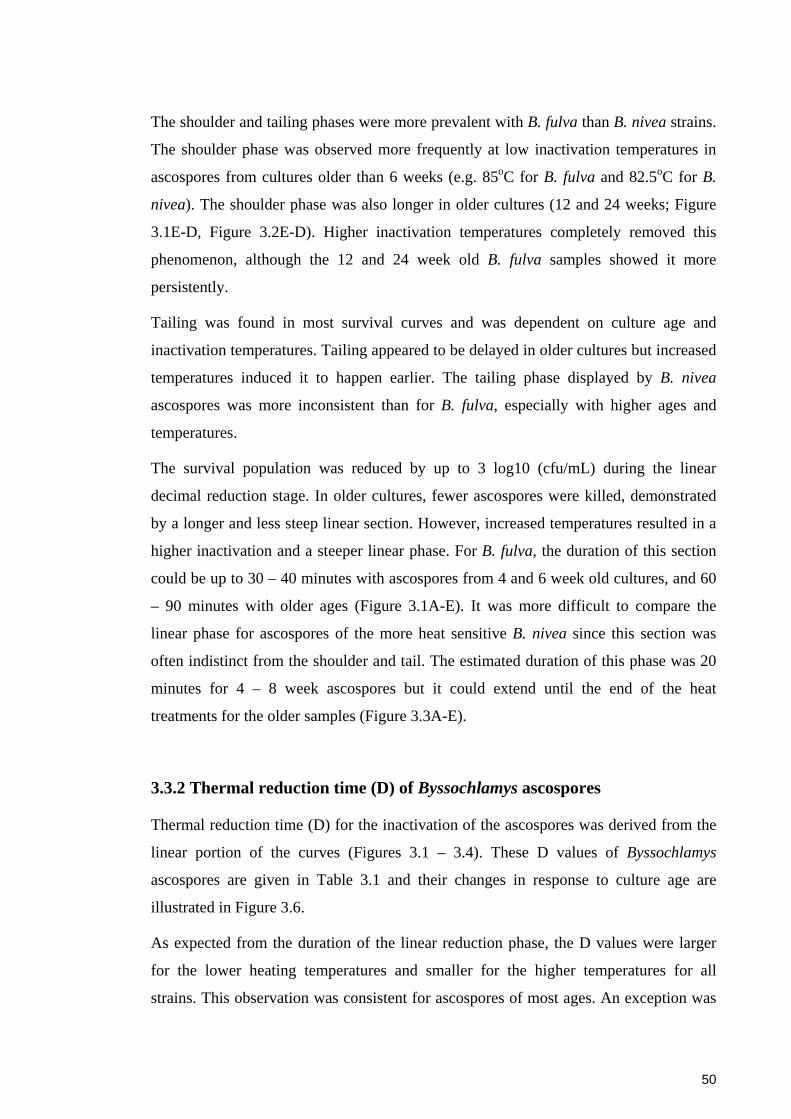
50
The shoulder and tailing phases were more prevalent with B. fulva than B. nivea strains.
The shoulder phase was observed more frequently at low inactivation temperatures in
ascospores from cultures older than 6 weeks (e.g. 85oC for B. fulva and 82.5oC for B.
nivea). The shoulder phase was also longer in older cultures (12 and 24 weeks; Figure
3.1E-D, Figure 3.2E-D). Higher inactivation temperatures completely removed this
phenomenon, although the 12 and 24 week old B. fulva samples showed it more
persistently.
Tailing was found in most survival curves and was dependent on culture age and
inactivation temperatures. Tailing appeared to be delayed in older cultures but increased
temperatures induced it to happen earlier. The tailing phase displayed by B. nivea
ascospores was more inconsistent than for B. fulva, especially with higher ages and
temperatures.
The survival population was reduced by up to 3 log10 (cfu/mL) during the linear
decimal reduction stage. In older cultures, fewer ascospores were killed, demonstrated
by a longer and less steep linear section. However, increased temperatures resulted in a
higher inactivation and a steeper linear phase. For B. fulva, the duration of this section
could be up to 30 – 40 minutes with ascospores from 4 and 6 week old cultures, and 60
– 90 minutes with older ages (Figure 3.1A-E). It was more difficult to compare the
linear phase for ascospores of the more heat sensitive B. nivea since this section was
often indistinct from the shoulder and tail. The estimated duration of this phase was 20
minutes for 4 – 8 week ascospores but it could extend until the end of the heat
treatments for the older samples (Figure 3.3A-E).
3.3.2 Thermal reduction time (D) of Byssochlamys ascospores
Thermal reduction time (D) for the inactivation of the ascospores was derived from the
linear portion of the curves (Figures 3.1 – 3.4). These D values of Byssochlamys
ascospores are given in Table 3.1 and their changes in response to culture age are
illustrated in Figure 3.6.
As expected from the duration of the linear reduction phase, the D values were larger
for the lower heating temperatures and smaller for the higher temperatures for all
strains. This observation was consistent for ascospores of most ages. An exception was
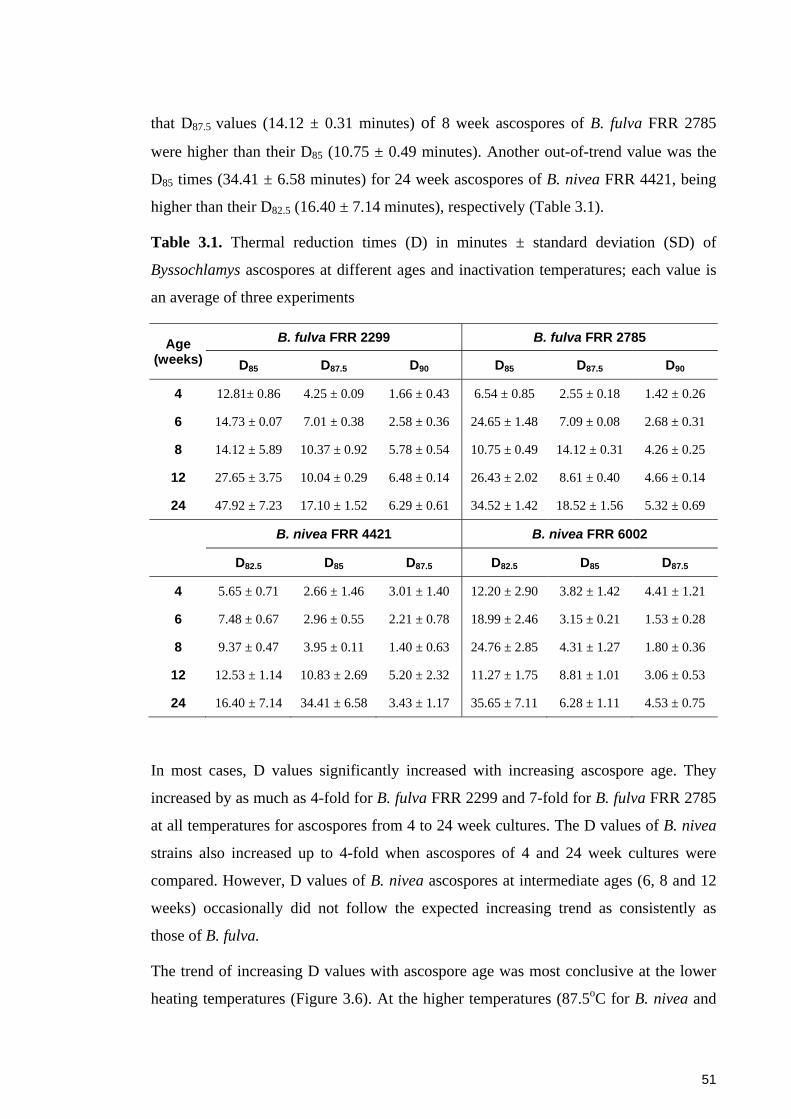
51
that D87.5 values (14.12 ± 0.31 minutes) of 8 week ascospores of B. fulva FRR 2785
were higher than their D85 (10.75 ± 0.49 minutes). Another out-of-trend value was the
D85 times (34.41 ± 6.58 minutes) for 24 week ascospores of B. nivea FRR 4421, being
higher than their D82.5 (16.40 ± 7.14 minutes), respectively (Table 3.1).
Table 3.1. Thermal reduction times (D) in minutes ± standard deviation (SD) of
Byssochlamys ascospores at different ages and inactivation temperatures; each value is
an average of three experiments
Age (weeks)
B. fulva FRR 2299 B. fulva FRR 2785
D85 D87.5 D90 D85 D87.5 D90
4 12.81± 0.86 4.25 ± 0.09 1.66 ± 0.43 6.54 ± 0.85 2.55 ± 0.18 1.42 ± 0.26
6 14.73 ± 0.07 7.01 ± 0.38 2.58 ± 0.36 24.65 ± 1.48 7.09 ± 0.08 2.68 ± 0.31
8 14.12 ± 5.89 10.37 ± 0.92 5.78 ± 0.54 10.75 ± 0.49 14.12 ± 0.31 4.26 ± 0.25
12 27.65 ± 3.75 10.04 ± 0.29 6.48 ± 0.14 26.43 ± 2.02 8.61 ± 0.40 4.66 ± 0.14
24 47.92 ± 7.23 17.10 ± 1.52 6.29 ± 0.61 34.52 ± 1.42 18.52 ± 1.56 5.32 ± 0.69
B. nivea FRR 4421 B. nivea FRR 6002
D82.5 D85 D87.5 D82.5 D85 D87.5
4 5.65 ± 0.71 2.66 ± 1.46 3.01 ± 1.40 12.20 ± 2.90 3.82 ± 1.42 4.41 ± 1.21
6 7.48 ± 0.67 2.96 ± 0.55 2.21 ± 0.78 18.99 ± 2.46 3.15 ± 0.21 1.53 ± 0.28
8 9.37 ± 0.47 3.95 ± 0.11 1.40 ± 0.63 24.76 ± 2.85 4.31 ± 1.27 1.80 ± 0.36
12 12.53 ± 1.14 10.83 ± 2.69 5.20 ± 2.32 11.27 ± 1.75 8.81 ± 1.01 3.06 ± 0.53
24 16.40 ± 7.14 34.41 ± 6.58 3.43 ± 1.17 35.65 ± 7.11 6.28 ± 1.11 4.53 ± 0.75
In most cases, D values significantly increased with increasing ascospore age. They
increased by as much as 4-fold for B. fulva FRR 2299 and 7-fold for B. fulva FRR 2785
at all temperatures for ascospores from 4 to 24 week cultures. The D values of B. nivea
strains also increased up to 4-fold when ascospores of 4 and 24 week cultures were
compared. However, D values of B. nivea ascospores at intermediate ages (6, 8 and 12
weeks) occasionally did not follow the expected increasing trend as consistently as
those of B. fulva.
The trend of increasing D values with ascospore age was most conclusive at the lower
heating temperatures (Figure 3.6). At the higher temperatures (87.5oC for B. nivea and
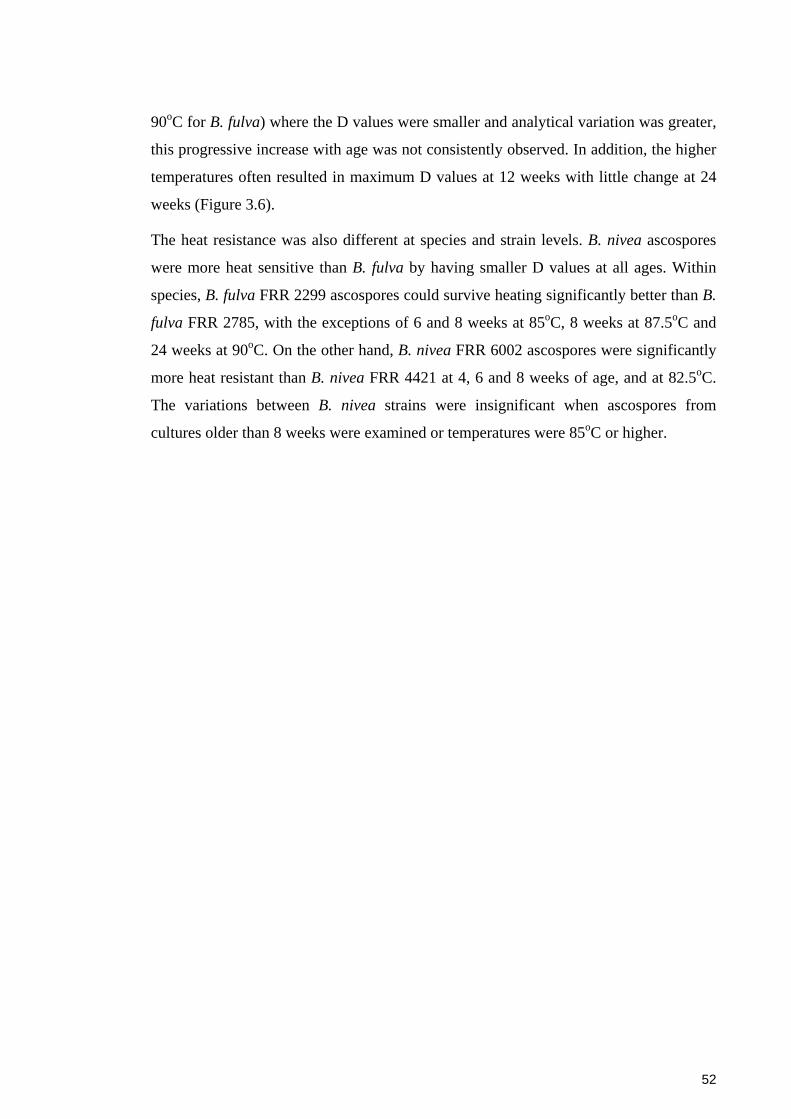
52
90oC for B. fulva) where the D values were smaller and analytical variation was greater,
this progressive increase with age was not consistently observed. In addition, the higher
temperatures often resulted in maximum D values at 12 weeks with little change at 24
weeks (Figure 3.6).
The heat resistance was also different at species and strain levels. B. nivea ascospores
were more heat sensitive than B. fulva by having smaller D values at all ages. Within
species, B. fulva FRR 2299 ascospores could survive heating significantly better than B.
fulva FRR 2785, with the exceptions of 6 and 8 weeks at 85oC, 8 weeks at 87.5oC and
24 weeks at 90oC. On the other hand, B. nivea FRR 6002 ascospores were significantly
more heat resistant than B. nivea FRR 4421 at 4, 6 and 8 weeks of age, and at 82.5oC.
The variations between B. nivea strains were insignificant when ascospores from
cultures older than 8 weeks were examined or temperatures were 85oC or higher.
53
A) B)
C) D)
Figure 3.6. D values of ascospores of B. fulva FRR 2299 (A) and FRR 2785 (B), B. nivea FRR 4421 (C) and FRR 6002 (D) at different culture
ages and inactivation temperatures; Temperature: 82.5oC (●), 85oC (♦), 87.5oC (■) and 90oC (▲)
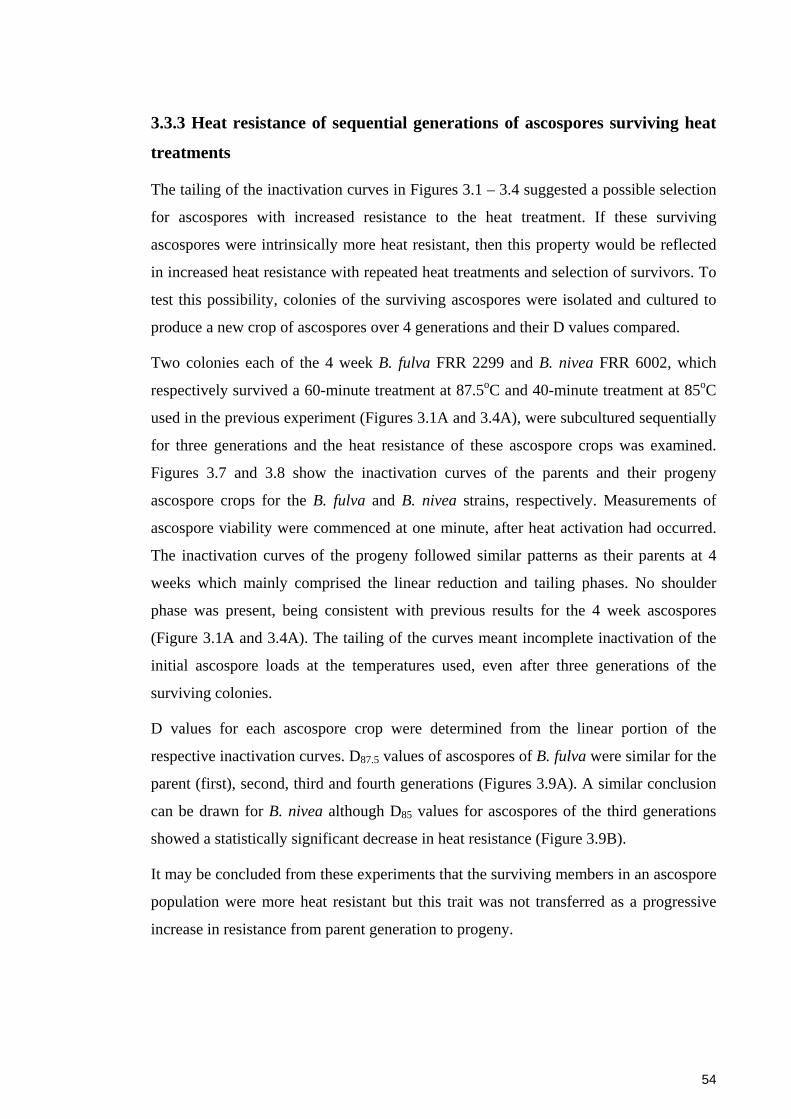
54
3.3.3 Heat resistance of sequential generations of ascospores surviving heat
treatments
The tailing of the inactivation curves in Figures 3.1 – 3.4 suggested a possible selection
for ascospores with increased resistance to the heat treatment. If these surviving
ascospores were intrinsically more heat resistant, then this property would be reflected
in increased heat resistance with repeated heat treatments and selection of survivors. To
test this possibility, colonies of the surviving ascospores were isolated and cultured to
produce a new crop of ascospores over 4 generations and their D values compared.
Two colonies each of the 4 week B. fulva FRR 2299 and B. nivea FRR 6002, which
respectively survived a 60-minute treatment at 87.5oC and 40-minute treatment at 85oC
used in the previous experiment (Figures 3.1A and 3.4A), were subcultured sequentially
for three generations and the heat resistance of these ascospore crops was examined.
Figures 3.7 and 3.8 show the inactivation curves of the parents and their progeny
ascospore crops for the B. fulva and B. nivea strains, respectively. Measurements of
ascospore viability were commenced at one minute, after heat activation had occurred.
The inactivation curves of the progeny followed similar patterns as their parents at 4
weeks which mainly comprised the linear reduction and tailing phases. No shoulder
phase was present, being consistent with previous results for the 4 week ascospores
(Figure 3.1A and 3.4A). The tailing of the curves meant incomplete inactivation of the
initial ascospore loads at the temperatures used, even after three generations of the
surviving colonies.
D values for each ascospore crop were determined from the linear portion of the
respective inactivation curves. D87.5 values of ascospores of B. fulva were similar for the
parent (first), second, third and fourth generations (Figures 3.9A). A similar conclusion
can be drawn for B. nivea although D85 values for ascospores of the third generations
showed a statistically significant decrease in heat resistance (Figure 3.9B).
It may be concluded from these experiments that the surviving members in an ascospore
population were more heat resistant but this trait was not transferred as a progressive
increase in resistance from parent generation to progeny.
55
A)
B)
Figure 3.7. B. fulva FRR 2299: representative survivor curves of subsequent
generations of 4 week ascospore cultures derived from the ‘tailing’ phase of the parent
and three sequential generations; A – Colony 1, B – Colony 2; all inactivation
treatments were done at 87.5oC
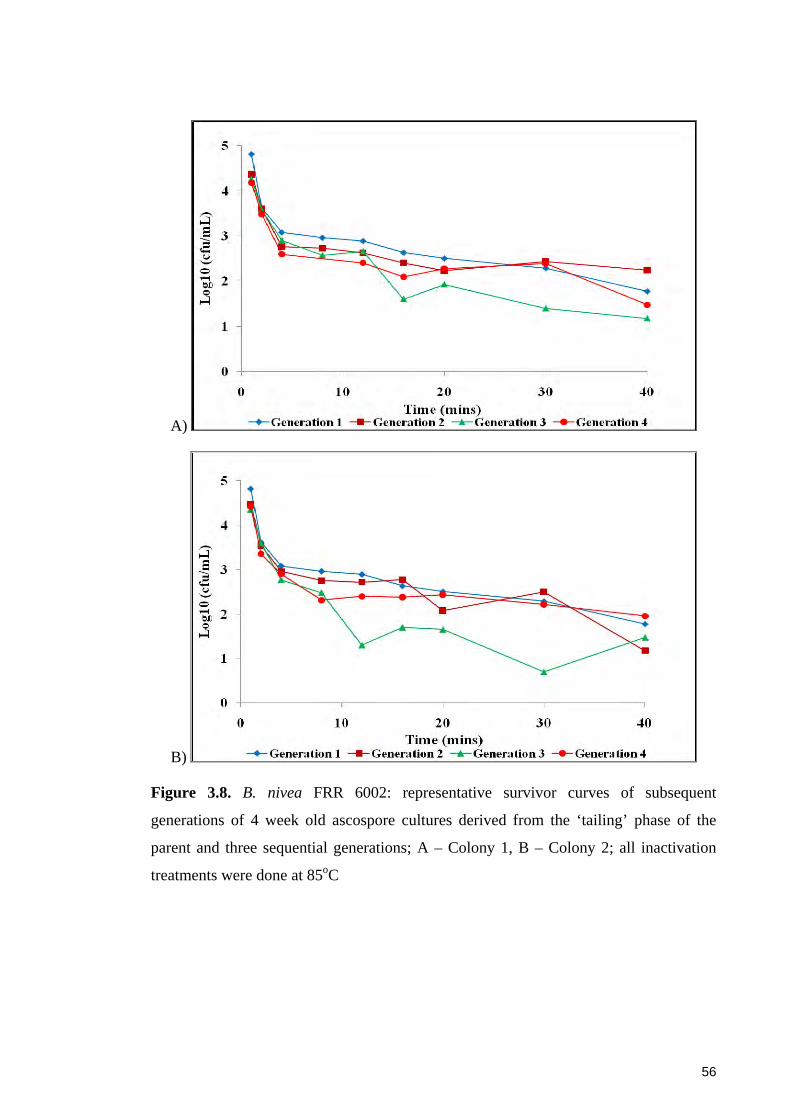
56
A)
B)
Figure 3.8. B. nivea FRR 6002: representative survivor curves of subsequent
generations of 4 week old ascospore cultures derived from the ‘tailing’ phase of the
parent and three sequential generations; A – Colony 1, B – Colony 2; all inactivation
treatments were done at 85oC
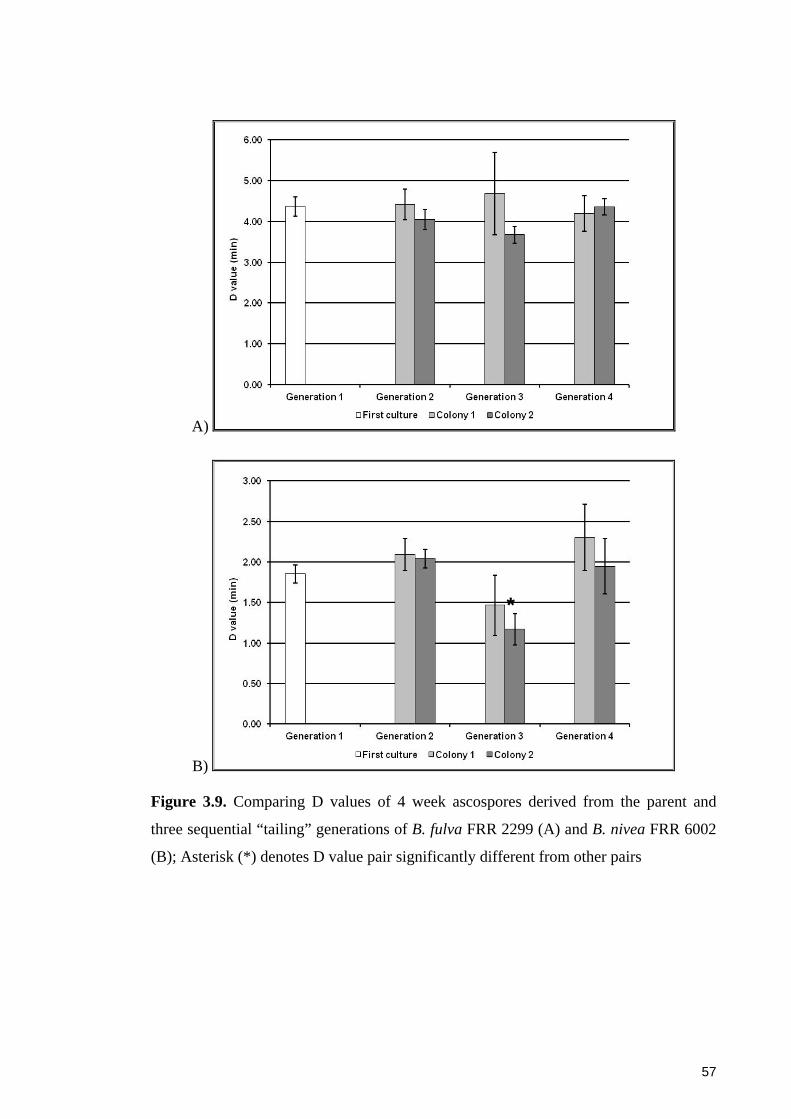
57
A)
B)
Figure 3.9. Comparing D values of 4 week ascospores derived from the parent and
three sequential “tailing” generations of B. fulva FRR 2299 (A) and B. nivea FRR 6002
(B); Asterisk (*) denotes D value pair significantly different from other pairs
*

58
3.4 Discussion
3.4.1 Inactivation kinetics of Byssochlamys ascospores
The inactivation curves of ascospores of B. fulva and B. nivea did not follow the
traditional logarithmic pattern for inactivation of microorganisms (Bigelow, 1921).
Their inactivation kinetics were characterised by multi-phasic survival curves, which
comprised activation, shoulder, exponential reduction and tailing phases. This non-
linear survival pattern of Byssochlamys ascospores has been reported by other workers
(Bayne and Michener, 1979; Casella et al., 1990; Sant’Ana et al., 2009). The non-linear
inactivation curves may be caused by environmental factors other than temperature,
such as pH, water activity or recovery media, and variability of heat resistant properties
(Mafart et al., 2010; Peleg and Cole, 1998).
3.4.1.1 Heat activation phase
The initial activation phase of the survival curves is expected because heating has been
known to break spore dormancy and induce germination (Finley and Fields, 1962;
Kikoku, 2003; Yates, 1973). Treatments at 70 – 75oC could activate less than 20% of
the ascospore population (Hebert and Larson, 1972; Yates et al., 1968) whereas
temperatures above 80oC increased the activation rates at the same time, inactivation of
a proportion of the ascospore population may be initiated (Beuchat, 1986; Splittstoesser
et al., 1971, 1972). The mechanism of heat activation is possibly related to changed
permeability of ascospore cell wall, allowing influx of water and activation/germination
factors, or inducing germinant receptors on the ascospore surface (Cronin and
Wilkinson, 2007; Foster and Johnstone, 1990; Yates et al., 1968). However, such
modifications could be lethal to the ascospores due to loss of essential cellular materials
(Coleman et al., 2007).
The dual activation/inactivation effects could be responsible for the incomplete
activation of all the ascospores initially added in the heat treatments for all strains
tested. This dynamic could also explain the lower inactivation levels occasionally at
high temperatures which caused more inactivation (Turnbull et al., 2007). For B. fulva,
the plate count technique could underestimate the number of activated ascospores

59
because the method treated single ascospores and intact asci similarly (Splittstoesser et
al., 1969).
The heat activation of ascospores was dependent on ascospore age, with rates increasing
for ascospores at 4 – 12 weeks (Figure 3.5). Older and more heat resistant ascospores
were less susceptible to the initial inactivation and therefore, the activation was more
prominent. This result agreed with findings of the study of Hebert and Larson (1972)
where asci older than 2 weeks had higher activation percentages. However, the 24
weeks ascospores could become more constitutionally dormant, reducing the heat
activation efficiency compared with the younger ascospores. A similar decrease in
activation was reported for ascospores of N. fischeri at 114 days which were heated in
apple juices (Conner and Beuchat, 1987). Contrarily, Slongo and Aragão (2006) found
that activation of N. fischeri ascospores in fruit nectars was not significantly affected by
ages between 1 and 3 months. However, the age of the ascospore crops used in the
study of Slongo and Aragão (2006) were younger than those in Conner and Beuchat
(1987) and the current study.
3.4.1.2 Shoulder and tailing phases
The shoulder and tailing phases are characteristics of the heat resistance of
Byssochlamys ascospores. These phenomena have been reported for ascospores of B.
fulva (Bayne and Michener, 1979; King et al., 1979) and B. nivea (Casella et al., 1990)
prior to this study. They are also associated with dormant structures of other heat
resistant moulds, such as T. flavus ascospores (Beuchat, 1988; King and Halbrook,
1987), N. fischeri ascospores (Beuchat, 1986; Salomão et al., 2007) and Aspergillus
niger conidia (Fujikawa and Itoh, 1996). Similar behaviour can be seen with endospores
of bacteria, such as Bacillus spp. (Furukawa et al., 2005) and Alicyclobacillus
acidoterrestris (Ceviz et al., 2009).
In this study, the shoulder phase could be ascribed to the dynamics of simultaneous heat
activation and inactivation of the ascospores. This relationship is in agreement with the
results of Casella et al. (1990). The fact that this phase always followed the initial
activation supported this conclusion because it took time for the ascospores to activate
and decrease the heat resistance. Moreover, increased inactivation temperatures, i.e.
inactivation energy, could shorten or remove the shoulder.
60
A common cause of the shoulder and tailing phases is the existence of ascospores in
groups. For B. fulva, the ascospore suspensions prepared for heat treatments still
contained intact asci at concentration of about 105 cells/mL (Appendix 3.4). Physically
bonded ascospores in the forms of asci and clumps could prevent uniform heat
penetration into individual cells (Cerf, 1977; Furukawa et al., 2005). Activation of these
structures would thus take more time and energy than required for single ascospores
(Splittstoesser et al., 1969). Additionally, all members of an asci or ascospore clumps
have to be killed in order to completely prevent the groups from forming visible
colonies on agar plates (Aiba and Toda, 1966). Thus, the mortality pattern of asci could
be skewed towards the beginning time of the heat treatments, which coincided with the
formation of the shoulder (Peleg and Cole, 1998). Similar delay during thermal
inactivation due to the increased mass has been observed with endospores of Bacillus
species and arthroconidia of Chrysosporium inops (Furukawa et al., 2005; Kinderlerer,
1996).
However, the ‘group’ theory could not account for the tailing phase of B. nivea samples
since their suspensions were almost free from groups of ascospores (Appendix 3.4).
Moreover, as shown in this study (section 3.3.3), the tailing could not be related to the
presence of a genetically heat resistant population because there was no inheritance of
this property across sequential generations of surviving colonies.
A possible explanation of the tailing phase was the presence of a small group of
ascospores that were intrinsically more heat resistant than the rest of the population.
This population could be a result of a normal distribution of the heat resistance
properties among ascospores or a heat adaptation (Casella et al., 1990; Han et al., 1976;
Peleg and Cole, 1998). For the distribution theory, the heat resistant group could have
remained dormant and insusceptible to heat activation and inactivation throughout the
heat treatments, a phenomenon described as super-dormancy in bacterial endospores
(Rodriguez-Palacios and LeJeune, 2011). Meanwhile, factors such as dehydration of the
ascospore core and heat shock proteins could have contributed to the heat adaptation
process (Casella et al., 1990; Mah et al., 2008).

61
3.4.2 Heat resistance and age of Byssochlamys ascospores
The heat resistance of Byssochlamys ascospores harvested from cultures at different
ages and heated at different temperatures was compared. The ascospore crops of these
strains were prepared from cultures that were grown for 4, 6, 8, 12 and 24 weeks.
Thermal treatments of the ascospores were carried out at 82.5 – 90oC for up 90 minutes
in a relatively simple medium (CPB pH 4.0). Their heat resistances were compared
according to patterns of their survival curves and D values. Since the heating medium
did not contain compounds, such as sugars, salts, preservatives, other organic acids,
which can impact on the viability of ascospores (Beuchat, 1981; Rajashekhara et al.,
1996; Splittstoesser et al., 1986), the observed changes in the heat resistance are solely
related to the culture age and inactivation temperatures.
The most significant result was that ascospores of B. fulva and B. nivea became more
heat resistant with increasing culture age (4 – 24 weeks), while more severe thermal
treatments resulted in higher inactivation of the ascospores. The increase of the heat
resistance based on D values was 4 – 7-fold for B. fulva strains and 2 – 4-fold for B.
nivea strains. Some D values at high heating temperatures, 90oC for B. fulva and above
85oC for B. nivea, were slightly out of trend due to increased heat sensitivity of the
ascospores in such severe conditions (King et al., 1979). In a few cases, the standard
deviations of D values were large, for instance 8 week old B. fulva FRR 2299 (D85 =
14.12 ± 5.89 min), which could be attributed to variations within the ascospore crops
and low recovery rate on MEA. However, those outliers did not affect the general trend
of increased heat resistance with age. Although the killing effect of various inactivation
temperatures on Byssochlamys ascospores has been abundantly reported (King et al.,
1969; Kotzekidou, 1997; Sant’Ana et al., 2009), the age-induced resistance has been
studied less intensively, mostly with B. nivea ascospores (Casella et al., 1990; Slongo et
al., 2008). The increased heat resistance observed here agrees with results of the
previous studies.
Casella et al. (1990) showed that D80 values of B. nivea ascospores increased from 15 to
76 minutes between 4 and 16 weeks, representing up to a 5-fold increase in heat
resistance. Meanwhile, the D85 values increased 2.5-fold, from 1.7 to 4.1 minutes. A
similar result between this study and Casella et al. (1990) was that the increase of D
values with age was more prominent at temperatures 85oC or below. At 87oC or above,
62
the change was inconsistent since the D values were mostly less than 1 minute. Thus,
both studies indicate the greater dependence of D values on inactivation temperatures
than on ascospore age.
However, the D85 – 87 values reported by Casella et al. (1990) were less than those found
in this study. The tailing of the survival curves was detected at 88oC or above
irrespective of ascospore age. This temperature was higher than 82.5oC where tailing
was observed in this study. These discrepancies were probably due to different strains
and heating protocols used in the two studies.
Casella et al. (1990) also reported higher viable counts at time 0 than our respective
counts, 5 – 6 log10 and 2 – 3 log10, respectively, which sometimes rendered the
shoulder and exponential reduction phases indistinguishable. The high initial counts
could be attributed to two ingredients, namely 0.1% peptone and 0.85% sodium chloride
(NaCl), of the heating medium. The 0.1% peptone has been found to favour the survival
of yeasts in suspension so it may have worked synergistically with heat to activate the
ascospores (Mian et al., 1997). On the other hand, NaCl was a heat resistant factor
which helped to minimise the inactivating effect during the first stage of the heat
treatments (Beuchat, 1981). Moreover, Casella et al. (1990) did not statistically compare
D values at different ages. That comparison was important at high temperatures where
D values decreased and became apparently similar between ages.
Slongo et al. (2008) examined the heat resistance of 1 and 2 month old ascospores of B.
nivea. The authors observed non-logarithmic survival curves with shoulders. Instead of
calculating D values, they linearised the survival curves by the method of Alderton and
Snell (1970) and determined 1/k values (k is a death rate constant), which were
analogous to D values. With this method, Slongo et al. (2008) showed that 1/k values of
B. nivea ascospores increased from 90.9 to 125 minutes, representing a 1.4-fold increase
in heat resistance. It is impractical to compare numerical results of Slongo et al. (2008)
and this study due to different approaches of determining heat resistance.
The aging effect on heat resistance has also been observed with other heat resistant
moulds. N. fischeri ascospores at 16 weeks old survived thermal treatment better than
those at 3 weeks (Conner and Beuchat, 1987; Slongo et al., 2008). Heat resistance of T.
flavus ascospores quickly increased with age up to 40 days but showed little change
with further aging up to 58 days (Beuchat, 1988; Dijksterhuis and Teunissen, 2004).
63
Because heat resistant fungi are also pressure resistant (Hocking et al., 2006), the
observed results mirror the findings which show age enhances pressure resistance of
various heat resistant moulds (Chapman et al., 2007a).
3.4.3 Proposed mechanisms of age-induced heat resistance in ascospores
Because age is an intrinsic property of the ascospores, increased heat resistance with age
suggests that critical changes occur to the physiology, ultrastructure and chemical
composition of Byssochlamys ascospores. Subsequent chapters of this thesis are devoted
to examining the relationship between age and the heat resistance in a greater depth.
Older ascospores may have time to undergo ultrastructural changes in order to obtain an
optimally strong conformation, without interfering with their sensitivity to germinating
signals (Chapman et al., 2007a). The ultrastructural changes could involve dehydration
of the central region of the ascospores and localisation of important proteins inside the
cells (Conner et al., 1987). That compact configuration can facilitate dehydration of the
ascospores, offering protection and repair of key cellular materials via a glassy state or
heat shock proteins (Dijksterhuis, 2007; Tereshina et al., 2005).
Structural modifications are known to play an important part in the thermo-tolerance of
bacterial spores (Orsburn et al., 2008). Dehydration of the spore protoplast helps to
stabilise molecules and genetic materials necessary for viability (Keynan, 1978; Novak
et al., 2003). Spores achieve a low moisture state by contracting the cortex and
maintaining pressure on the protoplast (Keynan, 1978; Sussman and Douthit, 1973).
Importantly, storage time is a limiting factor for bacterial endospores to modulate their
moisture content so that they achieve more dormant and resistant properties (Rodriguez-
Palacios and LeJeune, 2011).
3.4.4 Calculating D values from non-logarithmic survival curves
In this study, the D values of Byssochlamys ascospores were determined from the
exponential reduction portion of the survival curves. This method did not take into
account shoulder and tailing phases and potentially underestimated D values of the
ascospores. Moreover, determination of the reduction phase was relatively subjective,
particularly with B. nivea, which further reduced the certainty of the calculated D
64
values. Some anomalies were noted in the result section where D values did not always
increase with ascospore age (Figure 3.6). Using the same method to determine heat
resistance, Casella et al. (1990) showed similar inconsistencies in their age-related D
values. Therefore, the results from this experiment reinforce a need for a different
model to study thermal inactivation of Byssochlamys ascospores.
Some researchers have attempted to linearise the non-logarithmic curves and calculated
D-like and z-like values (Bayne and Michener, 1979; King et al., 1979; Slongo et al.,
2008). However, the model mostly dealt with survival curves with a shoulder phase and
would not be applicable to curves with strong tailing effect such as those in this
experiment. The Weibull frequency distribution model is another resource which is
firstly used for bacterial spores to solve the non-linear issue of the survival curves
(Mafart et al., 2002). This model has been recently applied to describe inactivation
kinetics of B. fulva ascospores in clarified apple juice by continuous pasteurisation
(Sant’Ana et al., 2009). Modifying these models so that they can be applied to multi-
phase survival curves of this experiment is out of the scope of the current project but it
deserves more research effort in the future.
3.5 Concluding remarks
This Chapter studied the thermal inactivation of B. fulva and B. nivea ascospores aged
4, 6, 8, 12 and 24 weeks. Two strains of each species were examined. The thermal
inactivation kinetics of the four tested strains strongly deviated from the conventional
linear logarithmic model as they comprised activation, shoulder, exponential reduction
and tailing phases. Thus, the D values were derived from the linear portion of the
inactivation curves
The heat resistance of the ascospores increased with ascospore age but decreased with
inactivation temperatures. Particularly, older ascospores had higher D values and their
survival curves exhibited longer shoulder and less steep reduction. The effects of age
were more prominent for B. fulva strains at inactivation temperatures below 87.5oC, and
for B. nivea strains at temperatures below 85oC. The D values increased up to 12 weeks
and changed little with further aging to 24 weeks.

65
The shoulder and tailing phases are characteristic for heat resistant structures like fungal
ascospores. The shoulder was attributed to the heat activation and aggregation of the
ascospores. The tailing resulted from the aggregation of ascospores and the presence of
an intrinsically more heat resistant population of ascospores. The complex inactivation
kinetics of Byssochlamys ascospores suggest more effort needs to be invested into
developing new models to better assess the heat resistance of these fungi.
Heat resistance (D values) of ascospores derived from ‘tailing’ populations were
generally similar after four successive generations. That means an ascospore population
was intrinsically more heat resistant than the rest of the population but the property was
not genetically transferred to progeny of the surviving colonies.
The age-induced heat resistance of Byssochlamys ascospores strongly suggests
physiological, chemical or structural developments in the cells during the aging process.
Some of these changes possibly involve developing ascospore layers and dehydration of
the central region inside the cells. Later chapters have built on this knowledge to link
heat resistant properties with other intrinsic factors of the ascospores.

66
Chapter 4 – Electron microscopy investigation of ultrastructure of Byssochlamys ascospores at two different ages and after different heating treatments
4.1 Introduction
In Chapter 3, the response of Byssochlamys ascospores to various heat processes was
reported. For some treatments, dormant ascospores were activated to a viable, culturable
state before inactivation to a non-culturable state was observed. In addition, ascospores
harvested from older cultures were more resistant to heat inactivation than those
harvested from younger cultures. Information on the ultrastructure of the ascospores
may assist in understanding the physiology and molecular bases of these changes.
Several studies have investigated the ultrastructure of ascospores of heat resistant
moulds using electron microscopy (Conner et al., 1987; Dijksterhuis et al., 2007).
Conner et al. (1987) used both scanning electron microscopy (SEM) and transmission
scanning microscopy (TEM) to examine differences in the ultrastructure of ascospores
of Neosartorya fischeri var. glaber from 11 and 25 day cultures, of which the older
ascospores were more heat resistant. The authors reported some differences in the
internal structures between the two types of ascospores. However, their findings were
limited by the relatively young age of the cultures examined. Using low temperature
SEM, Dijksterhuis et al. (2007) revealed the ultrastructure and highly viscous state of
ascospores of Talaromyces macrosporus. However, they did not examine development
of the structure during aging of the ascospores.
Only a few studies have used electron microscopy to examine the ultrastructure of
Byssochlamys ascospores. In particular, Partsch et al. (1969) used TEM to identify three
distinctive compartments in the ultrastructure of B. fulva ascospores, which included a
cell-wall, an extremely thick intermediate space and a highly dense cytoplasm in the
centre. The cell-wall of the ascospores was thicker than that of the more heat sensitive
conidia whereas the intermediate space and concentrated cytoplasm were quite unique
to the ascospores. Thus, the cell-wall and the intermediate space together possibly
protect the cytoplasm from thermal destruction. Using SEM, Hatcher et al., (1979)
showed increased thickness of the ascus wall of B. fulva asci when cultures aged

67
between 30 and 90 days were examined. The thick wall of the asci was another potential
heat resistance factor. The studies on the ultrastructure of Byssochlamys ascospores so
far are limited in that they concern only one species, a relatively young culture age (up
to 90 days) and have not examined the ascospores after exposure to different levels of
inactivation by heat treatments.
In this Chapter, SEM and TEM were applied to compare the ultrastructure of ascospores
of B. fulva and B. nivea after heat activation and inactivation, and dormant ascospores
harvested from young, 4 week cultures and older, 24 week cultures.
4.2 Materials and methods
4.2.1 Fungal samples and heat treatment of ascospores
Ascospores were prepared from 4 and 24 week old cultures of B. fulva FRR 2299 and B.
nivea FRR 4421 as described Chapter 3. Ascospore suspensions of approximately 106 –
107 ascospores/mL were kept in sterile distilled water (SDW) at 4oC until they were
processed for electron microscopy.
Ascospores at three different physiological states were examined by electron
microscopy. These were dormant, heat activated and heat inactivated states. Dormant
ascospores did not receive any heat treatment after harvest and were prepared as
described above. Activated samples suspended in SDW were heated in a water bath at
75oC for 30 minutes while inactivated ascospores were obtained by heating in SDW in a
water bath at 95oC for 30 minutes. The heat activation treatment in SDW was estimated
from results of a previous study which showed maximal viable counts (Splittstoesser et
al., 1972). After the treatments, heated and dormant samples were cooled in ice and
sample preparation for EM was carried out within 2 hours of cooling. Only ascospores
prepared from 24 week old cultures were used for activation and inactivation analyses.
All sample preparation steps and image viewing were carried out at the Electron
Microscopy Unit, Macquarie University (North Ryde, NSW, Australia).
68
4.2.2 Reagents used for sample preparation for EM
Glutaraldehyde prepared from 50% stock solution (EM grade, distillation purified)
came from Electron Microscopy Sciences (Hatfield, PA, USA). Osmium tetroxide,
(OsO4), uranyl acetate and LR white resin (medium grade, C023) were supplied by
ProSciTech (QLD, Australia). Polyethylenimine was obtained from Sigma-Aldrich
(MO, USA). Pure ethanol (Univar) came from Ajax FineChem (NSW, Australia).
Ultrapure low melt agarose was from J.T. Baker Inc. (Phillipsburg, NJ, USA).
Pioloform resin was from Structure Probe® (West Chester, PA, USA).
4.2.3 Sample preparation
One millilitre of ascospore suspensions (approximately 107 cells/mL for B. fulva
FRR2299 and 108 cells/mL for B. nivea FRR4421) in 1.5 mL microcentrifuge tubes
were centrifuged at 4000g for 5 minutes and the supernatant was removed without
disturbing the pellet of sedimented ascospores. Ascospores were then resuspended in 1
mL of 6% glutaraldehyde for an overnight fixation at 4oC. Fixed samples were then
washed three times in phosphate buffer (pH 7.2) before they were processed for either
SEM or TEM.
4.2.3.1 Scanning electron microscopy (SEM)
Washed samples were post-fixed in freshly made 2% OsO4 for 2 hours at room
temperature (ca. 20oC). After sedimentation and washing in Milli Q water, samples
were dehydrated for 15 minute in each of a 50 – 70 – 80 – 90 – 95% graded ethanol
series and twice for 15 minutes in 100% ethanol. Dehydrated ascospores were quickly
dried in CO2 in an EMITECH K850 critical point dryer (EMITECH, Ashford, Kent,
UK), then sputter coated with gold in an EMITECH K550 gold sputter coater unit
(EMITECH) (Waugh et al., 2001). Prepared samples were viewed under a JEOL JSM-
6480 LA Analytical scanning electron microscope (JEOL, Sydney, NSW, Australia).

69
4.2.3.2 Transmission electron microscopy (TEM)
Glutaraldehyde-fixed and washed ascospore pellets were embedded into 1% low melt
agarose. The agar blocks containing the cell pellets were post fixed in 2% OsO4 for 2
hours at room temperature (20oC) and then immersed in 1 mL of 2% uranyl acetate (en
bloc staining) for 30 minutes at room temperature. After a washing step in Milli Q water
for 10 minutes, ascospores were dehydrated in a similar graded ethanol series as SEM
samples. They were then infiltrated with LR white resin by using incremental 3:1, 2:1,
1:1, 1:2, 1:3 pure ethanol:resin mixtures and lastly pure resin. Each infiltration step
involved adding 1 mL of the ethanol-resin mixture and leaving for 1 hour at room
temperature. The pure resin infiltration was carried out overnight at 4oC. Polymerisation
of pure resin to embed the infiltrated ascospores was performed overnight at 60 – 70oC.
Thin sections from resin blocks were prepared using a Reichert ultracut ultramicrotome
(Reichert, NY, USA), collected on copper grids (200 mesh) (ProSciTech) that were
coated with 0.3% Pioloform resin in chloroform. The sections were stained in 7.7%
aqueous uranyl acetate then in lead citrate (Reynolds’ reagent) (Reynolds, 1963), and
observed with a Philips LM 10 transmission electron microscope (Philips, NY, USA)
(McKeown et al., 1996).
4.2.4 Dimensions of the ascospores and image processing
Measurements on electron micrographs were done using the ImageJ software, which
was available at http://www.macbiophotonics.ca/imagej/index.htm. The longest and
shortest diameters were regarded as lengths (L) and widths (W), respectively, of the
ascospores. In order to perform statistical comparisons, the lengths and widths of at
least 40 ascospores on SEM images or 20 ascospores on TEM images were measured.
In particular, only TEM images that clearly showed all compartments of ascospores
were used. For each ascospore, the length and width each were measured five times and
average values were determined. The cross section areas (A) of ascospores were
calculated by the equation: A = ¼ πLW assuming ascospores as ellipsoid (Dijksterhuis
et al., 2002).
For TEM images, L, W and A were also determined for the ascospore section without
the cell-wall and for the central cytoplasm. Because the TEM sections cut through
different positions of the ascospores, the absolute measurements on TEM images could
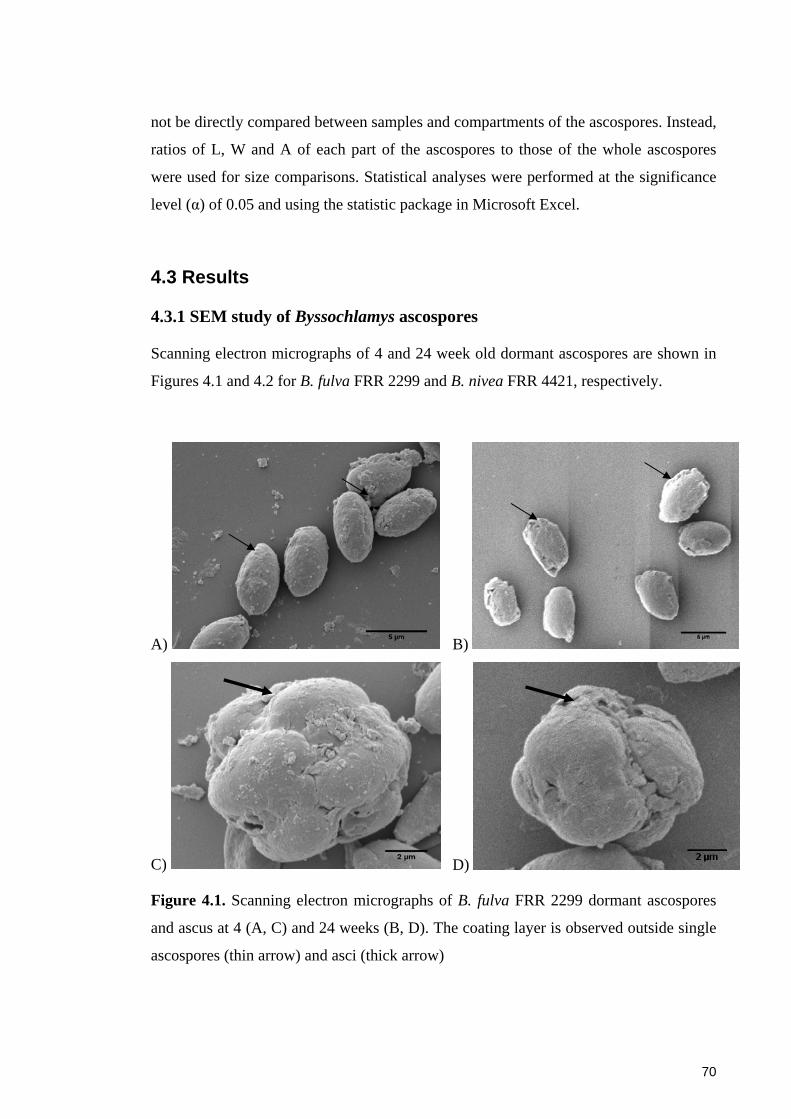
70
not be directly compared between samples and compartments of the ascospores. Instead,
ratios of L, W and A of each part of the ascospores to those of the whole ascospores
were used for size comparisons. Statistical analyses were performed at the significance
level (α) of 0.05 and using the statistic package in Microsoft Excel.
4.3 Results
4.3.1 SEM study of Byssochlamys ascospores
Scanning electron micrographs of 4 and 24 week old dormant ascospores are shown in
Figures 4.1 and 4.2 for B. fulva FRR 2299 and B. nivea FRR 4421, respectively.
A) B)
C) D)
Figure 4.1. Scanning electron micrographs of B. fulva FRR 2299 dormant ascospores
and ascus at 4 (A, C) and 24 weeks (B, D). The coating layer is observed outside single
ascospores (thin arrow) and asci (thick arrow)

71
The B. fulva samples contained single ascospores, intact asci and some debris whereas
the B. nivea samples comprised mainly free ascospores. All ascospores were ellipsoidal
without surface ornamentation. Dormant ascospores of both strains did not show any
visually significant differences on the surfaces between 4 and 24 weeks. However, B.
fulva ascospores possessed a layer of extracellular material that created roughness on
the outside of the ascospore wall (Figures 4.1 A, B). A similar coating was also
observed to form the ascus wall (Figures 4.1 C, D) and acted to hold the ascospores
together inside the asci. This surface layer was absent in B. nivea single ascospores but
was occasionally observed in the intact asci if they were present (Figure 4.2).
A) B)
C) D)
Figure 4.2. Scanning electron micrographs of B. nivea FRR 4421 dormant ascospores at
4 (A, C) and 24 weeks (B, D)
The heat activation treatment (75oC for 30 minutes) did not cause any significant
changes on the surface or to the shape of 24 week old ascospores of the B. nivea strain
(Figure 4.3 B, D). Conversely, activated ascospores of the B. fulva strain exhibited a

72
shattered outer layer. A smoother and darker surface than the coating layer was revealed
underneath places where the coat was removed (Figure 4.3 A – C).
A) B)
C) D)
E)
Figure 4.3. Scanning electron micrographs of 24 week old B. fulva FRR 2299 (A, C, E)
and B. nivea FRR 4421 (B, D) ascospores activated at 75oC for 30 minutes; the coating
layer was removed to reveal a shiny smooth surface (thin arrow) for the B. fulva
ascospores but not those of B. nivea

73
Heat inactivation (95oC for 30 minutes), on the other hand, induced modifications on
the ascospore surface of both B. fulva and B. nivea strains. B. nivea ascospores were
affected more frequently than B. fulva ascospores. The structural changes observed on
the ascospores included depression in the centre of the cells, swellings and openings in
the outer wall (Figures 4.4 A – D). B. fulva ascospores, in particular, displayed a loss of
the coating layer (Figure 4.4 E) that was usually observed on dormant ascospores.
A) B)
C) D)
E)
Figure 4.4. Scanning micrographs of 24 week old B. fulva FRR 2299 (A, C, E) and B.
nivea FRR 4421 (B, D) ascospores inactivated at 95oC for 30 minutes; modifications
occurred on the surface of the ascospores, include depression in the centre (thin arrow),
holes (thick arrow) or removal of the coating layer (arrow head)
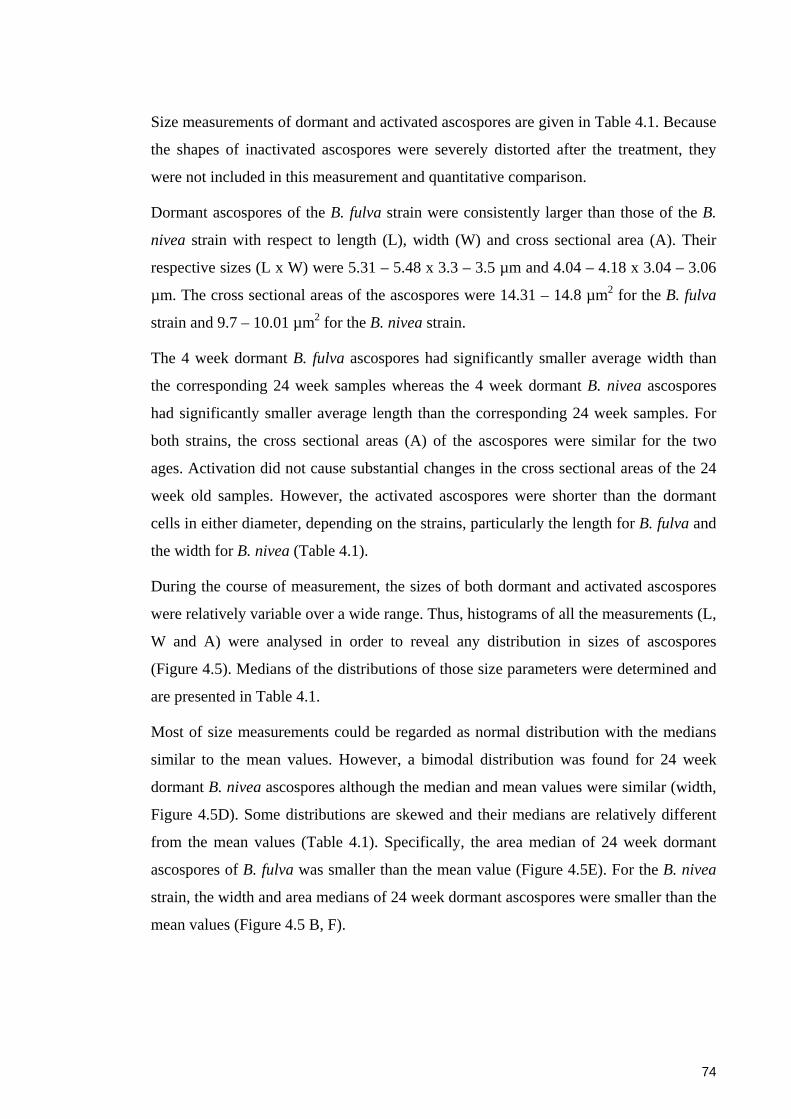
74
Size measurements of dormant and activated ascospores are given in Table 4.1. Because
the shapes of inactivated ascospores were severely distorted after the treatment, they
were not included in this measurement and quantitative comparison.
Dormant ascospores of the B. fulva strain were consistently larger than those of the B.
nivea strain with respect to length (L), width (W) and cross sectional area (A). Their
respective sizes (L x W) were 5.31 – 5.48 x 3.3 – 3.5 µm and 4.04 – 4.18 x 3.04 – 3.06
µm. The cross sectional areas of the ascospores were 14.31 – 14.8 µm2 for the B. fulva
strain and 9.7 – 10.01 µm2 for the B. nivea strain.
The 4 week dormant B. fulva ascospores had significantly smaller average width than
the corresponding 24 week samples whereas the 4 week dormant B. nivea ascospores
had significantly smaller average length than the corresponding 24 week samples. For
both strains, the cross sectional areas (A) of the ascospores were similar for the two
ages. Activation did not cause substantial changes in the cross sectional areas of the 24
week old samples. However, the activated ascospores were shorter than the dormant
cells in either diameter, depending on the strains, particularly the length for B. fulva and
the width for B. nivea (Table 4.1).
During the course of measurement, the sizes of both dormant and activated ascospores
were relatively variable over a wide range. Thus, histograms of all the measurements (L,
W and A) were analysed in order to reveal any distribution in sizes of ascospores
(Figure 4.5). Medians of the distributions of those size parameters were determined and
are presented in Table 4.1.
Most of size measurements could be regarded as normal distribution with the medians
similar to the mean values. However, a bimodal distribution was found for 24 week
dormant B. nivea ascospores although the median and mean values were similar (width,
Figure 4.5D). Some distributions are skewed and their medians are relatively different
from the mean values (Table 4.1). Specifically, the area median of 24 week dormant
ascospores of B. fulva was smaller than the mean value (Figure 4.5E). For the B. nivea
strain, the width and area medians of 24 week dormant ascospores were smaller than the
mean values (Figure 4.5 B, F).
75
Table 4.1. Dimensions of Byssochlamys ascospores at different ages and physiological states; measurements are expressed as average
values (mean) or medians of the distribution of the data sets
Strain Age (weeks) State N
Mean ± SD Median
Length (µm) Width (µm) Cross sectional area (µm2)
Length (µm)
Width (µm)
Cross sectional area (µm2)
B. fulva FRR 2299
4 Dormant 49 5.48 ± 0.38a 3.32 ± 0.17 14.31 ± 1.53 5.48 3.33 14.31
24 Dormant 47 5.31 ± 0.53a 3.54 ± 0.31b 14.80 ± 2.04 5.32 3.56 14.44*
24 Activated 66 5.11 ± 0.45 3.53 ± 026b 14.18 ± 1.70 5.13 3.51 14.20
B. nivea FRR 4421
4 Dormant 76 4.04 ± 0.37 3.06 ± 0.14d 9.70 ± 1.01 4.02 3.05 9.74
24 Dormant 100 4.18 ± 0.46c 3.04 ± 0.15d 10.01 ± 1.32 4.31* 3.06 10.20*
24 Activated 100 4.28 ± 0.31c 3.00 ± 0.16 10.09 ± 1.11 4.30 3.03 10.03
For the same strain, similar superscript letters indicate no significant difference (α = 0.05) between figures in either length, width or cross sectional area. Comparison
was not carried out between the two species because ascospores of B. fulva are generally larger than those of B. nivea (Pitt and Hocking, 2009)
N is the number of ascospores measured on scanning micrographs and used in statistical comparison
* Skewed distributions whose means and medians are greatly different

76
B. fulva FRR 2299 B. nivea FRR 4421
A) B)
C) D)
E) F)
Figure 4.5. Distributions of size measurements of dormant and activated ascospores of
B. fulva FRR 2299 and B. nivea FRR 4421. Size: length (A – B), width (C – D) and
cross sectional area (E – F). Physiological state: dormant, 4 weeks ( ); dormant, 24
weeks ( ); activated, 24 weeks ( )
77
4.3.2 TEM study of Byssochlamys ascospores
Transmission electron micrographs of ultrastructures of B. fulva and B. nivea ascospores
are shown in Figures 4.6 and 4.7, respectively. In the experiment, it was noted that the
fixing and embedding reagents did not enter dormant and activated ascospores
effectively resulting in loss of many cut sections.
Cross section images revealed three major layers in the ultrastructure of Byssochlamys
ascospores: a cell-wall (CW), a cytoplasm (CY), and an intermediate space (IMS)
sandwiched between the other two layers (Figures 4.6 A, B and 4.7A, B). The cell-wall
was a thick and unornamented mono-layer with medium to high electron density,
manifested as grey to dark coloured. The wall was relatively homogenous in structure
without any significant changes of density. There was occasionally a thin outer
membrane on the surface of the wall. Contrarily, the cytoplasm was highly electron
dense, extremely compact and occasionally exhibited a granular structure. It was located
approximately in the centre of the ascospores and had an ellipsoidal to irregular shape.
The rest of the ascospores was occupied by an exceptionally thick intermediate space.
The IMS was heterogeneous in the electron density but it mostly maintained a
translucent appearance.
The major difference between young and old dormant ascospores was observed inside
the IMS. The 24 week ascospores developed extra concentric layers around the
cytoplasm (Figures 4.6 A, B and 4.7 A, B). These layers could be clearly distinguished
by their optical densities. They were found in ascospores of both B. fulva and B. nivea.
However, the frequency of this feature was low since it was only observed in occasional
cut sections.
Activated ascospores had three layers similar to the dormant ascospores at 24 weeks,
including the sub-layers in the IMS. Importantly, there were sometimes discernable
organelles in the cytoplasm of the activated cells. The clear internal content was
observed in ascospores of both B. fulva and B. nivea strains (Figures 4.6D, 4.7D).
Damage to ascospores clearly occurred after heat inactivation since the cells were
significantly distorted and lost their original shapes (Figures 4.6E, 4.7E). The changes
to ascospore structures were relatively random on the cell-wall. The cytoplasm of
inactivated ascospores became less dense, which allowed the differentiation of internal
materials, such as mitochondria or ribosomes (Figure 4.6F, 4.7F).

78
A) B)
C) D)
E) F)
Figure 4.6. Ultrastructures of ascospores of B. fulva FRR 2299. Sample: 4 week,
dormant (A), 24 week, dormant (B), 24 week, activated (C – D), 24 week, inactivated
(E – F); Ultrastructure components: cell-wall (CW), intermediate space (IMS),
cytoplasm (CY); Special features: the thin outer membrane (thin arrow), sub-layers in
the IMS of 24 week ascospores (arrow head), cytoplasmic organelles such as
mitochondria (thick arrow). Scale bar: 1 µm (A – C and E), 0.5 µm (D and F)
CW
IMS
CY

79
A) B)
C) D)
E) F)
Figure 4.7. Ultrastructures of ascospores of B. nivea FRR 4421. Sample: 4 week,
dormant (A), 24 week, dormant (B), 24 week, activated (C – D), 24 week, inactivated
(E – F); Ultrastructure components: cell-wall (CW), intermediate space (IMS),
cytoplasm (CY); Special features: the thin outer membrane (thin arrow), sub-layers in
the IMS (arrow head), cytoplasmic organelles such as mitochondria (thick arrow)
CW
IMS
CY
80
The size measurements of each layer of the ascospores were variable depending on
angles and depths of the sections cut through the cells. Hence, the area-to-area ratios of
each compartment to the whole ascospore were used for the quantitative analysis instead
of the absolute measurements. For B. fulva ascospores, the IMS occupied approximately
70% of the cross sectional area, hence of the total volume, of the cells. The cytoplasm
was about 21 – 24% of the volume and the cell-wall accounted for the least proportion,
10 – 13% (Figure 4.8). Ascospores of B. nivea had a slightly smaller volume of the IMS
(61 – 64%) while the cytoplasm (23 – 25%) and the cell-wall (13 – 15%) both occupied
greater volume percentages than those of B. fulva (Figure 4.9).
The relative proportions for the cell-wall, IMS and cytoplasm components were similar
in dormant ascospores from either 4 or 24 week cultures for both B. fulva and B. nivea
(Figures 4.8A and 4.9A). However, activated ascospores of the B. fulva strain had
significantly larger cell-wall/whole cell ratios and smaller IMS/whole cell ratios than
both 4 and 24 week dormant ascospores. Meanwhile, the cytoplasm/whole cell ratios of
activated ascospores were only significantly larger than those of 24 week dormant
samples (Figure 4.8A). For the B. nivea strain, activated ascospores only had
significantly larger cell-wall/whole cell ratios than the 24 week dormant cells. Other
ratios were similar across ages and physiological states (Figure 4.9A).
An additional comparison was performed on the largest 25% of the length and width
measurements. These larger figures were more likely to be from sections cut through the
centre of the ascospores and therefore, they were closer to the actual ascospore
dimension. Using these numbers for comparison potentially reduced the complications
of variable cutting sections. The second comparison shows that the size ratios of the B.
nivea strain were similar irrespective of age or physiological states (Figure 4.9B).
Dormant ascospores of B. fulva also had similar size ratios irrespective of ages.
Activated ascospores of the B. fulva strain had significantly larger cell-wall/whole cell
ratios at both ages and smaller IMS/whole cell ratios at 24 weeks then the dormant
samples. The cytoplasm/whole cell ratios of B. fulva ascospores were not statistically
different between ages or across heat treatments (Figure 4.8B).
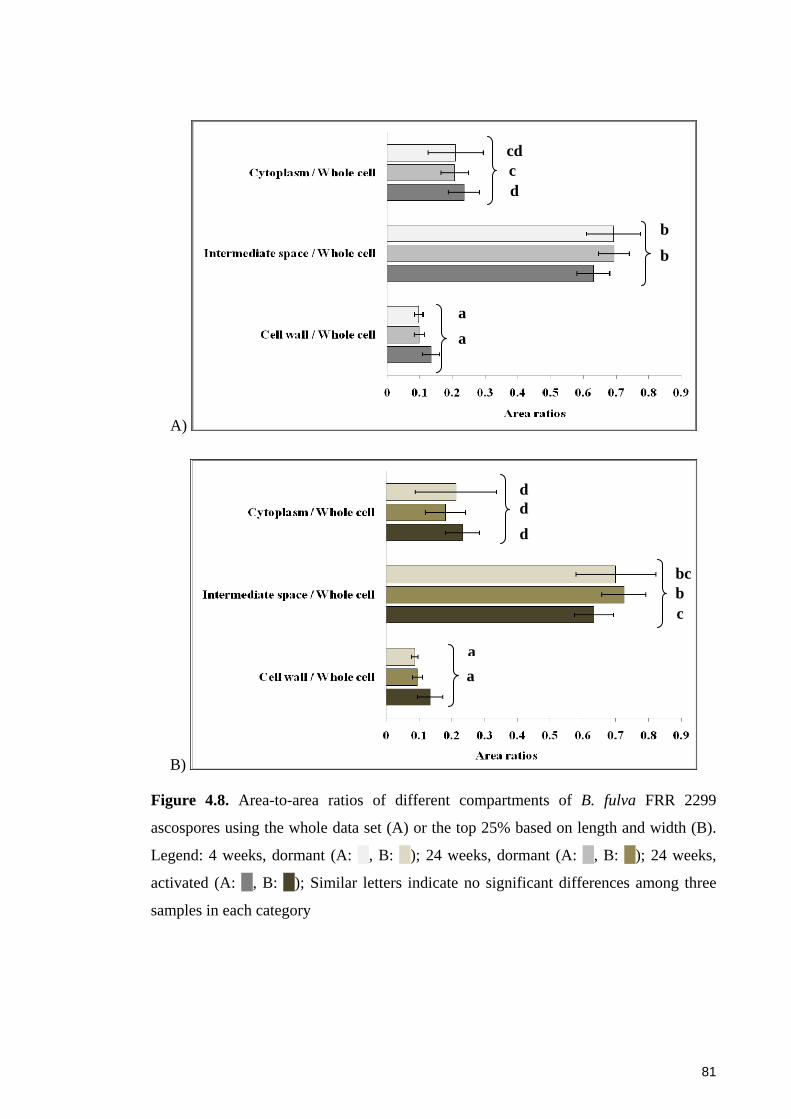
81
A)
B)
Figure 4.8. Area-to-area ratios of different compartments of B. fulva FRR 2299
ascospores using the whole data set (A) or the top 25% based on length and width (B).
Legend: 4 weeks, dormant (A: , B: ); 24 weeks, dormant (A: , B: ); 24 weeks,
activated (A: , B: ); Similar letters indicate no significant differences among three
samples in each category
b b
aa
aa
ccd
d
dd
d
bbc
c

82
A)
B)
Figure 4.9. Area ratios of different compartments of B. nivea FRR 4421 using the
whole data set (A) or the top 25% based on length and width (B). Legend: dormant, 4
weeks (A: , B: ); dormant, 24 week (A: , B: ); activated, 24 week (A: , B: ).
Similar letters indicate no significant difference among three samples in each category
c c c
aa a
b b b
cc c
dd d
abb a

83
4.4 Discussion
Dormant ascospores of B. fulva and B. nivea were examined by electron microscopy
(EM) for differences in their ultrastructure between 4 and 24 weeks. The ultrastructure
of 24 week ascospores was also inspected after heat activation and heat inactivation.
This study expands the previous findings of Partsch et al. (1969) by examining
qualitatively and quantitatively the ascospores at conditions other than the dormant state
at a single age. Both SEM and TEM methods revealed interesting results that could be
attributed to species, ascospore age and effects of the heat treatments used.
4.4.1 Multilayered ultrastructure and heat resistance of Byssochlamys
ascospores
The scanning electron micrographs displayed familiar ellipsoidal and unornamented
ascospores whose sizes were within commonly reported ranges for both species
examined (Pitt and Hocking, 2009). A notable observation was of the coating layer
found only on ascospores of the B. fulva strain. This layer was similar to, and therefore
possibly was a part of the ascus wall of B. fulva and B. nivea asci. For B. fulva, the
coating was particularly resistant since it was only removed after mechanical shaking
with glass beads (section 4.2.1) and thermal treatments. This outer layer may be similar
to that of the ascospore wall of Daldinia concentrica, which has been reported to be
removed by autoclaving in 4.5% potassium hydroxide (Beckett, 1976).
The chemical composition and functions of the outer coating of Byssochlamys
ascospores have not been researched thoroughly. This coating layer is likely to contain
chitin, chitosan and glucan as found in ascospore walls of many fungal species
(Bartnicki-Garcia, 1968; Ruiz-Herrera and Ortiz-Castellanos, 2010). It can function as
an interspore bridge to keep the ascus intact and to hold individual spores together
(Coluccio and Neiman, 2004). Considering its ability to resist mechanical and thermal
stresses, one can conclude that the coating provides the ascospores with a degree of
protection against environmental insults including heat (Coluccio et al., 2008; Hatcher
et al., 1979). The coating layer could be a heat resistance factor that renders B. fulva
ascospores more heat resistant than B. nivea as demonstrated in Chapter 3 (Section 3.3.1
and 3.3.2)

84
TEM revealed the ultrastructure of Byssochlamys ascospores that is characterised by
three major layers, namely cell-wall, intermediate space and cytoplasm. This
compartmentalised arrangement is consistent with previous results for B. fulva
ascospores (Partsch et al., 1969; Put and Kruiswijk, 1964). The names used in the
present study for these layers were kept consistent with the original terminology by
Partsch et al. (1969) to enable comparisons with the literature.
The cell-wall and the IMS were relatively resistant, hindering the penetration of
fixatives into the ascospores. Thus, they are possibly also protective factors against heat
damage. In fact, the spore wall is generally regarded as the physical barrier which
maintains the dormancy and provides resistance against physical and chemical
challenges (Coluccio et al., 2008, Sussman and Douhit, 1973). The coating layer of
Neurospora tetrasperma ascospores was also impermeable to EM fixing reagents
(Lowry and Sussman, 1968). The cell-wall of Saccharomyces cerevisiae ascospores
exhibited low permeability to movement of proteins (Suda et al., 2009). Insufficient
penetration of fixatives through the spore coats of Clostridium endospores also limited
structural details that could be visualised in the mature cells (Hoeniger and Headley,
1968; Stevenson et al., 1972).
The cytoplasm, in particular, was highly compact and electron dense. These properties
are consistent with a viscous and low moisture environment (Dijksterhuis et al., 2007).
These properties could manifest as a special structure called a glassy state inside the
ascospores (Stecchini et al., 2006). The presence of low moisture, glassy state is a
potential mechanism for elevated thermotolerance whereby it protects intracellular
organelles and essential proteins from denaturation (Sunde et al., 2009). A study
presenting evidence for a glassy state in Byssochlamys ascospores will be detailed in
Chapter 5.
The multilayered ultrastructure is relatively common in ascospores of other heat
resistant moulds. However, other species have been shown to have more structural
layers than Byssochlamys ascospores, depending on the microscopic techniques used.
With TEM and barium permanganate stain, the wall of dormant ascospores of N.
fischeri showed four distinct layers (Conner et al., 1987), of which the third one (W3)
was visually equivalent to the IMS of Byssochlamys ascospores. The plasma membrane
outside the cytoplasm of N. fischeri ascospores was also clearly distinguished. With low

85
temperature TEM, dormant ascospores of T. macrosporus showed the same three basic
compartments as seen in those of Byssochlamys. Upon germination, they exhibited two
additional fine layers that were next to the exterior side of the cytoplasm (Dijksterhuis
et al., 2007). Therefore, it may be possible to reveal finer details of the ultrastructure of
Byssochlamys ascospores if different microscopic or staining protocols are used in the
future.
4.4.2 Effects of heat treatments on the ultrastructure of Byssochlamys
ascospores
Ultrastructure of the ascospores was significantly modified by heat and changes
depended on the severity of applied treatments. Heat activation only removed the
coating layer of the ascospores. More detrimental damages to the ascospore structure
occurred with heat inactivation. The corroboration between scanning and transmission
images of inactivated ascospores suggests that heating probably affects the cell-wall and
the IMS first. This is in accordance with the design of ascospores where these two
layers are located outside and serve to protect the cytoplasm.
At the same time the heat treatments altered conditions of the cytoplasm so that its
content became discernable. This change correlated with a loss of viscosity inside
ascospores when they moved from activated to germinating or inactivated states
(Dijksterhuis et al., 2007). Interestingly, many of the visible organelles had a globular
shape and cristae that were similar to mitochondria found in Neurospora tetrasperma
ascospores (Lowry and Sussman, 1968). The presence of mitochondria in ascospores
prior to and following germination is common among ascomycete members, possibly as
a preparation strategy for outgrowth (Murray and Hynes, 2010; Niyo et al., 1986).
Activated ascospores had larger cell-wall area ratios but smaller IMS area ratios than
the dormant cells. This was probably due to the rehydration of activated ascospores that
changed the relative size proportion of each compartments. However, this theory is not
in agreement with the results showing that the cross sectional areas and cytoplasm area
ratios of the activated ascospores were similar to those of dormant ascospores. This may
be a limitation of using relative ratios instead of absolute data in quantitative
comparison.

86
4.4.3 Effects of age on the ultrastructure of Byssochlamys ascospores
The major difference between the 4 and 24 week ascospores was that the older samples
occasionally had sub-layers in the IMS. These additional layers had variable electron
densities and, therefore, different structural arrangements. The development of these
layers could result from post-sporulation modifications occurring inside the IMS when
ascospores matured to achieve a stable dormant state (Bomar, 1962). They may
comprise cross-linked carbohydrates and proteins (Banner et al., 1987), forming a
structure analogous to the peptidoglycan network making up the cortex of bacterial
spores (Atrih and Foster, 2002). The dehydration of the IMS and cytoplasm could then
create pressure inside the ascospores and compress similar networks into layers (Warth,
1985). As time can be a limiting factor, aging enables ascospores to undergo this
internal maturation and structural modification (Conner and Beuchat, 1987). Therefore,
the presence of several layers in the IMS of the matured ascospores was a possible
indicator of a higher thermo-tolerance.
The increasing complexity of ultrastructure of ascospores during aging has been
reported earlier in ascospores of N. fischeri. More defined layers in the cell-wall and
plasma membrane were observed in 25 day old, heat resistant ascospores, but not in 11
day old samples (Conner et al., 1987).
Older ascospores of Byssochlamys species were significantly larger than the younger
ones only in either one of the two diameters. The increase sizes could assist the
ultrastructural development of the older ascospores mentioned above. However, this
change was contradictory to the inverse relationship of size and heat resistance in
endospores of Clostridium species (Beaman et al., 1982; Mah et al., 2008; Novak et al.,
2003; Orsburn et al., 2008).
Additionally, Byssochlamys ascospores had similar area-to-area ratios at both tested
ages. This result was opposed to a trend in bacterial spores where spore coat and cortex
became thicker with heat resistance (Mah et al., 2008). The use of ratios may contribute
to the insignificance in the statistical comparisons. Additionally, Byssochlamys cultures
were grown for a relatively long time (4 and 24 weeks) compared with bacterial
samples. Thus, even the youngest ascospores at 4 weeks may have been already well-
developed and changed their sizes minimally when further aging.
87
4.4.4 Recommendations for future research using electron microscopy
The en bloc staining technique could inadvertently influence the preparation of TEM
samples. It is acknowledged that the method offered a convenient handling of
concentrated ascospores without losing materials after several washing steps. However,
because ascospores were pelletised and embedded into an agar block, this treatment
could hinder a uniform penetration of fixatives and resins into individual ascospores
(Dykstra and Reuss, 2002). It could constitute an extra complication, considering that
the ascospore wall is already highly impermeable.
Results of the present study open up avenues for future research on the relationship
between ultrastructure and heat resistance. Firstly, using different fixing protocols and a
number of stains will enhance quality of transmission images and reveal more details of
the ultrastructure (Conner et al., 1987). Secondly, instead of performing the fixing and
resin infiltration steps in a static condition as done in this experiment, a rotary shaker
can be used to facilitate the penetration of reagents into the ascospores (Kushida, 1969;
Glauert, 1974). Finally, although ultrastructural changes are not always visible, there
may be differences in chemical composition of the ascospores with heat treatments and
age. Chemical composition of the coats, cortex and protoplasm of Bacillus and
Clostridium endospores have been shown to affect their thermo-tolerance (Atrih and
Foster, 2002; Orsburn et al., 2008). Thus, chemical analysis of Byssochlamys
ascospores and each compartment may reveal subtle changes.
4.5 Concluding remarks
SEM and TEM were used in this experiment to study ultrastructure of Byssochlamys
ascospores, and changes brought about by age (i.e. heat resistance) and heat treatment.
There are interesting findings that link all the aspects being examined.
The ultrastructure of Byssochlamys ascospores consists of three distinct layers, namely
cell-wall, intermediate space and cytoplasm. There is also a coating layer outside the
ascospores which helps to hold them together in the asci. The cell-wall is relatively
impermeable to penetration of fixatives. The intermediate space is remarkably thick and
along with the cell-wall, is proposed to maintain the resistance of ascospores against
environmental insults. Sub-layers are occasionally developed in this space, which is the
88
major distinction between young, heat sensitive and old, heat resistant ascospores. The
mechanism of development of those sub-layers is unknown but may be a result of
dehydration of the internal content of the ascospores.
The cytoplasm has a high electron density during dormancy but after heat treatment
becomes less dark with discernable organelles. This phenomenon has been observed in
germinating ascospores of other fungi and it is a result of a viscosity drop and
disappearance of a glass structure. A group of organelles which has internal crossings
similar to the cristae of mitochondria frequently appears in the cytoplasm of heat treated
ascospores.
Heating also causes significant damage to ascospore ultrastructure. The coating layer is
partially removed during heat activation and dramatically lost on inactivated ascospores.
Moreover, inactivated ascospores have severely distorted shapes and modifications on
the cell-wall. These results suggest that the cell-wall and IMS may provide protection
for the cytoplasm against thermal stress.
Old dormant ascospores are larger than the younger ones in one of the two diameters
but their area ratios are similar. The larger size may accommodate the structural
development of the ascospores during aging. However, it contrasts the age-related
decreasing trend of size of bacterial spores, which probably helps the dehydration of
intracellular content and enhances their heat tolerance. Activated ascospores are also
smaller than dormant ones in one of the two diameters. Moreover, they have
significantly higher cell-wall and lower IMS area ratios. Activated ascospores are likely
to be rehydrated and may change in size but, based on the results of the EM
investigation, these findings are inconclusive.
This is the first time Byssochlamys ascospores have been subjects of significant
investigation using electron microscopy. The knowledge gained improves the current
understanding of ultrastructure of ascospores, and the connection to heat resistance
properties and mechanisms of thermal activation or inactivation. The study also points
out possible pitfalls of applying electron microscopy to the study of heat resistant
ascospores and potential directions for future research.
89
Chapter 5 – Application of Differential Scanning Calorimetry (DSC) to examine the arrangement of material in Byssochlamys ascospores
5.1 Introduction
In Chapter 4, ascospores of B. fulva and B. nivea were examined by electron
microscopy, which showed a dense and viscous cytoplasm in the centre of the
ascospores. Cellular organelles in the cytoplasm became discernable, possibly as a
result of rehydration of this region following heat treatments. The results suggested that
the intracellular environment of the ascospores may be protective for the internal
content. Thus, understanding the state of materials inside the ascospores may elucidate a
heat resistance factor of Byssochlamys species.
The cytoplasm of Byssochlamys ascospores is likely to be a dehydrated environment,
which has been observed in ascospores of Talaromyces macrospores (Dijksterhuis et
al., 2007). Byssochlamys ascospores may also contain a high concentration of trehalose,
a non-reducing sugar found abundantly in fungal spores (Thevelein, 1984). The low
moisture and high trehalose contents are often related to the anhydrobiosis phenomenon
and a special state of material called a glassy state (Aguilera and Karel, 1997). In that
condition, molecules are arranged in a quasi solid structure but maintain certain degree
of flexibility of the fluid state (Leopold et al., 1994). The dual property of the glassy
state enables the stabilisation of molecular structures and prevents denaturation.
Therefore, the glassy state has been considered to be a tentative mechanism of thermo-
tolerance of heat resistant moulds (Crowe et al., 1998; Dijksterhuis, 2007).
Differential scanning calorimetry (DSC) is often the chosen method to study glassy
states and other temperature-dependent structural changes in materials (Roos and Karel,
1990). Originally developed for polymers (Watson and O’Neill, 1966) and later
biomaterials (Kalichevsky et al., 1992; Spink, 2008; Sturtevant, 1987), DSC has been
used in the study of Bacillus endospores and has produced evidence to link a glassy
state and their heat resistance property (Katayama et al., 2008; Leuschner and Lillford,
2003; Sapru and Labuza, 1993a, b). In those works, the glassy state was characterised
by an endothermic peak at variable temperatures depending on samples and
90
experimental protocols. To date, the application of DSC in fungal research is very
sparse and mostly unrelated to the heat resistant property (Van Cauwelaert and Verbeke,
1979; Verbeke and Van Laere, 1982).
No studies so far have investigated the arrangement of materials, particularly structure
similar to the glassy state, in Byssochlamys ascospores. Thus, it is relevant to study
ultrastructure of the ascospores from the glassy state point of view. Findings will not
only complement the electron microscopic results but may also identify an essential
heat resistance factor of Byssochlamys ascospores.
This Chapter applies DSC to investigate changes in the structural configurations of
materials in the ascospores of B. fulva and B. nivea. Two strains of each species were
examined after heat activation and heat inactivation, and dormant ascospores harvested
from young, 6 week cultures and older, 24 week cultures. This study also aims to find
evidence of a glassy state in Byssochlamys ascospores.
5.2 Materials and methods
5.2.1 Fungal strains, ascospore harvest and heat treatment
Four Byssochlamys strains were used in this study, comprising B. fulva FRR 2299, B.
fulva FRR 2785, B. nivea FRR 4421 and B. nivea FRR 6002. The fungal cultures were
grown on MEA for 6 and 24 weeks at 30oC. Ascospores were harvested according to
the protocol described in Chapter 3. The harvesting procedure was briefly described as
follows: mould biomass was gently scraped off the agar surface, free ascospores were
released by vigorously shaking with glass beads of diameter less than 106 µm (Sigma-
Aldrich), samples were then filtered through sterile glass wool to remove mycelium and
cell debris, and the filtrate that mostly contained free ascospores and asci was washed
three time with SDW by repeated centrifugation. Harvested ascospores were stored in
SDW at 4oC until analysis.
Dormant ascospores did not receive any heat treatments prior to DSC analysis.
Activated ascospores were prepared by heating dormant ascospore solutions in SDW at
75oC for 30 minutes (Splittstoesser et al., 1972). Inactivated ascospores were prepared
in a similar way but heat treatment was done at 95oC for 30 minutes. All heated samples

91
were cooled down to room temperature (ca. 22oC) before being prepared for DSC
analysis.
5.2.2 Preparation of ascospore samples for DSC
The ‘dry’ method of preparing samples for DSC analysis was modified from a
previously described procedure (Stecchini et al., 2006). Approximately 1.5 mL of
dormant or heat treated ascospore solutions was centrifuged at 10,000 rpm for 5
minutes. Supernatant was decanted but a small amount of liquid was left to make a
dense suspension. About 30 µL of the dense ascospore solution was pipetted into 40 µL
DSC aluminium crucibles (ME – 26763, Mettler Toledo, VIC, Australia) which had
been weighed previously with their lids. All DSC crucibles were then dried over
granulated silica gel overnight in a desiccator at room temperature until constant
weights were achieved. At the end of the drying process, the pans were hermetically
sealed and weighed to determine dry sample weight. Post-DSC weights of closed pans
with samples were also measured to determine any loss of material. All the weights
were recorded up to two decimal places in milligrams.
5.2.3 Differential scanning calorimetry
All DSC analyses were performed in a Mettler Toledo DSC 822e platform (Mettler
Toledo) equipped with a sample robot TSO 801RO (Mettler Toledo). Nitrogen gas was
used as furnace and purge gases and liquid nitrogen was used for cooling. Heat flow
was calibrated against indium (ME-119442, Mettler Toledo) at the beginning of each
experiment day. An empty 40 µL aluminium crucible was used for reference.
5.2.3.1 Selection of scanning rates
Screening for an optimal scanning rate was conducted on the 6 week dormant
ascospores of B. fulva FRR 2299. Samples used for the screening test were prepared by
the ‘dry’ method. Four heating rates, 2.5 Kelvin per minute (Kmin-1), 5 Kmin-1, 7.5
Kmin-1 and 10 Kmin-1, were tested for potential to reveal reproducible and meaningful
events. The analysing program included alternating two heating and two cooling
segments between 10oC and 120oC (Table 5.1). All scans were performed in duplicate.
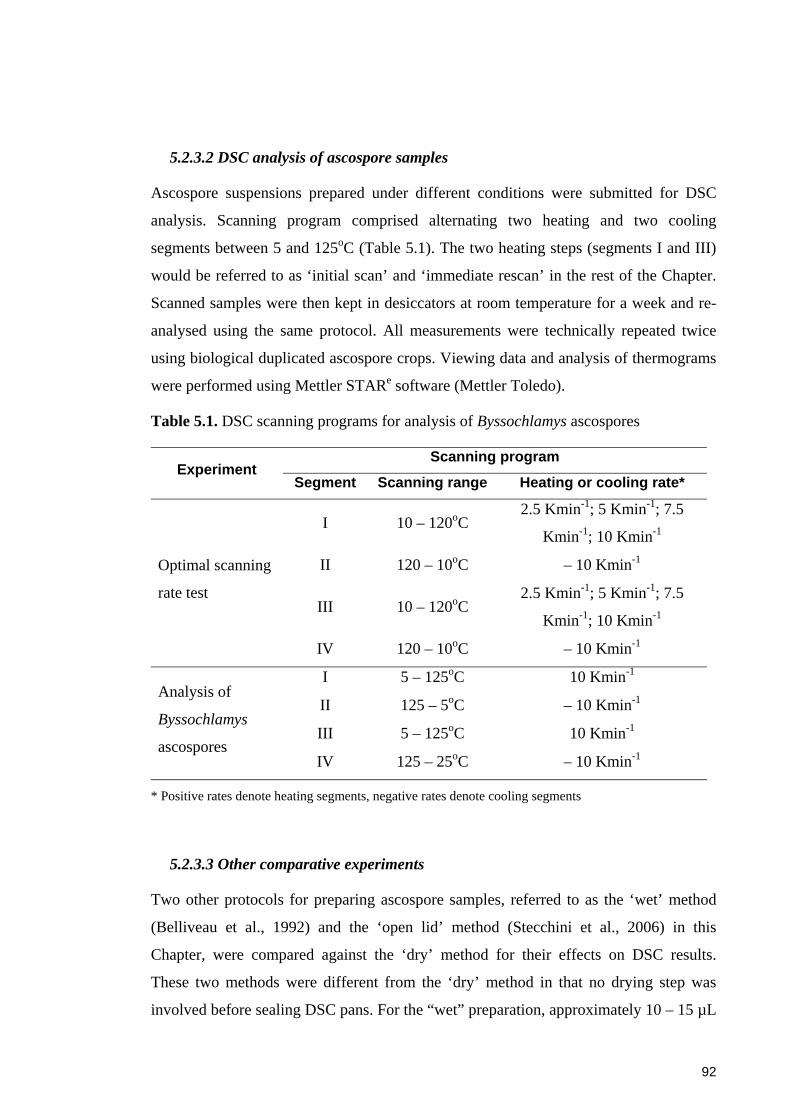
92
5.2.3.2 DSC analysis of ascospore samples
Ascospore suspensions prepared under different conditions were submitted for DSC
analysis. Scanning program comprised alternating two heating and two cooling
segments between 5 and 125oC (Table 5.1). The two heating steps (segments I and III)
would be referred to as ‘initial scan’ and ‘immediate rescan’ in the rest of the Chapter.
Scanned samples were then kept in desiccators at room temperature for a week and re-
analysed using the same protocol. All measurements were technically repeated twice
using biological duplicated ascospore crops. Viewing data and analysis of thermograms
were performed using Mettler STARe software (Mettler Toledo).
Table 5.1. DSC scanning programs for analysis of Byssochlamys ascospores
Experiment Scanning program
Segment Scanning range Heating or cooling rate*
Optimal scanning
rate test
I 10 – 120oC 2.5 Kmin-1; 5 Kmin-1; 7.5
Kmin-1; 10 Kmin-1
II 120 – 10oC – 10 Kmin-1
III 10 – 120oC 2.5 Kmin-1; 5 Kmin-1; 7.5
Kmin-1; 10 Kmin-1
IV 120 – 10oC – 10 Kmin-1
Analysis of
Byssochlamys
ascospores
I 5 – 125oC 10 Kmin-1
II 125 – 5oC – 10 Kmin-1
III 5 – 125oC 10 Kmin-1
IV 125 – 25oC – 10 Kmin-1
* Positive rates denote heating segments, negative rates denote cooling segments
5.2.3.3 Other comparative experiments
Two other protocols for preparing ascospore samples, referred to as the ‘wet’ method
(Belliveau et al., 1992) and the ‘open lid’ method (Stecchini et al., 2006) in this
Chapter, were compared against the ‘dry’ method for their effects on DSC results.
These two methods were different from the ‘dry’ method in that no drying step was
involved before sealing DSC pans. For the “wet” preparation, approximately 10 – 15 µL

93
of dense aqueous ascospore solution were pipetted into pre-weighed 40 µL DSC
aluminium crucibles which were then hermetically sealed and immediately analysed.
For the “open lid” method, orifices were made in the lid before crucibles were sealed
and submitted to the DSC instrument.
A vacuum drying method was also compared for any effects on the DSC results.
Dormant ascospores from 6 week cultures were dried in a desiccator under vacuum
instead of at normal atmosphere. Crucibles were then hermetically sealed and analysed
in the same manner as samples of the ‘dry’ method.
5.3 Results
DSC results of Byssochlamys ascospores were recorded on a Cartesian coordinate plane,
called a thermogram, which depicted heat flow through a sample with time. Thermal
transitions were recorded as first-order transitions, or peaks, and second-order
transitions, or step changes. A peak had a similar baseline on both sides whereas the
baseline of a step change was different prior to and after the event. Peaks and step
changes were characterised by peak temperatures (Tp) and mid-point temperatures
(Tm), respectively.
5.3.1 Screening for the optimal scanning rate
In this experiment, the optimal scanning rate which would reveal clearly thermal
transitions in both initial scans and immediate rescans was determined. The DSC
analyses of dormant ascospores of B. fulva at the four scanning rates are presented in
Figure 5.1. Events being recorded had relatively small total enthalpy and the integrated
energy was often less than 5 mW in most experiments. In addition, the four scanning
rates showed a similar pattern of events, although the transitions happened at slightly
different temperatures.
The general event pattern contained a major endothermic peak at 45 – 60oC in the initial
scans that was reversible at relatively similar temperatures in the immediate rescans.
The peak temperatures were variable with the scanning rates (Table 5.2). The scanning
rate of 10 Kmin-1 exhibited more consistent peaks than other rates in both rounds of
scanning (Figure 5.1D).
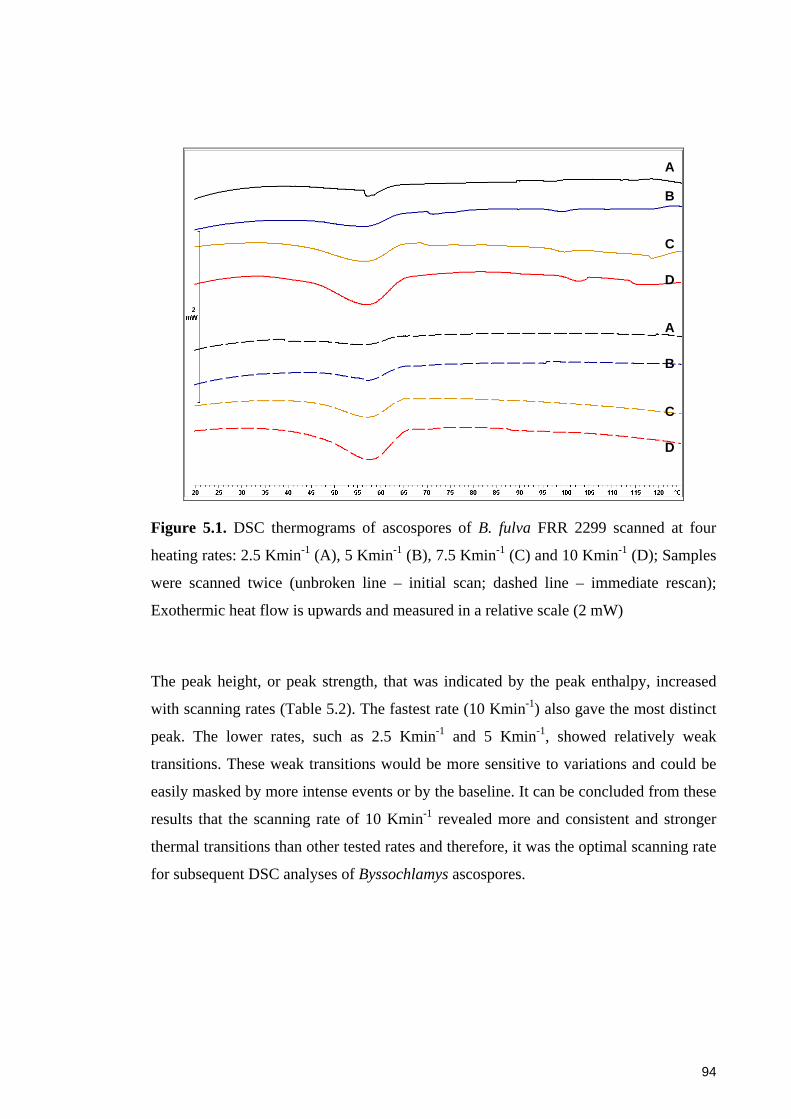
94
Figure 5.1. DSC thermograms of ascospores of B. fulva FRR 2299 scanned at four
heating rates: 2.5 Kmin-1 (A), 5 Kmin-1 (B), 7.5 Kmin-1 (C) and 10 Kmin-1 (D); Samples
were scanned twice (unbroken line – initial scan; dashed line – immediate rescan);
Exothermic heat flow is upwards and measured in a relative scale (2 mW)
The peak height, or peak strength, that was indicated by the peak enthalpy, increased
with scanning rates (Table 5.2). The fastest rate (10 Kmin-1) also gave the most distinct
peak. The lower rates, such as 2.5 Kmin-1 and 5 Kmin-1, showed relatively weak
transitions. These weak transitions would be more sensitive to variations and could be
easily masked by more intense events or by the baseline. It can be concluded from these
results that the scanning rate of 10 Kmin-1 revealed more and consistent and stronger
thermal transitions than other tested rates and therefore, it was the optimal scanning rate
for subsequent DSC analyses of Byssochlamys ascospores.
A
B
C
D
A
B
C
D
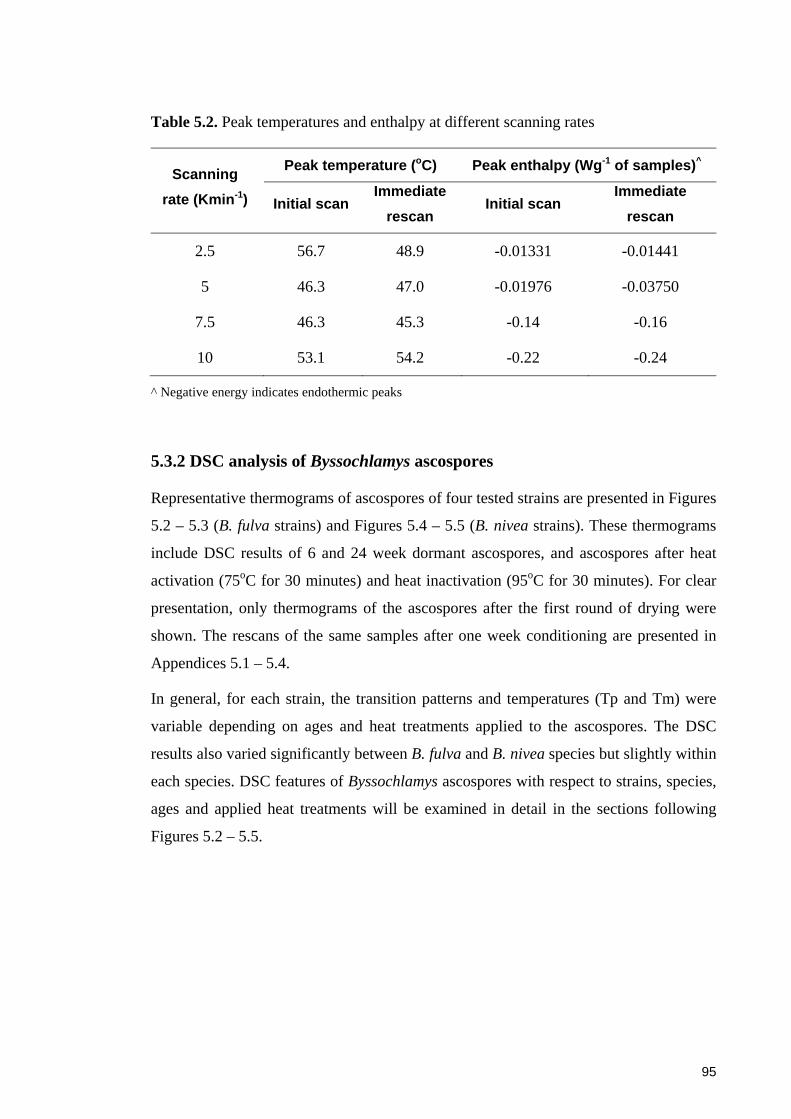
95
Table 5.2. Peak temperatures and enthalpy at different scanning rates
Scanning rate (Kmin-1)
Peak temperature (oC) Peak enthalpy (Wg-1 of samples)^
Initial scan Immediate
rescan Initial scan
Immediate rescan
2.5 56.7 48.9 -0.01331 -0.01441
5 46.3 47.0 -0.01976 -0.03750
7.5 46.3 45.3 -0.14 -0.16
10 53.1 54.2 -0.22 -0.24
^ Negative energy indicates endothermic peaks
5.3.2 DSC analysis of Byssochlamys ascospores
Representative thermograms of ascospores of four tested strains are presented in Figures
5.2 – 5.3 (B. fulva strains) and Figures 5.4 – 5.5 (B. nivea strains). These thermograms
include DSC results of 6 and 24 week dormant ascospores, and ascospores after heat
activation (75oC for 30 minutes) and heat inactivation (95oC for 30 minutes). For clear
presentation, only thermograms of the ascospores after the first round of drying were
shown. The rescans of the same samples after one week conditioning are presented in
Appendices 5.1 – 5.4.
In general, for each strain, the transition patterns and temperatures (Tp and Tm) were
variable depending on ages and heat treatments applied to the ascospores. The DSC
results also varied significantly between B. fulva and B. nivea species but slightly within
each species. DSC features of Byssochlamys ascospores with respect to strains, species,
ages and applied heat treatments will be examined in detail in the sections following
Figures 5.2 – 5.5.
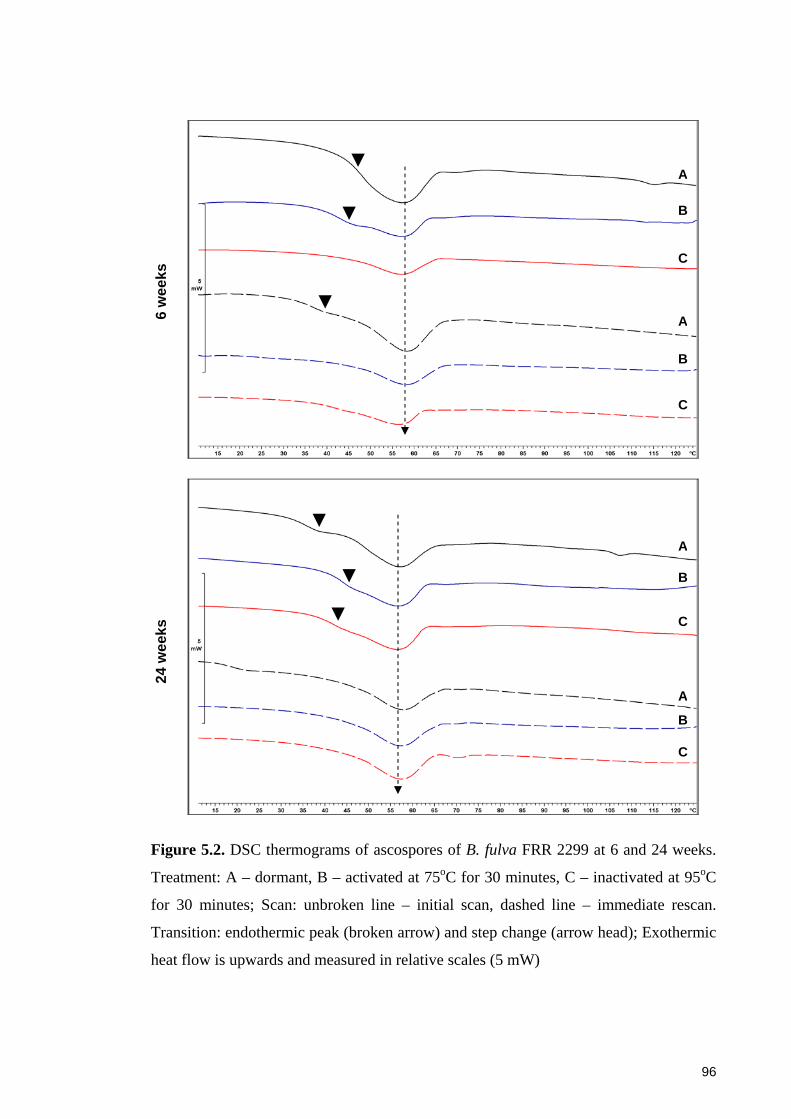
96
6 w
eeks
24 w
eeks
Figure 5.2. DSC thermograms of ascospores of B. fulva FRR 2299 at 6 and 24 weeks.
Treatment: A – dormant, B – activated at 75oC for 30 minutes, C – inactivated at 95oC
for 30 minutes; Scan: unbroken line – initial scan, dashed line – immediate rescan.
Transition: endothermic peak (broken arrow) and step change (arrow head); Exothermic
heat flow is upwards and measured in relative scales (5 mW)
A
B
C
A
B
C
A
A
B
B
C
C
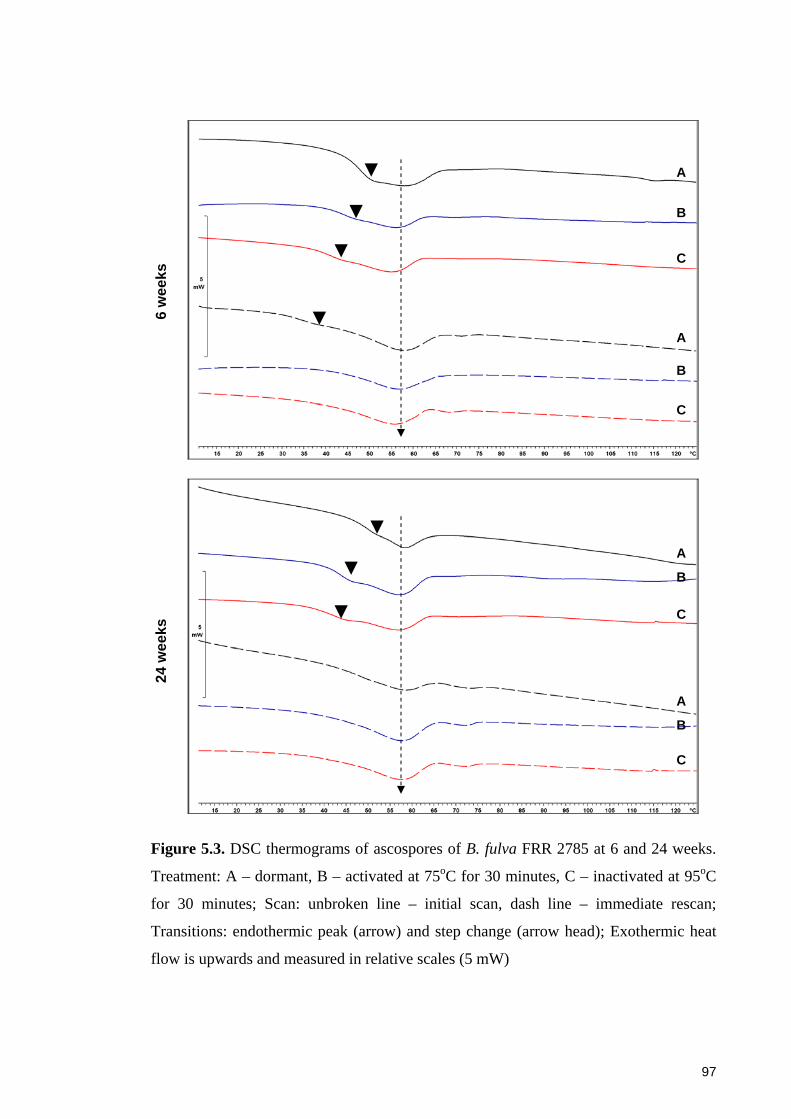
97
6 w
eeks
24 w
eeks
Figure 5.3. DSC thermograms of ascospores of B. fulva FRR 2785 at 6 and 24 weeks.
Treatment: A – dormant, B – activated at 75oC for 30 minutes, C – inactivated at 95oC
for 30 minutes; Scan: unbroken line – initial scan, dash line – immediate rescan;
Transitions: endothermic peak (arrow) and step change (arrow head); Exothermic heat
flow is upwards and measured in relative scales (5 mW)
A
A
B
B
C
C
A
A
B
B
C
C
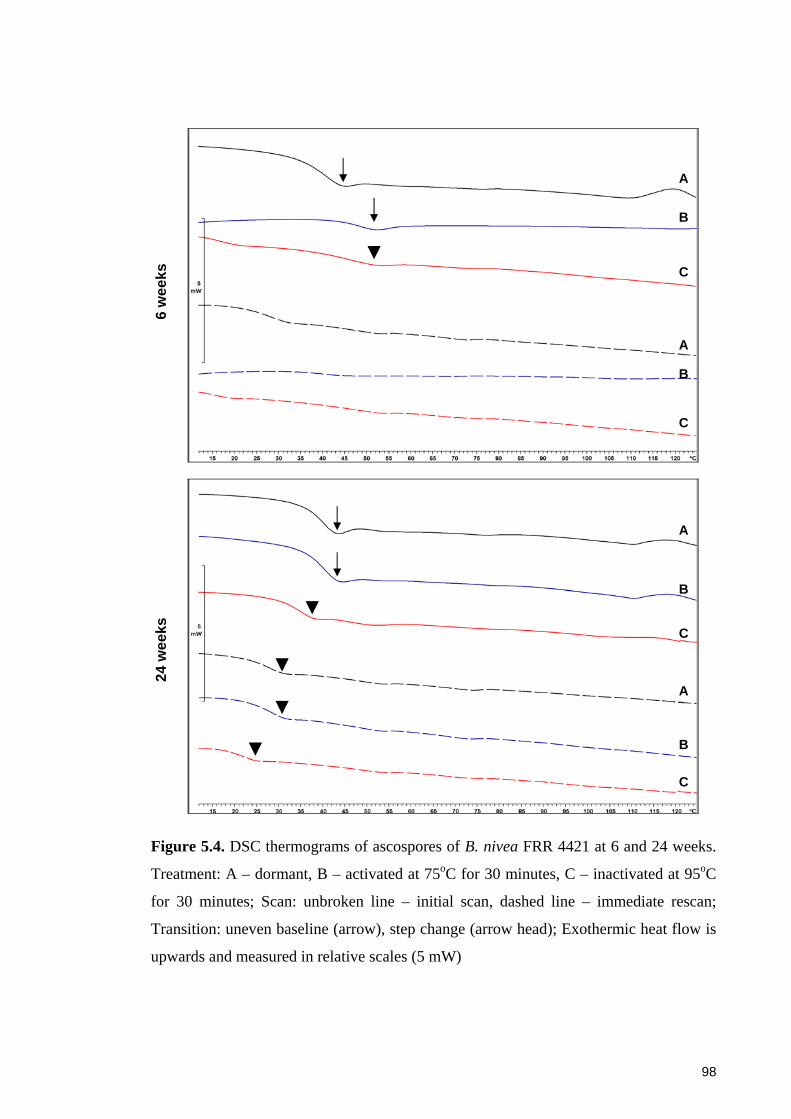
98
6 w
eeks
24 w
eeks
Figure 5.4. DSC thermograms of ascospores of B. nivea FRR 4421 at 6 and 24 weeks.
Treatment: A – dormant, B – activated at 75oC for 30 minutes, C – inactivated at 95oC
for 30 minutes; Scan: unbroken line – initial scan, dashed line – immediate rescan;
Transition: uneven baseline (arrow), step change (arrow head); Exothermic heat flow is
upwards and measured in relative scales (5 mW)
A
A
B
B
C
C
A
A
B
B
C
C

99
6 w
eeks
24 w
eeks
Figure 5.5. DSC thermograms of ascospores of B. nivea FRR 6002 at 6 and 24 weeks.
Treatment: A – dormant, B – activated at 75oC for 30 minutes, C – inactivated at 95oC
for 30 minutes; Scan: unbroken line – initial scan, dashed line – immediate rescan;
Transition: uneven baseline (arrow), step change (arrow head). Exothermic heat flow is
upwards and measured in relative scales (5 mW)
A
A
B
B
C
C
A
A
B
B
C
C
100
5.3.2.1 Comparison of dormant ascospores between ages, species and strains
Temperatures (Tp and Tm) of the major transitions exhibited by dormant ascospores at
6 and 24 weeks are tabulated in Table 5.3. They are complementary to the graphical
presentation of DSC data of dormant samples in Figures 5.2 – 5.5.
For B. fulva, the dormant ascospores showed a major endothermic peak at 56 – 59oC at
6 weeks and at slightly higher temperatures, 56 – 60oC, at 24 weeks. This peak was
consistently reversible at similar temperatures (Figures 5.2A and 5.3A). The Tp was
slightly higher for B. fulva FRR 2299 than B. fulva FRR 2785, which were 56 – 58.6oC
and 55 – 57.9oC, respectively (Table 5.3).
In addition, an endothermic step change preceded the major peak but its appearance was
variable between strains and ages. Dormant ascospores of B. fulva FRR 2299 exhibited
the step change at lower Tm than those of B. fulva FRR 2785, which were 28.7 – 48.2oC
and 42.4 – 50.8oC, respectively, regardless of ages and rounds of scanning. However,
the transition displayed by B. fulva FRR 2785 was recovered less consistently than B.
fulva FRR 2299 at both ages. Moreover, the step change displayed by 24 week
ascospores was generally more slowly recovered at higher Tm than the 6 week samples.
In contrast to B. fulva, B. nivea strains had completely different thermograms which
comprised only an endothermic peak with a lower returning baseline. The peak uneven
baseline could result from an overlapping of a peak and a step change, and was
characterised by a Tp in this experiment. At 6 weeks, this peak was at 44 – 49oC and
replaced only by a step change in the rescans (Figures 5.4A and 5.5A, 6 weeks).
However, it was slowly reversible at higher Tp = 43 – 51.8oC after one week for 24
week ascospores (Figures 5.4A and 5.5A, 24 weeks). At both ages, B. nivea FRR 6002
had higher peak temperature Tp than B. nivea FRR 4421, being 43.4 – 51.8oC and 42.4
– 45.6oC, respectively (Table 5.3).
The step changes of B. nivea ascospores consistently appeared in the immediate rescans.
They were more prominent and at higher temperatures at 24 weeks (Tm = 44 – 48.4oC)
than 6 weeks (Tm = 28 – 33.6oC) (Table 5.3). One week conditioning retained the
reversibility of the step changes but increased the Tm in most cases. Ascospores of B.
nivea FRR 6002 (Tm = 29 – 49oC) again showed slightly higher Tm than those of B.
nivea FRR 4421 (Tm = 28 – 47.4oC).

101
Table 5.3. Temperatures of major transitions (peaks and step changes) from the DSC analysis of dormant ascospores of Byssochlamys species
Strain Age (weeks)
Transition temperatures (oC) Peak temperature (Tp) Mid-point temperature (Tm)
Fresh sample One week sample Fresh sample One week sample Initial scan Immediate
rescan First scan Rescan Initial scan Immediate rescan First scan Rescan
B. fulva FRR 2299
6 56.0 – 57.5 56.0 – 58.4 56 – 57.9 56 – 58.6 40 – 47.2 34.2 – 35.7 44 – 46.5 28.7 – 32.9
24 56.0 – 59.5 57.0 – 60.0 56.0 – 59.0 57.6 – 59.9 35.6 – 39.6 46.4 – 48.3 - 44.6 – 48.2 31.6 – 34.5
B. fulva FRR 2785
6 56.2 – 57.9 56.3 – 57.7 55.0 – 58.8 56.5 – 57.6 46.2 – 47.6 33.7 46.0 36.2 – 38.0
24 57.4 – 58.7 58.4 – 59.0 56.1 – 58.4 58.4 – 59.2 42.4 – 50.8 - - -
B. nivea FRR 4421
6 45.4 - 45.6 - - - - 28.0 – 29.9 46.5 – 47.8 47.0 – 47.4
24 42.4 – 43.5 60.3 – 62.1 - 43.0 – 45.0
54.0 – 59.0 - - 45.8 – 46.4 - 40.3 – 52.1
B. nivea FRR 6002
6 44.0 – 49.0 - - - - 29 – 33.6 47 – 47.5 48.4 – 49.0
24 43.3 – 45.7 51.8 – 57.9 - 44.5 – 51.8 - - 44.0 – 48.4 - 44.2 – 47.5
- denotes no transition being observed
Italic denotes inconsistent transition being absent in one of the duplicates
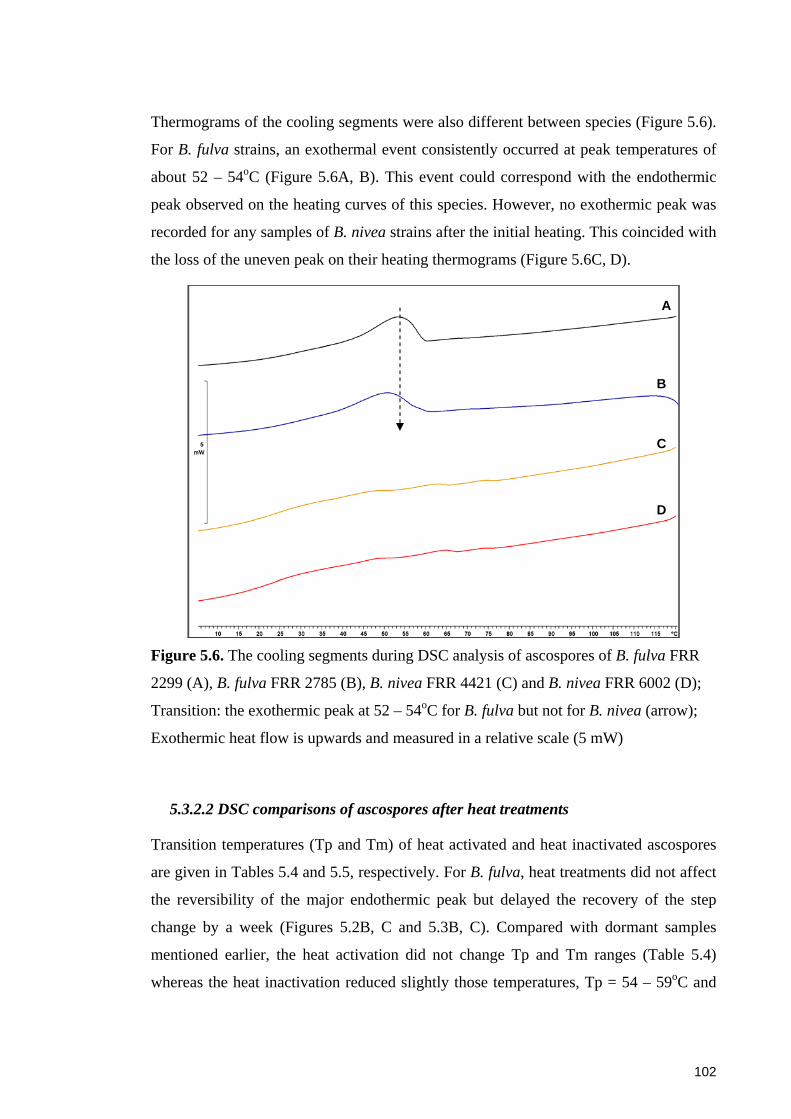
102
Thermograms of the cooling segments were also different between species (Figure 5.6).
For B. fulva strains, an exothermal event consistently occurred at peak temperatures of
about 52 – 54oC (Figure 5.6A, B). This event could correspond with the endothermic
peak observed on the heating curves of this species. However, no exothermic peak was
recorded for any samples of B. nivea strains after the initial heating. This coincided with
the loss of the uneven peak on their heating thermograms (Figure 5.6C, D).
Figure 5.6. The cooling segments during DSC analysis of ascospores of B. fulva FRR
2299 (A), B. fulva FRR 2785 (B), B. nivea FRR 4421 (C) and B. nivea FRR 6002 (D);
Transition: the exothermic peak at 52 – 54oC for B. fulva but not for B. nivea (arrow);
Exothermic heat flow is upwards and measured in a relative scale (5 mW)
5.3.2.2 DSC comparisons of ascospores after heat treatments
Transition temperatures (Tp and Tm) of heat activated and heat inactivated ascospores
are given in Tables 5.4 and 5.5, respectively. For B. fulva, heat treatments did not affect
the reversibility of the major endothermic peak but delayed the recovery of the step
change by a week (Figures 5.2B, C and 5.3B, C). Compared with dormant samples
mentioned earlier, the heat activation did not change Tp and Tm ranges (Table 5.4)
whereas the heat inactivation reduced slightly those temperatures, Tp = 54 – 59oC and
A
B
C
D

103
Tm = 40 – 46oC (Table 5.5). The 24 week ascospores generally had higher Tp and Tm
than the 6 week samples irrespective of heat treatments.
The heat treatments significantly altered the responses of B. nivea ascospores in DSC
analysis. The effects of the heating were either attenuating or removing transitions on
the thermograms depending on the severity of the treatment (Figure 5.4B, C and 5.5B,
C). The activation treatment generally reduced the reversibility of the uneven peak and
replaced it with a step change in the rescans. Effects of the inactivation treatment were
more severe, including removal of the peak and infrequent recovery of the step change.
The 24 week ascospores were more resistant to heat treatments, showing more
reversible transitions than the 6 week samples.
For B. nivea, the peak and step change transitions were relatively variable between sets
of the duplicates for heat treated samples, especially the heat inactivated ones. These
inconsistent results suggested complex effects of heat treatments on B. nivea
ascospores, causing various degrees of changes to the cellular structure (Tables 5.4 and
5.5). Similar variations were observed for the transition temperatures (Tp and Tm),
which were varied in the 40 – 50oC range without following specific trends as observed
with B. fulva ascospores.
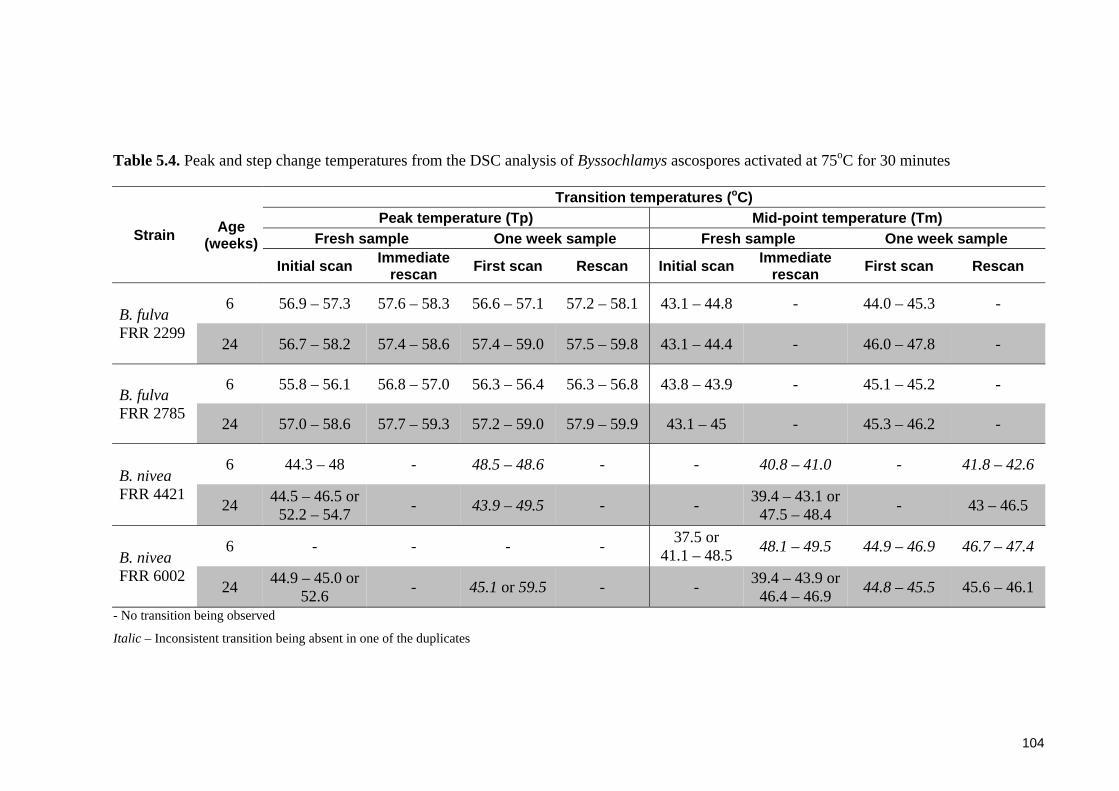
104
Table 5.4. Peak and step change temperatures from the DSC analysis of Byssochlamys ascospores activated at 75oC for 30 minutes
Strain Age (weeks)
Transition temperatures (oC) Peak temperature (Tp) Mid-point temperature (Tm)
Fresh sample One week sample Fresh sample One week sample Initial scan Immediate
rescan First scan Rescan Initial scan Immediate rescan First scan Rescan
B. fulva FRR 2299
6 56.9 – 57.3 57.6 – 58.3 56.6 – 57.1 57.2 – 58.1 43.1 – 44.8 - 44.0 – 45.3 -
24 56.7 – 58.2 57.4 – 58.6 57.4 – 59.0 57.5 – 59.8 43.1 – 44.4 - 46.0 – 47.8 -
B. fulva FRR 2785
6 55.8 – 56.1 56.8 – 57.0 56.3 – 56.4 56.3 – 56.8 43.8 – 43.9 - 45.1 – 45.2 -
24 57.0 – 58.6 57.7 – 59.3 57.2 – 59.0 57.9 – 59.9 43.1 – 45 - 45.3 – 46.2 -
B. nivea FRR 4421
6 44.3 – 48 - 48.5 – 48.6 - - 40.8 – 41.0 - 41.8 – 42.6
24 44.5 – 46.5 or 52.2 – 54.7 - 43.9 – 49.5 - - 39.4 – 43.1 or
47.5 – 48.4 - 43 – 46.5
B. nivea FRR 6002
6 - - - - 37.5 or 41.1 – 48.5 48.1 – 49.5 44.9 – 46.9 46.7 – 47.4
24 44.9 – 45.0 or 52.6 - 45.1 or 59.5 - - 39.4 – 43.9 or
46.4 – 46.9 44.8 – 45.5 45.6 – 46.1
- No transition being observed
Italic – Inconsistent transition being absent in one of the duplicates
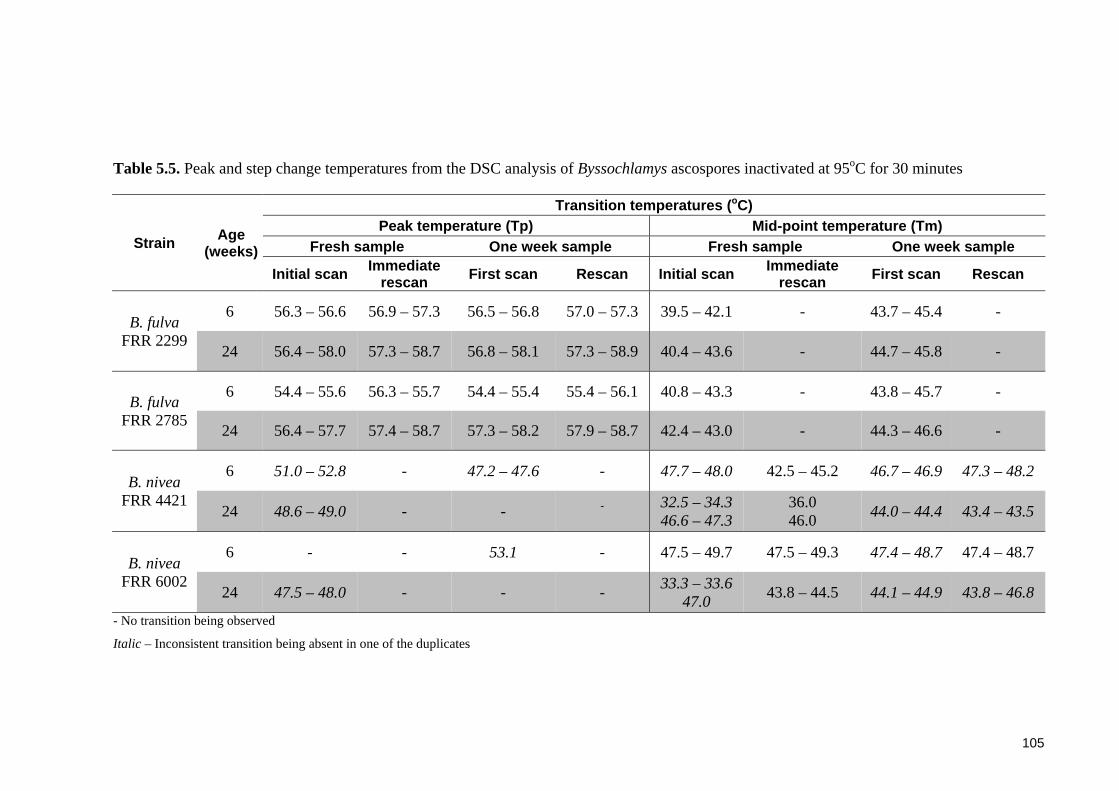
105
Table 5.5. Peak and step change temperatures from the DSC analysis of Byssochlamys ascospores inactivated at 95oC for 30 minutes
Strain Age (weeks)
Transition temperatures (oC) Peak temperature (Tp) Mid-point temperature (Tm)
Fresh sample One week sample Fresh sample One week sample Initial scan Immediate
rescan First scan Rescan Initial scan Immediate rescan First scan Rescan
B. fulva FRR 2299
6 56.3 – 56.6 56.9 – 57.3 56.5 – 56.8 57.0 – 57.3 39.5 – 42.1 - 43.7 – 45.4 -
24 56.4 – 58.0 57.3 – 58.7 56.8 – 58.1 57.3 – 58.9 40.4 – 43.6 - 44.7 – 45.8 -
B. fulva FRR 2785
6 54.4 – 55.6 56.3 – 55.7 54.4 – 55.4 55.4 – 56.1 40.8 – 43.3 - 43.8 – 45.7 -
24 56.4 – 57.7 57.4 – 58.7 57.3 – 58.2 57.9 – 58.7 42.4 – 43.0 - 44.3 – 46.6 -
B. nivea FRR 4421
6 51.0 – 52.8 - 47.2 – 47.6 - 47.7 – 48.0 42.5 – 45.2 46.7 – 46.9 47.3 – 48.2
24 48.6 – 49.0 - - - 32.5 – 34.3 46.6 – 47.3
36.0 46.0 44.0 – 44.4 43.4 – 43.5
B. nivea FRR 6002
6 - - 53.1 - 47.5 – 49.7 47.5 – 49.3 47.4 – 48.7 47.4 – 48.7
24 47.5 – 48.0 - - - 33.3 – 33.6 47.0 43.8 – 44.5 44.1 – 44.9 43.8 – 46.8
- No transition being observed
Italic – Inconsistent transition being absent in one of the duplicates

106
5.3.3 Effects of methods for sample preparations on DSC profiles of
Byssochlamys ascospores
Since DSC technique is not traditionally used to analyse microbial spores, methods for
preparing this type of sample are not standardised and different approaches can affect
the DSC results. The ‘wet’ and ‘open’ methods and vacuum drying were used to prepare
samples of Byssochlamys ascospores in this particular experiment. The thermograms of
samples made by these methods were compared against those of the ‘dry’ method for
their effects on DSC profiles of the ascospores.
Ascospore prepared by the ‘open’ method produced completely different thermograms
from the ‘dry’ method, comprising only a broad endothermic peak at 100oC with tails
spanning 50 – 120oC. This peak was possibly related to evaporation of water and may
have masked much smaller transitions of the ascospores (Figure 5.7). No transitions
were detected in the rescans or the cooling segments.
Figure 5.7. Thermograms of Byssochlamys dormant ascospores prepared in crucibles
with punctured lids; Species: A – B. fulva, B – B. nivea; Exothermic heat flow is
upwards and measured in relative scale (50 mW)
A
B

107
The lack of meaningful transitions was also seen with samples prepared by the ‘wet’
method. Although using wet samples in hermetically sealed crucibles avoided the broad
water peak, there was only a sharp increase of energy flow after 130oC (Figure 5.8). No
transitions occurred in the rescans. More importantly, crucibles prepared by the “wet”
method usually exploded after the initial scan with consequent loss of contents.
Figure 5.8. Thermograms of Byssochlamys dormant ascospores prepared in aqueous
forms without drying; Species: A – B. fulva, B – B. nivea. Scan: unbroken line – initial
scan, dashed line – rescan. Exothermic heat flow is upwards and measured in relative
scale (100 mW)
The effects of vacuum drying on DSC results were dependent on the species. Vacuum
drying did not change greatly the DSC profiles of B. fulva ascospores compared with
drying under normal atmosphere. The characteristic reversible endothermic peak and
step change were present at slightly lower temperatures, Tp = 56 – 57oC and Tm = 30 –
34.1oC, respectively (Figure 5.9A). However, B. nivea ascospores dried under vacuum
condition lost both the uneven peak and the step change. No transitions were recorded
in the rescans of B. nivea samples (Figure 5.9B).
A
A
B
B
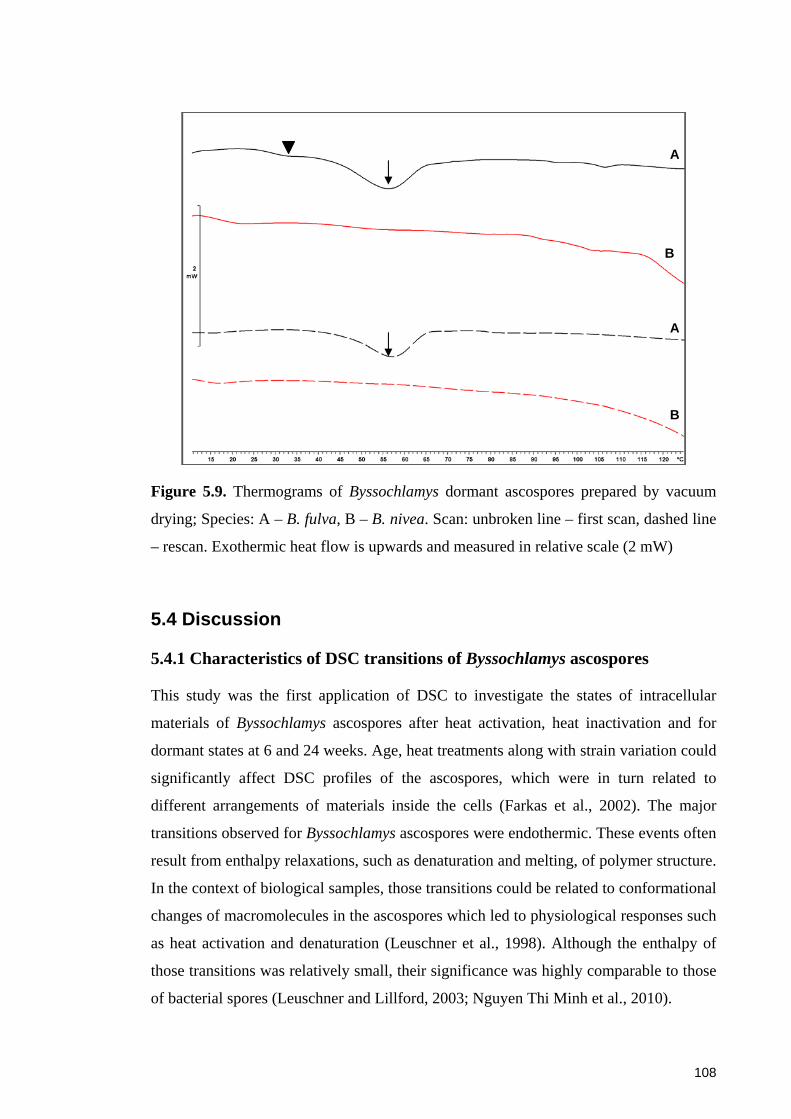
108
Figure 5.9. Thermograms of Byssochlamys dormant ascospores prepared by vacuum
drying; Species: A – B. fulva, B – B. nivea. Scan: unbroken line – first scan, dashed line
– rescan. Exothermic heat flow is upwards and measured in relative scale (2 mW)
5.4 Discussion
5.4.1 Characteristics of DSC transitions of Byssochlamys ascospores
This study was the first application of DSC to investigate the states of intracellular
materials of Byssochlamys ascospores after heat activation, heat inactivation and for
dormant states at 6 and 24 weeks. Age, heat treatments along with strain variation could
significantly affect DSC profiles of the ascospores, which were in turn related to
different arrangements of materials inside the cells (Farkas et al., 2002). The major
transitions observed for Byssochlamys ascospores were endothermic. These events often
result from enthalpy relaxations, such as denaturation and melting, of polymer structure.
In the context of biological samples, those transitions could be related to conformational
changes of macromolecules in the ascospores which led to physiological responses such
as heat activation and denaturation (Leuschner et al., 1998). Although the enthalpy of
those transitions was relatively small, their significance was highly comparable to those
of bacterial spores (Leuschner and Lillford, 2003; Nguyen Thi Minh et al., 2010).
A
A
B
B
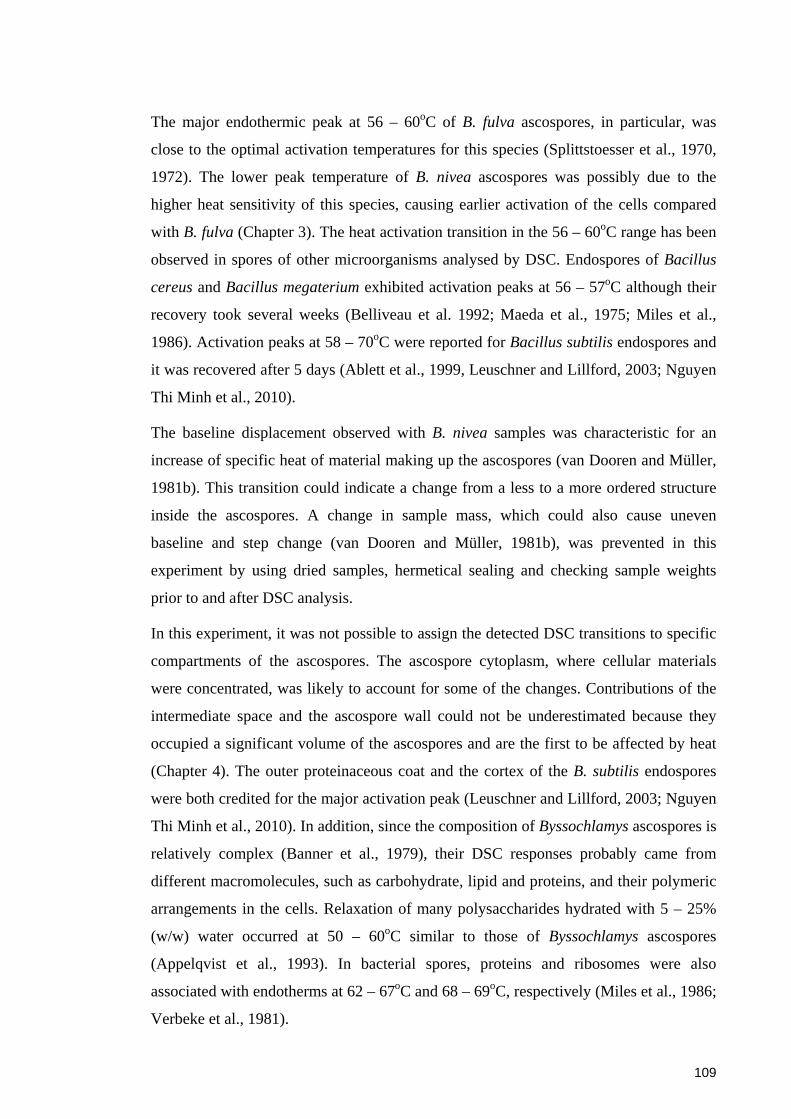
109
The major endothermic peak at 56 – 60oC of B. fulva ascospores, in particular, was
close to the optimal activation temperatures for this species (Splittstoesser et al., 1970,
1972). The lower peak temperature of B. nivea ascospores was possibly due to the
higher heat sensitivity of this species, causing earlier activation of the cells compared
with B. fulva (Chapter 3). The heat activation transition in the 56 – 60oC range has been
observed in spores of other microorganisms analysed by DSC. Endospores of Bacillus
cereus and Bacillus megaterium exhibited activation peaks at 56 – 57oC although their
recovery took several weeks (Belliveau et al. 1992; Maeda et al., 1975; Miles et al.,
1986). Activation peaks at 58 – 70oC were reported for Bacillus subtilis endospores and
it was recovered after 5 days (Ablett et al., 1999, Leuschner and Lillford, 2003; Nguyen
Thi Minh et al., 2010).
The baseline displacement observed with B. nivea samples was characteristic for an
increase of specific heat of material making up the ascospores (van Dooren and Müller,
1981b). This transition could indicate a change from a less to a more ordered structure
inside the ascospores. A change in sample mass, which could also cause uneven
baseline and step change (van Dooren and Müller, 1981b), was prevented in this
experiment by using dried samples, hermetical sealing and checking sample weights
prior to and after DSC analysis.
In this experiment, it was not possible to assign the detected DSC transitions to specific
compartments of the ascospores. The ascospore cytoplasm, where cellular materials
were concentrated, was likely to account for some of the changes. Contributions of the
intermediate space and the ascospore wall could not be underestimated because they
occupied a significant volume of the ascospores and are the first to be affected by heat
(Chapter 4). The outer proteinaceous coat and the cortex of the B. subtilis endospores
were both credited for the major activation peak (Leuschner and Lillford, 2003; Nguyen
Thi Minh et al., 2010). In addition, since the composition of Byssochlamys ascospores is
relatively complex (Banner et al., 1979), their DSC responses probably came from
different macromolecules, such as carbohydrate, lipid and proteins, and their polymeric
arrangements in the cells. Relaxation of many polysaccharides hydrated with 5 – 25%
(w/w) water occurred at 50 – 60oC similar to those of Byssochlamys ascospores
(Appelqvist et al., 1993). In bacterial spores, proteins and ribosomes were also
associated with endotherms at 62 – 67oC and 68 – 69oC, respectively (Miles et al., 1986;
Verbeke et al., 1981).
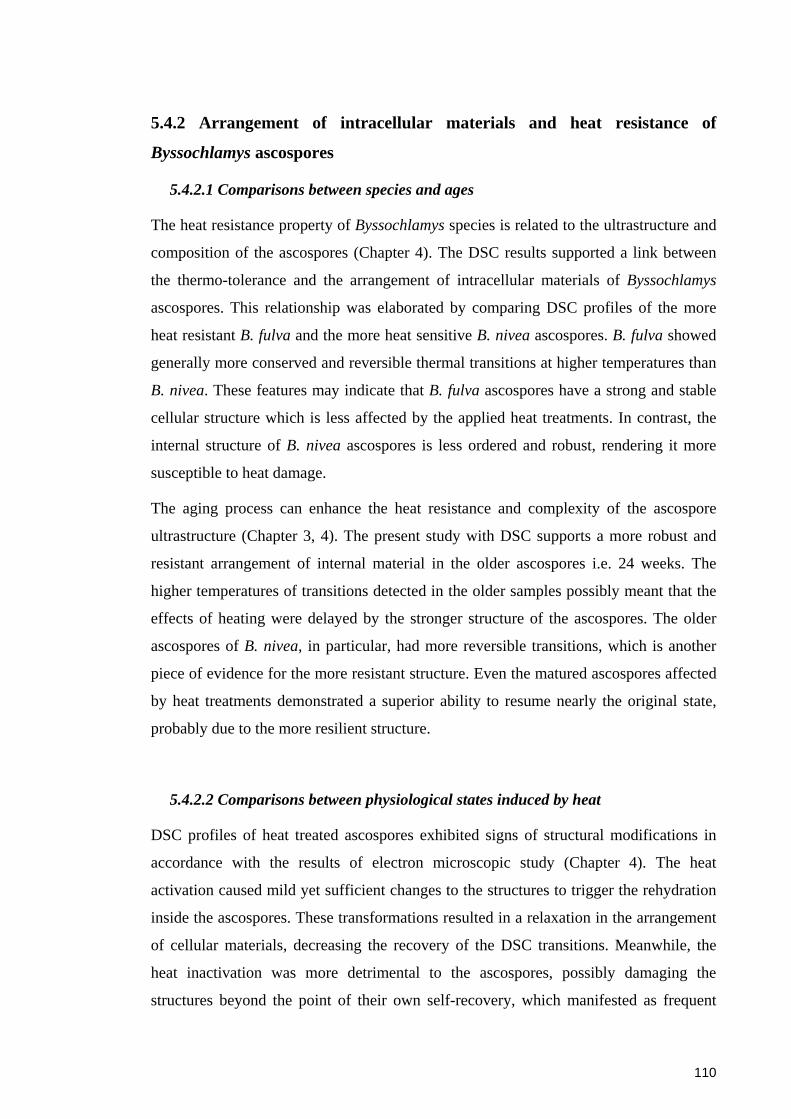
110
5.4.2 Arrangement of intracellular materials and heat resistance of
Byssochlamys ascospores
5.4.2.1 Comparisons between species and ages
The heat resistance property of Byssochlamys species is related to the ultrastructure and
composition of the ascospores (Chapter 4). The DSC results supported a link between
the thermo-tolerance and the arrangement of intracellular materials of Byssochlamys
ascospores. This relationship was elaborated by comparing DSC profiles of the more
heat resistant B. fulva and the more heat sensitive B. nivea ascospores. B. fulva showed
generally more conserved and reversible thermal transitions at higher temperatures than
B. nivea. These features may indicate that B. fulva ascospores have a strong and stable
cellular structure which is less affected by the applied heat treatments. In contrast, the
internal structure of B. nivea ascospores is less ordered and robust, rendering it more
susceptible to heat damage.
The aging process can enhance the heat resistance and complexity of the ascospore
ultrastructure (Chapter 3, 4). The present study with DSC supports a more robust and
resistant arrangement of internal material in the older ascospores i.e. 24 weeks. The
higher temperatures of transitions detected in the older samples possibly meant that the
effects of heating were delayed by the stronger structure of the ascospores. The older
ascospores of B. nivea, in particular, had more reversible transitions, which is another
piece of evidence for the more resistant structure. Even the matured ascospores affected
by heat treatments demonstrated a superior ability to resume nearly the original state,
probably due to the more resilient structure.
5.4.2.2 Comparisons between physiological states induced by heat
DSC profiles of heat treated ascospores exhibited signs of structural modifications in
accordance with the results of electron microscopic study (Chapter 4). The heat
activation caused mild yet sufficient changes to the structures to trigger the rehydration
inside the ascospores. These transformations resulted in a relaxation in the arrangement
of cellular materials, decreasing the recovery of the DSC transitions. Meanwhile, the
heat inactivation was more detrimental to the ascospores, possibly damaging the
structures beyond the point of their own self-recovery, which manifested as frequent
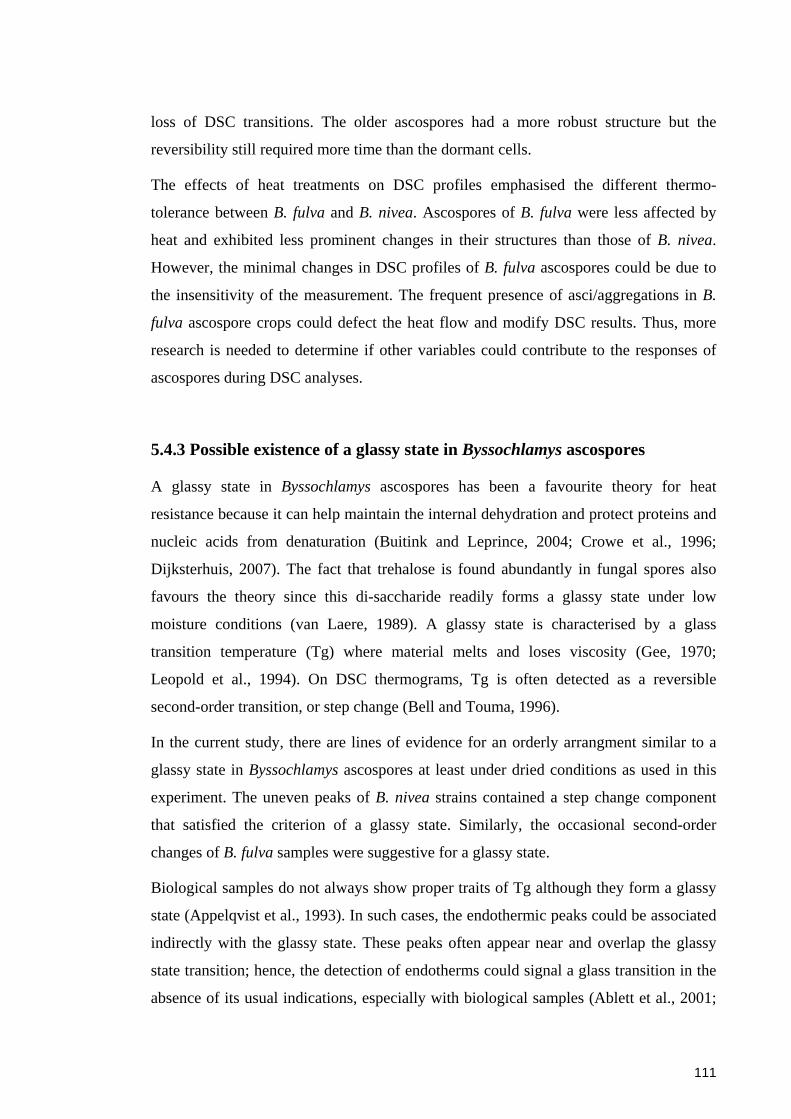
111
loss of DSC transitions. The older ascospores had a more robust structure but the
reversibility still required more time than the dormant cells.
The effects of heat treatments on DSC profiles emphasised the different thermo-
tolerance between B. fulva and B. nivea. Ascospores of B. fulva were less affected by
heat and exhibited less prominent changes in their structures than those of B. nivea.
However, the minimal changes in DSC profiles of B. fulva ascospores could be due to
the insensitivity of the measurement. The frequent presence of asci/aggregations in B.
fulva ascospore crops could defect the heat flow and modify DSC results. Thus, more
research is needed to determine if other variables could contribute to the responses of
ascospores during DSC analyses.
5.4.3 Possible existence of a glassy state in Byssochlamys ascospores
A glassy state in Byssochlamys ascospores has been a favourite theory for heat
resistance because it can help maintain the internal dehydration and protect proteins and
nucleic acids from denaturation (Buitink and Leprince, 2004; Crowe et al., 1996;
Dijksterhuis, 2007). The fact that trehalose is found abundantly in fungal spores also
favours the theory since this di-saccharide readily forms a glassy state under low
moisture conditions (van Laere, 1989). A glassy state is characterised by a glass
transition temperature (Tg) where material melts and loses viscosity (Gee, 1970;
Leopold et al., 1994). On DSC thermograms, Tg is often detected as a reversible
second-order transition, or step change (Bell and Touma, 1996).
In the current study, there are lines of evidence for an orderly arrangment similar to a
glassy state in Byssochlamys ascospores at least under dried conditions as used in this
experiment. The uneven peaks of B. nivea strains contained a step change component
that satisfied the criterion of a glassy state. Similarly, the occasional second-order
changes of B. fulva samples were suggestive for a glassy state.
Biological samples do not always show proper traits of Tg although they form a glassy
state (Appelqvist et al., 1993). In such cases, the endothermic peaks could be associated
indirectly with the glassy state. These peaks often appear near and overlap the glassy
state transition; hence, the detection of endotherms could signal a glass transition in the
absence of its usual indications, especially with biological samples (Ablett et al., 2001;

112
Appelqvist et al., 1993; Tunick et al., 2006). A similar indicator has been used to study
the glassy state in Bacillus spores (Ablett et al., 1999; Sapru and Labuza, 1993a;
Stecchini et al., 2006). The native dormant endospores of B. megarterium and B. cereus
had a slowly reversible, endothermic peak at 56 – 70oC, which was tentative evidence
for materials in the glassy state (Belliveau et al., 1992; Maeda et al., 1974, 1975).
It is noted that evidence of the glassy state does not guarantee a low moisture content
distributed homogenously within the ascospores. Instead, the cells could maintain some
low moisture regions such as cell wall or the cytoplasm where the glassy state was
likely to form locally (Leuschner and Lillford, 2003; Sunde et al., 2006). However,
moisture distribution in Byssochlamys ascospores is poorly understood and needs more
research.
5.4.4 Experimental designs and effects on DSC profiles
Because fungal ascospores are not conventional samples for DSC, prior knowledge
about standard methodology and expected results are relatively limited. There is a wide
range of variables that need to be optimised in order to obtain good DSC thermograms
(van Dooren and Müller, 1981a, b, c). In the present study, two major factors, sample
preparation methods and scanning rates, were considered.
5.4.4.1 Effects of sample preparation methods
Moisture content of samples is an essential determinant of the glass transition (Chen et
al., 2000). The plasticising effect of water on material structure is well-known for
altering its thermal profiles and therefore excessive water is undesirable in DSC
samples (Appelqvist et al., 1993; Frank, 2007). As shown in this experiment, the
moisture content can be influenced by preparation methods. The ‘dry’ method removed
most of the water in samples, resulting in satisfactory DSC profiles. However, the ‘wet’
method left much water in the final samples (Appendix 5.5) and the evaporation of
water masked all of the other transitions. Vapour also burst the sealed crucibles at high
temperatures, causing loss of samples and cross contamination.
Using the ‘dry’ method was supported by Stecchini et al. (2006) but was at odds with
other workers who analysed bacterial spores and vegetative cells apparently without
113
drying (Ablett et al., 1999; Belliveau et al., 1992; Leuschner and Lillford, 2003; Miles
et al., 1986). If moisture contents of samples are strictly monitored, it will become a
known variable and its influences can be effectively controlled (Maede et al., 1974;
Nguyen Thi Minh et al., 2010; van Cauwelaert and Verbeke, 1979; Verbekey et al.,
1981). Alternatively, the water issue could be mitigated by using special crucibles to
prevent loss of volatile components (Maeda et al., 1975).
Vacuum drying did not give as good results as the air drying method, especially for B.
nivea samples. Vacuum drying was supposed to draw more moisture out of samples.
However, it may disrupt structure due to pore formation and puff effect (Hawlader et
al., 2006). The ruptured ultrastructure can explain the loss of the major transition in
thermograms of B. nivea ascospores.
5.4.4.2 Effects of scanning (heating) rates
The heating rate of 10 Kmin-1 selected in this study has been successfully used to probe
thermal changes and the glassy state in bacterial spores (Ablett et al., 1999; Belliveau et
al., 1992; Leuschner and Lillford, 2003; Miles et al., 1986). Slower rates tended to
decrease both transition temperatures and enthalpy (Nguyen Thi Minh et al., 2010).
Samples also take a longer time to undergo a transition and may cause irregularities
(van Dooren and Müller, 1981b). However, it is not uncommon to find slower scans
(0.6 – 2.5 Kmin-1) being used in spore studies (Maeda et al., 1974, 1975; van
Cauwelaert et al., 1979; Verbeke et al., 1981). In those cases, slow scanning rates
allowed sufficient time for individual transition to occur and avoid potential
overlapping.
Meanwhile, rates above 10 Kmin-1 accelerate the scans but reduce significantly the
resolution power because samples have less time to rearrange their structures. Thermal
transitions scanned at higher rates are often shifted to higher temperature ranges and
neighbour events may overlap with one another (Tan and Che Man, 2002). However,
extremely fast scanning rates (100 and 200 Kmin-1) are able to differentiate a glassy
state in spores (Katayama et al., 2008). The argument for the rapid heating is to force
conventionally long transitions to occur in a shorter period of time, which enhances the
clarity and detection.
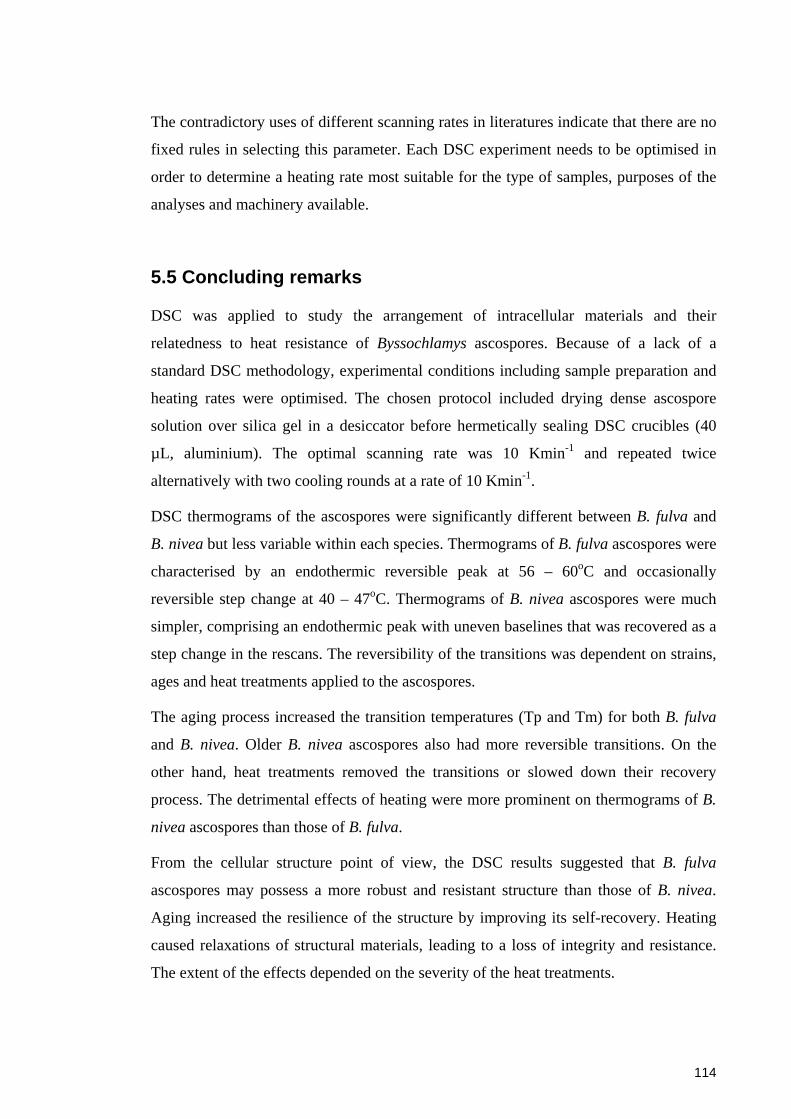
114
The contradictory uses of different scanning rates in literatures indicate that there are no
fixed rules in selecting this parameter. Each DSC experiment needs to be optimised in
order to determine a heating rate most suitable for the type of samples, purposes of the
analyses and machinery available.
5.5 Concluding remarks
DSC was applied to study the arrangement of intracellular materials and their
relatedness to heat resistance of Byssochlamys ascospores. Because of a lack of a
standard DSC methodology, experimental conditions including sample preparation and
heating rates were optimised. The chosen protocol included drying dense ascospore
solution over silica gel in a desiccator before hermetically sealing DSC crucibles (40
µL, aluminium). The optimal scanning rate was 10 Kmin-1 and repeated twice
alternatively with two cooling rounds at a rate of 10 Kmin-1.
DSC thermograms of the ascospores were significantly different between B. fulva and
B. nivea but less variable within each species. Thermograms of B. fulva ascospores were
characterised by an endothermic reversible peak at 56 – 60oC and occasionally
reversible step change at 40 – 47oC. Thermograms of B. nivea ascospores were much
simpler, comprising an endothermic peak with uneven baselines that was recovered as a
step change in the rescans. The reversibility of the transitions was dependent on strains,
ages and heat treatments applied to the ascospores.
The aging process increased the transition temperatures (Tp and Tm) for both B. fulva
and B. nivea. Older B. nivea ascospores also had more reversible transitions. On the
other hand, heat treatments removed the transitions or slowed down their recovery
process. The detrimental effects of heating were more prominent on thermograms of B.
nivea ascospores than those of B. fulva.
From the cellular structure point of view, the DSC results suggested that B. fulva
ascospores may possess a more robust and resistant structure than those of B. nivea.
Aging increased the resilience of the structure by improving its self-recovery. Heating
caused relaxations of structural materials, leading to a loss of integrity and resistance.
The extent of the effects depended on the severity of the heat treatments.
115
Existence of a glassy state inside Byssochlamys ascospores was considered based on
evidence presented by DSC thermograms. Despite the lack of usual indicators of a
glassy state, the endothermic peak and the step change suggested the presence of an
ordered configuration similar to the glassy state in the ascospores.
This is the first time DSC has been used in research of ascospores of heat resistant
fungi. The findings revealed some aspects of the material arrangements inside
Byssochlamys ascospores, complementing the electron microscopy results (Chapter 4).
The evidence indicating the glassy state theory may shed light on an important
mechanism of heat resistance. Future research can expand this knowledge to
unequivocally prove the presence of the glassy state. For example, it is suggested to
determine and control the moisture content, e.g. aw or percentage of water, of ascospore
preparations. DSC examination of ascospores under controlled moisture conditions, for
instance in buffer at ambient temperatures, can be conducted. It may also be possible to
apply extremely high scanning rates to look for the reversible second-order transition
that is characteristic for a glassy state.
116
Chapter 6 – Heterogeneity in ascospore populations of Byssochlamys and its relationship with heat resistance
6.1 Introduction
In Chapter 3, the thermal inactivation of Byssochlamys ascospores was found to be
more complex than that of vegetative cells since it did not follow the conventional log-
linear pattern. The deviation from linearity, which is characterised by the shoulder and
tailing phases, of the heated ascospores can be ascribed to different groups of
ascospores in the treated populations. Ascospores can be different in a number of
aspects including morphology, size, shape, points of sporulation (age), chemical
composition and nucleic acid content (Dantigny and Nanguy, 2009; Gefen and Balaban,
2009). Such heterogeneity in the ascospore population can cause them to respond
differently to thermal treatment (Cronin and Wilkinson, 2008a; Rodriguez-Palacios and
LeJeune, 2011). There have been no systematic studies on the heterogeneity of
Byssochlamys ascospores and the relationship with heat resistance properties. Casella et
al. (1990) suggested that a small group of intrinsically more heat resistant ascospores of
B. nivea might explain tailing in the survival curves. However, their experiment was not
designed to screen different types of cells in the ascospore suspensions. Thus, more
research about the heterogeneity of Byssochlamys ascospores is needed for a better
understanding of their survival strategies.
Flow cytometry (FCM) is a culture-independent, high throughput, multi-parameter and
single-cell analytical method (Boye and Løbner-Olesen, 1990). In a flow cytometer,
individual cells are differentiated by the ability to scatter light in forward angles (FSC,
10 – 15o deflection from the detecting light), which is related to morphology and size, or
in a side angle (SSC, 90o deflection), which is related to internal complexity of the cell
(Davey, 2002; Salzman, 2001). Flow cytometry can also distinguish cells by their
ability to fluoresce after staining with fluorescent probes that differentially react with
and label cells, depending on their physiological states (Sträuber and Müller, 2010).
One such stain is SYTO 9, which is a dye that can pass through the cytoplasmic
membrane of vegetative cells to react with their nucleic acid. Propidium iodide (PI) is
another type of stain that reacts with nucleic acid materials, but can only enter cells

117
when the function of the cell membrane has been impaired. Therefore, SYTO 9 and PI
can be used to indicate the integrity of the cell membrane, which is strongly related to
cell viability (Armstrong and He, 2001; Breeuwer and Abee, 2000). In addition, these
stains may also be used to observe cells with microscopic techniques to elaborate data
from FCM (Ghosh et al., 2009; Rydjord et al., 2007).
FCM has been increasingly applied in food microbiology, especially for monitoring,
detection and quantification of pathogenic bacteria, where the method may produce
more sensitive and faster results than plate culturing techniques (Budde and Rasch,
2001; Dumain et al., 1990; Gunasekera et al., 2000; Laplace-Builhé et al., 1993; Lavilla
et al., 2009). Viability and germination of microbial spores can also be assessed by
FCM (Kong et al., 2010; Laflamme et al., 2005a; Cronin and Wilkinson, 2010). Several
studies using FCM coupled with fluorescent dyes have shown that stresses from heating
and long time storage can result in heterogeneous cell populations of Rhizopus
oligosporus sporangiospores (Thanh et al., 2007) and bacterial spores (Cronin and
Wilkinson, 2008a, b).
This Chapter investigates the use of FCM to characterise the heterogeneity within
ascospore preparations of Byssochlamys, with respect to sizes and cell wall integrity
(i.e. viability) at their dormant state and after heat treatments. Flow cytometry was used
alone and with staining using SYTO 9 and PI to determine sub-populations of
ascospores. Two strains of each species, B. fulva and B. nivea, were examined at 4, 8
and 12 weeks of culturing. Since commercially available fluorogenic dyes have not
been used previously for ascospore staining, a preliminary study based on an Optical
Microscope eXperimental (OMX) platform was performed to probe the penetration of
fluorescent dyes into the ascospores. Another preliminary evaluation of the two stains,
SYTO 9 and PI, in differentiating sub-populations of the ascospores was also
conducted.
6.2 Methodology
6.2.1 Fungal strains and ascospore preparation
Four Byssochlamys strains, B. fulva FRR 2299, B. fulva FRR 2785, B. nivea FRR 4421
and B. nivea FRR 6002, were used in this study. Fungal cultures were grown on MEA
118
and incubated at 30oC for 4, 8 and 12 weeks. At the end of the incubation, ascospores
were harvested from the MEA plates using the protocol described in Chapter 3. Some
modifications were included in the process in order to obtain ascospore suspensions that
were more suitable for FCM analysis. In particular, MEA plates were flooded with
0.05% (w/v) aqueous Tween 80 (Merck, VIC, Australia) solution that had been filtered
through 0.20µm syringe filters (Sartorius Stedim, VIC, Australia) and autoclaved.
Biomass was scraped from the surface of the plates using sterile bent glass rods. Free
ascospores were prepared from asci and mycelium using the glass bead shaking method
(Splittstoesser et al., 1974). About 1.4 mL of fungal biomass and 0.3 g of glass beads
(Chapter 3) were shaken in a tissue lyser (Retsch, PA, USA) at 30 Hertz for 15 minutes
for B. fulva strains and 7.5 minutes for B. nivea strains. The homogenates were filtered
through glass wool, and the ascospores in the filtrates were sedimented and washed by
centrifugation (4000g for 20 minutes at 4oC), and resuspended in filtered sterile distilled
water (SDW). The final suspension was layered on top of a 60% (w/w) sucrose (food
grade, Woolworths, NSW, Australia) solution, and purified by density centrifugation
(4000 rpm, 30 minutes, room temperature) in a Jouan CR3i Multifunction swinging
bucket centrifuge (Thermo Scientific, MA, USA). The sucrose solution was made with
filtered SDW to minimise particles interfering with flow cytometry. After removing the
supernatant, the pellets were washed twice in filtered SDW, resuspended in 0.05%
filtered aqueous Tween 80, and distributed as 1 mL aliquots that were kept at 4oC until
analysis. Ascospore concentrations in the aliquot were 108 – 109 cells/mL as determined
by microscopic observation using a haemocytometer (Marienfeld, Germany).
6.2.2 Thermal treatments of Byssochlamys ascospores for flow cytometry
Aliquots (1 mL) of the harvested Byssochlamys ascospores were diluted 20-fold in
filtered SDW. They were then further diluted 10-fold into capped glass tubes containing
filtered citrate phosphate buffer (CPB) pH 4.0 that had been pre-heated in a water-bath
set at 87.5oC for B. nivea samples and 90oC for B. fulva samples. The final volumes of
10 mL were heated for 1, 4, 12 and 30 minutes, then quickly cooled down in an ice
slurry and transferred to 28 mL sterile plastic tubes for easy pipetting. Mixtures of
dormant ascospore and buffer that were not heat treated were regarded as time “0”
samples. Experiments were performed in triplicate.
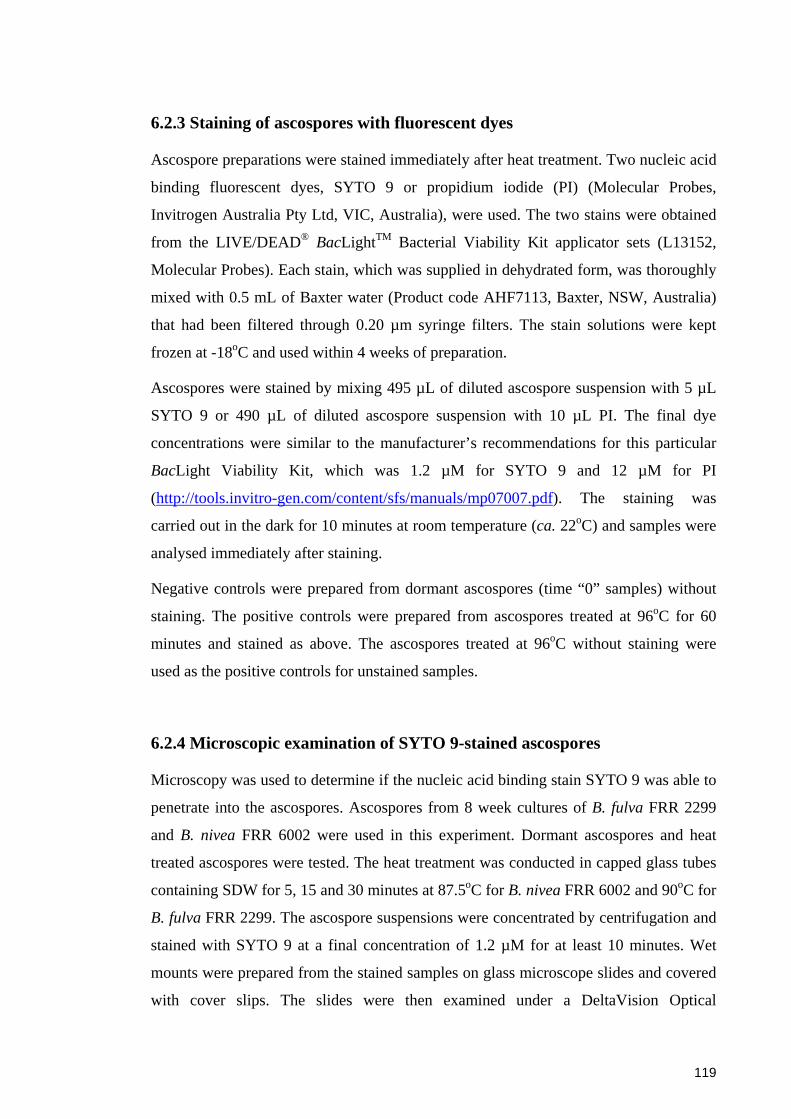
119
6.2.3 Staining of ascospores with fluorescent dyes
Ascospore preparations were stained immediately after heat treatment. Two nucleic acid
binding fluorescent dyes, SYTO 9 or propidium iodide (PI) (Molecular Probes,
Invitrogen Australia Pty Ltd, VIC, Australia), were used. The two stains were obtained
from the LIVE/DEAD® BacLightTM Bacterial Viability Kit applicator sets (L13152,
Molecular Probes). Each stain, which was supplied in dehydrated form, was thoroughly
mixed with 0.5 mL of Baxter water (Product code AHF7113, Baxter, NSW, Australia)
that had been filtered through 0.20 µm syringe filters. The stain solutions were kept
frozen at -18oC and used within 4 weeks of preparation.
Ascospores were stained by mixing 495 µL of diluted ascospore suspension with 5 µL
SYTO 9 or 490 µL of diluted ascospore suspension with 10 µL PI. The final dye
concentrations were similar to the manufacturer’s recommendations for this particular
BacLight Viability Kit, which was 1.2 µM for SYTO 9 and 12 µM for PI
(http://tools.invitro-gen.com/content/sfs/manuals/mp07007.pdf). The staining was
carried out in the dark for 10 minutes at room temperature (ca. 22oC) and samples were
analysed immediately after staining.
Negative controls were prepared from dormant ascospores (time “0” samples) without
staining. The positive controls were prepared from ascospores treated at 96oC for 60
minutes and stained as above. The ascospores treated at 96oC without staining were
used as the positive controls for unstained samples.
6.2.4 Microscopic examination of SYTO 9-stained ascospores
Microscopy was used to determine if the nucleic acid binding stain SYTO 9 was able to
penetrate into the ascospores. Ascospores from 8 week cultures of B. fulva FRR 2299
and B. nivea FRR 6002 were used in this experiment. Dormant ascospores and heat
treated ascospores were tested. The heat treatment was conducted in capped glass tubes
containing SDW for 5, 15 and 30 minutes at 87.5oC for B. nivea FRR 6002 and 90oC for
B. fulva FRR 2299. The ascospore suspensions were concentrated by centrifugation and
stained with SYTO 9 at a final concentration of 1.2 µM for at least 10 minutes. Wet
mounts were prepared from the stained samples on glass microscope slides and covered
with cover slips. The slides were then examined under a DeltaVision Optical

120
Microscope eXperimental (OMX) 3D-Sim Super-Resolution microscope (Applied
Precision, WA, USA) at The University of Technology, Sydney (Sydney, NSW,
Australia).
6.2.5 Flow cytometric analysis
Approximately 0.5 mL of stained ascospores was transferred to a 5 mL Falcon round-
bottom tube (BD Biosciences, CA, USA) for use in the flow cytometer. Flow cytometry
was performed in a FACSCaliburTM instrument (BD Biosciences) equipped with a 15
mW air-cooled 488 nm argon-ion laser. The flow cytometer was calibrated weekly by
BD CellQuest Pro software. Calibration was performed with CaliBRITE beads (BD
Biosciences) for three colour set-up using the FACSComp software. IsoflowTM sheath
fluid (Beckman Coulter, NSW, Australia) was used. Green fluorescence (FL1) was
collected through a 550 nm long-pass filter and red fluorescence (FL3) through a 650
nm long-pass filter. The voltage settings were manually adjusted to keep the forward-
angle light scatter (FSC), side scatter (SSC) and fluorescence signals on log-scale. The
typical setting was: FSC E00, SSC 200 mV, FL1 380 mV, FL2 378 mV and FL3 470
mV. Event rates were controlled to be less than 1000 events per second in all
experiments. An event in flow cytometry can be a single ascospore or an aggregation
which is hydro-dynamically focused and intercepts the light detection system.
6.2.6 Data collection and analysis
When samples were analysed by the flow cytometer, the number of events collected for
each sample was fixed at 10,000 events that occurred in a specified area of the forward
scattering (FSC) versus side scattering dot plots (Region R1, Figure 6.1). This region
was drawn in such a way that it excluded most of the noise and contained the key sub-
population that was always recognised by the flow cytometer. It was adjusted according
to species, strains and condition of ascospores.
Flow data were handled by FlowJo 7.6 software (Tree Star Inc., OR, USA). Statistical
analysis was performed using Minitab® 15 software (Minitab, PA, USA) and the
statistics package in Microsoft Excel. The one-way analysis of variance (ANOVA) and

121
Tukey’s test were used for multiple pair comparisons. The significance level of all
statistic comparisons was 95% (α = 0.05).
A) B)
C) D)
Figure 6.1. Data collecting area on forward scattering (FSC) versus side scattering
(SSC) dot plots for B. fulva FRR 2299 (A), B. fulva FRR 2785 (B), B. nivea FRR 4421
(C) and B. nivea FRR 6002 (D); the number of collected events was fixed at 10,000 in
the R1 region; noise (thin-lined circle) was removed during the data analysis
6.2.7 Procedure of differentiating groups of ascospores
Data of ascospore samples recorded by the flow cytometer were firstly displayed on the
FSC versus SSC dot plots. Events associated with ascospores were mostly in the upper
right quadrant (Q2) of the dot plot, clearly separated from noise (Figure 6.2A). The
subset of events in Q2 area were further analysed on different fluorescent intensity dot
plots depending on the stains being used. For unstained samples, the selected events in
Q2 were viewed on autofluorescence (FL1) versus size (FSC) dot plots. Data of SYTO
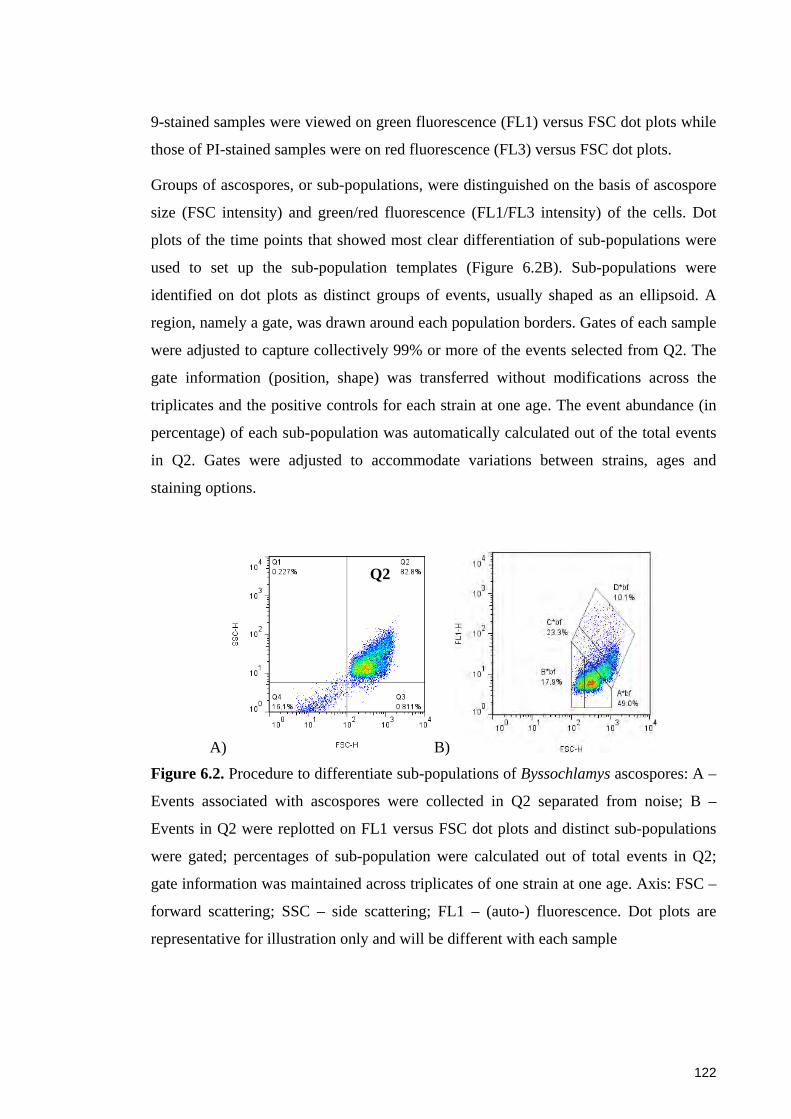
122
9-stained samples were viewed on green fluorescence (FL1) versus FSC dot plots while
those of PI-stained samples were on red fluorescence (FL3) versus FSC dot plots.
Groups of ascospores, or sub-populations, were distinguished on the basis of ascospore
size (FSC intensity) and green/red fluorescence (FL1/FL3 intensity) of the cells. Dot
plots of the time points that showed most clear differentiation of sub-populations were
used to set up the sub-population templates (Figure 6.2B). Sub-populations were
identified on dot plots as distinct groups of events, usually shaped as an ellipsoid. A
region, namely a gate, was drawn around each population borders. Gates of each sample
were adjusted to capture collectively 99% or more of the events selected from Q2. The
gate information (position, shape) was transferred without modifications across the
triplicates and the positive controls for each strain at one age. The event abundance (in
percentage) of each sub-population was automatically calculated out of the total events
in Q2. Gates were adjusted to accommodate variations between strains, ages and
staining options.
A) B)
Figure 6.2. Procedure to differentiate sub-populations of Byssochlamys ascospores: A –
Events associated with ascospores were collected in Q2 separated from noise; B –
Events in Q2 were replotted on FL1 versus FSC dot plots and distinct sub-populations
were gated; percentages of sub-population were calculated out of total events in Q2;
gate information was maintained across triplicates of one strain at one age. Axis: FSC –
forward scattering; SSC – side scattering; FL1 – (auto-) fluorescence. Dot plots are
representative for illustration only and will be different with each sample
Q2
123
6.3 Results
6.3.1 Penetration of SYTO 9 into ascospores
SYTO 9 penetrated poorly into the dormant ascospores of B. fulva FRR 2299 and B.
nivea FRR 6002. The stain only accumulated on the cell periphery, forming a distinct
fluorescent ring around the ascospores (Figure 6.3A, E). Intracellular configurations of
the dormant ascospores were not clearly shown. On the other hand, SYTO 9 was able to
penetrate heat treated ascospores and highlighted some details of the internal content as
well as the cell wall. Apart from the peripheral staining, the central cytoplasm of heated
ascospores fluoresced brightly and was clearly differentiated from the rest of the cells.
There was a void between the outer ring and the central area where no fluorescence was
detected (Figure 6.3D, H).
The intensity of staining by SYTO 9 increased with the length of the heat treatment,
indicating a higher permeability of ascospores to the dye. The central cytoplasm became
clearer and more distinctive in more severely heated ascospores (Figure 6.3B – D, F –
H). However, modifications on the surface of the ascospore wall also became more
prominent as heat progressed, especially after 30 minutes (Figure 6.3D, H).

124
Dor
man
t
A) E)
5 m
inut
es
B) F)
15 m
inut
es
C) G)
30 m
inut
es
D) H)
Figure 6.3. Penetration of SYTO 9 into ascospores in response to heat treatment at
90oC for B. fulva FRR 2299 (left) or 87.5oC B. nivea FRR 6002 (right). Note the stained
periphery (block arrow), the central cytoplasm (arrow) and the surface modifications
(arrow heads). Scale bar = 1 µm
125
6.3.2 Evaluation of fluorescent dyes for differentiating sub-populations of
Byssochlamys ascospores
Four week ascospores were subjected to three staining options: unstained, SYTO-
stained and PI-stained. The staining results for B. fulva FRR 2299 and B. nivea FRR
4421 are presented in Figures 6.4 and 6.5, respectively. For clear presentation, only data
at time 0 (dormant) and 30 minutes are shown. Dot plots of treatments at 1, 4 and 12
minutes showed intermediate states between 0 and 30 minutes. Similar staining patterns
were observed for 8 and 12 week ascospores (Appendices 6.1 – 6.4).
Unstained ascospores, as expected, had relatively low autofluorescence intensity,
irrespective of strain and age. Progressive heat treatment (1 – 30 minutes) resulted in a
concomitant increase in the autofluorescence but the change was relatively small even
after the longest heating time. Sub-populations could be observed in dormant and heated
samples. For B. fulva strains, sub-populations were separated better by autofluorescence
(FL1) than by size (FSC). Even then, the sub-populations were closely stacked on top of
each other (Figure 6.4 A, B, E, F). For B. nivea strains, sub-populations were well
separated by size and auto-fluorescence (FL1) (Figure 6.5 A, B, E, F). For both species,
the whole populations were partially clustered on the FSC axis, making it difficult to
distinguish sub-populations.
SYTO 9-stained ascospores exhibited about 10 times as much fluorescence (FL1) as the
unstained samples irrespective of strain and age, therefore elevating all events into the
centre of the dot plots. The fluorescence intensity increased slightly after 30 minute heat
treatment compared with the dormant samples. SYTO 9 staining could also separate
sub-populations of B. nivea strains better than the unstained ascospores (Figure 6.5 C,
D). However, the differentiation of sub-populations was not improved as much for B.
fulva ascospores (Figure 6.4 C, D).
PI-stained ascospores displayed slightly increased fluorescence on FL3 by about 3-fold
compared with unstained samples. This change occurred with both dormant and heat
treated samples irrespective of strain and age. For B. fulva strains, PI staining did not
enhance the separation of sub-populations better than SYTO 9 staining or no stain
(Figure 6.4 G, H). For B. nivea strains, PI-stained ascospores were differentiated
marginally better than unstained samples, but not as effectively as those stained with

126
SYTO 9. Additionally, a part of the PI-stained populations was still shadowed by the
FSC axis (Figure 6.5 G, H).
In conclusion, unstained ascospores can be separated by size and, to a lesser extent, by
autofluorescence. For staining options, SYTO 9-stained ascospores showed higher
fluorescence intensity and clearer separation of sub-populations, particularly for B.
nivea, than PI-stained samples. Thus, SYTO 9 was a better fluorogenic dye than PI in
differentiating sub-populations of Byssochlamys ascospores after aging and heat
treatments.

127
Unstained Stained
0 m
in
FL1
– G
reen
fluo
resc
ence
inte
nsity
(SYT
O 9
)
A) C)
30 m
in
B) D)
0 m
in
FL3
– R
ed fl
uore
scen
ce in
tens
ity (P
I)
E) G)
30 m
in
F) H)
FSC intensity – Size
Figure 6.4. Comparative staining of 4 week ascospores of B. fulva FRR 2299 with
different nucleic acid stains. Staining option: A, B, E, F – unstained, C and D – SYTO 9
stain, G and H – PI stain; ascospores were heat treated at 90oC for up o 30 minutes
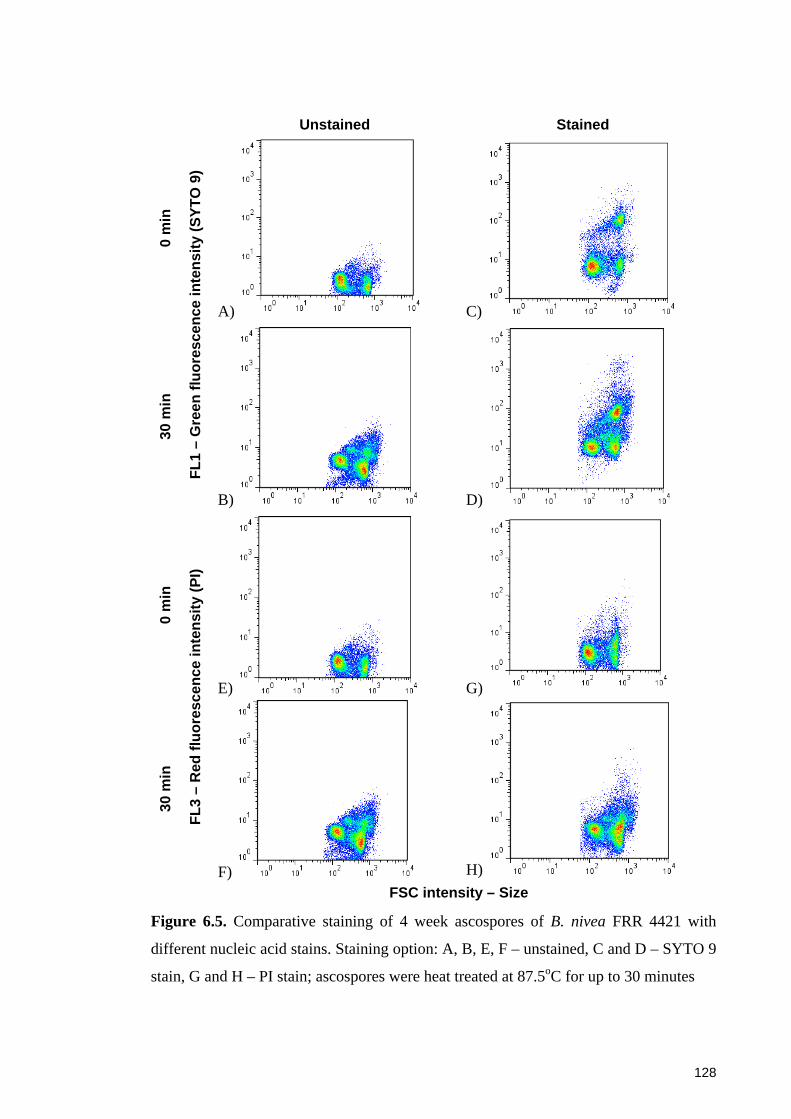
128
Unstained Stained
0 m
in
FL1
– G
reen
fluo
resc
ence
inte
nsity
(SYT
O 9
)
A) C)
30 m
in
B) D)
0 m
in
FL3
– R
ed fl
uore
scen
ce in
tens
ity (P
I)
E) G)
30 m
in
F) H)
FSC intensity – Size
Figure 6.5. Comparative staining of 4 week ascospores of B. nivea FRR 4421 with
different nucleic acid stains. Staining option: A, B, E, F – unstained, C and D – SYTO 9
stain, G and H – PI stain; ascospores were heat treated at 87.5oC for up to 30 minutes
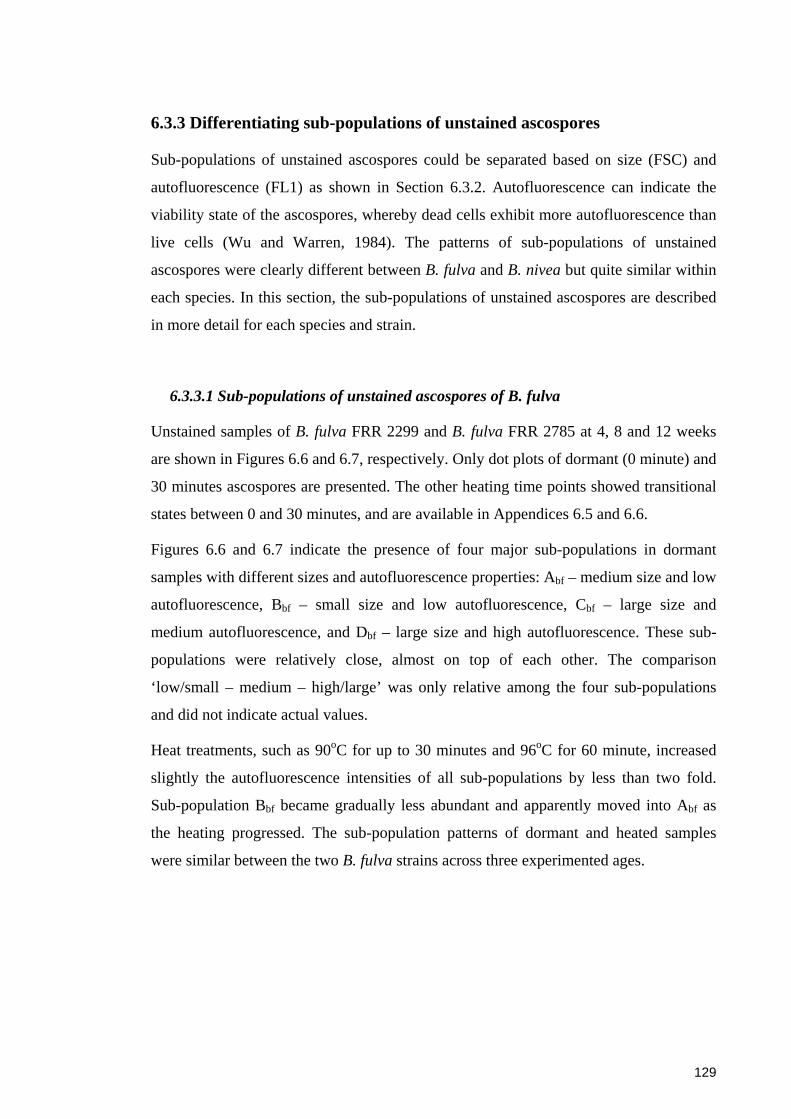
129
6.3.3 Differentiating sub-populations of unstained ascospores
Sub-populations of unstained ascospores could be separated based on size (FSC) and
autofluorescence (FL1) as shown in Section 6.3.2. Autofluorescence can indicate the
viability state of the ascospores, whereby dead cells exhibit more autofluorescence than
live cells (Wu and Warren, 1984). The patterns of sub-populations of unstained
ascospores were clearly different between B. fulva and B. nivea but quite similar within
each species. In this section, the sub-populations of unstained ascospores are described
in more detail for each species and strain.
6.3.3.1 Sub-populations of unstained ascospores of B. fulva
Unstained samples of B. fulva FRR 2299 and B. fulva FRR 2785 at 4, 8 and 12 weeks
are shown in Figures 6.6 and 6.7, respectively. Only dot plots of dormant (0 minute) and
30 minutes ascospores are presented. The other heating time points showed transitional
states between 0 and 30 minutes, and are available in Appendices 6.5 and 6.6.
Figures 6.6 and 6.7 indicate the presence of four major sub-populations in dormant
samples with different sizes and autofluorescence properties: Abf – medium size and low
autofluorescence, Bbf – small size and low autofluorescence, Cbf – large size and
medium autofluorescence, and Dbf – large size and high autofluorescence. These sub-
populations were relatively close, almost on top of each other. The comparison
‘low/small – medium – high/large’ was only relative among the four sub-populations
and did not indicate actual values.
Heat treatments, such as 90oC for up to 30 minutes and 96oC for 60 minute, increased
slightly the autofluorescence intensities of all sub-populations by less than two fold.
Sub-population Bbf became gradually less abundant and apparently moved into Abf as
the heating progressed. The sub-population patterns of dormant and heated samples
were similar between the two B. fulva strains across three experimented ages.
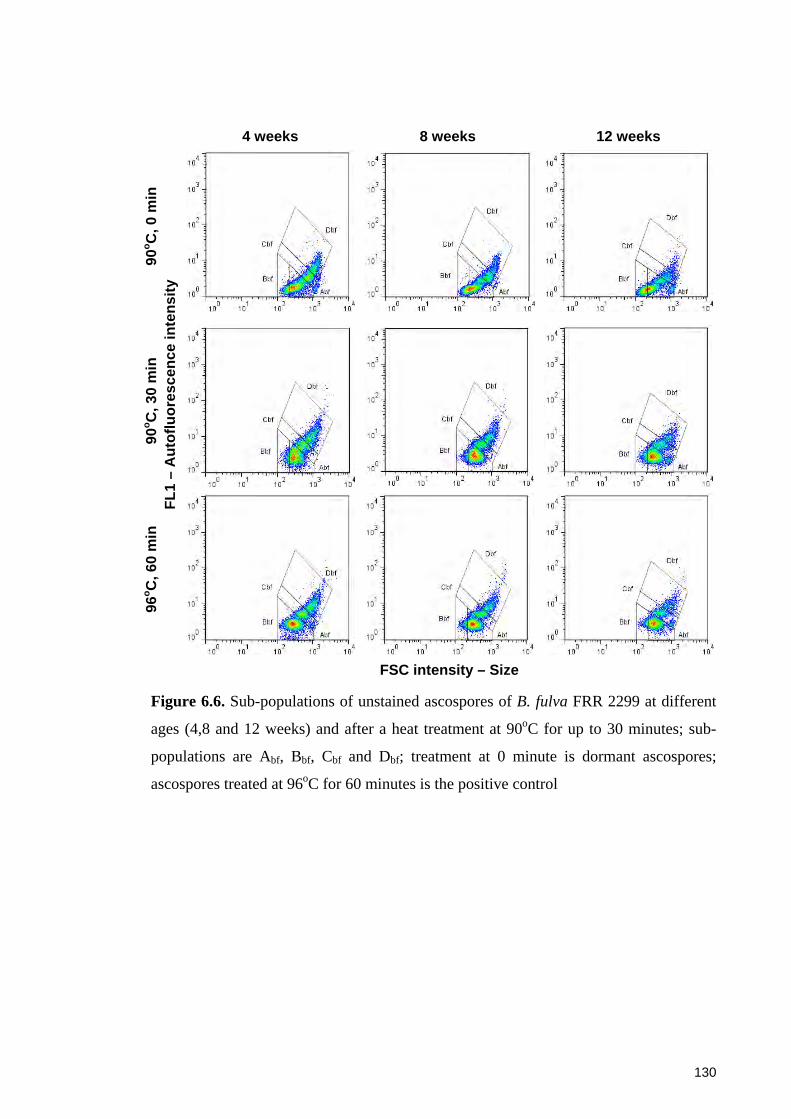
130
4 weeks 8 weeks 12 weeks
90o C
, 0 m
in
FL1
– A
utof
luor
esce
nce
inte
nsity
90
o C, 3
0 m
in
96o C
, 60
min
FSC intensity – Size
Figure 6.6. Sub-populations of unstained ascospores of B. fulva FRR 2299 at different
ages (4,8 and 12 weeks) and after a heat treatment at 90oC for up to 30 minutes; sub-
populations are Abf, Bbf, Cbf and Dbf; treatment at 0 minute is dormant ascospores;
ascospores treated at 96oC for 60 minutes is the positive control
131
4 weeks 8 weeks 12 weeks 90
o C, 0
min
FL
1 –
Aut
oflu
ores
cenc
e in
tens
ity
90o C
, 30
min
96
o C, 6
0 m
in
FSC intensity – Size
Figure 6.7. Sub-populations of unstained ascospores of B. fulva FRR 2785 at different
ages (4, 8 and 12 weeks) and after a heat treatment at 90oC for up to 30 minutes; sub-
populations are Abf, Bbf, Cbf and Dbf; treatment at 0 min is dormant ascospores;
ascospores treated at 96oC for 60 minutes is the positive control
Because of the much similar patterns of sub-populations before and after heat
treatments, identities of the sub-populations could not be fully elucidated. Prediction of
identities is attempted for some sub-populations based on size and autofluorescence
characteristics. Abf is predicted to be aggregated ascospores, which are partially coming
from Bbf sub-population of single ascospores after heat treatments. Abf may also
comprise heat affected ascospores. Cbf and Dbf are likely to be aggregated, severely
heat-damaged ascospores, including heat inactivated, due to their high levels of

132
autofluorescence. However, it is impossible to assign any specific viability state for
three sub-populations Abf, Cbf and Dbf. Properties and the predicted identities of sub-
populations for B. fulva ascospores are tabulated in Table 6.1.
Table 6.1. Predicted identities of sub-populations of unstained B. fulva ascospores
Sub-population
Relative cell size
Relative auto-fluorescence intensity
Predicted identity
Abf Medium Low Aggregated or heat inflicted
ascospores
Bbf Small Low Single, dormant ascospores
Cbf Large Medium Aggregated or heat damaged or
inactivated ascospores
Dbf Large High Aggregated or severely
damaged/inactivated ascospores
6.3.3.2 Sub-populations of unstained ascospores of B. nivea
Unstained ascospores of B. nivea FRR 4421 and B. nivea FRR 6002 at 4, 8 and 12
weeks are shown in Figures 6.8 and 6.9, respectively. As for B. fulva, only dormant and
30 minutes samples are shown here and data of the intermediate time points are
presented in Appendices 6.7 and 6.8.
Unstained, dormant ascospores displayed three major sub-populations: Abn – low
autofluorescence and small sizes, Bbn – low autofluorescence as Abn and large sizes, and
Cbn – high autofluorescence and medium sizes. These sub-populations were separated
better than those of B. fulva. The comparison of size and autofluorescence among the
sub-populations is only relative. Heating at 87.5oC for up to 30 minutes increased the
autofluorescence of all sub-populations by less than two fold. Sub-populations Bbn and
Cbn also became more abundant after the heat treatment. Moreover, as a result of
heating, a new sub-population Dbn appeared as an extension from Bbn, which had similar
size but higher autofluorescence than Bbn. Ascospores that were heated severely at 96oC
for 60 minutes had only two sub-populations Bbn and Dbn.
The developments of sub-populations for dormant and heated ascospores are similar
between two B. nivea strains. However, the abundance of some sub-populations was

133
different with ascospore age. Sub-population Bbn was more prominent at 4 weeks than 8
and 12 weeks both before and after the heat treatment. Sub-population Dbn was also
more pronounced at 4 weeks than the other ages. Contrarily, sub-population Cbn was
more abundant at 8 and 12 weeks than 4 weeks.
4 weeks 8 weeks 12 weeks
87.5
o C, 0
min
FL
1 –
Aut
oflu
ores
cenc
e in
tens
ity
87.5
o C, 3
0 m
in
96o C
, 60
min
utes
FSC intensity – Size
Figure 6.8. Sub-populations of unstained ascospores of B. nivea FRR 4421 at different
ages (4, 8 and 12 weeks) and after a heat treatment at 87.5oC for up to 30 minutes; sub-
populations are Abn, Bbn, Cbn and Dbn; ascospores treated at 96oC for 60 minute is the
positive control

134
4 weeks 8 weeks 12 weeks 87
.5o C
, 0 m
in
FL1
– A
utof
luor
esce
nce
inte
nsity
87
.5o C
, 30
min
96
o C, 6
0 m
inut
es
FSC intensity – Size
Figure 6.9. Sub-populations of unstained ascospores of B. nivea FRR 6002 at different
ages (4, 8 and 12 weeks) and after a heat treatment at 87.5oC for up to 30 minutes; sub-
populations are Abn, Bbn, Cbn and Dbn; ascospores treated at 96oC for 60 minute is the
positive control
The predicted states of B. nivea sub-populations are summarised in Table 6.2. The clear
difference between sub-population patterns of dormant ascospores and those treated at
96oC indicates that Abn may comprise single dormant ascospores whereas Bbn and Dbn
are aggregated, heat inactivated cells. Bbn possibly contain damaged cells with low
internal content, causing low level of autofluorescence. Sub-population Cbn could be
heat activated ascospores or smaller aggregations than Bbn.
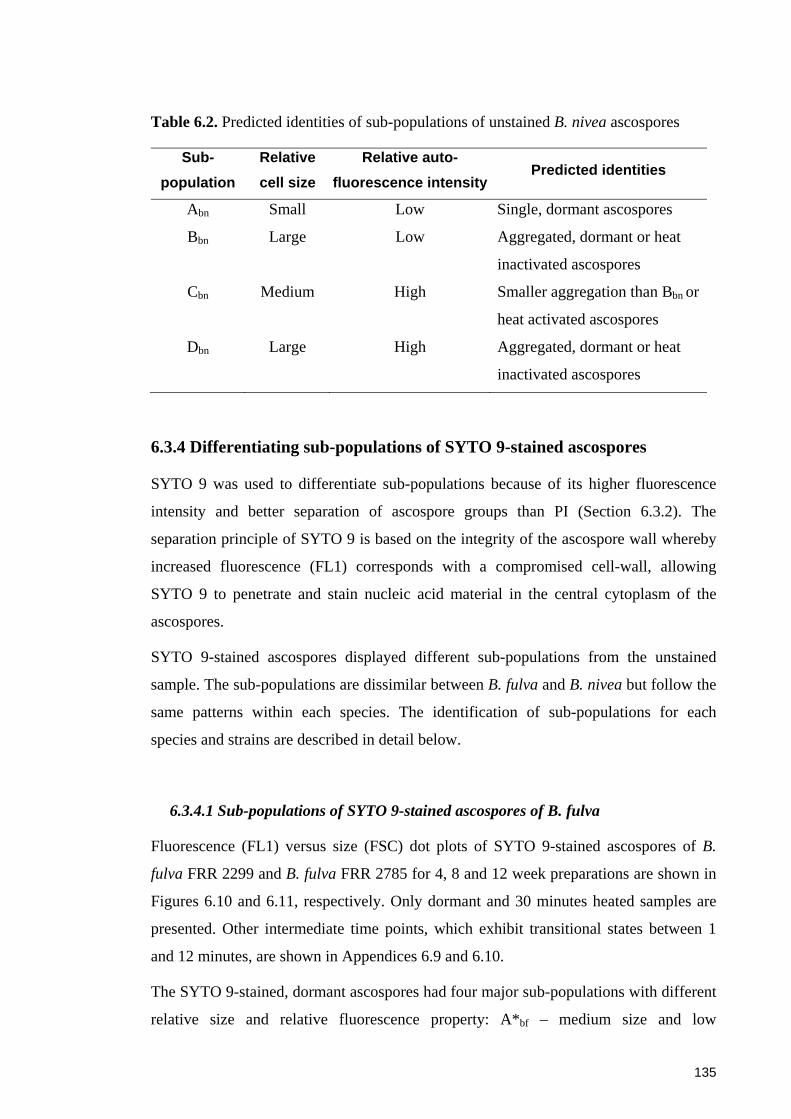
135
Table 6.2. Predicted identities of sub-populations of unstained B. nivea ascospores
Sub-population
Relative cell size
Relative auto-fluorescence intensity
Predicted identities
Abn Small Low Single, dormant ascospores
Bbn Large Low Aggregated, dormant or heat
inactivated ascospores
Cbn Medium High Smaller aggregation than Bbn or
heat activated ascospores
Dbn Large High Aggregated, dormant or heat
inactivated ascospores
6.3.4 Differentiating sub-populations of SYTO 9-stained ascospores
SYTO 9 was used to differentiate sub-populations because of its higher fluorescence
intensity and better separation of ascospore groups than PI (Section 6.3.2). The
separation principle of SYTO 9 is based on the integrity of the ascospore wall whereby
increased fluorescence (FL1) corresponds with a compromised cell-wall, allowing
SYTO 9 to penetrate and stain nucleic acid material in the central cytoplasm of the
ascospores.
SYTO 9-stained ascospores displayed different sub-populations from the unstained
sample. The sub-populations are dissimilar between B. fulva and B. nivea but follow the
same patterns within each species. The identification of sub-populations for each
species and strains are described in detail below.
6.3.4.1 Sub-populations of SYTO 9-stained ascospores of B. fulva
Fluorescence (FL1) versus size (FSC) dot plots of SYTO 9-stained ascospores of B.
fulva FRR 2299 and B. fulva FRR 2785 for 4, 8 and 12 week preparations are shown in
Figures 6.10 and 6.11, respectively. Only dormant and 30 minutes heated samples are
presented. Other intermediate time points, which exhibit transitional states between 1
and 12 minutes, are shown in Appendices 6.9 and 6.10.
The SYTO 9-stained, dormant ascospores had four major sub-populations with different
relative size and relative fluorescence property: A*bf – medium size and low
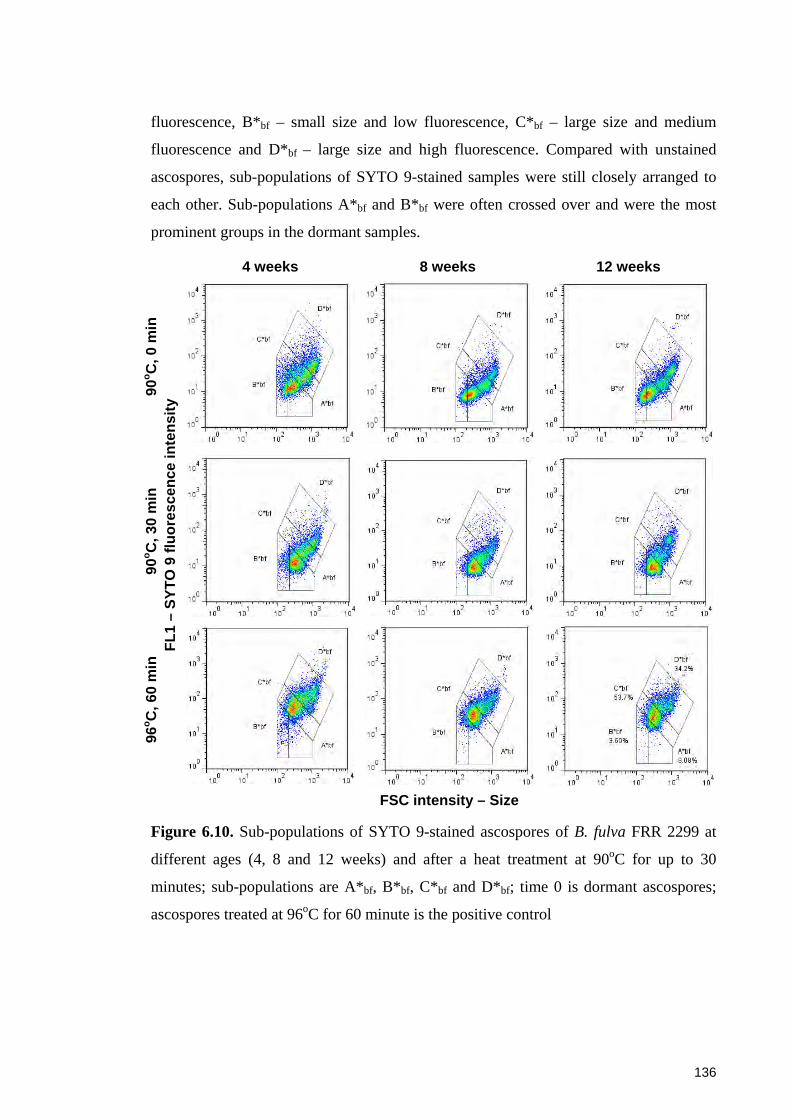
136
fluorescence, B*bf – small size and low fluorescence, C*bf – large size and medium
fluorescence and D*bf – large size and high fluorescence. Compared with unstained
ascospores, sub-populations of SYTO 9-stained samples were still closely arranged to
each other. Sub-populations A*bf and B*bf were often crossed over and were the most
prominent groups in the dormant samples.
4 weeks 8 weeks 12 weeks
90o C
, 0 m
in
FL1
– SY
TO 9
fluo
resc
ence
inte
nsity
90
o C, 3
0 m
in
96o C
, 60
min
FSC intensity – Size
Figure 6.10. Sub-populations of SYTO 9-stained ascospores of B. fulva FRR 2299 at
different ages (4, 8 and 12 weeks) and after a heat treatment at 90oC for up to 30
minutes; sub-populations are A*bf, B*bf, C*bf and D*bf; time 0 is dormant ascospores;
ascospores treated at 96oC for 60 minute is the positive control
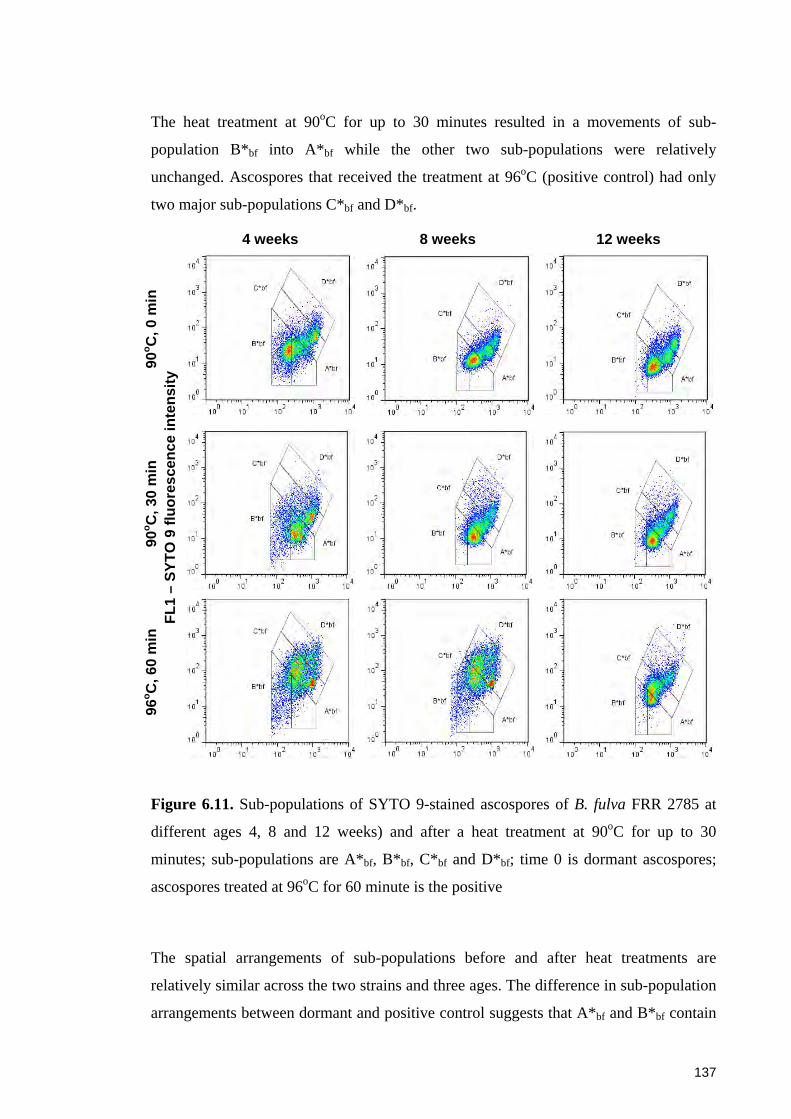
137
The heat treatment at 90oC for up to 30 minutes resulted in a movements of sub-
population B*bf into A*bf while the other two sub-populations were relatively
unchanged. Ascospores that received the treatment at 96oC (positive control) had only
two major sub-populations C*bf and D*bf.
4 weeks 8 weeks 12 weeks
90o C
, 0 m
in
FL1
– SY
TO 9
fluo
resc
ence
inte
nsity
90
o C, 3
0 m
in
96o C
, 60
min
Figure 6.11. Sub-populations of SYTO 9-stained ascospores of B. fulva FRR 2785 at
different ages 4, 8 and 12 weeks) and after a heat treatment at 90oC for up to 30
minutes; sub-populations are A*bf, B*bf, C*bf and D*bf; time 0 is dormant ascospores;
ascospores treated at 96oC for 60 minute is the positive
The spatial arrangements of sub-populations before and after heat treatments are
relatively similar across the two strains and three ages. The difference in sub-population
arrangements between dormant and positive control suggests that A*bf and B*bf contain
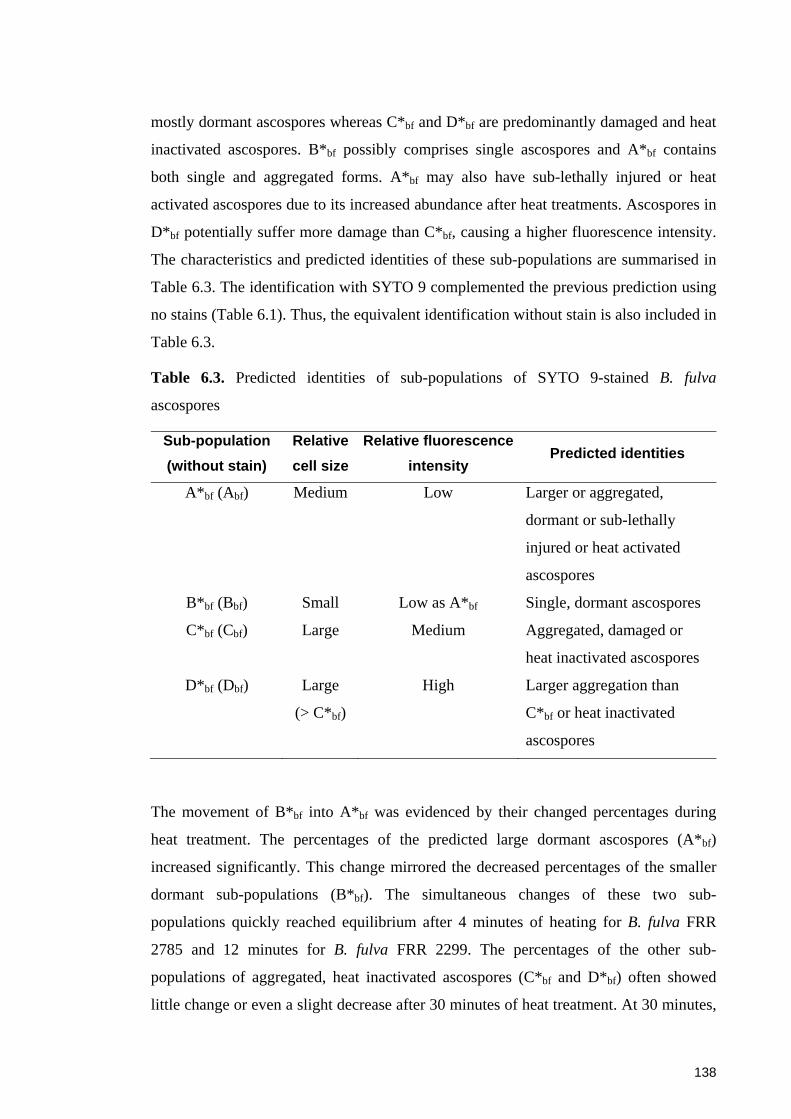
138
mostly dormant ascospores whereas C*bf and D*bf are predominantly damaged and heat
inactivated ascospores. B*bf possibly comprises single ascospores and A*bf contains
both single and aggregated forms. A*bf may also have sub-lethally injured or heat
activated ascospores due to its increased abundance after heat treatments. Ascospores in
D*bf potentially suffer more damage than C*bf, causing a higher fluorescence intensity.
The characteristics and predicted identities of these sub-populations are summarised in
Table 6.3. The identification with SYTO 9 complemented the previous prediction using
no stains (Table 6.1). Thus, the equivalent identification without stain is also included in
Table 6.3.
Table 6.3. Predicted identities of sub-populations of SYTO 9-stained B. fulva
ascospores
Sub-population (without stain)
Relative cell size
Relative fluorescence intensity
Predicted identities
A*bf (Abf) Medium Low Larger or aggregated,
dormant or sub-lethally
injured or heat activated
ascospores
B*bf (Bbf) Small Low as A*bf Single, dormant ascospores
C*bf (Cbf) Large Medium Aggregated, damaged or
heat inactivated ascospores
D*bf (Dbf) Large
(> C*bf)
High Larger aggregation than
C*bf or heat inactivated
ascospores
The movement of B*bf into A*bf was evidenced by their changed percentages during
heat treatment. The percentages of the predicted large dormant ascospores (A*bf)
increased significantly. This change mirrored the decreased percentages of the smaller
dormant sub-populations (B*bf). The simultaneous changes of these two sub-
populations quickly reached equilibrium after 4 minutes of heating for B. fulva FRR
2785 and 12 minutes for B. fulva FRR 2299. The percentages of the other sub-
populations of aggregated, heat inactivated ascospores (C*bf and D*bf) often showed
little change or even a slight decrease after 30 minutes of heat treatment. At 30 minutes,

139
the smaller and larger dormant sub-population accounted for 10 – 20% and 40%,
respectively of the total population. The corresponding figures of heat inactivated sub-
populations were 10 – 30% each. Figure 6.12 illustrates the changed abundance of sub-
populations with heating time for 4 week ascospores. Results are similar at 8 and 12
weeks, and are provided in Appendices 6.11 and 6.12.
A)
B)
Figure 6.12. Changed abundances of sub-populations of B. fulva ascospores stained by
SYTO 9 after a heat treatment at 90oC; ascospores are 4 weeks old. Strain: A – B. fulva
FRR 2299, B – B. fulva FRR 2785. Sub-population: A*bf (♦), B*bf (■), C*bf (▲) and
D*bf (●); each point is an average of three experiments
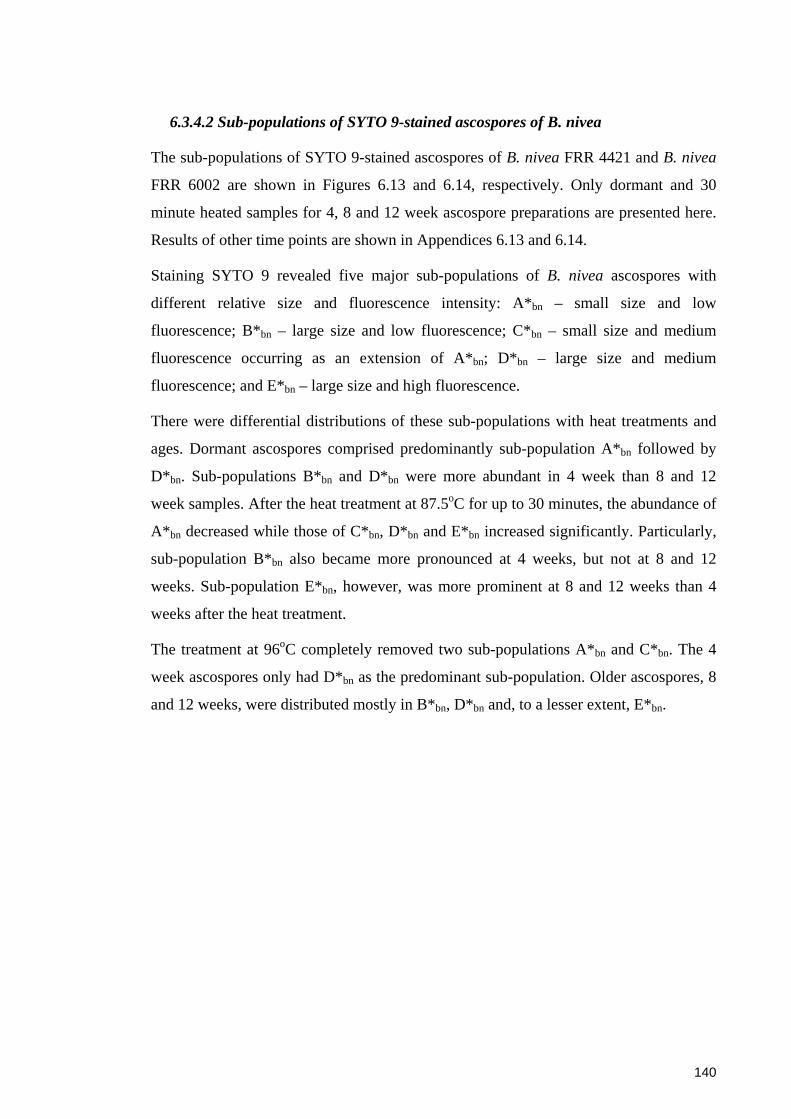
140
6.3.4.2 Sub-populations of SYTO 9-stained ascospores of B. nivea
The sub-populations of SYTO 9-stained ascospores of B. nivea FRR 4421 and B. nivea
FRR 6002 are shown in Figures 6.13 and 6.14, respectively. Only dormant and 30
minute heated samples for 4, 8 and 12 week ascospore preparations are presented here.
Results of other time points are shown in Appendices 6.13 and 6.14.
Staining SYTO 9 revealed five major sub-populations of B. nivea ascospores with
different relative size and fluorescence intensity: A*bn – small size and low
fluorescence; B*bn – large size and low fluorescence; C*bn – small size and medium
fluorescence occurring as an extension of A*bn; D*bn – large size and medium
fluorescence; and E*bn – large size and high fluorescence.
There were differential distributions of these sub-populations with heat treatments and
ages. Dormant ascospores comprised predominantly sub-population A*bn followed by
D*bn. Sub-populations B*bn and D*bn were more abundant in 4 week than 8 and 12
week samples. After the heat treatment at 87.5oC for up to 30 minutes, the abundance of
A*bn decreased while those of C*bn, D*bn and E*bn increased significantly. Particularly,
sub-population B*bn also became more pronounced at 4 weeks, but not at 8 and 12
weeks. Sub-population E*bn, however, was more prominent at 8 and 12 weeks than 4
weeks after the heat treatment.
The treatment at 96oC completely removed two sub-populations A*bn and C*bn. The 4
week ascospores only had D*bn as the predominant sub-population. Older ascospores, 8
and 12 weeks, were distributed mostly in B*bn, D*bn and, to a lesser extent, E*bn.
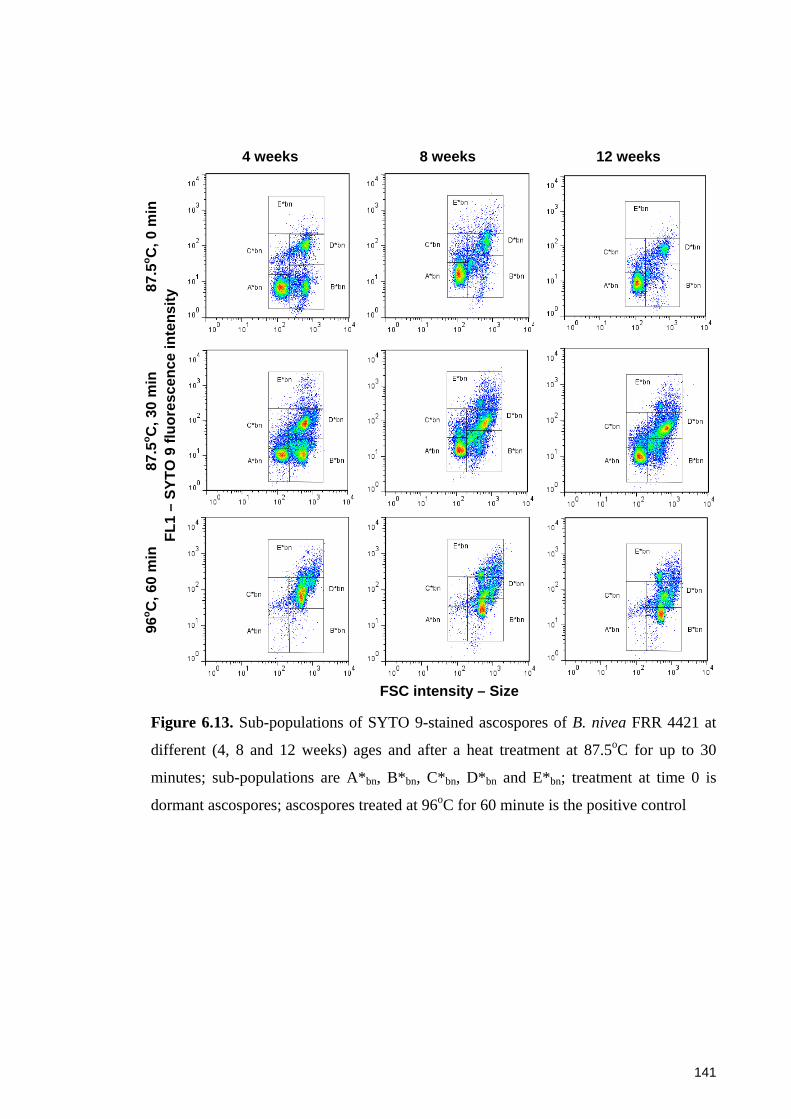
141
4 weeks 8 weeks 12 weeks 87
.5o C
, 0 m
in
FL1
– SY
TO 9
fluo
resc
ence
inte
nsity
87
.5o C
, 30
min
96
o C, 6
0 m
in
FSC intensity – Size
Figure 6.13. Sub-populations of SYTO 9-stained ascospores of B. nivea FRR 4421 at
different (4, 8 and 12 weeks) ages and after a heat treatment at 87.5oC for up to 30
minutes; sub-populations are A*bn, B*bn, C*bn, D*bn and E*bn; treatment at time 0 is
dormant ascospores; ascospores treated at 96oC for 60 minute is the positive control
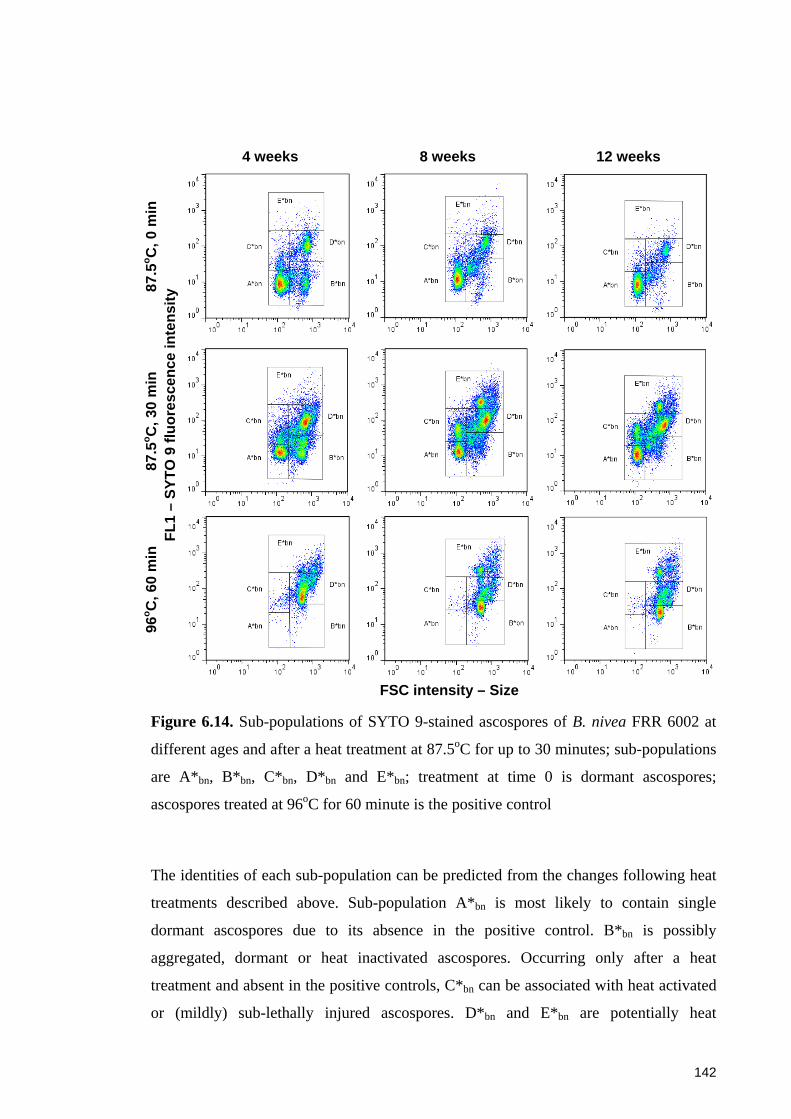
142
4 weeks 8 weeks 12 weeks 87
.5o C
, 0 m
in
FL1
– SY
TO 9
fluo
resc
ence
inte
nsity
87
.5o C
, 30
min
96
o C, 6
0 m
in
FSC intensity – Size
Figure 6.14. Sub-populations of SYTO 9-stained ascospores of B. nivea FRR 6002 at
different ages and after a heat treatment at 87.5oC for up to 30 minutes; sub-populations
are A*bn, B*bn, C*bn, D*bn and E*bn; treatment at time 0 is dormant ascospores;
ascospores treated at 96oC for 60 minute is the positive control
The identities of each sub-population can be predicted from the changes following heat
treatments described above. Sub-population A*bn is most likely to contain single
dormant ascospores due to its absence in the positive control. B*bn is possibly
aggregated, dormant or heat inactivated ascospores. Occurring only after a heat
treatment and absent in the positive controls, C*bn can be associated with heat activated
or (mildly) sub-lethally injured ascospores. D*bn and E*bn are potentially heat

143
inactivated ascospores since they became more pronounced after heating. In addition,
B*bn and D*bn may also contain mechanically damaged ascospores which are observed
frequently during harvesting ascospores for this experiment. The prediction with SYTO
9-stained ascospores improves the results of unstained samples (Table 6.2). Thus, the
predicted identities of the sub-populations with and without SYTO 9 stain are
summarised together in Table 6.4.
Table 6.4. Predicted identities of sub-populations of SYTO 9-stained B. nivea
ascospores
Sub-population
(without stain)
Relative cell size
Relative fluorescence intensity
Predicted identities
A*bn (Abn) Small Low Single, dormant ascospores
B*bn (Bbn) Large Low Larger or aggregated, dormant
or mechanically damaged or heat
inactivated ascospores
C*bn (Cbn) Small Medium Heat activated or (mildly) sub-
lethally injured ascospores
D*bn (Dbn) Large Medium Mechanically damaged or heat
inactivated ascospores
E*bn (Dbn) Large High Heat inactivated ascospores
The percentages of sub-populations reflected the concurrent, opposite changes of the
single dormant ascospores (A*bn) and the inactivated population (D*bn) during the heat
treatments. As the heating progressed, the abundance of dormant sub-population
decreased significantly whereas that of the heat inactivated sub-populations increased.
The percentages of other sub-populations increased slightly but significantly at 1 minute
and showed little changed until the end of the treatment. After 30 minute treatment, the
single dormant ascospores accounted for about 20% of the total population, aggregated
ascospores (B*bn) 20 – 30%, activated sub-population (C*bn) less than 10%, and
inactivated ascospores (D*bn and E*bn) 40% or more. These changes were similar at the
three experimented ages. Results of the 4 week ascospores are presented in Figure 6.15
and those of other ages are in Appendices 6.15 and 6.16.
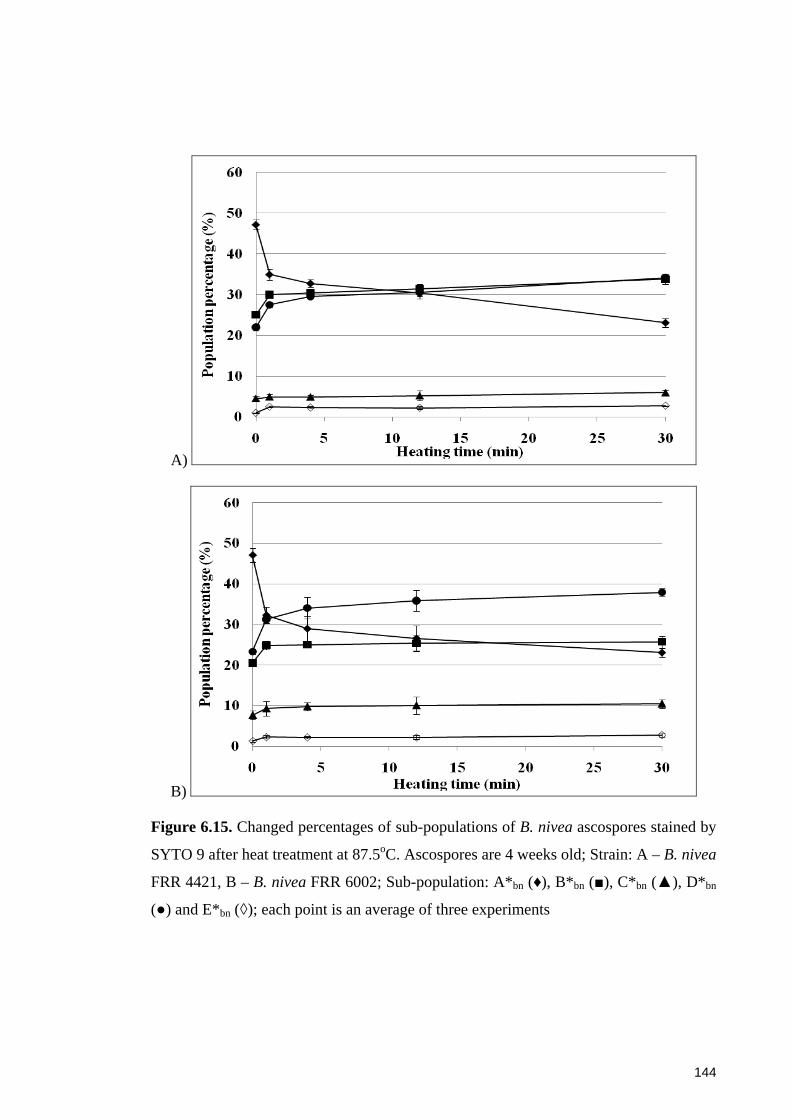
144
A)
B)
Figure 6.15. Changed percentages of sub-populations of B. nivea ascospores stained by
SYTO 9 after heat treatment at 87.5oC. Ascospores are 4 weeks old; Strain: A – B. nivea
FRR 4421, B – B. nivea FRR 6002; Sub-population: A*bn (♦), B*bn (■), C*bn (▲), D*bn
(●) and E*bn (◊); each point is an average of three experiments
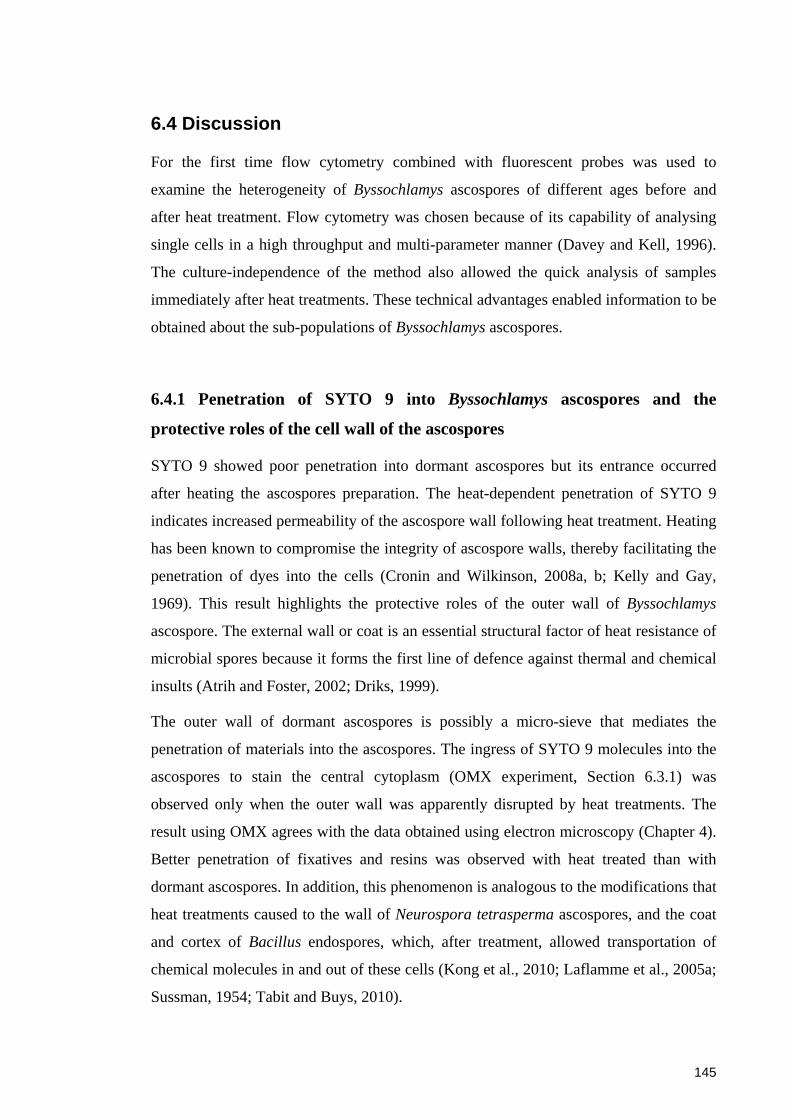
145
6.4 Discussion
For the first time flow cytometry combined with fluorescent probes was used to
examine the heterogeneity of Byssochlamys ascospores of different ages before and
after heat treatment. Flow cytometry was chosen because of its capability of analysing
single cells in a high throughput and multi-parameter manner (Davey and Kell, 1996).
The culture-independence of the method also allowed the quick analysis of samples
immediately after heat treatments. These technical advantages enabled information to be
obtained about the sub-populations of Byssochlamys ascospores.
6.4.1 Penetration of SYTO 9 into Byssochlamys ascospores and the
protective roles of the cell wall of the ascospores
SYTO 9 showed poor penetration into dormant ascospores but its entrance occurred
after heating the ascospores preparation. The heat-dependent penetration of SYTO 9
indicates increased permeability of the ascospore wall following heat treatment. Heating
has been known to compromise the integrity of ascospore walls, thereby facilitating the
penetration of dyes into the cells (Cronin and Wilkinson, 2008a, b; Kelly and Gay,
1969). This result highlights the protective roles of the outer wall of Byssochlamys
ascospore. The external wall or coat is an essential structural factor of heat resistance of
microbial spores because it forms the first line of defence against thermal and chemical
insults (Atrih and Foster, 2002; Driks, 1999).
The outer wall of dormant ascospores is possibly a micro-sieve that mediates the
penetration of materials into the ascospores. The ingress of SYTO 9 molecules into the
ascospores to stain the central cytoplasm (OMX experiment, Section 6.3.1) was
observed only when the outer wall was apparently disrupted by heat treatments. The
result using OMX agrees with the data obtained using electron microscopy (Chapter 4).
Better penetration of fixatives and resins was observed with heat treated than with
dormant ascospores. In addition, this phenomenon is analogous to the modifications that
heat treatments caused to the wall of Neurospora tetrasperma ascospores, and the coat
and cortex of Bacillus endospores, which, after treatment, allowed transportation of
chemical molecules in and out of these cells (Kong et al., 2010; Laflamme et al., 2005a;
Sussman, 1954; Tabit and Buys, 2010).
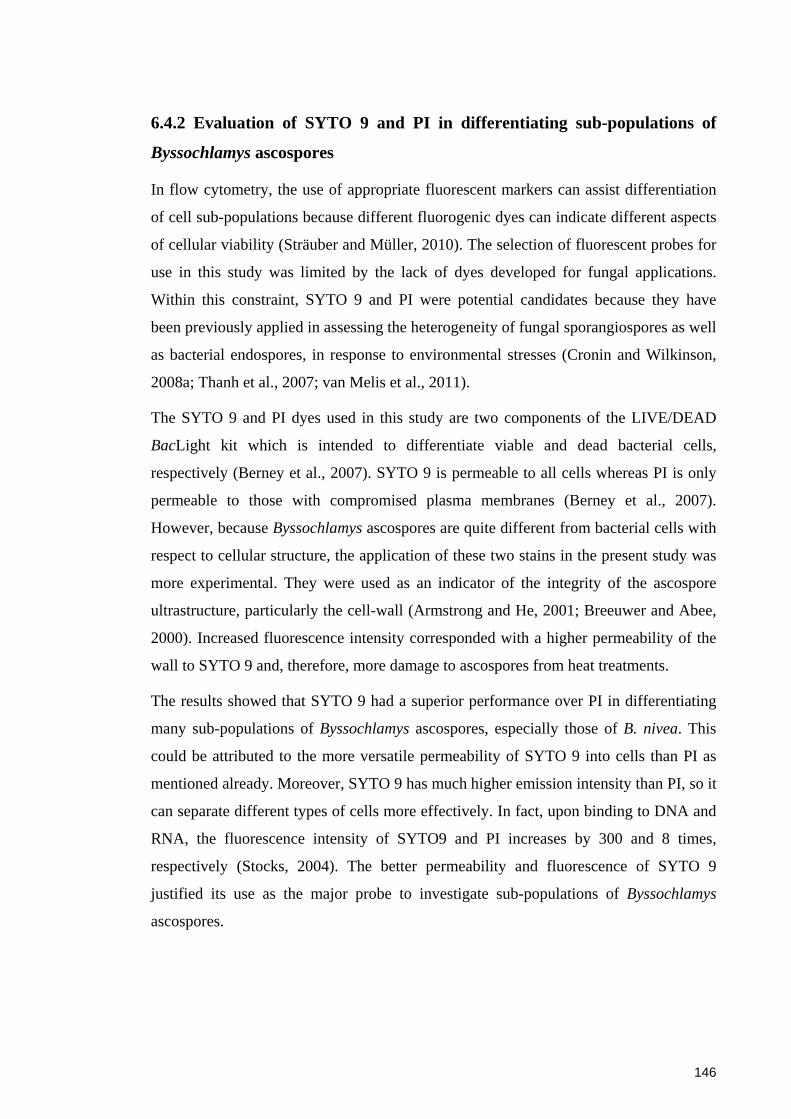
146
6.4.2 Evaluation of SYTO 9 and PI in differentiating sub-populations of
Byssochlamys ascospores
In flow cytometry, the use of appropriate fluorescent markers can assist differentiation
of cell sub-populations because different fluorogenic dyes can indicate different aspects
of cellular viability (Sträuber and Müller, 2010). The selection of fluorescent probes for
use in this study was limited by the lack of dyes developed for fungal applications.
Within this constraint, SYTO 9 and PI were potential candidates because they have
been previously applied in assessing the heterogeneity of fungal sporangiospores as well
as bacterial endospores, in response to environmental stresses (Cronin and Wilkinson,
2008a; Thanh et al., 2007; van Melis et al., 2011).
The SYTO 9 and PI dyes used in this study are two components of the LIVE/DEAD
BacLight kit which is intended to differentiate viable and dead bacterial cells,
respectively (Berney et al., 2007). SYTO 9 is permeable to all cells whereas PI is only
permeable to those with compromised plasma membranes (Berney et al., 2007).
However, because Byssochlamys ascospores are quite different from bacterial cells with
respect to cellular structure, the application of these two stains in the present study was
more experimental. They were used as an indicator of the integrity of the ascospore
ultrastructure, particularly the cell-wall (Armstrong and He, 2001; Breeuwer and Abee,
2000). Increased fluorescence intensity corresponded with a higher permeability of the
wall to SYTO 9 and, therefore, more damage to ascospores from heat treatments.
The results showed that SYTO 9 had a superior performance over PI in differentiating
many sub-populations of Byssochlamys ascospores, especially those of B. nivea. This
could be attributed to the more versatile permeability of SYTO 9 into cells than PI as
mentioned already. Moreover, SYTO 9 has much higher emission intensity than PI, so it
can separate different types of cells more effectively. In fact, upon binding to DNA and
RNA, the fluorescence intensity of SYTO9 and PI increases by 300 and 8 times,
respectively (Stocks, 2004). The better permeability and fluorescence of SYTO 9
justified its use as the major probe to investigate sub-populations of Byssochlamys
ascospores.
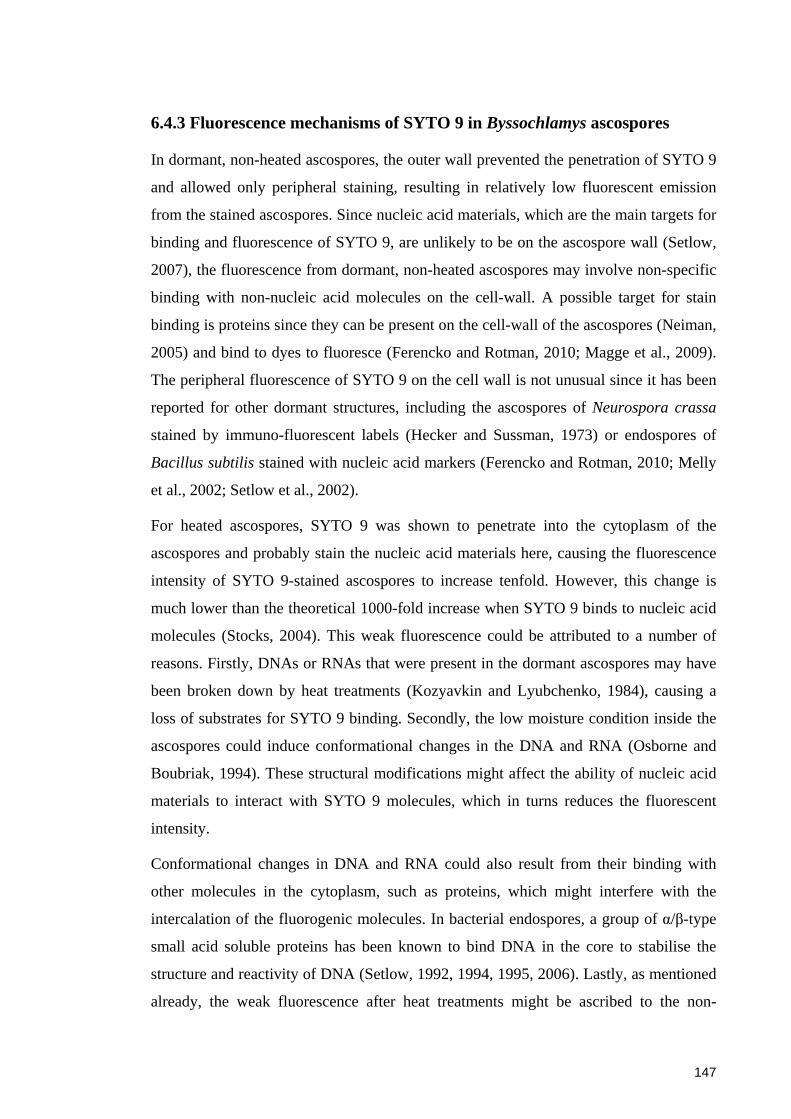
147
6.4.3 Fluorescence mechanisms of SYTO 9 in Byssochlamys ascospores
In dormant, non-heated ascospores, the outer wall prevented the penetration of SYTO 9
and allowed only peripheral staining, resulting in relatively low fluorescent emission
from the stained ascospores. Since nucleic acid materials, which are the main targets for
binding and fluorescence of SYTO 9, are unlikely to be on the ascospore wall (Setlow,
2007), the fluorescence from dormant, non-heated ascospores may involve non-specific
binding with non-nucleic acid molecules on the cell-wall. A possible target for stain
binding is proteins since they can be present on the cell-wall of the ascospores (Neiman,
2005) and bind to dyes to fluoresce (Ferencko and Rotman, 2010; Magge et al., 2009).
The peripheral fluorescence of SYTO 9 on the cell wall is not unusual since it has been
reported for other dormant structures, including the ascospores of Neurospora crassa
stained by immuno-fluorescent labels (Hecker and Sussman, 1973) or endospores of
Bacillus subtilis stained with nucleic acid markers (Ferencko and Rotman, 2010; Melly
et al., 2002; Setlow et al., 2002).
For heated ascospores, SYTO 9 was shown to penetrate into the cytoplasm of the
ascospores and probably stain the nucleic acid materials here, causing the fluorescence
intensity of SYTO 9-stained ascospores to increase tenfold. However, this change is
much lower than the theoretical 1000-fold increase when SYTO 9 binds to nucleic acid
molecules (Stocks, 2004). This weak fluorescence could be attributed to a number of
reasons. Firstly, DNAs or RNAs that were present in the dormant ascospores may have
been broken down by heat treatments (Kozyavkin and Lyubchenko, 1984), causing a
loss of substrates for SYTO 9 binding. Secondly, the low moisture condition inside the
ascospores could induce conformational changes in the DNA and RNA (Osborne and
Boubriak, 1994). These structural modifications might affect the ability of nucleic acid
materials to interact with SYTO 9 molecules, which in turns reduces the fluorescent
intensity.
Conformational changes in DNA and RNA could also result from their binding with
other molecules in the cytoplasm, such as proteins, which might interfere with the
intercalation of the fluorogenic molecules. In bacterial endospores, a group of α/β-type
small acid soluble proteins has been known to bind DNA in the core to stabilise the
structure and reactivity of DNA (Setlow, 1992, 1994, 1995, 2006). Lastly, as mentioned
already, the weak fluorescence after heat treatments might be ascribed to the non-
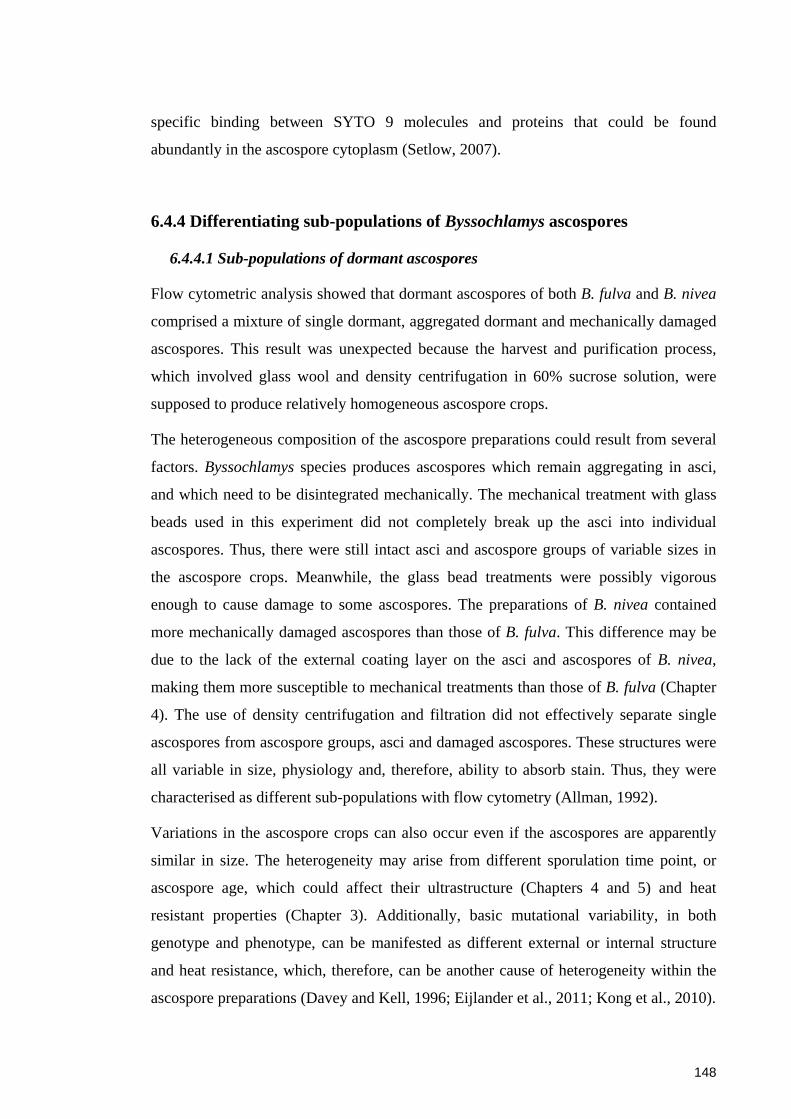
148
specific binding between SYTO 9 molecules and proteins that could be found
abundantly in the ascospore cytoplasm (Setlow, 2007).
6.4.4 Differentiating sub-populations of Byssochlamys ascospores
6.4.4.1 Sub-populations of dormant ascospores
Flow cytometric analysis showed that dormant ascospores of both B. fulva and B. nivea
comprised a mixture of single dormant, aggregated dormant and mechanically damaged
ascospores. This result was unexpected because the harvest and purification process,
which involved glass wool and density centrifugation in 60% sucrose solution, were
supposed to produce relatively homogeneous ascospore crops.
The heterogeneous composition of the ascospore preparations could result from several
factors. Byssochlamys species produces ascospores which remain aggregating in asci,
and which need to be disintegrated mechanically. The mechanical treatment with glass
beads used in this experiment did not completely break up the asci into individual
ascospores. Thus, there were still intact asci and ascospore groups of variable sizes in
the ascospore crops. Meanwhile, the glass bead treatments were possibly vigorous
enough to cause damage to some ascospores. The preparations of B. nivea contained
more mechanically damaged ascospores than those of B. fulva. This difference may be
due to the lack of the external coating layer on the asci and ascospores of B. nivea,
making them more susceptible to mechanical treatments than those of B. fulva (Chapter
4). The use of density centrifugation and filtration did not effectively separate single
ascospores from ascospore groups, asci and damaged ascospores. These structures were
all variable in size, physiology and, therefore, ability to absorb stain. Thus, they were
characterised as different sub-populations with flow cytometry (Allman, 1992).
Variations in the ascospore crops can also occur even if the ascospores are apparently
similar in size. The heterogeneity may arise from different sporulation time point, or
ascospore age, which could affect their ultrastructure (Chapters 4 and 5) and heat
resistant properties (Chapter 3). Additionally, basic mutational variability, in both
genotype and phenotype, can be manifested as different external or internal structure
and heat resistance, which, therefore, can be another cause of heterogeneity within the
ascospore preparations (Davey and Kell, 1996; Eijlander et al., 2011; Kong et al., 2010).
149
6.4.4.2 Sub-populations of heat activated ascospores
At the first minute of the heat treatments, FCM analysis showed significant changes in
the abundances of the ascospore subpopulations compared with the dormant samples. In
particular, the subpopulation of predicted single, dormant ascospores diminished
whereas those of predicted aggregated and heat inactivated ascospores became more
prominent. This meant that the applied heat treatments affected the cell-wall integrity of
the ascospores, causing ingress of SYTO 9 stain and increased size, within a relatively
short time after exposure to the wet-heat conditions.
The results obtained by flow cytometry supported a previous observation that the first
minute was the heat activation stage in the survival curves of Byssochlamys ascospores
(Chapter 3). Moreover, the effects of heating on the cell-wall as described above may
elaborate the activation mechanism of Byssochlamys ascospores. The activation of
fungal ascospores generally requires rehydration of the cytoplasm in order to activate
key enzymes for the germination (Dijksterhuis et al., 2007; Setlow, 2003). Since
dormant ascospores are relatively resistant to penetration of moisture and chemicals,
activating factors such as heating can break down the impermeable cell-wall, facilitating
the influx of water into the ascospores and the rehydration of the central cytoplasm.
However, the results of flow cytometry could not explain specifically the causes of the
increase in cell size during the heat activation stage. This change could result from
either the aggregation or the uptake of water into the heated ascospores. Clumping of
ascospores during heating may occur as the surface proteins of the cell-wall are
denatured, increasing the hydrophobicity of the ascospore wall surface (Furukawa et al.,
2005). For the water uptake theory, water upon entering the ascospores may expand the
cytoplasm (Setlow, 2007), resulting in an enlargement of the whole structure. The
increase of spore dimensions following hydration and expansion of the spore core
during activation has been observed in endospores of Bacillus subtilis (Katz, 2005a, b;
Leuschner and Lillford, 2000). However, Dijksterhuis et al. (2007) found no major
changes in size of the ascospores of Talaromyces macrosporus during activation.
6.4.4.3 Sub-populations of heat-inactivated ascospores
Heat treatment increased the heterogeneity of the ascospore populations, as indicated by
the appearance of new sub-populations that were absent in the dormant samples. The
150
heat-induced sub-populations included not only inactivated ascospores but also in-
between cells, which were stressed at different levels but could not be categorised
clearly as live or dead cells (Davey, 2011). These sub-populations may comprise heat
activated and several classes of sub-lethally injured ascospores (Cronin and Wilkinson,
2008a). This spectrum of responses to heat treatments from various ascospore groups
could be manifested as a non-linear semi-logarithmic survival curves (Peleg and Cole,
1998), which agrees with an observation of the thermal inactivation experiment
(Chapter 3).
Moreover, the presence of asci and clumps in the ascospore preparations can contribute
to their heterogeneous responses to heat. These aggregated structures are more heat
resistant than free, single ascospores since the heat penetration into them is not uniform,
causing different effects on individual members (Furukawa et al., 2005; Hatcher et al.,
1979; Splittstoesser et al., 1969).
At the end of the heat treatments, the sub-populations of dormant ascospores only
accounted for less than 20% of the total population whereas the aggregated and heat
inactivated ascospore sub-populations were 30 – 40% each. The remainder of the
dormant sub-populations somewhat agreed with a previous finding where the tailing
phase of the survival curves consistently occurred from 20 minutes until the end of the
heat treatment (Chapter 3). Thus, studies using thermal inactivation kinetics and flow
cytometry both indicate persisting sub-populations of heat resistant ascospores that are
present throughout the heating process.
Ascospores showed a general trend of increased size and autofluorescence or SYTO 9
fluorescence at the end of the heat treatments. The larger size could be attributed to
clumping of heated ascospores due to elevated hydrophobicity of the cell-wall as
mentioned for heat activated samples. The increased autofluorescence with longer
heating time may indicate damage inflicted on the ascospores, particularly the cell-wall.
Autofluorescence is common in fungal spores and often related to phenolic compounds
in the cytoplasm (Hecker and Sussman, 1973; Wu and Warren, 1984). This
phenomenon has been considered as a viability marker for bacterial spores whereby the
higher intrinsic fluorescence is associated with reviving spores and more permeable
cell-wall (Laflamme et al., 2005b, 2006). The results of autofluorescence agrees with
those of SYTO 9 fluorescence, which also suggest that further heating increased the
151
permeability of the ascospore wall, allowing the penetration of more stain molecules
into the cytoplasm.
However, differentiating the sub-populations using flow cytometry exhibited some
limitations. The sub-population maps of the ascospores before and after heat treatments
were not always clearly different, especially those of B. fulva strains. Thus, the
predicted identities of ascospore sub-populations in Table 6.1 – 6.4 were empirical and
would require more research for confirmation. Additionally, the use of nucleic acid
stains such as SYTO 9 can affect colony-forming ability of the ascospores and,
therefore, limit further viability tests using plating techniques.
6.5 Concluding remarks
This study examined the heterogeneity of ascospores of B. fulva and B. nivea following
heat treatments and at different ages by using flow cytometry and two fluorescent
probes, SYTO 9 and PI. To the author’s knowledge, this is the first study to apply single
cell analysing techniques to investigate the survival mechanisms of ascospores of a heat
resistant mould. This study was also exploratory in determining the use of fluorescent
dyes to evaluate viability states of the ascospores.
SYTO 9 was better than PI with respect to fluorescent intensity and separation of
various sub-populations. The penetration of SYTO 9 into ascospores was dependent on
the integrity of the ascospore wall. Dormant ascospores were stained peripherally
whereas heated ascospores with compromised cell-wall integrity allowed more SYTO 9
to enter and stain the cytoplasm.
Ascospore sub-populations of B. fulva and B. nivea could be differentiated with respect
to cell sizes and autofluorescence or SYTO 9 fluorescence. The identities of all sub-
populations could be predicted from the size and fluorescence characteristics, which
included dormant (single, asci, aggregated ascospores), heat activated, sub-lethally
injured and inactivated ascospores. Sub-populations of B. nivea samples were
differentiated and identified better than those of B. fulva with or without staining.
The heat treated ascospores moved towards the higher fluorescence and larger size areas
on the dot plots. This movement indicates that heat treatments caused cell aggregation,
152
cell enlargement and damage to the ascospore wall which allowed more (auto)-
fluorescence to be detected.
The results of this study were complicated by the heterogeneous composition of
ascospore crops and the heterogeneous responses of ascospores to heat treatments.
Future research can focus on developing sample preparation methods which produce
more homogeneous ascospore crops. Research also needs to elucidate the mechanisms
by which various fluorescent probes can be used in flow cytometric research on
ascospores.
153
Chapter 7 – Proteomic profiles of ascospores of Byssochlamys species detected by two dimensional gel electrophoresis during aging and heat treatment
7.1 Introduction
Resistance to environmental stresses such as high temperatures is an intrinsic property
of microorganisms and, therefore, may be tracked through molecular activities, such as
genomics or transcriptomics, of cells (Brul et al., 2011; Setlow and Setlow, 1996). For
vegetative cells of bacterial and fungal species, the acquired thermo-tolerance often
involves a global change in the physiology and metabolism of the cells, for instance via
the production of various groups of stress-related compounds such as proteins or sugars
(Goldani et al., 1994; Piper, 1993; Raju et al., 2007). For spores and ascospores, the
synthesis of new components may not be applicable but it is possible that stress-related
materials are already present intracellularly so that they protect cells during the course
of dormancy and activation (Brambl, 2009; Ruijter et al., 2003).
The most studied group of stressed-cell protectors are heat shock proteins (HSPs). They
are molecular chaperones found in different cell compartments and play a pivotal role in
protecting essential proteins from denaturation (Li and Srivastava, 2004). HSPs are
prevalent in fungal cells, and along with another abundant stress protector, namely
trehalose, represent a strategy to acquire thermo-tolerance (Elliot et al., 1996; Piper,
1993; Raggam et al., 2011; Singer and Lindquist, 1998; Tereshina, 2005).
Byssochlamys ascospores contain about 9% (w/w) of proteins which was similar
between strains of different heat resistance. The contents of individual amino acids were
also the same regardless the heat resistance level (Banner et al., 1979). Those proteins
may comprise stress proteins or components of protein synthesis pathways that enable
fungal cells to manufacture HSPs prior to dormancy (Brambl, 2009). However, no
research has been conducted to identify proteins and their functions in Byssochlamys
ascospores, especially whether HSPs are present and contribute to thermo-tolerance.
Proteomics provide researchers with an ability to examine global changes of the whole
protein content (proteome) in cells. It combines the resolving power of protein
154
electrophoresis with identification by mass spectrometry (MS). In particular, two-
dimensional gel electrophoresis (2D GE) is able to separate proteins extracted from cells
based on their molecular weight and charges (Lilley et al., 2001). If cells differentially
express proteins in varying conditions, 2D GE will facilitate a clear comparison of
proteomic profiles down to single proteins (Lee et al., 2008). Proteins of interest can
then be excised from gels and identified by different MS methods such as the matrix
assisted laser desorption-ionisation time-of-flight mass spectrometry (MALDI TOF-
MS) (Bonk and Humeny, 2001).
Proteomic approaches using 2D GE and MS have been applied to study responses of
fungal cells to environmental stresses such as antibiotic stress (Melin et al., 2002),
osmotic stress (Kim et al., 2007), oxidative stress (Lessing et al., 2007) and high
temperatures (Raggam et al., 2011). Research on proteomics of Bacillus endospores has
also generated novel information about the molecular aspects of heat resistance (Brul et
al., 2011; Lai et al., 2003).
Proteomics have not been used to study heat resistant ascospores of Byssochlamys
species. Compared with genomics and transcriptomics, proteomics is less dependent on
knowledge of the genome of Byssochlamys, the sequence of which is unavailable at the
moment. Genomic sequences and associated information are available for other fungal
species, such as some species of Aspergillus, Neurospora, Penicillium and Talaromyces
(Fedorova et al., 2007; Galagan et al., 2003; Pel et al., 2007; van den Berg et al., 2008)
and can be used as a reference point with respect to Byssochlamys.
Using 2D GE, this Chapter examines the proteomic profiles of ascospores of B. fulva
and B. nivea as affected by heat treatments and the aging process. Ascospores of 4 week
old cultures of each species were examined after heating at either 87.5 or 90oC for 1, 4
and 30 minutes. The proteomic profiles of dormant ascospores from 4 week and 12
week cultures were also compared.
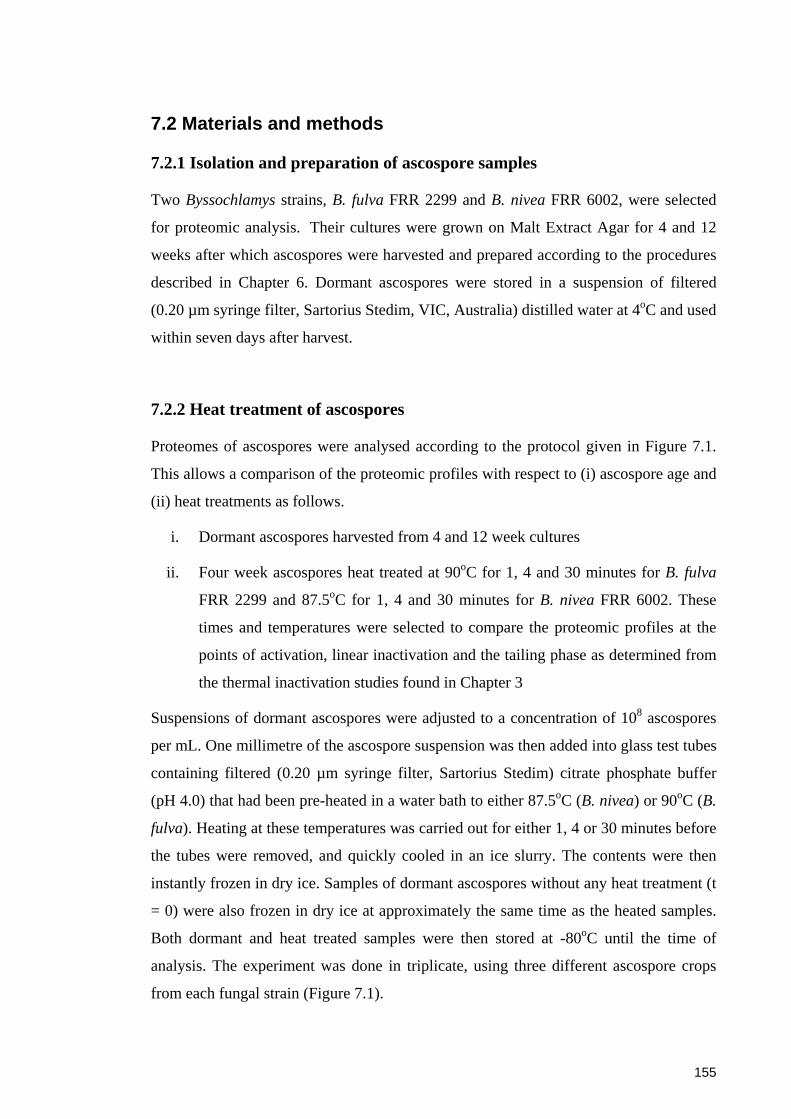
155
7.2 Materials and methods
7.2.1 Isolation and preparation of ascospore samples
Two Byssochlamys strains, B. fulva FRR 2299 and B. nivea FRR 6002, were selected
for proteomic analysis. Their cultures were grown on Malt Extract Agar for 4 and 12
weeks after which ascospores were harvested and prepared according to the procedures
described in Chapter 6. Dormant ascospores were stored in a suspension of filtered
(0.20 µm syringe filter, Sartorius Stedim, VIC, Australia) distilled water at 4oC and used
within seven days after harvest.
7.2.2 Heat treatment of ascospores
Proteomes of ascospores were analysed according to the protocol given in Figure 7.1.
This allows a comparison of the proteomic profiles with respect to (i) ascospore age and
(ii) heat treatments as follows.
i. Dormant ascospores harvested from 4 and 12 week cultures
ii. Four week ascospores heat treated at 90oC for 1, 4 and 30 minutes for B. fulva
FRR 2299 and 87.5oC for 1, 4 and 30 minutes for B. nivea FRR 6002. These
times and temperatures were selected to compare the proteomic profiles at the
points of activation, linear inactivation and the tailing phase as determined from
the thermal inactivation studies found in Chapter 3
Suspensions of dormant ascospores were adjusted to a concentration of 108 ascospores
per mL. One millimetre of the ascospore suspension was then added into glass test tubes
containing filtered (0.20 µm syringe filter, Sartorius Stedim) citrate phosphate buffer
(pH 4.0) that had been pre-heated in a water bath to either 87.5oC (B. nivea) or 90oC (B.
fulva). Heating at these temperatures was carried out for either 1, 4 or 30 minutes before
the tubes were removed, and quickly cooled in an ice slurry. The contents were then
instantly frozen in dry ice. Samples of dormant ascospores without any heat treatment (t
= 0) were also frozen in dry ice at approximately the same time as the heated samples.
Both dormant and heat treated samples were then stored at -80oC until the time of
analysis. The experiment was done in triplicate, using three different ascospore crops
from each fungal strain (Figure 7.1).
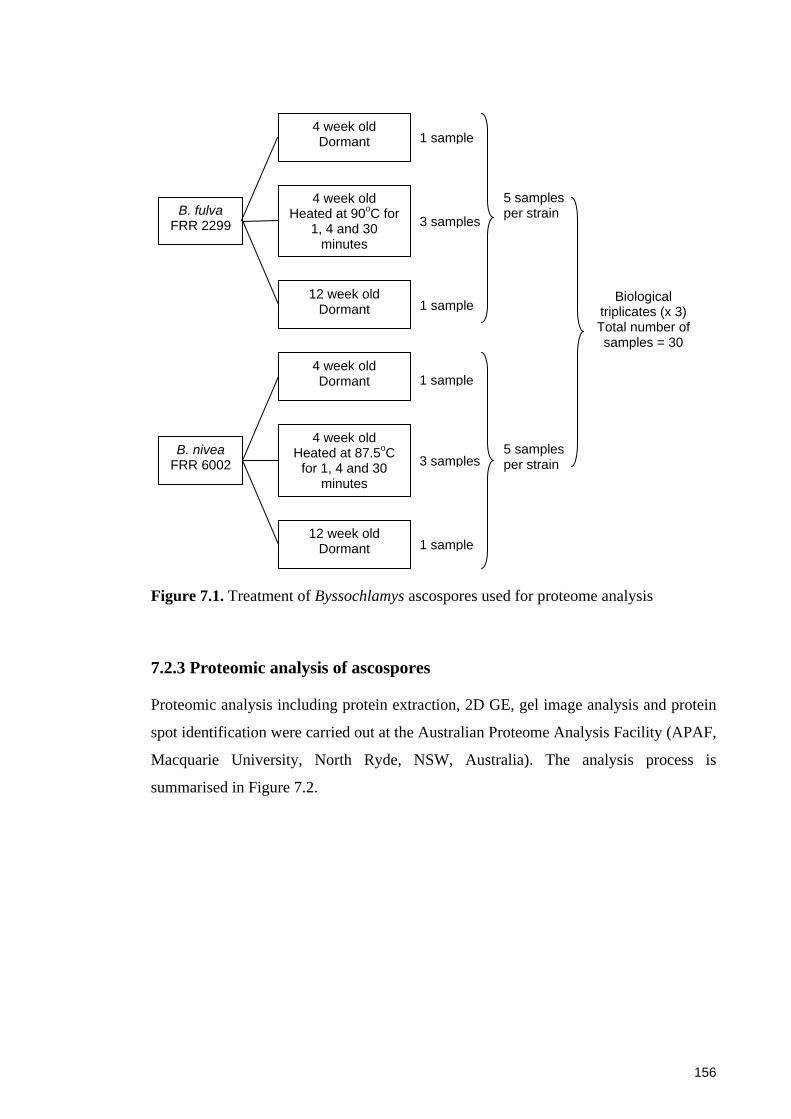
156
Figure 7.1. Treatment of Byssochlamys ascospores used for proteome analysis
7.2.3 Proteomic analysis of ascospores
Proteomic analysis including protein extraction, 2D GE, gel image analysis and protein
spot identification were carried out at the Australian Proteome Analysis Facility (APAF,
Macquarie University, North Ryde, NSW, Australia). The analysis process is
summarised in Figure 7.2.
B. fulva FRR 2299
4 week old Dormant
4 week old Heated at 90oC for
1, 4 and 30 minutes
12 week old Dormant
1 sample
3 samples
1 sample
1 sample
1 sample
3 samples
5 samples per strain
5 samples per strain
Biological triplicates (x 3) Total number of samples = 30
B. nivea FRR 6002
4 week old Dormant
4 week old Heated at 87.5oC
for 1, 4 and 30 minutes
12 week old Dormant

157
Figure 7.2. Proteome analysis of Byssochlamys ascospores; boxes with broken borders
and broken arrows could be omitted if not required
Beating with glass beads (x 3 times)
Reduction and alkylation (1 hr at ~22oC)
Centrifugation and collecting supernatant
Conductivity checking
Buffer exchange or concentration
Quantifying protein concentration (Bradford assay)
1D gel electrophoresis (SDS-PAGE)
Product checking
SDS-PAGE (test run)
Isoelectric focusing (pH 3 – 10, 20 hrs, 100 kVh)
SDS-PAGE (8 – 18%, 40mA per gel)
Image analysis and spot selection
Spot sequencing by MALDI – TOF/TOF
Coomassie staining (fix, stain and destain)
Search against database (NCBInr)
Ascospores in 2D buffer + protease inhibitor cocktail
2D gel electrophoresis
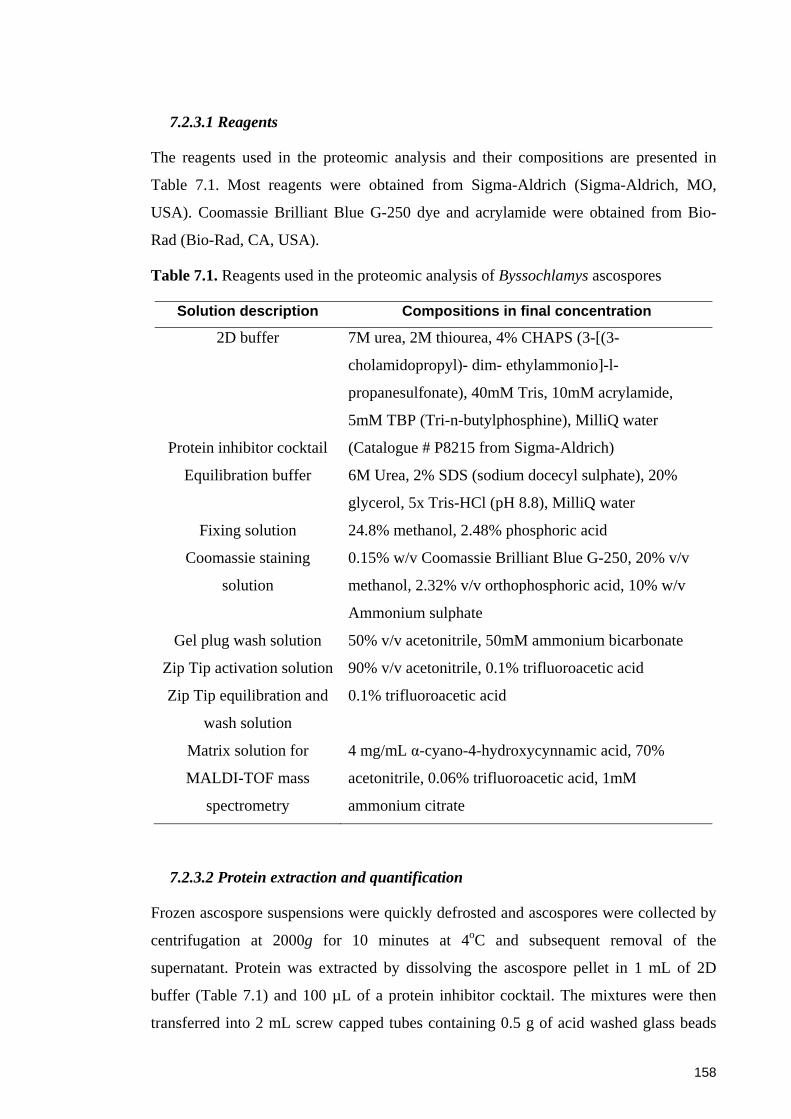
158
7.2.3.1 Reagents
The reagents used in the proteomic analysis and their compositions are presented in
Table 7.1. Most reagents were obtained from Sigma-Aldrich (Sigma-Aldrich, MO,
USA). Coomassie Brilliant Blue G-250 dye and acrylamide were obtained from Bio-
Rad (Bio-Rad, CA, USA).
Table 7.1. Reagents used in the proteomic analysis of Byssochlamys ascospores
Solution description Compositions in final concentration
2D buffer 7M urea, 2M thiourea, 4% CHAPS (3-[(3-
cholamidopropyl)- dim- ethylammonio]-l-
propanesulfonate), 40mM Tris, 10mM acrylamide,
5mM TBP (Tri-n-butylphosphine), MilliQ water
Protein inhibitor cocktail (Catalogue # P8215 from Sigma-Aldrich)
Equilibration buffer 6M Urea, 2% SDS (sodium docecyl sulphate), 20%
glycerol, 5x Tris-HCl (pH 8.8), MilliQ water
Fixing solution 24.8% methanol, 2.48% phosphoric acid
Coomassie staining
solution
0.15% w/v Coomassie Brilliant Blue G-250, 20% v/v
methanol, 2.32% v/v orthophosphoric acid, 10% w/v
Ammonium sulphate
Gel plug wash solution 50% v/v acetonitrile, 50mM ammonium bicarbonate
Zip Tip activation solution 90% v/v acetonitrile, 0.1% trifluoroacetic acid
Zip Tip equilibration and
wash solution
0.1% trifluoroacetic acid
Matrix solution for
MALDI-TOF mass
spectrometry
4 mg/mL α-cyano-4-hydroxycynnamic acid, 70%
acetonitrile, 0.06% trifluoroacetic acid, 1mM
ammonium citrate
7.2.3.2 Protein extraction and quantification
Frozen ascospore suspensions were quickly defrosted and ascospores were collected by
centrifugation at 2000g for 10 minutes at 4oC and subsequent removal of the
supernatant. Protein was extracted by dissolving the ascospore pellet in 1 mL of 2D
buffer (Table 7.1) and 100 µL of a protein inhibitor cocktail. The mixtures were then
transferred into 2 mL screw capped tubes containing 0.5 g of acid washed glass beads
159
(diameter 425 – 600 µm) (Sigma-Aldrich). Breaking ascospores was achieved by
shaking the solutions with glass beads three times in a FastPrep® FP120 bead beater
(BIO 101/Savant, MP Biomedicals, OH, USA) for 45 seconds at a speed of 6.5. After
each beating round, the tubes were cooled down in ice for 10 minutes.
Reduction and alkylation of proteins were carried out by adding 25 µL of 200 mM TBP
(Tri-n-butylphosphine) (Sigma-Aldrich) and 15 µL of 1M acrylamide (Bio-Rad) in
every 1 mL of beaten samples. The mixtures were then mixed by one round of shaking
in FastPrep as described above. They were cooled in down in ice for 10 minutes and
incubated at room temperature (ca. 22oC) for 1 hour. The reduction and alkylation
process was terminated by another round of bead beating (45 seconds) and ice cooling
(10 minutes). Extracted proteins from ascospores were collected in the supernatant layer
after a centrifugation step at 20,000g for 15 minutes at RT. The extract was distributed
into smaller aliquots and stored at -80oC until used.
Conductivity of the protein product was checked by a handheld Horiba B-173 Twin
Cond conductivity meter (Horiba, CA, USA) calibrated against a conductivity
calibration solution (Hanna Instruments, RI, USA). The conductivity of protein samples
was adjusted by buffer exchange or concentration so that a value of 0.3 milli Siemens
per centimetre (mS/cm) was achieved. Buffer exchange and concentration were done
with Vivaspin 5 kD centrifugal filter units (Sartorius Stedim) at 10,000g, 10oC for about
30 minutes. Proteins were retained in the filtered unit and were eluted into new 1.5 mL
centrifuge tubes.
Protein concentrations of the extracts were determined by the Bradford assay so that
optimal amounts of proteins were loaded onto gels. The extracts were diluted five-fold
with 2D buffer and 10 µL duplicates were pipetted into a 96 well polystyrene multititer
plate (Greiner Bio-one, Frickenhousen, Germany). Two hundred microlitres of Bradford
reagent (Sigma-Aldrich) was then added into each well and reactions were allowed to
take place for 5 minutes at RT under shaking conditions. Absorbance of solutions was
measured at 595 nm in a Fluostar Optima microplate reader (BMG Labtech, Offenberg,
Germany). Protein concentrations were determined from a standard curve that was
constructed from bovine serum albumin (BSA) (Sigma-Aldrich) solutions. Standard
BSA solutions were prepared at concentrations of 0.05, 0.1, 0.15, 0.25, 0.5, 0.75 and 1

160
mg/mL. Blank solution contained 2D buffer only. All standards and the blank were
measured in triplicate.
7.2.3.3 Two-dimensional (2D) gel electrophoresis
The protein extracts from ascospores was separated by 2D gel electrophoresis using
protocols previously described (Herbert et al., 2001; Lam et al., 2010) with some
modifications.
Isoelectric focusing (IEF) of proteins (first dimensional separation)
Approximately 100 µg of protein (determined from the Bradford assay) was made up to
300 µL with 2D buffer. IPG (Immobilised pH gradient) buffer pH 3 – 10 (GE
Healthcare BioSciences AB, Uppsala, Sweden) and bromophenol blue were added to
1% of the solution volume. Protein solutions were then absorbed onto 17 cm IPG strips
(GE Healthcare BioSciences AB) with linear pH gradient 3 -10 in rehydration trays (GE
Healthcare Bio-Sciences AB) for 6 hours at room temperature. Proteins in rehydrated
strips were focused on an Ettan IPGphor II (Amersham Biosciences, Uppsala, Sweden)
in Ondina medicinal-grade paraffin oil (Shell, Sydney, Australia) (Sewell and Bishop,
2009). The focusing program comprised 4 hours at 300V, 8 hours at linearly increased
voltage to 8000V, and at least 8 hours at 8000V. The total voltage product was
approximately 100 kVh. An average current of 40 mA per strip was applied during the
focusing. Focused IPG strips were equilibrated in equilibration buffer (Table 7.1) twice
for 15 minutes each, directly before the second dimensional electrophoresis step.
SDS-PAGE (second dimensional separation)
The second separation was a size-dependent SDS polyacrylamide gel electrophoresis
(SDS-PAGE). The equilibrated IPG strips were loaded onto SDS-PAGE gels and
separation was performed at 5 mA per gel until the bromophenol blue front just ran off
the bottom of the gels. Gel dimension and polyacrylamide gradient were 21 cm x 22 cm
and 8 – 18%, respectively. Gels were prepared in the APAF laboratory using Tris-
acetate buffer pH 7. Gels were transferred to a fixing solution (Table 7.1) for 2 hours,
then stained with Coomassie Brilliant Blue G-250 solution (Table 7.1). Background
stain was removed by immersing gels in 1% acetic acid for 30 minutes. Destained gels
were then stored in new 1% acetic acid solution on a gel rocker, prior to the protein

161
visualisation step. Before scanning, destained gels were transferred into MilliQ water
for 30 minutes.
7.2.3.4 Protein visualisation and gel image analysis
Gels were scanned by an Odyssey infrared scanner (Li-cor Biosciences, NE, USA) set
at 700 nm wavelength and medium resolution. Gel images were analysed and compared
across treatments and between ages using Progenesis SameSpots 4.0 coupled with
Progenesis PG240 Image Analysis Software (Nonlinear Dynamics, NC, USA). Protein
spots were first identified by the software and individually reviewed by a trained
operator to confirm their authenticity.
The relative abundance of proteins was measured by normalised volumes of spots on
gels. They were then compared within the triplicates, across treatment times and ages.
Normalisation was necessary to remove technical noise on 2D gels due to preparation
and electrophoretic process (Levänen and Wheelock, 2009). Spot volumes were
normalised by expressing the volume of each spot in a gel relative to the total spot
volume of the entire gel (Keeping and Collins, 2011). The normalisation algorithm was
built in the Progenesis Samespots 4.0 software and automatically performed.
Changes of normalised spot volumes indicated differential expressions of proteins in
various tested conditions. In this experiment, meaningful changes were based on
statistical significance by ANOVA one-way test (α = 0.05) and at least a two-fold
change. The protein spots also had to appear consistently in all triplicate gel images.
A subset of the significantly changed spots was selected for identification. Apart from
the criteria mentioned above, the chosen spots needed to be clearly visible on the
stained gels so that the excision could be carried out without aided scanning methods.
7.2.3.5 Sample preparation for mass spectrometry
Selected spots on Coomassie stained gels were automatically excised from 2D gels by
ExQuest Spot Cutter (Bio-Rad) and collected in a 96-well microtitre plate. Three
abundant spots on a gel were also processed as internal controls for this step and the
subsequent identification. The gel plugs were destained in 250 µL of wash solution
(Table 7.1) at 37oC for 5 minutes with shaking. The washing and destaining step was

162
repeated three times. The gel pieces were washed in 20 µL of acetonitrile for 10 minutes
at room temperature and then removed followed by drying in an oven at 37oC for 30
minutes. Trypsin (Sigma-Aldrich) at a final concentration of 4 ng/µL (10 µL) in 25 mM
ammonium bicarbonate (20 µL) was added to each sample and the in-gel digestion
occurred overnight (ca. 16 hours) in an oven set at 37oC.
After digestion, the resultant solution was acidified with 10 µL of 0.1% trifluoroacetic
acid and peptides were extracted from gel pieces in a sonic water bath for 20 minutes.
The extracted peptides were desalted and concentrated by the zip tipping method as
follows. For each peptide extract solution, a ZipTipsTM C18 micro-column tip (Millipore,
MA, USA) was used to withdraw and dispense repeatedly 10 µL Zip Tip activation
solution (Table 7.1) 3 times, then 10 µL of Zip Tip equilibration solution (Table 7.1) 3
times, then 10 µL of the peptide extract 15 times, then 10 µL of Zip Tip washing
solution (Table 7.1) 3 times and 1µL of matrix solution (Table 7.1) 10 times. The last
matrix-peptide solution (1 µL) was deposited directly onto a 192-well stainless steel
target plate (Applied Biosystems, CA, USA) and allowed to air dry.
7.2.3.6 Peptide mass fingerprinting by mass spectrometry
Peptides were identified by Matrix-assisted Laser Desorption Ionization tandem mass
spectrometry (MALDI-TOF MS/MS) using a 4800 Plus MALDI TOF/TOFTM Analyser
(Applied Biosystems). A Nd:YAG (neodymium-doped yttrium aluminium garnet) laser
(355 nm) was used to irradiate samples. The spectra were acquired in reflectron mode in
the mass range 700 – 4000 Da and were externally calibrated using known peptide
standards including bradykinin, neurotensin, angiotensin and ACTH
(adrenocorticotropic hormone). The instrument was then switched to MS/MS mode
where the eight strongest peptides from the first MS scan were isolated and fragmented
by collision-induced dissociation using filtered laboratory air, then re-accelerated to
measure their masses and intensities. A near point calibration was applied and would
give a typical mass accuracy better than 50 ppm.
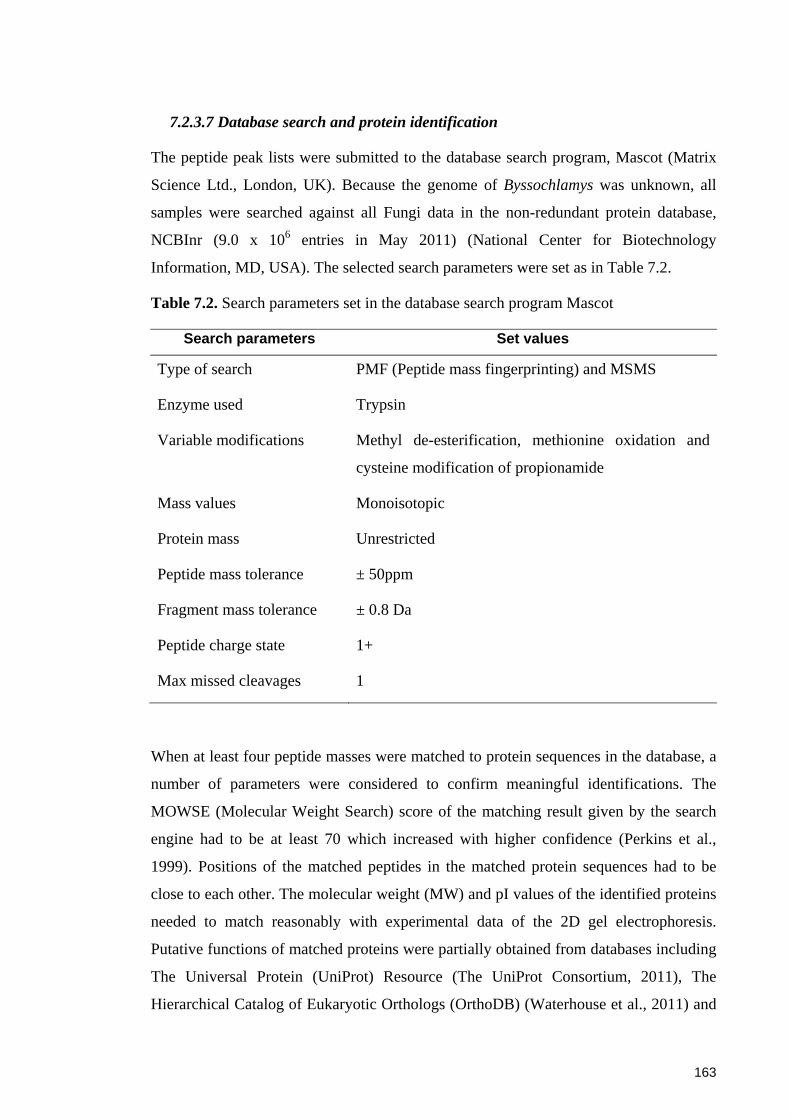
163
7.2.3.7 Database search and protein identification
The peptide peak lists were submitted to the database search program, Mascot (Matrix
Science Ltd., London, UK). Because the genome of Byssochlamys was unknown, all
samples were searched against all Fungi data in the non-redundant protein database,
NCBInr (9.0 x 10⁶ entries in May 2011) (National Center for Biotechnology
Information, MD, USA). The selected search parameters were set as in Table 7.2.
Table 7.2. Search parameters set in the database search program Mascot
Search parameters Set values
Type of search PMF (Peptide mass fingerprinting) and MSMS
Enzyme used Trypsin
Variable modifications Methyl de-esterification, methionine oxidation and
cysteine modification of propionamide
Mass values Monoisotopic
Protein mass Unrestricted
Peptide mass tolerance ± 50ppm
Fragment mass tolerance ± 0.8 Da
Peptide charge state 1+
Max missed cleavages 1
When at least four peptide masses were matched to protein sequences in the database, a
number of parameters were considered to confirm meaningful identifications. The
MOWSE (Molecular Weight Search) score of the matching result given by the search
engine had to be at least 70 which increased with higher confidence (Perkins et al.,
1999). Positions of the matched peptides in the matched protein sequences had to be
close to each other. The molecular weight (MW) and pI values of the identified proteins
needed to match reasonably with experimental data of the 2D gel electrophoresis.
Putative functions of matched proteins were partially obtained from databases including
The Universal Protein (UniProt) Resource (The UniProt Consortium, 2011), The
Hierarchical Catalog of Eukaryotic Orthologs (OrthoDB) (Waterhouse et al., 2011) and

164
the World Health Organisation/International Union of Immunological Societies
(WHO/IUIS) Allergen Nomenclature database (Chapman et al., 2007b).
7.3 Results
7.3.1 General features of proteome of Byssochlamys ascospores
Protein concentrations and conductivity measurements of all protein extracts are
summarised in Appendix 7.1. They were used to determine the amounts of proteins
loaded to the 2D gels.
On typical 2D gels, a total of 509 and 502 protein spots were resolved for B. fulva FRR
2299 and B. nivea FRR 6002, respectively. The overall separation and clarity of the
spots were comparable to other 2D gels of Aspergillus nidulans conidia (Oh et al.,
2010) and Bacillus subtilis cells (Movahedi and Waites, 2000) and better than those
reported for Rhizopus oligosporus sporangiospores (Thanh, 2004). As also observed in
the cases of A. nidulans and B. subtilis, the protein contents were relatively high within
the pH range 4 – 7, which caused smearing and apparently overlapping regions.
Identified spots of the B. fulva strain had MWs varying from 10 to 170 KDa and pI
values from 4 to 10. About 70% of the spots had MWs of 10 – 59 KDa and about 80%
had pI of 4 – 7.9 (Appendix 7.2). The MW of identified spots of the B. nivea strain
varied over a smaller range, 10 – 100 KDa but their pI spanned a slightly wider range,
3.5 – 10. Approximately 70% of the spots had MW of 10 – 49 KDa while nearly 80%
had pI of 3.5 – 7.4 (Appendix 7.2).
Less than 4% of the 500 plus protein spots significantly changed their normalised
volumes (p < 0.05, minimum two-fold change) with either heating or aging. The
differential proteomic profiles of ascospores in response to each condition are described
in more detail in the following sections.
7.3.2 Proteomic profiles of ascospores following heat treatments
Protein spots that significantly changed (p < 0.05, minimum two-fold change) with heat
treatments are summarised in Table 7.3 for both tested B. fulva and B. nivea strains. The
MW and pI of each spot were estimated from its migrating position on the 2D gels.
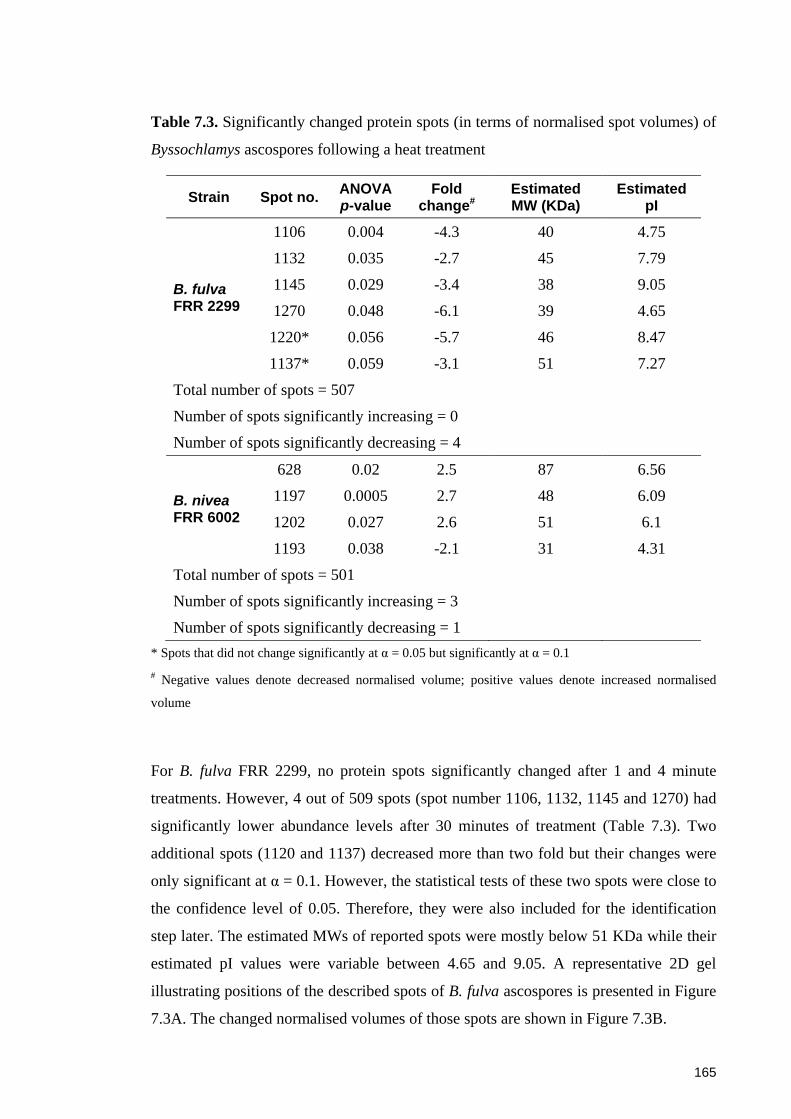
165
Table 7.3. Significantly changed protein spots (in terms of normalised spot volumes) of
Byssochlamys ascospores following a heat treatment
Strain Spot no. ANOVA p-value
Fold change#
Estimated MW (KDa)
Estimated pI
B. fulva FRR 2299
1106 0.004 -4.3 40 4.75
1132 0.035 -2.7 45 7.79
1145 0.029 -3.4 38 9.05
1270 0.048 -6.1 39 4.65
1220* 0.056 -5.7 46 8.47
1137* 0.059 -3.1 51 7.27
Total number of spots = 507
Number of spots significantly increasing = 0
Number of spots significantly decreasing = 4
B. nivea FRR 6002
628 0.02 2.5 87 6.56
1197 0.0005 2.7 48 6.09
1202 0.027 2.6 51 6.1
1193 0.038 -2.1 31 4.31
Total number of spots = 501
Number of spots significantly increasing = 3
Number of spots significantly decreasing = 1 * Spots that did not change significantly at α = 0.05 but significantly at α = 0.1 # Negative values denote decreased normalised volume; positive values denote increased normalised
volume
For B. fulva FRR 2299, no protein spots significantly changed after 1 and 4 minute
treatments. However, 4 out of 509 spots (spot number 1106, 1132, 1145 and 1270) had
significantly lower abundance levels after 30 minutes of treatment (Table 7.3). Two
additional spots (1120 and 1137) decreased more than two fold but their changes were
only significant at α = 0.1. However, the statistical tests of these two spots were close to
the confidence level of 0.05. Therefore, they were also included for the identification
step later. The estimated MWs of reported spots were mostly below 51 KDa while their
estimated pI values were variable between 4.65 and 9.05. A representative 2D gel
illustrating positions of the described spots of B. fulva ascospores is presented in Figure
7.3A. The changed normalised volumes of those spots are shown in Figure 7.3B.
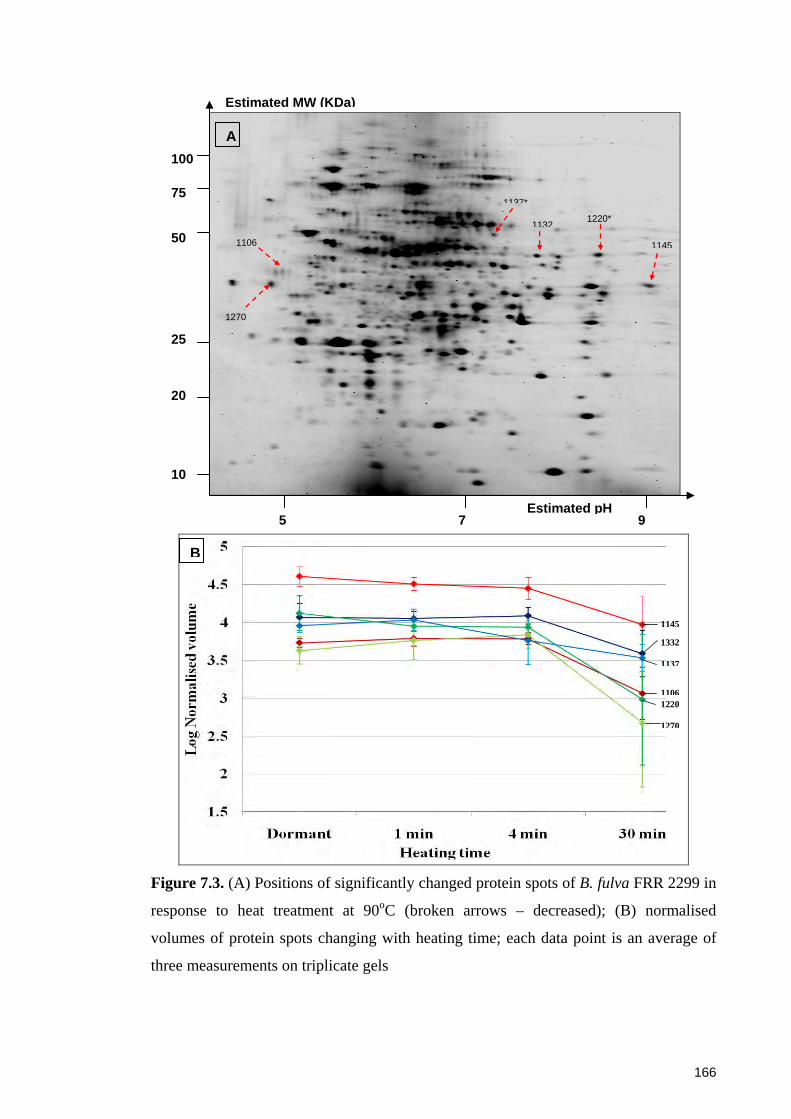
166
Figure 7.3. (A) Positions of significantly changed protein spots of B. fulva FRR 2299 in
response to heat treatment at 90oC (broken arrows – decreased); (B) normalised
volumes of protein spots changing with heating time; each data point is an average of
three measurements on triplicate gels
Estimated MW (KDa)
Estimated pH
1106 1145
1132
1270
1220*
1137*
5 7 9
75
100
25
50
20
10
A
1145
1220
1332
1137
1106
1270
B
167
For B. nivea FRR 6002, there were no significant changes at 1 minute but 3 out of 502
identified spots (628, 1197 and 1202) significantly increased their normalised volumes
at 4 minutes. After 30 minutes, four spots (628, 1193, 1197 and 1202) showed
significant changes (Table 7.3). Three of them (628, 1197, 1202) had increased
normalised volumes and only one (1193) decreased its relative abundance at the end of
the heating. Three increased spots had estimated pI values in the neutral region (6.09 –
6.56) while the last one was more in the acidic environment (pI = 4.31). Spot 628 had a
MW of 87 KDa, but the MWs of the three other proteins were 31, 48 and 51 KDa. The
positions and changes of the four mentioned spots of B. nivea ascospores on 2D gels are
shown in Figure 7.4.
For a clearer presentation, the gel images of individual spot showing its differential
expressions after various heating times are presented in Appendices 7.3 (B. fulva FRR
2299) and 7.4 (B. nivea FRR 6002).

168
Figure 7.4. (A) Positions of significantly changed protein spots of B. nivea FRR 6002
in response to heat treatment at 87.5oC (unbroken arrows – increased, broken arrows –
decreased); (B) normalised volumes of protein spots changing with heating time; each
data point is an average of three measurements on triplicate gels
628
1197
1202
1193
A
Estimated pH9 54 7
Estimated MW (KDa)
100
75
50
25
20
10
1202
1193
1197
628
B
169
7.3.3 Proteomic profiles of ascospores at two ages
More protein spots significantly changed their normalised volumes when ascospore age
increased from 4 to 12 weeks compared with the heat treatment. Ascospores of B. fulva
FRR 2299 had 6 out of 509 detectable spots satisfying the significant change criteria
(Table 7.4). Two of those proteins were more abundant and four were less in 12 week
ascospores than the 4 week ones. The two proteins showing an increase had higher
estimated MWs and pI values than those that decreased. In particular, the MWs and pI
of the proteins that increased were above 55 KDa and 6.5, respectively whereas those of
the proteins that decreased were below 33 KDa and 5.8, respectively. Positions of the
six investigated spots of B. fulva FRR 2299 on 2D gels and their changes with ages are
shown in Figure 7.5.
B. nivea FRR 6002 had the most number of spots (17) that significantly changed their
expressions in response to aging (Table 7.4). Out of those 17 protein spots, 9 spots
increased their expression levels and the remaining 8 spots decreased during the aging
of ascospores. The MW ranges of both groups were overlapping between 18 and 52
KDa. The pI range of the proteins that decreased was 5.3 – 8.69, being slightly more
basic than those that increased, which was 4.47 – 7.77. The separation of the 17 protein
spots on 2D gels and the changes of their expression levels are shown in Figure 7.6.
The differential expression of each of the protein spots that significantly changed
between 4 and 12 weeks is presented in Appendices 7.5 (B. fulva FRR 2299) and 7.6 (B.
nivea FRR 6002).
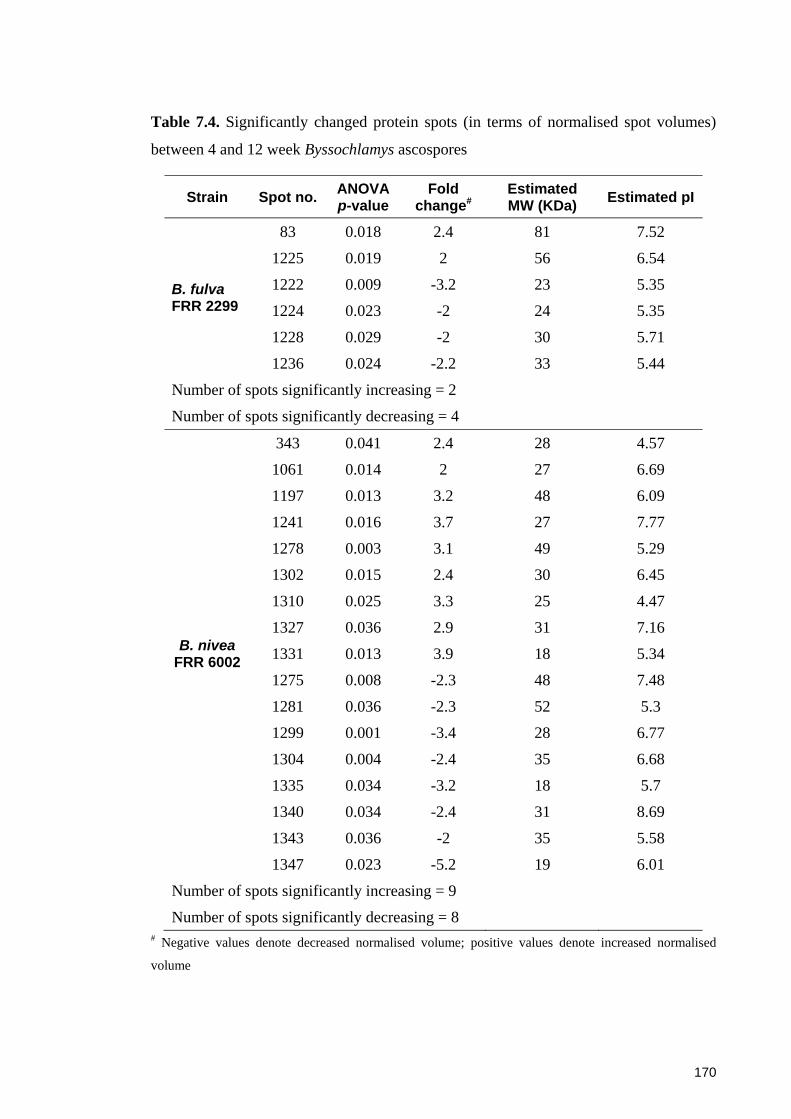
170
Table 7.4. Significantly changed protein spots (in terms of normalised spot volumes)
between 4 and 12 week Byssochlamys ascospores
Strain Spot no. ANOVA p-value
Fold change#
Estimated MW (KDa) Estimated pI
B. fulva FRR 2299
83 0.018 2.4 81 7.52
1225 0.019 2 56 6.54
1222 0.009 -3.2 23 5.35
1224 0.023 -2 24 5.35
1228 0.029 -2 30 5.71
1236 0.024 -2.2 33 5.44
Number of spots significantly increasing = 2
Number of spots significantly decreasing = 4
B. nivea FRR 6002
343 0.041 2.4 28 4.57
1061 0.014 2 27 6.69
1197 0.013 3.2 48 6.09
1241 0.016 3.7 27 7.77
1278 0.003 3.1 49 5.29
1302 0.015 2.4 30 6.45
1310 0.025 3.3 25 4.47
1327 0.036 2.9 31 7.16
1331 0.013 3.9 18 5.34
1275 0.008 -2.3 48 7.48
1281 0.036 -2.3 52 5.3
1299 0.001 -3.4 28 6.77
1304 0.004 -2.4 35 6.68
1335 0.034 -3.2 18 5.7
1340 0.034 -2.4 31 8.69
1343 0.036 -2 35 5.58
1347 0.023 -5.2 19 6.01
Number of spots significantly increasing = 9
Number of spots significantly decreasing = 8 # Negative values denote decreased normalised volume; positive values denote increased normalised
volume
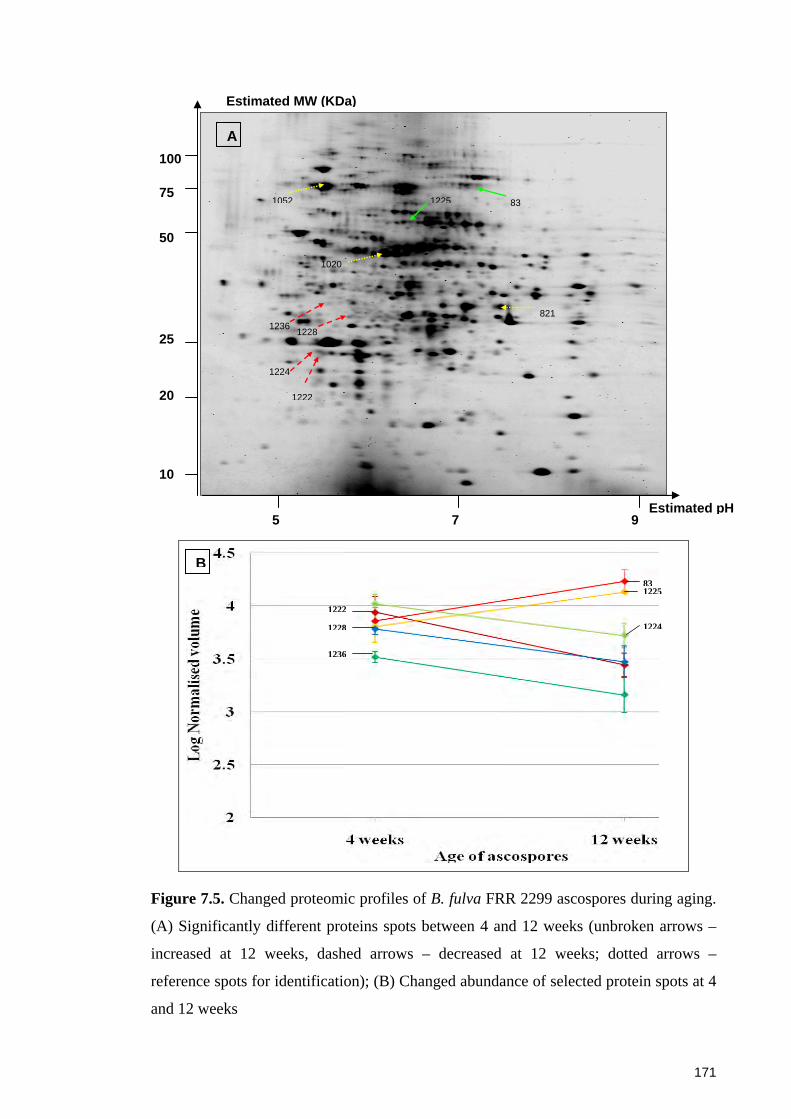
171
Figure 7.5. Changed proteomic profiles of B. fulva FRR 2299 ascospores during aging.
(A) Significantly different proteins spots between 4 and 12 weeks (unbroken arrows –
increased at 12 weeks, dashed arrows – decreased at 12 weeks; dotted arrows –
reference spots for identification); (B) Changed abundance of selected protein spots at 4
and 12 weeks
1222
83 1225
1224
1236 1228
A
Estimated pH5 7 9
Estimated MW (KDa)
75
100
25
50
20
10
1052
1020
821
831225
12241228
1222
1236
B

172
Figure 7.6. Changed proteomic profiles of B. nivea FRR 6002 ascospores during aging. (A) Significantly different spots between 4 and 12
weeks (unbroken arrows – increased at 12 weeks, broken arrows – decreased at 12 weeks); (B) Increased abundance of selected protein spots at
4 and 12 weeks; (C) Decreased abundance of selected protein spots at 4 and 12 weeks
1331
12781281
1299
A
1304
12751197
1061
1302
1241
1347
1310
1335
1340
13271343
343
Estimated pH
Estimated MW (KDa) 100
75
50
25
20
10
B1310
1331 1061
1302
12413431197
13271278
12991335 1340
1343 1304
13471281
C
1275
95 4 7
173
7.3.4 Protein identification
A total of 20 protein spots, including 8 spots from B. fulva FRR 2299 and 12 from B.
nivea FRR 6002, were selected from those shown in Tables 7.3 and 7.4 for protein
identification. Three highly intense spots (821, 1020 and1052) from B. fulva FRR 2299
were chosen as internal controls for the identification process (Figure 7.5A). The
identifications of the selected spots and their putative functions are shown in Tables 7.5
(B. fulva FRR 2299) and 7.6 (B. nivea FRR 6002). For each protein, the top two results
based on MOWSE scores are included only if they score above 70. The closest matches
of spots with scores below 70 are also given in Tables 7.5 and 7.6. The MWs estimated
from 2D gels of all spots are repeated in those tables to assist the comparison with those
of matched proteins. For further reference, amino acid sequences of the matched
proteins and peptide coverage are given in Appendix 7.7.
All reference spots were identified with high MOWSE scores, confirming that the
preparation and identification processes were working properly (Table 7.5). Of
particular interest, spot 1052 was matched with heat shock protein (HSP) 70 from
Talaromyces and Aspergillus species. The other two reference spots, 821 and 1020,
were similar to members of the oxidoreductase and mannose-6-phosphate isomerase
families, respectively. Their estimated MWs and pI values were relatively close to those
of the matched proteins. Exceptionally, spot 1052 showed large differences between the
estimated MW (75 KDa) and that of the matched protein (69 KDa).
7.3.4.1 Identification of proteins from B. fulva ascospores
Of the 8 spots from B. fulva FRR 2299, only four were identified with scores above 70
and they all had decreased expressions with heat treatment. They had good sequence
coverage and peptide matches with the theoretical proteins (Appendix 7.7). However,
comparing MWs and pI values did not show strong agreements between the estimated
results from 2D gels and those of the matched proteins. The identified proteins were
predominantly enzymes involving in the citric acid cycle (TCA cycle) for metabolism
and energy generation, such as oxidoreductase, citrate synthase and its mitochondrial
precursor. The hypothetical protein An07g00820 (1132) possibly had oxidoreductase
activity specific to flavin-containing compounds. Another protein (1270) was identified
as the pepsin precursor, pepsinogen, or aspartic protease pepE (Table 7.5).
174
For spots scoring below 70, the best matches included a variety of protein types
including enzymes (aspartic endopeptidase enzyme), nucleic acid binding and mRNA
splicing proteins. One protein (1224) was similar to a predicted protein from Botryotinia
fuckeliana B05.10 with currently uncharacterised functions. The estimated MWs and pI
values of the proteins scoring below 70 were weakly correlated with those of the
matched proteins (Table 7.5).
7.3.4.2 Identification of proteins from B. nivea ascospores
For B. nivea FRR 6002, 2 out of 4 selected heat-related spots and 6 out of 8 age-related
spots had matches with scores above 70. Both heat-related proteins were identified as
putative erythromycin esterase. Among the 6 age-related spots, two proteins, 1281 and
1299, were matched with HSP 60 and general stress protein (GSP) 39, respectively.
Two other proteins (1331 and 1335) were similar to allergen Asp F3 usually found in
Aspergillus clavatus or N. fischeri. This allergen protein also functions as an
oxidoreductase to maintain the intracellular reduction-oxidation environment. The last
two spots, 1061 and 1241, were the TCA cycle enzyme, malate dehydrogenase, and the
pentose-phosphate pathway enzyme, transaldolase, respectively. In the case of MWs
and pI values, 3 spots (1202, 1331 and 1335) had close results from 2D gels and the
matched proteins whereas other protein spots were not matched.
Three out of 4 spots that scored below 70 were best matched with various types of
hypothetical proteins and conserved hypothetical proteins with uncharacterised
functions. Only one spot (1193) was closer to a precursor for protease A in vacuoles.
The estimated MWs and pI values of those proteins showed large discrepancies with
those of the matched results.
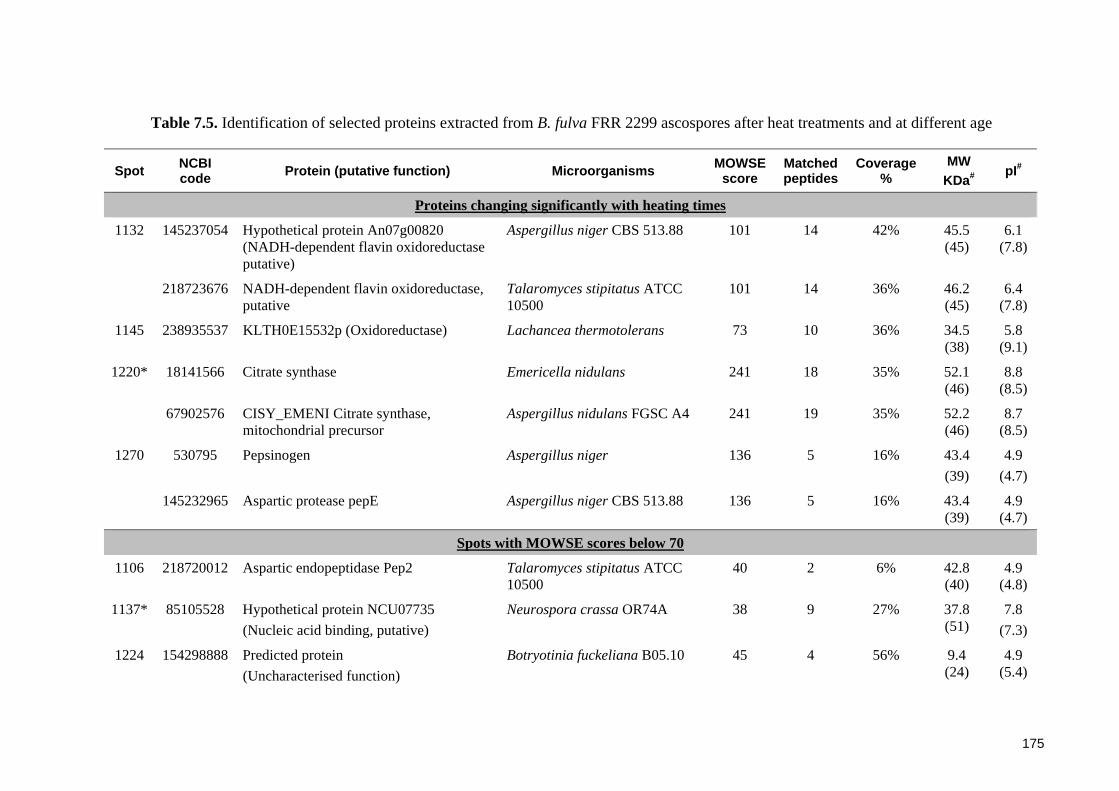
175
Table 7.5. Identification of selected proteins extracted from B. fulva FRR 2299 ascospores after heat treatments and at different age
Spot NCBI code Protein (putative function) Microorganisms MOWSE
score Matched peptides
Coverage %
MW KDa#
pI#
Proteins changing significantly with heating times
1132 145237054 Hypothetical protein An07g00820 (NADH-dependent flavin oxidoreductase putative)
Aspergillus niger CBS 513.88 101 14 42% 45.5 (45)
6.1 (7.8)
218723676 NADH-dependent flavin oxidoreductase, putative
Talaromyces stipitatus ATCC 10500
101 14 36% 46.2 (45)
6.4 (7.8)
1145 238935537 KLTH0E15532p (Oxidoreductase) Lachancea thermotolerans 73 10 36% 34.5 (38)
5.8 (9.1)
1220* 18141566 Citrate synthase Emericella nidulans 241 18 35% 52.1 (46)
8.8 (8.5)
67902576 CISY_EMENI Citrate synthase, mitochondrial precursor
Aspergillus nidulans FGSC A4 241 19 35% 52.2 (46)
8.7 (8.5)
1270 530795 Pepsinogen Aspergillus niger 136 5 16% 43.4 (39)
4.9 (4.7)
145232965 Aspartic protease pepE Aspergillus niger CBS 513.88 136 5 16% 43.4 (39)
4.9 (4.7)
Spots with MOWSE scores below 70
1106 218720012 Aspartic endopeptidase Pep2 Talaromyces stipitatus ATCC 10500
40 2 6% 42.8 (40)
4.9 (4.8)
1137* 85105528 Hypothetical protein NCU07735 (Nucleic acid binding, putative)
Neurospora crassa OR74A 38 9 27% 37.8 (51)
7.8 (7.3)
1224 154298888 Predicted protein (Uncharacterised function)
Botryotinia fuckeliana B05.10 45 4 56% 9.4 (24)
4.9 (5.4)
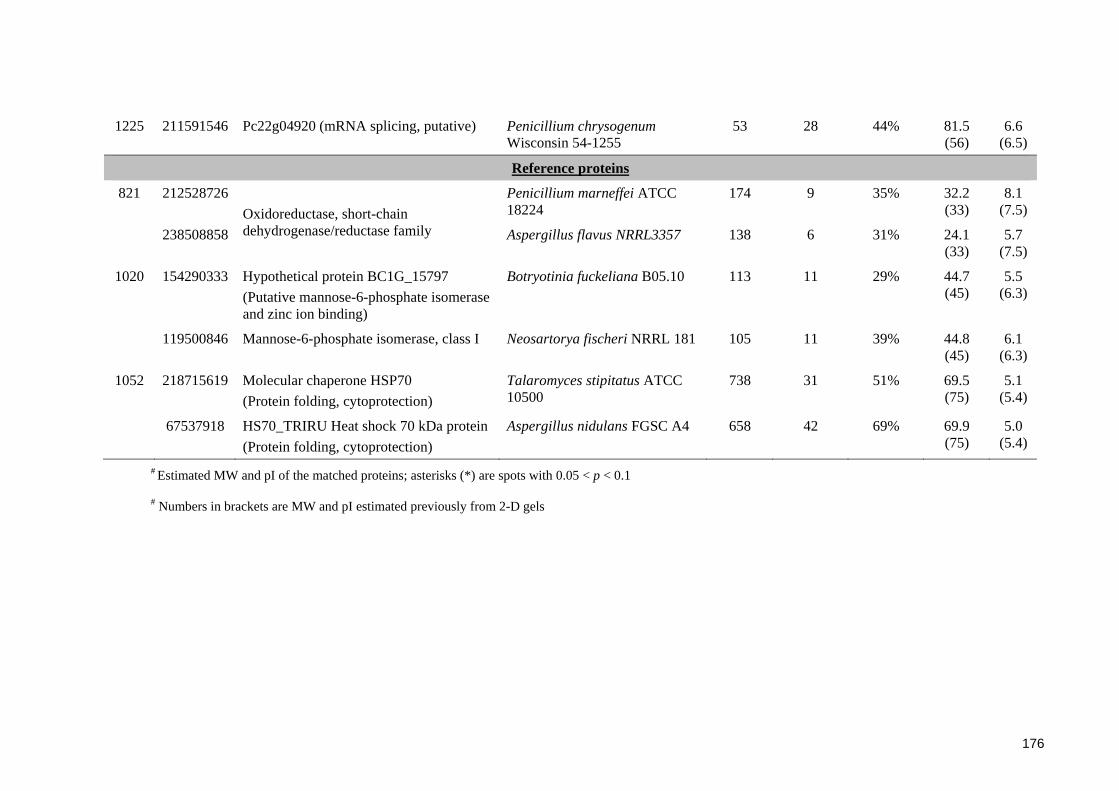
176
1225 211591546 Pc22g04920 (mRNA splicing, putative) Penicillium chrysogenum Wisconsin 54-1255
53 28 44% 81.5 (56)
6.6 (6.5)
Reference proteins
821 212528726 Oxidoreductase, short-chain dehydrogenase/reductase family
Penicillium marneffei ATCC 18224
174 9 35% 32.2 (33)
8.1 (7.5)
238508858 Aspergillus flavus NRRL3357 138 6 31% 24.1 (33)
5.7 (7.5)
1020 154290333 Hypothetical protein BC1G_15797 (Putative mannose-6-phosphate isomerase and zinc ion binding)
Botryotinia fuckeliana B05.10 113 11 29% 44.7 (45)
5.5 (6.3)
119500846 Mannose-6-phosphate isomerase, class I Neosartorya fischeri NRRL 181 105 11 39% 44.8 (45)
6.1 (6.3)
1052 218715619 Molecular chaperone HSP70 (Protein folding, cytoprotection)
Talaromyces stipitatus ATCC 10500
738 31 51% 69.5 (75)
5.1 (5.4)
67537918 HS70_TRIRU Heat shock 70 kDa protein (Protein folding, cytoprotection)
Aspergillus nidulans FGSC A4 658 42 69% 69.9 (75)
5.0 (5.4)
# Estimated MW and pI of the matched proteins; asterisks (*) are spots with 0.05 < p < 0.1
# Numbers in brackets are MW and pI estimated previously from 2-D gels
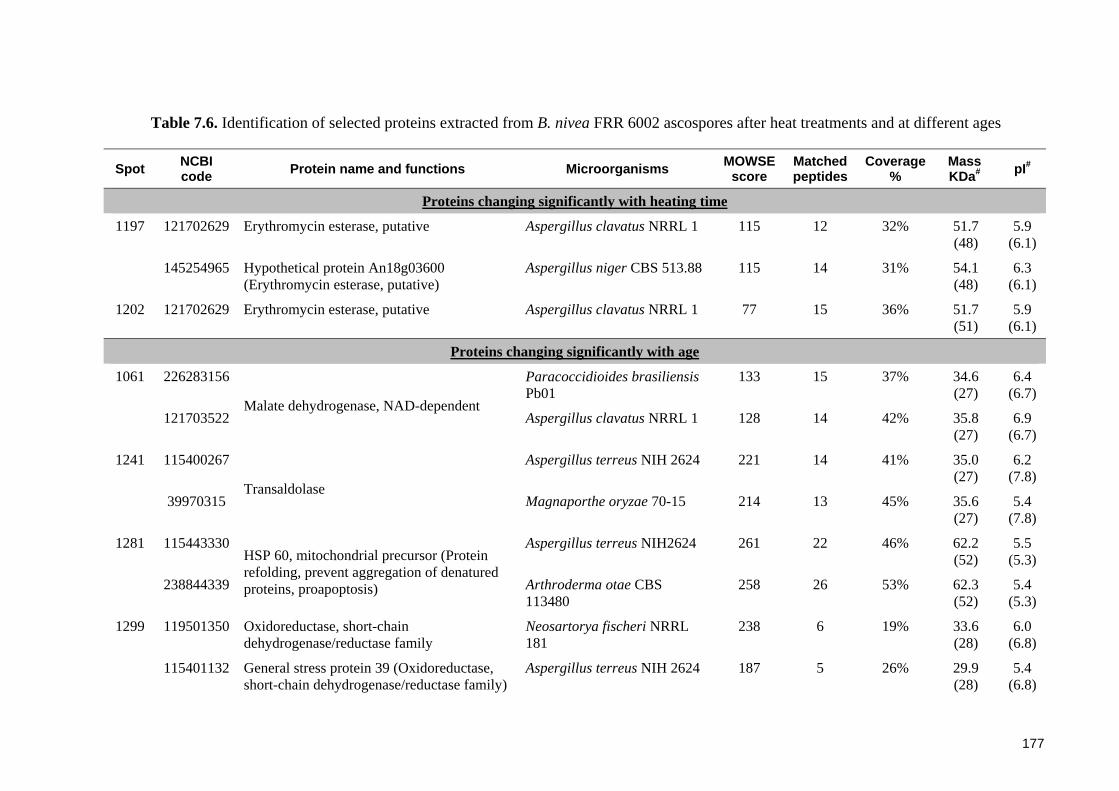
177
Table 7.6. Identification of selected proteins extracted from B. nivea FRR 6002 ascospores after heat treatments and at different ages
Spot NCBI code Protein name and functions Microorganisms MOWSE
score Matched peptides
Coverage %
Mass KDa# pI#
Proteins changing significantly with heating time
1197 121702629 Erythromycin esterase, putative Aspergillus clavatus NRRL 1 115 12 32% 51.7 (48)
5.9 (6.1)
145254965 Hypothetical protein An18g03600 (Erythromycin esterase, putative)
Aspergillus niger CBS 513.88 115 14 31% 54.1 (48)
6.3 (6.1)
1202 121702629 Erythromycin esterase, putative Aspergillus clavatus NRRL 1 77 15 36% 51.7 (51)
5.9 (6.1)
Proteins changing significantly with age
1061 226283156
Malate dehydrogenase, NAD-dependent
Paracoccidioides brasiliensis Pb01
133 15 37% 34.6 (27)
6.4 (6.7)
121703522 Aspergillus clavatus NRRL 1 128 14 42% 35.8 (27)
6.9 (6.7)
1241 115400267
Transaldolase
Aspergillus terreus NIH 2624 221 14 41% 35.0 (27)
6.2 (7.8)
39970315 Magnaporthe oryzae 70-15 214 13 45% 35.6 (27)
5.4 (7.8)
1281 115443330HSP 60, mitochondrial precursor (Protein refolding, prevent aggregation of denatured proteins, proapoptosis)
Aspergillus terreus NIH2624 261 22 46% 62.2 (52)
5.5 (5.3)
238844339 Arthroderma otae CBS 113480
258 26 53% 62.3 (52)
5.4 (5.3)
1299 119501350 Oxidoreductase, short-chain dehydrogenase/reductase family
Neosartorya fischeri NRRL 181
238 6 19% 33.6 (28)
6.0 (6.8)
115401132 General stress protein 39 (Oxidoreductase, short-chain dehydrogenase/reductase family)
Aspergillus terreus NIH 2624 187 5 26% 29.9 (28)
5.4 (6.8)

178
1331 121704078Allergen Asp F3 (Oxidoreductase, cell redox homeostasis)
Aspergillus clavatus NRRL 1 190 7 44% 18.6 (18)
5.1 (5.3)
119467218 Neosartorya fischeri NRRL 181
186 6 36% 18.5 (18)
5.4 (5.3)
1335 121704078Allergen Asp F3 (Oxidoreductase, cell redox homeostasis)
Aspergillus clavatus NRRL 1 192 6 31% 18.6 (18)
5.1 (5.7)
119467218 Neosartorya fischeri NRRL 181
192 6 29% 18.5 (18)
5.4 (5.7)
Spots with MOWSE scores below 70
628 67522969 Hypothetical protein AN1941.2 (Putative uncharacterised protein)
Aspergillus nidulans FGSC A4 40 1 8% 18.7 (87)
4.6 (6.6)
1193 189211129 Vacuolar protease A precursor Pyrenophora tritici-repentis Pt-1C-BFP
69 4 16% 43.5 (31)
5.1 (4.3)
1310 116194057 Hypothetical protein CHGG_06746 (Putative uncharacterised protein)
Chaetomium globosum CBS 148.51
46 7 56% 20.6 (25)
9.7 (4.5)
1347 121698176 Conserved hypothetical protein (Putative uncharacterised protein)
Aspergillus clavatus NRRL 1 50 8 10% 95.6 (19)
9.9 (6.0)
# Estimated MW and pI of the matched peptides
# Numbers in brackets are MW estimated on 2-D gels

179
7.4 Discussion
This Chapter reports the first application of proteomics in studying heat resistant
ascospores of Byssochlamys species. The proteomic profiles of 4 week ascospores of
one strain of B. fulva and one strain of B. nivea were compared at various time points
during heat treatments (dormant, 1, 4 and 30 minutes) at 90oC and 87.5oC, respectively.
These sampling times corresponded with some distinct responses exhibited by
ascospores when subjected to heat inactivation at these temperatures (Chapter 3). In
particular, they show a clear activation stage during the first minute, followed by a
linear inactivation (usually 2 – 20 minutes) and then a tailing stage (after 20 minutes)
where surviving ascospores show little further inactivation. In addition, proteomic
analysis was conducted on dormant, non-heated ascospores from 4 and 12 week cultures
to examine the roles of proteins in age-related heat resistance, since it was found in
Chapter 3 that ascospores from older cultures were more heat resistant than those from
younger cultures.
7.4.1 Proteomes of Byssochlamys ascospores after heat treatments and aging
Proteins occur in dormant B. fulva ascospores and account for 8 – 12% of the total
ascospore weight (Banner et al., 1979). Proteomic analysis has now shown that heating
and aging caused small but significant changes to ascospore proteins. The selection of
significantly changed protein spots based on stringent criteria, namely ANOVA p <
0.05, minimum two fold change, clear spots and triplicate analyses, minimised possible
experimental and technical errors, ensuring validity of the results.
Heat treatments caused fewer variations in the proteomes than that of the aging,
suggesting time was an important factor. This was supported by the increasing number
of protein spots that were observed to change when the time of heating progressed to 30
minutes. No significant changes were observed at 1 minute (B. nivea FRR 6002) or 4
minutes (B. fulva FRR 2299) of heating. The delayed response may be ascribed to the
special ultrastructure of Byssochlamys ascospores, especially the cell wall and the thick
intermediate space (Chapter 4), which are likely to slow down the rate of thermal
disruption. Moreover, since the results of Chapter 3 show that the first minute is related
to the activation stage of the ascospores, this initial response could be predominantly
caused by modifications of the physical structure and less involved chemical (protein-
180
linked) process. Ascospores of B. nivea reacted more quickly and displayed earlier
proteomic changes than those of B. fulva and this observation was consistent with the
fact that they were more abundant as single forms (not clumps) and more prone to heat
inactivation.
7.4.1.1 Changed proteomic profiles of ascospores after heat treatments
The abundance of proteins in ascospores may either increase or decrease as a result of
heat treatments. The attenuation of particular proteins could be due to several causes.
Firstly, the heating process could disrupt the physical structure and integrity of the
ascospores, allowing extracellular loss of protein concentration or decrease in
concentration to levels that are no longer detectable on gels. It has been reported that
wet heat could moisten the structure of endospores of Bacillus sporothermodurans and
cause proteins to leak out of the cells (Tabit and Buys, 2010). Secondly, heating may
completely denature proteins due to unfolding of their tertiary and secondary structures,
leading to protein degradation and loss of materials detectable on gels (Dynlacht et al.,
2000). Temperatures above 40oC are sufficient to induce denaturation of many cellular
proteins, with the severity progressively increasing at higher temperatures (Belliveau et
al., 1992; Lepock, 2005; Nguyen et al., 1989). Intracellular proteins of wet heat-killed
endospores of Bacillus cereus and Bacillus megaterium underwent critical structural
modifications towards denatured states (Coleman et al., 2010). Thirdly, heating may
activate protein degradation by proteolytic enzymes. The environment of unheated
ascospores may not be conducive to such reactions because of high viscosity and
compartmental separation of substrates from enzymes (Setlow, 2003). Heating breaks
down these barriers such as rehydration of the cytoplasm thereby allowing enzymatic
proteolysis to occur (Cowan et al., 2003).
Factors that could explain an increase in the amount of a protein after heating of the
ascospores are protein synthesis, fragmentation of proteins into peptides and
aggregation of denatured proteins. The first cause, protein synthesis, is common
outcome of up-regulated genes during spore germination and outgrowth (Armstrong et
al., 1984; Oh et al., 2010). However, gene up-regulation and protein synthesis were
unlikely to occur in heated ascospores in the present study. The moist heat environment
was considerably hostile to any anabolic pathways and newly formed proteins (Zhang et
181
al., 2009). Additionally, the maximum heating time, 30 minutes, may be insufficient for
proper protein syntheses in high temperature conditions.
Fragmentation of proteins into peptides may occur as a result of thermal denaturation.
Instead of losing the peptide products as mentioned earlier, they could be retained by
the ascospores and subsequently detected by electrophoresis. Long heating time could
increase the quantity of those peptides, with their concentrations reflected by elevated
spot volumes on 2D gels (Havea et al., 1998).
Aggregation of proteins could be induced by heat treatments (Havea et al., 1998). In
fact, denatured proteins due to heat shock could act as nuclei for the aggregation of
more proteins, both native and denatured ones, thereby protecting them from further
denaturation (Lepock, 2005). Therefore, this could improve the concentration of
proteins detected on gels.
7.4.1.2 Changed proteomic profiles of ascospores during aging
The increased abundance of a protein during aging could be attributed to a latent protein
synthesis. Dormant ascospores of could maintain a relatively low respiration rate for
respiration purpose, or endogenous respiration, based on the oxidation of lipid
(Mandels, 1963; Mandels and Maguire, 1972). This low but important metabolism may
indicate protein turnover, which could be the main reason why older Byssochlamys
ascospores had increased expression of proteins. The latent protein synthesis was found
in dormant ascospores of Neosartorya fischeri during aging between 11 and 25 days,
manifesting an accumulation of proteins around the germ-tube area (Conner et al.,
1987). As also suggested for conidia of Aspergillus oryzae (Sinohara, 1970), some
enzymes of the dormant ascospores could be significantly induced and carried out their
specific reactions without signs of germination and swelling of the cells.
A decrease in expression of particular proteins during aging could be ascribed to
denaturation. As discussed in Chapter 4, aging could promote dormancy and heat
resistance by enhancing dehydration inside the ascospores. This reduced moisture
environment may denature protein structures and subsequently affect the proteomic
profiles of the matured ascospores. However, the results of proteomics and protein
identification in the present study were not sufficient to substantiate these theories.
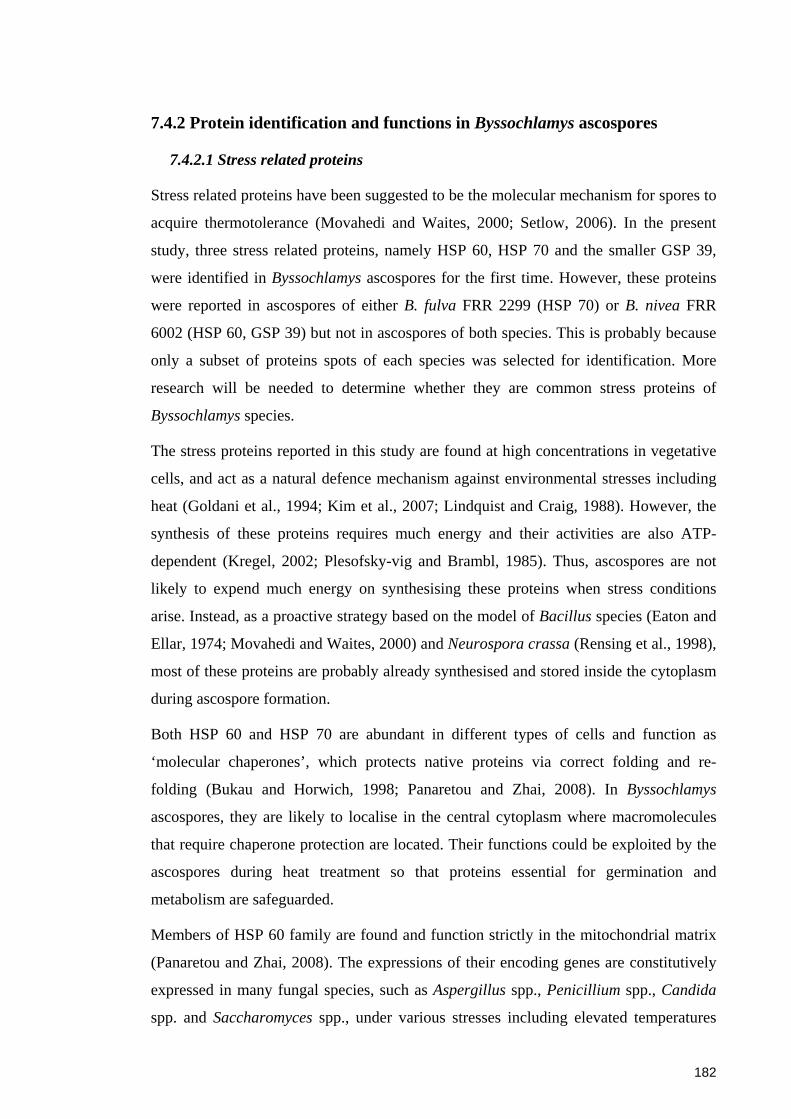
182
7.4.2 Protein identification and functions in Byssochlamys ascospores
7.4.2.1 Stress related proteins
Stress related proteins have been suggested to be the molecular mechanism for spores to
acquire thermotolerance (Movahedi and Waites, 2000; Setlow, 2006). In the present
study, three stress related proteins, namely HSP 60, HSP 70 and the smaller GSP 39,
were identified in Byssochlamys ascospores for the first time. However, these proteins
were reported in ascospores of either B. fulva FRR 2299 (HSP 70) or B. nivea FRR
6002 (HSP 60, GSP 39) but not in ascospores of both species. This is probably because
only a subset of proteins spots of each species was selected for identification. More
research will be needed to determine whether they are common stress proteins of
Byssochlamys species.
The stress proteins reported in this study are found at high concentrations in vegetative
cells, and act as a natural defence mechanism against environmental stresses including
heat (Goldani et al., 1994; Kim et al., 2007; Lindquist and Craig, 1988). However, the
synthesis of these proteins requires much energy and their activities are also ATP-
dependent (Kregel, 2002; Plesofsky-vig and Brambl, 1985). Thus, ascospores are not
likely to expend much energy on synthesising these proteins when stress conditions
arise. Instead, as a proactive strategy based on the model of Bacillus species (Eaton and
Ellar, 1974; Movahedi and Waites, 2000) and Neurospora crassa (Rensing et al., 1998),
most of these proteins are probably already synthesised and stored inside the cytoplasm
during ascospore formation.
Both HSP 60 and HSP 70 are abundant in different types of cells and function as
‘molecular chaperones’, which protects native proteins via correct folding and re-
folding (Bukau and Horwich, 1998; Panaretou and Zhai, 2008). In Byssochlamys
ascospores, they are likely to localise in the central cytoplasm where macromolecules
that require chaperone protection are located. Their functions could be exploited by the
ascospores during heat treatment so that proteins essential for germination and
metabolism are safeguarded.
Members of HSP 60 family are found and function strictly in the mitochondrial matrix
(Panaretou and Zhai, 2008). The expressions of their encoding genes are constitutively
expressed in many fungal species, such as Aspergillus spp., Penicillium spp., Candida
spp. and Saccharomyces spp., under various stresses including elevated temperatures

183
(Raggam et al., 2010). Their major operation is to stabilise intracellular proteins under
stress conditions, which is achieved by binding proteins to prevent them from
inactivation, blocking the aggregation of denatured proteins, and mediating the
refolding of mis-folded proteins (Burnie et al., 2005; Martin et al., 1992). The protective
activities of HSP 60 are often complemented by a group of smaller proteins, HSP 10,
together forming a chaperone machine inside mitochondria (Gomes and de Cássia
Garcia Simão, 2009). The HSP 60 family are also proapoptotic proteins that assist the
programmed breakdown of cellular components (Kregel, 2002).
Members of HSP 70 family are located in various compartments of the cells, including
the cytoplasm, mitochondria and endoplasmic reticulum (Gomes and de Cássia Garcia
Simão, 2009). The protections mechanisms offered by the HSP 70 family are relatively
diverse, with major functions involving assisting correct folding of newly formed or
denatured proteins, and maintaining native structures of proteins, preventing
aggregation of denatured proteins (Bukau and Horwich, 1998; Mayer and Bukau, 2005).
The HSP 70 also helps translocation of proteins across membranes into different
compartments (Panaretou and Zhai, 2008).
The general stress protein GSP 39 was first identified in stressed Bacillus subtilis cells
(Antelmann et al., 1997) but information about its functions is very sparse, probably
because of its specific expression in a limited numbers of species. The GSP 39 belongs
to the dehydrogenase/reductase family which plays a role in maintaining the redox
homeostasis in cells (Kavanagh et al., 2008). A similar function may be carried out by
the GSP 39 in Byssochlamys ascospores so that the intracellular environment is suitable
for protein conservation.
The activity of the GSP 39 is quite different from those of other stress proteins with
similar MW ranges. The HSP 40 (MW ~ 40 KDa), for instance, is co-chaperones for
HSP 70 (Qiu et al., 2006). Similarly, a class of small HSPs with MW 15 – 30 kDa
possess chaperone functions which include preserving native protein structures and
preventing protein aggregation. Interestingly, the activities of those small HSPs are ATP
independent so they may be compatible with ascospores which are low in energy
expenditure (Jakob et al., 1993; Mchaourab et al., 2009).
184
7.4.2.2 Other identified proteins and their potential functions in ascospores
Apart from the stress related proteins, some of the other identified proteins belonged to
various groups of enzymes which participate in key metabolic pathways in vegetative
cells. Citrate synthase and malate dehydrogenase are a part of the TCA cycle which is
central for the respiration and metabolism in vegetative cells (Xie et al., 2004).
Transaldolase involves in the pentose phosphate pathway which synthesises the
essential coenzyme NADPH (Xie et al., 2004). The pepsin precursor, pepsinogen, and
the pepsin-like aspartic protease pepE are necessary for catabolism of proteins (Fruton,
2002).
The finding of metabolic enzymes in Byssochlamys ascospores was comparable to that
of other species. Malate dehydrogenase and alcohol dehydrogenase were found in
dormant ascospores of Neurospora tetrasperma (Lingappa et al., 1970). Several
enzymes for metabolism and germination have also been detected in forespores and
endospores of Bacillus spp. and Clostridium difficile (DelVecchio et al., 2006; Kuwana
et al., 2002; Lawley et al., 2009). Conidia of A. oryzae contained inducible forms of
proteases such as α-amylase and invertase (Sinohara, 1970). Therefore, one can
conclude that enzymes required for metabolism have been pre-synthesised and stored in
dormant ascospores. This ensures a quick revival of the ascospores when environmental
conditions are hospitable for germination. The availability of metabolic enzymes also
avoids need for protein synthesis and energy requirements at the beginning of the
activation and germination processes.
The rest of the identified proteins possess unique functions and their involvement in
ascospores may present some competitive advantages in surviving in an unfavourable
environment. The hypothetical protein An07g00820 is a putative NADH-dependent
oxidoreductase for flavin-containing compounds, which are required in catabolism of
nitrogen-organic compounds (Morokutti et al., 2005). Many nitrogen-containing
compounds such as drugs and antibiotics are probably lethal to the mould, thus the
enzyme would allow the ascospores to survive and germinate in a special niche such as
the soil in an orchard. Similarly, the erythromycin esterase may offer a resistance
against the antibiotic erythromycin (Arthur et al., 1986). The identification of allergen
Asp F3 may be a possible invasive factor which could also provide an advantage in
mixed soil populations. The larger groups of allergen Asp F are often associated with

185
Aspergillus fumigatus species which are well-known for invasive and allergic
pulmonary aspergillosis in humans and birds. When conidia of A. fumigatus enter the
body and germinate, Asp F3 acts as an antigen triggering the immune responses of
various cells such as CD cells, T helper cells and interferon lambda (Chaudhary et al.,
2010). However, there is no available evidence to support any possible link between the
Asp F3 found in ascospores of Byssochlamys with the aspergillosis caused by A.
fumigatus.
7.4.3 Low percentage of significant matches and poor agreement between
estimated MW and pI values
A third of the proteins (8 out of 23 spots) chosen for MS/MS were not satisfactorily
matched (MOWSE score < 70) with proteins in the NCBInr fungal protein database.
Attempts to expand the search to include all species in the NCBInr protein database
(prokaryotes and human) did not improve the current results. Moreover, there were poor
agreements between MW and pI of matched proteins with the estimated values from 2D
gels. The identification process being employed in this experiment involved matching
the eight most abundant peptides of the test proteins with peptides generated by
theoretically enzymatic digestion of proteins in the database. The advantage of this
approach is rapid identification but it requires knowledge of the species’ genomes so
that protein sequences can be derived. The lack of information about Byssochlamys
genomes could explain the low rate of good identification and the low agreement of
MW and pI. Most of the successfully matched proteins came from a few well-known
fungi such as Aspergillus, Penicillium and Neosartorya whose genome sequences are
available. However, their proteins may not be homologous to those of Byssochlamys
species. The present study has highlighted a knowledge gap in the genomics of
Byssochlamys species which needs to be filled so that advances in understanding the
molecular aspects of heat resistance in the ascospores can be realised.
186
7.4.4 General assessment of the proteome of Byssochlamys ascospores
Ascospores of B. fulva FRR 2299 and B. nivea FRR 6002 strains exhibited more than
500 detectable spots on 2D gels irrespective of heating times and ages. This figure is
comparable to those of spores of other fungi. Proteomic profiles of conidia of A.
fumigatus generated on 2D gels contained 485 spots (Teutschbein et al., 2010). Using a
directly comparative technique called isobaric tagging for relative and absolute
quantitation (iTRAQ), Cagas et al. (2011) could identify 461 proteins in A. fumigatus
conidia. However, the proteome of Penicillium marneffei conidia showed only 270
detectable spots (Chandler et al., 2008).
However, the number of proteins may be less than that because one protein could be
presented by multiple spots as observed in the result. This phenomenon is usually due to
post-translational modifications (PTMs), which are common activities in protein
synthesis in eukaryotic cells (Mann and Jensen, 2003; Vödisch et al., 2009). In the
current experiment, the identification of various allergen Asp F3 proteins represented by
more than one spot supported the occurrence of PTMs in ascospore proteins. Series of
spots with similar MW but incrementally increasing pH are other lines of evidence of
PTMs in this experiment (Jacob and Turck, 2008; this study, Figures 7.3 and 7.4).
The wide MW and pI ranges of protein spots of Byssochlamys ascospores were not
uncommon considering similar variations in proteomic profiles of other fungal species.
Different strains, species and ascospores at various physiological states had dissimilar
proteomes, as could be expected, but there were no definite relationships between these
factors. Germinating and actively growing cells have highly active metabolism so they
could be expected to have more proteins expressed than dormant structures like
ascospores (Armstrong et al., 1984) although some proteins could be down-regulated or
disappear during germination and growth (Thanh, 2004). The number of proteins
detected in A. fumigatus conidia varied between 310 and 461 depending on the methods
used (Cagas et al., 2011; Teutschbein et al., 2010). Proteomic profiles of Trichophyton
rubrum conidia showed about 1026 proteins (Leng et al., 2008). Only 381 spots on 2D
gels representing 334 proteins were identified for the mycelium of A. fumigatus. The
figures for mitochondria of A. fumigatus were even less, with 234 spots and 147
proteins (Vödisch et al., 2009).
187
The spot resolution on 2D gels could vary with the chosen separation ranges. The wide
ranges of MW (10 – 100+ KDa) and pI (3 – 10) used in the current study greatly
contributed to a large number of detectable spots. Shorter ranges could resolve fewer
spots (Crespo-Sempere et al., 2011) but may separate groups of close proteins better,
giving more spots on gels (Khan et al., 2008).
The sensitivity of the dyes and viewing techniques also affected spot visualisation.
Coomassie Blue is less sensitive for viewing protein spots than other dyes such as
SYPRO Ruby or silver staining, so it could underestimate the number of spots (Harris et
al., 2007). In fact, the difference could be as many as 500 spots when Coomassie and
silver stains were applied to 2D gels of similar germinating conidia of Emericella
nidulans (Oh et al., 2010). The sensitivity of Coomassie Blue was significantly
enhanced in the present study by using an infrared fluorescence imaging system (Harris
et al., 2007).
7.4.5 Recommendations for future research
Because 2D GE has not been used to study Byssochlamys ascospores before, the results
present here are also exploratory and can be improved in some aspects. First, gels of
narrower MW and pH ranges than those used in the present study can be used to focus
on subsets of proteins so that the resolution and separation power of 2D gels are
improved. In particular, several groups of overlapping proteins are found in the pI range
4 – 7 and these proteins can be differentiated more clearly on gels with the similar pH
range (Khan et al., 2008). Second, apart from Coomassie blue, more sensitive protein
stains such as SYPRO Ruby can be used to enable better visualisation and quantitative
comparison of protein spots (Albrecht et al., 2010; Harris et al., 2007). Third, more
spots should be chosen for identification to reveal more information about functions of
proteins in ascospores. Another approach is to compare proteomic profiles of mycelium
and dormant ascospores of Byssochlamys, which may reveal proteins specific at
different developing stages of the fungi.
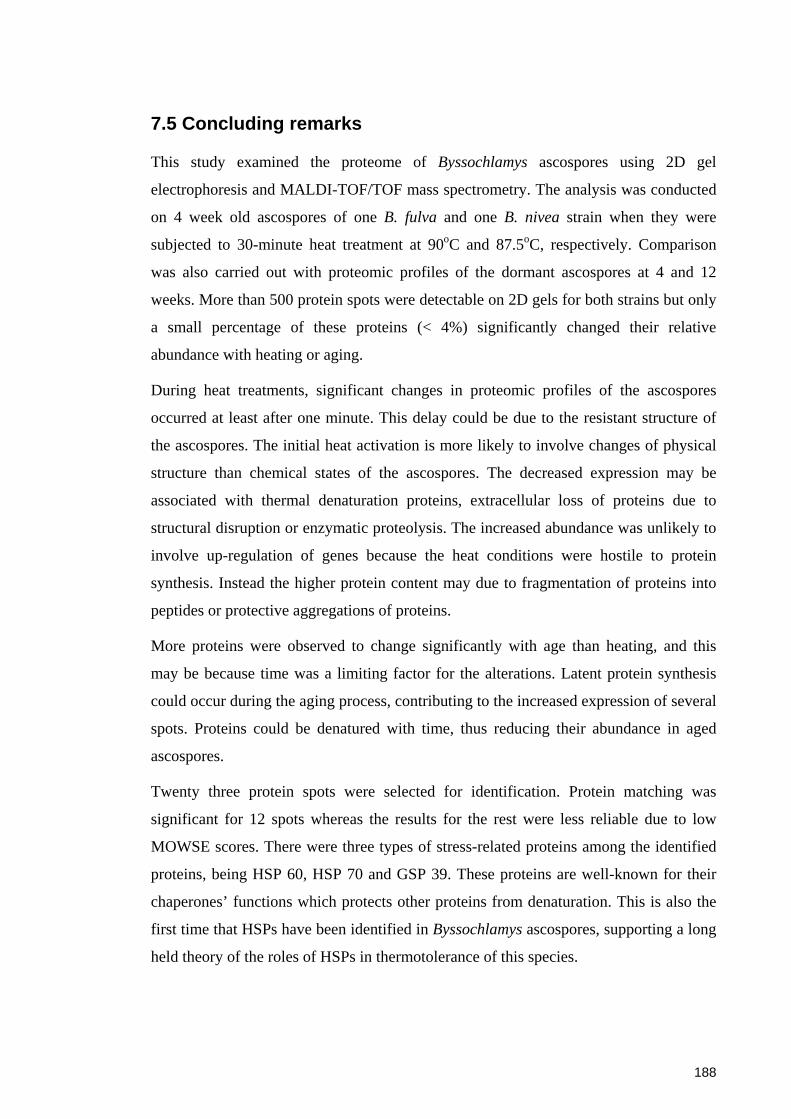
188
7.5 Concluding remarks
This study examined the proteome of Byssochlamys ascospores using 2D gel
electrophoresis and MALDI-TOF/TOF mass spectrometry. The analysis was conducted
on 4 week old ascospores of one B. fulva and one B. nivea strain when they were
subjected to 30-minute heat treatment at 90oC and 87.5oC, respectively. Comparison
was also carried out with proteomic profiles of the dormant ascospores at 4 and 12
weeks. More than 500 protein spots were detectable on 2D gels for both strains but only
a small percentage of these proteins (< 4%) significantly changed their relative
abundance with heating or aging.
During heat treatments, significant changes in proteomic profiles of the ascospores
occurred at least after one minute. This delay could be due to the resistant structure of
the ascospores. The initial heat activation is more likely to involve changes of physical
structure than chemical states of the ascospores. The decreased expression may be
associated with thermal denaturation proteins, extracellular loss of proteins due to
structural disruption or enzymatic proteolysis. The increased abundance was unlikely to
involve up-regulation of genes because the heat conditions were hostile to protein
synthesis. Instead the higher protein content may due to fragmentation of proteins into
peptides or protective aggregations of proteins.
More proteins were observed to change significantly with age than heating, and this
may be because time was a limiting factor for the alterations. Latent protein synthesis
could occur during the aging process, contributing to the increased expression of several
spots. Proteins could be denatured with time, thus reducing their abundance in aged
ascospores.
Twenty three protein spots were selected for identification. Protein matching was
significant for 12 spots whereas the results for the rest were less reliable due to low
MOWSE scores. There were three types of stress-related proteins among the identified
proteins, being HSP 60, HSP 70 and GSP 39. These proteins are well-known for their
chaperones’ functions which protects other proteins from denaturation. This is also the
first time that HSPs have been identified in Byssochlamys ascospores, supporting a long
held theory of the roles of HSPs in thermotolerance of this species.
189
Other identified proteins belong to groups of enzymes either participating in key
metabolic pathways or supporting competitive survival of ascospores in natural
environments such as soil.
The proteomic results suggest a survival strategy in Byssochlamys ascospores whereby
proteins essential for ascospore survival and germination are pre-synthesised and
packed inside the central cytoplasm, where they are protected by heat shock chaperones.
That arrangement minimises the need for protein synthesis and energy generation at the
beginning of the germination process.
The findings of this experiment were limited by the lack of genomic information on
Byssochlamys species. This knowledge gap needs to be addressed before the molecular
basis of heat resistance can be further elaborated. Future research can identify proteins
with a greater confidence, and relate them back to genes and transcriptomes during
aging or exposure to stresses such as heating.
190
Chapter 8 – General discussion and conclusions
8.1 Introduction
The studies reported in this thesis aimed to elucidate the contributions of some intrinsic
factors to the heat resistance of fungi in the genus Byssochlamys. Like other heat
resistant moulds, Byssochlamys species acquire thermo-tolerance through the sexual
production of ascospores, dormant structures which are much more tolerant to
environmental stresses than vegetative cells (Pitt and Hocking, 2009). Several previous
investigations have explored the heat resistance of Byssochlamys ascospores mostly in
complex media or other conditions, thereby introducing potential complications from a
number of external factors (Bayne and Michener, 1979; Beuchat and Toledo, 1977;
Splittstoesser et al., 1986). The studies reported here predominantly focused on
determinants of the heat resistance that are intrinsic to the ascospores, and would
therefore be expected to provide explanations of mechanisms more closely linked to the
properties of the cells. The factors investigated in this study included: thermal
inactivation of the ascospores from cultures at different ages, ascospore ultrastructure,
proteomic profiles and, population heterogeneity at the community level.
Each of these aspects and their relationship to the heat resistant properties were
separately investigated and discussed in previous chapters. However, it has been shown
on several occasions that these properties are not independent of each other, for instance
the relationship between aging and ultrastructure of the ascospores (Chapter 4). The
various components are likely to operate at different cellular levels and together
contribute to a greater heat resistance of the ascospores. This multifaceted heat
resistance is analogous to similar systems that have been elucidated in endospores of
bacterial species such as Bacillus spp. and Clostridium spp. (Orsburn et al., 2008;
Setlow, 2006).
This Chapter builds on the findings and discussions of other studies reported earlier to
elaborate further the interactions among these intrinsic factors, which partially define
the thermo-tolerance of Byssochlamys ascospores. The factors, except inactivation
temperatures, and their inter-dependent relationships with respect to the heat resistance
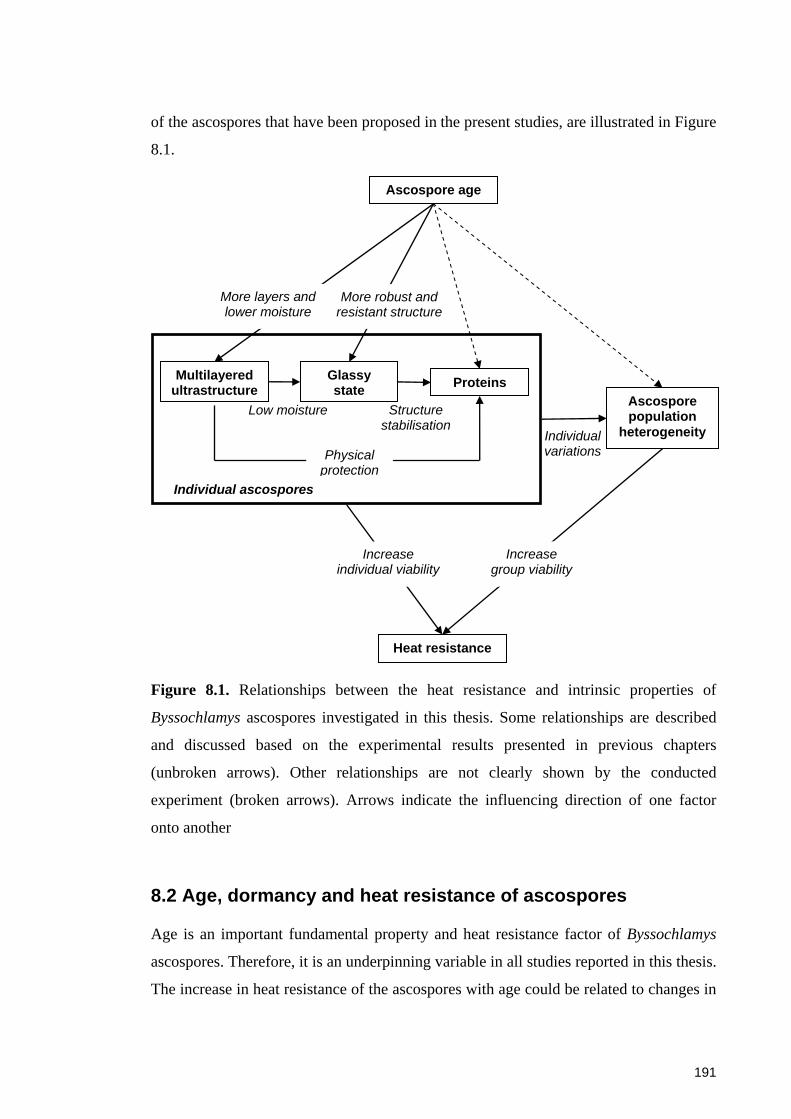
191
of the ascospores that have been proposed in the present studies, are illustrated in Figure
8.1.
Figure 8.1. Relationships between the heat resistance and intrinsic properties of
Byssochlamys ascospores investigated in this thesis. Some relationships are described
and discussed based on the experimental results presented in previous chapters
(unbroken arrows). Other relationships are not clearly shown by the conducted
experiment (broken arrows). Arrows indicate the influencing direction of one factor
onto another
8.2 Age, dormancy and heat resistance of ascospores
Age is an important fundamental property and heat resistance factor of Byssochlamys
ascospores. Therefore, it is an underpinning variable in all studies reported in this thesis.
The increase in heat resistance of the ascospores with age could be related to changes in
Ascospore age
Multilayered ultrastructure
Glassy state Proteins
Ascospore population
heterogeneity
Heat resistance
Individual ascospores
More layers and lower moisture
More robust and resistant structure
Structure stabilisation
Physical protection
Low moisture
Increase individual viability
Increase group viability
Individual variations
192
the physiology, ultrastructure, chemical composition and population distribution of the
cells.
Dormancy is a unique physiological feature of microbial spores. It is generally
associated with elevated resistance to environmental stresses including heating
(Newsome, 2003; Sussman and Douthit, 1973). For Byssochlamys species, aging may
enhance the level of dormancy and consequently increase the heat resistance of the
ascospores. In Chapter 3, older ascospores exhibited lower percentage of activation than
the younger ones. If the decreased activation had been due to dead ascospores, one
would have expected a sudden drop in the survival counts following heat treatments.
Contrarily, the thermal inactivation kinetics of the matured ascospores showed a long
shoulder stage, a gradually linear inactivation and a tailing at a similar count as that
observed for younger cells. Thus, aged ascospores may become more heat resistant as a
result of an enhanced dormancy.
The relationship of three aspects, including age, dormancy and heat resistance, is not
limited to ascospores of B. fulva and B. nivea. Conner and Beuchat (1987) proposed a
similar interaction in ascospores of Neosartorya fischeri after the fungal cultures were
grown for up to 114 days. At the end of the longest incubation, ascospores became more
dormant and required more energy to germinate and inactivate. Thus, the age-induced
dormancy could be postulated to be a driving force behind the higher heat resistance of
Byssochlamys ascospores.
8.3 Ultrastructure and heat resistance of ascospores
The unique ultrastructure of microbial spores is essential for their dormancy and,
therefore, plays a crucial role in their stress resistance (Driks, 2003; Sussman and
Douthit, 1973). Protection of the dormancy involves physically preventing the entering
of water and harmful chemicals into the spores as well as the loss of DNA and
important macromolecules from the cells. For the ascospores of B. fulva and B. nivea,
the cell-wall and the thick intermediate space (IMS) could be regarded as the protective
shells safe-guarding materials in the central cytoplasm from physical insults.
Additionally, in dormant, non-heated ascospores, these two layers may also be
impermeable to water and chemicals, which would be crucial in maintaining a
dehydrated intracellular core.

193
The function of the cell wall and the IMS as physical barriers was highlighted by their
ability to hinder SYTO9 or fixatives for electron microscopy from entering freely the
ascospores (Chapters 4 and 6). This obstruction was partially removed when the wall
and structure was compromised by heating. Modifications inflicted by heat treatments
to the ascospores could be opening pores or disrupted integrity of the cell-wall and the
IMS. Consequently, following thermal treatments, the cytoplasm of the ascospores was
transformed, being either stained brightly with SYTO 9 (Chapter 6), or less dense and
displaying many discernable organelles, as observed in the EM studies (Chapter 4).
Similar results have been reported for ascospores of Talaromyces macrosporus
(Dijksterhuis et al., 2007) and endospores of Bacillus stearothermophilus (Beaman et
al., 1988). In these cases, the heated spores allowed higher permeation of water and
chemical compounds, changing the structural appearance of the central region.
It has been noted in Chapter 4 that ascospores of B. fulva appeared to have extra
protection from remnants of the ascus wall which was mostly absent in those of B.
nivea. This layer could also help by bonding individual ascospores in the asci, which
hindered uniform heat penetration into these structures to inactivate them. However,
there have not been any reports on the differences between the outer coats of ascospores
of B. fulva and B. nivea. The formation and chemical composition of this layer may
contribute to this discrepancy and, therefore, can be a topic for further research.
While the central cytoplasm is the target of the protection offered by the two outer
layers, this compartment also contributes to the general stress resistance of the
ascospores. Its high density and special configuration are protective factors for the
enclosed constituents. Chapter 5 presents evidence of a glass state and a low moisture
environment existing in Byssochlamys ascospores. These observations support a long
held theory about the glassy state and its protective mechanisms underpinning the heat
resistance of spore structures such as the ascospores (Dijksterhuis, 2007; Leuschner and
Lillford, 2003).
Once formed, the ultrastructure of the ascospores may not be static but may develop
with time, or ascospore age, as shown in Chapters 4 and 5. The appearance of additional
sub-layers in the IMS, the better recovery of DSC transitions and the higher transition
temperatures all indicated a more robust and resilient ultrastructure of the more matured

194
ascospores. These developments possibly enable an enhanced level of dormancy and a
greater heat resistance of the ascospores.
Despite the potential roles of each ultrastructural compartment in the heat resistance of
Byssochlamys ascospores, the chemical composition of these layers is poorly
understood and deserves more research effort. It would be useful to understand the
construction of the cell-wall and the IMS from the molecular point of view i.e. genes
and encoded enzymes that take part in synthesising the layers. In yeast ascospore walls,
networks of polysaccharides, such as chitin, chitosan or glucan, and amino acids, such
as dityrosine, may partially contribute to the structures of those compartments because
of their prevalence and stress resistance functions (Adams, 2004; Coluccio et al., 2008;
Suda et al., 2009). Moreover, information about the composition of the cytoplasm
would also be useful to explain the arrangement of the intracellular materials, which
were reported in Chapter 5. Trehalose, in particular, is commonly found in fungal
spores and has been associated with the glassy state (Dijksterhuis et al., 2002;
Thevelein, 1984). Detection of trehalose in Byssochlamys ascospores could not be done
using DSC and this will require a thorough chemical analysis of the ascospores in future
studies. Additionally, the states and spatial distribution of water in the ascospores would
be a pertinent research topic for a better understanding of the glassy state, dormancy and
heat resistant properties.
8.4 Proteins and heat resistance of ascospores
Proteomic profiles of Byssochlamys ascospores exhibited many proteins, several of
which were enzymes necessary for key metabolic pathways such as the TCA cycle,
pentose-phosphate pathway and glycolysis (Chapter 7). Another group of proteins
consisted of molecular chaperones, such as HSP 60, HSP 70 and GSP 39, which help to
protect the active structures of other proteins (Chapter 7). The existence of these
proteins is in accordance with the dormancy theory, which together may indicate the
storage of pre-synthesised materials essential for cellular viability inside the ascospores,
possibly in the cytoplasm compartment, for post-activation utilisation. This strategy has
been reported for bacterial endospores where newly synthesised proteins accumulate
during the forespore state and are then packaged in matured spores (Eaton and Ellar,
1974). With this approach, proteins of the ascospores could be preserved by a low
195
moisture environment and a glassy state, protecting them from environmental insults
and extracellular loss. Concurrently, the stress-related proteins act synergistically with
the intracellular environment to protect other enzymes, which further increases the
survival ability of the ascospores in harsh conditions.
Aging affected the proteomic profiles of Byssochlamys ascospores by increasing or
decreasing the abundances of particular proteins (Chapter 7). This result further
supports the theory that culture age could be an important factor in changing intrinsic
properties of the ascospores. More importantly, the age-associated changes in proteomes
indicate that the intracellular content of dormant ascospores may not be static but
transform incrementally towards an optimal state of dormancy and resistance. This may
corroborate the findings of ultrastructure studies with EM and DSC (Chapters 4 and 5)
to explain why ascospores of Byssochlamys species become more heat resistant when
aging.
In Chapter 7, the selection of identified proteins mainly focused on the ‘significant
change’ parameters. Thus, only a small percentage of the total proteins observed was
chosen for identification, leaving a wealth of uncharacterised ascospore proteins. The
unidentified proteins could harbour valuable knowledge about cell-wall assembly,
intermediate space composition, ascospore formation and other stress-related proteins. It
is also worth reiterating the knowledge gap in the genomics of Byssochlamys spp. which
needs to be addressed if molecular mechanisms of heat resistance are to be better
elucidated.
8.5 Population heterogeneity and heat resistance of ascospores
Sections 8.2 – 8.5 are predominantly concerned with individual ascospores that acquire
thermo-tolerance by maintaining a high level of dormancy via the ultrastructure and
intracellular contents. However, the heat resistant factors of one ascospore are not
necessarily similar to those of their neighbouring cells even though they may be derived
from genetically similar cultures. The differences between individual ascospores may
result from variations in time of sporulation, access to nutrients, rates of ultrastructural
development and chemical composition (Allman, 1992; Dantigny and Nanguy, 2009).
Thus, the heat resistant properties within a population may be expected to vary
196
significantly among individual ascospores (Casella et al., 1990; Junior and Massaguer,
2007).
The heterogeneity of populations of Byssochlamys ascospores was partially resolved by
flow cytometry, based on cell sizes and the cell integrity. The heterogeneity of dormant
ascospores was maintained when they were heat treated, indicating that inactivation of
ascospores was not as simple a process as the transition from dormancy to death. A
proportion of the dormant sub-populations changed minimally their flow cytometric
properties during the course of heat treatment. These persistent groups of dormant
ascospores could result from the tailing stage on the survival curves of Byssochlamys
ascospores (Chapter 3). The similar heat resistance of the tailing ascospore populations
after several generations excludes the possibility of genetically more heat resistant
ascospores (Chapter 3). These ascospores may result from the natural selection of the
heat resistant properties or phenotypic variations, such as more compact and dehydrated
ultrastructure (Kort et al., 2005; Peleg and Cole, 1998). The persistent sub-populations
and the tailing phenomenon may also coincide with the ‘super-dormancy’ theory in
bacterial spores (Ghosh et al., 2010; Rodriguez-Palacios and LeJeune, 2011) although
the mechanisms of their existence in populations of Byssochlamys ascospores are a
question for further research.
The heterogeneous responses of ascospores to heat treatments was reflected as a
spectrum of thermally affected ascospores, such as those predicted as activated, sub-
lethally injured, inactivated and the persistently dormant ascospores (Chapter 6). These
diverse populations could increase the survival chance of particular sub-populations
during heat treatments. Moreover, heat inflicted ascospores often exhibited higher levels
of fluorescence with SYTO 9, indicating the presence of compromised cell-wall
(Chapter 6). These results of flow cytometry reiterate the important roles of the
ultrastructure, particularly the cell wall, in protecting the ascospores from chemical and
physical stresses.
Effects of aging on the heterogeneity of Byssochlamys ascospores could not be clearly
demonstrated in the flow cytometry analysis (Chapter 6). There was much similarity
between ages in regards to the sub-population maps of ascospores in their dormant
stages and after heat treatments. For similar reasons, the identification of the exact
physiological states of all sub-populations was empirical and needs confirmation from

197
more studies. If future research is to investigate the heterogeneity of Byssochlamys
ascospores, there is a need for a harvesting process to generate homogeneous ascospore
crops comprising one type of dormant ascospores so that their changes with heating or
aging can be more clearly characterised. Efforts would also be needed in selecting more
compatible fluorescent probes to resolve sub-populations and track them during heat
treatment.
8.6 Recommendations for future research
Several suggestions for future research have been made in previous chapters when the
limitations of each experiment were discussed. In summary, more studies are required
in the following areas in order to gain a great understanding of the heat resistance of
Byssochlamys ascospores.
Firstly, it is necessary to know the chemical composition of the ascospores. The focus
should be on the cell wall and the intermediate space which form the first line of
defence for the ascospores against thermal insults. Moreover, knowledge about moisture
content and viscosity of the internal environment would be useful in understanding the
existence of a glassy state inside the ascospores. It is then also important to determine
the distribution of water inside the ascospores since this result would reveal if the glassy
state is uniform or compartmentalised in the ascospores.
Secondly, the ultrastructure of Byssochlamys ascospores needs to be further investigated
using more effective electron microscopic protocols. For TEM, particularly, it is
important to ensure that ascospore samples are properly fixed and infiltrated by fixatives
and resins. Other microscopic techniques such as fluorescence, confocal or OMX
microscopy might be employed to observe ultrastructural changes in a timely manner
with less invasive preparation procedures.
Thirdly, in order to study the heterogeneity of Byssochlamys ascospores especially by
flow cytometry, it is essential to understand the properties (size, cell-wall integrity) of
more homogeneous populations. That will require more effective methods for
harvesting and purifying ascospores. It is equally important to focus on selecting
appropriate detection staining probes to track the transformation of heated ascospores.
198
The next consideration is to sort subpopulations and characterise them unequivocally in
terms of morphology, ultrastructure, viability and heat resistance.
Fourthly, the proteomic findings presented in this thesis can be improved by using more
sensitive techniques to visualise and compare 2D gels. Some direct and quantitative
comparison methods such as Isotope-coded Affinity tags, isobaric peptide tags for
relative and absolute quantification or 2D fluorescence difference gel electrophoresis
can be used for that purpose (Albrecht et al., 210; Gygi et al., 1999; Ross et al., 2004).
Moreover, the sequences of genomes of Byssochlamys species will be absolutely
necessary to make further progresses in understanding the molecular mechanisms of
heat resistance of their ascospores.
8.7 Conclusions
In this project, the heat resistance of Byssochlamys ascospores was studied from the
perspective of their intrinsic properties, which included ascospore age, the
ultrastructure, presence of the glassy state, population heterogeneity and their
proteomics. Integrated results of all the experiments have shown that the heat resistance
mechanism is multifactorial, involving contributions from all the factors at different
levels of the ascospores.
At the cellular level, Byssochlamys ascospores acquire their thermo-tolerance by the
specific multilayered ultrastructure. The two compartments, cell-wall and intermediate
space, are impermeable to water and many chemicals and, therefore, they represent the
protective layers of the ascospores. Their major function is to maintain the dehydrated
environment inside the ascospores, which is equivalent to promoting dormancy of the
cells. They are also the first line of defence against environmental stresses, such as
heating, and extracellular loss of internal content.
Ascospores also maintain a glassy state at least in the central cytoplasm where materials
essential for germination and surviving are stored. The glassy state can effectively
preserve macromolecules by hindering harmful chemical reactions and denaturation.
Additionally, heat shock proteins are pre-synthesised and present in the cytoplasm,
providing proteins with further protection. The packaging of stress proteins and
metabolic enzymes inside the ascospore is likely to take place prior to or during
199
sporulation, which is also a strategy for reproduction and surviving in adverse
conditions.
Aging can increase heat resistance by inducing structural and biochemical changes
inside the ascospores. A noticeable change is the development of sub-layers in the
intermediate space, probably for better dehydration and dormancy. Additionally, the
protein content of dormant ascospores may also change significantly towards an optimal
composition for heat resistance.
At the population level, ascospores are not homogenous with respect to morphology,
cell integrity and possibly age. This heterogeneity can result in different responses of
individual ascospore to heat treatments. Some sub-populations are less affected by heat
than others and, therefore, survive better.
Although definitive answers to all the questions about heat resistance may not have
been answered, this study has advanced knowledge about heat resistant fungi, bringing
researchers incrementally closer to understanding the mechanisms behind this important
characteristic of fungal ascospores. Future research can build on the findings presented
here to advance understanding in this field. An ultimate goal is to provide better
information to enable food manufacturers to more effectively control food and beverage
spoilage caused by heat resistant fungi.
200
References
Ablett, S., Darke, A.H., Lillford, P.J. and Martin, D.R. 1999. Glass formation and
dormancy in bacterial spores. International Journal of Food Science and Technology
34, 59 - 69.
Ablett, S., Lillford, P.J. and Leuschner, R.G.K. 2001. Biophysical approach to spore
germination. In: Berk, Z., Lillford, P.J., Leslie, J., Mizrahi, S., (Eds.), Water science
for food, health, agriculture and environment. Technomics Pub. Co. 163-173.
Adamek, P. and Rönner, U. 1996. Heat resistant fungi: a literature study SIK - Rapport.
Adams, D.J. 2004. Fungal cell wall chitinases and glucanases. Microbiology 150, 2029-
2035.
Adams, M.R. and Moss, M.O. 2008. Food microbiology. 3rd ed. The Royal Society of
Chemistry, Cambridge.
Aguilera, J.M. and Karel, M. 1997. Preservation of biological materials under
desiccation. Critical Reviews in Food Science and Nutrition 37, 287 - 309.
Aiba, S. and Toda, K. 1966. Some analysis of thermal inactivation of bacterial-spore
clump. Journal of Fermentation Technology 44, 301-304.
Albrecht, D., Guthke, R., Brakhage, A. and Kniemeyer, O. 2010. Integrative analysis of
the heat shock response in Aspergillus fumigatus. BMC Genomics 11, 1-17.
Alderton, G. and Snell, N. 1970. Chemical states of bacterial spores: heat resistance and
its kinetics at intermediate water activity. Applied and Environmental Microbiology
19, 565-572.
Allison, S.D., Chang, B., Randolph, T.W. and Carpenter, J.F. 1999. Hydrogen bonding
between sugar and protein is responsible for inhibition of dehydration-induced
protein unfolding. Archives of Biochemistry and Biophysics 365, 289-298.
Allman, R. 1992. Characterisation of fungal spores using flow cytometry. Mycological
Research 96, 1016-1018.
Andersen, B. and Thrane, U. 2006. Food-borne fungi in fruit and cereals and their
production of mycotoxins. In: Hocking, A.D., Pitt, J.I., Samson, R.A., Thrane, U.,
(Eds.), Advances in food mycology, vol. 571. Springer, New York. 137-152.

201
Antelmann, H., Bernhardt, J., Schmid, R., Mach, H., Völker, U. and Hecker, M. 1997.
First steps from a two-dimensional protein index towards a response-regulation map
for Bacillus subtilis. Electrophoresis 18, 1451-1463.
Appelqvist, I.A.M., Cooke, D., Gidley, M.J. and Lane, S.J. 1993. Thermal properties of
polysaccharides at low moisture: 1--An endothermic melting process and water-
carbohydrate interactions. Carbohydrate Polymers 20, 291-299.
Armstrong, D.W. and He, L. 2001. Determination of cell viability in single or mixed
samples using capillary electrophoresis laser-induced fluorescence microfluidic
systems. Analytical Chemistry 73, 4551-4557.
Armstrong, R.L., West, T.P. and Magee, P.T. 1984. Protein synthesis in germinating
Saccharomyces cerevisiae ascospores. Canadian Journal of Microbiology 30, 345-
352.
Arthur, M., Autissier, D. and Courvalin, P. 1986. Analysis of the nucleotide sequence of
the ereB gene encoding the erythromycin esterase type II. Nucleic Acids Research
14, 4987-4999.
Atrih, A. and Foster, S.J. 2001. Analysis of the role of bacterial endospore cortex
structure in resistance properties and demonstration of its conservation amongst
species. Journal of Applied Microbiology 91, 364-372.
Atrih, A. and Foster, S.J. 2002. Bacterial endospores the ultimate survivors.
International Dairy Journal 12, 217-223.
Awuah, G.B., Ramaswamy, H.S. and Economides, A. 2007. Thermal processing and
quality: principles and overview. Chemical Engineering and Processing 46, 584-602.
Aydin, A., Ulusoy, B.H. and Ergün, Ö. 2005. A survey on heat-resistant moulds in heat
treated milk, milk products and fruit juices. Archiv für Lebensmittelhygiene 56, 49-
72.
Ayesha, F. and Viswanath, P. 2006. Byssochlamys spp in sugarcane juice and its
significance. Journal of Food Science and Technology 43, 407-409.
Banner, M.J., Mattick, L.R. and Splittstoesser, D.F. 1979. Chemical composition of the
ascospores of Byssochlamys fulva. Journal of Food Science 44, 545-548.
Bartnicki-Garcia, S. 1968. Cell wall chemistry, morphogenesis, and taxonomy of fungi.

202
Annual Review of Microbiology 22, 87-108.
Bates, R.P., Morris, J.R. and Crandall, P.G. 2001. Principles and practices of small- and
medium-scale fruit juice processing FAO, Rome.
Bayne, H.G. and Michener, H.D. 1979. Heat resistance of Byssochlamys ascospores.
Applied and Environmental Microbiology 37, 449-453.
Beaman, T.C., Greenamyre, J.T., Corner, T.R., Pankratz, H.S. and Gerhardt, P. 1982.
Bacterial spore heat resistance correlated with water content, wet density, and
protoplast/sporoplast volume ratio. Journal of Bacteriology 150, 870-877.
Beaman, T.C., Pankratz, H.S. and Gerhardt, P. 1988. Heat shock affects permeability
and resistance of Bacillus stearothermophilus spores. Applied and Environmental
Microbiology 54, 2515-2520.
Beaven, G.H. and Brown, F. 1949. The pectic enzymes of the mould Byssochlamys
fulva. The Biochemical Journal 45, 221-224.
Becci, P.J., Hess, F.G., Johnson, W.D., Gallo, M.A., Babish, J.G., Dailey, R.E. and
Parent, R.A. 1981. Long-term carcinogenicity and toxicity studies of patulin in the
rat. Journal of Applied Toxicology 1, 256-261.
Beckett, A. 1976. Ultrastructural studies on exogenously dormant ascospores of
Daldinia concentrica. Canadian Journal of Botany 54, 689-697.
Bell, L.N. and Touma, D.E. 1996. Glass transition temperatures determined using a
temperature-cycling differential scanning calorimeter. Journal of Food Science 61,
807-810.
Belliveau, B.H., Beaman, T.C., Pankratz, H.S. and Gerhardt, P. 1992. Heat killing of
bacterial spores analyzed by differential scanning calorimetry. Journal of
Bacteriology 174, 4463-4474.
Berney, M., Hammes, F., Bosshard, F., Weilenmann, H.-U. and Egli, T. 2007.
Assessment and interpretation of bacterial viability by using the LIVE/DEAD
BacLight kit in combination with flow cytometry. Applied and Environmental
Microbiology 73, 3283-3290.
Beuchat, L.R. 1976. Effectiveness of various food preservatives in controlling the
outgrowth of Byssochlamys nivea ascospores. Mycopathologia 59, 175-178.

203
Beuchat, L.R. 1981. Combined effects of solutes and food preservatives on rates of
inactivation of and colony formation by heated spores and vegetative cells of molds.
Applied and Environmental Microbiology 41, 472-477.
Beuchat, L.R. 1986. Extraordinary heat resistance of Talaromyces flavus and
Neosartorya fischeri ascospores in fruit products. Journal of Food Science 51, 1506-
1510.
Beuchat, L.R. 1988. Thermal tolerance of Talaromyces flavus ascospores as affected by
growth medium and temperature, age and sugar content in the inactivation medium.
Transactions of the British Mycological Society 90, 359-364.
Beuchat, L.R. 1992. Media for detecting and enumerating yeasts and moulds.
International Journal of Food Microbiology 17, 145-158.
Beuchat, L.R. 1998. Spoilage of acid products by heat resistant molds. Dairy, Food and
Environmental Sanitation 18, 588-593.
Beuchat, L.R. and Pitt, J.I., (Eds.) 2001. Detection and enumerations of heat-resistant
molds. American Public Health Association, Washington DC.
Beuchat, L.R. and Rice, S.L. 1979. Byssochlamys spp. and their importance in
processed fruits. Advances in Food Research 25, 237-288.
Beuchat, L.R. and Toledo, R.T. 1977. Behaviour of Byssochlamys nivea ascospores in
fruit syrups. Transactions of the British Mycological Society 68, 65-71.
Bigelow, W.D. 1921. The logarithmic nature of thermal death time curves. The Journal
of Infectious Diseases 29, 528-536.
Black, E.P., Setlow, P., Hocking, A.D., Stewart, C.M., Kelly, A.L. and Hoover, D.G.
2007. Response of spores to high-pressure processing. Comprehensive Reviews in
Food Science and Food Safety 6, 103-119.
Bomar, M. 1962. The relationship between the age of Bacillus subtilis spores and their
resistance to ethylene oxide. Folia Microbiologica 7, 259-261.
Bonk, T. and Humeny, A. 2001. MALDI-TOF-MS Analysis of Protein and DNA. The
Neuroscientist 7, 6-12.
Boye, E. and Løbner-Olesen, A. 1990. Flow cytometry: Illuminating microbiology. The
New Biologist 2, 119-125.

204
Bradford, M.M. 1976. A rapid and sensitive method for the quantitation of microgram
quantities of protein utilizing the principle of protein-dye binding. Analytical
Biochemistry 72, 248-254.
Brambl, R. 2009. Fungal physiology and the origins of molecular biology.
Microbiology 155, 3799-3809.
Breeuwer, P. and Abee, T. 2000. Assessment of viability of microorganisms employing
fluorescence techniques. International Journal of Food Microbiology 55, 193-200.
Brown, A.H.S. and Smith, G. 1957. The genus Paecilomyces Bainier and its perfect
stage Byssochlamys Westling. Transactions of the British Mycological Society 40,
17-89.
Brul, S., van Beilen, J., Caspers, M., O'Brien, A., de Koster, C., Oomes, S., Smelt, J.,
Kort, R. and Ter Beek, A. 2011. Challenges and advances in systems biology
analysis of Bacillus spore physiology; molecular differences between an extreme
heat resistant spore forming Bacillus subtilis food isolate and a laboratory strain.
Food Microbiology 28, 221-227.
Budde, B.B. and Rasch, M. 2001. A comparative study on the use of flow cytometry
and colony forming units for assessment of the antibacterial effect of bacteriocins.
International Journal of Food Microbiology 63, 65-72.
Budnik, W.S. and Hocking, A.D. 1981. Heat resistant moulds in fruit based products,
The Australian Society of Microbiology Annual Meeting 22, 22, Canberra, Australia.
Buitink, J. and Leprince, O. 2004. Glass formation in plant anhydrobiotes: survival in
the dry state. Cryobiology 48, 215-228.
Bukau, B. and Horwich, A.L. 1998. The Hsp70 and Hsp60 chaperone machines. Cell
92, 351-366.
Burnie, J.P., Carter, T.L., Hodgetts, S.J. and Matthews, R.C. 2006. Fungal heat-shock
proteins in human disease. FEMS Microbiology Reviews 30, 53-88.
Butz, P., Funtenberger, S., Haberditzl, T. and Tauscher, B. 1996. High pressure
inactivation of Byssochlamys nivea ascospores and other heat resistant moulds.
Lebensmittel-Wissenschaft und-Technologie 29, 404-410.
Cagas, S.E., Jain, M.R., Li, H. and Perlin, D.S. 2011. The proteomic signature of
205
Aspergillus fumigatus during early development. Molecular & Cellular Proteomics
10, 10.1074/mcp.M1111.010108.
Cain, R.F. 1956. Studies of soil fungi. Saturnomyces a new genus of the Aspergillaceae.
Canadian Journal of Botany 34, 135-140.
Cartwright, P. and Hocking, A.D. 1984. Byssochlamys in fruit juices. Food technology
in Australia 36, 210-211.
Casella, M.L.A., Matasci, F. and Schmidt-Lorenz, W. 1990. Influence of age, growth
medium, and temperature on heat resistance of Byssochlamys nivea ascospores.
Lebensmittel-Wissenschaft und-Technologie 23, 404-411.
Cerf, O. 1977. A review: Tailing of survival curves of bacterial spores. Journal of
Applied Microbiology 42, 1-19.
Ceviz, G., Tulek, Y. and Con, A.H. 2009. Thermal resistance of Alicyclobacillus
acidoterrestris spores in different heating media. International Journal of Food
Science & Technology 44, 1770-1777.
Chandler, J., Treece, E., Trenary, H., Brenneman, J., Flickner, T., Frommelt, J., Oo, Z.,
Patterson, M., Rundle, W., Valle, O., Kim, T., Walker, G. and Cooper, C. 2008.
Protein profiling of the dimorphic, pathogenic fungus, Penicillium marneffei.
Proteome Science 6, 17.
Chapman, B., Winley, E., Fong, A.S.W., Hocking, A.D., Stewart, C.M. and Buckle,
K.A. 2007a. Ascospore inactivation and germination by high pressure processing is
affected by ascospore age. Innovative Food Science and Emerging Technologies 8,
531-534.
Chapman, M.D., Pomés, A., Breiteneder, H. and Ferreira, F. 2007b. Nomenclature and
structural biology of allergens. Journal of Allergy and Clinical Immunology 119,
414-420.
Chaudhary, N., Staab, J.F. and Marr, K.A. 2010. Healthy human T-cell responses to
Aspergillus fumigatus antigens. PLoS ONE 5, e9036.
Chen, K.-Y. and Chen, Z.-C. 2004. Heat shock proteins of thermophilic and
thermotolerant fungi from Taiwan. Botanical Bulletin of Academia Sinica 45, 247-
257.
206
Chen, T., Fowler, A. and Toner, M. 2000. Literature review: Supplemented phase
diagram of the trehalose-water binary mixture. Cryobiology 40, 277-282.
Chu, F.S. and Chang, C.C. 1973. Pecteolytic enzymes of eight Byssochlamys fulva
isolates. Mycologia 65, 920-924.
Chu, F.S., Nei, P.Y.W. and Leung, P.S.C. 1973. Byssochlamyopeptidase A, a rennin-
like enzyme produced by Byssochlamys fulva. Applied Microbiology 25, 163-168.
Coleman, W.H., Chen, D., Li, Y.-q., Cowan, A.E. and Setlow, P. 2007. How moist heat
kills spores of Bacillus subtilis. Journal of Bacteriology 189, 8458-8466.
Coleman, W.H., Zhang, P., Li, Y.q. and Setlow, P. 2010. Mechanism of killing of
spores of Bacillus cereus and Bacillus megaterium by wet heat. Letters in Applied
Microbiology 50, 507-514.
Coluccio, A. and Neiman, A.M. 2004. Interspore bridges: a new feature of the
Saccharomyces cerevisiae spore wall. Microbiology 150, 3189-3196.
Coluccio, A.E., Rodriguez, R.K., Kernan, M.J. and Neiman, A.M. 2008. The yeast
spore wall enables spores to survive passage through the digestive tract of
Drosophila. PLoS ONE 3, e2873.
Conner, D.E. and Beuchat, L.R. 1987. Efficacy of media for promoting ascospore
formation by Neosartorya fischeri, and the influence of age and culture temperature
on heat resistance of ascospores. Food Microbiology 4, 229-238.
Conner, D.E., Beuchat, L.R. and Chang, C.J. 1987. Age-related changes in
ultrastructure and chemical composition associated with changes in heat resistance of
Neosartorya fischeri ascospores. Transactions of the British Mycological Society 89,
539-550.
Cowan, A.E., Koppel, D.E., Setlow, B. and Setlow, P. 2003. A soluble protein is
immobile in dormant spores of Bacillus subtilis but is mobile in germinated spores:
Implications for spore dormancy. Proceedings of the National Academy of Sciences,
USA 100, 4209-4214.
Crespo-Sempere, A., Gil, J.V. and Martínez-Culebras, P.V. 2011. Proteome analysis of
the fungus Aspergillus carbonarius under ochratoxin A producing conditions.
International Journal of Food Microbiology 147, 162-169.

207
Cronin, U.P. and Wilkinson, M.G. 2007. The use of flow cytometry to study the
germination of Bacillus cereus endospores. Cytometry Part A 71A, 143-153.
Cronin, U.P. and Wilkinson, M.G. 2008a. Bacillus cereus endospores exhibit a
heterogeneous response to heat treatment and low-temperature storage. Food
Microbiology 25, 235-243.
Cronin, U.P. and Wilkinson, M.G. 2008b. Monitoring changes in germination and
permeability of Bacillus cereus endospores following chemical, heat and enzymatic
treatments using flow cytometry. Journal of Rapid Methods & Automation in
Microbiology 16, 164-184.
Cronin, U.P. and Wilkinson, M.G. 2010. The potential of flow cytometry in the study of
Bacillus cereus. Journal of Applied Microbiology 108, 1-16.
Crowe, J.H., Carpenter, J.F. and Crowe, L.M. 1998. The role of vitrification in
anhydrobiosis. Annual Review of Physiology 60, 73-103.
Crowe, J.H., Crowe, L.M. and Chapman, D. 1984. Preservation of membranes in
anhydrobiotic organisms: the role of trehalose. Science 223, 701-703.
Crowe, L.M., Reid, D.S. and Crowe, J.H. 1996. Is trehalose special for preserving dry
biomaterials? Biophysical Journal 71, 2087-2093.
Dantigny, P. and Nanguy, S.P.-M. 2009. Significance of the physiological state of
fungal spores. International Journal of Food Microbiology 134, 16-20.
Davey, H. and Kell, D. 1996. Flow cytometry and cell sorting of heterogeneous
microbial populations: the importance of single-cell analyses. Microbiological
Reviews 60, 641-696.
Davey, H.M. 2002. Flow cytometric techniques for the detection of microorganisms.
Methods in Cell Science 24, 91-97.
Davey, H.M. 2011. Life, death, and in-Between: Meanings and methods in
microbiology. Applied and Environmental Microbiology 77, 5571-5576.
Delage, N., d'Harlingue, A., Colonna Ceccaldi, B. and Bompeix, G. 2003. Occurrence
of mycotoxins in fruit juices and wine. Food Control 14, 225-227.
DelVecchio, V.G., Connolly, J.P., Alefantis, T.G., Walz, A., Quan, M.A., Patra, G.,
Ashton, J.M., Whittington, J.T., Chafin, R.D., Liang, X., Grewal, P., Khan, A.S. and

208
Mujer, C.V. 2006. Proteomic profiling and identification of immunodominant spore
antigens of Bacillus anthracis, Bacillus cereus, and Bacillus thuringiensis. Applied
and Environmental Microbiology 72, 6355-6363.
den Besten, H.M.W., van der Mark, E.-J., Hensen, L., Abee, T. and Zwietering, M.H.
2010. Quantification of the effect of culturing temperature on salt-induced heat
resistance of Bacillus species. Applied and Environmental Microbiology 76, 4286-
4292.
Denny, C.B. and Brown, C.K. 1969. Report on findings with mold types, Byssochlamys
Seminar Abstracts, vol. Research Circular No. 20. New York State Agricultural
Experiment Station, Geneva, New York. 5 - 6.
Dijksterhuis, J. 2007. Heat resistant ascospores. In: Dijksterhuis, J., Samson, R.A.,
(Eds.), Food mycology: a multifaceted approach to fungi and food. CRC Press
Taylor & Francis Group, Boca Raton. 101-120.
Dijksterhuis, J., Nijsse, J., Hoekstra, F.A. and Golovina, E.A. 2007. High viscosity and
anisotropy characterize the cytoplasm of fungal dormant stress-resistant spores.
Eukaryotic Cell 6, 157-170.
Dijksterhuis, J. and Samson, R.A. 2006. Activation of ascospores by novel food
preservation techniques. In: Hocking, A.D., Pitt, J.I., Samson, R.A., Thrane, U.,
(Eds.), Advances in experimental medicine and biology, vol. 571. Springer, New
York. 247 - 260.
Dijksterhuis, J. and Teunissen, P.G.M. 2004. Dormant ascospores of Talaromyces
macrosporus are activated to germinate after treatment with ultra high pressure.
Journal of Applied Microbiology 96, 162-169.
Dijksterhuis, J., van Driel, K., Sanders, M., Molenaar, D., Houbraken, J., Samson, R.
and Kets, E. 2002. Trehalose degradation and glucose efflux precede cell ejection
during germination of heat-resistant ascospores of Talaromyces macrosporus.
Archives of Microbiology 178, 1-7.
Dombrink-Kurtzman, M.A. and Engberg, A.E. 2006. Byssochlamys nivea with patulin-
producing capability has an isoepoxydon dehydrogenase gene (idh) with sequence
homology to Penicillium expansum and P. griseofulvum. Mycological Research 110,
1111-1118.
209
Dougan, L., Genchev, G.Z., Lu, H. and Fernandez, J.M. 2011. Probing osmolyte
participation in the unfolding transition state of a protein. Proceedings of the
National Academy of Sciences, USA 108, 9759-9764.
Doyle, E.M., Noone, A.M., Kelly, C.T., Quigley, T.A. and Fogarty, W.M. 1998.
Mechanisms of action of the maltogenic α-amylase of Byssochlamys fulva. Enzyme
and Microbial Technology 22, 612-616.
Driks, A. 1999. Bacillus subtilis spore coat. Microbiology and Molecular Biology
Reviews 63, 1-20.
Driks, A. 2003. The dynamic spore. Proceedings of the National Academy of Sciences
of the United States of America 100, 3007-3009.
Drusch, S. and Ragab, W. 2003. Mycotoxins in fruits, fruit juices, and dried fruits.
Journal of Food Protection 66, 1514-1527.
Dumain, P.-P., Desnouveaux, R., Bloc'h, L., Leconte, C., Fuhrmann, B., Colombel,
E.D., Plessis, M.-C. and Valery, S. 1990. Use of flow cytometry for yeast and mould
detection in process control of fermented milk products: The ChemFlow System - A
factory study. Biotech Forum Europe 7, 224-229.
Dykstra, M.J. and Reuss, L.E. 2003. Biological electron microscopy: theory, techniques
and troubleshooting. 2nd ed. Springer.
Dynlacht, J.R., Roberts, Z.V., Earles, M., Henthorn, J. and Seno, J.D. 2000. Different
patterns of DNA fragmentation and degradation of nuclear matrix proteins during
apoptosis induced by radiation, hyperthermia or etoposide. Radiation Research 154,
515-530.
Eaton, M.W. and Ellar, D.J. 1974. Protein synthesis and breakdown in the mother-cell
and forespore compartments during spore morphogenesis in Bacillus megaterium.
Biochemical Journal 144, 327-337.
Eckardt, C. and Ahrens, E. 1977a. Investigation about Byssochlamys fulva Olliver &
Smith as a potential spoilage agent in tinned strawberries. I. Occurrence and growth
of Byssochlamys fulva. Chemie Mikrobiologie Technologie der Lebensmittel 5, 71-
75.
Eckardt, C. and Ahrens, E. 1977b. Investigation about Byssochlamys fulva Olliver &
210
Smith as a potential spoilage agent in tinned strawberries. Chemie Mikrobiologie
Technologie der Lebensmittel 5, 76-80.
Eijlander, R.T., Abee, T. and Kuipers, O.P. 2011. Bacterial spores in food: how
phenotypic variability complicates prediction of spore properties and bacterial
behavior. Current Opinion in Biotechnology 22, 180-186.
Elbein, A.D. 1974. The metabolism of α,α-trehalose. Advances in Carbohydrate
Chemistry and Biochemistry 30, 227-256.
Elliott, B., Haltiwanger, R.S. and Futcher, B. 1996. Synergy between trehalose and
Hsp104 for thermotolerance in Saccharomyces cerevisiae. Genetics 144, 923-933.
Engel, G. 1991. Occurrence of ascospores of Byssochlamys nivea in milk and their
removal by bactofugation. Milchwissenschaft - Milk Science International 46, 442-
444.
Engel, G. and Teuber, M. 1991. Heat resistance of ascospores of Byssochlamys nivea in
milk and cream. International Journal of Food Microbiology 12, 225-234.
Eziashi, E.I., Omamor, I.B., Airede, C.E., Udozen, C.V. and Chidi, N. 2010. Heat
resistance of genus Byssochlamys isolated from bottled raphia palm wine. Journal of
Yeast and Fungal Research 1, 142-145.
Farkas, J., Andrássy, É., Formanek, Z. and Mészáros, L. 2002. Luminometric and
differential scanning calorimetry (DSC) studies on heat - and radiation inactivation
of Bacillus subtilis luxAB spores. Acta Microbiologica et Immunologica Hungarica
49, 141-150.
Fedorova, N.D., Joardar, V., Maiti, R., Schobel, S., Amedeo, P., Galens, K., Inman,
J.M., Galinsky, K.J., White, O.R., Whitty, B.R., Wortman, J.R. and Nierman, W.C.
2007. Genome sequence of Talaromyces stipitatus strain ATCC 10500 [Online].
Available at http://www.ncbi.nlm.nih.gov/nuccore/NZ_ABAS00000000 (Accessed:
11/8/2011).
Fedorova, N.D., Khaldi, N., Joardar, V.S., Maiti, R., Amedeo, P., Anderson, M.J.,
Crabtree, J., Silva, J.C., Badger, J.H., Albarraq, A., Angiuoli, S., Bussey, H.,
Bowyer, P., Cotty, P.J., Dyer, P.S., Egan, A., Galens, K., Fraser-Liggett, C.M., Haas,
B.J., Inman, J.M., Kent, R., Lemieux, S., Malavazi, I., Orvis, J., Roemer, T.,
Ronning, C.M., Sundaram, J.P., Sutton, G., Turner, G., Venter, J.C., White, O.R.,

211
Whitty, B.R., Youngman, P., Wolfe, K.H., Goldman, G.H., Wortman, J.R., Jiang, B.,
Denning, D.W. and Nierman, W.C. 2008. Genomic islands in the pathogenic
filamentous fungus Aspergillus fumigatus. PLoS Genetics 4, e1000046.
Ferencko, L. and Rotman, B. 2010. Constructing fluorogenic Bacillus spores (F-Spores)
via hydrophobic decoration of coat proteins. PLoS ONE 5, e9283.
Ferreira, E.H.d.R., Rosenthal, A., Calado, V., Saraiva, J. and Mendo, S. 2009.
Byssochlamys nivea inactivation in pineapple juice and nectar using high pressure
cycles. Journal of Food Engineering 95, 664-669.
Fillinger, S., Chaveroche, M.-K., van Dijck, P., de Vries, R., Ruijter, G., Thevelein, J.
and d'Enfert, C. 2001. Trehalose is required for the acquisition of tolerance to a
variety of stresses in the filamentous fungus Aspergillus nidulans. Microbiology 147,
1851-1862.
Finley, N. and Fields, M.L. 1962. Heat activation and heat-induced dormancy of
Bacillus stearothermophilus spores. Applied and Environmental Microbiology 10,
231-236.
Fisher, D.J., Holloway, P.J. and Richmond, D.V. 1972. Fatty acid and hydrocarbon
constituents of the surface and wall lipids of some fungal spores. Journal of General
Microbiology 72, 71-78.
Foster, S.J. and Johnstone, K. 1990. Pulling the trigger: the mechanism of bacterial
spore germination. Molecular Microbiology 4, 137-141.
Frank, G.A. 2007. Measurement analysis of glass transition temperature for sucrose and
trehalose aqueous solutions. Journal of Physical and Chemical Reference Data 36,
1279-1285.
Frisvad, J.C. and Thrane, U. 1995. Mycotoxin production by food-borne fungi. In:
Samson, R.A., Hoekstra, E.S., Frisvad, J.C., Filtenborg, O., (Eds.), Introduction to
food-borne fungi, 4th ed. Centraalbureau voor Schimmelcultures, Wageningen.
Fruton, J. S. 2002. A history of pepsin and related enzymes. The Quarterly Review of
Biology 77, 127-147.
Fujikawa, H. and Itoh, T. 1996. Tailing of thermal inactivation curve of Aspergillus
niger spores. Applied and Environmental Microbiology 62, 3745-3749.
212
Fujikawa, H., Morozumi, S., Smerage, G.H. and Teixeira, A.A. 2000. Comparison of
capillary and test tube procedures for analysis of thermal inactivation kinetics of
mold spores. Journal of Food Protection 63, 1404-1409.
Furukawa, H., Wieser, M., Morita, H. and Nagasawa, T. 1999a. Microbial synthesis of
coniferyl alcohol by the fungus Byssochlamys fulva V107. Bioscience,
Biotechnology, and Biochemistry 63, 1141-1142.
Furukawa, H., Wieser, M., Morita, H., Sugio, T. and Nagasawa, T. 1999b. Purification
and characterization of vanillyl-alcohol oxidase from Byssochlamys fulva V107.
Journal of Bioscience and Bioengineering 87, 285-290.
Furukawa, S., Narisawa, N., Watanabe, T., Kawarai, T., Myozen, K., Okazaki, S.,
Ogihara, H. and Yamasaki, M. 2005. Formation of the spore clumps during heat
treatment increases the heat resistance of bacterial spores. International Journal of
Food Microbiology 102, 107-111.
Galagan, J.E., Calvo, S.E., Borkovich, K.A., Selker, E.U., Read, N.D., Jaffe, D.,
FitzHugh, W., Ma, L.-J., Smirnov, S., Purcell, S., Rehman, B., Elkins, T., Engels, R.,
Wang, S., Nielsen, C.B., Butler, J., Endrizzi, M., Qui, D., Ianakiev, P., Bell-
Pedersen, D., Nelson, M.A., Werner-Washburne, M., Selitrennikoff, C.P., Kinsey,
J.A., Braun, E.L., Zelter, A., Schulte, U., Kothe, G.O., Jedd, G., Mewes, W., Staben,
C., Marcotte, E., Greenberg, D., Roy, A., Foley, K., Naylor, J., Stange-Thomann, N.,
Barrett, R., Gnerre, S., Kamal, M., Kamvysselis, M., Mauceli, E., Bielke, C., Rudd,
S., Frishman, D., Krystofova, S., Rasmussen, C., Metzenberg, R.L., Perkins, D.D.,
Kroken, S., Cogoni, C., Macino, G., Catcheside, D., Li, W., Pratt, R.J., Osmani, S.A.,
DeSouza, C.P.C., Glass, L., Orbach, M.J., Berglund, J.A., Voelker, R., Yarden, O.,
Plamann, M., Seiler, S., Dunlap, J., Radford, A., Aramayo, R., Natvig, D.O., Alex,
L.A., Mannhaupt, G., Ebbole, D.J., Freitag, M., Paulsen, I., Sachs, M.S., Lander,
E.S., Nusbaum, C. and Birren, B. 2003. The genome sequence of the filamentous
fungus Neurospora crassa. Nature 422, 859-868.
Gee, G. 1970. The glassy state in polymers. Contemporary Physics 11, 313 - 334.
Gefen, O. and Balaban, N.Q. 2009. The importance of being persistent: heterogeneity of
bacterial populations under antibiotic stress. FEMS Microbiology Reviews 33, 704-
717.

213
Gerhardt, P. and Marquis, R.E. 1989. Spore thermoresistance mechanisms. In: Smith, I.,
Slepecky, R.A., Setlow, P., (Eds.), Regulation of procaryotic development: structural
and functional analysis of bacterial sporulation and germination. American Society
for Microbiology, Washington DC. 43-63.
Gerhardt, P. and Murrell, W.G. 1978. Basis and mechanism of spore resistance: a brief
review. In: Chambliss, G., Vary, J.C., (Eds.), Seventh International Spore
Conference. American Society for Microbiology, Madison, Wisconsin. 18-20.
Ghosh, S. and Setlow, P. 2010. The preparation, germination properties and stability of
superdormant spores of Bacillus cereus. Journal of Applied Microbiology 108, 582-
590.
Ghosh, S., Zhang, P., Li, Y.-q. and Setlow, P. 2009. Superdormant spores of Bacillus
species have elevated wet-heat resistance and temperature requirements for heat
activation. Journal of Bacteriology 191, 5584-5591.
Gillespy, T.G. 1938. Studies on the mould Byssochlamys fulva II. The Annual Report of
the Fruit and Vegetable Preservation Research Station Campden, 67-78.
Gillespy, T.G. 1940. Studies on the mould Byssochlamys fulva III. The Annual Report
of the Fruit and Vegetable Preservation Research Station Campden, 54-61.
Gillespy, T.G. 1946. Studies on the mould Byssochlamys fulva IV. The Annual Report
of the Fruit and Vegetable Preservation Research Station Campden, 31-39.
Glauert, A.M. 1974. Fixation, dehydration and embedding of biological specimens. In:
Glauert, A.M., (Ed.), Practical Methods in Electronmicroscopy, vol. 3, part 1. North-
Holland Publishing Company, Amsterdam. 1-207.
Goldani, L.Z., Picard, M. and Sugar, A.M. 1994. Synthesis of heat-shock proteins in
mycelia and yeast forms of Paracoccidioides brasiliensis. Journal of Medical
Microbiology 40, 124-128.
Gomes, S.L. and de Cássia Garcia Simão, R. 2009. Stress responses: Heat. In: Moselio,
S., (Ed.), Encyclopedia of Microbiology. Academic Press, Oxford. 464-476.
Gunasekera, T.S., Attfield, P.V. and Veal, D.A. 2000. A flow cytometry method for
rapid detection and enumeration of total bacteria in milk. Applied and Environmental
Microbiology 66, 1228-1232.

214
Gygi, S.P., Rist, B., Gerber, S.A., Turecek, F., Gelb, M.H. and Aebersold, R. 1999.
Quantitative analysis of complex protein mixtures using isotope-coded affinity tags.
Nature Biotechnology 17, 994-999.
Han, Y.W., Zhang, H.I. and Krochta, J.M. 1976. Death rates of bacterial spores:
mathematical models. Canadian Journal of Microbiology 22, 295-300.
Harris, L.R., Churchward, M.A., Butt, R.H. and Coorssen, J.R. 2007. Assessing
detection methods for gel-based proteomic analyses. Journal of Proteome Research
6, 1418-1425.
Hatcher, W.S., Weihe, J.L., Murdock, D.I., Folinazzo, J.F., Hill, E.C. and Albrigo, L.G.
1979. Growth requirements and thermal resistance of fungi belong to the genus
Byssochlamys. Journal of Food Science 44, 118-122.
Havea, P., Singh, H., Creamer, L.K. and Campanella, O.H. 1998. Electrophoretic
characterization of the protein products formed during heat treatment of whey protein
concentrate solutions. Journal of Dairy Research 65, 79-91.
Hawlader, M.N.A., Perera, C.O., Tian, M. and Yeo, K.L. 2006. Drying of guava and
papaya: impact of different drying methods. Drying Technology: An International
Journal 24, 77 - 87.
Hebert, R.J. and Larson, A.D. 1972. Asci production by Byssochlamys fulva on a
synthetic medium. Journal of Food Science 37, 883-885.
Hecker, L.I. and Sussman, A.S. 1973. Localization of trehalase in the ascospores of
Neurospora: relation to ascospore dormancy and germination. Journal of
Bacteriology 115, 592-599.
Henry, C.J.K. and Heppell, N. 2002. Nutritional losses and gains during processing:
future problems and issues. Proceedings of the Nutrition Society 61, 145-148.
Herbert, B., Galvani, M., Hamdan, M., Olivieri, E., MacCarthy, J., Pedersen, S. and
Righetti, P.G. 2001. Reduction and alkylation of proteins in preparation of two-
dimensional map analysis: Why, when, and how? Electrophoresis 22, 2046 - 2057.
Hirst, F. and McMaster, N.B. 1933. Preliminary report on the heat-resistant mould
Byssochlamys fulva. The Annual Report of the Fruit and Vegetable Preservation
Research Station Campden, 53-60.
215
Hocking, A.D., Begum, M. and Stewart, C. 2004. Putting the pressure on spoilage
fungi. Microbiology Australia 25, 36-38.
Hocking, A.D., Begum, M. and Stewart, C.M. 2006. Inactivation of fruit spoilage yeasts
and moulds using high pressure processing. In: Hocking, A.D., Pitt, J.I., Samson,
R.A., Thrane, U., (Eds.), Advances in Food Mycology. Springer, New York.
Hocking, A.D. and Jensen, N. 2001. Soft drinks, cordials, juices, bottled water and
related products. In: Moir, C.J., Andrew-Kabilafkas, C., Arnold, G., Cox, B.M.,
Hocking, A.D., Jenson, I., (Eds.), Spoilage of processed foods: causes and diagnosis.
AIFST Inc. (NSW Branch) Food Microbiology Group, Australia. 91-100.
Hocking, A.D. and Pitt, J.I. 1984. Food spoilage fungi. II. Heat resistant fungi. CSIRO
Food Research Quarterly 44, 73-82.
Hoeniger, J.F.M. and Headley, C.L. 1968. Cytology of spore germination in
Clostridium pectinovorum. Journal of Bacteriology 96, 1835-1847.
Houbraken, J. and Samson, R.A. 2006. Standardization of methods for detecting heat
resistant fungi. In: Hocking, A.D., Samson, R.A., Pitt, J.I., Thrane, U., (Eds.),
Advances in experimental medicine and biology, vol. 571. Springer, New York. 107-
111.
Houbraken, J., Samson, R.A. and Frisvad, J.C. 2006. Byssochlamys: significance of heat
resistance and mycotoxin production. In: Hocking, A.D., Pitt, J.I., Samson, R.A.,
Thrane, U., (Eds.), Advances in experimental medicine and biology, vol. 571.
Springer, New York. 211-224.
Houbraken, J., Varga, J., Rico-Munoz, E., Johnson, S. and Samson, R.A. 2008. Sexual
reproduction as the cause of heat resistance in the food spoilage fungus
Byssochlamys spectabilis (anamorph Paecilomyces variotii). Applied and
Environmental Microbiology 74, 1613-1619.
Hull, R. 1939. Study of Byssochlamys fulva and control measures in processed fruits.
Annals of Applied Biology 26, 800-822.
Izutsu, K.-i. and Kojima, S. 2002. Excipient crystallinity and its protein-structure-
stabilizing effect during freeze-drying. Journal of Pharmacy and Pharmacology 54,
1033-1039.
216
Jacob, A.M. and Turck, C.W. 2008. Detection of post-translational modifications by
fluorescent staining of two-dimensional gels. In: Kannicht, C., (Ed.), Post-
translational Modifications of Proteins, vol. 446. Humana Press. 21-32.
Jagannath, A., Tsuchido, T. and Membré, J.M. 2005. Comparison of the thermal
inactivation of Bacillus subtilis spores in foods using the modified Weibull and
Bigelow equations. Food Microbiology 22, 233-239.
Jakob, U., Gaestel, M., Engel, K. and Buchner, J. 1993. Small heat shock proteins are
molecular chaperones. Journal of Biological Chemistry 268, 1517-1520.
Jesenská, Z., Piecková, E. and Bernát, D. 1992. Heat-resistant fungi in the soil.
International Journal of Food Microbiology 16, 209-214.
Jesenská, Z., Piecková, E. and Bernát, D. 1993. Heat resistance of fungi from soil.
International Journal of Food Microbiology 19, 187-192.
Junior, J.N. and De Massaguer, P.R. 2007. Thermal death kinetics of B.
stearothermophilus spores in sugarcane must. Journal of Food Process Engineering
30, 625-639.
Kalichevsky, M.T., Jaroszkiewicz, E.M., Ablett, S., Blanshard, J.M.V. and Lillford, P.J.
1992. The glass transition of amylopectin measured by DSC, DMTA and NMR.
Carbohydrate Polymers 18, 77-88.
Katayama, D.S., Carpenter, J.F., Manning, M.C., Randolph, T.W., Setlow, P. and
Menard, K.P. 2008. Characterization of amorphous solids with weak glass transitions
using high ramp rate differential scanning calorimetry. Journal of Pharmaceutical
Sciences 97, 1013-1024.
Katz, A., Alimova, A., Xu, M., Gottlieb, P., Rudolph, E., Steiner, J.C. and Alfano, R.R.
2005a. Changes in refractive index and size of Bacillus subtilis during activation,
measured by light transmission, Conference on Lasers and Electro-Optics/Quantum
Electronics and Laser Science and Photonic Applications Systems Technologies.
Optical Society of America, Maryland. 1575-1577.
Katz, A., Alimova, A., Xu, M., Gottlieb, P., Rudolph, E., Steiner, J.C. and Alfano, R.R.
2005b. In situ determination of refractive index and size of Bacillus spores by light
transmission. Optics Letters 30, 589-591.
217
Kavanagh, K., Jörnvall, H., Persson, B. and Oppermann, U. 2008. Medium- and short-
chain dehydrogenase/reductase gene and protein families. Cellular and Molecular
Life Sciences 65, 3895-3906.
Keeping, A.J. and Collins, R.A. 2011. Data variance and statistical significance in 2D-
gel electrophoresis and DIGE experiments: comparison of the effects of
normalization methods. Journal of Proteome Research 10, 1353-1360.
Kelly, M.S. and Gay, J.L. 1969. The basis of differential staining of ascospores and
vegetative cells of yeasts. Archives of Microbiology 66, 1-13.
Keynan, A. 1978. Spore structure and its relations to resistance, dormancy, and
germination. In: Chambliss, G., Vary, J.C., (Eds.), Seventh International Spore
Conference. American Society for Microbiology, Madison, Wisconsin. 43-53.
Khan, A., Williams, K.L., Soon, J. and Nevalainen, H.K.M. 2008. Proteomic analysis of
the knob-producing nematode-trapping fungus Monacrosporium lysipagum. British
Mycological Society 112, 1447 - 1452.
Kikoku, Y. 2003. Heat activation characteristics of Talaromyces ascospores. Journal of
Food Science 68, 2331-2335.
Kikoku, Y., Tagashira, N., Gabriel, A.A. and Nakano, H. 2009. Heat activation of
Neosartorya and Talaromyces ascospores and enhancement by organic acids.
Biocontrol Science 14, 87-95.
Kim, Y., Nandakumar, M.P. and Marten, M.R. 2007. Proteome map of Aspergillus
nidulans during osmoadaptation. Fungal Genetics and Biology 44, 886-895.
Kinderlerer, J.L. 1996. The effect of age on the thermal resistance of arthroconidia from
Chrysosporium inops. Letters in Applied Microbiology 23, 359-362.
King, A.D., Jr., Bayne, H.G. and Alderton, G. 1979. Nonlogarithmic death rate
calculations for Byssochlamys fulva and other microorganisms. Applied and
Environmental Microbiology 37, 596-600.
King, A.D., Jr. and Halbrook, W.U. 1987. Ascospore heat resistance and control
measures for Talaromyces flavus isolated from fruit juice concentrate. Journal of
Food Science 52, 1252-1254.
King, A.D., Jr., Michener, H.D. and Ito, K.A. 1969. Control of Byssochlamys and

218
related heat-resistant fungi in grape products. Applied Microbiology 18, 166-173.
Klimov, D.K. and Thirumalai, D. 1997. Viscosity dependence of the folding rates of
proteins. Physical Review Letters 79, 317.
Kong, L., Zhang, P., Yu, J., Setlow, P. and Li, Y.-q. 2010. Monitoring the kinetics of
uptake of a nucleic acid dye during the germination of single spores of Bacillus
species. Analytical Chemistry 82, 8717-8724.
Kort, R., O'Brien, A.C., van Stokkum, I.H.M., Oomes, S.J.C.M., Crielaard, W.,
Hellingwerf, K.J. and Brul, S. 2005. Assessment of heat resistance of bacterial spores
from food product isolates by fluorescence monitoring of dipicolinic acid release.
Applied and Environmental Microbiology 71, 3556-3564.
Kotzekidou, P. 1991. Production of polygalacturonase by Byssochlamys fulva. Journal
of Industrial Microbiology 7, 53-56.
Kotzekidou, P. 1997. Heat resistance of Byssochlamys nivea, Byssochlamys fulva and
Neosartorya fischeri isolated from canned tomato paste. Journal of Food Science 62,
410-412.
Kozyavkin, S.A. and Lyubchenko, Y.L. 1984. The nonequilibrium character of DNA
melting: effects of the heating rate on the fine structure of melting curves. Nucleic
Acids Research 12, 4339-4349.
Kramer, R.K., Davis, N.D. and Diener, U.L. 1976. Byssotoxin A, a secondary
metabolite of Byssochlamys fulva. Applied and Environmental Microbiology 31,
249-253.
Kregel, K.C. 2002. Invited review: Heat shock proteins: modifying factors in
physiological stress responses and acquired thermotolerance. Journal of Applied
Physiology 92, 2177-2186.
Ku, M.A. and Hang, Y.D. 1994. Lipolytic enzyme activity of Byssochlamys fulva.
Lebensmittel-Wissenschaft und-Technologie 27, 390-391.
Kushida, H. 1969. A new rotary shaker for fixation, dehydration and embedding.
Journal of Electron Microscopy 18, 137-139.
Kutama, A.S., Yusuf, I. and Hayatu, M. 2010. Detection of heat resistant molds in some
canned fruit juices sold in Kano, Nigeria. Bioscience Research Communications 22,
219
221-225.
Kuwana, R., Kasahara, Y., Fujibayashi, M., Takamatsu, H., Ogasawara, N. and Watabe,
K. 2002. Proteomics characterization of novel spore proteins of Bacillus subtilis.
Microbiology 148, 3971-3982.
Laflamme, C., Ho, J., Veillette, M., de Latrémoille, M.-C., Verreault, D., Mériaux, A.
and Duchaine, C. 2005a. Flow cytometry analysis of germinating Bacillus spores,
using membrane potential dye. Archives of Microbiology 183, 107-112.
Laflamme, C., Verreault, D., Ho, J. and Duchaine, C. 2006. Flow cytometry sorting
protocol of Bacillus spore using ultraviolet laser and autofluorescence as main
sorting criterion. Journal of Fluorescence 16, 733-737.
Laflamme, C., Verreault, D., Lavigne, S., Trudel, L., Ho, J. and Duchaine, C. 2005b.
Autofluorescence as a viability marker for detection of bacterial spores. Frontiers in
Bioscience 10, 1647-1653.
Lai, E.-M., Phadke, N.D., Kachman, M.T., Giorno, R., Vazquez, S., Vazquez, J.A.,
Maddock, J.R. and Driks, A. 2003. Proteomic analysis of the spore coats of Bacillus
subtilis and Bacillus anthracis. Journal of Bacteriology 185, 1443-1454.
Lam, F.F., Jankova, L., Dent, O.F., Molloy, M.P., Kwun, S.Y., Clarke, C., Chapuis, P.,
Robertson, G., Beale, P., Clarke, S., Bokey, E.L. and Chan, C. 2010. Identification of
distinctive protein expression patterns in colorectal adenoma. PROTEOMICS –
Clinical Applications 4, 60-70.
Laplace-Builhé, C., Hahne, K., Hunger, W., Tirilly, Y. and Drocourt, J.L. 1993.
Application of flow cytometry to rapid microbial analysis in food and drinks
industries. Biology of the Cell 78, 123-128.
Lavilla, M., Marzo, I., Luis, R.d., Perez, M.D., Calvo, M. and Sánchez, L. 2009.
Detection of Clostridium tyrobutyricum spores using polyclonal antibodies and flow
cytometry. Journal of Applied Microbiology 108, 488-498.
Lawley, T.D., Croucher, N.J., Yu, L., Clare, S., Sebaihia, M., Goulding, D., Pickard,
D.J., Parkhill, J., Choudhary, J. and Dougan, G. 2009. Proteomic and genomic
characterization of highly infectious Clostridium difficile 630 spores. Journal of
Bacteriology 191, 5377-5386.

220
Lee, S.-H., Kim, Y.-K., Yun, S.-H. and Lee, Y.-W. 2008. Identification of differentially
expressed proteins in a mat1-2 deleted strain of Gibberella zeae, using a comparative
proteomics analysis. Current Genetics 53, 175-184.
Leng, W., Liu, T., Li, R., Yang, J., Wei, C., Zhang, W. and Jin, Q. 2008. Proteomic
profile of dormant Trichophyton rubrum conidia. BMC Genomics 9, 303.
Leopold, A.C., Sun, W.Q. and Bernal-Lugo, I. 1994. The glassy state in seeds: analysis
and function. Seed Science Research 4, 267-274.
Lepock, J.R. 2005. How do cells respond to their thermal environment? International
Journal of Hyperthermia 21, 681-687.
Lessing, F., Kniemeyer, O., Wozniok, I., Loeffler, J., Kurzai, O., Haertl, A. and
Brakhage, A.A. 2007. The Aspergillus fumigatus transcriptional regulator AfYap1
represents the major regulator for defense against reactive oxygen intermediates but
is dispensable for pathogenicity in an intranasal mouse infection model. Eukaryotic
Cell 6, 2290-2302.
Leuschner, R.G.K., Darke, A.H. and Lillford, P.J. 1998. Impact of bacterial spores on
food safety. In: Gaukel, V., Spieß, W.E.L., (Eds.), 3rd Karlsruhe Nutrition
Symposium: European research towards safer and better food - Review and transfer
congress, vol. Proceedings Part 2. Bundesforschungsanstalt für Ernährung,
Karlsruhe, Germany. 10-15.
Leuschner, R.G.K. and Lillford, P.J. 2000. Effects of hydration on molecular mobility
in phase-bright Bacillus subtilis spores. Microbiology 146, 49-55.
Leuschner, R.G.K. and Lillford, P.J. 2003. Thermal properties of bacterial spores and
biopolymers. International Journal of Food Microbiology 80, 131-143.
Levänen, B. and Wheelock, Å.M. 2009. Troubleshooting image analysis in 2DE. In:
Tyther, R., Sheehan, D., (Eds.), Two-Dimensional Electrophoresis Protocols, vol.
519. Humana Press. 112-129.
Li, Z. and Srivastava, P. 2003. Heat-shock proteins, Current Protocols in Immunology.
John Wiley & Sons, Inc. A.1T.1-A.1T.6.
Lilley, K.S., Razzaq, A. and Dupree, P. 2002. Two-dimensional gel electrophoresis:
recent advances in sample preparation, detection and quantitation. Current Opinion
221
in Chemical Biology 6, 46-50.
Lindquist, S. and Craig, E.A. 1988. The heat-shock proteins. Annual Review of
Genetics 22, 631-677.
Lingappa, B.T., Lingappa, Y. and Turian, G. 1970. Phenethyl alcohol induced
germination of ascospores of Neurospora. Archives of Microbiology 72, 97-105.
Lowry, R.J. and Sussman, A.S. 1968. Ultrastructural changes during germination of
ascospores of Neurospora tetrasperma. Journal of General Microbiology 51, 403-
409.
Luangsa-ard, J.J., Hywel-Jones, N.L. and Samson, R.A. 2004a. The polyphyletic nature
of Paecilomyces sensu lato based on 18S-generated rDNA phylogeny. Mycologia 96,
773-780.
Luangsa-ard, J.J., Manoch, L., Hywel-Jones, N.L., Artjariyasripong, S. and Samson,
R.A. 2004b. Thermotolerant and thermoresistant Paecilomyces and its teleomorphic
states isolated from Thai forest and mountain soils. Kasetsart Journal Natural Science
38, 94 - 101.
Luo, Y., Li, W.M. and Wang, W. 2008. Trehalose: protector of antioxidant enzymes or
reactive oxygen species scavenger under heat stress? Environmental and
Experimental Botany 63, 378-384.
Maeda, Y., Noguchi, S. and Koga, S. 1974. Differential scanning calorimetric study of
spontaneous germination of Bacillus megaterium spores by water vapor. The Journal
of General and Applied Microbiology 20, 11-19.
Maeda, Y., Teramoto, Y. and Koga, S. 1975. Calorimetric study on heat activation of
Bacillus cereus spores. The Journal of General and Applied Microbiology 21, 119-
122.
Mafart, P., Couvert, O., Gaillard, S. and Leguerinel, I. 2002. On calculating sterility in
thermal preservation methods: application of the Weibull frequency distribution
model. International Journal of Food Microbiology 72, 107-113.
Mafart, P., Leguérinel, I., Couvert, O. and Coroller, L. 2010. Quantification of spore
resistance for assessment and optimization of heating processes: A never-ending
story. Food Microbiology 27, 568-572.

222
Magge, A., Setlow, B., Cowan, A.E. and Setlow, P. 2009. Analysis of dye binding by
and membrane potential in spores of Bacillus species. Journal of Applied
Microbiology 106, 814-824.
Maggi, A., Gola, S., Spotti, E., Rovere, P. and Mutti, P. 1994. High-pressure treatments
of ascospores of heat-resistant moulds and patulin in apricot nectar and water.
Industria Conserve 69, 26-29.
Mah, J.H., Kang, D.H. and Tang, J. 2008. Morphological study of heat-sensitive and
heat-resistant spores of Clostridium sporogenes, using transmission electron
microscopy. Journal of Food Protection 71, 953-958.
Malloch, D. 1981. Moulds: their isolation, cultivation and identification. 1 ed.
University of Toronto Press, Toronto.
Mandels, G.R. 1963. Endogenous respiration of fungus spores in relation to dormancy
and germination. Annals of the New York Academy of Sciences 102, 724-739.
Mandels, G.R. and Maguire, A. 1972. Endogenous metabolism of fungus spores:
stimulation by physical and chemical means. Plant Physiology 50, 425-431.
Mandels, G.R., Vitols, R. and Parrish, F.W. 1965. Trehalose as an endogenous reserve
in spores of the fungus Myrothecium verrucaria. Journal of Bacteriology 90, 1589-
1598.
Mann, M. and Jensen, O.N. 2003. Proteomic analysis of post-translational
modifications. Nature Biotechnology 21, 255-261.
Martin, J., Horwich, A. and Hartl, F. 1992. Prevention of protein denaturation under
heat stress by the chaperonin Hsp60. Science 258, 995-998.
Maunder, D.T. 1969. Summary of work on spoilage problems caused by molds of the
Byssochlamys - Paecilomyces group, Byssochlamys Seminar Abstracts, vol. Research
Circular No. 20. New York State Agricultural Experiment Station, Geneva, New
York. 12-16.
Mayer, M. and Bukau, B. 2005. Hsp70 chaperones: Cellular functions and molecular
mechanism. Cellular and Molecular Life Sciences 62, 670-684.
Mchaourab, H.S., Godar, J.A. and Stewart, P.L. 2009. Structure and mechanism of
protein stability sensors: Chaperone activity of small heat shock proteins.
223
Biochemistry 48, 3828-3837.
McKeown, T.A., Moss, S.T. and Jones, E.B.G. 1996. Ultrastructure of ascospores of
Tunicatispora australiensis. Mycological Research 100, 1247-1255.
Melin, P., Schnürer, J. and Wagner, E.G.H. 2002. Proteome analysis of Aspergillus
nidulans reveals proteins associated with the response to the antibiotic concanamycin
A, produced by Streptomyces species. Molecular Genetics and Genomics 267, 695-
702.
Melly, E., Cowan, A.E. and Setlow, P. 2002. Studies on the mechanism of killing of
Bacillus subtilis spores by hydrogen peroxide. Journal of Applied Microbiology 93,
316-325.
Mian, M.A., Fleet, G.H. and Hocking, A.D. 1997. Effect of diluent type on viability of
yeasts enumerated from foods or pure culture. International Journal of Food
Microbiology 35, 103-107.
Michener, H.D. and King, A.D., Jr. 1974. Preparation of free heat-resistant ascospores
from Byssochlamys asci. Applied and Environmental Microbiology 27, 671-673.
Miles, C.A., Mackey, B.M. and Parsons, S.E. 1986. Differential scanning calorimetry of
Bacteria. Journal of General Microbiology 132, 939-952.
Morokutti, A., Lyskowski, A., Sollner, S., Pointner, E., Fitzpatrick, T.B., Kratky, C.,
Gruber, K. and Macheroux, P. 2005. Structure and function of YcnD from Bacillus
subtilis, a flavin-containing oxidoreductase. Biochemistry 44, 13724-13733.
Mouchacca, J. 2007. Heat tolerant fungi and applied research: addition to the previously
treated group of strictly thermotolerant species. World Journal of Microbiology and
Biotechnology 23, 1755-1770.
Movahedi, S. and Waites, W. 2000. A two-dimensional protein gel electrophoresis
study of the heat stress response of Bacillus subtilis cells during sporulation. Journal
of Bacteriology 182, 4758-4763.
Murray, S.L. and Hynes, M.J. 2010. Metabolic and developmental effects resulting
from deletion of the citA gene encoding citrate synthase in Aspergillus nidulans.
Eukaryotic Cell 9, 656-666.
Nakayama, M., Hosoya, K., Matsuzawa, T., Hiro, Y., Sako, A., Tokuda, H. and
224
Yaguchi, T. 2010. A rapid method for identifying Byssochlamys and Hamigera.
Journal of Food Protection 73, 1486-1492.
Neiman, A.M. 2005. Ascospore formation in the yeast Saccharomyces cerevisiae.
Microbiology and Molecular Biology Reviews 69, 565-584.
Newsome, R. 2003. Dormant microbes: research needs. Food Technology 57, 38-42.
Nguyen Thi Minh, H., Perrier-Cornet, J.-M., Gervais, P. and Champion, D. 2010. New
insight into the thermal properties and the biological behaviour of the bacterial
spores. Food Biophysics 5, 238-246.
Nguyen, V.T., Morange, M. and Bensaude, O. 1989. Protein denaturation during heat
shock and related stress. Escherichia coli beta-galactosidase and Photinus pyralis
luciferase inactivation in mouse cells. Journal of Biological Chemistry 264, 10487-
10492.
Niyo, K.A., McNabb, H.S., Jr. and Tiffany, L.H. 1986. Ultrastructure of the ascocarps,
asci, and ascospores of Mycosphaerella populorum. Mycologia 78, 202-212.
Novak, J.S., Juneja, V.K. and McClane, B.A. 2003. An ultrastructural comparison of
spores from various strains of Clostridium perfringens and correlations with heat
resistance parameters. International Journal of Food Microbiology 86, 239-247.
Obeta, J.A.N. and Ugwuanyi, J.O. 1995. Heat-resistant fungi in Nigerian heat-processed
fruit juices. International Journal of Food Science and Technology 30, 587-590.
Oh, Y.T., Ahn, C.-S., Kim, J.G., Ro, H.-S., Lee, C.-W. and Kim, J.W. 2010. Proteomic
analysis of early phase of conidia germination in Aspergillus nidulans. Fungal
Genetics and Biology 47, 246-253.
Olliver, M. and Rendle, T. 1934. A new problem in fruit preservation. Studies of
Byssochlamys fulva and its effect on the tissues of processed fruit. Journal of the
Society of Chemical Industry - Transactions and Communications June 1, 166T-
172T.
Olliver, M. and Smith, G. 1933. Byssochlamys fulva sp. nov. The Journal of Botany
British and Foreign 71, 196-197.
Orsburn, B., Melville, S.B. and Popham, D.L. 2008. Factors contributing to heat
resistance of Clostridium perfringens endospores. Applied and Environmental
225
Microbiology 74, 3328-3335.
Orth, R. 1976. The influence of water activity on the spore germination of aflatoxin,
sterigmatocystin and patulin producing molds. Lebensmittel-Wissenschaft und-
Technologie 9, 156-159.
Osborne, D.J. and Boubriak, I.I. 1994. DNA and desiccation tolerance. Seed Science
Research 4, 175-185.
Palou, E., Lopez-Malo, A., Barbosa-Canovas, G.V., Welti-Chanes, J., Davidson, P.M.
and Swanson, B.G. 1998. Effect of oscillatory high hydrostatic pressure treatments
on Byssochlamys nivea ascospores suspended in fruit juice concentrates. Letters in
Applied Microbiology 27, 375-378.
Panagou, E.Z., Chelonas, S., Chatzipavlidis, I. and Nychas, G.-J.E. 2010. Modelling the
effect of temperature and water activity on the growth rate and growth/no growth
interface of Byssochlamys fulva and Byssochlamys nivea. Food Microbiology 27,
618-627.
Panaretou, B. and Zhai, C. 2008. The heat shock proteins: Their roles as multi-
component machines for protein folding. Fungal Biology Reviews 22, 110-119.
Partsch, G., Draxler, H. and Altmann, H. 1969. The ultra-structure of spores of
Byssochlamys fulva. Mycopathologia 39, 305-313.
Pel, H.J., de Winde, J.H., Archer, D.B., Dyer, P.S., Hofmann, G., Schaap, P.J., Turner,
G., de Vries, R.P., Albang, R., Albermann, K., Andersen, M.R., Bendtsen, J.D.,
Benen, J.A.E., van den Berg, M., Breestraat, S., Caddick, M.X., Contreras, R.,
Cornell, M., Coutinho, P.M., Danchin, E.G.J., Debets, A.J.M., Dekker, P., van Dijck,
P.W.M., van Dijk, A., Dijkhuizen, L., Driessen, A.J.M., d'Enfert, C., Geysens, S.,
Goosen, C., Groot, G.S.P., de Groot, P.W.J., Guillemette, T., Henrissat, B.,
Herweijer, M., van den Hombergh, J.P.T.W., van den Hondel, C.A.M.J.J., van der
Heijden, R.T.J.M., van der Kaaij, R.M., Klis, F.M., Kools, H.J., Kubicek, C.P., van
Kuyk, P.A., Lauber, J., Lu, X., van der Maarel, M.J.E.C., Meulenberg, R., Menke,
H., Mortimer, M.A., Nielsen, J., Oliver, S.G., Olsthoorn, M., Pal, K., van Peij,
N.N.M.E., Ram, A.F.J., Rinas, U., Roubos, J.A., Sagt, C.M.J., Schmoll, M., Sun, J.,
Ussery, D., Varga, J., Vervecken, W., van de Vondervoort, P.J.J., Wedler, H.,
Wosten, H.A.B., Zeng, A.-P., van Ooyen, A.J.J., Visser, J. and Stam, H. 2007.
226
Genome sequencing and analysis of the versatile cell factory Aspergillus niger CBS
513.88. Nature Biotechnology 25, 221-231.
Peleg, M. and Cole, M.B. 1998. Reinterpretation of microbial survival curves. Critical
Reviews in Food Science and Nutrition 38, 353-380.
Peleg, M., Normand, M.D., Corradini, M.G., Van Asselt, A.J., De Jong, P. and Ter
Steeg, P.F. 2008. Estimating the heat resistance parameters of bacterial spores from
their survival ratios at the end of UHT and other heat treatments. Critical Reviews in
Food Science and Nutrition 48, 634-648.
Perkins, D.N., Pappin, D.J.C., Creasy, D.M. and Cottrell, J.S. 1999. Probability-based
protein identification by searching sequence databases using mass spectrometry data.
Electrophoresis 20, 3551-3567.
Peterson, S.W. 2008. Phylogenetic analysis of Aspergillus species using DNA
sequences from four loci. Mycologia 100, 205-226.
Piecková, E., Bernát, D. and Jesenská, Z. 1994. Heat resistant fungi isolated from soil.
International Journal of Food Microbiology 22, 297-299.
Piper, P.W. 1993. Molecular events associated with acquisition of heat tolerance by the
yeast Saccharomyces cerevisiae. FEMS Microbiology Reviews 11, 339-355.
Pitt, J.I. and Hocking, A.D. 2009. Fungi and food spoilage. 3rd ed. Springer, New York.
Plesofsky-Vig, N. and Brambl, R. 1985. Heat shock response of Neurospora crassa:
protein synthesis and induced thermotolerance. Journal of Bacteriology 162, 1083-
1091.
Polydera, A.C., Stoforos, N.G. and Taoukis, P.S. 2003. Comparative shelf life study and
vitamin C loss kinetics in pasteurised and high pressure processed reconstituted
orange juice. Journal of Food Engineering 60, 21-29.
Puel, O., Galtier, P. and Oswald, I. 2010. Biosynthesis and toxicological effects of
patulin. Toxins 2, 613-631.
Puel, O., Tadrist, S., Delaforge, M., Oswald, I.P. and Lebrihi, A. 2007. The inability of
Byssochlamys fulva to produce patulin is related to absence of 6-methylsalicylic acid
synthase and isoepoxydon dehydrogenase genes. International Journal of Food
Microbiology 115, 131-139.

227
Puel, O., Tadrist, S., Galtier, P., Oswald, I.P. and Delaforge, M. 2005. Byssochlamys
nivea as a source of mycophenolic acid. Applied and Environmental Microbiology
71, 550-553.
Put, H.M.C. 1964. A selective method for cultivating heat resistant moulds, particularly
those of the genus Byssochlamys, and their presence in Dutch soil. Journal of
Applied Microbiology 27, 59-64.
Put, H.M.C. and Kruiswijk, J.T. 1964. Disintegration and organoleptic deterioration of
processed strawberries caused by the mould Byssochlamys nivea. Journal of Applied
Bacteriology 27, 53-58.
Qiu, X., Shao, Y., Miao, S. and Wang, L. 2006. The diversity of the DnaJ/Hsp40
family, the crucial partners for Hsp70 chaperones. Cellular and Molecular Life
Sciences 63, 2560-2570.
Quintavalla, S. and Spotti, E. 1993. Heat resistance of Talaromyces flavus, Neosartorya
fischeri and Byssochlamys nivea isolated from fresh fruits. Microbiologie-Aliments-
Nutrition 11, 335-341.
Raggam, R.B., Salzer, H.J.F., Marth, E., Heiling, B., Paulitsch, A.H. and Buzina, W.
2011. Molecular detection and characterisation of fungal heat shock protein 60.
Mycoses, doi: 10.1111/j.1439-0507.2010.01933.x.
Rajashekhara, E., Suresh, E.R. and Ethiraj, S. 1996. Note: Influence of different heating
media on thermal resistance of Neosartorya fischeri isolated from papaya fruit.
Journal of Applied Microbiology 81, 337-340.
Raju, D., Setlow, P. and Sarker, M.R. 2007. Antisense-RNA-mediated decreased
synthesis of small, acid-soluble spore proteins leads to decreased resistance of
Clostridium perfringens spores to moist heat and UV radiation. Applied and
Environmental Microbiology 73, 2048-2053.
Ram, C. 1968. Timber - Attacking fungi from the state of Maranhao, Brazil - Some new
species of Paecilomyces and its perfect stage Byssochlamys Westl. VIII. Nova
Hedwigia 16, 305-314.
Reich, H.J. 2005. Introducing JCE ChemInfo: Organic. Journal of Chemical Education
82, 495-496.
228
Reid, W.W. 1950. Pectic enzymes of the fungus Byssochlamys fulva. Nature 166, 76-77.
Rensing, L., Monnerjahn, C. and Meyer, U. 1998. Differential stress gene expression
during the development of Neurospora crassa and other fungi. FEMS Microbiology
Letters 168, 159-166.
Reynolds, E.S. 1963. The use of lead citrate at high pH as an electron-opaque satin in
electron microscopy. Journal of Cell Biology 17, 208-212.
Rice, S.L. 1980. Patulin production by Byssochlamys spp. in canned grape juice. Journal
of Food Science 45, 485-488.
Rice, S.L. and Beuchat, L.R. 1978a. Polygalacturonase, biomass and ascospore
production by Byssochlamys fulva. II. Effects of sugars found in fruits.
Mycopathologia 63, 89-95.
Rice, S.L. and Beuchat, L.R. 1978b. Polygalacturonase, biomass, and ascospore
production by Byssochlamys fulva. I. Effects of acids found in fruits.
Mycopathologia 63, 29-34.
Rice, S.L., Beuchat, L.R. and Heaton, E.K. 1977a. Changes in the composition and
texture of canned peach halves infected with Byssochlamys fulva. Journal of Food
Science 42, 1562 - 1565.
Rice, S.L., Beuchat, L.R. and Worthington, R.E. 1977b. Patulin production of
Byssochlamys spp. in fruit juices. Applied and Environmental Microbiology 34, 791-
796.
Richardson, K.C. 1965. Incidence of Byssochlamys fulva in Queensland grown canned
strawberries. Queensland Journal of Agricultural and Animal Sciences 22, 347-350.
Rodriguez-Palacios, A. and LeJeune, J.T. 2011. Moist-heat resistance, spore aging, and
superdormancy in Clostridium difficile. Applied and Environmental Microbiology
77, 3085-3091.
Roland, J.O. and Beuchat, L.R. 1984a. Biomass and patulin production by
Byssochlamys nivea in apple juice as affected by sorbate, benzoate, SO2 and
temperature. Journal of Food Science 49, 402-406.
Roland, J.O. and Beuchat, L.R. 1984b. Influence of temperature and water activity on
growth and patulin production by Byssochlamys nivea in apple juice. Applied and

229
Environmental Microbiology 47, 205-207.
Roland, J.O., Beuchat, L.R. and Heaton, E.K. 1984b. Viability of Byssochlamys nivea in
apple sauce containing sorbate, benzoate and sulfur dioxide and packed under
various oxygen levels. Journal of Food Protection 47, 685-687.
Roland, J.O., Beuchat, L.R., Worthington, R.E. and Hitchcock, H.L. 1984a. Effects of
sorbate, benzoate, sulfur dioxide and temperature on growth and patulin production
by Byssochlamys nivea in grape juice. Journal of Food Protection 47, 237-241.
Roos, Y. and Karel, M. 1990. Differential scanning calorimetry study of phase
transitions affecting the quality of dehydrated materials. Biotechnology Progress 6,
159-163.
Ruijter, G.J.G., Bax, M., Patel, H., Flitter, S.J., van de Vondervoort, P.J.I., de Vries,
R.P., vanKuyk, P.A. and Visser, J. 2003. Mannitol is required for stress tolerance in
Aspergillus niger conidiospores. Eukaryotic Cell 2, 690-698.
Ruiz-Herrera, J. and Ortiz-Castellanos, L. 2010. Analysis of the phylogenetic
relationships and evolution of the cell walls from yeasts and fungi. FEMS Yeast
Research 10, 225-243.
Rydjord, B., Namork, E., Nygaard, U.C., Wiker, H.G. and Hetland, G. 2007.
Quantification and characterisation of IgG binding to mould spores by flow
cytometry and scanning electron microscopy. Journal of Immunological Methods
323, 123-131.
Salomão, B.C.M., Slongo, A.P. and Aragão, G.M.F. 2007. Heat resistance of
Neosartorya fischeri in various juices. LWT - Food Science and Technology 40,
676-680.
Salomão, B.d.C.M., Massaguer, P.R. and Aragão, G.M.F. 2008. Isolamento e seleção de
fungos filamentosos termorresistentes em etapas do processo produtivo de néctar de
maçã. Ciência e Tecnologia de Alimentos 28, 116-121.
Salzman, G.C. 2001. Light Scatter: Detection and Usage, Current Protocols in
Cytometry. John Wiley & Sons, Inc.
Samson, R.A. 1989. Filamentous fungi in food and feed. Journal of Applied
Microbiology 67, 27s-35s.
230
Samson, R.A., Hoekstra, E.S., Frisvad, J.C. and Filtenborg, O. 1995. Identification of
the common food-borne fungi. In: Samson, R.A., Hoekstra, E.S., Frisvad, J.C.,
Filtenborg, O., (Eds.), Introduction to food-borne fungi, 4 ed. Centraalbureau voor
Schimmelcultures, Baarn. 3 - 234.
Samson, R.A., Houbraken, J., Varga, J. and Frisvad, J.C. 2009. Polyphasic taxonomy of
the heat resistant ascomycete genus Byssochlamys and its Paecilomyces anamorphs.
Persoonia - Molecular Phylogeny and Evolution of Fungi 22, 14-27.
Samson, R.A. and Tansey, M.R. 1975. Byssochlamys verrucosa sp. nov. Transactions of
the British Mycological Society 65, 512-514.
Sant'Ana, A.S., Rosenthal, A. and Massaguer, P.R. 2009. Heat resistance and the effects
of continuous pasteurization on the inactivation of Byssochlamys fulva ascospores in
clarified apple juice. Journal of Applied Microbiology 107, 197-209.
Sant'Ana, A.S., Simas, R.C., Almeida, C.A.A., Cabral, E.C., Rauber, R.H., Mallmann,
C.A., Eberlin, M.N., Rosenthal, A. and Massaguer, P.R. 2010. Influence of package,
type of apple juice and temperature on the production of patulin by Byssochlamys
nivea and Byssochlamys fulva. International Journal of Food Microbiology 142, 156-
163.
Sapru, V. and Labuza, T.P. 1993a. Glassy state in bacterial spores predicted by polymer
glass-transition theory. Journal of Food Science 58, 445-448.
Sapru, V. and Labuza, T.P. 1993b. Temperature dependence of thermal inactivation rate
constants of bacterial spores in a glassy state. Journal of Industrial Microbiology and
Biotechnology 12, 247-250.
Sautter, C. and Hock, B. 1982. Crozier formation in Byssochlamys nivea. Mycologia 74,
256-264.
Scheldeman, P., Herman, L., Foster, S. and Heyndrickx, M. 2006. Bacillus
sporothermodurans and other highly heat-resistant spore formers in milk. Journal of
Applied Microbiology 101, 542-555.
Scott, V.N. and Bernard, D.T. 1987. Heat resistance of Talaromyces flavus and
Neosartorya fischeri isolated from commercial fruit juices. Journal of Food
Protection 50, 18 - 20.
231
Setlow, B., Loshon, C.A., Genest, P.C., Cowan, A.E., Setlow, C. and Setlow, P. 2002.
Mechanisms of killing spores of Bacillus subtilis by acid, alkali and ethanol. Journal
of Applied Microbiology 92, 362-375.
Setlow, B. and Setlow, P. 1996. Role of DNA repair in Bacillus subtilis spore
resistance. Journal of Bacteriology 178, 3486-3495.
Setlow, P. 1992. I will survive: protecting and repairing spore DNA. Journal of
Bacteriology 174, 2737-2741.
Setlow, P. 1994. Mechanisms which contribute to the long-term survival of spores of
Bacillus species. Journal of Applied Microbiology 76, 49S-60S.
Setlow, P. 1995. Mechanisms for the prevention of damage to DNA in spores of
Bacillus species. Annual Review of Microbiology 49, 29-54.
Setlow, P. 2003. Spore germination. Current Opinion in Microbiology 6, 550-556.
Setlow, P. 2006. Spores of Bacillus subtilis: their resistance to and killing by radiation,
heat and chemicals. Journal of Applied Microbiology 101, 514-525.
Setlow, P. 2007. I will survive: DNA protection in bacterial spores. Trends in
Microbiology 15, 172-180.
Sewell, M. and Bishop, S. 2009. Application of proteomics to the study of gonad
development in sea urchins. In: Harris, L.G., (Ed.), Echinoderms 2006: Durham:
Proceedings of the 12th International Echinoderm Conference, 7-11 August 2006,
Durham, New Hampshire, U.S.A. Taylor and Francis. 541-545.
Silva, F.V.M. and Gibbs, P. 2004. Target selection in designing pasteurization processes
for shelf-stable high-acid fruit products. Critical Reviews in Food Science and
Nutrition 44, 353 - 360.
Singer, M.A. and Lindquist, S. 1998. Thermotolerance in Saccharomyces cerevisiae:
the Yin and Yang of trehalose. Trends in Biotechnology 16, 460-468.
Sinohara, H. 1970. Induction of enzymes in dormant spores of Aspergillus oryzae.
Journal of Bacteriology 101, 1070-1072.
Sloan, A.E. 2010. Giving consumers what they want. Food Technology 64, 52-53.
Sloan, A.E. 2011. Navigating the natural marketplace. Food Technology 65, 24-33.
232
Slongo, A.P. and Aragão, G.M.F.d. 2006. Factors affecting the thermal activation of
Neosartorya fischeri in pineapple and papaya nectars. Brazilian Journal of
Microbiology 37, 312-316.
Slongo, A.P., Salomão, B.C.M. and Aragão, G.M.F.d. 2008. Thermal resistance of heat
resistant molds in tropical nectars and mineral water, Proceedings of the International
Conference of Agricultural Engineering, XXXVII Brazilian Congress of Agricultural
Engineering, International Livestock Environment Symposium - ILES VIII.
International Commission of Agricultural Engineering (CIGR), Institut fur
Landtechnik, Iguassu Falls City, Brazil, 31st August to 4th September, 2008.
Sola-Penna, M. and Meyer-Fernandes, J.R. 1998. Stabilization against thermal
inactivation promoted by sugars on enzyme structure and function: why is trehalose
more effective than other sugars? Archives of Biochemistry and Biophysics 360, 10-
14.
Soto, T., Fernandez, J., Vicente-Soler, J., Cansado, J. and Gacto, M. 1999.
Accumulation of trehalose by overexpression of tps1, coding for trehalose-6-
phosphate synthase, causes increased resistance to multiple stresses in the fission
yeast Schizosaccharomyces pombe. Applied and Environmental Microbiology 65,
2020-2024.
Spink, C.H. 2008. Differential scanning calorimetry. In: Dr. John, J.C., Dr. H. William
Detrich, III, (Eds.), Methods in Cell Biology, vol. 84. Academic Press. 115-141.
Splittstoesser, D.F. 1978. Fruits and fruit products. In: Beuchat, L.R., (Ed.), Food and
beverage mycology. AVI, Westport. 83 - 109.
Splittstoesser, D.F., Cadwell, M.C. and Martin, M. 1969. Ascospore production by
Byssochlamys fulva. Journal of Food Science 34, 248-250.
Splittstoesser, D.F. and Churey, J.J. 1991. Reduction of heat resistance of Neosartorya
fischeri ascospores by sulfur dioxide. Journal of Food Science 56, 876 - 877.
Splittstoesser, D.F., Downing, D.L., Roger, N.F. and Murdock, D.I. 1974a. Influence of
the harvest method on contamination of fruit by Byssochlamys ascospores. Journal of
Milk and Food Technology 37, 445-447.
Splittstoesser, D.F., Kuss, F.R. and Harrison, W. 1970. Enumeration of Byssochlamys
and other heat-resistant molds. Applied Microbiology 20, 393-397.
233
Splittstoesser, D.F., Kuss, F.R., Harrison, W. and Prest, D.B. 1971. Incidence of heat-
resistant molds in eastern orchards and vineyards. Applied Microbiology 21, 335-
337.
Splittstoesser, D.F., Lammers, J.M., Downing, D.L. and Churey, J.J. 1989. Heat
resistance of Eurotium herbariorum, a xerophilic mold. Journal of Food Science 54,
683 - 685.
Splittstoesser, D.F., Leasor, S.B. and Swanson, K.M.J. 1986. Effect of food composition
on the heat resistance of yeast ascospores. Journal of Food Science 51, 1265-1267.
Splittstoesser, D.F. and Splittstoesser, C.M. 1977. Ascospores of Byssochlamys fulva
compared with those of a heat resistant Aspergillus. Journal of Food Science 42, 685-
688.
Splittstoesser, D.F., Wilkison, M. and Harrison, W. 1972. Heat activation of
Byssochlamys fulva ascospores. Journal of Milk and Food Technology 35, 399-401.
Splittstoesser, F., Einset, A., Wilkison, M. and Preziose, J. 1974b. Effect of food
ingredients on the heat resistance of Byssochlamys fulva ascospores, Proceedings of
the Fourth International Congress of Food Science and Technology III, vol. 3.
Instituto Nacional de Ciencia y Technologia de Alimentos, Consejo Superior de
Investigaciones Cientifica, Madrid, Spain. 79-85.
Spurgin, M.M. 1964. Suspected occurrence of Byssochlamys fulva in Queensland-
grown canned strawberries. The Queensland journal of agricultural science 21, 247-
250.
Stecchini, M.L., Del Torre, M., Venir, E., Morettin, A., Furlan, P. and Maltini, E. 2006.
Glassy state in Bacillus subtilis spores analyzed by differential scanning calorimetry.
International Journal of Food Microbiology 106, 286-290.
Stevenson, K.E., Vaughn, R.H. and Crisan, E.V. 1972. Fixation of mature spores of
Clostridium botulinum. Journal of Bacteriology 109, 1295-1297.
Stocks, S.M. 2004. Mechanism and use of the commercially available viability stain,
BacLight. Cytometry Part A 61A, 189-195.
Stolk, A.C. and Samson, R.A. 1971. Studies on Talaromyces and related genera I.
Hamigera gen. nov. and Byssochlamys. Persoonia 6, 341-357.
234
Sträuber, H. and Müller, S. 2010. Viability states of bacteria—Specific mechanisms of
selected probes. Cytometry Part A 77A, 623-634.
Sturtevant, J.M. 1987. Biochemical applications of differential scanning calorimetry.
Annual Review of Physical Chemistry 38, 463-488.
Suda, Y., Rodriguez, R.K., Coluccio, A.E. and Neiman, A.M. 2009. A screen for spore
wall permeability mutants identifies a secreted protease required for proper spore
wall assembly. PLoS ONE 4, e7184.
Sunde, E.P., Setlow, P., Hederstedt, L. and Halle, B. 2009. The physical state of water
in bacterial spores. Proceedings of the National Academy of Sciences 106, 19334-
19339.
Sussman, A.S. 1954. Changes in the permeability of ascospores of Neurospora
tetrasperma during germination. The Journal of General Physiology 38, 59-77.
Sussman, A.S. 1976. Activators of fungal spore germination. In: Weber, D.J., Hess,
W.M., (Eds.), The fungal spore: form and function. John Wiley and Sons, New York.
101-163.
Sussman, A.S. and Douthit, H.A. 1973. Dormancy in microbial spores. Annual Review
of Plant Physiology 24, 311-352.
Swanson, K.M.J., Leasor, S.B. and Downing, D.L. 1985. Aciduric and heat resistant
microorganisms in apple juice and cider processing operations. Journal of Food
Science 50, 336-339.
Tabit, F.T. and Buys, E. 2010. The effects of wet heat treatment on the structural and
chemical components of Bacillus sporothermodurans spores. International Journal of
Food Microbiology 140, 207-213.
Tan, C.P. and Che Man, Y.B. 2002. Differential scanning calorimetric analysis of palm
oil, palm oil based products and coconut oil: effects of scanning rate variation. Food
Chemistry 76, 89-102.
Taniwaki, M.H., Hocking, A.D., Pitt, J.I. and Fleet, G.H. 2001. Growth of fungi and
mycotoxin production on cheese under modified atmospheres. International Journal
of Food Microbiology 68, 125-133.
Taniwaki, M.H., Hocking, A.D., Pitt, J.I. and Fleet, G.H. 2010. Growth and mycotoxin

235
production by fungi in atmospheres containing 80% carbon dioxide and 20% oxygen.
International Journal of Food Microbiology 143, 218-225.
Teramoto, N., Sachinvala, N. and Shibata, M. 2008. Trehalose and trehalose-based
polymers for environmentally benign, biocompatible and bioactive materials.
Molecules 13, 1773-1816.
Tereshina, V.M. 2005. Thermotolerance in fungi: The role of heat shock proteins and
trehalose. Microbiology 74, 247-257.
Teutschbein, J., Albrecht, D., Pötsch, M., Guthke, R., Aimanianda, V., Clavaud, C.c.,
Latgé, J.-P., Brakhage, A.A. and Kniemeyer, O. 2010. Proteome profiling and
functional classification of intracellular proteins from conidia of the human-
pathogenic mold Aspergillus fumigatus. Journal of Proteome Research 9, 3427-3442.
Thanh, N., Rombouts, F. and Nout, M.J. 2007. Viability and physiological state
transitions of Rhizopus oligosporus sporangiospores in tempe starter culture. Antonie
van Leeuwenhoek 91, 35-44.
Thanh, N.V. 2004. Dormancy, activation and viability of Rhizopus oligosporus
sporangiospores. PhD Dissertation, Wageningen University, Wageningen.
The UniProt Consortium. 2011. Ongoing and future developments at the Universal
Protein Resource. Nucleic Acids Research 39, D214-D219.
Thevelein, J.M. 1984. Regulation of trehalose mobilization in fungi. Microbiology and
Molecular Biology Reviews 48, 42-59.
Tournas, V. 1994. Heat-resistant fungi of importance to the food and beverage industry.
Critical Reviews in Microbiology 20, 243-263.
Tribst, A.A.L., Santa' Ana, d.S.A. and de Massaguer, P.R. 2009. Review:
Microbiological quality and safety of fruit juices - past, present and future
perspectives. Critical Reviews in Microbiology 35, 310-339.
Tunick, M., Bayles, D. and Novak, J. 2006. DSC analysis of foodborne bacteria. Journal
of Thermal Analysis and Calorimetry 83, 23-26.
Turnbull, P.C.B., Frawley, D.A. and Bull, R.L. 2007. Heat activation/shock
temperatures for Bacillus anthracis spores and the issue of spore plate counts versus
true numbers of spores. Journal of Microbiological Methods 68, 353-357.

236
Ugwuanyi, J.O. and Obeta, J.A.N. 1991. Incidence of heat-resistant fungi in Nsukka,
Southern Nigeria. International Journal of Food Microbiology 13, 157-164.
Ugwuanyi, J.O. and Obeta, J.A.N. 1999. Pectinolytic and cellulolytic activities of heat
resistant fungi and their macerating effects on mango and African mango. Journal of
the Science of Food and Agriculture 79, 1054 - 1059.
Untereiner, W.A., Scott, J.A., Naveau, F.A., Currah, R.S. and Bachewich, J. 2002.
Phylogeny of Ajellomyces, Polytolypa and Spiromastix (Onygenaceae) inferred from
rDNA sequence and non-molecular data. Studies in Mycology 47, 25-35.
Valík, L.u. and Piecková, E. 2001. Growth modelling of heat-resistant fungi: the effect
of water activity. International Journal of Food Microbiology 63, 11-17.
Van Cauwelaert, F.H. and Verbeke, M.N. 1979. Differential scanning calorimetric
observations concerning the activation mechanism of spores of Phycomyces
blakesleeanus. Biochemical and Biophysical Research Communications 89, 414-419.
van den Berg, M.A., Albang, R., Albermann, K., Badger, J.H., Daran, J.-M., M
Driessen, A.J., Garcia-Estrada, C., Fedorova, N.D., Harris, D.M., Heijne, W.H.M.,
Joardar, V., W Kiel, J.A.K., Kovalchuk, A., Martin, J.F., Nierman, W.C., Nijland,
J.G., Pronk, J.T., Roubos, J.A., van der Klei, I.J., van Peij, N.N.M.E., Veenhuis, M.,
von Dohren, H., Wagner, C., Wortman, J. and Bovenberg, R.A.L. 2008. Genome
sequencing and analysis of the filamentous fungus Penicillium chrysogenum. Nature
Biotechnology 26, 1161-1168.
van der Riet, W.B., Botha, A. and Pinches, S.E. 1989. The effect of
dimethyldicarbonate on vegetative growth and ascospores of Byssochlamys fulva
suspended in apple juice and strawberry juice. International Journal of Food
Microbiology 8, 95-102.
van der Riet, W.B. and Pinches, S.E. 1991. Control of Byssochlamys fulva in fruit juices
by means of intermittent treatment with dimethyldicarbonate. Lebensmittel-
Wissenschaft und-Technologie 24, 501-503.
Van Dijck, P., Colavizza, D., Smet, P. and Thevelein, J.M. 1995. Differential
importance of trehalose in stress resistance in fermenting and nonfermenting
Saccharomyces cerevisiae cells. Applied and Environmental Microbiology 61, 109-
115.
237
van Dooren, A.A. and Müller, B.W. 1981a. Influence of experimental variables on
curves in differential scanning calorimetry. Part II. Effects on baseline-related
characteristics. Thermochimica Acta 49, 163-173.
van Dooren, A.A. and Müller, B.W. 1981b. Influence of experimental variables on
curves in differential scanning calorimetry. Part III. Effects on peak height, peak
width, shape index and baseline displacement. Thermochimica Acta 49, 175-183.
van Dooren, A.A. and Müller, B.W. 1981c. Influence of experimental variables on
curves in differential scanning calorimetry. Part IV. Effects on peak-related
temperatures and specific enthalpy. Thermochimica Acta 49, 185-191.
van Laere, A. 1989. Trehalose, reserve and/or stress metabolite? FEMS Microbiology
Reviews 63, 201-210.
van Melis, C.C.J., Nierop Groot, M.N., Tempelaars, M.H., Moezelaar, R. and Abee, T.
2011. Characterization of germination and outgrowth of sorbic acid-stressed Bacillus
cereus ATCC 14579 spores: Phenotype and transcriptome analysis. Food
Microbiology 28, 275-283.
Verbeke, M.N., Van Cauwelaert, F.H. and Jadot, R. 1981. Calorimetric aspects of the
heat activation of spores of Phycomyces blakesleeanus. Biochemical and Biophysical
Research Communications 98, 915-921.
Verbeke, M.N. and Van Laere, A.J. 1982. On the role of the spore cell wall in the
activation of Phycomyces blakesleeanus spores. Experimental Mycology 6, 313-320.
Vödisch, M., Albrecht, D., Leßing, F., Schmidt, A.D., Winkler, R., Guthke, R.,
Brakhage, A.A. and Kniemeyer, O. 2009. Two-dimensional proteome reference
maps for the human pathogenic filamentous fungus Aspergillus fumigatus.
PROTEOMICS 9, 1407-1415.
von Arx, J.A. 1986. On Hamigera, its Raperia anamorph and its classification in the
Onygenaceae. Mycotaxon 26, 119-123.
Wahid, O.A.A., Moustafa, A.F. and Ibrahim, M.E. 1997. Soil mycoflora in tomato
fields. Mycoscience 38, 237-241.
Warth, A.D. 1985. Mechanisms of heat resistance. In: Gould, G.W., Dring, G.J., Ellar,
D.J., (Eds.), Fundamental and applied aspects of bacterial spores: FEMS symposium,
238
vol. 18. Academic Press, London. 209 - 225.
Waterhouse, R.M., Zdobnov, E.M., Tegenfeldt, F., Li, J. and Kriventseva, E.V. 2011.
OrthoDB: the hierarchical catalog of eukaryotic orthologs in 2011. Nucleic Acids
Research 39, D283-D288.
Watson, E.S. and O'Neill, M.J. 1966. Differential microcalorimeter. In: United States
Patent Office., (Ed.), vol. 3,263,484. The Perkin-Elmer Corporation, Norwalk,
Connecticut, USA. 10.
Waugh, M.M., Stanghellini, M.E. and Kim, D. 2001. Scanning electron microscopy of
germinated ascospores of Monosporascus cannonballus. Mycological Research 105,
745-748.
Williams, F.T. 1936. Attempts to increase the heat resistance of bacterial spores. Journal
of Bacteriology 32, 589-597.
Wu, C.H. and Warren, H.L. 1984. Natural autofluorescence in fungi, and its correlation
with viability. Mycologia 76, 1049-1058.
Xie, X., Wilkinson, H.H., Correa, A., Lewis, Z.A., Bell-Pedersen, D. and Ebbole, D.J.
2004. Transcriptional response to glucose starvation and functional analysis of a
glucose transporter of Neurospora crassa. Fungal Genetics and Biology 41, 1104-
1119.
Yates, A.R. 1973. Factors affecting respiration and germination of ascospores of the
food spoilage mould Byssochlamys nivea. Canadian Institute of Food Science and
Technology Journal 6, 244-247.
Yates, A.R. 1974. The occurrence of Byssochlamys sp. molds in Ontario. Canadian
Institute of Food Science and Technology Journal 7, 148-150.
Yates, A.R. and Ferguson, W.E. 1963. Observation on Byssochlamys nivea isolated
from cucumber brine. Canadian Journal of Botany 41, 1599-1601.
Yates, A.R., Seaman, A. and Woodbine, M. 1967. Growth of Byssochlamys nivea in
various carbon dioxide atmospheres. Canadian Journal of Microbiology 13, 1120-
1123.
Yates, A.R., Seaman, A. and Woodbine, M. 1968. Ascospore germination in
Byssochlamys nivea. Canadian Journal of Microbiology 14, 319-325.
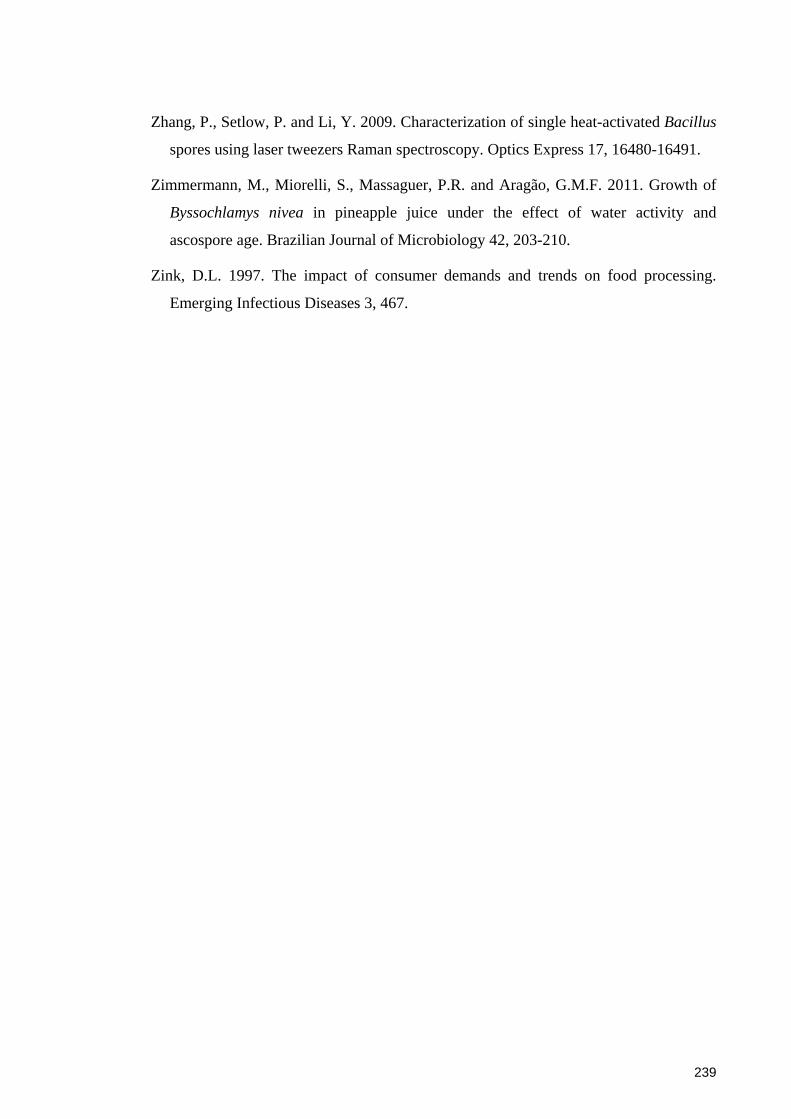
239
Zhang, P., Setlow, P. and Li, Y. 2009. Characterization of single heat-activated Bacillus
spores using laser tweezers Raman spectroscopy. Optics Express 17, 16480-16491.
Zimmermann, M., Miorelli, S., Massaguer, P.R. and Aragão, G.M.F. 2011. Growth of
Byssochlamys nivea in pineapple juice under the effect of water activity and
ascospore age. Brazilian Journal of Microbiology 42, 203-210.
Zink, D.L. 1997. The impact of consumer demands and trends on food processing.
Emerging Infectious Diseases 3, 467.

240
Appendices
Appendix 3.1. Screened heat resistance of the four Byssochlamys strains selected for
usage in this thesis. Comparative survival curves at 85oC of ascospores isolated from 6
weeks old cultures of B. fulva FRR 2299 (●), B. fulva FRR 2785 (▲), B. nivea FRR
4421 (♦) and B. nivea FRR 6002 (■)
Estimated D85 values: B. fulva FRR 2299: 14.7 min, B. fulva FRR 2785: 31.25 min, B.
nivea FRR 4421: 4.47 min. B. nivea FRR 6002: 5.91 min

241
Appendix 3.2. Proportions (in %) of the activated population at 1 minute out of the initially added ascospore concentration (5 – 6 log10); A –
B. fulva FRR 2299, B – B. fulva FRR 2785; C – B. nivea FRR 4421 and D – B. nivea FRR 6002; each column is an average of triplicates
A)
0
20
40
60
80
100
4 6 8 12 24Ascospore age (weeks)
Act
ivat
ion
leve
l (%
)
85oC
87.5oC
90oC
B)
0
20
40
60
80
100
4 6 8 12 24Ascospore age (weeks)
Act
ivat
ion
leve
l (%
)
85oC
87.5oC
90oC
C)
0
20
40
60
80
100
4 6 8 12 24Ascospore age (weeks)
Act
ivat
ion
leve
l (%
)
82.5oC
85oC
87.5oC
D)
0
20
40
60
80
100
4 6 8 12 24Ascospore age (weeks)
Act
ivat
ion
leve
l (%
)
82.5oC
85oC
87.5oC

242
Appendix 3.3. Average activation levels of the four B. fulva and B. nivea strains being tested in this experiment; each experiment started with a
population of 105 – 106 ascospores/mL
Strain Temp.
(oC)
Average activation ± SD (Log10 (cfu/mL))*
4 weeks 6 weeks 8 weeks 12 weeks 24 weeks
B. fulva FRR 2299
85 1.79 ± 0.67AB 2.80 ± 0.04A 2.69 ± 0.04aB 2.06 ± 0.01 2.62 ± 0.35
87.5 1.58 ± 0.47ABC 2.54 ± 0.40A 2.60 ± 0.16bB 2.32 ± 0.40 2.82 ± 0.12aC
90 1.88 ± 0.27 2.51 ± 0.31 1.93 ± 0.08ab 1.96 ± 0.33 2.09 ± 0.10a
B. fulva FRR 2785
85 1.17 ± 0.46ABC 2.77 ± 0.07AD 3.05 ± 0.04BE 2.83 ± 0.18CF 0.87 ± 0.20DEF
87.5 0.91 ± 0.01ABC 2.79 ± 0.05AD 2.71 ± 0.31BE 2.75 ± 0.16CF 0.73 ± 0.18DEF
90 1.71 ± 0.93 2.66 ± 0.08A 2.90 ± 0.11B 2.47 ± 0.62 0.84 ± 0.22AB
B. nivea FRR 4421
82.5 2.35 ± 0.07abA 2.67 ± 0.15B 2.00 ± 0.41C 1.86 ± 0.59D 0.86 ± 0.03abABCD
85 1.40 ± 0.05aABC 2.46 ± 0.25A 2.22 ± 0.24B 1.86 ± 0.10C 0.32 ± 0.32aABC
87.5 1.34 ± 0.17bA 2.16 ± 0.18B 1.60 ± 0.15C 1.76 ± 0.42D -0.14 ± 0.01bABCD
B. nivea FRR 6002
82.5 2.67 ± 0.60AB 2.45 ± 0.10C 2.25 ± 0.25 1.50 ± 0.46A 1.40 ± 0.04aBC
85 2.23 ± 0.52A 2.43 ± 0.22BC 2.41 ± 0.21DE 1.63 ± 0.05BD 1.39 ± 0.13bACE
87.5 1.44 ± 0.54A 2.26 ± 0.12BC 2.34 ± 0.36ADE 1.25 ± 0.02BD 0.93 ± 0.18abCE
* For each strain, similar normal letters (e.g. abc) indicate significance difference (p < 0.05) across temperatures at each age (column); similar capital letters (e.g. ABC)
indicate significant difference (p < 0.05) across ages at each temperature (row); each value is an average of triplicate
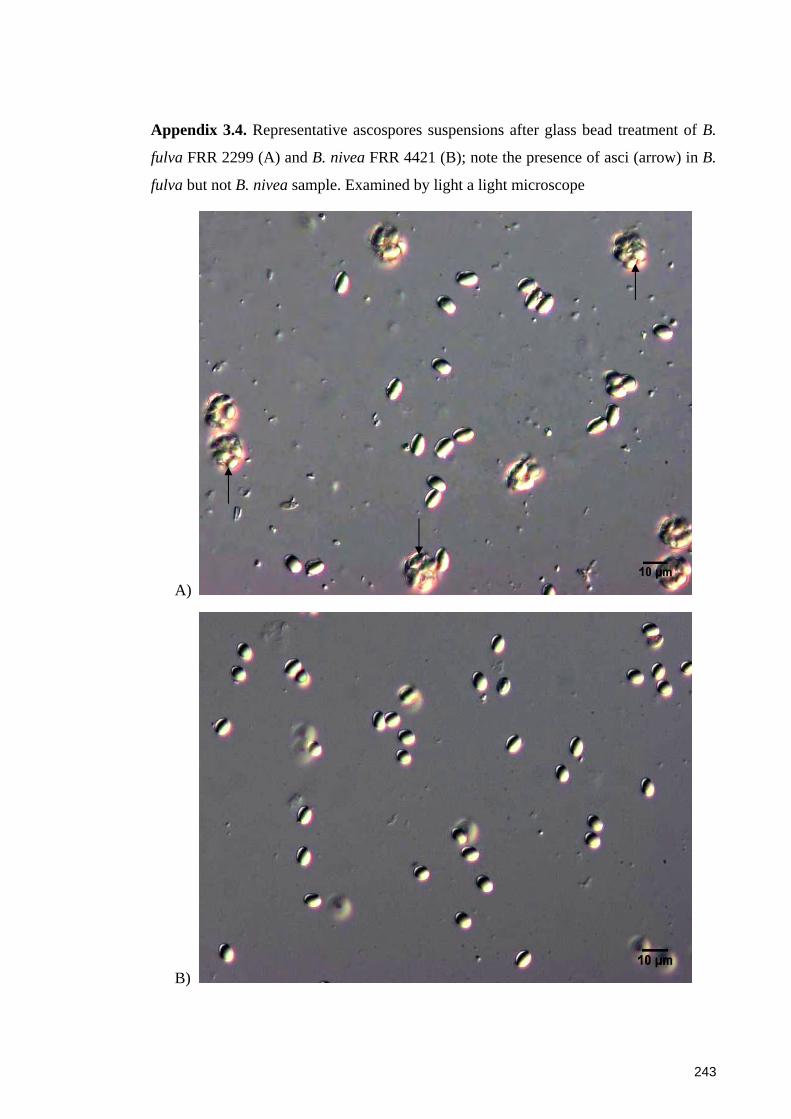
243
Appendix 3.4. Representative ascospores suspensions after glass bead treatment of B.
fulva FRR 2299 (A) and B. nivea FRR 4421 (B); note the presence of asci (arrow) in B.
fulva but not B. nivea sample. Examined by light a light microscope
A)
B)
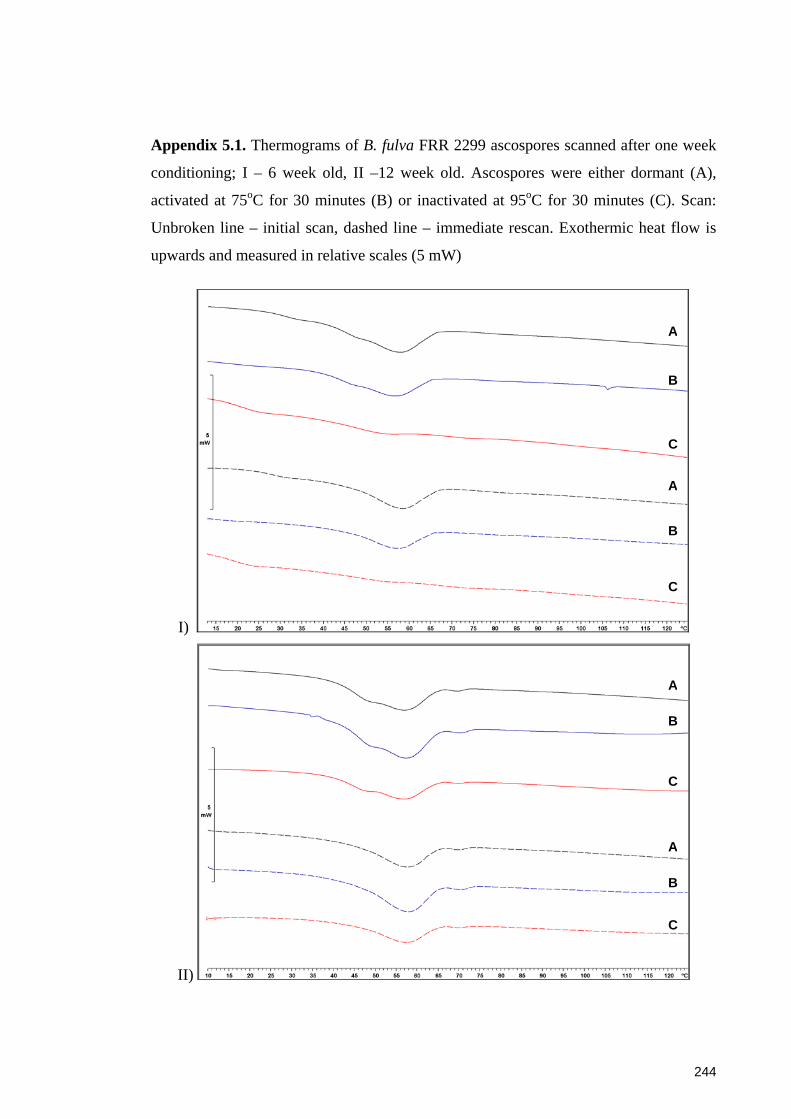
244
Appendix 5.1. Thermograms of B. fulva FRR 2299 ascospores scanned after one week
conditioning; I – 6 week old, II –12 week old. Ascospores were either dormant (A),
activated at 75oC for 30 minutes (B) or inactivated at 95oC for 30 minutes (C). Scan:
Unbroken line – initial scan, dashed line – immediate rescan. Exothermic heat flow is
upwards and measured in relative scales (5 mW)
I)
II)
A
A
A
A
B
B
B
B
C
C
C
C
245
Appendix 5.2. Thermograms of B. fulva FRR 2785 ascospores scanned after one week
conditioning; I – 6 week old, II –12 week old. Ascospores were either dormant (A),
activated at 75oC for 30 minutes (B) or inactivated at 95oC for 30 minutes (C). Scan:
unbroken line – initial scan, dashed line – immediate rescan. Exothermic heat flow is
upwards and measured in relative scales (5 mW)
I)
II)
A
A
B
B
C
C
A
A
B
B
C
C
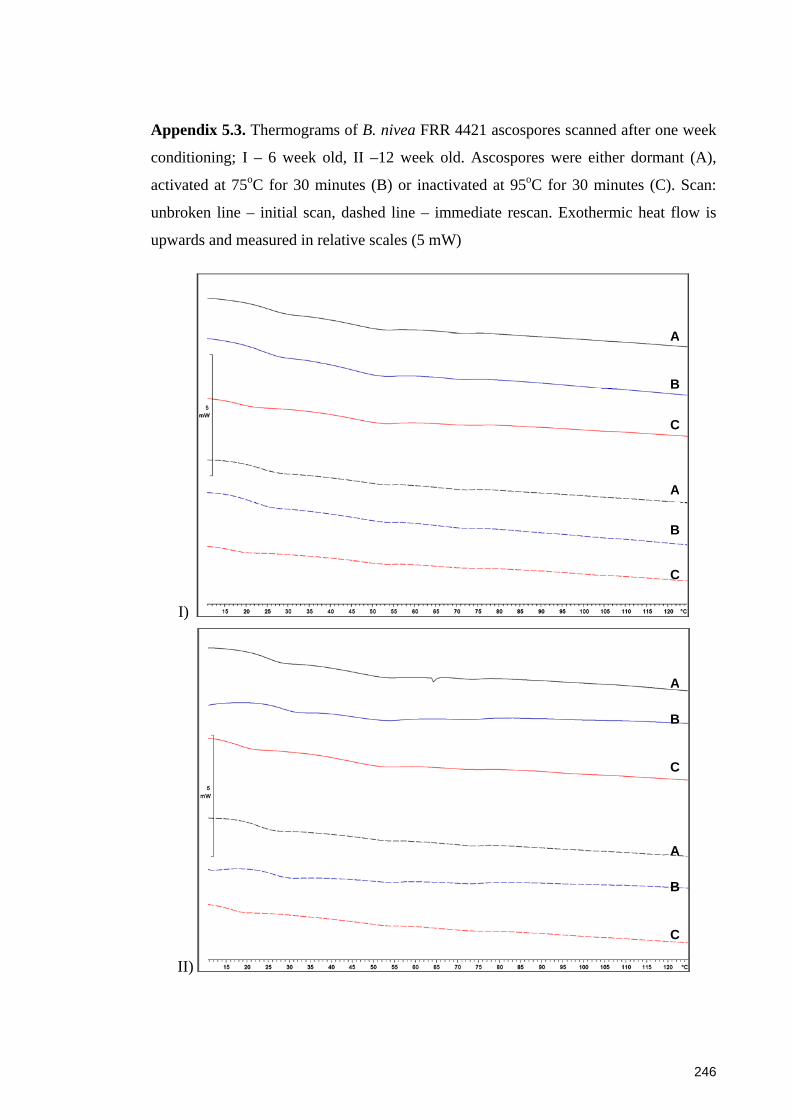
246
Appendix 5.3. Thermograms of B. nivea FRR 4421 ascospores scanned after one week
conditioning; I – 6 week old, II –12 week old. Ascospores were either dormant (A),
activated at 75oC for 30 minutes (B) or inactivated at 95oC for 30 minutes (C). Scan:
unbroken line – initial scan, dashed line – immediate rescan. Exothermic heat flow is
upwards and measured in relative scales (5 mW)
I)
II)
A
A
B
B
C
C
A
A
B
B
C
C
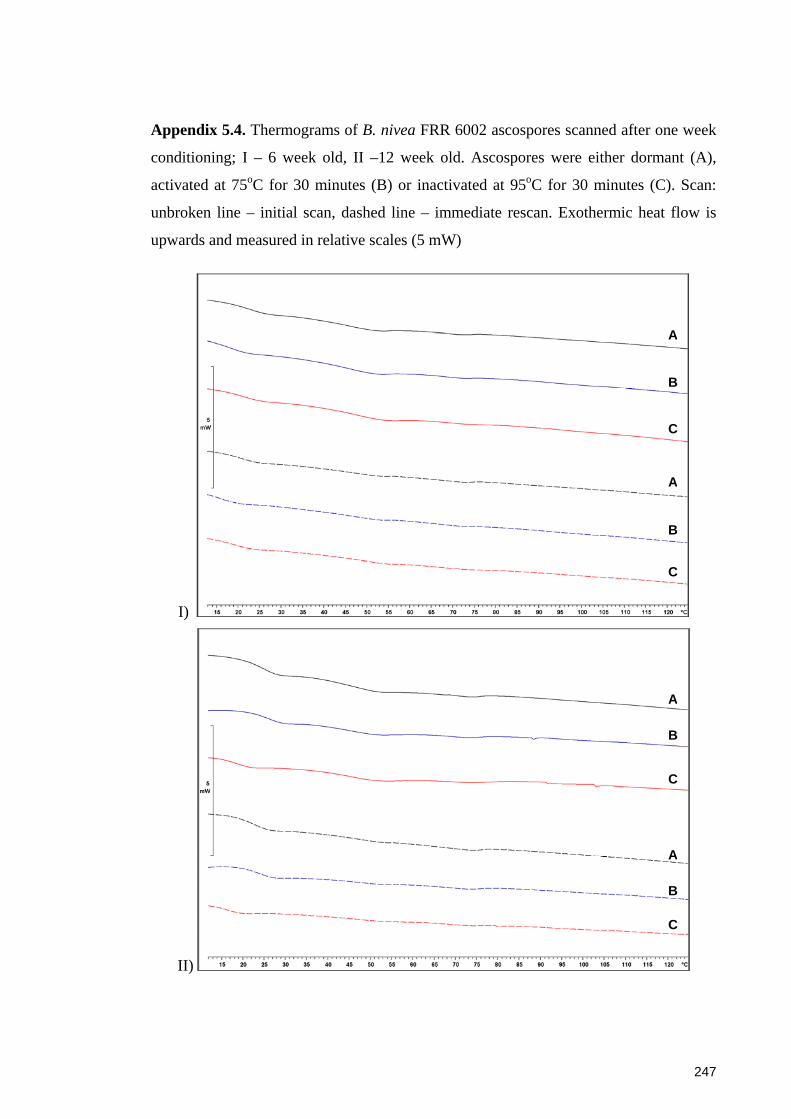
247
Appendix 5.4. Thermograms of B. nivea FRR 6002 ascospores scanned after one week
conditioning; I – 6 week old, II –12 week old. Ascospores were either dormant (A),
activated at 75oC for 30 minutes (B) or inactivated at 95oC for 30 minutes (C). Scan:
unbroken line – initial scan, dashed line – immediate rescan. Exothermic heat flow is
upwards and measured in relative scales (5 mW)
I)
II)
A
A
A
A
B
B
B
B
C
C
C
C

248
Appendix 5.5. Excess water in dense ascospore solutions being removed by drying over
granulated silica gel in a desiccator
Drying time (hours)
Sample weight (mg) B. fulva FRR 2299(Dense solution)
B. nivea FRR 6002(Dense solution)
B. nivea FRR 6002 (Lyophilised)
0 10.91 9.96 2.02
1 4.06 4.77 2
2 3.18 4.37 -
3 - - 1.96
4 3.16 4.18 -
6 - - 1.96
7 3.13 4.19 -
20 - - 1.95
21 3.12 4.18 - Final sample weight (mg) 3.12 4.18 1.95
Water loss (mg)^ 7.79 5.78 0.07
Water loss (% w/w)* 71 58 3
^ Water loss weight (mg) = Weight at time 0 – Final sample weight
* % water loss = (Water loss weight/Weight at time 0) x 100

249
Appendix 6.1. Comparative staining of 8 week ascospores of B. fulva FRR 2299 with
SYTO 9 and PI; ascospores are treated at 90oC for up to 30 minutes Unstained Stained
0 m
in
FL1
– G
reen
fluo
resc
ence
inte
nsity
(SYT
O 9
)
A) C)
30 m
in
B) D)
0 m
in
FL3
– R
ed fl
uore
scen
ce in
tens
ity (P
I)
E) G)
30 m
in
F) H)
FSC intensity – Size

250
Appendix 6.1. (cont’d) Comparative staining of 12 week ascospores of B. fulva FRR
2299 with SYTO 9 and PI; ascospores are treated at 90oC for up to 30 minutes Unstained Stained
0 m
in
FL1
– G
reen
fluo
resc
ence
inte
nsity
(SYT
O 9
)
A) C)
30 m
in
B) D)
0 m
in
FL3
– R
ed fl
uore
scen
ce in
tens
ity (P
I)
E) G)
30 m
in
F) H)
FSC intensity – Size
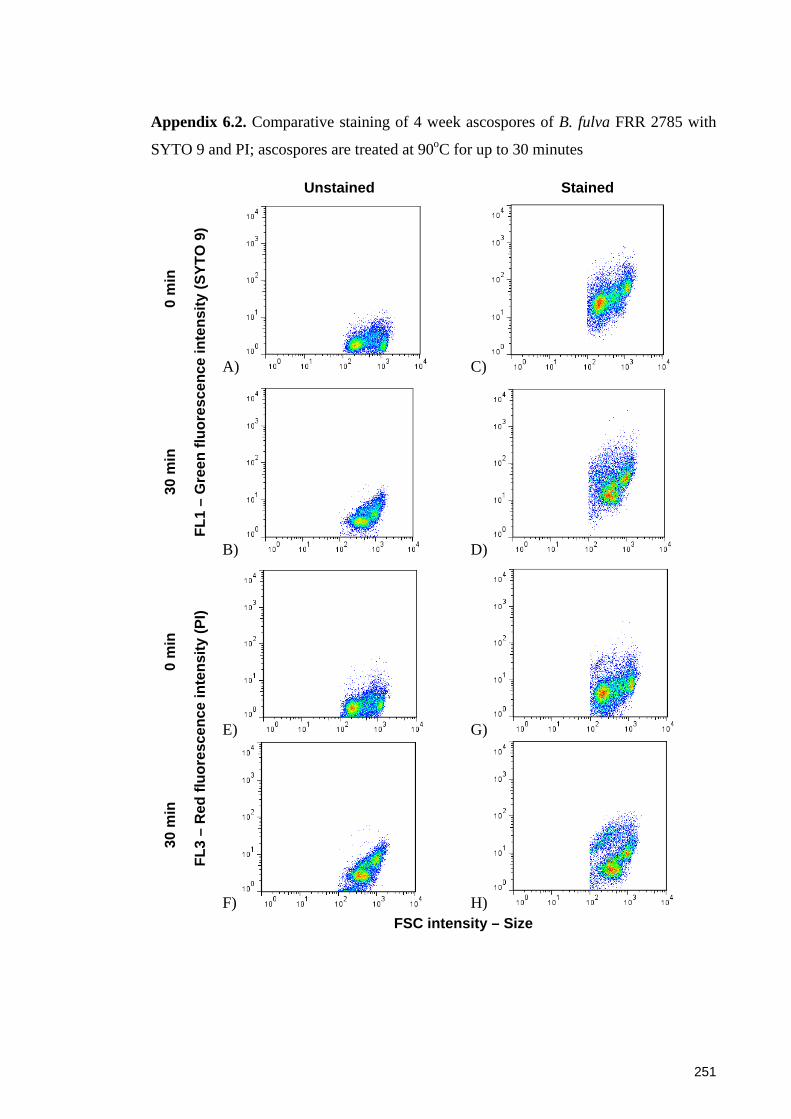
251
Appendix 6.2. Comparative staining of 4 week ascospores of B. fulva FRR 2785 with
SYTO 9 and PI; ascospores are treated at 90oC for up to 30 minutes Unstained Stained
0 m
in
FL1
– G
reen
fluo
resc
ence
inte
nsity
(SYT
O 9
)
A) C)
30 m
in
B) D)
0 m
in
FL3
– R
ed fl
uore
scen
ce in
tens
ity (P
I)
E) G)
30 m
in
F) H)
FSC intensity – Size
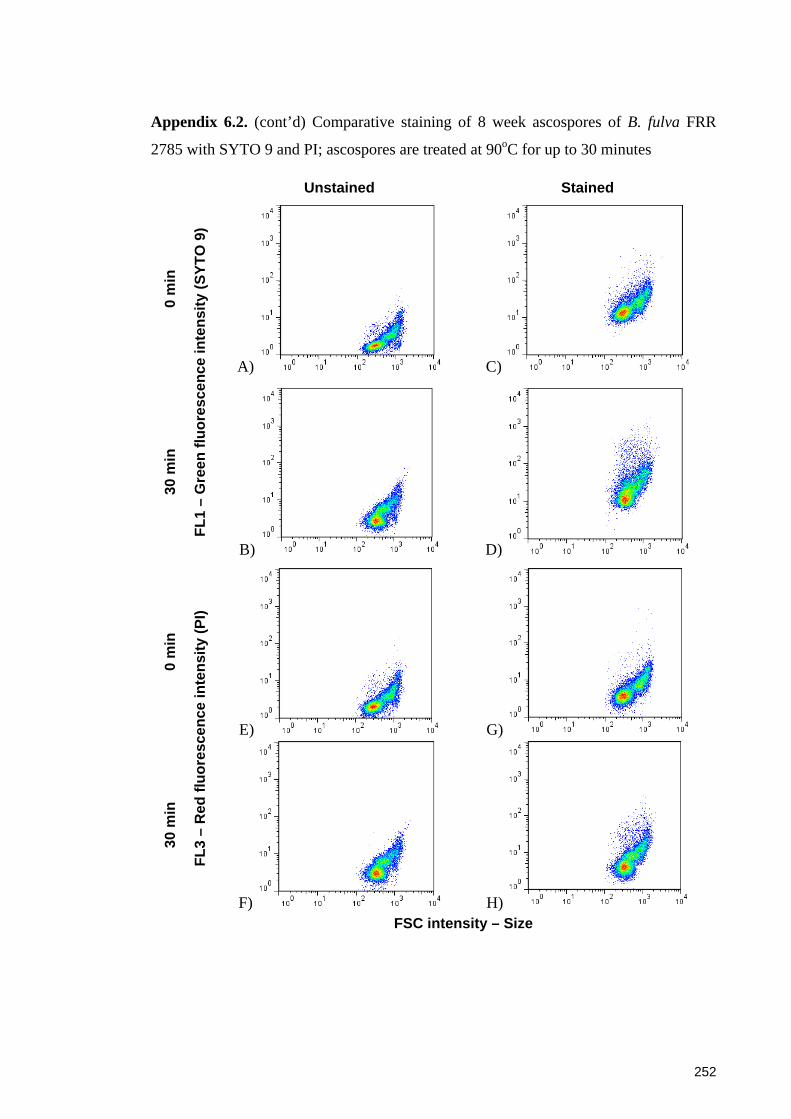
252
Appendix 6.2. (cont’d) Comparative staining of 8 week ascospores of B. fulva FRR
2785 with SYTO 9 and PI; ascospores are treated at 90oC for up to 30 minutes Unstained Stained
0 m
in
FL1
– G
reen
fluo
resc
ence
inte
nsity
(SYT
O 9
)
A) C)
30 m
in
B) D)
0 m
in
FL3
– R
ed fl
uore
scen
ce in
tens
ity (P
I)
E) G)
30 m
in
F) H)
FSC intensity – Size

253
Appendix 6.2. (cont’d) Comparative staining of 12 week ascospores of B. fulva FRR
2785 with SYTO 9 and PI; ascospores are treated at 90oC for up to 30 minutes Unstained Stained
0 m
in
FL1
– G
reen
fluo
resc
ence
inte
nsity
(SYT
O 9
)
A) C)
30 m
in
B) D)
0 m
in
FL3
– R
ed fl
uore
scen
ce in
tens
ity (P
I)
E) G)
30 m
in
F) H)
FSC intensity – Size
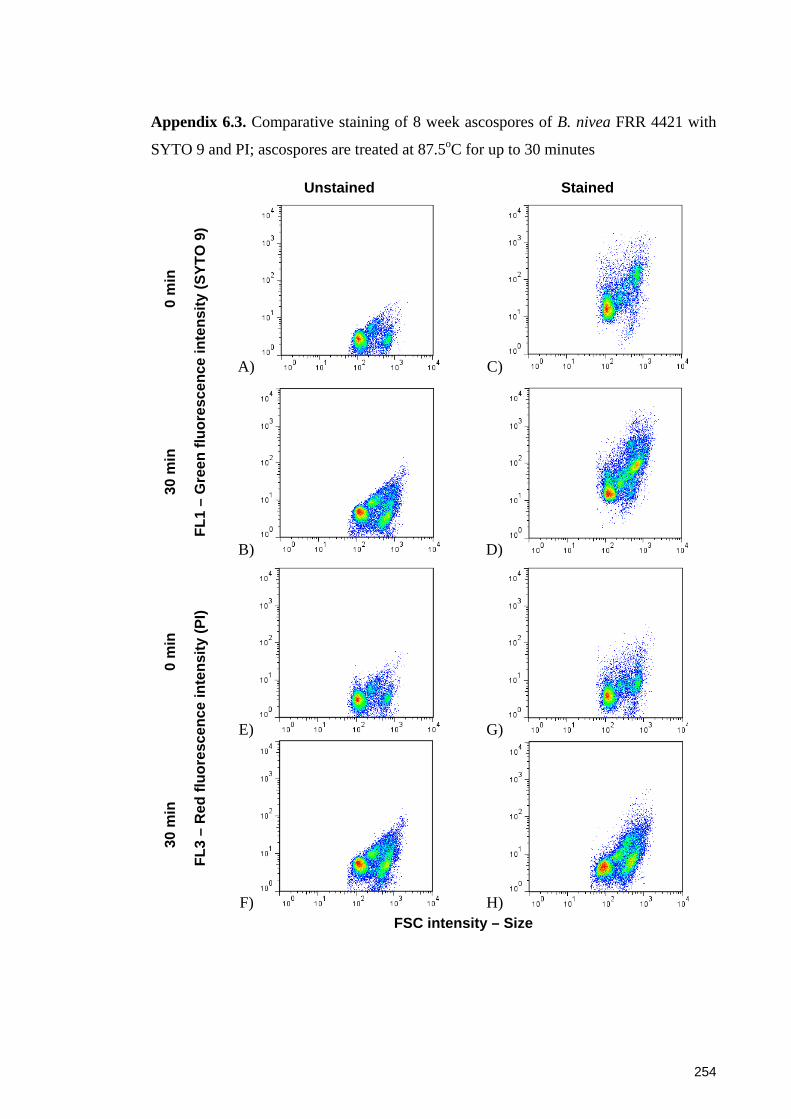
254
Appendix 6.3. Comparative staining of 8 week ascospores of B. nivea FRR 4421 with
SYTO 9 and PI; ascospores are treated at 87.5oC for up to 30 minutes Unstained Stained
0 m
in
FL1
– G
reen
fluo
resc
ence
inte
nsity
(SYT
O 9
)
A) C)
30 m
in
B) D)
0 m
in
FL3
– R
ed fl
uore
scen
ce in
tens
ity (P
I)
E) G)
30 m
in
F) H)
FSC intensity – Size
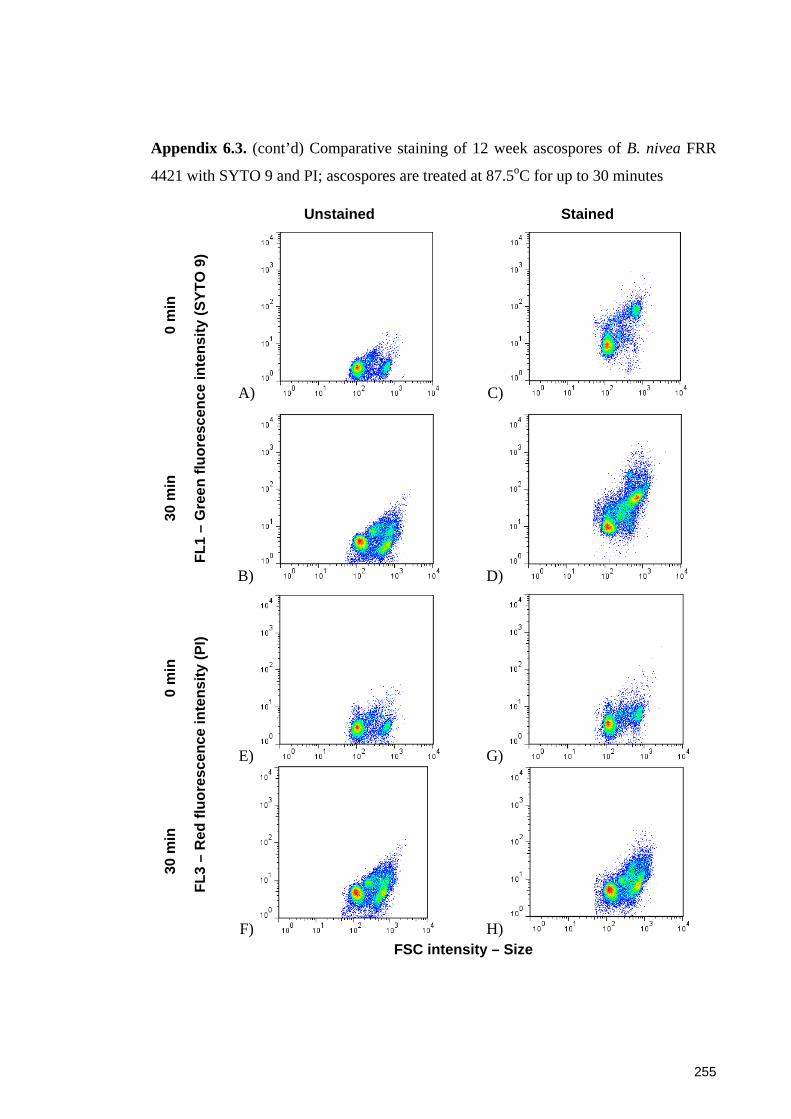
255
Appendix 6.3. (cont’d) Comparative staining of 12 week ascospores of B. nivea FRR
4421 with SYTO 9 and PI; ascospores are treated at 87.5oC for up to 30 minutes Unstained Stained
0 m
in
FL1
– G
reen
fluo
resc
ence
inte
nsity
(SYT
O 9
)
A) C)
30 m
in
B) D)
0 m
in
FL3
– R
ed fl
uore
scen
ce in
tens
ity (P
I)
E) G)
30 m
in
F) H)
FSC intensity – Size
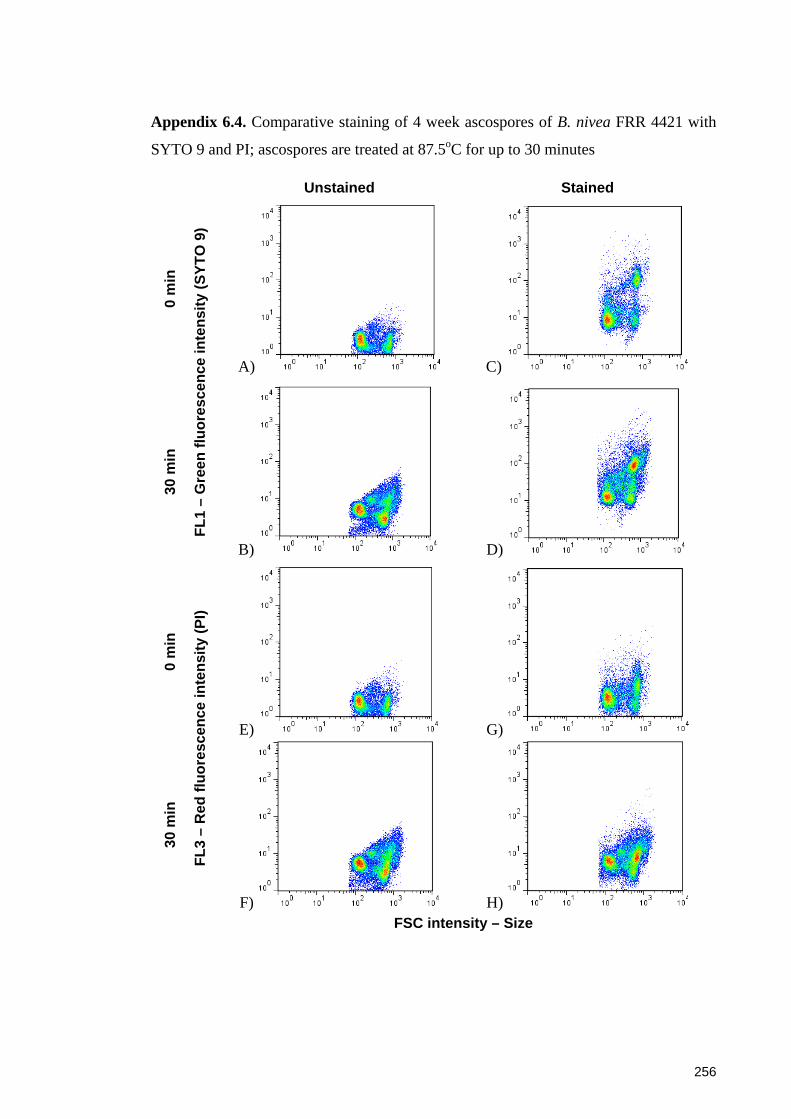
256
Appendix 6.4. Comparative staining of 4 week ascospores of B. nivea FRR 4421 with
SYTO 9 and PI; ascospores are treated at 87.5oC for up to 30 minutes Unstained Stained
0 m
in
FL1
– G
reen
fluo
resc
ence
inte
nsity
(SYT
O 9
)
A) C)
30 m
in
B) D)
0 m
in
FL3
– R
ed fl
uore
scen
ce in
tens
ity (P
I)
E) G)
30 m
in
F) H)
FSC intensity – Size

257
Appendix 6.4. (cont’d) Comparative staining of 8 week ascospores of B. nivea FRR
4421 with SYTO 9 and PI; ascospores are treated at 87.5oC for up to 30 minutes Unstained Stained
0 m
in
FL1
– G
reen
fluo
resc
ence
inte
nsity
(SYT
O 9
)
A) C)
30 m
in
B) D)
0 m
in
FL3
– R
ed fl
uore
scen
ce in
tens
ity (P
I)
E) G)
30 m
in
F) H)
FSC intensity – Size
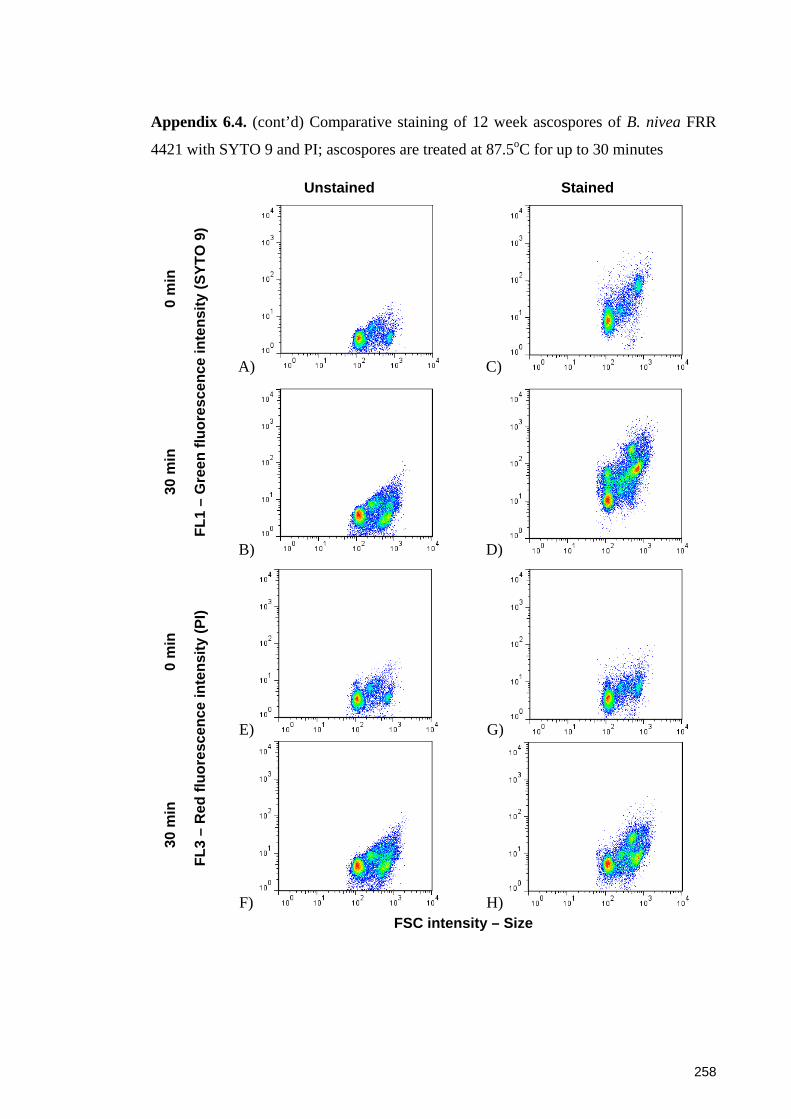
258
Appendix 6.4. (cont’d) Comparative staining of 12 week ascospores of B. nivea FRR
4421 with SYTO 9 and PI; ascospores are treated at 87.5oC for up to 30 minutes Unstained Stained
0 m
in
FL1
– G
reen
fluo
resc
ence
inte
nsity
(SYT
O 9
)
A) C)
30 m
in
B) D)
0 m
in
FL3
– R
ed fl
uore
scen
ce in
tens
ity (P
I)
E) G)
30 m
in
F) H)
FSC intensity – Size

259
Appendix 6.5. Subpopulations of unstained 4 week ascospores of B. fulva FRR 2299
following a heat treatment at 90oC for up to 30 minutes; the positive control is
ascospores heated at 96oC for 60 minutes
FL1
inte
nsity
– G
reen
fluo
resc
ence
0 min (dormant)
1 min
4 min
12 min
30 min
Positive control
FSC intensity – Size

260
Appendix 6.5. (cont’d) Subpopulations of 8 week unstained ascospores of B. fulva FRR
2299 FL
1 in
tens
ity –
Gre
en fl
uore
scen
ce
0 min (dormant)
1 min
4 min
12 min
30 min
Positive control
FSC intensity – Size

261
Appendix 6.5. (cont’d) Subpopulations of 12 week unstained ascospores of B. fulva
FRR 2299 FL
1 in
tens
ity –
Gre
en fl
uore
scen
ce
0 min (dormant)
1 min
4 min
12 min
30 min
Positive control
FSC intensity – Size
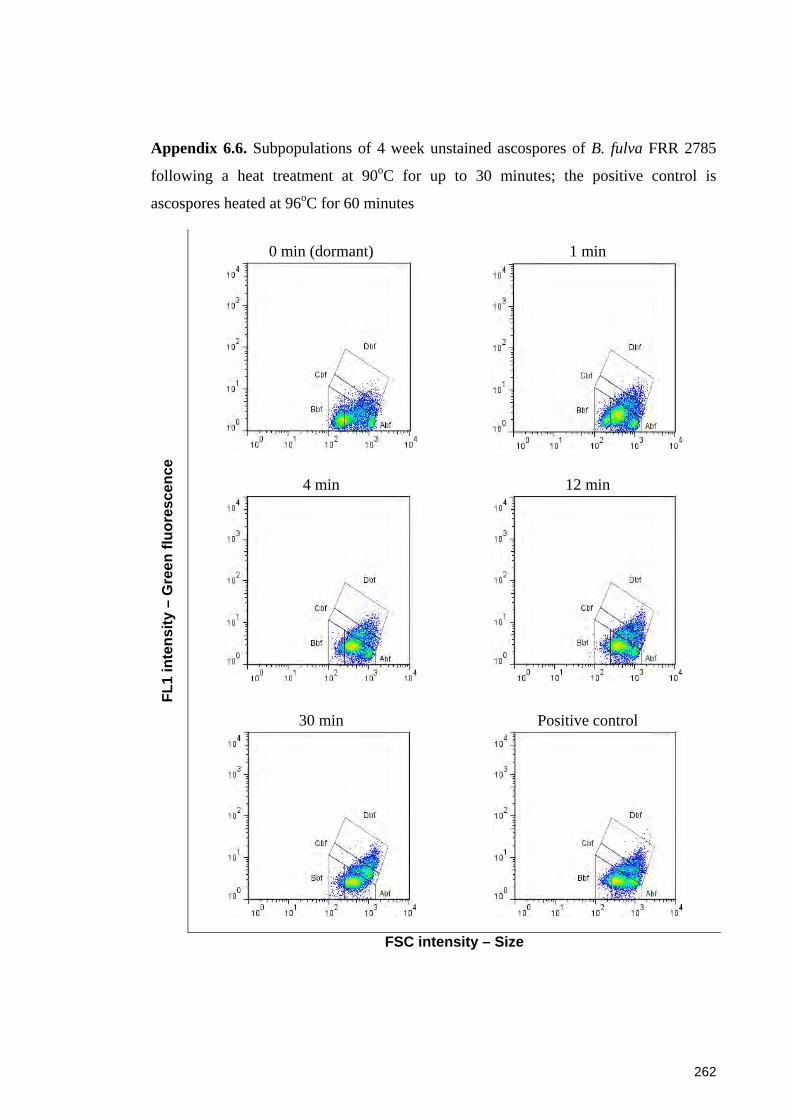
262
Appendix 6.6. Subpopulations of 4 week unstained ascospores of B. fulva FRR 2785
following a heat treatment at 90oC for up to 30 minutes; the positive control is
ascospores heated at 96oC for 60 minutes
FL1
inte
nsity
– G
reen
fluo
resc
ence
0 min (dormant)
1 min
4 min
12 min
30 min
Positive control
FSC intensity – Size

263
Appendix 6.6. (cont’d) Subpopulations of 8 week unstained ascospores of B. fulva FRR
2785 FL
1 in
tens
ity –
Gre
en fl
uore
scen
ce
0 min (dormant)
1 min
4 min
12 min
30 min
Positive control
FSC intensity – Size
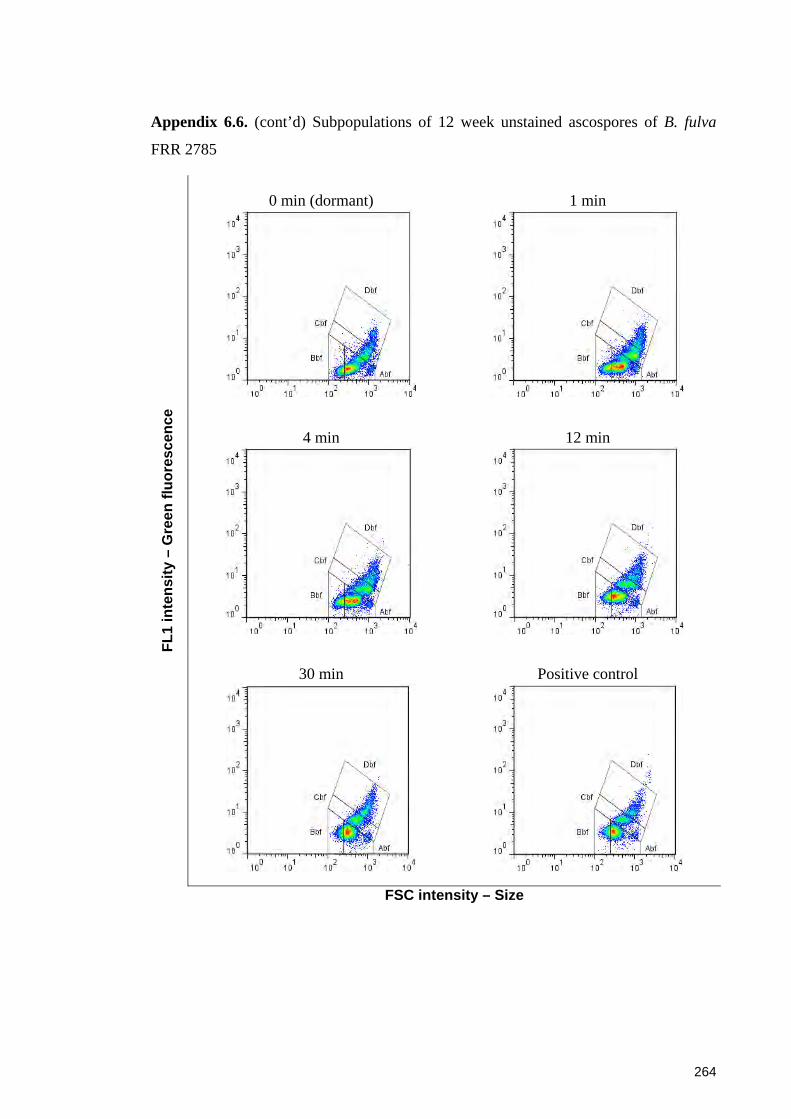
264
Appendix 6.6. (cont’d) Subpopulations of 12 week unstained ascospores of B. fulva
FRR 2785 FL
1 in
tens
ity –
Gre
en fl
uore
scen
ce
0 min (dormant)
1 min
4 min
12 min
30 min
Positive control
FSC intensity – Size

265
Appendix 6.7. Subpopulations of 4 week unstained ascospores of B. nivea FRR 4421
following a heat treatment at 87.5oC for up to 30 minutes; the positive control is
ascospores heated at 96oC for 60 minutes FL
1 in
tens
ity –
Gre
en fl
uore
scen
ce
0 min (dormant)
1 min
4 min
12 min
30 min
Positive control
FSC intensity – Size

266
Appendix 6.7. (cont’d) Subpopulations of 8 week unstained ascospores of B. nivea
FRR 4421 FL
1 in
tens
ity –
Gre
en fl
uore
scen
ce
0 min (dormant)
1 min
4 min
12 min
30 min
Positive control
FSC intensity – Size

267
Appendix 6.7. (cont’d) Subpopulations of 12 week unstained ascospores of B. nivea
FRR 4421 FL
1 in
tens
ity –
Gre
en fl
uore
scen
ce
0 min (dormant)
1 min
4 min
12 min
30 min
Positive control
FSC intensity – Size
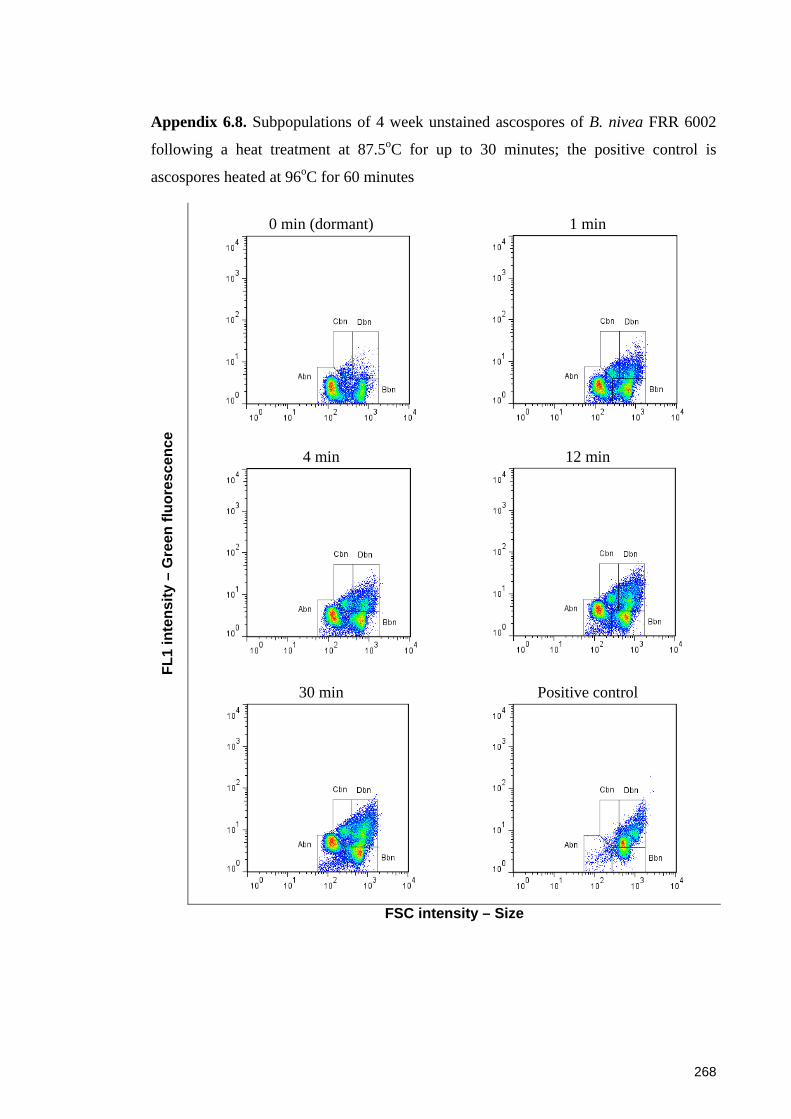
268
Appendix 6.8. Subpopulations of 4 week unstained ascospores of B. nivea FRR 6002
following a heat treatment at 87.5oC for up to 30 minutes; the positive control is
ascospores heated at 96oC for 60 minutes FL
1 in
tens
ity –
Gre
en fl
uore
scen
ce
0 min (dormant)
1 min
4 min
12 min
30 min
Positive control
FSC intensity – Size
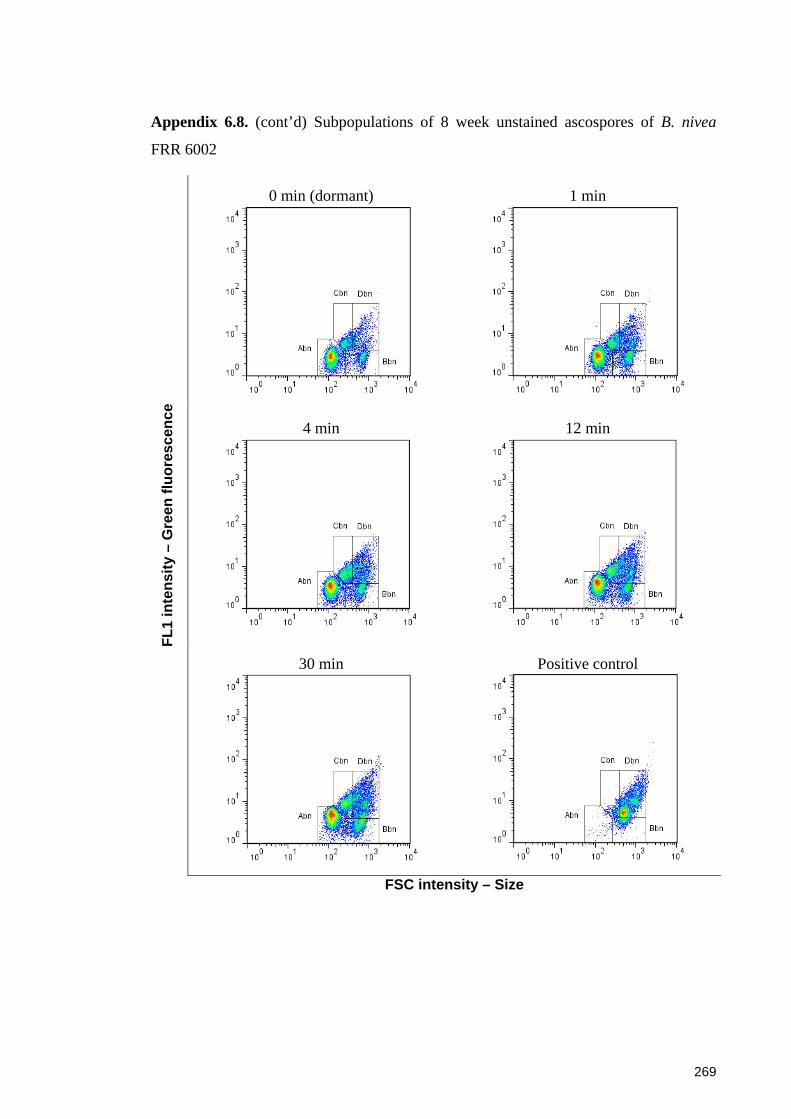
269
Appendix 6.8. (cont’d) Subpopulations of 8 week unstained ascospores of B. nivea
FRR 6002 FL
1 in
tens
ity –
Gre
en fl
uore
scen
ce
0 min (dormant)
1 min
4 min
12 min
30 min
Positive control
FSC intensity – Size
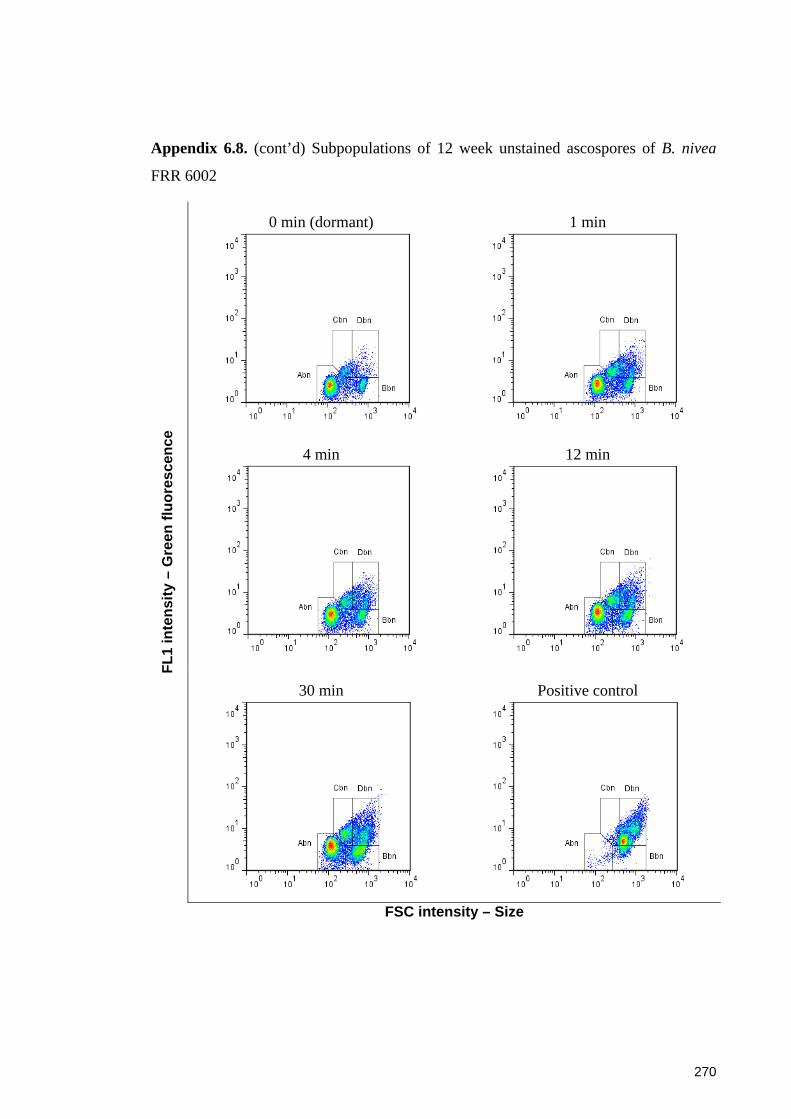
270
Appendix 6.8. (cont’d) Subpopulations of 12 week unstained ascospores of B. nivea
FRR 6002 FL
1 in
tens
ity –
Gre
en fl
uore
scen
ce
0 min (dormant)
1 min
4 min
12 min
30 min
Positive control
FSC intensity – Size
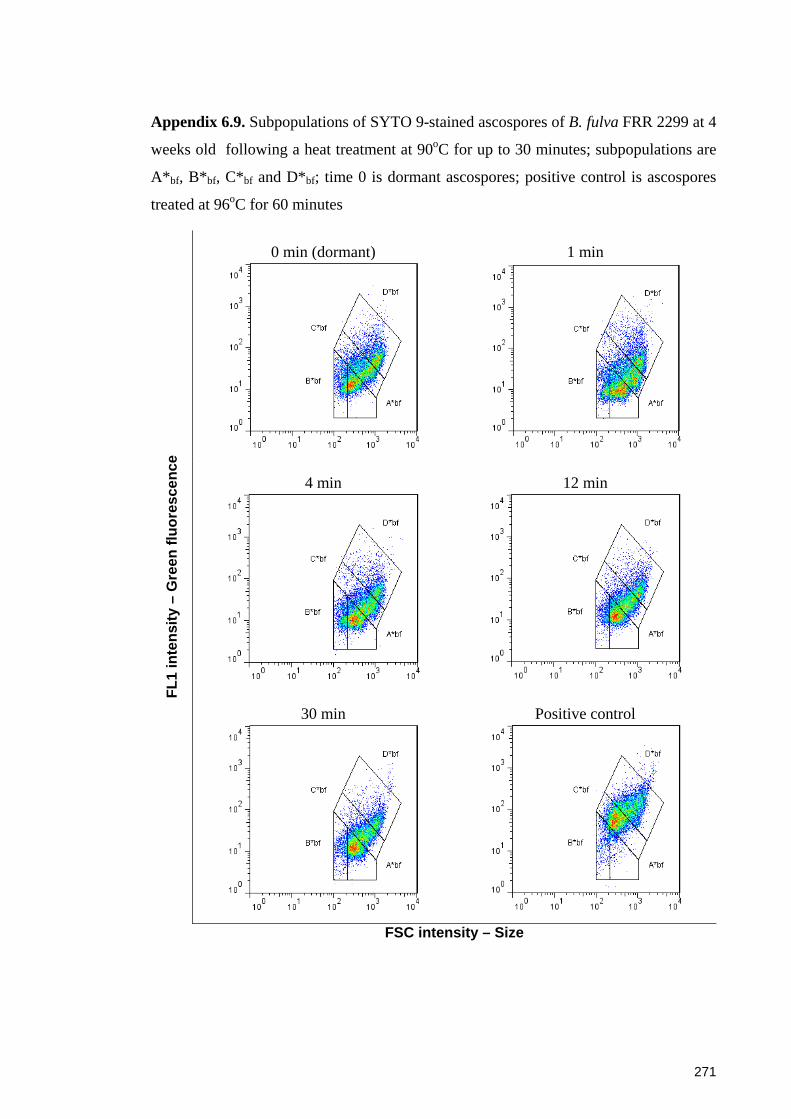
271
Appendix 6.9. Subpopulations of SYTO 9-stained ascospores of B. fulva FRR 2299 at 4
weeks old following a heat treatment at 90oC for up to 30 minutes; subpopulations are
A*bf, B*bf, C*bf and D*bf; time 0 is dormant ascospores; positive control is ascospores
treated at 96oC for 60 minutes
FL1
inte
nsity
– G
reen
fluo
resc
ence
0 min (dormant)
1 min
4 min
12 min
30 min
Positive control
FSC intensity – Size

272
Appendix 6.9. (cont’d) Subpopulations of SYTO 9-stained ascospores of B. fulva FRR
2299 at 8 weeks old FL
1 in
tens
ity –
Gre
en fl
uore
scen
ce
0 min (dormant)
1 min
4 min
12 min
30 min
Positive control
FSC intensity – Size

273
Appendix 6.9. (cont’d) Subpopulations of SYTO 9-stained ascospores of B. fulva FRR
2299 at 12 weeks old FL
1 in
tens
ity –
Gre
en fl
uore
scen
ce
0 min (dormant)
1 min
4 min
12 min
30 min
Positive control
FSC intensity – Size
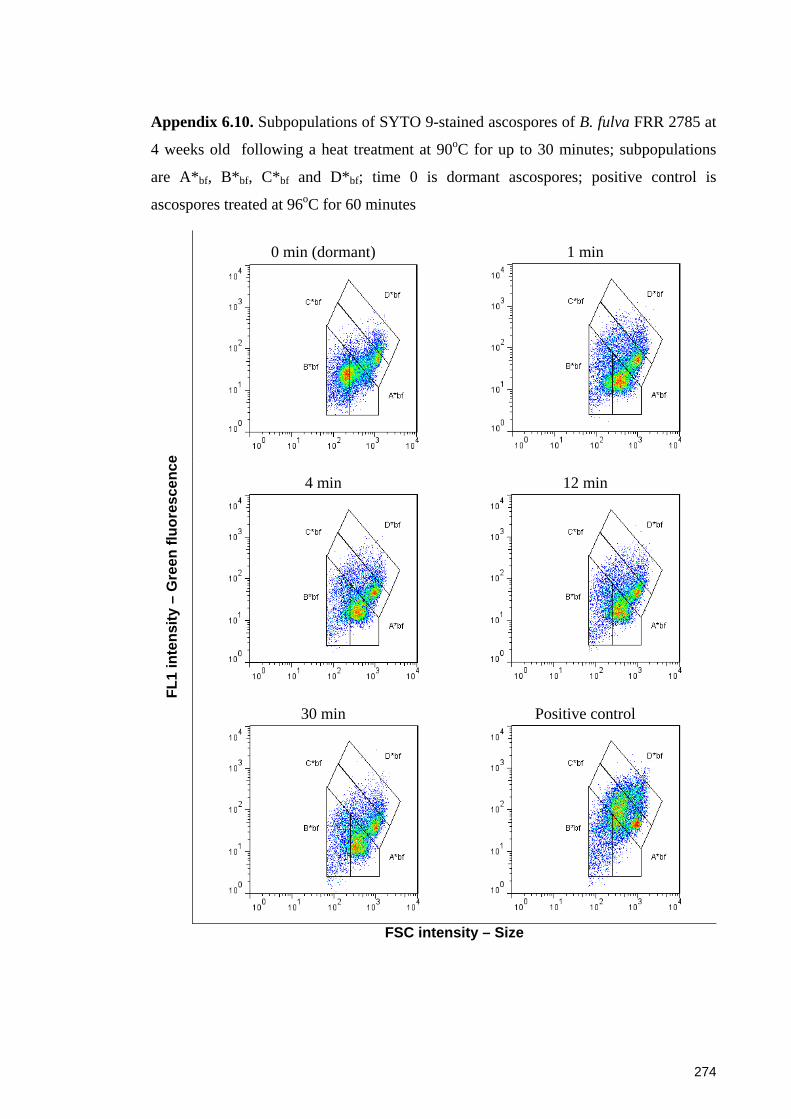
274
Appendix 6.10. Subpopulations of SYTO 9-stained ascospores of B. fulva FRR 2785 at
4 weeks old following a heat treatment at 90oC for up to 30 minutes; subpopulations
are A*bf, B*bf, C*bf and D*bf; time 0 is dormant ascospores; positive control is
ascospores treated at 96oC for 60 minutes
FL1
inte
nsity
– G
reen
fluo
resc
ence
0 min (dormant)
1 min
4 min
12 min
30 min
Positive control
FSC intensity – Size
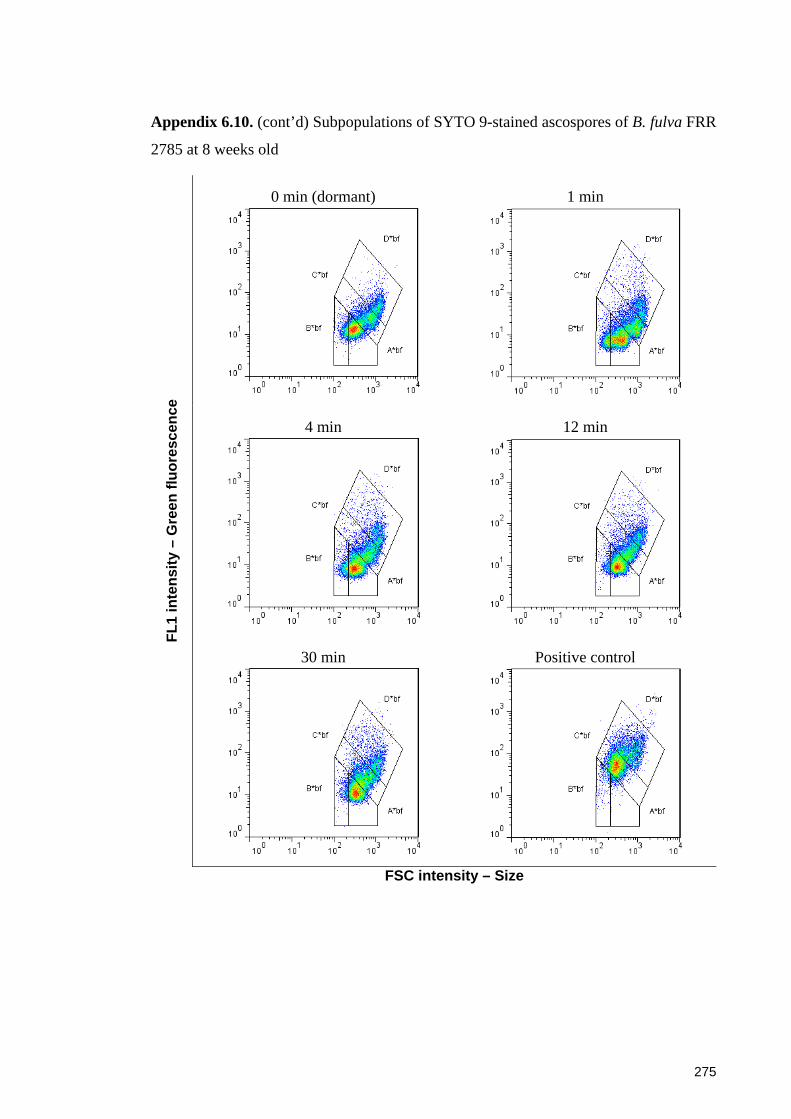
275
Appendix 6.10. (cont’d) Subpopulations of SYTO 9-stained ascospores of B. fulva FRR
2785 at 8 weeks old FL
1 in
tens
ity –
Gre
en fl
uore
scen
ce
0 min (dormant)
1 min
4 min
12 min
30 min
Positive control
FSC intensity – Size

276
Appendix 6.10. (cont’d) Subpopulations of SYTO 9-stained ascospores of B. fulva FRR
2785 at 12 weeks old FL
1 in
tens
ity –
Gre
en fl
uore
scen
ce
0 min (dormant)
1 min
4 min
12 min
30 min
Positive control
FSC intensity – Size
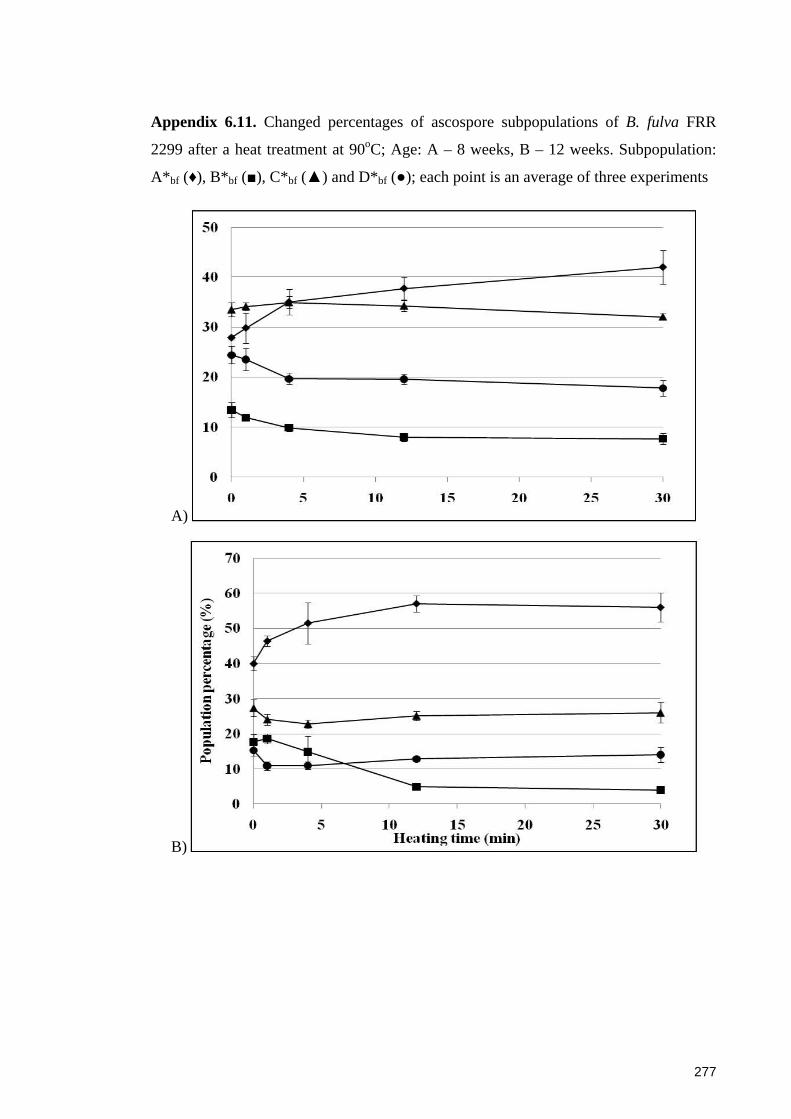
277
Appendix 6.11. Changed percentages of ascospore subpopulations of B. fulva FRR
2299 after a heat treatment at 90oC; Age: A – 8 weeks, B – 12 weeks. Subpopulation:
A*bf (♦), B*bf (■), C*bf (▲) and D*bf (●); each point is an average of three experiments
A)
B)
50
l 40 l
-.- I + = -
•
0 10 15 20 25 30
70
~-I
60 .I __.... ~ '-"
l I
~l) so I r i 40 .vr ______________________________________ ___ <.I ... ~ c. = 30 Q
:c ~ = =Q
~
0 5 10 15 20 25 30 Heating time (min)
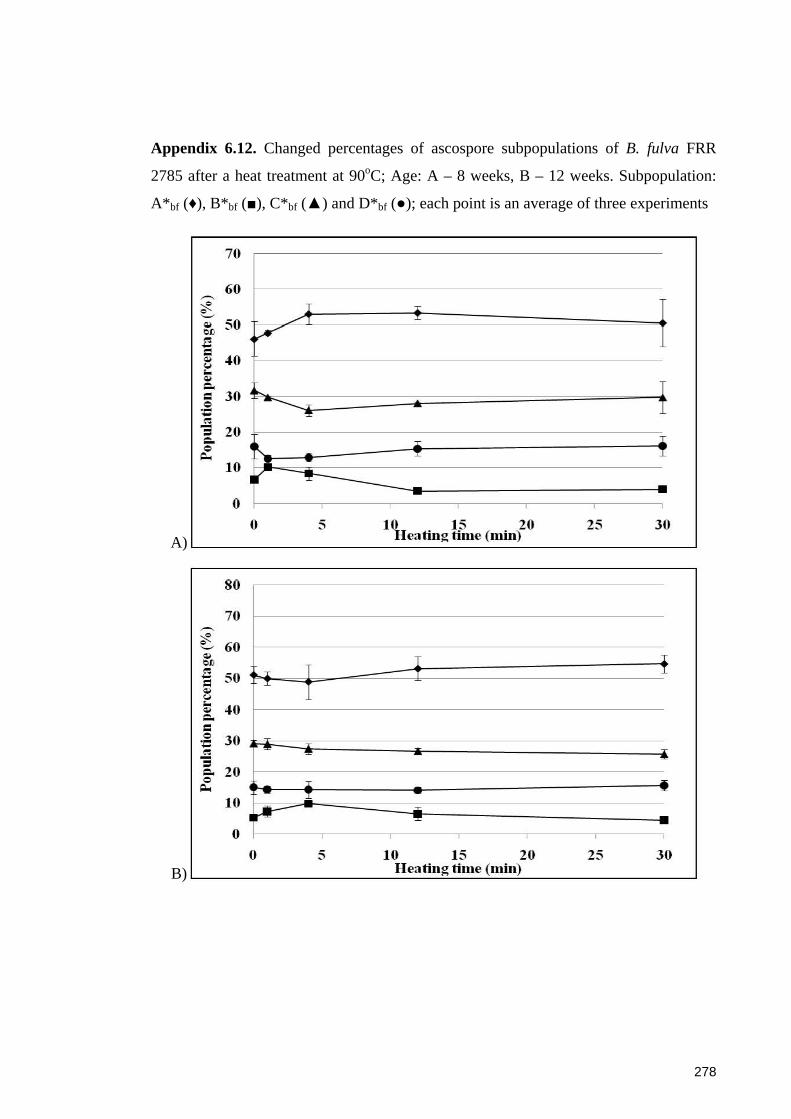
278
Appendix 6.12. Changed percentages of ascospore subpopulations of B. fulva FRR
2785 after a heat treatment at 90oC; Age: A – 8 weeks, B – 12 weeks. Subpopulation:
A*bf (♦), B*bf (■), C*bf (▲) and D*bf (●); each point is an average of three experiments
A)
B)
70
60 _,-.....
~ '-' ~ 50 I:)J)
~
~ 40
I ...........,.
CJ .. ~
~ 30 j~~========~==================~T ~ I ~ . I = 20 .
2 t. • ! !
~: r=:s;---. ------~ 0 5 10 15 20
Heatin g time (min) 25 30
80
70 _,-.....
-:!f.. ~ '-' 60 ~ I:)J)
~ 50 = ~ CJ ..
40 ~ :=.
T I I _I I I T
= ¢ 30 i: ~ -= 20 :=. ¢ ~
10
= ~ ,.. - -
J: - .... - I - "" . ..-- .. ~ -0
0 5 10 15 20 25 30 H eating time (min)

279
Appendix 6.13. Subpopulations of SYTO 9-stained ascospores of B. nivea FRR 4421 at
4 weeks old following a heat treatment at 87.5oC for up to 30 minutes; subpopulations
are A*bn, B*bn, C*bn, D*bn and E*bn; time 0 is dormant ascospores; positive control is
ascospores treated at 96oC for 60 minutes
FL1
inte
nsity
– G
reen
fluo
resc
ence
0 min (dormant)
1 min
4 min
12 min
30 min
Positive control
FSC intensity – Size
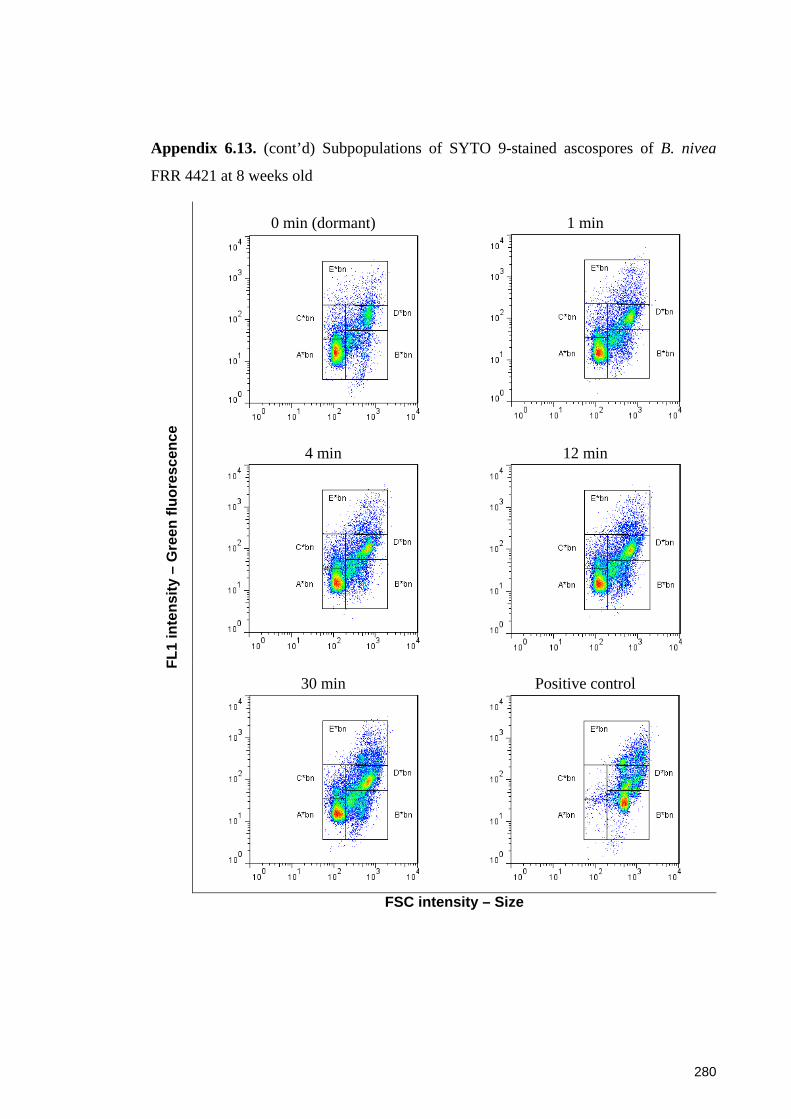
280
Appendix 6.13. (cont’d) Subpopulations of SYTO 9-stained ascospores of B. nivea
FRR 4421 at 8 weeks old FL
1 in
tens
ity –
Gre
en fl
uore
scen
ce
0 min (dormant)
1 min
4 min
12 min
30 min
Positive control
FSC intensity – Size
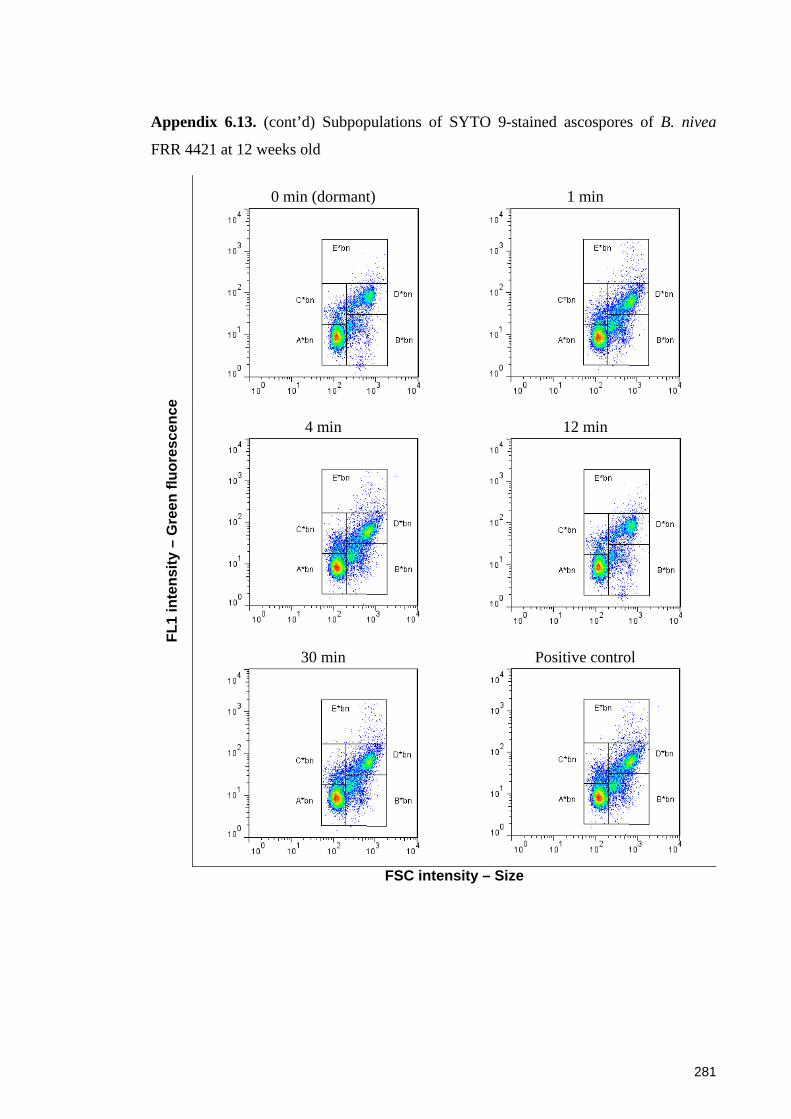
281
Appendix 6.13. (cont’d) Subpopulations of SYTO 9-stained ascospores of B. nivea
FRR 4421 at 12 weeks old FL
1 in
tens
ity –
Gre
en fl
uore
scen
ce
0 min (dormant)
1 min
4 min
12 min
30 min
Positive control
FSC intensity – Size
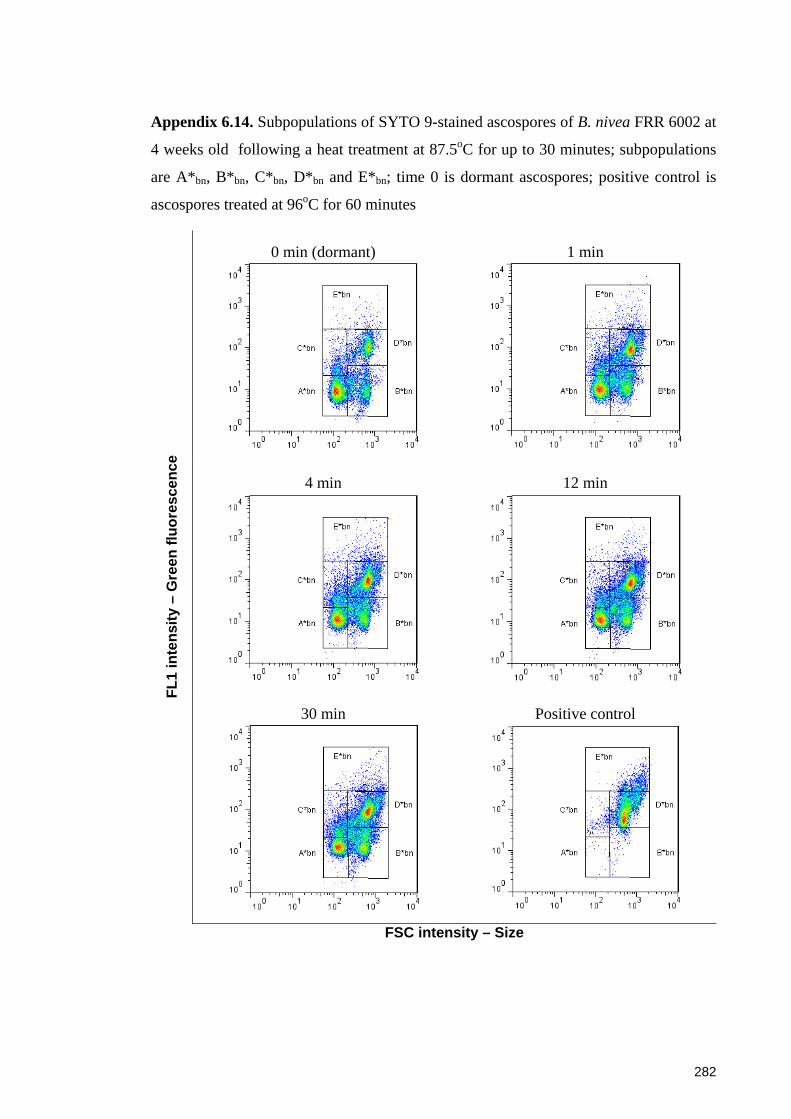
282
Appendix 6.14. Subpopulations of SYTO 9-stained ascospores of B. nivea FRR 6002 at
4 weeks old following a heat treatment at 87.5oC for up to 30 minutes; subpopulations
are A*bn, B*bn, C*bn, D*bn and E*bn; time 0 is dormant ascospores; positive control is
ascospores treated at 96oC for 60 minutes
FL1
inte
nsity
– G
reen
fluo
resc
ence
0 min (dormant)
1 min
4 min
12 min
30 min
Positive control
FSC intensity – Size
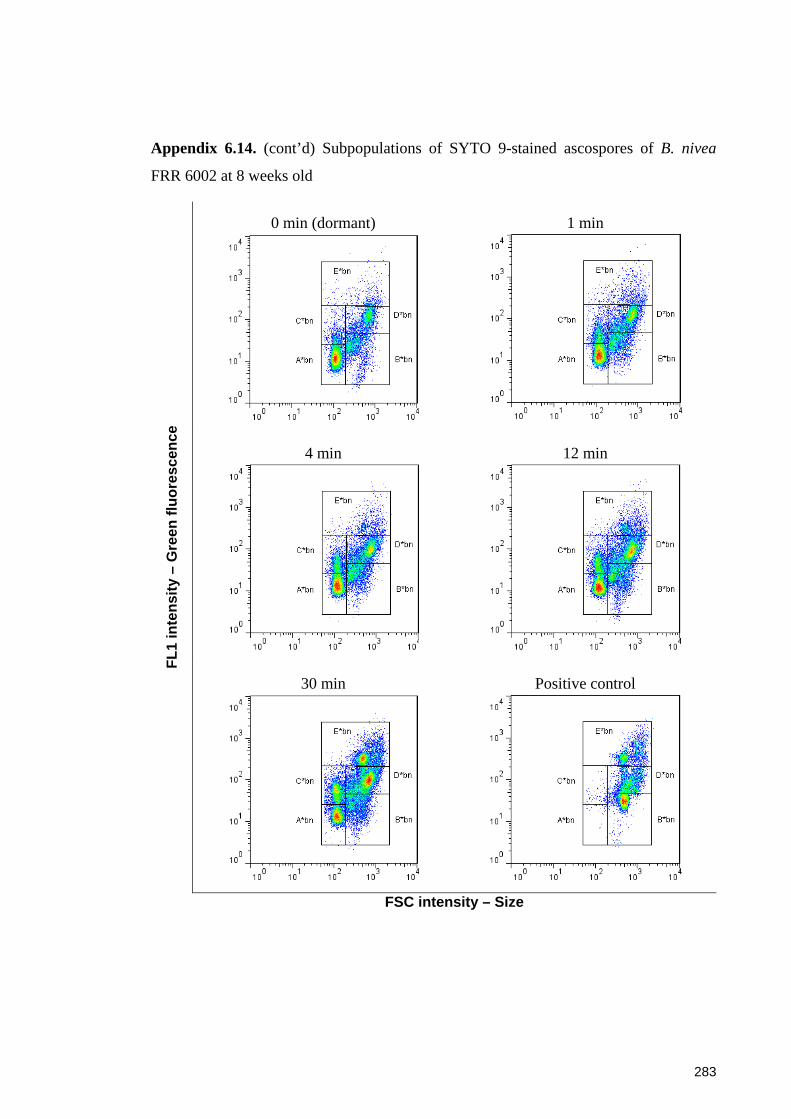
283
Appendix 6.14. (cont’d) Subpopulations of SYTO 9-stained ascospores of B. nivea
FRR 6002 at 8 weeks old FL
1 in
tens
ity –
Gre
en fl
uore
scen
ce
0 min (dormant)
1 min
4 min
12 min
30 min
Positive control
FSC intensity – Size
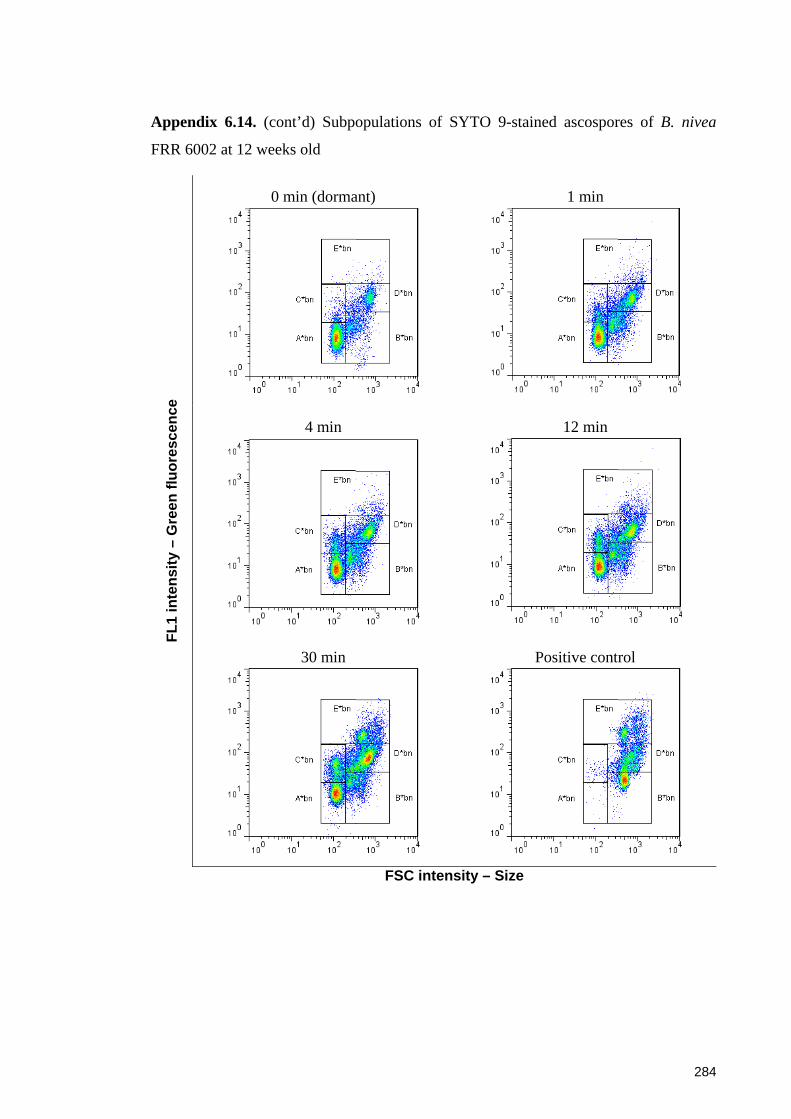
284
Appendix 6.14. (cont’d) Subpopulations of SYTO 9-stained ascospores of B. nivea
FRR 6002 at 12 weeks old FL
1 in
tens
ity –
Gre
en fl
uore
scen
ce
0 min (dormant)
1 min
4 min
12 min
30 min
Positive control
FSC intensity – Size
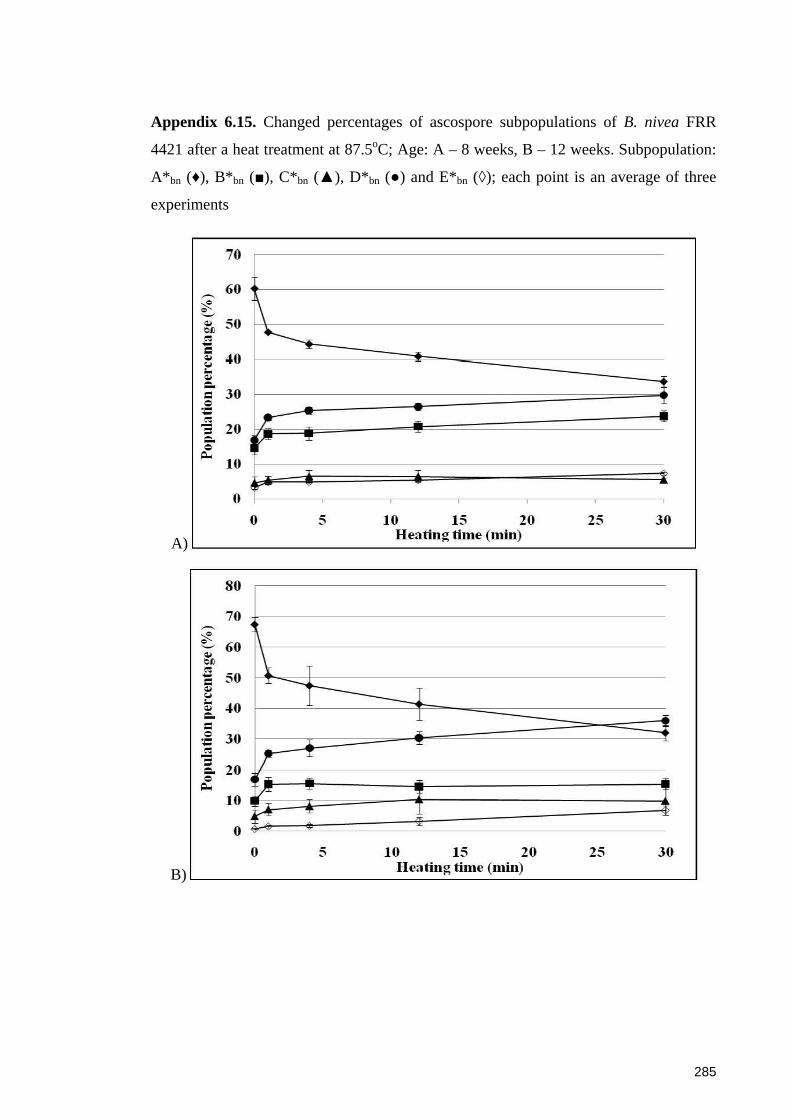
285
Appendix 6.15. Changed percentages of ascospore subpopulations of B. nivea FRR
4421 after a heat treatment at 87.5oC; Age: A – 8 weeks, B – 12 weeks. Subpopulation:
A*bn (♦), B*bn (■), C*bn (▲), D*bn (●) and E*bn (◊); each point is an average of three
experiments
A)
B)
70
60 -. ~ e ..._., ~ 50 I:)J)
,a = 40 ~ ~ .. ~ - 30 = Q
-.c ~ - 20 = c ~
10
\ ~
T
"! .I_
r- - - ---- ... ~r
~
i i 0
0 5 10 15 20 25 30 H eatin g time (m in)
80
70 -. ~ e 60 ..._., ~ I:)J)
.a 50 = ~ ~
t 40 Q.
= Q 30 -.c
\
~ _L ~ r-------r
1 .... -"' .... "' ~ -= 20 Q.
Q
~
r I
4
10
0 0 5 10 15 20 25 30
Hea ting time (min)

286
Appendix 6.16. Changed percentages of ascospore subpopulations of B. nivea FRR
6002 after a heat treatment at 87.5oC; Age: A – 8 weeks, B – 12 weeks. Subpopulation:
A*bn (♦), B*bn (■), C*bn (▲), D*bn (●) and E*bn (◊); each point is an average of three
experiments
A)
B)

287
Appendix 7.1. Standard curve of the Bradford assay (A); protein concentrations and
conductivity measurements of triplicate protein extracts (S1 – S3) from Byssochlamys
ascospores (B); shaded samples were subjected to buffer exchange and concentration
A)
y = 0.4777x + 0.6919R2 = 0.9923
0.6
0.7
0.8
0.9
1.0
1.1
1.2
0 0.2 0.4 0.6 0.8 1 1.2
Concentration (mg/mL)
Abso
rban
ce (a
bita
ry u
nit)
B)
Sample description Concentration (mg/mL) Conductivity (mS/cm) S1 S2 S3 S1 S2 S3
B. nivea FRR 6002, dormant, 4 weeks 2.90 4.81 3.10 0.64 0.65 0.63
B. nivea FRR 6002, dormant, 12 weeks 3.59 4.67 4.14 0.76 0.88 0.85
B. nivea FRR 6002, 4 weeks, 87.5oC, 1 min 4.28 4.33 4.20 0.79 0.64 0.82
B. nivea FRR 6002, 4 weeks, 87.5oC, 4 min 4.32 4.77 4.22 0.83 0.58 0.84
B. nivea FRR 6002, 4 weeks, 87.5oC, 30 min 4.56 4.36 4.08 0.91 0.64 0.98
B. fulva FRR 2299, dormant, 4 weeks 4.27 6.10 3.60 0.86 1.37 0.69
B. fulva FRR 2299, dormant, 12 weeks 3.23 3.10 2.25 0.62 0.7 0.65
B. fulva FRR 2299, 4 weeks, 90oC, 1 min 4.82 3.68 2.10 1.47 1.43 0.94
B. fulva FRR 2299, 4 weeks, 90oC, 4 min 5.74 3.73 1.55 1.29 1.44 1.02
B. fulva FRR 2299, 4 weeks, 90oC, 30 min 4.50 3.40 1.50 1.27 1.15 0.96
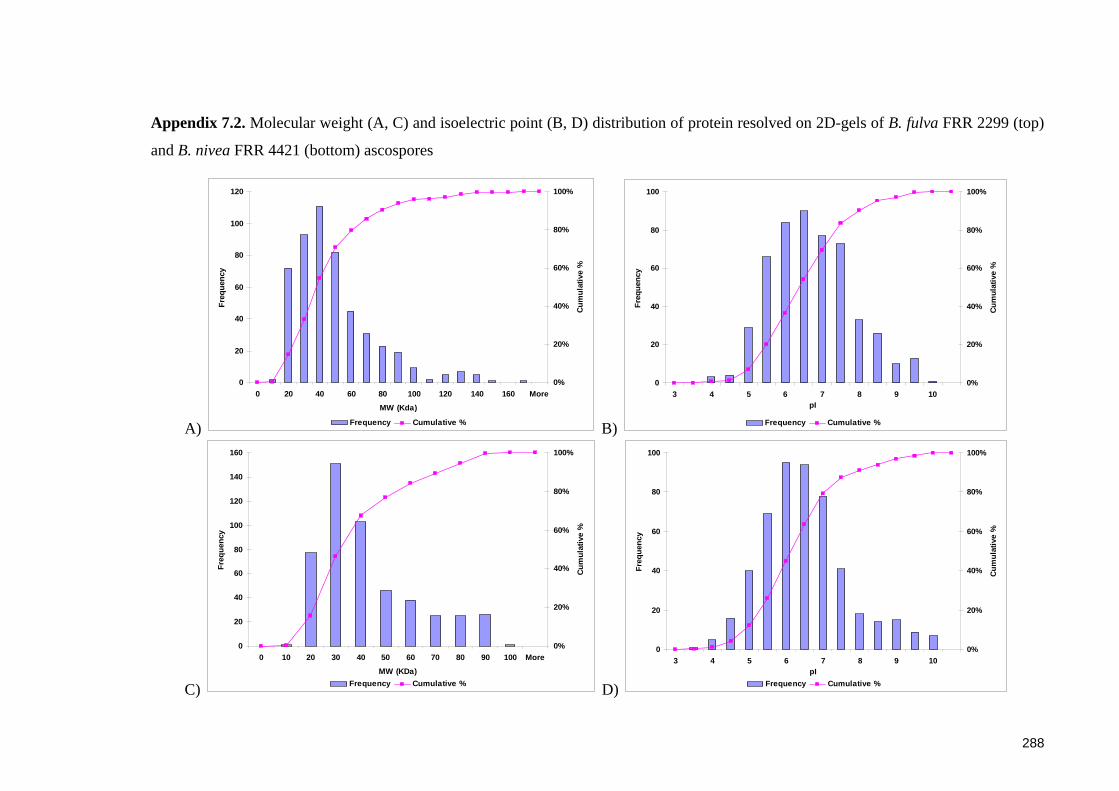
288
Appendix 7.2. Molecular weight (A, C) and isoelectric point (B, D) distribution of protein resolved on 2D-gels of B. fulva FRR 2299 (top)
and B. nivea FRR 4421 (bottom) ascospores
A)
0
20
40
60
80
100
120
0 20 40 60 80 100 120 140 160 More
MW (Kda)
Freq
uenc
y
0%
20%
40%
60%
80%
100%
Cum
ulat
ive
%
Frequency Cumulative % B)
0
20
40
60
80
100
3 4 5 6 7 8 9 10pI
Freq
uenc
y
0%
20%
40%
60%
80%
100%
Cum
ulat
ive
%
Frequency Cumulative %
C)
0
20
40
60
80
100
120
140
160
0 10 20 30 40 50 60 70 80 90 100 More
MW (KDa)
Freq
uenc
y
0%
20%
40%
60%
80%
100%
Cum
ulat
ive
%
Frequency Cumulative % D)
0
20
40
60
80
100
3 4 5 6 7 8 9 10pI
Freq
uenc
y0%
20%
40%
60%
80%
100%
Cum
ulat
ive
%
Frequency Cumulative %
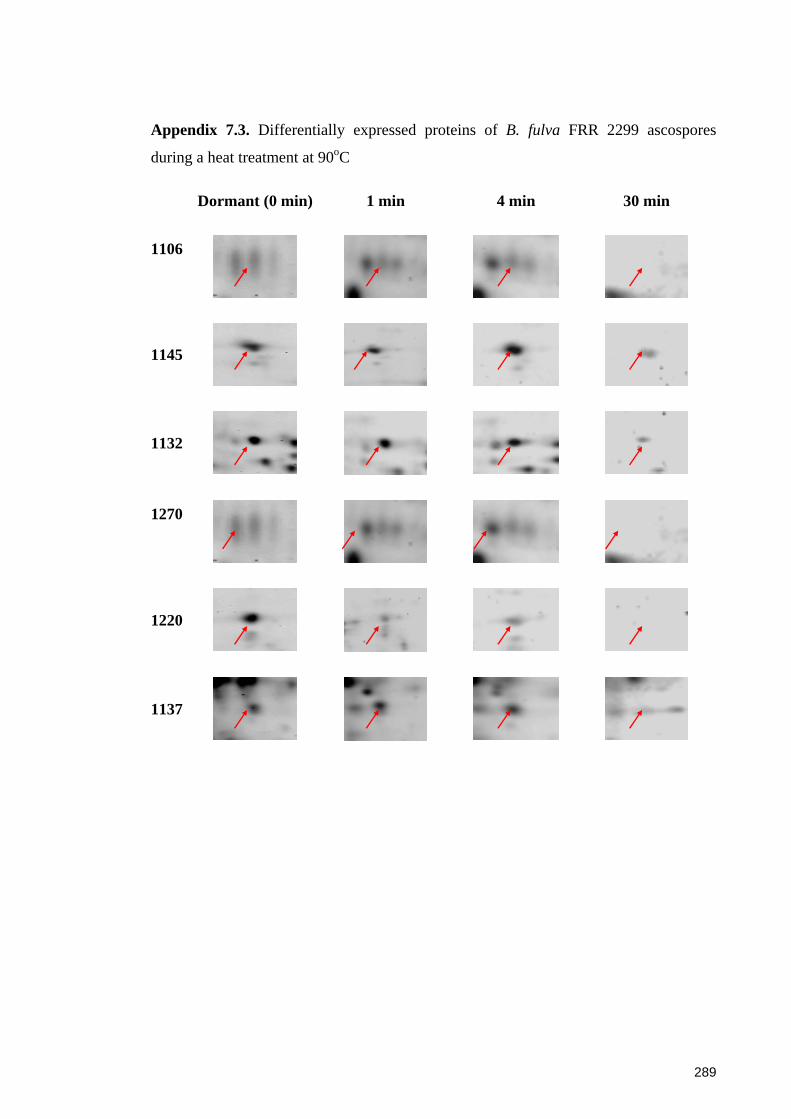
289
Appendix 7.3. Differentially expressed proteins of B. fulva FRR 2299 ascospores
during a heat treatment at 90oC
Dormant (0 min) 1 min 4 min 30 min
1106
1145
1132
1270
1220
1137
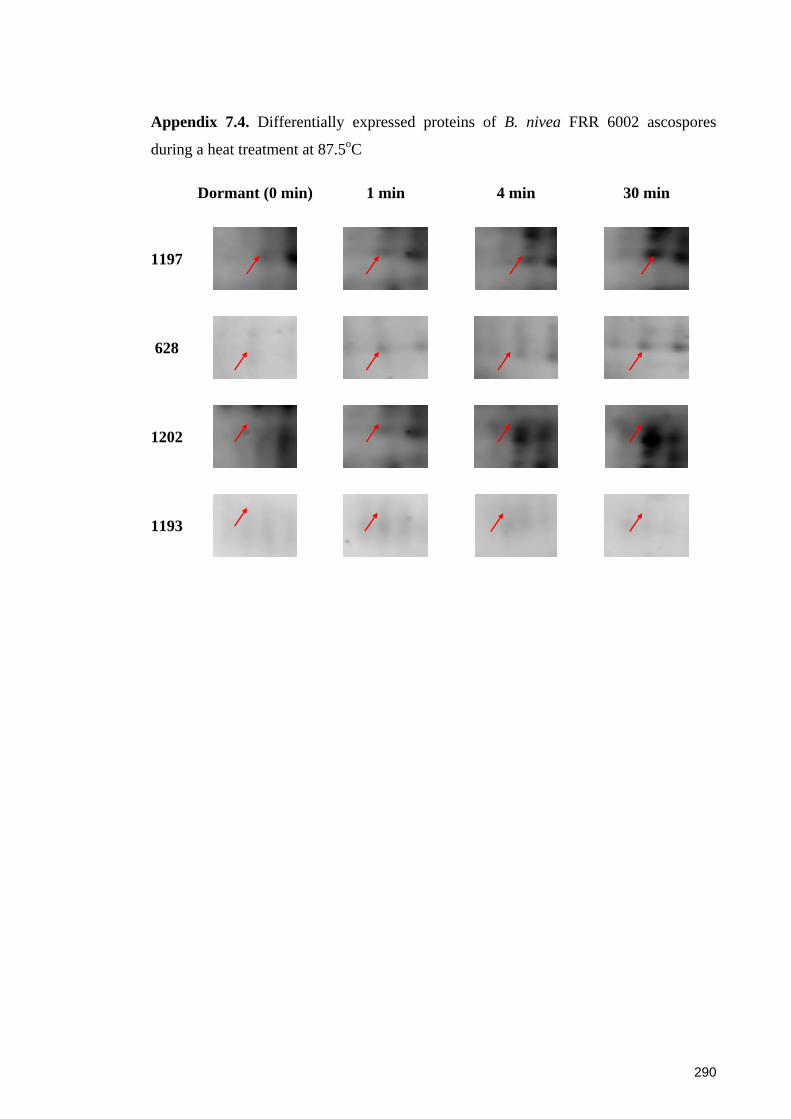
290
Appendix 7.4. Differentially expressed proteins of B. nivea FRR 6002 ascospores
during a heat treatment at 87.5oC
Dormant (0 min) 1 min 4 min 30 min
1197
628
1202
1193
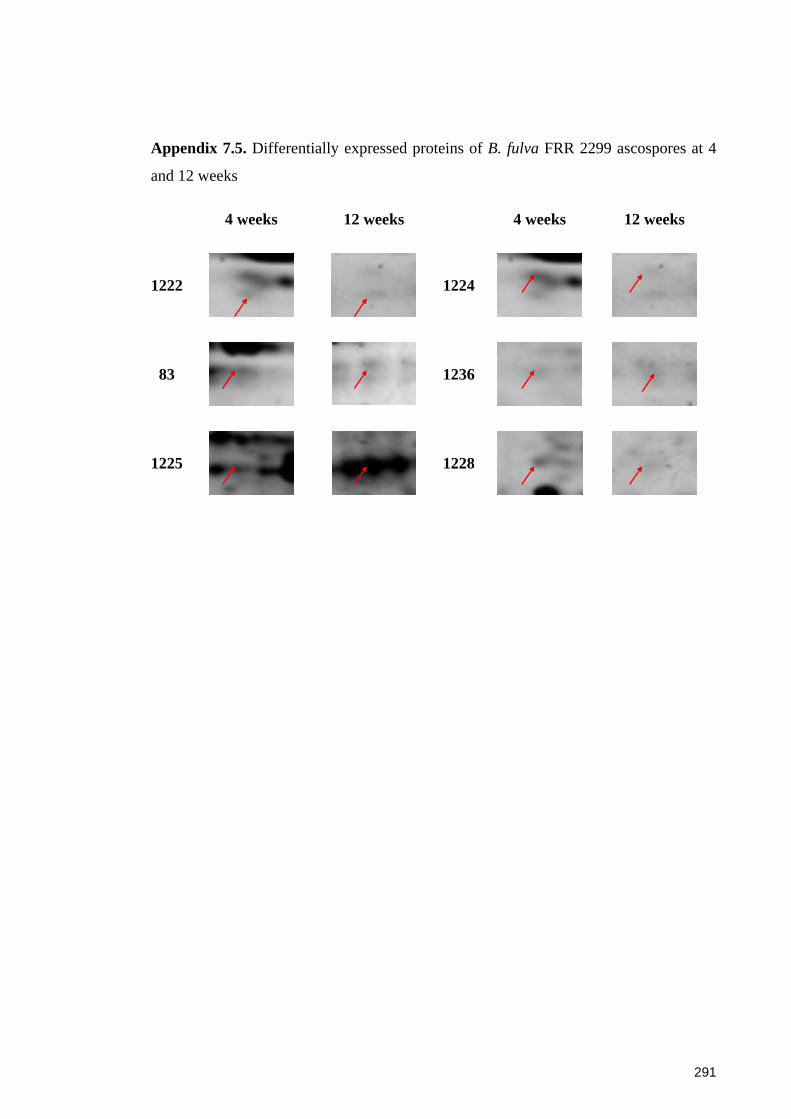
291
Appendix 7.5. Differentially expressed proteins of B. fulva FRR 2299 ascospores at 4
and 12 weeks
4 weeks 12 weeks 4 weeks 12 weeks
1222
1224
83
1236
1225
1228
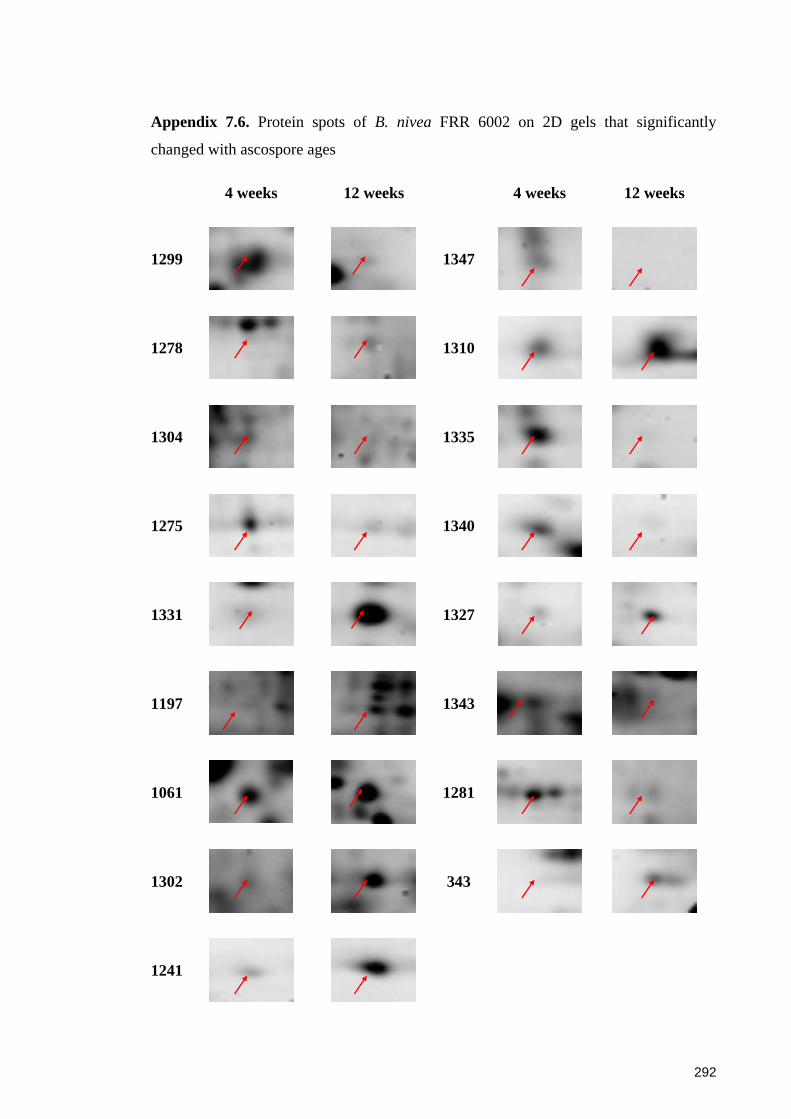
292
Appendix 7.6. Protein spots of B. nivea FRR 6002 on 2D gels that significantly
changed with ascospore ages
4 weeks 12 weeks 4 weeks 12 weeks
1299
1347
1278
1310
1304
1335
1275
1340
1331
1327
1197
1343
1061
1281
1302
343
1241

293
Appendix 7.7. Amino acid sequences of the matched proteins of Byssochlamys
ascospores; matched peptides between the searched proteins and the theoretical proteins
are in red
Spot NCBI code Peptide sequence
628 67522969
1 MHLISSLSLFLAFALSALAM TITSPKSTNQ KVDFSKPFTI RWTTVPSDPK
51 QFTITLVNMD GHNVDQDLAV DVDASEEEYT IDKIEDIPIA NNYQINFRST
101 EKNNMGILAQ SPRFNVTKVA EDEETAEPTA NATRTQSNMA PTETDANGAG
151 RAMGVFSGSV AMAGVMALAV FAL
1061 226283156
1 MVKAVVLGAS GGIGQPLSLL LKASPLVDEL ALYDVVNTPG VAADLSHIST
51 VATIKGYLPD NDGLKNALTG ADIIVIPAGI PRKPGMTRDD LFKVNAGIVQ
101 TLVKGIAEFS PKAFILVISN PVNSTVPIAA EVLKTAGVFD PKRLFGVTTL 151 DVVRAETFTQ EFTGQKDPSK ASIPVIGGHS GETIVPLFSQ AKPPVTIPAD
201 RYDSLVNRVQ FGGDEVVKAK DGAGSATLSM AYAGFRFAES VIKASKGEKG 251 IVEPTYIYLS GVDGGEAIKR EVGLDFFSIP VELGTSGAEK AHNILGGITE
301 QEKKLLEACT KGLKGNIEKG IEFAKNPPPK L
121703522
1 MVKAGKKRTD AYWIAVLGAS GGIGQPLSLL LKACPLVDEL ALYDVVNTPG
51 VAADLSHISS VAKITGYLPK DDGLKHALTG TDIVVIPAGI PRKPGMTRDD 101 LFKVNAGIVR DLVKGIAQYC PKAFVLIISN PVNSTVPIAA EILKNEGVFD
151 PKRLFGVTTL DVVRAETFTQ EYSGQKDPST VQIPVVGGHS GETIVPLFSK
201 ASPALNIPAD KYDALVNRVQ FGGDEVVKAK DGAGSATLSM AYAGFRFAES 251 VIKAAKGQSG IVEPTFVYLP GITGGDEIAK EAGADFFSTL VELGPNGAEK
301 AINILQGVTE QEKKLLEACI KGLKGNIEKG IDFIKNPPPK
1106 218720012
1 MKTASVLAAA ALVGAASAKV HKLKLDKVPL SEQFDKRSMN DHMRSLGQKY
51 MGVVPEGVYE DTSIRPEGGH DVLVDNFLNA QYFSEITIGT PPQNFKVVLD
101 TGSSNLWVPS ASCNSIACYL HNKYDSSSSS TYKKNGSEFA IQYGSGSLEG
151 FVSRDVVTIG DITIKDQDFA EATNEPGLAF AFGRFDGILG LGFDTISVNK
201 IVPPFYNMLN QKTLDEPVFA FYLGDSNKEG DNSEATFGGI DKSHYTGELV 251 KIPLRRKAYW EVDFDAVAFG DNVAELENTG VILDTGTSLI ALPSTLAELL
301 NKEIGASKSW NGQYTVDCTK RDSLPDLTVT LSGHNFSITA HDYVLEVQGS
1132 145237054
1 MTVTDLVNHP AQGISYFTPA QNIPAGTAAN PQSSGKPVPK LFHPLTVRGV
51 TFQNRLGLAP LCQYSAQDGH MTPYHIAHLG GIAQRGPGLM MIEATAVQAE 101 GRITPQDVGL WKDSQIGPMR QVVEFAHSQN QKIGVQLAHA GRKASTVAPW
151 ISATAMATEE LGGWPDRVIG PSDIPFADTF PKPKAMTKDD IVQFKNDWAA
201 AVKRALEVGV DFIEIHGAHG YLISSFLSPA ANNRTDEYGG SFENRIRLPL 251 EIAQITRDIV GPNVPVFLRV SASDWLEETL PEQSWGTEDT VKFAKALADQ 301 GAIDLIDIST GGVHAAQKVK SGPLFQAPFA VAVKQAVGDK LLVSAVGAIT
351 NGRQANDLLE KEGLDVALVG RGFQKDPGLT WTFAQHLDTE ISMASQIRWG
401 FTRRGGREYI DPSVYKPSIF DA
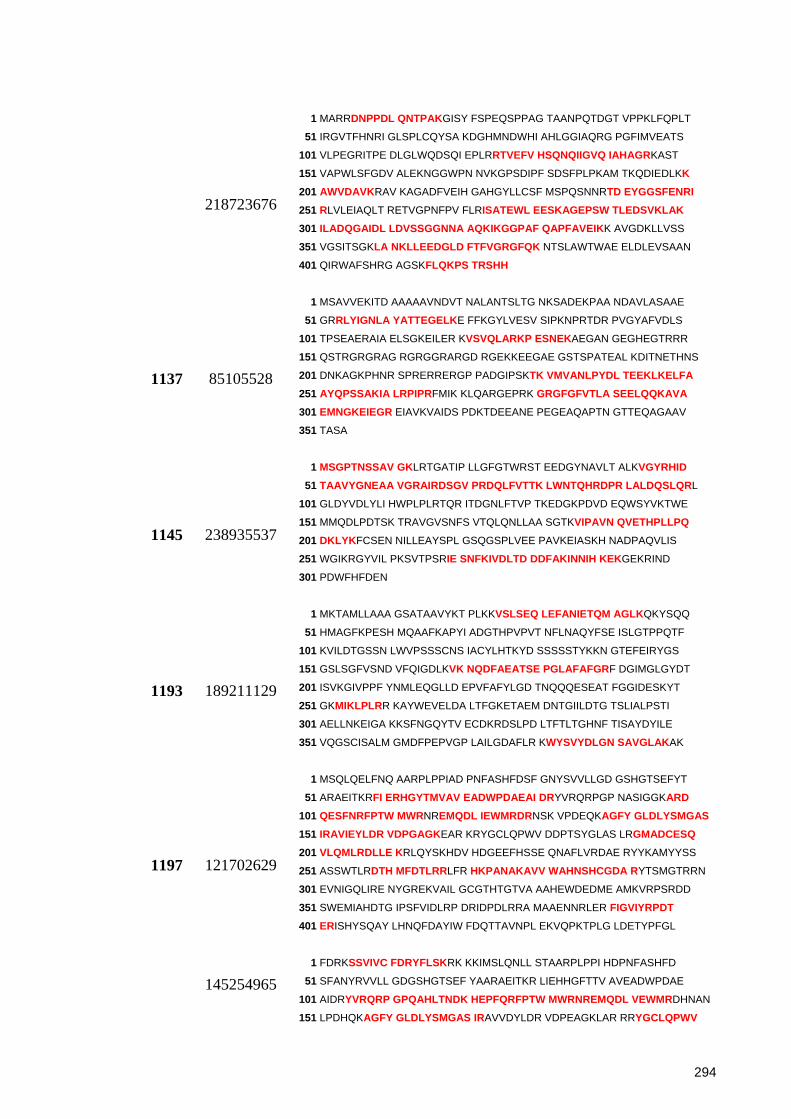
294
218723676
1 MARRDNPPDL QNTPAKGISY FSPEQSPPAG TAANPQTDGT VPPKLFQPLT
51 IRGVTFHNRI GLSPLCQYSA KDGHMNDWHI AHLGGIAQRG PGFIMVEATS
101 VLPEGRITPE DLGLWQDSQI EPLRRTVEFV HSQNQIIGVQ IAHAGRKAST
151 VAPWLSFGDV ALEKNGGWPN NVKGPSDIPF SDSFPLPKAM TKQDIEDLKK 201 AWVDAVKRAV KAGADFVEIH GAHGYLLCSF MSPQSNNRTD EYGGSFENRI 251 RLVLEIAQLT RETVGPNFPV FLRISATEWL EESKAGEPSW TLEDSVKLAK 301 ILADQGAIDL LDVSSGGNNA AQKIKGGPAF QAPFAVEIKK AVGDKLLVSS
351 VGSITSGKLA NKLLEEDGLD FTFVGRGFQK NTSLAWTWAE ELDLEVSAAN
401 QIRWAFSHRG AGSKFLQKPS TRSHH
1137 85105528
1 MSAVVEKITD AAAAAVNDVT NALANTSLTG NKSADEKPAA NDAVLASAAE
51 GRRLYIGNLA YATTEGELKE FFKGYLVESV SIPKNPRTDR PVGYAFVDLS
101 TPSEAERAIA ELSGKEILER KVSVQLARKP ESNEKAEGAN GEGHEGTRRR
151 QSTRGRGRAG RGRGGRARGD RGEKKEEGAE GSTSPATEAL KDITNETHNS
201 DNKAGKPHNR SPRERRERGP PADGIPSKTK VMVANLPYDL TEEKLKELFA 251 AYQPSSAKIA LRPIPRFMIK KLQARGEPRK GRGFGFVTLA SEELQQKAVA 301 EMNGKEIEGR EIAVKVAIDS PDKTDEEANE PEGEAQAPTN GTTEQAGAAV
351 TASA
1145 238935537
1 MSGPTNSSAV GKLRTGATIP LLGFGTWRST EEDGYNAVLT ALKVGYRHID 51 TAAVYGNEAA VGRAIRDSGV PRDQLFVTTK LWNTQHRDPR LALDQSLQRL
101 GLDYVDLYLI HWPLPLRTQR ITDGNLFTVP TKEDGKPDVD EQWSYVKTWE
151 MMQDLPDTSK TRAVGVSNFS VTQLQNLLAA SGTKVIPAVN QVETHPLLPQ 201 DKLYKFCSEN NILLEAYSPL GSQGSPLVEE PAVKEIASKH NADPAQVLIS
251 WGIKRGYVIL PKSVTPSRIE SNFKIVDLTD DDFAKINNIH KEKGEKRIND
301 PDWFHFDEN
1193 189211129
1 MKTAMLLAAA GSATAAVYKT PLKKVSLSEQ LEFANIETQM AGLKQKYSQQ
51 HMAGFKPESH MQAAFKAPYI ADGTHPVPVT NFLNAQYFSE ISLGTPPQTF
101 KVILDTGSSN LWVPSSSCNS IACYLHTKYD SSSSSTYKKN GTEFEIRYGS
151 GSLSGFVSND VFQIGDLKVK NQDFAEATSE PGLAFAFGRF DGIMGLGYDT
201 ISVKGIVPPF YNMLEQGLLD EPVFAFYLGD TNQQQESEAT FGGIDESKYT
251 GKMIKLPLRR KAYWEVELDA LTFGKETAEM DNTGIILDTG TSLIALPSTI
301 AELLNKEIGA KKSFNGQYTV ECDKRDSLPD LTFTLTGHNF TISAYDYILE
351 VQGSCISALM GMDFPEPVGP LAILGDAFLR KWYSVYDLGN SAVGLAKAK
1197 121702629
1 MSQLQELFNQ AARPLPPIAD PNFASHFDSF GNYSVVLLGD GSHGTSEFYT
51 ARAEITKRFI ERHGYTMVAV EADWPDAEAI DRYVRQRPGP NASIGGKARD 101 QESFNRFPTW MWRNREMQDL IEWMRDRNSK VPDEQKAGFY GLDLYSMGAS 151 IRAVIEYLDR VDPGAGKEAR KRYGCLQPWV DDPTSYGLAS LRGMADCESQ 201 VLQMLRDLLE KRLQYSKHDV HDGEEFHSSE QNAFLVRDAE RYYKAMYYSS
251 ASSWTLRDTH MFDTLRRLFR HKPANAKAVV WAHNSHCGDA RYTSMGTRRN
301 EVNIGQLIRE NYGREKVAIL GCGTHTGTVA AAHEWDEDME AMKVRPSRDD
351 SWEMIAHDTG IPSFVIDLRP DRIDPDLRRA MAAENNRLER FIGVIYRPDT 401 ERISHYSQAY LHNQFDAYIW FDQTTAVNPL EKVQPKTPLG LDETYPFGL
145254965
1 FDRKSSVIVC FDRYFLSKRK KKIMSLQNLL STAARPLPPI HDPNFASHFD
51 SFANYRVVLL GDGSHGTSEF YAARAEITKR LIEHHGFTTV AVEADWPDAE
101 AIDRYVRQRP GPQAHLTNDK HEPFQRFPTW MWRNREMQDL VEWMRDHNAN
151 LPDHQKAGFY GLDLYSMGAS IRAVVDYLDR VDPEAGKLAR RRYGCLQPWV
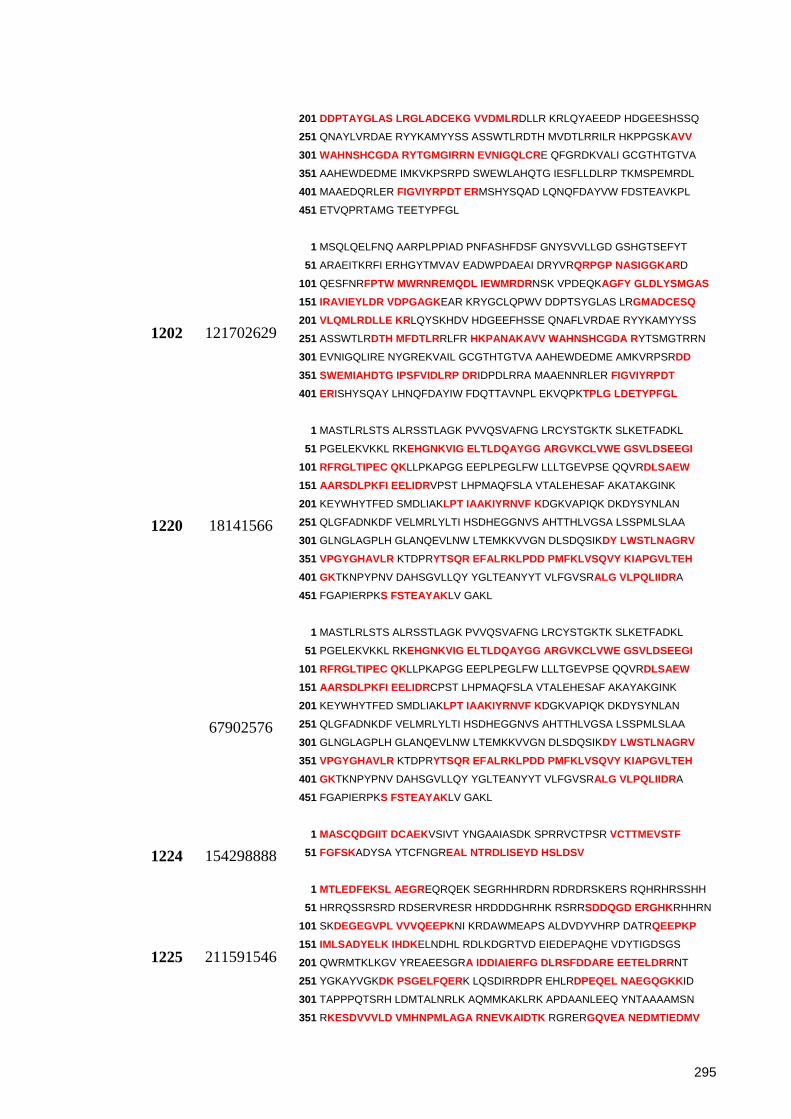
295
201 DDPTAYGLAS LRGLADCEKG VVDMLRDLLR KRLQYAEEDP HDGEESHSSQ
251 QNAYLVRDAE RYYKAMYYSS ASSWTLRDTH MVDTLRRILR HKPPGSKAVV 301 WAHNSHCGDA RYTGMGIRRN EVNIGQLCRE QFGRDKVALI GCGTHTGTVA
351 AAHEWDEDME IMKVKPSRPD SWEWLAHQTG IESFLLDLRP TKMSPEMRDL
401 MAAEDQRLER FIGVIYRPDT ERMSHYSQAD LQNQFDAYVW FDSTEAVKPL
451 ETVQPRTAMG TEETYPFGL
1202 121702629
1 MSQLQELFNQ AARPLPPIAD PNFASHFDSF GNYSVVLLGD GSHGTSEFYT
51 ARAEITKRFI ERHGYTMVAV EADWPDAEAI DRYVRQRPGP NASIGGKARD
101 QESFNRFPTW MWRNREMQDL IEWMRDRNSK VPDEQKAGFY GLDLYSMGAS 151 IRAVIEYLDR VDPGAGKEAR KRYGCLQPWV DDPTSYGLAS LRGMADCESQ 201 VLQMLRDLLE KRLQYSKHDV HDGEEFHSSE QNAFLVRDAE RYYKAMYYSS
251 ASSWTLRDTH MFDTLRRLFR HKPANAKAVV WAHNSHCGDA RYTSMGTRRN
301 EVNIGQLIRE NYGREKVAIL GCGTHTGTVA AAHEWDEDME AMKVRPSRDD 351 SWEMIAHDTG IPSFVIDLRP DRIDPDLRRA MAAENNRLER FIGVIYRPDT 401 ERISHYSQAY LHNQFDAYIW FDQTTAVNPL EKVQPKTPLG LDETYPFGL
1220 18141566
1 MASTLRLSTS ALRSSTLAGK PVVQSVAFNG LRCYSTGKTK SLKETFADKL
51 PGELEKVKKL RKEHGNKVIG ELTLDQAYGG ARGVKCLVWE GSVLDSEEGI 101 RFRGLTIPEC QKLLPKAPGG EEPLPEGLFW LLLTGEVPSE QQVRDLSAEW 151 AARSDLPKFI EELIDRVPST LHPMAQFSLA VTALEHESAF AKATAKGINK
201 KEYWHYTFED SMDLIAKLPT IAAKIYRNVF KDGKVAPIQK DKDYSYNLAN
251 QLGFADNKDF VELMRLYLTI HSDHEGGNVS AHTTHLVGSA LSSPMLSLAA
301 GLNGLAGPLH GLANQEVLNW LTEMKKVVGN DLSDQSIKDY LWSTLNAGRV 351 VPGYGHAVLR KTDPRYTSQR EFALRKLPDD PMFKLVSQVY KIAPGVLTEH 401 GKTKNPYPNV DAHSGVLLQY YGLTEANYYT VLFGVSRALG VLPQLIIDRA
451 FGAPIERPKS FSTEAYAKLV GAKL
67902576
1 MASTLRLSTS ALRSSTLAGK PVVQSVAFNG LRCYSTGKTK SLKETFADKL
51 PGELEKVKKL RKEHGNKVIG ELTLDQAYGG ARGVKCLVWE GSVLDSEEGI 101 RFRGLTIPEC QKLLPKAPGG EEPLPEGLFW LLLTGEVPSE QQVRDLSAEW 151 AARSDLPKFI EELIDRCPST LHPMAQFSLA VTALEHESAF AKAYAKGINK
201 KEYWHYTFED SMDLIAKLPT IAAKIYRNVF KDGKVAPIQK DKDYSYNLAN
251 QLGFADNKDF VELMRLYLTI HSDHEGGNVS AHTTHLVGSA LSSPMLSLAA
301 GLNGLAGPLH GLANQEVLNW LTEMKKVVGN DLSDQSIKDY LWSTLNAGRV 351 VPGYGHAVLR KTDPRYTSQR EFALRKLPDD PMFKLVSQVY KIAPGVLTEH 401 GKTKNPYPNV DAHSGVLLQY YGLTEANYYT VLFGVSRALG VLPQLIIDRA
451 FGAPIERPKS FSTEAYAKLV GAKL
1224 154298888 1 MASCQDGIIT DCAEKVSIVT YNGAAIASDK SPRRVCTPSR VCTTMEVSTF 51 FGFSKADYSA YTCFNGREAL NTRDLISEYD HSLDSV
1225 211591546
1 MTLEDFEKSL AEGREQRQEK SEGRHHRDRN RDRDRSKERS RQHRHRSSHH
51 HRRQSSRSRD RDSERVRESR HRDDDGHRHK RSRRSDDQGD ERGHKRHHRN
101 SKDEGEGVPL VVVQEEPKNI KRDAWMEAPS ALDVDYVHRP DATRQEEPKP 151 IMLSADYELK IHDKELNDHL RDLKDGRTVD EIEDEPAQHE VDYTIGDSGS
201 QWRMTKLKGV YREAEESGRA IDDIAIERFG DLRSFDDARE EETELDRRNT
251 YGKAYVGKDK PSGELFQERK LQSDIRRDPR EHLRDPEQEL NAEGQGKKID
301 TAPPPQTSRH LDMTALNRLK AQMMKAKLRK APDAANLEEQ YNTAAAAMSN
351 RKESDVVVLD VMHNPMLAGA RNEVKAIDTK RGRERGQVEA NEDMTIEDMV

296
401 REERKTRGQP GGEGRRLADQ IGRDAKFENR LEYMDDNASK LAKRVHRSEI 451 DLKNSTINDF HKMNRILDSC PLCHNEDKGT PPLAPVVSLA TRVFLTLPTE
501 PEVSEGGATI VPTQHRTNLM ECDDDEWEEI RNFMKSLTRM YHDQGRDVIF
551 YENAAQPERK RHASMEVVPL PYSLGETSPA FFKEAILSAE SEWSQHRKLI 601 DTLAKSKQGL GRSAFRRTLV KEMPYFHVWF ELDGGLGHIV EDSHRWPRGD 651 LFAREIIGGM LDIAPDVIKR QGRWNRGDRR VEGFRKRWKK FDWTRILVEG
1241 115400267
1 MSSSLEQLKA TGTVVVCDSA IGKYKPQDAT TNPSLILAAS KKPEYAALID
51 AAVAYGKQHG KTVDEQVDAT LDRLLVEFGK EILKIIPGKV STEVDARFSF 101 DTQASIDKAL HIIKLYEEIG IPKDRILIKI ASTWEGIKAA QVLQSQHGIN
151 CNLTLMFSTV QAIAAAEAGA YLISPFVGRI LDWYKAAHKR DYTAQEDPGV
201 KSVQAIFNYY KKYGYKTIVM GASFRNTGEI TELAGCDYLT ISPNLLEDLY
251 NSTAAVPKKL DAAAAASQDI PKRSYINDEA LFRFDFNEEA MAVEKLREGI 301 SKFAADAVTL KDLLKQKIQA
39970315
1 MSNSLDQLKS SGTTVVCDSG DFATIGKYKP QDATTNPSLI LAASKKAEYA
51 KLIDDAIAYA KKQGGSVDDQ VDASLDRLLV EFGKEILKII PGKVSTEVDA 101 RFSFDTKASV DKALHIIKLY EAEGISKDRV LIKIASTWEG IKAAEILQRD
151 HGINCNLTLM FSLVQAIAAA EADAFLISPF VGRILDWYKA AHKKEYKKEE
201 DPGVESVKNI FNYYKKFGYK TIVMGASFRN TGEITELAGC DYLTISPNLL
251 EELLNSSEAV PKKLDAQGAA ALDIQKKTYI SDEPLFRFDF NEDQMAVEKL 301 REGISKFAAD ADTLKGILKE KIQA
1270 530795
1 MKSASLLTAS VLLGCASAEV HKLKLNKVPL EEQLYTHNID AHVRALGQKY
51 MGIRPSIHKE LVEENPINDM SRHDVLVDNF LNAQYFSEIE LGTPPQKFKV
101 VLDTGSSNLW VPSSECSSIA CYLHNKYDSS ASSTYHKNGS EFAIKYGSGS
151 LSGFVSQDTL KIGDLKVKGQ DFAEATNEPG LAFAFGRFDG ILGLGYDTIS 201 VNKIVPPFYN MLDQGLLDEP VFAFYLGDTN KEGDESVATF GGVDKDHYTG
251 ELIKIPLRRK AYWEVELDAI ALGDDVAEME NTGVILDTGT SLIALPADLA
301 EMINAQIGAK KGWTGQYTVD CDKRSSLPDV TFTLAGHNFT ISSYDYTLEV
351 QGSCVSAFMG MDFPEPVGPL AILGDAFLRK WYSVYDLGNS AVGLAKAK
145232965
1 MKSASLLTAS VLLGCASAEV HKLKLNKVPL EEQLYTHNID AHVRALGQKY
51 MGIRPSIHKE LVEENPINDM SRHDVLVDNF LNAQYFSEIE LGTPPQKFKV
101 VLDTGSSNLW VPSSECSSIA CYLHNKYDSS ASSTYHKNGS EFAIKYGSGS
151 LSGFISQDTL KIGDLKVKGQ DFAEATNEPG LAFAFGRFDG ILGLGYDTIS 201 VNKIVPPFYN MLDQGLLDEP VFAFYLGDTN KEGDESVATF GGVDKDHYTG
251 ELIKIPLRRK AYWEVELDAI ALGDDVAEME NTGVILDTGT SLIALPADLA
301 EMINAQIGAK KGWTGQYTVD CDKRSSLPDV TFTLAGHNFT ISSYDYTLEV
351 QGSCVSAFMG MDFPEPVGPL AILGDAFLRK WYSVYDLGNS AVGLAKAK
1281 115443330
1 MQRALSSRTS VLSAASKRAP FYRSTGLNLQ QQRFAHKELK FGVEARAQLL
51 KGVDTLAKAV TSTLGPKGRN VLIESPYGSP KITKDGVTVA KAIQLQDKFE
101 NLGARLLQDV ASKTNELAGD GTTTATVLAR AIFSETVKNV AAGCNPMDLR 151 RGIQAAVDAV VDYLQQNKRD ITTGEEIAQV ATISANGDTH VGKLISTAME
201 RVGKEGVITV KEGKTLEDEL EVTEGMRFDR GYTSPYFITD PKAQKVEFEK 251 PLILLSEKKI SAVQDIIPAL EASTTLRRPL VIIAEDIEGE ALAVCILNKL
301 RGQLQVAAVK APGFGDNRKS ILGDLAVLTN GTVFTDELDI KLEKLTPDML 351 GSTGAITITK EDTIILNGEG SKDSIAQRCE QIRGVMADPT TSEYEKEKLQ
401 ERLAKLSGGV AVIKVGGASE VEVGEKKDRV VDALNATRAA VEEGILPGGG
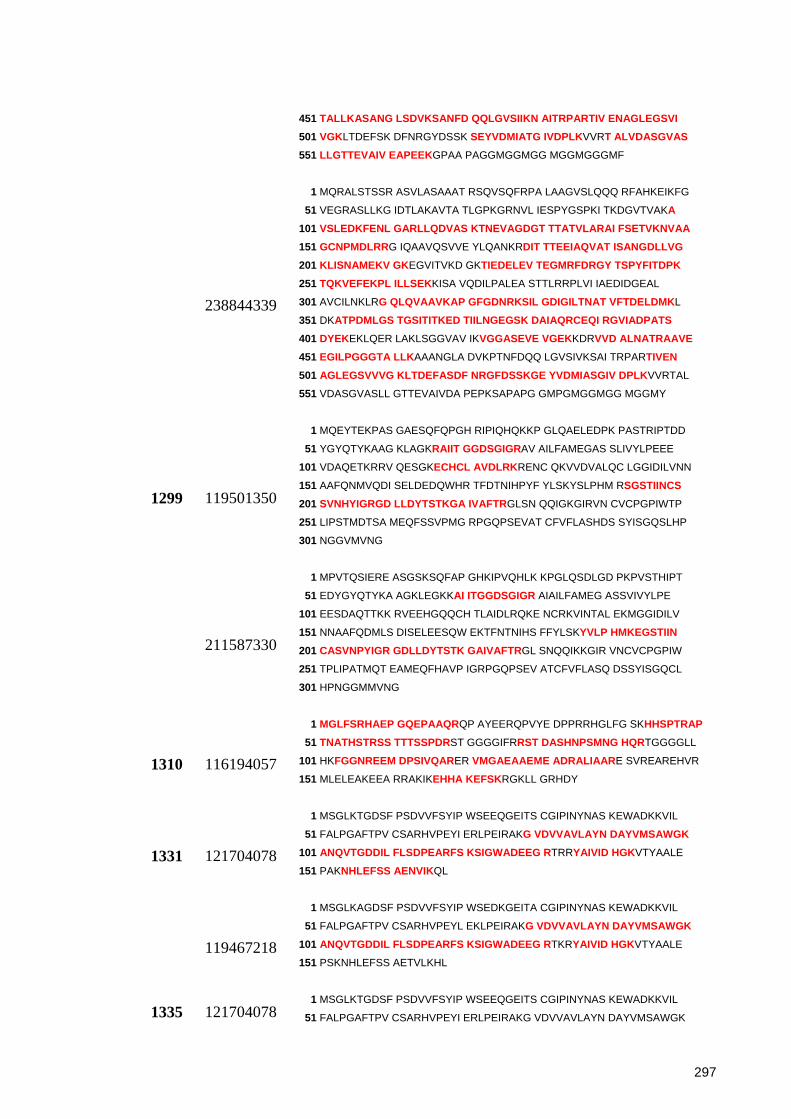
297
451 TALLKASANG LSDVKSANFD QQLGVSIIKN AITRPARTIV ENAGLEGSVI 501 VGKLTDEFSK DFNRGYDSSK SEYVDMIATG IVDPLKVVRT ALVDASGVAS 551 LLGTTEVAIV EAPEEKGPAA PAGGMGGMGG MGGMGGGMF
238844339
1 MQRALSTSSR ASVLASAAAT RSQVSQFRPA LAAGVSLQQQ RFAHKEIKFG
51 VEGRASLLKG IDTLAKAVTA TLGPKGRNVL IESPYGSPKI TKDGVTVAKA 101 VSLEDKFENL GARLLQDVAS KTNEVAGDGT TTATVLARAI FSETVKNVAA 151 GCNPMDLRRG IQAAVQSVVE YLQANKRDIT TTEEIAQVAT ISANGDLLVG 201 KLISNAMEKV GKEGVITVKD GKTIEDELEV TEGMRFDRGY TSPYFITDPK 251 TQKVEFEKPL ILLSEKKISA VQDILPALEA STTLRRPLVI IAEDIDGEAL
301 AVCILNKLRG QLQVAAVKAP GFGDNRKSIL GDIGILTNAT VFTDELDMKL
351 DKATPDMLGS TGSITITKED TIILNGEGSK DAIAQRCEQI RGVIADPATS 401 DYEKEKLQER LAKLSGGVAV IKVGGASEVE VGEKKDRVVD ALNATRAAVE 451 EGILPGGGTA LLKAAANGLA DVKPTNFDQQ LGVSIVKSAI TRPARTIVEN 501 AGLEGSVVVG KLTDEFASDF NRGFDSSKGE YVDMIASGIV DPLKVVRTAL
551 VDASGVASLL GTTEVAIVDA PEPKSAPAPG GMPGMGGMGG MGGMY
1299 119501350
1 MQEYTEKPAS GAESQFQPGH RIPIQHQKKP GLQAELEDPK PASTRIPTDD
51 YGYQTYKAAG KLAGKRAIIT GGDSGIGRAV AILFAMEGAS SLIVYLPEEE
101 VDAQETKRRV QESGKECHCL AVDLRKRENC QKVVDVALQC LGGIDILVNN
151 AAFQNMVQDI SELDEDQWHR TFDTNIHPYF YLSKYSLPHM RSGSTIINCS 201 SVNHYIGRGD LLDYTSTKGA IVAFTRGLSN QQIGKGIRVN CVCPGPIWTP
251 LIPSTMDTSA MEQFSSVPMG RPGQPSEVAT CFVFLASHDS SYISGQSLHP
301 NGGVMVNG
211587330
1 MPVTQSIERE ASGSKSQFAP GHKIPVQHLK KPGLQSDLGD PKPVSTHIPT
51 EDYGYQTYKA AGKLEGKKAI ITGGDSGIGR AIAILFAMEG ASSVIVYLPE
101 EESDAQTTKK RVEEHGQQCH TLAIDLRQKE NCRKVINTAL EKMGGIDILV
151 NNAAFQDMLS DISELEESQW EKTFNTNIHS FFYLSKYVLP HMKEGSTIIN 201 CASVNPYIGR GDLLDYTSTK GAIVAFTRGL SNQQIKKGIR VNCVCPGPIW
251 TPLIPATMQT EAMEQFHAVP IGRPGQPSEV ATCFVFLASQ DSSYISGQCL
301 HPNGGMMVNG
1310 116194057
1 MGLFSRHAEP GQEPAAQRQP AYEERQPVYE DPPRRHGLFG SKHHSPTRAP 51 TNATHSTRSS TTTSSPDRST GGGGIFRRST DASHNPSMNG HQRTGGGGLL
101 HKFGGNREEM DPSIVQARER VMGAEAAEME ADRALIAARE SVREAREHVR
151 MLELEAKEEA RRAKIKEHHA KEFSKRGKLL GRHDY
1331 121704078
1 MSGLKTGDSF PSDVVFSYIP WSEEQGEITS CGIPINYNAS KEWADKKVIL
51 FALPGAFTPV CSARHVPEYI ERLPEIRAKG VDVVAVLAYN DAYVMSAWGK 101 ANQVTGDDIL FLSDPEARFS KSIGWADEEG RTRRYAIVID HGKVTYAALE
151 PAKNHLEFSS AENVIKQL
119467218
1 MSGLKAGDSF PSDVVFSYIP WSEDKGEITA CGIPINYNAS KEWADKKVIL
51 FALPGAFTPV CSARHVPEYL EKLPEIRAKG VDVVAVLAYN DAYVMSAWGK 101 ANQVTGDDIL FLSDPEARFS KSIGWADEEG RTKRYAIVID HGKVTYAALE
151 PSKNHLEFSS AETVLKHL
1335 121704078 1 MSGLKTGDSF PSDVVFSYIP WSEEQGEITS CGIPINYNAS KEWADKKVIL
51 FALPGAFTPV CSARHVPEYI ERLPEIRAKG VDVVAVLAYN DAYVMSAWGK
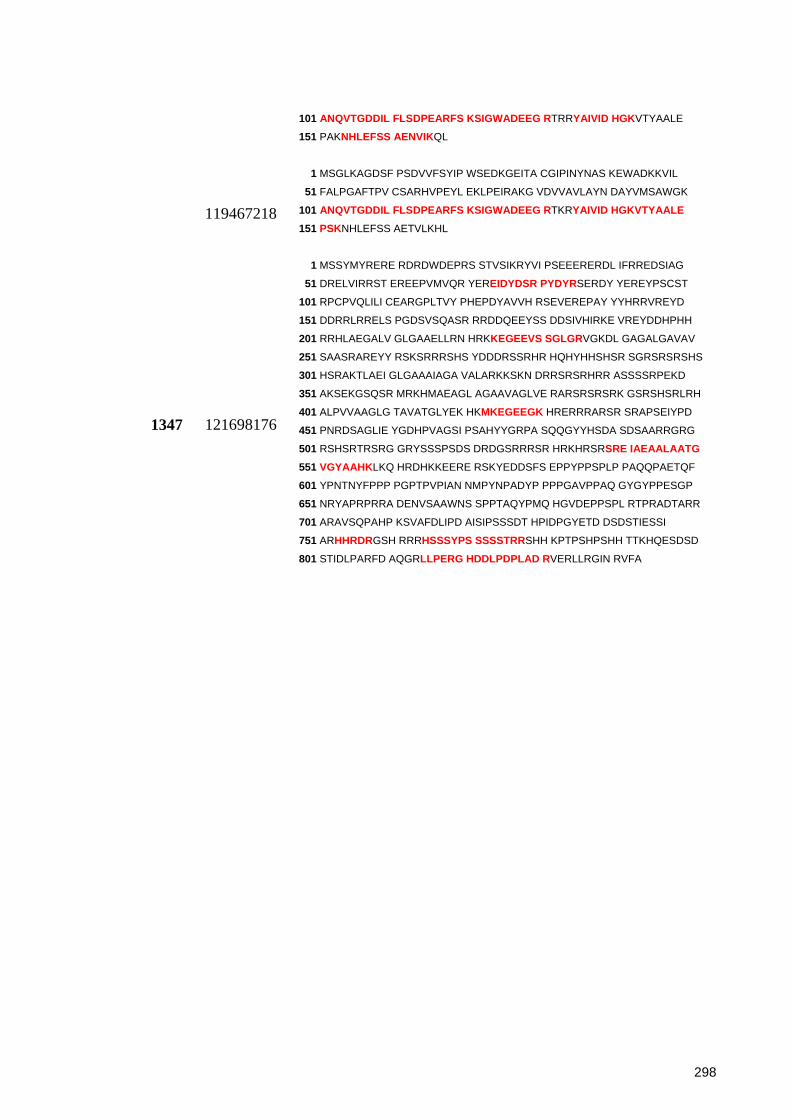
298
101 ANQVTGDDIL FLSDPEARFS KSIGWADEEG RTRRYAIVID HGKVTYAALE
151 PAKNHLEFSS AENVIKQL
119467218
1 MSGLKAGDSF PSDVVFSYIP WSEDKGEITA CGIPINYNAS KEWADKKVIL
51 FALPGAFTPV CSARHVPEYL EKLPEIRAKG VDVVAVLAYN DAYVMSAWGK
101 ANQVTGDDIL FLSDPEARFS KSIGWADEEG RTKRYAIVID HGKVTYAALE 151 PSKNHLEFSS AETVLKHL
1347 121698176
1 MSSYMYRERE RDRDWDEPRS STVSIKRYVI PSEEERERDL IFRREDSIAG
51 DRELVIRRST EREEPVMVQR YEREIDYDSR PYDYRSERDY YEREYPSCST
101 RPCPVQLILI CEARGPLTVY PHEPDYAVVH RSEVEREPAY YYHRRVREYD
151 DDRRLRRELS PGDSVSQASR RRDDQEEYSS DDSIVHIRKE VREYDDHPHH
201 RRHLAEGALV GLGAAELLRN HRKKEGEEVS SGLGRVGKDL GAGALGAVAV
251 SAASRAREYY RSKSRRRSHS YDDDRSSRHR HQHYHHSHSR SGRSRSRSHS
301 HSRAKTLAEI GLGAAAIAGA VALARKKSKN DRRSRSRHRR ASSSSRPEKD
351 AKSEKGSQSR MRKHMAEAGL AGAAVAGLVE RARSRSRSRK GSRSHSRLRH
401 ALPVVAAGLG TAVATGLYEK HKMKEGEEGK HRERRRARSR SRAPSEIYPD
451 PNRDSAGLIE YGDHPVAGSI PSAHYYGRPA SQQGYYHSDA SDSAARRGRG
501 RSHSRTRSRG GRYSSSPSDS DRDGSRRRSR HRKHRSRSRE IAEAALAATG 551 VGYAAHKLKQ HRDHKKEERE RSKYEDDSFS EPPYPPSPLP PAQQPAETQF
601 YPNTNYFPPP PGPTPVPIAN NMPYNPADYP PPPGAVPPAQ GYGYPPESGP
651 NRYAPRPRRA DENVSAAWNS SPPTAQYPMQ HGVDEPPSPL RTPRADTARR
701 ARAVSQPAHP KSVAFDLIPD AISIPSSSDT HPIDPGYETD DSDSTIESSI
751 ARHHRDRGSH RRRHSSSYPS SSSSTRRSHH KPTPSHPSHH TTKHQESDSD
801 STIDLPARFD AQGRLLPERG HDDLPDPLAD RVERLLRGIN RVFA