aqueous oxidation of pyrrhotite and pyrite minerals - UNSWorks
313
Measurement of the rate of aqueous oxidation of sulphide minerals: aqueous oxidation of pyrrhotite and pyrite minerals Author: Fabian, Cesimiro P. Publication Date: 1990 DOI: https://doi.org/10.26190/unsworks/5634 License: https://creativecommons.org/licenses/by-nc-nd/3.0/au/ Link to license to see what you are allowed to do with this resource. Downloaded from http://hdl.handle.net/1959.4/57693 in https:// unsworks.unsw.edu.au on 2022-07-14
-
Upload
khangminh22 -
Category
Documents
-
view
3 -
download
0
Transcript of aqueous oxidation of pyrrhotite and pyrite minerals - UNSWorks

Measurement of the rate of aqueous oxidation of sulphideminerals: aqueous oxidation of pyrrhotite and pyrite minerals
Author:Fabian, Cesimiro P.
Publication Date:1990
DOI:https://doi.org/10.26190/unsworks/5634
License:https://creativecommons.org/licenses/by-nc-nd/3.0/au/Link to license to see what you are allowed to do with this resource.
Downloaded from http://hdl.handle.net/1959.4/57693 in https://unsworks.unsw.edu.au on 2022-07-14

MEASUREMENT OF THE RATE OF AQUEOUS OXIDATION OF SULPHIDE
MINERALS
AQUEOUS OXIDATION OF PYRRHOTITE AND PYRITE MINERALS
A thesis submitted for the degree of Master of Science in
The University of New South Wales.
Cesimiro P. Fabian
June, 1990

Candidate's Certificate:
This is to certify that most of the work presented in this
thesis was carried out by the candidate in the School of
Materials Science and Engineering of the University of New
South Wales and part at Aurotech N.L. and has not been
submitted to any other University or Institution for a
higher degree.
Cesimiro P. Fabian
Bachelor in Chemical Engineering Science and
Chemical Engineer (Peru)

ABSTRACT
The rate of consumption of oxygen by the aqueous oxida
tion of pyrrhotite minerals has been measured by an oxygraph
at constant fixed atmospheric pressure and about 31.5°c
temperature. The oxygraph, designed for the purpose of this
study, consisted of an stirred reactor and an electrolytic
cell for the production of oxygen interfaced to a microcom
puter. The internal pressure of the system, controlled by a
manometer containing two electrodes (contacts), indicates to
the computer the ON and OFF time of the electrolytic cell.
The leaching rates were measured in both air and pure
oxygen, in the absence of bacteria and with inoculation of
T. Ferrooxidans.
New potential-pH diagrams for the Fe-S-H2o system at
2s0 c temperature, neglecting pyrite, were constructed in
order to analyze the mineral chemistry of stoichiometric and
monoclinic pyrrhotite. New predominance area diagrams for
both ferric hydroxyl complexes, and ferric hydroxyl and
sulphate complexed species were derived.
The overall rate of consumption of molecular oxygen by
pyrrhotite minerals at an initial pH of 4.0, was found to be
as follows (grams of oxygen per minute): chemical oxida
tion, 0.00037; chemical oxidation with pure oxygen 0.00057
and bacterial oxidation 0.0020. However, the highest initial
rate of consumption of oxygen occurred in presence pure
oxygen.

These results, when compared with those of ''shake
flasks" experiments in terms of the extent of reaction, were
in good agreement and explained in detail in terms of sul
phide ions oxidation. It was also derived that the oxygen
formed in the sulphate ions (secondary reaction) comes from
the water rather than from the oxygen partial pressure. Thus
the rate of consumption of oxygen is a reliable method to
determine the rate of oxidation of pyrrhotite minerals at pH
values about 4.0. So the initial assumption on the stoichi
ometry of the aqueous oxidation of pyrrhotite minerals,
whether or not in the presence of microorganisms was con
firmed to form ferric hydroxide and elemental sulphur,
predominantly.
FeS + O.SH20 +0.7502 -----> FeOOH + s 0
Fe7s8 + 3.5H20 + 5.2502 -----> 7FeOOH + 8S0 •
The present knowledge on continuous bacterial oxidation
of sulphide minerals (6 tanks x 30 L) is discussed in terms
of flow diagram, pulp density, bacterial recirculation and
dissolved oxygen concentration. At 1.5 initial pH, the main
oxidations products are ferric ions and sulphate ions. The
concentration of ferric ions, hence the potential, increases
steadily throughout the leaching tanks. The bacterial degra
dation process was improved up to 50 percent iron oxidation
in 250 hours residence time by increasing the air sparge to
about 2.6 scc/min/L of slurry.
ACKNOWLEDGEMENT
The author wishes to acknowledge and to thank firstly
to Mr. Bruce Harris, Senior Lecturer in the School. With out
his frequent stimulation, including very frank expressions
of criticism and his painstaking reading, the thesis might
well never have been completed. I also extent my sincere
gratitude to Mr. Fred Scott, Professional Officer in the
School, for advising me on the interfacing of the computers
with the experimental equipment. Thirdly to the management
of Aurotech N.L. for releasing me from the confidentiality
agreement. Finally to my wife and daughters for their under
standing because the entire thesis was prepared after my
normal hours of work at different companies.
CONTENT
PART A: LITERATURE REVIEW
CHAPTER I
Introduction
CHAPTER II
Physical Properties of Iron Sulphide Minerals
CHAPTER III
Aqueous Oxidation of Sulphide Minerals
III.1 Aqueous Oxidation Of Chalcopyrite
III.2 Reduction of Chalcopyrite
III.3 Aqueous Oxidation of Pyrite
III.4 Summary
CHAPTER IV
Aqueous Oxidation of Pyrrhotite Minerals
IV.1 Introduction
IV.2 Acid Decomposition of Pyrrhotites
IV.2.1 Stoichiometry and Reaction Order
IV.2.2 Summary
IV.3 Oxidation of Ferrous Ions by Oxygen
IV.3.1 Oxidation of Ferrous Ions in Strong
Sulphuric Acid Solutions
IV.3.2 Oxidation of Ferrous Ions In Low
Concentrations of Acid Solutions
IV.4 Hydrolysis and Precipitation of Ferric
Page
1
5
14
14
18
19
22
24
24
25
27
36
38
39
43

Page
Ions 51
IV.4.1 Ferric Iron Species in Solution 56
IV.4.2 Hydroxyl Complexes Species 56
IV.4.3 Development of Predominance Regions
for Ferric Hydroxyl Species 57
IV.4.4 Sulphate Complexed Species 62
IV.4.5 Development of Predominance Regions
Ferric Hydroxyl and Sulphate Complexes
65
IV.4.6 Precipitation of Ferric Ions
IV.5 Aqueous Oxidation of Pyrrhotite
Minerals by Oxygen and Ferric Ions
IV.5.1 Aqueous Oxidation of Pyrrhotites
65
69
by Ferric Ions 76
IV.5.2 Aqueous Oxidation of Pyrrhotites
at Elevated Temperatures 83
IV.6 Bacterial Oxidation of Pyrrhotite
Minerals 87
IV.7 Literature Survey Conclusions 96
PART B:
CHAPTER V
Development of Potential-pH Diagrams for Pyrrhotite
Minerals
V.l Thermodynamic Properties of Pyrrhotite Minerals
V.2 Derivation of Potential-pH Diagram for the
99
99
Fe-s-H2o System at 2s0 c Neglecting Pyrite
Page
99
V.3 Analysis of the Oxidation Leaching of Pyrrhotite
Minerals
PART C: EXPERIMENTAL PROGRAM
CHAPTER VI
Introduction to the Experimental Program
CHAPTER VII
VII.I Initial Equipment Design
VII.1.1 Procedure for Determining the
Rate of Oxygen Consumption
103
112
120
120
VII.1.2 Evaluation of the First Oxygraph 123
VII.2 Second Equipment Design 124
VII.2.1 Procedure for Determining the
Rate of Oxygen Consumption 124
VII.2.2 Evaluation of the Second Oxygraph 126
VII.3 Third Equipment Design 127
VII.3.1 Procedure for Determining the 127
Rate of Oxygen Consumption
VII.3.2 Evaluation of the Third Oxygraph 130
VII.4 Consumption of Oxygen During Aqueous
Oxidation of Pyrrhotite Minerals
VII.4.1 Rate of Consumption of Oxygen
During Chemical and Bacterial
131
Oxidation of Pyrrhotite Minerals 132
VII.5 Justification of the Method for Determining
for Aqueous Oxidation Rate of Pyrrhotite

Page
Minerals 144
VII.5.1 Reproducibility of Reaction Rate 153
VII.5.2 Ferrous and Ferric Ions in Solution 154
VII.5.3 Chemical Oxidation of Pyrrhotite
with Pure Oxygen and Air
VII.5.4 Effect of Sodium Chloride and
Copper Ions
VII.5.5 Mass Balance: Shake Flasks
Experiments
VII.6 Discussion and Conclusions
VII.7 Present Knowledge on Continuous Bacterial
Oxidation of Pyrite Concentrate
VII.7.1 Introduction
VII.7.2 Experimental Program
VII.7.3 Experimental Results
VII.7.4 Discussion and Conclusions
CHAPTER VIII
Discussion and Conclusions
APPENDIX A
APPENDIX B
APPENDIX C
APPENDIX D
APPENDIX E
APPENDIX F
APPENDIX G
APPENDIX H
REFERENCES
157
161
163
179
184
184
185
189
196
198
CHAPTER I
INTRODUCTION
Research and development in hydrometallurgical proc
esses continues providing potential alternative methods for
some pyrometallurgical processes (e.g. bacterial oxidation
of refractory gold minerals) as a replacement for conven
tional roast-leach process. The kinetics and mechanism of
such hydrometallurgical processes are frequently unclear
making it difficult to operate under optimum conditions.
Basic studies of the equilibrium concentrations of chemical
species with complicated solution chemistry involving
simultaneous oxidation-reduction, metal-ligand complexation
and hydrolysis and precipitation are valuable in understand
ing these processes.
This study commenced by reviewing the mineralogical
properties of the various iron sulphide phases and minerals
and was followed by an analysis of the aqueous oxidation
process of chalcopyrite, pyrite and pyrrhotite. The oxida
tion of chalcopyrite and pyrite was reviewed in order to
understand the preferential oxidation product(s) of sulphide
ions whether to elemental sulphur and/or sulphate.
Hydrometallurgical processing of pyrrhotite minerals
to recover tin from cassiterite concentrate tailings from
Renison Bell, Tasmania, appears to be economically attrac
tive. Since the rate of aqueous oxidation of pyrrhotite
1

minerals is faster than that of some other sulphide miner
als (e.g. bacterial degradation of chalcopyrite and pyrite),
the determination of the kinetics and mechanism of the
oxidation of pyrrhotite minerals should improve the knowl
edge of their mineral chemistry and also assist in the plant
design.
Aqueous oxidation of the pyrrhotite minerals is
discussed thoroughly with particular reference to their acid
decomposition, the oxidation of ferrous ions and the hydrol
ysis and precipitation of ferric ions. Using the most
recent thermodynamic data, two new
(modified potential-pH diagrams) have
activity diagrams
been developed in
order to analyze the equilibrium between the various ferric
hydroxyl species in solution and their stability in equi
librium with ferric hydroxide. The second activity diagram
is for the sulphate complexing species in solution with
ferric hydroxyl species.
A new potential-pH diagram for the Iron-Sulphur-Water
system at 2s0 c, neglecting pyrite, was developed in order to
analyze the aqueous oxidation process of pyrrhotite miner
als. Recently published thermodynamic data (1982) was used
to construct these diagrams.
It is widely recognized in the literature that reduc
tion of dissolved molecular oxygen is the most important
cathodic process during the aqueous oxidation of sulphide
minerals. It is important because, at or near the rest
potential range from Oto 0.62 V (SHE), the only cathodic
reaction capable of maintaining a significant current is
2

the reduction of oxygen. Reduction of other dissolved oxi
dants, e.g. ferric ions, may occur but reduction of dis
solved oxygen still plays the important role of regenerating
reduced species. Ferric ions as oxidant is thoroughly ana
lyzed in Section IV.5. Thus measurements of rate of con
sumption of oxygen may help determine the kinetics of the
aqueous oxidation process of such sulphide mineral.
The higher rest potential value, 0.62 V, is referred
to pyrite which does not decompose at an appreciable rate on
standing in acid solutions and, consequently, pyrite is
defined as the more active sulphide mineral for oxygen
reduction.
In this study, three designs of oxygraphs were de
veloped, constructed and used in order to measure the con
sumption of oxygen during a chemical and bacterial oxidation
of pyrrhotite minerals. The third version oxygraph, which
far exceeded the performance to the first two oxygraphs,
works under a fixed atmospheric pressure and at constant
ambient temperature.
The oxygen consumed was produced electrolytically as
demanded by the aqueous oxidation process thus maintaining a
constant pressure in the system. Solutions of dilute sulphu
ric acid, sodium hydroxide and copper sulphate were used as
electrolytes for the production of oxygen for the three
oxygraphs, respectively.
Attempts have been made to obtain a reproducible
reaction rate. The results were about ninety per cent repro-
ducible. The reaction rates measured in these series of
3

experiments were compared with those obtained from 'shake'
flask experiments. The results indicated that the extent of
reaction obtained from the oxygraph were higher than that
from the 'shake' flasks experiments. This difference is
probably due to higher transference of oxygen, hydrogen ions
and ferric ions in the oxygraph forced by the vibramix.
The rate of oxidation of pyrrhotite minerals or any
other sulphide mineral could be measured by the use of the
third oxygraph; provided no gas (e.g. hydrogen sulphide)
is produced.
4
CHAPTER II
PHYSICAL PROPERTIES OF IRON SULPHIDES
Iron sulphides are the most abundant of the natural
metal sulphides. Pyrrhotite and pyrite constitute the binary
boundary of many multicomponent base metal sulphides of
economic importance, e.g. copper, nickel, zinc and pyritic
gold bearing minerals. New hydrometallurgical processes,
such as those for the recovery of gold and silver from
refractory sulphide minerals, are becoming more attractive
as many materials can not be treated economically by the
more conventional roast-leach processes. Thus an analysis of
the physical properties of pyrrhotite minerals may lead to
a better understanding their aqueous oxidation process.
Craig et al. (1) reviewed the mineral phases of nine
teen compounds in the Fe-S system. Table II-1 lists the
minerals and phases having compositions in the range from
FeS to FeS2 , gives their stoichiometric structure and indi
cates their relative stability. This table is not exhaustive
but it does indicate the extensive and, in some cases,
complex nature of the iron sulphide system.
A number of minerals and phase have not been fully
characterized because many natural mineral systems are more
complex than synthetic ones, because they have had a much
longer time to approach equilibrium than can be afforded by
experimentalists and because metastable phases are often
5

produced during the formation of synthetic materials.
6

TABLE II-1
MINERALS AND PHASES IN THE Fe-s SYSTEM(l)
MINERAL
NAME
Troilite
COMPOSITION STRUCTURE TYPE
(cell edges, A)
FeS Hexagonal 2C
THERMAL
STABILITY, 0 c
Max. Min.
140
Mackinawite Fes1 _x Tetragonal P4/nmm Often contains
0.07>x>0.04 Ni and Co
Hexagonal
pyrrhotite
Fe1_xs
44.9-50.0
at.% Fe
MC-Type Fe1 _xS
pyrrhotite 47.4-44.7
at.% Fe
NA-type Fe1_xS
pyrrhotite 47.2-47.8
at.% Fe
NC-Type Fe 1_xS
pyrrhotite 47.2-48.1
at. % Fe
SC
pyrrhotite
11C
pyrrhotite
6C
pyrrhotite
Hexagonal 1C
Hexagonal?MC
Hexagonal?
3C
Hexagonal?
NC
Hexagonal
Orthorhombic
11C
Orthorhombic?
6C
7
mp.1190 100
NiAs structure
308 262
"'266 209
"'213 "'100
"'100
"'100

Metastable Fe1_xs Hexagonal Metastable
pyrrhotite 0.06>X>0.03 Hexagonal?
4C Fe7+xsa Monoclinic 254
monoclinic 46.4-47.3
pyrrhotite at. % Fe
Anomalous Fe7+xsa Triclinic? ?
pyrrhotite 46.4 at. % Fe
Gamma iron Fe2s 3 Spinel ?
sulphide
Smythite Fe9S11 Pseudo-rhombohedral '''75
Hexagonal or monoclinic?
Greigite Fe3 s 4 Spinel Metastable(?)
Pyrite Fes2 Cubic 743
Marcasite FeS2 Orthorhombic Metastable
slightly s-
deficient
8

Table II-2 lists the pyrrhotite minerals which occur
naturally(3}. For the purposes of this study, characteriza
tion of the physical properties of iron sulphides will be
confined to this list, excluding pyrite.
Troilite should only be used to describe a polymorph
of stoichiometric FeS which occurs in meteorites (1} but it
has recently been frequently reported in terrestrial envi-
ronments usually associated with low-temperature
pyrrhotite (1,5}. Naturally occurring troilite
hexagonal
has been
found to have an iron-to-sulphur ratio varying from 1:0.995
to 1:1.007 (3}. Troilite and a number of other polymorphs,
are p-type semiconductors with the positive holes associat
ed with the sulphur irons as opposed to forming Fe3 + by
association with iron (3}.
The nomenclature used in the literature for pyrrho
tites is based on the cell edges of the niccolite (hexagonal
NiAs) structure. Troilite, FeS, which has a hexagonal cell,
has an 'a' axis equal to /3A and its 'c' axis equal to 2C,
where A and C refer to the cell edges of NiAs, thus troilite
is called '2C pyrrhotite'.
Another naturally occurring iron sulphide mineral of
near-FeS composition is mackinawite, Fel+xs (x = 0.057 to
0.064}, which has also been described as natural pyrrhotite
by Smith et al. (5), but it is not described as such by
Lambert (3).
9

TABLE 11-2
COMMON IRON-SULPHUR COMPOUNDS (3)
Compound Name Structure Atomic yin FeSy
FeS2 Pyrite Cubic 33.33 2.000 0.667
Fe7S9 Monoclinic 4C 46.67 1.143 0.993
pyrrhotite
Fe9S1o Hexagonal SC 47.37 1.111 0.947
pyrrhotite
Fe10S11 Intermediate llC 47.62 1.60 0.952
Fe11 5 12 pyrrhotites 6C 47.83 1. 091 0.957
FeS Troilite 2C 50.00 1.00 1.000
* N = mole fraction of FeS in the FeS-FeS2 system.
10

When examining the voluminous literature on pyrrhotite
mineralogy, it seems that monoclinic pyrrhotite, Fe7s 8 and
hexagonal pyrrhotite are more common and more frequently
studied. Monoclinic pyrrhotite is ferromagnetic having a
monoclinic superlattice with composition centered about
Fe7s 8 while anomalous monoclinic pyrrhotite and the other
pyrrhotite minerals are antiferromagnetic (1,3).
Anomalous monoclinic pyrrhotite and hexagonal pyrrho
tite appear to be widespread in low temperature sedimentary
environments. Naturally occurring monoclinic pyrrhotite has
a room temperature magnetization of 13.1 emu/g, but this
decreases with increasing temperature and at 320°c it be
comes paramagnetic. Its density is 4.6 g/cm3 and it is
called '4C pyrrhotite'.
In general, the most abundant natural pyrrhotites are
believed to consist of three different pyrrhotites mainly,
4C (monoclinic pyrrhotite), nC (intermediate pyrrhotites)
and 2C (troilite). The nC pyrrhotites have a composition
range approximately from Fe9 s 10 to Fe11 s 12 and show integral
types of superstructure (4,6,22).
Figure II.1 shows a summary phase diagram for the FeS
Fes2 system below 3so0 c reported by Craig et al. (1). It can
be seen that hexagonal pyrrhotite and troilite may coexist
at temperatures below so0 c. Monoclinic pyrrhotite may exist
independently or in conjunction with smythite below this
temperature.
The structure of pyrrhotite is thought to consist of
s2- ions arranged in a 3-dimensional hexagonal packing with
11

350 ,----,.-----,--~.----.---,----"T_;__..---,-----.---,.--..---.-----.---,.-----~
300
250
0 0
~200 Q) .... ::> -0 .... Q)
0. E 150
~
100
50
w II-0 ::i: 0:: c:: >-
w a.. >-I-(.)
w I-;:: 0 ::i: 0:: a:: >-a.. _J <t z 0 Cl <t X w ::i:
I
0.. _J '....,..,-,-A,.,..,.,.-;i + 6 z 0:: 0 IC> <t X w ::i:
HEXAGONAL PYRRHOTITE (1C) + PYRITE
"HEXAGONAL" PYRRHOTITE (MC) + PYRITE
"HEXAGONAL " PYRRHOTITE (NA) + PYRITE
("HEXAGONAL" PYRRHOTITE (NA ) + MONOCLINIC PYRRHOTITE )
("HEXAGONAL" PYRRHOTITE (NC) -+ MONOCLIN IC PYRRHOTITE )
MONOCLINIC PYRRHOTITE + PYRITE
(SMYTHITE + MONOCLINIC PYRRHOTITE )
I ,._ I
I I
SMYTHITE + PYRITE
308°
262°
254"
,.,_, 75•
Q L---'-----'--'-'-..,____._ _ __.__~.____. __ ........_ _ _._ _ __._ _ __. __ ....__ _ _.__ ______ ___;.___..,___-'----' 50 4 8 OW 46 W 44 42 4 0 38 36 34 zl- I- ~ ~ ::::i§ :r: c::; Atomic % Fe _l Ox ~ w 0 Oo:: ::E o:: 0: Zo:: Vl 2 I- ~li::
FIGURE 11.1: The Summary Phase0
Hiagram for the FeS - FeS 2 Segment below 350 C ( 1 ) .

the Fe2+ ions in the interstices between the sulphurs. The
interstices are of two types, octahedral and tetrahedral.
The octahedral sites, which are the larger, are equal in
number to the s 2 - ions and are occupied by Fe2 +; the smaller
tetrahedral sites are vacant (2).
Smith et al.(5) cited Lotgering (1956) who represented
the formula Fe7s 8 as Fet;fe3o;s8 . The arrows denote the
direction of electron spin and represents a cation vacan-
cy. Smith et al.(5) also cited Subbarono who together with
Lotgering (1964) maintain that Fe7s8 must contain ferric
ions to preserve electrical neutrality and they suggest an
ionic formula, Fe1122 +/Fec 112_3x)> 2+Fe2
3+a;s for Fe1_xs
pyrrhotite. However no evidence of ferric ions was detected
using a Mossbauer spectroscopy and, moreover, the ferric
iron-to-sulphide bonding is known to be extremely unstable
( 5) .
In 1970, Ward (6) proposed that the formula for Fe7s8
can be written as Fe52+Fe2
3 + Cl ;s8 in which stands for an
Fe vacancy and that the whole structure is electrically
neutral. But he also suggested that a better formula would
be "Fe72+as h+ 2", (it is believed that there is an error in
the number of atoms of sulphur given in this representation
and it is though that the correct formula could be
Fe72+os8h+ 2 ) where h+ stands for two electron holes, the
location of which are not specified.
The characterization of the chemical structure of
troilite, FeS, seems widely accepted as comprising ferrous
and sulphide ions, while that of the other pyrrhotite miner-
12

als is not clearly understood. However, it is not necessary
to clarify the existence of ferric ions in the atomic struc
ture of hexagonal or monoclinic pyrrhotite for the purpose
of this study, nevertheless Ward's (6) second representa
tion, Fe72+as8h+ 2 will be accepted as the most probable
because the literature in general considers only ferrous
ions, Fe2+ as the product of acid dissolution.
13

CHAPTER III
AQUEOUS OXIDATION OF SULPHIDE MINERALS
III.1 AQUEOUS OXIDATION OF CHALCOPYRITE
The impetus for the development of alternative hydro
metallurgical processes for the treatment of sulphide miner
als comes principally from the desire to realize a process
which would provide a viable alternative to the sulphur
dioxide and arsenic emissions associated with pyrometallur
gical processes. Many hydrometallurgical processes have been
developed in recent years, particularly for the treatment of
copper concentrates and refractory gold minerals. For exam
ple many methods have been proposed to process chalcopyrite,
CuFeS2 , the most abundant copper sulphide mineral. Among
these are The Sherrit-Cominco process, The CLEAR process,
The Minimet Rescherche process, The Dextec Process and The
Cymet Process.
Several attempts have been made to devise a process
based on the following reaction (Equation III.1.1)
CuFeS2 + H2S04 + 1.2502 ----> CuS04 + O.SFe203 + s 0 + H2o
(III.1.1)
Copper could be easily recovered from the ferric iron
precipitate and elemental sulphur, but the low yield of this
reaction appears to be unacceptable. Under optimum condi-
14

tions of a temperature of 115°c and oxygen partial pressure
of 200-500 psi. only 65% of the copper was dissolved in 2
1/2 hours (7).
The attraction and advantages of sulphuric acid leach
system is obvious for leaching sulphide minerals and the
recovery of the precious metals seems to be comparable with
that obtained by smelting practices (7).
Aqueous oxidation of chalcopyrite by ferric (Fe3 +)
ions and oxygen (Equation III.1.2 and III.1.3) has been
extensively studied (8,9).
CuFeS2 + 4Fe3 + -----> cu2 + + 5Fe2 + + 2s0 (III.1.2)
(III.1.3)
It has been proposed (8,9) that both of these reac
tions occur during the dump leaching of chalcopyrite ores,
while reaction (III.1.2) has been proposed for the leaching
of chalcopyrite concentrate in the presence of ferric ions
(10). When oxygen is present in the system,
ferrous ions, Fe2 + also occurs (8-10).
oxidation of
However, it has been pointed out that the oxidation of
ferrous ions should be prevented in a dump leaching, if it
were possible, because according to Liddle et al. (8)
"supplying dissolved oxygen increases the amount of
copper dissolved before Fe(OH) 3 precipitates only if the
initial ferric sulphate, Fe2 (S0 4 )3 concentration is 10.0g.L-
1 or lower. Chalcopyrite dissolution could be increased at
higher sulphate levels but oxygen must be excluded if pre-
15

cipitation of ferric hydroxide is to be prevented. The
importance of solution pH in preventing precipitation should
be emphasized".
More recently, studies of hydrometallurgical process
ing of chalcopyrite have concentrated on the electrochemical
phenomena involved (11-13). Warren et al. (11) state that
"electrochemical reactions of a mineral are a direct result
of the thermodynamic properties of the mineral, properties
of the electrolyte and their interactions at the mineral
electrolyte interface". Further, anodic polarization of
chalcopyrite is sensitive to pH at potentials higher than
0.7V (vs SHE) and insensitive to pH at lower potentials in
sulphate solution. Based on current and mass balance meas
urements, two intermediate sulphide phases appears to form
in the sequence chalcopyrite (CuFeS2 ) ---->bornite
(Cu5 FeS4 )----> covellite (CuS) which, mixed with the elemen
tal sulphur produced, form an electron conducting passive
layer on the mineral surface (11).
Below potentials (0.45-0.550 V), the reactions are
reported to be consistent with the following equations;
provided y>x (11).
CuFeS2 ----->
cu1 _xFe1 _yS2 _z + xcu2 + + yFe2 + + zs0 + 2(x+y)e-(III.1.4)
Cu1-xFe1-yS2-z ----->
(2-z)CuSn-s + (1-y)Cu2 + + (1-y)Fe2 + + 2(1-y)e- (III.1.5)
CuS( ) -----> cu2 + + s 0 + 2en-s (III.1.6)
It is noted that ferrous ions formation occurs in this
16

potential range.
Warren et al. (11) states that at potentials higher
than 0.7V, the "previously suggested processes still occur
but the amount of Cu 1_xFe1_yS2 _z formed is negligible com
pared with the amount of CuFes2 oxidized completely to cu2 +
and Fe2 +. This is due to the greater amount of material
forced to dissolve at higher current". Thus the
process is represented by the following reactions:
CuFeS2 -----> cu2 + + Fe3 + + 2s0 + Se-
overall
(III.1.7)
CuFeS2 + 8H2o ----> cu2 + + Fe3 + + 2so42 - + 16H+ + 17e
(III.1.8)
It is though that 88-90% of the chalcopyrite reacts via the
first reaction and remainder via the second reaction (11).
Independently, Hillrichs et al. (12) also studied the
kinetics of the electrochemical dissolution of chalcopyrite
and suggested slightly different electrochemical reactions,
at low potentials, in terms of the solid intermediate
products and ferric iron. They indicated that three solid
intermediate products are formed simultaneously, but appar
ently these were not characterized. Equations (III.1.9,
III.1.10 and III.1.11) describes these reactions. , The
production of ferric (Fe3 +) ion, which is included in these
equations, also disagrees with the reactions suggested by
Warren et al. ( 11 ) .
CuFeS2 -----> cu 1_xFeS2 + xcu2 + + 2xe- (III.1.9)
CuFes2 -----> CuFe1_xs2 + xFe3 + + 3xe- (III.1.10)
CuFes2 ----->
cu 1_xFe1 _yS2 + xcu2 + + yFe3 + + (2x+3y)e- (III.1.11)
17

However, Hillrichs et al. (12) states that "upon
immersing the electrode in the electrolyte, Fe(II) will be
dissolved preferentially" according to equation (III.1.10).
Thus both Warren et al. (11) and Hillrichs et al. (12) agree
on the nature of the electrochemical dissolution of chal-
copyrite at high potentials but they are not in full
agreement on the reactions which occur at lower potentials.
Some apparent anomalies, such as these, in the behaviour of
the mineral are probably due to the inherent physical and
chemical differences between samples from different sources.
III.2 REDUCTION OF CHALCOPYRITE
Electrochemical reduction studies of chalcopyrite in
sulphuric acid based electrolytes lead to the proposal that
the overall reduction can be represented as follows (13):
(2-x)CuFeS2 + (6-4x)H+ + (2-2x)e- ----->
Cu(2-x)S + (2-x)Fe2 + + (3-2x)HzS (III.2.12)
CuFeS2 + (3-2x)cu2 + + (4-4x)e- -----> 2Cucz-x)s + Fe2 +
(III.2.13)
The first reaction is appropriate in solutions con
taining no dissolved cupric ion, and the second to solutions
where it is present (13). It is likely that the intermediate
copper-iron sulphides may form initially and that thin
layers may even be present beneath the djurleite or chalco-
18

cite product. Moreover, additions of either cupric or fer
rous ions cause significant increases in the reduction
currents. The Cuc 2 -x)S product layer formed must be a porous
layer (13). This interesting area is not fully understood
and it should be considered for further studies.
III.3 AQUEOUS OXIDATION OF PYRITE
The aqueous oxidation of pyrite is also an important proc
ess in hydrometallurgically treatment of sulphide minerals.
Singer et al. (14) proposed a model in which both oxygen and
ferric ions, Fe3 +, play an important role in the aqueous
oxidation of pyrite:
Initial reaction:
+02
FeS2 (s) ------------> Fe2 + + s-compounds
Propagation cycle:
(slow)
Fe2 + + o2 (aq) ---------> Fe3 +
(III.3.14)
(III.3.15)
I\ I I I
Fe3 + + FeS2 (s) --------> Fe2 + + so42 -
L---------------------------------" (III.3.16)
This model consists substantially of three reactions:
1. The oxidation of pyrite by molecular oxygen or simple
dissociation to ferrous ions, Fe2 +, and s- compounds; reac-
tion (III.3.14). This has been proposed as a necessary
step and has also been supported by Mathews and Robins
( 15) ,
2. The oxidation of ferrous ions, Fe2+, to
19
ferric

ions, Fe3 + by molecular oxygen; reaction
(III.3.15). This is regarded as the rate limiting step,
3. The oxidation of pyrite by ferric ions, Fe3 +,
reaction (III.3.16) considered to be a fast reaction.
Singer et al.(14) also reported that the rate of
oxidation of pyrite, by ferric ions, is independent of the
presence or absence of oxygen but that, in the presence of
oxygen alone (e.g. no ferric ions) no oxidation was ob
served even after one week. Conversely, Mathews and Robins
(15) suggested that the presence of oxygen is likely to
retard the aqueous oxidation of pyrite. It appears that the
presence of oxygen increases the rest potential of pyrite
from 0.25V (in an inert atmosphere) to 0.63V in the presence
of oxygen (15), warranting the term of passivation to de
scribe the extreme irreversibility of the process. Moreover,
if oxidation by ferric ions is retarded, it could be due to
the oxygen being adsorbed on the pyrite surface and reducing
the number of active sites available for the ferric ions
attack.
Thus the overall reactions involved in the aqueous
oxidation of pyrite are( 14-15,18):
FeS2 + 3.502 + H2o -----> Fe2 + + 2S04 2- + 2H+ (III.3.17)
Fe2+ + 0.2502 + H+ -----> Fe3 + + 0.5Hz0 (III.3.18)
FeS2 + 14Fe3 + + 8H20 -----> 15Fe2 + + 2SO 2 -4 + 16H+
(III.3.19)
Fe3 + + 3H2o -----> Fe(OH) 3 + 3H+ (III.3.20)
It is noted that the formation of elemental sulphur
20

was not reported (14-16), however, the partitioning of
pyritic sulphur between sulphate and elemental sulphur,
during the aqueous oxidation of pyrite, has been shown to be
a function of the potential of the system (16,17). An
increase in the potential favours sulphate formation. More
over, aqueous oxidation of pyrite in sulphuric acid media at
110°c and partial pressure of oxygen of 0.4 MPa (18) and
6.28 MPa (16), slowly produce acid when the free acid con
centration is less than about 0.15-0.17 M; and slowly con
sume acid at higher concentrations (16,18,19). It is consid
ered that, at low acid concentrations, oxidation of ferrous
ions and the subsequent hydrolysis and precipitation of
ferric ions are fast reactions. Thus the over-all mechanism
of aqueous oxidation of pyrite has been stated to be a
combination of two competing electrochemical reactions,
equation (III.3.21) and (III.3.22) (16):
FeSz + 8Hz0 -----> Fe2 + + 2S042 - + 16H+ + 14e
(III.3.21)
and
Fes2 -----> Fe2 + + s 0 + 2e- (III.3.22)
and the overall anodic reaction of one mole of pyrite
could be:
FeSz + 4yH20 ----->
Fe2 + + yso42 - + (2-y)S0 + 8yH+ + (2+6y)e- (III.3.23)
21

the cathodic reduction of oxidants are:
Fe3 + + e- ------> Fe2+
(III.3.24)
(III.3.25)
Bailey et al. (16) states that "the overall stoichiom
etry of the pyrite decomposition reaction can be written in
the form:
FeS2 + (0.5 + 1.Sy + 0.25x)02 + (2+x-2y)H+ -----> (1-x)Fe2 + + xFe3 + + (2-y)S0 + yS04
2 - + (1-y+O.Sx)H20
(III.3.26)
in view of the absence of any other observable reaction
products."
Finally, it was shown (16) that during the aqueous
oxidation of pyrite (in sulphuric acid media, at tempera
tures of about 110°c and high oxygen partial pressure) the
sulphate formed from pyritic sulphur contains oxygen taken
from the water rather than from the high pressure oxygen
phase. This suggestion conflicts with the mechanisms previ
ously proposed, where the principal reaction is a heteroge
neous one between dissolved oxygen and the solid surface to
form the sulphate product.
III.4 SUMMARY
From this section, it is important to note that:
1. The leaching process of chalcopyrite and pyrite
22

are explained in terms of oxygen adsorption and electrochem
ical processes. Chalcopyrite produces two intermediate
products during its anodic dissolution, bornite and covel
lite. However, it is not clearly understood whether the
oxygen in the sulphate ion formed proceeds from the dis
solved oxygen or from the water.
2. The leaching kinetics of chalcopyrite tend to
maintain a constant acidity. This corresponds to a condition
where the rate of acid consumption approximately equals the
rate of acid production. It is understood that this buffer
ing action is the result of a dynamic equilibrium between
elemental sulphur and sulphate ion. At 90°c and 3.1 MPa
oxygen pressure the buffer pH during the leaching of chal
copyrite appears to be 2.2. Leaching of pyrite at 110°c by
oxygen under pressure slowly produce acid when the free acid
concentration was less than 0.17M H2so4 and slowly consume
acid at higher concentrations.
3. The leaching products of chalcopyrite and pyrite,
in terms of elemental sulphur or sulphate, depends on the
potential of the system. At low potentials (<0.5-0.7V), it
appears that elemental sulphur is the main product. At
higher potentials than 0.7V, sulphate ions is the main
product.
23

CHAPTER IV
AQUEOUS OXIDATION OF PYRRHOTITE MINERALS
IV.1 INTRODUCTION
In 1935 Mellor (20) defined the basic chemistry of
the iron sulphide minerals in aqueous solutions as a contri
bution to the general interest in iron and its compounds.
This interest, particularly in the basic chemistry of the
oxidation of iron sulphides, decreased after the beginning
of this century when new alternative sources and processes
for the production of sulphuric acid were found {e.g. zinc
and copper processes which produces sulphur dioxide), and
iron sulphides became to be considered a nuisance, producing
environmental hazards. However, since 1980 it appears that
research, at least in the field of copper hydrometallurgy,
is changing from process developments to fundamental re
search.
A number of chemical reaction sequences have been
proposed for the hydrometallurgical oxidation of pyrrhotite
minerals. Acid decomposition, with and without the addition
of oxidants, and alkaline decomposition, at low and high
temperature, are possible methods of processing pyrrhotite
minerals in aqueous solutions. Bacterial oxidation is usual
ly considered as a separate area of study.
Measurement of the rate of acid decomposition of
pyrrhotite minerals has been usually obtained by the deter-
24

mination of iron in solution; very often as ferrous ions,
Fe2+, but since hydrogen ions are consumed during the reac
tion, measurement of the changing pH of the solution has
also been used as a means of obtaining information about the
kinetics of the process.
IV.2 ACID DECOMPOSITION OF PYRRHOTITES
The simple and widely accepted chemical reaction of
pyrrhotite with acid solutions, is represented by the fol
lowing equation (20-30):
+ F 2+ FeS(s) + 2H -----> e (aq) + H2S(g) (IV.2.1)
According to this equation pyrrhotite, usually repre-
sented by the stoichiometric compound troilite (FeS) for the
sake of simplicity, yields iron in solution (most probably
as ferrous ions Fe2 +) and hydrogen sulphide, H2S(g)· Most of
the naturally occurring pyrrhotites are not stoichiometric
and it appears that they yield elemental sulphur propor
tional to their non-stoichiometry according to the following
equation (21,22):
FeS(l+x) + 2H+ -----> Fe2 + + H2S + xs0 (IV.2.2)
For example, acid decomposition of monoclinic pyrrho
tite has been reported to follow equation (IV.2.3) (21,22):
25

(IV.2.3)
If monoclinic pyrrhotite is leached the stoichiometry
suggests that 12.5% of the sulphur would appear in the
elemental form while the remaining 87.5% would be expected
to be evolved as hydrogen sulphide. Ingraham et al.(21)
obtained about 13.3% elemental sulphur during the leaching
of a mainly monoclinic pyrrhotite sample and 12% elemental
sulphur from a hexagonal pyrrhotite sample.
Another source of pyrrhotite, sometimes known as
'activated pyrrhotite' is produced by thermal decomposition
of pyrite. The purpose of this process, at least theorical
ly, is to eliminate one atom of sulphur from the pyrite
molecule, at temperatures of soo-aoo0 c, to produce the
artificial pyrrhotite.
heat
-----> FeS + s (IV.2.3)
Acid leaching of this product produces elemental
sulphur instead of sulphuric acid (22). Some investigators
(22-30) have also studied the acid decomposition of an
artificially prepared pyrrhotite.
In general, most authors have clearly identified the
mineral(s) present in their samples, while others have only
used the sulphur/iron ratio to characterize the sample.
These experimentally determined ratios do not usually fall
into the composition range of any known pyrrhotite mineral
or phase. Hamilton et al.(17) for example studied a natural
pyrrhotite having a sulphur to iron ratio of 1.13; although
26

this ratio is close to that of monoclinic pyrrhotite (1.143)
it does not fall into the composition range of any pyrrho
tite mineral. It must therefore be assumed that the samples,
whether they are natural or artificial, are very often a
mixture of minerals or phases.
The reactivity to acid decomposition of one mixture
is probably different to any another, the bulk chemical and
kinetic stability might also change. It has been reported
(23) that a low excess of sulphur in the structure of pyr
rhotite results in a higher rate of dissolution than a
mineral with a higher sulphur excess. Harris et al. (79)
found that different samples of pyrrhotite from the same
source show significantly different reactivities to aqueous
oxidation. Bugajski et al.(24) suggested that the chemical
composition of the sulphide has a large influence on their
properties, consequently their results (discussed further)
were proposed to be applicable only to monoclinic pyrrho
tite.
IV.2.1 STOICHIOMETRY AND REACTION ORDER
Table IV.1 summarizes the kinetic data which has been
reported for the acid decomposition of pyrrhotite. Although
this is not an exhaustive list, it does emphasize the varia
bility of kinetic observations made by various authors on
more or less similar materials.
27

TABLE IV.1
KINETIC DATA FOR ACID DECOMPOSITION OF PYRRHOTITE
Kind of Acid Reaction Temp. Activ. Rate Control Ref.
sample Mole Order
Precipit- HCl [HCl] 25
ate (0.003-0.1)
Natural H2so4 [H2so4 J1 · 3 30-80
co.2s-1)
Natural HCl [HCl]o. 9 30-90
(5-36%)
Natural HCl [HCl]
and artif. (0.01-1.8)
prepared
30-80
Artificial H2S04 [H2S04l 20-90
troilite (pH 2-5)
Natural 40-90
monoclinic NaClo4
Energy
Kcal/mol
13.2
7.0
9.8
chemical
diffusion
chemical
14.3 chemical
14.0 chemical
pyrrhotite {[H+]=0.1,[Na+]=0.9 [Clo4-]=1.0 mol/kg.}
28
26
21
23
30
24

The reported reaction order, with respect to acid
concentration, is unity in almost all cases. Applying the
general concept of mass transfer, the steps involved in
acid decomposition of pyrrhotite could be the transport
hydrogen ions from the bulk solution to the surface of
the
of
t~.
solid, adsorption at the interface, formation of an activat
ed complex, decomposition of the complex to products, de
sorption of the products at the interface, and the transport
of products from the surface. In this model hydrogen ions,
H+, adsorb at the surface on the anionic sites possibly
forming a hydrogen bond with sulphide ions, s2-, this then
decomposes to HS- which in turn reacts rapidly with hydrogen
ions, to form H2s (30).
During the last twenty years two suggestions have been
made about the rate limiting step during the acid decomposi
tion of pyrrhotite. In the first, Ingraham et al. (21) in
1972 suggested that the first half of the dissolution proc
ess was a diffusion controlled process. In the second, it
was thought that an activated complex, [FeS-2H+], was
formed (25). Moreover, it was re-stated by Tewari et al. in
1976 (30) and more recently by Bugajski et al. (24) in 1982
that the rate limiting step during the dissolution of pyr
rhotite was controlled by a chemical reaction. From stirred
reactor experiments, Ingraham et al. (21) stated that:
''the first half of the dissolution process is proba
bly controlled by the diffusion of some species through a
liquid layer that is adjacent to the mineral surface. The
latter part of the reaction is almost certainly influenced
29

by presence of the sulphur layer."
This suggestion is based on the small activation
energy obtained (7 Kcal/mol) and on the observation that the
reaction rate depended on the half power of the stirring
speed.
Yazawa et al. (26} suggested that the acid decomposi
tion of pyrrhotite is a chemical controlled reaction. Their
evidence for this conclusion includes:-
a} The activation energy is 12.3 Kcal/mol, which is
larger than that for a diffusion controlled process,
b} the dissolution rate is approximately proportional
to the surface area of mineral and the molarity of sulphuric
acid; although this would be true of both an interface and a
transport controlled reaction, and
c} the dissolution rate is not increased by faster
stirring of the solution.
Moreover, Bugajski et al. (24} also indicated that the
rate of dissolution of monoclinic pyrrhotite remained con
stant when the angular velocity of a disc electrode was
varied. This implies that the dissolution, according to
reaction (IV.2.1), occurs in the kinetic region, where the
rate of transport of reactants in the solution is at least
one order of magnitude greater than the rate of chemical
reaction, e.g. the reaction is chemically controlled or
controlled by diffusion through a solid reaction product.
It has to be pointed out that these conflicting
sults are not fully understood. However, it is noted
the conditions of the experiments were different in
30
re-
that
both
cases. While Bugajski et al.(24) used a rotating disc method
in an oxygen free aqueous solution, Ingraham et al. (21)
used a stirred reactor containing a minus 150-plus 200 mesh
particle size of natural pyrrhotite. Complete dissolution
of a 2.0 g. sample was obtained in 15 seconds in 500 ml. of
20 per cent hydrochloric acid at a stirrer speed of 600
r.p.m. and 9o0 c.
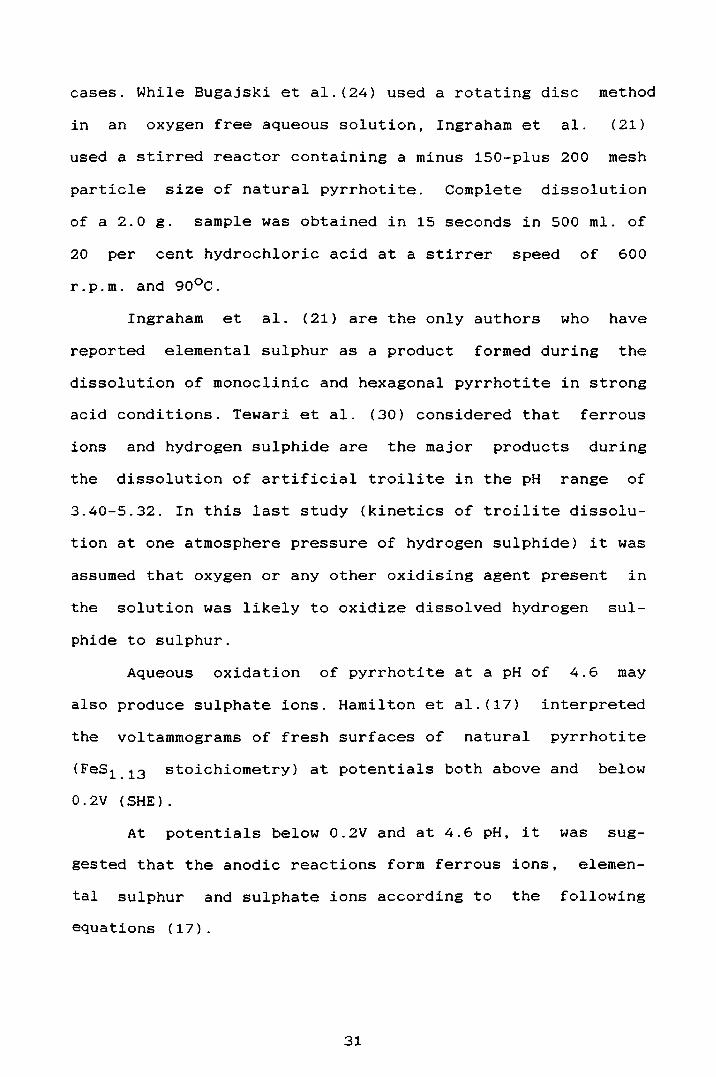
Ingraham et al. (21) are the only authors who have
reported elemental sulphur as a product formed during the
dissolution of monoclinic and hexagonal pyrrhotite in strong
acid conditions. Tewari et al. (30) considered that ferrous
ions and hydrogen sulphide are the major products during
the dissolution of artificial troilite in the pH range of
3.40-5.32. In this last study (kinetics of troilite dissolu
tion at one atmosphere pressure of hydrogen sulphide) it was
assumed that oxygen or any other oxidising agent present in
the solution was likely to oxidize dissolved hydrogen sul
phide to sulphur.
Aqueous oxidation of pyrrhotite at a pH of 4.6 may
also produce sulphate ions. Hamilton et al.(17) interpreted
the voltammograms of fresh surfaces of natural pyrrhotite
(Fes1 . 13 stoichiometry) at potentials both above and below
0.2V (SHE).
At potentials below 0.2V and at 4.6 pH, it was sug
gested that the anodic reactions form ferrous ions, elemen
tal sulphur and sulphate ions according to the following
equations (17).
31

Fes1 . 13 -----> Fe2 + + 1.13S0 + 2e
FeS1_13 + 4.52H20 ----->
(IV.2.4)
Fe2 + + 1.13S042 - + 9.04H+ + 8.78e- (IV.2.5)
At potentials higher than 0.2V and at 4.6 pH, the
stable iron species formed are ferric hydroxide, elemental
sulphur and sulphate ions. The inhibition to oxidation was
stated to be due to the formation of ferric hydroxide on the
surface of the mineral.
Fesl.13 + 3H20 -----> Fe(OH)3 + 1.13S0 + 3H+ + 3e
(IV.2.6)
Fes1 _13 + 7.52H2 ----->
Fe(OH) 3 + 1.13S042- + 12.04H+ + 9.78e- (IV.2.7)
However, it is pointed out (17) that at 4.6 pH, sul
phide ions, s 2-, are oxidised predominantly to elemental
sulphur rather than to sulphate ions. The formation of
ferric hydroxide is described as:-
Fe2 + + 3H20 -----> Fe(OH) 3 + 3H+ + e- (IV.2.8)
Thus it is noted that the aqueous oxidation of artifi
cial troilite in the pH range of 3.4-5.32 (30), in an hydro
gen sulphide environment, yields hydrogen sulphide rather
than elemental sulphur. Conversely, voltammographic studies
at potentials below 0.2V (SHE) and pH 4.6, in an inert
environment (nitrogen), showed that elemental sulphur is the
32

predominant product. It can be seen that under the same pH
conditions, the reaction products are affected by the envi
ronment in the system as would be expected.
It has been reported by Jibiki (23), G. van Weert et
al. (25) and Yazawa et al. (26) that acid decomposition of
pyrrhotite is characterized by an induction period during
which no hydrogen sulphide is evolved, although some iron
dissolved slowly. This induction period is reduced by in
creasing the temperature and the acid concentration of the
system. Jibiki (23) stated that:
"it was observed that the potential of the leaching
solution sharply decreases when the induction period ends."
Different suggestions have been made to explain the
cause of the induction period. For example it was suggested
by Yazawa et al. (26) that the induction period is a result
of prior oxidation of the mineral surface forming a rela
tively insoluble oxide film. They found a correlation be
tween the length of the induction period and the amount of
oxygen contained on the surface of the pyrrhotite. The
oxygen content was measured by weighing the amount of water
formed during the hydrogen reduction of the partially oxi-
dized pyrrhotite. G. van Weert et al.(25)
the preferential dissolution of magnetite,
proposed that
which existed
with their pyrrhotite sample, caused the induction period.
It should be noted that an induction period is not always
observed (23).
Scott et al.(27), Nicol et al.(29) and Nicol (30)
suggested that the induction period and the nature of the
33

rate limiting step during the dissolution of pyrrhotite can
best be interpreted by the use of an electrochemical model
rather than by the various adsorption theories previously
proposed. As these latter authors, except Ingraham et al.
(21), assumed that the dissolution rate of pyrrhotite is not
controlled by mass transfer processes, they reported that
the rate of dissolution must be limited by the transference
of the reactants species across the electrochemical-poten
tial barrier at the solid-solution phase boundary, a process
called 'ionic charge transference'. In other words, the rate
of dissolution must be controlled by a surface reaction in
the absence of protective surface-reaction products.
The electrochemical process stated by Nicol (30)
assumes that pyrrhotite minerals (non-stoichiometric slight
ly iron deficient compounds) dissolves through the following
mechanism:-
"only an FeS compound that is exactly stoichio
metric will dissolve in acid solutions by the transfer of
ferrous and sulphide (S2 _) ions across the
interface".
The following equations were found consistent with his
experiments:
Fe1-xS + 2xH+ + 2xe- -----> (1-x)FeS + XHzS (IV.2.9)
(1-x)FeS + 2(1-x)H+ -----> (1-x)Fe2 + + (1-x)H2s
(IV.2.10)
The rate of dissolution of various synthetic and
natural pyrrhotite minerals are dependent on the potential
34

of the sulphide surface. Figure IV.2 shows the rate of
dissolution of hexagonal and stoichiometric pyrrhotite, as a
function of potential, in 0.1 M HCl and 2s0 c as reported by
Nicol and Scott {29) and Nicol {30). It is noted that a
"triangular-wave potential sweep generator connected to a
potentiostat and a cyclic voltammogram" was used for the
experimentation. The small steady-state cathodic currents
were converted into equivalent rates {assuming two-electron
reduction reaction). The more important aspects of these
results were summarized by Nicol {30):-
"i. in each case, the rate increases rapidly with
decreasing potential with a maximum value at about
-0.3 to -0.4 {SCE) {-0.054V to -0.154V vs SHE).
Below this potential decreases slowly with decreasing poten
tial.
ii. The direct proportionality between the meas
ured dissolution rates and the cathodic currents is apparent
for both sulphides. The ratio of dissolution rate to
that of the two-electron reduction process was shown to be
consistent with equations 5 and 6 [{IV.2.9) and {IV.2.10)].
iii.The open circuit dissolution of the iron
sulphides was found to depend strongly on the potential
as would be expected. Thus, the addition of small amount of
reducing agents {including sulphide ions) resulted in in
creased rates whereas, the presence of some oxidising agents
significantly reduced the rate of dissolution.
iv. It was further demonstrated that under free
ly- dissolving conditions, the oxidation of hydrogen sul-
35

-6
FeS -7
-• • N
'n ... i -a .. ~
a ... Clthodlc current 0 ... FeS
-9
-100:-----:1..;---:i..:----:L.::--~~--:J~__,-__, -0. 1 -0.2 -0.3 -o... -0.5 -0.6 -o. 7
Potential V vs SCE
FIGURE IV.2. The rates of dissolution of iron sulphides in 0.1 HCl at 25 C as a function of potential. Cathodic currents were calculated from the two-electron reduction process shown in Equation (IV .2. 9) (29).

phide to elemental sulphur is the process that produces the
electrons required by reaction 5 [equation (IV.2.9)]"
An independent study (23), supports the observation
that the presence of oxygen, potassium dichromate, eerie
sulphate, potassium permanganate and hydrogen peroxide slows
the dissolution rate of pyrrhotite to an almost negligible
rate, though the critical concentration of each oxidant
(above which the effect of oxidant first appears) depends on
the particular oxidant, the acid concentration and the type
of pyrrhotite.
IV.2.2 SUMMARY
The acid decomposition of pyrrhotite is thought not to
be controlled by the transport of hydrogen ions, because
firstly the dissolution rate depends on the composition of
pyrrhotite, and secondly the estimated rate of hydrogen ion
diffusion controlled reaction is approximately
mole/cm2 .sec for a hydrogen ion concentration of 1 M (23)
and the maximum rate for pyrrhotite dissolution under the
same conditions is reported to be:
2.7 x 10⁻⁷ mole/cm2 .sec ( 1M HCl) Tewari et al. (30)
4 x 10- 7 mole/cm2 .sec [at -0.2 V (SCE), 1M HClO~] oJ
Nicol et al. (28)
10-9 mole/cm2 .sec (1M HCl) Jibiki (23)
1.095 x 10⁻⁶ mole/cm2 .sec (1M HCl) Ingraham et al.(21)
36

The transport of the reaction products, which are
predominantly ferrous ions and sulphide species of HS- or
H2S, also do not seem to control reaction rate of the proc
ess, since the ferrous ions concentration does not affect
the dissolution rate up to 0.1 M concentration and hydrogen
sulphide in solution does not slow the dissolution rate as
would be expected in a reaction controlled by the transport
of products from the reaction zone to the bulk solution.
Therefore, the dissolution of pyrrhotite must be controlled
by a chemical or an electrochemical reaction process at the
mineral surface.
When a sulphide has a very high decomposition rate, as
occurred in the study of Ingraham et al.(21), dissociation
of the solid may occur first with the subsequent reaction
between hydrogen ions and sulphide ions in the vicinity of
the solid surface (23). In this case, the reaction between
hydrogen ions and sulphide ions is, in general, fast because
of a homogeneous reaction. Therefore the transport of hydro
gen ions from the bulk solution to the sulphide ions or the
transport of reaction products from the vicinity of the
surface of the solid to the bulk solution will be the slow
est step for the reaction.
37

IV.3 OXIDATION OF FERROUS IONS, Fe(II), BY MOLECULAR
OXYGEN
Studies on the oxidation of ferrous sulphate
tions, made in the late 19th century and the early
century, were reviewed extensively by Mellor in 1935
solu-
20th
(20).
This
that
review and further work, discussed below, established
the rate of oxidation of ferrous ions depends on pH,
reaction media, ferrous ion concentration, molecular oxygen
concentration, temperature and the presence of certain
catalytic materials. Of these, the rate of oxidation of
ferrous ions seems to be more sensitive to pH and tempera
ture, thus the oxidation process may be classified, for
analysis, into two arbitrarily selected ranges of acid
concentrations:-
1. Strong concentrations of acid solutions of less
than pH 0, and
2. Acid solutions having a pH in the range Oto 7.
This analysis will concentrate mainly on solutions of
sulphuric acid and will attempt to highlight the variation
of the reaction rate when the acid concentration is changed
both at low and elevated temperatures. Oxidation of ferrous
ions at pHs greater than seven will not be discussed because
this study, the aqueous oxidation of pyrrhotite minerals,
will be conducted only in acid conditions.
38

IV.3.1 OXIDATION OF FERROUS IONS, Fe(II), IN STRONG
SULPHURIC ACID SOLUTIONS
The overall chemical reaction which takes place in
strong acid solutions, where Fe(III) remains soluble, is
described by the following equation (IV.3.1) (14,31-34):-
4Fe2+ + 02 + 4H+ -----> 4Fe3 + + 2Hz0 (IV.3.1)
The kinetics of oxidation of ferrous ions, Fe(II), in
this range of acid concentration has been reported to pro
ceed very slowly at ambient temperatures c~2s0 c) (14,31-34).
It has also been pointed out that the rate of reaction is
practically independent of acid concentration, second order
with respect to ferrous ions, Fe (II), and first order with
respect to the partial pressure of oxygen. In one molar
sulphuric acid solution the reaction, at 3o.s0 c, is de
scribed by the following rate equation (31):-
where Kt = 2.78 x 10⁻⁶ M- 1 atm.- 1 sec.-1 .
Since oxygen is only sparingly soluble in water,
supplying dissolved oxygen may be a problem in certain
aqueous oxidation processes involving sulphide minerals, if
oxygen is consumed by both homogeneous (e.g. oxidation of
ferrous ions) and heterogeneous processes (aqueous oxidation
of the sulphide mineral itself). Saturation with air at
39

ambient temperature provides only 6 or 7 mg.L- 1 of oxygen
(35).
The solubility of oxygen in water and in dilute acid
solutions (in moles of oxygen per liter of solution) may be
approximated by the use of Henry's Law:-
* [O laq. = 55.5 p02 / 14.7 (H - p02 > (IV.3.3)
H = Henry's Law constant value.
Biernat (32) (using this equation) calculated the
solubility of oxygen in sulphuric acid solutions and showed
that it decreases with increasing acid concentrations.
Similar decreases in the oxygen solubility have been shown
to result from increases in the concentration of ferrous
sulphate (32). The ratio of the solubility of oxygen in an
electrolyte solutions to that in pure water decreases as the
concentration of the electrolyte increases, but is essen
tially independent of both temperature (over the range of
298-348°K) and the oxygen partial pressure (over the range
O . 1-1 . o a tm . ) ( 36 ) .
The rate of oxidation of ferrous ions at elevated
temperatures is higher than that at ambient temperatures as
expected (31,33). Hoffman and Davidson (31), in 1956, point
ed out that the rate of oxidation, by molecular oxygen at
413 - 453°K, is very dependent upon the nature of the anions
present. At a given pH, the rate was found to increase in
the series perchlorate, sulphate, chloride, phosphate and
pyrophosphate. It is noted that the rate of oxidation of
40

ferrous ions, Fe(II), is higher in a chloride system than in
a sulphate system.
The oxidation of ferrous ions, at elevated tempera
tures, also proceeds by two independent paths (31,33). The
reaction rate at ferrous ions concentration of between 0.001
and 0.025 Min 1 M of sulphuric acid and at temperatures of
140-1So0 c can be expressed in terms of simultaneous bimolec
ular and termolecular paths (31):-
-d[Fe2 +] I dt = kb[Fe2 +].Po2·exp(-13,400/RT)
+ kt[Fe2 +] 2 .Po2·exp(-16,200/RT) (IV.3.4)
where Kb= 1.93 x 10⁻⁵ atm.- 1 sec.- 1 and
kt = 1.60 x 10⁻³m- 1 .atm.- 1 .sec-1 at 159°c.
and these "may be functions of sulphate and hydrogen
ions concentrations as well" (31).
Iwai et al.(33), in 1982, characterized more accurate
ly the oxidation of ferrous ions with dissolved molecular
oxygen identifying the effect of sulphate ions on the reac-
tion rate. This effect was identified in sulphuric acid
solutions containing 0.2 mol.L- 1 of ferrous sulphate "with a
sulphate ion concentration range below 0.01 mol.L- 1 ,
which approximately corresponds to a sulphuric acid
concentration above 0.4 mol.L- 1 ".
The oxidation reaction, in solutions of sulphuric acid
above 0.4 mol.L- 1 , was found to proceed through two parallel
paths. For the first path the reaction rate is independent
of the sulphate ion concentration, while both paths are
41

second order with respect to ferrous ions concentration and
first order with respect to the partial pressure of oxygen.
Thus, at 303.5°K, the kinetics in this range of acid concen
tration was described by
-d[Fe(II)] I dt = K1[Fe2 +1 2 .Po2·exp(-51,600/RT)
+ K2[S042-][Fe2 +1 2 .po2·exp(-144,600/RT) (IV.3.5)
where K1 = 9.1 x 10⁻¹⁰ .mol- 1 .L.Pa- 1 .min- 1
K2 = 1.61 x 10⁻⁷ .mo1- 2 .L2Pa- 1 .min- 1 .
The role of the sulphate ion, in the second reaction
path, is in controlling the actual concentration of the
ferrous ion reacting species and is related to other ferrous
sulphate complexes by their formation constants and the
dissociation constant of Hso4+ (33). Assuming that only Fe2 +
(aq), Feso4°, and FeHS04 are the principal species, the
predominance of ferrous sulphate species (Feso4°) was
calculated by Iwai et al.(33) from the following equations:
K, 3o.s0 c
Fe2 + + so 2 -4 = Feso4° K1 = 7.26 (IV.3.6)
Fe2 + + HS04 + = FeHS04
+ K2 = 1.67 (IV.3.7)
HS04 - H+ + so 2 - K3 = 0.0086 (IV.3.8) = 4
K1 = [Feso4°] I [Fe2 +] [S04 2+]'
K2 = [FeHS04 ] I [Fe2 +J [HS04 +],
K3 = [ H+] [So42-J I [HS04 -] .
Fe2+ (aq) = ferrous aquo-ion
42

These formation constants confirms the predominance
of ferrous sulphate, Feso4°, compared to the ionic species
under acid conditions.
Iwai et al.(33) suggested that the oxidation of fer
rous ions, in more dilute sulphuric acid solution, below 0.4
mol.L- 1 , also proceeds through a different reaction mecha-
nism. The reaction rate was second order with respect to
ferrous ions concentration and first order with respect to
the oxygen partial pressure. Furthermore, the reaction rate
was affected by sulphate and hydrogen ions. The rate clear
ly increased with a decrease in the hydrogen ion concentra
tion. However, Iwai et al. (33) stated that
"further detailed examination of the role of hydrogen
or sulphate ion in the oxidation of Fe(II) in dilute
sulphuric acid solution was not possible because of the
difficulty in manipulating experimental conditions''.
It is thought that the concentration of sulphate ion
is very sensitive to small changes of pH at concentrations
of sulphuric acid just below 0.4 mol.L- 1 containing 0.2
mol.L- 1 ferrous sulphate. Thus Iwai et al. (33) found it
difficult to maintain a constant concentration of sulphate
ions over a range of ferrous concentrations.
IV.3.2 OXIDATION OF FERROUS IONS, Fe(II) IN LOW
CONCENTRATIONS OF ACID SOLUTIONS
Oxidation of ferrous ions, Fe(II), in more dilute
solutions of sulphuric acid, (0-3.5 pH) and at temperature
43

of 2s0 c is slow (14,14,37,38) and the overall chemical
reaction proposed to take place up to a pH value about 3.5
appears to be the same overall reaction proposed in equation
(IV.3.1).
Although the reaction at pH values 0-2 also proceeds
along two paths (37), the reaction mechanism suggested in
this pH range differs from the reaction mechanism in strong
er acid solutions. The reaction mechanism suggested by Iwai
et al.(33), for the oxidation of ferrous ions, Fe(II), in
stronger solutions of sulphuric acid than pH zero is com
pared with the reaction mechanism proposed by Mathews and
Robins (37) at 0-2 pH.
Path 1 describes the proposed reaction mechanism when
the reaction rate is independent of sulphate ions in
stronger acid conditions than pH zero (33):
Path 1
Fe2 + + 02
Fe2 +o + Fe2 + 2
K1
<=====> Fe2 +o2
<=====>
fast
[Fe2 +-0=0-Fe2 +1 -----> [Fe3+-o-o-Fe3 +]
fast
(IV.3.9)
(IV.3.10)
(IV.3.11)
[Fe3 +-o-O-Fe3 +1 + 2H+ -----> [2Fe3 + + H202] (IV.3.12)
On the other hand, ferrous and sulphate ions may
associate themselves as the Lewis acid and base, respective-
44

ly, thus a Fe(II) sulphate-complex (Feso4°) may be the
reacting species in the rate determining step of the sul
phate ion dependent reaction path (31,33).
Path 2
Fe2 + +
ko
<=====> Fe2 +o 2
so 2 -4
kl
<======> Feso4° k'
(IV.3.13)
(IV.3.14)
fast
[Fe2+-0=0-FeS04°J----->[Fe3 +-o-O-Fe3 +.so42-] (IV.3.16)
fast
[Fe3 +-o-o-Fe3 +.so42-J + 2H+ ---->2Fe3 + + so4
2 - + H2o2
(IV.3.17)
Conversely, Mathews and Robins {37) suggested that
FeoH+ were the reacting species in the pH
range of 0-2. Although ferrous ions hydrolyzes to produce
FeoH+ and other arrays of mononuclear species at pH 7, their
stabilities are known with less precision than for other
common ions {49). The mechanisms proposed by Mathews and
Robins {37) are:
45

Path 1
k1
Fe2 + + o 2 <=====> Fe2 +.o22 +
k' 1
Fe2+.o22 + + Fe2 + +H2o----->
Path 2
Fe2 + + Oz <======> Fe2 +o2
Fe2 + + HzO -----> FeOH+
(IV.3.18)
2Fe3 + +OH-+ 0 H-2
(IV.3.19)
(IV.3.20)
(IV.3.21)
2Hz0 + Fe.022 + + FeOH+ -----> 2Fe3 + + SOH-
(IV.3.22)
(IV.3.23)
(IV.3.24)
The reaction paths suggested by Iwai et al.(33) and
Mathews and Robins (37) are not expected to follow the same
mechanism since the reactions are taking place at different
acid concentrations. The rate limiting step for both ranges
of pH values appears to be the formation of the Fe2 +o 2
complex. While the other rate limiting step in the pH range
below zero appears to be the formation of ferrous sulphate,
Feso4°, the other r.l.s. at pH values 0-2 appears to be the
formation of the Fe2 +.o22 + complex. Thus the rate equation
for the oxidation of ferrous ions, Fe(II), (Equation IV.3.1)
at pH values 0-2 appears to be more characterized by the
following rate expression (37,40):-
46
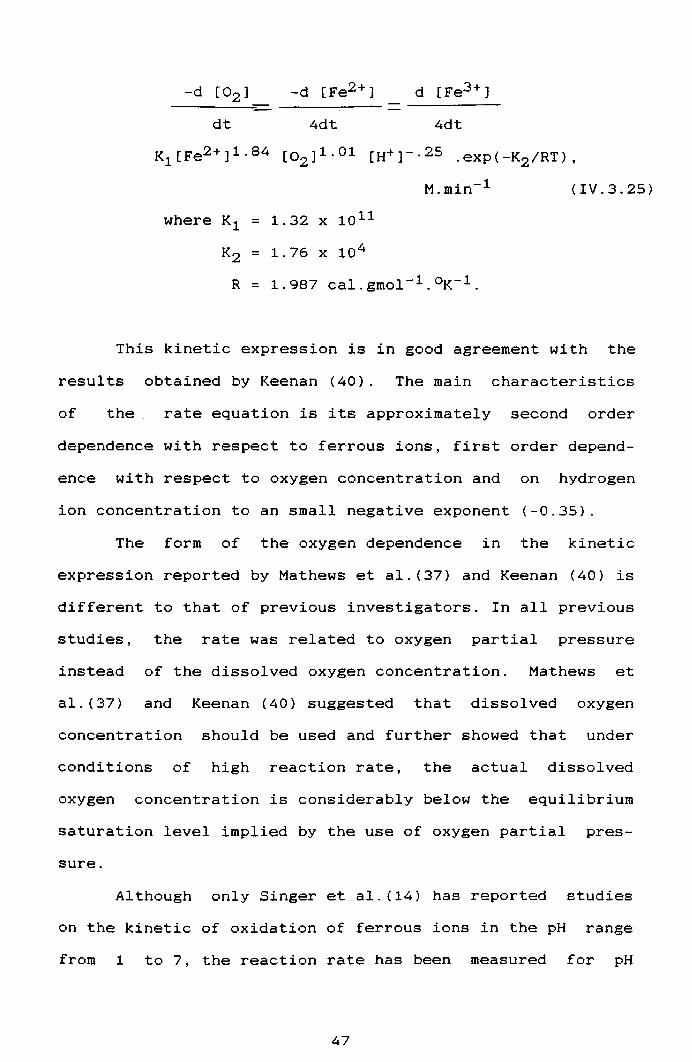
where K1 =
K2 = R =
-d [Fe2 +]
4dt
1.32 X 10¹¹
1.76 X 10⁴
d [Fe3 +]
4dt
M.min- 1
1.987 cal.gmol- 1 .°K- 1 .
(IV.3.25)
This kinetic expression is in good agreement with the
results obtained by Keenan (40). The main characteristics
of the rate equation is its approximately second order
dependence with respect to ferrous ions, first order depend
ence with respect to oxygen concentration and on hydrogen
ion concentration to an small negative exponent (-0.35).
The form of the oxygen dependence in the kinetic
expression reported by Mathews et al.(37) and Keenan (40) is
different to that of previous investigators. In all previous
studies, the rate was related to oxygen partial pressure
instead of the dissolved oxygen concentration. Mathews et
al.(37) and Keenan (40) suggested that dissolved oxygen
concentration should be used and further showed that under
conditions of high reaction rate, the actual dissolved
oxygen concentration is considerably below the equilibrium
saturation level implied by the use of oxygen partial pres-
sure.
Although only Singer et al.(14) has reported studies
on the kinetic of oxidation of ferrous ions in the pH range
from 1 to 7, the reaction rate has been measured for pH
47

2.0
Experimental points in low pH range
1.0 - d log I Fe(II) I
k" : dt
0 Po2 : 0.20 atm.
Temp. 2s·0c -1.0
7 - -2.0 >-n, "C 0 - I ... I ~ -3.0 I CTI I £ I
t:, I -4.0 6 / Extrapolation of
/ rate law:
-5.0 l d!Fe(II)] : k!F •2]!owJ2 R / dt e 02
I
-6.0 1 2 3 4 5 6 7
pH
Figure IV.3.1: Oxidation Rate of Ferrous Ions as a Function of pH (14).

values below 3.5 and for pH values greater than 4.5. The
reaction rate at pH values less than 3.5 is similar to that
formulated in equation (IV.3.2).
The mechanism of oxidation of ferrous ions in the pH
range from 3.5 to 4.5 does not appear to have been studied
by any investigator. The mechanism of reaction in this pH
range seems to be more complex since the reaction rate
increases rapidly. Figure IV.3.1 shows the dependence of
the rate of oxidation of ferrous ions on pH in the range of
1-7 as reported by Singer et al.(14).
At pH values greater than about 4.5, the overall
chemical reaction appears to be described by the following
equation (14,38,39):
Fe2+ + 0.2502 + 20H- + 0.5Hz0 -----> Fe(OH)3 (IV.3.28)
Minegishi et al.(38) pointed out that the overall
process comprises the sequential steps of the dissolution of
gaseous oxygen at the surface of rising bubbles and the
oxidation of ferrous ions by dissolved oxygen. Thus a better
approach would be to consider both processes:
0 2(g) ----> 0 2(aq)
Fe2+ + 0.25 Oz(aq) + 0.5 H2o =
(IV.3.29)
Fe(OH)~ ~
(IV.3.30)
Although the oxidation of ferrous ions at a constant
pH between 4.7-5.5 (38) and 6-7 (39) appears also to proceed
48

along two paths, one homogeneous reaction in the solution
and the other heterogeneous reaction on the surface of
ferric hydroxide precipitate; these reactions and the reac
tion rates were expressed differently,
a) homogeneous reactions:
Fe2 + + 0.25 Oz(aq) + 20H- + 0.5 HzO -----> Fe(OH)3
(38) (IV.3.31)
FeZ+ +Oz-----> Fe(III) + Oz- ( 39) (IV. 3. 32)
"the oxygen radical, o2-, is rapidly consumed to form
H02 by oxidising three additional ferrous ions" (39).
b) heterogeneous reactions:
Fe2+(ad) + 0.25 Oz(aq) + 20H- + 0.5 HzO -----> Fe(OH)3
( 38) (IV. 3. 33)
Fe2 +(ad) +Oz-----> Fe(III) + Oz- ( 39) (IV. 3. 34)
Where FeZ+(ad)• represents the adsorbed ferrous ions
on the surface of ferric hydroxide. Thus the catalytic
effect of ferric hydroxide, Fe(OH) 3 , on the oxidation of
ferrous ions was also expressed differently as follow,
Minegishi et al. (38): constant pH in the range 4.7-5.5
- d[Fe2 +] / dt = Ko[Fe2 +] [Oz(aq)J (IV.3.35)
Tamura et. al. ( 39): constant pH in the range 6-7
- d[FeZ+] / dt = K + k' [ Fe (III) ] [Fe2 +] (IV.3.36)
However, while the first rate equation, equation
IV.3.35, was obtained from studies in a sulphate system, the
second rate expression, equation IV.3.36, was obtained from
49

measurements in NaCl04-NaHC03 solution.
At pH values less than 5.0 and temperatures lower than
298°c the concentration of dissolved oxygen appears to reach
saturation immediately after the start of the oxidation
process. At higher pHs and temperatures, the oxygen concen
tration was found to be lower than the saturation value.
This observation led Minegishi et al. (38) to suggest that,
in the first case (pH<5, T<298°K), the overall rate was
likely to be controlled by chemical reactions; while at
higher pH and temperature, when the oxidation rate of fer
rous ions was higher, consequently controlled by both chemi
cal reactions and the rate of oxygen dissolution was in
volved. Figure IV.3.1 shows the dependence of the rate of
oxidation of ferrous ions on pH as found by Minegishi et al.
(38).
50

FIGURE (IV.3.~). Effect of pH on the Rate of Oxidation of
Ferrous Ions. Fe~·. after Minegishe et al. (38;.

IV.4 HYDROLYSIS AND PRECIPITATION OF FERRIC IONS
The hydrolysis and precipitation of ferric ions,
Fe(III), is an important process in the field of hydrometal
lurgy because it is a method for eliminating iron from leach
solutions.
Hydrolysis and precipitation of ferric ions is a
complicated process sensitive to a large number of varia
bles. It is recognized that this process has not been as
thoroughly studied in the sulphate system as it has in the
nitrate, perchlorate or chloride system (8,9,41). Although
ferric ions, Fe(III), complex strongly in sulphate and
chloride system, the chemistry in the sulphate system is
further complicated by the fact that the first dissociation
of sulphuric acid in aqueous solutions at 2s0 c proceeds
completely, [equation (IV.4.1)], while the second dissocia
tion is a moderately weak electrolyte, [equation (IV.4.2)],
(42). Thus it is worth to mention that the bisulphate ion
has a buffer action.
= +
= +
HSO + 4
so 2 -4
(IV.4.1)
(IV.4.2)
The pH at equilibrium between sulphate and bisul
phate ion is 1.99.
The composition and structures of iron (III)
(hydr)oxide precipitates depend on the ferric ion concentra
tion, the nature of the anion present, the pH, temperature
and period of ageing (45,47,48).
The polymers formed in nitrate solutions do not appear
51

to include this in the polymer chain. Whereas the polymers
formed in the chloride solution contain some chloride ions
in place of the hydroxyl ion (46,47)
Knight et al. (44) studied the hydrolysis and precipi
tation of ferric ions, Fe(III), in nitrate, perchlorate and
chloride systems. The time for a visible precipitate to form
during the addition of NaHC03 to iron solutions, having
concentrations in the range of O.Ol-0.3M, was measured at
2s0 c and the solid products formed were examined by x-ray
diffraction and electron microscopy. It was claimed that, in
the nitrate system, the precipitate is goethite, (alpha)
FeOOH, in perchlorate and chloride solutions the precipi
tates are lepidocrosite (beta)-FeOOH and (gamma)-FeOOH,
respectively. At high base concentrations (NaHC03 ), perchlo
rate solutions may produce (alpha)-FeOOH.
The hydrolysis and precipitation steps of iron (III)
at 90°c is followed by subsequent loss of water and internal
crystallization of (alpha)-FeOOH to (alpha)-Fe2o3 in nitrate
solution or by dissolution of (beta)-FeOOH and growth of
(alpha)-FeOOH in chloride solution (47).
Feitknecht et al. (48) measured the solubility con
stants of some metal oxides and hydroxides, including ferric
hydroxide, in aqueous solutions. Considering the case where
there exists only one modification of a certain crystalline
hydroxide or oxide and a sufficient amount of hydroxide ion
is added rapidly, a very fine crystalline precipitate is
formed with a disordered lattice, and this is an active
form of the compound Me(OH) 2 (active) or Me02 ; 2 (active). A
52

metastable equilibrium is established between this active
hydroxide or oxide and the solution, and this equilibrium
changes, more-or-less rapidly, approaching the limiting
value (of the solubility product) for an inactive form as
larger and ordered crystals are formed upon ageing. Thus
solubility product of a fresh precipitate is higher than
that of an aged, inactive form.
If there is only slight supersaturation of the metal
salt solution with hydroxide ions, nucleation and crystal
growth are often slow. Consequently, an inactive form of the
solid may settle out since equilibrium with the solution may
be established only gradually. Under such conditions short
term measurements do not give reliable values of the solu
bility product (48).
Hydroxides can occur in amorphous as well as various
crystalline modifications. The tendency to form amorphous
precipitates increases with the valency of the metal ion.
Amorphous precipitates may also show different activities.
Ageing of ferric hydroxide is strongly accelerated
when the temperature is increased and it may occur through
the following changes: either the active form of the unsta
ble precipitate becomes inactive, or a more stable modifica
tion of the precipitate is formed. Moreover, deactivation
of amorphous ferric hydroxide, Fe(OH) 3 may also be accompa
nied by condensation (formation of a more complex molecule)
and dehydration since ferric oxide, (alpha-Fe203), is more
stable than the primarily precipitated ferric hydroxide,
Fe(OH)~. Thus upon ageing of ferric hydroxide, non-homoge-~
53

neous solids may form and the solubility product, measured
under these circumstances, is usually referred to the most
active component (48):-
I
r----> (am.} Fe0n;2 (0H} 3 _n (inactive} I
(am.} Fe(OH} 3 (active~-----> (alpha}- FeOOH (active}
(am.}=amorphous
\ \
~----> (alpha}- Fe2o3
Feitknecht et al.(48} obtained the solubility
product for the various precipitates and they are reproduced
in Table IV.4.1.
54

TABLE IV.4.1
Precipitate Log S0
arn.Fe(OH) 3 (most active) -38
arn.Fe(OH) 3 (active) -38.7
arn.Fe(OH)? (inactive) -39.1 ~
(alpha)-Fe2o3 . -42.7
55

IV.4.1 FERRIC IRON SPECIES IN SOLUTION
Although a number of valence states of iron are well
known, the potential-pH diagram for the Fe-H2o system
(Figure IV.4.1) and other similar diagrams indicate that
only +2 and +3 oxidation states predominate at pH around 4.5
in the whole range of oxidation potential. Since it might be
assumed that the compounds precipitated are closely related
to the ferric complexes present at the instant of the pre
cipitation, it becomes very important to know which ferric
species exist in the solution.
IV.4.2 HYDROXYL COMPLEXED SPECIES
It is widely known that ferrous ions do not begin to
hydrolyze from an acid dissolution until the pH is in-
creased to around 7, thus an array of mononuclear species
such as FeOH+, Fe(OH) 2 , Fe(OH) 3 - and Fe(OH) 42 - are not
expected to be formed in solution. Conversely, ferric ions
begin to hydrolyze at pH>l (49).
Hedstrom (1953), quoted by Baes et al.(49), identified
various ferric hydroxyl species such as Fe(OH) 2 +, Fe(OH) 2 +
and Fe2 (0H) 24+ at 25°c in 3M sodium perchlorate. These
results have been widely referenced and confirmed by several
workers (18,41,43,44,63,46,50-52,54,55). Bierderman, also
quoted by Baes et al.(49), identified Fe3 (0H) 45 + as a minor
hydroxyl species. Moreover, ultracentrifugation of saturat
ed solutions led to an estimate of the equilibrium constants
56

-2 -1 a t 2 3 4 6 6 7 8 9 10 11 12 13 14 15 16 2,Z 2,2
Y)2 2
1,8 1,8
1,6 1,6
1,4 1,4
1,2 Fi O --? e " . 1,2
t t
0,8 ©----------.Q,8
0,6 0,6
0,4 --.... 0,4 -----0,2 0,2
0 ©-__ ++ 0 -- Fe - -0,2 0,2 -------- -0,4 --
-0,6
0,8 -0,8
-1 -1 I
Fe I
-1,2 cp -1,2
-1,4 -1,4
-1,6 -1,6
-1,s -1,8 -2 -1 0 1 2 3 -4 5 6 7 8 9 10 11 12 13 14 15pH16
F!GURF I\/ .4.1: Potential-pH Diagram for Lho Fe- Hz.0 S~stPm at 2':i°C (BS).

of Fe(OH) 3° and Fe(OH) 4 - hydroxyl species. Although other
hydroxyl species have been reported e.g., (Fe(H2o) 63+,
Fe(H2o) 5 (0H) 2 + and Fe2 (H2o) 8 (0H) 24+) there is still serious
disagreements about their exact chemical compositions and
equilibrium constants (49).
IV.4.3 DEVELOPMENT OF PREDOMINANCE REGIONS FOR FERRIC
HYDROXYL SPECIES
For the purpose of this study, predominance diagrams
showing the various ferric hydroxyl species and the solubil
ity of amorphous ferric hydroxide have been constructed on a
log-activity versus pH diagram. These diagrams were con
structed using software developed in the Department of
Mineral Processing and Extractive Metallurgy of The Univer
sity of New South Wales (95). In the first diagram, Figure
V.4.2, the predominance area of the various hydroxyl corn-
plexes is shown. In the second diagram, Figure V.4.3, the
stability of ferric hydroxide with respect to each ferric
hydroxyl species is given. Appendix D tabulates the recent
thermodynamic data used to construct these diagrams. The
hydrolysis reactions of ferric ions and the equations relat
ing their equilibrium constants and pH are presented in
Appendix E.
It can be seen from these diagrams that each complex
predominate under different conditions of pH and ferric ion
concentration. At low concentrations of hydroxyl species,
e.g. 1-5 mg.L- 1 , and pH values about 4.5, the predominant
57

··- --
0 1:298.15
' 6·· 7 . 1 l
21
3 l
4 l 1 3 4
2 I
5
6
~
::: 7 ..... ~
w ~8
0 1 2 3 4 5 6 7 8 9 10 11 pH
FIGLRE \V. 4 .2: Distribution of Ferric hydroxyl species as a function of pH at 25°C.
·-., 1 Fe+++ ( -1 • 1 l 12 Fel'JH++ (-54. 80) 3 Fe (CIH)2+(-106.74l 4 Fe (l'JHJ 3 CRQl C-154. 79) 5 FeCl'JHl4-C-198.39l 6 Fe2 CCIH) 2++++ (-111. 55)
17 Fe3Ce1Hl4+++++(-221.46l pH:0/0/.25 pHZel:0/0/0
lpFE!llll:0/.25/0
s
12 13 14

0 1:298.15
1 i I
~
3
4 1 5
6
~
::: 7 ...... - I w ~8
1
,.
B
2
3
1 Fe+++(-1.lJ
1
·2 FeClH++(-54.80) 3 Fe !ClHJ2+(-106.74J
14 Fe rnHJ 3 CRQJ C-154. 79) 5 Fe rnHJ 4- (-198. 39) 6 Fe2 (('.]HJ 2++++ (-111. 551
17 Fe3 Ct'lHJ 4+++++ (-221. 46) 8 f•t'lt'lH(RMJ (-109.B2J pH:0/0/.25 pH2t'l: 0/0/0 .
lpFE I I l I J: 0/. 25/0
0 1 2 3 4 5 6 7 B 9 10 11 12 13 14 pH
FIGURE lV .4.3: Distr ib.J tion of ferric hydroxyl species and their stability uith ferric hydroxide, Fe(OH~ (am.) at 25°C.
·-.,

ferric hydroxyl species would be Fe(OH) 2 +.
Table IV.4.2 summarizes the hydrolysis reactions for
ferric ions together with their equilibrium constants with 1
and 3M of sodium perchlorate solutions, or otherwise stated.
58

TABLE IV.4.2
-Log K, 25°c
lMa 3Ma Ref.
Fe(OH)~+ + H+ = Fe3 + + H2o 2.79 3.05 (49) (IV.4.3)
2.88b (52)
3 .16 3.06c (55)
2 .19 (58)
Fe(OH) 2 + + 2H+ = Fe3 + + 2H2o 5.85 6.31 (49) (IV.4.4)
6.85b 5.7c (52)
4.9 (55)
Fe2(0H)2 4+ + 2H+ = 2Fe3 + + 2Hz0 2.72 2.91 (49) (IV.4.5)
3.29b (52)
3.22c (55)
2.95 (58)
Fe3 (0H) 4 5+ + 4H+ = 3Fe3 + + 4Hz0 6.56 5.77 (49) (IV.4.6)
Fe(OH) 3 ° + 3H+ = Fe3 + + 3H2o <12 (49) (IV.4.7)
Fe(OH) 4 - + 4H+ Fe3 + + 4Hz0 <21. 6 (49) (IV.4.8) =
2Fe3 (0H) 4 5+ + 2H+ = 3Fe2 COH) 2
4+ + 2H2o (IV.4.9)
Fe2 COH) 2 + = 2Fe(OH) 2 + -3.19a (IV.4.10)
59

Although most of these species have been characterized
in the perchlorate system, it is assumed that they exist in
the sulphate system without incurring in great error (41).
This assumption was confirmed by Sapieszco et al. (1976)
(55) who studied the thermodynamics of aqueous hydroxo and
sulphate complexes and determined the equilibrium constants
for the three first hydrolysis reactions, given by equations
(IV.4.3), (IV.4.4) and (IV.4.5) over the temperature range
of 25-so0 c. The values of the equilibrium constants obtained
(included in Table IV.4.2) show a fair agreement with the
other values tabulated.
Music et al. (1982) (47) studied the formation of
Fe(III) oxyhydroxides and oxides formed by the hydrolysis of
nitrate, chloride and sulphate solutions and claimed that
"in sulphate solutions the formation of FeS04+
complex suppresses the polymerization process and the
formation of oxyhydroxides and oxides".
A Fe(OH)S04 precipitate is formed, at short times, by
hydrolysis of ferric solutions at 9o 0 c and transformation
occurs forming other relatively complex basic iron (III)
precipitates (brown precipitate) after long
times.
hydrolysis
There are still serious contradictions about the
composition and mechanisms of the hydrolysis process of
ferric iron, Fe(III). The difficulties involved in the
investigation of the composition and structures of iron
(III) hydroxide precipitates have been stated by Music et
al.(47) to be:
60

"i. small differences in the values of the parameters
change the composition, structure, and morphology of
the precipitate, and
ii.the experimental methods used in previous studies,
e.g. potentiometry, ultracentrifugation, electron
microscopy, visible spectrophotometry, IR spectropho
tometry and x-ray diffraction have limitations because
none can follow all the stages of the overall precipi
tation process.
Characterization of the precipitate in the colloidal
dimension range (where the hydroxy polymers, small iron
(III) (hydr)oxide particles of complex composition, and so
called amorphous iron (III) hydroxide form) is the least
susceptible to study. The use of 57Fe Mossbauer spectroscopy
does permit a study of each steps involved in the precipita
tion of iron hydroxides and their subsequent
transformation."
pre
and
In the absence of sulphate ions, hydrolysis and
cipitation of ferric ions, Fe(III), forms oxide
(oxy)hydroxide precipitates. The process is thought to take
place through the following steps (43-47).
i. The formation of low molecular weight species
(dimmers, trimmers),
ii. The formation of colloidal dispersions (sols.) of
ferric hydroxy polycations; and
iii.The formation of precipitates or colloidal
dispersions of various ferric oxyhydroxides.
On the basis of Mossbauer measurements, Music et al.
61
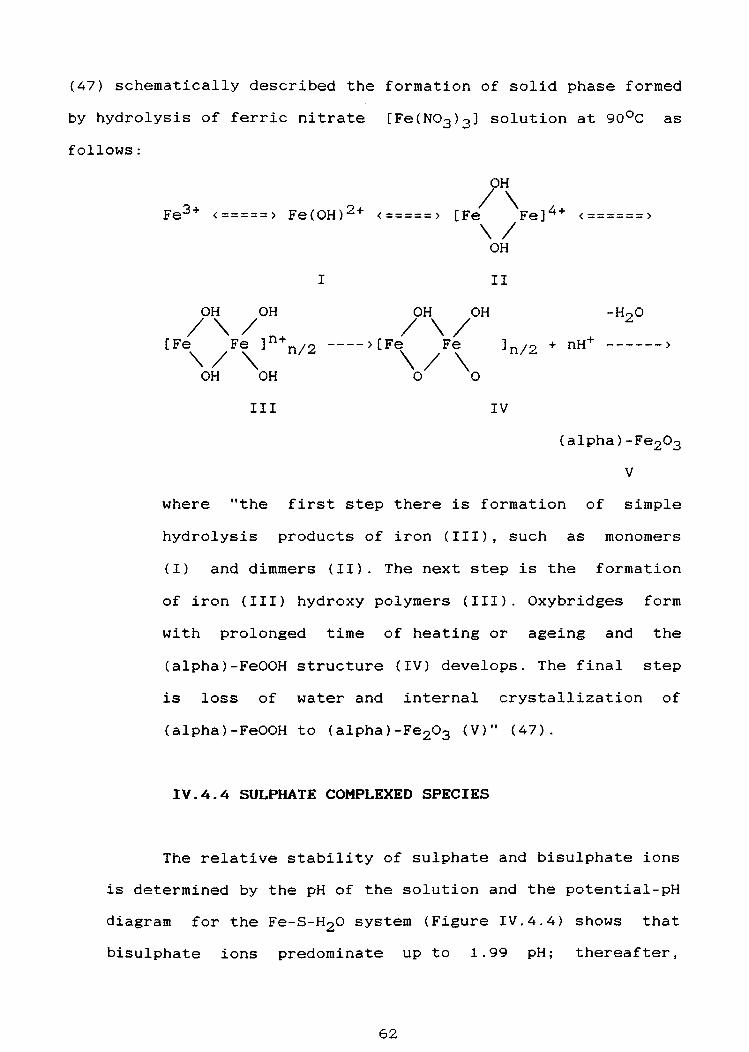
(47) schematically described the formation of solid phase formed
by hydrolysis of ferric nitrate [Fe(N03 ) 3 ] solution at go 0 c as
follows:
OH
Fe3 + <=====> Fe(OH) 2 + <=====> /\ [Fe Fe] 4 + <======> \/
OH
I II
OH OH OH OH
/ '- / n+ [Fe Fe] n/2
'\. / '\ OH OH
/\/ ---->[Fe Fe
\ / \ 0 0
Jn/2 + nH+ ------>
III IV
where "the first step there is formation of simple
hydrolysis products of iron (III), such as monomers
(I) and dimmers (II). The next step is the formation
of iron (III) hydroxy polymers (III). Oxybridges form
with prolonged time of heating or ageing and the
(alpha)-FeOOH structure (IV) develops. The final step
is loss of water and internal crystallization of
(alpha)-FeOOH to (alpha)-Fe2o3 (V)" (47).
IV.4.4 SULPHATE COMPLEXED SPECIES
The relative stability of sulphate and bisulphate ions
is determined by the pH of the solution and the potential-pH
diagram for the Fe-S-H2o system (Figure IV.4.4) shows that
bisulphate ions predominate up to 1.99 pH; thereafter,
62

sulphate ions. Thus ferric sulphate complexing reactions at
4-5 pH may take place predominantly at potentials above
about 0.6 V (SHE) (Figure IV.4.4).
In highly acidic solutions, where Fe(III) remains in
solution, the chemical reactions of ferric sulphate corn-
plexes can be described by the following equations (52,55-
57).
Fe3 + + SO 2- = 4 Feso4 +
Feso4 + + so42 - = Fe(S04 ) 2-
Fe3+ + HS04- = FeHS042 +
Log K,25°c Ref.
( 52) (IV. 4. 11)
1.92b (55)
(57) (IV.4.10)
(55) (IV.4.12)
If the reaction takes place in neutral sulphate solu
tions, the mechanism which describes the precipitation of
ferric hydroxide, would involve the following reactions
according to Sevryukov et al. (1981) (56).
(IV.4.13)
2Fe(OH)S04 + 2H20 = Fe2 (0H) 4 (S04 ) + so42 - + 2H+
(IV.4.14)
4Fe(OH)(S04) + 6H20 = Fe4S04(0H>10 + 3S042 - + 6H+
(IV.4.15)
4(H30)Fe(S04)2 + 6H20 = Fe4S04(0H>10 + 7S042 - + 14H+
(IV.4.16)
+ 2H20 = 4Fe(OH) 3 + so42 - + 2H+
(IV.4.17)
63

Thus it can be seen that the ferric sulphate complex
ing reactions are very dependent upon the pH of the system.
Formation of ferric hydroxide through this reaction mecha
nism implies a successive displacement of sulphate ions from
the inner sphere of the ionic complexes and the extent of
replacement increasing with the acidity. Moreover, the
above mechanism also suppresses the formation ferric hydrox
yl species as suggested by Music et al. (1981) (47). and
explains very well the formation of sulphuric acid during
the process. Goethite, detected in the precipitate, can be
formed by the loss of water according to the following
equation (56),
(IV.4.18)
64

V.4.5 DEVELOPMENT OF PREDOMINANCE REGIONS FOR FERRIC
HYDROXYL AND SULPHATE COMPLEXES
A third newly calculated diagram, Figure (IV.4.5),
showing the stability regions of both ferric hydroxyl and
sulphate complexes as a function of pH has also been con-
structed.
Feso4 +,
The ferric hydroxyl complexes
Feso4-, and Fe2 (S04 )3 in addition
considered are,
to the ferric
hydroxyl species. These are listed in Appendix D with their
thermodynamic data. It can be seen in Figure (IV.4.3) that,
at pH values around 4.5 and low ferric ion activity, the
predominant ferric hydroxyl species is Fe(OH) 2+.
IV.4.6 PRECIPITATION OF FERRIC IONS
Since the iron complexes described above are true
solution species which attain equilibrium with their sur
roundings in seconds (47); such species do not themselves
appear to precipitate although they may form polymers which
lead to iron precipitation. The mechanisms by which a solu
tion entity is transformed into a solid precipitate is
complex and not all steps are well understood. Moreover,
hydroxyl species can also contain sulphate, bisulphate or
sulphate-bisulphate ligands.
A number of precipitates of ferric ions, Fe(III), have
been reported to occur in leach dumps and laboratory column
leaching experiments. Unfortunately, all these precipitates
have not been characterized thoroughly. It appears that
65

0 T: 298.15 I • ' ' '9 )' ' ' ' ' ' ' ' ' [1 F • +++ (-1. I I
I: ·
0
4FoCOHl3CAQlC-154.79l
. . . . 2 FeCJH++ C-54. 80) . .• 3 Fe (l'JHl 2+ (-106. 74)
5 Fe CCJHl 4-C-198. 39) B 16 Fe2CCIH)2++++(-111.55l
21 , · 7Fe3CClHl4+++++C-221.46l 8 FeSC14+C-1B4.68l 9 Fe CSC4l 2- C-364. 36)
31 !10 Fe2(SCJ4l3CAQ) C-536.041 11 SC14--p H: 0/0/. 25
41---~..... 3 4 tpH2CJ:O/O/O · 5 pFECIIIl:0/.25/0
I I
5
;sl I 2 • • : 0...
,..... .... .... 7 ..... I.LI
~8
pSCl4:0/.25/0
o 1 2 3 4 s s 7 a s 10 11 12 13 14 \ pH
FIGURE I\/ .4.5: Distribution of Ferric hydroxyl and Sulphate complexes in
the Fe'+ -SO 2--H O system at 25°C. 4 2

various compounds precipitate simultaneously, and often only
the elemental composition of the precipitated material has
been determined, leaving its exact characterization uncer
tain. According to Sapieszko (55), in laboratory studies
"Fe(OH) 2+ and Feso4 + complexes seem to play the dominant
role in the precipitation of basic ferric sulphates. Feso4+
is the dominating species at all temperatures while Fe(OH) 2+
is the most abundant hydroxyl species at a pH less than 2,
at 25°C."
Thus the only chemical compound reported to precipi
tate was alunite type colloidal particles of hexagonal
crystal symmetry, having a chemical composition of
Fe3 (S04 )2 (0H) 5 .2H2o.
FeOH2+ + 2FeS04+ + 6Hz0 = Fe3(S04)z(OH)5.2H20 + 4H+
(IV.4.19)
Sabean (59) studied the formation of the jarosite
compound, KFe3 (S04 ) 2 (0H) 6 , and plotted a diagram showing the
role of temperature and pH in the Fe2 (S04 )3 - KOH system
(Figure IV.4.6). At temperatures up to 20°c and pH values
above 3.2, a nearly amorphous compound is formed (ferric
hydroxide). At higher temperatures, goethite and hematite
are formed. The hashed area represent the stability of the
jarosite compound, KFe3 cso4 ) 2 (0H) 6 . It can be seen that its
relative stability is increased as the temperature increases
from around 20°c and when the solution pH decreases from
around 3.2 to 1 pH.
Harvey and Linton (61), in 1981, speculated that fresh
precipitated amorphous ferric hydroxide, Fe(OH) 3 probably is
66

oc X Jarosite 200 A Hematite !'::I. /\!::,.
/ 0 Goethite 180 1/,
½ • nearly amorphous material 160 i
•XX b. b. 6 l). /1 140 % 120 i 100 •X,X/ 0 0
' 80
60 ~ . ~, 0 0 0 0 00 ,;o
~. 20 •,X·X. • • • • 0 00
0 1 2 J 4 5 6 1 8 9 10 11 12 13 1{
pi-I
FIGURE IV.4.6: Di2gram of Jarosi te Predominance in

a crystalline form of FeOOH but contains so much adsorbed
water that it appears to be noncrystalline. Their work was
done in nitrate media and whether this suggestion holds for
sulphate solution requires investigation.
Some potential-pH diagrams for the Fe-s-H2o system,
including the jarosite compound KFe3 cso4 ) 2 (0H) 6 have been
calculated at 25°c (19,60). It is seen in Figure IV.4.7
that this compound predominates at pH value less than about
3.0 and at potentials above 0.6 V (SHE). Moreover, this
stability partly supersedes the ferric ion predominance in
these diagrams. At higher pH values than 2.2, goethite,
FeOOH, (formulated as such by Lowson (19) and Brown (60)) is
the stable precipitate. Thus there is a correlation between
the temperature and pH stability plot derived by Babcan (59)
and the potential-pH for the Fe-s-H2o diagrams at 25°c where
jarosite compound is included.
Stumm et al. (54) stated that jarosite was a product
of the aqueous oxidation of pyrite. They emphasized that the
formation of jarosite is particularly favoured because
pyrite provides a source of iron and sulphuric acid. Thus
jarosite compounds are unlikely to form (unless sulphates
are already present) during the aqueous oxidation of pyrrho
tite minerals because the predominant sulphur species formed
is elemental sulphur and not sulphate ions.
The conclusions drawn from this literature are:
i. Jarosite is stable at low pH and moderately
oxidizing potentials,
ii. It is not clear how goethite forms. It may result
67

from ageing of Fe(OH) 3 or directly from the hydrolysis
process.
iii.Various crystalline or amorphous basic ferric
sulphate may precipitate under similar conditions.
Many of these compounds have not been well
characterized,
iv. Ferric hydroxide may form either from the
hydrolysis process or by ageing of basic sulphates.
68

, IGURE lV.4.7: SLabili ty Relati ons Among Jarosite- GoeLhite- Fe;.- -Fe:.;- at, 25°C, 1 aLm. as a funcUon of Eh, pH and activity of, total di ssolved iron. (Activi ty of total dissolved suiphur is 10~M and activity of dissolved pot,assium i s 10,'M) (60) .

IV.S AQUEOUS OXIDATION OF PYRRHOTITE MINERALS BY
MOLECULAR OXYGEN AND FERRIC IONS
In this section, the aqueous oxidation of pyrrhotite
minerals by molecular oxygen and ferric ions, Fe3 + will be
discussed in an attempt to characterize the chemical beha
viour of each pyrrhotite mineral whenever possible.
Table IV.5.1 lists the most common sulphide minerals
in order of their thermodynamic stability. It is noted
that, of the iron sulphides, monoclinic pyrrhotite, Fe7s8 ,
is the most thermodynamically unstable, followed by pyrite,
FeS2 , and troilite, FeS. However, it is known that pyrite
is the most widespread and abundant of all sulphide minerals
(62). This characteristic is not due entirely to its thermo
dynamic stability but as shown in Table IV.5.1, many more
reactive sulphides are theorically more stable than pyrite.
Thus other factors must contribute to the persistence of
pyrite or unstability of monoclinic pyrrhotite.
69

TABLE IV.5.1: FREE ENERGY OF FORMATION OF
FORMATION AT STANDARD TEMPERATURE AND PRESSURE (62)
SULPHIDES
MINERAL FORMULA G0 kJ/mole
Monoclinic Pyrrhotite Fe7s8 -748.52
Oldamite CaS -473.4
Tungstenite WS2 -298.0
Molybdenite MoS2 -297.6
Greigite (synthetic} Fe3s 4 -290.36 (63}
Alabondite MnS -218.1
Sphalerite ZnS -203.4
Chalcopyrite CuFeS2 -179.1
Stibnite Sb2s 3 -173.7
Orpiment As 2s 3 -168.7
Pyrite FeS2 -166.94 ( 7}
Greennockite CdS -145.7
Troilite Fe1.000S -100.42 ( 7}
Galena PbS -96.3
Mackinawite(synthetic} tetragonal FeS -93.30 (63}
Chalcocite cu2S -86.7
Cinnabar HgS -50.7
Covellite cus -48.98 (12}
Argentite Ag2S -40.2
70

Table IV.5.2 lists the equilibrium constant, K, for
acid decomposition of the common sulphide minerals. The
equilibrium constants are referred to the acid decomposition
of sulphides without the presence of an oxidant. The sul
phides may be attacked producing hydrogen sulphide and metal
salts. It is noted that the values vary widely from one
sulphide to another. While values of the equilibrium con
stant for monoclinic pyrrhotite, Fe7s8 , and troilite, FeS,
are large, the equilibrium constants for the copper sul
phides covellite, CuS, and chalcocite, cu2s, and silver
sulphide, argentite, Ag2S, are extremely small. Thus, it can
be seen that the acid decomposition of pyrrhotite minerals
is more favourable than that of copper and silver sulphides.
71

TABLE IV.5.2
CALCULATED EQUILIBRIUM CONSTANT VALUES FOR THE ACID DECOMPOSI
TION OF COMMON SULPHIDES AT 2s0 c (23)
SULPHIDE EQUILIBRIUM CONSTANT, K
9.95 X 10⁷
5.13 X 10³ (64)*
(artificially prepared)
FeS 3.91 X 10²
cos 2.30
NiS(alpha) 1. 75
NiS(beta) 1.12 X 10⁻⁷
ZnS (wur.) 1.55 X 10⁻²
ZnS (sphal.) 7.4 X 10-S
CdS 7.08 X 10⁻⁷
PbS 7.95 X 10⁻⁸
CuS 1 X 10-15
Cu2s 3.16 X 10⁻²⁸
Ag2s 1.26 X 10⁻²⁹
HgS 6.3 X 10⁻³³
72

Another fundamental property of conducting and semi
conducting minerals is the value of the rest potential. For
interfacial electrode processes, the rest potential corre
sponds to the equilibrium (no nett anodic cathodic current)
electrode potentials. Rest potential values for several
metal sulphides are shown in Table IV.5.3. It is important
to remember that a mineral electrode system will establish
and maintain a certain equilibrium potential that depends
not only on the solution composition but also on the compo
sition of the solid phase (65). Thus, when two phases of
different rest potentials are in electrical contact in an
electrolyte, they form a galvanic cell in which the current
will flow through the solution from the mineral having the
lowest potential. By such action, the phase with higher
rest potential in the electromotive series will behave
cathodically, acting as a site for the oxygen reduction
reaction and will be protected from dissolution, whereas the
phase with lower rest potential will undergo enhanced anodic
oxidation (66).
73
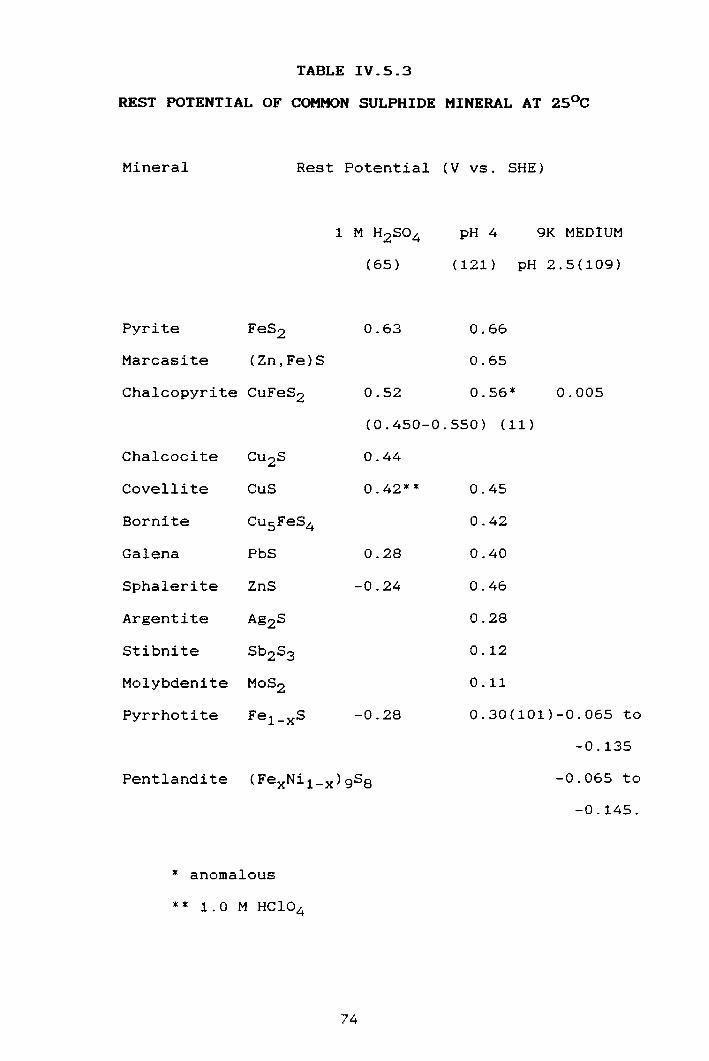
TABLE IV.5.3
REST POTENTIAL OF COMMON SULPHIDE MINERAL AT 2s0 c
Mineral Rest Potential (V vs. SHE)
pH 4 9K MEDIUM
(121) pH 2.5(109)
Pyrite FeS2 0.63 0.66
Marcasite (Zn,Fe)S 0.65
Chalcopyrite CuFeS2 0.52 0.56* 0.005
(0.450-0.550) (11)
Chalcocite cu2S 0.44
Covellite CuS 0.42** 0.45
Bornite Cu5 FeS4 0.42
Galena PbS 0.28 0.40
Sphalerite ZnS -0.24 0.46
Argentite Ag2S 0.28
Stibnite Sb2S3 0.12
Molybdenite Mos2 0.11
Pyrrhotite Fe1_xs -0.28 0.30(101)-0.065 to
-0.135
Pentlandite (FexNi1-x>9S0 -0.065 to
-0.145.
* anomalous
** 1.0 M HCl04
74

According to Table IV.5.3, pyrite has the highest rest
potential while pyrrhotite has the lowest. Consequently,
pyrite has been widely reported as the most active sulphide
mineral for oxygen reduction only slightly less active than
gold and platinum (67-69). Independently, Southwood (66)
presented an order of the common sulphide minerals according
to their rest potentials. Apparently, the acid and tempera
ture conditions are the same as such reported in Table
V.5.3. Although, both Hiskey et al. (65) and Southwood (66)
do agree in the following sequence, pyrite> chalcopyrite >
galena > sphalerite; the latter did not account for pyrrho
tite. Miller (121) reproduced the rest potential values of
various sulphide minerals reported by Majima (1969) at 4.0
pH value. It is seen that although pyrrhotite has also been
neglected the order, stated above, is maintained in this
medium. Natarajan et al.(109) measured the rest potential
of chalcopyrite, pentlandite and pyrrhotite in 9K medium and
2.5 pH and the values are reproduced in Table IV.5.3. In
this medium, pyrrhotite and pentlandite have similar rest
potentials which are approximately lOOmV lower than that of
chalcopyrite. Although it is not expected to have the same
rest potential value in these mediums (1M sulphuric acid, pH
4 and 2.5 pH), it is remarked that an accurate value of rest
potential for pyrrhotite may be difficult to determine since
the variable, heterogeneous composition of natural pyrrho
tite undoubtedly inhibits the reproducibility of the meas
urement. However, it might be concluded that pyrrhotite has
a lower rest potential value than the other common sulphide
75

minerals.
From the thermodynamic properties reported for pyrrho
tite minerals and their relationship with the other common
sulphide minerals, it is noted that monoclinic pyrrhotite
minerals are the most thermodynamically unstable sulphide
mineral followed by sphalerite, chalcopyrite, pyrite and
stoichiometric pyrrhotite. However, the highest equilibrium
constant for acid decomposition was reported for monoclinic
pyrrhotite, sphalerite and stoichiometric pyrrhotite. The
rest potential value for "pyrrhotite minerals" seems to have
the lowest value in the series. Thus pyrrhotite minerals, in
general, appears to be the most reactive common sulphide
mineral to acid decomposition and to an aqueous oxidation
process.
IV.5.1 AQUEOUS OXIDATION OF PYRRHOTITE MINERALS BY
FERRIC IONS
Ferric chloride and ferric sulphate are both impor
tant leaching reagents for sulphide minerals. Few investiga
tions have been conducted to elucidate the reaction kinetics
and to delineate the important leaching variables of pyrrho
tite minerals by these reagents. The stability of pyrrhotite
minerals in the presence of ferric ions, Fe3 +, can be pre
dicted by the oxidation potential of the ferrous-ferric
equilibrium (70) :-
76

Fe3 + + e- -----> Fe2 +
bG = -17.69 Kcal/mol
which at 25°c, is given by
[a.Fe3+]
Eh= 0.771 + 0.0591 log------
[a.Fez+]
a= activity.
(IV.5.1)
(IV.5.2)
Note that a solution of pure Fe3 + (without any
would have, in theory, an infinite oxidizing potential,
dilute solutions have virtually no oxidizing capacity since
even the slightest extent of reduction reduces the Fe3 +;Fe2 +
ratio quickly and hence the oxidizing potential.
The aqueous oxidation process of pyrrhotite minerals
whether as FeS, Fe7s8 or/and Fe9s 10 , by ferric ions, Fe3 +,
implies to possess a complicated model. This model must
explain the effect of the various chemical behaviours of the
pyrrhotite minerals, the media, acidity, and the concentra
tion of ferrous and ferric ions on the equilibrium and the
kinetics of oxidation. The process might be explained by
the following anodic reactions, (IV.5.3), (IV.5.4) and
(IV.5.5) where ferrous ions and elemental sulphur are
widely considered as the main products.
Fe1 _000s -----> Fe2 + + s 0 + 2e-
6G = -5.15 Kcal/mol, ( half-reaction)
Fe1 _000s + 2Fe3 + -----> 3Fe2 + + s 0
(IV.5.3)
bG = -30.35 Kcal/mol (overall reaction with ferric
ions)
77

Fe7s8 -----> 7Fe2+ + ss0 + 14e-
AG= -46.95 Kcal/mol,(half-reaction)
Fe7 S8 + 14Fe3 + -----> 21Fe2+ + s 0
(IV.5.4)
AG = -201.55 Kcal/mol(overall reaction with ferric
ions)
2+ 0 Fe9S1o -----> 9Fe + 10S + 18e- (IV.5.5)
(bG0 ) for Fe9s 10 appears to be not available)
It can be seen that the free energy change for the
overall reaction of monoclinic pyrrhotite with ferric ions
is more thermodynamically possible than that of stoichiomet
ric pyrrhotite and ferric ions. These reactions lead to a
decrease of ferric ions concentration and to an increase of
ferrous ions concentration if an oxidant, e.g. oxygen, is
absent from the solution.
Dissolved molecular oxygen may participate directly in
the aqueous oxidation process of pyrrhotite through a ca
thodic reduction process as well as indirectly by regenerat
ing ferric ions, Fe3 +. Oxygen is a strong oxidant if the
reduction occurs in a "more-or-less synchronous four-elec
tron step" (54). During the regeneration of ferric ions,
the maximum Fe3 +;Fe2+ ratio is limited to the equilibrium
value defined by the oxygen potential:-
78
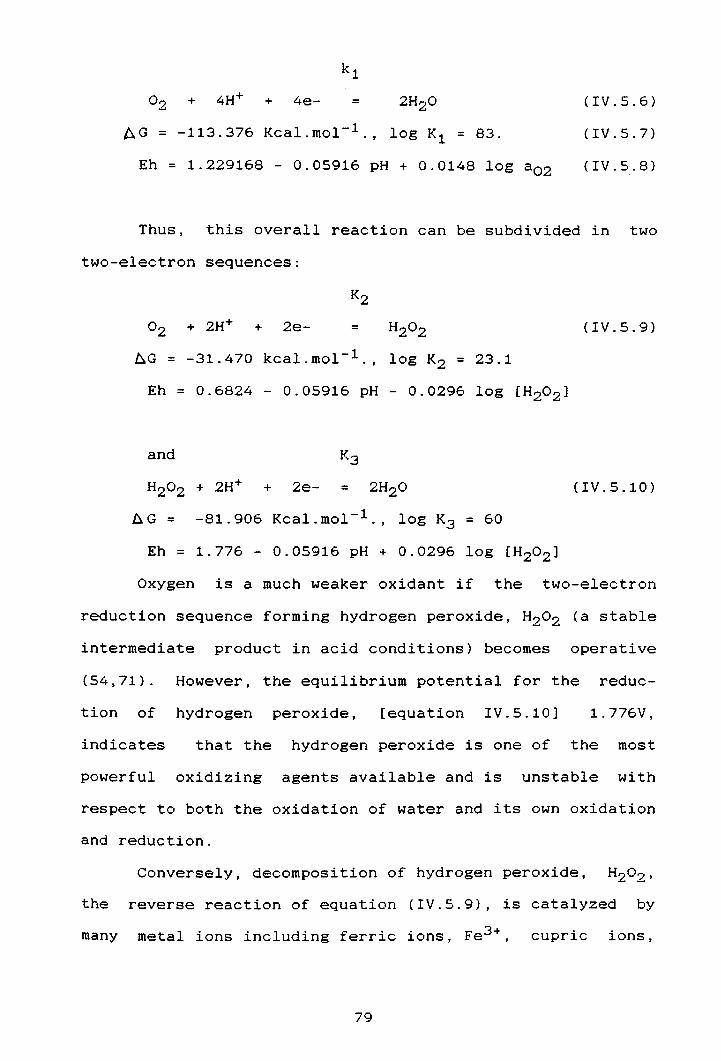
=
AG= -113.376 Kcal.mol- 1 ., log K1 = 83.
Eh= 1.229168 - 0.05916 pH+ 0.0148 log a02
(IV.5.6)
(IV.5.7)
(IV.5.8)
Thus, this overall reaction can be subdivided in two
two-electron sequences:
02 + 2H+ + 2e- = (IV.5.9)
~G = -31.470 kcal.mol- 1 ., log K2 = 23.1
Eh= 0.6824 - 0.05916 pH - 0.0296 log [H202 ]
and
H202 + 2H+ + 2e- = 2H20 (IV.5.10)
AG= -81.906 Kcal.mol- 1 ., log K3 = 60
Eh= 1.776 - 0.05916 pH+ 0.0296 log [H202]
Oxygen is a much weaker oxidant if the two-electron
reduction sequence forming hydrogen peroxide, H2o2 (a stable
intermediate product in acid conditions) becomes operative
(54,71). However, the equilibrium potential for the reduc-
tion of hydrogen peroxide, [equation IV.5.10] 1.776V,
indicates that the hydrogen peroxide is one of the most
powerful oxidizing agents available and is unstable with
respect to both the oxidation of water and its own oxidation
and reduction.
Conversely, decomposition of hydrogen peroxide, H2o2 ,
the reverse reaction of equation (IV.5.9), is catalyzed by
many metal ions including ferric ions, Fe3 +, cupric ions,
79

cu2+, and cobalt ions, Co2+ of which ferric ions is likely
the most effective (58). Moreover, the presence of ferrous
ions [Fe2 +J consumes hydrogen peroxide rapidly to form
ferric ions and this decomposition is known to be promoted
by the presence of freshly precipitated ferric hydroxide in
solutions where pH values vary from 4.3 to 11.3 {58). Thus
if hydrogen peroxide, H2o2 , is formed during the aqueous
oxidation of pyrrhotite by molecular oxygen at pH around
4.5, it might be decomposed to molecular oxygen or oxidize
ferrous to ferric ions and affect the oxidation process of
pyrrhotite.
Investigators of conventional leaching processes,
involving acid ferric chloride and ferric sulphate solu
tions, have found that the overall reaction is best de-
scribed by the following stoichiometries (22,70,72,73)
whether the mineral is natural, artificial (from thermally
decomposed pyrite), or a stoichiometric compound or not:
[Ref.]
Thermally decomposed pyrite (22):
Fesl.15 + 2Fe3 + -----> 3Fe2 + + 1.15S0 (IV.5.11)
Natural pyrrhotite (70):
FeS+2Fe2 (S04 ) 3 ----->3FeS04 + s 0 (IV.5.12)
Natural monoclinic and hexagonal pyrrhotite (72):
FeS + 2FeC13 -----> 3FeC12 + s 0
Natural pyrrhotite (73):
(IV.5.13)
1.82Fe3 + ----->
2.71Fe2 + + o.013Ni2 + + o.011cu2 + + 0.342Co2+ + s 0 (IV.5.14)
80
Thus ferric ion leaching has several advantages over
direct acid decomposition of pyrrhotite. Firstly, sulphur is
produced in the elemental form eliminating the need for an
additional plant to recover sulphur dioxide (from a pyromet
allurgical process). Secondly, acid is not consumed during
the reaction and only a relatively low acid concentrations
is necessary to prevent the precipitation of an iron com
pound. Thirdly, the iron leaching media can be conveniently
regenerated, either by electrolysis or bacterial oxidation
(70). Moreover, accumulation of ferrous ions has no effect
on the rate of leaching (22,70).
In studies of sulphate leaching of pyrrhotite (70), at
temperatures below 5o0 c, linear kinetics were observed. The
apparent activation energy was reported to be 37.7 KJ/mol.
The rate was found to be independent of the ferric ion
concentration between 0.025 to 0.208 M of ferric ions. These
results, reported by Dutrizac from the unpublished work of
Lowe, suggest that the rate is controlled by chemisorption
on the surface of pyrrhotite. At temperatures above 50°c the
reaction rate decreased sharply because of the formation of
hydrogen sulphide by direct attack on the sulphide.
Subramanian et al. (22) also found that leaching of
thermally decomposed pyrrhotite with about 111 g/1 ferric
sulphate at 0.5 pH about 50% of the sulphur was released in
two hours, but five hours was needed to complete the reac
tion. The temperature at which the reaction took place was
not reported. Precipitation of any ferric iron compound was
prevented by maintaining the pH below 0.5.
81

Recent study (73) on the kinetics of leaching of
nickel, cobalt and copper from pyrrhotite-pendlandite miner
als by acidic ferric sulphate, indicate that the rates are
dependent on both the ferric ion and sulphuric acid concen
tration. The reactions took place in a packed bed reactor in
the absence of oxygen. Potassium permanganate was added
during the dissolution process to maintain a constant poten
tial of 550 V.
It was found that, at a given total iron concentra
tion, the rate of oxidation of pyrrhotite increases rapidly
if the potential of the solution is below 0.550V, but it is
insensitive to further increase in the potential above that
value. When the potential of the solution is increased to
the point where all soluble iron is oxidised to the ferric
state, the leaching rate becomes constant (73). It is also
reported that "the highest oxidation rate is obtained as the
mole fraction of ferric ion in solution is increased to
1.0". This latter statement seems to be in conflict with
that where the rate of oxidation is insensitive to the
potential above 550 V since the potential at 1.0 mole
fraction of ferric ions should be above 0.771 V.
82

IV.5.2 OXIDATION OF PYRRHOTITE AT ELEVATED
TEMPERATURES
Study of the aqueous oxidation of sulphide minerals at
elevated temperatures mainly involves the effects of oxygen
pressure, temperature, particle size, aeration characteris
tics of the autoclave and mixing intensity.
Table V.5.4 presents the stoichiometric reactions,
some experimental conditions for the aqueous oxidation of
pyrrhotite at elevated temperatures and the ferric iron
products reported to have formed under different experimen
tal conditions by a number of authors. It can be seen that
the stoichiometric reactions reported vary even under the
same apparent conditions. The prevalent ferric iron product
is a mixture of various forms of ferric compounds which
have been named differently by various workers. While Downes
(76) simply called it an "iron oxide", Goryachkin (77)
identified goethite and hematite {hydrogoethite), ferrofer
rite, hydromagnetite and basic iron sulphates. The stoichi
ometries for oxygen also varies but the oxygen consumption
rates were not reported. The reaction stoichiometries seems
to have been balanced only according to the iron compound(s}
reported.
83

TABLE IV.5.4:
SOME EXPERIMENTAL CONDITIONS AND STOICHIOMETRIC REAC
TIONS FOR THE AQUEOUS OXIDATION OF PYRRHOTITE AT ELEVATED
TEMPERATURES
1. Mineral: thermally decomposed pyrite with solid/
liquid ratio: 20-30%. Reaction temperature: 110-120°c.
"little sulphuric acid added". Reaction product reported,
iron oxide, ( 76)
4FeS + 302 (IV.5.16)
2. Mineral: nickel-pyrrhotite concentrate. Initial
pure oxygen pressure: 0.21 atm., solid/liquid ratio: 35-40,
reaction time: 3.8 hr., conversion of pyrrhotite: 93.6%,
+and ferric iron reaction product: goethite (hydrogoethite)
and hematite mixture, reaction temperature: 110°c (77).
5FeS + 502 + 2H20----> 4FeOOH + FeS04 + 4S0 (IV.5.17)
3. Mineral: pentlandite and hexagonal and monoclinic
pyrrhotite, solid/liquid ratio: 50. Initial pure oxygen
pressure: 0.5-1.0 atm., Some acidification was required.
reaction time: 3-4 hrs., pyrrhotite conversion: 90-95 % and
ferric iron reaction product: hydrated ferric oxide (78).
2FeS + 1.5 02 + nH20 -----> Fez03.nHzO + 2s0 (IV.5.18)
84

In 1955, Downes (76) suggested a reaction mechanism
for the aqueous oxidation of natural pyrrhotite with water
or for thermally decomposed pyrite with a "small amount of
sulphuric acid'' at temperatures of 110-120°c. The suggested
mechanism is:
FeS + 202 -----> FeS04
6FeS04 + 1.5 0 2 -----> 2Fe2 (S04 )3 + Fe2o 3
Fe2 (S04 ) 3 + 3H20 -----> Fe2o 3 + 3H2so4
(IV.5.19)
(IV.5.20)
(IV.5.21)
FeS + H2so4 -----> FeS04 + H2S (IV.5.22)
2H2S + 02 -----) 2Hz0 + 2s0 (IV.5.23)
H2S + Fez(S04)3 -----) 2FeS04 + HzS04 + s 0 (IV.5.24)
If these reactions are added, the final reaction is
given by equation (IV.5.25):
2FeS + 2FeS04 + 2HzS + 4 1/2 Oz+ HzO -----)
2Fe203 + 3H2S04 + s 0 (IV.5.25)
As this equation differs from the overall reaction
suggested by Downes et al. (76) (Table IV.5.4) it is pointed
out that this mechanism which is the only one published,
was suggested considering the most likely chemical reactions
that could take place under the conditions reported in Table
IV.5.4. Nevertheless the mechanism suggests independent
dissolution processes for pyrrhotite by oxygen and by sul
phuric acid, to form ferrous sulphate. This product is
oxidised to ferric sulphate and then hydrolyzed. On the
85

other hand, hydrogen sulphide is oxidised to elemental sul
phur by oxygen and ferric sulphate. It is believed that
Downes et al. (76) did not account that the oxidation of
hydrogen sulphide is a fast reaction in the presence on an
oxidant, e.g. oxygen, even at ambient temperature. Thus
this compound should not exist as a reactant in the overall
reaction, Equation IV.5.25. Although the oxidation of fer
rous ions and then hydrolysis of ferric ions are fairly well
understood during the aqueous oxidation common sulphide
minerals at ambient and elevated temperatures, the reaction
mechanism of aqueous oxidation of pyrrhotite is far from
clear.
86

IV.6 BACTERIAL OXIDATION OF PYRRHOTITE MINERALS
Pyrrhotite minerals, as other common sulphide miner
als, have been subjected to bacterial oxidation studies. As
pyrrhotite minerals themselves have little or no economic
value, bacterial oxidation has been used as a beneficiation
process to recover the valuable mineral or metals associated
naturally with them.
From the various Thiobacillus species, it is believed
that Thiobacillus ferrooxidans and Thiobacillus thiooxidans
are the major microorganisms directly responsibles for the
aqueous oxidation of sulphide minerals. T. ferrooxidans are
able to derive energy from the oxidation of acidic ferrous
iron as well as inorganic sulphur compounds. T. thiooxidans
are typically found in acidic environments where they ac
count for the production of sulphuric acid from reduced
inorganic sulphur compounds. These bacteria have a remarka
ble acid tolerance, superior to that of any other Thiobacil
lus species, but its optimum growth occurs near pH 4 (110).
Bacterial oxidation of a tin waste concentrate, con
taining about 50 per cent of pyrrhotite minerals, can sub
stantially destroy the pyrrhotite/cassiterite association by
aerial aqueous oxidation. While bacterial oxidation of
pyrrhotite/cassiterite concentrate at 1.8 initial pH favours
the formation of ferric sulphate and sulphuric acid; bacte
rial oxidation stated at 4.5 pH favours the formation of
iron oxides/hydroxides and sulphur as insoluble reaction
products (79).
87
Galvanic interactions, in the presence of microorgan
isms leading to a preferential oxidation of the active
sulphide mineral, play a significant role in a selective
bacterial oxidation of a mixture of sulphide minerals. The
microorganisms first oxidize sulphide minerals having a
lower electrode potential. Therefore, bacterial oxidation of
sulphide minerals is electrochemical in nature.
The rate of bacterial oxidation of a mixture of
pyrrhotite-chalcopyrite and pyrite-chalcopyrite minerals has
been studied by Rossi et al.(80) and Ahonen et al. (111).
They found that pyrrhotite, in a mixture with chalcopyrite,
may have either a positive or negative effect on the solubi
lization of copper, depending on the relative ratio of the
minerals. At an initial pH of 2.38, a pyrrhotite-to-chal
copyrite ratio of 0.5:1 appears the optimum for maximizing
both the rate and extent of the dissolution of copper. At
lower pyrrhotite-to-chalcopyrite ratios, the rate of disso
lution of copper is slower; whereas at higher ratios, copper
tended to be removed from the leaching solution (80). It is
not known why pyrrhotite minerals should improve this proc
ess however, it is though that the preferential dissolution
of pyrrhotite may rapidly increase the presence of ferric
ions in solution attacking the chalcopyrite mineral.
It has been shown (111) that pyrite has a positive
catalytic effect on the dissolution of chalcopyrite because
the electrical conductivity of these minerals allows the
formation of galvanic couple pyrite/chalcopyrite. It has
been reported in an earlier section, Section IV.5, aqueous
88

oxidation of pyrrhotite minerals by molecular oxygen and
ferric ions, that chalcopyrite has a lower rest potential
than pyrite, acts as an anode and is thus preferentially
solubilized.
The reported stoichiometric reactions which occur
during the bacterial oxidation of pyrrhotite minerals are
reproduced below. It can be seen that the amount of oxygen
reported by every investigator varies according to the
particular pyrrhotite mineral and the pH of the leaching
system. Bacterial oxidation of high purity hexagonal pyrrho
tite concentrate at 1.8 initial pH was reported to form
ferrous sulphate, sulphuric acid and elemental sulphur
(Equation IV.6.9). However, X-ray diffraction of the same
leach residues indicated that potassium and ammonio-
jarosite were the principal precipitation products (81). The
amount of iron, precipitated as jarosites, was not stated.
1. Stated at pH: 4.5 (79)
(bacteria) + 2+ 0 2FeS + 4H + o2 -----> 2Fe + S + 2H20 (IV.6.1)
(bacteria)
2Fe2+ + 2H20 + 0.502 -----> Fe2o3 + 4H+ (IV.6.2)
Summing equations (IV.6.1) and (IV.6.2):
(bacteria)
2FeS + 1.502 -----> Fe2o 3 + 2s0 (IV.6.3)
2. Initial pH: 2.38; Final pH: not reported (80)
(bacteria)
89

4FeS + 902 + 4H2o -----> Fe2 (S04 ) 3 + 2Fe(OH) 3 + H2so4
(IV.6.4)
3. Initial pH: 1.8; Final pH: 1.4 (81)
FeS1.10 + H2S04 -----) FeS04 + HzS + O.lS
4FeS04 + 2HzS04 + Oz
(bacteria)
-----> 2Fe2 cso4 )3 + 2H2o
HzS + Fez{S04)3 -----> FeS04 + HzS04 + so
FeS1.10 + Fe2(S04)3 ----> 3FeS04 + 1.1s0
(IV.6.5)
{IV.6.6)
(IV.6.7)
{IV.6.8)
Summing equations (IV.6.5), (IV.6.6), (IV.6.7) and
{IV.6.8):
2FeS1.10 + 2HzS04 + 02
----->2FeS04 + 2.2s0 + 2Hz0 {IV.6.9)
4. Initial pH: 1.91, Final pH: 1.04 (111)
2FeS + 4.502 + 3H+----->2Fe3 + + so42 - + HS04 -{IV.6.10)
2FeS + 1.502 + 6H+ ----->2Fe3 + + 2s0 + 3Hz0 (IV.6.11)
The stoichiometric reactions for the oxidation of
pyrrhotite are directly related to the pH of the system.
While Harris et al.(79) report one and half moles of oxygen
for every two moles of pyrrhotite (FeS/02 = 0.75/1) at 4.5
stated pH, Rossi et al. {80) report nine moles for every
four moles of pyrrhotite (2.25/1) at 2.3 pH and Kandemir
(81) one mole for every two moles of pyrrhotite (0.5/1) at
1.8 initial pH. Ahonen et al. (111) presented two simultane
ous reactions where sulphate/bisulphate ions and elemental
sulphur are main reaction products. This information will
90

be evaluated in the present study.
The performance of bacterial oxidation process is
directly related to the activity level of the microorgan
isms. This activity could be evaluated indirectly by analy
sis of the accumulation of metals in solution, the constant
decrease of pH and constant increase of potential in the
leaching
level of
system. Further, estimation of the microorganisms
activity from the slurry could be obtained by
protein determination followed by fluorescence microscopy
(83,110). Thus, since T. thiooxidans can produce negative pH
values, highly active microorganisms will constantly both
decrease the pH and increase the potential of the system
from the beginning of the process. Higher potential values
are probably due to higher ferric/ferrous ions ratio formed
during the oxidation process.
In general, bacterial oxidation of sulphide minerals
depends greatly in the acclimatization of the bacteria to
the particular mineral, e.g. attachment to the preferred
mineral sites resulting in direct attack, development of
metal tolerant strains of bacteria and temperature. Most
studies on bacterial oxidation have usually employed T.
ferrooxidans and T. thiooxidans which have the ability to
oxidize reduced sulphur compounds and reduced iron to obtain
energy for growth and other life processes. However, there
are other microorganisms which are currently evaluated e.g.
the thermophilic bacterium Sulfolobus acidocaldarious (115)
and moderately thermophilic Thiobacillus-like microorgan
isms (Leptospirillum ferrooxidans) (113). It is claimed that
91

these organisms may operate at temperatures of 70°c and
45°c, respectively, compared with 35-37°c favoured by T.
ferrooxidans and T. thiooxidans. Temperature increase might
remove the need to cool the reactor and improve the kinetics
of the process.
Although it is not understood clearly how the presence
of Thiobacillus ferrooxidans can affect the oxidation of a
sulphide mineral itself; Kandemir (81) suggested that the
dissolution could occur through an electrochemical mechanism
in which bacteria accelerate the cathodic reduction of
oxygen at the sulphide-bacteria interface. Moreover, disso
lution of pyrrhotite could firstly occur through a non
oxidative reaction (reaction IV.6.5), followed by bacterial
cyclic oxidation of ferrous ions (reaction IV.6.6). Ferric
ions then react in fast chemical reactions with hydrogen
sulphide and pyrrhotite itself (reactions IV.6.7 and
IV.6.8). Ahonen et al. (111) restated the above partial
equations and showed that at low pH values, e.g. 1.91 pH,
ferric ions precipitated mainly as jarosites. At higher pH
values, it precipitated as ferric hydroxide. This chemical
behaviour of ferric iron was fully described in section
IV.4.
However, it has to also pointed out that Ahonen et al.
(111) prepared the 9K solution with 0.4 g.L-1 each of
(NH4 ) 2so4 and MgS04 .7H2 which is different to that
suggested by Silverman et al. (114) g.L- 1 :
KCl 0.10, K2HP04 0.50, and MgS04 .7HzO 0.50). It is not
understood the effect of 9K media. Moreover, solubilization
92

of iron from pyrrhotite commenced without a lag period and
was completed only in three weeks. In contrast, only a minor
amount of pyrite was oxidized during the same period, where
soluble sulphate paralleled the iron solubilization. The
faster rate of oxidation of pyrrhotite is ascribable to its
mixed potential, which yields a self-sustained dissolution
below -0.15 V (SCE) (27).
Pyrrhotite minerals have been classified according to
their reactivity to aqueous oxidation as "more" and "less"
reactive species (79). Harris et al. (79) indicated that
during the bacterial oxidation of a "reactive" pyrrhotite,
the pH increases to a value where the oxidation of ferrous
to ferric species becomes kinetically favourable and the
overall rate of oxidation is determined by the rate of
chemical oxidation of ferrous ions. On the other hand,
during the oxidation of a "less active pyrrhotite", the pH
may decrease until a significant ferric ion concentration is
established and the overall oxidation will be determined by
the biologically assisted oxidation of ferrous ions to
ferric ions. This chemical behaviour may not be observed in
an larger operation scale since highly active microorganisms
will constantly both decrease the pH and increase the poten
tial of the system from the beginning of the process
(116,118). A more detailed analysis of continuous bacterial
oxidation of refractory gold minerals is presented in sec
tion VII.7.
It is also indicated by Harris et al. (79) that the
results of the bacterial leaching of pyrrhotite minerals
93
show some degree of lack of reproducibility. The principal
contributing factors to the low degree of reproducibility
are probably the wide range of variability of reactiveness
of pyrrhotite reaction and the as yet incomplete information
on the components of the indigenous microbial population.
Bacteria speciation changes in operations where long resi
dence time, e.g. 50 days, are maintained by enhancing the
growth of other Thiobacillus species than T. ferrooxidans
and T. thiooxidans, e.g. fungus (117). Once acclimatized,
they also become dormant under adverse conditions and revive
as soon as the conditions return to normal (118). It has
also been stated by Miller et al. (119) that "brief inter
ruption in the air supply resulted in a one-week decrease in
the metal extraction".
The principal bacterial oxidation products of sulphide
minerals, particularly those of pyrrhotite minerals such as
elemental sulphur, sulphate ions, ferric ions and other
metal associated with the substrates vary as a function of
pH, potential, leach time and the mineralogical properties
of each substrate (79). Brock et al. (120) reported the
conclusion of Sato who stated that sulphur released from the
crystal structure of pyrite is converted to unstable s 2
molecules, which could be instantly oxidised in the presence
of oxidising agents. From other sulphides (copper, lead,
silver and zinc) stable solid sulphur, s 0 , would be formed
which would eventually be oxidised to sulphate and reacts
slowly with ferric ions in the presence of bacteria. Al
though pyrrhotite minerals have not been mentioned by Sato,
94

it might behave predominantly as the "other sulphides" since
it yields mainly elemental sulphur rather than sulphate
ions at pH values less than 7 (79,80,101,111). Thus, Brock
et al. proposed that the genera Thiobacillus are able to
reduce ferric iron when grown on elemental sulphur as energy
source.
The rate of bacterial oxidation of pyrite was found
related to its type of conductivity, its real electron
structure. According to Karavaico et al. (121) bacterial
oxidation of pyrite with hole conductivity takes place at
higher rate and continuously compared to pyrite electron
conductive. Apparently, electron conductive pyrite is oxi
dised until all excess iron is oxidised and FeS2 becomes
stoichiometric in composition increasing its electrochemical
potential. Oxidation of hole pyrite, iron deficient, a hole
semiconductor remains uncompensated producing ferric iron
into solution for a long time. This kind of study has not
been found in the literature for pyrrhotite minerals.
95

IV.7 LITERATURE SURVEY CONCLUSIONS
The study of the literature indicated that at pH
values less than 7, reduction of oxygen and ferric ions are
the main cathodic reactions during the aqueous oxidation of
common sulphide minerals. However, there is very little
information for the rate of uptake of molecular oxygen
during their aqueous oxidations; particularly for the aque
ous oxidation of pyrrhotite minerals. Reduction of oxygen
and ferric ions are likely the main cathodic reaction wheth
er the process takes place in the presence or absence of
microorganisms, e.g., T. ferrooxidans and T. thiooxidans.
The reaction products produced during bacterial oxida
tion appear to be determined mainly by the pH, temperature
of the system and the actual sulphide mineral. At pH values
above 2 and at ambient temperature; pyrrhotite minerals tend
to yield ferric hydroxide and elemental sulphur predominant
ly.
Autoclave oxidation and bacterial oxidation of common
sulphide minerals are the most attractive alternative proc
esses, to conventional pyrometallurgical processes, for the
recovery of metal values. The kinetics of bacterial oxida
tion or aqueous oxidation at elevated temperature for a
particular sulphide mineral should indicate the residence
time, and, hence, the economic feasibility of the process.
The lack of knowledge of the oxygen consumption rate re
strict the understanding of both chemical and bacterial
oxidation.
96

The mechanism of the aqueous oxidation of pyrrhotite
minerals, whether as stoichiometric, hexagonal or monoclinic
pyrrhotite, is far from clear. Measurement of the rate of
consumption of oxygen; whether in the presence or absence of
microorganisms, may help clarify the process in more detail.
Thus determination of this rate must add to the knowledge
already available and to establish more efficient operating
conditions for chemical and/or bacterial leaching opera
tions. Moreover, measurement of the rate of uptake of
oxygen by pyrrhotite minerals has been unlikely published.
Thus an equipment, called an 'OXYGRAPH' is to be developed
in order to measure this rate.
Aqueous oxidation of sulphide minerals whether at
elevated temperatures with oxygen under pressure or bacteri
ally catalyzed is an electrochemical process in nature.
Sulphide minerals ordered according to their rest potential
values as: FeS<ZnS<PbS<CuS<Cu2S<CuFeS2 <Fes2 appears to
predict their preferential aqueous oxidation, where pyrite
seems the more refractory mineral, cathodically protected,
in the aqueous oxidation process.
A recent and specific potential-pH diagram for the
Fe-s-H2o system at 2s0 c for only pyrrhotite minerals, wheth
er as stoichiometric pyrrhotite and/or monoclinic pyrrhotite
has been scarcely found in the literature. Hamilton et al.
(101) derived a diagram for "FeS and pyrrhotite" using an
earlier thermodynamic data than 1977. Thus using recently
published thermodynamic data, new potential-pH diagrams are
to be developed. Potential-pH diagrams for the Fe-S-H2o
97

system at 2s0 c and higher temperature, where pyrite is
included, indicate that the direction of aqueous oxidation
process for pyrrhotite minerals should produce pyrite.
However, in an aqueous oxidation process of pyrrhotite
minerals; pyrite is not formed as main reaction product.
Thus, elimination of pyrite in this particular potential-pH
diagram should facilitate the understanding the aqueous
oxidation process of pyrrhotite minerals.
Finally, the aqueous oxidation of pyrrhotite minerals
is fully analyzed using these potential-pH diagrams.
Bacterial oxidation of pyrite concentrate at miniplant
scale (30 L x 6 leaching tanks) has not been found in detail
in the literature. Thus, a study performed at Aurotech N.L.
is presented where the effect of flow diagram and dissolved
oxygen concentration are discussed in detail.
98

PART B:
CHAPTER V
DEVELOPMENT OF A POTENTIAL-pH DIAGRAM FOR THE IRON
SULPHUR-WATER SYSTEM AT 2s0 c
V.1 THERMODYNAMIC PROPERTIES OF PYRRHOTITE MINERALS
Lowson (19), in 1982, reviewed the aqueous oxidation
of pyrite and listed the thermodynamic properties of a
number of the iron sulphides. As this seems the most com
plete list published recently it is reproduced in Table V.1.
The free energy of formation of the stoichiometric pyrrho
tite, troilite, Fe1 _000s, and monoclinic pyrrhotite, Fe7s8 ,
have values of -100.42 and -748.52 KJ/mol, respectively.
Values for intermediate pyrrhotites, such as from Fe9s10 , to
Fe11s 12 do not appear to have been published. All the above
thermodynamic data, reported by Lowson, was taken from a
1982 National Bureau of Standards publication (84).
V.2 DERIVATION OF THE POTENTIAL-pH DIAGRAM FOR THE
IRON-SULPHUR-WATER SYSTEM AT 2S°C NEGLECTING PYRITE
Potential-pH diagrams can be used to indicate whether
a particular reaction is thermodynamically possible. These
diagrams first provide a summary of the electron-transfer,
proton-transfer and combined electron-proton-transfer reac-
99
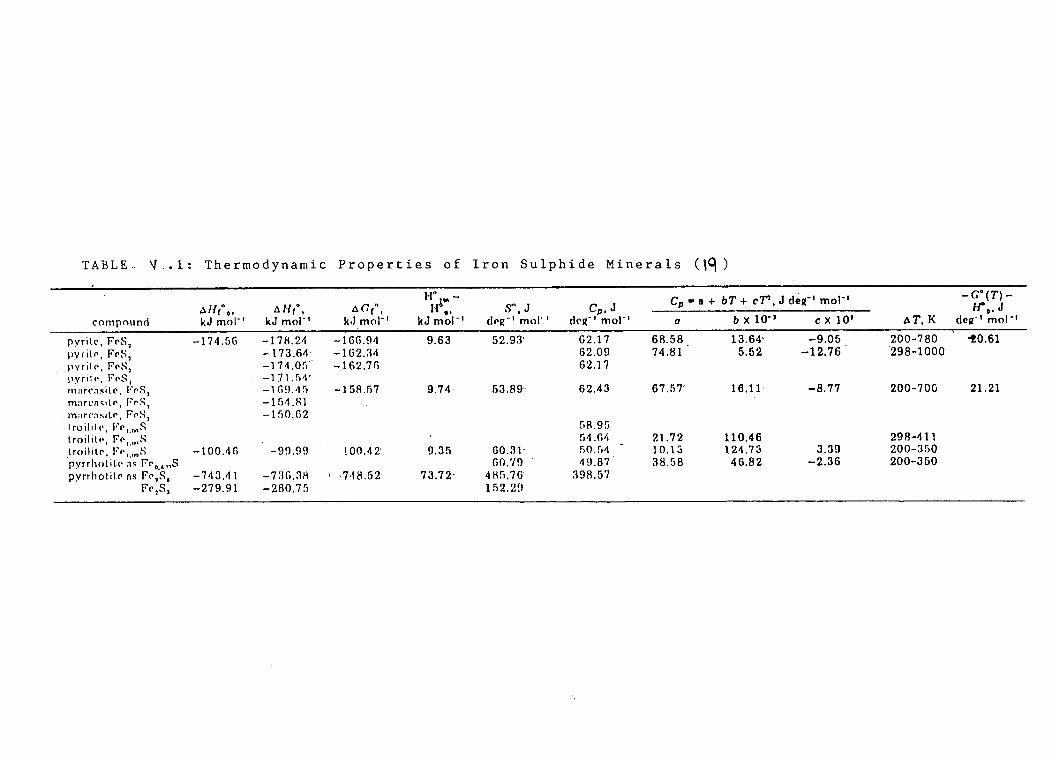
TABLE .. " .• 1 : Thermodynamic Properties of Iron Sulphide Minerals ( \'I )
H" A'" - Cp • a + bT + c'f'I, J de11-• mo1· 1 -G"(T)-Allr° 0 , Alft0
, A(°;t, H •• S",J Cp,J 1-/° O• J compouncl k,J mo1· 1 kJ mo1· 1 k,I moi- 1 kJ mo1· 1 clrll · 1 mol· 1 clr11· 1 mo1·• a b X 10·> C X 101 AT, K de1t· 1 mo1· 1
r,yrile, FrS 1 -174.56 -178.24 -166.9'1 9.63 52.93' 62.17 68.58 13.64· -9.05 200-780 -!0.61
pyrilr, FrS, -173.64 ~ 1 GZ.::1<1 62.09 74.81 5.52 -12.76 298-1000 pyril.r, P<'S, -17'1.0f, ~.162.7G 62.1 "/ pyril<', F<'S, -171.f,,1• mnrc.,~ilr, FrS, -1G9.'1f, -15R.57 9.74· 53.89· 62.43 67.67' 16.11 -8.77 200-70G 21.21 marl'nsilr, FrS, -l!iil.81 marr:isitr, FrS, -1 f10,Ci2 lroililt•, F1• 1_,.,S GR.95 t.roditc•, P<',_.,,S f,'1 .64 21.72 110.46· 29fHl 1 .troilitr. F" 1 •1111 S -100.4G -99.99 t00.'12' 9.35 G0.31· fiO.f,4 - 10.1:, 124.73 3.39 200-350 pyrrhotill' as Fr 0_,,.,S G0.79 49.87 38.58 46.82 -2.36 200-350 pyrrholilr ns Fr,S, -743.'I 1 -7:16.3H ·7•18.52· 73.72- 41:lf,.7G· 398.57
Fr,S, -279.91 -280.7!i 1,')2,2!1

proton-transfer and combined electron-proton-transfer reac
tions which are thermodynamically favourable when a mineral
is in a particular aqueous solution.
When a potential-pH diagram indicates that a particu
lar reaction is thermodynamically favourable it does not
mean that the reaction will take place at a significant
rate, or at all. Thermodynamics, therefore, only defines a
necessary precondition for a reaction and it determines the
direction in which an overall reaction will tend. Determina
tion of the rate and mechanism of the reaction can only be
obtained by a detailed study of the kinetics of the reaction
(85,86).
When pyrrhotite is leached by ferric sulphate or
ferric chloride solutions, or by oxygen under pressure in
acid solutions, iron enter the solution and the only new
solid phase formed is elemental sulphur. A study of the
potential-pH diagram for the Iron-Sulphur-Water system fails
to predict this chemistry. Pyrite occupies the region where
the products of the aqueous oxidation of pyrrhotite are
stable (87-91). Moreover, monoclinic pyrrhotite occupies the
region where the products of the aqueous oxidation of
stoichiometric pyrrhotite are stable. Pyrite can be formed
in hydrothermal systems involving hydrogen sulphide, e.g.,
it occurs through a dissolution, reprecipitation mechanism
rather than a transformation of the solid (17). Thus a
potential-pH diagram
pyrite should enhance
for the Fe-S-H2o system neglecting
the understanding of the mineral
chemistry of pyrrhotite minerals.
100

Apparently, nucleation and growth of a new mineral
phase is a process that does not take place readily at
ambient or elevated temperatures in these hydrometallurgical
processes. However, there is evidence to suggest that an
extremely thin layer of pyrite may form on the surface of
pyrrhotite preventing further reaction during aqueous oxida-
tion at ambient temperatures (or even autoclave) (88).
Moreover, after two hours of leaching, autoclave oxidation
of monoclinic pyrrhotite and troilite at 245°c, yielded
very small amount of pyrite and hexagonal
(92,93). •
pyrrhotite
Figures V.2.1, V.2.2 and V.2.3 show the potential-pH
diagrams for the Fe-s-H2o system constructed by various
authors. It is frequently reported that pyrite co-exist
with pyrrhotite minerals complicating the understanding of
their mineral chemistry. Aqueous oxidation of stoichiometric
pyrrhotite, formation of ferrous ions, Fe2 +, is pH dependent
rather than potential dependent. Contrarily, Aqueous oxida
tion of monoclinic pyrrhotite depends on both the potential
and pH.
The recent free energy of formation published and
used to construct the potential-pH diagrams are not only for
stoichiometric and monoclinic pyrrhotites, but also for the
other species considered; if they were available.
The potential-pH diagrams presented in Figures V.2.4
to V.2.9, were constructed by using software developed by
the Division of Mineral Chemistry of CSIRO (94). These
diagrams were forced to be consistent with the phase rela-
101

l·OrT -~-'- FccO,
O·!'> -
Fe ..
10• ~eS J
-o-s 1---'-"1 o'-·-) ~
I Fe
-.,
-1·0=
~L-ob--~1)-·-;--+---!:----:~----1-..:.H:s:·1.:s'....'_j 6 cl 10 12 14
HSO;;
0
Fez+
15a
-I Fe
-1· 5
0
pH
Unit activity for both dissolved sulphur and
dissolved iron.
Fe 0 2 - · ~--~
.... ----·---. ,_ -- -... __ ......... ..... --- ... T"::,-... ___ ....
I --I HFeo- >-
2
9b
HS lo S 2
-
. 8 12
pH
FIGURE V.2.1: Potential-pH Diagrams for the Fe-S-HzO System at 25°C. Reference (88) and (81), respectively.

0 2 4 6 8 10 12 14
2.0~----~---------------------~ 2
Uh
-0,0 ·
- :,0 . Fe -I
- 1,2 • 52-
-1,'l.
- 1,6
- 1,1)
- 2 '~ L< -_-1-.!.0 __ ...___2:,--,,,---'-4 -5:--cG::--, ---!7;---;:0--;;-9--;l;;--"0 °TI 1 2 13 l'l I~ 16 17 18-2
pH
FIGURE V.2.2: Potential-pH Diagrams for the Fe-S-He.o· System at 25°C. Reference (112) and (91), respectively.

O,!+ -, I I
0 -
0,2 ~so fy~ .?S FeqS10
-- ----- -- ----"""- ----- -- ------ -----Fe S
-02 ,·
0
r· l.SCE
-0,2,
-o 6 )
-OB I
-· -A t-lGLiRE V.2.3: Potential-pH Diagram for the FE:1-S System at 25°C for 10 M
cc,ncentraticm of dissol\,1ed speciPs (28).
tionship, actually observed during the oxidation-leaching
of pyrrhotite, by neglecting pyrite.
The potential-pH diagrams presented in the literature
for the Fe-S-H2o system usually include only stoichiometric
pyrrhotite and pyrite omitting monoclinic pyrrhotite (87-
91). Moreover, The stability of stoichiometric pyrrhotite at
a determined activity of iron dissolved species was present
ed differently by every author. This discrepancy mainly
stems from the value of the free energy of formation used.
Thus the mineral chemistry of pyrrhotite minerals will be
analyzed through the potential-pH diagrams presented for
this study drawn using the most recent thermodynamic data.
The species considered, and their free energy of
formation, are listed in Appendix A. Appendix B shows the
thermodynamic calculation involved in deriving the poten
tial-pH diagrams. Appendix C lists the equations relating
the potential and pH for the Fe-S-H2o system at 25°c involv
ing FeO, Fe3o4 , Fe2o3 and (alpha)-FeOOH species. However, it
is noted that the potential-pH diagrams being presented in
Figures V.2.4 to V.2.9 do not involve these species.
The temperature stability of the solid compound was
considered in estimating which solid is stable at 25°c.
The stability of a particular oxide, oxyhydroxide or hydrox-
ide was obtained from various sources (57,95). Ferric
hydroxide, Fe(OH) 3 , sometimes referred to as ferric oxy
hydroxide, FeOOH (95), is stable at 25°c. At temperatures
above about 90°c, well-defined crystals of goethite or
lepidocrocite are formed. On further heating, to above 130°,
102

2. 5.
2. 0~ s
1.5~
1. 0 ~
0 . 5 l::.__ Q
:r: 0~ w
-0.5~
- 1 . 0~
,._ - 1 . 5~
I -2.0
-2. ~ 2 0
FIGURE \/ .1.9: Eh-pH DIAGRAM FOR THE Fe-S-1120 SYSTEM AT 25°c Iron Sulphide Species: Fe
7s
8 _
1 Dissolved Species Activity: 10 M.
I R S + FE E-2 (RQ)
I~ S + FE? SB
I H2 S CRQl + FE E-2 D H2 S CAQJ + FE E
(RQ)
~I M IF H2 S CAQl + FE? SB H SE (RQ) + FE
G H SE CRQ) + FE7 SS
ILi ~ IH S E2 CRQl + FE ] S E2 CRQJ + FE [O H I 2 _J S E2 CAQJ + FE? SB
I ~ ~ IK S 04 E2 (AQ) + FE E-2 IRQJ L S 04 E2 CAQ) + FE E-3 ( AQ I
l~ S 04 E2 CAQ) + FE Qij E2 (RQ) S OLJ E2 CAQ) + FE [0 H 12
C S OLJ E2 CAQ) + FE CO H l 3
\ I I ~ IP S 04 E2 (AQ) + FE7 S8 =c:::: ~ Q H S OIJ E IRQJ + FE E-2 CAQJ
R H S OIJ E IRQ) + FE E-3 CAQ)
I ~ s H S OIJ E IRQ) + FE OIJ E:2 CRQJ T FE E-2 (AQJ + FE? SB
D I I I~ FE+ FE7 SB
H FE [OH 12 + FE7 SB F
I
2 LJ, 6 8 10 12 11.J 16 PH

2. 5.
2.0"-. T
1. 51-s
1. 0~
0.5l- A
:::r:: 0~ w
-0.5~
- 1. 01-
,,._ - 1 . 51-
-2. 0 1
-2. ~ 2 0
FIGURE \/ .1.i: Eh-pH DIAGRAM FOR THE Fe-S-H20 SYSTEM AT 25°c Iron Sulphide Species: Fe
1 000s_gnd Fe
7s
8 Dissolved S~ecies Activityi 10 M.
I A H2 S CAQJ + FE E-2 !AQ)
I~ H2 S CAQJ + FE
I H SE CAQl + FE E-2 CAQJ D H SE CRQ) + FE E H SE CRQl + FE CO H J 2
N F H SE CAQ) + FE 5 G S E2 CAQJ + FE 02 HE IAQJ H S E2 CAQJ + FE 1 S E2 CAQJ + FE CO H 12 .J S OLJ E2 CAQl -t- FE E-2 IAQJ
I "" ~ I t~ S 04 E2 CRQ) + FE (0 HI E-1 L S OLJ E2 CAQ) -+ FE 02 HE CAQJ
~,~ S OLJ E2 CAQl + FE E-3 IAQJ
-------- J ~ F S OLJ E2 CAQ) + FE 04: E2 IRQ) 0 S OLJ E2 CAQl + FE CO H 12 F S 04 E2 CRQ) + FE (0 H 13 Q S OLJ E2 CAQJ + FE S R H S 0~ E IRQ) + FE E-2 CRQl
I I~ Is H S 0~ E IRQ) + FE E-3 C AQ) T H S 0~ E IRQ) -t- FE 0~ E2 CAQJ
D . I ,~ FE E-2 lAQJ + FE S
8 I H FE CO H I E-1 IRQ) + FE S w FE+ FE S
I I ,x FE CO H 12 + FE 5
2 L! 6 8 10 12 14 16 PH
lrlt;

2. 51
2. 0~ w
1 • 5 f-
1 . 0 f-
0. 5~ u
::c 0~ w
-0.5
- 1 • 0f-
,._. - 1. 5f-
-2.0~
-2. ~'2 I 0
FIGURE \I .1.1: Eh-pH DIAGRA~ FOR THE Fe-S-H20 AT 2s 0 c Iron Sulphide Species: Fe
1 080s and Fe
7s
8 Dissolved Species Activity: .01 M.
I A S + FE E-2 CAQ)
I~ S + FE? SB
I H2 S CRQJ + FE E-2 IRQ) D H2 5 CAQJ + FE E H2 S CAQJ + FE S
~I p IF H2 S CAQl + FE7 58 G H SE CRQ) + FE
lul ~ IH H SE CRQ) + FE S H 5 E CRQ) + FE:7 58 ]
.J S E2 CAQJ + FE I ~ ~ IK S E2 CAQl + FE (0 H 12
L S E2 CAQl + FE S
l~ S E2 CRQl + FE7 S8 5 OY E2 CAQ) + FE E-2 IRQ) SOY E2 CAQ) + FE E-3 IAQJ
IP SOY E2 CAQ) + FE 04: E2 IRQ) SOY E2 CAQ) + FE (0 H l2 Q
R SOY E2 CRQ) + FE (0 H 13
I ~ s 5 OY E2 CAQ) + FE 5 T SOY E2 CAQ) + FE7 S8
D I u H S DY: E lAQ) + FE E-2 CAQ) V H S DY: E IRQ) + FE E-3 CAQ)
C .J w H S DY: E IRQ) + FE DY: E2 CRQJ
I I I~ FE E-2 lAQJ + FE 5 FE E-2 lAQJ + FE? SB
:z FE+ FE 5 I I I I I I I I I I RA FE [ 0 H l 2 + FE S 2 L! 6 8 10 12 1 lJ 1 ~B FE [ D H I 2 + F E7 S8
PH AC FE S + FE? S8
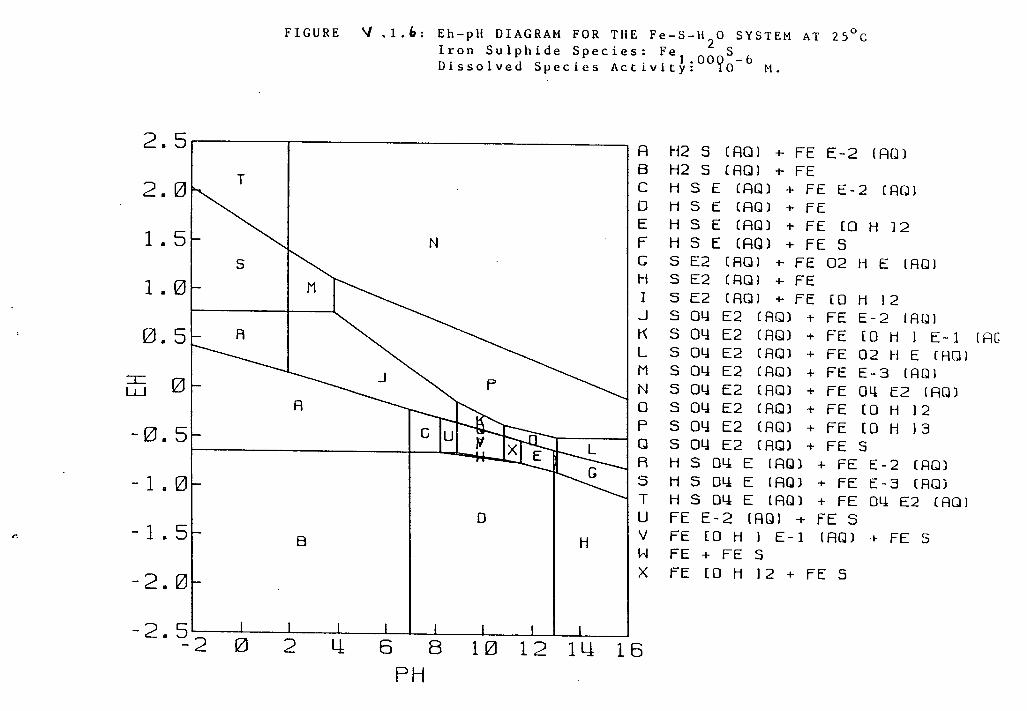
2. 5,
2. 0~ T
1 . 51-
1 . 01-
0. 5r- A
::r:: 0~ w
- 0. 51-
- 1 . 0~
r. - 1 . 51-
-2. 0 1
-2. ~ 2 IZl
FIGURE V .l.~: Eh-pH DIAGRAM FOR THE Fe-S-U20 SYSTEM AT 25°c Iron Sulphide Species: Fe
1 00 S_
6 Dissolved Species Activity: ?o M.
I A H2 S CAQl + FE E-2 IRQ)
I~ H2 S CAQl -t- FE
I H S E CRQl + FE E-2 CRQl D H 5 E CRQ) + FE E H S E CRQl + FE (0 H J 2
~I N IF H S E CAQ) + FE S G S E2 CAQJ + FE 02 HE IAQl
I ~ IH S E2 CRQl + FE M 5 E2 CAQl + FE (0 H I 2 I
.J S 04 E2 CAQl + FE E-2 IAQl I ~ ~ IK S 04 E2 C AQ l + FE [ 0 H I E- 1
L S 04 E2 CAQ) + FE 02 HE CAQl
~I~ S 04 E2 CRQ) + FE E-3 IAQl
-------- .J ~ f' 5 04 E2 CAQ) + FE 04: E2 IRQ) 0 S 04 E2 CAQ) + FE (0 H 12 F S 04 E2 CAQ) + FE (0 H 13 Q S 04 E2 CAQ) + FE S R H S 04: E IRQ) + FE E-2 CAQ)
I I~ I 5 H 5 04: E IRQ) + FE E-3 CAQ) T H S 04: E lAQ) + FE 04: E2 CAQl
0 I I~ FE E-2 (AQl + FE S B I H FE (0 H I E-1 IRQ) + FE S
w FE+ FE S I I iX FE [0 H 12 + FE 5
2 L! 6 8 10 12 14 16 PH
IRG

2. 5,
2. 0~ u
1. 5~ T
1 • 01
0.5t: s
:::c 0~ w
-0. 5~
-1.0~
.... -- 1. 5r
-2.01 -2.~2 0
f l G U l{ E 'I . 1 • ~ : Eh - p II U l AG l{ AM 1'' 0 l{ T II E i.,· e - S - II 2
U S Y ST EM AT :! :, " c
Iron SulphiQe Species: Fe1 0 0
s Dissolved Species Activity: 8.0001 M.
I A S + FE E-2 CRQ) ,~ H2 S CRQJ -t- FE E-2 IRQ)
I H2 S (RQl + FE ,
D H2 5 CRQJ + FE 5 E H SE CRQ) -t- FE
0 F H SE CRQ) + FE S G S E2 CRQJ + FE 02 HE !RQJ H S E2 CAQJ + FE 1 5 E2 CRQJ + FE CO H 12 .J S E2 CAQJ + FE S
I ~ ~ IK SOY E2 CRQ) + FE E-2 lAQJ L S OLJ E2 CRQJ + FE CO H l E-l
~~ S OLJ E2 CRQ) + FE 02 HE CRQJ
B ~ ~ Q 5 OY E2 CRQJ + FE E-3 IRQJ
SOY E2 ( AQ) -t- FE 04: E2 IRQ)
I u 1v ~~~ IP SOY E2 CAQ) + FE [0 H 12 Q S 04 E2 CRQJ + FE CO H I 3 R S QLJ E2 ( RQ) + FE S
I ~5 H 5 014 E IRQ) + FE E-2 CRQ) T H S DY: E IRQ) -t- FE E-3 CAQ)
C I I I~ H S 04: E lRQ) + FE 04: E2 CAQJ
H FE E-2 IAQJ + FE S E FE CO HI E-l IRQ) + FE S
X FE+ FE 5 1 FE CO H 12 -t- FE S
2 l! 6 8 10 12 14· 16 PH
(R[;

FIGURE V .1.4: Eh-pH DIAGRAM FOR THE Fe-s-112
0 SYSTEM AT 25°c Iron Sulphide Species: Fe
1 0 0s
Dissolved Species Activity: 8.01 M.
2. 5, I A S + FE E-2 CAQ) ,~ S ;- FE S 2. 0~
s I H2 S CRQJ + FE E-2 IRQ) 0 H2 5 CAQJ + FE E H2 S CAQJ + FE S
1.5~ ~I M IF H SE CAQ) + FE G H SE CRQ) + FE S
ILi ~ IH S E2 CRQJ + FE 1 . 01 1 5 E2 CAQJ + FE (0 H I 2 .J S E2 CAQJ + FE S
0. 5k._ Q ·1 ~ ~ IK S 04 E2 CAQ) + FE E-2 (RQl L S 04 E2 CAQJ + FE E-3 lAQl
~~ S 04 E2 CRQl + FE 04: E2 lRQ) ::c 0~ 5 04 E2 CAQJ + FE E o rt 1 2 w S 01.J E2 CAQ) + FE (0 H I 3 C .....
-0.5~ I I I . ~~ IP S 04 E2 CAQ) + FE S -c.: Q H S 01..! E lRQJ + FE E-2 CRQJ
A H S 01..! E lRQJ + FE E-3 CRQ) -1.01- I l 5 H 5 01..! E lRQJ + FE 01..! E2 CAQl
' T ' FE E-2 lAQ I ;- FE S 0 I I
u FE+ FE S -1.5~
H V FE (0 H 12 + FE S .....
F I I
-2.0
-2. ~ 2 0 2 lJ: 6 8 10 12 1 LJ 16 PH

these decompose to hematite, Fe2o3 . Ferrous hydroxide decom
poses to magnetite above 15o0 c (57,95). Thus, in this study,
only ferric hydroxide, stable at 25°c, was considered and
was referred to as FeOOH. Potential-pH diagrams for
stoichiometric pyrrhotite, FeS, were constructed for 10-2 ,
10-4 and 10-6 M dissolved iron species and these are pre
sented in Figures from V.2.4 to V.2.6. Stoichiometric pyr-
rhotite, (FeS) and monoclinic pyrrhotite,
superimposed for 10-2 and 10-6 M dissolved iron species.
These diagrams are represented in Figures V.2.7 and V.2.8.
Finally, a diagram for only monoclinic pyrrhotite at 10-2 M
was constructed, Figure V.1.9.
V.3 ANALYSIS OF THE CHEMISTRY OF PYRRHOTITE OXIDATION
LEACHING
The chemistry of pyrrhotite oxidation leaching is
analyzed in terms of the potential-pH diagrams derived for
the Fe-s-H2o system. At pH values less than 7, the stability
of pyrrhotite solid phase, whether as troilite, (FeS) or
monoclinic pyrrhotite, (Fe7s 8 ) is entirely located within
the predominance region of ferrous ions, Fe2 +. This thermo
dynamic behaviour might indicate that the initial reaction
of pyrrhotite takes place non-oxidatively.
1. Pyrrhotite can be dissolved non-oxidatively in acid
solutions producing ferrous ions and hydrogen
Stoichiometric pyrrhotite, monoclinic
sulphide.
pyrrhotite and
ferrous ions, predominate over the whole range of existence
103

of hydrogen sulphide.
(V.3.1)
Fe7Ss + 16H+ + 2e- -----> 7Fe2+ + 8H2S (V.3.2)
While dissolution of troilite may proceed independent
ly of the potential, dissolution of monoclinic pyrrhotite or
any other non-stoichiometric pyrrhotite mineral may depend
on the potential because it is a reduction process. A more
detailed discussion of this process has been given in the
section on acid decomposition of pyrrhotite (Section IV.2).
2. Aqueous oxidation of stoichiometric pyrrhotite at
pH values 4.0-4.5 may form only ferrous sulphate. Aqueous
oxidation of monoclinic pyrrhotite may also form an addi
tional molecule of elemental sulphur. This elemental sulphur
may oxidize to higher oxidation states such as sulphate ions
in the presence of sulphur oxidising bacteria.
FeS + 202 -----> FeS04 (V.3.3)
(V.3.4)
Additionally, it can be seen from Figures V.2.4,
V.2.6 and V.2.9 (0.01M activity of dissolved iron species)
that the aqueous oxidation of troilite and monoclinic pyr
rhotite at a pH less than about 4.2 and at potentials about
zero, may also form ferrous ions and elemental sulphur;
FeS + 2H+ + 0.502 -----> Fe2 + + s 0 + H2o (V.3.5)
104

Fe7S9 + 14H+ + 3.502 -----> 7Fe2 + + ss0 + 7Hz0 (V.3.6)
At pH greater than 4.2, at slightly negative poten
tials (Figures V.2.4, V.2.6 and V.2.9) stability of troilite
and monoclinic pyrrhotite with both elemental sulphur and
sulphate ions is thermodynamically possible. Further, it is
noted that the domain of stability of stoichiometric pyrrho
tite alone is congruent to that of monoclinic pyrrhotite at
the same activity of dissolved species, excepting at the
boundary line where stoichiometric pyrrhotite
potential independence.
exhibits
3. At potentials greater than zero and at pH values
around 4.0-4.5, aqueous oxidation of pyrrhotite may also
result in the production of ferric hydroxide and elemental
sulphur and/or ferric hydroxide and sulphuric acid:
FeS + 1.5H2o + 0.7502 -----> Fe(OH) 3 + s 0 (V.3.7)
Fe7S9 + 10.5H20 + 5.2502 ----->7Fe(OH)3 + ss0 (V.3.8)
and/or
FeS + 2.5H20 + 2.2502 -----> Fe(OH)3 + H2S04 (V.3.9)
Fe7S9 + 18.5H20 + 17.2502 -----> 7Fe(OH)3 + 8H2S04
{V.3.10)
These processes may occur through the
steps:-
a) An initial oxidation of pyrrhotite itself:
FeS + 2H+ + 0.502 -----> Fe2 + + s 0 + HzO
105
following
(V.3.11)

b)
hydroxide
Direct oxidation of ferrous ions to
rather than oxidation of ferrous ions
ferric
and
hydrolysis and precipitation of ferric ions:
Fe2 + + 2.5H20 + 0.2502 -----> Fe(OH)3 + 2H+ (V.3.12)
Adding equations (V.3.11) and (V.3.12), an identical
equation to (V.3.7) or (V.3.8) is obtained for stoichiomet
ric pyrrhotite and monoclinic pyrrhotite, respectively. Thus
these reaction products, ferric hydroxide and elemental
sulphur, seems to prevail at potential greater than zero and
at pH values around 4.0-4.5.
and
c) If oxidation of elemental sulphur to sulphur acid
occurs, the following equation may be added to equation
(V.3.9) and (V.3.10):
(V.3.13)
It is widely recognized that this reaction proceeds
very slowly at ambient temperatures and in the absence of
sulphur-oxidising microorganisms. Thus, adding equations a,
b, c, and d; and simplifying gives:-
FeS + 2.5Hz0 + 2.25 Oz -----> Fe(OH)3 + HzS04
(V.3.14)
The initial oxidation of pyrrhotite, step a, could be
confirmed with the following anodic reactions reported by
106

Hamilton et al.(17,101). Voltammograms for pyrrhotite at
4.6 pH and at 20 mV s- 1 were interpreted in terms of reac
tions forming elemental sulphur and sulphate. Below 0.2 V
(SHE), the reactions considered were (17,101):
Fes1 . 13 -----> Fe2 + + 1.13S + 2e
Fes1.13 + 4.52H2o ----->
Fe2 + + 1.13S042 - + 9.04H+ + 8.78e-
(V.3.15)
(V.3.16)
At higher potentials, the stable iron species at pH
4.6 was ferric hydroxide and hence the reactions would be:
Fesl.13 -----> Fe(OH)3 + 1.13S + 3e- (V.3.17)
Fes1 _13 + 4.52H2o ----->
Fe(OH) 3 + 1.13So42- + 9.04H+ + 9.78e- (V.3.18)
These reactions, equations (V.3.15) to (V.3.18) also
describe the potential-pH diagrams constructed by Hamilton
et al. and do agree with the chemical reactions discussed
above for this study. The potential-pH diagrams constructed
by Hamilton et al. (17) are reproduced in Figure (V.2.3).
Direct oxidation of ferrous ions to ferric hydroxide
at 4.6 pH value is referred to the study of Hamilton et al.
(17, 101) . A step on the voltammograph at 0.4 V (SHE) (17)
was assigned to the following reaction:
Fe2 + + 3H20----> Fe(OH) 3 + 3H+ + e- (V.3.19)
107

This half-reaction was added with the reduction of
oxygen to obtain equation (V.3.12). However, the second
publication of Hamilton et al. (101) indicates that this
reaction, equation (V.3.19), takes place at 0.2 V. Thus an
accurate potential at which this oxidation reaction occurs
is not yet determined.
4. Pyrrhotite minerals may also be leached by ferric
ions followed by re-oxidation of ferrous to ferric ions and
precipitation of ferric hydroxide, according to reactions:-
108

Stoichiometric pyrrhotite, FeS:
2FeS + 4 Fe3 + -----> 6Fe2 + +
2Fe2 + + 5Hz0 + 0.502 -----> 2Fe(OH)3 + 4H+
4Fe2 + + -----) 4Fe3 + + 2H 0 2
(V.3.20)
(V.3.21)
(V.3.22)
summing equations (V.3.20), (V.3.21) and (V.3.22)
2FeS + 3H20 + 1.502 -----) 2Fe(OH)3 + 2s0
Monoclinic pyrrhotite, Fe7s 8 :
-----> 21Fe2 + + ss0
4Fe2 + + 10Hz0 +Oz-----) 4Fe(OH)3 + 8H+
8Fe2 + + 202 + 8H+ -----> 8Fe3 + + H2o
(V.3.23)
(V.3.24)
(V.3.25)
(V.3.26)
similarly, summing equations (V.3.24), (V.3.25) and
(V.3.25)
-----> 252Fe2 + + 96S0 (V.3.27)
252Fe2 + + 126Hz0 + 6302 -----> 84Fe(OH)3 + 168Fe3 +
(V.3.28)
12Fe7S9 + 126Hz0 + 6302 -----) 84Fe(OH)3 + 96S0
(V.3.29)
simplifying:
Fe7S9 + 10.5Hz0 + 5.2502 -----> 7Fe(OH)3 + ss0
(V.3.30)
From these reactions, it can be deduced that oxidation
of ferrous ions, and hydrolysis and precipitation of ferric
ions, as well as the oxidation of sulphide ions play an
important role on the rate and extent of oxidation leaching
of pyrrhotite minerals themselves. Oxidation of hydro-
gen sulphide, H2s (S=-II), by oxygen may produce one or more
higher valence state sulphur compounds such as: s 0 (0),
s 2o 32-(+2), so3
2 - (+4) and so42 - (+6), from which only the
109

-II, 0 and +VI are "truly stable states" (96). A potential
pH diagram for the metastable sulphur-water system at 2s0 c,
Figure V.3.1, in which the +VI valence state is not consid
ered indicates the region of predominance of these metast-
able compounds (85,96). In the pH range of 4 to 6, the
species which might arise from the oxidation of hydrogen
sulphide consist of elemental sulphur, thiosulphate,
and thionates, HSo3 -.
SO 2 -2 3
Oxidation of sulphide ions, in solution, is affected
by several variables such as temperature, pH, sulphide ion
concentration, oxygen concentration, the presence of bacte
ria and neutral salts (96) as well as catalysts such as Pb,
Mno2 , etc.
Although there is disagreement on whether pyrite or
pyrrhotite produces more oxi-sulphur species (17,100) under
the same oxidation leaching conditions, the extent of oxida
tion of the sulphide ions depends on the ratio of molecular
oxygen to sulphide ion concentration, as well as the pH of
the system. In the concentration range of HS- lower than
2x10⁻³ M, the reaction product is elemental sulphur but at
concentration of 0.002M<[HS-]<0.003M a clear solution con
taining sulphur oxy-anions result. The oxidation is also
catalyzed by presence of metal ions even when a few parts
per million are present. The catalytic effect of metal ions
has been reported to be in the order Co>Ni>Mn>Cu=Fe (100).
Chen et al. (97) state that the rate of oxidation of
sulphide ion follows a complex relationship with pH. "The
rate increases from pH 6, reaching a maximum value at 8.5,
110

0·6
0·4
0·2
' ' 0 ' ...
IJJ
-0·2
-0·4
-0·6
-0·8
0
FIG." •?•l:
HS05
' ..........
........ .........
' ........ ........
HS-........
' ' ........
'
2 4 6 8 10 12
pH
Eh-pH Diagram for the Metastable S~lphuL 0
System at 25 C (8~.
14

declining to a minimum at 9.3 and attains a second maximum at
pH 11.5". It is also known (97) that the oxidation rate
between pH 2.2 and 6.5 is very slow.
The oxidation rate of elemental sulphur is greatly
dependent on the temperature and oxygen partial pressure.
Below the melting point of sulphur [120°c (52)) the oxida
tion rate is extremely slow and is chemically controlled
with an activation energy of 11.7 Kcal/mole (98).
Although potential-pH diagrams have proven to be very
useful in considering hydrometallurgical processes, they
have several shortcomings since the potential is considered
to be an independent variable (99). Angus et al.(99) argue
that potential is not a conserved quantity and consequently
it is impossible to locate a point on a potential-pH diagram
knowing a composition and pH. Secondly, small changes in
chemical composition can produce large potential differences
and, conversely, when two solid phases are present in equi
librium large composition changes do not produce a change in
potential. Thus Angus et al. (99) replaced the electrochemi
cal potential by its conjugate thermodynamic variable, the
average number of electrons per atom of the active element,
to produce a type of diagram similar to a conventional
metallurgical phase diagram. This type of diagram could be
developed further to study hydrometallurgical processes. A
diagram for the copper-water system is shown in Figure
V.3.2. At pH=O, the left hand solubility curve shows two
regions: one where cu1+ is the dominant species and the
other where cu2+ is dominant.
111

... -::, u
II
10
9
8
7
6
I l)l'i. o I
E • 0.102 V --------
E • 0.185 V
I
I I I
1I AQUEOUS 1
I
>I >1 ~· •I -1
~I Nf
WI i:.1 I
Q 5 ---------------.,.
.!2 4 I
3
2
Ir Cu o
8 AQUEOUS AQUEOUS
0 t__ _____ ---1, ______ ......_ _____ ___
0 2
ELECTRON NUMBER , Z
Figure 1/.3.Z. Electron number diagram for copper syste!T). Intersection of three dimensional figure ·with pH = 0 p 1 ane(.99).

PART C: EXPERIMENTAL PROGRAM
CHAPTER VI
VI.1 INTRODUCTION
Waste sulphide concentrate by Renison Bell, Tasmania
containing approximately 0.45% tin represents a loss of
about 19% of tin fed to the concentrator. This loss is
principally the result of an intimate association of cassit
erite pyrrhotite. The main objectives of the present study
are to modify the sulphide concentrate by chemical and/or
bacterial oxidation in order to release the tin mineral from
the cassiterite-pyrrhotite assemblage so that it becomes
amenable to recovery by physical separation processes, and
pyrrhotite minerals are converted to insoluble compounds
that are unlikely to produce environmental problems.
The mineralogical composition of this mineral was
reported in a previous study realized by Harris et al. (79).
The sulphide/cassiterite association comprise some 50 per
cent of mainly pyrrhotite but with minor amounts of chal
copyrite, pyrite, arsenopyrite, marcasite, sphalerite and
galena. Dolomite, siderite, quartz and other silicates
constitute the remaining gangue. The intimate association of
cassiterite mineral with sulphide minerals (and to a lesser
extent with silicates) essentially at particle size less
than 150 microns and the wide variability of the gange
minerals suite in the sill ores are the major factors influ-
112

encing to have up to 0.4% Sn in the waste concentrate.
Chemical analysis of this waste concentrate was reported in
an earlier study by Sawe (124) as follow,%: Fe 34.96, Cu
0.28, Ca 1.37, Mg 2.49, Pb 0.22, As 2.45, Zn 0.08, and Sn
0.40 (moisture 1.29%}.
Determination of the rate of aqueous oxidation of a
sulphide mineral is usually made by the measurement of the
accumulation of metallic and/or non-metallic cornponent(s} in
solution, e.g. iron, zinc and arsenic from bacterial oxida-
tion of pyrite-sphalerite-free arsenic mineral mixture
(116). It is also known that above pH 2, the rate of oxida
tion of ferrous ions and precipitation of ferric hydroxide
are enhanced. The use of this method to measure the rate of
aqueous oxidation of a sulphide mineral would not be suit
able to solutions where the pH value is higher than 2.
Another method used to determine the rate of aqueous
oxidation of a sulphide mineral is to measure the consump-
tion of oxygen. Vancelow (105) used an oxygraph to measure
the rate of aqueous oxidation of copper sulphide minerals
from bacterial oxidation. Bailey et al. (16) determined the
consumption of oxygen, produced electrolytically, during a
pressure leaching of pyrite. The use of this method assumed
that the reaction stoichiometry is fixed and known. Thus
the selection of the method to determine the rate of reac
tion of iron sulphide minerals depends on the pH.
At pH values higher than 2, determination of the rate
of aqueous oxidation of a sulphide mineral, e.g. pyrrhotite
minerals by the consumption of oxygen seems to be more
113

predictable than determination of any other reactant or
product. Moreover, the use of an oxygraph is easier and
gives continuous data. If determination of elemental sulphur
is used, there is also some concern about the solubility of
amorphous elemental sulphur in tetrachloroethylene. It has
been reported by Warren et al. (11) that amorphous elemental
sulphur, present from the aqueous oxidation of chalcopyrite,
is not soluble in carbon disulfide, cs2 . It is not known
whether some elemental sulphur formed during the aqueous
oxidation of pyrrhotite minerals is amorphous; if it is,
then if it is soluble in tetrachloroethylene.
In the present study, an attempt was made to measure
the rate of aqueous oxidation of a pyrrhotite concentrate
tailings from Renison Bell, Tasmania by continuously measur
ing the consumption of oxygen. In a preliminary study of
the aqueous oxidation of this mineral conducted by Harris et
al. (79); a series of stirred reactors and "shake flask"
experiments were tested in the presence of microorganisms.
At 4.5 controlled pH, the rate and extent of oxidation of
this reaction was determined by analysis of the leached
residue for total sulphur, sulphate sulphur and elemental
sulphur. The supernantant leachate was also analyzed for
ferrous and ferric ions.
The lack of reproducibility in terms of mass balance
and degree of pyrrhotite oxidation obtained by Harris et al.
(79) may be explained in terms of the oxidation of elemental
sulphur to sulphate ions and if the pH of the system is
controlled at 4.5 pH, jarosite compound may be formed which
114

has not been accounted for. Thus determination of the
consumption rate of oxygen during the aqueous oxidation of
sulphide minerals, e.g. pyrrhotite minerals seems a more
useful alternative at pH values above 2.0. Nevertheless, if
oxidation of elemental sulphur and/or oxidation of other
sulphides minerals are involved, the present method will
also account for the consumption of such oxygen.
The information about the kinetics and mechanism of the
aqueous oxidation of pyrrhotite minerals obtained, was
intended to add to the fundamental knowledge of the aqueous
oxidation of sulphide minerals and to assist in the develop
ment of a more viable process for the treatment of pyrrho
tite minerals containing valuable metals/minerals, such as
gold and cassiterite.
Particular attention was given to the design of the
equipment to determine the reproducibility of the measured
reaction rate and the range of oxidation reaction products
which are formed. Three equipment designs, called 'oxy
graphs' were developed to obtain a continuous measurement of
the reaction rate. Details of the designs are explained and
experimented in Chapter VII. However, it is pointed out
that the oxygraph only gives the rate of the aqueous oxida
tion. The assumption made is that a constant stoichiometry
stated as Equation VI.1.5 and/or Equation VI.1.12 will take
place constantly. If the actual reaction is stepwise, i.e.
oxidation of elemental sulphur to sulphate ions then precip
itation of jarosite compounds, which involve major consump
tion of oxygen, then the above assumption will not be cor-
115

rect.
As the leaching process takes place in a closed system,
isolated from the atmospheric pressure at constant tempera
ture; opening the system e.g. for sampling, will disturb the
internal pressure, as the atmospheric pressure could be
higher or lower than that at the beginning of the process.
Thus the number of samplings were reduced to two; the first,
on the third day of the process and last, at the termination
of the experiment. The progress of the reaction is indicated
by the rate of uptake of oxygen, as indicated by the time
the electrolytic cell is generating oxygen.
At 4.0 initial pH, the important partial reactions
which may take place during the aqueous oxidation of pyrrho
tite can be summarized as:
116

a. Acid dissolution of pyrrhotite:
FeS + 2H+ -----> Fe2 + + H2S (predominant)
FeS + H+ -----> Fe2 + + HS- (VI.1.2)
b. oxidation of hydrogen sulphide:
H2S + 0.5 02 -----> so + H2o
(metal catalyzed, cu2 + '
Fe2 + ( 97) )
c. oxidation of ferrous ions:
Fe2 + + 1.5H20 + 0.2502 -----> FeOOH + 2H+
Thus, the overall reaction would be, a+ b + c
FeS + 0.5H20 + 0.7502 -----> FeOOH + s 0
(VI.1.1)
(VI.1.3)
(VI.1.4)
(VI.1.5)
d. if oxidation of elemental sulphur takes place, the
additional consumption of oxygen would be:
s 0 + H2o + 1.5 Oz-----> HzS04 (VI.1.6)
However, it is known that this last reaction is very slow at
ambient temperature and it is unlikely to take place in
the absence of bacteria. Thus the overall reaction would
be; a+ b + c + d + e,
FeS + 1.5H20 + 2.2502 -----> FeOOH + H2so4 (VI.1.7)
It can be seen that stoichiometric pyrrhotite consumes
three times more oxygen and water when its reaction product
is sulphuric acid rather than elemental sulphur.
Similarly, aqueous oxidation of monoclinic pyrrhotite
may be considered as:
117

a. Fe7Ss + 14H+ -----> 7Fe2 + + 7H2S + s 0 (VI.1.9)
2+ + b. 7Fe + 1.7502 + 10.5H20 ----->7FeOOH + 14H
(VI.1.10)
c. (VI.1.11)
the overall reaction is
Fe7Ss + 3.5H20 + 5.2502 -----> 7FeOOH + ss0 (VI.1.12)
If sulphate ion is also formed, the overall reaction is
Fe7s8 + 11.5H2o + 17.2502 -----> 7FeOOH + SH2so4
{VI.1.13)
Thus, if the mass of the mineral is considered; one
gram of stoichiometric pyrrhotite and monoclinic pyrrhotite
consumes 0.2730 and 0.2595 grams, respectively of oxygen to
complete the reaction. This mass represents 208.8 and 198.5
cubic centimeters of oxygen for stoichiometric pyrrhotite
and monoclinic pyrrhotite, respectively (R=0.0821
L.atm/mol.°K)
It should be noted that no nett consumption or genera
tion of hydrogen ions is involved with either minerals when
ferric hydroxide and elemental sulphur are the only reaction
products. If oxidation of elemental sulphur takes place,
sulphuric acid may also be formed. These observations also
apply to hexagonal pyrrhotite, Fe9s 10 . However, elemental
sulphur has been shown to be the dominant product formed
from the oxidation of pyrrhotite at pH 4.6 although some
sulphate is also formed (17,101).
As the aqueous oxidation of pyrrhotite is heterogene
ous process, the slow steps in the series of reactions may
also be heterogeneous one involving solid-liquid and/or
118

solid-gas interfaces. However, in some cases, the slow step
in a heterogeneous process may be homogeneous, for example
the chemical oxidation of a soluble reactant to a soluble
product is involved, e.g. ferrous to ferric ions with dis
solved oxygen. It is not certain whether diffusion, as a
rate controlling step, can be eliminated even with the
vigorous agitation necessary to keep all the particles in
suspension. Diffusion across boundary layer of solution
associated with the solid surface may still be the rate
controlling step. Nevertheless, stirring as a variable, may
be eliminated provided great enough agitation is applied to
the leaching system and the rate does not increase with
increased stirring.
Continuous bacterial oxidation of pyrite concentrate
at miniplant scale {6reactors x 30 L capacity) developed at
Aurotech N.L. is discussed. In this study, the effect of
bacterial recycle whether with the slurry or liquor, and
dissolved oxygen on the rate of mineral degradation is
examined.
119

CHAPTER VII
VII.1 INITIAL EQUIPMENT DESIGN
The rate of consumption of oxygen can be used to deter
mine the oxidation rate of sulphide minerals at a given pH,
temperature and oxygen potential provided the stoichiometry
of the reaction is constant and known. Thus an 'oxygraph',
in principle, could be used to determine the rate of oxygen
consumption during the aqueous oxidation of pyrrhotite
minerals assuming the stoichiometry given in Equations
(VI.1.5) and/or (VI.1.12) take place.
FeS + 0.5H20 + 0.7502 -----> FeOOH + s 0
Fe7Sa + 3.5H20 + 5.2502 --->7FeOOH + as0
An 'oxygraph' would basically consist of:
1. a closed reactor for the aqueous oxidation
process itself,
2. a source of oxygen, which in this case was
produced electrolytically, and
3. an instrument to measure the oxygen consumed.
VII.1.1 PROCEDURE FOR DETERMINING THE RATE
CONSUMPTION OF OXYGEN
OF
The initial equipment design was based on maintaining a
constant oxygen pressure (and hence volume) in a closed (or
120

constant volume) reactor vessel. The oxygen consumed by the
aqueous oxidation was replaced almost instantaneously by
oxygen produced electrolytically in a separate reactor, in
order to maintain a constant pressure in the system.
The internal pressure in the leaching system was meas
ured with the aid of a manometer containing an electrical
contact. When the pressure in the cell decreased, the con
tact was 'broken' and this caused a constant current to flow
and generate oxygen in the electrolytic cell. When the
pressure increased, the contact was 'made' causing the
current, and hence oxygen generation, to cease. The rate of
oxygen consumption was therefore directly related to the
ON/OFF times of a constant current. Once the ON time start
ed, it was not turned off for a given time; thus uncertainty
in the measurement of small ON times or "noise" or "chatter"
were avoided. Details of the first oxygraph are shown in
Figure VII.1.
Solutions were prepared quantitatively in a volumetric
flask (lL) using analytical reagent grade chemicals. The
oxygen was produced electrolytically from acidified dis
tilled water. A "Towson and Mercer" hot-plate magnetic
stirrer was used to maintain the slurry in suspension.
A Rockwell AIM-65 computer recorded and stored the ON
and OFF times of the electrolytic cell. The data (maximum
1000 readings) was transferred to a PDP11 computer for
further calculations.
As the fresh waste concentrate samples contained in
fastened plastic bags and in drums of 25 Kg. were wet, a
121

FIGURE VII.1: First Oxygraph Design.
555 Timer
AIM-65
~-----------..
·-- ..... '
(B (A)
(D)
(A) Reactor Vessel (B) Electrolytic Cell (C) Manometer
(D) Magnetic Stirrer

sample of about 2 Kg. was taken to be washed with alcohol
and then several times with acetone and dried in a vacuum
for about 4 weeks. Once dried, the sample was ground in a
mortar and passed 100 % through a 150 mesh particle size.
These samples were kept in small plastic bags in a desicca
tor all the time.
A 5 per cent pulp density weight per volume of pyr
rhotite was used in each experiment, unless otherwise stat
ed. The sample studied in this experiment was identified as
Number 2 (79).
FIGURE VII.1
(A) Reaction Vessel: A vertical glass cylinder with
ground glass stopper (B 29/32 socket) with flat base was
used as the reaction vessel. A vertical glass rod was fixed
from the middle of the stopper with its end slightly bent
before a flattened section. The purpose of the rod was to
ensure good mixing of the slurry, which was stirred magneti
cally.
(B) Electrolytic Cell: Electrolysis of a dilute solu
tion of sulphuric acid produced the oxygen necessary to
continue the aqueous oxidation process. A platinum wire (the
anode) was installed inside the vertical glass tube (base
open). This vertical tube (which collected all the oxygen
produced) was connected to the reaction vessel by means of a
capillary tube. The cathode (platinum foil) was installed in
a 200 ml. beaker close against its wall. Hydrogen molecules
122

must be released quantitatively outside the system. A con
stant current of 80 mA was passed through the electrolytic
cell for a minimum period of 90 seconds per ON time, giving
0.0006 gr. oxygen/ON time.
(C) Manometer: The U tube attached to the reactor
vessel contained very dilute acidified water (2 drops of
concentrated sulphuric acid in 20 ml. distilled water) and
two platinum electrodes. In the left-side of the U tube, one
platinum electrode was immersed in the acidified water and
exited through a sealed socket (B 7/16 socket). This side of
the manometer was connected to the internal pressure of the
reactor vessel. The right-side electrode just touched the
water surface at the center of the glass tube; its vertical
position could be adjusted by a threaded screw connected to
the top of the socket (B 7/16 socket). This side of the U
tube was opened to the atmosphere.
The internal section of the system was completely
sealed from the external atmospheric pressure using high
vacuum silicone grease on ground glass joints.
VII.1.2 EVALUATION OF THE FIRST OXYGRAPH
A graph showing the rate of oxygen consumption of 1.5
grams of pyrrhotite at 4.5 pH is presented in Figure VII.1.2
and VII.1.3. As little information about the oxidation
behavior of pyrrhotite could be obtained from this design
due to the small reactor vessel and to the disturbance of
the manometer by stirring, a second larger 'oxygraph' and
123

1. ....... _-------------------------------,
-, L
0 H
f- .s
.8
Q. ~-J
~ 0
J en rJ) ~ .6 z ~ D a
u Z . 4 w Q )-
x D . 2
li Ll
w f-< er
0
FIGURE VII.1.2: Rate of Oxidation of 1.5 g. of Pyrrhotite at 4.5 pH.
1000 2000 3000 4000
Absolute Time (Min . )
5000

1------------------------------, FIGURE VII.1.3: Rate of Oxidation of Pyrrhotite at 4.5 pH.
(1.5 g. of mineral in 30 ml. of solution) Z I Moving Average: 5
.8 D H
~ ~ ~ J ~ z D u
C ·-E 'N 0
01
...:r .6 0 D D D
Z .4 w ~ > X D .2 ~ r, ~
,. ' UJ
~ <{ er:
0 10000 20000 30000 40000
ABSOLUTE TIME (Min.)
50000

electrolytic cell were designed.
VII.2 SECOND EQUIPMENT DESIGN
VII.2.1 PROCEDURE
CONSUMPTION OF OXYGEN
FOR DETERMINING THE RATE OF
The second equipment design is shown in Figure VII.2. A
one liter quick-fit reactor vessel was used and the oxygen
was produced electrolytically from a solution of potassium
hydroxide. Two kinds of pyrrhotite mineral samples were
processed in this series of experiments: Sample O and Sample
2. Identification of these samples was stated by Harris et
al. (79). Thirty grams of pyrrhotite mineral in 600 ml. of
pH 4.0 distilled water (unless otherwise stated), represent
ing 5 per cent (w/v) of pulp density was used in every
experiment.
FIGURE VII.2
(A) Reactor Vessel: The quick-fit reactor vessel had a
spherical bottom and five necks. A variable speed "Vibramix"
stirrer, inserted through the middle neck, was used to
agitate the slurry and disperse air/oxygen. The "Vibramix"
operated at about 200V. A peristaltic pump was installed to
recirculate the air/oxygen from the internal surface reactor
vessel through the shaft of the "Vibramix" in order to
124

.. __
motor vibramix 1111
[ air pump
• . I.. 1 . . ~· . ' . ~ • C
• r _ r' ,~ • w
. ~ (A) Reactor Vessel
e e
r---+==+=1r-----====isss
,·
i t) ~ I (C) manometer .~ ....
~ I g Q
l ) (B) Electrolytic Cell
FIGURE VII.2: SECOND OXYGRAPH DESIGN
Timer
AIM-65
Rockwell
I PDP-11

increase the oxygen mass transfer to the slurry. The third
neck was used to connect the reactor vessel to the electro
lytic cell. The fourth neck was used occasionally to make
additions, such as copper ions and sodium chloride, through
a seal without affecting the internal volume or pressure of
the system.
(B) Electrolytic Cell: The cell consisted of a U shaped
glass vessel designed specifically for this system. The
electrolyte was a solution of 40 percent of
droxide with nickel wires as electrodes. The
potassium
left-side
hy
of
the electrolytic cell contained the anode and anolyte and
was connected to the reactor vessel. The right-side, con
taining the cathode, was open to the atmospheric pressure.
The cell was closed with a B 34/35 and a B7/16 socket sup
porting the electrodes. A constant current of about 150 mA
was used for the electrolysis. It was observed that an ON
time value of 110 seconds was satisfactory to supply the
oxygen necessary for the reaction giving 0.0014 grams of
oxygen per ON time.
A small glass 'U' tube containing slightly acidified
water and platinum electrodes was used as the controlling
manometer. The left arm of this 'U' tube was connected to
the leaching cell through the electrolytic cell; and the
right-side to atmospheric pressure through the electrolytic
cell. Both pairs of electrodes (electrolytic cell and
manometer) were connected independently to the controller
timer.
The whole system was covered by a plastic sheet and
125

heated, when necessary, by an infrared lamp. This lamp,
connected to a thermostat and a temperature controller,
heated the system, when required, up to 3o0 c during the
process.
T. ferrooxidans (BJR-Kl) isolated and acclimatized to
sulphide concentrate by Khalid (125) was inoculated, if
required, to the leaching system. The 9K media composition
was prepared for 600 ml. as described by Sawe (126) and
added in solid form (K2HP04 , 0.5g.; MgS04 .7H2o, 0.5 g.;
(NH4 )2so4 3.0g; Ca(N03 )2 .4H2o, O.Olg and KCl, O.lg for litre
of solution) The bacteria growth was examined through a
microscope at the completion of every experiment. The pH
was read by an Orion Research Ion Analyzer EA 940 at comple
tion of the leaching process. The number of samples was
limited to one, at completion of the experiment.
VII.2.2 EVALUATION OF THE SECOND OXYGRAPH
The rate of oxygen consumption obtained during experi
ments 1, 5, 6 and 7 can be seen from Figures VII.2.1,
VII.2.2, VII.2.3 and VII.2.4, respectively. The typical
leach curves still include cyclical variations which are
attributed to changes in ambient temperature and pressure
during the day. For example, Figure VII.2.4 shows the start
ing time of the process at 7.20 P.M. An apparent decrease,
then increase, in the oxygen consumption rate from about
7.20 AM, the following morning, until about 3.20 PM is noted
throughout the experiment.
126

~=~==~~==:::::::=====--:'.'.'-._::_ ==-------------------··--·----·---------------
1-~-~. r ~
-
0 z
~~
.µ
C
£ QJ E
...... c... QJ Q
. X
w
£ .. .,-
N
>-<
s w
? n::: .:J ~
<
>-<
lJ
_
~~
~
-CD
tO
(\J
0 (\.l
0 0 0 If) ..-1
0 0 0 0 ~
0 0 0 lf)
2 ·u1w
/ 0 · 6 80 JO· O
• N
D
L
.L d
W n
S N
D
::=J
N
3 8
A)<
D
-=:I D
3 _.L
\:I ?::I
---z H
~-L..
..._ __ ,,
UJ
L
H
t--
LU
1 r----, _
__
,;
_j
0 U)
OJ
<r

C ·g .9
-----cf'-J
OJ
-:r ['\J 0 0
0
. z 0 H
r-0.. ~ J (fJ
z 0 u z w ~ >x 0 lL 0 w r~ er:
.8
.7
.6
.5
.4
.3
.2
. 1
0 0
FIGURE VII.2.2: Experiment 5
""'· ... t \
T
: "'... :· .. . .:: ., : ·:.:~:-:-. .. ,_ ...... ·~·.,.~-: • .,,.:_JI'_··.: • ·"'-· ... -.~ ... . -,...,,... . ...... .. . . ..
1440
1
. · .. ....
2880
2
.
.. ·~·· ..... _ ·... •. . -..... · ..... ·.. . .... ...... ·· ................ _ ... _. __ ..... ,_ .. .. -............
4320 5760 7200
3 4 '.:>
. .': ..... .. ...
··.. ...
8640
6
. ... . , . .. .... ..-......... .
10080
7
ABSOLUTE TIME (MIN.)
--... ··· ...... .
11520
8
.. ... •' ..
..,. ...
12960 14.i:
9 DAY-
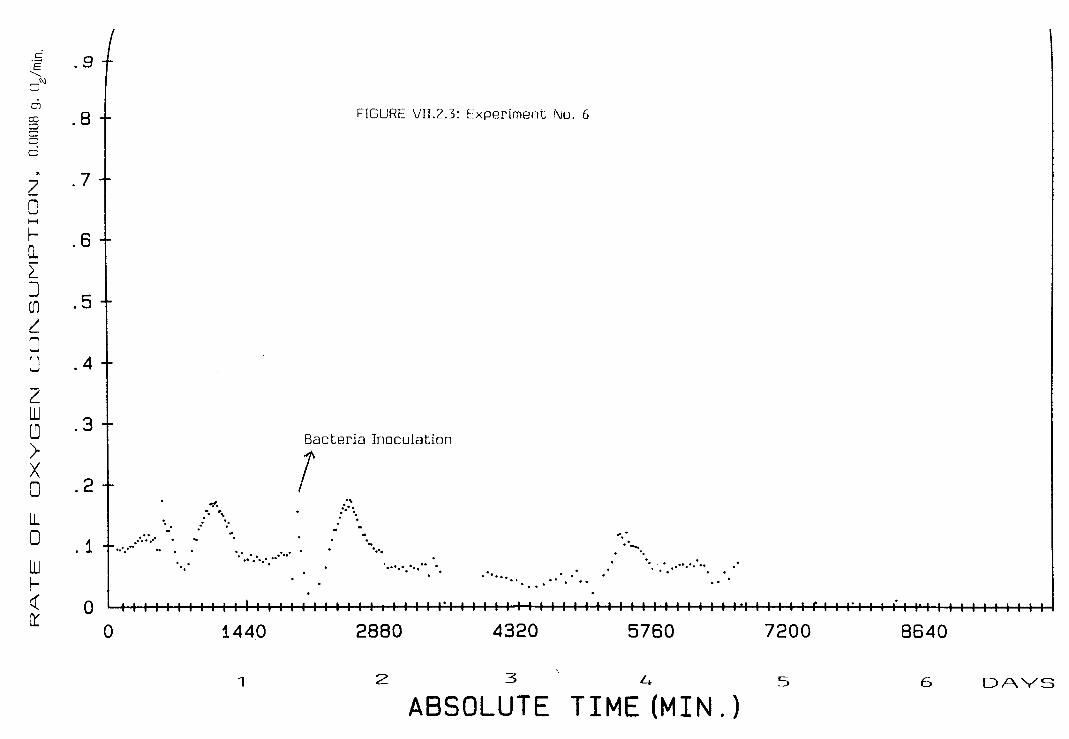
C
~~ . 9 Dis!
O')
~ .8 CJ CJ
0
. z 0 H
~ 0. ~ J G~ t_
0 r 1 \..,/
z w ~ > X 0 lL 0 w ~ <r: ('(
.7
.6
.5
.4
.3
.2
. 1
0
"·'· -. "\
. .. .......... .. . ..... - .. . .............. .
•,
0 1440
1
FIGURE VII.2.3: [xperiment !\Jo. 6
Bacteria Inoculation
7 .. ......... ' . .. .
-..... ...... · .. ··
2880
2
·····
4320
3
... ··..
······· .. . .
5760
4
ABSOLUTE TIME(MIN.)
7200 8640
s 6 DAYS

.s . 9 E -,
0~
OJ
co 0 0 0 0
. z 0
'. 8
.7
C .s I
0. ~ J /("\ UI
z 0 u z
.5
.4
W .3 ~
B . 2 / ~· _io f
7.2iJAtA..'-ro ~.2o fr'!
'~
~· )- t . !JT~ll.li ~ ,i""e
lL -~,_-
f. : f . ··1·- .: ..,..::--: .. , ... · ..... t,~ ... -..... "':' _ _. ___ ~-- -- -.:.--":- ·~---- -{·-------... __ } _____ ----t ··1 ·r--· --- .. ='. , . .,..•. ,, ·.. . ·'·· . . . .. . ,., . . - -0
w f-
:· . ~: '.· -, -··:' · .... -•.•· ·--:- . . . •... · . . 1 + , - . .. ··.,,
< er:
0 0 1440 2880
1 2
4320 5760
3 4
. . .
7200
5
FIGURE VII.2.4: Experiment 7
Slope = m = -0.00C00744
. .': ... '\ ,. .. ·-. . . ....
;_
8640
6
-6 =-7.44 X 10
:... .. .. . . . ', -· ..... . . . . . .... ·. . .·. .. ......... . ···.. ·,
10080 11520
7 8
ABSOLUTE TIME {MIN.J ' ... ,
. ,.._ , . .. •,
- .... •,•
12960 14.i:
9 DAYS

Although the whole equipment was covered with plastic
sheets and heated by infrared lamp, when necessary, the
systematic variations are ascribed to the ambient tempera
ture rise in the mornings to above 30°c and, reaching about
3s0 c during the day. As the equipment was installed at the
east side window and top floor of the building, the ambient
temperature above 30°c was uncontrollable.
It is also known that atmospheric pressure (reported
daily by the Bureau of Meteorology) changes in the range
from about 996 to 1028 hectopascals. Because the right side
of the of the electrolytic cell was opened to the atmospher
ic pressure, it affected the manometer (small U tube). This
behavior was also uncontrollable on this 'oxygragh'. Never
theless, as Figures VII.2.1, VII.2.2, VII.2.3 and VII.2.4
still show consistently an overall linearity throughout the
experiments, these results will be discussed in detail
later.
A third equipment design was constructed in order to
eliminate these systematic variations due to temperature and
atmospheric pressure changes. But, as the Rockwell AIM-65
computer became unserviceable, a "Microbee" computer was
installed to store the data.
VII.3 THIRD EQUIPMENT DESIGN
VII.3.1 PROCEDURE FOR DETERMINING THE RATE OF
CONSUMPTION OF OXYGEN
127

The third equipment design attempted to make the
'oxygraph' results independent of changes of atmospheric
pressure and ambient temperature. A constant atmospheric
pressure equivalent to the onset of the process and a con
stant temperature were maintained by sealing off the leach
ing system and enclosing it in a constant temperature
environment. Figure VII.3.1 shows the equipment in more
detail. It consisted of:
(A) Reactor Vessel: The same reactor vessel and agita
tor described for the second equipment was used. An air
sampler pump, Kimoto HS-6, was modified to recirculate air
or oxygen at about 9 1/min.
{B) Electrolytic Cell: Oxygen was produced by the
electrolysis of an acidified copper sulphate solution. It is
known that the electrode potential of copper and oxygen are
described by the following equations (110):
cu2 + + 2e- -----> cu0 E0 =0.3402 v
2H20 ----->Oz+ 4H+ + 4e- E0 =-1.229 V
(VII.3.1)
(VII.3.2)
(VII.3.3)
This reaction is forced to take place by a constant
current of 480 mA passed through the cell. In this process,
the anode reaction is the formation of oxygen and the
cathode reaction is the deposition of copper. Every experi
ment was started with a new copper sulphate solution con
taining at least 200 g/L of copper sulphate (solubility of
128

(11)
e
(5)
(4) (1) i
\ .. 0
(6) 0 •11 t, ~ .
(9) i.:..u--
FIGURE VII.3.1: THTRD OXYGRAPH DESIGN.
e
555 1 1 ~ Cu wire
p: / l'>Pt foil
1 @ (8)
(1) Reactor Vessel
(2) Electrolytic Cell
(3) Magnetic Stirrer
(4) Hg Manometer
(5) Air Pump
(6) Temperature Recorder·
Microbee Computer
IBM-PC
(7) Heating system
(8) fan
(9) Pt contacts
(10) Ammeter
(11) Vibramix

FlGURE VII. 3 .1: THIRD OXYGRAPH DESIGN

copper sulphate, cuso4 .5H2o in cold water is 24.3 in 100
parts (35)).
The anode was a platinum foil (2.5 cm x 6 cm, approx.)
and the cathode a copper wire. Therefore, hydrogen evolution
would not occur provided the copper concentration is high.
The electrical circuit was the same as that previously
described and it is detailed in Appendix H. The electrolytic
cell was connected to the leaching reactor by a short length
of thick walled high quality rubber tubing. The electrolyte
was gently agitated with a magnetic stirrer.
(C) Manometer: A conventional glass mercury manometer
(5mm internal diameter) was used to measure the pressure in
the system. The manometer was filled with mercury under
vacuum, the glass at the top was flame sealed. The bottom
part had three necks; two for the platinum electrodes used
to measure the height of the mercury interface, and the
third connected to the reactor system. One electrode was
immersed in the mercury and the other placed less than one
millimeter above the center of the mercury surface. These
electrodes were sealed at the sockets (B 7/16) with high
vacuum grease and black wax.
The ON/OFF time of the electrolysing current was
registered and stored in a "Microbee" computer,
able to save up to 2,500 readings. The data was
to a PDP-11 computer for processing, analysis and
which was
transferred
plotting.
As this computer became unserviceable, the data were trans
ferred to an IBM compatible PC.
Temperature of the environment was controlled by a
129

thermostat at 30.5(+/-1°c). Heat was supplied to the system
by means of an infrared heat lamp, and a fan was used to
ensure a uniform environmental temperature. It has to be
mentioned that the temperature in the environment increased
up to about 35°c due to the heat produced by the "Vibramix"
motor. To overcome this problem, a five centimeter hole was
made through the polystyrene wall, close to the motor, thus
the constant reaction temperature improved to about 31°C.
Ideally, the experimental equipment should have been in
stalled in an air conditioned environment.
Once the solution of sulphuric acid was placed in
leaching reactor, the system was operated for about a
hour in order to obtain a uniform temperature of 30.s0 c
the chamber. Then a sample of the mineral was added and
reactor system sealed off from atmospheric pressure.
VII.3.2 EVALUATION OF THE THIRD OXYGRAPH
the
half
in
the
The curves obtained for the rate of consumption of
oxygen from this 'oxygraph' are shown in Figures VII.3.2,
VII.3.3, VII.3.4, VII.3.5 and VII.3.6 and VII.3.7. It is
noted that the cyclic variations during the rate of oxygen
consumption were not eliminated fully. These cyclic varia
tions are directly related to the temperature variations
during the day. It was difficult to maintain a constant
temperature for extended periods without an air conditioned
environment. The temperature of the general environment
(outside of the system) and the heat produced by the motor
130
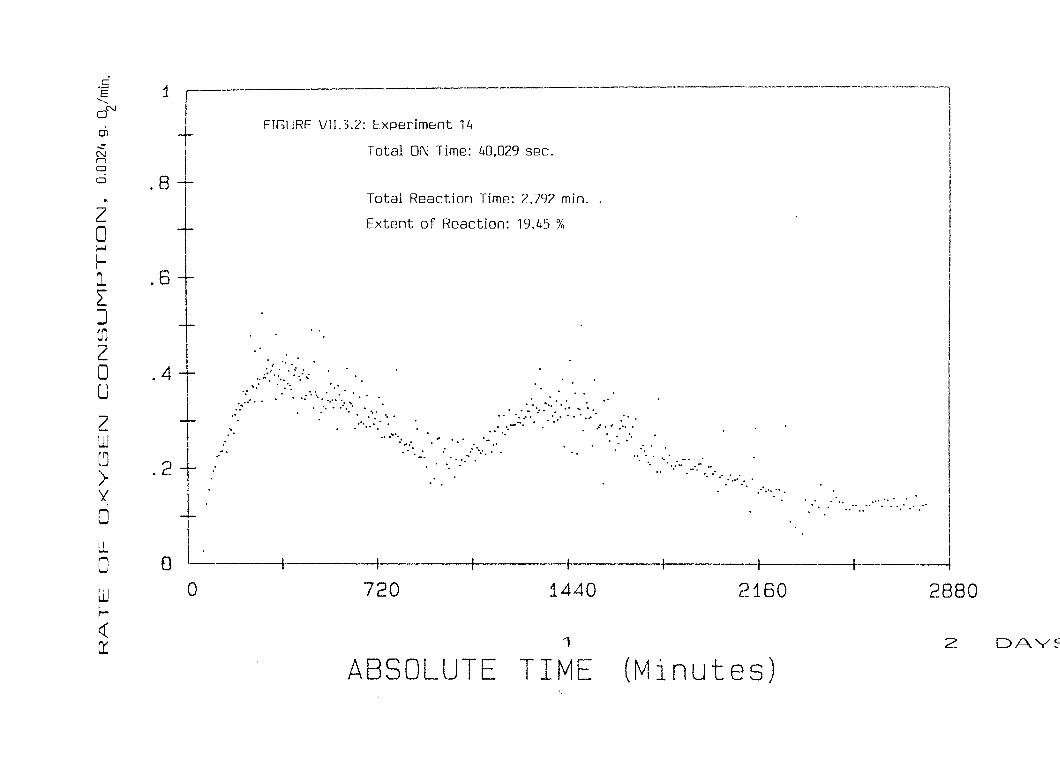
C ·g ,, ON
0)
...,. N n 0
D
. z D H
~ 0. ~ J G1 z 0 u z w [~
> y
0 u_ D w ~ er rr:
11 FIGURE Vll.3.2: Experiment 14 - .. ---1
l I
.8
.6
I .4 t . _.:.:., ........ ··.:.: ... . . . .
Total ON Time: 40,029 sec.
Total Reaction Time: 2,792 min ..
Extent of Reaction: 19.45 %
t .· .. ···, ..... ·:. ···,. . . ... : .:.-. . . ·. . ....... · .2 + ,. . . i ... .
tl • ---4--t----t-·-+-
... ··". . .... ·.. .... ......... .. .
··· .. ·. '
.· ... · ......... ·.· .. . . ___ :.:·. . .. · ·" .. · . .,.
o _· 1440 0 720 2160
1
ABSOLUTE TIME (Minutes)
I I
I I
2880
2 DAY~

it ----0,J 0
Ol
...:t N Cl C! D
~
z 0 H
rQ.
~ J (J)
z 0 u z w ~ )-x 0 lL 0 w r-~ er:
1 r
i T
I I
. 8 + I
I . 6 I
i
+ I i ,~ r_:._:. ,
f ':?ftJ, [ifL l T·· · · -.. -.... ~ .,_ · 1 e< . . ·'-\/ '\.,,,. : '/ .
....
2 +. .. ">; .. :..,t,,.,...r.. , ' .. ····;'·:·. . . . ,. <. ,:-:,:~ ..
0 0 1440
1
... '\.
2880
z
-----1 FIGURE VII.3.3: Experiment 15 Total ON Time: 114,617.4 sec. Total Reaction Time: 12,285.9 min. Extent of Reaction: 55.69 %
I I i
l
.,·,, . . ;:::: ...
. . t ,• ......... .
I' •'
.. .. ":· ....
:' /:? j f:'.jt'.? ,,. \:· .... .-.-::.:._!_._· .. :\·:·:_-_.:: ·-:.;·-· • .-..
..........
4320
3
. .....
5760
4
7200 5
8640 6
····:·-.- ... · .. -·. •.,.•,
10080 7
·1 I
11520 12960 8 DAYS
ABSOLUTE TIMt. (Minutes) \

C '§ 'N
0
OJ -;t N 0 0 0
. z D H
fQ.
~ J l8-z D u z w ~ > x D u. D w f<t cc
1
! .Bt.
I
I I
l I
i .GT I i
I . 4 + . •. ·-.:·.·.:· .. .. ' .
.2
I.· I k
I
·-------··------------- --·-1
FIGURE VII.3.4: Experiment 16 Total ON Time: 63,896.65 sec. Total Reaction Time: 4,212.7 min. Extent of Reaction: 31.04 %
··. !';,_::-::: .< :'._./ ·:_:;_,/·:··'': ._·., '•, :· : .:,. .-,./r '."'j:::.•i>'·'- _/i'·' , .. ,:-."·· ··'_::-, ..
. ...
!
:.-. . ,··. . :.:··.: ..
o L-+----+---~--1----t----t--+----'--~--+-_:_~· ·-+--0 1440 2aso 4320
1 2 .3 DAYS
ABSOLUTE TIME (Minutes)

C "§
" cI' OJ
-.:r N C) C)
C)
~
z 0 H
r-0.. ~ J '" Ui
z 0 u z w l'.l >x 0 u. 0
w r~ er
1 T---- --------' i !
I . 8 r
I I
j i
' 6 + . I
I
i I
\
.4 t i
... · ...
---
FIGURE VII.3.5: Experiment 17 Total ON Time: 88,474.27 sec. Total Reaction Time: 8,627.5 min. Extent of Reaction: 42.98 %
,~"'~.· .,. ~ . "•
:'":~~:; =:;)-.-:.
1• • I ,.. . : .... _
.. . 2 J/'{~:'.:}\//\,. :</'f /'.··.:/\\;:/LJ. I ·-
.. ···.· .. <:.:. ..... , .. ;.'\ ... ... ·· .... , .... .,. · .... ·/;_._~: ..... .-... :· .... :.:-.
·------·--··1
I I I
.;·. _::·~;.:.: ..
_\· ,,.
' ... ..
.--·.·. l --+---+-~~ 0 -- 2880
--+-----+----+------1-------l--0 1440 4320
1 2 3
ABSOLUTE TIME
5760 4
(Minutes)
7200 8640 5 6DAVS

C ·g ----... d'-1
OJ
-:r N Cl 0 0
. z D I-<
f-0.. ~ J ([)
Z' D u z w [j )-x D LL 0 w fer 0::
1 r-----------------------·--·-----·------------------- -------------·-----· -·----·------------ --------------· 1 I
I : j t FI~URE VII:3.~: Exp;riment 18 I 1 Total ON Time. 70,697.5 sec. 1 . 8 ~ Total Reaction Time: 4,523.3 min. I I Extent of Reaction: 34.35 % I + I
I t
.6 + \ : :, : .
+ -:>->. ... .... • ·.·:-,, i "?·'":.:·,:· .. I .. •· I···: ....
. 4 r . . ·" r '<\+~:::.<:f ::.t .. /);; /:\s;_.; ::.;; '
2 ), ., .. , .· ,.. .. ..... -
. T .. :\ ·:.: · ... :, .... . ,A•,,
+ i I
... ~·· . •, ..
:,\/',}·:·. :, . ·, ·.·
0 L--1 -1----1---t---+--- · I- I ---!-·--+--- I I ··-I----+-----!-- I I 0 1440
1
2880
2
ABSOLUTE TIME
4320 3
(Minutes)
5760
DAYS

C
~~ ON
OJ
..;r N 0 0 0
z D H
f-0. ~ J rJ)
z 0 u z w (.'.)
>x D LL D w f~ cc
1 ! /\,; -------------------- -----·--~---------- -- . ····-----·---·-·-·-----·-·--1 I . :,·.· T'· ...
I' · \. F;1GURE VIL 3. 7: Experiment 20 I
8 ·::· 1otal ON Time. 114,954 sec I · T ~\: Total Reaction Time: 7, 920 min. 1
, · X Extent of ReacU.on: 55. 85 % I I ;,;.. I
TI s
II , .. ··:~;. . I
..LI, . )\t ... . . ~ ...... :-:.:.
·~ • i • • • ··t.-t • ,.• ·. "·~ ·:,·. ·,·., ·:-~~-.
I ·.,. _. 4 -t- ilf t/,',':\}}: ~. ,
I ·: .. . . .. . : .· ..
. 2
. .. ..
:~?.i_: ·}· .. _:~::?-·.,_:. :::~::::~<,:~.---·.. ..,, ·.:
• .. ·
~-·'· ~. >
... ... · . .. : . ~."·:.
"lo • :: ...... ">.· ·,·: ..... . ..
........ · .. · ......
0 I I I I I -+-1 I 1. -t-+ I l-t------- +--+---t--i---- I I +--+---+- ·-r I I I I I 0 1440 2880 4320 5760 7200
1 2 3 4 5 DAYS
T I M E (MINUTES)

of "Vibramix" (constant) affected the system in the morn
ings.
However, it can be seen that all curves show consist
ently a general linearity, where the rate of consumption of
oxygen was faster at the beginning than that at the end of
experimentation, as would be expected.
The constant measurement of oxygen consumption during
the aqueous oxidation process allows us to determine the
extent of reaction. Thus the program "LEACH.BAS" also
calculates the extension of reaction and is presented for
each experiment in Figures VII.3.8, VII.3.9, VII.3.10,
VII.3.11, VII.3.12. These curves, tending to be parabolic,
also show the behavior of the extent of reaction, which
evidently is more aligned than the rate of oxygen consump
tion curves.
VII.4 OXYGEN CONSUMPTION DURING THE REACTION OF
PYRRHOTITE MINERALS
The rate of oxygen consumption will be analyzed in
three sections: Firstly, the results obtained from the
second oxygraph, where the rate of oxygen consumption was
determined for initial pH values of 5.5, 4.5 and 4.0. The
rate of oxygen consumption was compared when leaching took
place in the presence of bacteria and that against chemical
oxidation for two samples: Sample O and 2.
Secondly, an attempt was made to justify the fact that
131

·,o o'._
LU f-·f---i L--1
0 I :r-e---
'1 1 _ _,__
'~--/
o_
LL 0
~ L.--
0 ~ . . f--<(
D !--l X 0
2 a 1
--------------------------·------------------------------------------------------------·- __ 1
! ~~- i T ! t FIGURE VII.3.8: Experiment 14 I t Extent of Reaction I
1 ~ , 1 _ _, i I , I , I + I + ; i
10f
5
0
t i
+
t l
I
0
-·
720 1440 2160
A.BSOLUTE Titv1E (Minutes)
' ' i I I I
j
l ~
2880

60 --- ·---···
I ~
50 I LU FIGURE VII.3.9; Experiment 15 ------------r--Extent of Reaction r--l
L-I
0 I
40 a:: '.J LL
>-o_
30 ll 0
z 20 0 H ~-I
<t 10 0
ofL I H X
I 0 I I I I I --1 I I I I I I I I I I I 0 1440 2880 4320 5760 7200 8640 10080 11520 12960
A.BSOLUTE TIME (Minutes)

~
w fH f-0 I [[
IT >-0....
LL 0
z 0
40
30
H 10 f-<(
0 H X 0 0
0
FIGURE VII.3.10: Experiment 16 Extent of Reaction:
31.
04 %
720 1440 2160
-· --·--· I I
I
2880 3600 4320
ABSOLUTE TIME (tv1inutes)

'-._O o,
l .iJ 1-f --! ) r·-0 I (I [I
>Q_
LL 0
z 0 1--l !<(
D H X 0
50 .....----· --- ····-------- .... -·--·--··------- -. - -- ------- ·1
40 t
30 i 20 t 10
FIGURE VII.3.11: Experiment 17 Extent of Reaction: 42.98 %
I
0 w:c._-----•--i------t-----f------l 0 1440 2880 4320 5760 7200 8640
ABSOLUTE TIME (Minutes)

'-,0 0"-,
U_l L---., __ l I I
I ·--' 0 -T-__ ,:__
IT [[
>[l
I I L!., __
C.::J
"-7' ,:::_
0 l--i t-<t ii '·---~
l--l
X ,
CJ
5 0 -, · ---- --- ·- ---· I I
!
+ I
"O I .(4 ~
I 1 I I ' I
30 + I ! i
T I
I I
?OT l l
T I
10 t
0
I I
!
0
FIGURE VII.3.12: Experiment 18 Extent of Reaction: 34.35 %
-- ----- --·-·- --· ----- - ........ -1
/~
I I
--- 1--1----·+--+-----1---~----+--·-t----l-----+----t---+---1-----1
1440
~!SOI uT·r· /-. d L- j L
2880
T ·-1 J. MF
4320 5760
0v1inutes)

the rate of aqueous oxidation of pyrrhotite minerals could
be determined from the rate of oxygen consumption. There
fore, using the third 'oxygraph', the attempt consisted in
determining the reproducibility of the rate of oxygen con
sumption. The effect of air and pure oxygen on the rate of
oxygen consumption will be analyzed in terms of ferrous and
ferric ions in solution, pH in the system, the oxidation
products and extent of reaction.
Finally, the extent of oxidation obtained from 'shake'
flasks experiments was compared with those of both 'oxy
graphs' by determining the mass balance of the reaction
products.
VII.4.1 RATE OF CONSUMPTION OF OXYGEN DURING BACTERIAL
AND CHEMICAL OXIDATION OF PYRRHOTITE MINERALS.
Table VII.4.1 summarizes the results obtained from
seven experiments in terms of final pH, bacteria growth, if
inoculated, total hours of reaction and the number of read
ings, ON/OFF time of electrolytic cell (ON time fixed to be
constant).
Two preliminary investigations were conducted using
this sulphide
initiated the
microorganisms.
concentrate. Firstly, Sawe (124) in
experiments at pH 2.5 and the presence
In a second study, Harris et al. (79)
1980
of
in
1983 suggested 4.5 pH as the most favorable acidic condi
tion. It was thought that the soluble products, obtained
from the first study, are environmentally unacceptable. The
132

second experiment was aimed at producing both iron and
sulphur reaction products as insoluble and safe residues.
Thus, this study aims to determine the rate of consumption
of oxygen at 4.5 pH and, then, to evaluate the rate of
aqueous oxidation of pyrrhotite minerals, if the reaction
stoichiometries assumed are correct.
Experiment 1 and 2, both using Sample 2, took place to
validate the basic pH assumption at 5.5 and 4.0, respective
ly.
Experiment 1 (Figure VII.2.1) had a final pH of 3.85
and experiment 2, 3.1 after 237 (9.875 days) and 241 (10
days) hours of reaction, respectively. However, the number
of readings obtained for experiment 1 and 2 were 1,914 and
7,580. The number of ON times of the electrolytic cell is
determined by dividing the total number of readings by two.
This chemical behavior indicated that when the initial pH in
the system was decreased from 5.5 to 4.0, the oxygen con
sumption rate increased. As both experiments took place in
the absence of microorganisms, and under these conditions,
oxidation of elemental sulphur is unlikely to occur; it is
implied that the rate of consumption of oxygen increased due
to an increment in the rate of oxidation of pyrrhotite.
133

TABLE VII.4.1
Exper. Initial Final Bacteria Hours of Number
No. pH pH Growth Reaction Readings
Chemical Oxidation: Sample 2
1 5.5 3.85 negative* 237 1,914
2 4.0 3.10 negative* 241 7,580
Bacterial Oxidation: Sample 2
3 4.0 2.95 indicium** 456 5,864
4 4.5 3.88 indicium** 24 1,008
Chemical Oxidation: Sample 0
5 4.5 192 1,794
Chemical and Bacterial Oxidation: Sample 0
6 4.5 143 398
Chemical Oxidation: Sample No. 2
7 4.5 3.76 indicium 216 1,322
* not detected in the microscope.
** very small amount detected in the microscope.
134

Table VII.4.2 shows the oxygen consumed, extent of
oxidation and rate of oxygen consumption for every experi
ment. These values were determined on the assumption that
Equations (VI.1.5) and (VI.1.12) took place and Faraday's
Law applied, as stated in Appendix G.
Since the rate of oxygen consumption by the aqueous
oxidation of pyrrhotite minerals is slow under the present
conditions and seems to have a linear relationship with
time, the mean of the oxygen consumption rate might only be
used for explanation purposes.
It can be seen that the total oxygen consumed during
experiment 1 and 2 was found to be 1.309 and 5.1842 grams.
These values give 16.39 and 64.90 per cent of extent of
oxidation and 0.00009 g/min and 0.00036 g/min of rate of
oxygen consumption for experiment 1 and 2, respectively.
Faster consumption of oxygen at 4.0 initial pH than
that at 5.5 is probably ascribable to the initial reaction
of pyrrhotite that takes place non-oxidatively according to
the potential-pH diagrams. And, as stated by Yazawa (25),
dissolution of pyrrhotite is approximately proportional to
the surface area of the mineral and the molarity of sulphu
ric acid forming an [FeS-2H+] activated complex. Consequent
ly, higher oxygen usage was due to oxidation of ferrous to
ferric ions. At the final pH values obtained (above 2.0),
precipitation and hydrolysis of ferric ions is a fast reac
tion. Thus, the regeneration of hydrogen ions and continuity
of the reaction cycle seems to occur. On the other hand, as
oxidation of ferrous ions is fast at pH values around 4.5, a
135

direct attack of ferric ions on pyrrhotite minerals may also
occur.
It has been found in voltammographic studies that at
4.6 pH and potentials of 0.2V (101) ferric hydroxide dis
solves by the reverse of the following reaction:
Fe2 + + 3H20 ------> Fe{OH) 3 + 3H+ + e- {VII.4.4)
"This suggests that the oxide which gives rise to this
peak is formed directly and is not produced from species"
(17,101). As this work was done in nitrogen atmosphere, it
is not known whether this reaction would occur in the
presence of dissolved oxygen.
At the conditions of pH and potentials stated above,
the results were analyzed in terms of the formation of
ferrous ions, elemental sulphur and sulphate ions. At higher
potentials (0.4V), the stable iron species is "iron {III)
oxide", elemental sulphur and sulphate ions. Although the
potential in the present study has not been measured, it is
believed to be in this range, from 0.2 to 0.4 V(SHE). Thus,
the reaction products stated by Hamilton (101) (ferric
hydroxide, elemental sulphur and sulphate ions, where ele
mental sulphur is more predominant than sulphate ions) are
expected to occur here.
It was also stated by Hamilton et al. (101) that the
voltammetric study followed by X-ray photoelectron spectros
copy (XPS) results indicated that oxidation of pyrrhotite
proceeded through progressive removal of iron from the
136

lattice represented as:
Fes1 _13 ------> Fe1_xs1 _13 + xFe2 + + 2xe
and
(VII.4.5)
Fes1 _13 + 3xH2o -----> Fe1_xs1 _13 + xFe(OH) 3 + 3xH+
+3xe- (VII.4.6)
where the value of x will increase with an increase in
potential, and the rest potential of pyrrhotite in air
saturated pH 4.6 solution was found to be 0.3 V (SHE).
In experiments 3 and 4, Sample 2 was subjected to
bacterial oxidation at 4.0 and 4.5 initial pH values, re
spectively. Appendix G also shows the calculation by which
the oxygen consumption and oxygen generation could be ob
tained from the reaction stoichiometries and Faraday's Law.
It can be seen that 7.9877 grams of oxygen would be, in
theory, the amount of oxygen consumed by thirty grams of
pyrrhotite mineral sample.
Initially, the leaching system (containing only the
pyrrhotite sample) was sterilized with CIG "sterigas 27"
(12% w/w ethylene oxide in dichloro-difluoromethane) for
about 4 hours. Thereafter, the sterigas was flushed out by
sterile air. Distilled water (pH 4) was sterilized by auto
claving.
Experiment 3 started as a chemical oxidation, then
after 24 hours (770 readings were obtained already), the
system was inoculated with 5 ml, 109 bacterial suspension
acclimatized to this sulphide ore by Khalid (124). The 9K
137

nutrients were added in solid form equivalent to 600 ml of
solution. It was noted that the rate of oxygen consumption
was faster compared with that of experiments 1 and 2. It was
also observed that more froth was formed on the surface and
that the slurry showed to be more a brownish colour than
that of experiments 1 and 2. It has not been possible to
draw a graph for this experiment.
138

OXYGEN CONSUMED,
TABLE VII. 4. 2
EXTENT OF OXIDATION
CONSUMPTION OF OXYGEN
AND RATE
Experiment Oxygen Extent of Rate of Oxygen
Consumed,g. Reaction,% Consumption,g/hr.
Chemical Oxidation: Sample 2
1 1.309 16.39
2 5 .1842 64.90
Bacterial Oxidation: Sample 2
3* 5.469 68.47
4 0.6894 8.63
Chemical Oxidation: Sample 0
5 1.227 15.36
Chemical and Bacterial Oxidation: Sample O
6 0.2722 3.41
Chemical Oxidation: Sample 2
7 0.9042 11.32
* ON time 150 seconds
139
0.00009
0.00036
0.0020
0.00048
0.0001
0.000032
0.00007
OF

To determine the oxygen to be consumed theoretically,
it was assumed that the reaction stoichiometries, stated in
Equations (VI.1.5) and (VI.1.12), for stoichiometric and
monoclinic pyrrhotite were taking place. As 30 grams of pure
stoichiometric pyrrhotite and monoclinic pyrrhotite would
consume 8.1905 and 7.785 grams of oxygen, respectively, the
mean value, 7.9877 grams, is thought to be the more accu
rate.
As it was reported in Chapter II, Physical Properties
of Iron Sulphides, the most abundant natural pyrrhotites are
believed to consist of three kinds of pyrrhotites, mainly:
monoclinic pyrrhotite (4C), intermediate pyrrhotites (nC)
and troilite (2C). However, as nC pyrrhotites having a
composition range from Fe9s 10 to Fe11s 12 have been scarcely
reported in the literature of aqueous oxidation, troilite
and monoclinic pyrrhotite are considered the predominant
minerals.
Table VII.2.2 also shows the amount of oxygen consumed
and the extent of reaction of pyrrhotite for experiment 3
and 4. An extent of 68.47 per cent was obtained for the
bacterial oxidation of Sample 2 in 456 (19 days) hours for
experiment 3. However, it was noted that after 200 hours of
reaction, only a very small amount of oxygen was consumed.
It is not understood whether the second half of the reaction
(after 200 hours) was controlled by a diffusion process by
the formation of ferric hydroxide and elemental sulphur
and/or the bacteria became inactive by the absence of opti
mal growth conditions.
140

Microscopic examination of the leached material indi
cated that bacteria had not grown; in the best cases (exper
iment 3 and 4) only very few microorganisms were detected,
although according to Kuenen et al. (110) (The Prokaryotes,
Chapter 81) pH 4.0 is the optimal acid level required for
growth of T. Thiooxidans, it is probable that the bacteria
have lessened their activity due to the absence of other
growth requirements. T. ferrooxidans are able to derive
energy from ferrous iron oxidation as well as inorganic
sulphur compounds while T. thiooxidans, which have been
shown to possess the capacity to chemelithotrophically
oxidize ferrous ions and reduced inorganic sulphur com
pounds, have been reported more recently to be highly active
under the following conditions (107):
- A pH range of 0.5-6 (125) with an optimum pH for growth
of 2,
- optimum temperature of 15-25°c for T.ferrooxidans and 10-
250c for T. thiooxidans (125),
- a source of nitrogen, phosphate and trace amounts of
calcium, magnesium and potassium, and
- oxygen and carbon dioxide from air used for organic
synthesis.
It is believed that some of these requirements may have
been suppressed in the 'oxygragh' (e.g. nitrogen, carbon
dioxide) since the equipment was sealed from the atmosphere
and only pure oxygen was produced.
In experiment 5 and 6, chemical and bacterial oxidation
of Sample o, named as the "less reactive" pyrrhotite by
141

Harris et al. (79) compared with Sample 2, was studied.
Experiment 5 and 6, Figures VII.2.2 and VII.2.3, with
an initial pH of 4.5 gave an extent of oxidation of 15.36
and 3.41 per cent in 192 (8 days) and 143 (6 days) hours of
reaction, respectively. From which the average rates of
oxygen consumption were 0.0001 and 0.000032 g/min, respec
tively. Experiment 7, Figure VII.2.3, took place under the
same initial 4.5 pH using Sample 2. In 216 hours, it pro
duced an extent of reaction of 11.32 per cent with an aver
age of oxygen consumption of 0.00007 g/min. These experimen
tal results are not completely in agreement. The discrepan
cies in the rate of oxygen consumption during experiment 5
(higher than experiment 7) and 6 (lower than experiment 7),
shown in Figure VII.2.2 (experiment 5) indicates that molec
ular oxygen has constantly been consumed during 8 days and
no experimental errors can be found. Nevertheless, although
Figure VII.2.3, derived from experiment 6 (Sample 0), shows
a lower rate of oxygen consumption than experiment 5, it
might be attributable to an experimental error.
The rate of oxygen consumption of Sample 2 with an
initial pH of 4.0 ([H+] = 10 x 10-5 mol/L) (experiment 2) is
about 3.6 times faster than that of Sample Oat 4.5 initial
pH ([H+] = 3.16 x 10⁻⁵ mol/L) (experiment 5). On the other
hand, the rate of consumption of oxygen of Sample 2 (experi
ment 1) with an initial pH of 5.5 ([H+] = 3.16 x 10⁻⁶
mol/L) and that of Sample O (experiment 5) at inital pH of
4.5 are approximately the same. Thus, it is deduced that the
ratio of concentration of hydrogen ions of 10 between pH 4.5
142

and 5.5 did not increase the rate of consumption of oxygen
of Sample 0. However, a ratio of concentration of hydrogen
ions of 3.16 between 4.0 and 4.5 pH did increase the rate of
consumption of oxygen of Sample 2 about 3.6 times faster
than that of Sample 0.
Aqueous oxidation of Sample 2, named "reactive pyrrho
tite" (79), wich was slightly faster than Sample 0, is
probably ascribable to the initial reaction which takes
place non-oxidatively. This is likely to be the behaviour of
stoichiometric pyrrhotite according to its potential-pH
diagram. This could be confirmed by the statement made about
this kind of pyrrhotite: "the pH will increase to a value
where the oxidation of ferrous ions becomes kinetically
favourable and the overall rate of oxidation is determined
by the rate of chemical oxidation of ferrous ions" (79).
On the other hand, with the aqueous oxidation of Sample
0, named "less reactive pyrrhotite" (79), the initial reac
tion seems to predominate with ferric ions rather with
hydrogen ions. This is likely to be the behaviour of mono
clinic (or/and hexagonal pyrrhotite) due to its stability
in the potential-pH diagram (it is stable at higher poten
tials than sotichiometric pyrrhotite). This may also be
confirmed by the statement that "the pH may decrease until a
significant ferric ion concentration is established and the
overall oxidation will be determined by the biologically
assisted oxidation of ferrous ions" (79). Thus, it appears
that Sample O was predominantly monoclinic pyrrhotite and/or
hexagonal pyrrhotite and Sample 2, stoichiometric pyrrho-
143
tite.
Thus, the rate of consumption of oxygen during chemical
oxidation of Sample O is slightly higher than that of
Sample 2. A clear cut conclusion if there is any difference
in the rate of oxygen consumption during bacterial oxida
tion of both samples can not be drawn from these experi
ments. Moreover, as the exact origin of Sample O is uncer
tain and some variability of the reactiveness of pyrrhotite
fraction was also found in the mill processing practice
(79), a full reproducibility of both samples might also not
be expected.
VII.5 JUSTIFICATION OF THE METHOD FOR DETERMINING THE
AQUEOUS OXIDATION RATE OF PYRRHOTITE MINERALS
It is widely known in the literature that there are
three areas of investigation of a reaction whether it is
homogeneous or heterogeneous: the stoichiometry, the kinet
ics and the mechanism. In general, the stoichiometry is
studied first, and when this is far enough along the kinet
ics is then investigated. With empirical rate expressions
available, the mechanism is then looked into. In this sec
tion, an attempt will be made to justify the method by which
it is shown that the rate of consumption of oxygen obtained
from the 'oxygraph' may be used to determine the rate of
aqueous oxidation of pyrrhotite minerals. The results ob
tained from these experiments are compared with those of
'shake' flasks in terms of elemental sulphur formed and
144

extent of reaction. Table VII.5.3 summarizes the results
obtained in these series of experiments which took place in
the third •oxygraph'.
145

TABLE VII.5.3
Experi Initial Final Hours Total Fe2 + Fe3 + Air/
ment pH pH Reaction Reading ppm. ppm. Oxygen
-----------------------------------------------------14 4.5 4.10 120 878 air
15 4.5 3.6 215 2,520 air
16 3.0 4.6 24 air
4.8 120 1,522
17 4.0 3.90 120 1,958 air
18 4.0 4.073 72 1,818 18.5 nil air
3.014 144 9 3.5
19 4.0 4.232 72 11.6 0.1 air
2.988 120 3.72 0.355
20 4.0 3.721 72 2,294 22 0.3 oxygen
146

The main reaction products obtained from the aqueous
oxidation of pyrrhotite minerals are likely to be amorphous
ferric hydroxide, FeOOH and elemental sulphur. However,
oxidation of some elemental sulphur to sulphate seems to
occur as ferric hydroxide accumulation takes place or/and as
the oxidative leaching process advances. This reaction,
oxidation of elemental sulphur, will be discussed later in
detail.
Case et al. (126) examined the products in the solution
phase as well as precipitates and starting material residues
of aerobic "hydrolysis" (pH variation from 2.5 to 5.8) of
ferrous sulphide by potentiometry, X-ray diffraction, X-ray
fluorescence, scanning electron microscopy, infrared spec
trometry and reported that lepidocrosite, (reported only as
FeOOH, it is usually known as (beta)-FeOOH) and sulphate are
the main reaction products. However, voltammographic
studies of surface oxidation of pyrrhotite minerals at 4.7
pH (17,101) reported Fe(OH) 3 (sometimes called only Fe(III)
or "iron
products.
extent of
oxide") and elemental sulphur
Harris et al. (79) reported that
reaction of bacterial oxidation
as the major
monitoring the
of pyrrhotite
minerals (the same concentrate as this study, at 4.5 stated
pH), by examining the reaction products by scanning electron
microscopy with back scatter detection and EDAX analysis and
X-ray diffraction, proved generally unsatisfactory. Case et
al. (126) also presented a balance of materials with plus or
minus 20 per cent precision after using all the experimen
tal methods indicated above.
147

Qualitative and quantitative analysis of the solid
reaction products from aqueous oxidation sulphide minerals
at pH values above 2.0 is complex to determine. It is com
plicated firstly, because ferric iron precipitates can
occur in amorphous and crystalline modifications and second
ly, ferric iron and sulphate ions may form many crystalline
or/and amorphous ferric basic sulphate precipitates under
similar conditions. Thirdly, these precipitates have not
been characterized thoroughly. According to Music et al.
(47) the instrumental methods indicated-above by Case et al.
(126) and also IR spectrophotometry, and ultracentrifugation
have their limitations. However, the use of 57Fe Mossbauer
spectroscopy does permit us, according to Music et al. (47),
to study the steps involved in the precipitation and their
subsequent transformations.
Since the hydrolysis and precipitation of ferric ions
generates hydrogen ions, some elemental sulphur may also
oxidize to sulphate ions reducing the pH during the aqueous
oxidation process. Generation of sulphuric acid may not be
due to the oxidation of pyrite which was present in the
sample (79) since pyrite would be inert in this system.
Nevertheless, voltammographic studies of the oxidation
products of pyrite at 4.7 pH showed elemental sulphur with
very little sulphate (101).
The shift of the final pH during the oxidation process
of pyrrhotite, whether to higher or lower value than the
initial pH depends on the initial value of the hydrogen
ions. It can be seen in Table VII.3.1 that from an initial
148

pH of 4.5, it decreases to a value slightly above 3.0; but
from a initial pH of 3.0, the final pH increased to a values
of 4.6-4.8. However, with an initial pH of 4.0, it is likely
to remain more constant during the process. The pH changes
during the process are probably due to the consumption of
hydrogen ions, e.g. small amount of hydrogen sulphide,
oxidation of ferrous ions (consumption) and to the produc
tion of hydrogen ions from hydrolysis and precipitation of
ferric ions. The rate of consumption and production of
hydrogen ions are likely to be the same at initial pH of
4.0.
Stability of 4.0 pH might be indirectly confirmed from
a mineralogical and electrochemical stability study of nick
el-iron sulphides (pentlandite and violarite) by Thornber
(127). It was stated that the acid leaching behavior of
violarite would be very similar to that of hexagonal pyrrho
tite (Fe9s10 ). Thus a potential-pH diagram for violarite
compiled from intermittent galvanostatic polarization (IGP)
and cyclic voltammetry data indicate that below pH 4.0,
anodic dissolution favors sulphur formation, and above pH
4.0 sulphate is formed. Thus a pH value slightly less than
4.0 will form elemental sulphur predominantly.
The rate of consumption of oxygen hence and, conse
quently, the rate of oxidation of pyrrhotite, is higher at
the beginning of the process than at the end. It has been
reported by Herbst (102) that small particles leach at a
high rate giving an increase in the initial rate of the
leaching curves, whereas the large particles leach at a slow
149

rate giving rise to the shape of the curves after extended
leaching. The initial high rate of oxidation of pyrrhotite
during these experiments may be due to the particle size
distribution of the feed used. However, the initial high
rate may also be due to the uncoated surface area of pyrrho
tite at the beginning of the process. As has been suggested
by Hamilton et al. (101), the rate of pyrrhotite oxidation
at 4.6 pH may be inhibited as the active surface becomes
covered with ferric hydroxide.
The kinetics of oxygen-acid leaching of chalcopyrite is
controlled by surface reaction and a plot of the integrated
rate expression for bach leaching "1-(1-a) 1 / 3 ., versus time
for nearly spherical monosize particles should yield
astraight line (102). If the chalcopyrite feed has a wide
distribution of particle sizes, the overall reaction behav
ior deviates strongly from linearity, demonstrating the
overall size distribution kinetics do not follow the "1-(1-
a)1/3•• law; even though the kinetics of the individual
particles are controlled by surface-reaction-rate (102).
Thus similar behavior may be occurring during the aqueous
oxidation of pyrrhotite since about 25 per cent of Sample 2
was far below 38 um (micrometer) particle size.
The actual pH in the leaching system, during the proc
ess, depends on both the consumption of hydrogen by the
dissolution reactions of pyrrhotite and the generation of
hydrogen ions by the hydrolysis and precipitation of ferric
ions. At the beginning of the process, consumption of hydro
gen ions appears to be predominant until the rate of hydrol-
150

ysis and precipitation of ferric ions increases. Yazawa et
al. (26) showed that the non-oxidative dissolution rate of
pyrrhotite is second order in the concentration (pulp densi
ty} of pyrrhotite up to about 50 per cent of the dissolu
tion, e.g.
- d[FeS]
dt
= [Fes] 2 mole
(l.min}
(VII.5.7)
where [FeS] means the concentration of pyrrhotite and K2 is
a constant. This rate equation was confirmed in the ratio of
acid normality to pyrrhotite molarity from 1.78 to 4.95 by
Jibiki (23). Thus, if regeneration of hydrogen ions does not
occur, acid depletion during the leaching may affect the
reaction rate in the latter stages. It was also reported
that the presence of oxidants (in the concentrations of acid
stated) inhibited the dissolution process (23,26).
Then, at a constant concentration of dissolved oxygen,
both reactions (consumption and production) may occur at
about the same rate. Firstly, if the rate constant for
oxidation
greater
of ferrous ions by oxygen at 25°c and pH values
than 4.5 is K=8.0 x 10¹³ liter2 .mole-2 .atm-1 .min- 1
and at pH below 3.5 K'=l.O x 10-7 atm- 1 .min- 1 , according to
Singer (14), then at 4.0 pH the rate constant will be ap
proximately above the mean of both values (e.g. slightly
above than 4.5 x 10⁶ liter2 .mole-2 .atm-1 .min- 1 ). This value
shows that the oxidation of ferrous ions at 4.0 pH is a fast
reaction. Ferric hydroxide and any other oxide hydroxide of
151

Fe(III) precipitated in the leaching process is directly
related to their solubility product ([Fe3 +J[OH-J 3 = Kso).
According to Feitknecht et al. (48) fresh precipitates had
-log Kso values ranging from 38.0 to 42.7. Thus, the concen
tration of ferric ions is limited to the solubility product
of ferric hydroxide and to its reaction with pyrrhotite
minerals.
As previously discussed throughout the literature
review, hydrogen ions initially react with the sulphide
mineral to produce ferrous ions and some sulphur compounds,
which are predominantly elemental sulphur at 4.0 pH. The
oxidation of ferrous ions is fast at this pH giving ferric
ions, hydroxyl complexing species or may be even the sul
phate complexed species in solution. As the concentration of
ferric ions was found above the solubility of ferric hydrox-
ide, oxidation of pyrrhotite minerals by ferric ions may
also occur and this reaction is considered to be fast.
Otherwise, ferrous ions are directly oxidized to ferric
hydroxide producing hydrogen ions which could react with the
mineral. If the pH of the leaching solution is maintained
constant, the rate of consumption and production of hydrogen
ions must be the same.
Hydrogen Consuming Reactions:
FeS + 2H+ ------> Fe2 + + H2S
FeS + 2H+ + 0.502 -----> Fe2 + + s0
and/or
152
Equation
(V.3.1)
+ H20 (V.3.5)

Fe7S9 + 16H+ + 2e- -----> 7Fe2 + + 8HzS (V.3.2)
Hydrogen Producing Reactions:
Fe2 + + 2.5H20 + 0.2502 ------> Fe(OH) 3 + 2H+ (V.3.12)
If oxidation of elemental sulphur to sulphuric acid occurs,
the following equation may be added:
(V.3.13)
VII.5.1 REPRODUCIBILITY OF THE REACTION RATE
The reproducibility of the reaction rate measurement
was determined in experiments 14 and 15A, the results of
which are shown in Figures VII.5.13 and VII.5.14. It can be
seen that the reproducibility of the measured rate of reac
tion shows a satisfactory correspondence. This agreement
could be better appreciated by consulting the extent of
oxygen consumption curve, Figure VII.5.15.
It is noted that in order to determine the reproduci
bility of reaction experiments 14 and 15 were compared. As
only 878 readings were obtained from experiment 14 (Table
VII.3.1), the same number of readings were taken from the
results of experiment 15 and called experiment 15A. Table
VII.3.1 also shows the computerized total ON time values
obtained for all experiments. For the same number of read
ings, Experiments 14 and 15A indicate practically the same
153

C
--!:.::. ON 1 01
...:t N 0 0 0
. z D ~
r-0. ~ J (J)
z 0 u z w [j
>x 0 u. D w le:( Q:'.
.8 i
.6
FIGURE VII.5.13: Experiment 14
Total Ol'J Time: 40,029 sec.
Total Reaction Time: 2,792 min.
Extent of Reaction: 19.45 %
4 1 .,- •• : •
. T . :-·;.-'_,·. · :·/ \' .. >:·:· :o._, .. . . - , :--> .. ·.
1 . ... .. "q• ·.····.,
0
'· ··· .. · .... -··,. . . . ; .. ' ....
720 1440 1
2160
ABSOLUTE TIME · (Minutes) \
. ... ··· ··: ..
2880 2 DAYS

C "§ '-,
u 0
0)
.:J N Cl 0
0
~
z D H
~ 0.. ~ J u1 z D u z w [j
> X D LL D w ~ I
1 er
1
.8
I
.6 t t I
. 4 t 1
' ....
.2
FIGURE VII.5.14: Experiment 15 A
Total ON Time: 40,026 sec.
_ Total Reaction Time: 2,436 min.
Extent of Reaction: 19.45 %
.... . _._..-··: :,,.-._._..... . ·• ·.:, .- ........ _· ... -.. .-._ .. ·· ..
...... -;··.-'·:·. ... . : :: .. , _:.'/ ,. .. .. , ... · ...... ··.' - .. ·. . . .- . .. .. ·.. . . .... . ... -. -:.,_.:.. . ..... ~ ....
·:·
l
I 0 ~--+-----f-----+----------~
0 720 1440 2160 1 2 DAYS
ABSOLUTE Tit~E (Minutes)

~
UJ j--
H l-... I
0 I a:: CI >Q ..
LL 0 --,-
/ ,c_
0 r-1
f<(
0 H ' ,, /'-.
0
20-.------- -------·---- ------------· ------, ~~1
i I
15-:
t -r I
10
5±
0 0
FIGURE VII. 5. 15: Extent of Reactions
Experiments 111 & 15 A: 19.45 % I
I l
_,.c________ l---------t----1-------1-------+-------1-----J
720 1440 1
2160
ABSOLUTE TIME (Minutes)
2880 2 DAYS

total ON time (differing by only three seconds) verifying
the high reproducibility of the 'oxygraph' results.
The 878 readings obtained from experiment 14 took in
2,792 minutes (46.5 hrs) residence time compared with the
same number of readings from experiment 15A which took in
2,436 minutes (40.6 hrs), representing about 87.25 per cent
of reproducibility. This variation of results, under the
same apparent conditions, is not understood. The variations
of the ambient temperature were slightly different for both
experiments (the peaks observed in Figures VII.5.13 and
VII.5.14) and the atmospheric pressure at the beginning of
each experiment may have been different and responsible for
this disagreement. The extent of reaction obtained for both
Experiments was 19.45 per cent.
VII.5.2 FERROUS AND FERRIC IONS IN SOLUTION
Ferrous and ferric ion content were determined by an
UV/Visible spectrophotometer (Unicam 6000), using o-
phenanthroline and thiocyanate as indicators, respectively.
Figures VII.5.16 and VII.5.17 show the standardization plots
prepared for the analysis of both states of iron.
In all the experiments, the concentrations of ferrous
and ferric ions were less than 25 ppm and 5 ppm, respective
ly. It is shown in Table VII.5.3 that experiments 18 and 19
indicate two values for ferrous and ferric ions and pH. The
first value was taken after 72 hours of reaction and the
second value at the end of the experiment (about 120 hours).
154

QI
u i:: <1l
,.0 I-< 0 1/)
,.0
<
FIGURE VII.5.16: Ferrous Ions Absorbance
1.5
1.0
0.5
.'
5
A= 0.18 [Fe 2+]
Procedure:
1. up to 1 ml. 0.36N H2so 4
depending on pH, 2. 5 ml. O.lM KH phthalate
buffering to 3.9 pH, 3. 4 ml. 0.2% W/W H2o
o-phenanthroline, 4. total volume 50 ml.
10
Ferrous Ions ConceQt~ation, ppm.

(1)
u C: <1l .0
1-1 0 tll
.0 <i:
FIGURE Vli.5.17: Ferric Ions Absorbance
1.5
- 1.0
o.s
5
3+ A= 0.142[Fe ]
Procedure: 1. 2 ml. SN HCl, 2. 5 m 1. 2 M KC N S
3. total volume 50 ml.
10
Concentration of Ferric Ions, ppm.

These results show that concentrations of both states of
iron in solution were higher at 72 hours than at the end of
the experiment. The decrease in the concentrations of both
iron species results from the decrease in the rate of aque
ous oxidation of pyrrhotite at constant concentration of
dissolved oxygen.
The initial pH value is slightly lower than that taken
at 72 hours and slightly higher than the final pH. It is
evident that there was more consumption of hydrogen ions,
molecular oxygen and ferric ions at the beginning of the
process than after the 72 hours of reaction. Concentration
of ferric ions, shown in Table VII.5.3, at 72 hours of
reaction was lower than that at 120 hours of reaction. Lower
concentrations of ferric ions at early stages of the process
than those at later stages may indicate the catalytic effect
of ferric ions. The aqueous oxidation of pyrrhotite minerals
was unlikely to be due to only hydrogen ions and dissolved
oxygen, but also to ferric ions. For example, it is thought
that stoichiometric pyrrhotite may react predominantly non
oxidatively with hydrogen ions (according to the potential
pH diagram) and monoclinic pyrrhotite with molecular oxygen
and ferric ions. However, it would be incorrect to discard
the possibility of cathodic dissolution of monoclinic pyr
rhotite according to the following reaction stated in Equa
tion V.3.2,
+ ~+ Fe7s 8 + 16H + 2e- -----> 7Fe~ + 8H2S (VII.5.8)
155

The extent of reaction due to each, ferric ions, hydrogen
ions or dissolved oxygen, is difficult to establish.
The gradual decline on the rate of aqueous oxidation
of pyrrhotite, observed after about 24 hours of reaction,
could be due to the fact that ferric hydroxide coated the
mineral decreasing the active surface area in contact with
hydrogen ions, ferric ions and/or dissolved oxygen in the
absence of bacteria, thus increasing the concentration of
ferric ions slightly.
Concentrations of both ferrous and ferric ions were
higher when the aqueous oxidation of pyrrhotite minerals
were conducted in pure oxygen. Concentration of ferrous ions
in the presence of pure oxygen was 22 ppm compared with that
12 ppm in the presence of air. Although the concentration of
ferric ions in pure oxygen was only 0.3 ppm at 72 hours of
reaction, it is higher than that when the reaction took
place with air. It is not understood how pure oxygen would
affect the kinetics of the reaction if dissolved oxygen is
assumed to be at its saturation level in both cases. Never
theless, aqueous oxidation of copper (13) and iron sulphide
minerals (77,78,127) at ambient and elevated temperatures is
faster with pure oxygen than with air.
Although the concentration of dissolved oxygen was not
measured during the leaching process, a recirculation rate
of air and/or oxygen was maintained at about 9 1/min. The
air and/or oxygen was pumped beneath the "Vibramix"
tion plate where it was dispersed as very small
Mineguishi et al. (55) reported the oxidation of
156
agita
bubbles.
ferrous

ions at 4.7 pH from rising bubbles of oxygen and nitrogen
without agitation. The concentration of dissolved oxygen
reached saturation immediately after the start of the oxida
tion. Thus, it is assumed that the concentration of dis
solved oxygen was at saturation level in all the experi
ments. Although Mineguishi et al. (55) did not determine the
ferric(assumed to be very low)/ferrous ratio, they reported
that the oxidation rate was about three times higher in a
solution containing ferric hydroxide precipitate than in a
solution in which no precipitate was initially present.
VII.5.3 CHEMICAL OXIDATION OF PYRRHOTITE WITH PURE
OXYGEN AND AIR
Table VII.5.4 summarizes the total ON time, total
reaction time, oxygen, water consumption (according to
stoichiometric reaction stated in Equation VI.1.5) and the
extent of reaction for the aqueous oxidation of pyrrhotite
obtained for these series of experiments.
It is noted that the program written in Basic Language
(IBM PC compatible) calculates directly the amount of oxygen
consumed in grams and the extent of reaction at every ON
time value. Both programs, named "CLOCK" for the Microbee
computer and "LEACH.BAS" for the IBM PC compatible are
listed in Appendix F. The Microbee computer was interfaced
with the electrolytic cell through the 555 timer chip to
retrieve the data.
The highest extent of reaction obtained when the pyr-
157

rhotite mineral was oxidized with air was 55.69 per cent in
about 205 hours (12,285 min. ,8.54 days) residence time. This
experiment (experiment 15, Figures VII.3.3 and VII.3.9) took
place at 4.5 initial pH and gave a rate of oxygen consump
tion of 0.0004 g. of oxygen per minute. Experiment 16
(Figures VII.3.4 and VII.3.10) at 3.0 initial pH gave 0.0006
g. of oxygen per minute and the extent of reaction obtained
was 31.04 per cent in 70 hours (4,213 min. ,3 days) residence
time.
Apparently, at initial pH of 3.0, the overall rate of
oxygen consumption is faster than that at 4.5. However, the
pH value of experiment 16 increased from 3.0 to 4.6 after 24
hours of reaction, and after 120 hours, it was still 4.8. It
is not understood why the pH value increased from 3.0 to 4.8
and was maintained by itself at this pH value. It is under
stood that the aqueous oxidation would be faster at early
stages of the process due to higher concentration of hydro
gen ions and free surface area of pyrrhotite minerals
(predominance of non-oxidative dissolution). However, when
the pH value reaches 4.8, the aqueous oxidation process
seems to decrease drastically (126).
Evidently, hydrogen ions are not being regenerated if
the pH value is self maintained at 4.8 (no formation of
ferric ions). Case et al. (126) with 5.05 initial pH and
"aerobic" conditions (without air sparging) obtained about
2 per cent of iron sulphide "hydrolysis" in 6 days. The
final pH was 5.8. Thus, concentration of hydrogen ions of
4.0 pH (sparging with air) seems to maintain the aqueous
158

oxidation rate of pyrrhotite minerals at optimum conditions.
As expected, the rate of oxygen consumption is higher
when the aqueous oxidation process takes place with pure
oxygen rather than with air. As shown in Table VII.3.2, the
amount of oxygen consumed in experiment 20, which took place
at initial pH of 4.0, was 4.57 grams of oxygen giving an
extent of oxidation of 55.85 per cent in about 132 hours
reaction (7,920 min., 5.5 days). Correspondingly, experiment
17 which took place with air and at 4.0 initial pH gave
42.98 percent of extent of reaction in 144 hours (8,628
min., 6 days) residence time. Although the rate of uptake of
oxygen showed some deviation from linearity in experiment
20, the total amount of oxygen consumed was divided by the
total reaction time giving 0.0006 and 0.0004 grams of oxy-
gen/minute for experiment 20 and 17, respectively. Thus
the rate of uptake of oxygen for experiment 20 was a bout 33
per cent faster than that for experiment 17 over 144 hours
residence time.
159

TABLE VII.5.4
EXTENT OF REACTION IN TERMS OF OXYGEN CONSUMED
Experi- Total Total Oxygen Water Extent
ment ON Time Reaction Consumed Consumed Reaction
Sec. Time,Min grams grams %
* 14 40,029 2,792 1.5929 0.5979 19.45
15 114,617 12,286 4.5609 1.7104 55.69
* 15A 40,026 2,436 1.5979 0.5973 19.45
16 63,897 4,213 2.5426 0.9535 31.04
17 88,474 8,628 3.5206 1.3202 42.98
18 70,698 4,523 2.8133 1.0550 34.35
20 114,954 7,920 4.5743 1.7051 55.85
20A ** 43,423 1,138 1.7279 0.6480 21.09
* For comparison of reproducibility of reaction with air(*)
and pure oxygen(**).
160

Similar conclusions were not made on the results of
experiment 18 (also reacted with an initial pH of 4.0),
since the curve shows unusual behavior. It is likely that
the contact at the mercury interface (manometer) became
dirty and unreliable.
The first 878 readings of experiment 20, conducted with
pure oxygen, were named experiment 20A. The rate of consump
tion of oxygen and extent of reaction calculated from these
results,
plots are
were compared with experiment 14 and 15A. These
shown in Figures VII.3.18 VII.3.19. It can be
seen that the reaction rate of experiment 20A with pure
oxygen was about 55 per cent faster than that of experiments
14 and 15A in the first 48 hours of reaction. Thus the rate
of consumption of oxygen is faster throughout the experi-
ment with pure oxygen than with air.
As the stoichiometric reaction, shown in Equation
VI.1.5, implies the consumption of water, its amount was
calculated and listed in Table VII.3.2. It is noted that
this value is very small.
VII.5.4 EFFECT OF SODIUM CHLORIDE AND COPPER IONS
Electrochemical reduction studies of chalcopyrite (13)
indicate that additions of cupric chloride or ferric ions
enhance significantly the reduction current. It is also
known that sodium chloride in solution improves the conduc
tivity of an electrolyte. On the third day, 5 grams of
sodium chloride and one gram of copper sulphate (0.004 M
161

~ 2 5 ~---------------------------·----· ------ ------- ---·-·-·-··--·-····-·--·--,
LJJ 1-H I-· 0 I CI CI >Q_
LL
20
± 15
0 10
z 0 1---j
f<(
C::J H >( CJ
T
f 5t
--0
0
Experiment 20A Experiments
14 15A
FIGURE VII. 5.18: Experiments 14, 15A and 20A. Extent of Reactions:
Experiments 14 & 15 A: 19.45 %
Experiment 20A: 21.09 ¾
+-------+-·----!1-----t-----720 1440 2160
1
ABSOLlJTE TIME (Minutes)
2880 2 DAYS

C .E
" d'" Ol
-::r N 0 0 0
i r--
f . z D H L I
0.. ~ J ([)
z
.8 t i
t .6 i
0 u
l .4
z w ~ > .2 X D lL
,. D .-~ .. -08 w f-
0 <{ n::
.. ·. .. . .-. · ..... : .. . . ........... '· .,·
·····
·-'.
Total ON Time: 43,423.29 sec. Total Reaction Time: 1,137.5 mi.n. Extent of Reaction: 21.09 %
....... '
------------------··
FIGURE VII.S.19: Experiment ;~OA
.. ' .. ·. .....
•.· .. : :
.. •: .. .... ..
l
-+--+---·+---t---+-----l'----t---+---t---+----1
180 360 540 720 900 1080 1260 1440
ABSOLLJTE TIME (Minutes)

copper ions) were added to Experiments 16 (Figure VII.3.4 and
VII.3.10) and 18 (Figure VII.3.6 and VII.3.12), respective
ly. The aim was to improve the rate of uptake of oxygen if
they could act as catalysts. However, an improvement on the
rate of consumption of oxygen was not observed in either
case. It is thought that cupric ions reacted according to
the following equations:
cu2 + + H2S----->CuS(c) + 2H+ K=2 x 10-15
and
FeS(c) + 2H+ -----> Fe2 + + H2S K=3 x 10⁴
Where K is the equilibrium constant.
(VII.5.9)
(VII.5.10)
From which an overall reaction for monoclinic pyrrhotite
would be:
Fe7S0 + 7Cu2 + ----> 7Fe2 + + 7CuS + S (VII.5.11)
Electrochemical studies of the nature of the interac
tion of copper ions with galena and pyrrhotite in the pH
range of 3-5 was conduced by Nicol (128). It was found that
a surface layer with the electrochemical characteristic of
CuS is formed on these minerals, minimizing the oxidation of
the mineral. Contrarily to the aim of aqueous oxidation,
activation by copper ions at a pH value of 5 results in a
significant increase in recovery by flotation. It was also
reported that in the case of pyrite, a CuS layer is not
formed by the interaction with copper ions, alternatively
catalytic oxidation of the surface to elemental sulphur is
suggested.
162
VII.5.5 MASS BALANCE: SHAKE FLASKS EXPERIMENTS
A fourth series of experiment was performed in a shake
flask incubator in order to determine the extent of oxida
tion of pyrrhotite by measuring the quantity of elemental
sulphur formed and quantifying the unreacted mineral. The pH
values at which the oxidation took place and length of
reaction time were distributed as follows:
Initial pH: 1.5 2.5 3.5 4.0 4.5
Time, hrs.: 24
Number of Flasks: 1
24
1
72
3
120
5
120
5
This distribution allowed for the withdrawal of one
flask after 24, 48, 72, 96 and 120 hours of reaction. The
residue, a mixture of ferric iron precipitate, unreacted
pyrrhotite and elemental sulphur was filtrated and dried in
an airtight desiccator.
A laboratory size distillation column was installed in
a fume extraction cover to extract elemental sulphur using
tetrachlorethylene. The oxidized mineral was placed in an
extraction thimble and about 200 mls. of the extractant was
boiled
tilled,
thimble.
slowly overnight. The organic extractant, once dis
entirely covered the volume of the mineral in the
After the completion of the extraction process,
tetrachlorethylene was evaporated to dryness leaving the
elemental sulphur which was weighed.
From the residue, ferric hydroxide was separated from
163

the unreacted pyrrhotite manually by elution as the specific
gravities are 4.84 for ferrous sulphide and 3.4-3.9 for
ferric hydroxide (35). The limitations of this separation
are realized, since small particles of unreacted material
may remain with the ferric hydroxide. Table VII.5.5 shows
the results of this experiment.
164

TABLE VII.5.5
EXTENT OF REACTION IN TERMS OF ELEMENTAL SULPHUR PRODUCED
Residue Ferric Elemental Weight Reaction
!nit. Weight Hydroxide Sulphur Lost Extent as
pH grams + unreact. grams grams FeS Fe7s 8
pyrrhotite % %
grams
First day:
1.5 30.516 25.818 3.351 1.347 30.69 28.23
2.5 34.655 29.245 lost
3.5 35.090 29.050 5.246 0.794 48.04 44.19
4.0 34.765 29.009 5.103 0.653 46.73 42.98
4.5 33.876 28.361
Second day:
3.5 34.25 28.000 4.831 1.426 44.24 40.69
4.0 29.696 24.643 lost
4.5 34.958 28 .157 5.488 1.313 50.25 46.23
Third day:
3.5 34.728 28.285 5.346 1.097 48.95 45.03
4.0 35.560 28.239 5.741 1.580 52.57 48.36
4.5 35.386 28.203 6.140 1.043 56.22 51.72
Fourth day:
4.0 34.539 27.444 5.623 1.472 51.49 47.36
4.5 33.540 27.898 4.705 0.937 43.08 39.63
Fifth day:
4.0 32.960 28.240 4.720 1.327 43.22 39.76
4.5 33.838 27.535 4.200 2.103 38.46 35.38
* Weight lost after extraction of elemental sulphur.
165

From the results listed in Table VII.S.S two important
observations can be made. Firstly, the mass of the residue,
(mixture of ferric hydroxide, unreacted pyrrhotite and
elemental sulphur), is higher than the mass of the original
pyrrhotite sample. Secondly, the extent of reaction could be
determined from the amount of elemental sulphur extracted
from the residue and from a 30 gram sample of pyrrhotite
mineral. A value of 10.9411 and/or 11.8849 grams of elemen
tal sulphur could be theoretically obtained from 100 percent
of oxidation of 30 grams of mineral as stoichiometric pyr
rhotite and monoclinic pyrrhotite, respectively.
Figure VII.7.20, from (a) to (e), shows the extent of
oxidation versus pH obtained for each day. Plot (f) shows
the extent of reaction versus time (days) as a function of
pH. It can be seen that the extent of oxidation is lower at
low pH values, e.g. 1.5 pH than that at high pH values, e.g.
4.5 pH until the third day, whether stoichiometric or mono
clinic pyrrhotite is assumed. After the third day, the
extent of reaction is higher at 4.0 pH than that at 4.5 pH.
It can be seen in plot (f) that at 4.5 initial pH the
largest quantity of elemental sulphur, giving 53.97 per cent
of extent of oxidation, {mean value of 56.22 [FeS] and 51.72
[Fe7s8 ]), lessens after the third day to give 41.36 and
36.92 per cent as the aqueous oxidation continues. Similarly
at 4.0 initial pH, it lessens from 50.47 to 49.26 and 41.49
per cent. It is assumed that elemental sulphur
oxidized after the third day and this oxidation is
faster at 4.5 initial pH than that at 4.0.
166
is being
slightly

--··-
---
-------
.:t"
N
~----::----------~
...JO
...;__~
3 0
~
t<"
c-l
-·--------
~-------------~
..J 0
~o
o
o '
\ ...:r
\C"\
0
I Ct
r.n >
C
0 ·- .w
co D
·-X
0 q
_
0 .w
C
Q
.) .w
X
w
0 N
r--
- ...... >
~ ~
9 ~ ~
No
U. ~ 3c:) .::iO
.L N
3 .l. )(3
i ~
t
u, I..-
:z l.U
[ 0:: w
0
. X
w
-U
1 -::c U
1 c(
_J
lL
w
-::c c::( I :.(/1
::t
(C\
~
-~
---:-
-----------_
,...JO
~
C
r 0

It is not clearly understood why the formation of
elemental sulphur is lower at 1.5 pH than
er, this behavior is consistent with the
at 4.5 pH. Howev
results of the
toxygraph' at 3.0 initial pH. The pH after 24 hours in
creased to 4.6 and after 5 days to 4.8 and the leaching
process was slow. It was reported by Jibiki (23) and Yazawa
(26) that the presence of oxidants inhibits the non-oxida
tive dissolution of pyrrhotite minerals.
It is also not clear cut why elemental sulphur starts
to oxidize just after the third day of oxidation consistent
ly. Accumulation of oxidized sulphur species in solution may
had been taken place. It is agreed in the literature
(19,104) that the (main) overall oxidation reaction for
monosulphides (where sulphur is present as s2 - in the crys
tal lattice) produces Me2+, (Me=Fe, Zn, Pb), elemental
sulphur and to a lesser extent sulphate ions. Pyrite, in
which sulphur is present as s22- entities, is an exception
as virtually all its sulphur is converted to sulphate, and
s0 is generally reported to be absent or constitute a minor
product only.
Elemental sulphur
temperatures below its
is hardly oxidized, if at
melting point (119°c)
all, at
(98,104).
Therefore, it can be excluded as an intermediate in the
sulphate formation. At pH values about 4.0, the predominant
forms of reduced sulphur in water are H2s with 98 percent
and HS- with 2 percent (130). Chen and Morris (97) made an
extensive study on the effect of pH on the oxidation of H2s.
It was concluded that below a pH of 6, and in the absence of
167

biological activity, hydrogen sulphide can slowly be oxi
dized to sulphur which combines with the remaining sulphide
to form polysulphides. However, oxidation of sulphide to
sulphur by sulphur oxidizing bacteria can eliminate the rate
determining step on the initial sulphur formation.
Electrochemical studies in order to understand the
surface oxidation and/or floatability of pyrrhotite miner
als have been made by several investigators (17,101,128-
130). From these studies, it is generally established that
oxidation of pyrrhotite at pH about 4.0 would yield ferric
hydroxide, elemental sulphur and sulphate ions. Hodgson et
al. (129) from voltammographic studies stated that "strong"
oxidation would promote two sequential processes:
First Reaction: "this is considered as the partial
oxidation of Fe(II) to form a hydroxide and S(anionic) to
the polysulphide":
Fes1 _13 + H2 = [Fe(OH)aJ<s> 2 + s 22-(aq) + H+ + e
(VII.5.12)
Second Reaction: "Further oxidation of the solvatable
polysulphide formed and complete hydroxylation of the
Fe(OH>a site".
[Fe(OH)a](S2 ) +H2o= Fe(OH) 3 + S + H+ + e- (VII.5.13)
"Sulphur will continue to oxidize to so42-"
Adam et al. (130) indicated that in an oxygenated
solution at neutral pH the surface oxidation of pyrrhotite
to hydroxide or oxide and sulphate species of iron is
formed, accelerating electrochemical reactions. The electro
chemical reaction proposed are:
168

FeS = Fle
2+ + [_~ ::i::ociation)
Fe20(0HJ 3
4
or FeOOH (surface layer l formation)
Fe(OH)S04
(VII.5.14)
(VII.5.15)
"Ferrous ions released from pyrrhotite upon dissociation
react with hydroxyl ion generated by the reduction of oxygen
on the cathode surface of pyrrhotite and this results in a
stable iron hydroxide species" (130).
Thus from these electrochemical studies, it is general
ly agreed that the overall oxidation reaction products of
pyrrhotite minerals are ferric hydroxide and elemental
sulphur. Seemingly, some sulphide ion was oxidized to sul
phate at the surface of the iron hydroxide coating and
formed an iron basic sulphate.
The oxidation of elemental sulphur after the third day
may be explained by the effect of ferric hydroxide on sul
phide and ferrous ions. It was reported by Minegishi (38)
that the initial presence of 0.1 M of ferric hydroxide
enhanced the rate of oxidation of ferrous ions. Similarly,
Adam et al. (130) concluded that sulphide ion was oxidized
to sulphate at the surface of the ferric hydroxide. Thus, it
is proposed that ferric hydroxide also enhanced the oxida
tion of elemental sulphur after a certain value of ferric
hydroxide concentration. This process seems to proceed via
reduction of elemental sulphur to sulphide and then decompo
sition of H2s2o2 and H2so2 formed, according to equations
169

(VII.5.16 and VII.5.17 formulated by Lotens et al. ( 104) .
It is likely that the reduction of ferric hydroxide, report
ed from the electrochemical studies (17,101), takes place
due to this reaction. However, it is unlikely that the
consumption of oxygen increased from the third day of
oxidation, although some scatter is noted in the 'oxygraph"
results of experiment 15.
Bailey et al. (16) concluded from "oxygen-18 water
tracer tests" that "sulphate formed from pyritic sulphur
contains oxygen taken from water rather than from the high
pressure gas phase". It is assumed the same electrochemical
mechanism (oxidation of sulphur to sulphate) occurred during
the oxidation of pyrrhotite minerals. As no increase in the
consumption of oxygen is noted after the third day, the
sulphate formed from sulphur may contain oxygen from the
water rather than from the oxygen partial pressure.
In addition to elemental sulphur and sulphate, there
are indications that other sulphur species are present in
leach liquors. Lotens et al. referred to Brual et al., who
showed that not only s2o32-, but also s4o6
2 - exist during
the dissolution of pyrrhotite.
Independently, it is reported by Lotens et al. (104)
that oxidation of sulphide ion, s2 - at the crystal/leach
liquor interface to either s+ or s2+ depends on the oxida
tion agent used. The oxy-hydrolysis of those species to
H2s 2o2 and H2so2 , respectively, is followed by a "dispropor
tionation'' giving 75 and 50 per cent of elemental sulphur
yield, respectively.
170

2H2S202 ------> 3S + H2so3 + H2o
and
2H2S02 ------> S + H2so3 + H2o
(VII.5.16)
(VII.5.17)
"Higher sulphur yields can be achieved at pH level below a
certain value, which is specific for the particular
mineral,by direct formation of H2s which in turn reacts,
with oxidized sulphur species":
(VII.5.18)
It is proposed that this specific value for pyrrhotite
minerals is 4.0 pH. At this initial pH value, there is no
significant variation of pH during the oxidation process.
Table VII.5.6 shows the materials balance for experi
ments 18,19 and 20 conducted in the 'oxygraph' and in the
'shake' flasks. From the latter, the materials obtained from
5 days of leaching (120 hours) at initial pH values of 4.0
and 4.5 were selected.
The extent of reactions for experiments 18, 19, and 20
was derived from consumption of oxygen. For the 'shake'
flasks, it was derived from the elemental sulphur obtained.
171

TABLE VII.5.6
MATERIALS BALANCE
Base: 30 grams of Pyrrhotite Mineral (FeS)
Experiment 18 19 20
Extent of Reaction in Relation to:
- Oxygen Consumption, %:
34.35 40.79 55.85
- Elemental Sulphur, %:
25.61 36.66 26.09
4.0pH 5° 4.5pH 5°
Day Day
43.14 38.39
a: Final Weight, g:(FeOOH + s0 + FeS + Fe2 (S04 )3 .9H20)
33.285 32.534 32.700 32.960 33.838
b: Final Weight (theoretically), g:
33.869 34.592 36.291
Solution Phase:
H+ Liberated/consumed
Fe2 +, ppm: 9
Fe3 +, ppm: 3.5
3.72
0.355
22
0.3
Total Solution Phase, g: (b-a)
0.584 2.08 3.591
Leached Precipitated
c: Elemental Sulphur, g:
2.802 4.011 2.855
172
4.72* 4.20*

d: Elemental Sulphur to obtain (theoretically), g:
3.758 4.463 6.111 4.72* 4.20*
e: Residue (FeOOH + FeS + Fe2 (S04 ) 3 .xH20), g: (a-c)
30.483 28.523 29.845 28.240 29.638
f: Ferric Hydroxide to obtain (FeOOH, theoretically) g:
10.416 12.369 16.935 13.08 11.641
g: Unreacted FeS; g:
3.720 2.043 negli. 0.526 negli.
h: Unreacted FeS to obtain (theoretically), g:
19.695 17.76 13.245 17.058 18.483
i: Net Ferric hydroxide, FeOOH + Fe2 (s04 ) 3 .xH20:
10.788 10.763 16.6 11.182 11.155
Percentage of Elemental Sulphur Oxidized,%:
25.44 10.13 53.28
* considered the same value.
FeS Molecular Weight, g: 87.907.
FeOOH Molecular Weight, g: 88.8537.
173

The total value of oxygen consumed allows us to deter
mine the theoretical amount of elemental sulphur present in
the residue. If these values were compared with the practi
cal elemental sulphur obtained, it is noted that there is
variation. It is assumed that this variation is due to
oxidation of elemental sulphur of about 25.44, 10.13 and
53.28 (pure oxygen) per cent for experiment 18, 19 and 20,
respectively.
Similarly,
calculate the
the amount of oxygen consumed allows us to
theoretical quantity of ferric hydroxide
formed and of unreacted pyrrhotite. It is to be pointed out
that the extent of reaction of pyrrhotite minerals by
ferric ions is also included in the extent of reaction by
the consumption of oxygen since oxygen is consumed in the
oxidation of ferrous ions. If the theoretical amount of
unreacted pyrrhotite is compared with the practical value of
unreacted pyrrhotite, a ratio of discrepancies of theoreti
cal to practical values of 5.29, 8.69 and 13 is obtained.
Thus the separation by elution was not effective as expect
ed, but also these values appear appear to be to high.
There is a good agreement in the quantity of ferric
hydroxide obtained practically and theoretically. It is
expected that the practical value should be slightly higher
than the practical value since precipitation of basic ferric
sulphates is expected to occur as in experiment 18. The
practical value of experiment 19 is slightly lower than the
theoretical since collection of the slurry from the 'oxy
graph' was more difficult (due to splashes) than that from
174

'shake' flasks. Thus some experimental errors may have
occurred.
Theoretical values from the 'shake' flasks experiments
were derived from the practical elemental sulphur obtained.
Nevertheless, it is meanningless to calculate a comparison
between the extent of reactions obtained from the •oxygraph'
and those from the 'shake' flasks since the overall oxida
tion of elemental sulphur is about 18 per cent in the
•oxygraph' with air and 53 per cent with pure oxygen. The
percentage of overall oxidation of elemental sulphur ob
tained by Harris et al. (79) is from 2 to 20 five per cent
with T. ferrooxidans and in a non-sterile reactor.
(106) did not report elemental sulphur.
Sawe
Determination of the extent of oxidation by elemental
sulphur is also irrelevant since 0.902 grams of elemental
sulphur was extracted from 30 grams of unreacted pyrrhotite.
Moreover, apparently, the extent of oxidation was higher
from experiments conducted in the 'shake' flasks than from
those conducted in the •oxygraph'. This may not be correct
since oxidation of elemental sulphur could also depend on
the kind of stirring in the presence of ferric hydroxide and
unreacted pyrrhotite. The stirring was faster in the •oxy
graph' than in the 'shake' flasks, thus more elemental
sulphur was oxidized in the •oxygraph' than that in the
'shake' flasks.
If oxidation of elemental sulphur to sulphate has
occurred during the aqueous oxidation, the oxygen in the
sulphate was unlikely proceeded from the oxygen partial
175

pressure. It is shown in Table VII.5.7, 'oxygen distribu-
tion' that the oxygen consumed by the sulphur theoretically
oxidized for experiment 20 must be 6.4995 grams. The fact
that the actual oxygen consumed, 4.5743 grams, is less than
the oxygen to be consumed in the oxidation of sulphate
implies that the oxygen in the sulphate did not proceeded
from the dissolved oxygen. The fact that extent of reac
tion obtained for experiment 20 (conducted in pure oxygen)
is 55.85 and 26.09 per cent in terms of consumption of
oxygen and elemental sulphur, respectively; confirms that
the extent of reaction is more reliably determined by the
consumption of oxygen rather than by determining the elemen
tal sulphur formed. It was not possible to show the same
conclusion for experiment 18 and 19 since the oxygen to be
used in the sulphate is less than the actual oxygen con
sumed.
176

TABLE VII.5.7
DISTRIBUTION OF OXYGEN
18
Elemental Sulphur Obtained,g: 2.802
Experiments
19
4.011
20
2.855
Elemental Sulphur to be Obtained Theoretically, g:
3.758 4.463 6 .1·11
Elemental Sulphur Oxidized,g: 0.956 0.452 3.256
Sulphuric Acid to be formed,g:2.924 1.3827 9.96
Oxygen in Sulphuric Acid, g: 1.908 1.044 6.4995
Actual Oxygen Consumed, g: 2.8133 N.A. 4.5743
Final pH to be Obtained -1.095 -1. 043 -1.360
Final pH Obtained: 3.014 2.988 3.721
Stoichiometric Reactions: Equations VI.1.5 and VI.1.7
FeS + 0.7502 + 0.5H20 -----> FeOOH + s 0
FeS + 2.2502 + 1.5H20 -----> FeOOH + H2so4
(Molecular Weights: Sulphuric Acid, 98.0734; elemental
sulphur, 32.06; Oxygen, 15.9994; Hydrogen, 1.0079)
177

The fate of oxidized elemental sulphur products is not
clearly understood. The quantity of ferrous and ferric ions
in solution obtained does not balance the total amount of
sulphur variation between the actual and theoretical values
even as ferrous and ferric sulphate. No sulphur oxidized
compounds in solution such as H2s 2o 2 , H2so2 and so32 - has
been determined. Moreover, it was shown in the potential-pH
diagram (Figure V.3.1) for the metastable sulphur system
that at 25°c and 4.0 pH s 2o32 - and Hso3 - are stable. Thomp
son (125) mentioned thiosulphate, tetrathionate and tri
thionate which will be discussed later. However, precipita
tion of basic ferric sulphates such as defined by Adam et
al. (130) as Fe(OH)S04 , and/or Fe2 (S04 ) 3 .9H2o (coquimbite)
by Case et al. (126) can be expected from electrochemical
studies of pyrrhotite minerals at 3-5 pH values. More stud
ies need to be conducted to identify the sulphur species in
solution and 'basic ferric sulphate' precipitates, which are
beyond the aim of the present study.
178
VII.6 CONCLUSION AND DISCUSSION
Three designs of an 'oxygraph' were used in the deter
mination of the rate of consumption of oxygen during the
aqueous oxidation of a pyrrhotite concentrate tailing from
Renison Bell, Tasmania. The results of a fourth series of
experiments, using 'shake' flasks, were compared with those
of the 'oxygraph'.
The results obtained from the first oxygraph were not
reliable due to the reactor vessel size which could hold
only about 30 milliliters (1.5 grams of mineral
density of 5% w/v). Thus measurement of the low
at slurry
rate of
consumption of oxygen was affected by the vibration caused
by stirring the reactor vessel and by changes of temperature
and atmospheric pressure during the day.
The second oxygragh used, with a one liter reactor
vessel, was designed to determine the rate of consumption of
oxygen in the presence and absence of microorganisms. The
figures obtained from these series of experiments still
show some cyclic variations. The internal pressure of the
leaching
through
system was connected to the
the manometer. Thus, slight
atmospheric
variations
pressure
of both
ambient temperature and atmospheric pressure seemed to
disturb the electrolytic production of oxygen.
Nevertheless, as the rate of consumption
behaved with an overall linearity, it is posible
some conclusions. The higher consumption rate
179
of
to
of
oxygen
reach
oxygen

could be distinguished when the reaction process took place
in the presence of bacteria from a chemical process alone.
At 4.0 initial pH, the chemical oxidation of pyrrhotite
(Experiment 2) showed a rate of consumption of oxygen of
0.00036 grams per minute. Bacterial oxidation of the same
sample (Sample 2, Experiment 3) showed an improvement in the
rate of consumption of oxygen to 0.0020 grams/min.
The consumption of oxygen of Sample 2 was slightly
faster than that of Sample 0. It was not possible to state
accurately how much faster since 2 experiments at the same
conditions of initial pH were not conducted. This conclusion
is derived from the difference in the rate of consumption of
oxygen obtained by the difference in the ratio of hydrogen
ions concentrations at 5.5, 4.5 and 4.0 initial pH values
explained in the previous Section.
Under a constant fixed atmospheric pressure and tem
perature of about 31.5(+/- 5°) 0 c the rate of consumption of
oxygen during aqueous oxidation was controlled more accu
rately. Nevertheless, some cyclic variations due to ambient
temperature fluctuations were obtained. It was difficult to
maintain a constant temperature accurately (e.g. 31.s0 c
exactly) without an air conditioning system for long periods
(e.g. 8 days). However, the rate of consumption of oxygen in
the presence of air was 0.00037 grams per minute (experiment
15) and in pure oxygen 0.00057 grams/minute (experiment 20),
representing about 1.56 times faster in pure oxygen than
with air. The rate of uptake of oxygen in experiment 2
(second oxygraph) with air was 0.00036 g/min, which agrees
180

satisfactorily with experiment 15. Both experiments were
conducted for 9.5 days.
At an initial pH of 4.0, the overall chemical aqueous
oxidation of pyrrhotite minerals, was found to form ferric
hydroxide and elemental sulphur predominantly according to
Equations (VI.3.5) and/or (VI.3.12):
Stoichiometric pyrrhotite:
FeS + 0.5H20 + 0.7502 -----> FeOOH + s 0
Monoclinic pyrrhotite:
Fe7S9 + 3.5H20 + 5.2502 ---> 7FeOOH + ss0
Characterization and extent of formation of 'basic
ferric sulphate' compounds are difficult to determine with
out a 57Mossbauer sprectroscopy (47). Thus it is unkwon the
amount of Fe( 2 (S04 ) 3 .9H2o (coquimbite) (126), Fe(OH)S04
(130) and/or Fe2o3so3 .10H2o (56) that might have also
formed. These compounds were reported to form according to
electrochemical studies of ferrous sulphide and pyrrhotite
minerals in the pH range of 3 to 5.
The overall oxidation of elemental sulphur was found to
be about 18 per cent in a chemical oxidation process with
air and about 53 per cent with pure oxygen.
The source of oxygen consumed during the oxidation of
elemental sulphur is not clearly defined. However, it is
proposed that oxygen forming the oxidized sulphur species in
solution, e.g. sulphate, is provided by the water rather
than from the oxygen partial pressure. The fact that the
181

oxidation of elemental sulphur starts to occur after the
third day of the oxidation process implies that accumulation
of oxidized sulphur species and ferric hydroxide was taking
place. Moreover, oxidation of hydrogen sulphide and elemen
tal sulphur at 4.0 pH and ambient temperatures is very slow.
Lottens et al. (104) studied the behaviour of sulphur in the
oxidative leaching of sulphide minerals and described the
reaction mechanism as follows: "oxidation of s-2 at the
crystal/leach liquor interface to either s+ or s 2 + (depend
ing in the oxidizing agent used) and hydrolysis of s+ or s 2 +
sX+ + XH20 -----> H sXo + xH+ X X (VII.6.1)
disproportionate or react with hydrogen sulphide to form
elemental sulphur and so32-. The sulphite thus formed is
subsequently oxidized to sulphate or enters the "Wackenrod
er" reaction sequence with hydrogen sulphide generated from
the dissolution of the metal sulphide (104).
The proposition made in the present thesis may also be
confirmed by the electrochemical studies conducted by Bailey
and Peters (104) and Hamilton and Woods (17,101). Bailey et
al. (104) stated that "pyrite dissolution under acid oxygen
pressure leaching conditions was found to have an electro
chemical mechanism; i.e. the sulphate formed from pyrite
sulphur contains oxygen taken from water rather than from
the high-pressure gas phase". From the experimental condi
tions used to conduct the electrochemical studies, Hamilton
et al. (17,101) reported that in order to avoid any oxida-
182

tion of the electrode surface (pyrrhotite mineral) the prepa
ration was made in a nitrogen atmosphere (in a glove bag).
The cell solution was also purged with purified nitrogen.
Thus, it is assumed that oxygen was absent in the system and
the fact that formation of sulphate was determined also
confirms the possibility that the oxygen in the sulphate
formed from the pyrrhotite sulphur contains oxygen taken
from the water rather than from the oxygen partial pressure.
On the other hand, electrochemical studies on the reduc
tion of oxygen on sulphide minerals have shown that in the
limiting current region, all oxygen diffusing to the surface
is reduced to water (67-69).
Thus, it is concluded that if the oxygen forming the
sulphate ions comes from the water, the measurement of the
rate of consumption of oxygen is a reliable method to deter
mine the rate of oxidation pyrrhotite minerals.
More study needs to be conducted to identify the sulphur
species in solution and 'basic ferric sulphate' precipitates
to describe fully the reaction mechanism.
183

VII.7 PRESENT KNOWLEDGE ON CONTINUOUS BACTERIAL OXIDATION
OF PYRITE CONCENTRATE AT MINIPLANT SCALE
VII.7.1. INTRODUCTION
Neeling et al.(116) and Roberts (132) indicated some
results obtained from bacterial oxidation of pyrite concen
trate at pilot plant scale. Further evaluation of the
operation conditions of this pilot plant was needed in order
to reduce the processing time. Those operation conditions
were studied in the miniplant (the pilot plant was shut
down) and the results are presented in this study. Firstly,
it appeared that concentrations of dissolved oxygen higher
than about 3 mg.L- 1 have an adverse effect on the activity
of the microorganisms and hence on the rate of mineral
degradation. Secondly, in an attempt to enhance the rate of
bacterial growth and to prevent "washing out" of bacteria in
a continuous flow system, the recycling effect of some
concentrate and/or liquor was studied. Thirdly, the beha
viour of the microorganisms, T. ferrooxidans and T. Thiooxi
dans, in sulphur oxidizing 9K media was studied.
In this study, a continuous multistage bacterial
leaching plant, using the same concentrate as Neeling et al.
(116), was examined in order to clarify the effect of both
concentrate and liquor recycle, the effect of dissolved
oxygen and the effect of the 9K media on the bacterial
activity and the rate of mineral degradation.
184

VII.7.2 EXPERIMENTAL PROGRAM
The continuous bacterial oxidation of pyrite concen
trate from Hellyer, Tasmania in a small scale system con-
sisting of six stirred reactors in series, was studied.
system was operated continuously (24 hours per day - 7
per week) for the duration of all the experiments.
The
days
The
equipment used is shown in Figures VII.7.21 and VII.7.22.
The reactor tanks were constructed of PVC and used
stainless steel agitators with double radial impellers,
actuated by air motors. Diaphragm and peristaltic dosing
pumps were used to control the flow rates of slurry and
bacterial nutrients (9K solution). A pump installed between
the slurry feed tank (first tank) and Tl (second tank)
controlled the residence time throughout the system. Flow of
slurry through the reactors Tl to TS was by gravity.
The pyrite concentrate had an average chemical composi
tion of: gold 3 mg.L- 1 , silver 80 mg.L- 1 , iron 42.5 %, zinc
7.5 % and arsenic 0.5%. Mineralogical examination indicated
that the concentrate was predominantly pyrite with some
sphalerite and minor amounts of arsenic mostly in solid
solution with pyrite. The particle size was 90% passing 38
micrometers.
Results of the bacterial oxidation process were evalu
ated by analysis of iron, zinc and arsenic accumulated in
solution and by measuring the slurry potential (Eh) and pH.
The elements in solution were analyzed using an AA-1275
Varian Atomic Absortion Spectrophotometer (AAS); Eh and pH
185

H.C.
':llvQ.Q.'( Fi:f:.I) 16"'/0 v->/v l'D. (i-!EL.0?l) FIGURE VII. 7.21: CONTINUOUS BACTERIAL OXIDATION OF PYRITE CO,.\JCE:\/TRA TE
$I=
(_ Pver~,1 v-,1;111._ nrn1ro.li..,}c...( w£1.t.u-)
Aia, 5,11(2.bE: \\C..
12..rr,.l/r.,-,~
1\
PU ~P".J -0- peri'.:>foltcc.. -$- ~t).phrdm
\-\. c.. -= \.le.o.T..,0 (,O..t
II q~
11 I "" .,,,., 0 2. m\/m;" '::::,\vrr~ rec.it'<!.. 1---_
1'
T2
'T 0-\-c,.,\ \JolvMe./f11-n k. .. ,:.3 Z.4 L · \(.Jcrk:.;.,.,d \Jo\vMe/10."1<..-::. 28,4 L TvJc 1-0..J..:,:.\ ivv,~e.\\Qrs/10.,,,\:.....
a
TZ.
k"t.nu, \:ietwee"' h., pc.Iler~-:: 16cm. ,Di'bti:nc.e- be.."tweet'\ hdt0m'i,,,,.~el/t!.f"o..n.A ~o,...,4-e.nk: l,,-{5c...,... AiQ.. '!>fA!l.6'1::: '50 fhj\;>'12 = 345 ~h ... (flow \Uk ~sio). 5TIU.i.llJ~. 12-f'\1:. 220--2~0. Alfl MOTOl-S · 4AI,,\- H.Y~24 MC!).EL
C..FM (.j--re,e.. /.\,.() ~m~~ '& x (p (ht01ar:i)-=- 4'6 ci::-t1. 'IDLUM\: OF Tr\\C.1<.(IJ&(l,-:. \l.'2'l L.
0
T4 .1:.
"'T5
To d''"' 11,ic,

FIGURE VII.7.22: MINIPLANT FOR COI\JTJI\JUOUS BACTERIAL OXIDATION OF IRON SULPHIDE Ml!\iERALS

Varian Atomic Absortion Spectrophotometer (AAS); Eh and pH
by an Orion Research Ion Analyser EA940.
Samples from each stirred reactor and the thickener(s)
(overflow and underflow) were taken for analysis and the
pulp density was measured every Monday, Wednesday and Fri
day. Flow rates, pH, Eh and dissolved oxygen (D.O.) were
monitored every day. Procedure for the determination of
iron, arsenic and zinc is given in Appendix H.
A N.A.T.A. recognized external laboratory determined
the gold and silver contents of the original concentrate
and of the samples taken from slurry feed, Tl and TS.
Although cell counts could be made on the liquor and on
the surface of the mineral samples, the cell number determi
nation on the surface of the ore were usually used as a
measure of effectiveness of the leaching process. These cell
counts were usually higher that those obtained from the
liquor when the relative bacteria activity is high. Bacteria
activity and cell morphology, determined by the proportion
of green, orange and red cells, obtained from nitrogen
determination by the Kjeldahl Method and by Fluorescence
Microscopy, were examined by a microbiologist.
Water, at a controlled temperature of about 38°c,
circulated through independent coils in each stirred tank.
Additions of pyrite concentrate, bacterial nutrients (9K),
cell recycle, whether as slurry or solution, were made to
the slurry feed tank. The level of dissolved oxygen was
controlled by sparging compressed air (40 p.s.i.) into each
stirred reactor independently. A dissolved oxygen meter was
186

used to measure the oxygen in each tank and the sparged air
rate was adjusted manually to keep the oxygen level approxi
mately constant.
In this section, three flow diagrams designated as
MINIP 03, MINIP 04 and MINIP 05 are discussed. Table 1
shows the more important operating conditions under which
each system was run. Whether the slurry recycling took place
from TS to SF tank or from T2 to Tl, detailed in each mini
plant, it is reported simply as slurry recycle.
187

TABLE 1
OPERATION CONDITIONS
SYSTEM
Number of Reactors
Reactor Size, L.
Pulp Density, % (w/v)
MINIP 03
6
30
15
Initial pH in SF Tank 1.6-1.75 1.2
MINIP 04 MINIP 05
6 6
30 30
15 then 10 12-13
1.65,Tl:l.5
Rate Slurry Feed, ml/min 12.2 17-18 17-18
Slurry Recycle, ml/min 2.1 7-8 7-8
Dissolved Oxygen,mg.L- 1 . 2-3 3 3-5 then >6
Stirring Speed 210-220 200-210 215-220
9K Solution* standard standard modified
Temperature, 0 c 36-38 36-38 36-38
Flow Rate Air Sparge,scc/min/L:1.5
Residence Time, Hrs. 250
Total Time in Operation,Hrs.860
1.5
500
816
1.5 then 2.6
300
1780
* "Standard" 9K was prepared according to the formulation
described by Silverman et al.(114). For 1 L of solution
without ferrous ions as follow, g: (NH4 )2so4 3.0, KCl 0.10,
K2HP04 0.50, and MgS04 .7H2o 0.50. "Modified" indicates that
3 g of K2HP04 , instead of 0.50 g, was used.
188

VII.7.3 EXPERIMENTAL RESULTS
The rate of degradation of refractory gold minerals,
pyrite, by bacterial oxidation seems directly related to
the level of activity of the genera Thiobacillus, from which
T. Ferrooxidans and T. Thiooxidans seem to have more impor
tance. The level of activity may be indirectly determined by
the rate of accumulation of dissolved species in solution,
by the rate of reduction of pH values and by the increase
of slurry potential throughout the stirred reactors system.
The level of activity of microorganisms may be enhanced by
selecting a correct system pattern, level of dissolved
oxygen, residence time, pulp density and temperature among
other variables.
As would be expected, stirring speed and pulp density
influence dissolved the oxygen concentration in the system.
At constant air sparge flow rate, the concentration of
dissolved oxygen increased because the stirring speed in
creased automatically when the pulp density decreased. In
MINIP 03 and MINIP 04, the dissolved oxygen was maintained
at low level (<3 mg.L- 1 ) by decreasing the air sparge flow
rate. When the air sparge rate was increased, a reduction
in the ratio of active to inactive cell population from
about 85-90 per cent was noted. This reduction of activity
was accompanied by excessive formation of froth for several
hours, reduction in cell size and a change in cell shape.
The ferric ions concentration was found to increase
189
steadily from the slurry feed tank to TS. Table II shows the
typical values obtained from MINIP 05. The ferric ion
concentration is calculated as the difference between
"soluble" iron concentration (as measured by the AAS) and
the ferrous iron concentration as measured by potassium
permanganate titration.
The increase of slurry potential throughout the stirred
tanks is probably due to the increasing ferric/ferrous
ratio.
190
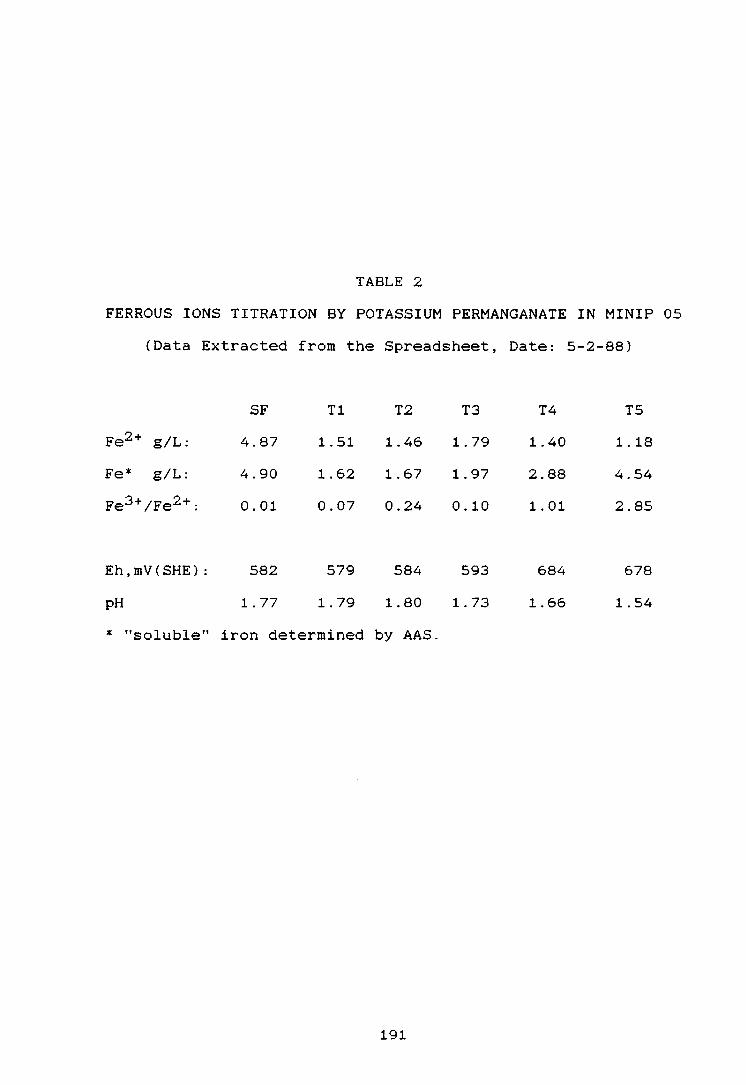
TABLE 2
FERROUS IONS TITRATION BY POTASSIUM PERMANGANATE IN MINIP 05
(Data Extracted from the Spreadsheet, Date: 5-2-88)
Fe2 + g/L:
Fe* g/L:
Fe3 +;Fe2 +:
Eh,rnV(SHE):
pH
SF
4.87
4.90
0.01
582
1. 77
Tl
1.51
1. 62
0.07
579
1. 79
T2
1.46
1.67
0.24
584
1.80
* "soluble" iron determined by AAS.
191
T3
1. 79
1.97
0.10
593
1. 73
T4
1.40
2.88
1.01
684
1.66
T5
1.18
4.54
2.85
678
1. 54

In MINIP 03 system described by flow diagram Figure
VII.7.20, the slurry feed rate was kept at about 12 ml/min
(SF to Tl) and bacteria recirculation took place from TS to
Tl at 2 ml/min as slurry. During the leaching run it was
found that the concentration of iron, zinc and arsenic
increased up to a maximum of 9500, 12000 and 350 mg.L- 1
after about 300 hours and then decreased to about 6000,
9500 and 280 mg.L- 1 , after 860 hours when the experiment was
terminated. Based on the "total" dissolved iron analysis,
the average extent of pyrite oxidation was only 12.5%.
In MINIP 04, Figure VII.7.22, because of the low oxida
tion rate it was decided to stop the bacterial recycle,
decrease the pulp density from 15 to 10 per cent and in
crease the residence time from 260 to about 500 hours main
taining about the same level of dissolved oxygen. Bacterial
recycle from T5 to Tl was suspended because it had been
found that inactive bacteria were occasionally pumped back
to the system. A net slurry flow of 5 ml/min was maintained
by pumping 15 ml/min of slurry with an initial pulp density
of 10 % (w/v) from SF to Tl and recirculating 10 ml/min from
Tl to SF tank. An automatic pH controller (Prominent dulcom
eter dosing pump, Type PHO) was installed to maintain the pH
at 1.2 in Tl. Using an air sparge of about 1.5 scc/min/L of
slurry, the dissolved oxygen was maintained at about 3
L-1 mg. .
Figures VII.7.23, VII.7.24 and VII.7.25 show the
variation of slurry potential (Eh), "total" dissolved iron
192

FIGURE \/II.7.22
MINI-PLANT 04, NO SLURRY OR SOLUTION RECYCLE SLURRY FLOW 5 ML/MIN AT 10% W/V SOLIDS
FEED
'- ~ ~
r""'\ ' ,, ·" / \../ .,.,..
15 'rr.\ lr,,·..-.
10 \"(111,~·.:1,. T2 T3 T4 TS
..
Tl

> E
...... 0 a 0
..:,
K .:. .,; 0 a:. Q lJ.i
~ 0 V) !Q. Q
700
690
680
670
660
650
64-0
630
620
610
600
690
580
570
1560
tltlO
a .a
9
8
7
6
5
..
3
2
D Sf
0 200
MTNTPT,Al\J'T' 04 SLURRY POTENTIAL
PER T.A.NK
400 600
cmAULATI\IE TIME, Hr51.
800
SF Tank + Tank 1 X fonk +
<> Tank 2 Tr;mk 3 V Timk 5
FIGURE VII.7.23: Variation of Potential in MINIP 04 at 1.5 Initial pH.
MlNIPLANT 04-IRoN OISSOWTION
0 200 400 600 800
CUMULATIVE TIME, HP.S.
+ Tt C> T2 t.. T3 X H V T5
FIGURE VII.7.24: Dissolved Iron in MINIP 04 per Tank

17
Hi
15
14
1.3
12 K
z 11
0 10 et:
Cl g
~ 8 Cl Li 7 Li
t;i u.
5
+ J
2 1
0 a
,-.r , . .., , .'lJ•::a.. J I
I RON DJ.S SOLU TION
r I t-~-.~
I \
PER TANK
/ ~
I /
v-J
/ u\
' l \ ' i \ F \ / \/ g C'J
.oaa
),'. Trinf; 5 ·
'"'"
V TOTAL
Q CH\
FIGURE VII.7.25 : Total and Pe r Tan k Dissolved Iron.
( MINIP 04).

17
Hi
15
14
1.3
12 ),:
11 z 0 10 It:
0. 9
~ 8 Q 7 ~, ~,
ti Cl.
5
4
:3
2
0
JRON DJ:SSOLUTION PER TANK
0 / \I // \\ ,/f \, I <4\
'· , ~ \ \ ~ ci ..... \ \.
(\ ,.aa "'"' '""' CUMUL'-.T!VE TIME, Hr.i.
r·, r..-1.,·, .:1r•XI I
V TOTAL
FIGURE VII.7.25: Total and Per Tank Dissolved Iron.
(MIN IP 04).

and the percentage of iron dissolution in each tank, respec
tively. At 1.5 pH in the SF tank, the slurry potential
initially increased then decreased steadily in all tanks.
This behaviour is not understood. However, it appears that
when the potential increased, the concentration of dissolved
species also increased.
Increasing the residence time from about 250 hours in
MINIP 03 to about 500 hours in MINIP 04 and decreasing the
pulp density from 15 to 10 % (w/v) resulted in the concen
tration of dissolved species in TS increasing to a maximum
of about 8,250 mg.L- 1 , 10,000 mg.L- 1 and 350 mg.L- 1 of iron,
zinc and arsenic, respectively. This indicated an extent of
oxidation of about 16 per cent of iron.
In contrast, the system described by the flow diagram
of MINIP 05, Figure VII.7.26, was run at a higher dissolved
oxygen concentration 3-5 mg.L- 1 . simply by slowly increas
ing the air sparge rate over a period of about 100 hours. In
the MINIP 05 system the leach solution, containing ferric
ions, was recycled via the overflow of thickener (2) to the
slurry feed tank. Ferric acid leaching took place in SF tank
and the resultant ferrous ions were eliminated via the
overflow of thickener 1. Some of the slurry from T2 was
recycled to Tl, in order to obtain longer residence time and
to enhance growth of the bacteria.
Figures VII.7.27, VII.7.28, VII.7.29 and VII.7.30 show
the variation of pH, Eh, "total" iron and zinc concentration
in each tank, respectively. After about 650 hours of opera
tion, the pH of the "modified" solution was maintained at
193

FIGURE \/II.7.26:
r·10 ollfied 9K
feed WO..
WO-t 0
( D
L. er . , '
r-) - ~ ., '- - - -, I t--
~~\ -n T3 T4 T5
•.
1 t . l 1 t soUd
.. '
Ill r--ecycle
'
- -Tr\'(,1 L) '- Tf-l'lz.
12.
~ //
wa.ste ,11 u (D
sotu-tlon recycle \
\V
oold lea.eh

It
z 0 ~ c,.
~ ...l 0 VI !!'.!. LI.
" 0 ~ N
c,.
~ 0 VI VI zs:
rJ
26
24
22
2(l
18
16
1+
12
10
B
fi
4
2
0
0
+ Tl&:2
0.2
MIN1PLANT 05 IRON DISSOLUTION
0.4 O.fi (Th0u50ndii)
CUMULATIVE TIME, HRS.
t.. T4 l( T5
0.1'1
V Toti;il
FIGURE VII.7.29: Total and per Tank Dissolved Iron.
·MIN1PLANT 05 ZINC DISSOLUTION
140
130
120
110
10(l
9~,
80
70
60
50
4-0
30
2(l
10
0
0 0.2 0.4 O.!i 0.8 ( Thou IIQn d~)
CUMULATIVE TME, HRS.
SF + Tl,i:2 <> T3 )( T5 V foli;il
FIGURE VIU.30: Total and per Tank Dissolved Zinc.

:c u.
/
> E £. 11.1
2.1
.R -2 ,/
'Ei I
1.9
1.8
1.7
1.6
1.5
1.4
1.J
1.2
1. 1
0
Li SF funk A T,1n,,. ,
.)
I I I
\ I I.
0.2
pH MJNIPLANT :> PER Tli.NK
-"1 __ .-----,,
\ \ C:r'
0.4 O.fi 0.8 ( Trou ,,,..n Qt1)
. CUMULATI\IE TIME, Hl"ll.
+ Tank I <> Tank 2 X fonk 4 V T,;mk 5
FIGURE VII.7.27: Variation of pH per Tank.
700
61)0
680
1570
660 fillO
6+i.1
6~0
6:'!0
610 fiOO
5!il0
!!BO
570
!ilSO
550 540
tiJO
0 0.2
D '.:iF TUl,r.
...:. 1nm: )
FIGURE VII. 7 .28:
SLURRY .POTENTIAL PER Tli.NK
0.4 0.6 (Thouer.in9")
CUMULATI\.£ Tl~4E, Hl"ll.
O.B
+ Tunk I X fon,: 4
<> Tank 2 V Trmk 5
Variation of Potential per Tank. (MINIP 05)

1.5. The potential in each tank did not vary greatly and
was almost constant in T4 and T5. Zinc was completely dis
solved in the first three tanks. The concentration of iron
in T5 improved after the pH of the "modified" 9K solution
was kept at 1.5.
Table 3 shows the results obtained when the air sparge
flow rate was increased to about 2.6 scc/min/L.slurry in
terms of dissolved iron, pH and Eh, after the oxygen concen-
tration was raised to >6 mg.L- 1 . The "total" iron concentra
tion in T5 was found to be about 20.6 compared with 27 mg.L-
1 in T4. It is not understood how the "total" iron concen-
tration in T5 can be lower than that in T4 but it could be
that, because of some lack of air sparge in TS, an iron
precipitation formed which is not soluble in the hydrochlor
ic acid leach in the chemical analysis procedure. No attempt
was made to identify any such material. A slight increase in
pH and decrease in slurry potential (Eh) in the same tank
was noted.
Dissolution of pyrite increased substantially up to
about 50 per cent related to iron oxidation. It was also
noted that dissolved oxygen concentration increased well
above 7 mg.L- 1 (7-9 mg.L- 1 )
194

TABLE 3
RESULTS FOR MINIP 05
For Dissolved Oxygen Concentration: >6 mg.L- 1
SF
pH 1. 35
Eh (mV) 677
Fe, g/L. 14. 1
Tl
1. 06
755
16.9
T2
0.97
783
21. 2
T3
0.88
807
24.7
T4
0.85
814
27.0
For Dissolved Oxygen Concentration: <6 mg.L- 1
At 1000 Hours of Operation (MINIP 05)
Fe,g/L 3.2 3.3 3.7 2.82 4.57 5.14
At 1440 Hours of Operation (MINIP 05)
Fe,g/L 4.74 2.66 2.84 3.08 3.63 4.15
195
T5
0.88
728
20.6

VII.7.4 DISCUSSION AND CONCLUSIONS
The rate of degradation of pyrite concentrate from
Hellyer, Tasmania by bacterial oxidation can be enhanced by
acclimatization of the microorganisms, F. ferrooxidans and
F. thiooxidans to high concentrations of dissolved
c-10 mg.L- 1 ). This acclimatization is a slow process.
oxygen
Under
the operation conditions of MINIP 05, it took about 4 weeks.
Bacterial oxidation of pyrite concentrate in a continuous
system was enhanced up to about 50 per cent based on iron in
pyrite oxidation (260 hours residence time) after the air
sparge rate was slowly increased to about 2.6 scc/min per
liter of slurry.
The effect of the 9K solution whether as "standard" or
"modified" on the rate of degradation of pyrite concentrate
at low air sparge rate was found to be non-existent. In
creasing the concentration of potassium ortho-phosphate in a
standard 9K solution from 0.5 to 3.0 grams/L was thought to
enhance the growth of sulphur oxidizing bacteria; hence the
oxidation of elemental sulphur and reduced sulphur compounds
formed during the process.
Bacterial oxidation of sulphide minerals is an electro
chemical process in nature as widely discussed in the liter
ature. The mineral sphalerite found in the pyrite concen
trate was oxidized completely in the first three tanks.
Thus sulphide minerals with lower rest potentials will be
oxidized before those sulphides with higher rest potentials.
196

This electrochemical behaviour seems to follow the next
pattern in a 9K medium and at 2.5 pH (109,124):
FeS<ZnS<CUS<Cu2S<CuFeS2<FeS2.
The effect of stirring speed up to 300 r.p.m. seems to
have no effect on bacterial oxidation as long as settlement
is avoided. In the equipment used for this study and with
about 15 per cent pulp density (w/v), 220 r.p.m with double
radial impellers and diffusing aeration kept the slurry
thoroughly suspended.
It is not known whether the flow diagram of MINIP 05 is
the optimum. However, new flow systems without bacterial
recycle should be studied. Growth of the microorganisms
might be enhanced in an independent batch reactor at low
pulp density (e.g. 5 per cent w/v} in order to be fed to the
slurry feed tank and thus avoid bacteria "wash out" and/or
the size of the first tank (SF} should be from 2 to 3 times
greater than the size of the following tanks.
Bacterial population of green cells found in the mini
plant (from the solids} varied from 7 x 10⁸ to 10 x 1012 per
milliliter of slurry. Once the microorganisms are acclima
tized, the number of inactive cells increase (red and orange
cells) when the environment is changed (e.g. dissolved
oxygen, presence of adverse conditions). But when the condi
tions return to normal, it seems that the microorganisms
revive or/and its rate of growth is very fast that the
number of green cells could be restored in about 24 hours.
No severe loss of microorganisms has been observed in the
miniplant at any time.
197

CHAPTER VIII
DISCUSSION AND CONCLUSION
Bacterial oxidation of iron sulphide minerals, with
particular reference to pyrrhotite and pyrite, is an at
tractive alternative to recover the metal values associated
with them. However, bacterial oxidation of pyrite is still
industrially impractical today due to its slow kinetics.
The electrochemistry of these minerals, as well as of
other sulphide minerals, is being explained more often by
using their potential-pH diagrams and electrochemical meth
ods. Firstly, because analysis of the lines in the poten
tial-pH diagrams may indicate the path in the leaching
mechanisms. Secondly, because electrodissolution of slurry
could play an emerging role in hydrometallurgy, e.g. to
process pyrite.
There is a dramatic difference in behaviour between the
aqueous oxidation of pyrite and pyrrhotite. The main differ
ence, found from this study and electrochemical studies
(16,101,104, 129,130), occurs in the production of elemental
sulphur and/or sulphate ions. Although it is known that
increasing the potential favours the formation of sulphate
in both cases, pyrite predominantly produces sulphate, and
pyrrhotite produces elemental sulphur. These electrochemical
behaviours are also found in the bacterial oxidation proc
ess. As the chemical oxidation of hydrogen sulphide and
198

elemental sulphur are very slow processes at ambient temper
ature, predominance of sulphur pyrite oxidation to sulphate
and sulphur pyrrhotite to elemental sulphur is not known
accurately. However, it seems that the state of oxidation of
sulphur present in pyrite and pyrrhotite as s 22- and s 2-,
respectively, their electronic structure, affects the anodic
electrochemistry.
The bacterial oxidation of pyrite concentrate in the
miniplant with initial and final pH values of 1.5 and ~1.0,
respecitively, was found to produce sulphuric acid predomi
nantly with small formation of elemental sulphur (less than
four per cent). Chemical oxidation of pyrrhotite minerals at
initial pH values of 4.0 was found to produce elemental
sulphur predominantly. Oxidation of reduced sulphur com
pounds from the leaching of pyrite and pyrrhotite is en
hanced by the presence of T. ferrooxidans and T. thiooxidans
and by chemical aqueous oxidation with pure oxygen.
Bacterial oxidation of pyrite concentrate at miniplant
scale was found to be faster than that at laboratory scale.
Although it is impossible to provide a complete explanation,
one reason could be an increased concentration of dissolved
oxygen in the system, a thorough acclimatization of the
microorganisms to the pyrite. At the beginning of any new
flow diagram, the rate of degradation is slow, then it
increases steadily by itself. The process increases to an
optimum level when a steady-state condition in each stage
of the process (acclimatization of the microorganisms to the
flow diagram) is reached. This process of acclimatization
199

could take 2 or 3 residence times.
The rate of degradation of pyrite by bacterial oxida
tion by T. ferrooxidans and T. thiooxidans needs to be
improved to become an economical process. It is expected
that the development of genetic engineering techniques may
greatly improve the bioprocessing of pyrite by the year
2000. However, under the conditions studied and the extent
of reactions obtained, bacterial oxidation of pyrrhotite
minerals is faster than that of pyrite: It could be said to
be approximately three times faster.
Thus if it is decided to recover the tin encapsulated
in the pyrrhotite mineral, chemical aqueous oxidation with
air or preferable with pure oxygen is an alternative. Howev
er, bacterial oxidation at initial pH value of 4.0 could be
more suitable. The next stage, after this study, should be
the investigation of this process at miniplant scale and/or
bacterial heap leaching.
200

APPENDIX A
THERMODYNAMIC DATA AT 25°c (10)
Formula Gf0 (Kcal/rnol)
HS- 2.88
s2- 20.5
HSO -4 -180.69
so 2 -4 -177.97
Fe2 + -21.75 (51)
-18. 95;1-.
FeOH+ -66.3 (7)
HFeo2 - -90.3 (7)
Fe3 + -4.06 (51)
-1. 1 *
FeoH2 + -54.83
Fe2 (0H) 2 4+ -111.68
Fe(OH)2 + -104.68
Feo42 - -111.7
H+ 0.0
Fe(s)(alfa) 0.0
FeO -58.59
Fe3o 4 -242.7
Fe203 -177.4
Fe(OH)2 -116.3
Fe(OH)3 -166.5
(alfa)-FeOOH -116.77(18)

H2S(aq) -6.66
S(s) 0.0
Fe1.000S -24.0
Fe7s8 -178.9(7)
H2 (g) 0.0
02 (g) 0.0
H20(l) -56.688
* Data used to calculate the equations in Appendix C.
--o--

APPENDIX B
DERIVATION OF POTENTIAL-pH DIAGRAMS
Equilibria in aqueous solutions can be represented by
the general reduction reaction:
aA + xH+ + ze- = bB +
for which the standard reaction isotherm:
AG - A.G 0 = RT ln K
can be treated using the following substitutions and
assumptions:
T = 298.15°K
~G = - zFE (in Kcals)
where activitity of water is assumed to have a value
of one and pH= -log aH+
F = 23.0609 Kcal/ volt,
R = 1.98717 cal / deg. mol.
to give the potential - pH relationship:
zE / 0.05916 = -!G0 /l.3642 - xpH - log a b1a a B I A
(in Kcal. l

APPENDIX C
EQUATIONS RELATING Eh, pH AND ACTIVITY FOR THE IRON-WATER
SULPHUR SYSTEM AT 25~c
A. 2H+ + 2e- -----> H2
Eh= 0 - 0.05916pH 0.0295 log a.H2
B. 02 + 4H+ + 4e- -----> 2H20
Eh= 1.229 - 0.05916 pH+ 0.0148 log a.02
Two Dissolved Species:
la. Fe(OH)+ + H+ = Fe2 + + H20
pH= 6.772 - log (Fe2 + / Fe(OH)+)
lb. HFeo2- + 2H· = Fe(OH)+ + H20
pH= 11.98 - 1/2 log (Fe(OH)+ I HFeo2-)
2a. Fe(OH) 2 • + H+ = Fe3 + + H20
pH= 2.168 - log [Fe3 • / Fe(OH) 2 +]
2b. Fe(OH)2+ + H+ = Fe(OH) 2 + + H20
pH= 4.983 - log [(Fe(OH) 2 + / Fe(OH)2•]
2c. Fe2(0H)24 + + 2H+ = 2Fe3 + + 2H20
pH= 1.421 - 1/2 log [(Fe3 +) 2 / Fe2(0H)24 +]
2d. 2Fe(OH)2· + 2H+ = Fe2(0H)24+ + 2H20
pH= 5.745 - 1/2 log [(Fe2(0H)24•) / (Fe(OH)2•) 2 ]
3a. Fe3 • + e- = Fe2 •
Eh= 0.770 - 0.0591 log (Fe2 • / Fe3 +)
3b. Fe(OH) 2 + + H+ + e- = Fe2 • + H2o
Eh= 0.898 - 0.0591pH - log [Fe2 • I Fe(OH) 2 +]
3c. Fe(OH)2+ + 2H+ + e- = Fe2• + 2H20
1

Eh= 1_193 - 0_1182pH - log [Fe2 • / Fe(OH)2•]
3d. Fe(OH) 2 • + e- = Fe(OH)•
Eh= 0.497 - 0.0591 log [Fe(OH)• / Fe(OH) 2 •]
3e. Fe(OH)2• + H· + e- = Fe(OH)• + H20
Eh= 0.793 - 0.05916pH - 0.05916 log (Fe(OH)• / Fe(OH)2+)
3f. Fe(OH) 2 • +H2o+ e- = HFeo2- + 2H·
Eh= -0.920 + 0.1183pH - 0.05916log [HFeo2- / Fe(OH) 2 ·]
3g. Fe(OH)2· + e- = HFeo2- + H·
Eh= -0.624 + 0.05916pH - 0.05916log [HFeo2- I Fe(OH)2•]
3h. Fe2(0H)24 • + 2e- = 2Fe(OH)•
Eh= 0.453 - 0.0296 log [(Fe(OH)•) 2 / Fe2(0H)24 •]
3i. Fe2(0H)24 • + 2H• + 2e- = 2Fe2 • + 2H20
Eh= 0.854 - 0.05916pH - 0.0296log [(Fe2 •) 2 / Fe2(0H)24 •]
4a. Fe042 - + 7H+ + 4e- = Fe(OH)• + 3H20
Eh= 1.352 - 0.104 pH - 0.0148 log [Fe(OH)· / FeQ42 -1
4b. Fe042 - + SH· + 4e7 = HFeo2- + 2H20
Eh= 1.000 - 0.0739pH - 0.0148log(HFe02- / Fe042 -)
Eh= 1.679 - 0.1576pH - 0.0197 log(Fe3 •/FeQ42 -)
Sb. Fe04 2 - + 7H• + 3e- = Fe(OH) 2 • + 3H20
Eh= 1.636 - 0.1379pH - 0.0197log[Fe(OH) 2 • I FeQ42 -1
Sc. FeQ4 2 - + 6H• + 3e- = Fe(OH)2• + 2H20
Eh= 1.537 - 0.1182pH - 0.0197log(Fe(OH)2•/Fe042 -)
Sd. 2Fe042 - + 14H+ + 6e- = Fe2(0H)24• + 6H20
Eh= 1.650 - 0.1379pH - 0.0098log[Fe2(0H)24 •/(Fe042 -) 2 ]
Two Solid Substances:
2

6a. FeO + 2H+ + 2e- =Fe+ H20
Eh= -0.041 - 0.05916pH
6b. Fe3Q4 + SH+ +Se-= 3Fe + 4H20
Eh = -0.086 - 0.05916pH
6c. Fe203 + 6H+ + 6e- = 2Fe + 3H20
Eh = -0.053 - 0.05916pH
7a. Fe304 + 2H+ + 2e- = 3Fe0 + H20
Eh = -0.212 - 0.05916pH
7b. Fe203 + 2H+ + 2e- = 2Fe0 + H20
Eh = -0.069 - 0.0591pH
7c. 3Fe203 + 2H+ + 2e- = 2Fe3Q4 +
Eh = 0.214 - 0.05916pH
H20
Sa. Fe(OH)2 + 2H+ + 2e- = Fe + 2H20
Eh = -0.063 - 0.05916pH
Sb. FeOOH + 3H+ + 3e- = Fe +
Eh = 0.003 - O.Os'916pH
Sc. Fe(OH)3 + 3H+ + 3e- = Fe
Eh= 0.051 - 0.05916pH
9a. FeOOH + H+ + e- = Fe(OH)2
Eh= 0.136 - 0.05916pH
2H20
+ 3H20
9b. Fe(OH)3 + H+ + e- = Fe(OH)2 + H2o
Eh= 0.281 - 0.05916pH
10a. 3FeOOH + H+ + e- = Fe3Q4 + 2H20
Eh= 0.719 - 0.05916pH
10b. 3Fe(OH)3 + H+ + e- = Fe3Q4 + SH20
Eh= 1.155 - O.G5916pH
Solid and dissolved species:
3

11a. FeO + 2H+ = Fe 2 + + H20
pH = 6 .155 - 1/2 log(Fe2 +)
llb. FeO + H+ = Fe(OH)+
pH = 5.68 - log [Fe(OH)+)J
llc. HFeo2- + H+ = FeO + H20
pH= 18.19 + log (HFeo2-)
2pH = 11.68 - log(Fe2 +)
lle. Fe(OH)2 + H+ = FeOH+ + H20
pH= 5.05 - log[Fe(OH)+J
llf. HFeo2- + H+ = Fe(OH)::z
pH= 18.82 + log (HFeo2-)
12a. Fe(OH)3 + 3H+ = Fe3• + 3H20
3pH = 3.42 - log(Fe3•)
12b. Fe(OH)3 + 2H ... = ,.Fe(OH) 2 • + 2H20
2pH = 1.25 - log[Fe(OH) 2 +J
12c. Fe(OH)3 +H ... = Fe(OH)2+ + H20
pH= -3.75 - log[Fe(OH)2+]
12d. 2Fe(OH)~ + 4H+ = Fe2(0H)2 4 + + 4H20
4pH = 4.00 - log[Fe2(0H)24 +]
13a. FeOOH + 3H+ = Fe3 + + 2H20
3pH = -1.682 - log(Fe3 +)
13b. FeOOH + 2H+ = Fe(OH) 2 + + H:20
2pH = -3.85 - logFe(OH) 2 +
13c. FeOOH + H ... = Fe (OH) 2+
pH = -8.86 - logFe(OH):2+
13d. 2FeOOH + 4H ... = Fe2(0H)2 4+ + 2H20
4

4pH = -6.2190 - log[Fe2(0H)2 4 +]
14a. Fe203 + 6H+ = 2Fe3 + + 3H20
6pH = -3.77 - log[(Fe3 •) 2 J
14b. Fe203 + 4H+ = 2Fe(OH) 2 + + H2o
4pH = -8.10-log[Fe(OH) 2 +] 2
14c. Fe203 +H2o+ 2H+ = 2Fe(OH)2+
2pH = -18.10 - log[Fe(OH) 2 +] 2
14d. Fe203 + 4H+ = Fe2(0H)24 + + H2o
4pH = -6.61 - log [Fe2(0H)2 4·]
15a. Fe2 + + 2e- = Fe
Eh= -0.409 + log(Fe2 •)
15b. FeOH· + H· + 2e- =Fe+ H2o
Eh= -0.213 - 0.0296pH + 0.0296log[Fe(OH)+J
15c. HFeo2- + 3H· + 2e- =Fe+ 2H20
Eh= 0.493 - 0.0887pH + o.u296log(~Feo2-)
15d. Fe3• + 3e- = Fe
Eh= -0.0159 + log(Fe3 +)
Eh= 0.880 - 0.2365 pH - 0.0296log[(Fe2 •) 3 J
16b. Fe3Q4 + SH+ + 2e- = 3Fe(OH)• + H20
Eh= 0.292 -0.148pH - 0.0296log[(Fe(OH)•J 3
16c. Fe3Q4 + 2H20 + 2e- = 3HFeo2- + H·
Eh= -1.82 + 0.0296pH - 0.0296log[(HFeo2-) 3]
16d. Fe203 + 6H• + 2e- = 2Fe2 • + 3H20
Eh= 0.658 - 0.177pH - 0.0296log[(Fe2 •) 2 ]
16e. Fe203 + 4H+ + 2e- = 2Fe(OH)• + H20
Eh= 0.266 - 0.118pH - 0.0296log[(Fe(OH)•) 2 ]
16f. Fe203 + H20 + 2e- = 2HFeo2-
5

Eh= -1.145 - 0.0296log((HFe02-) 2 ]
17a. Fe(OH)3 + 3H+ + e- = Fe2 + + 3H20
Eh= 0.972 - 0.177pH - 0.05916 log(Fe2 +)
17b. Fe(OH)3 + 2H+ + e- = Fe(OH)+ + 2H20
Eh= 0.580 - 0.118pH - 0.05916 log[Fe(OH)+J
17c. Fe(OH)3 + e- = HFeo2- + H20
Eh= -0.832 - 0.05916 log(HFeo2-)
17d. FeOOH + JH+ + e- = Fe2 + + 2H20
Eh= 0.67 - 0.177pH - 0.05916 log(Fe2 +)
17e. FeOOH + 2H+ + e- = Fe(OH)+ + H20
Eh= 0.2697 - 0.1183pH - 0.05916 log[Fe(OH)+)
17f. FeOOH + e- = HFeo2-
Eh = -1.1479 - 0.05916 log(HFeo2-)
18a. 2Fe04 2- + lOH+ + 6e- = Fe203 + 5H20
Eh= 1.716 - 0.098pH + 0.0098 log [(Fe042 -) 2 )
18b. FeQ42 - + 5H+ + ~- = FeOOH + 2H20
Eh= 1.712 - 0.099 pH+ 0.0197 log (Fe042 -)
18c. FeQ42 - + SH+ + 3e- = Fe(OH)3 + H20
Eh= 1.611 - 0.099 pH+ 0.0197 log(Fe042-)
Iron - Sulphur - Water System
19a. Fe2 + + H2S = FeS + 2H+
2pH = 1.106 - log[(Fe2 +) (H2S)aq]
19b. Fe2 + + Hs- = FeS + H+
pH= -5.89 - log [(Fe2 +) (Hs-)J
19c. FeS + 2H20 = HFeo2- + s 2 - + 3H+
3pH = 49.33 + log [HFeo2-)(s2 -)J
6

2pH = 36.41 + log [HFeo2-J
19e. FeS + 2H20 = HFeo2- + H2S + H+
pH= 29.42 + log [(HFe02-)(H2 S<aq>}]
19f. FeS + 2H20 = Fe(OH)2 + Hs- + H+
pH= 17.57 log(Hs-)
19g. FeS + 2H20 = Fe(OH)2 + 5 2 - + 2H+
2pH = 30.49 + log (s2 -)
20a. FeS + 2H+ + 2e- =Fe+ H2S
Eh= -0.376 - 0.05916pH - 0.0296 log[(H2S)<aq>J
20b. FeS + H+ + 2e- =Fe+ Hs-
Eh = -0.583 - 0.0296 pH - 0.0296 log(Hs-)
20c. FeS + 2e- =Fe+ s 2 -
Eh = -0.965 - 0.0296 log(s2 -)
21a. Fe3Q-4 + 3H2S + 2H+ + 2e- = 3FeS + 4H20
Eh = 0.782 - 0. 0)3916 + 0.0296 log [ ( H2S) -.q)
21b. Fe3Q-4 + 3Hs- + 5H+ + 2e- = 3FeS + 4H20
Eh = 1.402 - 0.148 pH + 0.0296 log[HS-) 3 ]
21c. Fe:304 + 3s2 - + 8H+ + 2e- = FeS + 4H20
Eh= 2.548 - 0.236 pH+ 0.0296 log [(s2 -) 3 )
21d. Fe(OH)3 + s 2 - + 3H+ + e- = FeS + 3H20
Eh= 2.084 - 0.177 pH+ 0.05916 log (s2 -)
21e. FeOOH + s2 - + 3H+ + e- = FeS + 2H20
Eh= -0.3857 - 0.1775 pH+ 0.05916 log (s2 -)
21f. Fe203 + 2s2 - + 6H+ + 2e- = 2FeS + 3H20
Eh= 0.5416 - 0.1775pH - 0.0296 log[(s2 -) 2 ]
22a. Fe7Se + 2H+ + 2e- = 7FeS + H2Scaq>
Eh= -0.0919 - 0.05916 pH - 0.02958 log [(H2S) (aq,J
7

22b. Fe,Se + H+ + 2e- = 7FeS + HS-<aq>
Eh= -0.2988 - 0.02958 pH - 0.02958 log [(HS-)]
22c. Fe,5e + 2e- = 7Fe5 + s 2 -
Eh = -0.6808 - 0.02958 log{S2 -)
Eh= 0.1373 - 0.4733pH - 0.02958 log[(Fe2 +) 7 (H2S)e<aq>J
23b. Fe,5a + 14H20 + 2e- = 7HFe02- + 852 - + 21H+
Eh = -10.938+0.6212pH-0.0296 log[(HFeo2-)'(S2-)
0 J
23c. Fe,5e + 14H20 + 2e- = 7Fe(OH)2 + 852- + 14H+
Eh= -6.99 + 0.414 pH - 0.02958 log ((52 -) 0]
23d. 3Fe,5a + 28H20 + 8e- = 7Fe3Q4 + 2452 - +56 H+
Eh= -4.97 + 0.4141 pH - 0.0074 log [(S2 -) 24 ]
24a. 7Fe2 + + 85 + 14e- = Fe,Se
Eh= 0.1454 + 0.0042 log (Fe2 +) 7
Eh= 0.3058 - o.~611 pH+ 0.0009 log [(Fe2 +)'(S042 -) 0 J
25b. 7HFe02- + 8S042 - + 85H+ + 62e- = Fe,Se + 46H20
Eh= 0.511 - 0.0811pH + 0.0010 log [(Fe2 +) 7 (504 2 -) 9 )
Eh= 0.29 - 0.053 pH+ 0.0010 log [(Fe2 +) 7 (HS04-) 8]
25d. 7HFe02- + 8H504- + 77H+ + 62e- = Fe,5e + 46H20
Eh = 0.4959-0.0735pH+0.0010 log[HFeo4-)'(HFeo4·· ~8]
25e. 7Fe(OH)2 + 85042 - + 78H+ + 62e- = Fe,Se + 46H20
Eh= 0.3838 - 0.0744 pH+ 0.0009 log [SQ42 -) 0)
25f. 7Fe(OH) 2 + 8HS04- + 70H+ + 62e- = Fe,5e + 46H20
Eh= 0.3686 - 0.0668 pH+ 0.0010 log [HS04-) 8 )
26a. 7Fe3 0 4 + 245042 - + 248 H+ + 200e- = 3Fe,Se + 124H20
Eh= 0.3460 - 0.0733 pH+ 0.0003 log [504 2-)
24)
8

Eh= 0.3319 - 0.0662 pH+ 0.0003 log [(HS04-) 24 ]
26c. 7Fe(OH)3 + 8S042 - + 85H+ + 69e- = Fe,Se + 53H20
Eh= 0.3734 - 0.0728 + 0.0009 log [S04 2 -) 8 J
26d. 7Fe(OH)3 + 8HS04- + 77H+ + 69e- = Fe,Se + 53H20
Eh= 0.3597 - 0.0660pH + 0.0009 log [HS04-) 8]
26e. 7Fe203 + l6S042 - + 170H+ + 138e- = 2Fe,Se + 85H20
Eh= 0.3416 - 0.07288 pH+ 0.0004 log [(S042 -) 16]
26f. 7Fe203 + 16HS04- + 154H+ + 138e- = 2Fe,Se + 85H20
Eh= 0.32789 - 0.0602 pH+ 0.0004 log [(HS04-) 16]
26g. 7FeOOH + 8S042 - + 85H+ + 69e- = Fe,Sa + 46H20
Eh= 0.3586 - 0.0729 pH+ 0.0008 log [(S042 -) 0]
26h. 7FeOOH + 8HS04- + 77H+ + 69e- = Fe,Sa + 46H20
Eh= 0.3449 - 0.0660 pH+ 0.0008 log [(HS04-) 8]
,,
9

APPENDIX D
FREE ENERGY OF FORMATION, G0 f, OF FERRIC IRON
HYDROXYL AND SULPHATE COMPLEXES AT 25°c.
Ferric Species G0 f, Kcal/ mol.
Robins (18) Naumov et. al. (70)
Fe3 + -1.1 -4.27
Fe(OH) 2 + -54.80 -58.0
Fe(OH) 2 + -106.74 -108.42
Fe(OH) 3 0 -154.79 -161.9
Fe(OH) 4 - -198.39 -201.7
Fe2 (0H) 2 4+ -111.55 -111.63 ( 7 )
Fe3 (0H) 4 5+ -221.46
FeOOH(am) -109.82 ( 7 )
Fe(OH)-:,(am.) -166.48 ...,
FeS04 + -184.68 ( 7)
Fe(S04 ) 2 - -364.36 ( 7)
Fe2 (S04 )3 -536.04 ( 7)
H2o (liqui'd) -56.688
H+ 0.0
--C1--

APPENDIX E
EQUILIBRIUM DATA FOR IRON (III)-WATER SYSTEM AT 25°C
1. Fe(OH) 2 + + ff+ = Fe3 + + H:20
pH = 2.19 log [Fe3 +] I [Fe(OH) 2 +]
pH = 2.16 log [Fe3 +] I [Fe(OH) 2+]
2. Fe(OH)2+ + 2H+ = Fe3 + + 2H::z0
pH = 2.835 - 1/2 log [Fe3 +J I [Fe(OH):2+]
pH = 3.367 1/2 log [Fe3 +] I [Fe(OH)2+]
3. Fe(OH):::;, 0 + 3H+ = Fe3 + + 3H20
pH= 4.00 - 1/3 log [Fe3 +] / [Fe(OH):::;,0]
4. Fe(OH)4- + 4H+ = Fe3 + + 4H20
pH= 5.399 - 1/4 log [Fe3 +] I [Fe(OH)4-J
5. Fe2(0H}:;;i:4 + + 2H+ = 2Fe3 + + 2H20
pH= 1.475 - 1/2 ;l,og [Fe3+]2 / [Fe2(0H)24 +]
6. Fe:::;,(OH).,._5 + + 4H+ = 3Fe 3 + + 4H20
pH= 1.575 - 1/4 log [Fe3+J::. I Fe:::;, (OH).,.. ,:5+
7. FeOOH<am> + 3H+ = Fe3 + + 2H20
pH= 1.136 - 1/3 log [fe3 +]
8. Fe(OH)2+ + H+ = Fe(OH) 2 + + H20
pH= 3.48 - log [Fe(OH) 2 +] / [Fe(OH)2+]
9. Fe(OH):::, 0 + 2H+ = Fe(OH) 2 + + 2H20
pH= 4.90 - 1/2 log [Fe(OH) 2 +] / [Fe(OH):::;, 0]
10. Fe(OH)4- + 3H+ = Fe(OH) 2 + + 3H20
pH= 6.469 - 1/3 log [Fe(OH) 2 +] / (Fe(OH)4-J
11. Fe2(0H)24 + = 2Fe(OH) 2 +
-1.429 = log [Fe(OH) 2 +] 2 / [Fe2(0H)24 +]
1
...

12. Fe3(0H)4 5+ + H+ = 3Fe(OH) 2 + + H20
pH = -0.273 - log [Fe(OH) 2 +] 3 I Fe::;,(OH)4 3+
13. FeOOHcam> + 2H+ = Fe(OH) 2 + + H20
pH = 0.611 - 1/2 log [Fe(OH) 2 +]
14. Fe(OH)::3° + H+ = Fe(OH):2+ + H20
pH = 6.332 - log [Fe(OH)2+] I [Fe(OH)3<:>)
15. Fe(OH)4- + 2H+ = Fe(OH):z+ + 2H20
pH= 7.96 - 1/2 log [Fe(OH)2+] / [Fe(OH)4-J
16. 2Fe(OH)2+ + 2H+ = Fe2(0H)24 + + 2H20
pH= 4.195 - 1/2 log [Fe2(0H)24 +] / [Fe(OH)2+] 2
17. 3Fe(OH)2+ + 2H+ = Fe3(QH)43 + + 2H20
pH= 5.357 - 1/2 log [Fe3(0H)43 +] / [Fe(OH)2+] 3
18. FeOOHcam> + H+ = Fe(OH)2+
pH= -2.25 - log [Fe(OH)2+]
19. Fe(OH)4- +ff+= Fe(OH)3° + H20
pH= 9.594 - log~[Fe(OH)3°) / [Fe(OH)4-J
20. 2Fe(OH)3° + 4H+ = Fe2(0H)24 + + 4H20
pH= +5.263 - 1/4 log[Fe2(0H)2 4 +] / [Fe(OH)::3°) 2
21. 3Fe(OH)3° + 5H+ = Fe3(QH)43+ + 5H20
pH= 5.942 - 1/5 log[Fe3(0H)4 5 +] / [F~~OH)::,,=] 3
22. FeOOHcam> + H20 = Fe(OH)::3°
-8.589 = log[Fe(OH)3°]
23. 2Fe(OH)4- + 6H+ = Fe2(0H)24 + + 6H20
pH= 6.706 - 1/6 log [Fe2(0H)2 4 +] / [Fe(OH)4-J 2
24. 3Fe(OH)4- + 8H+ = Fe3(QH)4 3 + + 8H20
pH= 7.31 - 1/8 log[Fe3(0H)45 +] / [Fe(OH)4-) 3
25. Fe(OH) 4 - + H· = FeOOHcam> + 2H20
pH= 18.183 + log[Fe(OH)4-]
2

26. 2Fe3(0H)45 + + 2H+ = 3Fe2(0H)24 + + 2H20
pH= 1.871 - 1/2 log [Fe2(0H)24 +] 3 / [Fe3(0H)45 +] 2
27. 2FeOOH<am> + 4H+ = Fe2(0H)2 4 + + 2H20
pH= 0.969 - 1/4 log [Fe2(0H) 2 4 +]
28. 3FeOOH<-m> + SH+ = Fe3(0H)4 5 + + 2H20
pH= 0.788 - 1/5 log[Fe3(0H) 45 +]
0000000000
* Equations using Naumov's data (70)
3

APPENDIX F
EXPERIMENTAL DATA CALCULATIONS
A representation of the ON and OFF sequence times of
the electrolytic production of oxygen may be represented
as:
0 1 3 4 5 .. I
!--------------!------!----------!------!------!-----)
OFF ON OFF ON OFF ON
The ON time was fixed at 140 seconds, but it could be
varied according to the consumption of oxygen in the system.
RATE OF UPTAKE OF OXYGEN
(a) ON Time: I - (I
(b) OFF Time: I - (I
1), FOR I= 2 to N step 2
1), FOR I= 1 to N - 1 Step 2
(c) Cycle Time: ON Time+ OFF Time
(d) Real Time: N - O (seconds)
I= actual reading of ON and OFF times of the
electrolytic cell.
N = Total number of readings during the experiment.
RATE OF UPTAKE OF OXYGEN= ON TIME/ ON TIME+ OFF TIME
= ON TIME/ CYCLE TIME
Thus, the rate of consumption of oxygen is plotted against

the real time, the rate of consumption of oxygen during the
aqueous oxidation of pyrrhotite could be obtained. A program
written in Basic Language showing the procedure to calculate
this rate is reproduced below.
PROGRAM

wo qE~ r11ia11titiriiriiitttistiiiit1iiiiia111is UO ?.Ef i LEACH. BAS ¥ 120 REn HHHUUUtUUUHHUHUHtUHUHt 130 c~s : ?RHi: : PRINT : PRINT 140 PRINT TAB(20)~P~JGRA~ME LEACHIN9 QF ?YRRHGTITE!' 150 ?R!N~ : ?RI~T : PRINT
200 FnirH "ANJ L:/\CH RATES IN DECIMAL FORriAT, THIS DATA FILE CAN BE PLOTTED'' 110 ?RlNT ·AS IS, QR IT CAN BE SMOOTHED £YTHE iiOvING AVERAGE METHOD USIN5 •; 120 PRINT 'LEACH, BAS;' 130 PRINT : PRINT : PRINT !40 PRINT "ENTER NAME OF DATA FILE CONTAINING ON i!MES AND OFF TIMES" :50 PRINT • IN DECIMAL FORnAT "; : INPUT I$ :60 CLOSE 2 : OPEN '1 ",2, I$+" .D65"
'.BO N:-1 90 IF EDFl2J THEN 310 00 N:Ntl : INPUT #2,D(N) : SOTO 290 10 PRINT : PRINT "ENTER NAME OF DATA FILE TO CONTAIN ABSOLUTE TIMES"; 20 PRINT "AND LEACH RATES"; : INPUTS$_ 30 CLCSE 3 : OPEN "0",3,S$t",D65" 40 PR!!4T : PRINT "HHER NAME OF DATA FILE TO CONTAIN EXTENT OF OX IDATHJN" !5 PRINT "OF PYRRHOTITE 1
; : INPUT S$ 10 CLOSE 4 : OPEN •o• ,4,S$t" .D65" 10 Q=O : DS=O : 06=0 : A=O lO rRINT : PRINT "DATA FILE •u•,D65 contains"D(O)"readings• : PRINT !O PRINT "How itany readings rio you want to process •; : INPUT N !1 CLS 12 FU=" 14 F2$="·
ABSOLUTE TINE
ON TINE
CYCLE TIHE
'6 F3$= 1 (minutes) (seconds) (seconds) ¼
LEACH RATE
8 F4$="11111 HHI.I Htl,1 IHI.I i,HHI 9 PRINT F1$: PRINT.F2$ : PRINT F3$ : PRINT 0 FOR I=2 TON STEP 2 0 REH CALCiJLAT:uN OF "REAL Til'iE" 5 IF Di!){D(i-2) THEN G=G+lOOOOO: IF D(I-2)=D{O) THEN G=O 0 Dl=(D(I}+A+QJ/60 3 N=INT{D1t10+::.;i10 0 REM CALCULATi'JN OF "ON THIE" J D2=D{!I-D(!-!):!F D(IJ<D(I-1) THEN D2=D(Il+100000!-D{I-11 ) D5=D5+D2 i REM C~LCULATIC'i OF "CYCi_E TIME" D3 ) F D(i-2):D(:;) •-iEN D(;-2)=(;
EHENTION OF" PYRRHDT ITE • OXIDATION, x• · H.HH"
) D3=D(I)-D(l-2;: IF !l(:) < D(I-2} THEN D3=D(l)+i0)00ti-D(I-2j I REi~ CALCULAT I QN OF nLEACH RATE '1
( D2iD:)
i REM CALCULATiC:ri uF THE EXTENT OF PYRRHOTITE OXIDATION 1 D6=06+(D2t .4:n2Hoo1; ( %se:0 1HEL11F15) ! PRINT USING ;4S;I 1M,D2 1D3 1D4,D6 · PR:NT ~3JJS!(?:1fi##fL# , !! ;:1; : ?RINT ~3,J4 1 PRINT i4,USI\3~#j#IILi , 1';M; : PRiNT 14,D6 N':X: I

OOO!)l =c~ •tt•Jll~t~1,1~1i•••••i•111•s~,•ttll~****'**~***III 000~0 ~~MI - . * 000~0 FE~ W CL0C~ B 2~-~AP-84 * (l(H).!I (1 F-:~·f'l * 000'.::0 !=·!::M :k OOOt:.O R~::t'! i:
00(.•70 F':::M t.
(>!)(JE~(~ ~:~:"1 t 00•)9i) ~ E·'1 t'. (;0 ~ 0(' F:::.'·1 :t. l)(l:. :. •.) C·C",vf :t:
(II) 1 '.20 !=:EM *
Programme ~o re~ord ~ne ~!mes a~ wni~n .ri c1!?.v: <:e c:onnect.ect to tn!?. c·c:1rc·l} !:"?:! o::w·t r::na.nq=:ts ·:;t.at::·. W~ tc ?~00 ~ead:ngs can ~e ~~~r?ci. and ~h~n ~r~r,c~Gr-~M ~~ ~h0-cnc11 •••"•••• - ;_,. :.)1 '• I •••-' __ ! · .. ; .,.•
00
t 1,,.#: .. .._.
or~gramme CL0CK S
* :« * * * :I{
* * *
00130 ~EM**************''*****'****************'*********** (II)! .!I(! F:EM 00150 GOSUB 30000 00160 GOSUB 1000 00170 PEM -------(H)'.:?(H) D1 !l·=~<EY$ : J:!= D1 $= 11 8 11 THEN LIOO
0021 0 U=UE:F' < B+ 1 7) : r F U=V THEN 200 00220 REM -------00230 T=PEEK<B>+256*PEEK<B+1) 00~40 T1=FLTCT> : IF Tl<O THEN LET T1=65536+Tl 002~0 T1=T1+65536*FL1<PEEKCB+2)) : Tl=T!/10 00~60 V=U: N~N+l : Al(N)=TJ : PRINT [IS NJ [~10.1 TlJ 00270 IF M-N>lOO THEN 200 00280 IF M=N THEN PRINT CHRC7> ~ GOTO 330 002q0 PRINT CHRC7) TABC20>: !NVERS~ 003(!!) PR I NT " li.JAF-:N I NG c,0310 GOTO 200 00320 RE~ -------
ClNLY"M-N" flEADIN5S LEFT 11
00330 PRINT: PRINT: PRINT
NOF~MAL.
00340 PRINT TAB<20): INVERSE PR! NT II - PROE,RAMME TERM I NA TED II
003~0 NORMAL: P~INT: PRINT 00360 REM -------00400 U=USRCB+23) : POK~ 140:b 00410 PRINT: PRINT: PRINT
Pm~:E 257. 1
00420 00430 0044() 1)0450 oo4c10 0047() (!!)480
PRINT F·F: I NT PF:!NT F·!=: !MT PF:INT Ft;·{"f"!"
;:.:=rr:
"Tc, II t . 11-,
4 • 114:!' -·. 114. II CS.
transfer dat~ tc the PDPll :" \ Swi"t~h ,:1ff ,::leek en.:ai.bl!= swi+:ch en :rear of Micr';>bee 11
Connect !Vii crobee ·to TT:?: !:>D:"""t of the PDPl l 11
~~~'li.tch .on 15 volt ocwer -::1..toolv 11
RLln oro9ramme DLl):INPUT or. tn~ PDPll." F,-:,J. l cw +:h·:· 1. n·=~ruct i -:Jns "::lrl -:he F·DP1 t 11
\ : END
00500 !J'..l:l_ 1f.'5 : LFR I NT N : :::,p I NT N : PLAY C'. 4!)
(10'.:·1(1 !=(J~ I=1 TC• N : . F'RIN·.- [!~ I:l, [!=10. ! Al(!) J
005::i:i u=c: r "ff r ". " A 1 < r} : NEXT r ~ c:·uw· ::3 00'::·:: (1 C! 1_!"T:... =H(' ()!.!"~- =!=V:· : E:ND <) 1. ,:) (:, c) ~ E :'""! () l. (: ~ •.) !'°'~=·::=(~.'() r=CM ··-·.
r-.1~.-, .-.' ..... .._ ••• I -
C.'C l'r~ I •.1.,.1 r
010~0 SDS: DIM A1!M! C) t (·.!:.(~ ~::::: ·: ·::: :1 :: .. 4 ~ \/:::I_:~:,~, ( E:-~ 4)
,· .. , '.·.--;·,:, r::L. :~· : '.~·(y::!:' :l ., El
~a~tmum numcer ~~ reaa~~as c~rc~ U0 PER CL8E c~ar2=~ers Di~abl~ ~REAK ~~~
() j_ ~)·:::~) ·= ~· ! l\!;' ii! f't:rTF: 1 ... !(~T ! •::~r,.1:::: ~()F. 1 • ..i~::E a II '\.
OJO~O f:-1::.-1,'-:,· "Conllt2C"t Ox'f9en 6eneratot"' Cof\troller fntertai:::.e," OltOO :.:c.: 0-, 7 · "sw1.tch on clock enabl.e <;,Wttch on year of Mi..c.robee. c•:.i 10 .:.F::t,_;·~· "t:n21-; press .any k;!:;y· to cont1111A.e,"
01. t 20 I)lt--KE''f$ : lF 0\$::''" THEN l t.30 ·:: 1 1 30 V=USf.< (B-tl '.l) ~ ~EM star\:. clock. ft takc2 ft r.st readir,9 O\L~O CL~ cu~s ,.s

01 l t,O s::·F: 1 r'-" "f'.·r·F.:iss:
01 !. 7') F·ET 1 •• 1F!'i 3CH)(~!:1 ;;·Er,;
:3:(;<) "!. •.) ~·EM
30030 FOF ~=OTO 164 ~ DEAD J ~ POKE ~2464+!.J ; NEXT! ~ P~T~PN
:'..(H)LH) !),:fTt::~ ~),(i.<).!). :7;·4:: .. ~:::;•., '":7 !~r. ::·11. :~,. 237 .. :8t:., :::'f)1 r. :·~·!. :··!)!::r J ! . :~·L~L}
:-;;; (H) ~ <) o·A T ;!.) ·:2 ~) 1 , 2 :!. ,;- • ~) • ~·: • (~ • 7 c;, , ·:: ~) i ~ :: 4 ::: . ·:: c, 1 . : · 1- 3 • ·:_ 4 S " ~ ,:;, 7 • :t 1 : ., : :2 ·:;
:o060 DAlA 22l.229.~53.22~.l.l.0.42.0.?a4!58,2,744,25~. 1~.32
30070 DATA 23,124.2~4.6&;31,!S. 125.2~~.63,32. 13.33.0,0.34
30080 DATA 0.244,62.(l,50.2.244.24.13,Q,34.0 1 244.48.7.58,2
30090 DATA 244,60.50.2,244.221.33. 164.244.221. 126.0.60.221
30100 DAlA 119.0.254. 10.32,8.221.54,0.0.221.~3.24.237.221
30110 DATA 33.159.244.253.33.57.:40.62.160.253.119,0,253
30120 DATA 35.6,5.221~126.0.198.176.253. 119,0.221.35.253
30130 DATA 35.16.242.62.160.253. 11°.0.253.225.221.225.225
30140 DATA 209.193.241.25!.237.77.n.n.n.n.n.0.n.o.n.n.o_n

APPENDIX G
CALCULATION OF OXYGEN CONSUMPTION AND PRODUCTION
The consumption of oxygen to be determined is based on
Equations (VI.1.5) and (VI.1.12) previously discussed and
thirty grams of sample of mineral.
Equation (VI.1.5): FeS + 0.5H20 + 0.7502 ----->
Equation (VI.1.12):
FeOOH +
Stoichiometric Monoclinic Oxygen
Pyrrhotite Pyrrhotite
Molecular Weight, grams: 87.907 647.409
Oxygen consumed, gr.: .75*32*30/55.847 5.25*32*30/647.409
8.1905 7.785
Average: 7.9877 grams of oxygen.
If this average value of both results is considered as
the theoretical amount of oxygen consumed by thirty grams of
the pyrrhotite mineral sample, the incurred error could be
minimal (2.48 per cent).
ELECTROLYTIC PRODUCTION OF OXYGEN
These calculations are based on Faraday's Laws
[M=(A/F)*I*t] and determined for experiments No.1 and 2 from
the second equipment design.

EXPERIMENT 1 EXPERIMENT r, .::...
Total Number of Readings: 1,914 7,580
Total Number of ON times: 957 3,790
ON Time Value, Sec.: 110 110
Current, mA. : 150 150
From Faraday's Law, it is known that in order to pro-
duce one mole of molecular oxygen from water it is necessary
to pass through the electrolytic cell four faradays. Thus,
M1 =(0.15coul/sec*110*957sec*32 g.02 *FJ/(4F*96500 coul]
M1 = 1.309 g of oxygen
M2 =(.15coul/sec*110*3790 sec *32 g.02 *FJ/(4F*96500 coul]
M2 = 5.1842 g. of oxygen
Thus the percentage of conversion of thirty grams of the
pyrrhotite mineral sample will be:
Experiment No.l: 1.309 * 100/7.9877 = 16.39 %
Experiment No.2: 5.1842 * 100/7.9877 = 64.90 %
RATE OF OXYGEN CONSUMED, g/hr.
Experiment No.1 = 1.309 g 02/237 hours
= 0.0055 g/min.
Experiment No.2 = 5.1842 g 02/241 hours
= 0.0215 g/min.
Note: ON time for experiments 14-20 was 480 mA.

APPENDIX H
PROCEDURE FOLLOWED TO DETERMINE IRON, ARSENIC AND ZINC
DURING THE CONTINUOUS BACTERIAL OXIDATION OF PYRITE
Samples of slurry from each stirred reactor and the
thickener(s) (overflow and underflow) were taken for analy
sis every Monday, Wednesday and Friday.
From each slurry sample, 1ml aliquot was taken into a
test tube and named "total" sample. Another 1 ml aliquot was
taken into another test tube and named "soluble" sample. To
the "total" sample, 1ml of SN HCl was added, stirred manual
ly and left for about 30 minutes. After this time, 8 ml of
pH 2 distilled water was added (dilution 10). The "soluble"
sample was diluted with 9 ml of pH 2 distilled water direct
ly. Both set of samples, "total" and "soluble" were centri
fuged at 1500 r.p.m for 20 minutes. The solution after
centrifugation was diluted further to 100 and/or 1000 in
order to read in the AAS.
It is believed that the 1ml of SN HCl added to the
"total" sample only redissolved the precipitation products
without attacking the mineral.
REFERENCES
1. Craig, J.R. and Scott S.D., Sulphide Mineralogy, Ed.
P.H. Ribbie, Mineralogical Society of Arn. Vol. 1,
1974.
2. Power, L.F. and Fine H.A., The Iron-Sulphur System,
Minerals Sci. Engng. Vol. 8, No.2, April 1976.
3. Lambert, J.M., PhD Thesis, The Pennsylvania State
Univ., 1982.
4. Marirnoto, N. et. al., Crystalograghy and Stability of
Pyrrhotites, Economic Geology, Vol. 70, 1975, pp. 824-
833.
5. Smith, J.S. and Miller, J.D.A., Nature of Sulphides
and their Corrosive Effect on Ferrous Metals: A
Review, Br. Corros. J., Vol. 10, No.3, 1975, pp.136-
143. ,, 6. Ward, J.C., The Structure and Prop~rties of Some Iron
7.
Sulphides Review, Pure and Applied Chem., 20, 1970,
pp.175-206.
Burkin, A.R., Topics on Non-fe~rous Extractive
Metallurgy, Blackwell Scientific Publications,
Melbourne, Vol. 1, 1979.
8. Liddel, K.C. and Bautista, R. G. ,A Partial Equilibrium
Model for the Dump Leaching of Chalcopyrite, Vol. l2B,
Dec. 1981, pp. 627-637.
9. Liddel, K. C. and Bautista, R. G., A Partial
Equilibrium Model to Characterize the Precipitation of
Ferric Iron During the Leaching of Chalcopyrite with
Ferric Sulphate Vol. 148, March 1983, pp. 5-15.

10. Jones, D.L. and Peters, E., The Leaching of Chalcopy
rite with Ferric Sulphate and Ferric Chloride, Ext.
Met. of Copper, Hydrometallurgy and Electrowinning,
Vol. II, Ed. J. C. Yannopoulos and J. C. Agarwal,
1976, pp. 633-653.
11. Warren, G. W., Wadsworth, M. E. and El-Raghy, S. M.,
Anodic Behaviour of Chalcopyrite in Sulphuric Acid,
Hydrometallurgy Research, Development and Plant
Practice, Ed. K. Osseo- Asare and J. M. Miller, TMS
AIME, 1983, pp. 261-275.
12. Hillrichs, E., Greulich, H. and Bertram R.,
Investigations of the Electrochemical Dissolution of
Copper Sulphide Ores in Sulphuric Acid Solutions,
Ibid, pp. 277-287.
13. Warren, G. W., Sohn, H. J., Wadsworth M. E. and Wang, ?'
T. G., The Effect of Electrolyte Composi~ion on the
Cathodic Reduction of CuFeS2 , Hydrometallurgy, 14,
1985, pp.133-149.
14. Singer, P.C. and Stumm, W., Acidic ~jne Drainage: The
Rate Determining Step, Science, Vol. 167, 1970, pp.
1121-1123.
15. Mathews, C. T. and Robins R.G., Aqueous Oxidation of
Iron Disulphide by Molecular Oxygen, Aust.Chem.
Engng., Nov./Dec. 1974, pp. 19-24.
16. Bailey, L. K. and Peters, E. Decomposition of Pyrite
in Acids by Pressure Leaching and Anodization: The
Case for an Electrochemical Mechanism, Can. Met. Q.,
Vol. 15, No.4, 1976, pp. 333-344.

17. Hamilton, I. c. and Woods, R., An Investigation Of
Surface Oxidation of Pyrite and Pyrrhotite by Linear
Potential Sweep Voltarnrnetry, J. Electroanal. Chern.,
118, 1981, pp. 327-343.
18. Mackay, D.R. and Halpern, J., A Kinetic Study of the
Oxidation of Pyrite in Aqueous suspension,
Trans., Vol. 212, 1958, pp. 301-309.
Met.
19. Lowson, R.T., Aqueous Oxidation of Pyrite by Molecular
Oxygen, Arn. Chern. Soc., Chern. Review, Vol. 82, No.5,
1982, pp. 461-496.
20. Mellor, J.W. ,A Comprehensive Treatise on Inorganic and
Theorical Chemistry, Vol. XIV, Fe-Co, Logrnans, Green
and Co., New York, 1935, pp.158
21. Ingraham, T.R., Parson, H.W. and Cabri, L.J., Leaching
of Pyrrhotite with Hydrochloric Acid, Canadian Met. Q., ~
Vol. 11, Number 2, 1972, pp. 407-411.
22. Subramanian, K. N., Stratigakos, E. S. and Jennings, P.
H., Hydrornetallurgical Processing of Pyrrhotit.e, Vol.
11, Number 2, 1972, pp. 425-434.
23. Jibiki, K., Acid Decomposition Reactions on Compounds
and Minerals in the Fe-Ni-Sulphide System, PhD Thesis,
University of British Columbia (Canada) 1974.
24. Bugajski, J. and Gamsjager, H., The Kinetics of the
Dissolution of Monoclinic Pyrrhotite in Aqueous Acidic
Solutions, Monatshefte fur Chemie, 113, 1982, pp.1087-
1092.
G. van Weert, K.' Mah, K., and Piret, N.L.,
Hydrochloric Acid Leaching of Nickeliferous Pyrrhotites

from the Sudbury Distric, CIM Bulletin, 67, 197~, pp.
97-103.
26. Yazawa, A. and Motorini, E., Study on the Dissolution
Rate of Pyrrhotite in Aqueous Sulphuric Acid, Tohoku
University, Research Institute of Mineral Dressing and
Metallurgy Bulletin, Vol. 23, 1967, pp.147-153.
27. Scott, P.D. and Nicol, M. J., The Kinetics and
Mechanism of the Non-oxidative Dissolution of Some Iron
Sulphides in Aqueous Acidic Solutions, National Inst.
for Metallurgy, Report No. 1858, Nov. 1976, 27 pp.
28. Nicol, M. J. and Scott, P. D., The Kinetics and
Mechanism of the Non-oxidative Dissolution of Some
Iron Sulphides in Aqueous Acidic Solutions, J. S. A.
Inst. M. & M, May 1979, pp. 298-305.
29. Nicol, M. J., The Non-oxidative Leaching of Oxides and ~
Sulphides: An Electrochemical Approach, Hydrometallurgy
Research, Development and Plant Practice, TMS-AIME, Ed.
K. Osseo-Asare and J.D. Miller, March 1983, pp. 177-195.
30. Tewari, H. P. and Campell, 8. A., D~§SOlution of Iron
Sulphide (Troilite) in Aqueous Sulphuric Acid, The J.
of Physical Chemistry, Vol. 80, No. 17, 1976, pp. 1844-
1848.
31. Huffman, R. E. and Davidson, N., Kinetics of the
Ferrous Iron-Oxygen Reaction in Sulphuric Acid, J. Am.
Chem. Soc., 78, 1956, pp. 4836-4842.
32. Biernat, R. J., The Kinetics of the Oxidation of
Sulphur and Metal Sulphides in Aqueous Systems. PhD
Thesis (unpublished), 1970, The University of New South

3 ·? ..., .
Wales.
Iwai, M., Majima H. and Awakura, Y., Oxidation of
Fe(II) in Sulphuric Acid Solutions with Dissolved
Molecular Oxygen, TMS-AIME, Met. Trans. 8, Vol. 138,
September 1982, pp.311-318.
34. Chmielewski, T and Charewicz, W., The Oxidation of
35.
Fe(II) in Aqueous Sulphuric Acid Under Oxygen Pressure,
Hydrometallurgy, 12, 1984, pp. 21-30.
Perry, Robert H. and Green, Don, Perry's Chemical
Engineers' Handbook, Sixth Edition, McGraw-Hill, 1985.
36. Narita, E., Lawson, F. and Han, K. N., Solubility of
Oxygen in Aqueous Electrolyte Solutions,
Hydrometallurgy, 10, 1983, pp. 21-37.
37. Mathews, C. T. and Robins, R. G., The Oxidation of
Aqueous Ferrous Sulphate Solutions by Molecular Oxygen, ,,
Proc. Aust. Inst. Min. & Met., No. 242, June 1972, pp.
47-56.
38. Minegishi, T., Asaki, Z., Higuchi, 8. and Kondo, Y.,
Oxidation of Ferrous Sulphate in Weakly Acidic
Solutions by Gas Bubbling, TMS-AIME, Met. Trans. 8.,
Vol. 148, March 1983, pp. 17-24.
39. Tamura, H., Goto, K. and Nagayama, M., The Effect of
Ferrous Hydroxide on the Oxygenation of Ferrous Ions in
Neutral Solutions, Corrosion Science, Vol. 16, 1976,
pp. 197-207.
40. Keenan, E. A., Bacterial Beneficiation of Uranium
Materials, PhD Thesis (unpublished) , 1969, The
University of New South Wales.

41. Dutrizac, J. E., The Physical Chemistry of Iron
Precipitation in the Zinc Industry, Lead-Tin-Zinc
'80, TMS-AIME, World Symposium On Metallurgy and
Enviromental Control, J. M. Cigan, T. S. Mackey and T.
J. O'Keefe, Eds. TMS-AIME, Warrendale, P.A., 1980, pp.
532-64.
42. Tozawa, K., Sasaki, K., and Umetsu Y., The Effect of
the Second Dissociation of
Hydrometallurgical Processes:
Sulphuric
The
Acid on
Electrical
Conductivity of Sulphuric Acid-Containing Electrolytes
and the Hydrolysis of ferric Sulphate Solutions at
Elevated Temperatures, HYDROMETALLURGY Research,
Development and Plant Practice Ed. by K. Osseo-Assare
and J. M. Miller, 1983, pp. 375-403.
43. Segal, D. L., A survey of Methods for the Preparation ?
of Colloidal Dispersions of Ferric-Hydroxy Polycations,
J. Chem. Tech. Biotechnology, 1984, 34A, 25-28.
44. Knigth, R. J. and Sylva R. N., Precipitation and
Hydrolysis of Iron (III) Solutions~. J. Inor. Nucl.
Chem., Vol. 36, 1974, pp. 591-597.
45. Prasad, S. V. and Sitacara, Rao V., Thermal
Transformation of Iron (III) Oxide Hydrate Gel, J. Of
Mat. Science, 19, 1984, pp. 3266-3270.
46. Dousma, J., Van Den Hoven and De Bruyn, P. L., The
Influence of Chloride Ions on the Formation of Iron
(III) Oxihydroxide, J. Inor. Nucl. Chem., Vol. 40,
1978, pp. 1089-1093.
47. Music, S., Vertes, A, Simmons, G. W., Czaco-Nagy, I.

and Leidheiser, H. Jr., Mossbauer Spectroscopy Study of
the Formation of Fe(III) Oxyhydroxides and Oxides by
Hydrolysis od Aqueous Fe(III) Salt Solutions, J. of
Colloid and Interface Science, Vol. 85, No.1, January
1982, pp. 256-266.
48. Feitknecht W. and Schindler P., Solubility Constants of
Metal Oxides, Metal Hydroxides and Metal Hydroxyl Salts
in Aqueous Solutions, Pure Appl. Chem., 6, 1963,
pp. 130-199.
49. Baes, C. F. and Mesmer R. E., The Hydrolysis of Ca
tions Wiley Intersience Publishers, New York, 1976.
50. McAndrew, R. T., Wang, S.S. and Brown, W. R.,
Precipitation of Iron Compounds From Sulphuric Acid
Leach Solutions, CIM Bulletin, January 1975, pp. 101-
110.
" 51. Flynn, Charles M. Jr. , Hydrolysis of I:1organic Iron
52.
53.
(III) Salts, Chem. Rew., 1984, 84, pp. 31-41.
Khoe, H. G.' Sylva, R. N. and Robins, R. G.' The
Complexation of Iron (III) with Sulpl')pte, Phosphate and
Arsenate Ion in Sodium Nitrate Medium at 25°c,
Naumov, c. N.' Ryzhenl~o, B. N. and Khodakovi:;.,ky, I. L.'
in Handbook of Thermodynamic Data (ed. I. Barnes and
v. Speltz), US Geol. Survey, NTIS, PB-226722, January
1974.
54. Stumrr., W. and Morgan, J.J., AQUATIC CHEMISTRY An
Introduction Emphasizing Chemical Equilibria in
Natural Waters, 2nd Ed., John Willey & Sons, 1981.
55. Sapieszko, R. S., Patel, R. C. and Matijevic, E.,

Ferrous Hydrous Oxide Sols. .... .f... Thermodynamics of
Aqueous Hydroxo and Sulphate Ferric Complexes, The J.
of Phys. Chem., Vol. 81, No.11, 1977, pp. 1061-1068.
56. Sevryukov, N. N., Emel'yanov, V.I., Chemistry of Iron
(III) Sulphate Hydrolysis in Aqueous Solutions, J.
Inor. Chem., 26(5), 1981, pp. 1281-1287.
57. Kwok, 0. K., Thermal Precipitation in Aqueous Metal
Sulphate Systems,
Engineering, The
Australia, 1974.
PhD Thesis, School of Chemical
University of New South Wales,
58. Eary, L. E. Catalytic Decomposition of Hydrogen
Peroxide by Ferric Ion in Dilute Sulphuric Acid
Solutions, Met. Trans. B, TMS-AIME, VOl. 168, No.2,
June 1985, pp. 181-186.
59. Babcan J., Die Synthese Von Jarosit KFe3 (so4 ) 2 (0H) 6 , ,, Geologicky Zbornik-Geologica Carpathica XXII, 2
Bratislava, Nov. 1971, pp. 299-304.
60. Brown, B., Jarosite-Geothite Stabilities at 25°c, 1
ATM., Mineral Deposita (Berl.) 6, 19?J, pp. 245-252.
61. Harvey, D.T. and Linton, R. W., Anal. Chem. Vol.
1981, pp.1648-1688.
r: ,:, ..J...J. '
62. Hiskey, J.B. and Schlitt, W.J., Aqueous Oxidation of
Pyrite, Interfacing Technologies in Solution Mining,
Ed. W.J. Schlitt, Proc. Second MSE-SPE Int. Solution
Mining Symposium, Denver, Co. Nov. 18-20 (1981),
Published 1982.
63. Berner, R.A., Thermodynamic Stability of Sedimentary
Iron Sulphides, Am. J. of Science, Vol.265, Nov.1967,

pp. 773-785.
64. Heindl R. and Gamsjager H., Solubility Constants and
Free Enthalpies of Metal Sulphides, Part 6: A New
Solubility Cell,
pp.1365-1369.
Monatshefte Chimie, 108, 1977,
65. Hiskey, J.B., and Wadsworth M.E., Electrochemical
Processes in the Leaching of Metal Sulphides and
Oxides, Process and Fundamental Considerations of
Selected Hydrornetallurgical Systems, Ed. by Kuhn, M.C.
,MSE-AIME, New York, 1981, pp. 303-327.
66. Southwood, M.J., The Acid Leaching of Nickel and
Copper from Sulphidic Ore in the Presence of Pyrite,
J. S. A. Inst. M.M., Vol. 85, No.11, Nov. 1985,
pp.395-401.
67. Biegler, T., Rand D.A.J. and Woods R., Oxygen ~
Reduction in Sulphide Minerals, Part I. Kinetics and
Mechanism at
Electroanalytical
Rotated
Chem.
Pyrite
and
Electrochemistry, 60, 1975, pp.151-162.
Electrodes,
Interfactal
68. Biegler, T., Oxygen reduction on Sulphide Minerals,
Part II. Relation Between Activity and Semiconducting
Properties of Pyrite Electrodes, J. Electroanal. Chem.
, 70, 1976, pp. 265-275.
69. Rand, D.A.J. Oxygen Reduction on Sulphide Minerals,
Part III. Comparison of Activities of Various Copper,
Iron, Lead and Nickel Mineral Electrodes, J.
Electroanal. Chem., 83, 1977, pp.19-32.
70. Dutrizac, J.E. and MacDonald R.J.C., Ferric Ion as a

Leaching Medium, Minerals Science and Engng. Vol.6,
April 1974, pp.59-99.
71. Bard Allen J., Encyclopedia of Electrochemistry of the
Elements Volume II, Marcel Dekker,
1974, pp. 190-350.
Inc. , New York,
72. Krestan, A.L., Leaching of Pyrrhotite Concentrates
with Ferric Chloride Solutions, Tsvetnye Metally/Non-
7 ~ ...) .
Ferrous Metals, Vol. 18, No.9, (English Trans.), Sept.
1977, pp. 31.
Zheng Ch. Q. and Bautista, R.G, A Kinetic Study of the
Oxidation of Complex Nickeliferous Sulphide Ore in
Aqueous Ferric Sulphate, The Eighth Int. Chern.
Reaction Engng. Symposium, The Inst. of Chem.
Engineers, Univ. of Edinburgh, 10-13 Sept. 1984,
Pergarnon Press. ,, 74. Pearse, M.J., Chemical Study of Oxidation of Sulphide
Concentrates, IMM, Trans. C, March 1980, pp. 26-36.
75. Severa, N.V. et. al. Two Stage Autoclave Leaching of
Pyrrhotite Concentrates,
No.4, 1975.
Tsvetnye Me.tally, Vol. 25,
76. Downes K.W. and Bruce R.W., The Recovery of El~mental
Sulphur from Pyrite and Pyrrhotite, Trans. Canad.
Inst. Min. Met., 1955, 58, pp.77-82.
77. Goryachkin, V.I. et. al. Developing a Technology for
Hydrometallurgical Beneficiation of Noril'sk
Pyrrhotite Concentrate, Tsvetnye Metally, Vol. 20, 9
(Engligh Translation), Sept. 1980.
78. Goryachkin, V. I., et. al. Hydrornetallurgical

Beneficition of Nickel-Pyrrhotite Concentrate,
Tsvetnye Metally, Vol. 15, 9, (English Trans.) Sept.
1974.
79. Harris, B, Khalid, A. M., Ralph B.J. and Winby, R.,
Biohydrometallurgical Beneficiation of Tin Process
Tailings, Progress in BiohydrometallUrgy, Cagliari,
May, 1983.
80. Rossi, G., Torma, A.E. and Trois, P., Pyrrhotite Ore:
Chalcopyrite/Pyrrhotite Interactions,
Biohydrometallurgy, Cagliari, May 1983.
Progress in
81. Kandemir, H.' A Fundamental Study on Bacterial
Oxidation of Sulphide Minerals, The Aus. I.M.M.,
Melbourne Branch, Symposium on Extractive Metallurgy,
November 1984.
82. Clum, J. A. and Haas, L. A., Microbiological Effects ,, on Metallurgical Processes, The MetalJ~rgical Society
of AIME, February 24-28, 1985.
83. Gormely, L.S. and Duncan, D.W., EEtimation of
Thiobacillus Ferrooxidans Concentrati0n, Canadian J.
Microbioly, 20, 1974, pp. 1453-1455.
84. Wagman et al.' Selected Values of Chemical
Thermodynamic Properties, J. of Phys. Chem., Ref.
Data, Vol. 11, Suppl.2, 1982.
85. Pourbaix, M. Atlas of Electrochemical Equilibrium in
Aqueous Soluttions, Pergamon Press, New York, NY,1966,
86. Bockris, .] . O'M . and Redy, A.K.N., Modern
Electrochernistry, Plenum Press, New York, NY, 1973,
Vol. 2, pp. 1281-1285.

87. Biernat, R. J. and Robins, R. G., High temperature
Potential-pH Diagrams for the Iron-Water and Iron
Water-Sulphur Systems, Electrochimia Acta, Vol. 17,
1972, pp. 1261-1283.
88. Peters, E., The Physical Chemistry of Hydrometallurgy,
Chap. 10, Int. Symposium on Hydrometallurgy, AIME, New
York, 1972, pp. 205-228.
89. Ferreira, R. C. H., High Temperature Eh-pH Diagrams for
90. Garrel, R.M. and Christ C.L., Solutions, Minerals and
Equilibria, Harper & Row Publishers, New York, 1965.
91. Bouet, J. and Brenet J.P., Controbution A L'etude du
Diagramme tension/pH du Fer en Milieux Sulfures,
Corrosion Science, Vol. 3, 1963, pp.51-63.
92. Vanyukov, A. V., Voitkovskii, Yu. B. and Razumorskaya, ~
Oxidation of Pyrrhotite in Aqueous Pulps, Tsvetnye
Metally, No.5, 1977, pp.18-20.
93. Vaughan, J. and Craig, J. R., Mineral Chemistry of
Metal Sulphides, Cambridge University.Press, 1978, pp.
315-330.
94. Turnbull, A.G. and Wadsley, M. W., The CSIRO-SGTE
Thermodata System, CSIRO, Institute oi Energy and
Earth Resources, Division of Mineral Chemistry. In
Proc., Australian Institute of Energy National
Conference, Melbourne, 27-29 Aug. 1985.
95. Robins, R. G., Stability Diagrams Related to Mineral
Extraction Processing, School of Chemical Engineering
and Industrial Chemistry, The University of New South

Wales, 1985 (class notes).
96. Kuhn, A.T., Kelsall, G.H. and Chana, M.S., A Review of
the Air Oxidation of aqueous sulphide solutions, J.
Chem. Tech. Biotechnol., 33A, 1983, pp. 406-414.
97. Chen, K. Y. and Morris, J. C., Kinetics of Oxidation
of Aqueous Sulphide by o2 , Enviromental Science and
Tech., Vol. 6, No.6, June 1972, pp.529-537.
98. Habashi, F. and Bauer, E. L., Aqueous Oxidation of
Elemental Sulphur, I & E. C. Fundamentals, Vol. 5,
No.4, Nov. 1966, pp. 469-471.
99. Angus, C.T. and Zappia, M.J., Electron Number Diagrams
Transformed Potential-pH Diagram, Proceedings of
Pourbaix Symposium, Electrochemical Society Meeting,
New Orleans, LA. October, 1984.
100. Wasserlauf, M. and Dutrizac J.E., Canment's Project on ,, the Chemistry, Generation and Treatment of Thiosalts
in Milling Effluents, Canan. Met. Q., Vol. 23, No.3,
1984, pp.259-269.
101. Hamilton, I.C. and Woods, R., A Vol~?mmeric Study of
the Surface Oxidation of Sulphide Minerals, Proc. of
the Int. Symposium on Electrochemistry in Mineral and
Metal Processsing, Ed. by P.E. Richardson, S.
Srinivarsan and R. Woods, The Electrochemical Society,
Inc., Vol. 84-10, June, 1984, pp. 259-279.
102. Sohn Hong Yong and Wadsworth, M.E., Rate Processes in
Extractive Metallurgy, Plenum Press, 1979.
103. Brescia, F.' et al., Fundamental of Chemistry,
Academic Press, Fourth Edition, 1980, pp.421.

104. Lotens, J.P. and Wesker, E., The Behaviour of Sulphur
in the Oxidation Leaching of Sulphide Minerals,
Hydrometallurgy, 18, 1987, pp. 39-54.
105. Vancelow, PhD Thesis, The University of New South
Wales, Australia
106. Sawe, A., The Beneficiation of Renison Sulphide Con
centrate by Bacterial Leaching, MSc Thesis, School of
Biological Technology, UNWS, 1980.
107. Khalid, A.M. Personal Communication.
108. Vetter, K. J., Electrochemical Kinetics, Theorical and
Experimental Aspects, Academic Press, New York, 1967.
109. Natarajan, K.A. and Iwasaki, I., Role of Galvanic
Interactions in the Bioleaching of Duluth Gabbro
Copper-Nickel Sulphides, Sepn. Sci. Technol., Vol. 18,
1983, pp. 1095-1111.
" 110. Starr P. Mortimer et al., The Prokaryotes, A Handbook
on Habitats, Isolation and Identification of Bacteria,
Springer-Verlag, 1981, Vol. 1, Chap. 81, 82.
111. Ahonen L., Hiltunen, P. and Tuovin~p, O.H., The Role
of Pyrrhotite and Pyrite in the Bacterial Leaching of
Chalcopyrite Ores, Fundamental and Applied
Biohydrometallurgy, Proc. of the Sixth Int. Symp. on
Biohydrometallurgy, Vancouver, B.C., Canada, 1985. Ed.
By R. W. Lawrence, R. M. R. Branion and H. G. Ebner,
1986, pp. 13-23.
112. Peters, E., Direct Leaching of Sulphides: Chemistry
and Applications, Met. Transactions 8, Vol. 78, Dec.
1976, pp. 505-517.

113. Barret, J., Hughes M.N. and Ewart & Robert, K., The
Isolation and Characterization of a Moderately
Thermophilic Mixed Culture of Autotrophic Bacteria:
Application
Concentrates,
to the Oxidation of Refractory Gold
Randol Perth International Gold
Conference, pp. 148-150, October 1988.
114. Silverman, M.P. and Lundgren, D.G., Studies on the
Chemoautotrophic Iron Bacterium Ferro bacillus
Ferrooxidans, Canadian Journal of Microbiology, 11,
1959, pp. 23-27.
115. Lawrence R.W. and Marchant P.B., Biochemical
Pretreatment in Arsenical Gold Ore Processing, Arsenic
Metallurgy - Fundamental and Applications, Ed. R.
Reedy, TMS-AIME, Warrendale, PA. 1988, pp.199-212.
116. Neeling, G.' Spencer, P.A., and Kandemir, H.,
" Treatment of Refractory Gold Concentrates by Bacterial
Oxidation, Proc. Gold Mining 87, Canada 1987, pp. 260-
272.
117. Keller, L. and Murr L.E., Lixiviaot Alteration by
Fungal Absortion of Iron During Acid-Bacterial
Leaching of Pure Pyrite, Met. Trans. B, Vol. 118,
March 1980, pp. 165-166.
118. Van Aswegen, P., Haines, A. K. and H.J. Marais, Design
and Operation of a Commercial Bacterial Oxidation
Plant at Fairview, Proc. Randol Perth Int. Gold
Conference, 1988, pp. 144-147.
119. Miller, P.C., Hubberts, R. and Livesey-Goldblatt, E.,
Fundamental and Applied Biohydrometallurgy, Pro. 6th

Int. Symp. ob Biohydrometallurgy, Vancouver, B.(:. '
Canada, 1985, pp.23-42.
120. Brock, T. D. and Gustafson, J., Ferric Iron Reduction
by Sulphur and Iron Oxidizing Bacteria, Appl. Environ.
Microbiol., Vol. 32, 1976.
121. Miller, J.D., The Significance of Electrochemistry in
the Analysis of Mineral Processing Phenomena, Electro
chemistry Current and Potential Applications, Ed. T.
Tran and M. Skillas-Kazacos, Proc. 7th Australian
Electrochemistry Conference, Feb. 1988, The University
of New South Wales, pp. 122-132.
122. Kontoupoulos, A. and Stefanakis, M., Process Selec-
tion for the Olympias Refractory Gold Concentrate,
Proc. TMS Annual Meeting and IPMI, Las Vegas, Nevada,
February 27-March 2, 1989, pp. 179-209. ,, 123. Licht, S., Aqueous Solubilities, Solubility Products
and Stardard Oxidation-Reduction Potentials of the
Metal Sulphides, J. Electrochem. Soc., Vol. 135,
No.12, Dec. 1988, pp. 2971-2975.
124. Attia, Y.A. and El-Zeky, M. Extraction of Precious
Metals From Refractory Sulphide Gomplex by Bioleach
ing: Effects of Galvanic Interactions of Sulphides,
Process Mineralogy VII, TMS Annual Meeting 1988,
pp.241-253.
125. Thompson, L. C. Bio-leaching of Sulphide Ores, Proc.
Int. Symposium on Metallurgical Processes for the Year
2000 and Beyond, TMS Annual Meeting, Las Vegas, Neva
da, Feb. 27-March 3, 1989, Ed. H.Y. Sohn and E.S.
Geskin., pp. 439-450.
126. Case, G. D., Farrior, W. L., Green, D. A. and Stewart,
G. W., The Kinetics and Reactions Products of Aerobic
Pyrrhotite (FeS) Hydrolysis at Ambient Temperatures,
Morgantown Energy Technology Center, METC/RI-79/3,
United States Department of Energy.
127. Lin, H.K., Sohn, H.Y. and Wadsworth, M. E., The Kinet
ics of Leaching of Chalcopyrite and Pyrite Grains in
Primary Copper Ore by Dissolved Oxygen, Hydrometallur
gical Reactor Design and Kinetics, Ed. R.G. Bautista,
R.J. Wesely and G.W. Warren, TMS Annual Meeting, New
Orleans, Luisiana, March 2-6, 1986, pp.149-168.
128. Nicol, M., An Electrochemical Study of the Interaction
of Copper (II) Ions with Sulphide Minerals, Proc. Int.
Symposium on Electrochemistry in Mineral and Metal ~
Processing, Ed. P.E. Richardson, S. Srinivasan and R.
Woods, Procedings Vol. 84-10, pp. 152-168.
129. Hodgson, M. and Agar, G.E., An Electroche~ical Inves
tigation into the Natural Flotability of Pyrrhotite.
Ibid, pp.185-201.
130. Adam, K. and Iwasaki, I., Grinding Media-Sulphide
Mineral Interaction and Its Effect on Flotation, Ibid,
pp.66-80.
131. Morse, J.W., Millero, F.J., Cornwell, C. and Rickard,
D., The Chemistry of the Hydrogen Sulphide and Iron
Sulphide Systems in Natural Waters, Earth Science
Reviews, 0/ ~~, 1987, pp. 1-42.
132. Roberts, R., Bacterial Process Ready for the Big Time,

Gold Gazette, March 14, 1988, pp. 27

6 Aurotech N. L.
1 June 1989
MrC Fabian 18 Broadhurst Crescent BATEMAN WA 6155
DearCes
L•,d floo~. 34 C(1l11, Sireel. \Vc;1 P,·,th. Wesiern 1\u,1rali,, 6()():, GP() Rox M9+1. Perth 6001
CONFIDENTIALITY COVENANT
Telephone lnt: +6193214400 Fax lnt: +619321 4646
We write in response to your request seeking a release from the Confidentiality Covenant you entered into with Aurotech N.L.
As Aurotech is changing its emphasis from bacterial leaching research and development to gold exploration/production we believe it to be fair and reasonable to release you from the Confidentiality Covenant.
We wish you well in your endeavours and thank you for the service given to Aurotech during the period of your employment.
Yours sincerely
BWRIDGEWAY Chairman/Managing Director